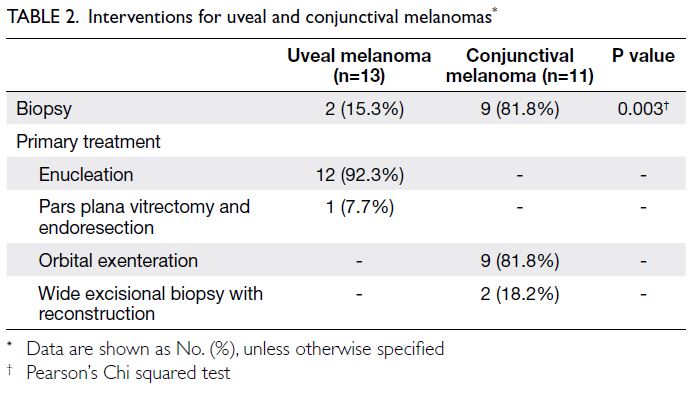
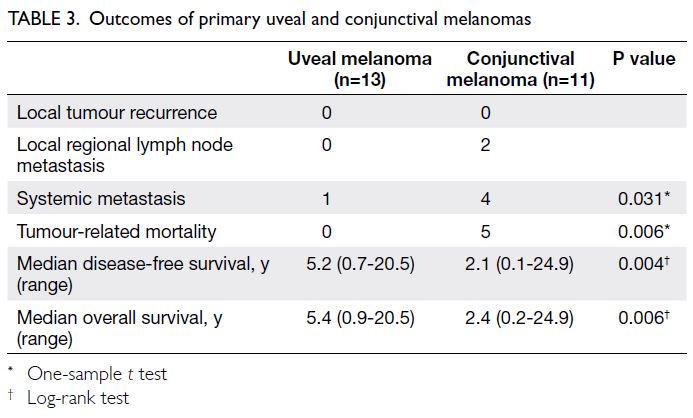
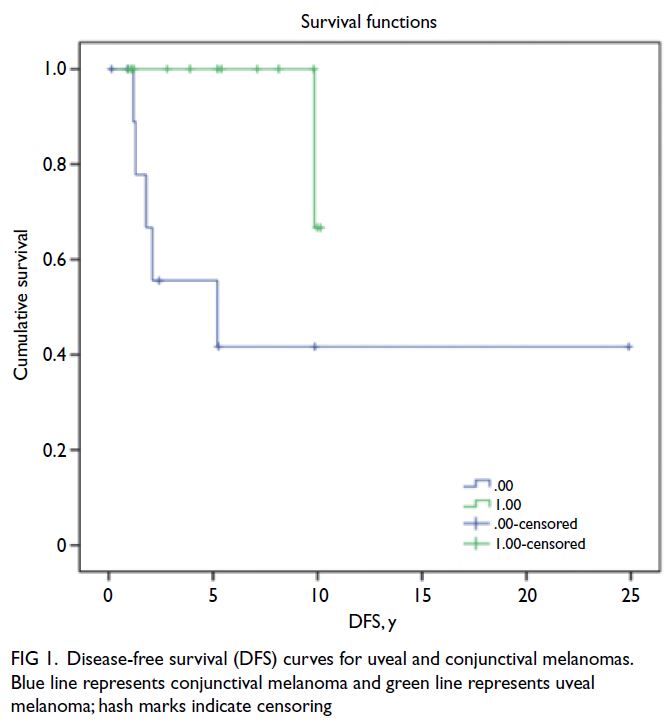
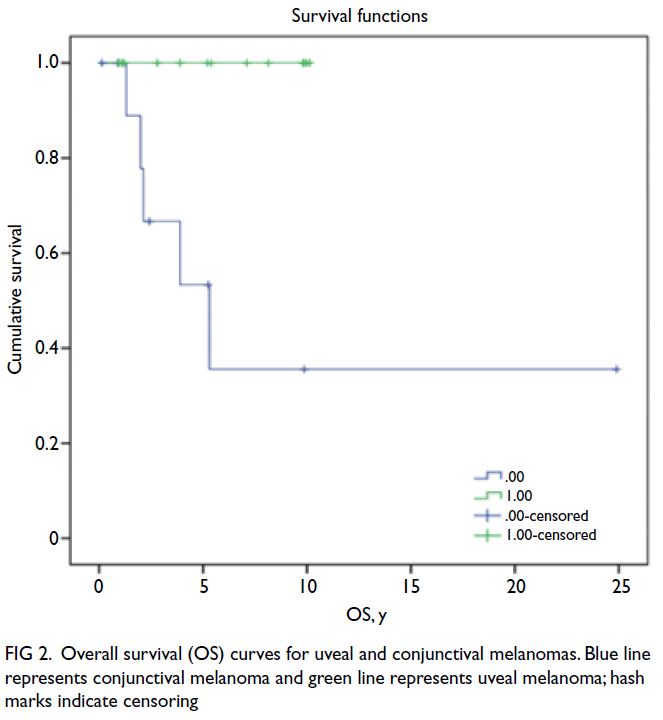
Genetic association of COVID-19 severe versus non-severe cases by RNA sequencing in patients hospitalised in Hong Kong
Hong Kong Med J 2024 Feb;30(1):25–31 | Epub 8 Feb 2024
© Hong Kong Academy of Medicine. CC BY-NC-ND 4.0
ORIGINAL ARTICLE
Genetic association of COVID-19 severe versus non-severe cases by RNA sequencing in patients hospitalised in Hong Kong
Qi Li, PhD1,2 #; Zigui Chen, PhD3 #; Yexian Zhang, PhD2 #; Renee WY Chan, PhD4,5,6,7; Marc KC Chong, PhD1,2; Benny CY Zee, PhD1,2; Lowell Ling, MD8; Grace Lui, MD8; Paul KS Chan, MD3; Maggie H Wang, PhD1,2
1 The Jockey Club School of Public Health and Primary Care, The Chinese University of Hong Kong, Hong Kong SAR, China
2 The Chinese University of Hong Kong Shenzhen Research Institute, Shenzhen, China
3 Department of Microbiology, Stanley Ho Centre for Emerging Infectious Diseases, Li Ka Shing Institute of Health Sciences, The Chinese University of Hong Kong, Hong Kong SAR, China
4 Department of Paediatrics, Faculty of Medicine, The Chinese University of Hong Kong, Hong Kong SAR, China
5 Laboratory for Paediatric Respiratory Research, Li Ka Shing Institute of Health Sciences, Faculty of Medicine, The Chinese University of Hong Kong, Hong Kong SAR, China
6 CUHK-UMCU Joint Research Laboratory of Respiratory Virus and Immunobiology, Department of Paediatrics, Faculty of Medicine, The Chinese University of Hong Kong, Hong Kong SAR, China
7 Hong Kong Hub of Paediatric Excellence, The Chinese University of Hong Kong, Hong Kong SAR, China
8 Department of Anaesthesia and Intensive Care, The Chinese University of Hong Kong, Hong Kong SAR, China
# Equal contribution
Corresponding author: Prof MH Wang (maggiew@cuhk.edu.hk)
 Full paper in PDF
Abstract
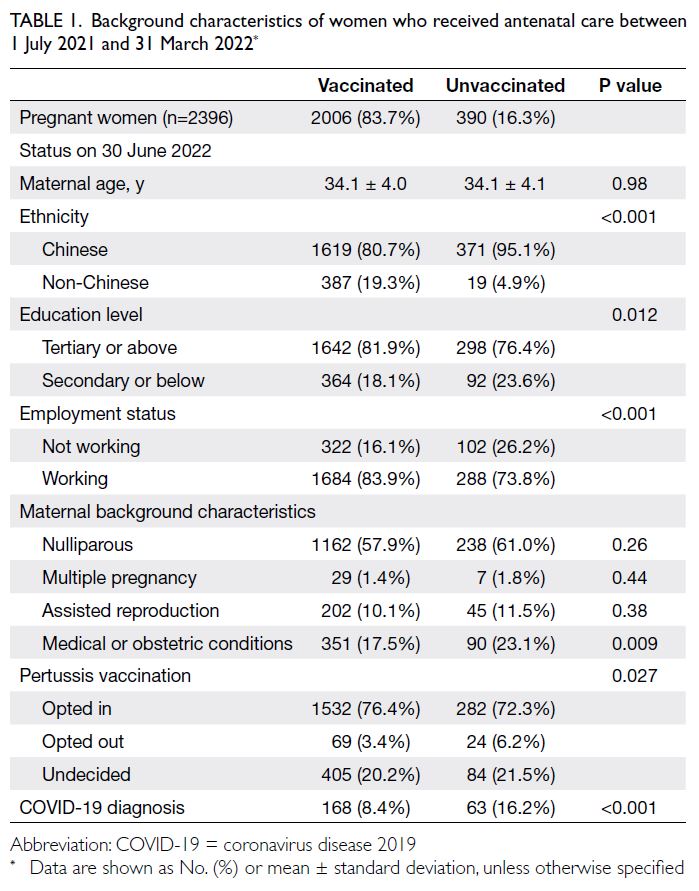
Introduction: The coronavirus disease 2019
(COVID-19) pandemic has caused extensive
disruption of public health worldwide. There were
reports of COVID-19 patients having multiple
complications. This study investigated COVID-19
from a genetic perspective.
Methods: We conducted RNA sequencing
(RNA-Seq) analysis of respiratory tract samples
from 24 patients with COVID-19. Eight patients
receiving mechanical ventilation or extracorporeal
membrane oxygenation were regarded as severe
cases; the remaining 16 patients were regarded as
non-severe cases. After quality control, statistical
analyses were performed by logistic regression and
the Kolmogorov–Smirnov test to identify genes
associated with disease severity.
Results: Six genes were associated with COVID-19
severity in both statistical tests, namely RPL15,
BACE1-AS, CEPT1, EIF4G1, TMEM91, and TBCK.
Among these genes, RPL15 and EIF4G1 played
roles in the regulation of mRNA translation. Gene
ontology analysis showed that the differentially
expressed genes were mainly involved in nervous
system diseases.
Conclusion: RNA sequencing analysis showed that
severe acute respiratory syndrome coronavirus 2
infection is associated with the overexpression of
genes involved in nervous system disorders.
New knowledge added by this study
- Differentially expressed genes between patients with severe and non-severe cases of coronavirus disease 2019 (COVID-19) were reported.
- Overexpression of genes involved in cell proliferation, viral binding and replication, and neurological and lung diseases was observed, suggesting a pathophysiological mechanism by which severe acute respiratory syndrome coronavirus 2 induces lung inflammation and neurological complications.
- Future studies that involve gene expression profiling with larger sample sizes, in vitro infection experiments, and animal models can help to elucidate the mechanisms and corresponding therapeutic approaches for neurological complications of COVID-19.
Introduction
Coronavirus disease 2019 (COVID-19) has spread to
>500 million people and caused 6.2 million deaths
worldwide as of 22 April 2022.1 Approximately
20% of patients with COVID-19 develop severe symptoms and 5% of patients require intensive care.2
A wide range of complications were reported with
COVID-19 infection, including nervous system
diseases,3 4 circulatory system diseases,5 6 7 8 9 urinary
system diseases,10 and digestive system diseases.11
Various genetic associations with COVID-19
outcomes have been explored.12 13 14 15 A whole-genome
sequencing study of germline mutations revealed
a cluster of six genes (SLC6A20, CCR9, FYCO1,
CXCR6, XCR1, and LZTFL1) that increased
susceptibility to severe COVID-19 with respiratory
failure.16 In a Chinese population, a whole-genome
sequencing study of 332 patients with COVID-19
identified loci in the genes TMEM189 and UBE2V1
with potential genome-wide implications through
the IL-1 signalling pathway.17 In an intensive care
unit cohort of 15 patients with severe COVID-19,
analysis of RNA sequencing (RNA-Seq) data from
blood samples showed that the immune-modulating
genes PD-L1 and PD-L2 were differentially expressed
among patients with fatal outcomes.18
Thus far, studies of gene expression at initial
sites of infection in patients with severe and non-severe
COVID-19 remain limited. To investigate
COVID-19 from a genetic perspective, we conducted
RNA-Seq analysis of respiratory tract samples from
patients with COVID-19; we sought to identify genes
associated with disease severity.
Methods
Patients
Twenty-four patients were recruited from Prince of
Wales Hospital in Hong Kong between 7 February
and 10 April 2020. All patients had severe acute
respiratory syndrome coronavirus 2 (SARS-CoV-2)
infection, confirmed by two independent real-time
reverse transcription–polymerase chain reaction
assays targeting the N gene.19 Symptoms on admission
were recorded, and medical histories were collected
from clinical health records. Among the recruited patients, eight who received mechanical ventilation
or extracorporeal membrane oxygenation were
regarded as severe cases; the remaining 16 patients
showed asymptomatic or mild (no pneumonia) to
moderate (pneumonia but not requiring oxygen
supplementation) disease and were regarded as non-severe
cases. RNA sequencing was performed on
upper and lower respiratory swab samples collected
within 3 days after hospitalisation.
RNA sequencing data
Total RNA was extracted from respiratory swab
samples using the QIAamp Viral RNA Mini Kit
(Qiagen, Hilden, Germany), pre-treated with DNase
I and depleted of human rRNA and globin genes
using the QIAseq FastSelect ribosomal RNA
and globin mRNA Removal Kit (Qiagen, Hilden,
Germany). Illumina libraries for RNA-Seq next-generation
sequencing were prepared using the
KAPA HyperPrep Kit (Roche, Pleasanton [CA], US)
in accordance with the manufacturer’s instructions,
then sequenced on an Illumina NextSeq 500 system
(Illumina, San Diego [CA], US) using 150 bp paired-end
reads. The raw data consisted of 58 735 Ensembl-annotated20
genes. Quality control was performed to
remove patients with low numbers of RNA-Seq reads
(three samples) and genes with zero reads in >20% of
samples (55 571 genes). Thus, 3164 genes remained
available for differential expression analysis. Raw
read count data were summarised as fragments per
million reads mapped21 and then log2-transformed.
Statistical analysis
Logistic regression was utilised to identify genes
associated with severity outcomes. Subsequent
evaluations by the Kolmogorov–Smirnov (KS)
test were performed to test for differences in
gene expression between groups. The Bonferroni
corrected significance threshold was 1.58 × 10⁻⁵.
Functional analysis of genes
According to their disease relevance in the
GeneCards21 22 and MalaCards23 24 databases, genes
were categorised into the following 10 disease groups:
nervous system, integumentary system, circulatory
system, urinary system, digestive system, respiratory
system, musculoskeletal system, endocrine system,
reproductive system, and infectious diseases.
Results
Demographics and baseline characteristics
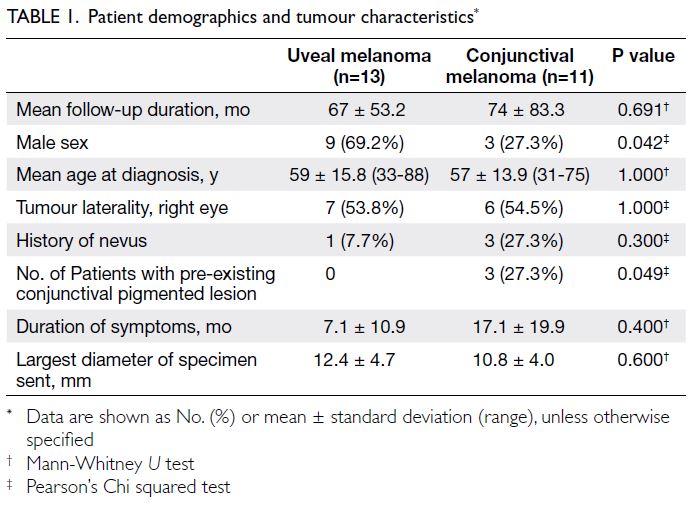
The patients’ demographics and baseline
characteristics are summarised in Table 1. The mean
age of patients in the severe group was 62.13 years
(95% confidence interval [CI]=53.34-70.91), which
was significantly higher than that in the non-severe group (29.73 years; 95% CI=22.11-37.36). Compared
with the non-severe group, the severe group had
higher prevalences of complications including
cardiovascular, liver, endocrine, and metabolic
disorders, as well as higher rates of respiratory, fever,
and diarrhoea symptoms. The COVID-19 World
Health Organization score25 was significantly higher
in the severe group than in the non-severe group.
Lopinavir, antibiotics, conventional oxygen therapy,
and mechanical ventilation were more commonly
used for treatment in the severe group than in the
non-severe group (Table 1).
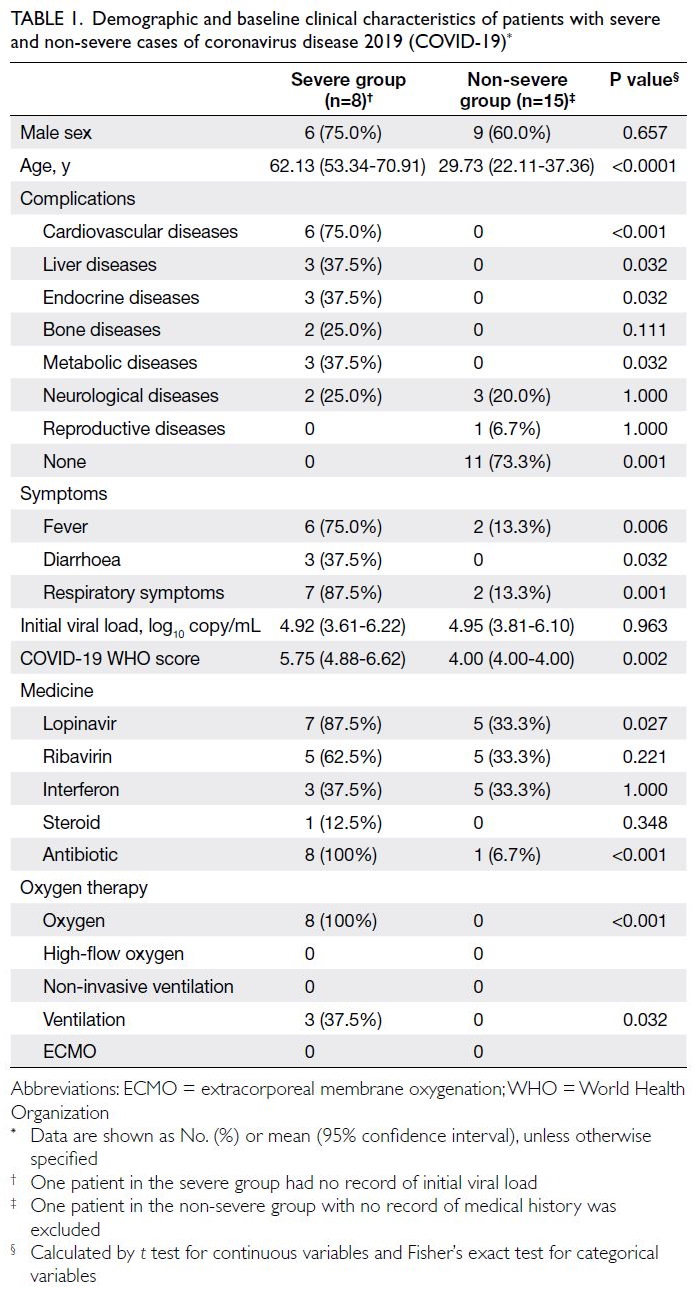
Table 1. Demographic and baseline clinical characteristics of patients with severe and non-severe cases of coronavirus disease 2019 (COVID-19)
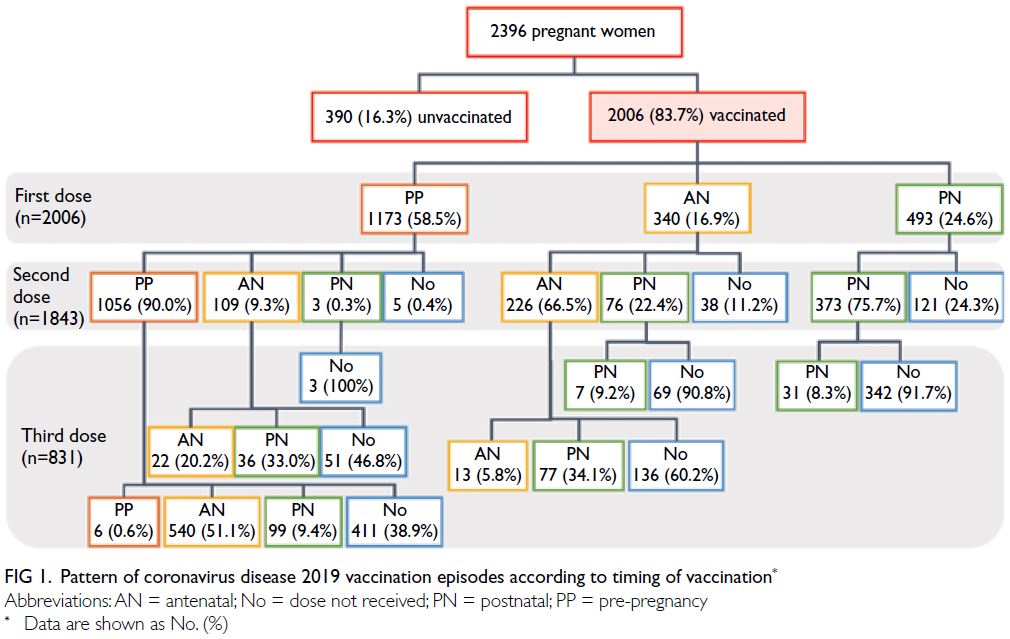
Differentially expressed genes according to
RNA sequencing
Six genes, namely RPL15, BACE1-AS, CEPT1, EIF4G1, TMEM91, and TBCK, were differentially
expressed between the severe and non-severe groups
(all P values <0.05 in both logistic regression and the
KS test) [Table 2]. Fold-change and odds ratio results
indicated that these genes were consistently highly
expressed in the severe group. The complete list of
genes with P values <0.05 in KS test is provided in
online supplementary Table 1.
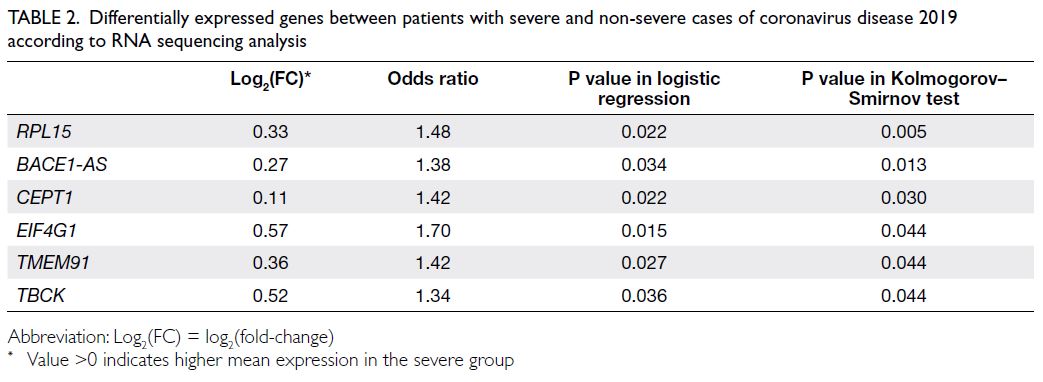
Table 2. Differentially expressed genes between patients with severe and non-severe cases of coronavirus disease 2019 according to RNA sequencing analysis
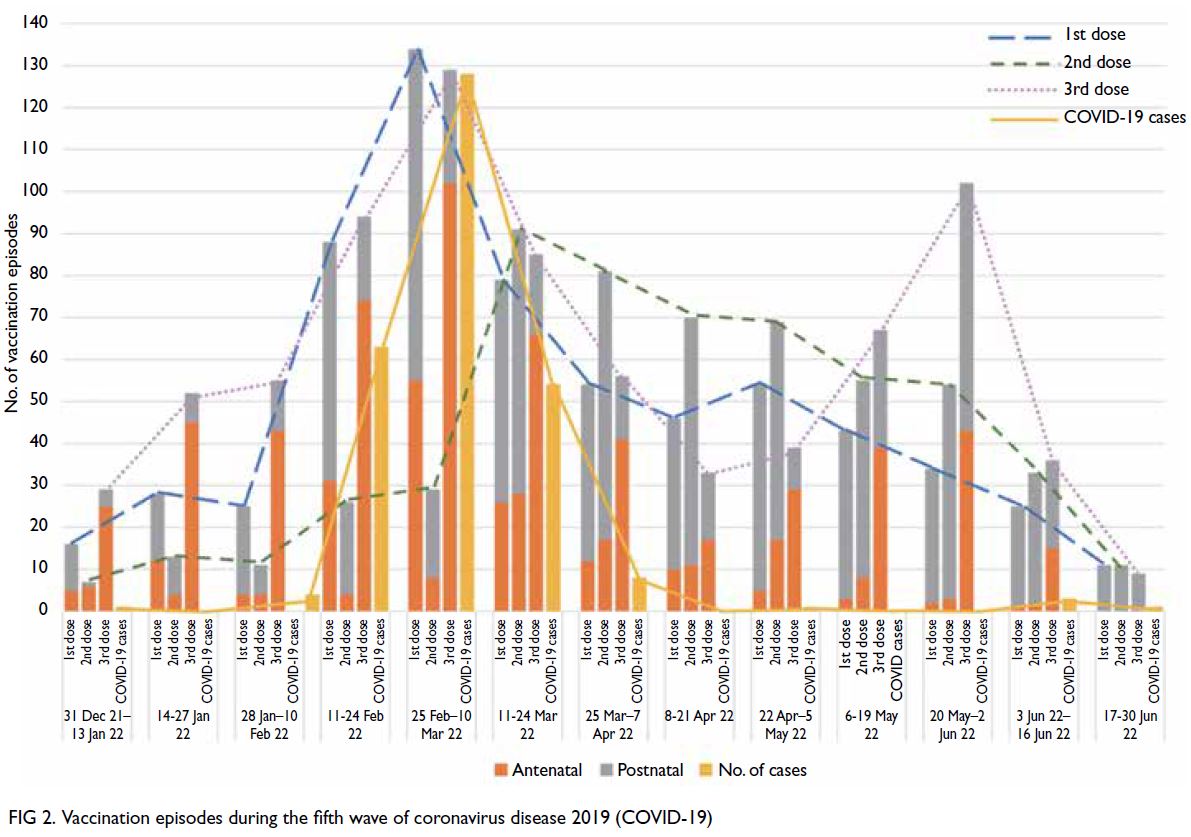
Gene ontology and enrichment analysis
The functions of the identified genes were
summarised through database and literature
searches. Two genes, 60S ribosomal protein L15
(RPL15) and eukaryotic translation initiation factor
4 gamma 1 (EIF4G1), play roles in host translation
of viral mRNA.26 27 28 Furthermore, the top genes were
mainly involved in neurological disorders. RPL15 is
involved in the life cycle of human immunodeficiency
virus,29 30 and baculovirus infection reportedly
disrupts the expression of this gene.31 32 EIF4G1 plays a role in viral binding and affects the pathogenicity
and virulence of H5N1 influenza A virus, foot-and-mouth disease virus, and vaccinia virus33 34 35; it also contains multiple mutations among patients
with familial Parkinson’s disease.36 TBCK encodes
a conserved protein kinase that regulates cell
size and proliferation.37 CEPT1 encodes choline/ethanolamine phosphotransferase, which is used
in the synthesis of choline- or ethanolamine-containing
phospholipids. The function of TMEM91,
a transmembrane protein, is unclear; however, the
results of genome-wide association studies suggest
that loci containing this gene are involved in lung
diseases.
The non-coding gene BACE1-AS regulates
the stability of the BACE1 protein and directly
increases the abundance of amyloid beta-peptide
(Aβ1-42) in Alzheimer’s disease.38 The implications
of this gene in severe COVID-19 are unclear. For
the top 15 overexpressed genes (P values in KS test
<0.05), disease relevance data were retrieved from
GeneCards22; 14 of the 15 genes (93.3%) have been linked to neurological diseases, followed by eye
(80.0%) and psychiatric (73.3%) diseases. Thus, all
of the top genes were involved in nervous system
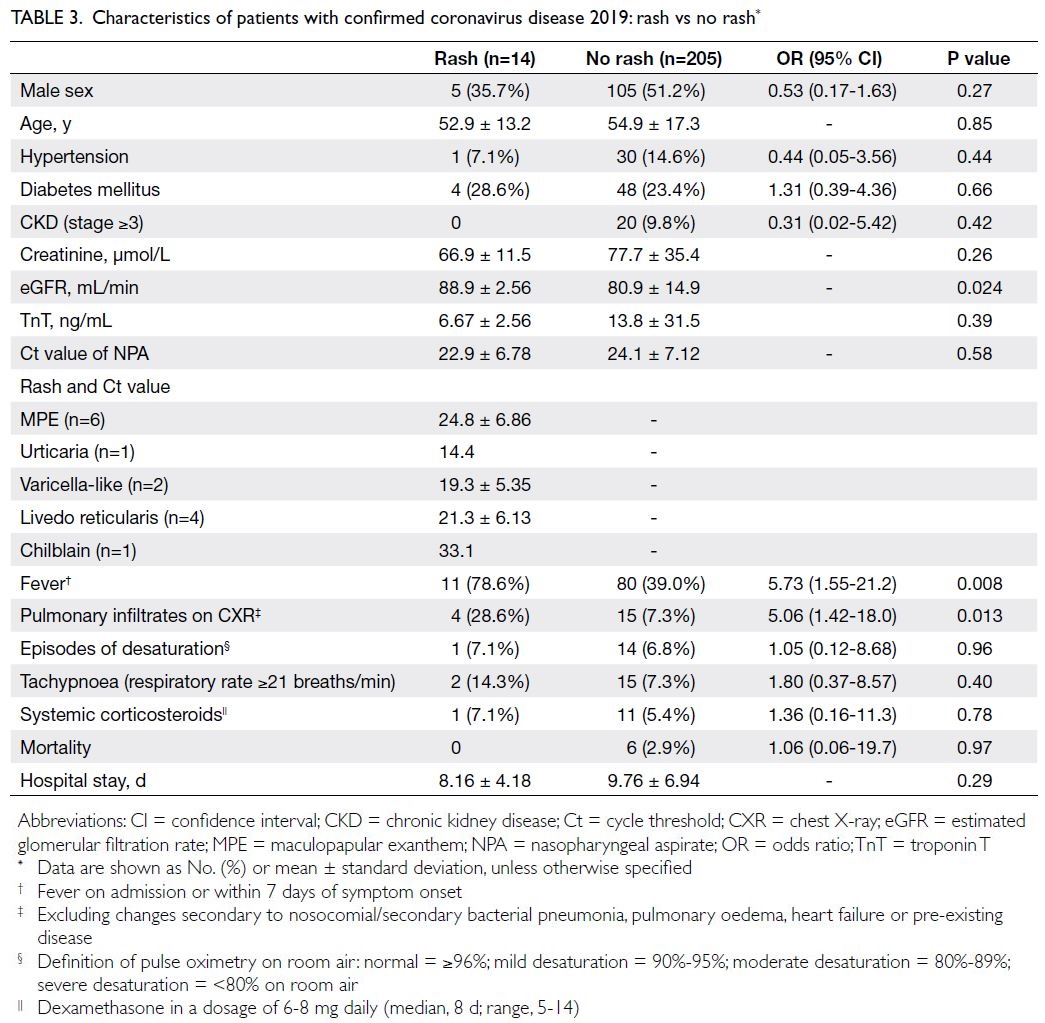
disorders (Fig).
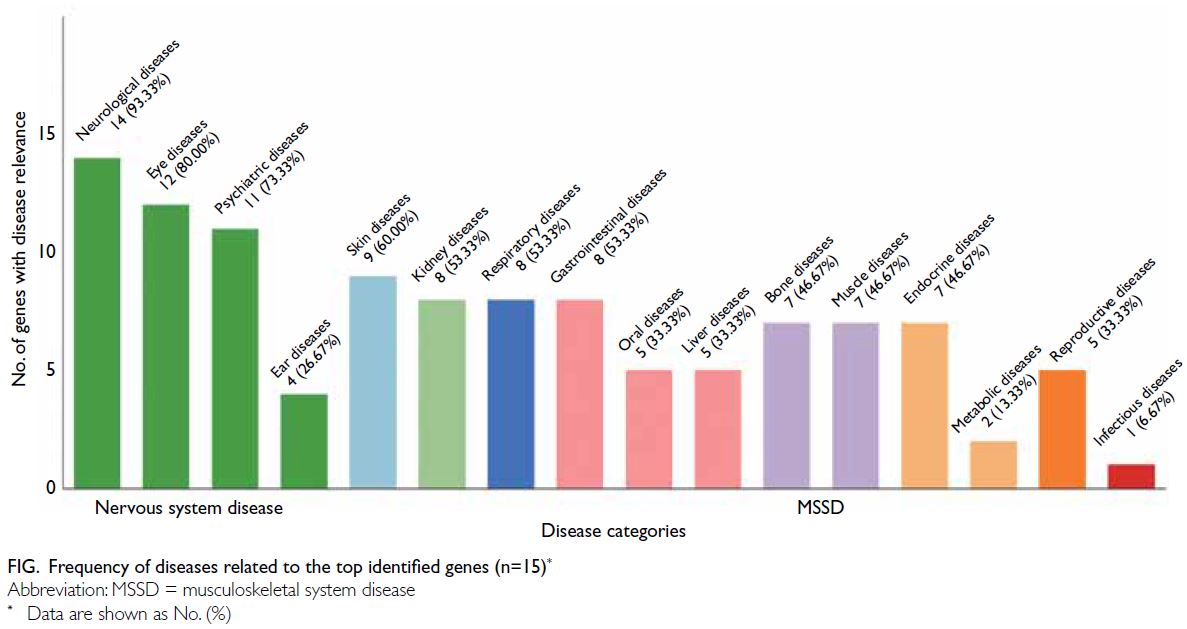
Figure. Frequency of diseases related to the top identified genes (n=15)
Discussion
Nervous system disorders such as encephalopathy,
impaired consciousness, seizure, ataxia, neuropathies, neurodegenerative diseases, and
anosmia have been extensively documented in
patients with COVID-19.39 40 41 The two major
potential pathogenesis pathways are direct viral
invasion and immune-mediated injury. Direct
viral entry to the central nervous system can travel
through hematogenous or olfactory routes, or by
transneuronal spread from the lungs.42 Post-mortem
analysis of brain tissue from patients with COVID-19
encephalitis reportedly contained SARS-CoV-2 viral
particles.43 44 Furthermore, a series of autopsy studies
showed that localised inflammation of the brainstem
nuclei, as well as the cytokine storm associated with
SARS-CoV-2 infection, could disrupt the blood–brain barrier and cause necrosis in the brains of
patients with severe COVID-19.45 46 In patients
with COVID-19, anosmia may be caused by an
inflammation-mediated decrease in odorant receptor
expression.47 Several studies have utilised RNA-Seq
to characterise the transcriptomic profiles of patients
with COVID-19.48 49 Significant downregulation of
genes related to the hypoxia-inducible factor system
was observed during periods of infection and oxygen
deprivation.50 Additionally, transcriptomic profiles
of peripheral blood mononuclear cells revealed that
patients with COVID-19 shared several dysregulated
genes with individuals who had bipolar illness, post-traumatic
stress disorder, or schizophrenia.51 The
present findings suggest that SARS-CoV-2 infection
is associated with differential expression of genes
involved in nervous system disorders. Future studies
that involve gene expression profiling with larger
sample sizes, in vitro infection experiments, and
animal models can help to elucidate the mechanisms
and corresponding therapeutic approaches for
neurological complications of COVID-19.
Limitations
A major limitation of this study was its small sample
size. Patient age distributions considerably differed
between groups. However, age-stratified analysis
showed effects consistent with the directions reported
in Table 2, although the statistical significance
was hindered by the small sample size (online supplementary Table 2 and online supplementary Fig). Further sequencing of samples collected from
respiratory tract sites may provide stronger evidence
of protein expression abnormalities at the initial site
of SARS-CoV-2 infection.
Conclusion
In this study, we conducted RNA-Seq analysis to
identify differentially expressed genes between
patients with severe and non-severe cases of
COVID-19. We observed overexpression of genes
involved in cell proliferation, viral binding and
replication, and neurological and lung diseases,
suggesting a pathophysiological mechanism by
which SARS-CoV-2 induces lung inflammation and
neurological complications.
Author contributions
Concept or design: BCY Zee, PKS Chan, MH Wang.
Acquisition of data: Z Chen, PKS Chan.
Analysis or interpretation of data: Q Li, Z Chen, Y Zhang, RWY Chan, MKC Chong, PKS Chan, G Lui, L Ling.
Drafting of the manuscript: Q Li, MH Wang.
Critical revision of the manuscript for important intellectual content: Q Li, Y Zhang, MH Wang.
Acquisition of data: Z Chen, PKS Chan.
Analysis or interpretation of data: Q Li, Z Chen, Y Zhang, RWY Chan, MKC Chong, PKS Chan, G Lui, L Ling.
Drafting of the manuscript: Q Li, MH Wang.
Critical revision of the manuscript for important intellectual content: Q Li, Y Zhang, MH Wang.
All authors had full access to the data, contributed to the study, approved the final version for publication, and take responsibility for its accuracy and integrity.
Conflicts of interest
BCY Zee is a shareholder of Health View Bioanalytic Limited.
As a statistical adviser of the journal, MKC Chong was not
involved in the peer review process. MH Wang is a shareholder
of Beth Bioinformatics Co, Ltd. Other authors have disclosed
no conflicts of interest.
Funding/support
This research was partially supported by the Health and
Medical Research Fund of the former Food and Health Bureau,
Hong Kong SAR Government (Ref Nos.: COVID190103,
COVID190112 and INF-CUHK-1), The Chinese University of
Hong Kong (CUHK) Project Impact Enhancement Fund (Ref
No.: CUPIEF/Ph2/COVID/06) and CUHK Direct Grant (Ref
No.: 2020.025). The funders had no role in study design, data
collection/analysis/interpretation, or manuscript preparation.
Ethics approval
The study protocol of this research was approved by the
Joint Chinese University of Hong Kong–New Territories
East Cluster Clinical Research Ethics Committee (Ref No.:
2020.076). All patients provided written informed consent for
participation in this research.
Supplementary material
The supplementary material was provided by the authors
and some information may not have been peer reviewed. Any opinions or
recommendations discussed are solely those of the author(s)
and are not endorsed by the Hong Kong Academy of
Medicine and the Hong Kong Medical Association. The Hong
Kong Academy of Medicine and the Hong Kong Medical Association disclaim all liability and responsibility arising
from any reliance placed on the content.
References
1. World Health Organization. COVID-19 global data.
Available from: https://covid19.who.int/WHO-COVID-19-global-data.csv. Accessed 22 Apr 2022.
2. Wu Z, McGoogan JM. Characteristics of and important
lessons from the coronavirus disease 2019 (COVID-19)
outbreak in China: summary of a report of 72 314 cases
from the Chinese Center for Disease Control and
Prevention. JAMA 2020;323:1239-42. Crossref
3. Gusev EI, Martynov MY, Boyko AN, et al. The novel
coronavirus infection (COVID-19) and nervous system
involvement: mechanisms of neurological disorders,
clinical manifestations, and the organization of
neurological care. Neurosci Behav Physiol 2021;51:147-54. Crossref
4. Kubota T, Kuroda N. Exacerbation of neurological
symptoms and COVID-19 severity in patients with
preexisting neurological disorders and COVID-19: a
systematic review. Clin Neurol Neurosurg 2021;200:106349. Crossref
5. Zhou F, Yu T, Du R, et al. Clinical course and risk factors
for mortality of adult inpatients with COVID-19 in Wuhan,
China: a retrospective cohort study. Lancet 2020;395:1054-62. Crossref
6. Li X, Xu S, Yu M, et al. Risk factors for severity and mortality
in adult COVID-19 inpatients in Wuhan. J Allergy Clin
Immunol 2020;146:110-8. Crossref
7. Chen R, Liang W, Jiang M, et al. Risk factors of fatal
outcome in hospitalized subjects with coronavirus
disease 2019 from a nationwide analysis in China. Chest
2020;158:97-105. Crossref
8. Docherty AB, Harrison EM, Green CA, et al. Features
of 20 133 UK patients in hospital with COVID-19
using the ISARIC WHO Clinical Characterisation
Protocol: prospective observational cohort study. BMJ
2020;369:m1985. Crossref
9. Richardson S, Hirsch JS, Narasimhan M, et al. Presenting
characteristics, comorbidities, and outcomes among 5700
patients hospitalized with COVID-19 in the New York City
area. JAMA 2020;323:2052-9. Crossref
10. Cheng Y, Luo R, Wang K, et al. Kidney disease is associated
with in-hospital death of patients with COVID-19. Kidney
Int 2020;97:829-38. Crossref
11. Mao R, Qiu Y, He JS, et al. Manifestations and prognosis
of gastrointestinal and liver involvement in patients with
COVID-19: a systematic review and meta-analysis. Lancet
Gastroenterol Hepatol 2020;5:667-78. Crossref
12. Pairo-Castineira E, Clohisey S, Klaric L, et al. Genetic
mechanisms of critical illness in COVID-19. Nature
2021;591:92-8. Crossref
13. COVID-19 Host Genetics Initiative. The COVID-19 Host
Genetics Initiative, a global initiative to elucidate the
role of host genetic factors in susceptibility and severity
of the SARS-CoV-2 virus pandemic. Eur J Hum Genet
2020;28:715-8. Crossref
14. Anastassopoulou C, Gkizarioti Z, Patrinos GP, Tsakris A.
Human genetic factors associated with susceptibility to
SARS-CoV-2 infection and COVID-19 disease severity.
Human Genomics 2020;14:40. Crossref
15. Kousathanas A, Pairo-Castineira E, Rawlik K, et al. Whole-genome
sequencing reveals host factors underlying critical
COVID-19. Nature 2022;607:97-103. Crossref
16. Severe Covid-19 GWAS Group; Ellinghaus D, Degenhardt
F, et al. Genomewide association study of severe
COVID-19 with respiratory failure. N Engl J Med
2020;383:1522-34. Crossref
17. Wang F, Huang S, Gao R, et al. Initial whole-genome
sequencing and analysis of the host genetic contribution
to COVID-19 severity and susceptibility. Cell Discov
2020;6:83. Crossref
18. Fredericks AM, Jentzsch MS, Cioffi WG, et al. Deep RNA
sequencing of intensive care unit patients with COVID-19.
Sci Rep 2022;12:15755. Crossref
19. Lui G, Ling L, Lai CK, et al. Viral dynamics of SARS-CoV-2
across a spectrum of disease severity in COVID-19. J Infect
2020;81:318-56. Crossref
20. Howe KL, Achuthan P, Allen J, et al. Ensembl 2021. Nucleic Acids Res 2021;49:D884-91. Crossref
21. Stelzer G, Rosen N, Plaschkes I, et al. The GeneCards
suite: from gene data mining to disease genome sequence
analyses. Curr Protoc Bioinformatics 2016;54:1.30.1-33. Crossref
22. GeneCards. Available from: www.genecards.org. Accessed 15 Jan 2024.
23. Rappaport N, Twik M, Plaschkes I, et al. MalaCards: an
amalgamated human disease compendium with diverse
clinical and genetic annotation and structured search.
Nucleic Acids Res 2017;45:D877-87. Crossref
24. MalaCards. Available from: www.malacards.org. Accessed 15 Jan 2024.
25. WHO Working Group on the Clinical Characterisation
and Management of COVID-19 infection. A minimal
common outcome measure set for COVID-19 clinical
research. Lancet Infect Dis 2020;20:e192-7. Crossref
26. Ulyanova V, Shah Mahmud R, Laikov A, et al. Anti-influenza
activity of the ribonuclease binase: cellular
targets detected by quantitative proteomics. Int J Mol Sci
2020;21:8294. Crossref
27. Hanson P, Zhang HM, Hemida MG, Ye X, Qiu Y, Yang D.
IRES-dependent translational control during virus-induced
endoplasmic reticulum stress and apoptosis. Front
Microbiol 2012;3:92. Crossref
28. Miller MD, Farnet CM, Bushman FD. Human
immunodeficiency virus type 1 preintegration complexes:
studies of organization and composition. J Virol
1997;71:5382-90. Crossref
29. Frankel AD, Young JA. HIV-1: fifteen proteins and an RNA.
Annu Rev Biochem 1998;67:1-25. Crossref
30. Kash JC, Goodman AG, Korth MJ, Katze MG. Hijacking
of the host-cell response and translational control during
influenza virus infection. Virus Res 2006;119:111-20. Crossref
31. van Oers MM, Doitsidou M, Thomas AA, de Maagd RA,
Vlak JM. Translation of both 5’ TOP and non-TOP host
mRNAs continues into the late phase of Baculovirus
infection. Insect Mol Biol 2003;12:75-84. Crossref
32. Zhou H, Zhu J, Tu J, et al. Effect on virulence and
pathogenicity of H5N1 influenza A virus through
truncations of NS1 eIF4GI binding domain. J Infect Dis
2010;202:1338-46. Crossref
33. Foeger N, Kuehnel E, Cencic R, Skern T. The binding
of foot-and-mouth disease virus leader proteinase to
eIF4GI involves conserved ionic interactions. FEBS J 2005;272:2602-11. Crossref
34. Zaborowska I, Kellner K, Henry M, Meleady P, Walsh D.
Recruitment of host translation initiation factor eIF4G by
the Vaccinia Virus ssDNA-binding protein I3. Virology
2012;425:11-22. Crossref
35. Chartier-Harlin MC, Dachsel JC, Vilariño-Güell C, et al.
Translation initiator EIF4G1 mutations in familial
Parkinson disease. Am J Hum Genet 2011;89:398-406. Crossref
36. Bhoj EJ, Li D, Harr M, et al. Mutations in TBCK, encoding
TBC1-domain-containing kinase, lead to a recognizable
syndrome of intellectual disability and hypotonia. Am J
Hum Genet 2016;98:782-8. Crossref
37. Chong JX, Caputo V, Phelps IG, et al. Recessive inactivating
mutations in TBCK, encoding a Rab GTPase-activating
protein, cause severe infantile syndromic encephalopathy.
Am J Hum Genet 2016;98:772-81. Crossref
38. Khatoon F, Prasad K, Kumar V. COVID-19 associated
nervous system manifestations. Sleep Med 2022;91:231-6. Crossref
39. Butowt R, von Bartheld CS. Anosmia in COVID-19:
underlying mechanisms and assessment of an olfactory
route to brain infection. Neuroscientist 2021;27:582-603. Crossref
40. Ye M, Ren Y, Lv T. Encephalitis as a clinical manifestation
of COVID-19. Brain Behav Immun 2020;88:945-6. Crossref
41. Johansson A, Mohamed MS, Moulin TC, Schiöth HB.
Neurological manifestations of COVID-19: a
comprehensive literature review and discussion of
mechanisms. J Neuroimmunol 2021;358:577658. Crossref
42. Paniz-Mondolfi A, Bryce C, Grimes Z, et al. Central
nervous system involvement by severe acute respiratory
syndrome coronavirus-2 (SARS-CoV-2). J Med Virol
2020;92:699-702. Crossref
43. Moriguchi T, Harii N, Goto J, et al. A first case of meningitis/encephalitis associated with SARS-coronavirus-2. Int J Infect Dis 2020;94:55-8. Crossref
44. von Weyhern CH, Kaufmann I, Neff F, Kremer M. Early
evidence of pronounced brain involvement in fatal
COVID-19 outcomes. Lancet 2020;395:e109. Crossref
45. Virhammar J, Kumlien E, Fällmar D, et al. Acute necrotizing
encephalopathy with SARS-CoV-2 RNA confirmed in
cerebrospinal fluid. Neurology 2020;95:445-9. Crossref
46. Radmanesh A, Derman A, Ishida K. COVID-19–associated
delayed posthypoxic necrotizing leukoencephalopathy. J
Neurol Sci 2020;415:116945. Crossref
47. Daamen AR, Bachali P, Owen KA, et al. Comprehensive
transcriptomic analysis of COVID-19 blood, lung, and
airway. Sci Rep 2021;11:7052. Crossref
48. Xiong Y, Liu Y, Cao L, et al. Transcriptomic characteristics
of bronchoalveolar lavage fluid and peripheral blood
mononuclear cells in COVID-19 patients. Emerg Microbes
Infect 2020;9:761-70. Crossref
49. Gagliardi S, Poloni ET, Pandini C, et al. Detection of SARS-CoV-2 genome and whole transcriptome sequencing in frontal cortex of COVID-19 patients. Brain Behav Immun 2021;97:13-21. Crossref
50. Moni MA, Lin PI, Quinn JM, Eapen V. COVID-19 patient
transcriptomic and genomic profiling reveals comorbidity
interactions with psychiatric disorders. Transl Psychiatry
2021;11:160. Crossref
51. MAQC Consortium; Shi L, Reid LH, et al. The
MicroArray Quality Control (MAQC) project shows
inter- and intraplatform reproducibility of gene expression
measurements. Nat Biotechnol 2006;24:1151-61. Crossref