 Vanessa Opladen
 Julia A. Tanck
 Julia Baur
 Andrea S. Hartmann
 Jennifer Svaldi
 Silja Vocks
- 1Department of Clinical Psychology and Psychotherapy, Osnabrück University, Osnabrück, Germany
- 2Department of Clinical Psychology and Psychotherapy, University of Tübingen, Tübingen, Germany
- 3Department of Psychology, Experimental Clinical Psychology, University of Konstanz, Konstanz, Germany
Introduction: Vocal analysis of fundamental frequency (f0) represents a suitable index to assess emotional activation. However, although f0 has often been used as an indicator of emotional arousal and different affective states, its psychometric properties are unclear. Specifically, there is uncertainty regarding the validity of the indices of f0mean and f0variabilitymeasures (f0dispersion, f0range, and f0SD) and whether higher or lower f0 indices are associated with higher arousal in stressful situations. The present study therefore aimed to validate f0 as a marker of vocally encoded emotional arousal, valence, and body-related distress during body exposure as a psychological stressor.
Methods: N = 73 female participants first underwent a 3-min, non-activating neutral reference condition, followed by a 7-min activating body exposure condition. Participants completed questionnaires on affect (i.e., arousal, valence, body-related distress), and their voice data and heart rate (HR) were recorded continuously. Vocal analyses were performed using Praat, a program for extracting paralinguistic measures from spoken audio.
Results: The results revealed no effects for f0 and state body dissatisfaction or general affect. F0mean correlated positively with self-reported arousal and negatively with valence, but was not correlated with HRmean/maximum. No correlations with any measure were found for any f0variabililtymeasures.
Discussion: Given the promising findings regarding f0mean for arousal and valence and the inconclusive findings regarding f0 as a marker of general affect and body-related distress, it may be assumed that f0mean represents a valid global marker of emotional arousal and valence rather than of concrete body-related distress. In view of the present findings regarding the validity of f0, it may be suggested that f0mean, but not f0variabilitymeasures, can be used to assess emotional arousal and valence in addition to self-report measures, which is less intrusive than conventional psychophysiological measures.
Introduction
Verbally expressing one’s emotions and understanding the affective responses of others are central to human communication. To assess the expression of affect, many studies [e.g., (1–3)] have integrated a two-dimensional approach splitting affect into arousal [level of physiological awareness; (4)] and valence [level of pleasure/displeasure; (5)]. While there are several well-validated questionnaires to measure both arousal and valence, the reliance on questionnaire data can entail a risk of self-report bias (6, 7). Further, a lack of emotional introspection or interoception in the participant may bias the data [e.g., (8)]. A more objective bodily indicator to measure affect is the use of psychophysiological indices [e.g., blood biomarkers, heart rate (HR), electrodermal activity or endocrine parameters]. Such markers are often applied in research in order to generate more objective data (9). However, although these psychophysiological measures are less subjective than self-report questionnaire measures, they likewise appear to come with a risk of bias: Due to their salience and visibility, they are likely to distract participants from the task at hand (6). Moreover, the invasive nature of some methods, such as the collection of blood markers, decreases participants’ compliance (10) and physical comfort (11). In addition, some psychophysiological measures are likely to cause artifacts due to the draping of wires and the restriction of participants’ mobility [cf. (12)]. These limitations of psychophysiological methods likely contribute to the low correspondence of psychophysiological measures among each other (13) and with subjective data (14).
Vocal analysis, as a well-established tool in clinical psychology (15), may counteract some of the disadvantages of psychophysiological measures. A particular quality of vocal analysis is that voice data can be derived from audio recordings (16), rendering the method user-friendly for the participant. Moreover, given its non-invasive nature (17), vocal analysis may potentially reduce the bias that is inherent in measuring affect using other psychophysiological methods (16). Fundamental frequency (f0) is a commonly used instrument to examine affect by means of the voice (18). F0 is the measurable substrate with which the perceived vocal pitch is highly correlated, and refers to the vibration of vocal folds (19). It physically represents the lowest vocal frequency harmonic of a waveform measured in Hertz (Hz); (20). Under the assumption that f0 is an indicator of vocally encoded emotional arousal [e.g., (21, 22)], it has been examined in a variety of different contexts. For example, f0 has been viewed as an indicator of arousal in the context of discussions in romantic relationships [(23); i.e., f0mean] or family conflicts [(24); i.e., f0range] and has also been investigated as an indicator of stress [(25); i.e., f0range], empathy [(26); i.e., f0mean] or to detect clinical social anxiety [(27); i.e., f0mean]. Besides this, numerous studies have suggested that f0 might represent a marker of specific emotional states (28) such as fear [e.g., (29); i.e., f0mean; (30); i.e., f0range]. Other studies found no difference in f0 between diametrically opposed emotions such as happiness and fear [(31); i.e., f0mean and adapted f0range], thus calling into question the suitability of deriving different emotions from f0. If not as a marker of a single emotion, but as a marker of the dimension of valence [pleasant, unpleasant; (5)], f0 has received less research attention (32) and there is little (if any) agreement on whether f0 is associated with valence in general [cf. (33)]. Therefore, while f0 has been studied in many contexts, it has not been directly validated as a marker of arousal. Likewise, while it has been examined with regard to specific emotional states, it has not yet been directly validated as a broad marker of valence.
Furthermore, the question of which distributional characteristic of f0 fits to examine affect remains unanswered. Two debated parameters described in literature are f0mean [e.g., (34, 35)] and f0variabilitymeasures [e.g., (30)]. F0mean refers to the arithmetic mean of f0. As the most common statistical measure used to indicate the central tendency of a distribution (36), it refers in this case to the interval-scaled variable of f0, and it is calculated as the sum of all measured values divided by the number of values (36). Regarding f0variabilitymeasures, we refer to the statistical indices of f0range (i.e., f0max–f0min) and f0SD. By using the term f0dispersion, we refer to an adapted range, because the usual calculation of f0range might bias information about the f0 distribution in the case of natural outliers (29). Therefore, as described in Hirst (37), f0dispersion displays the calculated difference between the largest and the smallest measured value with a cut of the 0.1 and the 0.2 quantile from the top and bottom f0. It is debatable whether f0mean (34, 35) or f0variabilitymeasures (30) are more valid to detect arousal and valence in acoustic features. Both indices seem reasonable, as they have been generally found to be markers of affect [for an overview see (28)]. However, in terms of direction, arousal and valence have been reported to be related to both higher f0mean (19, 38) and higher f0variabilitymeasures (39), as well as lower f0mean (34) and lower f0variabilitymeasures (30, 40). For instance, Rothkrantz and colleagues (38) designed an experiment in which cognitive workload was induced using different stress provoking tasks (e.g., Stroop test) and found an increase in f0mean and f0variability with heightened levels of emotional stress. Likewise, Lively and colleagues (40) induced emotional stress in their participants using a visual tracking task to manipulate cognitive workload. However, in this experiment, the authors found a decrease in f0variability and no consistent effect for f0mean. Therefore, although both tasks were equally stress-provoking, the outcome regarding f0 was ambivalent. Thus, it is unclear whether affect is associated with higher (19, 24, 41, 42) or lower (30, 43, 44) f0mean and f0variabilitymeasures.
To sum up, f0 has not yet been directly validated as a correlate of affect (i.e., arousal and valence). Moreover, its underlying dimensions of arousal and valence as well as the significance of high and low f0 indices are yet to be examined. The domain of body image might be a suitable research field to resolve this uncertainty and to further validate f0, as real-time measurements are of importance in this field: On the one hand, given that body image is known to have a trait-like and a state component (45), prospectively or retrospectively assessed questionnaire data might be biased due to natural state fluctuations in body image (46). On the other hand, non-invasive psychophysiological measurements may be useful in the field of body image. As the main stimulus or stressor is often the subject’s own body [e.g., (47)], visible psychophysiological measures applied on the body (e.g., electroencephalogram) may be distracting and might directly influence the validity of the respective studies. In the clinical context, body exposure is a commonly used technique to improve body image, in which individuals are instructed to look at their body while verbalizing the arising thoughts and emotions (48). Body exposure is therefore suitable to create physiological affective reactions [cf. (49)], as it has been shown to create arousal (50–52) and body-related distress (49) according to self-reported questionnaire data, including in healthy populations (47, 50).
Underlining the importance of non-invasive measures in the field of body image, two studies have already examined the predictive value of f0 as a correlate of body-related distress during a body exposure task (34, 35). However, in line with the aforementioned ambiguity of previous research, the results differed according to the respective sample of each study: F0mean was found to be positively related to the construct of state body dissatisfaction in a sample of female participants with overweight and obesity (35) but unrelated to the same construct in a sample of women with binge eating disorder (34). The authors explained this discrepancy by a lack of ability of individuals with eating pathology to adequately engage physiologically in tasks that provoke body-related distress (34). In both studies, f0 was assessed only as a correlate of body dissatisfaction and not as a correlate of affect or its underlying dimensions arousal and valence (3, 33). Besides the fact that the above-mentioned studies exclusively focused on body-related distress, they also lacked detailed analyses of other metrics: Contrary to recommendations [cf. (53)], additional vocal indices (e.g., f0varability measures) and the connection to different physiological measures such as HR (34) have not yet been discussed in the context of body exposure. As such, indications that f0 represents a marker of vocally encoded affect, arousal, valence, and potentially body-related distress, remain scarce.
In the present study, we therefore aimed to validate the indices of f0mean and f0varability measures (f0dispersion, f0range, f0SD) as correlates of vocally encoded emotional arousal, valence, and body-related distress (i.e., trait-like eating disorder severity and state body dissatisfaction) during body exposure in healthy women. To examine psychophysiological activation (i.e., valence, arousal, body-related distress), we used voice and HR data from a 7-min body exposure session in which participants looked at their body and freely described their body-related thoughts and feelings. We compared this body exposure (experimental) condition to a preceding neutral, non-body-related baseline (control) condition. Trait-like eating disorder severity was assessed directly before participants underwent the stressor of body exposure. As state measures, we administered self-report questionnaires on state body dissatisfaction, arousal, valence, and general affect before, (during), and after the body exposure.
Despite the ambiguity regarding the direction of f0, in our first hypothesis, we expected an increase in f0mean during the body exposure condition compared to the baseline condition, in line with previous studies on vocally encoded body-related distress (34, 35). Moreover, based on studies in patients with anxiety disorder [e.g., (30)], we expected a decrease in f0variabilitymeasures during the body exposure condition compared to the baseline condition. Second, in accordance with findings by Baur and colleagues (35), we hypothesized that body exposure would induce more arousal for individuals with higher trait-like eating disorder severity, which should be reflected in increased f0mean and decreased f0variabilitymeasures. Third, in line with the positive correlations between f0 and questionnaire-based pathology reported in patients with anxiety disorder (54), for state measures, we hypothesized positive correlations of f0mean/variability measures with state body-related distress, self-reported arousal, and negative correlations with self-reported valence and general negative affect. Fourth, also in terms of convergent validity, we hypothesized significant positive correlations between f0mean/variability measures and the psychophysiological marker of HRmean/maximum. Further, in terms of comparability between the two psychophysiological measures, we assumed that the HR would follow the expected pattern of an increase during body exposure, as also hypothesized for f0mean/variability measures.
Materials and methods
Participants
The study was approved by the local Ethics Committee (4/71043.5). The sample was community-based and recruited by means of the local university’s mailing list, social media advertisements, as well as personal contacts. The inclusion criteria were identifying as female and an age between 18 and 45 years, and the exclusion criteria were self-reported current or past diagnosis of a mental disorder, history of and current drug abuse or acute intoxication by psychotropic substances, and past or present suicidal tendencies or self-harm behavior. We only included participants who identified as female, as this population is likely to show greater body dissatisfaction than, for example, participants who identify as men (55), and we therefore expected higher stress responsiveness in females than in a mixed-gender sample. Moreover, due to potential natural variations in f0 between different genders [i.e., higher in females; (42) and lower in males, (56)], it was important for the comparability of the data to remain within the range of a female f0. Recruitment began with a first email contact and prospective participants subsequently underwent a structured telephone screening to check the inclusion and exclusion criteria. Out of 113 initial email contacts, n = 2 participants did not meet the inclusion criteria, n = 21 reported no further interest in participating, and n = 13 did not respond to any contact attempts. During the course of the study, n = 2 participants dropped out and n = 1 declared a diagnosed eating disorder in remission after testing. During the analysis, n = 1 participant was excluded due to missing data. Therefore, data from N = 73 female participants were ultimately analyzed. As reimbursement, participants received course credits or a €5 gift voucher per hour of participation.
Psychological measures
Trait-like measures
Sociodemographic and study-relevant characteristics
Participants provided information on basic sociodemographic data such as age, nationality, employment status, education, and body-related personal data such as hours of exercise including weight-training weight-training, dieting, and therapeutic treatment. The body mass index (BMI) was retrospectively calculated by dividing self-reported weight (in kg) by height squared (in m2).
Eating Disorder Examination-Questionnaire
The Eating Disorder Examination-Questionnaire [(EDE-Q); (57, 58)] is a trait-like instrument assessing the frequency and severity of eating disorder symptoms. It comprises 22 items divided across four subscales: Restraint, Eating Concern, Weight Concern, Shape Concern. Items are rated on a seven-point Likert scale (from 0 = no days/none of the time/not at all to 6 = every day/every time/markedly). Internal consistencies were found to be good to excellent in a validation study [α = 0.97 for the global score; 0.85 < α < 0.93 for the separate subscales; (59)] and in the present study (α = 0.92 for the global score, 0.76 < α < 0.86 for the separate subscales).
Eating Disorder Inventory-2
The Eating Disorder Inventory-2 [(EDI-2); (60, 61)] is a self-report instrument measuring trait-like eating disorder severity. In the present study, we used the two subscales Body Dissatisfaction (nine items) and Drive for Thinness (seven items) to assess the participants’ (dis)satisfaction with body parts and preoccupation with their body. All items are rated on a 6-point Likert scale (from 1 = never to 6 = always). Previous studies in healthy females have demonstrated excellent Cronbach’s α for both subscales [Body Dissatisfaction: α = 0.90, (62); Drive for Thinness: α > 0.86, (63)], as did the present study (Body Dissatisfaction α = 0.84; Drive for Thinness Scale α = 0.88)].
State measures
Body Image States Scale
The Body Image States Scale [(BISS); (45, 64)] was used to assess cognitive-affective changes in state body dissatisfaction. The BISS contains six items assessing current (dis)satisfaction with one’s physical appearance on a nine-point Likert scale (from 1 = extremely dissatisfied to 9 = extremely satisfied). In a previous study in healthy females (55), internal consistency ranged from good to excellent (0.82 < α < 0.90), which was also the case in the present study (0.89 < α < 0.91).
Self-Assessment Manikin
The Self-Assessment Manikin [(SAM); (65)] is a picture-based instrument in which participants rate the broad dimensions of Arousal and Valence on the depicted figures. In the present study, the SAM was used as a state instrument (i.e., directly before, during, and directly after body exposure). Participants performed single ratings on a nine-point Likert scale (from 1 = extremely calm to 9 = extremely aroused for Arousal and from 1 = extremely unpleasant to 9 = extremely pleasant for Valence). In a previous study in a population of individuals without mental disorders, Cronbach’s α values were excellent to acceptable [α = 0.98 for Arousal, and α = 0.63 for Valence; (66)]. In the present study, both dimensions showed excellent Cronbach’s α values (α = 0.90 for Arousal and α = 0.89 for Valence).
Positive and Negative Affect Schedule–Expanded Form
To assess self-reported general affect in relation to one’s body, the Positive and Negative Affect Schedule–Expanded Form [(PANAS-X); (67, 68)] was applied as a state measure. The General Negative Affect scale and the General Positive Affect scale each contain 10 items rated on a five-point Likert scale (1 = not at all to 5 = extremely). The German version of the PANAS-X has proven to be highly internal consistent for both subscales [0.77 < α < 0.92; (68)]. Internal consistency in the present study was in a similar range (0.69 < α < 0.78 for General Negative Affect; 0.86 < α < 0.90 for General Positive Affect).
Physiological measures
Fundamental frequency: vocally encoded emotional arousal and valence
F0 (in Hz) in the baseline condition and the body exposure condition was analyzed using Praat, a free-of-charge speech analysis program (69). The procedure of vocal analysis is depicted in Figure 1. Before examining f0, default settings limited the f0 range from 100 to 350 Hz, which corresponds to the usual female speaking voice (70). Next, the previously recorded instructions (lasting for 1 min) were muted on the tape in both conditions, leaving pure participant voice data for the baseline condition (3 min) and for the body exposure condition (6 min). Using the free audio editor Audacity 2.1.2 (71), the remaining voice data in the body exposure condition were cut into two 3-min intervals in order to facilitate the comparability with the baseline data within subsequent autocorrelation estimates. In a next step, using Praat, we manually eliminated non-verbal interjections (i.e., coughing, exhaling, throat-clearing), ambient noise (i.e., mouse clicking), and periodicity (i.e., existing algorithm without corresponding voice) to improve data quality. The specific excluded noises are shown in Table 1. A further f0 adaptation was implemented using the two-step approach suggested by Hirst (37). To further ensure that an individual’s range still corresponded to the usual female vocal range of 100 to 350 Hz, following the procedure of Hirst (37), an additional top and bottom limitation was added.
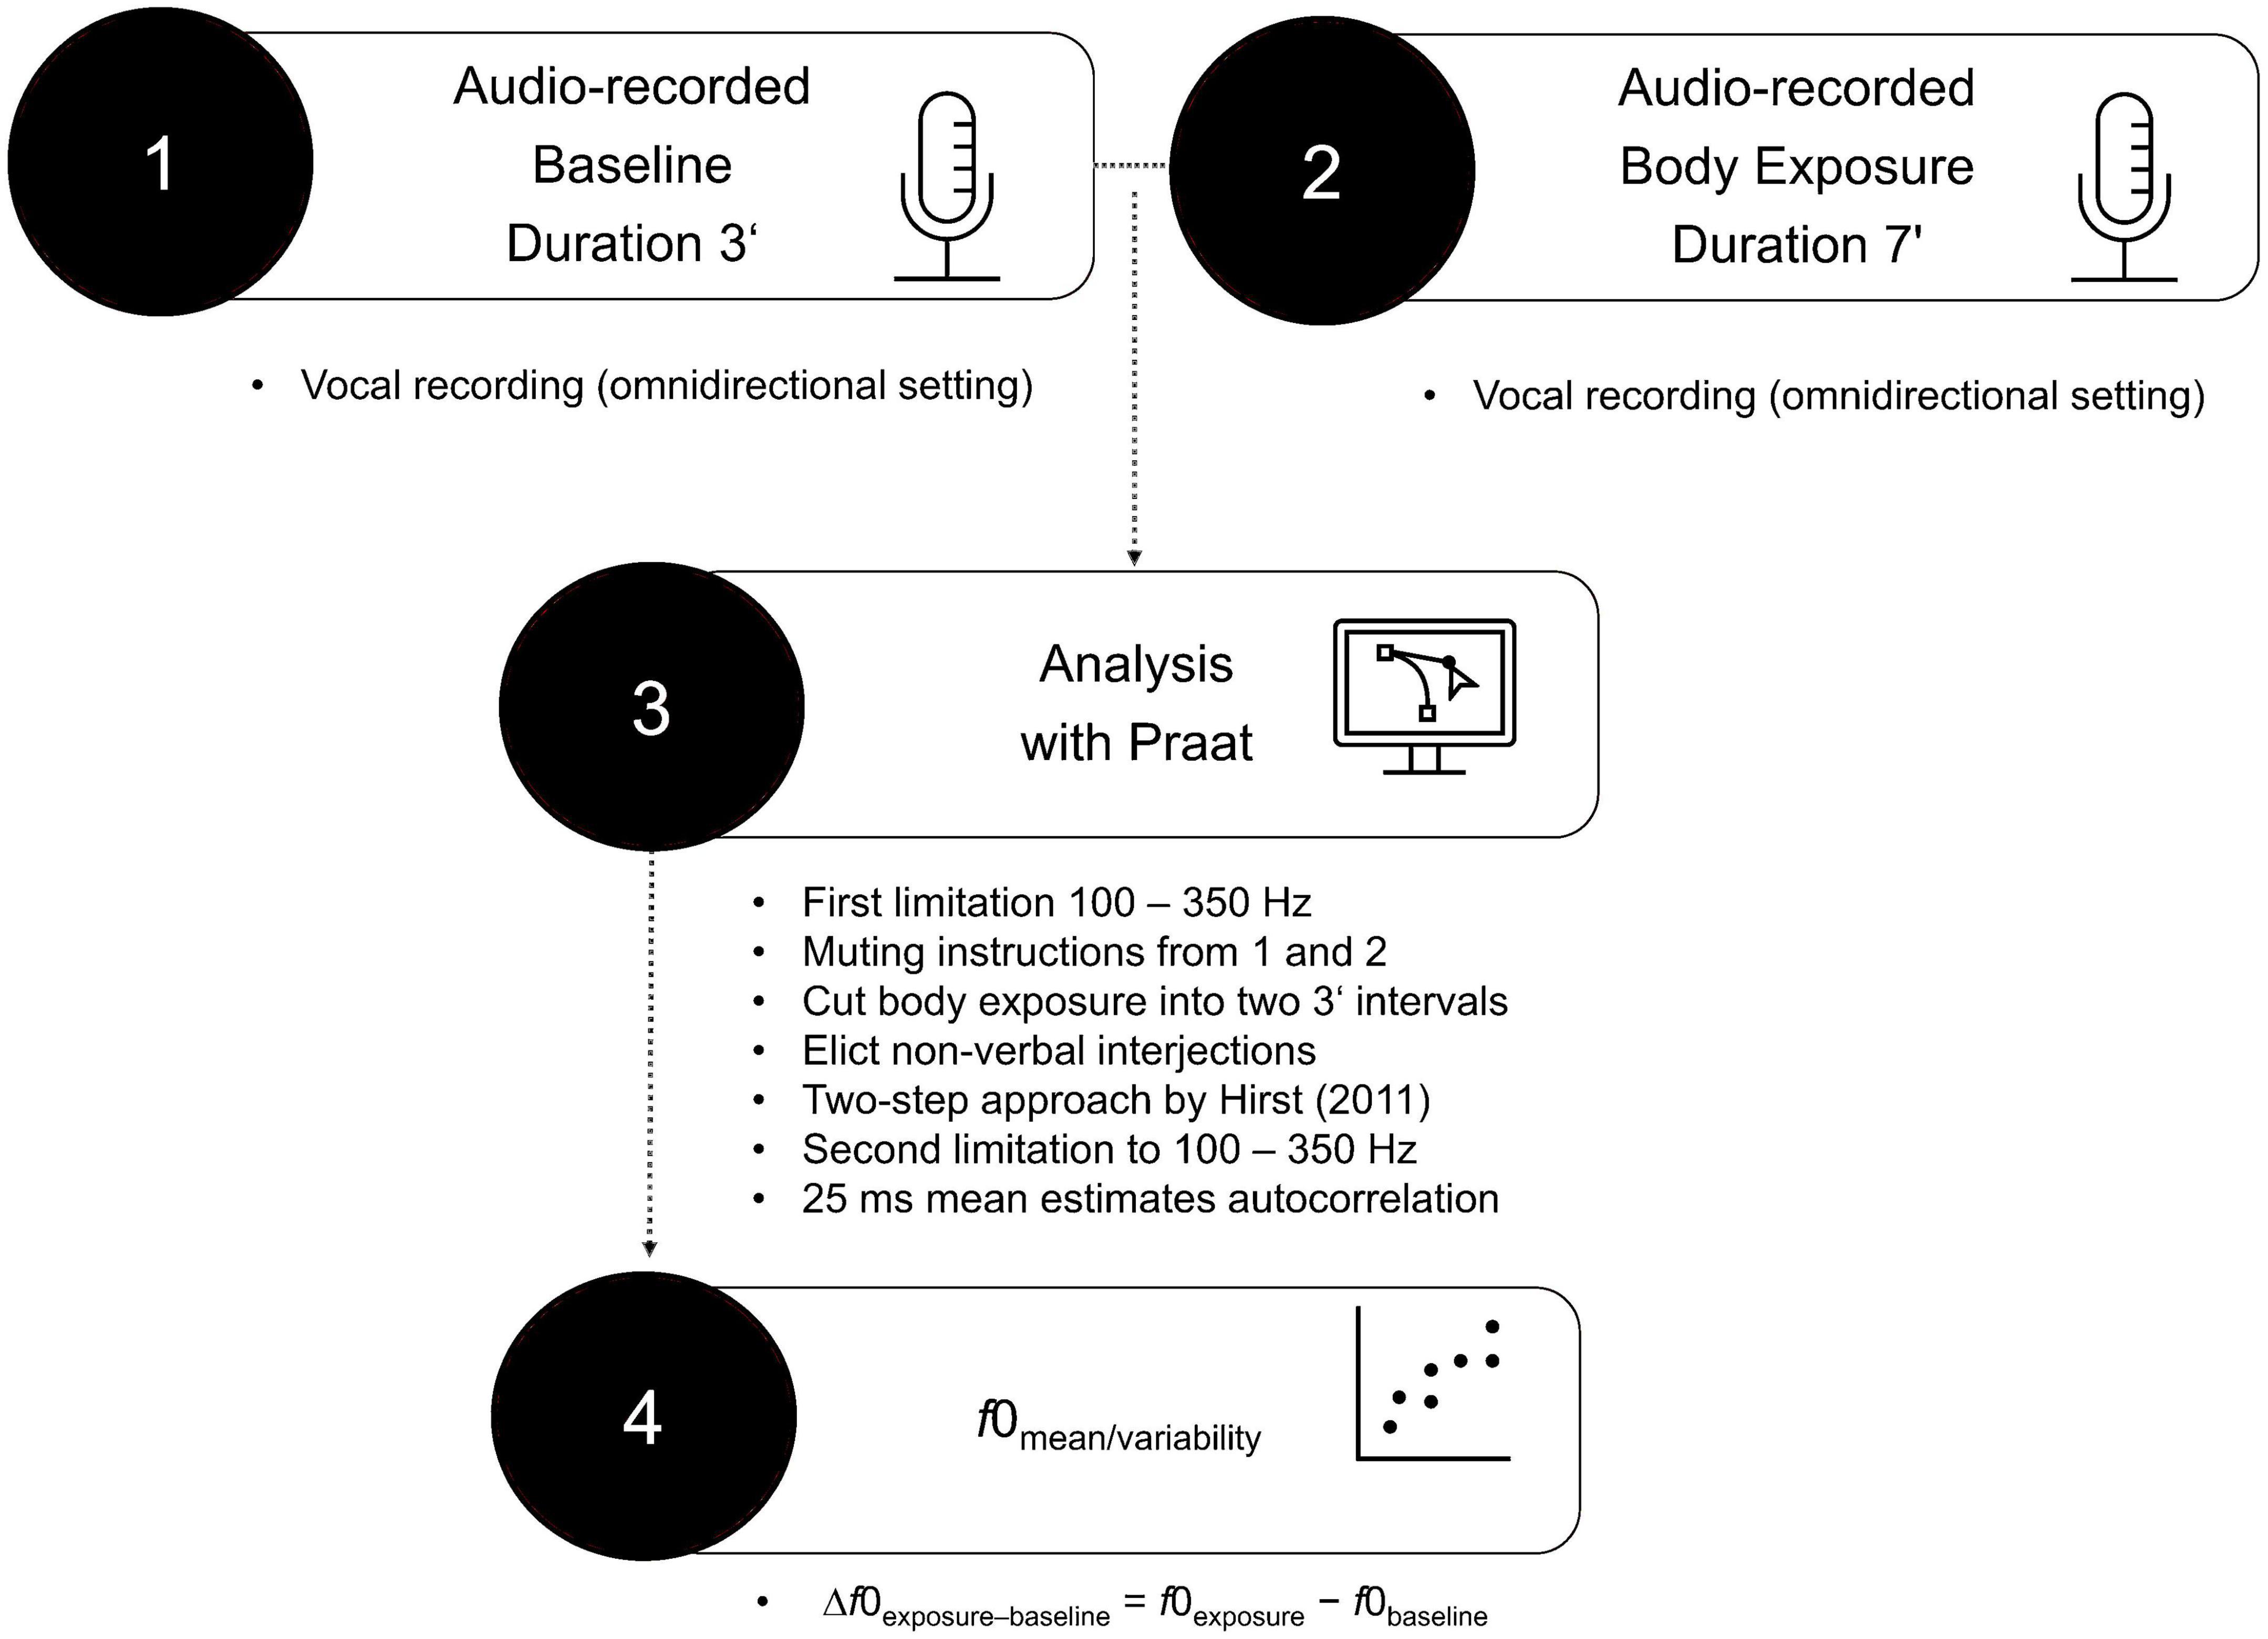
Figure 1. Procedure of vocal analysis.
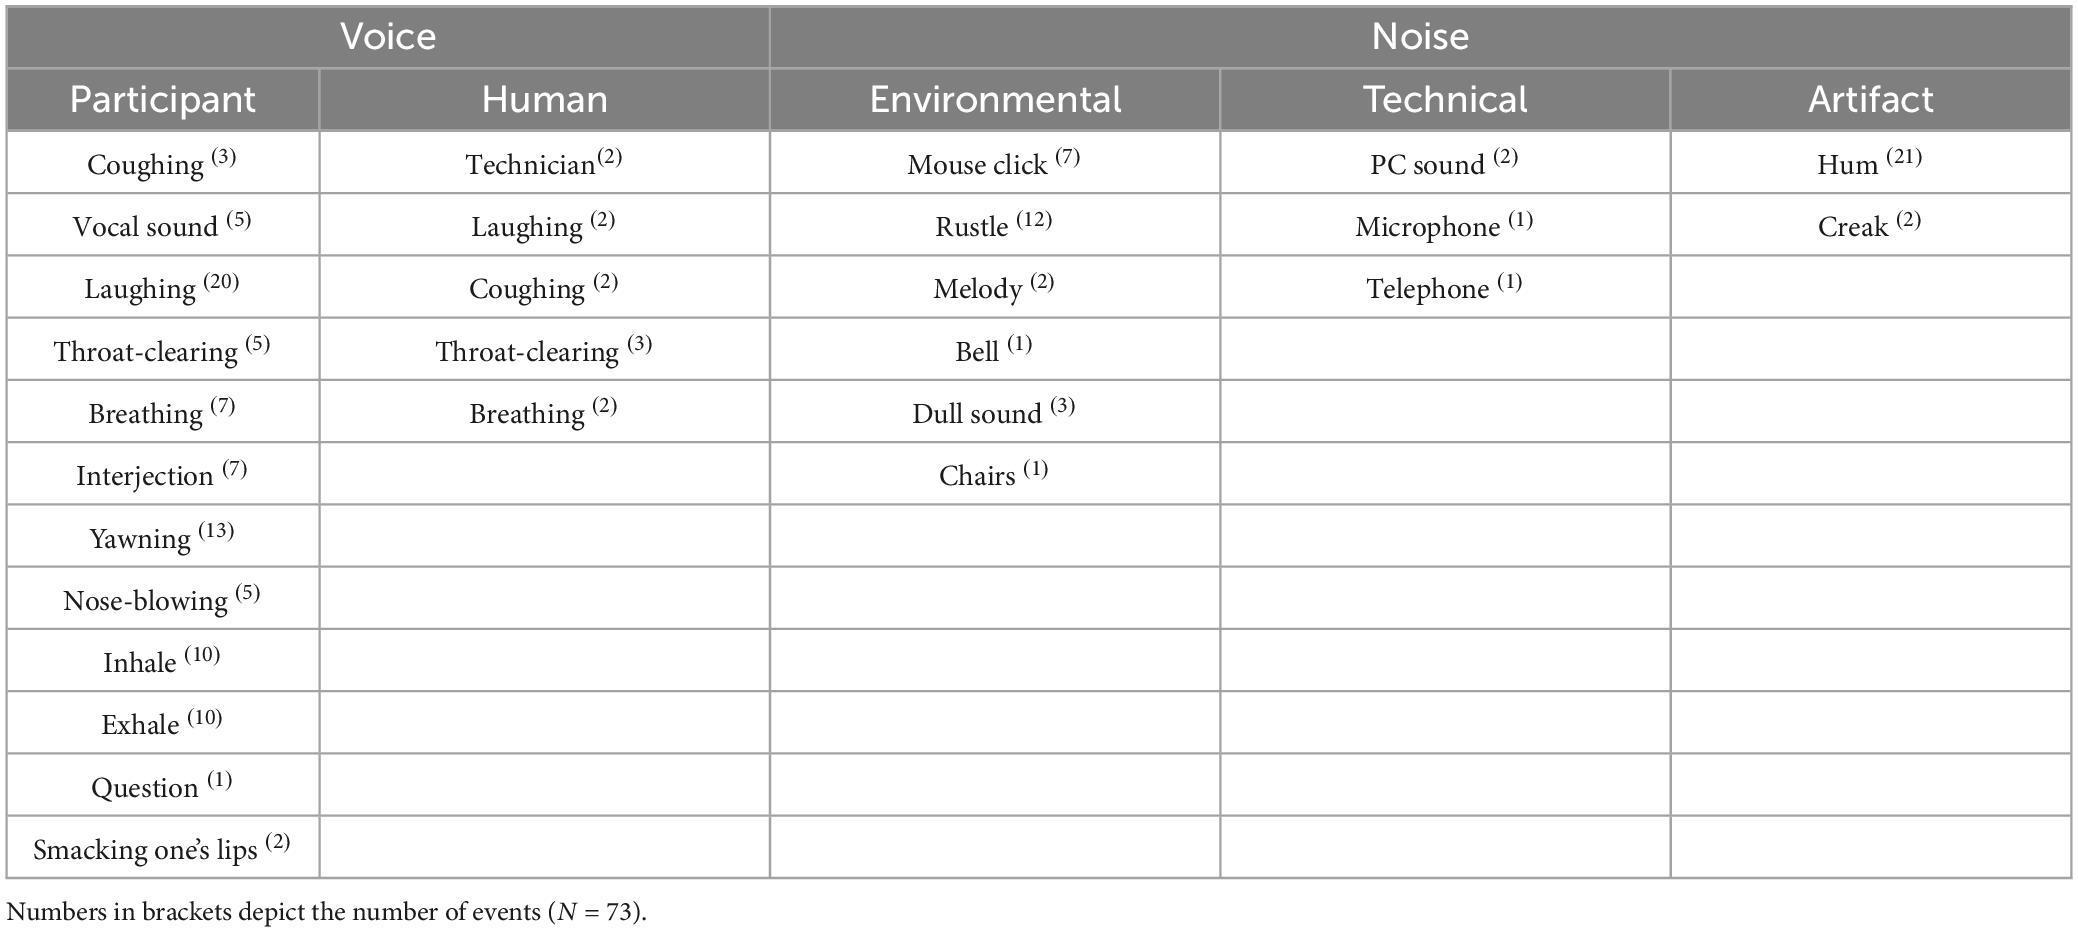
Table 1. Specific eliminated noises of voice recordings.
For all audio data, mean f0 estimates for each 25 ms were established using autocorrelation methods provided in Praat, resulting in an f0 score for each participant for the baseline and the body exposure condition. Following Baur and colleagues (35), it was necessary to calculate the f0 baseline for each person separately in order to control for pre-existing individual vocal differences. As a type of baseline centering (16), the calculated difference scores were assumed to depict the participants’ change in vocally encoded emotional arousal from baseline to body exposure (i.e., Δf0exposure–baseline = f0exposure–f0baseline).
Heart rate
Heart rate (in beats per minute; bpm) was assessed using an HR monitor (i.e., Garmin Vivosmart 4) worn on the participants’ left wrist. Participants told the instructor the time they started and ended each condition, such that a trigger was set and the HR monitor was paused when a new state measure was to be completed. Analogous to f0 [cf. (35)] and to account for individual differences in HR, mean difference scores in the body exposure condition relative to baseline were calculated (i.e., ΔHRexposure–baseline = HRexposure–HRbaseline). To draw from different indices, HR was assessed using two commonly used parameters, that is HRmean (72) and HRmaximum (73). HRmean describes the arithmetic mean of the HR interval while HRmaximum depicts the highest HR value of the HR interval.
Experimental conditions
The procedure of the present study was structured into a two-part repeated measures design consisting of baseline and a body exposure session (as depicted in Figure 2). The 3-min baseline measure served the purpose of using voice and HR as a reference for the body exposure condition. During the baseline measure, participants were asked to describe out loud nine neutrally validated pictures from the Open Affective Standard Image Set [(OASIS); (74)] database, which were hung at the top of a curtain in the mirror cabin. The instructions for the baseline condition were as follows: “For the next 3 min, please describe the nine pictures you see right in front of you. The accuracy of your statements is not important; all that matters is the recording of your voice and HR. It does not matter which images you describe in which order. We ask that you speak for the entire time. You are welcome to repeat sentences […].” During the baseline condition, participants wore their everyday clothes, and the mirror sides of the cabin were covered with a white curtain to avoid distraction. Subsequently, the experimental condition of body exposure with non-guided verbalization [cf. (47)] was implemented. During 7-min sessions encompassing 1 min of standardized audio instructions and 6 min of verbalization, participants were asked to freely reflect on their body-related cognitions and affect. The instructions for the experimental condition were as follows: “This exercise is about freely talking out loud about your thoughts and feelings about your body. There is no right or wrong way to do this; it is all about your feelings and thoughts. You will hear a tone signal right away, after which you should begin to talk about your thoughts […].” In the experimental condition, participants undressed to their underwear and the curtain of the mirror cabin was removed such that participants viewed their entire body from the front, back, and both side angles.
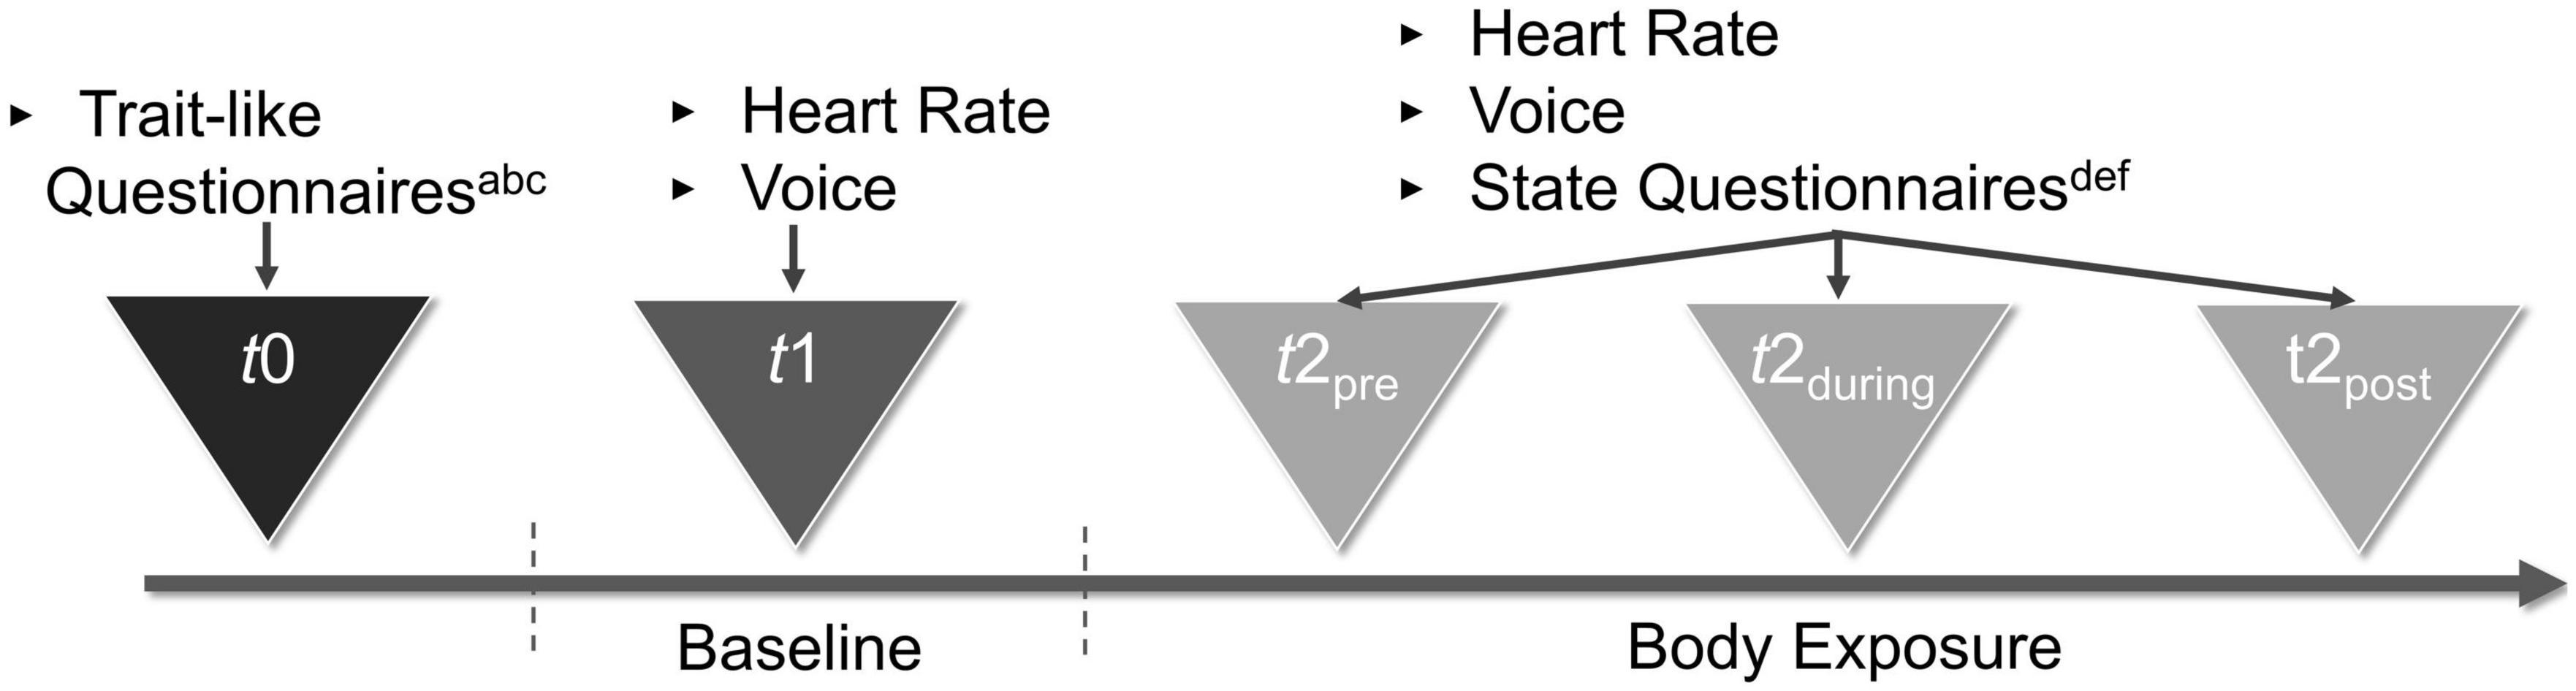
Figure 2. Procedure of the study. aSociodemographic Characteristics. bEating Disorder Examination-Questionnaire. cEating Disorder Inventory–2. dBody Image States Scale. eSelf-Assessment Manikin. fPositive and Negative Affect Schedule–Expanded Form.
Mirror cabin equipment
The standardized settings consisted of a three-sided mirror cabin designed for the purpose of the study, including a microphone (i.e., type: t.bone SC1100, Thomann GmbH Germany; setting: omnidirectional) and an LED light inside. Both the baseline and the body exposure condition took place in this cabin, which had a height of 2.12 m and a width of 0.85 m for each of the three sides, enabling the participants to look at themselves from all angles.
Procedure
The study was part of a larger experiment whose procedure is described elsewhere (47) and consisted of an additional three 48-min body exposure sessions that followed the present experiment. Data were gathered in two identically equipped laboratories of the local university. The general setup is depicted in Figure 2 and was as follows: First, the rationale of exposure was described, and participants were informed about the goals of the study and provided informed consent. Next, the participants completed the trait-like and state questionnaires. Subsequently, the HR monitor was placed around their wrist and they entered the mirror cabin. To protect their privacy, participants were alone in the cabin while a graduate student provided assistance, if necessary, from behind a screen. Then, the microphone and the HR monitor were started for continuous recording and the baseline condition was completed. First the baseline and then the body exposure condition took place. After completing the full experiment, participants got dressed and were shortly debriefed. In addition, they were able to talk about their mental state. For the purpose of standardization, all instructions in the baseline and body exposure conditions were played as pre-recorded audio instructions. When completing the paper-and-pencil measures on general state affect and state body-related distress before and after the baseline and the body exposure condition, the participants wore a bathrobe. State arousal and valence were assessed before, during, and after exposure by asking participants to describe their present arousal and valence with the help of the SAM figures that were hung on the mirror.
Data analysis
The analyses were run using the IBM Statistical Package for the Social Sciences (SPSS, version 28.0). Plausibility checks were performed for all variables. For this purpose, box plots created in SPSS were inspected for signs of obvious errors in f0 extraction. There were no extreme outliers (>three times the interquartile range). Moreover, Mahalanobis distance analysis only identified one participant’s vocal data as an outlier, but since this was due to a naturally high f0 we retained this participant’s responses in the dataset. Regarding the final dataset, sample characteristics were analyzed descriptively. Assumptions for the t-test for dependent variables were met and the robustness of bivariate normal distribution for correlations was presumed [cf. (75)]. The hypothesized increase in f0 during body exposure compared to baseline was likewise tested using a (two-tailed) t-test for dependent variables, separately for f0mean and f0variabilitymeasures. Furthermore, to test the influence of trait-like eating disorder severity on f0, we conducted linear regression analyses separately for f0mean and f0variabilitymeasures as dependent variable and trait-like questionnaires as independent variables. Regarding state measures, Pearson’s product-moment correlations were used to examine the relationship of f0 with self-reported state body-related distress (BISS), arousal and valence (SAM), and positive and negative affect (PANAS-X). To compare self-reported data with f0, for the SAM, we averaged arousal and valence measures using data from before, during, and after each condition; for the BISS and the PANAS-X, we aggregated data from before and after each condition. Pearson’s product-moment correlations between f0 and HR were additionally calculated. As a manipulation check for HR, to ensure that the task indeed elicited an HR response, we tested the difference between baseline and body exposure for HRmean and HRmaximum using a (two-tailed) t-test for dependent variables. Effect sizes were classified as small (|d|= 0.2), moderate (|d|= 0.5), and large (|d|= 0.8) in line with Cohen [(76), pp.77–83]. For all analyses, the significance level was set at α = 0.05, with Bonferroni-Holm alpha-level corrections (77) applied to account for multiple testing.
Results
Participant characteristics
Participants’ characteristics revealed a mean age in the early twenties (M: 23.1, SD: 3.2; range: 18–36), a mean BMI in the normal-weight range (M: 21.3 kg/m2, SD: 2.8 kg/m2; range: 18.2–37.9 kg/m2), and an average amount of exercise per week (M: 4.4 h, SD: 2.3 h; range: 1–8 h) compared to the general population (78). Likewise, the trait-like eating disorder severity and state body dissatisfaction (presented in Table 2) lay within the usual range for women without eating disorders (59, 64). Participants’ physiological characteristics are depicted in Table 3. For voice, the f0 ranged from 103.1 to 284.2 Hz in the baseline condition and from 110.2 to 285.81 Hz in the body exposure condition, which lies within the range of female f0 (70). HR ranged from 56 to 116 bpm during the baseline condition and from 65 to 123 bpm during the body exposure condition, indicating normotonic values within the sample [(79), (p. 12)].
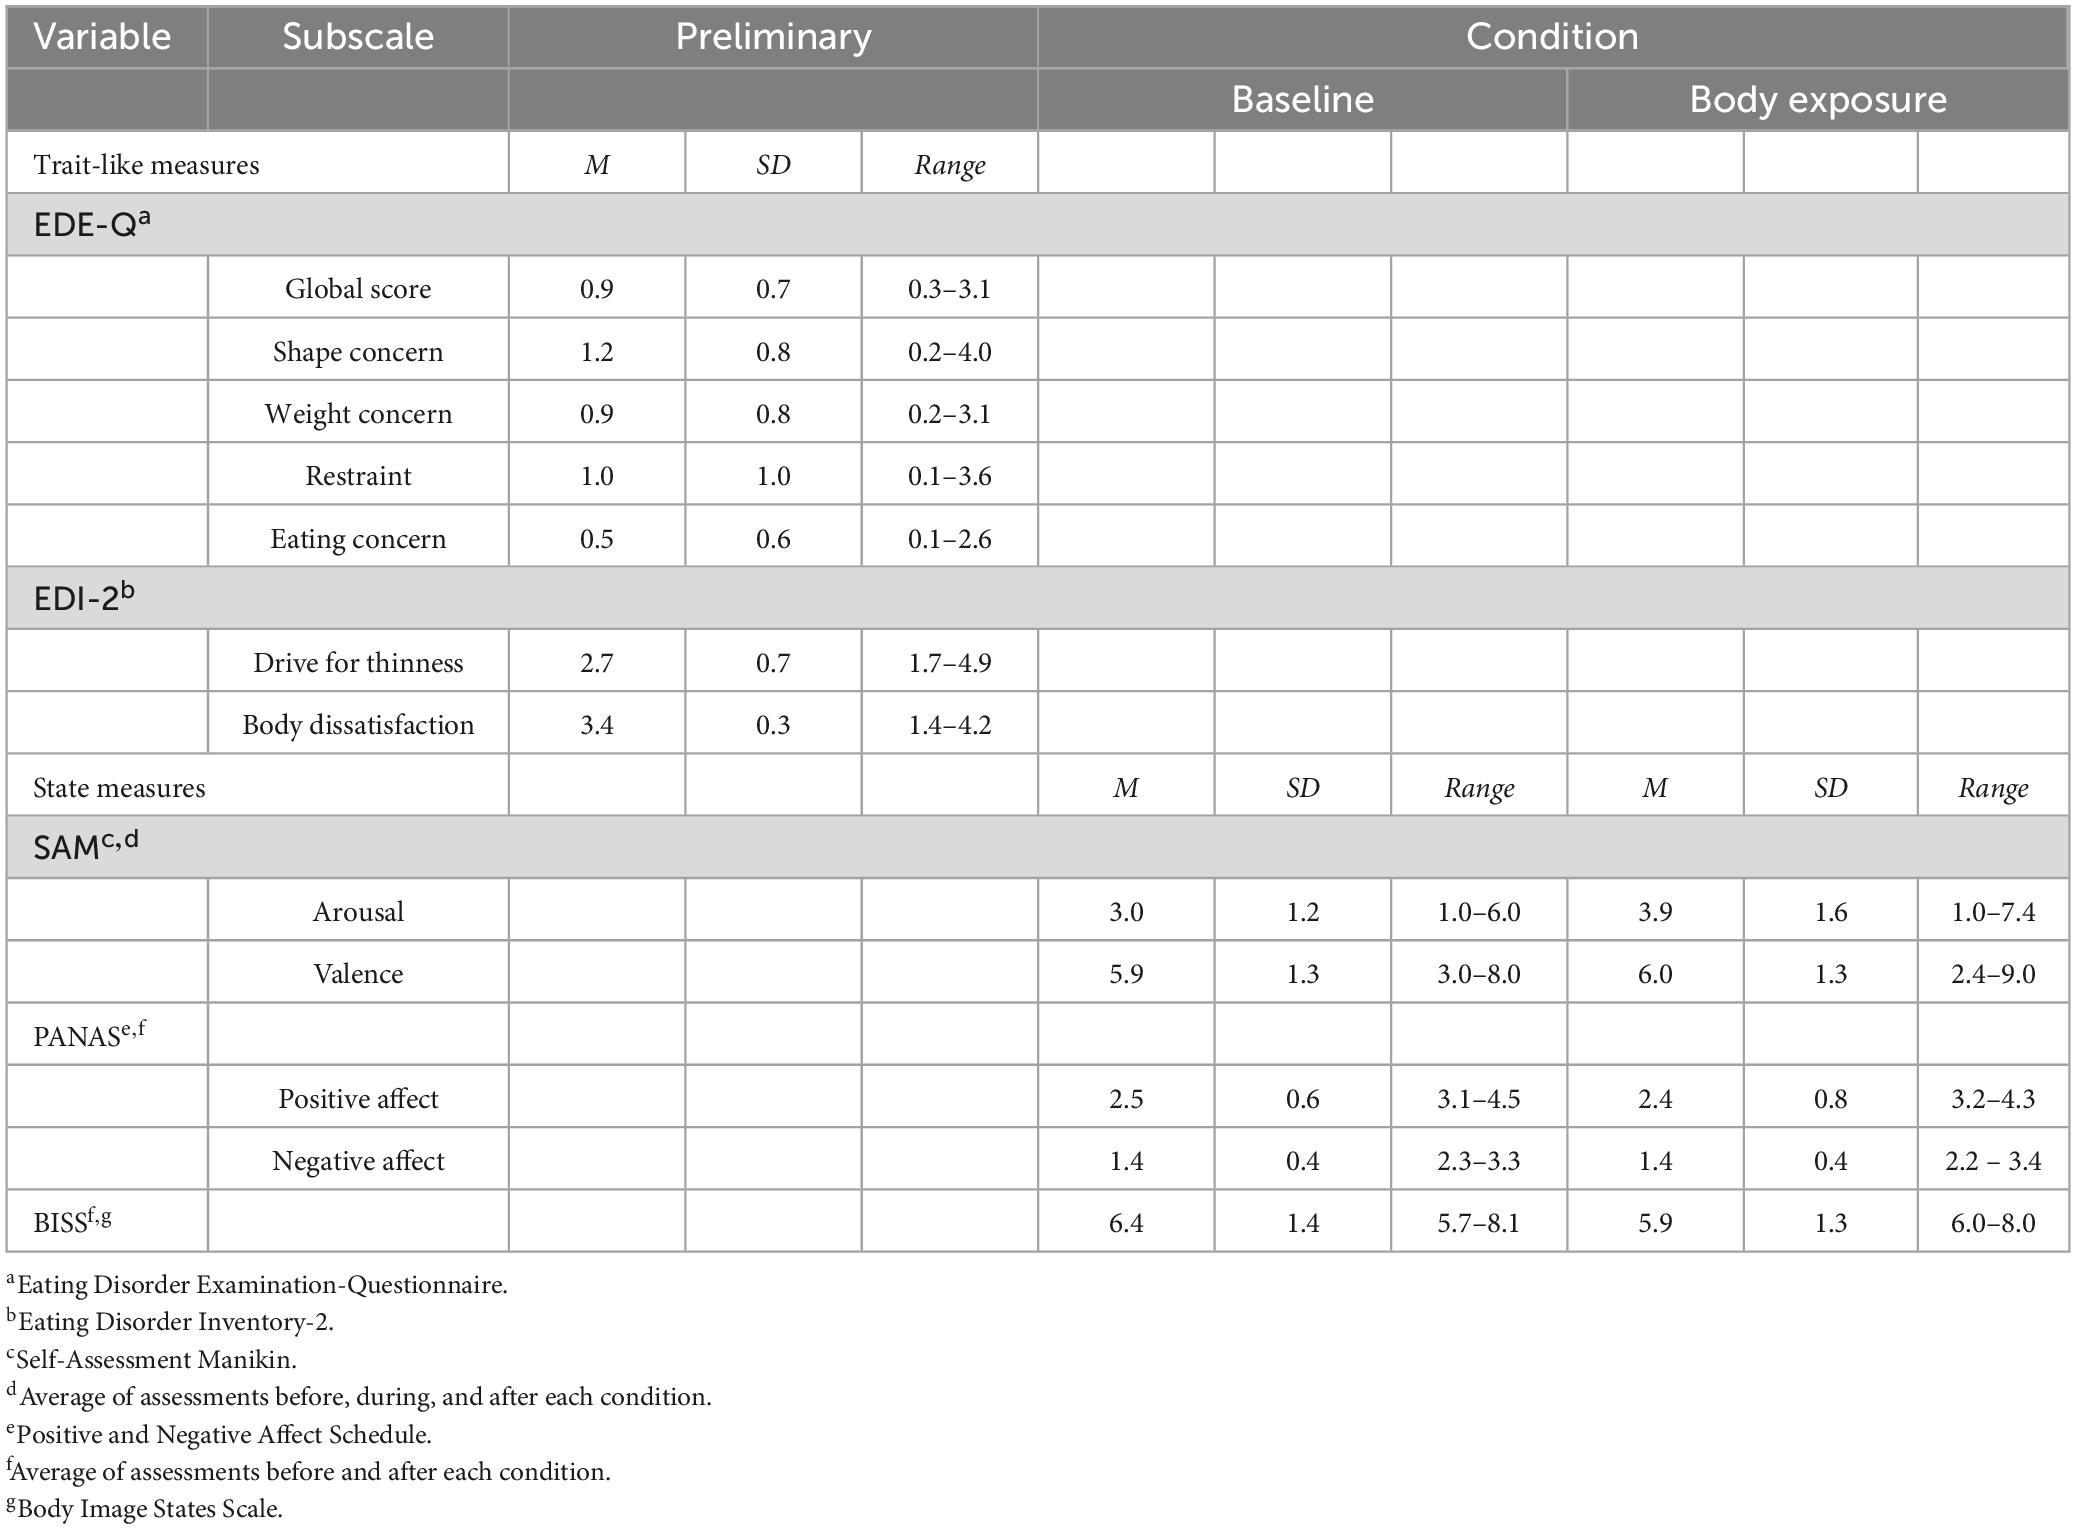
Table 2. Means and standard deviations of study-relevant trait-like and state measures.
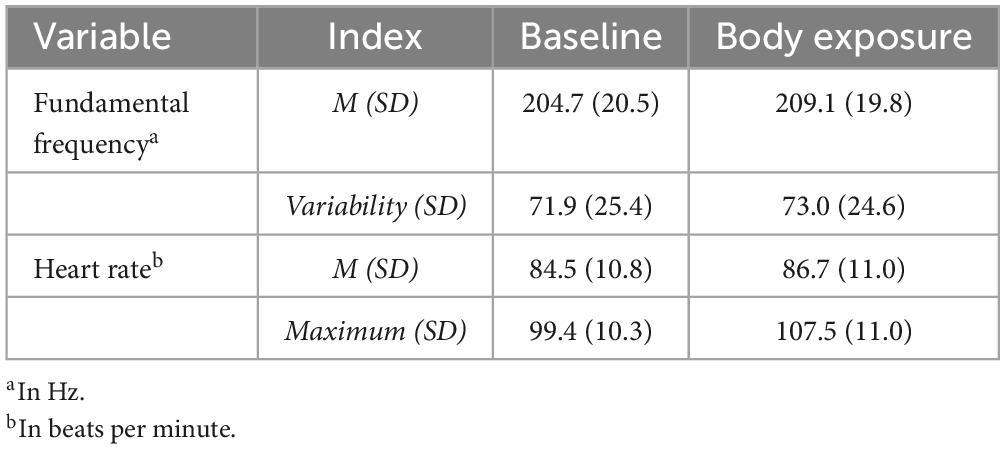
Table 3. Means and variabilities (standard deviations) of psychophysiological measures.
Increase of fundamental frequency during body exposure compared to baseline
With respect to the first hypothesis, paired-samples t-tests revealed a significant increase from baseline to body exposure for f0mean, indicating higher vocally encoded arousal during exposure sessions for f0mean [t(72) = –3.96, p ≤ 0.001, d = 0.46]. However, for f0variabilitymeasures, we did not find statistically significant differences after Bonferroni-Holm correction [for f0dispersion t(72) = –0.39, p = 0.694, d = 0.05; for f0range t(72) = –0.77, p = 0.223, d = 0.09; for f0SD t(72) = –1.09, p = 0.140, d = –0.13].
Prediction of fundamental frequency by trait-like eating disorder severity
Regarding the severity of eating disorder symptoms as a predictor of Δf0mean, the multiple correlation of R = 0.39 was found to be statistically significant [F(3,68) = 4.17, p = 0.009]. Furthermore, a higher EDE-Qglobal score led to higher f0 (β = 6.22, p = 0.026), while no significant predictions emerged for the EDI-2 subscales Body Dissatisfaction (β = 6.11, p = 0.116) and Drive for Thinness (β = –1.30, p = 0.623). Regarding the severity of eating disorder symptoms as a predictor of Δf0variabilitymeasures, no significant results emerged. Thus, for Δf0dispersion, the multiple correlation of R = 0.21 was not found to be statistically significant [F(3,68) = 1.08, p = 0.361]. Moreover, the EDE-Qglobal (β = –3.06, p = 0.681) and the EDI-2 subscales Body Dissatisfaction (β = –10.36, p = 0.320) and Drive for Thinness (β = –4.06, p = 0.570) did not contribute significantly to the prediction of Δf0dispersion. Likewise, regarding Δf0range, the multiple correlation of R = 0.28 was not found to be significant [F(6,65) = 2.84, p = 0.464] as neither were the EDE-Qglobal (β = –7.80, p = 0.420) as well as the EDI-2 subscales Body Dissatisfaction (β = –2.42, p = 0.856) and Drive for Thinness (β = –2.89, p = 0.757). Also, regarding Δf0SD, the multiple correlation of R = 0.27 was not statistically significant [F(6,65) = 2.73, p = 0.519]. Thus, no significant predictions could be done for the EDE-Qglobal (β = 3.14, p = 0.667) or the EDI-2 subscales Body Dissatisfaction (β = 15.78, p = 0.121) and Drive for Thinness (β = –3.16, p = 0.964).
Correlations between physiological variables and state questionnaire data
In terms of convergent validity, state body-related distress (BISS) was not significantly correlated with Δf0mean (r = 0.14, p = 0.218) or with Δf0variabilitymeasures (for Δf0dispersion: r = –0.17, p = 0.141; for Δf0range: r = –0.32, p = 0.792; for Δf0SD: r = –0.13, p = 0.264). Regarding the correlations of f0 and questionnaire-based arousal (SAM) averaged over the course of body exposure (i.e., before, during, and after body exposure), Δf0mean yielded significant positive correlations (r = 0.30, p = 0.026), while no significant correlation was shown between arousal and Δf0variability measures(for Δf0dispersion: r = –0.22, p = 0.058; for Δf0range: r = –0.07, p = 0.554; for Δf0SD: r = –0.01, p = 0.944). Regarding questionnaire-based valence (SAM) averaged across the three time stamps, Δf0mean correlated significantly negatively with valence (r = –0.34, p = 0.009), but again, no significant correlations were found for Δf0variabilitymeasures (for Δf0dispersion: r = 0.11, p = 0.353; for Δf0range: r = 0.57, p = 0.629; for Δf0SD: r = 0.15, p = 0.193). Regarding affect, no statistically significant results emerged when applying Bonferroni-Holm corrections. Thus, neither Δf0mean (r = 0.15, p = 0.192) nor Δf0variabilitymeasures (Δf0dispersion: r = 0.11, p = 0.361; Δf0range: r = –0.01, p = 0.992; Δf0SD: r = 0.21, p = 0.082) correlated significantly with General Positive Affect (PANAS-X). Likewise, neither f0mean (r = 0.23, p = 0.050) nor Δf0variabilitymeasures (Δf0dispersion: r = –0.33, p = 0.075; Δf0range: r = –0.39, p = 0.073; Δf0SD: r = –0.12, p = 0.299) correlated significantly with General Negative Affect (PANAS-X).
Further, in terms of the relationship of f0 with HR, no significant results emerged. Regarding ΔHRmean, neither Δf0mean (r = 0.15 p = 0.207) nor Δf0variabilitymeasures (Δf0dispersion: r = 0.03 p = 0.796; Δf0range: r = 0.06, p = 0.620; Δf0SD: r = –0.06, p = 0.614) correlated significantly with ΔHRmean. Also, regarding ΔHRmaximum, no significant correlations were found for Δf0mean (r = 0.06 p = 0.602) or Δf0variabilitymeasures (Δf0dispersion: r = 0.08 p = 0.506; Δf0range: r = 0.16, p = 0.167; Δf0SD: r = –0.13, p = 0.284). However, as with Δf0mean, HR increased during body exposure [for HRmaximum: t(71) = –2.09, p = 0.040, d = 0.25; for HRmean: t(71) = –5.80, p ≤ 0.001, d = 0.69] compared to baseline.
Discussion
The aim of the present study was to validate f0 mean and f0variabilitymeasures as correlates of vocally encoded arousal, valence, and body-related distress. To achieve this, healthy women underwent a 3-min neutral, non-body-related baseline condition and a subsequent 7-min body exposure session depicting an experimentally induced stressor. Both indices of f0 mean and f0variabilitymeasures have been used previously in different stress-provoking tasks but the results have been inconclusive overall. While higher self-reported arousal led to higher f0mean/variability in some studies [e.g., (38, 41)], it led to lower f0mean/variability measures in others [e.g., (30, 34)]. In line with our first hypothesis, for f0mean, we found the predicted increase during body exposure compared to baseline, providing a first indication that f0mean is influenced by psychological distress. However, regarding f0variabilitymeasures, we did not find the expected decrease or any differences between the baseline and body exposure condition, indicating that the induced stressor of body exposure was not evident in f0variabilitymeasures.
In terms of our second hypothesis, only one of two measures of trait-like eating disorder severity was found to be significant, with higher trait-like severity emerging as a predictor of higher f0mean. Again, no associations were found for f0variabilitymeasures. Therefore, it cannot be conclusively stated that f0 is a parameter of trait-like eating disorder severity. These findings corroborate the results of previous research: In a study in persons with binge eating disorder, lower f0mean was associated with higher trait-like body dissatisfaction (34), whereas in line with our study on eating disorder severity, a study in a sample of females with overweight and obesity reported that higher f0mean correlated with higher trait-like body dissatisfaction (35). This demonstrates the unclear direction of f0 as a correlate of trait-like eating disorder severity, which is potentially related to the different samples of clinical persons [i.e., females with binge eating disorder; (34)] and samples of individuals without mental disorders [i.e., females without mental disorders in our study, females with overweight/obesity; (35)].
Third, regarding the state parameters, the expected associations of f0mean/variability measures with state body dissatisfaction were not found in the present study. This is in line with the lack of correlation between f0mean and state body dissatisfaction in females with binge eating disorder reported by Baur and colleagues (34), but is in contrast to the negative correlation between state dissatisfaction and f0mean in females with overweight found in another study by Baur and colleauges (35). As a whole, no clear pattern emerges regarding f0 in terms of trait-like and state body-related distress. Therefore, f0 may not be suitable as a marker of distinct clinical constructs such as body-related distress, social anxiety disorder (54), or pathological fear (30), but may potentially be viewed as a broader correlate of arousal and valence.
Following the pattern of findings reported for the first hypothesis, the expected positive association between f0mean/variability measures and self-defined arousal and the negative association with valence were only evident for f0mean and not for f0variability mesasures. Regarding arousal, our results – in line with previous literature on anxiety exposure (54) and body exposure (35) – provide further indication that f0mean is a correlate of vocally encoded arousal. With regard to valence, the correlation with f0mean yields more evidence that not only specific emotional states [e.g., fear, (29)], but also general valence, should be considered as correlates of f0mean. Therefore, future studies should analyze affect in f0 on the bipolar dimension of arousal and valence (33). Contrary to our assumption, there were no significant correlations between general affect and f0mean/variability measures. In part, this contrasts with our findings on arousal and valence, which are both commonly seen as dimensions of affect (80). Hence, based on our inconclusive results, f0 cannot be clearly seen as a correlate of general affect. Fourth, the findings did not reveal the hypothesized positive association between f0mean/variability measures and HRmean/maximum, although greater activation was shown in both psychophysiological parameters in the body exposure condition compared to baseline.
The finding that both f0 and HR increased from baseline to body exposure is in line with several experiments on stress-inducing tasks [e.g., for f0: (38), for HR: (81)]. However, the lack of correlation between the two psychophysiological measures is unexpected, as theoretically, changes in f0 should (among other factors) be caused by cyclic changes in heartbeat (82). Further, positive associations between f0 and HR were found during other laboratory stressors [i.e., arithmetic mental stress task (83); or during a couple’s conflict about a problematic relationship topic (22)]. This is in contrast to the non-significant correlations of f0 and HR during body exposure found in the present study. One possible explanation for this finding may be that both markers seem to be dependent on the distinct stressor that is used to provoke arousal. For instance, Alvear and colleagues (83) found a stronger association between f0 and HR under stress induced by cognitive load (i.e., subtracting units from a number) compared to stress induced by physical stressors (i.e., cold pressor test). Moreover, the distinct variable assessed may influence the association, as f0 was unrelated to systolic, diastolic and mean blood pressure, but was related to HR (83). In addition, it has not yet been resolved which precise physiological mechanisms are responsible for the association between the two measures (83). To further explore the relationship between these two psychophysiological parameters, future investigations should include different stressors and different cardiovascular measures.
Further, the null findings for f0varability measures on all variables of our study indicate that the interpretation on f0varability measures lacks a clear direction. From a theoretical perspective, body-related distress is assumed to create sympathetic arousal, leading to a decrease in f0varability measures in stressful situations (18) such as body exposure. Moreover, our results are thus in contrast to Hagenaars and van Minnen (30), who reported negative associations between f0varability measures and the specific emotional state of fear in patients with panic disorder with agoraphobia. Nevertheless, the lack of effects regarding f0varability measures in the present study underline the inconsistent results in the literature [e.g., (4)], with some studies reporting increased f0varability measures in response to arousal and valence created using laboratory stressors (28), others reporting decreased f0varability measures (30), and some finding no correlation in this regard (84).
The present study was the first to examine arousal, valence, and general affect as depicted by f0mean and f0varability measures during body exposure. Some limitations need to be taken into consideration when interpreting the results: First, methodically, from our correlational findings, we are unable to draw conclusions regarding causality in the sense of a causal link between the psychophysiological cues of f0 and HR and the experience of arousal in the body exposure task. Moreover, the study might have lacked statistical power, because the sample was relatively small and the results showed mostly small to medium effects. With a larger sample size, effects might have become more visible or additional effects might have been detected. In addition, future studies should address the potential relationship between body size (i.e., height and weight) and f0. However, the literature is inconclusive: A recent metanalysis on 39 independent samples referring to this topic found that the relationship between f0 and height/weight accounted for only less than 2% variance within individuals (85). We retrospectively calculated the correlation between f0(all indices) and BMI and also found no significant effects in our study.
Furthermore, although we implemented a neutral baseline condition, we did not counterbalance the two conditions of baseline and body exposure, and therefore cannot rule out an order bias. However, body exposure is well researched as a suitable stressor, with previous studies demonstrating heightened levels of self-reported arousal (48) and body-related distress (49) in response to body exposure. Second, we examined emotions only in terms of general affect, arousal, and valence rather than analyzing specific emotions, whereas some studies reported a different pattern of f0 with regard to individual emotions such as anger [e.g., (19)], sadness [cf. (30)], or disgust [e.g., (86)]. We chose to stick to the two dimensions of arousal and valence because this bipolar scale has been used to measure affect in other questionnaire-based studies [e.g., (65)]. Moreover, the investigation of individual emotions may yield ambiguous findings due to the difficulty of differentiating between distinct emotions such as anger and sadness from one particular f0 pattern [cf. (18)]. Third, our sample only comprised Caucasian women without mental disorders, and future studies should therefore consider a more heterogeneous and potentially clinical sample. However, research on vocally encoded affect found comparable results across gender (87) and different ethnic groups (88), indicating that our findings might be transferred to different samples. Furthermore, some studies hint at an influence of phonological differences with regard to the language being spoken [(89); f0range], while others indicate that differences in f0 between languages might rather be a cultural artifact [(90); f0mean]. To contribute to resolving this debate, our study should be replicated in samples with other languages. Fourth, future research should consider validating f0 based on further acoustic parameters such as speech rate (30), amplitude (91), or formant frequencies (F1, F2; quality of voice; (92), and further on additional psychophysiological measures such as eye-tracking [e.g., 93), cortisol (24), blood pressure (42)], or neurological aspects [e.g., neural network-based approaches, (94)]. Finally, we utilized a wrist monitor as a non-invasive measure of HR. Although the device has shown appropriate validity and reliability in other studies (95), other specific instruments to assess HR or HR variability [e.g., electrocardiogram, (52); automatic cuffs for blood pressure, (42)] should be considered, albeit with the potential cost of distracting participants from the assigned task.
In summary, the present study contributes to research on vocal analyses of affect, as only f0mean, but not f0varability measures, emerged as a valid marker of vocally encoded arousal and valence. We further suggest that f0mean represents a valid global marker of emotional arousal and valence rather than of concrete body-related distress. Due to its economical and non-invasive nature (17, 96, 97) and – as our study shows – sufficient validity, the analysis of f0mean might be used prospectively as an adjunctive psychophysiological measure to examine affect in a manner that is less biased than conventional methods (16).
Data availability statement
The raw data supporting the conclusions of this article will be made available by the authors, without undue reservation.
Ethics statement
This study involving human participants was reviewed and approved by the Ethics Committee of Osnabrück University (4/71043.5). The patients/participants provided their written informed consent to participate in this study.
Author contributions
VO: data collection, analysis, writing—original draft, and review and editing. JT and SV: conceptualization and design. JB and JS: data–vocal analysis. AH: conceptualization. All authors contributed to the revision of the manuscript, read, and approved the submitted version.
Funding
We acknowledge support by the Deutsche Forschungsgemeinschaft (DFG) and Open Access Publishing Fund of Osnabrück University.
Conflict of interest
The authors declare that the research was conducted in the absence of any commercial or financial relationships that could be construed as a potential conflict of interest.
Publisher’s note
All claims expressed in this article are solely those of the authors and do not necessarily represent those of their affiliated organizations, or those of the publisher, the editors and the reviewers. Any product that may be evaluated in this article, or claim that may be made by its manufacturer, is not guaranteed or endorsed by the publisher.
References
1. Russell J. Core affect and the psychological construction of emotion. Psychol Rev. (2003) 110:145–72. doi: 10.1037/0033-295X.110.1.145
2. Russell J. Emotion, core affect, and psychological construction. Cogn Emot. (2009) 23:1259–83. doi: 10.1080/02699930902809375
3. Schröder M. Emotional speech synthesis: a review. In: Proceedings of the 7th European conference on speech communication and technology, eurospeech. Aalborg (2001). p. 561–4.
4. Kamiloğlu R, Fischer A, Sauter D. Good vibrations: a review of vocal expressions of positive emotions. Psychon Bull Rev. (2020) 27:237–65. doi: 10.3758/s13423-019-01701-x
5. Russell JA. A circumplex model of affect. J Pers Soc Psychol. (1980) 39:1161–78. doi: 10.1037/h0077714
6. Ganglbauer E, Schrammel J, Deutsch S, Tscheligi M. Applying psychophysiological methods for measuring user experience: possibilities, challenges and feasibility. In: Workshop on user experience evaluation methods in product development. Uppsala (2009).
7. Li S, Scott N, Walters G. Current and potential methods for measuring emotion in tourism experiences: a review. Curr Issues Tour. (2014) 18:805–27. doi: 10.1080/13683500.2014.975679
8. Silvia PJ, Gendolla GH. On introspection and self-perception: does self-focused attention enable accurate self-knowledge? Rev Gen Psychol. (2001) 5:241–69.
9. Wiles J, Cornwell TB. A review of methods utilized in measuring affect, feelings, and emotion in advertising. Curr Issues Res Advert. (1991) 13:241–75. doi: 10.1080/01633392.1991.10504968
10. Shetty V, Yamaguchi M. Salivary biosensors for screening trauma-related psychopathology. Oral Maxillofac Surg Clin North Am. (2010) 22:269–78. doi: 10.1016/j.coms.2010.01.004
11. Guilbault G. Non-invasive biosensors in clinical analysis. Biosens Bioelectron. (1995) 10:379–92. doi: 10.1016/0956-5663(95)96856-T
12. Fridlund A, Cacioppo J. Guidelines for human electromyographic research. Psychophysiology. (1986) 23:567–89. doi: 10.1111/j.1469-8986.1986.tb00676.x
13. Tomarken AJ. A psychometric perspective on psychophysiological measures. Psychol Assess. (1995) 7:387–95. doi: 10.1037/1040-3590.7.3.387
14. De Los Reyes A, Aldao A, Thomas S, Daruwala S, Swan A, Van Wie M, et al. Adolescent self-reports of social anxiety: can they disagree with objective psychophysiological measures and still be valid? J Psychopathol Behav Assess. (2012) 34:308–22. doi: 10.1007/s10862-012-9289-2
15. Tokuno S. “Pathophysiological voice analysis for diagnosis and monitoring of depression,” In: Kim Y editor. Understanding depression. Singapore: Springer (2018). p. 83–95.
16. Wieder G, Wiltshire T. Investigating coregulation of emotional arousal during exposure-based CBT using vocal encoding and actor–partner interdependence models. J Couns Psychol. (2020) 67:337–48. doi: 10.1037/cou0000405
17. Narayanan S, Georgiou P. Behavioral signal processing: deriving human behavioral informatics from speech and language. Proc IEEE. (2013) 101:1203–33. doi: 10.1109/JPROC.2012.2236291
18. Juslin P, Scherer K. Vocal expression of affect. In: Harrigan J, Rosenthal R, Scherer K editors. The new handbook of methods in nonverbal behavior research. Oxford: Oxford University Press (2005). p. 65–135.
19. Scherer K. Vocal affect expression: a review and a model for future research. Psychol Bull. (1986) 99:143–65. doi: 10.1037/0033-2909.99.2.143
20. Lieberman P, Blumstein S. Speech physiology, speech perception, and acoustic phonetics. Cambridge: Cambridge University Press (1988).
21. Scherer K. Adding the affective dimension: a new look in speech analysis and synthesis. In: Proceedings of the 4th international conference on spoken language processing. Philadelphia, PA: ICSLP (1996). p. 1808–11.
22. Kirchhübel C, Howard D, Stedmon A. Acoustic correlates of speech when under stress: research, methods and future directions. Int J Speech Lang Law. (2011) 18:75–98. doi: 10.1558/ijsll.v18i1.75
23. Baucom B, Sheng E, Christensen A, Georgiou P, Narayanan S, Atkins D. Behaviorally-based couple therapies reduce emotional arousal during couple conflict. Behav Res Ther. (2015) 72:49–55. doi: 10.1016/j.brat.2015.06.015
24. Baucom B, Weusthoff S, Atkins D, Hahlweg K. Greater emotional arousal predicts poorer long-term memory of communication skills in couples. Behav Res Ther. (2012) 50:442–7. doi: 10.1016/j.brat.2012.03.010
25. Sigmund M. Statistical analysis of fundamental frequency based features in speech under stress. Inf Technol Control. (2013) 42:286–91. doi: 10.5755/j01.itc.42.3.3895
26. Imel Z, Barco J, Brown H, Baucom B, Baer J, Kircher J, et al. The association of therapist empathy and synchrony in vocally encoded arousal. J Couns Psychol. (2014) 61:146–53. doi: 10.1037/a0034943
27. Laukka P, Linnman C, Åhs F, Pissiota A, Frans Ö, Faria V, et al. In a nervous voice: acoustic analysis and perception of anxiety in social phobics’ speech. J Nonverbal Behav. (2008) 32:195–214.
28. Juslin P, Laukka P. Communication of emotions in vocal expression and music performance: different channels, same code? Psychol Bull. (2003) 129:770–814. doi: 10.1037/0033-2909.129.5.770
29. Bugatti M. Intra-exposure levels of anxious arousal in a lab-based exposure intervention for fear of public speaking. Master’s thesis. New York, NY: University at Albany (2018).
30. Hagenaars M, van Minnen A. The effect of fear on paralinguistic aspects of speech in patients with panic disorder with agoraphobia. J Anxiety Disord. (2005) 19:521–37. doi: 10.1016/j.janxdis.2004.04.008
31. Paeschke A, Sendlmeier W. Prosodic characteristics of emotional speech: measurements of fundamental frequency movements. In: Proceedings of the ITRW on speech and emotion. Newcastle: Speech and Emotion (2000). p. 75.
32. Liscombe J. Prosody and speaker state: paralinguistics, pragmatics, and proficiency. Doctoral dissertation. New York, NY: Columbia University (2007). p. 232.
33. El Ayadi M, Kamel M, Karray F. Survey on speech emotion recognition: features, classification schemes, and databases. Pattern Recognit. (2011) 44:572–87. doi: 10.1016/j.patcog.2010.09.020
34. Baur J, Krohmer K, Tuschen-Caffier B, Svaldi J. Cognitive-emotional involvement during mirror exposure is not accompanied by physiological activation in binge eating disorder. Front Psychiatry. (2019) 10:745. doi: 10.3389/fpsyt.2019.00745
35. Baur J, Krohmer K, Naumann E, Tuschen-Caffier B, Svaldi J. Vocal arousal: a physiological correlate of body distress in women with overweight and obesity. Eat Weight Disord. (2020) 25:1161–9. doi: 10.1007/s40519-019-00744-2
37. Hirst D. The analysis by synthesis of speech melody: from data to models. J Speech Sci. (2011) 1:55–83. doi: 10.20396/joss.v1i1.15011
38. Rothkrantz LJ, Wiggers P, Van Wees JW, van Vark RJ. Text, speech and dialogue. In: Proceedings of the 7th international conference, TSD; 2004 Sep 8-11; Brno, Czech Republic. Berlin: Springer (2004). p. 449–56. doi: 10.1007/978-3-319-45510-5_54
39. Bergmann G, Goldbeck T, Scherer K. Emotionale eindruckswirkung von prosodischen sprechmerkmalen [The effects of prosodic speech characteristics on emotional impression]. Z Exp Angew Psychol. (1988) 35:167–200.
40. Lively S, Pisoni D, Van Summers W, Bernacki R. Effects of cognitive workload on speech production: acoustic analyses and perceptual consequences. J Acoust Soc Am. (1993) 93:2962–73. doi: 10.1121/1.405815
41. Cowie R, Cornelius R. Describing the emotional states that are expressed in speech. Speech Commun. (2003) 40:5–32. doi: 10.1016/S0167-6393(02)00071-7
42. Weusthoff S, Baucom B, Hahlweg K. Fundamental frequency during couple conflict: an analysis of physiological, behavioral, and sex-linked information encoded in vocal expression. J Fam Psychol. (2013) 27:212–20. doi: 10.1037/a0031887
43. Murray I, Arnott J. Toward the simulation of emotion in synthetic speech: a review of the literature on human vocal emotion. J Acoust Soc Am. (1993) 93:1097–108. doi: 10.1121/1.405558
44. Pittam J, Scherer K. Vocal expression and communication of emotion. In: Lewis M, Haviland J editors. HOE. New York, NY: Guilford Press (1993). p. 185–97.
45. Vocks S, Legenbauer T, Heil A. Food intake affects state body image: impact of restrained eating patterns and concerns about eating, weight and shape. Appetite. (2007) 49:467–75. doi: 10.1016/j.appet.2007.03.006
46. Haimovitz D, Lansky L, O’reilly P. Fluctuations in body satisfaction across situations. Int J Eat Disord. (1993) 13:77–84. doi: 10.1002/1098-108x(199301)13:1<77::aid-eat2260130110>3.0.co;2-n
47. Tanck J, Hartmann A, Svaldi J, Vocks S. Effects of full-body mirror exposure on eating pathology, body image and emotional states: comparison between positive and negative verbalization. PLoS One. (2021) 16:e0257303. doi: 10.1371/journal.pone.0257303
48. Hilbert A, Tuschen-Caffier B, Vögele C. Effects of prolonged and repeated body image exposure in binge-eating disorder. J Psychosom Res. (2002) 52:137–44. doi: 10.1016/s0022-3999(01)00314-2
49. Hartmann A, Naumann E, Vocks S, Svaldi J, Werthmann J. Body exposure, its forms of delivery and potentially associated working mechanisms: how to move the field forward. Clin Psychol Eur. (2021) 3:e3813. doi: 10.32872/cpe.3813
50. Guthoff H, Cordes M, Wilhelm L, Hartmann A, Vocks S. Body checking bei frauen mit hohen und niedrigen figur- und gewichtssorgen: arousal und negative emotionale valenz im verlauf einer kontrollverhaltens-episode. [Body checking in women with high and low shape and weight concerns: arousal and negative emotional valence in the course of a checking-behavior episode]. Z Klin Psychol Psychother. (2019) 48:166–76. doi: 10.1026/1616-3443/a000547
51. Trentowska M, Svaldi J, Blechert J, Tuschen-Caffier B. Does habituation really happen? Investigation of psycho-biological responses to body exposure in bulimia nervosa. Behav Res Ther. (2017) 90:111–22. doi: 10.1016/j.brat.2016.12.006
52. Vocks S, Legenbauer T, Wächter A, Wucherer M, Kosfelder J. What happens in the course of body exposure? J Psychosom Res. (2007) 62:231–9. doi: 10.1016/j.jpsychores.2006.08.007
53. Busso C, Lee S, Narayanan S. Analysis of emotionally salient aspects of fundamental frequency for emotion detection. IEEE Trans Audio Speech Lang Process. (2009) 17:582–96. doi: 10.1109/TASL.2008.2009578
54. Weeks J, Lee C, Reilly A, Howell A, France C, Kowalsky J, et al. “The sound of fear”: assessing vocal fundamental frequency as a physiological indicator of social anxiety disorder. J Anxiety Disord. (2012) 26:811–22. doi: 10.1016/j.janxdis.2012.07.005
55. Tanck J, Vocks S, Riesselmann B, Waldorf M. Gender differences in affective and evaluative responses to experimentally induced body checking of positively and negatively valenced body parts. Front Psychol. (2019) 10:1058. doi: 10.3389/fpsyg.2019.01058
56. Titze I. Physiologic and acoustic differences between male and female voices. J Acoust Soc Am. (1989) 85:1699–707. doi: 10.1121/1.397959
57. Fairburn C, Beglin S. Eating disorder examination questionnaire (EDE-Q 6.0). In: Fairburn C editor. Cognitive behavior therapy and eating disorders. New York, NY: Guilford Press (2008). p. 309–13.
58. Hilbert A, Tuschen-Caffier B. Eating disorder examination: deutschsprachige Übersetzung. [Eating disorder examination: German translation]. Tübingen: DGVT-Verlag (2016).
59. Hilbert A, Tuschen-Caffier B, Karwautz A, Niederhofer H, Munsch S. Eating disorder examination-questionnaire: evaluation der deutschsprachigen Übersetzung [Eating disorder examination-questionnaire: evaluation of the German translation]. Diagnostica. (2007) 53:144–54. doi: 10.1026/0012-1924.53.3.144
60. Garner D, Olmstead M, Polivy J. Development and validation of a multidimensional eating disorder inventory for anorexia nervosa and bulimia. Int J Eat Disord. (1983) 2:15–34.
61. Paul T, Thiel A. Eating disorder inventory-2 (EDI-2): deutsche version [Eating disorder inventory-2 (EDI-2): German version]. Göttingen: Hogrefe (2005).
62. Salbach-Andrae H, Schneider N, Bürger A, Pfeiffer E, Lehmkuhl U, Holzhausen M. Psychometrische gütekriterien des eating disorder inventory (EDI-2) bei jugendlichen. [Psychometric properties of the eating disorder inventory (EDI-2) in adolescents]. Z Kinder Jugendpsychiatr Psychother. (2010) 38:219–28. doi: 10.1024/1422-4917/a000035
63. Thiel A, Jacobi C, Horstmann S, Paul T, Nutzinger D, Schüßler G. Eine deutschsprachige version des eating disorder inventory EDI-2 [German translation of the eating disorder inventory EDI-2]. Psychother Psychosom Med Psychol. (1997) 47:365–76.
64. Cash T, Fleming E, Alindogan J, Steadman L, Whitehead A. Beyond body image as a trait: the development and validation of the body image states scale. Eat Disord. (2002) 10:103–13. doi: 10.1080/10640260290081678
65. Bradley M, Lang P. Measuring emotion: the self-assessment manikin and the semantic differential. J Behav Ther Exp Psychiatry. (1994) 25:49–59. doi: 10.1016/0005-7916(94)90063-9
66. Backs R, da Silva S, Han K. A comparison of younger and older adults’ self-assessment manikin ratings of affective pictures. Exp Aging Res. (2005) 31:421–40. doi: 10.1080/03610730500206808
67. Watson D, Clark L. The PANAS-X: manual for the positive and negative affect schedule - expanded form. Iowa City, IA: University of Iowa (1994). doi: 10.17077/48vt-m4t2
68. Grühn D, Kotter-Grühn D, Röcke C. Discrete affects across the adult lifespan: evidence for multidimensionality and multidirectionality of affective experiences in young, middle-aged and older adults. J Res Pers. (2010) 44:492–500. doi: 10.1016/j.jrp.2010.06.003
69. Boersma P, Weenink D. Praat: doing phonetics by computer. Version 6.0.37 [software]. (2019). Available online at: https://www.fon.hum.uva.nl/praat (accessed November 1, 2022).
70. Demenko G, Möbius B, Andreeva B. Analysis of pitch profiles in Germanic and Slavic languages. Forum acusticum. 2014 Sep 7-12; Kraków, Poland. Posen: European Acoustics Association (2014). p. 7–12.
71. Audacity Team. Audacity (R): free audio editor and recorder. Version 2.1.0 [computer program]. (2015). Available online at: https://www.audacityteam.org/ (accessed November 1, 2022).
72. Solhjoo S, Haigney M, McBee E, van Merrienboer J, Schuwirth L, Artino A, et al. Heart rate and heart rate variability correlate with clinical reasoning performance and self-reported measures of cognitive load. Sci Rep. (2019) 9:14668. doi: 10.1038/s41598-019-50280-3
73. Sarzynski M, Rankinen T, Earnest C, Leon A, Rao D, Skinner J, et al. Measured maximal heart rates compared to commonly used age-based prediction equations in the heritage family study. Am J Hum Biol. (2013) 25:695–701. doi: 10.1002/ajhb.22431
74. Kurdi B, Lozano S, Banaji M. Introducing the open affective standardized image set (OASIS). Behav Res Methods. (2017) 49:457–70. doi: 10.3758/s13428-016-0715-3
75. Field A. Discovering statistics using IBM SPSS statistics. Los Angeles, CA: SAGE publications (2013). p. 952.
76. Cohen J. Statistical power analysis for the behavioral sciences. 2 Edn. London: Routledge (1988). p. 77–83.
77. Aickin M, Gensler H. Adjusting for multiple testing when reporting research results: the Bonferroni vs Holm methods. Am J Public Health. (1996) 86:726–8. doi: 10.2105/AJPH.86.5.726
78. Moon K, Krems C, Heuer T, Roth A, Hoffmann I. Predictors of BMI vary along the BMI range of German adults - results of the German national nutrition survey II. Obes Facts. (2017) 10:38–49. doi: 10.1159/000456665
79. Vaitl D. Ratgeber bluthochdruck: informationen für betroffene und angehörige [Hypertension guide: information for affected people and their relatives]. Chapter 1, “Hypertonie” – was ist das? [“hypertension” - what is that?]. 5 ed. Göttingen: Hogrefe (2004). p. 12.
80. Kuppens P, Tuerlinckx F, Russell J, Barrett L. The relation between valence and arousal in subjective experience. Psychol Bull. (2013) 139:917–40. doi: 10.1037/a0030811
81. Schubert C, Lambertz M, Nelesen R, Bardwell W, Choi J, Dimsdale J. Effects of stress on heart rate complexity—a comparison between short-term and chronic stress. Biol Psychol. (2009) 80:325–32. doi: 10.1016/j.biopsycho.2008.11.005
82. Orlikoff R, Baken R. The effect of the heartbeat on vocal fundamental frequency perturbation. J Speech Hear Res. (1989) 32:576–82. doi: 10.1044/jshr.3203.576
83. Alvear R, Barón-López F, Alguacil M, Dawid-Milner MS. Interactions between voice fundamental frequency and cardiovascular parameters. Preliminary results and physiological mechanisms. Logoped Phoniatr Vocol. (2013) 38:52–8. doi: 10.3109/14015439.2012.696140
85. Pisanski K, Fraccaro P, Tigue C, O’Connor J, Röder S, Andrews P, et al. Vocal indicators of body size in men and women: a meta-analysis. Anim Behav. (2014) 95:89–99.
86. Juslin P, Laukka P. Impact of intended emotion intensity on cue utilization and decoding accuracy in vocal expression of emotion. Emotion. (2001) 1:381–412. doi: 10.1037/1528-3542.1.4.381
87. Tolkmitt F, Scherer K. Effect of experimentally induced stress on vocal parameters. J Exp Psychol Hum Percept Perform. (1986) 12:302–13. doi: 10.1037/0096-1523.12.3.302
88. Xue S, Fucci D. Effects of race and sex on acoustic features of voice analysis. Percept Mot Skills. (2000) 91:951–8. doi: 10.2466/pms.2000.91.3.951
89. Mennen I, Schaeffler F, Docherty G. Cross-language differences in fundamental frequency range: A comparison of English and German. J Acoust Soc Am. (2012) 131:2249–60. doi: 10.1121/1.3681950
90. Keating P, Kuo G. Comparison of speaking fundamental frequency in English and Mandarin. J Acoust Soc Am. (2012) 132:1050–60.
91. Corbeil M, Trehub S, Peretz I. Speech vs. singing: infants choose happier sounds. Front Psychol. (2013) 4:372. doi: 10.3389/fpsyg.2013.00372
92. Tanaka H, Campbell N. Acoustic features of four types of laughter in natural conversational speech. Proceedings of the international congress of phonetic sciences (ICPhS 2011). Hong Kong: (2011). p. 1958–61.
93. Naumann E, Biehl S, Svaldi J. Eye-tracking study on the effects of happiness and sadness on body dissatisfaction and selective visual attention during mirror exposure in bulimia nervosa. Int J Eat Disord. (2019) 52:895–903. doi: 10.1002/eat.23127
94. Chen L, Liu L, Ling Z, Jiang Y, Dai L. The USTC system for voice conversion challenge 2016: neural network based approaches for spectrum, aperiodicity and f0 conversion. Interspeech. San Francisco, CA: ISCA (2016). p. 1642–6.
95. Fuller D, Colwell E, Low J, Orychock K, Tobin M, Simango B, et al. Reliability and validity of commercially available wearable devices for measuring steps, energy expenditure, and heart rate: systematic review. JMIR Mhealth Uhealth. (2020) 8:e18694. doi: 10.2196/18694
96. Gaume J, Hallgren K, Clair C, Schmid Mast M, Carrard V, Atkins D. Modeling empathy as synchrony in clinician and patient vocally encoded emotional arousal: a failure to replicate. J Couns Psychol. (2019) 66:341–50. doi: 10.1037/cou0000322
Keywords: fundamental frequency, paralinguistic, psychophysiology, body exposure, body image
Citation: Opladen V, Tanck JA, Baur J, Hartmann AS, Svaldi J and Vocks S (2023) Body exposure and vocal analysis: validation of fundamental frequency as a correlate of emotional arousal and valence. Front. Psychiatry 14:1087548. doi: 10.3389/fpsyt.2023.1087548
Received: 02 November 2022; Accepted: 04 April 2023;
Published: 24 May 2023.
Edited by:
Jessica Uhl, University of Trier, GermanyReviewed by:
Jennifer Schmidt, Münster University of Applied Sciences, GermanyWilliam Haslett, Stripe, Inc., United States
Copyright © 2023 Opladen, Tanck, Baur, Hartmann, Svaldi and Vocks. This is an open-access article distributed under the terms of the Creative Commons Attribution License (CC BY). The use, distribution or reproduction in other forums is permitted, provided the original author(s) and the copyright owner(s) are credited and that the original publication in this journal is cited, in accordance with accepted academic practice. No use, distribution or reproduction is permitted which does not comply with these terms.
*Correspondence: Vanessa Opladen, vanessa.opladen@uni-osnabrueck.de