 Guofang Shen1†
 Kao Tang Ying Moua2†
 Kathryn Perkins2†
 Deron Johnson3Arthur Li4Peter Curtin1Wei Gao5
 Jeannine S. McCune1*
- 1Department of Hematologic Malignancies Translational Sciences, City of Hope, and Department of Hematopoietic Cell Transplantation, City of Hope Medical Center, Duarte, CA, United States
- 2Alfred E. Mann School of Pharmacy and Pharmaceutical Sciences, University of Southern California, Los Angeles, CA, United States
- 3Clinical Informatics, City of Hope Medical Center, Duarte, CA, United States
- 4Division of Biostatistics, City of Hope, Duarte, CA, United States
- 5Division of Engineering and Applied Science, Andrew and Peggy Cherng Department of Medical Engineering, California Institute of Technology, Pasadena, CA, United States
The mTOR inhibitor sirolimus is prescribed to treat children with varying diseases, ranging from vascular anomalies to sporadic lymphangioleiomyomatosis to transplantation (solid organ or hematopoietic cell). Precision dosing of sirolimus using therapeutic drug monitoring (TDM) of sirolimus concentrations in whole blood drawn at the trough (before the next dose) time-point is the current standard of care. For sirolimus, trough concentrations are only modestly correlated with the area under the curve, with R2 values ranging from 0.52 to 0.84. Thus, it should not be surprising, even with the use of sirolimus TDM, that patients treated with sirolimus have variable pharmacokinetics, toxicity, and effectiveness. Model-informed precision dosing (MIPD) will be beneficial and should be implemented. The data do not suggest dried blood spots point-of-care sampling of sirolimus concentrations for precision dosing of sirolimus. Future research on precision dosing of sirolimus should focus on pharmacogenomic and pharmacometabolomic tools to predict sirolimus pharmacokinetics and wearables for point-of-care quantitation and MIPD.
1 Introduction
Rapamune® (sirolimus) is approved to prevent organ rejection in patients aged 13 years or older receiving renal transplants by the Food and Drug Administration (Author Anonymous, 2022a). In addition, the European Medicines Agency (EMA) approved Rapamune® for prophylaxis of organ rejection in adults at low to moderate immunological risk receiving a renal transplant and for treatment of patients with sporadic lymphangioleiomyomatosis with moderate lung disease or declining lung function (EMA, 2022). Over the past 20 years since these initial approvals, sirolimus has expanded to treat children undergoing heart (Rossano et al., 2017), hematopoietic cell (Monagel et al., 2021), intestine (Andres et al., 2021), liver (Hendrickson et al., 2019), or lung transplant (Hayes et al., 2014). Furthermore, children with vascular anomalies are treated with sirolimus (Mizuno et al., 2017c).
Sirolimus is a lipophilic macrocytic lactone that binds distinctly to FK binding protein 12 (FKBP12), forming a complex with the mammalian target of rapamycin (mTOR) (Cutler and Antin, 2004). This sirolimus–FKBP12–mTOR complex inhibits multiple cytokine–stimulated cell cycling pathways by reducing DNA transcription, DNA translation, protein synthesis, and cell signaling (Sehgal, 2003). It also inhibits interleukin–2–mediated proliferation signaling, leading to T–cell apoptosis (Sehgal, 2003).
The most common toxicities (>20%) in patients taking sirolimus include hypertriglyceridemia (45%–57%), stomatitis, diarrhea, abdominal pain, nausea, nasopharyngitis, acne, chest pain, peripheral edema, upper respiratory tract infection, headache, dizziness, and myalgia (Author Anonymous, 2022a). Sirolimus is available as tablets (0.5, 1, 2 mg) and, in some countries, as a liquid solution (1 mg/mL) formulation. The long half–life of sirolimus allows for convenient once–daily dosing, but a loading dose is required to rapidly achieve target drug concentrations in whole blood. Therefore, it is usually administered once daily at a fixed dose in adults (one 6–12 mg loading dose, followed by 2–4 mg daily) and as a body surface area–based dose in children (2.5 mg/m2/day) (Supplementary Table S1).
Sirolimus has a narrow therapeutic window. Its product labeling recommends monitoring sirolimus trough concentrations for all patients, especially those likely to have altered drug metabolism, in patients ≥13 years who weigh less than 40 kg, in patients with hepatic impairment, when a change in the sirolimus dosage form is made, and during concurrent administration of strong cytochrome P450 3A (CYP3A) inducers and inhibitors (Author Anonymous, 2022a). Therefore, its doses are personalized dosing using therapeutic drug monitoring (TDM) of whole blood obtained immediately before the subsequent dose (i.e., trough or predose samples). This provides a useful strategy to optimize transplant pharmacotherapy (Kahan et al., 2000). For the past 20 years, the majority of patients have undergone the following TDM process for precision dosing of sirolimus: 1. choose the target trough concentration in whole blood, typically between 3 and 14 ng/mL (Claxton et al., 2005; Alyea et al., 2008; Ho et al., 2009; Nakamura et al., 2012; Khaled et al., 2013); 2. administer a sirolimus loading dose based on weight or body surface area; 3. Obtain a trough pharmacokinetic sample; 4. quantitate the sirolimus concentrations in whole blood, typically using liquid chromatography–mass spectrometry (LC–MS); 5. use that trough concentration to personalize the dose to achieve the target trough concentration. Notably, sirolimus whole blood concentrations may be measured by either chromatographic or immunoassay methods (Mahalati and Kahan, 2001; Schmid et al., 2009). Due to cross–reactivity with sirolimus metabolites, immunoassay methods have a positive bias ranging from 14% to 39% compared to LC–MS methods (Schmid et al., 2009). Because sirolimus whole blood concentrations vary by the type of assay used, concentrations are not interchangeable between methods. Therefore, sirolimus TDM should be conducted using one consistent bioanalytical method within an institution.
2 Why should we expand the precision dosing of sirolimus beyond TDM
Dosing sirolimus based on trough concentrations has been the current standard of care (Stenton et al., 2005) for over 20 years. However, trough concentrations only modestly correlate with AUC0–24hr, with R2 values between trough concentrations and area under the plasma concentration-time curve for sirolimus ranging from 0.52 to 0.84 (Schachter et al., 2004; Schubert et al., 2004; Goyal et al., 2013). We have not found publications regarding the existence or results from a sirolimus proficiency program that evaluates the accuracy of quantitation, pharmacokinetic modeling, and dose recommendations. Hopefully, such a proficiency program will be developed for sirolimus TDM because such programs have discovered challenges with TDM of other drugs (Neef et al., 2006; McCune et al., 2021b).
Although TDM is accepted for sirolimus, trough concentrations are limited because they fail to provide a rich, mechanistic description of the pharmacokinetic/pharmacodynamic relationship (Dupuis et al., 2013) that could advance our understanding of why certain patients experience adverse outcomes. Model-informed precision dosing (MIPD) may improve clinical outcomes by optimizing the personalized dose for an individual patient (Darwich et al., 2017). The development of such mechanistic models can help improve individual patients’ clinical outcomes, which can be attributed to the pharmacokinetics and pharmacodynamics of sirolimus. Regarding the pharmacokinetics, low immunosuppressant concentrations or exposure is multifactorial; they can result from insufficient dosing or dose personalization, aberrant pharmacokinetics due to patient covariates, and/or non-adherence (McCune and Bemer, 2016; McCune et al., 2016; Vaisbourd et al., 2022). Non-adherence is associated with the development and severity of adverse outcomes such as graft loss in solid organ transplant (Foster et al., 2018) and graft-versus-host disease (GVHD) hematopoietic cell transplant patients (Gresch et al., 2017; Ice et al., 2020). Thus, improvements in sirolimus dosing to minimize the between-patient variability in sirolimus concentrations through novel -omics techniques or point-of-care monitoring at home may be beneficial. These will be the focus of this review.
However, the promising innovations in -omics techniques and mathematical modeling related to the immune system necessitate that we briefly describe factors possibly affecting the pharmacodynamics of sirolimus. Pharmacodynamic monitoring of the cellular targets of immunosuppressant drugs may reflect clinical outcomes better than TDM (Monchaud and Marquet, 2009a; Monchaud and Marquet, 2009b). For example, recipient pretransplant inosine monophosphate dehydrogenase activity is associated with clinical outcomes after renal transplant or allogeneic hematopoietic cell transplant recipients treated with mycophenolate mofetil (MMF) (Glander et al., 2004; Bemer et al., 2014). However, a drug-specific pharmacodynamic biomarker for sirolimus’s effectiveness or toxicity has yet to be identified. Turning to the use of sirolimus to alter the immune system, the ontogeny of innate and adaptive immune responses involve more than 1,600 genes (Simon et al., 2015). These genes are essential to sustain life in a hostile environment. Yet the immune system is relatively immature at birth. It has to evolve during a lifetime of exposure to many foreign challenges through childhood, young and mature adulthood (including pregnancy). It subsequently declines in old age (Simon et al., 2015). Beyond the effects of these genes, patients may have several transcriptomic (Furlan et al., 2020), proteomic (Cohen Freue et al., 2013; Levitsky et al., 2013), metabolomic [reviewed in Supplementary Table S1 of McCune et al. (2021a)], and lipidomic (Liggett et al., 2022) characteristics that could influence the effectiveness and toxicity of transplantation and/or sirolimus. For example, metabolomics can offer discoveries yielding new insights into how metabolites (here, endogenous, not sirolimus metabolites) influence gut physiology, organ function, and immune function (Wishart, 2019). Given their signaling properties in addition to a multitude of other functions (Cockcroft, 2021), lipidomics may enable a deeper mechanistic understanding of the T-cell migration (Cucchi et al., 2020), drug-target interactions, and systems physiology from the molecular (genomic, proteomic, metabolomic) to cellular to whole-body levels. Collectively, these works could lead to a system-wide perspective of pathophysiology wherein genes, proteins, metabolites, and lipids are understood to interact synergistically to modify the functions within a patient receiving sirolimus. These insights may provide the foundation for enhanced pharmacokinetic/dynamic modeling to comprehensive quantitative systems pharmacology (QSP) models (Ayyar and Jusko, 2020). In homogenous and sufficiently powered populations of patients treated with sirolimus, multi-omic tools should be explored for precision dosing and for building QSP models to improve clinical outcomes.
Mathematical modeling and simulation can characterize the complexity and multiscale nature of the mammalian immune response and provide a mechanistic understanding of the data generated from the novel–omics technologies (Palsson et al., 2013). As an example of such modeling and simulation, the Fully-integrated Immune Response Model (FIRM) represents a multi-organ structure comprised of the target organ, where the immune response occurs, and circulating blood, lymphoid T, and lymphoid B tissue (Palsson et al., 2013). FIRM can be expanded to include novel biological findings relevant to sirolimus, such as incorporating novel medications that target antigen-presenting cells (B-cells), T-cell subsets, T-cell signal transduction, costimulatory molecules, or cytokines into QSP models. Early steps are being taken to apply QSP models to precision dosing, specifically in the context of the well-characterized coagulation cascade (Hartmann et al., 2016). However, the inherent complexity of the immune system and the difficulty of measuring many aspects of a patient’s immune state in vivo makes it challenging to develop such QSP models of immune response (Laubenbacher et al., 2022). Because the immune system has an important role in such a wide range of diseases and health conditions, digital twins of the immune system are of keen interest. Advanced medical digital twins will make precision medicine a reality (Laubenbacher et al., 2022).
Therefore, it is crucial to explore newer methods for precision dosing of sirolimus (Table 1). Here, we summarize our findings from a series of literature reviews (Supplementary Methods and Supplementary Figures S1–S5) about various –omic or point–of–care tools focusing on the sirolimus pharmacokinetics that may improve the precision dosing of sirolimus in children.
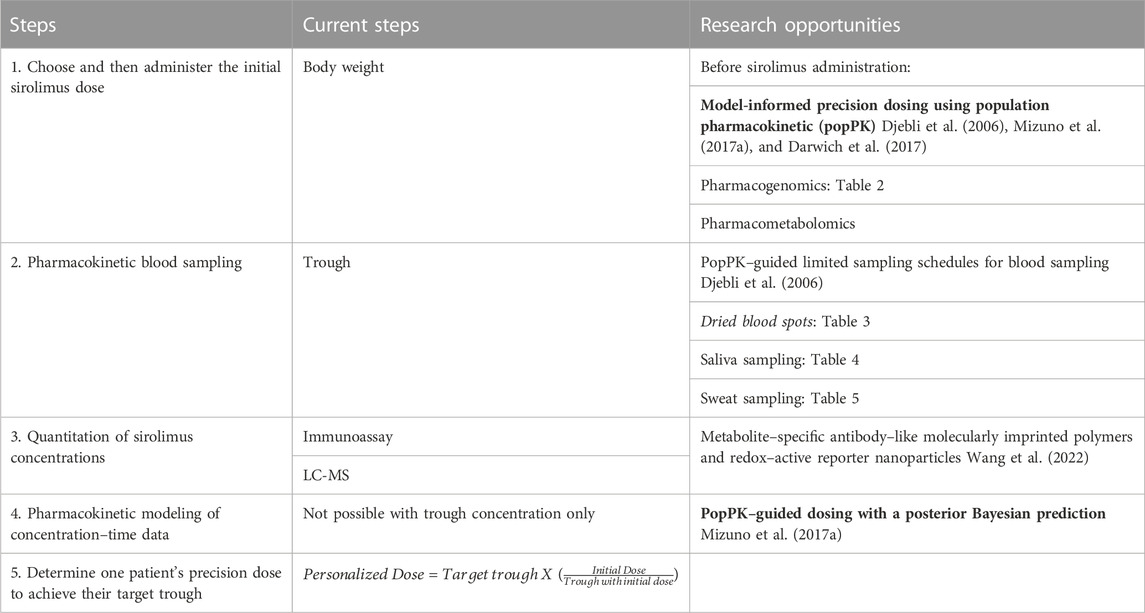
TABLE 1. Steps of and research about precision sirolimus dosing: TDM of sirolimus dosing the initial (first) dose to achieve the target trough. The tools in the bold font should be implemented, and those in the italicized font are not recommended for clinical use.
3 Sirolimus pharmacokinetics
After oral administration, sirolimus achieves its peak whole blood concentrations within 1–3.5 h (MacDonald et al., 2000; Stenton et al., 2005). The apparent oral bioavailability of sirolimus is poor (Stenton et al., 2005). Extensive intestinal and hepatic first-pass metabolism contributes to the low oral bioavailability.
Sirolimus is highly lipophilic (log P of 4.3, Supplementary Table S1). Sirolimus has a large apparent volume of distribution of (5.6–22.8 L/kg) (Brattstrom et al., 2000; Stenton et al., 2005). This large distribution volume implies extensive distribution to organs and tissues and contributes to the long half-life. The free fraction in plasma is 8% (MacDonald et al., 2000). Sirolimus is partitioned extensively into blood cells with a blood-to-plasma ratio of 35.6 (Tejani et al., 2004). In kidney transplant (KT) patients, this ratio is independent of sirolimus concentration and exhibits a large variability (Ferron et al., 1997). In humans, sirolimus is distributed among red blood cells (94.5%), whole blood (3.1%), lymphocytes (1.01%), and granulocytes (1.0%) (Stenton et al., 2005). The sequestration of sirolimus in red blood cells is believed to be partially due to their rich content of immunophilins (Stenton et al., 2005). In the whole blood compartment, sirolimus exhibits concentration–dependent binding to lipoproteins (40%) with a minor fraction (<4%) bound to plasma proteins. Therefore, whole blood is considered the most favorable matrix for TDM (Stenton et al., 2005).
The primary route of elimination occurs via fecal/biliary pathways, with an estimated terminal elimination half–life of approximately 62 ± 16 h (Stenton et al., 2005). After a single oral dose in healthy adults, sirolimus has a half-life of 81.5 h and a total body clearance is 278 mL/h/kg (Brattstrom et al., 2000).
Sirolimus is metabolized by CYP3A4 and CYP3A5 in both human liver and small intestinal microsomes to various demethylated and hydroxylated species (Paine et al., 2002). Degradation products, including an ester hydrolysis product and a ring–opened isomer, have also been described (Paine et al., 2002). In the liver, sirolimus is primarily metabolized by CYP3A4, with CYP3A5 and CYP2C8 having lesser roles (Jacobsen et al., 2001; Emoto et al., 2013). Sirolimus is transported by the multidrug resistance gene product pump p–glycoprotein (PgP) (Stenton et al., 2005), an apically directed ATP–dependent transmembrane secretory (efflux) pump expressed at high levels in enterocytes (Paine et al., 2002).
Examples of potential drug–drug interaction (DDI) with sirolimus result from concomitant calcium channel blockers, imatinib, antibiotics, or antifungals (Leather, 2004; Bernard et al., 2014; Bleyzac et al., 2014). Because of routine TDM of trough concentrations of the sirolimus, these results can be used to identify a DDI and appropriately personalize the sirolimus dose. For example, the DDI between azole antifungals and sirolimus has long been recognized (Yee and McGuire, 1990b; Yee and McGuire, 1990a) and can be managed through TDM (Leather, 2004). The azoles have variable CYP3A4 inhibition, potentially affecting CYP2C9, CYP2C19, and PgP (Leather, 2004). Although these azole–immunosuppression DDI are well known, their management can be variable and could benefit from improved pharmacokinetic/pharmacodynamic modeling. The EMA changed the drug label for sirolimus to include therapeutic monitoring during dose adjustments when inducers or inhibitors of CYP3A are concurrently administered and/or discontinued (Ehmann et al., 2014).
Furthermore, sirolimus is also susceptible to being the victim drug to natural products altering CYP3A or PgP activity, such as grapefruit juice and St. John’s wort (Edwards et al., 1999; Mai et al., 2003; Brantley et al., 2013). Sirolimus pharmacokinetics may have circadian variability, as the maximum plasma concentration and AUC of other CYP3A/PgP substrates (i.e., cyclosporine and tacrolimus) are higher in the morning than in the afternoon (Baraldo and Furlanut, 2006). Seasonal variation is also of concern, as it has recently been reported that duodenal CYP3A4 mRNA is significantly higher between April and September than between October and March (Thirumaran et al., 2012).
The maintenance dose of sirolimus should be adjusted in patients with hepatic impairment or at risk of interactions with sirolimus, either due to concomitant drugs (Author Anonymous, 2022a) or natural products (Paine et al., 2018) affecting CYP3A or PgP activity.
4 Model-informed precision dosing of sirolimus in children
Pharmacometrics enables developing models that describe factors affecting the pharmacokinetics and/or pharmacodynamics in children (Mehrotra et al., 2016). Children are not small adults because of differences in biochemical, body composition, and physiology processes (Rodman et al., 1993; Murry et al., 1995; de Wildt et al., 1999; Blanco et al., 2000; Kearns et al., 2003; Ince et al., 2009; Mahmood, 2014). Specific to sirolimus, the data regarding the maturation of CYP3A4 is conflicting, with different age variations in enzyme activity. For example, Salem et al. (2014) suggested that hepatic CYP3A4 increases from an early age and reaches the adult level by 2.5 years. In contrast, Upreti and Wahlstrom (2016) suggested that CYP3A4 maturation exceeds the adult level between 0.1 and 11 years. Using such enzyme maturation data is critical in creating physiologically based pharmacokinetic models (PBPK) to predict pediatric pharmacokinetics and dosing (Mehrotra et al., 2016).
A PBPK model for children aged 1 month to 2 years demonstrated that the relationship between allometrically scaled in vivo sirolimus clearance and age was described by the Emax model (Emoto et al., 2015a). Consistent with this increased clearance in patients, in vitro intrinsic clearance of sirolimus using pediatric liver microsomes shows a similar age-dependent increase. In children older than 2 years, allometrically scaled apparent oral clearance of sirolimus did not show further maturation. Simulated clearance estimates with a sirolimus PBPK model that included CYP3A4/5/7 and CYP2C8 maturation profiles were in close agreement with observed in vivo clearance values (Emoto et al., 2015a). However, further exploration of the impact of different assumptions regarding CYP3A4 age–related changes on the PBPK model predictive performance may be beneficial (Lang et al., 2021). In addition, PBPK model-simulated sirolimus pharmacokinetic profiles predicted the actual observations well (Emoto et al., 2015a). The mean sirolimus clearance was 11 ± 3 L/h, 17 ± 4 L/h, 21 ± 3 L/h, and 18 ± 6 L/h for the age groups of 1–8 months (<1), 1 year (1 to <2), 2 years (2 to <3), and 3–18 years (≥3), respectively (Emoto et al., 2015a). Sex, ethnicity, or race did not show a statistically significant association with sirolimus clearance in a cohort of 44 children (Emoto et al., 2015a). These results demonstrate the utility of a PBPK modeling approach for predicting the developmental trajectory of sirolimus metabolic activity and its effects on total body clearance in neonates and infants (Emoto et al., 2015a).
Complementing PBPK modeling, population pharmacokinetic (PopPK) models (Beal and Sheiner, 1982) can address relevant hurdles by accounting for variability and mitigating the resource intensity obtaining more pharmacokinetic samples beyond trough samples. PopPK models mathematically describe typical drug kinetics while accounting for between subject variability and residual unknown variability (Holford et al., 2000) and the role of demographic covariates responsible for or related to variability, such as age or gender. PopPK models also facilitate the development of limited sampling schedules, which is essential since most immunosuppression is administered in the outpatient clinic (Li et al., 2012; Li et al., 2013). PopPK models could overcome the major challenge of the –omics tools, specifically the interference from confounding factors (Ioannidis et al., 2009; Gu et al., 2012). Pharmacokinetics can be used to address these confounding factors by identifying factors associated with aberrant metabolism. Theoretical allometrically scaled body weight accounted for differences in body size (Mizuno et al., 2017b). Using a popPK model and more comprehensive blood sampling of sirolimus, MIPD was conducted in children with vascular anomalies as part of a prospective phase II trial (Mizuno et al., 2017a). In 52 children, the target trough was attained in 94%, specifically 49 of 52 children, across the age range of 3 weeks–18 years after 2–3 months of therapy (Mizuno et al., 2017a). The mean sirolimus dose to achieve the target trough of ∼10 ng/mL for patients older than 2 years was 1.8 mg/m2 twice daily (range 0.8–2.9), while it was 0.7–1.6 mg/m2 twice daily for patients 3 weeks of age to 2 years. The final popPK model included a maturation function for sirolimus clearance and allometrically scaled body weight to account for size differences. The mean allometrically scaled sirolimus clearance estimates increased from 3.9 to 17.0 L/h/70 kg with age from shortly after birth to 2 years of age, while the mean estimate for patients older than 2 years was 18.5 L/h/70 kg. This MIPD can be extended to other pediatric populations and perhaps adults (Mizuno et al., 2017a).
5 Multi-omics technologies
5.1 Pharmacogenomics
The pharmacokinetics and pharmacodynamics of sirolimus can be influenced by genetic polymorphisms influencing the expression of CYP3A4, CYP3A5, or PgP (Utecht et al., 2006). Pre–emptive genotyping, or using genotyping results to guide initial dosing before sirolimus administration, takes a step towards the “right–dose–first–time” paradigm (Minto and Schnider, 1998). However, preemptive genotype–directed dosing will not account for non-genetic factors associated with sirolimus pharmacokinetics (Section 3 and Section 4). Although the CYP3A4 and MDR1 genes may contribute to sirolimus pharmacokinetics, we focused on CYP3A5 because it is the only gene involved in sirolimus pharmacokinetics with Clinical Pharmacogenetics Implementation Consortium (CPIC®) guidelines. We reviewed the literature regarding the association of the CYP3A5 genotype with the pharmacokinetic phenotype (Supplementary Figure S1). Very few studies evaluated if the CYP3A5 genotype was associated with the effectiveness or toxicity (i.e., pharmacodynamics) of sirolimus–based immunosuppressive regimens (Mourad et al., 2005; Renders et al., 2007; Lukas et al., 2010; Zochowska et al., 2012; Wang et al., 2014; Khaled et al., 2016; Rodriguez-Jimenez et al., 2017).
A variant in intron 3 of CYP3A5 (rs776746) creates a cryptic splice site which results in aberrant splicing and creates a premature stop codon that results in transcript degradation (Hustert et al., 2001; Kuehl et al., 2001). This allele, now known as CYP3A5*3, explains the liver’s highly variable expression of CYP3A5 protein. Based on homozygosity for the CYP3A5*3 allele, individuals are divided into CYP3A5 non-expressors (CYP3A5*3/*3) and CYP3A5 expressors (CYP3A5*1/*3 and CYP3A5*1/*1) (Rodriguez-Antona et al., 2022). CYP3A5*3 is the most common allele in European and Asian populations, but it is the minor allele in people of African ancestry. Thus, CYP3A5 protein is only expressed in 10%–30% of Europeans and Asians but in ∼70% of people of African ancestry (Rodriguez-Antona et al., 2022).
The CYP3A5 rs776746 variant has been the most extensively evaluated for its association with sirolimus pharmacokinetics in transplant patients (Table 2). CYP3A5 non-expressors should have lower sirolimus clearance and, without TDM, should have higher dose–adjusted trough concentrations (Anglicheau et al., 2005). Conversely, the CYP3A5 expressors should have CYP3A5 protein and thus faster sirolimus clearance, and, without TDM, should have lower dose–adjusted trough concentrations. Anglicheau (Anglicheau et al., 2005) was one of the earliest and largest (n = 129) studies to demonstrate significant differences in dose–adjusted trough concentrations between the CYP3A5 genotypes. They evaluated three different KT patient treatment groups: 1) sirolimus rescue therapy after discontinuing calcineurin inhibitor (CNI) therapy for concerns of nephrotoxicity (n = 69), 2) sirolimus-based therapy de novo post–KT (n = 51), 3) sirolimus + CNI–based therapy (n = 29). In the rescue therapy group, expressors had an average weight adjusted trough concentration of 89 ± 65 (ng/mL)/(mg/kg) vs. non-expressors 145 ± 93 (ng/mL)/(mg/kg) (n = 69, p < 0.02) at 3 months post sirolimus initiation. Notably, only those patients who were transitioned onto sirolimus rescue therapy had a statistically significant association between CYP3A5 rs776746 genotype and dose–adjusted trough concentration (Anglicheau et al., 2005).
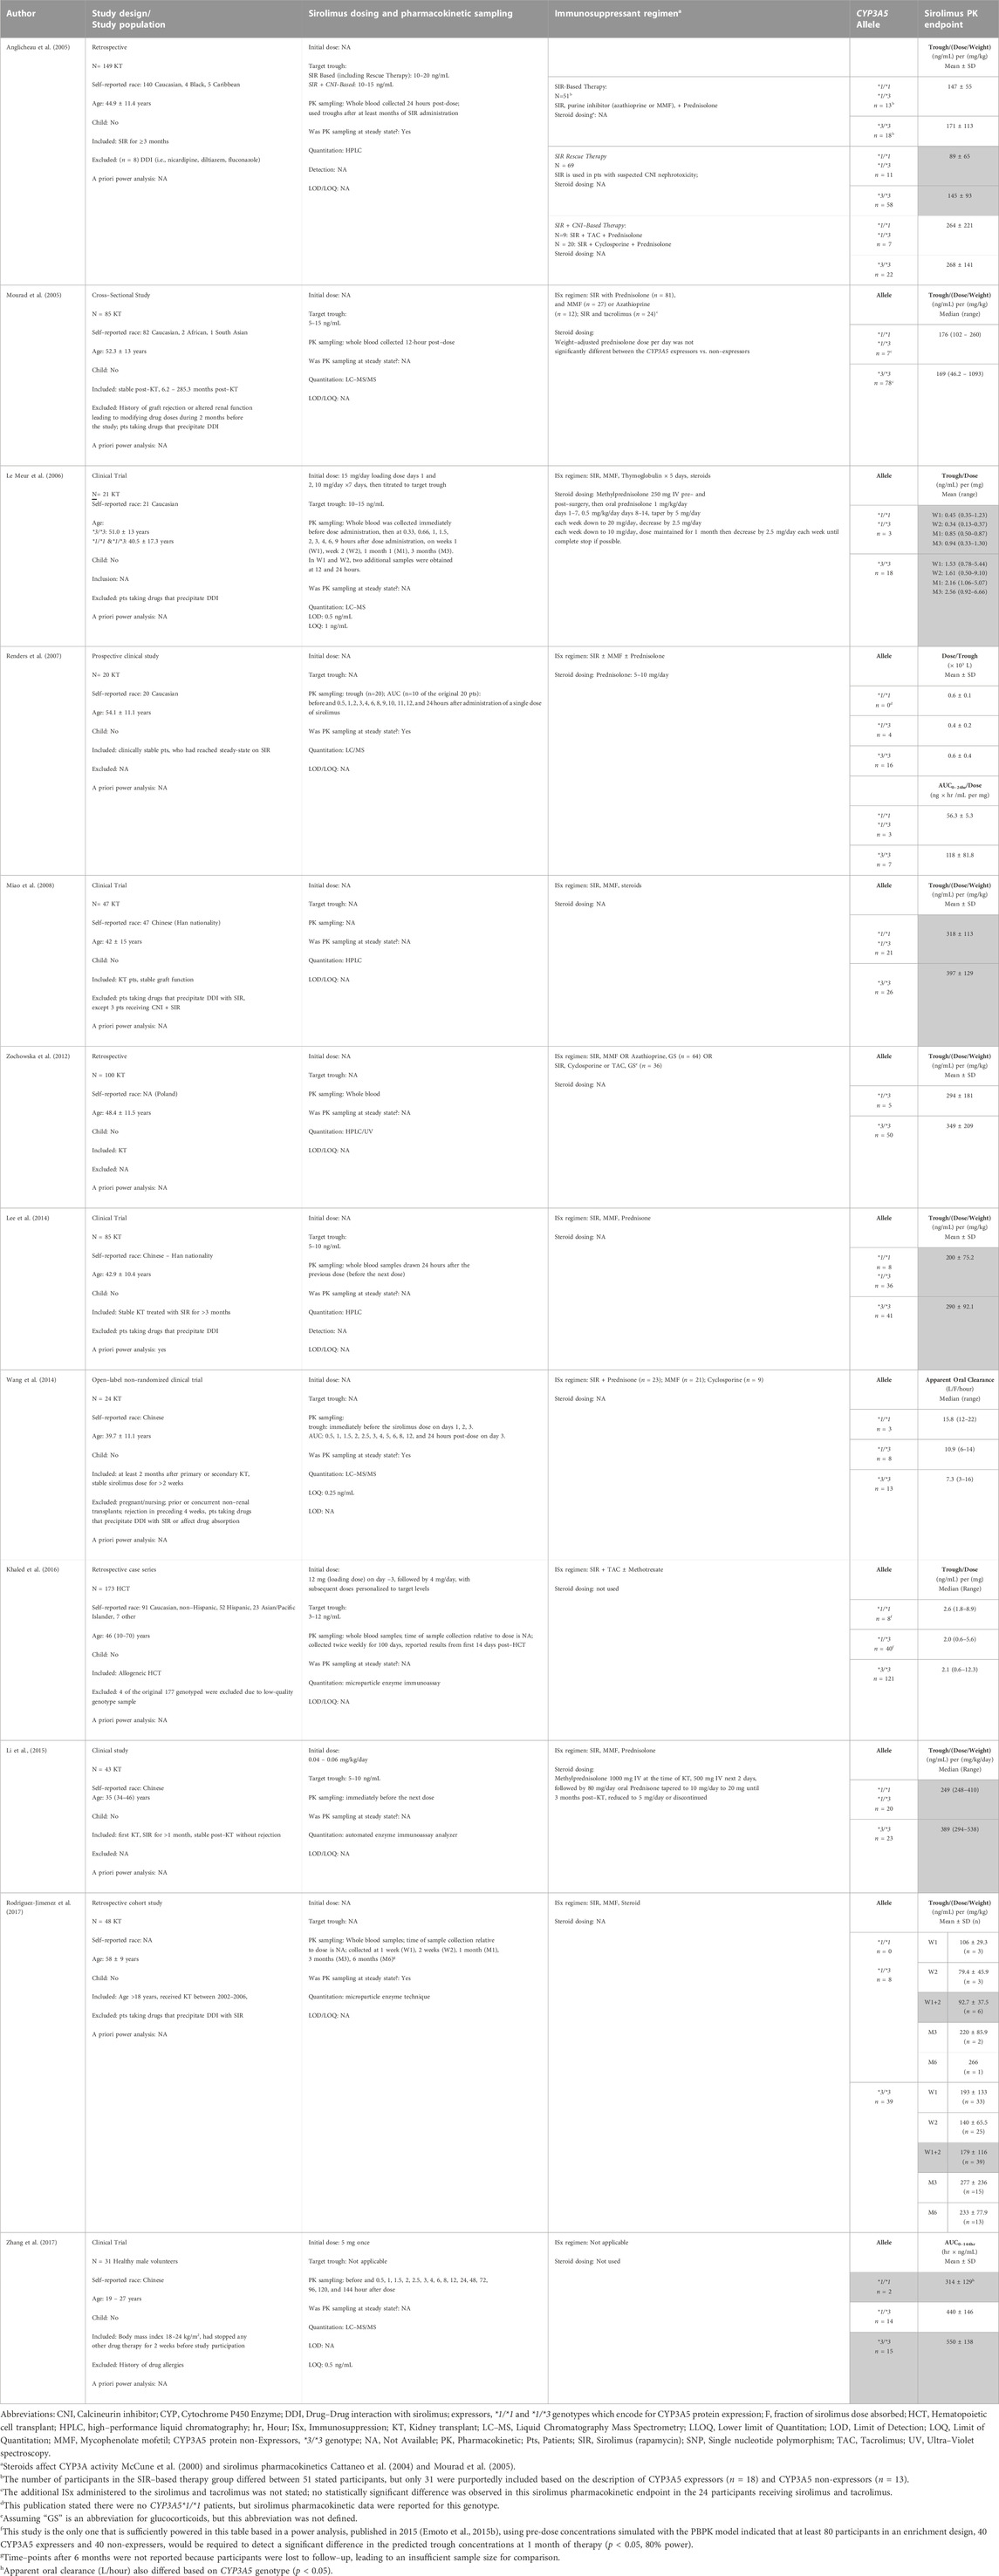
TABLE 2. Pharmacogenetic association of CYP3A5 rs776746 genotype with sirolimus pharmacokinetics. Publications are organized in order of publication date, starting with the oldest. Gray-shaded cells show results where the CYP3A5 genotype was associated with a statistically significant difference (p < 0.05) in sirolimus pharmacokinetics.
Le Meur had a similar finding that non-expressors of CYP3A5 consistently had higher dose–adjusted trough concentrations and AUC0–9hr when measured at 1 week, 2 weeks, 1 month, and 3 months post–KT (Le Meur et al., 2006). Miao et al. (2008), Lee et al. (2014), and Li et al. (2015) reported that the CYP3A5 non-expressors have a higher trough concentration/(dose/weight) than expressors. These three studies had a more even distribution of expressors and non-expressor in their treatment groups (i.e., Miao n = 21,26; Lee n = 36, 41; Li = 20, 23) compared to other studies with more patients with the expressor genotype (Miao et al., 2008; Lee et al., 2014; Li et al., 2015). In a long–term retrospective cohort study, Rodriguez–Jimenez reported an association of CYP3A5 expressor status with the sirolimus concentration/dose ratio at weeks 1 and 2 post–KT values (Rodriguez-Jimenez et al., 2017).
In addition to CYP3A5 rs776746, other CYP3A5 SNPs (i.e., rs4646453 and rs15524) have been evaluated for their association with sirolimus pharmacokinetics (Tamashiro et al., 2017; Liu et al., 2021). Liu reported that rs776746 is in strong linkage disequilibrium with rs4646453 and rs15524 in 69 Chinese KT recipients. In rs4646453, homozygous AA alleles were associated with lower dose–adjusted trough concentrations when compared to homozygous CC (p < 0.001), with CC being the more dominant genotype (n = 41) in the study population (Liu et al., 2021). In rs4646453, homozygous GG (n = 6) had lower dose–adjusted trough concentrations compared to homozygous AA (n = 36) (p < 0.001). Tamashiro also evaluated rs15524 and only found a significant association between genotype and dose–adjusted trough concentration at 9 months post–KT (p < 0.05) (Tamashiro et al., 2017).
Over the past 20 years, there have been 14 studies of the CYP3A5 rs776746 genotype to sirolimus pharmacokinetic phenotype studies in transplant patients. Table 2 summarizes the studies evaluating the CYP3A5 rs776746 genotypes associated with sirolimus pharmacokinetics. Nine of the fourteen studies included in this review found a significant association between the sirolimus adjusted trough value or AUC and CYP3A5 genotype (Anglicheau et al., 2005; Le Meur et al., 2006; Miao et al., 2008; Lee et al., 2014; Li et al., 2015; Rodriguez-Jimenez et al., 2017; Tamashiro et al., 2017; Zhang et al., 2017; Liu et al., 2021). The majority (80%) of these studies were conducted with less than 100 participants. An a priori power calculation could not be found in these studies, which leaves the question if statistically insignificant results were due to an underpowered sample size. Notably, a power analysis published in 2015, using pre-dose concentrations simulated with the PBPK model, indicated that at least 80 participants in an enrichment design, 40 CYP3A5 expressers, and 40 non-expressers, would be required to detect a significant difference in the predicted trough concentrations at 1 month of therapy (p < 0.05, 80% power) (Emoto et al., 2015b). Only one of the studies in Table 2 has 40 CYP3A5 expressors (Khaled et al., 2016). Furthermore, the studies were in heterogenous patient populations, with inconsistent eligibility criteria regarding drugs that precipitate a DDI with sirolimus. In addition, many studies had varying use of corticosteroids which affect CYP3A activity (McCune et al., 2000) and sirolimus pharmacokinetics (Cattaneo et al., 2004; Mourad et al., 2005). Thus, the studies were too heterogeneous and lacked adequately powered and sufficiently controlled studies for it to be feasible to establish a CYP3A5 genotype to sirolimus pharmacokinetic phenotype association. Novel CYP3A5 haplotypes are being identified and may yield insightful results (Rodriguez-Antona et al., 2022). Thus, we stress collaborative efforts to improve the accessibility of pharmacogenetic information to the entire pharmacogenetics community through the PharmGKB (Rodriguez-Antona et al., 2022). However, more research is needed regarding using preemptive CYP3A5-guided sirolimus for children.
5.2 Pharmacometabolomics
Metabolomics, which is the study of small molecule metabolite profiles in biological samples, is an additional promising new technology in precision medicine (Nicholson et al., 2002; Clayton et al., 2006; Clayton et al., 2009; Phapale et al., 2010; Wishart, 2019). Metabolomic experiments are occasionally categorized as targeted or untargeted (Wishart, 2019). The targeted metabolomic analysis involves evaluating a selected group of metabolites, often quantifying the metabolite concentrations relative to an authentic reference standard. In untargeted experiments, an unbiased approach is used, and all of the metabolites detected above the sensitivity threshold of the technology employed are analyzed. We demonstrated that pre–dose metabolomic profiling of plasma could predict busulfan clearance (Lin et al., 2016; Navarro et al., 2016; McCune et al., 2022b). Although the blood concentrations of many metabolites are tightly regulated (Homuth et al., 2012), we have found that the plasma metabolome does change after treatment with alkylating agents such as busulfan or cyclophosphamide (McCune et al., 2022a; McCune et al., 2022b).
The urinary metabolome is also of interest, as urine metabolite concentrations can vary widely and may serve as a “readout” of metabolic capacities that are not detected in blood (Schlosser et al., 2020). For tacrolimus, which is eliminated via similar drug-metabolizing enzymes and transporters as sirolimus, predose urine metabolites are associated with tacrolimus pharmacokinetics (Phapale et al., 2010). Further research is needed in this area, especially accounting for reduced kidney function resulting from concomitant cyclosporine or tacrolimus with sirolimus in transplant recipients. In 1,627 participants of the UK Biobank with reduced kidney function, the combination of metabolite quantitative trait loci revealed novel candidates for biotransformation and detoxification reactions (Schlosser et al., 2020). Thus, these novel biotransformation and detoxification reactions could influence the predose urinary metabolome in patients treated with sirolimus. Furthermore, the potential for renal metabolism of sirolimus should be considered because renal CYP3A can metabolize CYP3A-substrates (Dai et al., 2004; McCune et al., 2005).
6 Point-of-care sample collection of dried blood spots for precision dosing of sirolimus
Another approach to improving the precision dosing of sirolimus is simplifying the collection of the whole blood samples used for sirolimus TDM. There has been extensive interest in using dried blood spot (DBS) as a point-of-care method for obtaining blood samples to be used in sirolimus TDM. DBS sampling is a blood sampling method alternative to venipuncture and requires less blood volume, which makes it an attractive option for children. The DBS sampling process is not difficult to perform and does not require a trained phlebotomist for blood spot collection (Fokkema et al., 2009; Wagner et al., 2016). The patient provides a venipunctures capillary blood drop, places the blood onto a filter card, and subsequently allows the blood spot to dry. The DBS sample is then sent to a laboratory to quantify the sirolimus concentration with LC–MS (Wagner et al., 2016). DBS sampling may improve patient satisfaction by reducing commute times and possibly improving the precision dosing of sirolimus (Dickerson et al., 2015). For DBS to replace whole blood samples, it is important to evaluate if they provide similar sirolimus concentrations. Sirolimus concentration in DBS may be lower than in venous whole blood samples because drug concentrations tend to be lower in capillary blood (Klak et al., 2019). Veenhof et al. (2019) collected DBS and whole blood samples from patients and found that 76.9% of the samples were within acceptable limits.
The accurate quantitation of sirolimus concentration in DBS sampling depends on various factors, summarized in Supplementary Table S2. These factors range from 1. patient characteristics, 2. depositing the blood drop on the filter card; 3. the effect of how long it takes for the blood to dry on the filter card (i.e., drying time); 4. storing and transporting the DBS sample from the patient’s home to the laboratory; 5. punching the DBS section for quantitation; 6. extracting and quantitating sirolimus concentrations.
Table 3 summarizes the findings regarding the quantitation of sirolimus concentrations (abbreviated [SIR] in Table 3) from DBS samples. The patient’s characteristics, specifically their hematocrit and the sirolimus concentration at the time of the DBS collection, appreciably change the accuracy of sirolimus concentrations in DBS. Varying hematocrit influences the blood viscosity, the drying time needed for a DBS, and the potential interference with analyte recovery (De Kesel et al., 2013; Klak et al., 2019). Low hematocrit (less than 0.20 L/L) and high hematocrit (greater than 0.5 L/L) are associated with lower sirolimus recovery from DBS (den Burger et al., 2012; Koster et al., 2013). To obtain reliable sirolimus concentrations, it is optimal that the patient’s hematocrit range is between 0.23 and 0.50 L/L (den Burger et al., 2012; Koster et al., 2013; Koster et al., 2017). Therefore, DBS samples with high or low hematocrit concentrations must be corrected and interpreted cautiously (Klak et al., 2019). Also, better accuracy is achieved when sirolimus concentrations are at least 3.0 ng/mL; however, this may limit the use of DBS as trough concentrations may be lower than 3.0 ng/mL (Koster et al., 2015a; Koster et al., 2017).
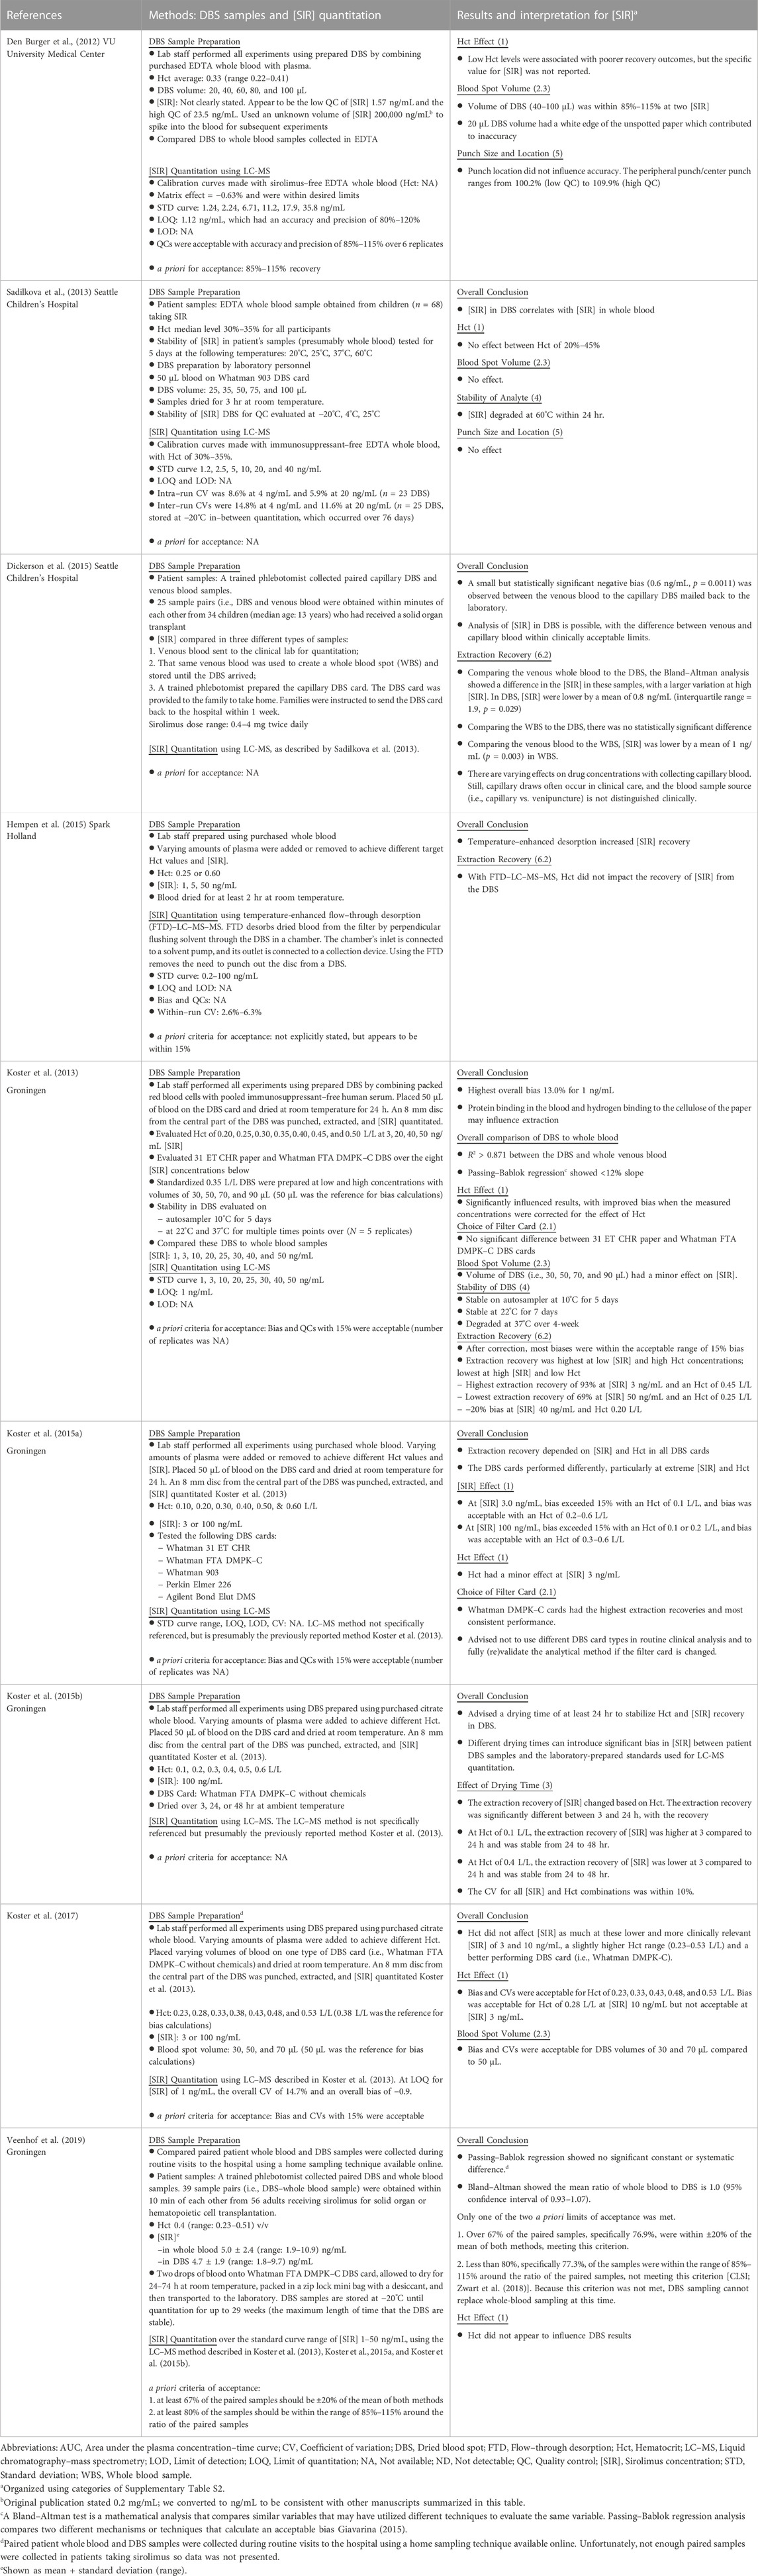
TABLE 3. Studies to quantitate sirolimus concentrations ([SIR]) in dried blood spots prepared in the laboratory or obtained from patients taking sirolimus. Publications are organized in order of publication of the researcher group, starting with the group’s oldest publication.
The second factor influencing sirolimus concentrations from DBS is depositing the blood spot on the filter card. Hydrogen bridges are known to form between sirolimus and cellulose filters (Klak et al., 2019). Because the sirolimus concentration is influenced by the type of filter card used, it is recommended that a laboratory use only one type of filter card for calibration purposes (Koster et al., 2015a). The Whatman FTA DMPK–C, 31 ET CHR, and Whatman DMPK–C filter cards have consistent sirolimus extraction recovery (Koster et al., 2013; Koster et al., 2015a). However, the Whatman 903 and Ahlstrom 226 filter cards are preferred because of their untreated cellulose filter and because they comply with CLSI guidelines (Klak et al., 2019; CLSI document EP09-A3, 2013). In addition to the effects of the filter card, the blood spot volume and homogeneity of its placement within one spot affect the accuracy of sirolimus concentrations from DBS samples. Filter card oversaturation by blood spot volumes equal to or greater than 100 µL (den Burger et al., 2012; Sadilkova et al., 2013) and volumes less than 20 or 30 µL can lead to inaccurate results (den Burger et al., 2012; Koster et al., 2013; Koster et al., 2017). Patients are more likely to provide low blood spot volumes when self–sampling than the recommended 50 µL blood spot volumes (Klak et al., 2019). Dickerson and others evaluated point-of-care (i.e., at-home) collection by providing and educating families about how to collect and mail DBS samples back to the laboratory (Dickerson et al., 2015). A small negative, but not statistically significant, bias between DBS and whole blood samples was found. The sirolimus concentrations in the DBS samples were within clinically acceptable limits (Dickerson et al., 2015). Although this is encouraging for self-sampling, additional studies in children are needed to evaluate if they can provide the recommended blood spot volume studied to date (den Burger et al., 2012; Koster et al., 2013; Koster et al., 2017; Klak et al., 2019; Veenhof et al., 2019).
The third and fourth factors influencing sirolimus concentrations are drying the filter card and storing and transporting the DBS on the filter card, respectively. DBS samples are recommended to be dried at room temperature and away from light for at least 24 hr to allow for accurate hematocrit effects during sirolimus recovery (Koster et al., 2015b; Klak et al., 2019). DBS samples can be stored for 20–29 weeks in the lab at −20°C before losing the stability of sirolimus concentrations (Koster et al., 2015b; Veenhof et al., 2019). All DBS samples require spot-checking for appropriate volume size (Veenhof et al., 2019). Sirolimus DBS samples degrade rapidly within 24 hr at 60°C, but sirolimus is relatively stable at 25°C (Sadilkova et al., 2013; Klak et al., 2019). Therefore, patients using DBS sampling must be educated on properly collecting, storing, and transporting their DBS samples.
The fifth and sixth factors influencing DBS’ sirolimus concentrations are punching out the DBS section for quantitation and the subsequent extraction and quantitation of the sirolimus concentrations, respectively. Punch size and location of the DBS do not appear to influence sirolimus concentrations (den Burger et al., 2012; Sadilkova et al., 2013; Koster et al., 2017; Klak et al., 2019). The highest extraction and recovery rates of sirolimus were found at high hematocrit and low sirolimus concentrations (Table 3) (Koster et al., 2013). When utilizing flow-through desorption (FTD) with LC-MS-enhanced temperature desorption, sirolimus recovery improved significantly (Hempen et al., 2015). However, further trials are still needed to confirm whether FTD–LC–MS–MS can be established as an accurate DBS tool.
In summary, some factors (i.e., hematocrit, sirolimus concentration, filter card, drying time) influence sirolimus concentrations from DBS. However, patient education is necessary for parents to collect sufficient blood spot volumes at the correct time (Dickerson et al., 2015; Klak et al., 2019). In addition, potentially losing samples in the mail is an ongoing concern (Dickerson et al., 2015; Urquhart and Knauer, 2015). Therefore, precision dosing of sirolimus using DBS samples is not recommended for children.
7 Point-of-care collection of saliva or sweat for precision dosing of sirolimus
Other matrices, such as saliva or sweat, can also be used in TDM. As a common alternative to a blood sample, the non-invasive and easily accessible nature of saliva samples makes it optimal for TDM in outpatient settings and potentially in children. Furthermore, with the help of PBPK modeling, the system drug exposure may be predicted from those non-plasma samples. Using PBPK models, we hypothesize that sirolimus concentrations in saliva or sweat can be related to whole blood concentrations to predict sirolimus exposure.
7.1 Precision sirolimus dosing based on salivary concentrations
Compared to collecting whole blood samples, collecting saliva samples is non-invasive, which can allow for more frequent sample collection and facilitate at–home personalization of sirolimus doses. Multiple factors, including saliva collection time, method, and the device, should all be carefully considered for sample collection. Generally, devices made of polyester and polyethylene outperform cotton in quantitating some (but not all) proteins, steroids, and small molecules (e.g., antidepressants, theophylline, and caffeine) (Ghareeb and Akhlaghi, 2015). A summary of the saliva collection methods and devices used in clinical trials and studies involving children is provided (Table 4). For younger children who cannot voluntarily spit or chew, uniquely designed saliva collection devices may be needed to aid sample collection. For TDM, unstimulated saliva samples were collected by expectorating or with the help of a saliva collection device such as Salivette® (Sarstedt, Nümbrecht, Germany). In some cases, saliva excretion is stimulated by paraffin wax (Cohen et al., 1985; Tarantino et al., 2018) or citric acid (Kirk et al., 1994; Kopecky et al., 1997) and collected by similar methods. For younger children, saliva collection is usually performed with the help of an adult and a variety of devices and collection methods to facilitate sample collection.
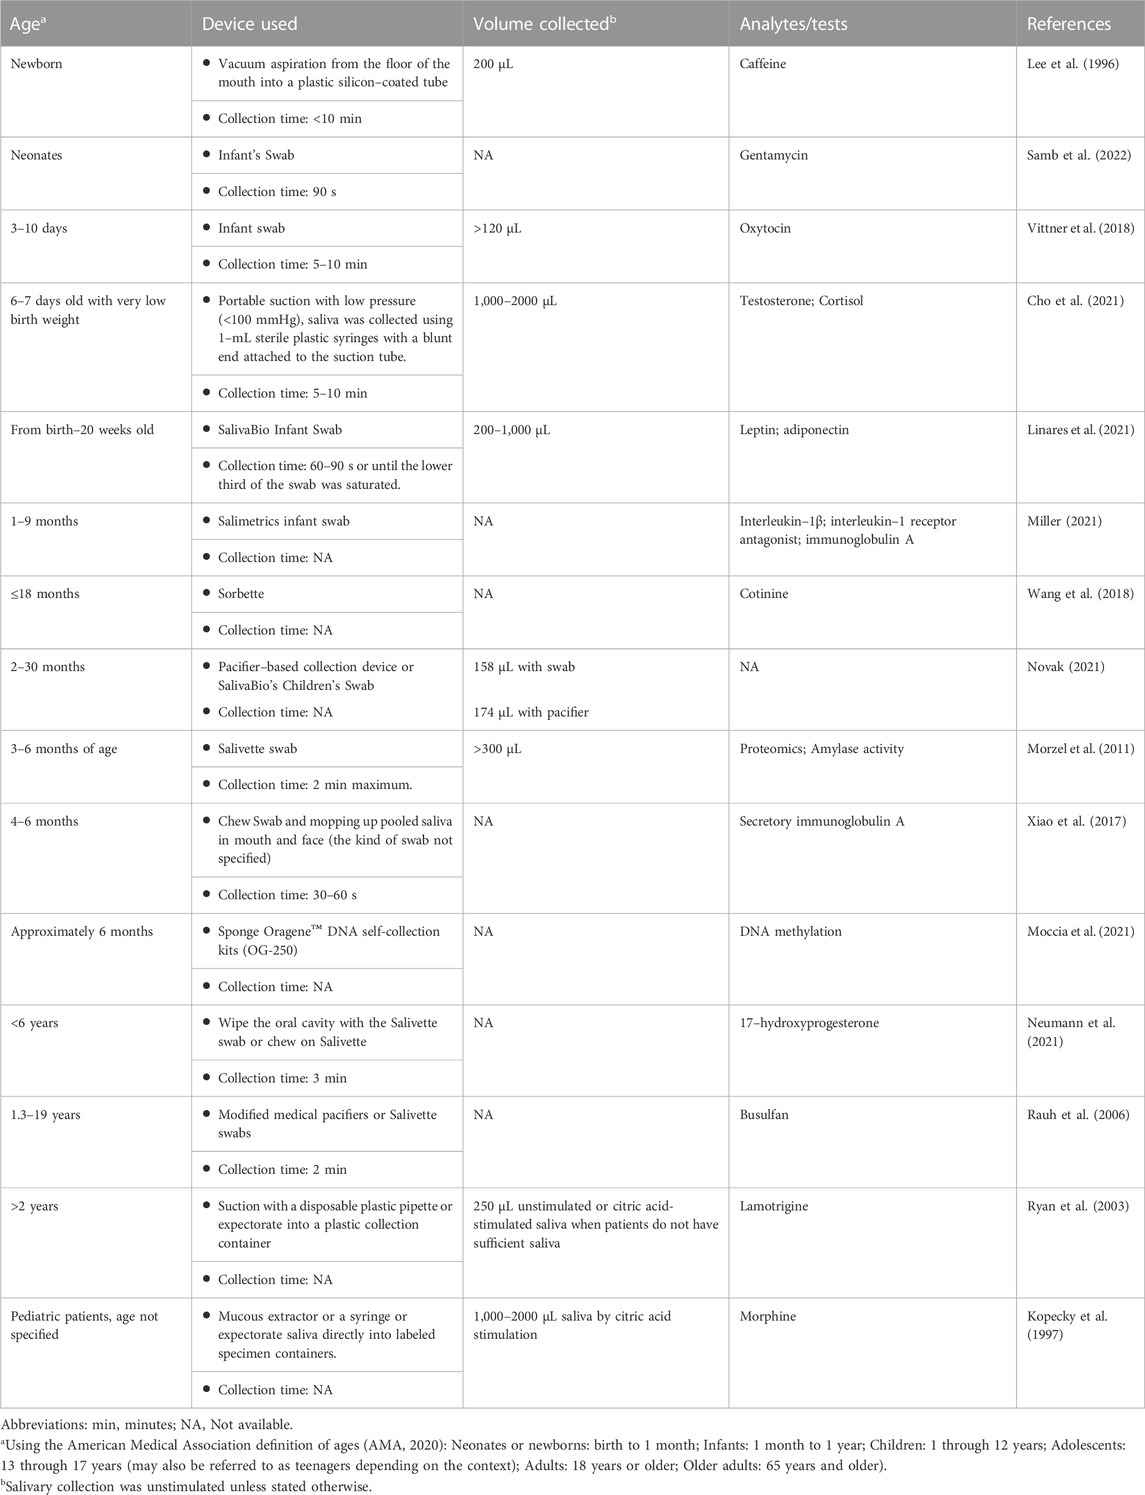
TABLE 4. Studies of saliva collection in children.
Most drugs enter the saliva by passive diffusion, and the salivary concentration is potentially proportional to its free and non-ionized fraction in the blood (Haeckel, 1993). A drug’s partition into saliva largely depends on the physiochemical properties of the drug, including protein binding, lipophilicity, ionization, molecular weight, and other confounding factors such as saliva flow rate, pH, and composition (Ghareeb and Akhlaghi, 2015). For example, the saliva to the plasma concentration ratio of drugs such as digoxin and primidone fluctuates significantly with the salivary flow rate. However, phenytoin and carbamazepine are less influenced by flow rate, likely due to their high lipophilicity (Haeckel, 1993). Sirolimus is highly lipophilic, as indicated by its high logP value (Supplementary Table S1); thus, its saliva concentration is predicted to be less affected by salivary flow rate.
Other factors, such as saliva pH and active saliva–secreting glands, may also affect the saliva-to-plasma ratio of drugs. Saliva stimulation increases the saliva production from the parotid gland, which may increase the salivary concentration of some drugs, such as diazepine, that are present higher in the parotid saliva (DiGregorio et al., 1978). Saliva pH can vary due to physiological factors and saliva flow rate (Tremblay et al., 2012). The actual pH determines the ionized portion of a drug in saliva; drugs that have pKa of less than 5.5 and greater than 8.5 exist in saliva (pH 5.8–7.8) in their non-ionized form. Sirolimus has a pKa value of 10.40 ± 0.07 (Supplementary Table S1), thus, should be affected less by changes in salivary pH (Haeckel, 1993; Ghareeb and Akhlaghi, 2015).
Compared to blood sampling, saliva sampling is non-invasive, which allows for more frequent collection and self-sampling (Ghareeb and Akhlaghi, 2015). Sirolimus was detected in the saliva of 4 adults with stable sirolimus trough concentration (Nudelman et al., 2013). However, in addition to the limited sample size, there was substantive variability in the ratio of sirolimus blood to saliva concentrations (range: not detected to 6.68). Therefore, more data is needed to determine if and how saliva could be used for pharmacokinetic sampling to enable precision dosing of sirolimus.
7.2 Precision sirolimus dosing using sweat concentrations
Sweat samples are used to evaluate if a patient has taken a drug of abuse (Chawarski et al., 2007; Barnes et al., 2009). Innovations in biosensing technology have enabled in situ sweat analysis (Tai et al., 2018; Wang et al., 2022), which has led to an interest in using sweat as a potential matrix for point-of-care precision dosing of sirolimus. Eccrine sweat glands are the most abundant sweat glands in most body surface areas. They contain a secretory coil and a duct (Baker and Wolfe, 2020). Sweat is secreted by cells on the secretory duct, and drug excretion into sweat mainly via passive diffusion. Research showed that the secretion of drugs into sweat depends on the free form of the drug in the plasma, the partition coefficient, and the pKa of the drug (Johnson and Maibach, 1971).
Several additional factors must be considered when considering sweat as a matrix for sirolimus TDM. 1. Is sirolimus excreted in sweat? 2. Is sirolimus metabolized or transported by the eccrine glands? 3. Is sirolimus metabolized by the skin, which may occur during sweat collection? 4. Does sweat gland density or sweat collection vary with anatomic regions (for example, can we collect sweat from the wrist using a wearable such as FitBit?). CYP3A4 is the most active human form of CYP for sirolimus metabolism, while PgP is the most active transporter for sirolimus. CYP3A4, 3A5, and 3A7 mRNA have been detected in the skin. However, their expression levels are lower than in the liver (Baron et al., 2008), and CYP3A activity in the skin is weak (Kazem et al., 2019). PgP is also expressed in dermal components, including sweat ducts, vessels, nerve sheaths, and muscles of human skin, and a moderate expression in the basal epidermis (Skazik et al., 2011). The presence of CYP3A in the skin and PgP expression on sweat ducts suggest that sirolimus could be metabolized or transported during sweat collection. These factors should be carefully considered while relating the drug concentration in sweat to that in the blood.
Other factors, such as variations in sweat rate and sweat gland density between individuals and anatomical regions, should be counted to establish a method for TDM using sweat. Sweat gland density varies among different skin surfaces. The average sweat gland densities on the finger, palm, back of the hand, wrist, forearm, forehead, and back of the neck are 441, 318, 290, 212, 171, 208, and 110 glands/cm2, respectively (Bariya et al., 2020). The dorsal hand, forehead, and upper back are among the regions that have the highest sweat flow during passive heating (Taylor and Machado-Moreira, 2013). Thus, the hand region could be a good target for sweat collection. In addition, there is individual variation in sweat perspiration rate (Sato and Sato, 1983). Those factors should be considered when optimizing methods for sweat collection.
A commonly used method for sweat collection is absorptive sweat patches, which can be left on the skin for a prolonged period (up to 3 weeks). Then, the absorbed sweat content is tested for illegal drugs [e.g., cocaine (Burns and Baselt, 1995) and fentanyl (Schneider et al., 2008)]. In this situation, the drug quantitation in sweat is limited to a “yes, the drug is present” or “no, the drug is not present” question. The concentration of the substance could not be quantitatively related to the intake amount. Thus, this method is not suitable for precision dosing of sirolimus. Another useful method for accessing sweat is iontophoresis sweat induction which has been widely used in diagnosing cystic fibrosis in children and adults (Accurso et al., 2014). An FDA-approved iontophoresis device, such as Macroduct®, has been used for iontophoretic sweat induction. It passes a tiny current (0.5 mA) through the skin to deliver the cholinergic agonists to stimulate the sweat gland locally to accelerate perspiration. Sweat is collected within 30 min after induction. This iontophoresis method enables on-demand sweat access which is optimal for TDM where continuous analytes monitoring may be beneficial (Bandodkar and Wang, 2014).
The muscarinic agonist, pilocarpine, was initially used for sweat collection to diagnose cystic fibrosis testing. It was reported to produce a localized sweating effect for up to 90 min (Simmers et al., 2018a). Carbachol has recently been used for longer durations of sweat collection. Carbachol is a synthetic choline ester that is a parasympathomimetic that mimics the effect of acetylcholine on both the muscarinic and nicotinic receptors. Carbachol is slowly metabolized by cholinesterase and may have a longer-lasting sweat-stimulating effect than pilocarpine (Simmers et al., 2018a). With carbachol induction (17.5–568 µg, Table 5), sweat is detected in the directly stimulated regions for over 5 hr (Sonner et al., 2017). We have also found in an ongoing trial that carbachol-based sweat stimulation could achieve more stable and effective sweat collection in a clinical setting.
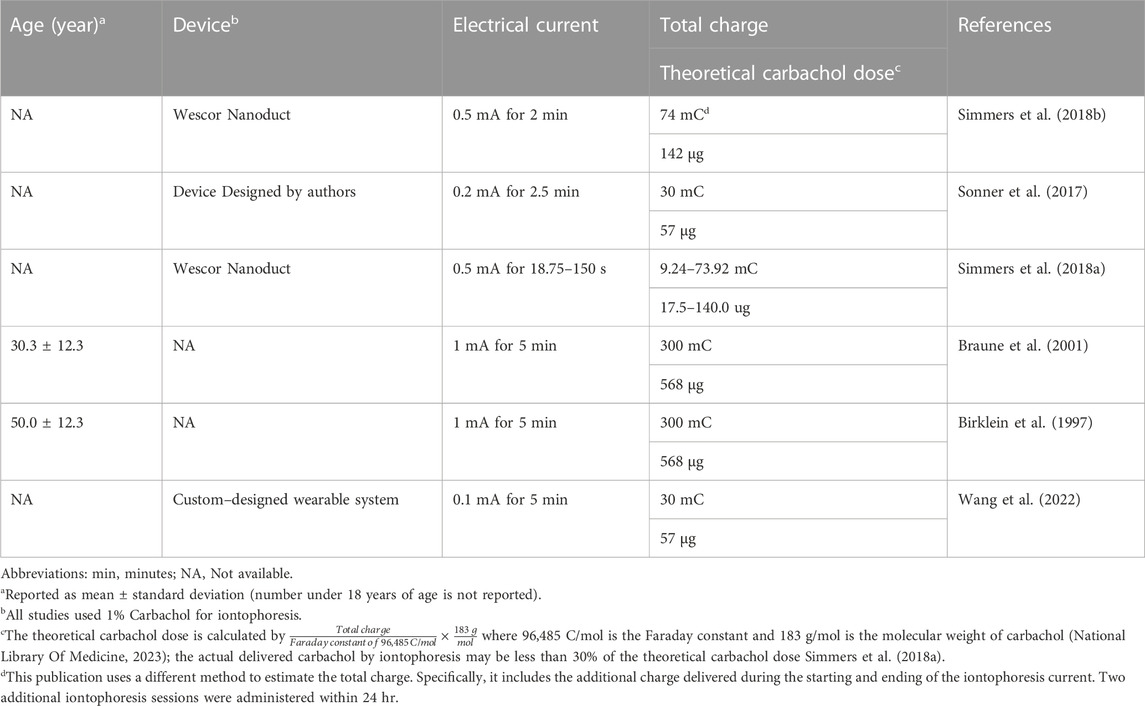
TABLE 5. Carbachol dose for sweat induction by iontophoresis.
More recently, carbachol has been used as a cholinergic agent to stimulate sweating with the newer sweat collection technology (Tai et al., 2018; He et al., 2019; Yang et al., 2020) to achieve real-time on-body sweat collection. Recently, a wearable sensor patch design incorporating a carbachol iontophoresis module can achieve on-demand sweat collection and real-time drug or metabolite quantitation (Wang et al., 2022). This technology could potentially revolutionize the field of precision dosing if successfully applied to this field. However, we could not find publications using carbachol for sweat induction in children (Table 5). To evaluate the safety of carbachol use, we summarized the literature on carbachol use in children (Supplementary Table S3). Carbachol, at doses less than 1.2 mg for inhalation, has been administered to evaluate bronchial response in children. This dose is higher than the carbachol dose delivered by iontophoresis (17.5–568 µg, Table 4) for sweat collection. Thus, carbachol could be safely used for sweat collection in children, although such studies have yet to be conducted. Because of the potential benefit of a point-of-care monitoring of sweat, such studies will hopefully be conducted.
8 Ongoing pilot studies
In combination with tacrolimus, sirolimus can be used to prevent GVHD in recipients of an allogeneic hematopoietic cell transplant (HCT) (Khaled et al., 2016; McCune and Bemer, 2016; McCune et al., 2016). Because GVHD persists as a significant source of non-relapse mortality (Bidgoli et al., 2022), we are describing preliminary data from two pilot studies seeking to improve the dosing of sirolimus and tacrolimus in HCT recipients.
8.1 Feasibility of preemptive CYP3A5–guided dosing
For tacrolimus, the CPIC summarized the published literature supporting the association of the CYP3A5 genotype with dose–adjusted trough concentrations of tacrolimus (Birdwell et al., 2015). CPIC also provided dosing recommendations for tacrolimus based on known CYP3A5 genotypes, facilitating the use of this pharmacogenetic test for patient care (Birdwell et al., 2015). Thus, an increasing number of solid organ transplant and HCT programs are implementing preemptive CYP3A5–guided tacrolimus dosing (Van Driest et al., 2014; Woillard et al., 2017). Tacrolimus and sirolimus have similar dispositions, both being metabolized by CYP3A4 and CYP3A5 and transported by PgP. However, CPIC does not provide dosing recommendations for sirolimus based on the CYP3A5 genotype. That is not surprising with the lack of compelling data on a CYP3A5 genotype to sirolimus pharmacokinetic phenotype association in heterogeneous populations with various pharmacokinetic endpoints (Table 2).
To take our first step towards the “right–dose–first–time” paradigm (Minto and Schnider, 1998) with tacrolimus, we conducted a pilot study to determine if CYP3A5*3 results can be obtained before the first tacrolimus dose is administered in 30 allogeneic HCT recipients. Thirty participants were enrolled between January and July 2022; all signed informed consent approved by the Institutional Review Board (COH Protocol 21233) of the City of Hope before study procedures started. Unfortunately, due to a delay at the genotyping laboratory (ARUP Laboratories, Salt Lake City, UT), the CYP3A5*3 results were not promptly obtained in one participant. However, that participant was one of four participants who did not receive an allogeneic HCT and, thus, did not receive tacrolimus or sirolimus. Of those 26 participants, their age was 64.5 (median, range: 26–79) years, and 13 were men. They were receiving their first allogeneic HCT to treat acute myeloid leukemia (n = 14; 53.9%), myelodysplastic syndrome (n = 7, 26.9%), and acute lymphocytic leukemia (n = 5, 19.2%). The majority were conditioned with non-myeloablative conditioning (n = 20, 76.9%) before a peripheral blood progenitor cell (n = 26, 100%) transplant from an HLA-mismatched unrelated, HLA identical sibling, Haploidentical or HLA-matched related donor, respectively (46.2%, 19.2%, 19.2%, 15.4%, respectively). The prescribed GVHD prophylaxis with tacrolimus and sirolimus (±other) is 61.5%, post-transplant cyclophosphamide with mycophenolate mofetil with either tacrolimus or sirolimus is 23.1%, and various other regimens (15.3%).
Of the 26 participants undergoing an allogeneic HCT, 24 received tacrolimus, and 21 received sirolimus. In general, precision dosing of tacrolimus and sirolimus doses was as follows: tacrolimus trough concentrations targeted between 5 and 15 ng/mL, and sirolimus trough concentrations targeted between 5 and 10 ng/mL (Khaled et al., 2016). The interpatient variability in the initial trough concentration divided by the initial dose divided by total body weight [(ng/mL) per (mg/kg)] by CYP3A5*3 genotype is shown in Table 6. However, it should be noted that the purpose of this research is not to evaluate these genotype–phenotype relationships but to work towards implementing CYP3A5–guided tacrolimus dosing. The initial trough concentration was evaluated before dose adjustments to achieve the target trough concentration. Some initial trough concentrations were obtained before the third dose, so they were not likely to be at steady-state. However, because of the frequency of dose adjustments and the long half-lives of both drugs, it was difficult to ascertain if steady-state was ever achieved. These pilot results support harmonization and standardization for the pharmacokinetic modeling and dose recommendations of these immunosuppressants and immunosuppressant assays, the latter of which was recently suggested (Veenhof et al., 2019). Genotyping was performed at an offsite laboratory, ARUP Laboratories (Salt Lake City, UT, United States). Patients were genotyped for SNPs in the CYP3A5*3 genes using Polymerase Chain Reaction/Fluorescence Monitoring for CYP3A5*3 rs776746, c.219-237A>G (ARUP Laboratories, 2022). These assays’ reference SNP ID number was CYP3A5*1>*3 (rs776746). A minority [7 of 24 (29.2%) tacrolimus, 3 of 19 (15.7%) sirolimus] participants had at least one copy of the CYP3A5*1 allele, which agrees with Hardy–Weinberg equilibrium for those who self-identify as Caucasian. The CYP3A5 genotype results were available 25 (3–175) days before the first tacrolimus dose. Thus, further supporting that preemptive CYP3A5-guided dosing is feasible even when the genotyping laboratory is off-site.
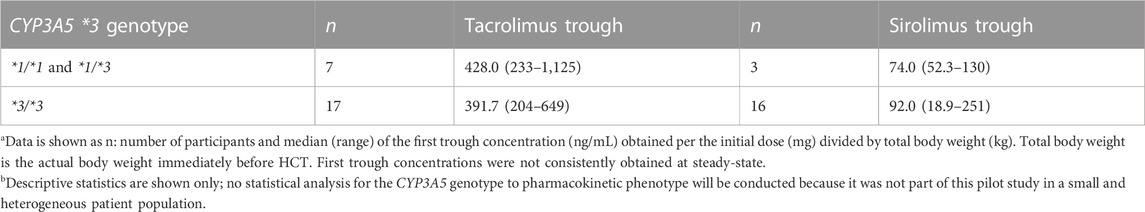
TABLE 6. Interpatient variability in the Trough per Dose/Weight [(ng/mL) per (mg/kg)] shown by CYP3A5*3 genotypea.
8.2 Feasibility of wearables to quantitate sirolimus
Although DBS does not appear feasible for sirolimus (Section 6), the recent development of wearables (Wang et al., 2022) may allow for point-of-care monitoring of sirolimus concentrations, which opens the opportunity for adherence monitoring and model MIPD at home. Toward that goal, we are conducting a pilot study to determine the feasibility of wearables to quantitate drug concentrations in plasma, saliva, and sweat in cancer patients (Clinicaltrials, 2022; NIH). Three allogeneic HCT recipients taking sirolimus had plasma, saliva, and sweat samples collected. None of the iontophoresis with pilocarpine yielded sufficient sweat volume to quantitate sirolimus. Thus, sweat collection using carbachol should be pursued (Table 5). In addition, the carbachol dose used for iontophoresis is lower than that used previously in children (Supplementary Table S3). Thus, we suggest future studies use carbachol for sweat induction in children and adults. The sirolimus concentrations ranged from 0.135 to 0.243 ng/mL in plasma and from 0.55 to 0.79 ng/mL in saliva, which may be detected using a wearable.
9 Conclusion
Dosing sirolimus based on trough concentrations is the current standard of care, although MIPD will be beneficial (McCune and Bemer, 2016; McCune et al., 2016). Therefore, the use of MIPD should be implemented. To date, the data do not suggest the use of DBS for point-of-care monitoring of sirolimus concentrations for precision dosing of sirolimus. Future research should focus on the use of preemptive CYP3A5–guided sirolimus dosing or the use of wearables for point-of-care quantitation of sirolimus in blood, saliva, or sweat.
Author contributions
GS, KM, KP, and JM, wrote the manuscript; DJ and JM designed the research; GS, DJ, PC, WG, and JM performed the research; DJ, AL, and JM analyzed the data. All authors edited the manuscript.
Funding
This work was supported by the Caltech–City of Hope Biomedical Research Initiative Pilot Grants, the Office of the Chief Medical Information Officer at City of Hope National Medical Center, the American Cancer Society RSG-21-181-01-CTPS, U01CA237393, R01GM129863, and P30CA033572 (Analytical Pharmacology Core, Biostatistics, and Hematopoietic Tissue Biorepository). The content is solely the responsibility of the authors and does not necessarily represent the official views of the National Institutes of Health.
Acknowledgments
We are grateful to the participants, their families, and the healthcare providers caring for them. We are also grateful to the research faculty and staff (Paul Fu Jr., Tinisha McDonald, Elena Pulkinen, Kelly Synold, Timothy Synold) involved in sample acquisition, transport, sample quantitation, and quality assurance, and data management. Finally, the authors would like to acknowledge the City of Hope Center for Informatics and the utilization of the POSEIDON platforms for data exploration, visualization, analysis, and discovery.
Conflict of interest
The authors declare that the research was conducted in the absence of any commercial or financial relationships that could be construed as a potential conflict of interest.
Publisher’s note
All claims expressed in this article are solely those of the authors and do not necessarily represent those of their affiliated organizations, or those of the publisher, the editors and the reviewers. Any product that may be evaluated in this article, or claim that may be made by its manufacturer, is not guaranteed or endorsed by the publisher.
Supplementary material
The Supplementary Material for this article can be found online at: https://www.frontiersin.org/articles/10.3389/fphar.2023.1126981/full#supplementary-material
References
Accurso, F. J., Van Goor, F., Zha, J., Stone, A. J., Dong, Q., Ordonez, C. L., et al. (2014). Sweat chloride as a biomarker of CFTR activity: Proof of concept and ivacaftor clinical trial data. J. Cyst. Fibros. 13 (2), 139–147. doi:10.1016/j.jcf.2013.09.007
Alyea, E. P., Li, S., Kim, H. T., Cutler, C., Ho, V., Soiffer, R. J., et al. (2008). Sirolimus, tacrolimus, and low-dose methotrexate as graft-versus-host disease prophylaxis in related and unrelated donor reduced-intensity conditioning allogeneic peripheral blood stem cell transplantation. Biol. Blood Marrow Transpl. 14 (8), 920–926. doi:10.1016/j.bbmt.2008.05.024
AMA (2020). American medical associations. Online Available at: https://www.nih.gov/nih-style-guide/age (Accessed November 29, 2022).
Andres, A. M., Talayero, P., Alcolea Sanchez, A., Sanchez Galan, A., Serradilla Rodriguez, J., Bueno Jimenez, A., et al. (2021). Delayed introduction of sirolimus in paediatric intestinal transplant recipients: Indications and long-term benefits. Transpl. Int. 34 (10), 1895–1907. doi:10.1111/tri.13959
Anglicheau, D., Le Corre, D., Lechaton, S., Laurent-Puig, P., Kreis, H., Beaune, P., et al. (2005). Consequences of genetic polymorphisms for sirolimus requirements after renal transplant in patients on primary sirolimus therapy. Am. J. Transpl. 5 (3), 595–603. doi:10.1111/j.1600-6143.2005.00745.x
ARUP Laboratories (2022). Cytochrome P450 genotyping. Online Available at: https://ltd.aruplab.com/api/ltd/pdf/186 (Accessed December 15, 2022).
Author Anonymous (2022a). Rapamune Sirolimus product information. Online Available at: https://www.pfizermedicalinformation.com/en-us/rapamune/dosage-admin (AccessedDecember 16, 2022).
Ayyar, V. S., and Jusko, W. J. (2020). Transitioning from basic toward systems pharmacodynamic models: Lessons from corticosteroids. Pharmacol. Rev. 72 (2), 414–438. doi:10.1124/pr.119.018101
Baker, L. B., and Wolfe, A. S. (2020). Physiological mechanisms determining eccrine sweat composition. Eur. J. Appl. Physiol. 120 (4), 719–752. doi:10.1007/s00421-020-04323-7
Bandodkar, A. J., and Wang, J. (2014). Non-invasive wearable electrochemical sensors: A review. Trends Biotechnol. 32 (7), 363–371. doi:10.1016/j.tibtech.2014.04.005
Baraldo, M., and Furlanut, M. (2006). Chronopharmacokinetics of ciclosporin and tacrolimus. Clin. Pharmacokinet. 45 (8), 775–788. doi:10.2165/00003088-200645080-00002
Bariya, M., Li, L., Ghattamaneni, R., Ahn, C. H., Nyein, H. Y. Y., Tai, L. C., et al. (2020). Glove-based sensors for multimodal monitoring of natural sweat. Sci. Adv. 6 (35), eabb8308. doi:10.1126/sciadv.abb8308
Barnes, A. J., De Martinis, B. S., Gorelick, D. A., Goodwin, R. S., Kolbrich, E. A., and Huestis, M. A. (2009). Disposition of MDMA and metabolites in human sweat following controlled MDMA administration. Clin. Chem. 55 (3), 454–462. doi:10.1373/clinchem.2008.117093
Baron, J. M., Wiederholt, T., Heise, R., Merk, H. F., and Bickers, D. R. (2008). Expression and function of cytochrome p450-dependent enzymes in human skin cells. Curr. Med. Chem. 15 (22), 2258–2264. doi:10.2174/092986708785747535
Beal, S. L., and Sheiner, L. B. (1982). Estimating population kinetics. Crit. Rev. Biomed. Eng. 8 (3), 195–222.
Bemer, M. J., Risler, L. J., Phillips, B. R., Wang, J., Storer, B. E., Sandmaier, B. M., et al. (2014). Recipient pretransplant inosine monophosphate dehydrogenase activity in nonmyeloablative hematopoietic cell transplantation. Biol. Blood Marrow Transpl. 20 (10), 1544–1552. doi:10.1016/j.bbmt.2014.05.032
Bernard, E., Goutelle, S., Bertrand, Y., and Bleyzac, N. (2014). Pharmacokinetic drug-drug interaction of calcium channel blockers with cyclosporine in hematopoietic stem cell transplant children. Ann. Pharmacother. 48 (12), 1580–1584. doi:10.1177/1060028014550644
Bidgoli, A., DePriest, B. P., Saatloo, M. V., Jiang, H., Fu, D., and Paczesny, S. (2022). Current definitions and clinical implications of biomarkers in graft-versus-host disease. Transpl. Cell Ther. 28, 657–666. doi:10.1016/j.jtct.2022.07.008
Birdwell, K. A., Decker, B., Barbarino, J. M., Peterson, J. F., Stein, C. M., Sadee, W., et al. (2015). Clinical pharmacogenetics implementation Consortium (CPIC) guidelines for CYP3A5 genotype and tacrolimus dosing. Clin. Pharmacol. Ther. 98 (1), 19–24. doi:10.1002/cpt.113
Birklein, F., Sittl, R., Spitzer, A., Claus, D., Neundorfer, B., and Handwerker, H. O. (1997). Sudomotor function in sympathetic reflex dystrophy. Pain 69 (1-2), 49–54. doi:10.1016/s0304-3959(96)03242-3
Blanco, J. G., Harrison, P. L., Evans, W. E., and Relling, M. V. (2000). Human cytochrome P450 maximal activities in pediatric versus adult liver. Drug Metab. Dispos. 28 (4), 379–382.
Bleyzac, N., Kebaili, K., Mialou, V., Bertrand, Y., and Goutelle, S. (2014). Pharmacokinetic drug interaction between cyclosporine and imatinib in bone marrow transplant children and model-based reappraisal of imatinib drug interaction profile. Ther. Drug Monit. 36 (6), 724–729. doi:10.1097/FTD.0000000000000084
Brantley, S. J., Graf, T. N., Oberlies, N. H., and Paine, M. F. (2013). A systematic approach to evaluate herb-drug interaction mechanisms: Investigation of milk thistle extracts and eight isolated constituents as CYP3A inhibitors. Drug Metab. Dispos. 41 (9), 1662–1670. doi:10.1124/dmd.113.052563
Brattstrom, C., Sawe, J., Jansson, B., Lonnebo, A., Nordin, J., Zimmerman, J. J., et al. (2000). Pharmacokinetics and safety of single oral doses of sirolimus (rapamycin) in healthy male volunteers. Ther. Drug Monit. 22 (5), 537–544. doi:10.1097/00007691-200010000-00006
Braune, C., Erbguth, F., and Birklein, F. (2001). Dose thresholds and duration of the local anhidrotic effect of botulinum toxin injections: Measured by sudometry. Br. J. Dermatol 144 (1), 111–117. doi:10.1046/j.1365-2133.2001.03961.x
Burns, M., and Baselt, R. C. (1995). Monitoring drug use with a sweat patch: An experiment with cocaine. J. Anal. Toxicol. 19 (1), 41–48. doi:10.1093/jat/19.1.41
Cattaneo, D., Merlini, S., Pellegrino, M., Carrara, F., Zenoni, S., Murgia, S., et al. (2004). Therapeutic drug monitoring of sirolimus: Effect of concomitant immunosuppressive therapy and optimization of drug dosing. Am. J. Transpl. 4 (8), 1345–1351. doi:10.1111/j.1600-6143.2004.00517.x
Chawarski, M. C., Fiellin, D. A., O'Connor, P. G., Bernard, M., and Schottenfeld, R. S. (2007). Utility of sweat patch testing for drug use monitoring in outpatient treatment for opiate dependence. J. Subst. Abuse Treat. 33 (4), 411–415. doi:10.1016/j.jsat.2007.03.004
Cho, J., Chien, L. C., and Holditch-Davis, D. (2021). Associations between hormonal biomarkers and preterm infant health and development during the first 2 Years after birth. Biol. Res. Nurs. 23 (2), 188–197. doi:10.1177/1099800420942893
Claxton, D. F., Ehmann, C., and Rybka, W. (2005). Control of advanced and refractory acute myelogenous leukaemia with sirolimus-based non-myeloablative allogeneic stem cell transplantation. Br. J. Haematol. 130 (2), 256–264. doi:10.1111/j.1365-2141.2005.05600.x
Clayton, T. A., Baker, D., Lindon, J. C., Everett, J. R., and Nicholson, J. K. (2009). Pharmacometabonomic identification of a significant host-microbiome metabolic interaction affecting human drug metabolism. Proc. Natl. Acad. Sci. U. S. A. 106 (34), 14728–14733. doi:10.1073/pnas.0904489106
Clayton, T. A., Lindon, J. C., Cloarec, O., Antti, H., Charuel, C., Hanton, G., et al. (2006). Pharmaco-metabonomic phenotyping and personalized drug treatment. Nature 440 (7087), 1073–1077. doi:10.1038/nature04648
Clinicaltrials. Biospecimen analysis in detecting chemical concentrations in patients with chronic or infectious diseases receiving medications. 2022, Online. Available at: https://clinicaltrials.gov/ct2/show/NCT04160429, [Accessed December 15, 2022].
CLSI document EP09-A3 (2013). Measurement procedure comparison and bias estimation using patient samples. Approved guideline—third edition. Wayne, PA: Clinical and Laboratory Standards Institute. Online Available at: https://clsi.org/media/1435/ep09a3_sample.pdf (Accessed January 12, 2023).
Cockcroft, S. (2021). Mammalian lipids: Structure, synthesis and function. Essays Biochem. 65 (5), 813–845. doi:10.1042/EBC20200067
Cohen, A. F., Ashby, L., Crowley, D., Land, G., Peck, A. W., and Miller, A. A. (1985). Lamotrigine (BW430C), a potential anticonvulsant. Effects on the central nervous system in comparison with phenytoin and diazepam. Br. J. Clin. Pharmacol. 20 (6), 619–629. doi:10.1111/j.1365-2125.1985.tb05120.x
Cohen Freue, G. V., Meredith, A., Smith, D., Bergman, A., Sasaki, M., Lam, K. K., et al. (2013). Computational biomarker pipeline from discovery to clinical implementation: Plasma proteomic biomarkers for cardiac transplantation. PLoS Comput. Biol. 9 (4), e1002963. doi:10.1371/journal.pcbi.1002963
Cucchi, D., Camacho-Munoz, D., Certo, M., Niven, J., Smith, J., Nicolaou, A., et al. (2020). Omega-3 polyunsaturated fatty acids impinge on CD4+ T cell motility and adipose tissue distribution via direct and lipid mediator-dependent effects. Cardiovasc Res. 116 (5), 1006–1020. doi:10.1093/cvr/cvz208
Cutler, C., and Antin, J. H. (2004). Sirolimus for GVHD prophylaxis in allogeneic stem cell transplantation. Bone Marrow Transpl. 34 (6), 471–476. doi:10.1038/sj.bmt.1704604
Dai, Y., Iwanaga, K., Lin, Y. S., Hebert, M. F., Davis, C. L., Huang, W., et al. (2004). In vitro metabolism of cyclosporine A by human kidney CYP3A5. Biochem. Pharmacol. 68 (9), 1889–1902. doi:10.1016/j.bcp.2004.07.012
Darwich, A. S., Ogungbenro, K., Vinks, A. A., Powell, J. R., Reny, J. L., Marsousi, N., et al. (2017). Why has model-informed precision dosing not yet become common clinical reality? Lessons from the past and a roadmap for the future. Clin. Pharmacol. Ther. 101 (5), 646–656. doi:10.1002/cpt.659
De Kesel, P. M., Sadones, N., Capiau, S., Lambert, W. E., and Stove, C. P. (2013). Hemato-critical issues in quantitative analysis of dried blood spots: Challenges and solutions. Bioanalysis 5 (16), 2023–2041. doi:10.4155/bio.13.156
den Burger, J. C., Wilhelm, A. J., Chahbouni, A., Vos, R. M., Sinjewel, A., and Swart, E. L. (2012). Analysis of cyclosporin A, tacrolimus, sirolimus, and everolimus in dried blood spot samples using liquid chromatography tandem mass spectrometry. Anal. Bioanal. Chem. 404 (6–7), 1803–1811. doi:10.1007/s00216-012-6317-8
de Wildt, S. N., Kearns, G. L., Leeder, J. S., van den Anker, J. N., den Burger, J. C., Wilhelm, A. J., et al. (1999). Cytochrome P450 3A: Ontogeny and drug disposition. Clin. PharmacokinetAnal Bioanal. Chem. 37404 (66-7), 4851803–5051811. doi:10.1007/s00216-012-6317-8
Dickerson, J. A., Sinkey, M., Jacot, K., Stack, J., Sadilkova, K., Law, Y. M., et al. (2015). Tacrolimus and sirolimus in capillary dried blood spots allows for remote monitoring. Pediatr. Transpl. 19 (1), 101–106. doi:10.1111/petr.12392
DiGregorio, G. J., Piraino, A. J., and Ruch, E. (1978). Diazepam concentrations in parotid saliva, mixed saliva, and plasma. Clin. Pharmacol. Ther. 24 (6), 720–725. doi:10.1002/cpt1978246720
Djebli, N., Rousseau, A., Hoizey, G., Rerolle, J. P., Toupance, O., Le Meur, Y., et al. (2006). Sirolimus population pharmacokinetic/pharmacogenetic analysis and bayesian modelling in kidney transplant recipients. Clin. Pharmacokinet. 45 (11), 1135–1148. doi:10.2165/00003088-200645110-00007
Dupuis, L. L., Seto, W., Teuffel, O., Gibson, P., Schultz, K. R., Doyle, J. D., et al. (2013). Prediction of area under the cyclosporine concentration versus time curve in children undergoing hematopoietic stem cell transplantation. Biol. Blood Marrow Transpl. 19 (3), 418–423. doi:10.1016/j.bbmt.2012.10.031
Edwards, D. J., Fitzsimmons, M. E., Schuetz, E. G., Yasuda, K., Ducharme, M. P., Warbasse, L. H., et al. (1999). 6',7'-Dihydroxybergamottin in grapefruit juice and seville orange juice: Effects on cyclosporine disposition, enterocyte CYP3A4, and P- glycoprotein. Clin. Pharmacol. Ther. 65 (3), 237–244. doi:10.1016/S0009-9236(99)70102-5
Ehmann, F., Caneva, L., and Papaluca, M. (2014). European Medicines Agency initiatives and perspectives on pharmacogenomics. Br. J. Clin. Pharmacol. 77 (4), 612–617. doi:10.1111/bcp.12319
EMA (2022). European medicines agency. Online Available at: https://www.ema.europa.eu/en/documents/product-information/rapamune-epar-product-information_en.pdf (Accessed November 29, 2022).
Emoto, C., Fukuda, T., Cox, S., Christians, U., and Vinks, A. A. (2013). Development of a physiologically-based pharmacokinetic model for sirolimus: Predicting bioavailability based on intestinal CYP3A content. CPT Pharmacometrics Syst. Pharmacol. 2, e59. doi:10.1038/psp.2013.33
Emoto, C., Fukuda, T., Johnson, T. N., Adams, D. M., and Vinks, A. A. (2015a). Development of a pediatric physiologically based pharmacokinetic model for sirolimus: Applying principles of growth and maturation in neonates and infants. CPT Pharmacometrics Syst. Pharmacol. 4 (2), e17. doi:10.1002/psp4.17
Emoto, C., Fukuda, T., Venkatasubramanian, R., and Vinks, A. A. (2015b). The impact of CYP3A5*3 polymorphism on sirolimus pharmacokinetics: Insights from predictions with a physiologically-based pharmacokinetic model. Br. J. Clin. Pharmacol. 80 (6), 1438–1446. doi:10.1111/bcp.12743
Ferron, G. M., Mishina, E. V., Zimmerman, J. J., and Jusko, W. J. (1997). Population pharmacokinetics of sirolimus in kidney transplant patients. Clin. Pharmacol. Ther. 61 (4), 416–428. doi:10.1016/S0009-9236(97)90192-2
Fokkema, M. R., Bakker, A. J., de Boer, F., Kooistra, J., de Vries, S., and Wolthuis, A. (2009). HbA1c measurements from dried blood spots: Validation and patient satisfaction. Clin. Chem. Lab. Med. 47 (10), 1259–1264. doi:10.1515/CCLM.2009.274
Foster, B. J., Pai, A. L. H., Zelikovsky, N., Amaral, S., Bell, L., Dharnidharka, V. R., et al. (2018). A randomized trial of a multicomponent intervention to promote medication adherence: The teen adherence in kidney transplant effectiveness of intervention trial (TAKE-IT). Am. J. Kidney Dis. 72 (1), 30–41. doi:10.1053/j.ajkd.2017.12.012
Furlan, S. N., Singh, K., Lopez, C., Tkachev, V., Hunt, D. J., Hibbard, J., et al. (2020). IL-2 enhances ex vivo-expanded regulatory T-cell persistence after adoptive transfer. Blood Adv. 4 (8), 1594–1605. doi:10.1182/bloodadvances.2019001248
Ghareeb, M., and Akhlaghi, F. (2015). Alternative matrices for therapeutic drug monitoring of immunosuppressive agents using LC-MS/MS. Bioanalysis 7 (8), 1037–1058. doi:10.4155/bio.15.35
Giavarina, D. (2015). Understanding bland altman analysis. Biochem. Med. Zagreb. 25 (2), 141–151. doi:10.11613/BM.2015.015
Glander, P., Hambach, P., Braun, K. P., Fritsche, L., Giessing, M., Mai, I., et al. (2004). Pre-transplant inosine monophosphate dehydrogenase activity is associated with clinical outcome after renal transplantation. Am. J. Transpl. 4 (12), 2045–2051. doi:10.1111/j.1600-6143.2004.00617.x
Goyal, R. K., Han, K., Wall, D. A., Pulsipher, M. A., Bunin, N., Grupp, S. A., et al. (2013). Sirolimus pharmacokinetics in early postmyeloablative pediatric blood and marrow transplantation. Biol. Blood Marrow Transpl. 19 (4), 569–575. doi:10.1016/j.bbmt.2012.12.015
Gresch, B., Kirsch, M., Fierz, K., Halter, J. P., Nair, G., Denhaerynck, K., et al. (2017). Medication nonadherence to immunosuppressants after adult allogeneic haematopoietic stem cell transplantation: A multicentre cross-sectional study. Bone Marrow Transpl. 52 (2), 304–306. doi:10.1038/bmt.2016.262
Gu, H., Gowda, G. A., and Raftery, D. (2012). Metabolic profiling: Are we en route to better diagnostic tests for cancer? Future Oncol. 8 (10), 1207–1210. doi:10.2217/fon.12.113
Haeckel, R. (1993). Factors influencing the saliva/plasma ratio of drugs. Ann. N. Y. Acad. Sci. 694, 128–142. doi:10.1111/j.1749-6632.1993.tb18347.x
Hartmann, S., Biliouris, K., Lesko, L. J., Nowak-Gottl, U., and Trame, M. N. (2016). Quantitative systems pharmacology model to predict the effects of commonly used anticoagulants on the human coagulation network. CPT Pharmacometrics Syst. Pharmacol. 5 (10), 554–564. doi:10.1002/psp4.12111
Hayes, D., Adler, B., Turner, T. L., and Mansour, H. M. (2014). Alternative tacrolimus and sirolimus regimen associated with rapid resolution of posterior reversible encephalopathy syndrome after lung transplantation. Pediatr. Neurol. 50 (3), 272–275. doi:10.1016/j.pediatrneurol.2013.11.006
He, W., Wang, C., Wang, H., Jian, M., Lu, W., Liang, X., et al. (2019). Integrated textile sensor patch for real-time and multiplex sweat analysis. Sci. Adv. 5 (11), eaax0649. doi:10.1126/sciadv.aax0649
Hempen, C. M., Maarten Koster, E. H., and Ooms, J. A. (2015). Hematocrit-independent recovery of immunosuppressants from DBS using heated flow-through desorption. Bioanalysis 7 (16), 2019–2029. doi:10.4155/bio.15.97
Hendrickson, R. J., Sujka, J., Fischer, R., Manalang, M., Daniel, J., and Andrews, W. S. (2019). Indications and efficacy of conversion from tacrolimus-to sirolimus-based immunosuppression in pediatric patients who underwent liver transplantation for unresectable hepatoblastoma. Pediatr. Transpl. 23 (3), e13369. doi:10.1111/petr.13369
Ho, V. T., Aldridge, J., Kim, H. T., Cutler, C., Koreth, J., Armand, P., et al. (2009). Comparison of Tacrolimus and Sirolimus (Tac/Sir) versus Tacrolimus, Sirolimus, and mini-methotrexate (Tac/Sir/MTX) as acute graft-versus-host disease prophylaxis after reduced-intensity conditioning allogeneic peripheral blood stem cell transplantation. Biol. Blood Marrow Transpl. 15 (7), 844–850. doi:10.1016/j.bbmt.2009.03.017
Holford, N. H., Kimko, H. C., Monteleone, J. P., and Peck, C. C. (2000). Simulation of clinical trials. Annu. Rev. Pharmacol. Toxicol. 40, 209–234. doi:10.1146/annurev.pharmtox.40.1.209
Homuth, G., Teumer, A., Volker, U., and Nauck, M. (2012). A description of large-scale metabolomics studies: Increasing value by combining metabolomics with genome-wide SNP genotyping and transcriptional profiling. J. Endocrinol. 215 (1), 17–28. doi:10.1530/JOE-12-0144
Hustert, E., Haberl, M., Burk, O., Wolbold, R., He, Y. Q., Klein, K., et al. (2001). The genetic determinants of the CYP3A5 polymorphism. Pharmacogenetics 11 (9), 773–779. doi:10.1097/00008571-200112000-00005
Ice, L. L., Bartoo, G. T., McCullough, K. B., Wolf, R. C., Dierkhising, R. A., Mara, K. C., et al. (2020). A prospective survey of outpatient medication adherence in adult allogeneic hematopoietic stem cell transplantation patients. Biol. Blood Marrow Transpl. 26 (9), 1627–1634. doi:10.1016/j.bbmt.2020.05.020
Ince, I., de Wildt, S. N., Tibboel, D., Danhof, M., and Knibbe, C. A. (2009). Tailor-made drug treatment for children: Creation of an infrastructure for data-sharing and population PK-pd modeling. Drug Discov. Today 14 (5-6), 316–320. doi:10.1016/j.drudis.2008.11.004
Ioannidis, J. P., Loy, E. Y., Poulton, R., and Chia, K. S. (2009). Researching genetic versus nongenetic determinants of disease: A comparison and proposed unification. Sci. Transl. Med. 1 (7), 7ps8. doi:10.1126/scitranslmed.3000247
Jacobsen, W., Serkova, N., Hausen, B., Morris, R. E., Benet, L. Z., and Christians, U. (2001). Comparison of the in vitro metabolism of the macrolide immunosuppressants sirolimus and RAD. Transpl. Proc. 33 (1-2), 514–515. doi:10.1016/s0041-1345(00)02116-3
Johnson, H. L., and Maibach, H. I. (1971). Drug excretion in human eccrine sweat. J. Invest. Dermatol 56 (3), 182–188. doi:10.1111/1523-1747.ep12260784
Kahan, B. D., Napoli, K. L., Kelly, P. A., Podbielski, J., Hussein, I., Urbauer, D. L., et al. (2000). Therapeutic drug monitoring of sirolimus: Correlations with efficacy and toxicity. Clin. Transpl. 14 (2), 97–109. doi:10.1034/j.1399-0012.2000.140201.x
Kazem, S., Linssen, E. C., and Gibbs, S. (2019). Skin metabolism phase I and phase II enzymes in native and reconstructed human skin: A short review. Drug Discov. Today 24 (9), 1899–1910. doi:10.1016/j.drudis.2019.06.002
Kearns, G. L., Abdel-Rahman, S. M., Alander, S. W., Blowey, D. L., Leeder, J. S., and Kauffman, R. E. (2003). Developmental pharmacology-drug disposition, action, and therapy in infants and children. N. Engl. J. Med. 349 (12), 1157–1167. doi:10.1056/NEJMra035092
Khaled, S. K., Palmer, J. M., Herzog, J., Stiller, T., Tsai, N. C., Senitzer, D., et al. (2016). Influence of absorption, distribution, metabolism, and excretion genomic variants on tacrolimus/sirolimus blood levels and graft-versus-host disease after allogeneic hematopoietic cell transplantation. Biol. Blood Marrow Transpl. 22 (2), 268–276. doi:10.1016/j.bbmt.2015.08.027
Khaled, S. K., Palmer, J., Stiller, T., Senitzer, D., Maegawa, R., Rodriguez, R., et al. (2013). A phase II study of sirolimus, tacrolimus and rabbit anti-thymocyte globulin as GVHD prophylaxis after unrelated-donor PBSC transplant. Bone Marrow Transpl. 48 (2), 278–283. doi:10.1038/bmt.2012.175
Kirk, J. K., Dupuis, R. E., Miles, M. V., Gaddy, G. D., Miranda-Massari, J. R., and Williams, D. M. (1994). Salivary theophylline monitoring: Reassessment and clinical considerations. Ther. Drug Monit. 16 (1), 58–66. doi:10.1097/00007691-199402000-00010
Klak, A., Pauwels, S., and Vermeersch, P. (2019). Preanalytical considerations in therapeutic drug monitoring of immunosuppressants with dried blood spots. Diagn. Berl. 6 (1), 57–68. doi:10.1515/dx-2018-0034
Kopecky, E. A., Jacobson, S., Klein, J., Kapur, B., and Koren, G. (1997). Correlation of morphine sulfate in blood plasma and saliva in pediatric patients. Ther. Drug Monit. 19 (5), 530–534. doi:10.1097/00007691-199710000-00008
Koster, R. A., Alffenaar, J. W., Greijdanus, B., and Uges, D. R. (2013). Fast LC-MS/MS analysis of tacrolimus, sirolimus, everolimus and cyclosporin A in dried blood spots and the influence of the hematocrit and immunosuppressant concentration on recovery. Talanta 115, 47–54. doi:10.1016/j.talanta.2013.04.027
Koster, R. A., Botma, R., Greijdanus, B., Uges, D. R. A., Kosterink, J. G. W., Alffenaar, J.-W. C., et al. (2015b). The influence of the dried blood spot drying time on the recoveries of six immunosuppressants. J. Appl. Bioanal. 1 (4), 116–122. doi:10.17145/jab.15.019
Koster, R. A., Botma, R., Greijdanus, B., Uges, D. R., Kosterink, J. G., Touw, D. J., et al. (2015a). The performance of five different dried blood spot cards for the analysis of six immunosuppressants. Bioanalysis 7 (10), 1225–1235. doi:10.4155/bio.15.63
Koster, R. A., Veenhof, H., Botma, R., Hoekstra, A. T., Berger, S. P., Bakker, S. J., et al. (2017). Dried blood spot validation of five immunosuppressants, without hematocrit correction, on two LC-MS/MS systems. Bioanalysis 9 (7), 553–563. doi:10.4155/bio-2016-0296
Kuehl, P., Zhang, J., Lin, Y., Lamba, J., Assem, M., Schuetz, J., et al. (2001). Sequence diversity in CYP3A promoters and characterization of the genetic basis of polymorphic CYP3A5 expression. Nat. Genet. 27 (4), 383–391. doi:10.1038/86882
Lang, J., Vincent, L., Chenel, M., Ogungbenro, K., and Galetin, A. (2021). Impact of hepatic CYP3A4 ontogeny functions on drug-drug interaction risk in pediatric physiologically-based pharmacokinetic/pharmacodynamic modeling: Critical literature review and ivabradine case study. Clin. Pharmacol. Ther. 109 (6), 1618–1630. doi:10.1002/cpt.2134
Laubenbacher, R., Niarakis, A., Helikar, T., An, G., Shapiro, B., Malik-Sheriff, R. S., et al. (2022). Building digital twins of the human immune system: Toward a roadmap. NPJ Digit. Med. 5 (1), 64. doi:10.1038/s41746-022-00610-z
Le Meur, Y., Djebli, N., Szelag, J. C., Hoizey, G., Toupance, O., Rerolle, J. P., et al. (2006). CYP3A5*3 influences sirolimus oral clearance in de novo and stable renal transplant recipients. Clin. Pharmacol. Ther. 80 (1), 51–60. doi:10.1016/j.clpt.2006.03.012
Leather, H. L. (2004). Drug interactions in the hematopoietic stem cell transplant (HSCT) recipient: What every transplanter needs to know. Bone Marrow Transpl. 33 (2), 137–152. doi:10.1038/sj.bmt.1704316
Lee, J., Huang, H., Chen, Y., and Lu, X. (2014). ABCB1 haplotype influences the sirolimus dose requirements in Chinese renal transplant recipients. Biopharm. Drug Dispos. 35 (3), 164–172. doi:10.1002/bdd.1881
Lee, T. C., Charles, B. G., Steer, P. A., and Flenady, V. J. (1996). Saliva as a valid alternative to serum in monitoring intravenous caffeine treatment for apnea of prematurity. Ther. Drug Monit. 18 (3), 288–293. doi:10.1097/00007691-199606000-00012
Levitsky, J., Mathew, J. M., Abecassis, M., Tambur, A., Leventhal, J., Chandrasekaran, D., et al. (2013). Systemic immunoregulatory and proteogenomic effects of tacrolimus to sirolimus conversion in liver transplant recipients. Hepatology 57 (1), 239–248. doi:10.1002/hep.25579
Li, H., Mager, D. E., Bemer, M. J., Salinger, D. H., Vicini, P., Sandmaier, B. M., et al. (2012). A limited sampling schedule to estimate mycophenolic acid area under the concentration-time curve in hematopoietic cell transplantation recipients. J. Clin. Pharmacol. 52 (11), 1654–1664. 0091270011429567 [pii] 10.1177/0091270011429567. doi:10.1177/0091270011429567
Li, H., Mager, D. E., Sandmaier, B. M., Maloney, D. G., Bemer, M. J., and McCune, J. S. (2013). Population pharmacokinetics and dose optimization of mycophenolic acid in HCT recipients receiving oral mycophenolate mofetil. J. Clin. Pharmacol. 53 (4), 393–402. doi:10.1002/jcph.14
Li, Y., Yan, L., Shi, Y., Bai, Y., Tang, J., and Wang, L. (2015). CYP3A5 and ABCB1 genotype influence tacrolimus and sirolimus pharmacokinetics in renal transplant recipients. Springerplus 4, 637. doi:10.1186/s40064-015-1425-5
Liggett, J. R., Kang, J., Ranjit, S., Rodriguez, O., Loh, K., Patil, D., et al. (2022). Oral N-acetylcysteine decreases IFN-gamma production and ameliorates ischemia-reperfusion injury in steatotic livers. Front. Immunol. 13, 898799. doi:10.3389/fimmu.2022.898799
Lin, Y. S., Kerr, S. J., Randolph, T., Shireman, L., Senn, T., and McCune, J. S. (2016). Prediction of intravenous busulfan clearance by endogenous plasma biomarkers using global pharmacometabolomics. Metabolomics 12, 161. doi:10.1007/s11306-016-1106-6
Linares, A. M., Rayens, M. K., Moylan, J. S., and Miller, C. S. (2021). Degree of agreement between infant serum and salivary concentration of leptin and adiponectin and its association with infants' feeding. Biol. Res. Nurs. 23 (3), 541–549. doi:10.1177/1099800420973366
Liu, J., Feng, D., Kan, X., Zheng, M., Zhang, X., Wang, Z., et al. (2021). Polymorphisms in the CYP3A5 gene significantly affect the pharmacokinetics of sirolimus after kidney transplantation. Pharmacogenomics 22 (14), 903–912. doi:10.2217/pgs-2021-0083
Lukas, J. C., Calvo, R., Zografidis, A., Ortega, I., and Suarez, E. (2010). Simulation of sirolimus exposures and population variability immediately post renal transplantation: Importance of the patient's CYP3A5 genotype in tailoring treatment. Biopharm. Drug Dispos. 31 (2-3), 129–137. doi:10.1002/bdd.697
MacDonald, A., Scarola, J., Burke, J. T., and Zimmerman, J. J. (2000). Clinical pharmacokinetics and therapeutic drug monitoring of sirolimus. Clin. Ther. 22, B101–B121. doi:10.1016/s0149-2918(00)89027-x
Mahalati, K., and Kahan, B. D. (2001). Clinical pharmacokinetics of sirolimus. Clin. Pharmacokinet. 40 (8), 573–585. doi:10.2165/00003088-200140080-00002
Mahmood, I. (2014). Dosing in children: A critical review of the pharmacokinetic allometric scaling and modelling approaches in paediatric drug development and clinical settings. Clin. Pharmacokinet. 53 (4), 327–346. doi:10.1007/s40262-014-0134-5
Mai, I., Stormer, E., Bauer, S., Kruger, H., Budde, K., and Roots, I. (2003). Impact of St John's wort treatment on the pharmacokinetics of tacrolimus and mycophenolic acid in renal transplant patients. Nephrol. Dial. Transpl. 18 (4), 819–822. doi:10.1093/ndt/gfg002
McCune, J. S., Bemer, M. J., and Long-Boyle, J. (2016). Pharmacokinetics, pharmacodynamics, and pharmacogenomics of immunosuppressants in allogeneic hematopoietic cell transplantation: Part II. Clin. Pharmacokinet. 55 (5), 551–593. doi:10.1007/s40262-015-0340-9
McCune, J. S., and Bemer, M. J. (2016). Pharmacokinetics, pharmacodynamics and pharmacogenomics of immunosuppressants in allogeneic haematopoietic cell transplantation: Part I. Clin. Pharmacokinet. 55 (5), 525–550. doi:10.1007/s40262-015-0339-2
McCune, J. S., Hawke, R. L., LeCluyse, E. L., Gillenwater, H. H., Hamilton, G., Ritchie, J., et al. (2000). In vivo and in vitro induction of human cytochrome P4503A4 by dexamethasone. Clin. Pharmacol. Ther. 68 (4), 356–366. doi:10.1067/mcp.2000.110215
McCune, J. S., McKiernan, J. S., van Maarseveen, E., Huitema, A. D. R., Randolph, T. W., Deeg, H. J., et al. (2021a). Prediction of acute graft versus host disease and relapse by endogenous metabolomic compounds in patients receiving personalized busulfan-based conditioning. J. Proteome Res. 20 (1), 684–694. doi:10.1021/acs.jproteome.0c00599
McCune, J. S., Nakamura, R., O'Meally, D., Randolph, T. W., Sandmaier, B. M., Karolak, A., et al. (2022a). Pharmacometabonomic association of cyclophosphamide 4-hydroxylation in hematopoietic cell transplant recipients. Clin. Transl. Sci. 15 (5), 1215–1224. doi:10.1111/cts.13239
McCune, J. S., Navarro, S. L., Baker, K. S., Risler, L. J., Phillips, B. R., Randolph, T. W., et al. (2022b). Prediction of busulfan clearance by predose plasma metabolomic profiling. Clin. Pharmacol. Ther. 113, 370–379. doi:10.1002/cpt.2794
McCune, J. S., Punt, A. M., Yeh, R. F., Dupuis, L. L., Kweekel, D. M., Franssen, E. J. F., et al. (2021b). Quality control of busulfan plasma quantitation, modeling, and dosing: An interlaboratory proficiency testing program. Ther. Drug Monit. 43 (5), 657–663. doi:10.1097/FTD.0000000000000862
McCune, J. S., Risler, L. J., Phillips, B. R., Thummel, K. E., Blough, D., and Shen, D. D. (2005). Contribution of CYP3A5 to hepatic and renal ifosfamide N-dechloroethylation. Drug Metab. Dispos. 33 (7), 1074–1081. doi:10.1124/dmd.104.002279
Mehrotra, N., Bhattaram, A., Earp, J. C., Florian, J., Krudys, K., Lee, J. E., et al. (2016). Role of quantitative clinical pharmacology in pediatric approval and labeling. Drug Metab. Dispos. 44 (7), 924–933. doi:10.1124/dmd.116.069559
Miao, L. Y., Huang, C. R., Hou, J. Q., and Qian, M. Y. (2008). Association study of ABCB1 and CYP3A5 gene polymorphisms with sirolimus trough concentration and dose requirements in Chinese renal transplant recipients. Biopharm. Drug Dispos. 29 (1), 1–5. doi:10.1002/bdd.577
Miller, E. M. (2021). Predictors of interleukin-1β and interleukin-1 receptor antagonist in infant saliva. Am. J. Hum. Biol. 33 (3), e23477. doi:10.1002/ajhb.23477
Minto, C., and Schnider, T. (1998). Expanding clinical applications of population pharmacodynamic modelling. Br. J. Clin. Pharmacol. 46 (4), 321–333. doi:10.1046/j.1365-2125.1998.00792.x
Mizuno, T., Emoto, C., Fukuda, T., Hammill, A. M., Adams, D. M., and Vinks, A. A. (2017a). Model-based precision dosing of sirolimus in pediatric patients with vascular anomalies. Eur. J. Pharm. Sci. 109S, S124–S131. doi:10.1016/j.ejps.2017.05.037
Mizuno, T., Fukuda, T., Christians, U., Perentesis, J. P., Fouladi, M., and Vinks, A. A. (2017b). Population pharmacokinetics of temsirolimus and sirolimus in children with recurrent solid tumours: A report from the Children's oncology group. Br. J. Clin. Pharmacol. 83 (5), 1097–1107. doi:10.1111/bcp.13181
Mizuno, T., Fukuda, T., Emoto, C., Mobberley-Schuman, P. S., Hammill, A. M., Adams, D. M., et al. (2017c). Developmental pharmacokinetics of sirolimus: Implications for precision dosing in neonates and infants with complicated vascular anomalies. Pediatr. Blood Cancer 64 (8), e26470. doi:10.1002/pbc.26470
Moccia, C., Popovic, M., Isaevska, E., Fiano, V., Trevisan, M., Rusconi, F., et al. (2021). Birthweight DNA methylation signatures in infant saliva. Clin. Epigenetics 13 (1), 57. doi:10.1186/s13148-021-01053-1
Monagel, D. A., Jadusingh, E., Jupp, J., Ho, J., and Guilcher, G. M. T. (2021). Absence of clinically relevant sirolimus-related hyperlipidemia in a cohort of children posthematopoietic cell transplantation for sickle cell disease. Pediatr. Blood Cancer 68 (4), e28782. doi:10.1002/pbc.28782
Monchaud, C., and Marquet, P. (2009a). Pharmacokinetic optimization of immunosuppressive therapy in thoracic transplantation: Part I. Clin. Pharmacokinet. 48 (7), 419–462. doi:10.2165/11317230-000000000-00000
Monchaud, C., and Marquet, P. (2009b). Pharmacokinetic optimization of immunosuppressive therapy in thoracic transplantation: Part II. Clin. Pharmacokinet. 48 (8), 489–516. doi:10.2165/11317240-000000000-00000
Morzel, M., Palicki, O., Chabanet, C., Lucchi, G., Ducoroy, P., Chambon, C., et al. (2011). Saliva electrophoretic protein profiles in infants: Changes with age and impact of teeth eruption and diet transition. Arch. Oral Biol. 56 (7), 634–642. doi:10.1016/j.archoralbio.2010.12.015
Mourad, M., Mourad, G., Wallemacq, P., Garrigue, V., Van Bellingen, C., Van Kerckhove, V., et al. (2005). Sirolimus and tacrolimus trough concentrations and dose requirements after kidney transplantation in relation to CYP3A5 and MDR1 polymorphisms and steroids. Transplantation 80 (7), 977–984. doi:10.1097/01.tp.0000174131.47469.d2
Murry, D. J., Crom, W. R., Reddick, W. E., Bhargava, R., and Evans, W. E. (1995). Liver volume as a determinant of drug clearance in children and adolescents. Drug Metab. Dispos. 23 (10), 1110–1116.
Nakamura, R., Palmer, J. M., O'Donnell, M. R., Stiller, T., Thomas, S. H., Chao, J., et al. (2012). Reduced intensity allogeneic hematopoietic stem cell transplantation for MDS using tacrolimus/sirolimus-based GVHD prophylaxis. Leuk. Res. 36 (9), 1152–1156. doi:10.1016/j.leukres.2012.04.022
National Library Of Medicine, 2023, Carbachol, Available at: https://pubchem.ncbi.nlm.nih.gov/compound/Carbachol [Online]. [Accessed January 6 2023].
Navarro, S. L., Randolph, T. W., Shireman, L. M., Raftery, D., and McCune, J. S. (2016). Pharmacometabonomic prediction of busulfan clearance in hematopoetic cell transplant recipients. J. Proteome Res. Aug 5 15 (8), 2802–2811. doi:10.1021/acs.jproteome.6b00370
Neef, C., Touw, D. J., Harteveld, A. R., Eerland, J. J., and Uges, D. R. (2006). Pitfalls in TDM of antibiotic drugs: Analytical and modelling issues. Ther. Drug Monit. 28 (5), 686–689. doi:10.1097/01.ftd.0000243966.97964.11
Neumann, U., Braune, K., Whitaker, M. J., Wiegand, S., Krude, H., Porter, J., et al. (2021). A prospective study of children aged 0-8 Years with CAH and adrenal insufficiency treated with hydrocortisone granules. J. Clin. Endocrinol. Metab. 106 (3), e1433–e1440. doi:10.1210/clinem/dgaa626
Nicholson, J. K., Connelly, J., Lindon, J. C., and Holmes, E. (2002). Metabonomics: A platform for studying drug toxicity and gene function. Nat. Rev. Drug Discov. 1 (2), 153–161. doi:10.1038/nrd728
Novak, D. (2021). A novel saliva collection method among children and infants: A comparison study between oral swab and pacifier-based saliva collection. J. Contemp. Dent. Pract. 22 (1), 9–12. doi:10.5005/jp-journals-10024-3028
Nudelman, Z., Keshet, N., Elhalal, M. D., Friedman, M., and Czerninski, R. (2013). Levels of Sirolimus in saliva vs. blood-the rationale of topical oral use for oral malignancy. Anticancer Res. 33 (2), 661–663. doi:10.1111/odi.12229
Paine, M. F., Leung, L. Y., Lim, H. K., Liao, K., Oganesian, A., Zhang, M. Y., et al. (2002). Identification of a novel route of extraction of sirolimus in human small intestine: Roles of metabolism and secretion. J. Pharmacol. Exp. Ther. 301 (1), 174–186. doi:10.1124/jpet.301.1.174
Paine, M. F., Shen, D. D., and McCune, J. S. (2018). Recommended approaches for pharmacokinetic natural product-drug interaction research: A NaPDI center commentary. Drug Metab. Dispos. 46 (7), 1041–1045. doi:10.1124/dmd.117.079962
Palsson, S., Hickling, T. P., Bradshaw-Pierce, E. L., Zager, M., Jooss, K., O'Brien, P. J., et al. (2013). The development of a fully-integrated immune response model (FIRM) simulator of the immune response through integration of multiple subset models. BMC Syst. Biol. 7, 95. doi:10.1186/1752-0509-7-95
Phapale, P. B., Kim, S. D., Lee, H. W., Lim, M., Kale, D. D., Kim, Y. L., et al. (2010). An integrative approach for identifying a metabolic phenotype predictive of individualized pharmacokinetics of tacrolimus. Clin. Pharmacol. Ther. 87 (4), 426–436. doi:10.1038/clpt.2009.296
Rauh, M., Stachel, D., Kuhlen, M., Gröschl, M., Holter, W., and Rascher, W. (2006). Quantification of busulfan in saliva and plasma in haematopoietic stem cell transplantation in children: Validation of liquid chromatography tandem mass spectrometry method. Clin. Pharmacokinet. 45 (3), 305–316. doi:10.2165/00003088-200645030-00006
Renders, L., Frisman, M., Ufer, M., Mosyagin, I., Haenisch, S., Ott, U., et al. (2007). CYP3A5 genotype markedly influences the pharmacokinetics of tacrolimus and sirolimus in kidney transplant recipients. Clin. Pharmacol. Ther. 81 (2), 228–234. doi:10.1038/sj.clpt.6100039
Rodman, J. H., Relling, M. V., Stewart, C. F., Synold, T. W., McLeod, H., Kearns, C., et al. (1993). Clinical pharmacokinetics and pharmacodynamics of anticancer drugs in children. Semin. Oncol. 20 (1), 18–29.
Rodriguez-Antona, C., Savieo, J. L., Lauschke, V. M., Sangkuhl, K., Drogemoller, B. I., Wang, D., et al. (2022). PharmVar GeneFocus: CYP3A5. Clin. Pharmacol. Ther. 112 (6), 1159–1171. doi:10.1002/cpt.2563
Rodriguez-Jimenez, C., Garcia-Saiz, M., Perez-Tamajon, L., Salido, E., and Torres, A. (2017). Influence of genetic polymorphisms of CYP3A5 and ABCB1 on sirolimus pharmacokinetics, patient and graft survival and other clinical outcomes in renal transplant. Drug Metab. Pers. Ther. 32 (1), 49–58. doi:10.1515/dmpt-2016-0040
Rossano, J. W., Jefferies, J. L., Pahl, E., Naftel, D. C., Pruitt, E., Lupton, K., et al. (2017). Use of sirolimus in pediatric heart transplant patients: A multi-institutional study from the pediatric heart transplant study group. J. Heart Lung Transpl. 36 (4), 427–433. doi:10.1016/j.healun.2016.09.009
Ryan, M., Grim, S. A., Miles, M. V., Tang, P. H., Fakhoury, T. A., Strawsburg, R. H., et al. (2003). Correlation of lamotrigine concentrations between serum and saliva. Pharmacotherapy 23 (12), 1550–1557. doi:10.1592/phco.23.15.1550.31957
Sadilkova, K., Busby, B., Dickerson, J. A., Rutledge, J. C., and Jack, R. M. (2013). Clinical validation and implementation of a multiplexed immunosuppressant assay in dried blood spots by LC-MS/MS. Clin. Chim. Acta 421, 152–156. doi:10.1016/j.cca.2013.02.009
Salem, F., Johnson, T. N., Abduljalil, K., Tucker, G. T., and Rostami-Hodjegan, A. (2014). A re-evaluation and validation of ontogeny functions for cytochrome P450 1A2 and 3A4 based on in vivo data. Clin. Pharmacokinet. 53 (7), 625–636. doi:10.1007/s40262-014-0140-7
Samb, A., Kruizinga, M., Tallahi, Y., van Esdonk, M., van Heel, W., Driessen, G., et al. (2022). Saliva as a sampling matrix for therapeutic drug monitoring of gentamicin in neonates: A prospective population pharmacokinetic and simulation study. Br. J. Clin. Pharmacol. 88 (4), 1845–1855. doi:10.1111/bcp.15105
Sato, K., and Sato, F. (1983). Individual variations in structure and function of human eccrine sweat gland. Am. J. Physiol. 245 (2), R203–R208. doi:10.1152/ajpregu.1983.245.2.R203
Schachter, A. D., Meyers, K. E., Spaneas, L. D., Palmer, J. A., Salmanullah, M., Baluarte, J., et al. (2004). Short sirolimus half-life in pediatric renal transplant recipients on a calcineurin inhibitor-free protocol. Pediatr. Transpl. 8 (2), 171–177. doi:10.1046/j.1399-3046.2003.00148.x
Schlosser, P., Li, Y., Sekula, P., Raffler, J., Grundner-Culemann, F., Pietzner, M., et al. (2020). Genetic studies of urinary metabolites illuminate mechanisms of detoxification and excretion in humans. Nat. Genet. 52 (2), 167–176. doi:10.1038/s41588-019-0567-8
Schmid, R. W., Lotz, J., Schweigert, R., Lackner, K., Aimo, G., Friese, J., et al. (2009). Multi-site analytical evaluation of a chemiluminescent magnetic microparticle immunoassay (CMIA) for sirolimus on the Abbott ARCHITECT analyzer. Clin. Biochem. 42 (15), 1543–1548. doi:10.1016/j.clinbiochem.2009.06.018
Schneider, S., Ait, M. B. Z., Schummer, C., Lemmer, P., Yegles, M., Appenzeller, B., et al. (2008). Determination of fentanyl in sweat and hair of a patient using transdermal patches. J. Anal. Toxicol. 32 (3), 260–264. doi:10.1093/jat/32.3.260
Schubert, M., Venkataramanan, R., Holt, D. W., Shaw, L. M., McGhee, W., Reyes, J., et al. (2004). Pharmacokinetics of sirolimus and tacrolimus in pediatric transplant patients. Am. J. Transpl. 4 (5), 767–773. doi:10.1111/j.1600-6143.2004.00411.x
Sehgal, S. N. (2003). Sirolimus: Its discovery, biological properties, and mechanism of action. Transpl. Proc. 35, 7S–14S. doi:10.1016/s0041-1345(03)00211-2
Simmers, P., Li, S. K., Kasting, G., and Heikenfeld, J. (2018a). Prolonged and localized sweat stimulation by iontophoretic delivery of the slowly-metabolized cholinergic agent carbachol. J. Dermatol Sci. 89 (1), 40–51. doi:10.1016/j.jdermsci.2017.10.013
Simmers, P., Yuan, Y., Sonner, Z., and Heikenfeld, J. (2018b). Membrane isolation of repeated-use sweat stimulants for mitigating both direct dermal contact and sweat dilution. Biomicrofluidics 12 (3). 034101, doi:10.1063/1.5023396
Simon, A. K., Hollander, G. A., and McMichael, A. (2015). Evolution of the immune system in humans from infancy to old age. Proc. Biol. Sci. 282 (1821), 20143085. doi:10.1098/rspb.2014.3085
Skazik, C., Wenzel, J., Marquardt, Y., Kim, A., Merk, H. F., Bickers, D. R., et al. (2011). P-glycoprotein (ABCB1) expression in human skin is mainly restricted to dermal components. Exp. Dermatol 20 (5), 450–452. doi:10.1111/j.1600-0625.2010.01237.x
Sonner, Z., Wilder, E., Gaillard, T., Kasting, G., and Heikenfeld, J. (2017). Integrated sudomotor axon reflex sweat stimulation for continuous sweat analyte analysis with individuals at rest. Lab. Chip 17 (15), 2550–2560. doi:10.1039/c7lc00364a
Stenton, S. B., Partovi, N., and Ensom, M. H. (2005). Sirolimus: The evidence for clinical pharmacokinetic monitoring. Clin. Pharmacokinet. 44 (8), 769–786. doi:10.2165/00003088-200544080-00001
Tai, L. C., Gao, W., Chao, M., Bariya, M., Ngo, Q. P., Shahpar, Z., et al. (2018). Methylxanthine drug monitoring with wearable sweat sensors. Adv. Mater 30 (23), e1707442. doi:10.1002/adma.201707442
Tamashiro, E. Y., Felipe, C. R., Genvigir, F. D. V., Rodrigues, A. C., Campos, A. B., Hirata, R. D. C., et al. (2017). Influence of CYP3A4 and CYP3A5 polymorphisms on tacrolimus and sirolimus exposure in stable kidney transplant recipients. Drug Metab. Pers. Ther. 32 (2), 89–95. doi:10.1515/dmpt-2016-0036
Tarantino, G., Capone, D., Contaldi, P., Gianno, A., Teresa, M., and Tufano, A. (2018). Phenotyping of CYP 4501A2 activity by total overnight salivary caffeine assessment (tosca) in patients on warfarin treatment: A cross-sectional study. Clin. Appl. Thromb. Hemost. 24 (6), 928–935. doi:10.1177/1076029617733040
Taylor, N. A., and Machado-Moreira, C. A. (2013). Regional variations in transepidermal water loss, eccrine sweat gland density, sweat secretion rates and electrolyte composition in resting and exercising humans. Extrem Physiol. Med. 2 (1), 4. doi:10.1186/2046-7648-2-4
Tejani, A., Alexander, S., Ettenger, R., Lerner, G., Zimmerman, J., Kohaut, E., et al. (2004). Safety and pharmacokinetics of ascending single doses of sirolimus (Rapamune, rapamycin) in pediatric patients with stable chronic renal failure undergoing dialysis. Pediatr. Transpl. 8 (2), 151–160. doi:10.1046/j.1399-3046.2003.00137.x
Thirumaran, R. K., Lamba, J. K., Kim, R. B., Urquhart, B. L., Gregor, J. C., Chande, N., et al. (2012). Intestinal CYP3A4 and midazolam disposition in vivo associate with VDR polymorphisms and show seasonal variation. Biochem. Pharmacol. 84 (1), 104–112. doi:10.1016/j.bcp.2012.03.017
Tremblay, M., Brisson, D., and Gaudet, D. (2012). Association between salivary pH and metabolic syndrome in women: A cross-sectional study. BMC Oral Health 12, 40. doi:10.1186/1472-6831-12-40
Upreti, V. V., and Wahlstrom, J. L. (2016). Meta-analysis of hepatic cytochrome P450 ontogeny to underwrite the prediction of pediatric pharmacokinetics using physiologically based pharmacokinetic modeling. J. Clin. Pharmacol. 56 (3), 266–283. doi:10.1002/jcph.585
Urquhart, B. L., and Knauer, M. J. (2015). Dried blood spots for therapeutic drug monitoring of tacrolimus and sirolimus in pediatric patients. Pediatr. Transpl. 19 (1), 3–4. doi:10.1111/petr.12394
Utecht, K. N., Hiles, J. J., and Kolesar, J. (2006). Effects of genetic polymorphisms on the pharmacokinetics of calcineurin inhibitors. Am. J. Health Syst. Pharm. 63 (23), 2340–2348. doi:10.2146/ajhp060080
Vaisbourd, Y., Dahhou, M., Zhang, X., Sapir-Pichhadze, R., Cardinal, H., Johnston, O., et al. (2022). Differences in medication adherence by sex and organ type among adolescent and young adult solid organ transplant recipients. Pediatr. Transpl. 27, e14446. doi:10.1111/petr.14446
Van Driest, S. L., Shi, Y., Bowton, E. A., Schildcrout, J. S., Peterson, J. F., Pulley, J., et al. (2014). Clinically actionable genotypes among 10,000 patients with preemptive pharmacogenomic testing. Clin. Pharmacol. Ther. 95 (4), 423–431. doi:10.1038/clpt.2013.229
Veenhof, H., Koster, R. A., Alffenaar, J. C., van den Berg, A. P., de Groot, M. R., Verschuuren, E. A. M., et al. (2019). Clinical application of a dried blood spot assay for sirolimus and everolimus in transplant patients. Clin. Chem. Lab. Med. 57 (12), 1854–1862. doi:10.1515/cclm-2019-0053
Vittner, D., McGrath, J., Robinson, J., Lawhon, G., Cusson, R., Eisenfeld, L., et al. (2018). Increase in oxytocin from skin-to-skin contact enhances development of parent-infant relationship. Biol. Res. Nurs. 20 (1), 54–62. doi:10.1177/1099800417735633
Wagner, M., Tonoli, D., Varesio, E., and Hopfgartner, G. (2016). The use of mass spectrometry to analyze dried blood spots. Mass Spectrom. Rev. 35 (3), 361–438. doi:10.1002/mas.21441
Wang, H. F., Qiu, F., Wu, X., Fang, J., Crownover, P., Korth-Bradley, J., et al. (2014). Steady-state pharmacokinetics of sirolimus in stable adult Chinese renal transplant patients. Clin. Pharmacol. Drug Dev. 3 (3), 235–241. doi:10.1002/cpdd.96
Wang, M. P., Suen, Y. N., Wong, B. Y., Li, W. H., Koh, D. S., Lam, T. H., et al. (2018). Paternal smoking and maternal protective behaviors at home on infant's saliva cotinine levels. Pediatr. Res. 83 (5), 936–942. doi:10.1038/pr.2017.279
Wang, M., Yang, Y., Min, J., Song, Y., Tu, J., Mukasa, D., et al. (2022). A wearable electrochemical biosensor for the monitoring of metabolites and nutrients. Nat. Biomed. Eng. 6, 1225–1235. doi:10.1038/s41551-022-00916-z
Wishart, D. S. (2019). Metabolomics for investigating physiological and pathophysiological processes. Physiol. Rev. 99 (4), 1819–1875. doi:10.1152/physrev.00035.2018
Woillard, J. B., Mourad, M., Neely, M., Capron, A., van Schaik, R. H., van Gelder, T., et al. (2017). Tacrolimus updated guidelines through popPK modeling: How to benefit more from CYP3A pre-emptive genotyping prior to kidney transplantation. Front. Pharmacol. 8, 358. doi:10.3389/fphar.2017.00358
Xiao, L., Ding, G., Ding, Y., Deng, C., Ze, X., Chen, L., et al. (2017). Effect of probiotics on digestibility and immunity in infants: A study protocol for a randomized controlled trial. Med. Baltim. 96 (14), e5953. doi:10.1097/MD.0000000000005953
Yang, Y., Song, Y., Bo, X., Min, J., Pak, O. S., Zhu, L., et al. (2020). A laser-engraved wearable sensor for sensitive detection of uric acid and tyrosine in sweat. Nat. Biotechnol. 38 (2), 217–224. doi:10.1038/s41587-019-0321-x
Yee, G. C., and McGuire, T. R. (1990a). Pharmacokinetic drug interactions with cyclosporin (Part I). Clin. Pharmacokinet. 19 (4), 319–332. doi:10.2165/00003088-199019040-00004
Yee, G. C., and McGuire, T. R. (1990b). Pharmacokinetic drug interactions with cyclosporin (Part II). Clin. Pharmacokinet. 19 (5), 400–415. doi:10.2165/00003088-199019050-00004
Zhang, J., Dai, Y., Liu, Z., Zhang, M., Li, C., Chen, D., et al. (2017). Effect of CYP3A4 and CYP3A5 genetic polymorphisms on the pharmacokinetics of sirolimus in healthy Chinese volunteers. Ther. Drug Monit. 39 (4), 406–411. doi:10.1097/FTD.0000000000000415
Zochowska, D., Wyzgal, J., and Paczek, L. (2012). Impact of CYP3A4*1B and CYP3A5*3 polymorphisms on the pharmacokinetics of cyclosporine and sirolimus in renal transplant recipients. Ann. Transpl. 17 (3), 36–44. doi:10.12659/aot.883456
Zwart, T. C., Gokoel, S. R. M., van der Boog, P. J. M., de Fijter, J. W., Kweekel, D. M., Swen, J. J., et al. (2018). Therapeutic drug monitoring of tacrolimus and mycophenolic acid in outpatient renal transplant recipients using a volumetric dried blood spot sampling device. Br. J. Clin. Pharmacol. 84 (12), 2889–2902. doi:10.1111/bcp.13755
Keywords: sirolimus (rapamycin), pediatrics, therapeutic drug monitoring (TDM), sweat, saliva, dried blood spots (DBS), pharmacogenomics, pharmacometabolomic
Citation: Shen G, Moua KTY, Perkins K, Johnson D, Li A, Curtin P, Gao W and McCune JS (2023) Precision sirolimus dosing in children: The potential for model-informed dosing and novel drug monitoring. Front. Pharmacol. 14:1126981. doi: 10.3389/fphar.2023.1126981
Received: 18 December 2022; Accepted: 14 February 2023;
Published: 20 March 2023.
Edited by:
Raffaele Simeoli, Bambino Gesù Children’s Hospital (IRCCS), ItalyReviewed by:
Paula Schaiquevich, Garrahan Hospital, ArgentinaTamorah Rae Lewis, University of Toronto, Canada
Copyright © 2023 Shen, Moua, Perkins, Johnson, Li, Curtin, Gao and McCune. This is an open-access article distributed under the terms of the Creative Commons Attribution License (CC BY). The use, distribution or reproduction in other forums is permitted, provided the original author(s) and the copyright owner(s) are credited and that the original publication in this journal is cited, in accordance with accepted academic practice. No use, distribution or reproduction is permitted which does not comply with these terms.
*Correspondence: Jeannine S. McCune, jmccune@uw.edu
†These authors share first authorship