 Zhiguang Wu1*
 Barbara Shih1,2
 Joni Macdonald1
 Dominique Meunier1Kris Hogan1Cosmin Chintoan-Uta1
 Hazel Gilhooley1
 Tuanjun Hu1
 Mariana Beltran3Neil C. Henderson3,4
 Helen M. Sang1
 Mark P. Stevens1
 Michael J. McGrew1
 Adam Balic1,5*
- 1The Roslin Institute, University of Edinburgh, Midlothian, United Kingdom
- 2Division of Biomedical and Life Sciences, Faculty of Health and Medicine, Lancaster University, Lancaster, United Kingdom
- 3Centre for Inflammation Research, The Queen’s Medical Research Institute, University of Edinburgh, Edinburgh, United Kingdom
- 4Medical Research Council (MRC) Human Genetics Unit, Institute of Genetics and Cancer, University of Edinburgh, Edinburgh, United Kingdom
- 5Department of Biochemistry and Pharmacology, Bio21 Molecular Science and Biotechnology Institute, The University of Melbourne, Parkville, VIC, Australia
Conventional dendritic cells (cDCs) are antigen-presenting cells (APCs) that play a central role in linking innate and adaptive immunity. cDCs have been well described in a number of different mammalian species, but remain poorly characterised in the chicken. In this study, we use previously described chicken cDC specific reagents, a novel gene-edited chicken line and single-cell RNA sequencing (scRNAseq) to characterise chicken splenic cDCs. In contrast to mammals, scRNAseq analysis indicates that the chicken spleen contains a single, chemokine receptor XCR1 expressing, cDC subset. By sexual maturity the XCR1+ cDC population is the most abundant mononuclear phagocyte cell subset in the chicken spleen. scRNAseq analysis revealed substantial heterogeneity within the chicken splenic XCR1+ cDC population. Immature MHC class II (MHCII)LOW XCR1+ cDCs expressed a range of viral resistance genes. Maturation to MHCIIHIGH XCR1+ cDCs was associated with reduced expression of anti-viral gene expression and increased expression of genes related to antigen presentation via the MHCII and cross-presentation pathways. To visualise and transiently ablate chicken XCR1+ cDCs in situ, we generated XCR1-iCaspase9-RFP chickens using a CRISPR-Cas9 knockin transgenesis approach to precisely edit the XCR1 locus, replacing the XCR1 coding region with genes for a fluorescent protein (TagRFP), and inducible Caspase 9. After inducible ablation, the chicken spleen is initially repopulated by immature CD1.1+ XCR1+ cDCs. XCR1+ cDCs are abundant in the splenic red pulp, in close association with CD8+ T-cells. Knockout of XCR1 prevented this clustering of cDCs with CD8+ T-cells. Taken together these data indicate a conserved role for chicken and mammalian XCR1+ cDCs in driving CD8+ T-cells responses.
Introduction
According to the Food & Agriculture Organisation, in 2021 an estimated 74 billion broiler chickens were killed for meat and laying hens produced 1.6 trillion eggs (1). Production of poultry on this scale is greatly facilitated by vaccination. However, a lack of knowledge of the sites, mechanisms and cell types involved in antigen presentation in the chicken hampers the development of new, more effective vaccines.
Conventional dendritic cells (cDCs) are potent activators of adaptive immune responses due to their ability to efficiently capture, process and present antigen to naïve T cells and drive clonal expansion of antigen-specific T-cell responses (2–5). The development and implementation of novel avian vaccines will require new knowledge of chicken cDC biology. In mammals, cDCs are rare Flt3 (CD135)-expressing cells (6) comprised of two functionally specialised subsets (5, 7). Despite emerging evidence for functional plasticity (8), the generation of distinct immune responses has been attributed to specific cDC subsets. Mammalian XCR1+ cDCs (cDC1) are described as being specialised for the induction of Th1 immune responses and the presentation of exogenously derived antigens to CD8+ T-cells via the MHC class I (MHCI) pathway (a process known as “cross-presentation”) (9–13). By contrast, the XCR1- mammalian cDC2 subset participates in the induction of Th2 and Th17 immune responses (14, 15).
Transcriptomic approaches have identified a chicken immune cell population expressing genes associated with the mammalian cDC1 subset (including XCR1, FLT3, ZBTB46, ID2, IRF8, CADM1) in the chicken spleen, liver and lungs (16–19). More recently, we developed tools to specifically identify and characterise chicken cDCs (20). In agreement with earlier transcriptomic approaches, we demonstrated that chickens contain a single XCR1+ cDC population that appears to be the counterpart of the mammalian cDC1 subset (18, 20). However, chicken splenic XCR1+ cDC showed significant differences to the mammalian cDC1 subset in terms of relative abundance in the spleen and liver, the expression of high levels of CSF1R and lack CSF2R expression (20). It remains unclear if the processes regulating the development of chicken splenic XCR1+ cDCs are conserved with mammals, nor if they have the same functional specialisations as reported for the mammalian XCR1+ cDC1 subset.
The vertebrate spleen comprises of two main types of tissue, white pulp (WP) and red pulp (RP). Splenic RP is rich in red blood cells whereas the WP is densely packed with immune cells (21). The afferent splenic artery branches into the central artery (CA), which further divides into penicillar capillaries (21). Splenic microstructure has best been described in mice which differs significantly from that of many other vertebrates, including humans and chickens (21). In mice, the CA is surrounded by WP composed of successive layers of immune cells, a T-cell rich structure known as the periarteriolar lymphoid sheath (PALS), followed by B-cell follicles, and finally the marginal zone (MZ) which marks the boundary between the WP and RP (22). Blood borne antigens enter RP, or the marginal sinuses via the CA where they encounter specialised MZ macrophage and B-cell subsets (21, 22). In chickens (23) and humans (21) large accumulations of B-cells and macrophages surround the penicillar capillaries. In chickens, the penicillar capillaries are fenestrated enabling blood-borne antigens, cells and pathogens access to splenic immune cells via the penicillar capillaries (23).
Murine cDC1s are found in both RP and WP area (24–26). During infection with mouse cytomegalovirus (MCMV), chemokine (C motif) ligand (XCL1) producing natural killer cells (NKs) attract and activate cDC1 in the RP resulting in their relocation to the PALS T-cell zone in the WP where they interact with CD8+ T-cells (26). In contrast to the murine spleen, chicken CD8+ T-cells are mainly located in the RP (27), not the T-cell zone of the PALS, which is largely composed of CD4+ T-cells (27). It remains unclear where XCR1+ cDCs reside in the chicken spleen.
Here we investigated the development, diversity and regulation of XCR1+ cDCs in the chicken spleen. Using flow cytometry and scRNAseq analysis we show that chicken splenic cDCs consist of a single, but heterogeneous, population of XCR1+ cells. Chicken XCR1+ cDCs show gene expression consistent with a specialisation for the recognition of viral pathogens and for antigen presentation via the MHCII- and MHCI-dependent cross-presentation pathways. We developed a novel XCR1-iCaspase9-TagRFP gene-edited chicken line that enables visualisation and conditional ablation of XCR1+ cDCs. Our findings demonstrate that assumptions on what constitutes the conserved features of XCR1+ cDCs in mammals do not fully apply in chickens, and highlights the requirement to develop avian specific tools to gain further knowledge of the avian immune system for the improvement of vaccine-mediated immunity.
Materials and methods
Chickens and welfare
All birds were obtained from the National Avian Research Facility (NARF) at The Roslin Institute, University of Edinburgh. All birds were hatched and housed in premises licensed under a UK Home Office Establishment License in full compliance with the Animals (Scientific Procedures) Act 1986 and the Code of Practice for Housing and Care of Animals Bred, Supplied or Used for Scientific Purposes. CSF1R-eGFP transgenic chickens (28), from newly hatched chicks to 20 weeks of age, were used for initial analysis of XCR1+ cDCs. Production of founder birds, the XCR1-reporter line and the XCR1 knockout line was carried out under UK Home Office Licenses (70/8528; 70/8940 and PP9565661). Inducible ablation of XCR1-iCaspase9-RFP+ cDCs by B/B homodimerizer drug was carried out under UK Home Office Licenses (PCD70CB48 and PP3522089). Experimental protocols and studies were approved by the Roslin Institute Animal Welfare and Ethical Review Board.
Tissue processing for flow cytometric analysis
Chicken splenocytes were isolated from birds as described previously (20). To isolate the peripheral blood mononuclear cells (PBMCs), 2-5 ml blood was collected into Eppendorf tubes containing 50 μl of 0.5M EDTA (Sigma-Aldrich). Blood was diluted in phosphate-buffered saline (PBS) at a 1:1 ratio, layered on Histopaque (1077-1, Sigma-Aldrich) and spun at 400 × g for 30 min without braking. Mononuclear cells were collected from the gradient interface and washed twice with 1.0% bovine serum albumin (BSA, Sigma-Aldrich) in PBS (BSA/PBS).
To isolate bone marrow cells, femurs and tibias were flushed with PBS and the cells disaggregated by forcing through a 100 μm nylon cell strainer (Corning Inc.). Cells were spun at 500 × g for 10 min. To remove red blood cells, the cell pellet was re-suspended in an appropriate volume of PBS and carefully layered on Histopaque (1077-1, Sigma-Aldrich) and spun at 400 × g for 30 min without braking. Cells were collected from the gradient interface and washed 2 times with PBS/BSA.
To isolate cells from the skin, after removing fat and feathers, the skin was cut into small pieces (2.5 cm2) and digested with 2.5 mg/ml Dispase (Roche) while incubating in a 37°C water bath for 1 h with brief vortexing every 10 minutes. Remaining adipose and subcutaneous tissues were removed under a dissecting microscope and the epidermis/dermis layer was digested with 1 mg/ml Collagenase/Dispase/0.1 mg/ml DNase (Roche) in 5 ml of Hanks’ Balanced Salt Solution (HBSS, Thermo Fisher Scientific) with pulse vortexing and incubation in 37°C water bath for another 1-1.5 h. The skin samples were then minced in a petri dish using two scalpels and the resulting cell suspension passed through 100 μm strainer. Cells were then washed with 10 ml PBS/BSA.
To isolate immune cells from Ileum and Peyer’s Patches, the small intestine from CSF1R-eGFP transgenic birds was initially flushed with PBS to remove remaining intestinal content. Tissues were then dissected under a fluorescence microscope to isolate ileal Peyer’s patch from the non-lymphoid ileum (28). Tissue samples were cut into 2.5 cm2 pieces and washed three times in 50 ml Falcon conical tubes with 20 ml of complete media [CM, HBSS with 2% heat-inactivated fetal bovine serum (FBS, Sigma-Aldrich)] by vortexing for 30 s and then replacing the CM. To remove the mucus, 25 ml of CM containing 1 mM dithiothreitol (DTT, Thermo Fisher Scientific) was added to the tissue samples in 50 ml Falcon tubes which were incubated in a shaking incubator at 37°C and 220 rpm for 20 min, followed by vortexing for 30 s. To remove epithelial cells, tissue samples were incubated in 50 ml Falcon tubes with 25 ml of CM/EDTA (CM with 1.3 mM EDTA) at 37°C in a shaking incubator at 220 rpm for 40 min, followed by vortexing for 30 s. Tissue samples were then rinsed with CM and then digested and homogenised using a Potter-Elvehjem Polytetrafluoroethylene (PTFE) pestle and glass mortar as described for isolation of cDC from spleen (20).
Flow cytometry analysis
Single-cell suspensions from tissues or blood were prepared and resuspended in cold FACS buffer (PBS, 1.0% BSA (w/v) and 0.05% sodium azide (w/v); Sigma-Aldrich) and placed on ice for 10 min. Cells were then incubated with reagents listed in Table 1 in FACS buffer for 30 min on ice in the dark. If required, cells were washed and incubated with secondary antibodies for 20 min on ice in the dark. Cells were then washed three times, resuspended in cold FACS buffer and stained with SYTOX® Blue Dead Cell Stain (Invitrogen; 1.0mM stock, 1/4000 dilution) prior to analysis with a LRSFortessa flow cytometer (BD Biosciences). Data were analysed using FlowJo V10 software. Dead cells were excluded by SYTOX® Blue staining and doublets were then discriminated based on signal processing (FSC-A/W). Fluorescence minus one controls (FMO) were used to confirm gating strategies.
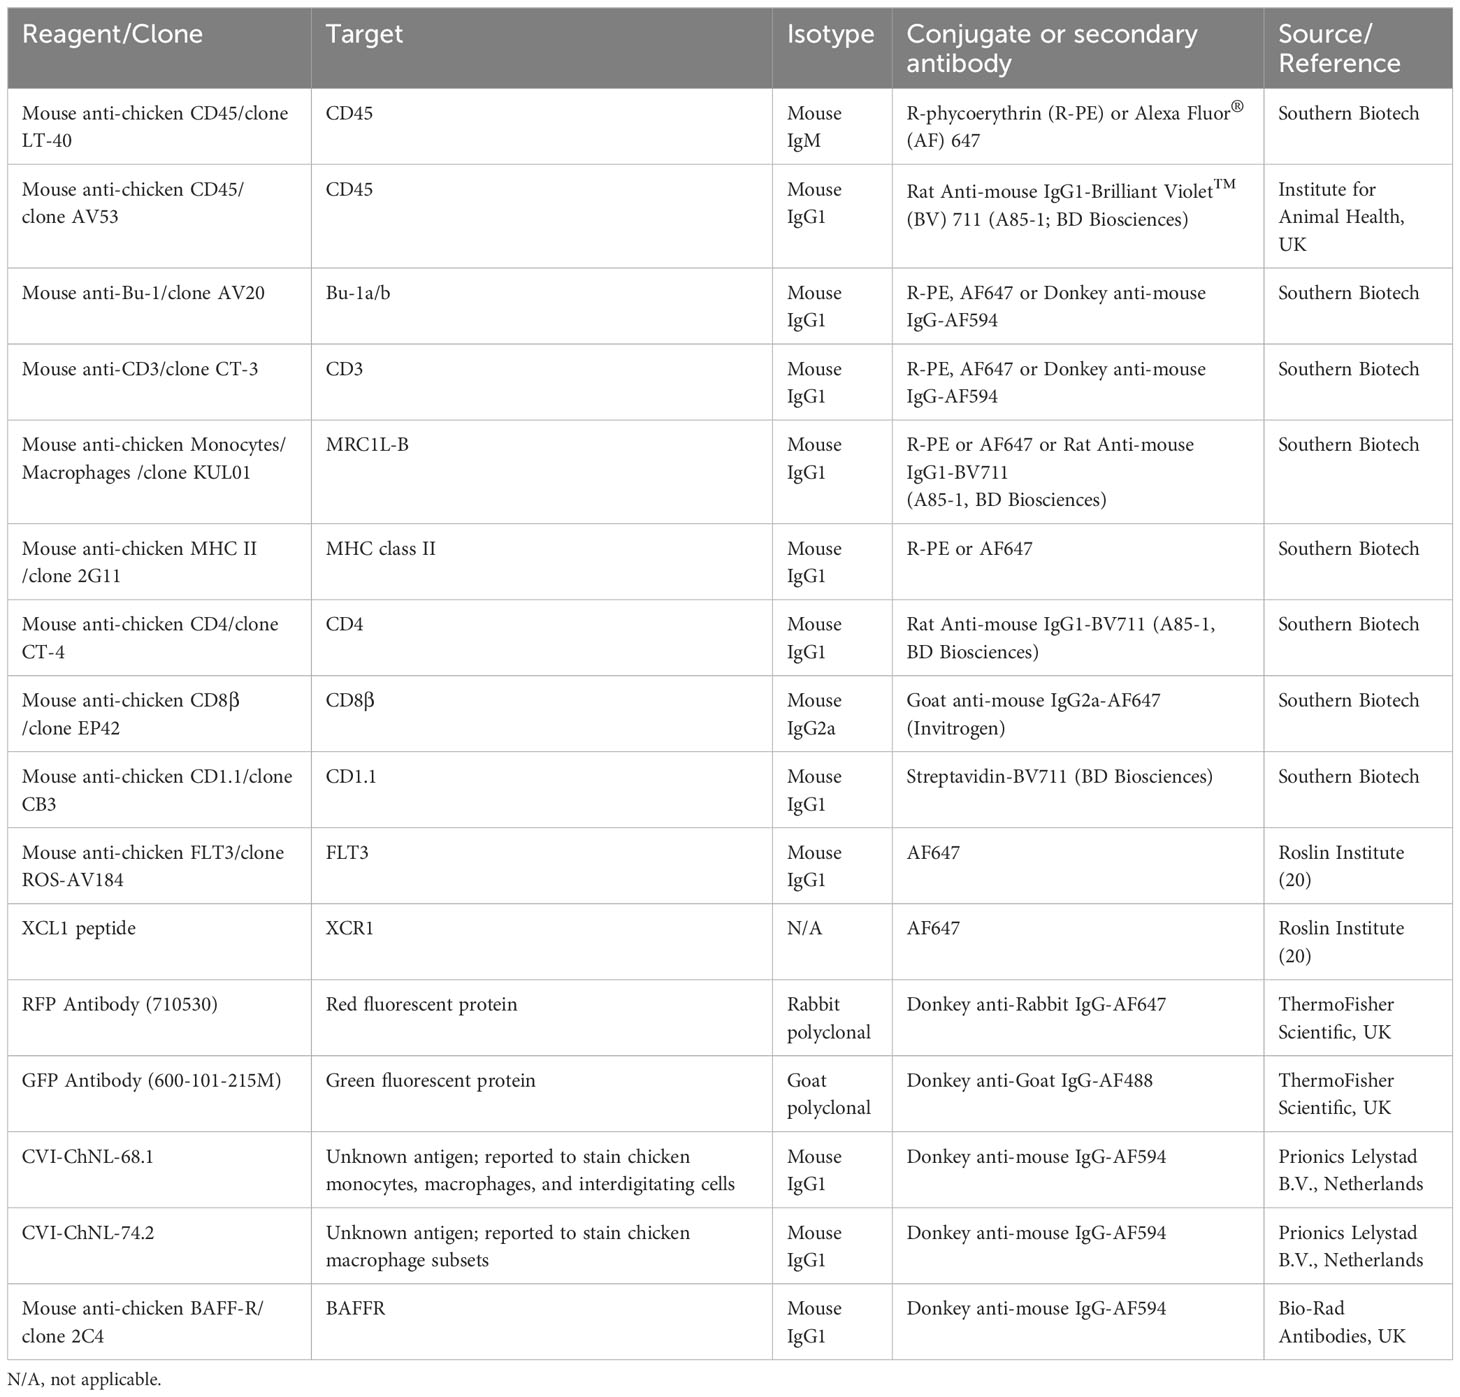
Table 1 Reagents used for flow cytometry and immunofluorescent microscopy analysis.
For DNA content staining, splenocytes were counted, washed with PBS and stained with Zombie Violet™ Fixable dye (Biolegend) at 1/500 in PBS at room temperature (RT) for 15 min in the dark. Cells were then washed twice with FACS buffer (with 1.0% (w/v) BSA) and stained with synthetic chicken XCL1 peptide conjugated to Alexa Fluor 647 (XCL1AF647) for 30 min on ice. Cells were then washed twice with PBS and fixed with 2.0% paraformaldehyde (PFA, Sigma-Aldrich) at RT for 20 min. Cells were further washed twice with PBS and fixed with ice-cold 70% ethanol for 24 h. Cells were then washed twice with PBS and stained with 0.5 ml of FxCycle™ PI/RNase Staining Solution (Invitrogen™ F10797) per sample. Samples were incubated in the dark for 15–30 min prior to analysis using a BD LRSFortessa.
Immunofluorescent staining and confocal imaging of tissue sections
Tissue samples were trimmed into 1.0 cm2 blocks and fixed overnight at 4°C in 4% PFA/PBS. Samples were removed from PFA/PBS and placed in 10% sucrose (w/v; Sigma-Aldrich)/PBS at 4°C overnight. Samples were then placed in 15/20/25/30% sucrose/PBS (w/v) for 24 h at 4°C for each sucrose concentration. Tissue samples were embedded in Cellpath™ OCT embedding matrix (Fisher Scientific UK Ltd, Loughborough, UK) and snap-frozen at −80˚C for two hours. 10µm sections were cut onto Superfrost Plus slides (Menzel-Gläser, Braunschweig, Germany) and air-dried for 1 h at RT. All primary antibodies used in this study are shown in Table 1. All slides were blocked for one hour in 10% normal horse serum (Sigma-Aldrich), 0.1% Triton X-100 (Sigma-Aldrich) in PBS (HST-PBS). All primary antibodies were diluted in blocking reagent (above) and incubated at 4°C overnight, washed for 20 min in PBS, followed by incubation with secondary antibodies for two hours (donkey anti-mouse IgG Alexa Fluor 594, donkey anti-mouse IgG1 Alexa Fluor 594, donkey anti-mouse IgG2a Alexa Fluor 647; Thermo Fisher Scientific) used at 1/300 dilution and mounted in ProLong® Gold Antifade Mountant (Thermo Fisher Scientific). Where appropriate, sections were counterstained with 1 μg/ml 4′, 6′-diamidino-2-phenylindole (DAPI; Sigma-Aldrich) in the final incubation step. Samples were imaged using an inverted confocal microscope (Zeiss LSM710) and images were analysed using Zeiss ZEN 3·1 software.
Cells sorting and single cell RNA-sequencing
Splenocytes were separately prepared from two 20-week-old female CSF1R-eGFP transgenic birds. CSF1R-eGFP+ cells were sorted using a BD FACS Aria IIIu sorter with the target of 5000 cells per sample. Libraries were prepared using a Chromium™ Single Cell 3’ Library & Gel Bead Kit v3 using the 10X Chromium Single Cell RNA Sequencing Platform at the University of Edinburgh. The single-cell libraries were sequenced at a depth of 50,000 reads per cells on an Illumina NovaSeq machine at Edinburgh Genomics, University of Edinburgh.
Single cell RNA-sequencing analysis
Cell Ranger (version 3.1.0) was used to generate transcriptomic reference index from Chicken reference genome (Gallus gallus GRCg6a, Ensembl version 101) through cellranger mkref, and gene expression matrix through cellranger count. Downstream analyses were performed on R Seurat (version 3.2.2) (29). Cells with low number of features (gene; <200) and outlier counts (unique molecule identifier; <300 or >12,000), or high mitochondrial count (>40% counts from mitochondrial genes) were removed from further analysis. Principal component analysis were performed on the cells using 50 components, and the top 30 components were used for generating a network graph using Graphia (version 2.0) (30) retaining nodes and edges fulfilling the following parameters: r ≥ 0.75, knn = 10, node degree > 5, and component size > 5. The resultant cells remained in the Graphia network graph were retained in the Seurat analysis, which was subjected to further quality control using DoubletDecon to remove doublets (31).
Following quality control, cells from two samples were integrated using Seurat SelectIntegrationFeatures, FindIntegrationAnchors and IntegrateData functions. Cell cycle states were labelled using CellCycleScoring using gene list organised by Seurat based on Tirosh et al. (2016) (32). Uniform Manifold Approximation and Projection (UMAP) dimension reduction was performed across all cell types under Seurat, and Potential of Heat-diffusion for Affinity-based Transition Embedding (PHATE) (33) was used to further interrogate the DC populations. The scRNAseq data for the study is available on https://www.ncbi.nlm.nih.gov/(BioProject: PRJNA996296).
Chicken primordial germ cell culture and transfection
PGCs were derived from embryos homozygous for the CSF1R-eGFP reporter transgene (28) at Hamburger–Hamilton (HH) stage 16 and expanded in vitro as previously described (34). Briefly, approximately 1 μl of embryonic blood was aspirated from the dorsal aorta of embryos and placed in FAot (FGF, Activin, ovotransferrin) culture medium to expand PGCs. After culturing for 2-3 weeks, PGCs were co-transfected with 2 μg of CRISPR-Cas9 vector (PX459 V2.0) (35, 36) which included two targeting guides (sgRNA) for the XCR1 locus and a double-stranded donor plasmid (Supplementary Table 1) using Lipofectamine 2000 (Thermo Fisher Scientific) as described previously (37, 38). After 24 h in culture, cells were treated with 0.6 µg/ml puromycin for 48 h for selection of transfected cells. After selection, PGCs were sorted into single wells of 96-well plates using a BD FACS Aria IIIu sorter at one PGC per well. PGCs were clonally expanded for 2 to 3 weeks (36). Genomic DNA (gDNA) was extracted for genotyping as described below. Edited PGCs were cryopreserved in STEM-CELLBANKER (AMSBIO).
Genetic screening
Genomic DNA from PGCs was extracted using QiaAmp DNA micro kit (Qiagen) according to the manufacturer’s instruction. Chorioallantoic membrane (CAM) lysate was prepared using a REDExtract-N-Amp Tissue PCR Kit (Sigma-Aldrich) and gDNA from blood was prepared using PUREGENE® DNA Purification Kit (Flowgen). Primer pairs were designed to amplify the XCR1-transgene or wild type XCR1 (Supplementary Table 1). PCR reactions included 100 ng of gDNA or CAM lysate, primer sets and REDExtract-N-Amp kit. PCR comprised the following cycling parameters: 94°C 3 min; 94°C 30 s, 58°C 30 s and 72°C 2 min for 30 cycles. Genotypes were distinguished by amplicons for the wild-type and edited allele (wild-type, monoallelic edit, and biallelic edit) (Supplementary Figure 1). Cultured PGCs and all birds were sexed using a W-chromosome-specific PCR (39).
Generation of surrogate host, XCR1-iCaspase9-RFP reporter and XCR1 knockout birds
Targeted male PGC lines were thawed after storage at −150°C and cultured for 5-10 days before injection into iCaspase9 surrogate host embryos as described previously (38). One male founder was bred to wild type hens to produce birds for following studies and to generate G1 offspring for breeding. All G1 offspring were screened by PCR for the presence of iCaspase9-RFP transgene. The expression of RFP in spleen and tissues was analysed by flow cytometry or confocal microscopy. G1 males and females were bred to produce G2 offspring. The G2 progenies were screened by PCR for the presence of iCaspase9-RFP transgene or native XCR1 gene. Homozygous (XCR1 KO), heterozygous (HET) and wild type birds were distinguished by PCR as described above.
Inducible ablation of XCR1+ cDC
B/B homodimerizer (AP20187, Takara) was injected intravenously into XCR1-iCaspase9-RFP reporter birds at a dose range of 0.5, 1 or 2 mg/kg, 6 birds per group. The stock solution of the drug was prepared in absolute ethanol at 62.5 mg/ml. The carrier solution was 10% PEG-400 and 2.0% Tween in sterile water. The control group received carrier solution only. Birds were sacrificed for tissues after 24 hours. Ablation rates were calculated for each dose. The optimised dose of B/B drug was then determined accordingly. For the time course, B/B homodimerizer was injected intravenously into XCR1-iCaspase-RFP birds at a dose of 0.5 mg/kg 6 birds per time-point. Birds were sacrificed for tissues 24 h, 48 h, 4 and 7 days after injection.
Statistical analysis
Data were analysed using GraphPad Prism 7.00 (GraphPad, US). Statistical analysis was conducted using unpaired non-parametric Mann-Whitney test or Multiple t-test. Statistical significance was defined as follows: no significant (ns), p > 0.05, ∗, p < 0.05; ∗∗, p < 0.01; and ∗∗∗, p < 0.001.
Results
Dynamics and relative abundance of XCR1+ cDC development in the chicken spleen
Previously we demonstrated that the chemokine receptor XCR1 is selectively expressed on chicken cDCs and staining for XCR1 on CSF1R-eGFP transgene-expressing cells could be used to identify and characterise these cells (20). In this study we extend these observations by examining the dynamics of XCR1+ cDC development in the spleen of chickens aged between day 1 post-hatch and sexual maturity (Figure 1). As a percentage of the CD45+ cell population the XCR1+ cDC population was relatively stable between hatch and sexual maturity (week 20), ranging between 0.7-2.0% of CD45+ cells (Figure 1A). While the proportion of CSF1R-eGFP transgene-expressing cells in the CD45+ cell population decreased over time, likely reflecting the maturation and emergence of B and T-cell populations, the proportion of XCR1+ cells within the CSF1R-eGFP+ population increased from ~3% on the day of hatch to ~40% in sexually mature males (Figures 1B, C). Compared with sexually mature females, males consistently showed a higher percentage of XCR1+ splenic cDCs, expressed as either a percentage of the CD45+ or CSF1R-eGFP+ cell populations (Figures 1A-C). We found that within the splenic CSF1R-eGFP+ population the ratio of XCR1+ cDCs to MRC1L-B+ macrophages increased from ~0.025 at hatch to ~0.5 in sexually mature birds (Figure 1C). MRC1L-B (also known as “KUL01”) is a classical marker of chicken splenic macrophages (40, 41) and is expressed on multiple splenic macrophage subsets (20, 42). Our data therefore imply that the XCR1+ cDC population becomes the most abundant CSF1R-eGFP+ subset in the chicken spleen by sexual maturity. Previously (20), we showed that ~80% of XCR1+ cDCs expressed the CSF1R-eGFP transgene in three-week-old chicks. We confirmed this result and showed that the proportion of CSF1R-eGFP+ XCR1+ cDCs is similar in all age groups (Figure 1D). We also examined the relative abundance of XCR1+ cDCs in the ileum, Peyer’s patches (PP), skin, bone marrow (BM) and blood (Supplementary Figures 2, 3). We have found that the prolonged enzymatic digestion required for extraction of cells from intestinal tissues and skin results in the loss of FLT3 staining. As such, FLT3 staining is not shown for cells derived from these tissues. XCR1+ cDCs are a relatively rare cell population in the BM and blood (Supplementary Figure 2), a minor (~1%) component of the CSF1R-eGFP+ cell population in the skin, but a major (30-40%) CSF1R-eGFP+ cell population in the ileum and PP (Supplementary Figure 3).
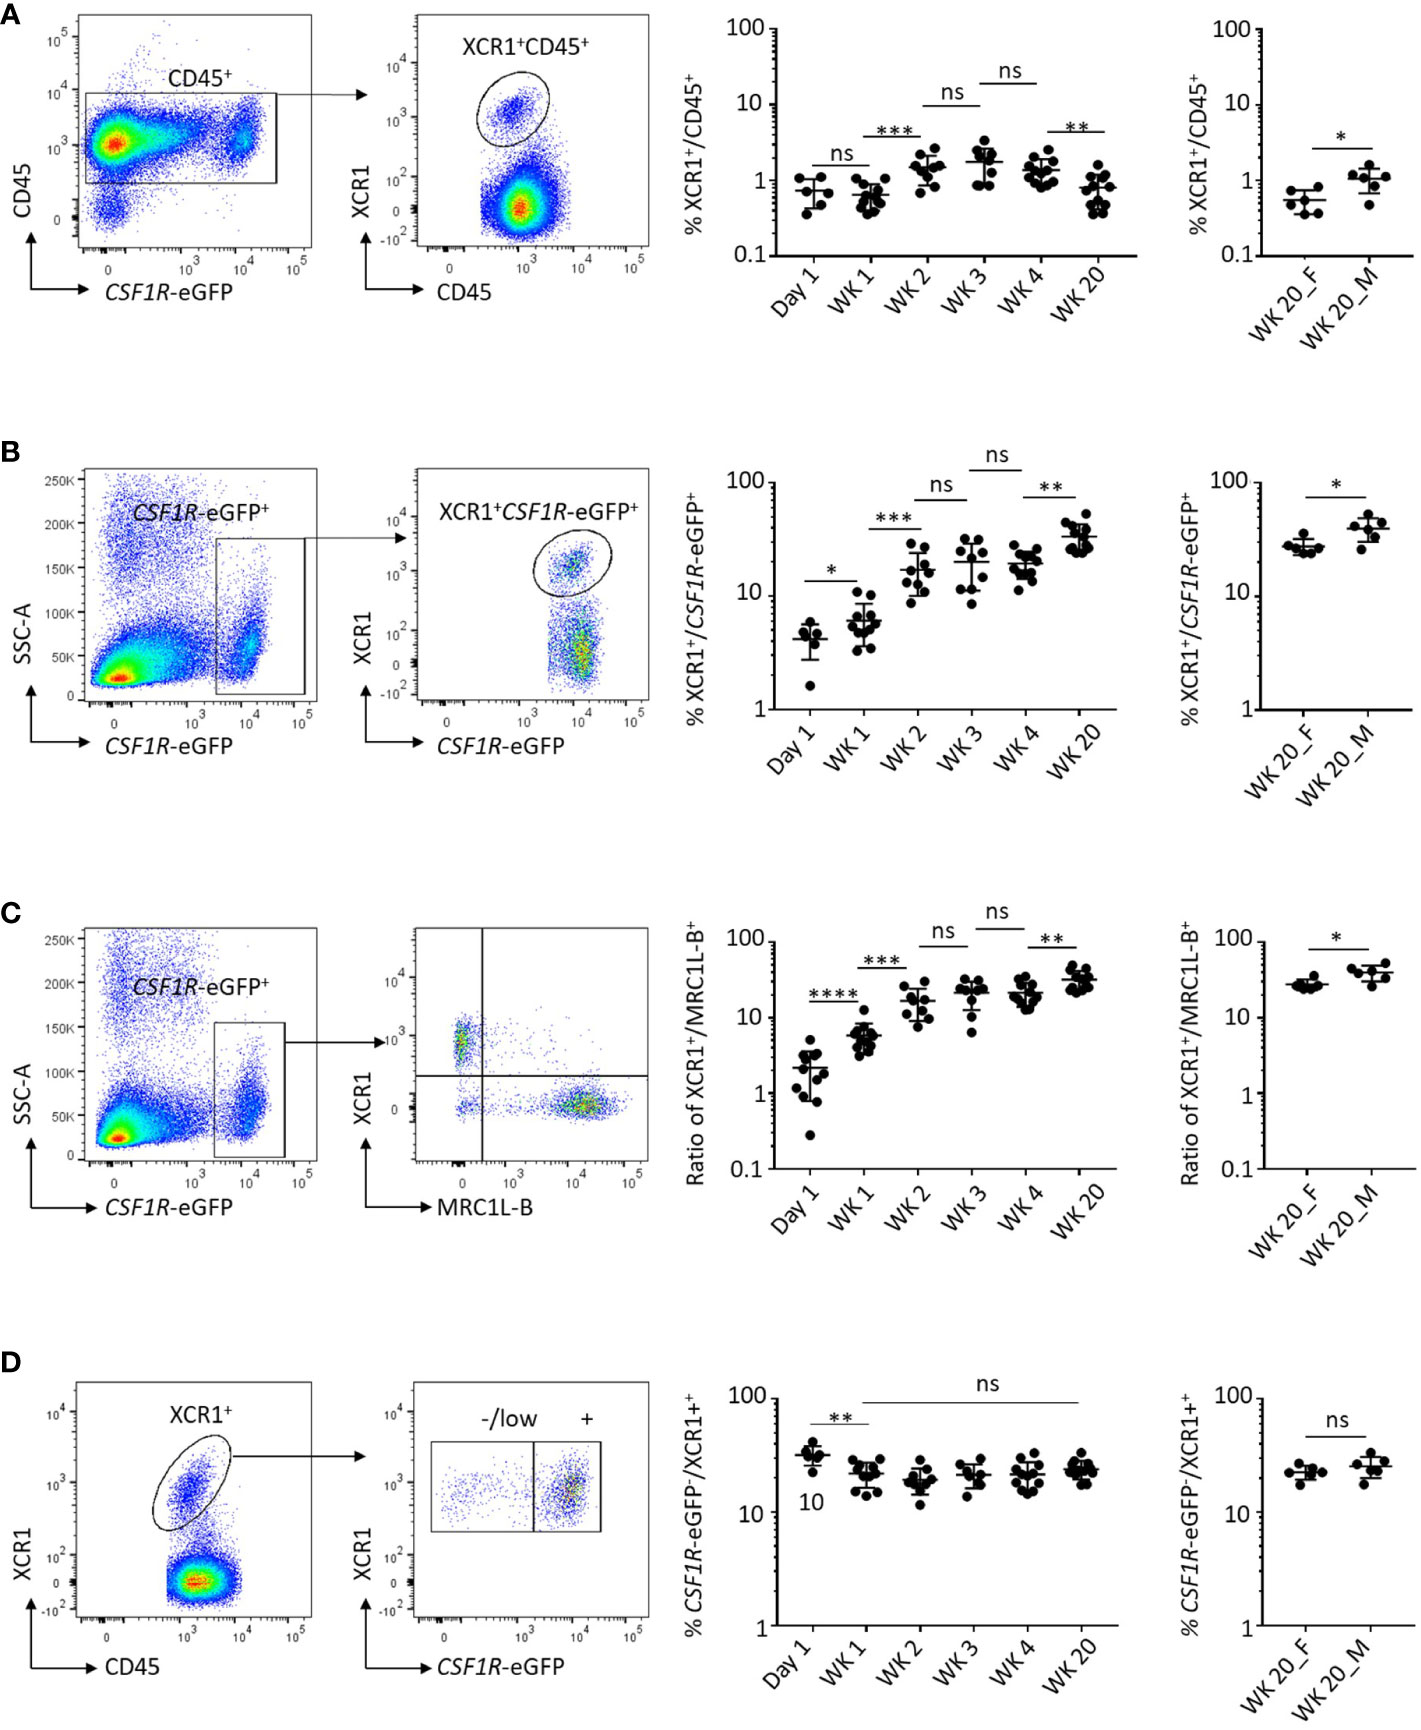
Figure 1 Dynamics of XCR1+ cDC development in the chicken spleen. (A) Frequency of XCR1+ cDCs in the chicken spleen from chicks and adult birds. Single, live and XCR1+ cells were gated for the analysis and expressed as a percentage of CD45+ cells. (B) Frequency of CSF1R-eGFP transgene expressing cells in the chicken spleen from chicks and adult birds. Single, live, CD45+ and CSF1R-eGFP transgene expressing cells were gated for the analysis and expressed as a percentage of CD45+ cells. Bii) Ratio of XCR1+ cDCs to CSF1R-eGFP transgene expressing cells. (C) Relationship of XCR1+ cDCs to MRC1L-B+ macrophages in the chicken spleen. Single, live, CD45+, CSF1R-eGFP transgene expressing XCR1+ or MRC1L-B+ cells were gated and expressed as a percentage of the CSF1R-eGFP transgene expressing cell population or ratios. (D) Percentage of the XCR1+ cDC population expressing the CSF1R-eGFP transgene. Single, live, CD45+, XCR1+ cDC were gated and expressed as a percentage of the CSF1R-transgene expressing cell population. Six birds per group. Chick groups were of mixed sex, whereas adult birds were separated into male and female groups. Statistical analysis was conducted using unpaired non-parametric Mann-Whitney test. Statistical significance was defined as follows: ∗p < 0·05; ∗∗p < 0·01; and ∗∗∗p < 0·001, ns, not significant.
Single-cell RNA sequencing analysis of chicken splenic dendritic cells
We and others have shown that in chicken, cells that express XCR1 also express high levels of genes associated with cDCs in mice and humans (e.g. FLT3, ZNF366, CIITA, CADM1, ID2, IRF8 and ZBTB46 (16–19);), but also the classic macrophage marker CSF1R (20) which is not detected or weakly detected on mammalian cDC1s (43–46). In our previous analysis of chicken splenic cDCs and macrophages (20), we identified a FLT3HI cell population that expressed the dendritic cell associated marker XCR1 and lacked expression of the chicken macrophage marker MRC1L-B, suggesting a bona fide cDC identity. Nevertheless, unlike mammalian XCR1+ cDCs, this chicken cell population expressed low levels of surface CSF1R and the vast majority of this population also expressed the CSF1R-transgene. In addition, we also described a FLT3LOW MRC1L-BLOW population, which expressed high levels of CSF1R and the CSF1R-transgene, but lacked expression of XCR1. Both cell populations expressed high levels of surface MHCII. Previously published data suggests a macrophage/monocytic origin for the MHCIIHIGH MRC1L‐BLOW (FLT3LOW) splenic cell population (42). To determine the relationship between these chicken splenic cell populations and other chicken splenic macrophage populations, which lack FLT3 expression, we performed single cell RNA-sequencing (scRNA-seq) of individual CSF1R-eGFP+ splenic cells isolated from sexually mature hens (n=2; twenty weeks of age). Across all samples, we generated 16,994 cell transcriptomes with median unique molecular identifier (UMI) and gene counts per cell of 932 and 538, respectively. For our analysis, we used two dimension-reduction techniques, Uniform Manifold and Approximation and Projection (UMAP (47);) and Potential of Heat-diffusion for Affinity-based Transition Embedding (PHATE (33);). UMAP analysis identified 10 clusters (Figure 2), comprising of macrophage and dendritic cells, as expected from our previous analysis of CSF1R-eGFP+ cells in the chicken spleen (Figure 2; Supplementary Table 2). Proliferating cells (predominately Clusters 7 and 10) were identified on the basis of expression of TOP2A, PCNA, SMC2 and MCM6 (Figures 2B, C) (48). Clusters were identified as macrophages on the basis of expression of genes for factors that regulate macrophage development and function (e.g. MAFB, SPIC, CSF3R and MRC1L-B; Figure 2; Supplementary Table 2). XCR1+ cDC clusters were identified on the basis of expression of FLT3, XCR1, IRF8, CADM1, and ID2 (Figure 2; Supplementary Table 2). MRC1L-B (also known as MMR1L4) encodes the macrophage mannose receptor recognised by antibody KUL01 (41). We and others have shown that the MRC1L-B is expressed by at least two distinct macrophage populations in the chicken spleen (20, 42). In the present analysis, we found that MRC1L-B is expressed by three distinct cell clusters (Figures 2B). Collectively, MRC1L-B expressing clusters comprised 36.8% (6,248 of 16,994 total cells) of total cells analysed. Thus, XCR1+ cDCs collectively formed the largest cell subset in this analysis, comprising of 45.5% (7,734 of 16,994 total cells) of the total cells analysed. Due to the complexity of the data, functional analysis of the macrophage clusters is beyond the scope of this paper and will be detailed in a separate publication.
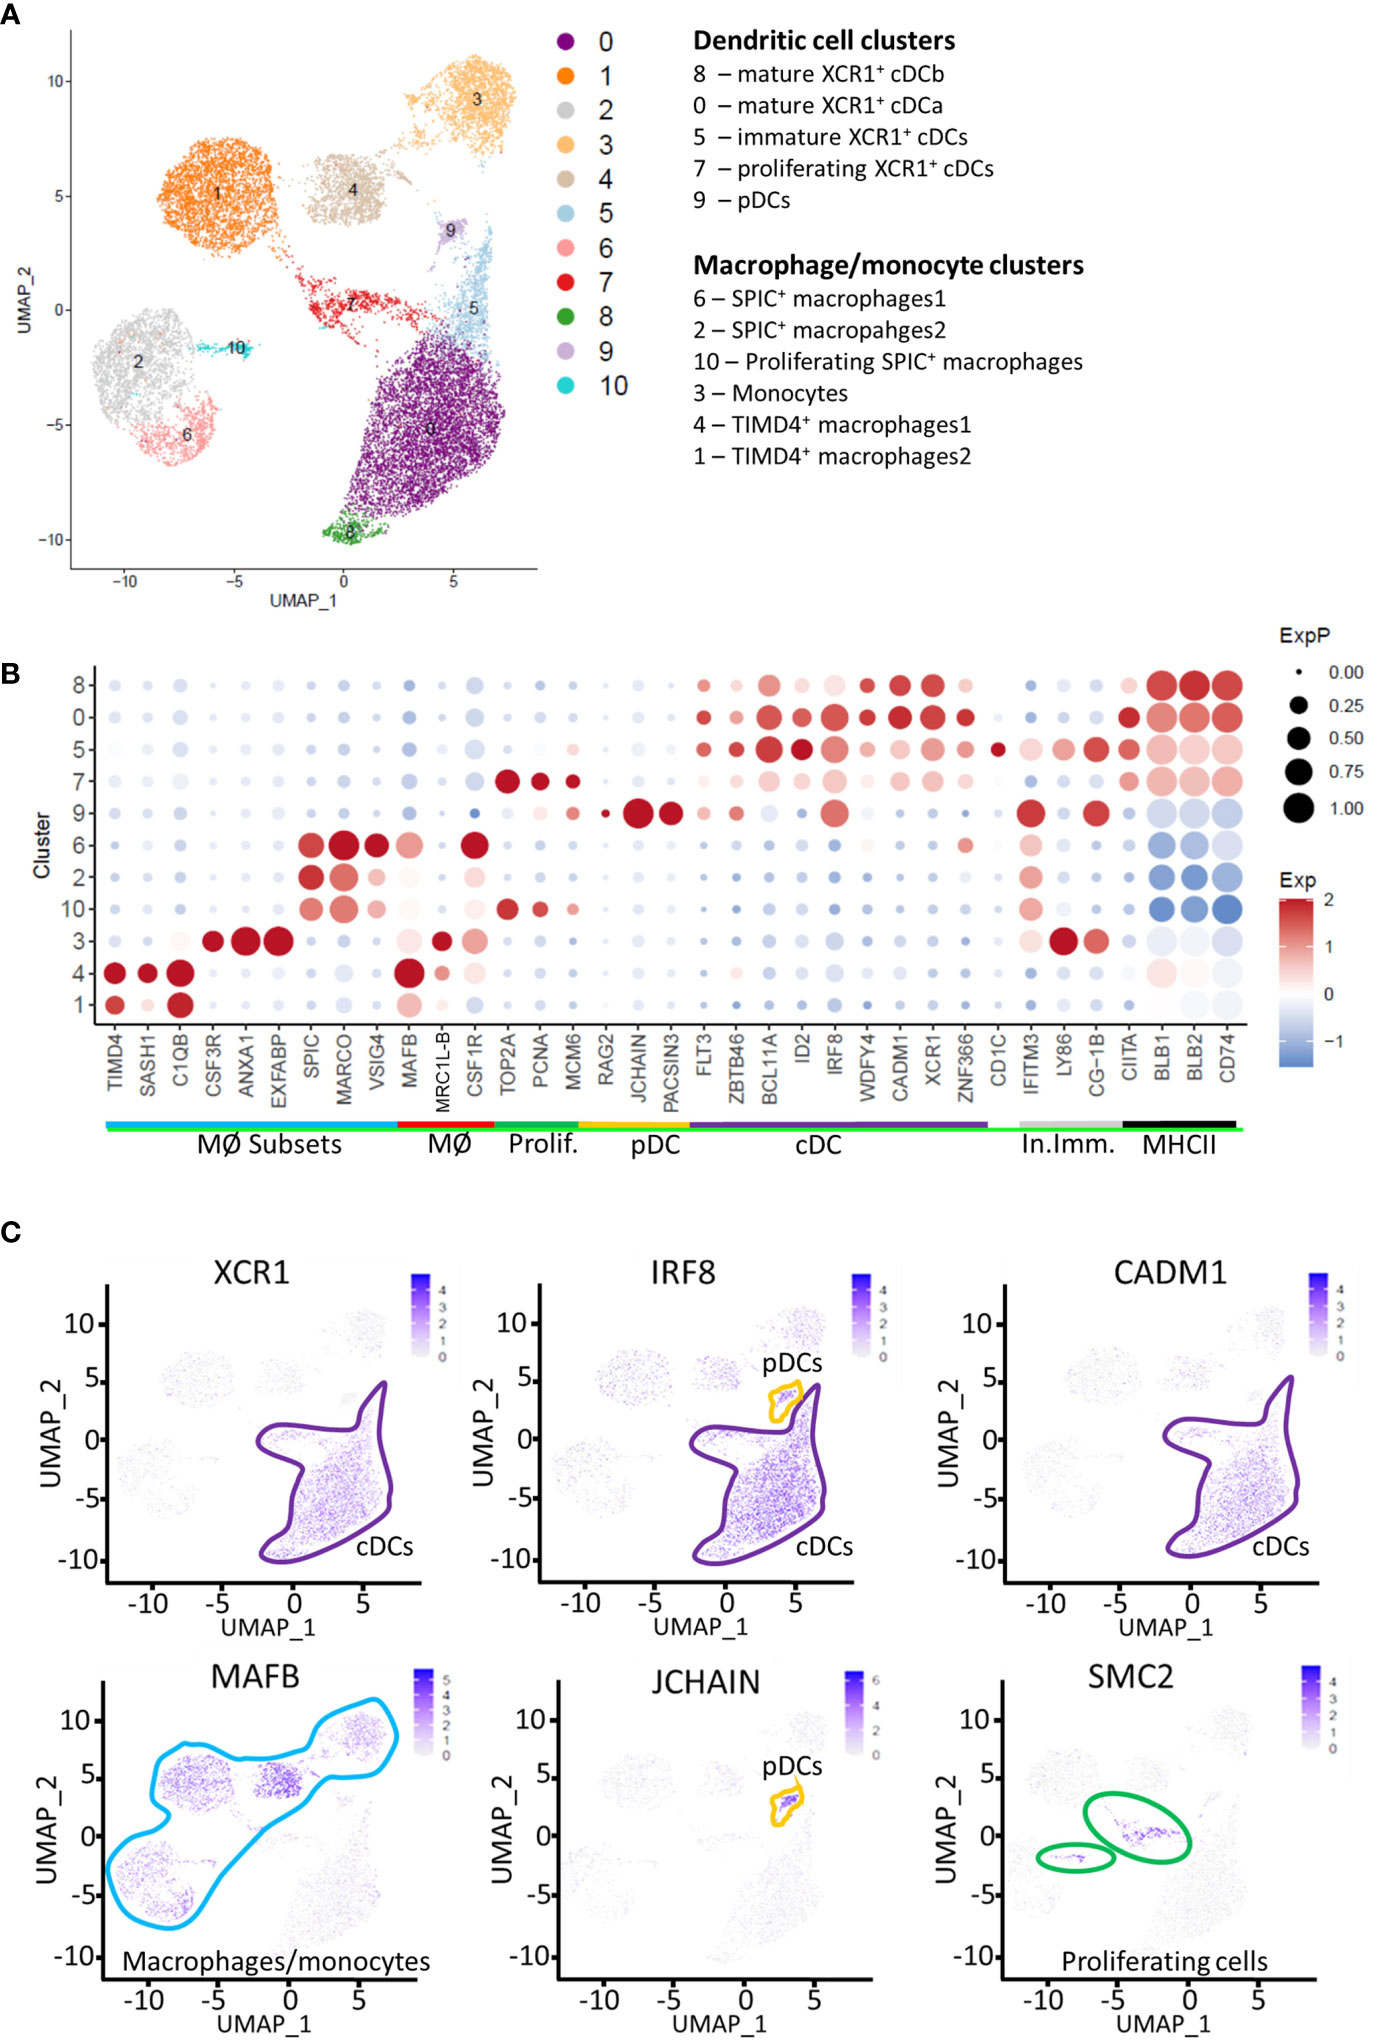
Figure 2 Single-cell transcriptome analysis of macrophages, monocytes and dendritic cells in the chicken spleen. (A) Unbiased clustering of RNA-sequence data from 16,994 CSF1R-eGFP transgene expressing cells derived from the spleens of two 20 week old hens. (B) Dotplot of selected transcript abundance in CSF1R-eGFP transgene expressing cell clusters. MØ Subsets, macrophage subset specific genes; MØ, pan-macrophage genes; Prolif, Proliferation genes; pDC, plasmacytoid dendritic cell genes; cDC, conventional dendritic cell genes; In. Imm, Innate immunity genes, MHCII, MHC Class II antigen presentation associated genes. (C) Feature plots of signature genes identifying cDCs, pDCs, macrophages/monocytes and proliferating cells.
Identification of chicken plasmacytoid dendritic cells
A small cluster of XCR1- FLT3+ IRF8+ cells was noted (“Cluster 9”; Figure 2; Supplementary Table 2). On the basis of high level of expression of JCHAIN (49, 50) and IRF8 (51) and the lack of expression of ID2 and CADM1 (51) (Figures 2, 3), we putatively identified these cells as chicken plasmacytoid dendritic cells (pDCs). The transcription factors TCF4 (also known as E2-2) and ZEB2 are essential for the development of pDCs (51). We found two TCF4 homologues in chickens ENSGALG00000055022 and ENSGALG00000033770 (referred to here as TCF4-like_A and TCF4-like_B respectively). While these genes are expressed in a subset of Cluster 9 cells (Figure 3), this was not at the high levels seen in mammalian pDCs. Similarly, ZEB2 was not highly expressed in Cluster 9 cells (Figure 4A). In mammals, pDCs are potent producers of type I interferon (IFN) (52, 53) in response to viral pathogens via the TLR-MyD88-IRF7 pathway (54, 55). As expected, in unstimulated pDCs, we did not detect expression of type I IFN genes, but we did detect the expression of genes associated with TLR recognition of viral pathogens (TLR3, TLR7 and TLR21) (56, 57) and type I IFN production (IRF7) (54), validating our identification of these cells as chicken pDCs (Figure 3).
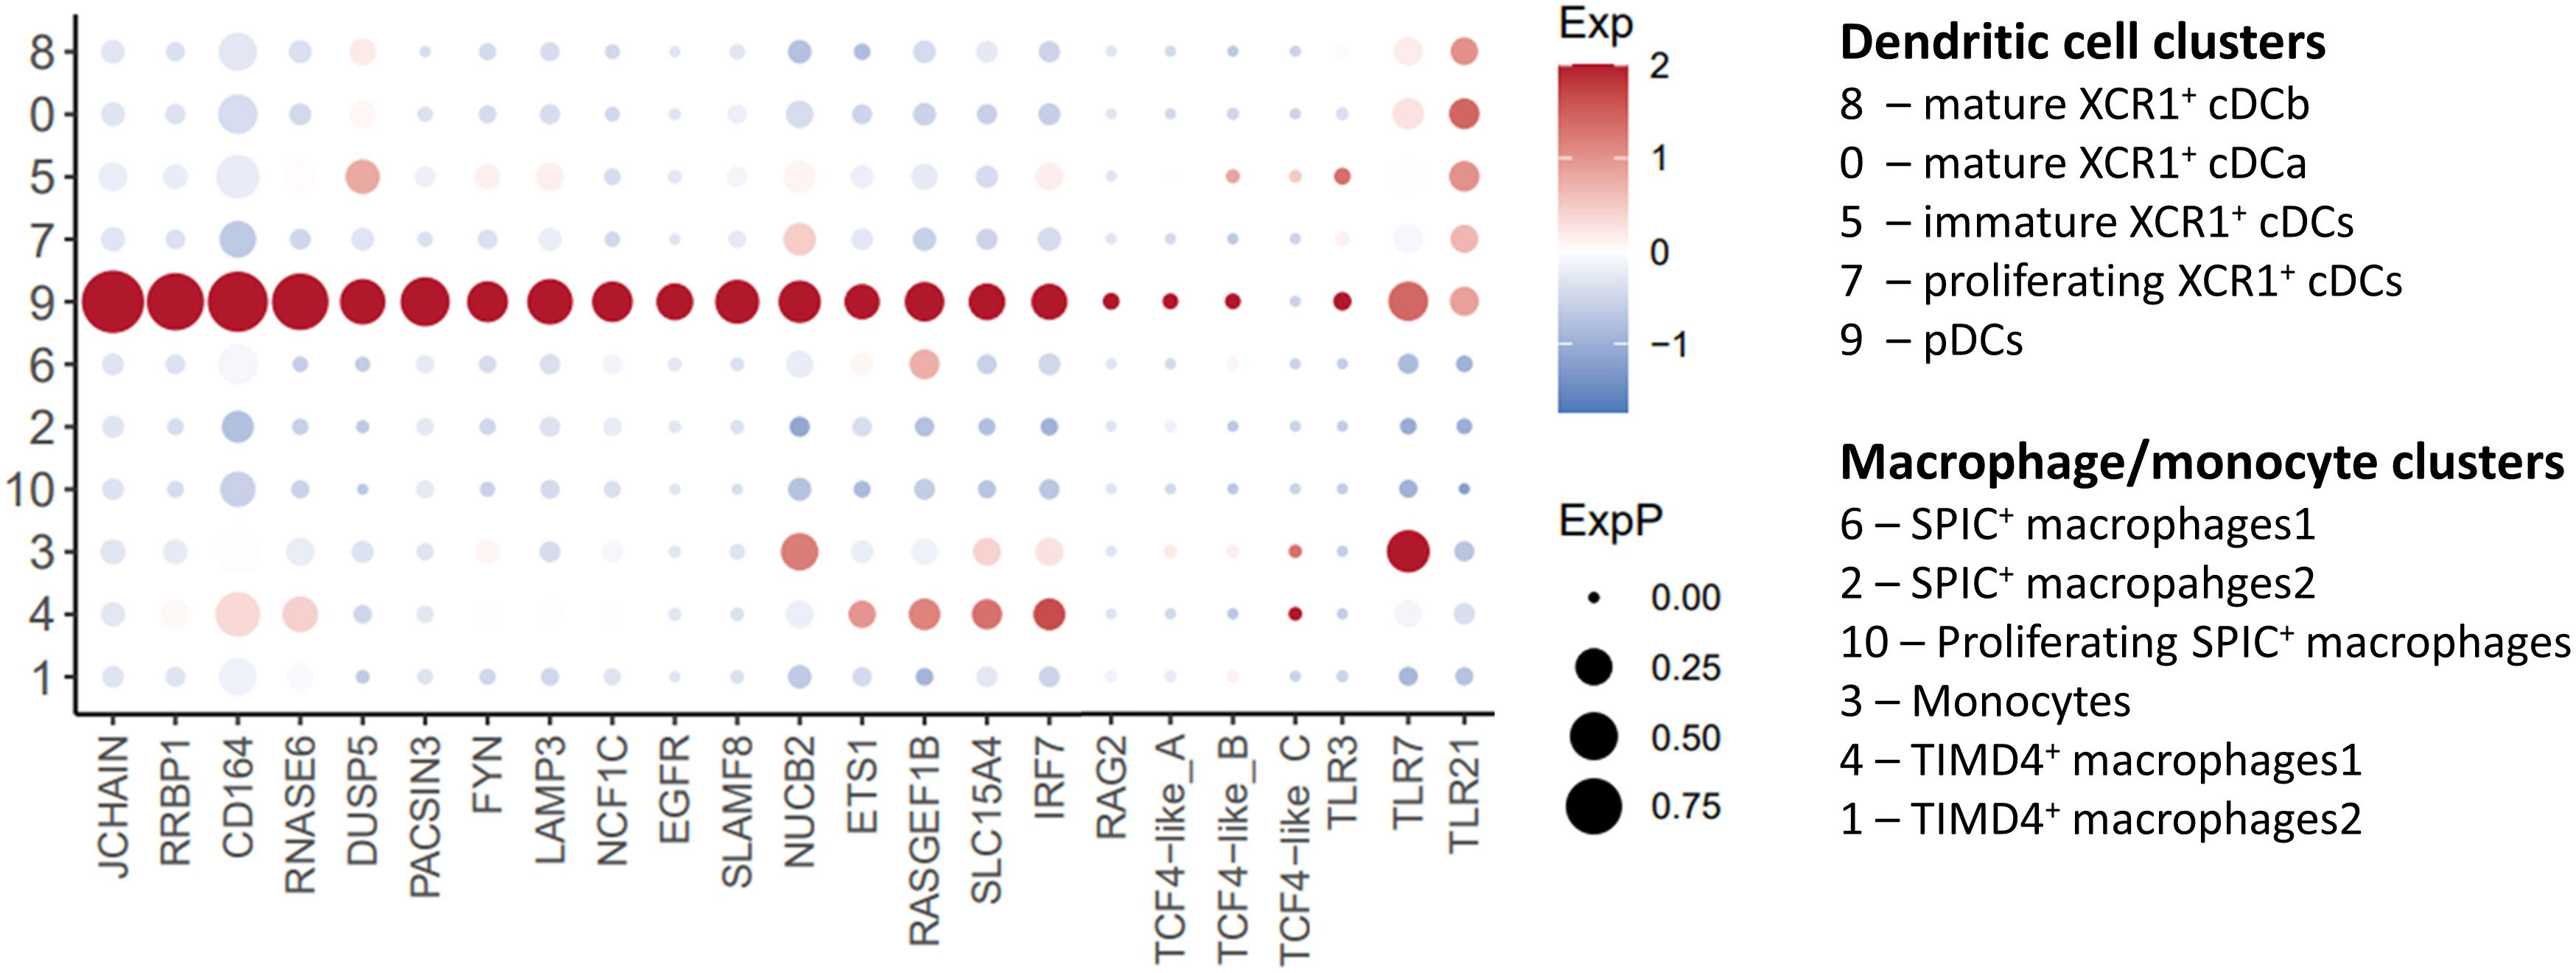
Figure 3 Single-cell transcriptomic identification of chicken pDCs. Dotplot of selected pDC associated genes transcript abundance in cell clusters.
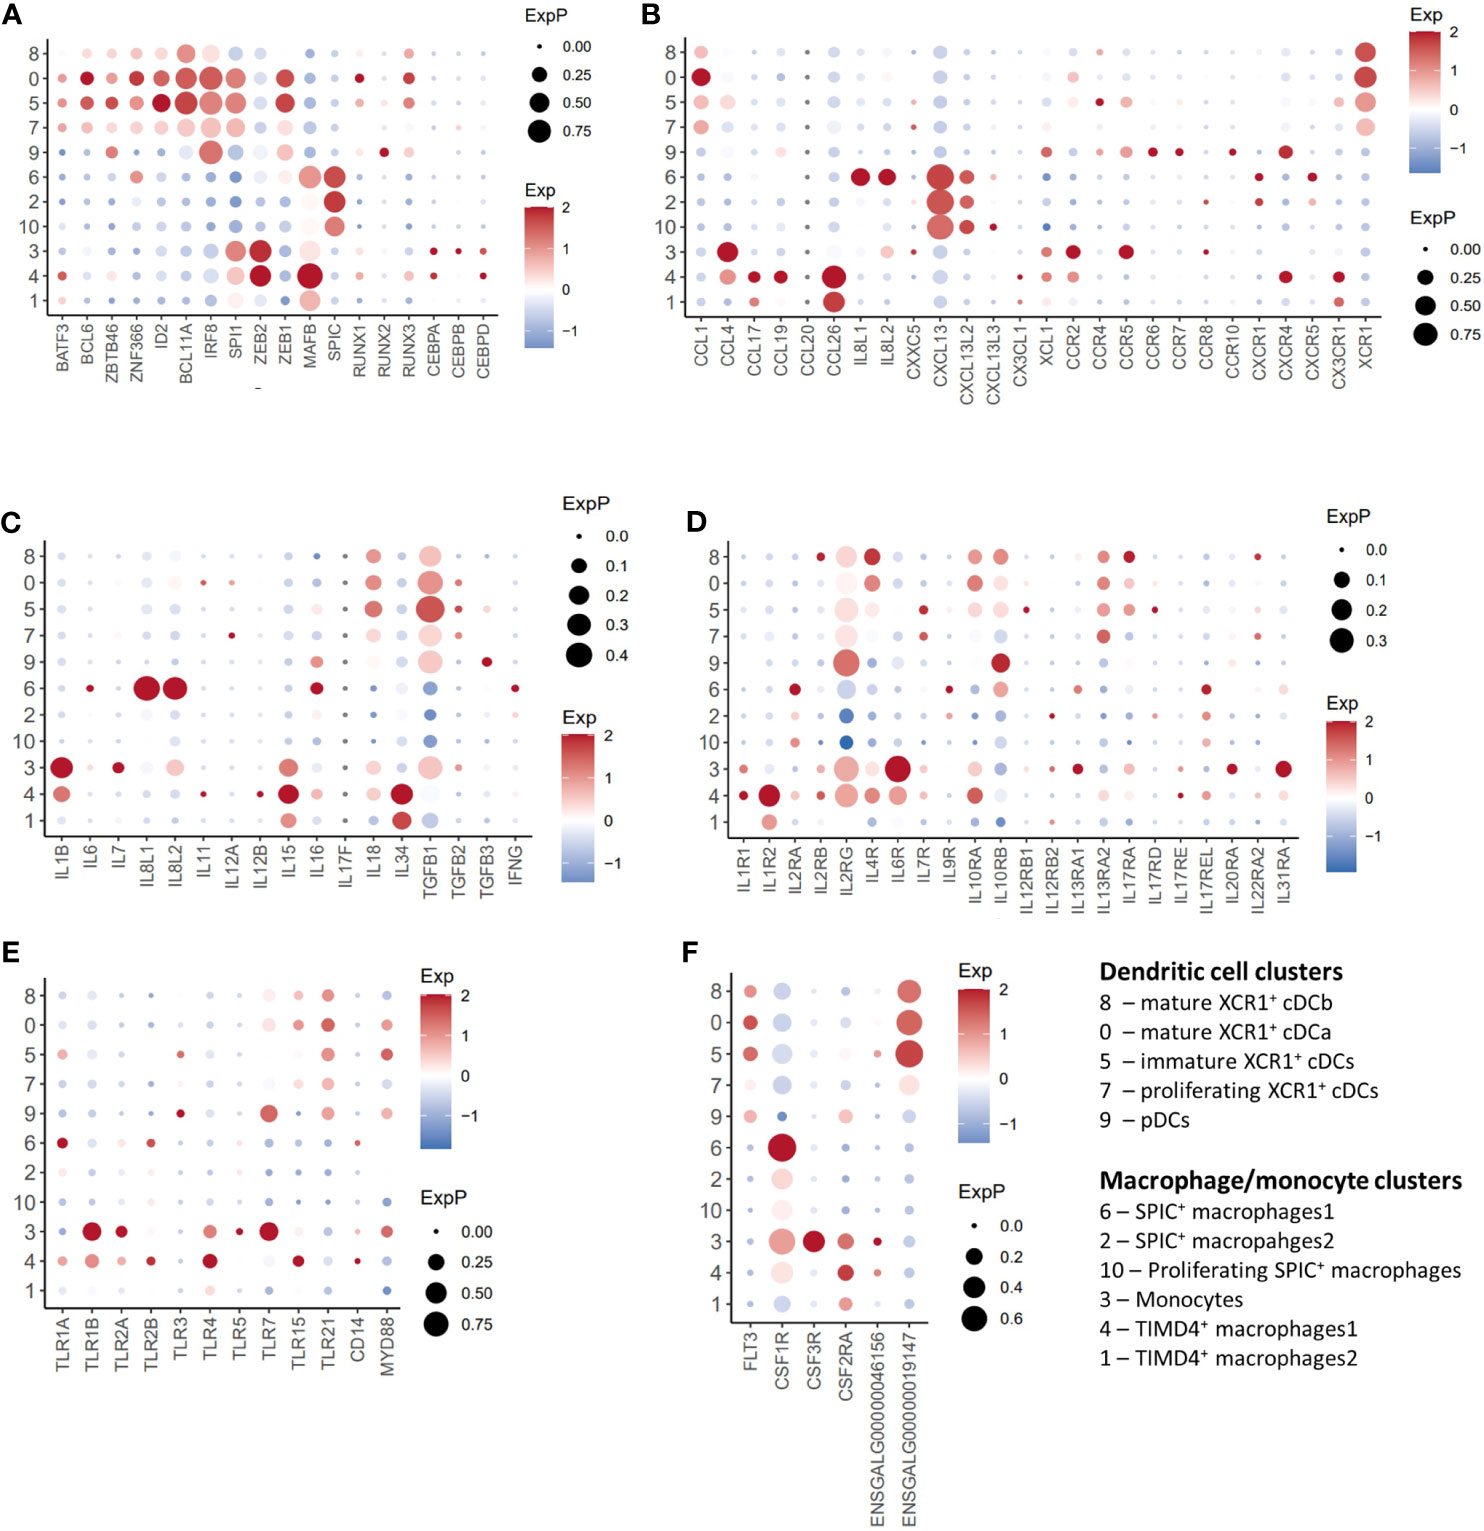
Figure 4 Single-cell transcriptomic analysis of transcription factor, cytokine, chemokine and TLR genes. (A) Dotplot of selected transcription factors transcript abundance. (B) Dotplot of selected chemokine/chemokine receptor transcript abundance. (C) Dotplot of selected cytokine transcript abundance. (D) Dotplot of selected cytokine receptor transcript abundance. (E) Dotplot of selected toll-like receptor (TLR) transcript abundance. (F) Dotplot of selected toll-like receptor growth factor transcript abundance.
Gene expression in chicken splenic dendritic cells
Transcription factors: Chicken XCR1+ cDC clusters (Clusters 0, 3, 5 and 8) expressed a range of transcription factors associated with mammalian XCR1+ cDC development and function, including BATF3 (58), BLC6 (59, 60), SPI1 (61), ZBTB46 (62), ZNF366 (63), ID2 (51), BCL11A (64), and IRF8 (51) (Figures 2B, 4A). In contrast to mice (62), ZBTB46 is also expressed in putative chicken pDCs (Figures 2B, 4A). The macrophage associated transcription factors SPIC, CEBPA/B/C, and MAFB (46, 65) were not expressed in pDCs or XCR1+ cDC clusters (Figure 2B).
Cytokines/chemokines: As is expected in unstimulated cells, chicken pDCs and XCR1+ cDC clusters expressed few detectable cytokines or chemokines, with the exception of TGFB1, IL18 and CCL1 in XCR1+ cDCs, and low levels of TGFB1 and IL16 in pDCs (Figures 4B, C). With the exception of XCR1 itself, XCR1+ cDC clusters did not globally express any other chemokine receptor (Figure 4B), although immature XCR1+ cDCs (Cluster 5; see below) expressed low levels of CCR2/4/5. pDCs expressed relatively low levels of CCR4/5/6/7/10 and CXCR4. XCR1+ cDC clusters expressed a wide range of cytokine receptors, including IL2RG, IL4R, IL10RA/B, IL13A2, and IL17RA (Figure 4D). In contrast, cytokine gene expression in pDCs was restricted to IL2RG and IL10RB (Figure 4D).
TLRs: Both chicken pDCs and XCR1+ clusters expressed TLR7 (albeit weakly in XCR1+ cDCs) and TLR21 [a functional homologue of mammalian TLR9 (66)]. XCR1+ cDCs, but not pDCs expressed TLR15 (Figure 4E), a TLR unique to avian, non-teleost fish, and reptilian lineages that recognises fungal-derived protease agonists (67). TLR3 expression was restricted to pDCs (Cluster 9) and immature XCR1+ cDCs (Cluster 5; Figure 4D). Immature XCR1+ cDCs also expressed weak levels of TLR1A.
Growth factors: pDCs expressed FLT3 and the gene annotated as CSF2RA (ENSGALT00000026942; Figure 4F). CSF1R expression in XCR1+ cDC clusters was not detectable, despite the cells expressing low levels of CSF1R and the CSF1R-transgene (20). Non-proliferating XCR1+ cDC clusters expressed high levels of FLT3 and the CSF2RA paralog ENSGALG00000019147, but not CSF2RA (ENSGALT00000026942).
Substructure of the splenic XCR1+ cDC population
XCR1+ cDC Cluster 7 expressed the cell proliferation markers TOP2A, PCNA, MCM6, MKI67 and STMN1 (Figure 5A). This represented 8.6% of XCR1+ cDCs (666 of 7,734 total XCR1+ cDCs). To confirm that chicken splenic XCR1+ cDCs are proliferating in situ, we independently determined the percentage of proliferating cells by measuring the DNA content of chicken XCR1+ cDCs (68). Consistent with the scRNASeq data, ~7% of XCR1+ cDCs were in S/G2/M phases (Supplementary Figure 4). Non-proliferating XCR1+ cDCs (Clusters 0, 5 and 8) could be differentiated from each other on basis of differential expression of genes associated with MHCII pathway antigen processing and presentation (e.g. BLB1, BLB2, CITTA, CD40, CD80, CD86, CD74, SCPEP1, NRP1, IFI30, CTSA and CTSS), or anti-viral activity (e.g. IFITM1, IFITM3, LY86, CG-1B and CD1c) (Figures 5B, C). We used PHATE to analyse the structure of the XCR1+ cDC population (Clusters 0, 5 and 8; Figure 5D), and confirm the separate developmental origin for these cells and the pDC population (Cluster 9; Figure 5D). Proliferating cells of different developmental origins share the expression of highly variable cell cycle genes. As this can confound trajectory analysis, we excluded proliferating XCR1+ cDCs (Cluster 7) from this analysis. All XCR1+ cDC clusters remained within the same cell trajectory, whereas pDCs were a separate population of cells. Non-proliferating XCR1+ cDC populations displayed a single cell trajectory with no obvious branching. The termini of the cell trajectory were represented by cells expressing high levels of genes related to MHCII antigen presentation (e.g. CD74 and BLB1) or IFITM3, CG-1B and CD1c (Figure 5D). The expression of CIITA, the main transcription factor controlling expression MHCII genes (i.e. BLB1 and BLB2 encode for MHCII beta chain in the chicken), was intermediate between BLB1 and IFITM3 expressing cells. These data suggested a single cell population undergoing local maturation within the spleen, with immature XCR1+ cDCs expressing IFITM1/3, CG-1B, LY86, CD1c and relatively low levels of MHCII related genes, and mature cells expressing high levels of MHCII, but not IFITM1/3, LY86, CG-1B or CD1c. As tools to stain for IFITM1/3, LY86, CG-1B were not available at this time, to confirm the substructure within the chicken splenic XCR1+ cDC population we used a monoclonal antibody to chicken CD1.1 (69), which detects chicken CD1c (Figure 6). We found that chicken splenic XCR1+ cDCs could be partitioned into of CD1.1LOW MHCIIHIGH, CD1.1HIGH MHCIIHIGH or CD1.1HIGH MHCIILOW subsets (Figure 6A), with the CD1.1HIGH MHCIILOW and CD1.1LOW MHCIIHIGH representing the least and most abundant subsets respectively. In contrast, the vast majority of blood XCR1+ cDCs are CD1.1HIGH MHCIILOW (Figures 6A, B). As maturation of XCR1+ cDCs is determined by cell intrinsic and local tissue conditions (reviewed by Roquilly et al., 2022) (70), we reasoned that recently hatched chicks would contain more immature XCR1+ cDCs than older birds. To test this hypothesis, we determined the proportion of CD1.1HIGH MHCIILOW and CD1.1LOW MHCIIHIGH XCR1+ cDCs in 1-week-old chicks compared to chicks aged 2 and 12 weeks (Figure 6C). Week-old chicks were found to have approximately 3-fold more CD1.1HIGH MHCIILOW XCR1+ cDCs than older chicks (Figure 6D). Taken together, these data suggest that splenic CD1.1HIGH MHCIILOW XCR1+ cDCs are immature recently migrated from the blood; and furthermore, CD1.1 (and also IFITM1, IFITM3, LY86 and CG-1B) expression diminishes as MHCII expression increases in maturing splenic XCR1+ cDCs.
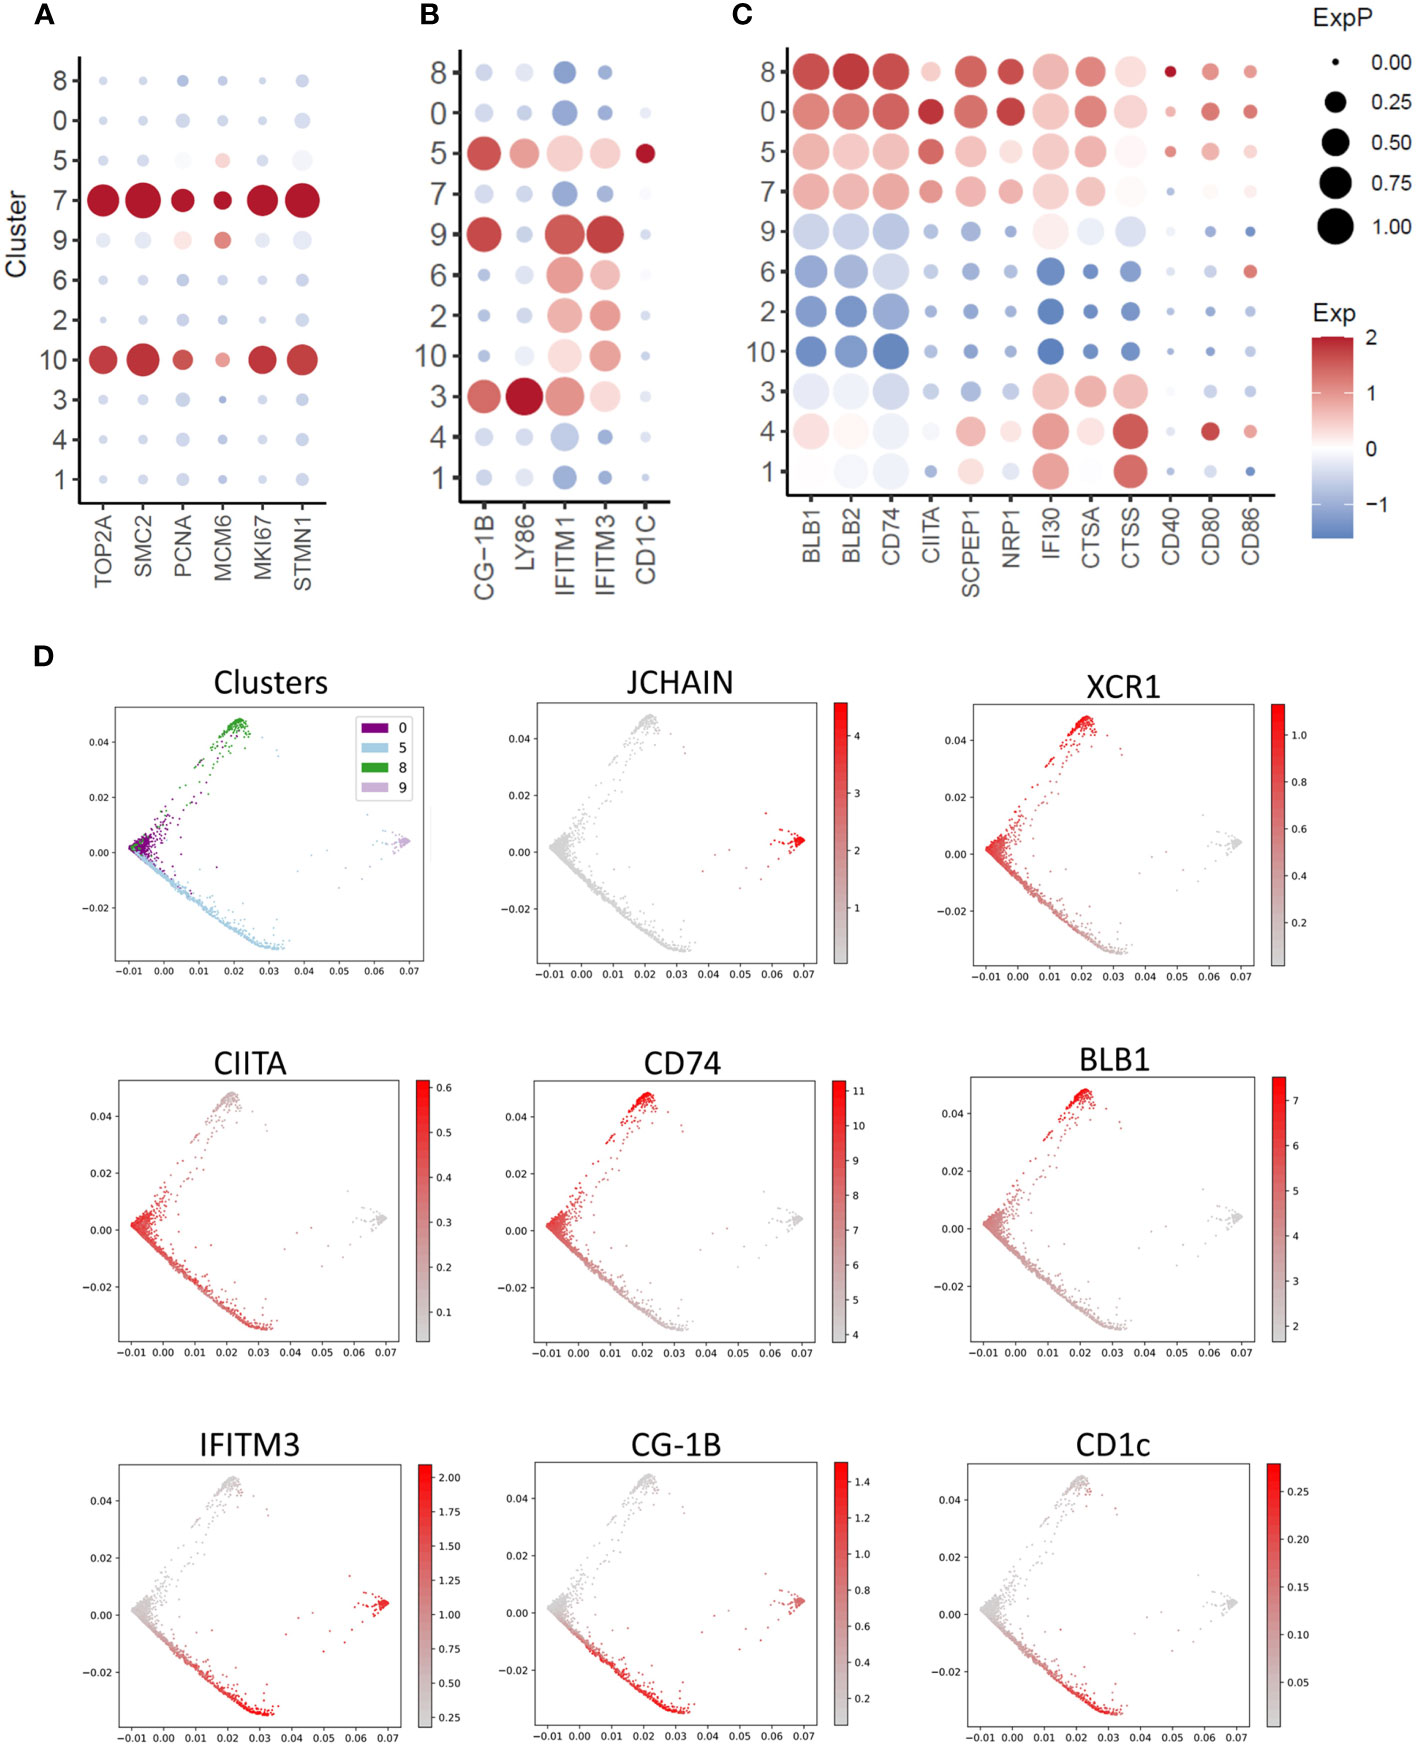
Figure 5 Single-cell transcriptomic analysis of cell proliferation, innate immunity and MHCII antigen presentation pathway associated genes. (A) Dotplot of transcript abundance for selected cell proliferation associated genes. (B) Dotplot of transcript abundance for selected innate immunity associated genes. (C) Dotplot of transcript abundance for selected MHCII antigen presentation associated genes. (D) PHATE map of dendritic cell clusters with feature plots of markers for pDCs (JCHAIN), cDCs (XCR1), MHCII antigen presentation (CITTA, CD74 and BLB1) and innate immunity (IFITM3, CG-1B and CD1c).
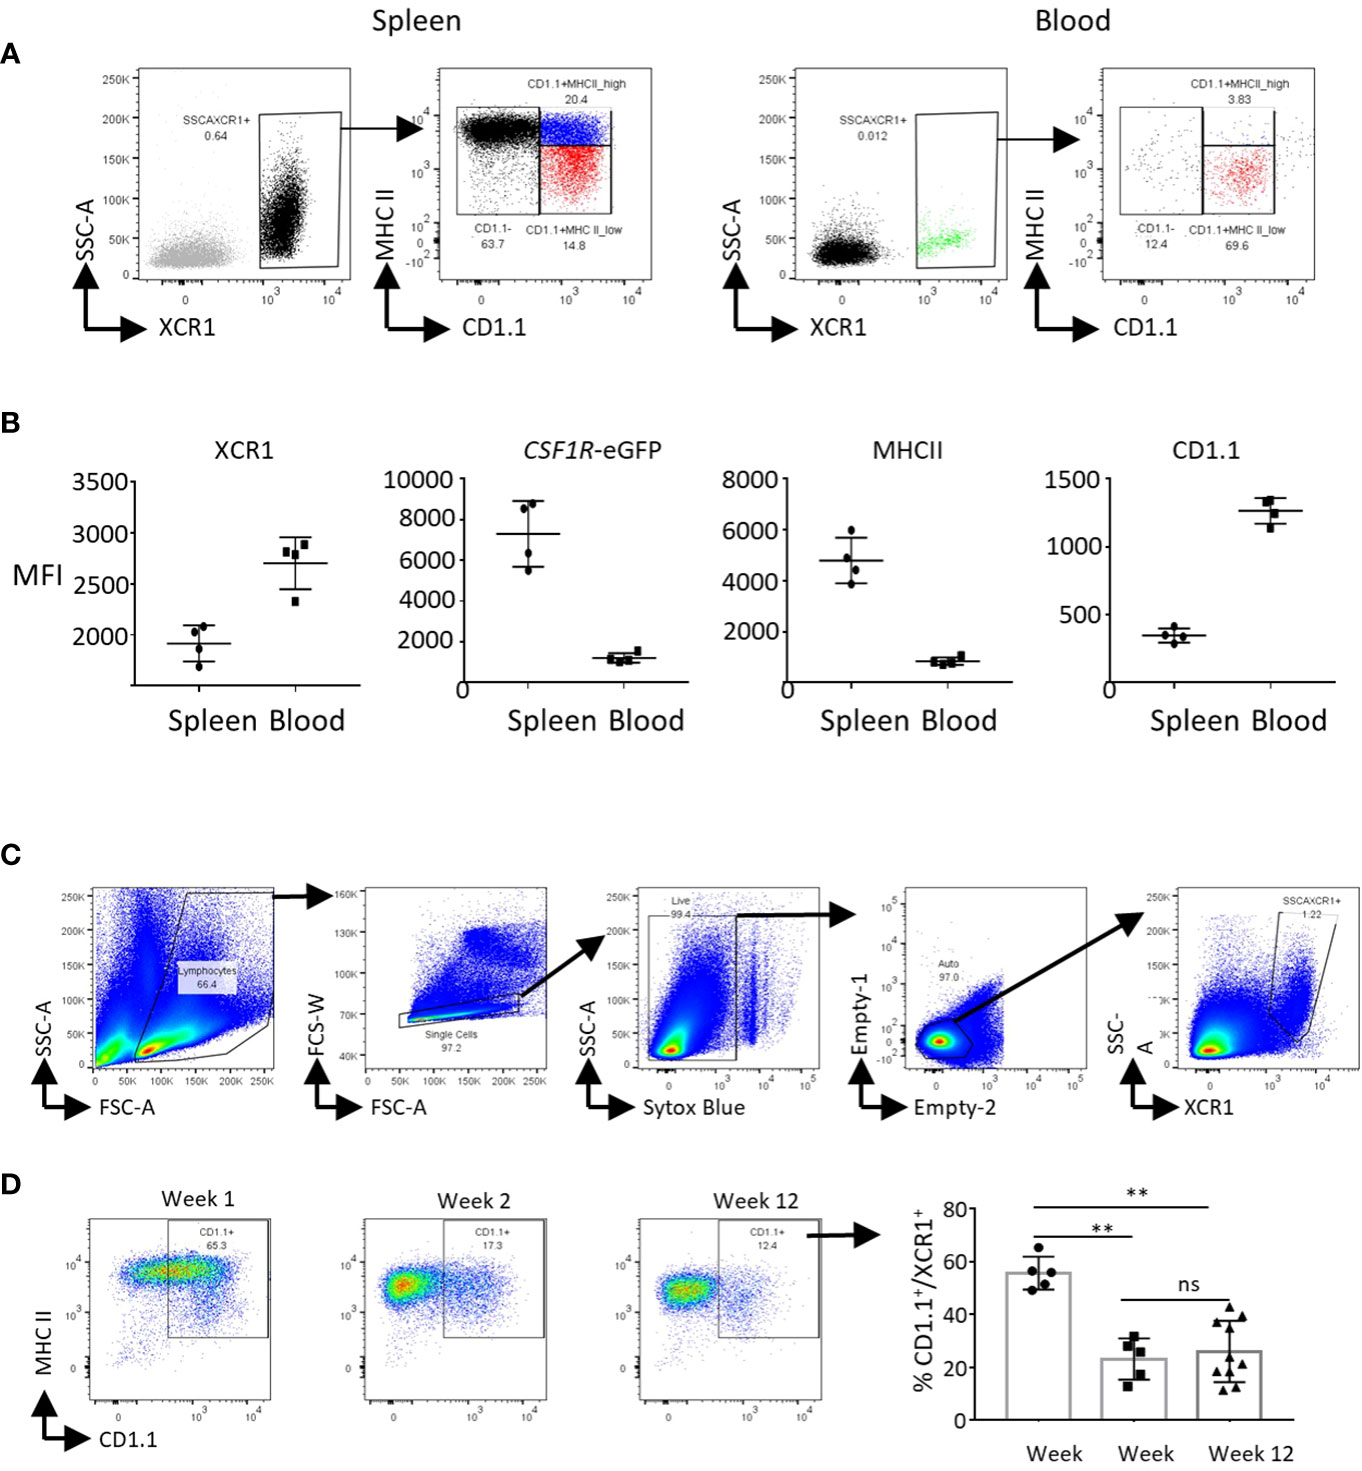
Figure 6 CD1.1 (CD1c) is a marker for immature splenic XCR1+ cDCs. (A) Single, live and XCR1+ cells from the spleen or blood were gated for flow cytometric analysis of MHCII and CD1.1 expression. (B) Mean fluorescence intensity of XCR1, MHCII and CD1.1 staining, and CSF1R-eGFP transgene expression on splenic and blood XCR1+ cDCs. (C) Flow cytometric analysis of CD1.1 and MHCII expression on splenic XCR1+ cDCs from chicks of difference ages.
Cross presentation
The priming of cytotoxic CD8+ T cells to exogenously-derived antigens is a process termed “cross-presentation”. Mammalian XCR1+ cDCs excel at cross-presentation of viral and tumour cell-associated antigens (9–13). As no chicken immortalised T-cell lines exist to directly test antigen cross-presentation function, we assessed the potential for antigen cross-presentation by chicken XCR1+ cDCs by examining the expression of genes involved in cross-presentation taken from previously published resources (Supplementary Figure 5). XCR1+ cDC clusters exhibited a range of upregulated cross-presentation genes compared to pDC or macrophage clusters. These included genes with functions directly (WDFY4, CD74 and PPT1) or indirectly (CADM1, DNASE1L3, XCR1 and LY75) related to cross-presentation.
Production of the gene-edited XCR1-iCaspase9-RFP chicken
Previously we developed tools to identify chicken XCR1+ cDCs (20). However, these did not enable specific in situ visualisation nor in vivo manipulation of XCR1+ cDCs. Analysis of XCR1+ cDCs was problematic in many tissues, as markers such as FLT3 are lost during the enzymatic digestion of tissues required for cell extraction. Therefore, we aimed to produce a gene edited chicken line in which XCR1+ cDCs could be visualised and conditionally ablated. Inducible caspase-9 (iCaspase9), developed as a cellular suicide gene for human stem cell therapy, is an effective system for cellular ablation in chicken embryos (38). We used CRISPR/Cas9-mediated homology-directed repair (HDR) to replace the single exon of the XCR1 gene with an iCaspase9 construct in PGCs (Figure 7A). The iCaspase9 transgene was followed by a 2A self-cleaving peptide sequence then an enhanced red fluorescent protein (RFP) reporter gene to mark cellular expression. Transfected CSF1R-eGFP transgene positive PGCs were screened and clonally expanded. 50% (20/40) of selected clones were found to have bi-allelic edits (Supplementary Figure 1A). A single male PGC clone with biallelic edits was selected and injected into surrogate host embryos (38). One male founder was bred to wild type hens to produce G1 offspring for breeding and analysis. All G1 offspring were screened by PCR for the presence of iCaspase9-RFP transgene (Supplementary Figure 1B). The expression of RFP expression in splenic cells of G1 offspring was analysed by flow cytometry (Figure 7B). The vast majority of RFP+ cells were found in the CSF1R-eGFP+ cell population, as expected for chicken XCR1+ cDCs (20). RFP+ cells were positive for the chicken cDC markers XCR1 and FLT3, expressed high levels of MHCII, but did not express markers for chicken macrophages (MRC1L-B), B-cells (Bu-1) nor T-cells (CD3), indicating the transgene was specifically expressed in chicken XCR1+ cDCs (Figure 7B). As the XCR1-iCaspase9-RFP transgene replaces the native XCR1 coding sequence, this has the potential to impact expression levels of XCR1. Previously we showed that XCR1 expression on chicken XCR1+ cDCs could be assessed by flow cytometry by measuring the binding of XCL1AF647 (20). We found that in birds homozygous for the iCaspase9-RFP transgene (i.e. deficient in XCR1) there was a total lack of binding to XCL1AF647; whereas heterozygous birds exhibited the same level of binding to XCL1AF647 as wild-type (WT) birds (Supplementary. Figure 6A). Heterozygous birds are therefore functionally wild-type for XCR1 expression and are suitable for assessing XCR1+ cDC development and function. We assessed the impact of XCR1 deficiency on splenic immune cell populations (Supplementary Figure 6B). Apart from a slight, but significant, decrease in B-cells (Bu-1+ cells) in homozygous XCR1-iCaspase9-RFP transgenic (i.e. XCR1 deficient; “KO”) compared to heterozygous birds (“HET”), no impact of XCR1 deficiency was noted in the CD45+, CSF1R-eGFP+, MRC1L-B+ (macrophages), CD4+ or CD8+ T-cell populations (Supplementary Figure 6B). As males have approximately twice as many splenic XCR1+ cDCs than females (Figure 1), we compared the number of XCR1+ cDCs between 20-week old CSF1R-eGFP XCR1-iCaspase9-RFP male and female chickens (Supplementary Figure 7). While the proportion of CSF1R-eGFP+ cells expressed as a percentage of the CD45+ population did not differ between the sexes, males had approximately two-fold more XCR1-RFP+ cDCs than females, expressed as either a percentage of the CD45+ or CSF1R-eGFP+ cell populations (Supplementary Figure 7).
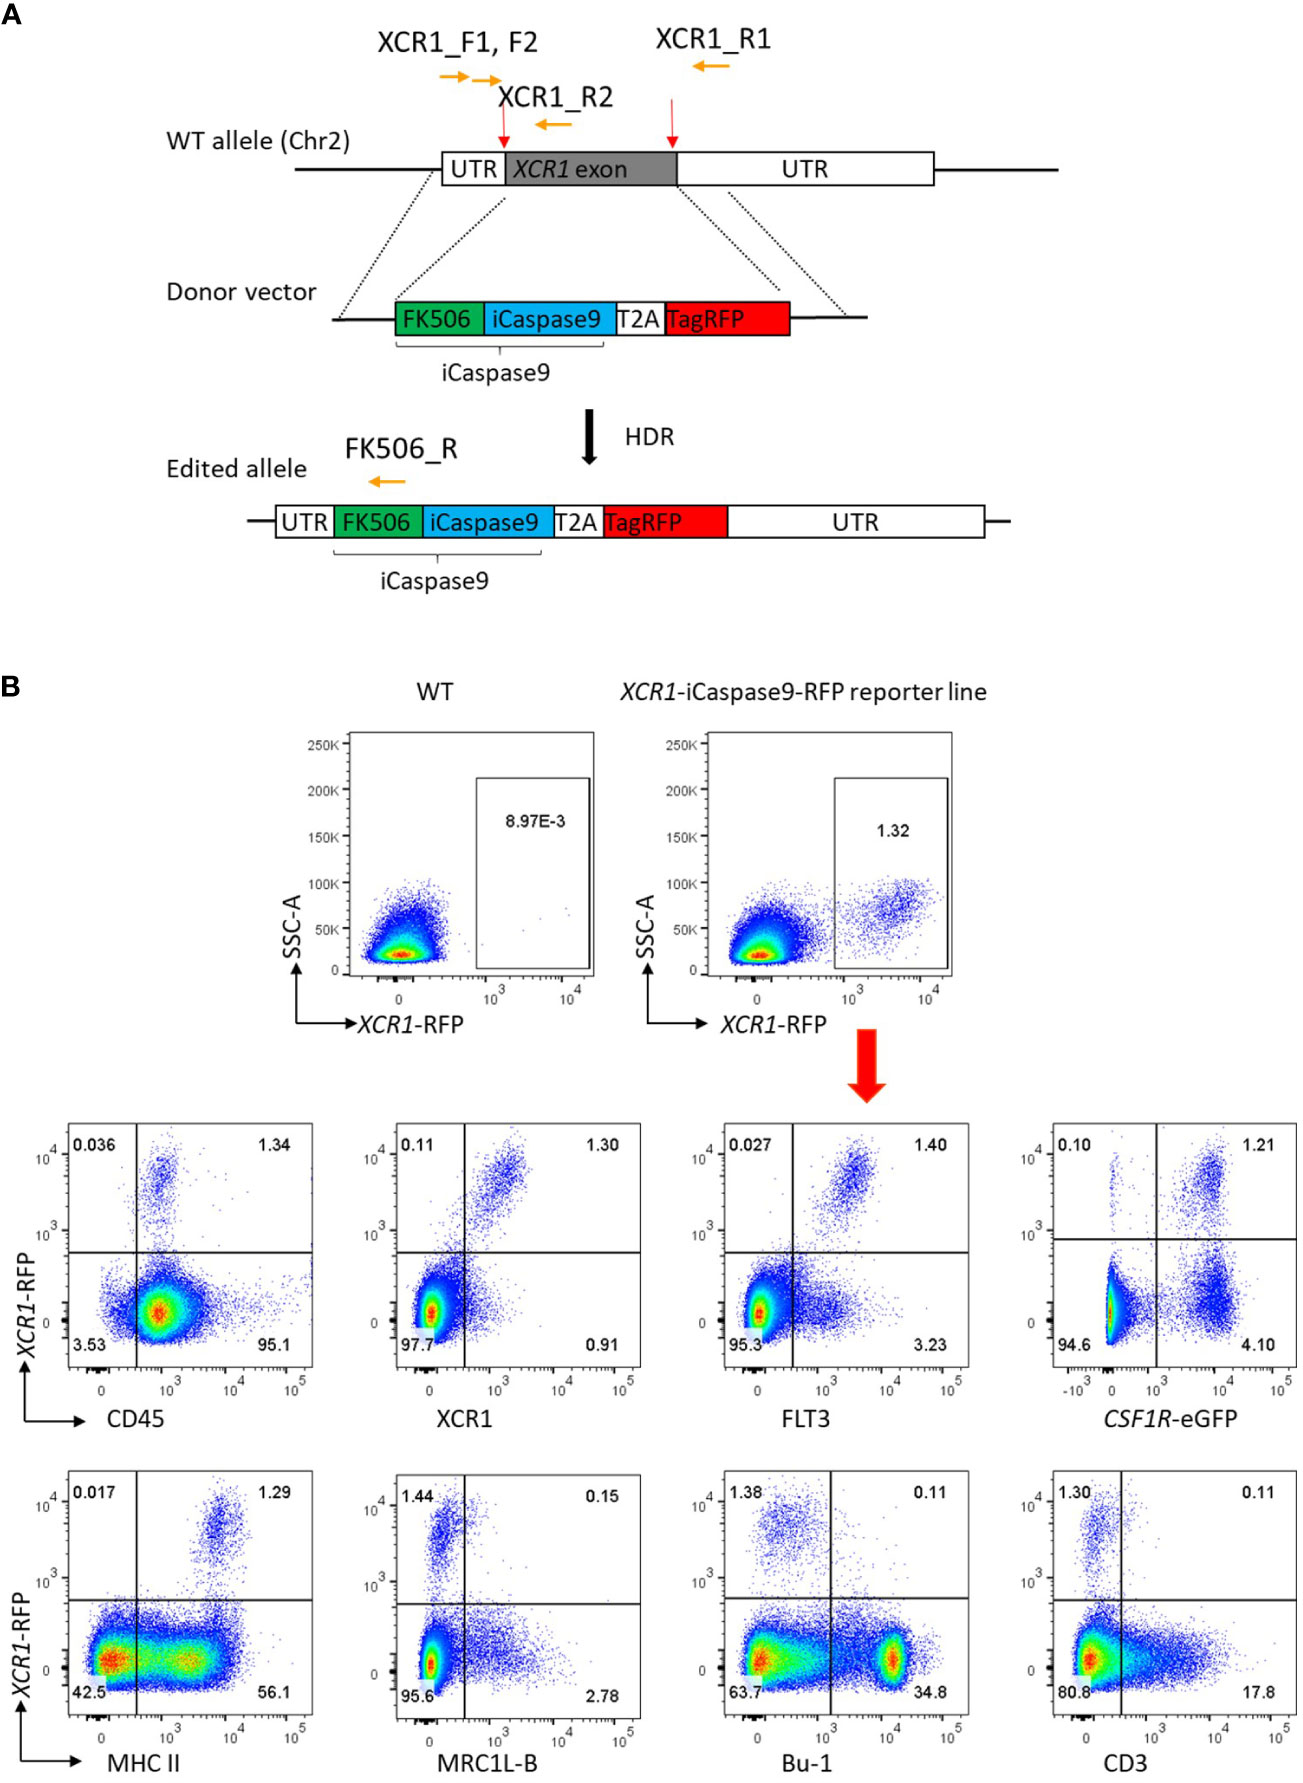
Figure 7 Production of the CSF1R XCR1-iCaspase9-RFP chicken. (A) CRISPR/Cas9-mediated recombination of an iCaspase9 and TagRFP (RFP) reporter gene to replace the exon at the XCR1 locus. Red arrows indicate the guide targets, orange arrows indicate the position of PCR primers used in analysis of gene targeting. (B) Flow cytometric analysis of splenic cells from dual transgenic XCR1-iCaspase9-RFP x CSF1R-eGFP (heterozygous for both XCR1-iCaspase9-RFP and CSF1R-eGFP transgenes). RFP expression is only detected in cells from the XCR1-iCaspase9-RFP chicken. RFP+ cells are CD45+, FLT3+, XCR1+, MHCIIHIGH. RFP expression is not detected in MRC1L-B+ (macrophage/monocyte), Bu-1+ (B-cells) or CD3+ (T-cell) populations. Representative of 20-30 animals.
XCR1-iCaspase9-RFP transgene reporter enables detection of chicken cDCs in situ
RFP transgene expression was used to detect splenic XCR1+ cDCs in situ by immunofluorescence microscopy (Figure 8). In the spleen, RFP+ cells were most abundant in the red pulp and located in the periarteriolar lymphoid sheaths (PALS), rarely located in the periellipsoid white pulp (PWP), and not detected in germinal centres (GC) (Figure 8A). XCR1-RFP+ cDCs were widely distributed in chicken tissues (Supplementary Figure 8). In the small intestine (ileum and caecal tonsils, Supplementary Figures 8A, B), XCR1-RFP+ cDCs were abundant in the lamina propria but excluded from germinal centres (GC) and the B-cell follicles of the bursa of Fabricius (Supplementary Figure 8F). XCR1-RFP+ cDCs were scattered through the parenchyma of the liver and lung (Supplementary Figures 8D, E). In the lung, XCR1-RFP+ cDCs were found within lymphocyte clusters adjacent to the parabronchi (Supplementary Figure 8D). In the thymus XCR1-RFP+ cDCs were abundant in the medulla and located in the septa but excluded from the cortex (Supplementary Figure 8C). Previously, two monoclonal antibodies, CVI-ChNL-68.1 and CVI-ChNL-74.2, were reported to stain red pulp macrophages (71). Due to the prominent location of XCR1-RFP+ cDCs in the chicken red pulp we investigated if either of these antibodies recognised XCR1+ cDCs. CVI-ChNL-68.1 marked XCR1-RFP+ cDCs in the red pulp and RFP- cells in PWP (Figure 8B). CVI-ChNL-74.2 stained a ring of RFP- cells surrounding the PWP and scattered RFP- cells in the red pulp (Figure 8C). ChNL-74.2 did not stain RFP+ cells.
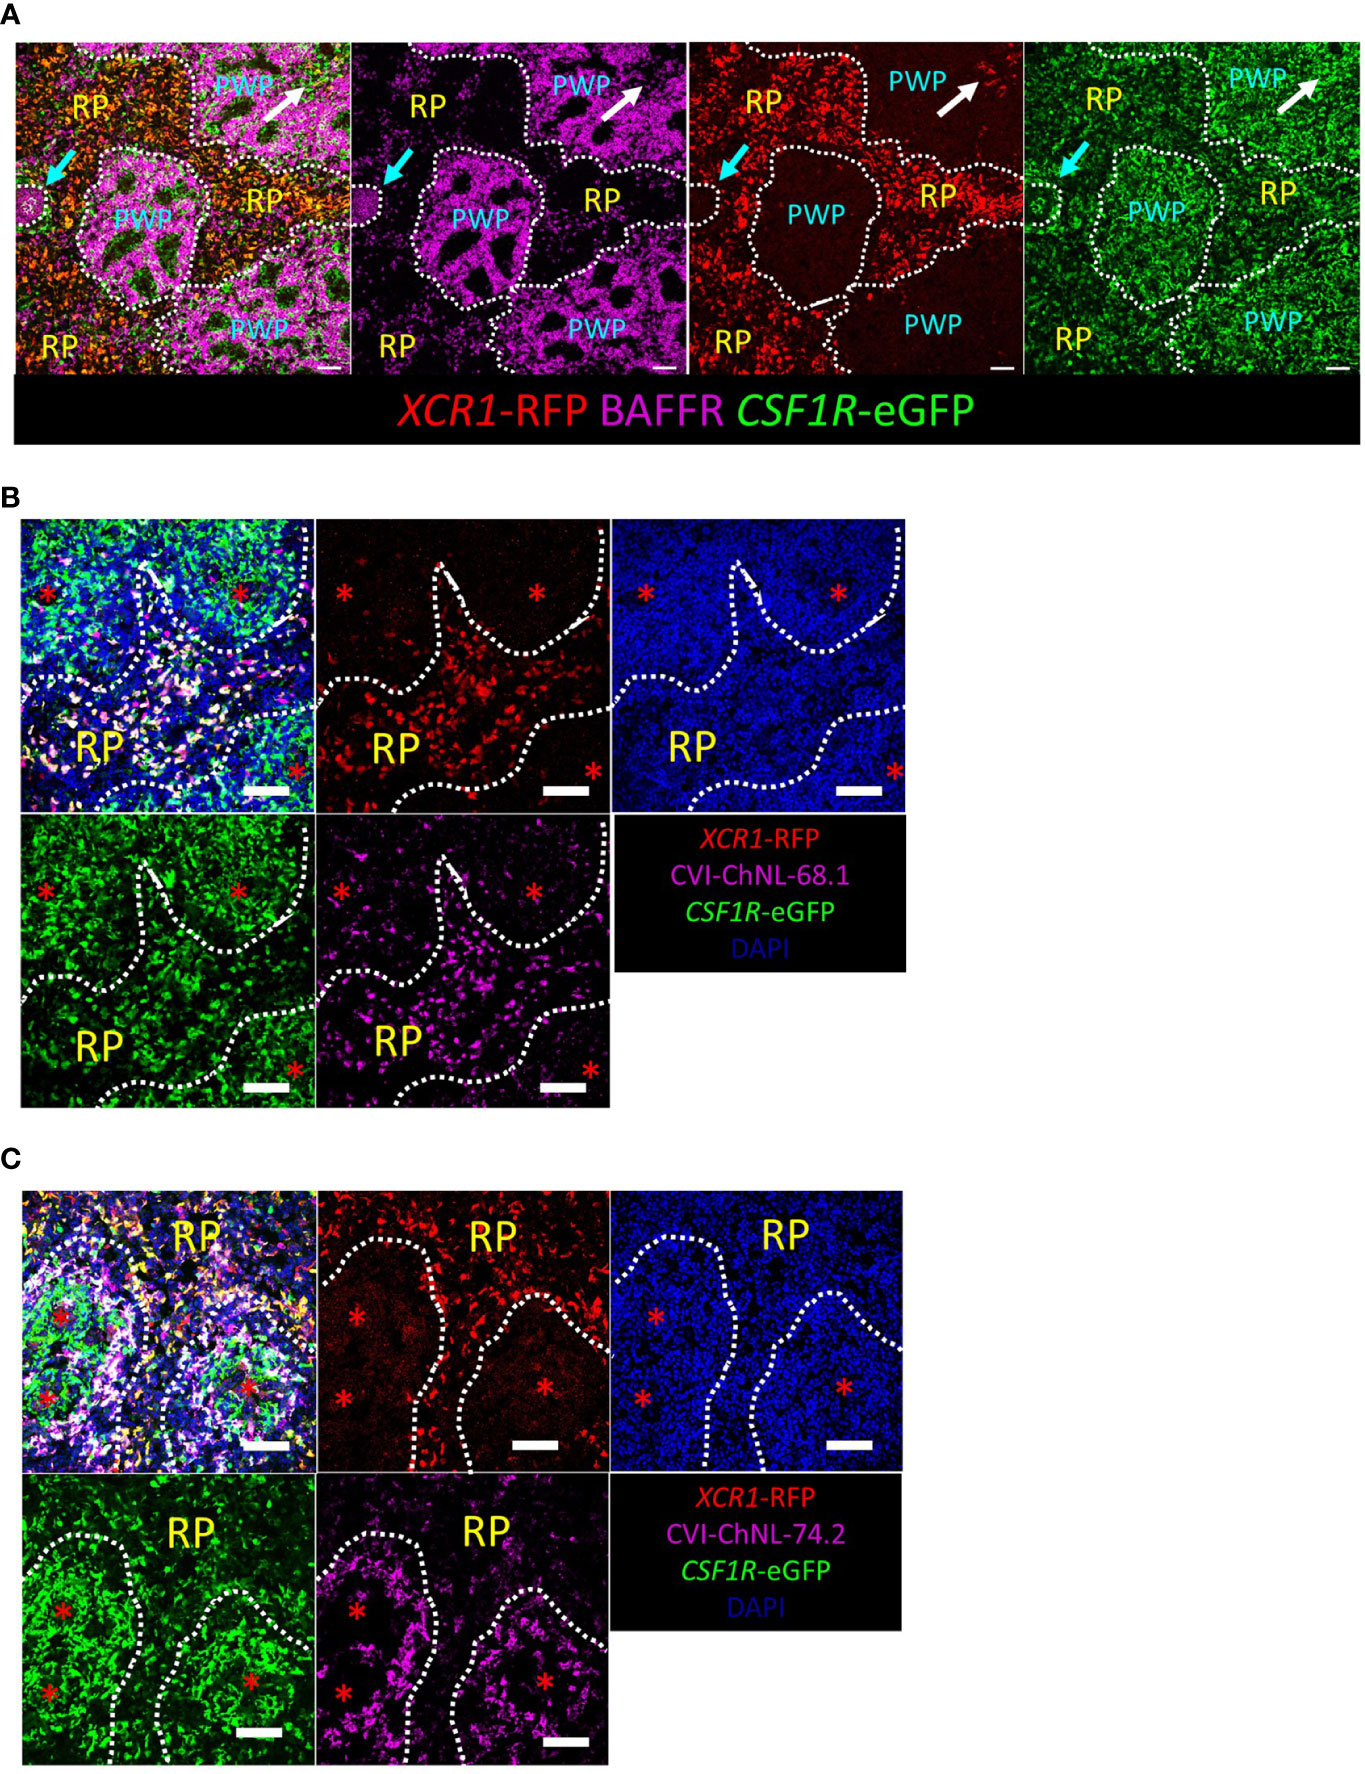
Figure 8 Confocal microscopic analysis of XCR1-RFP+ cDCs in the chicken spleen. Sections of spleen from dual transgenic XCR1-iCaspase9-RFP x CSF1R-eGFP were stained with anti-BAFFR (A) to identify the red pulp (RP) and periellipsoid white pulp (PWP). Cyan arrow = germinal centre (GC); white arrow = periarteriolar lymphoid sheaths (PALS). XCR1-RFP+ cDCs are located in the RP and PALS, but not the GC or PWP; scale bar = 50 μm. XCR1-RFP+ cells in the RP stained with the monoclonal antibody CVI-ChNL-68.1 (B), but not CVI-ChNL-74.2 (C). CVI-ChNL-68.1 in the PWP did not express RFP (B). Red asterisk = position of the splenic ellipsoid; white dashed line = PWP/RP boundary. Scale bar = 50 μm.
Chicken XCR1+ cDCs are closely associated with CD4+ T-cells in the PALS and CD8β+ T-cells in the splenic red pulp
Our scRNA-Seq analysis suggests that like their mammalian counter-part, chicken XCR1+ cDCs can present antigens to CD4+ T-cells via MHCII pathway and drive cytotoxic T-cell (CTL) responses by presenting exogenous antigen to CD8+ T-cells (known as “cross-presentation”) (72, 73). We examined the distribution of these cells by confocal microscopy (Figure 9). RFP+ cDCs were located in the RP and PALS, where they were intimately associated with CD4+ T-cells (Figures 9A, B). Like mice, the adult chicken spleen contains TCRαβ CD8αβ (CTLs), but chickens also have a TCRγδ CD8αβ population of cells (74, 75). CD8+ CTLs and TCRγδ+ T-cells can be distinguished by staining with antibodies to the chicken TCRγδ (75). Unfortunately, in our hands these antibodies did not work in the conditions required for detection of RFP. Therefore, we used a monoclonal antibody to chicken CD8β that detects both CTLs and TCRγδ+ CD8αβ. We found that RFP+cDCs were intimately associated with clusters of CD8β+ T-cells in the splenic RP (Figures 9C, D).
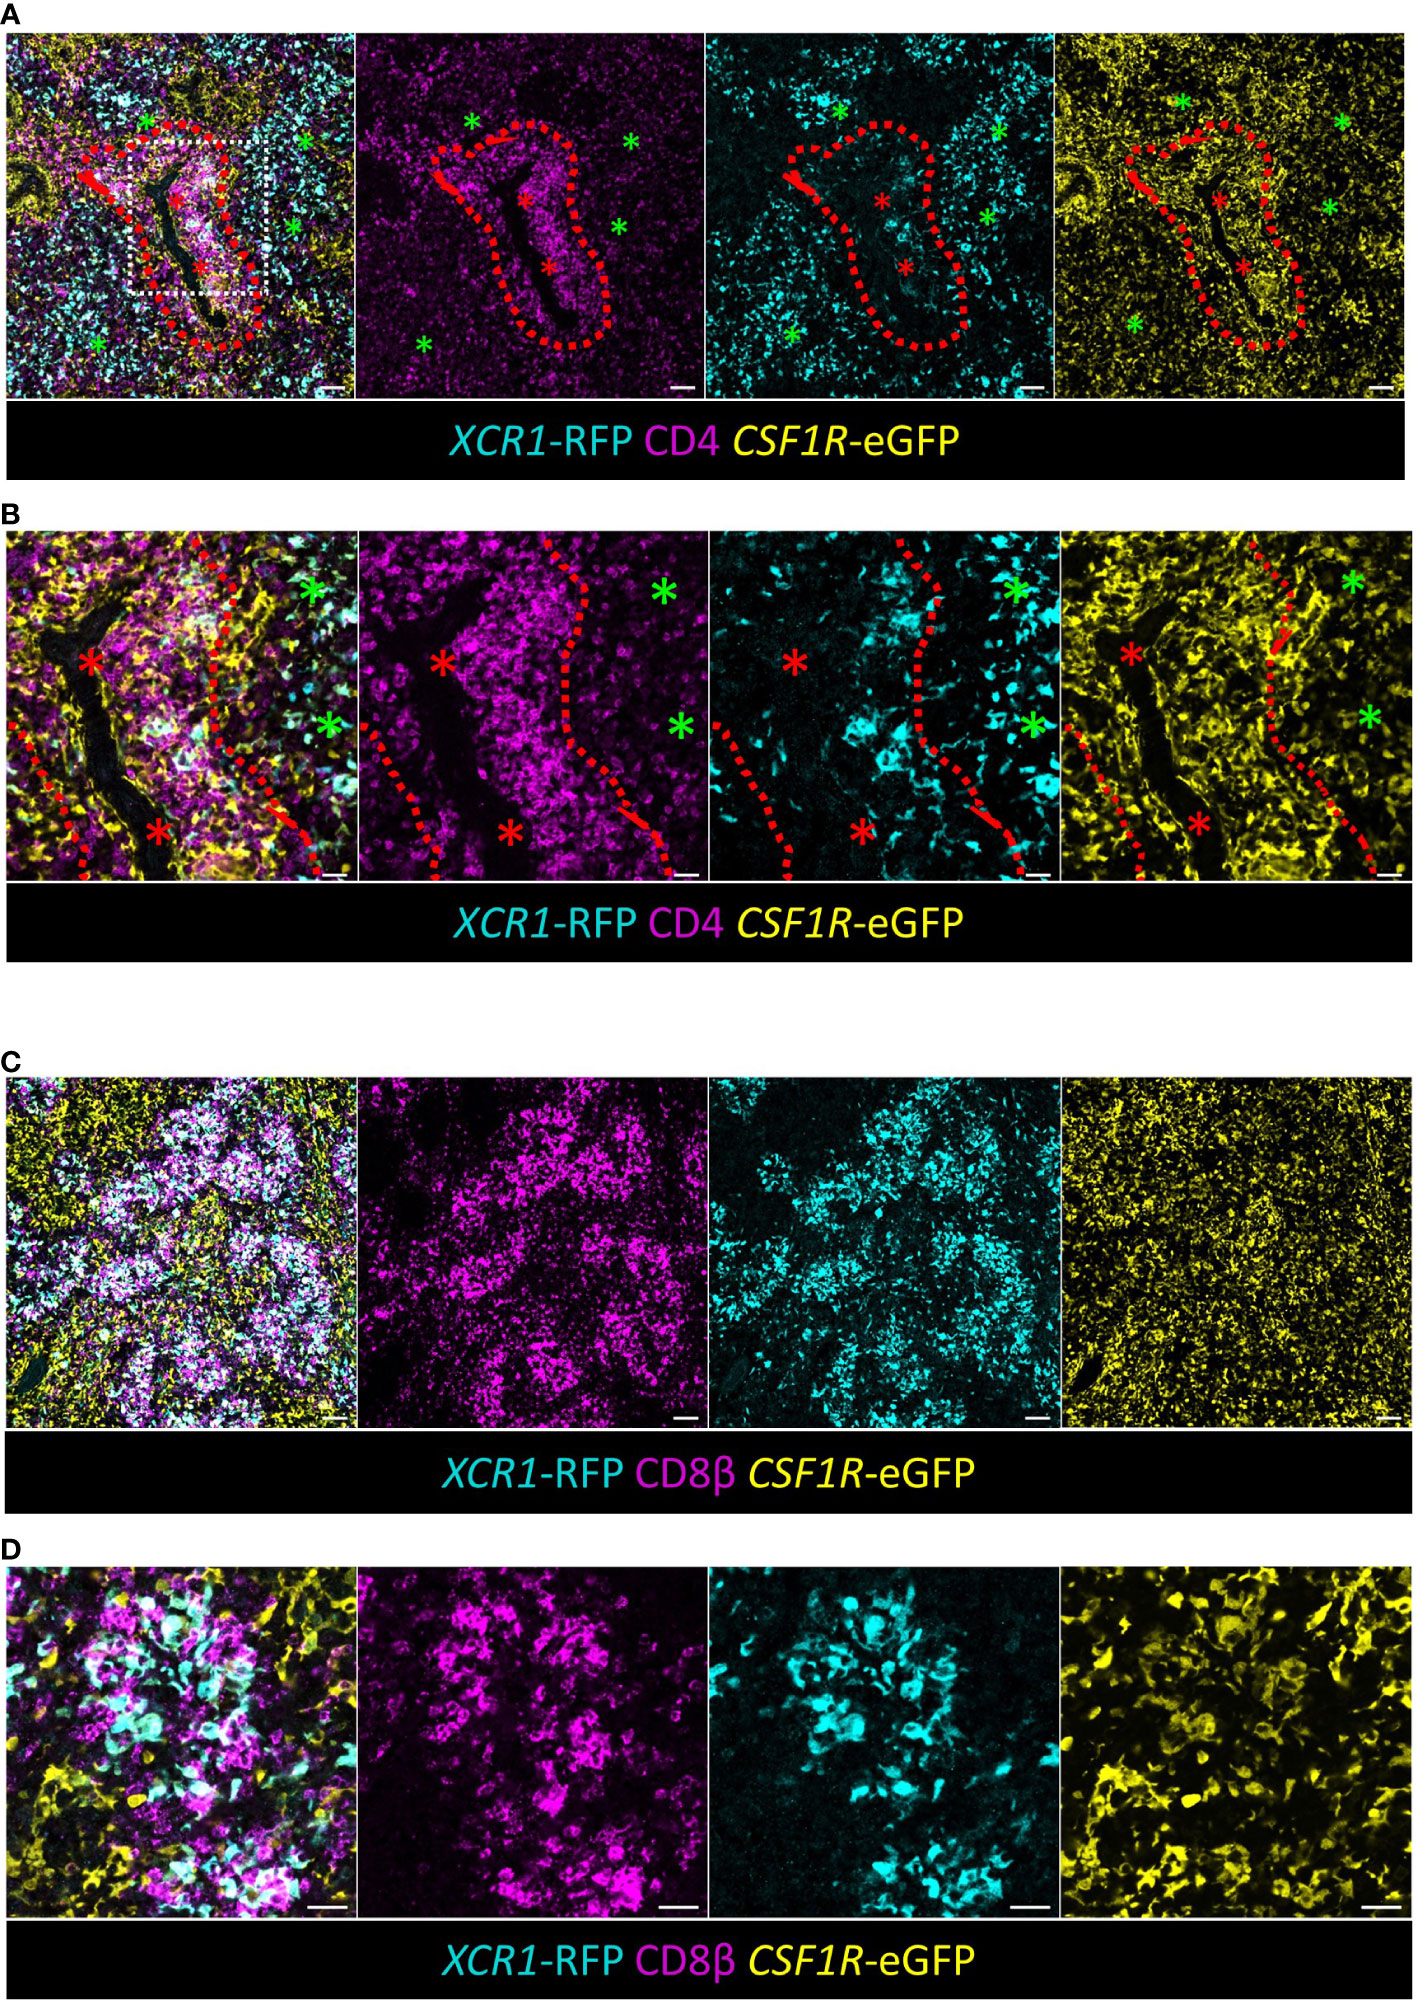
Figure 9 XCR1+ cDCs are found in close association with CD4+ T-cells in the PALS and CD8+ T-cells in the RP. (A, B) Sections of spleen from dual transgenic XCR1-iCaspase9-RFP x CSF1R-eGFP were stained with anti-CD4 to identify CD4+ T-cells. Red asterisk = artery, green asterisk = RP, dashed red line = PALS/RP boundary, scale bar = 20 μm. (B) A detailed area (white boxed region) in (A) is shown in (B). Scale bar = 50 μm. (C) Sections of spleen from dual transgenic XCR1-iCaspase9-RFP x CSF1R-eGFP were stained with anti-CD8β to identify CD8+ T-cells in the RP. Scale bar = 50 μm. (D) A higher magnification image of the RP, showing the intimate association of XCR1-RFP+ cDCs with clusters of CD8+ T-cells in the RP. Scale bar = 20 μm.
Inducible ablation of chicken splenic XCR1+ cDCs
iCaspase9 has previously been used to ablate cell lineages in early chicken embryos (38). Its suitability as a system for ablating specific cell populations in post-hatch chickens was unknown. We tested the efficacy of the iCaspase9 gene under control of the chicken XCR1 promoter for the specific ablation of chicken XCR1+ cDCs. Groups of six birds heterozygeous for XCR1-iCaspase9-RFP transgene were intravenously injected with 0.5, 1.0 or 2.0 mg/kg of the B/B dimerization drug or carrier alone (Figure 10A). All dosage levels were found to specifically ablate XCR1+ cDCs (FLT3HIGH XCR1+ XCR1-RFP+ cells) at an ablation rate of 94-96% (Figure 10A; Supplementary Figure 9A). No effects were noted on macrophage, granulocyte, T or B-cell populations (Supplementary Figure 9B). Next we assessed the repopulation of the spleen by XCR1+ cDCs after ablation. Groups of six chickens were intravenously injected with B/B dimerization drug or carrier alone (Figure 10B) at a dose rate of 0.5mg/kg. Chickens were culled at 1, 2, 4 or 7 days post-injection (Figure 10B). After initial ablation, the spleen was rapidly repopulated by XCR1+ cDCs with the levels of splenic XCR1+ cDCs returning to the same level as in control birds by day 4-post injection. However, it was noted that the repopulating XCR1+ cDCs expressed lower levels of the RFP transgenic reporter, therefore despite the numbers of XCR1+ cDCs being normal by day 4, the mean fluorescence intensity (MFI) of the RFP expression did not return to the same level as control birds until day 7 post-injection (Figure 10B). We hypothesised that the reduced RFP levels observed in repopulating XCR1+ cDCs after ablation was due to the repopulation of spleen by immature XCR1+ cDCs. To test this hypothesis, we measured the levels of CD1.1 expression on XCR1+ cDCs after B/B reagent induced ablation (Figure 11). We observed that the proportion of CD1.1HIGH XCR1+ immature cDCs increased significantly at two days post- ablation and then returned to the same levels as observed in control birds by day 4 post-ablation (Figure 11). In contrast, the MFI of RFP transgene expression did not return to the same levels as observed in control birds until day 7 post-ablation. (Figure 10B). Taken together, these data suggest that after ablation the spleen is initially repopulated by immature XCR1-RFPLOW CD1.1HIGH XCR1+ cDCs emigrating from the blood. Once recruited to the spleen these cells mature in situ to a mature CD1.1LOW XCR1-RFPHIGH phenotype, with the two markers showing different expression dynamics.
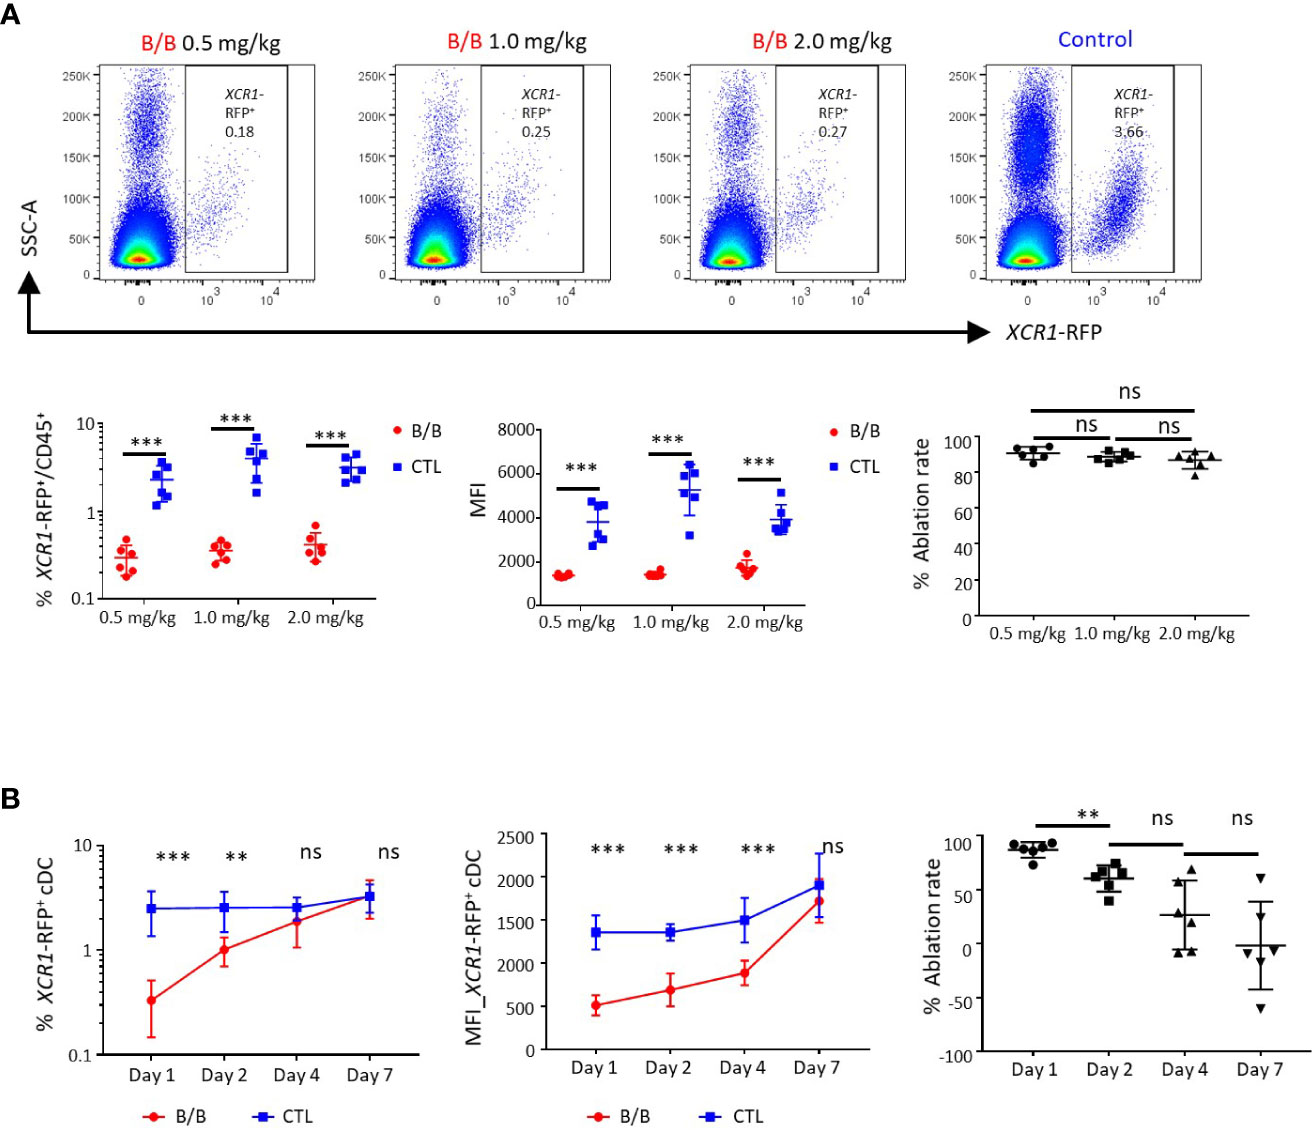
Figure 10 Conditional ablation of chicken XCR1-RFP+ cDCs using B/B dimerization reagent. (A) Confocal analysis of splenic XCR1-RFP+ cDCs from XCR1-iCaspase9-RFP transgenic chickens 24 hours after receiving various doses of B/B dimerization reagent or vehicle alone (Control, CTL). At all doses of B/B reagent a decrease in both the frequency of XCR1-RFP+ cDCs and the mean fluorescent intensity (MFI) of RFP expression in relation to vehicle alone was noted. (B) Time-course of XCR1-RFP+ cDC recovery in the spleen after a single dose of B/B dimerization reagent at a dose rate of 0.5 mg/kg. While the number of XCR1-RFP+ cDCs recovered within four days of B/B reagent administration, the MFI of RFP expression did not recover to pre-challenge levels until day 7. Six birds per group. Statistical analysis was conducted using unpaired nonparametric Mann-Whitney test for ablation rate and Multiple t-test for others. Statistical significance was defined as follows: ∗p < 0·05; ∗∗p < 0·01; and ∗∗∗p < 0·001, ns, not significant.
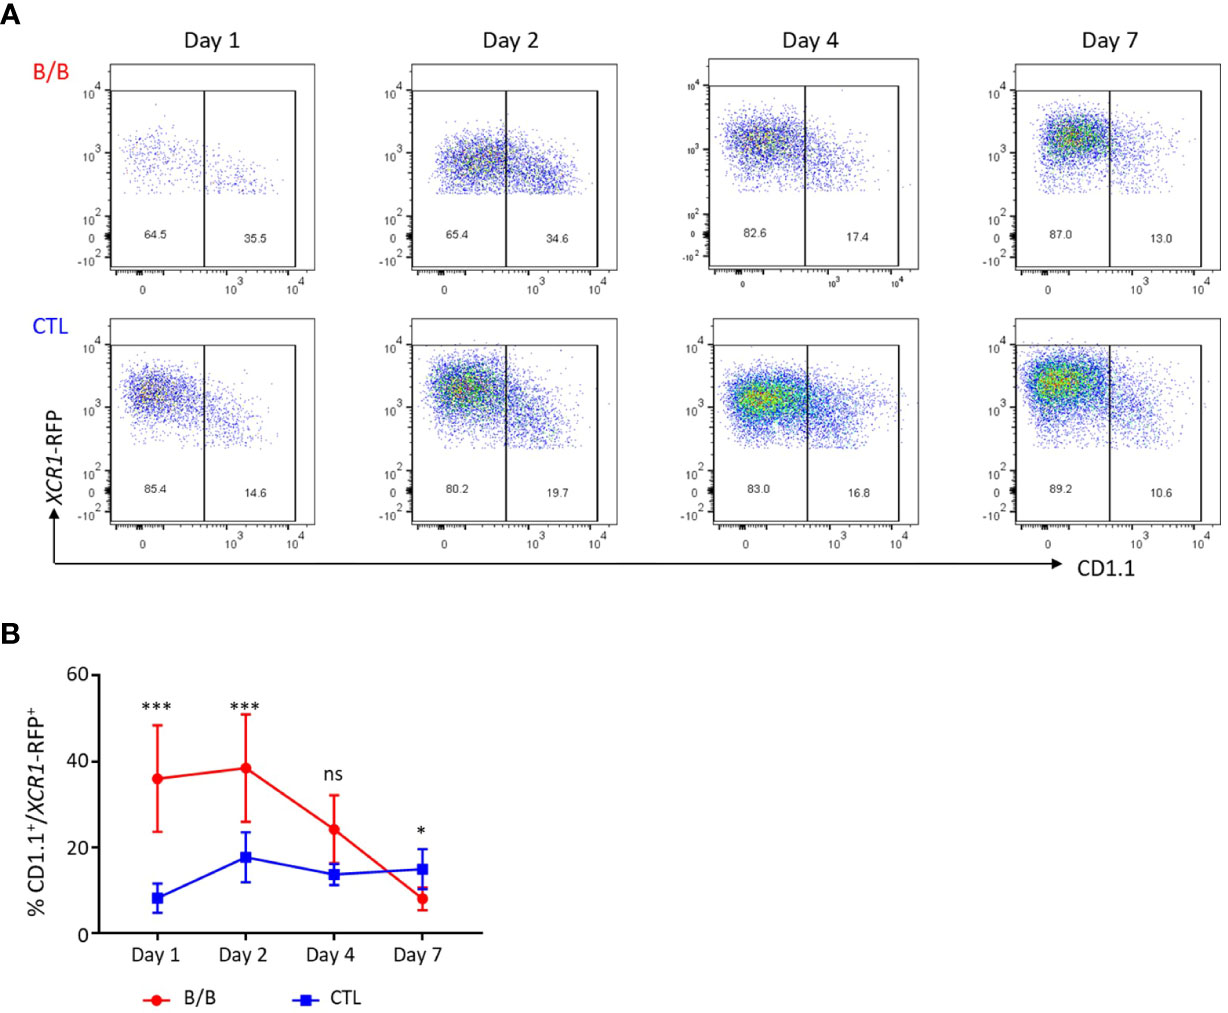
Figure 11 The spleen is initially repopulated by immature XCR1-RFP+ cDCs after conditional ablation. (A, B) Single, live and XCR1-RFP+ cells from the spleen or blood were gated for flow cytometric analysis of CD1.1 and XCR1-iCaspase9-RFP transgene expression. Time-course of CD1.1 and XCR1-iCaspase9-RFP transgene expression after a single dose of B/B dimerization reagent at a dose rate of 0.5 mg/kg. Six birds per group. Statistical analysis was conducted using Multiple t test. Statistical significance was defined as follows: ∗p < 0·05; ∗∗p < 0·01; and ∗∗∗p < 0·001, ns, not significant.
XCR1 deficiency blocks XCR1+ cDC interaction with CD8+ T-cells in the chicken spleen
In mice, the chemokine receptors XCR1 and CCR7 jointly control XCR1+ cDC migration to CD8+ CTLs in T-cell areas within the splenic PALS (26). Chicken XCR1+ cDCs did not express CCR7, indeed, with the exception of weak expression of CCR4, CCR5 and CX3CR1 in immature XCR1+ cDCs, XCR1 itself was the only chemokine receptor expressed at high levels in these cells (Figure 4). The organisation of immune cell compartments of the murine spleen differs significantly from that of chickens and other vertebrates (21). Chicken CD8+ CTLs are predominately found in the RP (27), so we examined the impact of XCR1 deficiency on distribution of RFP+ cDCs in the chicken spleen. B-cells are the major immune cell population of the PWP, with a ring of CVI-ChNL-74.2+ macrophages demarking the boundary between the PWP and RP (Supplementary Figures 10, 11). In birds heterozygous for the XCR1-iCaspase9-RFP transgene (wild-type (WT) for XCR1 expression) RFP+ cDCs were largely confined to the splenic RP (Figure 12, Supplementary Figures 10, 11). WT RFP+ cDCs were rarely observed within the PWP, with the exception of the PALS. In contrast, in birds homozygous for XCR1-iCaspase9-RFP transgene (deficient for XCR1 expression) RFP+ cDCs were only occasionally located in the RP, being mostly concentrated within the PWP, intermingled with BAFFR+ B-cells and CVI-ChNL-74.2+ macrophages (Supplementary Figures 10, 11). In XCR1 deficient birds, but not WT birds, RFP+ cDCs were also observed within the splenic ellipsoid (Supplementary Figure 10). We found that XCR1 deficiency results in a significant reduction in the number of RFP+ cDCs associated with CD8+ T-cell areas in the RP (Figure 12). Taken together, these data indicate that while XCR1 is not required for recruitment of XCR1+ cDCs to the chicken spleen, it is the main chemokine receptor orchestrating movement of XCR1+ cDCs to the CD8+ T-cell areas in the splenic RP.
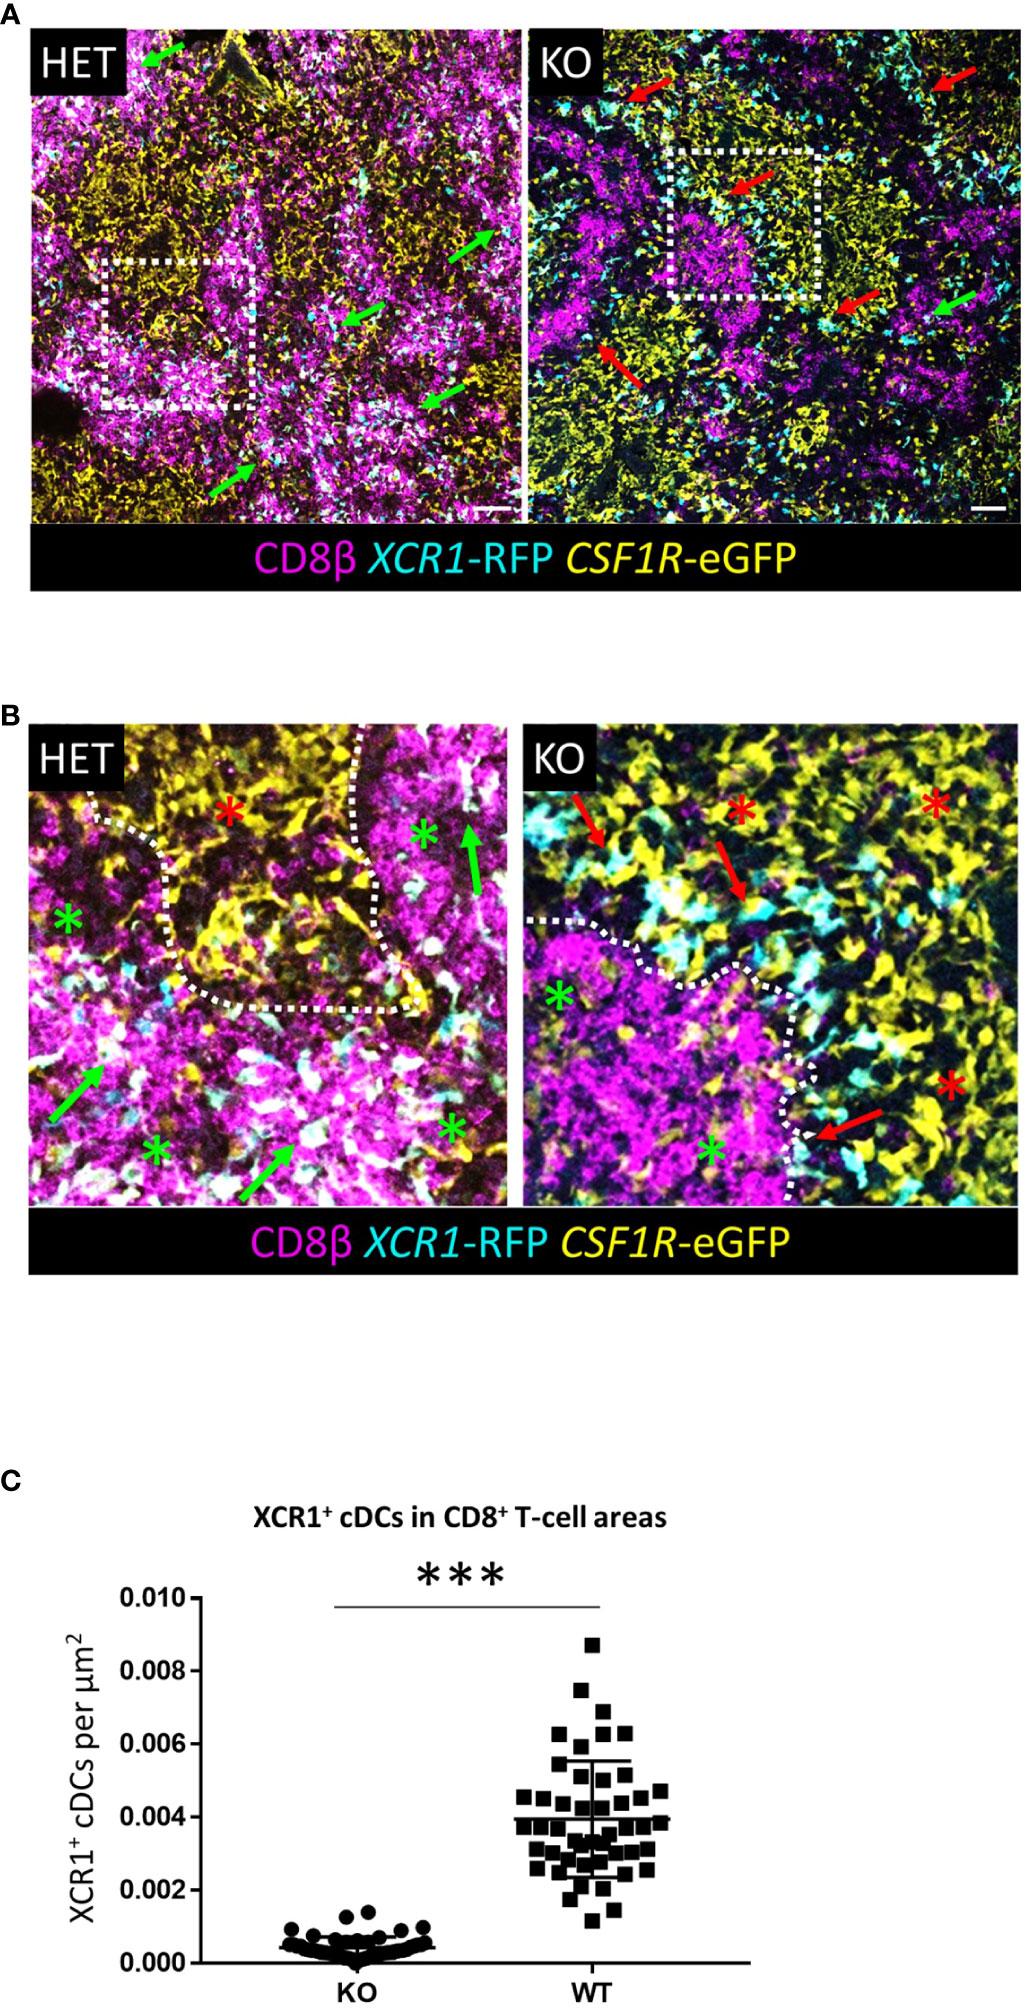
Figure 12 XCR1 deficiency alters the distribution on XCR1-RFP+ cDCs in the chicken spleen. (A, B) Sections of spleen from XCR1 heterozygous (HET, wild-type for XCR1 expression) or knock-out (KO, deficient for XCR1 expression) of dual transgenic XCR1-iCaspase9-RFP x CSF1R-eGFP were stained with anti-CD8β to identify the CD8+ T-cell areas in the splenic RP. (B) Higher magnification detail of the relative position of XCR1-RFP+ cDCs from the boxed regions in (A). In HET birds XCR1-RFP+ cDCs are intimately associated with CD8+ T-cell clusters (green arrows) in the RP (red asterisk), whereas in KO birds the XCR1-RFP+ cDCs (red arrows) are position at the boundary (dotted line) between the red-pulp and PWP (green asterisk). (C) Quantification of the number of XCR1-RFP+1 cDCs found within CD8+ T-cell clusters. Statistical analysis was conducted using unpaired non-parametric Mann-Whitey test. Statistical significance was defined as ∗∗∗p < 0·001. 50 independent CD8+ T-cell clusters from three birds per group were counted.
Discussion
Management of infectious diseases is a major challenge to poultry production in terms of economic cost, animal welfare and zoonosis that threaten human health. A plethora of avian viruses pose important challenges. Protective immune responses to viral pathogens are largely dependent on the efficient induction of antigen-specific CD8+ cytotoxic T lymphocytes (CTLs) and memory T-cells. Understanding the underlying immunological mechanisms that drive these T-cell responses will be required to design the next generation of poultry vaccines. XCR1+ cDCs are found in both mammals and chickens (16–19), and in mammalian models they drive potent CD8+ CTL responses (72, 73). By extension, improved vaccine responses in chickens could be achieved by manipulating cDC biology; however, basic knowledge of the biology of chicken XCR1+ cDCs is lacking. Here we have made significant gains in the understanding of chicken XCR1+ cDC biology using our previously developed chicken XCR1+ cDC immunological tools (20), a novel gene-edited XCR1-iCaspase9-RFP chicken and scRNA-seq. We provide the first detailed analysis of chicken XCR1+ cDC development and function. The XCR1-iCaspase9-RFP chicken enables both visualisation and conditional ablation of XCR1+ cDCs, as well as enabling the production of XCR1 knockout chickens. We confirmed our earlier observations (20) that chicken XCR1+ cDCs are much more abundant in comparison to their mammalian counterparts and that chickens do not have the equivalent of the mammalian cDC2 subset. XCR1 was not required for the normal development and migration of chicken cDCs to the spleen but was essential for the positioning within the spleen and clustering with CD8+ T-cells. Finally, we were able to differentiate between immature and mature splenic XCR1+ cDCs based on differential expression of genes for anti-viral activity or antigen presentation.
In mammalian studies the cDC1 (XCR1+) subset is the least abundant cDC subset (76). In an analysis of cDC distribution and abundance in human tissues, cDC1 frequencies are reported as 0.03-0.06% of CD45+ cells (77). We show here that in contrast, chicken XCR1+ cDCs are the most abundant population of splenic APC, with frequencies range from ~0.3-2% of total CD45+ cells. A similar higher abundance of XCR1+ cDCs was observed in the chicken small intestine, which has ~100-fold more (~3% of CD45+ cells) XCR1+ cDCs than has been reported in the human (77). We and others (17, 18, 20) have found evidence for the chicken equivalent of the mammalian XCR1+ cDC subset, but not the cDC2 subset. The XCR1+ cDC1-like and pDC-like cells have also recently been identified in teleost fish (78). This suggests that these dendritic cell subsets arose in an early vertebrate ancestor, more than 450 million years ago (79), whereas the cDC2 subset may represent a mammalian evolutionary innovation.
The existence of a single cDC subset in chickens may contribute the to the higher frequency of XCR1+ cDCs observed in chickens. However, the combined frequency of total human splenic cDC population remains ~20-fold less [~0.1% of CD45+ cells (77)] than the frequency of XCR1+ cDCs observed in the spleen of sexually mature chickens, indicating that factors other than the number of cDC subsets is contributing to the relative abundance of chicken XCR1+ cDCs. The contrasting relative abundance of cDCs between mammals and birds is likely a consequence of a fundamental difference in the composition of the secondary lymphoid organ system between mammals and all other bony vertebrates. While all bony vertebrates have spleens, complex encapsulated, tissue-draining lymph nodes are a mammalian evolutionary innovation (80). Mammalian lymph nodes act as immune hubs, ensuring efficient immune response development by increasing the likelihood of cell-cell contact between cDCs and effector cells (81–83). Our data suggests that chickens, and likely other non-mammalian vertebrates, increase the likelihood of cell-cell contact between cDCs and effector cells, by having increased numbers of cDCs within tissues that experience high levels of foreign antigen contact, such as the gut and spleen. Given birds are found on every continent and occupy diverse ecological niches where they will face similar pathogenic challenges to mammals, this alternate immune strategy is demonstrably an evolutionary success.
We noted that in addition to being more abundant than their mammalian counterparts in general, chicken XCR1+ cDCs are twice as abundant in the spleen of male chickens, compared to female chickens. This is potentially explained by chromosomal location of the ZNF366, encoding DC-SCRIPT, which controls XCR1+ cDC development and function (84). As chicken ZNF366 is located on the sex-determining Z-chromosome, if expression is not completely dosage compensated, ZZ males will express more ZNF366 than ZW females. Differences in the expression of ZNF366 between male and female chickens have indeed been reported (85). Sex differences in resistance to infectious disease is a well-known phenomenon in chickens, which is in part due to the Z-chromosomal location of type I IFN genes in chickens (86–88). Given that type I IFN are key regulators of XCR1+ cDC function (89–91), it is likely that the observed sex-specific differential resistance to infectious disease is due to both qualitative and quantitative differences in XCR1+ cDC development and function.
Differences in local abundance of XCR1+ cDCs between mammals and chickens may also be due to growth factor requirements. While chicken XCR1+ cDCs express the developmentally critical growth factor receptor FLT3, they lack expression of CSF2R (20), which controls terminal differentiation and survival of mammalian XCR1+ cDCs (92). Birds also lack lymphotoxin genes (93), which are critical for the formation of lymph nodes and development of the cDC2 subset in mammals (94). We confirm here the lack of expression of the CSF2RA gene in chicken XCR1+ cDCs, and instead show high-level expression of ENSGALG00000019147, which encodes for a protein with homology to both mammalian CSF2RA and the interleukin-3 receptor subunit alpha (IL3RA/CD123). In humans and mice, pre-DCs express CD123, but this is lost upon differentiation into mature cDCs (95). Chicken IL3, encoding IL-3, is highly expressed in lymphoid organs, the small intestine and the lungs (http://animal.omics.pro/code/index.php/ChickenVar), supporting a role for IL-3 in XCR1+ cDC development in local tissues. Future studies to determine the role of IL-3 and other factors which support chicken XCR1+ cDC development and function, will be critical to the understanding of chicken XCR1+ cDC biology and developing methods for manipulating these cells in vitro.
In scRNA-seq analysis of splenic macrophages and cDCs we found that chicken splenic XCR1+ cDCs can be broadly divided into proliferating and non-proliferating cells. The percentage of XCR1+ cDCs proliferating in the chicken spleen was similar to that reported in the murine spleen (68), indicating that local proliferation in lymphoid tissues during steady state conditions is a likely conserved feature of XCR1+ cDCs in vertebrates. Non-proliferating XCR1+ cDCs could be differentiated based on opposing gradients of expression of genes related to antigen presentation and viral resistance and/or innate immune function, such as IFITM1/3, CG-1B, LY86 and CD1c (96–104). We used a monoclonal antibody to chicken CD1.1 (69) (encoded by CD1c) in combination with anti-MHCII staining to identify this subset. Circulating XCR1+ cDCs uniformly showed a CD1.1HIGH MHCIILOW phenotype, while splenic XCR1+ cDCs exhibited a continuous distribution between CD1.1HIGH MHCIILOW to CD1.1LOW MHCIIHIGH subsets, with the majority of cells exhibiting a CD1.1LOW MHCIIHIGH phenotype. These data are consistent with a scenario where circulating immature CD1.1HIGH MHCIILOW XCR1+ cDCs, enter the spleen and undergo maturation, characterised by the down-regulation of viral resistance/innate immunity gene expression and up-regulating genes related to antigen presentation. In support of this, after inducible ablation of XCR1+ cDCs, the spleen is initially repopulated CD1.1HIGH XCR1+ cDCs. Despite the rapid repopulation of the spleen post-ablation, mature CD1.1LOW XCR1+ cDCs do not reach pre-ablation levels until day seven post-ablation, indicative of the maturation XCR1+ cDCs within the spleen. Chicks less than one week old exhibit poor responses to vaccination and possess functionally immature T- and B-cell populations (105–109). We show here that the chicken spleen contains elevated numbers of immature CD1.1HIGH XCR1+ cDCs in the first week post-hatch. A preponderance of immature XCR1+ cDCs with reduced antigen presentation capacity would provide a mechanistic basis for age-dependent immune responses in chickens. As immune unresponsiveness in young chicks can be overcome by in ovo vaccination (110), it is likely that manipulation of XCR1+ cDC development and/or function in embryos/young chicks will lead to further improvements in vaccine performance.
As viral infection of cDCs may give the opportunity for some viruses to interfere with cross-presentation in cDCs (111), cDCs must balance the uptake and processing of viral antigens against the need to retain functionality. Steady-state murine cDCs employ a number of mechanisms to limit viral infection, including constitutive basal expression of antiviral IFITM1/3 (90) and high level of expression of the thioesterase, PPT1, which protects steady state DCs from viral infection by promoting antigen degradation (112). We found that immature chicken XCR1+ cDCs express a range of genes that potentially limit viral infection. IFITM1/3 restricts infection of chicken cells by a range of different viruses (96, 113, 114), including highly pathogenic avian influenza virus (115), and expression of chicken galectin-1 (encoded by CG-1B) inhibits Newcastle disease virus adsorption and replication in chicken cells in vitro (99). LY86 controls TLR4 signalling in mammals (116) and promotes anti-viral responses in zebrafish (101). The CD1 family of MHC related molecules participates in innate immunity/antiviral responses due to their ability to present lipid antigens to immune effectors cells, such as NK cells (102–104). Taken together, these data suggest that immature chicken XCR1+ cDCs may limit infection by viruses by expressing genes encoding antiviral molecules; however, optimal antigen presentation is co-incident with the down regulation in expression of these genes (112).
In mammals, pDCs are key mediators of antiviral immunity due their ability to produce large amounts of type I interferon (IFN) pathway upon detection of viral nucleic acids. As such, they are of considerable interest in the development of effective anti-viral vaccines. However, despite the identification over 60 years ago of “interferon” in influenza virus-challenged chicken embryonic chorioallantoic membranes (117), pDCs have not been formally identified in the chicken. In scRNA-seq analysis we identified chicken splenic cells expressing the dendritic associated genes FLT3 and IRF8, but not the XCR1+ cDC associated genes ID2, XCR1, CADM1 and ZNF366. As expected in unstimulated cells, we did not detect type I IFN transcripts in these cells, but we did find that these cells are enriched in expression of transcripts related to type I IFN production in pDCs. These include TLR3, TLR7 and TLR21, encoding chicken TLRs which detect viral nucleic acids (57); IRF7, the “master regulator” of type I IFN production (118) in mammalian pDCs; as well as FYN, EGFR and SLC15A4 which are all essential for TLR mediated production of type I IFN in pDCs (119–121). PACSIN1, which regulates the TLR7/9-mediated type I interferon responses (122), is expressed in mouse pDCs, whereas PACSIN 1 and 3 are broadly expressed in other immune cells. In contrast, we found that PACSIN3, but not PACSIN1 was highly and specifically expressed in putative chicken pDC cells, suggesting a similar role for mediating type I interferon responses in these cells. As well as genes associated with type I IFN production, we also detected other pDC associated transcripts, including JCHAIN (49, 50), RAG2 (123), RRBP1 (124), RNASE6 (125), SLAMF8 (126) and RASGEF1B (124). On this basis, we believe these cells to be bona fide chicken pDCs, which like their mammalian counterparts show specialisation for the recognition of viral pathogens and the production of type I IFN.
The toll-like receptor (TLR) family is a diverse and evolutionary conserved group of pattern recognition receptors (PRRs), with endosomally located TLRs 3, 7 and 9 detecting viral double-stranded RNA, single-stranded RNA and microbial DNA molecules respectively (57), whereas the other TLRs, located on the cell plasma membrane, mainly recognise microbial/fungal membrane components, such as lipids, peptidoglycans, lipoproteins, and proteins (127). In mice and humans, XCR1+ cDC1s express high levels of TLR3, as well as TLR7, TLR9 and TLR10 (humans only) (128, 129). However, in pigs, XCR1+ cDCs express TLR8 and 9, and pDC express TLR3, TLR7 and TLR9 (43). We found that chicken immature (CD1.1HIGH) XCR1+ cDCs expressed TLR1A, TLR3 and TLR21 (a functional homologue to mammalian TLR9 (66)), while mature XCR1+ cDCs expressed TLR7, TLR15 and TLR21. Therefore, not only do vertebrates XCR1+ cDCs exhibit differences in TLR expression between species, but TLR expression differs between different XCR1+ cDC maturation states.
The XCR1+ cDC subset has an essential role in the generation of CTL responses via the cross-presentation pathway (72, 73). Cross-presentation enables presentation of exogenous antigen to CD8+ T cells, including cell-associated antigens from dead/apoptotic cells. Mammalian XCR1+ cDC1s are able to recognise and internalise apoptotic cells and/or cell fragments via the C-type lectin Clec9A/DNGR1 (130). CLEC9A is not present in the chicken genome, however, we previously reported that chicken XCR1+ cDCs express the apoptotic cell receptor TIM4, albeit at lower levels than in macrophages (17), and found that the XCR1 ligand XCL1 binds to dead cells (20). In this study, we found that chicken XCR1+ cDC1 also express the related apoptotic cell receptor HAVCR1. These data show that despite the lack of CLEC9A, the ability of XCR1+ cDCs to recognise apoptotic/dead cells is conserved in chickens. As the necessary tools to directly test the cross-presentation potential of chicken XCR1+ cDCs are presently lacking, especially T-cell lines, we identified genes suggestive of a specialised role in cross-presentation in chicken XCR1+ cDCs. These include genes encoding for WDFY4, which is essential for cross-presentation of cell-associated antigens by cDC1 via the cytosolic pathway (131) and PPT1, which protects XCR1+ cDCs from viral infection by promoting antigen degradation and endosomal acidification. PPT1 expression is down-regulated after TLR stimulation to facilitate efficient cross-presentation (112). As chicken XCR1+ cDCs from unstimulated spleens expressed both high levels of WDFY4 and PPT1, this suggests that additional signals, such as TLR signalling, may be required for efficient cross-presentation in chicken XCR1+ cDCs. The identification of further genes and signalling pathways related to recognition of apoptotic cells and cross-presentation in chickens XCR1+ cDCs will be critical to the development of novel avian vaccines to viral pathogens.
The effective generation of immune responses depends not only on the ability of cDCs to recognise specific pathogen types and/or antigens, but also on the relocation of cDCs from areas where they encounter antigens to T-cell areas of lymphoid organs where they can process and present antigen to T-cells (24, 26, 132, 133). It is known that upon activation naive CD8+ T cells rapidly produce XCL1 (134), resulting in clustering of XCR1+ cDCs and CD8+ T-cells, which enables T cell priming and the development of effector functions (25, 135). However, the factors that control the relocation of cDCs from areas of antigen encounter to T-cell zones in lymphoid tissues are poorly understood. In the murine spleen, XCR1+ cDCs are located in the RP and T-cell zone (the PALS) of the WP (25). Due to the open circulatory system of the murine spleen, cDCs and innate immune cells will initially encounter antigen/pathogens in the RP. During mouse cytomegalovirus (MCMV) infection, activated XCR1+ cDCs cluster in the RP with natural killer (NK) cells in a XCR1 dependent fashion (26). These activated NK cells in turn produce granulocyte-macrophage colony-stimulating factor (GM-CSF, also known as CSF2), resulting in up-regulation of CCR7 by XCR1+ cDCs and CCR7-dependent migration and clustering with CD8+ T-cells in the PALS (26). Chicken XCR1+ cDCs lack CSF2R expression (20) and CCR7 expression (Figure 4B), suggesting that migration of XCR1+ cDCs to T-cell areas is controlled by different molecular signals. In addition, the organisation of lymphoid compartments in the spleen differs considerably between mice and chickens (21). In mice, the PALS is separated from the RP by surrounding B-cell follicles and a macrophage and B-cell rich marginal zone (21). In chickens, the PALS is largely composed of CD4+ T-cells and not separated from the RP by B-cells follicles or a marginal zone. CD8+ T-cells are predominately located in the RP (23). The chicken spleen has a closed circulatory system and cells, pathogens and antigens enter via fenestrated capillaries (ellipsoids) which are surrounded by a sheath of B-cells and specialised antigen trapping macrophages, the periellipsoid white pulp (PWP) (23). We show here that chicken XCR1+ cDCs are relatively abundant in both the RP and the PALS, where they cluster with CD8+ and CD4+ T-cells respectively, but rare in the PWP. While XCR1 deficiency does not alter splenic XCR1+ cDC numbers, it dramatically alters their tissue distribution in the spleen. In XCR1-deficient chickens, cDCs are found scattered within the PWP and localised to the PWP/RP boundary, but rarely observed clustering with CD8+ T-cells in the RP. These data suggest that XCR1 is not required for normal development or migration of chicken XCR1+ cDCs from the blood to the spleen, but is rather required for relocation of cDCs from the splenic PWP to RP, and clustering with CD8+ T-cells. These data suggest that while the expression of XCR1 on cDCs, with a specialised function of priming CD8+ T-cell responses through the process of antigen cross-presentation, is evolutionary conserved in vertebrates, the precise mode of action of XCL1/XCR1 differs between species. As the organisation of lymphoid compartments in the murine spleen appears to be significantly different to that of other vertebrates (including humans), it remains to be seen if the role of XCR1 in human cDC biology more closely resembles that observed in mice or in chickens.
In conclusion, we have shown that while chicken XCR1+ cDCs share many features in common with their mammalian counterparts, they display distinct species-specific differences. The most striking of these is the relative abundance of XCR1+ cDCs in chicken tissues, likely reflecting the requirements for antigen presentation in peripheral tissues and the spleen, due to the absence of lymph nodes. We also show that the XCR1-iCaspase9-RFP chicken is a powerful new tool for the analysis of chicken XCR1+ cDC development and function. We show that XCR1 is not required for normal development or migration to the spleen, but is absolutely required for the re-location of chicken cDCs to the CD8+ T-cell zone in the RP. Immature and mature splenic XCR1+ cDCs can be distinguished based on reciprocal expression of genes relating to anti-viral/innate immunity genes (e.g. IFITM1/3, CG-1B, LY86 and CD1c) and antigen presentation. Finally, we show that in the first week of life post-hatch the chicken spleen is dominated by immature XCR1+ cDCs. This suggests that vaccination outcomes in young chicks will be improved by manipulating XCR1+ cDC development and function.
Data availability statement
The data presented in this study are deposited in National Library of Medicine BioProject repository, accession number PRJNA996296. All data is publicly available: https://www.ncbi.nlm.nih.gov/bioproject/PRJNA996296.
Ethics statement
The animal study was approved by Roslin Institute Animal Welfare and Ethical Review Board. The study was conducted in accordance with the local legislation and institutional requirements.
Author contributions
ZW: Conceptualization, Data curation, Formal Analysis, Investigation, Methodology, Project administration, Validation, Visualization, Writing – original draft, Writing – review & editing. BS: Data curation, Formal Analysis, Investigation, Software, Validation, Visualization, Writing – review & editing. JM: Formal Analysis, Investigation, Methodology, Writing – review & editing. DM: Data curation, Formal Analysis, Investigation, Methodology, Supervision, Writing – review & editing. KH: Investigation, Methodology, Supervision, Writing – review & editing. CC-U: Investigation, Writing – review & editing. HG: Investigation, Writing – review & editing. TH: Investigation, Writing – review & editing. MB: Investigation, Writing – review & editing. NH: Investigation, Supervision, Writing – review & editing. HS: Supervision, Writing – review & editing. MS: Supervision, Writing – review & editing. MM: Conceptualization, Supervision, Writing – review & editing. AB: Conceptualization, Funding acquisition, Investigation, Methodology, Project administration, Supervision, Writing – original draft, Writing – review & editing, Formal Analysis.
Funding
The author(s) declare financial support was received for the research, authorship, and/or publication of this article. This work was supported by the Biotechnology and Biological Sciences Research Council (BBSRC) through the project grant BB/R003653/1 and the Institute Strategic Programme Grants BBS/E/D/10002071, BBS/E/D/20002174, BB/X010945/1 and BB/X010937/1. N.C.H. is supported by a Wellcome Trust Senior Research Fellowship in Clinical Science (ref. 219542/Z/19/Z).
Acknowledgments
We thank Drs Maeve Ballantyne, Lorna Taylor, Alewo Idoko-Akoh, Derya Ozdemir and Sunil Nandi for discussions and support for the production of the XCR1-transgene line; Drs Anirudh Patir and Richard Taylor for initial analysis of single cell sequencing data. We thank the members of NARF Greenwood for care and breeding of the chickens (www.narf.ac.uk).
Conflict of interest
The authors declare that the research was conducted in the absence of any commercial or financial relationships that could be construed as a potential conflict of interest.
The author(s) declared that they were an editorial board member of Frontiers, at the time of submission. This had no impact on the peer review process and the final decision.
Publisher’s note
All claims expressed in this article are solely those of the authors and do not necessarily represent those of their affiliated organizations, or those of the publisher, the editors and the reviewers. Any product that may be evaluated in this article, or claim that may be made by its manufacturer, is not guaranteed or endorsed by the publisher.
Supplementary material
The Supplementary Material for this article can be found online at: https://www.frontiersin.org/articles/10.3389/fimmu.2023.1273661/full#supplementary-material
Supplementary Table 1 | Sequences for single guide RNA (sgRNA), donor DNA and primers.
Supplementary Table 2 | Summary of the identified clusters from Single-cell RNA sequencing analysis of chicken splenic dendritic cells.
Supplementary Figure 1 | PCR screening of edited PGC and gene edited chickens.
Supplementary Figure 2 | Flow cytometric analysis of chicken XCR1+ cDCs in the blood and bone-marrow (BM).
Supplementary Figure 3 | Flow cytometric analysis of chicken XCR1+ cDCs in the spleen, ileum, Peyer’s Patch and skin.
Supplementary Figure 4 | Quantification of proliferation of XCR1+ cDCs in the chicken spleen.
Supplementary Figure 5 | Expression of cross-presentation related genes.
Supplementary Figure 6 | Analysis of the impact of XCR1 gene knockout on XCR1 expression and relative numbers of XCR1-RFP+ cDCs and various selected splenic cell populations.
Supplementary Figure 7 | Male birds contain a higher proportion of splenic XCR1+ cDCs than female birds.
Supplementary Figure 8 | Confocal analysis of XCR1-RFP+ cDCs in chicken tissues.
Supplementary Figure 9 | Impact of B/B dimerization reagent ablation of XCR1-RFP+ cDC on selected splenic cell populations.
Supplementary Figure 10 | Impact of XCR1 deficiency on the distribution of XCR1-RFP+ cDCs in the chicken spleen; B-cell staining.
Supplementary Figure 11 | Impact of XCR1 deficiency on the distribution of XCR1-RFP+ cDCs in the chicken spleen; Macrophage staining.
References
2. Itano AA, Jenkins MK. Antigen presentation to naive CD4 T cells in the lymph node. Nat Immunol (2003) 4(8):733–9. doi: 10.1038/ni957
3. Steinman RM, Witmer MD. Lymphoid dendritic cells are potent stimulators of the primary mixed leukocyte reaction in mice. Proc Natl Acad Sci U S A (1978) 75(10):5132–6. doi: 10.1073/pnas.75.10.5132
4. Van Voorhis WC, Hair LS, Steinman RM, Kaplan G. Human dendritic cells. Enrichment and characterization from peripheral blood. J Exp Med (1982) 155(4):1172–87. doi: 10.1084/jem.155.4.1172
5. Vremec D, Pooley J, Hochrein H, Wu L, Shortman K. CD4 and CD8 expression by dendritic cell subtypes in mouse thymus and spleen. J Immunol (2000) 164(6):2978–86. doi: 10.4049/jimmunol.164.6.2978
6. Waskow C, Liu K, Darrasse-Jeze G, Guermonprez P, Ginhoux F, Merad M, et al. The receptor tyrosine kinase Flt3 is required for dendritic cell development in peripheral lymphoid tissues. Nat Immunol (2008) 9(6):676–83. doi: 10.1038/ni.1615
7. Guilliams M, Ginhoux F, Jakubzick C, Naik SH, Onai N, Schraml BU, et al. Dendritic cells, monocytes and macrophages: a unified nomenclature based on ontogeny. Nat Rev Immunol (2014) 14(8):571–8. doi: 10.1038/nri3712
8. Bosteels C, Neyt K, Vanheerswynghels M, van Helden MJ, Sichien D, Debeuf N, et al. Inflammatory Type 2 cDCs Acquire Features of cDC1s and Macrophages to Orchestrate Immunity to Respiratory Virus Infection. Immunity (2020) 52(6):1039–56 e9. doi: 10.1016/j.immuni.2020.04.005
9. den Haan JM, Lehar SM, Bevan MJ. CD8(+) but not CD8(-) dendritic cells cross-prime cytotoxic T cells in vivo. J Exp Med (2000) 192(12):1685–96. doi: 10.1084/jem.192.12.1685
10. Iyoda T, Shimoyama S, Liu K, Omatsu Y, Akiyama Y, Maeda Y, et al. The CD8+ dendritic cell subset selectively endocytoses dying cells in culture and in vivo. J Exp Med (2002) 195(10):1289–302. doi: 10.1084/jem.20020161
11. Kroczek RA, Henn V. The role of XCR1 and its ligand XCL1 in antigen cross-presentation by murine and human dendritic cells. Front Immunol (2012) 3:14. doi: 10.3389/fimmu.2012.00014
12. Draheim M, Wlodarczyk MF, Crozat K, Saliou JM, Alayi TD, Tomavo S, et al. Profiling MHC II immunopeptidome of blood-stage malaria reveals that cDC1 control the functionality of parasite-specific CD4 T cells. EMBO Mol Med (2017) 9(11):1605–21. doi: 10.15252/emmm.201708123
13. Harpur CM, Kato Y, Dewi ST, Stankovic S, Johnson DN, Bedoui S, et al. Classical type 1 dendritic cells dominate priming of th1 responses to herpes simplex virus type 1 skin infection. J Immunol (2019) 202(3):653–63. doi: 10.4049/jimmunol.1800218
14. Leal Rojas IM, Mok WH, Pearson FE, Minoda Y, Kenna TJ, Barnard RT, et al. Human blood CD1c(+) dendritic cells promote th1 and th17 effector function in memory CD4(+) T cells. Front Immunol (2017) 8:971. doi: 10.3389/fimmu.2017.00971
15. Gao Y, Nish SA, Jiang R, Hou L, Licona-Limon P, Weinstein JS, et al. Control of T helper 2 responses by transcription factor IRF4-dependent dendritic cells. Immunity (2013) 39(4):722–32. doi: 10.1016/j.immuni.2013.08.028
16. Alber A, Morris KM, Bryson KJ, Sutton KM, Monson MS, Chintoan-Uta C, et al. Avian pathogenic escherichia coli (APEC) strain-dependent immunomodulation of respiratory granulocytes and mononuclear phagocytes in CSF1R-reporter transgenic chickens. Front Immunol (2019) 10:3055. doi: 10.3389/fimmu.2019.03055
17. Hu T, Wu Z, Bush SJ, Freem L, Vervelde L, Summers KM, et al. Characterization of subpopulations of chicken mononuclear phagocytes that express TIM4 and CSF1R. J Immunol (2019) 202(4):1186–99. doi: 10.4049/jimmunol.1800504
18. Vu Manh TP, Marty H, Sibille P, Le Vern Y, Kaspers B, Dalod M, et al. Existence of conventional dendritic cells in Gallus gallus revealed by comparative gene expression profiling. J Immunol (2014) 192(10):4510–7. doi: 10.4049/jimmunol.1303405
19. Wu Z, Harne R, Chintoan-Uta C, Hu TJ, Wallace R, MacCallum A, et al. Regulation and function of macrophage colony-stimulating factor (CSF1) in the chicken immune system. Dev Comp Immunol (2020) 105:103586. doi: 10.1016/j.dci.2019.103586
20. Wu Z, Hu T, Chintoan-Uta C, Macdonald J, Stevens MP, Sang H, et al. Development of novel reagents to chicken FLT3, XCR1 and CSF2R for the identification and characterization of avian conventional dendritic cells. Immunology (2022) 165(2):171–94. doi: 10.1111/imm.13426
21. Steiniger BS. Human spleen microanatomy: why mice do not suffice. Immunology (2015) 145(3):334–46. doi: 10.1111/imm.12469
22. Mebius RE, Kraal G. Structure and function of the spleen. Nat Rev Immunol (2005) 5(8):606–16. doi: 10.1038/nri1669
23. Nagy N, Biro E, Takacs A, Polos M, Magyar A, Olah I. Peripheral blood fibrocytes contribute to the formation of the avian spleen. Dev Dyn (2005) 232(1):55–66. doi: 10.1002/dvdy.20212
24. Calabro S, Liu D, Gallman A, Nascimento MS, Yu Z, Zhang TT, et al. Differential intrasplenic migration of dendritic cell subsets tailors adaptive immunity. Cell Rep (2016) 16(9):2472–85. doi: 10.1016/j.celrep.2016.07.076
25. Dorner BG, Dorner MB, Zhou X, Opitz C, Mora A, Guttler S, et al. Selective expression of the chemokine receptor XCR1 on cross-presenting dendritic cells determines cooperation with CD8+ T cells. Immunity (2009) 31(5):823–33. doi: 10.1016/j.immuni.2009.08.027
26. Ghilas S, Ambrosini M, Cancel JC, Brousse C, Masse M, Lelouard H, et al. Natural killer cells and dendritic epidermal gammadelta T cells orchestrate type 1 conventional DC spatiotemporal repositioning toward CD8(+) T cells. iScience (2021) 24(9):103059. doi: 10.1016/j.isci.2021.103059
27. Kon-Ogura T, Kon Y, Onuma M, Kondo T, Hashimoto Y, Sugimura M. Distribution of T cell subsets in chicken lymphoid tissues. J Vet Med Sci (1993) 55(1):59–66. doi: 10.1292/jvms.55.59
28. Balic A, Garcia-Morales C, Vervelde L, Gilhooley H, Sherman A, Garceau V, et al. Visualisation of chicken macrophages using transgenic reporter genes: insights into the development of the avian macrophage lineage. Development (2014) 141(16):3255–65. doi: 10.1242/dev.105593
29. Stuart T, Butler A, Hoffman P, Hafemeister C, Papalexi E, Mauck WM 3rd, et al. Comprehensive integration of single-cell data. Cell (2019) 177(7):1888–902 e21. doi: 10.1016/j.cell.2019.05.031
30. Freeman TC, Horsewell S, Patir A, Harling-Lee J, Regan T, Shih BB, et al. Graphia: A platform for the graph-based visualisation and analysis of high dimensional data. PloS Comput Biol (2022) 18(7):e1010310. doi: 10.1371/journal.pcbi.1010310
31. DePasquale EAK, Schnell DJ, Van Camp PJ, Valiente-Alandi I, Blaxall BC, Grimes HL, et al. DoubletDecon: deconvoluting doublets from single-cell RNA-sequencing data. Cell Rep (2019) 29(6):1718–27 e8. doi: 10.1016/j.celrep.2019.09.082
32. Tirosh I, Izar B, Prakadan SM, Wadsworth MH 2nd, Treacy D, Trombetta JJ, et al. Dissecting the multicellular ecosystem of metastatic melanoma by single-cell RNA-seq. Science (2016) 352(6282):189–96. doi: 10.1126/science.aad0501
33. Moon KR, van Dijk D, Wang Z, Gigante S, Burkhardt DB, Chen WS, et al. Visualizing structure and transitions in high-dimensional biological data. Nat Biotechnol (2019) 37(12):1482–92. doi: 10.1038/s41587-019-0336-3
34. Whyte J, Glover JD, Woodcock M, Brzeszczynska J, Taylor L, Sherman A, et al. FGF, insulin, and SMAD signaling cooperate for avian primordial germ cell self-renewal. Stem Cell Rep (2015) 5(6):1171–82. doi: 10.1016/j.stemcr.2015.10.008
35. Ran FA, Hsu PD, Wright J, Agarwala V, Scott DA, Zhang F. Genome engineering using the CRISPR-Cas9 system. Nat Protoc (2013) 8(11):2281–308. doi: 10.1038/nprot.2013.143
36. Idoko-Akoh A, Taylor L, Sang HM, McGrew MJ. High fidelity CRISPR/Cas9 increases precise monoallelic and biallelic editing events in primordial germ cells. Sci Rep (2018) 8(1):15126. doi: 10.1038/s41598-018-33244-x
37. Ioannidis J, Taylor G, Zhao D, Liu L, Idoko-Akoh A, Gong D, et al. Primary sex determination in birds depends on DMRT1 dosage, but gonadal sex does not determine adult secondary sex characteristics. Proc Natl Acad Sci U.S.A. (2021) 118(10). doi: 10.1073/pnas.2020909118
38. Ballantyne M, Woodcock M, Doddamani D, Hu T, Taylor L, Hawken RJ, et al. Direct allele introgression into pure chicken breeds using Sire Dam Surrogate (SDS) mating. Nat Commun (2021) 12(1):659. doi: 10.1038/s41467-020-20812-x
39. Clinton M. A rapid protocol for sexing chick embryos (Gallus g. domesticus) Anim Genet (1994) 25(5):361–2. doi: 10.1111/j.1365-2052.1994.tb00374.x
40. Mast J, Goddeeris BM, Peeters K, Vandesande F, Berghman LR. Characterisation of chicken monocytes, macrophages and interdigitating cells by the monoclonal antibody KUL01. Vet Immunol Immunopathol (1998) 61(2-4):343–57. doi: 10.1016/S0165-2427(97)00152-9
41. Staines K, Hunt LG, Young JR, Butter C. Evolution of an expanded mannose receptor gene family. PloS One (2014) 9(11):e110330. doi: 10.1371/journal.pone.0110330
42. Yu K, Gu MJ, Pyung YJ, Song KD, Park TS, Han SH, et al. Characterization of splenic MRC1(hi)MHCII(lo) and MRC1(lo)MHCII(hi) cells from the monocyte/macrophage lineage of White Leghorn chickens. Vet Res (2020) 51(1):73.
43. Auray G, Keller I, Python S, Gerber M, Bruggmann R, Ruggli N, et al. Characterization and transcriptomic analysis of porcine blood conventional and plasmacytoid dendritic cells reveals striking species-specific differences. J Immunol (2016) 197(12):4791–806. doi: 10.4049/jimmunol.1600672
44. Ginhoux F, Liu K, Helft J, Bogunovic M, Greter M, Hashimoto D, et al. The origin and development of nonlymphoid tissue CD103+ DCs. J Exp Med (2009) 206(13):3115–30. doi: 10.1084/jem.20091756
45. Hawley CA, Rojo R, Raper A, Sauter KA, Lisowski ZM, Grabert K, et al. Csf1r-mApple transgene expression and ligand binding in vivo reveal dynamics of CSF1R expression within the mononuclear phagocyte system. J Immunol (2018) 200(6):2209–23. doi: 10.4049/jimmunol.1701488
46. Summers KM, Bush SJ, Hume DA. Network analysis of transcriptomic diversity amongst resident tissue macrophages and dendritic cells in the mouse mononuclear phagocyte system. PloS Biol (2020) 18(10):e3000859. doi: 10.1371/journal.pbio.3000859
47. Becht E, McInnes L, Healy J, Dutertre CA, Kwok IWH, Ng LG, et al. Dimensionality reduction for visualizing single-cell data using UMAP. Nat Biotechnol (2019) 37:38–44. doi: 10.1038/nbt.4314
48. Giotti B, Chen SH, Barnett MW, Regan T, Ly T, Wiemann S, et al. Assembly of a parts list of the human mitotic cell cycle machinery. J Mol Cell Biol (2019) 11(8):703–18. doi: 10.1093/jmcb/mjy063
49. Kallberg E, Leanderson T. A subset of dendritic cells express joining chain (J-chain) protein. Immunology (2008) 123(4):590–9. doi: 10.1111/j.1365-2567.2007.02733.x
50. Villani AC, Satija R, Reynolds G, Sarkizova S, Shekhar K, Fletcher J, et al. Single-cell RNA-seq reveals new types of human blood dendritic cells, monocytes, and progenitors. Science (2017) 356(6335). doi: 10.1126/science.aah4573
51. Bagadia P, Huang X, Liu TT, Durai V, Grajales-Reyes GE, Nitschke M, et al. An Nfil3-Zeb2-Id2 pathway imposes Irf8 enhancer switching during cDC1 development. Nat Immunol (2019) 20(9):1174–85. doi: 10.1038/s41590-019-0449-3
52. Siegal FP, Kadowaki N, Shodell M, Fitzgerald-Bocarsly PA, Shah K, Ho S, et al. The nature of the principal type 1 interferon-producing cells in human blood. Science (1999) 284(5421):1835–7. doi: 10.1126/science.284.5421.1835
53. Fitzgerald-Bocarsly P, Dai J, Singh S. Plasmacytoid dendritic cells and type I IFN: 50 years of convergent history. Cytokine Growth Factor Rev (2008) 19(1):3–19. doi: 10.1016/j.cytogfr.2007.10.006
54. Honda K, Ohba Y, Yanai H, Negishi H, Mizutani T, Takaoka A, et al. Spatiotemporal regulation of MyD88-IRF-7 signalling for robust type-I interferon induction. Nature (2005) 434(7036):1035–40. doi: 10.1038/nature03547
55. Bao M, Liu YJ. Regulation of TLR7/9 signaling in plasmacytoid dendritic cells. Protein Cell (2013) 4(1):40–52. doi: 10.1007/s13238-012-2104-8
56. Akira S, Hemmi H. Recognition of pathogen-associated molecular patterns by TLR family. Immunol Lett (2003) 85(2):85–95. doi: 10.1016/S0165-2478(02)00228-6
57. Chen S, Cheng A, Wang M. Innate sensing of viruses by pattern recognition receptors in birds. Vet Res (2013) 44(1):82. doi: 10.1186/1297-9716-44-82
58. Hildner K, Edelson BT, Purtha WE, Diamond M, Matsushita H, Kohyama M, et al. Batf3 deficiency reveals a critical role for CD8alpha+ dendritic cells in cytotoxic T cell immunity. Science (2008) 322(5904):1097–100. doi: 10.1126/science.1164206
59. Watchmaker PB, Lahl K, Lee M, Baumjohann D, Morton J, Kim SJ, et al. Comparative transcriptional and functional profiling defines conserved programs of intestinal DC differentiation in humans and mice. Nat Immunol (2014) 15(1):98–108. doi: 10.1038/ni.2768
60. Bagadia P, O'Connor KW, Wu R, Ferris ST, Ward JP, Schreiber RD, et al. Bcl6-independent in vivo development of functional type 1 classical dendritic cells supporting tumor rejection. J Immunol (2021) 207(1):125–32. doi: 10.4049/jimmunol.1901010
61. Zhu XJ, Yang ZF, Chen Y, Wang J, Rosmarin AG. PU.1 is essential for CD11c expression in CD8(+)/CD8(-) lymphoid and monocyte-derived dendritic cells during GM-CSF or FLT3L-induced differentiation. PloS One (2012) 7(12):e52141. doi: 10.1371/journal.pone.0052141
62. Satpathy AT, Kc W, Albring JC, Edelson BT, Kretzer NM, Bhattacharya D, et al. Zbtb46 expression distinguishes classical dendritic cells and their committed progenitors from other immune lineages. J Exp Med (2012) 209(6):1135–52. doi: 10.1084/jem.20120030
63. Triantis V, Trancikova DE, Looman MW, Hartgers FC, Janssen RA, Adema GJ. Identification and characterization of DC-SCRIPT, a novel dendritic cell-expressed member of the zinc finger family of transcriptional regulators. J Immunol (2006) 176(2):1081–9. doi: 10.4049/jimmunol.176.2.1081
64. Wu X, Satpathy AT, Kc W, Liu P, Murphy TL, Murphy KM. Bcl11a controls Flt3 expression in early hematopoietic progenitors and is required for pDC development in vivo. PloS One (2013) 8(5):e64800. doi: 10.1371/journal.pone.0064800
65. Kohyama M, Ise W, Edelson BT, Wilker PR, Hildner K, Mejia C, et al. Role for Spi-C in the development of red pulp macrophages and splenic iron homeostasis. Nature (2009) 457(7227):318–21. doi: 10.1038/nature07472
66. Brownlie R, Zhu J, Allan B, Mutwiri GK, Babiuk LA, Potter A, et al. Chicken TLR21 acts as a functional homologue to mammalian TLR9 in the recognition of CpG oligodeoxynucleotides. Mol Immunol (2009) 46(15):3163–70. doi: 10.1016/j.molimm.2009.06.002
67. Boyd AC, Peroval MY, Hammond JA, Prickett MD, Young JR, Smith AL. TLR15 is unique to avian and reptilian lineages and recognizes a yeast-derived agonist. J Immunol (2012) 189(10):4930–8. doi: 10.4049/jimmunol.1101790
68. Cabeza-Cabrerizo M, van Blijswijk J, Wienert S, Heim D, Jenkins RP, Chakravarty P, et al. Tissue clonality of dendritic cell subsets and emergency DCpoiesis revealed by multicolor fate mapping of DC progenitors. Sci Immunol (2019) 4(33). doi: 10.1126/sciimmunol.aaw1941
69. Pickel JM, Chen CL, Cooper MD. An avian B-lymphocyte protein associated with beta 2-microglobulin. Immunogenetics (1990) 32(1):1–7. doi: 10.1007/BF01787321
70. Roquilly A, Mintern JD, Villadangos JA. Spatiotemporal adaptations of macrophage and dendritic cell development and function. Annu Rev Immunol (2022) 40:525–57. doi: 10.1146/annurev-immunol-101320-031931
71. Jeurissen SH, Claassen E, Janse EM. Histological and functional differentiation of non-lymphoid cells in the chicken spleen. Immunology (1992) 77(1):75–80.
72. Gurka S, Hartung E, Becker M, Kroczek RA. Mouse conventional dendritic cells can be universally classified based on the mutually exclusive expression of XCR1 and SIRPalpha. Front Immunol (2015) 6:35. doi: 10.3389/fimmu.2015.00035
73. Shortman K, Heath WR. The CD8+ dendritic cell subset. Immunol Rev (2010) 234(1):18–31. doi: 10.1111/j.0105-2896.2009.00870.x
74. Luhtala M. Chicken CD4, CD8alphabeta, and CD8alphaalpha T cell co-receptor molecules. Poult Sci (1998) 77(12):1858–73. doi: 10.1093/ps/77.12.1858
75. Hao X, Li S, Chen L, Dong M, Wang J, Hu J, et al. Establishing a multicolor flow cytometry to characterize cellular immune response in chickens following H7N9 avian influenza virus infection. Viruses (2020) 12(12). doi: 10.3390/v12121396
76. Backer RA, Diener N, Clausen BE. Langerin(+)CD8(+) dendritic cells in the splenic marginal zone: not so marginal after all. Front Immunol (2019) 10:741. doi: 10.3389/fimmu.2019.00741
77. Granot T, Senda T, Carpenter DJ, Matsuoka N, Weiner J, Gordon CL, et al. Dendritic cells display subset and tissue-specific maturation dynamics over human life. Immunity (2017) 46(3):504–15. doi: 10.1016/j.immuni.2017.02.019
78. Zhou Q, Zhao C, Yang Z, Qu R, Li Y, Fan Y, et al. Cross-organ single-cell transcriptome profiling reveals macrophage and dendritic cell heterogeneity in zebrafish. Cell Rep (2023) 42(7):112793. doi: 10.1016/j.celrep.2023.112793
79. Jaillon O, Aury JM, Brunet F, Petit JL, Stange-Thomann N, Mauceli E, et al. Genome duplication in the teleost fish Tetraodon nigroviridis reveals the early vertebrate proto-karyotype. Nature (2004) 431(7011):946–57. doi: 10.1038/nature03025
80. Neely HR, Flajnik MF. Emergence and evolution of secondary lymphoid organs. Annu Rev Cell Dev Biol (2016) 32:693–711. doi: 10.1146/annurev-cellbio-111315-125306
81. Mingozzi F, Spreafico R, Gorletta T, Cigni C, Di Gioia M, Caccia M, et al. Prolonged contact with dendritic cells turns lymph node-resident NK cells into anti-tumor effectors. EMBO Mol Med (2016) 8(9):1039–51. doi: 10.15252/emmm.201506164
82. Castellino F, Huang AY, Altan-Bonnet G, Stoll S, Scheinecker C, Germain RN. Chemokines enhance immunity by guiding naive CD8+ T cells to sites of CD4+ T cell-dendritic cell interaction. Nature (2006) 440(7086):890–5. doi: 10.1038/nature04651
83. Huang AY, Qi H, Germain RN. Illuminating the landscape of in vivo immunity: insights from dynamic in situ imaging of secondary lymphoid tissues. Immunity (2004) 21(3):331–9. doi: 10.1016/j.immuni.2004.08.001
84. Zhang S, Coughlan HD, Ashayeripanah M, Seizova S, Kueh AJ, Brown DV, et al. Type 1 conventional dendritic cell fate and function are controlled by DC-SCRIPT. Sci Immunol (2021) 6(58). doi: 10.1126/sciimmunol.abf4432
85. Deist MS, Gallardo RA, Bunn DA, Dekkers JCM, Zhou H, Lamont SJ. Resistant and susceptible chicken lines show distinctive responses to Newcastle disease virus infection in the lung transcriptome. BMC Genomics (2017) 18(1):989. doi: 10.1186/s12864-017-4380-4
86. Leitner G, Heller ED, Friedman A. Sex-related differences in immune response and survival rate of broiler chickens. Vet Immunol Immunopathol (1989) 21(3-4):249–60. doi: 10.1016/0165-2427(89)90035-4
87. Garcia-Morales C, Nandi S, Zhao D, Sauter KA, Vervelde L, McBride D, et al. Cell-autonomous sex differences in gene expression in chicken bone marrow-derived macrophages. J Immunol (2015) 194(5):2338–44. doi: 10.4049/jimmunol.1401982
88. Barbour EK, Hamadeh SK, Hilan C, Abbas SS. Comparison of immunity and resistance to diseases in male and female poultry breeders in Lebanon. Trop Anim Health Prod (1995) 27(2):65–70. doi: 10.1007/BF02236311
89. Schiavoni G, Mattei F, Gabriele L. Type I interferons as stimulators of DC-mediated cross-priming: impact on anti-tumor response. Front Immunol (2013) 4:483. doi: 10.3389/fimmu.2013.00483
90. Schaupp L, Muth S, Rogell L, Kofoed-Branzk M, Melchior F, Lienenklaus S, et al. Microbiota-induced type I interferons instruct a poised basal state of dendritic cells. Cell (2020) 181(5):1080–96 e19. doi: 10.1016/j.cell.2020.04.022
91. Longhi MP, Trumpfheller C, Idoyaga J, Caskey M, Matos I, Kluger C, et al. Dendritic cells require a systemic type I interferon response to mature and induce CD4+ Th1 immunity with poly IC as adjuvant. J Exp Med (2009) 206(7):1589–602. doi: 10.1084/jem.20090247
92. Balan S, Arnold-Schrauf C, Abbas A, Couespel N, Savoret J, Imperatore F, et al. Large-scale human dendritic cell differentiation revealing notch-dependent lineage bifurcation and heterogeneity. Cell Rep (2018) 24(7):1902–15 e6. doi: 10.1016/j.celrep.2018.07.033
93. Magor KE, Miranzo Navarro D, Barber MR, Petkau K, Fleming-Canepa X, Blyth GA, et al. Defense genes missing from the flight division. Dev Comp Immunol (2013) 41(3):377–88. doi: 10.1016/j.dci.2013.04.010
94. De Togni P, Goellner J, Ruddle NH, Streeter PR, Fick A, Mariathasan S, et al. Abnormal development of peripheral lymphoid organs in mice deficient in lymphotoxin. Science (1994) 264(5159):703–7. doi: 10.1126/science.8171322
95. See P, Dutertre CA, Chen J, Gunther P, McGovern N, Irac SE, et al. Mapping the human DC lineage through the integration of high-dimensional techniques. Science (2017) 356(6342). doi: 10.1126/science.aag3009
96. Smith J, Smith N, Yu L, Paton IR, Gutowska MW, Forrest HL, et al. A comparative analysis of host responses to avian influenza infection in ducks and chickens highlights a role for the interferon-induced transmembrane proteins in viral resistance. BMC Genomics (2015) 16(1):574. doi: 10.1186/s12864-015-1778-8
97. Zhu X, He Z, Yuan J, Wen W, Huang X, Hu Y, et al. IFITM3-containing exosome as a novel mediator for anti-viral response in dengue virus infection. Cell Microbiol (2015) 17(1):105–18. doi: 10.1111/cmi.12339
98. Spence JS, He R, Hoffmann HH, Das T, Thinon E, Rice CM, et al. IFITM3 directly engages and shuttles incoming virus particles to lysosomes. Nat Chem Biol (2019) 15(3):259–68. doi: 10.1038/s41589-018-0213-2
99. Sun J, Han Z, Qi T, Zhao R, Liu S. Chicken galectin-1B inhibits Newcastle disease virus adsorption and replication through binding to hemagglutinin-neuraminidase (HN) glycoprotein. J Biol Chem (2017) 292(49):20141–61. doi: 10.1074/jbc.M116.772897
100. Sullivan C, Soos BL, Millard PJ, Kim CH, King BL. Modeling virus-induced inflammation in zebrafish: A balance between infection control and excessive inflammation. Front Immunol (2021) 12:636623. doi: 10.3389/fimmu.2021.636623
101. Candel S, Sepulcre MP, Espin-Palazon R, Tyrkalska SD, de Oliveira S, Meseguer J, et al. Md1 and Rp105 regulate innate immunity and viral resistance in zebrafish. Dev Comp Immunol (2015) 50(2):155–65. doi: 10.1016/j.dci.2015.01.005
102. Kasmar A, Van Rhijn I, Moody DB. The evolved functions of CD1 during infection. Curr Opin Immunol (2009) 21(4):397–403. doi: 10.1016/j.coi.2009.05.022
103. Van Rhijn I, Young DC, De Jong A, Vazquez J, Cheng TY, Talekar R, et al. CD1c bypasses lysosomes to present a lipopeptide antigen with 12 amino acids. J Exp Med (2009) 206(6):1409–22. doi: 10.1084/jem.20082480
104. Pereira CS, Macedo MF. CD1-restricted T cells at the crossroad of innate and adaptive immunity. J Immunol Res (2016) 2016:2876275. doi: 10.1155/2016/2876275
105. van Ginkel FW, Padgett J, Martinez-Romero G, Miller MS, Joiner KS, Gulley SL. Age-dependent immune responses and immune protection after avian coronavirus vaccination. Vaccine (2015) 33(23):2655–61. doi: 10.1016/j.vaccine.2015.04.026
106. Lowenthal JW, Connick TE, McWaters PG, York JJ. Development of T cell immune responsiveness in the chicken. Immunol Cell Biol (1994) 72(2):115–22. doi: 10.1038/icb.1994.18
107. Song B, Tang D, Yan S, Fan H, Li G, Shahid MS, et al. Effects of age on immune function in broiler chickens. J Anim Sci Biotechnol (2021) 12(1):42. doi: 10.1186/s40104-021-00559-1
108. Mast J, Goddeeris BM. Development of immunocompetence of broiler chickens. Vet Immunol Immunopathol (1999) 70(3-4):245–56. doi: 10.1016/S0165-2427(99)00079-3
109. Bar-Shira E, Sklan D, Friedman A. Establishment of immune competence in the avian GALT during the immediate post-hatch period. Dev Comp Immunol (2003) 27(2):147–57. doi: 10.1016/S0145-305X(02)00076-9
110. Astill J, Alkie T, Yitbarek A, Taha-Abdelaziz K, Bavananthasivam J, Nagy E, et al. Induction of immune response in chickens primed in ovo with an inactivated H9N2 avian influenza virus vaccine. BMC Res Notes (2018) 11(1):428. doi: 10.1186/s13104-018-3537-9
111. Yewdell JW, Hill AB. Viral interference with antigen presentation. Nat Immunol (2002) 3(11):1019–25. doi: 10.1038/ni1102-1019
112. Ou P, Wen L, Liu X, Huang J, Huang X, Su C, et al. Thioesterase PPT1 balances viral resistance and efficient T cell crosspriming in dendritic cells. J Exp Med (2019) 216(9):2091–112. doi: 10.1084/jem.20190041
113. Smith SE, Gibson MS, Wash RS, Ferrara F, Wright E, Temperton N, et al. Chicken interferon-inducible transmembrane protein 3 restricts influenza viruses and lyssaviruses in vitro. J Virol (2013) 87(23):12957–66. doi: 10.1128/JVI.01443-13
114. Zhao R, Shi Q, Han Z, Fan Z, Ai H, Chen L, et al. Newcastle Disease Virus Entry into Chicken Macrophages via a pH-Dependent, Dynamin and Caveola-Mediated Endocytic Pathway That Requires Rab5. J Virol (2021) 95(13):e0228820. doi: 10.1128/JVI.02288-20
115. Rohaim MA, Al-Natour MQ, Abdelsabour MA, El Naggar RF, Madbouly YM, Ahmed KA, et al. Transgenic chicks expressing interferon-inducible transmembrane protein 1 (IFITM1) restrict highly pathogenic H5N1 influenza viruses. Int J Mol Sci (2021) 22(16). doi: 10.3390/ijms22168456
116. Gorczynski RM, Kai Y, Miyake K. MD1 expression regulates development of regulatory T cells. J Immunol (2006) 177(2):1078–84. doi: 10.4049/jimmunol.177.2.1078
117. Isaacs A, Lindenmann J. Virus interference. I. The interferon. Proc R Soc Lond B Biol Sci (1957) 147(927):258–67. doi: 10.1098/rspb.1957.0048
118. Honda K, Yanai H, Negishi H, Asagiri M, Sato M, Mizutani T, et al. IRF-7 is the master regulator of type-I interferon-dependent immune responses. Nature (2005) 434(7034):772–7. doi: 10.1038/nature03464
119. Dallari S, Macal M, Loureiro ME, Jo Y, Swanson L, Hesser C, et al. Src family kinases Fyn and Lyn are constitutively activated and mediate plasmacytoid dendritic cell responses. Nat Commun (2017) 8:14830. doi: 10.1038/ncomms14830
120. Veleeparambil M, Poddar D, Abdulkhalek S, Kessler PM, Yamashita M, Chattopadhyay S, et al. Constitutively bound EGFR-mediated tyrosine phosphorylation of TLR9 is required for its ability to signal. J Immunol (2018) 200(8):2809–18. doi: 10.4049/jimmunol.1700691
121. Rimann I, Gonzalez-Quintial R, Baccala R, Kiosses WB, Teijaro JR, Parker CG, et al. The solute carrier SLC15A4 is required for optimal trafficking of nucleic acid-sensing TLRs and ligands to endolysosomes. Proc Natl Acad Sci U S A (2022) 119(14):e2200544119. doi: 10.1073/pnas.2200544119
122. Esashi E, Bao M, Wang YH, Cao W, Liu YJ. PACSIN1 regulates the TLR7/9-mediated type I interferon response in plasmacytoid dendritic cells. Eur J Immunol (2012) 42(3):573–9. doi: 10.1002/eji.201142045
123. Luo XM, Lei MY. Recombination activating gene-2 regulates CpG-mediated interferon-alpha production in mouse bone marrow-derived plasmacytoid dendritic cells. PloS One (2012) 7(10):e47952. doi: 10.1371/journal.pone.0047952
124. Cheng M, Zhang X, Yu H, Du P, Plumas J, Chaperot L, et al. Characterization of species-specific genes regulated by E2-2 in human plasmacytoid dendritic cells. Sci Rep (2015) 5:10752. doi: 10.1038/srep10752
125. Santer DM, Wiedeman AE, Teal TH, Ghosh P, Elkon KB. Plasmacytoid dendritic cells and C1q differentially regulate inflammatory gene induction by lupus immune complexes. J Immunol (2012) 188(2):902–15. doi: 10.4049/jimmunol.1102797
126. Sever L, Radomir L, Stirm K, Wiener A, Schottlender N, Lewinsky H, et al. SLAMF9 regulates pDC homeostasis and function in health and disease. Proc Natl Acad Sci U S A (2019) 116(33):16489–96. doi: 10.1073/pnas.1900079116
127. Takeda K, Akira S. Microbial recognition by Toll-like receptors. J Dermatol Sci (2004) 34(2):73–82. doi: 10.1016/j.jdermsci.2003.10.002
128. Soltani S, Mahmoudi M, Farhadi E. Dendritic Cells Currently under the Spotlight; Classification and Subset Based upon New Markers. Immunol Invest (2021) 50(6):646–61. doi: 10.1080/08820139.2020.1783289
129. Collin M, Bigley V. Human dendritic cell subsets: an update. Immunology (2018) 154(1):3–20. doi: 10.1111/imm.12888
130. Canton J, Blees H, Henry CM, Buck MD, Schulz O, Rogers NC, et al. The receptor DNGR-1 signals for phagosomal rupture to promote cross-presentation of dead-cell-associated antigens. Nat Immunol (2021) 22(2):140–53. doi: 10.1038/s41590-020-00824-x
131. Theisen DJ, Davidson J, Briseno CG, Gargaro M, Lauron EJ, Wang Q, et al. WDFY4 is required for cross-presentation in response to viral and tumor antigens. Science (2018) 362(6415):694–9. doi: 10.1126/science.aat5030
132. Idoyaga J, Suda N, Suda K, Park CG, Steinman RM. Antibody to Langerin/CD207 localizes large numbers of CD8alpha+ dendritic cells to the marginal zone of mouse spleen. Proc Natl Acad Sci U S A (2009) 106(5):1524–9. doi: 10.1073/pnas.0812247106
133. Pack M, Trumpfheller C, Thomas D, Park CG, Granelli-Piperno A, Munz C, et al. DEC-205/CD205+ dendritic cells are abundant in the white pulp of the human spleen, including the border region between the red and white pulp. Immunology (2008) 123(3):438–46. doi: 10.1111/j.1365-2567.2007.02710.x
134. Brewitz A, Eickhoff S, Dahling S, Quast T, Bedoui S, Kroczek RA, et al. CD8(+) T cells orchestrate pDC-XCR1(+) dendritic cell spatial and functional cooperativity to optimize priming. Immunity (2017) 46(2):205–19. doi: 10.1016/j.immuni.2017.01.003
Keywords: chicken, conventional dendritic cells, XCR1, conditional ablation, single cell RNA-seq
Citation: Wu Z, Shih B, Macdonald J, Meunier D, Hogan K, Chintoan-Uta C, Gilhooley H, Hu T, Beltran M, Henderson NC, Sang HM, Stevens MP, McGrew MJ and Balic A (2023) Development and function of chicken XCR1+ conventional dendritic cells. Front. Immunol. 14:1273661. doi: 10.3389/fimmu.2023.1273661
Received: 07 August 2023; Accepted: 06 October 2023;
Published: 25 October 2023.
Edited by:
Artur Summerfield, Institute of Virology and Immunology (IVI), SwitzerlandReviewed by:
Nicolas Bertho, INRA Biologie, Épidémiologie et Analyse de Risque en santé animale (BIOEPAR), FranceSonja Härtle, Ludwig Maximilian University of Munich, Germany
Copyright © 2023 Wu, Shih, Macdonald, Meunier, Hogan, Chintoan-Uta, Gilhooley, Hu, Beltran, Henderson, Sang, Stevens, McGrew and Balic. This is an open-access article distributed under the terms of the Creative Commons Attribution License (CC BY). The use, distribution or reproduction in other forums is permitted, provided the original author(s) and the copyright owner(s) are credited and that the original publication in this journal is cited, in accordance with accepted academic practice. No use, distribution or reproduction is permitted which does not comply with these terms.
*Correspondence: Adam Balic, adam.balic@unimelb.edu.au; Zhiguang Wu, zhiguang.wu@roslin.ed.ac.uk