 Bo Ma*
 Riyue Yu*
- Department of Stomatology, Beijing Shijitan Hospital, Capital Medical University, Beijing, China
Background: Members of a disintegrin and metalloproteinase (ADAM) family play a vital role in cancer development. However, a comprehensive analysis of the landscape of the ADAM family in pan-cancer remains to be performed.
Methods: The correlation of the expression level and prognostic value with ADAMs in a pan-cancer cohort and the relationship between ADAMs and the stemness score, tumour microenvironment (TME), chemotherapy-related drug sensitivity, immune subtype, and immunotherapy outcome were investigated.
Results: ADAMs were differentially expressed between tumour and para-carcinoma tissues in the pan-cancer cohort, and the expression of ADAMs was significantly correlated with patient prognosis. Furthermore, ADAMs were significantly correlated with the stromal score and immune score based on the TME analysis. Additionally, ADAMs were also correlated with DNAss and RNAss in the pan-cancer cohort. On investigating the CellMiner database, ADAMs were revealed to be significantly correlated with the sensitivity of various drugs, including raloxifene and tamoxifen. Moreover, in the IMvigor210 and GSE78220 cohorts, ADAMs were correlated with immunotherapy response and immune activation genes. Furthermore, quantitative real-time polymerase chain reaction (qRT-PCR) and immunohistochemistry (IHC) were utilised to determine the differential level of ADAM9 in cancer and para-carcinoma tissues in patients’ samples.
Conclusion: This study elucidates the importance of ADAMs in cancer progression and lays a foundation for further exploration of ADAMs as potential pan-cancer targets.
1 Introduction
The extracellular matrix (ECM) is a macromolecular structure consisting of the basement membrane (BM) and intercellular substance (Padhi and Nain, 2020). The ECM constitutes a complex network structure that supports and connects tissue structures and regulates tissue formation and cellular physiological activities (Valdoz et al., 2021).
The ECM acts as an important bio-barrier for tumour local or distant metastasis. Tumour cells secrete proteolytic enzymes to degrade the ECM, thereby creating a local lysis zone for cancer cell intravasation and extravasation (Najafi et al., 2019). Generally, cancer cells with a high degree of malignancy have a strong proteolytic effect, which can erode and destroy the membrane and promote metastasis. The enzymes involved in this process are mainly serine proteases, such as plasminogen activator (PA) and metalloproteinase (MP), which include collagenase IV, matrix-degrading enzymes, and hyaluronidase (Mohan et al., 2020). Various secreted proteins, including cross-linkers, modifying enzymes, and proteases and their inhibitors, regulate ECM homoeostasis. Thus, the activation or inhibition of the aforementioned proteins promotes the proliferation and invasion of cancer cells, which suggests their potential as therapeutic targets in cancer treatment (Walker et al., 2018).
In addition to degradation, the turnover of the matrix is also significantly important for ECM homoeostasis (Huang et al., 2021). The substrate turnover of the matrix is regulated by various enzyme families. The “normal” stroma degradation followed by an increase in the stromal turnover of the tumour promotes the replacement by the tumour stroma, reinforces aggressive features, and removes physical barriers (e.g., the basement membrane), consequently favouring the malignancy and metastasis of tumours (Nissen et al., 2019). As an important ligand pool of growth factors, the degradation and turnover of the ECM could activate the binding growth factors and induce intracellular signalling responses. Moreover, the ECM not only includes enzymes such as growth factors, chemokines, and cytokines but also is a repository for inorganic molecules (Girigoswami et al., 2021). During matrix remodelling, divalent cations like calcium ions are activated to facilitate calcium transport, which further induces the activation of matrix metalloproteinases (MMPs), a disintegrin and metalloproteinases (ADAMs), and ADAMs with thrombospondin motifs (ADAMTSs), which constitute the calcium-dependent, zinc-containing thyroxine superfamily endopeptidases (Theret et al., 2021).
The ADAM family can be divided into trans-model ADAM and secretory ADAM components based on structural differences (Saha et al., 2019). The genomic distribution of ADAMs is presented in Table 1. The pre-control region ensures that the metalloprotease domain is inactive, while the catalytic site is activated by the activation of the cysteine switch mechanism. The furin recognition site (RXXR sequence) is located between the pre-control region and the metalloprotease domain, which is involved in the intracellular activation of many ADAM family members in a trans-Golgi network by a furin-like preprotein convertase. The active site of the metalloprotease domain of ADAM molecule with proteolytic activity contains a common “HEXGH” conserved sequence, whose alteration will result in the loss of proteolytic activity (Malemud, 2019). Although the ADAM family has been extensively studied, little is known about the specificity of ADAM substrates, which are hypothesised to be determined by disintegrin and cysteine domains, especially the interaction of a substrate and enzyme (Heib et al., 2020). The main function of ADAM molecules is to mediate “extracellular domain shedding,” a post-translational mechanism. ADAMs can induce proteolytic processing to release the membrane-attached proteins and activate the cleaved molecules, which are involved in growth factor signalling, cell migration, cell adhesion, and other aspects (Camodeca et al., 2019). Studies report that ADAM is abnormally upregulated and downregulated in various malignant tumour tissues, such as lung cancer, liver cancer, and colon cancer (Li et al., 2018; Jin et al., 2020; Du et al., 2022). Such abnormal expression promotes the proliferation of tumour cells and participation in tumour angiogenesis by regulating intercellular adhesion and degrading the intercellular substance.
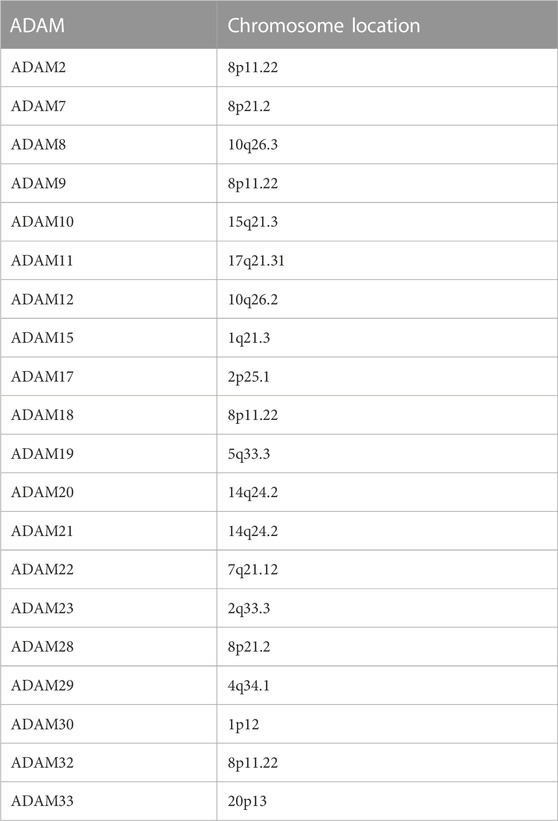
TABLE 1. Chromosome location of ADAMs.
In this study, we aimed to investigate the potential effects and mechanisms of ADAM families for pan-cancer analysis across 33 distinct tumours by integrating bulk RNA-seq, tumour mutation burden (TMB), and clinicopathological parameters in The Cancer Genome Atlas (TCGA) datasets. Moreover, we further used ESTIMATE and CIBERSORT to explore the correlation of ADAMs with immune cell infiltration and TME status. Moreover, the sensitivity of distinct FDA-approved drugs to target cancers was also examined through the CellMiner database. Furthermore, as ADAMs were significantly correlated with TME infiltration, the sensitivity of immune checkpoint inhibitor (ICI)-based immunotherapy and the association between the expression of ADAMs and the outcomes of patients treated with ICIs were explored in IMvigor210 and GSE78220 cohorts, and we found that ADAM19 was strikingly correlated with ICI immunotherapy response. Moreover, we also found that ADAMs, especially ADAM9, were strikingly correlated with the sensitivity of FDA-approved drugs. Considering the correlation of all ADAMs with drug sensitivity and immunotherapy response, we finally verified that ADAMs were significantly associated with all types of cancers and might be the novel targets for chemotherapy and immunotherapy.
2 Materials and methods
2.1 Identification of ADAMs in TCGA pan-cancer cohort
RNA-seq (FPKM) gene expression data were downloaded from the open access database UCSC Xena (http://xena.ucsc.edu) and were transformed into transcripts per kilobase million (Wagner et al., 2012). Clinical information of the samples and pathological information, including immune subtypes and stemness scores (RNA-based, RNAss; DNA methylation, DNAss), for all these cancers were also acquired from UCSC Xena (Miao et al., 2020). For pan-cancer TCGA analysis, a total of 20 ADAM (Supplementary Table S1) expression levels were extracted (Supplementary Table S2), and the differences in para-carcinoma and tumour tissue samples were evaluated using Student’s t-test. Importantly, the number of normal samples of some cancer types was less than five; hence, these cancer types were excluded to prevent a statistical error. The box plots and heat maps were designed using “ggpubr” and “pheatmap” in R. The ADAM internal correlation was performed using “corrplot” in R.
2.2 Survival analyses of ADAMs in pan-cancers
Kaplan–Meier survival curves and log-rank test (p-value cut-off point 0.05) were used for the survival analysis. The cut-off was selected based on the average expression level of ADAMs in each tumour sample, and the patients were divided into high-expression and low-expression groups. Survival curves were plotted using the R packages “survminer” and “survival.” Furthermore, Cox analysis was performed to determine the relationship between ADAMs and cancer prognosis. Finally, the forest plot was drawn using the R packages “survival” and “forestplot.”
2.3 Correlation of ADAMs with the TME and stemness score in pan-cancers
The stromal scores and immune cell scores were calculated using “ESTIMATE” and “limma” in R for evaluating the stromal cell and immune cell infiltrating levels. Spearman’s correlations were used to analyse the correlation between ADAMs and RNAss/DNAss, and the R package “corrplot” was used to visualise the results.
2.4 Correlation of ADAMs with chemotherapy-related drug sensitivity and the immune subtype
We acquired the chemotherapy-related drug sensitivity data from an open access database CellMiner (https://discover.nci.nih.gov/cellminer/loadDownload.do). Moreover, “limma” and “ggplot2” were used for data analysis and visualisation. Th immune subtypes of the samples were acquired from UCSC Xena. Furthermore, the correlation between immune subtypes and ADAMs was analysed by “limma” and “reshape2” in R.
2.5 Correlation of ADAMs and immunotherapy
The immunotherapy data were obtained from the IMvigor210 and GSE78220 datasets. The treatment outcomes are shown in Supplementary Table S3. Visualisation and response analysis of the result were processed using “ggpubr,” “ggplot2,” and “limma” in R.
2.6 Correlation of ADAM19 with TMB, microsatellite instability, and immune activation-related genes
The TMB and microsatellite instability (MSI) were calculated using TCGA somatic mutation data. A radar legend was established to show the relationship between ADAM19 and the TMB and MSI using Spearman’s correlation analysis. Additionally, the co-expression of ADAM19 and immune activation-related genes was further analysed.
2.7 Tissue specimens and immunohistochemistry
We collected 18 paired KIRC and BLCA samples from Beijing Friendship Hospital, Capital Medical University (Beijing, China), between June 2022 and October 2022. The Institutional Research Ethics Committee approved the sample collection (No. 2021-P2-159). All samples were pathologically confirmed to be KIRC or BLCA. The antibody of ADAM9 was acquired from ABclonal (A22058, Wuhan, China).
2.8 Total RNA extraction, reverse transcription, and quantitative real-time polymerase chain reaction
The RNeasy Plus Mini Kits (74136, QIAGEN, Germany) were used to extract the total RNA of the samples. Subsequently, the quality of the extracted RNA was examined using NanoDrop (NP80, Implen, Germany). Following this, the ReverTra Ace qPCR RT Kit (FSQ-201, TOYOBO, Japan) was used for further cDNA synthesis. Finally, reverse and forward primers designed by us and iQTM SYBR® Green Supermix (1708880, Bio-Rad, United States) were mixed to perform qRT-PCR. The expression of the targeted genes was normalised using the expression of GAPDH (Schmittgen and Livak, 2008).
2.9 Statistical analyses
Statistical significance between two groups was tested using Student’s t-test. For variables that fall into more than three groups, a one-way analysis of variance or the Kruskal–Wallis test was used, depending on the type of data. Kaplan–Meier (KM) curves were used to calculate and visualise the survival rates, and the log-rank test was used to test whether differences were significant. Correlation coefficients were calculated using Spearman’s correlation analysis. A univariate Cox proportional hazards model was used to determine the timing of the variables and whether they were independent predictors. Statistical significance was set at p < 0.05.
3 Results
3.1 The landscape of ADAMs in the pan-cancer cohort
Figure 1A displays the expression of ADAMs in 33 types of cancers. Moreover, a series of genes in ADAMs, namely, ADAM8, ADAM9, ADAM10, ADAM11, ADAM12, ADAM17, ADAM19, ADAM21, ADAM22, ADAM23, ADAM28, ADAM32, and ADAM33, were highly expressed among all types of cancers. Additionally, the correlation between different ADAMs was also explored (Figure 1B), with ADAM8 and ADAM22 exhibiting the most significant positive correlation, whereas ADAM9 and ADAM10/ADAM17 exhibiting the most negative correlation. We further explored the expression of all ADAMs in 33 cancers (Figure 1C). ADAM9 was observed to be highly expressed in CHOL, whereas ADAM33 had a significantly lower expression in pan-cancers, especially in BLCA and UCEC (Figure 1C).
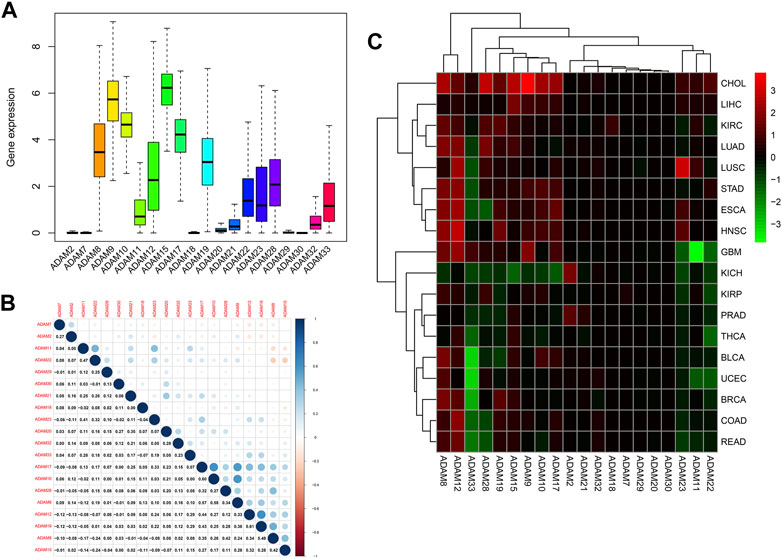
FIGURE 1. Expression levels and correlations of ADAM family genes in different types of cancer in TCGA. (A) Over-expression or under-expression of the ADAM family in various types of cancer. (B) Expression data from TCGA showing the ADAM family expressed in different types of cancer. The colour of each small rectangle represents high or low expression of ADAM family genes in each cancer. Red and green colours indicate high and low expression, respectively. (C) Correlations between ADAM family genes. Blue dots represent positive correlations, and red dots represent negative correlations. ACC, adrenocortical carcinoma; BLCA, bladder urothelial carcinoma; BRCA, breast invasive carcinoma; CESC, cervical squamous cell carcinoma and endocervical adenocarcinoma; CHOL, cholangiocarcinoma; COAD, colon adenocarcinoma; DLBC, diffuse large B-cell lymphoma; ESCA, oesophageal carcinoma; GBM, glioblastoma multiforme; HNSC, head and neck squamous cell carcinoma; KICH, kidney chromophobe; KIRC, kidney renal clear cell carcinoma; KIRP, kidney renal papillary cell carcinoma; LAML, acute myeloid leukaemia; LGG, brain lower-grade glioma; LIHC, liver hepatocellular carcinoma; LUAD, lung adenocarcinoma; LUSC, lung squamous cell carcinoma; MESO, mesothelioma; OV, ovarian serous cystadenocarcinoma; PAAD, pancreatic adenocarcinoma; PRAD, prostate adenocarcinoma; READ, rectum adenocarcinoma; SKCM, skin cutaneous melanoma; STAD, stomach adenocarcinoma; TGCA, testicular germ-cell tumour; THCA, thyroid carcinoma; THYM, thymoma; UCEC, uterine corpus endometrial carcinoma; UVM, uveal melanoma.
We also extracted the expression of ADAMs in TCGA database using R software, and the resultant expression is presented in Supplementary Table S2. ADAMs were differentially expressed among all cancers and para-carcinoma tissues (Figure 2; Supplementary Figure S1).
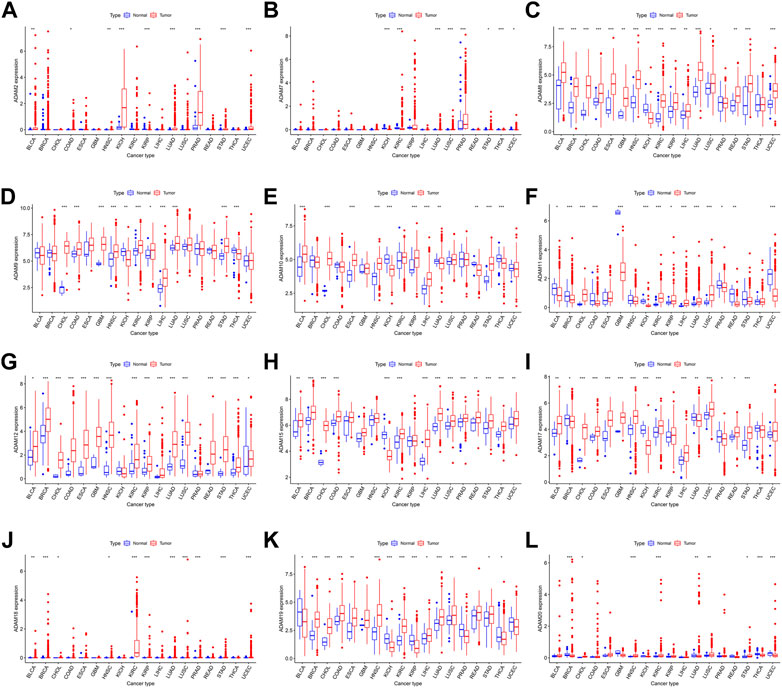
FIGURE 2. ADAM family expression levels in different cancer and para-carcinoma tissues. (A) Differential expression of ADAM2, (B) differential expression of ADAM7, (C) differential expression of ADAM8, (D) differential expression of ADAM9, (E) differential expression of ADAM10, (F) differential expression of ADAM11, (G) differential expression of ADAM12, (H) differential expression of ADAM15, (I) differential expression of ADAM17, (J) differential expression of ADAM18, (K) differential expression of ADAM19, and (L) differential expression of ADAM20. The red rectangle box represents gene expression levels in tumour tissue, and the blue rectangle box represents normal tissue. *p < 0.05, **p < 0.01, and ***p < 0.001. Cancer names in red indicate high expression, and cancer names in blue indicate low expression of the corresponding ADAM family gene.
3.2 Correlation of ADAMs and prognosis in the pan-cancer cohort
The number of normal samples of some cancer types was less than five in our study; hence, these cancers were excluded to prevent a statistical error, and a total of 28 cancers were contained in this study. We subsequently analysed the correlation between the expression of ADAMs and prognostic data. The Kaplan–Meier survival curves of ADAM9 and ADAM19 are shown in Figure 3, and the p-values of the survival analysis of other ADAMs are listed in Supplementary Table S4. Among the analysed ADAMs, ADAM9 had a negative effect on BLCA (N = 406, p = 0.042; Figure 3A), CESC (N = 293, p = 0.009; Figure 3B), KICH (N = 64, p = 0.009; Figure 3C), LGG (N = 524, p < 0.001; Figure 3D), LIHC (N = 368, p < 0.001; Figure 3E), MESO (N = 84, p = 0.005; Figure 3F), PAAD (N = 177, p < 0.001; Figure 3G), and THYM (N = 118, p = 0.019; Figure 3H). Furthermore, ADAM19 also had a negative effect on ACC (N = 79, p = 0.028; Figure 3I), KIRP (N = 286, p = 0.034; Figure 3J), LGG (N = 524, p < 0.001; Figure 3K), LIHC (N = 368, p = 0.039; Figure 3L), MESO (N = 84, p = 0.002; Figure 3M), and UVM (N = 80, p < 0.001; Figure 3O), while ADAM19 appeared to induce a protective effect on SKCM (N = 457, p = 0.023; Figure 3N). Furthermore, we investigated the prognostic risk of ADAMs in pan-cancers using Cox regression analysis, which revealed results consistent with that of the Kaplan–Meier survival curves (Figure 4).
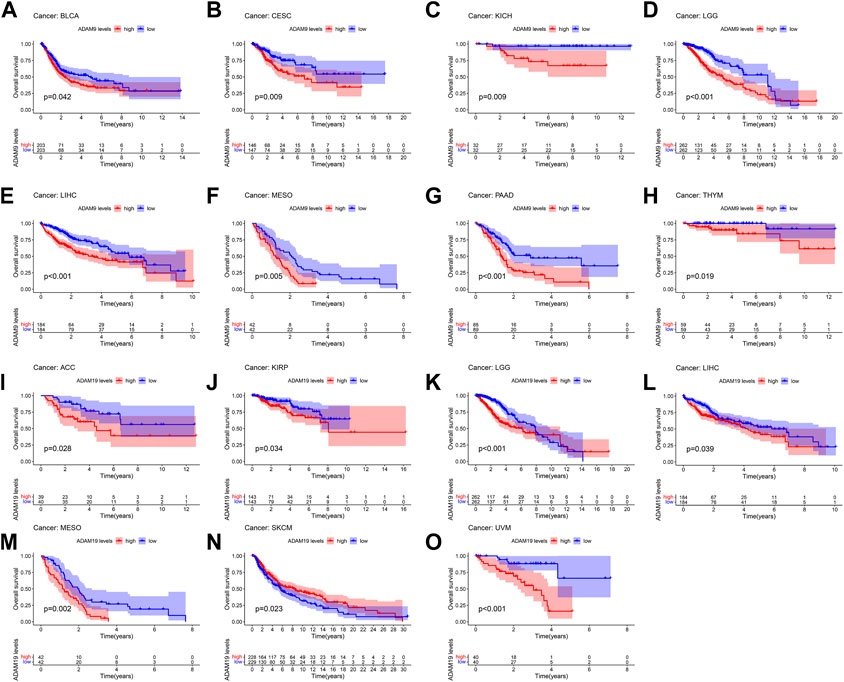
FIGURE 3. Kaplan–Meier survival curve comparison of high/low expression of ADAM family genes in pan-cancer. (A) Survival curves of ADAM9 in BLCA (N = 406), (B) survival curves of ADAM9 in CESC (N = 293), (C) survival curves of ADAM9 in KICH (N = 64), (D) survival curves of ADAM9 in LGG (N = 524), (E) survival curves of ADAM9 in LIHC (N = 368), (F) survival curves of ADAM9 in MESO (N = 84), (G) survival curves of ADAM9 in PAAD (N = 177), (H) survival curves of ADAM9 in THYM (N = 118), (I) survival curves of ADAM19 in ACC (N = 79), (J) survival curves of ADAM19 in KIRP (N = 286), (K) survival curves of ADAM19 in LGG (N = 524), (L) survival curves of ADAM19 in LIHC (N = 368), (M) survival curves of ADAM19 in MESO (N = 84), (N) survival curves of ADAM19 in SKCM (N = 457), and (O) survival curves of ADAM19 in UVM (N = 80).
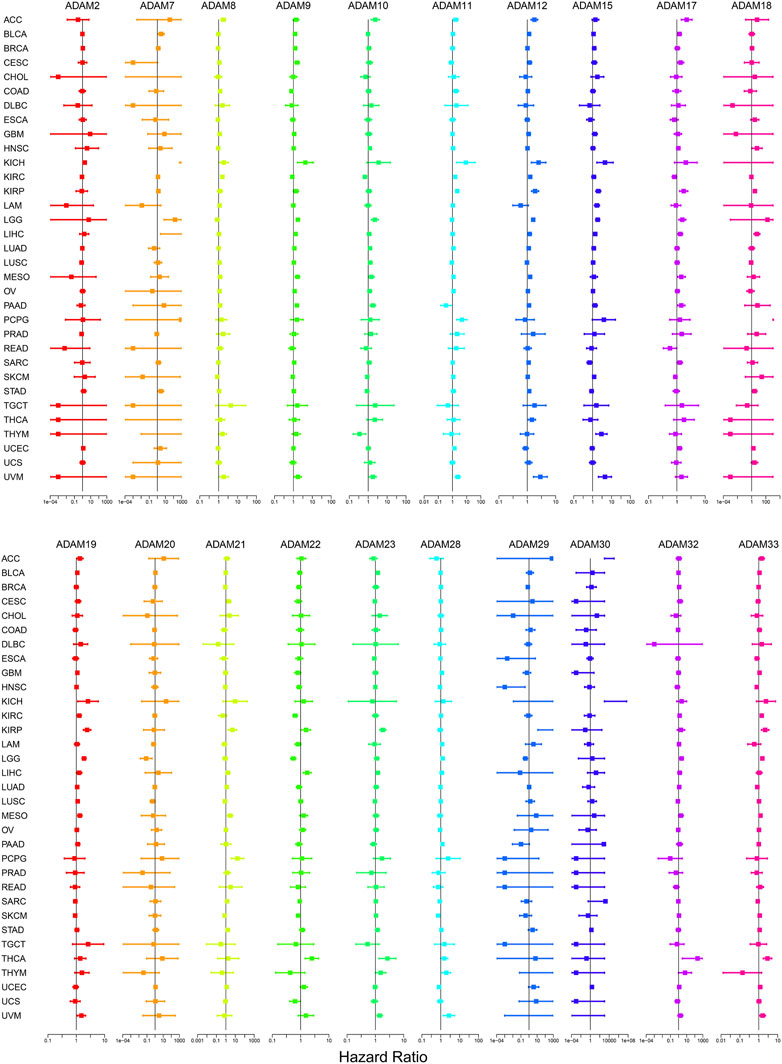
FIGURE 4. Cox regression analysis of the correlation between ADAM family expression and survival. Lines with different colours represent the risk values for different genes within the tumour, with a hazard ratio <1 indicating low risk and a hazard ratio >1 indicating high risk.
3.3 Association of ADAMs with the TME and stemness score in pan-cancers
We explored the relationship between the expression of ADAMs and the TME in pan-cancers. The immune scores and stromal scores were significantly positively correlated with the expression of ADAMs (Figures 5A, B). Furthermore, significant negative or positive correlations were found between ADAMs and RNAss (Figure 5C). A correlation between ADAMs and DNAss (Figure 5D) was also found in pan-cancers (Supplementary Table S5).
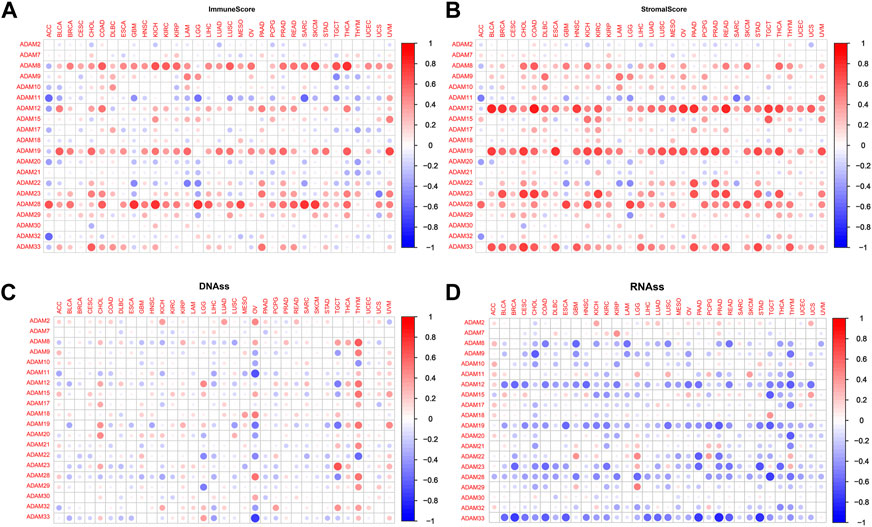
FIGURE 5. Correlation of ADAM family gene expression with the tumour microenvironment and stemness score in pan-cancer. (A, B) ADAM family gene expression correlates with various mesenchymal and immune cancer scores. Red dots indicate a positive correlation between tumour gene expression and mesenchymal score, and green dots indicate a negative correlation between tumour gene expression and mesenchymal score. (C, D) Correlation of ADAM family expression with RNAss and DNAss in pan-cancer. Red dots indicate a positive correlation between tumour gene expression and immune score, and blue dots indicate a negative correlation between tumour gene expression and immune score.
We also revealed the relevance between ADAMs and the stromal score, immune score, stemness score, and ESTIMATE score in certain types of cancer (BLCA and KIRC) (Figures 6, 7; Supplementary Table S6) and found that ADAMs had an extensive correlation with the BLCA and KIRC TME as well as DNAss and RNAss.
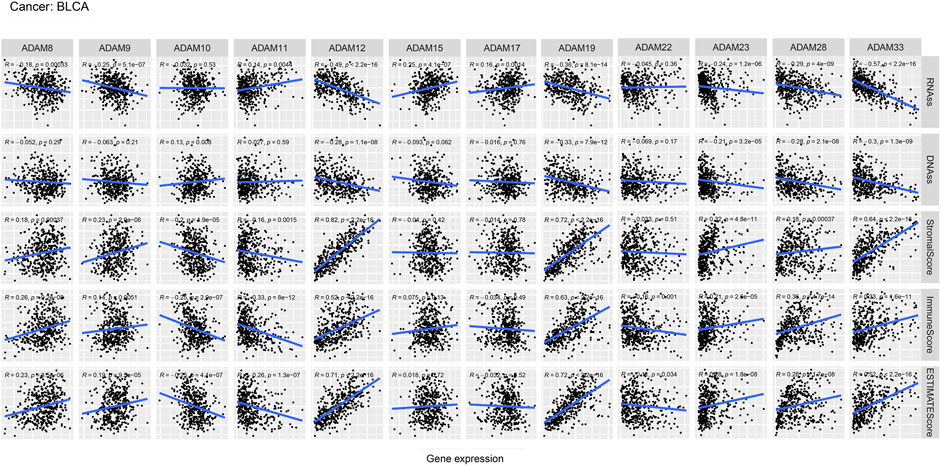
FIGURE 6. Correlation analysis of ADAM family gene expression with RNAss, DNAss, stromal score, immune score, and ESTIMATE score in BLCA.
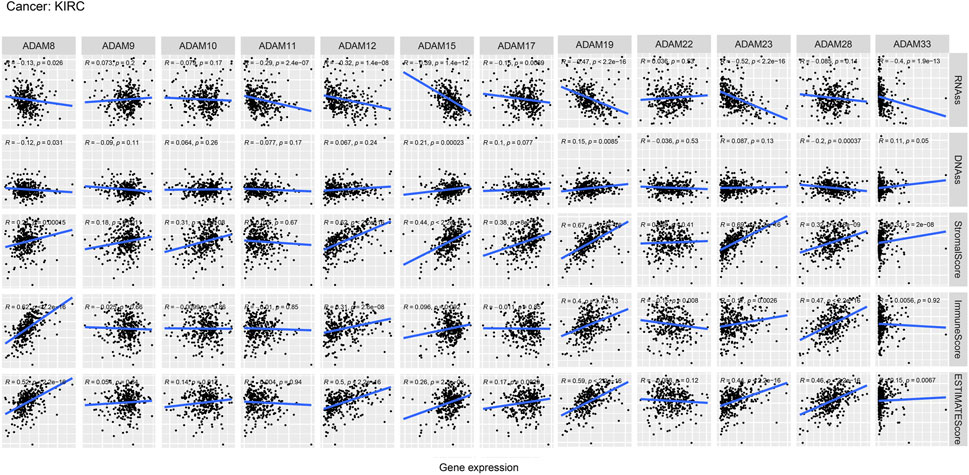
FIGURE 7. Correlation analysis of ADAM family gene expression with RNAss, DNAss, stromal score, immune score, and ESTIMATE score in KIRC.
3.4 Association of ADAMs with immune subtypes in pan-cancers
Thorsson et al. (2019) put forward six immune subtypes (C1–C6) among 33 pan-cancer types. They performed an extensive immunogenomic analysis of over 10,000 tumours, comprising 33 diverse cancer types and utilising data compiled by TCGA. They identified six immune subtypes: IFN-γ-dominant, wound healing, lymphocyte-depleted, inflammatory, TGF-β-dominant, and immunologically quiet, which showed the different characteristics of immune cell infiltration and prognosis. The immune subtypes were significantly associated with tumour prognosis and genetic and immunomodulatory changes. Thus, we further explored the correlation of ADAMs with the immune subtypes and observed that ADAM8, ADAM10, ADAM11, ADAM12, ADAM15, ADAM19, ADAM22, ADAM23, ADAM28, and ADAM33 were differentially expressed in both BRCA and COAD (Figure 8). Additionally, ADAM19 showed a significantly higher expression in C1–C3 of BLCA and KIRC, whereas ADAM8 was highly expressed in C6 of BLCA and KIRC. Moreover, the expression of the ADAM family in C5 was generally lower than that in other immune subtypes in KIRC. Thus, ADAMs were correlated with these immune subtypes (Figure 8), which improved the prognostic value and potential clinical use of ADAMs.
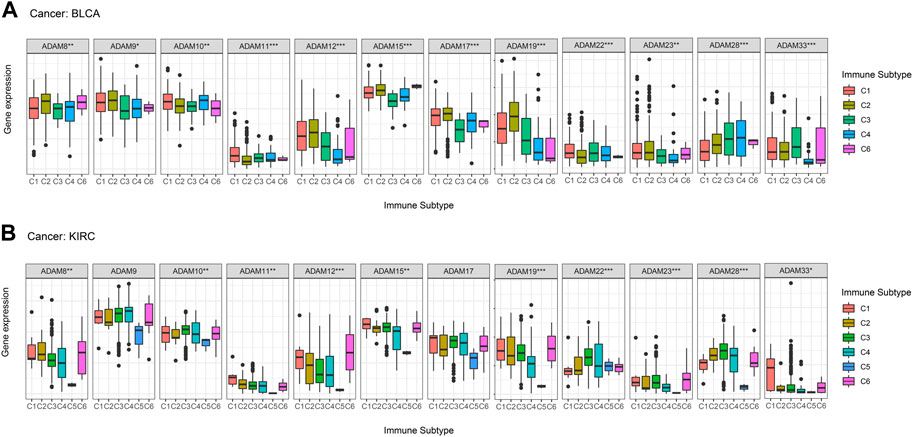
FIGURE 8. Correlation between ADAM family expression and immune subtypes in BLCA and KIRC. (A) ADAM family expression in different immune subtypes in BLCA. (B) ADAM family expression in different immune subtypes in KIRC. The X-axis represents the immune subtype, and the Y-axis represents gene expression. C1, wound healing; C2, IFN-γ-dominant; C3, inflammatory; C4, lymphocyte-depleted; C5, immunologically quiet; C6, TGF-β-dominant. p < 0.05; **p < 0.01; ***p < 0.001.
3.5 Association of ADAMs with the outcome of chemotherapy and immunotherapy treatments in the pan-cancer cohort
We extracted drug sensitivity data from the CellMiner database to determine the correlation between ADAMs and drug sensitivity. The top 16 drugs showing sensitivity to ADAMs are shown in Figure 9 and Supplementary Table S7. Notably, ADAM33 was positively correlated with the sensitivity of nelarabine, chelerythrine, fluphenazine, dexamethasone (Decadron), PX-316, asparaginase, fludarabine, and fenretinide (Figures 9A–D, G, J, O, P). Additionally, raloxifene, tamoxifen, and bafetinib were negatively correlated with ADAM9 (Figures 9E, F, M). Furthermore, nelarabine was positively correlated with ADAM22 (Figure 9H); procarbazine and itraconazole shared a positive correlation with ADAM8 (Figures 9K, L); ADAM28 was negatively correlated with ixazomib citrate (Figure 9I); and ADAM17 was negatively correlated with tamoxifen (Figure 9N). ADAM9 was significantly associated with 82 different drug sensitivities, including tamoxifen, cyclophosphamide, oxaliplatin, and bafetinib. Furthermore, ADAM9 showed significantly different expression between tumour and para-carcinoma tissues in KIRC using qRT-PCR analysis (Figure 9Q). The protein expression of ADAM9 in KIRC using immunohistochemistry revealed results consistent with that of qRT-PCR, wherein a significantly higher expression of ADAM9 in tumour tissues was confirmed. However, the differential expression of ADAM9 in BLCA samples was also observed (Supplementary Figure S2).
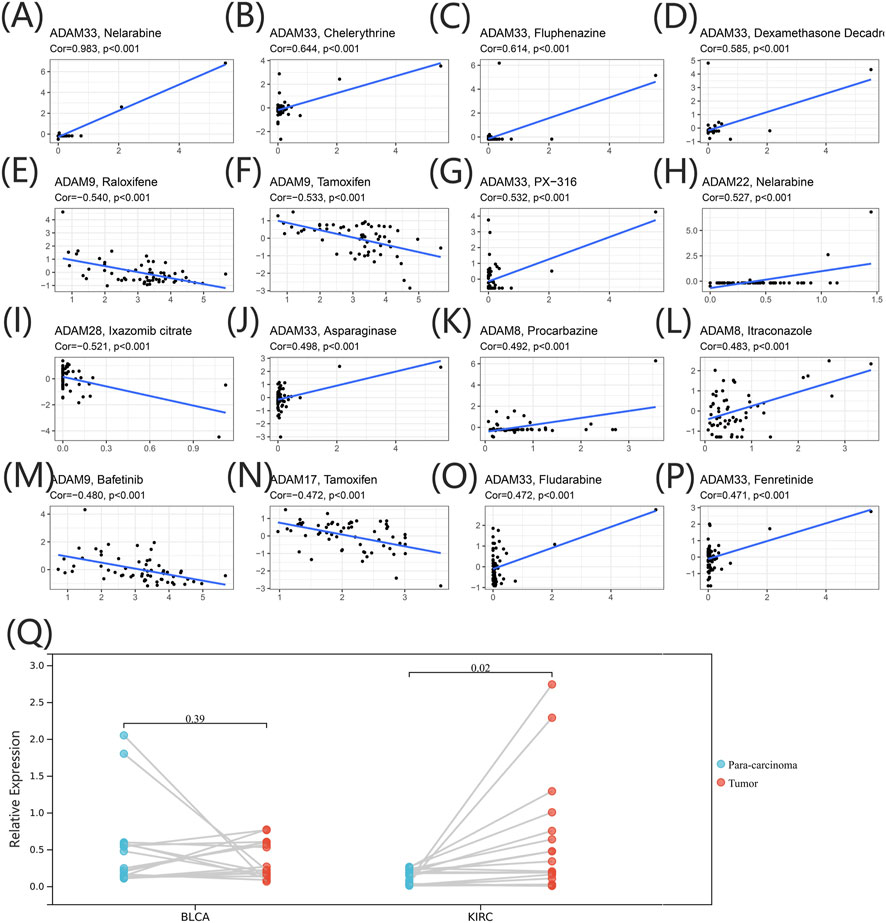
FIGURE 9. (A–P) Drug sensitivity analysis of the ADAM family gene. The X-axis represents the relative sensitivity with certain drugs, and the Y-axis represents the relative expression of ADAMs. (Q) Differential expression of ADAM9 in BLCA and KIRC tissues.
We further extracted the expression levels of ADAM19 from the GSE78220 (Figure 10A) and IMvigor210 (Figure 10B) datasets and compared the expression with immune response. ADAM19 was significantly negatively correlated with immunotherapy response.
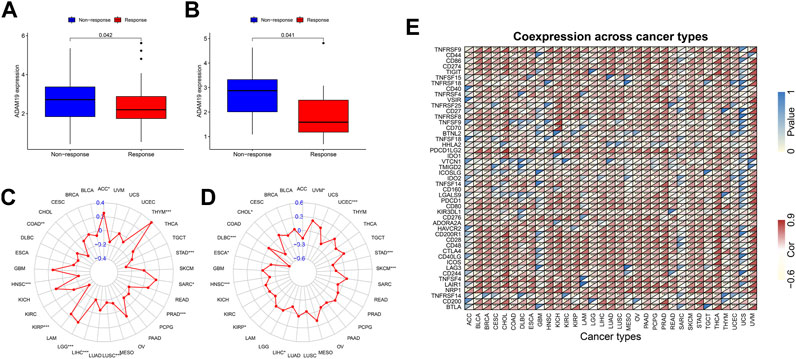
FIGURE 10. Correlation of immunotherapy outcome, TMB, MSI, and immune activation-related genes with the expression of ADAM19. (A) Expression levels of ADAM19 in GSE78220. (B) Expression levels of ADAM19 in IMvigor210 (C) The relationship between TMB and ADAM19 expression (D) The relationship between MSI and ADAM19 expression (E) Co-expression of immune activation genes with ADAM19.
TMB has been recently considered a potential predictive biomarker of immunotherapy (Picard et al., 2020; Jardim et al., 2021; Rizzo et al., 2021). Meanwhile, MSI has also been reported to be correlated with immunotherapy outcomes (Rizzo et al., 2021). The relationship between TMB and ADAM19 expression was explored (Figure 10C; Supplementary Table S8), and the significant correlation between ADAM19 expression and MSI was detected in various types of cancers, including CHOL, DLBC, ESCA, HNSC, KIRP, LICH, SKCM, STAD, UCEC, and UVM (Figure 10D).
Furthermore, we found the co-expression of immune activation genes and ADAM19 (Figure 10E), revealing a significant correlation of ADAM19 with immune activation genes among almost all 33 types of cancer.
4 Discussion
Cancer is the leading cause of death globally (Shams-White et al., 2021; Soerjomataram and Bray, 2021). In 2022, approximately 4.82 million new cancer cases and 3.21 million cancer-related deaths have been reported in China (Xia et al., 2022). Since 2000, the number of cancer-related morbidity and mortality along with their incidence has been increasing annually in China (Wei et al., 2020). Accumulating evidence indicated that proteolytic enzymes, such as MMPs and closely related ADAMs and ADAMTSs, play key roles in cancer initiation and progression (Rocks et al., 2008). Wei et al. (2019) reported that the over-expression of ADAM28 in pancreatic cancer was closely correlated with the regulation of gemcitabine resistance. Similarly, Wang et al. (2011) reported that ADAM10 was significantly associated with lymph node and distant metastasis in gastric cancer. In this study, we focused on the pan-cancer analysis of all ADAMs and explored the differential expression of ADAMs in various types of cancer, as shown in Table 1; we found that both ADAM8 and ADAM12 were located at 10q26. In our results, we also found a significant positive correlation between ADAM8 and ADAM12. Similar results were also observed between ADAM21 and ADAM22. Shimura et al. (2015) revealed that urinary MMP-9/NGAL and urinary ADAM12 are potential non-invasive biomarkers for gastric cancer, including early-stage diseases. Xiao et al. (2012) reported that ADAM17 was an important contributor to prostate cancer invasion according to the shedding of the EGFR ligand TGF-α, which subsequently activates the EGFR–MEK–ERK signalling pathway and induces the over-expression of MMP-2 and MMP-9. Furthermore, Karan et al. (2003) indicated that an inverse expression pattern of ADAM17/TACE and TIMP3 and the regulation of ADAMs with DHT could play an important role in the pathogenesis of prostate cancer. Currently, the most specific therapeutic monoclonal antibody against ADAM17 is D1 (A12), which binds to both the catalytic and disintegrin/cysteine-rich domains of ADAM17 (Tape et al., 2011). It has been proven to be effective in ovarian cancer cells (Richards et al., 2012), breast cancer (Caiazza et al., 2015), and head and neck cancer (Huang et al., 2014). Additionally, ADAM inhibitors can also effectively assist the therapeutic effect of existing monoclonal antibodies. ADAM10 inhibitors have been reported to be protective against HER2-positive breast cancers, which are resistant to Herceptin (trastuzumab) (Rimawi et al., 2015).
The role of ADAMs in tumours remains limited, despite the increasing knowledge of the overall role of ADAMs. In our study, significant differential expression of ADAM8, ADAM9, ADAM10, ADAM11, ADAM12, ADAM15, ADAM17, ADAM19, ADAM22, ADAM23, and ADAM33 was observed among almost all types of cancer. ADAM8 was significantly highly expressed in tumour tissue compared with para-cancerous tissue in all types of cancer, except for KIRC, PRAD, and THCA, indicating ADAM8 could be a significant biomarker for tumours. Notably, the correlation of ADAM8 with tumour progression, metastasis, and chemoresistance in various invasive cancers, including pancreatic cancer (Yu et al., 2019), breast cancer (Conrad et al., 2018), and lung cancer (Ishikawa et al., 2004), has been previously reported. Furthermore, ADAM12 was also generally highly expressed in almost all types of tumour tissues. Wang et al. (2021) reported that ADAM12 inhibition, which was induced by a hypoxia-inducible factor, could effectively downregulate migration and invasion in breast cancer cell lines and also in immuno-deficient mice.
Recently, researchers have been increasingly focusing on the surroundings of solid cancers instead of the tumour itself (Quail and Joyce, 2013; Wu and Dai, 2017; Hinshaw and Shevde, 2019). The surroundings of the cancers are collectively known as the TME which includes immune and stromal cells, and these factors synergistically formed an inflammatory, tumour-promoting, and immuno-suppressive environment which helps cancer cells escape from immune surveillance (Wu and Dai, 2017). In this study, the ESTIMATE algorithm was used to calculate the immune score and stromal score as well as explore the correlation between these scores and ADAM expression. As shown in Figures 5A, B, ADAM8, 19, and 28 showed a significantly positive correlation with both the immune score and stromal score in pan-cancers, indicating that these genes may play an important role in TME development and could be potential immunotherapy targets. Furthermore, we assessed tumour stemness among different ADAMs in cancers using RNAss and DNAss. These results highlighted the negative effect of ADAMs on characterising cancer cells. Furthermore, as shown in Figures 6, 7, a significant positive correlation was observed between ADAM expression, including ADAM8, 9, 12, 19, 23, 28, and 33, whereas ADAM10, 11, and 22 were negatively correlated with the stromal score and immune score.
Although most studies related to ADAM9 focused more on its effect on tumour proliferation, migration, and invasion, various studies have pointed out the value of ADAM9 for tumour drug therapy. In the current study, ADAM9 was significantly associated with 82 different drug sensitivities, including tamoxifen, cyclophosphamide, oxaliplatin, and bafetinib. Liu et al. (2021) revealed that the cisplatin treatment of non-small-cell lung cancer could be promoted by ADAM9 while being negatively regulated by miR-126-5p. Slapak et al. (2021) reported a novel ADAM9-responsive, protease-dependent, drug delivery system for patients with pancreatic ductal adenocarcinoma that can reduce the cytotoxicity of systemic chemotherapy. As for the different results of ADAM9 of PCR and immunohistochemistry in BLCA, it happens occasionally. The transcription and translation of eukaryotic genes were differentially expressed; hence, it is also necessary to determine how the protein level changes.
In terms of cancer treatment, monoclonal antibodies also have their niche population. Monoclonal antibodies have a more specific mode of action and thus cause fewer cytotoxic side effects than low-molecular-weight antibodies. In addition, some monoclonal antibodies can exert anti-cancer activity by inducing antibody-dependent cytotoxicity (Mullooly et al., 2016). Furthermore, in the current study, ADAM19 was negatively correlated with immunotherapy outcomes and strongly correlated with chemotherapy drugs, thus providing a solid theoretical foundation for further research.
5 Conclusion
The expression profile of ADAMs in pan-cancers has been demonstrated to correlate with prognosis, tumour microenvironment, treatment outcome, and stemness score. Furthermore, the expression levels of ADAMs in tumour cells are also related to the efficacy of different chemotherapy-related drugs and their response to immunotherapy. These results thus provide a reference for future research on ADAM family genes as potential pan-cancer targets.
Data availability statement
The datasets presented in this study can be found in online repositories. The names of the repository/repositories and accession number(s) can be found in the article/Supplementary Material.
Ethics statement
The studies involving human participants were reviewed and approved by the Institutional Research Ethics Committee. The clinical specimens were collected with permission from the Institutional Research Ethics Committee (No. 2021-P2-159). The Ethics Committee waived the requirement of written informed consent for participation.
Author contributions
BM and RY made substantial contributions to the conception and design of the research. BM integrated and analysed the data and drafted the manuscript. RY edited the manuscript and provided critical comments. All authors read and approved the final manuscript.
Funding
This work was funded by the Beijing Natural Science Foundation (Grant No. 7194279).
Acknowledgments
The authors are grateful to The Cancer Genome Atlas Research Network for the clinicopathological and genetic alteration data. They are also thankful to the Urology Department of Beijing Friendship Hospital, Capital Medical University, for their contribution in obtaining the tissue samples of BLCA and KIRC. They also thank Bullet Edits Limited for the linguistic editing and proofreading of the manuscript.
Conflict of interest
The authors declare that the research was conducted in the absence of any commercial or financial relationships that could be construed as a potential conflict of interest.
Publisher’s note
All claims expressed in this article are solely those of the authors and do not necessarily represent those of their affiliated organizations, or those of the publisher, the editors, and the reviewers. Any product that may be evaluated in this article, or claim that may be made by its manufacturer, is not guaranteed or endorsed by the publisher.
Supplementary material
The Supplementary Material for this article can be found online at: https://www.frontiersin.org/articles/10.3389/fgene.2023.1105900/full#supplementary-material
References
Caiazza, F., McGowan, P. M., Mullooly, M., Murray, A., Synnott, N., O'Donovan, N., et al. (2015). Targeting ADAM-17 with an inhibitory monoclonal antibody has antitumour effects in triple-negative breast cancer cells. Br. J. Cancer 112 (12), 1895–1903. doi:10.1038/bjc.2015.163
Camodeca, C., Cuffaro, D., Nuti, E., and Rossello, A. (2019). ADAM metalloproteinases as potential drug targets. Curr. Med. Chem. 26 (15), 2661–2689. doi:10.2174/0929867325666180326164104
Conrad, C., Gotte, M., Schlomann, U., Roessler, M., Pagenstecher, A., Anderson, P., et al. (2018). ADAM8 expression in breast cancer derived brain metastases: Functional implications on MMP-9 expression and transendothelial migration in breast cancer cells. Int. J. Cancer 142 (4), 779–791. doi:10.1002/ijc.31090
Du, S., Sun, L., Wang, Y., Zhu, W., Gao, J., Pei, W., et al. (2022). ADAM12 is an independent predictor of poor prognosis in liver cancer. Sci. Rep. 12 (1), 6634. doi:10.1038/s41598-022-10608-y
Girigoswami, K., Saini, D., and Girigoswami, A. (2021). Extracellular matrix remodeling and development of cancer. Stem Cell Rev. Rep. 17 (3), 739–747. doi:10.1007/s12015-020-10070-1
Heib, M., Rose-John, S., and Necroptosis, Adam D. (2020). Necroptosis, ADAM proteases and intestinal (dys)function. Int. Rev. Cell Mol. Biol. 353, 83–152. doi:10.1016/bs.ircmb.2020.02.001
Hinshaw, D. C., and Shevde, L. A. (2019). The tumor microenvironment innately modulates cancer progression. Cancer Res. 79 (18), 4557–4566. doi:10.1158/0008-5472.CAN-18-3962
Huang, J., Zhang, L., Wan, D., Zhou, L., Zheng, S., Lin, S., et al. (2021). Extracellular matrix and its therapeutic potential for cancer treatment. Signal Transduct. Target Ther. 6 (1), 153. doi:10.1038/s41392-021-00544-0
Huang, Y., Benaich, N., Tape, C., Kwok, H. F., and Murphy, G. (2014). Targeting the sheddase activity of ADAM17 by an anti-ADAM17 antibody D1(A12) inhibits head and neck squamous cell carcinoma cell proliferation and motility via blockage of bradykinin induced HERs transactivation. Int. J. Biol. Sci. 10 (7), 702–714. doi:10.7150/ijbs.9326
Ishikawa, N., Daigo, Y., Yasui, W., Inai, K., Nishimura, H., Tsuchiya, E., et al. (2004). ADAM8 as a novel serological and histochemical marker for lung cancer. Clin. Cancer Res. 10 (24), 8363–8370. doi:10.1158/1078-0432.CCR-04-1436
Jardim, D. L., Goodman, A., de Melo Gagliato, D., and Kurzrock, R. (2021). The challenges of tumor mutational burden as an immunotherapy biomarker. Cancer Cell 39 (2), 154–173. doi:10.1016/j.ccell.2020.10.001
Jin, Q., Jin, X., Liu, T., Lu, X., Wang, G., and He, N. (2020). A disintegrin and metalloproteinase 8 induced epithelial-mesenchymal transition to promote the invasion of colon cancer cells via TGF-β/Smad2/3 signalling pathway. J. Cell Mol. Med. 24 (22), 13058–13069. doi:10.1111/jcmm.15907
Karan, D., Lin, F. C., Bryan, M., Ringel, J., Moniaux, N., Lin, M. F., et al. (2003). Expression of ADAMs (a disintegrin and metalloproteases) and TIMP-3 (tissue inhibitor of metalloproteinase-3) in human prostatic adenocarcinomas. Int. J. Oncol. 23 (5), 1365–1371. doi:10.3892/ijo.23.5.1365
Li, Y. Q., Liu, Y. S., Ying, X. W., Zhou, H. B., Wang, Z., Wu, S. C., et al. (2018). Lentivirus-mediated disintegrin and metalloproteinase 17 RNA interference reversed the acquired resistance to gefitinib in lung adenocarcinoma cells in vitro. Biotechnol. Prog. 34 (1), 196–205. doi:10.1002/btpr.2564
Liu, B., Wang, R., and Liu, H. (2021). mir-126-5p promotes cisplatin sensitivity of non-small-cell lung cancer by inhibiting ADAM9. Biomed. Res. Int. 2021, 6622342. doi:10.1155/2021/6622342
Malemud, C. J. (2019). Inhibition of MMPs and ADAM/ADAMTS. Biochem. Pharmacol. 165, 33–40. doi:10.1016/j.bcp.2019.02.033
Miao, Y., Wang, J., Li, Q., Quan, W., Wang, Y., Li, C., et al. (2020). Prognostic value and immunological role of PDCD1 gene in pan-cancer. Int. Immunopharmacol. 89, 107080. doi:10.1016/j.intimp.2020.107080
Mohan, V., Das, A., and Sagi, I. (2020). Emerging roles of ECM remodeling processes in cancer. Semin. Cancer Biol. 62, 192–200. doi:10.1016/j.semcancer.2019.09.004
Mullooly, M., McGowan, P. M., Crown, J., and Duffy, M. J. (2016). The ADAMs family of proteases as targets for the treatment of cancer. Cancer Biol. Ther. 17 (8), 870–880. doi:10.1080/15384047.2016.1177684
Najafi, M., Farhood, B., and Mortezaee, K. (2019). Extracellular matrix (ECM) stiffness and degradation as cancer drivers. J. Cell Biochem. 120 (3), 2782–2790. doi:10.1002/jcb.27681
Nissen, N. I., Karsdal, M., and Willumsen, N. (2019). Collagens and Cancer associated fibroblasts in the reactive stroma and its relation to Cancer biology. J. Exp. Clin. Cancer Res. 38 (1), 115. doi:10.1186/s13046-019-1110-6
Padhi, A., and Nain, A. S. (2020). ECM in differentiation: A review of matrix structure, composition and mechanical properties. Ann. Biomed. Eng. 48 (3), 1071–1089. doi:10.1007/s10439-019-02337-7
Picard, E., Verschoor, C. P., Ma, G. W., and Pawelec, G. (2020). Relationships between immune landscapes, genetic subtypes and responses to immunotherapy in colorectal cancer. Front. Immunol. 11, 369. doi:10.3389/fimmu.2020.00369
Quail, D. F., and Joyce, J. A. (2013). Microenvironmental regulation of tumor progression and metastasis. Nat. Med. 19 (11), 1423–1437. doi:10.1038/nm.3394
Richards, F. M., Tape, C. J., Jodrell, D. I., and Murphy, G. (2012). Anti-tumour effects of a specific anti-ADAM17 antibody in an ovarian cancer model in vivo. PLoS One 7 (7), e40597. doi:10.1371/journal.pone.0040597
Rimawi, M. F., Schiff, R., and Osborne, C. K. (2015). Targeting HER2 for the treatment of breast cancer. Annu. Rev. Med. 66, 111–128. doi:10.1146/annurev-med-042513-015127
Rizzo, A., Ricci, A. D., and Brandi, G. (2021). PD-L1, TMB, MSI, and other predictors of response to immune checkpoint inhibitors in biliary tract cancer. Cancers (Basel) 13 (3), 558. doi:10.3390/cancers13030558
Rocks, N., Paulissen, G., El Hour, M., Quesada, F., Crahay, C., Gueders, M., et al. (2008). Emerging roles of ADAM and ADAMTS metalloproteinases in cancer. Biochimie 90 (2), 369–379. doi:10.1016/j.biochi.2007.08.008
Saha, N., Robev, D., Himanen, J. P., and Nikolov, D. B. (2019). ADAM proteases: Emerging role and targeting of the non-catalytic domains. Cancer Lett. 467, 50–57. doi:10.1016/j.canlet.2019.10.003
Schmittgen, T. D., and Livak, K. J. (2008). Analyzing real-time PCR data by the comparative C(T) method. Nat. Protoc. 3 (6), 1101–1108. doi:10.1038/nprot.2008.73
Shams-White, M. M., Barajas, R., Jensen, R. E., Rotunno, M., Dueck, H., Ginexi, E. M., et al. (2021). Systems epidemiology and cancer: A review of the national institutes of health extramural grant portfolio 2013-2018. PLoS One 16 (4), e0250061. doi:10.1371/journal.pone.0250061
Shimura, T., Dagher, A., Sachdev, M., Ebi, M., Yamada, T., Yamada, T., et al. (2015). Urinary ADAM12 and MMP-9/NGAL complex detect the presence of gastric cancer. Cancer Prev. Res. (Phila). 8 (3), 240–248. doi:10.1158/1940-6207.CAPR-14-0229
Slapak, E. J., Kong, L., El Mandili, M., Nieuwland, R., Kros, A., Bijlsma, M. F., et al. (2021). ADAM9-Responsive mesoporous silica nanoparticles for targeted drug delivery in pancreatic cancer. Cancers (Basel) 13 (13), 3321. doi:10.3390/cancers13133321
Soerjomataram, I., and Bray, F. (2021). Planning for tomorrow: Global cancer incidence and the role of prevention 2020-2070. Nat. Rev. Clin. Oncol. 18 (10), 663–672. doi:10.1038/s41571-021-00514-z
Tape, C. J., Willems, S. H., Dombernowsky, S. L., Stanley, P. L., Fogarasi, M., Ouwehand, W., et al. (2011). Cross-domain inhibition of TACE ectodomain. Proc. Natl. Acad. Sci. U. S. A. 108 (14), 5578–5583. doi:10.1073/pnas.1017067108
Theret, N., Bouezzedine, F., Azar, F., Diab-Assaf, M., and Legagneux, V. (2021). ADAM and ADAMTS proteins, new players in the regulation of hepatocellular carcinoma microenvironment. Cancers (Basel) 13 (7), 1563. doi:10.3390/cancers13071563
Thorsson, V., Gibbs, D. L., Brown, S. D., Wolf, D., Bortone, D. S., Ou Yang, T. H., et al. (2019). The immune landscape of cancer. Immunity 51 (2), 411–412. doi:10.1016/j.immuni.2019.08.004
Valdoz, J. C., Johnson, B. C., Jacobs, D. J., Franks, N. A., Dodson, E. L., Sanders, C., et al. (2021). The ECM: To scaffold, or not to scaffold, that is the question. Int. J. Mol. Sci. 22, 12690. doi:10.3390/ijms222312690
Wagner, G. P., Kin, K., and Lynch, V. J. (2012). Measurement of mRNA abundance using RNA-seq data: RPKM measure is inconsistent among samples. Theory Biosci. 131 (4), 281–285. doi:10.1007/s12064-012-0162-3
Walker, C., Mojares, E., and Del Rio Hernandez, A. (2018). Role of extracellular matrix in development and cancer progression. Int. J. Mol. Sci. 19 (10), 3028. doi:10.3390/ijms19103028
Wang, R., Godet, I., Yang, Y., Salman, S., Lu, H., Lyu, Y., et al. (2021). Hypoxia-inducible factor-dependent ADAM12 expression mediates breast cancer invasion and metastasis. Proc. Natl. Acad. Sci. U. S. A. 118 (19), e2020490118. doi:10.1073/pnas.2020490118
Wang, Y. Y., Ye, Z. Y., Li, L., Zhao, Z. S., Shao, Q. S., and Tao, H. Q. (2011). ADAM 10 is associated with gastric cancer progression and prognosis of patients. J. Surg. Oncol. 103 (2), 116–123. doi:10.1002/jso.21781
Wei, L., Wen, J. Y., Chen, J., Ma, X. K., Wu, D. H., Chen, Z. H., et al. (2019). Oncogenic ADAM28 induces gemcitabine resistance and predicts a poor prognosis in pancreatic cancer. World J. Gastroenterol. 25 (37), 5590–5603. doi:10.3748/wjg.v25.i37.5590
Wei, W., Zeng, H., Zheng, R., Zhang, S., An, L., Chen, R., et al. (2020). Cancer registration in China and its role in cancer prevention and control. Lancet Oncol. 21 (7), e342–e349. doi:10.1016/S1470-2045(20)30073-5
Wu, T., and Dai, Y. (2017). Tumor microenvironment and therapeutic response. Cancer Lett. 387, 61–68. doi:10.1016/j.canlet.2016.01.043
Xia, C., Dong, X., Li, H., Cao, M., Sun, D., He, S., et al. (2022). Cancer statistics in China and United States, 2022: Profiles, trends, and determinants. Chin. Med. J. Engl. 135 (5), 584–590. doi:10.1097/CM9.0000000000002108
Xiao, L. J., Lin, P., Lin, F., Liu, X., Qin, W., Zou, H. F., et al. (2012). ADAM17 targets MMP-2 and MMP-9 via EGFR-MEK-ERK pathway activation to promote prostate cancer cell invasion. Int. J. Oncol. 40 (5), 1714–1724. doi:10.3892/ijo.2011.1320
Keywords: ADAMs, pan-cancer, TME, prognosis, chemotherapy, immunotherapy
Citation: Ma B and Yu R (2023) Pan-cancer analysis of ADAMs: A promising biomarker for prognosis and response to chemotherapy and immunotherapy. Front. Genet. 14:1105900. doi: 10.3389/fgene.2023.1105900
Received: 23 November 2022; Accepted: 20 March 2023;
Published: 04 April 2023.
Edited by:
Changsheng Xing, University of Southern California, United StatesReviewed by:
Xin Liu, University of Southern California, United StatesLaralynne Przybyla, University of California, San Francisco, United States
Jianyang Du, Shandong Provincial Hospital Affiliated to Shandong First Medical University, China
Copyright © 2023 Ma and Yu. This is an open-access article distributed under the terms of the Creative Commons Attribution License (CC BY). The use, distribution or reproduction in other forums is permitted, provided the original author(s) and the copyright owner(s) are credited and that the original publication in this journal is cited, in accordance with accepted academic practice. No use, distribution or reproduction is permitted which does not comply with these terms.
*Correspondence: Bo Ma, mabo3476@bjsjth.cn; Riyue Yu, yu-riyue@bjsjth.cn