 Dan Zhu1,2†
 Chunyang Wang3†
 Lining Guo2†
 Daojun Si4Mengge Liu2
 Mengjing Cai2Lin Ma2Dianxun Fu2
 Jilian Fu2*
 Junping Wang2*
 Feng Liu2*
- 1Department of Radiology, Tianjin Medical University General Hospital Airport Hospital, Tianjin, China
- 2Department of Radiology and Tianjin Key Laboratory of Functional Imaging, Tianjin Medical University General Hospital, Tianjin, China
- 3Department of Scientific Research, Tianjin Medical University General Hospital, Tianjin, China
- 4National Supercomputer Center in Tianjin, Tianjin, China
Schizophrenia (SCZ) is an idiopathic psychiatric disorder with a heritable component and a substantial public health impact. Although abnormalities in total brain volumetric measures (TBVMs) have been found in patients with SCZ, it is still unknown whether these abnormalities have a causal effect on the risk of SCZ. Here, we performed a Mendelian randomization (MR) study to investigate the possible causal associations between each TBVM and SCZ risk. Specifically, genome-wide association study (GWAS) summary statistics of total gray matter volume, total white matter volume, total cerebrospinal fluid volume, and total brain volume were obtained from the United Kingdom Biobank database (33,224 individuals), and SCZ GWAS summary statistics were provided by the Psychiatric Genomics Consortium (150,064 individuals). The main MR analysis was conducted using the inverse variance weighted method, and other MR methods, including MR-Egger, weighted median, simple mode, and weighted mode methods, were performed to assess the robustness of our findings. For pleiotropy analysis, we employed three approaches: MR-Egger intercept, MR-PRESSO, and heterogeneity tests. No TBVM was causally associated with SCZ risk according to the MR results, and no significant pleiotropy or heterogeneity was found for instrumental variables. Taken together, this study suggested that alterations in TBVMs were not causally associated with the risk of SCZ.
Introduction
Schizophrenia (SCZ) is one of the most serious mental disorders; it has a high disability rate worldwide and has brought heavy economic burdens and life pressure to families and society (Mueser and McGurk, 2004). SCZ has been shown to have a high rate of heritability (60–80%), much of which is attributable to common risk alleles, suggesting that the genome-wide association study (GWAS) can enhance our understanding of the etiology of SCZ (Kahn et al., 2015). The GWAS has revealed that single-nucleotide polymorphisms (SNPs) at novel loci confer risk for SCZ, and these results have been obtained by enlarging sample sizes and incorporating more ethnicities (Ripke et al., 2013; Schizophrenia Working Group of the Psychiatric Genomics Consortium, 2014; Lam et al., 2019).
In addition to the genetic basis, substantial efforts have been made in the past decade to elucidate the neural basis of SCZ by using neuroimaging techniques (Kahn et al., 2015). Neuroimaging measures can be considered as endophenotypes, which are quantitative indicators of brain structure or function that index genetic liability for neuropsychiatric disorders (Meyer-Lindenberg and Weinberger, 2006). Compared to neuropsychiatric disorders, endophenotypes are hypothesized to have less polygenicity, have a greater effect size of susceptible SNPs, and require smaller sample sizes to discover the SNPs (Gottesman and Gould, 2003; Meyer-Lindenberg and Weinberger, 2006). A number of studies have reported alterations in total brain volumetric measures (TBVMs), such as total gray matter volume (TGMV), total white matter volume (TWMV), total cerebrospinal fluid volume (TCSFV), and total brain volume (TBV), in patients with SCZ. For example, Haijma et al. (2013) conducted a meta-analysis on TBVMs in more than 18,000 patients and controls, demonstrating a significant reduction in intracranial volume (ICV, sum of TGMV, TWMV, and TCSFV) and TBV (sum of TGMV and TWMV) and an increase in TCSFV in SCZ patients. In addition, progressive decreases in TBV and ventricular expansions (increased in TCSFV) were found in longitudinal studies of SCZ (Kempton et al., 2010; Olabi et al., 2011). However, all these findings were based on observational studies, which may be limited by the possibility of confounding factors and reserve causation; thus, it is still unknown whether TBVM alterations have a causal effect on the risk of SCZ.
Mendelian randomization (MR) is an epidemiological approach that could overcome the limitations in observation studies by using genetic variants associated with exposure as instrumental variables to uncover the causal relationship between an exposure and an outcome (Lawlor et al., 2008). In addition, MR can control the confounding factors and reverse causation that are usually encountered in observation studies. To date, MR has been successfully applied to assess causal relationships in pioneer studies of neuropsychiatric diseases (Hartwig et al., 2017a; Liu et al., 2018; Vaucher et al., 2018; He et al., 2020; Wang et al., 2020; Zhang et al., 2020). For instance, Hartwig et al. found a protective effect of C-reactive protein and a risk-increasing effect of soluble interleukin-6 receptor on SCZ risk (Hartwig et al., 2017a). Vaucher et al. reported that the use of cannabis was causally associated with an increased risk of SCZ (Vaucher et al., 2018). Therefore, in this study, by leveraging data from the largest GWAS summary statistics on both TBVMs and SCZ, we performed a two-sample MR study to estimate the causal effect of TBVMs, including TGMV, TWMV, TCSFV, and TBV, on the risk of SCZ.
Materials and Methods
Study Design
MR is an approach that uses genetic variants as instrumental variables to investigate the causal relationship between exposures and outcomes, which should satisfy three principal assumptions: 1) the instrumental variables should be significantly associated with exposure; 2) the instrumental variables should not be associated with any confounders; and 3) the instrumental variables should affect the risk of the outcome only by the exposure. The second and third assumptions are also considered independent of pleiotropy. In this study, MR is based on the publicly available GWAS summary datasets of TBVMs (Smith et al., 2021) and SCZ (Schizophrenia Working Group of the Psychiatric Genomics Consortium, 2014), and all subjects provided informed consent in the original studies. Specifically, the genetic variants that were significantly associated with TBVMs were used as instrumental variables to examine the causal influence of TBVMs on SCZ risk (Figure 1).
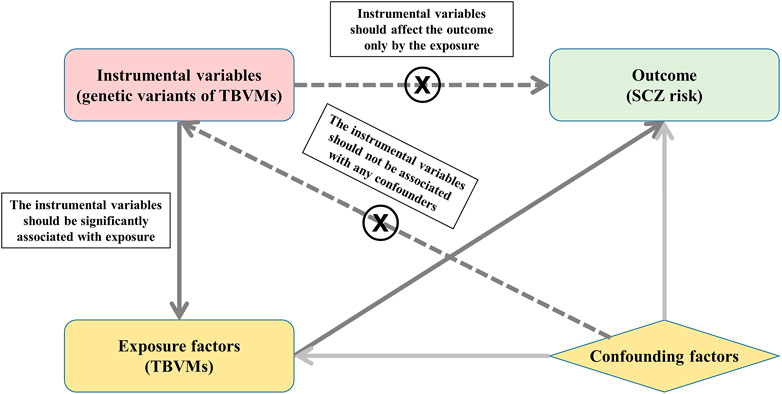
FIGURE 1. Study design based on MR principal assumptions. In this study, MR is based on the publicly available GWAS summary datasets in TBVMs and SCZ. Specifically, the genetic variants that are significantly associated with TBVMs were used as the instrumental variables to examine the causal influence of TBVMs on SCZ risk. Abbreviations: SCZ, Schizophrenia; TBVMs, total brain volumetric measures.
Total Brain Volumetric Measure Genome-Wide Association Study Dataset
The GWAS summary data of TBVMs, including TGMV, TWMV, TCSFV, and TBV, were downloaded from an open resource named the Oxford Brain Imaging Genetics (BIG40) web server (https://open.win.ox.ac.uk/ukbiobank/big40/), which included GWAS summary statistics with 33,224 individuals in the United Kingdom Biobank (Smith et al., 2021). The genome-wide significance threshold was set at p < 5 × 10⁻⁸ in the discovery cohort (N = 22,138) and p < 0.05 in the replication cohort (N = 11,086). Only SNPs that met the significance level in both cohorts were used as instrumental variables in MR analyses, and these SNPs were independent and had no linkage disequilibrium, as described in the original studies (Elliott et al., 2018; Smith et al., 2021). Detailed information about the instrumental variables of TGMV, TWMV, TCSFV, and TBV is shown in Supplementary Tables S1-S4.
Genome-Wide Association Study of Schizophrenia
GWAS summary data regarding SCZ were downloaded from a meta-analysis provided by the Schizophrenia Working Group of Psychiatric Genomics Consortium (https://www.med.unc.edu/pgc/pgc-workgroups/schizophrenia/), including 36,989 cases and 113,075 controls of predominantly European ancestry without population stratification. In total, 128 significant associations in 108 genetic loci were identified (Schizophrenia Working Group of the Psychiatric Genomics Consortium, 2014).
Pleiotropy Analysis
Comprehensive pleiotropy analyses were performed to assure that instrumental variables met the MR assumptions. First, an MR-Egger intercept test was performed to evaluate the potential pleiotropic associations of the instrumental variables with known and unknown confounders (Bowden et al., 2015; Bowden et al., 2016; Burgess and Thompson, 2017). Second, an MR pleiotropy residual sum and outlier (MR-PRESSO) analysis was carried out to detect horizontal pleiotropy (i.e., MR-PRESSO global test) (Verbanck et al., 2018). Heterogeneity across instrumental variables is also an indicator of pleiotropy. Thus, Cochran’s Q test and I2 statistic were calculated to estimate the heterogeneity (Sun et al., 2021). Specifically, Cochran’s Q test is a conventional test for heterogeneity and approximately follows a chi-square distribution with n-1 degrees of freedom (here, n is the number of instrumental variables). The I2 index is another measure to quantify heterogeneity, which divides the difference between the Q statistic and its degrees of freedom by the Q statistic itself and then multiplies by 100. The value of the I2 index ranges from 0 to 100%, with 0%–25%, 25%–50%, 50%–75%, and 75%–100% representing low, moderate, large, and extreme heterogeneity, respectively (Liu et al., 2013; He et al., 2020). The significance threshold of all the MR-Egger intercept, MR-PRESSO, and Cochran’s Q tests was set at p < 0.05.
Aligning Effect Alleles With Exposure and Outcome
The effect alleles of the instrumental variables were adjusted to be associated with increased TBVMs (i.e., the effect estimates of SNPs were larger than zero). Subsequently, the effect alleles of these genetic variants were aligned to be consistent with the effect alleles in the SCZ GWAS dataset. If the instrumental SNPs were not available in the outcome dataset, a proxy SNP that was in high linkage disequilibrium (r2 > 0.8) with the requested SNP was searched instead with the online tool SNiPA (https://snipa.helmholtz-muenchen.de/snipa3/index.php) (Arnold et al., 2015).
Two-Sample Mendelian Randomization Analysis
The inverse variance weighted (IVW) method was employed to estimate the causal effects of TGMV, TWMV, TCSFV, and TBV on SCZ risk. Specifically, for each TBVM, the effect estimates of each instrumental variable on TBVMs and SCZ were extracted, and Wald estimates and their standard errors were then calculated (Burgess et al., 2017b). The Wald estimates of all the instrumental variables were combined with a weighted mean using inverse variance weights. The significance threshold of the associations between exposures and outcomes was set at p < 0.05.
Power Analysis
For each TBVM, the proportion of variance explained by each instrumental variable (
where MAF represents the minor allele frequency for a given SNP, β represents the effect size associated with the TBVM for a given SNP,
Then, the strength of instrument variables can be measured by F-statistics, which were calculated based on the following equation:
where R2 is the proportion of the variance explained by each SNP, and N represents the sample size of the exposure GWAS data. To minimize weak instrument bias, SNPs with F-statistics > 10 were retained for subsequent analyses (Lawlor et al., 2008).
Sensitivity Analysis
A series of sensitivity analyses were conducted to validate the robustness of the results. First, four different MR methods including MR-Egger, weighted median, simple mode, and weighted mode methods were performed to estimate the causal effect of TBVMs on SCZ risk. Specifically, the MR-Egger method allows all variants to have pleiotropic effects and can provide a consistent estimate of the causal effect under a weaker instrument strength independent of direct effects (InSIDE) assumption (Burgess and Thompson, 2017); the weighted median method can provide valid causal estimates even if up to 50% of instruments are not valid (Bowden et al., 2016); and the model-based methods (i.e., simple mode and weighted mode) use the causal effect estimates for individual SNPs to form clusters, and the causal effect is estimated in the largest cluster of SNPs (Hartwig et al., 2017b). Second, a leave-one-out sensitivity analysis was carried out to identify SNPs that could potentially bias the causal relationship. To this aim, by sequentially removing each SNP, we estimated the relationship between the remaining SNPs and the risk of SCZ using the IVW method. Finally, reverse causation bias may occur when the outcome variable is at an earlier time point (i.e., the risk of SCZ causally influences the changes of each TBVM). Therefore, we also tested the possibility of reverse causation by treating the risk of SCZ as an exposure and each TBVM as an outcome. Specifically, the instrumental variables were the significant genetic variants associated with SCZ risk, and the same procedures as the main analyses were used to perform reverse MR causality detection.
All statistical analyses were conducted using R version 4.0.4 (R Foundation for Statistical Computing, Vienna, Austria) using the packages of “TwoSampleMR” (Hemani et al., 2018b) and “MR-PRESSO” (Verbanck et al., 2018).
Results
Association of Total Brain Volumetric Measure Variants With Schizophrenia
Only two genetic variants without linkage disequilibrium were found to be associated with TGMV, and their summary statistics were extracted from SCZ GWAS data for MR analyses (Supplementary Table S1). Of the five genetic variants associated with TWMV, rs742396 was a palindromic SNP. Thus, we deleted it in the subsequent MR analyses (Supplementary Table S2). Seven genetic variants were associated with TCSFV. All seven instrumental SNPs were located on different chromosomes and were not in linkage disequilibrium with each other. However, rs4843550 is a palindromic SNP and was removed from the subsequent MR analyses. The summary statistics for these TCSFV variants are shown in Supplementary Table S3. Of the five genetic variants associated with TBV, the summary statistics for the four variants could be extracted from the SCZ GWAS data. The SNP rs2732714 was not available in the SCZ GWAS data, therefore, we used the information of its proxy SNP rs113138968, which was in high linkage disequilibrium (r2 > 0.8), to perform the following analyses. All five instrumental SNPs were not in linkage disequilibrium with each other, and none of them were palindromic SNPs. Detailed information about these five instrumental SNPs is shown in Supplementary Table S4.
Pleiotropy Analysis
Both the MR-Egger intercept test and MR-PRESSO test showed no significant pleiotropy for the genetic variants of TBVMs (all ps > 0.05). Furthermore, Cochran’s Q test and I2 statistic revealed no significant heterogeneity for these SNPs (Supplementary Table S5).
Two-Sample Mendelian randomization Analysis
We performed a two-sample MR analysis by using genetic variants from TGMV, TWMV, TCSFV, and TBV as instrumental variables. As shown in Table 1, we did not find any causal influence on the risk of SCZ with the IVW method (p > 0.05).

TABLE 1. Results of the causal effect of TBVMs on SCZ risk.
Power Analysis
The explained variances (R2) and F-statistics of each instrumental variable are shown in Supplementary Tables S1-S4, and the F-statistics of each instrumental variable were larger than 10, indicating no weak instrumental bias among these variables.
Sensitivity Analysis
All other MR approaches, including the MR-Egger, weighted median, simple mode, and weighted mode methods, did not identify any significant causal effects of TGMV, TWMV, and TBV on the risk of SCZ (Table 1). Although TCSFV was found to be causally associated with the risk of SCZ when using the MR-Egger method (BETA = 0.646, SE = 0.220, p value = 0.042), this result was not validated by other methods. In leave-one-out sensitivity analyses, no genetic variants could significantly affect the MR estimates (Figure 2). For the reverse MR causality analysis, 111 leading SNPs associated with SCZ risk were extracted from the GWAS summary data of TBVMs. Among them, ten palindromic SNPs were removed, and the remaining 101 SNPs were retained for subsequent analyses (Supplementary Table S6). All the MR methods indicated that there was no causal influence of any TBVM on SCZ risk (Supplementary Table S7).
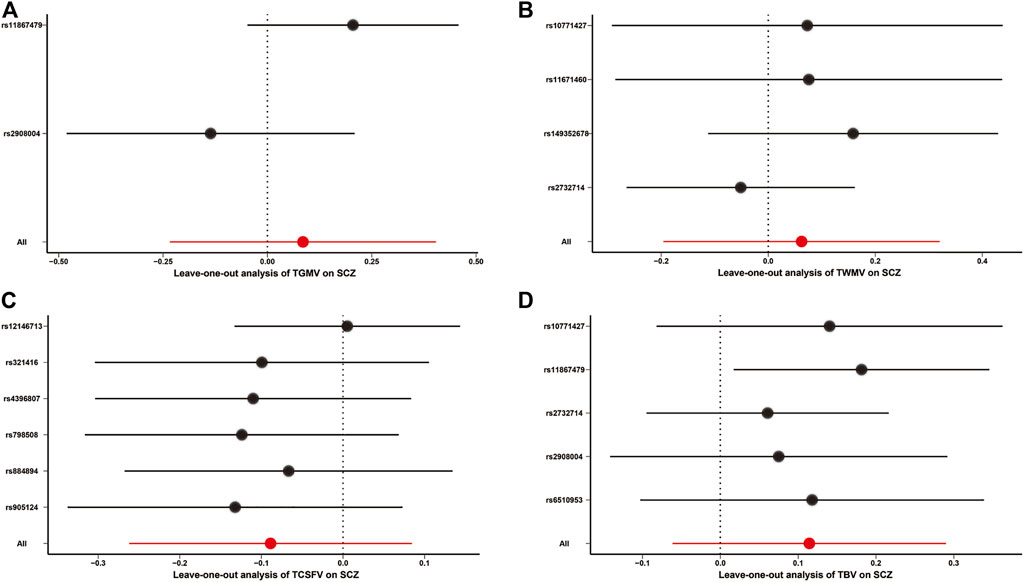
FIGURE 2. Leave-one-out analysis for MR causality analysis between TBVMs and SCZ risk. (A). Leave-one-out analysis for MR causality analysis between TGMV and SCZ risk. (B). Leave-one-out analysis for MR causality analysis between TWMV and SCZ risk. (C). Leave-one-out analysis for MR causality analysis between TCSFV and SCZ risk. (D). Leave-one-out analysis for MR causality analysis between TBV and SCZ risk. The red points and red lines represent the BETA and 95% confidence interval in MR analyses, while the black points and black lines represent the BETA and 95% confidence interval after removing each SNP sequentially. Of note, only the IVW method was used in the leave-one-out sensitivity analysis. Abbreviations: SCZ, Schizophrenia; TBV, total brain volume; TCSFV, total cerebrospinal fluid volume; TGMV, total gray matter volume; TWMV, total white matter volume.
Discussion
SCZ is a chronic, complex mental disorder characterized by an array of symptoms, including delusions, hallucinations, disorganized speech, and impaired cognitive ability, that typically emerges in late adolescence and early adulthood (Mueser and McGurk, 2004; Sheffield and Barch, 2016; Marder and Cannon, 2019; McCutcheon et al., 2020). Several lines of evidence have suggested that structural brain abnormalities play an important role in the pathology of SCZ (Okada et al., 2016; Zhao et al., 2018; Kuo and Pogue-Geile, 2019). Using neuroimaging methods, some researchers found TBVM abnormalities in patients with SCZ relative to age-matched healthy controls (Staal et al., 1998; Haijma et al., 2013), and progressive reductions in TBVMs might be associated with disease progression (Kempton et al., 2010). However, evidence has pointed toward the possibility that antipsychotic drugs might have an effect on TBVM alterations (Olabi et al., 2011; Guo et al., 2015; Emsley et al., 2017). In addition, as a risk factor for SCZ, experience with cannabis use could also lead to brain structural alterations (Kumra et al., 2012; Rapp et al., 2012; Navarri et al., 2022). Hence, the causality between the changes in TBVMs and the risk of SCZ remains largely unclear.
In this study, we aimed to explore whether there is a causal effect of changes in TBVMs on the risk of SCZ by using MR, one of the powerful genetic-epidemiological approaches. Here, we used four reliable TBVMs (TGMV, TWMV, TCSFV, and TBV) derived from structural neuroimaging data. Specifically, genetic variants of TGMV, TWMV, TCSFV, and TBV without any pleiotropy and heterogeneity were selected as the instrumental variables, and five MR methods were used to ensure the reliability of the results. Different from the observational studies, no significant result was found using MR between any TBVMs and SCZ risk. The possible explanations for the difference are as follows: 1) the substantial brain structural heterogeneity exists across the individuals with SCZ (Alnæs et al., 2019). The changes in TBVMs might not be a sensitive risk factor for SCZ, since alterations (increase or decrease) in the volume of some specific brain regions have been reported in patients with SCZ (Kuo and Pogue-Geile, 2019); 2) some observational studies showed that the decrease in TBVMs in SCZ might be the result of antipsychotics, aging, or other unknown confounders (Kumra et al., 2012; Emsley et al., 2017); and 3) SCZ is a cognitive and behavioral dysfunction with complex symptoms (Sheffield and Barch, 2016), the onset of which might be linked to functional abnormalities rather than structural abnormalities of the brain. Hence, more attention should be devoted to the changes in specific brain region volumes by removing the effects of antipsychotics and aging and the functional neural mechanisms of SCZ.
Our study design has many advantages. First, the exposure and outcome datasets were from a large-scale GWAS of TBVMs (N = 33,224) and SCZ (36,989 cases and 113,075 controls). The large sample sizes of GWAS typically led to higher levels of statistical power (van der Sluis et al., 2013). Second, we utilized independent SNPs as the instrumental variables in each MR analysis, which could effectively avoid the influence caused by linkage disequilibrium. Third, a series of pleiotropy and sensitivity analyses based on different principles and assumptions were carried out to detect pleiotropy and heterogeneity to ensure that the instrumental variables we used here were reliable (Burgess et al., 2017a; Hemani et al., 2018a). Finally, to increase the robustness of the MR results, different methods were applied to investigate the causal relationship between the exposures and the outcomes. Assessing the causal relationship by using a variety of methods is more reliable because the different MR methods we used here were based on the different assumptions (Burgess and Thompson, 2017).
Some limitations needed to be addressed in this study. First, the subjects from the outcome GWAS dataset were of transancestral descent (both European and East Asian); however, the subjects from the TBVM GWAS dataset were of pure European descent. Population stratification might have a potential confounding effect on the causal estimate. Second, although a series of statistical methods were used to identify pleiotropy, it is impossible to fully remove all pleiotropy in MR studies. Third, the instrumental variables of TBVMs were obtained from United Kingdom Biobank GWAS summary data. The participants in the United Kingdom Biobank were aged from 45 to 81 years (Smith et al., 2021), which is not the typical age of onset for SCZ (Howard et al., 2000). The genetic variants determining TBVMs in childhood and/or adolescence may differ from those determining TBVMs in adulthood used in this study. Therefore, it would be better to use instrumental variables from large-scale TBVMs GWAS data in childhood and/or adolescence that are not publicly available to date. Fourth, the generalized summary-based MR (GSMR) method is also a popular MR approach to assess the causal association between exposure and outcome (Zhu et al., 2018). The rule of thumb advises that the application of GSMR requires ten or more independent genome-wide significant SNPs, but there were fewer than ten instrumental variables used in each two-sample MR analysis in our study, especially those of TGMV. Thus, we could not use the GSMR method to test the causal associations of TBVMs with SCZ risk. Finally, ICV is also an important TBVM, and alterations in ICV were found in SCZ patients (Haijma et al., 2013). We did not investigate the causal relationship between ICV and SCZ risk in this study because there are no GWAS summary data of ICV in the United Kingdom Biobank database.
Conclusion
In conclusion, although the previous neuroimaging studies showed the changes in TBVMs in patients with SCZ, our MR results demonstrated that there was no causal relationship between alterations in TBVMs and the risk of SCZ at the genetic level. Further studies with independent data are warranted to confirm these findings.
Data Availability Statement
Publicly available datasets were analyzed in this study. These data can be found here: the brain volume GWAS summary data were downloaded from the Oxford Brain Imaging Genetics (BIG40) web server (https://open.win.ox.ac.uk/ukbiobank/big40/). GWAS summary data of SCZ were provided by the Schizophrenia Working Group of Psychiatric Genomics Consortium (https://www.med.unc.edu/pgc/pgc-workgroups/SCZ/).
Ethics Statement
The MR is based on the publicly available GWAS summary datasets of TBV and SCZ, and all patients have provided informed consent in these corresponding original studies.
Author Contributions
FL, JW, and JF conceived and designed the experiments. LM, ML, and DF prepared and managed the data. DZ, DS, CW, LG, and MC conducted the experiment and analyzed the data. DZ, MC, and FL wrote the manuscript. All authors contributed to and have approved the final manuscript.
Funding
This work was supported by the Natural Science Foundation of China (grant numbers 82072001, 82171905, and 81871431), Natural Science Foundation of Tianjin Municipal Science and Technology Commission (grant number 18JCYBJC26300), Medical Foundation of Jieping Wu (grant number 320.6750.19089-56), and Medical Foundation of Yicheng Zhao (grant number ZYY2019007).
Conflict of Interest
The authors declare that the research was conducted in the absence of any commercial or financial relationships that could be construed as a potential conflict of interest.
Publisher’s Note
All claims expressed in this article are solely those of the authors and do not necessarily represent those of their affiliated organizations, or those of the publisher, the editors, and the reviewers. Any product that may be evaluated in this article, or claim that may be made by its manufacturer, is not guaranteed or endorsed by the publisher.
Supplementary Material
The Supplementary Material for this article can be found online at: https://www.frontiersin.org/articles/10.3389/fgene.2022.782476/full#supplementary-material
References
Alnæs, D., Kaufmann, T., van der Meer, D., Córdova-Palomera, A., Rokicki, J., Moberget, T., et al. (2019). Brain Heterogeneity in Schizophrenia and its Association with Polygenic Risk. JAMA Psychiatry 76, 739–748. doi:10.1001/jamapsychiatry.2019.0257
Arnold, M., Raffler, J., Pfeufer, A., Suhre, K., and Kastenmüller, G. (2015). SNiPA: an Interactive, Genetic Variant-Centered Annotation Browser. Bioinformatics 31, 1334–1336. doi:10.1093/bioinformatics/btu779
Bowden, J., Davey Smith, G., and Burgess, S. (2015). Mendelian Randomization with Invalid Instruments: Effect Estimation and Bias Detection through Egger Regression. Int. J. Epidemiol. 44, 512–525. doi:10.1093/ije/dyv080
Bowden, J., Del Greco M, F., Minelli, C., Davey Smith, G., Sheehan, N. A., and Thompson, J. R. (2016). Assessing the Suitability of Summary Data for Two-Sample Mendelian Randomization Analyses Using MR-Egger Regression: the Role of the I2 Statistic. Int. J. Epidemiol. 45, 1961–1974. doi:10.1093/ije/dyw220
Burgess, S., and Thompson, S. G. (2017). Interpreting Findings from Mendelian Randomization Using the MR-Egger Method. Eur. J. Epidemiol. 32, 377–389. doi:10.1007/s10654-017-0255-x
Burgess, S., Bowden, J., Fall, T., Ingelsson, E., and Thompson, S. G. (2017a). Sensitivity Analyses for Robust Causal Inference from Mendelian Randomization Analyses with Multiple Genetic Variants. Epidemiology 28, 30–42. doi:10.1097/ede.0000000000000559
Burgess, S., Small, D. S., and Thompson, S. G. (2017b). A Review of Instrumental Variable Estimators for Mendelian Randomization. Stat. Methods Med. Res. 26, 2333–2355. doi:10.1177/0962280215597579
Elliott, L. T., Sharp, K., Alfaro-Almagro, F., Shi, S., Miller, K. L., Douaud, G., et al. (2018). Genome-wide Association Studies of Brain Imaging Phenotypes in UK Biobank. Nature 562, 210–216. doi:10.1038/s41586-018-0571-7
Emsley, R., Asmal, L., du Plessis, S., Chiliza, B., Phahladira, L., and Kilian, S. (2017). Brain Volume Changes over the First Year of Treatment in Schizophrenia: Relationships to Antipsychotic Treatment. Psychol. Med. 47, 2187–2196. doi:10.1017/s0033291717000642
Gottesman, , and Gould, T. D. (2003). The Endophenotype Concept in Psychiatry: Etymology and Strategic Intentions. Ajp 160, 636–645. doi:10.1176/appi.ajp.160.4.636
Guo, J. Y., Huhtaniska, S., Miettunen, J., Jääskeläinen, E., Kiviniemi, V., Nikkinen, J., et al. (2015). Longitudinal Regional Brain Volume Loss in Schizophrenia: Relationship to Antipsychotic Medication and Change in Social Function. Schizophrenia Res. 168, 297–304. doi:10.1016/j.schres.2015.06.016
Haijma, S. V., Van Haren, N., Cahn, W., Koolschijn, P. C. M. P., Hulshoff Pol, H. E., and Kahn, R. S. (2013). Brain Volumes in Schizophrenia: a Meta-Analysis in over 18 000 Subjects. Schizophr Bull. 39, 1129–1138. doi:10.1093/schbul/sbs118
Hartwig, F. P., Borges, M. C., Horta, B. L., Bowden, J., and Davey Smith, G. (2017a). Inflammatory Biomarkers and Risk of Schizophrenia: A 2-Sample Mendelian Randomization Study. JAMA Psychiatry 74, 1226–1233. doi:10.1001/jamapsychiatry.2017.3191
Hartwig, F. P., Davey Smith, G., and Bowden, J. (2017b). Robust Inference in Summary Data Mendelian Randomization via the Zero Modal Pleiotropy assumption. Int. J. Epidemiol. 46, 1985–1998. doi:10.1093/ije/dyx102
He, Y., Zhang, H., Wang, T., Han, Z., Ni, Q.-b., Wang, K., et al. (2020). Impact of Serum Calcium Levels on Alzheimer's Disease: A Mendelian Randomization Study. Jad 76, 713–724. doi:10.3233/jad-191249
Hemani, G., Bowden, J., and Davey Smith, G. (2018a). Evaluating the Potential Role of Pleiotropy in Mendelian Randomization Studies. Hum. Mol. Genet. 27, R195–r208. doi:10.1093/hmg/ddy163
Hemani, G., Zheng, J., Elsworth, B., Wade, K. H., Haberland, V., Baird, D., et al. (2018b). The MR-Base Platform Supports Systematic Causal Inference across the Human Phenome. Elife 7, e34408. doi:10.7554/eLife.34408
Howard, R., Rabins, P. V., Seeman, M. V., and Jeste, D. V. (2000). Late-Onset Schizophrenia and Very-Late-Onset Schizophrenia-like Psychosis: An International Consensus. Am. J. Psychiatry 157, 172–178. doi:10.1176/appi.ajp.157.2.172
Kahn, R. S., Sommer, I. E., Murray, R. M., Meyer-Lindenberg, A., Weinberger, D. R., Cannon, T. D., et al. (2015). Schizophrenia. Nat. Rev. Dis. Primers 1, 15067. doi:10.1038/nrdp.2015.67
Kempton, M. J., Stahl, D., Williams, S. C. R., and DeLisi, L. E. (2010). Progressive Lateral Ventricular Enlargement in Schizophrenia: a Meta-Analysis of Longitudinal MRI Studies. Schizophrenia Res. 120, 54–62. doi:10.1016/j.schres.2010.03.036
Kumra, S., Robinson, P., Tambyraja, R., Jensen, D., Schimunek, C., Houri, A., et al. (2012). Parietal Lobe Volume Deficits in Adolescents with Schizophrenia and Adolescents with Cannabis Use Disorders. J. Am. Acad. Child Adolesc. Psychiatry 51, 171–180. doi:10.1016/j.jaac.2011.11.001
Kuo, S. S., and Pogue-Geile, M. F. (2019). Variation in Fourteen Brain Structure Volumes in Schizophrenia: A Comprehensive Meta-Analysis of 246 Studies. Neurosci. Biobehavioral Rev. 98, 85–94. doi:10.1016/j.neubiorev.2018.12.030
Lam, M., Chen, C.-Y., Chen, C.-Y., Li, Z., Martin, A. R., Bryois, J., et al. (2019). Comparative Genetic Architectures of Schizophrenia in East Asian and European Populations. Nat. Genet. 51, 1670–1678. doi:10.1038/s41588-019-0512-x
Lawlor, D. A., Harbord, R. M., Sterne, J. A., Timpson, N., and Davey Smith, G. (2008). Mendelian Randomization: Using Genes as Instruments for Making Causal Inferences in Epidemiology. Stat. Med. 27, 1133–1163. doi:10.1002/sim.3034
Liu, G., Zhang, S., Cai, Z., Ma, G., Zhang, L., Jiang, Y., et al. (2013). PICALM Gene Rs3851179 Polymorphism Contributes to Alzheimer's Disease in an Asian Population. Neuromol. Med. 15, 384–388. doi:10.1007/s12017-013-8225-2
Liu, G., Zhao, Y., Jin, S., Hu, Y., Wang, T., Tian, R., et al. (2018). Circulating Vitamin E Levels and Alzheimer's Disease: a Mendelian Randomization Study. Neurobiol. Aging 72, 189.e1–189.e9. doi:10.1016/j.neurobiolaging.2018.08.008
Marder, S. R., and Cannon, T. D. (2019). Schizophrenia. N. Engl. J. Med. 381, 1753–1761. doi:10.1056/nejmra1808803
McCutcheon, R. A., Reis Marques, T., and Howes, O. D. (2020). Schizophrenia-An Overview. JAMA Psychiatry 77, 201–210. doi:10.1001/jamapsychiatry.2019.3360
Meyer-Lindenberg, A., and Weinberger, D. R. (2006). Intermediate Phenotypes and Genetic Mechanisms of Psychiatric Disorders. Nat. Rev. Neurosci. 7, 818–827. doi:10.1038/nrn1993
Mueser, K. T., and McGurk, S. R. (2004). Schizophrenia. Lancet 363, 2063–2072. doi:10.1016/s0140-6736(04)16458-1
Navarri, X., Afzali, M. H., Lavoie, J., Sinha, R., Stein, D. J., Momenan, R., et al. (2022). How Do Substance Use Disorders Compare to Other Psychiatric Conditions on Structural Brain Abnormalities? A Cross-Disorder Meta-Analytic Comparison Using the ENIGMA Consortium Findings. Hum. Brain Mapp. 43, 399–413. doi:10.1002/hbm.25114
Okada, N., Fukunaga, M., Yamashita, F., Koshiyama, D., Yamamori, H., Ohi, K., et al. (2016). Abnormal Asymmetries in Subcortical Brain Volume in Schizophrenia. Mol. Psychiatry 21, 1460–1466. doi:10.1038/mp.2015.209
Olabi, B., Ellison-Wright, I., McIntosh, A. M., Wood, S. J., Bullmore, E., and Lawrie, S. M. (2011). Are There Progressive Brain Changes in Schizophrenia? A Meta-Analysis of Structural Magnetic Resonance Imaging Studies. Biol. Psychiatry 70, 88–96. doi:10.1016/j.biopsych.2011.01.032
Rapp, C., Bugra, H., Riecher-Rössler, A., Tamagni, C., and Borgwardt, S. (2012). Effects of Cannabis Use on Human Brain Structure in Psychosis: a Systematic Review Combining In Vivo Structural Neuroimaging and post Mortem Studies. Curr. Pharm. Des. 18, 5070–5080. doi:10.2174/138161212802884861
Ripke, S., O'Dushlaine, C., Chambert, K., Moran, J. L., Kähler, A. K., Akterin, S., et al. (2013). Genome-wide Association Analysis Identifies 13 New Risk Loci for Schizophrenia. Nat. Genet. 45, 1150–1159. doi:10.1038/ng.2742
Schizophrenia Working Group of the Psychiatric Genomics Consortium (2014). Biological Insights from 108 Schizophrenia-Associated Genetic Loci. Nature 511, 421–427. doi:10.1038/nature13595
Sheffield, J. M., and Barch, D. M. (2016). Cognition and Resting-State Functional Connectivity in Schizophrenia. Neurosci. Biobehav. Rev. 61, 108–120. doi:10.1016/j.neubiorev.2015.12.007
Smith, S. M., Douaud, G., Chen, W., Hanayik, T., Alfaro-Almagro, F., Sharp, K., et al. (2021). An Expanded Set of Genome-wide Association Studies of Brain Imaging Phenotypes in UK Biobank. Nat. Neurosci. 24, 737–745. doi:10.1038/s41593-021-00826-4
Staal, W. G., Hulshoff Pol, H. E., Schnack, H., van der Schot, A. C., and Kahn, R. S. (1998). Partial Volume Decrease of the Thalamus in Relatives of Patients with Schizophrenia. Am. J. Psychiatry 155, 1784–1786. doi:10.1176/ajp.155.12.1784
Sun, J. Y., Zhang, H., Zhang, Y., Wang, L., Sun, B. L., Gao, F., et al. (2021). Impact of Serum Calcium Levels on Total Body Bone mineral Density: A Mendelian Randomization Study in Five Age Strata. Clin. Nutr. 40, 2726–2733. doi:10.1016/j.clnu.2021.03.012
van der Sluis, S., Posthuma, D., Nivard, M. G., Verhage, M., and Dolan, C. V. (2013). Power in GWAS: Lifting the Curse of the Clinical Cut-Off. Mol. Psychiatry 18, 2–3. doi:10.1038/mp.2012.65
Vaucher, J., Keating, B. J., Lasserre, A. M., Gan, W., Lyall, D. M., Ward, J., et al. (2018). Cannabis Use and Risk of Schizophrenia: a Mendelian Randomization Study. Mol. Psychiatry 23, 1287–1292. doi:10.1038/mp.2016.252
Verbanck, M., Chen, C. Y., Neale, B., and Do, R. (2018). Detection of Widespread Horizontal Pleiotropy in Causal Relationships Inferred from Mendelian Randomization between Complex Traits and Diseases. Nat. Genet. 50, 693–698. doi:10.1038/s41588-018-0099-7
Wang, L., Qiao, Y., Zhang, H., Zhang, Y., Hua, J., Jin, S., et al. (2020). Circulating Vitamin D Levels and Alzheimer's Disease: A Mendelian Randomization Study in the IGAP and UK Biobank. J. Alzheimers Dis. 73, 609–618. doi:10.3233/jad-190713
Zhang, H., Wang, T., Han, Z., Wang, L., Zhang, Y., Wang, L., et al. (2020). Impact of Vitamin D Binding Protein Levels on Alzheimer's Disease: A Mendelian Randomization Study. J. Alzheimers Dis. 74, 991–998. doi:10.3233/jad-191051
Zhao, C., Zhu, J., Liu, X., Pu, C., Lai, Y., Chen, L., et al. (2018). Structural and Functional Brain Abnormalities in Schizophrenia: A Cross-Sectional Study at Different Stages of the Disease. Prog. Neuropsychopharmacol. Biol. Psychiatry 83, 27–32. doi:10.1016/j.pnpbp.2017.12.017
Keywords: schizophrenia, total brain volumetric measures, genetic, causality, Mendelian randomization
Citation: Zhu D, Wang C, Guo L, Si D, Liu M, Cai M, Ma L, Fu D, Fu J, Wang J and Liu F (2022) Total Brain Volumetric Measures and Schizophrenia Risk: A Two-Sample Mendelian Randomization Study. Front. Genet. 13:782476. doi: 10.3389/fgene.2022.782476
Received: 24 September 2021; Accepted: 02 March 2022;
Published: 31 March 2022.
Edited by:
Guiyou Liu, Tianjin Institute of Industrial Biotechnology (CAS), ChinaReviewed by:
Fengmei Lu, University of Macau, ChinaAlexandre Bureau, Laval University, Canada
Minghao Dong, Xidian University, China
Copyright © 2022 Zhu, Wang, Guo, Si, Liu, Cai, Ma, Fu, Fu, Wang and Liu. This is an open-access article distributed under the terms of the Creative Commons Attribution License (CC BY). The use, distribution or reproduction in other forums is permitted, provided the original author(s) and the copyright owner(s) are credited and that the original publication in this journal is cited, in accordance with accepted academic practice. No use, distribution or reproduction is permitted which does not comply with these terms.
*Correspondence: Feng Liu, fengliu@tmu.edu.cn; Junping Wang, wangjunping_tj@163.com; Jilian Fu, fujilian2015@163.com
†These authors have contributed equally to this work