Simulation of radiation belt wave-particle interactions in an MHD-particle framework
 Anthony A. Chan1*
  Scot R. Elkington2*
  William J. Longley1,3
  Suhail A. Aldhurais1,4,5
  Shah S. Alam1
  Jay M. Albert6
  Allison N. Jaynes7
  David M. Malaspina2,8
  Qianli Ma9
  Wen Li9
- 1Department of Physics and Astronomy, Rice University, Houston, TX, United States
- 2Laboratory for Atmospheric and Space Physics, University of Colorado, Boulder, CO, United States
- 3Center for Solar-Terrestrial Research, New Jersey Institute of Technology, Newark, NJ, United States
- 4Applied Physics Graduate Program, Smalley-Curl Institute, Rice University, Houston, TX, United States
- 5Physics Department, King Fahd University of Petroleum and Minerals, Dhahran, Saudi Arabia
- 6Air Force Research Laboratory, Kirtland AFB, NM, United States
- 7Department of Physics and Astronomy, University of Iowa, Iowa, IA, United States
- 8Astrophysical and Planetary Sciences Department, University of Colorado, Boulder, CO, United States
- 9Center for Space Physics, Boston University, Boston, MA, United States
In this paper we describe K2, a comprehensive simulation model of Earth’s radiation belts that includes a wide range of relevant physical processes. Global MHD simulations are combined with guiding-center test-particle methods to model interactions with ultra low-frequency (ULF) waves, substorm injections, convective transport, drift-shell splitting, drift-orbit bifurcations, and magnetopause shadowing, all in self-consistent MHD fields. Simulation of local acceleration and pitch-angle scattering due to cyclotron-scale interactions is incorporated by including stochastic differential equation (SDE) methods in the MHD-particle framework. The SDEs are driven by event-specific bounce-averaged energy and pitch-angle diffusion coefficients. We present simulations of electron phase-space densities during a simplified particle acceleration event based on the 17 March 2013 event observed by the Van Allen Probes, with a focus on demonstrating the capabilities of the K2 model. The relative wave-particle effects of global scale ULF waves and very-low frequency (VLF) whistler-mode chorus waves are compared, and we show that the primary acceleration appears to be from the latter. We also show that the enhancement with both ULF and VLF processes included exceeds that of VLF waves alone, indicating a synergistic combination of energization and transport processes may be important.
1 Introduction
The inner magnetosphere supports a host of physical processes driving acceleration, transport, and loss of radiation belt electrons, including acceleration and transport by drift-interaction with ultra low-frequency (ULF) waves, local acceleration and loss by cyclotron-interaction with higher frequency (VLF and ELF) plasma waves, transport due to substorm activity and large-scale convection, and loss by particle scattering into the atmosphereor interaction with the magnetopause. A fundamental challenge in constructing physical models of the radiation belts is capturing this broad range of processes across many different time and spatial scales.
Recent radiation belt research has been summarized in two comprehensive reviews, and references therein, by Li and Hudson (2019) and Ripoll et al. (2020). As described in those reviews, the main current method of modeling Earth’s radiation belts is solution of a three-dimensional Fokker-Planck equation that uses quasilinear diffusion coefficients, as in the following codes: the ONERA Salammbô code (e.g., Beutier and Boscher, 1995; Maget et al., 2015), the BAS (British Antarctic Survey) code (e.g., Glauert et al., 2014), the AFRL code (e.g., Albert et al., 2009), the UCLA code (e.g., Li et al., 2016; Ma et al., 2016), the VERB code (Shprits et al., 2009; Drozdov et al., 2015), the LANL DREAM-3D code (e.g., Tu et al., 2014), the CEA CEVA code (e.g., Ripoll et al., 2016), the STEERB code (e.g., Su et al., 2011), and the REM SDE (stochastic differential equation) code developed at Rice University (Zheng et al., 2014) that was later developed into the UBER SDE code (Zheng et al., 2021).
Although 3-D radiation belt diffusion codes have had success in reproducing some features of radiation belt observations, there is still much work to be done to assess their quantitative agreement between the simulations and observations (Tu et al., 2019), and there are still some basic unanswered questions regarding the applicability of the diffusion approach, particularly for the use of radial diffusion (see Lejosne and Kollmann (2020), for example). Specifically, the following questions are active research areas: What are the relative roles of local acceleration and radial transport? (as discussed in Drozdov et al. (2022), for example.) Is there sufficient phase randomization to justify a quasilinear diffusion approach? What are the relative roles of diffusive versus advective transport? How important are nonlinear wave-particle interactions, either for cyclotron-frequency wave-particle interactions or for drift-frequency wave-particle interactions?
In this Methods paper we describe K2, a comprehensive radiation belt modeling code especially designed for event simulations, that contains the basic physics of radial transport, local acceleration, and loss; all of which are important processes in solving the questions of the previous paragraph (Elkington et al., 2004; Chan et al., 2010). The code is named after the mountain K2 in the northwestern Karakoram Range, the second-highest mountain on Earth. This paper outlines the method used in the K2 modeling framework, and provides an example of its use in the context of the geomagnetic storm beginning on 17 March 2013. This event was chosen because it is a well-known radiation belt enhancement event (Li W et al., 2014; Tu et al., 2014), and because the chorus wave diffusion coefficients that are an important input to the K2 code were available from the NSF Geopsace Environment Modeling (GEM) QARBM (Quantitative Assessment of Radiation Belt Models) focus group challenge (Ma et al., 2018). In the subsequent sections, we describe the general MHD/test particle method and history; give an overview of the SDE method used to simulate local wave-particle interactions; discuss how event-specific chorus wave diffusion coefficients may be obtained and implemented with a test particle method; and follow up with a discussion of initial simulation results for the 17 March 2013 geomagnetic event.
2 MHD-particle simulations and stochastic differential equations
2.1 MHD-particle simulations
MHD-particle simulations have been used to elucidate the physics and dynamics of the radiation belts for a broad range of phenomena, including the effects of CMEs/shocks in the solar wind (Li et al., 1993; Hudson et al., 1998; Elkington et al., 2002; Hudson et al., 2015; Li et al., 2015), radial transport driven by ULF waves (Elkington et al., 1999; Elkington et al., 2003; Fei et al., 2006), effects of substorms and advective injections of particles from the plasma sheet (Birn et al., 1997; Kim et al., 2000; Elkington et al., 2005; Kress et al., 2014; Merkin et al., 2019), and in recent plasma sheet, ring current and radiation belt simulations (Sorathia et al., 2018; Sorathia et al., 2021).
We now summarize the main features of the MHD-particle methods that form the basis for the K2 framework, based on our earlier work (Elkington et al., 2002; Elkington et al., 2004). The MHD model uses solar wind conditions observed at L1 to provide time-dependent, event-specific upstream boundary conditions for the MHD model, and the magnetohydrodynamic state vector is solved on a grid. An example of the output of an MHD simulation is indicated in Figure 1, showing an equatorial snapshot of the electric and magnetic field values (color scale and contours, respectively), and the direction and relative magnitude of magnetospheric plasma flow velocities (vectors). Flow channels associated with substorm activity are clearly shown in the pre- and post-midnight tail regions. Such activity is difficult to model in diffusive Fokker-Planck simulations of the radiation belts because those models do not contain magnetospheric fields with these spatial and temporal scales and they do not contain associated non-diffusive advective transport. In contrast, effects of such activity on radiation belt particles are a natural feature of the MHD-particle method. Solar wind conditions driving the MHD simulation are indicated in the right-hand panels of Figure 1.
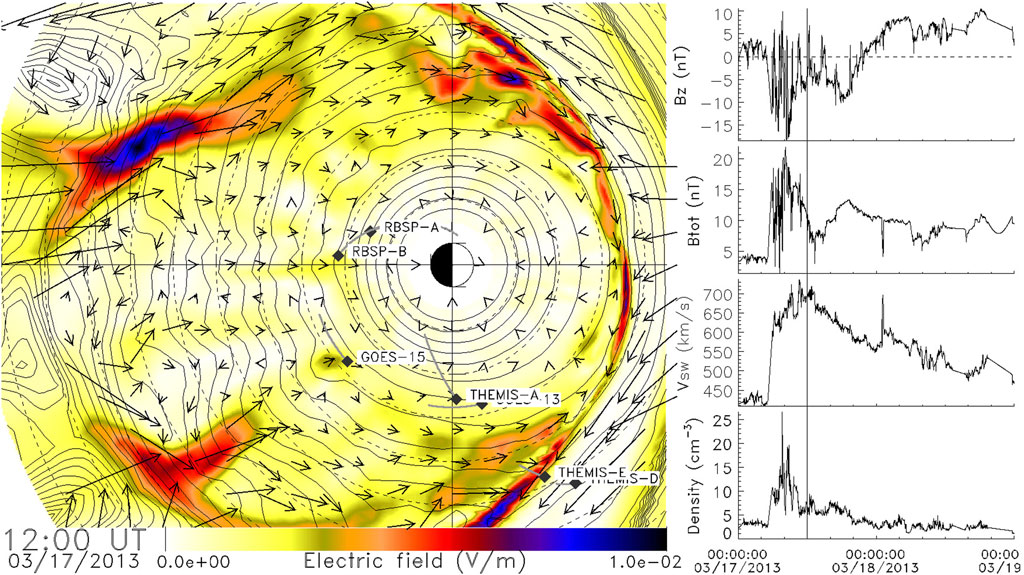
FIGURE 1. Snapshot of the equatorial results of an MHD simulation driven by the upstream solar wind conditions in the right-hand panel. Contours of constant magnetic field strength are shown, with plasma flow velocities indicated by vectors and the associated electric field magnitude indicated on the color scale. The location of several spacecraft at this time is also shown.
The test particle portion of the MHD-particle method uses the electric and magnetic field values from the MHD simulation, interpolated in space and time from the MHD solution grid to each test particle’s location, and these values are used to advance the particle’s position in time using a 3d guiding center approximation. The validity of the guiding center approximation must be checked at each point in the particle’s trajectory to ensure that the instantaneous particle gyroradius is much smaller than both parallel and perpendicular gradients in the local magnetic fields, and that the gyrofrequency is much larger than the corresponding temporal changes in the local fields. These particle simulations may comprise 105-106 test particles representing a range of energies and pitch angles, and may be conducted either forward or backward in time (e.g., Kress et al., 2015). By assigning a phase-space density to each test particle based on either initial or boundary conditions and invoking Liouville’s theorem, the aggregate dynamics of the radiation belts may be simulated as a function of driving solar wind conditions.
We note that the accuracy of any MHD/particle simulation will be limited by the accuracy of the underlying geomagnetic field model. For example, inadequate representation of the ring or tail current in an MHD model will lead to a reduction in the stretching and overall morphology of individual field lines (e.g., Wiltberger et al., 2000), and thus lead to inaccurate drift and bounce trajectories. Similarly, inaccuracies in the cold plasma distribution in the inner magnetosphere will change the propagation characteristics of Alfvénic wave activity in these regions, leading to errors in the rates and effect of radial transport in the simulation.
2.2 Stochastic differential equations
The application of SDEs to solving radiation belt Fokker-Planck equations has been developed and described by Tao et al. (2008), Tao et al. (2009), Selesnick et al. (2013), Zheng et al. (2014), Zheng et al. (2021), and references therein. Essentially, an n-dimensional Fokker-Planck equation is equivalent to n SDEs. Solving the SDEs generates an ensemble of random walk trajectories, and each of those trajectories carries information about the phase-space density from either a boundary or from an initial condition, as illustrated in Figure 2. Using SDEs, complicated general boundary conditions and initial conditions can be implemented easily, and the solution of the SDEs is highly parallelizable.
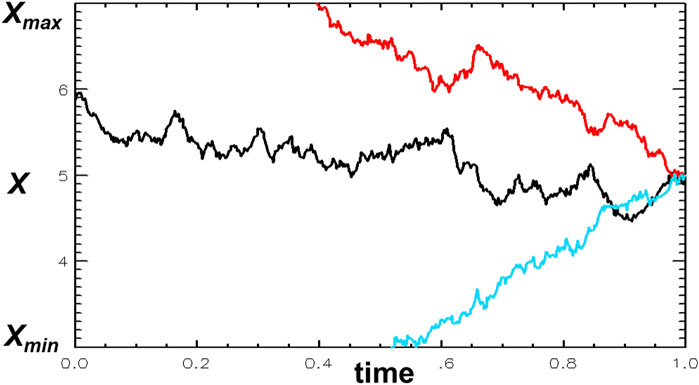
FIGURE 2. An illustration of SDE random walk trajectories, followed backwards in time from a phase-space position X at time t. A trajectory may either encounter a boundary (the red and blue trajectories) or an initial condition (the black trajectory), and contributions from those locations are summed to find the overall phase-space density at X and t. For a Dirichlet boundary condition the value at the boundary contributes directly, and for a Neumann boundary condition the trajectory is reflected and then followed until it encounters a Dirichlet boundary or an initial condition (Tao et al., 2008).
In this work, we incorporate cyclotron-frequency wave-particle interactions into an MHD-particle simulation code by following Hamiltonian guiding center particle motion (Brizard and Chan, 2001; Tao et al., 2007), and by using SDEs to give random kicks to the equatorial pitch angle and momentum of each particle (or to an equivalent pair of particle variables, such as the first adiabatic invariant and the parallel momentum). The random kicks are made according to bounce-averaged diffusion coefficients for the wave-particle interactions (details of the coefficients are given in the next section). The SDEs used in K2 that advance the equatorial pitch-angle α0 and momentum p of each particle from an “initial” value (before the kick) to a “final” value (after the kick, corresponding to a time interval Δs) are (Tao et al., 2008):
where N1, N2, N3, and N4 are Gaussian random numbers with zero mean and unit variance, and on the σ and b coefficients we use a subscript 1 for α0 and a subscript 2 for p. For convenience we make the choice σ12 = 0, and then the other σ coefficients are:
and the b1, b2 coefficients are given by
We have the freedom to choose σ12 = 0 because i) the matrix σ only needs to satisfy the condition σσT = a [where σT is the transpose and where a is a diffusion matrix that appears in Equation 2 of Tao et al. (2008)], but that condition is not sufficient to uniquely fix σ; and ii) as described below Equation 5 of Tao et al. (2008), because of Levy’s theorem, different choices of σ generate equivalent stochastic processes that yield the same solution of the diffusion equation.
Consistent with the magnetic dipole field approximations assumed in the diffusion coefficients themselves, the Jacobian is given by the dipole formula G = p2T(α0) sin(α0) cos(α0), where the normalized bounce period is T(α0) ≈ 1.3801730 − 0.639693 sin4/3(α0) (Schulz and Lanzerotti, 1974).
Quantitatively assessing the effect of these dipole field approximations is difficult without doing the full non-dipolar field calculations. Orlova and Shprits (2010) have calculated diffusion coefficients in a Tsyganenko 89c (non-dipolar) magnetic field, and they compared corresponding scattering rates with those calculated in a dipole field. They demonstrated that on the dayside the effects of a non-dipolar magnetic field are negligible at distances less than six Earth radii, and on the nightside the diffusion coefficients may significantly depend on the assumed field model. We regard the dipole approximation as temporary at this stage–we assume it is reasonable in the inner magnetosphere, but the non-dipolar effects should be studied in future work (with the caveat that the amount of computation involved in calculating the diffusion coefficients would increase significantly).
3 Implementation in K2
3.1 Chorus wave diffusion coefficients
The K2 model can use any set of pre-computed diffusion coefficients for wave-particle interactions using the SDE method (2.2). In this paper we use a set of event specific chorus diffusion coefficients for the 17 March 2013 geomagnetic storm from Ma et al. (2018). These coefficients are calculated using quasilinear theory, with the chorus wave intensity estimated from National Oceanic and Atmospheric Administration (NOAA) Polar Orbiting Environmental Satellites (POES) measurements of precipitating and trapped electron fluxes using the method in Li et al. (2013) and Ni et al. (2014). The diffusion coefficients used in this study do not include the effects of a changing ωpe/ωce ratio, which can substantially affect the wave power estimated from POES observations (Longley et al., 2022). The set of coefficients in Ma et al. (2018) are calculated separately for upper and lower band chorus with Gaussian frequency and wave normal angle distributions in each band. The limited orbital coverage of POES means the coefficients are binned in 1 hour time increments, L values of 3.0, 3.5, … , 7.0, and MLT bins of 00:00-04:00, 04:00-08:00, 08:00-12:00, and 20:00-24:00. The diffusion coefficients are assumed 0 in the 12:00-20:00 MLT interval. This assumption is made because the frequent presence of whistler waves in plumes in the afternoon to dusk sector introduces a higher level of uncertainty in the POES technique, which used the empirical plasmatrough density model (Sheeley et al., 2001) to infer chorus wave amplitudes. Pitch angle is resolved in 2° intervals from 1° to 89° with an additional point at 89.5°, and energy is resolved from 0.1 keV to 10 MeV with 71 values equally spaced. Figure 3 shows the pitch angle, momentum, and mixed diffusion coefficients at several times for an L-shell of 5, and MLT in the range of 00:00-04:00.

FIGURE 3. The chorus wave diffusion coefficients are plotted for several times during the event on 17 March 2013. Here Daa, Dap, and Dpp represent the α0α0, α0p, and pp diffusion coefficients, and the Dxx label on the color bar represents any of those three coefficients. The coefficients are for an L-shell of 5, and an MLT range of 00:00-04:00. Note the colorbar and axes are the same in each subplot, and each coefficient is in units of 1/hours.
Diffusion coefficients are computed in the framework of the Fokker-Planck equation, with units of 1/s. For use in K2, we convert precomputed coefficients to the Langevin equation formalism in Section 2.2. To avoid discretization errors, we compute the derivatives with respect to momentum in log space using
A centered finite difference is used for both the ∂/∂p and ∂/∂α0 derivatives. The diffusion coefficients are computed and pre-processed independently from K2. K2 then reads in the pre-processed file at runtime and stores the set of diffusion coefficients in memory. A linear interpolation provides the diffusion coefficient at any L-shell, energy, and equatorial pitch angle for a fixed MLT (magnetic local time) bin.
3.2 Implementing SDE kicks
The SDE method tracking the effects of whistler-mode chorus on energetic particles is combined with a global 3d test particle code capable of tracking the radial transport of the particles under the influence of ULF wave activity, substorm injections, and perturbations in the solar wind. The fields in this effort were taken from an MHD simulation of the solar wind/magnetosphere interaction driven by upstream boundary conditions measured at L1. The global MHD code used in this simulation was the Lyon-Fedder-Mobarry (LFM) MHD code (Lyon et al., 2004), although the method described can use any gridded simulation output or analytic model of the background electric and magnetic fields.
The test particle code is based on that described by (Elkington et al., 2002; Elkington et al., 2004). The 3d Hamiltonian guiding center equations (Brizard and Chan, 2001) are solved using a Runge-Kutta method with an adaptive time step (Cash and Karp, 1990), with background fields interpolated to the location of each test particle from a regular grid containing the MHD electric and magnetic fields as they evolve in time. In the examples shown in this paper, the MHD field grids are Cartesian with a uniform grid spacing of 0.2RE in all dimensions; basic benchmark tests indicate that errors in the drift trajectories due to field interpolation are not larger than those resulting from the relative local truncation error tolerance set in our adaptive Runge-Kutta solver (here 10–4/step). The test particle code is capable of being run either in a time-forward or a time-backward fashion; in this work, we run time-backward to minimize the number of points in phase space from which particles need to be initialized. Each particle is run backward in time until it hits either a boundary condition or initial condition, and a phase-space density is assigned to that particle based on that boundary/initial condition. In this work, we use the AE-8max trapped electron model (Vette, 1991) to assign phase-space densities to those particles that intersect an initial condition. In the current version of K2, time-backward simulations for longer and longer time intervals become more computationally costly quite rapidly (approximately quadratically in the time interval). In future work we plan to investigate ways to improve the efficiency of K2 to reduce computation time. We are considering variance-reduction methods and/or source-biasing methods, and we may apply methods developed by Woodroffe et al. (2018).
The effects of wave-particle interactions are simulated by periodically “kicking” the particle pitch angle and momentum in accordance with Eqs 1, 2. The particle may be allowed to traverse through several bounce periods before the trajectory is modified through simulated interaction with chorus waves via the SDE solver, so long as the time between SDE kicks is much less than a drift period. For the particle simulations described in this paper, the number of bounces Nb between kicks was experimentally varied between Nb = 3 and Nb = 60 with no significant change in the aggregate results of the test particle results, but with a small increase in code efficiency as we increased Nb. The results shown here, we used Nb = 15 as a compromise between code efficiency and temporal fidelity of the chorus wave interactions.
The time-backward trajectory of each test particle is tracked throughout its bounce motion, noting the time and spatial location at which the particle passes through its local magnetic minimum on each bounce. Once the specified number of bounces, Nb, has been completed, the particle location, momentum, and time are reset to the most recent traversal of the magnetic minimum, and Eqs 1, 2 are solved to give updated equatorial pitch angle and momentum. The Gaussian random number generator used in this step is based on the Mersenne Twister as described in Matsumoto and Nishimura (1998). Once the pitch angle and momentum is updated, the particle trajectory continues to be tracked backward in time through the next interval of Nb bounces, and the next update to the momentum and pitch angle applied. Examples of the trajectory of individual particles undergoing combined drift motion and interaction with chorus-mode whister waves is shown in Figure 4. Here the first adiabatic invariant (solid line) and energy (dashed line) are shown in the left-hand panel of the figure, with the equatorial parallel momentum (solid line) and equatorial pitch angle (dashed line) shown in the right-hand panel as the particle drifts in time about the Earth. The local time variation in the effects of the inferred chorus wave activity is clearly evident in the drift trajectories, with regions of little to no chorus activity evident in the trajectory plots centered around 500s simulation time and again centered around ∼1250s simulation time.
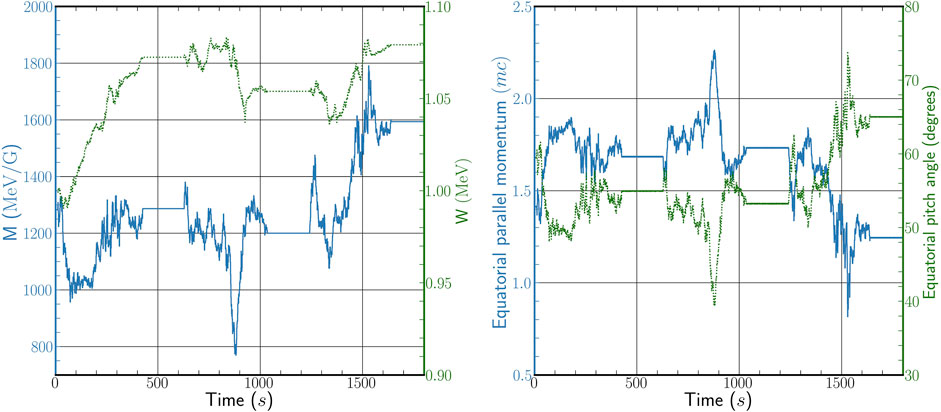
FIGURE 4. Example of a particle drifting about the Earth in a dipole field and undergoing interactions with whistler-mode chorus at different local times. In the left-hand figure, the particle’s first invariant M (blue, solid) and energy W (green, dotted) are shown; in the right-hand figure, the particle’s equatorial parallel momentum (blue, solid; in units of particle mass times c) and equatorial pitch angle (green, dotted) are shown. The effect of azimuthal variations in the chorus-based local diffusion coefficients are clearly visible as the particle drifts through local times.
The first-order numerical scheme for integrating the SDEs in Eqs 1, 2 is known as the Euler-Murayama scheme. Because the transport terms on the right-hand side of those equations are a small perturbation to the overall guiding center motion, the first-order errors accumulated in integrating the SDEs with the Euler-Murayama method become higher-order infinitesimals in the final results. The insensitivity of the calculated PSD to the value of ds, as described in the previous two paragraphs, justifies this approach. We note that there are also higher-than-first-order schemes of integrating SDEs, but these would greatly increase the computational cost and would require more stringent restrictions on the smoothness of the equation coefficients, so in practice the Euler-Maruyama scheme used in this paper is by far the most commonly used numerical solver for SDE calculations.
4 K2 simulations of a storm-time enhancement event
We have applied the K2 code to an idealized simulation of a radiation belt enhancement event, with drivers and inputs motivated by the 17 March 2013 storm (Li Z et al., 2014). This storm was characterized by a strong CME shock first depleting the phase-space density, with a subsequent rapid increase in electron phase-space density (PSD) and energies beginning first around L = 4 (Thorne et al., 2013; Li W et al., 2014). The solar wind conditions during this event are indicated in Figure 1 and discussed in more detail in Li et al. (2015). We used event-specific bounce-averaged chorus wave diffusion coefficients calculated for the NSF GEM QARBM (Quantitative Assessment of Radiation Belt Models) focus group challenge (Ma et al., 2018). In this section we have plotted K2 simulated PSD profiles, event-specific averaged chorus wave diffusion coefficients, and the spatial distribution of precipitated particles.
In these K2 simulations we have not yet implemented contributions to the PSD from a possible low-energy (∼100 keV) boundary population of particles (analogous to the blue random walk in Figure 2). Thus the current K2 PSDs are due to contributions from the initial condition only (the black random walk in Figure 2). This simplifies the interpretation of the simulated PSD profiles, but it omits potentially important contributions to PSD and precludes a comparison with measured PSDs. In later work we plan to implement a time-varying low-energy PSD boundary condition (corresponding to a time-dependent seed population for the radiation belt electrons) and compare K2 simulation results with measurements from spacecraft missions, such as the NASA Van Allen Probes mission and the ERG (Arase) mission.
Figure 5 plots K2 values of PSD f(M, K, L) vs. L, for M = 500 MeV/G and K = 0.056
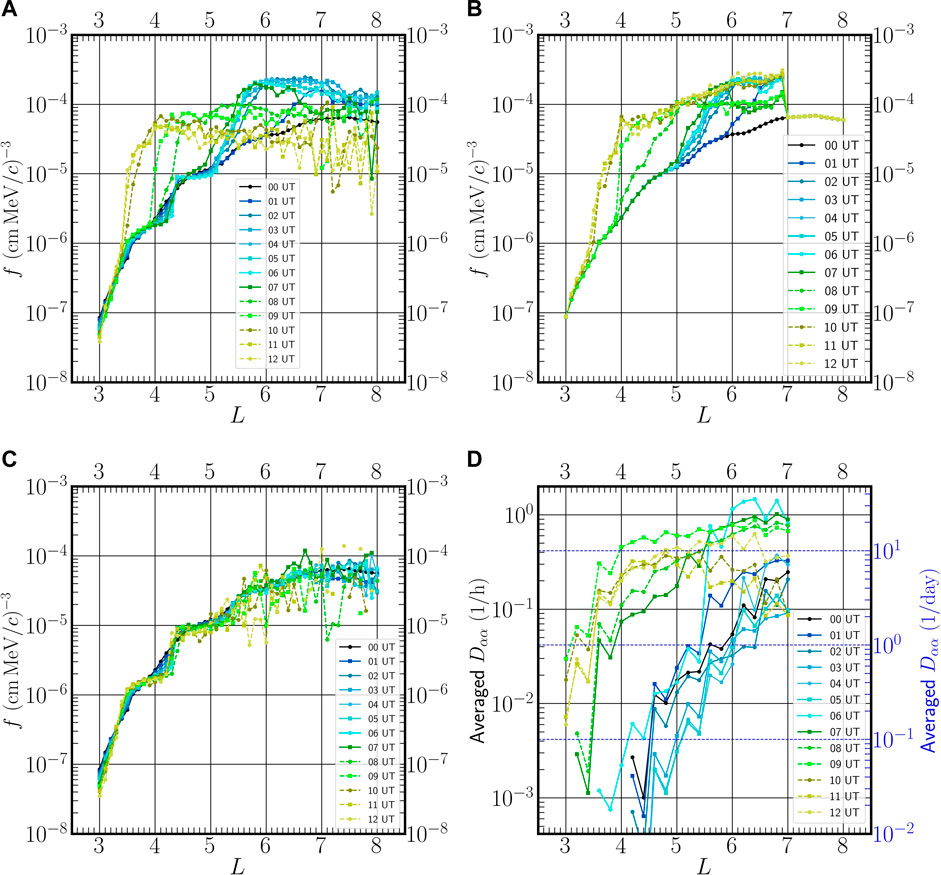
FIGURE 5. Phase-space density f in units (cm MeV/c)−3, for electrons with M = 500 MeV/G and
Figure 5A shows PSD profiles calculated in MHD fields with SDE wave-particle interactions; thus it includes effects of radial transport and chorus wave-particle interactions. The resulting PSD profiles vary significantly and in a complicated way in L and time. In order to better understand these dynamic PSD profiles, in Figures 5B, C we first isolate the chorus wave-particle interactions and the radial transport, respectively, and then we will return to a discussion of Figure 5A.
Figure 5B shows PSD profiles calculated in a static dipole magnetic field with SDE wave-particle interactions; thus it isolates effects of chorus wave-particle interactions on the PSD profiles. At all times, the absence of changes in the PSD profiles for L ≥ 7 is because the QARBM diffusion coefficients are zero there. We note two main increases in PSD: i) for UT = 1 to UT = 7 PSD profiles in the range 5 < L < 7 increase (while PSD profiles below L = 5 are unchanged), and ii) from UT = 8 to UT = 10, PSD profiles in the range 3.4 < L < 5.4 increase (while PSD profiles in the range 6 < L < 7 decrease mildly). This results in PSD values between L = 3.4 and L = 7 that are significantly higher than the initial condition, with a maximum increase near L = 4 by a factor of about 30. Overall, we see that PSD increases predominantly at early times at large L, and then at late times at small L. In the next paragraph we argue that the two main PSD increases can be identified with changes in the chorus wave diffusion coefficients.
For comparison with Figures 5B, D plots averaged values of the Dαα diffusion coefficients over the course of the simulation. These values are plotted as a function of L, and are taken on a surface of constant K = 0.056
Figure 5C shows PSD profiles calculated in MHD fields, but without SDE wave-particle interactions; thus it isolates effects of MHD-induced radial transport on the PSD profiles. Throughout the 12 h of the simulation the PSD profiles are relatively constant. They show small deviations from the initial condition for L ≲ 5.5, and larger, more-variable fluctuations for L ≳ 5.5. The latter are due to insufficient numbers of particles contributing to the PSD (including several cases of zero contributions that occur because the particle’s backward-in-time trajectory does not reach the initial condition), and as a result, for UT = 8 to UT = 12 PSD values for L ≳ 5.5 are not reliable. We usually start with around N = 10,000 backward trajectories to obtain each final value of f. Because the relative error scales as
Revisiting Figure 5A we can now identify and interpret the main features of the overall PSD evolution in MHD fields with SDE wave-particle interactions included. First, for UT = 1 to UT = 7 the PSD profiles between L = 5 and L = 7 increase almost an order of magnitude, associated primarily with local acceleration, while the PSD increase for L > 7 is consistent with outward radial diffusion. Note that the sharp gradient in Figure 5B at L = 7 is smoothed out within 1 hour. Second, for UT = 7 to UT = 10 the PSD profiles for L ≲ 5 increase rapidly, also associated primarily with local acceleration; in particular, near L = 4.1 PSD increases by an order of magnitude within 1 hour (from UT = 8 to UT = 9). Note that combined radial transport and chorus wave-particle interactions can result in PSD increases that are larger than the increase with SDEs alone (for example, the PSD increase near L = 3.5 at UT = 11 is larger in Figure 5A than in Figure 5B). Third, for UT = 10-12 the PSD profiles for L ≳ 7 have decreased compared to UT = 8, probably due to magnetopause shadowing and outward radial transport, but these values are less reliable because of low statistics and large error bars. Further work is needed to better model PSD at these late times and large L values.
Just as we calculate PSD in Figure 5 from the mean of the PSD values from all the contributing time-reversed trajectories, we have calculated the error bars from the corresponding standard deviation of those PSD values. In general, except for late times and large L values in Figure 5A, the error bars are mostly smaller than, or comparable to, the size of the plotting symbols. We also note that for this Methods paper, we chose to show results for only one pair of M and K values, in order to demonstrate the capabilities of the K2 code, and we plan to investigate the dependence of our simulation results on changing values of M and K in future work.
Figure 6 replots the same data as Figure 5 using the same four panels, but using heatmap plots rather than line plots. Comparing Figure 5 and Figure 6 we see that the heatmap format can be better for visualizing certain features of the data. For example, the heatmap plots better show the noisy low-statistics PSD values and the zero PSD values seen at late times and large L, particularly in Figures 5A versus Figure 6A and Figures 5C versus Figure 6C. This is primarily because the noisy overlapping lines in Figure 5 are difficult to separate visually. Also, the grey regions of the heatmap plots clearly show regions with zero values, whereas the zero values are omitted from the line plots.
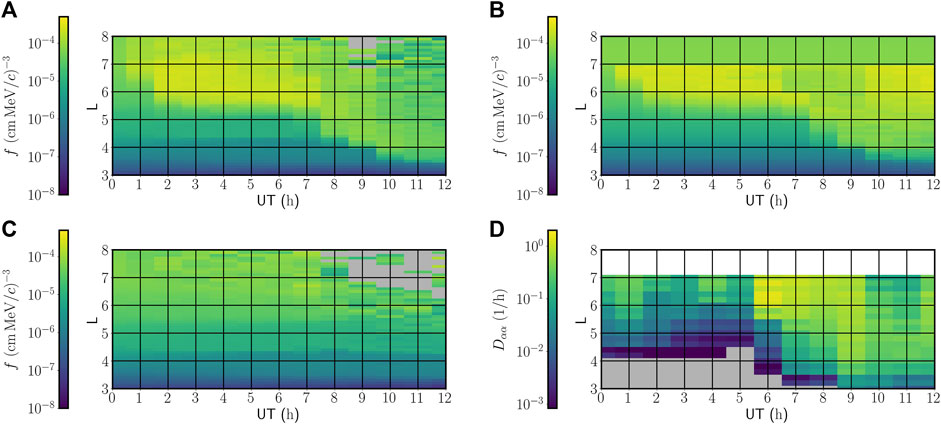
FIGURE 6. Phase-space densities f and averaged Dαα diffusion coefficients from Figure 5, re-plotted in L-t heatmap format. The subfigure labels (A–D) correspond to the same labels in Figure 5. Grey pixels show zero values and white indicates no values were calculated there.
In Figure 7 we show how the K2 code may be used to examine particle loss to the atmosphere as a result of scattering via interactions with whistler-mode chorus waves. Here, particles were launched in the interval L = [3.0,8.0] with a constant initial value of K; in this instance, we chose K = .0561
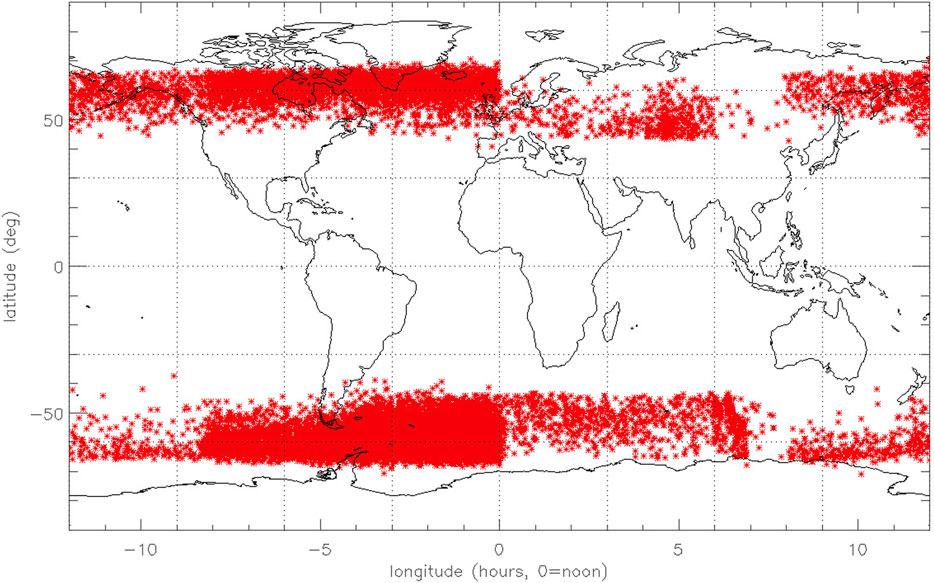
FIGURE 7. Figure showing the location where individual test particles intersect the inner boundary of the MHD simulation at
Figure 7 marks the location of each precipitated electron as a function of latitude and longitude, integrated over the full 12 h duration of the simulation. We note that the density of marks varies with both latitude and longitude, reflecting the local time variation of the event-specific local diffusion coefficients used in this simulation. In particular, we note a relatively high density of marks in the southern hemisphere between 0 and -5 h LT. This feature may be appearing because the event-specific diffusion coefficients we use are determined from POES precipitation data, which would be enhanced near the South Atlantic Anomaly (SAA); we note that this feature is not in the expected latitudinal range of the SAA (namely, between about 50° south and the equator), but because the MHD simulations do not contain the dipole field offset associated with the SAA, we do not expect to accurately reproduce the SAA location. We also note a North-South asymmetry in the number of test particles precipitating into the atmosphere, which we suggest is a result of the prevailing dipole tilt during this 12 h period of the simulation.
Test particles are also self-consistently lost from the simulation as they intersect the magnetopause: during periods of southward IMF, these test particles fail a check on the conservation of the first adiabatic invariant as they transition from the northward fields interior to the magnetopause, to the southward fields in the magnetosheath and solar wind. During periods of northward IMF, those test particles intersecting the magnetopause and not failing the adiabaticity check simply drift with the solar wind until they reach an outer boundary of the simulation domain. Further work contrasting the time history and phase-space density of precipitating particles to those lost to the magnetopause will allow us to examine the conditions and extent to which each loss process affects the dynamics of the radiation belts.
5 Summary and discussion
In summary, the main conclusions of this work are:
1. SDEs provide a powerful and general method to incorporate stochastic cyclotron-frequency wave-particle interactions into MHD-particle simulation codes. This includes quasilinear wave-particle interactions (WPIs) and stochastic nonlinear WPIs. The methods are adaptable to full-particle, guiding center, and bounce-center particle tracing.
2. In the K2 code, we have implemented the SDE methods into a guiding-center MHD-particle simulation code for Earth’s radiation belts.
3. The K2 code can comprehensively simulate radiation belt dynamics, including radial transport (which may be diffusive or non-diffusive), mesoscale magnetospheric field effects (such as magnetopause shadowing and drift-orbit bifurcation), and effects of cyclotron-frequency WPIs (such as precipitation losses to the ionosphere, local acceleration, and cross-term energy and pitch-angle diffusion).
4. We have performed a K2 radiation belt simulation motivated by the 17 March 2013 storm (e.g., Li W et al., 2014). We used event-specific bounce-averaged chorus wave diffusion coefficients calculated for the NSF GEM QARBM (Quantitative Assessment of Radiation Belt Models) focus group challenge, and plotted PSD profiles, averaged event-specific diffusion coefficients, and a spatial distribution of precipitated particles.
5. In this K2 simulation we find that local chorus wave-particle interactions can give rapid (≲ 1 hour) changes in PSD, MHD-driven radial transport can smooth out sharp radial PSD gradients within 1 hour, combined chorus wave-particle interactions and radial transport can give PSD incresaes greater than chorus wave-particle interactions alone, and losses seen in the simulation are qualitatively consistent with magnetopause shadowing and chorus wave-induced precipitation.
Compared to other radiation belt models, K2 has a number of strengths. First, unlike 3D diffusion models, K2 is not bounded by a last closed drift shell. Second, K2 contains both diffusive and nondiffusive radial transport. Third, K2 includes effects of off-diagonal radial-energy and radial-pitch-angle scattering associated with drift-shell splitting, and Shabansky orbits are automatically included. Fourth, K2 contains dynamic meso-scale magnetospheric field effects such as magnetopause shadowing and subsequent outward radial transport. The K2 code contains similar basic physics (bounce-averaged particle dynamics and quasilinear cyclotron wave interactions) to existing 4D radiation belt transport models described by Jordanova et al. (2008), Fok et al. (2008), and Shprits et al. (2015), but the main advantage of the K2 code over those models is the use of dynamic global MHD fields, which is especially important for event simulations. That said, K2 is computationally demanding and storage intensive, both in terms of the underlying global MHD simulations used to drive the test particles, and the test particle simulations themselves. The high time resolution required to fully resolve the bounce-drift motion of the particles makes this method better-suited to simulating radiation belt dynamics during individual geomagnetic events, rather than simulating weeks or months of radiation belt evolution.
We note that the background fields provided by the LFM MHD simulation code are susceptible to the sources of error discussed in Section 2.1. In the case of the results presented here, we used a version of the LFM code that is coupled with the Rice Convection Model (RCM) (Pembroke et al., 2012). The RCM provides a representation of the inner magnetospheric ring current, reducing errors in the stretching and morphology of the global magnetic field. The RCM also provides a model plasmasphere that dynamically changes with solar wind driving conditions, reducing errors in ULF wave propagation and the resulting radial transport of energetic particles. However, the version of the LFM used in this manuscript does not include potentially-relevant physical effects such as self-consistent plasmaspheric refilling via ionospheric outflow. Coupling the K2 framework to MHD models with better representations of the ring current and plasmasphere could improve the overall accuracy of the test particle simulation results.
While these preliminary results show the promise of the comprehensive global simulations made possible by K2, there are still several areas where the current framework may be improved. For example, the results shown here commonly assume a dipole field geometry in initializing the particle populations (e.g., in the calculation of the invariant K and corresponding initialization latitudes of test particles), as well as in the ordering of simulation results (e.g., assuming an L corresponding to a dipole field rather than the MHD fields distorted by external fields associated with magnetospheric currents). To that end, we are implementing an efficient iterative method that allows fast calculation of adiabatic invariants in dynamically-evolving MHD fields, to be described in another manuscript. Also, we currently assume a constant low-energy (keV) seed population given by the AE-8 trapped electron model; future improvements will use data-driven low-energy seed particle populations to provide time-dependent boundary conditions based on (where available) observations. Similarly, a non-zero outer boundary condition corresponding to energetic particles in the plasmasheet and near-Earth tail may be implemented to model the effects of those particles that may be convectively trapped in the inner magnetosphere or injected via substorm activity. With these improvements, we expect the K2 model to provide a comprehensive framework for simulating a wide range of physical processes, and allow detailed comparison of global radiation belt dynamics to those provided by in situ measurements.
Data availability statement
The datasets presented in this study can be found in online repositories. The names of the repository/repositories and accession number(s) can be found below: https://doi.org/10.5281/zenodo.8030588, https://doi.org/10.6084/m9.figshare.23405129.
Author contributions
AC and SE developed the concepts and implementation of the K2 model and wrote the first draft of the manuscript. SSA and WJL assisted with the incorporation of the chorus wave diffusion coefficients into K2. SAA contributed to the K2 coding and plotting of the results. JA discussed the conceptual basis of K2 with AC. AJ and DM contributed to the conception and development of this paper. QM and WL provided the chorus wave diffusion coefficients. All authors contributed to the article and approved the submitted version.
Funding
SE, AC, WJL, and SAA were supported by NASA LWS grant number 80NSSC21K1323. AJ, DM, SE, AC, and WJL were supported by NASA H-SR grant number NNX17AI51G. WL would like to acknowledge the NASA grants 80NSSC19K0845 and 80NSSC20K0698. QM is supported by the NASA grant 80NSSC20K0196.
Acknowledgments
The authors acknowledge Professor Xin Tao and Dr. Liheng Zheng for important contributions to the development of the radiation belt SDE methods that were adapted for use in the K2 model.
Conflict of interest
The authors declare that the research was conducted in the absence of any commercial or financial relationships that could be construed as a potential conflict of interest.
Publisher’s note
All claims expressed in this article are solely those of the authors and do not necessarily represent those of their affiliated organizations, or those of the publisher, the editors and the reviewers. Any product that may be evaluated in this article, or claim that may be made by its manufacturer, is not guaranteed or endorsed by the publisher.
References
Albert, J. M., Meredith, N. P., and Horne, R. B. (2009). Three-dimensional diffusion simulation of outer radiation belt electrons during the 9 October 1990 magnetic storm. J. Geophys. Res. Space Phys. 114. doi:10.1029/2009JA014336
Beutier, T., and Boscher, D. (1995). A three-dimensional analysis of the electron radiation belt by the Salammbô code. J. Geophys. Res. 100, 14853. doi:10.1029/94JA03066
Birn, J., Thomsen, M. F., Borovsky, J. E., Reeves, G. D., McComas, D. J., and Belian, R. D. (1997). Characteristic plasma properties during dispersionless substorm injections at geosynchronous orbit. J. Geophys. Res. 102, 2309–2324. doi:10.1029/96JA02870
Brizard, A. J., and Chan, A. A. (2001). Relativistic bounce-averaged quasilinear diffusion equation for low-frequency electromagnetic fluctuations. Phys. Plasmas 8, 4762–4771. doi:10.1063/1.1408623
Cash, J. R., and Karp, A. H. (1990). A variable order Runge-Kutta method for initial value problems with rapidly varying right-hand sides. ACM Trans. Math. Softw. 16, 201–222. doi:10.1145/79505.79507
Chan, A. A., Elkington, S. R., and Albert, J. M. (2010). Development of MHD-SDE methods for radiation belt simulations. 38th COSPAR Sci. Assem. 38, 4.
Drozdov, A. Y., Blum, L. W., Hartinger, M., Zhao, H., Lejosne, S., Hudson, M. K., et al. (2022). Radial transport versus local acceleration: the long-standing debate. Earth Space Sci. 9. doi:10.1029/2022EA002216
Drozdov, A. Y., Shprits, Y. Y., Orlova, K. G., Kellerman, A. C., Subbotin, D. A., Baker, D. N., et al. (2015). Energetic, relativistic, and ultrarelativistic electrons: comparison of long-term VERB code simulations with van allen probes measurements. J. Geophys. Res. Space Phys. 120, 3574–3587. doi:10.1002/2014JA020637
Elkington, S. R., Baker, D. N., and Wiltberger, M. (2005). “Injection of energetic ions during the 31 March 2001 0630 substorm,” in The inner magnetosphere: Physics and modeling. Editors T. I. Pulkkinen, N. A. Tsyganenko, R. H. W. Friedel, and D. C. Washington (American Geophysical Union). vol. 155 of Geophysical Monographs, 147. doi:10.1029/155GM17
Elkington, S. R., Hudson, M. K., and Chan, A. A. (1999). Acceleration of relativistic electrons via drift-resonant interaction with toroidal-mode Pc-5 ULF oscillations. Geophys. Res. Lett. 26, 3273–3276. doi:10.1029/1999gl003659
Elkington, S. R., Hudson, M. K., and Chan, A. A. (2003). Resonant acceleration and diffusion of outer zone electrons in an asymmetric geomagnetic field. J. Geophys. Res. 108, 1116. doi:10.1029/2001JA009202
Elkington, S. R., Hudson, M. K., Wiltberger, M. J., and Lyon, J. G. (2002). MHD/Particle simulations of radiation belt dynamics. J. Atmos. Sol. Terr. Phys. 64, 607–615. doi:10.1016/S1364-6826(02)00018-4
Elkington, S. R., Wiltberger, M., Chan, A. A., and Baker, D. N. (2004). Physical models of the geospace radiation environment. J. Atmos. Sol. Terr. Phys. 66, 1371–1387. doi:10.1016/j.jastp.2004.03.023
Fei, Y., Chan, A. A., Elkington, S. R., and Wiltberger, M. J. (2006). Radial diffusion and MHD particle simulations of relativistic electron transport by ULF waves in the September 1998 storm. J. Geophys. Res. 111, A12209. doi:10.1029/2005JA011211
Fok, M.-C., Horne, R. B., Meredith, N. P., and Glauert, S. A. (2008). Radiation belt environment model: application to space weather nowcasting. J. Geophys. Res. 113, A03S08. doi:10.1029/2007JA012558
Glauert, S. A., Horne, R. B., and Meredith, N. P. (2014). Three-dimensional electron radiation belt simulations using the BAS radiation belt model with new diffusion models for chorus, plasmaspheric hiss, and lightning-generated whistlers. J. Geophys. Res. Space Phys. 119, 268–289. doi:10.1002/2013JA019281
Hudson, M. K., Marchenko, V. A., Roth, I., Temerin, M., Blake, J. B., and Gussenhoven, M. S. (1998). Radiation belt formation during storm sudden commencements and loss during main phase. Adv. Space Res. 21, 597–607. doi:10.1016/s0273-1177(97)00969-1
Hudson, M. K., Paral, J., Kress, B. T., Wiltberger, M., Baker, D. N., Foster, J. C., et al. (2015). Modeling CME-shock driven storms in 2012-2013: MHD-test particle simulations. J. Geophys. Res. 120, 1168–1181. doi:10.1002/2014JA020833
Jordanova, V. K., Albert, J., and Miyoshi, Y. (2008). Relativistic electron precipitation by EMIC waves from self-consistent global simulations. J. Geophys. Res. 113, A00A10. doi:10.1029/2008JA013239
Kim, H.-J., Chan, A. A., Wolf, R. A., and Birn, J. (2000). Can substorms produce relativistic electrons? J. Geophys. Res. 105, 7721–7735. doi:10.1029/1999JA900465
Kress, B. T., Hudson, M. K., and Paral, J. (2014). Rebuilding of the Earth’s outer electron belt during 8–10 October 2012. Geophys. Res. Lett. 41, 749–754. doi:10.1002/2013GL058588
Kress, B. T., Hudson, M. K., Selesnick, R. S., Mertens, C. J., and Engel, M. (2015). Modeling geomagnetic cutoffs for space weather applications. J. Geophys. Res. 120, 5694–5702. doi:10.1002/2014JA020899
Lejosne, S., and Kollmann, P. (2020). Radiation belt radial diffusion at Earth and beyond. Space Sci. Rev. 216, 19. doi:10.1007/s11214-020-0642-6
Li, W., and Hudson, M. K. (2019). Earth’s van allen radiation belts: from discovery to the van allen probes era. J. Geophys. Res. 124, 8319–8351. doi:10.1029/2018JA025940
Li, W., Ma, Q., Thorne, R. M., Bortnik, J., Zhang, X.-J., Li, J., et al. (2016). Radiation belt electron acceleration during the 17 March 2015 geomagnetic storm: observations and simulations. J. Geophys. Res. Space Phys. 121, 5520–5536. doi:10.1002/2016JA022400
Li, W., Ni, B., Thorne, R. M., Bortnik, J., Green, J. C., Kletzing, C. A., et al. (2013). Constructing the global distribution of chorus wave intensity using measurements of electrons by the POES satellites and waves by the Van Allen Probes. Geophys. Res. Lett. 40, 4526–4532. doi:10.1002/grl.50920
Li, W., Thorne, R. M., Ma, Q., Ni, B., Bortnik, J., Baker, D. N., et al. (2014). Radiation belt electron acceleration by chorus waves during the 17 March 2013 storm. J. Geophys. Res. 119, 4681–4693. doi:10.1002/2014JA019945
Li, X., Roth, I., Temerin, M., Wygant, J. R., Hudson, M. K., and Blake, J. B. (1993). Simulation of the prompt energization and transport of radiation belt particles during the March 24, 1991 SSC. Geophys. Res. Lett. 20, 2423–2426. doi:10.1029/93gl02701
Li, Z., Hudson, M. K., Jaynes, A. N., Boyd, A. J., Malaspina, D. M., Thaller, S. A., et al. (2014). Modeling gradual diffusion changes in radiation belt electron phase space density for the March 2013 Van Allen Probes case study. J. Geophys. Res. 119, 8396–8403. doi:10.1002/2014JA020359
Li, Z., Hudson, M., Kress, B., and Paral, J. (2015). Three-dimensional test particle simulation of the 17-18 March 2013 CME shock-driven storm. Geophys. Res. Lett. 42, 5679–5685. doi:10.1002/2015gl064627
Longley, W. J., Chan, A. A., Jaynes, A. N., Elkington, S. R., Pettit, J. M., Ross, J. P. J., et al. (2022). Using MEPED observations to infer plasma density and chorus intensity in the radiation belts. Front. Astronomy Space Sci. 9. doi:10.3389/fspas.2022.1063329
Lyon, J. G., Fedder, J. A., and Mobarry, C. M. (2004). The Lyon–Fedder–Mobarry (LFM) global MHD magnetospheric simulation code. J. Atmos. Sol. Terr. Phys. 66, 1333–1350. doi:10.1016/j.jastp.2004.03.020
Ma, Q., Li, W., Bortnik, J., Thorne, R. M., Chu, X., Ozeke, L. G., et al. (2018). Quantitative evaluation of radial diffusion and local acceleration processes during GEM challenge events. J. Geophys. Res. Space Phys. 123, 1938–1952. doi:10.1002/2017JA025114
Ma, Q., Li, W., Thorne, R. M., Nishimura, Y., Zhang, X.-J., Reeves, G. D., et al. (2016). Simulation of energy-dependent electron diffusion processes in the Earth’s outer radiation belt. J. Geophys. Res. Space Phys. 121, 4217–4231. doi:10.1002/2016JA022507
Maget, V., Sicard-Piet, A., Bourdarie, S., Lazaro, D., Turner, D. L., Daglis, I. A., et al. (2015). Improved outer boundary conditions for outer radiation belt data assimilation using THEMIS-SST data and the Salammbo-EnKF code. J. Geophys. Res. Space Phys. 120, 5608–5622. doi:10.1002/2015JA021001
Matsumoto, M., and Nishimura, T. (1998). Mersenne twister: a 623-dimensionally equidistributed uniform pseudo-random number generator. ACM Trans. Model. Comp. Sim. 8, 3–30. doi:10.1145/272991.272995
Merkin, V. G., Panov, E. V., Sorathia, K. A., and Ukhorskiy, A. Y. (2019). Contribution of bursty bulk flows to the global dipolarization of the magnetotail during an isolated substorm. J. Geophys. Res. 124, 8647–8668. doi:10.1029/2019JA026872
Ni, B., Li, W., Thorne, R. M., Bortnik, J., Green, J. C., Kletzing, C. A., et al. (2014). A novel technique to construct the global distribution of whistler mode chorus wave intensity using low-altitude POES electron data. J. Geophys. Res. Space Phys. 119, 5685–5699. doi:10.1002/2014JA019935
Orlova, K. G., and Shprits, Y. Y. (2010). Dependence of pitch-angle scattering rates and loss timescales on the magnetic field model. Geophys. Res. Lett. 37, L05105. doi:10.1029/2009GL041639
Pembroke, A., Toffoletto, F., Sazykin, S., Wiltberger, M., Lyon, J., Merkin, V., et al. (2012). Initial results from a dynamic coupled magnetosphere-ionosphere-ring current model. J. Geophys. Res. 117, A02211. doi:10.1029/2011JA016979
Ripoll, J.-F., Claudepierre, S. G., Ukhorskiy, A. Y., Colpitts, C., Li, X., Fennell, J. F., et al. (2020). Particle dynamics in the Earth’s radiation belts: review of current research and open questions. J. Geophys. Res. Space Phys. 125, e2019JA026735. doi:10.1029/2019ja026735
Ripoll, J. F., Reeves, G. D., Cunningham, G. S., Loridan, V., Denton, M., Santolík, O., et al. (2016). Reproducing the observed energy-dependent structure of Earth’s electron radiation belts during storm recovery with an event-specific diffusion model. Geophys. Res. Lett. 43, 5616–5625. doi:10.1002/2016GL068869
Schulz, M., and Lanzerotti, L. J. (1974). “Particle diffusion in the radiation belts,” in Physics and chemistry in space, vol. 7 (New York: Springer-Verlag). doi:10.1007/978-3-642-65675-0
Selesnick, R. S., Hudson, M. K., and Kress, B. T. (2013). Direct observation of the CRAND proton radiation belt source. J. Geophys. Res. Space Phys. 118, 7532–7537. doi:10.1002/2013JA019338
Sheeley, B. W., Moldwin, R., Rassoul, H. K., and Anderson, R. R. (2001). An empirical plasmasphere and trough density model: CRRES observations. J. Geophys. Res. 106, 25631–25641. doi:10.1029/2000JA000286
Shprits, Y. Y., Kellerman, A. C., Drozdov, A. Y., Spence, H. E., Reeves, G. D., and Baker, D. N. (2015). Combined convective and diffusive simulations: VERB-4D comparison with 17 March 2013 van allen probes observations. Geophys. Res. Lett. 42, 9600–9608. doi:10.1002/2015GL065230
Shprits, Y. Y., Subbotin, D., and Ni, B. (2009). Evolution of electron fluxes in the outer radiation belt computed with the VERB code. J. Geophys. Res. Space Phys. 114. doi:10.1029/2008JA013784
Sorathia, K. A., Michael, A., Merkin, V., Ukhorskiy, A., Turner, D. L., Lyon, J., et al. (2021). The role of mesoscale plasma sheet dynamics in ring current formation. Front. Astronomy Space Sci. 8. 761875. doi:10.3389/fspas.2021.761875
Sorathia, K. A., Ukhorskiy, A. Y., Merkin, V. G., Fennell, J. F., and Claudepierre, S. G. (2018). Modeling the depletion and recovery of the outer radiation belt during a geomagnetic storm: combined mhd and test particle simulations. J. Geophys. Res. Space Phys. 123, 5590–5609. doi:10.1029/2018JA025506
Su, Z., Xiao, F., Zheng, H., and Wang, S. (2011). CRRES observation and STEERB simulation of the 9 October 1990 electron radiation belt dropout event. Geophys. Res. Lett. 38, L06106. doi:10.1029/2011GL046873
Tao, X., Albert, J. M., and Chan, A. A. (2009). Numerical modeling of multidimensional diffusion in the radiation belts using layer methods. J. Geophys. Res. 114, A02215. doi:10.1029/2008JA013826
Tao, X., Chan, A. A., Albert, J. M., and Miller, J. A. (2008). Stochastic modeling of multidimensional diffusion in the radiation belts. J. Geophys. Res. 113, A07212. doi:10.1029/2007JA012985
Tao, X., Chan, A. A., and Brizard, A. J. (2007). Hamiltonian theory of adiabatic motion of relativistic charged particles. Phys. Plasmas 14, 092107. doi:10.1063/1.2773702
Thorne, R. M., Li, W., Ni, B., Ma, Q., Bortnik, J., Chen, L., et al. (2013). Rapid local acceleration of relativistic radiation-belt electrons by magnetospheric chorus. Nature 504, 411–414. doi:10.1038/nature12889
Tu, W., Cunningham, G. S., Chen, Y., Morley, S. K., Reeves, G. D., Blake, J. B., et al. (2014). Event-specific chorus wave and electron seed population models in DREAM3D using the Van Allen Probes. Geophys. Res. Lett. 41, 1359–1366. doi:10.1002/2013GL058819
Tu, W., Li, W., Albert, J. M., and Morley, S. K. (2019). Quantitative assessment of radiation belt modeling. J. Geophys. Res. Space Phys. 124, 898–904. doi:10.1029/2018JA026414
Vette, J. I. (1991). The AE-8 trapped electron model environment. Tech. Rep. NSSDC/WDC-A-R&S 91-24. Greenbelt, MD: NASA Goddard Space Flight Center.
Wiltberger, M., Pulkkinen, T. I., Lyon, J. G., and Goodrich, C. C. (2000). MHD simulation of the magnetotail during the December 10, 1996, substorm. J. Geophys. Res. 105, 27649–27663. doi:10.1029/1999ja000251
Woodroffe, J., Brito, T., Jordanova, V., Henderson, M., Morley, S., and Denton, M. (2018). Data-optimized source modeling with the backwards Liouville test–kinetic method. J. Atmos. Solar-Terrestrial Phys. 177, 125–130. doi:10.1016/j.jastp.2017.09.010
Zheng, L., Chan, A. A., Albert, J. M., Elkington, S. R., Koller, J., Horne, R. B., et al. (2014). Three-dimensional stochastic modeling of radiation belts in adiabatic invariant coordinates. J. Geophys. Res. Space Phys. 119, 7615–7635. doi:10.1002/2014JA020127
Keywords: radiation belts of magnetized planets, wave-particle interaction, energetic particles, magnetospheric plasma waves, quasilinear and non-linear theory, numerical simulation
Citation: Chan AA, Elkington SR, Longley WJ, Aldhurais SA, Alam SS, Albert JM, Jaynes AN, Malaspina DM, Ma Q and Li W (2023) Simulation of radiation belt wave-particle interactions in an MHD-particle framework. Front. Astron. Space Sci. 10:1239160. doi: 10.3389/fspas.2023.1239160
Received: 12 June 2023; Accepted: 21 August 2023;
Published: 26 September 2023.
Edited by:
Robert Demajistre, Johns Hopkins University, United StatesReviewed by:
Alex Degeling, Shandong University, Weihai, ChinaAlexander Chernyshov, Space Research Institute (RAS), Russia
Copyright © 2023 Chan, Elkington, Longley, Aldhurais, Alam, Albert, Jaynes, Malaspina, Ma and Li. This is an open-access article distributed under the terms of the Creative Commons Attribution License (CC BY). The use, distribution or reproduction in other forums is permitted, provided the original author(s) and the copyright owner(s) are credited and that the original publication in this journal is cited, in accordance with accepted academic practice. No use, distribution or reproduction is permitted which does not comply with these terms.
*Correspondence: Anthony A. Chan, aac@rice.edu; Scot R. Elkington, scot.elkington@lasp.colorado.edu