A prominence eruption from the Sun to the Parker Solar Probe with multi-spacecraft observations
 Tatiana Niembro1*
  Daniel B. Seaton2
  Phillip Hess3
  David Berghmans4
  Vincenzo Andretta5
  Katharine K. Reeves1
  Pete Riley6
  Michael L. Stevens1
  Federico Landini7
  Clementina Sasso5
  Cis Verbeeck4
  Roberto Susino7
  Michela Uslenghi8
- 1Center for Astrophysics, Harvard & Smithsonian, Cambridge, MA, United States
- 2Southwest Research Institute, Boulder, CO, United States
- 3U.S. Naval Research Laboratory, Washington, DC, United States
- 4Solar-Terrestrial Centre of Excellence—SIDC, Royal Observatory of Belgium, Brussels, Belgium
- 5INAF—Osservatorio Astronomico di Capodimonte, Naples, Italy
- 6Predictive Science Inc., San Diego, CA, United States
- 7Istituto di Astrofisica Spaziale e Fisica Cosmica, Osservatorio Astrofisico di Torino, Pino Torinese, Italy
- 8INAF—Istituto di Astrofisica Spaziale e Fisica Cosmica, Milan, Italy
In the early hours of 2021 April 25, the Solar Probe Cup on board Parker Solar Probe registered the passage of a solar wind structure characterized by a clear and constant He2+/H+ density ratio above 6% during three hours. The He2+ contribution remained present but fainting and intermittent within a twelve-hour window. Solar Orbiter and Parker Solar Probe were in nearly perfect quadrature, allowing for optimal observing configuration in which the material impacting the Parker Solar Probe was in the Solar Orbiter plane of the sky and visible off the limb. In this work, we report the journey of the helium-enriched plasma structure from the Sun to the Parker Solar Probe by combining multi-spacecraft remote-sensing and in situ measurements. We identify an erupting prominence as the likely source, behind the Sun relative to the Earth, but visible to multiple instruments on both the Solar-Terrestrial Relations Observatory-A and Solar Orbiter. The associated CME was also observed by coronagraphs and heliospheric imagers from both spacecrafts before reaching the Parker Solar Probe at 46 R⊙, 8 h after the spacecraft registered a crossing of the heliospheric current sheet. Except for extraordinary helium enhancement, the CME showed ordinary plasma signatures and a complex magnetic field with an overall strength enhancement. The images from the Wide-field Imager for Solar Probe (WISPR) aboard Parker Solar Probe show a structure entering the field of view a few hours before the in situ crossing, followed by repetitive transient structures that may be the result of flying through the CME body. We believe this to be the first example of a CME being imaged by WISPR directly before and during being detected in situ. This study highlights the potential of combining the Parker Solar Probe in situ measurements in the inner heliosphere with simultaneous remote-sensing observations in (near) quadrature from other spacecrafts.
1 Introduction
Coronal mass ejections (CMEs) are sudden releases of large amounts of plasma dragging magnetic fields throughout the heliosphere (Webb and Howard, 2012). CMEs have been imaged in remote-sensing data since the 1970s, with missions such as OSO-7 (Tousey et al., 1973), Skylab (MacQueen et al., 1974), the Solar Maximum Mission (MacQueen et al., 1980), and P78-1 (Solwind; Sheeley et al., 1980).
Shortly after the first observation, a relationship was discovered between CMEs at the Sun, and in situ signatures recorded near the Earth (Burlaga et al., 1982) further strengthened in the following years (Richardson et al., 2000). The remote-sensing observations were improved with the continuous, near-Earth imaging of the Large Angle and Spectrometric COronagraph Experiment (LASCO, Brueckner et al., 1995) aboard the SOlar and Heliospheric Observatory (SOHO, Domingo et al., 1995), beginning in 1996 and still operating today. Moreover, since 2006, after the launch of the Solar TErrestrial RElations Observatory (STEREO, Kaiser, 2005), multiple viewpoints and imaging from the solar surface to beyond 1∼au are obtained with the Sun Earth Connection Coronal and Heliospheric Investigation instrument suite (SECCHI, Howard et al., 2008).
This improved observational coverage allowed a direct link between the imaging data and in situ data (Rouillard, 2011; DeForest et al., 2013), followed by statistical studies comparing properties of CMEs throughout the heliosphere to the in situ properties (Hess and Zhang, 2017; Wood et al., 2017) of their counterparts, the interplanetary coronal mass ejections (ICMEs). From a comprehensive analysis of 310 ICMEs, Zurbuchen et al. (2016) found that not only ICMEs exhibit systematic element abundance enhancements compared to quasi-stationary solar wind but also that the in situ composition measurements provide a unique way to determine the location and dynamics of their source region. Furthermore, it was found that more than 70% of CMEs are associated with prominence eruptions (Munro et al., 1979; Gopalswamy et al., 2003), which are related to the settlement of cool and dense plasma in the highly sheared, mainly horizontal, magnetic field above polarity-inversion lines (Priest et al., 1989; Gibson, 2018). Moreover, inside ICMEs, the composition has been found to be elevated in He2+/H+ (Borovsky, 2008; Yermolaev et al., 2020) particularly with larger values when the ICMEs are related to prominences (Hirshberg et al., 1972; Borrini et al., 1982; Lepri and Rivera, 2021).
Prominence eruptions are routinely observed, near the Sun, with visible (e.g., Hα) and extreme ultraviolet (EUV) telescopes, in the middle corona with visible light coronagraphs and with heliospheric imagers at larger distances from the Sun (a review on prominence observations can be found in Parenti, 2014, and references therein). In favorable circumstances, these remote-sensing observations may be supplemented by in situ measurements, which provide highly localized information about the speed, composition, and magnetic field.
While propagating from the Sun into the heliosphere, prominences and associated CMEs must be observed in widely disparate domains as no single instrument can provide an overview of their evolution (Thernisien et al., 2009; Luhmann et al., 2020). For the most part, gaps between these measurements and the challenges of processing data in a unified way have inhibited complete analyses of eruption initiation and propagation to in situ instruments.
In contrast, one example of this kind of study that does achieve the rare unification of observations that span from the Sun to the heliosphere is described in a series of papers by Howard and DeForest (2012) and DeForest et al. (2013), using data from STEREO-A, the Advance Composition Explorer (ACE, Stone et al., 1998), the Wind spacecraft (Ogilvie and Desch, 1997), and extensive image processing to track a small CME from its genesis at the Sun through the heliosphere to Earth.
More recently, studies have demonstrated the feasibility of closing some important observational gaps in the early evolution of erupting prominences using extended EUV observations. Reva et al. (2016) used the TESIS instrument assembly on the Russian CORONAS-PHOTON mission, along with images from LASCO, to observe the onset and early evolution of an erupting prominence, producing a complete trajectory from initiation to about 25 R⊙. Seaton et al. (2021) used a special campaign of the GOES Solar Ultraviolet Imager to track several small eruptions continuously from the solar surface to heights that are well-observed by coronagraphs. Other studies have leveraged the large field of view and off-pointing capabilities of the SWAP EUV imager on PROBA2 to characterize the early evolution of eruptions (O’Hara et al., 2019) and, when combined with STEREO-A observations, to develop three-dimensional understanding of erupting features (Mierla et al., 2013).
The advent of the Parker Solar Probe (PSP, Fox et al., 2016) and Solar Orbiter (SolO, Müller et al., 2020) missions has provided a new opportunity to study the origins and evolution of eruptions as they propagate from the Sun into the heliosphere. With a highly elliptical orbit that, using a series of gravity assists from Venus, will continue to get closer to the Sun, PSP enables an unprecedented ability to observe at heliospheric distances as close to the Sun as 0.04 au (less than 9 R⊙). While not getting as close to the Sun as PSP, SolO still takes science observations down to 0.28 au (60 R⊙) and further improves observational coverage with remote-sensing capabilities extending from the EUV to visible light, including coronagraphy and, at a later stage of the mission, by leaving the ecliptic plane.
Given the combined ability to observe both near the Sun and off of the Sun–Earth line, these spacecrafts significantly extend our ability to track eruptions continuously, with multiple perspectives, and the capability to directly sample localized plasma and magnetic conditions within an eruption and, when combined with additional observations, three-dimensional characterization of these features.
Unlike the past 1 au missions, PSP and SolO, due to their rapid changes in radial distance from the Sun, are not intended to take consistent data at regular intervals but are instead designed to focus science observations at specific periods and locations. Given the need to inform the in situ observations at one satellite with the context of remote-sensing observations at another, exploiting the uniquely advantageous orbital configurations is vital to achieving deep understanding, significantly augmenting the science results that could be achieved by any individual mission (Velli et al., 2020).
A favorable configuration occurred in late 2021 April, while PSP was approaching its eighth perihelion and was in near quadrature with SolO. Rodriguez et al. (2023) reported in detail an eruptive event that happened on 2021 April 22. With multiple independent lines of evidence (from different instruments and spacecraft), they showed, for the first time, the direct connection between the eruption and continuous magnetic reconnection and heating processes. The related ICME, which arrived on the Earth late on 2021 April 24, causing a minor geomagnetic storm, highlights the importance to establish a connection between solar eruptions observed in the solar corona and their in situ signatures measured by spacecraft in interplanetary space.
Two days later, during the late hours of 2021 April 23, another unrelated eruption event took place, reaching PSP in the early hours of 2021 April 25. In this investigation, we identify the eruption of prominence material at the surface of the Sun as the source of a helium-enriched plasma structure measured in situ by the PSP spacecraft. We use multi-spacecraft remote-sensing observations (STEREO-A and SolO) to track the propagation of the associated CME from the Sun to the PSP location.
This work is organized as follows. In Section 2, we describe the models, locations, and datasets of the different spacecraft used to track the CME from the Sun to PSP. In Section 3, we present the PSP in situ observations and how we use them to predict solar wind conditions at 10–20 R⊙. Then, we present an overview of the remote-sensing observations (Section 4): from the EUV images (Section 4.1), coronagraphs (Section 4.2), and heliospheric images (Section 4.3). The results of the reconstruction using the Graduated Cylindrical Shell model (GCS Thernisien et al., 2006; Thernisien et al., 2009) are shown in Section 4.4. Finally, we summarize, discuss our results in a height–time plot (distances between 1.5 and 20 R⊙) combining all observations, and present our conclusions in Section 5.
2 Data, spacecraft location, and models
To study the full evolution of the event, we combine the in situ detectors on board Parker Solar Probe (PSP, Fox et al., 2016), including the plasma parameter measurements from the Solar Wind Electrons Alphas and Protons (SWEAP, Kasper et al., 2016) and the Electromagnetic Fields Investigation (FIELDS, Bale et al., 2016) instruments, with remote-sensing observations from the Solar TErrestrial RElations Observatory (STEREO, Kaiser, 2005), Solar Orbiter (SolO, Müller et al., 2020), and PSP. Due to the location of the prominence on the far side of the Sun from the Earth’s perspective (see Figure 1), there were no obvious signatures in any Earth-orbiting in situ or remote-sensing observatories.
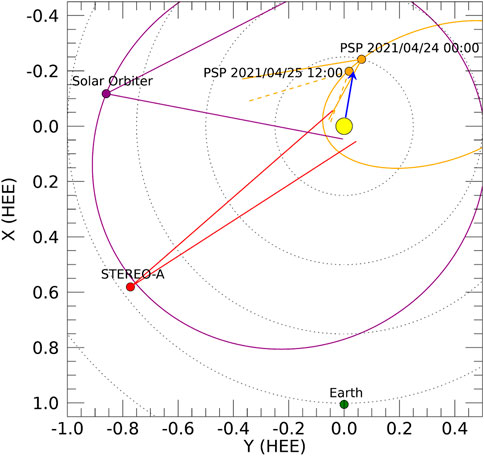
FIGURE 1. Location of Earth, SolO, and STEREO-A spacecraft when the CME impacted PSP on 2021 April 25 at 01:00 UT given in Heliocentric Earth Ecliptic (HEE) coordinates. The blue arrow represents the approximate propagation direction of the CME as determined from a forward modeling reconstruction of the eruption. The PSP and STEREO-A orbits are shown in orange and purple solid circles, respectively. Two PSP locations are shown, representing the inbound trajectory of the spacecraft. PSP and SolO were in nearly perfect quadrature during the event, allowing the observation of the eruption from the SolO plane of the sky. The lines on the plot show the cumulative fields of view from the remote-sensing instruments of each spacecraft used in this study. The changing field of view for WISPR is highlighted by the difference between the solid (earlier) and dashed (later) lines. The position of SDO can be assumed to be that of the Earth.
On PSP, the in situ plasma conditions are obtained from the data registered by three electrostatic analyzers, called the Solar Probe ANalyzers (SPAN, Whittlesey et al., 2020), and the Solar Probe Cup (SPC, Case et al., 2020), which are part of SWEAP suite, while the magnetic field measurements are from FIELDS instrument. On SolO, the plasma is measured by the Solar Wind Analyzer (SWA, Owen et al., 2020) and the magnetic fields with the magnetometer (MAG, Horbury et al., 2020).
For remote sensing, SolO carries the Extreme Ultraviolet Imager (EUI, Rochus et al., 2020), the Metis coronagraph (Antonucci et al., 2020), and the SolO Heliospheric Imager (SoloHI, Howard et al., 2020). EUI includes the Full Sun Imager (FSI), a wide field of view EUV imager with 174 and 304 Å channels which overlaps with the fields of view of Metis, that images the corona in the Visible and Ly-α. PSP, in addition to extensive in situ instrumentation, and carries its own Wide-field Imager for Solar Probe (WISPR, Vourlidas et al., 2016). STEREO images are obtained with the Sun-Earth Connection Coronal and Heliospheric Investigation instrument suite (SECCHI, Howard et al., 2008) consisting of five telescopes: an EUV imager (EUVI), two white light coronagraphs (COR1 and COR2), and two wide-field imagers (HI-1 and HI-2).
To image the prominence near the Sun, in the inner and middle corona, we use FSI from SolO and SECCHI from STEREO-A spacecraft. FSI was operating alternatively in its 174 and 304 Å channels, resulting in over eight images per hour of each type (Mampaey et al., 2022). SolO was at 0.87 au distance from the Sun, resulting in an FSI field of view of 12.4 R⊙.
In the middle and outer corona, we utilize the COR2 and Metis coronagraphs. The Metis white light (WL) and Lyman-α channel observations were obtained during a synoptic program, with a cadence of one dataset per hour. Each dataset consists of four polarized (WL) images, which, combined together, produce one (pB) image and three UV images. The acquired data were processed and calibrated following the procedure described in Romoli et al. (2021) and subsequently updated by Andretta et al. (2021). Small variations of the baseline level of data in the UV channel were corrected with a procedure devised and later implemented in the standard data processing pipeline.
Imaging at even greater heights is provided by SoloHI and WISPR. SoloHI observes off the east limb of the Sun with a 40° field of view, centered near 25° from the center of the solar disk. SoloHI consists of four separate 2k×2k APS detectors, arranged in a square pattern and sharing a single optical system for a total 4k×4k field of view. The boundaries between these tiles form a visible, stable cross-pattern in the images when the four tiles are correctly assembled into a single mosaic. WISPR consists of two 2k×2k APS detectors. The WISPR-Inner telescope (WISPR-I) has a 40° field of view, centered approximately 13.5° off the western limb of the Sun, relative to the spacecraft. The WISPR-Outer telescope (WISPR-O) has a 60° field of view centered at approximately 73°.
The locations of Earth, PSP, STEREO-A, and SolO are shown in Figure 1 in the Heliocentric Earth Ecliptic (HEE) coordinate system. PSP and SolO orbits are shown in orange and purple solid lines, respectively. PSP and SolO were in nearly perfect quadrature when the CME was launched to space from the Sun (its direction is marked with a blue arrow in the figure), allowing us the remote-sensing observation of the eruption from SolO’s point of view. In Table 1, we summarize the radial distance (R), longitude (lon), and latitude (lat) of all spacecraft. In both Figure 1 and Table 1, the locations of PSP are given for both the approximate onset time of the prominence eruption as well as for 24 h later, when the in situ signatures are first observed. In this time span, PSP moves 5.7° in longitude and 7.2 R⊙ toward the Sun.
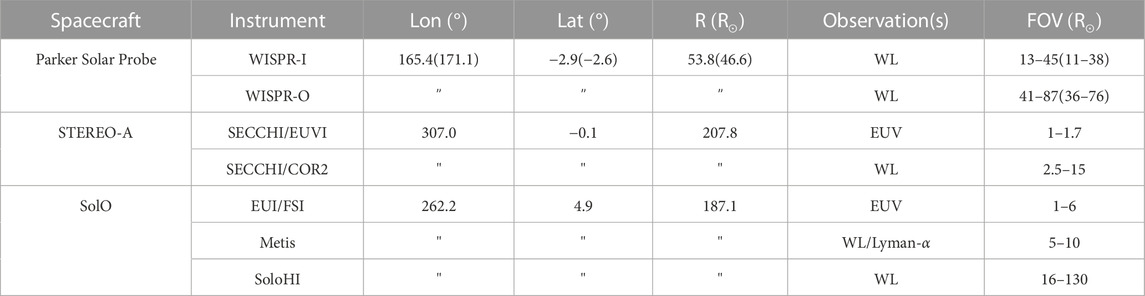
TABLE 1. Positions (longitude, latitude, and radial distance) in HEE coordinates of PSP, SolO, and STEREO-A on 2021 April 24 at 00:00 UT. The values in parentheses are PSP position on 2021 April 25 at 00:00 UT, 1 hour before the arrival detection of the structure at PSP. The other missions remained quasi-stationary throughout the period. The remote-sensing instruments used from each spacecraft have been listed along with their observed physical quantities (white light (WL), extreme ultraviolet (EUV), and Lyman−α radiation) and field of views (FOVs), respectively. The FOVs listed are approximations of the radial heights of the angular field of view at the radial distance of the respective individual spacecraft.
We model the background magnetic field using the Magnetohydrodynamic (MHD) Algorithm outside a Sphere (MAS) model from Predictive Science Inc. (PSI). We use the semi-empirical thermodynamic approach described in Riley et al. (2021), which includes conductive and radiative losses, and an empirical term for the coronal heating term (see Lionello et al., 2001; 2009; Reeves et al., 2010, for details involved in solving the MHD equations). The model consists of coronal solution (1–30 R⊙) and heliospheric solution (30 R⊙—1 au), with the heliospheric solution being driven by the results of the coronal solution. The boundary conditions for the coronal solution are derived from the Helioseismic and Magnetic Imager (HMI Schou et al., 2012) aboard Solar Dynamics Observatory (SDO Pesnell et al., 2012), and the boundary conditions for the heliospheric solution are based on the Distance from the Coronal Hole Boundary (DCHB) method (Riley et al., 2001; 2015). This model has been found to have very good agreement with magnetic field measurements taken in situ at the Earth, STEREO-A, and PSP for the first four PSP perihelia (Riley et al., 2021). Figure 2 shows the magnetic field obtained from the model and its relationship to the Sun and the location of PSP during the eruption.
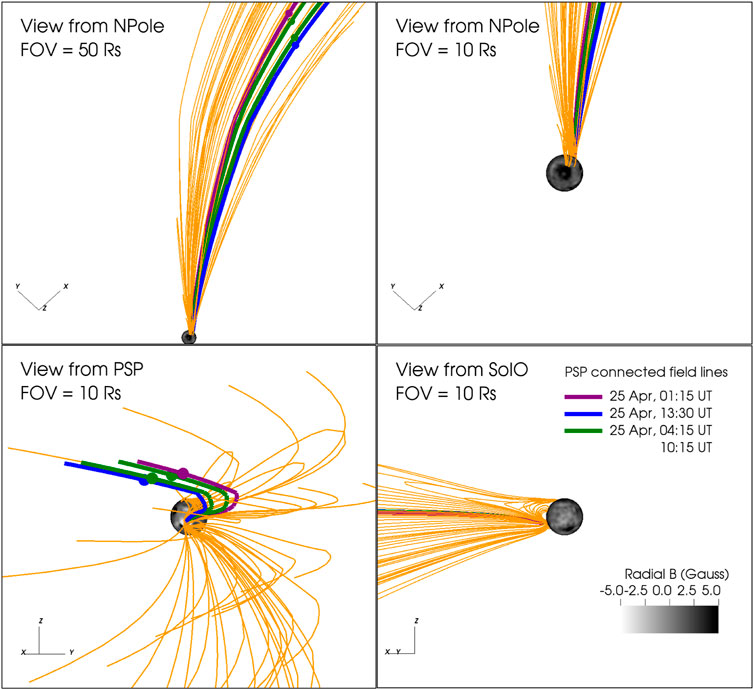
FIGURE 2. Different views (NPole—solar North Pole, PSP, SolO) of model field lines using the PSI/MAS model. Arbitrary magnetic field lines are drawn in orange showing open and close magnetic field configurations near the surface of the Sun. We mapped and colored four magnetic field lines connecting the surface of the Sun with PSP (colored dot symbols). The purple field line is related to the arrival time of the first structure at PSP reaching a maximum speed of 420 km s−1. The two green field lines delimit a flow region of constant speed (300 km s−1). The blue field line corresponds to a second structure moving at 350 km s−1.
In order to model the kinematics of the CME, we use the Graduated Cylindrical Shell model (GCS Thernisien et al., 2006; Thernisien et al., 2009), which is an empirical geometric model used to represent the flux-rope configuration of CMEs. This model was used to reconstruct many CMEs from LASCO and SECCHI data (e.g., Hess and Zhang, 2017; Kilpua et al., 2019; Zhao et al., 2019; Scolini et al., 2020; Palmerio et al., 2021; Nieves-Chinchilla et al., 2022). The same approach can be adapted to include WISPR and SoloHI data while still including the older datasets (Braga et al., 2022).
To reconstruct the solar wind conditions from PSP data (speed and density) back to 10–20 R⊙, we solve Bernoulli’s equation (Landau and Lifshitz, 1987) assuming the adiabatic expansion of a polytropic flow and neglecting the contribution of gravity force. Backward reconstruction methods have been extensively used (Parker, 1958; Weber and Davis, 1967; Tasnim et al., 2018; Biondo et al., 2021) with their limitations extensively discussed (Schatten, 1971; Pizzo, 1981; Ness and Burlaga, 2001).
3 The in situ observation of a helium-enriched plasma structure
In Figure 3, from top to bottom, we show the 15-min time series of the PSP in situ measurements of (first panel) the normalized differential energy flux versus azimuth angle SPAN − ϕ computed from SPAN instrument (Livi et al., 2022); (second panel) the PSP distance to the Sun (R, in black) with both flow angles SPC − θ (in peach) and SPC − ϕ (in teal) measured from SPC (Case et al., 2020)1; (third panel) the magnitude of the proton speed by both SPC (SPC-|V| in black) and SPAN (SPAN-|V| in gray) and the magnetic field strength (|B|, shown in navy) overplot. In the fourth panel, we show the radial (BR, in blue), tangential (BT, in green), and normal (BN, in red) components (measured by FIELDS). Then, in the fifth panel, the electron pitch angle (PA) for an energy of 314.45 eV with the color scale represents the logarithm of the energy flux vs. PA (from SPAN instrument, Whittlesey et al., 2020). In the sixth panel, we show the velocity distribution functions (VDFs) measured by SPC. Then, we present the SPC-β parameter and proton temperature (SPC-T) in the seventh panel while SPC-N and SPAN-N densities in the eighth panel.
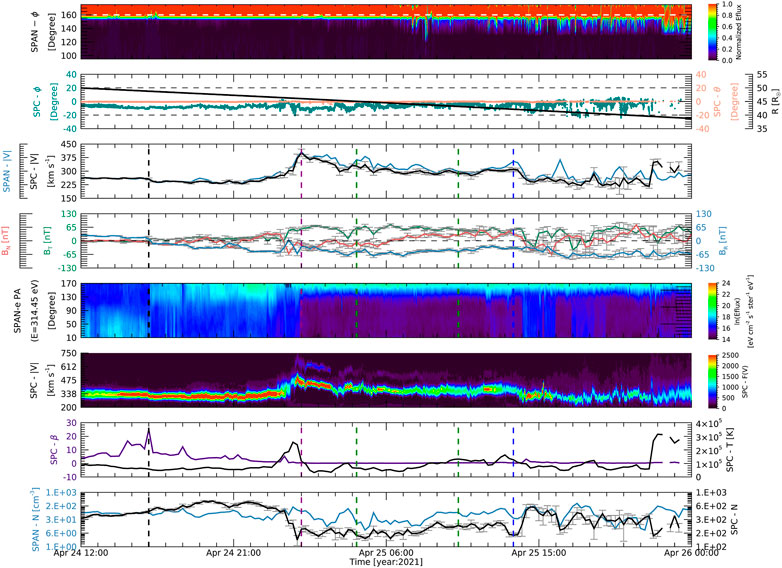
FIGURE 3. 15-min resolution in situ data registered by PSP (SWEAP and FIELDS suites). From top to bottom, we show (first panel) the normalized energy flux distributions in function of SPAN-ϕ-angle. During the event, most of the SPAN-distribution maxima were found when SPAN −ϕ >160° (horizontal white dash line). In the second panel, we show the SPC-ϕ (in teal) and SPC-θ (in peach) flow angles. Due to cross-correlation between two plates of the Faraday’s cup, we were not able to resolve SPC-θ. Still, most of SPC-measurements were obtained with SPC −ϕ <|±20°| (horizontal black dash lines). The PSP radial distance (R) to the Sun is overplot and shown in black. PSP was moving inbound when it registered the arrival of the prominence material at 46 R⊙. In the third panel, we show both SPC-|V| (shown in black) and SPAN-|V| (in gray) proton speed and the magnitude of the magnetic field (|B| in navy). Next, we show the radial (R, in blue), tangential (T in green), and the normal (N in red) B components. In the fifth panel, the electron pitch angle (PA) for an energy of 314.45 eV with the color scale representing the logarithm of the energy flux vs. PA is shown. In the sixth panel, we show the SPC velocity distribution functions. Within 6 h after arrival, a second peak was clearly observed that remained constant for 12 h. Then, the SPC-β parameter and proton temperature (SPC-T) are shown in the seventh panel, while in the last one, SPC-N and SPAN-N densities are shown. The structure is characterized by a sudden speed enhancement (reaching 400 km s−1 and shown with a purple vertical line), followed by a constant speed region (300 km s−1, green vertical lines) with no clear flux-rope configuration and ending with a structure at 310 km s−1 (shown with a blue vertical line) but with no clear signatures of flux-rope configuration. The vertical black dash line shows the time where PSP crossed the heliospheric current sheet.
For this period, the majority of the solar wind flow was out of the SPAN field of view (SPAN − ϕ > 160°, top panel) resulting in large and systematic underestimates in the proton density, SPAN-N (bottom in Figure 3), from that instrument. The solar wind is fully within the SPC sensor field of view; however, the flow SPC-ϕ direction (second panel) is only roughly estimated due to the crosstalk anomaly described in the SPC data quality flags. For this analysis, we approximate that |V|∼|VR|, which is roughly consistent with both sets of observations. We note that the SPAN spectrogram, capturing the tail of the proton distribution, does not show significant signs of flow deflection for at least the first half of the period.
PSP crossed over the heliospheric current sheet (HCS) on 2021 April 24 16:15 UT. Before this time, the magnetic field components and plasma parameters show quiet solar wind conditions, the flow was propagating at a speed between 230 and 260 km s−1 and positive BR value. The electron pitch angle corroborates the change of magnetic field sector which we marked with a black vertical dash line. After the HCS crossing, the spacecraft passed through a high-density region (reaching a maximum value of 692 cm−3) traveling at a very low speed of 250 km s−1.
The structure of interest arrived at the spacecraft on 2021 April 25 at 01:15 UT (marked with purple dashed vertical line) with no shock signatures and characterized by SPC-N = 214 cm−3, SPC-T = 96,423 K, β = 0.38, and |B| = 73 nT. The low density, beta parameter, and temperature values have been found as characteristic in situ signatures of magnetic clouds (Zurbuchen and Richardson, 2006). Moreover, in several investigations, it has been suggested that magnetic clouds are related to the eruption of prominence material (Bothmer and Schwenn, 1994; Burlaga et al., 1998; Wang et al., 2018).
We also observed a clear and continuous He2+/H+ > 8% ratio, that is, the presence of alpha-particles. The alpha-particle population is identified, in this case, from the clear secondary peak in the 1D reduced distribution functions (see sixth panel from Figure 3) from the SPC instrument (VDF, Case et al., 2020). The primary peak is, usually, associated with the core protons in the plasma, and it is well-measured throughout this period. The secondary peak is observed at roughly twice the kinetic-energy-per-charge of the proton core peak. This is often expressed in terms of the proton-equivalent speed,
Alternatively, a secondary peak might be associated with a proton beam component in the solar wind (Marsch et al., 1982; Alterman et al., 2018). In Figure 4, we present the 82-s time series of the alpha speed (first panel) and alpha ratio (second) estimated by SPAN’s partial field of view. In the third panel, we show the alpha ratio computed with SPC. In the fourth panel, we present the magnetic field direction where ϕB is shown in black and θB in blue. In the fifth panel, we show BR/|B| (shown in blue) and SPC-|V| for the VDF first (V1) and second (V2) peaks (in black) with the VDF maxima marked with black +. The VDF maxima were located computing the first and second derivatives of the VDF function.

FIGURE 4. 82-s time series of the alpha speed (first panel) and the alpha ratios measured by SPAN (second panel) and SPC (third panel) compared with the 15-min time series of the magnetic field direction by FIELDS (ϕB shown in black and θB in blue); the BR/|B| ratio (in blue) and SPC-|V| (in black). In the bottom panel, overplot, we marked the VDF maxima, first and second peaks, with black +. The vertical dash lines correspond to the arrival of the first structure (shown in purple), the constant speed region (delimited by two green lines), and the second structure at 310 km s−1 (in blue). During this period, the flow is fully captured by the SPC sensor and partially by SPAN. Still, both instruments observed speed and alpha ratio enhancements due to the arrival of prominence material.
In this case, we find the proton beam interpretation to be highly unlikely, as such secondary proton beams typically drift along the local magnetic field direction, relative to the core, with a drift speed that is at most on the order of the local Alfvén speed. Thus, the radial component of a proton distribution with a beam component would be expected to exhibit roughly Alfvénic or sub-Alfvénic drift speeds that modulate with the magnetic field angle. For the periods under consideration, the local Alfvén speed is roughly 100–200 km s−1, which is comparable to the observed difference in the proton-equivalent speed and, coincidentally, to
4 Remote-sensing observations
The remote-sensing observations (from both spacecraft SolO and STEREO-A) show that the eruption occurred in two phases. The first one, a smaller outburst, began in the more southerly part of the prominence around 2021 April 23 at 21:25 UT, and the second, characterized by a substantial eruption, originated from the more northerly part of the prominence around 2021 April 24 at 02:32 UT. It is impossible to say from our observations whether these individual features seen in the EUV and in coronograph observations are really two distinct events or part of a single, more complex one.
For the sake of clarity in the text, we refer to the earlier, smaller outburst as the first eruption and the latter, substantial one, as the second eruption. As these features propagated into the field of view of the several heliospheric imagers we used in this study, they began to become less distinct. Moreover, by the time they reach the PSP spacecraft, they can no longer be distinguished as completely separate events.
During the event, the eruptions propagated to the backside of the Sun from the SDO point of view. In Figure 5, we show the modeled background magnetic field (see Section 2) in different views combined with FSI 304 Å images of the Sun. We note that the model is based on SDO/HMI data from the previous visibility of this region, so there is some uncertainty in the boundary conditions. Assuming that the general magnetic configuration is preserved, the model gives insight into the background magnetic field configuration on 2021 April 23–24. The top panels show the magnetic field configuration from the solar North Pole. The bottom panels are from PSP (left) and SolO (right) points of view.
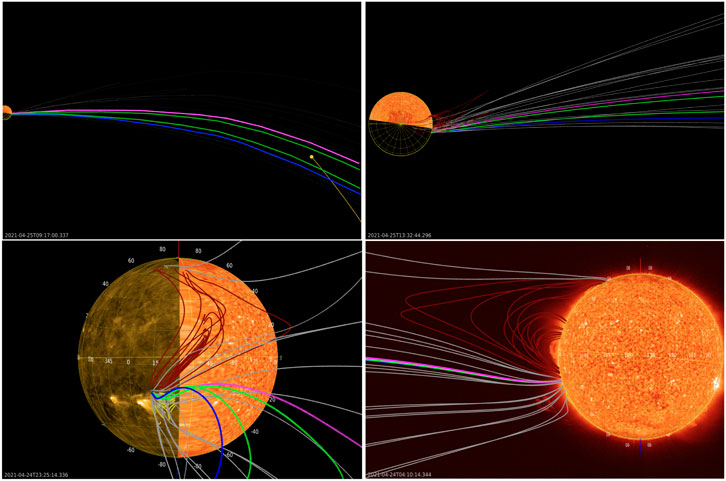
FIGURE 5. Different views of the MAS model field lines with several open (gray), close (red), and short, low-lying (yellow) magnetic field lines with the Sun at 304 Å as seen by FSI. The top panels are views down on the solar North Pole, while the bottom panels correspond to PSP left and SolO (right) perspectives. Purple, green, and blue fields are open and connect to the PSP orbit on 2021 April 25 at 01:15 (first transient), 04:15, 10:15 (both related to the constant speed patch), and 13:30 (second transient) UT (same as in Figures 2, 3). In the top left view, the bundle of magnetic field lines moves upward in time with the solar rotation with the PSP trajectory shown as a yellow line ending in a dot. PSP was moving toward the Sun, first crossing the purple field line. In the bottom left panel, we also include the Sun SDO/AIA 174 Å image on 2021 April 16 at 09:55 UT to illustrate the Sun from the backside as seen from SolO.
In Figure 5, we also show several open (gray), closed (red), and short, low-lying (yellow) magnetic field lines obtained with the MAS model. Purple, green, and blue colored lines are related to the different structures tracked from the Sun to PSP following Figures 2, 3. These lines originate close to the boundary between open and closed field lines (see Figure 5 bottom left panel). The top right and bottom left panels of Figure 5 show these field lines bending forward from the solar back-side toward the front-side and also toward the solar equator. The low-lying lines barely stick out behind the limb in the bottom right perspective and are roughly at the same solar latitude as the erupting filaments (−25 to −45°).
The magnetic field model results predict a scenario in which both eruptions strongly interact with their surroundings. It also predicts the possible filament source region close to the boundaries between open and closed field lines. At the source region, the eruptions are expected to encounter a domain where the magnetic field is complicated, while at farther distances from the Sun, the structures are embedded in regions dominated by open magnetic field lines. In this case, the results also suggest the eruptions being deflected toward the ecliptic plane.
4.1 Inner corona
The FSI telescope of EUI, on board SolO, imaged prominence in its 304 Å passband, near the South East limb (from SolO perspective) beginning early on 2021 April 22, as shown in Figure 6 and the accompanying animation. By 2021 April 23, 18:10 UT, this prominence grew into a full arch spanning position angles 120°–135° east from solar north. The first small eruption was seen beginning on 2021 April 23 at 21:25 UT, and the larger part of the prominence, the second eruption, began to untwist and erupted on 2021 April 24 at 02:32 UT.2
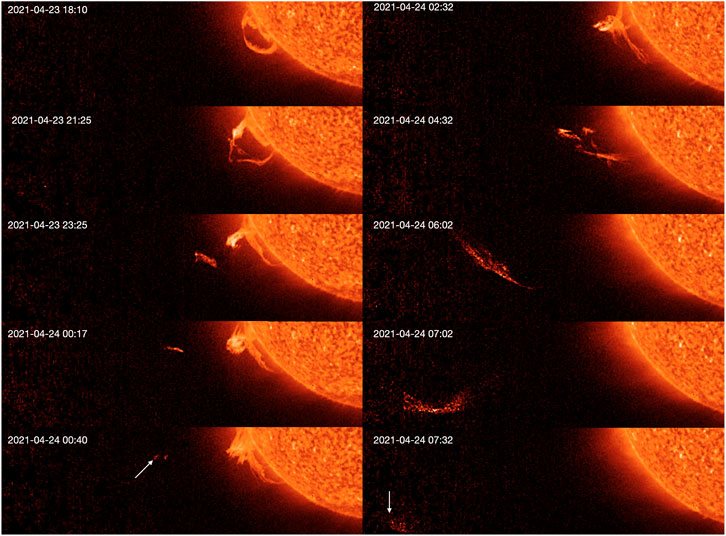
FIGURE 6. Overview of the first (left column) and second (right column) eruptions as observed by FSI in its 304 Å channel. The arrows in the last row point to a radial height of 1.66 R⊙ for the first eruption and 2.70 R⊙ for the second eruption. The position angle for both points is 110°.
Both eruptions were also seen in the FSI 174 Å channel. They initially travel (presumably confined by the local magnetic field structures in the corona) strongly non-radially toward decreasing position angles (i.e., northward). Although an FSI data gap (from 03:54 to 06:01 UT) interrupts the observations of the eruption’s final lift-off, the eruption was observed and followed at 304 Å reaching 2.7 R⊙ at position angle 110° from the solar disc center on 2021 April 24 at 07:32 UT.
Even though the eruptions originated on the backside of the Sun relative to STEREO-A, they were also visible in the 304 Å channel of EUVI above heights of 1.3 R⊙. Their trajectory in the middle corona was difficult to track due to the severe compression of the EUVI extended field of view. However, the data were nonetheless sufficient to reconstruct the 3D position of the erupting structure using triangulation via epipolar geometry (see Inhester, 2006) with the scc_measure.pro program in the SolarSoft IDL (Freeland and Handy, 1998) software package. From this, we conclude that the second eruption’s initial longitude is around −175° ± 5°, consistent with the magnetic field reconstructions discussed in Section 2. The same reconstruction put the initial eruption around a latitude of about −25°, moving progressively northward to −15°, consistent with the behavior visible across our several remote-sensing observations, although it was difficult to localize due to its extended nature.
4.2 Middle and outer corona
With the prominence erupting behind the limb from the perspective of the STEREO-A spacecraft, there was a subtle signal visible in the COR1 and plainly visible in COR2 coronagraphs. In Figure 7, we show snapshots of these structures. The first had the appearance of an extended loop just to the south of the equatorial plane (Figure 7A) that started to appear early hours on 2021 April 24. The loop was rapidly followed by a faint blob in the equatorial plane (Figures 7B, C) with some vague flux-rope-like structure.
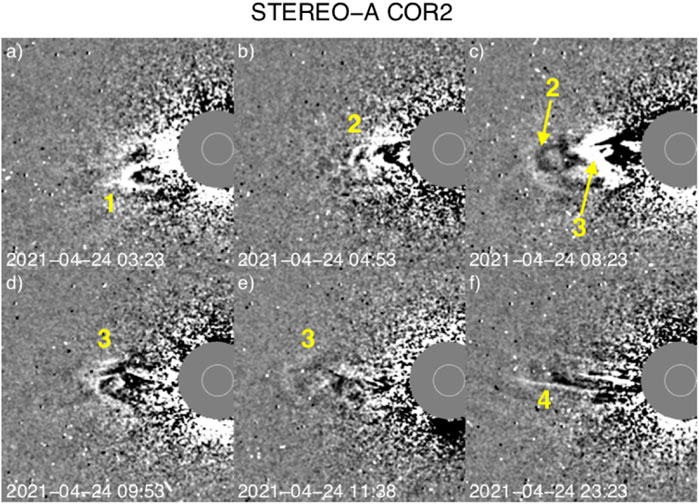
FIGURE 7. A series of running-difference screenshots from the COR2 coronagraph. The images are cropped to highlight the series of features associated with the eruption visible over the eastern limb of the Sun relative to the STEREO-A spacecraft. There are a number of features noted in the panels. In panel (A), there is a loop-like structure (1) visible just to the south of the solar equatorial plane. This is followed by a transient blob (2) seen most clearly in panel (B) that is still visible in panel (C). In panels (C–E), the main eruption related to the prominence (3) can be seen propagating out, with a circular feature we associated with a flux-rope cross-section. Last, in panel (F), there is a long radial feature (4) that seems related to an outflow after the main prominence eruption.
Around 2021 April 24 at 08:00 UT, a CME with the visual characteristics of a small flux-rope entered the COR2 field of view and propagated across it over the course of about 8 h (Figures 7C–E). The structure is defined by the overlap of a circular cross-section feature and a claw-like structure behind it. The first structure we take to be the flux-rope body, while the second one is the CME legs along the line of sight. The rest of the front of the CME body is visible to the sides of the circular cross-section structure. After the CME leaves the field of view, there are a number of small blobs and outflows propagating outward from a similar latitude (Figure 7F). We estimate the CME speed to be ∼300 km s−1, based solely on the transit time of the front through the COR2 field of view, assuming the front is near the plane of the sky.
Additionally, coronagraphic images from Metis (WL and Lyman-α UV channels) reveal the propagation of the CME closer to the plane of the sky. Although the eruption is also subtle in these images, the combination of both STEREO-A and SolO views allows us to constrain the CME trajectory.
In Figure 8, we show a sequence of close-up WL and UV images covering the evolution of the event through the Metis field of view. The first structure was seen in WL images after 2021 April 24 at 01:20 UT, centered roughly on the equatorial region, till approximately 09:20 UT. This phase of the event was, however, barely visible in the Lyman-α UV channel. After 10:20 UT, a relatively narrow and bright feature appeared in the FSI images at a position angle
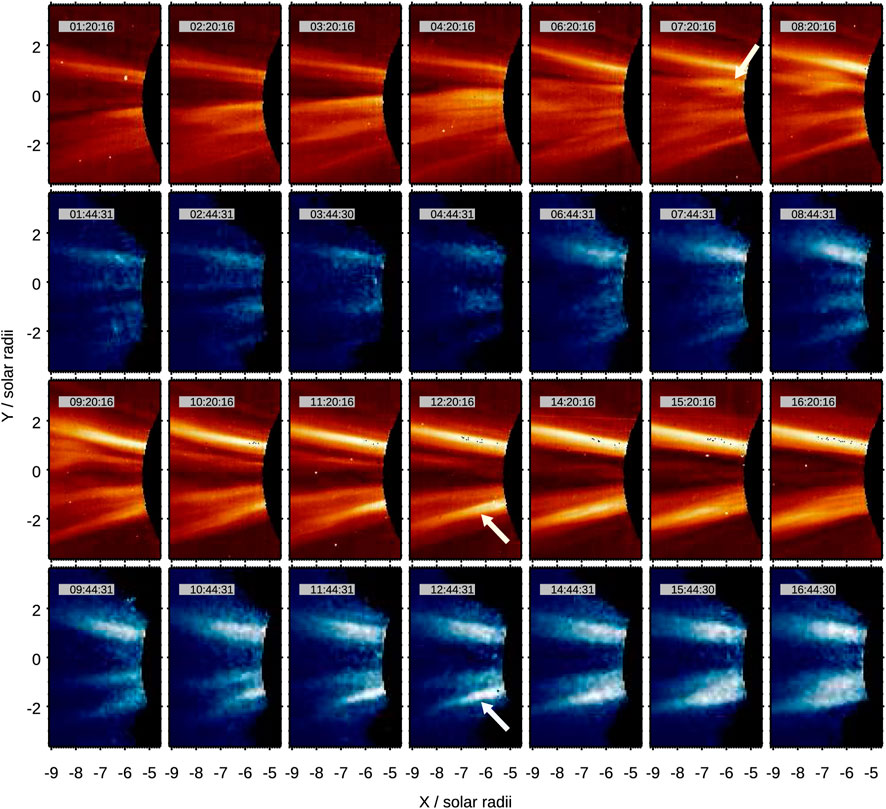
FIGURE 8. A series of images taken by the Metis coronagraphs almost simultaneously in its WL (odd rows, in red gradient color) and UV (even rows, in blue) channels, covering the transit of the CME through the SolO field of view. The arrows indicate the features corresponding with the FSI first and second eruption structures.
4.3 Heliosphere
SoloHI observed the erupting prominence during a brief observing period during the cruise phase. When the second structure erupted near the ecliptic plane, SolO was in an ideal position for eastern limb SoloHI observations. However, the instrument was designed for optimal observations during the SolO perihelia between 0.3–0.6 au, and in this case, the spacecraft was near 0.87 au, too far from the Sun for optimal cadence and noise level. The instrument was running at just a 3-h cadence and with longer exposures that tend to increase noise. Furthermore, about 5% of the inner portion of the field of view is impacted by stray light from the solar arrays. In general, when SolO is closer to the Sun and to reduce the amount of stray light, the solar arrays are angled away from the star. At 0.87 au, to absorb the necessary amount of sunlight, these arrays are angled toward the Sun and more stray light is visible on the detector, causing much of the inner 2° of the field of view to saturate.
Despite the observational limitations, a number of transient structures were observed by SoloHI, as seen in Figure 9. The snapshots were processed with a wavelet technique to remove the F-corona and cropped to a 15° field of view to highlight the transients and reduce the amount of visible stray light. The black line is a remnant of the cross-pattern discussed in Section 2. Between 2021 April 24 and 26, the PSP is located within the SoloHI field of view. Though the spacecraft is far too small to actually be observed, its location has been labeled in orange in each frame of Figure 9.
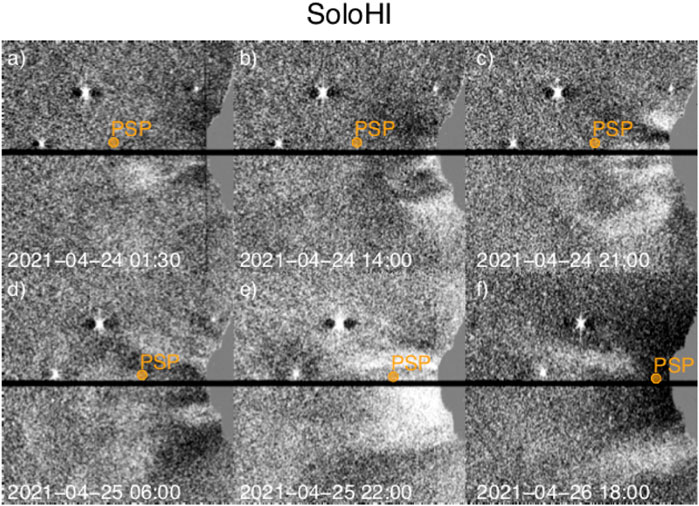
FIGURE 9. A series of snapshots from SoloHI. The images have been processed with a wavelet processing technique to remove the background and cropped to show a roughly 15° field of view corresponding to 25−75R⊙. The Sun is on the right side. The black line in the middle of each panel is the boundary between tiles 1 and 2 of the SoloHI instrument. The approximate location of PSP is labeled in orange. We consider the features visible in panels (A, B) to be related to the initial outflows seen in Figures 7A–C. This feature from panel (B) is visible to the south and well in front of PSP in panel (C). Also, in panel (C), the visible region in front of PSP is related to the second eruption first seen in Figure 7C. The larger object visible more toward the north is the Venus, while the smaller one near the tile boundary is the Mercury.
The first visible signal in SoloHI is seen well within the field of view by 2021 April 24, 14:00 UT (Figure 9B). Because the entire SoloHI field of view is beyond the COR2 field of view (see Table 1), and based on the timing of the associated structure in COR2 (Figures 7C–E), it is highly unlikely that this initial SoloHI structure is directly related to the prominence. Given its presence to the south of the equatorial plane, it is likely related to the initial loop/blob structures seen in COR2 (Figure 7A).
Closer to the equatorial plane, a second eruption was visible in the SoloHI field of view around 2021 April 24 at 21:00 UT. The structure correlates in terms of time, location, and size with the CME seen in COR2 (at 08:00 UT). Because of the low cadence, and high noise, the low CME density does not remain clearly visible for long or throughout much of the SoloHI field of view.
Later, on 2021 April 25 and into the 26th (Figures 9E, F), some diffuse structures can still be seen, which may or may not be related to the later outflows seen in COR2 (Figure 7F).
WISPR has been used to observe and track CMEs since the first encounter of the mission (Hess et al., 2020; Wood et al., 2020; Braga et al., 2022; Howard et al., 2022) and has also been observed to fly through the heliospheric current sheet. However, the first seven encounters contained no obvious candidate CME in the imaging data that could be directly linked to an in situ crossing at the spacecraft.
After receiving the data following the 8th perihelion of Parker Solar Probe, a new feature that had not been observed previously was identified in the data between 2021 April 24 and 25. A series of successive out-flowing loop-like structures could be seen in the data. These structures are shown in both telescopes, WISPR-I and WISPR-O, in Figures 10 and 11, using the level-3 calibrated images with F-corona removed (Hess et al., 2021; Howard et al., 2022). To highlight the transients, a median of the signal in both detectors has been subtracted from the images reducing the contribution from the stable streamer structure.
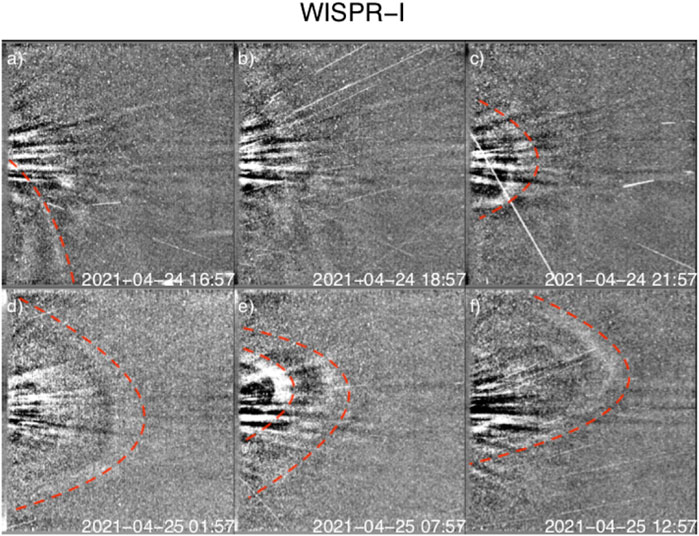
FIGURE 10. A series of snapshots from the WISPR-I detector. These are the WISPR background subtracted level-3 images, with an additional median subtraction to remove the stable streamer visible in the raw images. The Sun is to the left of the FOV. In (A), there is a feature in the southern part of the image corresponding to the initial eruption in Figure 7A. (B) Faint fronts which are difficult to isolate, corresponding to both the feature to the south highlighted in the previous panel and further north, as seen more clearly in subsequent panels, are visible. The front region corresponding to the CME is first visible in panel (C) and begins to expand and covers most of the FOV in (D). Subsequent fronts can be seen in panels (E, F). The rough outline of some of these features is identified with the dashed red line to aid in guiding the eye.
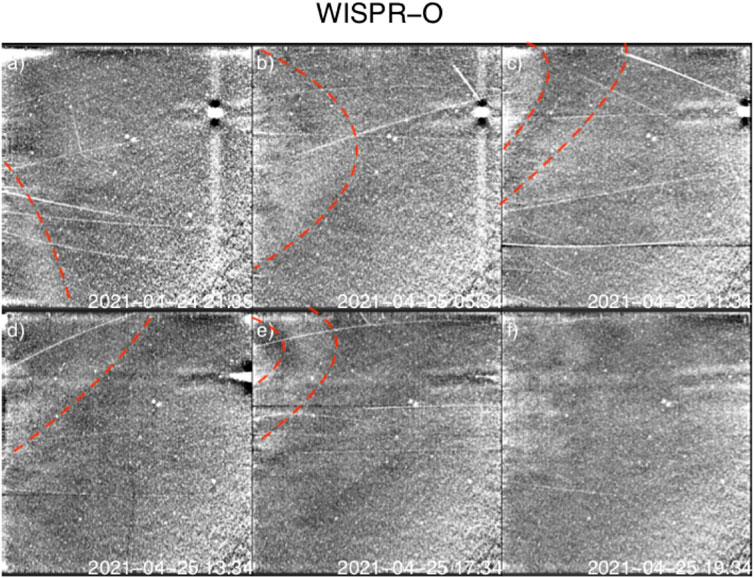
FIGURE 11. A series of snapshots from the WISPR-O detector. These are the WISPR background subtracted level-3 images, with an additional median subtraction to remove the stable streamer in the raw images. The Sun and WISPR-I are to the left of the field of view. In panel (A), there is a feature in the southern part of the image corresponding to the initial eruption in Figure 7A. The CME front is first visible in panel (B). Subsequent fronts can be seen in panels (C–F). The rough outline of some of these features is identified with the dashed red line to aid in guiding the eye.
In Figure 10A, we observed a transient to the south, similar to the structures seen in Figures 7A–C and 9. The second eruption related to the flux-rope is first visible in Figure 10C, which is approximately two hours before the PSP in situ observations shown in Figure 3. Within four hours, a large loop structure was observed consuming most of the WISPR-I field of view. This is followed by several consecutive loop structures that continue to be observed after 2021 April 25, 12:00 UT.
Similarly, in WISPR-O, a number of separate distinct outflows are visible throughout 2021 April 25, as seen in Figure 11. This type of repeated outflow has not been seen before or after this event. We believe this is due to a combination of the spacecraft flying through the CME and the different distinct blobs seen inFigure 7F.
4.4 GCS reconstruction
The determined GCS structure (details of the model described in Section 2) is displayed in Figure 12. This structure was determined largely from the COR2 observations, making the geometry more uncertain given the single viewpoint. Later observations from WISPR and SoloHI, while not overlapping with COR2, were used to determine if this GCS structure was plausible.
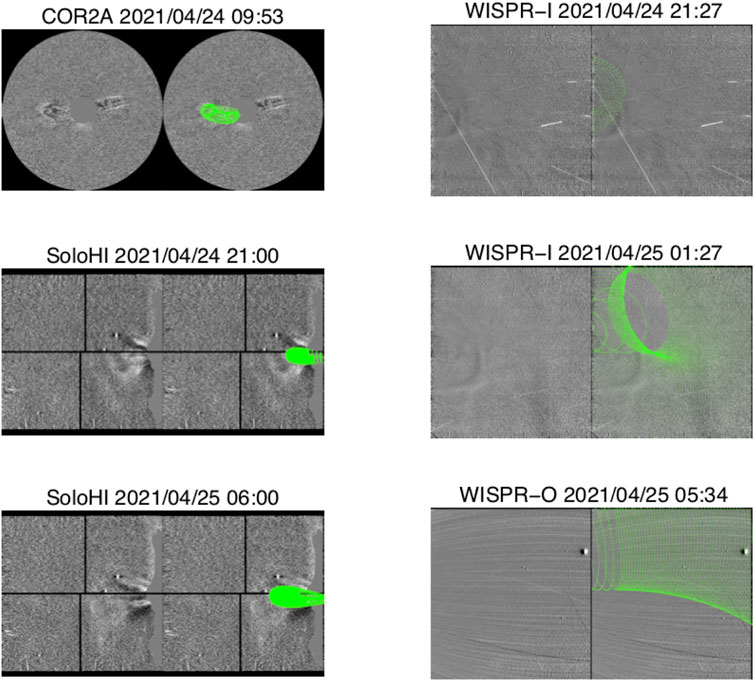
FIGURE 12. Example frames with (right) and without (left) the GCS mesh overlay from COR2, SoloHI, and WISPR-I and WISPR-O. The discrepancies between the GCS model and the observed features in the WISPR frames are due to the Thomson scattering effects.
The parameters of the model are listed in Table 2. Given the relatively faint CME observations and assuming low values of the width and aspect ratio (which controls the minor axis cross-section), we found that the CME nose is almost directly pointed at the PSP spacecraft.
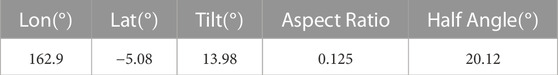
TABLE 2. GCS parameters determined to best recreate the CME. The longitude and latitude have been converted into HEE coordinates for the sake of comparison to Table 1.
COR2 and SoloHI were optimally positioned to observe the event. However, because the field of views did not overlap and had similar lines of sight, a true multi-viewpoint triangulation was not possible, and the reconstruction should be considered to have significant uncertainties. The SoloHI observations are further limited by the low resolution and cadence of the images due to the larger radial distance of the spacecraft. The WISPR data overlap with the SoloHI data at a much better resolution and cadence, but given that the derived GCS direction is pointing toward the PSP spacecraft, much of the CME front is likely unable to be resolved due to the poor Thompson scattering angle.
It should be noted that the different outflows observed, especially the two apparent flux-rope-like structures seen through Figure 7C, make it challenging to directly and confidently link the in situ data to what is imaged remotely. By fitting the GCS to the clearest observed flux-rope seen in COR2, we have produced a plausible geometric and kinematic structure that seems to match the various observations. We do acknowledge the possibility that another structure, such as that seen in front of the structure, fits with the GCS model in Figure 7C and could have been oriented toward PSP and produced the resulting in situ signatures. Regardless, the kinematics of the GCS blob should represent a useful velocity for the various related outflows seen in the imaging.
5 Discussion
To relate features observed in FSI and Metis, COR2, and PSP, we constructed a height–time plot (Figure 13) that combines the FSI and COR2 data, with overlays from measured or extrapolated positions of the eruptions as observed in other instruments. The plot shows the average over a radial cut through the images along the primary propagation direction of the eruption, between about 108° and 122° in the heliocentric radial coordinate system (where 0° is at the Sun’s north pole and 90° points due east).
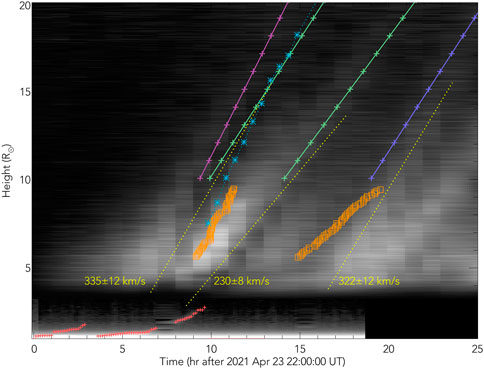
FIGURE 13. Composite FSI and Metis and COR2 height–time plot showing the relationships between erupting features tracked in EUI (red + symbols), COR2 GCS fits (light blue * symbols), Metis (orange □), and backward extrapolations from PSP in situ measurements of three different patches corresponding to those marked with vertical dash lines in Figure 3. The first transient with magenta +, the constant speed patch delimit between the lines marked with green +, and the third transient marked with indigo +. The dashed yellow lines and velocities are fit directly to features in the height–time plot.
Above 4 R⊙, we use COR2 observations to track the motion of the eruption, interpolated to match the spatial and temporal resolution of the FSI observations, and corrected to match the line of sight based on the known spacecraft locations and our 3D reconstruction (see Section 4.1). Note that the timing error introduced by SolO and STEREO-A’s different distances from the Sun is about 45 s, which is negligible compared to the uncertainty introduced by the observation cadence of COR2 and the assumptions underpinning the de-projection of the STEREO-A data to match SolO’s perspective, and are, therefore, neglected in this plot.
To relate the multiple observations, reconstructions, and extrapolations of the eruption from different instruments to one another and to validate that each tracking method has indeed produced self-consistent results, in a simple, unified view, we overlay our measurements of the position of the eruption on the height–time plot, including FSI (red +), COR2 GCS reconstructions (light blue *), Metis (orange □), and backward extrapolations from PSP’s position using the velocities measured in situ (first transient in magenta +, constant speed patch in green +, and the second transient in indigo +; these colors are selected to generally correspond to the colors of specific field lines in Figure 2 but must be lightened somewhat to be visible on the dark height–time image).
From the in situ observations, we analytically reconstruct the speed values from the PSP location back to 10–20 R⊙. We track back three different patches of plasma: the first structure (vertical magenta dash line in Figure 3) that crossed PSP at 412 km s−1, the second at a constant speed of 300 km s−1 (delimit between the two vertical green dash lines), and the third structure at 310 km s−1 (vertical indigo dash line).
We assume steady flows of adiabatic gas in each patch to solve the 1D spherical symmetric Bernoulli’s equation (integrated momentum equation) and obtain their speeds at ten different distances between 10 and 20 R⊙. We neglect gravity forces, assume a polytropic gas (Shi et al., 2022, in our case, γ = 5/3), and include the molecular weight μ to consider the He2+/H+ density ratio measured by SWEAP, to get the following:
where k is the Boltzmann constant, mH is the proton mass, v0 and r0 are the speed and radial distance near the Sun (in this case between 10 and 20 R⊙), and v and r are the speed and radial distance at the PSP location, respectively. We reconstruct analytically the information of the structures back to the Sun by assuming constant speed motion (see Figure 13).
In this case, we did not pursue running MHD numerical simulations (e.g., ENLIL (Odstrcil and Pizzo, 2009), PLUTO (Mignone et al., 2007; Mignone et al., 2012), and EUHFORIA (Pomoell and Poedts, 2018) numerical codes) by extrapolating the photospheric fields due to the difficulty of analyzing the event at its source region, observational limitations, and possible prediction of transit times to follow the eruption from the Sun to the PSP location with an analytical approach.
The analytical equations predict between 10 and 20 R⊙: the passage of the first structure on 2021 April 24, 08:40 UT, propagating away from the Sun with a speed of 389 km s−1, the constant speed structure on 2021 April 24, 10:00 to 18:00 UT, at 290 km s−1, and the third transient on 2021 April 24, 23:00 UT, at 302 km s−1.
Fitting the slopes of the two eruptions observed in the height–time plot, corresponding to the feature observed near the first sets of orange Metis points, we obtain a velocity of 335 ± 12 km s−1. The second major eruption, around the second set of orange Metis points, has a velocity of 322 ± 12 km s−1. A dark intermediate feature, corresponding to the third set of red points, is probably the trailing edge of the first eruption and has a slower speed, 230 ± 8 km s−1.
The strong agreement between the different sets of observations suggests we are tracking the same features in all of our data. The velocities we measure from these height–time plots also agree well with the PSP-derived velocities, indicating that the propagation of the CME is not strongly influenced by interactions in interplanetary space.
Early in the first eruption, the prominence appears to follow the local magnetic field in the low corona, which is highly non-radial, and thus the radially plotted height–time diagram does not fully capture the prominence’s trajectory or velocity. Outside of the FSI field of view, the eruption moves primarily radially, with essentially constant velocity.
By combining the analytical model with the connectivity derived from the MAS model, it is clear that, for much of the propagation of the eruption, the CME is propagating constantly along the open field lines connected to PSP because of the close proximity of the initial prominence to these field lines. While the magnetograms used in the MAS model for the area around the eruption are necessarily somewhat out of date because the eruption occurred on the backside of the Sun with respect to Earth, all of the remote-sensing data supports the notion of a simple propagation originating in the south and following open field lines northward toward the equator.
6 Conclusion
We reported the propagation of a complex prominence eruption that reached PSP on 2021 April 25 at 01:00 UT when the spacecraft was located at 46 R⊙. To study the full evolution of the event, we combined multi-spacecraft remote-sensing observations with the in situ measurements onboard PSP. The structure, as sampled by SPC, was characterized as a low temperature and low-density transient with complex magnetic field configuration and a He2+/H+ > 8% ratio indicating the presence of alpha particles identified from the clear secondary peak in the 1D reduced distribution functions moving at a velocity ranging between 550 and 650 km s−1. Although the structure lacks a coherent magnetic field configuration, the rest of the characteristics observed are signatures common in magnetic clouds, particularly when related to prominences. We identified the complex prominence eruption as the source by tracking from the Sun to PSP location the propagation of the associated CME, which was only possible due to the nearly perfect quadrature of PSP and SolO.
We analyzed FSI, Metis, and COR2 images, tracked the structure evolution up to 20 R⊙, and identified that the eruption occurred in two phases: a smaller outburst beginning in the more southerly part of a prominence and the substantial eruption originated from the more northerly part of the structure. Below 4 R ⊙, the set of remote-sensing observations showed that the structure is complex.
Above 20 R⊙, the CME kinematics was modeled using the GCS reconstruction method over WISPR and COR2 coronagraph images and by modeling the background magnetic field using the MHD PSI/MAS model and backward analytic reconstruction starting from PSP in situ data. The strong agreement between the different sets of observations and models showed that the ICME propagated radially at a constant speed and that it was not strongly influenced by interactions in interplanetary space.
This work highlights the importance of studying the propagation of transients from a multi-spacecraft point of view, as their combination enables a better understanding of the phenomena by closing gaps between the sets, e.g., the distance ranges covered by the different instruments, the image dependence with the spacecraft location which also reverberates on the possibility to model the events from remote-sensing observations, and the limits of the current reconstruction models back to the Sun from in situ data. Particularly in this case, we were able to follow a complex structure that, during the first stages of propagation, it seems to be evolving non-radially before propagating at a constant rate. Moreover, the eruption conserves its plasma and magnetic properties up to 46 R⊙.
Data availability statement
PSP SWEAP and FIELDS data are publicly available and can be found at: https://cdaweb.gsfc.nasa.gov/. The SoloHI data will be accessible at https://solohi.nrl.navy.mil/so_data/L1/ while WISPR at https://wispr.nrl.navy.mil/data/rel/fits/L3/orbit08/ and SECCHI at https://stereo-ssc.nascom.nasa.gov/data/ins_data/secchi/L0/a. Metis data will become available through the Solar Orbiter Archive (SOAR) by the end of 2023. Data are in any case available from the instrument Principal Investigator, prof. Marco Romoli (marco.romoli@unifi.it) upon request. EUI data is available through the Solar Orbiter Archive (SOAR, https://soar.esac.esa.int/). Our MAS model results are all available online at www.predsci.com.
Author contributions
TN, DS, PH, DB, VA, KK and MS contributed to conception, design of the study and writing of the first draft of the manuscript. TN carried out the PSP in situ data analysis and backward reconstruction models. MS performed the alpha ratio estimation and in situ data analysis. DS carried out height-time analysis for the near-sun observations and contributed to the characterization of the magnetic topology of the eruption's source region. PH performed analysis of the WISPR, SoloHI and COR2 images, including the GCS reconstruction of the CME on those data sets. DB contributed the EUI image processing and the visualization of the magnetic field lines. CV was the science planner and campaign leader for EUI that produced the EUI data analyzed in this paper. VA performed analysis of Metis data, including the determination of Metis height-time curves. PR and KR performed and worked the magnetic field simulations. FL and CS worked with the Metis observation plan that produced the Metis data analyzed in this paper. RS worked with the Metis observation plan and processed the resulting data analyzed in this paper. MU performed Metis UV data processing. All authors contributed to manuscript revision, and approved the submitted version. TN would like to thank Kristoff Paulson and Anthony Case for all their helpful discussions.
Funding
Parker Solar Probe was designed, built, and is now operated by the Johns Hopkins Applied Physics Laboratory as part of NASA's Living with a Star (LWS) program (contract NNN06AA01C). This work was supported by the NASA Parker Solar Probe Program Office for the WISPR program (contract NNG11EK11I). Support from the LWS management and technical team has played a critical role in the success of the Parker Solar Probe mission. The FIELDS experiment on the Parker Solar Probe spacecraft was designed and developed under NASA contract NNN06AA01C. Thanks to the Solar Wind Electrons, Alphas, and Protons (SWEAP) team for providing data (PI: Justin Kasper, BWX Technologies) also to the FIELDS team for providing data (PI: Stuart D. Bale, UC Berkeley). The Wide-Field Imager for Parker Solar Probe (WISPR) instrument was designed, built, and is now operated by the US Naval Research Laboratory in collaboration with Johns Hopkins University/Applied Physics Laboratory, California Institute of Technology/Jet Propulsion Laboratory, University of Gottingen, Germany, Centre Spatiale de Liege, Belgium and University of Toulouse/Research Institute in Astrophysics and Planetology. Solar Orbiter is a space mission of international collaboration between ESA and NASA, operated by ESA. The EUI instrument was built by CSL, IAS, MPS, MSSL/UCL, PMOD/WRC, ROB, LCF/IO with funding from the Belgian Federal Science Policy Office (BELSPO/PRODEX PEA 4000134088); the Centre National d’Etudes Spatiales (CNES); the UK Space Agency (UKSA); the Bundesministerium für Wirtschaft und Energie (BMWi) through the Deutsches Zentrum für Luft- und Raumfahrt (DLR); and the Swiss Space Office (SSO). The SoloHI instrument was designed and built at the U.S. Naval Research Laboratory and supported by NASA under contract NNG09EK11I. Metis was built and operated with funding from the Italian Space Agency (ASI), under contracts to the National Institute of Astrophysics (INAF) and industrial partners. Metis was built with hardware contributions from Germany (Bundesministerium für Wirtschaft und Energie through DLR), from the Czech Republic (PRODEX) and from ESA. The SECCHI data are produced by an international consortium of the NRL, LMSAL, and NASA GSFC (USA), RAL and U. Bham (UK), MPS (Germany), CSL (Belgium), IOTA, and IAS (France). The HMI data used are courtesy of NASA/SDO and the HMI science team. Partial funding for this project was supplied by the NASA HSO Connect Program, grant number 80NSSC20K1283, to the Smithsonian Astrophysical Observatory. MS and TN were supported by the Parker Solar Probe project through the SAO/SWEAP subcontract 975569. PH also acknowledges the support of the Office of Naval Research. PR gratefully acknowledges support from NASA (80NSSC20K0695, 80NSSC20C0187, 80NSSC20K1403, and 80NSSC22CA210).
Conflict of interest
PR is employed by Predictive Science Inc.
The remaining authors declare that the research was conducted in the absence of any commercial or financial relationships that could be construed as a potential conflict of interest.
Publisher’s note
All claims expressed in this article are solely those of the authors and do not necessarily represent those of their affiliated organizations, or those of the publisher, the editors, and the reviewers. Any product that may be evaluated in this article, or claim that may be made by its manufacturer, is not guaranteed or endorsed by the publisher.
Footnotes
1SWEAP instrument suite measures the particles of the solar wind, including the direction of the flows. SPC is optimized for flows perpendicular to the PSP heat shield, while SPAN is for flows at wider angles
2Note that observation times throughout this section are reported at the location of their respective spacecraft (see Figure 1)
References
Alterman, B. L., Kasper, J. C., Stevens, M. L., and Koval, A. (2018). A comparison of alpha particle and proton beam differential flows in collisionally young solar wind. ApJ 864, 112. doi:10.3847/1538-4357/aad23f
Andretta, V., Bemporad, A., De Leo, Y., Jerse, G., Landini, F., Mierla, M., et al. (2021). The first coronal mass ejection observed in both visible-light and UV H I Ly-α channels of the Metis coronagraph on board Solar Orbiter. AAP 656, L14. doi:10.1051/0004-6361/202142407
Antonucci, E., Romoli, M., Andretta, V., Fineschi, S., Heinzel, P., Moses, J. D., et al. (2020). Metis: The solar orbiter visible light and ultraviolet coronal imager. AAP 642, A10. doi:10.1051/0004-6361/201935338
Bale, S. D., Goetz, K., Harvey, P. R., Turin, P., Bonnell, J. W., Dudok de Wit, T., et al. (2016). The FIELDS instrument suite for solar Probe plus. Measuring the coronal plasma and magnetic field, plasma waves and turbulence, and radio signatures of solar transients. SSR 204, 49–82. doi:10.1007/s11214-016-0244-5
Biondo, R., Bemporad, A., Mignone, A., and Reale, F. (2021). Reconstruction of the parker spiral with the reverse in situ data and MHD APproach - rimap. J. Space Weather Space Clim. 11, 7. doi:10.1051/swsc/2020072
Borovsky, J. E. (2008). Flux tube texture of the solar wind: Strands of the magnetic carpet at 1 AU? J. Geophys. Res. (Space Phys. 113, A08110. doi:10.1029/2007JA012684
Borrini, G., Gosling, J. T., Bame, S. J., and Feldman, W. C. (1982). Helium abundance enhancements in the solar wind. JGR 87, 7370–7378. doi:10.1029/JA087iA09p07370
Bothmer, V., and Schwenn, R. (1994). Eruptive prominences as sources of magnetic clouds in the solar wind. SSR 70, 215–220. doi:10.1007/BF00777872
Braga, C. R., Vourlidas, A., Liewer, P. C., Hess, P., Stenborg, G., and Riley, P. (2022). Coronal Mass Ejection Deformation at 0.1 au Observed by WISPR. ApJ 938, 13. doi:10.3847/1538-4357/ac90bf
Brueckner, G. E., Howard, R. A., Koomen, M. J., Korendyke, C. M., Michels, D. J., Moses, J. D., et al. (1995). The large angle spectroscopic coronagraph (LASCO). Sol. Phys. 162, 357–402. doi:10.1007/BF00733434
Burlaga, L., Fitzenreiter, R., Lepping, R., Ogilvie, K., Szabo, A., Lazarus, A., et al. (1998). A magnetic cloud containing prominence material: January 1997. JGR 103, 277–285. doi:10.1029/97JA02768
Burlaga, L. F., Klein, L., Sheeley, J., Michels, D. J., Howard, R. A., Koomen, M. J., et al. (1982). A magnetic cloud and a coronal mass ejection. GRL 9, 1317–1320. doi:10.1029/GL009i012p01317
Case, A. W., Kasper, J. C., Stevens, M. L., Korreck, K. E., Paulson, K., Daigneau, P., et al. (2020). The solar Probe cup on the parker solar Probe. ApJS 246, 43. doi:10.3847/1538-4365/ab5a7b
DeForest, C. E., Howard, T. A., and McComas, D. J. (2013). Tracking coronal features from the low corona to Earth: A quantitative analysis of the 2008 december 12 coronal mass ejection. ApJ 769, 43. doi:10.1088/0004-637X/769/1/43
Domingo, V., Fleck, B., and Poland, A. I. (1995). SOHO: The solar and heliospheric observatory. SSR 72, 81–84. doi:10.1007/BF00768758
Fox, N. J., Velli, M. C., Bale, S. D., Decker, R., Driesman, A., Howard, R. A., et al. (2016). The solar Probe plus mission: Humanity’s first visit to our star. SSR 204, 7–48. doi:10.1007/s11214-015-0211-6
Freeland, S. L., and Handy, B. N. (1998). Data analysis with the SolarSoft system. Sol. Phys. 182, 497–500. doi:10.1023/A:1005038224881
Gibson, S. E. (2018). Solar prominences: Theory and models. Fleshing out the magnetic skeleton. Living Rev. Sol. Phys. 15, 7. doi:10.1007/s41116-018-0016-2
Gopalswamy, N., Shimojo, M., Lu, W., Yashiro, S., Shibasaki, K., and Howard, R. A. (2003). Prominence eruptions and coronal mass ejection: A statistical study using microwave observations. ApJ 586, 562–578. doi:10.1086/367614
Hess, P., Howard, R. A., Stenborg, G., Linton, M., Vourlidas, A., Thernisien, A., et al. (2021). In-flight calibration and data reduction for the WISPR instrument on board the PSP mission. Sol. Phys. 296, 94. doi:10.1007/s11207-021-01847-9
Hess, P., Rouillard, A. P., Kouloumvakos, A., Liewer, P. C., Zhang, J., Dhakal, S., et al. (2020). WISPR imaging of a pristine CME. ApJS 246, 25. doi:10.3847/1538-4365/ab4ff0
Hess, P., and Zhang, J. (2017). A study of the earth-affecting CMEs of solar cycle 24. Sol. Phys. 292, 80. doi:10.1007/s11207-017-1099-y
Hirshberg, J., Bame, S. J., and Robbins, D. E. (1972). Solar flares and solar wind helium enrichments: July 1965 July 1967. SolPhys 23, 467–486. doi:10.1007/BF00148109
Horbury, T. S., O’Brien, H., Carrasco Blazquez, I., Bendyk, M., Brown, P., Hudson, R., et al. (2020). The solar orbiter magnetometer. AAP 642, A9. doi:10.1051/0004-6361/201937257
Howard, R. A., Moses, J. D., Vourlidas, A., Newmark, J. S., Socker, D. G., Plunkett, S. P., et al. (2008). Sun Earth connection coronal and heliospheric investigation (SECCHI). SSR 136, 67–115. doi:10.1007/s11214-008-9341-4
Howard, R. A., Stenborg, G., Vourlidas, A., Gallagher, B. M., Linton, M. G., Hess, P., et al. (2022). Overview of the remote sensing observations from PSP solar encounter 10 with perihelion at 13.3 R ⊙. ApJ 936, 43. doi:10.3847/1538-4357/ac7ff5
Howard, R. A., Vourlidas, A., Colaninno, R. C., Korendyke, C. M., Plunkett, S. P., Carter, M. T., et al. (2020). The solar orbiter heliospheric imager (SoloHI). AAP 642, A13. doi:10.1051/0004-6361/201935202
Howard, T. A., and DeForest, C. E. (2012). Inner heliospheric flux rope evolution via imaging of coronal mass ejections. ApJ 746, 64. doi:10.1088/0004-637X/746/1/64
Kaiser, M. L. (2005). The STEREO mission: An overview. Adv. Space Res. 36, 1483–1488. doi:10.1016/j.asr.2004.12.066
Kasper, J. C., Abiad, R., Austin, G., Balat-Pichelin, M., Bale, S. D., Belcher, J. W., et al. (2016). Solar wind electrons alphas and protons (SWEAP) investigation: Design of the solar wind and coronal plasma instrument suite for solar Probe plus. SSR 204, 131–186. doi:10.1007/s11214-015-0206-3
Kilpua, E. K. J., Good, S. W., Palmerio, E., Asvestari, E., Lumme, E., Ala-Lahti, M., et al. (2019). Multipoint observations of the june 2012 interacting interplanetary flux ropes. Front. Astronomy Space Sci. 6, 50. doi:10.3389/fspas.2019.00050
Lepri, S. T., and Rivera, Y. J. (2021). Elemental abundances of prominence material inside ICMEs. ApJ 912, 51. doi:10.3847/1538-4357/abea9f
Lionello, R., Linker, J. A., and Mikić, Z. (2001). Including the transition region in models of the large-scale solar corona. ApJ 546, 542–551. doi:10.1086/318254
Lionello, R., Linker, J. A., and Mikić, Z. (2009). Multispectral emission of the sun during the first whole sun month: Magnetohydrodynamic simulations. ApJ 690, 902–912. doi:10.1088/0004-637X/690/1/902
Livi, R., Larson, D. E., Kasper, J. C., Abiad, R., Case, A. W., Klein, K. G., et al. (2022). The solar Probe ANalyzer-ions on the parker solar Probe. ApJ 938, 138. doi:10.3847/1538-4357/ac93f5
Luhmann, J. G., Gopalswamy, N., Jian, L. K., and Lugaz, N. (2020). ICME evolution in the inner heliosphere. Sol. Phys. 295, 61. doi:10.1007/s11207-020-01624-0
MacQueen, R. M., Csoeke-Poeckh, A., Hildner, E., House, L., Reynolds, R., Stanger, A., et al. (1980). The high altitude observatory coronagraph/polarimeter on the solar maximum mission. Sol. Phys. 65, 91–107. doi:10.1007/BF00151386
MacQueen, R. M., Eddy, J. A., Gosling, J. T., Hildner, E., Munro, R. H., Newkirk, J., et al. (1974). The outer solar corona as observed from Skylab: Preliminary results. ApJL 187, L85. doi:10.1086/181402
Mampaey, B., Verbeeck, F., Stegen, K., Kraaikamp, E., Gissot, S., Auchère, F., et al. (2022). Solo/eui data release 5.0 2022-04. Published by Royal Observatory of Belgium (ROB). doi:10.24414/2qfw-tr95
Marsch, E., Schwenn, R., Rosenbauer, H., Muehlhaeuser, K. H., Pilipp, W., and Neubauer, F. M. (1982). Solar wind protons: Three-dimensional velocity distributions and derived plasma parameters measured between 0.3 and 1 AU. JGR 87, 52–72. doi:10.1029/JA087iA01p00052
Mierla, M., Seaton, D. B., Berghmans, D., Chifu, I., De Groof, A., Inhester, B., et al. (2013). Study of a prominence eruption using PROBA2/SWAP and STEREO/EUVI data. Sol. Phys. 286, 241–253. doi:10.1007/s11207-012-9965-0
Mignone, A., Bodo, G., Massaglia, S., Matsakos, T., Tesileanu, O., Zanni, C., et al. (2007). Pluto: A numerical code for computational Astrophysics. ApJS 170, 228–242. doi:10.1086/513316
Mignone, A., Zanni, C., Tzeferacos, P., van Straalen, B., Colella, P., and Bodo, G. (2012). The PLUTO code for adaptive mesh computations in astrophysical fluid dynamics. ApJS 198, 7. doi:10.1088/0067-0049/198/1/7
Müller, D., Cyr, St.O. C., Zouganelis, I., Gilbert, H. R., Marsden, R., Nieves-Chinchilla, T., et al. (2020). The Solar Orbiter mission. Science overview. AAP 642, A1. doi:10.1051/0004-6361/202038467
Munro, R. H., Gosling, J. T., Hildner, E., MacQueen, R. M., Poland, A. I., and Ross, C. L. (1979). The association of coronal mass ejection transients with other forms of solar activity. Sol. Phys. 61, 201–215. doi:10.1007/BF00155456
Ness, N. F., and Burlaga, L. F. (2001). Spacecraft studies of the interplanetary magnetic field. JGR 106, 15803–15817. doi:10.1029/2000JA000118
Nieves-Chinchilla, T., Alzate, N., Cremades, H., Rodríguez-García, L., Dos Santos, L. F. G., Narock, A., et al. (2022). Direct first parker solar Probe observation of the interaction of two successive interplanetary coronal mass ejections in 2020 november. ApJ 930, 88. doi:10.3847/1538-4357/ac590b
Odstrcil, D., and Pizzo, V. J. (2009). Numerical heliospheric simulations as assisting tool for interpretation of observations by STEREO heliospheric imagers. Sol. Phys. 259, 297–309. doi:10.1007/s11207-009-9449-z
Ogilvie, K. W., and Desch, M. D. (1997). The wind spacecraft and its early scientific results. Adv. Space Res. 20, 559–568. doi:10.1016/S0273-1177(97)00439-0
O’Hara, J. P., Mierla, M., Podladchikova, O., D’Huys, E., and West, M. J. (2019). Exceptional extended field-of-view observations by PROBA2/SWAP on 2017 April 1 and 3. ApJ 883, 59. doi:10.3847/1538-4357/ab3b08
Owen, C. J., Bruno, R., Livi, S., Louarn, P., Al Janabi, K., Allegrini, F., et al. (2020). The solar orbiter solar wind analyser (SWA) suite. AAP 642, A16. doi:10.1051/0004-6361/201937259
Palmerio, E., Nieves-Chinchilla, T., Kilpua, E. K. J., Barnes, D., Zhukov, A. N., Jian, L. K., et al. (2021). Magnetic structure and propagation of two interacting CMEs from the sun to saturn. J. Geophys. Res. (Space Phys. 126, e2021JA029770. doi:10.1029/2021JA029770
Parenti, S. (2014). Solar prominences: Observations. Living Rev. Sol. Phys. 11, 1. doi:10.12942/lrsp-2014-1
Parker, E. N. (1958). Dynamics of the interplanetary gas and magnetic fields. ApJ 128, 664. doi:10.1086/146579
Patel, R., Majumdar, S., Pant, V., and Banerjee, D. (2022). A simple radial gradient filter for batch-processing of coronagraph images. Sol. Phys. 297, 27. doi:10.1007/s11207-022-01957-y
Pesnell, W. D., Thompson, B. J., and Chamberlin, P. C. (2012). The solar dynamics observatory (SDO). Sol. Phys. 275, 3–15. doi:10.1007/s11207-011-9841-3
Pizzo, V. J. (1981). On the application of numerical models to the inverse mapping of solar wind flow structures. JGR 86, 6685–6690. doi:10.1029/JA086iA08p06685
Pomoell, J., and Poedts, S. (2018). Euhforia: European heliospheric forecasting information asset. J. Space Weather Space Clim. 8, A35. doi:10.1051/swsc/2018020
Priest, E. R., Hood, A. W., and Anzer, U. (1989). A twisted flux-tube model for solar prominences. I. General properties. ApJ 344, 1010. doi:10.1086/167868
Reeves, K. K., Linker, J. A., Mikić, Z., and Forbes, T. G. (2010). Current sheet energetics, flare emissions, and energy partition in a simulated solar eruption. ApJ 721, 1547–1558. doi:10.1088/0004-637X/721/2/1547
Reva, A. A., Ulyanov, A. S., and Kuzin, S. V. (2016). Current sheet structures observed by the TESIS EUV telescope during a flux rope eruption on the sun. ApJ 832, 16. doi:10.3847/0004-637X/832/1/16
Richardson, I. G., Cliver, E. W., and Cane, H. V. (2000). Sources of geomagnetic activity over the solar cycle: Relative importance of coronal mass ejections, high-speed streams, and slow solar wind. JGR 105, 18203, 203–18213, 213. doi:10.1029/1999JA000400
Riley, P., Linker, J. A., and Arge, C. N. (2015). On the role played by magnetic expansion factor in the prediction of solar wind speed. Space weather. 13, 154–169. doi:10.1002/2014SW001144
Riley, P., Linker, J. A., and Mikić, Z. (2001). An empirically-driven global MHD model of the solar corona and inner heliosphere. JGR 106, 15889–15901. doi:10.1029/2000JA000121
Riley, P., Lionello, R., Caplan, R. M., Downs, C., Linker, J. A., Badman, S. T., et al. (2021). Using Parker Solar Probe observations during the first four perihelia to constrain global magnetohydrodynamic models. AAP 650, A19. doi:10.1051/0004-6361/202039815
Rochus, P., Auchère, F., Berghmans, D., Harra, L., Schmutz, W., Schühle, U., et al. (2020). The solar orbiter EUI instrument: The extreme ultraviolet imager. AAP 642, A8. doi:10.1051/0004-6361/201936663
Rodriguez, L., Warmuth, A., Andretta, V., Mierla, M., Zhukov, A. N., Shukhobodskaia, D., et al. (2023). The eruption of 22 April 2021 as observed by solar orbiter: Continuous magnetic reconnection and heating after the impulsive phase. SolPhys 298, 1. doi:10.1007/s11207-022-02090-6
Romoli, M., Antonucci, E., Andretta, V., Capuano, G. E., Da Deppo, V., De Leo, Y., et al. (2021). First light observations of the solar wind in the outer corona with the Metis coronagraph. AAP 656, A32. doi:10.1051/0004-6361/202140980
Rouillard, A. P. (2011). Relating white light and in situ observations of coronal mass ejections: A review. J. Atmos. Solar-Terrestrial Phys. 73, 1201–1213. doi:10.1016/j.jastp.2010.08.015
Schatten, K. H. (1971). Current sheet magnetic model for the solar corona. Cosm. Electrodyn. 2, 232–245.
Schou, J., Scherrer, P. H., Bush, R. I., Wachter, R., Couvidat, S., Rabello-Soares, M. C., et al. (2012). Design and ground calibration of the helioseismic and magnetic imager (HMI) instrument on the solar dynamics observatory (SDO). Sol. Phys. 275, 229–259. doi:10.1007/s11207-011-9842-2
Scolini, C., Chané, E., Temmer, M., Kilpua, E. K. J., Dissauer, K., Veronig, A. M., et al. (2020). CME-CME interactions as sources of CME geoeffectiveness: The formation of the complex ejecta and intense geomagnetic storm in 2017 early september. ApJS 247, 21. doi:10.3847/1538-4365/ab6216
Seaton, D. B., Hughes, J. M., Tadikonda, S. K., Caspi, A., DeForest, C. E., Krimchansky, A., et al. (2021). The Sun’s dynamic extended corona observed in extreme ultraviolet. Nat. Astron. 5, 1029–1035. doi:10.1038/s41550-021-01427-8
Sheeley, J., Michels, D. J., Howard, R. A., and Koomen, M. J. (1980). Initial observations with the SOLWIND coronagraph. ApJL 237, L99–L101. doi:10.1086/183243
Shi, C., Velli, M., Bale, S. D., Réville, V., Maksimović, M., and Dakeyo, J.-B. (2022). Acceleration of polytropic solar wind: Parker Solar Probe observation and one-dimensional model. Phys. Plasmas 29, 122901. doi:10.1063/5.0124703
Stone, E. C., Frandsen, A. M., Mewaldt, R. A., Christian, E. R., Margolies, D., Ormes, J. F., et al. (1998). The advanced composition explorer. SSR 86, 1–22. doi:10.1023/A:1005082526237
Tasnim, S., Cairns, I. H., and Wheatland, M. S. (2018). A generalized equatorial model for the accelerating solar wind. J. Geophys. Res. (Space Phys. 123, 1061–1085. doi:10.1002/2017JA024532
Thernisien, A. F. R., Howard, R. A., and Vourlidas, A. (2006). Modeling of flux rope coronal mass ejections. ApJ 652, 763–773. doi:10.1086/508254
Thernisien, A., Vourlidas, A., and Howard, R. A. (2009). Forward modeling of coronal mass ejections using STEREO/SECCHI data. Sol. Phys. 256, 111–130. doi:10.1007/s11207-009-9346-5
Tousey, R., Bartoe, J. D. F., Bohlin, J. D., Brueckner, G. E., Purcell, J. D., Scherrer, V. E., et al. (1973). A preliminary study of the extreme ultraviolet spectroheliograms from Skylab. Sol. Phys. 33, 265–280. doi:10.1007/BF00152418
Velli, M., Harra, L. K., Vourlidas, A., Schwadron, N., Panasenco, O., Liewer, P. C., et al. (2020). Understanding the origins of the heliosphere: Integrating observations and measurements from parker solar Probe, solar orbiter, and other space- and ground-based observatories. AAP 642, A4. doi:10.1051/0004-6361/202038245
Vourlidas, A., Howard, R. A., Plunkett, S. P., Korendyke, C. M., Thernisien, A. F. R., Wang, D., et al. (2016). The wide-field imager for solar Probe plus (WISPR). SSR 204, 83–130. doi:10.1007/s11214-014-0114-y
Wang, J., Feng, H., and Zhao, G. (2018). Cold prominence materials detected within magnetic clouds during 1998-2007. AAP 616, A41. doi:10.1051/0004-6361/201731807
Webb, D. F., and Howard, T. A. (2012). Coronal mass ejections: Observations. Living Rev. Sol. Phys. 9, 3. doi:10.12942/lrsp-2012-3
Weber, E. J., and Davis, J. (1967). The angular momentum of the solar wind. ApJ 148, 217–227. doi:10.1086/149138
Whittlesey, P. L., Larson, D. E., Kasper, J. C., Halekas, J., Abatcha, M., Abiad, R., et al. (2020). The solar Probe ANalyzers—electrons on the parker solar Probe. ApJS 246, 74. doi:10.3847/1538-4365/ab7370
Wood, B. E., Hess, P., Howard, R. A., Stenborg, G., and Wang, Y.-M. (2020). Morphological reconstruction of a small transient observed by parker solar Probe on 2018 november 5. ApJS 246, 28. doi:10.3847/1538-4365/ab5219
Wood, B. E., Wu, C.-C., Lepping, R. P., Nieves-Chinchilla, T., Howard, R. A., Linton, M. G., et al. (2017). A STEREO survey of magnetic cloud coronal mass ejections observed at Earth in 2008-2012. ApJS 229, 29. doi:10.3847/1538-4365/229/2/29
Yermolaev, Y. I., Lodkina, I. G., Yermolaev, M. Y., Riazantseva, M. O., Rakhmanova, L. S., Borodkova, N. L., et al. (2020). Dynamics of large-scale solar-wind streams obtained by the double superposed epoch analysis: 4. Helium abundance. J. Geophys. Res. (Space Phys. 125, e27878. doi:10.1029/2020JA027878
Zhao, X., Liu, Y. D., Hu, H., and Wang, R. (2019). Quantifying the propagation of fast coronal mass ejections from the sun to interplanetary space by combining remote sensing and multi-point in situ observations. ApJ 882, 122. doi:10.3847/1538-4357/ab379b
Zurbuchen, T. H., and Richardson, I. G. (2006). In-situ solar wind and magnetic field signatures of interplanetary coronal mass ejections. SSR 123, 31–43. doi:10.1007/s11214-006-9010-4
Keywords: prominence, coronal mass ejection, space weather, multi-spacecraft observations, Parker Solar Probe
Citation: Niembro T, Seaton DB, Hess P, Berghmans D, Andretta V, Reeves KK, Riley P, Stevens ML, Landini F, Sasso C, Verbeeck C, Susino R and Uslenghi M (2023) A prominence eruption from the Sun to the Parker Solar Probe with multi-spacecraft observations. Front. Astron. Space Sci. 10:1191294. doi: 10.3389/fspas.2023.1191294
Received: 21 March 2023; Accepted: 02 June 2023;
Published: 03 August 2023.
Edited by:
Mario J. P. F. G. Monteiro, University of Porto, PortugalReviewed by:
João José Graça Lima, Universidade do Porto, PortugalDavid Barnes, Science and Technology Facilities Council, United Kingdom
Copyright © 2023 Niembro, Seaton, Hess, Berghmans, Andretta, Reeves, Riley, Stevens, Landini, Sasso, Verbeeck, Susino and Uslenghi. This is an open-access article distributed under the terms of the Creative Commons Attribution License (CC BY). The use, distribution or reproduction in other forums is permitted, provided the original author(s) and the copyright owner(s) are credited and that the original publication in this journal is cited, in accordance with accepted academic practice. No use, distribution or reproduction is permitted which does not comply with these terms.
*Correspondence: Tatiana Niembro, tniembro@cfa.harvard.edu