Hyperspectral estimation of the soluble solid content of intact netted melons decomposed by continuous wavelet transform
 Chao Zhang1,2
  Yue Shi1,2 Zhonghui Wei3 Ruiqi Wang1,2 Ting Li4 Yubin Wang1,5 Xiaoyan Zhao1,5 Xiaohe Gu3*
- 1Institute of Agri-Food Processing and Nutrition, Beijing Academy of Agriculture and Forestry Sciences, Beijing, China
- 2Beijing Agricultural Technology Extension Station, Beijing, China
- 3Beijing Key Laboratory of Fruit and Vegetable Storage and Processing, Beijing, China
- 4Research Center of Information Technology, Beijing Academy of Agriculture and Forestry Sciences, Beijing, China
- 5Key Laboratory of Vegetable Postharvest Processing of Ministry of Agriculture and Rural Affairs, Beijing, China
Netted melons are welcomed for their soft and sweet pulp and strong aroma during the best-tasting period. The best-tasting period was highly correlated with its soluble solid content (SSC). However, the SSC of the intact melon was difficult to determine due to the low relationship between the hardness, color, or appearance of fruit peel and its SSC. Consequently, a rapid, accurate, and non-destructive method to determine the SSC of netted melons was the key to determining the best-tasting period. A hyperspectral model was constructed to estimate the SSC of intact netted melons. The combination of continuous wavelet transform and partial least squares or random forest algorithm was employed to improve the estimation accuracy of the hyperspectral model. Specifically, the hyperspectra of the diffuse reflection and SSC of 261 fruit samples were collected. The sensitivity band was screened based on the correlation analysis and continuous wavelet transform decomposition. The correlation coefficient and RMSE of the random forest regression model decomposed by the continuous wavelet transform were 0.72 and 0.98%, respectively. The decomposition of the continuous wavelet transform improved the correlation coefficient by 5 and 1.178 times at 754 and 880 nm, respectively. The random forest regression model enhanced the determination coefficient by at least 56.5% than the partial least squares regression model, and the continuous wavelet transform decomposition further enhanced the determination coefficient of the random forest regression model by 4.34%. Meanwhile, the RMSE of the random forest regression model was reduced. Therefore, the decomposition of the continuous wavelet transform improved the stability and prediction ability of the random forest regression model.
1 Introduction
Netted melon (Cucumis melo L. var. reticulatus Naud.) is a member of the genus Cucumis, subtribe Cucumerinae. Netted melon shows soft and sweet pulp and strong aroma for only 3–5 days which is known as the best-tasting period [1, 2]. The best-tasting period of netted melons is highly correlated with their soluble solid content (SSC). Specifically, the SSC increased slowly when the pulp of fruit was hard with low sweetness and weak aroma in the expansion stage of the fruit. The SSC reached a certain threshold which remained for about 3–5 days when the fruit showed a soft and sweet pulp and strong aroma. After the best-tasting period, the SSC increased quickly with the obvious drip loss and fibrosis of the pulp. Consequently, the SSC showed a plateau for about 3–5 days during the whole growth period [3]. However, the plateau of the SSC was not related to the hardness, color, or appearance of the fruit peel [1]. Therefore, the SSC was the key to determining the best-tasting period of netted melons.
Hyperspectra was a non-destructive method for the internal quality of intact fruit, which had determined the SSC of apple, pear, pineapple, and jujube successfully based on the spectral responses of the reflectance, transmission, or diffuse reflection of fruit [4–10]. The peel of the netted melon was about 1.0 cm which was thicker than that of apple, pear, pineapple, and jujube, which was an obstacle to the acquisition of the transmission of spectral [11]. Moreover, the chemical ingredient of the peel was not related to the variation of the SSC. Consequently, the reflectance of the peel would not reflect the variation of the SSC. The diffuse reflection came from the muti-reflection in the peel and edge pulp of the fruit. Therefore, the spectra of the diffuse reflection showed the potential to include the SSC information of fruit. However, the diffuse reflection had not been used to construct the estimation model of intact netted melons.
The diffuse reflection collected information on each ingredient of the fruit, including the moisture, SSC, pectin, cellulose, and even pollutants on the surface of the peel [12]. The SSC was relatively low which led to a relatively weak spectral response [5]. Therefore, an effective decomposition of the spectrum could improve the estimation accuracy of the SSC. Spectral analysis techniques such as mathematical transformation, principal component analysis, and spectral absorption characteristic analysis had been used to decompose the spectra to explore the SSC of fruit and enhance its spectral sensitivity. Moreover, partial least squares (PLS), neural networks, random forest (RF), and deep learning methods have been used to acquire higher precision regression models of the SSC [8–10, 13, 14]. However, recent studies focused on the enhancement of the sensitivity of spectral information of the SSC, rather than finding the directions of different spectral information in depth. Exploring an efficient spectrum transformation to decompose the weak sensitive information would improve the estimation accuracy of the SSC of the intact netted melon.
A hyperspectral regression model was constructed to estimate the SSC of intact netted melons in the current study. The combination of continuous wavelet transform (CWT) and PLS or RF was used to extract weak useful information and improve the estimation accuracy of the SSC of intact netted melon. Specifically, the spectra of the diffuse reflection and SSC of 261 fruit samples were collected. The diffuse reflection was collected based on the optimization of the incidence angle and intensity of the light source, and acquisition times of the spectrometer. The CWT algorithm was used to extract high- and low-frequency detailed information at multiple decompositional scales. Sensitive wavelet coefficients with the SSC of the fruit were selected. Finally, an estimation model was constructed to predict the SSC of the intact netted melon by the PLS or RF.
2 Materials and methods
2.1 Sample preparation
A total of 261 netted melons (Cucumis melo L. var. reticulatus Naud.) were harvested in June and July 2021 in Beijing Tongzhou District International Seed Industry Science and Technology Park (Tongzhou District, Beijing). During the best-tasting period, the fruit was nearly round and light green with a light yellow net. The fruit was around 1.50 kg per fruit with an SSC of 6 %–11%. Specifically, the melon was colonized on 5 February 2021 and pollinated on 2 April 2021. The random fruit was harvested on June 2, June 12, June 22, and 2 July 2021, respectively. The harvested fruit was transported to the laboratory immediately. The SSC and hyperspectra of the diffuse reflection of the fruit were recorded.
2.2 Measurement of the hyperspectra of the diffuse reflection
The hyperspectra of the diffuse reflection of fruit samples were collected by a self-made spectrometer whose sketch was shown in Figure 1. The sketch was 3D printed by the Acrylonitrile Butadiene Styrene resin. The LED lights and integrating spheres were mounted in a hemispherical frame. A total of four LED lights with a color temperature of 6,500 K, light flus of 210 Lux, and power of 3 W were mounted in the frame as the light source (Guanghong HG-SG1XHH-F-3W, Guangzhou Hengguang Light Co. Ltd., Guangzhou, China). The integrating sphere was mounted on the bottom of the hemispherical frame and connected to a spectral sensor. The spectral sensor collected the spectrum ranging from 650 to 950 nm with a resolution of 2.5 nm based on the previous studies [7, 11]. The annular silicone buffer washer was mounted on the grooves of the LED lights and integrating sphere, which ensured the well fit of the fruit and hemispherical frame. Specifically, the netted melon was placed on the frame and ensured the well contact between the fruit surface and the buffer washers. The LED light sent the light signal when the spectral sensor collected the spectrum of the diffuse reflection of fruit for 60 ms. A total of 30 hyperspectral were collected and averaged as the sample spectrum. The surface of the fruit contacted with the buffer washer on the integrating sphere was marked for the SSC analysis.
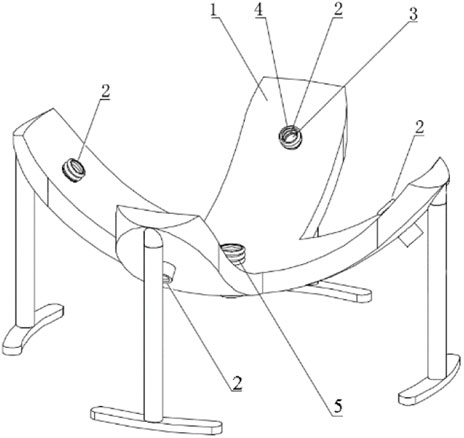
FIGURE 1. Sketch of the spectrometer. 1: bracket; 2: LED-mounting groove; 3: light source; 4: annular silicone buffer washer; and 5: integrating sphere mounting hole.
2.3 Measurement of the soluble solid content
After the measurement of the hyperspectra, a circle with a radius of 1.0 cm was drawn with a marked point as the center on the fruit surface. The cylinder of the fruit was cut. The edge pulp with 1.0–2.0 cm from the exocarp of the cylinder was used for the measurement of the SSC. The SSC of samples was measured by a digital refractometer (PAL-α, ATAGO Company Ltd., Japan) at room temperature with water as blank.
2.4 Screening of the sensitivity band
The sensitivity band was screened based on the correlation analysis and CWT decomposition. The CWT is a signal processing technology derived from the fourier transform. It analyzes in the field of time and frequency at the same time, which is helpful to extract the effective information in the signal [15]. Specifically, the spectrum of the fruit was processed based on the mexh wavelet base written in MATLAB language. The original spectrum was decomposed by 10 layers of wavelet to generate a series of wavelet coefficients (Eq. 1 and Eq. 2).
where a is the expansion factor, b is the translation factor and
where
2.5 Establishment and validation of the regression model
The spectral estimation models were prepared by the PLS and RF, respectively. Specifically, the sensitivity bands based on the correlation analysis and CWT were used as the independent variables with the SSC as the dependent variables.
A training set and testing set were prepared with a sample number of 3:1. In order to ensure the uniform distribution of each set, all samples were sorted from large to small according to the SSC of the fruit. The samples with the number of multiples of four were nominated as the testing set (66 samples), and the others were nominated as the training set (195 samples). The testing set of 66 samples was used to validate the determination coefficient (R2) (Eq. 3) and root mean squared error (RMSE) (Eq. 4), and Line y = x of the prediction spectral model, respectively.
where
Specifically, R2 is used to characterize the stability of the model. The closer it is to 1, the more stable and better fitting the model is. RMSE is used to detect the prediction ability of the model. The smaller the RMSE is, the better the prediction ability of the model is. Line y = x represents the deviation of the point composed of the measured value and the predicted value from in the Line y = x.
3 Results and discussion
3.1 Hyperspectra and SSC of netted melons
The hyperspectra and SSC of 261 fruit were collected. The SSC covered a relatively wide range from 3.8% to 9.6% with the average value and standard deviation of 6.93% and 1.60%, respectively. The samples were divided into high-SSC, middle-SSC, and low-SSC groups based on the SSC. Specifically, the SSC of the high-SSC, middle-SSC, and low-SSC groups was 6.9%–9.6%, 5.8%–6.9%, and 3.8%–5.8%, respectively. The hyperspectra of the three groups were averaged and shown in Figure 2. The relative intensity of the hyperspectra decreased sharply at 690–750 nm, remained relatively constant at 770–830 nm, and increased at 850–950 nm. The relative intensity of the hyperspectra was negatively related to the SSC. The fruit of the high SSC group showed the weakest relative intensity, while that of the low SSC group showed the strongest relative intensity. Being different from our results, the spectra with the wavelength of 750–950 nm were used to estimate the SSC of melon [11]. The narrow range of the spectra possibly missed the sensitivity band of the SSC information.
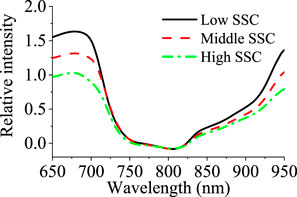
FIGURE 2. Spectral profiles of netted melons.
3.2 Screening the sensitivity band of the hyperspectra
The sensitivity band was screened based on the correlation analysis and CWT decomposition, respectively. The profile of the correlation coefficient between the SSC and relative intensity of the hyperspectra of netted melons is shown in Figure 3, which is based on 301 points due to the resolution of 2.5 nm of the spectrometer. A positive correlation was shown in 724–739 and 800–810 nm, while a negative correlation was shown in the other bands. The correlation coefficient ranged from -0.49 to 0.08. The absolute value of the correlation coefficient reached the highest at 826 nm with a correlation coefficient of −0.49. Therefore, the band of 826 nm was the sensitivity band based on the correlation analysis.
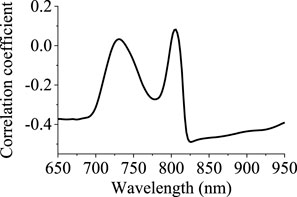
FIGURE 3. Correlation coefficient between the SSC and relative intensity of the hyperspectra of netted melons.
CWT served as a time-frequency window with shorter time-window width for higher frequencies and wider time-window width for lower frequencies. Consequently, CWT possibly raised the spectral response of useful information and removed the noise of the spectra [15, 16]. Figure 4 showed the spectra decomposed by the CWT on a 10 scale. The decomposed spectra of Scale 1-6 showed a large variety smoothly, while those of Scale 7–10 were relatively flat but jagged. The CWT decomposition amplified and highlighted the features of the original spectra. Consequently, the spectra decomposed by CWT provided more efficient information on the feature band.
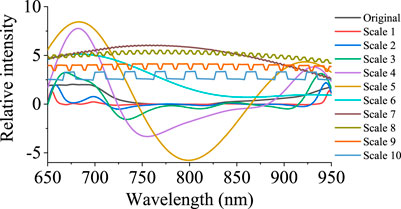
FIGURE 4. Decomposed spectra of netted melons by CWT.
The correlation coefficient between the relative intensity of CWT decomposed spectra and SSC of netted melons was shown in Figure 5. The red represented the high correlation band, while the blue represented the low correlation band. The spectral effective information is mainly presented in the 700–800 nm of the scale 1–6, while no spectral effective information is presented in the scale 7–10. The correlation coefficient reached the highest at 754 nm of scale 5 with a correlation coefficient of 0.60.
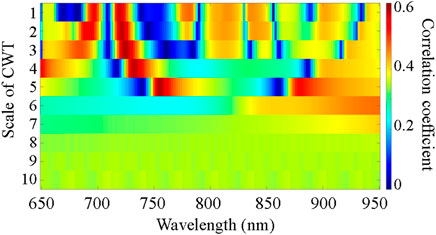
FIGURE 5. Correlation coefficient matrix between the relative intensity of CWT decomposed spectra and SSC of netted melons.
The red light band (670–760 nm) and near-infrared band (761–950 nm) represent the sample feathers in a different dimension [17]. Consequently, the sensitivity band was selected in the red light band and near-infrared band based on the correlation coefficient respectively. The correlation coefficient matrix reached the highest in the 754 nm of scale 5 with the correlation coefficient of 0.60 in the red light band, while that in the 880 nm of the scale 5 with the correlation coefficient of -0.53 in the near-infrared band. Therefore, the bands of 754 and 880 nm were the sensitivity bands based on the CWT decomposition.
The absolute value of the correlation coefficient of 754 and 880 nm in the CWT decomposition was 5 and 1.178 times that without CWT decomposition. The CWT decomposition improved the correlation coefficient of the selected sensitivity bands. Therefore, the bands of 754 and 880 nm were selected as the sensitivity bands for the estimation model. Similar to our results, the CWT decomposition significantly improved the estimation accuracy of chicory leaf Cu content when the best decomposition scales were Scale 3, 4, and 5 [18].
3.3 Modeling and validation of the regression models
PLS and RF were employed to construct the estimation model of the SSC of intact netted melons. The PLS regression model has related the independent variables (e.g., spectra) to an integer that designates the class of the sample [19], while RF is integrated several classifiers to achieve better performance than a single classifier and is especially good for resolving two-class problems based on a bootstrap aggregating algorithm [14]. PLS has been used to construct the estimation model of the SSC successfully [6, 12, 20, 21]. Specifically, the relative intensities of sensitivity bands (754 and 880 nm) with or without CWT decomposition were employed to construct the estimation model by the PLS and RF regression respectively. The R2 and RMSE of the models were measured respectively (Table 1). The R2 of the training set of the RF regression model was raised by 64.3% without CWT decomposition and 56.5% with CWT decomposition than that of the PLS regression model, respectively. The R2 of the testing set of the RF regression model was raised by −4.87% without CWT decomposition and 9.30% with the CWT decomposition than that of the PLS regression model, respectively. The R2 of the training set of the RF regression model was 50% higher than that of the PLS regression model. Being different from our results, the PLS and lambda-lambda r2 regression models were used to analyze the relationships between leaf Cu content and the hyperspectral reflectance. They demonstrated the better feasibility of the CWT and PLS algorithms for estimating the Cu status of chicory [18]. This phenomenon resulted from the different hyperspectral reflectance data and different estimating objects. Moreover, the RF constructed many classification and regression trees, which integrated several classifiers to achieve better performance than a single classifier. The hyperspectra provided more classifiers rather than a single one [14]. Therefore, the RF regression model showed higher stability than the PLS regression model.
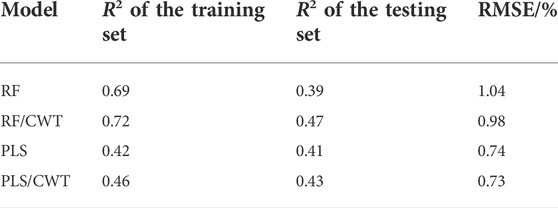
TABLE 1. Determination coefficient and root mean squared error of the estimation models.
The R2 of the training set and testing set of the RF regression model were raised by 4.34% and 20.5% by the CWT decomposition. The RMSE of the RF regression model decreased by 6.12% based on the CWT decomposition. Moreover, the R2 of the training set and testing set of the PLS model was raised by 9.52% and 4.88% based on the CWT decomposition. The RMSE of the RF regression model decreased by 1.37% based on the CWT decomposition. Consequently, the CWT decomposition raised R2 and decreased the RMSE of both models. Therefore, the CWT decomposition improved the stability and estimation ability of the model. Being consistent with our result, the spectral model denoised by the CWT decomposition was better to predict the Vc content of navel orange than that by 11 different decomposition approaches [22]. The improvement of the predicting capacity was a possible result of the noise removal ability of CWT decomposition on the spectra [16]. Remarkably, the R2 and RMSE of the competitive adaptive reweighted sampling-PLS model for the SSC of melon were 0.83 and 0.73, respectively [11]. This difference resulted from the different algorithms and number of the samples.
Figure 6 compared the estimation profile of the regression models with Line y = x. The Line y = x reflected the deviation of the point composed of the measured value and the predicted value. The points of each model are distributed along the Line y = x. Remarkably, the points of the training set of the RF/CWT and PLS models are evenly distributed around the Line y = x, while that of the RF and PLS/CWT is biased toward the high-value session of the Line y = x. The points of the testing set of the RF, RF/CWT, and PLS are evenly distributed around the Line y = x, while that of the PLS/CWT is biased towards the high-value session of the Line y = x. These phenomena possibly resulted from the overestimate of the RF and PLS/CWT models.
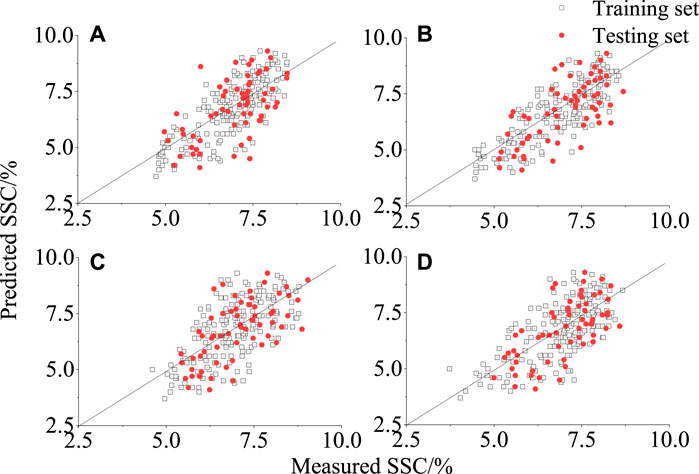
FIGURE 6. Estimation profiles of the RF (A), RF/CWT (B), PLS (C), and PLS/CWT (D) models.
The RF regression model enhanced the R2 by at least 56.5% more than the PLS model, and the CWT decomposition further enhanced the R2 of the RF regression model by 4.34%. Meanwhile, the RMSE of the RF/CWT model was reduced. Consequently, the stability and estimation ability of the RF/CWT model was significantly improved.
4 Conclusion
The combination of CWT and PLS or RF algorithm was employed to improve the estimation accuracy of the hyperspectral model. Specifically, the SSC and hyperspectra of the diffuse reflection of 261 fruit samples were collected to construct the hyperspectral estimation model. The SSC covered a relatively wide range from 3.8% to 9.6% with the average value and standard deviation of 6.93% and 1.60%, respectively. The relative intensity of the spectra was negatively related to the SSC. The sensitivity band was screened based on the correlation analysis and CWT decomposition. The correlation coefficient reached the highest in the 754 nm of the scale 5, being 0.60 by the CWT decomposition, while that was −0.53 in the 880 nm of the scale 5. The absolute value of the correlation coefficient of 754 and 880 nm with the CWT decomposition was 5 and 1.178 times of those without CWT decomposition. The PLS and RF algorithm were employed to construct the estimation model of the SSC of intact netted melons. The RF regression model enhanced the R2 by at least 56.5% than the PLS model, and the CWT decomposition further enhanced the R2 by 4.34%. Meanwhile, the RMSE of the RF/CWT model was reduced. The points of the testing set of the RF, RF/CWT, and PLS are evenly distributed around the line y = x, while that of the PLS/CWT is biased towards the high-value session of the line y = x. Consequently, the stability and estimation ability of the RF/CWT regression model were improved significantly. The RF/CWT regression model had the potential to estimate the SSC of the intact netted melons in the industry.
Data availability statement
The raw data supporting the conclusions of this article will be made available by the authors, without undue reservation.
Author contributions
All authors agreed to be accountable for the content of the work. CZ: investigation, formal analysis, and prepare draft; YS: investigation; ZW: investigation; RW: validation and methodology; TL: conceptualization, methodology, and funding acquisition; YW: investigation and methodology; XZ: funding acquisition; and XG: writing, review and editing, project administration, and funding acquisition.
Funding
The authors are grateful for the financial support of the National Natural Science Foundation of China (32172237), Beijing Academy of Agricultural and Forestry Sciences (KJCX20211004), China Agricultural Research System (CARS-25), Collaborative Innovation Center of the Beijing Academy of Agricultural and Forestry Sciences (KJCX201915), and Beijing Innovation Consortium of Agriculture Research System (BAIC4-2022).
Conflict of interest
The authors declare that the research was conducted in the absence of any commercial or financial relationships that could be construed as a potential conflict of interest.
Publisher’s note
All claims expressed in this article are solely those of the authors and do not necessarily represent those of their affiliated organizations, or those of the publisher, the editors, and the reviewers. Any product that may be evaluated in this article, or claim that may be made by its manufacturer, is not guaranteed or endorsed by the publisher.
References
1. Saltveit ME. 2 - melon (Cucumis melo L.). In: EM Yahia, editor. Postharvest biology and technology of tropical and subtropical fruits. Sawston, United Kingdom: Woodhead Publishing (2011). p. 31–45e.
2. Schaffer AA, Paris HS. Melons, squashes, and gourds. Reference module in food science. Amsterdam, Netherlands: Elsevier (2016).
3. Kesh H, Kaushik P. Advances in melon (Cucumis melo L.) breeding: An update. Scientia Horticulturae (2021) 282:110045. doi:10.1016/j.scienta.2021.110045
4. Zeb A, Qureshi WS, Ghafoor A, Malik A, Imran M, Iqbal J, et al. Is this melon sweet? A quantitative classification for near-infrared spectroscopy. Infrared Phys Tech (2021) 114:103645. doi:10.1016/j.infrared.2021.103645
5. Sun M, Zhang D, Liu L, Wang Z. How to predict the sugariness and hardness of melons: A near-infrared hyperspectral imaging method. Food Chem (2017) 218:413–21. doi:10.1016/j.foodchem.2016.09.023
6. Wang F, Zhao C, Yang H, Jiang H, Li L, Yang G. Non-destructive and in-site estimation of apple quality and maturity by hyperspectral imaging. Comput Electron Agric (2022) 195:106843. doi:10.1016/j.compag.2022.106843
7. Manthou E, Lago S-L, Dagres E, Lianou A, Tsakanikas P, Panagou EZ, et al. Application of spectroscopic and multispectral imaging technologies on the assessment of ready-to-eat pineapple quality: A performance evaluation study of machine learning models generated from two commercial data analytics tools. Comput Electron Agric (2020) 175:105529. doi:10.1016/j.compag.2020.105529
8. Li Y, Ma B, Li C, Yu G. Accurate prediction of soluble solid content in dried Hami jujube using SWIR hyperspectral imaging with comparative analysis of models. Comput Electron Agric (2022) 193:106655. doi:10.1016/j.compag.2021.106655
9. Tian X, Li J, Wang Q, Fan S, Huang W. A bi-layer model for nondestructive prediction of soluble solids content in apple based on reflectance spectra and peel pigments. Food Chem (2018) 239:1055–63. doi:10.1016/j.foodchem.2017.07.045
10. Kusumiyati HY, Putri IE, Munawar AA. Multi-product calibration model for soluble solids and water content quantification in Cucurbitaceae family, using visible/near-infrared spectroscopy. Heliyon (2021) 7(8):e07677. doi:10.1016/j.heliyon.2021.e07677
11. Li M, Han D, Liu W. Non-destructive measurement of soluble solids content of three melon cultivars using portable visible/near infrared spectroscopy. Biosyst Eng (2019) 188:31–9. doi:10.1016/j.biosystemseng.2019.10.003
12. Xia Y, Huang W, Fan S, Li J, Chen L. Effect of spectral measurement orientation on online prediction of soluble solids content of apple using Vis/NIR diffuse reflectance. Infrared Phys Tech (2019) 97:467–77. doi:10.1016/j.infrared.2019.01.012
13. Vasques GM, Grunwald S, Sickman JO. Comparison of multivariate methods for inferential modeling of soil carbon using visible/near-infrared spectra. Geoderma (2008) 146(1-2):14–25. doi:10.1016/j.geoderma.2008.04.007
14. Hou L, Liu Y, Wei A. Geographical variations in the fatty acids of zanthoxylum seed oils: A chemometric classification based on the random forest algorithm. Ind Crops Prod (2019) 134:146–53. doi:10.1016/j.indcrop.2019.03.070
15. Huang S-Y, Wavelets BZ. Advanced. In: RA Meyers, editor. Encyclopedia of physical science and technology. 3rd ed. New York: Academic Press (2003). p. 753–71.
16. Abasi S, Minaei S, Jamshidi B, Fathi D, Khoshtaghaza MH. Rapid measurement of apple quality parameters using wavelet de-noising transform with Vis/NIR analysis. Scientia Horticulturae (2019) 252:7–13. doi:10.1016/j.scienta.2019.02.085
17. Pan S, Zhang X, Xu W, Yin J, Gu H, Yu X. Rapid On-site identification of geographical origin and storage age of tangerine peel by Near-infrared spectroscopy. Spectrochimica Acta A: Mol Biomol Spectrosc (2022) 271:120936. doi:10.1016/j.saa.2022.120936
18. Lin D, Li G, Zhu Y, Liu H, Li L, Fahad S, et al. Predicting copper content in chicory leaves using hyperspectral data with continuous wavelet transforms and partial least squares. Comput Electron Agric (2021) 187:106293. doi:10.1016/j.compag.2021.106293
19. Luna AS, de Gois JS. Chapter seven - application of chemometric methods coupled with vibrational spectroscopy for the discrimination of plant cultivars and to predict physicochemical properties using R. In: J Lopes, and C Sousa, editors. Comprehensive analytical chemistry, 80. Amsterdam, Netherlands: Elsevier (2018). p. 165–94.
20. Li H, Zhu J, Jiao T, Wang B, Wei W, Ali S, et al. Development of a novel wavelength selection method VCPA-PLS for robust quantification of soluble solids in tomato by on-line diffuse reflectance NIR. Spectrochimica Acta Part A: Mol Biomol Spectrosc (2020) 243:118765. doi:10.1016/j.saa.2020.118765
21. Fan S, Wang Q, Tian X, Yang G, Xia Y, Li J, et al. Non-destructive evaluation of soluble solids content of apples using a developed portable Vis/NIR device. Biosyst Eng (2020) 193:138–48. doi:10.1016/j.biosystemseng.2020.02.017
Keywords: netted melon, soluble solid content, hyperspectra, continuous wavelet transform, random forest
Citation: Zhang C, Shi Y, Wei Z, Wang R, Li T, Wang Y, Zhao X and Gu X (2022) Hyperspectral estimation of the soluble solid content of intact netted melons decomposed by continuous wavelet transform. Front. Phys. 10:1034982. doi: 10.3389/fphy.2022.1034982
Received: 02 September 2022; Accepted: 29 September 2022;
Published: 14 October 2022.
Edited by:
Kun Wang, Aerospace Information Research Institute (CAS), ChinaReviewed by:
Ye Liu, Beijing Technology and Business University, ChinaChifang Peng, Jiangnan University, China
Copyright © 2022 Zhang, Shi, Wei, Wang, Li, Wang, Zhao and Gu. This is an open-access article distributed under the terms of the Creative Commons Attribution License (CC BY). The use, distribution or reproduction in other forums is permitted, provided the original author(s) and the copyright owner(s) are credited and that the original publication in this journal is cited, in accordance with accepted academic practice. No use, distribution or reproduction is permitted which does not comply with these terms.
*Correspondence: Xiaohe Gu, guxh@nercita.org.cn