Distribution of polysaccharidic and proteinaceous gel−like particles in three cyclonic eddies in the Eastern Tropical North Atlantic
 Quentin Devresse
 Kevin W. Becker
 Anja Engel
- GEOMAR Helmholtz Centre for Ocean Research Kiel, Kiel, Germany
Transparent exopolymer particles (TEP) and Coomassie stainable particles (CSP), two prominent classes of gel−like particles in the ocean primarily produced by phytoplankton, play crucial roles in ecological and biogeochemical processes, influencing microbial nutrition, growth, and particle aggregation. The distribution of these particles is intricately linked to the spatiotemporal dynamics of phytoplankton. Mesoscale cyclonic eddies (CEs) are known to stimulate phytoplankton growth and influence particle transport, but their effects on TEP and CSP remain to be determined. In the Eastern Tropical North Atlantic (ETNA), we examined three CEs: one off the Mauritanian coast during summer (Mau), one offshore during winter (Sal), and another near Brava island during winter. Mau and Brava CEs were in their intensification/maturity phase, while the Sal CE was in its decay phase. Both TEP and CSP concentrations correlated with primary productivity, but TEP increased with chlorophyll−a concentration, whereas elevated CSP coincided also with the highest abundance of pico−nanophytoplankton (<20 µm), mainly Synechococcus. Both gels exhibited a positive correlation with bacterial biomass production, indicating their consumption by heterotrophic bacteria. TEP total area in the epipelagic waters of all CEs (Mau, Brava, and Sal) was elevated compared to surrounding waters, with on average 4, 2.5, and 1.6−fold higher values, respectively. However, no significant difference in TEP size distribution was observed within any CEs and their surroundings. Similarly, CSP total area increased in the epipelagic waters of Mau and Brava CEs, with on average 5 and 2.4−fold higher values, respectively, compared to surrounding waters. CSP particles were notably larger in these two eddies, while the Sal CE showed no significant difference from surrounding waters in CSP abundance and size. Overall, TEP and CSP exhibited distinct responses to CEs, with increased concentrations during their intensification/maturation stage and remineralization dominating during their decaying stage.
1 Introduction
The injection of organic matter from the well−lit surface into the dark interior of the ocean is a key process of carbon sequestration that also supports deep ocean life known as the ‘biological carbon pump’ (Siegel et al., 2023). Organic carbon export is driven mainly by the aggregation of organic matter, lithogenic ballasting, and zooplankton fecal pellets (Armstrong et al., 2002; Burd and Jackson, 2009). Suspended particles predominate in the horizontal transport of organic matter, whereas sinking particles control the vertical exchange between the euphotic zone and the deep ocean (Lam and Marchal, 2015). Marine organisms exude dissolved and colloidal organic matter that aggregates and forms gel−like particles (Passow, 2000; Engel et al., 2004; Verdugo et al., 2004). Those act as a bridge between the dissolved and particulate fractions of organic matter, leading to a size continuum of particles in the ocean (Verdugo et al., 2004; Verdugo, 2012). The two best−studied marine gel particles are polysaccharide−containing transparent exopolymer particles (TEP) and protein−containing Coomassie stainable particles (CSP) (Alldredge et al., 1993; Long and Azam, 1996; Engel et al., 2020). TEP and CSP are independent particle classes with different origins and fates (Cisternas–Novoa et al., 2015; Thornton and Chen, 2017; Zamanillo et al., 2021). TEP are neutrally or positively buoyant and favor aggregate formation by increasing bulk particle volume concentration and, hence, collision between particles and by raising the bulk stickiness of particles (Alldredge et al., 1993; Engel, 2000; Azetsu–Scott and Passow, 2004; Engel, 2004). Thus, TEP can enhance large aggregate formation, favoring the aggregation and sinking of suspended particles (Engel et al., 2004; Burd and Jackson, 2009) and strengthening the vertical transport of organic carbon (Passow et al., 2001). Due to their relatively low density, the proportion of TEP to other particles in aggregates will determine their sinking rates (Engel and Schartau, 1999; Mari et al., 2017). In contrast to TEP, the physical properties of CSP, such as density or stickiness, remain largely unknown, and more studies are needed to confirm whether or not CSP enhance aggregate formation (Prieto et al., 2002; Cisternas–Novoa et al., 2015; Yamada et al., 2018). Heterotrophic prokaryotes colonize both TEP and CSP, which thus represent important microbial habitats comprising significant fractions of extracellular organic carbon and nitrogen (Pedrotti et al., 2009; Cisternas–Novoa et al., 2015; Busch et al., 2017).
Phytoplankton are the primary sources of TEP and CSP in the ocean, but both particles exhibit taxonomic variability and different behavior along bloom stages (see Mari et al., 2017; Thornton, 2018 and reference therein). TEP concentration and aggregation in marine waters continue to increase after the peak of phytoplankton blooms (Alldredge et al., 1995; Mari and Kiørboe, 1996; Engel, 2002; Engel et al., 2004), which has been explained by a ‘carbon−overflow’ mechanism (Schartau et al., 2007; Kreus et al., 2015). CSP reach a maximum during the exponential phase of phytoplankton blooms and decrease during bloom decline (Cisternas–Novoa et al., 2015). Viral lysis and zooplankton grazing may also play a significant role in TEP and CSP production and fate (Bochdansky and Herndl, 1992; Møller et al., 2003; Møller, 2007; Vardi et al., 2012; Lønborg et al., 2013; Yamada et al., 2018). The presence of TEP and CSP is widespread in the ocean, spanning from the surface to the bathypelagic layer (Cisternas−Novoa et al., 2015; Engel et al., 2020). Nevertheless, the determinants that impact their distribution both horizontally and vertically remain unclear, thereby impeding our comprehension of the fate of organic matter.
Mesoscale eddies are ubiquitous rotating water masses crossing the ocean and affect ocean stratification (McGillicuddy, 2016; Gaube et al., 2019). Among them, cyclonic eddies (CEs) can inject nutrients into the euphotic zone through upwelling, thereby stimulating phytoplankton growth even in oligotrophic water (McGillicuddy et al., 2003, 2007; Klein and Lapeyre, 2009; Chelton et al., 2011). For example, patchy blooms of diatoms have been observed in open ocean CEs depending on the relative abundance of silicate over nitrate upwelled (Lochte and Pfannkuche, 1987; Bibby and Moore, 2011). Stimulated phytoplankton activity in CEs has further been shown to attract zooplankton and enhance carbon export fluxes (Shih et al., 2015; Belkin et al., 2022; Zhou et al., 2022). In contrast, anticyclonic eddies (ACEs) are mostly oligotrophic structures characterized by nutrient−poor surface waters constraining primary production (Falkowski et al., 1991; McGillicuddy et al., 1998). Eddies can amplify near−inertial waves, augmenting shear, and potentially leading to increased vertical mixing (Kunze, 1985). Thus, eddies can introduce spatial heterogeneity and variability across scales of 10s to 100s kilometers (Sweeney et al., 2003), affecting phytoplankton community composition (e.g. Lochte and Pfannkuche, 1987), primary productivity (Lasternas et al., 2013; Devresse et al., 2022), viral lysis (Boras et al., 2010) and zooplankton grazing rates (Hernández–León et al., 2001; Belkin et al., 2022). Consequently, eddies can be enriched in organic carbon compared to their adjacent waters (Amos et al., 2019; Zhang et al., 2020).
ACEs are known to agglomerate particles at their edges in shallow waters and in their core at greater depth with an export shape known as the “wine glass effect” (Samuelsen et al., 2012, Waite et al., 2016). Particle dynamics, agglomeration, and fate (export or remineralization) are more difficult to predict in CEs. Horizontal shear instabilities promote cyclonic shear and spirals (Munk et al., 2000). As a result, CEs can relocate floating particles that tend to gather in their cores. This can be visualized by the transport of summer blooms of cyanobacteria in spiral form by CEs in the Baltic Sea (Zhurbas et al., 2019). Shear and turbulence are also known to impact TEP formation rates (Engel and Passow, 2001; Burd and Jackson, 2009). However, particles are formed within CEs mainly as a result of phytoplankton growth triggered by nutrient−rich upwelling. The size and age of the eddies determine the strength of the upwelling (McGillicuddy, 2016), which affects the generation and agglomeration of particles. Most CEs have a lifespan of less than a week, but some live for months and travel hundreds of kilometers, influencing global ocean biogeochemistry (Garçon et al., 2001; Chelton et al., 2011; Schütte et al., 2016). Among these long−lived CEs, some common patterns are described: during their period of intensification (~0−2 months), CEs trigger a notable biological reaction, while in their maturity stage (~2−3 months), they exhibit a biological response along with substantial organic carbon fluxes. As CEs enters their decaying phase (>3 months), remineralization increase with reduced export of organic carbon (Sweeney et al., 2003; Zhou et al., 2020; Zhu et al., 2023).
Gel−like particles that impact the particle size continuum, particle sinking, their rate of remineralization/exportation, and thus the horizontal and vertical distribution of organic matter have not yet been studied in eddies. Here, we investigated the distribution of TEP and CSP at high resolution in and around three CEs in the Mauritanian Upwelling System (13−20°N), a region in which ∼150 eddies are generated per year (Schütte et al., 2016). The CEs differed by their life stage (intensification/decay), source (island/coastal), and the time of year they were sampled (summer/winter). We analyzed the strength of upwelling in CEs by examining the distribution of nutrients and hydrographic parameters. To infer particle aggregation, we investigated the size−frequency distribution of TEP and CSP. To understand their origins, we explored the relationship between these gels and phytoplankton biomass (Chl−a), as well as the abundance of phytoplankton based on size (<20µm) and their carbon production through primary production rates (total and exuded). Additionally, we examined how these gels were linked to the abundance of heterotrophic bacteria, the rates of bacterial biomass production, and planktonic community respiration to understand their sinks. Furthermore, we estimated the relative contribution of TEP to the particulate organic carbon (POC). We investigated the connections between TEP and CSP with various biogeochemical and ecological variables, such as the quality (lability) and quantity of dissolved organic matter, the quantity of particulate organic matter, and the abundance of virus−like particles.
2 Materials and methods
2.1 Study area and eddy characterization
Data used in this study were collected during the cruises M156 (July 3rd to August 1st 2019) and M160 (November 22nd to December 20th, 2019), on board R/V Meteor, in the Eastern Tropical North Atlantic (ETNA) in the vicinity of the Cape Verde archipelago and the Mauritanian coast. During the cruises, three eddies (Mau, Brava, and Sal) differing in their origin, position, and lifespan were sampled at high spatial resolution. Sea surface height (SSH) and Acoustic Doppler Current Profiler (ADCP) velocity data characterized the three eddies as cyclonic eddies (CE). Salinity, temperature, and depth were determined using a Seabird 911 plus CTD system equipped with two independently working sets of temperature−conductivity−oxygen sensors and the WetLabs turbidity/chlorophyll sensor. The oxygen sensor was calibrated against discrete water samples using the Winkler method (Winkler, 1888; Strikland, 1968). The WetLabs Chl−a sensor was calibrated against discrete water samples for cruise M160 (Supplementary Figure S1). Seawater samples were collected using 10 L Niskin bottles attached to the CTD Rosette. During the cruise M156, 25 stations were sampled; with 14 of them inside the Mau eddy (Devresse et al., 2022). During the cruise M160, 26 stations were sampled with 4 stations inside the Brava eddy (Devresse et al., 2023) and 5 inside the Sal eddy (Figure 1). Sampling was conducted in the epi−mesopelagic layer (0−800m during M156 and 0−400m during M160), including samples from the surface mixed layer, the Chl−a maximum, and the shallow oxygen minimum zone (OMZ;<50 µM kg−1 between 0−200 m) when present. Analysis of eddy statistics from an eddy detection and tracking algorithm (Le Vu et al., 2018) established Mau, Brava and Sal CEs to be 1.5, 1.5, and 4 months old, respectively. The Mau and Brava CEs were extensively described in (Devresse et al., 2022, 2023). Briefly, during M156, the Mau CE was sampled at ∼ 200km off the Mauritanian Coast. In addition, water was sampled along a typical coast−to−open ocean trajectory of eddies in this region (Schütte et al., 2016; Devresse et al., 2022; Figure 1). In M160, the Brava and Sal CEs were sampled near the Brava and Sal Islands respectively (Figure 1). Peripheries of Mau, Brava (Devresse et al., 2022, 2023), and Sal (Supplementary Figure S2) CEs were defined as the area influenced by eddies, based on sea surface temperature, salinity, dissolved inorganic nitrogen (DIN) and Chl−a data through high−resolution sampling. During cruise M156, just beyond the eddy periphery at St. E3, a front was observed with surface temperature and salinity (not compensated by density) different from the adjacent stations. Hence, we referred to that station as “frontal zone” (Devresse et al., 2022).
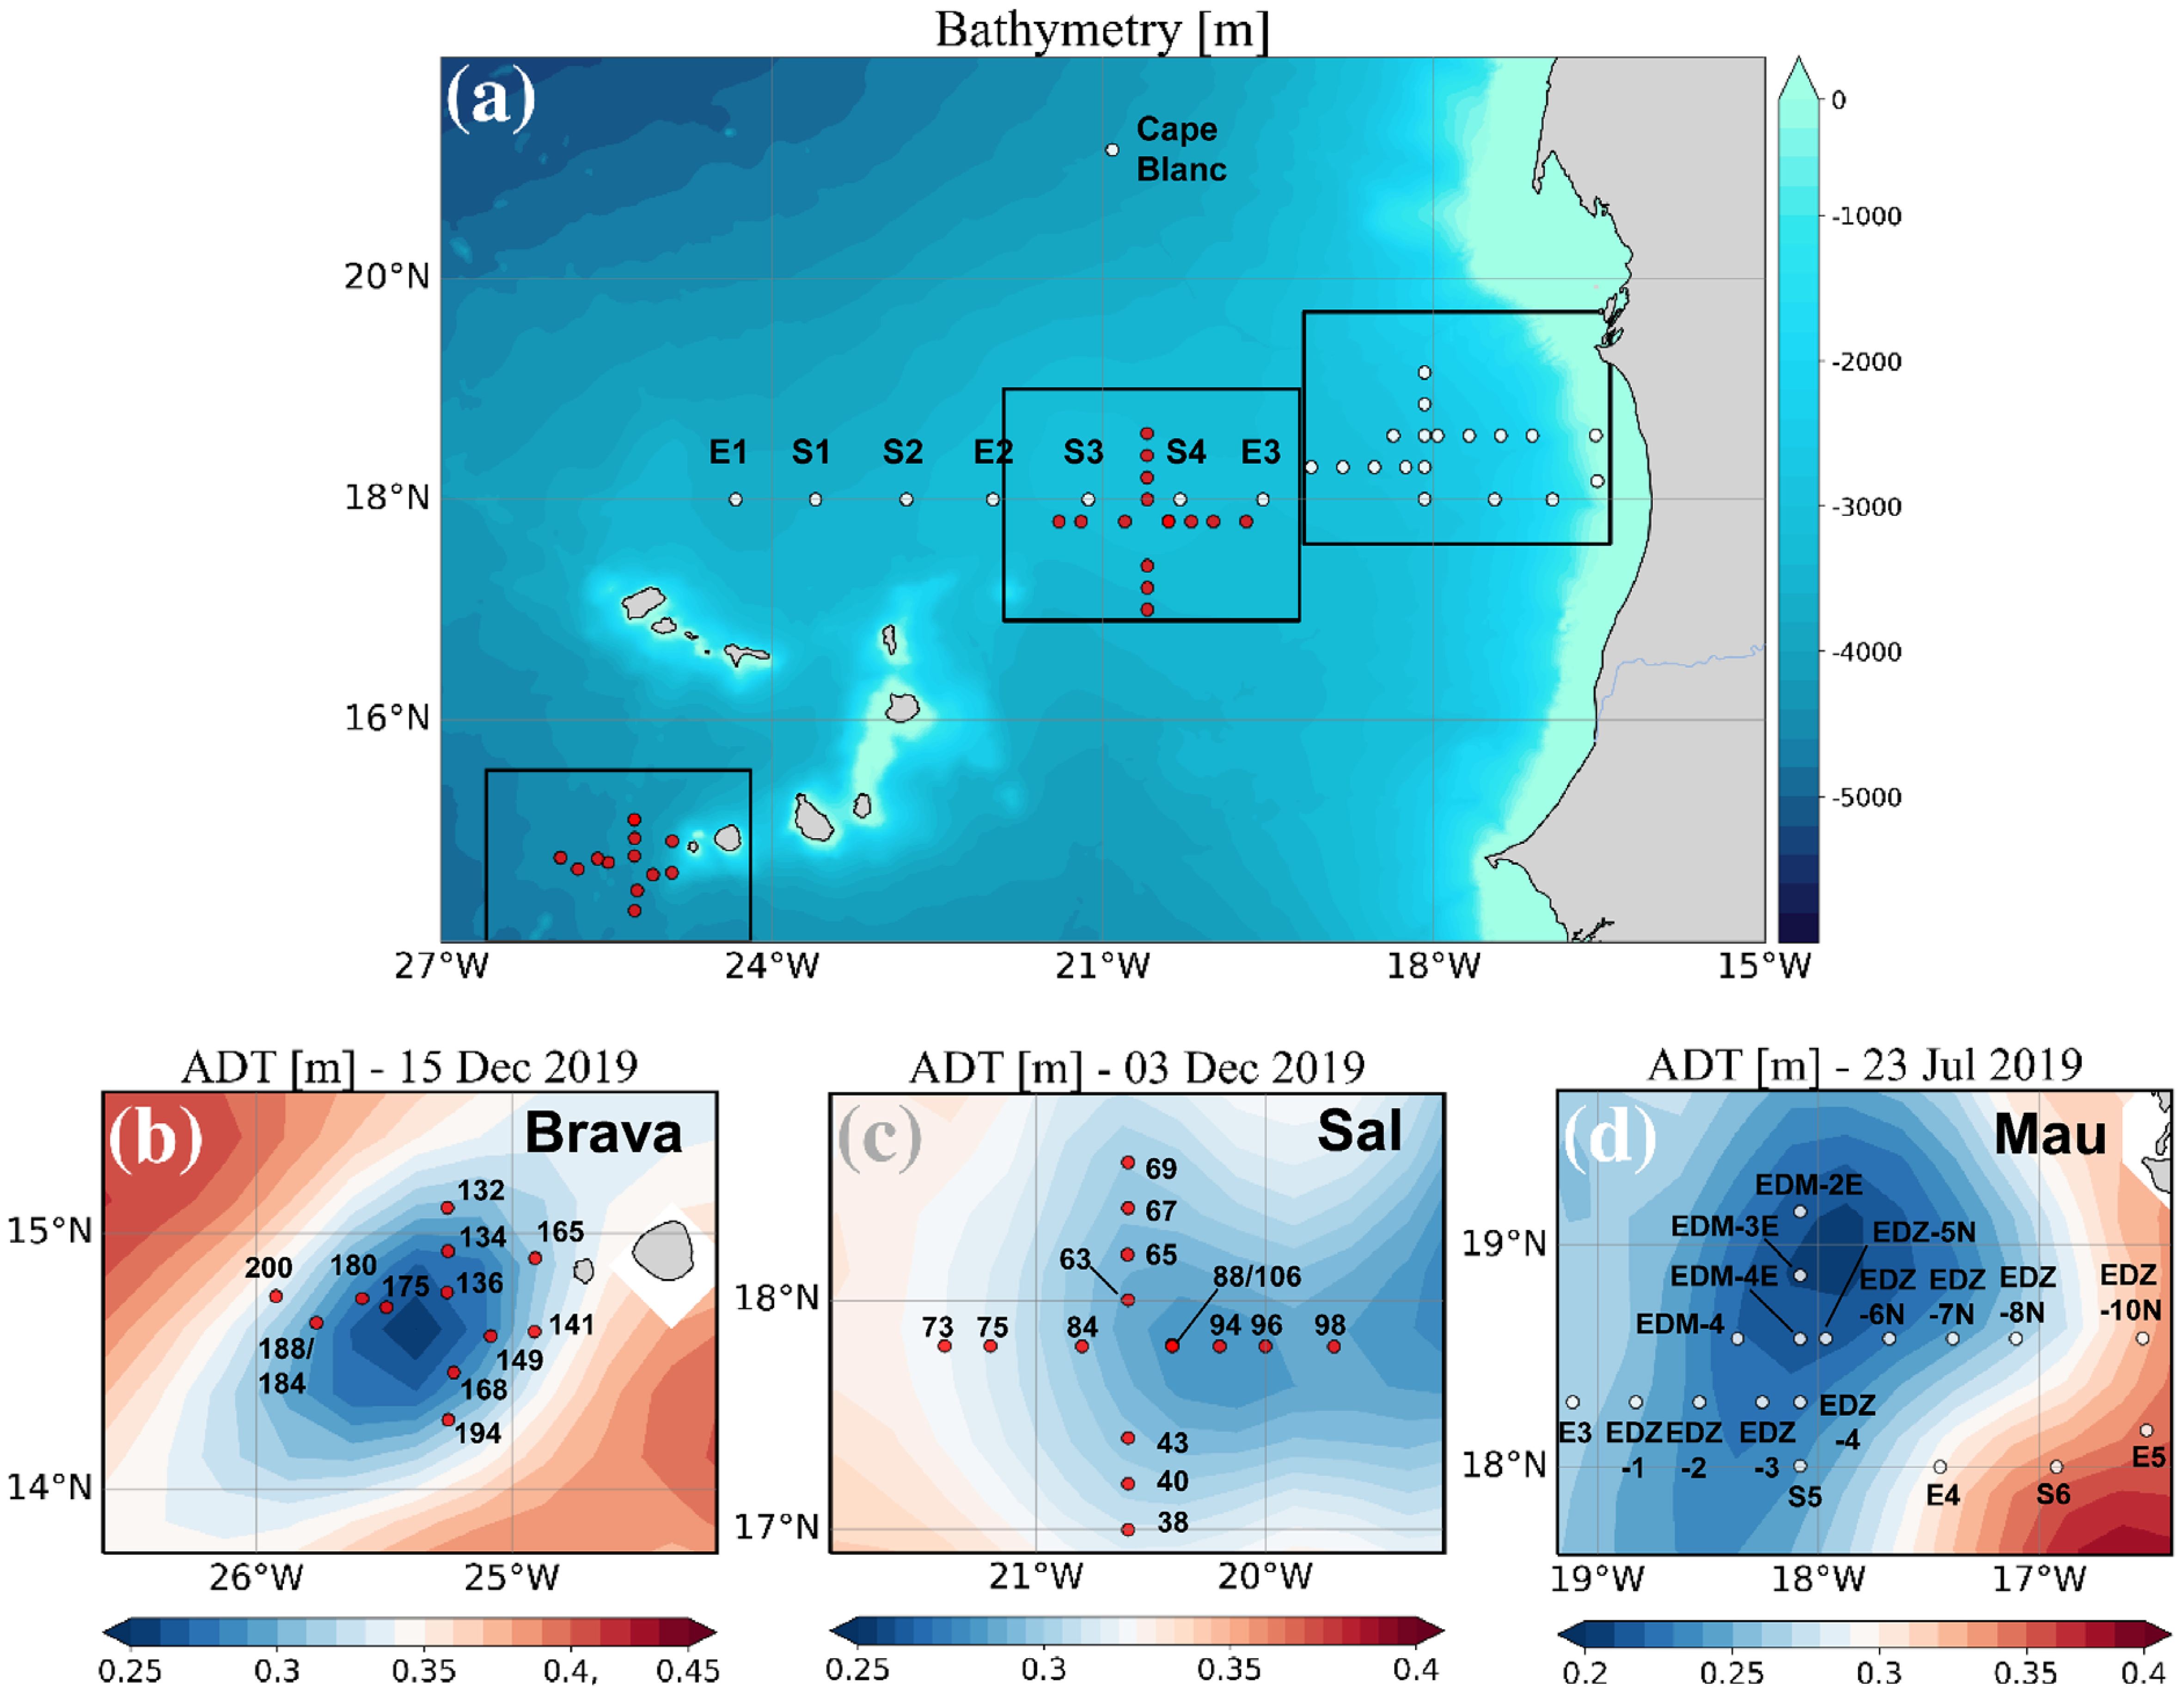
Figure 1 Sampling stations during RV Meteor cruises M156 (white dots) and M160 (red dots) (A), with zoom into the Brava eddy (B), Sal (C), and Mau eddy (D). The background in (B–D) shows the variations in Absolute Dynamic Topography (ADT) obtained from http://www.aviso.altimetry.fr. Adapted from Devresse et al. (2023) with permission.
2.2 Analysis of gel−like particles
Filtration and analyses of TEP and CSP were performed according to Engel (2009). For each sample, 15−300 mL of seawater were filtered onto 0.4 µm pore size polycarbonate filters (Nucleopore track−etched, 25 mm, Whatman, GE Healthcare Life Sciences, UK), and subsequently stained with 1 mL of either Alcian Blue Working Solution (0.02% final concentration, Alcian Blue 8GX, pH 2.5, Sigma Aldrich, Germany) for 5 s or with Coomassie Brilliant Blue (0.04% final concentration, Coomassie Brilliant Blue, G−250, SERVA Electrophoresis, Germany) for 30 s to stain TEP or CSP particles, respectively. Both dyes were stored at 5°C and pre−filtered through 0.2 µm syringe filters before use (Acrodisk, Sigma Aldrich). The volume of samples was selected based on microscopic inspection of the filter directly on board of the research vessel and assuring that the filters contain neither too little nor too high amounts of particles. In particular, a high particle load should be avoided to allow for later identification of individual particles using automated image analysis. Filters were air−dried, mounted on glass slides (Menzel Gläser, Thermo Scientific, Germany) using two drops (∼10 µL each) of immersion oil (Standard series A, nD 1.5840 ± 0.0002, Cargille, USA), covered with coverslips (Menzel Gläser, Thermo Scientific, Germany) and stored at −20°C until microscopic analysis in the home laboratory. Filters were then screened at 200× magnification using a light microscope (Zeiss Axio Scope A.1) connected to a camera (AxioCAM Mrc5). About 30−40 images were taken randomly from each filter in two perpendicular cross−sections (15−20 images each; resolution 1040 × 1040 pixels, 8−bit color depth). The equivalent spherical diameter (ESD) of individual particles was calculated by measuring its cross−sectional area with image−analysis software (Image J, US National Institutes of Health), and counts were combined and classified into 99 logarithmic size classes from 0.5 to 50 µm. The concentrations of TEP and CSP were reported in two different ways: i) as the area covered by exopolymer particles per volume (cm2 L−1) and, ii) as the number of particles per volume (particles L−1).
The carbon content of TEP (TEP−C) was estimated after Mari (1999) using the size−dependent relationship (Equation 1):
with ni being the number of TEP in the size class i and ri being the mean equivalent spherical radius of the size class. The constant a = 0.25 × 10⁻⁶ µg C and the fractal dimension of aggregates D = 2.55 were proposed by Mari (1999). To relate to organic carbon concentration in seawater, concentrations of TEP−C are given as µmol L−1. The size−frequency distribution of TEP and CSP gels was described by (Equation 2):
where is the number of particles per unit water volume in the size range to [ + ()] (Mari and Kiørboe, 1996). The factor k is a constant that depends on the total number of particles per volume, and δ (δ <0) describes the spectral slope of the size distribution. The less negative is δ, the greater the fraction of larger gels. The process of collision of particles in shear is typically important for particles larger than a few micrometers in diameter and less important than Brownian motion for particles in the submicron size range (McCave, 1984); therefore, both δ and k were derived from regressions of log[dN/d(dp)] versus log[dp] over the size range 0.5−50 µm ESD, size class with less than ten counts were excluded (Supplementary Figure S3).
2.3 Inorganic nutrients
Nutrient concentrations were measured onboard in duplicates from unfiltered seawater samples (11 mL). Phosphate (PO43−), nitrate (NO3−), and nitrite (NO2−) were measured photometrically with continuous−flow analysis on an auto−analyzer (QuAAtro; Seal Analytical) after Grasshoff et al. (1999). Detection limits for PO43−, NO3−, and NO2− were 0.02, 0.1, and 0.02 µM, respectively, for M156 and 0.01 µM for M160. Dissolved inorganic nitrogen (DIN) was determined as the sum of NO3− and NO2−.
2.4 Semi−labile dissolved organic matter
Analyses of semi−labile dissolved organic matter are described in detail in Devresse et al (Devresse et al., 2022, 2023). Briefly, we determined high−molecular−weight (HMW > 1 kDa) dissolved combined carbohydrates (dCCHO) and dissolved hydrolyzable amino acids (dHAA) as the main biochemical components of DOM (Carlson, 2002). dCCHO samples were desalted by membrane dialysis (1 kDa, Spectra Por), which exclude polysaccharides<1 kDa, oligosaccharides, and monosaccharides. After desalination, samples were hydrolyzed and analyzed with high−performance anion exchange chromatography coupled with pulsed amperometric detection (HPAEC−PAD) (DIONEX ICS3000DC) after Engel and Händel (2011). The analysis detected 11 monomers: arabinose, fucose, galactose, galactosamine, galacturonic acid, glucosamine, glucose, glucuronic acid, rhamnose, co−elute mannose, and xylose. For dHAA, samples were measured by high−performance liquid chromatography (HPLC; Agilent Technologies, USA) and detected fluorometrically after hydrolysis and neutralization and in−line ortho−phthaldialdehyde derivatization with mercaptoethanol (Lindroth and Mopper, 1979; Dittmar et al., 2009). The analysis classified 13 monomers: alanine, arginine, aspartic acid, isoleucine, glutamic acid, glycine, leucine, phenylalanine, serine, threonine, tyrosine, valine; and γ−aminobutyric acid (GABA). The calculations for the carbon and nitrogen content of dCCHO and dHAA were based on carbon and nitrogen atoms contained in the identified monomers. Hydrolyzable HMW compounds have varying lability and can be defined as labile or semi−labile with degradation time from hours to month (Carlson and Hansell, 2015, and references therein). Here, the sum of dCCHO and dHAA carbon and nitrogen contents are referred to as semi−labile dissolved organic carbon (SL−DOC) and nitrogen (SL−DON), respectively.
2.5 Dissolved organic carbon and nitrogen
Analyses of dissolved organic matter are described in detail in Devresse et al. (2023). Briefly, duplicate samples for DOC and dissolved organic nitrogen (DON) were filtered through 0.45 µm GMF GD/X filters (Whatman, GE Healthcare Life Sciences, UK) and collected in combusted glass ampoules. Samples were acidified with 20 µL of hydrochloric acid (30%) and stored at 4°C. DOC was analyzed by high−temperature combustion using a Shimadzu TOC−VCSH after Engel and Galgani (2016), and total dissolved nitrogen (TDN) was measured in parallel with a TNM−1 detector of the Shimadzu analyzer (Dickson et al., 2007). Values of TDN were corrected with DIN and thereafter referred to as dissolved organic nitrogen (DON).
2.6 Particulate organic carbon and nitrogen
For analyses of particulate organic carbon (POC) and particulate nitrogen (PN), water samples (0.5−1 L) were filtered onto pre−combusted (450°C for 5 h) Whatman GF/F filters (25 mm, 0.7 µm) under low pressure (<200 mbar). Filters were frozen at −20°C and stored until analysis. Prior to analysis, filters were acid−fumed (37% HCl for 24 h) in order to remove inorganic carbon and dried at 40°C for 24 h. Subsequently, filters were wrapped in tin cups (8×8×15 mm), combusted, and analyzed according to Sharp (1974) using an elemental analyzer (Euro EA).
2.7 Chlorophyll−a
Analyses of chlorophyll−a are described in detail in Devresse et al (Devresse et al., 2022; Devresse et al., 2023). Briefly, during the M156 cruise, 1 L samples were collected on 25 mm GF/F (Whatman, GE Healthcare Life Sciences, UK). The samples were stored frozen (−20°C) until extraction using 90% acetone for photometric analyses (Turner Designs, USA), slightly modified after Evans et al. (1987). During M160, the concentration of Chl−a was determined by separation through HPLC and was detected fluorometrically (Shimadzu). after a modified version of the method described in Garrido et al. (2003). For HPLC system calibration, pigment standards from DHILAB products (Denmark) and Sigma−Aldrich (St. Louis, MO, USA) were used. The true concentrations of the standards were determined by spectrophotometric measurements using the specific extinction coefficient for each pigment based on Roy et al. (2011).
2.8 Determination of microbial cells (prokaryotes and micro−plankton) and virus abundance
Seawater samples (1.7 mL) were collected and glutaraldehyde (1% and 0.5% final concentration, respectively) was added to fix heterotrophic bacterial cells and viruses. The samples were stored at −80°C after being flash−frozen in liquid nitrogen. Bacteria and viruses were counted after thawing using flow cytometry (FACSCalibur, Becton Dickinson, Oxford, UK) after Brussaard (2004) and Marie et al. (1999). For viruses, thawed samples were diluted in TE buffer (10 mM Tris HCl, 1 mM EDTA; pH 8). Bacteria and viruses were stained with SYBR Green I (molecular probes) and enumerated with a laser emitting at 488 nm and detected by their signature in a plot of side scatter (SSC) versus green fluorescence (FL1). Three distinct viral populations (V1–V3) were identified; the sum of the three populations is referred to as “Virus”. Cell counts were determined with the CellQuest software (Becton Dickinson). Heterotrophic bacteria were distinguished from photosynthetic bacteria (Prochlorococcus spp. and Synechococcus spp.) by their signature in a plot of red fluorescence (FL2) versus green fluorescence (FL1). Yellow−green latex beads (1 µm, polysciences) were used as an internal standard (Gasol and Del Giorgio, 2000). Picoplankton and nanoplankton populations containing Chl−a and/or phycoerythrin (i.e. Synechococcus) were identified and enumerated. We converted the cell abundance of the different autotrophic pico− and nanoplankton populations into biomass assuming 120 fg C cell−1 for Synechococcus, 500 fg C cell−1 for eukaryotic picoplankton and, 3.100 fg C cell−1 for eukaryotic nanoplankton after Hernández–Hernández et al. (2020).
2.9 Microbial activities
Analyses of microbial activities are described in detail in Devresse et al (Devresse et al., 2022, 2023). Primary productivity (PP) was determined from 14C incorporation, according to Gargas (1975) and Nielsen (1952). Polycarbonate bottles (Nunc EasYFlask, 75 cm2) were filled with 260 mL prefiltered (mesh size of 200 µm) sample and spiked with 50 µL of an ∼11 µCi NaH14CO3− solution (Perkin Elmer, Norway). Two hundred microliters were removed immediately after spiking and transferred to a 5 mL scintillation vial for determination of added activity. Then 50 µL of 2N NaOH and 4 mL scintillation cocktail (Ultima Gold AB) were added. Duplicate samples from the top three depths at selected stations were incubated in 12−hour light and 12−hour darkness at 22°C. Incubations were stopped by filtration of a 70 mL sub−sample onto 0.4 µm polycarbonate filters (Nuclepore). Particulate primary production (PPPOC) was determined from the material collected on the filter, while the filtrate was used to determine dissolved primary production (PPDOC).
PP of organic carbon was calculated according to Gargas (1975) (Equation 3):
where a1 and a2 are the activities (DPM: disintegrations per minute) of the added solution and the sample corrected for the dark sample, respectively, and DI12C is the concentration (µmol L−1) of dissolved inorganic carbon (DIC) in the sample. DIC concentration was calculated from total alkalinity using the R package seacarb (Gattuso et al., 2021). The total alkalinity of the seawater was acquired through the open−cell titration method (Dickson et al., 2007). The value 1.05 is a correction factor for the discrimination between 12C and 14C, as the uptake of the 14C isotope is 5% slower than the uptake of 12C, k1 is a correction factor for sub−sampling (bottle volume = filtered volume), and k2 is the incubation time (d−1). Total primary production (PPTOT; µmol C L−1 d−1) was derived from the sum of PPPOC and PPDOC according to (Equation 4):
Bacterial biomass production rates (BP) were measured through the incorporation of radiolabeled leucine (3H) (specific activity 100 Ci mmol−1, Biotrend) using the microcentrifuge method (Kirchman et al., 1985; Smith and Azam, 1992). Duplicate samples and one killed control (1.5 mL each) were labeled using 3H−leucine at a final concentration of 20 nmol L−1. BP was determined down to 800 m depth in M156 and to 450 m depth in M160, and, for practical reasons, we chose an incubation temperature of 14°C and 13°C respectively as an average over those depth intervals. However, in this paper, only data from the top 100 m depth are shown, and BP rates were corrected for the difference between incubation and in situ temperature (Equations 5 and 6). All samples were incubated for 6 h in the dark with headspace. Controls were poisoned with trichloroacetic acid. All Samples were measured on board with a liquid scintillation analyzer (Packard Tri−Carb, model 1900 A). 3H−leucine uptake was converted to carbon units by applying a conversion factor of 1.55 kg C mol−1 leucine (Simon and Azam, 1989). BP rates from incubations at 13 and 14°C, respectively, were converted to BP rates at 22°C following the equation from López–Urrutia and Morán (2007):
Community respiration rates (CR) were estimated from quadruplicate incubations at selected station in the top 100 m depth by measuring changes of dissolved oxygen over 24−36 hours at the same temperature as used for BP (14°C in M156, 13°C in M160) using optode spot mini sensors (PreSens PSt3; Precision Sensing GmbH, Regensburg, Germany). The detection limit (DL) for CR was 0.55 µM O2 L−1 d−1. CR at 22°C was estimated using the extrapolation from Regaudie–de Gioux and Duarte (2012) (Equations 7 and 8):
BP and CR extrapolation to 22°C were described in detail in the supplement of Devresse et al. (2022) for incubations from cruise M156 and the same procedures were applied for incubation from cruise M160.
2.10 Data analysis
Statistical analyses and calculations were conducted using the software R (v4.0.2) in R studio (v1.1.414; Ihaka and Gentleman, 1996). Spearman correlation matrices were done with corrplot (Wei and Simko, 2021). Vertical and surface distribution figures were realized with R packages ggplot2 v3.3.3 (Wickham and Wickham, 2016) using multilevel B−spline approximation (Lee et al., 1997) and inverse distance weighted interpolation (Kravchenko and Bullock, 1999) respectively. TEP and CSP did not follow a normal distribution (Shapiro−Wilk test, p<0.05), and non−parametric test were used. Data from the cruises M156 and M160 used in the Spearman correlation matrix are available in the open database PANGAEA.
3 Results
3.1 Hydrography and biogeochemical variability
The hydrography of the cruises M156 and M160 (Brava eddy) were extensively described for the epipelagic layer (0−200 m depth) in Devresse et al. (2022) and Devresse et al. (2023). Briefly, the regions of interest exhibit distinct differences in hydrography associated with local dynamics. Along the transect during cruise M156, open ocean waters (from 20 to 24.5°W) had a temperature and salinity range of 17.9–24.2°C and 36.19–36.79, respectively, in the upper 100 m depth and 7.9–17.9°C and 34.92−35.45 between 100 and 800 m depth (Supplementary Figures S4A, B). Oxygen decreased with depth until ∼400–500 m depth, where it reached ∼50−60 µM and increased towards 800 m depth with a concentration of ∼100 µM (Supplementary Figure S4C). DIN was depleted (<0.5 µM) over the upper ∼50 m depth and its concentration increased with depth (Supplementary Figure S4D). Depth distribution showed a Chl−a maximum in the open ocean around ∼75 m from 23.61 to 24.33°W and around ∼50 m from 22.78 to 20.3°W, up to 0.68 µg L−1 (Supplementary Figure S4E). At the coastal stations (16.51–16.92°W), the temperature and salinity had a range of 16.0–26.1°C and 35.94–36.08 respectively in the upper 100 m depth and 7.2–15.7°C and 34.95–35.69 respectively between 100 and 800 m depth (Supplementary Figure S4B). Two peaks of oxygen decline with concentration<50 µM were observed at coastal stations, one at ∼70 m depth and one at ∼400 m depth (Supplementary Figure S4C). DIN was depleted at the surface (5 m depth), while the deeper coastal waters (∼80 to 200 m depth) were colder and richer in DIN than the open ocean waters (Supplementary Figure S4D). At the coastal stations, the Chl−a maxima were found between 30 and 40 m with values up to 0.96 µg L−1. The frontal zone station E3 (19.55°W) was distinct from the adjacent stations with respect to surface temperature (1°C colder; Supplementary Figure S4A). In Mau and Brava eddies and at the frontal zone, elevated DIN (>1 µM) concentrations were observed at the surface (Devresse et al., 2022, 2023). In those regimes, a compression of isopycnals with a strong doming of the nitraclines, isotherms, isohalines, and oxyclines was observed (Supplementary Figures S4A–D, 5A–D). In the Mau eddy, two zones of oxygen decline were observed at coastal stations, one at ∼30−75 m depth with [O2]<25 µM and one at ∼200−400 m depth with [O2]<50 µM (Supplementary Figure S4C). Chl−a concentrations >0.5 µg L−1 were detected down to ∼45−70 m depth in both Mau and Brava eddies and at the Frontal Zone (Supplementary Figures S4E, 5E). Chl−a was significantly higher in the upper 100 m depth of both eddies compared to their respective surrounding waters (Wilcox test, p<0.05; Figure 2A). In the Sal eddy, the temperature and DIN concentration at the surface were lower and higher respectively than in the station around the eddy (Supplementary Figure S2). The effect of the eddy on surface Chl−a was masked by the northern stations outside the eddy which displayed higher concentration (Supplementary Figure S2). At depth, colder and less saline waters were found within the eddy in the upper ∼40 m depth, with slightly higher DIN concentration in the eddy with on average 1.7 ± 3.5 µM within the eddy and 1.2 ± 2.9 µM outside (Supplementary Figures S6A, B, D). The distribution of oxygen in the eddy and its surrounding waters was similar (Supplementary Figure S6C). In the Sal eddy, Chl−a formed a layer from the surface down to 40 m depth with an average of 0.60 ± 0.12 µg L−1, whereas outside the eddy Chl−a concentration for the same depth range was on average 0.35 ± 0.18 µg L−1 (Supplementary Figure S6E).
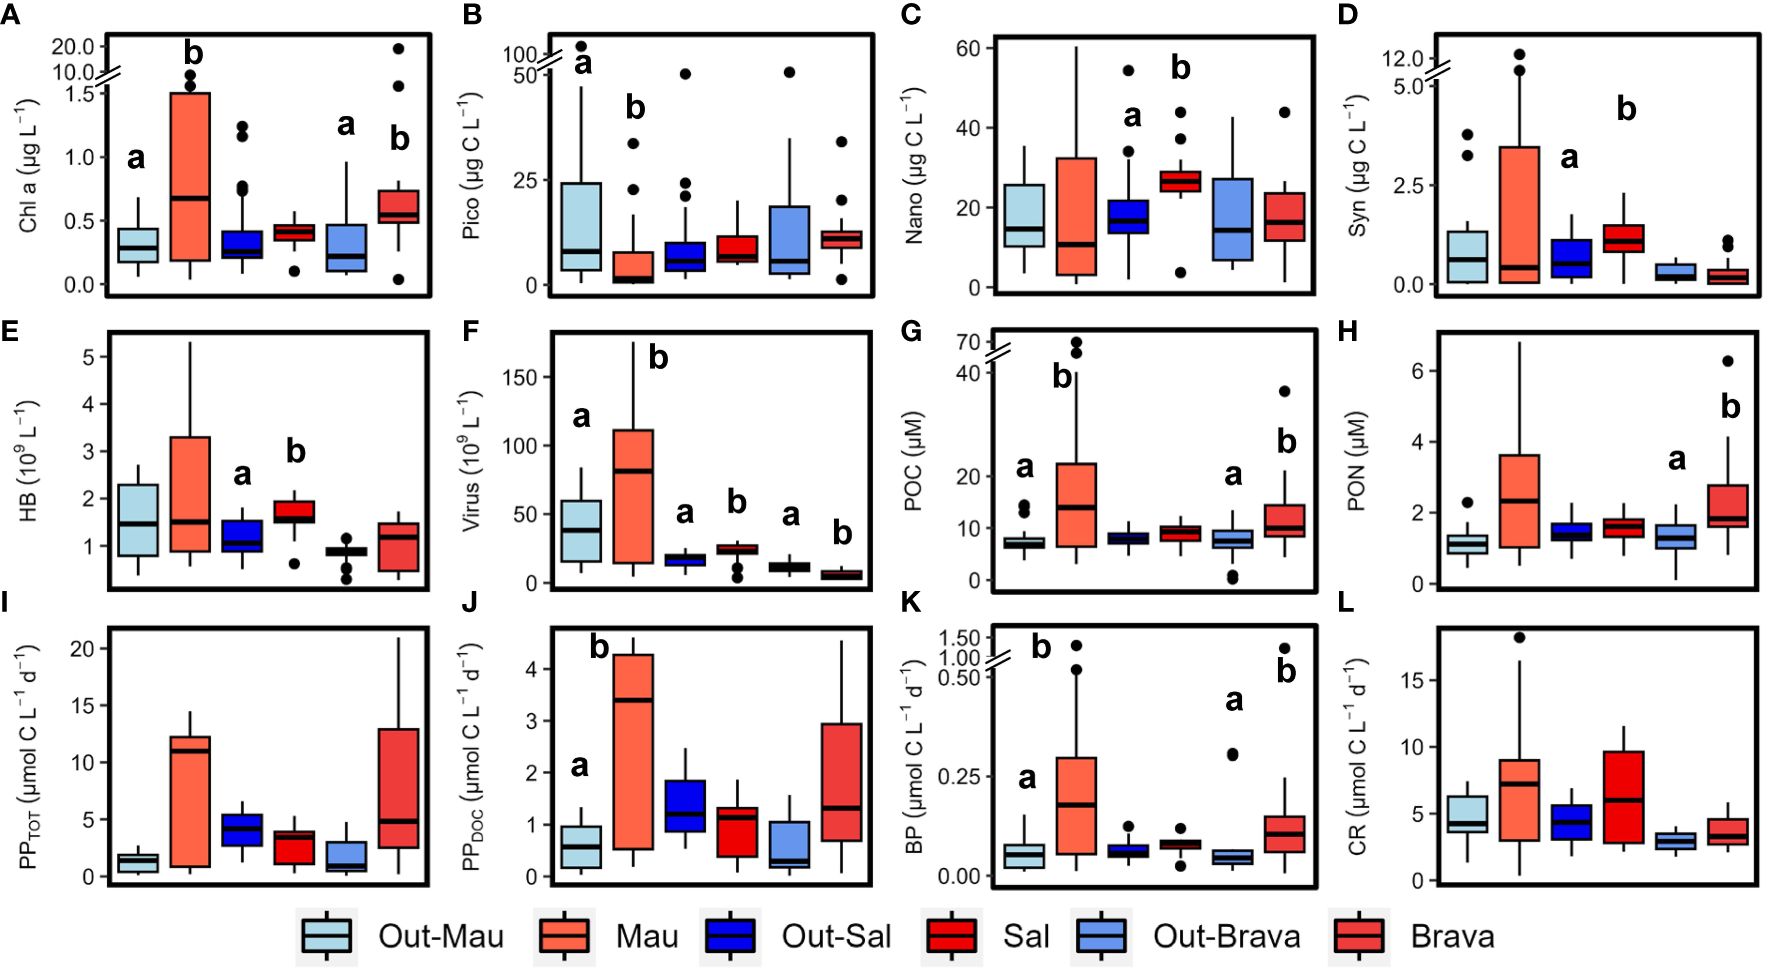
Figure 2 Box plots showing the epipelagic distribution (< 100 m depth) of chlorophyll−a, (Chl−a; A), picoplankton (pico; B), nanophytoplankton (nano; C), Synechococcus (syn; D), heterotrophic bacterial (HB; E), virus (F), particulate organic carbon (POC; G), particulate organic nitrogen (PON; H), total primary production (PPTOT; I), dissolved primary production (PPDOC; J), bacterial production (BP; K) and community respiration (CR; L) in the three cyclonic eddies (red) compared to their respective outer waters (blue). Out−Mau refers to open ocean stations in cruise M156. Systems connected by different letters (a, b) are significantly different (Wilcox test, p<0.05).
Cyanobacteria (Synechococcus) and eukaryotic nanoplankton biomass in the upper 100 m depth of Mau and Brava eddies were not statistically different compared to their respective surrounding waters (Wilcox test, p<0.05; Figures 2C, D). Yet, biomass were unevenly distributed within both eddies. In the Mau eddy Synechococcus and eukaryotic nanoplankton biomass were relatively depleted on the western edges (St. E3 to EDZ−2) compared to the rest of the eddy (Supplementary Figure S7). In the Brava eddy, at the core (St. 136), where the isoclines rise and DIN concentrations are higher, Synechococcus, eukaryotic pico− and nanophytoplankton, and heterotrophic bacteria dropped in abundance (Supplementary Figure S8). In the Sal eddy, eukaryotic nanophytoplankton and Synechococcus abundances were significantly higher compared to its surrounding waters (Wilcox test, p<0.05; Figures 2C, D; Supplementary Figure S9). Heterotrophic bacterial abundance was higher within the upper 100 m depth of Mau, Brava and Sal eddies compared to their respective surrounding−waters, although with high spatial variability (Figure 2E; Supplementary Figures S7, 8; Devresse et al., 2022). Virus−like particle abundance was significantly higher in the Mau and Sal eddies and lower in the Brava eddy compared to their surrounding waters (Wilcox test, p<0.05; Figure 2F).
Dissolved (DOC, DON) and semi−labile (SL−DOC, SL−DON) dissolved organic matter distribution in the epipelagic layer (0−200 m depth) were extensively described for the cruises M156 and for the Brava eddy in Devresse et al. (2023). Briefly, we observed a relative depletion in surface DOC at the center of both Mau and Brava eddies, with higher values in all stations collected during M156 than in those collected during M160. DOC distributions showed compression of isoclines with a dome shape in both eddies, but contrarily to DIN, waters uplifted had lower DOC concentrations. In the Sal eddy, albeit no clear compression of isocline was observed, DOC concentration was slightly lower compared to surrounding waters with on average 65 ± 2 µM and 71 ± 9 µM respectively, in the upper 20 m depth (Supplementary Figure S10). DON distribution was contrasted during cruise M156, with elevated values (>5 µM) down to 800 m depth (data not shown) from the eddy center (St. EDM−4) to open ocean St. S1. During cruise M160, depth distribution did not show contrasting differences between eddy and non−eddy stations (Supplementary Figures S10, 11; Devresse et al., 2023). Semi−labile DOC (SL−DOC) and semi−labile DON (SL−DON) concentrations varied considerably during M156 ranging from 1.7 to 54.4 µM and from 0.15 to 3.49 µM, respectively, in the upper 100 m depth. In contrast, during M160, SL−DOC variations were lower, with SL−DOC ranging between 0.5 and 7.4 µM and SL−DON between 0.14 and 1.3 µM (Devresse et al., 2023; Supplementary Figures S10, 11). Particulate organic carbon (POC) ranged between 1.0 and 69.6 µM in the epi−mesopelagic waters (0−800m depth) during cruise M156 (Figure 3A) and was significantly higher in the upper 100 m depth within the Mau eddy than in the open ocean stations (Wilcox test, p<0.05; Figure 2G). Particulate organic nitrogen (PON) ranged between 0.14 to 6.8 µM during cruise M156 (Figure 3B) and was also significantly higher in the upper 100 m depth within the Mau eddy than in the open ocean stations (Wilcox test, p<0.05; Figure 2H). During cruise M160, POC and PON ranged between 0.19 to 36.4 µM and between 0.11 to 6.3 µM respectively in the epi−mesopelagic waters (0−450m depth; Figures 3C–F) and were both significantly higher in upper 100m depth of the Brava eddy than its surrounding waters (Wilcox test, p<0.05; Figures 2G, H).In the Sal eddy, POC and PON were slightly higher than in its surrounding waters but not significantly (Wilcox test, p=0.08 and 0.18, respectively; Figures 2G, H).
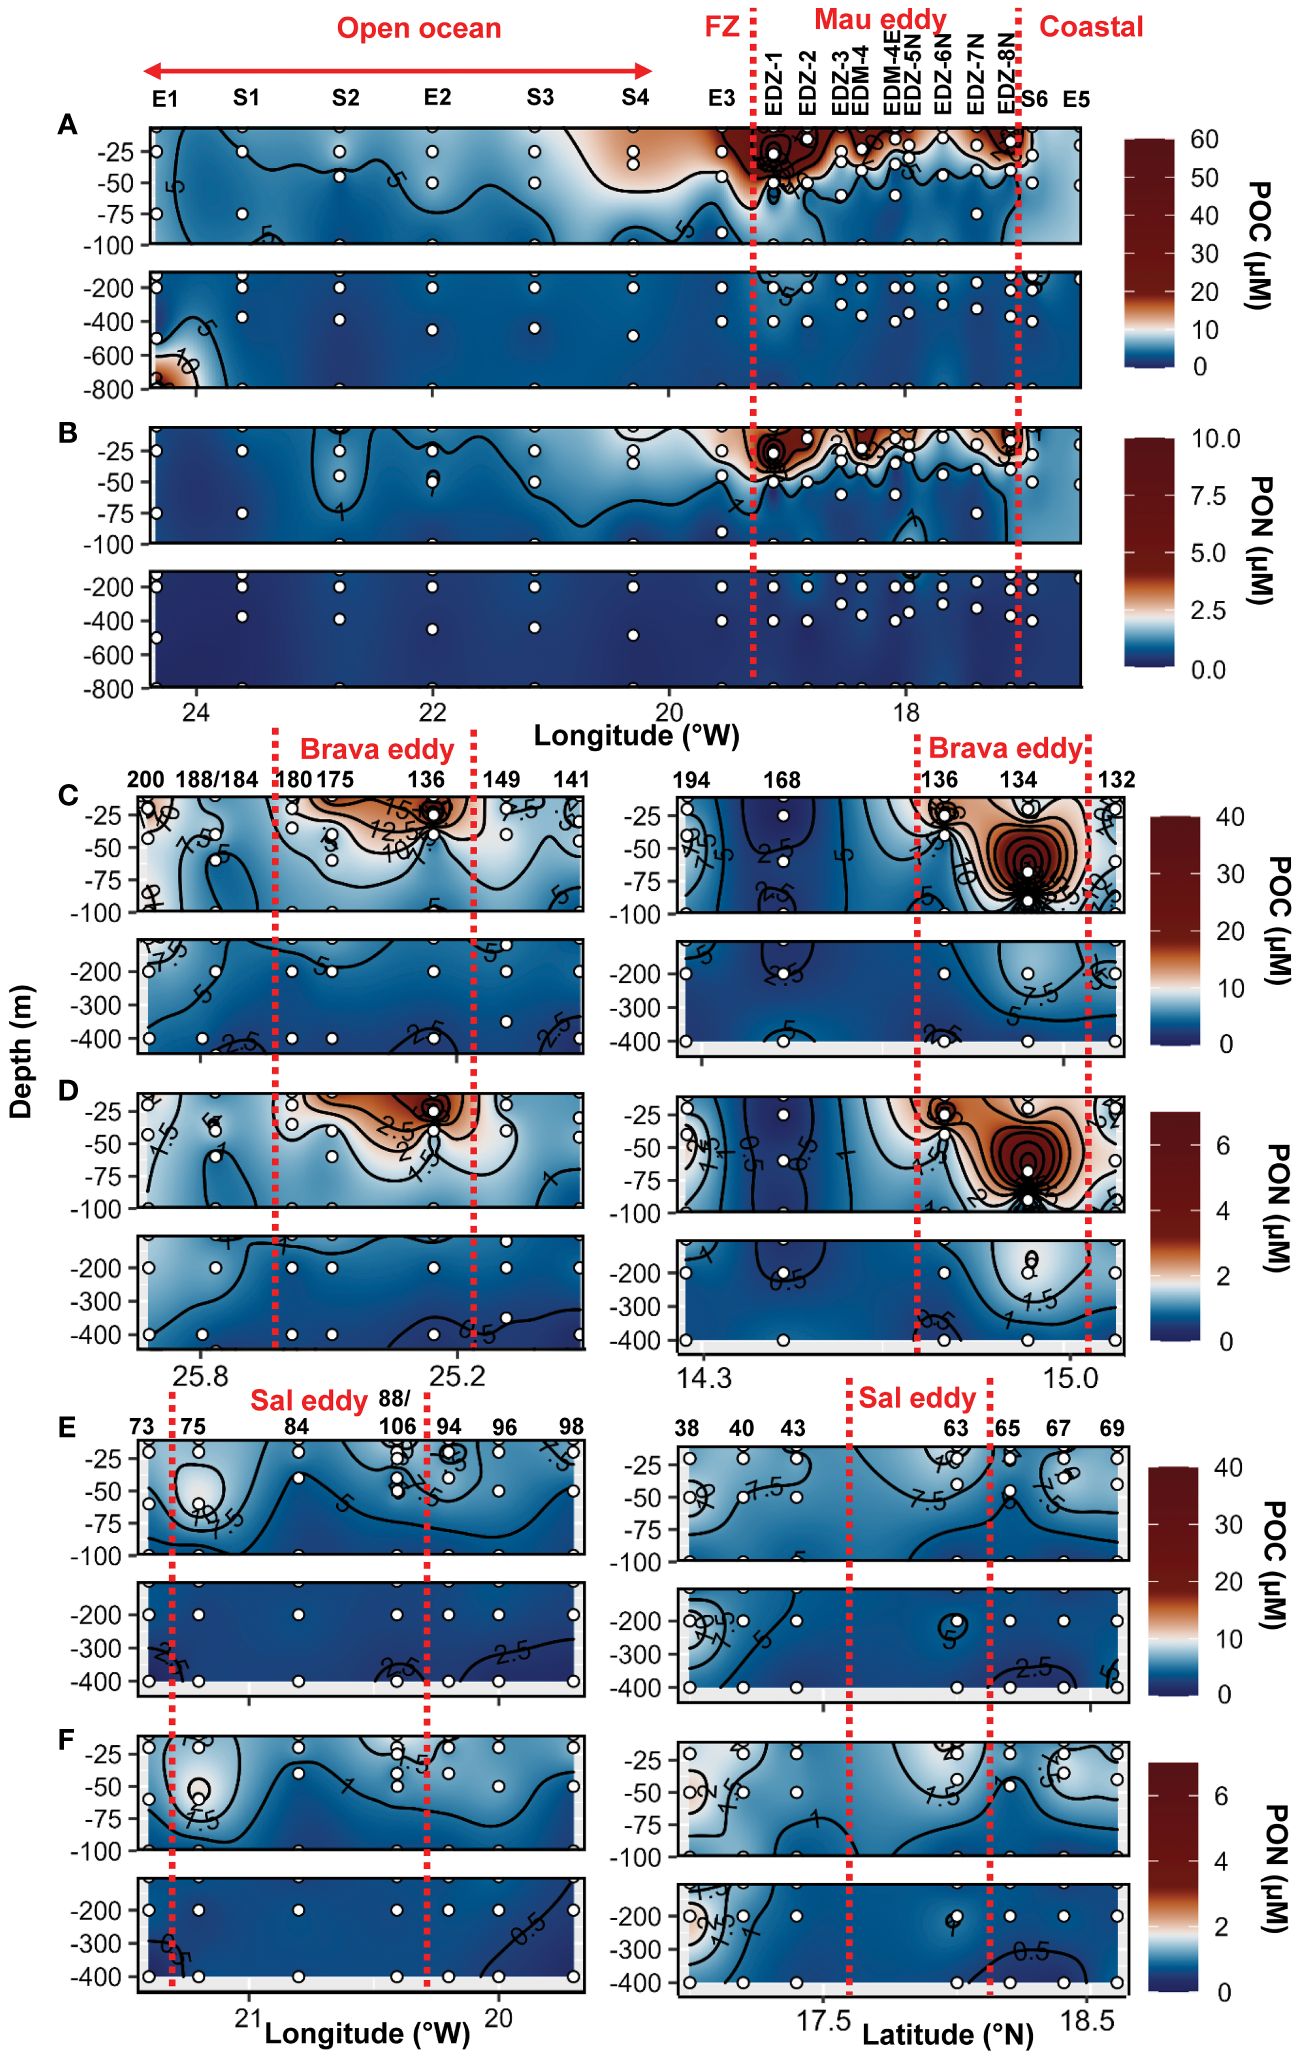
Figure 3 Epi− and mesopelagic distribution (0−800 m) of particulate organic carbon (POC) and particulate organic nitrogen (PON) concentrations in samples collected during cruise M156 (A, B) and during cruise M160 along West−East (left) and South −North (right) transect across Brava (C, D) and Sal (E, F) eddies. Red dashed lines show the boundaries of the eddies periphery. FZ refers to the Frontal Zone.
3.2 Microbial activities
Microbial activities (BP, CR, PPDOC, PPTOT) for the Mau eddy were extensively described in Devresse et al. (2022). Higher rates were observed within the Mau eddy compared to open ocean waters (Out−Mau; Figures 2I–L), although significantly higher only for BP and PPDOC (Wilcox test, p<0.05). The epipelagic distribution of all rates showed strong sub−mesoscale variability, with higher rates at the western edge (St. E3 to St. EDZ−2) of the eddy (Devresse et al., 2022). During M160, the submesoscale variability could not be resolved in the same details due to lower spatial coverage of sampling locations across Sal and Brava eddies. In any case, we observed differences between the eddies and their surrounding waters. Total and dissolved primary production rates (PPTOT, PPDOC) were higher and lower respectively in the upper 100 m depth of the Brava and Sal eddies compared to their respective surrounding waters albeit not statistically different (Wilcox test, p>0.05; Figures 2I, J). Bacterial production and community respiration rates were higher in the eddies’ upper 100 m depth than in their respective surrounding waters albeit not significantly (Wilcox test, p>0.05) expected for BP in the Brava eddy (Figures 2K, L).
3.3 Gel−like particles distribution
During the cruise M156, TEP were widespread in the water column (5−800 m depth), but their abundance and total area (Figures 4A, B) varied considerably between 1x10⁶ to 7.4x10⁸ L−1 and between 9x10⁻³ to 18.5 cm2 L−1 respectively. The highest abundance and total area of TEP (> 0.5x10⁸ L−1 and >1 cm2 L−1) was observed in the ∼40 m upper surface waters in the Mau eddy and in the frontal zone (except St. S4 at 25 m depth and St. EDZ−2 at 400 m depth). In the epipelagic layer (<100 m depth), TEP abundance was on average 4−fold higher in the Mau eddy than in open ocean stations (Out−Mau; Wilcox test, p<0.01; Figure 5A). The carbon content of TEP (TEP−C) as a fraction of particulate organic carbon (POC; Figure 4C) was on average 9 ± 13.4%POC and varied greatly ranging between 0.23 − 96.3%POC. No significant differences in TEP−C contribution to POC were reported between stations within or outside the Mau eddy in the epipelagic layer (Wilcox test, p>0.05). TEP−C >20%POC was sporadically found everywhere along the water column (0−800 m depth) except in coastal stations. Size–−frequency distribution of TEP was also heterogeneous, with the spectral slope (TEP−δ) ranging between −3.56 and – 2.69. Different patterns could withal be noticed, TEP−δ was significantly lower in the epipelagic layer of coastal waters compared to the Mau eddy and open ocean stations (Wilcox test, p<0.05). TEP−δ was not statistically different between open ocean and Mau eddy stations (Wilcox test, p>0.05; Figure 5C). In open ocean (St. S3 and S4) and frontal zone (St. E3) stations, elevated slope (TEP−δ >−3) in the upper 50 m depth contrasted with lower slope (TEP−δ<−3) down to 800 m depth. Elevated slopes (TEP−δ >−3) were found at 400 m depth in the Mau eddy stations but also in open ocean stations (St. S2).
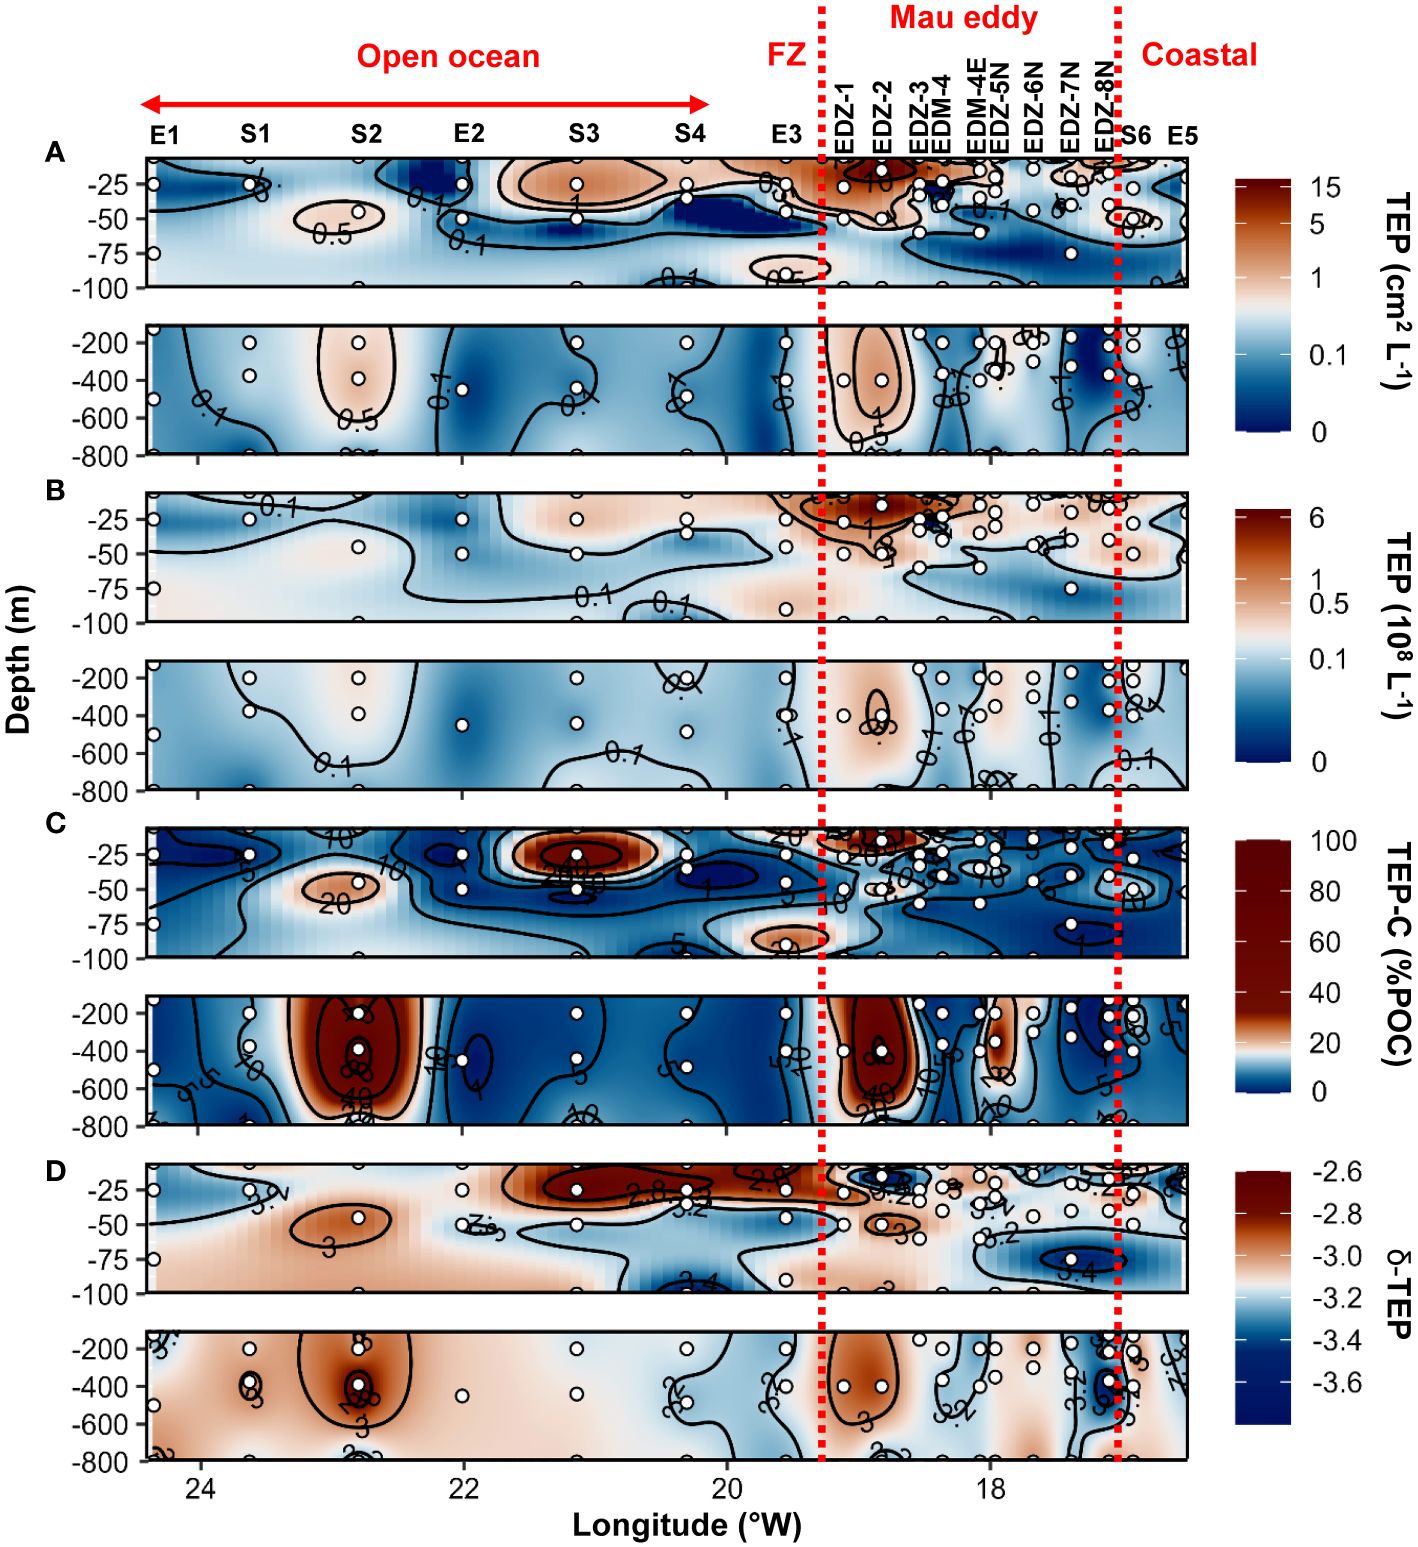
Figure 4 Epi− and mesopelagic distribution (0−800 m) of Transparent exopolymer particle (TEP) area (A) and abundance (B), TEP carbon content (TEP−C) as a percentage of particulate organic carbon (POC; C), slope (δ) of the size−frequency distribution of TEP (D; δ −TEP) in samples collected during cruise M156. Red dashed lines show the boundaries of the Mau periphery. FZ refers to Frontal Zone.
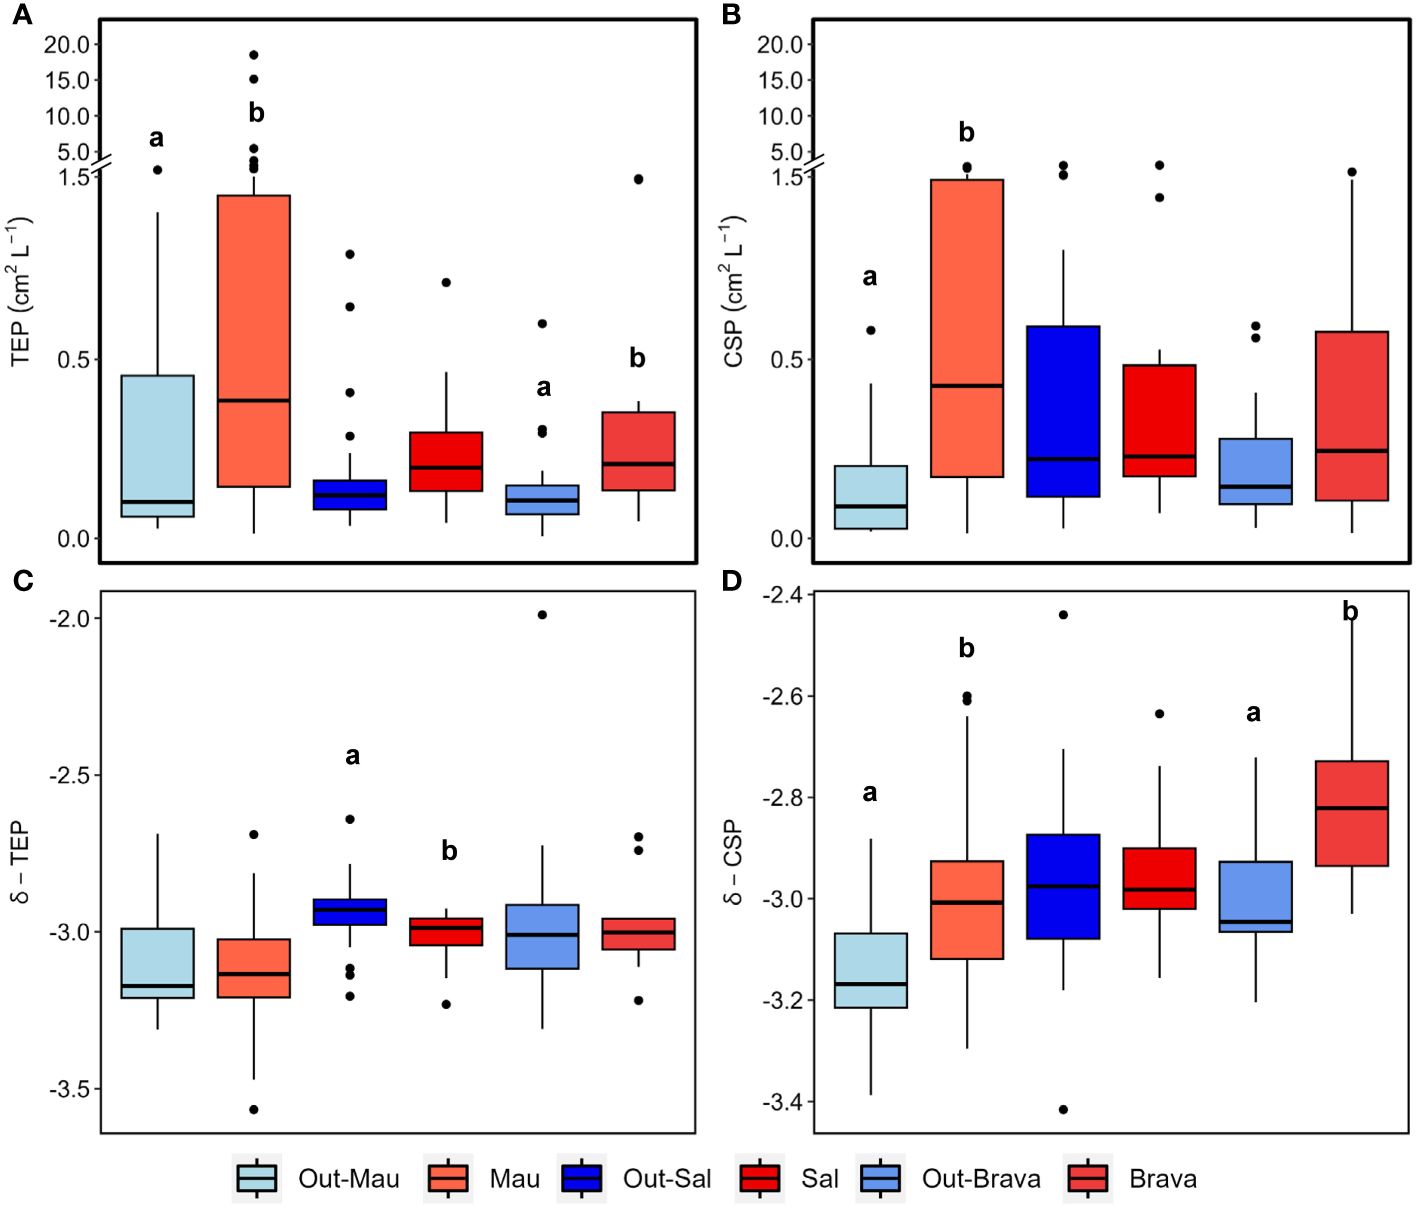
Figure 5 Box plots showing the epipelagic (<100 m depth) distribution of TEP and CSP area (A, B) and spectral slope (δ; C, D) in the three cyclonic eddies (red) compared to their respective surrounding waters (blue). Out−Mau refers to open ocean stations in cruise M156. Systems connected by different letters (A, B) are significantly different (Wilcox test, p<0.05).
CSP microgel abundance and total area (Figures 6A, B) ranged between 1x10⁶ to 1.1x10⁸ L−1 and 0.01 to 2.9 cm2 L−1, respectively. In the epipelagic layer, CSP total area was on average 4.7−fold higher in the Mau eddy than in open ocean stations (Wilcox test, p<0.01; Figure 5B). For all stations, CSP abundance and total area were globally higher in the upper 50 m depth, but vertical trends were also found in the Mau eddy with abundance >0.1x10⁸ L−1 and total area >0.1 cm2 L−1 down to 800 m depth. CSP spectral slope (CSP−δ) ranged between −3.54 to −2.36, with significantly higher values in the epipelagic layer in the Mau eddy compared to open ocean stations (Figures 5D, 6C; Wilcox test, p<0.05). The CSP spectral slope decreased from the coast to the open ocean, with δ >−3 found from the surface to 800 m depth until 20.3°W (St. S4). CSP, as a percentage of total gel area (TEP+CSP), represented between 2.1 to 95.6%, with values decreasing from the coast to the open ocean (Figure 6D). In the Mau eddy, values >50% were found from the surface to 800 m depth whereas at open ocean stations, this was mostly restricted to the upper 100 m depth (except St. E3, at 800 m depth with 52%).
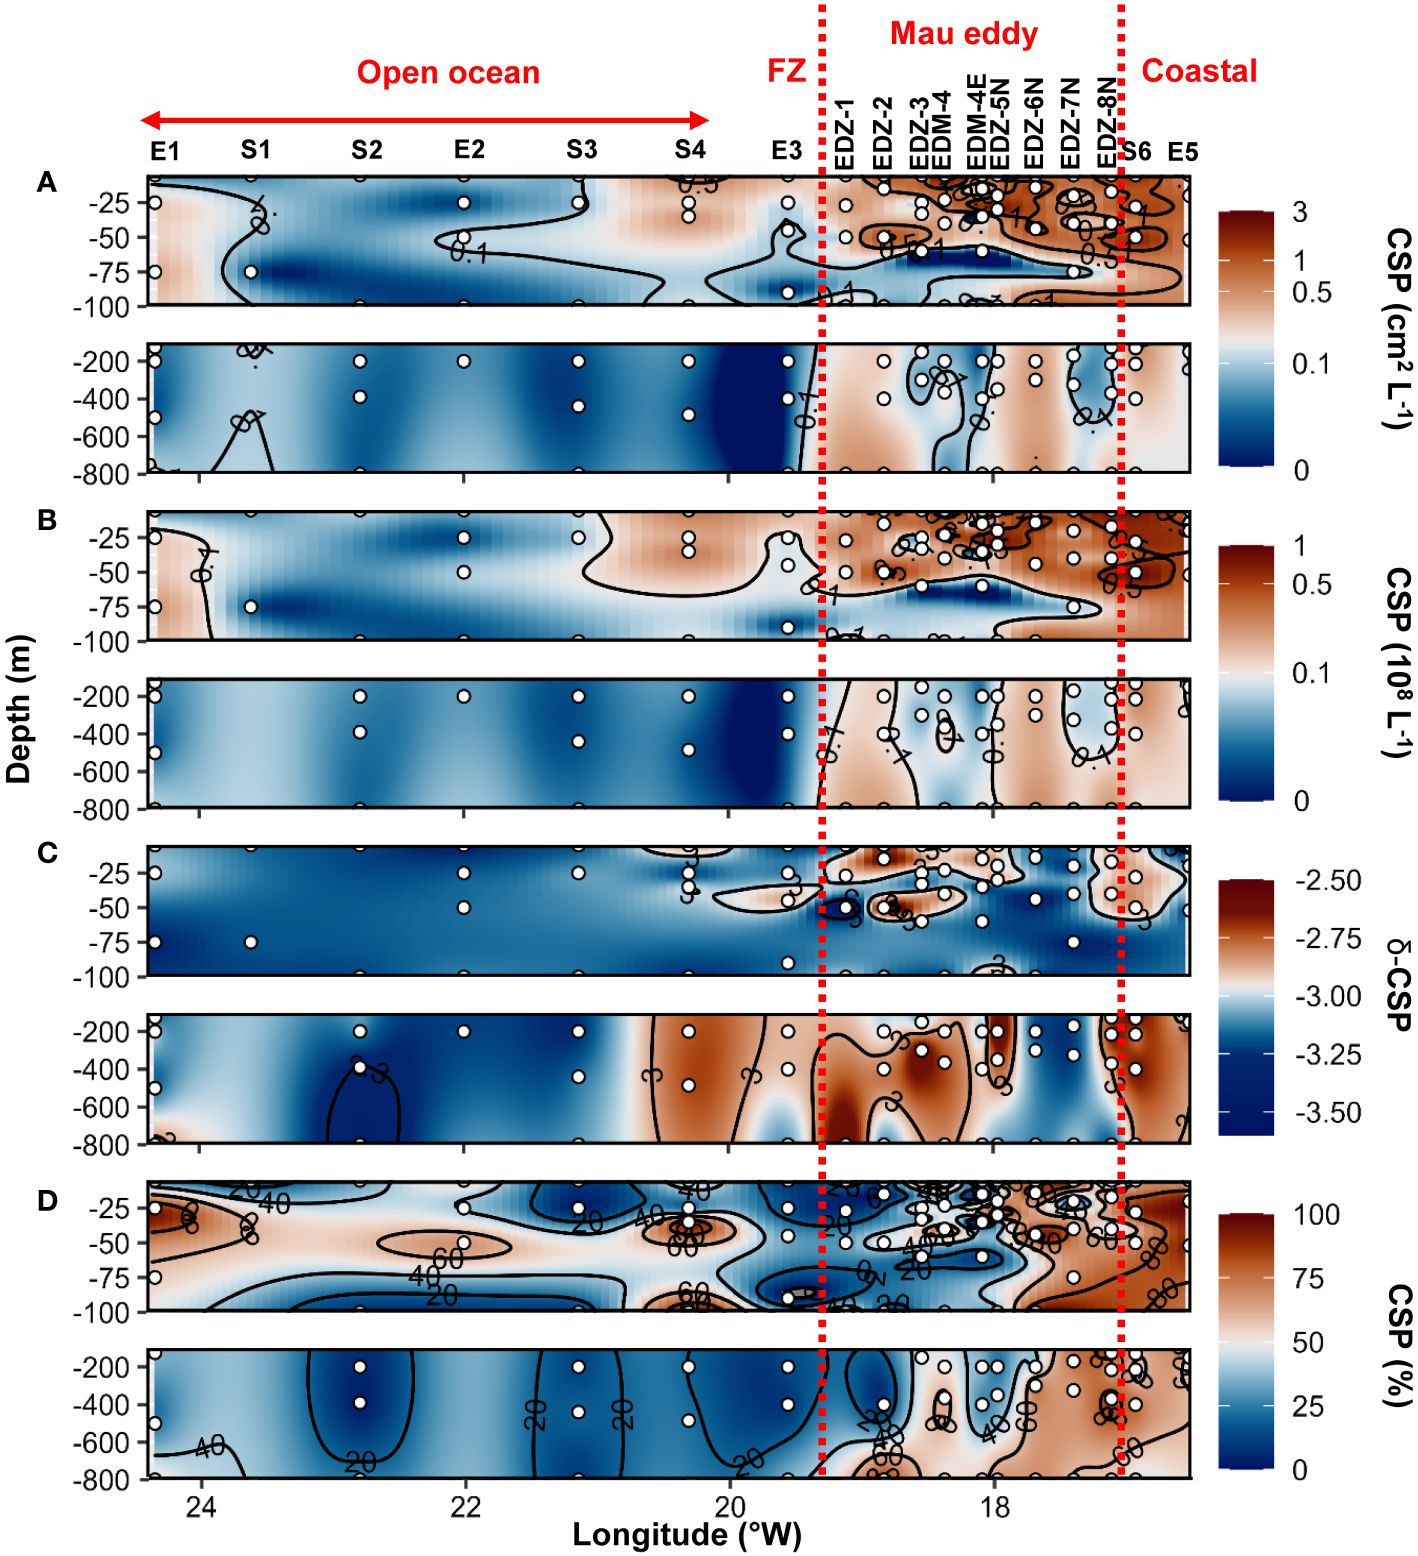
Figure 6 Epi− and mesopelagic distribution (0−800 m) of Coomassie blue stainable particle (CSP) area (A) and abundance (B), slope (δ) of the size−frequency distribution of CSP (C; δ −CSP) and CSP as a percentage of total area (D; TEP+CSP) in samples collected during cruise M156. Red dashed lines show the boundaries of the Mau periphery. FZ refers to Frontal Zone.
During the cruise M160, TEP abundance and total area ranged between 2x10⁵ to 7x10⁷ L−1 and 3x10⁻³ to 1.2 cm2 L−1, respectively. TEP−C between 0.04 and 17.3%POC. The slope of the TEP size−frequency distribution (δ −TEP) ranged between −3.4 and −2. CSP abundance and total area ranged between 1x10⁵ to 7x10⁷ L−1 and 2x10⁻³ to 3.1 cm2 L−1, respectively, representing 2 to 96% of the total gel area. CSP−δ ranged between −3.4 and −2.2. Within the Brava eddy at St. 175 and St. 180, TEP abundance > 0.1x10⁸ L−1, TEP total area> 0.1 cm2 L−1 and TEP−C > 1.5%POC were observed from the surface down to 200 m depth (Figures 7A–C). In the epipelagic layer (<100 m depth), TEP abundance and total area were on average 1.5−fold and 2.5−fold higher, respectively, in the Brava eddy compared to its surrounding waters (Wilcox test, p<0.05; Figure 5A). In contrast, δ −TEP did not show a significant difference between Brava eddy and its surrounding water (Figures 5C, 7D, Wilcox test, p>0.05). CSP abundance and total area were 1.6−fold and 2.4−fold higher, respectively, in the Brava eddy, albeit not significantly different, due to high variability (Wilcox test, p>0.05 for both; Figure 5B), contrarily to CSP−δ, which was significantly higher in the Brava eddy compared to its surrounding waters (Wilcox test, p<0.05; Figures 5B, 8A–C). CSP, as a percentage of total gel area (TEP+CSP), represented between 2.1 to 96.5%, and was not significantly different between the eddy and its surrounding waters (Wilcox test, p>0.05; Figure 8D).
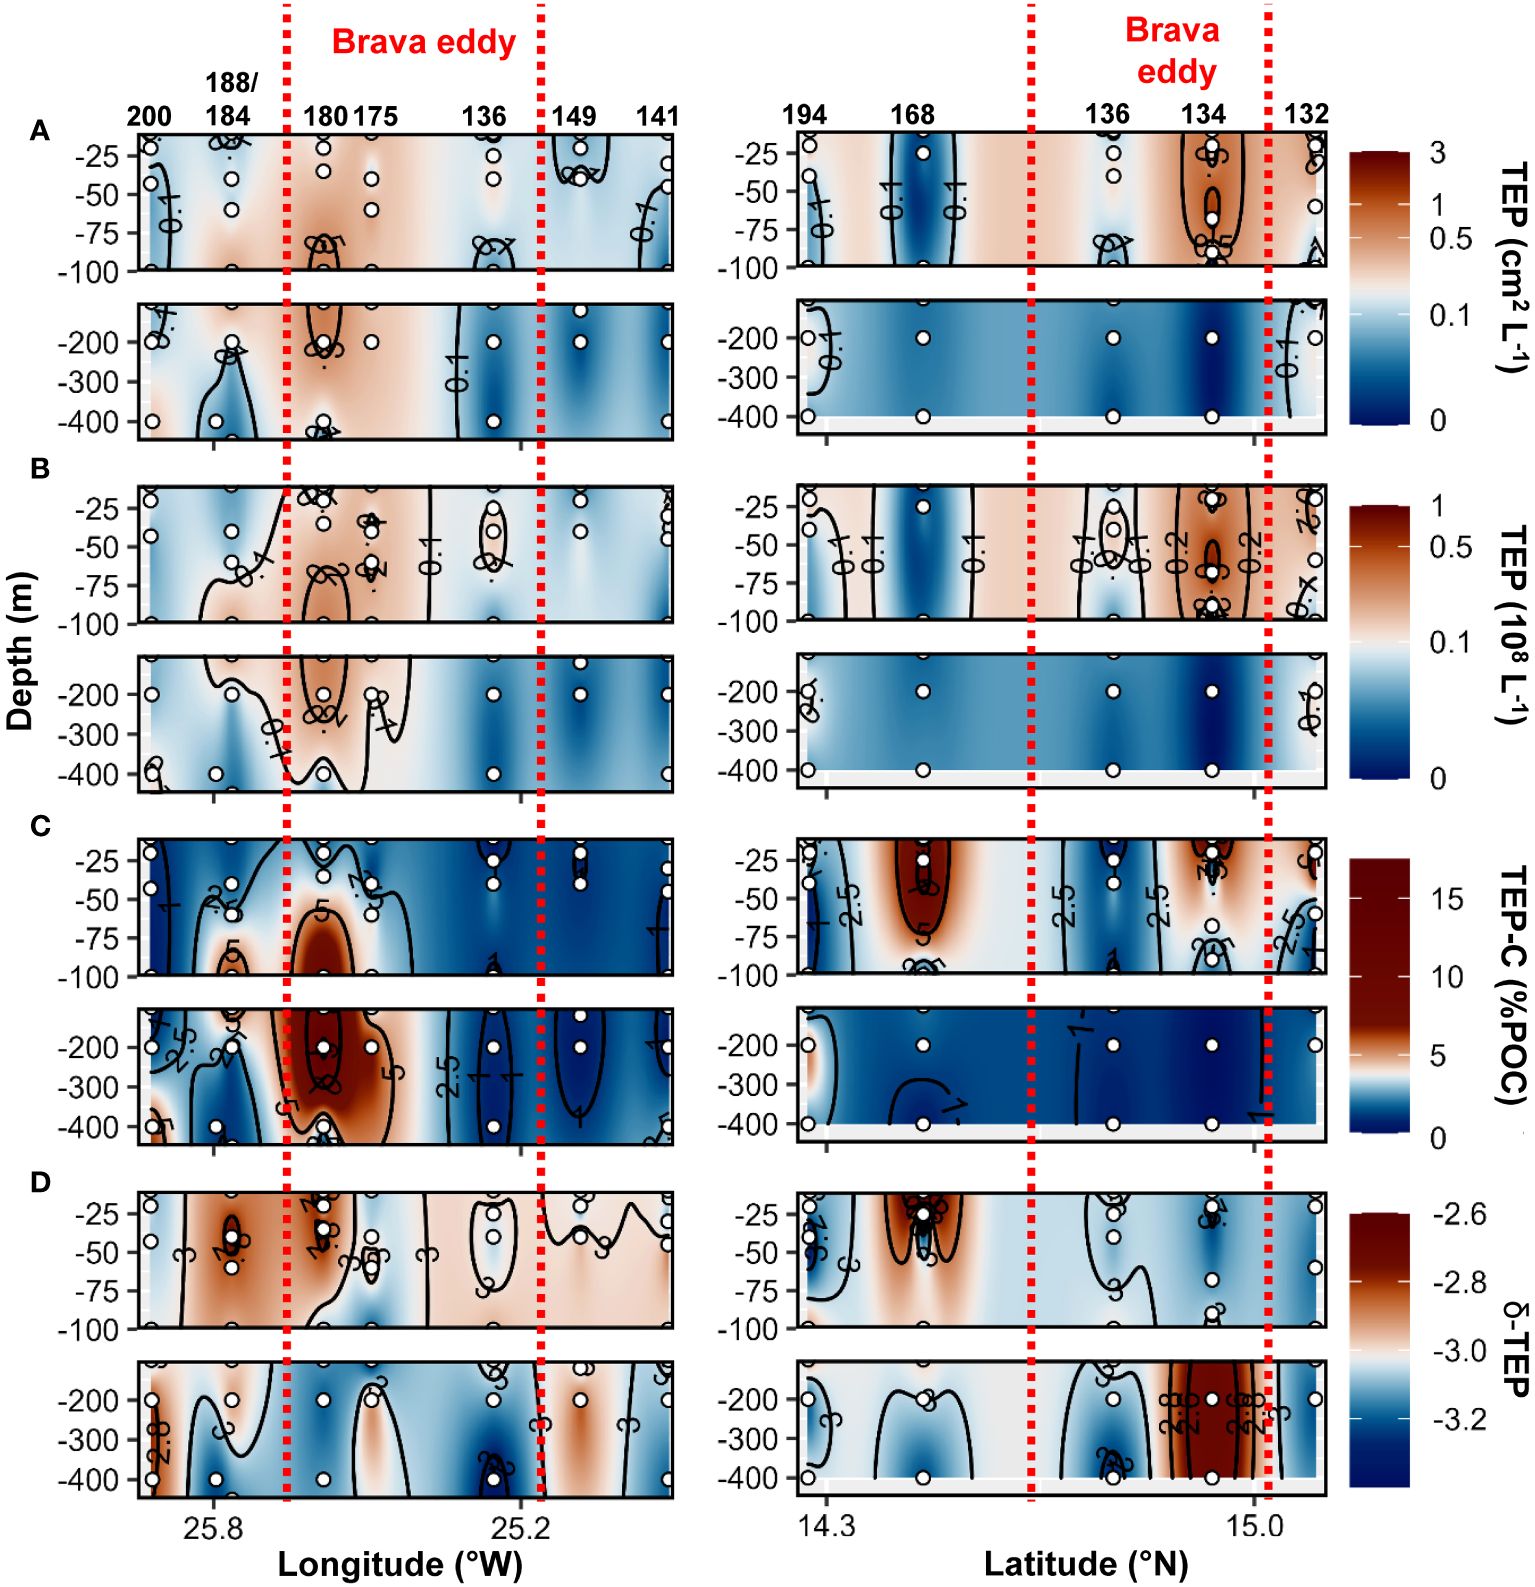
Figure 7 Epi− and mesopelagic distribution (0−450 m) of Transparent exopolymer particle (TEP) area (A) and abundance (B), TEP carbon content (TEP−C) as a percentage of particulate organic carbon (POC; C), slope (δ) of the size−frequency distribution of TEP (D; δ −TEP) along West−East (left) and South−North (right) transect across Brava eddy in samples collected during cruise M160. Red dashed lines show the boundaries of the eddy peripheries.
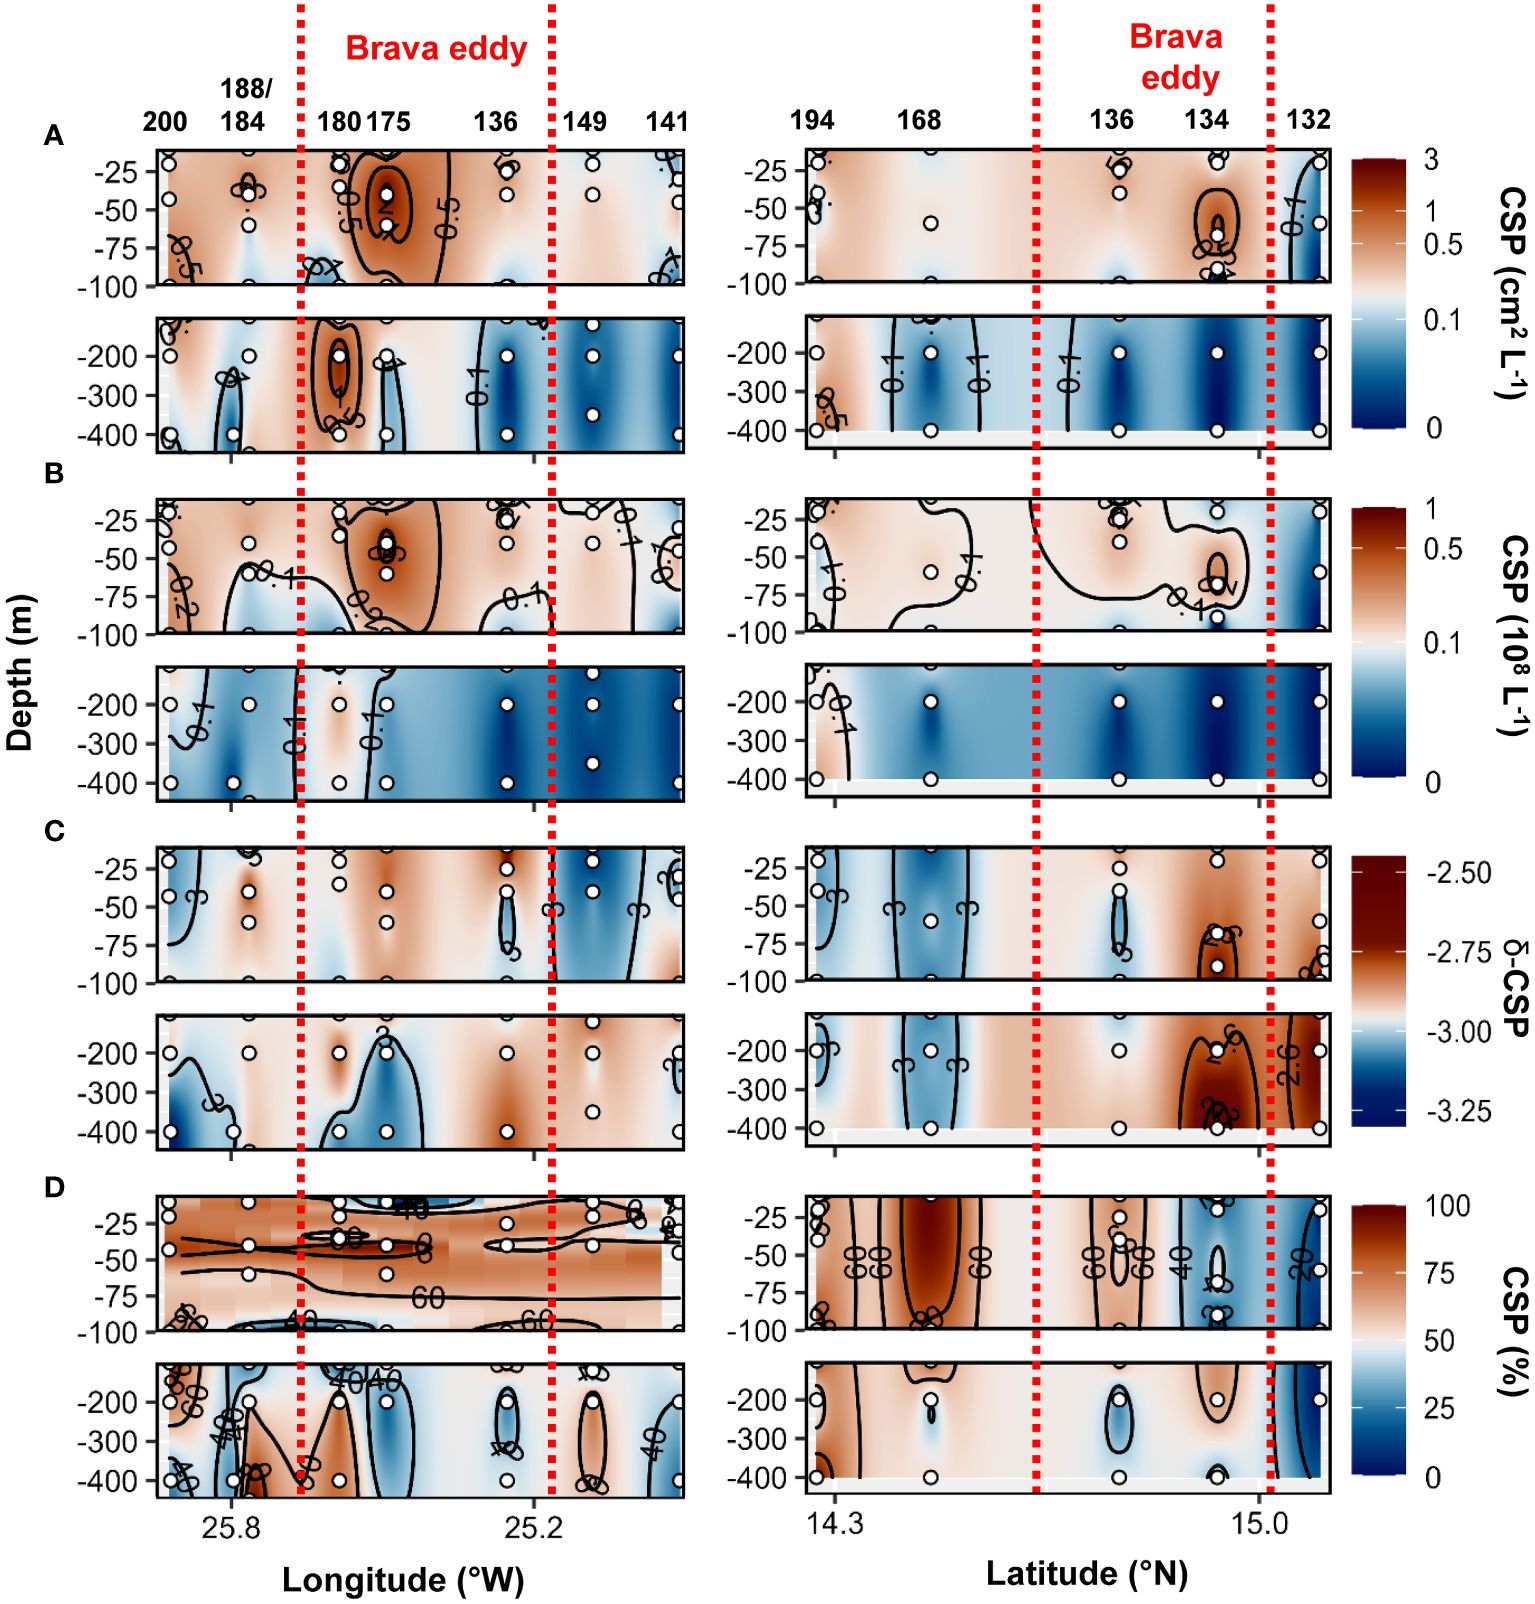
Figure 8 Epi− and mesopelagic distribution (0−450 m) of Coomassie blue stainable particle (CSP) area (A) and abundance (B), slope (δ) of the size−frequency distribution of CSP (C; δ −CSP) and CSP as a percentage of total area (D; TEP+CSP) along West−East (left) and South−North (right) transect across Brava eddy in samples collected during cruise M160. Red dashed lines show the boundaries of the eddy peripheries.
Higher TEP abundance, total area, TEP−C as %POC and TEP−δ were observed in the Sal eddy during the West−East transect (19.7 to 21.4°W at 17.8°N; Figure 9 panel left) compared to its surrounding waters but not in the Northern stations in the South−North transect where higher values were observed just outside of the eddy (St. 67 and St.69; Figure 9 panel right). Those stations were characterized by high Chl−a content at the surface (Supplementary Figures S2C, 6E). CSP abundance and total area presented similar distribution by being higher in the Sal eddy along the East−West transect (Figure 10 panel left), whereas higher values were found outside (St. 67 and 69) along the South−North transect (Figure 10 panel rigth). δ −CSP showed vertical trends with values >−3 from the surface to 400 m depth within and outside the Sal eddy (Figure 10C). In the epipelagic layer (<100 m depth), TEP and CSP total area were on average 1.6 and 1.2−fold higher, respectively in the Sal eddy compared to its surrounding water albeit not significantly different (Wilcox test, p=0.24 and 0.45 respectively; Figures 5A, B).
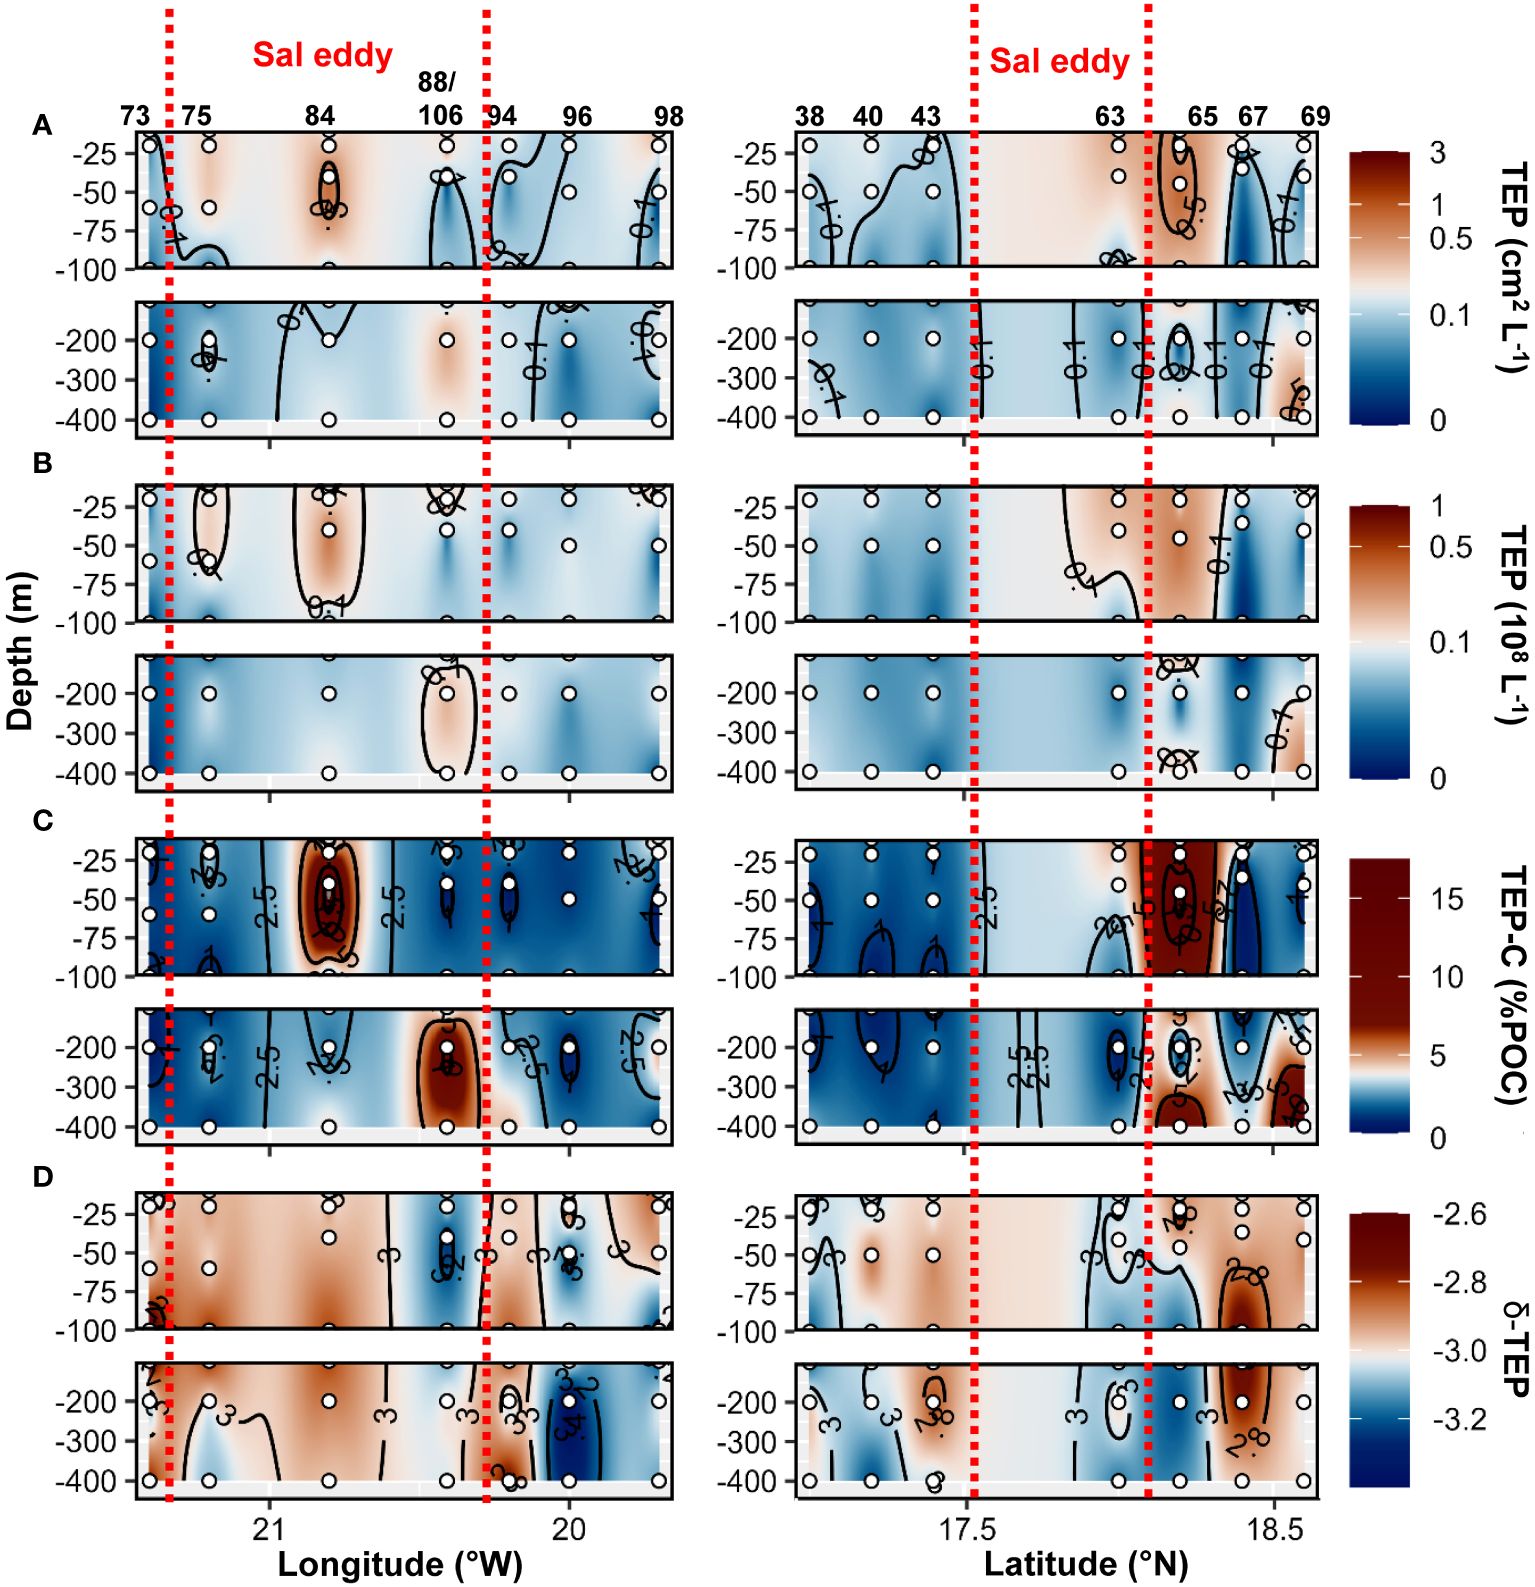
Figure 9 Epi− and mesopelagic distribution (0−450 m) of Transparent exopolymer particle (TEP) area (A) and abundance (B), TEP carbon content (TEP−C) as a percentage of particulate organic carbon (POC; C), slope (δ) of the size−frequency distribution of TEP (D; δ −TEP) along West−East (left) and South−North (right) transect across Sal eddy in samples collected during cruises M160. Red dashed lines show the boundaries of the eddy peripheries.
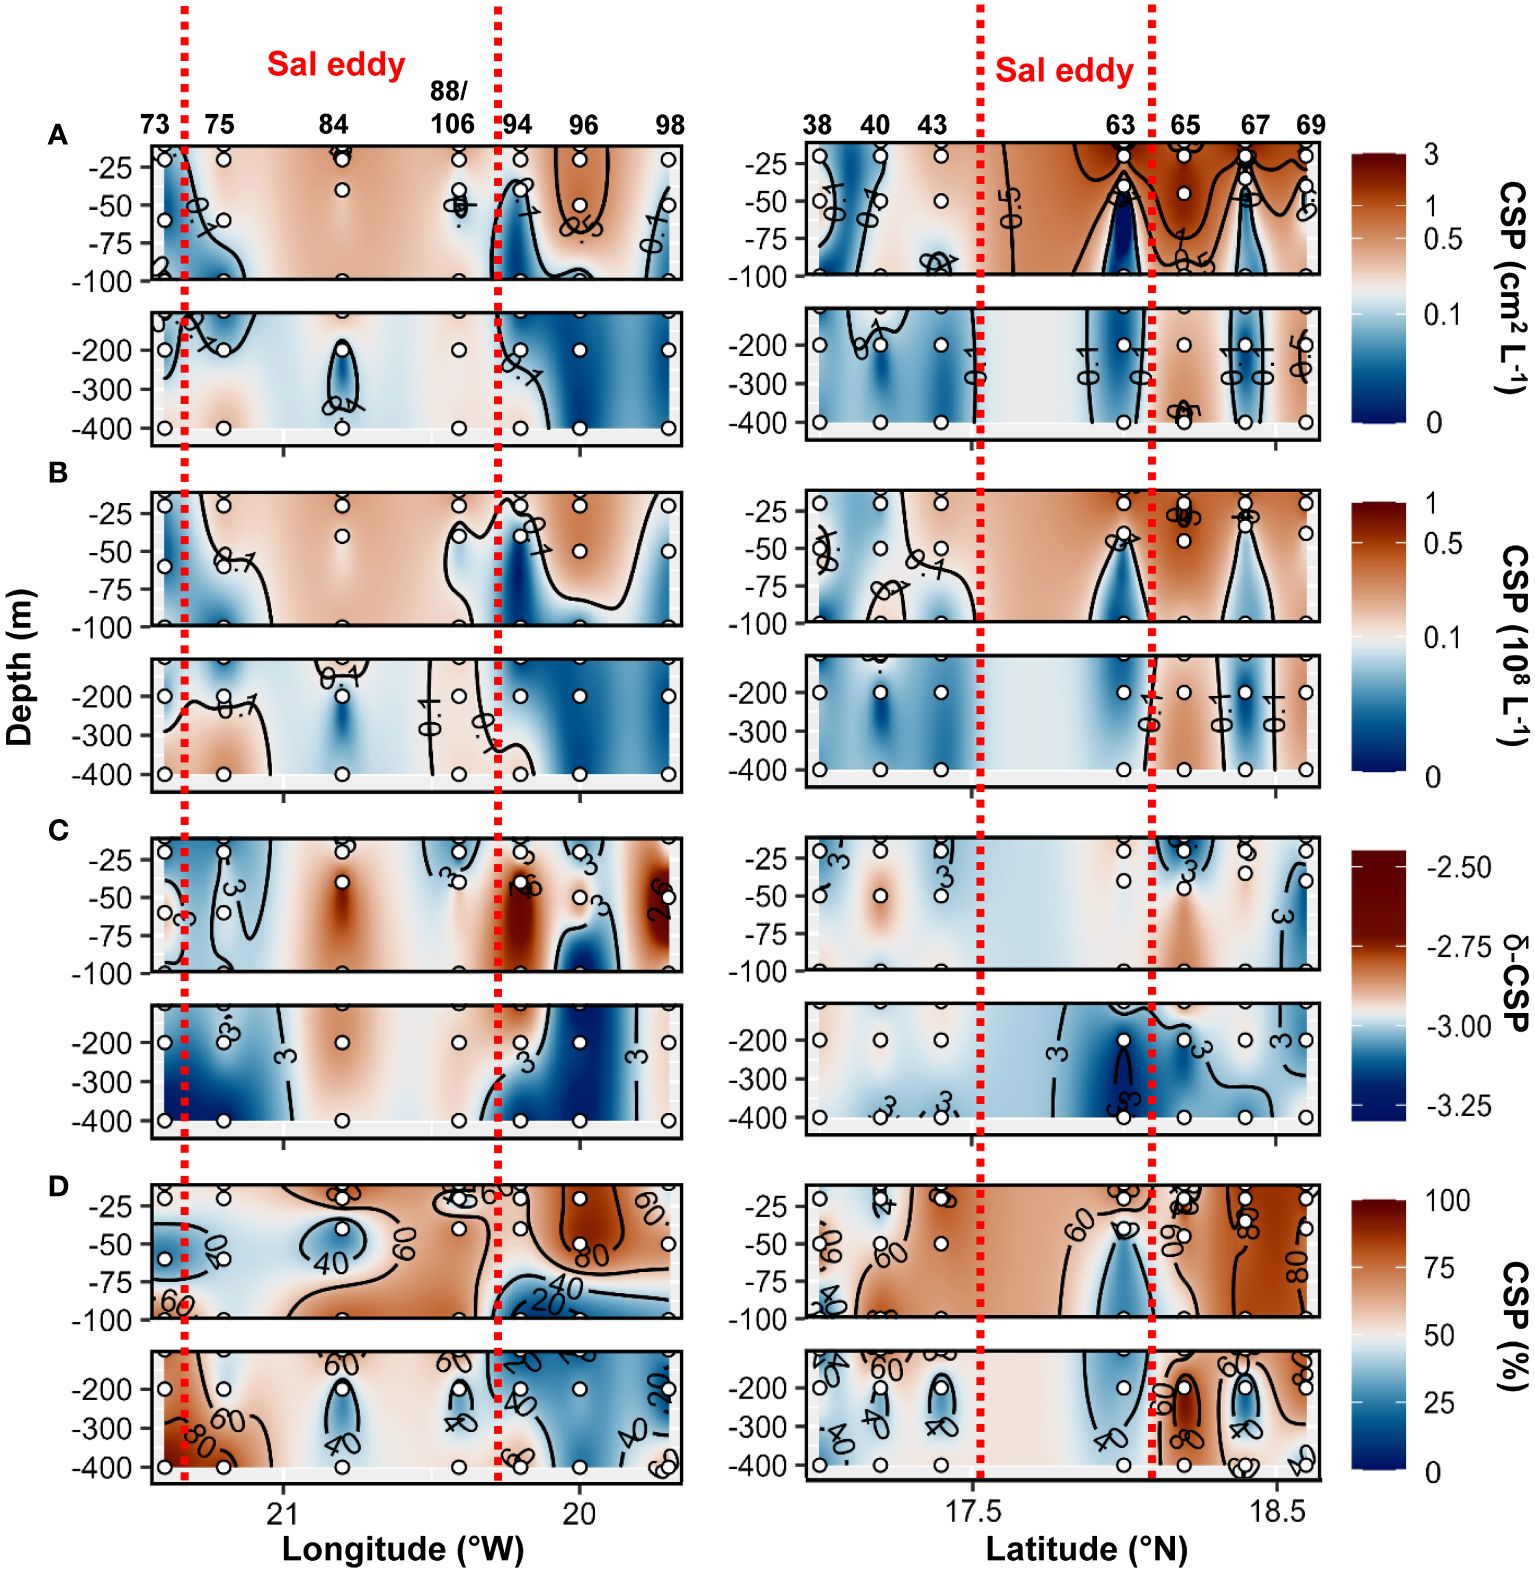
Figure 10 Epi− and mesopelagic distribution (0−450 m) of Coomassie blue stainable particle (CSP) area (A) and abundance (B), slope (δ) of the size−frequency distribution of CSP (C; δ −CSP) and CSP as a percentage of total area (D; TEP+CSP) along West−East (left) and South−North (right) transect across Sal eddy in samples collected during cruises M160. Red dashed lines show the boundaries of the eddy peripheries.
3.4 Correlation of gel-like particles with other biogeochemical parameters
We applied a Spearman correlation matrix to reveal significant correlations between TEP and CSP with the measured parameters in samples collected from the epipelagic layer (<100 m depth) of both cruises merged (Figure 11). The strongest correlations observed for TEP (number, area, and carbon content) were by order, bacterial production rates (BP; rs= 0.59, 0.57, 0.57; p<0.001), community respiration rates (rs= 0.44, 0.49, 0.47; p<0.001), POC (rs= 0.44, 0.43, 0.42; p<0.001), PON (rs= 0.42, 0.43, 0.40; p<0.001), Chl−a (rs= 0.43, 0.42, 0.41; p<0.001) and virus abundance (rs= 0.37, 0.34, 0.40; p<0.001). TEP (number, area, and carbon content) was also positively correlated to a lesser extent to dissolved organic matter (DOC, DON; p<0.001), and to semi−labile dissolved organic matter (SL−DOC, SL−DON; p<0.001), to heterotrophic bacterial abundance (HB; p<0.001) and dissolved primary production rates (PPDOC; p<0.05) and negatively to salinity (p<0.01). Spearman correlation matrices for each cruise taken individually reveal that these observations hold for cruise M156 (except for salinity p>0.05) but not for cruise M160 (Supplementary Figure S12). Plotting these correlations as a scatterplot showed that the linear trends were similar whether the cruises were taken individually or grouped together (Supplementary Figures S13–15). The differences observed were due to a smaller data set during M160 with a smaller concentration range. The size−frequency distribution slope of TEP was significantly positively correlated to oxygen concentration, pico− and nanophytoplankton biomass (p<0.01) and to salinity and Chl−a (p<0.05; Figure 11), albeit those correlations were weaker (all rs<0.3).
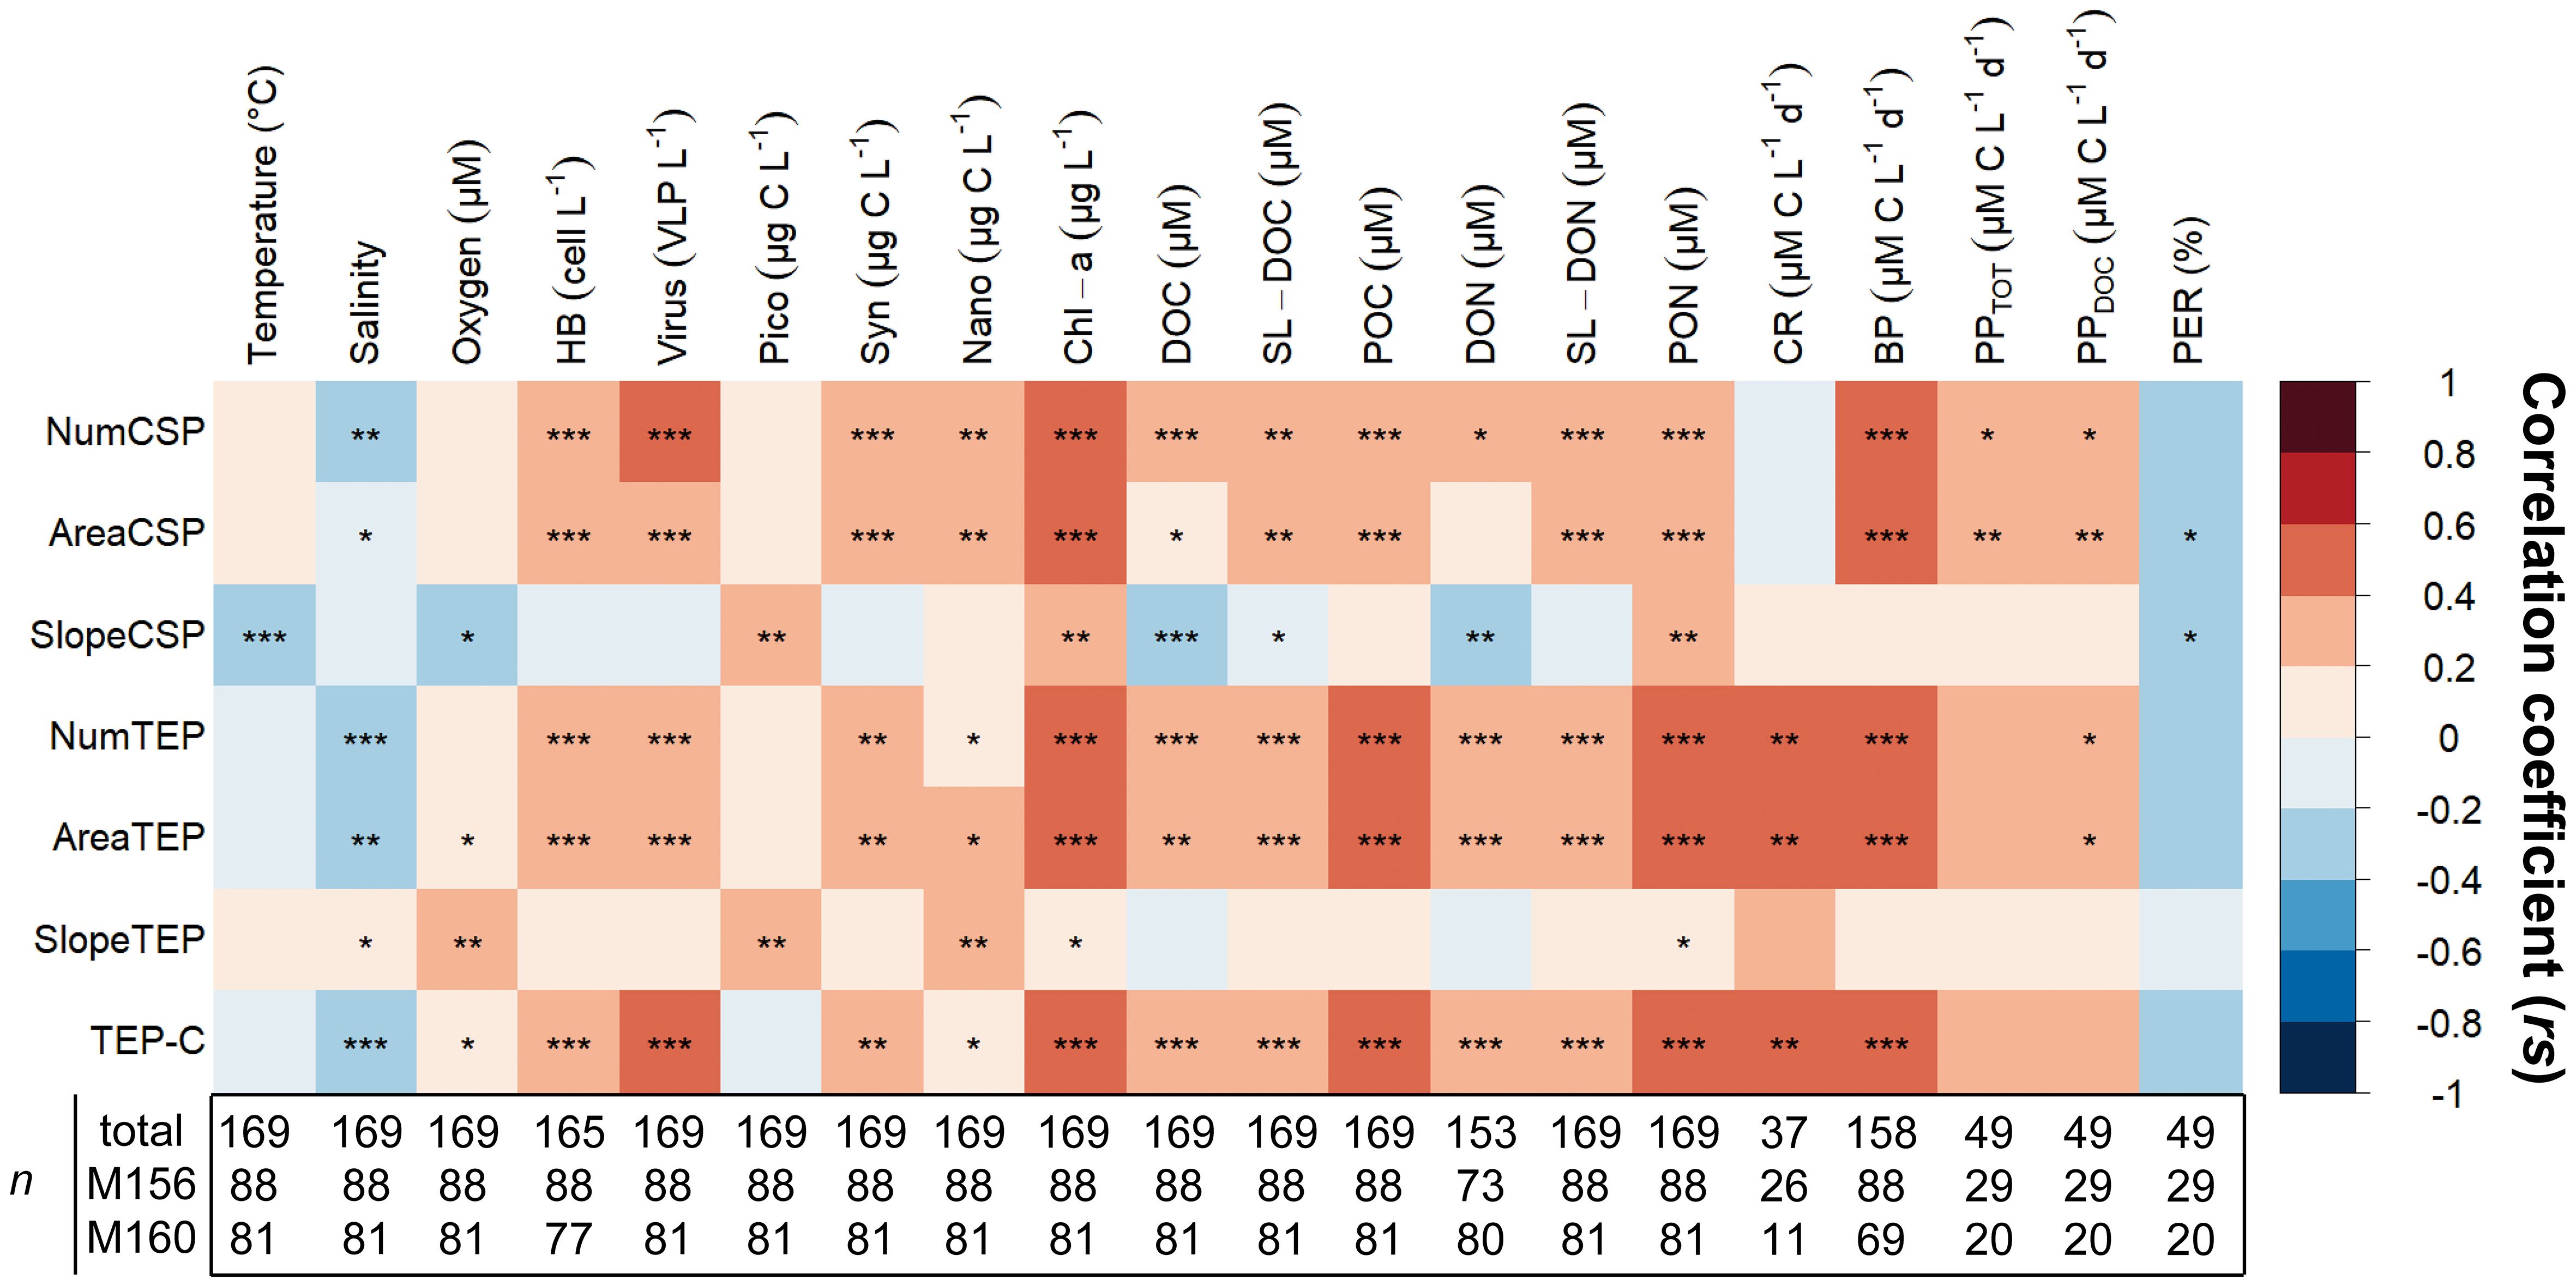
Figure 11 Spearman correlation of TEP and CSP against various biochemical parameters and microbial activities in the upper 100 m depth from the total of samples collected during cruises M156 and M160. Statistical significance: ‘***’< 0.001, ‘**’< 0.01, ‘*’< 0.05. HB, Heterotrophic bacteria; Pico, Picoplankton; Syn, Synechococcus; Nano, Nanophytoplankton; Chl−a, Chlorophyll−a; DOC, Dissolved organic carbon; SL−DOC, Semi−labile DOC; POC, Particulate organic carbon; DON, Dissolved organic nitrogen; SL−DON, Semi−labile DON; PON, Particulate organic nitrogen; CR, community respiration; BP, Bacterial production; PPTOT, Total primary production; PPDOC, dissolved primary production; PER, Percentage of extracellular release. n is the sample size used in Spearman correlations.
The strongest correlations observed for CSP (number and total area) were by order, BP (rs= 0.49, 0.49; p<0.001), Chl−a (rs= 0.44, 0.46; p<0.001), virus abundance (rs=0.41 and 0.36; p<0.001), SL−DON (rs=0.39 and 0.37; p<0.001), PON (rs=0.36 and 0.38; p<0.001), PPDOC (rs= 0.36 and 0.39; p<0.05 and<0.01), PPTOT (rs= 0.35 and 0.39; p<0.05 and<0.01), HB abundance (rs= 0.36 and 0.34; p<0.001) and Synechococcus biomass (Syn; rs=0.36 and 0.33; p<0.001). To a lesser extent, CSP number and area were also positively correlated to POC (p<0.001), DOC (p<0.001 and<0.05) nanophytoplankton biomass (p<0.01) and negatively to salinity (p<0.01 and<0.05). Separate Spearman matrices of the cruises also revealed that these observations hold for cruise M156 but not for cruise M160 (Figure S12). Although, individual scatterplot also showed that the differences observed were due to a smaller data set during M160 with a smaller concentration range (Supplementary Figures S13–15). The size−frequency distribution slope of CSP was significantly negatively correlated to temperature and DOC (p<0.001), and positively to picoplankton biomass (pico), Chl−a, an PON (p<0.01).
4 Discussion
4.1 Impact of cyclonic eddies on gel−like particles distribution in the Mauritanian upwelling system
4.1.1 Transparent exopolymer particles (TEP)
Marine gels abundance varied considerably in our study, but fall within the range of reported values for TEP particles abundance (between 104−108 L−1) (Mari et al., 2017 and reference therein) and total area (0.08−2.59 cm2 L−1; Engel et al., 2020). In a mesocosm study, Engel et al. (2015) investigated the effect of varied nitrate and phosphate supply on TEP and CSP production near Cape Verde. They reported a wide range of concentrations and of total gel area similar to those reported here highlighting the strong disparity in the ETNA, where ultra−oligotrophic waters are found alongside highly productive waters due to physical factors (currents and eddies) impacting nutrient distribution at the submesoscale. We observed a wide range of TEP contributions to the POC pool, in line with those reported in the north−east Atlantic Ocean (1.5−68%; Harlay et al., 2009, 2010) and the Mediterranean Sea (3−44%; Zamanillo et al., 2021). Albeit most studies report percentages in a higher range across various environments (see Zamanillo et al., 2021 and reference therein), our values concord with observations from surface water close to Cape Verde (3%; Engel et al., 2015) and from sediment trap values in the epi−mesopelagic waters of the subtropical northeastern Atlantic Ocean (2–7%; Engel et al., 2017). These differences can be explained by the fact that TEPs are mainly derived from bacteria or phytoplankton, whereas POCs can be included in various types of particles, such as large cells, detritus or fecal pellets.
Higher TEP total area was found in all eddies compared to their surrounding waters (Figure 5). It can be inferred that the increased production of TEP is due to the development of phytoplankton in the eddies caused by the upwelling of nutrients. TEP correlated with the particulate matter pool (POC, PON) and to Chl−a concentration suggesting that phytoplankton were the primary source (Engel et al., 2015). High TEP concentrations have been associated with phytoplankton blooms (Mari and Kiørboe, 1996; Hong et al., 1997; Engel et al., 2004) and regions where algal biomass increased due to favorable growth conditions (Prieto et al., 2006). TEP can accumulate after blooms as dissolved polysaccharide precursors aggregate together (Engel et al., 2004, 2015) and become stickier with age (Rochelle–Newall et al., 2010). As TEP are neutrally or even positively buoyant due to their high water content (Engel and Schartau, 1999; Azetsu–Scott and Passow, 2004), they might accumulate in eddies unless being ballasted by heavier particles. Hence, in the Sal eddy, despite lower productivity inside the eddy compared to its surrounding waters, TEP concentration remained higher. In the Mau and Brava eddies TEP abundance and total area were higher on the West edges of the CEs (Figures 4, 7). Horizontal advection within CEs may redistribute plankton communities due to their rotational velocities associated with their westward propagation (Chelton et al., 2011). Hence, phytoplankton (and likely TEP) tends to accumulate on the West edges of CEs where they also continue to produce TEP (by exudation or through cell lysis). Studies on cyclonic eddies reported higher organic matter export on their edges compared to their cores (Shih et al., 2015; Zhou et al., 2020, 2022). On CEs edges, TEP had higher chances to agglomerate with other particles (e.g. cell debris, fecal pellet) increasing their weight and ability to sink to deeper depths. In the Mau eddy, δ−TEP was higher below the surface on the edge of the eddy, which is potentially due to the rapid export of fast−sinking aggregate enriched in TEP. In the Sal eddy, it is possible that we did not observe such a gradient because the eddy rotated more slowly due to its lower azimuthal velocity than Mau and Brava eddies (Fischer et al., 2021).
Despite visible effect on TEP concentration, we did not observe any striking effect of eddies on δ−TEP We attribute this to a number of factors that can impact size distributions in different ways. Protists, small zooplankton, and larval stages of metazoans are known to fragment and ingest TEP (Bochdansky and Herndl, 1992; Passow and Alldredge, 1999; Dilling and Alldredge, 2000). They might have play a role in δ−TEP variation by fragmenting particles as they can be present and active in CEs (Hernández–León et al., 2001; Boras et al., 2010; Noyon et al., 2019). Turbulence and shear enhance encounter rates of TEP precursor and coagulation of particles increasing their sizes (Beauvais et al., 2006; Pedrotti et al., 2010; Burns et al., 2019). Floating particles tend to gather in CEs’s core due to horizontal shear instabilities promoting shear and spirals (Munk et al., 2000) and turbulence kinetics are higher at the center of the CEs due to upwelling (Li et al., 2021). Simultaneously, though, it is also expected that the increased frequency of collisions will facilitate more collisions amongst larger aggregates. Consequently, a rise in δ does not always correspond with an increase in shear rate (Li et al., 2004). But as TEP aggregation tends to increase in the course of phytoplankton blooms (Passow et al., 1994; Engel et al., 2015), we expected that δ−TEP would be higher in the mesopelagic waters of the eddies due to sedimentation. This might be due to the persistence of TEP associated with physical fluctuations surrounding the three CEs, which likely affected δ−TEP distribution. TEP may persist in the environment as its consumption by heterotrophic prokaryotes depends on their chemical composition which impacts their degree of lability (Zhou et al., 1998; Aluwihare and Repeta, 1999; Simon et al., 2002; Taylor and Cunliffe, 2017). TEP were correlated to BP (Figure 11; Supplementary Figure S15) in line with other studies (Sugimoto et al., 2007; Ortega–Retuerta et al., 2009; Pedrotti et al., 2009; Ortega–Retuerta et al., 2010; Bar–Zeev and Rahav, 2015; Ortega–Retuerta et al., 2017; von Jackowski et al., 2020) albeit this relationship has been shown to vary seasonally (Ortega–Retuerta et al., 2009). TEP was also correlated to community respiration (CR) but only during the M156 cruise when the two cruises were analyzed separately (Supplementary Figures S12, 15). This could be due to the quantity of TEP being greater during the cruise M156 allowing a better signal or to the nature of the polysaccharides making up the TEP. TEPs are a complex mixture of different polysaccharides that can be enzymatically degraded more or less quickly depending on the number of unique bonds they possess (Bligh et al., 2022). Furthermore, the Mau eddy was sampled during the relaxation period in which eddy generation peaks and their passage is recurrent (Schütte et al., 2016). Moreover, Saharan dust export peaks at this time of year potentially ballasting TEP and reducing δ−TEP in surface water (Engelstaedter and Washington, 2007; Louis et al., 2017; Van der Jagt et al., 2018). The Brava Island is a hotspot of eddy kinetic energy, a proxy for mesoscale variability in the ocean due to eddies (Cardoso et al., 2020). Fluctuations in the shape of the Brava eddy could have made the impact on δ−TEP indiscernible. The Sal eddy was in a complex eddy field in which eddy−eddy interaction likely occurred creating front and submesoscale variability (see review by Mahadevan, 2016).
During cruise M156, TEP concentration within upper 450 meters depth averaged four times higher than during cruise M160 (0.66 ± 2 compared to 0.16 ± 0.18 cm2 L−1, respectively). Despite depleted nutrients, a near−surface Chl−a layer was observed along the coastal offshore transect during M156 (Devresse et al., 2022, 2023; Figure 2). This coincided with a relaxation season where previously upwelled coastal waters moved offshore due to currents and eddies (Lovecchio et al., 2017, 2018; Devresse et al., 2023). We hypothesized that nutrient consumption and limited phytoplankton division led to significant carbon release as TEP due to carbon overflow (Engel et al., 2004; Schartau et al., 2007; Kreus et al., 2015), consistent with elevated extracellular release percentages along the coast−offshore transect; (25−97%; Devresse et al., 2022). Additionally, virus−like particles (VLP) abundance in the near−surface during M156 was notably high, exceeding 2x10¹⁰ L−1 until 700 km offshore (Devresse et al., 2023). This abundance was significantly correlated with TEP, suggesting a potential linkage between viral infections, phytoplankton lysis, and TEP formation. VLP abundance, was likely even higher as a substantial fraction of viruses might have been attached to TEP (Mari et al., 2007; Weinbauer et al., 2009). Virus infections are often associated with bloom termination resulting in cell lysis and TEP formation (Vardi et al., 2012; Lønborg et al., 2013; Nissimov et al., 2018; Vincent, 2023). Thus, both carbon overflow and viral lysis could contribute significantly to TEP production in the region. However, distinguishing the origin of viral abundance between bacterial and phytoplankton lysis remains challenging as viral production from bacteria has been linked to their abundance and to DOC concentration (Mojica et al., 2020) which were both widespread along the transect during cruise M156 (Devresse et al., 2022, 2023).
4.1.2 Coomassie stainable particles (CSP)
CSP also fall within the range of reported values for particles abundance (between 104−108 L−1) (Thornton, 2018 and reference therein) and total area (0.03−2.90 cm2 L−1 cm2 L−1; Engel et al., 2020). CSP was significantly correlated to Chl−a and Synechococcus biomass (Figure 11), which is consistent with previous studies linking CSP to cyanobacteria (Endres et al., 2013; Cisternas–Novoa et al., 2015; Thornton and Chen, 2017) and to phytoplankton biomass (Zamanillo et al., 2021). Cellular nutrient content in photosynthetic cells is allometric and nonscalable components such as nucleic acids and membranes occupy an increasingly large fraction of cell volume in smaller than in larger cells (Marañón et al., 2009). Thus, picoplankton cells such as Synechococcus are enriched in nitrogenous compounds compared to larger cells (e.g. diatoms). In addition, Synechococcus has been found to exude nitrogen−containing compounds to attract chemotactic bacteria and increase metabolite exchange (Raina et al., 2023). CSP was also linked to virus abundance, strengthening the hypothesis that viral lysis is a source of CSP (Lønborg et al., 2013; Yamada et al., 2018). CSPs are proteinaceous particles and are, therefore expected to contain large amounts of labile nitrogen compounds preferentially used by heterotrophic bacteria. These points are reinforced by the correlations of CSP with SL−DON, PON, and BP, in line with von Jackowski et al. (2020), who reported that CSP correlated with BP and dHAA.
Higher CSP total area was observed in the Mau and Brava eddies (Figure 5). Chl−a, and Synechococcus biomass alone do not explain CSP increased as their distributions were heterogeneous within the eddies (Supplementary Figures S7–9; Devresse et al., 2022). The epipelagic layer of Mau and Brava eddies exhibited larger CSP particle sizes compared to their surrounding waters (Figure 5). This observation suggests that CSP was able to accumulate in these CEs, despite being labile material preferentially used by bacteria. The production of CSP in these CEs was likely greater than their consumption and export to deeper depth. In addition, during cruise M156, in the mesopelagic water, CSP concentration was particularly elevated near the coast and in the Mau eddy, with relatively large aggregate (δ −CSP>−3) from the surface to 800 m depth, highlighting CSP sedimentation in those productive areas. In contrast, in the Sal eddy total CSP area and δ−CSP were not higher. Thus, we assume that in the Sal eddy, the consumption of CSP by microorganisms and its fragmentation were greater than its production.
4.2 Current understanding of gel−like particles dynamic in CEs
Condie and Condie (2016) estimated that plankton retention times in cyclonic eddies in CEs ranged from 13 to 67 days without influence from eddy size and latitude. From this range it can be assumes 1) that successions of trophic communities take place within them, impacting the production and fate of gel−like particles, and 2) that eddies release particles as they move. It has been reported that CEs have phytoplankton communities that are different from their surrounding waters, with compositional variability at the sub−mesoscale (Lochte and Pfannkuche, 1987; Lasternas et al., 2013). Differences in the distribution and concentration of phytoplankton size−classes population (Synechococcus, pico−, and nanophytoplankton; Supplementary Figures S4−6), point towards distinct phytoplankton community composition with submesoscale variability in the three CEs. The three CEs reported in our study differed by their age, origins, and upwelling intensity. The Mau and Brava CEs (1.5−month−old) were in their intensification/mature stage (Sweeney et al., 2003) as the upwelling within them was pronounced from nutrient and hydrographic parameters distributions. The Mau eddy was more productive (i.e. higher Chl−a, POC, PON, PPDOC, PPTOT) than the Brava eddy. This difference may be explained by the fact that coastal eddies incorporate nutrient− and POM−rich waters during their formation and are therefore more productive than island−induced eddies (Schütte et al., 2016; Amos et al., 2019; Dilmahamod et al., 2022; Devresse et al., 2023). In contrast, the Sal eddy (4 months old) was in the decaying stage (Sweeney et al., 2003), characterized by a barely visible upwelling, slightly higher Chl−a and lower productivity than in its surrounding waters. The higher abundance of heterotrophic bacteria, bacterial biomass production, and respiration rates of the planktonic community in the Sal eddy compared to its surrounding waters suggest a prevalence of remineralization of organic matter over production (Figure 2). Those observations are in accordance with Zhou et al. (2020) and Zhu et al. (2023) who found reduced export of organic carbon and enhanced particle remineralization/fragmentation in decaying CEs in the South China Sea. To summarize, Figure 12 illustrates our current understanding of gel−like particles dynamics in CEs. Initially, the upwelling of nutrients associated with eddies induces an increase in the growth and activity of phytoplankton and the growth and activity of heterotrophic bacteria with submesoscale variability. Phytoplankton (Chl−a) and TEP tend to accumulate on the West edges of CEs due to their horizontal advection and westward propagation, which results in increasing agglomeration with other particles, thereby enhancing the export of organic matter (Chelton et al., 2011; Zhou et al., 2020). As long as the upwelling in the eddy remains strong, the production of organic matter remains greater than its consumption, and the eddy propagates an autotrophic signal across oligotrophic waters. As the eddy enters its decaying stage, its azimuthal velocity decreases and the associated upwelling decreases or reverses (McGillicuddy, 2016). As a result, phytoplankton communities within the eddy shift from larger to smaller cells with lower phytoplankton biomass and primary productivity (Jiao et al., 2014; Zhang et al., 2018). The organic matter that had accumulated in the form of gel−like particles is less ballasted by heavier phytoplankton cells (e.g. diatoms frustule) and the export of organic matter is reduced (Rii et al., 2008; Jiao et al., 2014; Zhou et al., 2020). The organic matter within eddies is gradually degraded while being transported supporting heterotrophy in oligotrophic waters (Duarte et al., 2013; Serret et al., 2015).
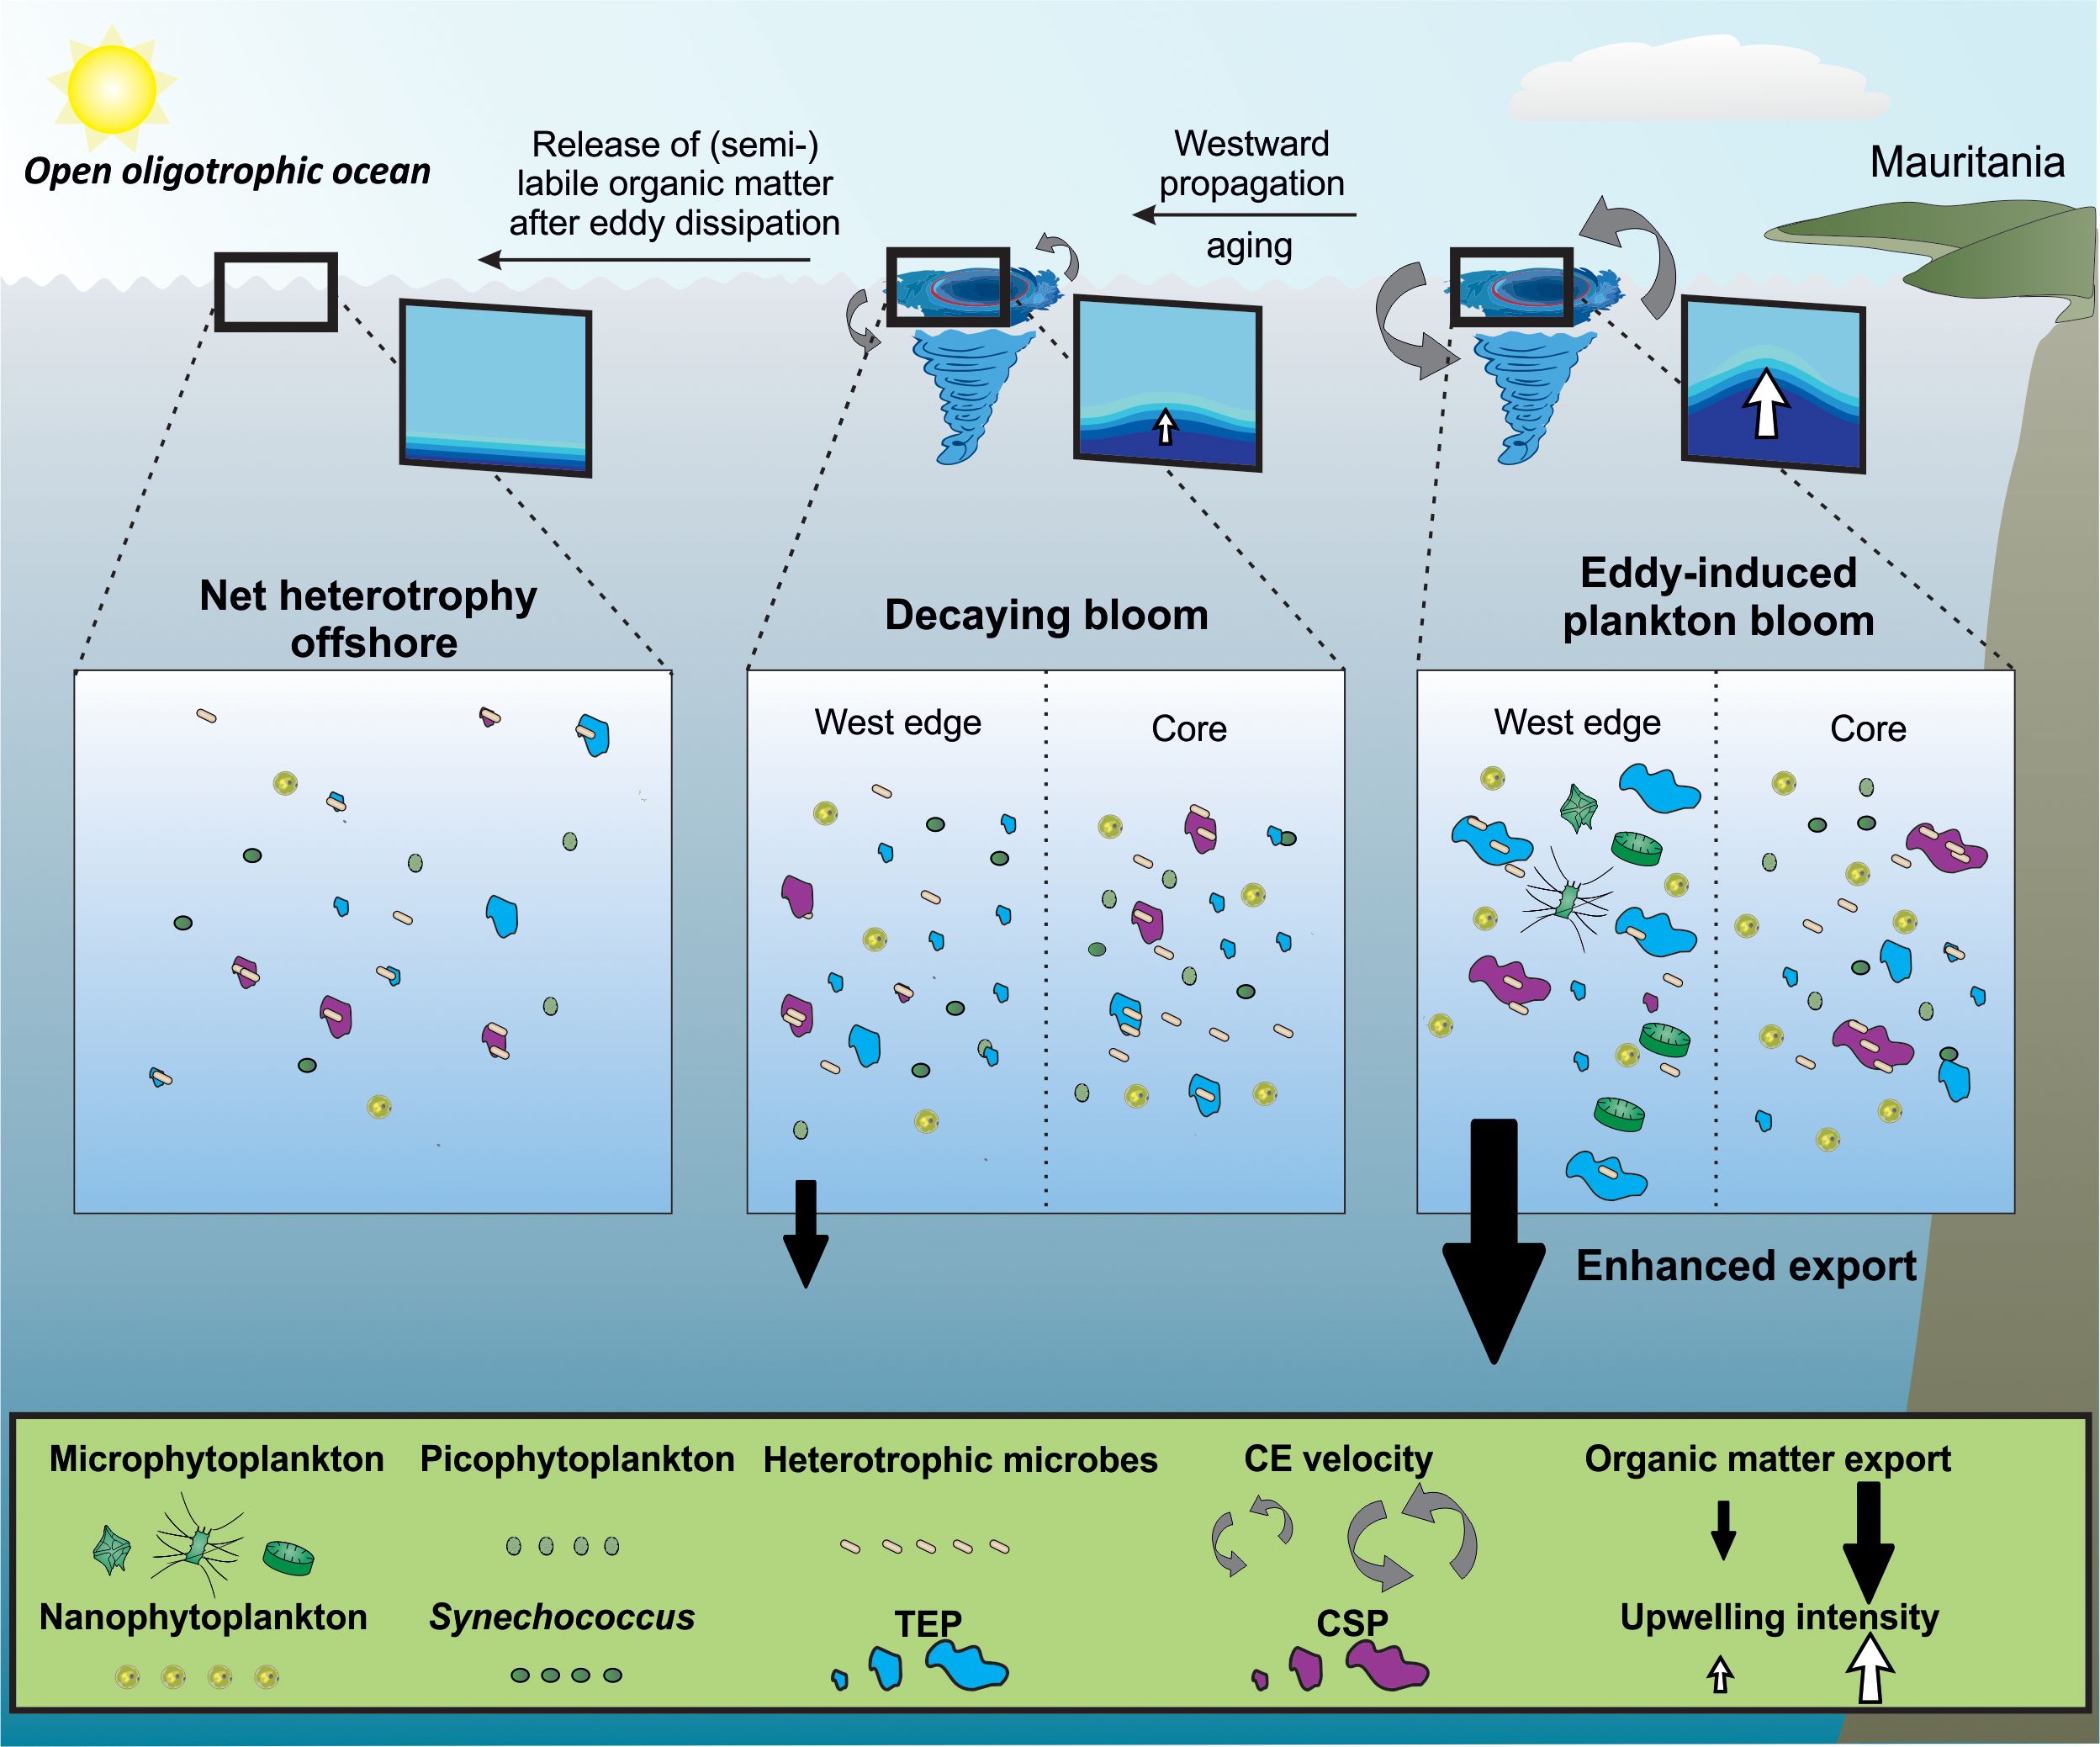
Figure 12 Schematic representation of the impact of cyclonic eddies on the distribution of phytoplankton and organic matter in the Mauritanian upwelling system. Nutrient supply induced by a young cyclonic eddy increases the growth and activity of different phytoplankton communities distributed differently within the eddy. The difference in horizontal advection within the eddy creates an accumulation of phytoplankton and organic matter at its edges. Some of this organic matter get recycled by heterotrophic bacteria and a part sinks, increasing carbon export. As long as there is upwelling in the eddy, it carries an autotrophic signal as a reservoir and source of semi−labile organic matter. As the eddy moves westward and ages, the upwelling associated with the eddy ceases. The organic matter it contains serves as fuel for microbes in the oligotrophic ocean, supporting heterotrophy.
5 Conclusion
Our study supports that cyclonic eddies induce higher TEP and CSP concentrations through nutrient upwelling and associated higher phytoplankton biomass. Yet, both particles presented distinct distributions within CEs, supporting that they are independent particles. Moreover, TEP and CSP correlated differently to physical and biogeochemical parameters and to the different groups of phytoplankton with variation among the cruises. This suggests that TEP and CSP originated from different phytoplankton communities between the cruises, which likely impacted their effect on microbial activities. In order to evaluate their impact on carbon export, further studies are required to follow their temporal evolution associated with bloom dynamics and phytoplankton community composition within CEs.
Data availability statement
The datasets presented in this study can be found in online repositories. The names of the repository/repositories and accession number(s) can be found below: A part of the data presented in this article have been published on PANGAEA: https://doi.pangaea.de/10.1594/PANGAEA.950510 https://doi.pangaea.de/10.1594/PANGAEA.959743 Complementary data are being processed on PANGAEA.
Author contributions
QD: Investigation, Visualization, Writing – original draft, Writing – review & editing. KB: Conceptualization, Investigation, Project administration, Supervision, Validation, Visualization, Writing – review & editing. AE: Conceptualization, Funding acquisition, Project administration, Resources, Supervision, Validation, Visualization, Writing – review & editing.
Funding
The author(s) declare financial support was received for the research, authorship, and/or publication of this article. This study is a contribution of the REEBUS project (Role of Eddies in the Carbon Pump of Eastern Boundary Upwelling Systems) sub-project WP4, funded by the BMBF (funding reference no. 03F0815A).
Acknowledgments
We thank the chief scientist, captain and crew of the R/V Meteor cruises M156 and M160 for their support. We thank J. Roa, T. Klüver, L. Scheidemann, S. Golde and H. Hepach for sampling on board. We thank J. Roa and S. Golde additionally for the analysis of dissolved organic matter and T. Klüver for cell counting, bacterial and phytoplankton activity analyses and for the analysis of particulate organic matter. We thank B. Domeyer, R. Suhrberg and B. Bogner for the nutrient analyses. We thank M. De Sisto for helping with the microscopic analysis of gel−like particles. We thank L. Scheidemann for developing the R script used to analyze the gel images. We thank F. A. Dilmahamod for the AMEDA analysis and for providing knowledge on eddies physic. We thank K. Heymann, M. Hieronymi and R. Röttgers for measuring and providing the Chlorophyll−a data from M160. We thank the two reviewers and the editor for their constructive comments on earlier versions of the manuscript.
Conflict of interest
The authors declare that the research was conducted in the absence of any commercial or financial relationships that could be construed as a potential conflict of interest.
Publisher’s note
All claims expressed in this article are solely those of the authors and do not necessarily represent those of their affiliated organizations, or those of the publisher, the editors and the reviewers. Any product that may be evaluated in this article, or claim that may be made by its manufacturer, is not guaranteed or endorsed by the publisher.
Supplementary material
The Supplementary Material for this article can be found online at: https://www.frontiersin.org/articles/10.3389/fmars.2024.1357646/full#supplementary-material
References
Alldredge A. L., Gotschalk C., Passow U., Riebesell U. (1995). Mass aggregation of diatom blooms: insights from a mesocosm study. Deep Sea Res. Part II Top. Stud. Oceanogr 42, 9–27. doi: 10.1016/0967-0645(95)00002-8
Alldredge A. L., Passow U., Logan B. E. (1993). The abundance and significance of a class of large, transparent organic particles in the ocean. Deep Sea Res. Part I Oceanogr. Res. Pap 40, 1131–1140. doi: 10.1016/0967-0637(93)90129-Q
Aluwihare L., Repeta D. (1999). A comparison of the chemical characteristics of oceanic DOM and extracellular DOM produced by marine algae. Mar. Ecol. Prog. Ser. 186, 105–117. doi: 10.3354/meps186105
Amos C. M., Castelao R. M., Medeiros P. M. (2019). Offshore transport of particulate organic carbon in the California current system by mesoscale eddies. Nat. Commun. 10, 4940. doi: 10.1038/s41467-019-12783-5
Armstrong R. A., Lee C., Hedges J. I., Honjo S., Wakeham S. G. (2002). A new, mechanistic model for organic carbon fluxes in the ocean based on the quantitative association of POC with ballast minerals. Deep–Sea Res. II 49, 219–236. doi: 10.1016/S0967-0645(01)00101-1
Azetsu–Scott K., Passow U. (2004). Ascending marine particles: Significance of transparent exopolymer particles (TEP) in the upper ocean. Limnol. Oceanogr. 49, 741–748. doi: 10.4319/lo.2004.49.3.0741
Bar–Zeev E., Rahav E. (2015). Microbial metabolism of transparent exopolymer particles during the summer months along a eutrophic estuary system. Front. Microbiol. 6. doi: 10.3389/fmicb.2015.00403
Beauvais S., Pedrotti M., Egge J., Iversen K., Marrase´ C. (2006). Effects of turbulence on TEP dynamics under contrasting nutrient conditions: implications for aggregation and sedimentation processes. Mar. Ecol. Prog. Ser. 323, 47–57. doi: 10.3354/meps323047
Belkin N., Guy–Haim T., Rubin–Blum M., Lazar A., Sisma–Ventura G., Kiko R., et al. (2022). Influence of cyclonic and anticyclonic eddies on plankton in the southeastern Mediterranean sea during late summertime. Ocean Sci. 18, 693–715. doi: 10.5194/os-18-693-2022
Bibby T. S., Moore C. M. (2011). Silicate: nitrate ratios of upwelled waters control the phytoplankton community sustained by mesoscale eddies in sub–tropical North Atlantic and Pacific. Biogeosciences 8, 657–666. doi: 10.5194/bg-8-657-2011
Bligh M., Nguyen N., Buck-Wiese H., Vidal-Melgosa S., Hehemann J. H. (2022). Structures and functions of algal glycans shape their capacity to sequester carbon in the ocean. Curr. Opin. Chem. Biol. 71, 102204. doi: 10.1016/j.cbpa.2022.102204
Bochdansky A. B., Herndl G. J. (1992). Ecology of amorphous aggregations (marine snow) in the northern Adriatic sea. 111. zooplankton interactions with marine snow. Mar. Ecol. Prog. Ser. 87, 135–146. doi: 10.3354/meps087135
Boras J. A., Montserrat Sala M., Baltar F., Arístegui J., Duarte C. M., Vaqué D. (2010). Effect of viruses and protists on bacteria in eddies of the canary current region (subtropical northeast Atlantic). Limnol. Oceanogr. 55, 885–898. doi: 10.4319/lo.2010.55.2.0885
Brussaard C. P. (2004). Optimization of procedures for counting viruses by flow cytometry. AEM 70, 1506–1513. doi: 10.1128/AEM.70.3.1506-1513.2004
Burd A. B., Jackson G. A. (2009). Particle aggregation. Annu. Rev. Mar. Sci. 1, 65–90. doi: 10.1146/annurev.marine.010908.163904
Burns W. G., Marchetti A., Ziervogel K. (2019). Enhanced formation of transparent exopolymer particles (TEP) under turbulence during phytoplankton growth. J. Plankton Res. 41, 349–361. doi: 10.1093/plankt/fbz018
Busch K., Endres S., Iversen M. H., Michels J., Nöthig E.–M., Engel A. (2017). Bacterial colonization and vertical distribution of marine gel particles (TEP and CSP) in the arctic fram strait. Front. Mar. Sci. 4. doi: 10.3389/fmars.2017.00166
Cardoso C., Caldeira R. M., Relvas P., Stegner A. (2020). Islands as eddy transformation and generation hotspots: Cabo verde case study. Prog. Oceanogr. 184, 102271. doi: 10.1016/j.pocean.2020.102271
Carlson C. A. (2002). “Production and removal processes,” in Biogeochemistry of marine dissolved organic matter, vol. 805 . Eds. Hansell D. A., Carlson C. A., (San Diego: Academic Press) 91–151). doi: 10.1016/b978–012323841–2/50006–3
Carlson C. A., Hansell D. A. (2015). “DOM sources, sinks, reactivity, and budgets,” in Biogeochemistry of marine dissolved organic matter. Eds. Hansell D. A., Carlson C. A. (Boston: Elsevier, Academic Press), 66–109).
Chelton D. B., Gaube P., Schlax M. G., Early J. J., Samelson R. M. (2011). The influence of nonlinear mesoscale eddies on near–surface oceanic chlorophyll. Science 334, 328–332. doi: 10.1126/science.1208897
Cisternas–Novoa C., Lee C., Engel A. (2015). Transparent exopolymer particles (TEP) and coomassie stainable particles (CSP): Differences between their origin and vertical distributions in the ocean. Mar. Chem. 175, 56–71. doi: 10.1016/j.marchem.2015.03.009
Condie S., Condie R. (2016). Retention of plankton within ocean eddies. Glob. Ecol. Biogeogr. 25, 1264–1277. doi: 10.1111/geb.12485
Devresse Q., Becker K. W., Bendinger A., Hahn J., Engel A. (2022). Eddy– enhanced primary production sustains heterotrophic microbial activities in the eastern tropical north Atlantic. Biogeosciences 19, 5199–5219. doi: 10.5194/bg-19-5199-2022
Devresse Q., Becker K. W., Dilmahamod A. F., Ortega–Retuerta E., Engel A. (2023). Dissolved organic matter fluorescence as a tracer of upwelling and microbial activities in two cyclonic eddies in the eastern tropical north Atlantic. J. Geophys. Res. Oceans 128 (8), e2023JC01982. doi: 10.1029/2023JC019821
Dickson A. G., Sabine C. L., Christian J. R. (2007). Guide to best practices for ocean CO2 measurements Vol. 3 (Sidney, British Columbia: PICES Special Publication), 191.
Dilmahamod A. F., Karstensen J., Dietze H., Löptien U., Fennel K. (2022). Generation mechanisms of mesoscale eddies in the Mauritanian upwelling region. J. Phys. Oceanogr. 52 (1), 161–182. doi: 10.1175/JPO-D-21-0092.1
Dilling L., Alldredge A. L. (2000). Fragmentation of marine snow by swimming macrozooplankton: A new process impacting carbon cycling in the sea. Deep Sea Res. Part I Oceanogr 47, 1227–1245. doi: 10.1016/S0967-0637(99)00105-3
Dittmar T., Cherrier J., Ludwichowski K. U. (2009). “The analysis of amino acids in seawater,” in Practical guidelines for the analysis of seawater. Ed. Wurl O. (Boca Raton: CRC Press).
Duarte C. M., Regaudie–de–Gioux A., Arrieta J. M., Delgado–Huertas A., Agustí S. (2013). The oligotrophic ocean is heterotrophic. Annu. Rev. Mar. Sci. 5, 551–569. doi: 10.1146/annurev-marine-121211-172337
Endres S., Unger J., Wannicke N., Nausch M., Voss M., Engel A. (2013). Response of nodularia spumigena to pco 2–part 2: Exudation and extracellular enzyme activities. Biogeosciences 10, 567–582. doi: 10.5194/bg-10-567-2013
Engel A. (2000). The role of transparent exopolymer particles (TEP) in the increase in apparent particle stickiness (α) during the decline of a diatom bloom. J. Plankton Res. 22, 485–497. doi: 10.1093/plankt/22.3.485
Engel A. (2002). Direct relationship between CO2 uptake and transparent exopolymer particles production in natural phytoplankton. J. Plankton Res. 24, 49–53. doi: 10.1093/plankt/24.1.49
Engel A. (2004). Distribution of transparent exopolymer particles (TEP) in the northeast Atlantic ocean and their potential significance for aggregation processes. Deep Sea Res. Part I Oceanogr 51, 83–92. doi: 10.1016/j.dsr.2003.09.001
Engel A. (2009). Determination of marine gel particles. Pract. guidelines Anal. seawater 1, 125–142.
Engel A., Passow U. (2001). Carbon and nitrogen content of transparent exopolymer particles (TEP) in relation to their Alcian Blue adsorption. Mar. Ecol. Prog. Ser. 219, 1–10. doi: 10.3354/meps219001
Engel A., Borchard C., Loginova A., Meyer J., Hauss H., Kiko R. (2015). Effects of varied nitrate and phosphate supply on polysaccharidic and proteinaceous gel particle production during tropical phytoplankton bloom experiments. Biogeosciences 12, 5647–5665. doi: 10.5194/bg-12-5647-2015
Engel A., Endres S., Galgani L., Schartau M. (2020). Marvelous marine microgels: On the distribution and impact of gel–like particles in the oceanic water–column. Front. Mar. Sci. 7. doi: 10.3389/fmars.2020.00405
Engel A., Galgani L. (2016). The organic sea–surface microlayer in the upwelling region off the coast of Peru and potential implications for air–sea exchange processes. Biogeosciences 13, 989–1007. doi: 10.5194/bg-13-989-2016
Engel A., Händel N. (2011). A novel protocol for determining the concentration and composition of sugars in particulate and in high molecular weight dissolved organic matter (HMW–DOM) in seawater. Mar. Chem. 127, 180–191. doi: 10.1016/j.marchem.2011.09.004
Engel A., Schartau M. (1999). Influence of transparent exopolymer particles (TEP) on sinking velocity of nitzschia closterium aggregates. Mar. Ecol. Prog. Ser. 182, 69–76. doi: 10.3354/meps182069
Engel A., Thoms S., Riebesell U., Rochelle–Newall E., Zondervan I. (2004). Polysaccharide aggregation as a potential sink of marine dissolved organic carbon. Nature 428, 929–932. doi: 10.1038/nature02453
Engel A., Wagner H., Le Moigne F. A., Wilson S. T. (2017). Particle export fluxes to the oxygen minimum zone of the eastern tropical north Atlantic. Biogeosciences 14, 1825–1838. doi: 10.5194/bg-14-1825-2017
Engelstaedter S., Washington R. (2007). Atmospheric controls on the annual cycle of North African dust. Geophys. Res. Atmos. 112. doi: 10.1029/2006JD007195
Evans C. A., O’Reily J. E., Thomas J. P. (1987). A handbook for measurement of Chl a and primary production (College Station, Tex.: Texas A and M University).
Falkowski P. G., Ziemann D., Kolber Z., Bienfang P. K. (1991). Role of eddy pumping in enhancing primary production in the ocean. Nature 352, 55–58. doi: 10.1038/352055a0
Fischer T., Karstensen J., Dengler M., Bendinger A. (2021). Multiplatform observation of cyclonic eddies during the REEBUS experiment. vEGU21 23rd EGU Gen. Assembly. doi: 10.5194/egusphere-egu21-6537
Garçon V. C., Oschlies A., Doney S. C., McGillicuddy D., Waniek J. (2001). The role of mesoscale variability on plankton dynamics in the North Atlantic. Deep-Sea Res. II: Top. Stud. Oceanogr. 48 (10), 2199–2226. doi: 10.1016/S0967-0645(00)00183-1
Gargas E. (1975). A manual for phytoplankton primary production studies in the Baltic. Baltic Mar. Biol. 2, 88. doi: 10.1007/978-3-642-66791-6_7
Garrido J. L., Rodríguez F., Campaña E., Zapata M. (2003). Rapid separation of chlorophylls a and b and their demetallated and dephytylated derivatives using a monolithic silica c18 column and a pyridine–containing mobile phase. J. Chromatogr. A 994, 85–92. doi: 10.1016/S0021-9673(03)00486-2
Gasol J. M., Del Giorgio P. A. (2000). Using flow cytometry for counting natural planktonic bacteria and understanding the structure of planktonic bacterial communities. Sci. Mar. 64, 197–224. doi: 10.3989/scimar.2000.64n2
Gattuso J.-P., Epitalon J.-M., Lavigne H., Orr J. (2021). seacarb: seawater carbonate chemistry. R package version 3.3.0. Available at: http://CRAN.R-project.org/package=seacarb.
Gaube P., McGillicuddy D. J., Moulin A. J. (2019). Mesoscale eddies modulate mixed layer depth globally. Geophys. Res. Lett. 46, 1505–1512. doi: 10.1029/2018GL080006
Grasshoff K., Kremling K., Ehrhardt M. (1999). Methods of seawater analysis (Weinheim: Wiley–VCH). doi: 10.1002/9783527613984
Harlay J., Borges A. V., van der Zee C., Delille B., Godoi R. H. M., Schiettecatte L.–S., et al. (2010). Biogeochemical study of a coccolithophore bloom in the northern bay of Biscay (NE Atlantic ocean) in June 2004. Prog. Oceanogr. 86, 317–336. doi: 10.1016/j.pocean.2010.04.029
Harlay J., De Bodt C., Engel A., Jansen S., d’Hoop Q., Piontek J., et al. (2009). Abundance and size distribution of transparent exopolymer particles (TEP) in a coccolithophorid bloom in the northern bay of Biscay. Deep Sea Res. Part I Oceanogr 56, 1251–1265. doi: 10.1016/j.dsr.2009.01.014
Hernández–Hernández N., Arístegui J., Montero M. F., Velasco–Senovilla E., Baltar F., Marrero–Díaz Á., et al. (2020). Drivers of plankton distribution across mesoscale eddies at submesoscale range. Front. Mar. Sci. 7. doi: 10.3389/fmars.2020.00667
Hernández–León S., Almeida C., Gómez M., Torres S., Montero I., Portillo–Hahnefeld A. (2001). Zooplankton biomass and indices of feeding and metabolism in island–generated eddies around gran canaria. J. Mar. Syst. 30, 51–66. doi: 10.1016/S0924–7963(01)00037–9
Hong Y., Smith W. O. Jr., White A.–M. (1997). Studies on transparent exopolymer particles (TEP) produced in the ross sea (Antarctica) and by phaeocystis Antarctica (prymnesiophyceae) 1. J. Phycol. 33, 368–376. doi: 10.1111/j.0022-3646.1997.00368.x
Ihaka R., Gentleman R. (1996). R: A language for data analysis and graphics. J. Comput. Graph. Stat 5, 299–314. doi: 10.2307/1390807
Jiao N., Zhang Y., Zhou K., Li Q., Dai M., Liu J., et al. (2014). Revisiting the co 2” source” problem in upwelling areas–a comparative study on eddy upwellings in the South China Sea. Biogeosciences 11, 2465–2475. doi: 10.5194/bg-11-2465-2014
Kirchman D., K’nees E., Hodson R. (1985). Leucine incorporation and its potential as a measure of protein synthesis by bacteria in natural aquatic systems. AEM 49, 599–607. doi: 10.1128/aem.49.3.599-607.1985
Klein P., Lapeyre G. (2009). The oceanic vertical pump induced by mesoscale and submesoscale turbulence. Annu. Rev. Mar. Sci. 1, 351–375. doi: 10.1146/annurev.marine.010908.163704
Kravchenko A., Bullock D. G. (1999). A comparative study of interpolation methods for mapping soil properties. J. Agron. 91, 393–400. doi: 10.2134/agronj1999.00021962009100030007x
Kreus M., Schartau M., Engel A., Nausch M., Voss M. (2015). Variations in the elemental ratio of organic matter in the central Baltic sea: Part i—linking primary production to remineralization. Cont. Shelf Res. 100, 25–45. doi: 10.1016/j.csr.2014.06.015
Kunze E. (1985). Near-inertial wave propagation in geostrophic shear. J. Oceanogr. 15 (5), 544–565. doi: 10.1175/1520-0485(1985)015<0544:NIWPIG>2.0.CO;2
Lam P. J., Marchal O. (2015). Insights into particle cycling from thorium and particle data. Annu. Rev. Mar. Sci. 7, 159–184. doi: 10.1146/annurev-marine-010814-015623
Lasternas S., Piedeleu M., Sangrà P., Duarte C. M., Agustí S. (2013). Forcing of dissolved organic carbon release by phytoplankton by anticyclonic mesoscale eddies in the subtropical NE Atlantic Ocean. Biogeosciences 10, 2129–2143. doi: 10.5194/bg-10-2129-2013
Lee S., Wolberg G., Shin S. Y. (1997). Scattered data interpolation with multilevel b–splines. IEEE Trans. Visualization Comput. Graphics 3, 228–244. doi: 10.1109/2945.620490
Le Vu B., Stegner A., Arsouze T. (2018). Angular momentum eddy detection and tracking algorithm (ameda) and its application to coastal eddy formation. J. Atmos. Ocean. Technol. 35, 739–762. doi: 10.1175/JTECH-D-17-0010.1
Li R., Xu J., Cen X., Zhong W., Liao J., Shi Z., et al. (2021). Nitrate fluxes induced by turbulent mixing in dipole eddies in an oligotrophic ocean. Limnol. Oceanogr. 66, 2842–2854. doi: 10.1002/lno.11794
Li X.–y., Zhang J.–j., Lee J. H. W. (2004). Modelling particle size distribution dynamics in marine waters. Water Res. 38, 1305–1317. doi: 10.1016/j.watres.2003.11.010
Lindroth P., Mopper K. (1979). High performance liquid chromatographic deter– mination of subpicomole amounts of amino acids by precolumn fluorescence derivatization with o–phthaldialdehyde. Anal. Chem. 51, 1667–1674. doi: 10.1021/ac50047a019
Lochte K., Pfannkuche O. (1987). Cyclonic cold–core eddy in the eastern north Atlantic. ii. nutrients, phytoplankton and bacterioplankton. Mar. Ecol. Prog. Ser. 39 (2), 153–164. doi: 10.3354/meps039153
Lønborg C., Middelboe M., Brussaard C. P. (2013). Viral lysis of micromonas pusilla: impacts on dissolved organic matter production and composition. Biogeochemistry 116, 231–240. doi: 10.1007/s10533-013-9853-1
Long R. A., Azam F. (1996). Abundant protein–containing particles in the sea. Aquat. Microb. Ecol. 10, 213–221. doi: 10.3354/ame010213
López–Urrutia Á., Morán X. A. G. (2007). Resource limitation of bacterial pro– duction distorts the temperature dependence of oceanic carbon cycling. Ecology 88, 817–822. doi: 10.1890/06–1641
Louis J., Pedrotti M. L., Gazeau F., Guieu C. (2017). Experimental evidence of formation of transparent exopolymer particles (TEP) and POC export provoked by dust addition under current and high p co2 conditions. PloS One 12, e0171980. doi: 10.1371/journal.pone.0171980
Lovecchio E., Gruber N., Münnich M. (2018). Mesoscale contribution to the long–range offshore transport of organic carbon from the canary upwelling system to the open north Atlantic. Biogeosciences 15, 5061–5091. doi: 10.5194/bg-15-5061-2018
Lovecchio E., Gruber N., Münnich M., Lachkar Z. (2017). On the long–range offshore transport of organic carbon from the canary upwelling system to the open north Atlantic. Biogeosciences 14, 3337–3369. doi: 10.5194/bg-14-3337-2017
Mahadevan A. (2016). The impact of submesoscale physics on primary productivity of plankton. Annu. Rev. Mar. Sci. 8, 161–184. doi: 10.1146/annurev-marine-010814-015912
Marañón E., Steele J., Thorpe A., Turekian K. (2009). “Phytoplankton size structure,” in Elements of physical oceanography: A derivative of the encyclopedia of ocean sciences, vol. 85. (Oxford: Academic Press).
Mari X., Kerros M. E., Weinbauer M. G. (2007). Virus attachment to transparent exopolymeric particles along trophic gradients in the southwestern lagoon of New Caledonia. Appl. Environ. Microbiol. 73 (16), 5245–5252. doi: 10.1128/AEM.00762-07
Mari X. (1999). Carbon content and c: N ratio of transparent exopolymeric particles (TEP) produced by bubbling exudates of diatoms. Mar. Ecol. Prog. Ser. 183, 59–71. doi: 10.3354/meps183059
Mari X., Kiørboe T. (1996). Abundance, size distribution and bacterial coloniza– tion of transparent exopolymeric particles (TEP) during spring in the kattegat. J. Plankton Res. 18, 969–986. doi: 10.1093/plankt/18.6.969
Mari X., Passow U., Migon C., Burd A. B., Legendre L. (2017). Transparent exopolymer particles: Effects on carbon cycling in the ocean. Prog. Oceanogr. 151, 13–37. doi: 10.1016/j.pocean.2016.11.002
Marie D., Brussaard C. P., Thyrhaug R., Bratbak G., Vaulot D. (1999). Enumeration of marine viruses in culture and natural samples by flow cytometry. AEM 65, 45–52. doi: 10.1128/AEM.65.1.45-52.1999
McCave I. (1984). Size spectra and aggregation of suspended particles in the deep ocean. Deep–Sea Res. I: Oceanogr. Res. 31, 329–352. doi: 10.1016/0198-0149(84)90088-8
McGillicuddy D. J. (2016). Mechanisms of physical–biological–biogeochemical interaction at the oceanic mesoscale. Annu. Rev. Mar. Sci. 8, 125–159. doi: 10.1146/annurev-marine-010814-015606
McGillicuddy D. J., Anderson L. A., Bates N. R., Bibby T., Buesseler K. O., Carlson C. A., et al. (2007). Eddy/wind interactions stimulate extraordinary mid–ocean plankton blooms. Science 316, 1021–1026. doi: 10.1126/science.1136256
McGillicuddy D., Anderson L., Doney S., Maltrud M. (2003). Eddy–driven sources and sinks of nutrients in the upper ocean: Results from a 0.1 resolution model of the north Atlantic. Glob. Biogeochem. Cycles. 17. doi: 10.1029/2002GB001987
McGillicuddy D. J. Jr., Robinson A. R., Siegel D. A., Jannasch H. W., Johnson R., Dickey T. D., et al. (1998). Influence of mesoscale eddies on new production in the Sargasso Sea. Nature 394, 263–266. doi: 10.1038/28367
Mojica K. D., Carlson C. A., Behrenfeld M. J. (2020). Regulation of low and high nucleic acid fluorescent heterotrophic prokaryote subpopulations and links to viral–induced mortality within natural prokaryote–virus communities. Microb. Ecol. 79, 213–230. doi: 10.1007/s00248-019-01393-9
Møller E. F. (2007). Production of dissolved organic carbon by sloppy feeding in the copepods acartia tonsa, centropages typicus, and temora longicornis. Limnol. Oceanogr. 52, 79–84. doi: 10.4319/lo.2007.52.1.0079
Møller E. F., Thor P., Nielsen T. G. (2003). Production of doc by calanus fin– marchicus, c. glacialis and c. hyperboreus through sloppy feeding and leakage from fecal pellets. Mar. Ecol. Prog. Ser. 262, 185–191. doi: 10.3354/meps262185
Munk W., Armi L., Fischer K., Zachariasen F. (2000). Spirals on the sea. Proc. Math. Phys. Eng. Sci. 456, 1217–1280. doi: 10.1098/rspa.2000.0560
Nielsen E. S. (1952). The use of radio–active carbon (C14) for measuring organic production in the sea. ICES J. Mar. Sci. 18, 117–140. doi: 10.1093/icesjms/18.2.117
Nissimov J. I., Vandzura R., Johns C. T., Natale F., Haramaty L., Bidle K. D. (2018). Dynamics of transparent exopolymer particle production and aggregation during viral infection of the coccolithophore, emiliania huxleyi. Environ. Microbiol. 20, 2880–2897. doi: 10.1111/1462-2920.14261
Noyon M., Morris T., Walker D., Huggett J. (2019). Plankton distribution within a young cyclonic eddy off south–western Madagascar. Deep Sea Res. Part II Top. Stud. Oceanogr., 166. doi: 10.1016/j.dsr2.2018.11.001
Ortega–Retuerta E., Duarte C. M., Reche I. (2010). Significance of bacterial activity for the distribution and dynamics of transparent exopolymer particles in the Mediterranean sea. Microb. Ecol. 59, 808–818. doi: 10.1007/s00248-010-9640-7
Ortega–Retuerta E., Reche I., Pulido–Villena E., Agustí S., Duarte C. M. (2009). Uncoupled distributions of transparent exopolymer particles (TEP) and dissolved carbohydrates in the southern ocean. Mar. Chem. 115, 59–65. doi: 10.1016/j.marchem.2009.06.004
Ortega–Retuerta E., Sala M. M., Borrull E., Mestre M., Aparicio F. L., Gallisai R., et al. (2017). Horizontal and vertical distributions of transparent exopolymer particles (TEP) in the nw mediterranean sea are linked to chlorophyll a and o2 variability. Front. Microbiol. 7. doi: 10.3389/fmicb.2016.02159
Passow U. (2000). Formation of transparent exopolymer particles, TEP, from dissolved precursor material. Mar. Ecol. Prog. Ser. 192, 1–11. doi: 10.3354/meps192001
Passow U., Alldredge A. L. (1999). Do transparent exopolymer particles (TEP) inhibit grazing by the euphausiid euphausia pacifica? J. Plankton Res. 21, 2203–2217. doi: 10.1093/plankt/21.11.2203
Passow U., Alldredge A. L., Logan B. E. (1994). The role of particulate carbohydrate exudates in the flocculation of diatom blooms. Deep Sea Res. Part I Oceanogr. Res. Pap. 41, 335–357. doi: 10.1016/0967-0637(94)90007-8
Passow U., Shipe R., Murray A., Pak D., Brzezinski M., Alldredge A. (2001). The origin of transparent exopolymer particles (TEP) and their role in the sedimentation of particulate matter. Cont. Shelf Res. 21, 327–346. doi: 10.1016/S0278-4343(00)00101-1
Pedrotti M., Beauvais S., Kerros M.–E., Iversen K., Peters F. (2009). Bacterial colonization of transparent exopolymeric particles in mesocosms under different turbulence intensities and nutrient conditions. Aquat. Microb. Ecol. 55, 301–312. doi: 10.3354/ame01308
Pedrotti M. L., Peters F., Beauvais S., Vidal M., Egge J., Jacobsen A., et al. (2010). Effects of nutrients and turbulence on the production of transparent exopolymer particles: a mesocosm study. Mar. Ecol. Prog. Ser. 419, 57–69. doi: 10.3354/meps08840
Prieto L., Navarro G., Cózar A., Echevarría F., García C. M. (2006). Distribution of TEP in the euphotic and upper mesopelagic zones of the southern Iberian coasts. Deep Sea Res. Part II Top. Stud. Oceanogr. 53, 1314–1328. doi: 10.1016/j.dsr2.2006.03.009
Prieto L., Ruiz J., Echevarrıa F., Garcıa C., Bartual A., Gálvez J., et al. (2002). Scales and processes in the aggregation of diatom blooms: high time resolution and wide size range records in a mesocosm study. Deep Sea Res. Part I Oceanogr. 49, 1233–1253. doi: 10.1016/S0967-0637(02)00024-9
Raina J. B., Giardina M., Brumley D. R., Clode P. L., Pernice M., Guagliardo P., et al. (2023). Chemotaxis increases metabolic exchanges between marine picophytoplankton and heterotrophic bacteria. Nat. Microbiol. 8, 510–521. doi: 10.1038/s41564-023-01327-9
Regaudie–de Gioux A., Duarte C. M. (2012). Temperature dependence of plank– tonic metabolism in the ocean. Glob. Biogeochem. Cycles. 26. doi: 10.1029/2010GB003907
Rii Y. M., Brown S. L., Nencioli F., Kuwahara V., Dickey T., Karl D. M., et al. (2008). The transient oasis: Nutrient–phytoplankton dynamics and particle export in hawaiian lee cyclones. Deep Sea Res. Part II Top. Stud. Oceanogr. 55, 1275–1290. doi: 10.1016/j.dsr2.2008.01.013
Rochelle–Newall E. J., Mari X., Pringault O. (2010). Sticking properties of transparent exopolymeric particles (TEP) during aging and biodegradation. J. Plankton Res. 32, 1433–1442. doi: 10.1093/plankt/fbq060
Roy S., Llewellyn C. A., Egeland E. S., Johnsen G. (2011). Phytoplankton pig– ments: characterization, chemotaxonomy and applications in oceanography (Cambridge UK: Cambridge University Press).
Samuelsen A., Hjøllo S. S., Johannessen J. A., Patel R. (2012). Particle aggregation at the edges of anticyclonic eddies and implications for distribution of biomass. Ocean Sci. 8, 389–400. doi: 10.5194/os-8-389-2012
Schartau M., Engel A., Schröter J., Thoms S., Völker C., Wolf–Gladrow D. (2007). Modelling carbon overconsumption and the formation of extracellular particulate organic carbon. Biogeosciences 4, 433–454. doi: 10.5194/bg-4-433-2007
Schütte F., Karstensen J., Krahmann G., Hauss H., Fiedler B., Brandt P., et al. (2016). Characterization of “dead–zone” eddies in the eastern tropical north Atlantic. Biogeosciences 13, 5865–5881. doi: 10.5194/bg–13–5865–2016
Serret P., Robinson C., Aranguren–Gassis M., García–Martín E. E., Gist N., Kitidis V., et al. (2015). Both respiration and photosynthesis determine the scaling of plankton metabolism in the oligotrophic ocean. Nat. Commun. 6, 6961. doi: 10.1038/ncomms7961
Sharp J. H. (1974). Improved analysis for “particulate” organic carbon and nitrogen from seawater 1. Limnol. Oceanogr. 19, 984–989. doi: 10.4319/lo.1974.19.6.0984
Shih Y.–Y., Hung C.–C., Gong G.–C., Chung W.–C., Wang Y.–H., Lee I.–H., et al. (2015). Enhanced particulate organic carbon export at eddy edges in the oligotrophic western north Pacific ocean. PloS One 10, e0131538. doi: 10.1371/journal.pone.0131538
Siegel D. A., DeVries T., Cetinić I., Bisson K. M. (2023). Quantifying the ocean’s biological pump and its carbon cycle impacts on global scales. Annu. Rev. Mar. Sci. 15, 329–356. doi: 10.1146/annurev-marine-040722-115226
Simon M., Azam F. (1989). Protein content and protein synthesis rates of planktonic marine bacteria. Mar. Ecol. Prog. Ser. 51, 201–213. doi: 10.3354/meps051201
Simon M., Grossart H.–P., Schweitzer B., Ploug H. (2002). Microbial. Ecology of organic aggregates in aquatic ecosystems. Aquat. Microb. Ecol. 28, 175–211. doi: 10.3354/ame028175
Smith D. C., Azam F. (1992). A simple, economical method for measuring bac– terial protein synthesis rates in seawater using 3h–leucine. Mar. microbial. Food webs 6, 107–114.
Strikland J. (1968). A practical handbook of sea water analysis. Bull. Fish. Res. Board. 167, 49–80. doi: 10.25607/OBP-1791
Sugimoto K., Fukuda H., Baki M. A., Koike I. (2007). Bacterial contributions to formation of transparent exopolymer particles (TEP) and seasonal trends in coastal waters of sagami bay, Japan. Aquat. Microb. Ecol. 46, 31–41. doi: 10.3354/ame046031
Sweeney E. N., McGillicuddy D. J., Buesseler K. O. (2003). Biogeochemical impacts due to mesoscale eddy activity in the Sargasso sea as measured at the Bermuda atlantic time–series study (bats). Deep Sea Res. Part II Top. Stud. Oceanogr. 50, 3017–3039. doi: 10.1016/j.dsr2.2003.07.008
Taylor J. D., Cunliffe M. (2017). Coastal bacterioplankton community response to diatom–derived polysaccharide microgels. Environ. Microbiol. Rep. 9, 151–157. doi: 10.1111/1758-2229.12513
Thornton D. C. (2018). Coomassie stainable particles (CSP): protein containing exopolymer particles in the ocean. Front. Mar. Sci. 5. doi: 10.3389/fmars.2018.00206
Thornton D. C., Chen J. (2017). Exopolymer production as a function of cell permeability and death in a diatom (thalassiosira weissflogii) and a cyanobacterium (synechococcus elongatus). J. Phycol. 53, 245–260. doi: 10.1111/jpy.12470
Van der Jagt H., Friese C., Stuut J.–B.W., Fischer G., Iversen M. H. (2018). The ballasting effect of Saharan dust deposition on aggregate dynamics and carbon export: Aggregation, settling, and scavenging potential of marine snow. Limnol. Oceanogr. 63, 1386–1394. doi: 10.1002/lno.10779
Vardi A., Haramaty L., Van Mooy B. A., Fredricks H. F., Kimmance S. A., Larsen A., et al. (2012). Host–virus dynamics and subcellular controls of cell fate in a natural coccolithophore population. PNAS 109, 19327–19332. doi: 10.1073/pnas.1208895109
Verdugo P. (2012). Marine microgels. Annu. Rev. Mar. Sci. 4, 375–400. doi: 10.1146/annurev-marine-120709-142759
Verdugo P., Alldredge A. L., Azam F., Kirchman D. L., Passow U., Santschi P. H. (2004). The oceanic gel phase: a bridge in the DOM–POM continuum. Mar. Chem. 92, 67–85. doi: 10.1016/j.marchem.2004.06.017
Vincent F., Gralka M., Schleyer G., Schatz D., Cabrera-Brufau M., Kuhlisch C., et al. (2023). Viral infection switches the balance between bacterial and eukaryotic recyclers of organic matter during coccolithophore blooms. Nat. Commun. 14 (1), 510. doi: 10.1038/s41467-023-36049-3
von Jackowski A., Grosse J., Nöthig E.–M., Engel A. (2020). Dynamics of organic matter and bacterial activity in the fram strait during summer and autumn. Philos. Trans. R. Soc A 378, 20190366. doi: 10.1098/rsta.2019.0366
Waite A. M., Stemmann L., Guidi L., Calil P. H., Hogg A. M. C., Feng M., et al. (2016). The wineglass effect shapes particle export to the deep ocean in mesoscale eddies. Geophys. Res. Lett. 43, 9791–9800. doi: 10.1002/2015GL066463
Wei T., Simko V. (2021). Package “corrplot”: Visualization of a correlation matrix (version 0.92). Package Corrplot R Software.
Weinbauer M. G., Bettarel Y., Cattaneo R., Luef B., Maier C., Motegi C., et al. (2009). Viral ecology of organic and inorganic particles in aquatic systems: avenues for further research. Aquat. Microb. Ecol. 57 (3), 321–341. doi: 10.3354/ame01363
Wickham H., Wickham H. (2016). “Programming with ggplot2,” in ggplot2: Elegant graphics for data analysis, (Cham: Springer). 241–253. doi: 10.1007/978-3-319-24277-4
Winkler L. W. (1888). Die Bestimmung des im Wasser gelösten Sauerstoffes. Berichte der Deutschen Chemischen Gesellschaft 21, 2843–2854. doi: 10.1002/cber.188802102122
Yamada Y., Tomaru Y., Fukuda H., Nagata T. (2018). Aggregate formation during the viral lysis of a marine diatom. Front. Mar. Sci. 5. doi: 10.3389/fmars.2018.00167
Zamanillo M., Ortega–Retuerta E., Cisternas–Novoa C., Marrasé C., Pelejero C., Pascual J., et al. (2021). Uncoupled seasonal variability of transparent exopolymer and coomassie stainable particles in coastal mediterranean waters: Insights into sources and driving mechanisms. Elem Sci. Anth 9, 165. doi: 10.1525/elementa.2020.00165
Zhang C., Dang H., Azam F., Benner R., Legendre L., Passow U., et al. (2018). Evolving paradigms in biological carbon cycling in the ocean. Natl. Sci. 5, 481–499. doi: 10.1093/nsr/nwy074
Zhang M., Wu Y., Wang F., Xu D., Liu S., Zhou M. (2020). Hotspot of organic carbon export driven by mesoscale eddies in the slope region of the northern South China Sea. Front. Mar. Sci. 7. doi: 10.3389/fmars.2020.00444
Zhou K., Benitez–Nelson C. R., Huang J., Xiu P., Sun Z., Dai M. (2022). Decoupling between particulate carbon, nitrogen and biogenic silica export mediated by cyclonic eddies in the north pacific subtropical gyre. Authorea Preprints. doi: 10.1002/essoar.10504572.1
Zhou K., Dai M., Xiu P., Wang L., Hu J., Benitez–Nelson C. R. (2020). Transient enhancement and decoupling of carbon and opal export in cyclonic eddies. J. Geophys. Res. Oceans 125, e2020JC016372. doi: 10.1029/2020JC016372
Zhou J., Mopper K., Passow U. (1998). The role of surface–active carbohydrates in the formation of transparent exopolymer particles by bubble adsorption of seawater. Limnol. Oceanogr. 43, 1860–1871. doi: 10.4319/lo.1998.43.8.1860
Zhu X. Y., Yang Z., Xie Y., Zhou K., Wang W. L. (2023). Strong particle dynamics counteract the nutrient–pumping effect leading to weak carbon flux in a cyclonic eddy. Mar. Chem. 255, 104279. doi: 10.1016/j.marchem.2023.104279
Keywords: TEP, CSP, Eastern tropical North Atlantic (ETNA), carbon, phytoplankton, virus, POC
Citation: Devresse Q, Becker KW and Engel A (2024) Distribution of polysaccharidic and proteinaceous gel−like particles in three cyclonic eddies in the Eastern Tropical North Atlantic. Front. Mar. Sci. 11:1357646. doi: 10.3389/fmars.2024.1357646
Received: 18 December 2023; Accepted: 26 March 2024;
Published: 10 April 2024.
Edited by:
Jun Sun, China University of Geosciences (Wuhan), ChinaReviewed by:
Hideki Fukuda, The University of Tokyo, JapanSatheeswaran Thangaraj, China University of Geosciences Wuhan, China
Copyright © 2024 Devresse, Becker and Engel. This is an open-access article distributed under the terms of the Creative Commons Attribution License (CC BY). The use, distribution or reproduction in other forums is permitted, provided the original author(s) and the copyright owner(s) are credited and that the original publication in this journal is cited, in accordance with accepted academic practice. No use, distribution or reproduction is permitted which does not comply with these terms.
*Correspondence: Anja Engel, aengel@geomar.de