Relationship between the carbonate system and phytoplankton community in the Gulf of Guinea-Africa
 Kouakou Urbain Koffi
 Estelle Severine Konan2
  Abed EI Rahman Hassoun
- 1Département des Sciences et Technologies, École Normale Supérieure, Abidjan, Côte d'Ivoire
- 2Centre de Recherches Océanologiques (CRO), Abidjan, Côte d'Ivoire
- 3National Council for Scientific Research, National Center for Marine Sciences, Batroun, Lebanon
- 4GEOMAR Helmholtz Centre for Ocean Research Kiel, Kiel, Germany
- 5LASMES, UFR SSMT, Université Félix Houphouët-Boigny, Abidjan, Côte d'Ivoire
We carried out measurements of the CO2 system parameters to evaluate the impact of carbonate and nutrients’ chemistry on phytoplankton populations in the Gulf of Guinea (GoG). The seasonal variations of the CO2 system parameters (fCO2, DIC, pH and TA) along with nitrates and phosphates were quantified weekly at surface (between 0 and 5 m depth) (5.57°N - 4.57°W) in the GoG from May to December 2020. Seawater pH varied widely during the study period, ranging between 8.10-8.35 pH units; DIC and TA varied between 1810 and 2094 μmol kg-1, and between 2051 and 2216 μmol-1 respectively. DIC peaks coincided with the high upwelling period (August and September). For phytoplankton, a total of 60 species were found belonging to four taxonomic phyla: Bacillariophyta, Dinophyta, Chlorophyta and Dictyochophyta. The highest number of phytoplanktonic species were recorded for Bacillariophyta phylum with 36 species (60%). The phylum Dinophyta comprised 22 taxa (36%) and Chlorophyta and Dictyochophyta recorded only one species (2%). The highest specific diversities were observed in August and September with 29 and 26 taxa respectively and the lowest was found in October-November (5 taxa) and December (one taxa). Bacillariophyta and Dinophyta appeared throughout the entire study period. The only species for Chlorophyta phylum appeared in June and July and the Dictyochophyta’s one in May, July and August. In general, the physical (SST, SSS) and chemical (TA, DIC, pH) parameters influenced less than 50% of the phytoplankton population in the coastal area of the GoG. Our study shows that Bacillariophyta population grows up when the physicochemical parameters’ variability increase.
1 Introduction
The ocean absorbs approximately 25% of the global CO2 emissions with an uptake of ~ 2.9 ± 0.4 GtC yr−1 during the decade 2012–2021 (Friedlingstein et al., 2022).This ocean carbon sink slows down the rate of global warming caused by human activities, but reduces ocean pH and the carbonate ions’ concentration in a phenomenon known as ocean acidification (OA) (Doney et al., 2009). The global mean pH trend follows thus the rate of increase in surface ocean carbon dioxide fugacity (fCO2) (1.75 ± 0.4 μatm yr-1). This latter is almost the same as the increase of atmospheric CO2 rate of 1.5 μatm yr-1 (Takahashi et al., 2009). The net effect of the increased atmospheric CO2 concentration in the seawater is the increase in the concentration of H+ or the decrease of pH (Gattuso and Hansson, 2011; Santana-Casiano and González-Dávila, 2011; Doney et al., 2020).
In coastal areas, the carbon cycle and marine ecosystems are influenced by terrestrial inputs, such as river outflow and upwelling dynamics. Therefore, it is essential to understand and monitor changes in coastal zones where marine ecosystems are witnessing multiple pressures related to direct anthropogenic activities, as well as climate change consequences such as warming and acidification among others (Abboud-Abi Saab and Hassoun, 2017; Cramer et al., 2020). For example, in Western Africa, the domestic, industrial and agricultural activities were identified as the main driving forces of water pollution (Scheren et al., 2004). Households produce 90% of solid waste, and industry is responsible for substantial amounts of hazardous waste. The prevalence of either nonexistent or insufficient wastewater treatment infrastructures exacerbates this issue (Scheren et al., 2002). Such deficiencies culminate in eutrophication and a reduction in oxygen levels, thereby instigating a surge in chlorophyll concentrations. These concentrations are observed to be thrice as high as those recorded in rural settings, leading to a doubling in chlorophyll production (Binet et al., 1995).
The Gulf of Guinea (GoG) is considered as one of the World’s most productive marine economic zones with fishery resources, oil and gas reserves, and precious minerals (Amuwo, 2013; Francis Abiodun and Mohammed Yakubu Dahiru, 2020). It is also a significant global reservoir of marine biological diversity (Jones, 1994; Ukwe et al., 2003; Francis Abiodun and Mohammed Yakubu Dahiru, 2020). It is estimated that the region is home to over 300 species of finfish, 17 species of cephalopods, 25 species of crustaceans, and 3 species of turtles (Belhabib et al., 2016). These resources are exploited by both artisanal and industrial fishing fleets, of which the latter is made up of both local and foreign vessels (Perry and Sumaila, 2007; Belhabib et al., 2016; Okafor-Yarwood, 2019), reflecting the economic importance of the GoG to 472 million people of coastal communities living in its vicinity (Francis Abiodun and Mohammed Yakubu Dahiru, 2020).
To constrain fCO2 variability in the GoG, many cruises have been conducted such as FOCAL cruises from 1982 to 1984, Cither 1 cruise in 1993 and EGEE cruises from 2005 to 2007 (Andrié et al., 1986; OUDOT et al., 1995; Koffi et al., 2010). The station PIRATA in the Eastern tropical Atlantic at 6°S, 10°W which comes under the influence of the equatorial upwelling (Lefèvre, 2009), was associated with the upwelling of CO2-rich waters from June to September. A fCO2 peak of ~440 µatm was observed in September and remained stable until December, before dropping to a minima of ~360 µatm in May (Parard et al., 2010). The PIRATA buoy observations clearly showed this seasonality but also provided the interannual variability in in-situ fCO2. Further north at 2°N, 10°W, Koffi et al. (2010) suggested that this region followed a similar seasonal cycle as the station at 6°S, 10°W but that pCO2 is ~30 µatm lower (Koffi et al., 2016). Despite these observations in the GoG, there is still a need to acquire accurate temporal changes that would permit to draw solid conclusions related to the long-term trends of the carbonate system parameters in this economically important area. Consequently, it is crucial to study the carbonate system and its potential relationship with marine organisms in the GoG to advance our understanding of the role and response of biological communities to changes in the carbonate chemistry and the effect of this latter on marine resources.
In this study, our primary focus is on marine phytoplankton, recognizing their critical role in the marine ecosystem, particularly on the carbonate system. The structure and composition of marine phytoplankton depend on each species’ presence and relative abundance, which can vary temporally due to differences in the relative rates of increase and decrease of each population (Shayestehfar et al., 2010; Dutkiewicz et al., 2020; Henson et al., 2021; Naselli-Flores and Padisák, 2023). Understanding the spatial and temporal variability in phytoplankton community structure is essential for assessing their ecological significance and their impact on the broader marine food web. Due to the ecological importance of phytoplankton populations in the marine environment, and given the harmful nature of certain species, several studies have been carried out to investigate these organisms and understand how their growth is influenced by their respective environment (Glibert et al., 2014; Edworthy et al., 2022; Dahunsi et al., 2023). Some studies, using model simulations, have predicted the increase of harmful algal blooms (HABs) in response to global warming (Glibert et al., 2014; Moore et al., 2015). Despite the increasing research focusing on OA and its impacts on marine organisms, there is still a lack of local data for several oceanic regions, and this gap is particularly apparent in coastal environments (Tilbrook et al., 2019), such as in the GoG. Along the Côte d’Ivoire coast, only a few relatively old studies tackled phytoplankton populations and their relationship with environmental factors (Dandonneau, 1971, Dandonneau, 1972, Dandonneau, 1973; Sevrin-Reyssac, 1993). Many of the recent investigations devoted to phytoplankton were carried out using in-situ or satellite data for a specific season and area (Hardman-Mountford and McGlade, 2002; Djagoua et al., 2011; Djakouré et al., 2014). Also, the variability of chlorophyll-a concentration and its relation to physical oceanographic variables have been studied (Nubi et al., 2014, Nubi et al., 2016; Nieto and Mélin, 2017). In general, these studies investigated the impact of the equatorial undercurrent on the distribution of nutrients, chlorophyll-a and the fertility process. However, none of these studies dealt with ocean acidification impact on the coastal biological processes in the GoG. This underscores the pressing need for a comprehensive study that concurrently examines carbonate and nutrients’ chemistry alongside phytoplankton populations in this underexplored region. Our work aims to address this gap by providing an updated assessment of phytoplankton populations in Côte d’Ivoire’s marine waters. Specifically, we focus on elucidating their structure and their intricate relationship with the carbonate system, contributing to a deeper understanding of the GoG’s vital marine ecosystem.
2 Materials and methods
2.1 The study area and its hydrography
Carbonate system parameters have been measured in the Eastern coastal part of the Atlantic Ocean, in the GoG, offshore Côte d’Ivoire at the site of Jacqueville (5.19°N, 4.45°W) (Figure 1) for more than one year (from end of November 2018 to the beginning of 2020 with a break between April 2019 to April 2020). The following carbonate system parameters were studied: total dissolved inorganic carbon (DIC), total alkalinity (TA) and pH. Jacqueville is located at around 50 km far from the capital, Abidjan (5.19°N; 4°W). This town is less polluted than Abidjan, a city with a big harbor and many industrial companies. 60 samples were collected from the sea surface of the study area for DIC and TA analyses. In addition, pH was derived using in-situ Sea Surface Salinity (SSS), Sea Surface Temperature (SST) combined with TA and DIC data at 25°C (pHT25) in the total scale with the “CO2SYS” program configured for Excel by Pierrot et al. (2006).
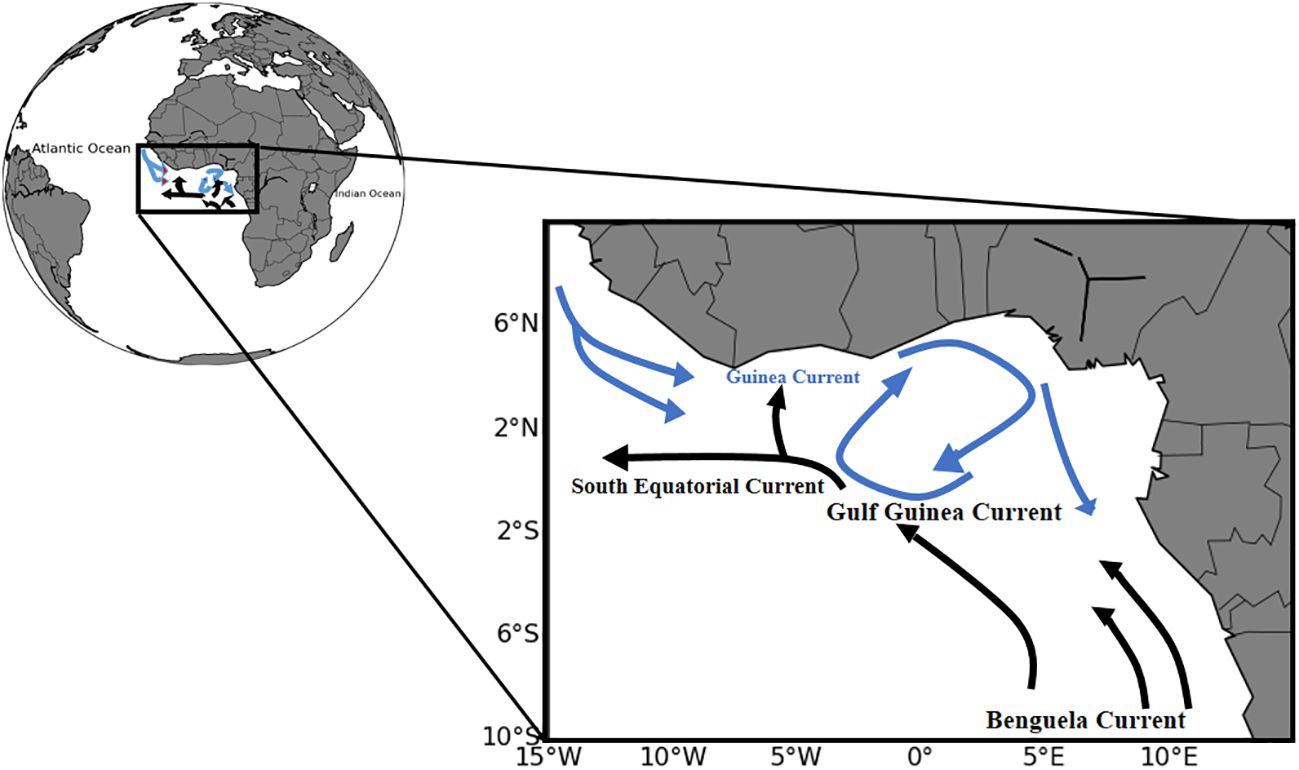
Figure 1 Schematic distribution of the horizontal circulation: the Guinea Current (blue); the South Equatorial Current (black) and the Benguela Current (black).
The principal current in the study area is the Guinea Current (GC). The GC might be the main driver of the coastal upwelling (Verstraete, 1992). Thus in model simulations, it has been suggested that both minor and major coastal upwelling processes are strongly related to the GC detachment and non-linear dynamics (Djakouré et al., 2017a). Flowing Eastward all the year with surface current speeds about 50 cm s-1 and a thickness of 30 to 40 m deep, the GC is located in the Northern GoG (Longhurst and Gallardo, 1966; Ingham, 1970; Djakouré et al., 2017b). The GC is flowing along the western African coast between 28° and 58°N (approximately 200 km in width). Indeed, there was a rare documentation relating physical features of the GoG with the carbonate system and HABs dynamics. Nevertheless, some studies (Nubi et al., 2014, Nubi et al., 2016) have been conducted along the Eastern equatorial Atlantic showing the impact of equatorial upwelling on the biological productivity. Few high surface fluorescence values are measured near the equator at 10°W, in upwelled waters. The highest value (0.87 μg L−1) is observed in June 2005 at 1°N, 10°W. Averaging all the surface fluorescence data of the six cruises gives a value of 0.12 ± 0.15 μg L− 1 with a mean maximum value of 0.21 ± 0.22 μg L−1 observed in June 2005 and a minimum of 0.05 ± 0.04 μg L−1 observed in November 2006 when the upwelling disappeared (Koffi et al., 2010). There was an Eastward weakening of the equatorial undercurrent (EUC) from 10°W until its complete disappearance at 6°E. The highest concentration of nitrates ~0.37 μmol.kg-1 (< 1 μmol.kg-1) recorded at the surface at 10°W was attributed to the shoaling pycnocline observed at this region (Nubi et al., 2019). Thus, nutrients were mostly consumed at the depth of the subsurface chlorophyll maximum and very low surface values were measured (Koffi et al., 2010; Nubi et al., 2019). Moreover, westward advection from the nutrient-rich African coast is responsible for equatorial enrichment in the GoG (Nubi et al., 2016). It is demonstrated that nutrients’ influx to the upper layer occurred more strongly at 10°W along the equator and increased the consumption of nutrients by phytoplankton (Nubi et al., 2016).
2.2 Sampling and analysis
2.2.1 Physical and chemical parameters
Sampling of physico-chemical parameters were conducted during two separate periods. From 2018-10-23 to 2019-04-25 and from 2020-05-01 to 2020-12-01, surface seawater (between 0 and 5 m depth) were sampled once per week for analyzing TA and DIC. The instruments used did not allow to sample layers beyond this depth. Samples were bottled in 500 mL high-density polyethylene (HDPE) flasks with screw caps, poisoned with a saturated HgCl2 solution, and analyzed potentiometrically. All TA and DIC measurements were performed simultaneously using a potentiometric acid titration in a closed cell following the DOE Handbook of CO2 Analysis Methods (DOE, 1994). The principles and procedures of these measurements, as well as a complete description of the system used to carry out the analyses are detailed in Hassoun et al. (2015); Hassoun et al. (2019). The TA and DIC concentrations were averaged from the replicates (two measurements per bottle). The precision of measurements was determined to be ± 3.5 μmol kg−1 for both TA and DIC, by titrating 85 seawater samples, with temperature and salinity, collected from an open-sea station, 5 km offshore the National Center for Marine Sciences-Batroun, Lebanon to monitor the reproducibility of the system. The accuracy of the measurements was determined to be ± 2.5 μmol kg−1 for TA and ± 3 μmol kg−1 for DIC based on a total of 30 Certified Reference Material bottles (CRM, batches 158, A.G. Dickson, Scripps Institution of Oceanography, La Jolla, CA, USA).
Direct potentiometric measurements of seawater pH (total scale) have been conducted in-situ using a multiparameter sensor ‘‘AquaRead 5000-P’ (along with temperature and salinity) for all the samples after calibration with Tris buffer standards (pH =4, 7 and 10). The pH measurements range from 0 to 14 and the sensor accuracy is of 0.1 pH unit. Also, fCO2 and pH were calculated using the CO2SYS software (Pierrot et al., 2006)
In addition, ancillary parameters such as nutrients were measured at ‘‘Centre de Recherches Océanologiques (CRO)’’, Abidjan, Côte d’Ivoire as follow:
2.2.1.1 Nitrates analysis
To 10 mL aliquots of sample, a quantity of 0.5 mL of sodium azide solution (NaN3) and 0.2 mL of acetic acid (CH3COOH) was added. The whole mixture was homogenized and after 5 min, it was evaporated to dryness in a water bath. Afterwards, 1 mL of sodium salycilate solution (C7H5NaO3) was added and the whole was homogenized, and then evaporated again to dryness. After cooling, 1 mL of sulfuric acid (H2SO4) was added to recover the sample residue. Then, 15 mL of water and 10 mL of the alkali solution were added for the development of the yellow coloration after 10 minutes of waiting. The absorbance was read with a molecular absorption spectrometer (Rodier et al., 2009) and the wavelength was 543 nm.
2.2.1.2 Phosphates analysis
A quantity of 100 mL of water sample was introduced into a test tube, containing 10 mL of a reagent mixture (100 mL of ammonium molybdate [(NH4)2MoO4], 250 mL of sulfuric acid 2.5 mol L-1 [H2SO4], 100 mL ascorbic acid [(C6H8O6], and 50 mL potassium antimony oxytartrate [K2Sb2(C8H4O12), 3H2O]. The resulting solution was immediately homogenized. After homogenization, the solution was kept for 5 min. A blue coloration was obtained according to the quantity of phosphate ions contained in the solution. The absorbance was then measured in a 10 cm cell at a wavelength of 885 nm, using distilled water as a reference.
The nutrients (nitrates and phosphates) were measured by a molecular absorption spectrometer, according to the methods described by Association Française de NORmalisation (AFNOR; NF EN 26777). The concentrations of nutrients are expressed in µmol L-1.
2.2.2 Phytoplankton sampling and identification
Phytoplankton sampling was performed using a 20-µm mesh size net, also between 0 and 5 m depth, from May to December 2020. In this study, we were able to identify only microphytoplankton populations while nano- and pico-phytoplankton were difficult to identify due to the available mesh size. Samples were fixed in formalin solution (5% final concentration). Afterwards, phytoplankton taxa were examined in the laboratory using a standard optic microscope (Olympus) equipped with a digital camera. The observations were made using the 40X magnification. The quantitative estimation of the phytoplankton species was performed by counting with an inverted Diavert microscope, using the Utermöhl method (Uthermöhl, 1958). We used 10 mL and 25 mL chambers in which sedimentation times reached 10 and 18 hours respectively. For these samples, 30 and 40 fields were counted, and the total number exceeded 400 units. Dilutions (1/2) were made for samples where a high concentration of cells was observed in sedimentation chambers. The counts of unicellular, colonial, or filamentous algae are expressed as Cells L-1. Specimen identification was based on cellular morphology and undertaken to species level, using the species’ identification detailed in the literature (Theriot et al., 1992; Hargraves, 1998; Da Graça Sophia et al., 2005; Komoé, 2010; Omura et al., 2012; Konan, 2014). Percentages of occurrence were also calculated and three categories of species were defined according to the classification of Kruk et al. (2002).
2.2.3 Satellite data and statistical analysis
In an attempt to bridge the gap in our in-situ SST data for the computation of fCO2 during the study period, we conducted a comparative analysis of in-situ SSTs and satellite data (Reynolds et al., 2007) between November 2018 and December 2021. To facilitate data interpretation, we incorporated smoothed curves in plots displaying the in-situ data for both SSS and SST.
We employ data derived from the Soil Moisture and Ocean Salinity (SMOS) satellite mission (Boutin et al., 2018, Boutin et al., 2022) and compare it with in-situ SSS data. The SMOS satellite data offer a spatial resolution of approximately 25 km.
We used cross correlation and PCA. Indeed, PCA focuses on finding linear combinations that account for the most variance in one data set. To do all the statistical analysis, we used Python software (version 3.11) and its libraries for statistics.
Multiple linear regressions are also used to evaluate the impacts of the physical and chemical parameters on the density of phytoplankton (ΔY) in the coastal ocean, particularly in the GoG. The equation resulting from this relationship is described as follow:
where mi represents the sensitivity of the phytoplankton to each parameter in the equation and C the potential nonlinear effects of these parameters.
3 Results and discussion
3.1 Physical features
Measured SSS and SST ranged from 30 to 37.07, and from 21.9°C to 30.8°C respectively. The average observed SSS and SST were 33.20 ± 1.49 and 27.63 ± 2.53°C, respectively. These hydrological parameters (SSS and SST) exhibited contrasting variations (Figure 2). The lowest SSTs were typically observed from July to September, coinciding with the upwelling period. In contrast, the lowest SSSs were recorded from October to January, following the conclusion of the upwelling season. Notably, there was a remarkable time lag between the increase in SST and the decrease in SSS, and vice versa. This temporal relationship in the GoG is influenced by various factors, including river discharges, vertical mixing, and vertical salinity advection, all of which contribute to the seasonal variations in SSS. Precipitation patterns play a pivotal role in shaping the seasonal cycle of SSS, with variations linked closely to the seasonal precipitation cycle (Dessier and Donguy, 1994; Foltz and McPhaden, 2008; Da-Allada et al., 2013, Da-Allada et al., 2017). The variability in SSS is primarily attributed to precipitation patterns and zonal advection. This pattern of variability was consistently observed during EGEE cruises in the GoG (Koffi et al., 2010) and in marginal seas, such as the Mediterranean Sea (Marcellin Yao et al., 2016).
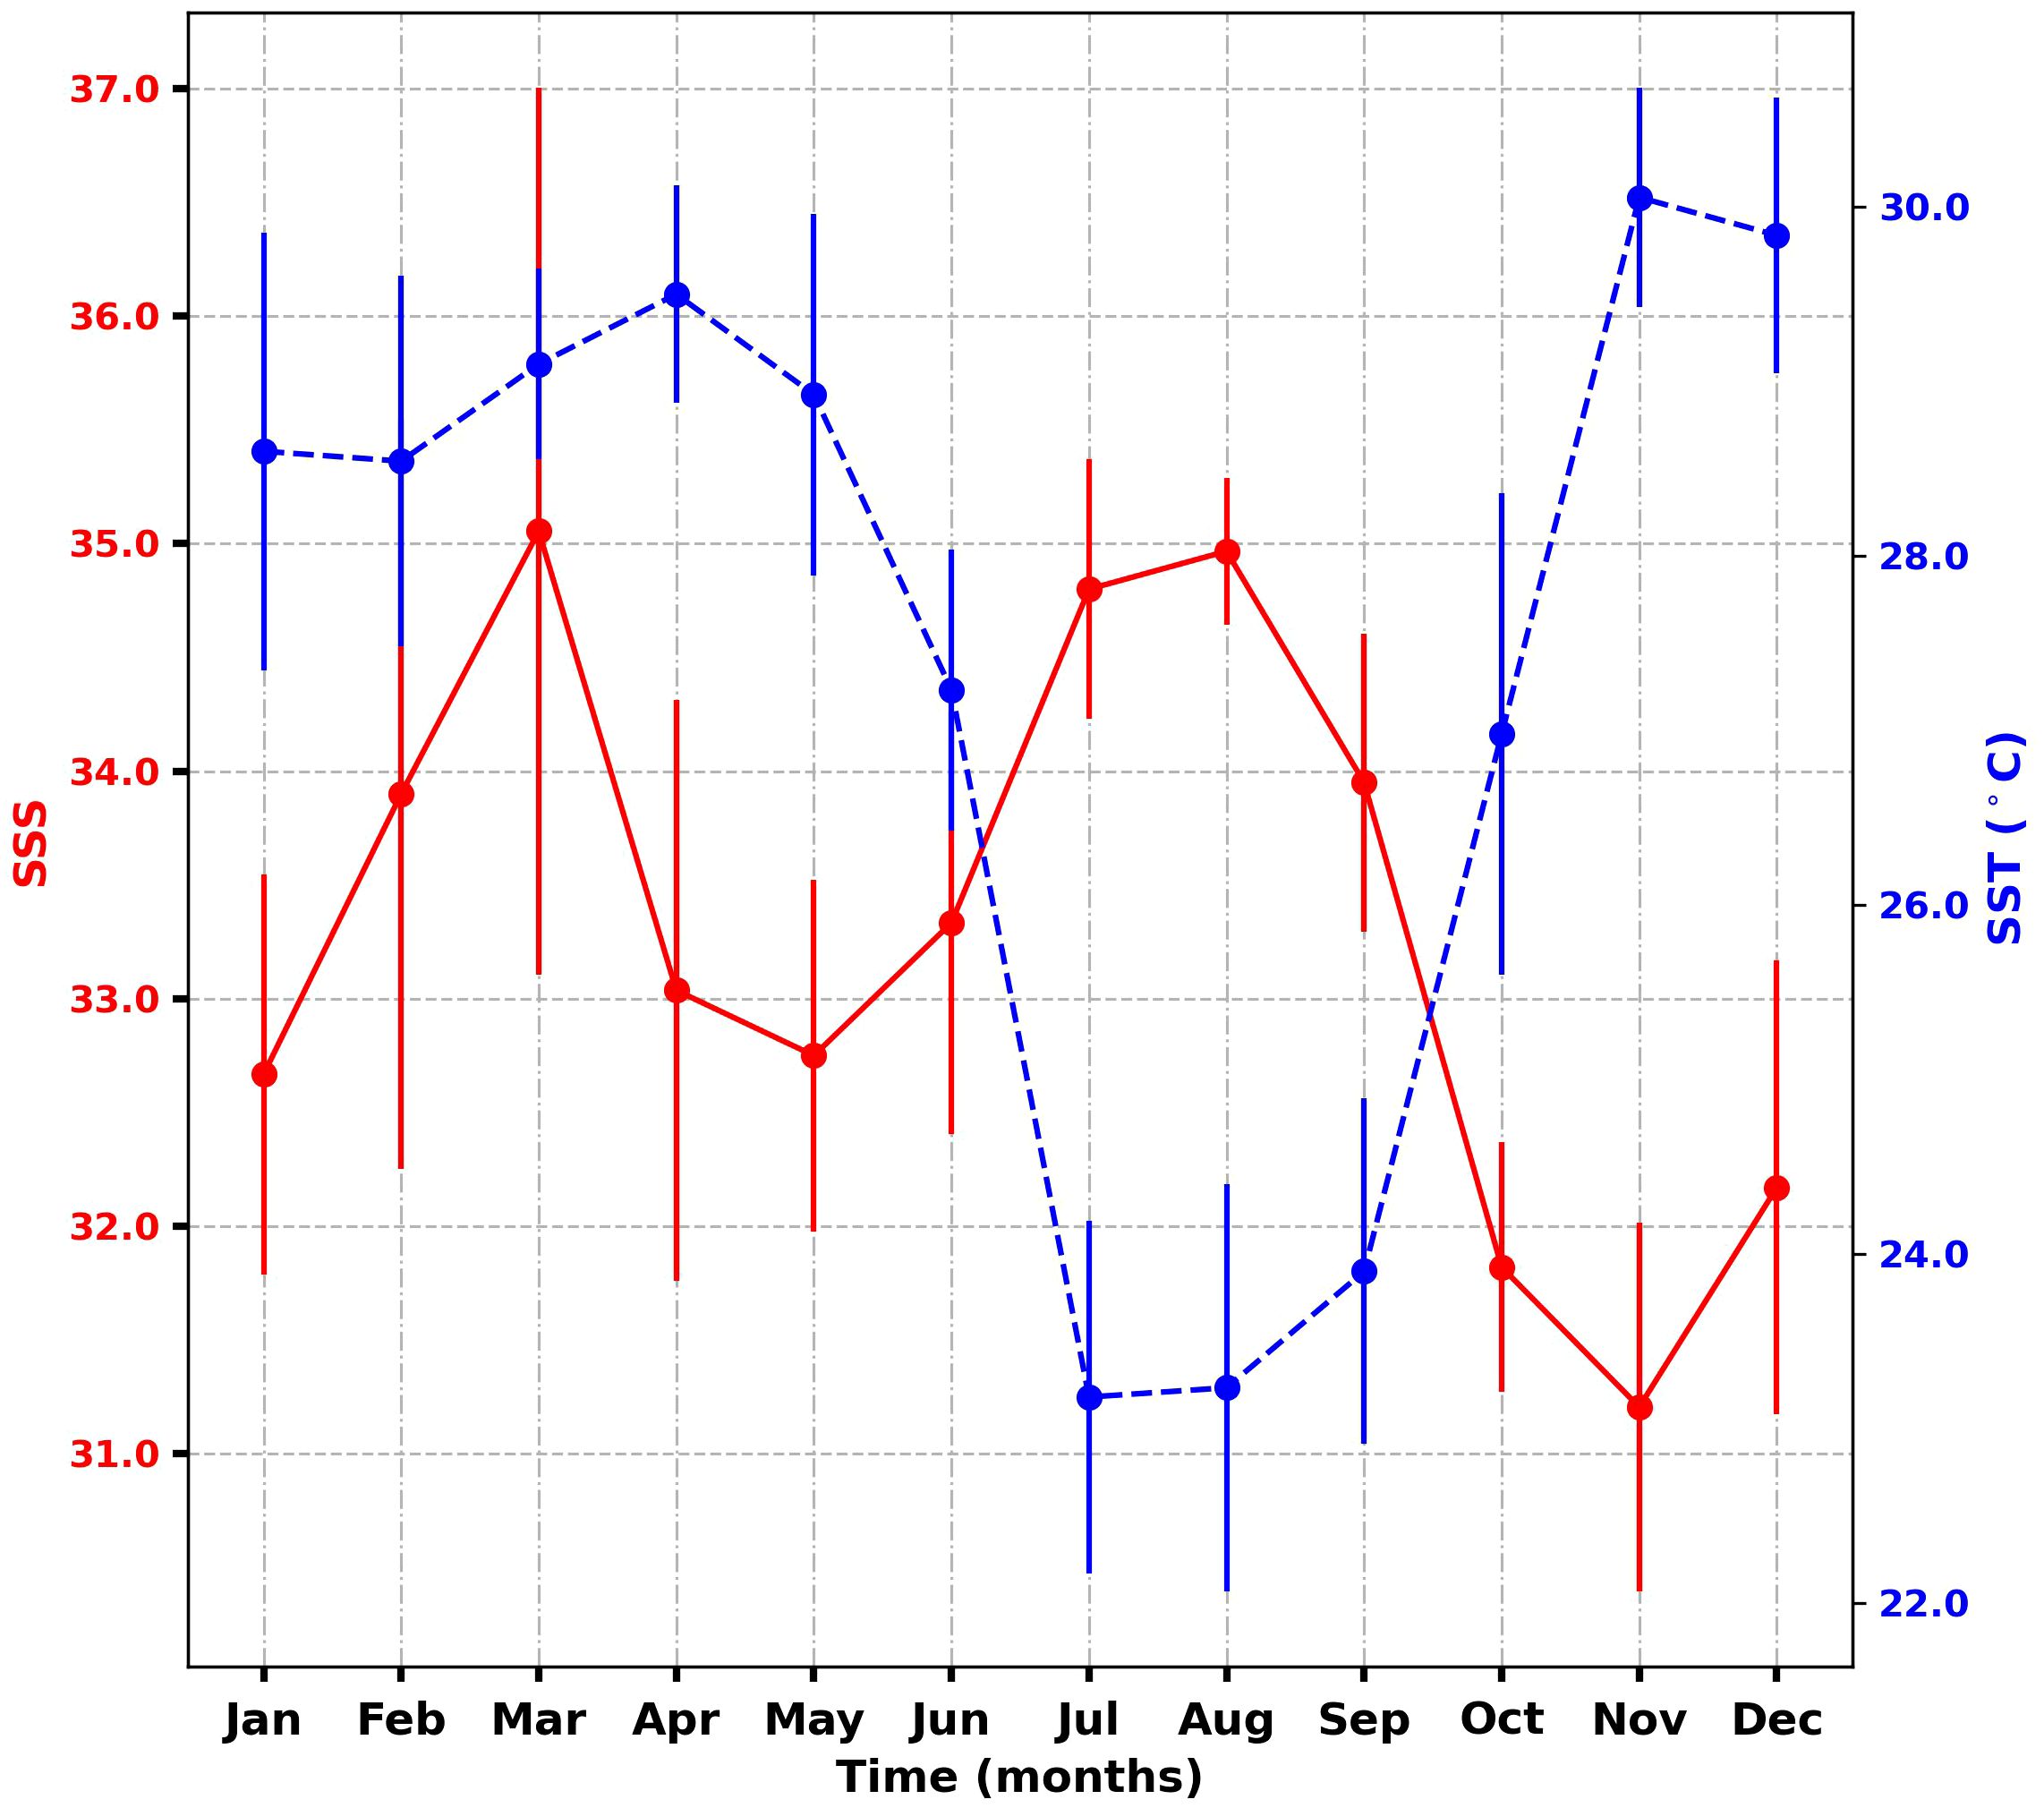
Figure 2 Mean monthly distribution of SSS (red) and SST (blue) from January 2019 to December 2020 in the GoG. Standard deviations are indicated in bars (±σ).
3.2 Total alkalinity and dissolved inorganic carbon distributions
3.2.1 Features of TA and DIC
TA concentrations ranged from 2047 to 2336 μmol kg−1, while DIC oscillated from 1810 and 2139 μmol kg−1. The high DIC concentration was found in February and August, while the lowest TA concentration was observed in October at the end of the upwelling. These high DIC was observed during minor upwelling (February) and major upwelling periods (August). During EGEE cruises in the Eastern tropical Atlantic, the averaged TA and DIC were 2282±26 μmol kg−1 and 1967±48 μmol kg−1 respectively (Koffi et al., 2010). In the Western tropical Atlantic close to the Amazon River, the averaged TA and DIC were 2280±138 μmol kg−1 and 1938±138 μmol kg−1 respectively (Bonou et al., 2016). In comparison of observed TA and DIC in the Eastern and Western tropical Atlantic, our measured TA and DIC were in the same range of values.
On average, the distribution of TA and DIC showed high seasonal variability (Figure 3). From January to December, TA and DIC had the same pattern with the highest concentrations in February and the lowest in November. Although the trend of TA changed slightly, it decreased until November and then increased in December. Low TA concentration was due to dilution (Koffi et al., 2010), while the abrupt increase of DIC was the result of the upwelling process from July to the end of September (Lefèvre et al., 2008).
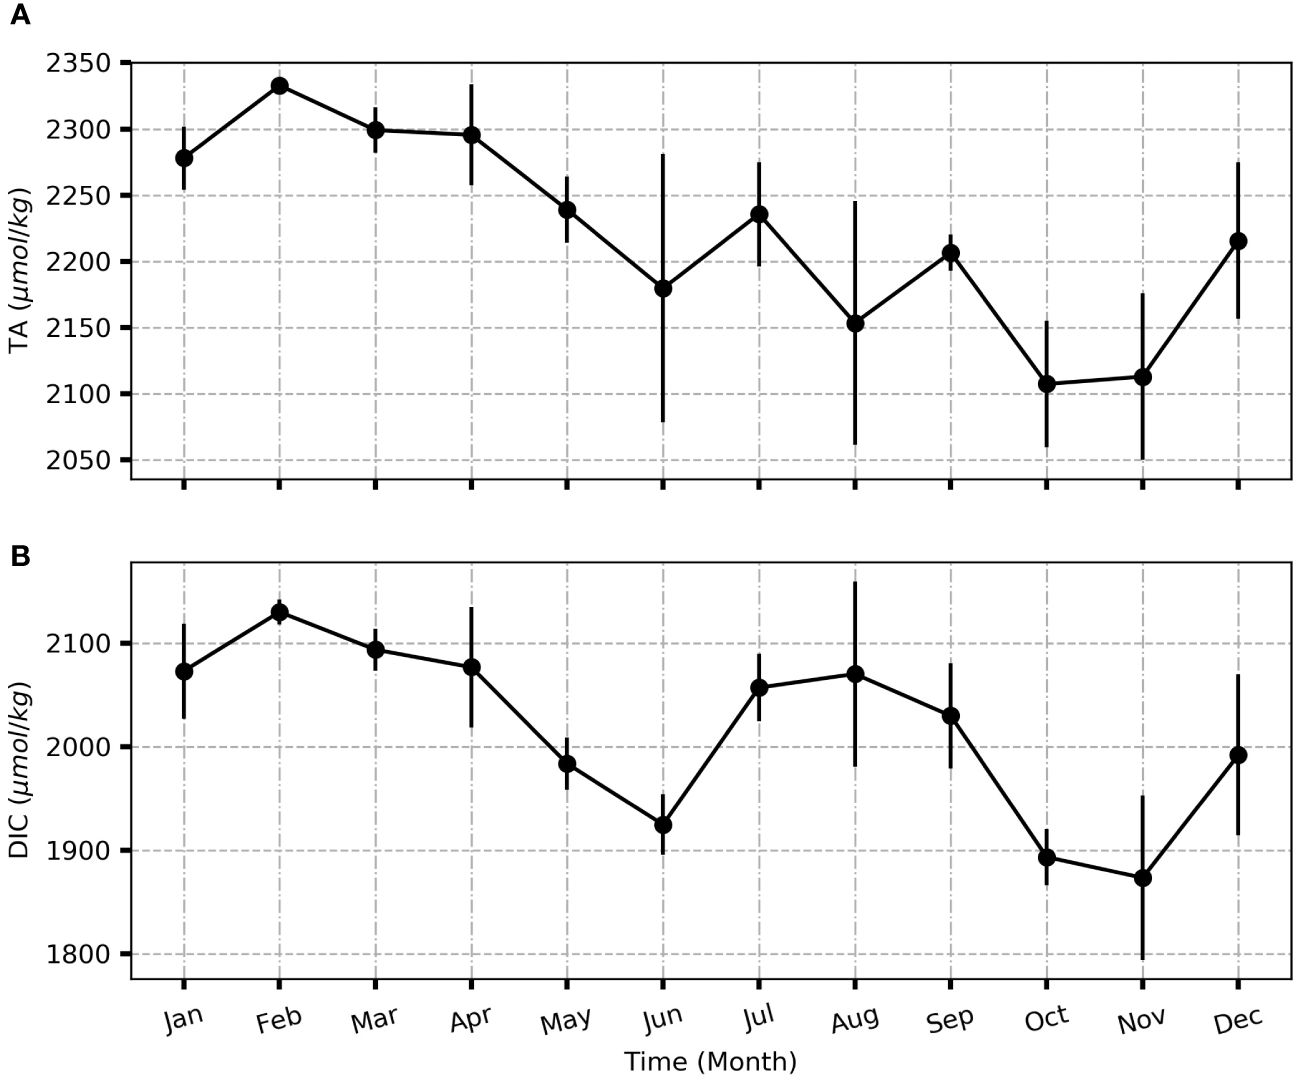
Figure 3 Mean monthly distribution of TA (A) and DIC (B) from January 2019 to December 2020 in the GoG. Standard deviation is indicated in bars (±σ).
During the EGEE cruise (2005-2007), Koffi et al. (2010) determined an empirical relationship between TA and SSS with 190 collected samples. This relationship serves as a valuable correlation for estimating TA when only SSS data is available, making it particularly useful in situations where carbonate system measurements are lacking. However, when this correlation was applied to our coastal TA dataset, it yielded a relatively high Root Mean Square Error (RMSE) of 102 μmol kg−1, showing clear discrepancy between measured and calculated total alkalinity. Consequently, it is evident that while this relationship is suitable for open ocean conditions, it may not be applicable in coastal regions where the normalized TA (NTA= TA * SSSref/SSS with SSSref=35) does not remain constant (Millero et al., 1998).
In the context of this study, an examination of coastal data revealed a linear correlation between TA and SSS with an r2 value of 0.24 (p=0.0004). This signifies that only 24% of the variation in TA can be attributed significantly to changes in SSS. While a discernible TA-SSS relationship is evident during this period, it is important to note that the correlation is relatively weak. Conversely, the variability in SSS is primarily influenced by precipitations, terrestrial and river inputs, as illustrated by the seasonal fluctuations in TA and DIC (Figure 3), in comparison to the distribution of SSS (and SST) (Figure 2). Furthermore, the correlations (r2) observed between SSS (ranging from 0.42) and TA, as well as DIC (ranging from 0.10), along with SSS (0.74) and SST (0.55) throughout the year, were not statistically significant (Figure 4).
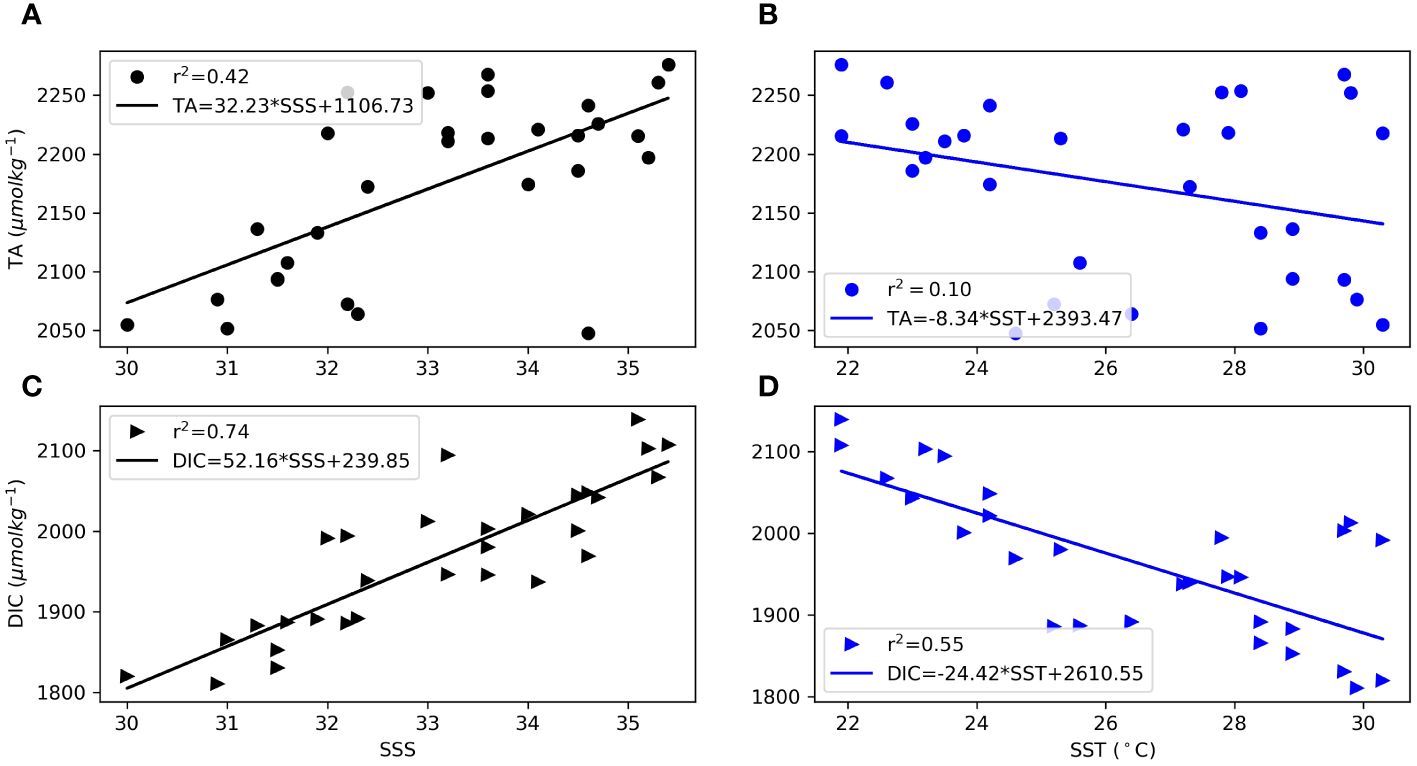
Figure 4 Relationship between TA vs SSS (A), TA vs SST (B); DIC vs SSS (C) DIC vs SST (D) from November 2018 to December 2020 in the GoG. The fit is indicated by a solid line.
This analysis suggests that only a quarter of the variation in TA can be attributed to changes in SSS. The weak correlation indicates that factors (not well captured in our study period) other than SSS significantly influence TA.
3.2.2 Comparison of in-situ and derived parameters from satellite
Notably, we observed that prior to and following the gap period (from July 2019 to May 2020), the satellite SST data and observed SSTs exhibited a harmonious relationship (Figure 5). In fact, when we compared the satellite SSTs corresponding to the same dates as our in-situ SST data, we obtained a RMSE of 1.04°C, indicating minimal disparity and confirming similar SST trends. However, it is important to acknowledge that while the computed SSTs generally aligned, they also exhibited smoothed variations, leading to discernible differences during the same timeframe.
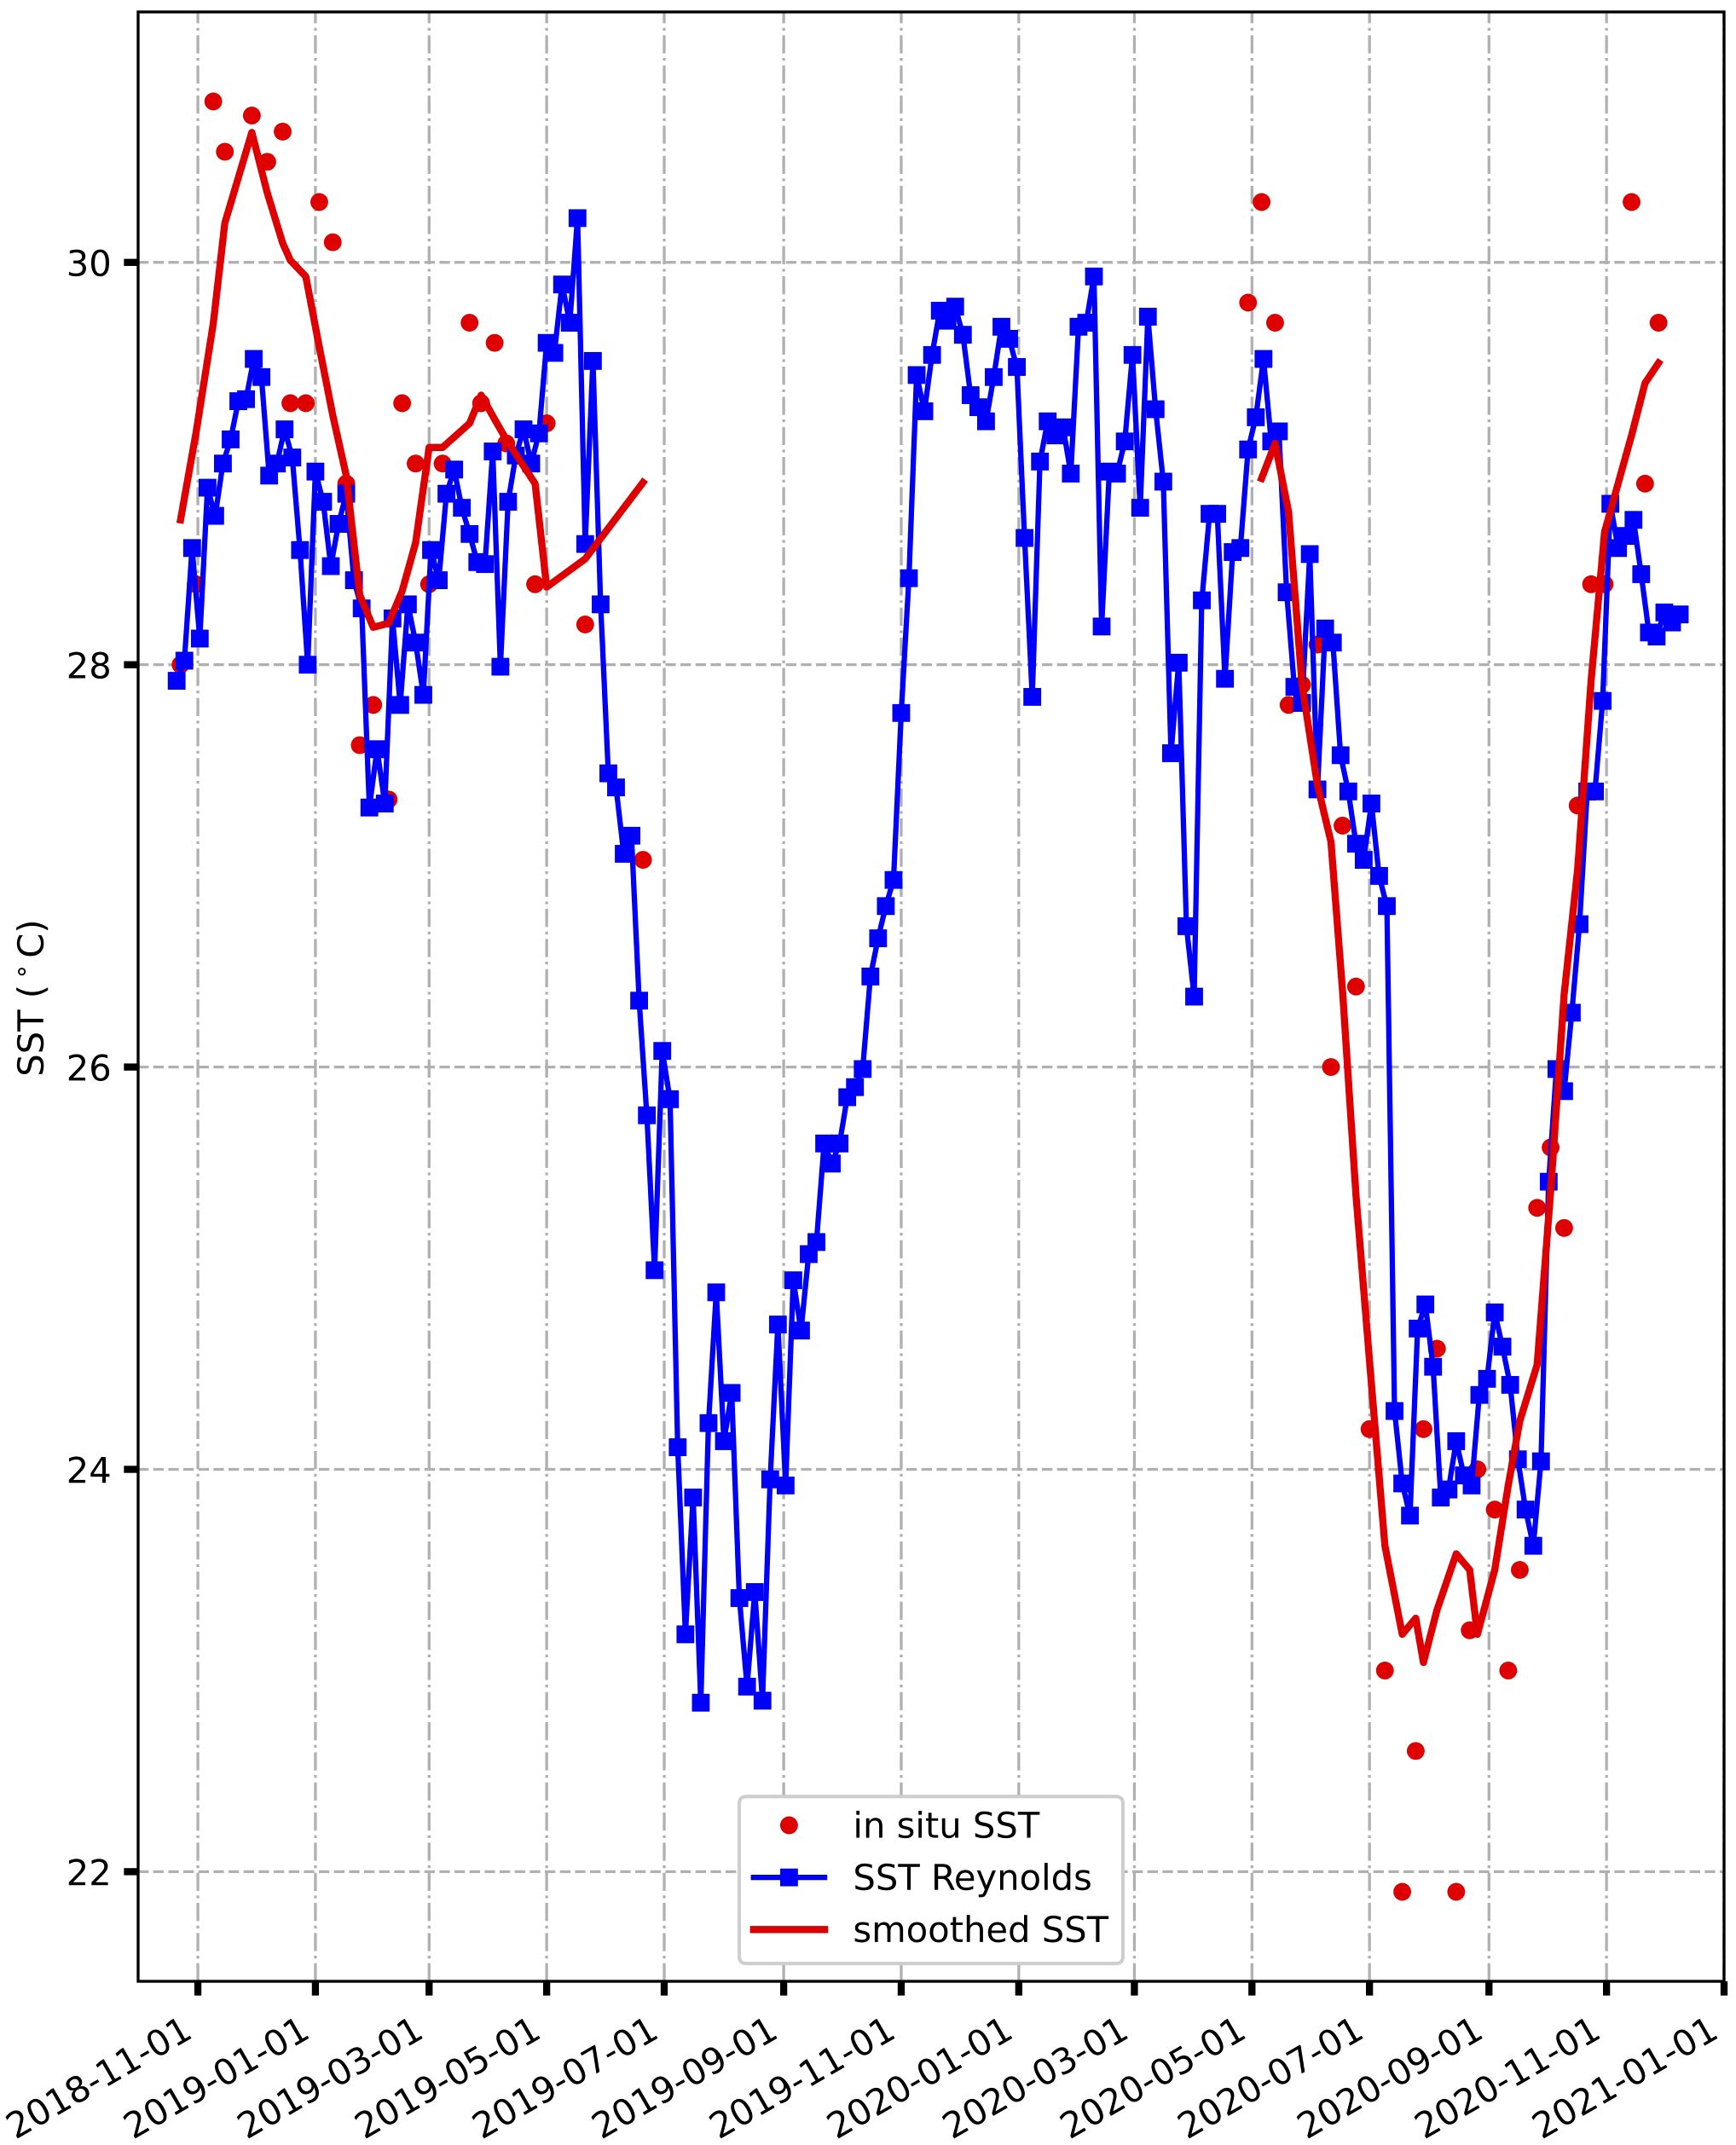
Figure 5 Comparison of in-situ SSTs (red dots) and SSTs Reynolds (blue dots) and smoothed SSTs (solid line in red) from November 2018 to December 2020.
The lowest observed SST was recorded at 22°C at the onset of July 2020, which can likely be attributed to coastal upwelling. Following this minimum value, SSTs gradually increased, surpassing 24°C. Satellite SSTs, on the other hand, ranged from 25°C to 29°C, while in-situ SSTs fluctuated between 22°C (in September 2020) and 34°C (in December 2019). Notably, the signature of upwelling became evident in August 2019 and 2020 in the Reynolds SST data, showcasing low values that closely coincided with our in-situ measurements (Figure 5). It is worth mentioning that both in-situ SSTs and observed SSS were collected on a weekly basis.
A contrast is observed between the observed SSS values (depicted in red) and those derived from the satellite dataset (Figure 6). The in-situ SSS values exhibited pronounced variability and weaker values compared to their satellite counterparts. The lowest in-situ SSS measurements were recorded in November 2019 and December 2020 (~30). Conversely, the satellite-derived SSS values (illustrated in blue) appeared smoother and generally higher than the observed SSS values, especially from 2020 to 2021. SMOS salinity data ranged consistently between 34 and 35 and exhibited relative stability. Although the observed salinity distribution appeared somewhat scattered, ranging from 30 to 37, the RMSE calculated akin to SST (for the same dates) yielded a modest difference of 1.8, indicating acceptable agreement. However, it is important to note that the satellite data failed to capture the high SSS variability observed during the two study periods. For instance, substantial in-situ SSS variability persisted until June 2019, primarily attributed to horizontal advection and coastal upwelling events off the coast of Côte d’Ivoire (Nyadjro et al., 2022). A similar pattern was evident in the pH measurements, particularly towards the end of December 2018 and through June 2019 (Figure 7). In contrast, pH measurements remained relatively stable throughout 2020, with values predominantly around 8.3.
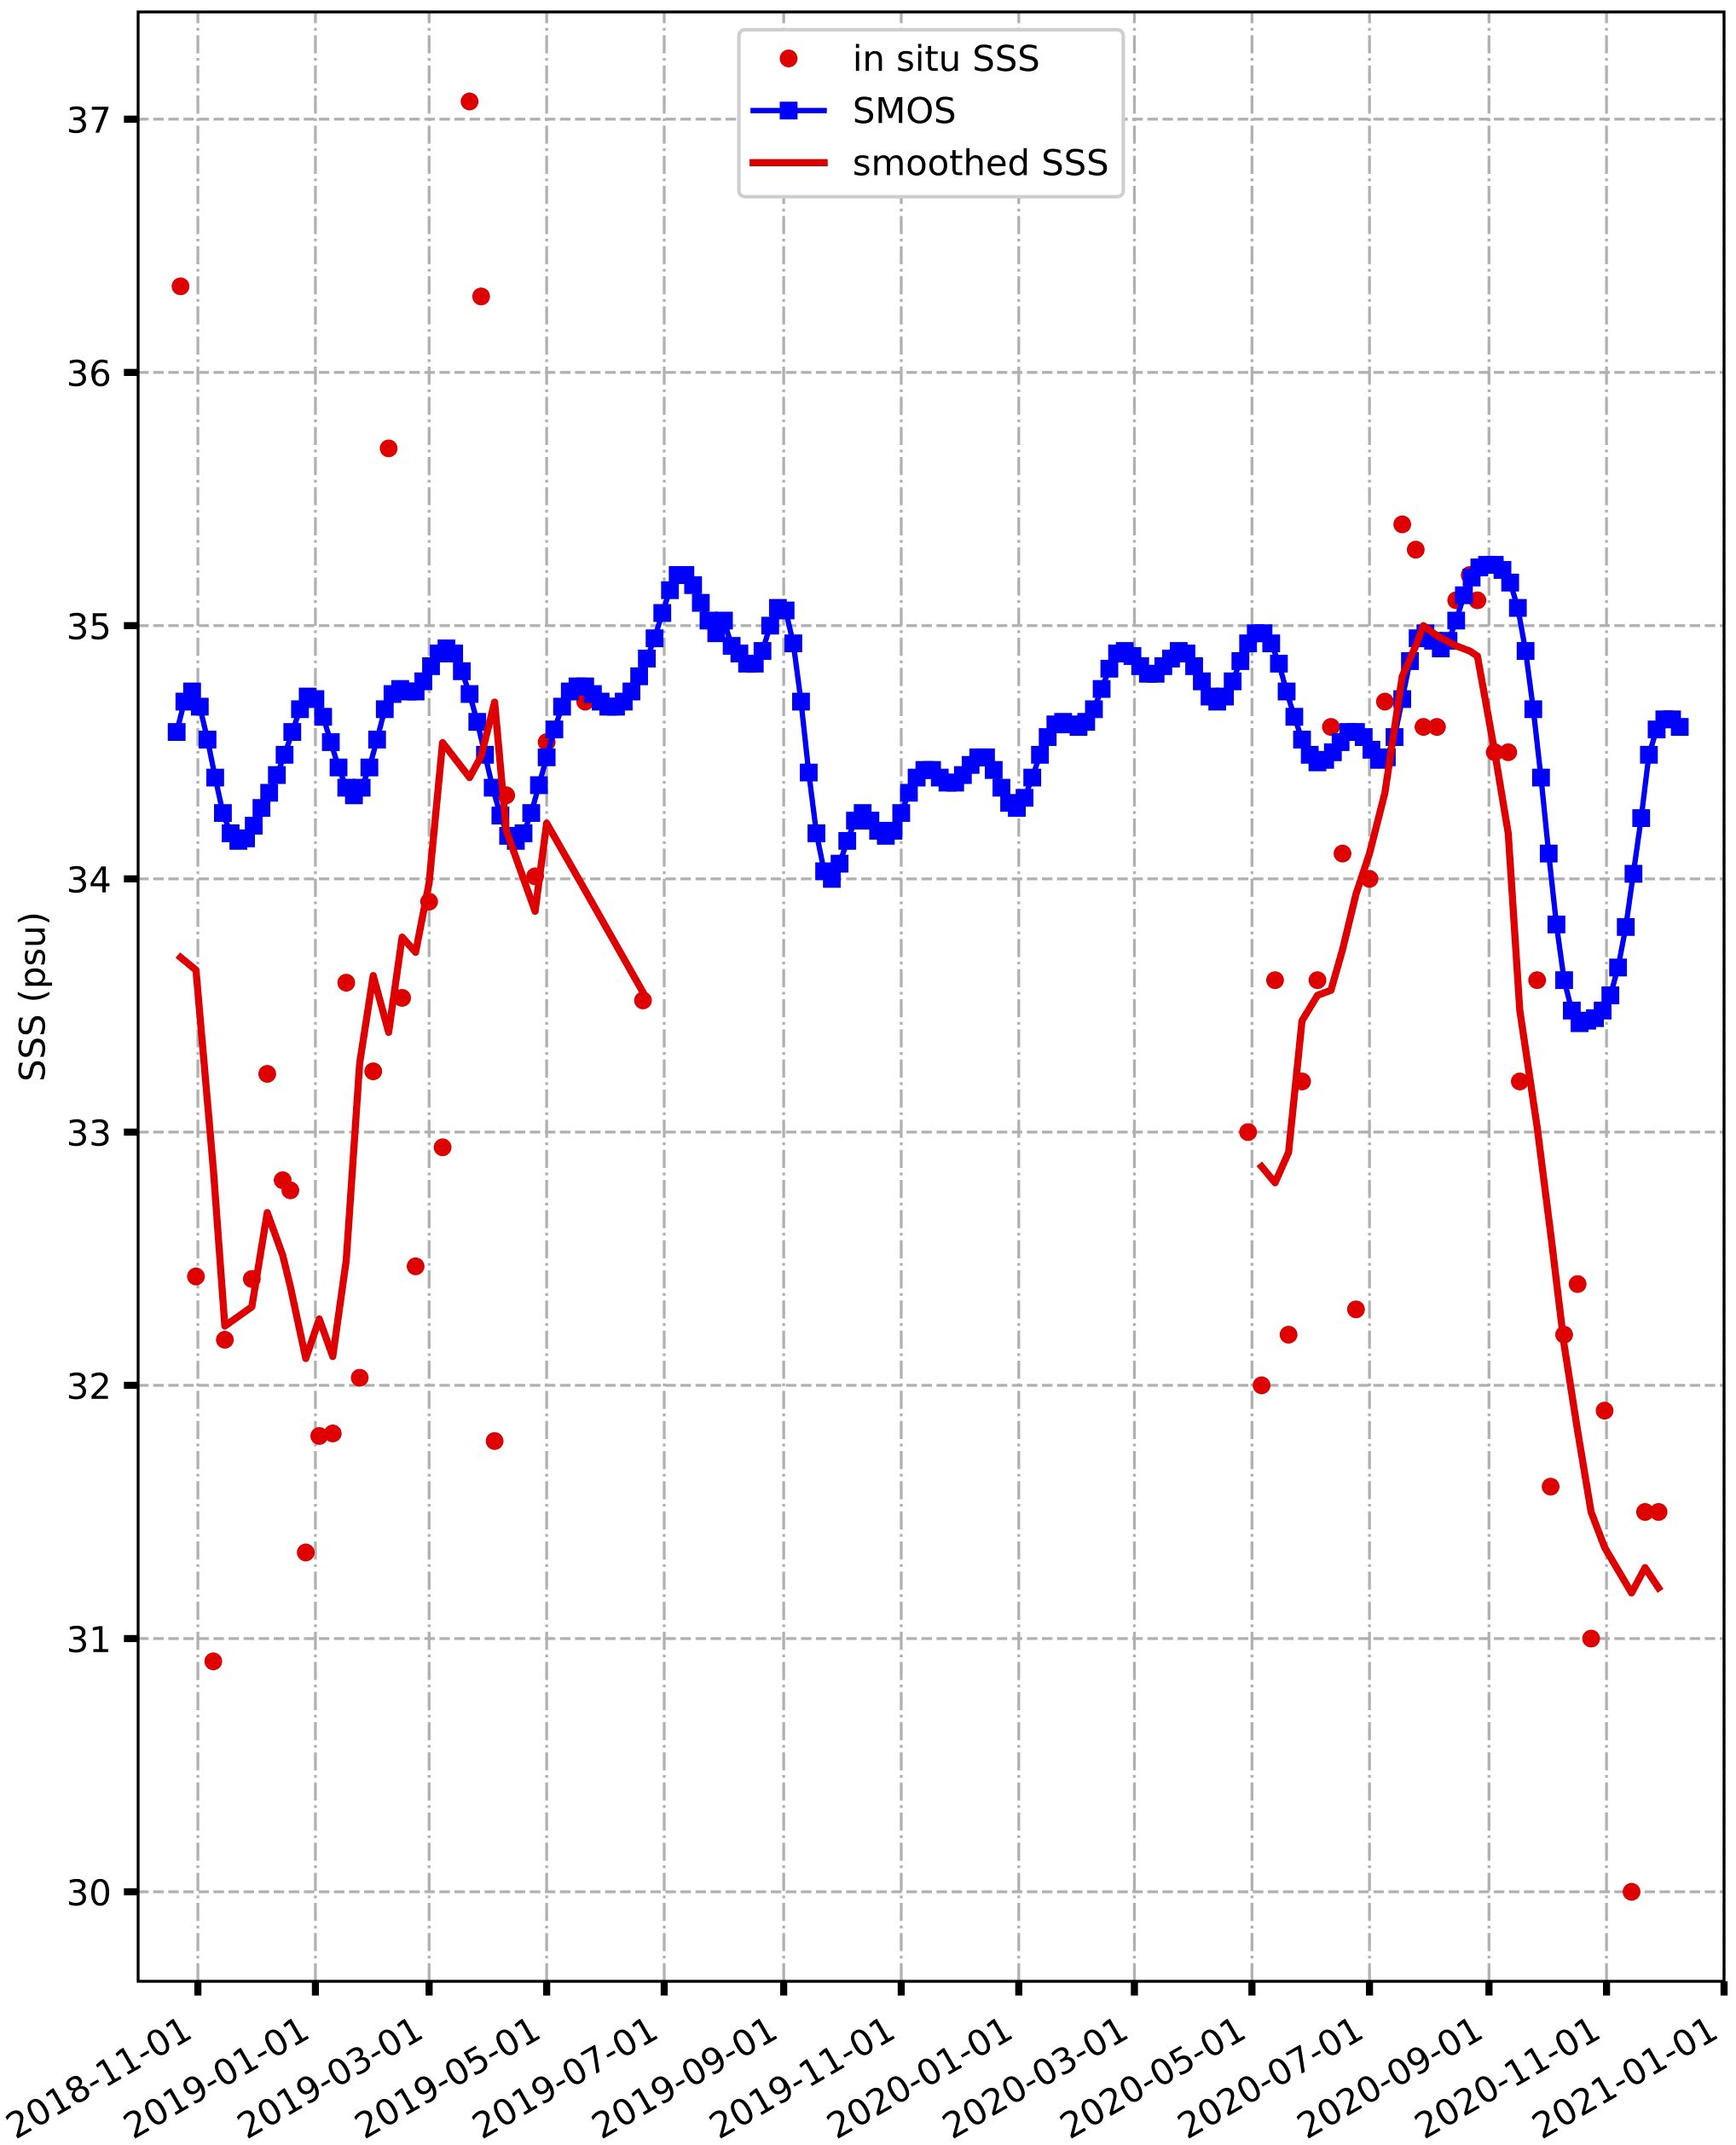
Figure 6 Comparison of in-situ SSS (red), SSS SMOS (blue) and smoothed SSS (solid line in red) from November 2018 to December 2020.
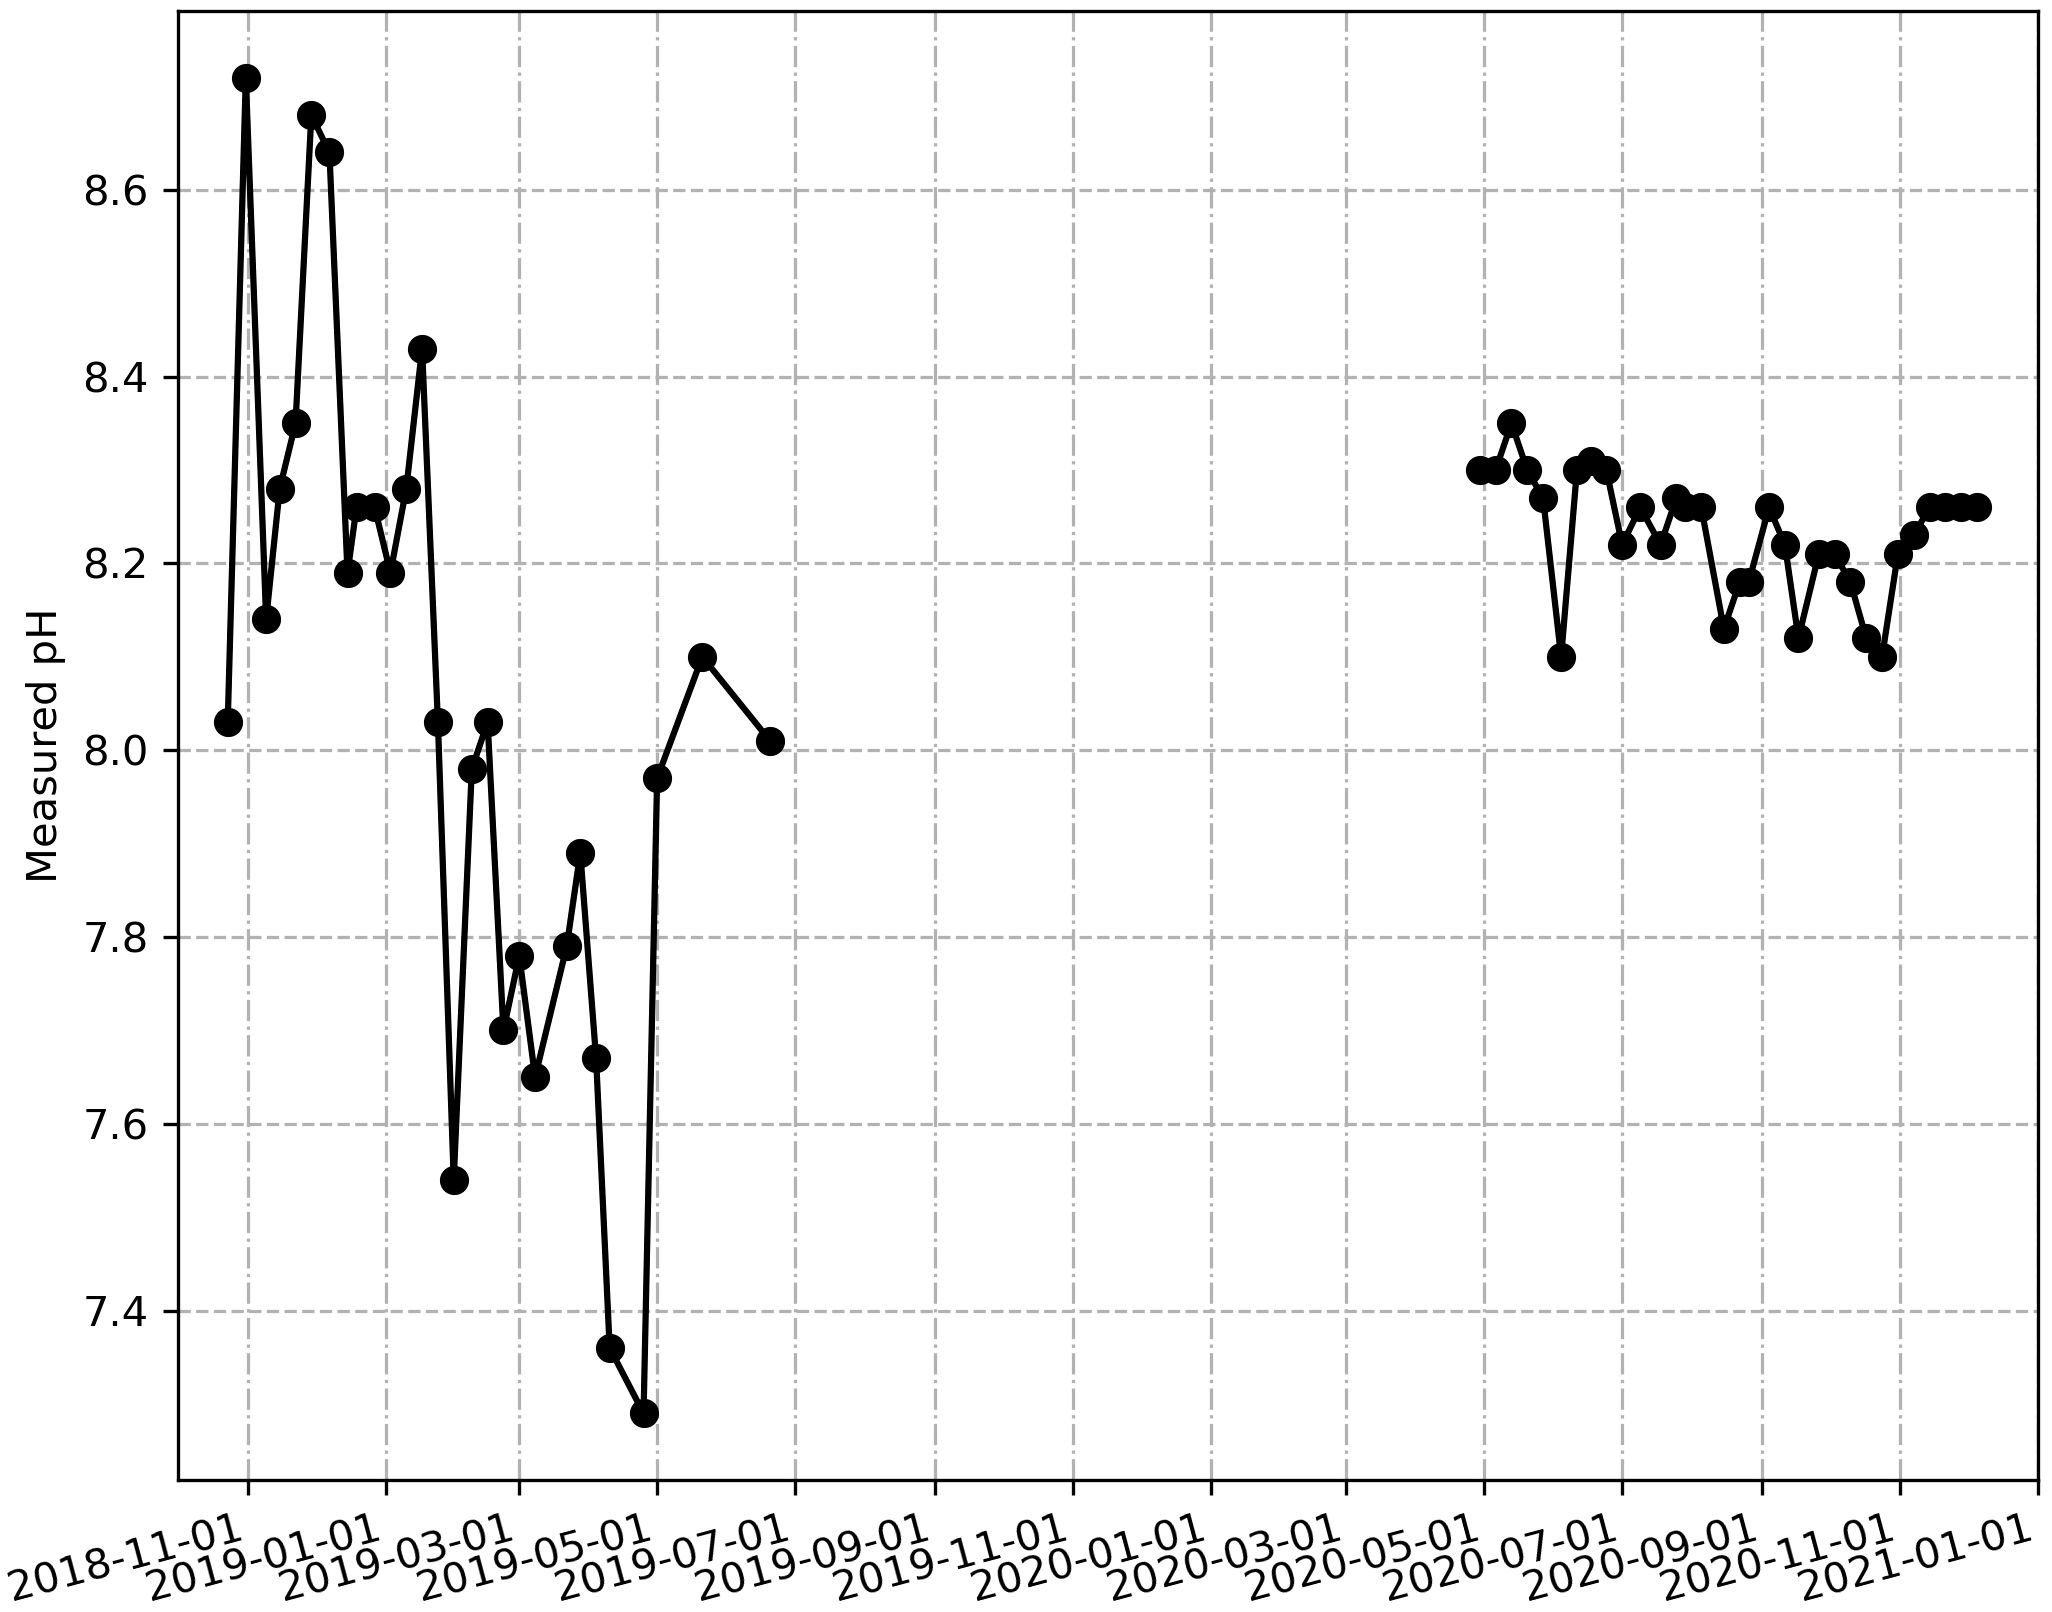
Figure 7 Weekly variability of measured pH from sampling in coastal ocean area from November 2018 to December 2020.
This assessment points to the importance of considering both satellite and in-situ data for a comprehensive understanding of SST variations, especially in the context of coastal upwelling events which have a significant impact on local marine ecosystems. As demonstrated earlier, the data gap during both years of this study could not be effectively reconstructed due to the absence of robust relationships between carbonate system parameters and hydrological variables. This underscores the significance of sustained monitoring efforts to comprehensively capture the spatio-temporal variability of these parameters and discern potential long-term trends in the GoG.
3.3 Surface nutrient measurements
The period from the end of 2018 to April 2019 exhibited the highest recorded concentrations of nitrates and orthophosphates (Figure 8). Notably, nitrate levels peaked at 120 μmol L-1 in December 2018, while orthophosphate concentrations exceeded 25 μmol L-1 during the same month. These high nutrient concentrations strongly suggest that our study site may be classified as a eutrophic coastal area due to the substantial nutrient values observed during this period. During the subsequent period, spanning from April 2020 to December 2020, nitrate concentrations remained relatively high, ranging between 38 and 110 μmol L-1. In contrast, orthophosphate concentrations were exceptionally low, nearly approaching zero. The surges in nutrient concentrations during this period are likely attributed to domestic discharges in the vicinity (Abboud-Abi Saab and Hassoun, 2017).
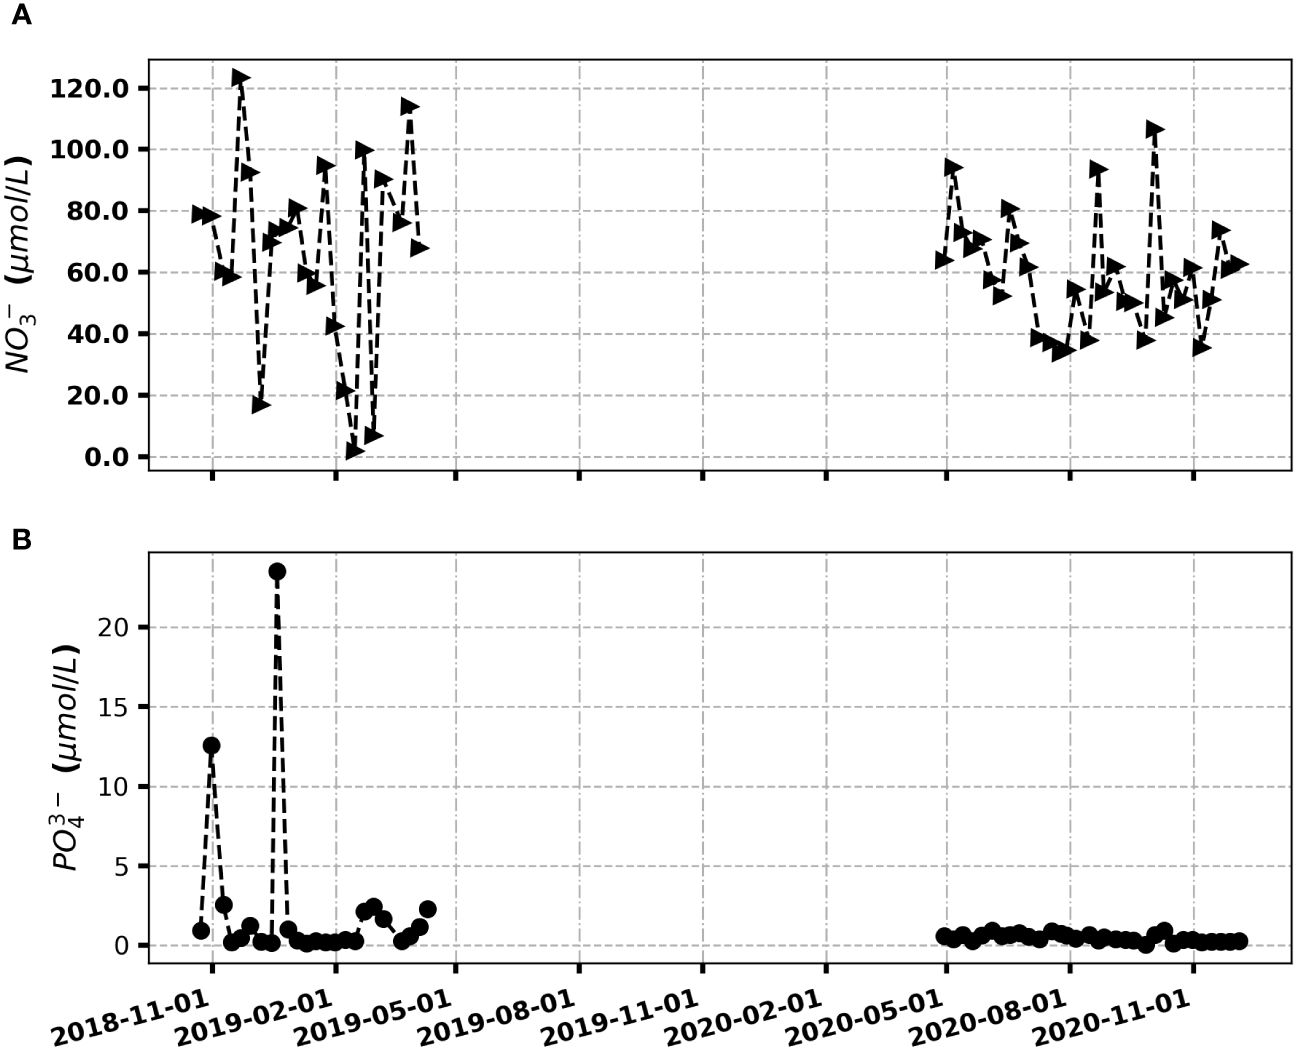
Figure 8 Weekly variability of nutrients (A) NO3-; (B) PO43- obtained from sampling in coastal ocean area from November 2018 to December 2020.
Comparing our in-situ nutrient measurements with both climatological data and data from Subramaniam et al. (2013) reveals striking disparities (Table 1). Particularly, our observed nitrate and orthophosphate levels are considerably higher. In contrast, both climatological and Subramaniam et al. (2013) data consistently indicate lower nutrient concentrations, typically below 1 μmol L-1. This divergence can be primarily attributed to the proximity of our study site to the coastline. In the surface waters of the upwelling region of the Eastern equatorial Atlantic, we observed orthophosphate rates averaging two to eight times higher and nitrate concentrations substantially elevated compared to measurements typically obtained farther away from coastal areas (Subramaniam et al., 2013).
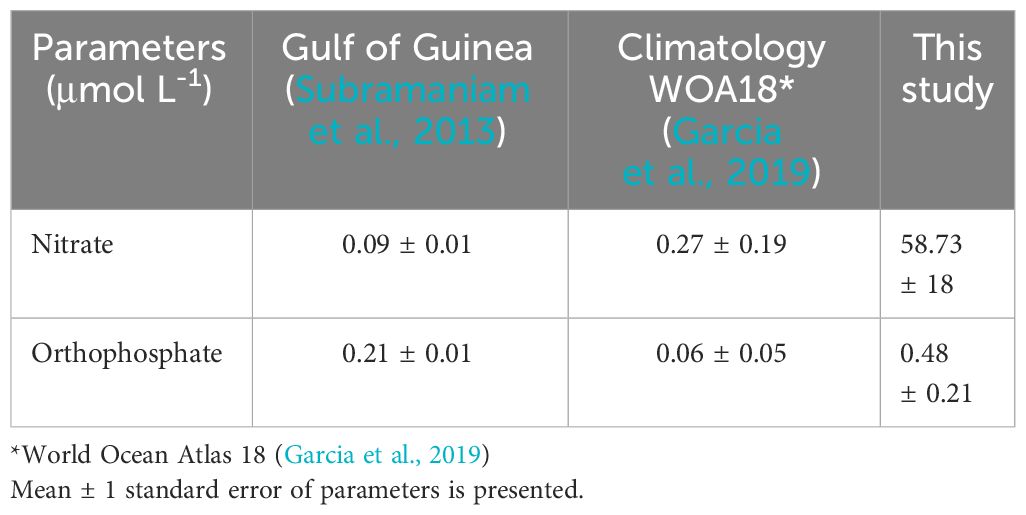
Table 1 Mean Sea Surface nitrates and orthophosphates from March to June in the GoG, Eastern of the Equatorial Atlantic.
3.4 Phytoplankton dynamics
A total of 60 phytoplankton species were found belonging to four taxonomic phyla: Bacillariophyta, Dinophyta, Chlorophyta and Dictyochophyta (Figure 9). High number of species were recorded for Bacillariophyta phylum with 36 species (60%). The phylum Dinophyta comprised 22 taxa (36%), including species that might cause harmful algal blooms (HABs) such as Dinophysis acuminata, Dinophysis caudata, Dinophysis rotundata and Pyrodinium bahamense. Only one species was recorded for each of the phylum Chlorophyta and Dictyochophyta (2%). The most commonly encountered taxa were Coscinodiscus sp. (present in 26 out of 32 samples), Thalassionema frauenfeldianum (25 out of 32) and Ceratium furca (28 out of 32). The genus with the high number of species is Ceratium with 7 taxa.
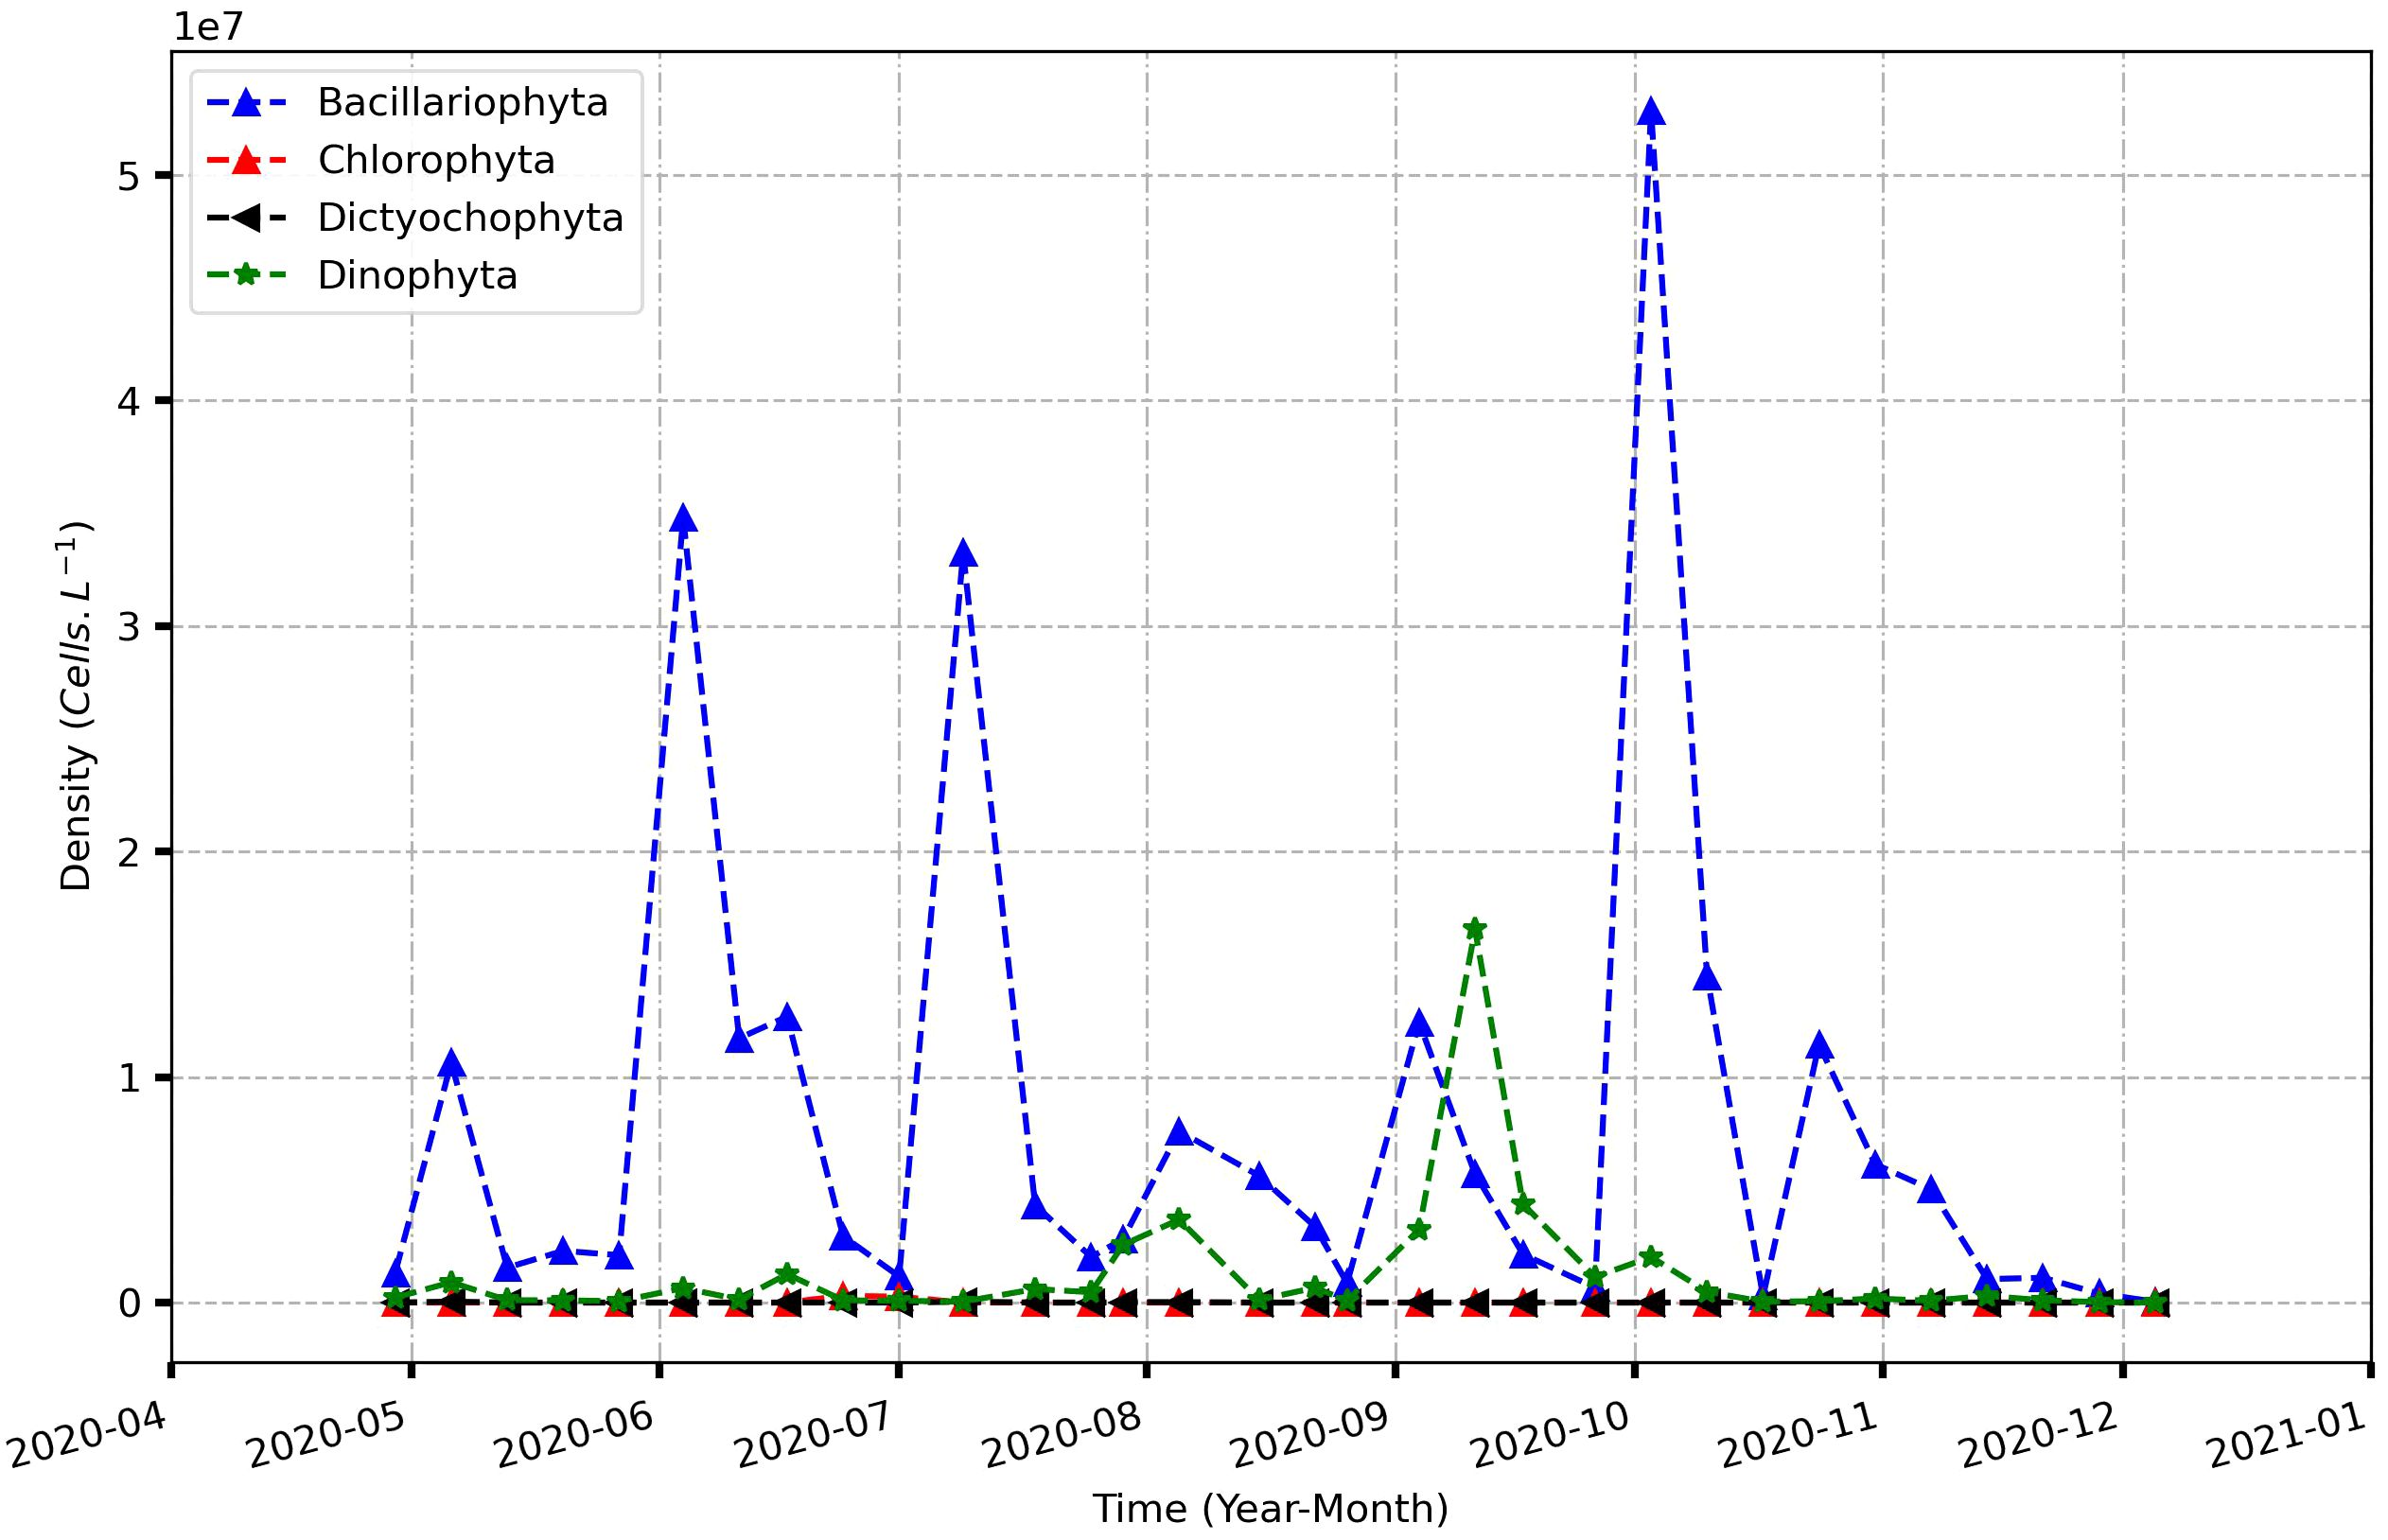
Figure 9 Monthly density of different phytoplankton groups (Cell L-1) from April 2020 to December 2020.
The highest specific diversities were observed in August and September with 29 and 26 taxa respectively and the lowest was found in October-November (5 taxa) and December (one taxa). Bacillariophyta and Dinophyta appeared throughout the study period. The only species for Chlorophyta (Pediastrum duplex) phylum appeared in June and July and the Dictyochophyta’s one (Dictyocha fibula) in May, July and August.
The occurrence calculations showed 9 constantly present taxa, 7 for Bacillariophyta (Coscinodiscus asteromphalus 65.62%, Coscinodiscus sp. 81.25%, Bellerochea malleus 62.5%, Actynoptichus adriaticus 50%, Coelosphaerium dubium 59.37%; Thalassionema frauenfeldianum 78.12%; Odontella mobiliensis 59.37%), and 2 for Dinophyta (Ceratium furca 87.5%; Dinophysis caudata 53.12%). In addition, 15 taxa are accessory with nine taxa for Bacillariophyta and 6 for Dinophyta, while 36 taxa are accidental, 20 for Bacillariophyta, 14 for Dinophyta and 1 for Chlorophyta and Dictyochophyta each.
The results show that the structure (composition of phytoplankton) and dynamic (temporal variation of phytoplankton densities) of the phytoplankton population in Ivorian coastal waters is characterized by a predominance of Bacillariophyta, followed by Dinophyta. Generally, these two groups of algae were found in coastal marine waters, as already demonstrated in previous works conducted in Nigeria (Adekunle et al., 2010) and Senegal (Abdou Salam et al., 2020). The predominance of Bacillariophyta could be explained by their adaptation to marine turbulence. Indeed, they have specialized structures that allow them to colonize environments efficiently and quickly (Hoagland et al., 1986). As for the Dinophyta, they proliferate more in high salinity environments. The Dinophyta unlike the Bacillariophyta, are more oceanic than coastal. A very low representation of microalgae belonging to the Chlorophyta group may be associated with their ecological need because the only one species of this group is a freshwater species, reflecting low salinity condition (Sun et al., 2023). One species of group Dictyochophyta and the species of Chlorophyta were the first species encountered in Ivorian oceanic waters. In an old study (Sevrin-Reyssac, 1993), these two groups were absent, but Cyanobacteria was found amongst other groups. The specific diversity of phytoplankton showed seasonal variation, and the occurrence calculations identified several consistently present taxa. The predominance of Bacillariophyta could be attributed to their adaptation to marine turbulence (Carstensen et al., 2015; Sun et al., 2022). In contrast, Dinophyta proliferate more in higher salinity environments and are more oceanic than coastal. This indicates the significant role of environmental conditions, such as salinity and turbulence, in shaping phytoplankton community structure in coastal waters and the importance of doing a long-term monitoring to better evaluate the role of biogeochemical parameters in this coastal phytoplanktonic community. In addition, low values of orthophosphates were observed during sampling period. These values could be due to rapid assimilation by bacteria and phytoplankton. It is the most important form of mineral phosphorus, the only soluble one to be directly used by aquatic organisms (Van den Broeck and Moutin, 2002).
3.5 Impact of physico-chemical parameters on the increase of phytoplankton populations
In order to better understand the relationships between the carbonate system parameters, the hydrological parameters and the phytoplankton, principal components analysis (PCA) was implemented. The measured carbonate system parameters (TA, DIC) have weak correlations with nutrients and phytoplankton compared to SSS (Figure 10). This indicates that while the carbonate system is an integral part of the marine environment, its direct influence on phytoplankton populations in the GoG might be less pronounced than initially thought. This finding suggests that hydrographic factors such as SSS might have a more significant role in shaping phytoplankton dynamics than the carbonate system in the GoG. This insight can lead to a re-evaluation of the traditional understanding of the carbonate system’s role in phytoplankton dynamics in coastal areas. Changes in DIC and TA were also significant, mainly in biogeochemical areas influenced by continental freshwater inflow or upwelling. Liutti et al. (2021) showed that upwelling can play an unpredictable role in CO2 dynamics due to the transport of nutrient-rich water and DIC near the surface.
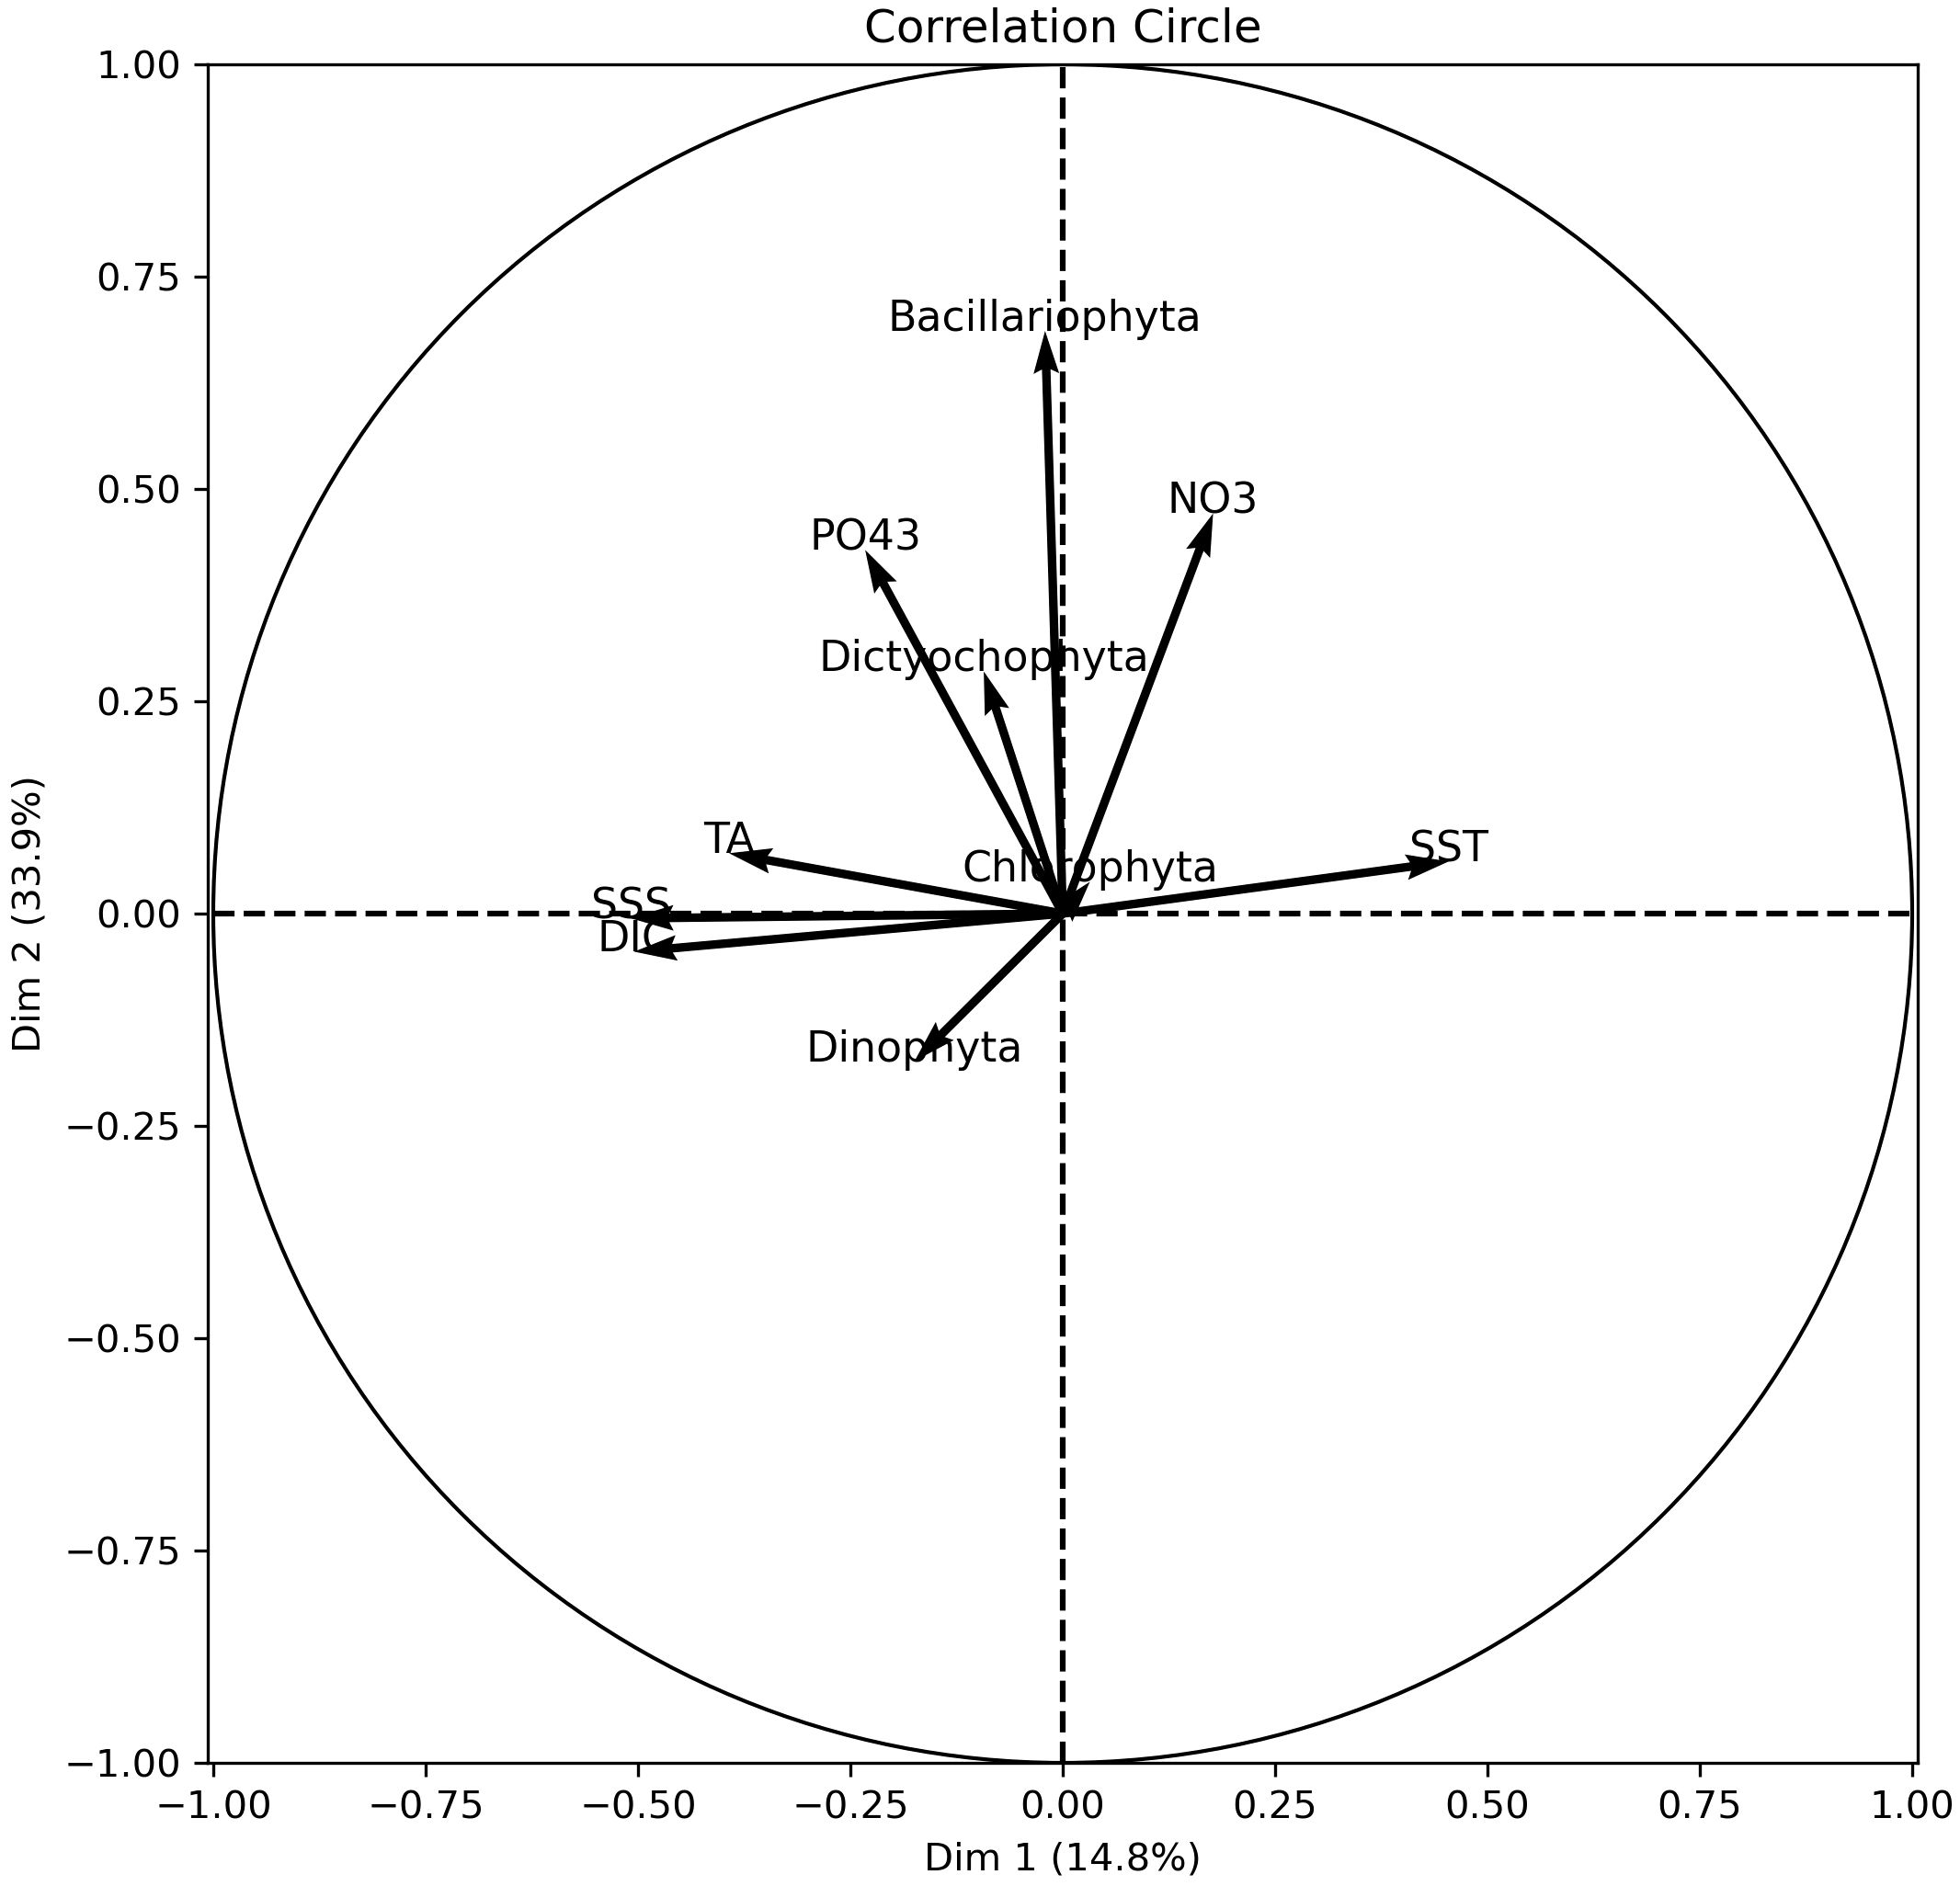
Figure 10 Correlation circle of the principal components analysis (PCA) of hydrological parameters, carbonate system parameters and nutrients data.
Further, our results are in harmony with the findings of a recent study conducted in the Cabo Frio upwelling area of the Brazilian coastal region (Silva et al., 2023). This latter study highlighted that physical variables like temperature and salinity were more determinant in the dynamics of the carbonate system’s parameters than biological processes such as respiration and photosynthesis. This parallels our findings in the GoG, where SSS appears to exert a more substantial influence than the carbonate system on phytoplankton populations. This congruence suggests the necessity for broader research perspectives that encompass physical and climatic influences when assessing the impact of the carbonate system on marine biota, particularly in coastal ecosystems. Besides, we acknowledge here the limitations of PCA in capturing complex ecological relationships, as it might not fully capture nonlinear interactions between the various environmental variables assessed in our study. Also, PCA reduces dimensionality based on variance, which does not always equate to ecological significance (Liu et al., 2018). That being said, the PCA analysis conducted in this study might help future studies to build on our findings. For instance, more targeted studies should be implemented to assess the role of specific variables (like SSS or nutrients) on phytoplankton ecology, or the use of more advanced multivariate techniques, in addition to a longer dataset, to further explore the complex interactions in the marine environment.
Moreover, DIC concentrations were calculated using the empirical relationships “DIC-SSS-SST” from Koffi et al. (2010) and “DIC-SSS-SST-YEAR” from Lefèvre et al. (2021). The obtained RMSE was 161 μmol kg−1 and 138 μmol kg−1 respectively, applying the previously mentioned equations respectively. The resulted RMSE values are considered very high compared to those found in the original studies, using their own data (~15 μmol kg−1). Further, RMSE (DIC-SSS-SST-YEAR) calculated from this study’s data was 59 μmol kg−1, also considered very high. Consequently, it is clear that the classic empirical relationships could not reproduce the concentrations of DIC in coastal areas, as it does not reflect the entire coastal ocean dynamics that impact DIC spatio-temporal variability as presented by Vance et al. (2022).
To highlight how phytoplankton population could be influenced by both biogeochemical and physical parameters variability, a statistical relationship was established between phytoplankton and nutrients, carbonate system and physical variables. For instance, some studies (Voituriez and Herbland, 1984; Herbland and Le Loeuff, 1993) have established statistical relationship between NO3 and SST in the coastal area of the GoG. In our case, we used multiple linear regressions. This relationship couples 3 types of variables (biological, physical and biogeochemical). The calculated pH is included in this equation because it is less scattered. This equation ignores wind speed, vertical and horizontal turbulence of the seawater, the sunshine rate and others meteorological conditions. It represents a useful first-order estimate of seasonal variability in phytoplankton population growth over the studied period. All calculated coefficient values of this Equation 1 are given in Table 2.
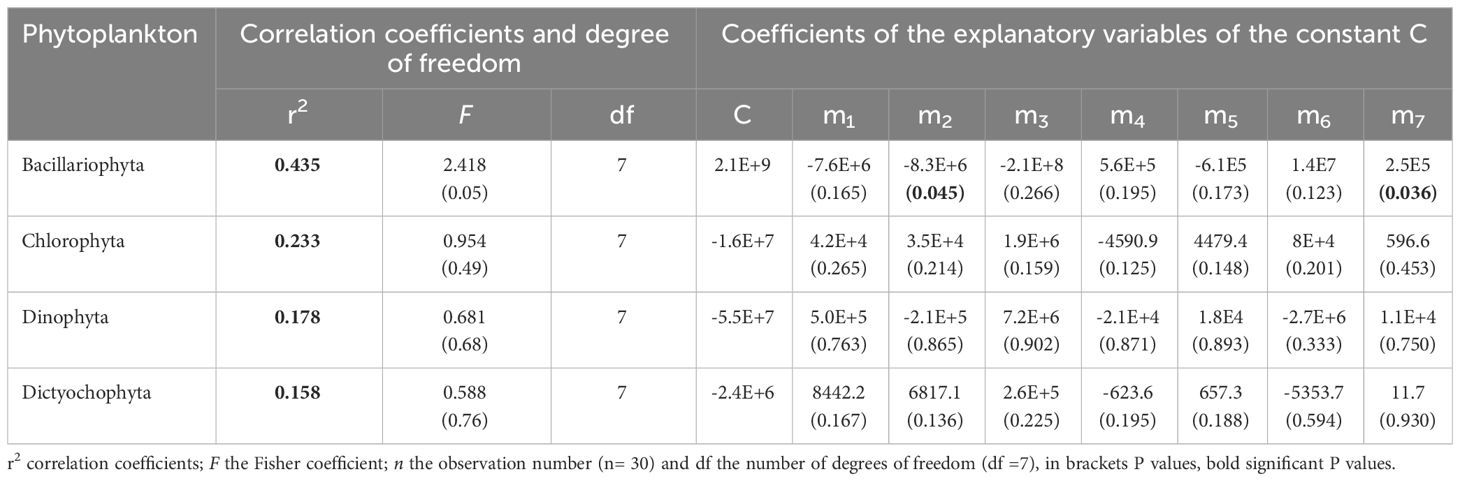
Table 2 Multiple regression coefficients applied to the explanatory variables.
As presented in Table 2, r2 ranges between 0.158 (~15.8%) and 0.435 (~43.5%), reflecting weak correlations for all groups of phytoplankton mentioned. Generally, the physico-chemical parameters studied here influence less than 50% the phytoplankton population growth in this coastal area. Bacillariophyta is the phylum the most impacted positively by the assessed physico-chemical parameters (r2 = 43.5%) and it is significantly correlated with these parameters (Table 2). This phytoplankton group seems well adapted to ocean acidification conditions while Chlorophyta, Dinophyta and Dictyochophyta are poorly adapted to changes in physical and chemical conditions in the coastal ocean. Indeed, the Chlorophyta are primarily living in freshwater and only about 10% of this algae are marine, whereas 90% are freshwater species (Smith, 1955). In the marine environment, the green algae in the warmer tropical waters tend to be similar everywhere in the world. This is not true for Chlorophyta in the colder marine waters (Lee, 2008). In our samples, Pediastrum duplex was the only species that was found belonging to Chlorophyta group. This species lives in freshwater environments, so this can explain its poor adaptation. The warmer waters near the Equator, like in the GoG, act as a geographical barrier for the evolution of new species and genera (Lee, 2008).
Concerning Dinophyta (r2 = 17.8%) and Dictyochophyta (r2 = 15.8%), the correlations were weak and not significant. It seems that physical, biogeochemical and carbonate system variables did not influence these species along the coast. It may be pointed out that the samples were taken in the shallow coastal area and not from deep waters where these species better proliferate under high salinity conditions. Thus, the environmental conditions in the coastal waters were unfavorable to allow high occurrence of these species. These observations were in accordance with the study of Zendong et al. (2016) in the Nigerian coastal waters, close to Côte d’Ivoire.
Several studies (Donahue et al., 2019; Seifert et al., 2020, Seifert et al., 2023) presented that phytoplankton community composition can be significantly affected by changes in environmental conditions. Looking at the Equation 1 when the coefficient of the explanatory is negative (Table 2), the evolution of the parameter of this coefficient is opposite to the phytoplankton density, i.e., when the observed parameter increases, the phytoplankton growth drops and vice-versa. The coefficients of explanatory for SST (m2 = -8.3 106) and NO3 (m7 = 2.5 105) were significant because their p-values were less than 0.05. This means that Bacillariophyta increases concomitantly with NO3 when SST decreases. During upwelling periods, SST drops to less than 24°C. The negative coefficient of explanatory indicates that SST well impacts Bacillariophyta life conditions, as they are generally considered to be better adapted to lower temperatures than other algae (Zhang et al., 2018). In contrast, the negative coefficient of explanatory showed also that the ocean warming could significantly reduce species richness. This results is in agreement with the ones of Tatters et al. (2013) who noted that acidification and temperature had both individual and interactive impacts on community structure, but temperature has more influence.
Furthermore, TA and DIC had little influence on phytoplankton (see Table 2). These parameters are included in the SST and SSS variability as shown by the PCA analysis and in various works (Koffi et al., 2010). Whereas pH (m3 = -2.1 108) had a negative and non-significant effect on diatom in the coastal waters of the GoG, according to the Equation 1. However, Doney et al. (2009) noted that if ocean acidification is expected to exacerbate, pH will decrease and only Bacillariophyta could witness a population growth. Moreover, the potential presence of siliceous or chitinous spines as well as the wide variety of 3D shapes of the frustule would be the result of a process aimed in particular at reducing predation pressures. This physical protection could allow the maintenance and development of these micro-algae, hence their massive presence in aquatic environments (Bussard, 2015). The other phytoplankton populations are suggested to decrease as they present positive coefficient of explanatory (see Table 2). Dutkiewicz et al. (2015) also anticipated primary productivity to decrease in the tropics and mid-latitudes due to intensifying nutrients’ limitation, possibly amplified by exacerbated acidification. They suggested that longer timescales of competition and transport-mediated adjustments are essential for predicting changes to phytoplankton community structure.
Here, the positive coefficient of explanatory of NO3 indicates a similar evolution with Bacillariophyta. It means that Bacillariophyta can store nitrates for respiration in the absence of light because their populations migrate deep into sediments where they are exposed to dark and anoxic conditions for 75% of the day (Merz et al., 2021). So, they can accumulate nitrates intracellularly for surviving in the dark ocean (Kamp et al., 2011) and utilize it for nitrogen assimilation, dissipation of excess photosynthetic energy, and Dissimilatory Nitrate Reduction to Ammonium (Stief et al., 2022). Ecologically, Bacillariophyta are also known to modulate the biogeochemical cycling of nutrients such as carbon, nitrogen, and silica in the ocean (Litchman et al., 2009).
While our initial findings present intriguing insights, there is a clear necessity for refinement. Specifically, the phytoplankton community comprises a diverse assemblage of species spanning various sizes. Our current methodology, particularly the mesh size employed, results in an insufficient representation of picoplankton and nanoplankton. This oversight potentially renders the interpretation of our results as somewhat incomplete, given the competitive dynamics between these organisms for both macro- and micro-nutrients.
4 Conclusions
In our study, we conducted a comprehensive exploration of the CO2 system parameters to shed light on potential ocean acidification signs within the Gulf of Guinea—an often-overlooked region in the Atlantic Ocean. Our primary objective was to unravel potential linkages between physical factors, carbonate system variables, and the intricate marine ecosystem, with a specific emphasis on the phytoplankton community. Complementary seawater parameters, including salinity, temperature, nitrates, and reactive phosphorus, also demonstrated significant variability. Notably, we observed distinct episodes of upwelling, primarily manifesting from early June to early October.
However, the most intriguing revelation from our study was the relatively subdued influence of physicochemical parameters on the phytoplankton population in the coastal expanse of the Gulf of Guinea. Our findings suggest that these parameters collectively accounted for less than 50% of the observed variability. Remarkably, Bacillariophyta, a prominent phytoplankton group, exhibited a notable positive response to the fluctuations in these physicochemical variables.
While our study provides an invaluable foundational understanding of the Gulf of Guinea’s carbonate system, it is essential to acknowledge the temporal and spatial limitations inherent in our research. To embark on a more in-depth exploration of the ramifications of ocean acidification on marine organisms, including phytoplankton and zooplankton, we advocate for the establishment of an expansive observational network. This network should encompass strategic measurement sites along the Ivorian coast, stretching from the Eastern to Western regions. By doing so, we can unravel the intricacies of biogeochemical spatio-temporal dynamics within this vital coastal area and pave the way for a more comprehensive comprehension of its ecological complexities. In addition, using adequate instruments will allow us to improve data collection in the Gulf of Guinea.
Data availability statement
The raw data supporting the conclusions of this article will be made available by the authors, without undue reservation.
Author contributions
KK: Conceptualization, Data curation, Methodology, Validation, Writing – original draft. EK: Methodology, Validation, Writing – original draft. AH: Methodology, Validation, Writing – original draft. YK: Methodology, Validation, Writing – original draft.
Funding
The author(s) declare that financial support was received for the research, authorship, and/or publication of this article. This research was funded by The Ocean Foundation (TOF), for Global Ocean Acidification Network (GOA-ON) a collaborative international network between Mentors and Mentees.
Acknowledgments
We are very grateful to the volunteers who collected the samples during the sampling periods near Jacqueville, Côte d’Ivoire, and to the colleagues who have analyzed DIC and TA parameters at the National Center for Marine Sciences-Batroun, Lebanon. We thank M. KONE Mamadou for his help in python software. Also, we would like to acknowledge the grants provided by the Pier2Peer program to be able to start this observing research in the Gulf of Guinea.
In memoriam
This work is respectfully dedicated in memorium to Drs. Yefalan KONE (Ivorian team member) and Marcellin YAO (P.I. of the project in Côte d’Ivoire), both sadly passed away during the course of this project. Their contributions were invaluable.
Conflict of interest
The authors declare that the research was conducted in the absence of any commercial or financial relationships that could be construed as a potential conflict of interest.
Publisher’s note
All claims expressed in this article are solely those of the authors and do not necessarily represent those of their affiliated organizations, or those of the publisher, the editors and the reviewers. Any product that may be evaluated in this article, or claim that may be made by its manufacturer, is not guaranteed or endorsed by the publisher.
References
Abboud-Abi Saab M., Hassoun A. E. R. (2017). Effects of organic pollution on environmental conditions and the phytoplankton community in the central Lebanese coastal waters with special attention to toxic algae. Reg. Stud. Mar. Sci 10, 38–51. doi: 10.1016/j.rsma.2017.01.003
Abdou Salam A. M., Ba N., Ndour I., Sane S., Thiaw M., Diouf N., et al. (2020). Caractérisation de la flore phytoplanctonique dans l’Aire Marine Protégée (AMP) de Bamboung et de deux sites environnants (Sénégal). Int. J. Biol. Chem. Sci 14, 2452–2462. doi: 10.4314/ijbcs.v14i7.7
Adekunle I. M., Ajijo M. R., Adeofun C. O., Omoniyi I. T. (2010). Response of four phytoplankton species found in some sectors of Nigerian coastal waters to crude oil in controlled ecosystem. Int. J. Environ. Res 4, 65–74.
Amuwo K. (2013). Oil and gas : National sovereignty , foreign interests and local bunkering in the gulf of Guinea ( GoG ). Covenant Univ. J. Polit. Int. Aff 1, 148–178.
Andrié C., Oudot C., Genthon C., Merlivat L. (1986). CO2 fluxes in the tropical Atlantic during FOCAL cruises. J. Geophys. Res 91, 11741–11755. doi: 10.1029/JC091iC10p11741
Belhabib D., Hellebrandt Da Silva D., Allison E. H., Zeller D., Pauly D. (2016). Filling a blank on the map: 60 years of fisheries in Equatorial Guinea. Fish. Manage. Ecol 23, 119–132. doi: 10.1111/fme.12161
Binet D., Le Reste L., Diouf P. S. (1995)The influence of runoff and fluvial outflow on the ecosystems and living resources of West African coastal waters. In: Effects of riverine inputs on coastal ecosystems and fisheries resources (FAO fisheries Technical Paper, No 349). Available online at: https://books.google.com/books?hl=fr&lr=&id=Sqk-O253Q20C&oi=fnd&pg=PA89&ots=PEMdZC62t5&sig=O7lqsV5LpP9IURdey0dc4NkQ-pU (Accessed December 15, 2023).
Bonou F. K., Noriega C., Lefèvre N., Araujo M. (2016). Distribution of CO2 parameters in the western tropical Atlantic Ocean. Dyn. Atmos. Ocean 73, 47–60. doi: 10.1016/j.dynatmoce.2015.12.001
Boutin J., Vergely J.-L., Khvorostyanov D. (2022). SMOS SSS L3 maps generated by CATDS CEC LOCEAN. debias V5.0. SEANOE. doi: 10.17882/52804
Boutin J., Vergely J. L., Marchand S., D’Amico F., Hasson A., Kolodziejczyk N., et al. (2018). New SMOS Sea Surface Salinity with reduced systematic errors and improved variability. Remote Sens. Environ 214, 115–134. doi: 10.1016/j.rse.2018.05.022
Bussard A. (2015) Capacité d’acclimatation des diatomées aux contraintes environnementales (Laboratoire de biologie des organismes et des écosystèmes aquatiques) (Accessed August 14, 2023).
Carstensen J., Klais R., Cloern J. E. (2015). Phytoplankton blooms in estuarine and coastal waters: Seasonal patterns and key species. Estuar. Coast. Shelf Sci 162, 98–109. doi: 10.1016/j.ecss.2015.05.005
Cramer W., Marini K., Guiot J. (2020). Climate and environmental change in the Mediterranean Basin–current situation and risks for the future. First Mediterranean assessment report. doi: 10.5281/ZENODO.4768833
Da-Allada C. Y., Alory G., Du Penhoat Y., Kestenare E., Durand F., Hounkonnou N. M. (2013). Seasonal mixed-layer salinity balance in the tropical Atlantic Ocean: Mean state and seasonal cycle. J. Geophys. Res. Ocean 118, 332–345. doi: 10.1029/2012JC008357
Da-Allada C. Y., Jouanno J., Gaillard F., Kolodziejczyk N., Maes C., Reul N., et al. (2017). Importance of the Equatorial Undercurrent on the sea surface salinity in the eastern equatorial Atlantic in boreal spring. Wiley Online Libr 122, 521–538. doi: 10.1002/2016JC012342
Da Graça Sophia M., Dias I. C. A., De Araújo A. M. (2005). Chlorophyceae and zygnematophyceae from the turvo state forest park, state of Rio Grande do Sul, Brazil. Iheringia - Ser. Bot 60, 25–47.
Dahunsi A. M., Oyikeke T. S., Abdulfatai M. A., Afolabi L. A. (2023). Spatio-temporal assessment of the impacts of the trends in physical and biogeochemical parameters on the primary production of the Gulf of Guinea. Heliyon 9, e13047. doi: 10.1016/j.heliyon.2023.e13047
Dandonneau Y. (1971) Etude du phytoplancton sur le plateau continental de cote d’ivoire. Off Rech Sci Tech Outre Mer, Paris. Cah ORSTOM Ser Ocean. IX n° 2, 247–265.
Dandonneau Y. (1972). Étude du phytoplancton sur le plateau continental. Coh. ORSTOM sér. Océanogr, 267–274.
Dandonneau Y. (1973). Étude du phytoplancton sur le plateau continental de Côte d’Ivoire. III- Facteurs dynamiques et variations spatio-temporelles. Cah ORSTOM Ser Ocean. Off Rech Sci Tech Outre Mer, 431–454. doi: 10.3/JQUERY-UI.JS
Dessier A., Donguy J. R. (1994). The sea surface salinity in the tropical Atlantic between 10°S and 30°N-seasonal and interannual variations, (1977-1989). Deep. Res. Part I 41, 81–100. doi: 10.1016/0967-0637(94)90027-2
Djagoua É.V., Larouche P., Kassi J. B., Affian K., Saley B. (2011). Seasonal and inter-annual variability of the chlorophyll concentration in the coastal area of Gulf of Guinea using SeaWIFS images. Int. J. Remote Sens 32, 3851–3874. doi: 10.1080/01431161003782072
Djakouré S., Araujo M., Hounsou-Gbo A., Noriega C., Bourlès B. (2017a). On the potential causes of the recent Pelagic Sargassum blooms events in the tropical North Atlantic Ocean. Biogeosciences Discuss. 2017, 1–20. doi: 10.5194/bg-2017-346
Djakouré S., Penven P., Bourlès B., Koné V., Veitch J. (2017b). Respective roles of the Guinea current and local winds on the coastal upwelling in the northern Gulf of Guinea. J. Phys. Oceanogr 47, 1367–1387. doi: 10.1175/JPO-D-16-0126.1
Djakouré S., Penven P., Bourlès B., Veitch J., Koné V. (2014). Coastally trapped eddies in the north of the Gulf of Guinea. J. Geophys. Res. Ocean 119, 6805–6819. doi: 10.1002/2014JC010243
DOE (1994). Handbook of methods for the analysis of the various parameters of the carbon dioxide system in sea water. Version 2, Dickson A. G., Goyet C. eds. ORNL/CDIAC-74. U. S. Dep. Energy 1994,187. doi: 10.2172/10107773
Donahue K., Klaas C., Dillingham P. W., Hoffmann L. J. (2019). Combined effects of ocean acidification and increased light intensity on natural phytoplankton communities from two Southern Ocean water masses. J. Plankton Res 41, 30–45. doi: 10.1093/plankt/fby048
Doney S. C., Busch D. S., Cooley S. R., Kroeker K. J. (2020). The impacts of ocean acidification on marine ecosystems and reliant human communities. Annu. Rev. Environ. Resour 45, 83–112. doi: 10.1146/annurev-environ-012320-083019
Doney S. C., Fabry V. J., Feely R. A., Kleypas J. A. (2009). Ocean acidification: The other CO2 problem. Ann. Rev. Mar. Sci 1, 169–192. doi: 10.1146/annurev.marine.010908.163834
Dutkiewicz S., Cermeno P., Jahn O., Follows M. J., Hickman A. A., Taniguchi D. A. A., et al. (2020). Dimensions of marine phytoplankton diversity. Biogeosciences 17, 609–634. doi: 10.5194/bg-17-609-2020
Dutkiewicz S., Morris J. J., Follows M. J., Scott J., Levitan O., Dyhrman S. T., et al. (2015). Impact of ocean acidification on the structure of future phytoplankton communities. Nat. Clim. Change 5, 1002–1006. doi: 10.1038/nclimate2722
Edworthy C., Potts W. M., Dupont S., Duncan M. I., Bornman T. G., James N. C. (2022). A baseline assessment of coastal pH variability in a temperate South African embayment: implications for biological ocean acidification research. African J. Mar. Sci. 44, 367–381. doi: 10.2989/1814232X.2022.2147999
Foltz G. R., McPhaden M. J. (2008). Seasonal mixed layer salinity balance of the tropical North Atlantic Ocean. J. Geophys. Res. Ocean 113. doi: 10.1029/2007JC004178
Francis Abiodun T., Mohammed Yakubu Dahiru C. (2020). Maritime insecurity in the gulf of Guinea (GoG) and the quest for security intelligence deployment in combating the menace. International Journal of Advanced Academic Research. 6, 79–99.
Friedlingstein P., O’sullivan M., Jones M. W., Andrew R. M., Gregor L., Hauck J., et al. (2022). Global carbon budget 2022. Earth Syst. Sci. Data 14, 4811–4900. doi: 10.5194/essd-14-4811-2022
Garcia H., Weathers K., Paver C., Smolyar I., Boyer T., Locarnini M., et al. (2019). World Ocean Atlas 2018. Vol. 4: Dissolved Inorganic Nutrients (phosphate, nitrate and nitrate+nitrite, silicate). doi: 10.18142/228
Gattuso J., Hansson L. (2011) Ocean acidification (USA: Oxford University Press). Available online at: https://books.google.com/books?hl=fr&lr=&id=8yjNFxkALjIC&oi=fnd&pg=PP1&ots=NjoXKN5l:&sig=t7xlxn4suEGF1IGogL-ckRNt2jY (Accessed January 15, 2024). Renewable Resources Journal.
Glibert P. M., Icarus Allen J., Artioli Y., Beusen A., Bouwman L., Harle J., et al. (2014). Vulnerability of coastal ecosystems to changes in harmful algal bloom distribution in response to climate change: Projections based on model analysis. Glob. Change Biol 20, 3845–3858. doi: 10.1111/gcb.12662
Hardman-Mountford N. J., McGlade J. M. (2002). 6 Defining ecosystem structure from natural variability: Application of principal components analysis to remotely sensed SST. Large Mar. Ecosyst 11, 67–82. doi: 10.1016/S1570-0461(02)80028-3
Hargraves P. E. (1998). Identifying marine phytoplankton. Eos Trans. Am. Geophys. Union 79, 99–99. doi: 10.1029/98EO00066
Hassoun A. E. R., Fakhri M., Raad N., Abboud-Abi Saab M., Gemayel E., De Carlo E. H. (2019). The carbonate system of the Eastern-most Mediterranean Sea, Levantine Sub-basin: Variations and drivers. Deep. Res. Part II Top. Stud. Oceanogr 164, 54–73. doi: 10.1016/j.dsr2.2019.03.008
Hassoun A. E. R., Gemayel E., Krasakopoulou E., Goyet C., Abboud-Abi Saab M., Guglielmi V., et al. (2015). Acidification of the Mediterranean Sea from anthropogenic carbon penetration. Deep. Res. Part I Oceanogr. Res. Pap 102, 1–15. doi: 10.1016/j.dsr.2015.04.005
Henson S. A., Cael B. B., Allen S. R., Dutkiewicz S. (2021). Future phytoplankton diversity in a changing climate. Nat. Commun 12, 1–8. doi: 10.1038/s41467-021-25699-w
Herbland A., Le Loeuff P. (1993)“Les sels nutritifs au large de la Côte d’Ivoire,”. In: Environnement et ressources aquatiques de Côte d’Ivoire. Tome I - Le milieu marin. Available online at: https://www.documentation.ird.fr/hor/fdi:37712 (Accessed December 21, 2023).
Hoagland K. D., Zlotsky A., Peterson C. G. (1986). The source of algal colonizers on rock substrates in a freshwater impoundment. Stud. Environ. Sci 28, 21–39. doi: 10.1016/S0166-1116(08)72168-X
Jones P. J. (1994). Biodiversity in the gulf of Guinea: an overview. Biodivers. Conserv 3, 772–784. doi: 10.1007/BF00129657
Kamp A., De Beer D., Nitsch J. L., Lavik G., Stief P. (2011). Diatoms respire nitrate to survive dark and anoxic conditions. Proc. Natl. Acad. Sci. U. S. A 108, 5649–5654. doi: 10.1073/pnas.1015744108
Koffi U., Kouadio G., Kouadio Y. K. (2016). Estimates and variability of the air-sea CO2 fluxes in the gulf of Guinea during the 2005-2007 period. Open J. Mar. Sci 06, 11–22. doi: 10.4236/ojms.2016.61002
Koffi U., Lefèvre N., Kouadio G., Boutin J. (2010). Surface CO2 parameters and air-sea CO2 flux distribution in the eastern equatorial Atlantic Ocean. J. Mar. Syst 82, 135–144. doi: 10.1016/j.jmarsys.2010.04.010
Komoé K. (2010) Distribution du phytoplancton dans le complexe lagunaire de Grand-Lahou en Côte d’Ivoire (Accessed December 21, 2023). Thèse Dr.
Konan E. S. (2014) Distribution spatio-temporelle du peuplement phytoplanctonique en relation avec les facteurs abiotiques de la lagune de Fresco. Available online at: https://scholar.google.com/scholar?q=Distribution+spatio-temporelle+du+peuplement+phytoplanctonique+en+relation+avec+les+facteurs+abiotiques+de+la+lagune+de+FrescoDistribution+spatio-temporelle+du+&hl=fr&as_sdt=0,5 (Accessed December 21, 2023). Thèse Dr. unique.
Kruk C., Mazzeo N., Lacerot G., Reynolds C. S. (2002). Classification schemes for phytoplankton: A local validation of a functional approach to the analysis of species temporal replacement. J. Plankton Res 24, 901–912. doi: 10.1093/plankt/24.9.901
Lee R. E. (2008). Phycology. fourth edition. Cambridge University Press. doi: 10.1017/CBO9780511812897
Lefèvre N. (2009). Low CO2 concentrations in the Gulf of Guinea during the upwelling season in 2006. Mar. Chem 113, 93–101. doi: 10.1016/j.marchem.2009.01.001
Lefèvre N., Guillot A., Beaumont L., Danguy T. (2008). Variability of fCO2 in the Eastern Tropical Atlantic from a moored buoy. J. Geophys. Res. Ocean 113. doi: 10.1029/2007JC004146
Lefèvre N., Mejia C., Khvorostyanov D., Beaumont L., Koffi U. (2021). Ocean circulation drives the variability of the carbon system in the eastern tropical atlantic. Oceans 2, 126–148. doi: 10.3390/oceans2010008
Litchman E., Klausmeier C. A., Yoshiyama K. (2009). Contrasting size evolution in marine and freshwater diatoms. Proc. Natl. Acad. Sci. U. S. A 106, 2665–2670. doi: 10.1073/pnas.0810891106
Liu L. T., Dobriban E., Singer A. (2018). ePCA: High dimensional exponential family PCA. Ann. Appl. Stat 12, 2121–2150. doi: 10.1214/18-AOAS1146
Liutti C. C., Kerr R., Monteiro T., Orselli I. B. M., Ito R. G., Garcia C. A. E. (2021). Sea surface CO2 fugacity in the southwestern South Atlantic Ocean: An evaluation based on satellite-derived images. Mar. Chem 236. doi: 10.1016/j.marchem.2021.104020
Longhurst A., Gallardo Y. (1966) A review of the oceanography of the Gulf of Guinea. Available online at: https://www.documentation.ird.fr/hor/fdi:010027608 (Accessed August 11, 2020).
Marcellin Yao K., Marcou O., Goyet C., Guglielmi V., Touratier F., Savy J. P. (2016). Time variability of the north-western Mediterranean Sea pH over 1995-2011. Mar. Environ. Res. 116, 51–60. doi: 10.1016/j.marenvres.2016.02.016
Merz E., Dick G. J., de Beer D., Grim S., Hübener T., Littmann S., et al. (2021). Nitrate respiration and diel migration patterns of diatoms are linked in sediments underneath a microbial mat. Environ. Microbiol 23, 1422–1435. doi: 10.1111/1462-2920.15345
Millero F. J., Lee K., Roche M. (1998). Distribution of alkalinity in the surface waters of the major oceans. Mar. Chem. 60, 111–130. doi: 10.1016/S0304-4203(97)00084-4
Moore S. K., Johnstone J. A., Banas N. S., Salathé E. P. (2015). Present-day and future climate pathways affecting Alexandrium blooms in Puget Sound, WA, USA. Harmful Algae 48, 1–11. doi: 10.1016/j.hal.2015.06.008
Naselli-Flores L., Padisák J. (2023). Ecosystem services provided by marine and freshwater phytoplankton. Hydrobiologia 850, 2691–2706. doi: 10.1007/s10750-022-04795-y
Nieto K., Mélin F. (2017). Variability of chlorophyll-a concentration in the Gulf of Guinea and its relation to physical oceanographic variables. Prog. Oceanogr 151, 97–115. doi: 10.1016/j.pocean.2016.11.009
Nubi O., Bourlès B., Edokpayi C., Hounkonnou N. (2014). Influence of equatorial upwelling on biological productivity in the eastern equatorial Atlantic. Doc. Nubi B Bourlès CA Edokpayi NM Hounkonnou J. Biodivers. Environ. Sci 4, 72–80.
Nubi O. A., Bourlès B., Edokpayi C. A., Hounkonnou M. N. (2016). On the Nutrient distribution and phytoplankton biomass in the Gulf of Guinea equatorial band as inferred from In-situ measurements. J. Oceanogr. Mar. Sci 7, 1–11. doi: 10.5897/JOMS
Nubi O. A., Oyatola O., Bonou F. (2019). Spatial variability in autumnal equatorial upwelling intensity within the Gulf of Guinea as inferred from in situ measurements. J. Oceanogr. Mar. Sci 10, 1–10. doi: 10.5897/JOMS
Nyadjro E. S., Foli B. A. K., Agyekum K. A., Wiafe G., Tsei S. (2022). Seasonal Variability of Sea Surface Salinity in the NW Gulf of Guinea from SMAP Satellite. Remote Sens. Earth Syst. Sci. 5, 83–94. doi: 10.1007/s41976-021-00061-2
Okafor-Yarwood I. (2019). Illegal, unreported and unregulated fishing, and the complexities of the sustainable development goals (SDGs) for countries in the Gulf of Guinea. Mar. Policy 99, 414–422. doi: 10.1016/j.marpol.2017.09.016
Omura T., Iwataki M., Valeriano M. B., Haruyoshi T. (2012) Marine phytoplankton of the Western Pacific (Kouseisha Kouseikaku Co. Ltd). Available online at: https://scholar.google.com/scholar?hl=fr&as_sdt=0%2C5&q=Takuo+O.%2C+Mitsunori+I.%2C+Valeriano+M.B.%2C+Haruyoshi+T.+et+Yasuwo+F.%2C+2012.+Marine+Phytoplankton+of+the+western+Pacific.160+p.&btnG (Accessed December 21, 2023).
OUDOT C., Ternon J.-F. F., LECOMTE J. (1995). Measurements of atmospheric and oceanic CO2 in the tropical Atlantic: 10 years after the 1982-1984 FOCAL cruises. Tellus B 47, 70–85. doi: 10.1034/j.1600-0889.47.issue1.8.x
Parard G., Lefévre N., Boutin J. (2010). Sea water fugacity of CO2 at the PIRATA mooring at 6°S, 10°W. Tellus Ser. B Chem. Phys. Meteorol 62, 636–648. doi: 10.1111/j.1600-0889.2010.00503.x
Perry R. I., Sumaila U. R. (2007). Marine ecosystem variability and human community responses: The example of Ghana, West Africa. Mar. Policy 31, 125–134. doi: 10.1016/j.marpol.2006.05.011
Pierrot D., Lewis E., Wallace D. (2006) MS Excel Program Developed for CO2 System CalculationsProgram developed for CO2 system calculations (ORNL/CDIAC-105a). Available online at: https://cir.nii.ac.jp/crid/1362544418739093760 (Accessed August 23, 2023).
Reynolds R. W., Smith T. M., Liu C., Chelton D. B., Casey K. S., Schlax M. G. (2007). Daily high resolution-blended analyses for sea surface temperature. J. Clim. 20, 5473–5496. doi: 10.1175/2007JCLI1824.1
Rodier J., Legube B., Merlet N., Brunet R., Mialocq J. C. (2009) L’analyse de l’eau-9e edition: eaux naturelles, eaux résiduaires, eaux de mer (Dunod). Available online at: https://scholar.google.com/scholar?hl=en&as_sdt=0%2C5&q=rodier%3A+l%27analyse+de+l%27eau-9e+edition%3A+eaux+naturelles%2C+eaux+residuaires%2C+eaux+de+mer&btnG (Accessed February 16, 2023).
Santana-Casiano J. M., González-Dávila M. (2011). ““pH decrease and effects on the chemistry of seawater,”,” in Oceans and the Atmospheric Carbon Content (Springer, Netherlands), 95–114. doi: 10.1007/978-90-481-9821-4_5
Scheren P. A., Ibe A. C., Janssen F. J., Lemmens A. M. (2002). Environmental pollution in the Gulf of Guinea - A regional approach. Mar. pollut. Bull 44, 633–641. doi: 10.1016/S0025-326X(01)00305-8
Scheren P. A. G. M., Kroeze C., Janssen F. J. J. G., Hordijk L., Ptasinski K. J. (2004). Integrated water pollution assessment of the Ebrié Lagoon, Ivory Coast, West Africa. J. Mar. Syst 44, 1–17. doi: 10.1016/j.jmarsys.2003.08.002
Seifert M., Nissen C., Rost B., Vogt M., Völker C., Hauck J. (2023). Interaction matters: Bottom-up driver interdependencies alter the projected response of phytoplankton communities to climate change. Glob. Chang. Biol. 29, 4234–4258. doi: 10.1111/gcb.16799
Seifert M., Rost B., Trimborn S., Hauck J. (2020). Meta-analysis of multiple driver effects on marine phytoplankton highlights modulating role of pCO2. Glob. Change Biol 26, 6787–6804. doi: 10.1111/gcb.15341
Sevrin-Reyssac J. (1993). Phytoplancton et production primaire dans les eaux marines ivoiriennes (Côte d’Ivoire Bull. I.F.: Environ. ressources Aquat), 869–981.
Shayestehfar A., Noori M., Shirazi F. (2010). Environmental factor effects on the seasonally changes of zooplankton density in Parishan Lake (Khajoo Spring site), Iran. Asian J. Exp. Biol. Sci 1, 840–844.
Silva C. A. R., de Godoy Fernandes L. V., de Souza F. E. S., Marotta H., da Costa Fernandes F., Mello T. M. S., et al. (2023). Carbonate system in the Cabo Frio upwelling. Sci. Rep 13, 1–16. doi: 10.1038/s41598-023-31479-x
Smith G. M. (1955) CRYPTOGAMIC BOTANY : Volume I, Algae and Fungi. Available online at: https://www.abebooks.com/CRYPTOGAMIC-BOTANY-Volume-Algae-Fungi-2nd/3194038916/bd (Accessed August 14, 2023). Near Fine Hardcover (1955) 2nd Revised Edition, First Thus | 100POCKETS.
Stief P., Schauberger C., Lund M. B., Greve A., Abed R. M. M., Al-Najjar M. A. A., et al. (2022). Intracellular nitrate storage by diatoms can be an important nitrogen pool in freshwater and marine ecosystems. Commun. Earth Environ 3, 1–11. doi: 10.1038/s43247-022-00485-8
Subramaniam A., Mahaffey C., Johns W., Mahowald N. (2013). Equatorial upwelling enhances nitrogen fixation in the Atlantic Ocean. Geophys. Res. Lett. 40, 1766–1771. doi: 10.1002/grl.50250
Sun Y., Youn S. H., Oh H. J., Joo H. T., Kim Y., Kang J. J., et al. (2022). Spatial and temporal distribution of phytoplankton community in relation to environmental factors in the southern coastal waters of Korea. Front. Mar. Sci 9. doi: 10.3389/fmars.2022.950234
Sun X., Zhang H., Wang Z., Huang T., Huang H. (2023). Phytoplankton community response to environmental factors along a salinity gradient in a seagoing river, Tianjin, China. Microorganisms 11. doi: 10.3390/microorganisms11071638
Takahashi T., Sutherland S. C., Wanninkhof R., Sweeney C., Feely R. A., Chipman D. W., et al. (2009). Climatological mean and decadal change in surface ocean pCO 2, and net sea–air CO 2 flux over the global oceans. Deep Sea Res. Part II Top. Stud. Oceanogr. 56, 554–577. doi: 10.1016/j.dsr2.2008.12.009
Tatters A. O., Roleda M. Y., Schnetzer A., Fu F., Hurd C. L., Boyd P. W., et al. (2013). Short- and long-term conditioning of a temperate marine diatom community to acidification and warming. Philos. Trans. R. Soc B Biol. Sci 368. doi: 10.1098/rstb.2012.0437
Theriot E., Herbarium D., Round F. E., Crawford R. M., Mann D. G. (1992). The diatoms. Biology and morphology of the genera. Syst. Biol 41, 125. doi: 10.2307/2992511
Tilbrook B., Jewett E. B., DeGrandpre M. D., Hernandez-Ayon J. M., Feely R. A., Gledhill D. K., et al. (2019). An enhanced ocean acidification observing network: From people to technology to data synthesis and information exchange. Front. Mar. Sci 6. doi: 10.3389/fmars.2019.00337
Ukwe C. N., Ibe C. A., Alo B. I., Yumkella K. K. (2003). Achieving a paradigm shift in environmental and living resources management in the Gulf of Guinea: The large marine ecosystem approach. in. Mar. Pollut. Bull, 219–225. doi: 10.1016/S0025-326X(02)00473-3
Uthermöhl H. (1958). Zur Vervollkommung der quantitativen phytoplankton-metodik Mitteilung. Int. Vereinigung fuer Theor. unde Amgewandte Limnol 1, 38.
Vance J. M., Currie K., Zeldis J., Dillingham P. W., Law C. S. (2022). An empirical MLR for estimating surface layer DIC and a comparative assessment to other gap-filling techniques for ocean carbon time series. Biogeosciences 19, 241–269. doi: 10.5194/bg-19-241-2022
Van den Broeck N., Moutin T. (2002). Phosphate in the sediments of the Gulf of Lions (NW Mediterranean Sea), relationship with input by the river Rhone. Hydrobiologia 472, 85–94. doi: 10.1023/A:1016308931115
Verstraete J. M. (1992). The seasonal upwellings in the Gulf of Guinea. Prog. Oceanogr 29, 1–60. doi: 10.1016/0079-6611(92)90002-H
Voituriez B., Herbland A. (1984). Signification de la relation nitrate/température dans l’upwelling équatorial du Golfe de Guinée. Oceanol. Acta 7, 169–174.
Zendong Z., Kadiri M., Herrenknecht C., Nézan E., Mazzeo A., Hess P. (2016). Algal toxin profiles in Nigerian coastal waters (Gulf of Guinea) using passive sampling and liquid chromatography coupled to mass spectrometry. Toxicon 114, 16–27. doi: 10.1016/j.toxicon.2016.02.011
Keywords: ocean acidification, Gulf of Guinea, biota, phytoplankton, Atlantic Ocean
Citation: Koffi KU, Konan ES, Hassoun AEIR and Kouadio Y (2024) Relationship between the carbonate system and phytoplankton community in the Gulf of Guinea-Africa. Front. Mar. Sci. 11:1286338. doi: 10.3389/fmars.2024.1286338
Received: 31 August 2023; Accepted: 13 March 2024;
Published: 27 March 2024.
Edited by:
Antonio Mannino, National Aeronautics and Space Administration, United StatesReviewed by:
Joaquim I. Goes, Columbia University, United StatesAndréa Carvalho, Federal University of Ceara, Brazil
Copyright © 2024 Koffi, Konan, Hassoun and Kouadio. This is an open-access article distributed under the terms of the Creative Commons Attribution License (CC BY). The use, distribution or reproduction in other forums is permitted, provided the original author(s) and the copyright owner(s) are credited and that the original publication in this journal is cited, in accordance with accepted academic practice. No use, distribution or reproduction is permitted which does not comply with these terms.
*Correspondence: Kouakou Urbain Koffi, urban.koffi@gmail.com