Sedimentary processes in the bottom boundary layer of a contourite drift in the northern South China Sea
 Longwei Wu
 Yulong Zhao
 Zhifei Liu
 Pengfei Ma
 Yanwei Zhang
- State Key Laboratory of Marine Geology, Tongji University, Shanghai, China
Ocean dynamic processes in the bottom boundary layer (BBL) are crucial for sedimentation, such as deposition and resuspension of marine sediments. In this study, we conducted in-situ tripod observations of the sediment ridge of a contourite drift in the northern South China Sea to understand the main dynamic processes affecting sedimentation on the contourite drifts. It was found that the diurnal tidal current was the strongest current at the study site, thus acting as the main dynamic affecting sedimentation processes. Periodic events of elevated suspended sediment concentration (SSC) were observed, some of which occurred only within 15 m above the seafloor and were termed near-bottom high SSC events, while others covered the entire range of the observed water column and were termed full-depth high SSC events. In-situ sediment resuspension at the sediment ridge is not an important factor affecting the formation of high SSC events. Rather, these high SSC events were mainly caused by lateral transport of sediments from the main body of the contourite drift by the northwestward diurnal tidal currents. The seafloor sediments at the main drift body are resuspened owing to the near-critical reflection of diurnal tidal currents on the slope topography of the drift. During periods when diurnal tidal currents were weak, locally generated internal waves could also induce burst-like full-depth high SSC events. This study highlights the diurnal tidal current as the main dynamic regulating the sedimentary processes of the contourite drifts in regions where the near-critical reflection prone to occur, implying the complexity of sediment dynamics of contourite drifts.
1 Introduction
The oceanic bottom boundary layer (BBL) is the part of the water column directly affected by the drag of ocean currents on the seafloor, typically with a thickness on the order of meters to tens of meters. The BBL is an important interface for the exchange of particles, chemicals, and biomass between the surface sediments and the overlying water column, through which the particulate matter from the interior of the ocean must pass before settling on the seafloor to form sediments (Grant and Madsen, 1986; Trowbridge and Lentz, 2018). Most sediment dynamic processes in the oceanic environment occur within the BBL, such as: sediment resuspension (Beaulieu and Baldwin, 1998; Villacieros-Robineau et al., 2019), intermittent movement of bottom sediments (Butman et al., 1979), and formation of bottom nepheloid layers due to elevated suspended sediment concentrations (SSC) (McCave, 1986; Churchill et al., 1988; Urban et al., 2004; Gardner et al., 2018; Tian et al., 2019). Such sediment dynamic processes in the BBL have a major impact on seafloor topography and landforms by shaping slope topography (Cacchione, 2002), and forming deep-water contourite depositional systems and sediment waves (Hernández-Molina et al., 2011; Reeder et al., 2011; Rebesco et al., 2014).
The active sedimentary activities in the BBL are directly related to the ocean dynamical processes at multiple scales. Observations have shown that various physical processes, such as tides (Stow et al., 2002; He et al., 2008; Zhao et al., 2019), seasonal current reversals (DeMadron and Weatherly, 1994; Gao et al., 1998), mesoscale eddies (Zhang et al., 2014), internal waves (Hosegood and Van Haren, 2004; Pomar et al., 2012; Shanmugam, 2013; Shanmugam, 2014), and deep-sea storms (Hollister et al., 1974; Nowell and Hollister, 1985; Hollister, 1993) can affect sedimentation in the BBL. The energy and momentum carried by those oceanic dynamical processes can be strongly dissipated in the BBL (McWilliams, 2005), leading to an increase in current velocity and shear stress (Wang C. et al., 2022), causing resuspension (Quaresma et al., 2007; Schaeffer et al., 2013; Sun et al., 2016) and even intermittent movement of sediments on the seafloor (Butman et al., 1979). Among many other processes, tidal activity, both barotropic and baroclinic, has a strong influence on turbulent mixing in the BBL. Internal tides generated near Hawaii have caused a 10-fold increase of the turbulent dissipation rate in the BBL (Rudnick et al., 2003). Observations have shown that the tide-induced enhancement of turbulent mixing is a key mechanism shaping the slope topography (Cacchione, 2002) and even driving the global overturning circulation (Ledwell et al., 2000). Such strong mixing in the BBL has broken the stratification (Kineke et al., 1996), led to an increase in SSC (Li et al., 2018; Wang H et al., 2022) and the formation of the bottom nepheloid layer (Ribbe and Holloway, 2001). The internal wave is another important factor affecting sediment suspension and transport within the BBL. The interaction between internal waves and the BBL triggers resuspension (Zulberti et al., 2020) and vertical pumping of sediments into the water column (Bogucki et al., 1997; Stastna and Lamb, 2002). However, most observations focusing on the mechanism of the influence of ocean dynamic processes, such as tides and internal waves, on sediment dynamics in the BBL have been conducted on continental shelves or in shallow seas. Little attention has been paid to the sediment dynamics of the BBL in the deep-sea environment.
The South China Sea is characterized by active dynamical processes and strong deep-water mixing (Sun et al., 2016; Yang et al., 2016). Previous studies have shown that multiple oceanic processes, such as tides, nonlinear internal waves, and mesoscale eddies, have a remarkable influence on diapycnal mixing in the deep South China Sea, making it 1–2 orders of magnitude higher than that in the Pacific Ocean (Sun et al., 2016; Yang et al., 2016; Wang et al., 2019). Such active ocean processes and strong turbulent mixing lead to active sedimentary processes in the deep South China Sea (Reeder et al., 2011; Zhang et al., 2014; Chen et al., 2016; Chen et al., 2019), providing an ideal natural laboratory to observe the sediment dynamics of the BBL. In this study, in situ observational data obtained by a tripod deployed on the contourite drift southeast of Dongsha Islands in the South China Sea are used to investigate the sedimentary processes of the BBL and to explore the effects of tides, internal waves, and other oceanic processes on sediment resuspension, with the aim of providing new clues for understanding the sediment dynamic processes involved in the formation of deep-water contourite drifts.
2 Data and methods
2.1 Tripod observation
The contourite drift, located about 150 km southeast of the Dongsha Islands in the northern South China Sea (Figure 1A), is a typical elongated mounded drift, with an average width of about 17 km (Yin et al., 2019). A moat of 300-m deep is formed between the contourite drift and the seamount to its north. This contourite drift has been investigated previously using the seismic reflection profiles and several deep-sea sediment cores have been collected on the drift (Sarnthein et al., 1994; Wong et al., 1994; Shao et al., 2001; Lüdmann et al., 2005; Laj et al., 2005; Shao et al., 2007). The sedimentation rate on the ridge adjacent to the moat of this drift has reached ~ 100 cm/kyr since the Holocene (Shao et al., 2007), which is much higher than the average sedimentation rate in the northern South China Sea, indicating its active sedimentation activity. Based on current mooring observations, Zhou et al. (2020) found that the counterclockwise Deep Western Boundary Current, which flows westward at the northern border and southward at the western border of the South China Sea at an average velocity of 1–4 cm/s, is the main background flow in the South China Sea below 2000 m. Such currents, as well as the mesoscale eddies and tidal activities, can strongly affect sedimentary processes over the contourite drifts in the northern South China Sea (Zhang et al., 2014; Zhao et al., 2015; Chen et al., 2019; Zhao et al., 2019). Zhao et al. (2019) showed that seasonal variations of tidal currents play a key role in regulating deep water mixing and sediment resuspension on the seafloor. Here, an instrumented bottom tripod was deployed on the ridge of this contourite drift (20°07.9716′ N, 117°28.4022′ E, water depth 1858 m, Figure 1B), using the CSSF ROPOS remotely operated vehicle (ROV) during the KK1803 cruise of R/V Tan Kah-Kee in 2018. The tripod was deployed on April 23 and recovered on May 8, 2018, with a total observation time of ~ 15 days. An upward-looking Teledyne RDI Workhorse Sentinel 300 kHz acoustic doppler current profiler (ADCP) was mounted on the tripod, with the center of the transducer beams ~ 65 cm above the seafloor. The ADCP was set up with the following parameters: water bin size of 4 m, 25 bins in total, sampling interval of 2 min, and 120 pings per sample. The ADCP was used to record high-resolution changes in deep-sea currents and suspended sediment concentration (SSC) in the water column within 100 m above the seafloor (masf). A 23-cm long sediment core (SD-A-7) was collected in the immediate vicinity of the tripod using the ROV manipulators.
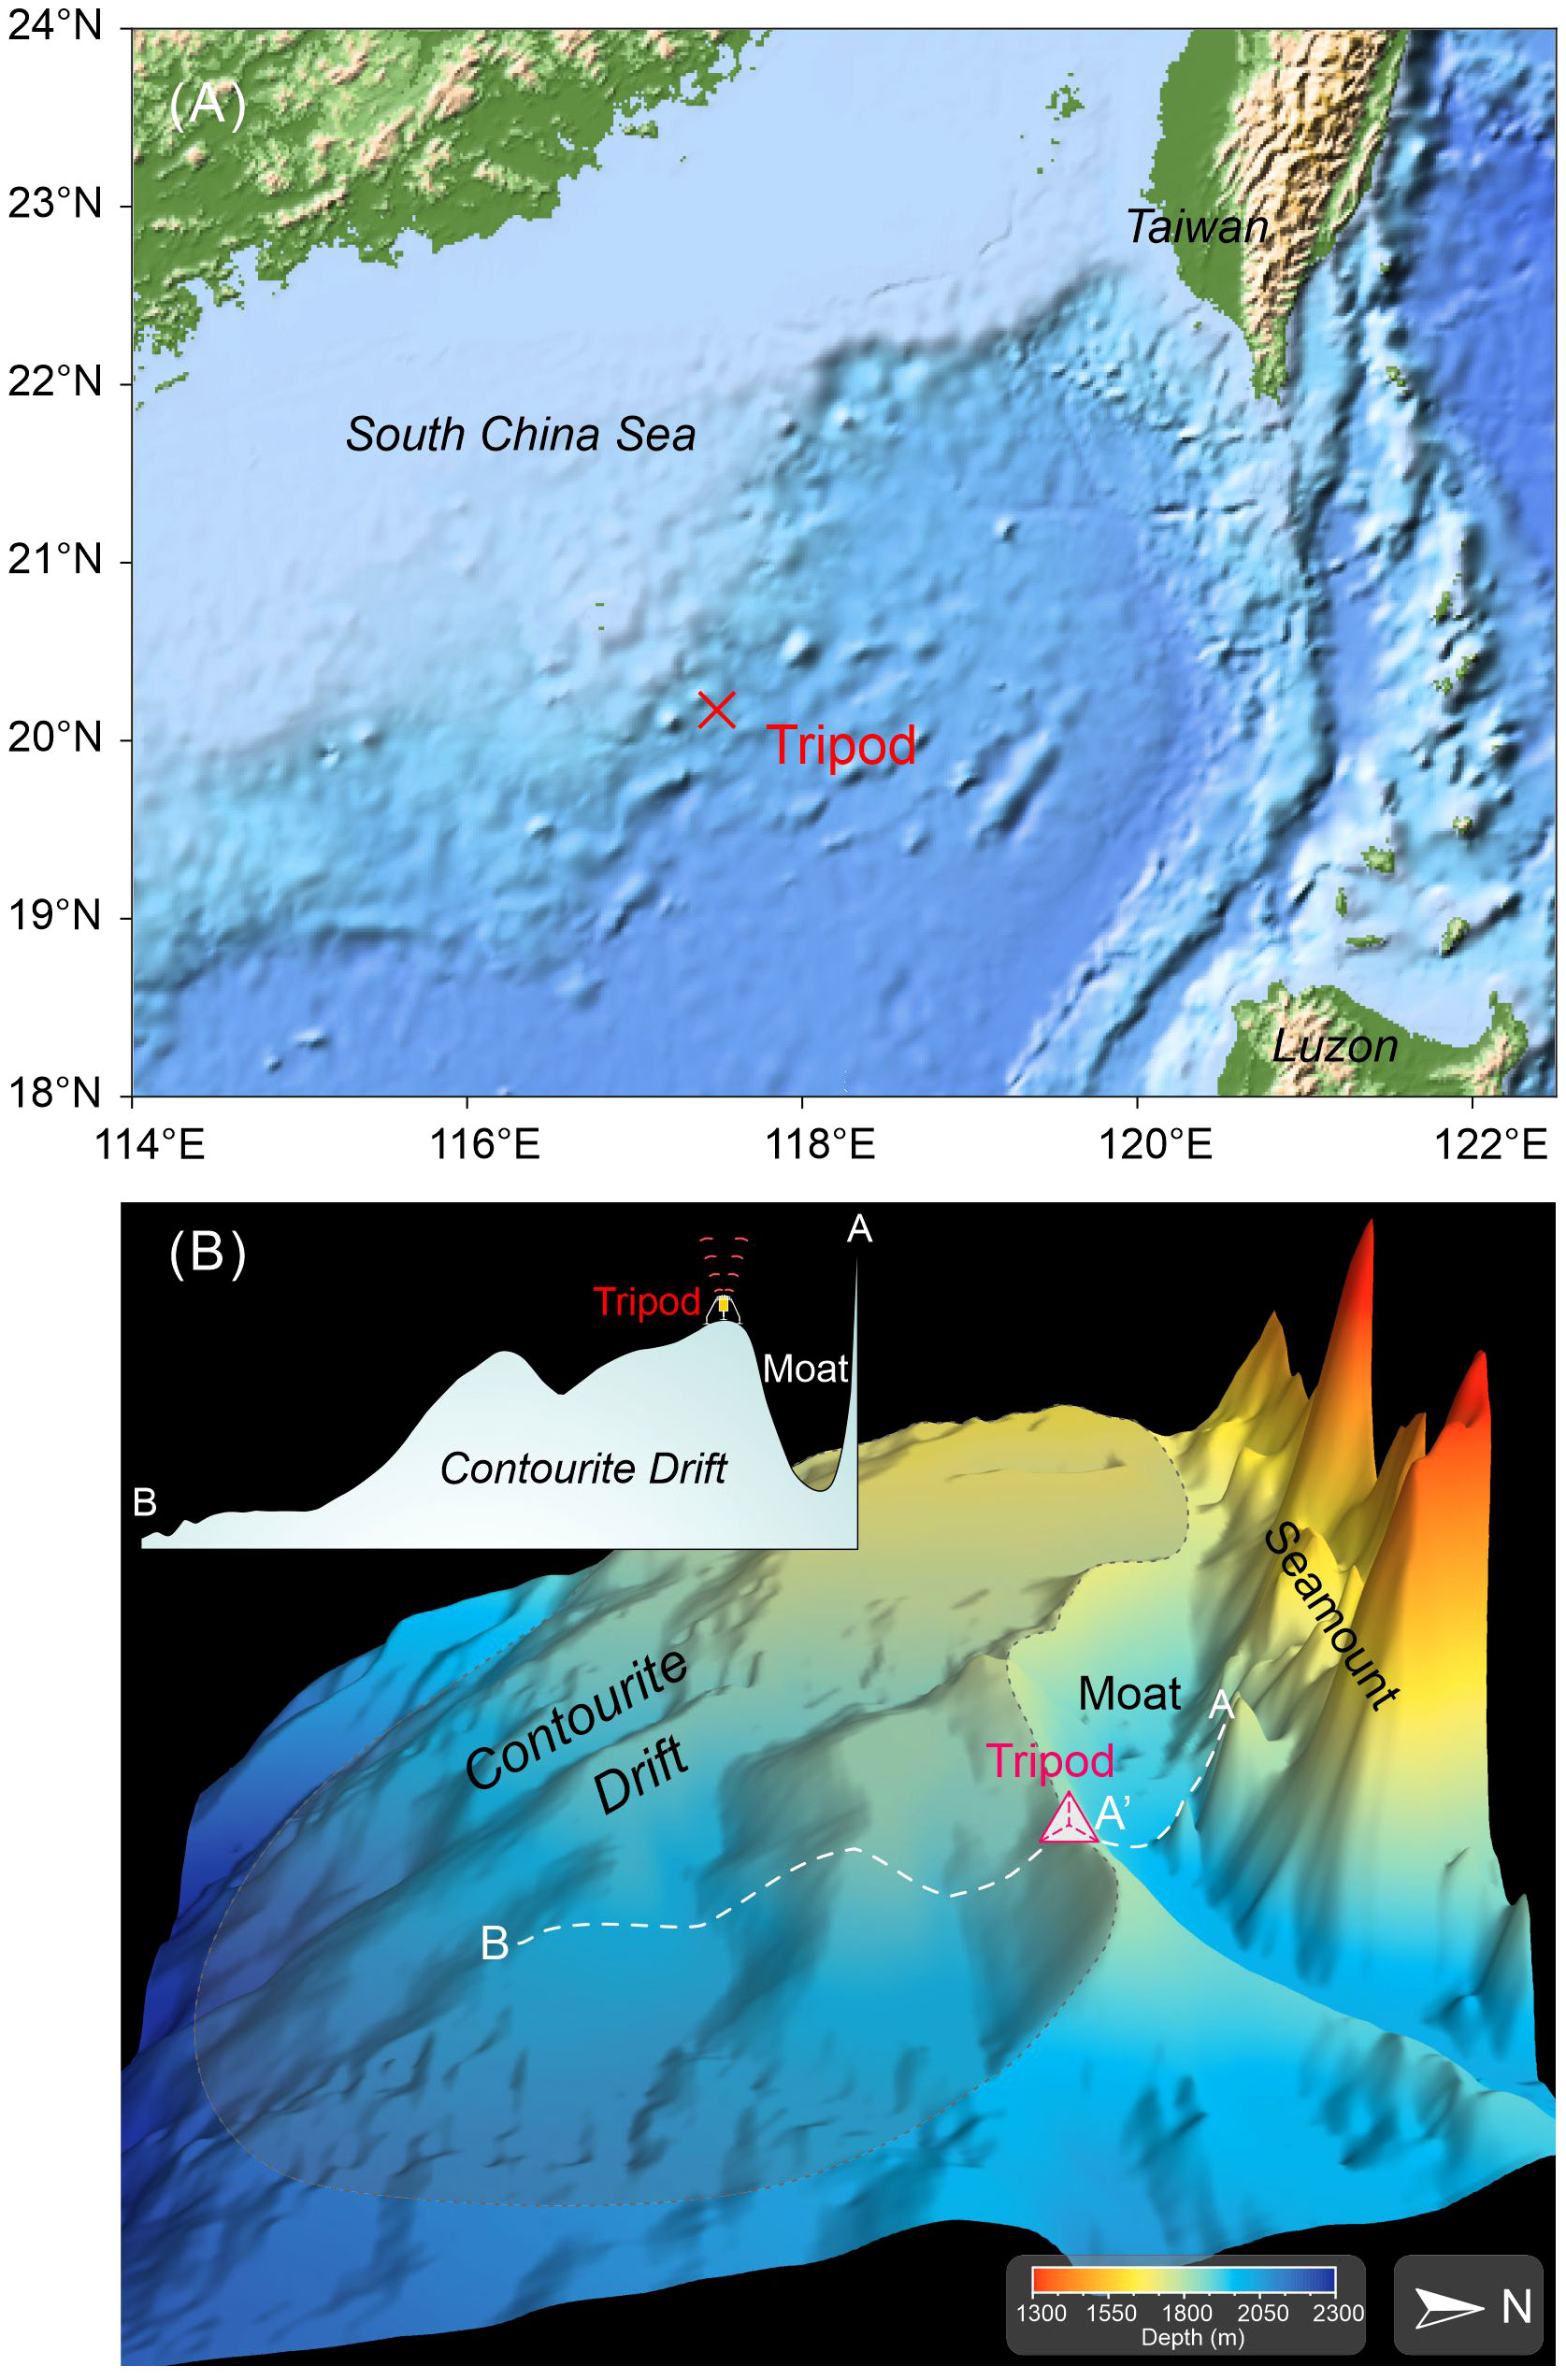
Figure 1 The 3D view of the contourite drift southeast off Dongsha Island showing the location of the tripod. The shaded area shows the approximate extent of the contourite drift. The inset in the upper left corner shows transect (A, B). The geographical location of the contourite drift can be found in Zhao et al. (2015).
2.2 Processing of ADCP data
The original dataset includes data collected during the descent and ascent of the ROV, as well as the period when the sediments on the seafloor were heavily disturbed by landing of the tripod. To ensure the accuracy of the results, these data points must be eliminated from the data set. In addition, due to attenuation of the acoustic signals, some data points at the distal end are flagged as “bad” by the manufacturer’s QA/QC program (Symonds, 2006) and are also eliminated. Water bins with more than 50% invalid data are completely excluded from the dataset to ensure continuity of results. By performing these steps, the valid depth range for ADCP observations is limited to 1790–1854 m (68–4 masf), and the valid time range is between 14:00 UTC on April 23 and 23:00 UTC on May 7, 2018.
2.2.1 Extraction of tidal signals
A fourth-order Butterworth bandpass filter with cutoff frequencies of [1/30, 1/20] cph (cycles per hour) and [3/40, 11/120] cph was applied to the raw ADCP data to obtain the variability of diurnal and semidiurnal tidal currents. Tidal harmonic analysis was performed on the depth-averaged current velocities using the T_TIDE MATLAB program package (Pawlowicz et al., 2002). Based on previous studies of tidal variability in the northern South China Sea, 8 dominant tidal constituents, 4 diurnal and 4 semidiurnal, are taken into accounts when performing the tidal harmonic analysis (Beardsley et al., 2004; Zhao et al., 2019). The 4 diurnal constituents are the principal lunar diurnal O1 (period 25.82 hours), the principal lunisolar diurnal K1 (period 23.93 hours), the principal solar declinational diurnal P1 (period 24.07 hours), and the larger lunar elliptic diurnal Q1 (period 24.07 hours). The 4 semidiurnal constituents are the principal lunar semidiurnal M2 (period 12.42 hours), the principal solar semidiurnal S2 (period 12.00 hours), the larger lunar elliptic semidiurnal N2 (period 12.66 hours), and the lunisolar semidiurnal K2 (period 11.97 hours).
2.2.2 Calculation of shear variance in the BBL and bed shear stress
The variability of the current velocity along the water column represents the degree of vertical shear, which is critical for the suspension of sediments in the water column. Here, the shear variance (), which can indirectly reflect the vertical turbulent mixing, is calculated as
where u and v are the zonal (E-W) and meridional (N-S) current velocities, and z is the vertical depth interval, which equals to the size of the water bins (4 m). The flow velocities of the lowermost 2 bins (4–8 and 8–12 masf) were used herein to obtain the in the near-bottom water column.
Using the law of the wall of the BBL, shear velocity () and bed shear stress () at seafloor can be calculated:
where is the mean current velocity measured at a depth of z masf, is the von Kármán constant, is a reference height related to the roughness of the seafloor. Here, was taken as the current velocity at the first water bin, and was the distance between the center of the first water bin and the seafloor. According to recent experimental results, the best estimate for the von Kármán constant is 0.40 ± 0.02 (Bailey et al., 2014). The reference height for muddy seafloors can be estimated to be ~ 0.2 mm (Soulsby, 1983).
The relationship between the bed shear stress and the critical erosion shear stress can be used to evaluate whether or not resuspension occurs at certain current velocities. When exceeds , the surface sediments at the seafloor are resuspended. The of seafloors composed mainly of cohesive sediments can be calculated using Eqs. (4) – (6) (Miller et al., 1977; Soulsby and Whitehouse, 1997).
where is the acceleration of gravity, is the critical Shields parameter when sediment particles initiate suspension, is the grain density of sediment particles, and v are the density and kinematic viscosity of seawater, d is the size of sediment particles, and is a dimensionless particle size parameter.
2.2.3 Calculation of volume backscatter strength
The volume backscatter strength calculated from the ADCP echo intensities can provide useful information on sediment concentrations in the ocean (Gartner, 2004). Here, the volume backscatter strength was calculated using the equation developed by Mullison (2017):
where is the volume backscatter strength, E is the time- and depth-dependent matrices of the echo intensities and is the noise level of the echo intensities, R is the along-beam range of water bins, is the temperature measured at the transducer (in °C), is the attenuation coefficient of sound in water, is the scale factor to convert echo intensity counts to decibels, and C is a constant specific to each instrument model. and can be calculated from and , where is the bin size and p is a constant determined by the voltage of the battery packs. Values of kc = 0.5, α = 0.068 dB/m, C = -151.64 dB, and PDBM = 16.6 dB were adopted for the Workhorse Sentinel 300 kHz ADCP (Mullison, 2017).
2.3 Surface sediment particle size analysis
In order to obtain the grain size of the sediments at the location where the tripod was deployed, 3 samples were collected from the top 0-5 cm of Core SD-A-7 for grain-size analyses. Pretreatment of the bulk samples was performed according to Bianchi et al. (1999). The bulk samples were first treated with 1 mol/L hydrogen chloride (HCl) and 3% (~ 1 mol/L) hydrogen peroxide (H2O2) solutions to remove biogenic organic matter and carbonates. The mixtures were then rinsed with deionized water to remove residual H2O2 and HCl, until the pH of the solutions was near neutral. Deionized water was added to bring the sediment concentration to ~ 2%, and then sodium hexametaphosphate [(NaPO3)6] was added (0.1 mol/L) to avoid aggregation of fine fractions. Grain-size analysis was performed using a Micromeritics SediGraphIII Plus 5120 particle size analyzer at the State Key Laboratory of Marine Geology, Tongji University, with a measuring range set to 0.1–300 μm.
3 Results
3.1 Characteristics and variability of raw and tidal currents
The raw zonal and meridional currents obtained by the ADCP showed a strong-weak-strong variability trend between April 23 and May 7, with velocities from April 29 to May 1 significantly weaker than other periods (Figure 2). The temporal variability of the raw current velocities showed an apparent 24-hour cycle, probably reflecting the influence of the diurnal tides. Along the depth profile, no significant change in the zonal and meridional current velocities was observed (Figure 2), implying that the entire profile was under the control of the similar physical processes.
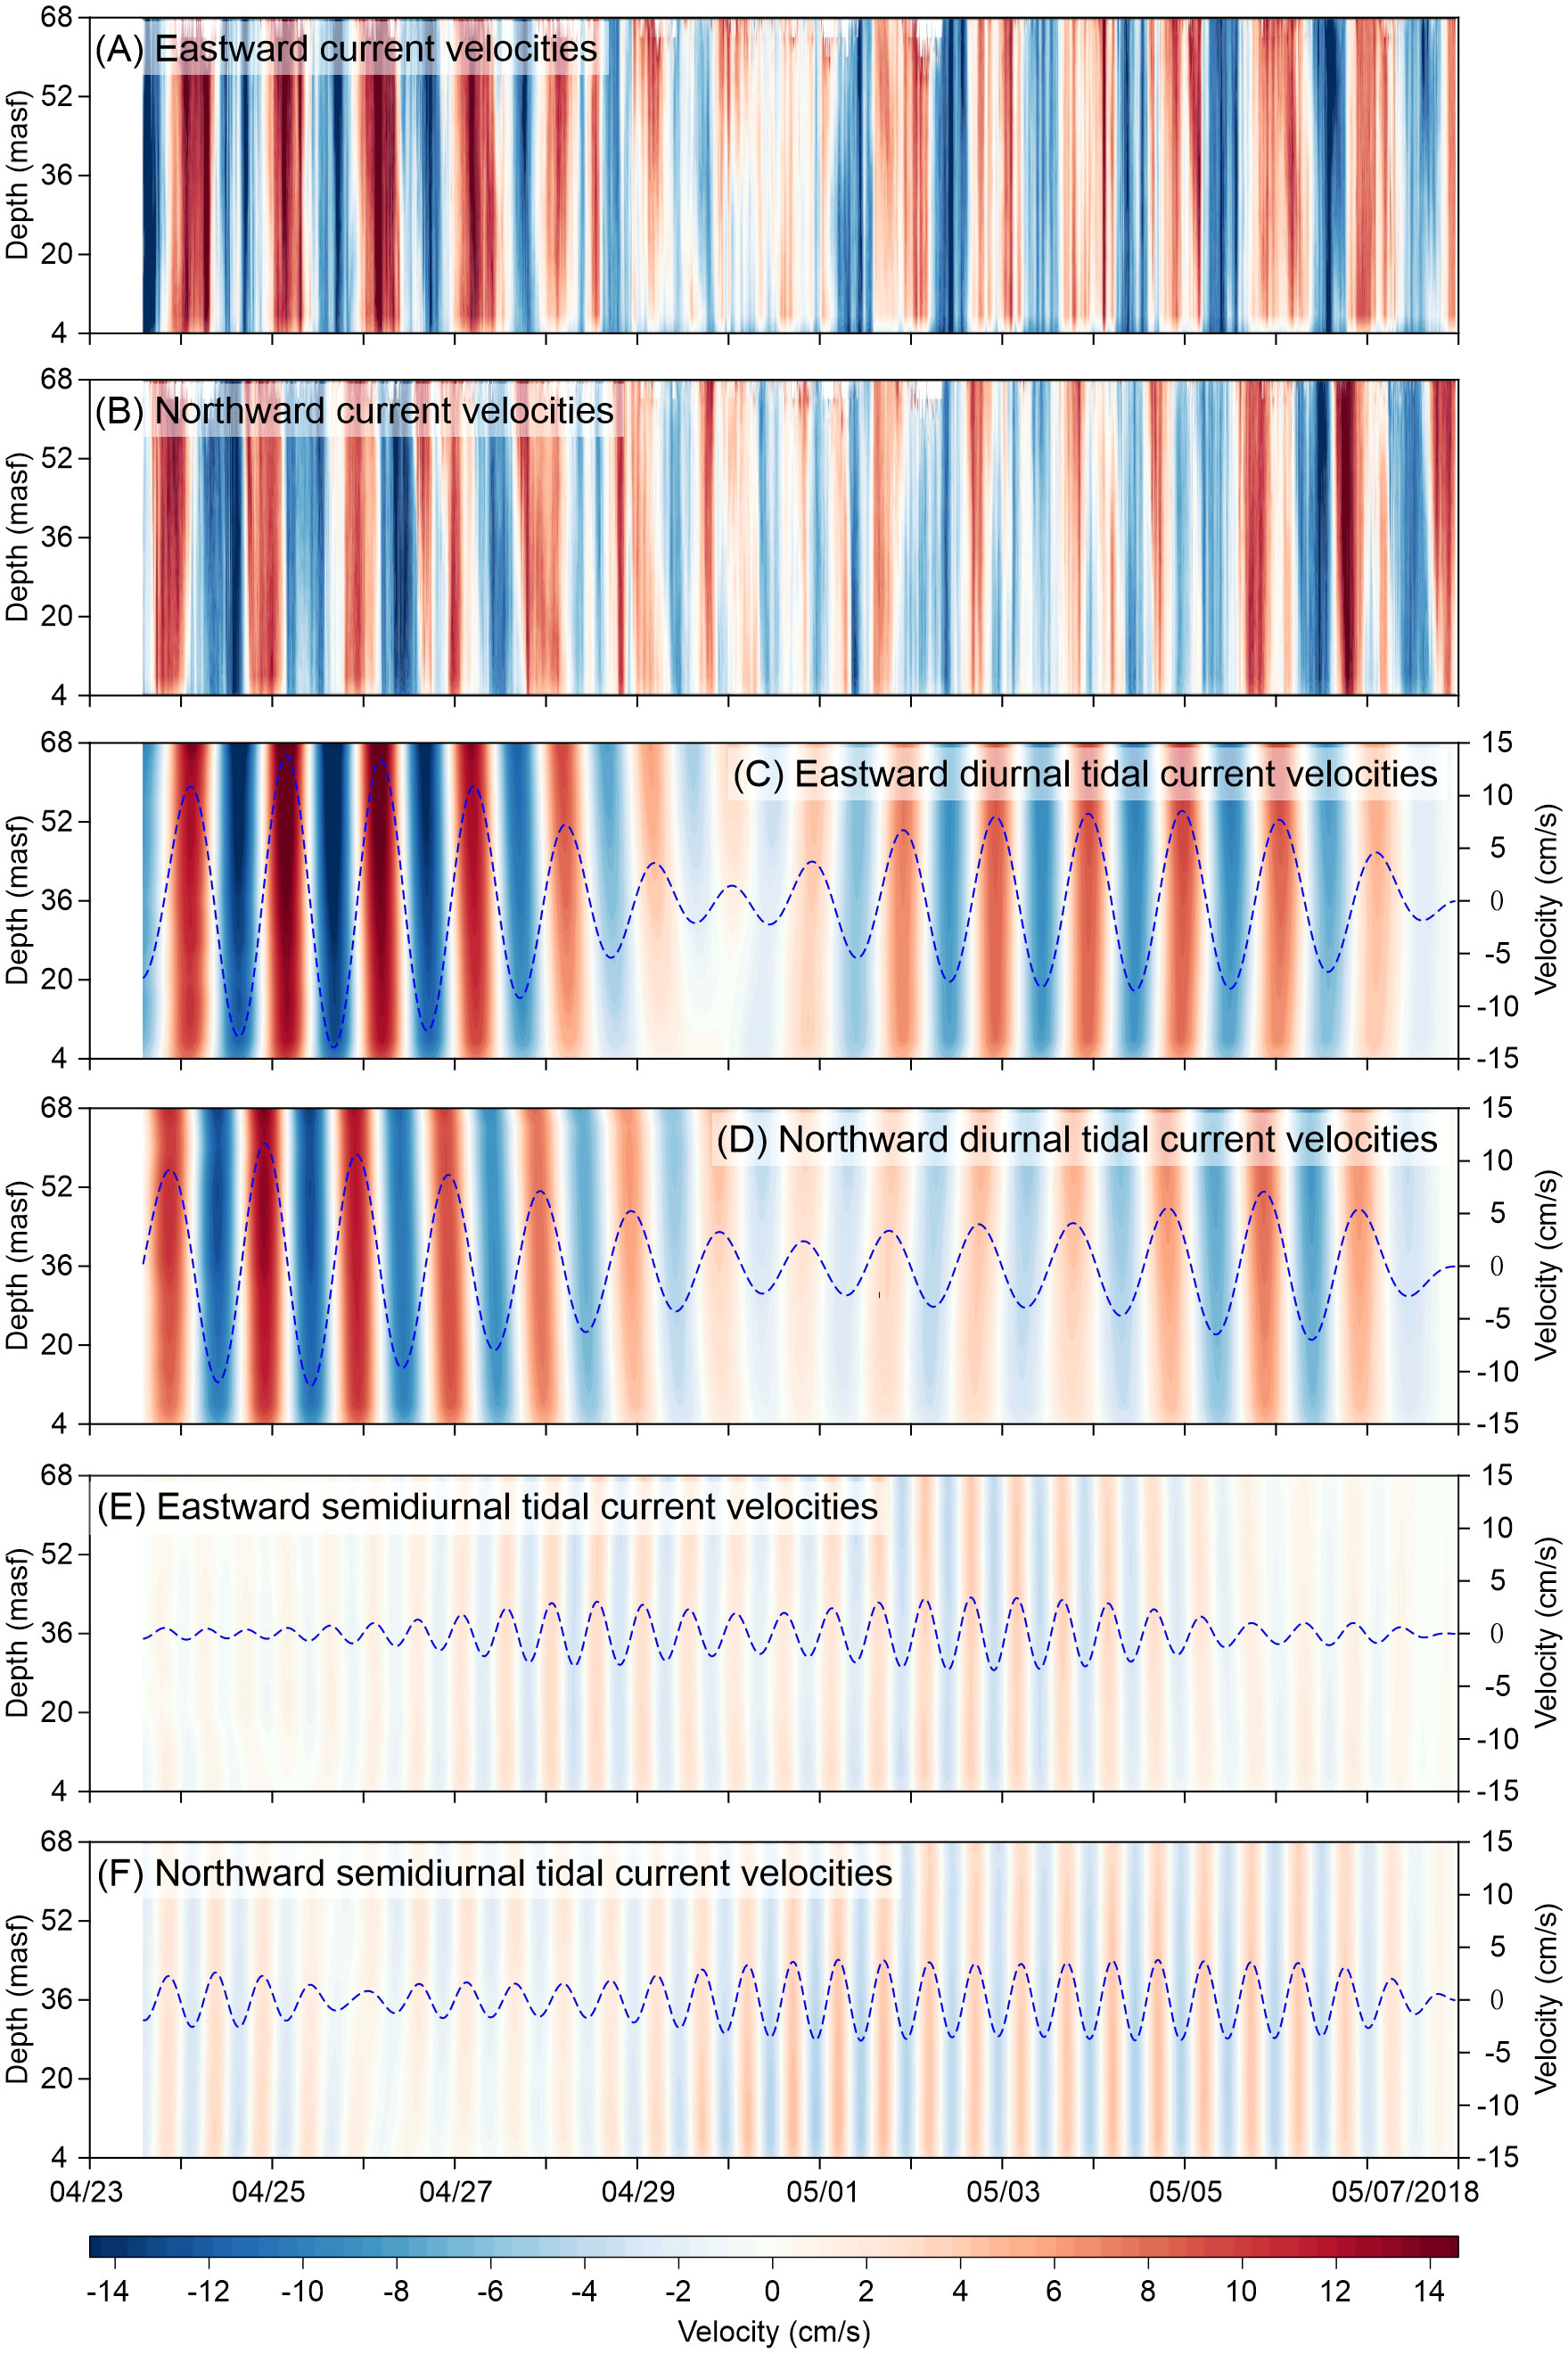
Figure 2 Variations of zonal (E-W) and meridional (N-S) raw (A, B), diurnal (C, D), and semidiurnal (E, F) tidal current velocities from April 23 to May 07, 2018. The blue dashed lines in (C–F) show the depth-averaged velocity of the tidal currents.
The results of the harmonic analysis showed that the diurnal tide was dominated by the K1 and O1 constituents, while the semidiurnal tide was dominated by the M2 and S2 constituents (Table 1). The major axes of both diurnal and semidiurnal tidal ellipses were NW-SE, i.e. parallel to the dip direction of the contourite drift. This is inconsistent with previous results on the same contourite drift (Zhao et al., 2019), probably due to shortness of the observation period (Pawlowicz et al., 2002). The magnitude of the diurnal tidal currents was much stronger than that of the sem-diurnal tidal currents. During the observation period (April 23–May 7), the diurnal tidal currents also showed a strong-weak-strong variability, similar to the variation of the raw current velocities. During the strong tidal current period, especially during April 25–27, the zonal tidal current velocity was up to 17.9 cm/s and -17.8 cm/s, and the meridional tidal current velocity was up to 12.8 cm/s and -13.8 cm/s, with the zonal component slightly stronger than the meridional component. During the weak tidal current period (April 29–May 1), the maximum zonal diurnal tidal currents were about 7.7 cm/s and -6.4 cm/s, and the maximum meridional diurnal tidal currents were about 5.6 cm/s and -6.1 cm/s (Figure 2). The semidiurnal tidal currents were generally weaker than the diurnal tidal currents. The maximum velocity of the zonal semidiurnal tidal currents was about 4.7 cm/s and the maximum velocity of the meridional semidiurnal tidal currents was about 4.1 cm/s. The variability of the semi-diurnal tidal currents was opposite to that of the diurnal components, i.e. it showed a weak-strong-weak variability throughout the observation period. When the diurnal tidal velocity was weakest (April 29–May 1), the magnitude of the semidiurnal tidal velocity was comparable to the diurnal tidal velocity.
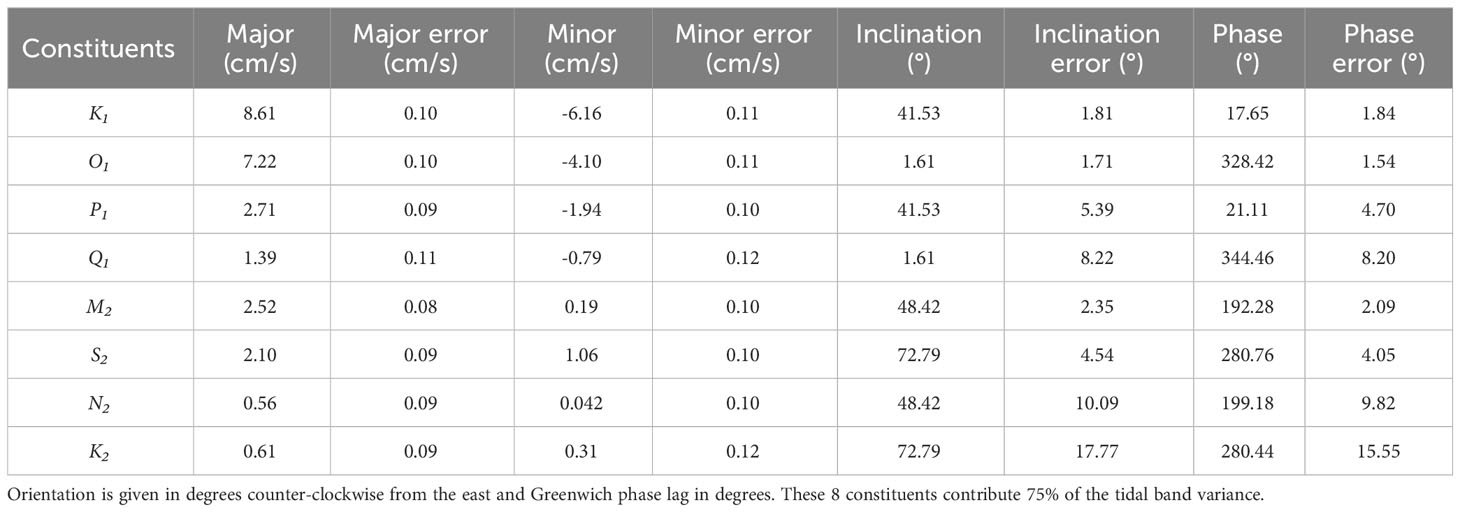
Table 1 Tidal current ellipse parameters and error values of the observed site.
3.2 Suspended sediment concentration variation characteristics
The relative changes in SSC in the near-bottom ~ 70 m water layer, obtained from the echo intensity profiles recorded by the ADCP, show the characteristics of a periodic increase in SSC. The high SSC events can be divided into two types according to the depth range covered: one type occurs only in the lowermost 15 m (near-bottom events), while the other type covers the entire observed depth range (full-depth events) (Figure 3A). The near-bottom high SSC events occurred mainly during the first half of the observation period, i.e. before April 30. During this period, the full-depth high SSC events were characterized by burst-like high SSC events, usually lasting less than 2 hours, with prolonged high SSC at the bottom of the profile (< 15 masf), similar to the near-bottom high SSC events. After April 30, the high SSC events were mostly of the full-depth type, with most of them characterized by the burst-like events. Only a few full-depth high SSC events could last very long, for example the one that occurred on May 2–3 had a temporal duration of ~ 18 hours.
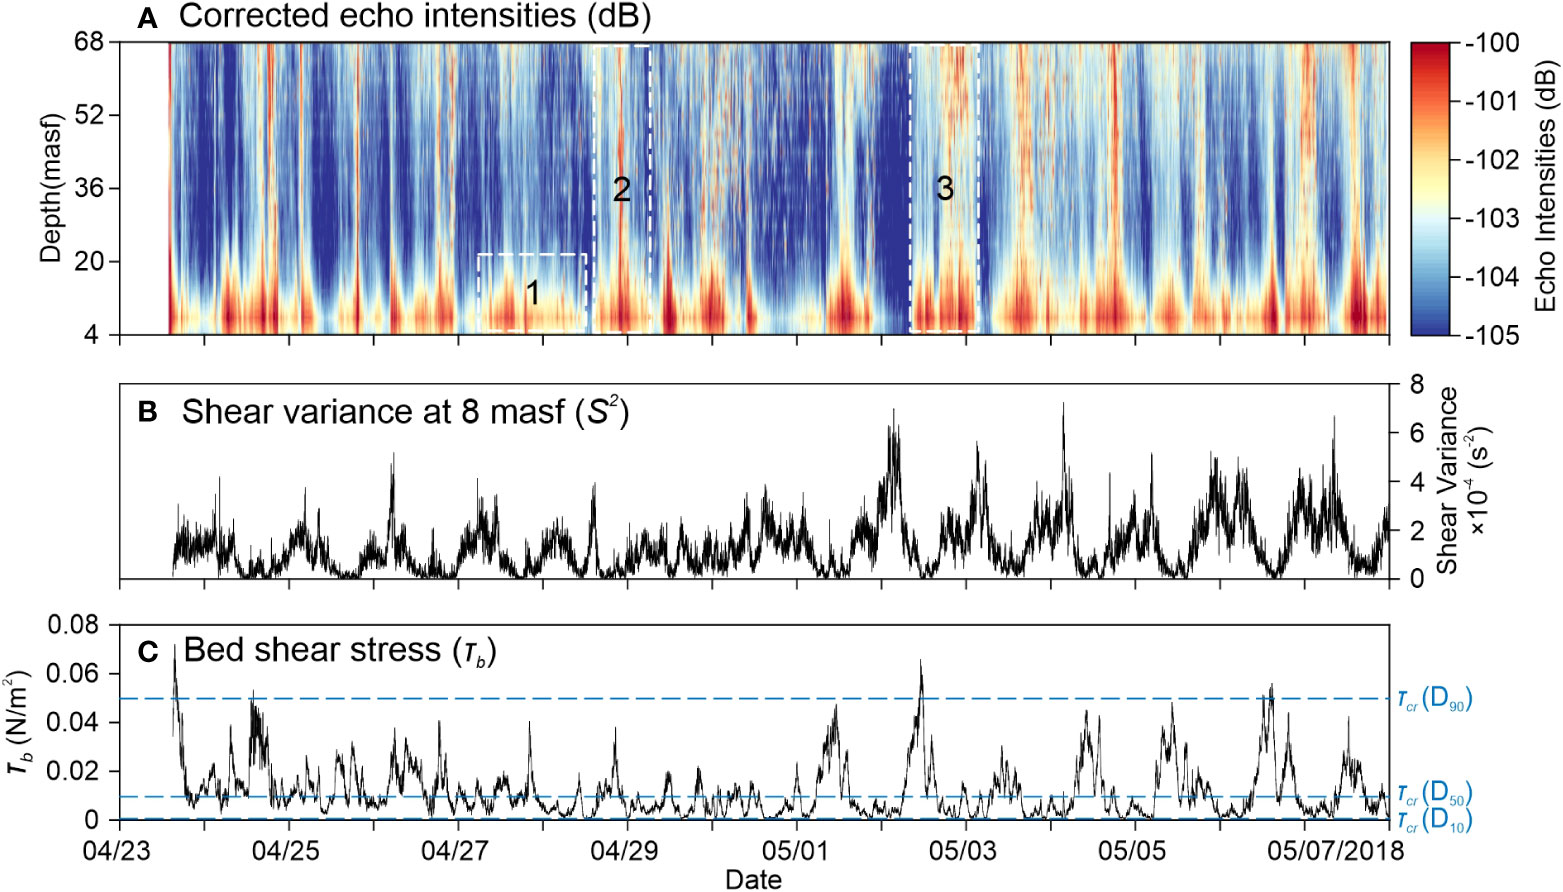
Figure 3 Variations of (A) the volume backscatter strength of the ADCP echo intensities, (B) the shear variance () at ~ 8 masf and (C) the bed shear stress from April 23 to May 07, 2018. The blue dashed lines show the critical shear stresses for particles of sizes D10, D50 and D90, respectively. The white boxes in (A) show high SSC events of different temporal and spatial extents: (1) near-bottom, (2) burst-like full-depth, and (3) extended full-depth.
Over the fortnightly tidal period, a correspondence was observed between the intensities of the tidal currents and the variability of SSC in the water column (Figure 3). Along with the strong-weak-strong variation of the diurnal tidal currents, the depth coverage and intensity of SSC also showed a strong-weak-strong variation. Before April 30, when the diurnal tidal current gradually weakened from April 23 (maximum 9.6 cm/s) to the lowest on April 30 (maximum 2.6 cm/s), the depth coverage and intensity of SSC also gradually decreased from full-depth burst-like events to near-bottom high SSC events (Figure 4). After April 30, the high SSC events were mostly of the full-depth type, with the maximum diurnal tidal current velocity gradually increasing from 2.6 cm/s to 6.1 cm/s. It was worth noting that the correspondence between tidal current velocity and the occurrence of high SSC events was not linear. The most prominent high SSC event occurred on May 2–3, but the tidal current was not the strongest during this period. Within a diurnal tidal cycle, the SSC generally increased once or twice. Before April 30, two burst-like events were observed in each diurnal tidal cycle, except for April 29, when only one burst-like high SSC event occurred. After April 30, one full-depth high SSC event was observed in each diurnal tidal cycle.
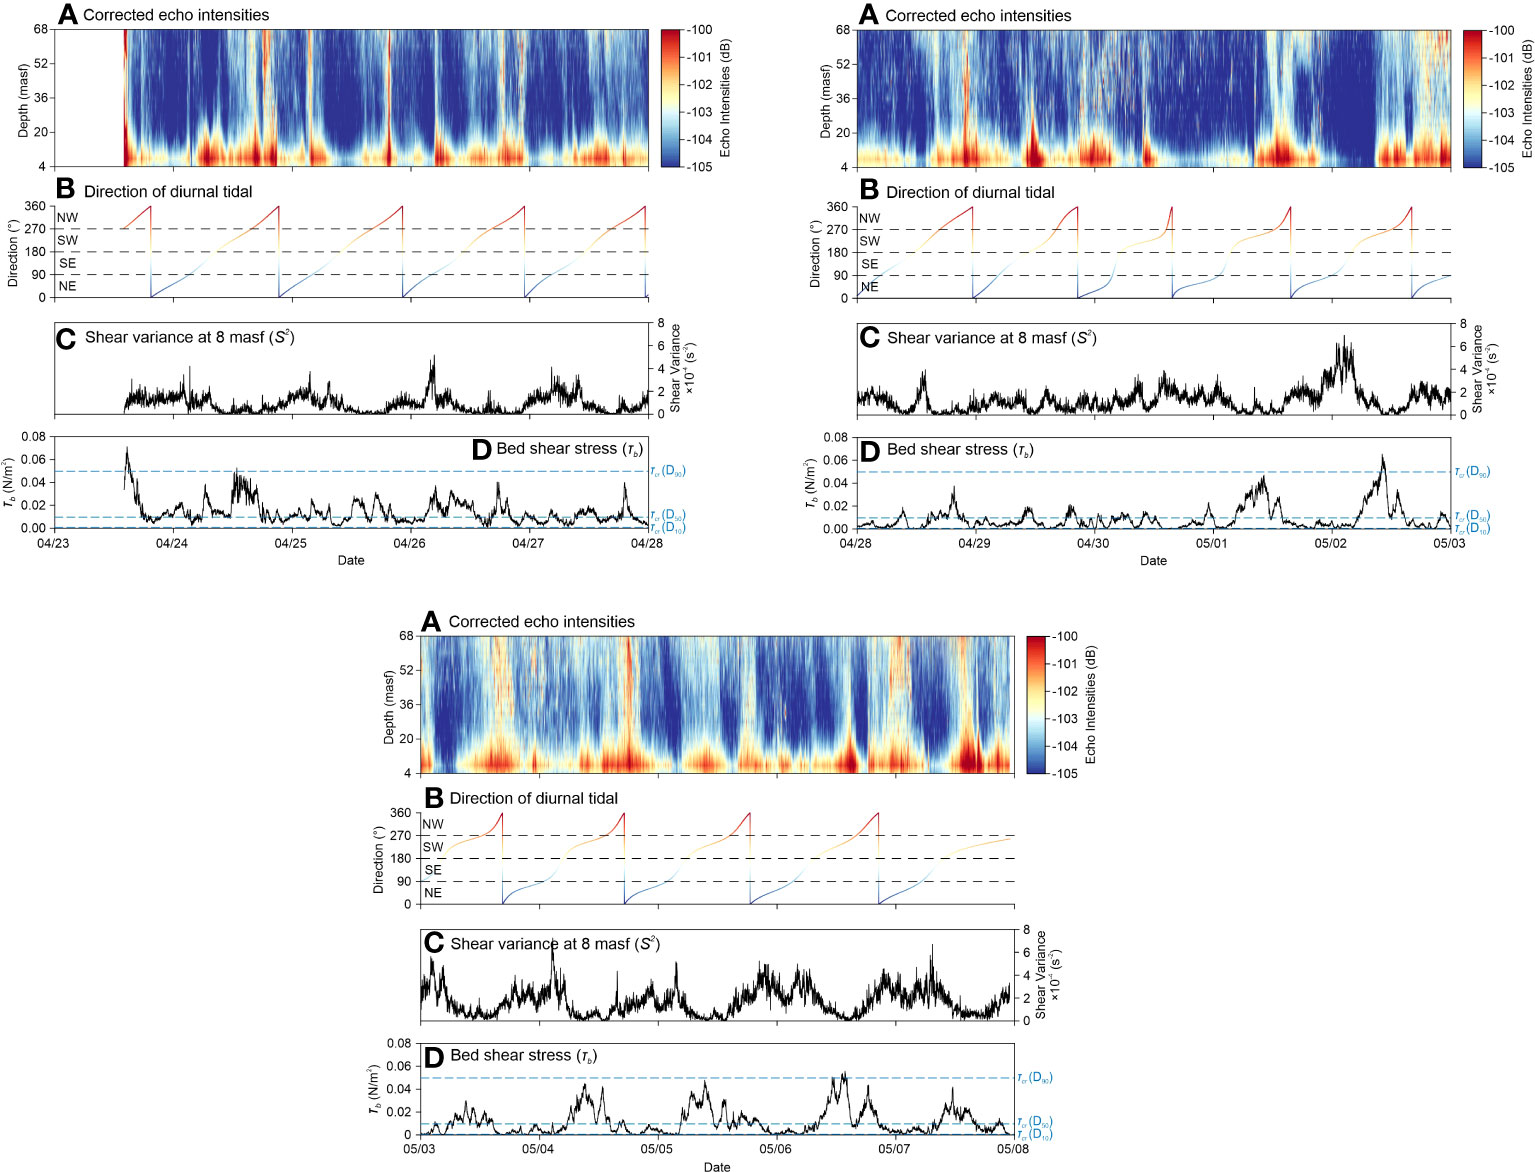
Figure 4 Correlation between (A) high SSC events and (B) diurnal tidal current direction, (C) and .
3.3 Shear variance in the BBL and bed shear stress
Using the raw current velocity of the first and second water bins (closest to the seafloor), the shear variance () at ~ 8 masf in the BBL was calculated. It was clearly observed that varied on an approximate 24-hour cycle, with high largely corresponding to low SSC in the water column (Figure 3B). Over the entire observation period, May 1–7 had higher peak values (average 1.62 × 10⁻⁴ s-2) than April 23–30 (average 9.70 × 10⁻⁵ s-2).
The bed shear stresses were calculated using the shear velocity for the raw current velocities. also varied on an approximate 24-hour cycle, but high values of generally corresponded to high SSC in the water column (Figure 3C). Over the entire observation period, the second half (May 1–7) also had higher peak values than the first half (April 23–30), similar to the variations in .
3.4 Critical shear stress for resuspension
The results of the grain size analysis showed that the sediments of the upper 5 cm of Core SD-A-7 had similar grain size characteristics. Here, the 10th, 50th, and 90th percentiles (D10, D50 and D90) of the particle size distribution were employed to represent the fine, medium and coarse fractions of the sediment particles, respectively, where Dx is the size at which x% of the particles are smaller than this size. The average values of D10, D50 and D90 for the upper 5 cm of Core SD-A-7 were 0.120 μm, 2.084 μm and 13.343 μm, respectively (Table 2).

Table 2 Grain size percentiles of the upper 0-5 cm of Core SD-A-7.
Substituting the above grain-size percentiles into Eqs. (4)–(6), taking the mean density of clay minerals (2.655 × 10³ kg/m3) as (the grain density of sediments), the density of seawater as 1.025 × 10³ kg/m3, and the kinematic viscosity of seawater as 1.7 × 10⁻⁶ m2/s (value for seawater at 2.5°C, 35 PSU), the critical shear stresses for particles of sizes D10, D50 and D90 were 5.74 × 10⁻⁴ N/m2, 0.96 × 10⁻² N/m2, and 4.98 × 10⁻² N/m2, respectively (Figure 3C). The physical significance of these three critical shear stresses is that when the bed shear stress exceeds them, 10%, 50% and 90% of the sediments are resuspended.
4 Discussion
4.1 Formation of high SSC events in the bottom water and mechanism
Numerous high SSC events were observed during the observation period, with several events occurring only in the lowermost 15 m (near-bottom events), while the remainder covered the entire observed depth range (full-depth events) (Figure 3). Possible causes of such high SSC events on the ridge of the contourite drift include in-situ sediment resuspension, lateral sediment transport, either horizontal or vertical, and sinking particles from the overlying water column. The contourite drift where the tripod was deployed is located beneath a seamount connected to the Dongsha Atoll. Downslope transport of sediment to the contourite drift is infrequent, if not absent, due to the lack of a stable sediment supply to the coral atoll. As a result, vertical sediment transport to the tripod is unlikely to be the main process driving these high SSC events. Meanwhile, the vertical sinking of sediment particles from the overlying water is also negligible. It is estimated that sinking particles account for only <1.5% of the sediment flux to the studied contourite drift (Zhao et al., 2023). Therefore, the high SSC events observed by the tripod were triggered by either in-situ sediment resuspension or horizontal sediment transport.
Sediment resuspension is determined by the bed shear stress , and it occurs when exceeds the critical shear stress for erosion (). It was observed that varied largely with semidiurnal cyclicity before April 30 and with diurnal cyclicity thereafter (Figure 3). exceeded for D10 (5.74 × 10⁻⁴ N/m2) for almost the entire observation period and it also exceeded for D50 (0.96 × 10⁻² N/m2) for more than 50% of the observation period (Figure 3). It suggests that sediment resuspension occurs very common at the studied site, especially for the finer fraction of sediments. On April 23, May 2 and May 6, exceeded for D90 (4.98 × 10⁻² N/m2), indicating that more than 90% of the sediments were resuspended during these intervals. It is worth noting that sediment resuspension, indicated by the peaks of , occurred hours earlier than the high SSC events (Figure 4). This then raised a question: Does such time lag represent the time consumed for the resuspended sediment to form high SSC events in the bottom water column, or does it imply that the high SSC events were not triggered by in-situ sediment resuspension?
To form high SSC events in the bottom water by in-situ erosion, two processes are involved: (1) sediment resuspension from the seafloor and (2) uplift of sediments from the logarithmic layer, which typically covers tens of centimeters to about 1 meter above the seafloor, to the outer layer, which covers the water column from the top of the logarithmic layer to about 100 masf, of the BBL. The former is determined by whether or not exceeds , while the latter depends largely on the rate of turbulent mixing in the BBL. The shear variance () at ~ 8 masf represents the intensity of shear in the bottom water. It can be used as an indicator of vertical turbulent mixing, as strong vertical shear is required to maintain the turbulent mixing. During the observation period, it was observed that high SSC events mostly occurred corresponding to low values of , while in most intervals where exceeded ~ 3 × 10⁻⁴ s-2, the SSC was relatively low throughout the observed depth range (Figures 3, 4). This suggests that the vertical turbulent mixing in the bottom water is quite weak during the occurrence of most high SSC events. Such weak turbulent mixing makes it difficult for the resuspended sediments to be lifted into the outer layer to form the observed high SSC events. Accordingly, the correspondence between low and high SSC events indicates that the high SSC events observed on the ridge of the contourite drift in the northern South China Sea are unlikely to have been triggered by in-situ sediment resuspension.
Using the clay mineralogy of riverine and surface sediments, Liu et al. (2016) found that detrital sediments from Taiwan account for 50% to 80% of the total sediment flux to the contourite drift where the tripod is located. This implies that horizontal sediment transport is a crucial process affecting sedimentary dynamics of this contourite drift. It has been proposed that these sediments are transported mostly by the South China Sea Deep Western Boundary Current, or contour current in the nomenclature of sedimentology, with mesoscale eddies playing a minor role (Zhang et al., 2014; Zhao et al., 2015). Nonetheless, the high SSC events observed by the tripod present clear diurnal and semidiurnal tidal cyclicity, indicating that such events are closely linked to the tidal activities. These low-frequency oceanic processes (contour currents and mesoscale eddies) cannot explain the tidal cyclicity of the observed high SSC events, though they may be the most prominent sources of sediment delivered to the contourite drift.
Theoretical studies and numerical simulations have suggested that when oceanic waves propagate to a sloping boundary with a slope γ that is equal to the slope c of the wave group velocity to the horizontal plane, a significant energy dissipation can occur due to near-critical reflection (Legg and Adcroft, 2003). Near-critical reflection results in enhanced diapycnal mixing and increased bed shear stresses () (Moum et al., 2002; Nash et al., 2007), and thus has a major influence on oceanic sedimentation patterns (Cacchione, 2002). Long-term in-situ observations have shown that the near-critical reflection of semidiurnal internal tides at a boundary condition of γ/c ≈ 1 is the main process shaping the morphology of the North American continental slopes (Cacchione, 2002). As aforementioned, high SSC events in the bottom water on the ridge of the contourite drift present apparent tidal cyclicity. Therefore, we calculated the critical slope of the diurnal and semidiurnal tides using Equation (8):
where: is the wave frequency, equal to 2.314 × 10⁻⁵ s-1 and 1.157 × 10⁻⁵ s-1 for semidiurnal and diurnal tides respectively; f is the local inertial frequency, equal to 0.792 × 10⁻⁵ s-1 at ~ 20°N; N is the Brunt-Vaisala frequency and is calculated from the vertical oceanic density gradient. As there was no pressure sensor equipped on the tripod, the mean value of calculated at a nearby site on the same contourite drift (0.6 × 10⁻⁵ s-2) was adopted (Zhang et al., 2015).
Using the above equation, we obtained that the critical slope for the diurnal tide (c1) is ~ 5.7°, while that for the semidiurnal tide (c2) is ~ 2.65°. These values are very close to the topographic slope of the contourite drift, thus near-critical reflection of tidal currents may occur. The topography of the contourite drift where the tripod was deployed is undulated, and the slope for the main drift body (γ1) is ~ 4.80°, close to c1; while the slope for the local concave topography adjacent to the tripod (γ2) is ~ 2.80°, approaching c2 (Figure 5). The direction of the diurnal tidal currents at the study site is across the slope (northwest-southeast), parallel to the dip direction of the main drift body, while the direction of the semidiurnal tidal currents is along the slope (northeast-southwest), i.e. perpendicular to the dip direction of the main drift body (Zhao et al., 2019). Therefore, when the diurnal tide comes into contact with the contourite drift, because the slope is near-critical (γ1/c1 ≈ 1), the energy carried by the tidal currents is strongly dissipated, increasing the near-bottom diapycnal mixing and bed shear stresses, leading to the resuspension of already-deposited sediments on the main drift body (Figure 5). On the other hand, the direction of the semidiurnal tidal currents is roughly parallel to the strike line of the sediment ridge, so that near-critical reflection does not occur (Figure 5).
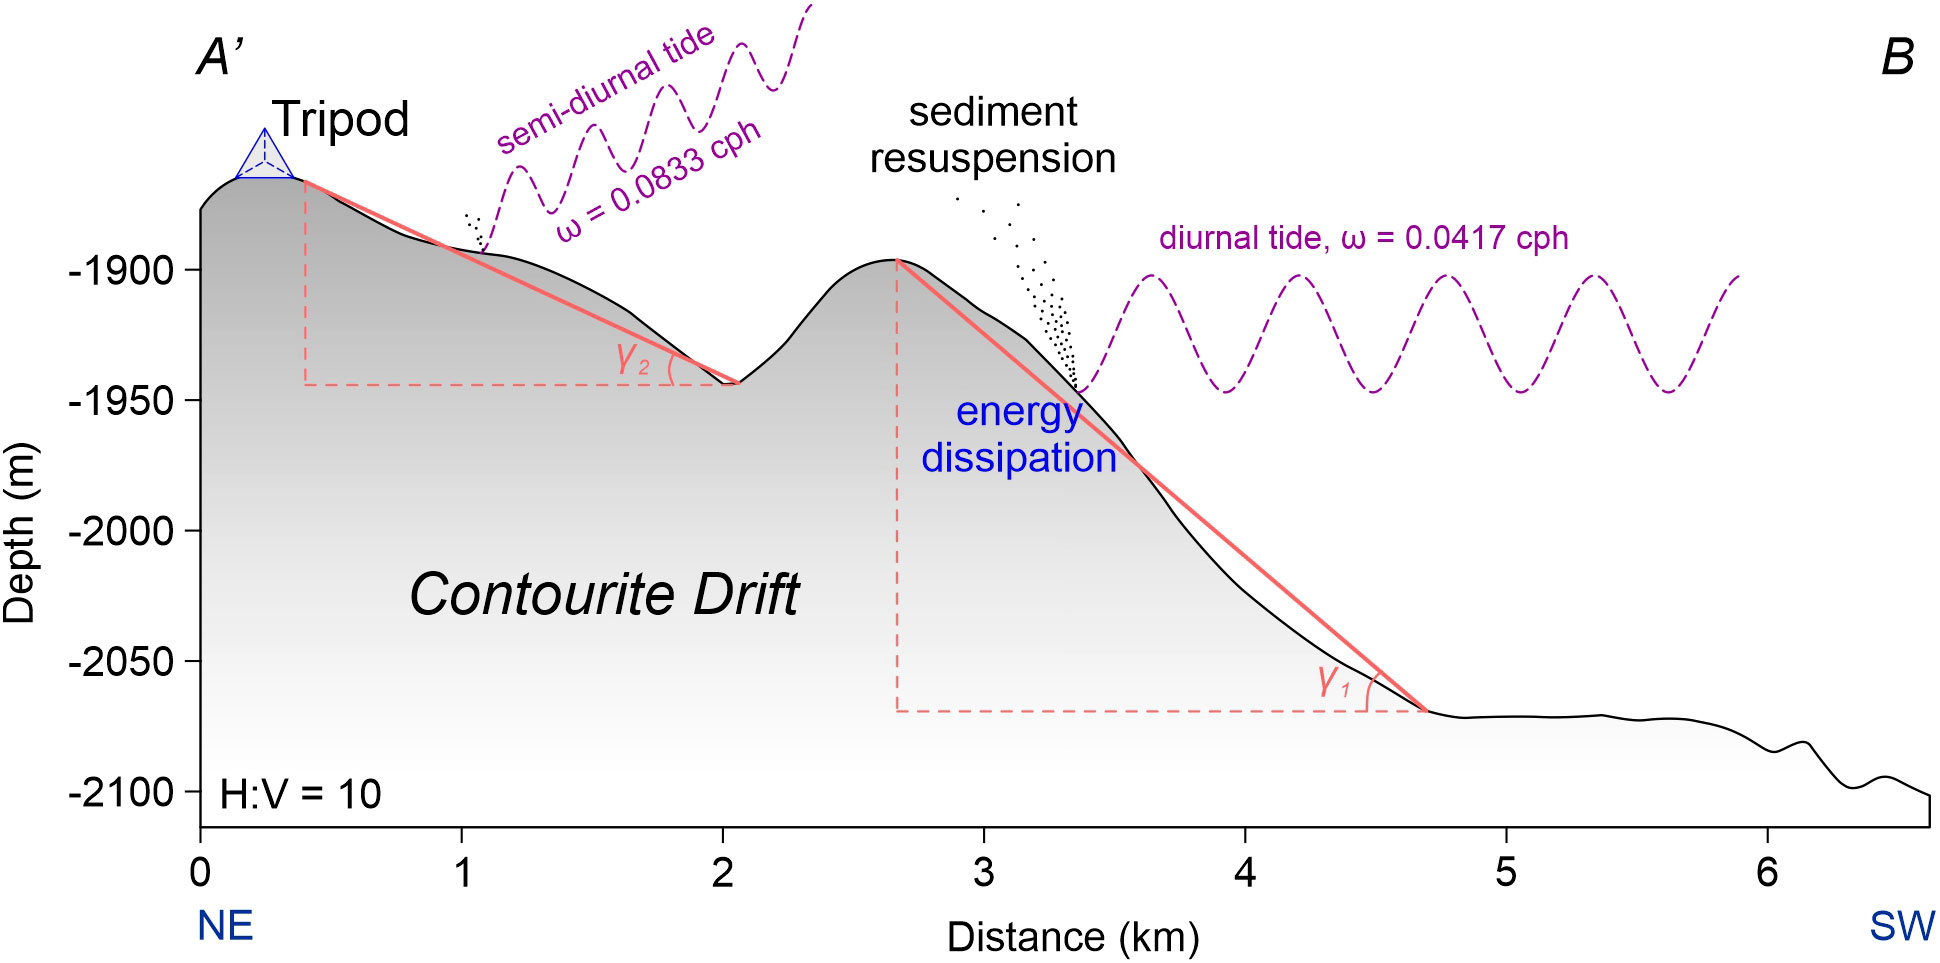
Figure 5 Schematic diagram showing sediment resuspension triggered by near-critical reflection of diurnal tidal currents on the slope topography of the contourite drift.
Near-critical reflection of tidal currents on the continental slope can lead to an increase of the turbulent mixing (eddy diffusivity) and turbulent energy dissipation rates in the BBL by two orders of magnitude (Moum et al., 2007; Nash et al., 2007), resulting in the formation of a bottom nepheloid layer and sometimes an intermediate nepheloid layer in the lowermost 50–100 m of water (Moum et al., 2007). Sediments resuspended by near-critical reflection on the main drift body are mobilized by the diurnal tidal currents toward the sediment ridge, while sinking under gravity. As the main drift body is around 2–3 km away from the ridge, it takes few hours for the sediments to reach the ridge. It is thus important to assess the relative importance of the particle settling time compared to the diurnal tidal periods. The particle settling time () is the ratio between the height (H) and the settling velocity of particles (), where can be obtained from the Stokes′ law:
where is the dynamic viscosity of seawater (~ 1.8 × 10⁻³ Pa·s at 2.5°C and 35 PSU). Taking the median grain size D50 (2.084 μm), the mean density of clay minerals (2.655 × 10³ kg/m3), and the density of seawater (1.025 × 10³ kg/m3), we can obtain the mean particle settling velocity is ~ 17 cm/d. Even if we take the 90th percentile (D90) of the grain-size cumulative curve, the settling velocity is ~ 7.7 m/d. If the resuspended sediments can be lifted to ~ 50 masf, it takes days to months for these particles to sink to the seafloor. Such a settling time is much longer than the diurnal tidal cycle, implying that most sediments maintain suspended on the contourite drift for a long time. These sediments can be transported to the ridge of the contourite drift by the northwestward diurnal tidal currents to form the high SSC events observed by the tripod. It explains why most high SSC events occurred during northwestward diurnal tidal currents (Figure 4).
Combining all the results, we propose that the high SSC events observed at the ridge of the contourite drift are caused by lateral transport of resuspended sediments from the main drift body. Sediment resuspension is probably the results of near-critical reflection of diurnal tidal currents on the sloped topography of the mounded contourite drift body.
4.2 Sediment resuspension induced by internal waves
Apart from tidal currents, active oceanographic processes such as mesoscale eddies, internal waves (Reeder et al., 2011; Zhang et al., 2014), and deep-sea storms (Hollister et al., 1974; Nowell and Hollister, 1985; Hollister, 1993) may also have a potential influence on sediment remobilization. However, owing to the shortness of the observation period, no mesoscale eddies were observed to pass the studied site from 23 April to 8 May 2018. Deep-sea storms usually refer to the events when the background current velocities increase rapidly to > 20 cm/s, followed by elevated SSC in the bottom water (Hollister and Mccave, 1984; Gross and Williams, 1991). During our observation, the background current velocity varies from -7.9 cm/s to 6.8 cm/s (not shown), and no deep-sea storms are found. It is proposed that the South China Sea one of the regions with the most active generation of internal waves in the world ocean (Jackson, 2009). Most internal waves in the northeastern South China Sea are generated close to the Luzon Strait and propagate westward to the interior of the South China Sea (Alford et al., 2015). However, these internal waves mainly affect the upper ~500 m of the water column (Guo and Chen, 2014), and thus have no influence on the studied site.
Previous numerical simulations have shown that when tidal currents approach an abyssal hill or seamount, if f< ω< N and f is close to ω, internal waves of inertial frequency are generated (Kasahara, 2010). At the studied site, the wave frequency of the diurnal tide ω1 (1.157 × 10⁻⁵ s-1), which is slightly larger than the inertial frequency f (0.792 × 10⁻⁵ s-1), and much smaller than the buoyancy frequency N (~ 2.5 × 10⁻³ s-1), exactly fulfils the conditions for the generation of internal waves. Therefore, generation of internal waves on the slope topography of the contourite drift is possible. During the observation period, pulses of high velocity along the upslope direction, accompanied by obvious vertical velocity anomalies, were observed, indicating the occurrence of internal waves (Figures 6A, B). The interaction of internal waves with the slope topography is capable of inducing global instability at seafloor, resulting in the resuspension of sediments (Boegman and Stastna, 2019). Therefore, these locally generated internal waves can also cause the formation of high SSC events at the studied site. For example, two high-velocity flow cores (up to 12 cm/s) toward the upslope, with background tidal currents also oriented in the same direction, were observed at ~ 19:05 and 19:35 UTC on April 28. Elevated was observed at the same interval, indicating strong sediment resuspension (Figure 6E). However, most of the sediment was confined to the near-bottom layer (< 20 masf, Figure 6C) and gradually increased thereafter (Figure 6D). High values of upward vertical velocity were observed following the internal waves, with the strongest upward flow (> 2 cm/s) occurring ~ 2 hours later (Figure 6B). The SSC throughout the observed depth range increased rapidly along with the occurrence of the strongest upward flow, indicating the formation of a full-depth high SSC event. The high SSC event lasted for ~ 70 min (Figure 6C). The interlayer shear variance was low before and during the first half of the high SSC event, and gradually increased thereafter. The full-depth high SSC event ceased when reached the maximum value. The formation of this full-depth high SSC event can be explained by the interaction between the internal wave of elevation and the slope topography (Boegman and Stastna, 2019). As the internal wave of elevation propagates upslope, boluses (ejected vortices) along with a thin stratified jet of dense water directed downslope adjacent to the boundary are formed (Stastna and Lamb, 2008). The jet yields shear instability in the BBL and a larger overturning region in the final phase of wave shoaling (presented ~ 19:35 to 21:35 UTC, Figures 6A, B). Our results indicate that the strong shear instability in the BBL maintains the sediments resuspended, and the formation of the full-depth high SSC event is closely related to the upwelling in the overturning region. As the diurnal tidal currents were weak from April 28 to May 1, the kinetic energy of the diurnal tidal currents was not sufficient to induce full-depth high SSC events to induce full-depth high SSC events (Figure 6). The locally generated internal wave thus provides a possible mechanism to interpret the full-depth high SSC events that occurred during weak diurnal tidal currents.
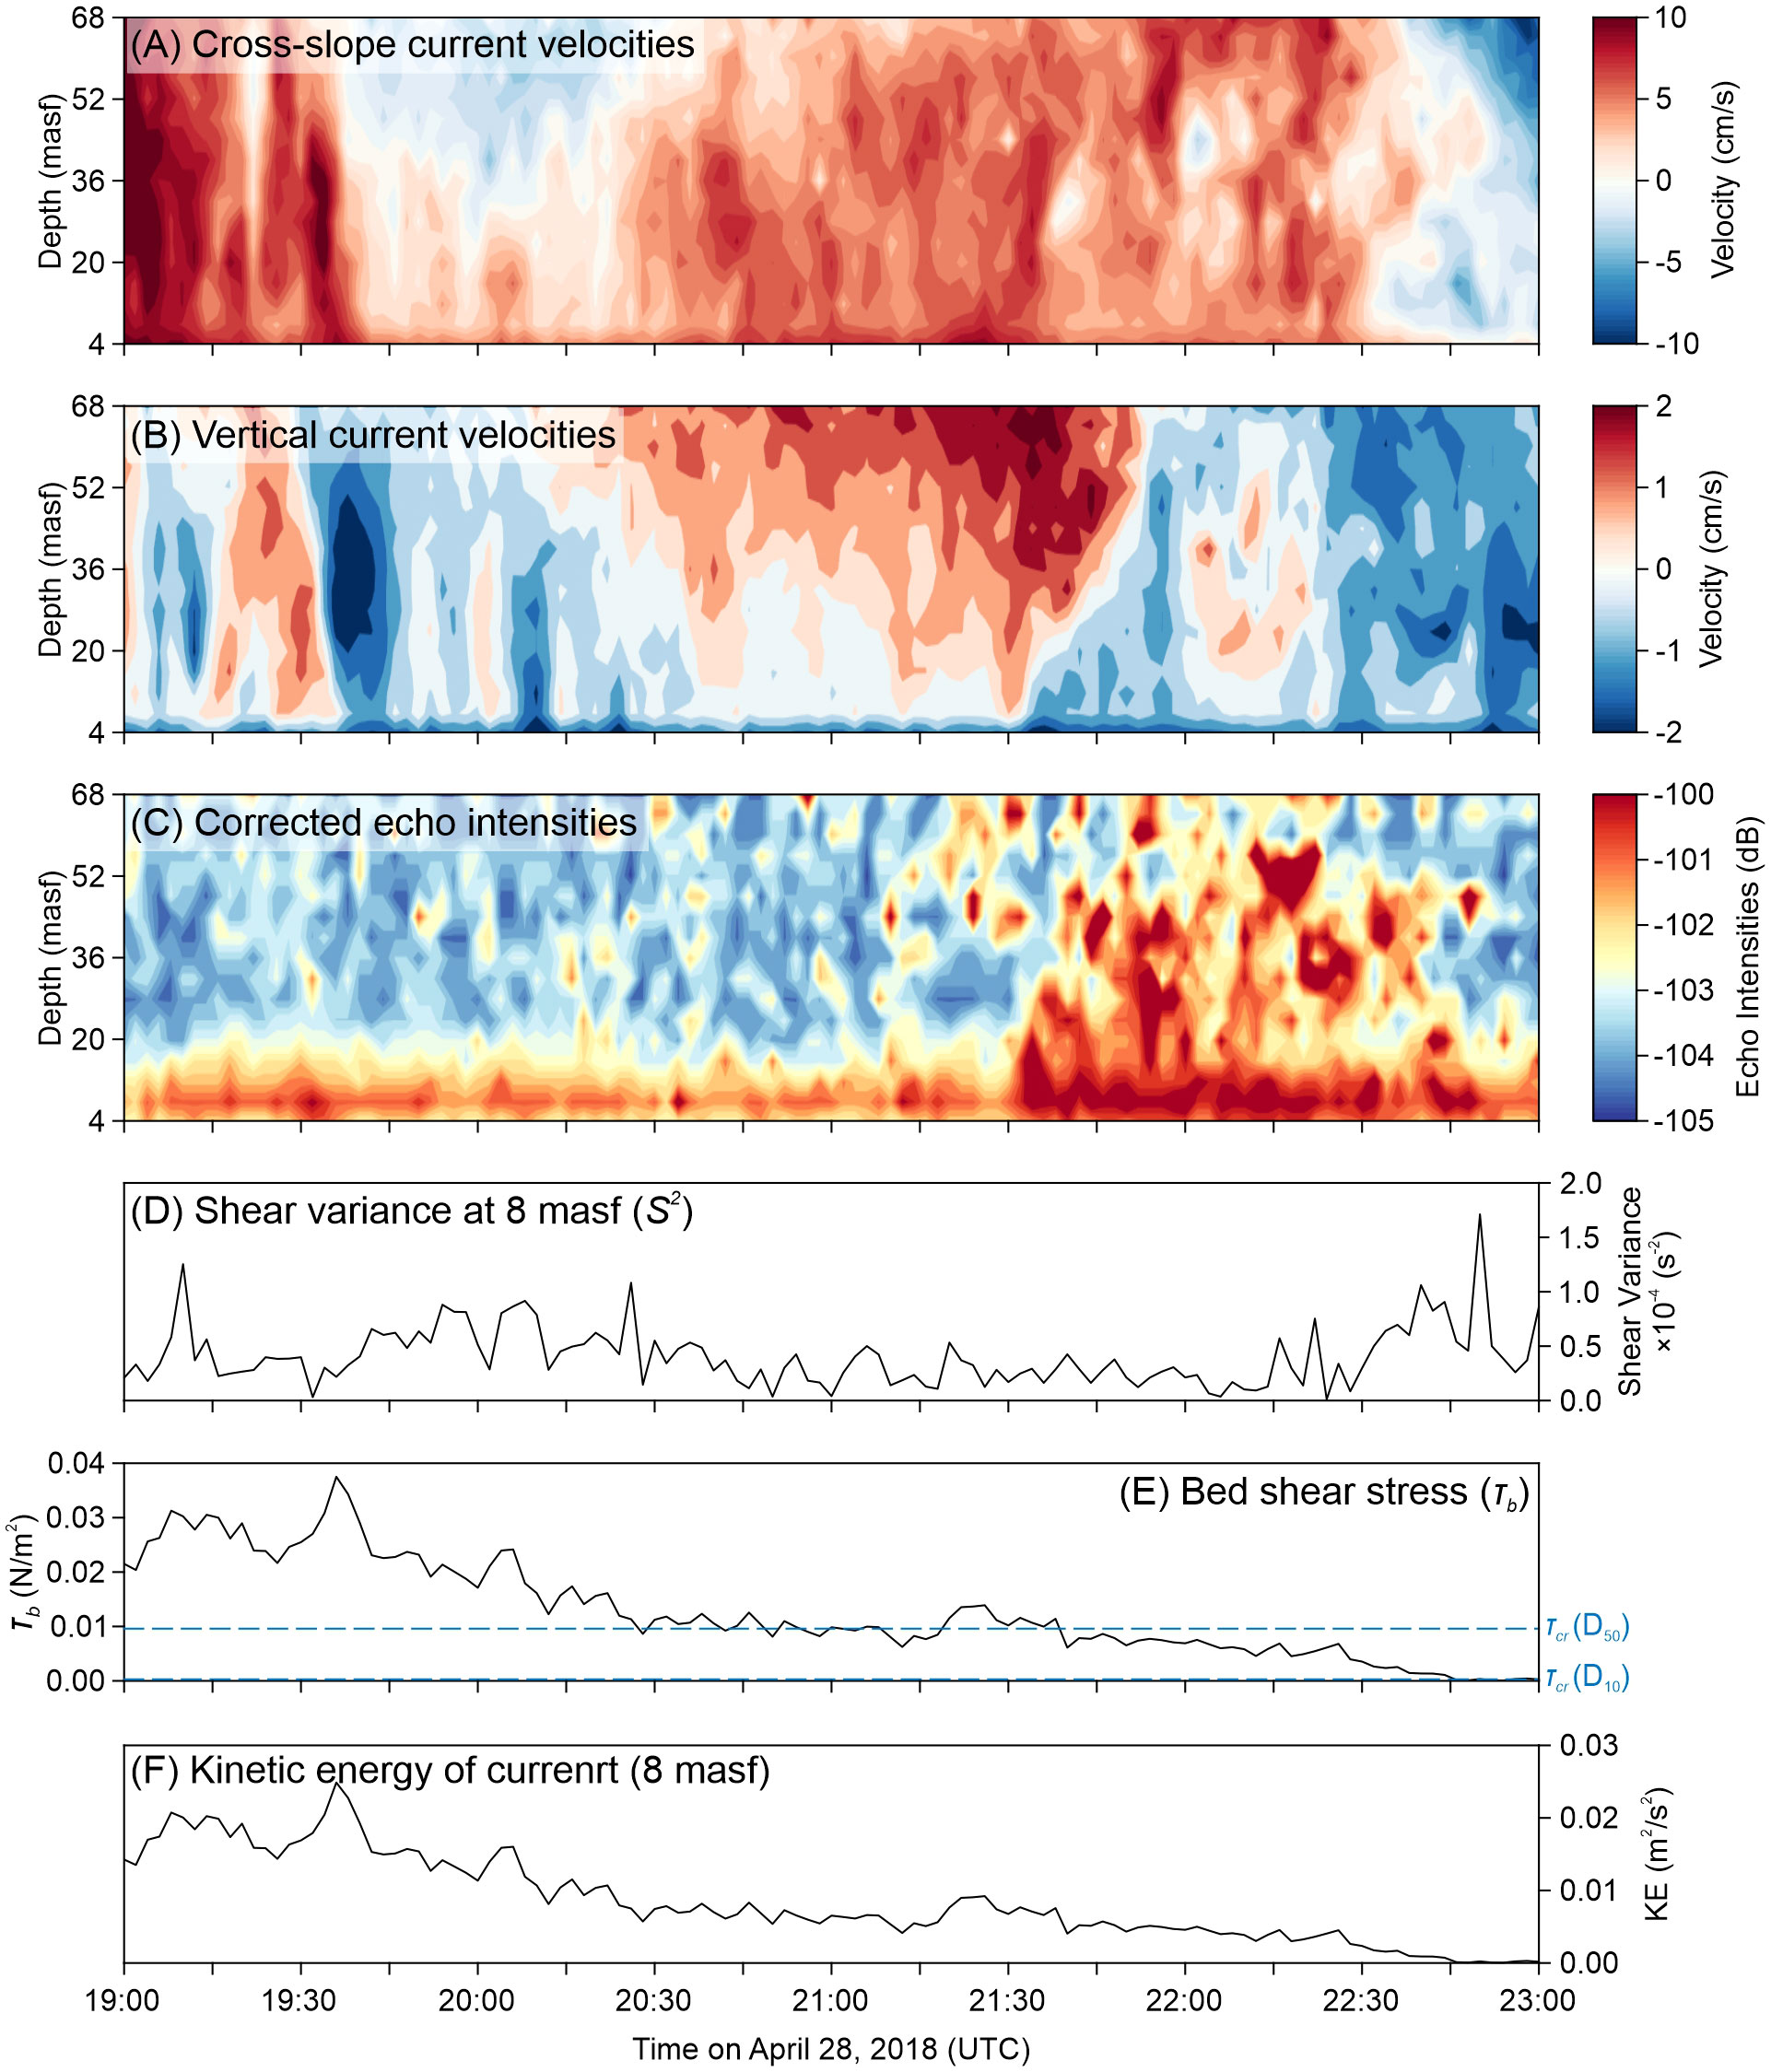
Figure 6 Responses of (A) horizontal (cross-slope) and (B) vertical velocities, (C) SSC, (D) , (E) and (F) kinetic energy of currents to the occurrence of a locally generated internal wave of elevation.
5 Concluding remarks
In the present study, we conducted ADCP velocity observations on the ridge of a contourite drift to understand the dynamic processes regulating sedimentary processes on the contourite drift. We found that the diurnal tidal current is the most prominent oceanic process affecting sediment remobilization. Since the topographic slope of the contourite drift is close to the critical slope of the diurnal tidal currents, the kinetic energy of the diurnal tidal currents is strongly dissipated where they encounter the seafloor, leading to strong turbulent mixing in the BBL and resuspension of already-deposited sediments. These sediments are mobilized by the northwestward diurnal tidal currents to the ridge of the drift, forming the near-bottom high SCC events observed by the tripod. During the period when the diurnal tidal currents are weak, the locally generated internal wave provides another potential mechanism for the formation of high SSC events. In this case, the strong shear instability induced by the internal waves causes sediment resuspension, and these sediments are lifted into the overlying water column by the upwelling in the overturning region tailing the internal waves.
The results of the present study highlight tidal currents and internal waves as the critical factors affecting sediment resuspension and the formation of high SSC in the BBL. Such results shed light on the understanding of sedimentary processes of contourite drifts. We found that besides the contour current, which is conventionally considered by sedimentologists as the main factor controlling sedimentary processes of the contourite drift, the high-frequency oceanic processes, such as tidal activities and internal waves are also important mechanisms driving sediment remobilization on the contourite drift.
Data availability statement
The original contributions presented in the study are included in the article/supplementary material. Further inquiries can be directed to the corresponding author.
Author contributions
YLZ, ZL, and YWZ designed the study. YLZ and PM participated in the cruise to perform the observations. LW processed the data and wrote the original draft. All authors contributed to the article and approved the submitted version.
Funding
This work was funded by the National Natural Science Foundation of China (41776047).
Acknowledgments
All crew and scientists aboard KK1803 (South China Sea Remotely Operated Diving) Cruise of the R/V Tan Kah-Kee, and technical staffs of the ROPOS ROV from the Canadian Scientific Submersible Facility were acknowledged for their assistance in deploying and recovering the tripod, and collecting the sediment cores. Dr. Oliver Fringer and Dr. Francisco Javier Hernández-Molina are appreciated for their valuable comments during the review process.
Conflict of interest
The authors declare that the research was conducted in the absence of any commercial or financial relationships that could be construed as a potential conflict of interest.
Publisher’s note
All claims expressed in this article are solely those of the authors and do not necessarily represent those of their affiliated organizations, or those of the publisher, the editors and the reviewers. Any product that may be evaluated in this article, or claim that may be made by its manufacturer, is not guaranteed or endorsed by the publisher.
References
Alford M. H., Peacock T., MacKinnon J. A., Nash J. D., Buijsman M., Centurioni L. R., et al. (2015). The formation and fate of internal waves in the South China Sea. Nature 521, 65–69. doi: 10.1038/nature14399
Bailey S. C. C., Vallikivi M., Hultmark M., Smits A. J. (2014). Estimating the value of von Kármán's constant in turbulent pipe flow. J. Fluid Mech. 749, 79–98. doi: 10.1017/jfm.2014.208
Beardsley R. C., Duda T. F., Lynch J. F., Irish J. D., Ramp S. R., Chiu C.-S., et al. (2004). Barotropic tide in the northeast South China Sea. IEEE J. Ocean. Eng. 29, 1075–1086. doi: 10.1109/JOE.2004.833226
Beaulieu S., Baldwin R. (1998). Temporal variability in currents and the benthic boundary layer at an abyssal station off central California. Deep-Sea Res. Part II Top. Stud. Oceanogr. 45, 587–615. doi: 10.1016/s0967-0645(97)00095-7
Bianchi G. G., Hall I. R., McCave I. N., Joseph L. (1999). Measurement of the sortable silt current speed proxy using the SediGraph 5100 and Coulter Multisizer IIe: precision and accuracy. Sedimentology 46, 1001–1014. doi: 10.1046/j.1365-3091.1999.00256.x
Boegman L., Stastna M. (2019). Sediment resuspension and transport by internal solitary waves. Annu. Rev. Fluid Mech. 51, 129–154. doi: 10.1146/annurev-fluid-122316-045049
Bogucki D., Dickey T., Redekopp L. G. (1997). Sediment resuspension and mixing by resonantly generated internal solitary waves. J. Phys. Oceanogr. 27, 1181–1196. doi: 10.1175/1520-0485(1997)027<1181:srambr>2.0.co;2
Butman B., Noble M., Folger D. W. (1979). Long-term observations of bottom current and bottom sediment movement on the mid-Atlantic continental shelf. J. Geophys. Res. 84, 1187–1205. doi: 10.1029/jc084ic03p01187
Cacchione D. A. (2002). The shaping of continental slopes by internal tides. Science 296, 724–727. doi: 10.1126/science.1069803
Chen H., Xie X., Zhang W., Shu Y., Wang D., Vandorpe T., et al. (2016). Deep-water sedimentary systems and their relationship with bottom currents at the intersection of Xisha Trough and Northwest Sub-Basin, South China Sea. Mar. Geol. 378, 101–113. doi: 10.1016/j.margeo.2015.11.002
Chen H., Zhang W., Xie X., Ren J. (2019). Sediment dynamics driven by contour currents and mesoscale eddies along continental slope: A case study of the northern South China Sea. Mar. Geol. 409, 48–66. doi: 10.1016/j.margeo.2018.12.012
Churchill J. H., Biscaye P. E., Aikman F. (1988). The character and motion of suspended particulate matter over the shelf edge and upper slope off Cape Cod. Cont. Shelf Res. 8, 789–909. doi: 10.1016/0278-4343(88)90077-5
DeMadron X. D., Weatherly G. (1994). Circulation, transport and bottom boundary layers of the deep currents in the Brazil Basin. J. Mar. Res. 52, 583–638. doi: 10.1357/0022240943076975
Gao Z., Eriksson K. A., He Y., Luo S., Geng J. (1998). Deep-water traction current deposits: A study of internal tides, internal waves, contour currents and their deposits (Beijing: Science Press).
Gardner W. D., Richardson M. J., Mishonov A. V., Biscaye P. E. (2018). Global comparison of benthic nepheloid layers based on 52 years of nephelometer and transmissometer measurements. Prog. Oceanogr. 168, 100–111. doi: 10.1016/j.pocean.2018.09.008
Gartner J. W. (2004). Estimating suspended solids concentrations from backscatter intensity measured by acoustic Doppler current profiler in San Francisco Bay, California. Mar. Geol. 211, 169–187. doi: 10.1016/j.margeo.2004.07.001
Grant W. D., Madsen O. S. (1986). The continental-shelf bottom boundary layer. Annu. Rev. Fluid Mech. 18, 265–305. doi: 10.1146/annurev.fl.18.010186.001405
Gross T. F., Williams III. A. J. (1991). Characterization of deep-sea storms. Mar. Geology. 99 (3-4), 281–301. doi: 10.1016/0025-3227(91)90045-6
Guo C., Chen X. (2014). A review of internal solitary wave dynamics in the northern South China Sea. Prog. Oceanography. 121, 7–23. doi: 10.1016/j.pocean.2013.04.002
He Y., Duan T., Gao Z. (2008). “Sediment entrainment,” in Contourites. Eds. Rebesco M., Camerlenghi A. (Amsterdam: Elsevier).
Hernández-Molina F. J., Stow D., Llave E., Rebesco M., Ercilla G., van Rooij D., et al. (2011). Deep-water circulation: processes and products (16–18 June 2010, Baiona): introduction and future challenges. Geo-Mar. Lett. 31, 285–300. doi: 10.1007/s00367-011-0261-z
Hollister C. D. (1993). The concept of deep-sea contourites. Sediment. Geol. 82, 5–11. doi: 10.1016/0037-0738(93)90109-i
Hollister C. D., Johnson D. A., Lonsdale P. E. (1974). Current controlled abyssal sedimentation: Samoan Passage, Equatorial West Pacific. J. Geol. 82, 275–299. doi: 10.1086/627965
Hollister C. D., Mccave I. N. (1984). Sedimentation under deep-sea storms. Nature 309 (5965), 220–225. doi: 10.1038/309220a0
Hosegood P., Van Haren H. (2004). Near-bed solibores over the continental slope in the Faeroe-Shetland Channel. Deep-Sea Res. Part II Top. Stud. Oceanogr. 51, 2943–2971. doi: 10.1016/j.dsr2.2004.09.016
Jackson C. R. (2009). An empirical model for estimating the geographic location of nonlinear internal solitary waves. J. Atmospheric Oceanic Technology. 26 (10), 2243–2255. doi: 10.1175/2009JTECHO638.1
Kasahara A. (2010). A mechanism of deep-ocean mixing due to near-inertial waves generated by flow over bottom topography. Dyn. Atmos. Oceans 49, 124–140. doi: 10.1016/j.dynatmoce.2009.02.002
Kineke G. C., Sternberg R. W., Trowbridge J. H., Geyer W. R. (1996). Fluid-mud processes on the Amazon continental shelf. Cont. Shelf Res. 16, 667–696. doi: 10.1016/0278-4343(95)00050-X
Laj C., Wang P., Balut Y. (2005). Les rapports de campagnes à la mer – MD147/MARCO POLO-IMAGES XII. Institut Polaire Français. 43. doi: 10.17600/5200050
Ledwell J. R., Montgomery E. T., Polzin K. L., St Laurent L. C., Schmitt R. W., Toole J. M. (2000). Evidence for enhanced mixing over rough topography in the abyssal ocean. Nature 403, 179–182. doi: 10.1038/35003164
Legg S., Adcroft A. (2003). Internal wave breaking at concave and convex slopes. J. Phys. Oceanogr. 33, 2224–2246. doi: 10.1175/1520-0485(2003)033<2224:iwbaca>2.0.co;2
Li D., Chou W. C., Shih Y. Y., Chen G. Y., Chang Y., Chow C. H., et al. (2018). Elevated particulate organic carbon export flux induced by internal waves in the oligotrophic northern South China Sea. Sci. Rep. 8, 2042. doi: 10.1038/s41598-018-20184-9
Liu Z., Zhao Y., Colin C., Stattegger K., Wiesner M. G., Huh C.-A., et al. (2016). Source-to-sink transport processes of fluvial sediments in the South China Sea. Earth-Sci. Rev. 153, 238–273. doi: 10.1016/j.earscirev.2015.08.005
Lüdmann T., Wong H. K., Berglar K. (2005). Upward flow of north pacific deep water in the northern South China Sea as deduced from the occurrence of drift sediments. Geophys. Res. Lett. 32 (5), 215–236. doi: 10.1029/2004GL021967
McCave I. N. (1986). Local and global aspects of the bottom nepheloid layers in the world ocean. Neth. J. Sea Res. 20, 167–181. doi: 10.1016/0077-7579(86)90040-2
McWilliams J. C. (2005). Fundamentals of Geophysical Fluid Dynamics (Cambridge: Cambridge University Press).
Miller M. C., McCave I. N., Komar P. D. (1977). Threshold of sediment motion under unidirectional currents. Sedimentology 24, 507–527. doi: 10.1111/j.1365-3091.1977.tb00136.x
Moum J. N., Caldwell D. R., Nash J. D., Gunderson G. D. (2002). Observations of boundary mixing over the continental slope. J. Phys. Oceanogr. 32, 2113–2130. doi: 10.1175/1520-0485(2002)032<2113:OOBMOT>2.0.CO;2
Moum J. N., Klymak J. M., Nash J. D., Perlin A., Smyth W. D. (2007). Energy transport by nonlinear internal waves. J. Phys. Oceanogr. 37, 1968–1988. doi: 10.1175/JPO3094.1
Mullison J. (2017). “Backscatter estimation using broadband acoustic doppler current profilers-updated,” in Hydraulic measurements and experimental methods conference, Durham, USA: American Society of Civil Engineers (ACSE).
Nash J. D., Kunze E., Toole J. M., Martini K., Kelly S. (2007). Hotspots of deep ocean mixing on the Oregon continental slope. Geophys. Res. Lett. 34, L01605. doi: 10.1029/2006GL028170
Nowell A., Hollister C. D. (1985). The objectives and reationale of HEBBLE. Mar. Geol. 66, 1–11. doi: 10.1016/0025-3227(85)90019-2
Pawlowicz R., Beardsley B., Lentz S. (2002). Classical tidal harmonic analysis with error analysis in MATLAB using T_TIDE. Comput. Geosci. 28 (8), 929–937. doi: 10.1016/S0098-3004(02)00013-4
Pomar L., Morsilli M., Hallock P., Bádenas B. (2012). Internal waves, an under-explored source of turbulence events in the sedimentary record. Earth-Sci. Rev. 111, 56–81. doi: 10.1016/j.earscirev.2011.12.005
Quaresma L. S., Vitorino J., Oliveira A., da Silva J. (2007). Evidence of sediment resuspension by nonlinear internal waves on the western Portuguese mid-shelf. Mar. Geol. 246, 123–143. doi: 10.1016/j.margeo.2007.04.019
Rebesco M., Hernández-Molina F. J., van Rooij D., Wåhlin A. (2014). Contourites and associated sediments controlled by deep-water circulation processes: State-of-the-art and future considerations. Mar. Geol. 352, 111–154. doi: 10.1016/j.margeo.2014.03.011
Reeder D. B., Ma B. B., Yang Y. J. (2011). Very large subaqueous sand dunes on the upper continental slope in the South China Sea generated by episodic, shoaling deep-water internal solitary waves. Mar. Geol. 279, 12–18. doi: 10.1016/j.margeo.2010.10.009
Ribbe J., Holloway P. E. (2001). A model of suspended sediment transport by internal tides. Cont. Shelf Res. 21, 395–422. doi: 10.1016/S0278-4343(00)00081-9
Rudnick D. L., Boyd T. J., Brainard R. E., Carter G. S., Egbert G. D., Gregg M. C., et al. (2003). From tides to mixing along the Hawaiian ridge. Science 301, 355–357. doi: 10.1126/science.1085837
Sarnthein M., Pflaumann U., Wang P., Wong H. K. (1994). Preliminary report on sonne-95 cruise 'monitor monsoon' to the South China Sea. Geologisch- Paläeontologisches Institut der Universität Kiel. 48 (255).
Schaeffer A., Roughan M., Wood J. E. (2013). Observed bottom boundary layer transport and uplift on the continental shelf adjacent to a western boundary current. J. Geophys. Res. 119, 4922–4939. doi: 10.1002/2013jc009735
Shanmugam G. (2013). New Perspectives on deep-water sandstones: implications. Pet. Explor. Dev. 40, 316–324. doi: 10.1016/s1876-3804(13)60038-5
Shanmugam G. (2014). Modern internal waves and internal tides along oceanic pycnoclines: Challenges and implications for ancient deep-marine baroclinic sands: Reply. Am. Assoc. Pet. Geol. Bull. 98, 858–879. doi: 10.1306/09111313115
Shao L., Li X., Geng J., Pang X., Lei Y., Qiao P., et al. (2007). Deep water bottom current deposition in the northern South China Sea. Sci. Chn. Earth Sci. 50, 1060–1066. doi: 10.1007/s11430-007-0015-y
Shao L., Li X., Wei G., Liu Y., Fang D. (2001). Provenance of a prominent sediment drift on the northern slope of the South China Sea. Sci. Chn. Earth Sci. 44 (10), 919–925. doi: 10.1007/bf02907084
Soulsby R. L. (1983). “The bottom boundary layer in shelf seas,” in Physical Oceanography of Coastal and Shelf Seas. Ed. Johns B. (Amsterdam: Elsevier), 189–266.
Soulsby R. L., Whitehouse R. (1997). “Threshold of sediment motion in coastal environments,” in Proc. Pac. Coast. Port. '97 Conf, New Zealand. Vol. 149–154.
Stastna M., Lamb K. G. (2002). Vortex shedding and sediment resuspension associated with the interaction of an internal solitary wave and the bottom boundary layer. Geophys. Res. Lett. 29, 1512. doi: 10.1029/2001gl014070
Stastna M., Lamb K. G. (2008). Sediment resuspension mechanisms associated with internal waves in coastal waters. J. Geophys. Res. 113, C10016. doi: 10.1029/2007jc004711
Stow D. A. V., Kahler G., Reeder M. (2002). Fossil contourites: type example from an Oligocene palaeoslope system, Cyprus. Geol. Soc Lond. Mem. 22, 443–455. doi: 10.1144/gsl.mem.2002.022.01.31
Sun H., Yang Q., Zhao W., Liang X., Tian J. (2016). Temporal variability of diapycnal mixing in the northern South China Sea. J. Geophys. Res. 121, 8840–8848. doi: 10.1002/2016jc012044
Symonds D. R. (2006). QA/QC Parameters for Acoustic Doppler Current Profilers (San Diego, CA: Teledyne RD Instruments).
Tian Z., Jia Y., Zhang S., Zhang X., Li Y., Guo X. (2019). Bottom and intermediate nepheloid layer induced by shoaling internal solitary waves: Impacts of the angle of the wave group velocity vector and slope gradients. J. Geophys. Res. 124, 5686–5699. doi: 10.1029/2018jc014721
Trowbridge J. H., Lentz S. J. (2018). The bottom boundary layer. Annu. Rev. Mar. Sci. 10, 397–420. doi: 10.1146/annurev-marine-121916-063351
Urban N. R., Jeong J., Chai Y. (2004). The benthic nepheloid layer (BNL) north of the Keweenaw Peninsula in Lake Superior: Composition, dynamics, and role in sediment transport. J. Great Lakes Res. 30, 133–146. doi: 10.1016/s0380-1330(04)70382-2
Villacieros-Robineau N., Zúñiga D., Barreiro-González B., Alonso-Pérez F., de la Granda F., Froján M., et al. (2019). Bottom boundary layer and particle dynamics in an upwelling affected continental margin (NW Iberia). J. Geophys. Res. 124, 9531–9552. doi: 10.1029/2019jc015619
Wang C., Huang B., Xu T., Zhu D., Wang L., Wang Y. (2022). Numerical modeling of energy dissipation of internal solitary waves encountering step topography. Ocean Eng. 259, 111853. doi: 10.1016/j.oceaneng.2022.111853
Wang H., Jia Y., Ji C., Jiang W., Bian C. (2022). Internal tide-induced turbulent mixing and suspended sediment transport at the bottom boundary layer of the South China Sea slope. J. Mar. Syst. 230, 103723. doi: 10.1016/j.jmarsys.2022.103723
Wang D., Wang Q., Cai S., Shang X., Peng S., Shu Y., et al. (2019). Advances in research of the mid-deep South China Sea circulation. Sci. Chn. Earth Sci. 62, 1192–2004. doi: 10.1007/s11430-019-9546-3
Wong H. K., Lüdmann T., Wollschlager M. (1994). “Seismic reflection profiling at the northern continental margin of the South China Sea (SONNE-95 Cruise),” in Preliminary Report on Sonne-95 Cruise “Monitor Monsoon” to the South China Sea, vol. 68 . Eds. Sarnthein M., Pflaumann U., Wang P., Wong H. K. (Kiel, Germany: Geol.-Palaont. Inst. Univ. Kiel Reports), 46–53.
Yang Q., Zhao W., Liang X., Tian J. (2016). Three-dimensional distribution of turbulent mixing in the South China Sea. J. Phys. Oceanogr. 46, 769–788. doi: 10.1175/jpo-d-14-0220.1
Yin S., Hernández-Molina F. J., Zhang W., Li J., Wang L., Ding W., et al. (2019). The influence of oceanographic processes on contourite features: A multidisciplinary study of the northern South China Sea-Science Direct. Mar. Geol. 415, 105967. doi: 10.1016/j.margeo.2019.105967
Zhang Y., Liu Z., Zhao Y., Li J., Liang X. (2015). Effect of surface mesoscale eddies on deep-sea currents and mixing in the northeastern South China Sea. Deep-Sea Res. Part II Top. Stud. Oceanogr. 122, 6–14. doi: 10.1016/j.dsr2.2015.07.007
Zhang Y., Liu Z., Zhao Y., Wang W., Li J., Xu J. (2014). Mesoscale eddies transport deep-sea sediments. Sci. Rep. 4, 5937. doi: 10.1038/srep05937
Zhao Y., Liu Z., Zhang Y., Li J., Wang M., Wang W., et al. (2015). In situ observation of contour currents in the northern South China Sea: Applications for deep-water sediment transport. Earth Planet. Sci. Lett. 430, 477–485. doi: 10.1016/j.epsl.2015.09.008
Zhao Y., Wang Y., Liu Z., Li X., Yang W. (2023). Deep-water circulation intensity and stratification in the South China Sea since the last glaciation. Mar. Geol. 457, 107004. doi: 10.1016/j.margeo.2023.107004
Zhao J., Zhang Y., Liu Z., Zhao Y., Wang M. (2019). Seasonal variability of tides in the deep northern South China Sea. Sci. Chn. Earth Sci. 62, 671–683. doi: 10.1007/s11430-017-9315-7
Zhou M., Wang G., Liu W., Chen C. (2020). Variability of the observed deep western boundary current in the South China Sea. J. Phys. Oceanography. 50 (10), 1–1. doi: 10.1175/JPO-D-20-0013.1
Keywords: bottom boundary layer, contourite drift, sediment resuspension, South China Sea, tripod observation
Citation: Wu L, Zhao Y, Liu Z, Ma P and Zhang Y (2023) Sedimentary processes in the bottom boundary layer of a contourite drift in the northern South China Sea. Front. Mar. Sci. 10:1217216. doi: 10.3389/fmars.2023.1217216
Received: 05 May 2023; Accepted: 19 October 2023;
Published: 02 November 2023.
Edited by:
Xingsen Guo, University College London, United KingdomReviewed by:
Oliver B. Fringer, Stanford University, United StatesF. Javier Hernandez-Molina, University of London, United Kingdom
Yan Liu, Southern University of Science and Technology, China
Copyright © 2023 Wu, Zhao, Liu, Ma and Zhang. This is an open-access article distributed under the terms of the Creative Commons Attribution License (CC BY). The use, distribution or reproduction in other forums is permitted, provided the original author(s) and the copyright owner(s) are credited and that the original publication in this journal is cited, in accordance with accepted academic practice. No use, distribution or reproduction is permitted which does not comply with these terms.
*Correspondence: Yulong Zhao, yeoloon@tongji.edu.cn