Satellite-Derived Trends in Inundation Frequency Reveal the Fate of Saltmarshes
 Marieke Liesa Laengner
 Daphne van der Wal
- 1NIOZ Royal Netherlands Institute for Sea Research, Department of Estuarine and Delta Systems, Yerseke, Netherlands
- 2Faculty of Geo-Information Science and Earth Observation (ITC), University of Twente, Enschede, Netherlands
Some of the world’s coastal saltmarshes experience loss in area due to environmental changes, such as relative sea level rise and limited sediment supply. We use satellite remote sensing to assess changes in inundation (flooding) frequency in tidal basins and investigate the bio-physical interactions with saltmarshes. We apply a simple automated method to retrieve time series of inundation frequency change and seaward habitat change of saltmarshes and tidal flats from Landsat-5 TM satellite imagery between 1985 and 2011, for a number of contrasting tidal basins (estuaries, deltas) globally. We evaluated the satellite-derived information on inundation frequency with such information obtained from elevation and tide gauge data for the Western Scheldt estuary, showing good agreement. Application of the method on all study sites reveal which tidal basins are stable or net emerging and which tidal basins are net drowning, but also show large spatial variation in the changes in inundation frequency within each basin. Tidal basins experiencing an overall significant increase in inundation frequency (Mississippi Delta and Venice Lagoon) were associated with an overall loss of saltmarsh area. Satellite-derived temporal and spatial information on inundation frequency helps to assess the fate of saltmarshes in light of sea level change, changes in sediment supply and subsidence.
1 Introduction
Saltmarshes are the transition zone between land and sea and are regularly flooded due to tides (Adam, 1990) and waves. These highly productive ecosystems provide crucial functions for flora, fauna, and humankind (Costanza et al., 1997; Barbier et al., 2011). They provide many organisms with a place for resting, breeding, feeding, and hiding from predators. Furthermore, saltmarshes provide many ecosystem services, such as carbon sequestration, improvement of water quality, and coastal protection (Barbier et al., 2011).
Saltmarshes have the ability to increase in elevation with rising sea levels by trapping sediments, provided sufficient sediments are available (Reed, 1990; Kirwan and Murray, 2007; Day et al., 2011). Nevertheless, some studies raise concerns that saltmarshes may experience habitat loss due to high rates of sea level rise (SLR) in combination with decreasing sediment availability [(for example due to damming of rivers; see Grill et al. (2019)], so that vertical sediment accretion may not be sufficient to keep pace with global SLR (Reed, 1995; Weston, 2014). In some areas, subsidence caused by water, oil, or gas extraction adds to drowning of the saltmarsh (Turner and Mo, 2020). On the other hand, Kirwan et al. (2016) showed in their meta-analysis that saltmarshes are more resilient to SLR than widely assumed. This has been predicted by models of marsh response to SLR when considering biophysical feedback effects, which enhance accretion of sediment with SLR, as well as the possibility of landward marsh migration (Schuerch et al., 2018). The ability to survive a specific rate of sea level rise may also vary within a saltmarsh (Bartholdy et al., 2010). Overall, severe saltmarsh habitat loss mostly occurs where human activity has altered sediment and nutrient fluxes or caused relative SLR through subsidence (Kirwan et al., 2016).
Besides vertical accretion of saltmarshes to keep up with relative SLR, it is important to also consider lateral saltmarsh development at the saltmarsh–tidal flat boundary (Allen, 2000; van der Wal et al., 2008; Balke et al., 2016; Kirwan et al., 2016). Like vertical drowning, the combination of rising sea levels and reduced sediment availability leads to rapid lateral saltmarsh retreat at the seaward saltmarsh–tidal flat boundary in several places in the world (Ladd et al., 2019) and may differ from internal habitat changes (Burns et al., 2021). This may have major impacts on saltmarshes, especially when seawalls or dikes are present, which prohibits landward migration (Doody, 2004).
Indicators to reveal the fate of saltmarshes are needed, such as the flood/ebb suspended sediment concentration (SSC) differential, the organic–inorganic suspended sediment ratio (Ganju et al., 2015), or the unvegetated/vegetated marsh ratio (UVVR) (Ganju et al., 2017). In particular, there is a need to assess how saltmarshes develop relative to the tidal frame at the basin scale. Inundation frequencies in coastal wetlands are changing caused by changes in tidal range due to relative SLR and coastal engineering (Pickering et al., 2012), which may impact vertical and lateral saltmarsh development. Inundation frequency change in coastal areas indicates elevation change relative to the sea level, with consequences for the amount and habitat characteristics of intertidal areas (van der Wal et al., 2010; Laengner et al., 2019; Fitton et al., 2021).
Spatial data of elevation in the intertidal zone have been generated using UAV-borne or airborne LiDAR techniques [e.g., Gesch (2009); Rogers et al. (2018); Lin et al. (2019); Shaker et al. (2019); Pinton et al. (2020)]. These techniques are suitable for local studies for which very-high-resolution data are needed (resolution ca 1 m), as their acquisition is costly and time consuming compared to acquisition of satellite data. National precise elevation maps generated from airborne LiDAR exist as well (e.g., USGS 3DEP National Seamless DEM), but these data are merged from data acquired in different years to cover large areas. Such data sets are not available globally. Several approaches are applied to retrieve elevation in the intertidal zone over larger areas in a consistent manner, e.g., using the waterline method from SAR satellite remote sensing [e.g., Mason et al. (1995); Horritt et al. (2003); Zhang et al. (2022)] or optical satellite data (e.g., Zhao et al. (2008); Tong et al. (2020); Castelle et al. (2021)]. van der Wal et al. (2010) generated maps of emersion percentages for several tidal basins in the Netherlands and the UK using a large set of freely available MODIS 250 images from NASA’s Aqua satellite.
With the release of browser-based developer platforms for geo-spatial and remote sensing analysis, such as Google Earth Engine (GEE), the development of automated remote sensing methods to investigate coastal areas has been growing [e.g., Luijendijk et al. (2018); Laengner et al. (2019); Murray et al. (2019); Campbell and Wang (2020); Fitton et al. (2021); Li et al. (2021); Haarpaintner and Davids (2021)]. Automated techniques enable to easily analyze changes in inundation (flooding) frequency on time scales of years to decades using satellite data from e.g., Landsat, Sentinel, or MODIS, e.g., globally for surface waters in rivers, lakes, and wetlands (Donchyts et al., 2016; Pekel et al., 2016). for intertidal zones in Australia (Sagar et al., 2017), and locally, e.g., in the Mekong Delta (Park et al., 2020). Recently, Fitton et al. (2021) presented an automated method in GEE to retrieve the intertidal zone of the UK by calculating water occurrence from Sentinel-2 imagery over 5 years (2015–2020) combined with a national tidal model.
Here we apply a simple automated method to derive maps of yearly inundation frequency change and time series of mean inundation frequency over a respective basin, as well as habitat development using GEE based on the method by Laengner et al. (2019). We retrieved inundation frequency for eight contrasting tidal basins around the world using the entire Landsat 5 TM surface reflectance data set and generated time series between 1986 and 2010 in 3-year bins to investigate whether saltmarshes can keep up with relative sea level change. This study aims (1) to retrieve time series over 27 years of inundation frequency change along with saltmarsh habitat change; (2) to analyze trends in inundation frequency change in a spatial context; (3) to analyze the relationship between basin-wide inundation frequency change and changes in saltmarsh habitat.
2 Materials and Methods
2.1 Study Sites
We selected eight tidal basins across the world (Figure 1) based on their contrasting physiographic setting, such as tidal regime, sediment input, and human activity.
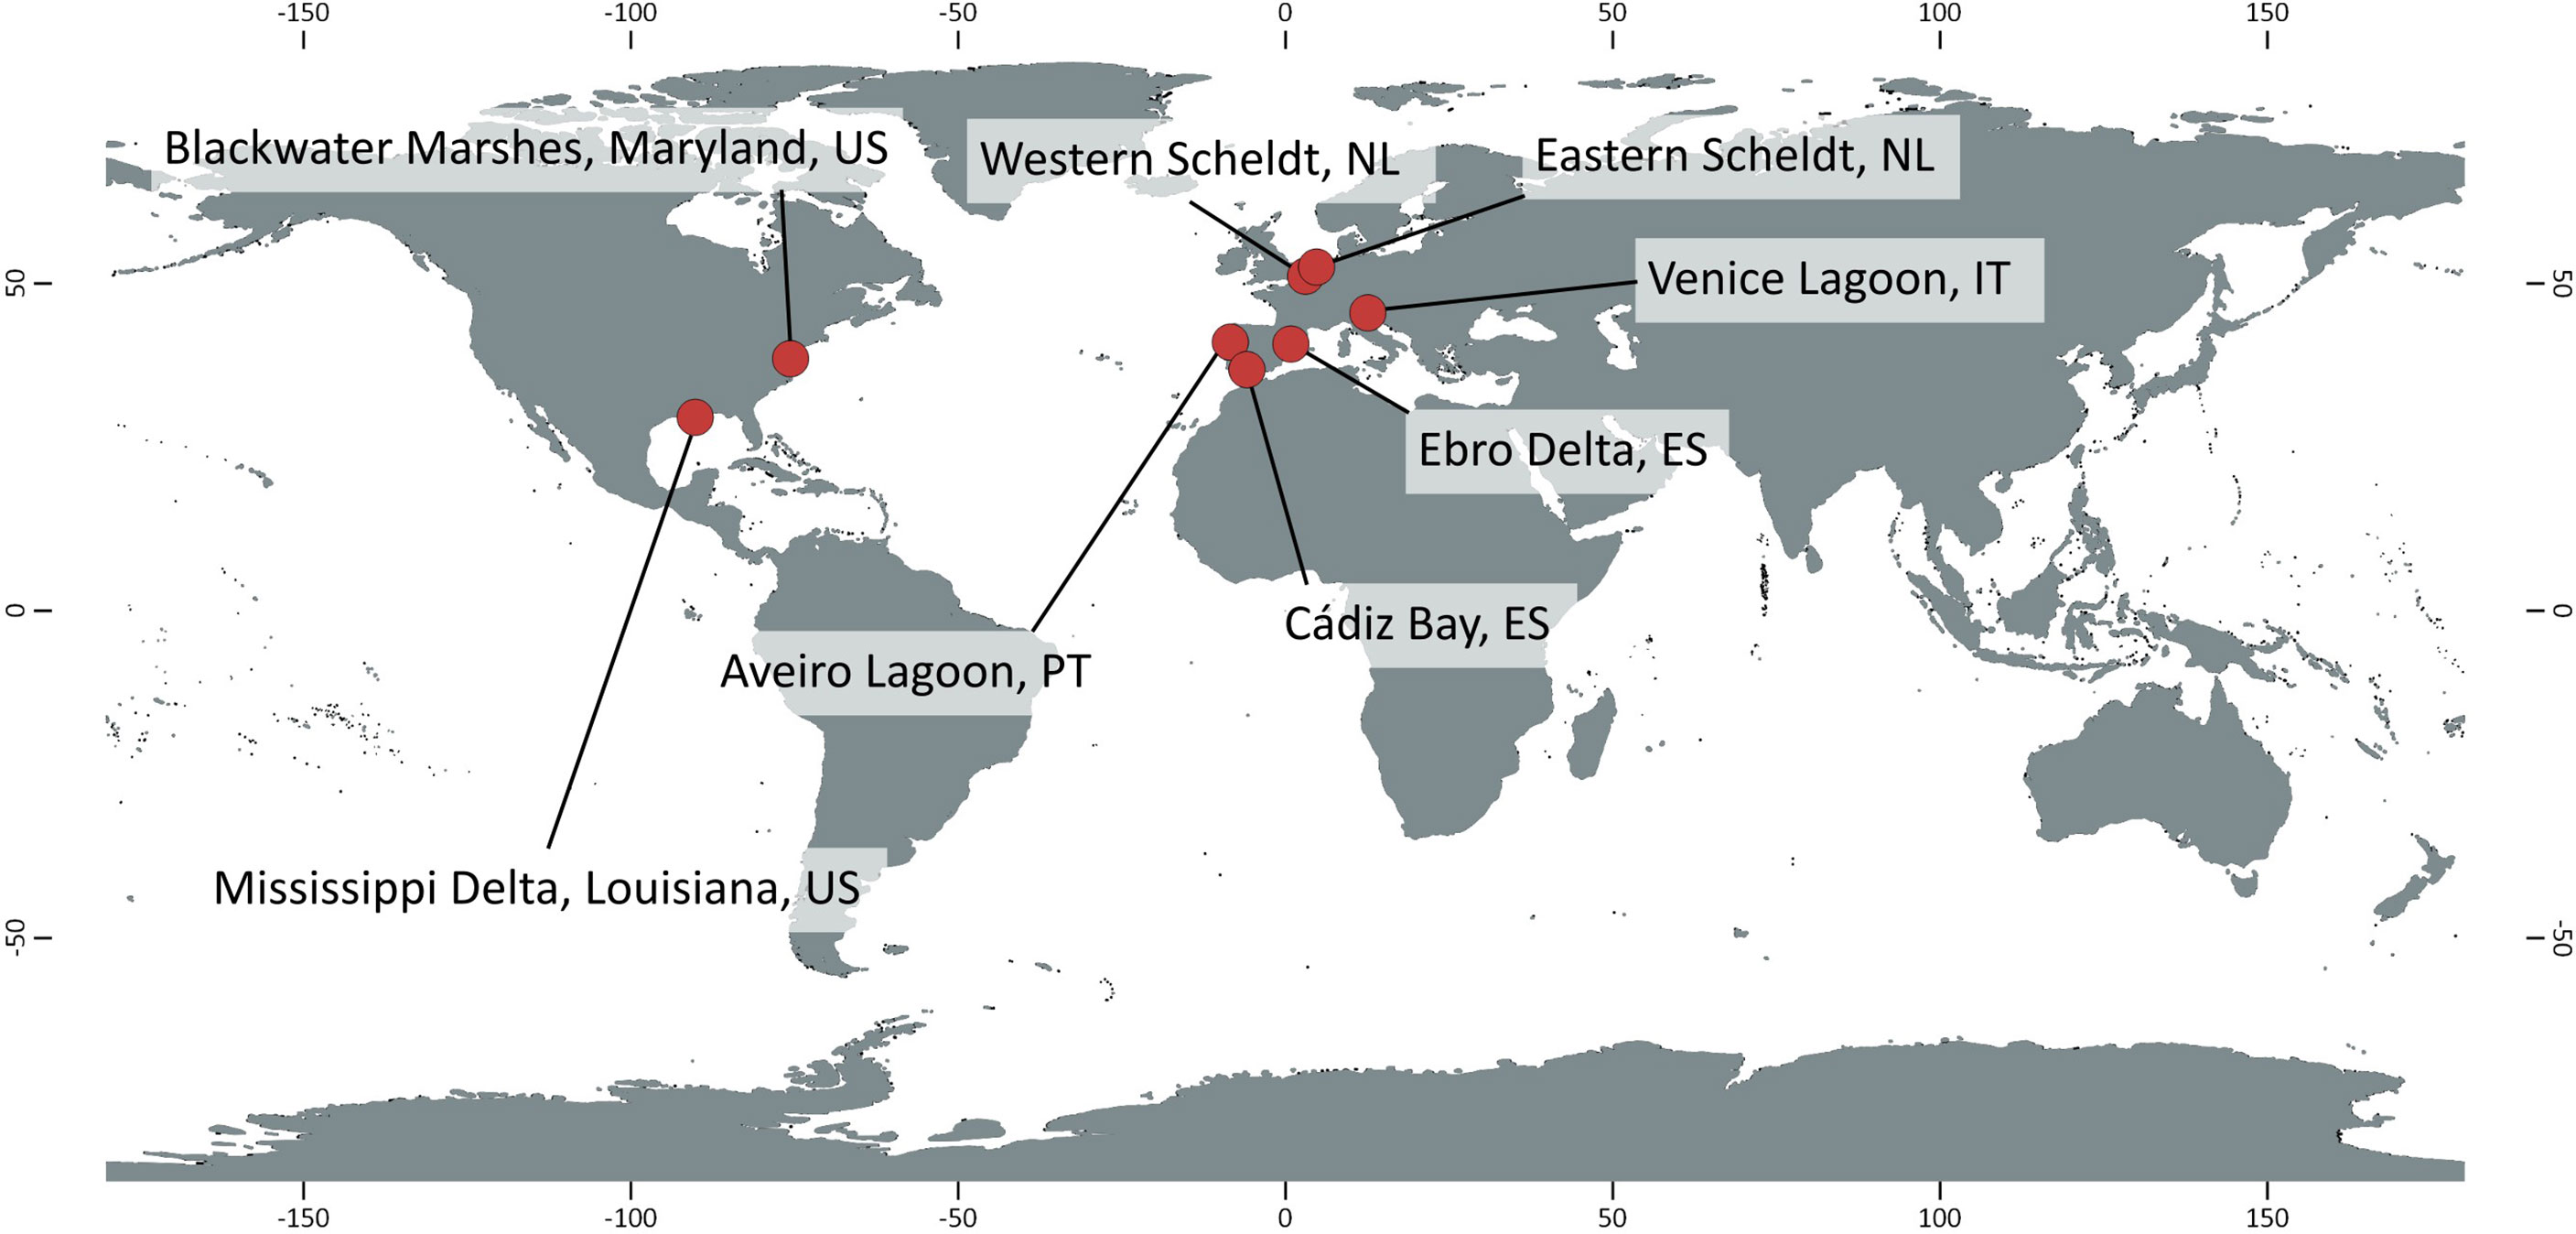
Figure 1 World background made with Natural Earth.
The Western Scheldt and the Eastern Scheldt, Netherlands, are tide-dominated estuaries (meso- to macrotidal) bordering the North Sea. The Western Scheldt receives (limited) discharge from the River Scheldt, while the neighboring Eastern Scheldt estuary does not receive river inflow since the construction of compartment dams in the 1980s (De Vet et al., 2017).
The Venice Lagoon, Italy, and the Ebro Delta, Spain, are microtidal study sites in the Mediterranean Sea. Prolonged saltmarsh habitat loss in the Venice Lagoon is attributed to a reduction of sediment inputs from rivers and the sea into the lagoon, as well as subsidence, both through human activity (Day et al., 1999). The Ebro receives river discharge, but riverine sediment transport to the delta has reduced with the construction of large dams upstream in the 1960s (Jiménez et al., 1997).
The Aveiro Lagoon, Portugal, and Cádiz Bay, Spain, are mesotidal and located in the North Atlantic. The Aveiro Lagoon is a dynamic lagoon with many channels, with main fluvial input delivered from the Vouga and Antuã rivers (Picado et al., 2010). Cádiz Bay is a shallow bay. The construction of ports and the dredging and deepening of navigation channels influence the ecology and hydrodynamics in this area (Zarzuelo et al., 2015).
The Mississippi Delta, Louisiana, US, and Blackwater Marshes, Maryland, US, are microtidal areas in the North Atlantic on the US East Coast. For the Mississippi Delta, riverine input is very important for vertical accretion through direct deposition and nutrient transport to enhance organic soil formation. Subsidence and reduction of sediment input, caused by various human activities, are the main factors associated with wetland loss in this area (Cahoon et al., 1995; Day et al., 2000; Syvitski et al., 2009). The Blackwater Marshes experiences subsidence from postglacial rebound, and reduction of riverine sediment transport to the study site further contributes to ongoing saltmarsh loss in this area (Kearney et al., 2002; Kearney and Turner, 2016).
2.2 Estimating Inundation Frequency Change From Landsat 5 TM Imagery
Inundation frequency (IF) change was calculated in Google Earth Engine (GEE), using the entire atmospherically corrected Landsat 5 TM surface reflectance data set (provided by the U.S. Geological Survey) from the GEE-catalogue. Landsat 5 is a sun-synchronous satellite (NASA/USGS), with an equator crossing time between 10h00 and 10h15 a.m. in descending orbit (Chander et al., 2004). Landsat 5 TM data cover a long time period, the spatial resolution is 30 m, the revisit time is 16 days, and the spatial coverage is 185 km by 185 km (Adam et al., 2010; Gómez et al., 2016).
We delineated the eight tidal basins using a polygon drawn by hand roughly around the respective basin. Land areas included in this polygon were masked using a global land mask, proposed by Laengner et al. (2019). Furthermore, we masked unusable pixels (e.g., clouds, cloud shadow, snow, data insufficiency), following Laengner et al. (2019). We calculated the Normalized Difference Water Index (NDWI) (McFeeters, 1996) for each unmasked pixel of all images by applying the equation
and assigned a pixel to water with NDWI > 0, and built binaries (maps with classes water and no water). The available images were split in 3-year bins, that is, each 3-year image collection consisted of all images available within that specific 3-year period, as part of a time series between 1986 (i.e., first time step generated from images of 1985, 1986, and 1987) and 2010 (i.e., last time step generated from images of 2009, 2010, and 2011) (Laengner et al., 2019). We assume that with all available satellite images over 3 years, the whole range of tidal stages are represented well in each time step. If the amount of usable data within a 3-year image collection is too small (mean number of unmasked images per pixel < 10), we mask this 3-year bin in the generated time series, following Laengner et al. (2019).
For each pixel in each 3-year image collection, we calculated how often a pixel was inundated (i.e., assigned to class water) and expressed this as percentage, i.e., inundation frequency percentage. From these time series maps (1986–2010) of inundation frequency, we calculated the mean inundation frequency over the total area of the respective basin.
We used GEE to create a time series of inundation frequency between 1986 and 2010 for each pixel. From the time steps, we calculate the slope for each pixel using a non-parametric method called Sen’s estimator (Sen, 1968) and from this determined the yearly change in IF (slope/3) for each pixel and tested its significance using the non-parametric Mann–Kendall trend test (Mann, 1945) with a significance level of 0.05. From this, we generated maps showing the yearly change in IF for those pixels for which a significant trend could be detected. We used Inkscape 0.91 to combine the inundation maps to one figure with panels (Figure 5 and Figure S5–S12).1
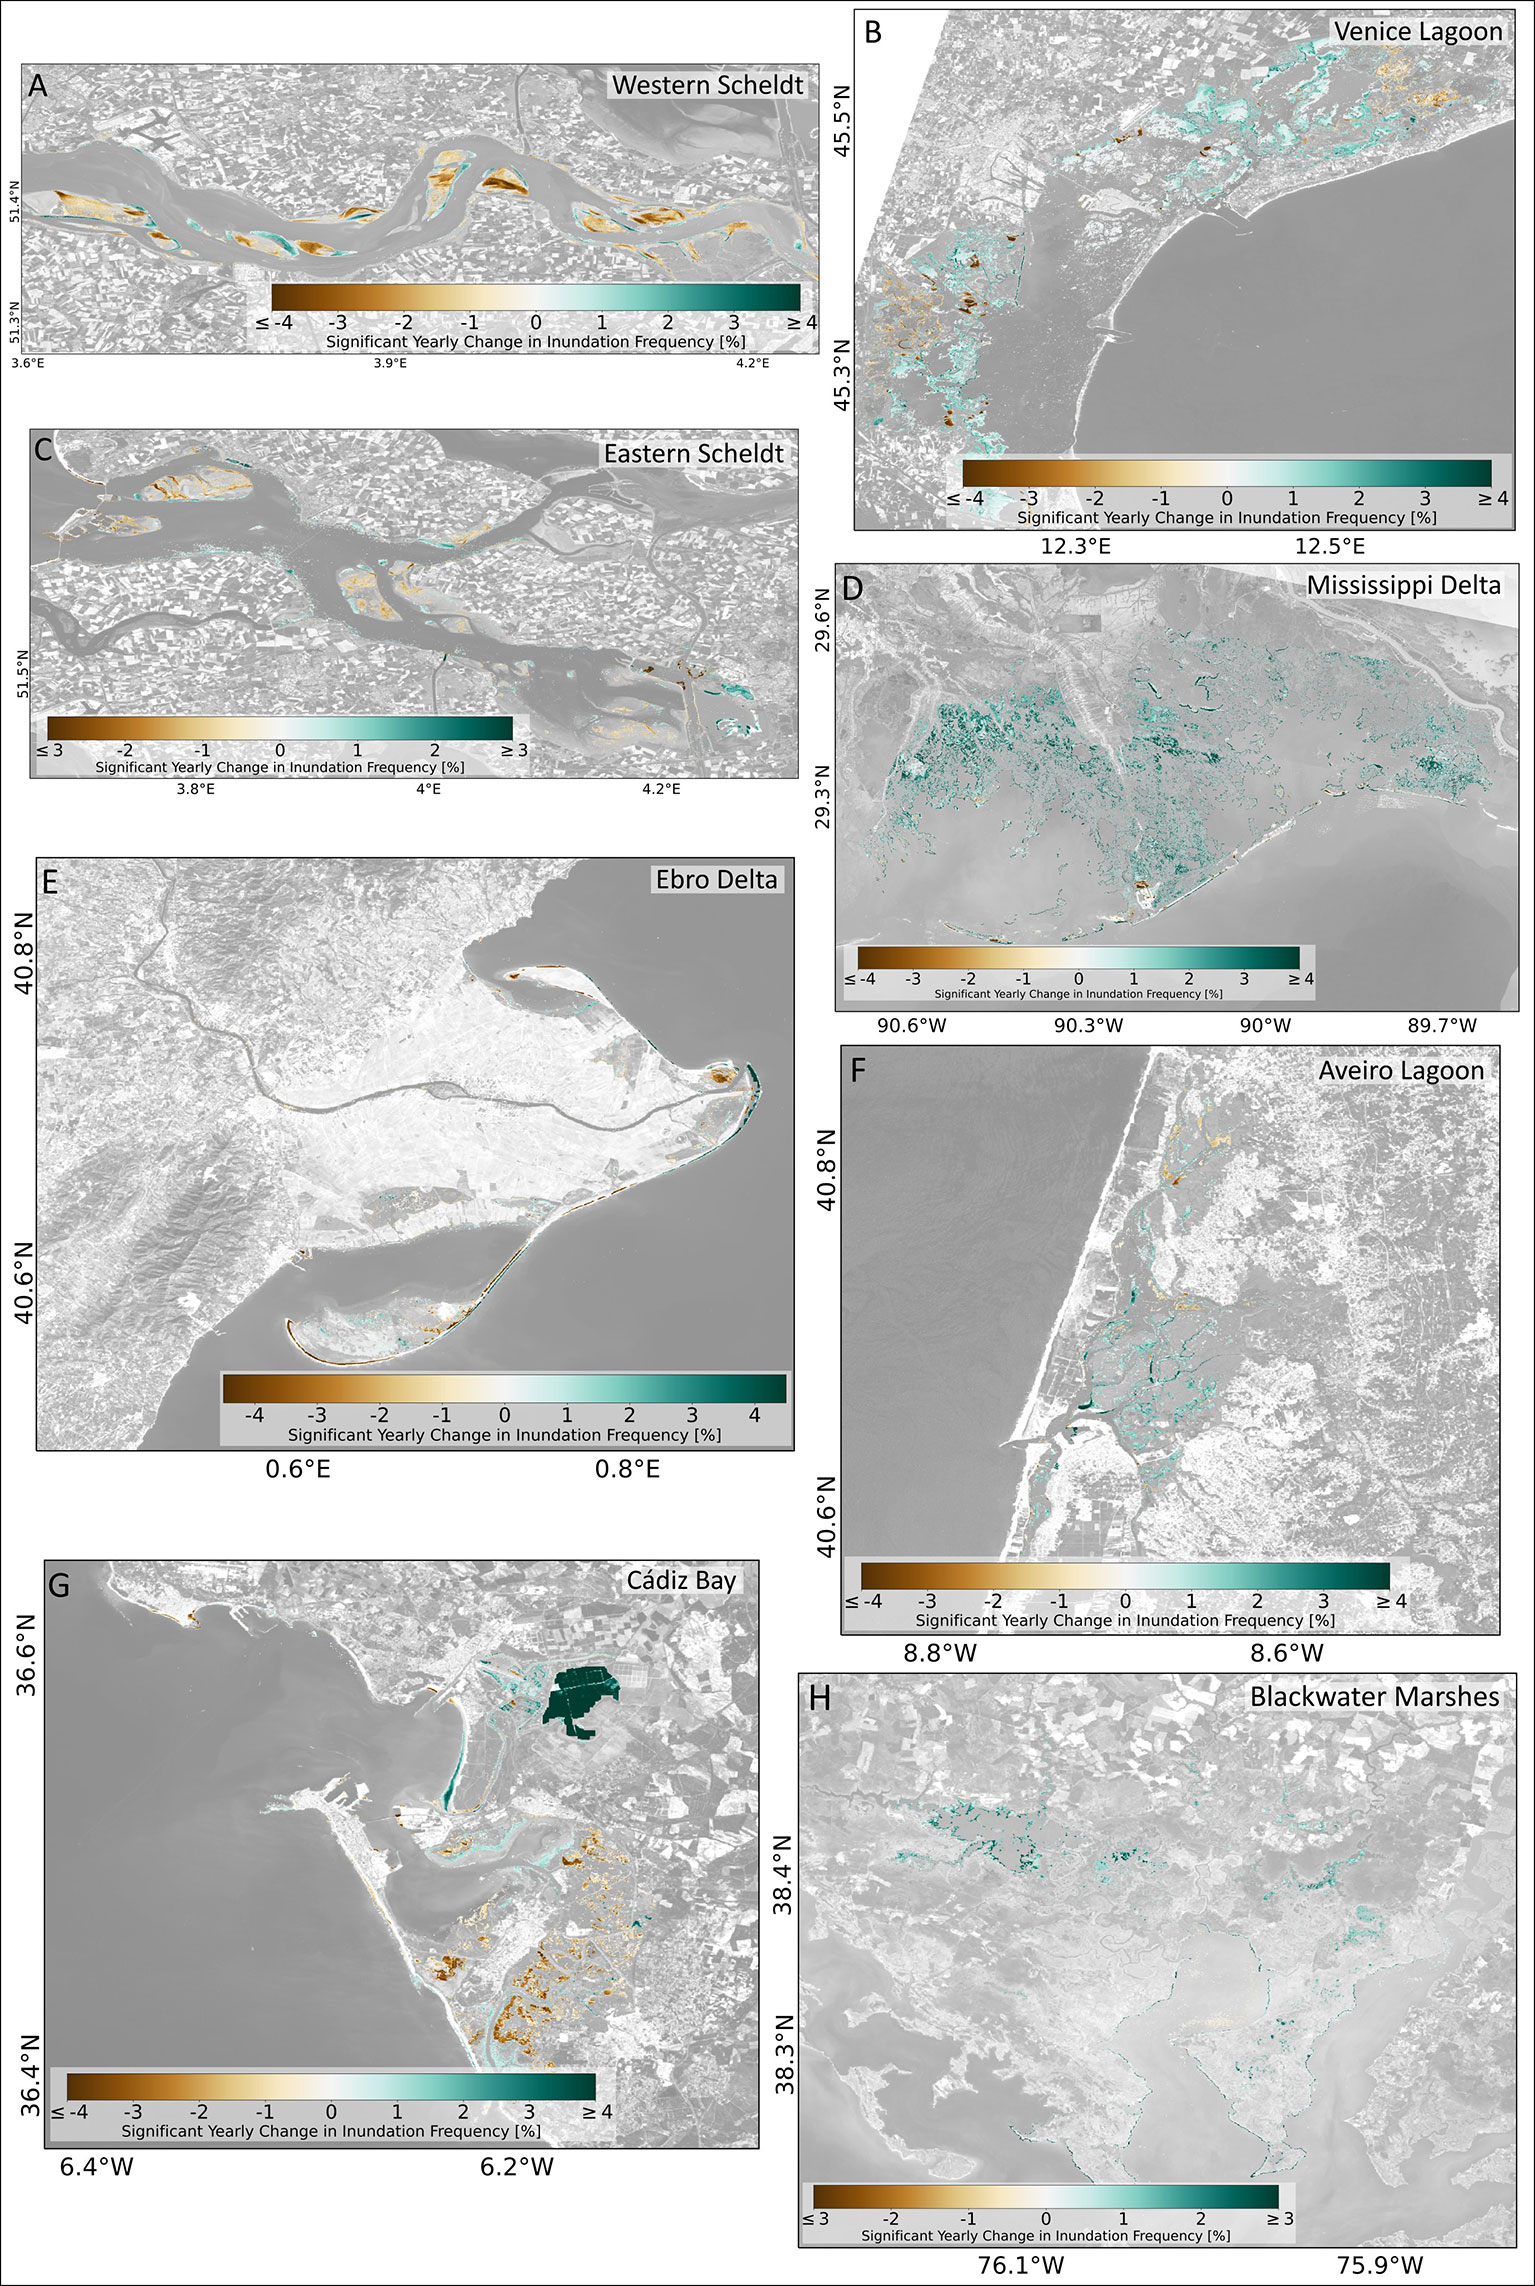
Figure 5 Maps of significant yearly change in inundation frequency [%] for each of the eight selected study sites. The background of each map is grayscale Landsat 8 OLI imagery (background images courtesy of the U.S. Geological Survey).
2.3 Evaluating Estimated Inundation Frequencies From Landsat 5 TM Imagery
To evaluate the generated inundation frequency (IF) results, we compared our results to spatial emersion frequency [%] data of the Western Scheldt obtained from Rijkswaterstaat, the Dutch Ministry of Infrastructure and Water Management 1. Furthermore, Rijkswaterstaat provides the underlying elevation data [m + NAP, i.e., above Dutch Ordnance Datum]. Both data sets were available from Rijkswaterstaat for the years 1996, 2001, 2004, 2008, and 2010 (Walburg and De Jong, 2016a; Walburg and De Jong, 2016b; Walburg and De Jong 2016c; Walburg and De Jong 2016d; Walburg and De Jong 2016e), as well as for 2015 (Buiks, 2016), 2018 (Paree, 2019), and 2020 (Paree, 2021). The elevation maps were produced by Rijkswaterstaat from a combination of airborne laser altimetry data, single-beam echo sounding data, and multibeam echo sounding data, gridded to rasters with a 20 by 20 m spatial resolution. For each year, Rijkswaterstaat combined the elevation data with a 4-year period of actual water level data at tide gauge stations, to construct the map of emersion frequency (Kers et al., 2013; Walburg and De Jong, 2016c). For example, for the emersion frequency map of 2004, the elevation map of 2004 and time series of water level data from 2001, 2002, 2003, and 2004 were used (Walburg and De Jong, 2016c).
We converted the emersion frequency data of the years available within the investigated time period (1996, 2001, 2004, 2008, 2010) to inundation frequency [%] (100−emersionfrequency) and correlated the data with our IF data generated from Landsat 5 TM pixel by pixel. The years 1996 and 2008 do not match the 3-year time steps in our generated time series of inundation frequency. In order to compare all available data within the investigated time period by Rijkswaterstaat to our results, we additionally generated IF maps for the years 1996 (based on a Landsat 5 TM image collection between 1995 and 1997) and 2008 (based on a Landsat 5 TM image collection between 2007 and 2009). We also correlated the Rijkswaterstaat elevation data with matching IF data generated from the Landsat 5 TM time series. To provide a perspective for the use of other satellite sensors, the comparison was also tested for inundation frequency retrieved from Sentinel-2 MSI, level-2A data (provided by EU/ESA/Copernicus), and atmospherically corrected surface reflectance data from the Landsat 8 OLI/TIRS sensors (provided by the U.S. Geological Survey), both obtained from the GEE catalogue. For these sensors, we used 1-year image collections rather than 3-year image collections because more usable data were available for the Western Scheldt.
2.4 Assessing Habitat Change From Landsat 5 TM Imagery
We applied an unsupervised decision tree (DT) classification procedure in Google Earth Engine (GEE), developed by Laengner et al. (2019) to the eight selected basins. We used the same data set of satellite images as used to retrieve inundation frequency time series (see Section 2.2). The DT method classifies images into the classes vegetated saltmarsh, unvegetated tidal flat, and open water automatically. For example, it considers intertidal areas with presence or absence of vegetation, respectively based on a fixed NDVI threshold of 0.3 Laengner et al. (2019). Each classification result is based on an image collection containing all available images over 3 years, thus at different seasons, tidal and wave conditions rather than only one satellite image. Frequency thresholds were set as in Laengner et al. (2019) to decide how a pixel in an image collection is classified. For example, the NDVI of a saltmarsh changes throughout the seasons or can be negative due to inundation during high tides, which is why a threshold of how often a pixel must have a NDVI value of 0.3 or higher to be classified as saltmarsh was set to 20%. Likewise, thresholds for the other land cover classes were applied (see Laengner et al. (2019) for procedure). Laengner et al. (2019) evaluated the classification results using spatial data of vegetation presence provided by Rijkswaterstaat for the Western Scheldt and found that the method was robust, and the outcome was not sensitive to the chosen thresholds. With this classification principle, local information on tides, waves, and seasonality is not needed. For the eight investigated study sites in the present paper, we generated time series of net habitat change over a respective basin from 1986 (generated from images between 1985 and 1987) to 2010 (generated from images between 2009 and 2011). If the amount of usable data within a 3-year image collection is too small (mean number of unmasked images per pixel < 10), we mask this 3-year bin in the generated time series, following Laengner et al. (2019).
We further revealed transitions between the land cover classes saltmarsh, tidal flat, and water in GEE. Between each bin of 3 years, we revealed the number of pixels of each land cover class becoming another land cover class. Then, we averaged these transitions over the time period to calculate the mean area [km2] transitioning from one land cover class to another one between two time steps in Python 3.7 and expressed them as relative area [%], i.e., area relative to the size of the respective basin. Transitions were visualized using Inkscape 0.91 (i.e., for Figure S4).
2.5 Comparing Inundation Frequency Change and Habitat Change
From the generated time series of habitat change and inundation frequency change, we calculated the yearly change for each defined land cover class (saltmarsh, tidal flat, water), as well as mean inundation frequency over a respective basin. We masked time steps with sparse usable data using the threshold for data availability (mean value of usable images per pixel over the whole basin smaller than 10), defined by Laengner et al. (2019). Yearly change was calculated in Python 3.7 using the Python module mkt which computes the Mann–Kendall trend test Mann (1945) for trends in time-series data, with slope as one of the outputs. We chose this non-parametric method as it does not require normally distributed data and is robust against missing data and outlier values, e.g., due to remaining clouds (Laengner et al., 2019). We defined a significance level of 0.05 to detect significant trends in the time series.
We compared the trends of habitat change with trends in inundation frequency change to investigate the fate of saltmarshes. The relationship between basin-wide inundation frequency change and saltmarsh habitat change was tested calculating a linear least square regression in Python 3.7 (scipy.stats.linregress) using a significance level of 0.05.
3 Results
3.1 Evaluating Estimated Inundation Frequency From Landsat 5 TM Imagery
The Western Scheldt estuary was used as a test case to evaluate the retrieval of inundation frequency from Landsat 5 imagery. Figure 2 shows a strong correlation (R ≤ 0.96) between inundation frequency (IF) provided by Rijkswaterstaat and IF estimated from the Landsat 5 TM time series. The strong fits are also highlighted by the density points around the 1:1 line, although scattering around the 1:1 line can be observed. Scattering and stripes can especially be observed for the year 2001 (Figure 2B), which was not included in the time-series analysis because of insufficient usable data. The 2008 bin (Figure 2D) also shows some scattering and stripes, but the point density around the 1:1 line is much higher compared to the scattered points. Limited data were available for the 2001 and the 2008 bins (see gray bars in Figure 3); if IF is calculated from few data, not all frequency values would occur, e.g., with only two images, we would only obtain frequencies of 0%, 50%, or 100%. In the supplementary (Figure S2), we show additional plots with strong correlations (R = 0.98) between IF provided by Rijkswaterstaat and IF generated using Landsat 8 OLI imagery (2015, 2018, 2020) or Sentinel-2 MSI data (2018, 2020). This provides a perspective for the use of the method not only for Landsat 5 TM but also for other sensors, such as Landsat 8 OLI and Sentinel-2 MSI.
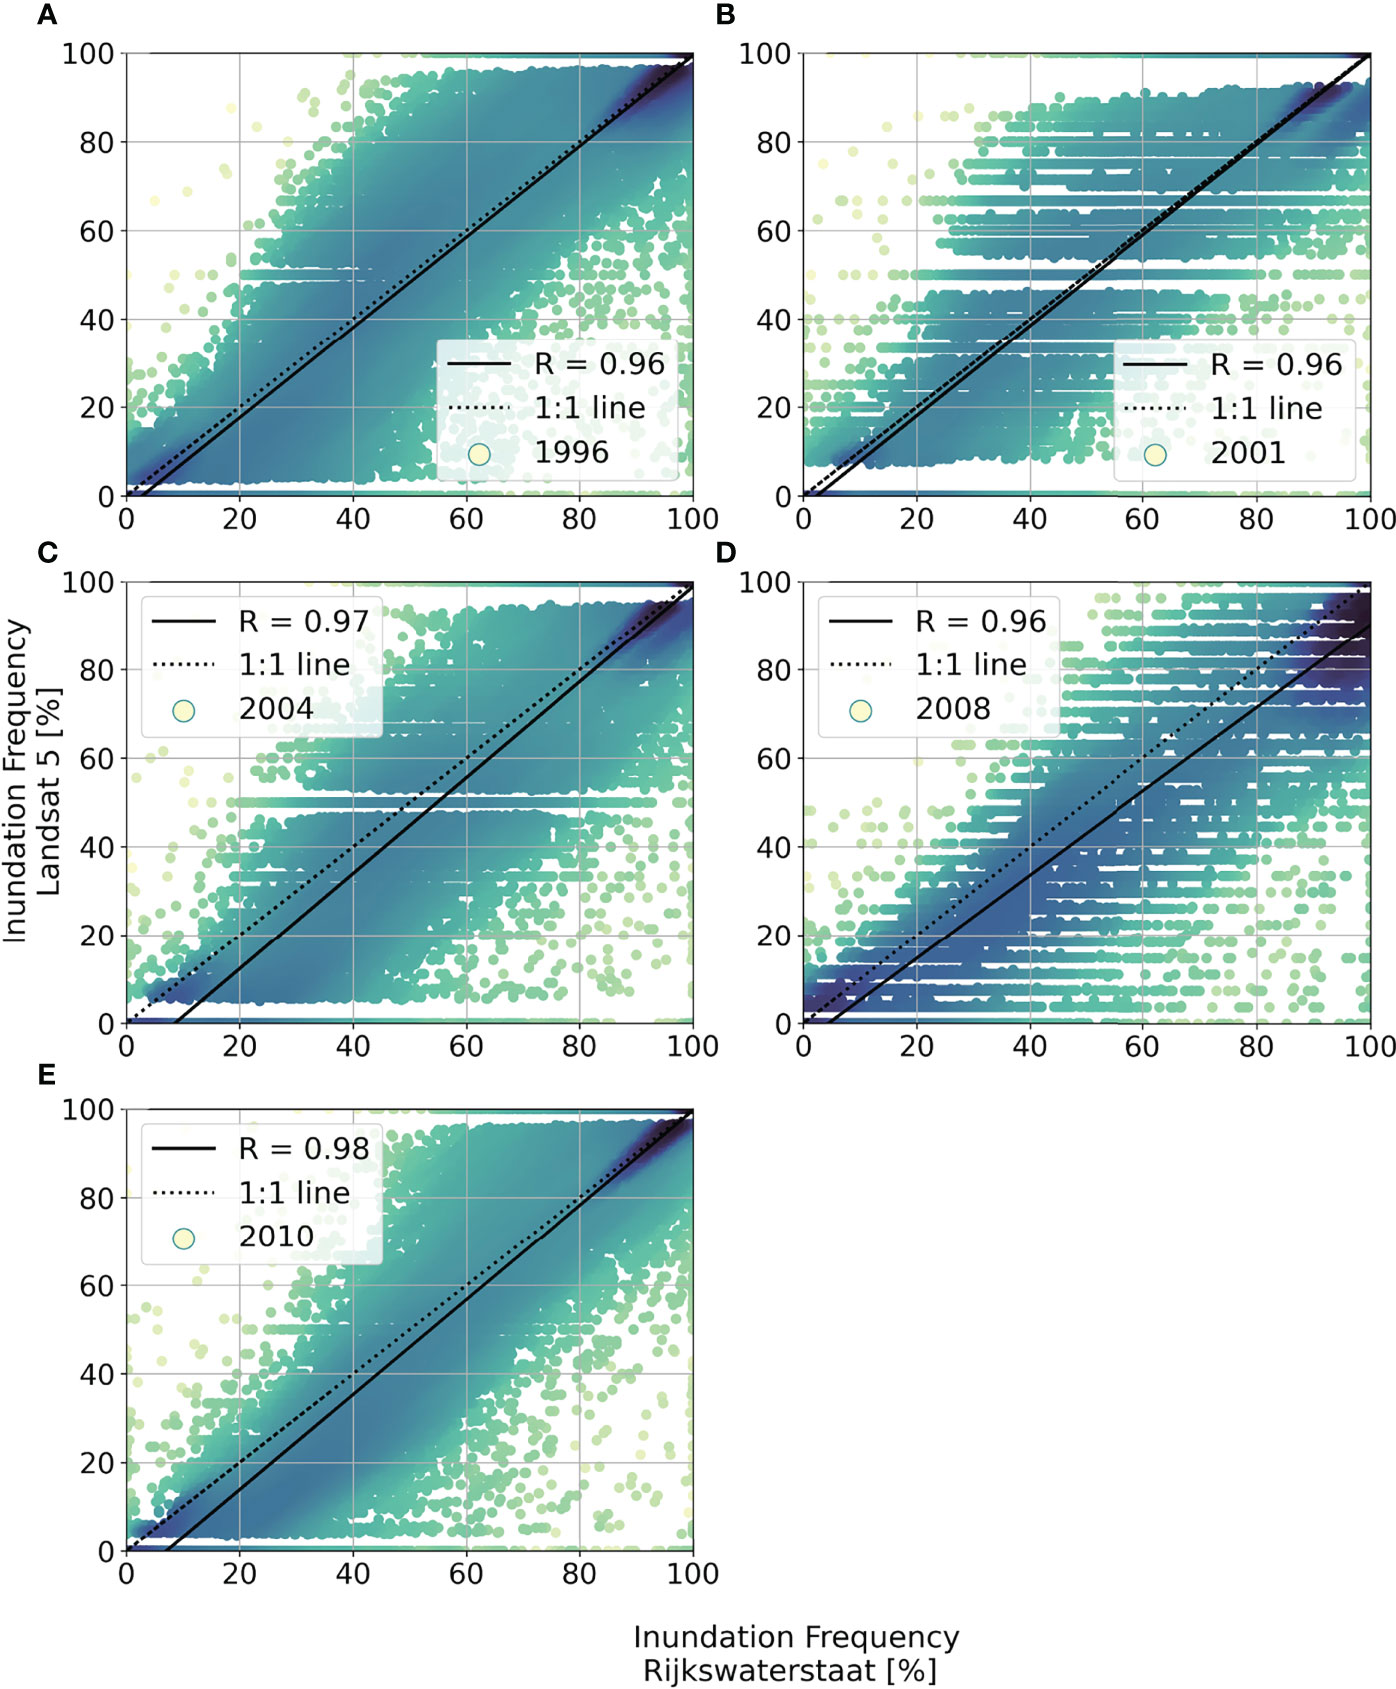
Figure 2 Correlation between inundation frequency [%] provided by Rijkswaterstaat (x-axis) and generated from Landsat 5 TM imagery (y-axis). The color shows the plot density on a logarithmic scale, with darker colors indicating higher densities of points.
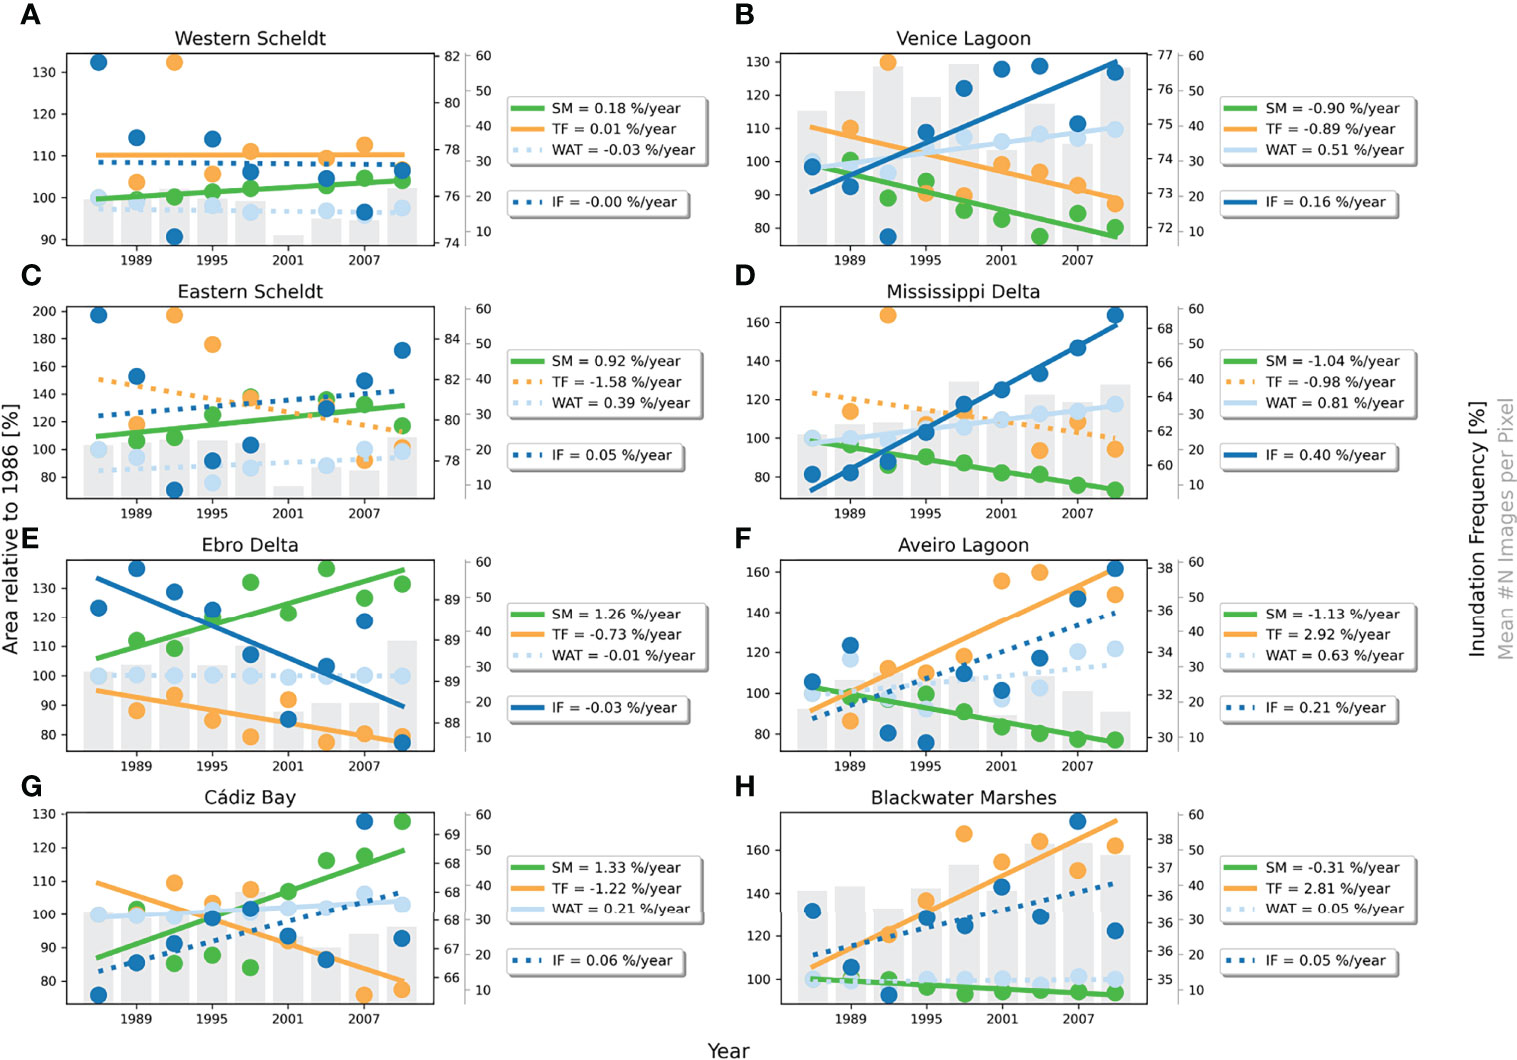
Figure 3 Time series of saltmarsh (SM), tidal flat (TF), and water (WAT) area [%] for each study site (left y-axis) and of inundation frequency [%] (right y-axis). Mean number of unmasked images per pixel of each 3-year bin is shown by the gray bars in the background (second right hand y-axis). Study sites with expanding saltmarshes are shown in the left column, and those with retreating saltmarshes in the right column. Significant trends are given with a solid line, non-significant trends are indicated by a dashed line. The slope, i.e., yearly change, is indicated in the legend.
3.2 Temporal Inundation Frequency and Habitat Change
Half of the investigated sites experienced basin-wide significant saltmarsh habitat gain (Western Scheldt, Eastern Scheldt, Ebro Delta, Cádiz Bay), and the other half of the basins experienced significant saltmarsh habitat loss (Venice Lagoon, Aveiro Lagoon, Mississippi Delta, Blackwater Marshes) over the study period (Figure 3. The trends in saltmarsh habitat change were significant for both relative change (Figure 3) and absolute change (Supplementary Figure S1). Changes in saltmarsh area, tidal flat area, and water, as well as changes in mean inundation frequency differed among the study sites, but some systems (e.g., the Blackwater and Aveiro Lagoon) show similarities (Figure 3).
In the Western Scheldt, the overall increase in saltmarsh area was accompanied by a significant increase in area of tidal flats, while the inundation frequency (IF) did not change over time. In the Ebro Delta and Cádiz Bay, tidal flats decreased with increasing saltmarsh area, and IF in the Ebro Delta decreased significantly. In the Eastern Scheldt, only saltmarsh expansion was significant. In Venice Lagoon and the Mississippi Delta, a significant decrease in saltmarsh area coincided with a significant increase in water area and IF. The Venice Lagoon further lost tidal flats. In the Aveiro Lagoon and the Blackwater Marshes, substantial tidal flat expansion with retreating saltmarshes was observed.
Mean data availability per pixel differ among the basins, as some areas are more influenced by clouds. For Venice Lagoon and the Blackwater Marshes, more unmasked images were available compared to the Western Scheldt and the Eastern Scheldt (cf gray bars, Figure 3).
A relationship could be detected between yearly change in saltmarsh habitat and yearly change in mean inundation frequency (Figure 4). In all basins experiencing net saltmarsh loss, mean IF either increased or did not change significantly, while in those basins with expanding saltmarsh habitat IF either decreased or did not change significantly (Figures 3, 4).
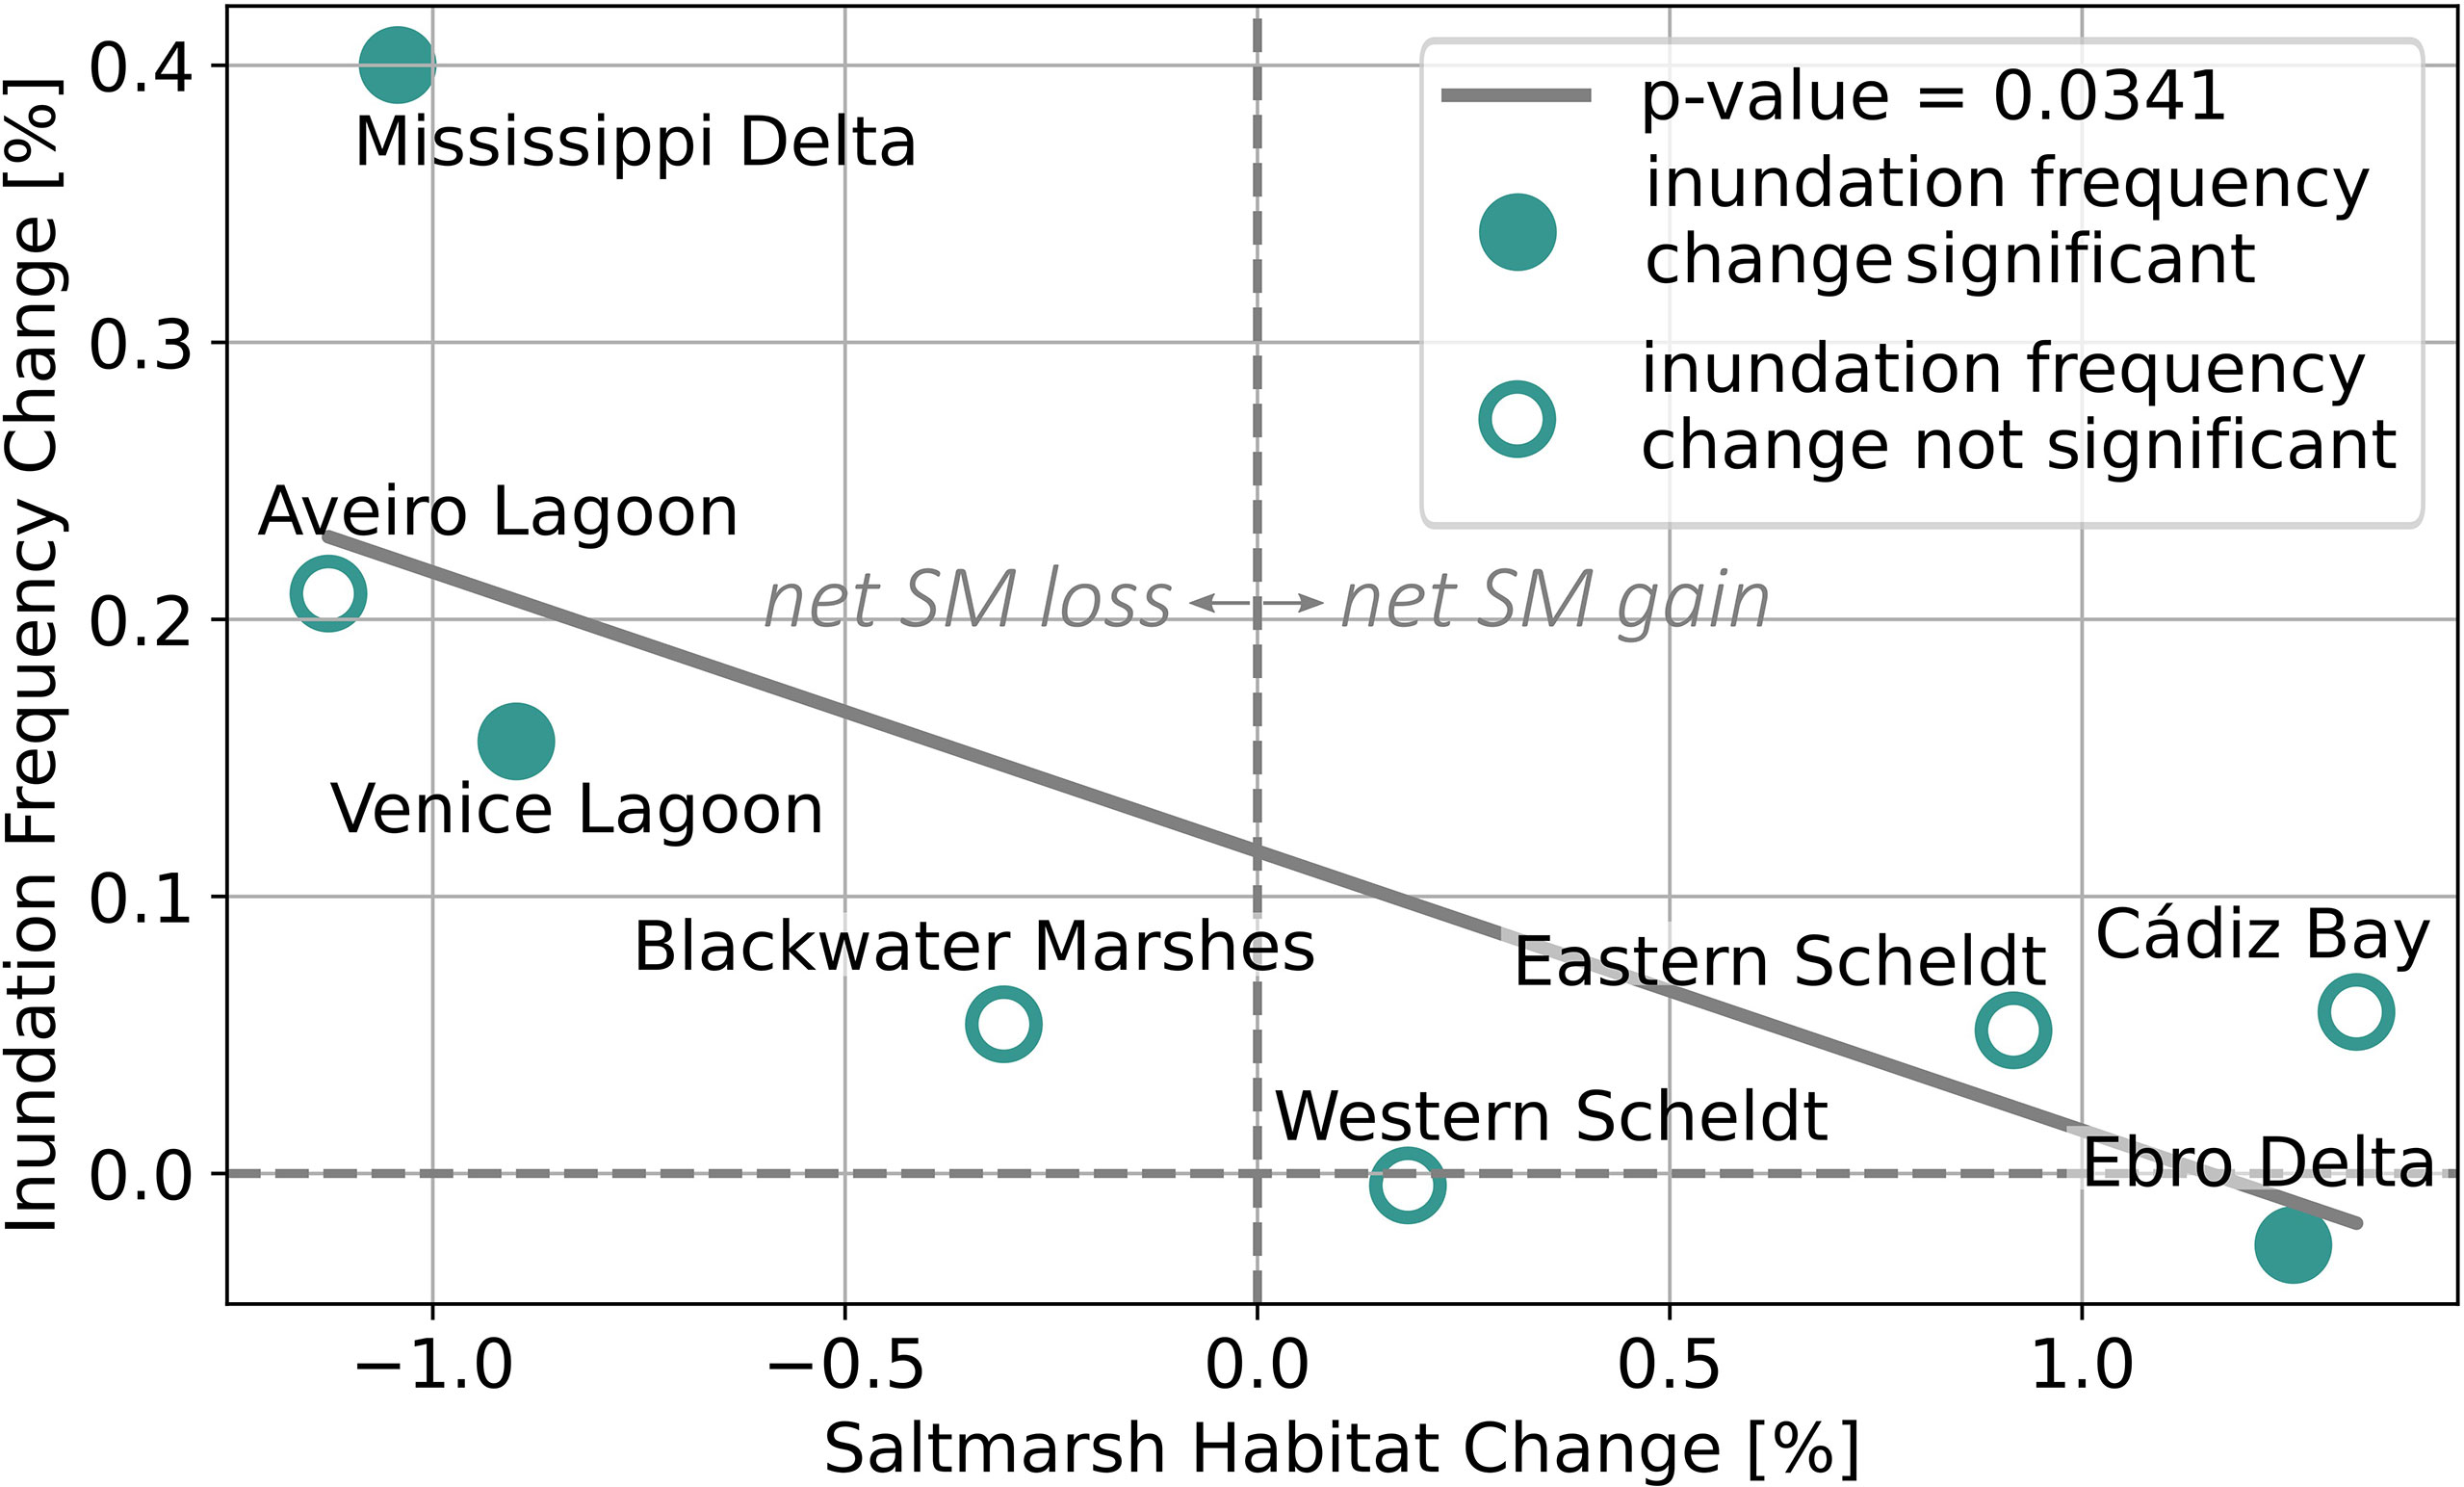
Figure 4 Relationship between yearly change in saltmarsh area [%] and inundation frequency [%] between 1986 and 2010.
3.3 Spatial Patterns of Inundation Frequency Change
Maps of significant yearly inundation frequency (IF) change (Figure 5) indicate that basins with expanding saltmarshes (left column in Figure 5) experience an IF decrease in most parts of the basin or almost no change. In the Western Scheldt, it seems that tidal flats grew and moved over time with IF decreasing on parts of the tidal flats and increasing at the edges. In the Cádiz Bay, an area in the North-East showed a strong increase in IF, while other areas experienced overall less frequent inundation. Basins with retreating saltmarshes (right column in Figure 5) became more frequently inundated over time in most places. Especially Venice Lagoon and the Mississippi Delta showed a strong increase in IF throughout the basin. While mean basin-wide IF changes in the retreating Blackwater Marshes and Aveiro Lagoon were not significant (Figures 3F, H), IF maps showed similar patterns of significant increase throughout the basins as the Mississippi Delta and the Venice Lagoon. Likewise, no significant overall IF decrease was shown for the Western Scheldt and the Eastern Scheldt (Figures 3A,C) but maps revealed large areas of significant IF decrease (as well as some significant IF increase near the edges of the tidal flats). Detailed maps of yearly IF change can be found in the supplementary (Supplementary Figures S5–S12), including habitat classification results from 1986 and 2010.
4 Discussion
4.1 Assessing Estimated Inundation Frequency From Landsat 5 TM Imagery
Our methods allow an assessment of how saltmarshes and tidal flats develop relative to their inundation frequency. In order to analyze changes in inundation frequency (IF), we used the NDWI to retrieve water occurrence (Laengner et al., 2019) from 3-year Landsat 5 TM image collections to ensure a sufficient amount of usable satellite data across all basins. Other sensors than Landsat 5 TM may allow smaller bins, for example Landsat 8 OLI and Sentinel-2 show good results with only 1-year bins (Supplementary Figure S2), but long time series of these sensors are not available yet. We assumed that the whole range of tidal stages is represented well within a 3-year bin. Data availability differed among the basins and limited data in some 3-year bins may have influenced the results. In addition, Landsat and Sentinel-2 follow a sun-synchronous orbit, which may result in a bias relative to the tides (e.g., only specific combinations of the semidiurnal and fortnightly tidal stage may be captured by the satellite) (Eleveld et al., 2014). Nevertheless, the method allowed to assess trends over almost 30 years. The comparison between generated IF with local data of the Western Scheldt confirms that inundation frequency is captured well; here we assessed five bins of the basin with the least amount of usable data compared to the other investigated basins and still observed a very good agreement with local data. Scattering around the 1:1 line can partly be explained by the limitations discussed above and partly because the local inundation maps (obtained from the combination of elevation and tide gauge data) also contain errors, while morphodynamics may further add variations, particularly at the lower edge of the tidal flat (with potentially large temporal variations in elevation as slopes are steeper and, e.g., channels migrate). Further evaluation in other tidal basins is recommended to test whether the method performs well under a range of conditions, for example under different water clarity conditions.
Fitton et al. (2021) applied a similar method to derive inundation frequency using Sentinel-2 data to map the intertidal zone. They calculated water occurrence [%] and generated a 5-year mosaic. From this, they further generated a pseudo DEM [m] for the intertidal area for the UK. They calibrated the Sentinel-2 data set with a national tide model to make sure that all tidal stages are represented well, but simultaneously assume that this is not necessarily needed, which facilitates a global application. As we are primarily interested in whether saltmarshes can keep up with relative sea level rise, rather than in absolute height, we did not apply a tidal calibration to our 3-year image collections and assume that the different tidal stages are represented well.
For the time series and corresponding trends, we do not retrieve IF separately for each land cover class but as a mean over the whole basin for each 3-year bin. This is because the definition of the saltmarsh–tidal flat boundary as well as the tidal flat–water boundary is highly dynamic and difficult to define. By considering the mean over the whole basin, resulting trends from the time series imply changes in IF over both saltmarshes and tidal flats. Furthermore, inundated saltmarshes can only be detected by optical satellite remote sensing when vegetation is largely covered by water, as the sensor cannot detect water underneath vegetation cover. Attempts to solve this with Sentinel-1 C-band satellite data failed, possibly because backscatter characteristics of flooded and not flooded, but still wet sediments below the vegetation cover are too similar for an accurate discrimination. Consequently, we only used optical satellite data, meaning only highest tidal stages and storm events are detected as inundated on the high marsh, depending on vegetation height. Changes in IF on saltmarshes are still implied in the calculated trends of the means over the basins and evident from the trends per pixel shown in the generated maps of significant yearly IF change. Similar limitations and advantages regarding data availability as discussed above hold for estimated time series and trends of habitat change and have been assessed and discussed by Laengner et al. (2019).
4.2 Inundation Frequency Change and Habitat Development
Time series of long-term (27 years), basin-wide habitat and inundation frequency (IF) development indicate that prevailing processes may be similar among some of the systems. In the Western Scheldt, both saltmarsh and tidal flat area increased and maps show large areas of significant IF decrease on the tidal flats. The formation of saltmarsh habitat on tidal flats may also be assumed for the Eastern Scheldt, Ebro Delta, and Cádiz Bay. In a previous research of the Eastern Scheldt, tidal flats were found to have decreased in height (De Vet et al., 2017) following the completion of the open storm surge barrier and compartment dams in 1986 and associated changes, such as a decrease in tidal range and reduction of sediment supply (Louters et al., 1998). The reduced tides also had consequences for saltmarsh vegetation (De Leeuw et al., 1994). Our data confirm an increase in permanently flooded area in the dammed eastern part of the Eastern Scheldt since our first bin of 1985–1987. However, our data do not show significant overall long-term changes in tidal flat area or mean IF for the still open part of the basin. Instead2, strong fluctuations can be observed over time, which may be due to the limited amount of usable data for some bins in this area. The same may apply for some bins in the Western Scheldt. In the Ebro Delta and Cádiz Bay, saltmarsh habitat gain coincided with loss of tidal flat area, indicating that little new tidal flat habitat was formed. Sediment availability for new tidal flat habitat formation seems to be low in these basins or may originate from sources within the basin, which may lead to a negative sediment budget on a longer term (Ganju et al., 2015). In the Ebro Delta, overall IF decrease indicates that habitats are able to keep up with relative SLR. Strong changes of mean IF increase in Cádiz Bay may partly be explained by the newly flooded area in the North-East, i.e., the restored Balbanera saltmarshes and Salinas2.
Despite overall expanding saltmarsh habitat in the basins named above, periods of saltmarsh habitat loss occurred as well within the time series. This fluctuation may be biased due to data insufficiency as discussed above, but fluctuations also occur in basins with ample data. Fluctuations may point to a dynamic system but may also be associated with cyclic saltmarsh dynamics (Allen, 2000; van de Koppel et al., 2005). When saltmarsh erodes, tidal flats may increase in elevation through the deposition of the eroded saltmarsh sediments on the adjacent tidal flat. The more elevated tidal flat lowers wave energy, thus slowing down saltmarsh erosion so that new vegetation can establish in front of the eroding cliff, given adequate boundary conditions for saltmarsh growth, as also found from aerial photos and in situ data in the Western Scheldt by van der Wal et al. (2008). This pioneer vegetation further reduces wave energy, and with this slows down lateral retreat of saltmarsh habitat. However, when sediment availability is not sufficient, tidal flats in front of the saltmarshes may become too steep, and hence vulnerable to waves, and conditions may not be suitable for establishment of pioneer vegetation, the saltmarsh may continue to erode (van de Koppel et al., 2005; van der Wal et al., 2008). This emphasizes the importance of sediment inputs from external sources (van der Wal et al., 2008; Ganju et al., 2015).
Our results additionally reveal different processes among those basins that experience saltmarsh habitat loss over time. Time series of habitat and IF change imply similar processes prevailing in Venice Lagoon and the Mississippi Delta. Saltmarsh habitat loss in these areas coincided with increasing water area and strong IF increase, indicating that the Mississippi Delta and the Venice Lagoon cannot keep up with relative SLR. Inundation frequency change maps show a significant increase throughout the whole basins, hinting at interior drowning of habitat. Interior drowning and formation of pools have been discovered in earlier studies in the Mississippi Delta and the Venice Lagoon (Day et al., 1999; Rizzetto and Tosi, 2011), as well as in the Blackwater Marshes (Schepers et al., 2017), although in the latter area, also changes along the marsh edge are apparent. Interior pools grow until they provide a large fetch area to generate wind, triggering wave erosion at the saltmarsh edges (Mariotti and Fagherazzi, 2013). Consequently, pool formation can lead to further saltmarsh habitat loss through wave erosion, rather than drowning (Mariotti, 2020a). Our results of the Blackwater Marshes and the Aveiro Lagoon indeed suggest both that saltmarsh habitat converts to tidal flat, as tidal flat area expanded with decreasing saltmarsh area. Transitions between the land cover classes saltmarshes and tidal flats also seem to be highest in these two basins (Supplementary Figure S4). However, when pools are drained, especially when located close to channels, they can experience higher accretion rates of inorganic material, mainly due to lower relative elevation locally. Vegetation can reestablish and pools can recover within a few decades (Wilson et al., 2014; Schepers et al., 2017; Spivak et al., 2017). Nevertheless, these high accretion rates through sediments from edge erosion may be local. For basin-wide saltmarsh development, the sediment budget of the whole basin has to be taken into account (Ganju et al., 2015; Mariotti, 2020a; Mariotti et al., 2020b).
The comparison between our IF time series and habitat maps also show that local change in IF can differ from basin-wide changes (e.g., Western Scheldt, Aveiro Lagoon, Blackwater Marshes), which may point to local driving forces (e.g., wave exposure) or biophysical feedbacks. Local spatial variation in IF may also result from sediment transport (e.g., moving channels and tidal flats, see for example Western Scheldt).
4.3 Relationship Between Inundation Frequency Change and Saltmarsh Development
Basin-wide saltmarsh development was associated with basin-wide inundation frequency (IF) change. IF increase seemingly can induce saltmarsh habitat loss, as observed in the Mississippi Delta and the Venice Lagoon. Likewise, IF decrease can be associated with saltmarsh habitat gain as detected in the Ebro Delta. These associations can also result from positive feedbacks of plants trapping sediments during inundation, thereby increasing the elevation of the saltmarsh and decreasing the inundation frequency (van de Koppel et al., 2005; Cahoon et al., 2021). Even though saltmarshes can benefit from inundation delivering sediments for vertical accretion (Pethick, 1981; Temmerman et al., 2003), they also need sufficient inundation free periods to recover from inundation stress, i.e., to allow reestablishment of vegetation after disturbance (van Belzen et al., 2017). When exceeding a certain threshold of disturbance so that recovery is not possible, ecosystems may undergo a sudden shift (Scheffer et al., 2001) leading to plant disappearance in coastal saltmarshes. This recovery time can lengthen with increasing IF (van Belzen et al., 2017). Thresholds of IF tolerance vary among sites, for example due to varying plant species with specific inundation stress tolerance (Olff et al., 1988), or varying tidal or wave regimes. Thus, IF governs species compositions to a large extent (Bockelmann et al., 2002). Furthermore, stable bed levels may raise the tolerance of plants to withstand higher inundation stress (Willemsen et al., 2018).
4.4 Revealing the Fate of Saltmarshes
In conclusion, our methods allow an assessment of how saltmarshes and tidal flats develop in area, and if their relative position within the hydrodynamic frame is changing, either passively or actively through biophysical feedbacks. Such an assessment is valuable to assess the vulnerability and fate of saltmarshes. In general, we found that basins with a significant increase in inundation frequency (Mississippi Delta and Venice Lagoon) were associated with saltmarsh loss. In contrast, basins with saltmarsh loss may not necessarily also experience loss of tidal flats, and vice versa. We have also shown how our methods can be used to evaluate the effect of artificial constructions (e.g., dam building) and restoration measures, such as managed realignment schemes and conversion of salt pans into wetlands (Boorman and Hazelden, 2017).
Data Availability Statement
The raw data supporting the conclusions of this article can be found in the 4TU. Research Data repository with the doi: 10.4121/20066333.
Author Contributions
ML and DW contributed to the conception, methodology, data curation, writing of the review, and editing of the study. ML performed the formal analysis and investigation, wrote the first draft of the manuscript, and performed the visualization. DW wrote sections of the manuscript, acquired the funding, and supervised the study. All authors contributed to the manuscript revision and read and approved the submitted version.
Funding
This research was funded by the User Support Programme (USP) Space Research of the Netherlands Organisation for Scientific Research, grant number ALW-GO-16-37 to DW.
Conflict of Interest
The authors declare that the research was conducted in the absence of any commercial or financial relationships that could be construed as a potential conflict of interest.
Publisher’s Note
All claims expressed in this article are solely those of the authors and do not necessarily represent those of their affiliated organizations, or those of the publisher, the editors and the reviewers. Any product that may be evaluated in this article, or claim that may be made by its manufacturer, is not guaranteed or endorsed by the publisher.
Acknowledgments
We thank the User Support Programme (USP) Space Research of the Netherlands Organisation for Scientific Research for their support of our research.
Supplementary Material
The Supplementary Material for this article can be found online at: https://www.frontiersin.org/articles/10.3389/fmars.2022.942719/full#supplementary-material
Footnotes
- ^ https://maps.rijkswaterstaat.nl/dataregister.
- ^ https://seo.org/2022/02/17/un-nuevo-proyecto-para-restaurar-salinas-en-la-bahia-de-cadiz/
References
Adam E., Mutanga O., Rugege D. (2010). Multispectral and Hyperspectral Remote Sensing for Identification and Mapping of Wetland Vegetation: A Review. Wetlands. Ecol. Manage. 18, 281–296. doi: 10.1007/s11273-009-9169-z
Allen J. R. (2000). Morphodynamics of Holocene Salt Marshes: A Review Sketch From the Atlantic and Southern North Sea Coasts of Europe. Quaternary. Sci. Rev. 19, 1155–1231. doi: 10.1016/S0277-3791(99)00034-7
Balke T., Stock M., Jensen K., Bouma T. J., Kleyer M. (2016). A Global Analysis of the Seaward Salt Marsh Extent: The Importance of Tidal Range. Water Resour. Res. 52, 3775–3786. doi: 10.1002/2015WR018318l
Barbier E. B., Hacker S. D., Kennedy C., Koch E. W., Stier A. C., Silliman B. R. (2011). The Value of Estuarine and Coastal Ecosystem Services. Ecol. Monogr. 81, 169–193. doi: 10.1890/10-1510.1
Bartholdy A. T., Bartholdy J., Kroon A. (2010). Salt Marsh Stability and Patterns of Sedimentation Across a Backbarrier Platform. Mar. Geology. 278, 31–42. doi: 10.1016/j.margeo.2010.09.001
Bockelmann A. C., Bakker J. P., Neuhaus R., Lage J. (2002). The Relation Between Vegetation Zonation, Elevation and Inundation Frequency in a Wadden Sea Salt Marsh. Aquat. Bot. 73, 211–221. doi: 10.1016/S0304-3770(02)00022-0
Boorman L. A., Hazelden J. (2017). Managed Re-Alignment; a Salt Marsh Dilemma? Wetlands. Ecol. Manage. 25, 387–403. doi 10.1007/s11273-017-9556-9
Buiks J. (2016). Toelichting Op De Zoute Ecotopenkaart Westerschelde 2015. Biologische Monitoring Zoute Rijkswateren (Delft: Rijkswaterstaat - Centrale Informatievoorziening).
Burns C. J., Alexander C. R., Alber M. (2021). Assessing Long-Term Trends in Lateral Salt-Marsh Shoreline Change Along a Us East Coast Latitudinal Gradient. J. Coast. Res. 37, 291–301. doi: 10.2112/JCOASTRES-D-19-00043.1
Cahoon D. R., McKee K. L., Morris J. T. (2021). How Plants Influence Resilience of Salt Marsh and Mangrove Wetlands to Sea-Level Rise. Estuaries. Coasts. 44, 883–898. doi: 10.1007/s12237-020-00834-w
Cahoon D. R., Reed D. J., Day J. W. (1995). Estimating Shallow Subsidence in Microtidal Salt Marshes of the Southeastern United States: Kaye and Barghoorn Revisited. Mar. Geology. 128, 1–9. doi: 10.1016/0025-3227(95)00087-F
Campbell A. D., Wang Y. (2020). Salt Marsh Monitoring Along the Mid-Atlantic Coast by Google Earth Engine Enabled Time Series. PLos One 15, e0229605. doi: 10.1371/journal.pone.0229605
Castelle B., Masselink G., Scott T., Stokes C., Konstantinou A., Marieu V., et al. (2021). Satellite-Derived Shoreline Detection at a High-Energy Meso-Macrotidal Beach. Geomorphology 383, 107707. doi: 10.1016/j.geomorph.2021.107707
Chander G., Helder D. L., Markham B. L., Dewald J. D., Kaita E., Thome K. J., et al. (2004). Landsat-5 Tm Reflective-Band Absolute Radiometric Calibration. IEEE Trans. Geosci. Remote Sens. 42, 2747–2760. doi: 10.1109/TGRS.2004.836388
Costanza R., Limburg K., Naeem S., O’Neill R. V., Paruelo J., Raskin R. G., et al. (1997). The Value of the World’s Ecosystem Services and Natural Capital. Nature 387, 253–260. doi: 10.1038/387253a0
Day J. W., Britsch L. D., Hawes S. R., Shaffer G. P., Reed D. J., Cahoon D. (2000). Pattern and Process of Land Loss in the Mississippi Delta: A Spatial and Temporal Analysis of Wetland Habitat Change. Estuaries 23, 425–438. doi: 10.2307/1353136
Day J. W., Kemp G. P., Reed D. J., Cahoon D. R., Boumans R. M., Suhayda J. M., et al. (2011). Vegetation Death and Rapid Loss of Surface Elevation in Two Contrasting Mississippi Delta Salt Marshes: The Role of Sedimentation, Autocompaction and Sea-Level Rise. Ecol. Eng. 37, 229–240. doi: 10.1016/j.ecoleng.2010.11.021
Day J. W., Rybczyk J., Scarton F., Rismondo A., Are D., Cecconi G. (1999). Soil Accretionary Dynamics, Sea-Level Rise and the Survival of Wetlands in Venice Lagoon: A Field and Modelling Approach. Estuarine. Coast. Shelf. Sci. 49, 607–628. doi: 10.1006/ecss.1999.0522
De Leeuw J., Apon L. P., Herman P. M. J., De Munck W., Beeftink W. G. (1994). The Response of Salt Marsh Vegetation to Tidal Reduction Caused by the Oosterschelde Storm-Surge Barrier. Hydrobiologia 282/283, 335–353. doi: 10.1007/BF00024640
De Vet P. L. M., Van Prooijen B. C., Wang Z. B. (2017). The Differences in Morphological Development Between the Intertidal Flats of the Eastern and Western Scheldt. Geomorphology 281, 31–42. doi: 10.1016/j.geomorph.2016.12.031
Donchyts G., Baart F., Winsemius H., Gorelick N., Kwadijk J., Van de Giesen N. (2016). Earth’s Surface Water Change Over the Past 30 Years. Nat. Climate Change 6, 810–813. doi: 10.1038/nclimate3111
Doody J. P. (2004). ˜coastal Squeeze’—an Historical Perspective. J. Coast. Conserv. 10, 129–138. doi: 10.1652/1400-0350(2004)010[0129:CSAHP]2.0.CO;2
Eleveld M. A., van der Wal D., Van Kessel T. (2014). Estuarine Suspended Particulate Matter Concentrations From Sun-Synchronous Satellite Remote Sensing: Tidal and Meteorological Effects and Biases. Remote Sens. Environ. 143, 204–215. doi: 10.1016/j.rse.2013.12.019
Fitton J. M., Rennie A. F., Hansom J. D., Muir F. M. E. (2021). Remotely Sensed Mapping of the Intertidal Zone: A Sentinel-2 and Google Earth Engine Methodology. Remote Sens. Applications.: Soc. Environ. 22, 100499. doi: 10.1016/j.rsase.2021.100499
Ganju N. K., Defne Z., Kirwan M. L., Fagherazzi S., D’Alpaos A., Carniello L. (2017). Spatially Integrative Metrics Reveal Hidden Vulnerability of Microtidal Salt Marshes. Nat. Commun. 8, 14156. doi: 10.1038/ncomms14156
Ganju N. K., Kirwan M. L., Dickhudt P. J., Guntenspergen G. R., Cahoon D. R., Kroeger K. D. (2015). Sediment Transport-Based Metrics of Wetland Stability. Geophysical. Res. Lett. 42, 7992–8000. doi: 10.1002/2015GL065980
Gesch D. B. (2009). Analysis of Lidar Elevation Data for Improved Identification and Delineation of Lands Vulnerable to Sea-Level Rise. J. Coast. Res. 53, 49–58. doi: 10.2112/SI53-006.1
Gómez C., White J. C., Wulder M. A. (2016). Optical Remotely Sensed Time Series Data for Land Cover Classification: A Review. ISPRS. J. Photogrammetry. Remote Sens. 116, 55–72. doi: 10.1016/j.isprsjprs.2016.03.008
Grill G., Lehner B., Thieme M., Geenen B., Tickner D., Antonelli F., et al. (2019). Mapping the World’s Free-Flowing Rivers. Nature 569, 215–221. doi: 10.1038/s41586-019-1111-9
Haarpaintner J.,, Davids C. (2021). Mapping Atmospheric Exposure of the Intertidal Zone with Sentinel-1 CSAR in Northern Norway. Remote Sensing 13, 3354. doi: 10.3390/rs13173354
Horritt M., Mason D., Cobby D. M., Davenport I. J., Bates P. D. (2003). Waterline Mapping in Flooded Vegetation From Airborne Sar Imagery. Remote Sens. Environ. 85, 271–281. doi: 10.1016/S0034-4257(03)00006-3
Jiménez J., Sánchez-Arcilla A., Bou J., Ortiz M. A. (1997). Analysing Short-Term Shoreline Changes Along the Ebro Delta (Spain) Using Aerial Photographs. J. Coast. Res. 13, 1256–1266. http://www.jstor.org/stable/4298735
Kearney M. S., Rogers A. S., Townshend J. R. G., Rizzo E., Stutzer D., Stevenson J. C., et al. (2002). Landsat Imagery Shows Decline of Coastal Marshes in Chesapeake and Delaware Bays. Eos. Trans. Am. Geophysical. Union. 83, 173–184. doi: 10.1029/2002EO000112
Kearney M. S., Turner R. E. (2016). Microtidal Marshes: Can These Widespread and Fragile Marshes Survive Increasing Climate–Sea Level Variability and Human Action? J. Coast. Res. 32, 686–699. doi: 10.2112/JCOASTRES-D-15-00069.1
Kers A., Walburg L., Bakker J., Daane A. H., De Jong D. J., Schrijver M., et al. (2013). Dienstbeschrijving Zoute Ecotopenkarteringen (Delft/Middelburg: Rijkswaterstaat CIV/ZD).
Kirwan M. L., Murray A. B. (2007). A Coupled Geomorphic and Ecological Model of Tidal Marsh Evolution. Proc. Natl. Acad. Sci. 104, 6118–6122. doi: 10.1073/pnas.0700958104
Kirwan M. L., Temmerman S., Skeehan E. E., Guntenspergen G. R., Fagherazzi S. (2016). Overestimation of Marsh Vulnerability to Sea Level Rise. Nat. Climate Change 6, 253–260. doi: 10.1038/nclimate2909
Ladd C. J. T., Duggan-Edwards M. F., Bouma T. J., Pages J. F., Skov M. W. (2019). Sediment Supply Explains Long-Term and Large-Scale Patterns in Salt Marsh Lateral Expansion and Erosion. Geophysical. Res. Lett. 46, 11178–11187. doi: 10.1029/2019GL083315
Laengner M. L., Siteur K., van der Wal D. (2019). Trends in the Seaward Extent of Saltmarshes Across Europe From Long-Term Satellite Data. Remote Sens. 11, 1653. doi: 10.3390/rs11141653
Li J., Knapp D. E., Lyons M., Roelfsema C., Phinn S., Schill S. R., et al. (2021). Automated Global Shallow Water Bathymetry Mapping Using Google Earth Engine. Remote Sens. 13, 1469. doi: 10.3390/rs13081469
Lin Y. C., Cheng Y.-T., Zhou T., Ravi R., Hasheminasab S. M., Flatt J. E., et al. (2019). Evaluation of Uav Lidar for Mapping Coastal Environments. Remote Sens. 11, 2893. doi: 10.3390/rs11242893
Louters T., van den Berg J. H., Mulder J. P. M. (1998). Geomorphological Changes of the Oosterschelde Tidal System During and After the Implementation of the Delta Project. J. Coast. Res. 14, 1134–1151. http://www.jstor.org/stable/4298864
Luijendijk A., Hagenaars G., Ranasinghe R., Baart F., Donchyts G., Aarninkhof S. (2018). The State of the World’s Beaches. Sci. Rep. 8, 6641. doi: 10.1038/s41598-018-24630-6
Mann H. B. (1945). Nonparametric Tests Against Trend. Econometrica 13, 245–259. doi: 10.2307/1907187
Mariotti G. (2020a). Beyond Marsh Drowning: The Many Faces of Marsh Loss (and Gain). Adv. Water Resour. 144, 103710. doi: 10.1016/j.advwatres.2020.103710
Mariotti G., Fagherazzi S. (2013). Critical Width of Tidal Flats Triggers Marsh Collapse in the Absence of Sea-Level Rise. Proc. Natl. Acad. Sci. 110, 5353–5356. doi: 10.1073/pnas.1219600110
Mariotti G., Spivak A., Luk S., Ceccherini G., Tyrrell M., Gonneea M. E. (2020b). Modeling the Spatial Dynamics of Marsh Ponds in New England Salt Marshes. Geomorphology 365, 107262. doi: 10.1016/j.geomorph.2020.107262
Mason D. C., Davenport I. J., Robinson G. J., Flather R. A., McCartney B. S. (1995). Construction of an Inter-Tidal Digital Elevation Model by the ‘Water-Line’method. Geophysical. Res. Lett. 22, 3187–3190. doi: 10.1029/95GL03168
McFeeters S. K. (1996). The Use of the Normalized Difference Water Index (Ndwi) in the Delineation of Open Water Features. Int. J. Remote Sens. 17, 1425–1432. doi: 10.1080/01431169608948714
Murray N. J., Phinn S. R., DeWitt M., Ferrari R., Johnston R., Lyons M. B., et al. (2019). The Global Distribution and Trajectory of Tidal Flats. Nature 565, 222–225. doi: 10.1038/s41586-018-0805-8
Olff H., Bakker J. P., Fresco L. F. M. (1988). The Effect of Fluctuations in Tidal Inundation Frequency on a Salt-Marsh Vegetation. Vegetatio 78, 13–19. doi: 10.1007/BF00045634
Paree E. (2019). Toelichting Op De Zoute Ecotopenkaart Westerschelde 2018. Biologische Monitoring Zoute Rijkswateren (Delft: Rijkswaterstaat - Centrale Informatievoorziening).
Paree E. (2021). Toelichting Op De Zoute Ecotopenkaart Westerschelde 2020. Biologische Monitoring Zoute Rijkswateren (Delft: Rijkswaterstaat - Centrale Informatievoorziening).
Park E., Ho H. L., Tran D. D., Yang X., Alcantara E., Merino E., et al. (2020). Dramatic Decrease of Flood Frequency in the Mekong Delta Due to River-Bed Mining and Dyke Construction. Sci. Total. Environ. 723, 138066. doi: 10.1016/j.scitotenv.2020.138066
Pekel J. F., Cottam A., Gorelick N., Belward A. S. (2016). High-Resolution Mapping of Global Surface Water and its Long-Term Changes. Nature 540, 418–422. doi: 10.1038/nature20584
Pethick J. S. (1981). Long-Term Accretion Rates on Tidal Salt Marshes. J. Sedimentary. Res. 51, 571–577. doi: 10.1306/212F7CDE-2B24-11D7-8648000102C1865D
Picado A., Dias J. M., Fortunato A. B. (2010). Tidal Changes in Estuarine Systems Induced by Local Geomorphologic Modifications. Continental. Shelf. Res. 30, 1854–1864. doi: 10.1016/j.csr.2010.08.012
Pickering M. D., Wells N. C., Horsburgh K. J., Green J. A. M. (2012). The Impact of Future Sea-Level Rise on the European Shelf Tides. Continental. Shelf. Res. 35, 50–68. doi: 10.1016/j.csr.2011.11.011
Pinton D., Canestrelli A., Wilkinson B., Ifju P., Ortega A. (2020). A New Algorithm for Estimating Ground Elevation and Vegetation Characteristics in Coastal Salt Marshes From High-Resolution Uav-Based Lidar Point Clouds. Earth Surface. Processes. Landforms. 45, 3687–3701. doi: 10.1002/esp.4992
Reed D. J. (1990). The Impact of Sea-Level Rise on Coastal Salt Marshes. Prog. Phys. Geography.: Earth Environ. 14, 465–481. doi: 10.1177/030913339001400403
Reed D. J. (1995). The Response of Coastal Marshes to Sea-Level Rise: Survival or Submergence? Earth Surface. Processes. Landforms. 20, 39–48. doi: 10.1002/esp.3290200105
Rizzetto F., Tosi L. (2011). Aptitude of Modern Salt Marshes to Counteract Relative Sea-Level Rise, Venice Lagoon (Italy). Geology 39, 755–758. doi: 10.1130/G31736.1
Rogers J. N., Parrish C. E., Ward L. G., Burdick D. M. (2018). Improving Salt Marsh Digital Elevation Model Accuracy With Full-Waveform Lidar and Nonparametric Predictive Modeling. Estuarine. Coast. Shelf. Sci. 202, 193–211. doi: 10.1016/j.ecss.2017.11.034
Sagar S., Roberts D., Bala B., Lymburner L. (2017). Extracting the intertidal extent and topography of the Australian coastline from a 28 year time series of Landsat observations. Remote Sens. Environ. 195, 153–169. doi: 10.1016/j.rse.2017.04.009
Scheffer M., Carpenter S., Foley J. A., Folke C., Walker B. (2001). Catastrophic Shifts in Ecosystems. Nature 413, 591–596. doi: 10.1038/35098000
Schepers L., Kirwan M., Guntenspergen G., Temmerman S. (2017). Spatio-Temporal Development of Vegetation Die-Off in a Submerging Coastal Marsh: Spatio-Temporal Marsh Die-Off. Limnology. Oceanography. 62, 137–150. doi: 10.1002/lno.10381
Schuerch M., Spencer T., Temmerman S., Kirwan M. L., Wolff C., Lincke D., et al. (2018). Future Response of Global Coastal Wetlands to Sea-Level Rise. Nature 561, 231–234. doi: 10.1038/s41586-018-0476-5
Sen P. K. (1968). Estimates of the Regression Coefficient Based on Kendall’s Tau. J. Am. Stat. Assoc. 63, 1379–1389. doi: 10.1080/01621459.1968.10480934
Shaker A., Yan W. Y., LaRocque P. E. (2019). Automatic Land-Water Classification Using Multispectral Airborne Lidar Data for Near-Shore and River Environments. ISPRS. J. photogrammetry. Remote Sens. 152, 94–108. doi: 10.1016/j.isprsjprs.2019.04.005
Spivak A. C., Gosselin K., Howard E., Mariotti G., Forbrich I., Stanley R., et al. (2017). Shallow Ponds are Heterogeneous Habitats Within a Temperate Salt Marsh Ecosystem. J. Geophysical. Research.: Biogeosciences. 122, 1371–1384. doi: 10.1002/2017JG003780
Syvitski J. P. M., Kettner A. J., Overeem I., Hutton E. W. H., Hannon M. T., Brakenridge G. R., et al. (2009). Sinking Deltas Due to Human Activities. Nat. Geosci. 2, 681–686. doi: 10.1038/ngeo629
Temmerman S., Govers G., Wartel S., Meire P. (2003). Spatial and Temporal Factors Controlling Short-Term Sedimentation in a Salt and Freshwater Tidal Marsh, Scheldt Estuary, Belgium, Sw Netherlands. Earth Surface. Processes. Landforms. 28, 739–755l. doi: 10.1002/esp.495
Tong S. S., Deroin J. P., Pham T. L. (2020). An Optimal Waterline Approach for Studying Tidal Flat Morphological Changes Using Remote Sensing Data: A Case of the Northern Coast of Vietnam. Estuarine. Coast. Shelf. Sci. 236, 106613. doi: 10.1016/j.ecss.2020.106613
Turner R. E., Mo Y. (2020). Salt Marsh Elevation Limit Determined After Subsidence From Hydrologic Change and Hydrocarbon Extraction. Remote Sens. 13, 49. doi: 10.3390/rs13010049
van Belzen J., van de Koppel J., Kirwan M. L., van der Wal D., Herman P. M., Dakos V., et al. (2017). Vegetation Recovery in Tidal Marshes Reveals Critical Slowing Down Under Increased Inundation. Nat. Commun. 8, 15811. doi: 10.1038/ncomms15811
van de Koppel J., van der Wal D., Bakker J. P., Herman P. M. J. (2005). Self-Organization and Vegetation Collapse in Salt Marsh Ecosystems. Am. Nat. 165, E1–E12. doi: 10.1086/426602
van der Wal D., Wielemaker-van den Dool A., Herman P. M. J. (2008). Spatial Patterns, Rates and Mechanisms of Saltmarsh Cycles (Westerschelde, The Netherlands). Estuarine. Coast. Shelf. Sci. 76, 357–368. doi: 10.1016/j.ecss.2007.07.017
van der Wal D., Wielemaker-van den Dool A., Herman P. M. J. (2010). Spatial Synchrony in Intertidal Benthic Algal Biomass in Temperate Coastal and Estuarine Ecosystems. Ecosystems 13, 338–351. doi: 10.1007/s10021-010-9322-9
Walburg L., De Jong D. J. (2016a). “Zoute Ecotopenkaart Westerschelde 1996 - Toelichting Op De Samenstelling Van De Zoute Ecotopenkaart,” in Biologische Monitoring Zoute Rijkswateren ( Rijkswaterstaat - Centrale Informatievoorziening).
Walburg L., De Jong D. J. (2016b). “Zoute Ecotopenkaart Westerschelde 2001 - Toelichting Op De Samenstelling Van De Zoute Ecotopenkaart,” in Biologische Monitoring Zoute Rijkswateren ( Rijkswaterstaat - Centrale Informatievoorziening).
Walburg L., De Jong D. J. (2016c). “Zoute Ecotopenkaart Westerschelde 2004 - Toelichting Op De Samenstelling Van De Zoute Ecotopenkaart,” in Biologische Monitoring Zoute Rijkswateren ( Rijkswaterstaat - Centrale Informatievoorziening).
Walburg L., De Jong D. J. (2016d). “Zoute Ecotopenkaart Westerschelde 2008 - Toelichting Op De Samenstelling Van De Zoute Ecotopenkaart,” in Biologische Monitoring Zoute Rijkswateren ( Rijkswaterstaat - Centrale Informatievoorziening).
Walburg L., De Jong D. J. (2016e). “Zoute Ecotopenkaart Westerschelde 2010 - Toelichting Op De Samenstelling Van De Zoute Ecotopenkaart,” in Biologische Monitoring Zoute Rijkswateren ( Rijkswaterstaat - Centrale Informatievoorziening).
Weston N. B. (2014). Declining Sediments and Rising Seas: An Unfortunate Convergence for Tidal Wetlands. Estuaries. Coasts. 37, 1–23. doi: 10.1007/s12237-013-9654-8
Willemsen P. W. J. M., Borsje B. W., Hulscher S. J. M. H., van der Wal D., Zhu Z., Oteman B., et al. (2018). Quantifying Bed Level Change at the Transition of Tidal Flat and Salt Marsh: Can We Understand the Lateral Location of the Marsh Edge? J. Geophysical. Research.: Earth Surface. 123, 2509–2524. doi: 10.1029/2018JF004742
Wilson C. A., Hughes Z. J., FitzGerald D. M., Hopkinson C. S., Valentine V., Kolker A. S. (2014). Saltmarsh Pool and Tidal Creek Morphodynamics: Dynamic Equilibrium of Northern Latitude Saltmarshes? Geomorphology 213, 99–115. doi: 10.1016/j.geomorph.2014.01.002
Zarzuelo C., Díez-Minguito M., Ortega-Sánchez M., López-Ruiz A., Losada M.Á. (2015). Hydrodynamics Response to Planned Human Interventions in a Highly Altered Embayment: The Example of the Bay of Cádiz (Spain). Estuarine. Coast. Shelf. Sci. 167, 75–85. doi: 10.1016/j.ecss.2015.07.010
Zhang S., Xu Q., Wang H., Kang Y., Li X. (2022). Automatic Waterline Extraction and Topographic Mapping of Tidal Flats From Sar Images Based on Deep Learning. Geophysical. Res. Lett. 49, e2021GL096007. doi: 10.1029/2021GL096007
Keywords: inundation frequency, saltmarsh, Landsat, intertidal, relative SLR
Citation: Laengner ML and van der Wal D (2022) Satellite-Derived Trends in Inundation Frequency Reveal the Fate of Saltmarshes. Front. Mar. Sci. 9:942719. doi: 10.3389/fmars.2022.942719
Received: 12 May 2022; Accepted: 10 June 2022;
Published: 22 July 2022.
Edited by:
Qiusheng Wu, The University of Tennessee, Knoxville, United StatesReviewed by:
A. Rita Carrasco, University of Algarve, PortugalPaula Canal-Verges, University of Southern Denmark, Denmark
Copyright © 2022 Laengner and van der Wal. This is an open-access article distributed under the terms of the Creative Commons Attribution License (CC BY). The use, distribution or reproduction in other forums is permitted, provided the original author(s) and the copyright owner(s) are credited and that the original publication in this journal is cited, in accordance with accepted academic practice. No use, distribution or reproduction is permitted which does not comply with these terms.
*Correspondence: Marieke Liesa Laengner, marieke.laengner@nioz.nl