Olfactory System Morphology Suggests Colony Size Drives Trait Evolution in Odorous Ants (Formicidae: Dolichoderinae)
 R. Keating Godfrey1*†
  Jill T. Oberski2
  Taylor Allmark3 Caleb Givens4 Jessica Hernandez-Rivera3
  Wulfila Gronenberg1,3
- 1Department of Neuroscience, University of Arizona, Tucson, AZ, United States
- 2Department of Entomology, University of California, Davis, Davis, CA, United States
- 3Neuroscience and Cognitive Science Program, University of Arizona, Tucson, AZ, United States
- 4Biology Program, Morehouse College, Atlanta, GA, United States
In social insects colony fitness is determined in part by individual worker phenotypes. Across ant species, colony size varies greatly and is thought to affect worker trait variation in both proximate and ultimate ways. Little is known about the relationship between colony size and worker trait evolution, but hypotheses addressing the role of social structure in brain evolution suggest workers of small-colony species may have larger brains or larger brain regions necessary for complex behaviors. In previous work on odorous ants (Formicidae: Dolichoderinae) we found no correlation between colony size and these brain properties, but found that relative antennal lobe size scaled negatively with colony size. Therefore, we now test whether sensory systems scale with colony size, with particular attention to olfactory components thought to be involved in nestmate recognition. Across three species of odorous ants, Forelius mccooki, Dorymyrmex insanus, and D. bicolor, which overlap in habitat and foraging ecology but vary in colony size, we compare olfactory sensory structures, comparing those thought to be involved in nestmate recognition. We use the visual system, a sensory modality not as important in social communication in ants, as a control comparison. We find that body size scaling largely explains differences in eye size, antennal length, antennal sensilla density, and total number of olfactory glomeruli across these species. However, sensilla basiconica and olfactory glomeruli in the T6 cluster of the antennal lobe, structures known to be involved in nestmate recognition, do not follow body size scaling observed for other structures. Instead, we find evidence from the closely related Dorymyrmex species that the larger colony species, D. bicolor, invests more in structures implicated in nestmate recognition. To test for functional consequences, we compare nestmate and non-nestmate interactions between these two species and find D. bicolor pairs of either type engage in more interactions than D. insaus pairs. Thus, we do not find evidence supporting a universal pattern of sensory system scaling associated with changes in colony size, but hypothesize that observed differences in the olfactory components in two closely related Dorymyrmex species are evidence of a link between colony size and sensory trait evolution.
Introduction
Superorganisms represent an increase in biological complexity from solitary organisms, making them a common focus of complexity studies (Cole, 1985; Bonner, 1993; Szathmáry and Maynard Smith, 1995; Bourke, 1999; Anderson and McShea, 2001; Jeanson et al., 2012; Kennedy et al., 2017). In social insects the colony is the reproductive unit of the superorganism and complexity may scale with colony size in a manner similar to complexity scaling with body size or group size across other taxa (Bonner, 1993). Indeed, across ant species, reproductive dimorphism (Bourke, 1999), worker polymorphism (Bonner, 1993; Murakami et al., 2000), and division of labor (Jeanson et al., 2007; Ferguson-Gow et al., 2014) are correlated with colony size. Importantly, components of increased complexity, e.g., morphological (Tschinkel, 1988; Thomas and Elgar, 2003) and behavioral (Jeanson et al., 2007; Ferguson-Gow et al., 2014) differentiation in a colony, sometimes arise only after colonies reach a certain size (Dornhaus et al., 2011).
Studies addressing the role of social structure in nervous system trait evolution often propose that social complexity, generally measured by colony size, will be negatively correlated with individual worker behavioral complexity (Anderson and McShea, 2001; Gronenberg and Riveros, 2009; O’Donnell et al., 2015) and hypothesize that relative brain investment, particularly in brain regions associated with more complex behaviors such as multi-modal learning and memory, will decrease with increasing colony size (Riveros et al., 2012; O’Donnell et al., 2015; Kamhi et al., 2016). However, individual workers of social species often show behavioral and cognitive skills comparable to solitary relatives (Gruter et al., 2011; Pasquier and Grüter, 2016; Hollis et al., 2017; Yilmaz et al., 2017), and comparisons seeking to link colony size with changes in brain structure may be complicated by confounding variables such as habitat differences or phylogenetic distance (Kamhi et al., 2016; Godfrey and Gronenberg, 2019b). Furthermore, complex collective behaviors may emerge from expanded communication systems or require relatively small changes in neural circuitry (Lihoreau et al., 2012; Bouchebti and Arganda, 2020) without changes to individual behavioral complexity (Jeanson et al., 2012; Feinerman and Korman, 2017). Thus, our understanding of the role of system complexity in individual-level trait evolution will be aided by comparisons of individuals from closely related species that vary in mature colony size but overlap in other drivers of trait evolution such as habitat and foraging ecology (Godfrey and Gronenberg, 2019a).
The evolution of larger social groups is hypothesized to act as a unique driver of trait evolution, particularly in traits related to intraspecific communication and recognition of group members (Stuart, 1991; Bourke, 1999; Freeberg et al., 2012). In solitary organisms, intraspecific communication and kin recognition are important to coordinating reproductive and familial relationships; in social organisms these same systems may be expanded or modified for interactions among individuals of varied relatedness. Since the evolution of sociality involves an expansion of the type and number of relationships among conspecifics, it represents an increase in biological complexity from solitary life histories (McShea, 1996). Similarly, the number and type of interactions may also scale with group size across social species and have consequences for individual traits (Anderson and McShea, 2001), particularly those related to intraspecific recognition and communication (Dunbar, 1992).
Superorganisms are colonies, not societies, with important differences in intragroup recognition and communication. Rather than individualized recognition of group members (Wells et al., 2003), superorganismal species are thought to use a general recognition system that allows them to assess whether an individual is a nestmate or non-nestmate (Breed, 2014; Esponda and Gordon, 2015). Intraspecific communication in Hymenoptera is largely chemosensory and mechanosensory in nature (Hölldobler, 1999), with the origins of chemical signaling in social insects originating from those used in defense (Mitra, 2013), fertility (Van Oystaeyen et al., 2014; Oi et al., 2015) and kin recognition (Lihoreau et al., 2007) by solitary species. Chemosensory information is processed primarily in the antennal lobe, and the diversification of signaling in Hymenoptera is mirrored by a notable expansion in olfactory receptor genes (Zhou et al., 2015), and increased complexity of olfactory system morphology (Dacks and Nighorn, 2011; Rössler and Zube, 2011).
In ants, social signal reception occurs primarily through sensilla on the antennae and maxillary palps. The sensilla basiconica have been identified as important in nestmate recognition in ants (Ozaki et al., 2005; Nishikawa et al., 2012; Sharma et al., 2015). These stout, pegged sensilla are set in a small indentation in the cuticle (Hashimoto, 1990; Renthal et al., 2003) and, while originally described as having a single apical pore (Hashimoto, 1990), but are now known to be multiporous (Sharma et al., 2015). Most other types of sensilla house a small number of sensory neurons, but each s. basiconicum can be innervated by more than 100 sensory neurons (Nakanishi et al., 2009). Olfactory sensory neurons (OSNs) expressing a particular odorant receptor complex converge on the same glomerulus (synaptic cluster) in the antennal lobe such that the number of glomeruli is often a good estimate of odorant receptor (OR) genes (Hansson and Stensmyr, 2011; Haverkamp et al., 2018; but see Younger et al., 2020). In ants, OSNs from the s. basiconica form glomeruli in a cluster called T6, suggesting this region plays a role in nestmate recognition (Ozaki et al., 2005; Nakanishi et al., 2009; D’Ettorre et al., 2017) and may be subject to selection on social communication. On the other hand, while some ants have elaborate visual systems used in navigation, foraging, and learning and memory (Jaffé et al., 1990; Narendra et al., 2011; Yilmaz et al., 2017, 2019; Fernandes et al., 2018; Wehner, 2020), and may rely on multiple modalities for nestmate recognition (Bos et al., 2010), there are no documented examples of visually based nestmate recognition systems in ants (Hölldobler, 1999).
With approximately 900 described species, Dolichoderinae is one of the four largest, species-rich subfamilies of ants (Ward et al., 2010). They are commonly referred to as odorous ants, a moniker referencing the volatile compounds reminiscent of fermented cheese or rotting fruit (Penick and Smith, 2015) emitted from their pygydial (anal) gland (Wheeler et al., 1975). However, the species diversity of dolichoderine ants is not reflected in relative research interest in dolichoderine ant biology, where the majority of studies focus on the invasive pest Argentine ant (Linepithema humile). In the experiments described here, we ask if differences in sensory systems across workers of three species of odorous ants in the tribe Leptomyrmecini—Dorymyrmex bicolor, D. insanus, and Forelius mccooki (Formicidae, Dolichoderinae; Figures 1, 2A,B)—are explained by body size scaling and if not, whether variation in colony size better explains differences. Importantly, these species overlap in habitat and foraging ecology, even competing with each other for resources (Bestelmeyer, 2005), commonalities leveraged here to control for differences in sensory ecology driven by these variables. We predict that variation in visual sensory systems, presumably marginally related or unrelated to social communication in these species, will be explained largely by body size. In contrast, given that the olfactory system supports social communication in ants, its evolution should be influenced by or influence colony size evolution. We therefore expect differences in the olfactory system, particularly in structures related to nestmate recognition, to correlate better with colony size than body size.
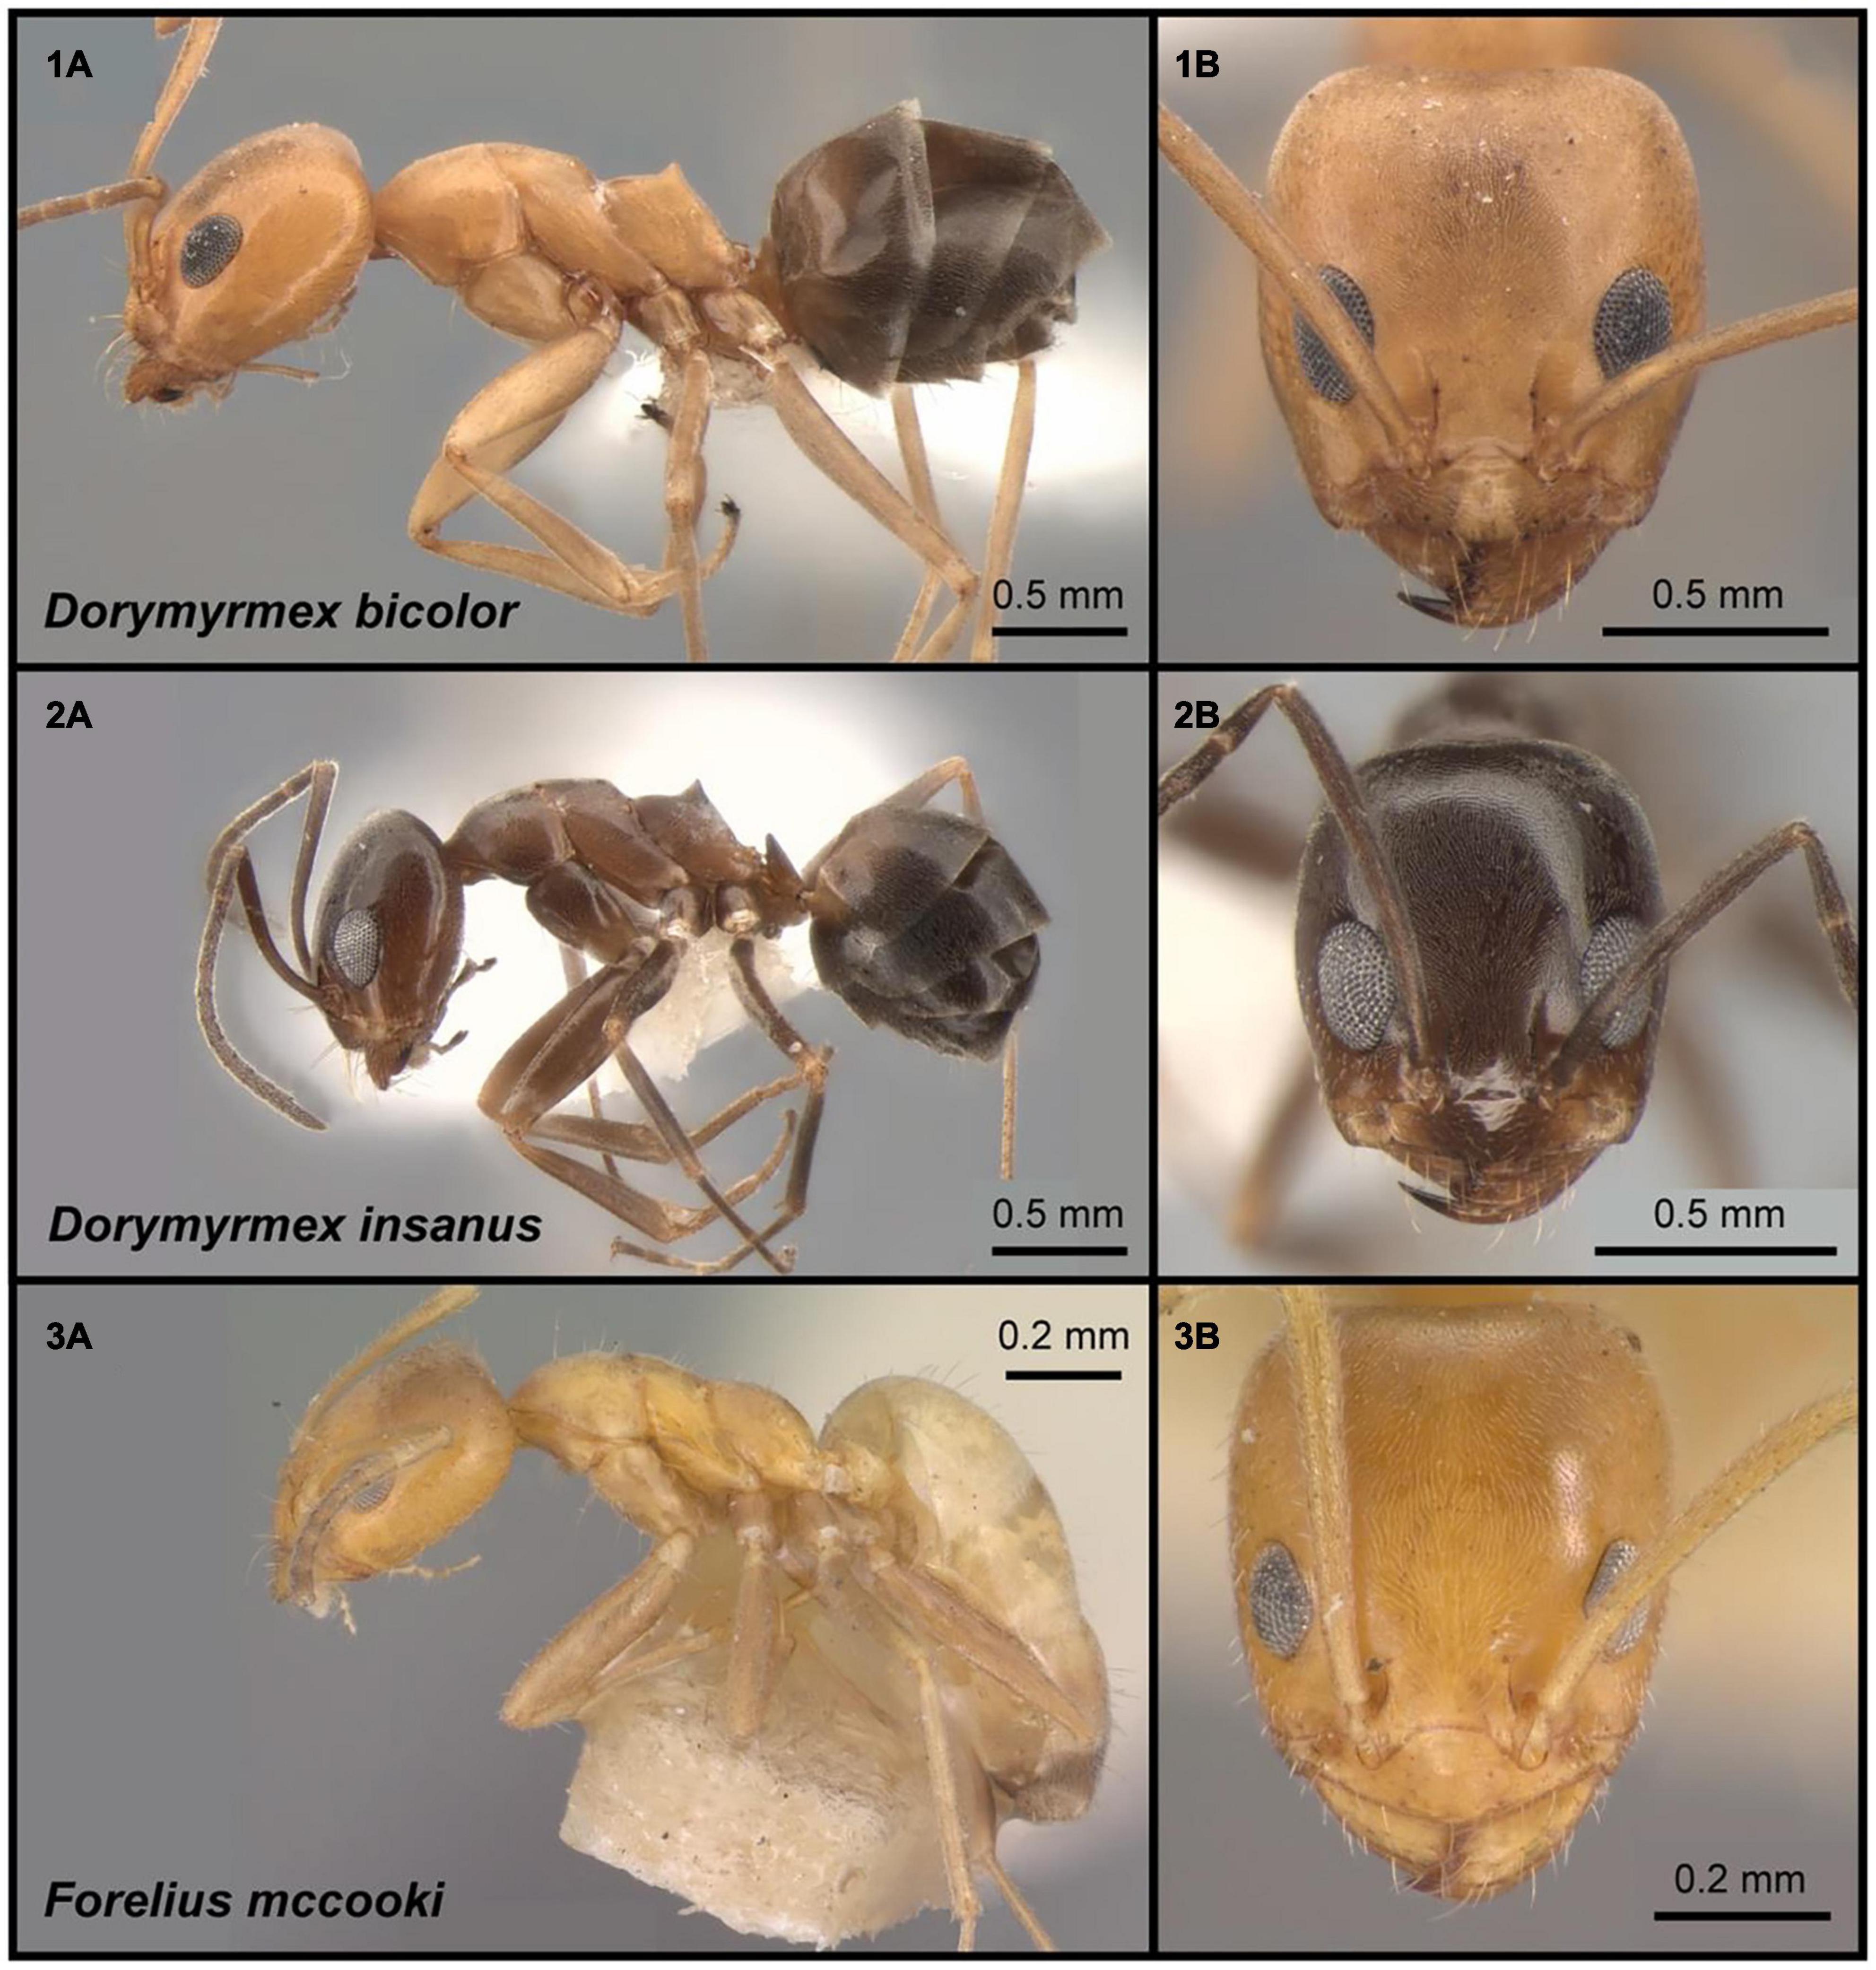
Figure 1. Three sympatric species of dolichoderine ants at the focus of the present work. (1A,B) Dorymyrmex bicolor, specimen CASENT0841125. (2A,B) Dorymyrmex insanus, specimen CASENT0841126. (3A,B) Forelius mccooki, specimen CASENT0102754. Complete specimen data and images are hosted on AntWeb (www.antweb.org); photographers Jill Oberski (1,2), Jen Fogarty (3).
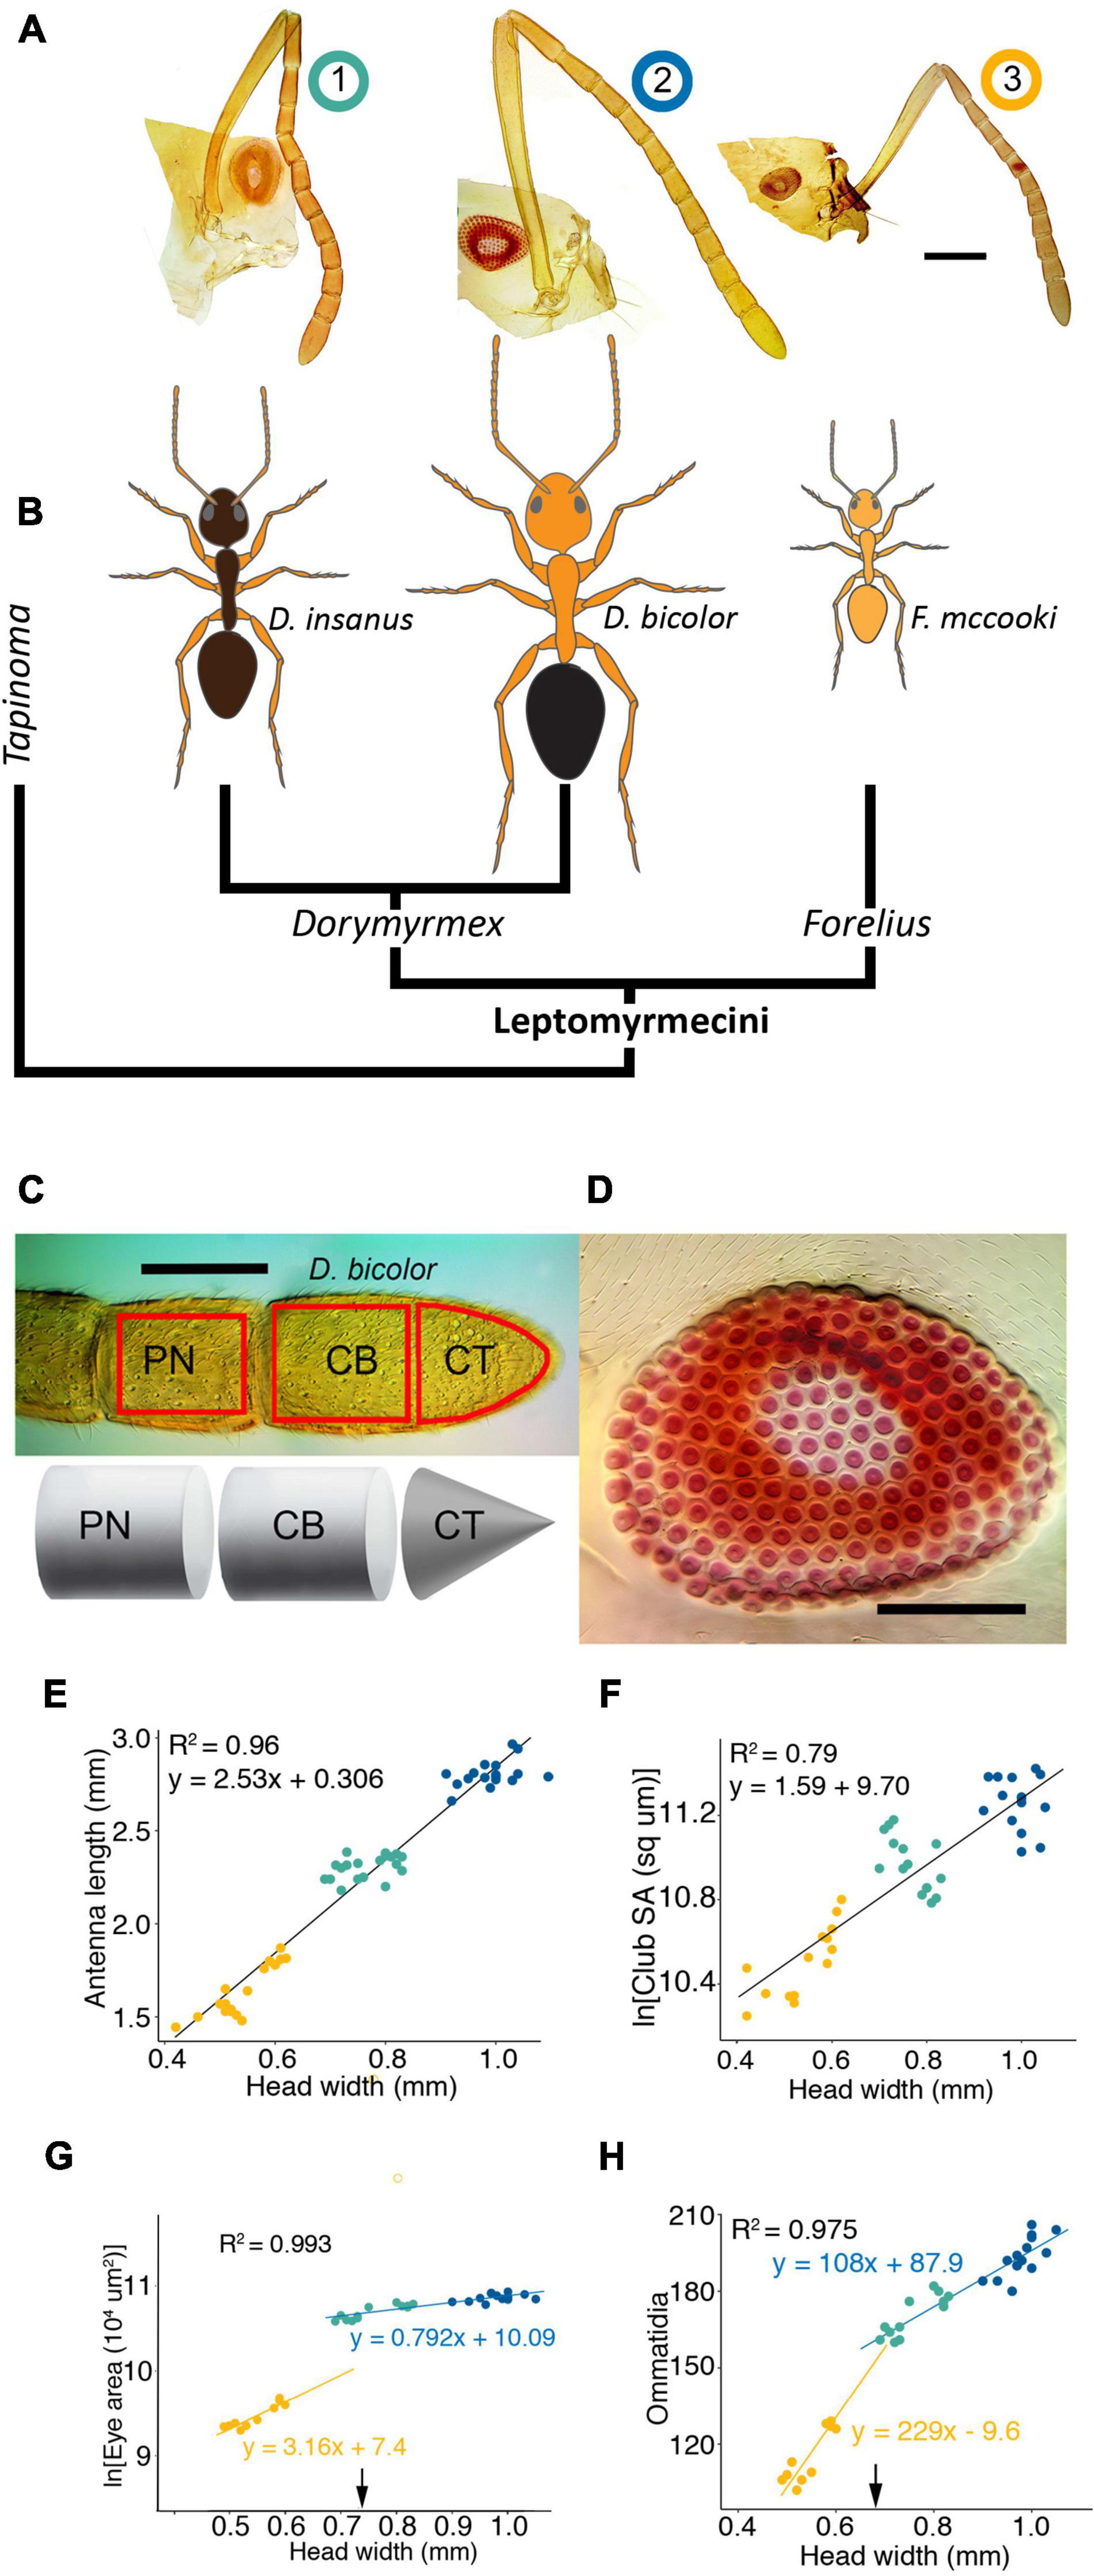
Figure 2. External sensory structures scale with body size. (A) Microphotographs of parts of the head capsule including the eye and antenna of the three focal species arranged by colony size indicated by number rankings above (B). (B) Phylogenetic relationships among dolichoderine ants included in this study. (C) Sampling area for the three antennal regions (top; red boxes) and diagram of measurements taken for surface area (bottom); penultimate segment = PN; club base = CB; club tip = CT. (D) Photomicrograph of the eye of D. bicolor; to show ommatidia; eye surface area measured as footprint of eye on head capsule. Scale bars in (A,C,D) = 100 μm. Differences in antennal length (E) and antennal surface area (F) are explained largely by differences in body size. Eye area (G) and Ommatidia numbers (H) scale with body size, but significant differences exist between Forelius and the Dorymyrmex species and scaling is best described using piecewise regression (yellow and blue lines, respectively) using head width of 0.69 mm as a breakage point (black arrow). For (G,H) R-squared from piecewise linear regression indicated in black. Slopes for piecewise regression indicated in colors that correspond to lines above and below breakage point. Color code for (B,E–H), this figure and Figures 3, 4: F. mccooki yellow; D. insanus cyan; D. bicolor blue.
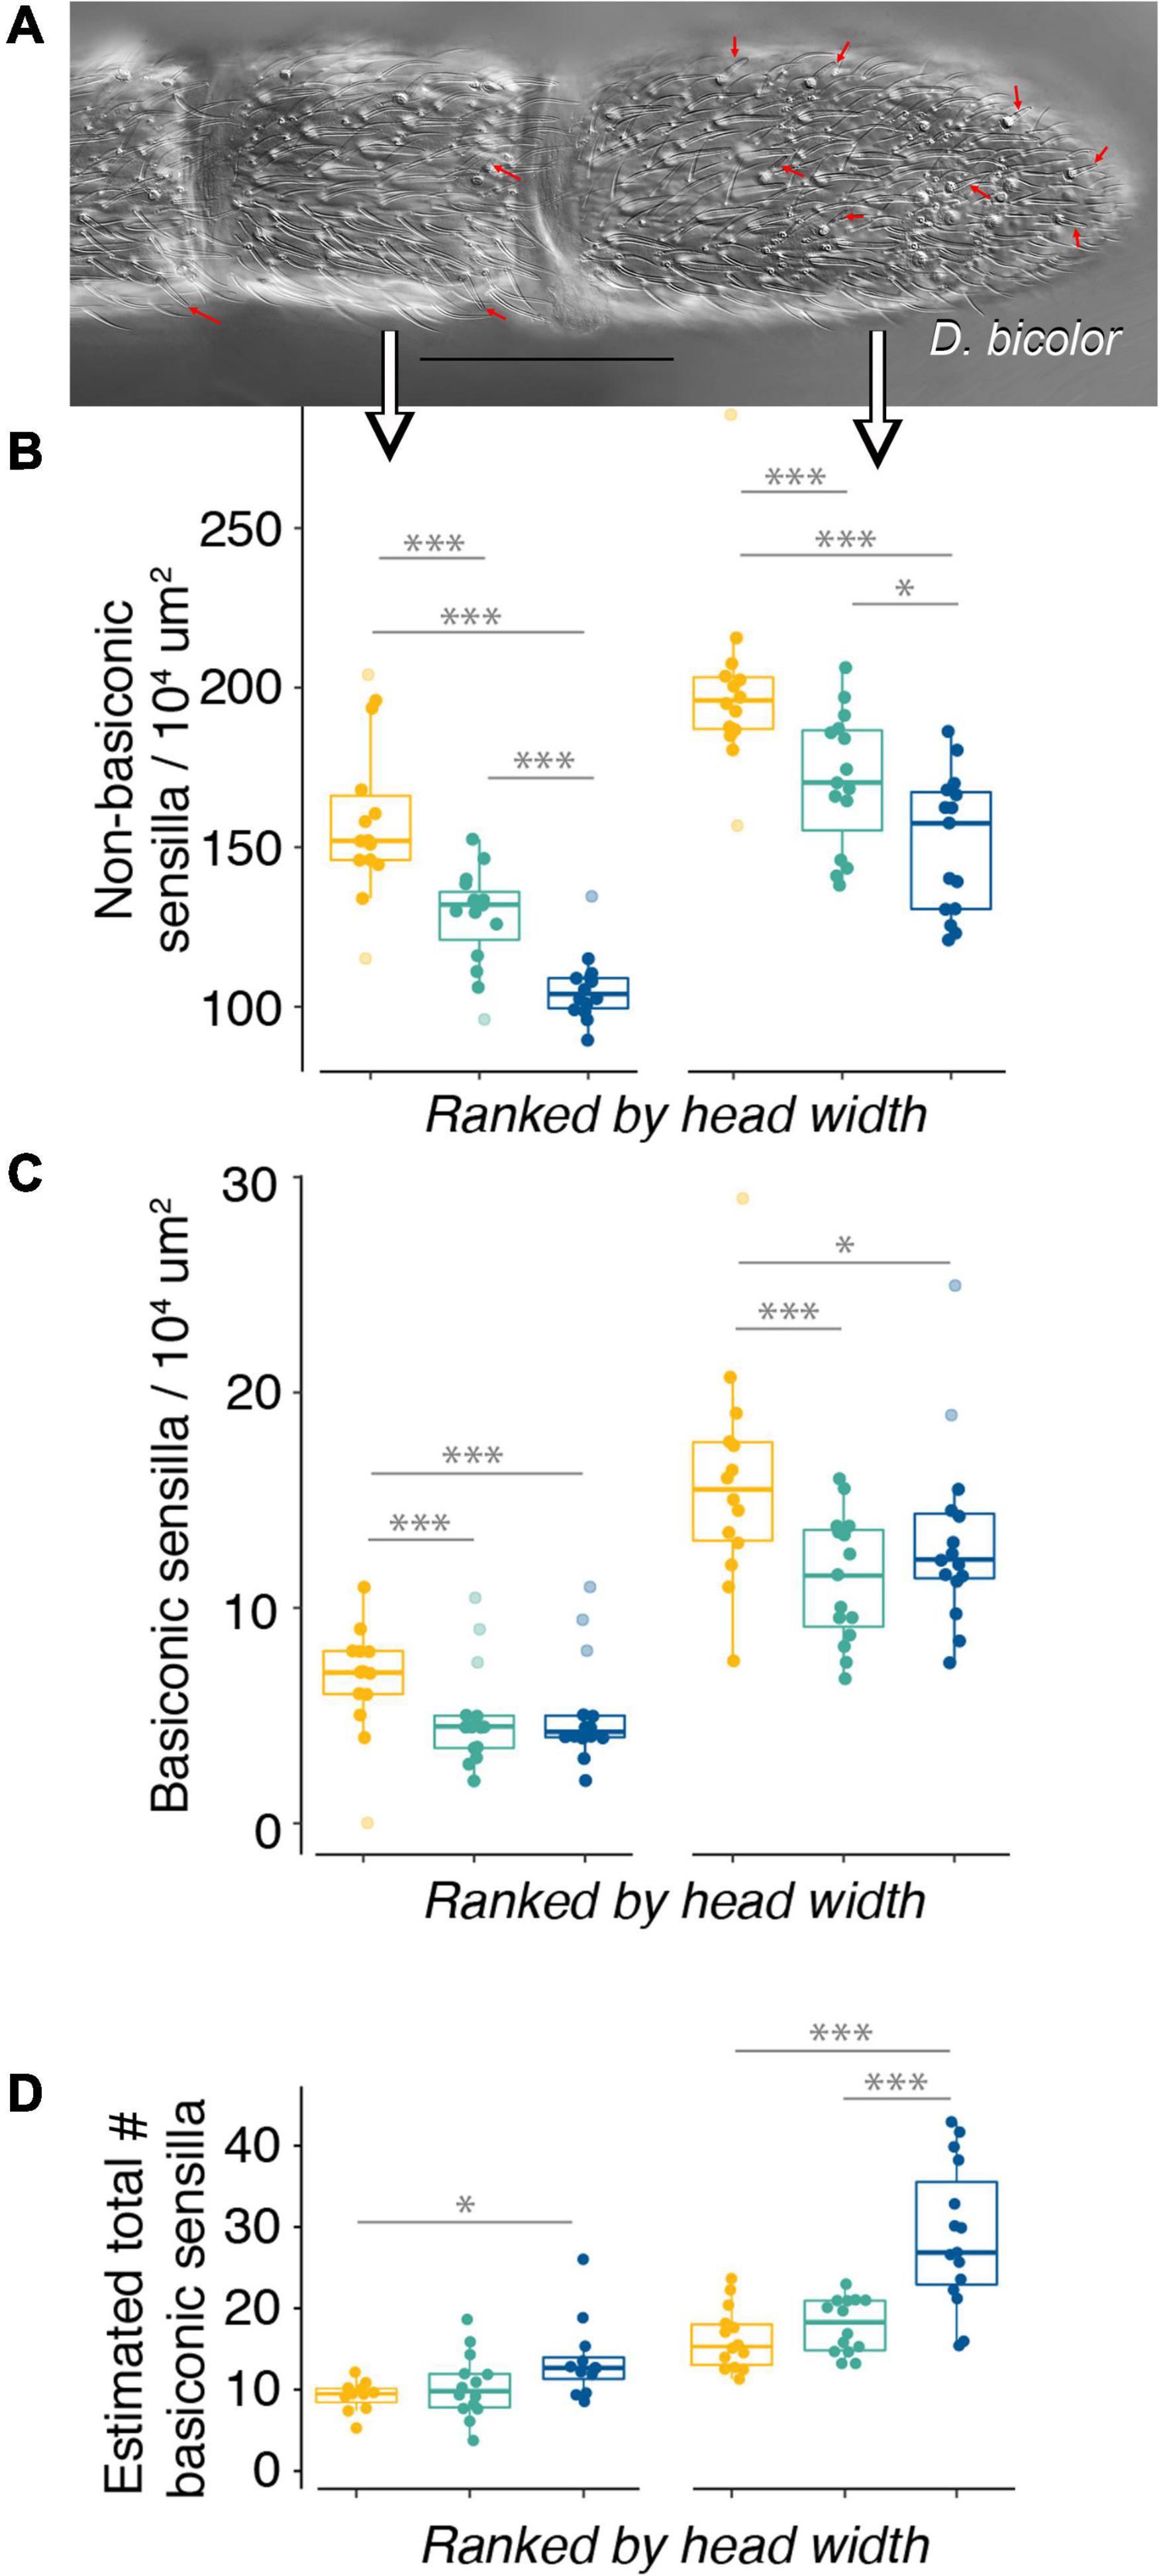
Figure 3. Basiconic sensilla density specifically does not scale with body size. (A) Microphotograph (63× oil immersion lens) of distal antennal segments [penultimate (left) and club (right)] of Dorymyrmex bicolor; red arrows point to basiconic sensilla; scale bar = 100 μm; large arrows point at the respective data sets in (B,C). (B) Non-basiconic sensilla density decreases with increasing body size on both the penultimate and club segments. (C) Basiconic sensilla density does not decrease with increasing body size, specifically in the comparison of Dorymyrmex species. (B,C) Show sensilla density for the penultimate (left) and club (right) antennal segments; outliers excluded from analysis shown with decreased saturation. (D) Estimated total number of basiconic sensilla when mean basiconic sensilla density is multiplied by mean surface area for each segment (penultimate, left; club, right) for individual ants; data shown does not include outliers. Statistical comparisons of sensilla density across species made using a generalized linear model with a quasi-Poisson distribution followed by ANOVA and post hoc comparisons using Tukey’s Honestly Significant Difference. *p < 0.05; ***p < 0.001. Color code for (B–D): F. mccooki yellow; D. insanus cyan; D. bicolor blue.
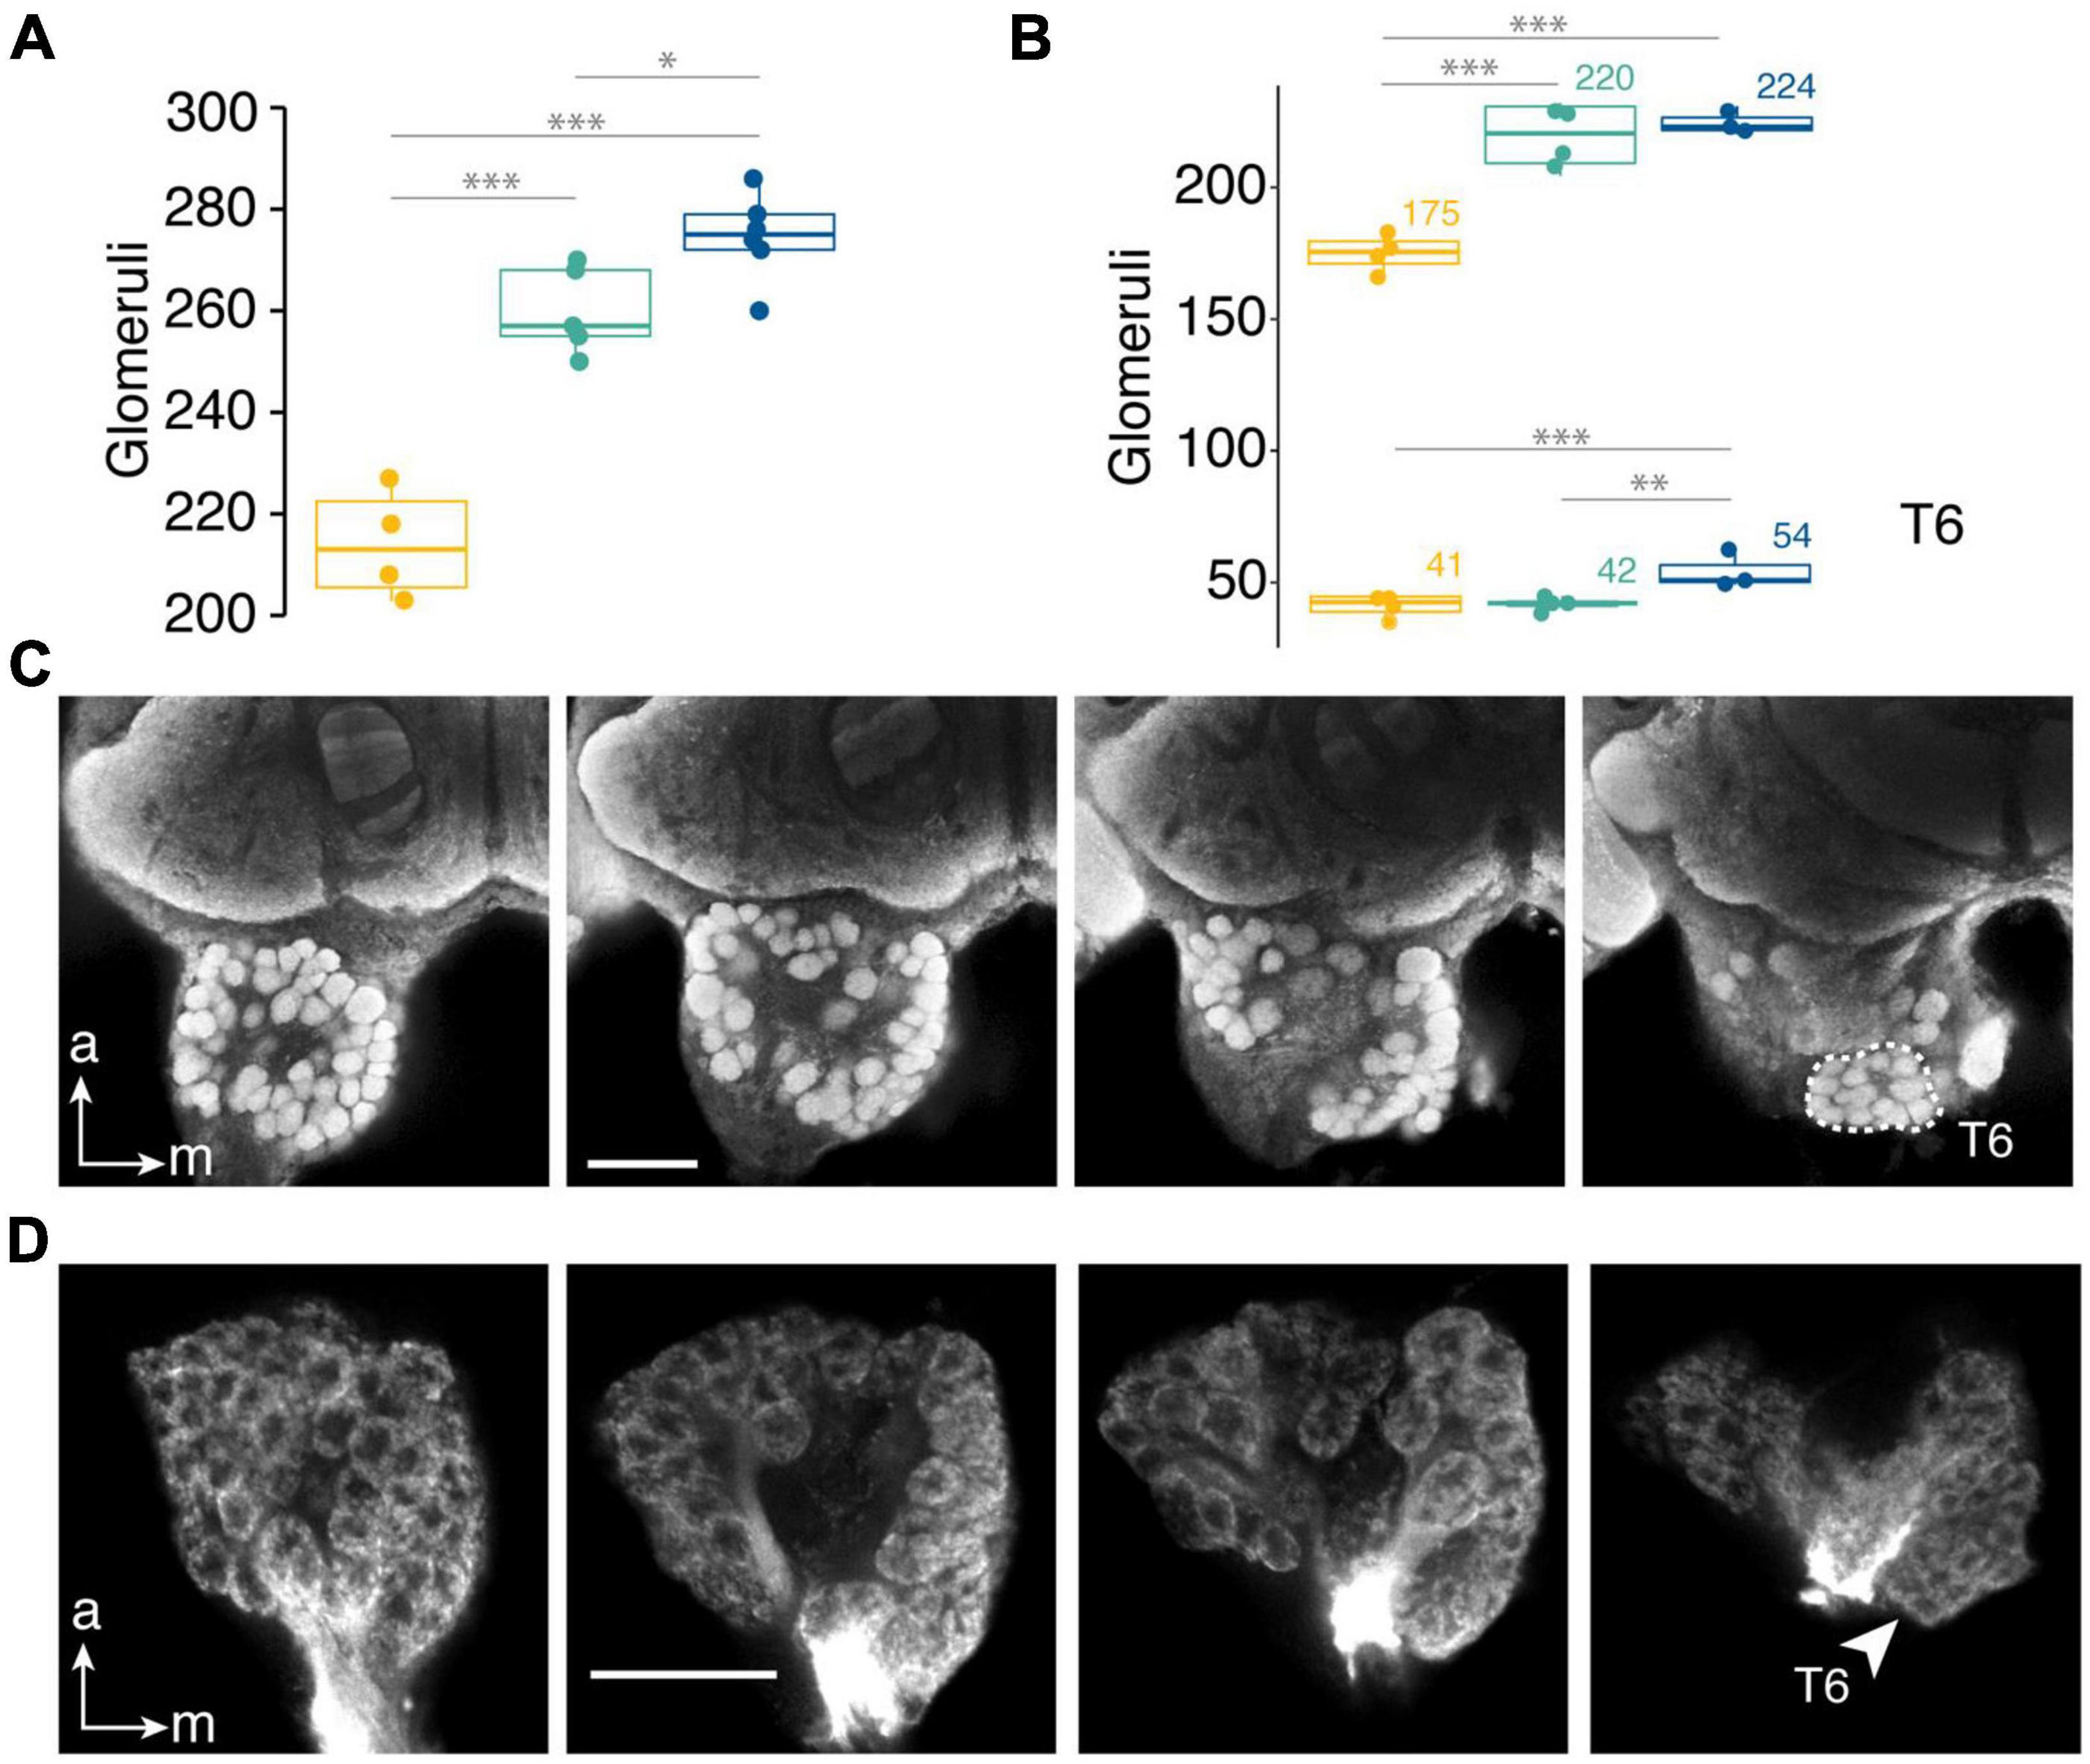
Figure 4. Glomeruli in the T6 cluster account for differences in antennal lobe glomeruli between Dorymyrmex species. (A) Number of antennal lobe glomeruli. (B) glomeruli in the T6 cluster and other clusters in three species that vary in colony size. Number above boxes indicate mean glomeruli number for T6 cluster (bottom) and all other glomeruli (top). Species ranked in order of increasing mean head width along the x-axis. (C) Synapsin-labeled antennal lobe and (D) mass staining (dextran tracer) of antennal sensory neurons in the antennal lobe of D. bicolor with T6 cluster outlined (C) or indicated by arrowhead (D), scale bars = 50 μm. Generalized linear model with gamma distribution and log link function used for statistical comparisons. Pairwise comparisons made using Tukey’s honestly significant difference (HSD) test. *p < 0.05; **p < 0.01; ***p < 0.001.
Materials and Methods
Species Identification and Collection
Forelius and Dorymyrmex, two sister dolichoderine ant genera known for their xerophilic and thermophilic habits, also have in common a tendency toward remarkable intraspecific variation. There are currently three species of Forelius in the United States, F. damiani (Guerrero and Fernández, 2008) (known in the United States only from southern Texas), F. pruinosus (Roger, 1863) and F. mccooki (McCook, 1880). The last two species vary significantly in color and hardly at all in morphology; few features can reliably separate them. The primary distinction is one of standing pilosity: F. mccooki has erect setae on the scapes, posterior margin of the head, and external face of the tibiae, while F. pruinosus has few to none of these standing hairs—but even this character has occasional intermediates (Ward, 2005). The small yellow Forelius abundant in Tucson, Arizona that were collected for our study have numerous standing setae on the aforementioned structures, so we identify these samples as F. mccooki. Some researchers have found preliminary evidence of two Forelius clades throughout the western United States, but also found conflicting results that suggest F. mccooki, F. pruinosus, and an undescribed orange Forelius sp. are tangled together in a single clade (Cover, pers. comm., 2021). We concur with Ward (2005) and Fisher and Cover (2007) that North American Forelius taxonomy needs further study.
The taxonomy of North American Dorymyrmex is notoriously complicated (Creighton, 1950; Snelling, 1995; Deyrup, 2017). An ongoing phylogenetic analysis and taxonomic revision has confirmed that species delimitation, particularly based on the worker caste, is extremely difficult in this group (Oberski, in press) and there are a number of species in western North America that have yet to be described (Fisher and Cover, 2007). Three Dorymyrmex species undoubtedly found in Arizona are D. bicolor (Wheeler, 1906), D. insanus (Buckley, 1866), and D. wheeleri (Kusnezov, 1952). D. wheeleri is a small, rather distinctive Dorymyrmex species, and although its type locality is Tucson, Arizona—the source of our colonies for this study—no confirmed collections of the species exist beyond the type series. Both D. insanus (type locality Howard Co., Texas) and D. bicolor (Maricopa Co., Arizona) are conspicuously present across the south-central and southwestern United States and northern Mexico. However, there are other species known from neighboring states whose range may very well extend into Arizona: D. flavus (McCook, 1880) and D. smithi (Cole, 1936) have been recorded from New Mexico; D. paiute (Snelling, 1995), southern Utah; and D. lipan (Snelling, 1995), west Texas (Snelling, 1995; Mackay and Mackay, 2002). To confirm our hypothesis that the dark and bicolored Dorymyrmex samples we collected are D. insanus and D. bicolor, we first checked Snelling’s (1995) literature review and key to United States Dorymyrmex based on workers, which is partially recounted below. Morphometrics include head length (HL), head width (HW), cephalic index (ratio of HW/HL) (CI), eye length (EL), and interocular distance (IOD).
Snelling (1995): Head relatively narrow, CI usually less than 88, rarely up to 90. Vertex of head straight or slightly convex. Eye relatively large, IOD usually less than 1.5 × EL. Propodeal tubercle relatively prominent. Pronotum usually with discal seta pair. Color light to dark brownish, head and gaster commonly darker than mesosoma. (Kansas to central Texas, west to southern California)
= insanus (Buckley, 1866)
Snelling (1995): Head relatively broad, CI over 90. Vertex of head usually distinctly concave in frontal view, rarely straight. Eye relatively small, IOD at least 1.75 × EL. Head and mesosoma red. (Western Texas to southern Nevada and California)
= bicolor (Wheeler, 1906)
Our Tucson collections of Dorymyrmex each conform to one of these two descriptions, with the exception of the cephalic index measurements of D. insanus—even those of the neoparatype series, which contradict Snelling’s key. Our D. bicolor and D. insanus can also be differentiated by worker body size; D. bicolor individuals are larger than D. insanus (HW 0.84–1.00 mm vs. 0.73–0.81 mm; Supplementary Figure 1), although this trend may weaken with larger sample sizes. Among these populations, species-level mean head width corresponds with body size measured by mass (Godfrey and Gronenberg, 2019b); thus, head width is used as a proxy for body size throughout this study, although it may not hold true in other locations or with different species of Dorymyrmex.
Across D. bicolor colonies, consistent differences appear to create two morphotypes (Supplementary Figure 2). Some measurements distinguish these D. bicolor morphotypes quite well, such as the ratio of eye size to head width (Supplementary Figure 1B) and body size (DPL, DF) (Supplementary Figures 2D,E), while others show all D. bicolor samples as a single undifferentiated cluster, such as cephalic index (Supplementary Figure 2F) or scape length (Supplementary Figure 2E). Variation in allometry and color seem consistent at the colony level, and thus may indicate simple variation at the level of the reproductive unit or perhaps differences in colony age or some other unidentified factor. Ultimately, for the purposes of the present work, we treat our D. bicolor samples as a single species.
To ease future taxonomic efforts, we have also selected a representative voucher specimen for each species and morphotype. These specimens have been deposited at the University of California Davis insect collection (UCDC) with the following unique identifiers: D. bicolor morphotype 1, CASENT0841125; D. bicolor morphotype 2, CASENT0841124; D. insanus, CASENT0841126; F. mccooki, CASENT0841127.
Colony size rankings are based on previously reported measurements of workers outside the nest during peak foraging times (Godfrey and Gronenberg, 2019b). Based on these observations D. insanus was considered to have small colonies ( = 2, s = 1.5 workers outside nest); D. bicolor, intermediate sized colonies ( = 14, s = 7.3); and F. mccooki, large colonies ( = 46, s = 14; Godfrey and Gronenberg, 2019b). For the current study, individual workers observed foraging at regularly monitored colonies in Tucson, Arizona and adjacent municipalities (Supplementary Table 1) were collected live into Falcon 50 mL conical centrifuge tubes (Corning, #352070) using an aspirator and transported back to the lab for experiments.
External Sensory Morphology
To count sensilla and ommatidia, head capsules were cleared in 30% hydrogen peroxide for 1–3 days, rinsed, incubated in 80% glycerol, mounted on a slide with a polyvinyl alcohol mounting medium, Mowiol® 4–88 (Sigma-Aldrich), and covered with a #1.5 coverslip. Antennae and eyes were imaged in brightfield with a SpotFlex camera (FX1500WS, Diagnostic Instruments, Inc., Sterling Heights MI, United States) mounted on a Zeiss Axioplan microscope. Entire antennae were imaged using a 2.5× objective, eyes using a 20× or 40× objective, and antennae segments using a 63× objective (Figure 2A). Images were captured with SPOT Basic image software (Diagnostic Instruments, Inc., Sterling Heights MI, United States). Antenna length, eye size, ommatidia number and sensilla density were measured from stacks of images in Fiji (Schindelin et al., 2012). All measurements were averaged over the two sides to produce individual-level measurements for each sensory structure for statistical analysis. Some head capsules were particularly fragile following clearing and, in these cases, only one antenna or eye was available for analysis.
The surface area (SA) of antennae segments was approximated from measurements of segment diameter and height (Figure 2C). The penultimate segment was approximated as a cylindrical tube with SApen = 2πrh. Surface area of the apical club segment (SAclub) was approximated as a cylindrical tube for the proximal two thirds of its height and the lateral surface of a cone for the distal most third such that
(Figure 2C). Eye area was measured as the traced boundary of the eye on the cuticle (Figure 2D). Ommatidia were counted using the Cell Counter plugin in Fiji (De Vos, 2001).
To quantify sensilla density, three polygons were drawn along the antenna, one on the penultimate segment, one on each of the base and tip of the club (Figure 2C). Depending on segment size and shape, polygons sampled from 20 to 30% of the approximate total surface area of the segment (Supplementary Figure 4A). All sensilla with their base inside the sampling polygon were counted. Sensilla density was averaged over segment and antennae. Sensilla basiconica (s. basiconica) were identified as stout, pegged sensilla with a blunt, terminal end (Nakakuki, 1986; Renthal et al., 2003; Ramirez-Esquivel et al., 2014) which protrude from the antenna surface at a more obtuse angle than other sensilla (indicated by red arrows in Figure 3A) and are easily distinguished using brightfield microscopy (Kelber et al., 2010).
Antennal Lobe Morphology
To quantify differences in the number of olfactory glomeruli, brains were labeled with an α-synapsin antibody to visualize glomeruli. Brains were dissected in phosphate-buffered saline (PBS) and microwave-fixed in 4% paraformaldehyde in PBS (low power at 18°C under vacuum for two cycles of 2 min), then left in fixative for 12 h at room temperature. Following blocking with 2% normal goat serum (Thermo Fisher Scientific # 31872), brains were permeabilized with 1% Triton X-100 in PBS (Electron Microscopy Supply, Fort Washington, PA; PBS-TX), rinsed with 0.1% PBS-TX, and incubated on a shaker at 25°C for two nights in primary antibody (1:500 in 2% goat serum in 0.2% PBS-TX). Monoclonal Drosophila synapsin I antibody (SYNORF1, AB_2315426; Developmental Studies Hybridoma Bank #3C11) was used as the primary antibody to label synapsin. Subsequently, brains were washed in 0.1% PBS-TX and incubated overnight at room temperature in Alexa Fluor 568 (AB_2534072, Thermo Fisher Scientific #A-11004) goat anti-mouse secondary antibody (1:100 in PBS) on a shaker. After secondary incubation, brains were washed in 0.1% PBS-TX and rinsed with distilled water before being dehydrated in increasing concentrations of ethanol in distilled water (10 min each in 50, 70, 80, 95, 100, 100%) and mounted in custom-made aluminum well slides with #1.5 coverslips. Brains were cleared by incrementally removing ethanol and replacing it with methyl salicylate. Brains were imaged on an inverted Zeiss 880 Laser Scanning Confocal Microscope using a plan-Apochromat 20× 0.8 aperture objective and optically sectioned in the horizontal plane at 1-micron intervals. Section thickness was corrected by a factor of 1.64 (adjusted section thickness = 1.64 microns) to account for the refractive index mismatch between air and methyl salicylate (Bucher et al., 2000).
To visualize olfactory sensory neuron (OSN) tracts and glomerular clusters in the antennal lobe, mass fills of OSNs were performed. For these experiments workers were anesthetized on ice and the club or last three segments of their antennae were removed with surgical scissors. A small crystal of Dextran, Texas Red, 3,000 MW was dissolved in physiological saline (130 mM NaCl/5 mM KCl/4 mM MgCl2/5 mM CaCl2/15 mM Hepes/25 mM glucose/160 mM sucrose, pH 7.2; Groh et al., 2004), allowed to dry until sticky, and placed on the excised tip. Ants were allowed to recover in humidified chambers with sucrose (30% w/w) for 2–4 days until anesthetized and euthanized. Brains were fixed in 2% glutaraldehyde, 2% paraformaldehyde for 24 h at room temperature, then rinsed, dehydrated, mounted, and imaged as described for whole mount synapsin labeling.
Whole-brain images were manually segmented using the TrakEM2 software package in Fiji (Cardona et al., 2012). Volumes of histologically recognizable subunits, the glomeruli, were traced in one or both hemispheres in 4–6 individuals of each species. Because basiconic sensilla innervate the T6 cluster of glomeruli (Kelber et al., 2010; Nakanishi et al., 2010), glomeruli of this cluster were identified from segmented images following tracing of all glomeruli in order to look for differences that correspond with differences in basiconic sensilla across taxa. The T6 cluster was identified based on location description and images from the myrmicine ant, Atta vollenweideri (Kelber et al., 2010) and the formicine ant, Camponotus japonicus (Nakanishi et al., 2010; Nishikawa et al., 2012). Brains were not always imaged in the same plane and, while it is possible to count all glomeruli from any plane, it was difficult to distinguish T6 glomeruli in images taken outside the dorsoventral (neural axis) plane. Therefore, to ensure T6 glomeruli could be appropriately quantified, four antennal lobes from each of the focal species for this analysis, D. bicolor, D. insanus, and F. mccooki, were chosen based on image quality and orientation.
Potential Pheromone Compounds
Because D. bicolor showed significantly greater estimated total s. basiconica (Figure 3D) than the small-colony relative, D. insanus, and because differences in glomeruli number between these species could be explained largely by those in the T6 cluster (Figures 4A,B), we asked if the number of compounds we could detect through gas chromatography/mass spectroscopy (GC-MS) from D. bicolor was greater than from D. insanus, with a particular interest in putative cuticular hydrocarbons that are in part detected by s. basiconica. Eight ants from a single colony of each species were used in the analysis. The gaster contents and bodies were analyzed separately with the expectation that cuticular hydrocarbons would show up in both samples, whereas many of those produced for alarm and recruitment would be unique to the metasoma (”gaster”). Ants were anesthetized on ice and the gaster excised from the head and remaining thorax segments. Compounds were eluted in the following manner: the head and thorax from the 8 ants were placed in one 2 ml glass vial and soaked with 500 μL dichloromethane (DCM; check supplier) for 15 min, and gasters were placed in a different 2 ml vial with 500 μL DCM and crushed using a tissue grinder. A control vial of 500 μL DCM was prepared at the same time. These procedures were carried out in a lab hood and all tools, vials, and lids were rinsed three times in DCM prior to use. Chemical analysis of Dorymyrmex compounds was carried out at the Analytical & Biological Mass Spectrometry facility at the University of Arizona using a Shimadzu SHRXI GC column. The eluent was introduced into a Shimadzu QP2010S mass spectrometer and ionized by electron impact. Identification of peaks was accomplished by comparison to the National Institute of Standards and Technology (NIST) mass spectral library (Shen et al., 2016). Existing reports of gland contents in the literature were consulted to determine potential gland sources of compounds identified from D. bicolor and D. insanus. For detailed methods, see Supplementary Material.
Behavior
To test whether the difference in total s. basiconica between D. insanus and D. bicolor is correlated with behavior, we recorded and scored interactions between pairs of nestmates and non-nestmates for each species. Ants were collected from nest entrances between 08:00 and 10:00 and stored in a cool chamber to be transported to the lab. Once in the lab ants were stored in fluon-lined plastic boxes and given 30 min to acclimate before pairings occurred. Nestmate or non-nestmate pairs were placed in a 9 cm KIMAX® borosilicate glass petri dish on white lab paper and illuminated with a 75 W incandescent bulb surrounded by an aluminum diffuser and warmed to 30–32°C with a 1,500 W personal space heater (Holmes Products Corp., Milford, MA, United States) to mimic outdoor thermal conditions. Ants were filmed using a Sony HDR XR200 Handicam camera positioned on a tripod and focused down onto the petri dish. Ants were placed in the petri dish in succession and each was given 30 s to acclimate before either the addition of the second ant or the behaviors were coded. Ants were filmed for 3 min. Interactions were coded using the open-source event logging software, Behavioral Observation Research Interactive Software (Figure 5A, BORIS; Friard and Gamba, 2016). The following behaviors were coded: antennation (one or both ants tapping antennae on the other), grooming (one ant licking areas of the other ant’s head or body; Figure 5B), trophallaxis, mandible flaring, biting (Figure 5B), retreating (when one ant moved quickly away from an interaction), chasing (when one ant moved quickly away from an interaction and the other followed), fighting (when ants were biting and wrestling occurred), and touch (fast or incidental contact that could not be coded as one of the other behaviors). Only behaviors that involved ants interacting were coded. Behaviors were scored as point events or state events, with state events including duration information. Behaviors scored as state events included antennation, grooming, and fighting. For the purpose of analysis, grooming and trophallaxis were considered affiliative behaviors, mandible flaring, biting, chasing, and fighting were considered aggressive behaviors, and touch and antennation were considered neutral behaviors.
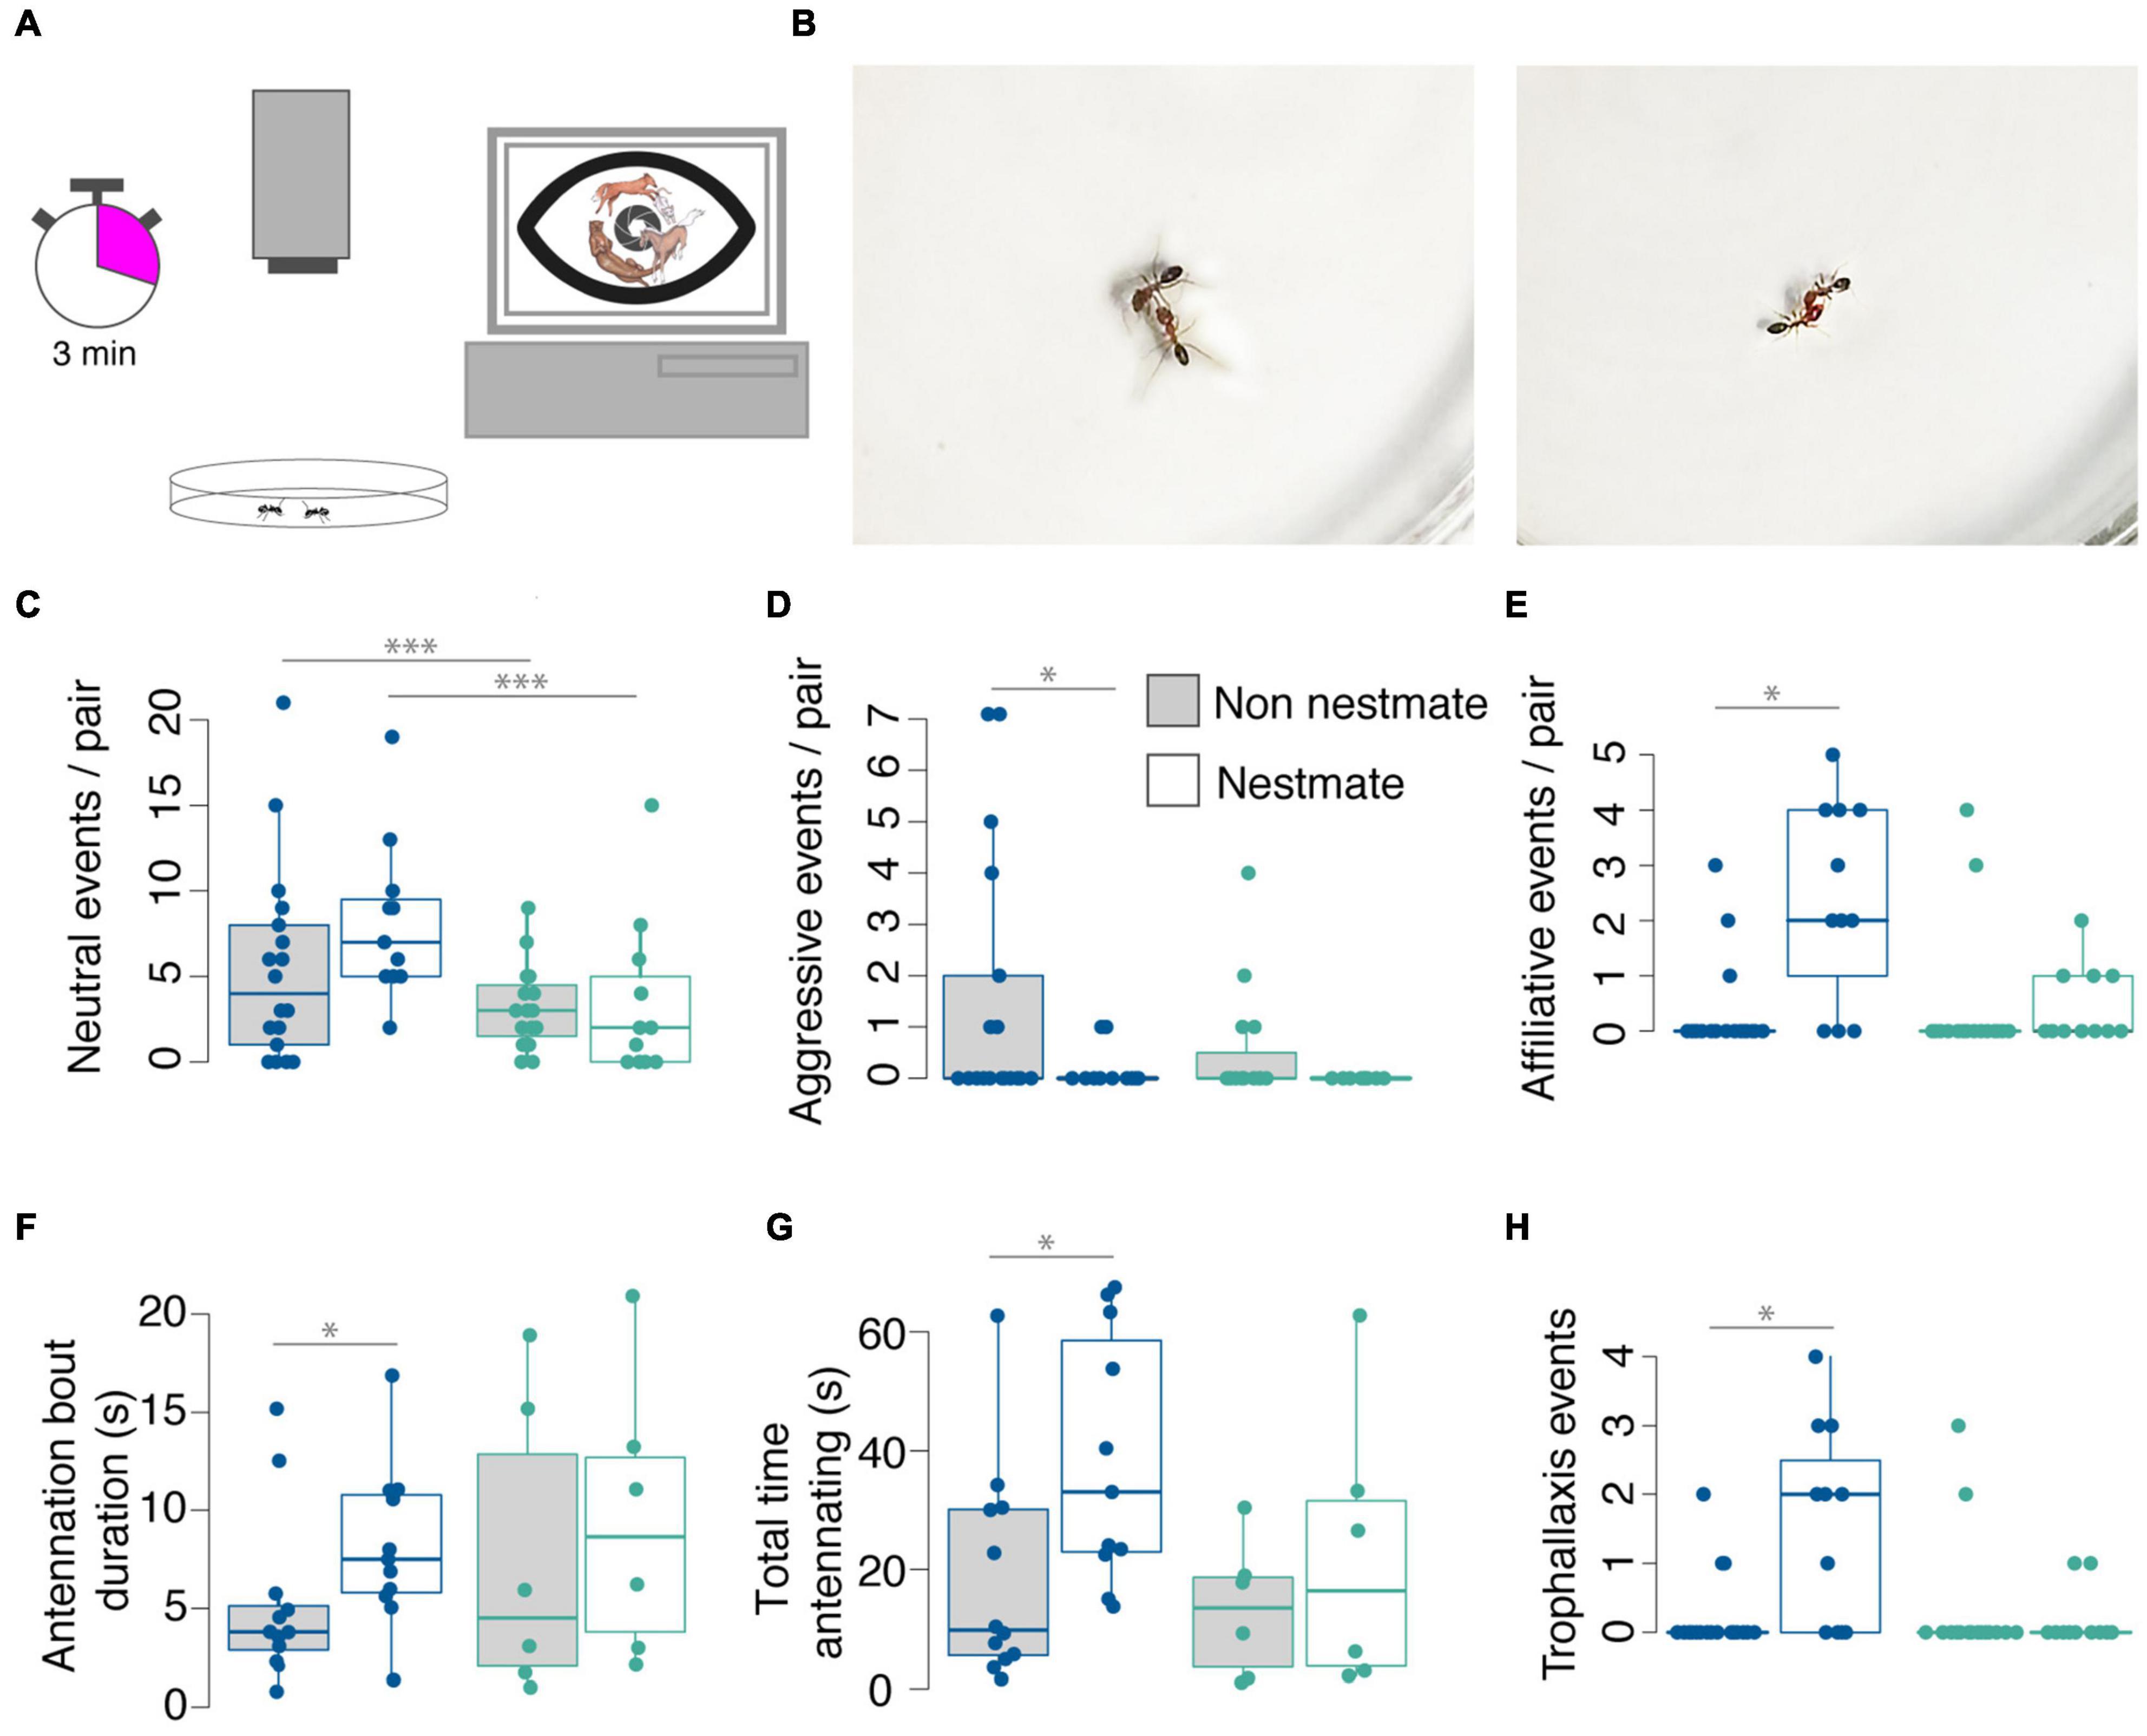
Figure 5. Dorymyrmex bicolor engage in more social interactions than D. insanus. (A) Schematic of behavior method with pairs of ants filmed in a glass petri dish for 3 min and interactions coded in BORIS (Friard and Gamba, 2016). (B) Stills from recordings showing D. bicolor engaging in biting (left) and grooming (right) behaviors. In comparisons of nestmate interactions or non-nestmate interactions between species, D. bicolor interact more often than D. insanus (C). In comparisons of nestmate and non-nestmate behavior within species, D. bicolor non-nestmates display significantly more aggressive interactions (D) and significantly fewer affiliative interactions (E) than nestmates, an effect not detected in D. insanus. D. bicolor nestmates participate in antennation for longer duration bouts (F) and a greater amount of total time than non-nestmates (G); D. insanus nestmates and non-nestmates show comparable antennation bout duration and total time. (H) Dorymyrmex insanus display few trophallaxis events with no differences among nestmate or non-nestmate pairs, whereas D. bicolor nestmates engage in trophallaxis more frequently than non-nestmates. Statistical comparisons in (A–E,H) were made using a generalized linear model with a Poisson distribution followed by ANOVA and post hoc comparisons using Tukey’s Honestly Significant Difference. Statistical comparisons in F and G were made using pairwise Mann-Whitney U-test between non-nestmate and nestmate pairs of a species. *p < 0.05; ***p < 0.001; Color code for data point in (C–H): D. insanus cyan; D. bicolor blue.
Statistics
All statistics were conducted in R version 4.0.2 (R Core Development Team, 2020) using the R studio interface (R Studio Team, 2020) and the tidyverse (Wickham et al., 2019), lme4 (Bates et al., 2015), emmeans (Lenth, 2021), and ggpubr (Kassambara, 2020) packages. Hypothesis testing for scaling relationships in antennal length, club surface area, eye area, and ommatidia number were achieved with the construction of linear models (LMs) followed by ANOVA (Supplementary Table 2). Surface area measurements were natural log-transformed for these analyses. Tukey-adjusted least square means were used for pairwise comparisons. LMs that included head width alone were used to approximate slopes and intercepts for antennal length and club surface area (Figures 2E,F). Piecewise LMs with a break point at 0.69 mm were used to assess scaling in eye surface area and ommatidia number between F. mccooki and the Dorymyrmex species. Piecewise LMs estimate a single R-squared value and slopes for lines above and below the break point are presented. Differences in sensilla and ommatidia density across species were assessed using ANOVA on GLMs with quasi-Poisson likelihood. We tested whether sensilla density varied predictably with body size using the assumption that mean sensilla density should be significantly different in all pairwise comparisons of species in either an increasing or decreasing manner with body size. We detected significant differences in sensilla density between segments (χ2 = 124.885, df = 1, p < 0.001), which is not part of our hypothesis structure and therefore segments were analyzed separately. We used GLMs with quasi-Poisson likelihood where head width was the predictor variable to determine the slope and fit of the relationship between body size and sensilla density across all species (Supplementary Table 3). Affiliative, aggressive, and neutral behavior events were compared using GLMs with Poisson likelihood followed by post hoc tests. Antennation durations were compared using the Mann-Whitney U-test across treatments within species.
Results
Summary
Species rankings according to body size (Figure 1) do not correspond with species rankings according to colony size (Figures 2A,B, ranked smallest to largest colony size). This allowed us to assess whether sensory system scaling is explained by body size and whether patterns that are not associated with body size differences could be due to colony size differences. We found that gross morphological structures including antennal length (Figure 2E), surface area (Figure 2F), eye area (Figure 2G), ommatidita number (Figure 2H, Supplementary Figure 3), along with estimated total number of sensilla (Supplementary Figure 4C), and olfactory glomeruli (Figure 4A) scaled positively with body size. However, the total number of s. basiconica (Figure 3D) and glomeruli in the T6 cluster (Figure 4B), structures thought to play a role in social communication in ants, deviated from this pattern. While the density of total (Supplementary Figure 4B) and non-basiconic sensilla (Figure 3B) scaled negatively with body size, the density of s. basiconica did not and the large bodied, intermediate colony sized D. bicolor had s. basiconica density comparable to the medium body sized, small-colony D. insanus (Figure 3C). These sensilla innervate a cluster of the antennal lobe called T6 and coinciding with the s. basiconica findings, D. bicolor showed a greater number of T6 glomeruli than the other species (Figure 4B). In subsequent experiments to probe functional differences, we compared the closely related Dorymyrmex species and found no differences in the number of chemical compounds identified from bodies of workers (Supplementary Figure 5 and Supplementary Table 6). However, we detected differences in the frequency and duration of social interactions, with D. bicolor individuals engaging more in interactions with nestmates or non-nestmates than D. insanus (Figure 5).
External Sensory Morphology
Across species, antennal length and club surface area scaled positively with head width (HW; Figures 2E,F). However, in comparisons of club surface area, we detected a significantly greater club surface area in D. bicolor as compared with D. insanus when body size was taken into account (t-ratio = 2.511, df = 38, p = 0.042). Eye area and ommatidia number also scaled positively with head width (Figures 2G,H), but F. mccooki had significantly smaller eyes than would be predicted from the Dorymyrmex spp. regression line (Figure 2G) and steeper slope for ommatidia scaling with body size (Figure 2H), resulting in significantly greater ommatidia density in this species (Supplementary Figure 3).
Mounting antennae on glass slides provided little control over orientation; therefore, sensilla were sampled randomly from surfaces of antennae without a way of identifying whether the ventral or dorsal surface was sampled. Sensilla appeared to be somewhat stereotyped in their distribution in that similar patterns of sensilla at particular locations were recognizable across individuals. It is possible that density is not homogenous across the segment, particularly on the club, where the ventral surface is used frequently to probe objects in the environment. Even if sensilla distributions are non-homogenous, sampling was random and therefore sampling of two antennae seemed to provide a reasonable estimate of mean sensilla density, but variation in our estimates is somewhat large (Figures 3B,C), producing weak regression fits (Supplementary Table 3). Forelius mccooki samples were very fragile and often one of the two antennae was not of sufficient quality to count sensilla. Therefore, individual-level estimates from a single antenna were more common in this species and may explain greater variation in estimates for this species (Figures 3B,C; F. mccooki).
Non-basiconic sensilla density decreased with body size rankings on both the penultimate and club segments (Figure 3B and Supplementary Table 3). In all species, s. basiconica on the penultimate segment were located near the rostral edge (Figure 3A) and appeared to have a somewhat stereotyped pattern, occurring at regular intervals. During counting it appeared that density increased toward the tip of the club, with occurrences less apparently stereotyped than on the penultimate segment (Figure 3A). However, because the dorsoventral axis of the club could not be discerned from images, it is possible they are stereotyped along this axis. Density of s. basiconica did not scale as strongly with body size on either segment, as F. mccooki had densities greater than the two larger species, but D. bicolor had densities comparable to those of D. insanus (Figure 3C). In a generalized linear model using a pseudo-Poisson distribution, body size explained 49% of the variation in non-basiconic sensilla density on the club segment but only 12% of the variation in basiconic sensilla on this segment (Supplementary Table 3).
We hypothesized that differences in s. basiconica density may be due to changes in antennal surface area related to body size and, when surface area is taken into account, the total number of sensilla might still increase with body size across species. However, despite high s. basiconica density, F. mccooki had total sensilla numbers comparable to D. insanus, but fewer total sensilla than D. bicolor (Figure 3D) on both segments. In comparisons of D. insanus and D. bicolor, differences in total basiconic sensilla number were detected specifically on the club segment (Figure 3D), an effect likely driven by the combination of D. bicolor showing a larger than expected club surface area and comparable instead of lower s. basiconica density to D. insanus.
Antennal Lobe Anatomy
Somewhat unexpectedly, glomeruli number scaled positively with body size across species (c, t = 0.4.61, df = 12, p < 0.001; Figure 4A; F. mccooki, = 214, SD = 10.7; D. insanus, = 260, SD = 8.6; D. bicolor, = 275, SD = 9.8). Because estimated total s. basiconica number did not scale with body size, instead displaying a pattern suggesting either D. insanus had fewer s. basiconica than would be expected from its body size or that D. bicolor had many more, of particular interest was the difference in T6 glomeruli among species. The T6 glomerular cluster was identified in four antennal lobe samples from each of three species (Figures 4C,D), F. mccooki, D. insanus, and D. bicolor. Two of the D. bicolor antennal lobes used to identify T6 glomeruli came from the same individual and these values were averaged for statistical comparisons. D. bicolor had comparable mean numbers of non-T6 glomeruli to D. insanus, but these species differed in the T6 cluster with D. bicolor having approximately 12 more T6 glomeruli than D. insanus (Figure 4B). Conversely, F. mccooki, which showed estimated total s. basiconica numbers comparable to D. insanus (Figure 3D), had nearly the same number of T6 glomeruli and the difference in glomeruli numbers between these species was in non-T6 glomeruli (Figure 4B). Thus, estimated total s. basiconica number corresponded best with the number of glomeruli in the T6 cluster.
Potential Pheromone Compounds
A total of 58 peaks were isolated through GC-MS for both Dorymyrmex species and all body parts analyzed (Supplementary Tables 4, 5 and Supplementary Figure 5), including a total of 43 peaks from D. bicolor and 44 from D. insanus (Supplementary Table 6). This analysis identified a number of compounds known to be recruitment or alarm pheromone components in other dolichoderines, including the monoterpenoids iridomyrmecin, citronellal (3,7-dimethyloct-6-en-1-al), and limonene, and the ketone sulcatone (6-methyl-5-heptenone) (Supplementary Figure 5; Cavill and Ford, 1953; Cavill and Hinterberger, 1960; Blum et al., 1963; Crewe and Blum, 1971; Cavill et al., 1979; Tomalski et al., 1987). A large number of the peaks were identified as unbranched alkanes, with the majority isolated from both metasoma (”gaster”) (G) and combined head and mesosoma (”thorax”; HT) samples (Supplementary Table 5 and Supplementary Figure 5), suggesting they are distributed across the body. The total number of shared and unique compounds was comparable between the species, with 14 compounds unique to D. bicolor and 15 unique to D. insanus (Supplementary Table 6). This analysis detected a set of peaks between 16.07 and 17.02 min unique to D. insanus and a set of peaks between 18.61 and 19.12 min unique to D. bicolor, identified as acyclic alkanes. Nearly one third (17 of 58) peaks did not match existing records in the NIST library, and 13 of 58 were identified as having multiple matches (Supplementary Table 5).
Behavior
We measured interactions in 11 nestmate and 18 non-nestmate pairs of D. bicolor and in 11 nestmate and 16 non-nestmate pairs of D. insanus (Figure 5). Overall, D. bicolor pairs interacted more with each other than D. insanus, shown by more frequent incidental or fast contact (Figure 5C). While D. bicolor non-nestmate pairs had a greater number of aggressive interactions (Figure 5D) and significantly fewer affiliative interactions than nestmates (Figure 5E), D. insanus pairs showed no significant differences in these interactions (Figures 5D,E). We also recorded trophallaxis, an important means of sharing resources among members of a nest, and we found that D. bicolor nestmate pairs engage in this behavior more frequently than non-nestmates (Figure 5H). We recorded very few trophallaxis events for D. insanus and there were no differences in trophallaxis frequency between nestmates and non-nestmates (Figure 5H). Since differences in contact could be explained by differences in general activity or movement, and since we are specifically interested in sensory structures on the antennae, we also looked at the time pairs spent engaged in antennation. In these comparisons only pairs that showed this behavior were included in the analysis. A greater percentage of D. bicolor pairs showed this behavior (25 out of 29 pairs of D. bicolor and 13 out of 27 pairs of D. insanus; p = 0.0038, Fisher’s exact test). We found that D. bicolor nestmates spend a longer total time antennating than non-nestmates, with the duration of antennation bouts being longer between nestmates (Figures 5F,G). We did not detect differences in total antennation time or bout duration between D. insanus nestmates and non-nestmates (Figures 5F,G).
Discussion
In the experiments described here we tested whether differences in sensory and antennal lobe structures across workers of three species of odorous ants (Formicidae, Dolichoderinae) are explained by body size scaling or variation in colony size. We hypothesized that variation in visual sensory systems would be explained largely by body size and that differences due to colony size, if they exist, would be found in the olfactory system structures implicated in social communication, specifically nestmate recognition, in ants. We find that body size explains most of the variation in sensory structures across our sample of dolichoderine ants. Olfactory structures in general vary with body size and not with colony size across all species, but components of the olfactory system related to social cue processing, specifically sensilla basiconica and T6 glomeruli, do not follow patterns of body size variation seen for other sensory structures. Instead, the small-bodied F. mccooki had significantly fewer s. basiconica than the large-bodied D. bicolor but not the medium-sized D. insanus. This suggests either the small-colony D. insanus has fewer s. basiconica than would be predicted from body size, or its larger colony relative, D. bicolor has far more. This class of sensilla is associated with nestmate recognition in ants (Ozaki et al., 2005) and innervates the T6 cluster of glomeruli in the antennal lobe (Kelber et al., 2010). Observed differences in total glomeruli number among D. bicolor, D. insanus, and F. mccooki are explained by differences in the T6 cluster, suggesting differences between the Dormyrmex species are due to greater investment in these structures in D. bicolor. In probing functional consequences of this difference, we found D. bicolor show a greater number of social interactions than D. insanus, contacting both nestmates and non-nestmates more frequently, and displaying more affiliative and aggressive behaviors, respectively, during these pairings. Without clear taxonomic classifications and a robust phylogeny for Dorymyrmex, it is difficult to assess whether these traits are expanded in D. bicolor or reduced in D. insanus, but our findings suggest a link between colony size and these sensory structures.
Body Size and Sensory Structure Scaling
Intraspecific differences in body size are associated with variation in behavior in Hymenoptera (Nowbahari et al., 1999; Spaethe and Weidenmüller, 2002), including division of labor in ants (Wilson, 1980; Muscedere and Traniello, 2012), and sensory structure scaling (Renthal et al., 2003; Smallegange et al., 2008; Kelber et al., 2010; Perl and Niven, 2016). Sensilla density determines behavioral sensitivity for some tasks (Gill et al., 2013; but see Leitner et al., 2019). Interestingly, the number of olfactory glomeruli can vary across morphological castes in ants (Mysore et al., 2009; Kuebler et al., 2010), suggesting the regulation of olfactory receptor expression may be linked with body size within some species. Despite documented sensory structure scaling in solitary and social insects, behavioral consequences are not well-studied. In the buff-tailed bumblebee (Bombus terrestris) both sensilla number and odor sensitivity scale positively with body size intraspecifically (Spaethe et al., 2007), but little is known about functional consequences of interspecific scaling. Given that variation in individual sensory thresholds is hypothesized to underly division of labor in social insects (Beshers et al., 1999), regulation of worker size may be one mechanism to achieve this (Beshers and Fewell, 2001). Across closely related species, body size differences may influence differences in sensory structures and, by extension, sensory reception or perception.
In the ants studied here, sensory structure size and component number are positively correlated with body size across species. However, while the visual system generally scales with body size, F. mccooki eye area and ommatidia number do not scale with the same slope as Dorymyrmex spp. (Figures 2G,H), resulting in a significantly greater ommatidia density in this smaller species (Supplementary Figure 3). In our previous work we did not detect statistically significant differences in visual regions of the brains of these species, but F. mccooki trended toward greater mean investment in visual regions than would be predicted based on body or brain size rankings (Godfrey and Gronenberg, 2019b). It would be interesting to investigate differences in visually guided behavior across species, because while their foraging times in the Sonoran Desert do overlap, F. mccooki foraging times extend farther into the middle of the day than Dorymyrmex spp. (personal observation). Similar to visual systems, total antennal sensilla density (of all types, including s. basiconica) scales negatively with body size on both the penultimate and club segments (Supplementary Figure 4B), an effect driven by non-basiconic sensilla, since this holds true when basiconic sensilla are removed and non-basiconic sensilla are analyzed separately (Figure 3B).
We previously reported that antennal lobe size expressed as a relative proportion of brain size scales negatively with colony size in these ants (Godfrey and Gronenberg, 2019b), but here we find the total number of glomeruli can be ranked by body size across species (Figure 4A). In insects a one-to-one correspondence between olfactory receptors and glomeruli has been observed (Vosshall et al., 2000; Robertson and Wanner, 2006, but see Fishilevich and Vosshall, 2005; Younger et al., 2020), and we did not have reason to expect the total number of glomeruli (as an estimate of olfactory receptors) to scale positively with body size as seen here. Intraspecific variation in glomeruli number based on body size has been reported in the polymorphic ants Camponotus compressa (subfamily Formicinae) and Atta wollenweideri (subfamily Myrmicinae). In A. wollenweideri, smaller workers have fewer sensilla and antennal lobe glomeruli, whereas these numbers scale negatively with body size in C. compressa such that the smallest class of workers have the most sensilla and glomeruli (Mysore et al., 2009, 2010). Thus, intraspecific variation may be due to differences in gene expression linked to body size (Mysore et al., 2010), and, if so, in dramatically different ways across species. It is possible that similar mechanisms linking body size with gene expression could drive odorant receptor differences coincident with body size across very closely related species.
Evidence for Colony Size-Driven Differences in Sensory Structures
There exists little information on sensory trait evolution and social complexity, though studies generally predict a decrease in sensory system component number or size with transitions to sociality or increases in colony size. Indeed, in halictid bees, reductions in total sensilla density coincide with transitions from social to solitary habits, suggesting that even broad patterns of sensory investment may be related to social structure (Wittwer et al., 2017). While nearly all of the sensory structure variables in this study could be correlated with body size, s. basiconica density specifically could not be ranked by body size. However, this variable could also not be neatly linked with colony size across all three species. Gronenberg and Riveros (2009) suggested brain trait scaling may form a humped-shaped curve in relation to social complexity such that on the extreme ends there exists lower investment in structures involved in complex behaviors or social signaling, and Riveros et al. (2012) find support for this across olfactory structures in fungus-growing ants, but it is difficult to assess this with only the three species. Instead, our data indicate that D. bicolor may invest proportionally more in s. basiconica than its close relative, the smaller-colony D. insanus, resulting in a greater number of these socially relevant sensilla in the large-colony species. Total glomeruli counts show D. bicolor has 15–16 more total antennal lobe glomeruli than D. insanus (Figure 4A) and, given that olfactory sensory neurons (OSNs) housed in s. basiconica form the presynaptic terminals of the T6 glomeruli (Kuebler et al., 2010), we hypothesized that differences in the total number of glomeruli would be explained by differences in this cluster. Indeed, the T6 cluster differed by an average of 12 glomeruli between species (Figure 4B, D. bicolor vs. D. insanus,, indicating the difference in the antennal lobe may be linked to differences in total number of s. basiconica. This kind of expansion in sensory reception systems has been attributed to strong selection for systems that maintain group cohesion and efficiently coordinate group behaviors (Leonhardt et al., 2016).
Because the OSNs of s. basiconica respond to large, cuticular hydrocarbons that act as nestmate recognition cues in ants (Ozaki et al., 2005), we predicted D. bicolor might show a greater diversity or a higher number of these compounds than D. insanus. A preliminary analysis of compounds found on the body and inside the gaster of D. bicolor and D. insanus revealed no differences that correspond clearly with colony size or sensory structure scaling. While analysis showed a set of large, unbranched alkanes unique to D. bicolor (Supplementary Table 5 and Supplementary Figure 5; peaks 44, 49, 51, 53, 54, 55), there was a set similar in number unique to D. insanus (Supplementary Table 5 and Supplementary Figure 5; peaks 37–40, 41). In many ant species, Dufour’s gland produces alkanes used as recruitment and defensive signals (Cavill and Ford, 1953; Lenoir et al., 2011), but the broad distribution reported here suggests at least some of these may be cuticular hydrocarbons (Supplementary Table 5). However, cuticular hydrocarbon-based signaling among conspecifics in social species may not actually involve more varied or complex signaling molecules when compared with signaling in solitary species (Kather and Martin, 2015), nor is there evidence for a relationship between social complexity and signal complexity across ants (Ord and Garcia-Porta, 2012). However, the morphology required to interpret specific compounds may be expanded in social species (Dacks and Nighorn, 2011; Zhou et al., 2015). This is in line with our observation of expanded s. basiconica and T6 glomeruli in D. bicolor, when compared with D. insanus, without detectable qualitative differences in compounds produced by these species.
Colony size may be causally related to cuticular hydrocarbon profiles through genetic diversity. Polygynous colonies are often larger (Buczkowski and Bennett, 2008; dos Reis et al., 2011; Boulay et al., 2014) and the genetic diversity associated with polygyny may result in greater CHC diversity or variation in olfactory receptors, though evidence from the ant Formica exsecta suggests that polygyny may actually reduce CHC diversity (Martin et al., 2009). It is possible that the differences between D. bicolor and D. insanus stem not only from colony size directly, but from polygyny and associated differences in colony-level genetic diversity. However, while Nickerson et al. (1975) suggest both polygynous and monogynous species of Dorymyrmex exist in North America, queen number is not known for species used in this study.
In a previous study we found differences in exploratory behavior linked with colony size in these species, with the smaller-colony D. insanus showing greater exploratory activity. From those experiments we suggested these differences may be driven in part by differences in social interactions such as extended periods of contact in D. bicolor (Godfrey and Gronenberg, 2019b). Here, the differences in socially relevant sensory systems between D. bicolor and D. insanus correlate with the frequency and duration of social interaction within these species, suggesting observed differences in s. basiconica and T6 glomeruli may indeed be functional.
Undoubtedly, colony size plays a role in social insect evolution, as it is involved in both proximate (e.g., Jeanson et al., 2007; Ferguson-Gow et al., 2014) and ultimate (e.g., Robinson and Page, 1988) causes of worker trait variation or specialization. The current study focuses on the relationship between colony size and the size and number of sensory system components, with an emphasis on differences in sensory structures known to be involved in nestmate recognition, though not exclusively used for that purpose (D’Ettorre et al., 2017). We find evidence that communication systems change with colony size in closely related species, potentially because selection acts on nestmate recognition and signaling related to cooperative behaviors. However, our data do not support a universal pattern of sensory system scaling associated with changes in colony size. Here we compare a small number of species for which a clear taxonomy and robust phylogeny are only now being assembled, so we offer no a priori hypothesis regarding causation or directional evolution; it seems equally possible that shifts in communication systems drove expansion of colony size (LeBoeuf et al., 2013) as the inverse (Riveros et al., 2012), and these traits very likely coevolve.
Data Availability Statement
The datasets presented in this study can be found in online repositories. The names of the repository/repositories and accession number(s) can be found below: University of Arizona Research Data Repository (ReData) 10.25422/azu.data.14878110.
Author Contributions
RKG conceived, designed the experiments, collected, analyzed the data, and wrote the manuscript. JTO provided taxonomic assessment of species and created figures. TA, CG, JH-R, and JTO collected, analyzed the data, and provided critical revisions of the manuscript. WG assisted in experimental design, created figures, and critically revised the manuscript. All authors contributed to the article and approved the submitted version.
Funding
This work was funded by the NSF grant ISO-1353191 to WG and a grant from the University of Arizona Graduate Student and Professional Council (GPSC) to RKG.
Conflict of Interest
The authors declare that the research was conducted in the absence of any commercial or financial relationships that could be construed as a potential conflict of interest.
Publisher’s Note
All claims expressed in this article are solely those of the authors and do not necessarily represent those of their affiliated organizations, or those of the publisher, the editors and the reviewers. Any product that may be evaluated in this article, or claim that may be made by its manufacturer, is not guaranteed or endorsed by the publisher.
Acknowledgments
We are very grateful to Adriana Ivich and Vanessa Shedd for assisting with segmentation of antennal lobes.
Supplementary Material
The Supplementary Material for this article can be found online at: https://www.frontiersin.org/articles/10.3389/fevo.2021.733023/full#supplementary-material
References
Anderson, C., and McShea, D. (2001). Individual versus social complexity, with particular reference to ant colonies. Biol. Rev. Camb. Philos. Soc. 76, 211–237. doi: 10.1017/S1464793101005656
Bates, D., Mächler, M., Bolker, B., and Walker, S. (2015). Fitting linear mixed-effects models using lme4. J. Stat. Softw. 67, 1–51. doi: 10.18637/jss.v067.i01
Beshers, S. N., and Fewell, J. H. (2001). Models of division of labor in social insects. Annu. Rev. Entomol. 46, 413–440. doi: 10.1146/annurev.ento.46.1.413
Beshers, S. N., Robinson, G. E., and Mittenthal, J. E. (1999). “Response thresholds and division of labor in insect colonies,” in Information Processing in Social Insects, eds C. Detrain, J. L. Deneubourg, and J. M. Pasteels (Basel: Birkhäuser Basel).
Bestelmeyer, B. T. (2005). Does desertification diminish biodiversity? Enhancement of ant diversity by shrub invasion in southwestern USA. Divers Distrib. 11, 45–55. doi: 10.1111/j.1366-9516.2005.00122.x
Blum, M. S., Warter, S. L., Monroe, R. S., and Chidester, J. C. (1963). Chemical releasers of social behaviour-I. Methyl-n-amyl ketone in Iridomyrmex pruinosus (Roger) (Formicidae: Dolichoderinae). J. Insect. Physiol. 9, 881–885. doi: 10.1016/0022-1910(63)90047-7
Bos, N., Guerrieri, F. J., and d’Ettorre, P. (2010). Significance of chemical recognition cues is context dependent in ants. Anim. Behav. 80, 839–844. doi: 10.1016/j.anbehav.2010.08.001
Bouchebti, S., and Arganda, S. (2020). Insect lifestyle and evolution of brain morphology. Curr. Opin. Insect. Sci. 42, 90–96. doi: 10.1016/j.cois.2020.09.012
Boulay, R., Arnan, X., Cerdá, X., and Retana, J. (2014). The ecological benefits of larger colony size may promote polygyny in ants. J. Evol. Biol. 27, 2856–2863. doi: 10.1111/jeb.12515
Bourke, A. F. G. (1999). Colony size, social complexity and reproductive conflict in social insects. J. Evol. Biol. 12, 245–257. doi: 10.1046/j.1420-9101.1999.00028.x
Breed, M. D. (2014). Kin and nestmate recognition: the influence of W. D. Hamilton on 50 years of research. Anim. Behav. 92, 271–279. doi: 10.1016/j.anbehav.2014.02.030
Bucher, D., Scholz, M., Stetter, M., Obermayer, K., and Pflüger, H. J. (2000). Correction methods for three-dimensional reconstructions from confocal images: I. Tissue shrinking and axial scaling. J. Neurosci. Methods 100, 135–143. doi: 10.1016/S0165-02700000245-4
Buckley, S. B. (1866). Descriptions of new species of North American Formicidae. Proc. Entomol. Soc. Philadelphia 6, 335–350. doi: 10.4039/Ent15209-11
Buczkowski, G., and Bennett, G. (2008). Seasonal polydomy in a polygynous supercolony of the odorous house ant, Tapinoma sessile. Ecol. Entomol. 33, 780–788. doi: 10.1111/j.1365-2311.2008.01034.x
Cardona, A., Saalfeld, S., Schindelin, J., Arganda-Carreras, I., Preibisch, S., Longair, M., et al. (2012). TrakEM2 software for neural circuit reconstruction. PLoS One. 7:e38011. doi: 10.1371/journal.pone.0038011
Cavill, G. W. K., and Hinterberger, H. (1960). The chemistry of ants. IV. Terpenoid constituents of some Dolichoderus and Iridomyrmex species. Aust. J. Chem. 13, 514–519. doi: 10.1071/CH9600514
Cavill, G. W. K., Robertson, P. L., and Davies, N. W. (1979). An Argentine ant aggregation factor. Experientia 35, 989–990. doi: 10.1007/BF01949898
Cole, A. C. (1936). Descriptions of seven new western ants. (Hymenop.: Formicidae). Entomol. News 47, 118–121.
Cole, B. J. (1985). Size and behavior in ants: constraints on complexity. Proc. Natl. Acad. Sci. U. S. A. 82, 8548–8551. doi: 10.1073/pnas.82.24.8548
Creighton, W. S. (1950). Ants of North America. Bull. Mus. Comp. Zool. 104, 1–585. doi: 10.1525/9780520934559
Crewe, R. M., and Blum, M. S. (1971). 6-Methyl-5-hepten-2-one. chemotaxonomic significance in an Iridomyrmex sp. (Hymenoptera: Formicidae). Ann. Entomol. Soc. Am. 64, 1007–1010. doi: 10.1093/aesa/64.5.1007
Dacks, A. M., and Nighorn, A. J. (2011). The organization of the antennal lobe correlates not only with phylogenetic relationship, but also life history: a basal hymenopteran as exemplar. Chem. Senses 36, 209–220. doi: 10.1093/chemse/bjq121
D’Ettorre, P., Deisig, N., and Sandoz, J. C. (2017). Decoding ants’ olfactory system sheds light on the evolution of social communication. Proc. Natl. Acad. Sci. U. S. A. 114, 8911–8913. doi: 10.1073/pnas.1711075114
De Vos, K. (2001). Cell Counter [ImageJ Plugin]. Available online at: https://imagej.nih.gov/ij/plugins/cell-counter.html
Deyrup, M. (2017). Ants of Florida. Identification and Natural History. Boca Raton, FL: CRC Press (Taylor & Francis Group).
Dornhaus, A., Powell, S., and Bengston, S. (2011). Group size and Its effects on collective organization. Annu. Rev. Entomol. 57, 123–141. doi: 10.1146/annurev-ento-120710-100604
dos Reis, E. P., de Oliveira Campos, L. A., and Tavares, M. G. (2011). Prediction of social structure and genetic relatedness in colonies of the facultative polygynous stingless bee Melipona bicolor (Hymenoptera. Apidae). Genet Mol. Biol. 34, 338–344. doi: 10.1590/S1415-47572011005000008
Dunbar, R. I. M. (1992). Neocortex size as a constraint on group size in primates. J. Hum. Evol. 22, 469–493. doi: 10.1016/0047-2484(92)90081-J
Esponda, F., and Gordon, D. M. (2015). Distributed nestmate recognition in ants. Proc. R Soc. B 282:20142838. doi: 10.1098/rspb.2014.2838
Feinerman, O., and Korman, A. (2017). Individual versus collective cognition in social insects. J. Exp. Biol. 220, 73–82. doi: 10.1242/jeb.143891
Ferguson-Gow, H., Sumner, S., Bourke, A. F. G., and Jones, K. E. (2014). Colony size predicts division of labour in attine ants. Proc. R Soc. B Biol. Sci. 281:20141411. doi: 10.1098/rspb.2014.1411
Fernandes, A. S. D., Buckley, C. L., and Niven, J. E. (2018). Visual associative learning in wood ants. J. Exp. Biol. 221:jeb173260. doi: 10.1242/jeb.173260
Fisher, B. L., and Cover, S. P. (2007). Ants of North America. Berkley : University of California Press.
Fishilevich, E., and Vosshall, L. B. (2005). Genetic and functional subdivision of the Drosophila antennal lobe. Curr. Biol. 15, 1548–1553. doi: 10.1016/j.cub.2005.07.066
Freeberg, T. M., Dunbar, R. I. M., and Ord, T. J. (2012). Social complexity as a proximate and ultimate factor in communicative complexity. Philos. Trans. R. Soc. B Biol. Sci. 367, 1785–1801. doi: 10.1098/rstb.2011.0213
Friard, O., and Gamba, M. (2016). BORIS: a free, versatile open-source event-logging software for video/audio coding and live observations. Methods Ecol. Evol. 7, 1325–1330. doi: 10.1111/2041-210X.12584
Gill, K. P., van Wilgenburg, E., Macmillan, D. L., and Elgar, M. A. (2013). Density of antennal sensilla influences efficacy of communication in a social insect. Am. Nat. 182, 834–840. doi: 10.1086/673712
Godfrey, R. K., and Gronenberg, W. (2019b). Linking colony size with foraging behavior and brain investment in odorous ants (Formicidae: Dolichoderinae). Brain Behav. Evol. 95, 15–24. doi: 10.1159/000504643
Godfrey, R. K., and Gronenberg, W. (2019a). Brain evolution in social insects: advocating for the comparative approach. J. Comp. Physiol. Neuroethol. Sensory Neural Behav. Physiol. 205, 13–32. doi: 10.1007/s00359-019-01315-7
Groh, C., Tautz, J., and Rössler, W. (2004). Synaptic organization in the adult honey bee brain is influenced by brood-temperature control during pupal development. Proc. Natl. Acad. Sci. U.S.A. 101, 4268–4273. doi: 10.1073/pnas.0400773101
Gronenberg, W., and Riveros, A. J. (2009). “Social brains and behavior: past and present,” in Organization of Insect Societies, eds J. Gadau and J. Fewell (Cambridge, MA: Harvard University Press), 377–401.
Gruter, C., Czackes, T. J., Ratnieks, F. L. W., Grüter, C., Czaczkes, T. J., Ratnieks, F. L. W., et al. (2011). Decision making in ant foragers (Lasius niger) facing conflicting private and social information. Behav. Ecol. Sociobiol. 65, 141–148. doi: 10.1007/s00265-01
Guerrero, R. J., and Fernández, F. (2008). A new species of the ant genus Forelius (Formicidae: Dolichoderinae). Zootaxa 60, 51–60.
Hansson, B. S., and Stensmyr, M. C. (2011). Evolution of insect olfaction. Neuron 72, 698–711. doi: 10.1016/j.neuron.2011.11.003
Hashimoto, Y. (1990). Unique features of sensilla on the antennae of formicidae (Hymenoptera). Appl. Entomol. Zool. 25, 491–501. doi: 10.1303/aez.25.491
Haverkamp, A., Hansson, B. S., and Knaden, M. (2018). Combinatorial codes and labeled lines: how insects use olfactory cues to find and judge food, mates, and oviposition sites in complex environments. Front. Physiol. 9:49. doi: 10.3389/fphys.2018.00049
Hölldobler, B. (1999). Multimodal signals in ant communication. J. Comp. Physiol. Sensory Neural Behav. Physiol. 184, 129–141. doi: 10.1007/s003590050313
Hollis, K. L., McNew, K., Sosa, T., Harrsch, F. A., and Nowbahari, E. (2017). Natural aversive learning in Tetramorium ants reveals ability to form a generalizable memory of predators’ pit traps. Behav. Processes 139, 19–25. doi: 10.1016/j.beproc.2017.03.003
Jaffé, K., Ramos, C., Lagalla, C., and Parra, L. (1990). Orientation cues used by ants. Insectes Soc. 37, 101–115. doi: 10.1007/BF02224024
Jeanson, R., Dussutour, A., and Fourcassié, V. (2012). Key factors for the emergence of collective decision in invertebrates. Front. Neurosci. 6:121. doi: 10.3389/fnins.2012.00121
Jeanson, R., Fewell, J. H., Gorelick, R., and Bertram, S. M. (2007). Emergence of increased division of labor as a function of group size. Behav. Ecol. Sociobiol. 62, 289–298. doi: 10.1007/s00265-007-0464-5
Kamhi, J. F., Gronenberg, W., Robson, S. K. A., and Traniello, J. F. A. (2016). Social complexity influences brain investment and neural operation costs in ants. Proc. R Soc. B Biol. Sci. 283:20161949. doi: 10.1098/rspb.2016.1949
Kassambara, A. (2020). ggpubr: “ggplot2” Based Publication Ready Plots. R Package Version 0.4.0. Available online at: https://CRAN.R-project.org/package=ggpubr
Kather, R., and Martin, S. J. (2015). Evolution of cuticular hydrocarbons in the hymenoptera: a meta-analysis. J. Chem. Ecol. 41, 871–883. doi: 10.1007/s10886-015-0631-5
Kelber, C., Rössler, W., and Kleineidam, C. J. (2010). Phenotypic plasticity in number of glomeruli and sensory innervation of the antennal lobe in leaf-cutting ant workers (A. vollenweideri). Dev. Neurobiol. 70, 222–234. doi: 10.1002/dneu.20782
Kennedy, P., Baron, G., Qiu, B., Freitak, D., Helanterä, H., Hunt, E. R., et al. (2017). Deconstructing superorganisms and societies to address big questions in biology. Trends Ecol. Evol. 32, 861–872. doi: 10.1016/j.tree.2017.08.004
Kuebler, L. S., Kelber, C., and Kleineidam, C. J. (2010). Distinct antennal lobe phenotypes in the leaf-cutting ant (Atta vollenweideri). J. Comp. Neurol. 518, 352–365. doi: 10.1002/cne.22217
LeBoeuf, A. C., Benton, R., and Keller, L. (2013). The molecular basis of social behavior: models, methods and advances. Curr. Opin. Neurobiol. 23, 3–10. doi: 10.1016/j.conb.2012.08.008
Leitner, N., Charbonneau, D., Gronenberg, W., and Dornhaus, A. (2019). Peripheral sensory organs vary among ant workers but variation does not predict division of labor. Behav. Processes 158, 137–143. doi: 10.1016/j.beproc.2018.10.016
Lenoir, A., Benoist, A., Hefetz, A., Francke, W., Cerdá, X., and Boulay, R. (2011). Trail-following behaviour in two Aphaenogaster ants. Chemoecology 21, 83–88. doi: 10.1007/s00049-011-0071-9
Lenth, R. V. (2021). emmeans: Estimated Marginal Means, aka Least-Squares Means. R Package Version 1.6.3. Available online at: https://CRAN.R-project.org/package=emmeans
Leonhardt, S. D., Menzel, F., Nehring, V., and Schmitt, T. (2016). Ecology and evolution of communication in social insects. Cell 164, 1277–1287. doi: 10.1016/j.cell.2016.01.035
Lihoreau, M., Latty, T., and Chittka, L. (2012). An exploration of the social brain hypothesis in insects. Front. Physiol. 3:439. doi: 10.3389/fphys.2012.00439
Lihoreau, M., Zimmer, C., and Rivault, C. (2007). Kin recognition and incest avoidance in a group-living insect. Behav. Ecol. 18, 880–887. doi: 10.1093/beheco/arm046
Mackay, W. P., and Mackay, E. E. (2002). The Ants of New Mexico (Hymenoptera: Formicidae). Lewiston, NY: The Edwin Mellen Press.
Martin, S. J., Helanterä, H., Kiss, K., Lee, Y. R., and Drijfhout, F. P. (2009). Polygyny reduces rather than increases nestmate discrimination cue diversity in Formica exsecta ants. Insectes Soc. 56, 375–383. doi: 10.1007/s00040-009-0035-z
McCook, H. C. (1880). “Formicariae,” in Report Upon Cotton Insects, ed. J. H. Comstock (Washington, D.C: Government Printing Office), 182–189.
McShea, D. W. (1996). Metazoan complexity and evolution: is there a trend? Evolution (N Y) 50, 477–492. doi: 10.1111/j.1558-5646.1996.tb03861.x
Mitra, A. (2013). Function of the Dufour’s gland in solitary and social Hymenoptera. J. Hymenopt Res. 35, 33–58. doi: 10.3897/JHR.35.4783
Murakami, T., Higashi, S., and Windsor, D. (2000). Mating frequency, colony size, polyethism and sex ratio in fungus-growing ants (Attini). Behav. Ecol. Sociobiol. 48, 276–284. doi: 10.1007/s002650000243
Muscedere, M. L., and Traniello, J. F. A. (2012). Division of labor in the hyperdiverse ant genus Pheidole is associated with distinct subcaste- and age-related patterns of worker brain organization. PLoS One 7:e31618. doi: 10.1371/journal.pone.0031618
Mysore, K., Shyamala, B. V., and Rodrigues, V. (2010). Morphological and developmental analysis of peripheral antennal chemosensory sensilla and central olfactory glomeruli in worker castes of Camponotus compressus (Fabricius, 1787). Arthropod. Struct. Dev. 39, 310–321. doi: 10.1016/j.asd.2010.04.003
Mysore, K., Subramanian, K. A., Sarasij, R. C., Suresh, A., Shyamala, B. V., VijayRaghavan, K., et al. (2009). Caste and sex specific olfactory glomerular organization and brain architecture in two sympatric ant species Camponotus sericeus and Camponotus compressus (Fabricius, 1798). Arthropod. Struct. Dev. 38, 485–497. doi: 10.1016/j.asd.2009.06.001
Nakakuki, S. (1986). Unique features of sensilla on the antennae of formicidae. Chem. Pharm. Bull. 34, 430–433.
Nakanishi, A., Nishino, H., Watanabe, H., Yokohari, F., and Nishikawa, M. (2009). Sex-specific antennal sensory system in the ant Camponotus japonicus: Structure and distribution of sensilla on the flagellum. Cell Tissue Res. 338, 79–97. doi: 10.1007/s00441-009-0863-1
Nakanishi, A., Nishino, H., Watanabe, H., Yokohari, F., and Nishikawa, M. (2010). Sex-specific antennal sensory system in the ant Camponotus japonicus: glomerular organizations of antennal lobes. J. Comp. Neurol. 518, 2186–2201. doi: 10.1002/cne.22326
Narendra, A., Reid, S. F., Greiner, B., Peters, R. A., Hemmi, J. M., Ribi, W. A., et al. (2011). Caste-specific visual adaptations to distinct daily activity schedules in Australian Myrmecia ants. Proc. R. Soc. B Biol. Sci. 278, 1141–1149. doi: 10.1098/rspb.2010.1378
Nickerson, J. C., Cromroy, H. L., Whitcomb, W. H., and Cornell, J. A. (1975). Colony organization and queen numbers in two species of conomyrma. Ann. Entomol. Soc. Am. 68, 1083–1085. doi: 10.1093/aesa/68.6.1083
Nishikawa, M., Watanabe, H., and Yokohari, F. (2012). Higher brain centers for social tasks in worker ants, Camponotus japonicus. J. Comp. Neurol. 520, 1584–1598. doi: 10.1002/cne.23001
Nowbahari, E., Fénéron, R., and Malherbe, M. C. (1999). Effect of body size on aggression in the ant, Cataglyphis niger (Hymenoptera; Formicidae). Aggress Behav. 25, 369–379.
Oberski, J. T. (in press). First phylogenomic assessment of amphitropical Dorymyrmex ants (Hymenoptera: Formicidae), a longstanding taxonomic puzzle. Insect Syst. Divers.
O’Donnell, S., Bulova, S. J., Deleon, S., Khodak, P., Miller, S., Sulger, E., et al. (2015). Distributed cognition and social brains: reductions in mushroom body investment accompanied the origins of sociality in wasps (Hymenoptera: Vespidae). Proc. R. Soc. B Biol. Sci. 282:20150791. doi: 10.1098/rspb.2015.0791
Oi, C. A., van Zweden, J. S., Oliveira, R. C., Van Oystaeyen, A., Nascimento, F. S., and Wenseleers, T. (2015). The origin and evolution of social insect queen pheromones: Novel hypotheses and outstanding problems. BioEssays 37, 808–821. doi: 10.1002/bies.201400180
Ord, T. J., and Garcia-Porta, J. (2012). Is sociality required for the evolution of communicative complexity? evidence weighed against alternative hypotheses in diverse taxonomic groups. Philos. Trans. R. Soc. B Biol. Sci. 367, 1811–1828. doi: 10.1098/rstb.2011.0215
Ozaki, M., Wada-Katsumata, A., Fujikawa, K., Iwasaki, M., Yokohari, F., Satoji, Y., et al. (2005). Ant nestmate and non-nestmate discrimination by a chemosensory sensillum. Science 309, 311–314. doi: 10.1126/science.1105244
Pasquier, G., and Grüter, C. (2016). Behavioral Individual learning performance and exploratory activity are linked to colony foraging success in a mass-recruiting ant. Behav. Ecol. 27, 1702–1709. doi: 10.1093/beheco/arw079
Penick, C. A., and Smith, A. A. (2015). The true odor of the odorous house ant. Am. Entomol. 61, 85–87. doi: 10.1093/ae/tmv023
Perl, C. D., and Niven, J. E. (2016). Colony-level differences in the scaling rules governing wood ant compound eye structure. Sci. Rep. 6, 1–8. doi: 10.1038/srep24204
Ramirez-Esquivel, F., Zeil, J., and Narendra, A. (2014). The antennal sensory array of the nocturnal bull ant Myrmecia pyriformis. Arthropod Struct. Dev. 43, 543–558. doi: 10.1016/j.asd.2014.07.004
R Core Development Team (2020). R: A Language and Environment for Statistical Computing. Geneva: R Core Development Team.
Renthal, R., Velasquez, D., Olmos, D., Hampton, J., and Wergin, W. P. (2003). Structure and distribution of antennal sensilla of the red imported fire ant. Micron 34, 405–413. doi: 10.1016/S0968-4328(03)00050-7
Riveros, A. J., Seid, M. A., and Wcislo, W. T. (2012). Evolution of brain size in class-based societies of fungus-growing ants (Attini). Anim. Behav. 83, 1043–1049. doi: 10.1016/j.anbehav.2012.01.032
Robertson, H. M., and Wanner, K. W. (2006). The chemoreceptor superfamily in the honey bee, Apis mellifera: expansion of the odorant, but not gustatory, receptor family. Genome Res. 16, 1395–1403. doi: 10.1101/gr.5057506
Robinson, G. E., and Page, R. E. (1988). Genetic determination of guarding and undertaking in honey-bee colonies. Nature 333, 356–358. doi: 10.1038/333356a0
Roger, J. (1863). Die neu aufgeführten Gattungen und Arten meines Formiciden-Verzeichnisses. Berl. Z. 7, 131–214.
Rössler, W., and Zube, C. (2011). Dual olfactory pathway in Hymenoptera: evolutionary insights from comparative studies. Arthropod. Struct. Dev. 40, 349–357. doi: 10.1016/j.asd.2010.12.001
Schindelin, J., Arganda-Carreras, I., Frise, E., Kaynig, V., Longair, M., Pietzsch, T., et al. (2012). Fiji: an open-source platform for biological-image analysis. Nat. Methods 9, 676–682. doi: 10.1038/nmeth.2019
Sharma, K. R., Enzmann, B. L., Schmidt, Y., Moore, D., Jones, G. R., Parker, J., et al. (2015). Cuticular hydrocarbon pheromones for social behavior and their coding in the ant antenna. Cell Rep. 12, 1261–1271. doi: 10.1016/j.celrep.2015.07.031
Shen, V. K., Siderius, D. W., Krekelberg, W. P., and Hatch, H. W. (2016). NIST Standard Reference Simulation Website, NIST Standard Reference Database Number 173. Gaithersburg, MD: National Institute of Standards and Technology.
Smallegange, R. C., Kelling, F. J., and Den Otter, C. J. (2008). Types and numbers of sensilla on antennae and maxillary palps of small and large houseflies, Musca domestica (Diptera, Muscidae). Microsc. Res. Tech. 71, 880–886. doi: 10.1002/jemt.20636
Snelling, R. R. (1995). Systematics of nearctic ants of the genus dorymyrmex. Contrib Sci. 454, 1–14.
Spaethe, J., Brockmann, A., Halbig, C., and Tautz, J. (2007). Size determines antennal sensitivity and behavioral threshold to odors in bumblebee workers. Naturwissenschaften 94, 733–739. doi: 10.1007/s00114-007-0251-1
Spaethe, J., and Weidenmüller, A. (2002). Size variation and foraging rate in bumblebees (Bombus terrestris). Insectes Soc. 49, 142–146. doi: 10.1007/s00040-002-8293-z
Stuart, R. J. (1991). Nestmate recognition in leptothoracine ants: testing for effects of queen number, colony size and species of intruder. Anim. Behav. 42, 277–284. doi: 10.1016/S0003-3472(05)80559-7
Szathmáry, E., and Maynard Smith, J. (1995). The major evolutionary transitions. Nature 374, 227–232. doi: 10.1038/374227a0
Thomas, M. L., and Elgar, M. A. (2003). Colony size affects division of labour in the ponerine ant Rhytidoponera metallica. Naturwissenschaften 90, 88–92. doi: 10.1007/s00114-002-0396-x
Tomalski, M. D., Blum, M. S., Jones, T. H., Fales, H. M., Howard, D. F., and Passera, L. (1987). Chemistry and functions of exocrine secretions of the ants Tapinoma melanocephalum and T. erraticum. J. Chem. Ecol. 13, 253–263.
Tschinkel, W. R. (1988). Colony growth and the ontogeny of worker polymorphism in the fire ant, Solenopsis invicta. Behav. Ecol. Sociobiol. 22, 103–115. doi: 10.1007/BF00303545
Van Oystaeyen, A., Oliveira, R. C., Holman, L., van Zweden, J. S., Romero, C., Oi, C. A., et al. (2014). Conserved class of queen pheromones. Science 343, 287–291.
Vosshall, L. B., Wong, A. M., and Axel, R. (2000). An olfactory sensory map in the fly brain. Cell 102, 147–159. doi: 10.1016/S0092-86740000021-0
Ward, P. S. (2005). A synoptic review of the ants of California (Hymenoptera: Formicidae). Zootaxa 936:1.
Ward, P. S., Brady, S. G., Fisher, B. L., and Schultz, T. R. (2010). Phylogeny and biogeography of dolichoderine ants: effects of data partitioning and relict taxa on historical inference. Syst. Biol. 59, 342–362. doi: 10.1093/sysbio/syq012
Wehner, R. (2020). Desert Navigator: the Journey of an Ant. Cambridge, MA: Belknap Press of Harvard University.
Wells, R. S., De Waal, F. B. M., and Tyack, P. (2003). Animal Social Complexity: Intelligence, Culture, and Individualized Societies. Cambridge, MA: Harvard University Press.
Wheeler, J., Evans, S. L., Blum, M., and Torgerson, R. (1975). Cyclopentyl ketones: identification and function in Azteca ants. Science 181, 254–256. doi: 10.1126/science.187.4173.254
Wickham, H., Averick, M., Bryan, J., Chang, W., McGowan, L., François, R., et al. (2019). Welcome to the tidyverse. J. Open Source Softw. 4:1686. doi: 10.21105/joss.01686
Wilson, E. O. (1980). Caste and division of labor in leaf-cutter ants (Hymenoptera: Formicidae: Atta): I. the overall pattern in A. sexdens. Behav. Ecol. Sociobiol. 7, 143–156. doi: 10.1007/BF00299520
Wittwer, B., Hefetz, A., Simon, T., Murphy, L. E. K., Elgar, M. A., Pierce, N. E., et al. (2017). Solitary bees reduce investment in communication compared with their social relatives. Proc. Natl. Acad. Sci. U.S.A. 114, 6569–6574. doi: 10.1073/pnas.1620780114
Yilmaz, A., Dyer, A. G., Rössler, W., and Spaethe, J. (2017). Innate colour preference, individual learning and memory retention in the ant Camponotus blandus. J. Exp. Biol. 220, 3315–3326. doi: 10.1242/jeb.158501
Yilmaz, A., Grübel, K., Spaethe, J., and Rössler, W. (2019). Distributed plasticity in ant visual pathways following colour learning. Proc. R. Soc. B Biol. Sci. 286:20182813. doi: 10.1098/rspb.2018.2813
Younger, M. A., Herre, M., Ehrlich, A. R., Gong, Z., Gilbert, Z. N., Rahiel, S., et al. (2020). Non-canonical odor coding ensures unbreakable mosquito attraction to humans. bioRxiv [Preprint]. doi: 10.1101/2020.11.07.368720
Keywords: antennal sensilla, ommatidia, antennal lobe glomeruli, social interactions, pheromone GC-MS
Citation: Godfrey RK, Oberski JT, Allmark T, Givens C, Hernandez-Rivera J and Gronenberg W (2021) Olfactory System Morphology Suggests Colony Size Drives Trait Evolution in Odorous Ants (Formicidae: Dolichoderinae). Front. Ecol. Evol. 9:733023. doi: 10.3389/fevo.2021.733023
Received: 29 June 2021; Accepted: 06 September 2021;
Published: 28 October 2021.
Edited by:
J. Frances Kamhi, Oberlin College, United StatesReviewed by:
Julie Carcaud, UMR 9191 Évolution, Génomes, Comportement et Écologie (EGCE), FranceRavindra Palavalli-Nettimi, Florida International University, United States
Copyright © 2021 Godfrey, Oberski, Allmark, Givens, Hernandez-Rivera and Gronenberg. This is an open-access article distributed under the terms of the Creative Commons Attribution License (CC BY). The use, distribution or reproduction in other forums is permitted, provided the original author(s) and the copyright owner(s) are credited and that the original publication in this journal is cited, in accordance with accepted academic practice. No use, distribution or reproduction is permitted which does not comply with these terms.
*Correspondence: R. Keating Godfrey, rkeating.godfrey@ufl.edu
†Present address: R. Keating Godfrey, McGuire Center for Lepidoptera and Biodiversity, Florida Museum of Natural History, University of Florida, Gainesville, FL, United States