Modelling the nexus of carbon dioxide emissions, economic growth, electricity production and consumption: Assessing the evidence from Pakistan
 Sajjad Ali1
  Amogh Ghimire1
  Adnan Khan2
  Gulzara Tariq3
  Ashfaq Ahmad Shah4
  Muhammad Atiq Ur Rehman Tariq5,6,7*
- 1School of Management, Jiangsu University, Zhenjiang, China
- 2University of Waikato, Hamilton, New Zealand
- 3School of Finance and Economics, Jiangsu University, Zhenjiang, China
- 4School of Public Administration, Hohai University, Nanjing, Jiangsu, China
- 5College of Engineering and Science, Victoria University, Melbourne, VIC, Australia
- 6College of Engineering, IT & Environment, Charles Darwin University, Darwin, NT, Australia
- 7Institute for Sustainable Industries & Liveable Cities, Victoria University, Melbourne, VIC, Australia
The economy of Pakistan has constantly been plunged due to its severe electricity shortages over the last 2 decades and persistently faces challenges in revamping its electricity supply network. The purpose of this research was to assess the causal relationship between carbon dioxide emissions (CO2), combustible renewable and waste (CRW), electric power consumption (EC), electricity production from coal (EPC), hydroelectric (EPH) and natural gas (EPN) sources, energy use (EU) and gross domestic product (GDP). The scope of this research included Pakistan’s annual time series data from 1971 to 2014. This study employed Autoregressive Distributed Lag (ARDL) bound testing analysis to determine the long-term and short-term correlations among all research parameters. This research also conducted Augmented Dickey-Fuller (ADF), Phillips-Perron (PP) and Kwiatkowski-Phillips-Schmidt-Shin (KPSS) tests to evaluate the stationarity existence among dependent variable and independent variables. The outcomes of the fully modified least squares (FMOLS), dynamic ordinary least square (DOLS) and canonical co-integrating regression (CCR) estimators showed that coefficients of EC, EPH and GDP all were a significantly positive relationship with CO2 emissions, while the coefficients of CRW, EPC and EU were negatively significant, respectively. Furthermore, the outcomes from the short-run analysis revealed that the error correction term value was -0.8668, which indicates that from short-run to long-run equilibrium, the adjustment of the deviation of CO2 emission is by 86.68 percent annually. Moreover, the diagnostic results also demonstrated that the model employed in this research is stable and reliable. Pakistan was selected in this research work because of the deficit of power and if environmental degradation continues unchecked, it will eventually affect the state’s economic growth and CO2 emissions. The study’s primary policy recommendation is that government energy policymakers in Pakistan who create the environment framework in should pursue conservative energy measures as such measures will not negatively impact economic growth.
1 Introduction
The impact of economic activities on carbon dioxide emissions at both national and international levels has become a prominent subject in the past 3 decades (Pata and Caglar, 2021). The dramatic increase in energy consumption in recent years has directly contributed to severe energy shortages in most countries worldwide (Balcilar et al., 2010; Tamba et al., 2017; Balcilar et al., 2019). Countries are increasing their energy use and other natural resources to attain maximum economic growth, which elevates greenhouse gas emissions (Rehman and Rehman, 2022). This is because energy (electricity) is a crucial component of economic growth and development in developing and developed countries. Sustainable economic growth and development are essential for improving social wellbeing. It indicates that economic progress should not come at the expense of environmental damage but rather environmental sustainability should be preserved (Azam et al., 2016). Because of its worldwide relevance, the issue of carbon dioxide (CO2) emissions remains a critical research priority. Despite the negative consequences, CO2 emissions are closely related to economic growth and development since most CO2 emissions are generated by fuel utilization, such as coal, oil, and gas, which are the primary sources of electricity for automobiles and industry (Rahman, 2017). It is a well-established fact that economists of the contemporary era are more concerned with exploring the dynamics of energy economics and the pollutant environment due to demand and supply gaps. These gaps are alarming not only for economic activities but also for the globalization process. Hence, the conventional theory has not had enough to say about the association between energy and economic growth. Energy is the elementary part of the economy as it plays a vital role in economic development and provides a link between economic development and energy security with social stability. Numerous studies have linked poor infrastructure or low income levels to the lack of energy supply in developing nations (Aklin et al., 2016; Allcott et al., 2016). Almost every facet of the economy is coupled with electricity as it owes critical values that finally affect a country’s economy (Arrillaga et al., 1985; Dugan et al., 1996; Arrillaga et al., 1997; Caciotta et al., 2006).
Pakistan’s economy has suffered from persistent electricity shortages over the past 2 decades and thus persistently encountered a significant challenge in revamping its network responsible for electricity supply (Nawaz et al., 2013). This, in turn, had created a massive gap in the demand and supply of electricity, showing inability of the electricity sector to meet the demand for the growth of the emerging economy of Pakistan. The construction of the China-Pakistan Economic Corridor (CPEC) is seen as a positive shock that has opened up new opportunities for the energy sector as it endowed a major segment of its investment in electricity generation in Pakistan. According to Pakistan Economic Survey (PES) 2018–19, Pakistan has successfully detached bottlenecks in electricity generation after the completion of early harvest stage during the last tenure. This demands a comprehensive assessment of the electricity sector, specifically in place of the inauguration of CPEC. Pakistan is one of the countries facing energy shortage and using nuclear and renewable energy resources to grow is more minor. Moreover, less than half of the population in rural areas has either no or limited access to electricity. Pakistan fulfills most of its energy from fossil fuels that are the source of pollution and inject greenhouse gases into the environment, causing a severe threat. About 85 percent of the energy needs in Pakistan are contributed by oil, while the remaining are from renewable and nuclear energy consumption, i.e., 1.1 percent and 9.2 percent, respectively (Baloch et al., 2016). It has been reported that 99 percent of energy demands in Pakistan are fulfilled conventionally, such as oil, gas and hydel. However, 1 percent of the energy supply is accomplished by renewable resources (Sheikh, 2010). Recent economic collapse in Pakistan has led to a shortfall of 6–8 h and 9–12 h in urban and rural areas. From the report of IEA (2017), in 2017, the total energy production in Pakistan was comparable to almost 70 million tons of oil. Furthermore, the previous study has acknowledged that energy is a life of an economy, though, in this background, nuclear and renewable energy may be the source of a prosperous future for the maintenance and development of growth and it can also subside electricity shortage matters in Pakistan (Ahmad and Du, 2017).
For the past few decades, the lack of effective policies in the energy field has led Pakistan to face serious economic challenges that ultimately result in harmful poor economic growth. Electricity demands in any country depend highly on the population growth rate and several other factors such as prices, migration to the cities and prevailing weather conditions. Though, there are various other particular factors in Pakistan, such as political controversy, corruption, lack of adequate policy, provision of major share to the industries, mismanagement, and theft that badly influence the energy sector and damage the economy (GOP, 2014). Pakistan’s population growth has substantially increased to 176.17 compared to 79.98 in 1980, eventually enhancing people’s demands that directly escalate electricity provision (SESRIC, 2014). The association between electricity consumption and economic growth has been comprehensively debated in the literature due to its supposed prominence in determining the growth patterns of the economy. Considering the growth rates, it is evident that there is an inconsistent link between electricity consumption and gross domestic product from the 1970s–1980s due to inefficient and ineffective policy measures (Nadeem and Munir, 2016). Besides, the trend was steady after the 1980s and the end of the 1990s, while a variation was observed in later years. It can be determined that the economic growth and energy consumption data are symmetric for the initial years, while it exhibited a slight irregularity in the late few years.
Although Pakistan’s average energy consumption is currently 17,000 MW, there is a deficit of 400–5,000 MW. In the next 10 years, global energy demand is expected to increase by about 1,500 MW or four to five percent (Kazmi, 2014). In 2015, the shortage was 5,500 MW and the supply was 15,500 MW, while the installed capacity was about 23,000 MW. The rise of energy demands is mainly noticed in specific sectors such as agriculture, construction, manufacturing, education and most notably, in sustainable development to uplift the economic sector (Santoyo-Castelazo and Azapagic, 2014). Total electricity generation during 2014–2015 was noted to be 109,059 GWh, of which about two-thirds was produced from thermal sources (NEPRA, 2015). Available sources of electricity production include hydro-power, nuclear power and thermal energy. Secondary resources include renewable energy, mainly solar energy, wind power, biomass and coal, which are less focused but may become primary sources in the near future (Sahir and Qureshi, 2008). In Pakistan, parts of the hybrid industry consist of hydro-power, thermal, and nuclear power plants. About 31% and 66.8% of electricity are produced by hydro-power and thermal systems, respectively, while the leftover 2.2% is accomplished by nuclear power. Moreover, to fulfill energy demand, the country imports natural gas by 29.4%, oil by 37.8%, hydro-power by 29.4%, and natural gas by 0.26%, respectively. There is a minimal share of coal (0.1%) and nuclear power (3.02%) energy supply (GOP, 2013).
A significant question that arises is how Pakistan might achieve environmental sustainability by reducing carbon dioxide emissions. This issue may be addressed by evaluating the potential consequences of Pakistan’s emission reduction components that might provide policy suggestions for Pakistan’s sustainable development. Moreover, there is a dearth of research examining the potential of decarbonization factors in Pakistan by employing econometric methodologies, despite the fact that this has become a hot issue among scholars currently. This research work’s main contribution is to explore and inspect the association between CO2, CRW, EC, EPC, EPH, EPN, EU, and GDP in Pakistan. This study is significant because it contributes to the recent literature and policy-making in Pakistan in several directions. First, this study fills a gap in the current academic literature by exploring the relationship between CO2 emissions and emission reduction parameters using a comprehensive econometric technique. Second, the novelty of this research is to investigates the presence and direction of causal correlation between CO2 emissions, electricity production and consumption, energy use and GDP to construct beneficial policy decisions regarding electricity use in Pakistan. Third, this study also employed several procedures such as the Augmented Dickey-Fuller (ADF), Kwiatkowski, Phillips, Schmidt, and Shin (KPSS), and the Phillips and Perron (PP) unit root tests to inspect the stationarity. Fourth, this study exploits the Autoregressive distributed lag (ARDL) bound testing, fully modified least squares (FMOLS), dynamic ordinary least square (DOLS) and canonical co-integrating regression (CCR) estimators design for determining the degree of association between variables in a study. Fifth, to determine the reliability of the results, this study used the Cumulative sum, Pairwise Granger causality test and variance decomposition method. Finally, the outcomes of the research would provide policymakers with more comprehensive and insightful information for designing efficient policies in the areas of low-carbon economy, promoting renewable energy use and economic development which would guarantee sustainable development in Pakistan by reducing emissions. In addition, the findings of this study might provide recommendations for other developing nations looking to develop effective policies for environmental sustainability and climate change mitigation.
The remaining research is organized as follows: Section 2 provides a brief summary of the existing literature. Section 3 illustrates the data sources and methodology of the study. Section 4 discusses the results and discussion part. Lastly, Section 5 summarizes the study based on the analysis outcomes.
2 Literature review
2.1 Electricity consumption and economic growth
The driving force behind economic growth is electricity. It stimulates complements capital, manufacturing, labor, and a deficiency in it causes economic expansion (Oconnell et al., 2014; Lin and Chang, 2016; Shahbaz et al., 2017a; Jaiyesim et al., 2017) and limits production (Sarwar et al., 2017; Khan et al., 2016). Enormous studies explored the causal associations within the scope of the main components of electricity consumption and economic growth. These studies were supposed to provide sophisticated findings and thus, the scholars preferred autoregressive distributed lag (ARDL) analysis, vector error correction model (VECM) and co-integration analysis. Previous studies ended up on one-way causality between electricity consumption and economic growth (Yaşar, 2017; Omay et al., 2014; Dogan, 2014; Lee and Chang, 2008; Asafu-Adjaye, 2000). According to the research (Akinlo 2008; Apergis and Payne 2010) found a two-way causality using the same econometric methods, while the study (Mehrara, 2007) explored evidence of a conservative hypothesis for economic growth and electricity consumption model given the selected samples of economies. Additionally, some researchers quoted country-specific causalities in the panel of D8 economies (Razzaqi et al., 2011), while another researcher found neutrality evidence (Soytas and Sari, 2003). It is pertinent to mention that there is limited literature on economic growth and electricity consumption nexus for South Asian economies, pointing to a research gap in the literature. The time trend analysis in panel II consists of much literatures discussing all three main hypotheses, focusing on electricity consumption and economic growth nexus. The growth hypothesis was recently affirmed for the economies of Kazakhstan, Angola, Australia, Kenya and Tanzania, respectively (Khan MTI. et al., 2018; Solarin et al., 2016; To et al., 2013; Odhiambo, 2009; Odhiambo, 2010). Further, another scholar explored conservative causality for China (Zhang and Cheng, 2009), while the previous study disclosed two-way causality for Portugal (Shahbaz et al., 2011). On a concluding note, for trend studies, scholars continued to explore the nexus through different model specifications, providing diverging findings even for the same economies. For instance, a previous study indicated an electricity use is a unidirectional cause of economic growth in the economy of India by employing the non-linear estimation technique (Shahbaz et al., 2017b). The author also pointed to an asymmetry in the model due to adverse economic shocks, denying the possibility of reverse causality. Contrary to this, another study already declared two-way causality favoring the feedback hypothesis of economic growth and electricity consumption in India using two different Granger causality techniques (Paul and Bhattacharya, 2004). Additionally, previous scholars quoted causalities in a different direction for the economy of Turkey (Altinay and Karagol, 2005; Pempetzoglou, 2014).
Starting from the national study in panel III, the ARDL estimation provided a recent declaration favoring the economic growth and electricity consumption association (long run) for the time of 1972–2014 (Nadeem and Munir, 2016). Another researcher also developed the same dynamic model of ARDL and elucidated a bi-directional electricity consumption and economic growth causality (Shahbaz and Lean, 2012). In the same year, a researcher developed the electricity consumption and economic growth model for a different time and concluded a reverse causality between the two core variables (Shahbaz and Feridun, 2012). A previous study found a one-way causality (Atif and Siddiqi, 2012), while another scholar ended up on reverse causality from electricity consumption to economic growth (Aqeel and Butt, 2001). Contrary to the electricity consumption and economic growth literature, there is recently a turn in national studies from traditional causality analysis to more impressive yet sophisticated econometric applications and findings. In this regard, a previous study applied the SVAR from 1971 to 2012 and found an unstable electricity consumption and economic growth model (Nadeem and Munir, 2016). The authors stressed-on the enhancement of energy inputs to facilitate capital stock in accordance with more labor utilization. Correspondingly, another study explored the traditional long-run perspective with the STAR model, further explored the insensitivity of electricity consumption to prices and associated it with a lack of electricity alternatives (Nawaz et al., 2013). A previous study applied VECM and ARDL estimations and found that there is a significant long-run relationship between electricity consumption and economic development in Pakistan (Chandio et al., 2020a).
2.2 Carbon dioxide emissions, energy use and economic growth
Major barriers to sustainable development include severe energy shortages and growing pollution levels. It has been illustrated that energy usage links economic growth with a sustainable environment, making energy, environment, and economy common research areas (Mirza and Kanwal, 2017). By using the Autoregressive distributed lag (ARDL) approach, the statistical evidence showed that electricity consumption and economic growth have positive impact on carbon dioxide emissions in Turkey over the period of 1970–2014 (Akadiri et al., 2020). Consequently, the association between the economy, energy and the environment has turned out to be a major area of research. A group of researchers have conducted a study to elaborate the relation between energy consumption, economic growth and carbon emission in various areas using distinct approaches (Zhang and Cheng 2009; Omri 2013; Alshehry et al., 2015; Dong et al., 2018). A bidirectional relationship between energy consumption, economic growth and CO2 emissions was illustrated by different researchers (Mirza and Kanwal 2017; Liu and Yu 2018). Data analysis across China from 1990 to 2012 by applying co-integration analysis, vector error correction model (VECM) impulse response analysis and Granger causality tests revealed a unidirectional association between energy consumption and CO2 emissions (Wang et al., 2016). In contrast, the researchers found that the relationship between economic growth and energy consumption was bidirectional. Furthermore, no statistically significant relationship was found between economic growth and energy consumption in response to CO2 emissions. A study conducted across China from 1960 to 2007 employed causality tests and generalized impulse response (Zhang and Cheng, 2009). The Granger causality test findings revealed a unidirectional association between energy consumption and CO2 emissions and even between gross domestic product (GDP) and energy consumption. It was also demonstrated that energy consumption and CO2 emissions might not affect economic growth. Co-integration techniques were used from 1981 to 2005 across 12 Middle East and North African (MENA) countries (Arouri et al., 2012). It was shown that CO2 emissions would increase due to energy consumption in the long run, and real GDP correlated with the country’s CO2 emissions at a quadratic rate. Furthermore, the study outcomes confirm a positive relationship between economic growth and CO2 emissions using for Zimbabwe using Maki co-integration method (Samu et al., 2019). Previous study investigated a bi-directional causality between CO2 emissions and economic growth and electricity energy consumption and CO2 emissions in Africa over the period of 1980–2014 (Asongu et al., 2020).
A study conducted in Pakistan showed that in the long run, CO2 emissions, electric power consumption and renewable electricity output had a positive and significant relationship with the gross domestic product per capita over the period of 1990–2017 (A. Rehman et al., 2019). A previous study examined the dynamic relationship between energy consumption, CO2 emissions, and economic growth based on the Environmental Kuznets Curve (EKC) hypothesis across Iran from 1971 to 2007 (Saboori and Soleymani, 2012). The findings revealed long-term relationships between variables in three forms, retaining CO2 emissions, economic growth, and energy consumption as dependent variables use of the Autoregressive Distributed Lag Model (ARDL). Although the EKC hypothesis predicted a U-shaped relationship between income and environmental degradation, it was not confirmed by the results. However, the results do not contradict the hypothesis. The study showed that the impact of energy consumption on CO2 emissions in the long-run was significantly positive. A study across India from 1971 to 2005 used variables such as energy consumption, CO2 emissions and economic growth and used a static and dynamic framework (Tiwari, 2011). CO2 emissions were found to be a Granger causality cause of energy consumption, but GDP was not a Granger causality cause of CO2 emissions, and energy consumption was found to be a Granger causality cause of CO2 emissions, but GDP was not a Granger causality cause of CO2 emissions. The outcome suggests that Indian government should opt for strategies and procedures focusing on energy conservation and adequate energy consumption. Another study analyzed the impact of electricity consumption in Kuwait on the country’s CO2 emissions and GDP growth from 1980 to 2013 using the ARDL method. According to the outcomes of the study, electricity consumption has a negative impact on CO2 emissions in both the short and long term. Using the Granger causality test, the authors estimated a positive and statistically significant correlation between electricity consumption and CO2 emissions (Salahuddin et al., 2018). Based on the annual data of China from 1990 to 2016, a previous study applied ARDL bounds testing approach and confirmed that crop production and livestock production have a significant positive relationship with CO2 emissions in both short and long-run estimations (Chandio et al., 2020b).
3 Data description and research methodology
3.1 Data Source
A recent study considered annual data of Pakistan covering the period from 1971 to 2014. Access to data was the key concern and hence we found the time span depending on the accessibility of research variables. The Pakistan statistical yearbooks and World Development Indicator (WDI) collect the data for the different variables of this proposed study. The contribution of the present study is to use the data of carbon dioxide emissions (CO2) in metric tons per capita. The combustible renewable and waste (CRW) is in percentage of total energy. The electric power consumption (EC) is in KWh per capita. For the electricity production from coal sources (EPC), electricity production from hydroelectric sources (EPH) and electricity production from natural gas sources (EPN), all the data is in percentage of total electricity production. The energy use (EU) data is taken in Kilogram oil equivalent per capita, while the gross domestic product (GDP) data is obtained in current LUC per capita. The present study aims to identify the relationship between CO2, CRW, EC, EPC, EPH, EPN, EU and GDP, respectively. Table 1 shows the source and description of all study variables.
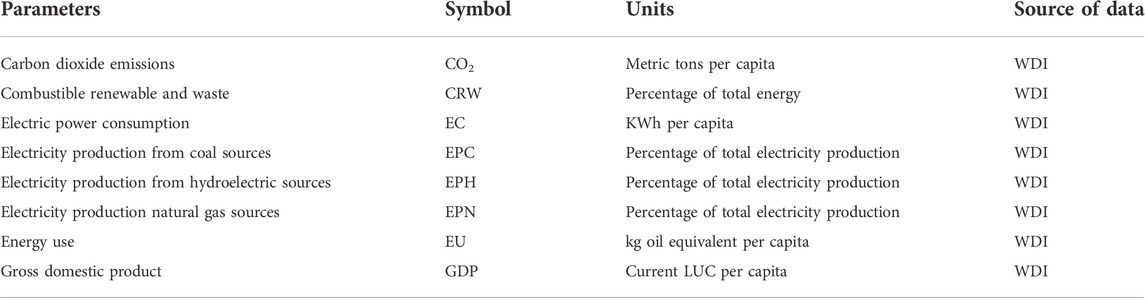
TABLE 1. Description of the study parameters.
3.2 Model specification
Primarily focused on the econometric model proposed by Asumadu-sarkodie et al. (2017), this research work calculated the relationship between a dependent variable (CO2 emissions) and the independent variables (CRW, EC, EPC, EPH, EPN, EU and GDP). The econometric representation of the research variables can be modeled as follows.
Where CO2 represents the carbon dioxide emissions, CRW is for combustible renewable and waste, EC is for electric power consumption, EPC is for electricity production from coal sources, EPH is for electricity production from hydroelectric sources, EPN is for electricity production from natural gas sources, EU is for energy use and GDP is for gross domestic product respectively in the above Equation 1.
All analysis variables have been converted into a logged mode (ln). The parameters in Equation 2;
3.3 ARDL bounds testing method
In this research, an autoregressive distributed lag (ARDL) approach introduced by Pesaran et al. (2001) is investigated. This approach is utilized to study the equations when the variables are stationary at a level I (0) and in first difference I (1). This is why this method is investigated in the current study (Shahbaz et al., 2013; Rahman and Abul Kashem, 2017; Danish et al., 2018). Before applying the ARDL approach, it is necessary to determine whether the variables in question exhibit co-integration. To determine whether there is co-integration between the study variables in terms of their short-term and long-term relationships, an ARDL bound test was conducted.
In this study, the ARDL model is used because it has several desirable features. a) When the data collection is relatively small, the ARDL model should be used. b) Another feature of the ARDL model variables may be stationary in their level form (I (0)), integrated to first order and stationary in their difference (I (1)), or a mixture of I (0) and I (1) is acceptable. When the data collection is relatively small, the ARDL model is optimal. (c) The ARDL approach can simultaneously measure the short-term and long-term coefficients. The short-term coefficients illustrate the correlation between the independent variable and its long-term trend when the dependent variable deviates from its long-term trend. It is noteworthy that the ARDL method combines the nonlinear functions of the coefficients of the conditional error correction model with the bias-corrected bootstrap technique. This is a remarkable feature of the ARDL method. Because of these features, the method can draw statistical conclusions about the predictability of the long-run relationship between the variables under study.
Where
4 Results and discussions
4.1 Descriptive statistics and correlation statistics
Descriptive statistical analysis is initially designed to interpret the main characteristics of all sample variables (Table 2). Skewness measures how evenly the data are distributed, while kurtosis measures how evenly the dispersion order is distributed. EC and EU both have negative left skews, while all other variables have positive right skews (Table 2). The normality of each variable is determined using the Jarque-Bera test (J-B test). The J-B test yields highly insignificant results at a significance threshold of 5 percent, demonstrating the residuals of all variables are normal. EPC and GDP exhibit a leptokurtic distribution, meaning their respective kurtosis values are above 3 (Table 2). As with the previous variables, a plarykurtic distribution is characterized by a kurtosis value of less than 3 (CO2, CRW, EC, EPH, EPN, and EU).
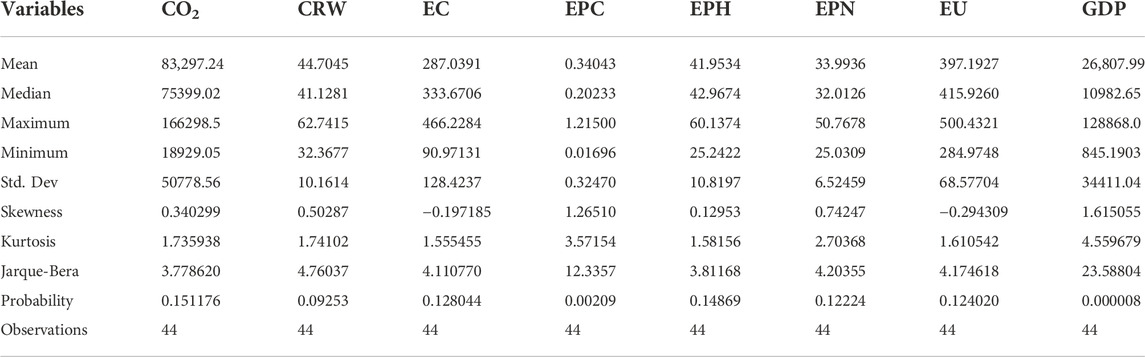
TABLE 2. Descriptive statistics analysis for all variables.
For all variables used in this study, correlation analysis is measured to determine the intertwined relationship between one variable and another (Table 3). The variables EC, EU and GDP positively impact carbon dioxide emissions, with 96.31 percent, 94.53 percent and 87.95 percent, respectively. Figure 1 illustrates the trend analysis for all the study variables.
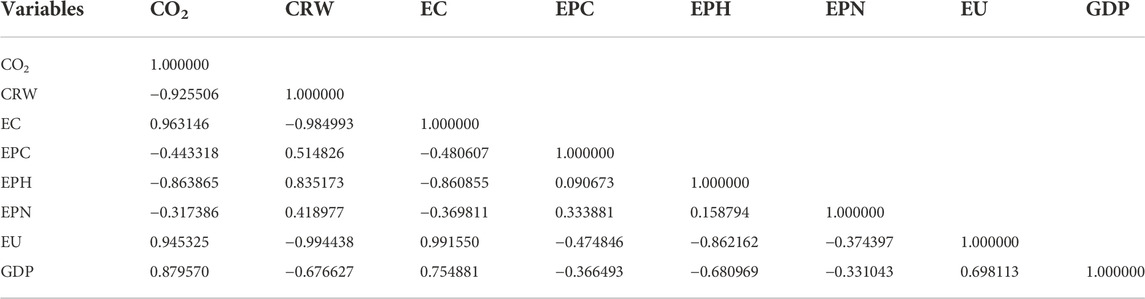
TABLE 3. Correlation matrix results.
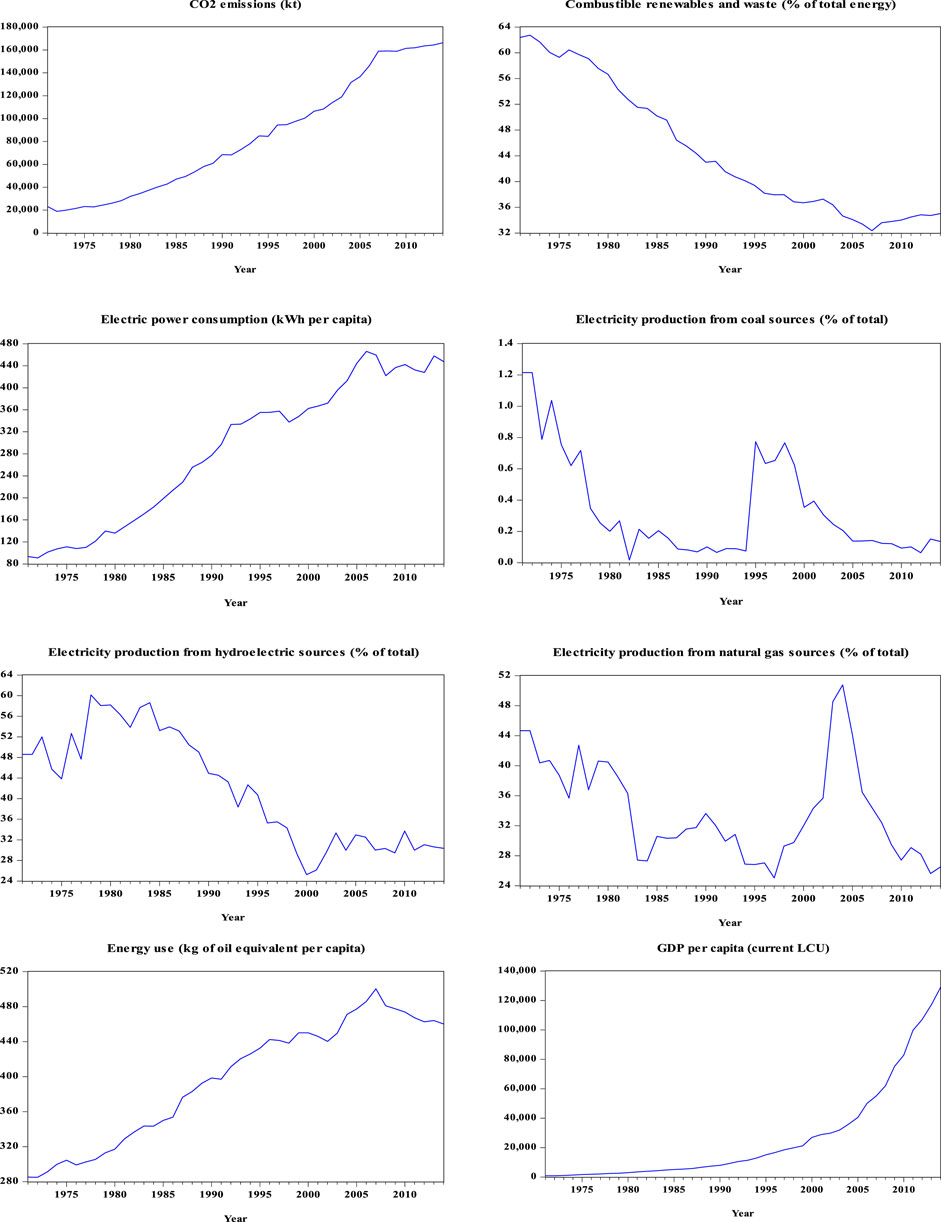
FIGURE 1. The trend of data variables.
4.2 Unit root test results
It is essential to know the stationarity situation of all variables in the study before measuring the ARDL bounds technique. We use the Augment Dickey and Fuller (ADF) test (Dickey and Fuller 1979), Phillips-Perron (PP) test (Phillips and Perron 1988) and Kwiatkowski-Phillips-Schmidt-Shin (KPSS) unit root tests such as ADF, PP, and KPSS were used to determine whether or not the regressors and regressed variables were stationary (Table 4). Findings show that almost all parameters at the I (0) level are non-stationary, while most of the first difference I (1) variables are stationary with a significance of 5%. From the observations, no variable in the second difference I (2) is stationary. These results prove that the ARDL limit method is an appropriate tool for studying both short-term and long-term relationships. The results may become meaningless and deceptive if the data are not stable.
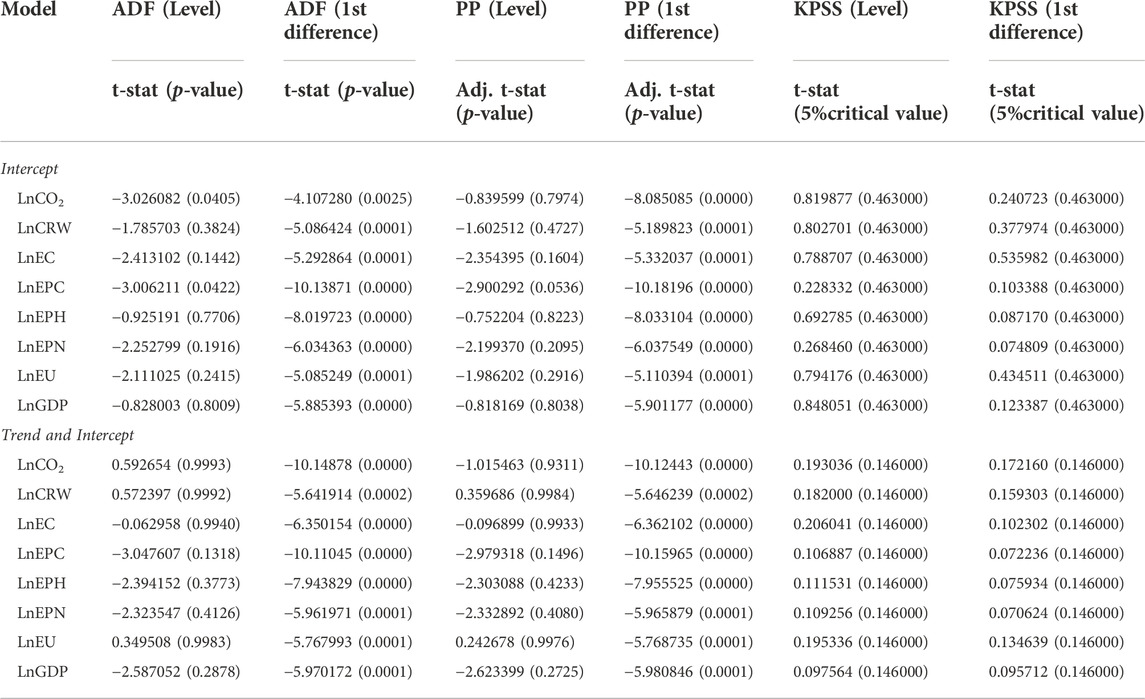
TABLE 4. Results of unit root analysis.
4.3 Lag order selection criteria and breakpoint unit root test
When using the ARDL method, it is essential to determine the appropriate delay lag length. To achieve this goal, the unconstrained vector autoregression criterion (VAR) is utilized to select the optimal number of model lags. Researchers often avoid long lags because they lead to fewer degrees of freedom. The duration of the lag VAR is determined based on a number of selection factors, with a rule of thumb recommending the adoption of the lag determined by the maximum information criterion. In most cases, the Akaike information criterion (AIC) (Akaike 1974) and Schwarz Information Criterion (SIC) (Schwarz 1978) are used as criteria. The Akaike information criterion (AIC) architecture for selecting lags was applied to determine the correct lags for the model in our research. Based on the AIC and SIC data, the authors of this study concluded that “1″ is the appropriate lag (Table 5). Previous studies (Farhani and Ozturk, 2015; Jebli and Ben Youssef, 2017; Xu and Lin, 2017; Rauf et al., 2018; Ali et al., 2019a; 2019c; Naseem et al., 2020) used the AIC criterion to calculate the number of lag lengths in the ADF test.
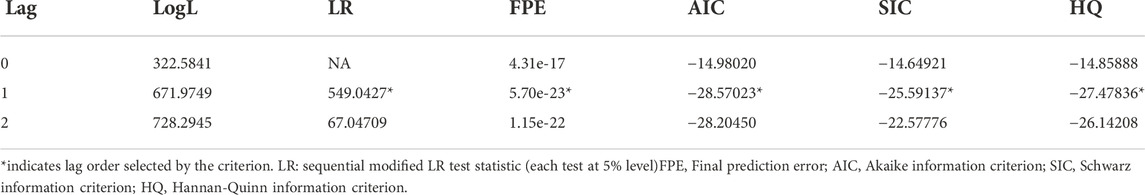
TABLE 5. Lag selection criteria.
The time series reliability of the unit root test is unlikely to be exceptionally high unless there are structural perturbations. As an immediate consequence, the breakpoint unit root test is performed sequentially. The unit root test findings reveal that the null hypothesis cannot be rejected for most research variables in the level format. After being identified in the 1990s, the remaining 62.5 percent of structural breaks were found in the 2000s (Table 6).
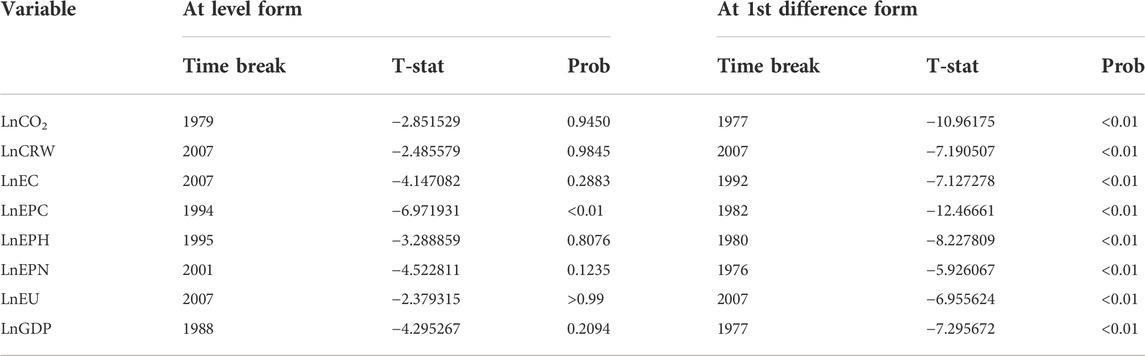
TABLE 6. Breakpoint unit root test.
4.4 ARDL bound testing and johansen co-integration technique
After completing the unit root test, the next phase in this investigation is to use the ARDL bound test technique. The AIC and SIC are generally used as the basis for the ARDL boundary test method because they tend to determine the requirements more compactly. The value of F-statistic (13.4477) surpasses the upper bounds of critical I (1) values at a 1% significance level (3.9), indicating a long-term relationship between CO2 emissions, CRW, EC, EPC, EPH, EPN, EU, and GDP in Pakistan (Table 7). The results indicate that there is no co-integration and the alternative hypothesis of co-integration is confirmed. Figure 2 estimated the appropriate lag order for the ARDL (1,1,1,0,0,1,1,0) model using the Akaike information criterion (AIC) technique.
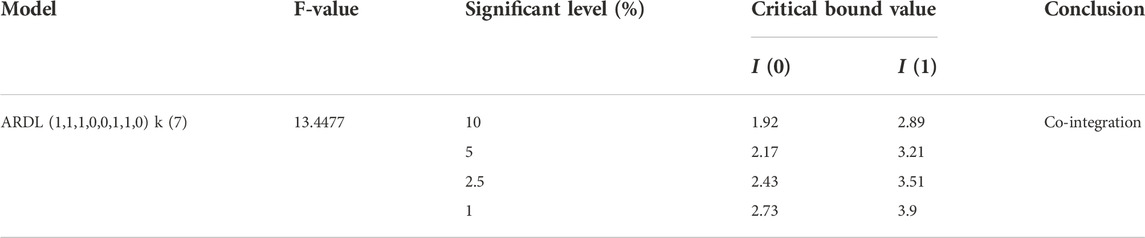
TABLE 7. ARDL Bound Test for co-integration.

FIGURE 2. ARDL model selection criterion.
To assess the long-term relationship between CO2 emissions, CRW, EC, EPC, EPH, EPN, EU, and GDP, the study provides an overview of Johansen’s co-integration approach (Johansen and Juselius, 1990) (Table 8). Six co-integration equations are statistically significant at the 5 percent level, as determined by the trace statistics test. Five co-integration equations are statistically significant at the 5 percent level, as indicated by the maximum eigenvalue test. According to the Trace Statistic and Maximum Eigenvalue outcomes, there is a long-standing relationship between variables under investigation.
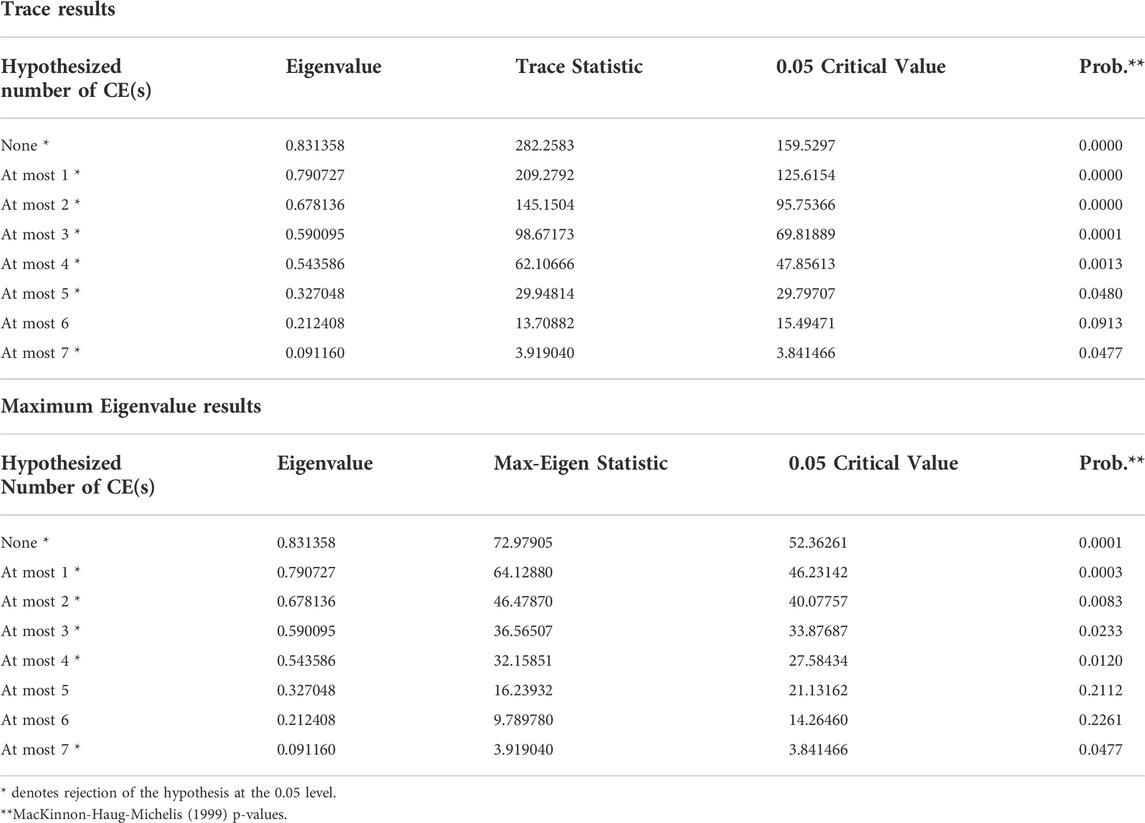
TABLE 8. Johansen method of unrestricted co-integration results.
4.5 Short-run and long-run estimates
The short-run and long-run dynamic impacts of study parameters are presented in Table 9. Both the LnCRW and LnEU coefficients have a negative impact on long-term CO2 emissions (LnCO2), as shown by the short-run elasticity values at the 1% significance level (Table 9). Changes of only one percent in the coefficients of LnCRW and LnEU result in a reduction in carbon dioxide emissions of 5.6526 and 4.495%, respectively. Contrary to previous studies that found a positive and significant relationship between CO2 emissions and energy use in the short and long run (Sarkodie 2018; Sarkodie and Adams, 2018; Wang et al., 2018; Bekun et al., 2019). These studies concluded that carbon dioxide emissions have a positive effect on energy use. The effect of the coefficient of LnEPN on carbon dioxide emissions is both favourable and significant. Carbon dioxide emissions increase by 0.0568 percentage points for every 1 percent change in LnEPN. When applied to short-term calculations, the ECM shows transition rate from the short-term to the long-term. The ECT (-1) experiment produced a negative result, statistically significant at the 1% level. According to the ECT (-1) results, the divergence between the short-term and long-term equilibrium CO2 emissions is corrected by 86.6 percent annually. A previous study indicated that an increase in economic growth and electricity consumption in the agriculture sector decreases environmental quality in Pakistan (Chandio et al., 2019).
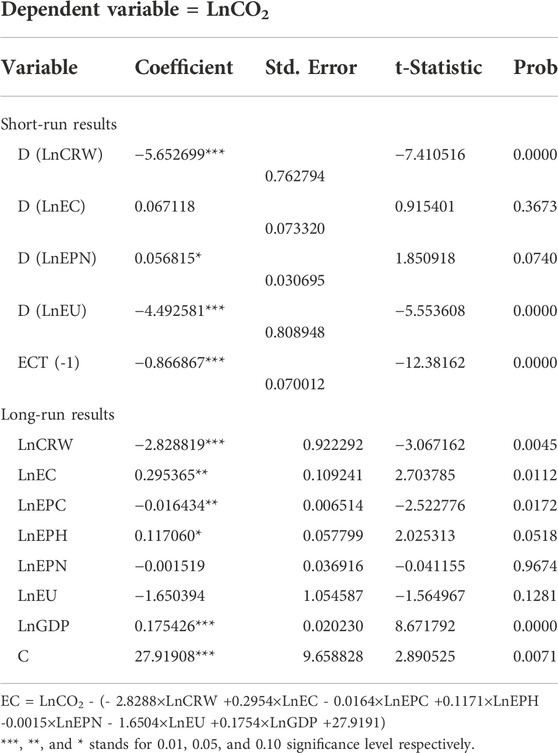
TABLE 9. Short-run and long-run relationship estimates ARDL (1,1,1,0,0,1,1,0).
The long-run relationship shows that three regressors (LnEC, LnEPH and LnGDP) impact the level of LnCO2 emissions positively significant, while the LnCRW, LnEPC coefficients have a negative and significant association with Pakistan’s LnCO2 emissions throughout the sample period (Table 9). A one percent increase in the coefficients of LnEC, LnEPH, and LnGDP results in an increase in LnCO2 emissions of 0.2953 percent, 0.117 percent, and 0.1754 percent, respectively. The outcomes also display that a 1 percent increase in the coefficients of LnCRW and LnEPC will decrease LnCO2 emissions by 2.8288 percent and 0.0164 percent. The remaining variables (LnEPN and LnEU) have a negative and insignificant relationship with LnCO2 emissions.
This research also investigates the long-run estimates by running CCR, FMOLS and DOLS estimate. FMOLS estimates show that for each percent increase in LnCRW, CO2 emissions decrease by 4.7625 percent; for each percent increase in LnEC, CO2 emissions increase by 0.2379 percent; for each percent increase in LnEPH, CO2 emissions increase by 0.1839 percent; and for each percent increase in LnGDP, CO2 emissions increase by 0.1414 percent in Table 10. Similarly, the outcome from DOLS estimates show that a 1 percent rise in LnEC, LnEPH and LnGDP will increase CO2 emissions by 0.2733 percent, 0.1621 percent and 0.1246 percent, respectively. Results from FMOLS, DOLS and CCR estimations gave similar results. Therefore, it can be said that the findings of this study are robust.
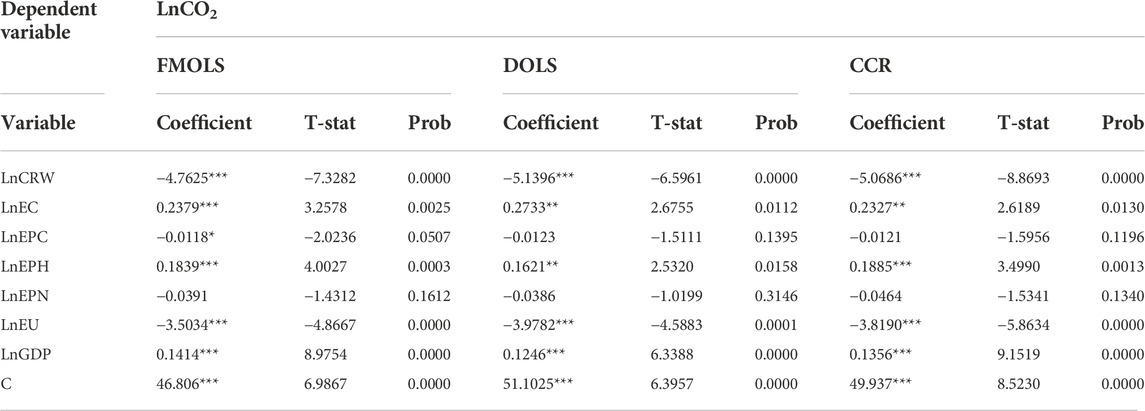
TABLE 10. FMOLS, DOLS and CCR Long-run coefficient estimates.
4.6 ARDL diagnostic tests
In addition, to measure model dependability, this research applied Cumulative sum (CUSUM) and Cumulative sum of the square of the recursive residuals (CUSUMsq) tests. To calculate the performance of the existing model, both the CUSUM and CUSUMsq tests (Brown, Durbin, and Evans 1975) are suggested. It is abundantly clear that the crucial values are within the 5% significance level, indicating that all calculated parameters remained constant during the sample period (Figure 3). Therefore, the recommended ARDL approach is appropriate and effective. Many researchers have performed CUSUM and CUSUMsq tests to verify the model’s stability (Mackinnon et al., 1999; Xiao and Phillips, 2002; Lee et al., 2003; Seker et al., 2015; Jebli and Ben Youssef, 2017; Khan S. et al., 2018; Koondhar, 2021; Ali et al., 2019a; Ali et al., 2019b).
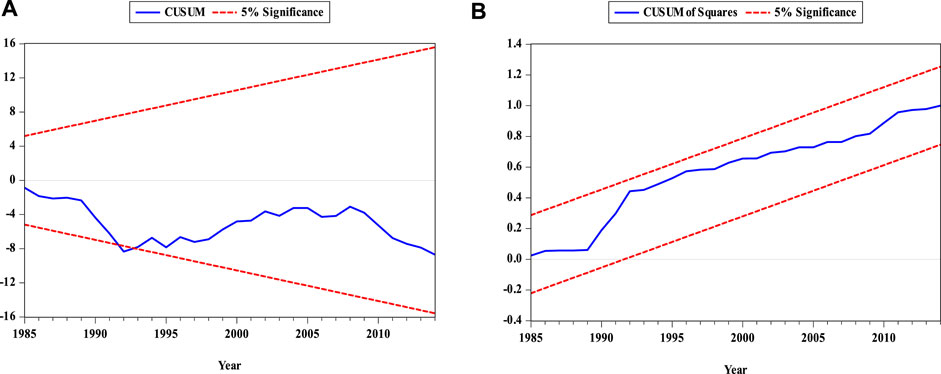
FIGURE 3. Stability test based on (A) CUSUM and (B) CUSUM of squares.
To confirm the reliability of the proposed model, residual diagnostic tests are performed, such as the Breusch-Godfrey serial correlation LM test and the heteroscedasticity test (Table 11). The stability vector autoregression test (VAR) suggested by Pesaran et al. (2001) demonstrates the inverse root estimate of the polynomial AR (Figure 4). All red points are visible within the circle shown on the model, indicating that our model is well constructed for this study.
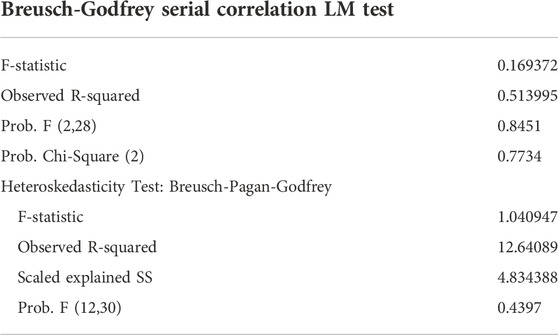
TABLE 11. Diagnostic tests results.
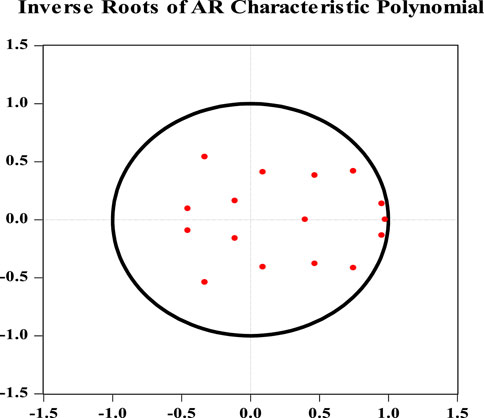
FIGURE 4. Checking the stability of vector autoregression (VAR).
4.7 Pairwise Granger causality and variance decomposition analysis
A pairwise Granger causality test was also used in the study to determine how reliable the model (Granger and Jji 1988), to clarify causality quickly, and correctly determine the dynamic point of view. This was done to determine the dynamic point of view accurately. Table 12 displays the results of a paired Granger causality test. This test determines whether or not there is a statistically significant link between the study variables and the direction of those correlations. It does so by examining the strength of the correlations between the study variables. The Granger test for directionality demonstrates that the flow of causation between the variables only goes in unidirectional from LnEC → LnCO2, LnEU → LnCO2, LnEU → LnCRW, LnEPC → LnEC, LnEPC → LnEPN, LnEPN → LnEPH and LnGDP → LnEPH, respectively. The outcomes from preceding studies (Shahbaz e al., 2012; Balsalobre-Lorente et al., 2018; Bekun et al., 2019) reported there is a unidirectional causal relationship between energy use and CO2 emissions. The outcomes also display that there is bidirectional causality between LnEPH ↔ LnCO2, LnEC ↔ LnCRW, LnEPH ↔ LnCRW, LnEPH ↔ LnEC, LnEU ↔ LnEC and LnEU ↔ LnEPH respectively.
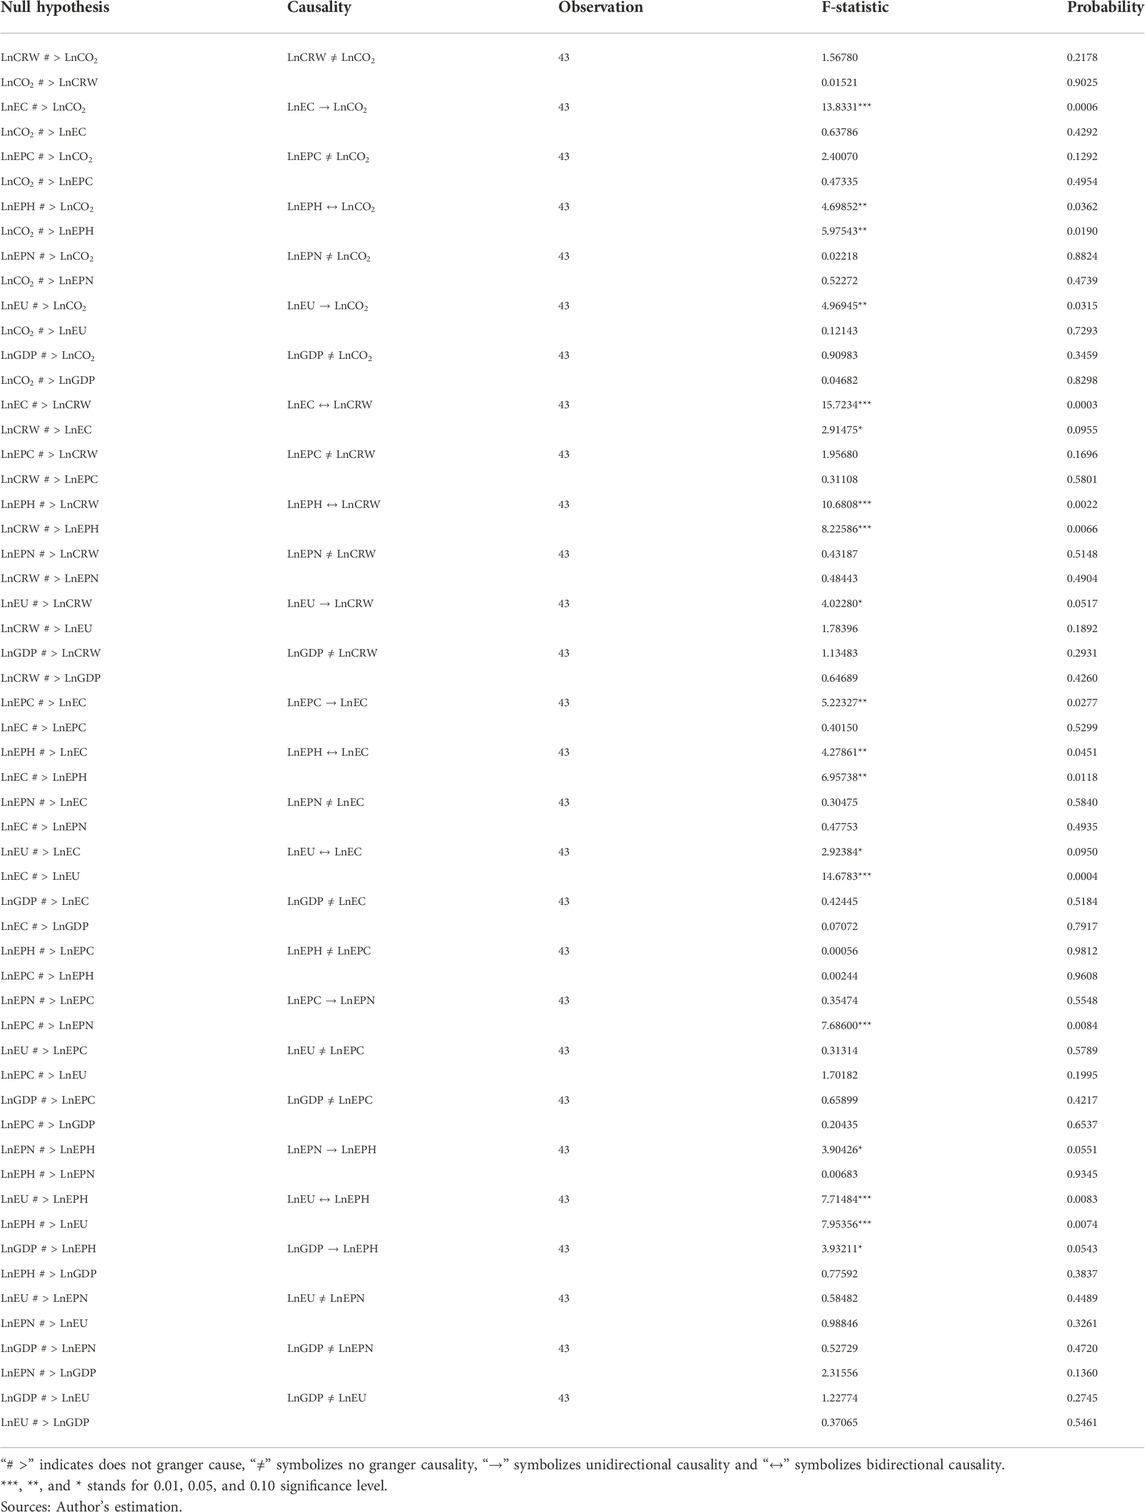
TABLE 12. Pairwise Granger causality relationship.
To evaluate the model’s efficacy, the pairwise Granger causality test and variance decomposition are calculated and analyzed for all variables in the research. The outcomes of the Cholesky random intervention strategy are shown in Table 13 of this study. According to the results, nearly 0.75 percent of forthcoming variants in LnCO2 are attributable to interference in LnCRW; 26.6% of forthcoming variations in LnCO2 are attributable to interference in LnEC; 1.03 percent of long-term variations in LnCO2 are attributable to interference in LnEPC; 2.71 percent of forthcoming variants in LnCO2 are attributable to interference in LnEPH; and 2.7% of forthcoming variants in LnCO2 are attributable to interference in LnEPH.
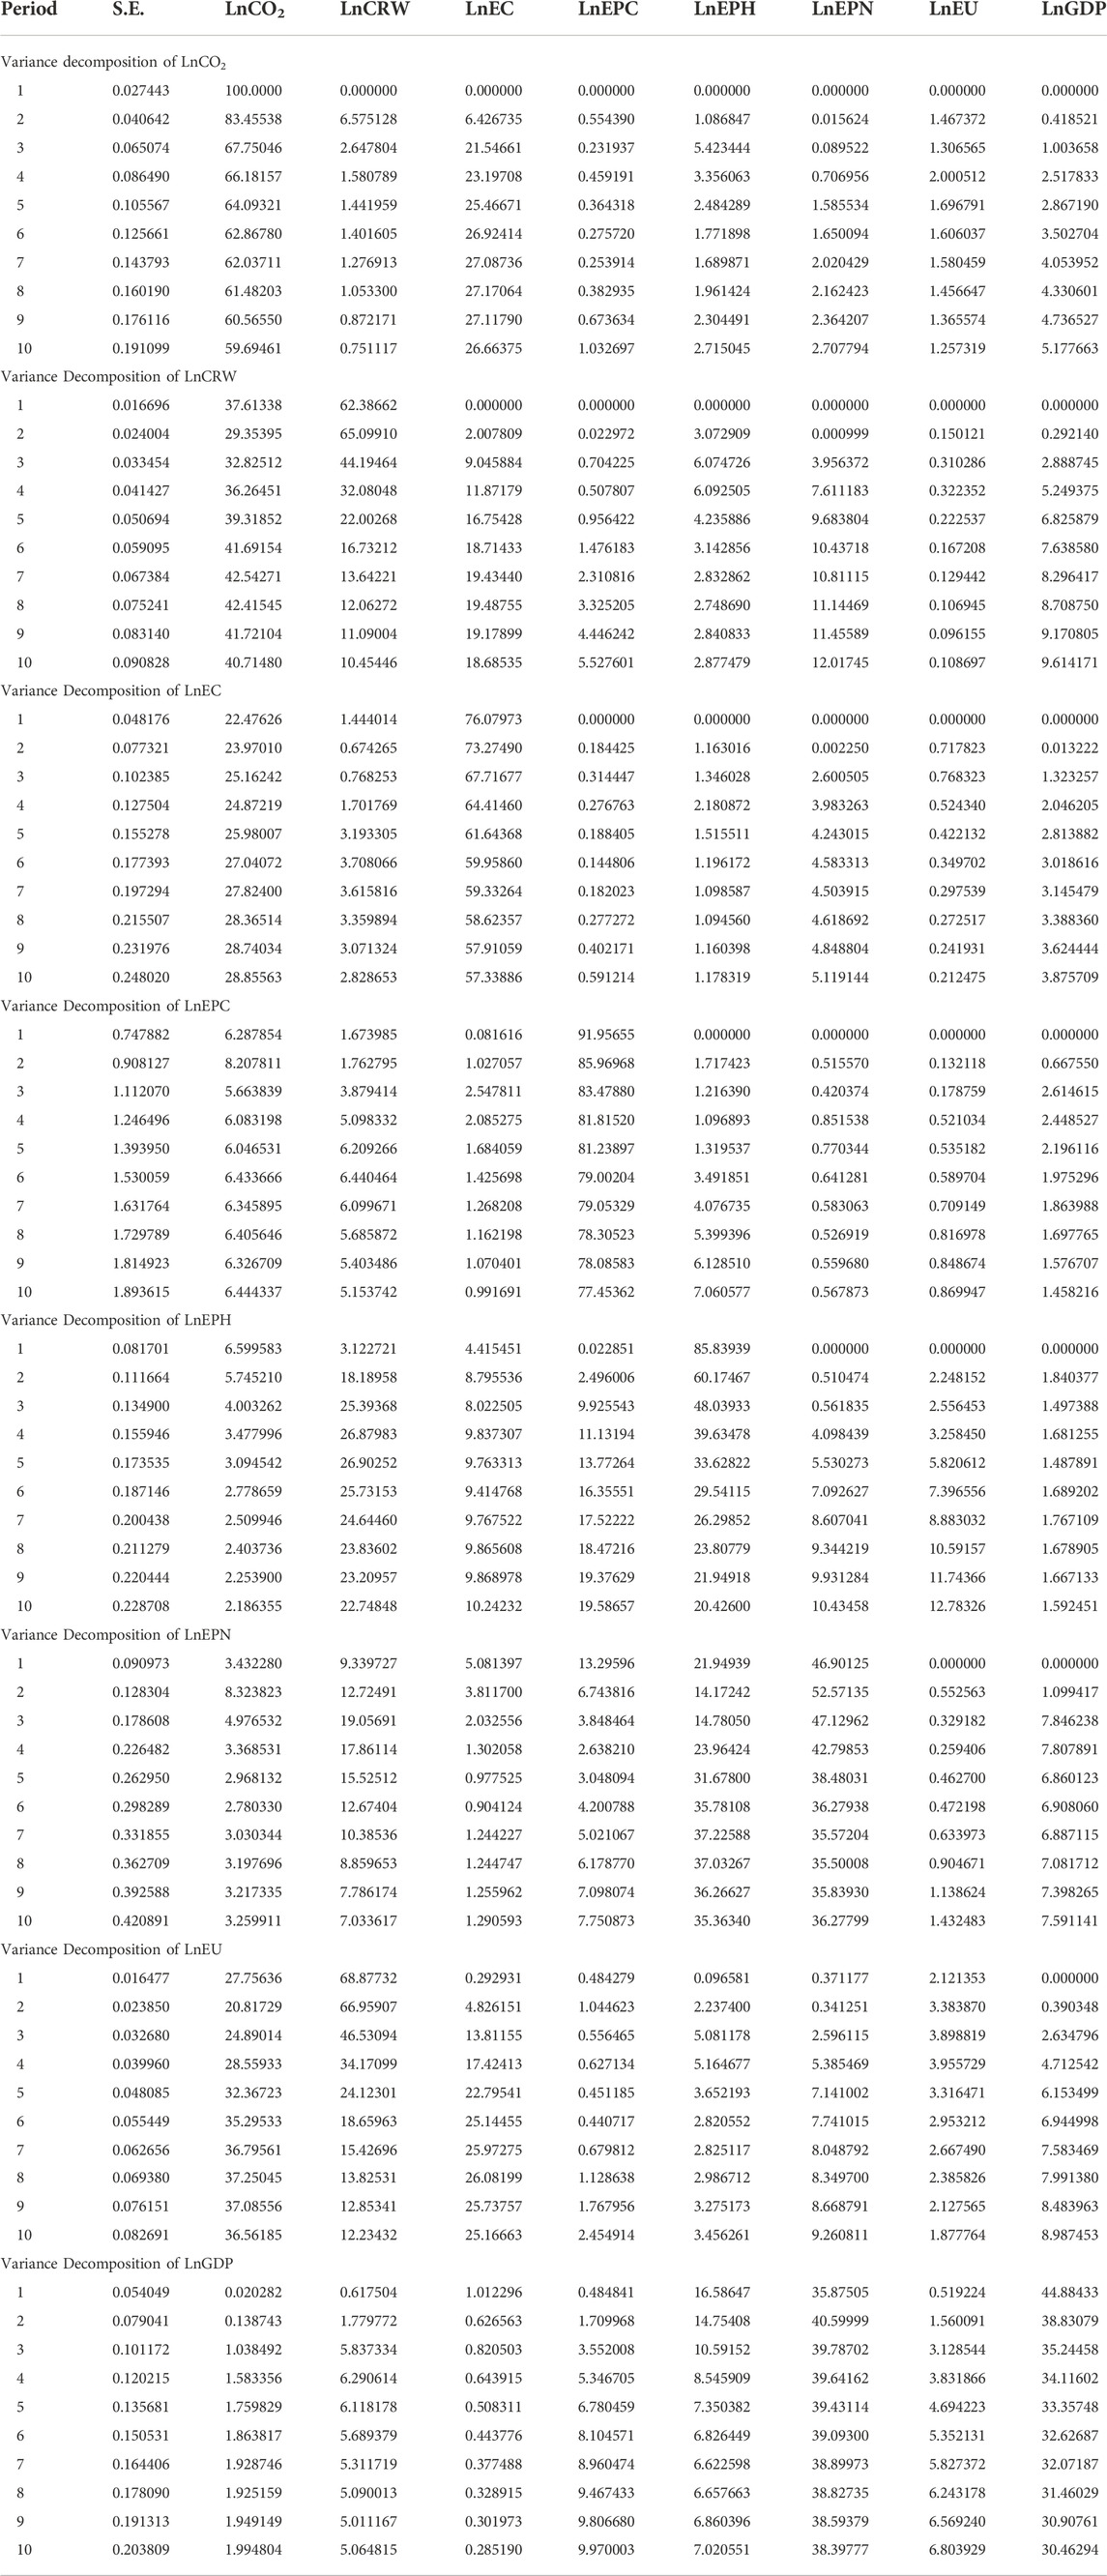
TABLE 13. Variance decomposition using cholesky ordering: LnCO2, LnCRW, LnEC, LnEPC, LnEPH, LnEPN, LnEU and LnGDP.
Description from the table indicates that nearly 40.1 percent of the forthcoming variations in LnCRW is due to disturbance in the LnCO2, 18.6 percent of forthcoming variants in the LnCRW is attributable to disruption in LnEC, 5.52 percent of forthcoming variants in the LnCRW is attributable to disruption in LnEPC, 2.87 percent of forthcoming variants in the LnCRW is forthcoming variants in LnEPH, 12 percent of forthcoming variants in the LnCRW is forthcoming variants in LnEPN, 0.1 percent of forthcoming variants in the LnCRW is due to disruption in LnEU, and 9.61 percent of forthcoming variants in the LnCRW is due to disruption in LnGDP respectively.
Furthermore, verification from the outcomes show that almost 28.8 percent of the forthcoming variants in LnEC is due to disturbance in the LnCO2, 2.82 percent of forthcoming variants in the LnEC is attributable to disruption in LnCRW, 0.59 percent of forthcoming variants in the LnEC is attributable to disruption in LnEPC, 1.17 percent of forthcoming variants in the LnEC is attributable to disruption in LnEPH, 5.11 percent of forthcoming variants in the LnEC is attributable to disruption in LnEPN, 0.21 percent of forthcoming variants in the LnEC is attributable to disruption in LnEU, and 3.87 percent of future variations in the LnEC is attributable to disruption in LnGDP respectively.
Moreover, the outcomes in the table display that almost 6.44 percent of the forthcoming variants in LnEPC is attributable to disruption in the LnCO2, 5.15 percent of forthcoming variants in the LnEPC is attributable to disruption in LnCRW, 0.99 percent of forthcoming variants in the LnEPC is attributable to disruption in LnEC, 7.06 percent of forthcoming variants in the LnEPC is attributable to disruption in LnEPH, 0.56 percent of forthcoming variants in the LnEPC is attributable to disruption in LnEPN, 0.86 percent of forthcoming variants in the LnEPC is attributable to disruption in LnEU, and 1.45 percent of forthcoming variants in the LnEPC is attributable to disruption in LnGDP respectively.
In conclusion, the results in the table illustrate that almost 1.99 percent of the forthcoming variants in LnGDP is attributable to disruption in the LnCO2, 5.06 percent of forthcoming variants in the LnGDP is attributable to disruption in LnCRW, 0.28 percent of forthcoming variants in the LnGDP is attributable to disruption in LnEC, 9.97 percent of forthcoming variants in the LnGDP is attributable to disruption in LnEPC, 7.02 percent of forthcoming variants in the LnGDP is attributable to disruption in LnEPH, 38.3 percent of forthcoming variants in the LnGDP is attributable to disruption in LnEPN, and 6.8 percent of forthcoming variants in the LnGDP is attributable to disruption in LnEU respectively.
4.8 Impulse response analysis
After the Pairwise Granger causality test’s estimation, the model’s efficacy will be tested using the Impulse response analysis. This analysis signifies the mechanism through which any certain shock (positive or negative) exhibits spread over time. Figure 5 displays the impulse response of CO2 emissions to the elasticity coefficient of CRW, EC, EPC, EPH, EPN, EU and GDP within 10-period horizons, respectively. The results display that the response of CO2 emissions to LnEC, LnEPN and LnEU is significant inside 10-period. The early response of CO2 emissions to LnCRW is negative over a 2-period and then starts increasing upward over a 9-period horizon. Similarly, the response of CO2 emissions to LnEPC is negative over a 4-period and abruptly starts an upward trend over a 10-period horizon. However, the initial response of CO2 emissions to LnEPH is positive over a 5-period and then starts decreasing over a 10-period. Furthermore, the response of CO2 emissions to LnGDP is negative and shows decreasing trend within a 10-period. Figure 6 illustrates the response of LnCRW, LnEC, LnEPC, LnEPH, LnEPN, LnEU and LnGDP to CO2 emissions, respectively.
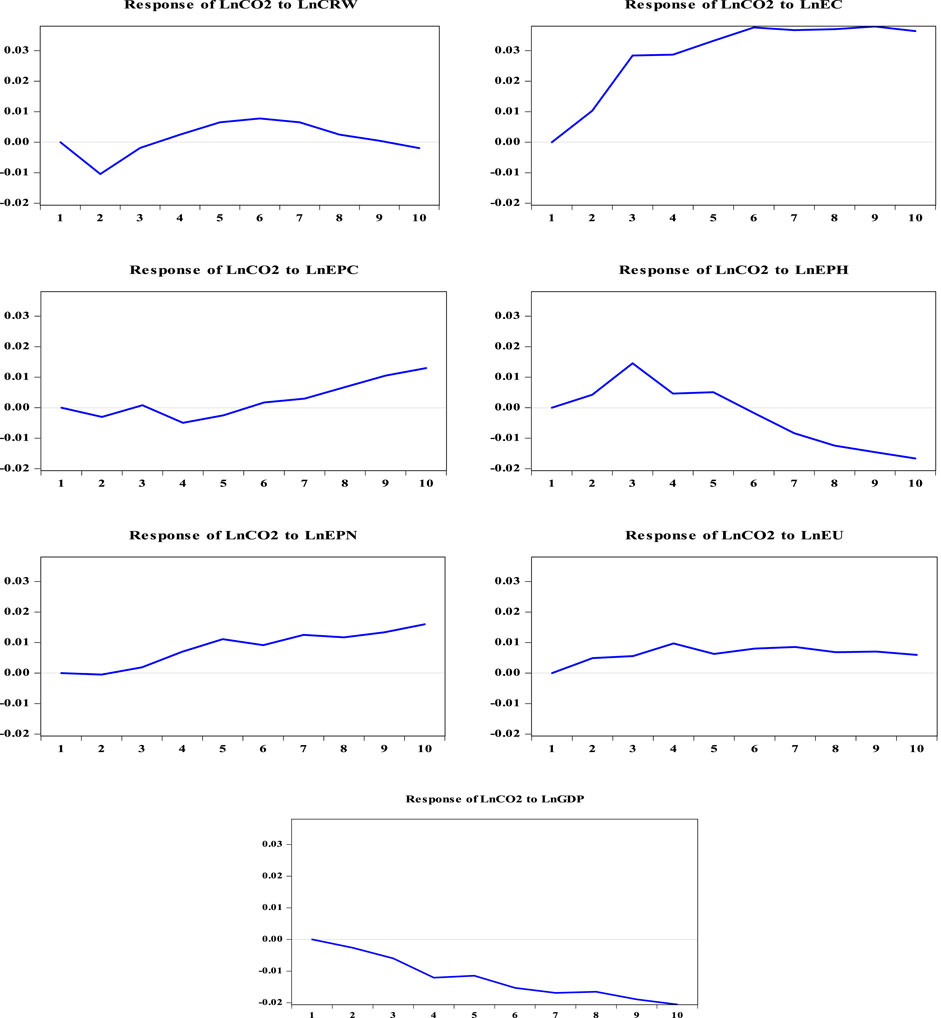
FIGURE 5. Impulse response of CO2 emissions to other variables.
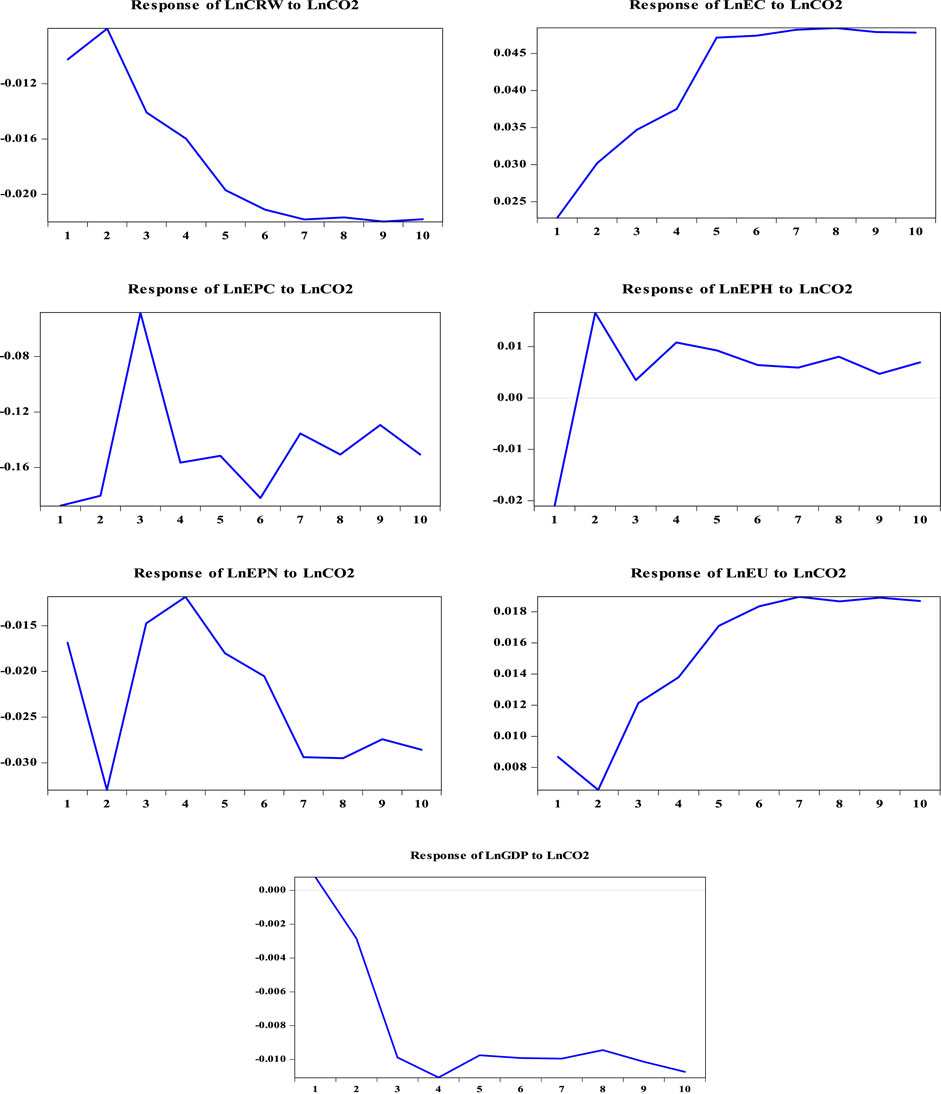
FIGURE 6. Impulse response of other variables to CO2 emissions.
5 Conclusion and policy recommendations
This research explores the relationship between carbon dioxide emissions (CO2), combustible renewable and waste (CRW), electric power consumption (EC), electricity production from coal (EPC), hydroelectric (EPH) and natural gas (EPN) sources, energy use (EU) and gross domestic product (GDP). This study considered annual data from 1971 to 2014 to estimate the potential relationship between the selected variables for Pakistan. The empirical evidence has been developed by employing unit root tests and the co-integration method used under the Autoregressive distributed lag (ARDL) model. According to the estimation results, the relationship between the dependent and independent variables is both long-term and short-term. The findings of the FMOLS, DOLS and CCR estimation revealed that the coefficients of EC, EPH and GDP all were significantly positive relationship with carbon dioxide emissions, while the coefficients of CRW, EPC and EU were negatively significant, respectively. The short-run analysis indicates that the coefficients of CRW and EU were negative and significantly associated with CO2 emissions. Furthermore, the outcomes from short-run analysis also indicated that the value of ECT was −0.8668, which describes that the variance of CO2 emissions from short-run to long-run equilibrium is adjusted by 86.68 percent annually.
The scope of the study was limited to the following variables in the context of Pakistan: i.e., carbon dioxide emissions, combustible renewable and waste, electric power consumption, electricity production from coal, hydroelectric and natural gas sources, energy use and gross domestic product. Pakistan was chosen as the focus of this study project because the country has experienced an increase in the severity of its power outages and pollution of its natural habitats, both of which directly impact the country’s economic growth and carbon dioxide emissions. However, the consequences may differ in other developing countries operating in the same environment. To implement a low-carbon energy system, Pakistan will need significant planning and financing, in addition to concerted efforts across a wide range of economic sectors. In summary, the main policy recommendation from this study is that Pakistan’s environmental authorities should pursue conservative energy policies, as these policies will not negatively impact the country’s economic development. Expanding Pakistan’s energy portfolio to include renewable energy sources such as biofuel, solar and wind energy is necessary to create a greener environment in the country.
Despite the fact that the present study produced significant empirical findings in the context of Pakistan, there are several shortcomings in our analysis that might be addressed in future studies. One of the drawback of our analysis is the unavailability of the data for some parameters which can have potential impact on carbon emissions in Pakistan. Future studies will need to consider a number of other essential aspects, such as value added by the industrial sector, value added by agriculture, population, level of financial development, foreign direct investment, etc., to produce useful results. Furthermore, this study utilized CO2 emissions as an indicator for environmental pollution from GHGs emissions. More research could be done utilizing consumption-based carbon emissions as a proxy for environmental pollution, as well as other emission indicators, such as nitrous oxide, sulfur dioxide, methane and other short-lived climate forces. Nevertheless, CO2 emission is regarded as a proxy for environmental pollution in this study, which is not the only cause of declining environmental sustainability. Additional indicators of environmental pollution, such as water pollution and land pollution, may be investigated in the future.
Data availability statement
The original contributions presented in the study are included in the article/supplementary material, further inquiries can be directed to the corresponding author.
Author contributions
Conceptualization by SA; Data curation by AK and GT; Formal analysis by SA; Methodology by SA, AG; Supervision by MT; Writing-original draft by SA; Writing-review and editing by AS.
Acknowledgments
The authors would also like to extend gratitude to reviewers for providing helpful suggestions on an earlier draft of this paper.
Conflict of interest
The authors declare that the research was conducted in the absence of any commercial or financial relationships that could be construed as a potential conflict of interest.
Publisher’s note
All claims expressed in this article are solely those of the authors and do not necessarily represent those of their affiliated organizations, or those of the publisher, the editors and the reviewers. Any product that may be evaluated in this article, or claim that may be made by its manufacturer, is not guaranteed or endorsed by the publisher.
References
Ahmad, N., and Du, L. (2017). Effects of energy production and CO2 emissions on economic growth in Iran: ARDL approach. Energy 123, 521–537. doi:10.1016/j.energy.2017.01.144
Akadiri, S., Alola, A. A., Olasehinde-Williams, G., and Etokakpan, M. U. (2020). The role of electricity consumption, globalization and economic growth in carbon dioxide emissions and its implications for environmental sustainability targets. Sci. Total Environ. 708, 134653. doi:10.1016/j.scitotenv.2019.134653
Akaike, H. (1974). A new look at the statistical model identification. IEEE Trans. Autom. Contr. 19 (6), 716–723. doi:10.1109/TAC.1974.1100705
Akinlo, A. E. (2008). Energy consumption and economic growth: Evidence from 11 sub-sahara african countries. Energy Econ. 30 (5), 2391–2400. doi:10.1016/j.eneco.2008.01.008
Aklin, M., Cheng, C., Johannes, U., Ganesan, K., and Jain, A. (2016). Factors affecting household satisfaction with electricity supply in rural India. Nat. Energy 1, 16170–16176. doi:10.1038/NENERGY.2016.170
Ali, S., Li, G., Liu, Y., Ishaq, M., and Shah, T. (2019a). The relationship between carbon dioxide emissions, economic growth and agricultural production in Pakistan: An autoregressive distributed lag analysis. Energies 12 (24), 4644. doi:10.3390/en12244644
Ali, S., Liu, Y., Abdullah, A. N., Ishaq, M., Shah, T., Ye, X., et al. (2019b). The effect of climate change on economic growth: Evidence from Pakistan. Pac. Int. J. 2 (3), 44–53. doi:10.1007/s10018-015-0116-3
Ali, S., Liu, Y., Shah, T., Azam, T., Ali Chandio, A., and Ali, I. (2019c). Analysis of the nexus of CO2 emissions, economic growth, land under cereal crops and agriculture value-added in Pakistan using an ARDL approach. Energies 12 (23), 4590–4619. doi:10.3390/en12234590
Allcott, H., Collard-wexler, A., and Connell, S. D. O. (2016). How do electricity shortages affect industry? evidence from India. Am. Econ. Rev. 106 (3), 587–624. doi:10.1257/aer.20140389
Alshehry, A. S., and Belloumi, M. (2015). Energy consumption, carbon dioxide emissions and economic growth: The case of Saudi arabia. Renew. Sustain. Energy Rev. 41, 237–247. doi:10.1016/j.rser.2014.08.004
Altinay, G., and Karagol, E. (2005). Electricity consumption and economic growth: Evidence from Turkey. Energy Econ. 27 (6), 849–856. doi:10.1016/j.eneco.2005.07.002
Apergis, N., and Payne, J. E. (2010). Renewable energy consumption and economic growth: Evidence from a panel of OECD countries. Energy Policy 38 (1), 656–660. doi:10.1016/j.enpol.2009.09.002
Aqeel, A., and Butt, M. S. (2001). The relationship between energy consumption and economic growth in Pakistan. Asia-Pacific Dev. Journa 8 (2), 101–110. doi:10.1016/j.enpol.2009.08.008
Arouri, M. E. H., Ben Youssef, A., M’henni, H., and Rault, C. (2012). Energy consumption, economic growth and CO 2 emissions in Middle East and North African countries. Energy Policy 45, 342–349. doi:10.1016/j.enpol.2012.02.042
Arrillaga, J., Bradley, D., and S Bodger, P. (1985). Power system harmonics. Hoboken, NJ, USA: John Wiley & Sons.
Arrillaga, J., C Smith, B., R Watson, N., and Wood, A. R. (1997). Power system harmonic analysis. New York, NY, USA: John Wiley & Sons.
Asafu-Adjaye, J. (2000). The relationship between energy consumption, energy prices and economic growth: Time series evidence from asian developing countries. Energy Econ. 22 (6), 615–625. doi:10.1016/S0140-9883(00)00050-5
Asongu, S. A., Agboola, M. O., and Bekun, F. V. (2020). Mary oluwatoyin agboola, andrew adewale alola, and festus victor BekunThe criticality of growth, urbanization, electricity and fossil fuel consumption to environment sustainability in Africa. Sci. Total Environ. 712, 136376. doi:10.1016/j.scitotenv.2019.136376
Asumadu-sarkodie, S., Asantewaa Owusu, P., and Asumadu-sarkodie, S. (2017). The relationship between carbon dioxide emissions, electricity production and consumption in Ghana. Energy Sources, Part B Econ. Plan. Policy 00 (00), 547–558. doi:10.1080/15567249.2016.1227885
Atif, S. M., and Siddiqi, M. (2012). The electricity consumption and economic growth nexus in Pakistan: A new evidence. SSRN J. doi:10.2139/ssrn.1569580
Azam, M., Qayyum Khan, A., and Qureshi, M. E. (2016). The impact of CO 2 emissions on economic growth: Evidence from selected higher CO 2 emissions economies. Environ. Sci. Pollut. Res. 23, 6376–6389. doi:10.1007/s11356-015-5817-4
Balcilar, M., Abidin Ozdemir, Z., and Arslanturk, Y. (2010). Economic growth and energy consumption causal nexus viewed through a bootstrap rolling window. Energy Econ. 32 (6), 1398–1410. doi:10.1016/j.eneco.2010.05.015
Balcilar, M., Bekun, F. V., and Uzuner, G. (2019). Revisiting the economic growth and electricity consumption nexus in Pakistan. Environ. Sci. Pollut. Res. 26 (12), 12158–12170. doi:10.1007/s11356-019-04598-0
Baloch, M. H., Kaloi, G. S., and Memon, Z. A. (2016). Current scenario of the wind energy in Pakistan challenges and future perspectives: A case study. Energy Rep. 2, 201–210. doi:10.1016/j.egyr.2016.08.002
Balsalobre-Lorente, D., Shahbaz, M., Roubaud, D., and Farhani, S. (2018). How economic growth, renewable electricity and natural resources contribute to CO2 emissions? Energy Policy 113, 356–367. doi:10.1016/j.enpol.2017.10.050
Bekun, F. V., Emir, F., and Asumadu Sarkodie, S. (2019). Another look at the relationship between energy consumption, carbon dioxide emissions, and economic growth in South Africa. Sci. Total Environ. 655, 759–765. doi:10.1016/j.scitotenv.2018.11.271
Brown, R. L., Durbin, J., and Evans, J. M. (1975). Techniques for testing the constancy of regression relationships over time. J. R. Stat. Soc. Ser. B Methodol. 37 (2), 149–163. doi:10.1111/j.2517-6161.1975.tb01532.x
Caciotta, M., Leccese, F., and Trifirò, T. (2006). “From power quality to perceived power quality,” in Proceedings of the IASTED international conference on energy and power systems (Thailand: Chiang Mai), 94–102.
Chandio, A. A., Akram, W., Ahmad, F., and Ahmad, M. (2020a). Dynamic relationship among agriculture-energy-forestry and carbon dioxide (CO2) emissions: Empirical evidence from China. Environ. Sci. Pollut. Res. 27 (27), 34078–34089. doi:10.1007/s11356-020-09560-z
Chandio, A. A., Jiang, Y., Ahmad, F., Akram, W., Ali, S., and Rauf, A. (2020b). Investigating the long-run interaction between electricity consumption, foreign investment, and economic progress in Pakistan: Evidence from VECM approach. Environ. Sci. Pollut. Res. 27 (20), 25664–25674. doi:10.1007/s11356-020-08966-z
Chandio, A. A., Jiang, Y., Mirani, A. A., Ahmad, F., and Shehzad, K. (2019). Does energy-growth and environment quality matter for agriculture sector in Pakistan or not? An application of cointegration approach. Energies 12 (10), 1879–1917. doi:10.3390/en12101879
Danish, B. Z., Wang, Z., and Wang, B. (2018). Energy production, economic growth and CO2 emission: Evidence from Pakistan. Nat. Hazards (Dordr). 90 (1), 27–50. doi:10.1007/s11069-017-3031-z
Dickey, D. A., and Fuller, W. A. (1979). Distribution of the estimators for autoregressive time series with a unit root. J. Am. Stat. Assoc. 74 (366), 427–431. doi:10.1080/01621459.1979.10482531
Dogan, E. (2014). Energy consumption and economic growth: Evidence from low-income countries in sub-saharan Africa. Int. J. Energy Econ. Policy 4 (2), 154–162.
Dong, K., Sun, R., and Dong, X. (2018). CO2 emissions, natural gas and renewables, economic growth: Assessing the evidence from China. Sci. Total Environ. 640–641, 293–302. doi:10.1016/j.scitotenv.2018.05.322
Dugan, R. C., F McGranaghan, M., W Beaty, H., and Santoso, S. (1996). Electrical power systems quality. New York, NY, USA: McGraw-Hill.
Farhani, S., and Ozturk, I. (2015). Causal relationship between CO2 emissions, real GDP, energy consumption, financial development, trade openness, and urbanization in Tunisia. Environ. Sci. Pollut. Res. 22 (20), 15663–15676. doi:10.1007/s11356-015-4767-1
GOP (2013). Pakistan economic Survey 2012–2013; ministry of finance, finance division, economic adviser’s wing: Islamabad, Pakistan, 2013. Islamabad, Pakistan: Government of Pakistan.
GOP (2014). Pakistan economic Survey 2013–2014; ministry of finance, finance division, economic adviser’s wing: Islamabad, Pakistan, 2014. Islamabad, Pakistan: Government of Pakistan.
Granger, C. W. J., and Jji, E. (1988). Some recent development in a concept of causality. J. Econ. 39, 199–211. doi:10.1016/0304-4076(88)90045-0
IEA (2017). International Energy Agency. World Energy Outlook. Available at: https://www.iea.org/reports/world-energy-outlook-2017.
Jaiyesim, M. T., LloydOsinubi, A., and Tokunbo, S. 2017. Energy consumption and ggp in the oecd countries: A causality analysis. Rev. Econ. Bus. Stud. 10 (1), 55–74. doi:10.1515/rebs-2017-0048
Jebli, M. B., and Ben Youssef, S. (2017). Renewable energy consumption and agriculture: Evidence for cointegration and granger causality for Tunisian economy. Int. J. Sustain. Dev. World Ecol. 24 (2), 149–158. doi:10.1080/13504509.2016.1196467
Johansen, S., and Juselius, K. (1990). Maximum likelihood estimation and inference on cointegration — with applications to the demand for money. Oxf. Bull. Econ. Stat. 52 (2), 169–210. doi:10.1111/j.1468-0084.1990.mp52002003.x
Kazmi, Z. (2014). Pakistan’s energy security 2014. AvaliableAt: http://tribune.com.pk/tory/655573/pakistansenergy-%0Asecurity.
Khan, M. M., Zaman, K., Irfan, D., Awan, U., Ali, G., Kyophilavong, P., et al. (2016). Triangular relationship among energy consumption, air pollution and water resources in Pakistan. J. Clean. Prod. 112, 1375–1385. doi:10.1016/j.jclepro.2015.01.094
Khan, M. T. I., Qamar, A., and Ashfaq, M. (2018a). The nexus between greenhouse gas emission, electricity production, renewable energy and agriculture in Pakistan. Renew. Energy 118, 437–451. doi:10.1016/j.renene.2017.11.043
Khan, S., Ahmed Jam, F., Shahbaz, M., and Mamun, M. D. (2018b). Electricity consumption, economic growth and trade openness in Kazakhstan: Evidence from cointegration and causality. OPEC Energy Rev. 42 (3), 224–243. doi:10.1111/opec.12130
Koondhar, M. A. (2021). Asymmetric causality among carbon emission from agriculture, energy consumption, fertilizer, and cereal food production – A nonlinear analysis for Pakistan. Sustain. Energy Technol. Assess. 45, 101099. doi:10.1016/j.seta.2021.101099
Lee, C. C., and Chang, C. P. (2008). Energy consumption and economic growth in asian economies: A more comprehensive analysis using panel data. Resour. Energy Econ. 30 (1), 50–65. doi:10.1016/j.reseneeco.2007.03.003
Lee, S., Ha, J., Na, O., and Seongryong, N. (2003). The cusum test for parameter change in time series models. Scand. J. Stat. 30 (4), 781–796. doi:10.1111/1467-9469.00364
Lin, B., and Chang, L. (2016). Why is electricity consumption inconsistent with economic growth in China? Energy Policy 88, 310–316. doi:10.1016/j.enpol.2015.10.031
Liu, Y., and Yu, H. (2018). The dynamic links between CO2 emissions, energy consumption and economic development in the countries along ‘the belt and road. Sci. Total Environ. 645, 674–683. doi:10.1016/j.scitotenv.2018.07.062
Mackinnon, J. G., Haug, A. A., and Michelis, L. (1999). Numerical distribution functions of likelihood ratio tests for cointegration. J. Appl. Econ. Chichester. Engl. 14 (5), 563–577. doi:10.1002/(sici)1099-1255(199909/10)14:5<563::aid-jae530>3.0.co;2-r
Mehrara, M. (2007). Energy consumption and economic growth: The case of oil exporting countries. Energy Policy 35 (5), 2939–2945. doi:10.1016/j.enpol.2006.10.018
Mirza, F. M., and Kanwal, A. (2017). Energy consumption, carbon emissions and economic growth in Pakistan: Dynamic causality analysis. Renew. Sustain. Energy Rev. 72, 1233–1240. doi:10.1016/j.rser.2016.10.081
Nadeem, S., and Munir, K. (2016). Energy Consumption and Economic Growth in Pakistan: A Sectoral Analysis. Munich Personal RePEc Archive [Preprint], (74569).
Naseem, S., Tong, G. J., and Kashif, U. (2020). Asymmetrical ARDL correlation between fossil fuel energy, food security, and carbon emission: Providing fresh information from Pakistan. Environ. Sci. Pollut. Res. 27 (25), 31369–31382. doi:10.1007/s11356-020-09346-3
Nawaz, S., Iqbal, N., and Anwar, S. (2013). Electricity demand in Pakistan: A nonlinear estimation. Pak. Dev. Rev. 52 (4I), 479–492. doi:10.30541/v52i4ipp.479-492
NEPRA (2015). National electric power regulatory authority; state of industry report 2015. AvaliableAt: http://nepra.org.pk/industryreports.htm.
Oconnell, N., Pierre, P., Madsen, H., and Omalley, M. (2014). Benefits and challenges of electrical demand response: A critical review. Renew. Sustain. Energy Rev. 39, 686–699. doi:10.1016/j.rser.2014.07.098
Odhiambo, N. M. (2010). Electricity consumption, labour force participation rate and economic growth in Kenya: An empirical investigation. Problems Perspect. Manag. 8 (1), 31–38.
Odhiambo, N. M. (2009). Energy consumption and economic growth nexus in Tanzania: An ARDL bounds testing approach. Energy Policy 37 (2), 617–622. doi:10.1016/j.enpol.2008.09.077
Omay, T., Hasanov, M., and Uçar, N. (2014). Energy consumption and economic growth: Evidence from nonlinear panel cointegration and causality tests. Appl. Econ. 34 (2), 36–55.
Omri, A. (2013). CO2 emissions, energy consumption and economic growth nexus in MENA countries: Evidence from simultaneous equations models. Energy Econ. 40, 657–664. doi:10.1016/j.eneco.2013.09.003
Pata, U. K., and Caglar, A. E. (2021). Investigating the EKC hypothesis with renewable energy consumption, human capital, globalization and trade openness for China: Evidence from augmented ARDL approach with a structural break. Energy 216, 119220. doi:10.1016/j.energy.2020.119220
Paul, S., and Bhattacharya, R. N. (2004). Causality between energy consumption and economic growth in India: A note on conflicting results. Energy Econ. 26 (6), 977–983. doi:10.1016/j.eneco.2004.07.002
Pempetzoglou, M. (2014). Electricity consumption and economic growth: A linear and nonlinear causality investigation for Turkey. Int. J. Energy Econ. Policy 4 (2), 263–273.
Pesaran, M. H., Shin, Y., and Smith, R. J. (2001). Bounds testing approaches to the analysis of level relationships. J. Appl. Econ. Chichester. Engl. 16 (3), 289–326. doi:10.1002/jae.616
Phillips, P. C. B., and Perron, P. (1988). Testing for a unit root in time series regression. Biometrika 75 (2), 335–346. doi:10.1093/biomet/75.2.335
Rahman, M. M. (2017). Do population density, economic growth, energy use and exports adversely affect environmental quality in asian populous countries? Renew. Sustain. Energy Rev. 77, 506–514. doi:10.1016/j.rser.2017.04.041
Rahman, M. M., and Abul Kashem, M. (2017). Carbon emissions, energy consumption and industrial growth in Bangladesh: Empirical evidence from ARDL cointegration and granger causality analysis. Energy Policy 110, 600–608. doi:10.1016/j.enpol.2017.09.006
Rauf, A., Zhang, J., Li, J., and Amin, W. (2018). Structural changes, energy consumption and carbon emissions in China: Empirical evidence from ARDL bound testing model. Struct. Change Econ. Dyn. 47, 194–206. doi:10.1016/j.strueco.2018.08.010
Razzaqi, S., Bilquees, F., and Sherbaz, S. (2011). Dynamic relationship between energy and economic growth: Evidence from D8 countries. Pak. Dev. Rev. 50 (4), 437–458. doi:10.30541/v50i4iipp.437-458
Rehman, A., Ahmad, M., Ali Chandio, A., Zhang, D., and Deyuan, Z. (2019). The effect of carbon dioxide emission and the consumption of electrical energy, fossil fuel energy, and renewable energy, on economic performance: Evidence from Pakistan. Environ. Sci. Pollut. Res. 26 (21), 21760–21773. doi:10.1007/s11356-019-05550-y
Rehman, E., and Rehman, S. (2022). Modeling the nexus between carbon emissions, urbanization, population growth, energy consumption, and economic development in asia: Evidence from grey relational analysis. Energy Rep. 8, 5430–5442. doi:10.1016/j.egyr.2022.03.179
Saboori, B., and Soleymani, A. (2012). Environmental Kuznets Curve in Indonesia, the role of energy consumption and foreign trade. MPRA Work. Pap. 31534, 1–17.
Sahir, M. H., and Qureshi, A. H. (2008). Assessment of new and renewable energy resources potential and identification of barriers to their significant utilization in Pakistan. Renew. Sustain. Energy Rev. 12 (1), 290–298. doi:10.1016/j.rser.2006.07.002
Salahuddin, M., Alam, K., Ozturk, I., and Sohag, K. (201820172002). The effects of electricity consumption, economic growth, financial development and foreign direct investment on CO2 emissions in Kuwait. Renew. Sustain. Energy Rev. 81, 2002–2010. doi:10.1016/j.rser.2017.06.009
Samu, R., Bekun, F. V., and Fahrioglu, M. (2019). Electricity consumption and economic growth nexus in Zimbabwe revisited: Fresh evidence from Maki cointegration. Int. J. Green Energy 16 (7), 540–550. doi:10.1080/15435075.2019.1598417
Santoyo-Castelazo, E., and Azapagic, A. (2014). Sustainability assessment of energy systems: Integrating environmental, economic and social aspects. J. Clean. Prod. 80, 119–138. doi:10.1016/j.jclepro.2014.05.061
Sarkodie, S. A., and Adams, S. (2018). Renewable energy, nuclear energy, and environmental pollution: Accounting for political institutional quality in South Africa. Sci. Total Environ. 643, 1590–1601. doi:10.1016/j.scitotenv.2018.06.320
Sarkodie, S. A. (2018). The invisible hand and EKC hypothesis: What are the drivers of environmental degradation and pollution in Africa? Environ. Sci. Pollut. Res. 25 (22), 21993–22022. doi:10.1007/s11356-018-2347-x
Sarwar, S., Chen, W., and Waheed, R. (20172016). Electricity consumption, oil price and economic growth: Global perspective. Renew. Sustain. Energy Rev. 76, 9–18. doi:10.1016/j.rser.2017.03.063
Schwarz, G. (1978). Estimating the dimension of a model. Ann. Stat. 6 (2), 461–464. doi:10.1214/aos/1176344136
Seker, F., Ertugrul, H. M., and Cetin, M. (2015). The impact of foreign direct investment on environmental quality: A bounds testing and causality analysis for Turkey. Renew. Sustain. Energy Rev. 52, 347–356. doi:10.1016/j.rser.2015.07.118
SESRIC (2014). The statistical, economic and social research and training centre for islamic countries. AvaliableAt: http://www.sesric.org/publications-books.php?year=2014.
Shahbaz, M., Chaudhary, A. R., and Ozturk., I. (2017a). Does urbanization cause increasing energy demand in Pakistan? Empirical evidence from STIRPAT model. Energy 122, 83–93. doi:10.1016/j.energy.2017.01.080
Shahbaz, M., and Feridun, M. (2012). Electricity consumption and economic growth empirical evidence from Pakistan. Qual. Quant. 46 (5), 1583–1599. doi:10.1007/s11135-011-9468-3
Shahbaz, M., Hong, T., Kumar Mahalik, M., and Roubaud, D. (2017b). Energy consumption, financial development and economic growth in India: New evidence from a nonlinear and asymmetric analysis. Energy Econ. 63, 199–212. doi:10.1016/j.eneco.2017.01.023
Shahbaz, M., Hye, Q. M. A., Tiwari, A. K., and Leitao, N. C. (2013). Economic growth, energy consumption, financial development, international trade and CO2 emissions in Indonesia. Renew. Sustain. Energy Rev. 25, 109–121. doi:10.1016/j.rser.2013.04.009
Shahbaz, M., and Lean, H. H. (2012). The dynamics of electricity consumption and economic growth: A revisit study of their causality in Pakistan. Energy 39 (1), 146–153. doi:10.1016/j.energy.2012.01.048
Shahbaz, M., Tang, C. F., and Shabbir, M. S. (2011). Electricity consumption and economic growth nexus in Portugal using cointegration and causality approaches. Energy Policy 39 (6), 3529–3536. doi:10.1016/j.enpol.2011.03.052
Shahbaz, M., Zeshan, M., and Afza, T. (2012). Is energy consumption effective to spur economic growth in Pakistan? New evidence from bounds test to level relationships and granger causality tests. Econ. Model. 29 (6), 2310–2319. doi:10.1016/j.econmod.2012.06.027
Sheikh, M. A. (2010). Energy and renewable energy scenario of Pakistan. Renew. Sustain. Energy Rev. 14 (1), 354–363. doi:10.1016/j.rser.2009.07.037
Solarin, S. A., Shahbaz, M., and Hussain Shahzad, S. J. (2016). Revisiting the electricity consumption-economic growth nexus in Angola: The role of exports, imports and urbanization. Int. J. Energy Econ. Policy 6 (3), 501–512.
Soytas, U., and Sari, R. (2003). Energy consumption and GDP: Causality relationship in G-7 countries and emerging markets. Energy Econ. 25 (1), 33–37. doi:10.1016/S0140-9883(02)00009-9
Tamba, J. G., Armand Fopah, L., and Sapnken, F. E. (2017). Electricity consumption and economic growth: Evidence from Cameroon. Energy Sources, Part B Econ. Plan. Policy 12 (11), 1007–1014. doi:10.1080/15567249.2017.1349211
Tiwari, A. (2011). Primary energy consumption, CO2 emissions and economic growth: Evidence from India. South East Eur. J. Econ. Bus. 6 (2), 99–117. doi:10.2478/v10033-011-0019-6
To, H., Albert, W., and Charles, M. B. (2013). Energy consumption and economic growth—the case of Australia. Aust. Conf. Econ. 1, 25.
Wang, S., Li, G., and Fang, C. (2018). Urbanization, economic growth, energy consumption, and CO2 emissions: Empirical evidence from countries with different income levels. Renew. Sustain. Energy Rev. 81, 2144–2159. doi:10.1016/j.rser.2017.06.025
Wang, S., Li, Q., Fang, C., and Zhou, C. (2016). The relationship between economic growth, energy consumption, and CO2 emissions: Empirical evidence from China. Sci. Total Environ. 542, 360–371. doi:10.1016/j.scitotenv.2015.10.027
Xiao, Z., and Phillips, P. C. B. (2002). A CUSUM test for cointegration using regression residuals. J. Econ. 108 (1), 43–61. doi:10.1016/S0304-4076(01)00103-8
Xu, B., and Lin, B. (2017). What cause a surge in China’s CO2 emissions? A dynamic vector autoregression analysis. J. Clean. Prod. 143, 17–26. doi:10.1016/j.jclepro.2016.12.159
Yaşar, N. (2017). The relationship between energy consumption and economic growth: Evidence from different income country groups. Int. J. Energy Econ. Policy 7 (2), 86–97.
Keywords: carbon dioxide emissions, electricity consumption, economic growth, ARDL bound testing, Pakistan
Citation: Ali S, Ghimire A, Khan A, Tariq G, Shah AA and Tariq MAUR (2022) Modelling the nexus of carbon dioxide emissions, economic growth, electricity production and consumption: Assessing the evidence from Pakistan. Front. Environ. Sci. 10:1075730. doi: 10.3389/fenvs.2022.1075730
Received: 20 October 2022; Accepted: 22 November 2022;
Published: 08 December 2022.
Edited by:
Khurram Shehzad, Southeast University, ChinaReviewed by:
Abbas Ali Chandio, Sichuan Agricultural University, ChinaLifang Zhang, Dongbei University of Finance and Economics, China
Copyright © 2022 Ali, Ghimire, Khan, Tariq, Shah and Tariq. This is an open-access article distributed under the terms of the Creative Commons Attribution License (CC BY). The use, distribution or reproduction in other forums is permitted, provided the original author(s) and the copyright owner(s) are credited and that the original publication in this journal is cited, in accordance with accepted academic practice. No use, distribution or reproduction is permitted which does not comply with these terms.
*Correspondence: Muhammad Atiq Ur Rehman Tariq, atiq.tariq@yahoo.com