Performance evaluation of solar PV mini grid system in Nepal: a case study Thabang and Sugarkhal
 Sanjay Lal Karna1,2
  Ajay Kumar Jha
 Jiwan Kumar Mallik
- 1Central Department of Physics, Tribhuvan University, Kirtipur, Nepal
- 2Department of Physics, Tri-Chandra Multiple Campus, Tribhuvan University, Kathmandu, Nepal
- 3Department of Mechanical and Aerospace Engineering, Institute of Engineering, Tribhuvan University, Pulchowk Campus, Lalitpur, Nepal
- 4Department of Physics, Patan Multiple Campus, Tribhuvan University, Lalitpur, Nepal
- 5Innovative Ghar Nepal, Lalitpur, Nepal
- 6Renewable Energy for Rural Livelihood, Lalitpur, Nepal
This article investigates the performance metrics of two solar mini-grid systems, Thabang Solar Mini-Grid (TSMG) and Sugarkhal Solar Mini-Grid (SSMG), based on secondary live data, collected from Renewable Energy for Rural Livelihood (RERL) and PVsyst software 7.4 spanning the years 2021–2023. Notably, the highest irradiance levels were recorded in April for both TSMG and SSMG. TSMG exhibited an energy generation of 83.206 MWh/year in 2021 and 112.140 MWh/year in 2022, with a peak sun hour (PSH) of 5.5 h. Conversely, SSMG energy generated 64.14 MWh/year in 2021 and 68.79 MWh/year in 2022, with a PSH of 5.7 h. The capture loss of SSGM recorded 0.239 kWh/day to 3.322 kWh/day in 2021 and 0.082 kWh/day to 2.086 kWh/day in 2022. Also, the capture loss of TSGM recorded 1.573 kWh/day to 5.011 kWh/day in 2021 and 0.470 kWh/day to 4.261 kWh/day in 2023. The efficiency of SSMG is consistently higher efficiency compared to TSMG. The capture factor of SSMG increased from 9.76% in 2021 to 10.47% in 2022, while of TSMG 6.33% in 2021 to 8.53% in 2023. The findings provide valuable insights into the comparative performance of these solar mini-grid systems, contributing to the optimization and improvement of solar energy generation in diverse environmental conditions.
1 Introduction
Global interest is growing regarding the localization of renewable energy resources (RER) using solar mini grids (SMG). Social issues, financial, ecological, and technological advantages all come with SMG use. They reduce blackouts, deliver electricity in remote areas, and improve energy efficiency. However, due to increased demand, it has become harder to combine microgrids (MGs) and systems for managing energy while retaining robustness and effectiveness. Investigating renewable energy resources and building MGs with efficient and long-lasting power storage systems and demand-side control require sustainable techniques (Shafiullah et al., 2022). Solar panels are used in photovoltaic (PV) systems, which can range in size from tiny rooftop installations to massive utility-scale power plants. A basic PV system that connects to the grid is shown in Figure 1. Global energy consumption has grown significantly over the past three decades, increasing from 6131 TWh in 1973 to 23816 TWh in 2014, and it is anticipated that this increase will enable new technology and hence enhance quality of life. According to Guichi et al., by 2040, 56% of the global energy supply would have been used (Guichi et al., 2018). Environmentally responsible and renewable sources of energy, such as solar energy, were one potential power source to replace non-renewable energy sources.
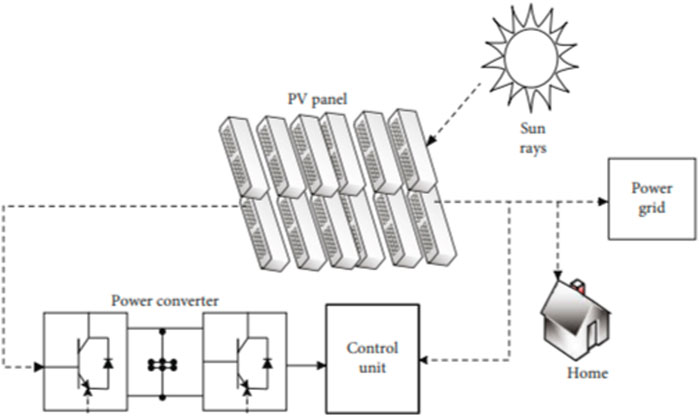
FIGURE 1. Grid-Connection PV module’s configuration (Srimathi et al., 2022).
Solar energy has been popularly adopted as an off-grid electrification solution in many developing countries around the world, with varying degrees of success. It has been a successful solution in South Asia (Palit and Chaurey, 2011), in Tanzania and Mozambique (Ahlborg and Hammar, 2014), and in South Africa. It has also been found an affordable solution for rural electrification in Sub-Saharan Africa (Baurzhan and Jenkins, 2016). A review of global rural electrification policies across the world; found that off-grid renewable energy-based electrification is the best answer where grid extension is not feasible. An effective electrification strategy is one where the on-grid and off-grid electrification plans are complementary and avoid duplication of resources (Aziz and Chowdhury, 2020).
Currently, 69% of the nation’s energy needs are met by biomass, which includes firewood and agricultural waste. Hydropower and small-scale renewable energy sources including PV, biogas, and micro-hydro that are purchased from India produce 25% of the remaining energy. Nepal is the nation that is most at risk from the effects of climate change. The Ministry of Energy and Water Resources (2023) aims to increase annual household electricity use between 267 and 700 kWh in 5 years and 1,500 kWh in 10 years. According to Kafle et al. (2023), Nepal experiences approximately 300 days of sunshine annually, resulting in an average daily amount of six and a half hours of sunlight and 4.7 kWh/m2/day of insolation. Given the available resources and local knowledge, Nepal’s existing MGs are not sufficiently built for the region (Shrestha et al., 2020).
Regarding Nepal specifically, over 55 MW of electricity have been generated through micro-hydropower and solar energy, supplying 3.6 million households, or 18% of the population, with access to electricity. Since the establishment of the Alternative Energy Promotion Center (AEPC) in 1996, Nepal has experienced a rapid acceleration in the growth of mini- and micro-hydropower, solar PV, and wind generating. The establishment of an off-grid SMG system and aggressive grid extension have both contributed to the electrification of rural areas of Nepal. In Nepal, 95.5% of families have some form of access to electricity, including grid or SMG power, solar home power, solar lights, rechargeable batteries, etc. Only 67% of people in the nation have access to power, according to the same survey (ESMAP, 2017). As an illustration, the loading factor and utilization factor for Baglung SMG in western Nepal have been determined to be 23% and 26%, respectively (Shrestha et al., 2020). Even though Nepal has a huge amount of potential for producing electricity from various renewable energy sources, 4.5% of its population still lacks access to electricity. This is a result of the country’s hilly terrain. In terms of a management system for the long-term success of plants, Nepalese MGs have a significant failure rate. Rural areas still have trouble accessing dependable and consistent electricity because of these various concerns (SE4ALL, 2020).
1.1 Electricity scenarios in Nepal
Modern energy, comprising electricity, petroleum, and renewable, constitutes approximately 20% of Nepal’s total energy consumption, a figure steadily on the rise. Among these modern energy sources, petrol holds the largest share at around 65%, while electricity accounts for approximately 15%, and the remaining 20% is attributed to other sources like coal. Nepal faces a rising demand for electricity, particularly in remote areas, where access is limited. Despite the availability of various renewable energy sources for lighting and cooking, achieving sustainable development goal number 7, which emphasizes universal access to affordable, reliable, and modern energy, remains a challenge. In alignment with global sustainability efforts, Nepal, during COP26, committed to achieving net-zero emissions by 2045 and increasing the share of clean energy to 15% while expanding forest cover to 45% by 2030. As of now, the country’s total installed power plant capacity stands at 2,265 MW, with 74 MW designated for off-grid use and 2,191 MW connected to the grid. The grid-connected facilities consist of 49.76 MW solar, 53.4 MW thermal, 6 MW biomass, and the majority, 2082 MW, from hydroelectric sources. An additional 74 MW of off-grid isolated generation capacity, developed by the AEPC, contributes to the overall installed capacity (Nepal Energy Outlook, 2022). The projected demand for electricity is expected to surge from an estimated 10,138 gigawatt-hours (GWh) in 2019–2020 to 31,196 GWh in 2029–2030, as per the National Planning Commission’s 2018 projections. The complete SMG in the context of Nepal is shown in Table 1 reported by AEPC and the ongoing SMG under construction is shown in Table 2 reported by RERL.
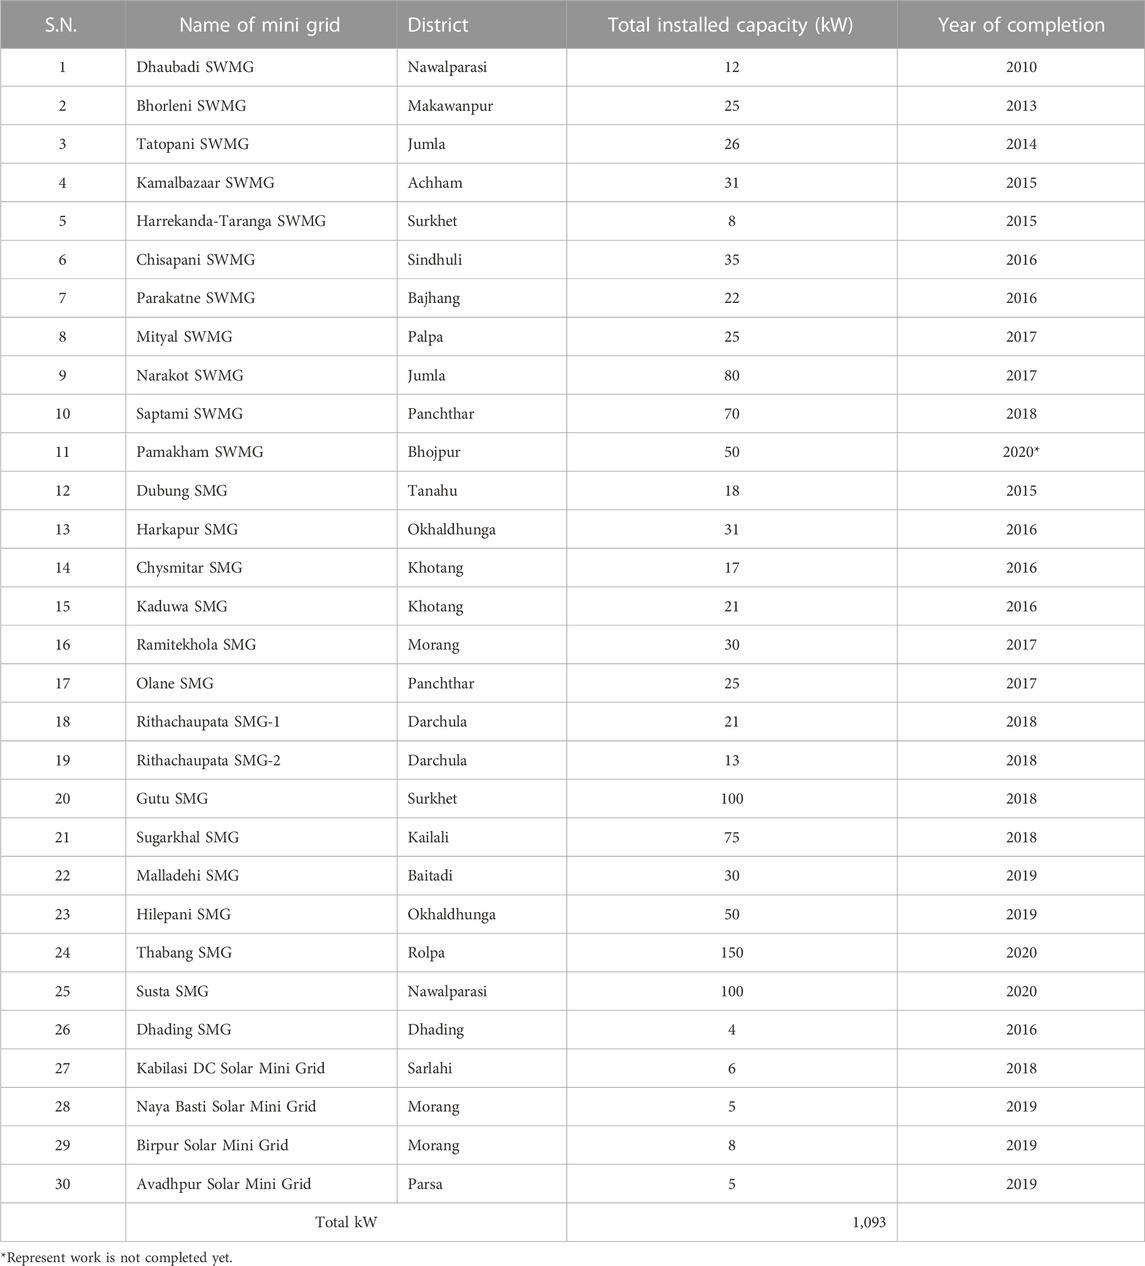
TABLE 1. SMG completed project reported by AEPC.
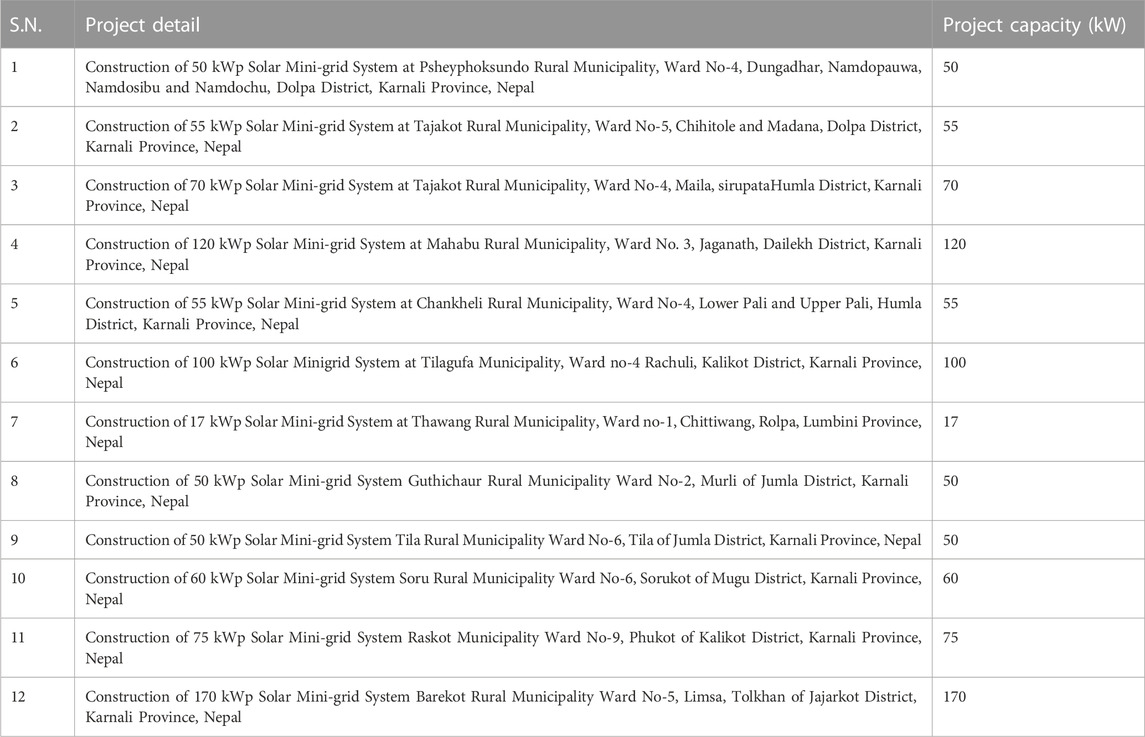
TABLE 2. Ongoing SMG project reported by RERL.
PV systems offer an efficient and environmentally beneficial energy source, among its numerous benefits. According to research, Nepal has serious policy problems that have a negative impact on the growth of PV systems like poor technological standards, inadequate knowledge, absence of information transmission, etc. Low power factors, high voltage levels, and reduced losses are all benefits of the PV system. The nation’s power utility does not provide electricity to about 22% of the population of Nepal, forcing them to find other means of electrification. This is because of the cost, performance, and reliability of rural electrification, non-technologically or economically feasible. So, the MG technology is one of the promising methods. The goal of this work is to evaluate the performance of the two TSMG and SSMG systems in Nepal, which have been constantly providing services to the community in the current environment. The performance metric help to understand the different problem which is helpful to other SMG.
1.2 Research gap
The performance and viability of off-SMG systems in the remote hilly regions of Sugarkhal and Thabang, particularly in Nepal are one of the biggest concerns of this study because no such research has been conducted in the context of Nepal for SSGM and TSMG systems. The research is about global interest in renewable energy resources, SMGs, and the challenges associated with integrating renewable energy into existing systems, because of the geographical structure of the research area and SMG system. The existing literature highlights the success of solar energy in various regions, including South Asia and Sub-Saharan Africa, but there is a dearth of information regarding the practical application and outcomes of off-SMGs in the unique context of remote hilly Sugarkhal and Thabang as well as in Nepal. Sugarkhal and Thabang encounter difficulties in conventional power infrastructure development due to challenging terrains, lack of transport infrastructure, and limited alternative energy sources, there is a need for a comprehensive study that evaluates the effectiveness, sustainability, and community impact of off-SMG systems in these specific locations. The areas have populations of 15,000 and 20,000, respectively according to the census of 2011, and exploring how SMGs can address their energy needs while considering factors such as population density, environmental sustainability, and economic viability would contribute valuable insights to the existing literature. The analysis of the performance metrics of TSMG and SSGMG systems is crucial for understanding their success and identifying potential areas for improvement. By focusing on these specific remote locations in the hilly region of Nepal. This research can provide actionable recommendations for other regions with similar characteristics, contributing to the broader goal of sustainable and effective off-grid electrification in remote hilly areas. The research parameters of the two systems are to comprehensively study PR, capture loss, system loss, irradiance, energy generation, capture factors, and system efficiency for TSMG and SSMG.
1.3 Novelty of the study
The novelty of this work is to explore the off-SMG systems located in remote hilly regions of Sugarkhal and Thabang. The research area faces different difficulties like encountering obstacles in conventional power infrastructure development due to challenging terrain, lack of transport infrastructure, and limited alternative energy sources. The establishment of SMGs offers a decentralized and adaptable energy solution tailored to the specific needs of these communities. The study of performance metrics of SSGM and TSGM help to evaluate the performance of the system and suggest the possibilities of improvement of the system which help us to preserve energy and make the system more effective in different aspect like cost, energy efficiency, loss of the system, performance ratio, capture factors, etc. This study also helped the improvement of other SMG systems located in different parts of remote Nepal. In remote regions, where there is a lack of road infrastructure and a national grid such a system is more beneficial. Because embracing clean and renewable solar energy aligns with environmental sustainability goals crucial for preserving the ecologically sensitive environment near SMG. The long-term cost-effectiveness of solar systems, coupled with the potential for job creation and community empowerment, renders this solution economically viable and socially beneficial. Additionally, the swift deployment of SMG systems enhances resilience to natural disasters, while ongoing technological innovations contribute to continuous improvements in solar technology.
2 Methods and materials
2.1 Research area
This research considered two research sites of SMG Nepal, Thabang and Sugarkhal, more detail in Figure 2. TSMG has been operated since 2021 with a 150 kWp installation capacity in the Thabang Rural Municipality of the Rolpa District of Nepal. The ground-mounted TSMG PV system is located at latitude 28.4954° North and longitude 82.7140° East. The tilt angle of the system’s PV panels is 33°. SSMG has been operated since 2021 with a 75 kWp installation capacity in the Mohanyal Rural Municipality, Kailali District by AEPC. The ground-mounted SSMG PV system is located at latitude 28.7822°N and longitude 81.2358°E. The tilt angle of the PV panels is 29°.
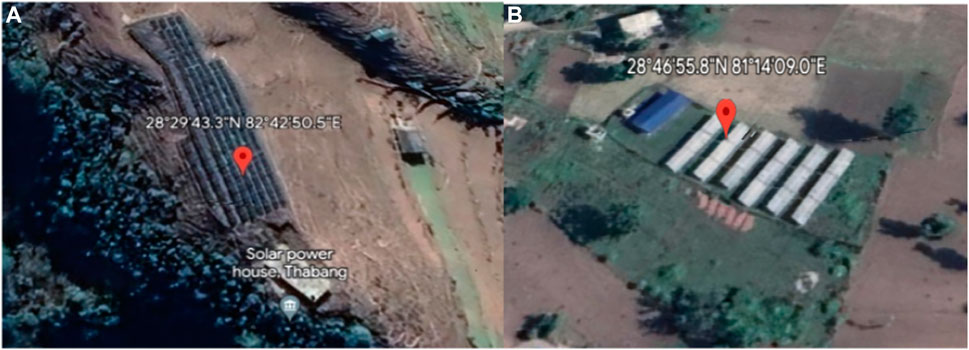
FIGURE 2. Google Earth image of (A) TSMG and (B) SSMG.
2.2 Specification of the system module
The specifications of SSMG and TSMG systems with different specifications of major components are listed in Table 3. This helps to design and configuration of the system and also provide detail of the established system.
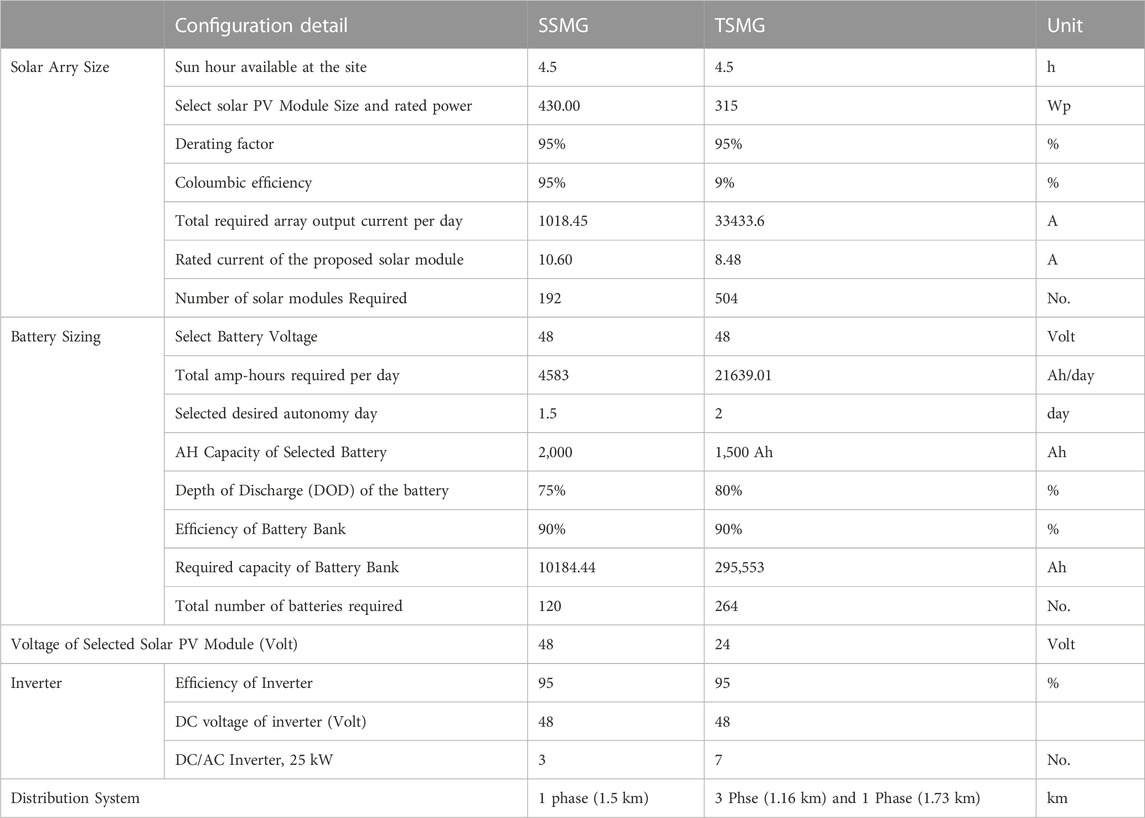
TABLE 3. Detail configuration and specification of SMG.
2.3 Sketch of PV module of SSGM and TSMG
The framework of SSGM and TSMG is shown in Figure 3 and a description of the major components is shown in Table 3.
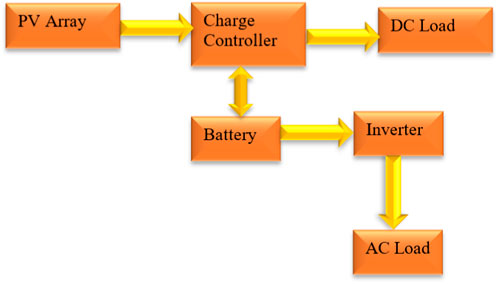
FIGURE 3. Configuration of SSMG and TSGM.
2.4 Sun path
Along with an increasing need for electrification and worries about climate change, the use of renewable energy has started to rise. The best solar energy conversion takes place during insolation at an average maximum irradiation time, or PSH. PSH is a parameter that expresses the relationship between the maximum daily sun radiation exposure and the standard solar radiation intensity of 1 kW/m2 (Megantoro et al., 2022). The University of Oregon’s Solar Radiation Monitoring Laboratory’s web resources were used to obtain the PSH of Thabang and Sugarkhal and found PSH for SSMG is 5.73 and TSMG is 5.49.
2.5 Tilt angle
The tilt angle refers to the inclination of photovoltaic modules from the horizontal plane in a fixed (non-tracking) mounting system. It is commonly advised to install photovoltaic systems with a tilt angle matching the latitude of the site (Mondol et al., 2007). Figure 4, presents the concept and measurement of the tilt angle (Božiková et al., 2021).
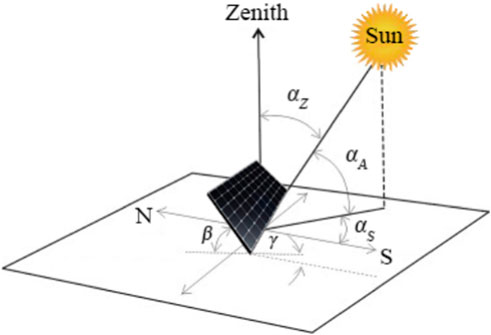
FIGURE 4. Simple Sketch of tilt angle, solar azimuth angle, and the azimuth orientation.
The azimuth angle signifies the orientation of PV modules in relation to the South, where −90° represents East, 0° is South, and +90° indicates West (Božiková et al., 2021). In Figure 4, the solar altitude angle (αA) is the angle between the horizontal plane and the line pointing to the Sun (0°≤ αA ≤ 90°). The zenith angle (αZ), which complements this angle, is defined by the vertical plane and the line to the Sun, representing the angle of incidence of beam radiation on a horizontal surface. The parameters β is the tilt angle, and γ is the azimuth angle, jointly determining the azimuthal orientation of the solar module.
2.6 Data collection
The global horizontal irradiance at all sky conditions is taken using PVsyst software 7.4 because the global horizontal irradiance is not uniformly available for the research site. The total energy generation of the TSMG and SSGM PV system is collected from RERL, Nepal on 3rd March 2023.
2.7 PV module technologies
There are four systems that makeup PV cell technologies; they are mono-crystalline (m-Si), poly-crystalline (p-Si), thin film, and hybrid systems. Table 4 below lists the specifications of the polycrystalline employed for our station under consideration.
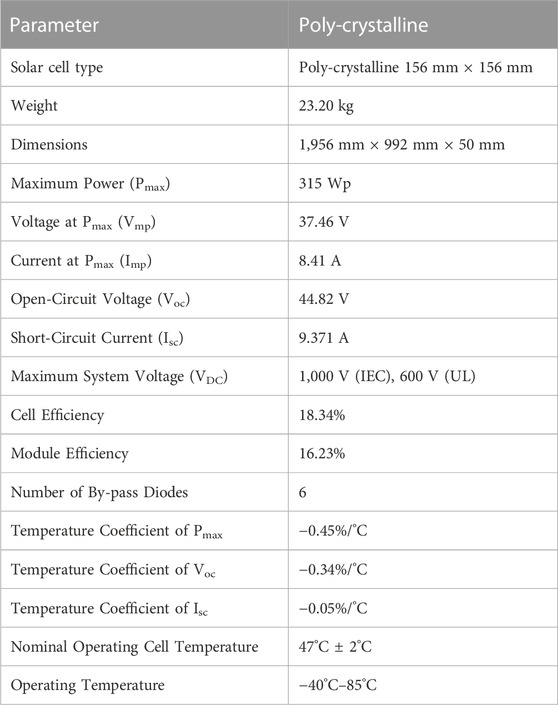
TABLE 4. Technical specification (Sunceco, 2023).
2.8 PV module connections
To extract solar energy, there are four systems that make up PV cell technologies mono-crystalline (m-Si), poly-crystalline (p-Si), thin film, and hybrid systems. However, for this research, authors considered poly-crystalline because it is a dominant module in the context of Nepal. In addition, due to their great precision and performance under consistent solar insolation. The cell connections between the PV cells create a module or an array in order to maximize the current and voltage flowing. Cells coupled in series or parallel produce higher output voltage and cell current, respectively. There are 504–476 PV modules (Sunceco) in the TSMG plant with series and parallel arrangement with the tilt angle of 33°. Also, there are 192–238 PV modules in the SSMG plant with series and parallel with the tilt angle of 29° of 315 Wp(poly-crystalline) with an efficiency of 16.23%.
2.9 PV system
The performance of a grid-connected PV system is calculated based on a number of factors, including the PV system’s energy production, PV yields (
where
The PV system’s efficiency is ηpv,sys. The reference yield (Yr), which is expressed in kWh/kWp, is derived by comparing the measured reference irradiation (GI,ref) of the PV system to the global solar irradiation of the desired location. One kW/m2 is the value of GI,ref under standard test conditions (STC). The PSH occurs every year. The reference yield is the total quantity of theoretical energy present at a specific location for a specific amount of time. It represents the exact energy that was observed.
The PR is the proportion of actual output as compared to anticipated output for a particular reporting period. It serves as a gauge for the overall impact on the rated output of the PV system. It shows the overall impact of output losses on the plant’s rated array caused by environmental factors like temperature and irradiation along with system element inefficiencies like the inverter, cabling, connections, or failure, etc. (Kavuma et al., 2022).
The PV array losses (LC) create the array’s capture losses (Lc), whereas the PV losses (Ls) are brought on by the inverter’s DC-AC conversion.
The efficiency of the PV system, which consists of PV arrays and inverters, can be calculated as the ratio of the AC energy produced to the average daily radiation quantities HI,d. Using the actual irradiation in the array’s plane, these are determined (Kavuma et al., 2022).
The PV plant’s efficiency is represented by its capacity factor (CF). It is the ratio of actual power produced to theoretical power; for instance, the capacity factor for a year is equal to real (average) power produced (kWh/year) divided by nominal power produced (kW)
Since the performance of a PV system in a laboratory environment differs from the performance of a PV system in actual open-air conditions, performance evaluation of PV systems in actual outside situations is crucial.
2.10 Solar irradiance in Nepal
The average daily irradiation for the horizontal surface in Nepal varies from about 4.5 kWh/m2 in December to around 7.2 kWh/m2 in May and more detail in Figure 5, in accordance with NASA’s Surface Meteorology and sun Energy dataset. In the month of May average irradiance per month is highest while in month of December it is lowest.
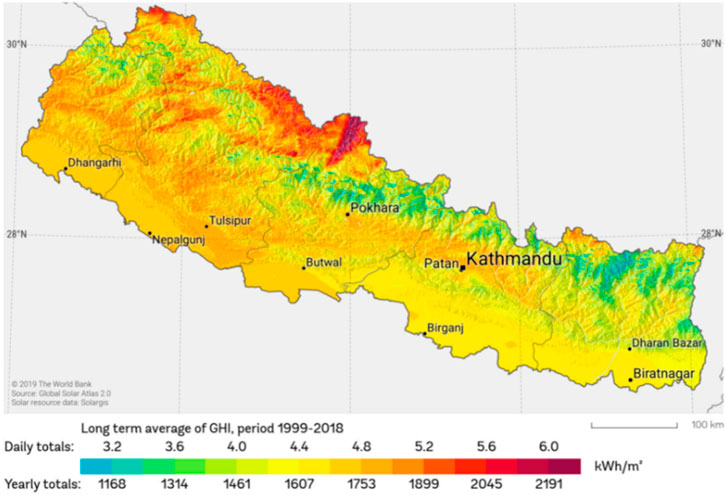
FIGURE 5. Solar irradiance above Nepal (Global Solar Atlas, 2023).
2.11 Performance ratio, capture loss and system loss of SSGM and TSMG
The solar irradiance values mentioned in Table 5 show the amount of solar energy available at SSGM station for different months of 2021 and 2022. The monthly solar irradiance data was collected using PVsyst software 7.4 because ground-based data of solar irradiance is not available in considered location. The solar irradiance recorded at SSGM station is high during April 2021 and 2022 is 6.708 kWh/day and 6.098 kWh/day, respectively. In contrast, the minimum solar irradiance is also recorded during the months of December 2021 and January 2022 is 2.94 kWh/day and 2.646 kWh/day, respectively. The solar irradiance has a significant impact on the performance of a solar PV system. Higher solar irradiance values result in more electricity generation, whereas lower values result in less generation. Therefore, it is essential to consider the regional solar irradiance when designing and implementing solar mini grid PV systems. For instance, in regions with higher solar irradiance values, solar PV systems can be designed to produce more electricity and meet the higher demand during peak months, while in regions with lower solar irradiance values, solar PV systems may need to be supplemented with additional storage capacity or other energy sources to meet the demand during low solar irradiance months. It is also observed that the capture loss is higher in the months of April 2021 and 2022 is 3.322 kWh/day and 2.986 kWh/day, respectively. This higher capture loss may be due to a combination of factors, such as higher temperatures, shading from nearby buildings or vegetation, or soiling on the surface of the PV panels. The higher temperatures can cause the PV panels to operate less efficiently, leading to a higher capture loss. On the other hand, the minimum capture loss is observed in the months of July 2021 and January 2022 is 0.239 kWh/day and 0.082 kWh/day, respectively. These lower capture loss values may be due to favorable weather conditions, such as clear skies and low humidity, which result in better performance and efficiency of the PV panels.
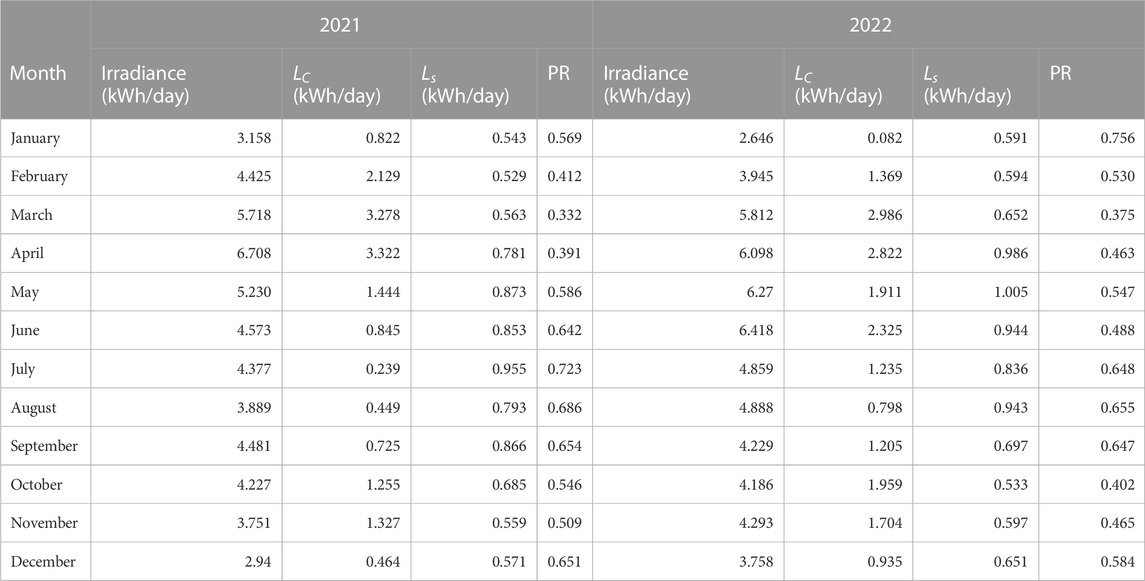
TABLE 5. Performance ratio, capture loss and system loss of SSGM.
System loss in a PV system is due wiring, inverter inefficiencies, and other losses in the system. It is observed that the system loss is higher in the months of July 2021 and August 2022 with 0.955 kWh/day and 0.943 kWh/day, respectively. This higher system loss could be due to several factors such as aging of the system, inefficiencies in the inverter or wiring, or faulty components in the system. On the other hand, the minimum system loss is observed in the months of February 2021 and January 2022 with 0.529 kWh/day and 0.591 kWh/day, respectively. The performance ratio is observed higher in the months of July 2021 and January 2022 with 0.723 and 0.756, respectively. This higher PR could be due to favorable weather conditions, good maintenance, and efficient operation of the system. On the other hand, the minimum PR is observed in the months of March 2021 and March 2022, with values of 0.332 and 0.375, respectively. This lower PR could be due to unfavorable weather conditions, reduced system efficiency, and maintenance issues. A higher PR indicates that the system is performing efficiently and producing more energy, while a lower PR indicates that the system is not operating efficiently and may require maintenance or upgrades. Therefore, regular monitoring, maintenance, and upgrading of the system can help to improve the PR and optimize the performance of the PV system. In Nepal for consider SMG station, the higher PR observed in July 2021 and January 2022 can be attributed to the favorable weather conditions during these months. Nepal experiences a warm and dry climate during the summer months, which can enhance the performance of PV systems. However, during the winter months, the weather conditions can be challenging, with low temperatures and reduced sunlight, which can affect the performance of the PV systems. Therefore, proper system design and maintenance are crucial to ensuring the optimal performance of PV systems in Nepal.
The solar irradiance at TSGM station shows high values in April months of 2021 and 2022, with a minimum value in January of both years, more detail in Table 6. The capture loss is highest in April of both years, while the minimum is in August of 2021 and January of 2022. The system loss is highest in June of 2021 and December of 2022, while the minimum is in February of 2021 and October of 2022. The performance ratio is highest in June of 2021 and January of 2022, while the minimum is in April of 2021 and 2022. Also Table 7 shows the performance ratio, capture and system loss of TSGM and SSMG of 2023. These results suggest that the solar mini grid PV system in TSGM station has high solar irradiance values during the summer months, but experiences higher capture and system losses during the same time period. The performance ratio is also affected, indicating a need for optimization of the system to improve efficiency.
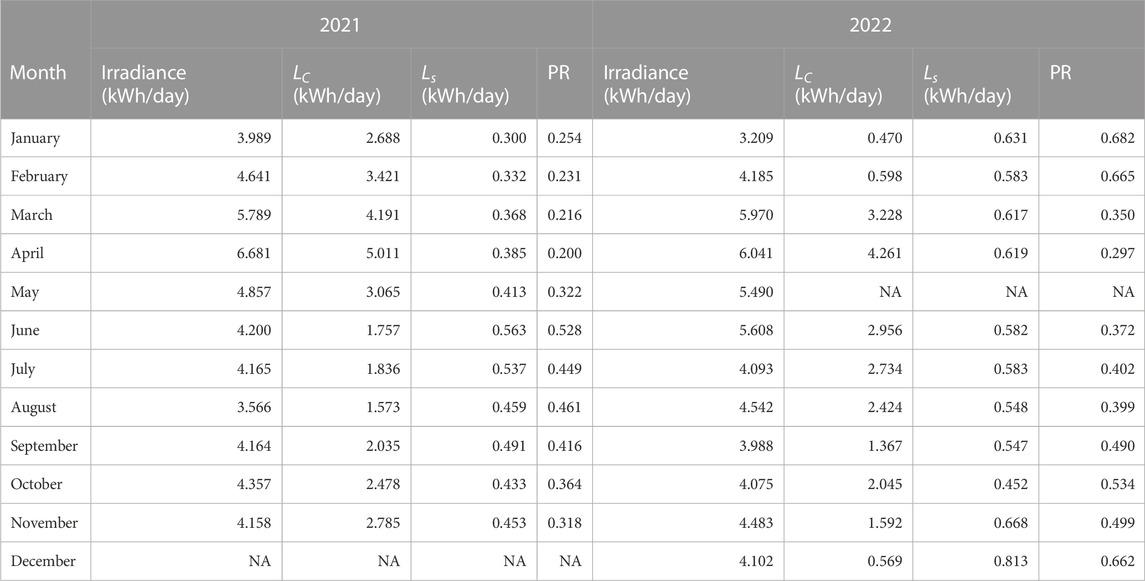
TABLE 6. Performance ratio, capture loss and system loss of TSMG.
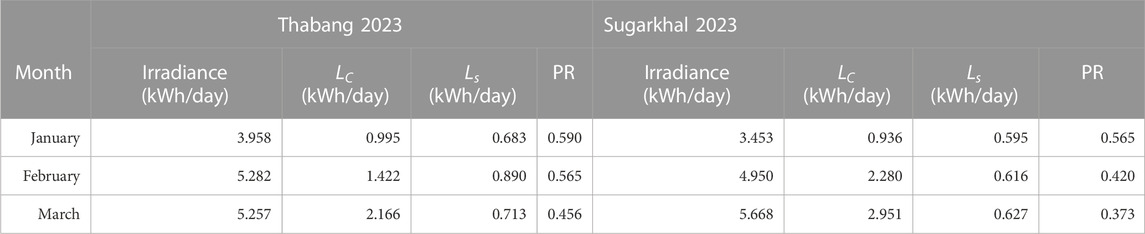
TABLE 7. Performance ratio, capture loss and system loss of TSMG and SSMG.
3 Results and discussion
3.1 Average solar irradiance and energy generation of Thabang solar mini grid
Figure 6, represent the daily solar irradiance with temperature and the energy generated by TSMG station and solar average irradiance variation with months, with standard error bar. The generation of energy per day is 419.5 kWh/day to 445.5 kWh/day when irradiance 5 kWh/m2/day to 5.2 kWh/m2/day with narrow temperature 7°C–10°C. The generation of energy in 2021 by TSMG is 83.206 MWh/year and 112.140 MWh/year in 2022. According to RERL report 2021/2022 the sunshine day is 311 days. Therefore, the energy generated per day is 0.268 MWh/day in 2021 and 0.361 MWh/day in 2022 with PHS 5.49. This suggests that the energy generation from solar PV modules is directly proportional to the irradiance level, as a higher irradiance level results in a higher energy generation. Additionally, the energy generation is also influenced by temperature, with higher temperatures resulting in lower energy generation. This is because solar cells have a maximum efficiency at a specific temperature and irradiance level, and changing as these factors change, the efficiency of the cells. This results in a change in the amount of electrical energy that can be generated by the cells. Additionally, changes in temperature can affect the electrical resistance of the cells and the electrical output of the system, further influencing the energy generation.
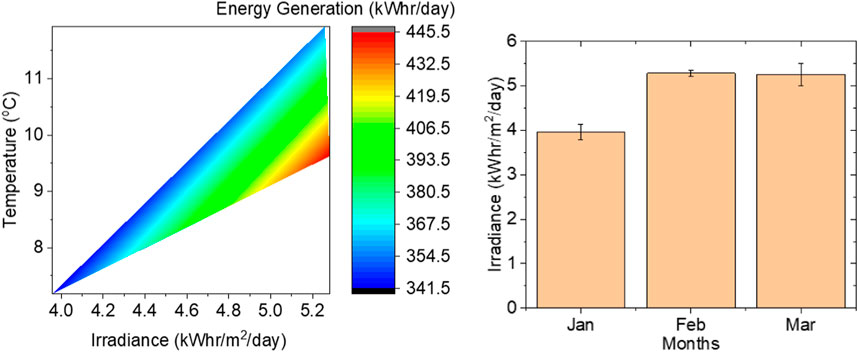
FIGURE 6. Energy generation in 2023 Thabang.
Figure 7, represent the energy generated by TSMG is high in between irradiance 3.75 to 4.27 kWh/m2/day and at temperature 7°C to 10°C. Also, the variation of irradiance with month, the irradiance of solar is found higher in April. Even during months with high irradiance, shading from trees or buildings or the accumulation of dust on the solar panels can reduce the energy generation of a solar mini-grid. For example, the capacity of the system’s components, such as the solar panels, inverter, and battery, may not be sufficient to handle the high irradiance levels during certain months. Additionally, if the solar panels are not positioned and angled optimally, they may not be able to capture the maximum amount of sunlight, reducing energy generation. Regular maintenance of the solar mini-grid system is essential for optimal energy generation. If the system is not maintained correctly, it can reduce the efficiency of the components and reduce the energy generation. The energy demand from the users connected to the solar mini-grid may vary throughout the year. During months with high irradiance, if the energy demand is low, the energy generation of the system may not reach its maximum capacity.
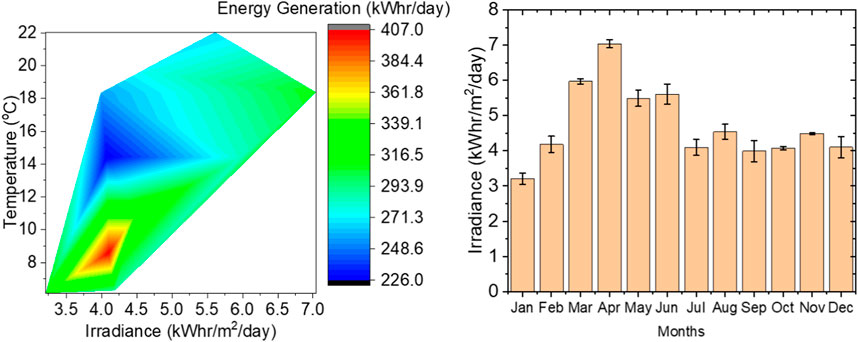
FIGURE 7. Energy generation in 2022 Thabang.
Figure 8, represent the energy generated by solar min grid is higher when irradiance is 4 kWh/m2/day to 4.5 kWh/m2/day at temperature 18.75°C–20°C. Also, the variation average irradiance with the months of 2021, the variation shows the irradiance is high in April month. The energy generation recorded up to 282.0 kWh/day maximum which is less than 2022 and 2023. This may be due to environmental factors such as shading, temperature, dust accumulation, cloud and other weather parameters.
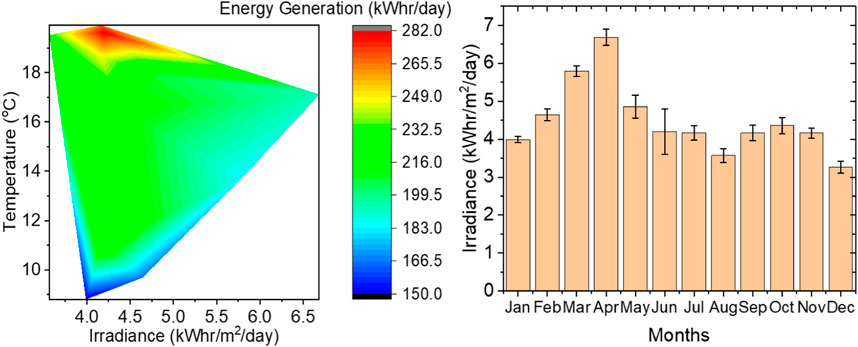
FIGURE 8. Energy generation at TSMG in 2021.
3.2 Average solar irradiance and energy generation of Sugarkhal solar mini grid
Figure 9, represent the energy generated by solar min grid is higher when irradiance is 4.5 kWh/m2/day to 5 kWh/m2/day at temperature 22.0°C–24°C. Also, the variation average irradiance with the months of 2021, the variation shows the irradiance is high in April month. In 2021 SSMG generated maximum energy up to 239.0 kW/h/day and maximum irradiance 6.7 kWh/m2/day in April month. The high energy generated by SSMG is lower than 2022 with very narrow region of irradiance. The energy generated by SSMG in 2021 is 64.14 MWh/year and 68.79 MWh/year in 2022. According to RERL report 2021/2022 the sunshine day is 311 days therefore the energy generated per day is 0.206 MWh/day in 2021 and 0.221 MWh/day in 2022 with PHS 5.73.
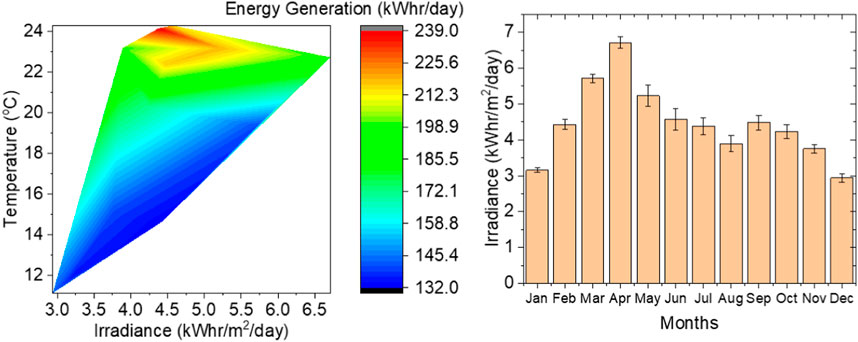
FIGURE 9. Energy generation in 2021 Sugarkhal.
Figure 10, represent the energy generated by solar min grid is higher when irradiance is 4.5 kWh/m2/day to 7 kWh/m2/day at temperature 21.5°C–28°C. Also, the variation average irradiance with the months of 2022, the variation shows the irradiance is high in April month. In addition, the irradiance is highly observed than 2021, in general. This causes the variation of wider range of energy generation of SSMG in 2022. In 2022 SSMG generated maximum energy up to 251.5 kW/h/day and maximum irradiance 6.9 kWh/m2/day in April month. The energy generated by SSMG in 2022 is higher than 2021 with wider region of irradiance.
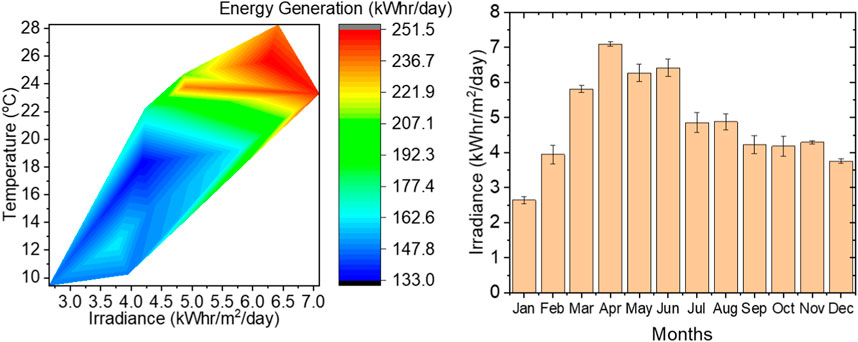
FIGURE 10. Energy generation in 2022 Sugarkhal.
Figure 11, represent the energy generated by solar min grid is higher when irradiance is 4.75 kWh/m2/day to 5.5 kWh/m2/day at temperature 13.5°C–17.4°C. Also, the variation average irradiance with the months of 2023 (till the date), the variation shows the irradiance is high in March month. The variation of irradiance causes the variation of wider range of energy generation of SSMG. In 2022 SSMG generated maximum energy up to 156.8 kW/h/day and maximum irradiance 5.5 kWh/m2/day in April month.
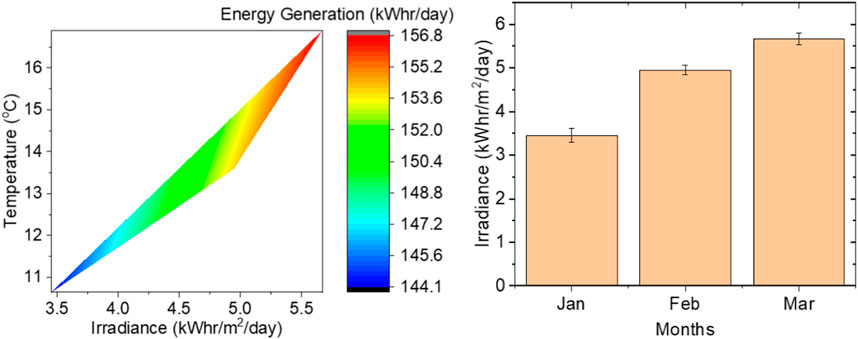
FIGURE 11. Energy generation in 2023 Sugarkhal.
3.3 Performance ratio of Sugarkhal solar mini grid
Tiwari et al. reported performance ratio have been found to vary from 0.34 to 70 (Tiwari et al., 2017). Wassie and Ahlgren (2023) reported the performance ratio 0.47. Compared to this, the performance ratio of SSGM system falls within the low range. The impact of temperature, humidity, shadow, inclination angle of sun and dust are the most visible factors in December, where the SSMG experienced a PR drop of nearly 9% despite the high level of solar irradiation in the month. However, it is also important to note that a low PR value for an off-grid PV plant does not necessarily mean that the system is experiencing technical difficulties. Instead, it can be caused by a poor match between the SSMG system’s installed capacity and electricity demand.
The PR of SSMG observed monthly shows PR ranges from 0.33 (33%) to 0.75 (75%). The PR is maximum recorded in January 2022 till date of research and lower in March 2023. Figure 12 visualized the performance ratio SSMG 2021–2023. A low PR value indicates that the system is not performing at its maximum potential and hence may not be meeting the energy demands of the users. System design plays a critical role in the performance of a SMG system. Sizing the system components appropriately is essential to ensure that enough energy is generated and stored to meet the demand. If the system is undersized, it may not be able to generate enough energy, resulting in a lower PR. Additionally, the choice of system components, such as solar panels, batteries, and inverters, can also affect performance. Choosing high-quality components can help to ensure that the system operates efficiently and maintains a high PR. Installation of a SMG system is also critical to its performance. Correct installation, including proper wiring, grounding, and orientation and tilt angles of solar panels, can help to maximize efficiency and energy output. Additionally, the proper placement of components, such as charge controllers and inverters, can also affect performance. Maintenance is essential to maintaining the performance of a solar mini-grid system. Regular cleaning of solar panels, inspection and replacement of damaged components, and proper charging and discharging of batteries are all critical to ensuring that the system operates efficiently and maintains a high PR. Environmental factors, such as temperature, humidity, and shading, can also affect the performance of a solar mini-grid system. High temperatures can reduce the efficiency of solar panels, while shading from trees, buildings, or other obstructions can reduce the amount of sunlight reaching the panels, resulting in a lower PR. Finally, technical issues, such as faults in inverters, charge controllers, or other system components, can also cause a decrease in system performance. Regular monitoring and analysis of system performance can help to identify and address these issues, ensuring that the system operates efficiently and maintains a high PR.
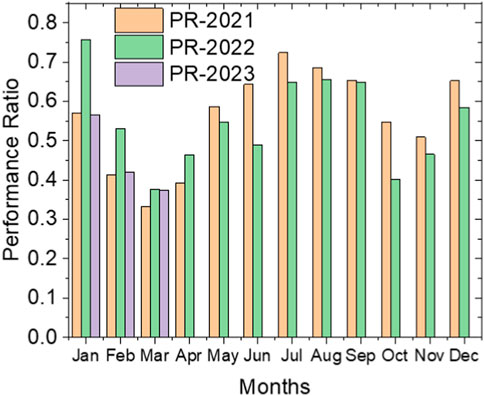
FIGURE 12. Performance ratio of SSMG.
Higher temperatures can reduce the efficiency of the solar panels, leading to a lower PR. Additionally, during the spring and summer months, there may be more cloud cover and occasional rain showers, which can further reduce the amount of sunlight reaching the solar panels and reduce energy output. It is worth noting that the exact pattern of monthly PR variation can depend on a variety of factors, including the location of the SMG system, local weather patterns, and the design and configuration of the system itself. Therefore, it is important to monitor the performance of the system regularly and make adjustments as necessary to ensure optimal energy output and PR over time.
3.4 Performance of Thabang solar mini grid
The PR of TSMG is shown in Figure 13 and shows that is ranges from 0.20 (20%) to 0.69 (69%), 2021–2023. The PR is maximum recorded in January 2022 till date of research and lower in March 2023. Figure 13 visualized the PR SSMG since established.
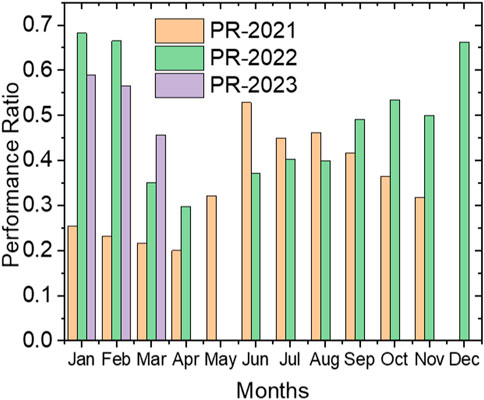
FIGURE 13. Performance ratio of TSMG.
The results of the efficiency analyses showed that this PV power plant performs poorly with an average PR of 47.92%. A PV power system is typically considered to have high performance when its PR vale is above 70% (Kumar and Sudhakar, 2015). However, it is also important to note that a low PR value for an off-grid PV plant does not necessarily mean that the system is experiencing technical difficulties. Instead, it can be caused by a poor match between the MG system’s installed capacity and electricity demand.
3.5 Capture loss
Capture loss in SMG systems refers to the amount of energy that is not captured or harnessed by the system due to various factors such as inefficiencies in the components, shading, weather conditions, and so on. The capture loss is measured in kWh/day (kilowatt-hours per day). Based on the given information, the capture loss of two types of solar mini grid systems (SSGM and TSGM) has been recorded for the years 2021, 2022, and 2023. For SSGM, the capture loss in 2021 ranged from 0.239 kWh/day to 3.322 kWh/day, in 2022 it ranged from 0.082 kWh/day to 2.086 kWh/day, and in 2023 it ranged from 0.935 kWh/day to 2.951 kWh/day. For TSGM, the capture loss in 2021 ranged from 1.573 kWh/day to 5.011 kWh/day, in 2022 it ranged from 0.470 kWh/day to 4.261 kWh/day, and in 2023 it ranged from 0.995 kWh/day to 2.166 kWh/day. It is important to note that capture loss is a normal occurrence in SMG systems, and the goal is to minimize it as much as possible. By regularly monitoring and optimizing the system’s components and operation, it is possible to reduce capture loss and improve overall system efficiency.
3.6 System loss
System loss in a SMG refers to the amount of energy that is lost within the system due to various factors such as resistance in wires and cables, inefficiencies in components like inverters and batteries, and other electrical losses. The system loss is measured in kWh/day. Based on the given information, the system loss of two types of solar mini grid systems (SSGM and TSGM) has been recorded for the years 2021, 2022, and 2023. For SSGM, the system loss in 2021 ranged from 0.543 kWh/day to 0.955 kWh/day, in 2022 it ranged from 0.533 kWh/day to 1.005 kWh/day, and in 2023 it ranged from 0.595 kWh/day to 0.627 kWh/day. For TSGM, the system loss in 2021 ranged from 0.300 kWh/day to 0.563 kWh/day, in 2022 it ranged from 0.453 kWh/day to 0.813 kWh/day, and in 2023 it ranged from 0.683 kWh/day to 0.890 kWh/day. It is important to minimize system loss as it reduces the amount of energy that can be used by the consumers. By regularly maintaining and monitoring the SMG systems, it is possible to reduce system loss and improve the overall efficiency of the system. As noted by Hartvigsson et al. (2021) the viability and operational behavior of distributed MGs heavily depends on the interactions and feedback between endogenous factors (e.g., between electricity demand and supply) rather than exogenous factors. As such, the low PR value of PV system might be due more to the limited battery capacity limiting the amount of solar energy the system can capture and deliver. The disparity in module efficiency is related to the large PV array capture losses (Lc = 2.75 kWh/kWp/day). System and distribution losses (Ls = 0.40 kWh/kWp/day) accounted for the remaining 13% (Wassie and Ahlgren, 2023).
3.7 Capture factor
The CF of a SMG system refers to the ratio of the total energy produced by the solar panels to the amount of energy that is actually captured or harnessed by the system. It is expressed as a percentage and represents the efficiency of the system in capturing solar energy. Based on the given information, the capture factor of two types of solar mini grid systems (SSMG and TSGM) has been recorded for the years 2021, 2022, and 2023. For TSGM, the capture factor in 2021 was 6.33%, and in 2023 it was 8.53%. For SSGM, the capture factor was 9.76% in 2021 and 10.47% in 2022. A high capture factor indicates that the SMG system is efficiently capturing and utilizing the available solar energy. Factors such as proper maintenance, monitoring, and optimization of system components can help improve the capture factor of the SMG system. It is important to note that the capture factor can vary depending on various factors such as weather conditions, shading, and the efficiency of the components used in the system. Regular monitoring and optimization of the SMG system can help ensure that the capture factor remains high and the system operates at optimal efficiency.
3.8 Efficiency of system
The solar PV efficiency is typically measured by the amount of energy produced by the system relative to the amount of sunlight it receives. In this case, we have two different solar PV systems, one with a global irradiance of TSMG and the other with a global irradiance of SSMG (data sources: Global Solar Atlas, 2023). The solar PV system with TSMG had an efficiency of 10.40% in 2021 and 14.05% in 2022, while the system with SSMG had an efficiency of 15.02% in 2021 and 16.11% in 2022. Comparing these results with other solar PV systems requires additional information about the irradiance and energy generated by those systems. However, based on the provided information, we can see that the solar PV system with SSMG has a higher efficiency than the system with TSMG. This is likely due to the higher global irradiance of SSMG, which allows the system to produce more energy relative to the amount of sunlight it receives. It is important to note that solar PV efficiency can vary widely depending on factors such as weather conditions, system design, and maintenance. Therefore, it is crucial to perform regular monitoring and maintenance to ensure optimal system performance.
3.9 Possibilities for improve the performance of grid system
The current trend is to integrate renewable energy sources like solar and wind into the grid for efficiency and demand improvement. However, this integration, along with power electronic devices and non-linear loads, poses power quality issues. To address this, researchers are developing new controllers and techniques, such as the Unified Power Quality Conditioner (UPQC) associated with solar power and battery storage, optimized through Boost and Buck Boost converters (Srilakshmi et al., 2022a). Additionally, for superior UPQC performance in unbalanced/distorted voltage conditions, a fuzzy logic controller and synchronization methods like self-tuning filter and unit vector generation are proposed (Srilakshmi et al., 2022b). Furthermore, the integration of renewable sources into local distribution systems and the non-linear behavior of advanced power electronics impact power quality. Approaches like the firefly algorithm-trained ANN controller for the shunt active filter and proportional-integral controller for the series active filter of UPQC, integrated with solar energy systems and battery storage via boost and buck boost converters, show excellent performance in reducing voltage fluctuations and total harmonic distortion, thereby improving power factor (Ramadevi et al., 2023). These approaches highlight the importance of advanced control methods for enhancing the performance of solar grid systems.
4 Conclusion
In conclusion, the analysis of energy generation data from the TSMG and SSMG solar mini-grid plants reveals distinct performance characteristics. TSMG exhibits optimal energy generation in the irradiance range of 4 kWh/m2/day–4.5 kWh/m2/day at temperatures between 18.75°C and 20°C, while SSMG performs better with irradiance levels between 4.75 kWh/m2/day and 5.5 kWh/m2/day and temperatures ranging from 13.5°C to 17.4°C. The performance ratios for both plants fall within a range of 20%–75%. Capture losses for SSMG and TSMG vary, with SSMG experiencing losses between 0.082 and 3.322 kWh/day and TSMG ranging from 0.470 to 5.011 kWh/day. Notably, SSMG demonstrates higher efficiency and capture factor compared to TSMG.
Data availability statement
The raw data supporting the conclusion of this article will be made available by the authors, without undue reservation.
Author contributions
SK: Formal Analysis, Writing–original draft. AJ: Supervision, Writing–review and editing. KY: Conceptualization, Validation, Writing–review and editing. JK: Writing–review and editing, Formal Analysis, Investigation.
Funding
The authors declare that no financial support was received for the research, authorship, and/or publication of this article.
Acknowledgments
The authors would like to express their sincere gratitude to all the faculties members of Central department of physics, Department of Mechanical and Aerospace Engineering, IOE, Pulchowk Campus, Department of physics of Tri-Chandra Multiple Campus and Patan Multiple Campus, Tribhuvan University, Renewable Energy for Rural Livelihood, Innovative Ghar Nepal, and Robotics Academy of Nepal for their valuable support and guidance throughout this research work. Their contributions and insights have been immensely helpful in shaping this article.
Conflict of interest
The authors declare that the research was conducted in the absence of any commercial or financial relationships that could be construed as a potential conflict of interest.
Publisher’s note
All claims expressed in this article are solely those of the authors and do not necessarily represent those of their affiliated organizations, or those of the publisher, the editors and the reviewers. Any product that may be evaluated in this article, or claim that may be made by its manufacturer, is not guaranteed or endorsed by the publisher.
References
Ahlborg, H., and Hammar, L. (2014). Drivers and barriers to rural electrification in Tanzania and Mozambique – grid-extension, off-grid, and renewable energy technologies. Renew. Energy 61, 117–124. doi:10.1016/j.renene.2012.09.057
Al-Najjar, H., Pfeifer, C., Al Afif, R., and El-Khozondar, H. J. (2022). Performance evaluation of a hybrid grid-connected photovoltaic biogas-generator power system. Energies 15 (9), 3151. doi:10.3390/en15093151
Aziz, S., and Chowdhury, S. A. (2020). Performance evaluation of solar mini-grids in Bangladesh: a two-stage Data Envelopment Analysis. Clean. Environ. Syst. 2 (1), 100003. doi:10.1016/j.cesys.2020.100003
Baurzhan, S., and Jenkins, G. P. (2016). Off-grid solar PV: is it an affordable or appropriate solution for rural electrification in Sub-Saharan African countries? Renew. Sustain. Energy Rev. 60, 1405–1418. doi:10.1016/j.rser.2016.03.016
Božiková, M., Bilcík, M., Madola, V., Szabóová, T., Kubík, L. ’., Lendelová, J., et al. (2021). The effect of azimuth and tilt angle changes on the energy balance of photovoltaic system installed in the southern Slovakia region. Appl. Sci. 11 (19), 8998. doi:10.3390/app11198998
Energy Sector Management Assistance Program (ESMAP) (2017). Multi-tier framework for measuring energy access household survey (MTF). Nepal: World Bank. Avaliable at: https://www.esmap.org/sites/default/files/esmap-npl-mtf-2017_final_2018-04-05.pdf.
Global Solar Atlas (2023). Globalsolaratlas. Avaliable at: https://globalsolaratlas.info/map (Accessed October 10, 2023).
Guichi, A., Talha, A., Berkouk, E. M., and Mekhilef, S. (2018). Energy management and performance evaluation of grid connected PV-battery hybrid system with inherent control scheme. Sustain. Cities Soc. 41, 490–504. doi:10.1016/j.scs.2018.05.026
Hartvigsson, E., Ehnberg, J., Ahlgren, E. O., and Molander, S. (2021). Linking household and productive use of electricity with mini-grid dimensioning and operation. Energy Sustain. Dev. 60, 82–89. doi:10.1016/j.esd.2020.12.004
Kafle, U., Anderson, T., and Lohani, S. P. (2023). The potential for rooftop photovoltaic systems in Nepal. Energies 16 (2), 747. doi:10.3390/en16020747
Kavuma, C., Sandoval, D., and Khan Jean de Dieu, H. (2022). Analysis of solar photovoltaic for grid integration viability in Uganda. Energy Sci. Eng. 10, 694–706. doi:10.1002/ese3.1078
Kumar, B. S., and Sudhakar, K. (2015). Performance evaluation of 10 MW grid connected solar photovoltaic power plant in India. Energy Rep. 1, 184–192. doi:10.1016/j.egyr.2015.10.001
Megantoro, P., Syahbani, M. A., Sukmawan, I. H., Perkasa, S. D., and Vigneshwaran, P. (2022). Effect of peak sun hour on energy productivity of solar photovoltaic power system. Bull. Electr. Eng. Inf. 11 (5), 2442–2449. doi:10.11591/eei.v11i5.3962
Mondol, J. D., Yohanis, Y. G., and Norton, B. (2007). The impact of array inclination and orientation on the performance of a grid-connected photovoltaic system. Renew. Energy 32, 118–140. doi:10.1016/j.renene.2006.05.006
Nepal Energy Outlook (2022). Kathmandu university, Institute of engineering, Nepal energy foundation, and niti foundation. Avaliable at: https://energizenepal.ku.edu.np/wp-content/uploads/2022/08/NEO-2022-Final.pdf.
Odeh, S. (2018). Analysis of the performance indicators of the PV power system. J. Power Energy Eng. 6, 59–75. doi:10.4236/jpee.2018.66005
Palit, D., and Chaurey, A. (2011). Off-grid rural electrification experiences from South Asia: status and best practices. Energy Sustain. Dev. 15 (3), 266–276. doi:10.1016/j.esd.2011.07.004
Ramadevi, A., Srilakshmi, K., Balachandran, P. K., Colak, I., Dhanamjayulu, C., and Khan, B. (2023). Optimal design and performance investigation of artificial neural network controller for solar- and battery-connected unified power quality conditioner. Int. J. Energy Res. 2023, 1–22. doi:10.1155/2023/3355124
SE4ALL (2020). Sustainable energy for all (SE4ALL) database from the SE4ALL global tracking framework. Washington, DC, USA: The World Bank.
Shafiullah, M., Refat, A. M., Haque, M. E., Chowdhury, D. M. H., Hossain, M. S., Alharbi, A. G., et al. (2022). Review of recent developments in microgrid energy management strategies. Sustainability 14 (22), 14794. doi:10.3390/su142214794
Shrestha, A., Rajbhandari, Y., Khadka, N., Bista, A., Marahatta, A., Dahal, R., et al. (2020a). Status of micro/mini-grid systems in a himalayan nation: a comprehensive review. IEEE Access 8, 120983–120998. doi:10.1109/access.2020.3006912
Shrestha, P., Shrestha, A., Shrestha, N. T., Papadakis, A., and Maskey, R. K. (2020b). Assessment on scaling-up of mini-grid initiative: case study of minigrid in rural Nepal. Int. J. Precis. Eng. Manufacturing-Green Technol. 7 (2), 391–405. doi:10.1007/s40684-019-00115-2
Srilakshmi, K., Srinivas, N., Balachandran, P. K., Reddy, J. G. P., Gaddameedhi, S., Valluri, N., et al. (2022a). Design of soccer league optimization based hybrid controller for solar-battery integrated UPQC. IEEE Access 10, 107116–107136. doi:10.1109/ACCESS.2022.3211504
Srilakshmi, K., Sujatha, C. N., Balachandran, P. K., Mihet-Popa, L., and Kumar, N. U. (2022b). Optimal design of an artificial intelligence controller for solar-battery integrated UPQC in three phase distribution networks. Sustainability 14, 13992. doi:10.3390/su142113992
Srimathi, R., Meenakshi, J., Vijayabhasker, R., and Belay, S. S. (2022). Performance evaluation and estimation of energy measures of grid-connected PV module. Int. J. Photoenergy 2022, 1–13. doi:10.1155/2022/7228470
Sunceco (2023). SEP300/320 solar electric propulsion system. Avaliable at: http://sunceco.com/wp-content/uploads/2017/01/SEP300-320.pdf.
Tiwari, B. R., Bhattarai, N., and Jha, A. K. (2017). Performance analysis of a 100 kWp grid connected solar photovoltaic power plant in kharipati, bhaktapur, Nepal. Proc. IOE Graduate Conf. 5, 629–636.
The Ministry of Energy and Water Resources (2023). Energy Synopsis Report 2023. FY 2078/79, Nepal. Available at: http://wecs.gov.np/source/Energy%20Synopsis%20Report%2C%202023.pdf.
Keywords: TSMG, SSMG, PVsyst software 7.4, energy generation, capture loss, capture factor
Citation: Karna SL, Jha AK, Yadav K and Kumar Mallik J (2024) Performance evaluation of solar PV mini grid system in Nepal: a case study Thabang and Sugarkhal. Front. Energy Res. 11:1321945. doi: 10.3389/fenrg.2023.1321945
Received: 15 October 2023; Accepted: 28 November 2023;
Published: 16 January 2024.
Edited by:
Praveen Kumar Balachandran, Vardhaman College of Engineering, IndiaReviewed by:
Sadhan Mahapatra, Tezpur University, IndiaKoganti Srilakshmi, Sreenidhi Institute of Science and Technology, India
Copyright © 2024 Karna, Jha, Yadav and Kumar Mallik. This is an open-access article distributed under the terms of the Creative Commons Attribution License (CC BY). The use, distribution or reproduction in other forums is permitted, provided the original author(s) and the copyright owner(s) are credited and that the original publication in this journal is cited, in accordance with accepted academic practice. No use, distribution or reproduction is permitted which does not comply with these terms.
*Correspondence: Ajay Kumar Jha, akjha@ioe.edu.np