Effects of wave-current interactions on sediment dynamics in Hangzhou Bay during Typhoon Mitag
 Li Li
Li Li Jiayang Xu1
  Yuezhang Xia
- 1Ocean College, Zhejiang University, Zhoushan, China
- 2The Sino-Australian Research Consortium for Coastal Management, School of Science, University of New South Wales at Canberra, Canberra, ACT, Australia
The hydrodynamics and sediment characteristics of muddy estuaries and coasts during typhoons are closely related to the geomorphic evolution, ecological environment, and economic development of coastal zones. Taking the macro-tidal turbid Hangzhou Bay (HZB) as an example, the sediment characteristics and effects of wave-current interactions on sediment dynamics during Typhoon Mitag were studied using a fully-calibrated numerical model. The model considered tide-wave sediment interactions and the reconstructed typhoon wind field. Net sediment fluxes were controlled by residual currents and suspended sediment concentration (SSC). The combined interactions of currents and waves led to a high SSC during the typhoon. Under calm weather conditions, the impact of wave-current interactions (wave dissipation, form drag, wave radiation stress, mean current advection and refraction) was small, except for the combined bottom stresses. The combined bottom stress was the primary wave-current interaction that changed sediment resuspension and increased SSC, particularly in shallow waters or during storms. The advection term, which played an essential role in reducing SSC in HZB, mainly affected SSC by increasing the velocity. The wave dissipation term enhanced vertical mixing, which involved the vertical exchange of suspended sediment and currents. In the shallow waters of the southern bay, the wave dissipation term mostly led to decreased bottom stresses, increased currents, decreased SSC, and increased SSC in deep waters. The effects of form drag, wave radiation stress, and refraction terms on the suspended sediment dynamics were relatively small. These findings provide a theoretical foundation for the study of dynamic geomorphology in macro-tidal estuaries.
Highlights
1 A numerical model coupling tides, waves, storm surges, reconstructed winds, and sediments was used and calibrated to study the effects of wave-current interactions on sediment dynamics in Hangzhou Bay during Typhoon Mitag.
2 Wave-current interactions during the typhoon changed the hydro and sediment dynamics in Hangzhou Bay, mainly through combined wave-current bottom stress, which changed sediment resuspension and, therefore, affected SSC.
3 Compared to during calm weather, lateral circulation at the Andong tidal flat was reversed during Typhoon Mitag, and sediment flux subsequently changed, controlled by the friction term and vertical profile of SSC.
1 Introduction
The dynamic characteristics of estuarine and coastal sediments are closely related to geomorphological evolution, the ecological environment, and marine and coastal economic development. The dynamic processes of estuaries, particularly currents and waves, are closely related to sediment resuspension processes. The hydrodynamics of estuaries and coasts are influenced by various factors, for example, tides, wind stress, river flow, and horizontal density gradients associated with ocean circulation (Soulsby, 1997). In the East China Sea, tides are the dominant forces in the area, and tidal energy accounts for 80% or more of the total energy in this ocean dynamics (Wang, 2014). Waves occur intermittently, and typically, the period of wind waves in estuaries and coasts is between 0.5–5 s. The period of surge waves may exceed 20 s (Shi et al., 2006). The nonlinear coupling of waves and currents is important in shallow seas because it drives sediments, shapes coastal geomorphology, and even causes greater erosion and siltation (Wang, 2014). Fast-varying strong turbulence near the bottom can also have important effects on sediment processes, such as flocculation, sedimentation, and the resuspension of sediments (Yuan et al., 2009; Yang et al., 2016). Therefore, studying hydrodynamic and sediment characteristics and mechanisms during typhoons is critical in estuarine sediment dynamics (Jiang et al., 2014).
Bed shear stress is an important parameter for discussing sediment resuspension (Zhu, 2017), and bed shear stress is difficult to directly measure (Grant and Madsen, 1979). Widely used theories for calculating flow-induced shear stress τc include the logarithmic distribution of current velocity, turbulent kinetic energy, and Reynolds stress, and there can be a 19% difference between different methods (Kim et al., 2000). Wave-induced shear stress τw is usually calculated based on linear wave theory (Green and Coco, 2007). Comparative studies on bed shear stress under the combined action of waves and currents have been conducted worldwide. Yang (2016) measured sediment resuspension in a radial sand ridge and Yangzi shoal in Jiangsu Province, China. The results showed that flow-induced shear stress was substantially larger than wave-induced shear stress in this tidal-dominated environment. For shallow water areas, such as tidal flats, wave motion is more likely to penetrate down to the seabed, and the effect of waves on sediment resuspension cannot be ignored, particularly during storms (Green and Coco, 2014). Many studies have shown that orbital motion, even under very small waves (<0.2 m), can lead to the resuspension of intertidal sediments (Dyer et al., 2000; Uncles and Stephens, 2010; Green, 2011). Christie et al. (1999) found that in the intertidal zone of the Humber Estuary in the UK, sediment resuspension was dominated by flow-induced shear stress during calm weather, while wave was dominant during storms, and the suspended sediment concentration (SSC) increased substantially. Xu et al. (2021) conducted continuous observations of sediment dynamics in the near-bottom layer of the southern channel of the Yangtze Estuary during Typhoon Rann. The results showed that the waves contributed significantly to increasing the shear stress in the bottom bed during the typhoon, SSC in the near-bottom layer of the south channel could reach 10 kg/m3, and a fluid mud layer with a thickness of more than 1.15 m occurred.
In most coastal areas, waves and currents play an extremely important role in sediment dynamics. Wave-current interactions are complex and are not only a linear sum of their individual behaviors. Wave-current interactions mainly include wave-induced currents (including coastal current and bottom return flows), wave refraction (flow changes wavelength and phase velocity), and wave-current interactions in the boundary layer, leading to the nonlinear enhancement of sub-bed shear stress (Soulsby et al., 1993). Green et al. (1997) provided evidence for the effect of wave-current interactions on the intertidal zone based on seabed hydraulic roughness z0. When waves are negligible, z0 remains constant during the tidal cycle and when waves are present, z0 changes immediately and increases markedly. Bricker et al. (2005) discussed wave-current coupling in terms of additional drag on the mean fluvial flow in the presence of waves. Talke and Stacey (2003) found a significant increase in the bottom bed shear stress and associated drag coefficient in the intertidal zone of San Francisco Bay in the presence of waves, which they attributed to wave-current coupling. D'Alpaos et al. (2013) analyzed the statistical characteristics of resuspension events caused by the total bed shear stress τcw in Venice Slipper Lake with exponentially distributed intervals. The effect of the non-linear interaction between waves and currents is defined as τcw-(τc+τw), which is approximately 10% of the total bottom shear stresses.
The suspended sediment flux at any given location can be defined as the integral of the product of SSC and horizontal current velocity over the water depth (Green and Coco, 2014). In general, tidal currents lift and transport sediment so that sediment transport essentially follows the tidal direction. However, the direction of long-period net suspended sediment transport may differ substantially from the direction of the residual flow because the suspended sediment transport rate is nonlinearly related to current velocity and the effect of wave mixing is considered (Soulsby, 1997).
In the intertidal zones of estuaries and coasts, the mean suspended sediment transport direction of the tidal cycle under calm weather conditions is usually landward because of tidal asymmetry, subsidence lag effect, and scour lag effect (Green and Coco, 2014). Van Straaten and Kuenen (1957) and Postma (1961) elaborated on the settling time lag and scouring time lag and their resulting siltation of fine-grained sediments. Dronkers (1986) further refined this theory. Settling time lag is the lag between the time when advection decreases to the velocity at which a sediment particle is no longer suspended, and the time required for that particle to be finally deposited on the seabed. If the tidal velocity decreases shoreward, the settling time delay will lead to a net transport of sediment to the shore. The scour lag effect is similarly defined and depends on the difference between transport and erosion velocities. Dyer et al. (2000) observed a net landward transport of fine-grained sediment during calm weather in contrast to an ebb tide dominant tide, which they attributed to a lag mechanism. Pritchard (2005) confirmed that for fine-grained sediment, the settling time lag generally leads to landward transport, while the scouring time lag plays a weak but detectable role in enhancing landward net transport.
Several studies have measured and assessed the importance of waves in suspended sediment transport. Christie and Dyer (1998) concluded that wave transport (oscillating flux) is two orders of magnitude smaller than tidal transport (mean flux), and that the direction of wave transport is random. Green and MacDonald (2001) found that wave-induced suspended sediment flux is smaller than tidal transport flux, and decreases rapidly with increasing height above the bottom bed. On average, the direction of wave-induced suspended sediment flux is opposite to the direction of the tides. Wave orbital velocity and wave-induced bottom turbulence can have opposite effects on the direction of net transport. When sedimentation is delayed by additional wave-induced mixing, the settling time lag is prolonged and net landward suspended sediment transport is reduced (Shi and Chen, 1996).
Field data have shown that net landward suspended sediment transport under calm weather conditions can be reversed by waves (Christie and Dyer, 1998; Dyer et al., 2000; Andersen and Pejrup, 2001). This is typically attributed to the offsetting effect of waves on the settling time lag, where waves can prevent suspended sediment settling. Waves may also interact with baroclinic processes to affect net suspended sediment transport. For example, Ralston and Stacey (2007) conducted field observations of tidal flats in San Francisco Bay, where baroclinic dynamics associated with salinity fronts dominated sediment transport. During the storm, increased freshwater input and resuspension of sediment under wave influence resulted in a net suspended sediment transport in the offshore direction.
Hangzhou Bay (HZB) is located south of the Changjiang River Estuary. It is a macro-tidal turbid bay with a water area of approximately 4,800 km2 and an average water depth of approximately 8–10 m. The northern side of HZB is a deep water tidal channel, while most of the southern shore is muddy tidal flat with an average water depth of less than 4 m (Hu et al., 2019). The bay is affected by its funnel-shaped coastline and sill-shaped bar. It has a macro-tidal range and strong tides, with annual averaged tidal range of 5.61 m (Jin and Sun, 1992; Xie et al., 2008). In addition, the seawater is highly turbid, and SSC is high (He et al., 2013; Hu et al., 2019). The bay is known for its tidal bores and has one of the highest SSCs in the world, with an average sand content of 1–3 kg/m3 below Ganpu and a SSC of 10.6 kg/m3 at the top of the bay during spring tides (Pan et al., 2013). HZB has strong tides and relatively weak runoffs, and the turbulence at the bottom layer because of friction is sufficient to agitate all the water (Ji and Lu, 2008), which is a typical strongly mixed estuary. Many studies, for example, Pan et al. (2013) and Zhang et al. (2017) have demonstrated that after the arrival of the tidal bore, the flow changed dramatically, and SSC increased significantly in the near-bottom layer. Wang and Eisma (1990) studied sand transport in northern tidal flats and showed clear seasonality in the hydro-sediment dynamics. The wave direction is southeast in the wet season and is northeast-northwest in the dry season. Sediment mainly comes from the Changjiang River, with a small amount from the Qianjiang River, and the sediment supply is largest in winter. Shi (2001) analyzed sediment data observed in the deep-water channel of the bay and found a stratified structure of near-bottom sediment, with low SSC near the surface layer, high SSC in the lower middle layer, and a fluid mud layer near the bed. Xie et al. (2013) established a two-dimensional suspended sediment numerical model based on Delft3D. They reproduced three high and two low turbidity zones in HZB, and concluded that sediment transport is controlled by tidal asymmetry patterns. Using field data in the upper HZB, Tu and Fan (2017) confirmed that the flood tides is abnormally accelerated in the first 10 minutes, tidal asymmetry is significant, and near-bottom turbulence generation and dissipation are in local equilibrium. Tu et al. (2019) further analyzed the data and found that the sediment concentration gradient changed flow structure.
Hangzhou Bay is a funnel shaped bay located on the coast of the East China Sea and is significantly affected by typhoons. According to statistical data, the East China Sea is affected by an average of four typhoons per year (Lu et al., 2018). The effects of storm events on estuarine hydrodynamic and sediment characteristics vary depending on the storm and estuary types (Williams, 2009; Leonardi et al., 2018). During Typhoon Chan-hom, the storm surge in HZB was mainly influenced by wind field and air pressure (Tang, 2018), sediment dynamics were most influenced by wave-current coupling (Yu, 2020), and the near-bottom sediment resuspension process in the tidal area was mainly influenced by turbulence and waves (Li et al., 2022a).
In this study, the macro-tidal of HZB was selected to investigate suspended sediment dynamics under wave-current interactions during calm and extreme weather conditions. A three-dimensional wave-current-sediment coupling model was used and calibrated to study the multi-temporal scale hydrodynamic and physical sediment characteristics, focusing on determining the relative contribution and role of each wave-current coupling mechanism to the suspended sediment dynamics. The methodology is described in Section 2. The results are described in Section 3, and the mechanisms are discussed in Section 4. Section 5 summarizes the conclusions of this study.
2 Methodology
2.1 Wave-current coupling hydrodynamic model
The hydrodynamic model is based on the finite-volume coastal ocean model (FVCOM) (Chen et al., 2006) and coupled with the wave interaction process proposed by Mellor et al. (2008). The model uses unstructured triangular grid coordinates in the horizontal direction and sigma coordinates in the vertical direction. The model uses the finite volume method, which combines the advantages of a finite-element method for geometric flexibility and a finite-difference method for simple discrete computation. Dry and wet grid treatment method was used to determine the dry and wet states of the tidal flats. The vertical direction of the model uses sigma coordinates, as follows:
where z is the Cartesian vertical coordinate (positive upward), ξ is the free water surface, D is the total water depth, and ς is -1 and 0 at the seabed and surface, respectively.
In sigma coordinates, the continuity and momentum equations in the horizontal direction are
where x and y are the eastward and northward components of the coordinates, respectively, u and v are the velocity components in the x and y directions, respectively, ω is the vertical velocity, ρ is the density of the water column, f is the Coriolis parameter, g is the gravitational acceleration, and Fu and Fv are horizontal momentum diffusion terms. τtx and τty are the components of the viscous part of the wind-stress turbulence. The model employs the Smagorinsky turbulence closure scheme (Smagorinsky, 1963) and the Mellor-Yamada level 2.5 turbulence closure scheme (Mellor and Yamada, 1982).
The form drag (τpx, τpy) and wave radiation stress (Rx, Ry) because of wave action are calculated as follows:
where a is the amplitude, ϕ is the phase,
The wave energy density
where xα is the horizontal coordinate, x1 = x, x2 = y and α and β contain the implicit summation. The first two terms on the left-hand side of Eq. 8 determine the wave energy propagation in time and horizontal space, respectively, the third term is the refraction term, which reflects the change of wave energy propagation direction, the fourth term indicates the energy exchange with the mean velocity energy equation, and Sαβ is the wave radiation stress term. The right side of Eq. 8 represents the wave energy term and wave dissipation term of the surface and bottom layers, respectively. The upper horizontal line represents the spectral average. For example, the spectral average wave group velocity expression is:
where cgα is the component of the wave group velocity cg in the α direction and uAα is the component of the Doppler velocity uA in the α direction.
where k is the wave number, Uα is the component of the current velocity in the α direction plus the component of the Stokes drift velocity in the α direction, and cθ is the wave energy refraction velocity defined as follows:
where c is the phase velocity of wave propagation.
Based on the spinlessness of the wave number, the wave frequency σθ at the angle θ can be solved using the following equation:
where
where σp is the peak frequency and
Wave-current coupling mainly includes combined wave-current bottom stress, wave dissipation, vertical transfer of wave-generated pressure to the mean momentum equation (also known as form drag), radiation stress, Stokes drift velocity, mean current advection of wave energy, and refraction (Mellor et al., 2008; Mellor, 2015). Wave-current coupling has received extensive domestic and international research, but almost all the studies have focused on only one or several wave-current coupling terms rather than their combined effects (Gao et al., 2018). Most studies use one-way coupling between the current and wave modules because two-way coupling has low computational efficiency. Taking POM as an example, coupling the SWAN model requires 86 times more computational time (Mellor et al., 2008). Therefore, Mellor et al. (2008) developed a more computationally efficient wave model (Mellor-Donelan-Oey wave model) (shoni2. princeton.edu/ftp/glm/). The model parameterizes the spectrum shape and treats wave energy as a function of wave propagation direction, horizontal coordinates, and time. In addition, wave frequency depends on the direction and is not an independent variable. Compared with the third-generation wave model, this model is relatively simple, with higher computational efficiency and better accuracy (Sheng and Liu, 2011).
2.2 Estuarine sediment model
The sediment model considers water-sediment density coupling, flocculation-sedimentation process, and fluid mud bottom boundary layer properties (Wang, 2002; Li et al., 2017; Li et al., 2018; Ye et al., 2019). Suspended sediment is calculated using the following concentration dispersion equation (Warner et al., 2008):
where C and w are the SSC and sink velocity, respectively and AH and Kh are the horizontal and vertical vortex viscosity coefficients, respectively.
The model surface and bottom suspended sediment flux boundary conditions are defined separately as follows:
where E is the sediment resuspension flux, D = Cbwb is the bottommost sediment deposition flux, Cb is the bottommost SSC, wb is the bottommost suspended sediment sink rate, and H is the height of the seafloor to mean sea level.
The sediment resuspension flux, E, was calculated according to Van Prooijen and Winterwerp (2010):
where E0 is the sediment erosion rate, Pb is the porosity, τb is the bottom bed shear stress, the maximum instantaneous value under wave-flow coupling is the vector sum of the time-averaged flow shear stress τc, and the maximum wave shear stress τwm; τce is the critical starting stress of the sediment. When E is greater than D, the bottom bed erodes and the total thickness decreases. When E is less than D, the bottom bed is deposited, and the total thickness increases.
The model allows SSC to affect water density, and therefore, water circulation, based on the high turbidity of HZB. Winterwerp (2001) calculated seawater density ρ when considering the contribution of suspended sediment through a volumetric relationship.
where ρw is the density of seawater when water-sand density coupling is not considered and ρs is the sediment density.
Shi (2001) analyzed the sediment data of HZB and found that the near-bottom sediment had a stratified structure of a low-concentration suspended sediment layer, high-concentration suspended sediment layer, and fluid mud layer, in order from top to bottom. The rheological and consolidation characteristics of the fluid mud layer significantly influence the bottom boundary layer. The flux Richardson number Rf in the turbulence closure equation is introduced into the bottom friction coefficient Cd calculation equation to generalize the effect of the fluid mud layer on the bottom boundary layer (Wang, 2002; Wang et al., 2005):
where A = 5.5 is the empirical coefficient, κ is the Karmen constant, h is the water depth, and z0 is the bottom roughness height; Rf is given by
where Km is the vertical eddy viscosity coefficient.
The sediments in HZB waters are dominated by fine-grained and clayey silt (Pang et al., 2015; Chen et al., 2018), which are highly susceptible to flocculation in a high turbidity water environment (Tang, 2007). The physical properties of sediment particles, such as particle size, density, and sink rate, change with flocculation. The model is based on the sediment flocculation method proposed by Cao and Wang (1994):
where ws0 is the settling velocity of a single sediment particle calculated using Stokes’ sink velocity formula, u is the current velocity, and ks, c1, c2, m1 and m2 are empirical parameters.
Wind field data are particularly important during typhoons. To obtain more accurate wind fields, the rotational and moving wind fields of Typhoon Mitag were superimposed with the National Centers for Environmental Prediction (NCEP) wind field to reconstruct wind data. The Holland-Miyazaki model performed well and was used to reconstruct the wind field data in this study (Miyazaki et al., 1962; Holland, 1980; Ren, 2022).
2.3 Model configurations
The model domain encompassed a large area to ensure model stability during typhoons (Figure 1). The grid had 107,898 cells and 57,354 nodes. The resolution at the ocean open boundary was approximately 30 km and was refined to 150–800 m to fit the complex coastlines and bathymetry inside the bay. The grid resolution was higher than 100 m in the southern tidal flat of HZB. Eleven vertical layers are employed in the vertical direction (ζ = 0.0, −0.02, −0.08, −0.18, −0.32, −0.5, −0.68, −0.82, −0.92, −0.98, and −1.0). The model was calculated with a time step of 0.5 s for the outer mode and 5 s for the inner mode. Dry and wet module calculations were initiated with a critical minimum water depth of 0.05 m. The shoreline data of the model were obtained from the data provided by the National Oceanic and Atmospheric Administration (NOAA) (https://ngdc.noaa.gov). The shoreline data for Hangzhou Bay were corrected using 2019 annual Landsat satellite maps (http://www.gscloud.cn). The bathymetry data used were ETOP1 and were provided by NOAA. Topographic data with a resolution of 1′ × 1′ were supplemented by high-resolution measured data and nautical chart data for key study areas.
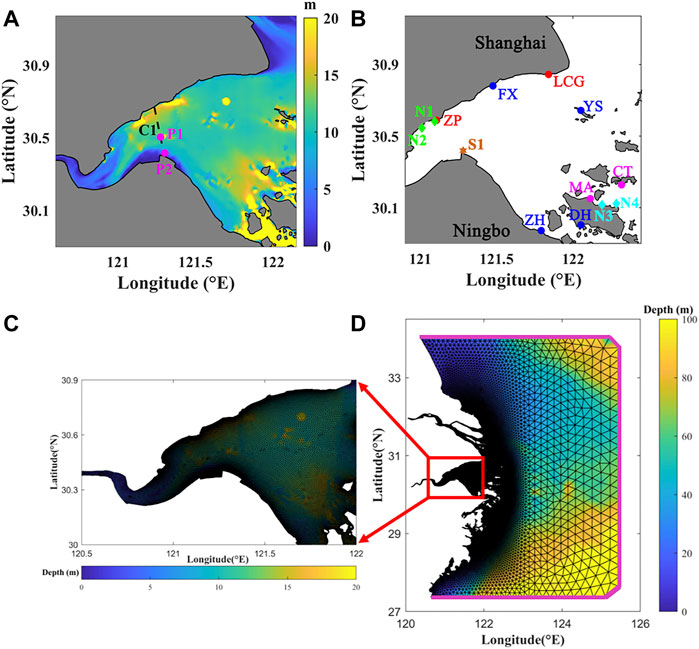
FIGURE 1. (A) Map of Hangzhou Bay. The color indicates water depth. (B) Field stations. LCG is Luchaogang, ZP is Zhapu, GP is Ganpu, MA is Maao, CT is Changtu, FX is Fengxian, YS is Yangshan, ZH is Zhenhai, and DH is Dinghai. Circles indicate tidal stations and diamonds indicate current and SSC stations. (C) Grids of Hangzhou Bay. (D) Grids of study area. Pink lines represent the oceanic boundaries.
The model’s time period was from 20 February to 31 March 2013 (calm weather condition), and from 20 September to 15 October 2019 (Typhoon Mitag). The first 6 days were used for spin-up, and the subsequent results were used for the analysis. The model was cold-started, with initial tide level, current velocity, and SSC set to 0, and temperature and salinity set to 18°C and 27 psu, respectively (Chen et al., 2017). The model was driven by tides, runoff, and wind. The time series of tidal levels generated by the TPXO7.2 global tidal model was used at the ocean open boundary. The hourly tidal levels consisted of four diurnal tides (K1, O1, P1, and Q1), four semi-diurnal tides (M2, S2, N2, and K2), three shallow-water tides (M4, MS4, and MN4), and two long-period tides (Mf and Mm). HZB is influenced by the Changjiang and Qianjiang rivers (Shou et al., 2009), and therefore, the model includes the effects of these two rivers. River discharge and sediment load data were obtained from the 2019 China River Sediment Bulletin (http://www.mwr. gov. cn/sj). The wind data under calm weather were at 10 m above sea level obtained from NCEP (https://rda.ucar.edu/datasets/ds084.1) with a temporal resolution of 6 h and a spatial resolution of approximately 0.2°. The Holland-Miyazaki method was used to re-construct the wind field data in this study (Li et al., 2022b). After sensitivity analysis (Ye, 2019), the main parameters of the model are shown in Table 1.
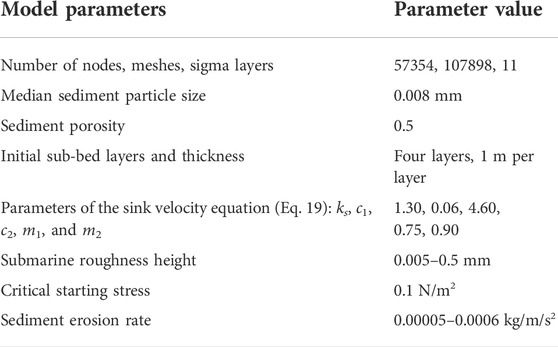
TABLE 1. Main parameters of the model.
2.4 Numerical tests
The wave-current interaction mainly includes combined wave-current bottom stress, wave dissipation, form drag, radiation stress, Stokes drift velocity, mean current advection of wave energy, and refraction (Mellor et al., 2008; Mellor, 2015; Gao et al., 2018). To quantify the effects of the wave-current coupling mechanism on the characteristics of suspended sediment during calm weather and Typhoon Mitag, seven numerical conditions were designed to evaluate the contribution of different wave-current coupling terms (Table 2).
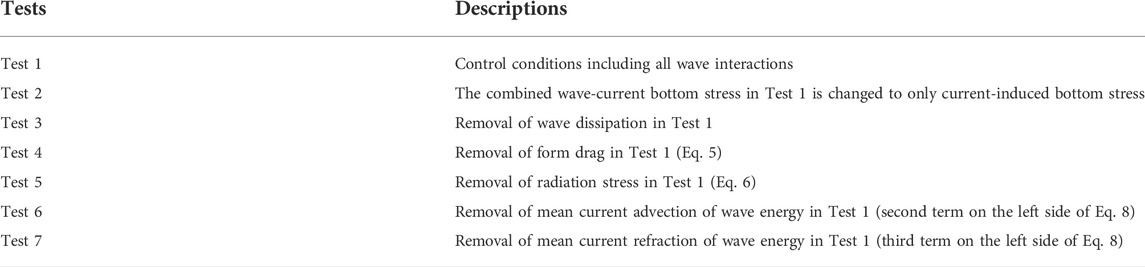
TABLE 2. Numerical experiments.
Test 1 was the reference model, which included all wave-current coupling effects. In Test 2, the combined wave-current bottom stress was replaced by the current-induced bottom stress, and the effect of wave-current bottom stress was removed. In Tests 3–7, the effects of wave dissipation, form drag, radiation stress, mean current advection of wave energy, and refraction terms were removed from the model. Separating the Stokes drift velocity from the current velocity at the equation level is difficult and unnecessary (Mellor, 2005). Therefore, the contribution of Stokes drift velocity is not discussed in this study.
Station P2 is located at the edge of the shallow shore of HZB, close to observation point S1, and is subject to significant wave-current interactions. Station P2 is used to illustrate the effects of wave-current coupling on suspended sediment dynamics during calm weather and during Typhoon Mitag. This paper will focus on the analysis of calm weather (three tidal cycles) and Typhoon Mitag (three tidal cycles) in Section 4. Under calm weather conditions, the waves inside HZB were generally weak. However, during the typhoon, typhoon waves could propagate from the East China Sea into Hangzhou Bay, accompanied by a significant increase in both the significant wave height and wave orbital velocity within HZB.
2.5 Model validation
2.5.1 Calm weather
To ensure the accuracy and reliability of the established three-dimensional wave-current-sediment coupled model in HZB, the results were validated from multiple spatial and temporal perspectives using actual measurement data. The correlation coefficient (CC) and model evaluation coefficient (SS) were introduced to quantify the validation results (Murphy, 1992):
where mi and oi are the calculated and measured values of the model, respectively,
The hydrodynamics model was validated from multiple spatial and temporal perspectives under calm weather conditions based on measured data from 2010, 2013, and 2014 (Figure 2A). The CC values for the four tidal elevation stations were 0.98, 0.98, 0.97, and 0.98, respectively. The SS values were 0.94, 0.94, 0.94, and 0.98, respectively. The current velocity and direction were verified using field data at stations N1–N4 during the neap and spring tides (Figure 2B). The average CC values at the four stations were 0.93, 0.94, 0.90, and 0.94, and the average SS values were 0.92, 0.91, 0.84, and 0.93, respectively. The average CC values for the current direction were 0.92, 0.91, 0.93, and 0.94, and the average SS values for the current direction were 0.90, 0.88, 0.93, and 0.92, respectively.
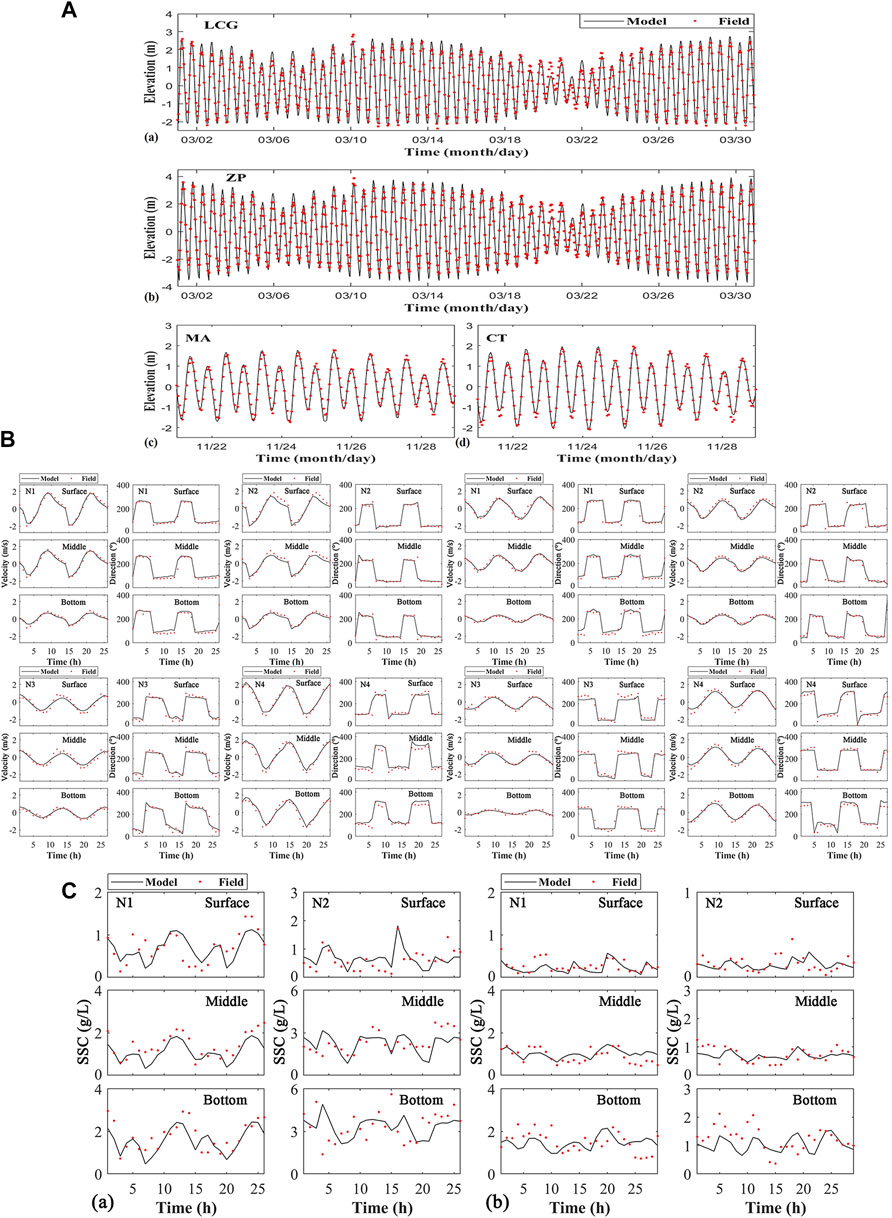
FIGURE 2. Model validation of (A) sea surface level (a,b) 2013, (c,b) 2014; (B) currents during spring tides and neap tides, N1 N2 were measured in 2013 and N3 N4 were measured in 2014; (C) SSC (a) spring tides and (b) neap tides in 2013.
The harmonic constants of the M2, S2, K1, O1, M4, and MS4 tidal components (Pawlowicz et al., 2002) from September 2010 (An, 2016) were also validated (Ren, 2022). The absolute values of the amplitude differences of the M2, S2, K1, O1, M4, and MS4 were 0.02, 0.03, 0.03, 0.03, 0.02, and 0.01 m, respectively. The absolute values of the phase differences were 9.2°, 9.9°, 10.8°, 14.5°, 10.3°, and 11.8°, respectively.
The sediment model was validated based on measured vertical SSC data from the N1 and N2 stations in Zhapu (Figure 2C). The average CC values were 0.55 and 0.49, respectively, and the average SS values were 0.47 and 0.45, respectively.
2.5.2 Typhoon Mitag
The model was validated during Typhoon Mitag using water levels, current velocity, and significant wave heights (Figure 3). The simulated significant wave height was lower than the measured value, with a CC value of 0.93 and an SS value of 0.86. The CC values of current velocity and direction were 0.79 and 0.66, and SS values were 0.63 and 0.39, respectively. The simulated results of SSC were similar to the measured values, with a CC value of 0.70 and an SS value of 0.47. The validation of the significant wave heights had a CC value of 0.95 and an SS value of 0.91 (Figure 3F). The model was also validated using sea surface level, current, and significant wave height data during Typhoon Chan-hom at the bay mouth (Yangshan Harbour) (He et al., 2020; Yu, 2020).
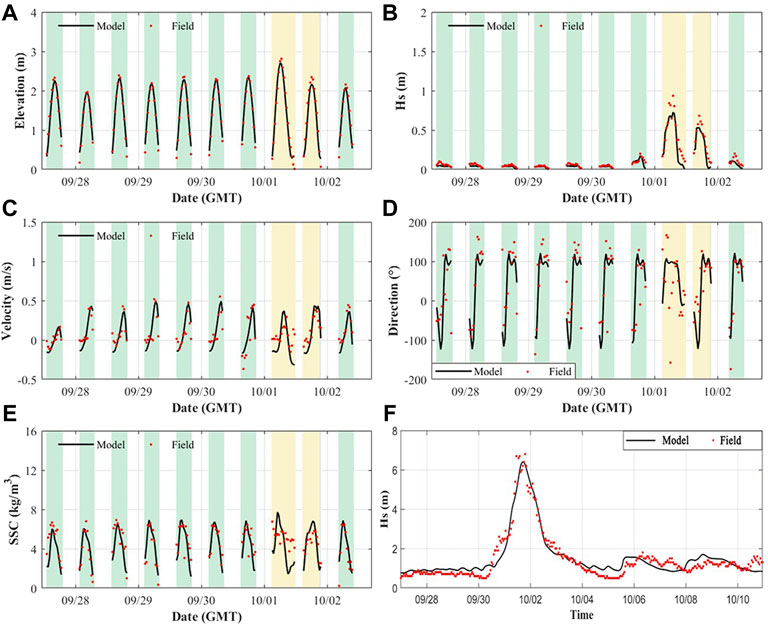
FIGURE 3. Model validation of sea surface level, currents, significant wave height, and SSC. (A–E) Station S1 in the Andong Shoal (F) near Zhoushan Islands. The green background represents the probes were underwater, and the yellow background represents that the speeds of local wind were larger than 10 m/s.
3 Results
3.1 Asymmetric sediment dynamics during calm weather
The distribution of SSC in the HZB changes periodically with the tidal cycle (Figure 4A). During the spring tides, the shallow water of the southern shore is well mixed, and the SSC in the surface and bottom layers are both at a high level. The SSC near the bottom layer exceeds 6 kg/m3 during the flood tides. The surface SSC on the northern side of HZB is relatively low. SSC gradually decreases with decreased current velocity during high water and low water. The significant reduction in hydrodynamic forces during neap tides causes a decrease in sediment resuspension, and both the surface and bottom SSC are smaller than those during spring tides.
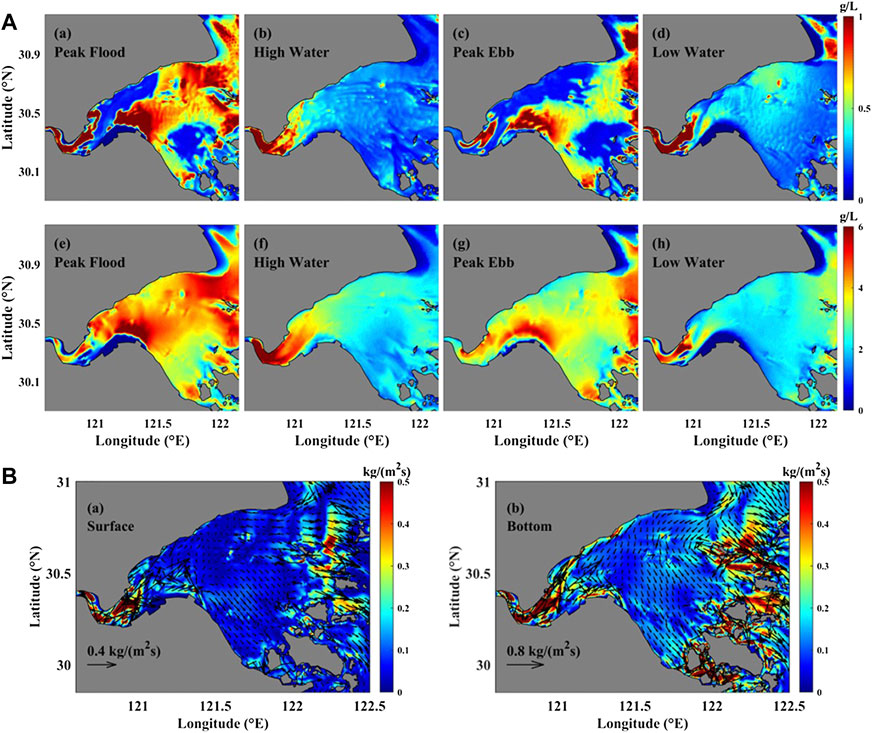
FIGURE 4. (A) Surface (a–d) and bottom (e–h) SSC during spring tides. (B) Cumulative (a) surface and (b) bottom net suspended sediment fluxes in 1 month (1–30 March 2013, GMT).
The tidal averaged sediment fluxes near the surface and bottom layers of HZB in 1 month are shown in Figure 4B. The net sediment flux at the head and mouth of the bay are large (approximately 0.5 kg/m/s2) because of the large residual flow and high SSC (Figure 4A). The surface sediment flux is mostly smaller than that near the bottom level. Suspended sediment moves into the bay along the northern coast and out of the bay along the southern coast.
The net sediment transport near the Andong (AD) tidal flat (C1 section) is northward near the surface and southward near the bottom. Near the AD tidal flat (Figure 5), during the spring tides, the maximum value of the along-estuarine suspended sediment flux during the flood tide is close to 4 kg/m2/s. Laterally, the peak sediment flux (0.8 kg/m2/s) occurs near the bottom layer of the northern bank (Figure 5). This is because the SSC in the near-bottom layer is higher (Figure 4A). The maximum value of the along-estuarine sediment flux during the ebb tide is similar to that during the flood tide, except that the value is smaller (more than 2 kg/m2/s). The maximum value of lateral suspended sediment flux is located in the bottom layer near the southern bank, which is approximately 0.7 kg/m/s2. During neap tides, as the current velocity and SSC decrease, the characteristics of the along-estuarine and lateral suspended sediment fluxes are similar to those during spring tides, but the magnitudes are smaller.
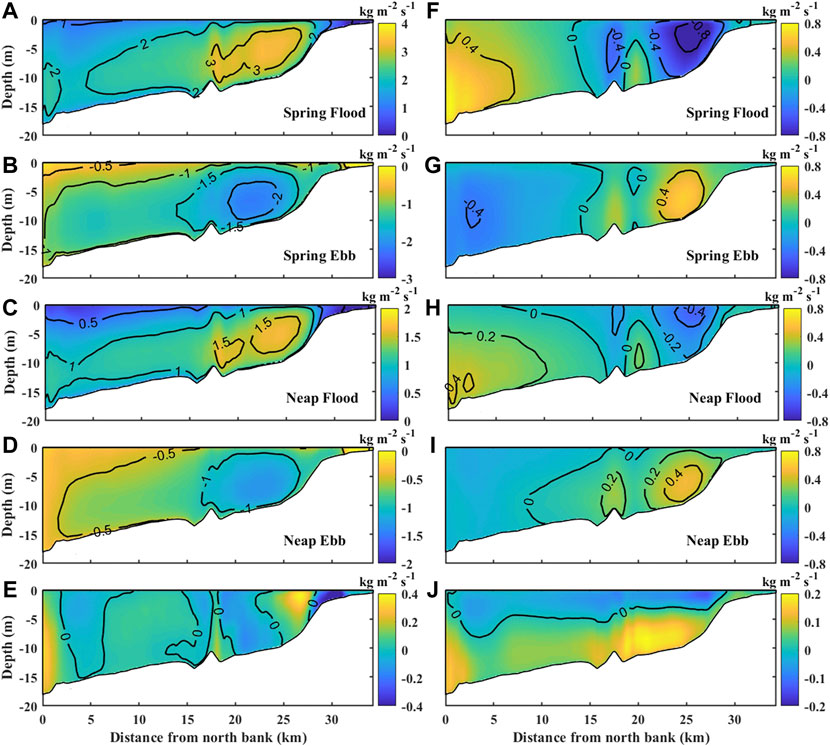
FIGURE 5. The distribution of sediment flux in the C1 section during the spring-flood tide (A) along-estuarine and (F) lateral. (B,G), (C,H), (D,I) are the same as (A,F), and the times are for spring-ebb tide, neap-flood tide, and neap-ebb tide, respectively. (E,J) are the averaged along-estuarine and lateral sediment fluxes in 1 month, respectively. Positive values indicate landward or southern direction.
Figures 5E,J show the along-estuarine and lateral sediment fluxes averaged over 1 month. The along-estuarine sediment fluxes indicate an alternative pattern of seaward and landward directions. Near the tidal flats and in the middle part of the tidal channel, net sediment fluxes are mainly seaward. Near the northern bank and approximately 20–25 km from the northern bank, sediment fluxes are mainly landward. Lateral net sediment fluxes are northward near the surface layer and southward near the bottom.
3.2 Asymmetric sediment dynamics during Typhoon Mitag
Figures 6A,B show the distributions of the surface and bottom SSC during Typhoon Mitag. During the typhoon, the wave height and wave orbital velocity in HZB gradually increase from the bay mouth to the bay head. The increased bottom stress leads to increased SSC. The tidal effect is stronger at the time of peak floods and peak ebbs, and the combined effect of currents and waves causes a higher SSC. In shallow water areas near the southern shore of the bay, the combined effect of the current-wave induces strong mixing, and the surface and bottom SSC values are large, with the maximum bottom SSC exceeding 6 kg/m3. The high-turbidity area gradually expands to the northern bank and the head of the bay, and the maximum bottom SSC at the top of the bay during the storm exceeds 8 kg/m3. The bottom SSC is less affected by the storm near the northern bank because of the presence of deep water, and the increase is less than 0.8 kg/m3 (Figures 6B,D).
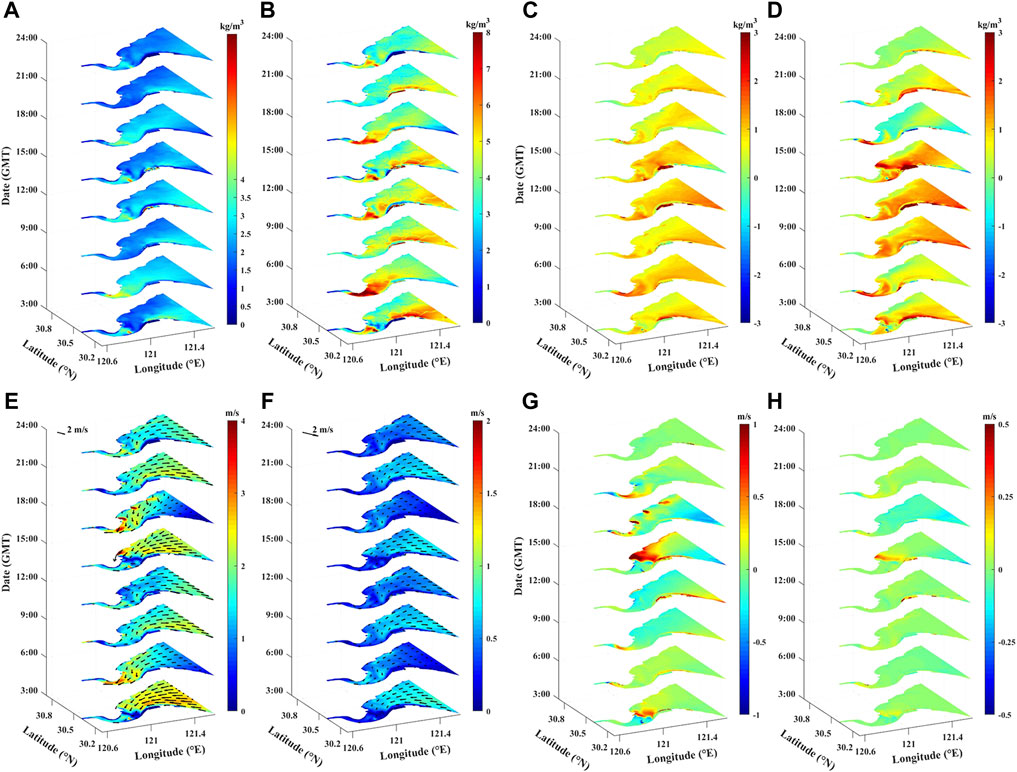
FIGURE 6. Distribution of SSC. (A) Surface layer and (B) bottom layer. (C,D) are the same as (A,B) except for difference in SSC between the test with Typhoon Mitag and the test with only tidal forcing (GMT 1 October 2019, 3:00–24:00). (E–H) are the same as (A–D) except for currents.
Typhoon Mitag strengthens the asymmetry of the flow field characteristics, and the surface currents are mainly controlled by winds (Figures 6E–H). The surface currents are enhanced by the typhoon (by ∼0.2 m/s) during the flood tide (GMT 10-3–3:00) and are weakened during the typhoon departure period (GMT 10-1-15:00–18:00), depending on the directions of the tidal currents and winds. The surface currents increase because of the southward rotating wind field in the bay, moving mainly towards the south coast at the peak wind moment (GMT 10-1-12:00). The increased bottom currents are similar to, but smaller than, the increased surface currents.
The average along-estuarine and lateral suspended sediment fluxes during flood and ebb tides during the storm were studied in Section C1 (Figure 7). During flood tides, the average SSC in the near-bottom layer is approximately 4 kg/m3 at 10–30 km from the northern bank, and the relative increase is more than 0.4 kg/m3. The average suspended sediment flux in the landward direction is more than 4 kg/(m2s), and the relative increase compared to the tidal drive is more than 1 kg/(m2s). The northward and southward net suspended sediment fluxes near the surface level along the northern bank are enhanced by the typhoon, with an increase of more than 40%. During ebb tides, SSC and sediment fluxes are significantly weaker than during flood tides, and the average SSC near the bottom layer is approximately 3 kg/m3. The suspended sediment moves out of the bay through two channels near the southern and northern bank (LS and LN in Figure 1), and the flux increases by more than 0.5 kg/(m2s). Laterally, the southward net suspended sediment flux in the near-surface layer increases by approximately 0.4 kg/(m2s), and the northward net suspended sediment flux in the near-bottom layer near the northern bank increases by approximately 0.2 kg/(m2s).
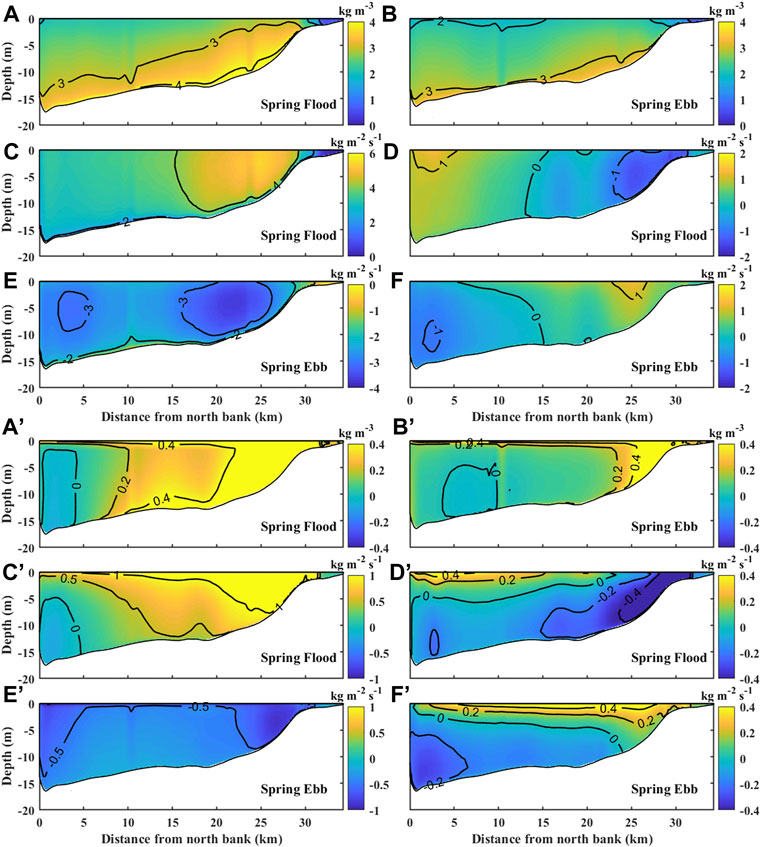
FIGURE 7. SSC at section C1 during spring (A) flood tide and (B) ebb tide. Along-estuarine and lateral sediment fluxes in section C1 (C,D) during spring-flood tide. (E,F) are the same as (C,D) except for the spring-ebb tide. Positive values indicate landward or southward direction. Difference of SSC at section C1 during spring flood (A’) and ebb (B’) tides between the test with Typhoon Mitag and the test with only tidal forcing. Difference of sediment flux at section C1 during spring-flood tides between the test with Typhoon Mitag and the test with only tidal forcing: (C’) along-estuarine and (D’) lateral. (E’,F’) are the same as (C’,D’) except for the spring ebb tide.
Lateral sediment flux (Figures 7D,F) is reversed during Typhoon Mitag, with southward surface sediment flux and northward bottom sediment flux compared with that during calm weather (Figures 5F,G).
3.3 Mechanism of lateral circulation and sediment fluxes
3.3.1 Calm weather
During calm weather conditions (Ren, 2022), the lateral circulation at section C1 is towards the northern/southern bank at the surface/bottom layer (Figure 8A). Based on the analysis of the lateral circulation mechanism (Figure 9) (Kalkwijk and Booij, 1986; Xiao et al., 2019; Ren, 2022), convection, centrifugal force, and friction dominate lateral circulation. Convection and centrifugal force are of equal strength and in opposite directions in the surface and bottom layers. The friction effect is stronger in the bottom layer. Combined with the characteristics of high SSC in the bottom layer and low SSC in the surface layer (Figure 4), the net flux of sediment shows southward characteristics in the bottom layer and northward characteristics in the surface layer. The net sediment fluxes are towards the southern shoal.
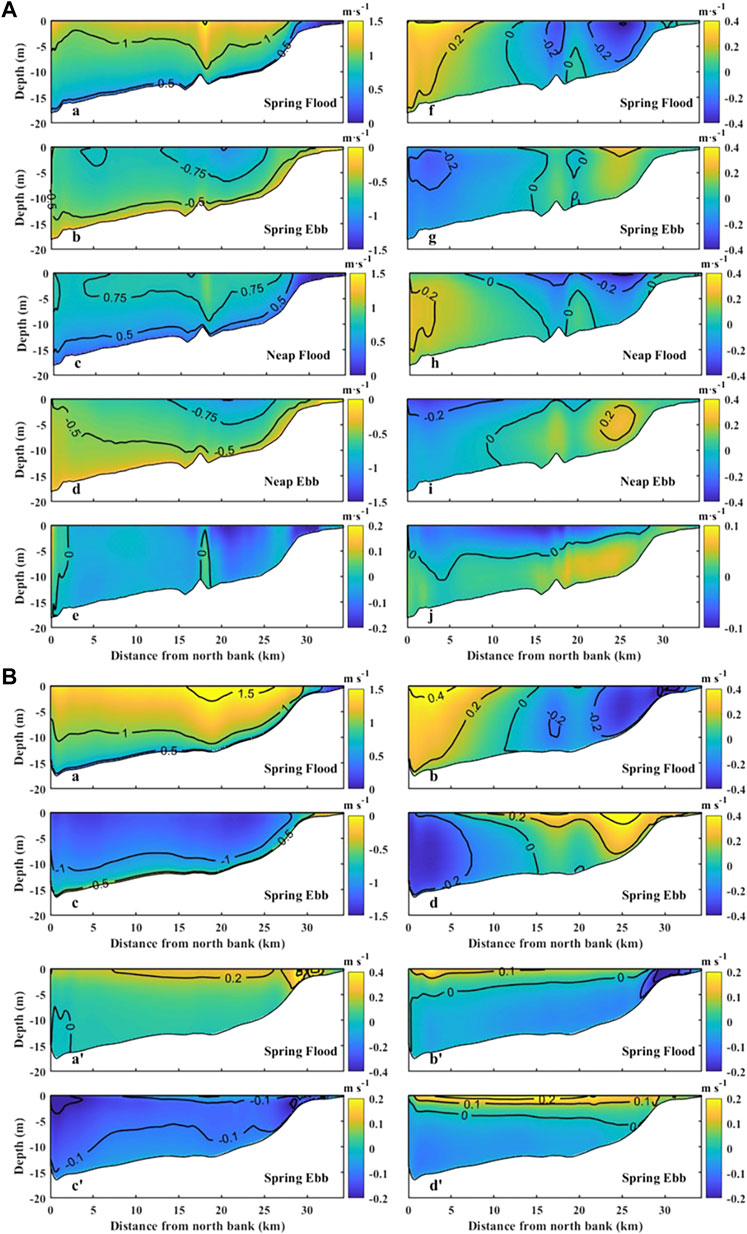
FIGURE 8. (A) Along-estuarine (left column) and lateral currents (right column) in section C1 (calm weather, 1–30 March 2013, GMT) (a,f) are for spring flood tide. (b,g) are for the spring ebb tide. (c,h) are for neap flood tide. (d,i) are for the neap ebb tide. (e,j) are for the averaged along-estuarine and lateral currents in 1 month. (B) Along-estuarine and lateral currents in section C1 (Typhoon Mitag). (a,b) are for spring flood tide and (c,d) is the same as (a,b) except for the spring ebb tide. Positive values indicate landward or southward direction. (a’–d’) are the same as (a–d) except for the differences of spring flood currents at section C1 between the test with Typhoon Mitag and the test with only tidal forcing.
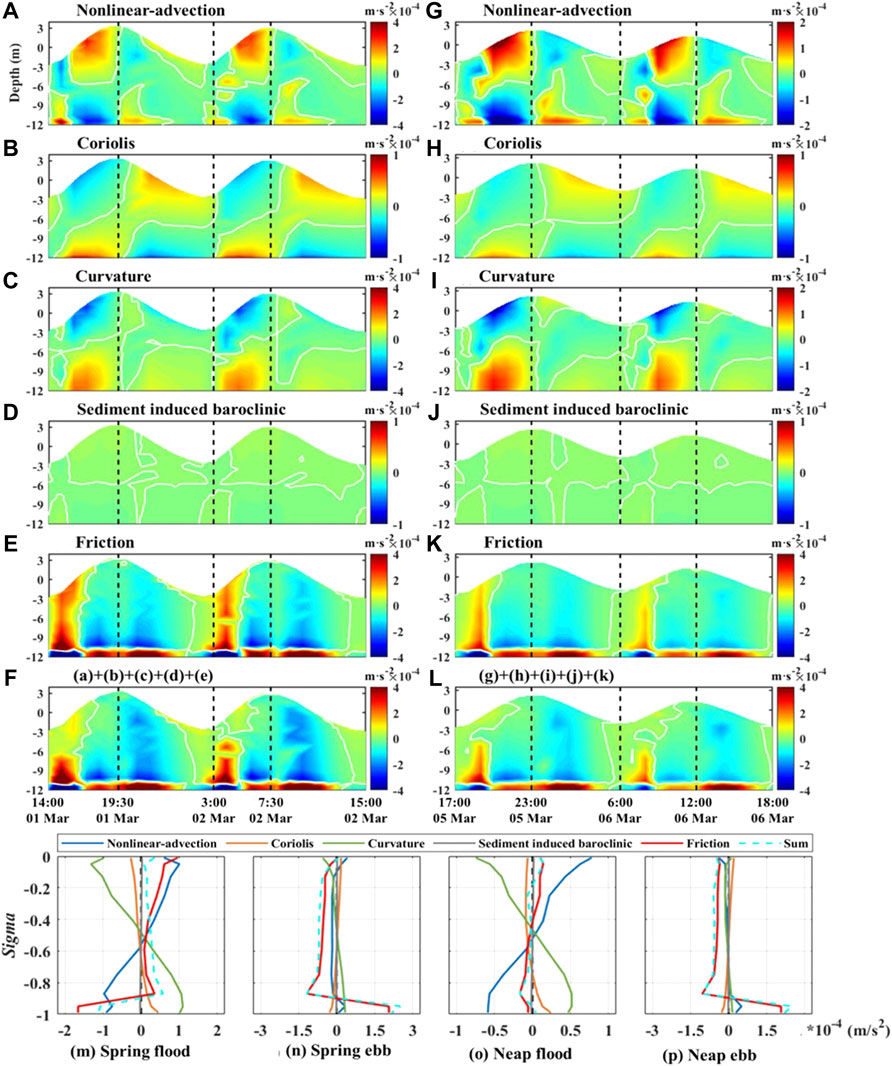
FIGURE 9. Times series of momentum terms in the main tidal channel at station P (calm weather) during (A–F) spring tides and (G–L) neap tides: vertical deviation from depth-averaged terms in lateral momentum Eq. 16. Vertical profile of the principal momentum terms in Eq. 16 at station P during (M) spring flood and (N) spring ebb tides. (O–P) Depict the same as (M–N) except for neap tides. Positive values indicate southward directions.
3.3.2 Typhoon Mitag
The moments with peak surges during flooding (GMT 10-1-1:00–6:00) and ebbing (GMT 10-1-19:00–10-2-2:00) tides are selected to illustrate the along-estuarine and lateral currents during typhoons at AD (section C1, Figures 8Ba–d,a’–d’). During flood tides, the along-estuarine currents in the northern tidal channel is approximately 1.5 m/s. The increase of velocity exceeds 0.2 m/s, with a larger increase occurring near the southern bank. Lateral currents are southward in the surface level near the northern bank and northward in the bottom level near the northern bank, and velocity exceeds 0.4 m/s (with an increase of less than 0.2 m/s during the typhoon). During ebb tides, waters flow out of the bay through the two tidal channels, with a vertical-averaged along-estuarine current speed of approximately 1–1.5 m/s, which is slightly higher than that during calm weather. The lateral current was southward near the surface level near the southern bank and northward near the bottom level near the northern bank. The magnitude of the southward current is increased by 0.2 m/s.
During the typhoon, the friction term dominated lateral circulation (Figures 10E,F), and changed the lateral circulation direction at section C1. The strong wave and current interaction impacts wave dissipation, form drag and advection, and changes the vertical profile of eddy viscosity (Km). Subsequently, the friction term was affected. During flood tides, the friction term was enhanced by the typhoon by 90% near the bottom level (Figure 10E), while it was reduced by 86% near the bottom level during ebb tides (Figure 10F). During ebb tides, the effect of the friction term occurs southward near the surface and northward near the bottom level.
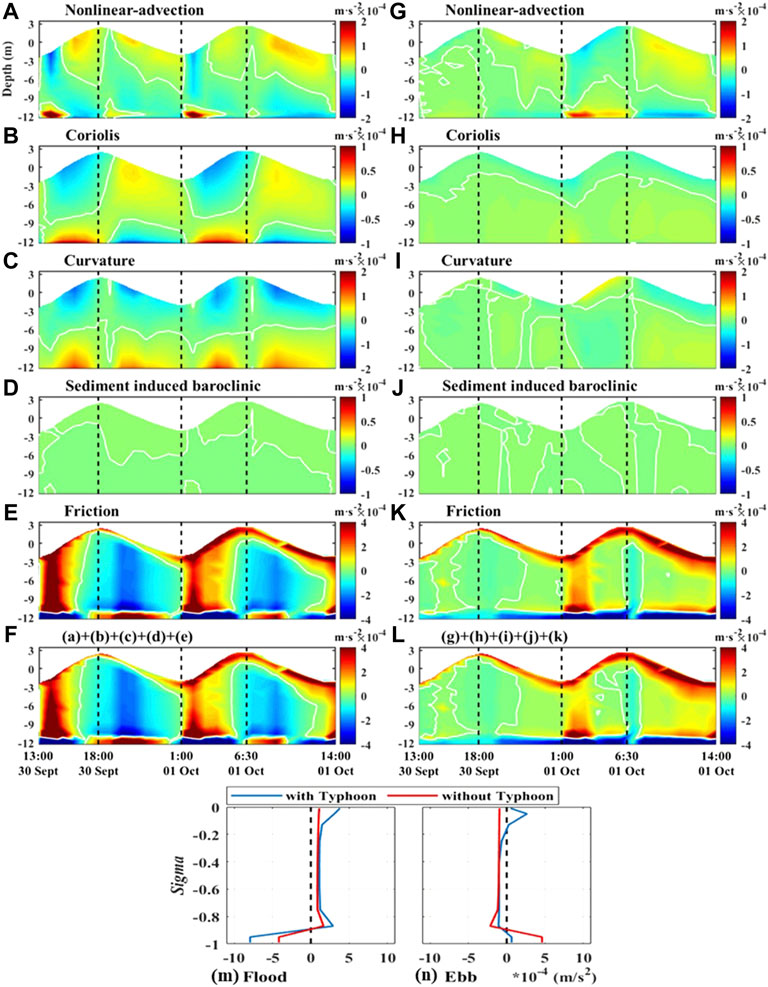
FIGURE 10. Times series in the main tidal channel at station P (during Typhoon Mitag) during (A–F) spring tides and (G–L) neap tides: vertical deviation from depth-averaged terms in lateral momentum (Eq. 16). Vertical profile of the principal momentum terms in Eq. 16 at station P during (M) flood and (N) ebb tides during the typhoon. Positive values indicate southward directions.
Lateral circulation in the curvature was enhanced during Typhoon Mitag, and sediment flux was subsequently changed, controlled by the friction term and vertical profile of SSC.
4 Discussion
Wave-current coupling is critical to estuarine hydrodynamics and sediment processes, especially during storms (Graber et al., 1989; Dufois et al., 2014) and is an important research element in marine engineering and coastal dynamic geomorphology. Waves contribute substantially to sediment dynamics during typhoons in HZB, but have a small effect during calm weather conditions. Typhoon Mitag was used as an example to study the effect of wave-current interactions on sediment dynamics during extreme weather conditions.
4.1 Tide-surge interaction
During typhoons, the strong tides in Hangzhou Bay interact nonlinearly with surges:
where ηT is astronomical tidal level (only tidal forcing), ηS is the water level during storms (only wind forcing); ηT+S is the total water level; ηN is the water level owing to the nonlinear interaction of tides and surges.
Figures 11A–E shows the trends of total water level, total surge, storm surge, nonlinear surge and significant wave height in Hangzhou Bay during thw Typhoon Mitag. The typhoon occurred during spring tides in the bay. At 18:00 (GMT), the significant wave height at the mouth and the middle of the bay exceeded 2 m (Figure 11E). The total water level showed semi-diurnal tides frequency variation and peaked (over 3 m) at 06:00 (GMT) on 1 October (Figure 11A). The surge occurred at the mouth of Hangzhou Bay and then propagated upstream to the bay head (Figure 11B). Owing to the effect of funnel-shaped geomorphology, the peak of surge gradually increased from the bay mouth towards the bay head. The trend of the non-linear surge was similar to that of the total surge (Figure 11D), with a gradual increase from the mouth to the top of the bay. The peak of non-linear surge occurred later than the peak of total surge (Figure 11C), corresponding to a period of greater total water level.
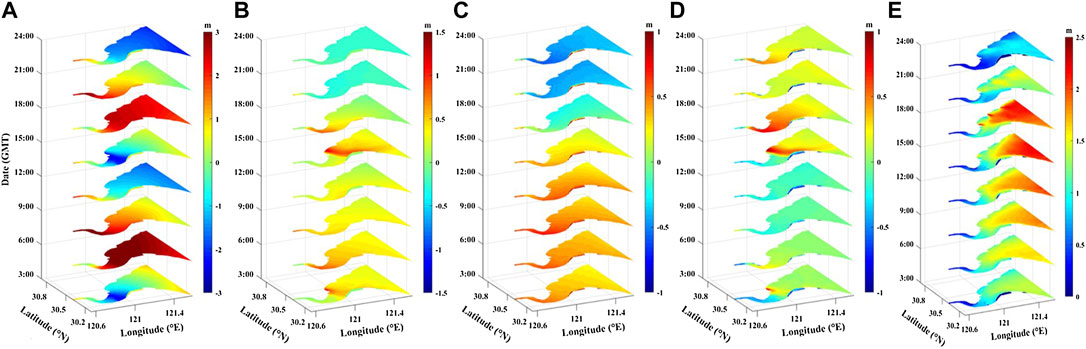
FIGURE 11. (A) Total water level, (B) total surge, (C) storm surge and (D) nonlinear surge (E) Hs (GMT 2019-10-01, 3:00–24:00).
4.2 Combined wave-current bottom stress
The combined wave-current bottom stress is the vector sum of the time-averaged instantaneous current-induced bottom stress and wave-caused maximum bottom stress (Gao et al., 2018). The combined bottom stress of wave-current influences SSC through its effect on the resuspension process. The 50 h mean values before (calm weather condition) and during the typhoon (extreme weather condition) were used to illustrate the results in the discussion section.
During calm weather, the combined current-wave shear stress is only significantly different in shallow water compared to the current-induced shear stress condition, with little effect in deeper water on the north shore. This is because wave-induced bottom stress is proportional to the square of the wave orbital velocity, which is more prominent in shallow water. The 50-h mean near-bottom SSC difference has the same distribution pattern, with an increase of more than 0.2 kg/m3 in shallow water.
During the typhoon (Figure 12), the effect of the combined wave-current bottom stress (Figure 12A’–F’) is more significant, with a large increase in significant wave height and wave orbital velocity. The 50-h mean bottom stress difference in shallow water exceeds 0.8 N/m2, and the mean near-bottom SSC difference is greater than 1 kg/m3 (Figures 12A–F).
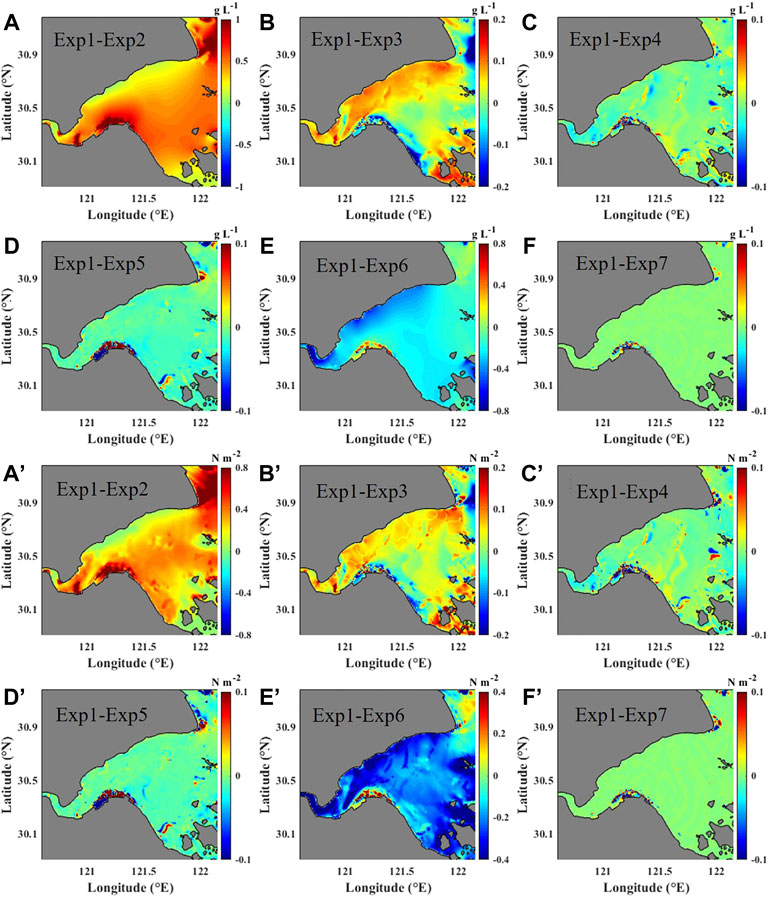
FIGURE 12. Differences of 50 h averaged (A–F) near-bottom SSC and (A’–F’) bottom stress during the Typhoon Mitag.
Figure 13A shows the differences in bottom bed shear stress, SSC, Km, and current velocity between Tests 1 and 2 at station P2 during calm weather and Typhoon Mitag. Compared with current-induced shear stress, the combined wave-current bottom stress under calm weather conditions is elevated, with values not exceeding 0.02 N/m2. The difference in SSC is also not significant, and the difference exceeds 0.1 kg/m3 only at 12:00 on 27 September.
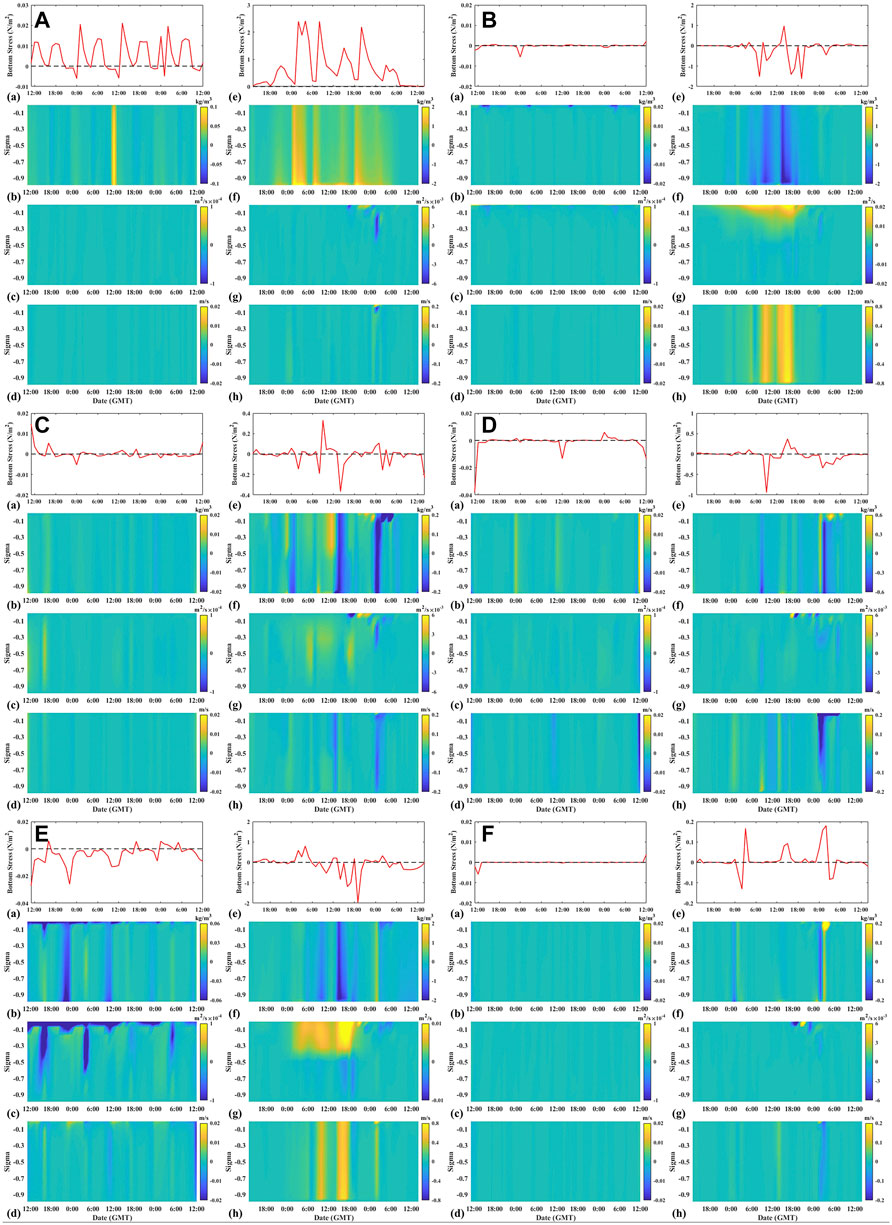
FIGURE 13. Differences between (A) Test 1 and Test 2, (B) Test 1 and Test 3, (C) Test 1 and Test 4, (D) Test 1 and Test 5, (E) Test 1 and Test 6, and (F) Test 1 and Test 7. (a) bottom bed shear stress, (b) SSC, (c) Km and (d) current velocity during calm weather (averaged in 50 h before the typhoon) at station P2. (e–h) are the same as (a–d) except for Typhoon Mitag (averaged in 50 h during the typhoon).
The difference in bottom stress between Tests 1 and 2 at station P2 is more than 2.4 N/m2. The difference in near-bottom SSC exceeds 2 kg/m3 at 2:00, 8:00, and 20:00 on October 1, which is similar to the distribution pattern of bottom stress. The increase in SSC decreases from the bottom layer to the surface layer. In addition, the difference between the vertical eddy viscosity coefficient and current velocity between Tests one and two at station P2 is not significant, even during the storm. In summary, combined wave-current bottom stress can significantly affect the sediment resuspension process and consequently, SSC, particularly in shallow water or during storms.
4.3 Wave dissipation
Wave dissipation is an energy sink in the wave-energy equation (Eq. 8). However, wave dissipation at the surface and bottom is a source term in the vertical turbulence energy equation (a diffusion boundary condition). Therefore, wave dissipation can enhance vertical mixing. Enhanced vertical mixing not only acts on the vertical exchange of suspended sediment but also affects the flow and, therefore, the advection and resuspension processes of suspended sediment.
Under calm weather conditions, the effect of wave dissipation on suspended sediments in HZB is negligible (Figures 13Ba–d). During Typhoon Mitag, the difference in bottom stress between Tests 1 and 3 (Figure 13Be) and the difference in SSC in the near-bottom layer (Figures 13Bf) show spatial variability. In the shallow waters of southern HZB, wave dissipation mostly leads to decreased bottom stress and near-bottom SSC. In contrast, in deep tidal channels, bottom stress and near-bottom SSC mainly increase, and the difference in near-bottom SSC can reach 0.07–0.08 kg/m3. Focusing on station P2, surface dissipation significantly enhances vertical mixing during the typhoon, whereas bottom dissipation has little effect on vertical mixing (Figure 13Bg).
On 1 October, station P2 experienced two events with significant wave-dissipation effects at 09:00 (peak ebb) and 16:00 (peak flood). During this period, bottom stress decreases by more than 0.5 N/m2 (Figure 13Bg), current velocity increases by more than 0.3 m/s (Figure 13Bh), and vertical SSC decreases by approximately 1 kg/m3.
In summary, the wave dissipation term is a source of the energy equation of vertical turbulence, which enhances vertical mixing. Enhanced vertical mixing not only affects the vertical exchange of suspended sediment but also influences the flow, which in turn affects the advection and resuspension processes of sediment. The wave dissipation term has a substantial effect in the bay only during typhoons, and its effect is related to water depth and tidal phases. In shallow waters, bottom stress and SSC are reduced, while current velocity is increased.
4.4 Form drag
The effect of wind stress can be divided into a turbulent viscous component (surface friction) and a pressure component (form drag). Form drag is related to the horizontal gradient of wave pressure because of wave-induced water level rise (Eq. 5). Wind pressure acts on the water column as form drag, therefore, entering the momentum equation and vertical turbulence closure equation (Mellor, 2005).
Similar to wave dissipation, the differences in form drag are almost 0 under calm weather conditions (Figure 13Ce), with almost no effect on the sediment dynamics in the bay (Figures 13Ca–d). During the typhoon, form drag mainly affects the vertical mixing of each sigma layer in the vertical direction. However, the deviation is small, and the average Km value of P2 differs by 7% at sigma = 0.5. Compared with Test 3, the form drag of Test one increases significantly in the surface layer and decreases with depth during Typhoon Mitag (Figure 13Cj), while enhancing vertical mixing in the upper layers of the water column (Figure 13Ch). The difference between the current velocity and bottom stress fluctuates and mainly decreases. The effect of form drag on SSC is relatively complex (Figure 13Cg). SSC in the middle and upper layers increases by more than 0.1 kg/m3 at 13:00 on 1 October, which may be related to the enhanced vertical eddy viscosity coefficient. As the difference between the current velocity and bottom stress decreases, the difference between SSC at 15:00 on 1 October and 2:00 on 2 October is approximately 0.2 kg/m3.
In general, form drag affects suspended sediment mainly by influencing Km and has a significant effect only during storms in the bay, which is weaker than the combined bottom stress and wave dissipation.
4.5 Wave radiation stress
Wave radiation stress can be described as the energy exchange during the wave-current interaction, which is a wave residual momentum flow (Zou, 2005). Longuet-Higgins and Stewart (1962) defined radiation stress as the difference between the time-averaged value of the total momentum flow acting on a unit area of the water column and the hydrostatic pressure in the absence of waves. When a wave breaks, wave height and momentum are subsequently reduced, and the reduced momentum is converted into a force acting on the surrounding fluid. Conversely, to maintain wave momentum, the surrounding fluid also exerts forces on the wave (Mu, 2020).
Under calm weather conditions, the effect of wave radiation stress on hydro and sediment dynamics in the bay is almost negligible, except for small shallow areas (Figures 13Da–d). During Typhoon Mitag, the wave radiation stress reduced SSC in most of the bay (approximately 0.01 kg/m3), and it increased SSC in the shallow waters of the southern bay (approximately 0.3 kg/m3) (Figure 13Dd). Wave radiation stress affects advective transport and subsequently changes SSC by changing the current velocity, for example, at 2:00 on 2 October. Changes in current velocity near the bottom also led to changes in bottom stress, with a maximum reduction of 0.94 N/m2, at 9:00 on 1 October (Figure 13De). This, in turn, led to a significant decrease in SSC, with a decrease of more than 0.4 kg/m3 in the middle and lower layers.
In summary, radiation stress affects advection by changing current velocity, and the change in bottom velocity also changes bottom stress, which in turn affects the resuspension process. Both processes have a negligible effect outside the shallow area of the bay and are weaker than the combined wave-current bottom stress and wave dissipation.
4.6 Mean current advection and refraction of wave energy
Flow can affect the propagation of wave energy through the advection term (second term on the left side of Eq. 8) and the refraction term (third term on the left side of Eq. 8). Both mechanisms provide feedback from the wave to the flow, which in turn affects SSC. If these two terms are omitted from the wave model, the effect of waves on the current changes.
Under calm weather conditions, the mean current advection of wave energy mainly reduces the surface vertical eddy viscosity coefficient (Figure 13Ec), which in turn affects SSC (Figure 13Eb). Large differences were observed during the typhoons. The mean current advection of wave energy generally reduces the near-bottom SSC in the bay, especially at the top of the bay and near the northern bank (Figure 13Ee). SSC in the shallow waters of the southern bay increases slightly, and its distribution pattern is consistent with that of the bottom stress difference (Figure 13Ee). At station P2, the difference in current velocity during the typhoon (Figure 13Eh) correlates with the difference in SSC (Figure 13Ef).
Two significant increases in current velocity difference were experienced at 10:00 and 15:00 on 1 October. Advective transport was affected, which in turn led to a decrease in SSC exceeding 1 kg/m3. The change in the near-bottom current velocity also changed the bottom stress, with a maximum decrease of approximately 2 N/m2 at 19:00 on 1 October (Figure 13Ee). The Km values near the surface level (sigma > −0.45) increased significantly during the typhoon and decreased slightly near the bottom level (sigma < −0.45). The effect of wave energy mean flow refraction is small during both calm weather and Typhoon Mitag (Figure 13Eg).
The effect of the mean current refraction of wave energy is also small during both calm weather and Typhoon Mitag (Figure 13Ff). At 2:00 on 2 October, SSC at station P2 decreased by more than 0.15 kg/m3. At 4:00 on 2 October, surface SSC increased by approximately 0.3 kg/m3.
Generally, the advection term is the second most important term following the combined wave-current bottom stress, and works to reduce SSC. The refraction term is the weakest term among the six mechanisms.
5 Conclusion
This study uses the macro-tidal turbid HZB as an example to investigate sediment dynamics and the physical mechanism of wave-current interaction on sediment dynamics during Typhoon Mitag. The main conclusions are as follows.
(1) A numerical model coupled tide-wave-surge-sediment is established and fully validated in the HZB. The wave-current coupling process of the model fully considers combined wave-current bottom stress, wave dissipation, form drag, radiation stress, Stokes drift velocity, mean current advection of wave energy, and refraction. The sediment model coupled water-sediment density and considered the flocculation-settlement process and fluid mud bottom boundary layer characteristics. The surge model considered reconstructing and verifying the rotating and moving wind fields of typhoons using the Holland-Miyazaki model. The model results are thoroughly validated using field data of water levels, currents, significant wave heights, and SSC data during calm and extreme weather conditions.
(2) Hydro and sediment dynamics in HZB are spatially and temporally asymmetric and are controlled by different mechanisms, depending on water depth and tidal phases. The typhoon changed the asymmetrical characteristics of hydro and sediment dynamics in HZB. The increased bottom currents caused by typhoons are similar to, but smaller than, the increased surface currents. The combined interactions of currents and waves led to more sediment resuspension during the typhoon. The lateral circulation in the curvature was reversed during Typhoon Mitag, and the sediment flux subsequently changed, controlled by the friction term and vertical profile of SSC.
(3) The combined bottom stresses were the main wave-current interactions leading to increased SSC in HZB, which significantly affected sediment resuspension and, therefore, affected SSC. Under calm weather conditions, except for the combined wave-current bottom stress, the effects of the other terms were minor. The combined bottom stress is the most critical wave-current interaction mechanism that increases SSC, which significantly affects sediment resuspension and SSC, especially in shallow waters or during storms. The advection term plays an essential role in reducing SSC by increasing current velocity and influencing advection transport. The wave dissipation term enhances vertical mixing. The enhancement of vertical mixing acts on the vertical exchange of suspended sediment, which affects flow, and further affects the advection and resuspension process. In the shallow waters of the southern bay, wave dissipation mostly leads to lower bottom stress, increased current velocity, and reduced SSC. In the deep tidal channels, SSC primarily increases. Form drag mainly influences the vertical eddy viscosity coefficient. Wave radiation stress affects advective transport by changing current velocity and then changes the bottom stress, which in turn affects the resuspension process. The effects of form drag and wave radiation terms are insignificant, and the effect of the refraction term is the smallest, even during storms.
Data availability statement
The original contributions presented in the study are included in the article/supplementary material, further inquiries can be directed to the corresponding authors.
Author contributions
LL, XW, and YX: manuscript writing, data analysis, methodology, and modelling. JX and YR: material collection, modelling, and data analysis.
Funding
This research was supported by the National Natural Science Foundation of China (41976157 and 42076177), and the Science Technology Department of Zhejiang Province (2020C03012, 2022C03044, and 2021C03180).
Conflict of interest
The authors declare that the research was conducted in the absence of any commercial or financial relationships that could be construed as a potential conflict of interest.
Publisher’s note
All claims expressed in this article are solely those of the authors and do not necessarily represent those of their affiliated organizations, or those of the publisher, the editors and the reviewers. Any product that may be evaluated in this article, or claim that may be made by its manufacturer, is not guaranteed or endorsed by the publisher.
References
Allen, J. I., Somerfield, P. J., and Gilbert, F. J. (2007). Quantifying uncertainty in high-resolution coupled hydrodynamic-ecosystem models. J. Mar. Syst. 64 (1-4), 3–14. doi:10.1016/j.jmarsys.2006.02.010
An, B. C. (2016). Numerical studies and application of tidal dynamics based on FVCOM in Hangzhou Bay and adjacent seas. Shanghai: Shanghai Ocean University.
Andersen, T. J., and Pejrup, M. (2001). Suspended sediment transport on a temperate, microtidal mudflat, the Danish Wadden Sea. Mar. Geol. 173 (1-4), 69–85. doi:10.1016/s0025-3227(00)00164-x
Bricker, J. D., Inagaki, S., and Monismith, S. G. (2005). Bed drag coefficient variability under wind waves in a tidal estuary. J. Hydraul. Eng. 131 (6), 497–508. doi:10.1061/(asce)0733-9429(2005)131:6(497)
Cao, Z. D., and Wang, Y. H. (1994). Numerical simulation of hydrodynamic sediment. Tianjin: Tianjin University Press.
Chen, C. S., Beardsley, R. C., and Cowles, G. (2006). An unstructured grid, finite-volume coastal ocean model: FVCOM user manual. second edition. Oceanography. doi:10.5670/oceanog.2006.92
Chen, M., Yu, C. G., Hou, W. F., Xu, Y. J., Zheng, J., Deng, X. Y., et al. (2017). Study on distribution characteristics of temperature and salinity in spring and autumn in zhoushan coastal fishing ground. J. Zhejiang Ocean Univ. Nat. Sci. 36 (06), 495–502. doi:10.3969/j.issn.1008-830X.2017.06.005
Chen, Y., Cai, T., Chang, Y., Huang, S., and Xia, T. (2018). “Comparison of flow and energy reduction by representative intertidal plants, Southeast China,” in The 28th International Ocean and Polar Engineering Conference, Sapporo, Japan, June 2018.
Christie, M. C., and Dyer, K. R. (1998). Measurements of the turbid tidal edge over the Skeffling mudflats. Geol. Soc. Lond. Spec. Publ. 139 (1), 45–55. doi:10.1144/gsl.sp.1998.139.01.04
Christie, M. C., Dyer, K. R., and Turner, P. (1999). Sediment flux and bed level measurements from a macro tidal mudflat. Estuar. Coast. Shelf Sci. 49 (5), 667–688. doi:10.1006/ecss.1999.0525
D'Alpaos, A., Carniello, L., and Rinaldo, A. (2013). Statistical mechanics of wind wave-induced erosion in shallow tidal basins: Inferences from the Venice Lagoon. Geophys. Res. Lett. 40 (13), 3402–3407. doi:10.1002/grl.50666
Dronkers, J. (1986). Tidal asymmetry and estuarine morphology. Neth. J. Sea Res. 20 (2-3), 117–131. doi:10.1016/0077-7579(86)90036-0
Dufois, F., Verney, R., Le Hir, P., Dumas, F., and Charmasson, S. (2014). Impact of winter storms on sediment erosion in the rhone river prodelta and fate of sediment in the gulf of lions (north western mediterranean sea). Cont. Shelf Res. 72, 57–72. doi:10.1016/j.csr.2013.11.004
Dyer, K. R., Christie, M. C., Feates, N., Fennessy, M. J., Pejrup, M., Van der Lee, W., et al. (2000). An investigation into processes influencing the morphodynamics of an intertidal mudflat, the dollard estuary, The Netherlands: I. Hydrodynamics and suspended sediment. Estuar. Coast. Shelf Sci. 50 (5), 607–625. doi:10.1006/ecss.1999.0596
Gao, G. D., Wang, X. H., Song, D., Bao, X., Yin, B. S., Yang, D. Z., et al. (2018). Effects of wave–current interactions on suspended-sediment dynamics during strong wave events in Jiaozhou Bay, Qingdao, China. J. Phys. Oceanogr. 48 (5), 1053–1078. doi:10.1175/jpo-d-17-0259.1
Graber, H. C., Beardsley, R. C., and Grant, W. D. (1989). Storm-generated surface waves and sediment resuspension in the East China and Yellow Seas. J. Phys. Oceanogr. 19 (8), 1039–1059. doi:10.1175/1520-0485(1989)019<1039:sgswas>2.0.co;2
Grant, W. D., and Madsen, O. S. (1979). Combined wave and current interaction with a rough bottom. J. Geophys. Res. 84 (C4), 1797–1808. doi:10.1029/jc084ic04p01797
Green, M. O., Black, K. P., and Amos, C. L. (1997). Control of estuarine sediment dynamics by interactions between currents and waves at several scales. Mar. Geol. 144 (1-3), 97–116. doi:10.1016/s0025-3227(97)00065-0
Green, M. O., and Coco, G. (2014). Review of wave-driven sediment resuspension and transport in estuaries. Rev. Geophys. 52 (1), 77–117. doi:10.1002/2013rg000437
Green, M. O., and Coco, G. (2007). Sediment transport on an estuarine intertidal flat: Measurements and conceptual model of waves, rainfall and exchanges with a tidal creek. Estuar. Coast. Shelf Sci. 72 (4), 553–569. doi:10.1016/j.ecss.2006.11.006
Green, M. O., and MacDonald, I. T. (2001). Processes driving estuary infilling by marine sands on an embayed coast. Mar. Geol. 178 (1-4), 11–37. doi:10.1016/s0025-3227(01)00188-8
Green, M. O. (2011). Very small waves and associated sediment resuspension on an estuarine intertidal flat. Estuar. Coast. shelf Sci. 93 (4), 449–459. doi:10.1016/j.ecss.2011.05.021
He, X., Bai, Y., Pan, D., Huang, N. L., Dong, X., Chen, J. S., et al. (2013). Using geostationary satellite ocean color data to map the diurnal dynamics of suspended particulate matter in coastal waters. Remote Sens. Environ. 133, 225–239. doi:10.1016/j.rse.2013.01.023
He, Z. G., Tang, Y. L., Xia, Y. Z., Chen, B. D., Xu, J., Yu, Z. Z., et al. (2020). Interaction impacts of tides, waves and winds on storm surge in a channel-island system: Observational and numerical study in yangshan harbor. Ocean. Dyn. 70 (3), 307–325. doi:10.1007/s10236-019-01328-5
Holland, G. J. (1980). An analytic model of the wind and pressure profiles in hurricanes. Mon. Weather Rev. 108 (8), 1212–1218. doi:10.1175/1520-0493(1980)108<1212:aamotw>2.0.co;2
Hu, Y. K., Yu, Z. F., Zhou, B., Li, Y., Yin, S. J., He, X. Q., et al. (2019). Tidal-driven variation of suspended sediment in Hangzhou Bay based on GOCI data. Int. J. Appl. Earth Observation Geoinformation 82, 101920. doi:10.1016/j.jag.2019.101920
Ji, R. Y., and Lu, Y. J. (2008). Advances in hydrodynamic and sedimentary processes of macro tidal estuary. Hydro-Science Eng. 3, 64–69. doi:10.16198/j.cnki.1009-640x.2008.03.011
Jiang, C. B., Wu, Z. Y., Chen, J., and Liu, J. (2014). Review of sediment transport and beach profile changes under storm surge. J. Changsha Univ. Sci. Technol. Nat. Sci. 11, 1–9. doi:10.3969/j.issn.1672-9331.2014.01.001
Jin, Y. H., and Sun, Z. L. (1992). Mixing characteristics of salt water and fresh water in Chinese estuaries. Acta Geogr. Sin. 47 (2), 165–173.
Kalkwijk, J. P. T., and Booij, R. (1986). Adaptation of secondary flow in nearly-horizontal flow. J. Hydraul. Res. 24 (1), 19–37. doi:10.1080/00221688609499330
Kim, S. C., Friedrichs, C. T., Maa, J. Y., and Wright, L. D. (2000). Estimating bottom stress in tidal boundary layer from acoustic Doppler velocimeter data. J. Hydraul. Eng. 126 (6), 399–406. doi:10.1061/(asce)0733-9429(2000)126:6(399)
Leonardi, N., Carnacina, I., Donatelli, C., Ganju, N. K., Plater, A. J., Schuerch, M., et al. (2018). Dynamic interactions between coastal storms and salt marshes: A review. Geomorphology 301, 92–107. doi:10.1016/j.geomorph.2017.11.001
Li, L., Guan, W. B., He, Z. G., Yao, Y. M., and Xia, Y. Z. (2017). Responses of water environment to tidal flat reduction in xiangshan bay: Part II locally re-suspended sediment dynamics. Estuar. Coast. Shelf Sci. 198, 114–127. doi:10.1016/j.ecss.2017.08.042
Li, L., Guan, W. B., Hu, J. Y., Cheng, P., and Wang, X. H. (2018). Responses of water environment to tidal flat reduction in xiangshan bay: Part I hydrodynamics. Estuar. Coast. Shelf Sci. 206, 14–26. doi:10.1016/j.ecss.2017.11.003
Li, L., Li, Z., He, Z., Yu, Z., and Ren, Y. (2022a). Investigation of storm tides induced by super typhoon in macro-tidal Hangzhou bay. Front. Mar. Sci. 9, 890285. doi:10.3389/fmars.2022.890285
Li, L., Ren, Y. H., Wang, X. H., and Xia, Y. Z. (2022b). Sediment dynamics on a tidal flat in macro-tidal Hangzhou bay during typhoon Mitag. Cont. Shelf Res. 237, 104684. doi:10.1016/j.csr.2022.104684
Longuet-Higgins, M. S., and Stewart, R. W. (1962). Radiation stress and mass transport in gravity waves, with application to ‘surf beats. J. Fluid Mech. 13 (4), 481–504. doi:10.1017/s0022112062000877
Lu, J., Jiang, J., Li, A., and Ma, X. (2018). Impact of typhoon chan-hom on the marine environment and sediment dynamics on the inner shelf of the east China sea: In-situ seafloor observations. Mar. Geol. 406, 72–83. doi:10.1016/j.margeo.2018.09.009
Mellor, G. (2015). A combined derivation of the integrated and vertically resolved, coupled wave–current equations. J. Phys. Oceanogr. 45 (6), 1453–1463. doi:10.1175/jpo-d-14-0112.1
Mellor, G. L., Donelan, M. A., and Oey, L. Y. (2008). A surface wave model for coupling with numerical ocean circulation models. J. Atmos. Ocean. Technol. 25 (10), 1785–1807. doi:10.1175/2008jtecho573.1
Mellor, G. L., and Yamada, T. (1982). Development of a turbulence closure model for geophysical fluid problems. Rev. Geophys. 20 (4), 851–875. doi:10.1029/rg020i004p00851
Mellor, G. (2005). Some consequences of the three-dimensional current and surface wave equations. J. Phys. Oceanogr. 35 (11), 2291–2298. doi:10.1175/jpo2794.1
Miyazaki, M., Ueno, T., and Unoki, S. (1962). Theoretical investigations of typhoon surges along the Japanese coast. Oceanogr. Mag. 13 (2), 103–117.
Mu, H. R. (2020). Study on the radiation stress of waves over two-dimensional variable bathymetry. Dalian: Dalian University of Techonology.
Murphy, A. H. (1992). Climatology, persistence, and their linear combination as standards of reference in skill scores. Weather Forecast. 7 (4), 692–698. doi:10.1175/1520-0434(1992)007<0692:cpatlc>2.0.co;2
Pan, C. H., Zeng, J., Tang, Z. W., and Shi, Y. B. (2013). A study of sediment characteristics and riverbed erosion/deposition in Qiantang estuary. Hydro-Science Eng. (01), 1–7. doi:10.3969/j.issn.1009-640X.2013.01.001
Pang, H. J., Lou, Z. H., Jin, A. M., Yan, K. K., Jiang, Y., Yang, X. H., et al. (2015). Contamination, distribution, and sources of heavy metals in the sediments of Andong tidal flat, Hangzhou bay, China. Cont. Shelf Res. 110, 72–84. doi:10.1016/j.csr.2015.10.002
Pawlowicz, R., Beardsley, B., and Lentz, S. (2002). Classical tidal harmonic analysis including error estimates in MATLAB using T_TIDE. Comput. Geosciences 28 (8), 929–937. doi:10.1016/s0098-3004(02)00013-4
Postma, H. (1961). Transport and accumulation of suspended matter in the Dutch Wadden Sea. Neth. J. Sea Res. 1 (1-2), 148–190. doi:10.1016/0077-7579(61)90004-7
Pritchard, D. (2005). Suspended sediment transport along an idealised tidal embayment: Settling lag, residual transport and the interpretation of tidal signals. Ocean. Dyn. 55 (2), 124–136. doi:10.1007/s10236-005-0004-7
Ralston, D. K., and Stacey, M. T. (2007). Tidal and meteorological forcing of sediment transport in tributary mudflat channels. Cont. Shelf Res. 27 (10-11), 1510–1527. doi:10.1016/j.csr.2007.01.010
Ren, Y. (2022). Characteristics and mechanism of suspended sediment in Hangzhou bay considering wave-current interaction. Zhoushan: Zhejiang University.
Sheng, Y. P., and Liu, T. (2011). Three-dimensional simulation of wave-induced circulation: Comparison of three radiation stress formulations. J. Geophys. Res. 116 (C5), C05021. doi:10.1029/2010jc006765
Shi, J. Z., Luther, M. E., and Meyers, S. (2006). Modelling of wind wave-induced bottom processes during the slack water periods in Tampa Bay, Florida. Int. J. Numer. Methods Fluids 52 (11), 1277–1292. doi:10.1002/fld.1377
Shi, Z., and Chen, J. Y. (1996). Morphodynamics and sediment dynamics on intertidal mudflats in China (1961–1994). Cont. Shelf Res. 16 (15), 1909–1926. doi:10.1016/0278-4343(95)00059-3
Shi, Z. (2001). Observations on fluid mud in the deep water channel of Hangzhou Bay. Mar. Sci. Bull. 20 (06), 40–50. doi:10.3969/j.issn.1001-6392.2001.06.006
Shou, W. W., Wu, J. Z., Hu, R. J., and Zhu, L. H. (2009). 3-D hydrodynamic numerical modelling around the sea area of zhoushan islands. Mar. Geol. Lett. 25 (11), 1–9. doi:10.3969/j.issn.1009-2722.2009.11.001
Smagorinsky, J. (1963). General circulation experiments with the primitive equations: I. The basic experiment. Mon. Weather Rev. 91 (3), 99–164. doi:10.1175/1520-0493(1963)091<0099:gcewtp>2.3.co;2
Soulsby, R. L. (1997). Dynamics of marine sands: A manual for practical applications. Oceanogr. Lit. Rev. 9 (44), 947.
Soulsby, R. L., Hamm, L., Klopman, G., Myrhaug, D., Simons, R. R., Thomas, G. P., et al. (1993). Wave-current interaction within and outside the bottom boundary layer. Coast. Eng. 21 (1-3), 41–69. doi:10.1016/0378-3839(93)90045-a
Talke, S. A., and Stacey, M. T. (2003). The influence of oceanic swell on flows over an estuarine intertidal mudflat in San Francisco Bay. Estuar. Coast. Shelf Sci. 58 (3), 541–554. doi:10.1016/s0272-7714(03)00132-x
Tang, J. H. (2007). Characteristics of fine cohesive sediment’s flocculation in the Changjiang estuary and its adjacent sea area. Shanghai: East China Normal University.
Tang, Y. L. (2018). Numerical simulation of characteristics of storm tide in Yangshan Harbor based on tide-surge-wave model. Zhoushan: Zhejiang University.
Tu, J., and Fan, D. (2017). Flow and turbulence structure in a hypertidal estuary with the world's biggest tidal bore. J. Geophys. Res. Oceans 122 (4), 3417–3433. doi:10.1002/2016jc012120
Tu, J., Fan, D., Zhang, Y., and Voulgaris, G. (2019). Turbulence, sediment‐induced stratification, and mixing under macrotidal estuarine conditions (Qiantang Estuary, China). J. Geophys. Res. Oceans 124 (6), 4058–4077. doi:10.1029/2018jc014281
Uncles, R. J., and Stephens, J. A. (2010). Turbidity and sediment transport in a muddy sub-estuary. Estuar. Coast. Shelf Sci. 87 (2), 213–224. doi:10.1016/j.ecss.2009.03.041
Van Prooijen, B. C., and Winterwerp, J. C. (2010). A stochastic formulation for erosion of cohesive sediments. J. Geophys. Res. 115 (C1), C01005. doi:10.1029/2008jc005189
Van Straaten, L. M. J. U., and Kuenen, P. H. (1957). Accumulation of fine grained sediments in the Dutch Wadden Sea. Geol. Mijnb. 19, 329–354.
Wang, B. C., and Eisma, D. (1990). Supply and deposition of sediment along the north bank of Hangzhou Bay, China. Neth. J. sea Res. 25 (3), 377–390. doi:10.1016/0077-7579(90)90045-i
Wang, X. H., Byun, D. S., Wang, X. L., and Cho, Y. K. (2005). Modelling tidal currents in a sediment stratified idealized estuary. Cont. shelf Res. 25 (5-6), 655–665. doi:10.1016/j.csr.2004.10.013
Wang, X. H. (2002). Tide-induced sediment resuspension and the bottom boundary layer in an idealized estuary with a muddy bed. J. Phys. Oceanogr. 32 (11), 3113–3131. doi:10.1175/1520-0485(2002)032<3113:tisrat>2.0.co;2
Wang, Y. N. (2014). Three-dimensional numerical simulation of tidal flow and sediment movement near shore. Taiyuan: Taiyuan University of Technology.
Warner, J. C., Sherwood, C. R., Signell, R. P., Harris, C. K., and Arango, H. G. (2008). Development of a three-dimensional, regional, coupled wave, current, and sediment-transport model. Comput. geosciences 34 (10), 1284–1306. doi:10.1016/j.cageo.2008.02.012
Williams, H. F. (2009). Stratigraphy, sedimentology, and microfossil content of Hurricane Rita storm surge deposits in southwest Louisiana. J. Coast. Res. 25 (4), 1041–1051. doi:10.2112/08-1038.1
Winterwerp, J. C. (2001). Stratification effects by cohesive and noncohesive sediment. J. Geophys. Res. 106 (C10), 22559–22574. doi:10.1029/2000jc000435
Xiao, Z., Wang, X. H., Roughan, M., and Harrison, D. (2019). Numerical modelling of the sydney Harbour estuary, new south wales: Lateral circulation and asymmetric vertical mixing. Estuar. Coast. Shelf Sci. 217, 132–147. doi:10.1016/j.ecss.2018.11.004
Xie, D. F., Shu, G. A. O., Wang, Z. B., and Pan, C. H. (2013). Numerical modeling of tidal currents, sediment transport and morphological evolution in Hangzhou Bay, China. Int. J. Sediment Res. 28 (3), 316–328. doi:10.1016/s1001-6279(13)60042-6
Xie, M. X., Zhang, W., and Xie, H. J. (2008). Simplification method in numerical modeling of bridge pier group. Chin. J. Hydrodynamics 23 (4), 464–471.
Xu, S., Li, Z. H., Wang, Y. P., and Jia, J. J. (2021). Near-bottom sediment dynamical processes in the South Passage of the Yangtze Estuary during typhoon season. J. Sediment Res. 46 (04), 48–53. doi:10.16239/j.cnki.0468-155x.2021.04.008
Yang, Y., Wang, Y. P., Gao, S., Wang, X. H., Shi, B. W., Zhou, L., et al. (2016). Sediment resuspension in tidally dominated coastal environments: New insights into the threshold for initial movement. Ocean. Dyn. 66 (3), 401–417. doi:10.1007/s10236-016-0930-6
Ye, T. Y., Li, L., Wang, Y. X., He, Z. G., and Xia, Y. Z. (2019). Impacts of tidal flat reduction on suspended sediment dynamics in Hangzhou bay. J. Tianjin Univ. Sci. Technol. 52 (04), 392–403. doi:10.11784/tdxbz201804092
Ye, T. Y. (2019). The multi-scale variations of suspended sediment dynamics in Hangzhou Bay and its interaction with tidal flat variations. Zhoushan: Zhejiang University.
Yu, Z. Z. (2020). Hydrodynamics and sediment transport during typhoon in Hangzhou Bay. Zhoushan: Zhejiang University.
Yuan, Y., Wei, H., Zhao, L., and Cao, Y. (2009). Implications of intermittent turbulent bursts for sediment resuspension in a coastal bottom boundary layer: A field study in the Western yellow sea, China. Mar. Geol. 263 (1-4), 87–96. doi:10.1016/j.margeo.2009.03.023
Zhang, W., He, Z. G., Tan, L. M., Gao, G., He, H. Z., Hu, P., et al. (2017). Dynamic characteristics of Qiantang tidal bore based on field observations at a fixed location. Chin. J. Hydrodynamics 32 (02), 253–259. doi:10.16076/j.cnki.cjhd.2017.02.016
Zhu, Q. (2017). Sediment dynamics on intertidal mudflats: A study based on in situ measurements and numerical modelling. Shanghai: East China Normal University.
Keywords: ssc, sediment dynamics, wave-current interactions, Typhoon Mitag, Hangzhou Bay
Citation: Li L, Xu J, Ren Y, Wang XH and Xia Y (2022) Effects of wave-current interactions on sediment dynamics in Hangzhou Bay during Typhoon Mitag. Front. Earth Sci. 10:931472. doi: 10.3389/feart.2022.931472
Received: 29 April 2022; Accepted: 14 July 2022;
Published: 19 August 2022.
Edited by:
Paul Liu, North Carolina State University, United StatesReviewed by:
Marcos Eduardo Cordeiro Bernardes, Federal University of Southern Bahia, BrazilJunbiao Tu, Tongji University, China
Copyright © 2022 Li, Xu, Ren, Wang and Xia. This is an open-access article distributed under the terms of the Creative Commons Attribution License (CC BY). The use, distribution or reproduction in other forums is permitted, provided the original author(s) and the copyright owner(s) are credited and that the original publication in this journal is cited, in accordance with accepted academic practice. No use, distribution or reproduction is permitted which does not comply with these terms.
*Correspondence: Li Li, lilizju@zju.edu.cn; Yuezhang Xia, yzxia@zju.edu.cn