Inactivation of the Euchromatic Histone-Lysine N-Methyltransferase 2 Pathway in Pancreatic Epithelial Cells Antagonizes Cancer Initiation and Pancreatitis-Associated Promotion by Altering Growth and Immune Gene Expression Networks
 Guillermo Urrutia1†
  Thiago Milech de Assuncao1,2†
  Angela J. Mathison1,2
  Ann Salmonson1
  Romica Kerketta1,2
  Atefeh Zeighami1,2
  Timothy J. Stodola1,2
  Volkan Adsay3 Burcin Pehlivanoglu4
  Michael B. Dwinell1,5,6,7
  Michael T. Zimmermann2,8,9
  Juan L. Iovanna10
  Raul Urrutia1,2,7,8,11*‡
  Gwen Lomberk1,2,7,12*‡
- 1Division of Research, Department of Surgery, Medical College of Wisconsin, Milwaukee, WI, United States
- 2Genomic Sciences and Precision Medicine Center, Medical College of Wisconsin, Milwaukee, WI, United States
- 3Department of Pathology, Koç University Hospital, Istanbul, Turkey
- 4Department of Pathology, Adiyaman University Training and Research Hospital, Adiyaman, Turkey
- 5Department of Microbiology and Immunology, Medical College of Wisconsin, Milwaukee, WI, United States
- 6Center for Immunology, Medical College of Wisconsin, Milwaukee, WI, United States
- 7LaBahn Pancreatic Cancer Program, Medical College of Wisconsin, Milwaukee, WI, United States
- 8Department of Biochemistry, Medical College of Wisconsin, Milwaukee, WI, United States
- 9Clinical and Translational Sciences Institute, Medical College of Wisconsin, Milwaukee, WI, United States
- 10Centre de Recherche en Cancérologie de Marseille (CRCM), INSERM U1068, CNRS UMR 7258, Aix-Marseille Université and Institut Paoli-Calmettes, Parc Scientifique et Technologique de Luminy, Marseille, France
- 11Department of Physiology, Medical College of Wisconsin, Milwaukee, WI, United States
- 12Department of Pharmacology and Toxicology, Medical College of Wisconsin, Milwaukee, WI, United States
Pancreatic ductal adenocarcinoma (PDAC) is an aggressive, painful disease with a 5-year survival rate of only 9%. Recent evidence indicates that distinct epigenomic landscapes underlie PDAC progression, identifying the H3K9me pathway as important to its pathobiology. Here, we delineate the role of Euchromatic Histone-lysine N-Methyltransferase 2 (EHMT2), the enzyme that generates H3K9me, as a downstream effector of oncogenic KRAS during PDAC initiation and pancreatitis-associated promotion. EHMT2 inactivation in pancreatic cells reduces H3K9me2 and antagonizes KrasG12D-mediated acinar-to-ductal metaplasia (ADM) and Pancreatic Intraepithelial Neoplasia (PanIN) formation in both the Pdx1-Cre and P48Cre/+ KrasG12D mouse models. Ex vivo acinar explants also show impaired EGFR-KRAS-MAPK pathway-mediated ADM upon EHMT2 deletion. Notably, KrasG12D increases EHMT2 protein levels and EHMT2-EHMT1-WIZ complex formation. Transcriptome analysis reveals that EHMT2 inactivation upregulates a cell cycle inhibitory gene expression network that converges on the Cdkn1a/p21-Chek2 pathway. Congruently, pancreas tissue from KrasG12D animals with EHMT2 inactivation have increased P21 protein levels and enhanced senescence. Furthermore, loss of EHMT2 reduces inflammatory cell infiltration typically induced during KrasG12D-mediated initiation. The inhibitory effect on KrasG12D-induced growth is maintained in the pancreatitis-accelerated model, while simultaneously modifying immunoregulatory gene networks that also contribute to carcinogenesis. This study outlines the existence of a novel KRAS-EHMT2 pathway that is critical for mediating the growth-promoting and immunoregulatory effects of this oncogene in vivo, extending human observations to support a pathophysiological role for the H3K9me pathway in PDAC.
Introduction
Pancreatic cancer remains a devastating disease, currently ranking 3rd for cancer-related deaths in the United States and predicted to rank 2nd by 2030 (Rahib et al., 2014). Pancreatic ductal adenocarcinoma (PDAC), the most common type, arises through a stepwise progression from low-grade to high-grade Pancreatic Intraepithelial Neoplasia (PanINs) and eventually leading to invasive adenocarcinoma (Andea et al., 2003). The transitions through increasingly aggressive lesions are accompanied by accumulation of genetic and epigenetic alterations (Macgregor-Das and Iacobuzio-Donahue, 2013; Lomberk et al., 2019). Activating mutations in the KRAS gene are almost consistently the initiator and present even in low-grade PanINs (Hezel et al., 2006). As a result, oncogenic KRAS, in particular KrasG12D, serves as the cornerstone of genetically engineered mouse models (GEMM) for PanIN lesions, as well as PDAC, when crossed to additional genetic models (Herreros-Villanueva et al., 2012). Activation of a KrasG12D allele in mice induces hyperplasia, acinar-to-ductal metaplasia (ADM), and PanIN formation (Hingorani et al., 2003). Given the lack of additional genetic events prior to higher-grade PanIN lesions, these transitions from hyperplasia and ADM through establishing low-grade PanIN are thought to occur at an epigenomic level (Shibata et al., 2018). In addition, evidence supports that the heterogeneity of PDAC results from the presence of distinct epigenomic landscapes, which also carries the potential to induce certain types of plasticity between PDAC subtypes (Lomberk et al., 2018). Therefore, dissecting the role of various epigenomic pathways should provide important insights into PDAC tumorigenesis.
Histone H3 lysine 9 (H3K9) methylation is emerging as an important transcriptional regulatory and epigenetic pathway in pancreatic cancer (McDonald et al., 2017; Lomberk et al., 2019). Histone lysine methylation plays a critical role, along with DNA methylation, for long-term epigenetic maintenance, as well as propagation of overall chromosome structural features and stability (Sims et al., 2003; Martin and Zhang, 2005). Euchromatic histone-lysine N-methyltransferase 2 (EHMT2/G9a) is the main SET domain-containing histone lysine methyltransferase (HMT) responsible for catalyzing H3K9 mono- and di-methylation (H3K9me1 and H3K9me2) (Casciello et al., 2015). The fact that EHMT2 functions in the regulation of various processes, including cellular differentiation, proliferation, epithelial-to-mesenchymal transition (EMT), senescence, DNA replication and DNA repair among others, has suggested a key role for this protein in the epigenetics of human cancers (Shinkai and Tachibana, 2011; Dong et al., 2012; Casciello et al., 2015; Yang et al., 2017). Indeed, EHMT2 is upregulated in many cancers, including PDAC (Casciello et al., 2015), in which its expression correlates with shorter times to relapse and survival (Pan et al., 2016). Pharmacological inhibition of EHMT2 in the PANC-1 PDAC cell line has implicated potential roles in senescence, autophagy and overcoming chemotherapy resistance (Yuan et al., 2012, 2013; Pan et al., 2016). However, the impact that its function has on the effect of activated oncogenes, such as KRAS, during PDAC development in vivo remained to be defined and constitutes the main goal of the current study. Initial studies in P48Cre/+ KrasG12D mice showed that EHMT2 deficiency modifies PanIN progression and animal survival (Kato et al., 2020). The current study uses several in vivo along with in vitro models to extend mechanistic information on the impact of EHMT2 in KrasG12D-mediated initiation. In addition, we also study the role of this protein in the context of inflammation-associated pancreatic cancer using pancreatitis-induced neoplastic promotion. We provide new mechanistic information that supports the dysregulation of gene expression networks antagonistic to cell growth and induction of P21/β-galactosidase-positive senescence. We also report that oncogenic KRAS regulates EHMT2 levels and the formation of its complex with EHMT1 and WIZ, leading to increased levels of its enzymatic product, the H3K9me2 mark. We find reduced inflammatory responses in pancreas tissue from animals carrying EHMT2 inactivation compared to KrasG12D mice retaining the wildtype allele, which is also reflected by functionally coherent gene expression networks. Moreover, genetic inactivation of EHMT2 sustains the antagonistic effects on initiation of KrasG12D-driven neoplastic cell growth even in the pancreatitis-associated promotion model. This phenotypic response is accompanied by alterations in both cell growth and immunoregulatory gene expression networks, thereby affecting the tumor microenvironment through disruption of this pathway in epithelial cells. Combined, these data designate EHMT2 as part of the KrasG12D pathway, as well as reveal a role for this epigenetic regulator in the growth-promoting effects and inflammatory response necessary for KrasG12D-induced carcinogenesis.
Materials and Methods
Cell Lines and Reagents
Mouse iKras 4292 cell lines were obtained from Dr. Marina Pasca di Magliano [University of Michigan](Collins et al., 2012). Cells were maintained in RPMI 1640 media supplemented with 10% (v/v) FBS and 10 μg/ml doxycycline hyclate (doxy, Sigma Aldrich, Cat# D9891) for regular culture. For KrasG12D induction experiments, cells were deprived of doxy at least 48 h for beginning experiments (0 h, baseline). Then, fresh media containing doxy 10 μg/ml was added, and cells maintained under culture during multiple time intervals (12, 24 and 48 h). Human hTERT-E6/E7-HPNE (ATCC Cat# CRL-4037, RRID: CVCL_C468) and hTERT-E6/E7-HPNE-KRASG12D (ATCC Cat# CRL-4039, RRID: CVCL_C470) pancreatic cell lines were obtained from ATCC and maintained in appropriate media according to recommendations. All cells were cultured at 37°C in a humidified incubator with 5% CO2 and were used to a maximum of 30 passages. All cell lines tested negative for Mycoplasma with last testing performed in July 2020.
Western Blot Analysis
Mouse pancreas (∼100 mg) was cut in small pieces and homogenized in protein extraction buffer [10 mM Tris–HCl, 1 mM EDTA, 1% (v/v) Triton-X100, 1% (w/v) Sodium Deoxycholate, 0.1% (w/v) SDS, 140 mM NaCl and 1 mM PMSF] with freshly added protease and phosphatase inhibitors (Thermo Fisher Scientific). Homogenized tissue was moved to a 2 mL microcentrifuge tube containing 1 stainless steel bead (7 mm diameter) and further dissociated using TissueLyser LT (2 min at 50 Hz). The lysate was then sonicated twice (amplitude 5 for 10 s) and supernatant was cleared by centrifugation (10,000 rpm, 10 min, 4°C). HPNE and iKras proteins were collected from cells by lysis in protein extraction buffer supplemented with phosphatase and protease inhibitors. Equal amounts of protein from pancreas or cell lysates were electrophoresed on 12% SDS-PAGE gels and transferred to nitrocellulose membranes (GE Healthcare). Membranes were blocked in either 5% (w/v) milk or 3% (w/v) BSA for 1 h, and primary antibody incubations were performed overnight at 4°C with rocking. Supplementary Table 1 contains primary antibodies used. Anti-mouse or anti-rabbit HRP-conjugated secondary antibodies (1:5000, Millipore) were incubated on the membranes for 1 h at room temperature with agitation, followed by detection with chemiluminescence (Thermo Fisher Scientific). Quantification of bands in n = 3 experiments was completed using ImageJ and statistical significance determined by Student’s t-tests in GraphPad Prism 7.
Immunofluorescence, Proximity Ligation Assays (PLA) and Confocal Microscopy
iKras 4292 cells were stimulated with doxy at the indicated intervals, fixed using 4% Formaldehyde and washed three times with 1× PBS. Cells were permeabilized using 0.2% Triton X-100 for 10 min, PBS washed and blocked with 1% (w/v) BSA in PBS-Tween 20 solution. Slides were then incubated with EHMT2, EHMT1 and WIZ primary antibodies at 4°C overnight and labeled using Alexa Fluor-conjugated secondary antibodies. For proximity ligation assays (PLA) assays, the Duolink PLA Starter Kit (Sigma Aldrich, Cat# DUO92102) was used according to manufacturer’s instructions. Coverslips were mounted using Prolong Gold antifade mounting media (with DAPI, Life technologies, Cat# P36930). Antibodies used are listed in Supplementary Table 1. Images were acquired using a Zeiss LSM510 confocal microscope with a 63× magnification objective.
Immunoprecipitation (IP) and Mass Spectrometry
Immunoprecipitation (IP) of EHMT2 was performed by conjugating the EHMT2 antibody (Thermo Fisher Scientific Cat# PA5-34971, RRID: AB_2552320) or control IgG antibody to Protein A/G Magnetic Beads (Thermo Fisher Scientific) through disuccinimidyl suberate crosslinking. iKras 4292 cells were grown and then stimulated with doxy for 24 h. Cells were lysed with IP Lysis/Wash Buffer (Thermo Fisher Scientific-Pierce), and lysates were incubated overnight with the antibody conjugates at 4°C. Immunoprecipitated complexes were washed, eluted, and run on a 4–15% CriterionTM Tris–HCl Protein Gel (Bio-Rad). The gel was subsequently visualized with BioSafeTM Coomassie Stain (Bio-Rad). Each gel lane was de-stained, dehydrated, dried, and subjected to trypsin digestion. Subsequently, liquid chromatography (LC)-ESI-MS/MS analysis was performed on a Thermo Scientific LTQ Orbitrap mass spectrometer at the Mayo Clinic Proteomics Core.
Mouse Breeding, Genotyping and Caerulein Treatment
Animals were housed in standard mouse housing with controlled temperature, humidity and light cycles and provided with ad libitum standard rodent chow and water. Mice were euthanized using CO2 following institutional guidelines. Tissues were collected and preserved in formaldehyde for 24 h and then moved to 70% (v/v) ethanol for histological analysis or freshly processed for cellular studies. B6.129S4-KrasTM 4Tyj/J (LSL-KrasG12D, IMSR Cat# JAX:008179, RRID: IMSR_JAX:008179) (Jackson et al., 2001), B6.FVB-Tg(Pdx1-Cre)6Tuv/J (Pdx1-Cre, IMSR Cat# JAX:014647, RRID: IMSR_JAX:014647) (Hingorani et al., 2003), Ptf1aTM 1(cre)Hnak/RschJ (P48Cre/+, IMSR Cat# JAX:023329, RRID: IMSR_JAX:023329) (Nakhai et al., 2007), and B6.Cg-Tg(CAG-cre/Esr1∗)5Amc/J (CAGGCre-ERTM, IMSR Cat# JAX:004682, RRID: IMSR_JAX:004682) (Hayashi and McMahon, 2002) were purchased from Jackson Laboratories. EHMT2 flox/flox (EHMT2fl/fl) animals were a generous gift received from Dr. Oltz (Tachibana et al., 2007). All animals have been described previously and were maintained on a C57Bl/6 background. EHMT2fl/fl mice were crossed with animals containing LSL-KrasG12D, Pdx1-Cre, P48Cre/+ or tamoxifen-inducible (CAGGCre-ERTM) Cre drivers. Animals were weaned after 3 weeks and 0.4–0.8 cm length of tail was taken for genotyping. DNA was extracted from the tail pieces using Qiagen’s DNeasy® Blood and Tissue kit (Cat# 69506). PCR was performed as previously described (Tachibana et al., 2007) with products run out an 2.5% agarose gel. Animals that were used in aging studies with no additional treatments were sacrificed at 4, 6, or 8 weeks.
To induce chronic pancreatitis, caerulein was administered via IP injection to 4-week-old mice once a day, five times a week, for a total of 4 weeks at a dose of 50 μg/kg. Animals were given 7 days with no treatment before sacrifice to allow recovery. Animal and pancreas weights were recorded at the time of sacrifice and tissue was taken for RNA, protein and histological analysis.
Immunohistochemistry
Immunohistochemistry was performed on mouse pancreas tissue as described previously (Mathison et al., 2013). Primary antibodies (Supplementary Table 1) were incubated overnight at 4°C. Slides were developed with Nova Red (Vector Laboratories, Cat# SK-4800) and counterstained with Mayer hematoxylin. Five random fields (10× objective) per slide, containing at least 1,000 cells per field, were imaged, and counted.
3D Acinar Culture
CAGGCre-ERTM and CAGGCre-ERTM;EHMT2fl/fl mice were euthanized and pancreas immediately injected with 2 mL of chilled collagenase P (1.33 mg/ml), dissected and cut into small pieces for digestion (20 min at 37°C with gentle shaking). Acinar cells were collected by centrifugation and resuspended in 3D culture base medium (RPMI 1640 medium supplemented with 1% FBS, 0.1 mg/ml soybean trypsin inhibitor, sodium pyruvate 1× and antibiotics). 96-well plates were pre-coated with Matrigel (Corning, Cat# 356231, 30 μL) for 1 h at 37°C. Cell suspensions were mixed 1:1 with Matrigel and plated (100 μL/well). The cell/Matrigel mix was allowed to solidify for 1 h at 37°C before addition of 175 μL 3D culture media. For the first 48 h, DMSO or 4-OHT (10 mmol/L) was added, followed by EGF (20 ng/mL) or TGFα (50 ng/mL) for an additional 5–6 days (Martinelli et al., 2016). Pictures from ductal structures were taken after 8 days in culture using a Canon EOS Rebel Xsi camera mounted on a Nikon Eclipse TS100 microscope at 10× magnification. Duct size was measured using ImageJ software, and plotted values represent fold-change of treated groups over respective controls.
RNA Extraction
For RNA extraction from tissue, a section of pancreas was taken at time of euthanasia, minced in RNAlater and snap frozen with liquid nitrogen. RNA extraction was completed with ToTALLY RNA Kit (Ambion, Cat# AM1910) according to manufacturer’s protocols. Briefly, frozen samples were lysed with tissue Denaturation Solution and disrupted in the TissueLyser LT (Qiagen, 2 min at 50 Hz) with a single, 7 mm stainless steel bead. RNA isolation continued with Phenol:Chloroform:IAA and Acid-Phenol:Chloroform extractions to the aqueous phase and a final isopropanol precipitation. Precipitated RNA was cleaned up according to Qiagen’s protocol on the miRNeasy column (Qiagen, Cat# 217004), with an on-column DNA digestion and RNaseOUT (Invitrogen, Cat# 10777019) added to final elution to reduce degradation during storage at −80°C. Isolation of RNA from cells was completed according to Qiagen’s protocol for the RNeasy kit, including an on-column DNase digestion.
RNA-seq and Bioinformatic Analysis
RNA was quantified by Qubit (Invitrogen) and quality assessed with a Fragment Analyzer (Agilent), with the highest quality (typically RINs > 6, DV200 > 80%) utilized for library preparations. Pancreas RNA was prepared and sequenced in the Mayo Clinic Medical Genomics Core using the Illumina TruSeq RNA v2 library preparation kit and the Illumina High Seq-2000 with 101 bp paired end reads. Reads were aligned to the mouse reference transcriptome Gencode vM23 (GRCm38.p6) with at least 24 million mapped read pairs acquired per sample. Sequencing reads were processed through the GSPMC workflow including MapRseq3 (Kalari et al., 2014) and differential expression calculated by EdgeR (McCarthy et al., 2012). Differentially expressed genes (DEGs) were filtered based on a false discovery rate (FDR) < 0.1 and an absolute FC ≥ | 1.5| called between at least one condition and the reference control sample. For RNA-seq on caerulein-treated animals, DEGs were filtered with FC ≥ | 2| and FDR < 0.05. Pathway analysis of DEGs was completed with RITAN (R package-rapid integration of annotation, network, and molecular database) (Zimmermann et al., 2019), which queries different annotation resources to analyze enrichment for an input set of genes. RITAN performs a hypergeometric test and generates FDR adjusted p-values, called q-values, for assessing pathway significance, which queries different annotation resources to analyze enrichment for an input set of genes. The Molecular Signatures Database (MSigDB) hallmark gene set collection (Liberzon et al., 2015) was used as the annotation resource. Pathways with q-values < 0.05 were considered enriched. Gene network and upstream regulatory analyses were performed using Ingenuity® Pathway Analysis (IPA®; Qiagen). To quantitatively determine the percentage of infiltrating immune cell types, we utilized a “digital cytometry” method called the quanTIseq deconvolution algorithm, which estimates the absolute proportions of relevant infiltrating immune cell types from bulk RNA-seq profiles (Finotello et al., 2019). The cell type fraction scores provided by this method allow intra-sample and inter-sample comparisons of 10 immune cell type fractions. We applied the quanTIseq method through an R package called Immunedeconv (Sturm et al., 2019) on DEGs from the Pdx1-Cre;EHMT2fl/fl, Pdx1-Cre;LSL-KrasG12D, and Pdx-Cre;LSL-KrasG12D;EHMT2fl/fl dataset (1039 DEGs), as well as the caerulein-treated animals dataset (4654 DEGs).
Reverse Transcriptase Quantitative PCR (RT-qPCR)
Reverse transcriptase was performed using RT2 first strand kit (Qiagen) following manufacturer’s protocol. Real-time PCR was performed in a volume of 20 ul using SYBR Green Master Mix and CFX96 Real Time System (Bio-Rad). Primer sequences are shown in Supplementary Table 2. RT2 Profiler PCR Array (SA Biosciences, Qiagen) was used to examine the expression patterns of 84 genes involved in cell cycle. The array was performed following manufacturer instructions. ddCT was obtained using Qiagen software and all groups were normalized to Pdx1-Cre mice, with an absolute FC ≥ | 1.5| for the generation of a heatmap using R-studio.
Senescence β-Galactosidase Staining
Senescence-associated β-galactosidase activity was assessed in fresh pancreas tissue using the Cell Signaling β-Galactosidase Staining kit, according to manufacturer’s protocol (Cell Signaling Technologies, Cat# 9860S). Briefly, under terminal anesthesia, pancreas from LSL-KrasG12D;EHMT2+/+ and LSL-KrasG12D;EHMT2fl/fl with both Pdx1-Cre and P48Cre/+ drivers were collected, washed in PBS (1×) and placed in a well of a 12-well dish containing 1 mL of fixative solution for 15 min. Pancreas were then rinsed twice with PBS (1×) and stained with β-galactosidase solution at 37°C overnight in a dry incubator. Next morning, pancreata were washed with PBS (1×), and images acquired.
Ethics Statement
Animal care and all protocols were reviewed and approved by the Institutional Animal Care and Use Committees of Mayo Clinic Rochester (IACUC protocols A00002240-16 and A24815) and the Medical College of Wisconsin (AUA00005963).
Data Availability
RNA-seq datasets that support the findings of this study have been deposited to the public database repository Gene Expression Omnibus (GEO) under accession code GSE169525.
Results
Genetic Inactivation of EHMT2 Interrupts KrasG12D-Driven Initiation at the ADM Stage
By regulating H3K9me2 levels, EHMT2 plays a role in human pancreatic cancer (Yuan et al., 2012, 2013; Casciello et al., 2015; Pan et al., 2016). Initial studies in P48Cre/+ KrasG12D mice indicated that EHMT2 deficiency prolonged survival by reducing PanIN growth, which was accompanied by a decreased number of phosphorylated Erk-positive and Dclk1-positive cells, both populations that contribute to PDAC initiation (Kato et al., 2020). To extend these studies, here, we use several distinct models; two purely genetic ones to express KrasG12D for studying initiation combined with EHMT2 deletion (Pdx-Cre;LSL-KrasG12D;EHMT2fl/fl and P48Cre/+;LSL-KrasG12D;EHMT2fl/fl), an inducible Cre to investigate EHMT2 inactivation ex vivo (CAGGCre-ERTM;EHMT2fl/fl), as well as the model of pancreatitis-associated promotion (Guerra et al., 2007). Prior to crossing with KrasG12D, both Pdx1-Cre;EHMT2fl/fl and P48Cre/+;EHMT2fl/fl reproduced at Mendelian ratios and thrived similar to controls. Pancreata from 10-day and 4 to 6-week-old animals demonstrated normal structure and histology (Figure 1A and Supplementary Figure 1A). Body weights of EHMT2 knockout mice were not different from controls for both Pdx1-Cre and P48Cre/+ animals (Figure 1B and Supplementary Figure 1B). The pancreatic cell nuclei from control animals were positive for H3K9me2, while from EHMT2fl/fl mice displayed global reduction in H3K9me2 (8.0 ± 1.4% for Pdx1-Cre vs. 4.0 ± 1.0% for Pdx1-Cre;EHMT2fl/fl, p = 0.08; Figures 1C,D). Reverse transcriptase quantitative PCR (RT-qPCR) showed that Pdx1-Cre;EHMT2fl/fl mice display reduced EHMT2 levels in whole pancreas (1.94 ± 0.31 FC) (Figure 1E). EHMT2 inactivation in the P48Cre/+ model also showed reduced H3K9me2 by IHC (9.02 ± 1.26% for P48Cre/+ vs. 1.85 ± 0.28% for P48Cre/+;EHMT2fl/fl, p < 0.05; Supplementary Figures 1C,D) with a reduction in EHMT2 transcript by RT-qPCR (3.6 ± 0.55 FC, Supplementary Figure 1E). Cre-mediated EHMT2 exon excision in the pancreas of Pdx1-Cre;EHMT2fl/fl and P48Cre/+;EHMT2fl/fl mice was detected by PCR (Supplementary Figure 1F). Notably, for the Pdx1-Cre or P48Cre/+-driven models, organ-specific EHMT2 inactivation occurs at embryonic day 8.5 or 9.5, respectively (Herreros-Villanueva et al., 2012). Therefore, the H3K9me2 pathway is not required for pancreas exocrine development independent of the Cre model used for EHMT2 inactivation. Subsequently, we crossed Pdx1-Cre;EHMT2fl/fl and P48Cre/+;EHMT2fl/fl animals to LSL-KrasG12D mice. IHC staining demonstrated that LSL-KrasG12D;EHMT2fl/fl mice displayed global reduction of H3K9me2 (17.1 ± 2.7% for Pdx-Cre;LSL-KrasG12D vs. 3.5 ± 1.3% for Pdx-Cre;LSL-KrasG12D;EHMT2fl/fl, p < 0.05; Figures 1C,D). We also detected a 2.27 ± 0.25 FC reduction of EHMT2 transcript in whole pancreas from Pdx-Cre;LSL-KrasG12D;EHMT2fl/fl mice compared to Pdx-Cre;LSL-KrasG12D animals (Figure 1E). Similar results were obtained using P48Cre/+ with reductions in the H3K9me2 mark (17.5 ± 1.3% for P48Cre/+;LSL-KrasG12D vs. 4.6 ± 1.0% for P48Cre/+;LSL-KrasG12D;EHMT2fl/fl, p < 0.01; Supplementary Figures 1C,D) and EHMT2 transcript (4.8 ± 0.25 FC for P48Cre/+;LSL-KrasG12D;EHMT2fl/fl vs. P48Cre/+;LSL-KrasG12D mice, p < 0.001; Supplementary Figure 1E). Western blots on pancreas protein lysates from Pdx1-Cre;LSL-KrasG12D;EHMT2fl/fl animals showed reduction in EHMT2 and H3K9me2 levels when compared to Pdx-Cre;LSL-KrasG12D (3.5 ± 0.2 FC for EHMT2, p < 0.05 and 2.46 ± 0.34 FC for H3K9me2, p < 0.05, respectively, in Pdx1-Cre;LSL-KrasG12D;EHMT2fl/fl vs. Pdx1-Cre;LSL-KrasG12D mice; Figure 1F). Noteworthy, while KrasG12D expression results in larger pancreas size (Hingorani et al., 2003), knockout of EHMT2 counteracts this effect (pancreas-to-body weight ratios: 1.45 ± 0.04% for Pdx1-Cre;LSL-KrasG12D vs. 1.17 ± 0.03% for Pdx1-Cre;LSL-KrasG12D;EHMT2fl/fl mice, p < 0.001; Figure 2A). Similar results were found in P48Cre/+;LSL-KrasG12D mice (1.43 ± 0.06% from P48Cre/+;LSL-KrasG12D vs. 1.1 ± 0.02% from P48Cre/+;LSL-KrasG12D;EHMT2fl/fl mice, p < 0.001; Supplementary Figure 2A). Hence, while genetic inactivation of EHMT2 is tolerated by the organ during development, its presence appears to be critical for supporting KrasG12D-induced pancreatic neoplastic growth (Figure 2B and Supplementary Figure 2B). Next, blinded histological examination of tissues was performed by two separate pathologists (V.A. and B.P.). We found that KrasG12D-expressing EHMT2 knockout mice with both Cre models had limited acinar tubular complexes and atypical flat lesions with a reduction in ADM formation (Figures 2C,D and Supplementary Figures 2C,D), which is the earliest morphological hallmark of PDAC initiation (Esposito et al., 2014; Murtaugh and Keefe, 2015). In support of this observation, western blot analyses of lysates from KrasG12D-expressing pancreata showed reduced cytokeratin 19 (Krt19) levels in Pdx-Cre;LSL-KrasG12D;EHMT2fl/fl animals (2.12 ± 0.28 FC on Pdx-Cre;LSL-KrasG12D;EHMT2fl/fl vs. Pdx-Cre;LSL-KrasG12D mice, Figure 2E). Figure 2F demonstrates that Pdx1-Cre;LSL-KrasG12D;EHMT2fl/fl mice indeed had reduced PanIN when compared to Pdx1-Cre;LSL-KrasG12D mice, (0.14 ± 0.07% vs. 0.39 ± 0.05%, respectively; p < 0.05). Similar findings were obtained with P48Cre/+;LSL-KrasG12D and P48Cre/+;LSL-KrasG12D;EHMT2fl/fl animals (0.56 ± 0.05% vs. 0.23 ± 0.08%, respectively; p < 0.05, Supplementary Figure 2E). Our studies, stringently obtained with the two most often used Cre-drivers for KRAS-mediated initiation, suggest that EHMT2 inactivation antagonizes PanIN formation, as early as its ADM precursor stage.
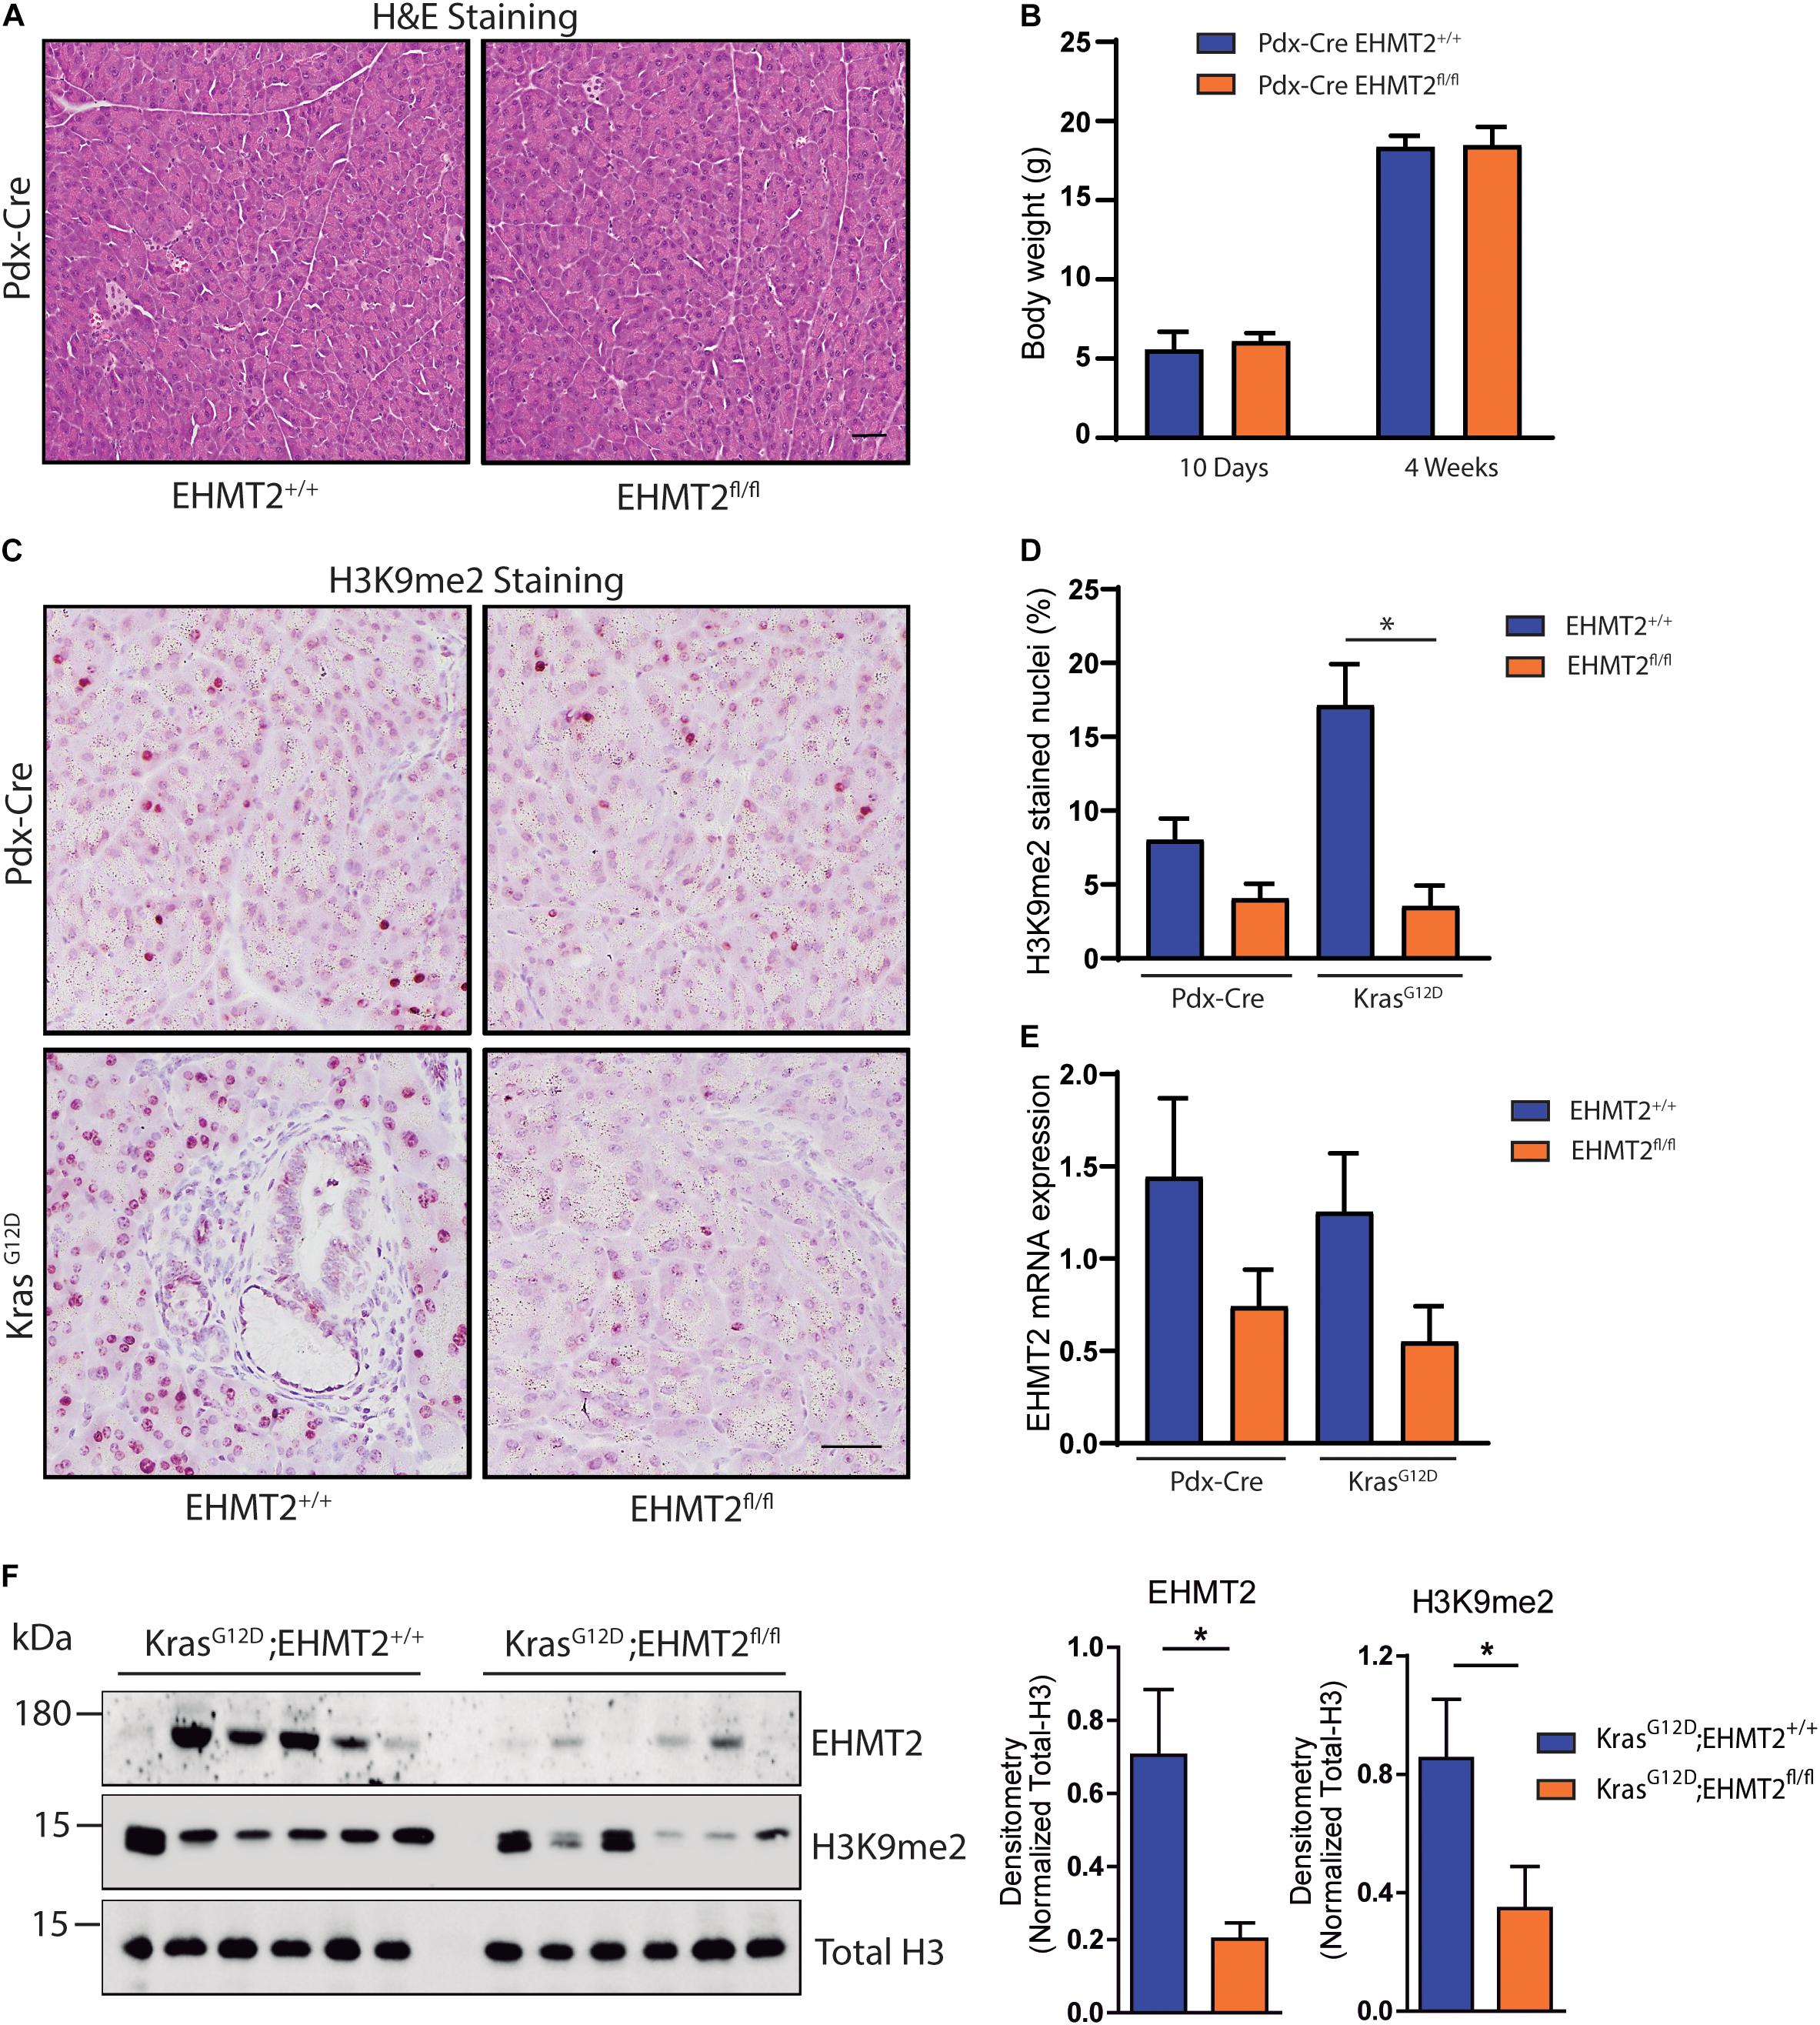
Figure 1. Conditional knockout of EHMT2 driven by Pdx1-Cre does not impede normal development or architecture of the mouse pancreas. (A) Representative images from H&E stained pancreas tissues from Pdx1-Cre;EHMT2+/+ and Pdx1-Cre;EHMT2fl/fl mice. No significant histologic or architectural changes were found. Scale = 50 μM. (B) Graph depicts body weight from Pdx1-Cre;EHMT2+/+ and Pdx1-Cre;EHMT2fl/fl mice at 10 days (n = 3 Pdx1-Cre;EHMT2+/+ and n = 4 Pdx1-Cre;EHMT2fl/fl) and 4 weeks (n = 16 Pdx1-Cre;EHMT2+/+ and n = 7 Pdx1-Cre;EHMT2fl/fl) of age. (C) Representative images of H3K9me2 IHC on pancreatic tissues from Pdx1-Cre and Pdx1-Cre;LSL-KrasG12D mice with WT EHMT2 alleles (EHMT2+/+) or crossed to homozygous floxed EHMT2 (EHMT2fl/fl) animals. Scale = 50 μM. (D) Percentage of nuclei positive for H3K9me2 was quantified from a minimum of 5 random fields at 10× magnification (n = 3/group). (E) Levels of EHMT2 transcript were measured by RT-PCR on RNA isolated from whole pancreas of Pdx1-Cre;EHMT2+/+ and Pdx1-Cre;EHMT2fl/fl mice, as well as after crossing to LSL-KrasG12D animals (n = 8/group). The EHMT2 levels were normalized to GAPDH, B2M and β-actin transcripts. (F) Protein lysates from whole pancreas of Pdx1-Cre;LSL-KrasG12D and Pdx1-Cre;LSL-KrasG12D;EHMT2fl/fl mice were evaluated. Left: Western blots were probed with antibodies against EHMT2 and H3K9me2. Total H3 was used as loading control. Right: Graph depicts relative densitometry values for EHMT2 and H3K9me2 levels normalized to total H3 (n = 6/group). * indicates p-value ≤ 0.05. All data is expressed as mean ± SEM.
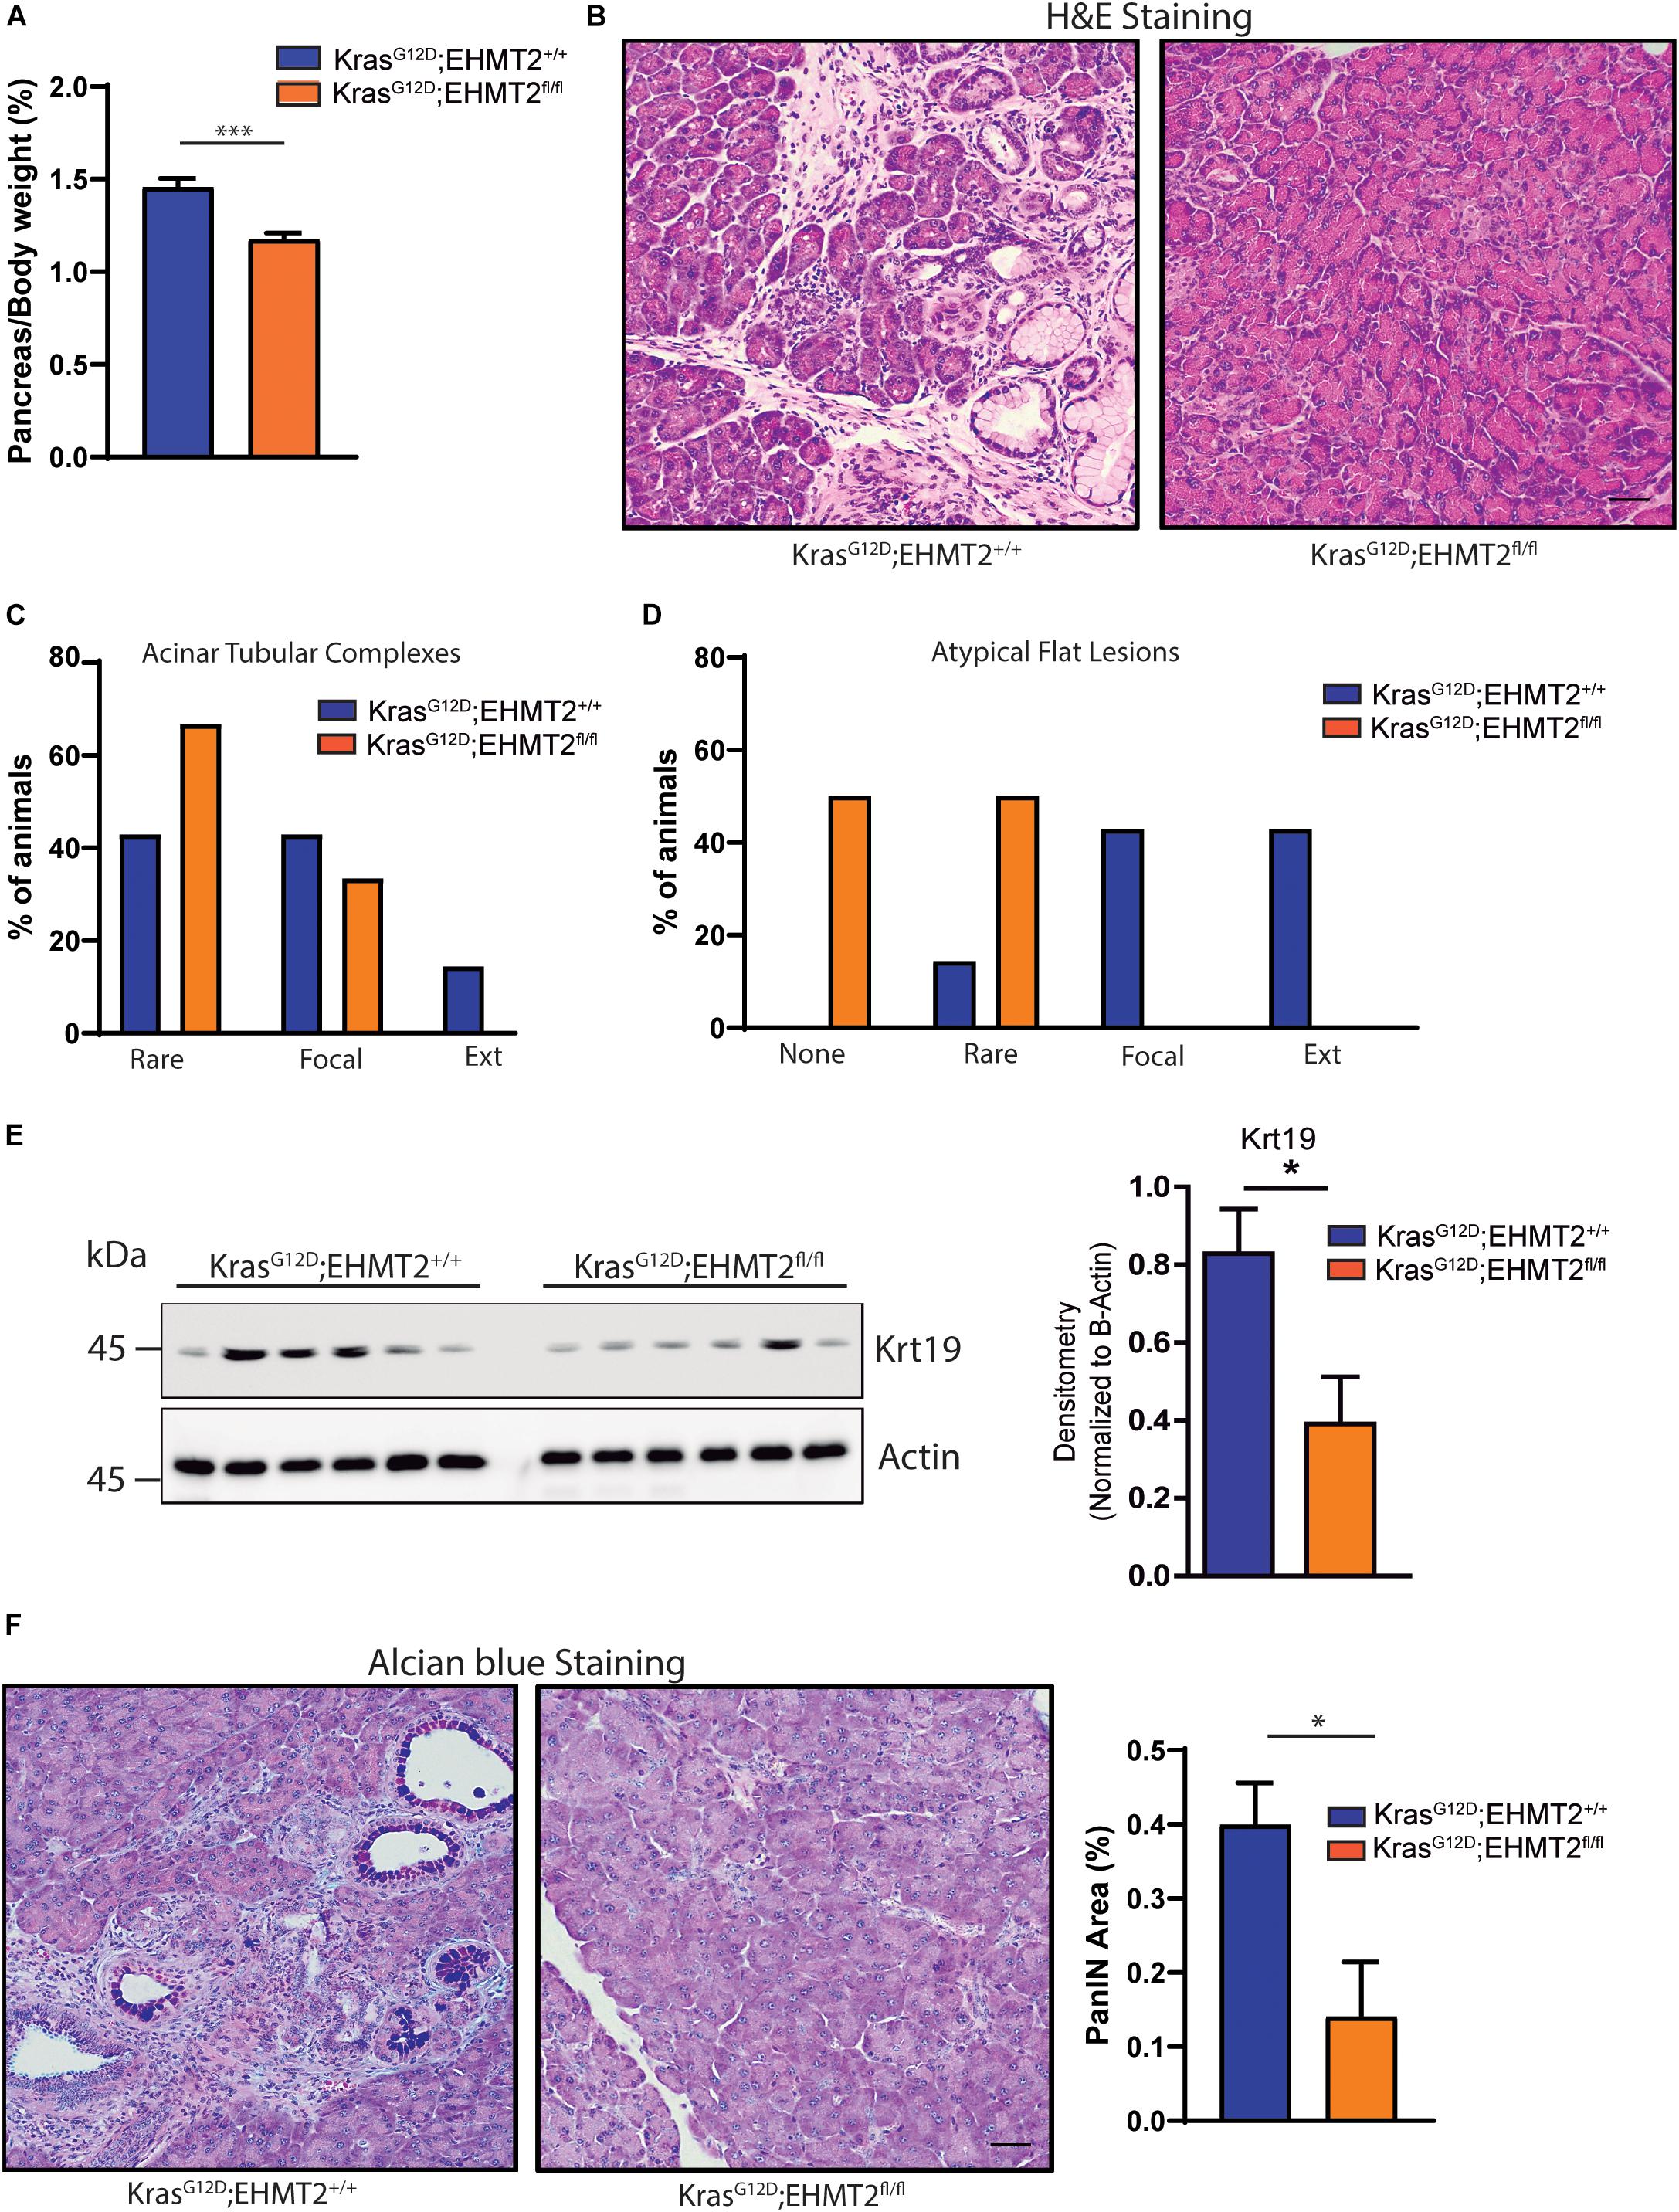
Figure 2. Genetic inactivation of EHMT2 antagonizes increased pancreas-to-body weight ratios and PanIN development induced by the KrasG12D mouse model. (A) Graph shows reduced pancreas-to-body weight ratios after EHMT2 inactivation in Pdx1-Cre;LSL-KrasG12D mice (n = 16) compared to Pdx1-Cre;LSL-KrasG12D;EHMT2+/+ animals (n = 14). (B) Representative H&E images of pancreatic tissue from Pdx1-Cre;LSL-KrasG12D;EHMT2+/+ (left) and Pdx1-Cre;LSL-KrasG12D;EHMT2fl/fl (right) mice. Scale = 50 μM. Graph represents scoring from histological assessment of precursor acinar tubular complexes (C) and atypical flat lesions (D) in pancreatic tissue from Pdx1-Cre;LSL-KrasG12D;EHMT2+/+ (n = 7) and Pdx1-Cre;LSL-KrasG12D;EHMT2fl/fl (n = 6) animals. Lesions were classified as none (for atypical flat lesions only), rare, focal or extensive (Ext). (E) Cytokeratin 19 (Krt19) levels were examined as a surrogate for the amount of duct-like epithelium, or ADM, in protein lysates from Pdx1-Cre;LSL-KrasG12D;EHMT2+/+ and Pdx1-Cre;LSL-KrasG12D;EHMT2fl/fl animals. Left: Western blots were probed with an antibody against Krt19, and β-actin was used as loading control. Right: Graph depicts relative densitometry values for Krt19 levels normalized to β-actin (n = 6/group). (F) Alcian blue staining was used to quantify the burden of mucin-rich PanIN lesions. Left: Representative images from Alcian blue staining on Pdx1-Cre;LSL-KrasG12D;EHMT2+/+ and Pdx1-Cre;LSL-KrasG12D;EHMT2fl/fl pancreas tissue. Scale = 50 μM. Left: quantification of Alcian blue-positive PanIN lesions expressed as percentage (%) of pancreas area from Pdx1-Cre;LSL-KrasG12D;EHMT2+/+ (n = 7) and Pdx1-Cre;LSL-KrasG12D;EHMT2fl/fl (n = 6) mice. ∗ indicates p-value ≤ 0.05, and ∗∗∗ indicates p-value ≤ 0.001. All data is expressed as mean ± SEM.
To mechanistically complement our in vivo data, we next investigated whether EHMT2 is involved in the ADM process, using a genetically engineered ex vivo approach with acinar explants from a tamoxifen-inducible model of EHMT2 knockout. This model carries a CAGGCre-ERTM transgene, which has the chicken β-actin promoter/enhancer coupled with the cytomegalovirus immediate-early enhancer to drive high levels of Cre expression, allowing this enzyme to translocate into the nucleus (Hayashi and McMahon, 2002) upon tamoxifen treatment. Acinar cells from CAGGCre-ERTM and CAGGCre-ERTM;EHMT2fl/fl animals were isolated and grown in 3D matrigel in the absence (−) or presence (+) of 4-Hydroxytamoxifen (4-OHT) to inactivate EHMT2. Western blot showed that EHMT2 protein levels were reduced after 4-OHT treatment (Figure 3A). Subsequently, acinar cell explants were cultured in presence of EGF or TGFα for 5–6 days to activate the KRAS-MAPK pathway, which induces ex vivo ADM formation. Phase microscopy of 3D cultures showed that EGF and TGF-α induced duct-like structures from acini isolated from CAGGCre-ERTM (−/+4-OHT) controls, demonstrating ADM formation (Figure 3B). No significant difference was observed in the size of duct-like structures formed from acini of CAGGCre-ERTM alone animals either in the absence or presence of 4-OHT upon EGF treatment (17.51 ± 0.6 FC with DMSO vs. 19.07 ± 0.6 FC with 4-OHT) or after TGFα treatment (14.3 ± 0.7 FC with DMSO vs. 15.05 ± 1.4 FC with 4-OHT; Figure 3B). CAGGCre-ERTM;EHMT2fl/fl without 4-OHT treatment also demonstrated ADM formation after EGF and TGFα treatment (Figure 3C). However, upon EHMT2 inactivation (+4-OHT), the quantification of duct-like structures revealed significantly reduced ADM formation with EGF (19.08 ± 0.7 FC with DMSO vs. 8.36 ± 0.6 FC with 4-OHT; p < 0.001) or TGFα (17.58 ± 0.5 FC with DMSO vs. 8.19 ± 0.75 FC with 4-OHT; p < 0.001; Figure 3C). Thus, congruent with the antagonism to KrasG12D-mediated ADM and PanIN initiation found in LSL-KrasG12D;EHMT2fl/fl mice, loss of EHMT2 impairs the phenotypic conversion of acinar cells to more duct-like structures in 3D ex vivo cultures stimulated with growth factors that activate the EGF-KRAS pathway, further supporting the rigor of our in vivo observations.
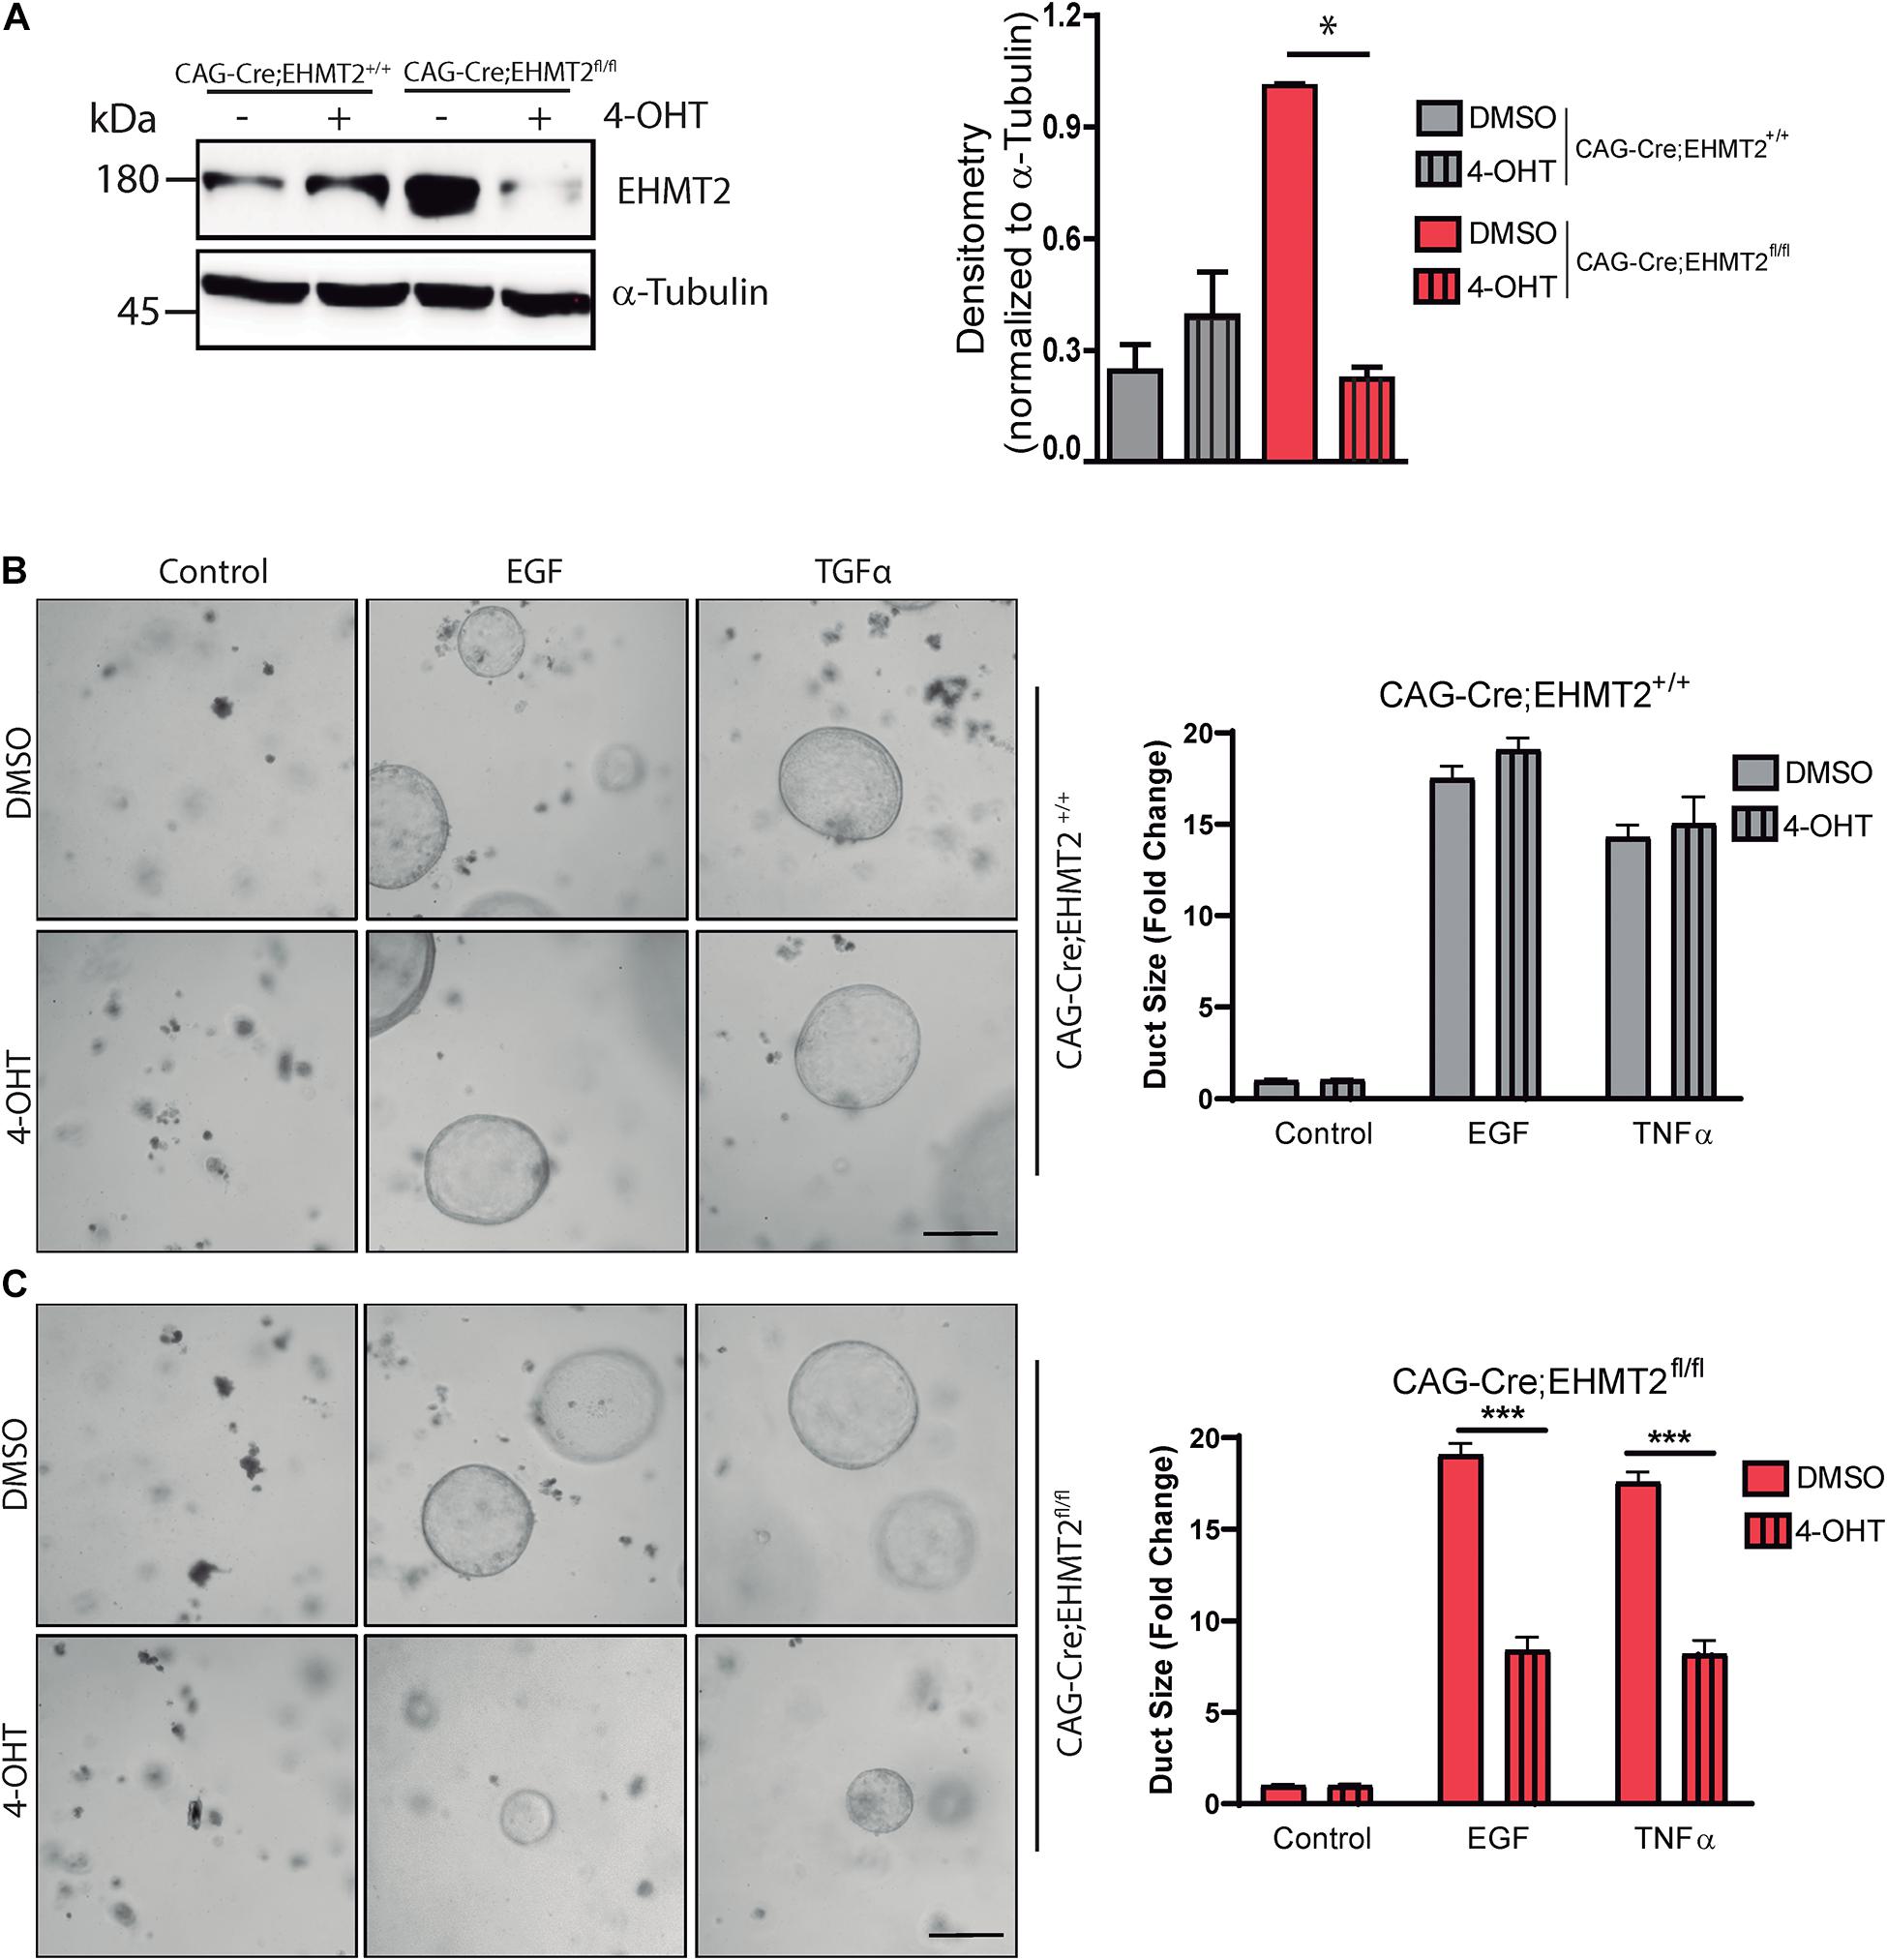
Figure 3. EHMT2 inactivation impairs EGFR-KRAS-MAPK pathway-driven ADM in primary acinar cell explant cultures. (A) Acinar cell explant cultures derived from CAGGCre-ERTM;EHMT2+/+ and CAGGCre-ERTM;EHMT2fl/fl animals were grown in the absence (–) or presence (+) of 4-Hydroxytamoxifen (4-OHT) to achieve EHMT2 knockout. Left: Western blot evaluation of protein lysates from acinar explant cultures was performed to confirm that 4-OHT treatment reduced EHMT2 levels in cells derived from CAGGCre-ERTM;EHMT2fl/fl mice. Alpha-tubulin was used as a loading control. Right: Graph depicts relative densitometry values for EHMT2 normalized to tubulin. Representative phase contrast images of CAGGCre-ERTM;EHMT2+/+ (B) and CAGGCre-ERTM;EHMT2fl/fl (C) explant cultures after 5–6 days of EGF (20 ng/mL) or TGFα (50 ng/mL) exposure to induce ADM. Cells were also treated with vehicle (DMSO) or 4-OHT to inactivate EHMT2. Right: Quantification of duct-like structures is shown as fold-change in size relative to control. * indicates p-value ≤ 0.05, and *** indicates p-value ≤ 0.001. All data is expressed as mean ± SEM (experiment performed in triplicate).
KrasG12D Induces Heterotrimerization of the EHMT2-EHMT1-WIZ Complex, Increasing H3K9me2 Levels
We also investigated whether KrasG12D behaves as an upstream regulator of EHMT2 activity. For this purpose, we utilized a GEMM-derived PDAC cell model in which oncogenic KrasG12D expression is induced by doxycycline (Collins et al., 2012) (iKras 4292) to evaluate downstream effects on the EHMT2-H3K9me2 epigenetic pathway. We induced KrasG12D expression and collected lysates at various timepoints to examine levels of proteins from this pathway (Figure 4A). KrasG12D protein levels were detected at 12 h, reaching maximum after 48 h (10.57 ± 1.6-fold change (FC) vs. 0 h; p < 0.01; Supplementary Figure 3A). We found that KrasG12D increased protein levels for both, H3K9 methyltransferases EHMT2 and EHMT1, peaking at 48 h (4.6 ± 1.2 FC for EHMT2 at 48 h vs. 0 h, p < 0.05, and 4.18 ± 1.7 FC for EHMT1 at 48 h compared to 0 h, p < 0.01; Supplementary Figure 3A). EHMT2 and EHMT1 form an enzymatically active heterotrimer with WIZ, which stabilizes the complex on chromatin (Simon et al., 2015). We also observed increased levels of WIZ (3.2 ± 1.3 FC at 48 h vs. 0 h; p < 0.05; Supplementary Figure 3A). Levels of the H3K9me2 mark increased upon KrasG12D induction as well (2.50 ± 0.4 FC at 48 h vs. 0 h; p < 0.001; Supplementary Figure 3A). In addition, using immunofluorescence-based confocal microscopy, we detected increased protein levels for EHMT2, EHMT1, WIZ, and H3K9me2 (Supplementary Figures 3B–E). Indeed, the mean fluorescence intensity (MFI) for EHMT2 at baseline (0 h) was 2.81e4 ± 2.41e3 compared with 6.97e4 ± 3.21e3 at 48 h (p < 0.001; Supplementary Figure 3C). For EHMT1, MFI values were 2.40e4 ± 2.21e3 at 0 h vs. 6.42e4 ± 3.91e3 at 48 h (p < 0.001; Supplementary Figure 3C). For WIZ, the MFI increased from 3.59e4 ± 3.25e3 at 0 h to 8.60e4 ± 4.96e3 at 48 h (p < 0.001; Supplementary Figure 3D). H3K9me2 MFI values were 1.38e4 ± 3.51e3 for 0 h vs. 1.20e5 ± 1.01e4 at 48 h (p < 0.001; Supplementary Figure 3E). Lastly, using a set of genetically engineered human pancreatic duct-derived cell models specifically designed to study KRASG12D, hTERT-HPNE E6/E7 (HPNE), and hTERT-HPNE E6/E7 KRASG12D (HPNE-KRASG12D), we observed a similar increase in the EHMT2-EHMT1-WIZ complex along with di-methylation of its H3K9 substrate. Congruent with the data described above, HPNE-KRASG12D cells displayed higher protein levels of EHMT2, EHMT1, WIZ, and H3K9me2 compared to its HPNE counterpart (Figure 4B and Supplementary Figure 3F). Thus, activation of oncogenic KRAS, the earliest genetic event in PDAC, results in increased levels of the EHMT2 complex and its catalytic product, the H3K9me2 mark.
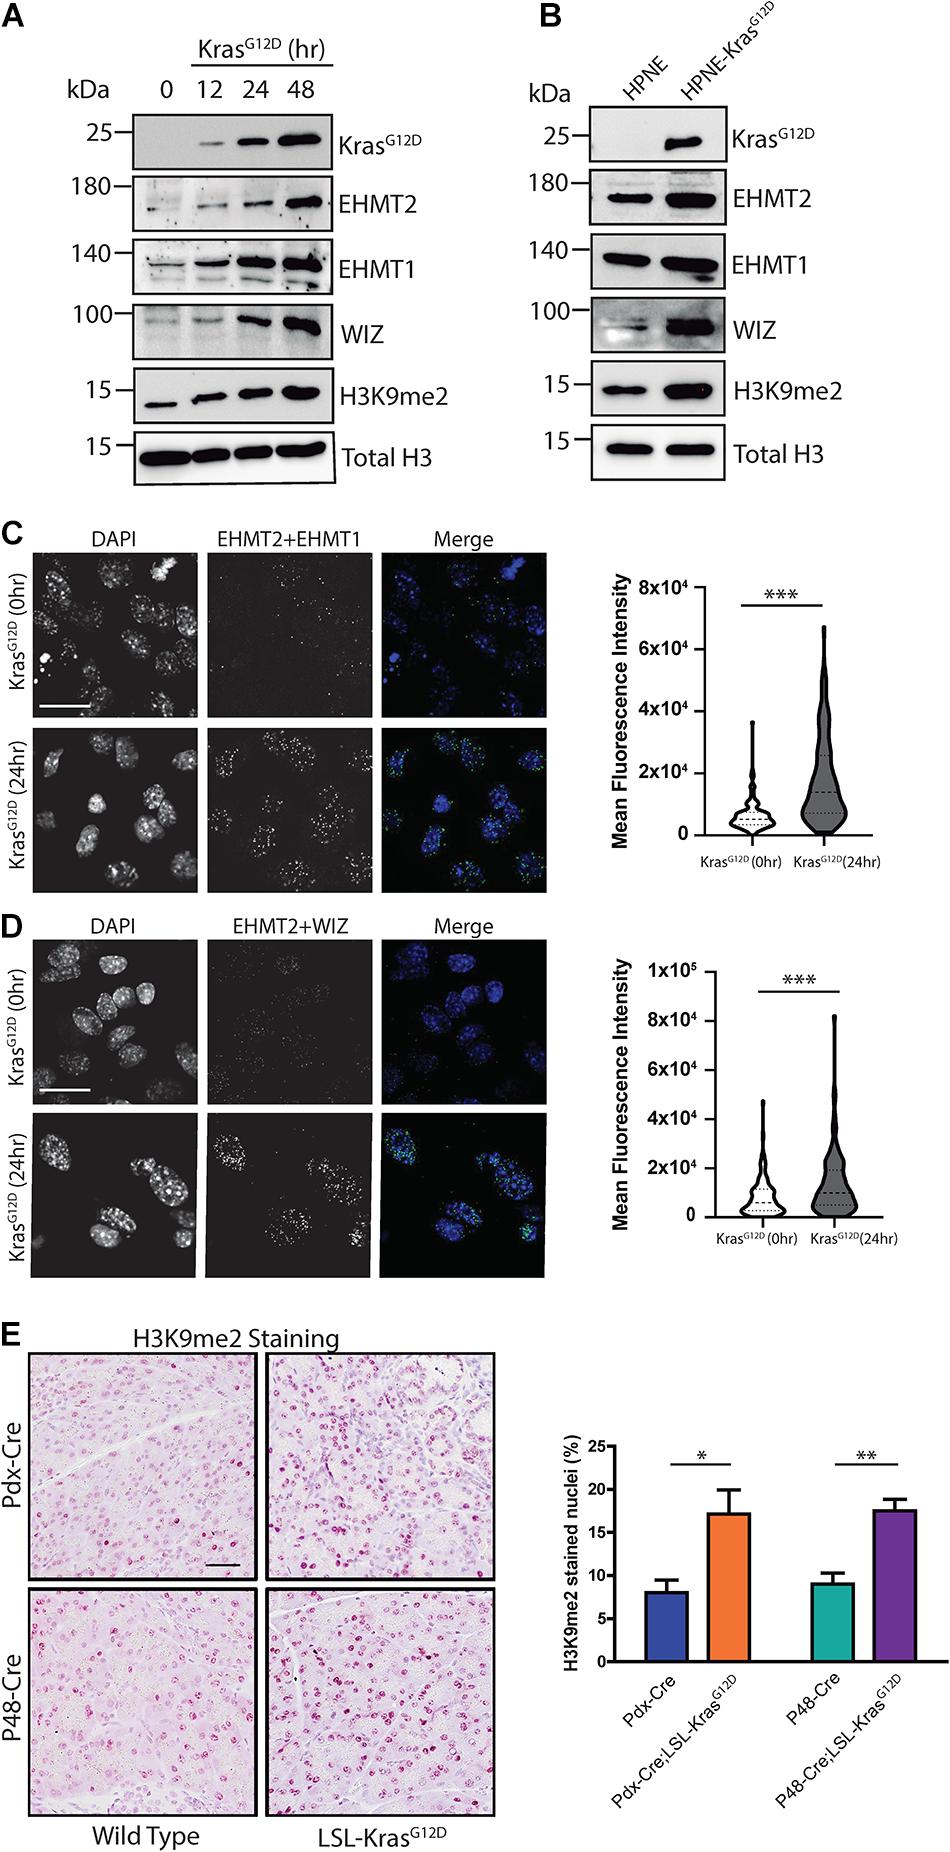
Figure 4. KrasG12D promotes EHMT2-EHMT1-WIZ complex formation and H3K9me2 deposition. (A) Western blot evaluation of iKras 4292 cells after expression of KrasG12D. KrasG12D expression was stimulated with doxycycline for 12, 24, and 48 h, then members of the EHMT2 complex, including EHMT2, EHMT1, and WIZ, as well as its product, H3K9me2, were evaluated. Induction of KrasG12D was verified, and total H3 was used as loading control. Quantification is represented in Supplementary Figure 3A (experiment performed in triplicate). (B) Expression of KRASG12D, EHMT2, EHMT1, WIZ, and H3K9me2 was evaluated by western blot in HPNE and HPNE-KRASG12D cells, developed from human pancreatic ducts. KrasG12D expression is shown to be specific to HPNE-KRASG12D cells. Total H3 was used as loading control. Quantification is represented in Supplementary Figure 3F (experiment performed in triplicate). (C) Interaction between EHMT2 and EHMT1 was evaluated using PLA. Left: Representative pictures of iKras 4292 cells at 0 and 24 h after KrasG12D activation. Scale = 50 μM. Right: Violin plot representing Mean Fluorescence Intensity (MFI) of EHMT2/EHMT1 positive PLA signal (experiment performed in triplicate). (D) Interaction between EHMT2 and WIZ was also evaluated using PLA. Left: Representative pictures of iKras 4292 cells at 0 and 24 h post-KrasG12D induction. Scale = 50 μM. Right: Violin plot representing MFI of EHMT2/WIZ PLA signal (experiment performed in triplicate). (E) Levels of the EHMT2 product, H3K9me2, as measured by IHC staining. Left: Representative images of pancreas tissue from Pdx1-Cre and P48Cre/+ WT and KrasG12D-expressing mice stained for H3K9me2. Scale = 50 μM. Right: Percentage of nuclei positive for H3K9me2 was quantified from a minimum of 5 random fields at 10× magnification (n = 3/group). ∗ indicates p-value ≤ 0.05, ∗∗ indicates p-value ≤ 0.01, and ∗∗∗ indicates p-value ≤ 0.001. All data is expressed as mean ± SEM.
Next, since stability and methyltransferase activity depends on formation of the complex (Ueda et al., 2006), we immunopurified EHMT2 from iKras 4292 cells and performed mass spectrometry, which revealed increased hetero-trimerization of EHMT2, EHMT1, and WIZ after 24 h of KrasG12D expression (Supplementary Figure 3G). We also used PLA to detect, in situ, the interaction between endogenous EHMT2 and EHMT1 or WIZ (Figures 4C,D and Supplementary Figures 4A,B). PLA signals from EHMT2 + EHMT1 complexes increased after KrasG12D induction, with MFI of 6.29e3 ± 3.98e2 at baseline and 1.75e4 ± 1.12e3 after 24 h (p < 0.001, Figure 4C). This effect was also accompanied by increased PLA signals for EHMT2 + WIZ complexes upon KrasG12D expression (MFI of 7.89e3 ± 6.47e2 at baseline vs. 1.33e4 ± 1.16e3 at 24 h, p < 0.001, Figure 4D). The induction of EHMT2, EHMT1, and WIZ protein levels, as well as the formation of their complex detected by mass spectrometry and PLA are important since we did not detect changes in their mRNA levels either in the absence or presence of KrasG12D (Supplementary Figure 4C). This result was recapitulated in the human KRASG12D cell models, as we found no statistical difference in EHMT2, EHMT1 and WIZ transcript levels from HPNE cells compared to HPNE-KRASG12D cells (Supplementary Figure 4D). These comparable transcript levels in the absence and presence of oncogene activation suggest that KRASG12D-effects on the EHMT2 complex are possibly not via transcriptional regulation of these genes but rather potentially due to protein stability. Given this result, we also performed staining for the H3K9me2 mark, by immunohistochemistry (IHC) in wild-type and KrasG12D expressing mice to translate these effects to the in vivo situation. Pancreata were harvested from both, Pdx1-Cre;LSL-KrasG12D and P48Cre/+;LSL-KrasG12D mouse models. Upon quantification of positively stained nuclei compared to total nuclei, we found that Pdx1-Cre;LSL-KrasG12D animals had higher levels of H3K9me2 compared to control Pdx1-Cre mice (17.1 ± 2.7% vs. 8.0 ± 1.4%, p < 0.05; Figure 4E). Similar results were obtained when KrasG12D activation was driven by Cre expression from the Ptf1a-P48 promoter via knock-in (17.5 ± 1.3% in P48Cre/+;LSL-KrasG12D mice compared to 9.0 ± 2.1% in P48Cre/+ controls, p < 0.01; Figure 4E). Thus, based on these collective data, we conclude that EHMT2, EHMT1 and WIZ proteins form a stable complex upon KrasG12D activation, which leads to enhanced deposition of the H3K9me2 mark, supporting a role for this epigenetic pathway downstream of the most commonly mutated oncogene in PDAC.
EHMT2 Inactivation Establishes a Transcriptional Landscape Antagonistic to PDAC Initiation
Oncogenic KRAS mounts transcriptional responses that program the growth-promoting phenotype that characterizes pancreatic cancer initiation (Waters and Der, 2018). This observation, along with the fact that EHMT2 is a well-known regulator of transcriptional responses (Shankar et al., 2013), led us to carry out RNA-seq from whole pancreas to evaluate gene expression networks affected by EHMT2 inactivation. We performed these experiments comparatively in four murine lines, namely Pdx1-Cre, Pdx1-Cre;EHMT2fl/fl, Pdx1-Cre;LSL-KrasG12D, and Pdx-Cre;LSL-KrasG12D;EHMT2fl/fl. We found a total of 767 DEGs (with 257 upregulated and 510 downregulated) in Pdx1-Cre;EHMT2fl/fl, 790 DEGs (691 up, 99 down) in Pdx1-Cre;LSL-KrasG12D and 878 DEGs (305 up, 573 down) in Pdx1-Cre;LSL-KrasG12D;EHMT2fl/fl, normalized to Pdx1-Cre mice, with an absolute FC ≥ | 1.5| and FDR < 0.1 (Figure 5A and Supplementary Table 3). The largest subset of regulated genes across all three experimental conditions was comprised of 530 DEGs. The second largest subset of 188 DEGs were differentially expressed only in EHMT2 inactivated samples, irrespective of KrasG12D (Figure 5A). On the other hand, KrasG12D carrying mice showed 114 DEGs irrespective of their EHMT2 status (Figure 5A). Principal component analysis (PCA) using all 1039 DEGs led to separation of samples by cluster and experimental conditions (Figure 5B). Next, we performed calculations of distances among cluster centroids for experimental samples and controls (marked by empty circles in Figure 5B), as a similarity measure among genetic conditions. The distance between the EHMT2 inactivated groups was 21.7 while the distance between Pdx1-Cre;EHMT2fl/fl and Pdx1-Cre;LSL-KrasG12D was 46.8 and between the two KrasG12D activated groups was 48.7. Thus, EHMT2 inactivation in the Pdx1-Cre;LSL-KrasG12D EHMT2fl/fl animals clustered much closer to Pdx1-Cre;EHMT2fl/fl and significantly separated from KrasG12D mice with EHMT2 intact, indicating that EHMT2 inactivation is characterized by a transcriptional profile that is functionally antagonistic to oncogenic KRAS. Hierarchical clustering of normalized DEG across all three conditions (1039 genes) revealed four major expression patterns (Figure 5C). When compared to Pdx1-Cre controls and KrasG12D animals, the 245 genes defining cluster 1 (green) were upregulated in EHMT2fl/fl and KrasG12D;EHMT2fl/fl mice, while 647 genes characterized cluster 2 (yellow) with genes downregulated upon EHMT2 inactivation, either alone or with KrasG12D. Cluster 3 (pink) displayed 65 genes upregulated in KrasG12D animals, and Cluster 4 (purple) was defined by 82 genes downregulated in KrasG12D animals, independent of EHMT2 status. Notably, ADM and PanIN-related mRNA markers, such as Gkn1, Gkn2, and Muc5a, were downregulated in Pdx1-Cre;LSL-KrasG12D;EHMT2fl/fl animals (Supplementary Figure 5A), supporting our histological observations. Together, these studies revealed that mice with EHMT2 inactivated in their pancreas epithelial cells displayed a gene expression pattern antagonistic to the KrasG12D-regulated gene expression program.
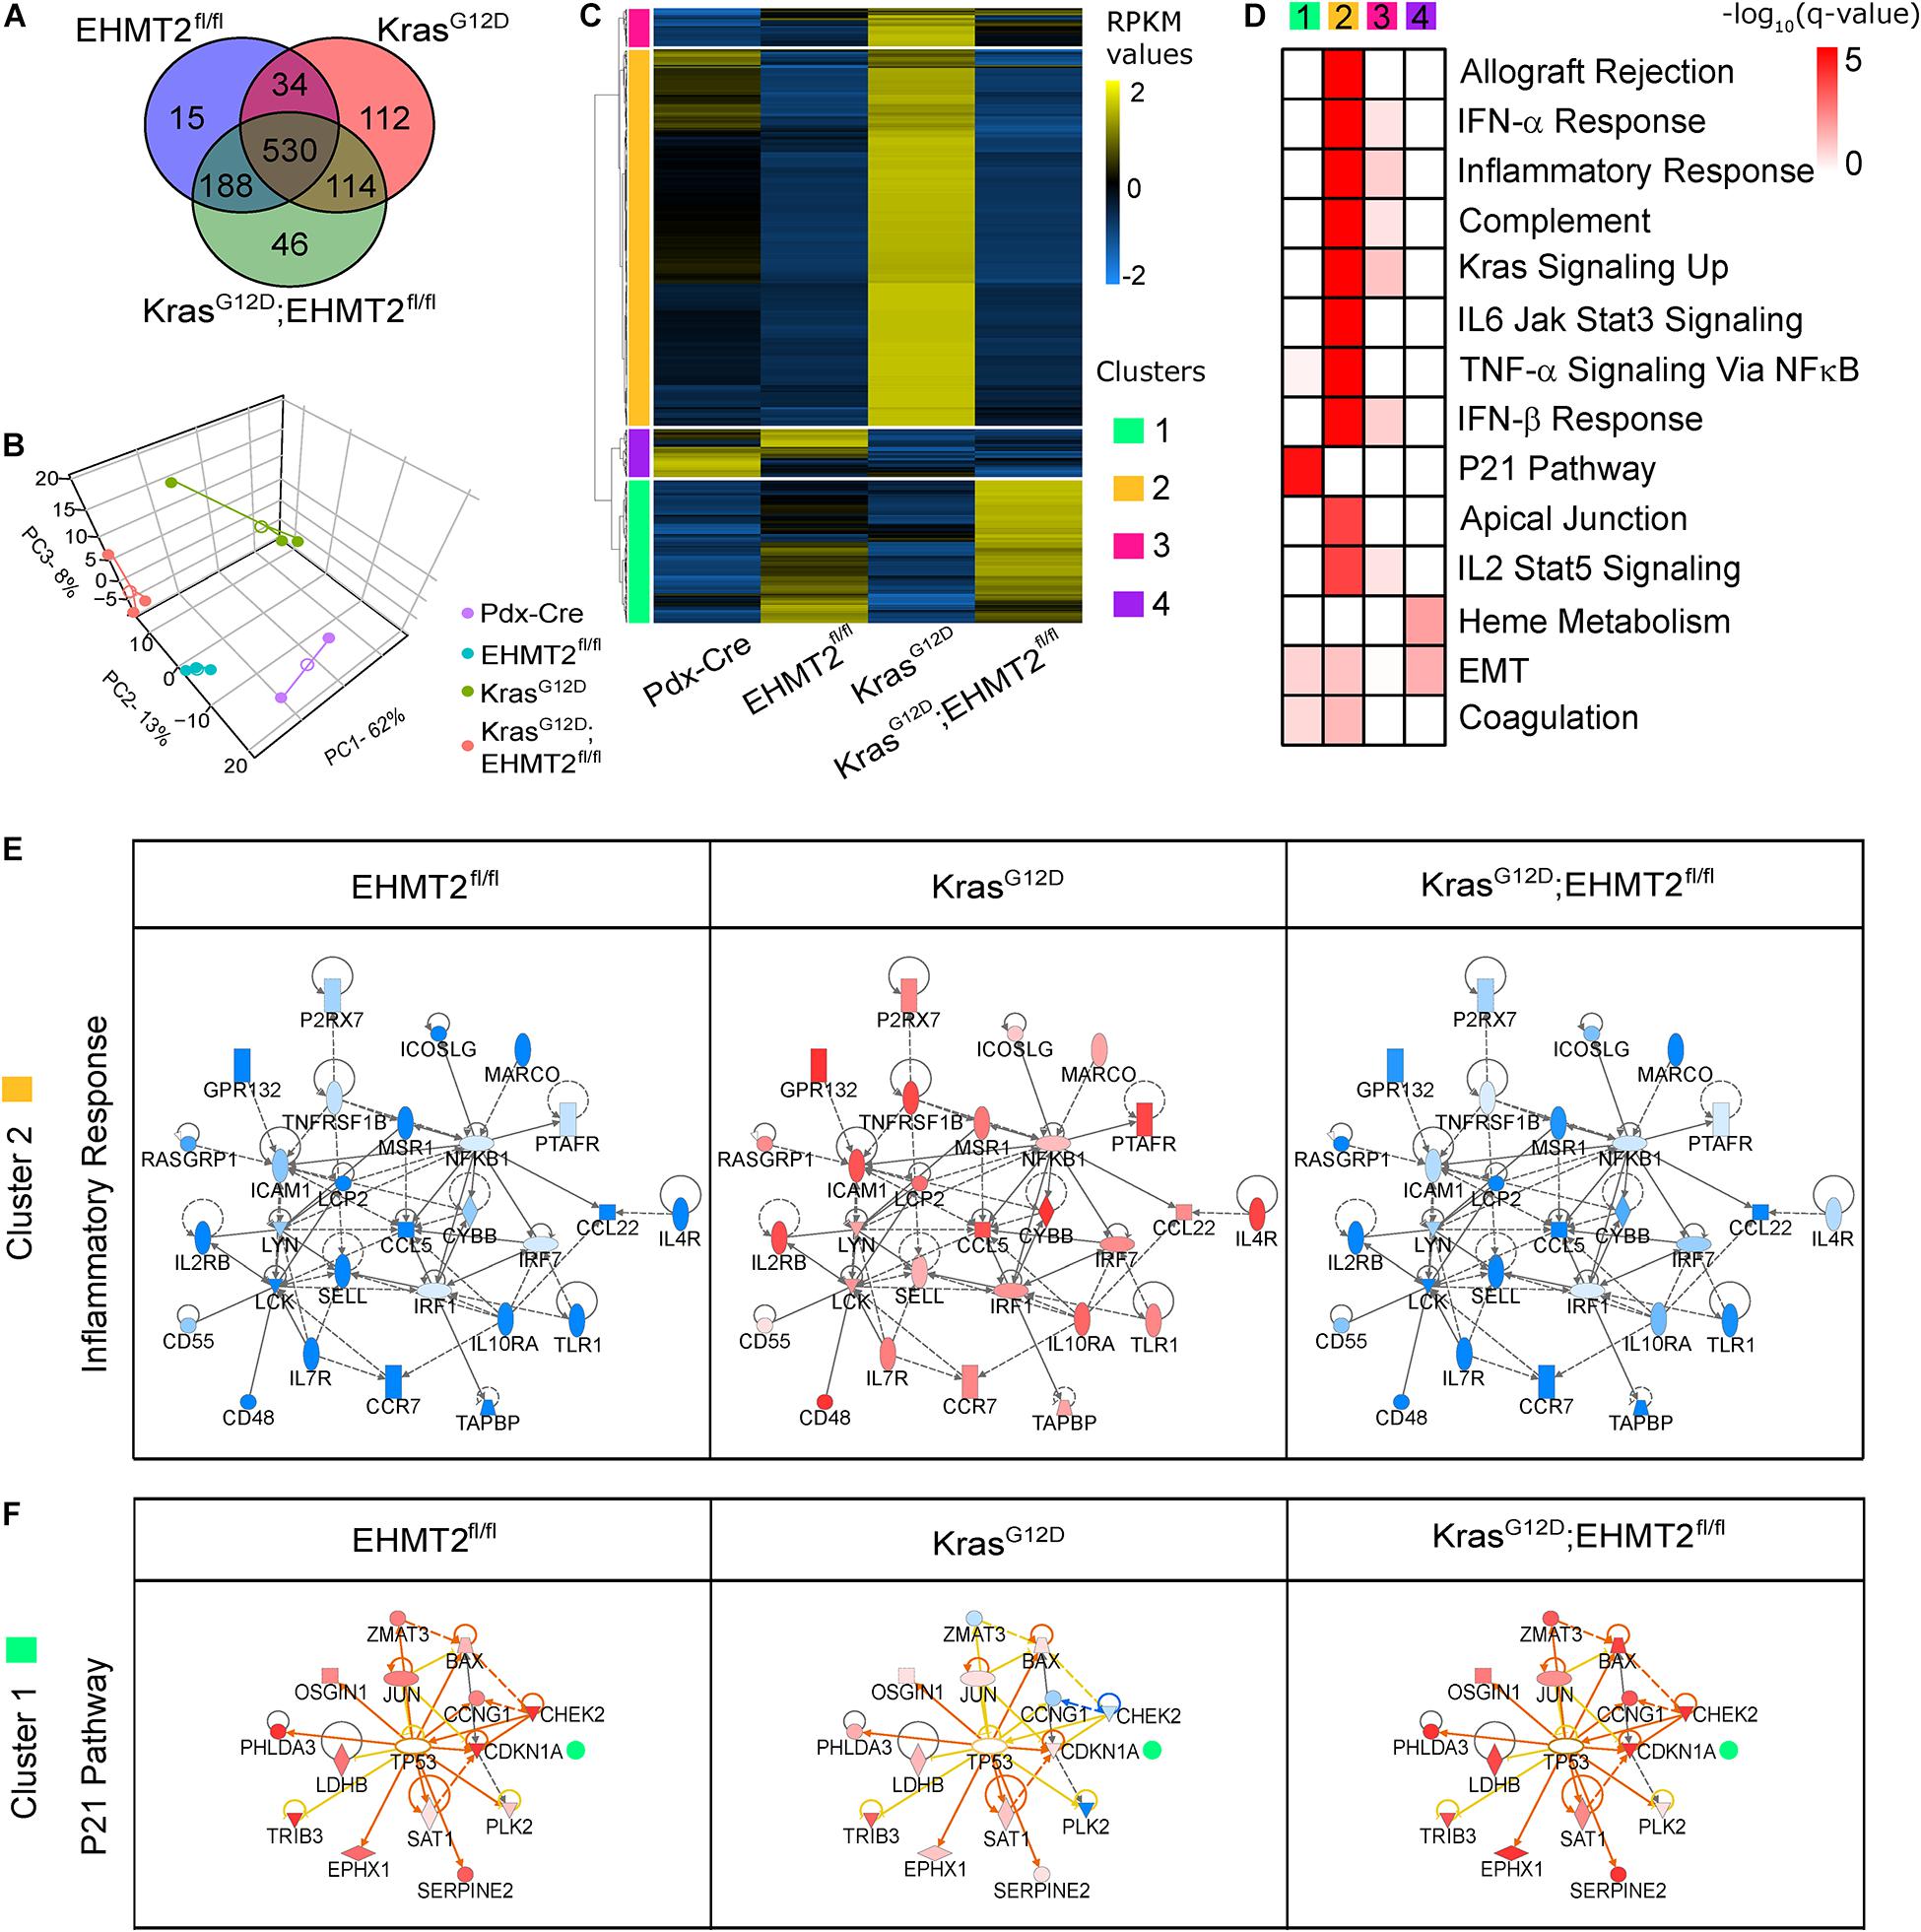
Figure 5. RNA-seq analysis of conditional knockout of EHMT2 in KrasG12D-expressing animals reveals an antagonistic transcriptional response. (A) Venn diagram of differentially expressed genes (DEGs) from Pdx1-Cre;EHMT2fl/fl (n = 3), Pdx1-Cre;LSL-KrasG12D;EHMT2+/+ (n = 3), and Pdx1-Cre;LSL-KrasG12D;EHMT2fl/fl (n = 3) mice relative to Pdx1-Cre control animals (n = 2) by RNA-seq. (B) PCA plot comparing genotype groups with centroids (open circles) and individual animals (filled circles) using RPKM expression values of DEGs. (C) Heatmap depicts RPKM expression levels of DEGs normalized to the z-scale. Hierarchical clustering representing four major expression patterns is labeled on the left of the heatmap (green, Cluster 1; orange, Cluster 2; pink, Cluster 3; and purple, Cluster 4). Average of normalized RPKM values is represented in yellow (up), blue (down), and black (no change). (D) Pathway enrichment analysis of gene clusters in panel (C). Color scale denotes –log10(q-value) for significance of each represented pathway. (E) The inflammatory gene network enriched in Cluster 2, which represents genes upregulated by KrasG12D activation but downregulated in animals carrying the EHMT2fl/fl allele. Gene fold changes with respect to controls are represented with red (up) and blue (down) nodes. (F) Upstream regulatory analysis of genes in Cluster 1, which represent the P21 pathway upregulated in EHMT2fl/fl mice. Color scheme of nodes is same as in panel (E). Outlined central node represents the predicted link with the upstream regulator, TP53, while orange lines and blue lines indicate predicted relationships that lead to activation or inhibition, respectively. Yellow lines designate that the predicted relationship is inconsistent with gene expression, and gray lines denote no predicted effect.
Growth-Inhibitory Gene Networks Are a Hallmark of EHMT2 Inactivation During KRAS-Mediated Initiation
We used different tools for data mining the biological and mechanistic significance of the gene expression networks identified by RNA-seq. Hierarchical clustering identified four main patterns of gene expression. Cluster 1 genes represented those upregulated upon EHMT2 inactivation that remained elevated in EHMT2fl/fl crossed to KrasG12D mice. Notably, cluster 1 included a gene network corresponding to the P21 pathway (q-value = 1.81 × 10⁻⁵; Figure 5D and Supplementary Table 4), which causes growth arrest. Cluster 2 genes, downregulated by EHMT2 inactivation, involved gene networks that participate in KRAS signaling (q-value = 1.5 × 10⁻¹⁰) and immunoregulatory/inflammation-related pathways (q-value = 2.3 × 10⁻¹⁴), (e.g., type I interferon response, IL6-Jak-Stat3 signaling, and IL2-Stat5 signaling; Supplementary Table 4). This is important since inflammatory responses are required for KrasG12D-mediated initiation (di Magliano and Logsdon, 2013). No biological pathway was found to be significant in cluster 3, while cluster 4 contained genes downregulated in KrasG12D animals, which participate in EMT (q-value = 2.3 × 10⁻²). Additional gene network enrichment and visualization analyses using semantic-based algorithms (Krämer et al., 2014) showed that EHMT2 inactivation results in antagonism of transcriptional networks corresponding to inflammatory responses as part of gene networks that participate in KRAS signaling (Figure 5E). Upstream Regulatory Analysis linked the upregulation of Cdkn1a/p21, Chek2, Bax, Jun, and Ccng1, among other genes, to a P53-like transcriptional network activated in EHMT2fl/fl mice, and this molecular phenotype was transferred to the KrasG12D;EHMT2fl/fl mice (Figure 5F). Therefore, EHMT2 inactivation antagonizes oncogenic KrasG12D at the molecular level, at least in part, by upregulating well-known pathways for cell cycle inhibitory checkpoints, though also unexpectedly, downregulating inflammatory responses.
RNA-seq counts from pancreas are dominated by the high expression of multiple key digestive enzyme genes (Hoang et al., 2016), occasionally masking genes expressed at lower levels that can be causal of phenotypes. For this reason, we also utilized more sensitive, pathway-specific RT-qPCR-based gene expression profiling focused on cell cycle-related transcripts to monitor the status of the entire gene expression network that regulates cell cycle. Results from EHMT2fl/fl, KrasG12D, or KrasG12D;EHMT2fl/fl mice were normalized to those from Pdx1-Cre mice. Indeed, this approach revealed that KrasG12D;EHMT2fl/fl and EHMT2fl/fl animals clustered closer to each other than with KrasG12D, sharing a similar expression profile for cell cycle-related genes (Supplementary Figure 5B). Genes forming Cluster 1 were involved in cell cycle arrest and senescence after replication stress (Cdkn1a/p21 and Chek2) (Aliouat-Denis et al., 2005; Cook, 2009), remaining upregulated in both EHMT2fl/fl and KrasG12D;EHMT2fl/fl mice (orange, Supplementary Figure 5B). Genes within cluster 2 contained networks that also function in replication stress responses (Atr, Wee1, Brca1, and Rad9a), which often also result in senescence induction (Gralewska et al., 2020), as well as genes, including Skp2 and Cdc6, involved in origin licensing during DNA replication (Cook, 2009). These genes ranged in levels from unchanged to slightly increased by KrasG12D but underwent further upregulation upon EHMT2 inactivation, whether in the absence or presence of KrasG12D (purple, Supplementary Figure 5B). Cluster 3 genes were characterized by the presence of the replication stress kinase Chek1 and several cyclins (Ccna2, Ccnb1, Ccnd1, and Ccnd2). These genes were downregulated by KrasG12D alone but markedly upregulated in both EHMT2fl/fl and KrasG12D;EHMT2fl/fl mice (green, Supplementary Figure 5B). Thus, combined these data suggest that EHMT2 inactivation alone increases the levels of cell cycle regulatory molecules known to function as checkpoints to arrest cell growth in response to replication stress, congruent with emerging data suggesting that this protein localizes and works at the replication fork (Estève et al., 2006; Dungrawala et al., 2015; Ferry et al., 2017) and pharmacological data that has implicated a role of this protein in senescence without much mechanistic insight (Yuan et al., 2012). Notably, these expression networks were inherited when EHMT2fl/fl mice were crossed to the KrasG12D background. While cluster 4 was primarily formed by KrasG12D-downregulated transcripts, its pattern displayed a mixed profile of downregulated, unchanged, and minimally upregulated transcripts in the EHMT2fl/fl and KrasG12D;EHMT2fl/fl mice (red, Supplementary Figure 5B). EHMT2fl/fl and KrasG12D;EHMT2fl/fl mice blunted the KrasG12D-mediated downregulation of transcripts in this cluster, which encompassed DNA damage and apoptosis-related genes. Thus, these data further support the significant role that EHMT2 inactivation plays in the regulation of gene expression networks that are primarily involved in signaling for replication stress, cell cycle arrest and senescence.
Inactivation of EHMT2 Gives Rise to a P21-Mediated Senescent Phenotype
Based on the discovery that EHMT2 inactivation upregulates the Cdkn1a/p21-Chek2 pathway, which when participating in prolonged cell cycle arrest, leads to senescence (Aliouat-Denis et al., 2005; d’Adda di Fagagna, 2008), we hypothesized that loss of EHMT2 may prevent KrasG12D-mediated cell growth, at least in part, through this mechanism. Thus, we performed fresh tissue senescence-associated β-galactosidase staining on Pdx1-Cre;LSL-KrasG12D and Pdx1-Cre;LSL-KrasG12D;EHMT2fl/fl pancreas tissue. Tissue from KrasG12D;EHMT2fl/fl mice displayed marked blue staining indicating increased senescence compared to KrasG12D mice with EHMT2 intact (Figure 6A). Similar results were obtained with P48Cre/+;KrasG12D;EHMT2fl/fl (Supplementary Figure 6A). Concomitantly, using western blot using lysates from Pdx1-Cre;LSL-KrasG12D and Pdx1-Cre;LSL-KrasG12D;EHMT2fl/fl mice (n = 6/group), we found that EHMT2 inactivation, which upregulated Cdkn1a/p21 mRNA, also increased the levels of its encoded cell cycle regulator protein (2.19 ± 0.38 FC for Pdx1-Cre;LSL-KrasG12D;EHMT2fl/fl vs. Pdx1-Cre;LSL-KrasG12D; p < 0.05; Figure 6B and Supplementary Figure 6B). IHC performed on tissue from these animals further supported the increase of P21 protein in the nuclei of pancreas cells with EHMT2 inactivated (0.45 ± 0.05% from Pdx1-Cre;LSL-KrasG12D vs. 12.03 ± 2.00% from Pdx1-Cre;LSL-KrasG12D;EHMT2fl/fl animals, p < 0.05; and 0.26 ± 0.05% from P48Cre/+;LSL-KrasG12D vs. 4.35 ± 0.06% from P48Cre/+;LSL-KrasG12D;EHMT2fl/fl mice, p < 0.001; Figure 6C and Supplementary Figure 6C). Thus, EHMT2 inactivation exerts its inhibitory effects on KrasG12D, at least in part, by one cellular mechanism, namely senescence. At the molecular level, we reveal that genetic inactivation of EHMT2 generates a transcriptional profile, which is antagonistic to oncogenesis and transferred to the cross with KrasG12D. This profile is represented by linked nodes that converge on the upregulation of P21-mediated pathways, a finding that is validated by evidence gathered at the transcriptional level, protein level, and by in situ immunostaining.
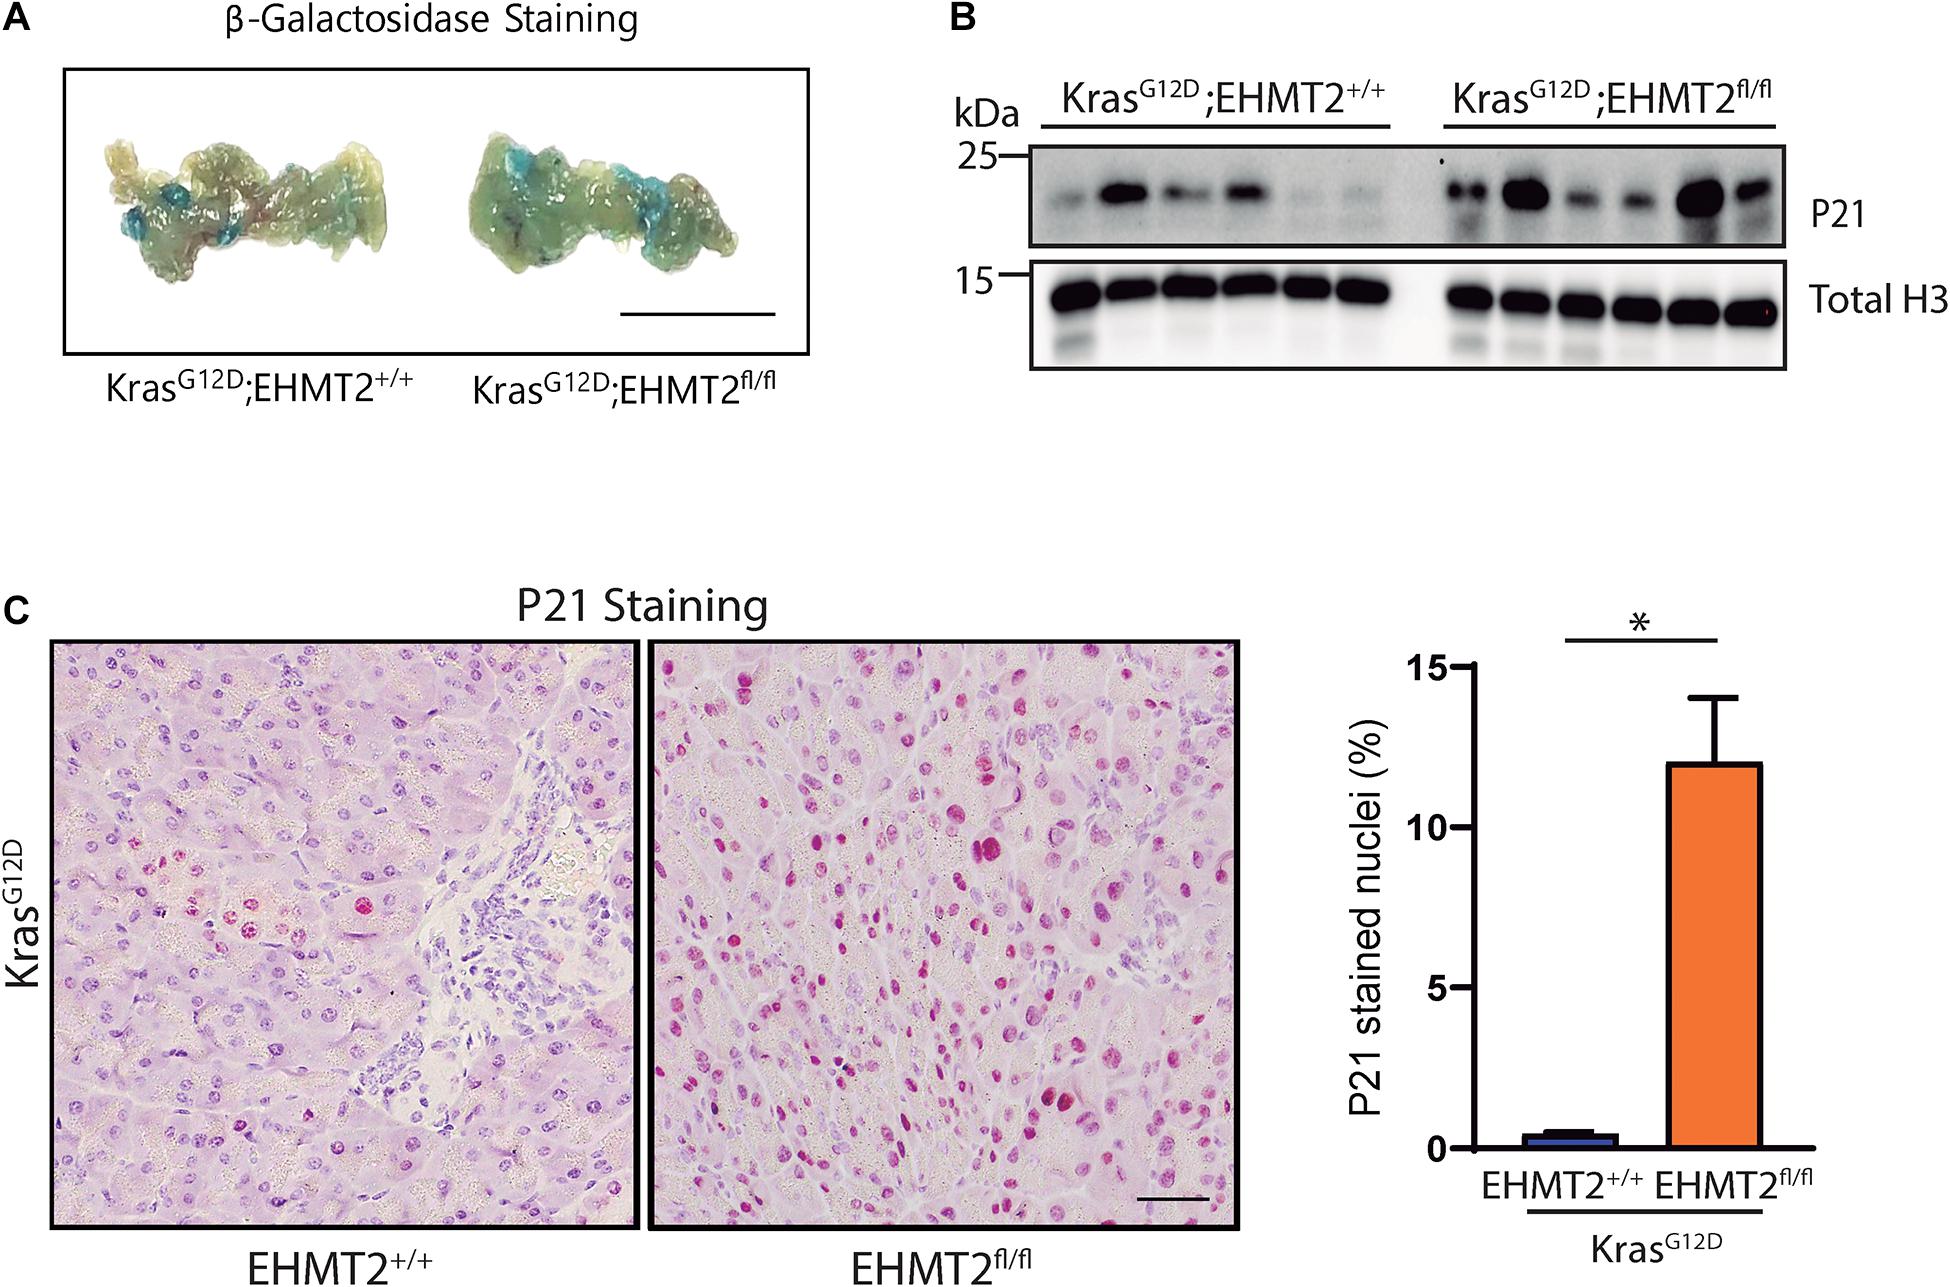
Figure 6. EHMT2 inactivation induces cell senescence in the KrasG12D-expressing mouse pancreas coincident with increased P21. (A) Senescence-associated β-galactosidase staining on fresh pancreas tissue extracted from Pdx1-Cre;LSL-KrasG12D;EHMT2+/+ and Pdx1-Cre;LSL-KrasG12D;EHMT2fl/fl animals. The presence of blue staining indicates senescence. Scale = 1 mm. (B) Western blot evaluation of P21 protein levels in whole pancreas lysates from Pdx1-Cre;LSL-KrasG12D;EHMT2+/+ and Pdx1-Cre;LSL-KrasG12D;EHMT2fl/fl mice. Total H3 was used as loading control (n = 6/group). Quantification is represented in Supplementary Figure 6B. (C) Left: Representative images from IHC staining for P21 on Pdx1-Cre;LSL-KrasG12D;EHMT2+/+ and Pdx1-Cre;LSL-KrasG12D;EHMT2fl/fl pancreas tissue. Scale = 50 μM. Right: Graph represents percentage of nuclei positive for P21 as quantified from a minimum of 5 random fields at 10× magnification (n = 3/group). ∗ indicates p-value ≤ 0.05; Student’s t-test with Welch’s correction. All data is expressed as mean ± SEM.
EHMT2 Inactivation Modifies the Immune Landscape Underlying KrasG12D-Mediated PDAC Initiation
Pancreatic Intraepithelial Neoplasia formation and progression requires infiltration of immune cells, which is known to be initiated by Kras activity (Guerra et al., 2007; di Magliano and Logsdon, 2013). In fact, an inflammatory response supports cells to overcome the oncogene-induced senescence (OIS) barrier (Guerra et al., 2011). Considering that our transcriptional signatures show an antagonistic effect of EHMT2 inactivation on the expression of Kras-mediated inflammatory genes (Figures 5D,E), we performed histopathological examination of 8-week-old Pdx1-Cre pancreata to evaluate the inflammatory cell infiltration. On the Pdx1-Cre background, we found that 100% of KrasG12D animals showed the presence of polymorphonuclear (PMN) leukocytes or histiocytes compared to only 33.3% of KrasG12D;EHMT2fl/fl animals (Figure 7A). When evaluating P48Cre/+ animals, again 100% of KrasG12D animals had infiltration of these inflammatory cells as opposed to only 81.8% of KrasG12D;EHMT2fl/fl animals (Figure 7A). Subsequently, the extent of PMN or histiocyte luminal infiltration was scored as absent, rare, focal or substantial. For Pdx1-Cre mice, all KrasG12D animals (100%) presented with rare infiltration, while these cells were absent in the majority of KrasG12D;EHMT2fl/fl animals (66.6%) with few mice demonstrating rare (16.7%) or focal (16.7%) infiltration (Figure 7B). In a similar manner, all P48Cre/+;KrasG12D mice showed either focal (60%) or substantial (40%) infiltration. However, in P48Cre/+;KrasG12D;EHMT2fl/fl animals, infiltration of these cells was mostly absent (18.2%) or rare (72.7%) with a minor portion of focal (9.1%). Additionally, we examined the degree of inflammation at foci of acinar tubular complexes and atypical flat lesions, which was categorized as absent, mild, moderate or severe. All of the Pdx1-Cre;KrasG12D animals showed moderate (40%) to severe (60%) inflammation, compared to 66.6% of the KrasG12D;EHMT2fl/fl animals with only mild inflammation and few with moderate (16.7%) to severe (16.7%) inflammation (Figure 7C). Likewise, P48Cre/+;KrasG12D animals presented with moderate (20%) to severe (80%) inflammation, whereas those carrying inactivating EHMT2fl/fl alleles most commonly demonstrated mild inflammation (72.7%) with only 18.2% scored as moderate (Figure 7C). For both Cre backgrounds, KrasG12D animals predominantly had a mixed cell type infiltrate (60% for Pdx1-Cre and 100% for P48Cre/+), while KrasG12D;EHMT2fl/fl animals had a lymphoplasmacytic predominant cell type (50% for Pdx1-Cre and 45% for P48Cre/+), rather than neutrophilic or mixed (Figure 7D). Utilizing a deconvolution approach for bulk RNA-seq (Finotello et al., 2019), we estimated the proportions of different types of immune cell populations. This approach revealed that Pdx1-Cre;KrasG12D animals had a markedly higher amount of DEG markers for T cells, neutrophils, B cells, and M1 macrophages (28.4, 28.3, 20.6, and 6.4%, respectively) when compared to Pdx1-Cre;EHMT2fl/fl (0.20, 6.98, 0.26, and 0.40%, respectively) and Pdx1-Cre;LSL-KrasG12D;EHMT2fl/fl (0.06, 4.96, 0.08, and 0.27%, respectively; Figure 7E). Together, these data corroborate our gene network enrichment findings, demonstrating that EHMT2 inactivation promotes an anti-inflammatory phenotype that antagonizes KrasG12D, leading to reduced inflammatory cell infiltration seen by both, histology and deconvolution of RNA-seq data.
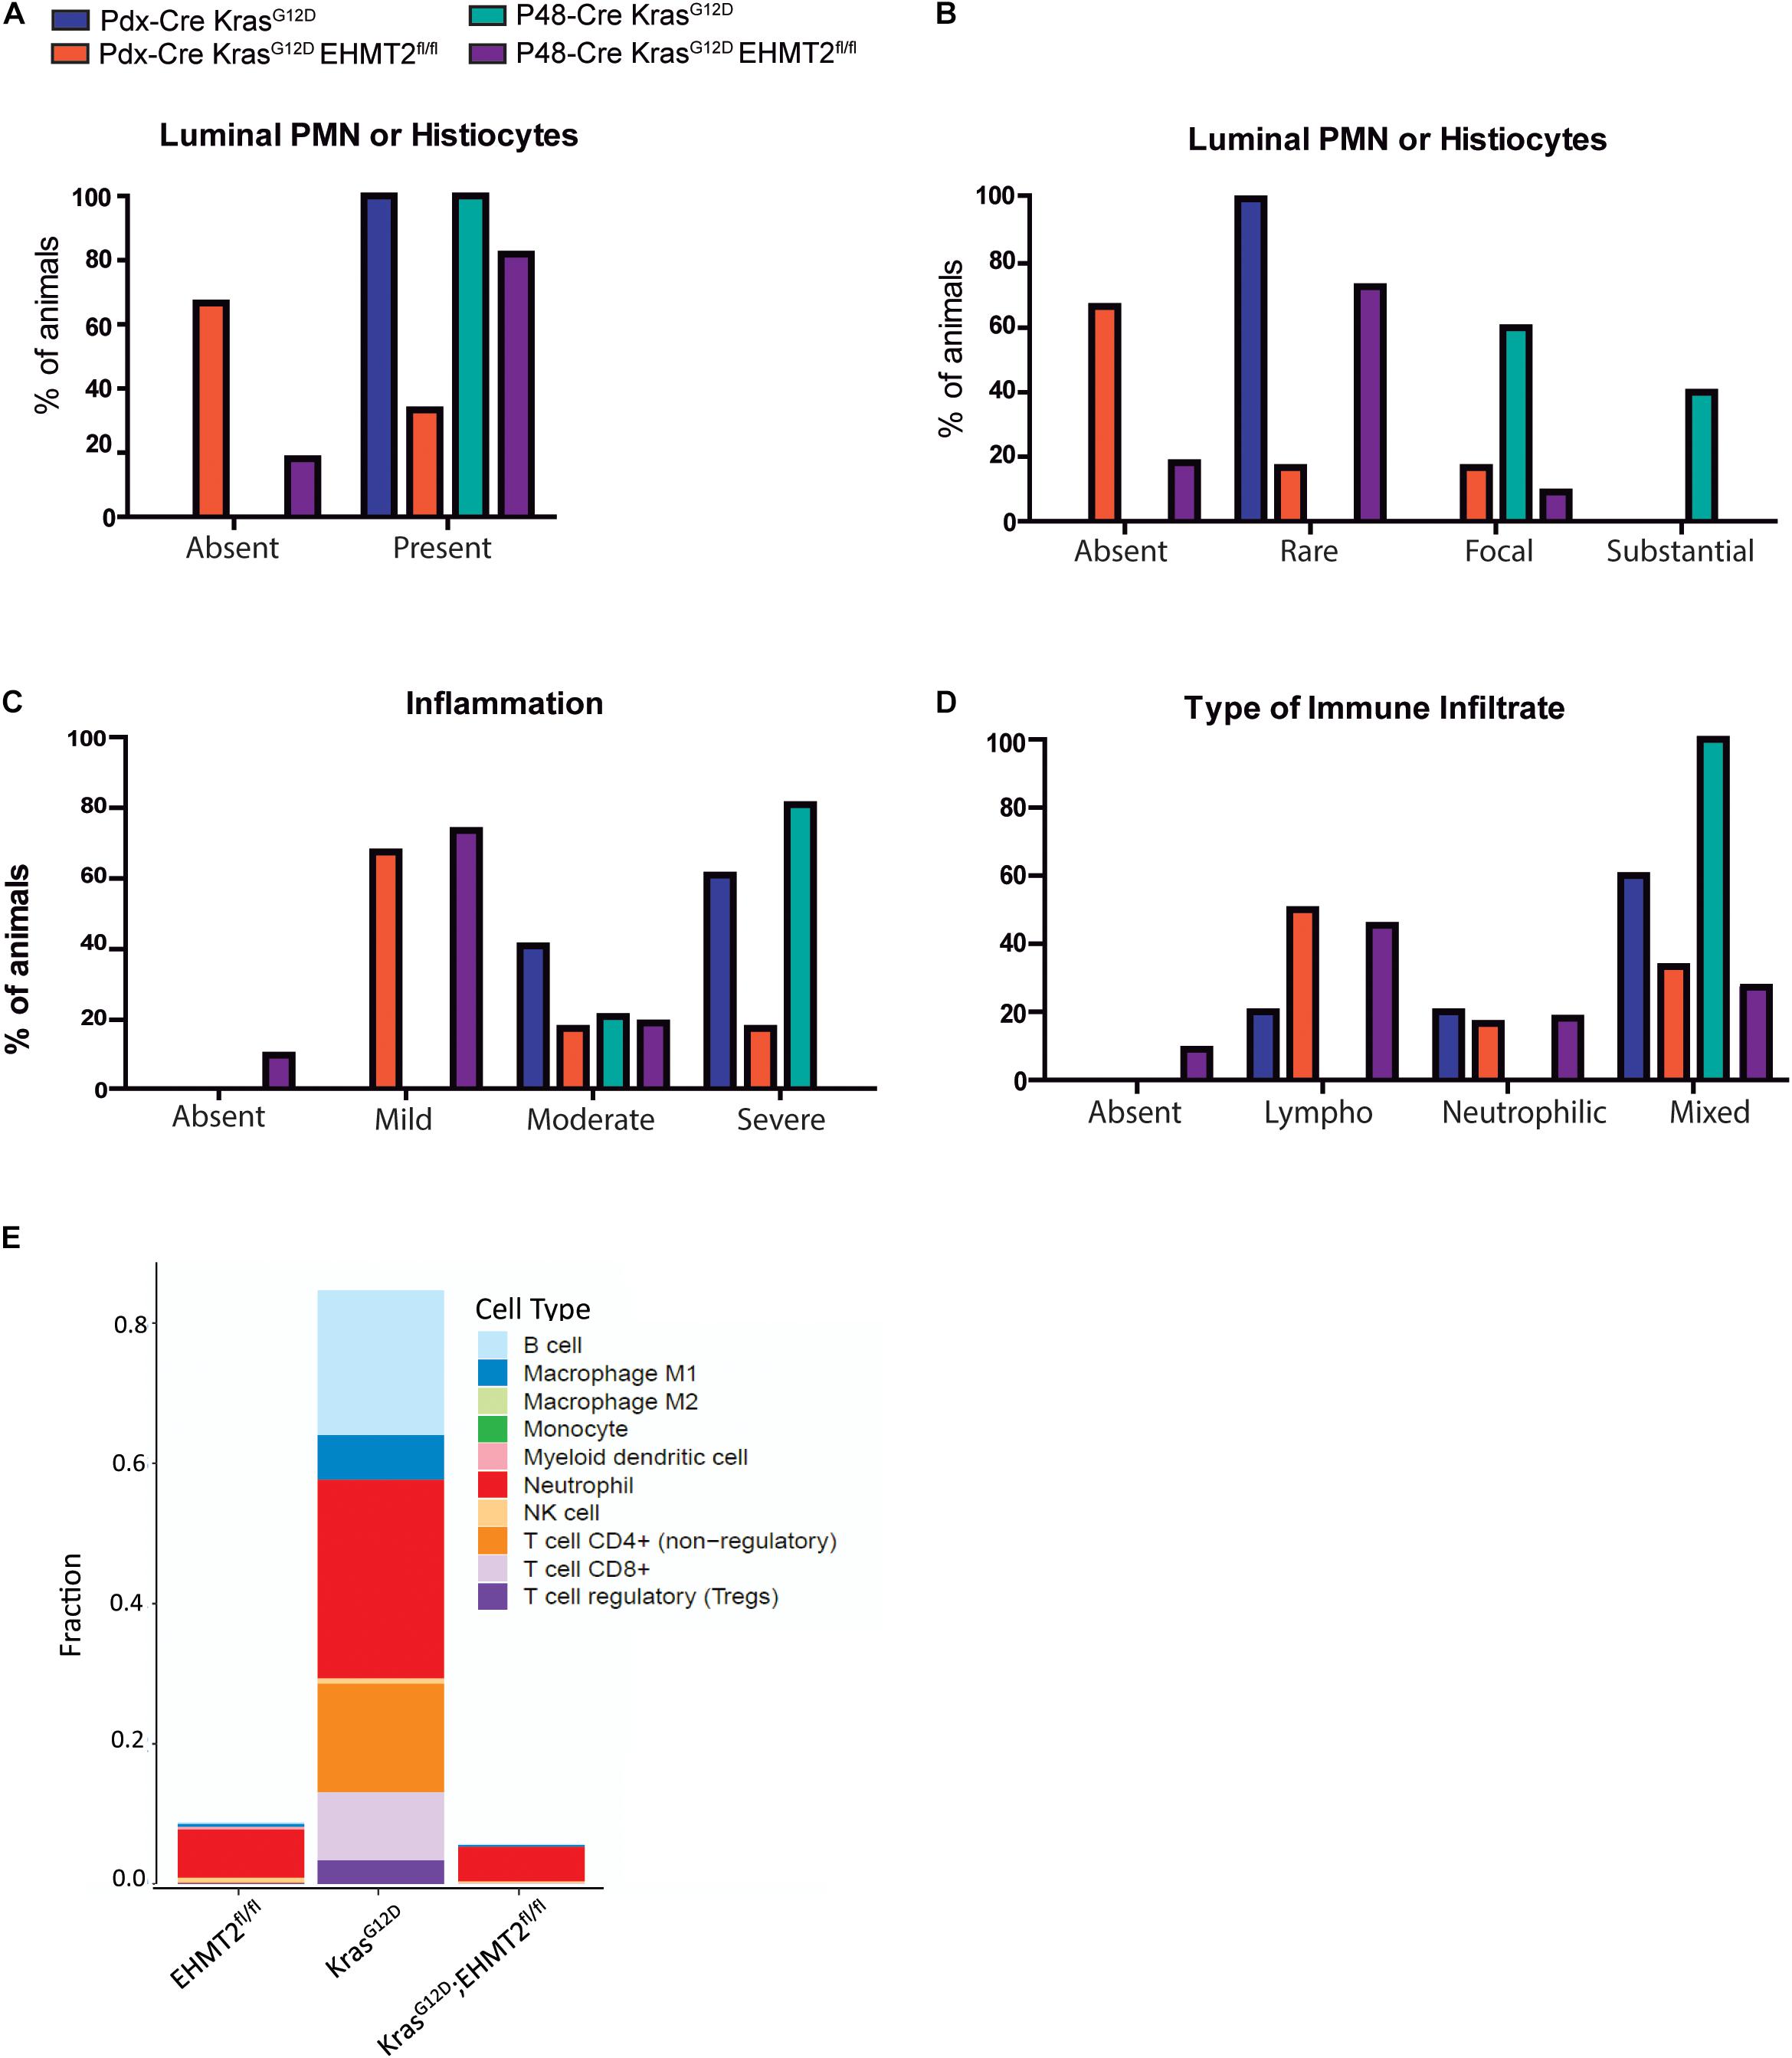
Figure 7. Genetic inactivation of EHMT2 in the mouse pancreas modifies the inflammatory phenotype that characterizes KrasG12D-mediated initiation. (A) Graph depicts the presence of polymorphonuclear (PMN) leukocytes or histiocytes in tubular complexes from KrasG12D;EHMT2+/+ and KrasG12D;EHMT2fl/fl animals driven by Pdx1-Cre (n = 5 or 6, respectively) or P48Cre/+ (n = 5 or 11, respectively). (B) The extent of PMN or histiocyte luminal infiltration was scored as absent, rare, focal or substantial. KrasG12D animals with EHMT2 inactivation showed reduced infiltration of these cells for both backgrounds (Pdx1-Cre and P48Cre/+). (C) The degree of inflammation in tubular complexes was classified as absent, mild, moderate or severe. While KrasG12D mice predominantly presented with moderate to severe inflammation, the majority of KrasG12D;EHMT2fl/fl animals only showed mild inflammation. (D) The type of inflammatory cells infiltrating these precursor lesions was evaluated and classified as absent, lymphoplasmacytic (Lympho), neutrophilic or mixed. While KrasG12D animals mostly presented with a mixed inflammatory infiltrate, KrasG12D;EHMT2fl/fl mice predominantly demonstrated lymphoplasmacytic infiltrate. (E) Immune cell type profiling demonstrates the percentage of infiltrating immune cell types obtained by quanTIseq analysis of DEG from Pdx1-Cre;EHMT2fl/fl, Pdx1-Cre;LSL-KrasG12D;EHMT2+/+, and Pdx1-Cre;LSL-KrasG12D;EHMT2fl/fl mice. Scores representing the absolute fractions of immune cells reveal that there is enrichment of T cells, neutrophils, M1-type macrophages and B cells in KrasG12D animals, which is not present in mice with EHMT2 inactivation.
EHMT2 Knockout in the Epithelium Alters the Tumor Microenvironment During Pancreatitis in Kras Mice
Prolonged or chronic inflammatory conditions promote the initiation and development of neoplastic and fibrotic events, serving as a major risk factor leading to PDAC (Momi et al., 2012). Pancreatitis induced by caerulein, a decapeptide that stimulate Gq-coupled growth regulatory receptors (e.g., CCK), accelerates the effects of oncogenic Kras (Murtaugh and Keefe, 2015). Pancreatitis-accelerated Kras-induced neoplastic growth in mice experimentally models the inflammation-associated progression, in which the microenvironment aids the growth-promoting process (Perez-Mancera et al., 2012). We injected 4-week-old Pdx1-Cre;LSL-KrasG12D and Pdx1-Cre;LSL-KrasG12D;EHMT2fl/fl mice with caerulein for 4 weeks to induce repeated chronic pancreatitis. Macroscopic examination of the pancreas in animals sacrificed after 4 weeks of caerulein treatment demonstrated that EHMT2 deletion antagonizes the known effect of KrasG12D to increase pancreas-to-body weight ratios (Figure 8A; 3.27 ± 0.09% for Pdx1-Cre;LSL-KrasG12D vs. 1.43 ± 0.06% for Pdx1-Cre;LSL-KrasG12D;EHMT2fl/fl; p < 0.001; n = 5 and 13, respectively). Histopathology showed extensive and dysplastic PanIN lesions with caerulein treatment in KrasG12D animals, while pancreatic tissues from KrasG12D mice with EHMT2 inactivation displayed more limited dysplasia (Figure 8B). Measurements of pancreas area with mucin-rich PanIN lesions detected by Alcian Blue staining substantiated that KrasG12D;EHMT2fl/fl mice had reduced area occupied by PanIN lesions, even when challenged by the inflammation-stimulating conditions (Figure 8C; 1.28 ± 0.13% KrasG12D;EHMT2fl/fl + caerulein vs. 2.64 ± 0.23% KrasG12D + caerulein; p < 0.001). We conclude that EHMT2 deletion antagonizes KrasG12D-mediated cell growth even after enhanced stimulation by pancreatitis.
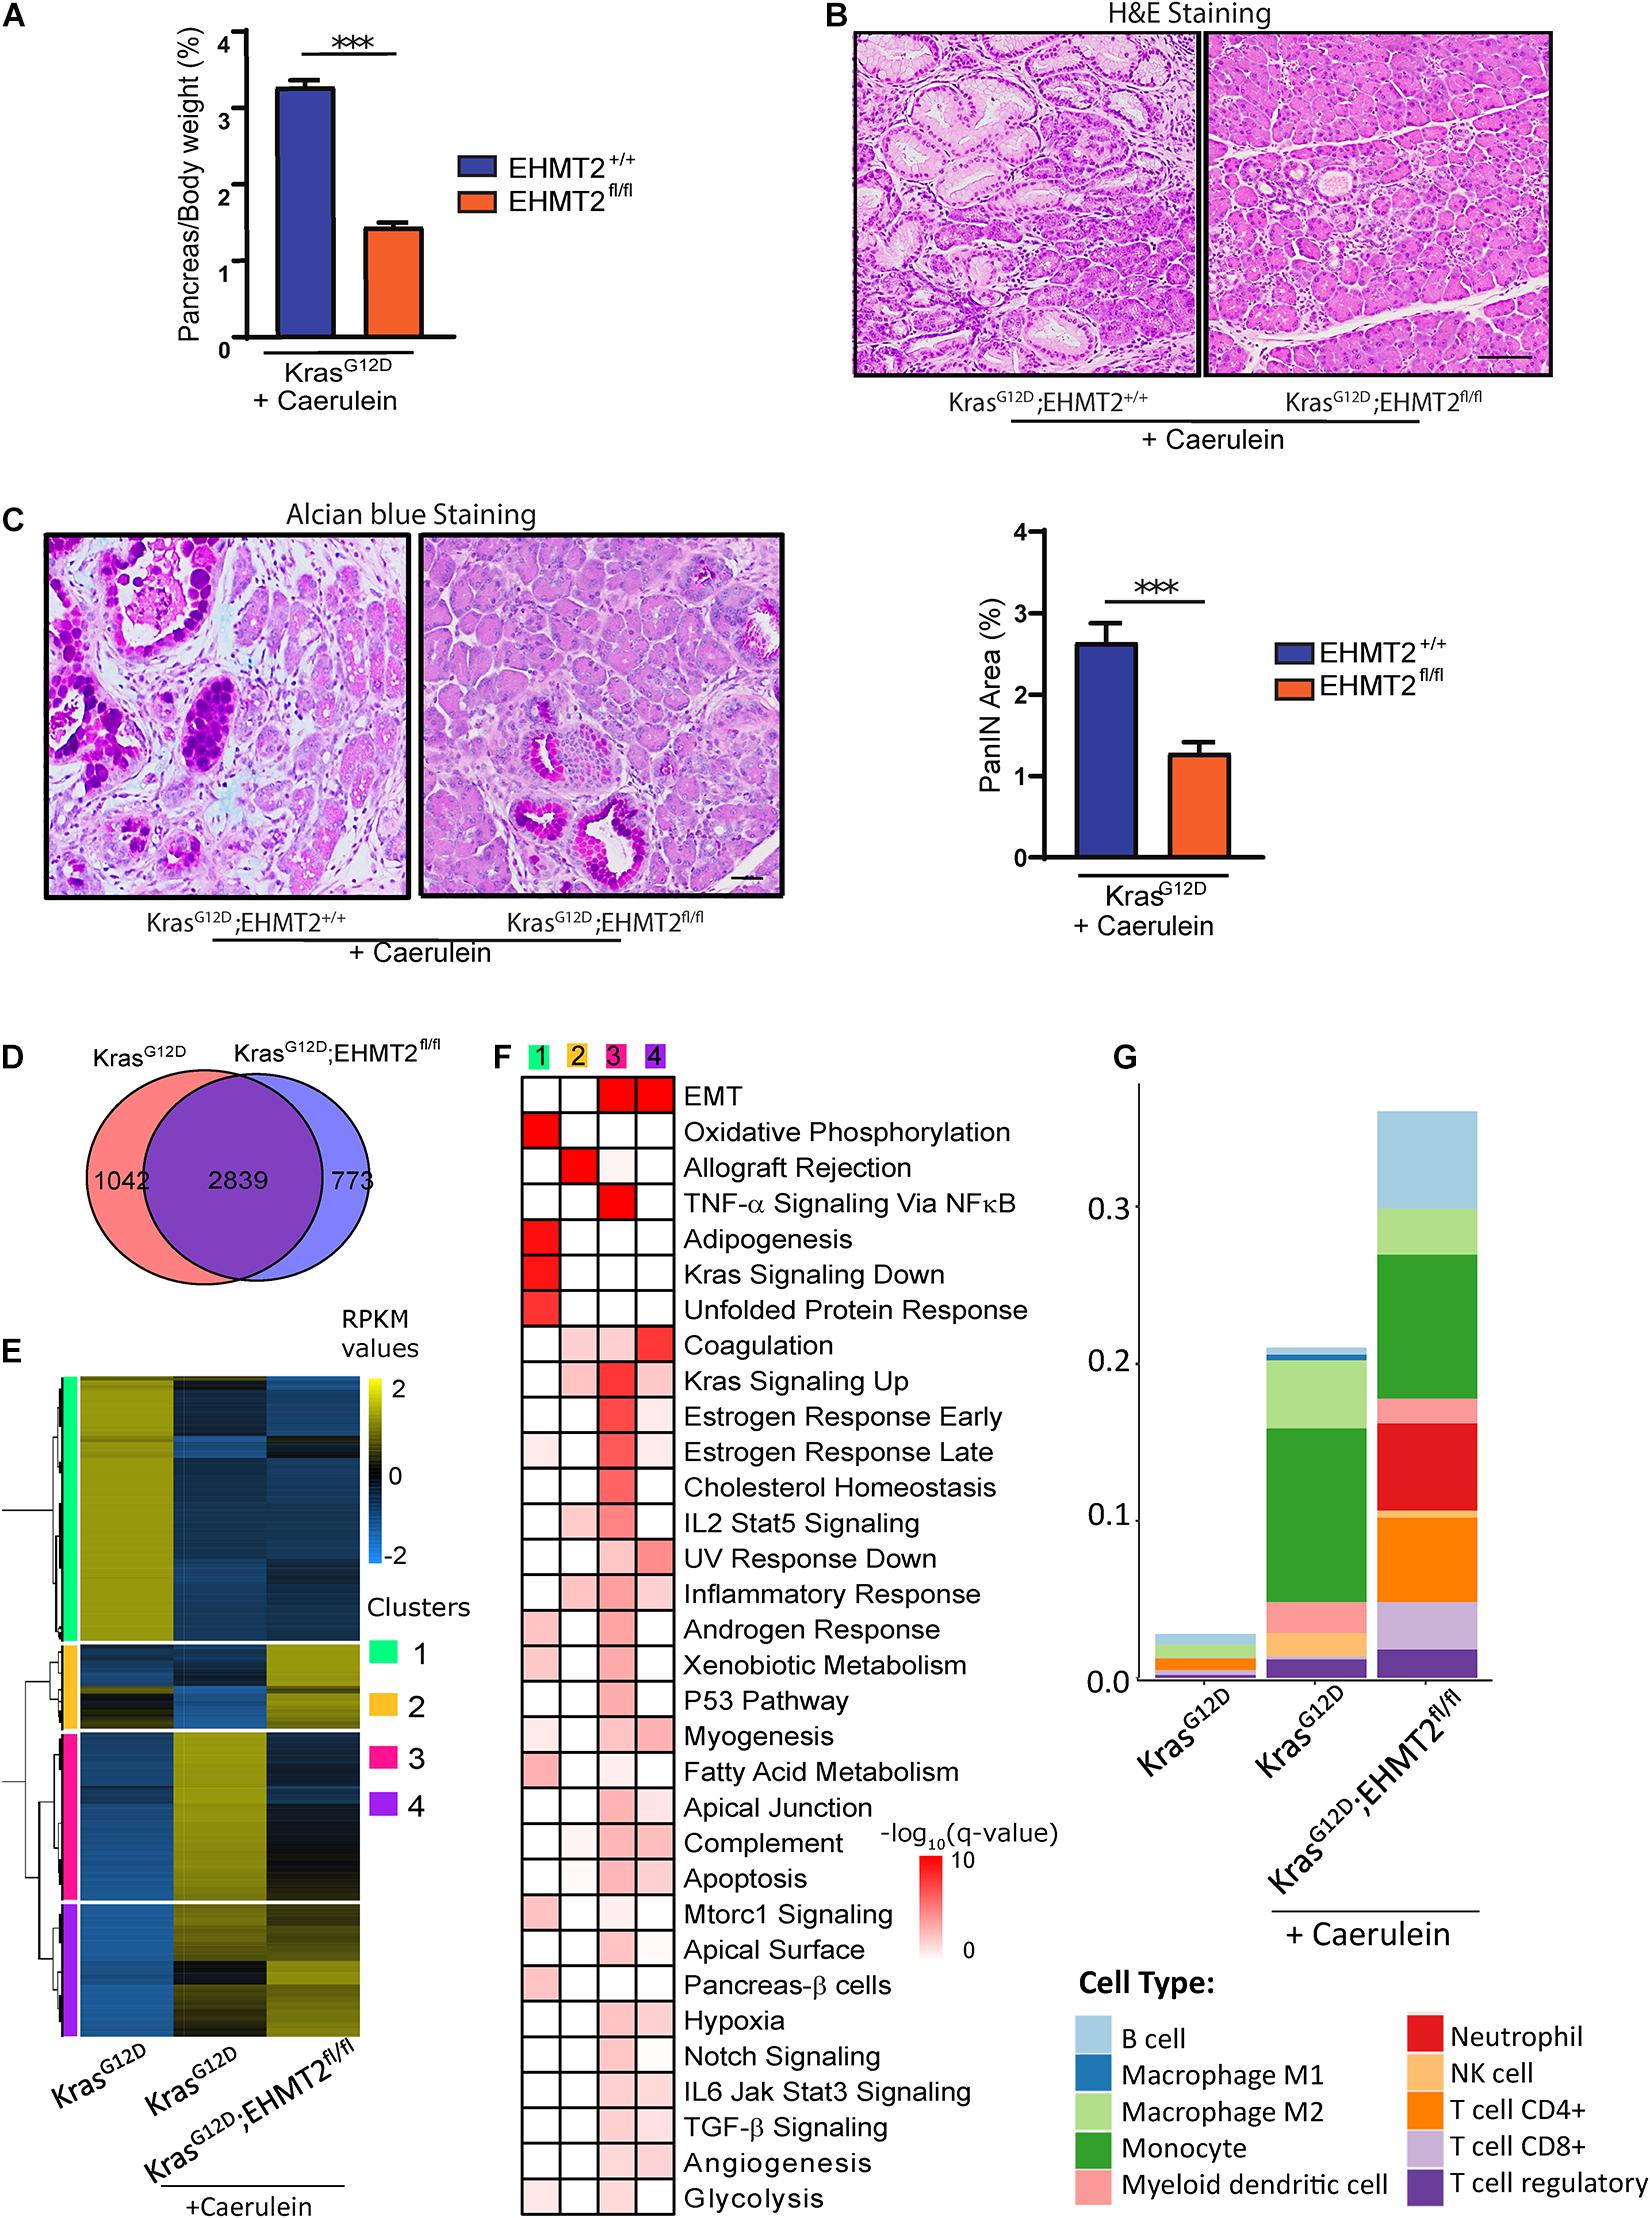
Figure 8. Genetic inactivation of EHMT2 in the inflammation-accelerated KrasG12D progression model diminishes effects on cell growth and gene expression. (A) 4-week-old Pdx1-Cre;LSL-KrasG12D;EHMT2+/+ (n = 5) and Pdx1-Cre;LSL-KrasG12D;EHMT2fl/fl (n = 14) mice were treated with caerulein (50 μg/kg/day) for 4 weeks to induce repeated chronic pancreatitis. Graph depicts reduced pancreas-to-body weight ratios after caerulein treatment in Pdx1-Cre;LSL-KrasG12D mice with EHMT2 inactivation. (B) Representative H&E images from pancreas tissue after 4 weeks of caerulein treatment in Pdx1-Cre;LSL-KrasG12D;EHMT2+/+ (left) and Pdx1-Cre;LSL-KrasG12D;EHMT2fl/fl (right) animals. Image on the right demonstrates significantly fewer lesions in animals carrying EHMT2 inactivation. Scale = 50 μM. (C) Representative Alcian blue images from pancreas tissue after 4 weeks of caerulein treatment in Pdx1-Cre;LSL-KrasG12D;EHMT2+/+ and Pdx1-Cre;LSL-KrasG12D;EHMT2fl/fl animals (left). Scale = 50 μM. Quantification of Alcian blue-positive PanIN lesions expressed as percentage (%) of pancreas area in Pdx1-Cre;LSL-KrasG12D;EHMT2+/+ (n = 5) and Pdx1-Cre;LSL-KrasG12D;EHMT2fl/fl (n = 6) animals after caerulein treatment (right). (D) Venn diagram of DEGs in caerulein-treated Pdx1-Cre;LSL-KrasG12D;EHMT2+/+ and Pdx1-Cre;LSL-KrasG12D;EHMT2fl/fl animals relative to age-matched, untreated Pdx1-Cre;LSL-KrasG12D;EHMT2+/+ control animals (n = 3/group). (E) Heatmap shows RPKM expression levels of DEGs normalized to the z-scale. Hierarchical clustering representing four major expression patterns is labeled on the left of the heatmap (green, Cluster 1; orange, Cluster 2; pink, Cluster 3; and purple, Cluster 4). Average of normalized RPKM values is represented in yellow (up), blue (down) and black (no change). (F) Pathway enrichment analysis of gene clusters in panel (E). Color scale designates –log10(q-value) for significance of each represented pathway. Gene networks of specific pathways are illustrated in Supplementary Figure 7B. (G) Immune cell type profiling demonstrates the percentage of infiltrating immune cell types obtained by quanTIseq analysis of DEG from caerulein-treated Pdx1-Cre;LSL-KrasG12D;EHMT2+/+ and Pdx1-Cre;LSL-KrasG12D;EHMT2fl/fl mice. Scores representing the absolute fractions of immune cells show that while caerulein-treated KrasG12D animals had an enrichment in Tregs, NK cells, myeloid dendritic cells, monocytes and M2-type macrophages, caerulein-treated KrasG12D animals with inactivation of EHMT2 also had increased infiltration of CD8+ and non-regulatory CD4+ T cells, B cells and neutrophils. ∗∗∗ indicates p-value ≤ 0.001. All data is expressed as mean ± SEM.
We performed RNA-seq in both caerulein-treated KrasG12D, and KrasG12D;EHMT2fl/fl animals and compared them with untreated KrasG12D mice as controls (Figure 8D; fold change ≥ |2| and FDR < 0.05). We identified 3881 caerulein-induced DEGs in KrasG12D animals (2024 upregulated and 1857 downregulated). The upregulated subset included not only 6 distinct AP-1 transcription factors, which participate in growth, but also 19 different collagen genes and 11 chemokine ligands (Supplementary Table 5), reflecting the functional expansion of the tumor microenvironment. Among downregulated networks, we found 10 different subunits of mitochondrial respiratory chain complexes (Supplementary Table 5). Caerulein-treated KrasG12D;EHMT2fl/fl mice displayed 3612 DEGs (1949 upregulated and 1663 downregulated). Of these, 2839 DEGs were shared with caerulein-treated KrasG12D mice, but 773 DEGs were unique to EHMT2 inactivation (Figure 8D). Thus, overall, chronic caerulein treatment of KrasG12D;EHMT2fl/fl mice induces significant changes of gene expression. Consequently, we used PCA to measure genome-wide level differences in the transcriptional landscape of these animals by comparing the position of centroids in 3D (Supplementary Figure 7A). The centroid separation in 3D of the KrasG12D and caerulein-treated KrasG12D mice was 114, while for KrasG12D and caerulein-treated KrasG12D;EHMT2fl/fl, it was 105. The distance between the two caerulein treated conditions was 60, indicative of a dominant effect of caerulein administration on gene expression. Hierarchical clustering of RPKM for these DEGs (4654 genes), depicted as a heatmap in Figure 8E, identified four main expression patterns or clusters, which were annotated for pathway enrichment analyses (Figure 8F). Cluster 1 included metabolic gene networks that were downregulated by caerulein in KrasG12D mice regardless of EHMT2 status (Figure 8F and Supplementary Table 6). This observation is relevant in light of the emergent relationship between metabolism and cell growth regulation by oncogenic KRAS (Kimmelman, 2015). Another important downregulated gene network, ontologically known as KRAS signaling “down,” contained genes typically downregulated by KRAS signaling (q-value = 6.1 × 10⁻¹⁰), which is congruent with caerulein signaling via the Gq pathway (Goldsmith and Dhanasekaran, 2007). EMT gene networks were upregulated by caerulein independent of the EHMT2 status, forming cluster 4 (q-value = 1.6 × 10⁻²²; Figures 7E,F and Supplementary Table 6). Cluster 2 was comprised of genes with expression upregulated by caerulein in KrasG12D;EHMT2fl/fl mice in comparison with caerulein-treated KrasG12D mice with EHMT2 intact (Figure 8E). Networks in cluster 2 were prominently represented by immunoregulatory genes (Figure 8F and Supplementary Table 6), such as H2-Oa (human gene HLA-DOA), H2-Ob (human gene HLA-DOB), H2-DMb2 (human gene HLA-DMB), Cd2, Cd96, Cd28, Cd8a, Ccl5, Lck, and Zap70 (q-value = 1.5 × 10⁻¹⁴), congruent with lymphocyte infiltration of T-cell origin. Finally, cluster 3 contained genes downregulated in KrasG12D animals carrying EHMT2 inactivation (Figure 8E), primarily representing EMT processes (q-value = 7.7 × 10⁻¹²), TNF-α signaling via NFκB (q-value = 2.3 × 10⁻¹²), as well as genes upregulated in response to KRAS signaling (q-value = 1.4 × 10–08) among others (Figure 8F and Supplementary Table 6). Overall, these data suggest that during the process of pancreatitis-enhanced carcinogenesis by KrasG12D, EHMT2 influences immunomodulatory processes, while reducing EMT, TNF-α signaling via NFκB, and KRAS signaling, which have well-documented effects on growth promotion (Thiery et al., 2009; Taniguchi and Karin, 2018; Waters and Der, 2018). Functional inferences were further gathered by building gene expression networks represented with color-coded nodes, corresponding to fold changes in gene expression (Supplementary Figure 7B). These networks better illustrate that both, Kras and TNF-α-NFκB pathways were upregulated by pancreatitis to a significantly lesser extent in mice carrying EHMT2 inactivation. This effect is particularly evident for a portion of the KRAS-associated gene network, composed of Itga2, Etv4, and Wnt7a, and the TNF-α-NFκB pathway, containing Areg, Fos, and Cxcl5 (human gene CXCL6) (Supplementary Figure 7B). Notably, the growth inhibitory networks that included Cdkn1a/p21 and Chek2, which were upregulated in animals with EHMT2 inactivation under basal conditions (Figure 5F and Supplementary Figure 5), were no longer a hallmark of the caerulein-treated KrasG12D;EHMT2fl/fl transcriptome. Using the same RNA-seq deconvolution approach shown in Figure 7E from pancreas tissue, we found that the treatment of KrasG12D mice with caerulein increased regulatory T cells (Tregs), NK cells, myeloid dendritic cells, monocytes and M2 macrophages (Figure 8G). Surprisingly, caerulein-treated KrasG12D animals with inactivation of EHMT2 not only had the presence of the immune cell types found in the caerulein-treated KrasG12D mice, but in addition, increased the infiltration of CD8+ and non-regulatory CD4+ T cells, B cells and neutrophils (Figure 8G). This result demonstrated that inactivation of this histone methyl transferase, in epithelial cells, leads to a change in the KrasG12D immune landscape in response to pancreatitis by significantly enriching the infiltrate with both cytotoxic and non-regulatory T cells and B cells, which are known to work in concert to mount more efficient antitumor responses (Wörmann et al., 2014). Immunohistochemical analyses, using CD3 as a pan-T cell marker, supported the increased immune infiltration in the pancreas of caerulein-treated KrasG12D;EHMT2fl/fl mice (18.76 ± 2.88% for caerulein-treated Pdx1-Cre;LSL-KrasG12D;EHMT2fl/fl vs. 8.96 ± 1.66% for caerulein-treated Pdx1-Cre;LSL-KrasG12D; p < 0.05; n = 4) that was not detected in their corresponding untreated cohort (0.57 ± 0.14% for Pdx1-Cre;LSL-KrasG12D;EHMT2fl/fl vs. 1.08 ± 0.28% for Pdx1-Cre;LSL-KrasG12D; n = 4; Supplementary Figure 7C). In summary, our data demonstrate that genetic inactivation of EHMT2 interferes with caerulein-induced promotion of KrasG12D-induced effects at the gross and histopathological levels. At a molecular level, EHMT2 inactivation affects gene expression networks involved in growth and immunoregulatory processes. This genotype-phenotype integration of transcriptomic data suggests that targeting EHMT2 for inactivation ameliorates cell growth- and inflammation-associated KrasG12D functions, most likely by a combined effect not only on the targeted pancreatic epithelial cells but also in its contributions to cell populations in the microenvironment, such as those from the immune system.
Discussion
The current study provides better insight on how the H3K9 methylation pathway, found to be altered on promoters in a specific subtype of human pancreatic cancer (Lomberk et al., 2018), influences the responses downstream of genetic alterations. This provides data to advance our understanding of the repertoire of epigenomic regulators that support the function of oncogenes (e.g., KRAS) so as to give rise to the pancreatic cancer phenotype. For PDAC, this observation extends the pathway of “initiation” from the membrane (EGFR) through the cytoplasm (KRAS) into the nucleus (EHMT2), as the functional communication between receptor and the oncogene is necessary for this process (Navas et al., 2012; Baumgart et al., 2014). Growing evidence has revealed the intricate involvement of epigenetic regulators in KRAS-mediated PDAC development, which includes those that support neoplastic progression [e.g., Bmi1 (Bednar et al., 2015) and Setdb1 (Ogawa et al., 2020)] and others serving as barriers to this process [e.g., Ezh2 (Mallen-St Clair et al., 2012), Brg1 (von Figura et al., 2014), Kdm6a (Mann et al., 2012; Andricovich et al., 2018), Arid1a (Kimura et al., 2018; Wang S. C et al., 2019; Wang W et al., 2019), Setd2 (Niu et al., 2020), and Bap1 (Perkail et al., 2020)]. Concurrent with the conclusion of our study, another report also found that EHMT2 deficiency impairs the progression of PanIN lesions and prolongs survival of P48Cre/+ KrasG12D mice (Kato et al., 2020). Our investigations corroborate and extend those findings, utilizing the Pdx1-Cre KrasG12D mouse model in addition to the P48-driven Cre, to demonstrate that EHMT2 inactivation in mice with activated KrasG12D inhibits ADM and PanIN formation. By inactivating EHMT2 in the pancreas with either Pdx1-Cre or P48Cre/+, we provide robust evidence that this pathway is not required for pancreas exocrine development and is tolerated in this organ under basal contexts. While EHMT2 is critical to support mouse embryonic life at the level of the whole organism (Tachibana et al., 2002), we add the pancreas to the list of cell lineages, such as skeletal muscle (Zhang et al., 2016), that do not require this epigenetic regulator for proper development. Setdb1, a methyltransferase for the H3K9me3 mark, was also recently shown to also be dispensable for proper pancreas development in mice (Ogawa et al., 2020). Thus, H3K9 methylation pathways, at least after embryonic day 8.5 or 9.5, do not appear to be necessary during pancreatic development, although it remains unknown whether confounding effects would occur with more than one H3K9 methyltransferase inactivated simultaneously. Genetic inactivation of EHMT2 with the same two Cre-drivers crossed to the LSL-KrasG12D model and the tamoxifen-inducible CAGGCre-ERTM demonstrated how loss of this epigenetic complex antagonizes EGF-KRAS-mediated PDAC initiation via ADM, in vitro and in vivo, as well as PanIN formation in vivo. Furthermore, we show that levels of the EHMT2-EHMT1-WIZ complex in exocrine pancreatic cells are normally low but are induced by the KRAS growth regulatory pathway. This increase in formation of the enzymatic EHMT2-EHMT1-WIZ complex in response to KRAS leads to enhanced deposition of its product, the H3K9me2 mark, supporting a novel role of this epigenetic regulator downstream of this mitogenic signaling pathway.
To examine molecular mechanisms that may account for how EHMT2 inactivation antagonizes the functions of oncogenic KrasG12D, we considered the properties of this epigenomic protein on transcriptional regulation. Indeed, RNA-seq and targeted pathway-specific RT-qPCR analyses indicated that mice carrying conditional EHMT2 inactivation in their pancreas had transcriptional profiles that were dominant over the KrasG12D-regulated gene expression program, highlighting the contribution that this histone methyltransferase has in promoting the KrasG12D-regulated gene expression program. EHMT2 inactivation resulted in the upregulation of key cell cycle inhibitory checkpoints, including Chk2 and Cdkn1a/p21, which function in cell cycle arrest in a manner that if persistent can induce senescence (Aliouat-Denis et al., 2005; d’Adda di Fagagna, 2008). Congruently, investigations of cellular mechanisms that could be responsible for the antagonism of KrasG12D-mediated growth determined that EHMT2 deletion in the KrasG12D-expressing exocrine pancreas leads to senescence. Senescence is mechanistically important since it occurs in the context of KrasG12D oncogene-induced stress, a phenomenon that is operational in pancreatic cells and drives the accelerated firing of replication forks with uninterrupted cycles of cell proliferation caused by the oncogenic stimulus (Kotsantis et al., 2018). Under normal conditions, this stress is compensated so that this oncogene can proceed with accelerated growth unless cell cycle regulators and checkpoint proteins become activated leading to OIS (Liu et al., 2018). OIS is often a dominant mechanism that antagonizes the transformation process (Lowe et al., 2004). However, studies have shown that physiological levels of oncogenic Kras have the capacity to suppress premature senescence of pancreatic ductal epithelium in vivo, bypassing this process (Lee and Bar-Sagi, 2010). In this regard, our data is, at least in large part, consistent with the escape from senescence being operational under KrasG12D activation in vivo, which is thwarted when combined with EHMT2 deletion. Indeed, combined data from histology, IHC, β-galactosidase staining, RT-qPCR and RNA-seq identifies the previously unknown cooperation between EHMT2 and KrasG12D, which must be actively maintained to eventually bypass OIS and support PDAC initiation. Inactivation of EHMT2 in other organs can trigger different mechanisms, depending upon the cell type and the physiological or pathological context (Shankar et al., 2013; Casciello et al., 2015; Kramer, 2015). In these studies, EHMT2 has been found to participate in a large number of phenomena, and in some cells, loss of this epigenetic regulator induces senescence even in the absence of oncogenic stimulation (Takahashi et al., 2012; Wang et al., 2013). Interestingly, ectopic oncogenic Ras-induced senescence in human diploid fibroblasts results in proteosomal degradation of the EHMT2 complex by APC/C(cdh1) (Takahashi et al., 2012). In addition, pharmacological inhibitors of EHMT2, which have similar pleomorphic effects in distinct cells and tissues (Casciello et al., 2015; Charles et al., 2019; Griñán-Ferré et al., 2019; Kim et al., 2019; Rybak et al., 2019), in certain cases, also induce senescence (Yuan et al., 2012). Altogether, our results support the conclusion that enhanced senescence is one important cellular mechanism by which EHMT2 inactivation appears to antagonize KrasG12D in exocrine pancreatic cells in vivo. Notably, the effects of EHMT2 inactivation on KrasG12D-induced growth remained under pancreatitis-stimulated conditions, providing further evidence that targeting this epigenomic regulator exerts a dominant effect over the functions of this oncogene. However, we also found that EHMT2 inactivation in caerulein-treated KrasG12D mice had additional impact on expression of immunoregulatory gene networks, which were not activated by the genetic manipulation of either EHMT2 or KrasG12D alone, and altered the composition of immune cell infiltration, enriching the proportion of cytotoxic and non-regulatory T cells and B cells, which is suggestive of an antitumor response (Wörmann et al., 2014). Thus, EHMT2 inactivation appears play a role in regulating pancreatitis-enhanced KrasG12D effects, not only through cell growth regulatory pathways, but also in part via immunomodulatory effects, thereby affecting the tumor microenvironment.
In summary, this work identifies EHMT2 as a KRAS-inducible epigenetic regulator which enables this oncogene to exert its effects on growth and inflammation, even when challenged in the pancreatitis-associated promotion model. Indeed, at the molecular level KrasG12D induces the levels of EHMT2, its heterotrimeric complex with EHMT1 and WIZ, as well as its enzymatic product, H3K9me2. Consequently, EHMT2 inactivation significantly reduces the levels of H3K9me2. The role of EHMT2 as a regulator of gene expression is clearly demonstrated by the fact that its inactivation changes the transcriptional profile of KrasG12D in a dominant manner. Noteworthy, while we manipulated the KRAS-EHMT2 pathway in epithelial cells, the results extend beyond this compartment to affect the tissue microenvironment, namely immune cell populations.
Besides the mechanistic importance of these results, this new information reinforces the role of EHMT2 as a potential therapeutic or chemopreventive target for pancreatic cancer and highlights the possibilities of this therapeutic strategy in combination with current inhibitors of the EGFR-KRAS pathway, which are widely available for clinical trials. In addition, the discovery that inhibition of EHMT2 in epithelial cells leads to reorganization of the immune landscape in the tumor microenvironment serves as the foundation for future studies focused on designing combinations with immunomodulatory agents. Lastly, the existence of this novel KRAS-EHMT2 pathway that is critical for mediating the growth-promoting and immunoregulatory effects of this oncogene in vivo predicts that these therapies will likely impact both the tumor-initiating epithelial cells and the tumor microenvironment.
Data Availability Statement
The datasets presented in this study can be found in online repositories. The names of the repository/repositories and accession number(s) can be found below: GEO with dataset number GSE169525.
Ethics Statement
Animal care and all protocols were reviewed and approved by the Institutional Animal Care and Use Committees of Mayo Clinic Rochester (IACUC protocols A00002240-16 and A24815) and the Medical College of Wisconsin (AUA00005963).
Author Contributions
RU and GL conceived and designed the study. GU, TA, AM, and AS conducted the experiments, acquired and analyzed the data. GU, RK, AZ, TS, VA, and BP participated in formal analysis. TA assembled figures. GU, TA, AM, MBD, MZ, JI, RU, and GL contributed to data interpretation. TA, JI, RU, and GL wrote the original draft. GL supervised the study. All authors provided valuable intellectual input on experiments, as well as read, offered feedback and approved the manuscript.
Funding
This work was supported by NIH Grants R01CA178627 (GL), R01CA247898 (GL), R01DK52913 (RU and GL), and R01CA226279 (MBD), Advancing a Healthier Wisconsin Endowment (GL and RU), We Care Fund for Medical Innovation and Research (GL and RU), MCW Cancer Center (GL) and The Linda T. and John A. Mellowes Endowed Innovation and Discovery Fund (RU).
Conflict of Interest
MBD is a co-founder and has ownership interests in Protein Foundry, LLC and Xlock Biosciences, LLC.
The remaining authors declare that the research was conducted in the absence of any commercial or financial relationships that could be construed as a potential conflict of interest.
Supplementary Material
The Supplementary Material for this article can be found online at: https://www.frontiersin.org/articles/10.3389/fcell.2021.681153/full#supplementary-material
References
Aliouat-Denis, C.-M., Dendouga, N., Van den Wyngaert, I., Goehlmann, H., Steller, U., van de Weyer, I., et al. (2005). p53-Independent Regulation of p21Waf1/Cip1 Expression and Senescence by Chk2. Mol. Cancer Res. 3, 627–634. doi: 10.1158/1541-7786.MCR-05-0121
Andea, A., Sarkar, F., and Adsay, V. N. (2003). Clinicopathological Correlates of Pancreatic Intraepithelial Neoplasia: a Comparative Analysis of 82 Cases With and 152 Cases Without Pancreatic Ductal Adenocarcinoma. Mod. Pathol. 16, 996–1006. doi: 10.1097/01.MP.0000087422.24733.62
Andricovich, J., Perkail, S., Kai, Y., Casasanta, N., Peng, W., and Tzatsos, A. (2018). Loss of KDM6A Activates Super-Enhancers to Induce Gender-Specific Squamous-like Pancreatic Cancer and Confers Sensitivity to BET Inhibitors. Cancer cell 33, 512–526.e8. doi: 10.1016/j.ccell.2018.02.003
Baumgart, S., Chen, N.-M., Siveke, J. T., König, A., Zhang, J.-S., Singh, S. K., et al. (2014). Inflammation-induced NFATc1-STAT3 transcription complex promotes pancreatic cancer initiation by KrasG12D. Cancer Discov. 4, 688–701. doi: 10.1158/2159-8290.CD-13-0593
Bednar, F., Schofield, H. K., Collins, M. A., Yan, W., Zhang, Y., Shyam, N., et al. (2015). Bmi1 is required for the initiation of pancreatic cancer through an Ink4a-independent mechanism. Carcinogenesis 36, 730–738. doi: 10.1093/carcin/bgv058
Casciello, F., Windloch, K., Gannon, F., and Lee, J. S. (2015). Functional Role of G9a Histone Methyltransferase in Cancer. Front. Immunol. 6:487. doi: 10.3389/fimmu.2015.00487
Charles, M. R. C., Dhayalan, A., Hsieh, H.-P., and Coumar, M. S. (2019). Insights for the design of protein lysine methyltransferase G9a inhibitors. Future Med. Chem. 11, 993–1014. doi: 10.4155/fmc-2018-0396
Collins, M. A., Bednar, F., Zhang, Y., Brisset, J.-C., Galbán, S., Galbán, C. J., et al. (2012). Oncogenic Kras is required for both the initiation and maintenance of pancreatic cancer in mice. J. Clin. Invest. 122, 639–653. doi: 10.1172/JCI59227
Cook, J. G. (2009). Replication licensing and the DNA damage checkpoint. Front. Biosci. 14:5013–5030. doi: 10.2741/3584
d’Adda di Fagagna, F. (2008). Living on a break: cellular senescence as a DNA-damage response. Nat. Rev. Cancer 8, 512–522. doi: 10.1038/nrc2440
di Magliano, M. P., and Logsdon, C. D. (2013). Roles for KRAS in pancreatic tumor development and progression. Gastroenterology 144, 1220–1229. doi: 10.1053/j.gastro.2013.01.071
Dong, C., Wu, Y., Yao, J., Wang, Y., Yu, Y., Rychahou, P. G., et al. (2012). G9a interacts with Snail and is critical for Snail-mediated E-cadherin repression in human breast cancer. J. Clin. Invest. 122, 1469–1486. doi: 10.1172/JCI57349
Dungrawala, H., Rose, K. L., Bhat, K. P., Mohni, K. N., Glick, G. G., Couch, F. B., et al. (2015). The Replication Checkpoint Prevents Two Types of Fork Collapse without Regulating Replisome Stability. Mol. cell 59, 998–1010. doi: 10.1016/j.molcel.2015.07.030
Esposito, I., Konukiewitz, B., Schlitter, A. M., and Klöppel, G. (2014). Pathology of pancreatic ductal adenocarcinoma: facts, challenges and future developments. World. J. Gastroenterol. 20, 13833–13841. doi: 10.3748/wjg.v20.i38.13833
Estève, P.-O., Chin, H. G., Smallwood, A., Feehery, G. R., Gangisetty, O., Karpf, A. R., et al. (2006). Direct interaction between DNMT1 and G9a coordinates DNA and histone methylation during replication. Genes Dev. 20, 3089–3103. doi: 10.1101/gad.1463706
Ferry, L., Fournier, A., Tsusaka, T., Adelmant, G., Shimazu, T., Matano, S., et al. (2017). Methylation of DNA Ligase 1 by G9a/GLP Recruits UHRF1 to Replicating DNA and Regulates DNA Methylation. Mol. Cell 67, 550–565.e5. doi: 10.1016/j.molcel.2017.07.012
Finotello, F., Mayer, C., Plattner, C., Laschober, G., Rieder, D., Hackl, H., et al. (2019). Molecular and pharmacological modulators of the tumor immune contexture revealed by deconvolution of RNA-seq data. Genome Med. 11:34. doi: 10.1186/s13073-019-0638-6
Goldsmith, Z. G., and Dhanasekaran, D. N. (2007). G Protein regulation of MAPK networks. Oncogene 26, 3122–3142. doi: 10.1038/sj.onc.1210407
Gralewska, P., Gajek, A., Marczak, A., and Rogalska, A. (2020). Participation of the ATR/CHK1 pathway in replicative stress targeted therapy of high-grade ovarian cancer. J. Hematol. Oncol. 13, 39–39. doi: 10.1186/s13045-020-00874-6
Griñán-Ferré, C., Marsal-García, L., Bellver-Sanchis, A., Kondengaden, S. M., Turga, R. C., Vázquez, S., et al. (2019). Pharmacological inhibition of G9a/GLP restores cognition and reduces oxidative stress, neuroinflammation and β-Amyloid plaques in an early-onset Alzheimer’s disease mouse model. Aging 11, 11591–11608. doi: 10.18632/aging.102558
Guerra, C., Collado, M., Navas, C., Schuhmacher, A. J., Hernández-Porras, I., Cañamero, M., et al. (2011). Pancreatitis-induced inflammation contributes to pancreatic cancer by inhibiting oncogene-induced senescence. Cancer cell 19, 728–739. doi: 10.1016/j.ccr.2011.05.011
Guerra, C., Schuhmacher, A. J., Cañamero, M., Grippo, P. J., Verdaguer, L., Pérez-Gallego, L., et al. (2007). Chronic Pancreatitis Is Essential for Induction of Pancreatic Ductal Adenocarcinoma by K-Ras Oncogenes in Adult Mice. Cancer Cell 11, 291–302. doi: 10.1016/j.ccr.2007.01.012
Hayashi, S., and McMahon, A. P. (2002). Efficient Recombination in Diverse Tissues by a Tamoxifen-Inducible Form of Cre: a Tool for Temporally Regulated Gene Activation/Inactivation in the Mouse. Dev. Biol. 244, 305–318. doi: 10.1006/dbio.2002.0597
Herreros-Villanueva, M., Hijona, E., Cosme, A., and Bujanda, L. (2012). Mouse models of pancreatic cancer. World J. Gastroenterol. 18, 1286–1294. doi: 10.3748/wjg.v18.i12.1286
Hezel, A. F., Kimmelman, A. C., Stanger, B. Z., Bardeesy, N., and DePinho, R. A. (2006). Genetics and biology of pancreatic ductal adenocarcinoma. Genes Dev. 20, 1218–1249. doi: 10.1101/gad.1415606
Hingorani, S. R., Petricoin, E. F., Maitra, A., Rajapakse, V., King, C., Jacobetz, M. A., et al. (2003). Preinvasive and invasive ductal pancreatic cancer and its early detection in the mouse. Cancer Cell 4, 437–450. doi: 10.1016/S1535-6108(03)00309-X
Hoang, C. Q., Hale, M. A., Azevedo-Pouly, A. C., Elsässer, H. P., Deering, T. G., Willet, S. G., et al. (2016). Transcriptional Maintenance of Pancreatic Acinar Identity, Differentiation, and Homeostasis by PTF1A. Mol. Cell. Biol. 36:3033–3047. doi: 10.1128/MCB.00358-16
Jackson, E. L., Willis, N., Mercer, K., Bronson, R. T., Crowley, D., Montoya, R., et al. (2001). Analysis of lung tumor initiation and progression using conditional expression of oncogenic K-ras. Genes Dev. 15, 3243–3248. doi: 10.1101/gad.943001
Kalari, K. R., Nair, A. A., Bhavsar, J. D., O’Brien, D. R., Davila, J. I., Bockol, M. A., et al. (2014). MAP-RSeq: mayo Analysis Pipeline for RNA sequencing. BMC Bioinformatics 15:224. doi: 10.1186/1471-2105-15-224
Kato, H., Tateishi, K., Fujiwara, H., Ijichi, H., Yamamoto, K., Nakatsuka, T., et al. (2020). Deletion of Histone Methyltransferase G9a Suppresses Mutant Kras-driven Pancreatic Carcinogenesis. Cancer Genomics Proteomics 17, 695–705. doi: 10.21873/cgp.20224
Kim, Y., Wang, S. E., and Jiang, Y.-H. (2019). Epigenetic therapy of Prader-Willi syndrome. Transl. Res. 208, 105–118. doi: 10.1016/j.trsl.2019.02.012
Kimmelman, A. C. (2015). Metabolic Dependencies in RAS-Driven Cancers. Clin. Cancer Res. 21, 1828–1834. doi: 10.1158/1078-0432.CCR-14-2425
Kimura, Y., Fukuda, A., Ogawa, S., Maruno, T., Takada, Y., Tsuda, M., et al. (2018). ARID1A Maintains Differentiation of Pancreatic Ductal Cells and Inhibits Development of Pancreatic Ductal Adenocarcinoma in Mice. Gastroenterology 155, 194–209.e2. doi: 10.1053/j.gastro.2018.03.039
Kotsantis, P., Petermann, E., and Boulton, S. J. (2018). Mechanisms of Oncogene-Induced Replication Stress: jigsaw Falling into Place. Cancer Dis. 8, 537–555. doi: 10.1158/2159-8290.CD-17-1461
Krämer, A., Green, J., Pollard, J. Jr., and Tugendreich, S. (2014). Causal analysis approaches in Ingenuity Pathway Analysis. Bioinformatics 30, 523–530. doi: 10.1093/bioinformatics/btt703
Kramer, J. M. (2015). Regulation of cell differentiation and function by the euchromatin histone methyltranserfases G9a and GLP. Biochem. Cell Biol. 94, 26–32. doi: 10.1139/bcb-2015-0017
Lee, K. E., and Bar-Sagi, D. (2010). Oncogenic KRas suppresses inflammation-associated senescence of pancreatic ductal cells. Cancer Cell 18, 448–458. doi: 10.1016/j.ccr.2010.10.020
Liberzon, A., Birger, C., Thorvaldsdóttir, H., Ghandi, M., Mesirov, J. P., and Tamayo, P. (2015). The Molecular Signatures Database (MSigDB) hallmark gene set collection. Cell Syst. 1, 417–425. doi: 10.1016/j.cels.2015.12.004
Liu, X.-l, Ding, J., and Meng, L.-h (2018). Oncogene-induced senescence: a double edged sword in cancer. Acta Pharmacol. Sin. 39, 1553–1558. doi: 10.1038/aps.2017.198
Lomberk, G., Blum, Y., Nicolle, R., Nair, A., Gaonkar, K. S., Marisa, L., et al. (2018). Distinct epigenetic landscapes underlie the pathobiology of pancreatic cancer subtypes. Nat. Commun. 9:1978. doi: 10.1038/s41467-018-04383-6
Lomberk, G., Dusetti, N., Iovanna, J., and Urrutia, R. (2019). Emerging epigenomic landscapes of pancreatic cancer in the era of precision medicine. Nat. Commun. 10, 3875–3875. doi: 10.1038/s41467-019-11812-7
Lowe, S. W., Cepero, E., and Evan, G. (2004). Intrinsic tumour suppression. Nature 432, 307–315. doi: 10.1038/nature03098
Macgregor-Das, A. M., and Iacobuzio-Donahue, C. A. (2013). Molecular pathways in pancreatic carcinogenesis. J. Surg. Oncol. 107, 8–14. doi: 10.1002/jso.23213
Mallen-St Clair, J., Soydaner-Azeloglu, R., Lee, K. E., Taylor, L., Livanos, A., Pylayeva-Gupta, Y., et al. (2012). EZH2 couples pancreatic regeneration to neoplastic progression. Genes Dev. 26, 439–444. doi: 10.1101/gad.181800.111
Mann, K. M., Ward, J. M., Yew, C. C. K., Kovochich, A., Dawson, D. W., Black, M. A., et al. (2012). Sleeping Beauty mutagenesis reveals cooperating mutations and pathways in pancreatic adenocarcinoma. Proc. Natl. Acad. Sci. U. S. A. 109, 5934–5941. doi: 10.1073/pnas.1202490109
Martin, C., and Zhang, Y. (2005). The diverse functions of histone lysine methylation. Nat. Rev. Mol. Cell Biol. 6, 838–849. doi: 10.1038/nrm1761
Martinelli, P., Madriles, F., Cañamero, M., Pau, E. C., Pozo, N. D., Guerra, C., et al. (2016). The acinar regulator Gata6 suppresses KrasG12V-driven pancreatic tumorigenesis in mice. Gut 65, 476–486. doi: 10.1136/gutjnl-2014-308042
Mathison, A., Grzenda, A., Lomberk, G., Velez, G., Buttar, N., Tietz, P., et al. (2013). Role for Krüppel-like transcription factor 11 in mesenchymal cell function and fibrosis. PLoS One 8:e75311. doi: 10.1371/journal.pone.0075311
McCarthy, D. J., Chen, Y., and Smyth, G. K. (2012). Differential expression analysis of multifactor RNA-Seq experiments with respect to biological variation. Nucleic Acids Res. 40, 4288–4297. doi: 10.1093/nar/gks042
McDonald, O. G., Li, X., Saunders, T., Tryggvadottir, R., Mentch, S. J., Warmoes, M. O., et al. (2017). Epigenomic reprogramming during pancreatic cancer progression links anabolic glucose metabolism to distant metastasis. Nat. Genet. 49, 367–376. doi: 10.1038/ng.3753
Momi, N., Kaur, S., Krishn, S. R., and Batra, S. K. (2012). Discovering the route from inflammation to pancreatic cancer. Minerva Gastroenterol. Dietol. 58, 283–297.
Murtaugh, L. C., and Keefe, M. (2015). Regeneration and Repair of the Exocrine Pancreas. Annu. Rev. Physiol. 77, 229–249. doi: 10.1146/annurev-physiol-021014-071727
Nakhai, H., Sel, S., Favor, J., Mendoza-Torres, L., Paulsen, F., Duncker, G. I. W., et al. (2007). Ptf1a is essential for the differentiation of GABAergic and glycinergic amacrine cells and horizontal cells in the mouse retina. Development 134, 1151–1160. doi: 10.1242/dev.02781
Navas, C., Hernández-Porras, I., Schuhmacher, A. J., Sibilia, M., Guerra, C., and Barbacid, M. (2012). EGF receptor signaling is essential for k-ras oncogene-driven pancreatic ductal adenocarcinoma. Cancer cell 22, 318–330. doi: 10.1016/j.ccr.2012.08.001
Niu, N., Lu, P., Yang, Y., He, R., Zhang, L., Shi, J., et al. (2020). Loss of Setd2 promotes Kras-induced acinar-to-ductal metaplasia and epithelia–mesenchymal transition during pancreatic carcinogenesis. Gut 69, 715–726. doi: 10.1136/gutjnl-2019-318362
Ogawa, S., Fukuda, A., Matsumoto, Y., Hanyu, Y., Sono, M., Fukunaga, Y., et al. (2020). SETDB1 Inhibits p53-Mediated Apoptosis and Is Required for Formation of Pancreatic Ductal Adenocarcinomas in Mice. Gastroenterology 159, 682–696.e13. doi: 10.1053/j.gastro.2020.04.047
Pan, M.-R., Hsu, M.-C., Luo, C.-W., Chen, L.-T., Shan, Y.-S., and Hung, W.-C. (2016). The histone methyltransferase G9a as a therapeutic target to override gemcitabine resistance in pancreatic cancer. Oncotarget 7, 61136–61151. doi: 10.18632/oncotarget.11256
Perez-Mancera, P. A., Guerra, C., Barbacid, M., and Tuveson, D. A. (2012). What We Have Learned About Pancreatic Cancer From Mouse Models. Gastroenterology 142, 1079–1092.
Perkail, S., Andricovich, J., Kai, Y., and Tzatsos, A. (2020). BAP1 is a haploinsufficient tumor suppressor linking chronic pancreatitis to pancreatic cancer in mice. Nat. Commun. 11, 3018–3018. doi: 10.1038/s41467-020-16589-8
Rahib, L., Smith, B. D., Aizenberg, R., Rosenzweig, A. B., Fleshman, J. M., and Matrisian, L. M. (2014). Projecting Cancer Incidence and Deaths to 2030: the Unexpected Burden of Thyroid, Liver, and Pancreas Cancers in the United States. Cancer Res. 74, 2913–2921. doi: 10.1158/0008-5472.CAN-14-0155
Rybak, L. P., Dhukhwa, A., Mukherjea, D., and Ramkumar, V. (2019). Local Drug Delivery for Prevention of Hearing Loss. Front. Cell. Neurosci. 13:300. doi: 10.3389/fncel.2019.00300
Shankar, S. R., Bahirvani, A. G., Rao, V. K., Bharathy, N., Ow, J. R., and Taneja, R. (2013). G9a, a multipotent regulator of gene expression. Epigenetics 8, 16–22. doi: 10.4161/epi.23331
Shibata, H., Komura, S., Yamada, Y., Sankoda, N., Tanaka, A., Ukai, T., et al. (2018). In vivo reprogramming drives Kras-induced cancer development. Nat. Commun. 9:2081. doi: 10.1038/s41467-018-04449-5
Shinkai, Y., and Tachibana, M. (2011). H3K9 methyltransferase G9a and the related molecule GLP. Genes Dev. 25, 781–788.
Simon, J. M., Parker, J. S., Liu, F., Rothbart, S. B., Ait-Si-Ali, S., Strahl, B. D., et al. (2015). A Role for Widely Interspaced Zinc Finger (WIZ) in Retention of the G9a Methyltransferase on Chromatin. J. Biol. Chem. 290, 26088–26102. doi: 10.1074/jbc.M115.654459
Sims, R. J., Nishioka, K., and Reinberg, D. (2003). Histone lysine methylation: a signature for chromatin function. Trends Genet. 19, 629–639. doi: 10.1016/j.tig.2003.09.007
Sturm, G., Finotello, F., Petitprez, F., Zhang, J. D., Baumbach, J., Fridman, W. H., et al. (2019). Comprehensive evaluation of transcriptome-based cell-type quantification methods for immuno-oncology. Bioinformatics 35, i436–i445. doi: 10.1093/bioinformatics/btz363
Tachibana, M., Nozaki, M., Takeda, N., and Shinkai, Y. (2007). Functional dynamics of H3K9 methylation during meiotic prophase progression. EMBO J. 26, 3346–3359. doi: 10.1038/sj.emboj.7601767
Tachibana, M., Sugimoto, K., Nozaki, M., Ueda, J., Ohta, T., Ohki, M., et al. (2002). G9a histone methyltransferase plays a dominant role in euchromatic histone H3 lysine 9 methylation and is essential for early embryogenesis. Genes Dev. 16, 1779–1791. doi: 10.1101/gad.989402
Takahashi, A., Imai, Y., Yamakoshi, K., Kuninaka, S., Ohtani, N., Yoshimoto, S., et al. (2012). DNA Damage Signaling Triggers Degradation of Histone Methyltransferases through APC/C-Cdh1 in Senescent Cells. Mol. Cell 45, 123–131. doi: 10.1016/j.molcel.2011.10.018
Taniguchi, K., and Karin, M. (2018). NF-κB, inflammation, immunity and cancer: coming of age. Nat. Rev. Immunol. 18, 309–324. doi: 10.1038/nri.2017.142
Thiery, J. P., Acloque, H., Huang, R. Y. J., and Nieto, M. A. (2009). Epithelial-Mesenchymal Transitions in Development and Disease. Cell 139, 871–890. doi: 10.1016/j.cell.2009.11.007
Ueda, J., Tachibana, M., Ikura, T., and Shinkai, Y. (2006). Zinc Finger Protein Wiz Links G9a/GLP Histone Methyltransferases to the Co-repressor Molecule CtBP. J. Biol. Chem. 281, 20120–20128. doi: 10.1074/jbc.M603087200
von Figura, G., Fukuda, A., Roy, N., Liku, M. E., Morris Iv, J. P., Kim, G. E., et al. (2014). The chromatin regulator Brg1 suppresses formation of intraductal papillary mucinous neoplasm and pancreatic ductal adenocarcinoma. Nat. Cell Biol. 16, 255–267. doi: 10.1038/ncb2916
Wang, L., Xu, S., Lee, J.-E., Baldridge, A., Grullon, S., Peng, W., et al. (2013). Histone H3K9 methyltransferase G9a represses PPARγ expression and adipogenesis. EMBO J. 32, 45–59. doi: 10.1038/emboj.2012.306
Wang, S. C., Nassour, I., Xiao, S., Zhang, S., Luo, X., Lee, J., et al. (2019). SWI/SNF component ARID1A restrains pancreatic neoplasia formation. Gut 68, 1259–1270. doi: 10.1136/gutjnl-2017-315490
Wang, W., Friedland, S. C., Guo, B., O’Dell, M. R., Alexander, W. B., Whitney-Miller, C. L., et al. (2019). ARID1A, a SWI/SNF subunit, is critical to acinar cell homeostasis and regeneration and is a barrier to transformation and epithelial-mesenchymal transition in the pancreas. Gut 68, 1245–1258. doi: 10.1136/gutjnl-2017-315541
Waters, A. M., and Der, C. J. (2018). KRAS: the Critical Driver and Therapeutic Target for Pancreatic Cancer. Cold Spring Harbor Perspect. Med. 8:a031435. doi: 10.1101/cshperspect.a031435
Wörmann, S. M., Diakopoulos, K. N., Lesina, M., and Algül, H. (2014). The immune network in pancreatic cancer development and progression. Oncogene 33, 2956–2967. doi: 10.1038/onc.2013.257
Yang, Q., Zhu, Q., Lu, X., Du, Y., Cao, L., Shen, C., et al. (2017). G9a coordinates with the RPA complex to promote DNA damage repair and cell survival. Proc. Natl. Acad. Sci. U. S. A. 114, E6054–E6063. doi: 10.1073/pnas.1700694114
Yuan, Y., Tang, A. J., Castoreno, A. B., Kuo, S. Y., Wang, Q., Kuballa, P., et al. (2013). Gossypol and an HMT G9a inhibitor act in synergy to induce cell death in pancreatic cancer cells. Cell Death Dis. 4:e690. doi: 10.1038/cddis.2013.191
Yuan, Y., Wang, Q., Paulk, J., Kubicek, S., Kemp, M., Adams, D., et al. (2012). A Small-Molecule Probe of the Histone Methyltransferase G9a Induces Cellular Senescence in Pancreatic Adenocarcinoma. ACS Chem. Biol. 7, 1152–1157. doi: 10.1021/cb300139y
Zhang, R.-H., Judson, R. N., Liu, D. Y., Kast, J., and Rossi, F. M. V. (2016). The lysine methyltransferase Ehmt2/G9a is dispensable for skeletal muscle development and regeneration. Skelet. Muscle 6, 22–22. doi: 10.1186/s13395-016-0093-7
Keywords: pancreatic carcinoma, epigenomics, histone methyltransferases, gene regulatory networks, tumor microenvironment
Citation: Urrutia G, de Assuncao TM, Mathison AJ, Salmonson A, Kerketta R, Zeighami A, Stodola TJ, Adsay V, Pehlivanoglu B, Dwinell MB, Zimmermann MT, Iovanna JL, Urrutia R and Lomberk G (2021) Inactivation of the Euchromatic Histone-Lysine N-Methyltransferase 2 Pathway in Pancreatic Epithelial Cells Antagonizes Cancer Initiation and Pancreatitis-Associated Promotion by Altering Growth and Immune Gene Expression Networks. Front. Cell Dev. Biol. 9:681153. doi: 10.3389/fcell.2021.681153
Received: 16 March 2021; Accepted: 27 April 2021;
Published: 23 June 2021.
Edited by:
Andrei V. Chernov, University of California, San Diego, United StatesReviewed by:
Jiajun Zhu, Memorial Sloan Kettering Cancer Center, United StatesSeth Frietze, University of Vermont Cancer Center, United States
Copyright © 2021 Urrutia, de Assuncao, Mathison, Salmonson, Kerketta, Zeighami, Stodola, Adsay, Pehlivanoglu, Dwinell, Zimmermann, Iovanna, Urrutia and Lomberk. This is an open-access article distributed under the terms of the Creative Commons Attribution License (CC BY). The use, distribution or reproduction in other forums is permitted, provided the original author(s) and the copyright owner(s) are credited and that the original publication in this journal is cited, in accordance with accepted academic practice. No use, distribution or reproduction is permitted which does not comply with these terms.
*Correspondence: Raul Urrutia, rurrutia@mcw.edu; Gwen Lomberk, glomberk@mcw.edu
†These authors have contributed equally to this work and share first authorship
‡These authors share senior authorship