Estimated zip code population in 2022: 38,883 Zip code population in 2010: 29,085 Zip code population in 2000: 16,065
Houses and condos: 17,223 Renter-occupied apartments: 5,825
% of renters here:
36%
State:
40%
March 2022 cost of living index in zip code 89012: 99.9 (near average, U.S. average is 100)
Land area: 11.0 sq. mi. Water area: 0.0 sq. mi.
Population density: 3,542 people per square mile
(average).
OSM Map
General Map
Google Map
MSN Map
OSM Map
General Map
Google Map
MSN Map
OSM Map
General Map
Google Map
MSN Map
OSM Map
General Map
Google Map
MSN Map
Please wait while loading the map...
Real estate property taxes paid for housing units in 2022:
This zip code:
0.5% ($2,378)
Nevada:
0.4% ($1,889)
Median real estate property taxes paid for housing units with mortgages in 2022: $2,387 (0.5%) Median real estate property taxes paid for housing units with no mortgage in 2022: $2,356 (0.5%)
Estimated median house/condo value in 2022: $512,499
89012:
$512,499
Nevada:
$434,700
According to our research of Nevada and other state lists, there were 28 registered sex offenders living in 89012 zip code as of April 27, 2024. The ratio of all residents to sex offenders in zip code 89012 is 1,145 to 1. The ratio of registered sex offenders to all residents in this zip code is much lower than the state average.
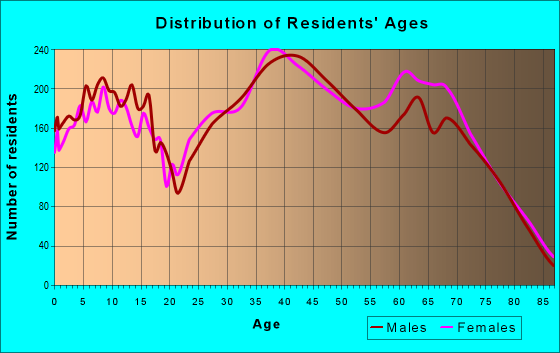
Median resident age:
This zip code:
45.8 years
Nevada median age:
39.0 years
Average household size:
This zip code:
2.4 people
Nevada:
2.6 people
Averages for the 2020 tax year for zip code 89012, filed in 2021:
Average Adjusted Gross Income (AGI) in 2020: $146,000 (Individual Income Tax Returns)
Here:
$146,000
State:
$78,964
Salary/wage: $87,057 (reported on 74.8% of returns)
Here:
$87,057
State:
$54,472
(% of AGI for various income ranges: 1058.3% for AGIs below $25k, 3261.0% for AGIs $25k-50k, 6010.5% for AGIs $50k-75k, 8486.4% for AGIs $75k-100k, 17372.2% for AGIs $100k-200k, 106389.8% for AGIs over 200k)
Taxable interest for individuals: $7,634 (reported on 35.7% of returns)
This zip code:
$7,634
Nevada:
$3,521
(% of AGI for various income ranges: 33.7% for AGIs below $25k, 44.1% for AGIs $25k-50k, 68.8% for AGIs $50k-75k, 72.7% for AGIs $75k-100k, 171.2% for AGIs $100k-200k, 8657.7% for AGIs over 200k)
Ordinary dividends: $14,677 (reported on 25.4% of returns)
Here:
$14,677
State:
$13,390
(% of AGI for various income ranges: 42.0% for AGIs below $25k, 56.0% for AGIs $25k-50k, 152.9% for AGIs $50k-75k, 229.8% for AGIs $75k-100k, 440.2% for AGIs $100k-200k, 10514.3% for AGIs over 200k)
Net capital gain/loss in AGI: +$109,205 (reported on 25.9% of returns)
Here:
+$109,205
State:
+$63,025
(% of AGI for various income ranges: 17.9% for AGIs below $25k, 53.0% for AGIs $25k-50k, 121.8% for AGIs $50k-75k, 279.4% for AGIs $75k-100k, 775.8% for AGIs $100k-200k, 101953.4% for AGIs over 200k)
Profit/loss from business: +$20,753 (reported on 18.1% of returns)
Here:
+$20,753
State:
+$11,500
(% of AGI for various income ranges: 116.9% for AGIs below $25k, 191.3% for AGIs $25k-50k, 235.2% for AGIs $50k-75k, 249.9% for AGIs $75k-100k, 783.5% for AGIs $100k-200k, 7697.9% for AGIs over 200k)
Taxable individual retirement arrangement distribution: $24,567 (reported on 11.5% of returns)
89012:
$24,567
Nevada:
$23,628
(% of AGI for various income ranges: 101.1% for AGIs below $25k, 159.1% for AGIs $25k-50k, 292.0% for AGIs $50k-75k, 380.2% for AGIs $75k-100k, 797.1% for AGIs $100k-200k, 3867.7% for AGIs over 200k)
Self-employed (Keogh) retirement plans: $28,145 (reported on 0.6% of returns)
89012:
$28,145
Nevada:
$26,634
(% of AGI for various income ranges: 30.2% for AGIs $100k-200k, 537.2% for AGIs over 200k)
Total itemized deductions: $75,481 (reported on 13.7% of returns)
Here:
$75,481
State:
$44,173
(% of AGI for various income ranges: 76.9% for AGIs below $25k, 182.2% for AGIs $25k-50k, 438.8% for AGIs $50k-75k, 657.9% for AGIs $75k-100k, 1283.7% for AGIs $100k-200k, 29050.4% for AGIs over 200k)
Charity contributions: $23,051 (reported on 11.5% of returns)
Here:
$23,051
State:
$12,589
(% of AGI for various income ranges: 4.6% for AGIs below $25k, 19.3% for AGIs $25k-50k, 65.8% for AGIs $50k-75k, 105.4% for AGIs $75k-100k, 259.4% for AGIs $100k-200k, 8263.0% for AGIs over 200k)
Taxes paid: $6,589 (reported on 13.6% of returns)
89012:
$6,589
State:
$6,112
(% of AGI for various income ranges: 11.7% for AGIs below $25k, 30.2% for AGIs $25k-50k, 70.9% for AGIs $50k-75k, 118.0% for AGIs $75k-100k, 248.5% for AGIs $100k-200k, 1572.1% for AGIs over 200k)
Earned income credit: $1,883 (reported on 8.8% of returns)
Here:
$1,883
State:
$2,214
(% of AGI for various income ranges: 57.6% for AGIs below $25k, 44.0% for AGIs $25k-50k, 0.7% for AGIs $50k-75k)
Percentage of individuals using paid preparers for their 2020 taxes: 93.4%
Here:
93%
State:
93%
(% for various income ranges: 92.6% for AGIs below $25k, 93.9% for AGIs $25k-50k, 93.1% for AGIs $50k-75k, 93.1% for AGIs $75k-100k, 93.6% for AGIs $100k-200k, 94.7% for AGIs over 200k)
Averages for the 2012 tax year for zip code 89012, filed in 2013:
Average Adjusted Gross Income (AGI) in 2012: $100,084 (Individual Income Tax Returns)
Here:
$100,084
State:
$61,164
Salary/wage: $65,131 (reported on 77.0% of returns)
Here:
$65,131
State:
$45,924
(% of AGI for various income ranges: 62.5% for AGIs below $25k, 69.6% for AGIs $25k-50k, 69.6% for AGIs $50k-75k, 70.9% for AGIs $75k-100k, 72.3% for AGIs $100k-200k, 27.1% for AGIs over 200k)
Taxable interest for individuals: $3,451 (reported on 39.1% of returns)
This zip code:
$3,451
Nevada:
$3,137
(% of AGI for various income ranges: 2.0% for AGIs below $25k, 1.1% for AGIs $25k-50k, 1.0% for AGIs $50k-75k, 0.7% for AGIs $75k-100k, 0.8% for AGIs $100k-200k, 1.8% for AGIs over 200k)
Ordinary dividends: $10,436 (reported on 24.6% of returns)
Here:
$10,436
State:
$11,762
(% of AGI for various income ranges: 3.8% for AGIs below $25k, 1.8% for AGIs $25k-50k, 1.3% for AGIs $50k-75k, 1.6% for AGIs $75k-100k, 1.6% for AGIs $100k-200k, 3.5% for AGIs over 200k)
Net capital gain/loss in AGI: +$18,948 (reported on 22.1% of returns)
Here:
+$18,948
State:
+$33,127
(% of AGI for various income ranges: 0.2% for AGIs $25k-50k, 0.2% for AGIs $50k-75k, 0.5% for AGIs $75k-100k, 1.2% for AGIs $100k-200k, 8.2% for AGIs over 200k)
Profit/loss from business: +$16,540 (reported on 15.3% of returns)
Here:
+$16,540
State:
+$12,567
(% of AGI for various income ranges: 8.3% for AGIs below $25k, 3.3% for AGIs $25k-50k, 2.1% for AGIs $50k-75k, 1.5% for AGIs $75k-100k, 2.8% for AGIs $100k-200k, 2.2% for AGIs over 200k)
Taxable individual retirement arrangement distribution: $18,289 (reported on 14.1% of returns)
89012:
$18,289
Nevada:
$20,808
(% of AGI for various income ranges: 6.0% for AGIs below $25k, 3.4% for AGIs $25k-50k, 3.5% for AGIs $50k-75k, 3.5% for AGIs $75k-100k, 3.4% for AGIs $100k-200k, 1.4% for AGIs over 200k)
Self-employment retirement plans: $30,300 (reported on 0.5% of returns)
89012:
$30,300
Nevada:
$22,197
(% of AGI for various income ranges: 0.2% for AGIs $25k-50k, 0.1% for AGIs $100k-200k, 0.2% for AGIs over 200k)
Total itemized deductions: $33,160 (18% of AGI, reported on 40.2% of returns)
Here:
$33,160
State:
$26,148
Here:
18.1% of AGI
State:
20.0% of AGI
(% of AGI for various income ranges: 15.4% for AGIs below $25k, 12.2% for AGIs $25k-50k, 13.8% for AGIs $50k-75k, 14.0% for AGIs $75k-100k, 14.9% for AGIs $100k-200k, 12.4% for AGIs over 200k)
Charity contributions: $5,185 (reported on 34.7% of returns)
Here:
$5,185
State:
$4,329
(% of AGI for various income ranges: 1.1% for AGIs below $25k, 1.2% for AGIs $25k-50k, 1.6% for AGIs $50k-75k, 1.7% for AGIs $75k-100k, 1.9% for AGIs $100k-200k, 2.0% for AGIs over 200k)
Taxes paid: $5,965 (reported on 39.7% of returns)
89012:
$5,965
State:
$5,116
(% of AGI for various income ranges: 2.5% for AGIs below $25k, 2.2% for AGIs $25k-50k, 2.5% for AGIs $50k-75k, 2.5% for AGIs $75k-100k, 2.9% for AGIs $100k-200k, 2.1% for AGIs over 200k)
Earned income credit: $1,804 (reported on 9.1% of returns)
Here:
$1,804
State:
$2,279
(% of AGI for various income ranges: 3.4% for AGIs below $25k, 0.5% for AGIs $25k-50k)
Percentage of individuals using paid preparers for their 2012 taxes: 53.3%
Here:
53%
State:
55%
(% for various income ranges: 45.8% for AGIs below $25k, 50.0% for AGIs $25k-50k, 53.2% for AGIs $50k-75k, 54.0% for AGIs $75k-100k, 61.4% for AGIs $100k-200k, 80.8% for AGIs over 200k)
Averages for the 2004 tax year for zip code 89012, filed in 2005:
Average Adjusted Gross Income (AGI) in 2004: $82,063 (Individual Income Tax Returns)
Here:
$82,063
State:
$58,367
Salary/wage: $58,030 (reported on 79.6% of returns)
Here:
$58,030
State:
$42,695
(% of AGI for various income ranges: 205.9% for AGIs below $10k, 66.2% for AGIs $10k-25k, 73.0% for AGIs $25k-50k, 73.0% for AGIs $50k-75k, 75.0% for AGIs $75k-100k, 44.5% for AGIs over 100k)
Taxable interest for individuals: $3,538 (reported on 50.7% of returns)
This zip code:
$3,538
Nevada:
$3,867
(% of AGI for various income ranges: 18.1% for AGIs below $10k, 3.7% for AGIs $10k-25k, 2.1% for AGIs $25k-50k, 1.6% for AGIs $50k-75k, 1.6% for AGIs $75k-100k, 2.3% for AGIs over 100k)
Taxable dividends: $4,147 (reported on 28.3% of returns)
Here:
$4,147
State:
$5,770
(% of AGI for various income ranges: 15.1% for AGIs below $10k, 2.3% for AGIs $10k-25k, 1.2% for AGIs $25k-50k, 1.2% for AGIs $50k-75k, 0.9% for AGIs $75k-100k, 1.5% for AGIs over 100k)
Net capital gain/loss: +$44,704 (reported on 26.8% of returns)
Here:
+$44,704
State:
+$50,644
(% of AGI for various income ranges: 9.3% for AGIs below $10k, 0.2% for AGIs $10k-25k, 0.6% for AGIs $25k-50k, 1.6% for AGIs $50k-75k, 1.2% for AGIs $75k-100k, 23.7% for AGIs over 100k)
Profit/loss from business: +$15,524 (reported on 15.3% of returns)
Here:
+$15,524
State:
+$13,618
(% of AGI for various income ranges: 10.7% for AGIs below $10k, 5.0% for AGIs $10k-25k, 3.0% for AGIs $25k-50k, 2.3% for AGIs $50k-75k, 2.2% for AGIs $75k-100k, 3.0% for AGIs over 100k)
IRA payment deduction: $3,453 (reported on 3.0% of returns)
89012:
$3,453
Nevada:
$3,054
(% of AGI for various income ranges: 1.0% for AGIs below $10k, 0.3% for AGIs $10k-25k, 0.3% for AGIs $25k-50k, 0.2% for AGIs $50k-75k, 0.2% for AGIs $75k-100k, 0.1% for AGIs over 100k)
Self-employed pension: $13,555 (reported on 0.9% of returns)
Here:
$13,555
Nevada:
$16,706
(% of AGI for various income ranges: 0.2% for AGIs $10k-25k, 0.1% for AGIs $50k-75k, 0.0% for AGIs $75k-100k, 0.2% for AGIs over 100k)
Total itemized deductions: $25,450 (21% of AGI, reported on 50.8% of returns)
Here:
$25,450
State:
$22,990
Here:
20.9% of AGI
State:
21.8% of AGI
(% of AGI for various income ranges: 67.8% for AGIs below $10k, 17.9% for AGIs $10k-25k, 18.5% for AGIs $25k-50k, 20.8% for AGIs $50k-75k, 22.0% for AGIs $75k-100k, 12.5% for AGIs over 100k)
Charity contributions deductions: $3,310 (3% of AGI, reported on 45.8% of returns)
Here:
$3,310
State:
$3,443
Here:
2.7% of AGI
State:
3.1% of AGI
(% of AGI for various income ranges: 3.2% for AGIs below $10k, 1.3% for AGIs $10k-25k, 1.7% for AGIs $25k-50k, 2.1% for AGIs $50k-75k, 2.2% for AGIs $75k-100k, 1.8% for AGIs over 100k)
Total tax: $14,994 (reported on 84.2% of returns)
89012:
$14,994
State:
$10,585
(% of AGI for various income ranges: 7.1% for AGIs below $10k, 4.5% for AGIs $10k-25k, 7.4% for AGIs $25k-50k, 9.3% for AGIs $50k-75k, 10.3% for AGIs $75k-100k, 19.9% for AGIs over 100k)
Earned income credit: $1,387 (reported on 6.3% of returns)
Here:
$1,387
State:
$1,676
Percentage of individuals using paid preparers for their 2004 taxes: 57.0%
Here:
57%
State:
60%
(% for various income ranges: 47.3% for AGIs below $10k, 53.9% for AGIs $10k-25k, 54.1% for AGIs $25k-50k, 57.4% for AGIs $50k-75k, 59.2% for AGIs $75k-100k, 69.8% for AGIs over 100k)
Likely homosexual households (counted as self-reported same-sex unmarried-partner households)
Lesbian couples: 0.4% of all households
Gay men: 0.4% of all households
Household received Food Stamps/SNAP in the past 12 months: 871 Household did not receive Food Stamps/SNAP in the past 12 months: 15,240
Women who had a birth in the past 12 months: 441 (339 now married, 110 unmarried) Women who did not have a birth in the past 12 months: 8,145 (3,606 now married, 4,526 unmarried)
Housing units in zip code 89012 with a mortgage: 7,308 (600 second mortgage, 599 both second mortgage and home equity loan) Houses without a mortgage: 115
Median monthly owner costs for units with a mortgage: $1,914 Median monthly owner costs for units without a mortgage: $503
Residents with income below the poverty level in 2022:
This zip code:
7.0%
Whole state:
12.5%
Residents with income below 50% of the poverty level in 2022:
This zip code:
3.4%
Whole state:
5.9%
Median number of rooms in houses and condos:
Here:
6.1
State:
6.0
Median number of rooms in apartments:
Here:
4.3
State:
4.2
Notable locations in this zip code not listed on our city pages
Notable locations in zip code 89012: Paseo Library (A), Henderson Fire Department Station 97 (B), Henderson Police North and West Patrol Command (C), Desert Willow Community Center (D). Display/hide their locations on the map
5,489 married couples with children.
1,407 single-parent households (623 men, 784 women).
82.4% of residents of 89012 zip code speak English at home.
7.5% of residents speak Spanish at home (84% very well, 14% well, 3% not well).
4.1% of residents speak other Indo-European language at home (87% very well, 12% well, 1% not well).
5.7% of residents speak Asian or Pacific Island language at home (81% very well, 13% well, 6% not well).
0.5% of residents speak other language at home (91% very well, 9% well).
Foreign born population: 5,109 (13.1%) (70.6% of them are naturalized citizens)
Facilities with environmental interests located in this zip code:
DELL WEBB COMMUNITIES (11500 EASTERN AVE in HENDERSON, NV)
AIR MINOR (AIRS/AFS) (Integrated Compliance Information System) - ICIS-09-2000-0169, FORMAL ENFORCEMENT ACTION Business SIC classification: GENERAL CONTRACTORS-SINGLE-FAMILY HOUSES; NONCLASSIFIABLE ESTABLISHMENTS Alternative names: DEL WEBB COMMUNITIES
LAMPING, FRANK ELEM (2551 SUMMIT GROVE DR. in HENDERSON, NV)
(National Center for Education Statistics) - STATE ID-02-166 Organizations: CLARK CO SCH DIST (SCHOOL DISTRICT)
TWITCHEL, NEIL ELEM (2060 DESERT SHADOW TRAIL in HENDERSON, NV)
(National Center for Education Statistics) - STATE ID-02-176 Organizations: CLARK CO SCH DIST (SCHOOL DISTRICT)
NVANG HENDERSON ARMORY (PACIFIC AVENUE AND BLACK MOUNTAIN ROAD in HENDERSON, NV) . Federal Facility. U.S. ARMY
(Resource Conservation and Recovery Act (tracking hazardous waste)) Organizations: STATE OF NEVADA (CONTACT/OWNER)
RALEYS 131 (55 SOUTH VALLE VERDE DRIVE in HENDERSON, NV)
(Resource Conservation and Recovery Act (tracking hazardous waste)) Organizations: RALEYS NO 131 (CONTACT/OPERATOR)
Alternative names: RALEYS NO 131
SMITHS PHOTO LAB NO 346 (10616 S EASTERN AVE in HENDERSON, NV)
(Resource Conservation and Recovery Act (tracking hazardous waste)) Organizations: SMITHS FOOD AND DRUG CENTER INC (CONTACT/OWNER)
VILLAGE EAST CLEANERS (1760 W HORIZON RIDGE in HENDERSON, NV)
Small Quantity Generators, between 100 kg and 1000 kg of hazardous waste/month (Resource Conservation and Recovery Act (tracking hazardous waste)) Organizations: ZIARKOWSKI PROPERTIES LLC (CONTACT/OWNER)
FOOTHILLS CLEANERS (1450 W HORIZON RIDGE PKWY in HENDERSON, NV)
Small Quantity Generators, between 100 kg and 1000 kg of hazardous waste/month (Resource Conservation and Recovery Act (tracking hazardous waste)) - notification
LEVI STRAUSS AND CO (501 EXECUTIVE AIRPORT DR in HENDERSON, NV)
Conditionally Exempt Small Quantity Generators, less than 100 kg/month of hazardous waste (Resource Conservation and Recovery Act (tracking hazardous waste)) - notification
Housing units lacking complete plumbing facilities: 0.3% Housing units lacking complete kitchen facilities: 0.3%
76.4%Utility gas
21.2%Electricity
1.3%Solar energy
0.6%Bottled, tank, or LP gas
Place of birth for U.S.-born residents:
This state: 7,574
Northeast: 4,426
Midwest: 6,324
South: 3,831
West: 10,576
5% of the 89012 zip code residents lived in the same house 5 years ago. Out of people who lived in different houses, 37% lived in this county. Out of people who lived in different counties, 50% lived in Nevada.
85% of the 89012 zip code residents lived in the same house 1 year ago. Out of people who lived in different houses, 50% moved from this county. Out of people who lived in different houses, 2% moved from different county within same state. Out of people who lived in different houses, 46% moved from different state. Out of people who lived in different houses, 3% moved from abroad.
Private vs. public school enrollment:
Students in private schools in grades 1 to 8 (elementary and middle school): 718
Here:
18.2%
Nevada:
12.9%
Students in private schools in grades 9 to 12 (high school): 154
Here:
8.8%
Nevada:
6.9%
Students in private undergraduate colleges: 285
Here:
15.6%
Nevada:
16.0%
Occupation by median earnings in the past 12 months ($)
165,452Law enforcement workers including supervisors
132,414Legal occupations
108,883Computer and mathematical occupations
98,666Management occupations
88,674Health diagnosing and treating practitioners and other technical occupations
81,188Life, physical, and social science occupations
Companies with federal contracts located in this zip code:
OMEGA GROUP (1550 W HORIZION RIDGE PKWY in HENDERSON, NV; small business) : $1,082,786 in 4 contractsin 2005
$524,000 with Navy for Hospital Buildings. Taking place in CA. Signed on 2005-09-28. Completion date: 2006-09-30.
$440,000, same as above.Signed on 2005-09-28. Completion date: 2006-09-30.
$59,684 with Navy for Other Professional Services. Taking place in MS. Signed on 2005-07-11. Completion date: 2006-02-10.
$59,102 with Navy for Other Professional Services. Taking place in TX. Signed on 2005-07-29. Completion date: 2006-03-31.
Top industries in this zip code by the number of employees in 2005:
2002 - 2018 National Fire Incident Reporting System (NFIRS) incidents
Based on the data from the years 2002 - 2018 the average number of fires per year is 31. The highest number of reported fires - 50 took place in 2006, and the least - 6 in 2003. The data has a growing trend.
When looking into fire subcategories, the most incidents belonged to: Outside Fires (42.4%), and Structure Fires (28.7%).
Fire incident types reported to NFIRS in Zip Code 89012


 Nearest zip codes: 89074, 89014, 89052, 89002, 89120, 89122.


 Based on the data from the years 2002 - 2018 the average number of fires per year is 31. The highest number of reported fires - 50 took place in 2006, and the least - 6 in 2003. The data has a growing trend.
 When looking into fire subcategories, the most incidents belonged to: Outside Fires (42.4%), and Structure Fires (28.7%).