Estimated zip code population in 2022: 2,878 Zip code population in 2010: 3,291 Zip code population in 2000: 2,967
Houses and condos: 1,053 Renter-occupied apartments: 107
% of renters here:
12%
State:
46%
March 2022 cost of living index in zip code 10958: 117.6 (more than average, U.S. average is 100)
Land area: 22.9 sq. mi. Water area: 0.1 sq. mi.
Population density: 126 people per square mile
(very low).
OSM Map
General Map
Google Map
MSN Map
OSM Map
General Map
Google Map
MSN Map
OSM Map
General Map
Google Map
MSN Map
OSM Map
General Map
Google Map
MSN Map
Please wait while loading the map...
Real estate property taxes paid for housing units in 2022:
This zip code:
2.0% ($6,918)
New York:
1.5% ($6,180)
Median real estate property taxes paid for housing units with mortgages in 2022: $6,798 (2.0%) Median real estate property taxes paid for housing units with no mortgage in 2022: $7,483 (2.0%)
Estimated median house/condo value in 2022: $347,027
10958:
$347,027
New York:
$400,400
According to our research of New York and other state lists, there were 4 registered sex offenders living in 10958 zip code as of May 02, 2024. The ratio of all residents to sex offenders in zip code 10958 is 791 to 1. The ratio of registered sex offenders to all residents in this zip code is near the state average.
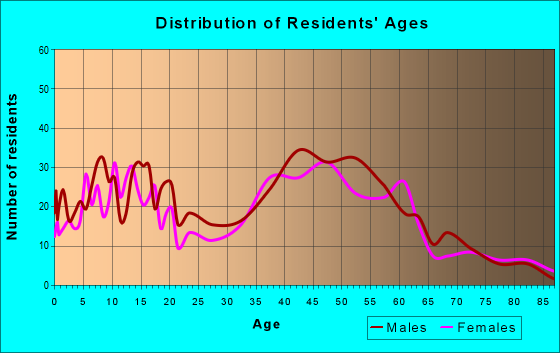
Median resident age:
This zip code:
41.9 years
New York median age:
40.0 years
Average household size:
This zip code:
2.6 people
New York:
2.5 people
Averages for the 2020 tax year for zip code 10958, filed in 2021:
Average Adjusted Gross Income (AGI) in 2020: $79,798 (Individual Income Tax Returns)
Here:
$79,798
State:
$90,930
Salary/wage: $69,710 (reported on 81.7% of returns)
Here:
$69,710
State:
$72,104
(% of AGI for various income ranges: 1148.1% for AGIs below $25k, 3706.8% for AGIs $25k-50k, 6756.2% for AGIs $50k-75k, 10239.1% for AGIs $75k-100k, 19066.3% for AGIs $100k-200k, 59642.5% for AGIs over 200k)
Taxable interest for individuals: $1,199 (reported on 40.9% of returns)
This zip code:
$1,199
New York:
$3,075
(% of AGI for various income ranges: 17.0% for AGIs below $25k, 31.8% for AGIs $25k-50k, 72.5% for AGIs $50k-75k, 72.7% for AGIs $75k-100k, 87.9% for AGIs $100k-200k, 810.0% for AGIs over 200k)
Ordinary dividends: $2,497 (reported on 23.8% of returns)
Here:
$2,497
State:
$11,095
(% of AGI for various income ranges: 21.1% for AGIs below $25k, 70.0% for AGIs $25k-50k, 73.8% for AGIs $50k-75k, 54.5% for AGIs $75k-100k, 187.4% for AGIs $100k-200k, 572.5% for AGIs over 200k)
Net capital gain/loss in AGI: +$8,997 (reported on 18.9% of returns)
Here:
+$8,997
State:
+$44,925
(% of AGI for various income ranges: 12.6% for AGIs below $25k, 27.3% for AGIs $25k-50k, 63.1% for AGIs $50k-75k, 31.8% for AGIs $75k-100k, 487.9% for AGIs $100k-200k, 4080.0% for AGIs over 200k)
Profit/loss from business: +$11,940 (reported on 12.2% of returns)
Here:
+$11,940
State:
+$14,940
(% of AGI for various income ranges: 114.1% for AGIs below $25k, 186.4% for AGIs $25k-50k, 123.8% for AGIs $50k-75k, 87.3% for AGIs $75k-100k, 522.6% for AGIs $100k-200k, 957.5% for AGIs over 200k)
Taxable individual retirement arrangement distribution: $14,391 (reported on 6.7% of returns)
10958:
$14,391
New York:
$19,609
(% of AGI for various income ranges: 88.6% for AGIs $25k-50k, 227.5% for AGIs $50k-75k, 538.9% for AGIs $100k-200k)
Total itemized deductions: $27,263 (reported on 11.6% of returns)
Here:
$27,263
State:
$39,326
(% of AGI for various income ranges: 522.5% for AGIs $50k-75k, 733.6% for AGIs $75k-100k, 1059.5% for AGIs $100k-200k, 3810.0% for AGIs over 200k)
Charity contributions: $7,225 (reported on 9.8% of returns)
Here:
$7,225
State:
$15,420
(% of AGI for various income ranges: 63.1% for AGIs $50k-75k, 91.8% for AGIs $75k-100k, 180.5% for AGIs $100k-200k, 1527.5% for AGIs over 200k)
Taxes paid: $9,137 (reported on 11.6% of returns)
10958:
$9,137
State:
$9,183
(% of AGI for various income ranges: 175.6% for AGIs $50k-75k, 315.5% for AGIs $75k-100k, 369.5% for AGIs $100k-200k, 1015.0% for AGIs over 200k)
Earned income credit: $1,633 (reported on 9.1% of returns)
Here:
$1,633
State:
$2,138
(% of AGI for various income ranges: 44.4% for AGIs below $25k, 56.8% for AGIs $25k-50k)
Percentage of individuals using paid preparers for their 2020 taxes: 93.3%
Here:
93%
State:
95%
(% for various income ranges: 90.9% for AGIs below $25k, 93.5% for AGIs $25k-50k, 95.8% for AGIs $50k-75k, 94.1% for AGIs $75k-100k, 94.4% for AGIs $100k-200k, 91.7% for AGIs over 200k)
Averages for the 2012 tax year for zip code 10958, filed in 2013:
Average Adjusted Gross Income (AGI) in 2012: $65,382 (Individual Income Tax Returns)
Here:
$65,382
State:
$77,088
Salary/wage: $60,799 (reported on 83.8% of returns)
Here:
$60,799
State:
$60,593
(% of AGI for various income ranges: 72.0% for AGIs below $25k, 76.3% for AGIs $25k-50k, 70.3% for AGIs $50k-75k, 82.7% for AGIs $75k-100k, 83.8% for AGIs $100k-200k, 67.6% for AGIs over 200k)
Taxable interest for individuals: $832 (reported on 45.6% of returns)
This zip code:
$832
New York:
$3,125
(% of AGI for various income ranges: 2.2% for AGIs below $25k, 1.3% for AGIs $25k-50k, 0.7% for AGIs $50k-75k, 0.4% for AGIs $75k-100k, 0.3% for AGIs $100k-200k, 0.4% for AGIs over 200k)
Ordinary dividends: $2,118 (reported on 24.4% of returns)
Here:
$2,118
State:
$10,299
(% of AGI for various income ranges: 2.1% for AGIs below $25k, 1.6% for AGIs $25k-50k, 0.7% for AGIs $50k-75k, 0.8% for AGIs $75k-100k, 0.5% for AGIs $100k-200k, 0.8% for AGIs over 200k)
Net capital gain/loss in AGI: +$2,027 (reported on 13.8% of returns)
Here:
+$2,027
State:
+$42,474
(% of AGI for various income ranges: 0.4% for AGIs $75k-100k, 0.3% for AGIs $100k-200k, 1.6% for AGIs over 200k)
Profit/loss from business: +$13,495 (reported on 13.8% of returns)
Here:
+$13,495
State:
+$16,168
(% of AGI for various income ranges: 5.1% for AGIs below $25k, 3.5% for AGIs $25k-50k, 2.6% for AGIs $50k-75k, 1.4% for AGIs $75k-100k, 4.0% for AGIs $100k-200k)
Taxable individual retirement arrangement distribution: $9,967 (reported on 7.5% of returns)
10958:
$9,967
New York:
$17,621
(% of AGI for various income ranges: 4.0% for AGIs below $25k, 3.0% for AGIs $50k-75k, 1.3% for AGIs $100k-200k)
Total itemized deductions: $24,742 (23% of AGI, reported on 46.2% of returns)
Here:
$24,742
State:
$34,985
Here:
23.1% of AGI
State:
21.3% of AGI
(% of AGI for various income ranges: 13.5% for AGIs below $25k, 13.2% for AGIs $25k-50k, 17.1% for AGIs $50k-75k, 17.9% for AGIs $75k-100k, 20.0% for AGIs $100k-200k, 15.3% for AGIs over 200k)
Charity contributions: $2,165 (reported on 39.4% of returns)
Here:
$2,165
State:
$5,572
(% of AGI for various income ranges: 0.6% for AGIs below $25k, 0.5% for AGIs $25k-50k, 1.4% for AGIs $50k-75k, 1.5% for AGIs $75k-100k, 1.5% for AGIs $100k-200k, 1.4% for AGIs over 200k)
Taxes paid: $12,089 (reported on 46.2% of returns)
10958:
$12,089
State:
$18,656
(% of AGI for various income ranges: 4.7% for AGIs below $25k, 5.2% for AGIs $25k-50k, 7.6% for AGIs $50k-75k, 8.5% for AGIs $75k-100k, 10.1% for AGIs $100k-200k, 9.1% for AGIs over 200k)
Earned income credit: $2,031 (reported on 10.0% of returns)
Here:
$2,031
State:
$2,230
(% of AGI for various income ranges: 4.0% for AGIs below $25k, 0.7% for AGIs $25k-50k)
Percentage of individuals using paid preparers for their 2012 taxes: 69.4%
Here:
69%
State:
66%
(% for various income ranges: 60.0% for AGIs below $25k, 67.9% for AGIs $25k-50k, 72.7% for AGIs $50k-75k, 72.2% for AGIs $75k-100k, 80.6% for AGIs $100k-200k, 83.3% for AGIs over 200k)
Averages for the 2004 tax year for zip code 10958, filed in 2005:
Average Adjusted Gross Income (AGI) in 2004: $52,323 (Individual Income Tax Returns)
Here:
$52,323
State:
$59,519
Salary/wage: $51,136 (reported on 85.5% of returns)
Here:
$51,136
State:
$50,673
(% of AGI for various income ranges: 111.3% for AGIs below $10k, 69.8% for AGIs $10k-25k, 82.8% for AGIs $25k-50k, 86.8% for AGIs $50k-75k, 87.5% for AGIs $75k-100k, 81.6% for AGIs over 100k)
Taxable interest for individuals: $888 (reported on 58.0% of returns)
This zip code:
$888
New York:
$2,377
(% of AGI for various income ranges: 9.0% for AGIs below $10k, 3.8% for AGIs $10k-25k, 1.3% for AGIs $25k-50k, 0.9% for AGIs $50k-75k, 0.4% for AGIs $75k-100k, 0.6% for AGIs over 100k)
Taxable dividends: $1,265 (reported on 28.5% of returns)
Here:
$1,265
State:
$5,394
(% of AGI for various income ranges: 6.6% for AGIs below $10k, 2.2% for AGIs $10k-25k, 1.0% for AGIs $25k-50k, 0.6% for AGIs $50k-75k, 0.2% for AGIs $75k-100k, 0.5% for AGIs over 100k)
Net capital gain/loss: +$4,861 (reported on 19.1% of returns)
Here:
+$4,861
State:
+$23,581
(% of AGI for various income ranges: -4.5% for AGIs below $10k, 0.6% for AGIs $10k-25k, -0.3% for AGIs $25k-50k, -0.3% for AGIs $50k-75k, 0.0% for AGIs $75k-100k, 4.8% for AGIs over 100k)
Profit/loss from business: +$8,939 (reported on 14.0% of returns)
Here:
+$8,939
State:
+$13,809
(% of AGI for various income ranges: 6.2% for AGIs below $10k, 7.7% for AGIs $10k-25k, 3.2% for AGIs $25k-50k, -0.0% for AGIs $50k-75k, 1.6% for AGIs $75k-100k, 2.8% for AGIs over 100k)
IRA payment deduction: $2,864 (reported on 2.9% of returns)
10958:
$2,864
New York:
$3,115
Self-employed pension: $12,800 (reported on 0.7% of returns)
Here:
$12,800
New York:
$19,016
Total itemized deductions: $23,660 (28% of AGI, reported on 47.7% of returns)
Here:
$23,660
State:
$25,864
Here:
28.1% of AGI
State:
21.9% of AGI
(% of AGI for various income ranges: 15.4% for AGIs below $10k, 15.1% for AGIs $10k-25k, 15.2% for AGIs $25k-50k, 19.8% for AGIs $50k-75k, 31.6% for AGIs $75k-100k, 21.2% for AGIs over 100k)
Charity contributions deductions: $2,397 (3% of AGI, reported on 43.9% of returns)
Here:
$2,397
State:
$4,439
Here:
2.8% of AGI
State:
3.6% of AGI
(% of AGI for various income ranges: 1.1% for AGIs $10k-25k, 1.6% for AGIs $25k-50k, 2.0% for AGIs $50k-75k, 2.7% for AGIs $75k-100k, 2.0% for AGIs over 100k)
Total tax: $6,616 (reported on 79.7% of returns)
10958:
$6,616
State:
$11,730
(% of AGI for various income ranges: 3.7% for AGIs below $10k, 5.2% for AGIs $10k-25k, 7.0% for AGIs $25k-50k, 8.0% for AGIs $50k-75k, 8.5% for AGIs $75k-100k, 14.0% for AGIs over 100k)
Earned income credit: $1,572 (reported on 9.6% of returns)
Here:
$1,572
State:
$1,757
Percentage of individuals using paid preparers for their 2004 taxes: 71.5%
Here:
71%
State:
67%
(% for various income ranges: 66.2% for AGIs below $10k, 67.7% for AGIs $10k-25k, 71.6% for AGIs $25k-50k, 68.5% for AGIs $50k-75k, 78.7% for AGIs $75k-100k, 79.8% for AGIs over 100k)
Notable locations in zip code 10958: F F Farms (A), Orange County Recycling Center (B), Soons Orchards (C), Turtle Bay Farms (D), Orange County Fire Training Center (E), New Hampton Fire Department (F). Display/hide their locations on the map
In group quarters: 436 (-1 institutionalized population)
Size of family households: 264 2-persons, 141 3-persons, 179 4-persons, 39 5-persons, 38 6-persons, 30 7-or-more-persons
Size of nonfamily households: 167 1-person, 63 2-persons
237 married couples with children.
255 single-parent households (179 men, 76 women).
89.0% of residents of 10958 zip code speak English at home.
8.5% of residents speak Spanish at home (43% very well, 37% well, 20% not well).
1.2% of residents speak other Indo-European language at home (82% very well, 18% well).
0.3% of residents speak Asian or Pacific Island language at home (100% well).
0.2% of residents speak other language at home (100% very well).
Foreign born population: 268 (9.3%) (34.6% of them are naturalized citizens)
This zip code:
9.3%
Whole state:
22.7%
25%Honduras
22%Haiti
22%Sweden
21%United Kingdom, excluding England and Scotland
4%El Salvador
4%Ireland
4%Dominica
21%American
9%Irish
9%Italian
7%English
5%Polish
5%Jamaican
2%Haitian
Year of entry for the foreign-born population
742010 or later
692000 to 2009
671990 to 1999
74Before 1990
Facilities with environmental interests located in this zip code:
AL SCALA DODGE (RTE 17M in NEW HAMPTON, NY)
(Resource Conservation and Recovery Act (tracking hazardous waste))
AL SCALA NISSAN INC (RTE 17M BOX 399 in NEW HAMPTON, NY)
(Resource Conservation and Recovery Act (tracking hazardous waste))
GOLZ ENTERPRISES INC (RD 1 BOX 673 in NEW HAMPTON, NY)
TRANSPORTER (Resource Conservation and Recovery Act (tracking hazardous waste)) - notification Organizations: MAC KINNON RODERICK (CONTACT/OWNER)
Housing units lacking complete plumbing facilities: 0.7% Housing units lacking complete kitchen facilities: 0.3%
54.6%Fuel oil, kerosene, etc.
26.7%Utility gas
9.8%Bottled, tank, or LP gas
6.0%Electricity
2.0%Wood
1.1%Other fuel
Population in 1990: 3,918.
Place of birth for U.S.-born residents:
This state: 2,289
Northeast: 169
Midwest: 25
South: 55
West: 46
63% of the 10958 zip code residents lived in the same house 5 years ago. Out of people who lived in different houses, 60% lived in this county. Out of people who lived in different counties, 50% lived in New York.
95% of the 10958 zip code residents lived in the same house 1 year ago. Out of people who lived in different houses, 52% moved from this county. Out of people who lived in different houses, 40% moved from different county within same state. Out of people who lived in different houses, 5% moved from different state.
Private vs. public school enrollment:
Students in private schools in grades 1 to 8 (elementary and middle school): 23
Here:
10.3%
New York:
15.6%
Students in private schools in grades 9 to 12 (high school): 77
Here:
26.5%
New York:
15.0%
Students in private undergraduate colleges: 39
Here:
28.8%
New York:
39.2%
Occupation by median earnings in the past 12 months ($)
138,516Business and financial operations occupations
102,162Fire fighting and prevention, and other protective service workers including supervisors
86,793Education, training, and library occupations
82,938Installation, maintenance, and repair occupations
78,257Law enforcement workers including supervisors
74,374Management occupations
Top industries in this zip code by the number of employees in 2005:
Health Care and Social Assistance: Psychiatric and Substance Abuse Hospitals (over 1000 employees: 1 establishment)
Construction: New Single-Family Housing Construction (except Operative Builders) (5-9: 1, 1-4: 5)
Real Estate and Rental and Leasing: Offices of Real Estate Agents and Brokers (10-19: 1, 1-4: 1)
Accommodation and Food Services: Hotels (except Casino Hotels) and Motels (10-19: 1, 1-4: 1)
Health Care and Social Assistance: Offices of Dentists (10-19: 1, 1-4: 1)
Health Care and Social Assistance: Residential Mental Retardation Facilities (10-19: 1)
People in group quarters in 2010:
270 people in mental (psychiatric) hospitals and psychiatric units in other hospitals
6 people in group homes intended for adults
People in group quarters in 2000:
283 people in mental (psychiatric) hospitals or wards
4 people in agriculture workers' dormitories on farms
3 people in other noninstitutional group quarters
Fatal accident statistics in 2014:
Fatal accident count: 1
Vehicles involved in fatal accidents: 1
Fatal accidents caused by drunken drivers: 0
Fatalities: 1
Persons involved in fatal accidents: 1
Pedestrians involved in fatal accidents: 0
Fatal accident statistics in 2012:
Fatal accident count: 1
Vehicles involved in fatal accidents: 2
Fatal accidents caused by drunken drivers: 0
Fatalities: 1
Persons involved in fatal accidents: 3
Pedestrians involved in fatal accidents: 0
Home Mortgage Disclosure Act Aggregated Statistics For Year 2009 (Based on 4 partial tracts)
A) FHA, FSA/RHS & VA Home Purchase Loans
B) Conventional Home Purchase Loans
C) Refinancings
D) Home Improvement Loans
F) Non-occupant Loans on < 5 Family Dwellings (A B C & D)
Number
Average Value
Number
Average Value
Number
Average Value
Number
Average Value
Number
Average Value
LOANS ORIGINATED
19
$269,065
38
$248,855
85
$217,514
6
$143,922
3
$178,660
APPLICATIONS APPROVED, NOT ACCEPTED
2
$284,900
6
$322,738
16
$215,618
2
$14,765
1
$224,410
APPLICATIONS DENIED
6
$210,240
7
$230,784
59
$282,252
13
$100,995
2
$165,035
APPLICATIONS WITHDRAWN
3
$240,023
4
$343,392
31
$259,821
2
$216,785
0
$0
FILES CLOSED FOR INCOMPLETENESS
0
$0
1
$240,600
8
$252,644
0
$0
0
$0
Aggregated Statistics For Year 2008 (Based on 4 partial tracts)
A) FHA, FSA/RHS & VA Home Purchase Loans
B) Conventional Home Purchase Loans
C) Refinancings
D) Home Improvement Loans
F) Non-occupant Loans on < 5 Family Dwellings (A B C & D)
Number
Average Value
Number
Average Value
Number
Average Value
Number
Average Value
Number
Average Value
LOANS ORIGINATED
9
$248,796
44
$260,496
71
$228,371
18
$64,916
2
$215,415
APPLICATIONS APPROVED, NOT ACCEPTED
2
$308,135
10
$336,439
17
$182,111
4
$70,460
0
$0
APPLICATIONS DENIED
0
$0
13
$252,641
63
$264,147
16
$50,681
1
$399,390
APPLICATIONS WITHDRAWN
4
$272,065
7
$297,681
29
$277,482
4
$192,612
0
$0
FILES CLOSED FOR INCOMPLETENESS
0
$0
3
$238,577
10
$221,874
0
$0
0
$0
Aggregated Statistics For Year 2007 (Based on 4 partial tracts)
A) FHA, FSA/RHS & VA Home Purchase Loans
B) Conventional Home Purchase Loans
C) Refinancings
D) Home Improvement Loans
F) Non-occupant Loans on < 5 Family Dwellings (A B C & D)
G) Loans On Manufactured Home Dwelling (A B C & D)
Number
Average Value
Number
Average Value
Number
Average Value
Number
Average Value
Number
Average Value
Number
Average Value
LOANS ORIGINATED
4
$280,825
94
$256,232
120
$228,921
33
$89,467
7
$221,434
1
$13,030
APPLICATIONS APPROVED, NOT ACCEPTED
1
$365,680
16
$288,571
32
$244,426
4
$134,608
1
$30,400
1
$18,690
APPLICATIONS DENIED
1
$366,430
28
$288,831
102
$274,838
19
$94,997
7
$211,450
3
$64,277
APPLICATIONS WITHDRAWN
1
$383,920
12
$297,186
41
$289,703
3
$228,863
3
$256,817
0
$0
FILES CLOSED FOR INCOMPLETENESS
0
$0
5
$264,054
17
$225,562
3
$43,720
2
$158,520
0
$0
Aggregated Statistics For Year 2006 (Based on 4 partial tracts)
B) Conventional Home Purchase Loans
C) Refinancings
D) Home Improvement Loans
E) Loans on Dwellings For 5+ Families
F) Non-occupant Loans on < 5 Family Dwellings (A B C & D)
G) Loans On Manufactured Home Dwelling (A B C & D)
Number
Average Value
Number
Average Value
Number
Average Value
Number
Average Value
Number
Average Value
Number
Average Value
LOANS ORIGINATED
130
$229,280
144
$204,460
46
$88,617
0
$0
13
$187,265
1
$78,170
APPLICATIONS APPROVED, NOT ACCEPTED
16
$218,638
37
$214,450
8
$115,166
0
$0
1
$350,860
0
$0
APPLICATIONS DENIED
34
$248,191
119
$250,783
38
$87,655
0
$0
10
$220,515
0
$0
APPLICATIONS WITHDRAWN
17
$258,575
93
$233,423
7
$158,683
1
$39,090
1
$335,140
0
$0
FILES CLOSED FOR INCOMPLETENESS
2
$280,360
24
$268,041
3
$134,123
0
$0
0
$0
0
$0
Aggregated Statistics For Year 2005 (Based on 4 partial tracts)
B) Conventional Home Purchase Loans
C) Refinancings
D) Home Improvement Loans
F) Non-occupant Loans on < 5 Family Dwellings (A B C & D)
G) Loans On Manufactured Home Dwelling (A B C & D)
Number
Average Value
Number
Average Value
Number
Average Value
Number
Average Value
Number
Average Value
LOANS ORIGINATED
130
$235,635
195
$209,992
39
$91,230
10
$230,331
0
$0
APPLICATIONS APPROVED, NOT ACCEPTED
17
$213,301
45
$209,221
15
$57,105
1
$296,250
1
$34,740
APPLICATIONS DENIED
37
$255,822
140
$259,743
33
$79,262
3
$205,747
1
$112,920
APPLICATIONS WITHDRAWN
21
$222,916
122
$243,881
21
$175,756
2
$329,505
0
$0
FILES CLOSED FOR INCOMPLETENESS
7
$231,551
26
$247,643
5
$75,296
0
$0
0
$0
Aggregated Statistics For Year 2004 (Based on 4 partial tracts)
A) FHA, FSA/RHS & VA Home Purchase Loans
B) Conventional Home Purchase Loans
C) Refinancings
D) Home Improvement Loans
E) Loans on Dwellings For 5+ Families
F) Non-occupant Loans on < 5 Family Dwellings (A B C & D)
G) Loans On Manufactured Home Dwelling (A B C & D)
Number
Average Value
Number
Average Value
Number
Average Value
Number
Average Value
Number
Average Value
Number
Average Value
Number
Average Value
LOANS ORIGINATED
2
$178,910
130
$254,018
197
$185,995
42
$81,451
0
$0
12
$177,481
1
$60,800
APPLICATIONS APPROVED, NOT ACCEPTED
1
$197,170
28
$273,696
33
$173,231
7
$41,083
0
$0
2
$774,510
1
$13,030
APPLICATIONS DENIED
0
$0
20
$223,835
91
$205,108
33
$70,129
0
$0
2
$237,590
5
$63,062
APPLICATIONS WITHDRAWN
0
$0
10
$255,861
102
$185,853
8
$43,448
1
$221,490
1
$236,480
0
$0
FILES CLOSED FOR INCOMPLETENESS
0
$0
9
$289,200
23
$221,965
5
$70,820
0
$0
1
$272,740
0
$0
Aggregated Statistics For Year 2003 (Based on 4 partial tracts)
A) FHA, FSA/RHS & VA Home Purchase Loans
B) Conventional Home Purchase Loans
C) Refinancings
D) Home Improvement Loans
E) Loans on Dwellings For 5+ Families
F) Non-occupant Loans on < 5 Family Dwellings (A B C & D)
Number
Average Value
Number
Average Value
Number
Average Value
Number
Average Value
Number
Average Value
Number
Average Value
LOANS ORIGINATED
4
$167,158
129
$213,468
381
$169,013
19
$59,785
2
$694,880
13
$112,855
APPLICATIONS APPROVED, NOT ACCEPTED
1
$172,850
13
$246,245
69
$139,175
7
$60,521
0
$0
2
$107,705
APPLICATIONS DENIED
0
$0
7
$209,234
136
$153,398
17
$37,156
0
$0
3
$151,603
APPLICATIONS WITHDRAWN
0
$0
11
$204,810
91
$174,266
9
$61,310
0
$0
3
$174,113
FILES CLOSED FOR INCOMPLETENESS
0
$0
4
$267,745
15
$163,484
1
$43,430
0
$0
0
$0
Aggregated Statistics For Year 2002 (Based on 4 partial tracts)
A) FHA, FSA/RHS & VA Home Purchase Loans
B) Conventional Home Purchase Loans
C) Refinancings
D) Home Improvement Loans
E) Loans on Dwellings For 5+ Families
F) Non-occupant Loans on < 5 Family Dwellings (A B C & D)
Number
Average Value
Number
Average Value
Number
Average Value
Number
Average Value
Number
Average Value
Number
Average Value
LOANS ORIGINATED
2
$98,585
131
$194,773
233
$153,122
37
$33,484
0
$0
6
$160,428
APPLICATIONS APPROVED, NOT ACCEPTED
0
$0
13
$220,905
41
$155,237
7
$36,349
1
$130,290
0
$0
APPLICATIONS DENIED
1
$100,250
16
$199,769
70
$160,984
25
$37,348
0
$0
3
$26,180
APPLICATIONS WITHDRAWN
0
$0
18
$218,687
66
$136,581
6
$27,507
0
$0
2
$102,400
FILES CLOSED FOR INCOMPLETENESS
0
$0
3
$293,420
19
$147,375
0
$0
0
$0
1
$338,280
Aggregated Statistics For Year 2001 (Based on 4 partial tracts)
A) FHA, FSA/RHS & VA Home Purchase Loans
B) Conventional Home Purchase Loans
C) Refinancings
D) Home Improvement Loans
F) Non-occupant Loans on < 5 Family Dwellings (A B C & D)
Number
Average Value
Number
Average Value
Number
Average Value
Number
Average Value
Number
Average Value
LOANS ORIGINATED
13
$134,017
105
$175,508
157
$131,921
25
$34,954
6
$126,150
APPLICATIONS APPROVED, NOT ACCEPTED
1
$36,480
4
$180,638
25
$136,049
5
$28,994
0
$0
APPLICATIONS DENIED
2
$129,860
18
$122,978
66
$122,785
18
$27,514
3
$75,857
APPLICATIONS WITHDRAWN
0
$0
15
$165,028
62
$110,296
16
$37,142
1
$137,140
FILES CLOSED FOR INCOMPLETENESS
1
$42,560
0
$0
10
$82,877
0
$0
0
$0
Aggregated Statistics For Year 2000 (Based on 4 partial tracts)
A) FHA, FSA/RHS & VA Home Purchase Loans
B) Conventional Home Purchase Loans
C) Refinancings
D) Home Improvement Loans
E) Loans on Dwellings For 5+ Families
F) Non-occupant Loans on < 5 Family Dwellings (A B C & D)
Number
Average Value
Number
Average Value
Number
Average Value
Number
Average Value
Number
Average Value
Number
Average Value
LOANS ORIGINATED
9
$130,761
117
$155,551
59
$98,296
32
$23,744
1
$803,460
5
$140,518
APPLICATIONS APPROVED, NOT ACCEPTED
1
$104,230
11
$184,521
15
$71,891
14
$28,999
0
$0
1
$155,480
APPLICATIONS DENIED
2
$101,625
20
$144,958
32
$73,118
19
$29,649
0
$0
1
$59,470
APPLICATIONS WITHDRAWN
3
$109,153
13
$136,970
46
$79,369
3
$46,490
0
$0
0
$0
FILES CLOSED FOR INCOMPLETENESS
0
$0
3
$148,240
10
$118,781
0
$0
0
$0
0
$0
Aggregated Statistics For Year 1999 (Based on 2 partial tracts)
A) FHA, FSA/RHS & VA Home Purchase Loans
B) Conventional Home Purchase Loans
C) Refinancings
D) Home Improvement Loans
F) Non-occupant Loans on < 5 Family Dwellings (A B C & D)
Detailed PMIC statistics for the following Tracts:0118.00
, 0119.00
2002 - 2018 National Fire Incident Reporting System (NFIRS) incidents
Based on the data from the years 2002 - 2018 the average number of fires per year is 7. The highest number of fire incidents - 15 took place in 2008, and the least - 0 in 2003. The data has a rising trend.
When looking into fire subcategories, the most reports belonged to: Structure Fires (37.4%), and Outside Fires (32.5%).
Fire incident types reported to NFIRS in Zip Code 10958


 Nearest zip codes: 10973, 10921, 10924, 10933, 10940, 10969.


 Based on the data from the years 2002 - 2018 the average number of fires per year is 7. The highest number of fire incidents - 15 took place in 2008, and the least - 0 in 2003. The data has a rising trend.
 When looking into fire subcategories, the most reports belonged to: Structure Fires (37.4%), and Outside Fires (32.5%).