


Introduction
Evidence of a pluvial lake in Deep SpringsFootnote 1 Valley (Fig. 1; DSV) has been known for nearly 100 years (Miller, Reference Miller1928), but unlike many surrounding basins, DSV has been practically ignored in regional paleohydrology and paleoclimatology studies (e.g., Hubbs and Miller, Reference Hubbs and Miller1948; Smith and Street-Perrott, Reference Smith, Street-Perrott, Wright and Porter1983; Smith, Reference Smith1984). This is likely because DSV is an isolated hydrologic unit (Jones, Reference Jones1965) with no native fish (Hubbs and Miller, Reference Hubbs and Miller1948). However, the hydrologic isolation and the unglaciated headwaters make the paleoclimate record of DSV important because it is a true effective precipitation record that is less complicated than are records from surrounding pluvial lakes that are fed by glacial runoff or inter-basin river flow.
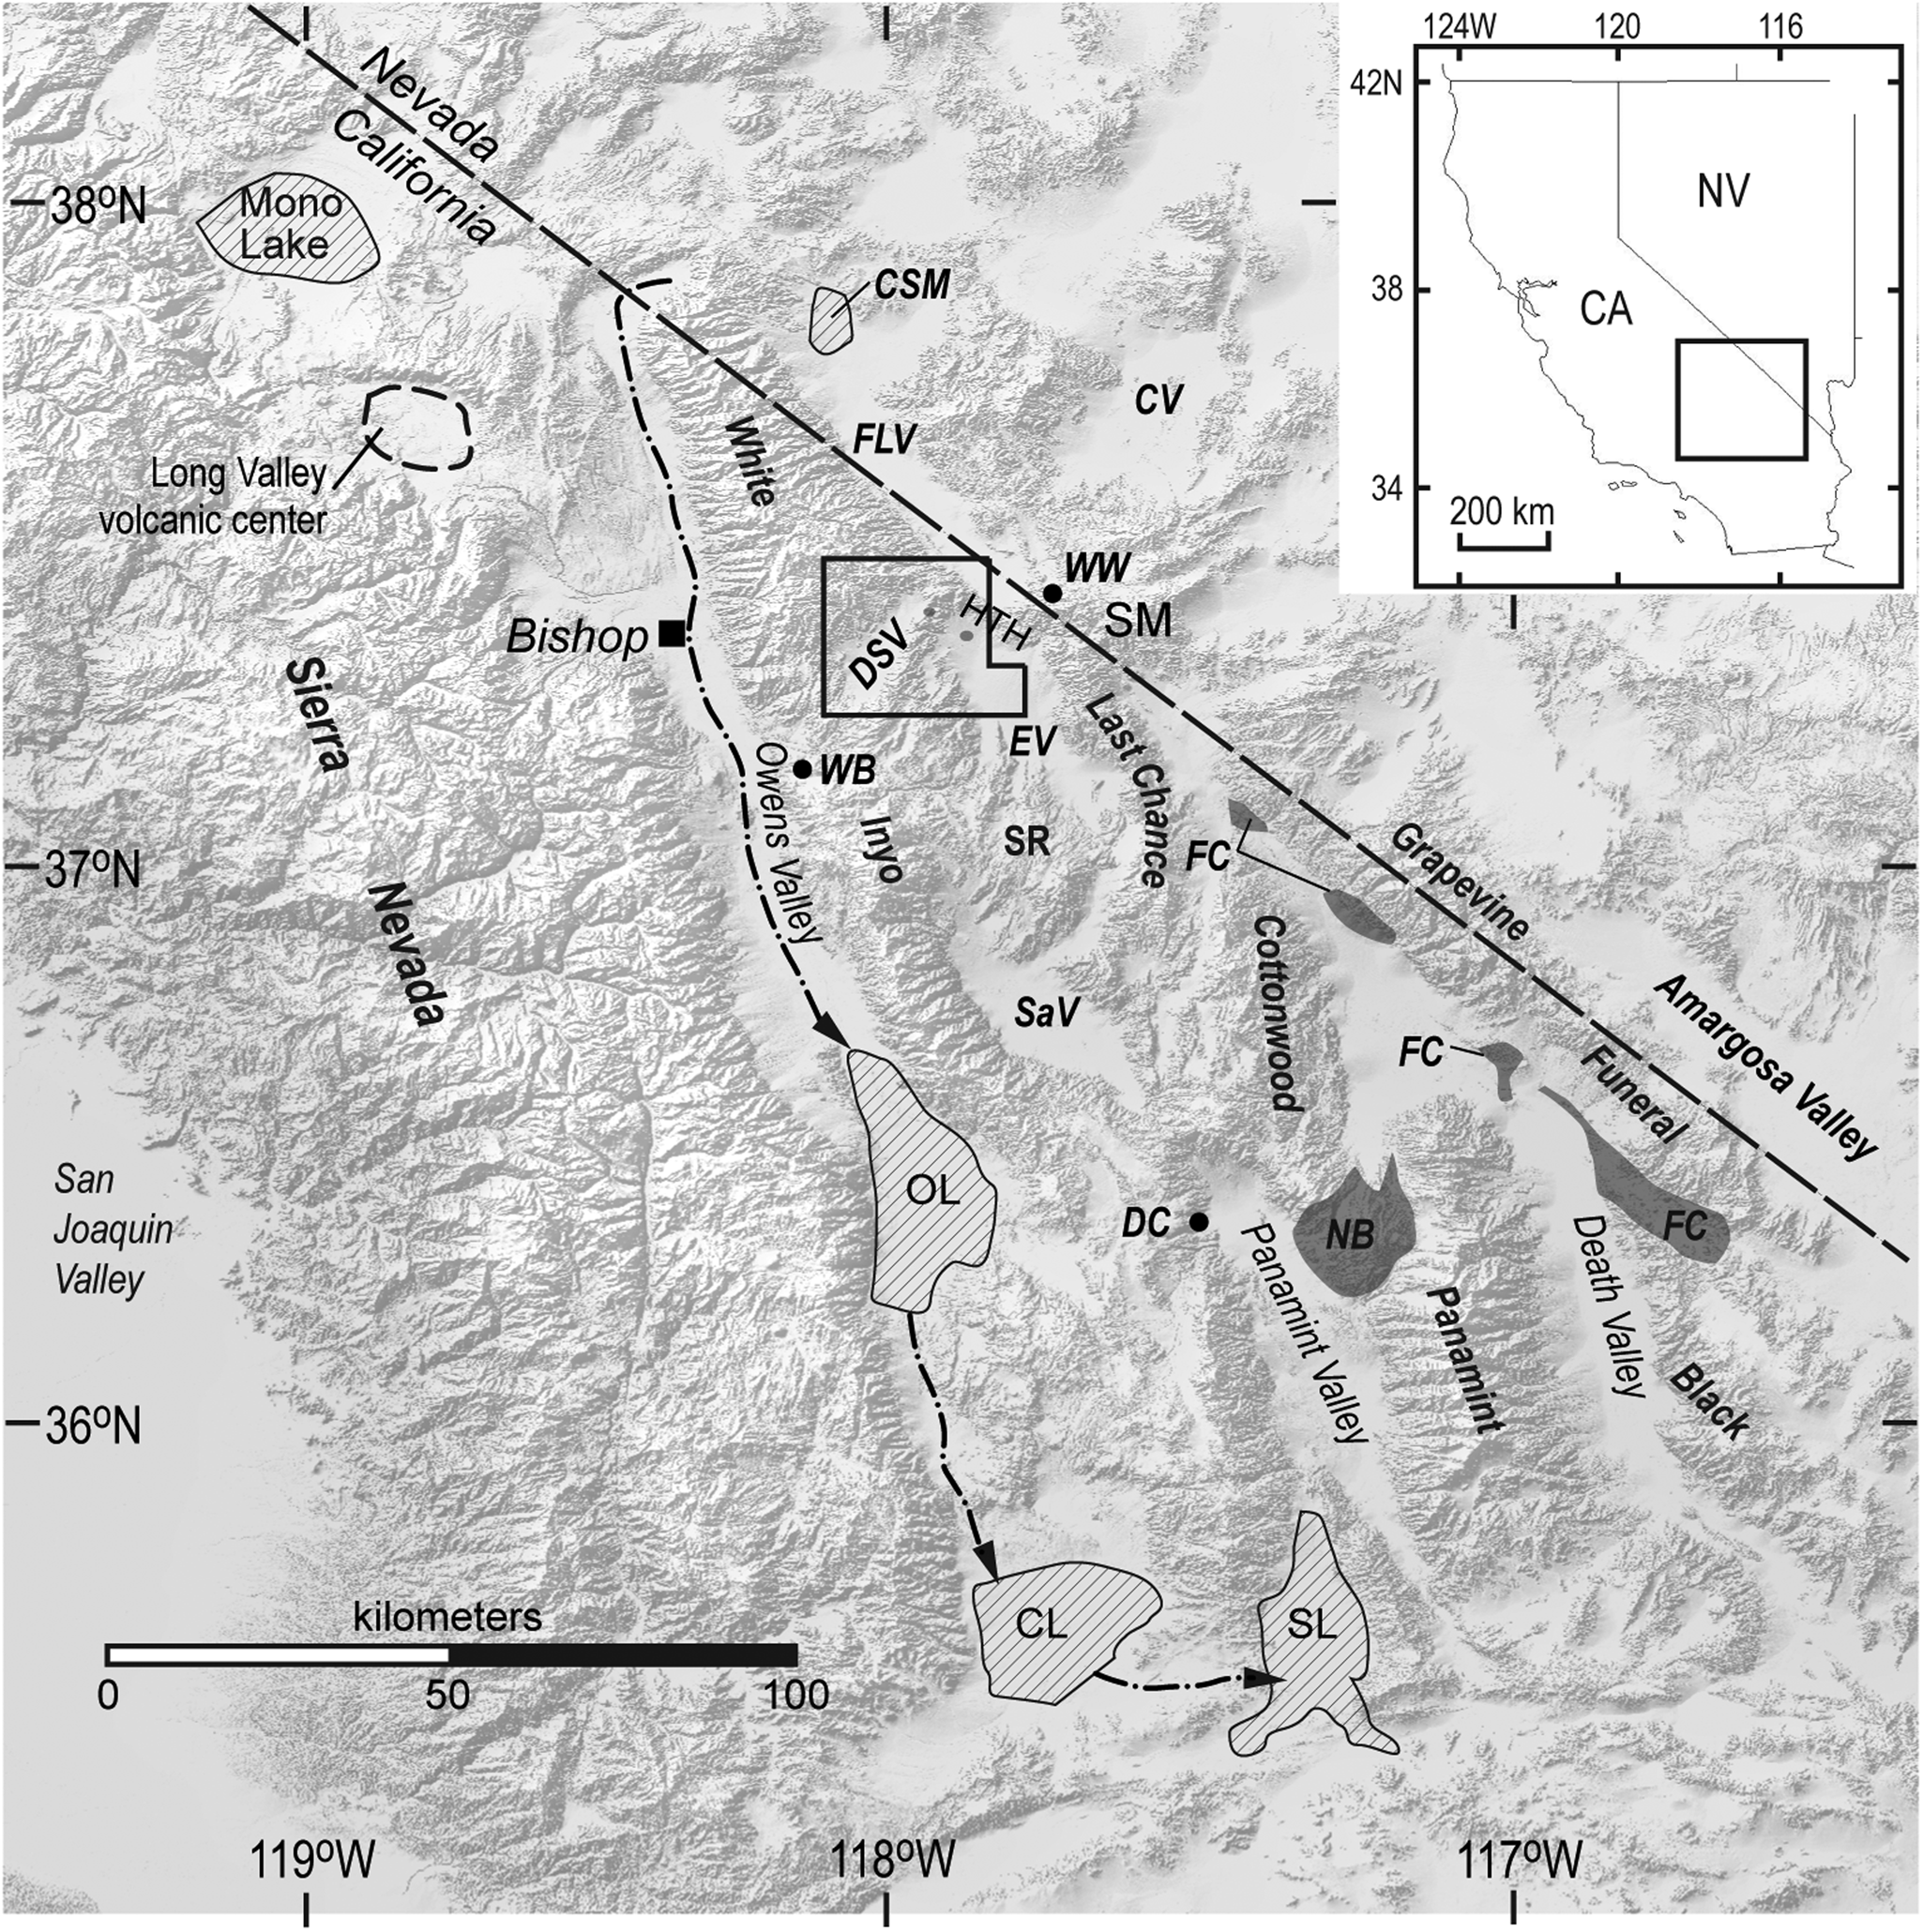
Figure 1. Shaded relief map of eastern California and western Nevada showing key mountain ranges and valleys in the western Great Basin and the Long Valley volcanic center. Diagonal lines indicate approximate extent of pluvial lakes and the paleo-Owens River system (dot-dashed line) during Marine Isotope Stage 4 (ca. 71–57 ka; after Lowenstein et al., Reference Lowenstein, Li, Brown, Roberts, Ku, Luo and Yang1999; Jayko et al., Reference Jayko, Forester, Kaufman, Phillips, Yount, McGeehin, Mahan, Reheis, Hershler and Miller2008; Smith, Reference Smith2009; this study). Shaded areas are Pliocene sedimentary deposits. The box is the outline of Figure 2. Abbreviations: CA = California; CL = China Lake; CSM = Columbus Salt Marsh; CV = Clayton Valley; DC = Darwin Canyon; DSV = Deep Springs Valley; EV = Eureka Valley; FC = Furnace Creek basin; FLV = Fish Lake Valley; HTH = Horse Thief Hills; NB = Nova Basin; NV = Nevada; OL = Owens Lake; SaV = Saline Valley; SL = Searles Lake; SM = Sylvania Mountains; SR = Saline Range; WB = Waucoba Beds; WW = Willow Wash.
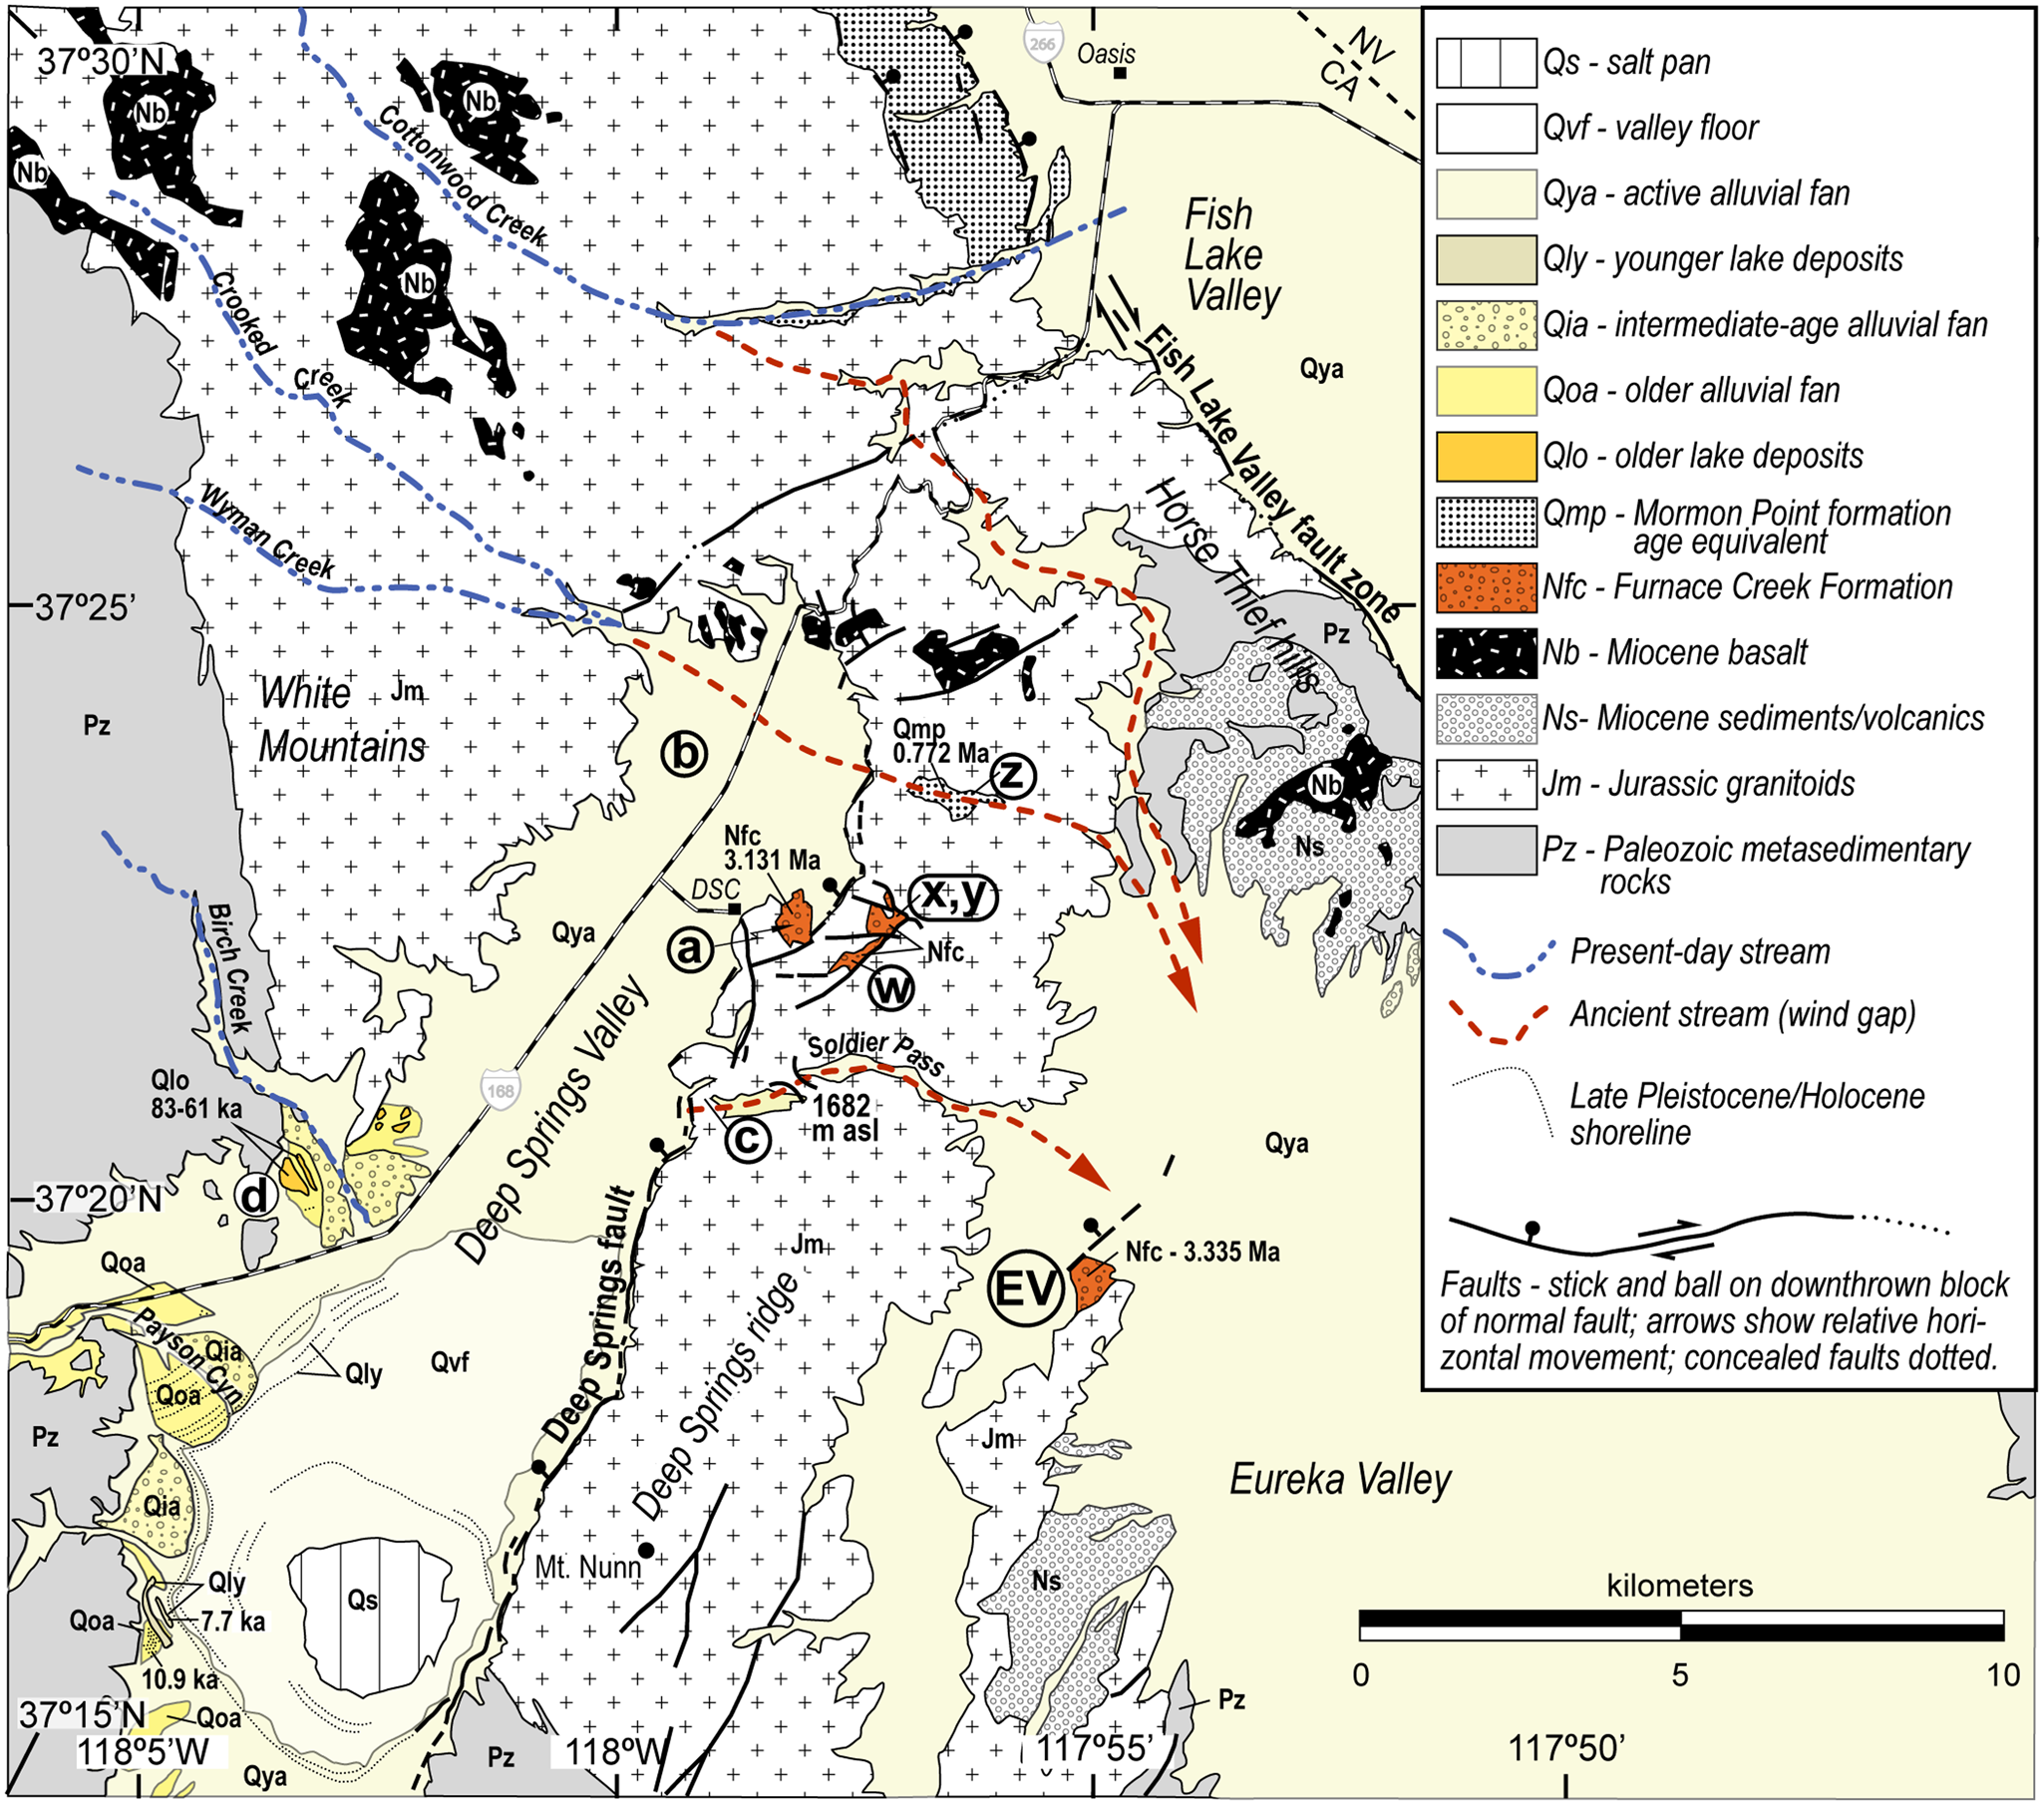
Figure 2. Generalized geologic map of the Deep Springs Valley area (modified from Nelson, Reference Nelson1966, and McKee and Nelson, Reference McKee and Nelson1967). Locations (a, b, c, d, w, x, y, z) are from Miller (Reference Miller1928); location EV from Knott et al. (Reference Knott, Liddicoat, Coe, Negrini, Starratt and Rosen2019b) and this study. Note elevation of Soldier Pass sill at 1682 meters above sea level (m asl). See text for explanation of dates noted for some geologic units. Abbreviations: DSC = Deep Springs College; CA = California; NV = Nevada.
In a reconnaissance of DSV, Miller (Reference Miller1928, p. 524) described what he called Quaternary freshwater lake deposits: “The lake beds consist mainly of soft, nearly white, limy, stratified material which contains numerous well-preserved, tiny, gastropod and pelecypod shells, including a number of species.” Miller (Reference Miller1928) inferred that this evidence supported the hypothesis that DSV was occupied by a lake, which he called Deep Spring Lake (hereafter called Deep Springs Lake). Miller (Reference Miller1928) hypothesized that during the late Quaternary, Deep Springs Lake overflowed across Deep Springs ridge (informally named herein), via the Soldier Pass Canyon wind gap (~1682 meters above sea level [m asl]), into Eureka Valley (Fig. 2). Miller (Reference Miller1928) also recognized older “river-bed boulders” of quartzite and sedimentary rocks on Deep Springs ridge. Miller (Reference Miller1928) speculated that the clast provenance of the “river-bed boulders” was Wyman Creek, and its tributary, Crooked Creek, in the White Mountains, meaning that Wyman Creek flowed across what is now Deep Springs ridge before DSV formed.
In contrast, Hubbs and Miller (Reference Hubbs and Miller1948) disputed Miller's (Reference Miller1928) hypotheses of a deeper, overflowing Deep Springs Lake and that Wyman Creek eroded the wind gap through Deep Springs ridge. Subsequent studies, however, supported Miller's (Reference Miller1928) observations and added Cottonwood Creek (Fig. 2) as another White Mountains stream that eroded a wind gap into Deep Springs ridge (Lustig, Reference Lustig1965; Reheis and McKee, Reference Reheis, McKee, Reheis, Sarna-Wojcicki, Meyer, McKee, Slate, Burbank, Sawyer and Pendall1991; Reheis and Sawyer, Reference Reheis and Sawyer1997).
To better understand the complex Neogene–Quaternary paleohydrology and tectonic history of DSV, we performed tephrochronology on a tuff and clast counts on the Pliocene conglomerate of DSV and Eureka Valley. In addition, we examined and dated sediments described as Quaternary lake beds in DSV (Miller, Reference Miller1928; Nelson, Reference Nelson1966). Our data support the earlier hypotheses that a fluvial system crossed what would become DSV during the Pliocene and middle Pleistocene and that Pleistocene tectonics formed DSV (Miller, Reference Miller1928; Lustig, Reference Lustig1965; Reheis and McKee, Reference Reheis, McKee, Reheis, Sarna-Wojcicki, Meyer, McKee, Slate, Burbank, Sawyer and Pendall1991; Reheis and Sawyer, Reference Reheis and Sawyer1997; Lee et al., Reference Lee, Rubin and Calvert2001). Our data show Deep Springs Lake occupied DSV beginning in Marine Isotope Stage (MIS) 5a (ca. 82 ka peak; Lisiecki and Raymo, Reference Lisiecki and Raymo2005) and throughout most of MIS 4 (ca. 71–57 ka; Lisiecki and Raymo, Reference Lisiecki and Raymo2005) when effective precipitation increased.
Geologic Setting
DSV is an intermontane valley with a well-studied playa lake at ~1500 m asl (Fig. 2; Jones, Reference Jones1965). DSV is bound on the northwest by the White Mountains and the southeast by Deep Springs ridge of the Inyo Mountains (Fig. 2). Wyman Creek, Birch Creek and Payson Canyon are the main streams emanating from the White Mountains and terminating in DSV (Fig. 2). The maximum elevation within the DSV watershed is County Line Hill (3428 m asl), with no evidence of glaciation within the watershed (Nelson, Reference Nelson1966; Krauskopf, Reference Krauskopf1971).
Deep Springs ridge has a maximum elevation of 2835 m asl at Mount Nunn (Fig. 2). Wind gaps at Soldier Pass Canyon (~1682 m asl) and the southeastern extension of Wyman Creek (~1815 m asl) cross Deep Springs ridge (Miller, Reference Miller1928; Reheis et al., Reference Reheis, Slate, Sarna-Wojcicki and Meyer1993; Reheis and Sawyer, Reference Reheis and Sawyer1997). Reheis and Sawyer (Reference Reheis and Sawyer1997) inferred that Cottonwood Creek, which presently flows east-northeast into Fish Lake Valley, previously flowed southeast toward Eureka Valley forming a third wind gap (~1900 m asl) across the north part of Deep Springs ridge (Fig. 2).
Bedrock exposed in the White and Inyo mountains surrounding DSV consists of Paleozoic metasedimentary rocks, Jurassic granitoids, sparse Miocene sedimentary rocks and tuffs, and Miocene basalt (Fig. 2). For the purposes of this study, we combine the quartzites, shales, sandstones, and limestones of the lower Cambrian Campito, Poleta, and Harkless formations into one geologic unit (Fig. 2). Again, for simplicity, we show the late Early Jurassic quartz monzonite of Beer Creek (179 ± 3 Ma; Nelson, Reference Nelson1966; Coleman et al., Reference Coleman, Briggs, Glazner and Northrup2003) and hornblende-augite monzonite of Joshua Flat (171–181 Ma; Nelson, Reference Nelson1966; McKee and Nelson, Reference McKee and Nelson1967) as Jurassic granitoids (Fig. 2). Miocene volcanic and sedimentary rocks and overlying Miocene basalt flows crop out in the Wyman Creek watershed of the White Mountains northwest of DSV and in the Horse Thief hills northeast of DSV (Fig. 2). The Miocene basalt (ca. 11.5 Ma; Mueller and Oldow, Reference Mueller and Oldow2017) is offset by the Deep Springs fault at the north end of DSV (Fig. 2; McKee and Nelson, Reference McKee and Nelson1967).
Miller (Reference Miller1928) identified both fluvial and Quaternary freshwater lake deposits during his reconnaissance (Fig. 2). The fluvial deposits, which Miller (Reference Miller1928) described as “river boulders and gravels” are at locations w, x, y, and z on Deep Springs ridge (Fig. 2). Miller (Reference Miller1928) described the lake deposits at locations a, b, c, and d as near shore, soft, and stratified. Miller's (Reference Miller1928) locations are shown on Figure 2 with approximate township and range locations in Table 1. These locations do not meet modern-day expectations for site or sample locations; however, Miller's (Reference Miller1928) locations are identifiable because they generally correspond with later geologic mapping (Nelson, Reference Nelson1966; McKee and Nelson, Reference McKee and Nelson1967; Reheis and Sawyer, Reference Reheis and Sawyer1997; Lee et al., Reference Lee, Rubin and Calvert2001).
Table 1. Locations of samples collected and location information for comparative tephra beds.

Deposits at locations a, w, x, and y subsequently were mapped as Neogene (Miocene–Pleistocene) tuffaceous sandstone, sandstone, and conglomerate (Fig. 2; Ts of McKee and Nelson, Reference McKee and Nelson1967; TQs of Lee et al., Reference Lee, Rubin and Calvert2001). Lee et al. (Reference Lee, Rubin and Calvert2001) described parts of their TQs unit as stream gravel. At Miller's (Reference Miller1928) location a, Lee et al. (Reference Lee, Rubin and Calvert2001) obtained an 40Ar/39Ar date of 3.13 ± 0.08 Ma (plagioclase; age corrected for updated constant data; see methods regarding age correction) on a tuff marker bed (Fig. 3).

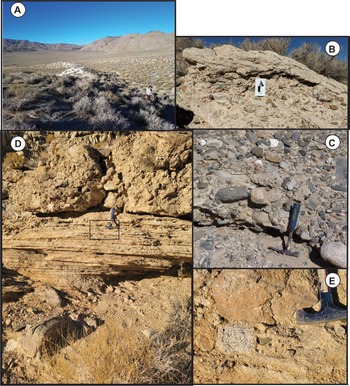
Figure 3. (A) View northwest of tuff of Mesquite Flat (white ridge) interbedded with east-dipping conglomerate (loc. a on Fig. 2); person at right for scale. (B) Pliocene sandstone to pebbly sandstone conglomerate (loc. a on Fig. 2); originally described as lake beds by Miller (Reference Miller1928). (C) Sandy conglomerate overlying tuff of Zabriskie Wash (ca. 3.335 Ma) (loc. EV on Fig. 2); originally mapped as lake beds by McKee and Nelson (Reference McKee and Nelson1967). (D) Bedded sandstone to sandstone breccia at west end of Soldier Pass (loc. c on Fig. 2); box outlines photograph (E) with hammer for scale. (E) Close-up of sandstone breccia orginially described as lake deposits by Miller (Reference Miller1928).
The Quaternary freshwater lake deposits of Miller (Reference Miller1928) at location b (Fig. 2) are found along the base of the White Mountains ~1–3 km south of the mouth of Wyman Creek. At location b, Nelson (Reference Nelson1966) and McKee and Nelson (Reference McKee and Nelson1967) mapped a combination of lake beds (Ql; older playa) and alluvial fan (Qf) deposits. The elevations of the putative lake beds mapped by Nelson (Reference Nelson1966) and McKee and Nelson (Reference McKee and Nelson1967) range from ~1660 to ~1600 m asl.
Location c of Miller (Reference Miller1928) is at the west end of Soldier Pass (Fig. 2). Lustig (Reference Lustig1965) noted carbonate-cemented pebble conglomerates at location c as evidence of stream flow west to east through Soldier Pass (Fig. 3). McKee and Nelson (Reference McKee and Nelson1967) mapped deposits in this area as Quaternary alluvium (Qa). More detailed mapping by Lee et al. (Reference Lee, Rubin and Calvert2001) showed Middle Miocene(?)–Pleistocene sandstone and conglomerate stream gravels (TQs) surrounded by Holocene alluvial fan deposits (Qf1 and Qf2). In summary, Miller (Reference Miller1928) described the deposits at location c as near-shore lake deposits; however, subsequent studies have described the deposits as coarse-grained fluvial deposits of different ages (Lustig, Reference Lustig1965; Lee et al., Reference Lee, Rubin and Calvert2001).
Location d of Miller (Reference Miller1928) is ~800 m south of the mouth of Birch Creek at the base of the White Mountains (Fig. 2). At this same location, Nelson (Reference Nelson1966) mapped Quaternary lake beds (Ql; older playa deposits) on the southern lobe of the Birch Creek alluvial fan. The elevation of the putative lake beds mapped by Nelson (Reference Nelson1966) is between ~1653 m asl and ~1600 m asl.
McKee and Nelson (Reference McKee and Nelson1967) mapped the deposits at Miller's (Reference Miller1928) location z, which is within an east-west trending valley incised into Deep Springs ridge (Fig. 2), as Quaternary alluvium (Qa). Reheis et al. (Reference Reheis, Slate, Sarna-Wojcicki and Meyer1993) correlated a tuff bed in these alluvium deposits with the Pleistocene Bishop ash bed, which is a widespread marker bed and the distal equivalent of the Bishop Tuff. According to Reheis and Sawyer (Reference Reheis and Sawyer1997), the source of these alluvial gravels is the Wyman Creek watershed in the White Mountains. Thus, the valley incised into Deep Springs ridge is now a wind gap eroded by Wyman Creek during the Pleistocene (Reheis and Sawyer, Reference Reheis and Sawyer1997). Lee et al. (Reference Lee, Rubin and Calvert2001) determined an 40Ar/39Ar date of 0.766 ± 0.034 Ma (sanidine) on this same tuff, which is consistent with the age of the Bishop Tuff (Sarna-Wojcicki et al., Reference Sarna-Wojcicki, Reheis, Pringle, Fleck, Burbank and Meyer2005). For this study, we use 0.772 ± 0.008 Ma from Knott et al. (Reference Knott, Machette, Wan, Klinger, Liddicoat, Sarna-Wojcicki and Fleck2018) as the age of the Bishop ash bed because this latter age determination uses the updated constant data (see methods below).
Knott et al. (Reference Knott, Wan, Deino, Casteel, Reheis, Phillips, Walkup, McCarty, Manoukian, Nunez, Starratt and Rosen2019a) showed that the lake beds of McKee and Nelson (Reference McKee and Nelson1967) in northwest Eureka Valley (location EV on Fig. 2) were fluvial sandstone and conglomerate (Fig. 3). Interbedded with the sandstone and conglomerate was a white, moderately indurated tephra bed whose glass shard composition correlates with the 3.335 ± 0.002 Ma tuff of Zabriskie Wash (Knott et al., Reference Knott, Wan, Deino, Casteel, Reheis, Phillips, Walkup, McCarty, Manoukian, Nunez, Starratt and Rosen2019a).
Jones (Reference Jones1965) described ancient shorelines in southern DSV. Nelson (Reference Nelson1966) mapped these shorelines and associated deposits as lake beds (Ql; older playa beds) or the same geologic unit as locations b and d, above. Nelson's (Reference Nelson1966) mapping shows both shorelines and Ql sediments in southern DSV as deposited on (or overlying) Quaternary older alluvial fan (Qof), alluvial fan (Qf), and valley fill (Qvf) deposits surrounding the Deep Springs salt pan between ~1590–1500 m asl (Fig. 2). Lawson (Reference Lawson2017) determined optically stimulated luminescence (OSL) ages of 10.94 ± 0.95 ka and 7.71 ± 0.67 ka on the lake beds mapped by Nelson (Reference Nelson1966) at 1570 m asl and 1537 m asl, respectively. It is important to note that Nelson (Reference Nelson1966) included all lacustrine deposits in one mapped unit (Ql).
Methods
Standard geologic field methods were employed to describe the geologic units and collect samples (Table 1). Bulk sediment samples were collected from a measured section near Birch Creek (Table 1; loc. d on Fig. 2). Fossils were separated from the sediment with the aid of a dissection microscope. Fossils visible at the outcrop were wrapped in aluminum foil for possible radiocarbon analysis and submitted to Aeon Labs for analysis. Portions of the bulk samples (> 90-μ fraction) were examined for ostracodes at the University of Arizona (J. Bright).
Collection and preparation of tephrochronology samples followed Sarna-Wojcicki et al. (Reference Sarna-Wojcicki, Reheis, Pringle, Fleck, Burbank and Meyer2005). Major (Si, Al, Fe, Ca, Na, K) and minor (Mg, Mn, Ti) -element concentrations were determined by electron microprobe analysis at the New Mexico Bureau of Geology and Mineral Resources (Table 2). Reported electron microprobe results are weight percent oxides with the FeO concentration mathematically converted to Fe2O3.
Table 2. Results of electron-microprobe analysis of volcanic glass shards from Deep Springs Valley tephra layers and similar or correlative tephra layers.

Note: Values are given in mean weight-percent oxide, recalculated to 100% fluid free basis; Lynn Heizler, New Mexico Bureau of Mines was analyst for JRK-DSV; C.E. Meyer, J. Walker, and D. Wahl, U.S. Geological Survey, Menlo Park, CA, were analysts for other samples.
* Samples are grouped according to best matches (inferred correlations).
† Abbreviations for localities are as follows: CC: Copper Canyon, Death Valley, CA; DSV: Deep Springs Valley; EV: Eureka Valley, CA; KFH: Kit Fox Hills, Death Valley, CA.
§ Original oxide totals before calculation expressed as percentage and indicate approximate degree of hydration of volcanic glass. Original values for each oxide can be obtained by multiplying T(o) by weight percent shown.
# Similarity Coefficient (SC) of Borchardt et al. (Reference Borchardt, Aruscavage and Millard1972) used to quantitatively compare the tephra samples, where 1.0000 represents a perfect match. All similarity coefficients calculated using concentrations of Si, Al,
The reported electron microprobe data for major and minor element oxides were normalized to 100% and compared to published data (e.g., Reheis et al., Reference Reheis, Sarna-Wojcicki, Burbank, Meyer, Reheis, Sarna-Wojcicki, Meyer, McKee, Slate, Burbank, Sawyer and Pendall1991; Sarna-Wojcicki et al., Reference Sarna-Wojcicki, Reheis, Pringle, Fleck, Burbank and Meyer2005; Knott et al., Reference Knott, Machette, Wan, Klinger, Liddicoat, Sarna-Wojcicki and Fleck2018). Similarity coefficients (Borchardt et al., Reference Borchardt, Aruscavage and Millard1972) were calculated using SiO2, Al2O3, Fe2O3, CaO, and MnO concentrations. We used a minimum similarity coefficient of 0.93 as a guide for identifying correlative tephra layers, following Sarna-Wojcicki et al. (Reference Sarna-Wojcicki, Bowman, Meyer, Russell, Woodward, McCoy, Rowe, Baedecker, Asaro and Michael1984). Legacy 40Ar/39Ar ages were recalculated using the updated reference age of 28.20 ± 0.046 Ma for the Fish Canyon Tuff (Kuiper et al., Reference Kuiper, Deino, Hilgen, Krijgsman, Renne and Wijbrans2008) and decay constants of Min et al. (Reference Min, Mundil, Renne and Ludwig2000).
Samples for IRSL dating were collected following the methods described in Mahan et al. (Reference Mahan, Donlan and Kardos2015) and Nelson et al. (Reference Nelson, Gray, Johnson, Rittenour, Feathers and Mahan2015). These samples were then submitted to the U.S. Geological Survey luminescence laboratory in Denver. Brass tubes were hammered or pushed into the sediment with the outward end covered by a plastic cap. Each tube was extracted, a plastic cap placed over the opposite end, and wrapped in aluminum foil. Bulk samples of the surrounding sediments above, below, and at the same elevation of the sample, were also collected for dose rate measurements in the laboratory.
Determining the Equivalent Dose (DE)
The systematics of IRSL techniques are well known (Thomsen et al., Reference Thomsen, Murray, Jain and Bøtter-Jensen2008; Steffan et al., Reference Steffan, Preusser and Schlunegger2009; Buylaert et al., Reference Buylaert, Huot, Murray and Van den haute2011). We report IRSL ages because post-IR IRSL ages derived from feldspars have proved more reliable than OSL ages on quartz in deposits elsewhere in the southern California and Nevada area (Sohn et al., Reference Sohn, Mahan, Knott and Bowman2007, Miller et al., Reference Miller, Schmidt, Mahan, McGeehin, Owen, Barron, Lehmkuhl and Lohrer2010, Lawson et al., Reference Lawson, Roder, Stang and Rhodes2012; Springer et al., Reference Springer, Pigati, Manker and Mahan2018). Briefly, under subdued orange-light conditions, applications of 4M HCl and 35% hydrogen peroxide (H2O2) are applied to the samples, followed by wet sieving isolated grains with diameters of 250–63 μm. After sieving and drying, heavy minerals and some feldspars were separated from the quartz with a Frantz magnetic separator using a high (2.0 Amps) current. Separation using heavy liquid (2.56 g/ml density) was used to isolate potassium-rich feldspars for collection.
Steel target discs were dabbed with a small circle of silica spray (1 mm, known as a “1-mm mask”) and a single-grain-thick layer of refined grains was dispersed onto steel discs. Approximately 50–150 grains were used for each disc. These discs were then loaded onto a carousel, ready for luminescence analyses. About 30–40 aliquots were measured to ensure the most reliable statistical trends (Rodnight, Reference Rodnight2008). Protocols and programs used for measuring the luminescence signals are listed in Mahan et al. (Reference Mahan, Krolczyk and Knott2023). Several tests were performed before obtaining replicate DE from each sample. First, we conducted preheat tests at a variety of temperatures from 180–300°C on three aliquots of a representative sample unit of the particular deposit being dated (Aitken, Reference Aitken1985; Roberts et al., Reference Roberts, Galbraith, Olley, Yoshida and Laslett1999). Based on the results of the preheat tests, a preheat temperature of 225°C was used for dating the potassium feldspars. We then conducted a dose recovery test with a set preheat temperature of 225°C where samples are bleached and then given a dose of 400 Gy (Roberts et al., Reference Roberts, Galbraith, Olley, Yoshida and Laslett1999). Finally, we calculated a dose response curve for a characteristic saturation dose in which exposure to higher radiation does not produce a linear increase in the luminescence signal.
A single aliquot regenerative dose (SAR) protocol (Wintle and Murray, Reference Wintle and Murray2006) was used to determine the DE for each feldspar aliquot using continuous-wave OSL (CW-OSL). Aliquots were as small as possible for each measurement, generally 25–50 grains per disc. SAR feldspar using IRSL was also successfully performed. We followed the Kars et al. (Reference Kars, Busschers and Wallinga2012) 230°C post-IR IRSL protocol when producing DE for fine-grained potassium feldspars. There was a small but persistent fade correction (in the range of 3.4%/decade) in the post-IR IRSL (Huntley and Lamothe, Reference Huntley and Lamothe2001), which is considerably smaller than anomalous fading ranges on the polymineral fraction that had been used in previous studies.
Dose rate (DR) determinations
Dose rates were determined based on concentrations of K, Rb, U, and Th, which were measured by gamma spectrometry following the procedures described in Snyder and Duvall (Reference Snyder and Duval2003). The gamma-ray spectrometer provides the isotopic discrimination of gamma rays; correspondingly, beta and alpha dose rates may be estimated. In the laboratory, bulk samples were counted in a low-resolution gamma spectrometer fitted with a germanium detector. The cosmic-ray DR was estimated for each sample as a function of depth, elevation, and geomagnetic latitude, and added to the total dose rate (Prescott and Hutton, Reference Prescott and Hutton1994). The cosmic-ray DR was combined with the alpha, beta, and gamma dose rates to give the total DR. The total DR was corrected for the effects of grain size and water content. The K-spar grains are not etched, therefore all components of the DR were maintained, resulting in a higher DR than that of the quartz.
The bulk sediment was generally coarse grained, with a field moisture reading of 1–10% water. After drying, the sediment was weighed, reintroduced to water, centrifuged to simulate compaction, the water poured off, and the sediment was re-weighed to obtain an approximation of potential total water content, referred to hereafter as saturation moisture. DR and ages were calculated using ~20–30% of the saturated moisture to simulate average yearly precipitation since the samples were collected from environs around a lake that would have had locally high, but variable, water tables in the past.
Finally, similar to the 14C results, all luminescence ages are presented in ka (0 year = AD 2020). Uncertainties are given at the 95% (2σ) confidence level.
Results
Our observations and results frequently agree with previous studies. On the other hand, some of our observations contradict earlier studies, especially with respect to Quaternary lake deposits. With this context, we summarize our observations and results with respect to the locations and interpretations of previous studies.
Tephrochronology
The glass shard composition of the marker bed tuff dated at 3.13 ± 0.08 Ma by Lee et al. (Reference Lee, Rubin and Calvert2001; Fig. 3; Table 2; sample JRK-DSV-010318-1) and interbedded with sandstone conglomerate at location a of Miller (Reference Miller1928; Fig. 2; loc. a) is similar to the Upper Pliocene tuff of Mesquite Flat (Table 2; sample JRK-DV-206). Knott et al. (Reference Knott, Machette, Wan, Klinger, Liddicoat, Sarna-Wojcicki and Fleck2018) informally named the tuff of Mesquite Flat for a 1.9-m-thick tephra bed found 100 km to the southeast in the Furnace Creek Formation at the Kit Fox Hills in northern Death Valley where it overlies the Upper Pliocene Nomlaki Tuff (ca. 3.30 Ma). The marker bed tuff in DSV is >3 m thick, white with euhedral biotite and pumice commonly 5 mm in longest dimension. The eruptive source of the tuff of Mesquite Flat is unknown; however, the larger pumice size and thickness in DSV compared to Death Valley suggest an eruptive source closer to DSV, possibly the Long Valley volcanic center or Saline Range (Fig. 1). Based on the glass shard composition and age, we correlate the marker bed tuff in DSV with the tuff of Mesquite Flat.
Notably, the glass shard composition of sample JRK-DSV-010318-1 neither matches the Upper Pliocene tuff of Kit Fox Hills (ca. 3.1 Ma; Table 2) nor the tuff of Hunt canyon (3.1 ± 0.2 Ma; Table 2). In addition, the glass shard composition also does not match a sample of the Upper Pliocene tuff of Zabriskie Wash (3.335 ± 0.002 Ma; Table 2) found 7 km to the southeast at location EV in Eureka Valley (Fig. 2).
Pliocene and Quaternary fluvial rocks
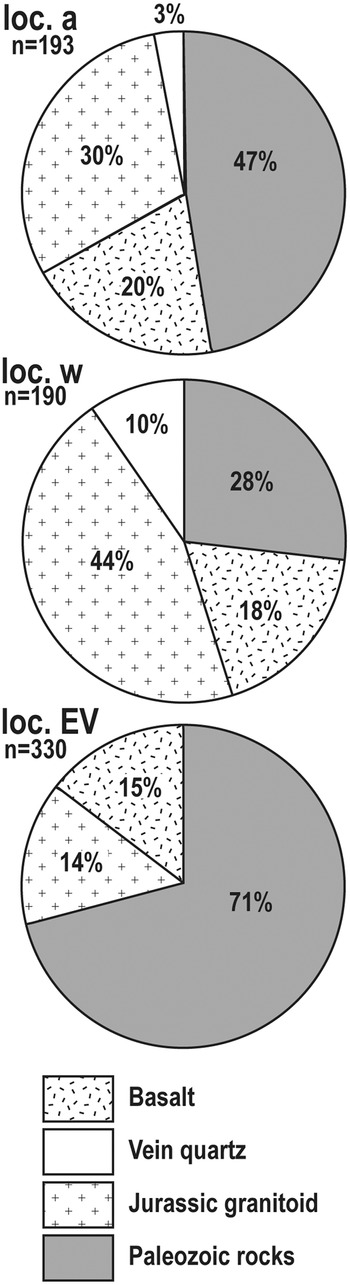
The rocks found west, atop and east of Deep Springs ridge, at locations a, w, x, y, and EV, respectively (Fig. 2), range from indurated, cross-bedded, medium- and coarse-grained sandstone to indurated boulder conglomerate (Fig. 3). Clast counts at locations a, w, and EV show that clasts consist primarily of Paleozoic metasedimentary quartzite and sandstone along with Jurassic granitoids, Miocene basalts, and vein quartz of unknown age (Fig. 4). The sandstone and conglomerate at locations a, w, x, and y were deposited on Jurassic granitoids and not within the Deep Springs ridge wind gaps.

Figure 4. Pie charts of clast counts from Pliocene sandstone conglomerate at locations a, w, and EV on Figure 2, with percentage of each rock type and number of clasts counted (n).
Miller (Reference Miller1928) inferred that the rocks at location a on Figure 2 were Quaternary lake beds; however, the presence of the tuff of Mesquite Flat (3.13 ± 0.08 Ma) interbedded with conglomerate shows that these rocks are Pliocene in age and too coarse for lacustrine deposits (Fig. 3). Similarly, Knott et al. (Reference Knott, Wan, Deino, Casteel, Reheis, Phillips, Walkup, McCarty, Manoukian, Nunez, Starratt and Rosen2019a) showed that the Quaternary lake beds mapped by McKee and Nelson (Reference McKee and Nelson1967) at location EV (Fig. 2) are also Pliocene sandstone and conglomerate interbedded with the tuff of Zabriskie Wash (3.335 ± 0.002 Ma). Based on similar lithology, geomorphic position, and age, we infer that the conglomerates at locations a, w, x, y, and EV are the same geologic unit.
Indurated sandstones to breccias crop out at the western mouth of Soldier Pass (loc. c on Fig. 2; Fig. 3; Miller, Reference Miller1928; Lustig, Reference Lustig1965). The cross-bedded, poorly sorted, medium- to thick-bedded (strike of beds: N12°E, dip of beds: 9°NW) sandstone to sandstone breccia is composed of angular to sub-angular, coarse-grained sand to pebble clasts (Fig. 3). The majority of clasts (>95%) are angular Jurassic granitoids that range from sand to boulder size, with sparse Paleozoic green shale pebbles (Fig. 3). As mapped by Lee et al. (Reference Lee, Rubin and Calvert2001; unit TQs), the outcrop covers a very limited area within the Soldier Pass wind gap. This deposit is undated; however, the geomorphic position within a wind gap suggests the deposit is equivalent in age to the Pleistocene Bishop ash bed-bearing deposits at location z (Fig. 2) in the Wyman Creek wind gap to the north.
Lake deposits
Nelson (Reference Nelson1966) mapped all lake beds as the same geologic unit (Ql). However, our observations of the relative stratigraphic relations show that there are older (Qlo) and younger (Qly) lake deposits (Fig. 2).
Upper Pleistocene lake deposits
Nelson (Reference Nelson1966) mapped lake beds (older playa lake) 1–3 km south of the mouth of Wyman Creek in northwest DSV (Fig. 2; loc. b). The deposits at location b are poorly cemented, massive, medium- to coarse-grained sandstone. The deposits overlie Jurassic granitoids and thicken toward DSV. Carbonate-filled root casts, consistent with paleo-spring or groundwater discharge through the sandstone, are also present. No playa lake deposits (thinly bedded, fine-grained mudstone or sandstone) were found at location b south of Wyman Canyon. These deposits are locally channelized; however, active erosion and deposition is occurring now, thus we have mapped these deposits as younger alluvium (Qya of Fig. 2).
Nelson (Reference Nelson1966) also mapped lake beds south of the mouth of Birch Creek in southwest DSV between ~1653 m asl and ~1600 m asl (Fig. 2; loc. d). We mapped these deposits as older lake beds (Qlo) because these lake beds are in buttress unconformity with older alluvial fan deposits (Qoa; see below), indicating the Qoa is younger than the lake beds. Intermediate-age alluvial fan deposits (Qia) and active channel deposits (Qya) also were mapped on the Birch Creek fan (Fig. 2). The Qya deposits are inset ~6 m below the top of the older lake beds.
The older lake beds are poorly exposed, except in a north-facing cut bank of Birch Creek (Fig. 5). The deposits are poorly cemented, laminated mudstone interbedded with massive, well-sorted, stratified, fine-grained sand interbedded with sparse gravel to pebble beds (Fig. 5). In the measured stratigraphic section at Birch Creek (Fig. 6), the basal contacts of the mudstone units are conformable, whereas basal contacts of the sand and gravel are disconformities. The beds are essentially horizontal, with the sand-rich units showing both asymmetrical and symmetrical ripples.

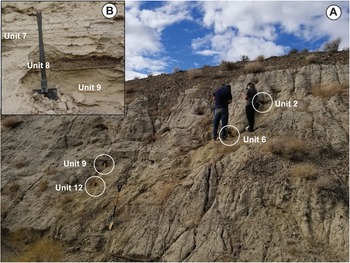
Figure 5. (A) Older lake beds of Deep Springs Valley where stratigraphic section was measured with locations of luminescence samples (circles) collected. (B) Close-up of massive sandstone of unit 9 overlain by pebbly conglomerate of unit 8 and poorly cemented mudstone of unit 7. See Figure 6 for full descriptions of units.

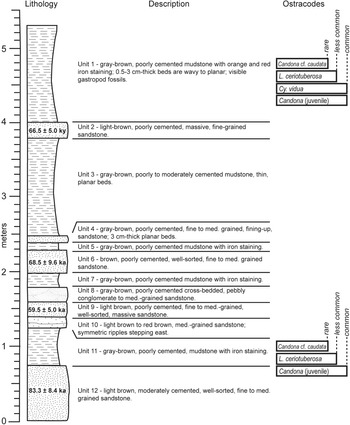
Figure 6. Measured stratigraphic section of nearshore older lake beds at the mouth of Birch Creek shown in Figure 5. Numbers in lithologic units 2, 6, 9, and 12 are infrared stimulated luminescence dates. Relative ostracode abundances are from units 1 and 11. Abbreviations: L. = Limnocythere, Cy. = Cypridopsis.
In the Birch Creek measured section, fossils were visible in outcrop at unit 1 (Fig. 6). We examined bulk samples of each stratigraphic unit, but fossil gastropods, ostracodes, and plants were found only in the mudstone of units 1 and 11. All sandstone units were devoid of fossils.
The freshwater gastropod fauna in unit 1 consists of two main families: Lymnaeidae (Stagnicola sp.) and Planorboidea (Gyraulus? sp. or Planorbella? sp.; Fig. 7; Lindsey Groves, Los Angeles County Museum of Natural History, written communication, 2021). The Lymnaeidae range in size from 3–15 mm in length. The Planorbidae fossils range from 1–6 mm. Most of the fossils are intact and well preserved, and the broad range in size indicates a population of juveniles and adults (Fig. 7).

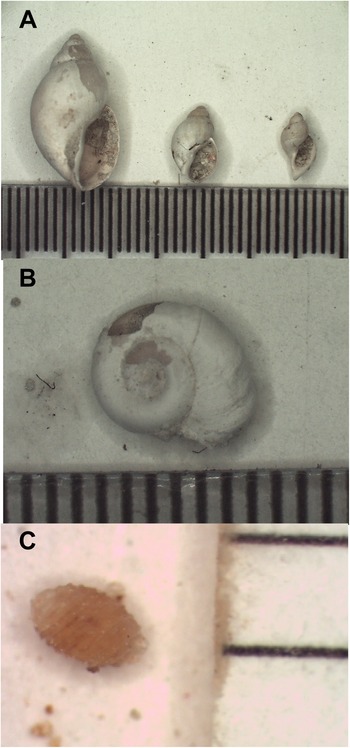
Figure 7. Photographs of fossils from unit 1 of measured section of lacustrine beds. (A) Stagnicola sp. (Family Lymnaeidae) adults and juveniles; (B) either Planorbella? sp. or Gyraulus? sp. (Family Planorbidae) adult; (C) charophyte oogonium. Scales in all photographs are in mm.
Freshwater ostracodes found in units 1 and 11 are: Candona cf. C. caudata, Limnocythere ceriotuberosa, and Cypridopsis (Cy.) vidua, with both adults and juveniles present. Cypridopsis vidua is common in unit 1, with C. cf. C. caudata and L. ceriotuberosa also present. In unit 11, C. cf. C. caudata is common.
Charophytes, including the female reproductive organ or oogonium, are plant fossils commonly found in lacustrine sediments that were deposited in the shallow littoral zone of lakes (Peck, Reference Peck1953; Tucker and Wright, Reference Tucker, Wright and Tucker1990). In DSV, charophyte oogonia <1 mm in diameter are abundant in unit 1 of the stratigraphic section (Fig. 7).
A sample of Stagnicola sp. from unit 1 of the measured section (Fig. 6) was submitted to Aeon Laboratory for accelerator mass spectrometry radiocarbon dating (Table 3). Analysis yielded a radiocarbon age of 39,930 ± 590 14C yr BP. Pigati et al. (Reference Pigati, McGeehin, Muhs and Bettis2013) stated that 14C dates on gastropod shells that approach ca. 40 ka should be viewed with caution because as little as 1% modern carbon may cause shells are that >50 ka to yield dates in the range of 35–40 ka.
Table 3. Results of radiocarbon analysis of gastropod Stagnicola sp. (Family Lymnaeidae) analyzed at Aeon Radiocarbon Dating Services.

a The amount of sample carbon analyzed for 14C.
b The percentage of carbon in the sub-sample, which is the portion of the total submitted material that is subjected to pretreatment.
c The 14C activity ratio, relative to “Modern” as defined by Oxalic Acid I standard, corrected for isotopic fractionation and normalized to ∂13C = −25‰.
d 14C age is the conventional radiocarbon age, based on the “Libby” 5568-year half-life.
e 1σ uncertainty.
Contamination by modern carbon appears to be responsible for the 39 14C ka date we obtained. The geomorphic position of the older lake deposits indicates they are older than the older alluvial fan deposits with well-developed desert pavements. Cosmogenic exposure dating of geomorphically similar older alluvial fan deposits in Death Valley are commonly ca. 90–60 ka (Frankel et al., Reference Frankel, Brantley, Dolan, Finkel, Klinger, Knott and Machette2007; Machette et al., Reference Machette, Slate and Phillips2008). The ca. 39 14C ka radiocarbon date is also in conflict with the IRSL dating (see below). Therefore, we consider the ca. 39 14C ka radiocarbon date as unreliable—likely the result of a mixture of dead and modern radiocarbon—and subsequently do not consider the radiocarbon date in our interpretations.
Four IRSL dates (Table 4) from well-sorted sandstone units 12, 9, 6, and 2 (lowest to highest) in the measured stratigraphic section of Qlo (Fig. 6) are : 83.3 ± 8.4 ka, 59.5 ± 5.0 ka, 68.5 ± 9.6 ka, and 66.5 ± 5.0 ka (2σ errors), respectively. All dates are corrected for anomalous fading.
Table 4. Feldspar infrared stimulated luminescence (IRSL) data and dates for Deep Springs Valley, CA.

a Units are from Figure 6.
b Field moisture, with figures in parentheses indicating the complete sample saturation %. Ages calculated using 20–30% of the saturated moisture (i.e., 0 (27) = 27*0.30 = 8).
c Analyses obtained using high-resolution gamma spectrometry (high purity Ge detector).
dIncludes cosmic doses and attenuation with depth calculated using the methods of Prescott and Hutton (Reference Prescott and Hutton1994). Cosmic doses were ~0.25–0.15 Gy/ka.
e Number of replicated equivalent dose (DE) estimates used to calculate the total. Figures in parentheses indicate total number of measurements included in calculating the represented DE and age using the minimum age model (MAM; Galbraith and Roberts, Reference Gailbraith and Roberts2012), except for unit 12 for which the central age model (CAM; Galbraith and Roberts, Reference Gailbraith and Roberts2012) was used; analyzed via single aliquot regeneration on K-feldspar grains.
f Defined as “over-dispersion” of the DE values. Obtained by the “R” factor program. Values >30% are considered to be poorly bleached or mixed sediments.
G Dose rate and age for fine-grained 250–90 μ K-feldspar, post IR230C; fade of 3.4%/decade. Exponential + linear fit used on DE, errors to 2σ.
These dates represent the most bleached grains in the minimum age model (Galbraith and Roberts, Reference Gailbraith and Roberts2012). We used the minimum age model, except for unit 12, where we used the central age model because the two equivalent dose measurements that made up the minimum age model were not reliable enough. Scatter in the equivalent dose was low (<30%) for all samples, which is an indication that samples are bleached (Table 4). We could not use quartz to check against the partial bleach in feldspars because of the underestimation it gives in equivalent dose due to a dominant slow component.
Upper Pleistocene(?)–Holocene lake deposits
Our observations near Birch Creek show that what we call the older lake deposits (Qlo) are older than the older alluvial fan deposits. As mentioned previously, Nelson (Reference Nelson1966) mapped shorelines and lake beds incised onto, and thus younger than, older Late Pleistocene alluvial fan deposits (Qoa). These relative stratigraphic relations clearly show there were two lakes: one older (Qlo) and one younger (Qly) than Qoa.
The linear, horizontal features formed by Qly and mapped as shorelines by Nelson (Reference Nelson1966) are visible in Google Earth imagery (v. 7.3.4.8642; image date: 8/9/2013) incised into and deposited on Late Pleistocene alluvial fans to Holocene basin-fill deposits between ~1592 m asl and ~1507 m asl, especially near Payson Canyon (Fig. 2). These linear features, which Nelson (Reference Nelson1966) described as “beach levels,” are not readily identifiable in the field. One of these “beach levels” appears as a faint, linear feature visible on the darker Qoa surface at elevation ~1592 m asl near location d.
Nelson (Reference Nelson1966) mapped lake bed deposits west of the Deep Springs playa (Fig. 2). Lawson (Reference Lawson2017) determined IRSL ages of 10.94 ± 0.95 ka and 7.71 ± 0.67 ka on these lake beds at ~1570 m asl and ~1537 m asl, respectively (Figs. 2, 8). Our observations are that the 1537-m-asl deposits consist of poorly cemented, cross-bedded, silty clay to sandy gravel whose geomorphic position suggests deposition as a beach bar.

Figure 8. Schematic profile from the mouth of Birch Creek in southwest Deep Springs Valley to the playa floor showing the pertinent geologic and hydrologic features with their present-day elevation in meters above sea level (m asl). Elevation of the Soldier Pass sill is projected from Deep Springs ridge. The Pleistocene lake water level is the elevation of the highest older lake beds (Qlo; 1653 m asl) plus the maximum water depth (15 m) that charophytes tolerate. The difference between the sill elevation and water level likely has increased due to tectonic uplift of the sill and erosion of the older lake beds. The highest and lowest elevations of the younger lake shorelines, Late Pleistocene(?)–Holocene, along with luminescence dates from Larson (2017) on these shorelines, are also shown.
Quaternary alluvial fans
Nelson (Reference Nelson1966) divided the alluvial fan deposits in southern DSV into older (Qof) and younger (Qf) fans. We divide the alluvial fans into older (Qoa), intermediate (Qia), and younger (Qya; active) alluvial fan deposits based on surface morphology and height above the active channel (Fig. 2; after Bedford et al., Reference Bedford, Miller and Phelps2006). Alluvial fans with a greater abundance of Paleozoic metasedimentary clasts have better developed desert pavements and a greater number of desert-varnished clasts.
The older alluvial fan deposits (Qoa) at Birch Creek largely consist of highly weathered Jurassic granitoid clasts mixed with Paleozoic metasedimentary clasts (e.g., shale, sandstone, and quartzite). The granitoid clasts readily weather, which produces a weak desert pavement with desert varnish relegated to Paleozoic metasedimentary rock clasts. The Qoa at Birch Creek extends to ~1575 m asl with a horizontal linear feature on the Qoa deposits at Birch Creek (Fig. 2; loc. d) at ~1592 m asl (Fig. 8).
At Payson Canyon (Fig. 2), the Qoa deposits are ~10 m above the active channel and mantled by darkly varnished clasts (5YR 3/1; Munsell Color, 2000) of Paleozoic metasedimentary rock in a well-developed desert pavement (Harmon et al., Reference Harmon, Khashchevskaya, Morency, Owen, Jennings, Knott and Dortch2021). Linear features and deposits interpreted as shorelines and lake deposits, respectively, by Nelson (Reference Nelson1966) are prominent on the Qoa in Google Earth imagery, but not detectable in the field.
The clast composition of the intermediate-age alluvial fan deposits (Qia) at Birch Creek and Payson Canyon is similar to the Qoa fans. The Qia deposits at Birch Creek retain a subdued bar-and-swale geomorphology and desert varnish is sparse. The Qia deposits at Payson Canyon, which are ~6 m above the active channel, have darkly varnished (10YR 3/1; Munsell Color, 2000) Paleozoic metasedimentary clasts with a well-developed desert pavement. The Qia deposits extend to ~1533 m asl with a possible shoreline feature visible on Google Earth imagery at ~1535 m asl on the Qia fan lobe of the Payson Canyon alluvial fan.
Active channels (Qya) at both Birch Creek and Payson Canyon are incised ~1–6 m into the Qia deposits. The Qya deposits consist of angular to subrounded Paleozoic metasedimentary and granitoid clasts with a bar-and-swale morphology and poorly developed desert varnish.
Discussion
Pliocene fluvial deposits
Our identification of basalt clasts in the Pliocene conglomerate at locations a, w, and EV (Fig. 4) supports the provenance of this conglomerate as the Crooked Creek tributary of the Wyman Creek watershed (Fig. 2). Previous studies had noted clasts of Paleozoic metasedimentary rock, granitoid rock, and rhyolite, but not basalt. West of Deep Springs ridge, Miocene basalt and Paleozoic metasedimentary rocks crop out exclusively in the Wyman Creek watershed (Fig. 2). Our clast counts support the earlier hypothesis that streams originating in the White Mountains had crossed into Eureka Valley prior to the formation of DSV and Deep Springs ridge (Fig. 8; Miller, Reference Miller1928; Reheis and McKee, Reference Reheis, McKee, Reheis, Sarna-Wojcicki, Meyer, McKee, Slate, Burbank, Sawyer and Pendall1991; Reheis and Sawyer, Reference Reheis and Sawyer1997; Lee et al., Reference Lee, Rubin and Calvert2001).
We assign the Late Pliocene fluvial conglomerate (ca. 3.3–3.1 Ma) found in DSV and Eureka Valley to the Furnace Creek Formation of Death Valley (Fig. 2). The age and depositional environment are consistent with the Furnace Creek Formation whose northernmost outcrops are 50 km to the southeast (Knott et al., Reference Knott, Machette, Wan, Klinger, Liddicoat, Sarna-Wojcicki and Fleck2018). In addition, paleogeographic reconstructions support a Pliocene hydrologic connection from the Eureka Valley to Death Valley (Lutz et al., 2023), which makes the deposits in DSV and Eureka Valley part of the same Pliocene watershed as the Furnace Creek Formation of Death Valley.
Other Upper Pliocene to Pleistocene geologic units are geographically closer than the Furnace Creek Formation; however, those other units are outside the Pliocene watershed. For example, the Miocene–Pliocene Esmeralda Formation of McKee and Nelson (Reference McKee and Nelson1967), which is 20 km east of Deep Springs ridge at Willow Wash in Fish Lake Valley, is also Upper Pliocene in age (Reheis et al., Reference Reheis, Sarna-Wojcicki, Burbank, Meyer, Reheis, Sarna-Wojcicki, Meyer, McKee, Slate, Burbank, Sawyer and Pendall1991); however, the Esmeralda Formation was not within the Pliocene watershed of Death Valley (Reheis and Sawyer, Reference Reheis and Sawyer1997). The Waucoba Lake Beds are 30 km to the southwest in Owens Valley; however, the Waucoba Lake beds are younger (≤ 2.8 Ma; Lueddecke et al., Reference Lueddecke, Pinter and Gans1998) and outside the Pliocene watershed.
Pleistocene Fluvial Deposits
Deposits in the Cottonwood Creek and Wyman Creek wind gaps, which include the Pleistocene Bishop ash bed, are age-equivalent to the informally named Mormon Point formation of Death Valley (Knott et al., Reference Knott, Sarna-Wojcicki, Meyer, Tinsley, Wells, Wan, Wright and Troxel1999); however, we only note the equivalence on Figure 2 and do not assign these to the Mormon Point formation. Deposits equivalent in age to the Mormon Point formation are of limited extent in DSV and deposits of this age already have several local names (e.g., Qa of McKee and Nelson, Reference McKee and Nelson1967; alluvium containing Bishop ash bed of Reheis and Sawyer, 1995; Middle Miocene(?)–Pleistocene sandstone and conglomerate of Lee et al., Reference Lee, Rubin and Calvert2001), so a more comprehensive assessment of these Pleistocene deposits is necessary rather than adding another name for consideration.
Although there is no direct dating of the deposit at location c, based on its geomorphic position in a wind gap, we tentatively infer that the coarse-grained sandstone to conglomerate at the western end of Soldier Pass (Fig. 2; loc. c; Fig. 3) is equivalent in age to the Bishop ash-bearing deposits at location z and the Mormon Point formation. The coarse-grained sandstone at location c is more indurated than the older lake deposits at location d. As observed by Lustig (Reference Lustig1965) and Reheis and McKee (Reference Reheis, McKee, Reheis, Sarna-Wojcicki, Meyer, McKee, Slate, Burbank, Sawyer and Pendall1991), the deposits at location c record the eastward flow of water through Soldier Pass. Reheis et al. (Reference Reheis, Slate, Sarna-Wojcicki and Meyer1993) inferred eastward flow of water through all three wind gaps across Deep Springs ridge during the Pleistocene.
Deep Springs Lake
Late Pleistocene lake
Our data and observations show that the deposits on the south lobe of the Birch Creek alluvial fan (Fig. 2; loc. d) are Quaternary freshwater lake deposits (Fig. 5). The other locations described as Quaternary freshwater lake deposits by Miller (Reference Miller1928; locs. a, b, and c) are either not Quaternary (loc. a) or not lake deposits (locs. b and c). Lee et al. (Reference Lee, Rubin and Calvert2001) mapped the so-called lake deposits of Miller (Reference Miller1928) at location a as conglomerate (Fig. 3) and provided a 40Ar/39Ar date of 3.13 ± 0.08 Ma on the tuff marker bed. Correlation of the tuff marker bed to the tuff of Mesquite Flat confirms the Pliocene age (Table 2). Thus, the deposits at location a are neither lacustrine nor Quaternary. The deposits south of the mouth of Wyman Creek (Fig. 2; loc. b) and at the west end of Soldier Pass (Fig. 2; loc. c), which were called Quaternary freshwater lake deposits by Miller (Reference Miller1928), are sandstone and sandstone conglomerate that are more consistent with alluvial fan and fluvial deposits (Fig. 3).
Interbedded mudstone and massive sandstone along with intercalated cross-bedded gravel (Figs. 5, 6) occur at location d on the south side of Birch Creek, which we map as the older lake beds (Qlo; Fig. 2). We interpret these alternating facies as a near shore, low energy, lacustrine ramp environment produced by rising and falling lake levels (Renault and Gierlowski-Kordesch, Reference Renault, Gierlowski-Kordesch, James and Dalrymple2010). Symmetric wave ripples in the sandstone beds also indicate deposition in a near shore lacustrine environment in as little as a few centimeters of water (Reineck and Singh, Reference Reineck and Singh1980).
In our interpretation, the measured section represents five transgressive/regressive lake sequences in a balanced-fill lake. Units 12, 10–8, 6, 4, and 2 are upper shoreface to lower shoreface facies sandstones in a shallowing lake (Renault and Gierlowski-Kordesch, Reference Renault, Gierlowski-Kordesch, James and Dalrymple2010). The overlying mudstone units (11, 7, 5, 3, and 1) are offshore facies produced by a deepening lake. In this interpretation, the pebbly sandstone of unit 8 represents a beach or, possibly, a distal fluvial deposit. The limited incision and lack of alluvial fan deposition suggests relatively small fluctuations in lake level, which is characteristic of a balanced-fill lake (Bohacs et al., Reference Bohacs, Carroll, Neal, Mankiewicz, Gierlowski-Kordesch and Kelts2000). As the name suggests, balanced-fill lakes are characterized by nearly equal water inflow and outflow with the fluctuations commonly caused by climate variability (Bohacs et al., Reference Bohacs, Carroll, Neal, Mankiewicz, Gierlowski-Kordesch and Kelts2000; Renault and Gierlowski-Kordesch, Reference Renault, Gierlowski-Kordesch, James and Dalrymple2010).
Fossil data from the measured section at location d (Figs. 2, 6) are consistent with a near shore lake environment in a balance-fill lake. The gastropods Stagnicola sp. and Planorbidae are air breathing freshwater snails that commonly live in calm, fresh water (Taylor, Reference Taylor and Smiley1985). Candona cf. C. caudata are ostracodes associated with freshwater lakes (<2000 mg/L total dissolved solids) supported by persistent stream flow (Forester et al., Reference Forester, Lowenstein and Spencer2005). Limnocythere ceriotuberosa are ostracodes found in low to moderate alkalinity lakes that receive high inflow (Forester, Reference Forester, Ruddiman and Wright1987; Forester et al., Reference Forester, Lowenstein and Spencer2005). Cypridopsis vidua is an ostracode species that favors the margins of fresh to saline lakes (Forester, Reference Forester1991). Charophytes are floating-leafed plants found in the littoral zone of lakes in <15 m of water (Tucker and Wright, Reference Tucker, Wright and Tucker1990). Collectively, these fossils are evidence of a freshwater lake with persistent inflow and that ~1653 m asl was near the lake shore and water's surface elevation.
The sedimentology and paleontology data suggest that the ~1653 m asl elevation of these near shore deposits at location d are either a few centimeters or, at most, 15 m (~1668 m) from the water level of the lake (Fig. 8). The symmetrical ripples suggest water only a few centimeters deep (Reineck and Singh, Reference Reineck and Singh1980). Charophytes are found in water that is, at most, 15 m deep (Tucker and Wright, Reference Tucker, Wright and Tucker1990), making the water surface between ~1653 m asl and ~1668 m asl (Fig. 8).
The sill in Soldier Pass is a hard sill composed of Jurassic granitoids at ~1682 m asl or ~15–30 m above the ~1668–1653 m asl lake level hypothesized at location d (Fig. 8). If the vertical slip rate of ~0.9 mm/yr on the Deep Springs fault determined by Lee et al. (Reference Lee, Rubin and Calvert2001) is correct, then ~53 m of vertical slip has occurred over the last 60 ka. Tilted beds on the Deep Springs ridge footwall (Lee et al., Reference Lee, Rubin and Calvert2001) show that some of the vertical slip resulted in tilting and uplift of Deep Springs ridge. Thus, the Soldier Pass sill is most likely higher than it was 60,000 years ago. The ~1668–1653 m asl water level assumes that the lake beds cropping out at location d have not eroded. Considering the poorly indurated nature of the sediments, a more appropriate assumption is that some portion of the lake beds at location d have eroded and the water level determined from the lake beds at location d is most likely underestimated due to erosion. We hypothesize that the water level underestimation, the uplift of Deep Springs ridge, and the balanced-fill nature of the older lake deposits are consistent with Deep Springs Lake overflowing the Soldier Pass sill into Eureka Valley.
Stratigraphically from lowest to highest, the IRSL dates from the older lake beds are 83.3 ± 8.4 ka, 59.5 ± 5.0 ka, 68.5 ± 9.6 ka, and 66.5 ± 5.0 ka (Table 4; Fig. 6). The IRSL dates are complicated by the lack of stratigraphic order in the upper three dates. The sequences in the stratigraphic section indicate that the lake fluctuated over time. This suggests that averaging the four IRSL dates (69.5 ± 8.7 ka) to depict a single lake event is not an accurate representation of the sedimentology and eliminates the simplest interpretation of a single lake. Alternatively, one or more of the upper three IRSL dates may be discounted due to partial bleaching; however, the over-dispersion of the equivalent dose rate (scatter) is within acceptable limits (<30%) for each sample, so none of the dates may be discounted as poorly bleached or mixed (Table 4).
In our interpretation, we treat the 83.3 ± 8.4 ka date at the base of the measured section as reliable and separate from the three overlying dates (59.5 ± 5.0 ka, 68.5 ± 9.6 ka, and 66.5 ± 5.0 ka). The three younger dates overlap within a 2σ error at ca. 64.5–61.5 ka (Fig. 9), with a mean of 64.8 ± 3.9 ka (ca. 69–61 ka). We infer that the wider age range represented by the mean and standard deviation (ca. 69–61 ka) is the most conservative age for the three upper IRSL dates. Using the depositional sequences, the lower part of the section (units 12 and 11) shows that Deep Springs Lake reached >1648 m asl at 83.3 ± 8.4 ka. In the balanced-fill lake, the water level fluctuated as the upper 4 m of the section (units 10–1) was deposited between ca. 69–61 ka.

Figure 9. Plot of total rock flour abundance (% of clay-sized sediment) in composite of cores OL 90/92 from Owens Lake (Owens L.) over time (after Bischoff and Cummins, Reference Bischoff and Cummins2001). Increasing rock flour corresponds to Sierra Nevada glacial advances or stades (S4, S5, S6, and S7). The times when Owens Lake was rising and a closed basin and when it overflowed are also shown. The squares are the individual infrared stimulated luminescence dates (ka) from Deep Springs Valley (with 2σ error bars). The triangle is the mean plus standard deviation of the younger three dates. The circle is the cosmogenic 36Cl date (ka) with 2σ error bars of Columbus Salt Marsh shoreline deposit. Age control for this part of the OL 90/92 core is ± 5000 years. The Marine Isotope Stages (MIS) 3/4 and 4/5 boundaries are from Lisiecki and Raymo (Reference Lisiecki and Raymo2005).
We did not observe evidence of substantial erosion (e.g., flutes, rip-up clasts, etc.) or soil development on the top of unit 11 to support a hiatus. The absence of a hiatus supports the interpretation that Deep Springs Lake was a fluctuating, balanced-fill lake that persisted above ~1653 m asl from ca. 83–61 ka, or beginning in MIS 5a and encompassing nearly all of the MIS 4 (ca. 71–57 ka; Lisiecki and Raymo, Reference Lisiecki and Raymo2005). The exact water level of Deep Springs Lake is unclear; however, in the balanced-fill lake model, water level persists at or near the sill elevation (Bohacs et al., Reference Bohacs, Carroll, Neal, Mankiewicz, Gierlowski-Kordesch and Kelts2000; Renault and Gierlowski-Kordesch, Reference Renault, Gierlowski-Kordesch, James and Dalrymple2010).
Support for the interpretation that units 12 and 11 in the stratigraphic section (ca. 83 ka; Fig. 6) represent one phase of lake deposition that is disconformably overlain by a second phase of deposition, which is recorded by units 10–1 (ca. 69–61 ka) is found in the Owens Lake core, which shares a drainage divide with DSV (Figs. 1, 9). Bischoff and Cummins (Reference Bischoff and Cummins2001) described a glacial advance in the Sierra Nevada (Fig. 9; stade 7) resulting in high water influx to Owens Lake starting at ca. 78 ka (Smith et al., Reference Smith, Bishchoff, Bradbury, Smith and Bishchoff1997). This glacial advance is followed by a significant glacial retreat ca. 76 ka between stades 7 and 6 (Fig. 9). Glacial advance during stade 6 caused high water influx in Owens Lake, which persisted until ca. 62 ka. Thus, Owens Lake level rose at ca. 78 ka (MIS 5a) with overflow conditions from ca. 72–62 ka (MIS 4). The age control in this portion of Owens Lake core 90/92 is by U-series with an error of ±5 ka (Biscoff and Cummins, 2001), so the timing of the MIS 5a and MIS 4 lake phases at both Owens Lake and Deep Springs Lake is within error for the dating methods.
Fish Lake Valley also shares a drainage divide with DSV and receives runoff from the eastern White Mountains north of DSV (Fig. 1). Columbus Salt Marsh is a closed basin in the northern portion of Fish Lake Valley. Cosmogenic 36Cl dating of the highest shoreline gravels at Columbus Salt Marsh yields a depositional age of 70 +20/−14 ka (Fig. 9; Kurth et al., Reference Kurth, Phillips, Reheis, Redwine and Paces2011). This 70 +20/−14 ka date for a high shoreline at Columbus Salt Marsh is within the time range (ca. 83–61 ka) for the balanced-fill lake in DSV.
According to Bischoff and Cummins (Reference Bischoff and Cummins2001), the Sierra Nevada glacial advance and coincident increased water flux into Owens Lake during MIS 5a and MIS 4 are due to lower summer insolation rather than increased precipitation. Bischoff and Cummins (Reference Bischoff and Cummins2001) observed that the Sierra Nevada glacial advance at 78 ± 5 ka (during MIS 5a) did not cause Owens Lake to overspill its sill. The glacial advance and increased effective precipitation (i.e., wetter conditions) during MIS 5a are unusual because often these climatic events coincide with even-numbered (e.g., MIS 4; ca. 71–57 ka) oxygen isotope stages (e.g., Gillespie and Clark, Reference Gillespie and Clark2011). Because Owens Lake remained a closed water body during the glacial advance, Bischoff and Cummins (Reference Bischoff and Cummins2001) inferred that the glacial advance was not accompanied by increased precipitation that would have fallen directly into pluvial Owens Lake and at lower elevations. Instead, they inferred that the glacial advance during stade 7 was due to low summer insolation. Insolation models support the lower summer insolation and cooler temperatures beginning in MIS 5a (Berger and Loutre, Reference Berger and Loutre1991; Doughty et al., Reference Doughty, Kaplan, Peltier and Barker2021). Thus, lower insolation and cooler temperatures were a regional climate change that produced Deep Springs Lake, which also was supported by snowmelt runoff and precipitation in the unglaciated watershed (Nelson, Reference Nelson1966; Krauskopf, Reference Krauskopf1971) from ca. 83–61 ka. The climate conditions during MIS 5a and MIS 4 contrast with the last glacial maximum (LGM, 29–14 ka; Lisiecki and Raymo, Reference Lisiecki and Raymo2005) when precipitation increased and summer temperatures decreased (Hostetler and Clark, Reference Hostetler and Clark1997; Smith et al., Reference Smith, Bishchoff, Bradbury, Smith and Bishchoff1997).
Late Pleistocene–Holocene lake
The shoreline features and deposits (Qly) mapped by Nelson (Reference Nelson1966) and shown on Figure 2 overlie the older alluvial fans (Qoa) and indicate that a lake existed in DSV during the Late Pleistocene and Holocene. This is confirmed by Lawson's (Reference Lawson2017) IRSL ages of 10.94 ± 0.95 ka and 7.71 ± 0.67 ka on beach bar deposits at 1570 m asl and 1537 m asl, respectively. Shorelines higher than the 10.94 ka shoreline at 1570 m asl must be older than 11 ka and, therefore, Late Pleistocene in age.
The higher elevation shorelines (~1592–1570 m asl) are undated; however, relative stratigraphic relations indicate an age that is younger than the older lake deposits (ca. 81–63 ka) and older than the ca. 10–7 ka lake deposits. Late Pleistocene high stands and transgressions occurred in Owens Valley (ca. 13.8 and 12.8 ka; Benson et al., Reference Benson, Burdett, Lund, Kashgarian and Mensing1997; Bacon et al., Reference Bacon, Jayko, Owen, Lindvall, Rhodes, Schumer and Decker2020), Searles Valley (ca. 14 ka; Smith, Reference Smith2009; Knott et al., Reference Knott, Liddicoat, Coe, Negrini, Starratt and Rosen2019b), Panamint Valley (ca. 24–17 ka; Jayko et al., Reference Jayko, Forester, Kaufman, Phillips, Yount, McGeehin, Mahan, Reheis, Hershler and Miller2008), Death Valley (ca. 34 ka, 25 ka, and 16 ka; Lowenstein et al., Reference Lowenstein, Li, Brown, Roberts, Ku, Luo and Yang1999) and Lake Lahontan to the north (ca. 14–13 ka; Adams and Wesnousky, Reference Adams and Wesnousky1998). Thus, a similar Late Pleistocene transgression is possible in DSV, with only the early Holocene deposits amenable for geochronology.
Deep Springs Valley paleogeography
Both Reheis and Sawyer (Reference Reheis and Sawyer1997) and Lee et al. (Reference Lee, Rubin and Calvert2001) described the tectonic development of DSV. Our data do not alter their main interpretations, but provide additional confirmation of the paleogeography. The conglomerate of the Pliocene Furnace Creek Formation found on either side of and atop Deep Springs ridge confirms a fluvial system flowing northwest-southeast and extending from the Wyman Creek basin in the White Mountains into Eureka Valley (Fig. 10). Based on a constant slip rate, Lee et al. (Reference Lee, Rubin and Calvert2001) inferred that the Deep Springs fault initiated ca. 1.7 Ma, which caused uplift of Deep Springs ridge and down dropping of DSV.

Figure 10. Model of the development of Deep Springs Valley based on Miller (Reference Miller1928), Reheis and McKee (Reference Reheis, McKee, Reheis, Sarna-Wojcicki, Meyer, McKee, Slate, Burbank, Sawyer and Pendall1991), Reheis and Sawyer (Reference Reheis and Sawyer1997), Lee et al. (Reference Lee, Rubin and Calvert2001), and this study. Lower case letters (a, b, c, d, w, x, y, z) are locations from Miller (Reference Miller1928; Fig. 2); location EV in Eureka Valley is from Knott et al. (Reference Knott, Wan, Deino, Casteel, Reheis, Phillips, Walkup, McCarty, Manoukian, Nunez, Starratt and Rosen2019). Streams emanating from the White Mountains are Cottonwood Creek (CWC), Crooked Creek (CC), Wyman Creek (WC), and Birch Creek (BC). Fish Lake Valley fault zone (fz) is shown for reference. (A) 3.4–3.1 Ma: CWC, CC, WC, and BC emmanate from the White Mountains and flow southeast across a fluvial plain into Eureka Valley depositing conglomerate of the Furnace Creek Formation at locations a, w and EV. (B) 1.7 Ma: As inferred by Lee et al. (Reference Lee, Rubin and Calvert2001), normal slip on the Deep Springs fault initiates down dropping on the NW side and uplifting of the Deep Springs ridge (DSr). We hypothesize that an antithetic fault formed on the southeast side of DSr to accommodate the elevation difference between locations EV and w. The slip rate on the Deep Springs fault is insufficient to defeat flow of the White Mountain streams across DSr. (C) About 0.772 Ma: Stream power increases producing incision of Soldier Pass (SP), Wyman wind gap (Wwg), and Cottonwood wind gap (Cwg) across DSr. Cottonwood Creek is captured and flows NE into Fish Lake Valley. The Bishop ash bed is incorporated into fluvial deposits in the Cwg and Wwg. (D) Present: Normal displacement on Deep Springs fault is sufficient to defeat WC and BC, forming a hydrologically isolated basin and the salt pan (circle with vertical lines) in southern Deep Springs Valley with one possible overflow event during Marine Isotope Stage 5a/4 across SP into Eureka Valley.
As described by Reheis and Sawyer (Reference Reheis and Sawyer1997), an increased slip rate on the Deep Springs fault prior to eruption of the Pleistocene Bishop ash bed (ca. 0.772 Ma) caused incision into Deep Springs ridge. The Bishop ash bed was then deposited into these incised valleys (Fig. 10). After 0.772 Ma, another slip rate increase ultimately defeated streams crossing Deep Springs ridge, forming the wind gaps (Reheis and Sawyer, Reference Reheis and Sawyer1997; Lee et al., Reference Lee, Rubin and Calvert2001). After 0.772 Ma, DSV was predominantly an isolated basin, except, perhaps, when Deep Springs Lake overflowed during MIS 5a and MIS 4.
After 60 ka, probably during the last glacial maximum (23–14 ka or MIS 2), when the northern White Mountains were glaciated (Elliott-Fisk, Reference Elliott-Fisk1987; Zreda and Phillips, Reference Zreda and Phillips1995), an ~60 km2 Deep Springs Lake occupied the southern part of DSV to elevation 1570 m asl. The 10.9–7.7 ka OSL dates obtained by Lawson (Reference Lawson2017) are most likely ages of recessional shoreline features of this desiccating lake.
Biogeography
The tectonic isolation of DSV between ca. 3.1 Ma and 0.7 Ma generally coincides with the timing of divergence and isolation for springsnails and pupfish in the western Great Basin (Echelle, Reference Echelle, Reheis, Hershler and Miller2008; Hershler and Liu, Reference Hershler, Liu, Reheis, Hershler and Miller2008). With respect to DSV, however, an important species is the black toad (Anaxyrus exsul) of Deep Springs Valley (Myers, Reference Myers1942). How this essentially aquatic, genetically unique, toad found in small ponds in southern DSV became isolated in DSV from other toads in North America is the subject of a long-running herpetological debate (i.e., Myers, Reference Myers1942; Goebel et al., Reference Goebel, Ranker, Corn and Olmstead2009). Using molecular clock data, Goebel et al. (Reference Goebel, Ranker, Corn and Olmstead2009) estimated that the A. exsul diverged from other toad species in western North America during the Early to Middle Pleistocene, which is consistent with the geologic data discussed above.
In addition, Goebel et al. (Reference Goebel, Ranker, Corn and Olmstead2009) placed A. exsul in the same clade with toads in Darwin Canyon (A. boreas halophilus), which are found 115 km south in Panamint Valley (Fig. 1). The distribution of Pliocene deposits supports a Pliocene interbasinal fluvial system from DSV southeast into Death Valley (Lutz et al., Reference Lutz, Knott, Phillips, Heizler, Heitkamp, Griffie, Asxen and Calzia2023). Also, water from the Nova basin (Fig. 1) flowed east from western Panamint Valley into Death Valley during the Pliocene. Thus, the potential exists for a fluvial system that connected the present-day habitats of the genetically similar toads in DSV and Darwin Canyon during the Pliocene. This fluvial system was tectonically disrupted after ca. 3 Ma (Lutz et al., Reference Lutz, Knott, Phillips, Heizler, Heitkamp, Griffie, Asxen and Calzia2023), which effectively isolated the toads.
Conclusions
We correlated the Upper Pliocene tuff marker bed dated at 3.13 ± 0.08 Ma by Lee et al., Reference Lee, Rubin and Calvert2001, with the tuff of Mesquite Flat by glass shard composition. Clast types in the Pliocene conglomerates at locations a, w, and EV (Figs. 2, 4) indicate that the clast provenance is the Wyman Creek watershed in the White Mountains across DSV. Based on the age, lithology, and geographic location, we assign the Pliocene fluvial conglomerates at locations a, w, x, y, and EV to the Furnace Creek Formation of Death Valley.
Examination of Miller's (Reference Miller1928) Quaternary freshwater lake deposits and lake beds mapped by Nelson (Reference Nelson1966) and McKee and Nelson (Reference McKee and Nelson1967) in DSV and Eureka Valley shows that lake deposits are found only at location d (Fig. 2), just south of the mouth of Birch Creek (Figs. 2, 5). Lithology, sedimentary structures, gastropods, ostracodes, and plant fossils indicate the lake sediments were deposited in the near shore environment of a balanced-fill, freshwater lake (Figs. 6, 7). Four IRSL dates in a 5.3-m-thick section of these older lake beds range from ca. 83–61 ka (Fig. 7; Table 4). The ca. 83–61 ka age of Deep Springs Lake begins in Late Pleistocene MIS 5a and persists through most of the MIS 4 climate interval. The timing of Deep Springs Lake corresponds with pluvial lakes formed in the adjoining watersheds of pluvial Owens Lake (Bischoff and Cummins, Reference Bischoff and Cummins2001) and Columbus Salt Marsh (Kurth et al., Reference Kurth, Phillips, Reheis, Redwine and Paces2011) and supports the hypothesis that increased effective precipitation that formed these pluvial lakes was the result of decreased summer insolation in the southwestern Great Basin during MIS 5a and MIS 4.
Our data and observations reinforce previous studies that inferred a Pliocene to Early Pleistocene hydrologic connection between the White Mountains and Eureka Valley, across what would become DSV and Deep Springs ridge (Miller, Reference Miller1928; Lustig, Reference Lustig1965; Reheis and McKee, Reference Reheis, McKee, Reheis, Sarna-Wojcicki, Meyer, McKee, Slate, Burbank, Sawyer and Pendall1991; Reheis and Sawyer, Reference Reheis and Sawyer1997; Lee et al., Reference Lee, Rubin and Calvert2001). This Pliocene hydrologic connection supplements paleogeographic reconstructions by Lutz et al. (Reference Lutz, Knott, Phillips, Heizler, Heitkamp, Griffie, Asxen and Calzia2023) and provides a potential hydrologic pathway between the Deep Springs Valley black toad and genetically related toads in Panamint Valley. We hypothesize that proximity of the elevation of the lake deposits and the elevation of Soldier Pass suggests a hydrologic connection between DSV and Eureka Valley during MIS 5a and MIS 4.
Acknowledgments
Thanks to Jeff Pigati of the U.S. Geological Survey (USGS) for advice regarding radiocarbon dating. Saxon Sharpe (DRI), Scott Starrett (USGS), and Lindsey Groves (LACMNH) assisted with fossil identification. Thanks to Lynn Heizler (NM Bureau of Mines) for tephra analysis. JRK benefited from discussions with Fred Phillips (NM Tech), Marith Reheis (USGS-retired), Don Sada (DRI), and John Umek (DRI). Deep Springs College and Padraic MacLeish (Director of Operations) graciously allowed access to field sites. JRK and CSUF students were supported by a grant from the National Science Foundation Integrated Earth Sciences (award EAR-1516593). Thanks to Harrison Gray (USGS), Nancy Stamm (USGS), Natalie Latysh (USGS), Kathleen Springer (USGS), an anonymous reviewer, Associate Editor Jason Dortch, and Editor Nick Lancaster for thoughtful reviews and comments that improved the manuscript. JRK hopes that C.A. Nelson would appreciate his “B student” taking an interest in Deep Springs Valley. None of the authors has any actual or potential financial or personal conflict of interest with people or organizations that could inappropriately influence this work. Any use of trade, firm or product names is for descriptive purposes only and does not imply endorsement by the U.S. Government.


 Open access