Is this the Fourth Industrial Age?

Oldest known medicine container from southern Africa
Nanomaterials: Commercialisation to health & safety

of Science volume 119 number 1/2
South African Journal
EDITOR-IN-CHIEF
Leslie Swartz
Academy of Science of South Africa
MANAGING EDITOR
Linda Fick
Academy of Science of South Africa
ONLINE PUBLISHING SYSTEMS ADMINISTRATOR
Nadia Grobler
Academy of Science of South Africa
MARKETING & COMMUNICATION
Henriette Wagener Academy of Science of South Africa
ASSOCIATE EDITORS
Priscilla Baker
Department of Chemistry, University of the Western Cape, South Africa
Pascal Bessong
HIV/AIDS & Global Health Research
Programme, University of Venda, South Africa
Floretta Boonzaier
Department of Psychology, University of Cape Town, South Africa
Chrissie Boughey
Centre for Postgraduate Studies, Rhodes University, South Africa
Teresa Coutinho
Department of Microbiology and Plant Pathology, University of Pretoria, South Africa
Jemma Finch
School of Agricultural, Earth and Environmental Sciences, University of KwaZulu-Natal, South Africa
Jennifer Fitchett
School of Geography, Archaeology and Environmental Studies, University of the Witwatersrand, South Africa
Michael Inggs
Department of Electrical Engineering, University of Cape Town, South Africa
Ebrahim Momoniat
Department of Mathematics and Applied Mathematics, University of Johannesburg, South Africa
Sydney Moyo
Department of Biology, Rhodes College, Memphis, TN, USA
ASSOCIATE EDITOR MENTEES
Nkosinathi Madondo
Academic Literacy and Language
Unit, Mangosuthu University of Technology, South Africa
Amanda-Lee Manicum
Department of Chemistry, Tshwane University of Technology, South Africa
Adriaan van der Walt
Department of Geography, University of the Free State, South Africa
EDITORIAL ADVISORY BOARD
Stephanie Burton
Professor of Biochemistry and Professor at Future Africa, University of Pretoria, South Africa
Felix Dakora
Department of Chemistry, Tshwane University of Technology, South Africa
South African Journal of Science
eISSN: 1996-7489
Immunological interaction during helminth and HIV co-infection: Integrative research needs for sub-Saharan Africa
January/February 2023 Volume 119 Number 1/2
Leader Science for social justice: Thinking more broadly about inclusion Leslie Swartz ............................................................................................................................ 1 Book Reviews Museum times and times in museums Cynthia Kros 2 Beyond rhetoric: A review of The Decolonization of Knowledge Wahbie Long ............................................................................................................................. 3 The challenges of institutionalising decolonization of the curriculum in South Africa Sabelo J. Ndlovu-Gatsheni 4 News The scientific community accepts marram grass to be non-invasive in dune stabilisation in the Cape Roy Lubke, Ted Avis, Ursula Higgins, Irma Knevel & Deon van Eeden 6 Perspective Lab-to-market guide for commercialisation of nanomaterials: A South African university perspective Sipho Dikweni, Boitumelo Makgabutane & Sabelo D. Mhlanga 9 Invited Commentary Contribution of hydrogeology to solving community water supply problems in South Africa Tamiru A. Abiye 12 Commentary
Miranda
Mpaka-Mbatha,
Naidoo,
Mazharul
Singh,
Bhengu, Nomzamo Nembe-Mafa, Roxanne Pillay, Zamathombeni Duma, Abraham J. Niehaus & Zilungile L. Mkhize-Kwitshana 15 Review Articles Science communication: The link to enable enquiry-based learning in underresourced schools Blessing Nemadziva, Steven Sexton & Catherine Cole 19
N.
Pragalathan
Md
Islam, Ravesh
Khethiwe N.
Saul Dubow
Smuts Professor of Commonwealth History, University of Cambridge, UK
Pumla Gobodo-Madikizela
Trauma Studies in Historical Trauma and Transformation, Stellenbosch University, South Africa
Robert Morrell
School of Education, University of Cape Town, South Africa
Catherine Ngila
Deputy Vice Chancellor – Academic Affairs, Riara University, Nairobi, Kenya
Lungiswa Nkonki
Department of Global Health, Stellenbosch University, South Africa
Daya Reddy
South African Research Chair –Computational Mechanics, University of Cape Town, South Africa
Brigitte Senut
Natural History Museum, Paris, France
Benjamin Smith
Centre for Rock Art Research and Management, University of Western Australia, Perth, Australia
Himla Soodyall
Academy of Science of South Africa, South Africa
Lyn Wadley
School of Geography, Archaeology and Environmental Studies, University of the Witwatersrand, South Africa
Published by the Academy of Science of South Africa (www.assaf.org.za) with financial assistance from the Department of Science & Innovation.
Design and layout
Elzahn Swarts E: swarts.elzahn@gmail.com
Correspondence and enquiries sajs@assaf.org.za
Copyright All articles are published under a Creative Commons Attribution Licence. Copyright is retained by the authors.
Disclaimer
The publisher and editors accept no responsibility for statements made by the authors.
Submissions
Submissions should be made at www.sajs.co.za
Current situation and future prognosis of health, safety and environment risk assessment of nanomaterials in South Africa
Melusi
Xolani Makhoba & Victor
bioactivity, and ethnopharmacological potential of selected indigenous plants
The effect of elevated temperatures on trichomes, essential oil composition and yield of Lippia javanica: A chemometric approach
Cover caption
“… a revolution that is fundamentally changing the way we live, work, and relate to one another. In its scale, scope and complexity… is unlike anything humankind has experienced before.” These are the words of Klaus Schwab speaking about the Fourth Industrial Revolution (4IR). In his article on page 93, Moll states that the ‘technologies of the 4IR’ are merely evolutions of the 3IR and not groundbreaking inventions of contemporary times. In their responses to Moll’s article, Marwala and Ntlatlapa argue for the existence of the Fourth Industrial Revolution.
Mary Gulumian,
28 Phytochemicals,
Matthew C. Achilonu, Xolile V. Ngubane, S’busiso M. Nkosi & Phiwe C. Jiyane 35 Research Articles
Thwala,
Wepener
Edith J. Singini, Yannick Nuapia, Luke Chimuka & Ida M. Risenga 42 Remote sensing monitoring of mangrove growth rate at selected planted sites in Mauritius Mahalaksmi D.D. Doodee, Soonil D.D.V. Rughooputh & Shobha Jawaheer 48 Deep learning for photovoltaic defect detection using variational autoencoders Edward J. Westraadt, Warren J. Brettenny & Chantelle M. Clohessy 55 A lifecycle-based evaluation of greenhouse gas emissions from the plastics industry in South Africa Taahira Goga, Kevin Harding, Valentina Russo & Harro von Blottnitz 63 Comparison of phosphorus-based extractants on manganese separation from citrate leach solutions for recycling of lithium-ion batteries Tiaan Punt, Robert C. Luckay, Guven Akdogan, Steven M. Bradshaw & A. Petrie van Wyk .......... 69 COVID-19 and common mental disorders among university students in South Africa Jason Bantjes, Sonja Swanevelder, Esme Jordaan, Nancy A. Sampson, Maria V. Petukhova, Christine Lochner, Dan J. Stein & Ronald C. Kessler 75 A 500-year-old medicine container discovered near Misgund, Eastern Cape, South Africa: Residue characterisation by GC-MS Justin Bradfield, Stephan Woodborne, Jeremy Hollmann & Ian Dubery 85 Discussions on 4IR Why there is no technological revolution, let alone a ‘Fourth Industrial Revolution’ Ian Moll 93 The Fourth Industrial Revolution has arrived. Comments on Moll (S Afr J Sci. 2023;119(1/2), Art. #12916) Tshilidzi Marwala 99 Defining the Fourth Industrial Revolution. Comments on Moll (S Afr J Sci. 2023;119(1/2), Art. #12916) Ntsibane Ntlatlapa 101
Science for social justice: Thinking more broadly about inclusion
In the previous issue of the Journal, we alluded to the World Science Forum, which was due to take place in Cape Town in December 2022. The event was lively and well attended, and many of the delegates commented on the value of a face-to-face meeting; for many of us this was the first in-person meeting since the start of the COVID-19 lockdown. As ever, many of the interesting discussions were those which took place informally and sometimes by chance, not in prepared sessions.
The theme of the Forum was ‘Science for Social Justice’, and on 9 December 2022, the text of the Declaration of the 10th World Science Forum on Science for Social Justice was adopted. This statement, which we encourage our readers to read and engage with, presents Science for Social Justice as “a responsibility, an opportunity and a commitment” and is organised under key themes, all globally relevant, and especially so to our African context. These key themes are:
1. Science for human dignity – What role for science in fighting poverty, unemployment, inequality and exclusion?

2. Science for climate justice – How can science working with civil society lead the way in correcting the failure of climate policy?
3. Science for Africa and the world – How to unleash the potential of African science in global cooperation?
4. Science for diplomacy – How can science reboot multilateralism and global solidarity?

5. Justice in science – How to ensure science reflects the society we want?
The Declaration concludes with a commitment by all parties: We accept our mutual responsibility to ensure integrity and respect for the ethical conduct of science. We commit to respond decisively to the “Science for Social Justice” Call to Action as set out in this Declaration.
There are those who, understandably, may regard the Declaration and the commitments therein with a degree of cynicism – statements are easy to make but much more difficult to implement and monitor. We believe that it may be more useful, though, to regard the Declaration as an ongoing challenge to all of us in the science community in Africa, and to take on the responsibility of engaging with it in our work. There may be fears that the Declaration is calling for an unreasonable amount of outside interference in what scientists study. Given the emphasis in the statement on the application of science to questions of social justice, for example, some may be concerned that this may create an impression that basic science is less valued than more applied scientific work. This question is in fact addressed directly in the Declaration:
We call for increased investment in education and science, recognizing that basic science, as celebrated by the International Year of Basic Sciences for Sustainable Development, constitutes the foundations of future innovations, economic prosperity, and societies strengthened by solidarity and democracy.
Our reading of the Declaration is that it is less focused on prescribing to scientists what we should do than on asking us to engage with important questions.
It is inevitable with any brief portmanteau statement on matters of great range and complexity that some issues will be left out and glossed over. As a Journal we would welcome the opportunity to consider commentaries on the Declaration which examine it critically. We encourage our readers to help all of us in the science community to keep thinking actively about what ‘Science for Social Justice’ means in a world which is patently not socially just, and in which access to the world of science and the benefits it brings is not equally distributed.

In the spirit of constructive engagement with the Declaration, one useful way of enlivening the debates may be through considering what is missing or glossed over. As we have noted in our previous Leader, as a journal we are committed to inclusion, and we have put policies and practices in place to help support inclusion. One aspect of inclusion which may be read as implicit but is not stated in the Declaration, is that of disability inclusion. South Africa, along with most other African countries, has ratified the United Nations Convention on the Rights of Persons with Disabilities (UNCRPD), and the African Disability Protocol is gaining traction. Declarations like the UNCRPD (the full text of which can be found here) are internationally binding instruments but, in our experience, are not widely known (and, indeed, may be treated with some of the cynicism we mentioned earlier regarding aspirational statements). According to the World Health Organization, about 1.3 billion people – 16% of the world’s population – experience a significant disability. There is a well-established relationship between disability and poverty. Extractive labour practices, environmental degradation, and common social features of unequal societies such as high rates of interpersonal violence, accidents, and exposure to toxins, are all associated with higher rates of disability. The focus for disability inclusion should not be solely or primarily on bodily impairments but on barriers to participation. For example, if a wheelchair user cannot be employed to work in a campus building which does not have a lift, the problem is with the building and not with the body of the wheelchair user. Similarly, if a website is inaccessible to users with visual impairments, this is a problem of poor design, not of visual impairment. And, most importantly, perhaps, if people with disabilities are discriminated against or thought not able to participate in society, this is a question of social relationships and not of problems with bodily impairments.
Watermeyer1, a South African academic and scientist with a severe visual impairment, shows that lack of equal access to print material, or to this material in accessible format, may lead to a range of consequences, both personal and professional, for academics who have much to offer the world of science but experience barriers. Similarly, Lourens2 describes the extra, and commonly hidden, labour that disabled academics may have to undertake to do the same work as others and to be seen as competent. The issues of exclusion and discrimination in science and the academy will be familiar to those concerned with important questions of race and gender bias. Most likely, and importantly, all South African scientists will have at some stage learned something about racial and gender discrimination in the academy; in our experience, though, disability discrimination is much less commonly discussed and is often not mentioned at all.
In line with this, in the Declaration on ‘Science for Social Justice’, the issues of racial and gender exclusion are, correctly, mentioned explicitly. Disability is not. In the planning and registration materials for the World Science Forum, as far as we have been able to see, delegates were not asked what their accessibility needs were. We did not see closed captioning or sign language interpreting in the sessions, for example. If disability is not thought about, not mentioned, or seen as a ‘boutique’ or special interest issue, this can have an impact on who participates and who contributes. For science to be inclusive, it is important to think about all forms of exclusion, and about how to address them. We need to be clear that we are harnessing the talents of all scientists and, more importantly, all potential scientists with disabilities, just as we need to harness the talents of more women in science, for example. When planning and conducting research, we need to think about the accessibility of this research to disabled people as research participants and beneficiaries of research. Science for social justice is an issue of inclusion for all, and requires contributions from as many diverse groups as possible.
References
1. Watermeyer B. Freedom to read: A personal account of the ‘book famine’. Afr J Disabil. 2014;3(1), Art. #144. https://ajod.org/index.php/ajod/article/view/144
2. Lourens H. Supercripping the academy: The difference narrative of a disabled academic. Disabil Soc. 2021;36(8):1205–1220. https://doi.org/10.1080/09 687599.2020.1794798
HOW TO CITE: Swartz L. Science for social justice: Thinking more broadly about inclusion. S Afr J Sci. 2023;119(1/2), Art. #15447. https://doi.org/10.17159/sajs.2023/15447
1 Volume 119| Number 1/2 January/February 2023 Leader https://doi.org/10.17159/sajs.2023/15447
BOOK TITLE: Museum times: Changing histories in South Africa

Museum times and times in museums
This is a very rich book – unsurprisingly given what Witz himself remarks is the ‘excess of museum making’ in South Africa after 1994 (p. 115) – and is occasionally overwhelming. Witz, a leading figure in public history based for three decades at the University of the Western Cape (UWC), has an impressive command of the museum literature and the proliferating and shifting museum terrain. The book is also, although not quite, an autobiography. Witz shows how his life and engagements in different capacities with the museum spaces he discusses became ‘intertwined’ (p. 15). This intertwining took root with his appointment at UWC in 1990 when he was caught up in ‘intoxicating’ debates around history (p. 23) and he stresses the importance of collaborative work with colleagues both at UWC and elsewhere. The emerging conception of public history in whose development he played a significant role, opened the way for meaningful engagement with productions of historical knowledge beyond the academy. After a relatively slow start, Witz came to recognise the immense value of museums, especially as sites of intellectual provocation.
Witz became estranged from social history with which he had worked previously, coming to regard his first book Write Your own History1 as representative of the limitations of the social historian’s tendency to write and teach history through a single focal corrective lens. In the empiricist endeavour shared by social history, he argues, museums habitually treat their artefacts as three-dimensional evidence for a history assumed to exist in the singular. Witz remains on guard against the temptation to reach for a unified history.
AUTHOR: Leslie Witz
ISBN: 9781800735385
(hardback, USD135, 300 pp)
9781800735392 (ebook, USD29.95, 300 pp)
PUBLISHER: Berghan Books, New York, USA
PUBLISHED: 2022
REVIEWER: Cynthia Kros1
AFFILIATION: 1Honorary Research Associate, Archive and Public Culture Research Initiative, University of Cape Town, Cape Town, South Africa
EMAIL: Cynthia.kros@uct.ac.za
HOW TO CITE: Kros C. Museum times and times in museums. S Afr J Sci. 2023;119(1/2), Art. #14908. https:// doi.org/10.17159/sajs.2023/14908
ARTICLE INCLUDES:
☐ Peer review
☐ Supplementary material
PUBLISHED: 31 January 2023
After 1990, anticipating the transition to democracy, museums took up several challenges, notably of inclusivity and addressing pertinent critiques of their representations of African people. Did museums act, Witz asks, in the way of the simplistic chameleon analogy used in contemporary accounts of the 1990s or more like the chameleon in nature that also uses its powers to attract or confront rather than only as defensive camouflage? The answer is not easy or generalisable. Witz is particularly intrigued by what museums do to time, often in response to new imperatives – lengthening it for millennia of geological history, shortening it to accommodate human memory, beating it out into a linear trajectory or relying on the cyclical dependability of commemoration.
Sometimes imprints left on Witz’s life by the intertwining are evident, especially in the case of the Lwandle Migrant Labour Museum with which he was closely involved for 20 years. Two of his chapters, which play with metaphors of beach and sea, wittily and poignantly (given South Africa’s histories of segregation), those on Lwandle near Strand and the Bartolomeu Dias Museum Complex in Mossel Bay, are arguably the most compelling of the emblem-led case study chapters (five of a total six). Lwandle Museum seemed poised to say something regionally distinctive about migrant workers’ experiences. However, the tide often turns against it. The migrant labour narrative, dominated by a Marxist paradigm, has deleterious consequences. Another set of challenges he explores revolves around making a hostel (this chapter’s emblem) the basis for a museum. Witz, his colleagues (including former UWC graduate Bongani Mgijima) and others in Lwandle are tossed about on the high seas of post-apartheid politics and are sometimes sucked further from shore by the riptide of social history. Lwandle not only survives, but also manages to tell some unique stories and holds out the possibility of a different kind of museum.
The Dias Museum boasts a caravel as replica of the one in which Bartolomeu Dias rounded the Cape in 1488, apparently a faithful reconstruction, but a claim impossible to check because of the absence of contemporary documentation. Significantly, the engine that secretly kept it going on its journey from Portugal to Mossel Bay in the 1980s is below the water line. The impostor caravel attracts a loyal public and Witz’s initial idea of encouraging visitors metaphorically to look below the water line seems nigh impossible to implement. He evaluates the mixed success of temporary exhibitions.
Huberta the fabled hippopotamus, slain by delinquent farmers in 1931 after a journey of well over a thousand kilometres, kept in the Amatole Museum in King William’s Town (now Qonce), for all her apparent solidity, like the caravel is surrounded by mythmaking. In her afterlife, Huberta has travelled an even greater distance than she did as a mortal hippopotamus – from being a fine exemplar of a mammal aligned with director Guy Shortridge’s vision for the former Kaffrarian Museum to embodying the spirit of amaXhosa heroes. In this fascinating chapter on revisiting Huberta, there is also an excellent, if challenging, analysis on limitations of the ‘frontier’ as vehicle for exploring histories of interaction.
Unlike Huberta and the caravel, the rabbit of Robben Island, initially emblematic of liberation that followed years of oppression, is alive. However, whereas Huberta and the caravel ride out the vicissitudes of the tide, the rabbit is marked for extermination. The Robben Island Museum’s experiments with diverging from the linear narrative come to be considered, like the rabbit to be destructive, capable even of undermining the foundations of Mandela’s prison-shrine. Witz’s account of many other forces also closing in around the rabbit sounds daunting. Yet he continues to hold out hope.
Also instructive is the chapter on the moveable Y350? Exhibition (2002–2004) whose title offers a nod to millennium bug paranoia as well as an opportunity for interrogating the purpose 350 years later of commemorating Jan Van Riebeeck’s arrival at the Cape, supposedly inaugurating white settlement and ‘civilisation’. Witz’s pathbreaking Apartheid’s Festival2, demonstrated how the 1952 Festival sought to establish Van Riebeeck as an icon to unite the white nation. In Y350? an upside-down statue of Van Riebeeck reprising the protest of 50 years earlier played a prominent role. Witz considers the different meanings the inversion assumed.
It is impossible to cover many aspects of this book, representing as it does decades of professional engagement by an author of considerable stature, and yet, like the Robben Island rabbit, is fleet of foot, incurably curious and temperamentally averse to confinement.
References
© 2023. The Author(s). Published under a Creative Commons Attribution Licence.
Book Review
1. Witz L. Write your own histor y Johannesburg: Ravan/Sached; 1988.
2. Witz L. Apar theid’s festival. Bloomington, IN: Indiana University Press; 2003.
https://doi.org/10.17159/sajs.2023/14908
2 Volume 119| Number 1/2 January/February 2023
BOOK TITLE: The decolonization of knowledge: Radical ideas and the shaping of institutions in South Africa and beyond

Beyond rhetoric: A review of The Decolonization of Knowledge
These days, with so many topics, fields, and disciplines being presented for decolonization, one can be forgiven for asking if there is any other game in town. Jonathan Jansen and Cyrill Walters’ new book, The Decolonization of Knowledge: Radical Ideas and the Shaping of Institutions in South Africa and Beyond, is a refreshing attempt at making sense of this ‘decolonial turn’, in part because it moves decolonization discourse past the ‘intellectually vapid, self-congratulatory’ antics that have come to typify aspects of it (p. 231).
It helps, therefore, that the book constitutes an empirical study as it tracks the academic uptake of the call for decolonization in 10 public institutions of higher learning in South Africa. More than 200 academics were interviewed; curriculum documents were analysed; institutional records – consisting variously of mandates, terms of reference, concept documents, commissioned reports, and management reports – were examined; while officials from external regulatory agencies – specifically, the South African Institute of Chartered Accountants (SAICA), the Engineering Council of South Africa (ECSA), and the Health Professions Council of South Africa (HPCSA) – were consulted too, mainly in the form of focus group discussions.
It is of course impossible to dissect in a thousand words every finding of such a richly conceived study. Instead, I shall focus on three of its key conclusions: first, decolonization has no fixed meaning; second, no matter the sound and fury, institutions live longer than ideas; and third, therefore, institutional analysis becomes critically important if the decolonization movement is to avoid morphing into just another endless series of talk shops.
AUTHORS: Jonathan D. Jansen and Cyrill A. Walters
ISBN:
9781009077934 (paperback, GBP22.99, 272 pp)
9781316514184 (hardback, GBP69.99, 272 pp)
9781009085373 (ebook, USD29.99, 272 pp)
PUBLISHER: Cambridge University Press, Cambridge, UK
PUBLISHED:
2022
REVIEWER: Wahbie Long1
AFFILIATION:
1Department of Psychology, University of Cape Town, Cape Town, South Africa
EMAIL: wahbie.long@uct.ac.za
HOW TO CITE: Long W. Beyond rhetoric: A review of The Decolonization of Knowledge S Afr J Sci. 2023;119(1/2), Art. #14992. https://doi. org/10.17159/sajs.2023/14992
ARTICLE INCLUDES:
☐ Peer review
☐ Supplementary material
PUBLISHED: 31 January 2023
The indeterminacy of the term ‘decolonization’ is consistent with Ernesto Laclau’s2 description of empty signifiers. On the one hand, the openness to all manner of projections runs the risk of diluting whatever radical potential the word may have. Yet this discursive quality is invaluable to populist causes because it allows for the structuring of contested political terrain in compelling ways. While supporters of decolonization are dismissed often for their reliance on an opaque language of critique in the absence of concrete alternative proposals – “just tell me what decolonization is”, says one lecturer, “and I will do it” (p. 90) – one should not overlook the larger strategy, a feature of which is simply to disrupt business as usual, to force the breaking of strides. Even so, it is hard to disagree with Jansen and Walters’ contention that, because it ends up meaning all things to all comers, decolonization is easily “defanged” (p. 67). After all, “if decolonization could mean anything, it also meant nothing” (p. 73).
Victor Hugo, to be sure, once opined that “an invasion of armies can be resisted but not an idea whose time has come”. Nonetheless, the power of an idea is not necessarily commensurate with its lifespan. Jansen and Walters catalogue an armamentarium of tactics that institutions deploy, effectively exhausting the idea of decolonization by sapping it of vitality and momentum. In the chapter, ‘How Does a Radical Curriculum Idea Travel through Institutional Life?’, they describe how universities can posture, dilute, bureaucratize, discipline, regulate, marginalize, and domesticate radical ideas. This is a subtle process in which institutions can neutralize ideas precisely because they seem willing to accommodate them. Herbert Marcuse’s3 concept of repressive tolerance is apposite, with institutions managing undesirable ideas by letting them enter through the proverbial front door. Writing about one university in particular, Jansen and Walters show how the mainstreaming of the decolonization agenda meant that “the chances of radical change to the curriculum were muted” (p. 38).
All of which points to the importance of institutional analysis: if the decolonization movement is to make meaningful inroads into university life, then focusing on curriculum reviews will not cut it for as long as the institutional curriculum –those invisible r ules that determine what counts as knowledge – remains settled. This leads Jansen and Walters to conclude that, “[i]n South Africa, at least, decolonization of the cur riculum did not fail to be taken up in institutions because it was too radical. The problem was that it was not radical enough” (p. 238).
When The Decolonization of Knowledge was launched at Stellenbosch University, a troubling question arose: “how do you decolonize in an unequal society?” While it does not fall within the ambit of Jansen and Walters’ book, the question does remind one at the very least that the gown is not the town. Students and professors do get excited at new academic trends and, as per Sayre’s law, the bitterness of university politics has much to do with the stakes being relatively low. At the risk of idealizing higher education, most young South Africans do not make it onto university campuses while many of those who do, will not finish their degrees. What is more, the corporate ethic that is overtaking tertiary institutions brings into focus powerful structural factors outside universities – against the constraints of which they must survive. Equally deserving of analysis, then, is the ‘societal curriculum’ that decides the parameters of institutional ones.
On more than one occasion, Jansen and Walters decry the “arcane… language of the high humanities” (p. 216) that marks out certain influential streams in the decolonization movement. Why an intelligentsia identified with the political left goes out of its way to obfuscate and alienate with a type of academic Scrabble that produces “a decolonial Tower of Babel” (p. 217) is something of a mystery. There is an anti-democratic impulse at the heart of such theory and it is surely no coincidence that its praxis – in the shape of certain Fallist spectacles – has been criticized on similar grounds.1 If it is to realize its radical ambitions, then the decolonization movement must democratize thoroughly its theories, practices, and, indeed, its areas of concern.
Jansen and Walters have done the South African academy a great service by stripping back the mystique and probing the contours, pathways, and possible futures of the decolonial turn in a straightforward and scholarly manner. The Decolonization of Knowledge is a rewarding read for anyone seeking to understand this significant moment in the world of higher education.
References
1. Habib A. Rebels and rage: Reflecting on #FeesMustFall. Johannesburg: Jonathan Ball; 2019.
2. Laclau E. On populist reason. London: Verso; 2005.
© 2023. The Author(s). Published under a Creative Commons Attribution Licence.
3. Marcuse H. Repressive tolerance. In: Wolff RP, Moore B Jr, Marcuse H. A critique of pure tolerance. Boston, MA: Beacon Press; 1965. p. 81–117.
https://doi.org/10.17159/sajs.2023/14992
3 Volume 119| Number 1/2 January/February 2023 Book
Review
BOOK TITLE: The decolonization of knowledge: Radical ideas and the shaping of institutions in South Africa and beyond

The challenges of institutionalising decolonization of the curriculum in South Africa
This is an important and unique scholarly contribution on the popular theme of decolonization of knowledge with a focus on South Africa, a country that became the site of the #RhodesMustFall and #FeesMustFall movements, which shook the higher education landscape in 2015 and 2016. Unlike Olufemi Taiwo’s Against Decolonization: Taking African Agency Seriously1, which was published at the same time as Jansen and Walters’ book and that sought to dismiss the very project of decolonization, this book takes the debate to the level of how the radical idea of decolonization made its way through institutions of higher education in South Africa. It is a work of serious scholarly engagement, not easy and opportunistic dismissal of decolonization – a battle cry that has assumed a planetary scale. It is not a polemic work like many other works amongst the fast-growing literature on decolonization and decoloniality. It is a detailed empirical study grounded in carefully executed fieldwork involving 10 institutions of higher education with over 200 academics interviewed.
AUTHORS:
ISBN:
9781009077934
(paperback, GBP22.99, 272 pp)
9781316514184
(hardback, GBP69.99, 272 pp)
9781009085373
(ebook, USD29.99, 272 pp)
PUBLISHER:
Cambridge University Press, Cambridge, UK
PUBLISHED:
2022
REVIEWER:
Sabelo J. Ndlovu-Gatsheni1,2
AFFILIATIONS:
1Chair of Epistemologies of the Global South, Faculty of Humanities and Social Sciences, University of Bayreuth, Bayreuth, Germany
2Vice-Dean: Research, Africa Multiple Cluster of Excellence, University of Bayreuth, Bayreuth, Germany
EMAIL:
sabelo.ndlovu-gatsheni@unibayreuth.de
HOW TO CITE:
Ndlovu-Gatsheni SJ. The challenges of institutionalising decolonization of the curriculum in South Africa. S Afr J Sci. 2023;119(1/2), Art. #15042. https://doi.org/10.17159/ sajs.2023/15042
ARTICLE INCLUDES:
☐ Peer review
☐ Supplementary material
PUBLISHED:
31 January 2023
Deploying the conceptual frames of sociology of knowledge and institutional/neo-institutional theory, it also offers nuanced critical reflections of the complex politics of knowledge and operations of power within the higher education sector. Of course, one can say that studying the journey of decolonization within universities from well-known theoretical frameworks such as neo-institutional theory and conventional curriculum theory is in a way part of defanging, dilution and technicalization of the revolutionary idea of decolonization. But at the same time, one has to consider that the two authors are educationists working with conventional curriculum theories and using them to make sense of the trajectories of decolonization across 10 selected universities. But what distinguishes the book under review from most of the existing works on decolonization of knowledge is that it is not a fast-paced theoretical intervention, and in this way, it escapes the pitfalls of generalizations and lack of nuance. It is a clearly focused work on decolonization of the curriculum and the concomitant challenges and politics of an institutional nature.
Therefore, if the rich and ever-expanding literature on the resurgent and insurgent decolonization of the 21st century (also known as decoloniality) has enabled us to understand the topicality of the return of decolonization in the present conjuncture, the book under review takes us into how the radical idea of decolonization is received, consumed, made sense of, diluted, defanged, institutionalised and disciplined and routinized into existing structures and institutions of the university. The book is well organised into eight chapters. The first chapter provides the introduction and articulates the historical context, definitions of working concepts such as curriculum, knowledge content, knowledge hierarchies and knowledge authorities as well as working theories such as sociology of knowledge, politics of knowledge (micropolitics of knowledge), curriculum theory and institutional/neo-institutional theory. The first chapter also explains the methodological approach adopted. Already in the introductory chapter Jansen and Walters warn the reader about “how institutions quarantine radical ideas” (p. 21).
Chapter 2 is entitled ‘Institutional Posturing: The Coming of Decolonization and the Scramble to Respond’. This is a revealing title which is very loud on what happens when a radical idea of decolonization enters universities, or for that matter any institution. Institutional posturing is a time-tested strategy of how institutions weather oppositional ideas through incorporating, disciplining and aligning them to the status quo, as the institution gives itself a new lease of life. Jansen and Walters provide empirical details on how 10 universities deployed institutional posturing to pacify student movements on the one hand, and, on the other hand, to dilute and defang decolonization from a revolutionary force into a reformism similar to the long-standing discourse transformation. Institutional posturing took various forms, ranging from setting up task teams, sponsoring workshops, and university senates to defanging decolonization. The other technique was that of “enclaving” and making those committed to decolonizing the curriculum exist as a “township within a city”. The third chapter provides “micropolitics of knowledge” that shaped and drove the institutionalization decolonization of the curriculum. In Chapter 4, Jansen and Walter argue that the lack of a clear definition of decolonization opened floodgates to the institutional strategies of quarantining of radical ideas. Drawing from the 10 universities studied, they also map out seven different threads of meaning for decolonization: addition of content, Africanization, good teaching, remediation, critical pedagogy, no change, and appropriation. The fifth chapter highlights that internal micro-institutional politics of knowledge have to be read in tandem with external regulating agencies (SAQA, CHE, DHET) that also play a role in the disciplining and defanging of decolonization. In Chapters 6 and 7, Jansen and Walters once again provide empirical details of selected academics that positively responded to the call and demand for decolonization of the curriculum but their efforts suffered “enclaving”. The last chapter comes back to the politics of knowledge and there is critical distillation of various ways through which universities responded to radical decolonization of curriculum ideas, ranging from posturing, diluting, bureaucratizing, disciplining, regulating, marginalising to domesticating them. Among the case studies, one would have expected to find the University of South Africa (UNISA), which for a long time prior to #RhodesMustFall and #FeesMustFall movements, had been the site of generation and advocacy for decolonization/decoloniality, with the UNISA Annual Decoloniality School having existed since 2014. UNISA has also been a site of Africanization for a long time. One wonders why such an institution did not attract the authors of this book. It is such neglect of this important institution that led to some factual inaccuracies in this book, for example, Africa Decolonial Research Network (ADERN) was formed in 2011, long before links were established with the Barcelona International Decoloniality Summer School in Spain. It was a homegrown idea by concerned UNISA scholars committed to decolonization.
© 2023. The Author(s). Published under a Creative Commons Attribution Licence.
This critique does not minimise the importance of this book. Published seven years after the whirlwind of #RhodesMustFall and #FeesMustFall, this book underscores that universities in South Africa could not just ignore
Book Review
https://doi.org/10.17159/sajs.2023/15042
4 Volume 119| Number 1/2 January/February 2023
Jonathan D. Jansen and Cyrill A. Walters
the demands and calls for change, rather the institutions evolved complex but well-known institutional behavioural strategies of killing radical ideas while pretending to be implementing them. Implementesis can be the best term to capture the crisis whereby radicals expect conservatives to implement radical ideas and fail to read into posturing as a survival strategy of institutions facing hurricanes of change.
Jansen and Walters nearly spoil their excellent work when they degenerate into the usual position of trying to dismiss decolonization as “language of replacement”, “language of lament” and “language of nostalgia” (p. 234–236), after having empirically demonstrated that the problem was institutional posturing and enclaving of those who positively embraced decolonization of the curriculum. There is also a complacent view of the resilient powerful political economy of knowledge, which like the posturing of universities is also playing the same strategy to perpetuate itself. It is from the decolonial scholars that such concepts as mosaic epistemologies, ecologies of knowledges and intercultural translation come, which gesture into the future of knowledge. To dismiss decolonization as discourse of succumbing to victimhood and to be blind to global coloniality, which is all over and not over, is to deliberately distort and minimise a planetary revolutionary phenomenon. Needless
to say, decolonization is not a singular school of thought, and like other bodies of thought there are conservative, moderate and radical elements. In the closing pages of the book, Jansen and Walters admit that decolonization is necessary: “However, for universities to deliver on the curriculum change project, a new radicalism is required that takes institutional analysis seriously as a point of departure for the decolonization of knowledge” (p. 238). How can one believe in “decolonization of knowledge” while dismissing decolonization? Jansen and Walters’ book is a good example of how to take decolonization forward with the hindsight of learning and unlearning from the consequences of the #RhodesMustFall and #FeesMustFall movements. The key lesson learned being that we should never trust the institutions when they pretend to be decolonizing themselves from the inside – we have to find ways to do decolonization better and more robustly – Aluta continua! Decolonization is a struggle. It is not an event. It has no readymade blueprints.
Reference
5 Volume 119| Number 1/2 January/February 2023 Book Review https://doi.org/10.17159/sajs.2023/15042
Challenges of institutionalising decolonization Page 2 of 2
1. Taiwo O. Against decolonization: Taking African agency seriously. London: Hurst Publishers; 2022.
AUTHORS: Roy Lubke1
Ted Avis2
Ursula Higgins3
Irma Knevel4
Deon van Eeden5
AFFILIATIONS:
1Department of Botany, Rhodes University, Makhanda, South Africa
2CES – Environmental and Social Advisory Services, Cape Town, South Africa
3Head: Research Support Office, University of Bayreuth, Bayreuth, Germany
4School of Science and Engineering, University of Groningen, Groningen, Netherlands
5Vula Environmental Services, Cape Town, South Africa
CORRESPONDENCE TO:
Roy Lubke
EMAIL: r.lubke@ru.ac.za
HOW TO CITE:
Lubke R, Avis T, Higgins U, Knevel
I, Van Eeden D. The scientific community accepts marram grass to be non-invasive in dune stabilisation in the Cape. S Afr J Sci. 2023;119(1/2), Art. #15107. https:// doi.org/10.17159/sajs.2023/15107
ARTICLE INCLUDES:
☐ Peer review
☐ Supplementary material
KEYWORDS:
marram grass, dune stabilisation, noninvasive, dune pioneer, research study
PUBLISHED:
31 January 2023
The scientific community accepts marram grass to be non-invasive in dune stabilisation in the Cape
Significance:
For more than three decades, botanists and dune ecologists in the Department of Botany at Rhodes University have spent over 20 000 people-hours researching marram grass. Because of the invasive nature of the plant in Australasia and North America, the plant was long thought to be invasive in the Cape. It has been concluded that the species is non-invasive so long as the variety present in the Cape is used and no new material is introduced. Despite this evidence, the authorities list marram grass as a Category 2 species of weed which may only be grown under permitted conditions in demarcated areas. In order to obtain a permit to use the grass in a large stabilisation project at Hout Bay, a detailed study was reinitiated on the distribution of marram grass 20 years after the original studies on its distribution had been completed. These results confirmed results of the previous studies that the grass was non-invasive. These findings were ratified in a peer-reviewed research paper published recently in a special issue on ‘Dynamics and Stability of Plant Communities in Coastal Sand Dunes’ of the open access journal Plants (Lubke; Plants 2022;11(17), Art. #2260). Finally, marram grass, as it occurs on our Cape dunes, may be accepted as a useful pioneer and dune stabiliser. No indigenous species are capable of performing the same process.
Imagine having purchased a beach house along the Cape coast on a fine summer day to spend family holidays relaxing and enjoying South Africa’s marvellous coastal environment. Then, on a visit to the beach house in the winter, when a strong southeasterly wind is blowing, you find that the dunes that naturally migrate along the shore are approaching your house at a rapid rate. When you approach a local environmental consultant, they assure you that, with permission from the authorities, you can stabilise the dune system and divert those sands away from your property.
© 2023. The Author(s). Published under a Creative Commons Attribution Licence.
Thanks to our team of researchers at Rhodes University’s Department of Botany, the process is clearly explained in the information pamphlet ‘Stabilization and management of coastal sand dunes’1. We have also researched the use of marram grass (Ammophila arenaria (L.) Link.), and established that it is the best dune stabiliser in very mobile sands. This information was codified into a recent paper2 that categorically establishes marram grass as a non-invader, thus making it available to use in the challenging task of stabilising dunes, although currently its use still requires a permit.
In Europe, marram grass (Figure 2) is the primary dune stabiliser of mobile dunes and is used extensively in many coastal parts to establish barriers to the sea in low-lying areas.3 Consequently, in the 1880s, with the Cape’s connection with European countries, marram grass was chosen to stabilise the drift sands on the Cape Flats.4 However, marram grass is aggressively invasive in some countries.5,6 When a colleague, Al Wiedemann, pointed out the problems of marram grass invasion on the west coast of the USA6, a team at Rhodes University led by Prof. Roy Lubke, some 25 years ago, initiated a large European Union funded study (INVASS) on potentially invasive grass species with colleagues in Botswana, the UK, and the Netherlands.
Dr Ted Avis, a local Eastern Cape PhD student, now the CEO of a large environmental company (CES), conducted a survey of the coastal zone of the Eastern Cape in the 1980s.7 He established that marram had been planted
https://doi.org/10.17159/sajs.2023/15107

6 Volume 119| Number 1/2 January/February 2023 News
Figure 1: A proper ty at Witsand on the southern Cape coast.
in numerous regions, sometimes over >100 ha in extent, by the then Department of Forestry as part of an extensive stabilisation programme of mobile dune systems.8 These stabilisation programmes were often inappropriate as dune studies at Rhodes University and the Coastal Research Unit at Nelson Mandela University only later showed. At this time, Roy Lubke and Ted Avis published their illustrated pamphlet.1
species.9 Her studies revealed that marram grass, as originally introduced, was non-invasive as it produced little or no seedlings from the parent plants and the plants never became established. Moreover, there was no conclusive evidence that marram grass rhizomes could be transported by sea currents. Knevel also looked at the viability of the use of other pioneers as stabilising agents, but none emerged as being satisfactory.10
Deon van Eeden, a past MSc student at Rhodes University, and practitioner of dune stabilisation for his company Vula Environmental Services in the Western Cape, has many years of experience in using marram grass as a stabiliser of mobile sands.11 He has contributed to the techniques of dune stabilisation using indigenous species and has also worked out mechanised methods of planting marram.
Professor Roy Lubke, leader of the INVASS Project, and now a retired lecturer and Research Associate in the Department of Botany, Rhodes University, and founder of CES with Ted Avis, put together the paper2, as is summarised in the graphic abstract (Figure 3).
Our quantitative study included 64 species on 36 plots sampled on the young dunes; these were divided into two communities:
• Early dune pioneer communities (25 plots)
• Early coastal scrub communities (11 plots)
Overall, we found that:
Dr Ursula Higgins (née Hertling), a PhD student from Germany, now head of the Research Support Division at the University of Bayreuth, did an extensive survey of the eastern, southern and western Cape coasts in the mid-1990s, and this provided reliable baseline data on the previous extent of marram grass plantings.3 These data were used by Roy Lubke in the 2017 survey to extract information about where marram grass was recorded. In addition, the sites of historical information on the plantings of marram were noted from other studies.8,9 In the 2017 survey, Lubke, if he found marram to be present, looked in adjacent sites up to 1 km away for other sites where marram could occur in order to record these sites as well.2
Dr Irma Knevel, a PhD student from the Netherlands, now following a career in Research and Student Development at Groningen University, studied numerous aspects of the biology of marram grass and indigenous
• Marram grass disappeared from four sites (the reason for which could not be established), and in others, it disappeared due to dune erosion. In still other sites where it had been planted, its disappearance was due to its inability to compete with other pioneers without a continuous sand supply.

• Of the 64 species sampled, we identified the average number of pioneers as 2, with the highest number of pioneer species (7) recorded at Kleinemonde (4 grass species, 1 herb, 1 creeper and 1 shrub). Marram grass was often one of the dune pioneers at many sites and fitted naturally into the dune system.
• In no cases where marram grass had been planted was the grass found in adjacent sites. In other words, marram may persist at some sites but there is no evidence of it having moved from these sites to adjacent favourable sites.

7 Volume 119| Number 1/2 January/February 2023 News https://doi.org/10.17159/sajs.2023/15107 Marram grass as a non-invasive in dune stabilisation Page 2 of 3
Figure 2: Ammophila arenaria (marram grass) at Oyster Bay being replaced by shrubs with coastal scrub in the distance.
Figure 3: Graphic abstract that summarises the study.2
Thus, we concluded:
• In the Cape dune systems, marram grass does not persist in the climax vegetation.
• If it occurs, it is present along with other pioneer species.
• In many cases, marram just disappears, as stabilised sand is unfavourable for the grass to persist.
Thanks to our research, marram grass was shown to be a non-invasive species that can be successfully used in dune stabilisation. Moreover, we established that marram grass behaves identically to the indigenous species as a dune pioneer species. These results are highly significant for future stabilisation and dune management in the Cape, as for example, where dune sands invade roads or car parks.
References
1. Lubke RA, Avis AM. Stabilization and management of coastal sand dunes. Coastal information pamphlet no. I. Grahamstown: Rhodes University; 1986.
2. Lubke R. A current state of Ammophila arenaria (marram grass) distribution in the Eastern Cape, South Africa, and the possible effect of the grass on the dune system dynamics. Plants. 2022;11(17), Art. #2260. https://doi. org/10.3390/plants11172260
3. Hertling UM. Ammophila arenaria (L.) Link (marram grass) in South Africa and its potential invasiveness [PhD thesis]. Grahamstown: Rhodes University; 1997.
4. Shaughnessy GL. Historical ecology of alien woody plants in the vicinity of Cape Town [PhD thesis]. Cape Town: University of Cape Town; 1980.
5. Van der Putten WH. Impacts of soil microbial communities on exotic plant invasions. Trends Ecol Evol. 2010;25:512–519. https://doi.org/10.1016/j. tree.2010.06.006
6. Wiedemann AM. Dry coastal ecosystems of north-western North America. In: Van der Maarel E, editor. Ecosystems of the world 2B: Dry coastal ecosystems: Africa, America, Asia and Oceania. New York: Elsevier; 1993. p. 341–358.
7. Avis AM. Coastal management and stabilisation of mobile dune systems [PhD thesis]. Grahamstown: Rhodes University; 1992.
8. Cobby JE. Management policy of the Directorate of Forestry in respect of diverse ecological types. In: Bruton MN, Gess FW, editors. Towards an environmental plan for the Eastern Cape. Grahamstown: Rhodes University; 1988.
9. Knevel IC. The life history of selected coastal foredune species of South Africa [PhD thesis]. Grahamstown: Rhodes University; 2001.
10. Knevel IC, Venema HG, Lubke RA. The search for indigenous dune stabilisers: Germination requirements of selected South African species. J Coast Conserv. 2002;8:169–178. https://doi.org/10.1652/1400-0350(2002)008[0169:TSF IDS]2.0.CO;2
11. Van Eeden JD. Cost-effective, post closure environmental restoration of an open-cast mine in a semi-arid environment on the West Coast of South Africa [MSc dissertation]. Grahamstown: Rhodes University; 2006.
https://doi.org/10.17159/sajs.2023/15107
8 Volume 119| Number 1/2 January/February 2023 News
Marram grass as a non-invasive in dune stabilisation Page 3 of 3
AUTHORS:
Sipho Dikweni1
Boitumelo Makgabutane2,3
Sabelo D. Mhlanga3,4
AFFILIATIONS:
1Technology Innovation Agency (TIA), Pretoria, South Africa
2School of Chemistry, University of the Witwatersrand, Johannesburg, South Africa
3SabiNano (Pty) Ltd, Johannesburg, South Africa
4Department of Chemistry, Nelson Mandela University, Gqeberha, South Africa
CORRESPONDENCE TO:
Sabelo Mhlanga
EMAIL:
Sabelo.Mhlanga@mandela.ac.za
HOW TO CITE:
Dikweni S, Makgabutane B, Mhlanga SD. Lab-to-market guide for commercialisation of nanomaterials: A South African university perspective. S Afr J Sci. 2023;119(1/2), Art. #14912. https:// doi.org/10.17159/sajs.2023/14912
ARTICLE INCLUDES:
☐ Peer review
☒ Supplementary material
KEYWORDS:
nanomaterials, nanotechnology, nanoproducts, commercialisation, research innovation, technology transfer
PUBLISHED:
31 January 2023
Lab-to-market guide for commercialisation of nanomaterials: A South African university perspective
Significance:
This Perspective presents a unique guide for South African university researchers on how to successfully commercialise their research, especially nanomaterials. The commercialisation of nanomaterials has been a challenge for many researchers in South Africa because of a lack of information that can serve as a guide. The guide presented here is applicable across many disciplines of science, engineering, and technology, where nanomaterials are a subject of research and innovation. The full guide is included as supplementary material for reference.
Introduction
Nanotechnology has become an integral platform for the development of new innovations and technologies for almost all industrial sectors. As such, the commercial exploitation of nanotechnology has become the key focus in many jurisdictions with universities and research institutions leading the discovery of nanomaterials, which are the foundational building block of nanotechnology. Many countries across the globe have already seen the introduction of nanomaterial-enabled products in their marketplaces.1 However, in many other countries, the successful commercialisation of nanomaterials and nanotechnologies has proven to be rather a difficult or an impossible task. In these jurisdictions, nanomaterial research output ends up in publications and a very small fraction has been successfully translated into nano-products.
It has become evident that successful development and commercialisation of nanoscience has been hindered by a number of barriers, such as immature manufacturing technology and infrastructure, immature markets, lack of funding, and stringent regulatory requirements.2 Moreover, the weak link between research institutions and the industry has immensely contributed to the slow translation of research output from the lab to the market. It is worth noting that such jurisdictions are missing out on a very lucrative market with an estimated value of around around USD8.5 billion and bolstered by a compound annual growth rate of about 13%.3 This exponential growth can be attributed to the ongoing technological advancement and the wide application areas of nanomaterials in different industrial sectors. Thus, there is an urgent need to develop practical materials to guide different institutions in the process of nanotechnology development and commercialisation.
It is therefore the intention of this Perspective piece to provide a guide for commercialising nanomaterials from a university perspective. The guide provides a two-dimensional approach which focuses on the simultaneous maturity of both the technology and business development. Having a clear grasp of overlapping development areas between technology maturity and business development makes it easy to manage the project and plan development milestones that entail concurrent validation of both technology and commercial opportunities of the nanomaterials. The guide largely focuses on the stages of nanomaterial development, the role of technology transfer offices, standards and regulations, intellectual property, funding instruments and the commercialisation options for nanomaterials.
Research and development of nanomaterials
The process of discovering and developing nanomaterials involves an integrated multi-stage process which includes research and development; manufacturing design in the lab; functionalisation and validation of nanomaterials and transitioning from the lab scale to manufacturing process; piloting and industrial manufacturing. Key to the successful development and commercialisation of nanomaterials is compliance with national and international standards of regulations, which seek to protect human and environmental health from any detrimental effects that the nanomaterials may have. Another important element is the clear understanding of the commercial value of the nanomaterials. Without clear understanding of the market needs and value proposition offered by the new materials, it becomes very difficult to realise successful commercialisation of such materials.
University research has been solely influenced by following technological trends and proving scientific principles with little to no attention paid to industry market needs. The focus has been limited to research problems and sometimes on getting a publication or making a synthesis process or making the nanomaterial ‘perfect’ without considering the potential end uses or industrial applications. In the process, market development has been neglected and that has significantly contributed to innovations that could not be realised in the marketplace. Universities have, however, realised the need to marry research with market and business development to speed up the process of translating research output from the lab to the market. For that, universities have since established Technology Transfer Offices (TTOs) tailored to strengthen the relationship between the universities and industry. These offices act as the bridge between university research units and industry, facilitating the management and the transfer of university intellectual property to the market. Researchers are given space to do what they are good at, which is research and development, whilst technology transfer professionals focus on identifying market opportunities for the research output. TTOs investigate commercial opportunities for innovations brought about by university researchers before a substantial amount of money can be invested in the project. This process focuses on the key market needs and challenges, competitor profiling and identifying key industry players, innovation revenue streams, market size, key market drivers and barriers to market entry.
© 2023. The Author(s). Published under a Creative Commons Attribution Licence.
Research and development of nanomaterials focuses on developing methods for synthesising novel materials with nanoscale dimensions, as well as their purification, functionalisation and characterisation. Functionalisation
Perspective https://doi.org/10.17159/sajs.2023/14912
9 Volume 119| Number 1/2 January/February 2023
includes modifying the newly discovered and/or developed nanomaterials to possess desired properties (e.g. solubility, electrical conductivity, thermal stability).4 Functionalisation is one of the key limiting factors towards the successful commercialisation of nanomaterials. The process enables researchers to demonstrate the competitive advantages of the newly formed nanomaterials in one or more industrial applications compared to incumbent materials.
This process is followed by validation which is an important aspect in the development and commercialisation of nanomaterials. From an investor perspective, the most valuable application data typically come from third parties who can independently vouch for the quality or value of the materials. Often, universities overlook this important step and focus solely on developing methods for manufacturing and producing nanomaterials. The validation of nanomaterial products is an institutional void in South Africa. There is therefore an opportunity for local institutions and businesses to provide this service to aspiring entrepreneurs and existing businesses wanting to adopt the use of nanomaterials at a commercial scale.
As the research transitions from concept to lab scale, researchers need to demonstrate that the identified and/or discovered nanomaterials are manufacturable in a timely and cost-effective manner. In cases of process innovation, researchers need to show and prove the competence of their innovations over existing methods. Therefore, the focus should be on proving the concept, i.e. to demonstrate the feasibility of the newly developed technique or process innovation in real-world applications. In the process, special attention is given to parameters for the manufacturing environment as well as the whole manufacturing value chain for nanomaterials. The value chain refers to a set of activities, processes and raw materials, suppliers, key resources and equipment required to get the product ready. Once the parameters for manufacturing have been determined, and the concept has been proven in the lab, the project can transition into small-scale manufacturing (piloting) and production of market samples. Whilst the researchers are busy with proof-of-concept, university TTOs would focus on the novelty aspects of the nanomaterials (IP), monetisation, identifying different revenue streams and assisting in taking the research from the lab to the market. To this effect, university TTOs provide support by facilitating IP protection; fundraising for technology development, assisting in project planning and management; identifying market opportunities and promoting the university developed nanomaterials to the industry and/or the market.
With the fast-growing and increasing interest in the use of nanomaterials and/or nanotechnologies for research and industrial purposes, it is
essential to prioritise the minimisation of the risks (known and unknown) associated with the use of nanomaterials, in terms of the health, safety and environmental hazards that they may pose. As such, the handling, use and disposal of nanomaterials in places of work, including research laboratories and industrial enterprises, need to be safeguarded and effectively regulated. As part of the safeguarding and regulation of the use of nanomaterials and nanotechnologies, the Responsible Nano Code was established amongst several other standards, wherein guidance is provided on what organisations can do to demonstrate responsible governance on the production, research, and disposal of materials containing nanomaterials.5,6 The code was designed to be adopted by organisations of all sizes, and in all countries under any regulatory regime. Moreover, it is founded on seven principles that are core to the responsible development of nanomaterials and nanotechnologies: (1) board accountability, (2) stakeholder involvement, (3) worker health and safety, (4) public health, safety and environmental risks, (5) wider social, environmental, health and ethical implications and impacts, (6) engagement with business partners, and (7) transparency and disclosure.
Every nanomaterial produced for sale must be accompanied by a materials safety data sheet (an MSDS) that must be provided by the manufacturer at any given time. MSDSs are important to manufacturers and those they supply to ensure that workplaces are safe and to protect the environment. More specifically, a MSDS contains information that enables a risk assessment as required by regulation. Researchers developing nanomaterials can partner with institutions such as the National Institute of Occupational Health (NIOH) in South Africa and various universities that conduct research on toxicity and exposure of nanomaterials.
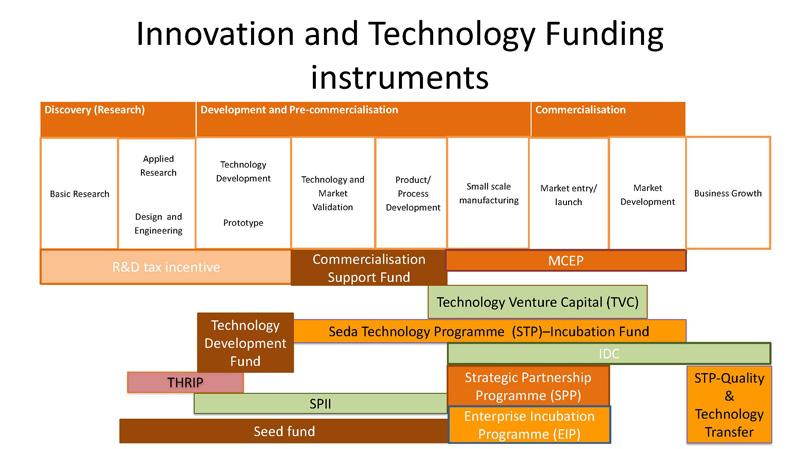
Funding opportunities
Funding is a critical component for the successful commercialisation of nanomaterials. The South African government has a wide range of institutions that provide funding for business ventures that can make a difference to the country’s economy. The funding can be in the form of innovation (product development), seed, or loan funding. The type of funding that one can secure is also determined by the maturity of a technology or product. Funders typically use a method of Technology Readiness Levels which help in understanding the maturity of a technology during its acquisition phase. A technology or product such as a nanoproduct or nanotechnology will undergo different phases including early stages of its discovery (research phase), its validation (development phase), and, finally, its full-scale commercialisation (deployment phase). Products and technologies at the lower spectrum of the Technology Readiness Levels will most likely secure innovation
10 Volume 119| Number 1/2 January/February 2023 Perspective https://doi.org/10.17159/sajs.2023/14912 Guide for commercialisation of nanomaterials Page 2 of 3
Source: South African Department of Trade, Industry and Competition7 Figure 1: Innovation and technology funding instruments.
and/or seed funding, whereas those that are highly mature can secure loans and venture capital funding. Figure 1 depicts a funding instrument that can be accessed by nanomaterial producers based on the stage of development. The figure has been sourced from the South African Department of Trade, Industry and Competition’s website.7
Commercialisation options
Commercial adoption of nanomaterials is accelerated by having a clear understanding of the characteristics of the nanomaterials produced as well as their correlation to application areas in different sectors. Having a clear understanding of the application areas of nanomaterials and their ability to improve the competitiveness of the customer’s products in the market is of utmost importance. For example, the produced nanomaterial may be both lightweight and conductive, making it suitable for conductive composites, electromagnetic shielding, thermal management, thermal detectors, and optical devices. But who needs lightweight and conductive materials and for what? That is the question university researchers must continuously ask themselves throughout the development of these materials. Answers can only be obtained by working in close collaboration with industry players as they know which materials would enhance their nano-based products and thus their competitiveness in the marketplace. Nanomaterials are an ocean that you cannot finish by swimming. Researchers need to concentrate on a specific topic or topics in the nanomaterial/s of interest and make a risk assessment for the commercialisation of that specific technology or product. The target customer segments need to be identified with their risks, opportunities and threats. Lack of attempts to understand market behaviour drives sellers to produce goods that do not fit market needs, which creates a disequilibrium in the supply demand function.
There are different commercialisation strategies that can be employed to take the product to the market. Deciding on which commercialisation strategy is influenced by several factors, such as the strength of the technology, market opportunity, and resource availability. Often universities license their intellectual property to well-established companies on an exclusive or non-exclusive basis. Alternatively, universities establish spinoff companies and take equity or assign the intellectual property to the new company or an outside company. There are also opportunities for collaborative arrangements with larger materials companies that would want to supplement their portfolios. The guide provides a brief description of the key commercialisation strategies.
After the decision has been taken to establish a spin-off company as a purpose vehicle to get to the market, the team must determine their business model. There are two models to consider in the process of commercialising nanomaterials. Researchers follow either the business to business (B2B) model or the business to consumer (B2C) model. The B2B model would imply that the university spin-off produces nanomaterials and distributes to different stakeholders for different applications and is not involved in the production of nano-based consumer products. For example, producing carbon nanotubes and selling them to an electronics company where they will produce nano-based electronic devices. The B2B model is easy to manage for a university spin-off company as there are fewer barriers in the marketplace compared to a B2C model. The B2C model is characterised by high infrastructure costs and barriers to market entry. It requires a strong market brand and reputation, which may present challenges for a newly established university spin-off. It is therefore common for a nanotechnology business to sail towards B2B; however, this must be controlled and fed by a substantial amount of B2C sales.
A few examples of nanomaterial-based university spin-off companies can be mentioned. These companies have been established based on new methods for cost-effective manufacturing nanomaterials. Oxford University has established a spin-off company based on a patented process for manufacturing carbon materials. The company, Designer Carbon Materials, uses their method and/or process to cost-effectively produce commercially useful quantities of the spherical carbon cage structures known as fullerenes or buckyballs. Investment in the company has been led by Oxford Technology and the Oxford Invention Fund. According to their website, Designer Carbon Materials Ltd is developing
advanced nanomaterials for a range of applications, including energy harvesting, bio-sensing and quantum nanoelectronics.
NANOGRAFI Co. Inc. was established in 2011 as a nanotechnology start-up to produce critical nanomaterials such as carbon nanotubes and graphene and to create a market for these materials. After the successful production of various types of carbon nanotubes, they began to study the applications of different nanomaterials including nanotubes, metal oxides, carbides, and cellulose nanoparticles. It is worth noting that the value creation for nanomaterial companies is not solely based on the production of novel materials; they further develop new applications for nanomaterials to be sustainable. For example, General Nano LLC, a nanotechnology company formed by University of Cincinnati scientists, is working to transition its carbon nanotube sheet product to commercial scale. This material is both lightweight and conductive, making it ideal for conductive composites, electromagnetic shielding, thermal management, thermal detectors, and optical devices. These attributes can lead to enhanced performance of next-generation air vehicles. In South Africa, a private start-up company has commercialised nanomaterials like carbon nanotubes and related nanoproducts for industrial applications such as fertiliser production.
Conclusion
The success of nanoscience and nanotechnology innovation/research commercialisation requires collaborative efforts from all relevant stakeholders. The full guide (available as a supplementary file to this Perspective) provides an indication of the expertise and support that is required from both the public and private sector to drive commercialisation. Moreover, the way research is conducted needs to change; research should be tailored to serve the needs of the industry if the aim is towards the application of nanomaterials in commercial products. The establishment of successful start-up companies providing nanotechnology solutions to South Africa’s grand challenges is an important success measure for the National Nanotechnology Strategy. It is also a key component for economic growth and global competitiveness.
Competing interests
We have no competing interests to declare.
References
1. Mufamadi MS. From lab to market: Strategies to nanotechnology commercialization in Africa. MRS Bull. 2019;44(6):421–422. https://doi. org/10.1557/mrs.2019.134
2. Rorwana A, Tengeh R. The role of academic entrepreneurs in the process of technology transfer and commercialization: The case of a university of technology in South Africa. Environ Econ. 2015;6(4):25–37.
3. Grand View Research. Nanomaterials market size, share & trends analysis report by product (gold, silver, iron, copper), by application (aerospace, automotive, medical), by region, and segment forecasts, 2021–2028 [document on the Internet]. No date [cited 2022 Feb 18]. Available from: https://www.grandviewresearch.com/industry-analysis/nanotechnology-andnanomaterials-market
4. Ruan S, Luo D, Li M, Wang J, Ling L, Yu A, et al. Synthesis and functionalization of 2D nanomaterials for application in lithium-based energy storage systems. Energy Storage Mater. 2021;38:200–230. https://doi.org/10.1016/j.ensm. 2021.03.001
5. Nanowerk. Nanotechnology accountability: Responsible nano code update [webpage on the Internet]. c2008 [cited 2022 Feb 18]. Available from: https:// www.nanowerk.com/news/newsid=5890.php
6. European Commission. Commission recommendation on a code of conduct for responsible nanosciences and nanotechnologies research & Council conclusions on responsible nanosciences and nanotechnologies research [document on the Internet]. c2009 [cited 2022 Feb]. Available from: https:// web.archive.org/web/20200606193125/http://ec.europa.eu/research/ science-society/document_library/pdf_06/nanocode-apr09_en.pdf
7. South African Department of Trade, Industry and Competition (DTIC). Innovation and technology funding instruments [webpage on the Internet. No date [cited 2022 Feb 18]. Available from: http://www.thedtic.gov.za/financial-and-nonfinancial-support/incentives/innovation-and-technology-funding-instruments/
11 Volume 119| Number 1/2 January/February 2023 Perspective https://doi.org/10.17159/sajs.2023/14912
Guide for commercialisation of nanomaterials Page 3 of 3
AUTHOR: Tamiru A. Abiye1
AFFILIATION:
1School of Geosciences, University of the Witwatersrand, Johannesburg, South Africa
CORRESPONDENCE TO:
Tamiru Abiye
EMAIL: Tamiru.abiye@wits.ac.za
HOW TO CITE: Abiye TA. Contribution of hydrogeology to solving community water supply problems in South Africa. S Afr J Sci. 2023;119(1/2), Art. #14599. https:// doi.org/10.17159/sajs.2023/14599
ARTICLE INCLUDES:
☐ Peer review
☐ Supplementary material
KEYWORDS: community water supply, groundwater, MSc in Hydrogeology, Wits School of Geosciences, South Africa
PUBLISHED: 31 January 2023
Contribution of hydrogeology to solving community water supply problems in South Africa
Professor Tamiru Abiye is the recipient of the 2021/2022 NSTF-South32 TW Kambule-NSTF Researcher award in recognition of his dedication to water science. Professor Abiye has focused on building research capacity and solving community water supply problems to promote sustainable development and water security in South Africa in the face of population, industrial, climate change and pandemic pressures.
Significance:
South Africa needs qualified hydrogeologists with high-level skills to address complex groundwater supply problems through research-based solutions. Water insecurity – due to population increases; expansion of industrial, agricultural and mining sectors; an increase in water pollution; impacts of climate change; and poor water resource management – affects sustainable development of the country. Often, groundwater is used to cover the water shortfall from surface water sources, and that use requires qualified hydrogeologists. Therefore, the training of qualified groundwater professionals at the MSc level is aimed to meet the demands of various stakeholders, which is our priority to facilitate groundwater management at all levels starting from municipalities to national government departments.
Background
Hydrogeology is the study of the occurrence of water in the subsurface geological environment. Therefore, a thorough understanding of rock formation, structural setting and geochemical composition of rocks help to conceptualise the occurrence and quality of groundwater. In South Africa, where climate change, water pollution and an increasing population challenge water security, hydrogeology plays a paramount role in the understanding of the groundwater reserve, quality and sustainability in order to supplement the current water supply, which is dependent on surface water. Therefore, in order to achieve successful management of water resources, particularly groundwater, the deployment of qualified hydrogeologists at all levels is important. The current reliance of authorities on surface water could be hampered by periodical droughts induced by El Nino, besides the disastrous effect of climate change in the long term.
Why does groundwater matter?
Groundwater occurs almost everywhere beneath the land surface under our feet. The quantity and quality of groundwater vary from place to place based on the geology and pollution sources. However, the crystalline nature of rocks in South Africa often makes it difficult to harvest a large quantity of groundwater, but it is still sufficient to supplement various economic sectors. Much of South Africa’s food is produced by irrigated agriculture, which relies on groundwater. Groundwater, in the form of baseflow, plays a paramount role in sustaining streamflow, lakes, wetlands and aquatic ecosystems during dry periods, and hence, we can use them to infer the occurrence and circulation of groundwater. According to the South African Department of Water and Sanitation, only 20% of groundwater has been used so far in South Africa. This percentage underestimates the actual groundwater use pattern, which is extensive throughout the country in all economic sectors, particularly for more than 85% of agricultural, mining and domestic uses (rural areas). As shown in Figure 1, groundwater is used primarily by the agricultural sector in South Africa.1
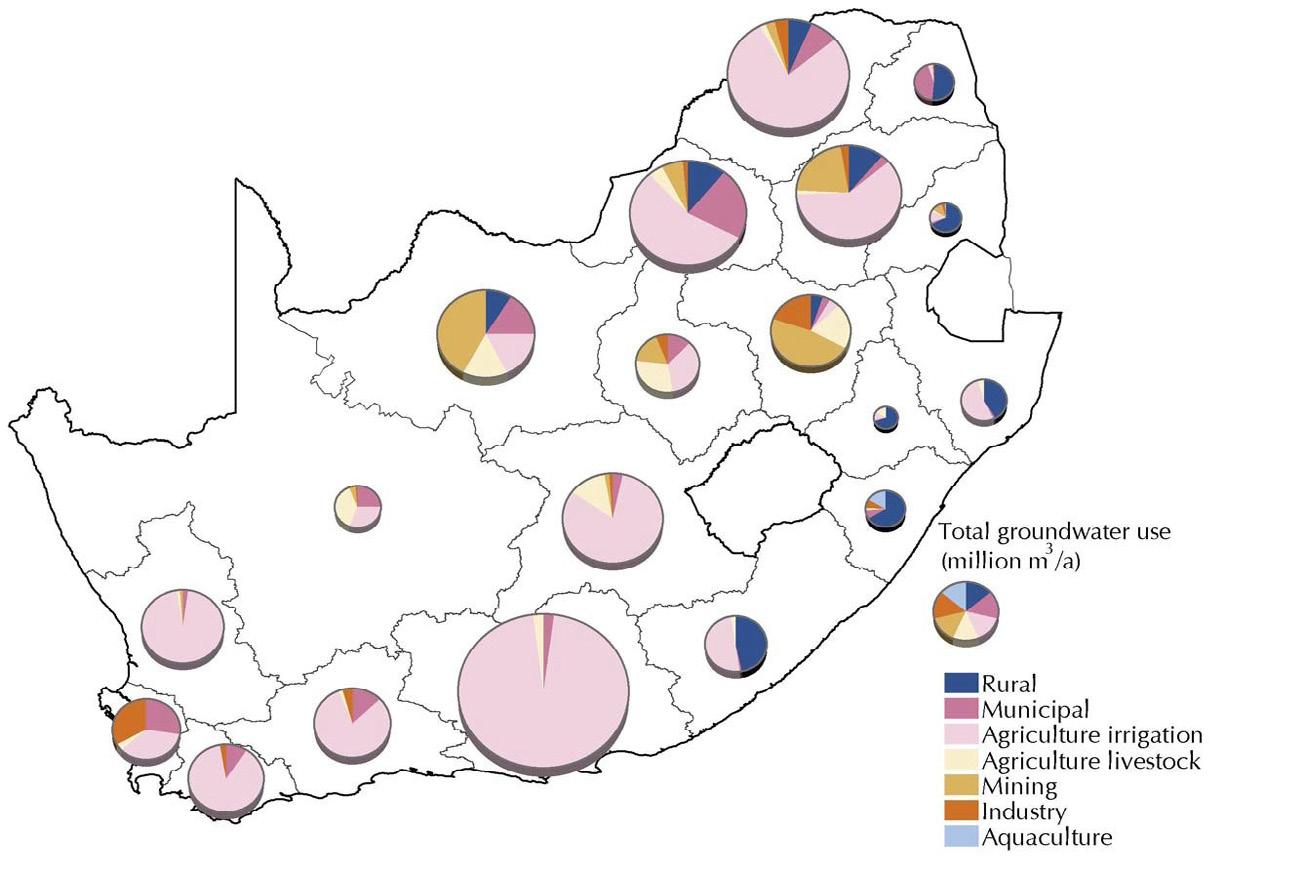
© 2023. The Author(s). Published under a Creative Commons Attribution Licence.
Invited Commentary
https://doi.org/10.17159/sajs.2023/14599
12 Volume 119| Number 1/2 January/February 2023
Source: StatsSA1
Figure 1: Total groundwater use in South Africa is dominated by the agricultural sector.
Groundwater use has increased dramatically, from approximately 684 million m3 in 1950 to 1770 million m3 in 2004, mainly due to an increase in irrigation for which groundwater comprises over 64%, while mining and domestic consumption in urban and rural areas each account for 8% of use.1 This shows that, in mining-dominated regions, such as in Gauteng, North West and Free State Provinces, groundwater sustains the mining sector, while in the dispersed human settlement areas of KwaZuluNatal, Mpumalanga and Limpopo Provinces, groundwater supplies water for domestic use. The dependence of water users on groundwater has substantially increased due to recurrent droughts that affect dams and rainfed agriculture. This shows that groundwater provides a lifeline that needs to be focused on for further utilisation to advance the sustainable development of South Africa.
What do hydrogeologists do?
• Identify rocks that host groundwater
• Divide the rocks into aquifers, aquitards, aquicludes and aquifuges
• Plan, design and construct boreholes for various economic uses
• Plan, conduct and analyse pumping test data
• Estimate groundwater storage
• Construct groundwater flow maps, identify recharge and discharge areas
• Estimate groundwater recharge, identify the source of recharge and residence time
• Investigate the quality of the groundwater to ensure that it is safe for the intended use
• Design aquifer clean-up techniques where aquifers are polluted
• Identify the source of groundwater pollution and suggest a remedy
• Design and construct dewatering schemes in mines
• Conduct field and lab-based measurements of water quality and geochemical modelling
• Conduct tracer tests and identify different water sources
• Operate scientific equipment that helps to generate data
• Predict groundwater abstraction, contaminant dispersion and aquifer potential based on numerical modelling
• Advise water managers, policy- and decision-makers, and water users on sustainable use of groundwater; food and energy production; environmental protection; and coping with the impact of climate change
• Engage and work closely with borehole owners (private owners, farmers, companies, industries, mines), contractors, scientists, engineers, geophysicists, agronomists, sociologists, economists, policy- and decision-makers, regulators, and planners.
Groundwater is resilient to climatic variability
Groundwater is often considered to be resilient to climatic variability, while surface water can be easily affected by extreme weather conditions. Shallow aquifers made of alluvials, weathered and intensively fractured rocks depend on periodical recharge (renewable recharge) and the interannual variation in rainfall could affect the storage. However, deep aquifers receive decadal or centennial recharge that may not be affected by the short- or medium-term changes in climate and hence such aquifers can provide groundwater throughout the year. In dolomitic aquifers in the Pretoria-Johannesburg region, the residence time of groundwater, which is currently extracted by water users, is in the range of 1650±50 to 1850±50 years, while in the Mogwadi (Dendron) area, the residence time of groundwater used by potato farmers ranges from 560 to 1400±50 years; these are classified as aquifers with historical recharge.2 Therefore, such aquifers may not be replenished from present-day rainfall. The importance of groundwater to combat
hydrological drought in Cape Town was extensively presented in Daily Maverick 3-7 Several emergency boreholes were installed during the 2015/2016 El Nino related drought across the country and later they were abandoned when dams were full. It is always recommended to supplement the water supply from boreholes as they are important for decentralised water provision. Even though the city of Cape Town embarked on developing the Table Mountain Group sedimentary rocks and the Cape Flat aquifers, there may not be a sufficient investment to exploit groundwater to meet the growing demand. In October 2022, when Rand Water reduced the water supply to the Gauteng municipalities for various reasons, groundwater provided a lifeline to the communities. The notion of using groundwater only during an emergency by authorities has to be replaced with necessity at all times.
Groundwater storage in South Africa
The total storage capacity of the 1086 dams in South Africa is 31 619 million m3, which is about 65% of the mean annual run-off of 49 000 million m3 8 While the total groundwater storage estimated based on globally accepted methods for South Africa is about 17 400 km3 9 Not all of this groundwater storage is available for abstraction as it varies spatially, and the estimated groundwater storage does not consider water quality. However, it is extensively used for various economic and domestic activities all over the country and is still available for use. The Northern Cape and the western section of the North West Province, which are dominated by the Kalahari sediments underlain by Karoo sedimentary rocks, contain the largest groundwater storage in South Africa, often due to the confined nature of the aquifers. Recharge (current and historic), geology and regional geophysics-based approaches could help to identify large groundwater aquifers in South Africa.
Using the unusable mine water
Acid mine drainage (AMD) is often a point of discussion due to its adverse environmental impact. The rising of acidic groundwater in abandoned mine shafts poses an environmental risk while the groundwater which was dewatered during gold mining is trying to establish its original hydraulic head. In addition, the leaching of toxic chemicals from tailings dams can be reused through efficient treatment technologies. The discharge of AMD, which amounts to 202 million L/day in the Johannesburg region, can be treated to obtain clean water that can supplement the current water supply, as well as to extract by-products such as metals, sulphuric acid and gypsum.10 Currently, there is an effort by the South African Department of Water and Sanitation to control the water levels in mine voids below the Environmental Critical Levels by pumping it out, as well as treating AMD through neutralisation by alkaline materials such as lime and discharging the water into streams.11 The eMalahleni Water Reclamation Plant is a very good example that can be replicated in the gold mining areas. It uses the Keyplan High Recovery Precipitating Reverse Osmosis (KHiPRO) technique, which provides about 24.2 million L/day of clean water to the local municipality with a recovery rate of 99%. As a byproduct, the treatment process produces about 100 tons of gypsum per day that is used as a building material for local houses.12 Appropriate investment either through the private sector or private–public partnership could help to manage AMD successfully for beneficial purposes.
Radioactivity in tailings and groundwater
The activity concentration for 238U in rocks ranges from 1.06 Bq/kg to 35.2 Bq/kg, while for 235U the activity concentration varies between 1.06 Bq/kg and 1.62 Bq/kg, as recorded in the quartzite of the Skunwerburg Formation (TMG). The activity concentration for 226Ra was found to be high (72 Bq/kg) in the Ceres Subgroup shale (TMG) which also contains a high exposure dose rate of 185.7 nS/h. In the Thyspunt area in the Eastern Cape Province, the activity of the radiotoxic and carcinogenic uranium (238U, 235U) and radium (226Ra) in water was found to be well above the World Health Organization (WHO) guidelines of 0.03 Bq/L and 1 Bq/L, respectively. The activity concentration of 238U in deep groundwater varies between 17.6 Bq/L and 5060 Bq/L (above the WHO recommended drinking water limit of 190 Bq/L) along with high 226Ra activity ranging from 1.1 Bq/L to 114 Bq/L, which is above the WHO recommended drinking water limit of 1.0 Bq/L.13 The high radioactivity of
13 Volume 119| Number 1/2 January/February 2023 Invited Commentary https://doi.org/10.17159/sajs.2023/14599 Hydrogeology for community water supply Page 2 of 3
groundwater has been attributed to the mineralisation of the TMG rocks due to metamorphism and subsequent release of radionuclides into groundwater through water-rock interaction processes.
The activity concentrations of 238U in the gold mine tailings of Gauteng Province were found to range from 210.0 Bq/kg to 2578.9 Bq/kg, which is higher than the regulatory limit of 500 Bq/kg. Similarly, the annual effective radiation dose from the tailings dams varies between 0.14 mSv/y and 1.09 mSv/y, with an average of 0.51 mSv/y, above the recommended exposure dose limit of 0.25 mSv/y for humans.14,15 Initial results of the radioactivity in fresh groundwater used for drinking show elevated activity concentrations in the West Rand region, Gauteng Province.15 In general, the presence of high activity concentrations of toxic radionuclides in the tailings dams, rocks and groundwater means that the use of tailings and rocks for house construction should be regulated, and toxic groundwater must not be used for any activity unless it is treated.
Hydrogeology at Wits
Hydrogeology is an applied geoscience. It is a relatively new branch of geoscience that equips researchers in the physics, chemistry, mathematics, hydrology and geology needed to solve groundwater-related community problems onsite efficiently and independently. Confidence of hydrogeologists increases based on the application of integrated methods to obtain the required solution. With the prime aim of skilled human capacity building to alleviate the water shortage in South Africa at a time of increasing water insecurity, the School of Geosciences at the University of the Witwatersrand launched the MSc in Hydrogeology programme (Coursework and Research Report) in 2015; the programme has attracted more than 120 postgraduate students so far. An appropriate need assessment was conducted and relevant stakeholders participated in the formulation of the courses. The programme allows working professionals from all sectors of the community to upgrade/refocus their skills, which is beneficial in terms of demographic transformation in attracting students from disadvantaged communities in South Africa and other southern African countries. The graduates are highly employable with a specific degree of ‘MSc in Hydrogeology’ as they are equipped with various scientific methods acquired through advanced courses as well as projects that have applied aspects. The training programme involves the participation of professional hydrogeologists from the private sector, government departments and mining companies who share job and management-related experiences.
Conclusion
A tailor-made programme, MSc in Hydrogeology (Course Work and Research Report), dedicated to training qualified and motivated hydrogeologists, is very helpful for the exploration of groundwater, as well as to provide knowledge-based support to communities and water managers. It is also quite important to refocus the groundwater research on community-related water supply problems and engage decisionmakers on the importance of groundwater as a dependable resource, which is buffered from climatic variabilities. Often groundwater is safe for use; however, in the case of high salinity, acidity and toxic metal content, there are readily available technologies to treat groundwater before use.
Acknowledgements
I thank the National Science and Technology Forum of South Africa for the encouragement to submit highlights of the work that led me to win the TW Kambule Researcher Award 2022 (Science Oscar of South Africa) and the Editor-in-Chief Prof. Leslie Swartz for the invitation to prepare this commentary piece. I also thank StatsSA for its 2010 report from where Figure 1 was obtained.
Competing interests
I have no competing interests to declare.
References
1. StatSA. National accounts: Water management areas in South Africa. Discussion document D0405.8. Pretoria: StatsSA; 2010. Available from: https://www.statssa.gov.za/publications/D04058/D04058.pdf
2. Abiye TA, Leketa KC. The need for managing historic groundwater in the Limpopo River Basin, southern Africa: Based on the δ18O, δ2H and 14C data. Groundw Sustain Dev. 2021;14, Art. #100583. https://doi.org/10.1016/j. gsd.2021.100583
3. Parsons R. Cape drought: What is happening to our groundwater? Daily Maverick. 30 July 2018. Available from: https://www.dailymaverick.co.za/ article/2018-07-30-cape-drought-whats-happening-to-our-groundwater/
4. Parsons R. The groundwater debate has to be science-based. Daily Maverick. 14 October 2018. Available from: https://www.dailymaverick.co.za/article/201810-14-the-groundwater-debate-has-to-be-science-based/
5. Parsons R. A delicate balance: Understanding underground water reserves. Daily Maverick. 03 April 2019. Available from: https://www.dailymaverick. co.za/article/2019-04-03-a-delicate-balance-understanding-undergroundwater-reserves/
6. Parsons R. Drought-proofing South Africa – Groundwater is the way to go. Daily Maverick. 23 October 2019. Available from: https://www.dailymaverick. co.za/article/2019-10-23-drought-proofing-south-africa-groundwater-isthe-way-to-go/
7. Parsons R. Making the invisible visible – tapping into groundwater must form part of Cape Town’s future water supply. Daily Maverick. 18 April 2022. Available from: https://www.dailymaverick.co.za/article/2022-04-19making-the-invisible-visible-tapping-into-groundwater-must-form-part-ofcape-towns-future-water-supply/
8. MacDonald AM, Bonsor HC, Dochartaigh BÉÓ, Taylor RG. Quantitative maps of groundwater resources in Africa. Environ Res Lett. 2012;7, e024009. https://doi.org/10.1088/1748-9326/7/2/024009
9. The South African National Committee on Large Dams. South African register of large dams. Pretoria: The South African National Committee on Large Dams; 2018.
10. Abiye TA, Ali KA. Potential role of acid mine drainage management towards achieving sustainable development in the Johannesburg region, South Africa. Groundw Sustain Dev. 2022;19, Art. #100839. https://doi.org/10.1016/j. gsd.2022.100839
11. South African Department of Water Affairs (DWA). Feasibility study for a longterm solution to address the acid mine drainage associated with the East, Central and West Rand underground mining basins. Assessment of the water quantity and quality of the Witwatersrand mine voids. DWA Report no. P RSA 000/00/16512/2. Pretoria: DWA; 2013.
12. Hutton B, Kahan I, Naidu T, Gunther P. Operating and maintenance experience at the Emalahleni water reclamation plant. Paper presented at: The International Mine Water Conference; 2009 October 19–23; Pretoria, South Africa.
13. Mohuba SC, Abiye TA, Demlie MB, Nhleko N. Natural radioactivity and metal concentration in the Thyspunt area, Eastern Cape Province, South Africa. Environ Monit Assess. 2022;194:112. https://doi.org/10.1007/s10661-02109725-4
14. Moshupya P, Mohuba S, Abiye TA, Korir I, Nhleko S, Mkhosi M. In-situ determination of radioactivity levels and radiological doses in and around the gold mine tailings dams, Gauteng Province, South Africa. Minerals. 2022;12, Art. #1295. https://doi.org/10.3390/min12101295
15. Mohuba SC, Abiye TA, Nhleko S. Evaluation of radionuclide levels in drinking water from communities near active and abandoned gold mines and tailings in the West Rand region, Gauteng, South Africa. Minerals. 2022;12, Art. #1370. https://doi.org/10.3390/min12111370
https://doi.org/10.17159/sajs.2023/14599
14 Volume 119| Number 1/2 January/February 2023 Invited Commentary
Hydrogeology for community water supply Page 3 of 3
AUTHORS:
Miranda N. Mpaka-Mbatha1,2,3
Pragalathan Naidoo2,3
Md Mazharul Islam4
Ravesh Singh5
Khethiwe N. Bhengu1,2,3
Nomzamo Nembe-Mafa2,3
Roxanne Pillay1,2,3
Zamathombeni Duma2,3,5
Abraham J. Niehaus6
Zilungile L. Mkhize-Kwitshana2,3
AFFILIATIONS:
1Department of Biomedical Sciences, Mangosuthu University of Technology, Durban, South Africa
2Department of Medical Microbiology, School of Laboratory Medicine and Medical Sciences, College of Health Sciences, Nelson R. Mandela Medical School, University of KwaZulu-Natal, Durban, South Africa
3Division of Research Capacity
Development, South African Medical Research Council (SAMRC), Cape Town, South Africa
4Department of Animal Resources, Ministry of Municipality, Doha, Qatar
5Department of Medical Microbiology, School of Laboratory Medicine and Medical Sciences, College of Health Sciences, Howard College, University of KwaZulu-Natal, Durban, South Africa
6Department of Microbiology, Ampath Laboratories, Cape Town, South Africa
CORRESPONDENCE TO:
Miranda Mpaka-Mbatha
EMAIL: mpakamiranda@gmail.com
HOW TO CITE:
Mpaka-Mbatha MN, Naidoo P, Mazharul Islam M, Singh R, Bhengu KN, Nembe-Mafa N, et al. Immunological interaction during helminth and HIV co-infection: Integrative research needs for sub-Saharan Africa. S Afr J Sci. 2023;119(1/2), Art. #15108. https:// doi.org/10.17159/sajs.2023/15108
ARTICLE INCLUDES:
☐ Peer review
☐ Supplementary material
KEYWORDS: helminths, HIV, co-infection, immunology, intervention programmes
FUNDING:
South African Medical Research Council
PUBLISHED:
31 January 2023
Immunological interaction during helminth and HIV co-infection: Integrative research needs for subSaharan Africa
Significance:
Sub-Saharan Africa is heavily burdened with human immunodeficiency virus (HIV) and helminth infections, which are potent activators of pro-inflammatory and anti-inflammatory immune responses, respectively. Considering that helminths (such as Necator americanus, Ancylostoma duodenale, Ascaris lumbricoides, Trichuris trichiura, Schistosoma haematobium, and Schistosoma mansoni) can potentially dampen the production and expression of vital anti-viral pro-inflammatory cytokines, leading to enhanced HIV replication and severity, well-designed intervention studies are needed which will offer conclusive data on the nature of these interactions and the impact of deworming in HIV-infected patients. Such research will impact governmental health policies and deworming programmes, allowing for the implementation of integrated systems that will contribute to the overall improvement of African health systems.
Background
Sub-Saharan Africa has an extensive epidemiological overlap between parasitic helminth infections and human immunodeficiency virus/acquired immune deficiency syndrome (HIV/AIDS).1 According to the World Health Organization, more than 1.5 billion people worldwide are infected with soil-transmitted helminths, and sub-Saharan Africa has the highest burden.2 It is also estimated that 90% of people in need of schistosomiasis treatment live in Africa.3 Approximately 85% of helminth infections in sub-Saharan Africa occur in areas exposed to poverty, overcrowding, inadequate sanitation, poor hygiene practices and unsafe water sources. These living conditions also promote the spread of HIV.1 The sub-tropical climate in sub-Saharan Africa also contributes to high transmission and infection rates.
During the early stages of helminth infection and pre-adult worm development, epithelial cells secrete thymic stromal lymphopoietin, interleukin (IL)-33 and IL-25, which stimulate the activation and differentiation of type 2 innate lymphoid cells (ILC2) and polyfunctional CD4+ T-helper type 2 (Th2) cells, resulting in the secretion of Th2 anti-inflammatory cytokines (IL-4, IL-5, IL-9, IL-10 and IL-13).4
CD4+ T-cells play an important role in the host defence against HIV.5 Unlike the anti-inflammatory Th2 immune response to helminths, HIV is controlled by a pro-inflammatory T-helper type 1 (Th1) immune response.6 CD4+ T-cell exposure to IL-12 triggers a Th1 response that leads to the secretion of vital anti-viral pro-inflammatory cytokines, including IL-2, tumour necrosis factor (TNF)-α, interferon (INF)-γ, macrophage inflammatory protein (MIP)-1α/1β, and regulated on activation, normal T-cell expressed and secreted (RANTES).6
The burden, severity and public health implications of helminth and HIV co-infections in South Africa have not been given the attention they warrant. This raises important research questions about the public health implications of helminth co-infection with HIV in terms of pathogenesis and treatment outcomes. Furthermore, although individual helminth and HIV infection-specific immune responses have been the target of extensive investigation, the specific immune mode of protection during co-infection remains unknown. There is no conclusive evidence to confirm whether helminth-induced immunity modulates HIV-specific immune responses or vice versa.7,8 By 2017, a number of studies carried out in southern Africa (Mozambique, South Africa, Zambia, Zimbabwe), West Africa (Nigeria) and East Africa (Ethiopia, Kenya, Uganda, Tanzania) reported contrasting findings, with some indicating the detrimental effects of helminthiasis on HIV immune responses, while others reported no evidence of harmful immunological interactions.9 Many of these studies were cross-sectional and observational in nature, which may have limited the ability of the results to be conclusive. The West and East African regions have the lowest HIV/AIDS burden when compared to the worst affected southern region, which may explain the lack of studies in the West African region. However, surprisingly, the East African region had the highest number of studies when compared to other African regions.9 Epidemiological data support a bidirectional interaction between helminths and HIV; however, it is challenging to distinguish the direction of effects in observational studies, and so in order to reach a definitive conclusion, well-designed, randomised and controlled intervention studies are urgently needed.10
Treatment of helminthic infections is simple, widely available, relatively inexpensive, and has recently become a priority for public health intervention in Africa.6 Albendazole and mebendazole are widely used anti-helminthic drugs.11 Hence, it would be more feasible if more concerted research is done to demonstrate the impact of deworming on HIV/AIDS disease progression. Additionally, a more effective strategy that can be employed to mitigate against the burden of helminth co-infections with HIV is described in the four-pronged approach in Figure 1. The results of such research would point towards identification of correlates of transmission, the immunological responses during co-infection, development of immunotherapeutic interventions, and development of locally relevant vaccines that are geared towards populations that are exposed to helminths.
Helminth and HIV/AIDS co-infection immune responses
© 2023. The Author(s). Published under a Creative Commons Attribution Licence.
Helminth-infected individuals have shown increased expression of co-receptors of HIV-1 chemokines on T-lymphocytes and monocytes.12,13 This is one of the contributing mechanisms in facilitating easy HIV-1 entry and increasing the pool of cells susceptible to infection. Peripheral blood mononuclear cells (PBMCs) obtained from helminth-infected individuals showed increased susceptibility to HIV-1 infection.14,15 Furthermore, a decreased CD8+ cytolytic HIV-1-
Commentary https://doi.org/10.17159/sajs.2023/15108
15 Volume 119| Number 1/2 January/February 2023
specific T-cell response and increased IL-10 production were observed in HIV patients co-infected with Schistosoma mansoni compared to those with HIV-1 infection only.16,17 Similarly, reduction of CD4+ cells and increased CD8+ cells were reported among helminth-infected and HIV1 uninfected individuals, suggesting that helminths on their own reduce the pool of CD4+ cells, which is critical in orchestrating effective immune responses against all pathogens.18 The predominance of Th2 cellular and molecular components resulting from helminth infections downregulates the dominance of the Th1 component, which is essential for the control of HIV infection.19
Another classic feature of helminth infection is marked eosinophilia. Eosinophils have been shown to express CD4+ molecules upon activation and are easily infectable by HIV.20 The increased number of eosinophils in the mucosa (gut, genital and rectal) may facilitate easy acquisition and cell-cell transmission of HIV in helminth-infected hosts.20 In a placebo-controlled trial, Ascaris lumbricoides co-infected HIV-positive patients treated with albendazole showed a significant increase in peripheral CD4+ T-cells and a decreasing trend in HIV-1 RNA levels compared to the placebo group.21 In summary, the above nonexhaustive account of immune dysregulation, Th2 bias and generalised immunosuppression caused by chronic helminth infections describes a favourable environment where HIV can rapidly replicate and spread in and amongst individuals chronically exposed to helminth infections.22
In South Africa, there is a striking paucity of data on the immunological consequences and therapeutic outcome of infection with helminths among HIV/AIDS infected individuals. For example, a South African study reported that dual HIV and helminth infection, together with helminth egg excretion and/or high levels of Ascaris-specific IgE, may be linked to a poor proliferative capacity and deleterious cytokine profile with regard to HIV control.23 In addition, results from the same study population concluded that people with both helminth egg excretion and high anti-Ascaris IgE levels had dysregulated immune cells and high viral loads.23 A modified Th2 helminth response in individuals with eggpositive stools and low levels of anti-Ascaris IgE showed an improved HIV-related immune profile.23 The association between HIV and helminth co-infections and lower biochemical micronutrients, protein and carbohydrate levels in humans has also been shown.24 Additionally, several nutrient deficiencies have been found to increase the likelihood of HIV and helminth co-infection.24 It is understood that various nutrient deficiencies cause impaired immunity.23 These findings illustrate the need for further research that may better describe and explain the effects of helminth immune modulation in individuals co-infected with HIV,
leading to successful development of helminth and HIV-related vaccines which will be effective and timely accessible to save lives and improve the general health of those co-infected.
Helminth treatment effect on HIV/AIDS co-infected patients
Treatment recommendations in regions where soil-transmitted helminths and schistosomiasis are co-prevalent include albendazole and praziquantel, respectively.25 Helminths are known to reduce the efficacy of the tuberculosis vaccine, Bacillus Calmette-Guérin, and reduce tumour immunosurveillance activities.14 Effective deworming has been associated with a reduction in HIV viraemia, leading to the slower progression to AIDS, and has been shown to normalise immunological parameters related to immune activation, Th2 immune response, and Treg-induced T-cell hypo-responsiveness.26 The synergy between antiretroviral therapy and albendazole in down-regulating the Th2-biased immune response strongly suggests that deworming can be a safe and effective strategy for improving the health and quality of life of coinfected individuals.26 More interventional research to demonstrate the impact of deworming on HIV/AIDS disease progression is thus required to improve our understanding of the detrimental and beneficial effects of helminth co-infection with HIV.

Knowledge gaps and way forward
The burden and severity of helminth and HIV co-infections have not been given the attention they warrant. Many questions remain unanswered regarding the immunological and pathological consequences of helminth and HIV co-infections. Several human studies investigated the immunological interactions between these infections but results thus far remain inconclusive. This raises important research questions about the public health implications of helminth co-infection with HIV in terms of pathogenesis and treatment outcomes. Furthermore, despite extensive research into individual helminth and HIV infection-specific immune response, the specific immune mode of protection by helminths remains unknown. It is, however, conceivable that the mechanisms involved in both pro-inflammatory and regulatory responses may impact the outcome of HIV/helminth exposure and infection.
There is a real need for interventions that can address the burden of helminth and HIV co-infections. The 95-95-95 targets set by UNAIDS were designed to end the AIDS epidemic by 2030. The three focal targets are that: (1) 95% of those living with HIV must be aware of
16 Volume 119| Number 1/2 January/February 2023 Commentary https://doi.org/10.17159/sajs.2023/15108 Immunology of helminth and HIV co-infection Page 2 of 4
Figure 1: A four-pronged approach for successful mitigation against the burden of helminth co-infections with HIV.
their status, (2) 95% of those who are aware of their status must be receiving treatment, and (3) 95% of those receiving treatment must have suppressed viral loads. In addition, other targets include achieving zero discrimination and reducing the annual number of new HIV infections among adults to under 200 000 per year. In addition to our proposed fourpronged approach to helminth elimination, similar to the UNAIDS 2030 target goals, the United Nations should also consider having a 95-95-95 target approach to eliminate helminthiasis by 2030. The three proposed focal targets to eliminate helminthiasis should include (1) having 95% of those living with helminth infections be aware of their status, (2) having 95% of those who are aware of their helminth infection status be on anti-helminthic treatment (albendazole, mebendazole and praziquantel) and (3) 95% of those receiving anti-helminthic treatment be educated on good hygiene practices to reduce the cycle of re-infection.
In addition, more transdisciplinary studies are needed to investigate the (1) immunomodulating effects of chronic helminth infection and the impact of such effects on HIV infection, with a focus on the functional and molecular profile of HIV-specific immune responses, (2) association of immunologic markers of helminths and HIV, with control of pathogen replication and disease, (3) impact of helminth co-infections on measures of disease activity for HIV, to promote the understanding of interactions between helminths and HIV, their influence on disease activity, and (4) impact of co-infection on treatment outcomes for HIV.
In conclusion, medical and technological advancements, as well as strengthened multi-pronged interventions, such as (1) early infection detection, (2) mass deworming programmes, (3) continuous surveillance, (4) proper sanitation and clean water provision, (5) development of sensitive diagnostic tools, (6) allocation of more research funds, (7) new therapeutic agents, and (8) prophylactic vaccines, are required for successful helminthiasis elimination.27
Disclaimer
The views and opinions expressed in this article are those of the authors and do not necessarily reflect the official policy or position of any affiliated institutions of the authors.
Acknowledgements
Research reported in this publication was supported by the South African Medical Research Council (SAMRC) through its Division of Research Capacity Development under the Research Capacity Development Initiative from funding received from the South African National Treasury. The content and findings reported / illustrated are the sole deduction, view and responsibility of the researchers and do not reflect the official position and sentiments of the SAMRC.
Competing interests
We have no competing interests to declare.
References
1. Simon GG. Impacts of neglected tropical disease on incidence and progression of HIV/AIDS, tuberculosis, and malaria: Scientific links. Int J Infect Dis. 2016;42:54–57. https://doi.org/10.1016/j.ijid.2015.11.006
2. World Health Organization. Soil-transmitted helminth infections [webpage on the Internet]. c2020 [cited 2022 Aug 04]. Available from: https://www.who. int/news-room/fact-sheets/detail/soil-transmitted-helminth-infections
3. World Health Organization. Schistosomiasis and soil-transmitted helminthiases: Number of people treated in 2016. Wkly Epidemiol Rec. 2017;49(92):749–760. Available from: http://www.ncbi.nlm.nih.gov/pubmed/19219964%5Cnhttp:// orton.catie.ac.cr/cgi-bin/wxis.exe/
4. Ramalingam TR, Pesce JT, Mentink-Kane MM, Madala S, Cheever AW, Comeau MR, et al. Regulation of helminth-induced Th2 responses by thymic stromal lymphopoietin. J Immunol. 2009;182(10):6452. https://doi. org/10.4049/jimmunol.0900181
5. Okoye AA, Picker LJ. CD4+ T cell depletion in HIV infection: Mechanisms of immunological failure. Immunol Rev. 2013;254(1):54. https://doi. org/10.1111/imr.12066
6. Salgame P, Yap GS, Gause WC. Effect of helminth-induced immunity on infections with microbial pathogens. Nat Immunol. 2013;14(11):1118–1126. https://doi.org/10.1038/ni.2736
7. Brown M, Mawa PA, Kaleebu P, Elliott AM. Helminths and HIV infection: Epidemiological observations on immunological hypotheses. Parasite Immunol. 2006;28(11):613–623. http://doi.wiley.com/10.1111/j.1365-3024. 2006.00904.x
8. Fincham JE, Markus MB, Adams VJ. Could control of soil-transmitted helminthic infection influence the HIV/AIDS pandemic. Acta Trop. 2003;86(2–3):315–333. https://doi.org/10.1016/S0001-706X(03)00063-9
9. Mkhize-Kwitshana ZL, Tadokera R, Mabaso MHL. Helminthiasis: A systematic review of the immune interactions present in individuals coinfected with HIV and/or tuberculosis. IntechOpen; 2017. https://doi.org/10.5772/66124
10. Brown M, Mawa PA, Kaleebu P, Elliott AM. Helminths and HIV infection: Epidemiological observations on immunological hypotheses. Parasite Immunol. 2006;28(11):613–623. https://doi.org/10.1111/j.1365-3024.2006.00904
11. Chai JY, Jung BK, Hong SJ. Albendazole and mebendazole as anti-parasitic and anti-cancer agents: An update. Korean J Parasitol. 2021;59(3):189. https://doi.org/10.3347/kjp.2021.59.3.189
12. Sundstrom JB, Hair GA, Ansari AA, Secor WE, Gilfillan AM, Metcalfe DD, et al. IgE-FcεRI interactions determine HIV coreceptor usage and susceptibility to infection during ontogeny of mast cells. J Immunol. 2009;182(10):6401–6409. https://doi.org/10.4049/jimmunol.0801481
13. Secor WE, Shah A, Mwinzi PMN, Ndenga BA, Watta CO, Karanja DMS. Increased density of human immunodeficiency virus type 1 coreceptors CCR5 and CXCR4 on the surfaces of CD4+ T cells and monocytes of patients with Schistosoma mansoni infection. Infect Immun. 2003;71(11):6668–6671. https://doi.org/10.1128/IAI.71.11.6668-6671.2003
14. Elias D, Wolday D, Akuffo H, Petros B, Bronner U, Britton S. Effect of deworming on human T cell responses to mycobacterial antigens in helminth-exposed individuals before and after bacille Calmette-Guérin (BCG) vaccination. Clin Exp Immunol. 2001;123(2):219–225. https://doi.org/10.1046/j.13652249.2001.01446.x
15. Borkow G, Weisman Z, Leng Q, Stein M, Kalinkovich A, Wolday D, et al. Helminths, human immunodeficiency virus and tuberculosis. Scand J Infect Dis. 2001;33(8):568–571. https://doi.org/10.1080/00365540110026656
16. Elrefaei M, Baker CAR, Jones NG, Bangsberg DR, Cao H. Presence of suppressor HIV-specific CD8+ T cells is associated with increased PD-1 expression on effector CD8+ T cells. J Immunol. 2008;180(11):7757–7763. https://doi.org/10.4049/jimmunol.180.11.7757
17. McElroy MD, Elrefaei M, Jones N, Ssali F, Mugyenyi P, Barugahare B, et al. Coinfection with Schistosoma mansoni is associated with decreased HIV-specific cytolysis and increased IL-10 production. J Immunol. 2005;174(8):5119–5123. https://doi.org/10.4049/jimmunol.174.8.5119
18. Eggena MP, Barugahare B, Jones N, Okello M, Mutalya S, Kityo C, et al. Depletion of regulatory T cells in HIV infection is associated with immune activation. J Immunol. 2005;174(7):4407–4414. https://doi.org/10.4049/ jimmunol.174.7.4407
19. Borkow G, Bentwich Z. Chronic immune activation associated with chronic helminthic and human immunodeficiency virus infections: Role of hyporesponsiveness and anergy. Clin Microbiol Rev. 2004;17(4):1012–1030. https://doi.org/10.1128/CMR.17.4.1012-1030.2004
20. Lucey DR, Dorsky DI, Nicholson-Weller A, Weller PF. Human eosinophils express CD4 protein and bind human immunodeficiency virus 1 gp120. J Exp Med. 1989;169(1):327. https://doi.org/10.1084/jem.169.1.327
21. Walson JL, Herrin BR, John-Stewart G. Deworming helminth co-infected individuals for delaying HIV disease progression. Cochrane Database of Systematic Reviews. 2009;3. https://doi.org/10.1002/14651858.CD006419. pub3
22. Maizels RM, McSorley HJ. Regulation of the host immune system by helminth parasites. J Allergy Clin Immunol. 2016;138(3):666–675. https:// doi.org/10.1016/j.jaci.2016.07.007
23. Mkhize-Kwitshana ZL, Mabaso MLH, Walzl G. Proliferative capacity and cytokine production by cells of HIV-infected and uninfected adults with different helminth infection phenotypes in South Africa. BMC Infect Dis. 2014;14(1):499. https://doi.org/10.1186/1471-2334-14-499
Commentary https://doi.org/10.17159/sajs.2023/15108
17 Volume 119| Number 1/2 January/February 2023
Page 3 of 4
Immunology of helminth and HIV co-infection
24. Mkhize BT, Mabaso MHL, Madurai S, Mkhize-Kwitshana ZL. The investigation of the use of prealbumin as a tool for nutritional assessment in adults coinfected with HIV and intestinal helminth parasites in KwaZulu-Natal, South Africa. Biomed Res Int. 2018;2018:1–8. https://doi.org/10.1155/2018/7805857
25. Fincham JE, Markus MB, Adams VJ. Could control of soil-transmitted helminthic infection influence the HIV/AIDS pandemic. Acta Trop. 2003;86(2–3):315–333. https://doi.org/10.1016/S0001-706X(03)00063-9
26. Brown M, Mawa PA, Joseph S, Bukusuba J, Watera C, Whitworth JAG, et al. Treatment of Schistosoma mansoni infection increases helminth-specific type 2 cytokine responses and HIV-1 loads in coinfected Ugandan adults. J Infect Dis. 2005;191(10):1648–1657. https://doi.org/10.1086/429668
27. Karunamoorthi K, Almalki M, Ghailan K. Schistosomiasis: A neglected tropical disease of poverty: A call for intersectoral mitigation strategies for better health. J Health Res Rev. 2018;5(1):1. https://doi.org/10.4103/jhrr.jhrr_92_17
Commentary https://doi.org/10.17159/sajs.2023/15108
18 Volume 119| Number 1/2 January/February 2023
Immunology of helminth and HIV co-infection Page 4 of 4
AUTHORS:
Blessing
Steven
Science communication: The link to enable enquiry-based learning in under-resourced schools
Nemadziva1
Sexton2
Catherine
Cole1
AFFILIATIONS:
1Department of Science
Communication, University of Otago, Dunedin, New Zealand
2College of Education, University of Otago, Dunedin, New Zealand
CORRESPONDENCE TO:
Blessing Nemadziva
EMAIL:
blessing.nemadziva@postgrad. otago.ac.nz
DATES:
Received: 18 Nov. 2021
Revised: 15 July 2022
Accepted: 15 Aug. 2022
Published: 31 Jan. 2023
HOW TO CITE:
Nemadziva B, Sexton S, Cole C. Science communication: The link to enable enquiry-based learning in under-resourced schools. S Afr J Sci. 2023;119(1/2), Art. #12819. https:// doi.org/10.17159/sajs.2023/12819
ARTICLE INCLUDES:
☒ Peer review
☐ Supplementary material
DATA AVAILABILITY:
☐ Open data set
☐ All data included
☐ On request from author(s)
☐ Not available
☒ Not applicable
EDITORS:
Chrissie Boughey
Nkosinathi Madondo
KEYWORDS: science communication, science education, enquiry-based learning, science models, STEM skills
FUNDING: University of Otago
Improving skills in STEM disciplines has been identified as essential in meeting South Africa’s economic growth targets. Despite this, learner uptake and completion rates within these subjects is currently well below international standards. We therefore examined key stages within the science education system to identify factors contributing to the low throughput in science education. We reviewed how national science policy changes have impacted the curriculum and teaching practices across different education establishments and socio-economic groups. We highlight that 80% of public schools have a lack of resources for practical learning, making it difficult for teachers to implement enquiry-based teaching methods. We explored strategies for effective engagement with science from the science communication literature and present recommendations to improve learner engagement with science in under-resourced school settings. Whilst education reform is needed at a national scale, we make a case for using science communication practices in science classes as a more immediate solution to generate greater interest and understanding, and encourage learners to pursue careers in science.
Significance:
• We examined key challenges in the science education and training pipeline in South Africa and recommend the use of science communication practices to design resources to enhance science teaching and learning in under-resourced schools.
• Exploring ways of integrating informal learning tools into schools could be a simple approach to improve science teaching and learning in developing countries such as South Africa where infrastructural deficit poses a longer-term barrier to learning.
Introduction
The shortage of qualified human resources in the science, technology, engineering, and mathematics (STEM) disciplines has been a recurring challenge in South Africa1, and is regarded as a key obstacle to the targeted 6% economic growth rate per annum2. In 2018, the South African government published a list of Occupations in High Demand (OIHD) in the Government Gazette. The gazette defines OIHD as occupations that have shown ‘relatively strong employment growth, and/or are experiencing shortages in the labour market or which are expected to be in demand in the future’3. The purpose of the OIHD gazette is to provide insightful information about the skill needs of the nation, thereby influencing informed prioritisation in resource allocation, particularly in education and training.3 In 2018, approximately 54% of the OIHD listed occupations belonged to the STEM disciplines.
Erasmus and Breier2 indicated that skills shortages in STEM could be traced to the inefficiencies in the current education and training pipeline which was characterised by low maths and science output. Realising the importance of STEM skills in economic development, we attempted to identify key factors causing low throughput within the science education and training pipeline in South Africa, and to recommend strategies for addressing these. Along the way, we address such important questions as:
1. How have the national policies on science changed since the first democratic government of South Africa was elected in 1994?
2. How have the science policies influenced curriculum design and teaching practice over the years?
3. What is the current status of STEM education in South Africa?
4. What resources are currently available for science education, and are these effective?
5. Can science communication approaches help improve STEM teaching and learning in schools, as well as improve the appeal of STEM careers among learners?
Brief history of South African education
When the first democratic government of South Africa was elected in 1994, some of its immediate priorities were to redress the complex socio-economic challenges in the country such as poverty, inequality, and high levels of unemployment. Education was viewed as a key transformative tool to achieve an egalitarian society, and as a result, a raft of reforms were implemented within the education sector. The initial changes were intended to unify the 19 racially, ethnically, and geographically separated departments of education which existed pre-1994, thus paving the way to the formation of a single national core syllabus4 (curriculum changes will be further discussed in detail).
The South African education and training pipeline
© 2023. The Author(s). Published under a Creative Commons Attribution Licence.
At the national level, education is governed by two ministries: the Department of Basic Education (DBE) and the Department of Higher Education and Training (DHET). The DBE is responsible for setting national policy for all school learning which is then implemented in schools through the nine provincial departments of education. South Africa uses the quintile ranking system to classify public schools based on the socio-economic status
Review Article https://doi.org/10.17159/sajs.2023/12819
19 Volume 119| Number 1/2 January/February 2023
of the communities in which they are located.5 There are five quintiles: Quintile 1 (Q1) describes schools located in impoverished communities and serves the poorest 20% of learners while Quintile 5 (Q5) describes schools located in wealthy communities and serves the 20% least poor learners. This system is mostly used to aid equitable resource allocation among public schools. The South African Schools Act (Act 84 of 1996) makes it compulsory for children between 7 and 15 years of age to attend school and complete Grade 9. Based on a learner’s career choice and performance in Grade 9, they can specialise at Grade 10 in humanities, commerce, or science. At Grade 12, learners sit for the national examination which is commonly referred to as ‘matric’ in South Africa. With the National Senior Certificate (NSC/matric certificate), learners can access tertiary education. The DHET is responsible for setting policy which governs tertiary learning at all Technical and Vocational Education and Training (TVET) colleges, private colleges, and universities in South Africa.
National science policy and its influence on science curriculum
Figure 1 provides a timeline of changes in the STEM curriculum alongside the changes in national science policies and strategies since 1994. The South African school curriculum has been revised three times in 15 years. The changes to national science policies and strategies were in response to factors such as STEM skill needs of the economy (e.g. the need to address the ‘ageing scientific population’ in the National Research & Development Strategy) and global competitiveness (e.g. identifying and supporting priority Science Technology and Innovation (STI) programmes linked to the Fourth Industrial Revolution in the White Paper on STI). Over this period, changes to the school curriculum primarily reflect policy flaws but there is little evidence to suggest improvement of individual subject content6 – what Le Grange7 describes as ‘change without difference’.

20 Volume 119| Number 1/2 January/February 2023 Review Article https://doi.org/10.17159/sajs.2023/12819 Science communication and enquiry-based learning Page 2 of 9
Figure 1: The response of the national science curriculum to changes in national science policy.
The first national curriculum, Curriculum 2005, was introduced in 1997 and framed after the Outcomes-Based Education (OBE) model. The Revised National Curriculum Statement (RNCS), also founded on the OBE model, replaced Curriculum 2005 in 2003 only to be revised again after 9 years. Both curricula were revised upon recommendation from review committees which highlighted a wide range of issues including vagueness on subject matter and assessment guidelines as well as complicated language leading to implementation challenges for teachers.4,8-11 In terms of subject matter design, both curricula broke away from the traditional subject demarcations and prescribed a blurred, integrated learning approach. For instance, science subjects for the Further Education and Training band (Grades 10–12) were blurred across a ‘learning field’ consisting of physical, mathematical, computer, life, and agricultural sciences. In critique of OBE, Allais6 (as cited by Le Grange7) argues that disciplinary knowledge is vital as it facilitates the sequencing of learning in the classroom. The consistent underperformance of South African learners in both national and international assessments in a way summed up the challenges with OBE in South Africa.12 The Curriculum and Assessment Policy Statements (CAPS) was introduced in 2012 to replace the RNCS. This marked a shift away from the OBE model and towards a ‘high knowledge curriculum that emphasises subject content and assessment as the centre-piece of curriculum implementation’13. In highlighting some of the key changes observed in the CAPS curriculum, Ramnarain14 notes that:
Inquiry-based science education is posited as the means by which the challenges of the previous curriculum related to inaccessibility, irrelevance and incompatibility with the nature of science can be negotiated.
A detailed discussion on enquiry-based learning is presented in sections below.
Figure 2 illustrates the complicated history of curriculum experiences that learners were exposed to as a result of the drastic curriculum changes. For instance, learners who were in Grade 1 in 2003 were exposed to Curriculum 2005 (2003), RNCS (2004–2011) and CAPS (2012–2014) during their schooling years.15 These changes would obviously affect both learner experience and performance as well as teacher teaching practice.
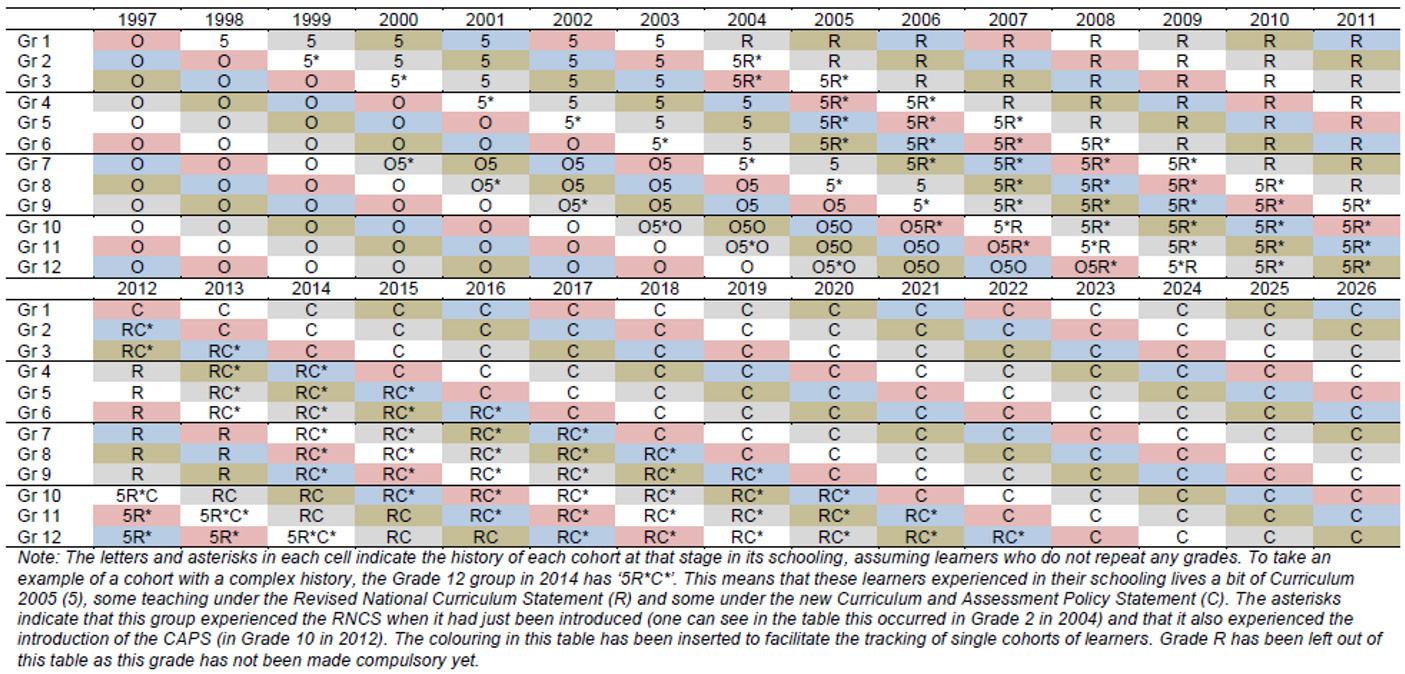
The current state of science education and training in South Africa
The Statistics on Post-School Education and Training in South Africa reports16 provide official annual records of enrolments and graduations
from South African higher education institutions (HEIs). Over the period 2015–2019, the South African STEM education and training pipeline seemingly reflected an improving system. The number of students who enrolled for STEM programmes at public HEIs increased by 9.6% (Table 1). Similarly, the number of STEM graduates emerging during the same period increased by an overall 11.3%. However, it is not possible to resolve the proportion of international students contributing to this figure for STEM enrolments. International students contribute substantially to total HEI enrolments (Table 1), and may not be evenly distributed across the fields of study. Furthermore, the data do not say much about the throughput rate, that is, how long students take from first-time enrolment until completion of the programme.
Table 1: Number of STEM student enrolments at South African higher education institutions
Source: Statistics on Post-School Education and Training in South Africa: 2015–2019.16
Reviewing first-time enrolment (students registering for the first time at any HEI) figures may therefore provide a clearer picture of the transition from basic to tertiary education and the uptake rates of STEM programmes at HEIs. To investigate this further, we estimated the possible number of learners eligible for STEM programmes at HEIs. The general minimum requirements for admission into HEIs is that learners should score at least 40% in four NSC subjects for eligibility into a diploma programme, or at least 50% in four NSC subjects for eligibility into a bachelor programme. According to data from the Central Applications Office, mathematics is considered a gatekeeper subject for admission into most STEM programmes.17 Therefore, in Table 2 we present the
21 Volume 119| Number 1/2 January/February 2023 Review Article https://doi.org/10.17159/sajs.2023/12819
Year STEM enrolments Total national enrolments Total international student enrolments Total graduates STEM graduates 2015 294 935 985 212 72 959 (7.4%) 191 524 58 090 2016 295 383 975 837 69 381 (7.1%) 203 076 59 125 2017 310 115 1 036 984 67 434 (6.5%) 210 931 61 581 2018 320 671 1 085 568 64 018 (5.9%) 227 188 65 211 2019 323 105 1 074 912 58 852 (5.5%) 221 942 64 636
Science communication and enquiry-based learning Page 3 of 9
Source: Gustafsson15
Figure 2: The curriculum experiences of different cohorts of learners from 1997. (O) Old curriculum inherited in 1994; (5) Curriculum 2005; (R) RNCS; (C) CAPS.
number of learners who scored at least 40% in the NSC mathematics exams during the 2015–2019 period18-22 (estimations have been used because there are no disaggregated statistics of first-time undergraduate enrolments in STEM programmes).
numbers have been fluctuating and relatively flat over this same period (2015–2019). A possible explanation for this mismatch could be that a significant number of students were failing to complete programmes within stipulated timeframes and therefore remained in the system for longer. Poor graduation rates among South African students are well documented.23,24 For example, as of 2015, only 31.9% of contact students doing 3-year degree programmes at public HEIs successfully graduated within the stipulated timeframe.25
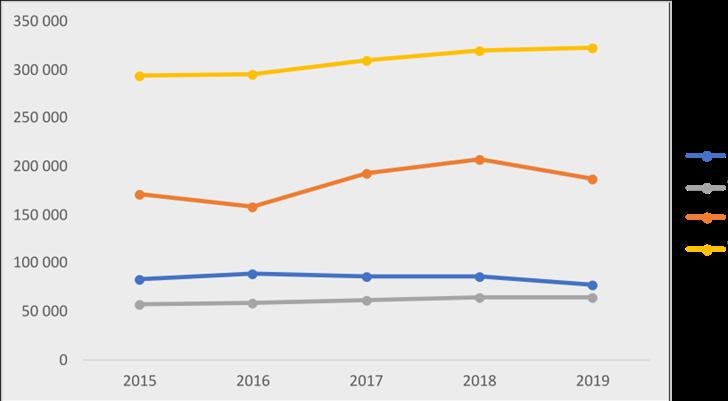
Source: National Senior Certificate Examination Report: 2015–2019.18-22
By using NSC mathematics exam results as estimates for STEM programme eligibility, we can assess how well the South African education system has prepared students for tertiary study in these subjects. While STEM enrolments and STEM graduation rates have reportedly increased by 9.6% and 11.3%, respectively, Figure 3 shows that learner eligibility to STEM programmes and first-time enrolment
In addition to this, learner performance has been consistently below international standards. South Africa has been participating in the Trends in International Mathematics and Science Study (TIMSS) since 1995. TIMSS compares the performance of learners from different countries in mathematics and science at Grades 4 and 8. As of 2011, South African assessments were performed on Grade 9 learners since ‘the TIMSS eighth grade assessment was too difficult for eighth grade students’26 Table 3 shows the rankings of South Africa in the TIMMS assessments, focusing on Grade 8/9 which is the last grade of compulsory schooling. The improvement in performance in the past six cycles has been insignificant for both science (44-point improvement) and mathematics (35-point improvement) as the average learner achievement is still below TIMMS’ minimum competency levels (Figure 4). However, the TIMMS 2015 Grade 9 National Report prepared by the South African Human Sciences Research Council (HSRC) declares that:
from 2003 to 2015 the country [South Africa] has shown the biggest positive improvement of all participating countries in both mathematics (by 90 points) and science (by 87 points), which is equivalent to an improvement in achievement by two grade levels.17
Learner Eligibility to STEM programmes
Total STEM programmes
First-time undergraduate enrolment
Total STEM enrolments
aDid not participate
bFrom 2011,
22 Volume 119| Number 1/2 January/February 2023 Review Article
Science communication and enquiry-based learning Page 4 of 9
https://doi.org/10.17159/sajs.2023/12819
Year Mathematics Life science Physical science Wrote Pass by at least 40% Wrote Pass by at least 40% Wrote Pass by at least 40% 2015 263 903 84 297 348 076 160 204 193 189 69 699 2016 265 810 89 084 347 662 157 177 192 618 76 044 2017 245 103 86 098 318 474 166 071 179 561 75 736 2018 233 858 86 874 310 041 160 208 172 319 84 002 2019 222 034 77 751 301 037 147 436 164 478 85 034
Table 2: Learner performance in National Senior Certificate mathematics, life science, and physical science exams
Figure 3: Trends of learner eligibility for STEM programmes, first-time undergraduate enrolment, and overall STEM enrolments for 2015–2019.
Mathematics Science Year Ranking Total participants International mean South African average score Ranking Total participants International mean South African average score 1995 41 41 513 354 41 41 516 326 1999 38 38 487 275 38 38 488 243 2003 45 45 466 264 45 45 473 244 2007a – – – – – – – –2011b 43 45 – 352 44 45 – 332 2015 38 39 481 372 39 39 486 358 2019 45 46 490 389 46 46 490 370
Table 3: The rankings of South African Grade 8/9 learners in the TIMMS assessments for mathematics and science
TIMMS assessments for South Africa were performed on Grade 9 learners.
This report does not account for the dip in performance between the 1999 to 2003 assessment cycles27 (Figure 4) which coincides with the period when Curriculum 2005 was introduced in 1997. According to scholars, this was ‘poorly planned and hastily introduced in schools with teachers being insufficiently prepared, with inadequate resources’9, leading to discussions which eventually led to its replacement by the RNCS in 2004. Whilst the TIMMS score recovered, it has plateaued and remains well below the lowest international benchmark. It is, however, acknowledged that there are other factors that contribute to this low performance in STEM subjects.
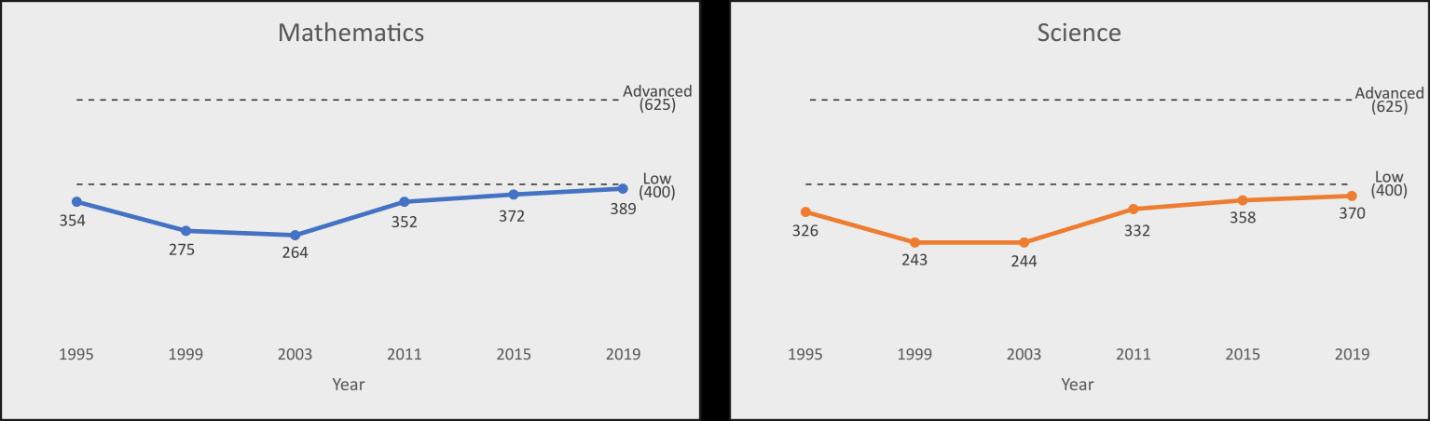
Barriers to effective teaching and learning in South Africa
In this section we discuss four barriers to learning and how they impact South Africa. These include socio-economic, infrastructural, pedagogical, and language challenges.
Socio-economic challenges
The socio-economic background of learners is a major determinant of school access as it is generally easier for learners to attend schools closer to home.28 Those from poor communities usually have access to Q1–Q3 schools while learners from wealthy communities can access Q4 and Q5 schools. As a result, learners tend to get education of variable quality depending on socio-economic background. A majority of underperforming secondary schools – those failing to achieve a pass rate of at least 60% in the NCS examination – are located in townships, informal settlements or rural areas.29 Indiscipline, lack of study motivation and parental support, poor school administration, and lack of qualified or experienced teachers generally characterise the learning environment at underperforming schools.28,30 Research strongly correlates background characteristics and learner performance; for example, van der Berg et al.28 state that ‘from an early age there are already stark distinctions between the prospects of children from poorer communities and those from more affluent communities’.
Infrastructural challenges
A significant number of schools in South Africa still lack adequate infrastructure required to create a conducive learning environment. As of 2020, of the 23 267 schools inspected, 24% used pit latrines, 25% had no reliable water source, and 16% were without or with unreliable electricity supply.31 Laboratories are central to science education, particularly in facilitating enquiry-based learning.32 However, it seems laboratories and library facilities are a very rare luxury for most public schools; 80% had no laboratory facilities, and 74% had no libraries. The famous ‘mud schools’ lawsuit which pitted Centre for Child Law and Others vs Government of the Eastern Cape Province and Others just exposed the extreme state of infrastructure deficit at most schools, especially those in rural areas.33
Pedagogical challenges
The quality of an education system is generally reliant on availability of competent teachers. According to research, the key issues affecting
expected outputs in the South African schooling system include teacher absenteeism, insufficient teacher content knowledge, and pedagogical skill.34,35 Several studies have shown that a significant number of teachers do not have adequate knowledge for the classes they teach. For example, results from the SACMEQ III (Southern and Eastern Africa Consortium for Monitoring Educational Quality) study showed that about 79% of Grade 6 mathematics teachers did not possess adequate knowledge to teach the subject at that level.36 Some studies have also indicated a slight correlation between teacher content knowledge and student achievement.37,38 In South Africa, there are indications that there is an uneven teacher distribution with Q5 schools having a high concentration of teachers with better subject matter knowledge when compared to Q1 schools.36,39
Language challenges
Language is a delicate subject as it has political, socio-cultural, and historical significance. In South Africa, there are 11 official languages. The South African Language in Education policy does not clarify the official language of learning and teaching (LoLT) as it merely states that ‘the language(s) of learning and teaching in a public school must be (an) official language(s)’. Schools are left to determine their own language policies. Except for language subjects, all NSC examination papers are set in English, which is generally the LoLT of choice in most schools. With only 8.1% of the South African population identifying English as a mother tongue40, researchers indicate that it is challenging and can take as long as 7 years for learners to master contextual proficiency in a second language41. It is common, in instances where both teachers and learners share a common language, for the teacher to codeswitch from the LoLT to the common language for clarity.42 However, reports show that learners who are assessed in a language other than their mother tongue are significantly disadvantaged compared to those who are assessed in the same language they speak at home.17,43
STEM teaching practices in South Africa
Teaching practices can have an impact on learner performance in STEM subjects as well as influence a learner’s general perception about science careers.44 In this section, we examine the science teaching orientations in South Africa as reported in the literature. ‘Teacher orientation’ is a term that has been debated among curriculum studies scholars.45-47 Friedrichsen et al.46 warned that the term has not been properly defined and as a result, has been used variably in different contexts. In this article, we discuss teacher orientation in reference to the teaching practices used in science classrooms following the classifications by Finson et al.44 and Ramnarain and Schuster48 These authors stipulated two distinct categories: (1) didactic/direct instruction (ready-made science) and (2) enquiry-based instruction (science-in-the-making).
Didactic orientation
Finson et al.44 use the terms ‘didactic’ and ‘expository’ interchangeably to describe what Ramnarain and Schuster48 refer to as ready-made science or direct instruction. Didactic orientation is considered a traditional teaching practice characterised by directly telling, showing, or explaining the
23 Volume 119| Number 1/2 January/February 2023 Review Article https://doi.org/10.17159/sajs.2023/12819
Science communication and enquiry-based learning Page 5 of 9
Figure 4: Trends in mathematics and science achievement for South African Grade 8/9 learners from 1995 to 2019. Data sourced from TIMMS reports.27
science concepts.47,48 It is teacher-centred and learning is predominately by memorisation of factual knowledge in preparation for examinations.49
A study by Ramnarain and Schuster48 showed that didactic teaching practices were more prevalent in South African schools located in lower income areas (e.g. townships48 or rural areas50) in comparison to suburban schools. According to their research, which was conducted with Grade 12 physical science teachers, 71% of their participating teachers in township schools employed direct instruction approaches compared to only 18% for suburban teachers.48 Reasons cited for teaching orientation choices were mostly determined by class sizes and availability of resources. For their participating teachers, their class sizes were 45–50 and 26–30 for townships and suburbs, respectively (the officially recommended learner-to-teacher ratio in South Africa is 40:1 for primary schools, and 35:1 for secondary schools51). It is worth noting that 48% of the participating township schoolteachers who chose direct instruction still believed in student-centred teaching methods as encouraged by the CAPS curriculum. For example, a township teacher who was interviewed remarked that:
although I want to structure the activity for the students, I still want them to be actively involved in it. I do not want to stand in front and demonstrate it to them. This will be too teachercentred, and the students will just be on the sidelines watching me.48
Other studies focusing on overcrowded classes in rural South African schools have similarly shown how situational factors influence teachers to resort to didactic teaching practices despite willingness to adopt enquiry-based strategies.50,52-54 There are reports however, which show that some teachers in under-resourced schools demonstrate teacher agency by using improvised materials to implement enquiry-based pedagogy. For example, one teacher used red cabbage juice as an improvised material to teach acid/base concepts.54
Enquiry-based orientation
Also referred to as the constructivist approach by Finson et al.44, the enquiry-based orientation emphasises student autonomy48. Learners learn by exploring ideas while the role of the teacher is to guide/facilitate towards the understanding of underlying scientific principles of the topic under study.47,48 In their study, Ramnarain and Schuster48 found that only 29% of participating teachers in township schools could employ enquiry-based instruction compared to 82% for suburban teachers. Ramnarain14,54 has researched extensively about enquiry-based learning in South Africa and concluded that its implementation was influenced by two major factors: (1) intrinsic teacher factors such as professional knowledge competency and teacher confidence in using enquirybased methods and (2) extrinsic school factors such as availability of resources, class sizes, availability of time and differences in culture with which teachers operate.
Enquiry-based practices are the recommended science teaching orientation.14 Finson et al.44 state that constructivist teaching approaches develop positive attitudes towards science in their participating learners. Emphasising enquiry-based practical learning in schools has proven effective in helping learners shift towards science careers55,56, because by engaging in the experimental process – enquiry, planning, investigating, gathering data to relate evidence and explanations, and communicating findings – learners get to experience how scientists work. As such, it is now widely acknowledged that learner experiences from an enquiry-based learning pedagogy contribute to increased interest in science careers.57,58
Experience vs performance in the science classroom
A literature survey of South African education shows that most research has focused more on learner performance compared to learner experience. However, learner experience in the science classroom is a subject that requires equal attention as it also contributes towards learner performance. For instance, psychological studies have highlighted that physical experience improves learner performance and understanding of
concepts.59 Ideal learner experience is achieved through ‘doing science’ (i.e. enquiry-based).60 However, in South Africa, this is not always achievable because of the lack of resources in a majority of schools. At the same time, an analysis of the TIMMS 2011 study by the HSRC showed that South African learners’ enjoyment and value of science were higher than the international average.61 This suggests that if resources to facilitate effective enquiry-based learning were sufficiently available, there could be significant improvement in the science education and training pipeline in South Africa. It is therefore vital to explore alternative strategies that can help improve the STEM learning experience in South African classrooms.
Integrating science communication practice into school learning
The academic field of science communication has grown rapidly in recent years, providing a better understanding of how to share knowledge effectively and engage diverse groups of society with science through different mediums (e.g. television, print media, Internet, exhibitions, and more).62,63 A contemporary definition of science communication directs that its purpose is to produce in publics at least one of the following: awareness, enjoyment, interest, opinions, understanding of science (the vowel analogy).64 This has clear relevance for STEM teaching and learning in schools, and the design of tools to enable students to experience science in engaging ways.65
Integrating science communication practice into school learning involves adopting tools and approaches that have proved effective in facilitating science learning in informal environments such as science museums, science centres, or planetariums. There is an increasing number of studies seeking to understand ways of integrating informal learning tools to formal science learning.66-70 Studies have also shown that informal learning tools not only result in increased appeal for science65,70, but also contribute to increased conceptual knowledge71. A common feature in most informal learning settings is interaction with phenomena, whether technological, natural, or designed exhibits. Museum exhibits are specifically designed to present challenges to visitors who will require further interaction to solve72, and through this process of enquiry, knowledge appropriation occurs73. Allen72 states that a typical enquiry cycle stimulated by an exhibit includes the following stages: (1) surprising phenomenon, which arouses visitor’s initial curiosity; (2) exploration, where the visitor further interacts with the exhibit; (3) explanation, in which the label explains the science; (4) relevance, where the label relates the phenomenon to everyday experiences. This cycle bears similarities to enquiry-based learning in formal learning environments where the learner, like the visitor, has the freedom to explore, and the teacher, like the label, guides the learner to understand and appreciate the science.
Integrate science communication strategies into school science
Science communication literature presents opportunities for ‘simple fixes’ which can be incorporated into formal STEM teaching in places where there are inadequate resources. The strategies can enhance the learning experience of learners in the 80% of South African public schools which lack adequate facilities for STEM learning. One simple fix is the development of inexpensive science models that can be easily used in non-laboratory settings. Over the years, a variety of science models of varying sophistication have been developed to aid enquiry-based learning in schools.55,74-76 A good example are the BioBits educational kits which were designed by a group of synthetic biologists in the USA to help high-school learners conduct biological activities in classroom settings. Evaluations showed that the kits were effective in improving learner confidence in topics under study such as antibiotic resistance and CRISPR-Cas9 gene editing, as well as in increasing learner self-identification as scientists.75 Another strategy is improvisation. Ramnarain and Mamutse77 tested the efficiency of improvised materials as teaching tools in under-resourced South African schools in research that involved using red cabbage juice as an indicator to test the pH of various household products. Results showed that the improvised cabbage juice indicator was effective in helping learners understand acid/base concepts better, relating the science to daily experiences, and
24 Volume 119| Number 1/2 January/February 2023 Review Article https://doi.org/10.17159/sajs.2023/12819
Science communication and enquiry-based learning Page 6 of 9
sparking scientific curiosity.77 Other strategies applicable for classroom settings include role-playing, storytelling, games, and do-it-yourself (DIY) sessions.78,79 The advantage with science communication is its flexibility which allows strategies to be customised to suit specific contexts (e.g. social contexts and education level of target audience, making use of available resources, relatability with target audience). However, using these strategies in a science classroom could be a challenge to most teachers who might lack the necessary skills. For example, a study by Asheela et al.80 on the use of everyday resources in hands-on classroom activities showed that teachers would require training for effective use of such resources in their teaching.
Include science communication in teacher training programmes
Integrating science communication strategies into school science can be easier when introduced through teacher professional training programmes. Here we cite two examples through which this can be implemented. The first approach may involve formation of school–university partnerships where teachers are paired with STEM postgraduate students to co-teach science classes (the collaborative apprenticeship model81,82). Similar programmes in the USA82,83 and Taiwan84 have proven effective both in helping improve learner cognition in science as well as improving teacher science content knowledge and confidence in using enquiry-based pedagogy.82-84 In addition, the presence of the graduate scientist in the classroom benefits the science teacher who can observe and learn new strategies of communicating science for their own professional development. Already, the 2019 White Paper on Science, Technology & Innovation has provisions to encourage such partnerships through providing incentives to universities which adopt schools for STEM skills training.85 The second approach can be including science communication coursework in teacher tertiary training programmes. A similar trend is being observed in most STEM degree programmes where science communication (sometimes packaged as ‘science in/and/for society’) is becoming a compulsory subject in STEM degree programmes with the idea that each graduate should be able to communicate science as much as they can do science. Essentially, it is expected that teachers would be more comfortable using science communication strategies in their classrooms if they had been part of their professional training programmes.
Expand public engagement with science initiatives to improve social support
Positive attitudes towards science from parents/guardians, and their active involvement in learners’ homework exercises, is a key factor in learner engagement with science.86 However, Zuze et al.17 report that a lot of learners attending poor public schools do not get help from parents in science and mathematics homework due to issues with language and complexity of assignments. Obviously, what usually attracts much attention in such statistics is the staggering illiteracy rates in the wider South African population (12% as of 201987). But this also points to the fact that public understanding of science campaigns have yet to make significant inroads in South Africa. There is therefore a need to increase support for public engagement initiatives using different media to make science accessible and attractive as a career route for high-school learners. With increased accessibility to information through TV, mobile phones and the Internet, one promising public engagement initiative is increasing support for storybased science video programmes. In reflection of the 2018 conference of the Public Communication of Science and Technology Network, Joubert et al.88 note the renewed interest among science communicators to use storytelling in science engagement initiatives as ‘it [stories] is about making people care…creating emotional connections between scientists and publics’. Such public engagement initiatives will not only help improve the appeal of science careers to learners, but also help improve social support from parents/guardians.
Conclusions
In this article, we traced factors responsible for the low throughput observed within the South African science education and training pipeline. We have identified that the challenges with STEM education in South Africa are
multi-layered: flawed education policies which were difficult for teachers to implement in the classroom; historical socio-economic challenges mean the majority of learners only receive low-quality education; and the lack of resources in 80% of public schools makes it difficult for teachers to implement enquiry-based teaching methods. Despite the complexity of the challenges, studies which have identified that South African learners enjoy and value science more than their international peers give cause for optimism. We recommend the adoption of science communication practices into science classes as an approach to help improve STEM education as well as improving the appeal of STEM careers among highschool learners. We also recommend the increase in public engagement of science initiatives through either media or outreaches as a means to attract high-school learners into STEM careers.
Acknowledgements
We thank Ms Alison Chisholm (Education Library, University of the Witwatersrand, South Africa) for assisting us to access copies of the Curriculum 2005 and the Revised National Curriculum Statements. B.N. is supported by the University of Otago Doctoral Scholarship.
Competing interests
We have no competing interests to declare.
Authors’ contributions
B.N.: Conceptualisation; writing − the initial draft; writing – revisions. S.S.: Conceptualisation; student supervision; writing − review and editing; validation. C.C.: Conceptualisation; student supervision; writing − review and editing; validation; project leadership.
References
1. Reddy V, Bhorat H, Powell M, Visser M, Arends F. Skills supply and demand in South Africa. Pretoria: HSRC Press; 2016.
2. Erasmus J, Breier M. Skills shortage in South Africa: Case studies of key professions. Cape Town: HSRC Press; 2009.
3. South African Department of Higher Education and Training (DHET). National list of occupations in high demand: 2018. Pretoria: DHET; 2018.
4. Jansen J, Taylor N. Educational change in South Africa 1994-2003: Case studies in large-scale education reform. Washington DC: The World Bank; 2003. Available from: https://www.jet.org.za/resources/jansen-and-taylorworld-bank-report.pdf/view
5. Ogbonnaya U, Awuah F. Quintile ranking of schools in South Africa and learners’ achievement in probability. Stat Educ Res J. 2019;18:106–119.
6. Allais SM. Education service delivery: The disastrous case of outcomesbased qualifications frameworks. Prog Dev Stud. 2007;7:65–78. https://doi. org/10.1177%2F146499340600700106
7. Le Grange L. Curriculum research in South Africa. In: Pinar WF, editor. International handbook of curriculum research. 2nd ed. New York: Routledge; 2013. p. 478–487.
8. Erduran S, Msimanga A. Science curriculum reform in South Africa: Lessons for professional development from research on argumentation in science education. Educ Change. 2014;18:S33–S46. https://doi.org/10.1080/1682 3206.2014.882266
9. Cross M, Mungadi R, Rouhani S. From policy to practice: Curriculum reform in South African education. Comp Educ. 2002;38:171–187. https://doi. org/10.1080/03050060220140566
10. Chisholm L, Volmink J, Ndhlovu T, Potenza E, Mahomed H, Muller J, et al. A South African curriculum for the twenty first century: Report of the review committee on Curriculum 2005. Pretoria: Department of Basic Education; 2000.
11. Dada F, Dipholo T, Hoadley U, Khembo E, Muller S, Volmink J. Report of the task team for the review of the implementation of the National Curriculum Statement. Pretoria: Department of Basic Education; 2009.
12. Motshekga A. We’ve signed OBE’s death certificate – Motshekga. Politicsweb. 06 November 2009 [cited 2021 Nov 01]. Available from: https://www. politicsweb.co.za/documents/weve-signed-obes-death-certificate--motshekga
13. South African Department of Basic Education (DBE). National Senior Certificate 2015: Technical report. Pretoria: DBE; 2015.
25 Volume 119| Number 1/2 January/February 2023 Review Article https://doi.org/10.17159/sajs.2023/12819
Science communication and enquiry-based learning Page 7 of 9
14. Ramnarain U. Inquiry-based learning in South African schools. In: Ramnarain U, editor. School science practical work in Africa. London: Routledge; 2020. p. 1–13. https://doi.org/10.4324/9780429260650
15. Gustafsson M. The introduction of the three waves of curriculum change in South Africa [document on the Internet]. c2012 [cited 2021 Nov 01]. Available from: https://www.education.gov.za/Portals/0/Documents/Reports/Research%20 Repository/Curriculum/Introduction%20of%20three%20waves%20on%20 curriculum%20change%20in%20SA.pdf?ver=2019-09-09-104816-753
16. South African Department of Higher Education and Training (DHET). Statistics on post-school education and training in South Africa: 2019. Pretoria: DHET; 2021.
17. Zuze L, Reddy V, Visser M, Winnaar L, Govender A. TIMSS 2015 Grade 9 national report: Understanding mathematics and science achievement amongst Grade 9 learners in South Africa. Cape Town: HSRC Press; 2017.
18. South African Department of Basic Education (DBE). National Senior Certificate examination report 2015. Pretoria: DBE; 2015.
19. South African Department of Basic Education (DBE). National Senior Certificate examination report 2016. Pretoria: DBE; 2016.
20. South African Department of Basic Education (DBE). National Senior Certificate examination report 2017. Pretoria: DBE; 2017.
21. South African Department of Basic Education (DBE). National Senior Certificate examination report 2018. Pretoria: DBE; 2018.
22. South African Department of Basic Education (DBE). National Senior Certificate examination report 2019. Pretoria: DBE; 2019.
23. Letseka M, Maile S. High university drop-out rates: A threat to South Africa’s future. Pretoria: HSRC Press; 2008.
24. South African Council on Higher Education (CHE). A proposal for undergraduate curriculum reform in South Africa: The case for a flexible curriculum structure. Pretoria: CHE; 2013.
25. South African Department of Higher Education and Training (DHET). 2000 to 2017 First time entering undergraduate cohort studies for public higher education institutions. Pretoria: DHET; 2020.
26. Provasnik S, Kastberg D, Ferraro D, Lemanski N, Roey S, Jenkins F. Highlights from TIMSS 2011: Mathematics and science achievement of U.S. fourthand eighth-grade students in an international context. Washington DC: US Department of Education; 2012.
27. US National Center for Education Statistics. Trends in International Mathematics and Science Study (TIMSS) [webpage on the Internet]. c2020 [cited 2021 Nov 01]. Available from: https://nces.ed.gov/timss/
28. Van der Berg S, Burger C, Burger R, de Vos M, du Rand G, Gustafsson M, et al. Low quality education as a poverty trap [working paper]. Stellenbosch: Stellenbosch University; 2011.
29. Louw W, Bayat A, Eigelaar-Meets I. A report of underperforming secondary schools in the Western Cape. Cape Town: University of the Western Cape; 2011.
30. Bayat A, Louw W, Rena R. The impact of socio-economic factors on the performance of selected high school learners in the Western Cape Province, South Africa. J Hum Ecol. 2014;45:183–196. https://doi.org/10.1080/0970 9274.2014.11906692
31. South African Department of Basic Education (DBE). National Education Infrastructure Management System Standard report. Pretoria: DBE; 2020.
32. Hofstein A, Lunetta VN. The laboratory in science education: Foundations for the twenty-first century. Sci Educ. 2003;88:28–54. https://doi.org/10.1002/ sce.10106
33. Skelton A. Leveraging funds for school infrastructure: The South African ‘mud schools’ case study. Int J Educ Dev. 2014;39:59–63. https://doi. org/10.1016/j.ijedudev.2014.07.008
34. Van der Berg S, Spaull N, Wills G, Gustafsson M, Kotzé J. Identifying binding constraints in education (2016 May 24). SSRN. Available from: https://dx.doi. org/10.2139/ssrn.2906945
35. Hungi N. Accounting for variations in the quality of primary school education. Gaborone: Southern and Eastern Africa Consortium for Monitoring Educational Quality; 2011.
36. Venkat H, Spaull N. What do we know about primary teachers’ mathematical content knowledge in South Africa? An analysis of SACMEQ 2007. Int J Educ Dev. 2015;41:121–130. https://doi.org/10.1016/j.ijedudev.2015.02.002
37. Spaull N. A preliminary analysis of SACMEQ III South Africa [working paper]. Stellenbosch: Stellenbosch University; 2011.
38. Bold T, Filmer D, Molina E, Svensson J. The lost human capital: Teacher knowledge and student achievement in Africa [working paper]. Washington DC: The World Bank; 2019. https://doi.org/10.1596/1813-9450-8849
39. Spaull N. South Africa’s education crisis: The quality of education in South Africa 1994-2011. Johannesburg: Centre for Development and Enterprise; 2013.
40. Tibane E. Official guide to South Africa 2018/19. Pretoria: GCIS; 2019.
41. De Wet C. Factors influencing the choice of English as language of learning and teaching (LoLT) – a South African perspective. S Afr J Educ. 2002;22:119–124.
42. Probyn M. Language and learning science in South Africa. Lang Educ. 2006;20:391–414. https://doi.org/10.2167/le554.0
43. Le Grange L. Rethinking learner-centred education: Bridging knowledge cultures. Afr Educ Rev. 2019;16:229–245. https://doi.org/10.1080/181466 27.2018.1464642
44. Finson KD, Pedersen J, Thomas J. Comparing science teaching styles to students’ perceptions of scientists. Sch Sci Math. 2006;106:8–15. https:// doi.org/10.1111/j.1949-8594.2006.tb18066.x
45. Gess-Newsome J. A model of teacher professional knowledge and skill including PCK: Results of the thinking from the PCK Summit. In: Berry A, Friedrichsen P, Loughran J, editors. Re-examining pedagogical content knowledge in science education: New York: Routledge; 2015. p. 38–52. https:// doi.org/10.4324/9781315735665
46. Friedrichsen P, Driel JHV, Abell SK. Taking a closer look at science teaching orientations. Sci Educ. 2010;95:358–376. https://doi.org/10.1002/sce.20428
47. Kind V. Preservice science teachers’ science teaching orientations and beliefs about science. Sci Educ. 2016;100:122–152. https://doi.org/10.1002/sce. 21194
48. Ramnarain U, Schuster D. The pedagogical orientations of South African physical sciences teachers towards inquiry or direct instructional approaches. Res Sci Educ. 2014;44:627–650. https://doi.org/10.1007/s11165-0139395-5
49. Koopman O. Science education and curriculum in South Africa. Cham: Palgrave Macmillan; 2017. https://doi.org/10.1007/978-3-319-40766-1
50. Ramnarain U, Hlatswayo M. Teacher beliefs and attitudes about inquiry-based learning in a rural school district in South Africa. S Afr J Educ. 2018;38(1), Art. #1431. https://doi.org/10.15700/saje.v38n1a1431
51. Marais P. “We can’t believe what we see”: Overcrowded classrooms through the eyes of student teachers. S Afr J Educ. 2016;36(2), Art. #1201. https:// dx.doi.org/10.15700/saje.v36n2a1201
52. Onwu G, Stoffels N. Instructional functions in large, under-resourced science classes: Perspectives of South African teachers. Perspect Educ. 2005;23:79–91. https://hdl.handle.net/10520/EJC87330
53. Ramnarain UD. Teachers’ perceptions of inquiry-based learning in urban, suburban, township and rural high schools: The context-specificity of science curriculum implementation in South Africa. Teach Teach Educ. 2014;38:65–75. https://doi.org/10.1016/j.tate.2013.11.003
54. Ramnarain U. Understanding the influence of intrinsic and extrinsic factors on inquiry-based science education at township schools in South Africa. J Res Sci Teach. 2016;53:598–619. https://doi.org/10.1002/tea.21315
55. Stark JC, Huang A, Nguyen PQ, Dubner RS, Hsu KJ, Ferrante TC, et al. BioBits™ Bright: A fluorescent synthetic biology education kit. Sci Adv. 2018;4:1–10. https://doi.org/10.1126/sciadv.aat5107
56. Mitchell R, Dori YJ, Kuldell NH. Experiential engineering through iGEM – An undergraduate summer competition in synthetic biology. J Sci Educ Technol. 2011;20:156–160. https://doi.org/10.1007/s10956-010-9242-7
57. Russell SH, Hancock MP, McCullough J. Benefits of undergraduate research experiences. Science. 2007;316:548–549. https://doi.org/10.1126/science. 1140384
26 Volume 119| Number 1/2 January/February 2023 Review Article https://doi.org/10.17159/sajs.2023/12819
Science communication and enquiry-based learning Page 8 of 9
58. Kang J, Keinonen T. The effect of inquiry-based learning experiences on adolescents’ science-related career aspiration in the Finnish context. Int J Sci Educ. 2017;39:1669–1689. https://doi.org/10.1080/09500693.2017.1350790
59. Kontra C, Lyons DJ, Fischer SM, Beilock SL. Physical experience enhances science learning. Psychol Sci. 2015;26:737–749. https://doi. org/10.1177%2F0956797615569355
60. Hodson D. Learning science, learning about science, doing science: Different goals demand different learning methods. Int J Sci Educ. 2014;36:2534–2553. https://doi.org/10.1080/09500693.2014.899722
61. Juan A, Reddy V, Zuze T, Wokadala C, Hannan S. Does it matter whether students enjoy learning science? Exploring student attitudes towards science in South Africa [policy brief]. Pretoria: Human Sciences Research Council; 2016. http://hdl.handle.net/20.500.11910/9543
62. Bubela T, Nisbet MC, Borchelt R, Brunger F, Critchley C, Einsiedel E, et al. Science communication reconsidered. Nat Biotechnol. 2009;27:514–518. https://doi.org/10.1038/nbt0609-514
63. Dawson E. Reimagining publics and (non) participation: Exploring exclusion from science communication through the experiences of low-income, minority ethnic groups. Public Underst Sci. 2018;27:772–786. https://doi. org/10.1177%2F0963662517750072
64. Burns TW, O’Connor DJ, Stocklmayer SM. Science communication: A contemporary definition. Public Underst Sci. 2003;12:183–202. https://doi. org/10.1177%2F09636625030122004
65. Martin K, Davis L, Sandretto S. Students as storytellers: Mobile-filmmaking to improve student engagement in school science. J Sci Commun. 2019;18:1–19. https://doi.org/10.22323/2.18050204
66. Zimmerman HT, Bell P. Everyday expertise: Learning within and across formal and informal settings. In: Land SM, Jonassen D, editors. Theoretical foundations of learning environments. 2nd ed. New York: Routledge; 2012. p. 224–241.
67. Zimmerman HT, Kanter DE, Ellenbogen K, Lyons L, Zuiker SJ, Satwicz T, et al. Technologies and tools to support informal science learning. In: Proceedings of the 9th International Conference of the Learning Sciences; 2010 June 29 – July 2; Chicago, IL, USA. Chicago, IL: International Society of the Learning Sciences; 2010.
68. Barab S, Zuiker S, Warren S, Hickey D, Ingram‐Goble A, Kwon EJ, et al. Situationally embodied curriculum: Relating formalisms and contexts. Sci Educ. 2007;91:750–782. https://doi.org/10.1002/sce.20217
69. Barab SA, Sadler TD, Heiselt C, Hickey D, Zuiker S. Relating narrative, inquiry, and inscriptions: Supporting consequential play. J Sci Educ Technol. 2007;16:59–82. https://doi.org/10.1007/s10956-006-9033-3
70. US National Research Council. Learning science in informal environments: People, places, and pursuits. Washington DC: The National Academies Press; 2009.
71. Yoon SA, Elinich K, Wang J, Steinmeier C, Tucker S. Using augmented reality and knowledge-building scaffolds to improve learning in a science museum. Int J Comput-Support Collab Learn. 2012;7:519–541. https://doi. org/10.1007/s11412-012-9156-x
72. Allen S. Designs for learning: Studying science museum exhibits that do more than entertain. Sci Educ. 2004;88:S17–S33. https://doi.org/10.1002/ sce.20016
73. Schiele B. Science museums and centres: Evolution and contemporary trends. In: Bucchi M, Trench B, editors. Routledge handbook of public communication of science and technology. 3rd ed. New York: Routledge; 2021. p. 53–76.
74. Huang A, Nguyen PQ, Stark JC, Takahashi MK, Donghia N, Ferrante T, et al. BioBits™ Explorer: A modular synthetic biology education kit. Sci Adv. 2018;4:1–10. https://doi.org/10.1126/sciadv.aat5105
75. Stark JC, Huang A, Hsu KJ, Dubner RS, Forbrook J, Marshalla S, et al. BioBits health: Classroom activities exploring engineering, biology, and human health with fluorescent readouts. ACS Synth Biol. 2019;8:1001–1009. https://doi. org/10.1021/acssynbio.8b00381
76. RADMASTE Microscience. RADMASTE Microscience Catalogue 2018 [catalogue]. Johannesburg: RADMASTE Microscience; 2018.
77. Ramnarain U, Mamutse K. The use of improvised resources in inquiry-based teaching in South Africa. In: Bungum B, Nilsson P, editors. Part 17 Strand 17: Science in the secondary school. 2016. p. 2795–2801.
78. Bray B, France B, Gilbert JK. Identifying the essential elements of effective science communication: What do the experts say? Int J Sci Educ B Commun Public Engagem. 2012;2:23–41. https://doi.org/10.1080/21548455.2011.6 11627
79. Rennie L, Howitt C, Evans R, Mayne F. Do-it-yourself astronomy: Getting the best out of a science kit. Teach Sci. 2010;56:13–17.
80. Asheela E, Ngcoza KM, Sewry J. The use of easily accessible resources during hands-on practical activities in rural under-resourced Namibian schools. In: Ramnarain U, editor. School science practical work in Africa. London: Routledge; 2020. p. 14–31. https://doi.org/10.4324/9780429260650
81. Glazer EM, Hannafin MJ. The collaborative apprenticeship model: Situated professional development within school settings. Teach Teach Educ. 2006;22:179–193. https://doi.org/10.1016/j.tate.2005.09.004
82. Ufnar JA, Lee C, Shepherd V. The Vanderbilt scientist in the classroom partnership: A novel collaborative apprenticeship model for situated professional development. JSO. 2018;1:78–92. https://doi.org/10.15695/jstem/v1i1.18
83. Abramowitz B, Ennes M, Killingsworth S, Antonenko PD, MacFadden B, Ivory A. Science in school: Transforming K-12 outreach through scientist teacher partnerships. JSO. 2021;4:1–14. https://doi.org/10.15695/jstem/v4i1.14
84. Shein PP, Tsai C-Y. Impact of a scientist–teacher collaborative model on students, teachers, and scientists. Int J Sci Educ. 2015;37:2147–2169. https://doi.org/10.1080/09500693.2015.1068465
85. South African Department of Science and Technology (DST). White Paper on Science, Technology and Innovation. Pretoria: DST; 2019.
86. Rice L, Barth JM, Guadagno RE, Smith GPA, McCallum DM, ASERT. The role of social support in students’ perceived abilities and attitudes toward math and science. J Youth Adolesc. 2013;42:1028–1040. https://doi.org/10.1007/ s10964-012-9801-8
87. Khuluvhe M. Adult illiteracy in South Africa. Pretoria: Department of Higher Education and Training; 2021.
88. Joubert M, Davis L, Metcalfe J. Storytelling: The soul of science communication. J Sci Comm. 2019;18:1–5. https://doi.org/10.22323/2.18050501
27 Volume 119| Number 1/2 January/February 2023 Review Article https://doi.org/10.17159/sajs.2023/12819
Science communication and enquiry-based learning Page 9 of 9
AUTHORS:
Mary Gulumian1,2
Melusi Thwala3,4*
Xolani Makhoba5
Victor Wepener2
AFFILIATIONS:
1Haematology and Molecular Medicine Department, University of the Witwatersrand, Johannesburg, South Africa
2Water Research Group, Unit for Environmental Sciences and Management, North-West University, Potchefstroom, South Africa
3Water Centre, Council for Scientific and Industrial Research, Pretoria, South Africa
4Centre for Environmental Management, University of Free State, Bloemfontein, South Africa
5Emerging Research Areas
Directorate, National Department of Science and Innovation, Pretoria, South Africa
*Current: Science Advisory Programme and Strategic Partnerships, Academy of Science of South Africa (ASSAf), Pretoria, South Africa
CORRESPONDENCE TO:
Victor Wepener
EMAIL: victor.wepener@nwu.ac.za
DATES:
Received: 02 July 2021
Revised: 07 Oct. 2022
Accepted: 08 Oct. 2022
Published: 31 Jan. 2023
HOW TO CITE:
Gulumian M, Thwala M, Makhoba X, Wepener V. Curent situation and future prognosis of health, safety and environment risk assessment of nanomaterials in South Africa. S Afr J Sci. 2023;119(1/2), Art. #11657. https://doi.org/10.17159/ sajs.2023/11657
ARTICLE INCLUDES:
☒ Peer review
☐ Supplementary material
DATA AVAILABILITY:
☐ Open data set
☐ All data included
☐ On request from author(s)
☐ Not available
☒ Not applicable
EDITOR:
Pascal Bessong
KEYWORDS:
nanotechnology, responsible development, characterisation, hazard identification, exposure assessment, effects assessment
FUNDING:
South African Department of Science and Innovation
Current situation and future prognosis of health, safety and environment risk assessment of nanomaterials in South Africa
The commercialisation and everyday use of nanomaterials and nanomaterial-enabled products (NEPs) is rising year-on-year. Responsible development of nanotechnology includes understanding their potential implications on health, safety, and the environment (HSE). The health risk assessment of nanomaterials has therefore become one of the major activities of international agencies including the Organisation for Economic Co-operation and Development and the Environmental Protection Agency for protection of human health and the environment. Nationally, with the foresight and the leadership of the Department of Science and Innovation, a HSE programme was initiated to establish the necessary infrastructure to conduct the tests in the hazard identification and exposure assessment that are needed in the risk assessment of nanomaterials synthesised as well as NEPs available in South Africa. Here we present the advances that have been made in elucidating the different facets that are required when undertaking risk assessments of nanomaterials, i.e. physicochemical characterisation, hazard identification, exposure assessment and effects assessment. These facets are increasingly being considered throughout the nanomaterials present in the life cycles of NEPs. South Africa’s research contribution to an international understanding of HSE risks of nanomaterials is highlighted and the future direction to generate the necessary information for effective risk communication and management is provided. This will assist in ensuring safer innovation of nanotechnology in South Africa and support the export of locally manufactured nanomaterials as per international requirements.
Significance:
• Significant contributions of South Africa to the nanomaterial HSE knowledge base are highlighted.
• Development of standardised testing methodologies in nanomaterial HSE and protection of human and ecological health through risk assessment of nanomaterials are discussed.
• This paper contributes to ensuring safer innovation of nanotechnology in South Africa.
Background
Nanomaterials are defined as “material with any external dimension in the nanoscale or having an internal structure or surface structure in the nanoscale”1. For new commercial nanomaterials (and respective applications) and nanomaterial-enabled products (NEPs), risk assessments are required to provide science-based information to predict or estimate risk associated with exposure. We anticipate that the health risk assessment of nanomaterials and NEPs will follow the traditional risk assessment paradigm for chemicals involving hazard identification, doseresponse assessment, exposure assessment and risk characterisation.2 A similar approach was proposed for the health risk assessment of nanomaterials to include the identification of their physicochemical properties, the assessment of their hazard and dose-response relationship, and the determination of exposure (occupational, consumer, environment), to facilitate robust and efficient evaluation of their associated risks during their entire life cycle. The health risk assessment of nanomaterials has therefore become one of the major activities globally to develop standardised testing procedures led by the Organisation for Economic Cooperation and Development (OECD).3 Moreover, international initiatives such as the US National Nanotechnology Initiative Research Strategy4 and the European Commission5 were established to ensure nanosafety in the United States of America and Europe. The need for the development of a focused research strategy for health, safety and environment (HSE) aspects in support of the South African National Nanotechnology Strategy was realised and initial research areas were proposed.6 Gulumian and others7 pointed out that these research activities should not be undertaken in isolation and that internationally derived best practice guidelines should be adopted so that research could be focused specific to South Africa’s requirements. To this end, the South African Department of Science and Innovation (DSI) established the Nanotechnology HSE Research Platform in 2015. It is within this platform that the bulk of the scientific information pertaining to Nano HSE, nationally, has been produced. This platform has enabled South Africa to establish and grow the necessary infrastructure required for the hazard identification and exposure assessment necessary in the risk assessment of nanomaterials or NEPs. The aim of this paper is therefore to describe the major contributions thus far by South Africa in the field of nanomaterial HSE, within the context of current international developments. We further evaluate the research needs in relation to national and international development needs in the field. It is anticipated that the achievements reached thus far and new directions identified will aid in the risk assessment, communication and management of nanomaterials and NEPs in South Africa.
Assessment of physicochemical properties
The physicochemical properties of nanomaterials determine their environmental fate and interaction with biological systems.7,8 Their significance became apparent with the recognition that small changes in these properties may influence environmental behaviour and subsequent biological uptake of nanomaterials. Nationally, the
© 2023. The Author(s). Published under a Creative Commons Attribution Licence.
Review Article https://doi.org/10.17159/sajs.2023/11657
28 Volume 119| Number 1/2 January/February 2023
infrastructure to determine dissolution properties has been established9, and, internationally, contributions have been made to determine the biodurability and dissolution of nanomaterials10,11. For example, the dissolution of gold nanoparticles (AuNPs) has been determined in different biological and environmental media.12
Hazard identification
For hazard identification, it became crucial for international agencies to develop in vitro and in vivo assays that characterise acute and chronic toxicity.13 The OECD Working Party on Manufactured Nanomaterials therefore launched the Sponsorship Programme in November 2007 to standardise testing, with South Africa being the Lead Sponsor for the safety testing of AuNPs.13
For in vitro tests, South African research has demonstrated the interference of nanomaterials in optical read-out tests14 and has contributed to international development of an interference-free in vitro colony-forming ability test15. Moreover, researchers have recommended the use of labelfree techniques to assess toxicity of nanomaterials16 and investigated their interference in genotoxicity and mutagenicity assays17 and with the RNA analyses18. More recently, research demonstrated the interference of AuNPs with in vitro endotoxin detection assays19 and provided guidance in the sterilisation of nanomaterials20 and proposed alternative testing strategies21. South Africa also contributed to elucidating the mechanism involved in the cellular uptake of AuNPs22,23 and in the mechanisms involved in the possible use of nanomaterials in nanomedicine24,25
As for in vivo tests, the derivation of no observed adverse effect levels (NOAELs) requires sub-chronic (90 d) or long-term chronic (>2 years) studies. Due to ethical concerns, sub-acute (28 d)26 studies were suggested as an alternative to ensure sufficient recovery time following exposure. This revised 90-day OECD Test Guideline 41327 further requires that retained lung burdens should be determined.
South Africa, in collaboration with leading international research groups, has conducted in vivo inhalation studies to assess the lung burden of high dissolution rate silver nanoparticles (AgNPs) and relatively lower dissolution rate AuNPs.28-31 Such collaborations also illustrated that the even lobar deposition of poorly soluble AuNPs and soluble AgNPs are similar28-30 and thus could propose the reduction of experimental animals to be used in the said 28-day inhalation toxicity and 90-day inhalation toxicity OECD guidelines. These inhalation studies also showed the sizedependent clearance from lungs after short-term inhalation exposure.32 South Africa further contributed to inhalation studies related to nano aerosol generation as part of the development of an international standard (ISO TR19601). Collaborative work was also conducted to investigate the tissue distribution of AuNPs and AgNPs after sub-acute intravenous co-administration of similarly sized counterparts33 as well as their effect on the blood biochemical and haematological parameters34
With regard to ecological hazard assessment of nanomaterials, standardised toxicity testing methodologies and test organisms were initially utilised to understand the effects of exposure. Tests were carried out using traditional standardised aquatic test species (i.e. algae, macroinvertebrates and fish) to determine the hazards of, for example, doublewalled carbon nanotubes35, induction of oxidative stress in the floating macrophyte Spirodela punctuta following exposure to AgNPs and zinc oxide (ZnO) nanoparticles36, and the mortality and behaviour effects of aluminium oxide and titanium dioxide (TiO2) to the early life stages of a freshwater snail (Physa acuta)37
Subsequently, South African and other international researchers have been evaluating the applicability of standardised toxicity tests for inter alia nematodes38, enchytraeid potworms39, aquatic invertebrates and fish40,41 Using these standardised OECD protocols, local studies conducted as part of the safety testing of AuNPs revealed that nanomaterials had lower toxicity than their chemical equivalents.39-41 These and other South African studies on the three most commonly used toxicity bioassays – i.e. the 72-h algal growth inhibition test, 48-h Daphnia immobilisation test, and 96-h fish mortality test – contributed towards adaptations needed for nanomaterial toxicity testing. For example, CytoViva Dark field imaging was used41 to demonstrate that the disposal of surface-bound AuNPs
by Daphnia occurs through increased moulting. Moreover, South Africa developed a standardised screening procedure to assess the hazard of nanomaterials in saline environments using brine shrimp (Artemia sp.)42 and proposed a new method to assess cell toxicity in real time using the xCELLigence real-time cell analyser to evaluate the effects of AuNPs and AgNPs to three different mammalian cells lines43
As part of the call for further development of sub-lethal endpoints of chronic (long-term) exposure, Botha et al.44 used an integrated physiological response (i.e. swimming behaviour) in zebra fish (Danio rerio) that showed sub-lethal dose-response effects of AuNPs where gene expression and oxidative stress enzymes did not reveal any effects. The sensitivity of this endpoint was further demonstrated following exposure of D. rerio to sub-lethal concentrations of CdTe quantum dots and nanodiamonds45
These different in vitro cell models and in vivo animal models described above, contribute to the techniques that are used in hazard assessment and regulation of nanoparticles before they are released into the market. This means that, for the safe development and commercialisation of nanotechnologies in South Africa, there are existing test systems that have successfully been validated and established to achieve the objectives for hazard assessment.
Assessment of exposure
Occupational exposure
Exposure to nanomaterials may occur directly through occupational and consumer exposure or indirectly through environmental exposure (Figure 1). There is thus the need for lifecycle risk assessment. The exposure assessment under the different scenarios critically requires that the nature and extent of contact with nanomaterials under different conditions and identified activities is determined. The identification of the routes of exposure such as inhalation, digestion, dermal or intravenous injection with dose and duration is also of great importance. The fact that nanomaterials come in various sizes, shapes, functionalities, concentrations, and chemical compositions must be borne in mind when undertaking exposure assessments.
Assessment of occupational exposure
Studies by the OECD and US National Institute for Occupational Safety and Health (NIOSH) provide guidance on strategies, techniques, and sampling protocols for determining nanomaterial concentrations in air. The three-tiered approach recommended by the OECD for occupational exposure assessment is as follows46:
• Tier 1: On-site inspection and questionnaire to determine if the nanomaterials can be released from the processes/tasks.
• Tier 2: Determine potential exposure in the workplace through screening and/or task specific measurements using the correct metrics (mass, number, surface area) with specialised online instrumentation. The establishment of background concentrations and levels in the personal breathing zone of the worker needs to be determined.
• Tier 3: Tier 2 with concurrent particle sampling for offline analysis of particle morphology, mass or fibre concentration and chemical composition. These are related to particle control values in order to ascertain whether controls are sufficient or need to be improved.
Recommended exposure limits, another term for occupational exposure levels (OELs), for carbon nanotubes and nanofibres were determined to be 1 µg/m3 elemental carbon as a respirable mass 8-h time-weighted average concentration47 and for nano-TiO2 to be 0.3 mg/m3 as timeweighted average concentrations for up to 10 h per day during a 40-h work week48. These recommended exposure limits have already been accepted by the US Occupational Safety and Health Administration (OSHA).49 The aforementioned examples demonstrate that there is advancement in deriving OELs for nanomaterials. However, with the rapid expansion of nanotechnology and development of new types of nanomaterials, the development of OELs in the workplace is lagging. Subsequently, for
29 Volume 119| Number 1/2 January/February 2023 Review Article https://doi.org/10.17159/sajs.2023/11657 Nanomaterial HSE risk assessment in SA Page 2 of 7
nanomaterials where no limit values are available, nano-reference values have been developed as provisional substitutes for health-based OELs or NOAELs. These nano-reference values are based on a precautionary approach and have been developed for four classes of nanomaterials: Class 1 – rigid, biopersistent nanofibre (e.g. carbon nanotubes, metal oxide fibres), Class 2 – biopersistent granular nanomaterials (e.g. Au, Fe, CoO), Class 3 – biopersistent granular and fibre nanomaterials (e.g. TiO2, ZnO, C60), Class 4 – non-persistent granular nanomaterials (e.g. fats, NaCl.50
Using the nano-reference values approach, South African researchers assessed exposure to AuNPs in a pilot scale facility where the measured nanoparticle emission was below the recommended nano-reference values.51 Using the tiered approach, exposure assessment was conducted in various research laboratories and in different industrial settings in South Africa to assess exposure to several types of nanomaterials utilising the established infrastructure. The values calculated from the measurements are used to calculate the 8-h time-weighted average exposure concentration to compare it to proposed OELs. Thereafter, proposed actions need to be taken to ensure the protection of workers, including engineering controls and personal protective equipment, to further minimise the risk of exposure.
Together with the identification of suitable biomarkers of internal exposure and indicators of toxicological responses52, it is also important to develop surveillance programmes to protect the workers dealing with nanomaterials53. To this end, South Africa contributed towards the development of World Health Organization guidelines to protect workers from potential risks of nanomaterials.54
Assessment of environmental exposure
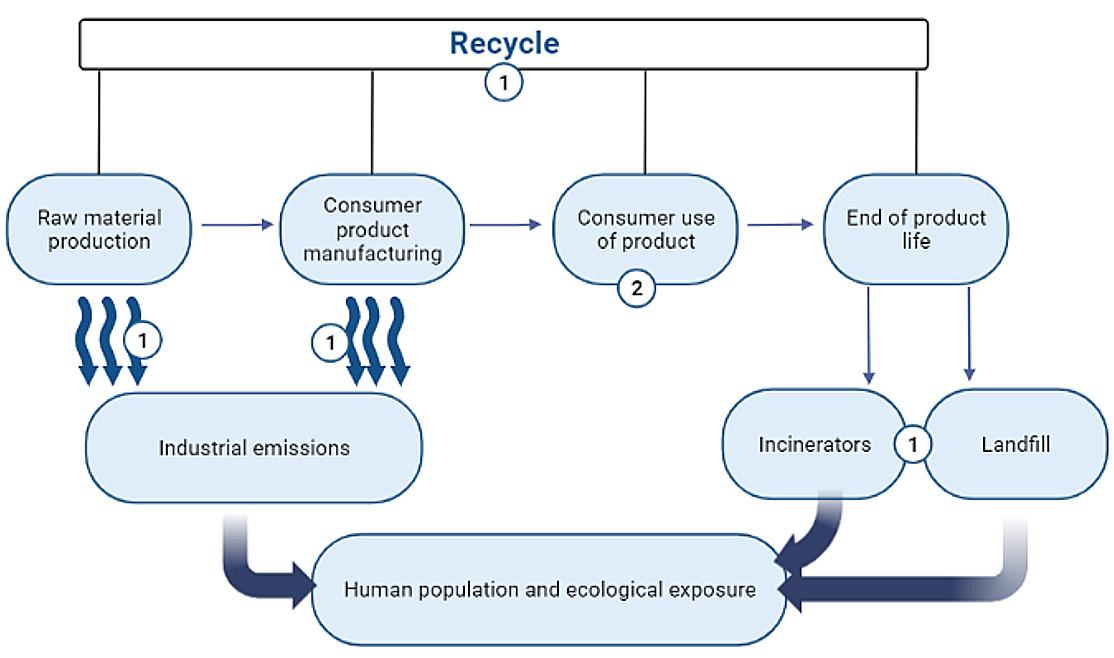
Most of the information related to the fate and transport of nanomaterials in the environment has been obtained from modelling studies. These approaches were applied to quantify the levels of AgNPs and TiO2NPs in terrestrial and aquatic ecosystems from the cosmetics industry passing through wastewater treatment plants.55 Further studies were conducted on simulated wastewater treatment plants to determine the fate and effect of AgNPs and ZnONPs56,57 and concluded that these materials predominantly remain in the sludge. Other studies found that aggregation and dissolution kinetics of aluminium oxide (Al2O3) and CuO nanoparticles were strongly influenced by source-specific physicochemical characteristics such as pH, natural organic matter and solutes.58 The latter physicochemical characteristics also influenced the toxicity of ZnO and iron oxide (FeOx) nanoparticles to the bacterium Bacillus subtilis.59
South African researchers conducted a comprehensive review of the existing approaches used to predict the bioaccumulation of nanomaterials. They concluded that the octanol-water partition coefficient (log Kow) may not be applicable but that kinetic models such as the physiologically based pharmacokinetic model showed the greatest promise in predicting bioaccumulation and biological exposure.60 South African researchers were further involved in a meta-analysis of existing nanomaterial bioaccumulation studies in fish to assess the bioaccumulation potential of nanomaterials.61 The authors found that a tiered approach that makes use of in vitro, in silica, ex vivo and, at the final tier, in vivo data shows promise as a new standardised protocol for nanomaterial bioaccumulation testing. It is currently being applied to assess CuO and quantum dots bioaccumulation in both terrestrial (i.e. earthworms) and aquatic (i.e. invertebrates and fish) organisms.
Assessment of exposure from consumer products
In terms of turnover, the pharmaceutical sector is currently the most important of the six considered nanotechnology markets, but all of them are expected to grow significantly in the future.62 The potential therefore exists for consumer and environmental exposure to nanomaterials present in NEPs at different product lifecycle phases, i.e. production, use, and end-of-life. Assessment of consumer exposure is therefore complex.63 An approach was developed to obtain sufficient quantities of materials (e.g. released from products, weathered fragmented products and sieved fragmented products) in order to study these nanomaterials during different lifecycle stages.64 Environmental exposure assessment due to release of nanomaterials has largely been dominated by pristine nanomaterial type, compared to those incorporated in NEPs.63 Because the functionalisation of nanomaterials into products alters their pristine state65, there are limitations in applying data obtained from pristine nanomaterials to elucidate exposure arising from the various lifecycle phases.
Prior to assessment of nanomaterials exposure in NEPs, it is important to establish the type of NEPs in the market. The global and local NEP markets are dominated by health and fitness products (e.g. sporting goods, active wear, personal care, and sunscreen products), being 42–81% of the identified or examined NEPs.66 Hence the potential for environmental exposure to occur consistently and likely to increase with future demand for more superior products preferred by consumers. In South Africa, it has been illustrated that NEPs extend beyond the products that are declared by manufacturers.67 There is increased need for regional and ultimately global databases to enhance value to industry, consumers, researchers, and government authorities, and at a lower cost than the current country-specific registries.68
30 Volume 119| Number 1/2 January/February 2023 Review Article https://doi.org/10.17159/sajs.2023/11657
Nanomaterial HSE risk assessment in SA Page 3 of 7
Figure 1: Diagram depicting the human and ecological exposure to nanomaterials during different product lifecycle stages of the materials in environmental, health and safety evaluations (1 = worker exposure, 2 = consumer exposure).
It is impractical, and in principle unnecessary, to analyse nanomaterial emissions from all NEPs; numerous studies have adopted a model that, at a lower tier, guides to priority emission-potential NEPs based on nanomaterials loci or fixation in the product.66 In brief, NEPs with nanomaterials suspended in liquid (e.g. shower gels, body creams), surface bound (e.g. toothbrush, fabrics), airborne (e.g. air conditioner) and suspended in solid gel (e.g. eye shadow, make-up sticks), exhibit elevated nanomaterials environmental exposure potential relative to counterparts where the nanomaterials are fixed in a solid matrix or nanostructured surface
Overall, information pertaining to nanomaterials environmental exposure has greatly improved compared to a decade ago. Locally, studies have proposed priority groups of NEPs exhibiting considerable pollution potential55,66,69 as well as steps that enrich the information gap raised by authorities concerning emerging environmental pollutants70 Additionally, through platforms such as the Nanotechnology Industries Association, prioritisation of NEPs that raise HSE concerns have been highlighted.71 In the USA, the Food and Drug Administration has also set regulations pertaining to NEPs falling within food and drug classes.72 Whilst such examples highlight efforts to identify and minimise NEP cases of nanomaterial concern, many exposure dynamics remain poorly understood or complex, hence considerable challenges remain in the regulation of commercial items. Closer cooperation between authorities, industry, research, and public communities on nanomaterial HSE matters can enrich and advance the debate in this matter; South Africa still needs to enhance such a robust approach.
Application of models and/or in silico approaches
The aim of computational in silico approaches is to develop predictive models that can replace in vitro and in vivo testing for the purposes of human and ecological risk assessment of nanomaterials.
Computational approaches and the prediction of toxicity
This involves the development of computational models of nanomaterial structure property/activity relationships (QSAR) to predict toxicity of nanomaterials and then to assist in safety by design considerations. These studies done in conjunction with EU partners are aimed at identifying relevant response descriptors in relation to toxicological, transcriptomic, and toxicogenomic endpoints that will assist in developing QSARs for predicting the toxicity of nanomaterials.73-77
Computational approaches and the prediction of dose
Dosimetry refers to estimating or measuring the amount (in terms of mass, number, surface area, volume, etc.) of a nanomaterial at a specific biological target site at a particular point in time.78 The assessment of the dose delivered to the cells and the internalised dose (i.e. the dosimetry) is essential for interpretation of both in vitro and in vivo toxicity data. South Africa therefore uses the sedimentation, diffusion and dosimetry (ISDD) and volumetric centrifugation method (VCM) modelling platforms to calculate cellular delivered dose79 for the hazard identification of nanoparticles.
Dosimetry is also important for in vivo studies where the delivered dose to internal organs needs to be determined. The physiologically based pharmacokinetic model is standard procedure that is applied to simulate the absorption, distribution, metabolism, and elimination of chemical substances in organisms. In collaboration with international organisations, South African partners recently outlined future directions in the physiologically based pharmacokinetic modelling of nanomaterials.80 A recent sub-acute inhalation study demonstrated how this approach could be applied to assess the lung retention and particokinetics of AgNPs and AuNPs co-exposure in rats.81
Chemoinformatics and chemical structures
Chemoinformatics has solved the issue of representing chemical structures for small molecules as simple 1D codes, such as SMILES and InChI, which are machine-readable chemical identifiers. South Africa has contributed to a recent collaborative work, which considered the issues involved in developing an InChI for nanomaterials (NInChIi).82
Risk assessment and risk management methods
To understand the risk of nanomaterials, it is essential to obtain basic information on the following aspects of nanomaterials: physicochemical properties, in vitro and in vivo toxicity, dose-effect relationships and exposure scenarios for workers, consumers and the general environment (i.e. determining levels, frequency and duration of exposure). Therefore, risk assessment and risk management considerations have formed the core research areas for the DSI Nanotechnology HSE Risk Assessment programme. The aim of the programme is to integrate the quantitative exposure and hazard data obtained from all the HSE programme projects into risk assessment and other in silico models to predict nanomaterial behaviour and risks across the different life cycles of NEPs. Through data generated in the HSE programme, South Africa has been able to contribute to the integration of safety testing measures across the innovation chain of nanomaterials using new approach methodologies.77
Future prognosis
Nanomaterials and NEPs are increasingly being synthesised and commercialised in South Africa. In the past 5 years, there have been significant advances in research related to the components of the risk assessment process. By and large, these research activities were not undertaken in isolation but formed part of international nanomaterial HSE research programmes.
The achievements of the HSE programme could therefore be summarised as:
1. Support of regulation and decision-making through evidencebased data derived from a broad-base nanotechnology HSE research platform.
2. Establishment of the required tests and the necessary infrastructure to assess the hazardous nature of and determine exposure to nanomaterials that are being synthesised and soon to be commercialised in South Africa.
3. Establishment of the necessary human capital development to conduct such tests.
4. Continued collaborative research efforts in international research initiatives that are aimed at developing nanotechnology HSE testing methodologies and regulatory approaches, e.g. the OECD Working Party on Manufactured Nanomaterials programme and EU Horizon 2020 supported research projects.
5. Continued support of the development of international standards through ISO 229 Nanotechnologies where South Africa is represented by the South African Bureau of Standards (SABS) and the appointed experts contribute to the development of such nano-safety guidelines and standards for nanomaterials and nanotechnologies.
Through the participation and contributions of South African scientists in large-scale EU FP7 and Horizon 2020 funded nanoresearch programmes (e.g. Nanosolutions, Nanoharmony, caLIBRAte, NanoSolveIT), significant amounts of data have been generated. The challenge that now faces international and South African researchers is how to validate these predictions from cell lines to whole organisms and indeed other species (i.e. read-across extrapolation) and determine how these in vitro mode of action predictions influence higher level biological responses such as growth, reproduction, etc. Therefore, both local and international focus is on the use of additional knowledge-based tools such as the development of adverse outcome pathways that can be implemented in the risk assessment of nanomaterials. The necessity of implementing tools such as adverse outcome pathways arises from the fact that it may not be possible to conduct separate risk assessments for every nanomaterial and NEP.
Furthermore, a glaring void that needs urgent attention in South Africa is nanomaterial HSE discussions between industry and authorities, as these have not yet been consistent. This partnership will facilitate in the risk management of NEPs produced in the country. Important work that still needs to be completed in this regard is:
31 Volume 119| Number 1/2 January/February 2023 Review Article https://doi.org/10.17159/sajs.2023/11657 Nanomaterial HSE risk assessment in SA Page 4 of 7
1. Facilitate partnerships with industry to provide guidance on process-related exposures and worker protection.
2. Develop guidelines for the development of safe handling and use (industry).
3. Develop guidelines and standards to train researchers and workers for activities involving nanomaterials in the research and workplace environments in South Africa.
4. Identify, characterise, and communicate risks to all stakeholders through appropriate risk communication and risk management strategies. This will require research into risk communication strategies and integration into risk management frameworks. Thus, in line with international initiatives, risk communication needs to form an integral component of all nanotechnology research programmes.
5. Facilitate communication between stakeholders by providing support for industry partnerships and informed regulatory decision-making.
Acknowledgements
The activities of the Nanotechnology HSE Research Platform would not have been possible without the funding received from the Department of Science and Innovation. This paper is contribution number 530 of the Water Research Group (NWU).
Competing interests
We have no competing interests to declare.
Authors’ contributions
M.G.: Conceptualisation; writing – initial draft; writing – revisions; project leadership. M.T.: Writing – initial draft; writing – revisions. X.M.: Project management; funding acquisition; writing – revisions. V.W.: Writing –initial draft; writing – revisions; corresponding author.
References
1. International Organization for Standardization (ISO). Nanotechnologies –Vocabulary – Part 1: Core terms. ISO standard number 80004-1:2010(en). Geneva: ISO; 2016.
2. US National Research Council (NRC). Science and judgment in risk assessment. Washington DC: National Academy Press; 1994.
3. Rasmussen K, Rauscher H, Kearns P, González M, Sintes JR. Developing OECD test guidelines for regulatory testing of nanomaterials to ensure mutual acceptance of test data. Reg Toxicol Pharmacol. 2019;104:74–83. https:// doi.org/10.1016/j.yrtph.2019.02.008
4. Nanoscale Science, Engineering, and Technology (NSET) Subcommittee NSET. National Nanotechnology Initiative Strategic Plan 20502. Washington DC: Executive Office of the President, National Science and Technology Council; 2014.
5. Savolainen K, Backman U, Brouwer D, Fadeel B, Fernandes T, Kuhlbusch T, et al. Nanosafety in Europe 2015-2025: Towards safe and sustainable nanomaterials and nanotechnology innovations. Helsinki: Finnish Institute of Occupational Health; 2013.
6. Musee N, Brent AC, Ashton PJ. A South African research agenda to investigate the potential environmental, health and safety risks of nanotechnology. S Afr J Sci. 2010;106(3/4), Art. #159. https://doi.org/10.4102/sajs.v106i3/4.159
7. Gulumian M, Kuempel ED, Savolainen K. Global challenges in the risk assessment of nanomaterials: Relevance to South Africa. S Afr J Sci. 2012;108(9/10), Art. #922. https://doi.org/10.4102/sajs.v108i9/10.922
8. Organisation for Economic Cooperation and Development (OECD). ENV/ JM/MONO(2016)2. Physical-chemical parameters: Measurements and methods relevant for the regulation of nanomaterials. No. 63. Paris: OECD Publishing; 2016.
9. Utembe W, Potgieter K, Stefaniak AB, Gulumian M. Dissolution and biodurability: Important parameters needed for risk assessment of nanomaterials. Part Fibre Toxicol. 2015;12:11. https://doi.org/10.1186/ s12989-015-0088-2
10. Organisation for Economic Cooperation and Development (OECD). ENV/JM/ MONO(2018)11. Assessment of biodurability of nanomaterials and their surface ligands. Paris: OECD Publishing; 2018.
11. International Organization for Standardization (ISO). Nanotechnologies – Use and application of acellular in vitro tests and methodologies to assess nanomaterial biodurability. ISO Report number ISO/TR 19057. Geneva: ISO; 2018.
12. Mbanga O, Cukrowska E, Gulumian M. Dissolution of citrate-stabilized, polyethylene glycol-coated carboxyl and amine-functionalized gold nanoparticles in simulated biological fluids and environmental media. J Nanopart Res. 2021;23:29. https://doi.org/10.1007/s11051-020-05132-x
13. Organisation for Economic Cooperation and Development (OECD). ENV/ JM/MONO(2015)7. Dossier on gold nanoparticles. No. 44. Paris: OECD Publishing; 2015.
14. Andraos C, Yu IJ, Gulumian M. Interference: A much-neglected aspect in high-throughput screening of nanoparticles. Int J Toxicol. 2020;39:397–421. https://doi.org/10.1177/1091581820938335
15. Ponti J, Kinsner-Ovaskainen A, Norlen H, Altmeyer S, Andreoli C, Bogni A, et al. Interlaboratory comparison study of the Colony Forming Efficiency assay for assessing cytotoxicity of nanomaterials. EUR 27009. Luxembourg: Publications Office of the European Union; 2014.
16. Vetten MA, Tlotleng N, Tanner Rascher D, Skepu A, Keter FK, Boodhia K, et al. Label-free in vitro toxicity and uptake assessment of citrate stabilised gold nanoparticles in three cell lines. Part Fibre Toxicol. 2013;10:50. https://doi. org/10.1186/1743-8977-10-50
17. George JM, Magogotya M, Vetten MA, Buys AV, Gulumian M. An investigation of the genotoxicity and interference of gold nanoparticles in commonly used in vitro mutagenicity and genotoxicity assays. Toxicol Sci. 2017;156(1):149–166. https://doi.org/10.1093/toxsci/kfw247
18. Sanabria NM, Gulumian M. The presence of residual gold nanoparticles in samples interferes with the RT-qPCR assay used for gene expression profiling. J Nanobiotechnol. 2017;15:72. https://doi.org/10.1186/s12951-017-0299-9
19. Vetten MA, Gulumian M. Interference of gold nanoparticles with in vitro endotoxin detection assays. Curr Nanosci. 2020;16:204–213. https://doi.org /10.2174/1573413715666181212120013
20. Vetten MA, Yah CS, Singh T, Gulumian M. Challenges facing sterilization and depyrogenation of nanoparticles: Effects on structural stability and biomedical applications. Nanomedicine. 2014;10:1391–1399. https://doi. org/10.1016/j.nano.2014.03.017
21. Stone V, Johnston HJ, Balharry D, Gernand JM, Gulumian M. Approaches to develop alternative testing strategies to inform human health risk assessment of nanomaterials. Risk Anal. 2016;36:1538–1550. https://doi.org/10.1111/ risa.12645
22. Vetten M, Gulumian M. Differences in uptake of 14nm PEG-liganded gold nanoparticles into BEAS-2B cells is dependent on their functional groups. Toxicol Appl Pharmacol. 2019;363:131–141. https://doi.org/10.1016/j. taap.2018.11.014
23. Tlotleng N, Vetten MA, Keter FK, Skepu A, Tshikhudo R, Gulumian M. Cytotoxicity, intracellular localization and exocytosis of citrate capped and PEG functionalized gold nanoparticles in human hepatocyte and kidney cells. Cell Biol Toxicol. 2016;32:305–321. https://doi.org/10.1007/s10565-016-9336-y
24. Andraos C, Gulumian M. Intracellular and extracellular targets as mechanisms of cancer therapy by nanomaterials in relation to their physicochemical properties. Wiley Interdiscip Rev Nanomed Nanobiotechnol. 2020; e1680. https://doi.org/10.1002/wnan.1680
25. Gulumian M, Andraos C. In search of a converging cellular mechanism in nanotoxicology and nanomedicine in the treatment of cancer. Toxicol Pathol. 2018;46:4–13. https://doi.org/10.1177/0192623317735776
26. Organisation for Economic Cooperation and Development (OECD). OECD/ OCDE 412. OECD guidelines on the testing of chemicals 28-day (subacute) inhalation toxicity study. Paris: OECD Publishing; 2018.
27. Organisation for Economic Cooperation and Development (OECD). OECD/ OCDE 413 (2018e). OECD guidelines for the testing of chemicals 90-day (subchronic) inhalation toxicity study. Paris: OECD Publishing; 2018.
32 Volume 119| Number 1/2 January/February 2023 Review Article https://doi.org/10.17159/sajs.2023/11657
Nanomaterial HSE risk assessment in SA Page 5 of 7
28. Park JD, Kim JK, Jo MS, Kim YH, Jeon KS, Lee JH, et al. Lobar evenness of deposition/retention in rat lungs of inhaled silver nanoparticles: An approach for reducing animal use while maximizing endpoints. Part Fibre Toxicol. 2019;16:2. https://doi.org/10.1186/s12989-018-0286-9
29. Jo MS, Kim JK, Kim Y, Kim HP, Kim HS, Ahn K, et al. Mode of silver clearance following 28-day inhalation exposure to silver nanoparticles determined from lung burden assessment including post-exposure observation periods. Arch Toxicol. 2020;94:773–784. https://doi.org/10.1007/s00204-020-02660-2
30. Kim HP, Kim JK, Jo MS, Park JD, Ahn K, Gulumian M, et al. Even lobar deposition of poorly soluble gold nanoparticles (AuNPs) is similar to that of soluble silver nanoparticles (AgNPs). Part Fibre Toxicol. 2020;17:54. https:// doi.org/10.1186/s12989-020-00384-w
31. Gulumian M, Kelman B, Choi J, Kim H, Yu IJ. Effect of long-term exposure to silver nanoparticles on blood coagulation in vivo. J Cardio Vasc Med. 2020;6:1–9.
32. Han SG, Lee JS, Ahn K, Kim YS, Kim JK, Lee JH, et al. Size-dependent clearance of gold nanoparticles from lungs of Sprague-Dawley rats after short-term inhalation exposure. Arch Toxicol. 2014;89:1083–1094. https:// doi.org/10.1007/s00204-014-1292-9
33. Lee JH, Sung JH, Ryu HR, Song KS, Song NW, Park HM, et al. Tissue distribution of gold and silver after subacute intravenous injection of coadministered gold and silver nanoparticles of similar sizes. Arch Toxicol. 2018;92:1393–1405. https://doi.org/10.1007/s00204-018-2173-4
34. Lee JH, Gulumian M, Faustman EM, Workman T, Jeon K, Yu IJ. Blood biochemical and hematological study after subacute intravenous injection of gold and silver nanoparticles and co-administered gold and silver nanoparticles of similar sizes. Biomed Res Int. 2018;2018, e8460910. https://doi.org/10.1155/2018/8460910
35. Lukhele LP, Mamba BB, Musee N, Wepener V. Acute toxicity of double-walled carbon nanotubes to three aquatic organisms. J Nanomater. 2015;2015, e219074. https://doi.org/10.1155/2015/219074
36. Thwala M, Musee N, Sikhwivhilu L, Wepener V. The oxidative toxicity of Ag and ZnO nanoparticles towards the aquatic plant Spirodela punctuta and the role of testing media parameters. Environ Sci Process Impacts. 2013;15:1830–1843. https://doi.org/10.1039/c3em00235g
37. Musee N, Oberholster PJ, Sikhwivhilu L, Botha AM. The effects of engineered nanoparticles on survival, reproduction, and behaviour of freshwater snail, Physa acuta (Draparnaud, 1805). Chemosphere. 2010;81:1196–1203. https://doi.org/10.1016/j.chemosphere.2010.09.040
38. Bosch S, Botha TL, Jordaan A, Maboeta M, Wepener V. Sublethal effects of ionic and nanogold on the nematode Caenorhabditis elegans. J Toxicol. 2018;2018, e6218193. https://doi.org/10.1155/2018/6218193
39. Voua Otomo P, Wepener V, Maboeta MS. Single and mixture toxicity of gold nanoparticles and gold(III) to Enchytraeus buchholzi (Oligochaeta). Appl Soil Ecol. 2014;84:231–234. https://doi.org/10.1016/j.apsoil.2014.08.007
40. Botha TL, James TE, Wepener V. Comparative aquatic toxicity of gold nanoparticles and ionic gold using a species sensitivity distribution approach. J Nanomater. 2015;2015, e986902. https://doi.org/10.1155/2015/986902
41. Botha TL, Boodhia K, Wepener V. Adsorption, uptake and distribution of gold nanoparticles in Daphnia magna following long term exposure. Aquat Toxicol. 2016;170:104–111. https://doi.org/10.1016/j.aquatox.2015.11.022
42. Johari SA, Rasmussen K, Gulumian M, Ghazi-Khansari M, Tetarazako N, Kashiwada S, et al. Introducing a new standardized nanomaterial environmental toxicity screening testing procedure, ISO/TS 20787: Aquatic toxicity assessment of manufactured nanomaterials in saltwater Lakes using Artemia sp. nauplii. Toxicol Mech Methods. 2019;29:95–109. https://doi.org/10.1080/15376516 .2018.1512695
43. Botha TL, Elemike EE, Horn S, Onwudiwe DC, Giesy JP, Wepener V. Cytotoxicity of Ag, Au and Ag-Au bimetallic nanoparticles prepared using golden rod (Solidago canadensis) plant extract. Sci Rep. 2019;9:4169. https://doi.org/10.1038/s41598-019-40816-y
44. Botha TL, Brand SJ, Ikenaka Y, Nakayama SMM, Ishizuka M, Wepener V. How toxic is a non-toxic nanomaterial: Behaviour as an indicator of effect in Danio rerio exposed to nanogold. Aquat Toxicol. 2019;215, e105287. https://doi. org/10.1016/j.aquatox.2019.105287
45. Brand SJ, Botha TL, Wepener V. Behavioural response as a reliable measure of acute nanomaterial toxicity in zebrafish larvae exposed to a carbon-based versus a metal-based nanomaterial. Afr Zool. 2020;55:57–66. https://doi.org /10.1080/15627020.2019.1702098
46. Organisation for Economic Cooperation and Development (OECD). ENV-JMMONO(2015)19: Harmonized tiered approach to measure and assess the potential exposure to airborne emissions of engineered nano-objects and their agglomerates and aggregates at workplaces. Paris: OECD Publishing; 2015.
47. US National Institute for Occupational Safety and Health (NIOSH). Current Intelligence Bulletin 65: Occupational exposure to carbon nanotubes and nanofibers. Number 2013-145. Washington DC: Department of Health and Human Services; 2013. Available from: http://www.cdc.gov/niosh/ docs/2013-145/
48. US National Institute for Occupational Safety and Health (NIOSH). Current Intelligence Bulletin 63: Occupational exposure to titanium dioxide. Number 2011-160. Washington: Department of Health and Human Services; 2011. Available from: https://www.cdc.gov/niosh/docs/2011-160/pdfs/2011-160.pdf
49. Occupational Safety and Health Administration (OSHA). OSHA fact sheet: Working safely with nanomaterials. Washington DC: OSHA; 2013. Available from: https://www.osha.gov/sites/default/files/publications/OSHA_FS-3634. pdf
50. Van Broekhuizen P, Dorbeck-Jung B. Exposure limit values for nanomaterials – capacity and willingness of users to apply a precautionary approach. J Occup Environ Hyg. 2013;10:46–53. https://doi.org/10.1080/15459624.20 12.744253
51. Organisation for Economic Cooperation and Development (OECD). ENV/JM/ MONO(2016)60. Gold nanoparticle occupational exposure assessment in a pilot scale facility. Paris: OECD Publishing; 2016.
52. Bergamaschi E, Gulumian M, Kanno J, Savolainen K. Engineered nanomaterials: Biomarkers of exposure and effects. In: Gupta R, editor. Biomarkers in toxicology. Amsterdam: Elsevier; 2014. p. 697–716. https:// doi.org/10.1016/B978-0-12-404630-6.00041-5
53. Gulumian M, Verbeek J, Andraos C, Sanabria N, de Jager P. Systematic review of screening and surveillance programs to protect workers from nanomaterials. PLoS ONE. 2016;11(11), e0166071. https://doi.org/10.1371/ journal.pone.0166071
54. World health Organization (WHO). WHO Guidelines on protecting workers from potential risks of manufactured nanomaterials. Geneva: WHO; 2017. Available from: https://apps.who.int/iris/bitstream/hand le/10665/259671/9789241550048-eng.pdf
55. Musee N. Simulated environmental risk estimation of engineered nanomaterials: A case of cosmetics in Johannesburg City. Hum Exp Toxicol. 2011;30:1181–1195. https://doi.org/10.1177/0960327110391387
56. Musee N, Zvimba JN, Schaefer LM, Nota K, Sikhwivhilu LM, Thwala M. Fate and behavior of ZnO- and Ag-engineered nanoparticles and a bacterial viability assessment in a simulated wastewater treatment plant. J Environ Sci Health A. 2014;49:59–66. https://doi.org/10.1080/10934529.2013.824302
57. Chaúque EFC, Zvimba JN, Ngila JC, Musee N. Fate, behaviour, and implications of ZnO nanoparticles in a simulated wastewater treatment plant. Water SA. 2016;42:72–81. https://doi.org/10.4314/wsa.v42i1.09
58. Nanja AF, Focke WW, Musee N. Aggregation and dissolution of aluminium oxide and copper oxide nanoparticles in natural aqueous matrixes. SN Appl Sci. 2020;2:1164. https://doi.org/10.1007/s42452-020-2952-4
59. Leareng SK, Ubomba-Jaswa E, Musee N. Toxicity of zinc oxide and iron oxide engineered nanoparticles to Bacillus subtilis in river water systems. Environ Sci: Nano. 2020;7:172–185. https://doi.org/10.1039/C9EN00585D
60. Utembe W, Wepener V, Yu IJ, Gulumian M. An assessment of applicability of existing approaches to predicting the bioaccumulation of conventional substances in nanomaterials. Environ Toxicol Chem. 2018;37:2972–2988. https://doi.org/10.1002/etc.4253
61. Handy RD, Clark NJ, Boyle D, Vassallo J, Green C, Nasser F, et al. The bioaccumulation testing strategy for nanomaterials: Correlations with particle properties and a meta-analysis of in vitro fish alternatives to in vivo fish tests. Environ Sci Nano. 2022;9:684–701. https://doi.org/10.1039/D1EN00694K
62. Forster SP, Olveira S, Seeger S. Nanotechnology in the market: Promises and realities. Int J Nanotech. 2011;8(6–7):592–613. https://doi.org/10.1504/ IJNT.2011.040193
33 Volume 119| Number 1/2 January/February 2023 Review Article
https://doi.org/10.17159/sajs.2023/11657
Nanomaterial HSE risk assessment in SA Page 6 of 7
63. Mitrano DM, Barber A, Bednar A, Westerhoff,P, Higgins CP, Ranvillea JF.Silver nanoparticle characterization using single particle ICP-MS (SP-ICP-MS) and asymmetrical flow field flow fractionation ICP-MS (AF4-ICP-MS) J Anal At Spectrom. 2012;27:1131–1142. https://doi.org/10.1039/c2ja30021d
64. Nowack B, Boldrin A, Caballero A, Hansen SF, Gottschalk F, Heggelund L, et al. Meeting the needs for released nanomaterials required for further testing –The SUN approach. Environ Sci Technol. 2016;50:2747–2753. https://doi. org/10.1021/acs.est.5b04472
65. Von der Kammer F, Ferguson PL, Holden PA, Masion, A, Rogers KR, Klaine SJ, et al. Analysis of engineered nanomaterials in complex matrices (environment and biota): General considerations and conceptual case studies. Environ Toxicol Chem. 2012;31:32–49. https://doi.org/10.1002/etc.723
66. Moeta PJ, Wesley-Smith J, Maity A, Thwala M. Nano-enabled products in South Africa and the assessment of environmental exposure potential for engineered nanomaterials. SN Appl Sci. 2019;1:577. https://doi.org/10.1007/ s42452-019-0584-3
67. Lehutso RF, Tancu Y, Maity A, Thwala M. Characterisation of engineered nanomaterials in nano-enabled products exhibiting priority environmental exposure. Molecules. 2021;26:1370. https://doi.org/10.3390/molecules 26051370
68. Hermann A, Diesner M-O, Abel J, Hawthorne C, Greßmann A. Assessment of impacts of a European register of products containing nanomaterials. Dessau-Roßlau: Umweltbundesamt [German Environment Agency]; 2014.
69. Nthwane YB, Tancu Y, Maity A, Thwala M. Characterisation of titanium oxide nanomaterials in sunscreens obtained by extraction and release exposure scenarios. SN Appl Sci. 2019;1:312. https://doi.org/10.1007/s42452-0190329-3
70. South African Department of Water and Sanitation (DWS). Water quality management policies and strategies for South Africa. Report no. 2.1. WQM Policy – Edition 1. Water Resource Planning Systems Series. DWS Report no.: 000/00/21715/12. Pretoria: DWS; 2016.
71. Scientific Committee on Consumer Safety (SCCS). Scientific advice of safety of nanomaterials in cosmetics. EU SCCS/1618/20. Luxembourg: European Commission; 2021. https://doi.org/10.2875/125512
72. Food and Drug Administration (FDA). Nanotechnology – Over a decade of progress and innovation. Washington DC: US Food and Drug Administration; 2020. Available from: https://www.fda.gov/media/140395/download0
73. Afantitis A, Melagraki G, Isigonis P, Tsoumanis A, Varsou DD, ValsamiJones E, et al. NanoSolveIT Project: Driving nanoinformatics research to develop innovative and integrated tools for in silico nanosafety assessment. Comput Struct Biotechnol J. 2020;18:583–602. https://doi.org/10.1016/j. csbj.2020.02.023
74. Kinaret PAS, Serra A, Federico A, Kohonen P, Nymark P, Liampa I, et al. Transcriptomics in toxicogenomics. Part I: Experimental design, technologies, publicly available data, and regulatory aspects. Nanomaterials. 2020;10(4):750. https://doi.org/10.3390/nano10040750
75. Federico A, Serra A, Ha MK, Kohonen P, Choi J-S, Liampa I, et al. Transcriptomics in toxicogenomics. Part II: Preprocessing and differential expression analysis for high quality data. Nanomaterials. 2020;10(4):903. https://doi.org/10.3390/nano10050903
76. Serra A, Fratello M, Cattelani L, Liampa I, Melagraki G, Kohonen P, et al. Transcriptomics in toxicogenomics. Part III: Data modelling for risk assessment. Nanomaterials. 2020;10(4):708. https://doi.org/10.3390/nano10040708
77. Nymark P, Bakker M, Dekkers S, Franken R, Fransman W, Gracía-Bilboa A, et al. Toward rigorous materials production: New approach methodologies have extensive potential to improve current safety assessment practices. Small. 2020:16(6), e1904749. https://doi.org/10.1002/smll.201904749
78. Organisation for Economic Cooperation and Development (OECD). ENV/JM/ MONO(2012)40. Guidance on sample preparation and dosimetry for the safety testing of manufactured nanomaterials. Paris: OECD Publishing; 2012.
79. Hinderliter PM, Minard KR, Orr G, Chrisler WB, Thrall BD, Pounds JG, et al. ISDD: A computational model of particle sedimentation, diffusion and target cell dosimetry for in vitro toxicity studies. Part Fibre Toxicol. 2010;7:36. https://doi.org/10.1186/1743-8977-7-36
80. Utembe W, Clewell H, Sanabria N, Doganis P, Gulumian M. Current approaches and techniques in physiologically based pharmacokinetic (PBPK) modelling of nanomaterials. Nanomaterials. 2020;10(4):1267. https://doi.org/10.3390/ nano10071267
81. Kim JK, Kim HP, Park JD, Ahn K, Kim WY, Gulumian M, et al. Lung retention and particokinetics of silver and gold nanoparticles in rats following subacute inhalation co-exposure. Part Fibre Toxicol. 2021;18:5. https://doi. org/10.1186/s12989-021-00397-z
82. Lynch I, Afantitis A, Exner T, Himly M, Lobaskin V, Doganis P, et al. Can an InChI for nano address the need for a simplified representation of complex nanomaterials across experimental and nanoinformatics studies? Nanomaterials. 2020;10(4):2493. https://doi.org/10.3390/nano10122493
https://doi.org/10.17159/sajs.2023/11657
34 Volume 119| Number 1/2 January/February 2023 Review Article
Nanomaterial HSE risk assessment in SA Page 7 of 7
AUTHORS: Matthew C. Achilonu1
Xolile V. Ngubane1
S’busiso M. Nkosi1
Phiwe C. Jiyane1
AFFILIATION:
1Technology Station in Chemicals, Mangosuthu University of Technology, South Africa
CORRESPONDENCE TO: Matthew Achilonu
EMAIL: mcachilonu@yahoo.co.uk
DATES:
Received: 06 Aug. 2021
Revised: 29 Aug. 2022
Accepted: 30 Aug. 2022
Published: 31 Jan. 2023
HOW TO CITE: Achilonu MC, Ngubane XV, Nkosi SM, Jiyane PC. Phytochemicals, bioactivity, and ethnopharmacological potential of selected indigenous plants. S Afr J Sci. 2023;119(1/2), Art. #11961. https://doi. org/10.17159/sajs.2023/11961
ARTICLE INCLUDES:
☒ Peer review
☐ Supplementary material
DATA AVAILABILITY:
☐ Open data
☐ All data included
☐ On request from author(s)
☐ Not available
☒ Not applicable
EDITOR: Teresa Coutinho
KEYWORDS: bioactivity, ethnopharmacological usage, phytochemistry, traditional medicine, wild plant
FUNDING:
None
Phytochemicals, bioactivity, and ethnopharmacological potential of selected indigenous plants
The coastal regions of Africa are endowed with indigenous wild fruit plants rich in nutritional and medicinal phytochemicals and micronutrients. South African wild fruit plants complement the diet and health needs of rural poor households by providing vital dietary nutrients and remedies for various health concerns, and alleviating food insecurity. Milk plum, Natal plum, wild custard apple, and wild medlar medicinal plants are found mainly in the coastal provinces of South Africa. Studies have established that these plants are good sources of vitamins, essential elements, and bioactive phytocompounds such as flavonoids, phenolic acids, and terpenoids, which demonstrate significant antioxidant, antimicrobial and anti-inflammatory activities. The plants studied possess anti-epileptic, antiplasmodial, and snake antivenom qualities. Here we highlight the views of different reports on ethnopharmacological relevance, phytochemistry, and bioactivity of the selected South African indigenous medicinal plants. We found a research gap in the phytochemical composition and phytopharmacological activity evaluation of Carissa macrocarpa and Englerophytum magalismontanum.
Significance:
South African indigenous medicinal plants augment the dietary and other health needs of the rural populace. The phytochemistry and phytopharmacological activities of C. macrocarpa and E. magalismontanum have been only partially studied, hence the need for further studies to examine their worth and possible use in cosmetic product enrichment.
Introduction
Africa is endowed with indigenous fruit plants rich in beneficial phytonutrients.1 The fruits are the most popular part of the fruit-bearing plants and they appeal to the young, the old, and the ill as they are a useful source of essential metals and bioactive phytochemicals such as polyphenolics, vitamin C, and beta-carotene (provitamin A).1 The minerals are building blocks for teeth, blood, muscle, and bone, and are essential in brain cell development.2 Daily consumption of a reasonable quantity of fruits substantially reduces the risk of contracting severe respiratory infections and long-lasting diarrhoea, while inadequacy of these in children’s diets results in stunted growth and poor academic ability.2
The rural populace of South Africa utilises traditional medicine and medicinal plants to augment their nutrition and in treating ailments such as skin cancer, tuberculosis, diarrhoea, malaria, fever, diabetes, gastritis, smallpox, chickenpox, snakebites, and erectile dysfunction.3-10 However, wasteful harvesting practices threaten the existence of these indigenous plants. This threat is exacerbated by periodic droughts and wildfires. These medicinal plants include milk plum (Englerophytum magalismontanum), Natal plum (Carissa macrocarpa), wild custard apple (Annona senegalensis), and wild medlar (Vangueria infausta). They are ubiquitous in the Eastern Cape, Free State, Gauteng, KwaZulu-Natal, Limpopo, Northern Cape, and North West Provinces.11,12
Reports reveal that approximately 80% of the South African population uses indigenous plants to meet their primary healthcare needs.2,6,13 This finding is congruent with a worldwide growing acceptance of traditional medicines, and hence the safe use of herbal concoctions has also become a medical issue.13 Information on indigenous medicinal plants is therefore necessary to enhance their phytopharmacological value and utilisation.
This review summarises different opinions and research findings on the ethnopharmacological uses, phytochemical constituents, and bioactivities of the four selected South African medicinal plants, thus highlighting their importance in addressing the nutritional and medicinal needs of rural communities. We recommend their sustainable harvesting/preservation as well as further exploratory studies of their potential utilisation as food and cosmetics enrichment sources.
Data sources
The major databases explored for this review were Web of Science, PubMed, Google Scholar, and Scopus. The key search words for each plant were ethnopharmacological uses, phytochemicals, and biological activities of the plant. Articles included in the study constitute those that were published in English with a focus on the four plants of interest. Primary consideration was on peer-reviewed articles, although some relevant non-peer-reviewed quality publications from government bodies were considered. The search covered the period from 2000 to 2021. The record identification process followed is presented in the PRISMA (Preferred Reporting Items for Systematic Reviews and Meta-Analyses) flow diagram (Figure 1).
Indigenous medicinal plants
© 2023. The Author(s). Published under a Creative Commons Attribution Licence.
Communities worldwide commonly use therapeutic herbs and plants to treat various health conditions. The widespread usage of multipurpose South African indigenous plants could therefore be attributed to their being ubiquitous and affordable.
https://doi.org/10.17159/sajs.2023/11961
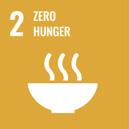
35 Volume 119| Number 1/2 January/February 2023 Review
Article
Descriptions of the indigenous plants with their phytochemical and bioactive profiles are provided below and summarised in Tables 1 and 2.
Wild custard apple (Annona senegalensis)
Annona senegalensis, belonging to the Annonaceae family, is a fruit plant that is native to South Africa, specifically found in the KwaZulu-Natal, Limpopo, and Mpumalanga Provinces.1,8 The English name is wild custard apple, while indigenous names are isiphofu, mamense, mokamanawe, mokokole, motlepe, muembe, muyembe, umhlalajuba, umphofu, umthofa, and wildesuikerappel. The plant is also found in Botswana, Lesotho, Mozambique, and Eswatini. This annual plant bears fleshy and lumpy fruits that are either ovoid or globose in shape.1 The unripe fruit is green on the outside but turns yellowish-orange when ripe. The edible white pulp has a characteristic pleasant pineapple-like taste. The seeds are many, cylindrical, oblong, and orange-brown in colour.1
As a multipurpose plant, A. senegalensis is used traditionally as food and as a concoction to treat many diseases. In folk medicine, reports reveal that the leaves, stem bark, and root bark are used in treating various health disorders1,14-21 (Table 1). One report notes that the leaves of the plant are locally used to protect cereals against weevil attacks.14
A plethora of studies have reported the phytochemical profiles and bioactivities of A. senegalensis, highlighting their significant health benefits4,7,8,15,21-23, as presented in Table 2. The investigations of the leaves, twigs, and stem-bark extracts revealed a substantial constituent of bioactive phytochemicals. The studies established that extracts of the leaves and the stem bark were laden with polyphenols and phenolic acids24, hence, their exhibition of significant antioxidant and hepatoprotective activities25
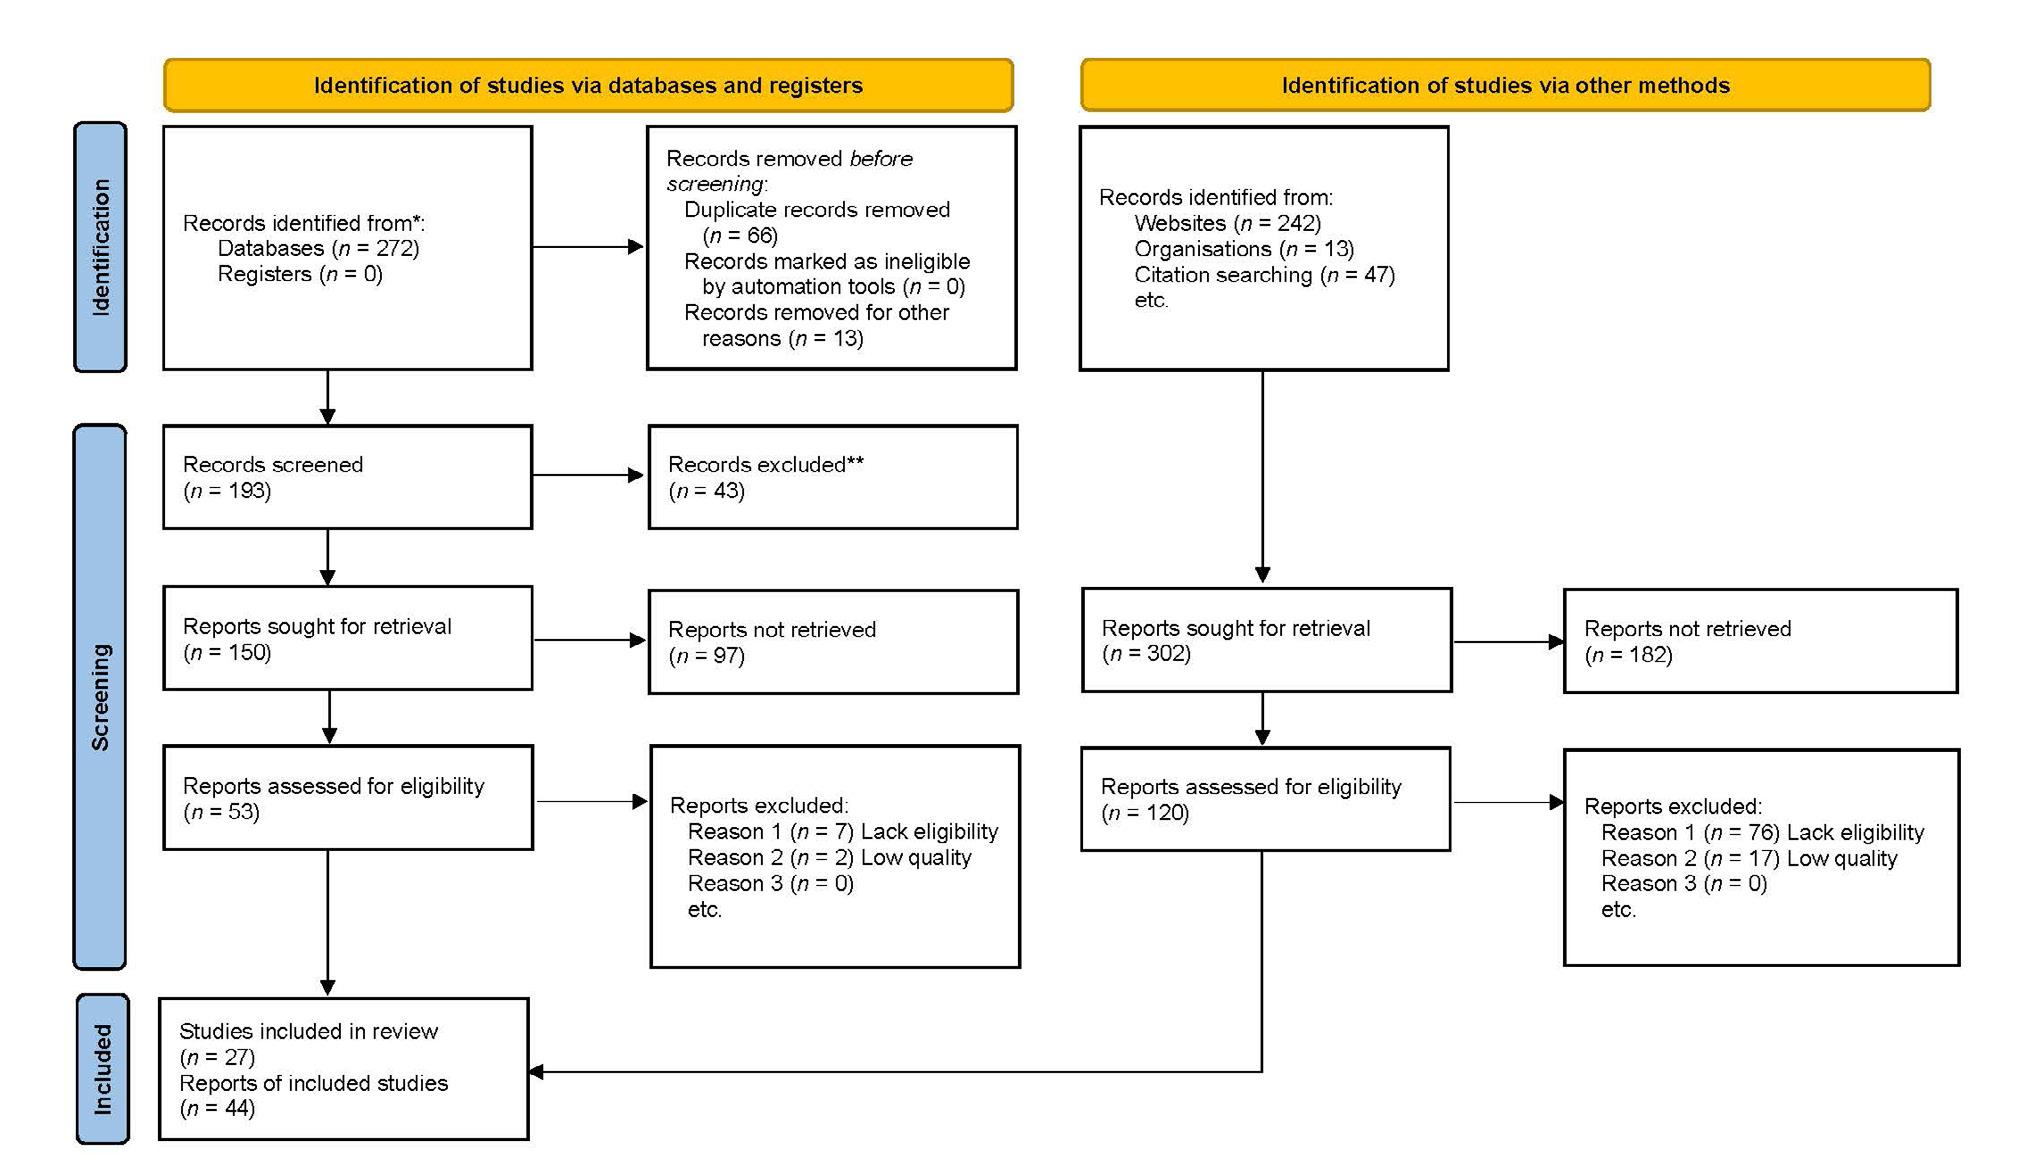
Agbo’Saga et al.26 noted that a crude extract from the leaf exhibited dosedependent effectiveness against breast cancer cells. The anticancer activity was attributed to the linalool20,26, amongst other phytoconstituents (citronellal, geranial, citronellol) of the leaf27. Rutin, epi-catechin, and quercetin glycoside isolated from the crude leaf extract displayed significant parasitic activity against Onchocerca ochengi28, while kaurenoic acids (root-bark extract)29 and 3-carene (fruit extract) showed strong antibacterial activities against tested strains20,30. The stem bark diethyl ether fraction (containing benzenediol, butylated hydroxytoluene,
hexadecanoic acid, oleic acid, octadecanoic acid, octadecandienal pentadecane, tetratriacontane, and squalene) demonstrated strong antimicrobial activity.31 The bioactive phytochemicals and bioactivities20,27-33 of A. senegalensis are listed in Table 2.
The cytotoxicity of A. senegalensis parts was also investigated. The highest cytotoxicity (93%) was demonstrated by the crude oil extract of the leaf, administered at a dose of 50 ppm in the brine shrimp lethality bioassay.34 Conversely, the phytochemical fractions obtained on further purification of the crude oil fraction caused a lower lethality (49%) in the brine shrimp larvae at the same concentration of 50 ppm. Caryophyllene oxide was identified as the major compound in the lower cytotoxic fraction. However, conducting a similar test with a pure caryophyllene oxide compound showed no toxicity on the target substrate. It was concluded that caryophyllene oxide works most effectively in synergy with other phytochemicals.34 An in vitro test reported that the leaf, stem bark, and root bark of A. senegalensis water/methanol extracts administered at 10 mg/mL demonstrated significant activity on Trypanosoma evansi by inhibiting its motility.35 Endophytes are endosymbionts that enhance the growth of the host by improving the medicinal plant’s nutrient acquisition, resistance to pathogens, repugnance to insects and herbivores, and tolerance ability over abiotic stresses, for example, drought.35-37 The methanol extract of A. senegalensis leaves showed dose-dependent activity against the malarial parasite Plasmodium berghei 15 However, the hexane and chloroform fractions from the leaf methanolic extract caused more mortality in the immature mosquito vectors.38 The aqueous extract of A. senegalensis leaves exhibited drug detoxification possibilities.39 A study recorded that the diethyl ether fraction of the stem bark exhibited significant antimicrobial activity against Escherichia coli, Salmonella enteritidis, and Shigella dysenteriae 22 Another investigation established that the crude methanolic extract from the stem bark of the plant demonstrated a minimum inhibitory concentration (MIC) at a dose of 100 mg/mL against Shigella species and E. coli strain and repressed Salmonella typhi growth at 50 mg/mL.40,41 The root-bark methanolic extract was reported to detoxify snake venom and stimulate a reduction in hyperthermia.42
A study evaluated the leaf ethanolic extract efficacy as an antimalarial remedy and found the extract to show moderate inhibitory effect on
36 Volume 119| Number 1/2 January/February 2023 Review Article https://doi.org/10.17159/sajs.2023/11961 Traditional use and photochemistry of medicinal plants Page 2 of 7
Figure 1: PRISMA diagram on the phytochemicals, bioactivities, and ethnopharmacological uses of selected medicinal plants.
Plasmodium falciparum and Plasmodium yoelii malaria parasite strains, as well as cytotoxicity towards leukaemia cell lines.21 The methanol, hexane, chloroform, and ethyl acetate extracts of the A. senegalensis leaves demonstrated significant (p<0.001) toxicity against Aedes aegypti larvae, which transmits yellow fever, dengue fever, Chikungunya, and Zika fever.43 However, the efficacy of the solvent extract fractions was dose-dependent, and the most effective was the hexane extract at a LC50 of 379.3 mg/L, that is, at a lethal concentration causing 50% death. Recent evaluations of oral toxicity of A. senegalensis extracts indicated that a lethal oral dose (LD50) of about 5 g/kg body weight (b.w.) of the plant parts extract administered to mice did not cause acute toxicity or motility in the mice.44 Another study confirmed that a mixture of aqueous root extracts of A. senegalensis and Asparagus africanus was given orally at a dose of about 12 800 mg/kg b.w. of mice and did not cause mortality in the experimental mice. However, the mice displayed mild signs of drowsiness, inactivity, and loss of appetite.45
Natal plum (Carissa macrocarpa)
The Natal plum belongs to the family Apocynaceae. The plant is indigenous to the province of KwaZulu-Natal and widely distributed along the coastal areas of the Eastern Cape, as well as inland in the Free State and Limpopo Provinces.1 The plant’s common name is Natal plum, and the indigenous names are amatungula, noemnoem, umbethankunzi, and ditokolo 40 White star-shaped flowers and protective Y-shaped thorns characterise this twig-like evergreen medicinal shrub. The fruit of C. macrocarpa is small, ovoid, and oozes delicious flavour. The sweetish and slightly sour cherry-red ripe fruit contains numerous small, flat, brown seeds. The fruits are used in the preparation of salads, cakes, puddings, ice-cream, pies, tarts, and sweet jelly46, with the leaves used to treat diarrhoea in livestock. According to the South African National Research Council, all of the parts of the plant are used in treating infections such as sexually transmitted ailments and coughs.1
The phytochemical composition of C. macrocarpa has not been thoroughly studied. However, some investigations have recorded that Natal plum parts are richly endowed with bioactive polyphenolics, vitamin C, and cardiac healthy fatty acids.2,47-51 The studies also noted that the fruit is rich in essential metals such as Mg, Ca, P, Fe, Zn, Mn, Cu, Se, Cr, and Ni47, and thus contributes significantly to the consumer’s dietary needs for micronutrients and bioactive phytochemicals.33,47 Zn, in particular, featured prominently as one of the key essential metals in combating the COVID-19 global pandemic.52 Mg is an essential element for cellular metabolism, protein digestion, Ca absorption, muscle growth, parathyroid hormone release, and proper functioning of the nervous system.53 Conversely, Mg deficiency in the body results in low vitamin activity and poor Ca absorption, which contributes to immune compromise, and accelerates ageing of the skin because of free radicals and uncontrollable movement of muscle twitching/tremor/ spasm/cramps.53,54 Ca improves muscle contraction and blood clotting, as well as controls the passage of nutrients through cell walls, and reduces insomnia. A deficiency in dietary Ca causes absorption of Ca from the bones, resulting in the bones becoming weak and brittle.54 This condition is known as osteoporosis. K acts as a buffer that prevents acidity change in body fluids.55 Fe assists in the formation of blood and in the transportation of oxygen and carbon dioxide in the body tissues. Fe deficiency causes anaemia and impaired learning and behavioural changes in children.54 Zn boosts hair growth, and promotes functioning of taste, touch and smell sense organs while contributing to the proper metabolism of carbohydrates and protein. Mn assists in carrying oxygen from the lungs to other organs in the body. In this way, Mn acts as an enzyme metabolic reaction activator necessary for food metabolism. Deficiency in Mn results in growth retardation and abnormal loss of weight, while Co facilitates vitamin B12 metabolism.54 Dietary intake of fibre reduces serum cholesterol and contributes to several other health benefits.54 A recent study reported that incorporation of C. macrocarpa fruit into mango fruit pulp affords functional food possessing betterquality dietary phytochemical content and nutritional value.56
In consideration of the utilisation of C. macrocarpa as an agricultural resource, crude phenolic and terpenoid extracts of the leaves, administered at a concentration of 10 mg/mL, demonstrated significant
in vitro inhibition of Aphis fabae (a devastating bean pest). Accordingly, the leaf extracts can act as a natural pesticide alternative to petroleumbased synthetic pesticides.57 The phytochemical constituents of essential oils from different parts of C. macrocarpa and their antimicrobial activities were investigated. The results showed pentadecanal and tetradecan-1-ol as the main compounds in the essential oils from the fresh leaves.58 The fruit essential oils contained nerolidol (a naturally occurring sesquiterpene alcohol extensively used in cosmetics and detergents) and caryophyllene oxide. The essential oils from the stem possessed linalool and hexahydrofarnesyl acetone, and the flower essential oils showed the presence of benzyl benzoate, which is used in treating lice and in repelling insects. The essential oils exhibited significant antimicrobial activities, which presented the plant oil as a potential source of antimicrobial compounds.58
An earlier study of the C. macrocarpa phytoconstituent profile reported pentacyclic oleanane triterpenes isolated from the fruits. The oleanane triterpenes included amyrin, methyl oleanolate, oleanolic acid, and hydroxyolean-11-en-28,13β-olide, whereas ursolic acid was obtained from the leaves. The oleanane triterpenes and the ursolic acid demonstrated good antibacterial activity against bacterial strains (Klebsiella pneumoniae, Pseudomonas aeruginosa, E. coli, Staphylococcus saprophyticu, Staphylococcus aureus, and Enterococcus faecium) at MICs ranging from 0.06 mg/mL to 1.0 mg/mL.5
Wild medlar (Vangueria infausta)
The Vangueria infausta from the Rubiaceae family is known by the common name wild medlar. Its local names are wildemispel, mmilo, muzwilu, mavelo, umviyo, umtulwa, mothwanye, umvile, and amantulwane. The plant is indigenous to southern Africa. In South Africa, it is widely distributed in the KwaZulu-Natal, Eastern Cape, Free State, Gauteng, Limpopo, and North West Provinces.1
The fruit of V. infausta is round and dark green when unripe and light brown when ripe. The ripe fruit is about 20–50 mm in diameter with soft and fleshy pulp. The orange pulp that contains roughly five seeds is slightly astringent and sweet-sour-bitter in taste. The flesh is usually eaten fresh and occasionally cooked. The fresh pulp, as a tradition, is processed into juice, jam, marmalade, puddings, and porridge, or sundried for storage.56
Diverse parts of V. infausta are used in the traditional treatment of various kinds of diseases and health disorders, as summarised in Table 1.
Reports on the phytochemical investigations of V. infausta plant parts available to us during this review were limited. However, the accessed papers reported the identification of the presence of flavonoids, tannins, coumarins, lignans, phenolic acids, saponins, fatty acids, terpenoids, and anthraquinones in different parts of the V. infausta plant extracts.58,59 The phytochemicals isolated from the extracts are listed in Table 2.
The biological activities of V. infausta have been extensively investigated, relative to its phytochemistry. The reviewed literature shows that all parts of the plant have exhibited both antimalarial60 and antifungal activities60-62 Inhibitory activities of leaf extracts against seven pathogenic fungi were observed with acetone and dichloromethane (DCM) extracts at a MIC of 0.32 mg/mL.36 An indole alkaloid, morindolide, isolated from the leaf displayed good antimalarial activity at IC50 = 107.1±0.6 µM.60 The hexane, DCM, acetone, and methanol extracts of V. infausta leaves demonstrated inhibitory activities against Enterococcus faecalis at a low MIC value of 0.02 mg/mL.60 The DCM extract of V. infausta root exhibited high inhibitory effects on the Leishmania protozoan with an IC50 value of 4.51 µg/mL63, a significant antiplasmodial activity at IC50 of 1.84 µg/mL, and a selectivity index of 25 against Plasmodium falciparum64 The report resonated with earlier findings, which identified chloroform extracts from the V. infausta root bark that markedly inhibited the activities of two Plasmodium falciparum strains at IC50s of 3.8 µg/mL and 4.50 µg/mL.64 The hexane, DCM, acetone, and methanol extracts of V. infausta leaves demonstrated inhibitory activities against Enterococcus faecalis at a low MIC value of 0.02 mg/mL.65
37 Volume 119| Number 1/2 January/February 2023 Review Article https://doi.org/10.17159/sajs.2023/11961
Traditional use and photochemistry of medicinal plants Page 3 of 7
Table 1: Ethnopharmacological uses of the various parts of the four plants under review
Annona senegalensis
The ripe fruit is eaten raw.
Treats pneumonia, yellow fever, tuberculosis, smallpox, toothache, fever, asthma, bronchitis, anxiety, dysentery, constipation, high blood pressure, rheumatism, and female infertility. Insecticide and anthelmintic.
Carissa macrocarpa
Processed into a salad, cake, pudding, ice-cream, pies, tarts, and sweet jelly. Treats hepatitis and HIV infection.
Remedy for worms, diarrhoea, gastroenteritis, venereal diseases, snakebites, toothache, respiratory infections, leukaemia, and skin cancer, and seals cuts and wounds.
Treats diarrhoea in animals. Treats cough and venereal infections.
Treats gastritis, stomachaches, diarrhoea, snakebites, male sexual impotence, tuberculosis, and diabetes. Antidote for necrotising toxins.
1,15–21
Treats diarrhoea, toothache, respiratory infection, and sores.
1,46
Vangueria infausta
Eaten or processed into juice, marmalade (jam), puddings, and porridge, or dried for storage.
Protective charm against sorcery. Treats dermatitis, malaria, pleurisy, headaches, abscesses, and swelling.
Treats malaria, syphilis, and haemorrhoids.
Processed into syrup, jelly, jam, vinegar, and wine (mampoer).
Treats epilepsy
Table
Annona senegalensis
Triterpenes, alkaloids, steroids, carbohydrates, and phenolic compounds were detected.
Remedy for diabetes mellitus, pain, and rheumatoid arthritis.
Treats pneumonia, fever, coughs, chest ailments, gastrointestinal disorders, epilepsy, measles, inflammation, stomach ulcers, headaches, hernias, malaria, asthma, blood pressure problems, diarrhoea, skin blisters, menstrual problems, vaginal discharge, infertility, male virility, candidiasis, helminthic concerns, snakebites, and nervous system disorders, and is a snake repellent.
Treats Alzheimer’s disease, inflammation, rheumatism, abdominal pain, and wounds.
3,5,56
Carissa macrocarpa
Kaurenoic acid, carene, linalool, roemerine, aporphine alkaloid, germacrene d, terpinen–4–ol, citronellal, geranial, citronellol, thymol, carvacrol, catechol, N-hexadecanoic acid, octadecanoic acid, oleic acid and linoleic acid were isolated.
Vitamin C, cyanidin derivatives, pentadecanal, tetradecan-1-ol, nerolidol, caryophyllene oxide, linalool, hexahydrofarnesyl acetone, benzyl benzoate, ursane, and fatty acids were present.
Exhibited antioxidant, antimicrobial, antidiarrhoeal, anti-inflammatory, antiparasitic, anticonvulsant, antimalarial, antitrypanosomal, antivenom, and antinociceptive activities.
Cytotoxic against Shigella species, Escherichia coli, Salmonella typhi, Plasmodium falciparum, Plasmodium yoelii bacterial strains, and Aegypti larvae.
Antimicrobial and cytotoxic against Aphis fabae Scopoli strain.
Active against Klebsiella pneumoniae, Pseudomonas aeruginosa, Escherichia coli, Staphylococcus saprophyticu, Staphylococcus aureus, and Enterococcus faecium bacterial strains.
6,13,67
4,7,8,15,21–23,27–33
Vangueria infausta
Polyphenols, lignans, phenolic acids, saponins, fatty acids, terpenoids, and anthraquinones were dictated, while octanoic acid, hexanoic acid, hexanoate derivatives, octanoate derivatives, hexahydroxy-biflavone, apigenin-7-O-rutinoside, daidzein, dihydrokaempferol, quercetin derivatives, epiafzelechin, epicatechin, genistein, luteolin derivatives, methylcylohex-1-ene, morindolide, friedelin, tomentosolic acid, vanguerolic acid were isolated.
Englerophytum magalismontanum
Vitamin C, Al, Ca, Fe, K, Mg, Mn, P, Pb, Se, and Zn minerals were detected.
Exhibited antibacterial and antifungal activities.
Cytotoxic against Aspergillus niger, Aspergillus parasiticus, Colletotricum gloeosporioides, Penicillium janthinellum, Penicillium expansum, Trichoderma harzianum and Fusarium oxysporum fungal strains; and Plasmodium falciparum and Leishmania donovani parasites
Exhibited anti-inflammatory and antimicrobial activities.
Cytotoxic against Actinomyces naeslundii, Actinomyces israelii, Porphyromonus gingivalis, Privotella intermedia and Streptococcus mutans microorganisms.
5,33,47–51,54–58
36,58–66,70,71
68,69
38 Volume 119| Number 1/2 January/February 2023 Review Article https://doi.org/10.17159/sajs.2023/11961
Plant Fruit Leaf Stem Root References
Englerophytum magalismontanum
Plant Phytochemicals Bioactivity
2: Phytochemical profiles and bioactivity potentials of the plants under review
References
Traditional use and photochemistry of medicinal plants Page 4 of 7
The cause of health conditions such as inflammatory and arthritic ailments (spondylitis, osteoarthritis, and rheumatoid arthritis) is related to protein denaturation. Therefore, any substance that could prevent or limit protein denaturation will consequently contribute to the prevention of inflammation and arthritic conditions of the body and skin. An investigation of V. infausta proved that this wild plant showed significant antiinflammatory activity from different phytochemical extracts of the plant parts on a substrate66, thus proving its health benefit.
Milk plum (Englerophytum magalismontanum)
The Englerophytum magalismontanum plant family is Sapotaceae. The common name is milk plum, and local names are stamvrug, motlhatswa, munombelo, amanumbela, and umnumbela 1 It grows in the riverine forest suburbs of Gauteng, North West, Mpumalanga, Limpopo, and the northern part of KwaZulu-Natal.11 The flesh of E. magalismontanum berry fruit is ellipsoid to round. The fruit ripens to a bright red colour and contains sticky, milky latex. The edible fruit serves as a thirst quencher. During the harvest season, the fruit is processed into syrup, jelly, jam, wine, vinegar, and a strong alcoholic drink, known as mampoer 13 Indigenous people use powdered roots to treat rheumatism; concentrated juice treats abdominal pain, while a mixture of finely powdered roots and fruits cures epilepsy. A recent review paper documented E. magalismontanum as one of the herbal plants that the local populace uses in the traditional treatment of diabetes mellitus.67
Evaluation of the mineral composition of E. magalismontanum fruit against 13 other selected indigenous wild southern African fruits, revealed the mineral content of E. magalismontanum as 109 mg/kg Al, 410 mg/kg Ca, 27 mg/kg Fe, 8464 mg/kg K, 777 mg/kg Mg, 50 mg/kg Mn, 718 mg/kg P, 131 mg/kg Pb, 286 mg/kg Se and 25 mg/kg Zn.68 Interestingly, Mg, Mn, Zn, and Se, which are known to be very beneficial minerals for human nutrition, are present in the fruit in significant amounts. These essential elements (Mg, Mn, Zn, and Se) are popular in nourishing and rejuvenating skin, particularly when incorporated into a product for topical application. Furthermore, the root is traditionally pulverised into powder and rubbed into incisions, to assist in healing.13
Research has revealed that E magalismontanum leaf extracts exhibit significant activity against acetylcholinesterase at a dose of 160 µg/mL. Extracts of different parts of the plant demonstrated strong activity in managing oxidative stress related diseases and ailments, such as Alzheimer’s disease, inflammation, and pain.6 Furthermore, extracts from E. magalismontanum parts exhibited significant antimicrobial activities against oral microorganisms such as Actinomyces naeslundii and Actinomyces israelii. The ethanol extract exhibited MIC values from 12.5 mg/mL 6.3 mg/mL, while the cytotoxicity test showed an IC50 value of about 98.8 mg/mL.69
Conclusion
Our review and summary of the literature on four indigenous medicinal plants in South Africa indicate that different parts of the plants have long been used in folk medicines and other remedies, including as dietary supplements, based on traditional beliefs. The phytochemical composition and biological activity profile of three of the reviewed plants were sparsely studied; hence, not much was reported. However, this review indicates the presence of the bioactive phytochemicals flavonoids, tannins, coumarins, lignans, phenolic acids, saponins, fatty acids, terpenoids, and anthraquinones in these plants, which relate to the demonstration of strong antioxidant, anti-inflammatory, antiparasitic, anthelmintic, anticonvulsant, antimalarial, antitrypanosoma, antinociceptive and antivenom activities. The study reveals that there is sufficient evidence to promote the consumption of V. infausta and A. senegalensis to manage various ailments, especially in the era of the COVID-19 pandemic that undermines the immune system.
We therefore recommend intense research on the phytochemical composition and bioactivity profiles of C. macrocarpa and E. magalismontanum. Such studies will improve their worth and facilitate their incorporation into communal medicaments such as cosmetics and other functional products.
Traditional use and photochemistry of medicinal plants
Competing interests
We have no competing interests to declare.
Authors’ contributions
M.C.A.: Conceptualisation; data collection; writing – initial draft. V.X.N. and S.M.N.: Revised the manuscript. C.P.J.: Reviewed the manuscript.
References
1. Vietmeyer N. Lost crops of Africa: Volume III: Fruits. Washington DC: The National Academies Press; 2008. p. 243–307. https://doi.org/10.17226/11879
2. Kucicha DA, Wicht MM. South African indigenous fruits – underutilized resource for boosting daily antioxidant intake among local indigent populations. S Afr J Clin Nutr. 2006;29(4):150–156. https://doi.org/10.1080/16070658.2 016.1219470
3. Lindsay EA, Berry Y, Jamie JF, Bremner JB. Antibacterial compounds from Carissa lanceolate R Br. Phytochemistry. 2000;55(5):403–406. https://doi. org/10.1016/S0031-9422(00)00343-5
4. Suleiman MM, Dzenda T, Sani CA. Antidiarrhoeal activity of the methanol stembark extract of Annona senegalensis Pers. (Annonaceae). J Ethnopharmacol. 2008;116:125–130. https://doi.org/10.1016/j.jep.2007.11.007
5. Moodley R, Chenia H, Jonnalagadda SB, Koorbanally N. Antibacterial and antiadhesion activity of the pentacyclic triterpenoids isolated from the leaves and edible fruits of Carissa macrocarpa. J Med Plants Res. 2011;5(19):4851–4858.
6. Dzoyem JP, Eloff JN. Anti-inflammatory, anticholinesterase and antioxidant activity of leaf extracts of twelve plants used traditionally to alleviate pain and inflammation in South Africa. J Ethnopharmacol. 2014;160(2015):194–201. https://doi.org/10.1016/j.jep.2014.11.034
7. Nwonuma C, Irokanulo E, Jolaiya A, Ore A. Effect of aqueous leaf extract of Annona senegalensis on selected testicular function indices of Wistar rats. Am J Life Sci. 2015;3(3):203–212. https://doi.org/10.11648/j.ajls.20150303.21
8. Okhale SE, Akpan E, Fatokun OT, Esievo KB, Kunle OF. Annona senegalensis Persoon (Annonaceae): A review of its ethnomedicinal uses, biological activities and phytocompounds. J Pharmacogn Phytochem. 2016;5(2):211–219.
9. Sibiya NP, Kayitesi E, Moteetee AN. Proximate analyses and amino acid composition of selected wild indigenous fruits of southern Africa. Plants. 2021;10:721. https://doi.org/10.3390/plants10040721
10. Masevhe NA, Mcgaw LJ, Eloff JN. The traditional use of plants to manage candidiasis and related infections in Venda, South Africa. J Ethnopharmacol. 2015;168:364–372. https://doi.org/10.1016/j.jep.2015.03.046
11. Behr K. Englerophytum magalismontanum. Pretoria: PlantZAfrica; 2020. Available from: http://pza.sanbi.org/englerophytum-magalismontanum
12. Steel B, Behr K. A small tree for rocky gardens – Vangueria infausta, wild medlar. Veld and Flora. 1986;72(3):88–89. http://dx.doi.org/10.10520/ AJA00423203_2780
13. Van Wyk B, Van Wyk P, Van Wyk B-E. Photographic guide to the trees of southern Africa. Pretoria: Briza Publications; 2000. p. 245–247.
14. Ngamo TSL, Ngassoum MB, Mapongmestsem PM, Noudjou WF, Malaisse F, Haubruge E, et al. Use of essential oils of plants as a protectant of grains during storage. Agric J. 2007;2(2):204–209.
15. Ajaiyeoba E, Falade M, Ogbole O, Okpako L, Akinboye D. In vivo antimalarial and cytotoxic properties of Annona senegalensis extract. Afr J Tradit Complement Altern Med. 2006;3(1):137–141. https://doi.org/10.4314/ajtcam.v3i1.31148
16. Ahombo G, Ampa R, Diatewa M, Mpati J, Abena A, Ouamba J. Investigating on related diabetes therapeutic plants used in traditional medicine at Brazzaville. J Med Plants Res. 2012;6(44):5630–5639. https://doi.org/10.5897/ JMPR12.261
17. Kaminta S, Boamah D, Debrah O, Quarcoo A, Ofosuhene M, Ayi I, et al. In vitro evaluation of anti-snake venom properties of the ethanolic extracts from Annona senegalensis (Pers) and Cinnamomum zeylanicum (Blume). Am J Trop Med Hyg. 2018;99:194–199.
18. Erukairoure OL, Islam S. Annona senegalensis shows potent anti-diabetic activity by attenuating DNA fragmentation in oxidative injury and inhibiting key-enzymes linked to type 2 diabetes. FASEB J. 2017;31(S1):766.7. https:// doi.org/10.1096/fasebj.31.1_supplement.766.7
39 Volume 119| Number 1/2 January/February 2023 Review Article https://doi.org/10.17159/sajs.2023/11961
Page
5 of 7
19. Ibrahim A, Umar IA, Aimola IA, Mohammed A. Inhibition of key enzymes linked to diabetes by Annona senegalensis Pers (Annonaceae) leaf in vitro. J Herbal Med. 2019;16. https://doi.org/10.1016/j.hermed.2018.11.004
20. Faleyimu O, Akinyemi O. Herbal approaches to the problem of erectile dysfunction in Kaduna State, Nigeria. Egypt J Biol. 2010;12:103–107.
21. Ngbolua K, Mudogo V, Mpiana PT, Tshibangu DST, Tshilanda DD, Ashande MC. In vitro and in vivo anti-malarial and cytotoxic activities of ethanolic extracts of Annona senegalensis Pers (Annonaceae) from Democratic Republic of the Congo. J Modern Drug Discov Drug Deliv Res. 2014;2(2):1–5.
22. Tamfu AN, Fotsing MT, Talla E, Jabeen A, Tanyi JM, Shaheen F. Bioactive constituents from seeds of Annona senegalensis Persoon (Annonaceae). Nat Prod Res. 2019;1–6. https://doi.org/10.1080/14786419.2019.1634713
23. Oladele OP, Nongo NN, Saganuwan SA. Anti-trypanosomal activity of aqueous leaf extract of Annona senegalensis against Trypanosoma congolense. EC Pharmacol Toxicol. 2020;9(4):38–45.
24. Kengni HY, Toghueo KRM, Hzounda JBF, Adamou S, Ngouana V, Fekam BF. Phenol content and antioxidant activity of crude extracts and fractions from Annona senegalensis. J Med Plants Stud. 2017;5(5):289–294.
25. Nwodo NJ, Ibezim A, Ntie-Kang F, Adikwu MU, Mbah CJ. Anti-trypanosomal activity of Nigerian plants and their constituents. Molecules. 2015;20(5):7750–7771. https://doi.org/10.3390/molecules20057750
26. Agbo’Saga FK, Ahissou H, Baouz S, Hountondji C. Bio guided search for anticancer natural products in the plant Annona senegalensis: A preliminary efficacy assessment. MOJ Bioorg Org Chem. 2019;3(2):65–70. https://doi. org/10.15406/mojboc.2019.03.00101
27. Ameen OM, Usman LA, Oganija FS, Hamid AA, Muhammed NO, Zubair MF, et al. Chemical composition of leaf essential oil of Annona senegalensis Pers. (Annonaceae) growing in North Central Nigeria. Int J Biol Chem Sci. 2011;5(1):375–379. https://doi.org/10.4314/ijbcs.v5i1.68117
28. Vildina JD, Ndjonka D, Schmidt TJ, Liebau E. Identification of antiCaenorhabditis and anti-Onchocerca constituents from leaves of Annona senegalensis Pers. (Annonaceae). S Afr J Bot. 2021;138:84–93. https://doi. org/10.1016/j.sajb.2020.12.019
29. Okoye TC, Akah PA, Okoli CO, Ezike AC, Omeje EO, Odoh UE. Antimicrobial effects of a lipophilic fraction and kaurenoic acid isolated from the root bark extracts of Annona senegalensis. Evid-Based Complement Alternat Med. 2012;2012, Art. #831327. https://doi.org/10.1155/2012/831327
30. Fofana S, Ziyaev R, Diallo SK, Camara M, Aripova SF. Alkaloids of Annona senegalensis. Chem Nat Compd. 2013;49:587–588. https://doi.org/10.1007/ s10600-013-0683-0
31. Farid K, Chafique Y, Rachid S, Jean MB. Chemical composition of the essential oils of Annona cuneata L. and Annona senegalensis Pers. stem barks. Flavour Fragr J. 2002;17(5):398–400. https://doi.org/10.1002/ffj.1115
32. Lall N, Kishore N, Bodiba D, More G, Tshikalange E, Kikuchi H, Oshima Y. Alkaloids from aerial parts of Annona senegalensis against Streptococcus mutans. Nat Prod Res. 2017;31:1944–1947. https://doi.org/10.1080/1478 6419.2016.1263847
33. Magadula JJ, Innocent E, Otieno JN. Mosquito larvicidal and cytotoxic activities of 3 Annona species and isolation of active principles. J Med Plant Res. 2009;3:674–680.
34. Ahmed AL, Bassem SEM, Mohamed YH, Gamila MW. Cytotoxic essential oil from Annona sengalensis Pers. leaves. Pharmacogn Res. 2010;2(4):211–215. https://doi.org/10.4103/0974-8490.69105
35. Adeiza AA, Maikai VA, Hassan FB. Phytochemical screening and evaluation of some medicinal plants for their in vitro activities on Trypanosoma evansi J Med Plant Res. 2009;3(4):315–318.
36. Mahlo SM, Chauke HR, Mcgaw L, Eloff J. Antioxidant and antifungal activity of selected medicinal plant extracts against phytopathogenic fungi. Afr J Tradit Complement Altern Med. 2016;13:216–222. https://doi.org/10.21010/ ajtcam.v13i4.28
37. Sibanda EP, Mabandla M, Chisango T, Nhidza AF, Mduluza T. Endophytic fungi associated with Annona senegalensis: Identification, antimicrobial and antioxidant potential. Curr Biotechnol. 2018;7(4):317–322. https://doi.org/1 0.2174/2211550107666180129154838
38. Lame Y, Nukenine EN, Pierre DYS, Elijah AE, Esimone CO. Laboratory evaluations of the fractions efficacy of Annona senegalensis (Annonaceae) leaf extract on immature stage development of malarial and filarial mosquito vectors. J Arthropod-Borne Dis. 2015;9:226–237.
39. Ajboye TO, Yakubu MT, Salau AK, Oladiji AT, Akanji MA, Okogun JI. Antioxidant and drug detoxification potential of aqueous extract of Annona senegalensis leaves in carbon tetrachloride-induced hepatocellular damage. Pharm Biol 2010;48:1361–1370. https://doi.org/10.3109/13880209.2010.483247
40. Jada MS, Usman WA, Olabisi AO. Crude flavonoids isolated from the stem bark of Annona senegalensis have antimicrobial activity. J Adv Biol Biotechnol. 2015;2(1):24–29. https://doi.org/10.9734/JABB/2015/11884
41. Awa EP, Ibrahim S, Ameh DA. In vitro evaluation of antibacterial activity of crude extract from the stem bark of Annona senegalensis pers. Int J Pharm Sci Res. 2012;3:1128–1132.
42. Adzu B, Abubakar MS, Izebe KS, Akumka DD, Gamaniel KS. Effect of Annona senegalensis root-bark extracts on Naja nigricotlis nigricotlis venom in rats. J Ethnopharmacol. 2005;96(3):507–513. https://doi.org/10.1016/j. jep.2004.09.055
43. Lame Y, Nukenine EN, Pierre DYS, Esimone CO. Larvicidal activity of Annona senegalensis and Boswellia dalzielii leaf fractions against Aedes aegypti (Diptera: Culicidae). Int J Mosq Res. 2014;1(4):25–29.
44. Ilboudo S, Some H, Ouedraogo GG, Kini FB, Ouedraogo S, Guissou IP. Phytochemical, acute and subacute toxicity studies of Annona senegalensis Pers. (Annonaceae) root wood extracts. Afr J Biomed Res. 2019;13(4):44–55. https://doi.org/10.5897/AJBR2019.1030
45. Okello OOP, Nkwangu D, Oloro J. Anti-fertility activity of aqueous root bark extracts of Asparagus africanus Lam and Annona senegalensis Pers combination on female Sprague Dawley rats. Afr J Pharm Pharmacol. 2019;13(3):12–16. https://doi.org/10.5897/AJPP2014.4229
46. Kaunda JS, Zhang Y-J. The genus Carissa: An ethnopharmacological, phytochemical and pharmacological review. Nat Prod Bioprospect. 2017;7:181–199. https://doi.org/10.1007/s13659-017-0123-0
47. Moodley R, Jonnalagadda SB, Koorbanally N. Elemental composition and fatty acid profile of the edible fruits of Amatungula (Carissa macrocarpa) and impact of soil quality on chemical characteristics. Anal Chim Acta. 2012;730:33–41. https://doi.org/10.1016/j.aca.2011.11.066
48. Ndou A, Tinyani PP, Slabbert RM, Sultanbawa Y, Sivakumar D. An integrated approach for harvesting Natal plum (Carissa macrocarpa) for quality and functional compounds related to maturity stages. J Food Chem. 2019;293:499–510. https://doi.org/10.1016/j.foodchem.2019.04.102
49. Mehmood T, Tanveer A, Nadeem F, Anwar F, Saeed S, Tabassam Q. Evaluation of effect of different solvent systems on functional and pharmacological properties of fruits and leaves extracts from Natal plum. J Food Meas Charact. 2021;15:2667–2678. https://doi.org/10.1007/s11694-021-00850-9
50. Souilem F, Dias MI, Barros L, Calhelha RC, Alves MJ, Harzallah-Skhiri F, et al. Amantagula fruit (Carissa macrocarpa (Eckl.) A.DC.): Nutritional and phytochemical characterization. Plant Foods Hum Nutr. 2019;74:76–82. https://doi.org/10.1007/s11130-018-0703-0
51. Souilem F, Dias MI, Barros L, Calhelha RC, Alves MJ, Harzallah-Skhiri F, et al. Phenolic profile and bioactive properties of Carissa macrocarpa (Eckl.) A.DC.: An in vitro comparative study between leaves, stems, and flowers. Molecules. 2019;24:1696. https://doi.org/10.3390/molecules24091696
52. Samad N, Sodunke TE, Abubakar AR, Jahan I, Sharma P, Islam S, et al. The implications of zinc therapy in combating the COVID-19 global pandemic. J Inflammation Res. 2021;14:527–550. https://doi.org/10.2147/JIR.S295377
53. Vormann J. Magnesium: Nutrition and metabolism. Mol Asp Med. 2003;24:27–37. https://doi.org/10.1016/S0098-2997(02)00089-4
54. Achilonu MC, Nwafor IC, Umesiobi DO, Sedibe MM. Biochemical proximates of pumpkin (Cucurbitaeae spp.) and their beneficial effects on the general wellbeing of poultry species. J Anim Physiol Anim Nutr (Berl). 2018;102(1):5–16. https://doi.org/10.1111/jpn.12654
55. He FJ, MacGregor GA. Beneficial effects of potassium on human health. Physiol Plant. 2008;133(4):725–735. https://doi.org/10.1111/j.13993054.2007.01033.x
https://doi.org/10.17159/sajs.2023/11961
40 Volume 119| Number 1/2 January/February 2023 Review Article
Traditional use and photochemistry of medicinal plants Page 6 of 7
56. Mphaphuli T, Manhivi VE, Slabbert R, Sultanbawa Y, Sivakumar D. Enrichment of mango fruit leathers with Natal plum (Carissa macrocarpa) improves their phytochemical content and antioxidant properties. Foods. 2020;9(4):431. https://doi.org/10.3390/foods9040431
57. Mohmed AS. Evaluation of the crude phenolic and terpenoid extracts of Carissa macrocarpa against Aphis fabae Scopoli (Hemiptera: Aphididae) invitro. J Biopestic. 2019;12(1):72–75.
58. Souilem F, El Ayeb A, Djlassi B, Ayari O, Chiboub W, Arbi F, et al. Chemical composition and activity of essential oils of Carissa macrocarpa (ECKL.) A. DC. cultivated in Tunisia and its anatomical features. Chem Biodivers. 2018;15(9):1–22. https://doi.org/10.1002/cbdv.201800188
59. Raice RT, Sjoholm I, Wang H-L, Bergenståh H. Characterization of volatile components extracted from Vangueria infausta (African medlar) by using GC-MS. J Essent Oil Res. 2015;27(1):76–81. https://doi.org/10.1080/104 12905.2014.962189
60. Bapela MJ, Heyman H, Senejoux F, Meyer JJM. 1H NMR-based metabolomics of antimalarial plant species traditionally used by Vha-Venda people in Limpopo Province, South Africa and isolation of antiplasmodial compounds. J Ethnopharmacol. 2019;228:148–155. https://doi.org/10.1016/j. jep.2018.07.022
61. Abosi AO, Mbukwa E, Majinda RRT, Raseroka BH, Yenesew A, Midiwo JO, et al. Vangueria infausta root bark: In vivo and in vitro antiplasmodial activity. Br J Biomed Sci. 2006;63(3):129–133. https://doi.org/10.1080/09674845 .2006.11732732
62. Maroyi A. Nutraceutical and ethnopharmacological properties of Vangueria infausta subsp. infausta. Molecules. 2018;23(1089):1–19. https://doi. org/10.3390/molecules23051089
63. Bapela MJ, Kaiser M, Meyer JJM. Antileishmanial activity of selected South African plant species. S Afr J Bot. 2017;108(2017):342–345. https:// doi.org/10.1016/j.sajb.2016.08.014
64. Bapela MJ, Meyer JJM, Kaiser M. In vitro antiplasmodial screening of ethnopharmacologically selected South African plant species used for the treatment of malaria. J Ethnopharmacol. 2014;156:370–373. https://doi. org/10.1016/j.jep.2014.09.017
65. Peter M. Ethnobotanical study of some selected medicinal plants used by traditional healers in Limpopo Province (South Africa). Am J Res Commun. 2013;1(8):8–23.
66. Gwatidzo L, Chowe L, Musekiwa C, Muchanyereyi NM. In vitro antiinflammatory activity of Vangueria infausta: An edible wild fruit from Zimbabwe. Afr J Pharm Pharmacol. 2018;12(13):168–175. https://doi. org/10.5897/AJPP2018.4894
67. Semenya SS, Maroyi A. A review of plants used against diabetes mellitus by Bapedi and Vhavenda ethnic groups in the Limpopo Province, South Africa. Asian J Pharm Clin Res. 2019;12(10):44–50. https://doi.org/10.22159/ ajpcr.2019.v12i10.34993
68. Sibiya NP, Kayitesi E, Moteeteea A. Mineral composition of selected indigenous wild southern African fruits. S Afr J Bot. 2020;132(2020):87–94. https://doi.org/10.1016/j.sajb.2020.04.014
69. More G, Tshikalangea TE, Lall N, Botha F, Meyer JJM. Antimicrobial activity of medicinal plants against oral microorganisms. J Ethnopharmacol. 2008;119(3):473–477. https://doi.org/10.1016/j.jep.2008.07.001
70. Ibrahim MA, Mohammed A, Isah MB, Aliyu AB. Anti-trypanosomal activity of African medicinal plants: A review update. J Ethnopharmacol. 2014;154:26–54. https://doi.org/10.1016/j.jep.2014.04.012
71. Mahlo SM, Chauke HR, Mcgaw L, Eloff J. Antioxidant and antifungal activity of selected medicinal plant extracts against phytopathogenic fungi. Afr J Tradit Complement Altern Med. 2016;13:216–222. https://doi.org/10.21010/ ajtcam.v13i4.28
41 Volume 119| Number 1/2 January/February 2023 Review Article
https://doi.org/10.17159/sajs.2023/11961
and photochemistry of medicinal plants Page 7 of 7
Traditional use
AUTHORS:
Edith J. Singini1,2
Yannick Nuapia2,3,4
Luke Chimuka4
Ida M. Risenga2
AFFILIATIONS:
1Department of Botany, Rhodes University, Makhanda, South Africa
2School of Animal, Plant and Environmental Sciences, University of the Witwatersrand, Johannesburg, South Africa
3Department of Pharmacy, School of Healthcare Sciences, University of Limpopo, Polokwane, South Africa
4Molecular Sciences Institute, School of Chemistry, University of the Witwatersrand, Johannesburg, South Africa
CORRESPONDENCE TO: Edith
Singini
EMAIL: ej.singini@gmail.com
DATES:
Received: 18 Jan. 2022
Revised: 23 Aug. 2022
Accepted: 25 Aug. 2022
Published: 31 Jan. 2023
HOW TO CITE: Singini EJ, Nuapia Y, Chimuka L, Risenga IM. The effect of elevated temperatures on trichomes, essential oil composition and yield of Lippia javanica: A chemometric approach. S Afr J Sci. 2023;119(1/2), Art. #13090. https://doi. org/10.17159/sajs.2023/13090
ARTICLE INCLUDES:
☒ Peer review
☒ Supplementary material
DATA AVAILABILITY:
☐ Open data set
☐ All data included
☒ On request from author(s)
☐ Not available
☐ Not applicable
EDITOR: Teresa Coutinho
KEYWORDS:
Lippia javanica, abiotic stress, essential oil, multivariate analysis, response surface methodology
FUNDING:
South African National Research Foundation (grant no. SFH180514329259); University of the Witwatersrand (grant no. 900005000001)
The effect of elevated temperatures on trichomes, essential oil composition and yield of Lippia javanica: A chemometric approach
Extreme changes in climate, especially in temperature, could have implications for herbal plants in various world regions. Medicinal plants often produce a wide variety of natural phytochemicals to enhance their defence and survival mechanisms against harsh environmental conditions, and when these mechanisms fail, plants consequently die. We investigated the impact of high temperatures coupled with the specific duration of exposure on the yield and composition of essential oils and trichomes in leaves of Lippia javanica
Plants were exposed to increasing temperatures (25 °C to 47 °C) for different durations (48 h to 144 h). Response surface methodology was applied to assess the interaction between temperature and length of exposure on the essential oil yield, trichome length, and trichome diameter. Essential oils were recovered from the control and treated leaf samples using hydrodistillation and volatile compounds were identified through gas chromatography–mass spectrometry (GC-MS). Multivariate analysis modelling allowed different clustering patterns to be detected. That is, increasing temperatures raised the oil yield, trichome length, and diameter from 1.007 mg/100 g to 3.58 mg/100 g, 50 µm to 160 µm, and 25 µm to 60 µm, respectively. Significant chemical differences between the essential oils were confirmed by the principal component and orthogonal projections to latent structures, which identified separate clusters for the control and treated samples. The current findings indicate that L. javanica has coping mechanisms against high temperatures.
Significance:
• High temperatures significantly alter the trichome morphology and secretion of essential oils in L. javanica, which adversely affects the shrub’s medicinal properties. Regardless of climate change, this finding could have major implications for indigenous people who continue to use the shrub for therapeutic purposes.
• L. javanica showed coping mechanisms against high temperatures for a maximum of six days; however, a prolonged exposure would be more detrimental. As a result, climate change will negatively influence the plant’s developmental and defence mechanisms.
Introduction
The fundamental cause of climate change has been identified as the worldwide rise of greenhouse gases.1,2 The increase in greenhouse gases results in increased temperatures which significantly impact the secretion of secondary metabolites in medicinal plants.3 Hence, plants exposed to abiotic stresses show crucial variations in their secondary metabolites.4 Moreover, plant responses to high temperatures are complex, and include deleterious effects and adaptive traits.5 The most basic morphological traits and biological processes key to plant growth are sensitive to temperature.3,4 As temperatures increase, the net photosynthetic rate is negatively affected, which leads to a decline in plant performance.4 Phenology is also driven by temperature6,7; thus, any moderate increase in temperature leads to the escalation in developmental processes resulting in the early blooming of plants8 South Africa is one of the countries in the world that has experienced a drastic increase in temperatures over the last 40 years.9 This means that medicinal plants are now exposed to higher temperatures than previously. Lippia javanica (Burm. F.) Spreng, commonly known as the fever tree, is a southern African indigenous medicinal plant in the Verbenaceae family and is widely distributed in the warmer eastern and northern provinces of South Africa. The shrub is used by indigenous people and herbal/traditional healers as an inexpensive, safer, and more desirable alternative for treating numerous ailments.10-12 The shrub is used to treat chronic respiratory diseases11,13,14, skin disorders12,15,16, and a wide range of immune-suppressant ailments such as malaria and HIV/Aids13,14,17. The commonly used parts of the shrub are the leaves and stems, but sometimes roots may also be utilised.18 Leaves and stems of L. javanica are together used as inhalants, teas, food additives or leafy vegetables, and for topical formulations12,19, whereas roots are used as an antidote against eye infections and food poisoning12. These different plant parts are commonly used because they contain high concentrations of secondary metabolites or phytochemicals, which are secreted in response to physiological and ecological pressures such as pathogens, insects, temperature extremes, and UV radiation.20-22
Plant leaves have been identified as the most flexible and adaptive part of a plant in response to changing environmental conditions23; thus the histology of the leaf reveals more dynamics than that of the root and stem24,25. Leaves of L. javanica contain trichomes which are specialised hairs on the adaxial and abaxial leaf surfaces.25-27 Glandular trichomes are an essential organ in the Verbenaceae family.26 These trichomes secrete and store phytochemicals that contain medicinal properties.25-27 The density of trichomes on leaves is dependent on the environmental conditions to which the plant is exposed.25 The harsher the environmental conditions, the greater the density of trichomes, because trichomes increase the production of essential oils, flavonoids and phenolics which increase the plasticity of the plant.
© 2023. The Author(s). Published under a Creative Commons Attribution Licence.
Research studies have reported that leaves of L. javanica are an excellent source of essential oils.11-14 Chagonda and Chalchat11 found that L. javanica has antiviral, antioxidant, antidiarrhoeal, antitrypanosomal, anti-inflammatory, antibacterial and anticonvulsant essential oil properties. The shrub has aromatic ingredients that have a range of commercially valuable properties.12 For example, L. javanica’s essential oils incorporated in candle wax provide mosquito repellent properties (repelling no less than 95% of mosquitoes) better than most available commercial
https://doi.org/10.17159/sajs.2023/13090
42 Volume 119| Number 1/2 January/February 2023 Research Article
products (which repel only 42% of mosquitoes).12 This suggests that L. javanica is used as a source of revenue in both the formal and informal sectors.
Numerous studies have been conducted on the wide range of chemical extracts used in traditional healing.21,28 Most studies have focused exclusively on the phytochemistry and trichome density of L. javanica 19,25,26 However, no studies investigated the impact of high temperatures on the essential oil yield and related histological changes in L. javanica. Therefore, in the present study, we used a chemometric approach to evaluate the effects of temperature variation and time as abiotic agents impacting the production of essential oils in the leaves of L javanica
Materials and methods
Plant material and chemicals
Samples of L. javanica (grown for ~2 years) were obtained from Mountain Herb Estate in Hartbeespoort (25.7236° S, 27.9653° E) and maintained in the greenhouse at the University of the Witwatersrand (26.1929° S, 28.0305° E), South Africa. Before moving samples into the climate test incubator (Conviron - CMP6010, Canada), they were watered twice a day for a month and were kept in the greenhouse at 25 °C/20 °C (day and night simulation). All the chemicals used in this investigation were of analytical grade. Hexane and anhydrous sodium sulfate were purchased from Merck (Johannesburg, South Africa).
Design of experiment
Plants were exposed to high temperatures (25 °C, 36 °C and 47 °C) in a climate test incubator (Conviron) for 6 days. Leaves were then harvested episodically after 48 h, 96 h and 144 h (n=30). The harvested leaves were air dried to investigate the effects of temperature (T) (25–47 °C) and time (t) (48–144 h) on the production of essential oils (Supplementary figure 1) and related histological modifications of L. javanica. A central composite design, MODDE 13.1 (Sartorius Stedim Biotech, Malmö, Sweden), was used to generate a full-factorial design with 12 experiments and three centre-point replicates (Table 1).
hydrodistillation process.27 A volume of 1 L of water was added to 300 g of leaf samples for 4 h. The recovered essential oil was then isolated and dried with anhydrous sodium sulfate, filtered through a small cottonwool plug, and shifted to a pre-weighed amber vial.27 The total yield was calculated using the formula below:
Percentage (%) yield=
where:
A = Mass of empty bottle (g)
B = Mass of bottle plus oil extracted (g)
C = Mass of distilled material (g)

Essential oil analysis (GC-MS/FID)
Before injection into the chromatogram, 15% (v/v) of essential oil samples in hexane were prepared before the analysis. They were scrutinised using a Hewlett-Packard G1800A GCD system gas chromatograph (GC) combined with flame-ionisation detection (FID) and a mass spectrometry (MS) detector. An Innowax FSC column (60 m × 0.25 mm diameter) was utilised, and helium was the carrier gas, with a 0.8 mL/min flow rate.27 The GC-MS was maintained at an oven temperature of 60 °C for the first 10 min, and then the temperature was programmed to rise to 220 °C at a rate of 10 °C/min, and it was kept constant at 220 °C for 10 min. Then again, temperature was programmed to rise to 240 °C at a rate of 10 °C/min. Split flow was adjusted to 50 mL/min, whereas the injector and detector temperatures were adjusted to 250 °C. The mass spectra/ionisation was taken at 70 eV, and the mass range was from 35 m/z to 425 m/z. Qualitative characterisation of L. javanica essential oil samples was performed using a GC-MS.
The US National Institute of Standards and Technology (NIST) Mass Spectral Library was used to characterise the shrub’s essential oil compounds. Using literature and databases, essential oil components were tentatively identified by comparing the retention indices, molecular weight, and mass fragmentation patterns. All matches reported in our study had match quality >90% with respect to the experimental spectrum. The first step was a spectrum comparison in all the matches, which offers a range of potential matches. The second step was a postsearch filter which rejected retention indices inconsistent with indices of unknown components. Using these calculated retention indices and interactive search filters built into the library decreases the chances of incorrect identifications.
Unsupervised and supervised machine learning exploratory approach
The temperature range was chosen based on the average temperatures obtained in all six South African provinces where L. javanica occurs (Mpumalanga, Limpopo, Gauteng, North West, Eastern Cape and KwaZulu-Natal). The control was kept at 25 °C, while 36 °C was based on current average summer temperatures, and 47 °C was assumed from the predicted increase in temperatures in the next 30 years.1,2 Humidity (55%), soil type (loam), and light conditions (under 12 hours of light with a photon flux density of 100 µmol/m2/s) in the Conviron were kept constant, and plants were watered once a day throughout the treatments.
Extraction of essential oils
Essential oils were extracted from the air-dried harvested leaves of the control and treated samples using a Clevenger-type apparatus for the
The complex total ion chromatogram data set (Supplementary figure 2) obtained from the essential oil GC-MS analysis was processed using commercial Leco Chroma TOF software. Total ion chromatogram data were aligned, and the baseline was corrected and smoothed. A MS Excel spreadsheet including all the main ion fragments for each peak was made and used for further assessment through SIMCA-17 (Umetrics AB, Malmo, Sweden). Various scaling approaches were applied before creating the unsupervised principal component (PCA) model. The PCA model was then used to investigate the relationship between variables and correlation for each variable to the principal components. The score plot was employed to identify similarity between individual clusters. The graphical output of this clustering tool shows the group-inclusive associations between classes and the value of the clustering criterion related to each treatment of the plant.29 The essential oils variability obtained through the clusters on the PCA scores plot was further assessed by the supervised orthogonal projections to latent structures discriminant analysis (OPLS-DA) model.
The samples were assigned classes based on the treatment of the plants. OPLS-DA loadings plots identified chemical markers driving the observed variability within the control and treated samples. The data set was randomly subdivided into the testing set (30%) and training set (70%). The OPLS-DA model was developed using the training data set, whereas the testing data set was used for cross-validation, validation, and prediction ability of the model.30 The variability of the essential oil compounds within the control and treated groups were identified using OPLS-DA scores and S-plots.
43 Volume 119| Number 1/2 January/February 2023 Research Article
The impact of high temperatures on Lippia javanica Page 2 of 6
https://doi.org/10.17159/sajs.2023/13090
Run order Temperature (°C) Time (h) Yield (%) Trichome diameter (µm) Trichome height (um) 9 25 48 0.91 25 54 6 25 96 0.95 25 54 10 25 144 0.97 25 54 7 36 48 1.45 30 83 8 36 96 1.78 36 89 2 36 144 1.89 39 98 1 47 48 2.18 44 130 4 47 96 2.45 47 134 12 47 144 3.58 54 139 5 36 96 2.02 39 95 3 36 96 1.97 35 86 11 36 96 2.45 37 90
Table 1: Essential oil yield, trichome height, and trichome diameter of Lippia javanica at set experimental conditions
A multiple linear regression was applied to calculate the fitting model and response surface. The R2 and Q2 values indicate the adequacy of the models (where R2 shows the model fit and Q2 shows an estimate of the future prediction precision), predicted vs. observed plot, and coefficient plots. A partial least squares regression was employed to assess the response surface and fitting model response surface. The adequacy of the models was evaluated using Q2 (an estimate of the future prediction precision) and R2 (the model fit values).
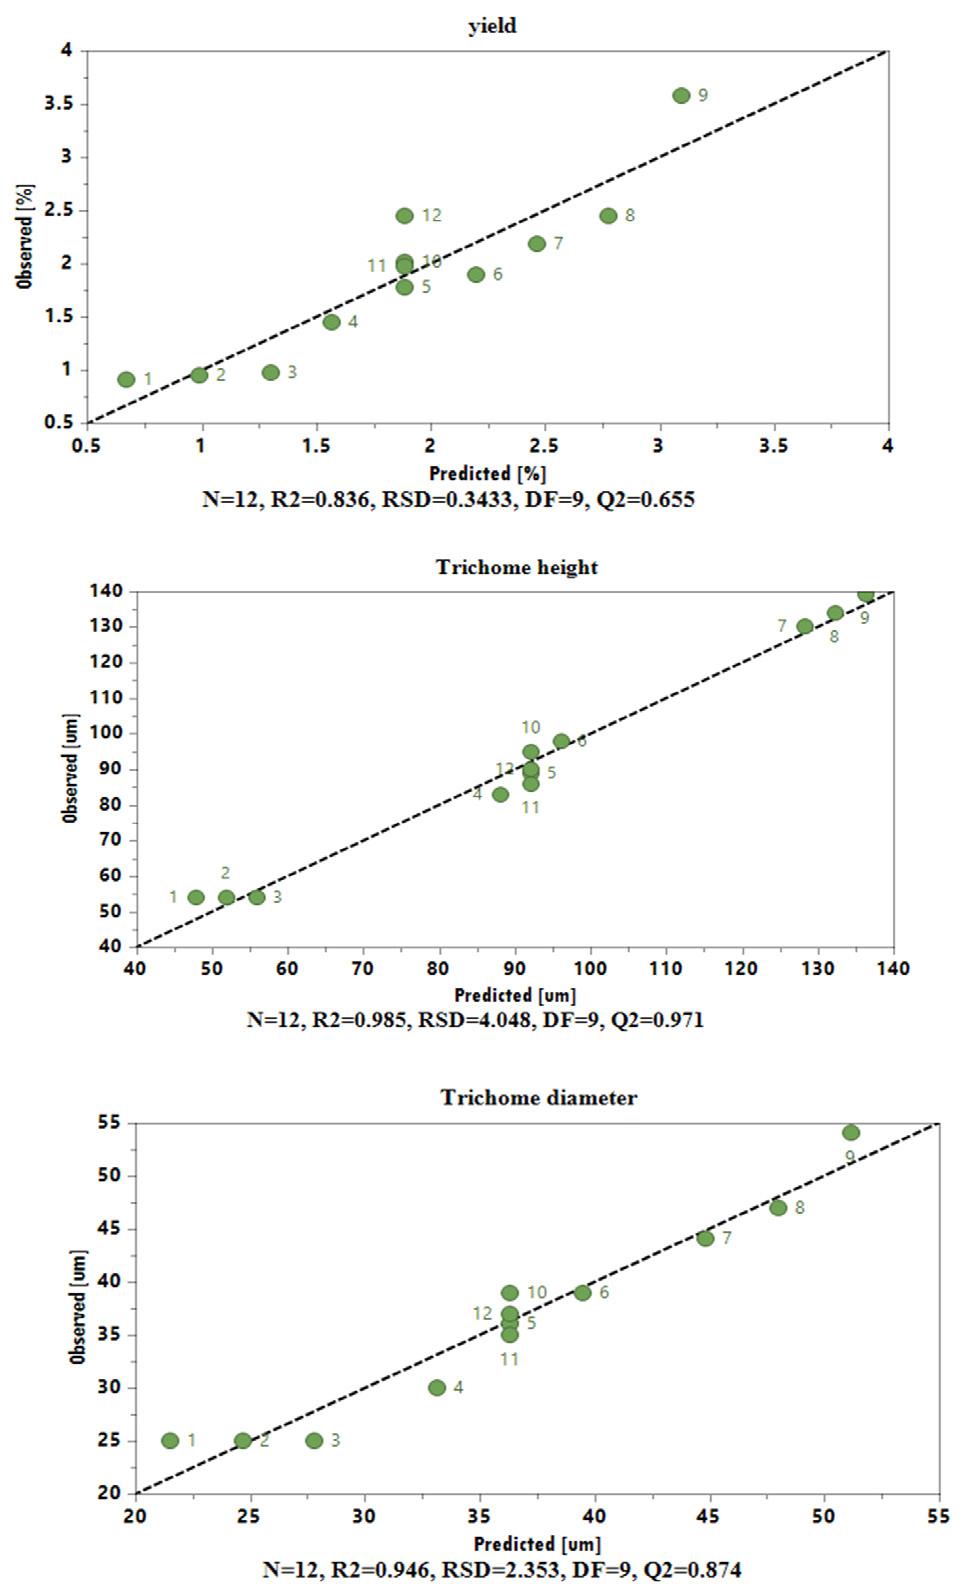
Results and discussion
Response surface methodology optimisation
The response surface methodology was used to assess the impact of temperature and time on the yield of essential oils and related histological modification of L. javanica. The model was achieved based on the experimental design defined by the central composite design. These experiments were carried out at all possible level combinations of temperature and time, and the response was given as the essential oil yield, trichome diameter, and trichome height (Table 1). Thereafter, the regression models were obtained by fitting the second-order polynomial equation to the experimental data set. The fitted model showed a total explained variance of 84% to 94% (R2 = 0.84–0.94) and cross-validated predictability of 65% to 97% (Q2 = 0.65–0.97), where R2 shows the model fit and Q2 offers an estimation of the future prediction and precision. The linearity of the predicted versus observed values plot (Figure 1) underlined the validity of the model and its capability to predict the best condition of the extraction within the range of the design.
The coefficients plot (Figure 2) revealed that high temperatures significantly affect the yield of essential oils, trichome height, and trichome diameter (p=0.002); in contrast, time does not significantly influence plant stress. The increase in temperature from 25 °C to 47 °C increased essential oil yield, trichome length, and trichome diameter from 1.007 mg/100 g to 3.58 mg/100 g, 50 µm to 160 µm, and 25 µm to 60 µm, respectively. This finding suggests that an increase in essential oil secretion, trichome height and diameter is a defence mechanism for plants exposed to environmental stress. Our data show that time did not affect plant stress; nonetheless, it is well recognised that the longer a plant is exposed to environmental stress, the more harmful the conditions are to the plant.
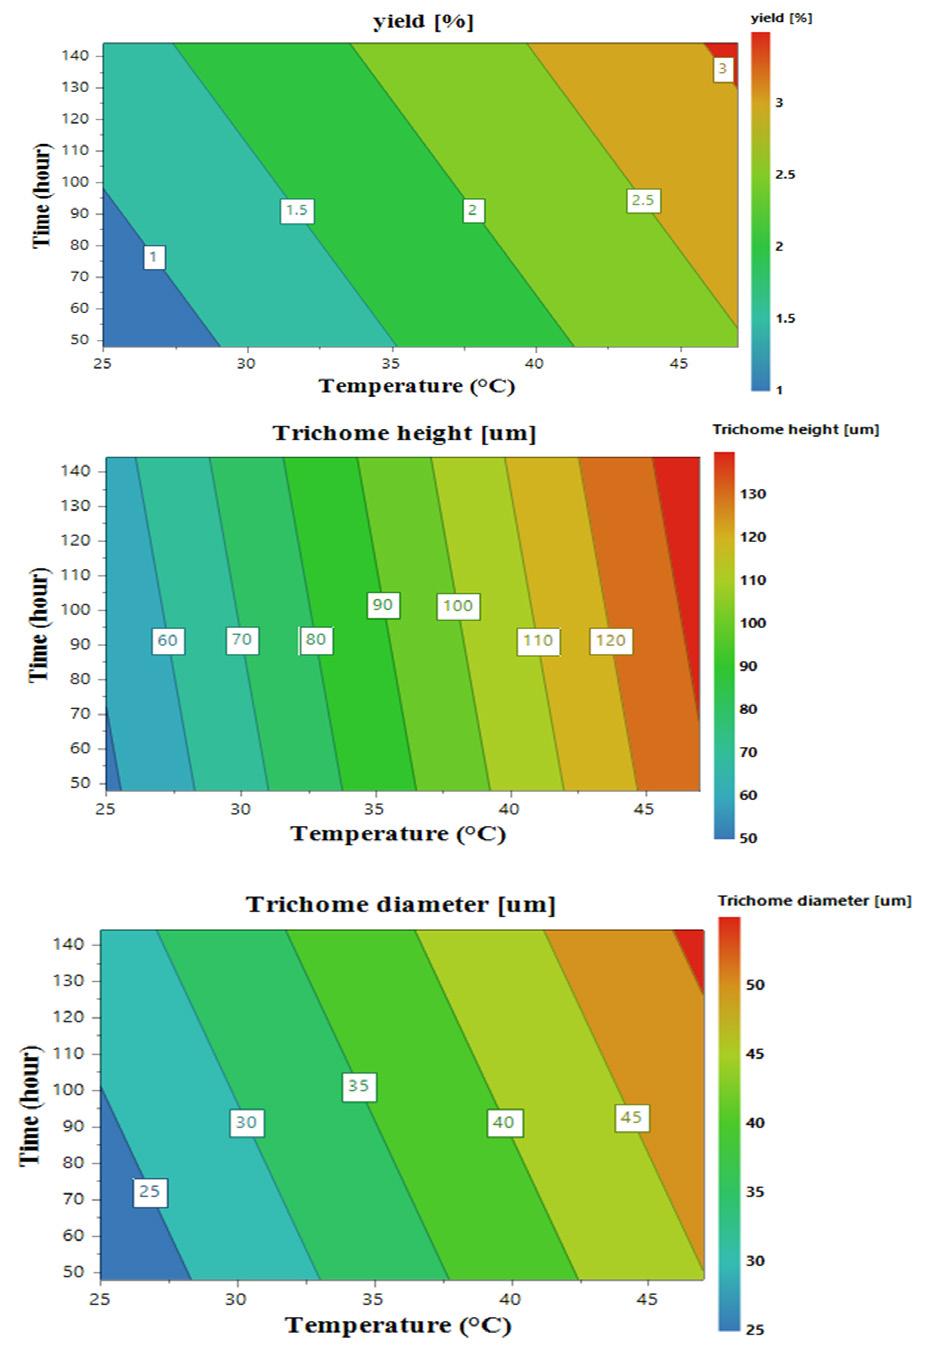
Figure 2:
the direct and interaction impacts of temperature and time on (a) essential oil yield, (b) trichrome height, and (c) trichome diameter of Lippia javanica
Several studies have shown that the increase in glandular trichome length and diameter are directly correlated to the yield of essential oils produced by the plant (Supplementary figure 1).31,32 Moreover, other studies have reported that both essential oil yield and the quality of aromatic compounds are primarily affected by environmental factors such as altitude, light intensity, and seasonality.11,28,33 Our findings are consistent with these studies because exposing L. javanica to high temperatures increased the length and diameter of trichomes, which was associated with the increase in essential oil yield (2.67% more than the control at 47 °C/144 h).
Our results clearly show that the production of essential oils in L. javanica is temperature sensitive (Supplementary figure 1) and that the increase in the secretion of essential oils is an indicator of environmental stress. However, it is unclear how these environmental factors affect the quality of essential oils. Al-Gabbiesh et al.34 stated that plants exposed to environmental stresses reveal a higher concentration and yield of essential oils than those cultivated under ambient conditions. In this context, however, exposure to environmental stresses significantly reduces plant growth because carbon meant to be allocated to growth is redirected to the production of secondary metabolites for plant
44 Volume 119| Number 1/2 January/February 2023 Research Article
https://doi.org/10.17159/sajs.2023/13090
a b c
Figure 1: The linearity of the predicted versus observed values plots for (a) yield, (b) trichome height and (c) trichome diameter of Lippia javanica
a b c
Contour plots showing
The impact of high temperatures on Lippia javanica Page 3 of 6
survival.4,34 Therefore, environmental stress could increase the toxicity of volatile compounds, which may be harmful to humans. The toxicity level may also depend on the duration of exposure to environmental stress.
Characterisation and identification of essential oils by GC-MS
The GC-MS analysis yielded 50 essential oil components (Supplementary table 1). The essential oils extracted from the control and treated samples displayed differences in their chemical composition. The primary essential oils found in the control samples were linalool, carvone, piperitenone and tagetenone, while the treated samples were contained eucalyptol, camphor, fenchone eucalyptol, p-cymene, caryophyllene and terpinen-4-ol. The largest relative peak area of the major compounds revealed significant chemical variations within the control and treated samples (Supplementary figure 3).
All samples fell within the Hotelling’s T2 ellipse on the scores plot (Figure 3), suggesting the nonexistence of strong outliers, and therefore all data were included. The total variation across the data was 99.7% (R2Xcum = 0.997), whereas Q2cum was 0.987, indicating a good model. The scores scatter plot of PC1 against PC2 (Figure 4) shows four clusters corresponding to the control and treatments. About 56.8% and 31.1% of the sample variability were explained by PC1 and PC2, respectively (Table 2). An OPLS-DA model was created from the data for the control and treated samples. Centre-scaled models generated the best statistics for the selected data set compared to other scaling approaches (Table 2).
Table 2: Centre-scaled principal components analysis (PCA) and orthogonal projections to latent structures discriminant analysis (OPLS-DA) model statistics output
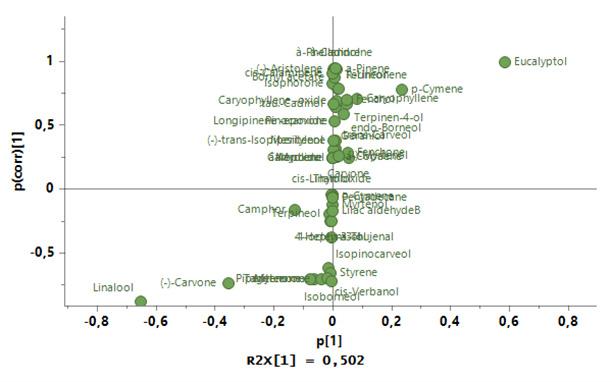
Figure 4: Orthogonal projections to latent structures discriminant analysis (OPLS-DA) scores scatter plot of Lippia javanica exposed to 25 °C (control) and 47 °C (for 48, 96 and 144 hours).
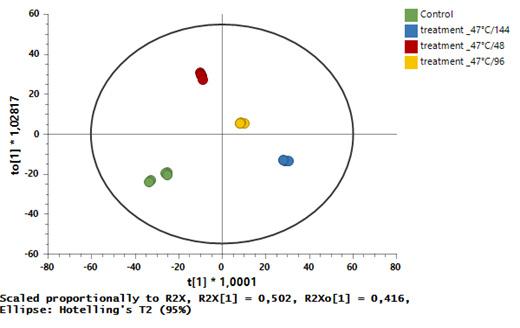
Four groups were distinguished in the corresponding OPLS-DA score plots (47 °C/48 h, 47 °C/96 h and 47 °C/144 h) (Figure 4), confirming the chemical variation of essential oils found in L. javanica at elevated temperatures. Major essential oil constituents (linalool, – (-) carvone, tagetenone and piperitenone) in the control disappeared in the high temperature treatments (Figure 5). However, eucalyptol, camphor, and p-cymene were major essential oils not previously present in the control and were produced when plants were exposed to high temperatures. Several essential oil constituents are not produced at certain temperature ranges; thus, temperature alterations significantly impact the essential oil composition of plants. A study by Lee and Ding35 found that the specific ratio of essential oil constituents determines the therapeutic and wellness-enhancing properties of the oil. However, a study by Nakatsu et al.36 suggested that, although there are differences in the composition of essential oils of various plants, there is considerable overlap in their overall properties. For example, Tetradenia riparia and Virola surinamensis have different essential oil profiles, but they are both reported to treat malaria symptoms.34 Therefore, the changes observed in the oil constituents of L. javanica after exposure to high temperatures may not suggest changes in the biological activity of the shrub. More research, however, is required to ascertain any changes in the biological activity of L. javanica and the implications of the additional compounds secreted in response to high temperatures.
Conclusion
Temperature was the most critical factor influencing the production of essential oils, trichome length and trichome diameter in L. javanica A significant degree of chemical variation was evident between the control and treated samples. Four essential oil compounds successfully identified within the control were not present in the treated samples and three compounds detected in the treated samples were absent in the control. This variation suggests resistance against high temperatures and
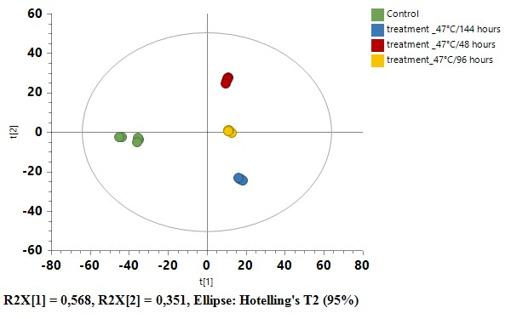
45 Volume 119| Number 1/2 January/February 2023 Research Article https://doi.org/10.17159/sajs.2023/13090 The impact of high temperatures on Lippia javanica Page 4 of 6
Statistical parameter Output PCA Model Number of principal components 3 R2Xcum 0.997 Q2cum 0.987 % Variation PC1 56.8 % Variation PC2 31.1 OPLS-DA Model Predictive components (P) 1 Orthogonal components (O) 1 R2X (P1) 0.502 R2X (O1) 0.416 R2Y 0.919 Q2Y 0.987
Figure 3: Principal component analysis (PCA) scores scatter plot of Lippia javanica exposed to 25 °C (control) and 47 °C (for 48, 96 and 144 hours).
Figure 5: S-plots of essential oil components of Lippia javanica
other physiological and ecological pressures. The increase in defence essential oil compounds could also indicate an increase in the medicinal properties of the shrub in treating various ailments. More studies should be conducted to investigate the pharmacological activities and toxicity levels of L. javanica exposed to high temperatures in order to elucidate any changes in the medicinal properties of the shrub.
Acknowledgements
This research was supported by the South African National Research Foundation (NRF): Freestanding, Innovation and Scarce Skill Development Fund (grant number SFH180514329259), a NRF Thuthuka grant awarded to I.M.R. which funded running costs, as well as a Post Graduate Merit Award (grant number 900005000001) to E.J.S. from the University of the Witwatersrand. We thank Dr Ellis Ayayee, Dr Tsitsi Maponga, and Prof. Ed Witkowski for their support throughout this research.
Competing interests
We have no competing interests to declare.
Authors’ contributions
E.J.S.: Sample analysis, data collection, writing – initial draft. Y.N.: Methodology, supervision, proofreading the draft. L.C.: Validation, project leadership, supervision. I.M.R.: Conceptualisation, validation, supervision, funding.
References
1. Nowak DJ. The atmospheric system: Air quality and greenhouse gases. In: Hall M, Balogh S, editors. Understanding urban ecology. Cham: Springer; 2019. p. 175–199. https://doi.org/10.1007/978-3-030-11259-2_8
2. Mikhaylov A, Moiseev N, Aleshin K, Burkhardt T. Global climate change and greenhouse effect. Entrep Sustain Issues. 2020;7(4):2897–2913. https://doi. org/10.9770/jesi.2020.7.4(21)
3. Hendawy SF, Hussein MS, El-Gohary AE, Soliman WS. Chemical constituents of essential oil in chervil (Anthriscus cerefolium L. Hoffm.) cultivated in different locations. J Essent Oil-Bearing Plants. 2019;22(1):264–272. https:// doi.org/10.1080/0972060X.2019.1587316
4. Caretto S, Linsalata V, Colella G, Mita G, Lattanzio V. Carbon fluxes between primary metabolism and phenolic pathway in plant tissues under stress. Int J Mol Sci. 2015;16(11):26378–26394. https://doi.org/10.3390/ijms161125967
5. Chaves MM, Pereira JS, Maroco J, Rodrigues ML, Ricardo CPP, Osório ML, et al. How plants cope with water stress in the field. Photosynthesis and growth. Ann Bot. 2002;89(7):907–916. https://doi.org/10.1093/aob/mcf105
6. Muhl QE, Du Toit ES, Robbertse PJ. Moringa oleifera (horseradish tree) leaf adaptation to temperature regimes. Int J Agric Biol. 2011;13(6):1021–1024.
7. Bita CE, Gerats T. Plant tolerance to high temperature in a changing environment: Scientific fundamentals and production of heat stress-tolerant crops. Front Plant Sci. 2013;4:1–18. https://doi.org/10.3389/fpls.2013.00273
8. Jump AS, Peñuelas J. Running to stand still: Adaptation and the response of plants to rapid climate change. Ecol Lett. 2005;8(9):1010–1020. https://doi. org/10.1111/j.1461-0248.2005.00796.x
9. Kruger AC, Sekele SS. Trends in extreme temperature indices in South Africa: 1962–2009. Int J Climatol. 2013;33(3):661–676. https://doi.org/10.1002/ joc.3455
10. Mander M, Ntuli L, Diederichs N, Mavundla K. Economics of the traditional medicine trade in South Africa: Health care delivery. S Afr Health Rev. 2007;1:189–196.
11. Chagonda LS, Chalchat JC. Essential oil composition of Lippia javanica (Burm.f.) Spreng chemotype from Western Zimbabwe. J Essent Oil-Bearing Plants. 2015;18(2):482–485. https://doi.org/10.1080/0972060X.2014. 1001140
12. Maroyi A. Lippia javanica (Burm.f.) Spreng.: Traditional and commercial uses and phytochemical and pharmacological significance in the African and Indian subcontinent. Evid Based Complement Alternat Med. 2017;2017, Art. #6746071. https://doi.org/10.1155/2017/6746071
13. Manenzhe NJ, Potgieter N, Van Ree T. Composition and antimicrobial activities of volatile components of Lippia javanica. Phytochemistry. 2004;65(16):2333–2336. https://doi.org/10.1016/j.phytochem.2004.07.020
14. Mujovo S, Hussein A, Meyer JJM, Fourie B, Muthivhi T, Lall N. Bioactive compounds from Lippia javanica and Hoslundia opposita. Nat Prod Res. 2008;22(12):1047–1054. https://doi.org/10.1080/14786410802250037
15. Abubakar EMM. The use of Psidium guajava Linn. in treating wound, skin and soft tissue infections. Sci Res Essays. 2009;4(6):605–611.
16. Mahlangeni NT, Moodley R, Jonnalagadda SB. Elemental composition of Cyrtanthus obliquus and Lippia javanica used in South African herbal tonic, Imbiza. Arab J Chem. 2018;11(1):128–136. https://doi.org/10.1016/j. arabjc.2014.07.007
17. Dlamini TP. Isolation and characterisation of bio-active compounds from Lippia javanica [Master of Technology dissertation]. Johannesburg: University of Johannesburg; 2006.
18. Viljoen AM, Subramoney S, Vuuren SFV, Başer KHC, Demirci B. The composition, geographical variation and antimicrobial activity of Lippia javanica (Verbenaceae) leaf essential oils. J Ethnopharmacol. 2005;96(1–2):271–277. https://doi.org/10.1016/j.jep.2004.09.017
19. Asowata-ayodele AM, Afolayan AJ, Otunola GA. Ethnobotanical survey of culinary herbs and spices used in the traditional medicinal system of Nkonkobe Municipality, Eastern Cape, South Africa. 2016;13:237–242. https://doi.org/10.4314/ajtcam.v13i2.28
20. Pereira DM, Valentão P, Pereira JA, Andrade PB. Phenolics: From chemistry to biology. Molecules. 2009;14(6):2202–2211. https://doi.org/10.3390/ molecules14062202
21. Sulaiman CT, Balachandran I. Total phenolics and total flavonoids in selected Indian medicinal plants. Indian J Pharm Sci. 2012;74(3):258–260. https:// doi.org/10.4103/0250-474X.106069
22. Matshediso PG, Cukrowska E, Chimuka L. Development of pressurised hot water extraction (PHWE) for essential compounds from Moringa oleifera leaf extracts. Food Chem. 2015;172:423–427. https://doi.org/10.1016/j. foodchem.2014.09.047
23. Nevo EN, Pavlílek TP, Beharav AB, Bolshakova MAB, Martyn GIM, Musatenko LIM, et al. Drought and light anatomical adaptive leaf strategies in three woody species caused by microclimatic selection at “evolution canyon”, Israel. Isr J Plant Sci. 2000;48(1):33–46. https://doi.org/10.1092/RNPF-9HJE-8J3L-B5F1
24. Rebecchi L, Altiero T, Guidetti R. Anhydrobiosis: The extreme limit of desiccation tolerance. Invertebr Surviv J. 2007;4(2):65–81.
25. Martínez-Natarén DA, Parra-Tabla V, Dzib G, Calvo-Irabién LM. Morphology and density of glandular trichomes in populations of Mexican oregano (Lippia graveolens H.B.K., Verbenaceae), and the relationship between trichome density and climate. J Torrey Bot Soc. 2011;138(2):134–144. https://doi. org/10.3159/TORREY-D-10-00007.1
26. Combrinck S, Du Plooy GW, McCrindle RI, Botha BM. Morphology and histochemistry of the glandular trichomes of Lippia scaberrima (Verbenaceae). Ann Bot. 2007;99(6):1111–1119. https://doi.org/10.1093/aob/mcm064
27. Serrato-Valenti G, Bisio A, Cornara L, Ciarallo G. Structural and histochemical investigation of the glandular trichomes of Salvia aurea L. leaves, and chemical analysis of the essential oil. Ann Bot. 1997;79(3):329–336. https:// doi.org/10.1006/anbo.1996.0348
28. Edeoga HO, Okwu DE, Mbaebie BO. Phytochemical constituents of some Nigerian medicinal plants. Afr J Biotechnol. 2005;4(7):685–688. https://doi. org/10.5897/AJB2005.000-3127
29. Maree J, Kamatou G, Gibbons S, Viljoen A, Van Vuuren S. The application of GC-MS combined with chemometrics for the identification of antimicrobial compounds from selected commercial essential oils. Chemom Intell Lab Syst. 2014;130:172–181. https://doi.org/10.1016/j.chemolab.2013.11.004
30. Eriksson L, Andersson PL, Johansson E, Tysklind M. Megavariate analysis of environmental QSAR data. Part I – A basic framework founded on principal component analysis (PCA), partial least squares (PLS), and statistical molecular design (SMD). Mol Divers. 2006;10(2):169–186. https://doi.org/10.1007/ s11030-006-9024-6
31. Navarrete A, Wallraf S, Mato RB, Cocero MJ. Improvement of essential oil steam distillation by microwave pretreatment. Ind Eng Chem Res. 2011;50(8):4667–4671. https://doi.org/10.1021/ie102218g
46 Volume 119| Number 1/2 January/February 2023 Research Article
https://doi.org/10.17159/sajs.2023/13090
The impact of high temperatures on Lippia javanica Page 5 of 6
32. Talebi SM, Behzadpour S, Yadegari P, Ghorbanpour M. Trichome structures and characterization of essential oil constituents in Iranian populations of Salvia limbata C.A. Meyer. Iran J Sci Technol Trans A Sci. 2021;45(1):41–54. https://doi.org/10.1007/s40995-020-01017-9
33. Tozin LRS, Marques MOM, Rodrigues TM. Glandular trichome density and essential oil composition in leaves and inflorescences of Lippia origanoides Kunth (Verbenaceae) in the Brazilian Cerrado. An Acad Bras Cienc. 2015;87(2):943–953. https://doi.org/10.1590/0001-3765201520140376
34. Al-Gabbiesh A, Kleinwächter M, Selmar D. Influencing the contents of secondary metabolites in spice and medicinal plants by deliberately applying drought stress during their cultivation. Jordan J Biol Sci. 2015;8(1):1–10. https://doi.org/10.12816/0026941
35. Lee YL, Ding P. Physiological production of essential oils in plants – Ontogeny, secretory structures and seasonal variations. Pertanika J Sch Res Rev. 2016;2(1):1–10.
36. Nakatsu [xc*] T, Lupo AT, Chinn JW, Kang RKL. Biological activity of essential oils and their constituents. Stud Nat Prod Chem. 2000;21:571–631. https:// doi.org/10.1016/S1572-5995(00)80014-9
https://doi.org/10.17159/sajs.2023/13090
47 Volume 119| Number 1/2 January/February 2023 Research Article
The
of
Page 6 of 6
impact
high temperatures on Lippia javanica
AUTHORS:
Mahalaksmi D.D. Doodee1
Soonil D.D.V. Rughooputh2
Shobha Jawaheer1
AFFILIATIONS:
1Department of Biosciences and Ocean Studies, Faculty of Science, University of Mauritius, Réduit, Mauritius
2Department of Physics, Faculty of Science, University of Mauritius, Réduit, Mauritius
CORRESPONDENCE TO:
Shobha Jawaheer
EMAIL: shobha@uom.ac.mu
DATES:
Received: 04 Apr. 2022
Revised: 02 Sep. 2022
Accepted: 05 Sep. 2022
Published: 31 Jan. 2023
HOW TO CITE:
Doodee MDD, Rughooputh SDDV, Jawaheer S. Remote sensing monitoring of mangrove growth rate at selected planted sites in Mauritius. S Afr J Sci. 2023;119(1/2), Art. #13716. https://doi. org/10.17159/sajs.2023/13716
ARTICLE INCLUDES:
☒ Peer review
☐ Supplementary material
DATA AVAILABILITY:
☐ Open data set
☐ All data included
☒ On request from author(s)
☐ Not available
☐ Not applicable
EDITORS:
Jennifer Fitchett
Adriaan van der Walt
KEYWORDS:
mangroves, canopy cover, remote sensing, growth monitoring
FUNDING:
University of Mauritius, Mauritian Higher Education Commission
Remote sensing monitoring of mangrove growth rate at selected planted sites in Mauritius
Mangroves are highly productive and rich ecosystems that thrive at the interface of land and sea. They provide a wide range of essential goods and services, contribute highly to coastal protection and the livelihood of coastal communities, and are also carbon-rich biomes contributing to carbon sequestration. Mangroves are primarily threatened by anthropogenic activities; a loss in biodiversity has been observed in the past years in many countries including Mauritius. Given their value to the ecosystem, it is important to have effective continuous monitoring of mangrove dynamics. We studied the rate of increase of canopy coverage of planted Rhizophora mucronata forests in two selected sites (Le Morne and Grande Rivière Noire) on a southern African island – Mauritius – using Google Earth Pro historical Landsat 7 and Landsat 8 images. Data were processed using ImageJ software. To our knowledge, this technique has not yet been applied for monitoring mangrove growth. The mangrove sites were classified into four zones based on water level and tidal variations. On average, the rate of increase of canopy coverage expressed by a coefficient ‘b’ at Le Morne (b = 1.901) was higher than that at Grande Rivière Noire (b = 1.823). The coefficient ‘b’ positively correlated with the zonations (r ~ 0.8). Higher ‘b’ values (2.319–2.886) were observed in Zone 1, where the substrate is always covered with water at low tide. The use of remote sensing data along with image processing analysis proved to be an effective tool to obtain relevant information, not only for mapping mangroves but also for monitoring the canopy growth rates of planted mangroves.
Significance:
• We describe a novel technique whereby remote sensing data are processed through image processing using ImageJ software, to effectively monitor planted mangrove canopy growth by pixel count.
• This study highlights the successful application of the technique to obtain relevant information for mapping and monitoring the canopy growth rates of planted mangroves.
• This technique can be further extended to identify potential areas for mangrove propagation worldwide based on tidal level variations.
Introduction
Mangroves are trees and shrubs that thrive in the harsh conditions between the land and sea. Mangrove forests form part of the most productive and unique ecosystems on earth. They are ecotone ecosystems occurring mostly along the tropical and subtropical coastlines.1 They adapt well to inter-tidal conditions, and play a vital role in the aquatic food web by providing a plethora of ecosystem services, particularly as a breeding ground for several fish and prawns species and as a food source for aquatic organisms. They also provide goods and services to people in fisheries; coastal protection against storm surges, rough waves and erosion; pollution abatement; and forest products.2 Mangrove forests are also important ecosystems for carbon sequestration, allowing carbon to be stored in their biomass and sediment.3 Even though mangroves are of prime importance to coastal ecosystems, the mangrove population worldwide is being threatened by anthropogenic activities and climate change.4,5
Mangroves are found in 123 countries and territories, and, as of 2016, their global coverage6 was around 136 000 km2 although mangrove forests in the southern African region account for around 7% of this area715. The largest southern African mangrove forests are found along the Indian Ocean coasts.9 Mozambique and Madagascar each harbours more than 3000 km2 (20% of African mangroves), making together 4% of the global distribution.10,11 In South Africa, the mangrove cover is estimated to be around 2000 km2,9,14 while for Tanzania mainland, Wang et al.12 estimated that there is about 1083 km2 of mangrove cover.13 Mauritius, a small island state off the southeast coast of the African continent, has a mangrove cover of 1.45 km2 15 Worldwide, a net loss of around 4.3% of mangroves was noted in the 20 years preceding 2016, although the average rate of mangrove loss is now reported to be slowing.6 Given the significance of mangrove forests, there is a need for continuous monitoring of their dynamics. However, precise, dependable and timely data on the world’s mangrove forests are not readily available.16
© 2023. The Author(s). Published under a Creative Commons Attribution Licence.
Research Article
In southern African countries17-21, and other regions with wide expanses of mangroves (e.g. Indonesia22, Malaysia23 and Thailand24), geographic information systems (GIS), based on digital satellite and aerial photographs, are most commonly used to create maps showing mangrove forests.25 Remote sensing techniques are ideal for inaccessible areas where in situ field data cannot be undertaken. Development in remote sensing with high spatial, spectral and temporal resolution, and historical remote sensing data provide the opportunity for better characterisation, mapping and monitoring of mangrove forests from local to global scales.26 Additionally, it allows ‘indirect’ access to mangrove habitats located in remote areas and areas that are usually temporarily swamped25-28, thus allowing scientists to focus their research on specific levels of ecological details26,29,30. Light detection and ranging (LiDAR), hyperspectral and multispectral optical images, and synthetic aperture radar (SAR), are among the satellite image data studied in addition to aerial imagery. The three types of digital image classification algorithms utilised for mangrove mapping and monitoring in diverse research are object-based, pixel-based, and knowledge-based
https://doi.org/10.17159/sajs.2023/13716
48 Volume 119| Number 1/2 January/February 2023
classifiers.31,32 By the determination of the percentage canopy closure of mangrove forests, further investigations based on the density of the mangrove area can be undertaken.30
The main objective of this study was to use remote sensing and image processing techniques to determine the extent of canopy coverage of mangrove forests and their distributions as part of our efforts to understand the ecosystem and ecophysiology of mangals. In this work, canopy coverage was established using image classification (pixel counting) with data acquired through the Google Earth engine Google Earth ProTM. This novel method developed here can be readily extended to study the temporal and spatial evolution of mangrove areas globally.
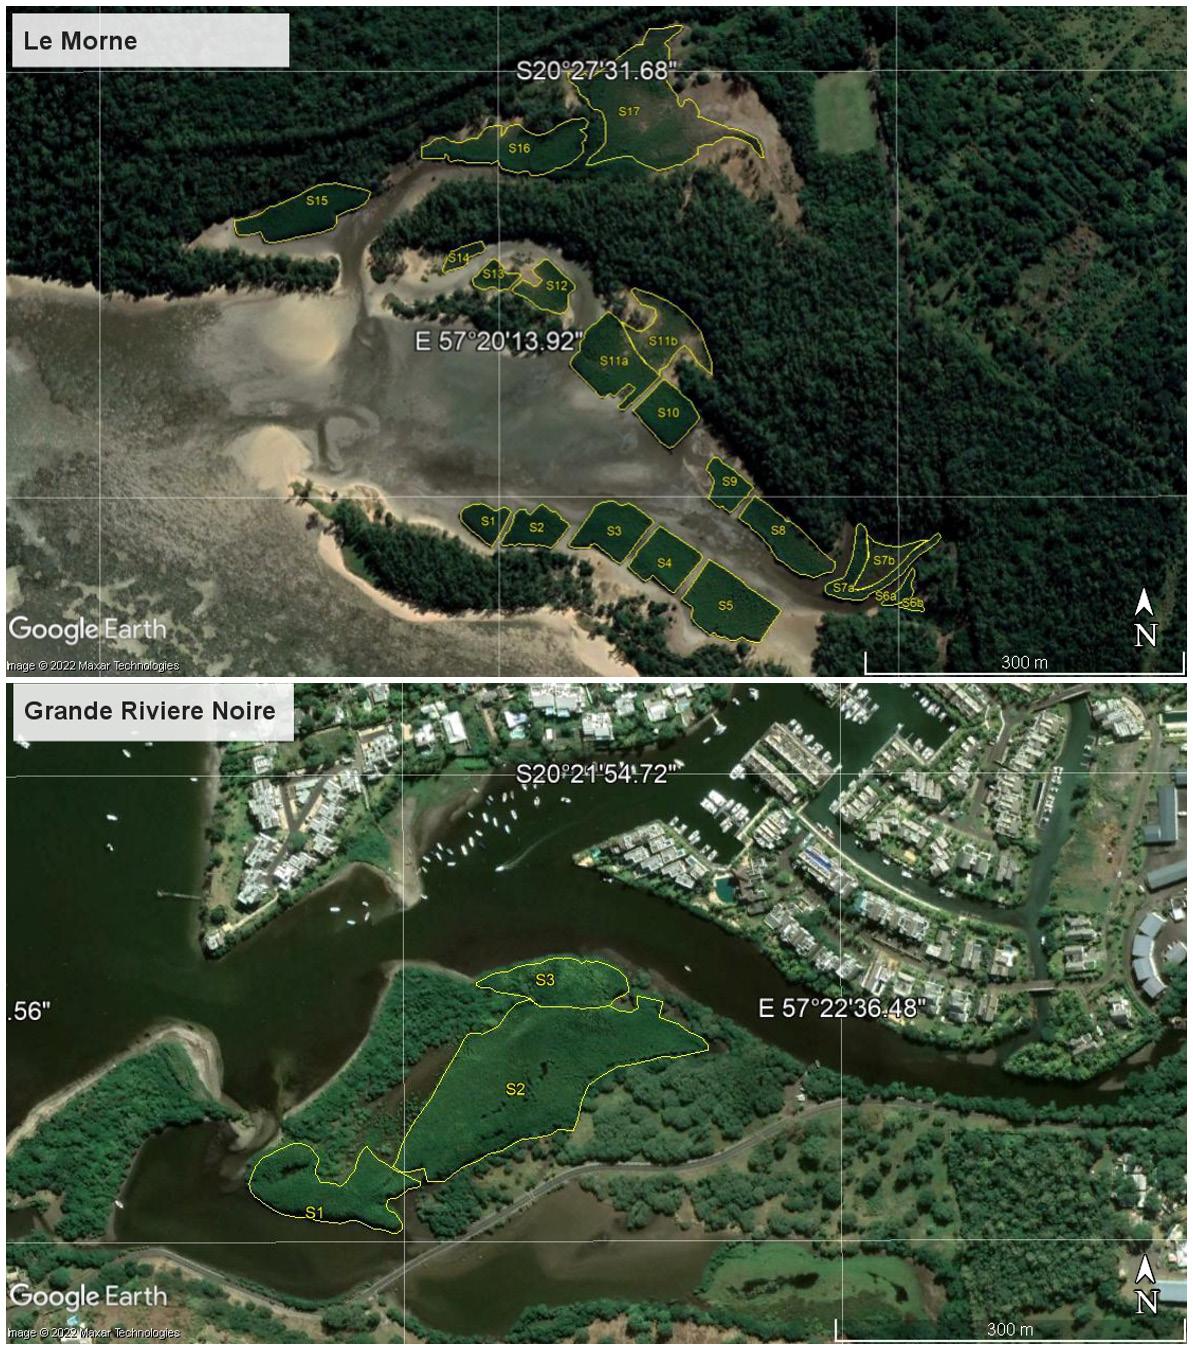
Materials and methods
Study area
This research study was focused on the two largest planted mangrove areas on the southwestern coast of Mauritius. The Republic of Mauritius is a small island developing state with the mainland, Mauritius, centred around 20°34’84” S and 57°55’22” E whilst other islands of the republic are scattered in the South-West Indian Ocean. Mauritius has a coastal zone inhabited by two mangrove species, namely Bruguiera gymnorrhiza (L.) Lam. and Rhizophora mucronata Lam., covering ~1.45 km2 15 Mauritius
has been experiencing a wide range of changes in its coastal zone over the last few decades due to anthropogenic activities (such as global warming and deforestation) and invasive plants, resulting in a loss of mangrove biodiversity. Since 1995, the Albion Fisheries Research Centre, under the aegis of the Ministry of Blue Economy, Marine Resources, Fisheries and Shipping, embarked on a Mangrove Propagation Programme to protect and restore denuded areas. As of 2019, the total area covered under mangrove propagation on mainland Mauritius was ~0.217 km2 (Ministry of Blue Economy, Marine Resources, Fisheries and Shipping 2021, written communication, September).
The study sites selected were Le Morne (LM) (centred around 20°27’46.62” S and 57°20’19.43” E) and Grande Rivière Noire (GRN) (centred around 20°22’03.96” S and 57°22’25.74” E). These leeward sites are not too far from each other, and they experience similar climates. Both sites are Rhizophora mucronata areas planted by the Albion Fisheries Research Centre – initially planted around April 2012 with some 47 000 seedlings covering an area of 23 500 m2 at LM and around May 2003 with 42 000 seedlings covering an area of 25 000 m2 at GRN (Ministry of Blue Economy, Marine Resources, Fisheries and Shipping 2021, written communication, September). It is important to emphasise that the GRN mangrove site is situated at a major estuary as opposed to the LM mangrove site (Figure 1).
49 Volume 119| Number 1/2 January/February 2023 Research Article https://doi.org/10.17159/sajs.2023/13716 Monitoring mangrove canopy growth using remote sensing Page 2 of 7
Source: Google Earth Pro, dated 2021
Figure 1: Google Earth Pro images (with 1 degree grid line) showing the mangrove study sites at Le Morne (top) and Grande Rivière Noire (bottom) along with their plot delineated by yellow boundaries; Le Morne (S1–S17) and Grande Rivière Noire (S1–S3).
The mangrove areas were classified into plot sites based on patches under mangrove cover and labelled LM (S1–S17) and GRN (S1–S3) for Le Morne and Grande Rivière Noire, respectively (Figure 1).
The planted mangrove plots were then divided into zones based on the tidal water-level variations as follows:
• Zone 1: Substrate always submerged with water at low tide
• Zone 2: Substrate exposed at low tide only
• Zone 3: Substrate exposed at intermediate times between high and low tide only
• Zone 4: Substrate exposed at high tide
Image and field data sets
The sites were studied using satellite imagery from Landsat 7 and 8 Google Earth ProTM (available free to the public) on spatial and temporal scales. Landsat 7 imagery, of 15-m spatial resolution, was used for data before 2013, and Landsat 8 imagery, of the same resolution, was used for data as of 2013. The imagery was selected in reference to the time periods from the year of propagation for each study area, 2003 for GRN and 2012 for LM, up to 2021.
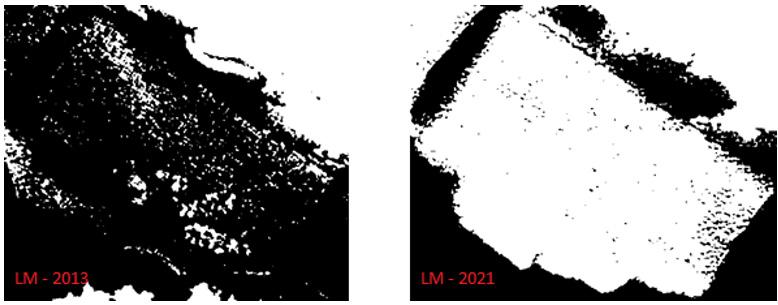
Image processing techniques and data analysis
Google Earth Pro images throughout the years were selected based on the image resolution, cloud cover, time period and colour correction. From 2004 to 2009, no satellite images were available through Google Earth Pro. Image classification (pixel counting) techniques were then applied by using ImageJ (National Institutes of Health and the Laboratory for Optical and Computational Instrumentation), an open-source software for image processing. The satellite images were adjusted to a black and white threshold colour, and a number was attributed to each pixel (0 and 255). The pixels covering the mangrove plots were then counted to retrieve the percentage canopy cover. Figure 2 represents

a typical plot in 2013 and 2021, after image processing techniques, for estimating the percentage canopy cover. The percentage canopy cover was then plotted in graphs using the function, y = aebt, where a and b are constants. The equation was linearised to extract ‘b’, the coefficient representing the rate of increase of canopy coverage. This function represents the onset of the expected sigmoid-shaped growth curves corresponding to three phases.33 The first initial phase or lag phase represents the initial growth stage, the second phase or log phase represents the exponential period of growth, and the third phase or the stationary phase represents the steady growth stage.
Field assessment
To estimate the percentage substrate underwater at high and low tides for each mangrove plot by Google Earth Pro, the GPS positioning at high and low tides was recorded using a GPS phone tracker. The pH, dissolved oxygen level and salinity were measured using portable instruments, namely a digital pH meter, dissolved oxygen meter and refractometer, respectively. The tidal water-level variations were monitored with a metre rod.
50 Volume 119| Number 1/2 January/February 2023 Research Article
https://doi.org/10.17159/sajs.2023/13716
Figure 2: Google Earth Pro images showing the mangrove plot at Le Morne plot S5 (2013 and 2021) after image processing for estimating percentage canopy cover.
Monitoring mangrove canopy growth using remote sensing Page 3 of 7
Figure 3: Google Earth Pro images of Le Morne (from 2011 to 2021) and Grande Rivière Noire (from 2003 to 2021) before and after image processing.
Statistical analysis
Tukey honest significant difference tests were done to detect differences between means. Correlations between the site assessment parameters and the linear equation function values were carried out using bivariate Pearson correlation analysis using the IBM SPSS Statistics 21 software.
Results
The rate of increase of canopy coverage, ‘b’, for each plot was determined from the second phase representing the exponential period of growth, and these were then correlated with chemical and physical parameters recorded at the mangrove sites to determine the factors affecting the growth and spread of the canopy cover.
Data processing and canopy cover
The mangrove canopy cover could easily be derived from the black and white image pixels as the mangrove plantation plots were free from other vegetation (Figure 3). At LM, S1, S2, S3, S4 and S5 plots (Zones 1–2) reached their steady growth state (percentage canopy cover >95%) as from 2019 and S8, S9, S10 and S15 plots (Zone 2) as from 2020 (~7–8 years after planting). However, as of August 2021 (~8–9 years after planting), S6, S7a, S11a, S12, S13 and S16a (Zone 3), and S7b, S11b and S16b (Zone 4) plots were still at 80–93% and 75–85%, respectively. The three mangrove plots at GRN reached their steady growth state as of 2018, i.e. ~15–16 years after planting. Total canopy area estimated from April 2012 to August 2021 at LM was 44 300 m2, and from May 2003 to August 2021 was 31 600 m2
Zonal growth rates
Table 1 summarises the characteristics of the plots studied with respect to their zonation. The Table also includes the percentage substrate underwater at low and high tides, tidal level variation, percentage of canopy cover in August 2021, and the coefficient of rate of increase of canopy coverage, ‘b’, for each site. The percentage substrate underwater and tidal level values (in cm) for Zones 1–4 were 100%, 80–100%, 0–100%, 0%, and 5.8–36.0, 2.1–34.1, 0.0–25.0, 0.0, respectively.
The range of values for ‘b’ for LM were compared zone-wise: Zone 1 (2.319–2.886) > Zone 2 (1.960–2.296) > Zone 3 (1.584–1.829) >
Zone 4 (1.392–1.554). At GRN, similar ‘b’ values were obtained for Zone 2 (1.761–1.957) and Zone 3 (1.752), showing a similar rate of canopy increase. It is noteworthy that the ‘b’ values of LM were higher than those of GRN.
Statistically significant positive correlations were obtained between the ‘b’ values and the percentage substrate underwater (r=0.822, p<0.01), and tidal level variation (r=0.601, p<0.01).
Canopy cover pattern
The sigmoid-shaped growth curves for representative sites in the four tidal zones are illustrated in Figure 4. It is noted that, at LM, the plots started to reach their steady state (>95%) after ~6.4 years while at GRN it was achieved after ~15.4 years. The exponential canopy growth for LM, as reflected by the ‘b’ values (Table 1) and time taken to reach the steady growth stage, was as follows: tZone 1 > tZone 2 > tZone 3 > tZone 4 At GRN, a similar pattern was obtained where tZone 2 > tZone 3
Chemical parameters
The variation of pH and dissolved oxygen across the sites studied was found to be insignificant (p>.01). The salinity values, recorded using the practical salinity scale at LM and GRN (Table 2), were found to vary based on the positioning of the plots (Figure 1). Salinity values for LM (S1, S2 and S3) in Zone 1 and LM (S4 and S5) in Zone 2, which were all on the seaward side, ranged from 35 to 36. The salinity in the rest of the LM mangrove plots, irrespective of their zones, varied from 31 to 36. The salinity at GRN (S1 and S2) ranged from 22 to 30, while that of S3, which was in close proximity to a river, ranged from 5 to 21. The ‘b’ values of all mangrove plots under study displayed a positive correlation with salinity (r=0.438, p<0.01).
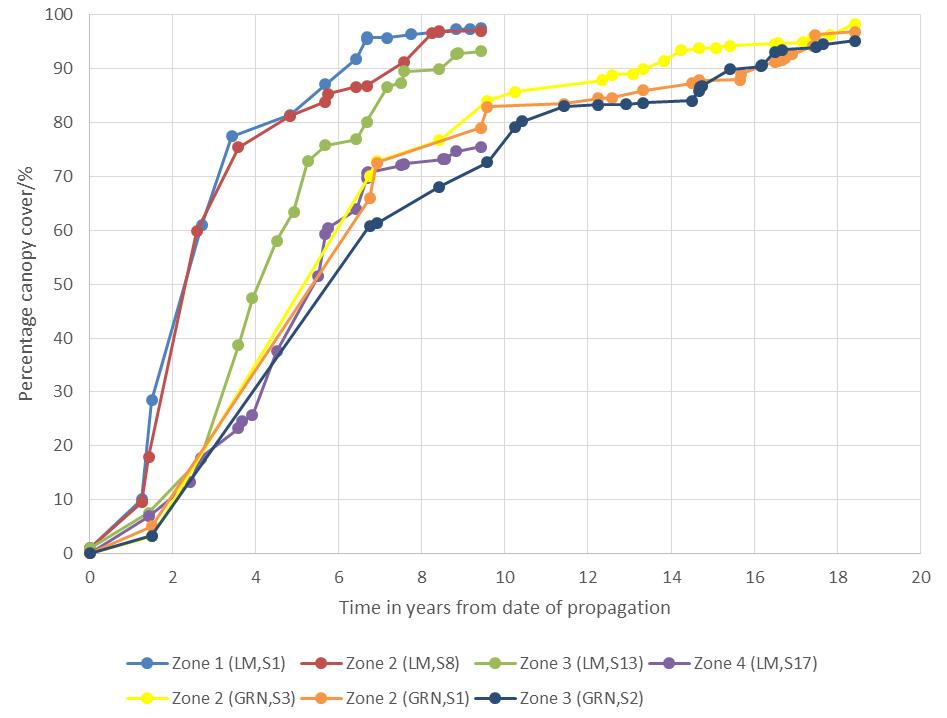
Discussion
The mangrove canopy for the two sites, LM and GRN, was compared over time. Higher ‘b’ values were recorded at LM (1.392–2.886) than at GRN (1.752–1.957). Because the mangrove planted under the Mangrove Propagation Programme at LM (2 seedlings per m2) was denser than that at GRN (1.68 seedlings per m2), it is expected that GRN plots took more time to reach a percentage canopy cover of >95% (stationary stage).
51 Volume 119| Number 1/2 January/February 2023 Research Article https://doi.org/10.17159/sajs.2023/13716 Monitoring mangrove canopy growth using remote sensing Page 4 of 7
Figure 4: Typical percentage canopy cover pattern observed at Le Morne (LM): Zone 1 (LM S1) in blue, Zone 2 (LM S8) in red, Zone 3 (LM S13) in green and Zone 4 (LM S17) in purple, and at Grande Rivière Noire (GRN): Zone 2 (GRN S3) in yellow, Zone 2 (GRN S1) in orange and Zone 3 (GRN S2) in dark blue. The x-axis represents the time in years from the date of propagation; GRN 2003 and LM 2012.
Table 1: Zonation, percentage substrate underwater at low and high tides, percentage of canopy cover as of 2021, area of mangrove plot and the coefficient of rate of increase of canopy coverage, ‘b’ at Le Morne (S1–S17) and Grande Rivière Noire (S1–S3)
However, adjustments for the plant densities indicate that the ‘b’ values of GRN (~2.3 for Zone 2) are slightly higher than those of LM (~2.0 for Zone 2); which is expected given their proximity and hence similar climate conditions, but with the added advantages of slightly longer hours of sunshine and a wider salinity range for GRN sites.
The two sites were further investigated zone-wise. The ‘b’ values were as follows: bZone 1 > bZone 2 > bZone 3 > bZone 4 (Table 1; Figure 4). As GRN plots correspond only to Zones 2 and 3, they showed more or less the same tidal variation, thus explaining their similar ‘b’ values. These results suggest that higher ‘b’ values relate to regions with longer periods of tidal inundation. This finding is in line with studies carried out by He et al.34 and Hoppe-Speer et al.35, who found that Rhizophora mucronata was healthier in inundated areas compared to non-inundation zones. Similarly, Jackson and Drew36 and Adams37 reported that, as a response to prolonged inundation, estuarine plants grow more rapidly to increase the biomass over the water surface.
The pH and and dissolved oxygen recorded at LM and GRN were in the ranges 7.4–8.2 ppm and 7.75–9.18 ppm, respectively, while the salinity at LM and GRN were in the ranges 31–36 and 5–30, respectively. Studies involving the physicochemical properties of the mangrove ecosystem show that pH (7.4 to 8.2)38-41 and dissolved oxygen level (2.71 to 9.93 ppm)42 are not limiting factors to mangroves within these ranges. It is interesting to note that Rakotomavo et al.43 reported higher growth percentages at salinities of 15–25, with an optimum around 25
under controlled conditions44. Hoppe-Speer et al.35, on the other hand, reported an optimal salinity range of 8–18. Our results for Rhizophora mucronata under natural environmental conditions are not necessarily in disagreement when taking other factors, such as nutrient availability at the sites, into consideration.
The application of this novel technique based on pixel count and image processing of planted mangrove areas was successfully employed to determine the mangrove canopy growth rate to better understand the strategies employed for planting mangroves and determining the important parameters that promote growth. It was found that the highest ‘b’ values for Rhizophora mucronata growing under natural environmental conditions were favoured by two specific criteria: zones with higher percentage substrate submerged by water at low tide (Zone 1) and with salinities >30.
This technique can be further extended to identify potential areas for mangrove propagation worldwide based on the optimum growth parameters identified, especially in areas where mangroves are declining rapidly, thereby preventing them from becoming critically vulnerable, endangered, or extinct.45
Conclusions
This study highlights the potential use of remote sensing techniques along with image processing for mapping and monitoring mangrove
52 Volume 119| Number 1/2 January/February 2023 Research Article https://doi.org/10.17159/sajs.2023/13716
Monitoring mangrove canopy growth using remote sensing Page 5 of 7
Mangrove plot Zonation Percentage substrate underwater Tidal level variation (cm) Percentage canopy cover (2021) Area of plot (m2) Coefficient of rate of increase of canopy coverage, ‘b’ At low tide At high tide Le Morne S1 Zone 1 100 100 6.2–36.0 97.5 1094 2.654 S2 Zone 1 100 100 6.2–29.5 96.6 1588 2.886 S3 Zone 1 100 100 5.8–28.8 96.7 2504 2.319 S4 Zone 2 80 100 5.4–22.5 98.9 2322 2.019 S5 Zone 2 80 100 5.2–21.3 96.5 3944 1.987 S6a Zone 3 0 100 0.0–5.8 90.6 671 1.791 S6b Zone 4 0 0 0.0–0.0 80.3 322 1.554 S7a Zone 3 0 100 0.0–8.7 81.9 2011 1.756 S7b Zone 4 0 0 0.0–0.0 72.7 1063 1.161 S8 Zone 2 80 100 9.0–34.1 97.1 2777 1.961 S9 Zone 2 80 100 8.2–28.5 95.0 1266 2.102 S10 Zone 2 80 100 2.0–16.8 96.6 2187 2.296 S11a Zone 3 0 100 0.0–8.7 82.5 4128 1.741 S11b Zone 4 0 0 0.0–0.0 75.3 1573 1.440 S12 Zone 3 0 75 0.0–8.8 91.0 1455 1.800 S13 Zone 3 0 100 1.9–25.0 93.3 688 1.792 S14 Zone 3 0 80 2.0–8.1 88.5 465 1.584 S15 Zone 2 80 100 2.1–22.5 95.6 3611 1.960 S16 Zone 3 0 100 0.0–14.8 85.5 8556 1.829 S17 Zone 4 0 0 0.0–0.0 75.5 3508 1.392 Grande Rivière Noire S1 Zone 2 50 100 7.5–41.5 96.8 6658 1.761 S2 Zone 3 0 100 3.8–7.8 95.2 19613 1.752 S3 Zone 2 50 100 3.5–42.1 98.3 4174 1.957
forests. Image classification (pixel counting) with data acquired through Google Earth ProTM was effectively used as a new approach to calculate the canopy coverage represented by ‘b’ values from the time of propagation; ‘b’ values were positively correlated with zonations based on substrate coverage by water, tidal level variation, and salinity for the two sites (with almost similar climates) studied. This technique can be extended to identify potential areas for mangrove propagation, especially in areas where mangroves are declining rapidly.
Acknowledgements
This paper is a component of M.D.D.’s doctoral project and the research was funded by the University of Mauritius and by the Higher Education Commission of Mauritius. We thank the Ministry of Blue Economy, Marine Resource, Fisheries and Shipping for authorisation to work at the selected mangrove sites and for provision of relevant information. We also thank the University of Mauritius for providing laboratory facilities and logistics facilities. Special thanks go to Mr Rookmoneea and Mr Khamun (who provided invaluable logistical assistance with fieldwork and the facilities) and the services section for logistic facilities.
Competing interests
We have no competing interests to declare.
Authors’ contributions
M.D.D.: Conceptualisation; methodology; data collection; sample analysis; data analysis; validation; data curation; writing – the initial draft; writing –revisions; project leadership; project management; and funding acquisition.
S.D.D.V.R: Conceptualisation; methodology; data analysis; validation; data curation; writing – revisions; student supervision; project leadership; project management; and funding acquisition. S.J.: Conceptualisation; methodology; data analysis; validation; data curation; writing – revisions; student supervision; project leadership; project management; and funding acquisition.
References
1. Liu H, Ren H, Hui D, Wang W, Liao B, Cao Q. Carbon stocks and potential carbon storage in the mangrove forests of China. J Environ Manage. 2014;133:86–93. https://doi.org/10.1016/j.jenvman.2013.11.037
2. Sandilyan S, Kathiresan K. Mangrove conservation: A global perspective. Biodivers Conserv. 2012;21:3523–3542. https://doi.org/10.1007/s10531012-0388-x
3. Mitra A. Mangrove forests in India: Exploring ecosystem services. Cham: Springer; 2020. https://doi.org/10.1007/978-3-030-20595-9
4. Naidoo G. The mangroves of South Africa: An ecophysiological review. S Afr J Bot. 2016;107:101–113. https://doi.org/10.1016/j.sajb.2016.04.014
5. Pysanczyn J. Threats to mangroves: The mangrove action project [document on the Internet] c2021 [cited 2022 Apr 11]. Available from: https://www. themarinediaries.com/tmd-blog/threats-to-mangroves-the-mangrove-actionproject
6. Spalding M, Leal M. The status of the world’s mangroves [document on the Internet]. c2021 [cited 2022 Apr 08]. Available from: https://www. mangrovealliance.org/wp-content/uploads/2021/07/The-State-of-theWorlds-Mangroves-2021-FINAL.pdf
7. Spalding M. World atlas of mangroves. 1st ed. London: Routledge; 2010. https://doi.org/10.4324/9781849776608
8. Ajonina G, Diamé A, Kairo J. Current status and conservation of mangroves in Africa: An overview. World Rainforest Movement Bulletin. 2008;133:1–6.
9. Adams JB, Rajkaran A. Changes in mangroves at their southernmost African distribution limit. Estuar Coast Shelf Sci. 2021;247, Art. #106862. https:// doi.org/10.1016/j.ecss.2020.106862
10. Western Indian Ocean Mangrove Network. Mangroves of Mozambique [document on the Internet]. c2022 [cited 2022 Aug 30]. Available from: http://wiomn.org/countries/mozambique/mangroves-of-mozambique/
11. Western Indian Ocean Mangrove Network. Mangroves of Madagascar [document on the Internet]. c2022 [cited 2022 Aug 30]. Available from: http://wiomn.org/mangroves-of-madagascar/
12. Wang Y, Bonynge G, Nugranad J, Traber M, Ngusaru A, Tobey J, et al. Remote sensing of mangrove change along the Tanzania coast. Marine Geodesy. 2003;26:35–48. https://doi.org/10.1080/01490410306708
13. Mangora MM, Lugendo BR, Shalli MS, Semesi S. Mangroves of Tanzania. In: Bosire JO, Mangora MM, Bandeira S, Rajkaran A, Ratsimbazafy R, Appadoo C, et al. editors. Mangroves of the Western Indian Ocean: Status and management. Zanzibar: WIOMSA; 2015. p. 161.
14. Adams JB, Veldkornet D, Tabot P. Distribution of macrophyte species and habitats in South African estuaries. S Afr J Bot. 2016;107:5–11. https://doi. org/10.1016/j.sajb.2016.08.001
15. Western Indian Ocean Mangrove Network. Mangroves of Mauritius [document on the Internet]. c2022 [cited 2022 Aug 30]. Available from: http://wiomn. org/mangroves-of-mauritius/
16. Giri C. Observation and monitoring of mangrove forests using remote sensing: Opportunities and challenges. Remote Sens. 2016;8(9):783. https:// doi.org/10.3390/rs8090783
17. Hoppe-Speer SCL, Adams JB, Rajkaran A. Mangrove expansion and population structure at a planted site, East London, South Africa. South For. 2015;77(1):131–139. https://doi.org/10.2989/20702620.2014.1001622
18. David RM, Rosserand NJ, Daniel N, Donoghuem M. Remote sensing for monitoring tropical dryland forests: A review of current research, knowledge gaps and future directions for southern Africa. Environ Res Commun. 2022;4(4):1–21. https://doi.org/10.1088/2515-7620/ac5b84
19. Fatoyinbo TE, Simard M. Height and biomass of mangroves in Africa from ICESat/GLAS and SRTM. Int J Remote Sens. 2013;34(2):668–681. https:// doi.org/10.1080/01431161.2012.712224
20. Republic of Mozambique. Mapping of healthy and degraded mangrove vegetation in the Limpopo basin estuary [document on the Internet]. c2022 [cited 2022 Apr 10]. Available from: https://www.climatelinks.org/resources/ mapping-healthy-and-degraded-mangrove-vegetation-limpopo-basinestuary
21. RCMRD GeoPortal. Mozambique mangrove cover [document on the Internet]. c2022 [cited 2022 Aug 23]. Available from: https://rcmrd. africageoportal.com/datasets/africageoportal::mozambiquemangrovecover/ explore?location=-22.294149%2C-18.715567%2C3.46
22. Suhardiman A, Tsuyuki S, Sumaryono M, Sulistioadi Y. Geostatistical approach for site suitability mapping of degraded mangrove forest in the Mahakam Delta, Indonesia. J Geogr Inf Syst. 2013;5:419–428. https://doi. org/10.4236/jgis.2013.55040
23. Omar H, Misman MA, Musa S. GIS and remote sensing for mangroves mapping and monitoring. In: Rocha J, Abrantes P, editors. Geographic information systems and science. London: IntechOpen; 2019. https://doi. org/10.5772/intechopen.81955
24. Walaiporn P, Manatsanan T. Mapping of mangrove change with remote sensing in Samut Songkhram Province, Thailand. In: Ahram T, Taiar R, Gremeaux-Bader V, Aminian K, editors. Human interaction, emerging technologies and future applications II. Cham: Springer; 2020. p. 1152. https://doi.org/10.1007/978-3-030-44267-5_29
25. Thakur S, Mondal I, Ghosh PB, Das P, De TK. A review of the application of multispectral remote sensing in the study of mangrove ecosystems with special emphasis on image processing techniques. Spat Inf Res. 2020;28:39–51. https://doi.org/10.1007/s41324-019-00268-y
26. Kamal M, Phinn S, Johansen K. Characterizing the spatial structure of mangrove features for optimizing image-based mangrove mapping. Remote Sens. 2014;6:984–1006. https://doi.org/10.3390/rs6020984
27. Ramsey EW III, Jensen JR. Remote sensing of mangrove wetlands: Relating canopy spectra to site-specific data. Photogramm Eng Remote Sens. 1996;62:939–948.
28. Davis BA, Jensen JR. Remote sensing of mangrove biophysical characteristics. Geocarto Int. 1998;13:55–64. https://doi.org/10.1080/10106049809354665
29. Heumann BW. Satellite remote sensing of mangrove forests: Recent advances and future opportunities. Prog Phys Geogr. 2011;35(1):87–108. https://doi. org/10.1177/0309133310385371
30. Kuenzer C, Bluemel A, Gebhardt S, Quoc TV, Dech S. Remote sensing of mangrove ecosystems: A review. Remote Sens. 2011;3:878–928. https:// doi.org/10.3390/rs3050878
53 Volume 119| Number 1/2 January/February 2023 Research Article
https://doi.org/10.17159/sajs.2023/13716
Monitoring mangrove canopy growth using remote sensing Page 6 of 7
31. Rajkaran A, Adams JB, Du Preez D. A method for monitoring mangrove harvesting at the Mngazana estuary, South Africa. Afr J Aquat Sci. 2004;29(1):57–65. https://doi.org/10.2989/16085910409503792
32. Maurya K, Mahajan S, Chaube N. Remote sensing techniques: Mapping and monitoring of mangrove ecosystem – A review. Complex Intell Syst. 2021;7:2797–2818. https://doi.org/10.1007/s40747-021-00457-z
33. Karadavut U. Non-linear models for growth curves of triticale plants under irrigation conditions. Turk J Field Crops. 2009;14(2):105–110.
34. He B, Lai T, Fan H, Wang W, Zheng H. Comparison of flooding-tolerance in four mangrove species in a diurnal tidal zone in the Beibu Gulf. Estuar Coast Shelf Sci. 2007;74:254–262. https://doi.org/10.1016/j.ecss.2007.04.018
35. Hoppe-Speer SCL, Adams JB, Rajkaran A, Bailey D. The response of the red mangrove Rhizophora mucronata Lam. to salinity and inundation in South Africa. Aquat Bot. 2011;95(2):71–76. https://doi.org/10.1016/j.aquabot.2011.03.006
36. Jackson MB, Drew MC. Effects of flooding on growth and metabolism of herbaceous plants. In: Kozlowski T, editor. Flooding and plant growth. New York: Academic Press; 1984. p. 47–128. https://doi.org/10.1016/b978-012-424120-6.50008-0
37. Adams JB. The importance of fresh water to the survival of estuarine plants [PhD thesis]. Port Elizabeth: University of Port Elizabeth; 1994. p. 172.
38. Sah KD, Sahoo AK, Gupta SK, Banerjee SK. Mangrove vegetations of Sunderbans and their effect on the physicochemical and nutrient status of the soils. Biol Sci. 1989;55:125–132.
39. Hossain MZ, Aziz CB, Saha ML. Relationships between soil physico-chemical properties and total viable bacterial counts in Sunderban mangrove forests, Bangladesh. Dhaka Univ J Biol Sci. 2012;21(2):169–175. https://doi. org/10.3329/dujbs.v21i2.11515
40. Das S, De M, Ganguly D, Maiti TK, Mukherjee A, Jana TK, et al. Depth integrated microbial community and physico-chemical properties in mangrove soil of Sundarban, India. Adv Microbiol. 2012;2:234–240. https://doi.org/10.4236/ aim.2012.23028
41. Hossain MD, Nuruddin AA. Soil and mangrove: A review. J Environ Sci Technol. 2016;9:198–207. https://doi.org/10.3923/jest.2016.198.207
42. Dubuc AIA. Dissolved oxygen as a constraint for the structure of mangrove fish assemblages and their patterns of mangrove utilisation: A comparison between natural and disturbed mangrove ecosystems through the Australian and Caledonian coastlines [PhD thesis]. Townsville, Qld: James Cook University; 2019.
43. Rakotomavo A, Mandimbinirina DS, Roger E. Development prospects of the mangrove relic of Foulpointe-East Madagascar. J Environ Prot. 2018;9(8):859–869. https://doi.org/10.4236/jep.2018.98053
44. Aziz I, Khan M. Salt tolerance in Rhizophora mucronata Lam. Pak J Bot. 2001;33.
45. Duke NC, Meynecke JO, Dittmann S, Ellison AM, Anger K, Berger U, et al. A world without mangroves? Science. 2007;317(5834):41–42. https://doi. org/10.1126/science.317.5834.41b
https://doi.org/10.17159/sajs.2023/13716
54 Volume 119| Number 1/2 January/February 2023 Research Article
Monitoring mangrove canopy growth using remote sensing Page 7 of 7
AUTHORS:
Edward J. Westraadt1
Warren J. Brettenny1
Chantelle M. Clohessy1
AFFILIATION:
1Department of Statistics, Nelson Mandela University, Gqeberha, South Africa
CORRESPONDENCE TO:
Edward Westraadt
EMAIL: s215052064@mandela.ac.za
DATES:
Received: 24 Jan. 2022
Revised: 28 July 2022
Accepted: 01 Sep. 2022
Published: 31 Jan. 2023
HOW TO CITE:
Westraadt EJ, Brettenny WJ, Clohessy CM. Deep learning for photovoltaic defect detection using variational autoencoders. S Afr J Sci. 2023;119(1/2), Art. #13117. https:// doi.org/10.17159/sajs.2023/13117
ARTICLE INCLUDES:
☒ Peer review
☐ Supplementary material
DATA AVAILABILITY:
☐ Open data set
☐ All data included
☒ On request from author(s)
☐ Not available
☐ Not applicable
EDITOR: Michael Inggs
KEYWORDS:
photovoltaics, fault detection and classification, deep learning, CNN, convolutional neural networks, VAE, variational autoencoders
FUNDING:
South African National Research Foundation (SFH180517331201, TTK190408428135); South African Statistical Association; Nelson Mandela University
Deep learning for photovoltaic defect detection using variational autoencoders
Faults arising in photovoltaic (PV) systems can result in major energy loss, system shutdowns, financial loss and safety breaches. It is thus crucial to detect and identify faults to improve the efficiency, reliability, and safety of PV systems. The detection of faults in large PV installations can be a tedious and timeconsuming undertaking, particularly in large-scale installations. This detection and classification of faults can be achieved using thermal images; use of computer vision can simplify and speed up the fault detection and classification process. However, a challenge often faced in computer vision tasks is the lack of sufficient data to train these models effectively. We propose the use of variational autoencoders (VAEs) as a method to artificially expand the data set in order to improve the classification task in this context. Three convolutional neural network (CNN) architectures – InceptionV3, ResNet50 and Xception – were used for the classification of the images. Our results provide evidence that CNN models can effectively detect and classify PV faults from thermal images and that VAEs provide a viable option in this application, to improve model accuracy when training data are limited.
Significance:
• Faults in PV systems can be labour and time consuming to detect and classify. This process can be automated by using computer vision and thermal images.
• CNN models (InceptionV3, ResNet50 and Xception) are effective in the detection and classification of PV faults from thermal images.
• Small data sets are a common barrier to entry for computer vision assessments. VAEs provide an effective method to artificially expand a limited data set to allow for the successful use of CNN models.
• The expansion of training data using VAEs for CNN models can improve the prediction accuracy in these models.
Introduction
The growing realisation that fossil fuels are not a long-term solution to the global energy demand has led to the exploration of alternative, environmentally sustainable, energy resources.1 In recent years, solar power has emerged as a leading renewable energy technology and is experiencing rapid adoption globally.2 South Africa is well placed to benefit from this drive towards renewable energy – particularly from photovoltaic (PV) systems – as the average annual 24-h global solar radiation for South Africa is 220 W/m2, which is higher than the 150 W/m2 observed for parts of the United States, and 100 W/m2 for Europe and the United Kingdom.3
The maintenance of such PV systems is often labour intensive and costly, particularly when there are undetected faults in the system. Such faults can result in major energy loss, system shutdowns, financial loss, and safety breaches. It is thus crucial to detect and identify such faults to improve the efficiency, reliability, and safety of such systems.4 Dunderdale et al.5 investigated the use of convolutional neural network (CNN) architectures on infrared (IR) thermal images to detect and classify module-level faults within PV systems in South Africa. The results of the study showed that this approach can provide a quick and effective solution to this problem. The challenge with many of these applications, however, is that CNN models typically require a considerably large data set to train effective models. In many smaller applications, and at the start of such an initiative, these data are not readily available. In the present study we propose the use of variational autoencoders (VAEs) to create synthetic training images based on a small sample of collected data. The CNN testing data were sampled prior to the VAE training, to ensure complete separation of the testing and training data. This approach can artificially increase the size of an image data set, thus overcoming this barrier to entry and opening up computer vision application to smaller PV operations. We also used the InceptionV36, ResNet507 and Xception8 CNN models to determine the effectiveness of this data augmentation approach and to expand upon the original study of Dunderdale et al.5
Literature review
Photovoltaic systems and fault detection
© 2023. The Author(s). Published under a Creative Commons Attribution Licence.
PV modules absorb energy from sunlight and convert this energy into electricity through a process called the ‘photovoltaic effect’.9 These PV systems are typically composed of one or more modules, an inverter and other mechanical and electrical hardware, all of which are susceptible to faults. PV faults can lead to prolonged reduction in power output or the complete failure of a cell, module or system.10 The detection of faults is therefore critical to the optimal functioning of a PV system. However, in large-scale PV plants, the inspection of solar modules is typically a manual and time-consuming process. As such, recent studies have used various techniques to improve this process. Faults can be classified as those originating on the direct current (DC) side or on the alternating current (AC) side of the module.11 Garoudja et al.4 proposed a model-based fault-detection approach for the early detection of faults on the DC side of PV systems and the identification of whether shading was present. This approach made use of extracted original design manufacturer model parameters and their associated residuals. Although this study provided useful results, noisy and correlated data degraded the fault detection quality.
https://doi.org/10.17159/sajs.2023/13117
55 Volume 119| Number 1/2 January/February 2023
Article
Research
Fault detection using electroluminescence and thermal imagery has gained interest over the last few years owing to the relative ease in which data can be collected. Electroluminescence imaging consists of applying a direct current to a PV module and measuring the resulting photoemissions using an IR-sensitive or charge-coupled device camera.12 This type of imaging is normally done in a dark room. Fioresi et al.13 made use of electroluminescence imagery to identify cracks and contact PV cell faults with promising results. However, this was done manually and proved time-consuming. Dos Reis Benatto et al.14 proposed the use of daylight electroluminescence images captured by a drone to detect faults in PV systems. This daylight-based electroluminescence system was able to capture electroluminescence images during high solar irradiance, but unfortunately resulted in lower-quality images when compared to indoor and stationary systems. More recent studies, such as those of Demirci et al.15 and Tang et al.16, have investigated the use of CNNs to automate this detection process using electroluminescence images. Maximum accuracies of 76% and 83% were obtained by these studies, respectively, but small data set sizes and significantly long training times were identified as limitations to the studies.
Unlike electroluminescence images, IR thermography images are created by IR radiation emitted from the object, whereby a thermal camera detects the temperature at the surface of an object and converts this temperature into colour-assigned electrical signals depending on the intensity reading.17 IR thermography has been applied as an effective tool for detecting faults in PV modules, and the recent development of unmanned aerial vehicles (UAV) has increased cost-effectiveness for large-scale PV plants to detect such faults.18 A UAV (e.g. a drone) equipped with a thermal camera can be flown over a PV system and images can be taken and analysed. Faults are identified as localised areas of higher heat, or ‘hot spots’, on the PV modules. These hot spots occur because the faults impede the flow of electricity, and the excess energy built up by this is dissipated as heat in these areas. These hot spots are evident in IR imaging as areas of discolouration, typically with darker colours indicating hotter regions. Using IR thermography in this manner has the potential for widespread adoption because the fault detection process, through statistical modelling, can be automated.19
Ancuta et al.20 investigated the use of IR thermography as well as solar module measurements, such as module surface temperature, for PV fault analysis, and showed that PV faults become evident as hot spots in IR images, with different fault types exhibiting different hot spot patterns. The identification of fault types in this study was done manually and without
the aid of computer vision and classification techniques. Tsanakas et al.21 performed a study implementing wide area orthophoto IR thermography to detect and classify faults in large-scale PV plants. In addition to IR thermography, electrical performance characterisation using currentvoltage characteristic (IV) curves, as well as electroluminescence images, were used to successfully validate results. According to the preliminary results, it was found that all detected faults were diagnosed, classified, and quantified in terms of fault type and electrical power loss per module. Jaffrey et al.22 produced a PV fault analysis algorithm for thermal images of PV modules using fuzzy logic and a six-class fuzzy logic categorical framework, which was implemented successfully to classify faults.
In a pioneering study in South Africa, Dunderdale et al.5 used thermal images for the detection and classification of faults in PV systems. In the first (detection) phase of the study each panel was classified as either faulty or non-faulty. Faulty panels were further classified according to the type of fault exhibited by the panel. The study made use of feature-based approaches with support vector machine and random forest classifiers as well as CNNs for the detection and classification. The study showed that the CNN approaches performed better for fault classification, obtaining an 89.5% average cross-validated accuracy, in comparison to a maximum accuracy of 82.9% obtained using the feature-based approach.
Photovoltaic fault types
The study of Dunderdale et al.5 proposed the classification of PV module faults as block faults, patchwork faults, single-cell faults, soiling faults, and string faults. These fault types were defined according to the shape of the hot spots present on thermal images. Depictions of these faults, as they would appear on thermal images, are provided in Figure 1.
A block fault is identified as a vertical band exhibiting temperatures significantly higher than those of the rest of the module. A single-cell fault can be identified as a small rectangular shape exhibiting higher temperatures than the rest of the module. Patchwork and string faults are considered extensions of single-cell faults, where multiple rectangular shapes exhibit temperatures higher than the rest of the module. Patchwork faults occur as single-cell faults in a random pattern across a module, while string faults consist of single-cell faults occurring in a straight vertical line on a module. Lastly, soiling faults are typically difficult to identify, mostly because they can differ in size, intensity, and shape. A lack of sufficient examples of the soiling fault class led to its omission in the classification study.5
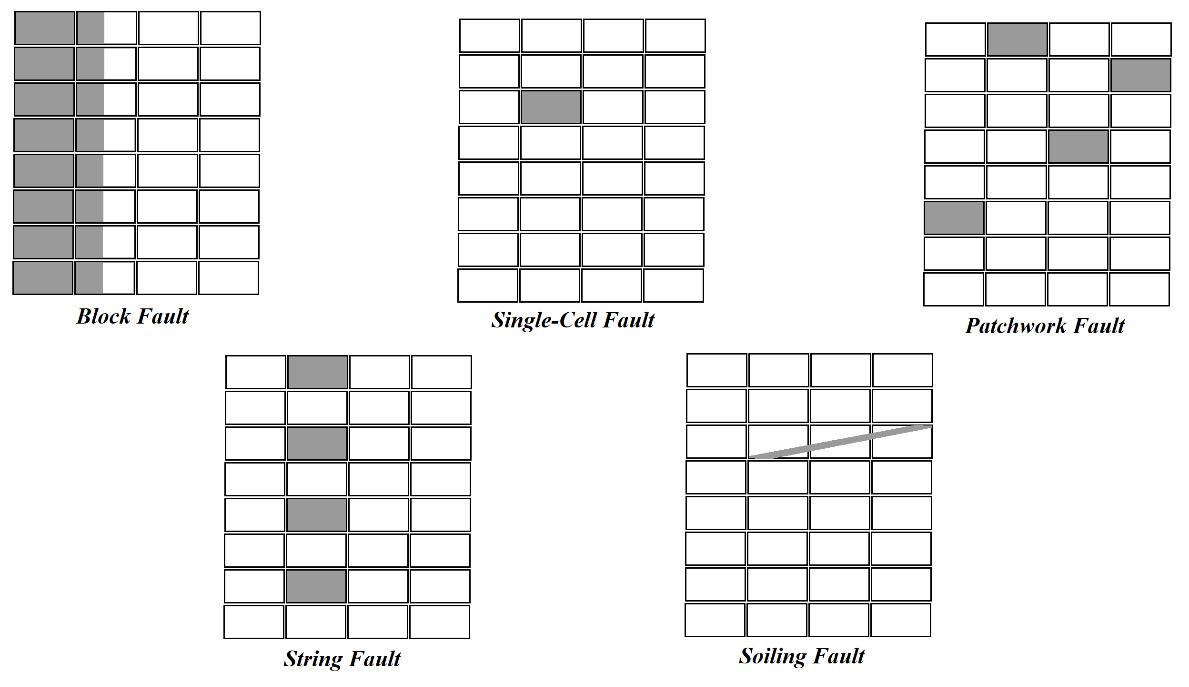
56 Volume 119| Number 1/2 January/February 2023 Research Article https://doi.org/10.17159/sajs.2023/13117 Deep learning for photovoltaic defect detection Page 2 of 8
Source: Based on Dunderdale et al.5 Figure 1: Classification of photovoltaic module faults.
Computer vision and image classification
Deep learning, a specialised form of machine learning, is fundamental in modern computer vision tasks. Computer vision refers to a computer’s ability to perceive and understand three-dimensional (3D) shapes and objects from two-dimensional (2D) imagery, using mathematical techniques and algorithms.23 In many applications, the purpose of the computer vision task is for image classification. That is, for the purposes of identifying and classifying images according to their attributes or contents. In such applications, supervised CNNs are the most prevalently used technique.24
Basic neural networks are designed to mimic the workings of biological neurons, which receive an input (or stimulus), process it, and respond accordingly. In their simplest form, these artificial neural networks (ANNs) consist of exactly this – an input layer, hidden layer(s), and an output layer. Deep neural networks can be thought of as ‘stacked’ ANNs, or ANNs which have numerous hidden layers, with deep learning representing the process of training or building these networks. According to some recent studies, deep learning models achieve state-of-the-art accuracy in many application areas such as object recognition (computer vision)25 and natural language processing26
In image classification tasks, the input layer of a neural network receives a digital image as a matrix of pixel values. The hidden layer(s) process the image in an effort to provide an accurate output – the label or classification of the image contents. CNNs are a class of artificial neural networks which use a convolution operation in at least one layer of the implemented neural network, although in most cases this operation is used in multiple layers.27 A convolution operation is a linear operation between matrices I and H, and can be defined as28:
where I(u,v) indicates the element located at row u and column v on the matrix (or digital image) I, and H(i,j) represents position of the element on the filter kernel matrix which specifies the weights assigned to each pixel in the convolution operation. The output matrix of the convolution operator is denoted I’
In supervised computer vision tasks, CNNs are trained to detect and classify images based on a given set of input data (training images). This process is achieved through using the backpropagation algorithm – which is ubiquitous in the field of neural networks. CNNs have proven to be highly successful in the field of image classification where the networks typically learn elementary shapes in the initial layers, and more complex details in the deeper layers of the network.27 Typically, a large set of training data (images) is required, as it is important to ensure that the trained model can perform the classification task to a sufficient
degree of accuracy on new and unseen data. In certain real-world applications, such as the one investigated in this study, there is a dearth of useable images for training, making the development of accurate classifications a challenge. To address this challenge, Dunderdale et al.5 used several data augmentation approaches including rotating, flipping, and inverting the training images to increase the sample size. This provided a moderate improvement to classification accuracy. The drawback to this approach is that the number of meaningful and possible augmentations is limited. Additionally, certain augmentations –rotation in this case – result in data augmentations that give misleading and unlikely scenarios. For example, a block fault indicates a vertical hot spot running the length of the panel. Under 90° and 270° rotation this would result in the hot spot running horizontally, which is at odds with the classification. A possible remedy for the data scarcity problem is to generate random synthetic images based on the identified fault classes. This can be achieved using deep generative modelling approaches such as generative adversarial networks and VAEs.29 VAEs are used in this study as generative adversarial networks, while known to provide higherquality images, are difficult to train. VAEs are more stable when training and generate satisfactory images for the current application.
Variational autoencoders
VAEs are generative models that have the ability to synthesise numerous complex data points in a potentially high-dimensional space30 (e.g. digital images) using a given set of training data. Using a generative approach, VAEs can create non-identical images which are similar to the images on which they are trained. As a result, small data sets can be artificially inflated to include any number of synthetic or simulated observations (or images). As a large data set is a common requirement for CNN training in computer vision tasks, VAEs can be used to synthesise training images when inadequate training observations are available.
VAEs are a special case of a traditional autoencoder which is made up of two connected (and trained) neural networks: an encoder and a decoder. The encoder reduces or constricts the representation of the input data to a given set of dimensions or units, and the decoder attempts to re-create the original input from this reduced representation in the latent space. This is illustrated in Figure 2 where an image I is passed through the encoder and represented as a reduced vector in the latent space. The decoder then takes this encoded vector in the latent space and attempts to reconstruct the image (denoted I’) from the reduced representation. The encoder and decoder are trained to minimise a loss function L(I,I’), which measures the differences between the original data (image) and the reconstructed data (image) – known as the reconstruction loss – ensuring that the input and output images are as similar as possible.
VAEs expand on this basic functioning by imposing a probabilistic structure on the latent variables and introducing a random sampling
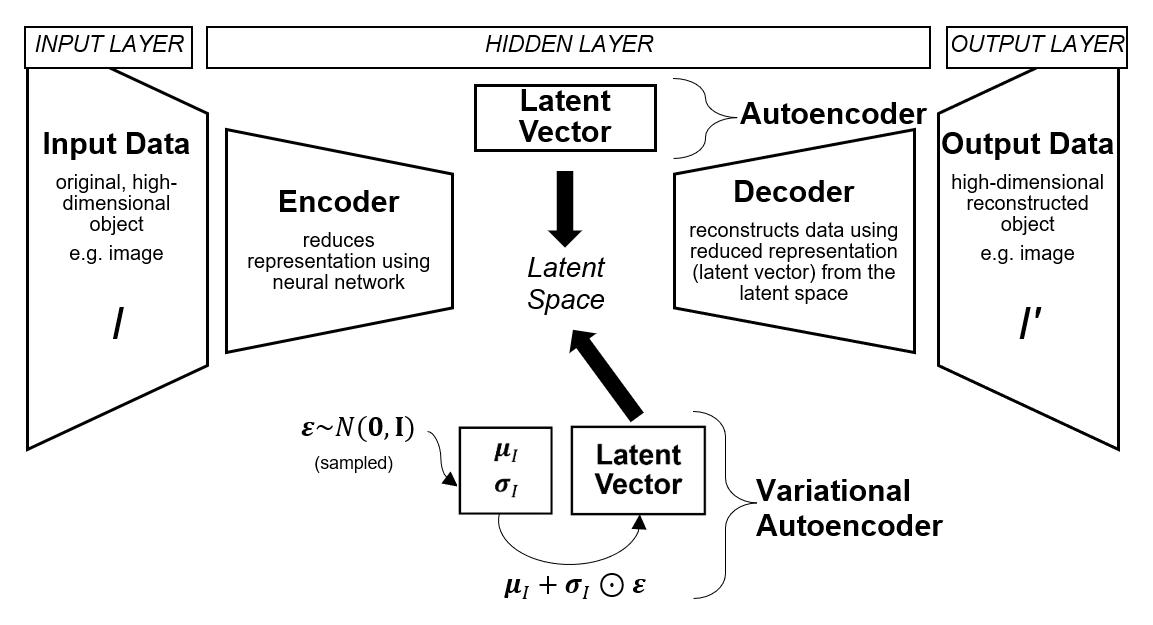
57 Volume 119| Number 1/2 January/February 2023 Research Article
https://doi.org/10.17159/sajs.2023/13117
Deep learning for photovoltaic defect detection Page 3 of 8
Figure 2: Representation of the traditional autoencoder and variational autoencoder.
step in the latent space. For each input object I the VAE determines a k x 1 vector of means (µI) and of standard deviations (σI) creating a single mean–standard deviation pair for each of the k variables in the latent space. Instead of sending the encoded latent values directly to the decoder, as in the traditional autoencoder, VAEs sample individual values from for each latent variable j, j=1,…,k. While this approach renders the network intractable to learning through backpropagation, this is overcome by constructing the latent variable realisations as µI+σI⊙ε where ε(k×1) is a random observation vector from a multivariate standard normal distribution and ⊙ represents the elementwise vector product.27 This is known as the ‘reparameterisation trick’.31
The loss function used for training the VAE consists of two competing terms, one which represents the reconstruction loss (L(I,I')) and another which represents the regularisation loss (R(I,I')). The regularisation loss uses the Kullback–Leibler divergence to measure the degree to which the distribution of the latent variables diverges from that of the multivariate standard normal distribution.27 The loss function is thus represented as
where λ>0 is the regularisation parameter. By using this loss function, the decoder is able to generate images (or outputs) that are similar (but not identical) to the data on which it is trained within a reasonable range.27 This allows for the creation of distinct yet similar images which can be used as training data for a computer vision model.
Data and methodology
Original data
The thermal image data for this study were collected from three different PV plants in South Africa. Due to the privacy agreement with the data’s supplier, the locations of these PV plants cannot be disclosed. All three sites under study make use of crystalline silicon PV modules. A total of 398 thermal images of singular defective PV modules were collected. The thermal images were captured using a UAV equipped with a FLIR Tau 2 640 thermal imaging camera. Once these thermal images were captured and stored, the images were then cropped to show individual PV modules.5 This resulted in a final data set of 376 thermal images indicating modules with hot spots or faults and an additional 400 images of non-faulty modules. The data supporting this study’s results can be obtained on request from the authors.


Dunderdale et al.5 used a four-class classification, namely: block faults, patchwork faults, string faults and single-cell faults. In the current study, it was decided to group string and patchwork fault data into a single class of ‘patchwork’ faults. The motivation behind this was that the string fault class can be considered a special case of the patchwork fault class, where all affected cells occur in a straight vertical line rather than in a random or scattered pattern.32 This is illustrated in Figure 3.
Using this new classification, the 376 fault images are categorised into three distinct classes. The composition of the data set by fault class is given in Table 1, where the three classes are easily identifiable upon examination of a thermal image.
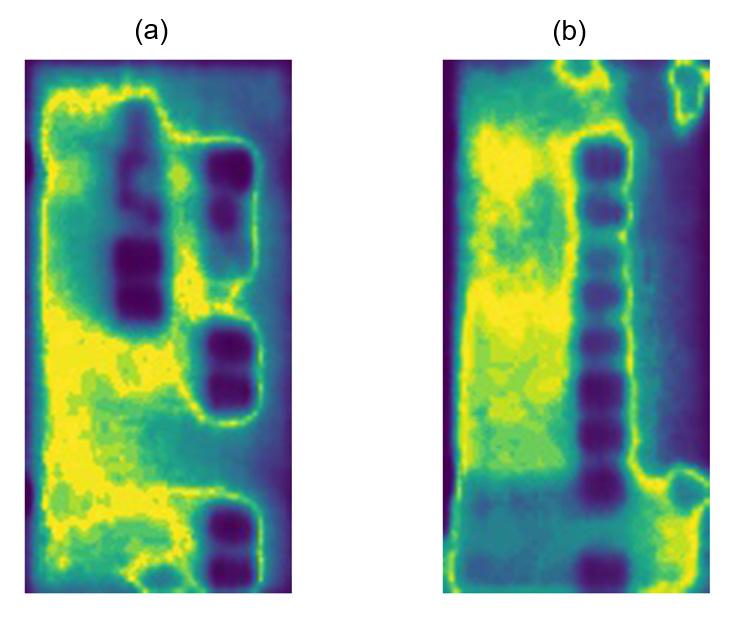
Synthetic images
The VAE approach outlined under the ‘Variational autoencoders’ section above was used to expand the data set. Prior to VAE training, 75 random images were sampled from the original data set and set aside for later use in CNN testing. Thereafter, the VAEs were trained separately for the block, single-cell, and patchwork PV fault classes. Each VAE generated an additional 900 images for each class. An example of the image generation for the single-cell fault class is provided in Figure 4.
For each class of VAE-generated images, manual data cleaning was also performed to remove any potentially ‘noisy’ synthesised images. Noisy images were considered to be any images in which random variations in colour or brightness were observed which may influence the results of analysis. When combined with the original data, the final data set consisted of 2881 images, as shown in Table 2. Included in this data set were the 75 randomly sampled images for testing once the three CNN architectures had been trained.
Data summary and validation
Testing and validation is an imperative step in statistical or machine learning implementation. For this study, approximately 20% of the original images were randomly removed to create the testing data sets.
58 Volume 119| Number 1/2 January/February 2023 Research Article https://doi.org/10.17159/sajs.2023/13117 Deep learning for photovoltaic defect detection Page 4 of 8
Figure 3: Thermal image showing (a) patchwork and (b) string faults.32
Fault class Image example Proportion Block 34% Patchwork and string 43% Single-cell 23%
Table 1: Composition of the data set by fault type32
The testing data sets were sampled from the original data both prior to model training and prior to the generation of synthetic images using VAEs. This ensured that the testing data sets were completely unseen in both assessments. The accuracy of the trained classifiers (one using the original data and one using the VAE-generated images) was determined on their respective testing data sets. The composition of the data sets used for the classification analysis is provided in Table 2.
modules with depth-wise separable convolutional layers.37 These three architectures were chosen because the ResNet50 and InceptionV3 architectures placed first and second in the 2015 ImageNet Large Scale Visual Recognition Challenge, respectively, with the Xception architecture being an extension of one of these high-performing architectures. All architectures were trained and optimised on the training data and their performance, or classification accuracy, was determined on the testing data which were removed prior to training.
Results
Photovoltaic fault detection
Before PV faults can be classified, they first need to be detected. Each of the three CNN models were trained and tested on the training data which consisted of using greyscale images.
Each of the proposed CNN models obtained 100% testing accuracy, indicating perfect out of sample performance. These results agree with those of Dunderdale et al.5, which also produced maximum testing accuracies of 100% for fault detection using two CNN architectures, namely MobileNet and VGG-16. Table 3 provides the confusion matrix for PV fault detection using each of the architectures.
Table 3: Confusion matrix for fault detection task (all models)
Classification methods: Convolutional neural networks
In this study, the deep learning approach constitutes what CNNs use to make decisions regarding fault detection and classification of PV modules. CNNs eliminate the need for manual feature extraction and are able to extract features directly from the raw image data.33 The CNNs are first trained using the training data with the corresponding classification labels, which then allows the system to find and extract features automatically.
Python 3.6.5 64-bit software was used for implementing the three CNN models/architectures: InceptionV3, ResNet and Xception. Python was used due to the vast number of packages available, as well as the easyto-access online support community. In this study, we also made use of the tensorflow package34 and Keras35 interface for analysis, as they allow for pre-trained CNN architectures to be downloaded, implemented, and adjusted in Python.
The Inception CNN architecture was initially introduced by Szegedy et al.36 in 2014. The InceptionV3 architecture (the third version of Inception) was later released by Google and introduced to the Keras core in 2015. The new InceptionV3 architecture allowed for higher computational efficiency with fewer parameters being required. The ResNet (or ResNet50) CNN architecture was introduced by Microsoft in 2015. This architecture was designed to enable a high number of convolutional layers with strong performance, as previous CNN architectures had a drop off in effectiveness owing to additional layers. The Xception CNN architecture was proposed by the creator and chief maintainer of the Keras library, François Chollet, in 2014. This architecture is an extension of the Inception architecture, which replaces the standard Inception
In classification models, this outcome may raise a concern that the models are overfitting the data. However, in this case it is noted both that the accuracy was determined using unseen test data and that the classification task was a straightforward one as the images under study (i.e. fault/no fault) were typically simple to differentiate.
Photovoltaic fault classification
The results of the classification analysis described in ‘Data and methodology’ for the VAE-augmented data set are given in Table 4 for each of the architectures. The values indicated in Table 4 are the row percentages for the confusion matrix; that is, the value of 3.8% in the first row and second column indicates that the InceptionV3 model incorrectly classified 3.8% of the block faults as patchwork faults. Table cells highlighted in grey indicate correctly classified images.
The overall classification accuracy for the InceptionV3 and Xception models was 92%, while for the ResNet50 an accuracy of 89.3% was achieved. This indicates that all the models performed well in this application. To identify the preferred model, both overall accuracy and fault-wise accuracy were considered. This ensured that the highest accuracies were achieved for all three fault types. For the best performing models (i.e. InceptionV3 and Xception), Table 4 indicates that the Xception model performed best for the classification of block and patchwork faults while the InceptionV3 model
59 Volume 119| Number 1/2 January/February 2023 Research Article https://doi.org/10.17159/sajs.2023/13117
Figure 4: An example of 400 synthetic images generated by the variational autoencoders trained on the single-cell fault images.
PREDICTED CLASS Faulty Non-faulty ACTUAL CLASS Faulty 100.0% 0.0% Non-faulty 0.0% 100.0%
Deep learning for photovoltaic defect detection Page 5 of 8
Original data set Testing data set Training data set VAE-generated images VAE-generated images after cleaning VAE-augmented data set† Block 128 27 101 900 847 975 Patchwork 162 32 130 900 837 999 Single-cell 86 16 70 900 821 907 Total 376 75 301 2700 2505 2881 †including testing data
Table 2: Composition of the data sets used for the classification task
achieved a 100% classification accuracy for the single-cell fault class. This indicates that the Xception model may perform better for multiple-cell faults, which make up a sizeable proportion of faults in practice and are also of interest to operators as this type of fault can significantly reduce module power.38 These results suggest that the Xception model may be preferred in practical applications.
Table 4: Confusion matrix for the classification task using the VAEaugmented data set. Table cells highlighted in grey indicate correctly classified images.
observed for the models trained on the original data and those trained on the VAE-augmented data validate the use of VAEs for data inflation purposes. As similar characteristics are observed for both approaches, there is evidence that the VAE process generates relevant and useful images which are in line with those from the original data set.
Table 6 provides a comparison of the accuracies of the three CNN modules based on the testing data for the VAE-augmented and original data sets.
The results in Table 6 provide evidence that the artificial inflation of the data set size using the synthetic images generated using VAEs does improve the classification accuracy of the fitted models. This indicates that, in applications where only small data sets are available, the use of VAEs to generate artificial training data, based on the original data, can lead to improved classification accuracies in these models. Because small data sets are a common problem in many applications, the results suggest that VAEs provide a viable method for data inflation which can lead to improved discrimination in classification models.
For comparative purposes, and to determine whether the use of VAEgenerated synthetic images in the training of the models improved the classification accuracy, the results of the same models trained on the original data set are provided in Table 5.
Table 5: Confusion matrix for the classification task using the original data set. Table cells highlighted in grey indicate correctly classified images.
The use of the VAE-augmented data set resulted in accuracy increases of between 0.3% and 4.3%. This appears to be dependent on the architecture on which the model is based, as the structurally similar InceptionV3 and Xception models both experienced considerably higher improvements than that of the ResNet50 model. For the models trained on the original data set, the results were similar to those of Dunderdale et al.5 who achieved a maximum accuracy of 89.5% for a four-category problem. The improved accuracy observed for the Xception model could simply be a result of the present study being reduced to a three-category problem. However, the improvement in accuracy as a result of the artificial inflation of data through VAEs provides a notable advancement to the work of Dunderdale et al.5
Conclusion
CNN models trained on the VAE-augmented data set showed that all three architectures were able to detect PV faults with 100% testing accuracy. These results are an improvement on those of Dunderdale et al.5 This indicates that the proposed method is highly effective in distinguishing between faulty and non-faulty PV modules using thermal images.
For fault classification, the VAE-augmented approach achieved an overall testing classification accuracy for the InceptionV3 and Xception models of 92%, with the ResNet50 model achieving an accuracy of 89.3%. This indicates that all models performed well in the classification task. Further investigation of the fault-wise accuracy found that the Xception model performed better in identifying multiple-cell faults of PV modules and tended to have a consistently higher accuracy for each fault type. As such, the Xception model is recommended ahead of the InceptionV3 and ResNet50 models.
The overall accuracy for the Xception model was 90.4%, while ResNet50 and InceptionV3 achieved accuracies of 89.0% and 87.7%, respectively. Similar to the previous results, the Xception model performed best for the multiple-cell faults, and all models performed relatively poorly for the classification of the patchwork fault class. These findings are in agreement with the results found in Dunderdale et al.5 Again, the Xception model may be considered to be the best performer as it has the highest accuracy and is the most consistent. Furthermore, similar traits
The comparative analysis performed in this study showed that the models trained using the VAE-augmented data consistently outperformed those trained on the original data set. This improvement was more evident for the InceptionV3 and Xception models than it was for the ResNet50 model. This may indicate that improved accuracies from a VAE-augmentation of a training data set may be model dependent.
In comparing the results obtained in the study to that of Dunderdale et al.5 the use of VAE-augmented training data improved model accuracies for fault classification. Although Dunderdale et al.5 reports results on a four-category problem, the combination of the string and patchwork
60 Volume 119| Number 1/2 January/February 2023 Research Article https://doi.org/10.17159/sajs.2023/13117
PREDICTED CLASS Block Patchwork Single-cell ACTUAL CLASS Block InceptionV3 92.5% 3.8% 3.8% ResNet50 96.2% 0.0% 3.8% Xception 96.2% 0.0% 3.8% Patchwork InceptionV3 0.0% 87.6% 12.4% ResNet50 0.0% 84.3% 15.7% Xception 0.0% 90.6% 9.4% Single-cell InceptionV3 0.0% 0.0% 100.0% ResNet50 5.8% 5.8% 88.5% Xception 0.0% 11.9% 88.1%
PREDICTED CLASS Block Patchwork Single-cell ACTUAL CLASS Block InceptionV3 100% 0.0% 0.0% ResNet50 100% 0.0% 0.0% Xception 100% 0.0% 0.0% Patchwork InceptionV3 3.3% 73.3% 23.3% ResNet50 0.0% 76.7% 23.3% Xception 3.3% 83.3% 13.3% Single-cell InceptionV3 0.0% 5.6% 94.4% ResNet50 0.0% 5.6% 94.4% Xception 0.0% 10.7% 89.3%
VAE-augmented Original InceptionV3 92.0% 87.7% ResNet50 89.3% 89.0% Xception 92.0% 90.4%
Table 6: Accuracy comparison of convolutional neural network models by training data
Deep learning for photovoltaic defect detection Page 6 of 8
faults is validated both by their similar appearance on thermal images as well as by similar groupings being used in related studies.39
The VAE approach used in this study proved to be successful in artificially increasing a data set size and is therefore recommended in applications where limited data are available for analysis. This finding shows that the entry point to the use of computer vision methods in practice is lower than originally thought as smaller data sets can be inflated using synthetic VAE-generated images to train effective and accurate classification models.
Acknowledgements
The financial assistance of the South African National Research Foundation (NRF) towards this research is hereby acknowledged. Opinions expressed and conclusions arrived at are those of the authors and are not necessarily to be attributed to the NRF. The workstation is funded through NRF grants SFH180517331201 and TTK190408428135. We also thank the South African Statistical Association (SASA) and Nelson Mandela University PGRS (Postgraduate Research Scholarships) for their financial support.
Competing interests
We have no competing interests to declare.
Authors’ contributions
E.J.W.: Methodology, sample analysis, data analysis, validation, data curation, writing – initial draft, writing – revisions, project management.
W.J.B.: Conceptualisation, methodology, data collection, writing –revisions, student supervision, project leadership, project management, funding acquisition. C.M.C.: Conceptualisation, methodology, data collection, writing – revisions, student supervision, project leadership, project management, funding acquisition.
References
1. Kirsch S. Running out? Rethinking resource depletion. Extr Ind Soc. 2020;7(3):838–840. https://doi.org/10.1016/j.exis.2020.06.002
2. Chen CJ. Physics of solar energy. Hoboken, NJ: John Wiley & Sons; 2011.
3. South African Department of Energy. Renewable energy: Solar power [webpage on the Internet]. c2010 [cited 2021 Sep 14]. Available from: https://www. energy.gov.za/files/esources/renewables/r_solar.html
4. Garoudja E, Harrou F, Sun Y, Kara K, Chouder A, Silvestre S. Statistical fault detection in photovoltaic systems. Sol Energy. 2017;150:485–499. https:// doi.org/10.1109/icosc.2017.7958710
5. Dunderdale C, Brettenny W, Clohessy C, Van Dyk EE. Photovoltaic defect classification through thermal IR imaging using a machine learning approach. Prog Photovolt. 2020;28(3):177–188. https://doi.org/10.1002/pip.3191
6. Szegedy C, Vanhoucke V, Ioffe S, Shlens J, Wojna Z. Rethinking the inception architecture for computer vision. Proceedings of the IEEE Conference on Computer Vision and Pattern Recognition. 2016:2818–2826. https://doi.org/ 10.1109/cvpr.2016.308
7. He K, Zhang X, Ren S, Sun J. Deep residual learning for image recognition. Proceedings of the IEEE Conference on Computer Vision and Pattern Recognition. 2016:770–778. https://doi.org/10.1109/cvpr.2016.90
8. Chollet F. Xception: Deep learning with depthwise separable convolutions. Proceedings of the IEEE Conference on Computer Vision and Pattern Recognition. 2017:1251–1258. https://doi.org/10.1109/cvpr.2017.195
9. Energy Education. Photovoltaic effect [webpage on the Internet]. No date [cited 2019 Oct 24]. Available from: https://energyeducation.ca/encyclopedia/ Photovoltaic_effect
10. Madeti SR, Singh SN. A comprehensive study on different types of faults and detection techniques for solar photovoltaic system. Sol Energy. 2017;158:161–185. https://doi.org/10.1016/j.solener.2017.08.069
11. Hu Y, Cao W, Ma J, Finney SJ, Li D. Identifying PV module mismatch faults by a thermography-based temperature distribution analysis. IEEE Transactions on Device and Materials Reliability. 2014;14(4):951–960. https://doi. org/10.1109/tdmr.2014.2348195
12. Jahn U, Herz M, Parlevliet D, Paggi M, Tsanakas I, Stein J, et al. Review on infrared and electroluminescence imaging for PV field applications. Photovoltaics Power Systems Programme: Report IEA-PVPS T13-10 [document on the Internet]. c2018 [cited 2021 Sep 24]. Available from: https://iea-pvps.org/ wp-content/uploads/2020/01/Review_on_IR_and_EL_Imaging_for_PV_Field_ Applications_by_Task_13.pdf
13. Fioresi J, Gupta R, Li M, Shah M, Davis K. Deep learning for defect classification of photovoltaic module electroluminescence images [document on the Internet]. c2020 [cited 2021 Oct 27]. Available from: https://www.crcv. ucf.edu/wp-content/uploads/2018/11/Joe_F_Report.pdf
14. Dos Reis Benatto GA, Mantel C, Spataru S, Lancia AA, Riedel N, Thorsteinsson S, et al. Drone-based daylight electroluminescence imaging of PV modules. IEEE J Photovolt. 2020;10(3):872–877. https://doi. org/10.1109/jphotov.2020.2978068
15. Demirci MY, Beşli N, Gümüşçü A. Defective PV cell detection using deep transfer learning and EL imaging [document on the internet]. c2019 [cited 2021 Oct 28]. Available from: https://www.researchgate.net/profile/Ozge-Doguc-2/ publication/344164531_Using_Dimensionality_Reduction_Techniques_to_ Determine_Student_Success_Factors/links/5f577c4b92851c250b9d53c1/ Using-Dimensionality-Reduction-Techniques-to-Determine-StudentSuccess-Factors.pdf#page=314
16. Tang W, Yang Q, Xiong K, Yan W. Deep learning based automatic defect identification of photovoltaic module using electroluminescence images. Sol Energy. 2020;201:453–460. https://doi.org/10.1016/j.solener.2020.03.049
17. Labomat. Thermography / IR temperature measurement: Theory and practice [webpage on the Internet]. No date [cited 2021 Sep 14]. Available from: https://labomat.eu/gb/faq-temperature-hygrometry/806-thermography-IRtemperature-measurement-theory-and-practice.html
18. De Oliveira AK, Aghaei M, Madukanya UE, Nascimento L, Rüther R. Aerial IR thermography of a utility-scale PV plant after a meteorological tsunami in Brazil. 2018 IEEE 7th World Conference on Photovoltaic Energy Conversion (WCPEC). 2018:684–689. https://doi.org/10.1109/pvsc.2018.8548019
19. Alves RH, de Deus Júnior GA, Marra EG, Lemos RP. Automatic fault classification in photovoltaic modules using Convolutional Neural Networks. Renew Energy. 2021;179:502–516. https://doi.org/10.1016/j. renene.2021.07.070
20. Ancuta F, Cepisca C. Fault analysis possibilities for PV panels. Proceedings of the 2011 3rd International Youth Conference on Energetics (IYCE). 2011:1–5. Available from: https://ieeexplore.ieee.org/stamp/stamp.jsp?arnumber= 6028341&casa_token=JCotV1YE6mcAAAAA:SMA8ewAE8tO pP_ uJF8csC7vXiWiOYe0IhWnUwwL1tNXUkukjgPBW_eBM2CmUPSi3WO9GRx9 cBhjrpw&tag=1
21. Tsanakas JA, Vannier G, Plissonnier A, Ha DL, Barruel F. Fault diagnosis and classification of large-scale photovoltaic plants through aerial orthophoto thermal mapping. Proceedings of the 31st European Photovoltaic Solar Energy Conference and Exhibition. 2015:1783–1788. https://doi.org/10.4229/ EUPVSEC20152015-5CO.15.2
22. Jaffery ZA, Dubey AK, Haque A. Scheme for predictive fault diagnosis in photo-voltaic modules using thermal imaging. Infrared Phys Technol. 2017;83:182–187. https://doi.org/10.1016/j.IR.2017.04.015
23. Szeliski R. Computer vision: Algorithms and applications [document on the Internet]. c2010 [cited 2021 Aug 17]. Available from: https://www.cs.ccu. edu.tw/~damon/tmp/SzeliskiBook_20100903_draft.pdf
24. LeCun Y, Bengio Y, Hinton G. Deep learning. Nature. 2015;521(7553):436–444. https://doi.org/10.1038/nature14539
25. Collobert R, Weston J. A unified architecture for natural language processing: Deep neural networks with multitask learning. Proceedings of the 25th International Conference on Machine Learning. 2008:160–167. https://doi. org/10.1145/1390156.1390177
26. Yu D, Hinton G, Morgan N, Chien JT, Sagayama S. Introduction to the special section on deep learning for speech and language processing. IEEE Transactions on Audio, Speech, and Language Processing. 2011;20(1):4–6. https://doi.org/10.1109/tasl.2011.2173371
27. Aggarwal CC. Convolutional Neural Networks. In: Neural networks and deep learning. Cham: Springer; 2018. p. 315–371. https://doi.org/10.1007/9783-319-94463-0_8
https://doi.org/10.17159/sajs.2023/13117
61 Volume 119| Number 1/2 January/February 2023 Research Article
Deep learning for photovoltaic defect detection Page 7 of 8
28. Burger W, Burge MJ. Filters. In: Digital image processing. London: Springer; 2016. p. 89–119. https://doi.org/10.1007/978-1-4471-6684-9_5
29. Gorijala M, Dukkipati A. Image generation and editing with variational info generative adversarial networks [document on the Internet]. c2017 [cited 2021 Oct 24]. Available from: https://arxiv.org/pdf/1701.04568.pdf
30. Doersch C. Tutorial on variational autoencoders [document on the Internet]. c2016 [cited 2021 Aug 10]. Available from: https://arxiv.org/pdf/1606. 05908.pdf
31. Kingma DP, Welling M. An introduction to variational autoencoders. Foundations and trends in machine learning. 2019;12(4):307–392. http:// dx.doi.org/10.1561/2200000056
32. Westraadt E, Clohessy C, Brettenny W. Deep learning techniques for the classification of photovoltaic faults using infrared thermal imagery [master’s dissertation]. Gqeberha: Nelson Mandela University; 2021.
33. Krishna ST, Kalluri HK. Deep learning and transfer learning approaches for image classification [document on the Internet]. c2019 [cited 2021 Jul 26]. Available from: https://www.researchgate.net/profile/Hemantha-Kumar-Kalluri/ publication/333666150_Deep_Learning_and_Transfer_Learning_Approaches_ for_Image_Classification/links/5cfbeeb9a6fdccd1308d6aae/Deep-Learningand-Transfer-Learning-Approaches-for-Image-Classification.pdf
34. Abadi M, Agarwal A, Barham P, Brevdo E, Chen Z, Citro C, et al. Tensorflow: Large-scale machine learning on heterogeneous distributed systems [document on the Internet]. c2016 [cited 2021 Aug 09]. Available from: https://arxiv.org/ pdf/1603.04467.pdf
35. Chollet F. Keras: Deep Learning for humans [webpage on the Internet]. c2015 [cited 2021 May 24]. Available from: https://github.com/fchollet/keras
36. Szegedy C, Liu W, Jia Y, Sermanet P, Reed S, Anguelov D, et al. Going deeper with convolutions. Proceedings of the IEEE Conference on Computer Vision and Pattern Recognition. 2015:1–9. https://doi.org/10.1109/cvpr.2015.7298594
37. Rosebrock, A. ImageNet: VGGNet, ResNet, Inception, and Xception with Keras [webpage on the Internet]. No date [cited 2020 Jan 09]. Available from: https://www.pyimagesearch.com/2017/03/20/imagenet-vggnet-resnetinception-xception-keras/
38. Köntges M, Kurtz S, Packard CE, Jahn U, Berger KA, Kato K, et al. Review of failures of photovoltaic modules. Photovoltaics Power Systems Programme: Report IEA-PVPS T13-01:2014 [document on the Internet]. c2014 [cited 2021 Aug 03]. Available from: http://repository.supsi.ch/9645/1/IEA-PVPS_T1301_2014_Review_of_Failures_of_Photovoltaic_Modules_Final.pdf
39. Haque A, Bharath KVS, Khan MA, Khan I, Jaffery ZA. Fault diagnosis of photovoltaic modules. Energy Sci Eng. 2019;7:622–644. https://doi. org/10.1002/ese3.255
62 Volume 119| Number 1/2 January/February 2023 Research Article
https://doi.org/10.17159/sajs.2023/13117
Deep learning for photovoltaic defect detection Page 8 of 8
AUTHORS:
Taahira Goga1
Kevin Harding2
Valentina Russo3
Harro von Blottnitz1
AFFILIATIONS:
1Environmental and Process Systems Engineering Research Group, Department of Chemical Engineering, University of Cape Town, Cape Town, South Africa
2Industrial and Mining Water Research Unit (IMWaRU), School of Chemical and Metallurgical Engineering, University of the Witwatersrand, Johannesburg, South Africa
3Sustainability, Economics and Waste Research Group, Smart Cluster, Council for Scientific and Industrial Research (CSIR), Stellenbosch, South Africa
CORRESPONDENCE TO:
Taahira Goga
EMAIL:
GGXTAA001@myuct.ac.za
DATES:
Received: 25 Apr. 2022
Revised: 28 Oct. 2022
Accepted: 25 Nov. 2022
Published: 31 Jan. 2023
HOW TO CITE:
Goga T, Harding K, Russo V, Von Blottnitz H. A lifecycle-based evaluation of greenhouse gas emissions from the plastics industry in South Africa. S Afr J Sci. 2023;119(1/2), Art. #13842. https:// doi.org/10.17159/sajs.2023/13842
ARTICLE INCLUDES:
☒ Peer review
☐ Supplementary material
DATA AVAILABILITY:
☐ Open data set
☐ All data included
☒ On request from author(s)
☐ Not available
☐ Not applicable
EDITOR: Michael Inggs
KEYWORDS:
plastics, greenhouse gas, carbon footprint, life cycle, South Africa
FUNDING:
South African National Research Foundation (grant no. 121668)
A lifecycle-based evaluation of greenhouse gas emissions from the plastics industry in South Africa
Increased production rates of plastic and limited disposal methods have fed concerns regarding environmental degradation. Whilst most of the focus is on plastic litter and marine pollution, greenhouse gas emissions of plastic over its value chains are also of interest and non-trivial at the global scale. To quantify the global warming potential of the local plastics industry, a lifecycle-based carbon footprint is presented encompassing activities such as resource extraction, polymer production and conversion, recycling, and disposal stages. The South African plastics sector is estimated to have emitted 15.8 Mt CO2eq in 2015, with the granulate production stage bearing the highest environmental load. The consumption of fossil fuel based electricity and the burning of plastic waste also contribute notably to the overall emissions. Additionally, the recycling process in 2015 saved approximately 1.4 Mt of greenhouse gas emissions.
Significance:
• Research has typically focused on the environmental impacts of the end-of-life stage of plastics, namely disposal and recycling. Despite growing concern, the global warming potential of the local plastics sector across its value chain has not been investigated.
• Greenhouse gas emissions arising from the South African plastic sector are non-trivial and are estimated to total 15.8 Mt CO2eq in 2015.
• Amongst the lifecycle stages, the resin production process had the highest contribution in South Africa due to the country’s coal-based monomer production process.
Introduction
Plastics have become ubiquitous in modern-day existence due to their unique properties, lending themselves to a wide range of applications, with production having increased at an annual global growth rate of 8.4% from 2 Mt in 1950 to 380 Mt in 2015. At the current trajectory, plastic production would reach 1600 Mtpa in 2050.1 In 2015, Geyer et al.1 estimated that 60% of all plastics produced were discarded as waste and are accumulating either in landfills or in the environment with less than 10% having been recycled. The projected demand for plastics as well as the limitations of the current disposal methods raise questions regarding associated environmental impacts such as climate change and marine pollution.
Previously, research was centred around comparing the end-of-life options for plastic waste and analysing various disposal methods for specific plastic products.2,3 Although it was estimated that the chemical industry is responsible for approximately 15% of global greenhouse gas (GHG) emissions, the contribution of plastics to climate change from a lifecycle perspective was unknown.4 A recent study published by Zheng and Suh5 undertook to provide an initial estimate of a carbon footprint on a global scale. The results indicated that global plastics production in 2015 contributed approximately 1.7 Gt CO2eq, equivalent to 3.8% of the total GHG emissions for that year.
With South Africa’s GHG emissions being 122% higher than the G20 average per capita6, carbon dioxide emissions need to be minimised in major industries. As the 32nd largest producer of plastics globally, and with one of the highest plastic consumption rates on the African continent with an average per capita consumption of 24.5 kg/year7, the South African plastics sector plays a significant role in the environmental and economic future of the country. To enable more informed debate, this paper presents an attempt to quantify GHG emissions of the South African plastics industry and value chain, using a lifecycle-based approach similar to Zheng and Suh5. As there is a single environmental impact being estimated, namely greenhouse gas emissions, the study is also referred to as a carbon footprint.
The plastics industry in South Africa
The South African plastics industry is well established with 1.8 million tons of polymer being converted into locally produced products in 2019.8 Just under half of this total was used in packaging (49% of the local market), becoming waste in less than a year, with longer-term applications used in the building and construction sector as well as agriculture. In terms of disposal, recent statistics indicate that one third of the population lack access to regular waste removal services.9 Consequently, an estimated 29% of domestic household waste is subject to what is termed ‘self-help disposal’.10 Although the preferred current waste management method is recycling, the ‘input recycling rate’ is only 40.3% of short-lived plastics and only 17.7% of all converted plastic is recycled content.11 These waste collection gaps thus imply a few associated challenges.8 Among these is that the local waste recycling economy is largely driven by the informal waste sector.12 Furthermore, there is still a significant quantity of post-consumer material (599 kt/a according to the 2019 SA Plastics recycling survey) that is not or is unable to be recycled which is partially disposed of in compliant sanitary landfill sites but also leads to illegal dumping and littering.
© 2023. The Author(s). Published under a Creative Commons Attribution Licence.
Research Article
The local chemical industry, which is responsible for half the polymers consumed in the country, has developed around the gasification of coal.13 Secunda Synfuel Operations produces synthetic liquid fuels via gasification followed by the proprietary Fischer–Tropsch synthesis process.14 Monomers are by-products of this coal-to-liquids
https://doi.org/10.17159/sajs.2023/13842
63 Volume 119| Number 1/2 January/February 2023
fuel production process, which are then converted into polymers such as polypropylene and polyethylene. Therefore, Sasol’s chemical production processes are highly integrated with their synfuels activities serving as a source of energy as well as chemical feedstock and intermediates. This unique situation highlights the intrinsic link between local coal supply, synfuel processing, and plastic production. In the context of a global lowering of CO2 emissions, the future of this coal-based emissionsintensive fuel and chemicals production activity is uncertain.
In Africa, life cycle assessment (LCA)-based research is limited, with few studies focusing on the quantification of plastic-related impacts. Sevitz et al.15 undertook a comparative environmental assessment study for paper and plastic carrier bags in South Africa. It was found that, amongst the dominant processes for the plastic bag life cycle, the electricity generation from coal as well as the coal gasification process had the highest contributions. In terms of end-of-life, Friedrich and Trois16 calculated and compared GHG emissions from waste management processes for municipalities in Africa, considering activities such as landfilling, recycling, and incineration. Results reveal that the greatest GHG savings are achieved through recycling with the potential for greater savings in countries where coal is the primary source of energy production. The Council for Scientific and Industrial Research (CSIR) recently conducted a life cycle sustainability assessment of various grocery carrier bags, of which the majority were plastic.17 For the global warming impact category, it was reported that the fossil-based plastic reusable bags performed better than the biodegradable alternatives, whereas higher recycled content improved the environmental performance of single-use plastic bags. Another recent study by Goga et al.11 showed that increasing mechanical rates to achieve targets set by the South African Plastics Pact would have a significant impact on future virgin polymer demand and waste disposal flows.
LCA is a well-established technique for identifying and quantifying potential environmental impacts of product systems, and the number of LCA-related research studies in South Africa has grown in the past 5 years.18 The recently gazetted regulations pertaining to the extended producer responsibility schemes mandate producers to conduct LCAs in relation to identified products.19 Plastic products identified within the scope include plastic packaging, single-use plastic products, and biodegradable and compostable alternatives.
Method
We aimed to estimate the annual carbon footprint of the South African plastics sector. The method, which entails using a combination of mass flow data and emission factors to estimate GHG emissions for the local plastics system, was loosely based on the approach employed by Zheng and Suh5. The system boundary was demarcated to incorporate three lifecycle stages namely:
1. granulate production, which covered the polymer production processes;
2. conversion, which included activities that transform polymers into plastic products; and
3. end-of-life, which encompassed the final disposal and treatment of plastic waste post-use.
The reference year was set as 2015 due to the availability of material flow data. Total GHG emissions were calculated as the product of plastic production/waste generation and the polymer-specific lifecycle GHG emissions as shown in the following equation:
where Mi represents the annual South African production/waste generation of polymer type i in megatons, and EFi,j represents the perunit emissions factor for polymer type i at its lifecycle stage j in kg CO2/ megaton polymer.

The flow of plastics was modelled as a composite of six major polymer types consumed in South Africa – namely low-density polyethylene, high-density polyethylene, polypropylene, polyethylene terephthalate, polyvinyl chloride, and polystyrene (LDPE, HDPE, PP, PET, PVC, and PS) – as well as an additional polymer sub-group to represent ‘other’
plastics. Three lifecycle stages were considered, namely granulate production, conversion to products, and end-of-life, with the specific flows per polymer obtained from a detailed material flow analysis undertaken for the South African plastics industry in 2015.20 The GHG emission factors were derived mainly from the ecoinvent 3.6 Life Cycle Inventory database21 (using the cut-off allocation system model and the IPCC 2013 GWP 100a impact assessment method) and supplemented by literature sources. These international data sets were generally adapted by including South African energy and water data as well as incorporating the local plastic waste scenario. The terms GLO and RoW symbolise data sets that encompass ‘global’ and ‘rest of world’ data, respectively, while ZA is the country code for South African data. Once the material flows and emission factors per stage were obtained, total GHG emissions were calculated using spreadsheet-based modelling.
Granulate production
To accurately reflect the raw material extraction and monomer production activities that are specific to the South African context, certain factors were incorporated into the research methodology. These factors include the selection of locally produced ethylene and propylene, which are byproducts of the proprietary Fischer–Tropsch synthesis process employed by Sasol to produce synthetic fuels.14 Data for this coal-based pathway were obtained from the most recent version of the ecoinvent database. An average production mix was thereafter compiled with the feedstock consisting of 85% ethylene from the coal gasification process at Sasol with the balance coming from the local refining of imported crude oil.15
In terms of individual polymer flows, certain assumptions were made to obtain a realistic representation of the local industry. As the original source of material flow data presented a total flow of polyethylene, the proportion of low- to high-density polyethylene was ratioed according to domestic consumption statistics presented in the Plastics Industry Master Plan.22 Similarly, the ratio of bottle-grade to amorphous polyethylene terephthalate was modelled according to the percentage provided in the PET producer responsibility organisation guidelines.23 Other modelling characteristics include the division of polystyrene production to satisfy both general and high-impact applications. In addition to the local production of polymers, granulate from imported sources was also considered. Unit processes for the resin production process of the selected polymers obtained from the ecoinvent database21 as well as adaptations for the local process are presented in Table 1.
Conversion
For the conversion stage, polymers are transformed into plastic products using technologies such as injection moulding, stretch blow moulding, and extrusion and thermoforming.24 In addition to incorporating local energy and water data, these data sets were adapted by including LDPE and PP granulate produced in South Africa to represent the bags used for collection and transport. Furthermore, the organic chemical data set that describes the detergents and solvents used was amended to the South African coal-based chemical production process. The selected data sets as well as the relevant adaptations are shown in Table 2.
End-of-life
The emission factor for recycling was obtained from Friedrich and Trois’ development of GHG factors for recycling various materials in Africa25 and included the collection and transport of plastics as well as operations related to the direct recycling process (washing, drying, granulation, and palletisation). For the landfill process, 56.4% of landfill sites treating general waste are unlicensed and were thus considered unsanitary with the remainder of landfilled plastic waste assumed to be treated under sanitary landfill conditions.26 Unrecovered informal waste comprises plastic that is not collected by formal municipal management services. This is typically generated by informal settlements and rural communities that use other forms of disposal such as dumping, burning, and operation of unlicensed landfills. To characterise this flow, it was estimated that 60% of the waste was burnt with the remainder discarded in open dumps.27 The open dump data set was also used to describe the flow of litter. The corresponding ecoinvent unit processes for each end-of-life process along with the necessary adaptations are detailed in Table 3.
64 Volume 119| Number 1/2 January/February 2023 Research Article https://doi.org/10.17159/sajs.2023/13842 Lifecycle-based carbon footprint for the SA plastics sector Page 2 of 6
Lifecycle-based carbon footprint for the SA plastics sector
Table 1: Data source, distribution, and adaptations for resin production processes
Polymer Sub-type and distribution Unit process
HDPE Polyethylene, high density, granulate production {RoW}
Adaptations for South African process
Average ethylene and propylene production mix {ZA}
Chemical, organic, synthetic fuel production from coal {ZA}
Electricity mix, medium voltage {ZA}
Water, unspecified natural origin {ZA}
Waste plastic, mixture {ZA}
LDPE Polyethylene, low density, granulate production {RoW} Same as HDPE
PP Polypropylene, granulate production {RoW}
PET 30% amorphous Polyethylene terephthalate, granulate production, amorphous {RoW}
Same as HDPE
Chemical, organic, synthetic fuel production from coal {ZA}
Ethylene glycol {GLO-ZA}
Electricity mix, medium voltage {ZA}
Water, unspecified natural origin {ZA}
Waste plastic, mixture {ZA}
70% bottle grade Polyethylene terephthalate, granulate production, bottle grade {RoW} Same as amorphous PET
Combination of emulsion and suspension polymerised PVC
Chemical, organic, synthetic fuel production from coal {ZA}
Vinyl chloride production, {RoW-ZA}
PVC Polyvinylchloride, production, bulk polymerisation {RoW}
electricity mix, medium voltage {ZA}
Water, cooling, unspecified natural origin {ZA}
Water, lake, river, and well {ZA}
Waste plastic, mixture {ZA}
Hard coal {ZA}
PS
50% general purpose Polystyrene, production, general purpose {RoW}
Water, cooling, unspecified natural origin {ZA}
Water, lake, river, and well {ZA}
Waste plastic, mixture {ZA}
50% high impact Polystyrene, production, high impact {RoW} Same as general purpose PS
HDPE, high-density polyethylene; LDPE, low-density polyethylene; PP, polypropylene; PET, polyethylene terephthalate; PVC, polyvinyl chloride; PS, polystyrene {RoW}, rest of world data set; {ZA}, South Africa data set; {GLO}, global data set
Table 2: Data source and adaptations for conversion processes
Technology
Unit process
Stretch blow moulding Stretch blow moulding {RoW}
Adaptations for SA process
Electricity mix, medium voltage {ZA}
Water, unspecified natural origin {ZA}
Waste plastic, mixture {ZA}
Chemical, organic, synthetic fuel production from coal {ZA}
Electricity mix, medium voltage {ZA}
Polyethylene, low density, granulate production {RoW-ZA}
Injection moulding
Injection moulding, processing {RoW}
Extrusion
Extrusion of plastic sheets and thermoforming, processing, inline {RoW}
{RoW}, rest of world data set; {ZA}, South Africa data set; {GLO}, global data set
Table 3: Data source and adaptations for end-of-life processes
Process
Sanitary landfill
Polypropylene, granulate production {RoW-ZA}
Water, unspecified natural origin {ZA}
Waste plastic, mixture {ZA}
Chemical, organic, synthetic fuel production from coal {ZA}
Electricity mix, medium voltage {ZA}
Polypropylene, granulate production {RoW-ZA}
Tap water {ZA}
Waste plastic, mixture {ZA}
Unit process
Waste plastic, mixture, treatment of waste plastic, sanitary landfill {RoW}
Adaptations for SA process
Electricity mix, low and high voltage {ZA}
Cement, unspecified {ZA}
Unsanitary landfill Waste plastic, mixture, treatment of waste plastic, unsanitary landfill, dry infiltration class (100 mm) {GLO} n/a
Open dump Waste plastic, mixture, treatment of waste plastic, open dump, dry infiltration class (100 mm) {GLO} n/a
Open burning Waste plastic, mixture, treatment of waste plastic, open burning {GLO} n/a
{RoW}, rest of world data set; {ZA}, South Africa data set; {GLO}, global data set
https://doi.org/10.17159/sajs.2023/13842
65 Volume 119| Number 1/2 January/February 2023 Research Article
Page 3 of 6
Results and discussion
Material flow data
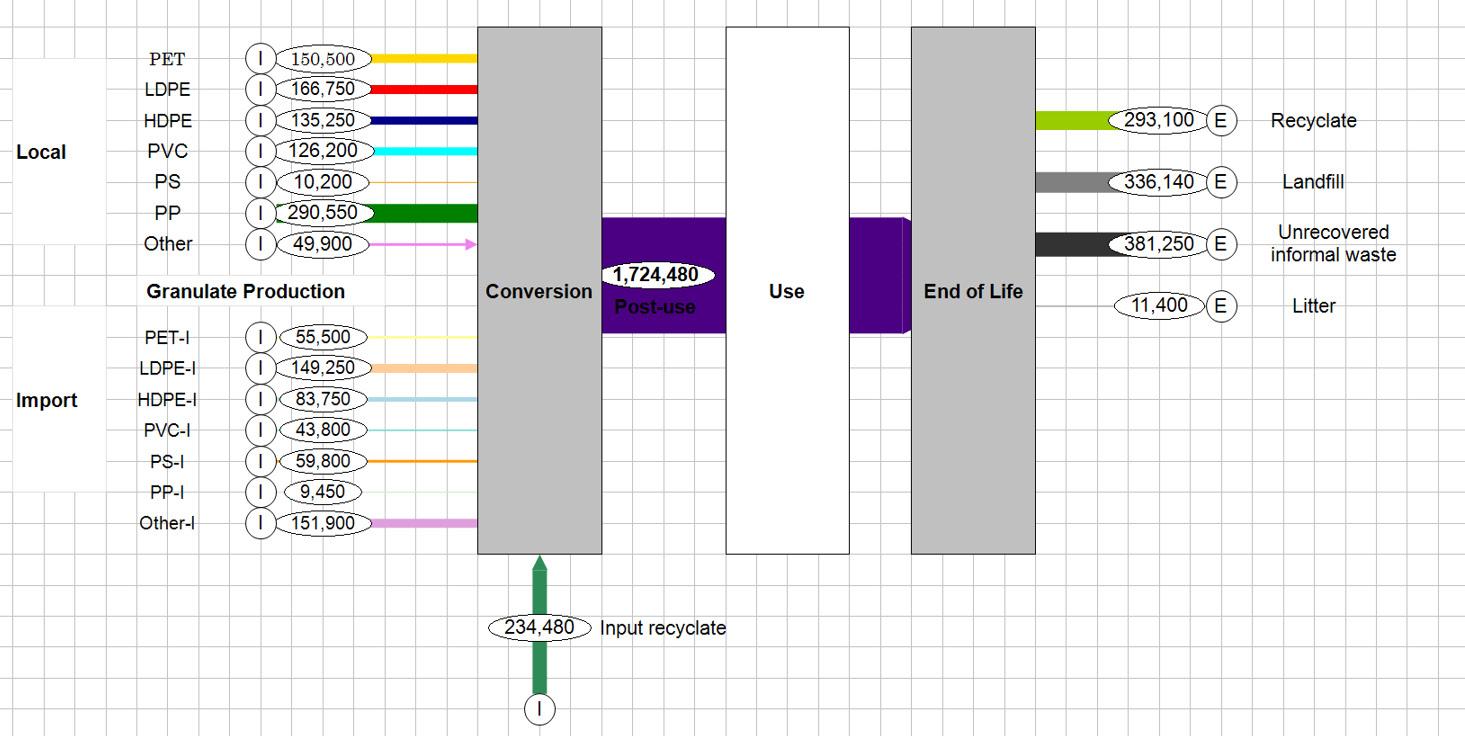
The disaggregation of total plastic flows to individual polymer streams per lifecycle stage is shown in the form of a Sankey diagram (Figure 1). The use stage (white process block) was excluded from the assessment as emissions can vary according to application and the source of the material flow analysis data20 did not include disaggregation per polymer. As the carbon footprint is based on the annual domestic consumption of plastics, the local production of polymers for the system was calculated as the total quantity of polymers produced in South Africa less exported polymers (primary form and intermediates). For the Group 7 plastics, i.e. other plastics, the re-export of the polymer was considered to maintain the integrity of the mass balance.
The material flows in Figure 1 show that polypropylene is the most highly produced local polymer. Polypropylene homopolymers are the only virgin raw material that are in abundance.22 In contrast, there is a shortage of ethylene monomer produced in South Africa. When disaggregating polyethylene, it is evident that this is mainly due to the demand for LDPE exceeding the supply. The Sankey diagram also indicates that polystyrene is mostly imported, which correlates with communication received by Polystyrene SA members stating that pellets are imported from countries such as Brazil, Singapore and Taiwan (Cloete V 2022, personal communication).
Post-use, the largest quantity of waste that is generated is classified as informal waste that remains uncollected and untreated. The output recycling rate (quantity of recyclate available as alternative raw material locally divided by the quantity of total waste) is 19.7%. As the amount of recyclate that feeds back into the system was unknown, a conservative virgin material substitution ration of 1:0.828 was applied. Although the quantity of litter at 11.4 kt is comparatively low, the lightweight nature of plastic implies that this amounts to a significant number of plastic items that end up residing in the natural environment.
Emission factors
The breakdown of the emission factors by lifecycle stage is shown in Table 4 where granulate production was further divided into local and imported production. In addition, the end-of-life stage consists of recycling, landfill, litter, and unrecovered informal waste.
For polymer production, the emission factor of the final polymer type, i.e. other plastics, was calculated as the average value of the other known plastic groups for both imported and local granulate production. For the conversion stage, the average value for the three most common technologies was used. In terms of end-of-life, the value used for recycling excluded any credits that may arise due to the substitution of virgin plastics.
HDPE, high-density polyethylene; LDPE, low-density polyethylene; PP, polypropylene; PET, polyethylene terephthalate; PVC, polyvinyl chloride; PS, polystyrene
Table 4 shows the significant difference in the granulate production from local and imported sources with the local emission factors of polyolefins such as polyethylene (both high and low density) and polypropylene calculated as five times greater than that of imported polymers. This is mainly attributed to their production as derivatives of the coalbased synthetic fuels manufacturing process. For the end-of-life stage, the emission factor for landfilling was low, as conventional plastics do not contain biodegradable carbon and thus do not generate methane. As unrecovered informal waste represents plastic waste that is not
66 Volume 119| Number 1/2 January/February 2023 Research Article https://doi.org/10.17159/sajs.2023/13842 Lifecycle-based carbon footprint for the SA plastics sector Page 4 of 6
Polymer Granulate production Conversion End-of-life Import Local Recycling Landfill Unrecovered informal waste Litter HDPE 2320 12 700 2203 611 131 1515 112 LDPE 2520 12 900 PP 2290 12 600 PET 2931 4968 PVC 2530 7560
3670 3680
Table 4: Emission factors per polymer for each lifecycle stage (kg CO2eq/ton polymer)
PS
Other 2710 9068
HDPE, high-density polyethylene; LDPE, low-density polyethylene; PP, polypropylene; PET, polyethylene terephthalate; PVC, polyvinyl chloride; PS, polystyrene
Figure 1: Mass flows for the South African plastics system in 2015 (tons).
managed by formal waste services, the fraction of waste that was burnt was incorporated into the calculation of the emission factor.
Carbon footprint
The assessment revealed that in 2015, the South African plastic sector was responsible for 15.8 Mt CO2eq over its life cycle (Figure 2). This amount corresponded to 3% of the 527.3 Mt CO2eq emitted in South Africa that year.29 For the modelled polymer flow, the South African economy produced 1.49 Mt of plastics from virgin polymer for domestic consumption in 2015.20 Using the projected annual global demand growth rate of 4%/year, local plastics consumption is expected to grow to 2.68 Mt in 2030.
recycling. In this case, the total demand for polymer would have to be fulfilled by virgin polymer from both local and imported sources. Using a virgin material substitution ratio of 1:0.828 means that an additional 234.5 kt of virgin polymer would have been required. This would have led to an increase in emissions of 1.4 Mt CO2eq from the granulate production stage. Thus, total lifecycle emissions would have been 17.2 Mt CO2eq. Put another way, plastics recycling in 2015 helped avoid 1.4 Mt of GHG emissions.
Conclusion and recommendations
On a life cycle basis, the plastic sector in South Africa emitted an estimated 15.3 Mt CO2eq in 2015. At 3% of total national GHG emissions, this is lower than the global average of 3.8% reported by Zheng and Suh5 The resin production stage was the dominant source of emissions due to the specific nature of ethylene and propylene monomer production in South Africa. Other significant contributions include the impact of coalbased energy in South Africa as well as the emissions from informal disposal methods, particularly the burning of plastic waste.
Recommendations emanating from this study include the extension of the impact assessment to incorporate other impact categories to develop a deeper picture of the environmental impacts of this industry, e.g. the human and ecotoxicity impacts of informal burning of plastic waste. Furthermore, to reduce the impact of the current fossil-based production process, several mitigation scenarios should be assessed. To counteract the high levels of emissions arising from the resin production stage, higher levels of mechanical recycling and the integration of biomass as an alternative to conventional petrochemical feedstock should be analysed. An additional scenario reflecting the incorporation of renewable energy into the country’s energy mix should be investigated to enable a further reduction in environmental impacts.
Acknowledgements
We gratefully acknowledge financial support from the National Research Foundation of South Africa (grant no. 121668).
HDPE, high-density polyethylene; LDPE, low-density polyethylene; PP, polypropylene; PET, polyethylene terephthalate; PVC, polyvinyl chloride; PS, polystyrene IM, injection moulding; SBM, stretch blow moulding; E&T, extrusion and thermoforming Figure 2: Breakdown of South African greenhouse gas (GHG) emissions for 2015 by lifecycle stage and polymer type.
According to the contribution analysis, the resin production stage generated most of the emissions (71%) due to the production of polyolefins such as high- and low-density polyethylene, polypropylene, polyvinyl chloride, and polyethylene terephthalate. This finding can be directly attributed to the unique coal-to-liquid process used in the production of the ethylene and propylene monomers in South Africa, as highlighted by the high local emission factors calculated in Table 4. These results are supported by the findings of two other studies30,31 where it was concluded that coal-based pathways generated higher CO2 emissions than the traditional petroleum-based processes which utilise crude oil as a feedstock. Lifecycle-based studies for plastic products such as HDPE pipes and bottles have also confirmed that most impacts arise from the raw material stage.32,33
Emissions from the conversion process, which accounted for 24% of the total GHG emissions, are a consequence of the coal-fired power that dominates the country’s electricity mix. The end-of-life stage, which contributed 5% to the total emissions, is eclipsed by the informal disposal process due to the incidence of plastic burning. Although landfilling handles most of the plastic waste, it is responsible for the lowest environmental impacts, as fossil fuel-based plastics experience minimal degradation in landfills, unless these experience landfill fires, which are not uncommon in South Africa, but have not been quantified in this study. The recycling process, which included indirect and direct activities, accounted for 0.18 Mt CO2eq.
An additional scenario was modelled to evaluate the impact which recycling is already making, by modelling a hypothetical case without
Competing interests
We have no competing interests to declare.
Authors’ contributions
T.G.: Conceptualisation, methodology, data collection, data analysis, writing – the initial draft. K.H.: Conceptualisation, student supervision. V.R.: Data analysis, student supervision. H.v.B.: Conceptualisation, student supervision.
References
1. Geyer R, Jambeck JR, Law KL. Production, use, and fate of all plastics ever made. Sci Adv. 2017;3, e1700782. https://doi.org/10.1126/sciadv.1700782
2. Dormer A, Finn DP, Ward P, Cullen J. Carbon footprint analysis in plastics manufacturing. J Clean Prod. 2013;51:133–141. https://doi.org/10.1016/j. jclepro.2013.01.014
3. Pasqualino J, Meneses M, Castells F. The carbon footprint and energy consumption of beverage packaging selection and disposal. J Food Eng. 2011;103:357–365. https://doi.org/10.1016/j.jfoodeng.2010.11.005
4. Intergovernmental Panel on Climate Change (IPCC). Edenhofer O, PichsMadruga R, Sokon Y, Farahani E, Kadner S, Seyboth K, et al., editors. Climate change 2014: Mitigation of climate change. Contribution of Working Group III to the Fifth Assessment Report of the Intergovernmental Panel on Climate Change. New York: Cambridge University Press; 2014.
5. Zheng J, Suh S. Strategies to reduce the global carbon footprint of plastics. Nat Clim Chang. 2019;9:374–378. https://doi.org/10.1038/s41558-019-0459-z
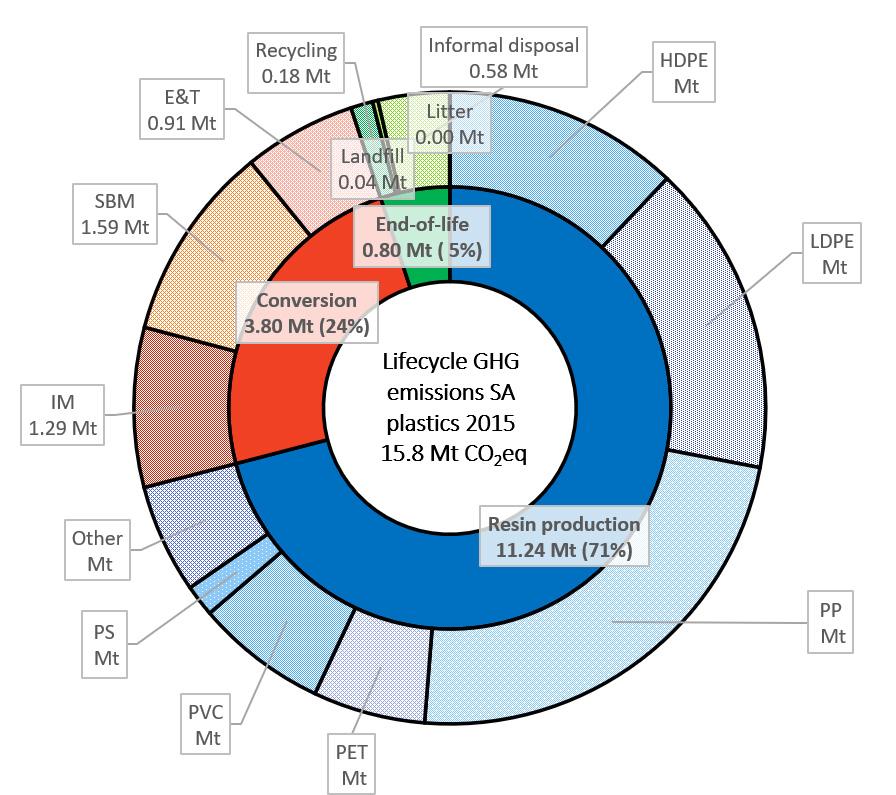
6. Climate Transparency. Climate Transparency report: Comparing G20 climate action towards net zero. Climate Transparency; 2021.
7. Babayemi JO, Nnorom IC, Osibanjo O, Weber R. Ensuring sustainability in plastics use in Africa: consumption, waste generation, and projections. Environ Sci Eur. 2019;31, Art. #60. https://doi.org/10.1186/s12302-019-0254-5
67 Volume 119| Number 1/2 January/February 2023 Research Article https://doi.org/10.17159/sajs.2023/13842
Lifecycle-based
for the SA
Page 5 of 6
carbon footprint
plastics sector
8. Plastics SA. South African Plastics Recycling Survey 2019. Johannesburg: Plastics SA; 2020.
9. Statistics South Africa (Stats SA). Community survey 2016. Statistical release P0301. Report no. 03-01-22. Pretoria: Stats SA; 2016.
10. Rodseth C, Notten P, Von Blottnitz H. A revised approach for estimating informally disposed domestic waste in rural versus urban South Africa and implications for waste management. S Afr J Sci. 2020;116(1/2), Art. #5635. https://doi.org/10.17159/sajs.2020/5635
11. Goga T, Harding K, Russo V, Von Blottnitz H. What material flow analysis and life cycle assessment reveal about plastic polymer production and recycling in South Africa. S Afr J Sci. 2022;118(Special issue: Waste as a Resource), Art. #12522. https://doi.org/10.17159/SAJS.2022/12522
12. Godfrey L, Oelofse S. Historical review of waste management and recycling in South Africa. Resources. 2017;6, Art. #57. https://doi.org/10.3390/ resources6040057
13. Majozi T, Veldhuizen P. The chemicals industry in South Africa. Am Inst Chem Eng. 2015:46–51.
14. Sasol. Secunda Synfuels Operations, Secunda Chemicals Operations and Sasol Oil. Secunda: Sasol; 2019.
15. Sevitz J, Brent AC, Fourie AB. An environmental comparison of plastic and paper consumer carrier bags in South Africa: Implications for the local manufacturing industry. S Afr J Ind Eng. 2003;14:67–82.
16. Friedrich E, Trois C. Quantification of greenhouse gas emissions from waste management processes for municipalities – A comparative review focusing on Africa. Waste Manag. 2011;31:1585–1596. https://doi.org/10.1016/j. wasman.2011.02.028
17. Russo V, Stafford W, Nahman A. Comparing grocery carrier bags in South Africa from an environmental and socio-economic perspective: Evidence from a life cycle sustainability assessment. Waste Research Development and Innovation Roadmap research report. Pretoria: DST/CSIR; 2020.
18. Harding KG, Friedrich E, Jordaan H, Le Roux B, Notten P, Russo V, et al. Status and prospects of life cycle assessments and carbon and water footprinting studies in South Africa. Int J Life Cycle Assess. 2021;26:26–49. https://doi. org/10.1007/S11367-020-01839-0
19. South African Department of Environment, Forestry and Fisheries (DEFF). Government Gazette 43879. Notice no. 1184. Pretoria: DEFF; 2020.
20. South African Department of Environmental Affairs (DEA). Plastic material flow and end of life management: Final report. Pretoria: DEA; 2017.
21. ecoinvent. ecoinvent v3.6 [webpage on the Internet]. c2022 [cited 2022 Mar 24]. Available from: https://ecoinvent.org/the-ecoinvent-database/datareleases/ecoinvent-3-6/
22. South African Department of Trade and Industry (DTI). Plastics industry 2020 – Master plan for growth. Pretoria: DTI; 2020.
23. PET Recycling Company NPC. Designing for the environment. Cape Town: PET Recycling Company NPC; 2019.
24. Franklin Associates. Life cycle impacts of plastic packaging compared to substitutes in the United States and Canada. Theoretical substitution analysis prepared for The Plastics Division of the American Chemistry Council (ACC); 2018.
25. Friedrich E, Trois C. GHG emission factors developed for the recycling and composting of municipal waste in South African municipalities. Waste Manag. 2013;33:2520–2531. https://doi.org/10.1016/J.WASMAN.2013.05.010
26. South African Department of Environmental Affairs (DEA). South Africa state of waste. A report on the state of the environment. Final draft report. Pretoria: DEA; 2018.
27. Intergovernmental Panel on Climate Change (IPCC). Guidelines for national greenhouse gas inventories. Hayama: Institute for Global Environmental Strategies (IGES); 2006.
28. Lazarevic D, Aoustin E, Buclet N, Brandt N. Plastic waste management in the context of a European recycling society: Comparing results and uncertainties in a life cycle perspective. Resour Conserv Recycl. 2010;55:246–259. https:// doi.org/10.1016/j.resconrec.2010.09.014
29. South African Department of Forestry, Fisheries and the Environment (DFFE). National GHG inventory report – South Africa 2017. Pretoria: DFFE; 2021.
30. Zhao Z, Liu Y, Wang F, Li X, Deng S, Xu J, et al. Life cycle assessment of primary energy demand and greenhouse gas (GHG) emissions of four propylene production pathways in China. J Clean Prod. 2017;163:285–292. https://doi.org/10.1016/j.jclepro.2015.12.099
31. Rodríguez-Vallejo DF, Guillén-Gosálbez G, Chachuat B. What is the true cost of producing propylene from methanol? The role of externalities. ACS Sustain Chem Eng. 2020;8:3072–3081. https://doi.org/10.1021/acssuschemeng.9b05516
32. Sangwan KS, Bhakar V. Life cycle analysis of HDPE pipe manufacturing –A case study from an Indian industry. Procedia CIRP. 2017;61:738–743. https://doi.org/10.1016/J.PROCIR.2016.11.193
33. Treenate P, Limphitakphong N, Chavalparit O. A complete life cycle assessment of high density polyethylene plastic bottle. IOP Conf Ser Mater Sci Eng. 2017;222, Art. #012010. https://doi.org/10.1088/1757-899X/222/1/012010
https://doi.org/10.17159/sajs.2023/13842
68 Volume 119| Number 1/2 January/February 2023 Research Article
Lifecycle-based carbon footprint for the SA plastics sector Page 6 of 6
AUTHORS:
Tiaan Punt1
Robert C. Luckay2
Guven Akdogan1
Steven M. Bradshaw1
A. Petrie van Wyk1
AFFILIATIONS:
1Department of Process Engineering, Stellenbosch University, Stellenbosch, South Africa
2Department of Chemistry and Polymer Science, Stellenbosch University, Stellenbosch, South Africa
CORRESPONDENCE TO:
Tiaan Punt
EMAIL:
tiaan@kth.se
DATES:
Received: 10 June 2021
Revised: 29 June 2022
Accepted: 21 Sep. 2022
Published: 31 Jan. 2023
HOW TO CITE:
Punt T, Luckay RC, Akdogan
G, Bradshaw SM, Van Wyk AP.
Comparison of phosphorus-based extractants on manganese separation from citrate leach solutions for recycling of lithium-ion batteries. S Afr J Sci. 2023;119(1/2), Art. #11399. https://doi. org/10.17159/sajs.2023/11399
ARTICLE INCLUDES:
☒ Peer review
☐ Supplementary material
DATA AVAILABILITY:
☐ Open data set
☐ All data included
☒ On request from author(s)
☐ Not available
☐ Not applicable
EDITOR: Michael Inggs
KEYWORDS:
citric acid, metal citrate complexes, solvent extraction, hydrometallurgy, lithium-ion battery recycling
FUNDING: Wilhelm Frank Trust
Comparison of phosphorus-based extractants on manganese separation from citrate leach solutions for recycling of lithium-ion batteries
The performance requirements of modern lithium-ion batteries (LIBs) necessitate the use of a number of scarce and strategically sensitive metals such as lithium and cobalt. Recycling end-of-life LIBs reduces the demand on the primary sources of these metals and helps reduce the environmental impact of LIB waste. Citric acid has proven to be an effective environmentally friendly and sustainable lixiviant; however, the formation of metal citrate complexes complicates subsequent metal separation processes such as solvent extraction. This study enhances the understanding of LIB metal separation from citric acid media by comparing the metal separation performance of phosphorus-based liquid-liquid extractants from a citric acid leach. The optimum Mn(II) extraction pH decreases as the extractant’s phosphorus oxidation state increases from phosphinic to phosphonic to phosphoric, due to the oxygen atoms that surround the central phosphorus atom. The maximum Mn(II) separation with Cyanex 272, PC-88A, and D2EHPA was observed at pHs of 6, 3, and 3, respectively. D2EHPA further provided the best separation of Mn(II) over Al, Co, Li, and Ni with separation factors of 137, 191, 118, and 601, respectively. No research is currently available on the metal separation performance of phosphonic (PC-88A) or phosphinic (Cyanex 272) organic extractants from citric acid media.
Significance:
• This study is the first to investigate the use of phosphonic and phosphinic extractants for metal separation from citric acid leach solutions, towards using citric acid as an environmentally friendly lixiviant.
• The phosphoric extractant, D2EHPA, enabled successful and sequential separation and extraction of aluminium, manganese and lithium, making the process technologically feasible and attractive
Introduction
Waste lithium-ion batteries (LIBs) contain a variety of metals and toxic organic compounds that prohibit the disposal thereof in landfill sites and other conventional waste streams. The size of the LIB waste streams have also become an ever-increasing concern as the demand for LIBs continues to increase annually for the mass production of electronic devices and electric vehicles.1 Predictions indicate that 11 million tonnes of LIBs will have been discarded by 20232, leading to the LIB recycling market recovering up to EUR555 million in valuable materials by 20303. Due to the strategically scarce metals used in LIBs like cobalt, and other valuable metals like lithium, manganese, and nickel, recycling has become a vital part of the waste treatment of spent LIBs. The recycling of LIBs not only provides an economic benefit through the recycling of these aforementioned metals but also reduces the environmental impact of hazardous components like fluorides, organic components, and toxic metals like cobalt, copper, and nickel.4
Various companies have invested in the recycling of LIBs and many make use of pyrometallurgical processes to recover the metals from the waste LIBs.5 However, pyrometallurgical processes require large amounts of energy, lose lithium to the slag6, and produce toxic gases from the plastics and organics that need to be treated before being released to the atmosphere. Hydrometallurgical processes require significantly less energy than pyrometallurgical processes and provide high recovery and purity for product streams, which has made hydrometallurgical processes highly desirable.
Recent research has shifted focus from inorganic acid lixiviants to that of more environmentally friendly and sustainable organic acids like citric acid and DL-malic acid.7,8 Citric acid has shown to be a promising alternative lixiviant to mineral acids due to its widely used applications from food to pharmaceuticals and its lower environmental impact. Furthermore, citric acid has strong chelating properties which allows it to effectively leach the variety of metals found in waste LIBs when paired with a reductant like hydrogen peroxide, comparable to that of the mineral acids that typically leach more than 90% of each metal.8-10 However, citric acid as a possible lixiviant is not without its challenges, as its lower acid strength limits its operation to higher pH values than most inorganic acids, and the possibility to recycle and reuse it in a typical solvent extraction process is still unknown. Both these factors will affect the technical and financial feasibility of any proposed process, especially considering the high cost of citric acid.
© 2023. The Author(s). Published under a Creative Commons Attribution Licence.
Citric acid contains three carboxylic and one hydroxyl function group, illustrated in Figure 1a with the α-functional groups indicated in red and the β-functional groups in blue. Citric acid is often written as HCitH3, where the first hydrogen refers to the proton of the hydroxyl group and the last protons refer to the carboxylic groups.11 The α-carboxylic group is deprotonated first (pKa,1 = 3.15), after which the two β-carboxylic groups are deprotonated (pKa,2 = 4.70 and pKa,3 = 6.21), with the respective pKa values averaged from different studies at 20 °C.12,13 The hydroxyl group is only deprotonated under extreme alkaline conditions due to its strong bond, with studies determining the pKa,4 = 14.4.14 Using the aforementioned pKa values for citric acid in water, the species distribution for citric acid can be simulated with the Henderson–Hasselbalch equation as illustrated in Figure 1b. As it is known from experimental measurements that a 1.5 M citric acid leach solution has a pH of about 2.5, it is expected that HCitH3 and (HCitH2)– will be present in the leach solution.
https://doi.org/10.17159/sajs.2023/11399
69 Volume 119| Number 1/2 January/February 2023 Research Article
Numerous studies have investigated the different metal citrate complexes of LIB metals like Al, Co, Li, Mn, and Ni which are of relevance to this study. Al has a coordination number of up to 6 when chelating with citric acid and can have varying degrees of hydration.15-17 Co citrate has been determined to be octahedral18,19 with low hydration and citric acid acting as a bridging ligand20. Li has a coordination number between 4 and 6 when complexing with citric acid21-25 and the tri-lithium pentahydrate complex has previously shown superior stability26. The structure of Mn citrate has been reported as tetrahedral with limited hydration.19,27 Ni has a coordination number of 4 or 5 when chelating with citrate as well as a relatively high hydration compared to the aforementioned metals.19,28-31
Most of the aforementioned studies evaluated the structure of single metal citrate complexes at dilute concentrations and therefore did not account for multiple (or different) metals competing for the same ligands. The significant influence of pH on the citric acid dissociation leads to notable changes in the structure of the metal citrate complexes.19,30 The structure and stability of the metal citrate complexes will further also be influenced by the temperature20, citric acid concentration30, and metal concentration31

Solvent extraction is often considered the most appropriate hydrometallurgical process for efficient metal purification, prior to recovery processes like electrowinning and precipitation, due to its low energy requirements, good separation performance, and well-defined operational conditions, at the cost of complex process interactions, safety considerations (flammable solvents), and expensive extractants.6 Phosphorus-based acidic cation extractants are commonly used for the separation of cobalt(II) and nickel(II) from acidic leach solutions.32,33 Poor extraction of cobalt(II) and nickel(II) from citric acid media has been found by previous studies9,34-36 which have concluded that a combination of solvent extraction and precipitation may be required to recover all the metals from complex LIB waste.
Phosphorus-based organic extractants

The composition and structure of three different phosphorus-based acidic extractants – phosphinic, phosphonic, and phosphoric acid – are shown in Figure 2. The influence of each extractant structure on the capability to recover the metals from a waste LIB citric acid leach solution was investigated. The most commonly used phosphinic, phosphonic, and phosphoric extractants for conventional base metal solvent extraction were found to be Cyanex 272, PC-88A, and di-(2-ethyl-hexyl)phosphoric acid (D2EHPA), respectively.37
All three extractants have the same coordinating atoms bound to the central phosphorus atom: a hydroxyl group and an oxygen atom with a double bond. The coordinating groups on a molecule of the phosphorus extractants will, however, first coordinate with those of another extractant molecule to form a dimeric structure in the form of an 8-membered pseudo-chelate ring in non-polar solvents as illustrated on the left in Figure 3.33 The hydrogen on the hydroxyl group hydrogen-bonds with the oxygen that is bound to the central phosphorus atom with a double bond, as the double bond oxygen has a pair of free electrons.
Source: Adapted from Wilson et al.33 under CC-BY licence Figure 3: Extraction mechanism of Cyanex 272 (R1 = C8H17).
When a metal cation (M) is extracted with these phosphorus-based acidic extractants, a proton(s) is displaced from the dimeric structure by the metal cation in an ion exchange reaction. Due to this exchange of protons with metal cations, the extraction capabilities can be determined as a function of pH. The phosphorus extractants are well known for separating divalent metal ions like cobalt(II) and nickel(II), and therefore two dimeric structures will be required to extract a divalent metal ion as illustrated in Figure 3 for Cyanex 272. The angle of the oxygen bonds to the divalent metal is responsible for the selectivity towards metals with a tetrahedral coordination geometry, as known for the first transition series metal sequence Zn > Cu > Mn > Co > Ni.33

The three phosphorus-based acidic extractants have the same carbon chain composition (C8H17) in their molecular structure, with minor structural differences as illustrated in Figure 2. The carbon chains located on the outside of the dimeric structure increase the hydrophobic characteristics of the metal complex, which increases the solubility of the complex in nonpolar solvents like kerosene. This mechanism enables the metal complexes, in the form of dimeric structures, to be extracted to the non-polar organic phase after the complexation reaction in the aqueous solution.
The major difference between the three phosphorus-based acidic extractants is the presence of oxygen atoms located between the carbon chain and the central phosphorus atom. Figure 2 illustrates that Cyanex
70 Volume 119| Number 1/2 January/February 2023 Research Article https://doi.org/10.17159/sajs.2023/11399 Effect of phosphorus-based extractants on metal separation Page 2 of 6
Figure 2: Simplified chemical structure of (a) Cyanex 272, (b) PC-88A, and (c) D2EHPA.
Figure 1: Citric acid (a) structure and (b) species distribution at 20 °C and I = 0.1 M.
272 has none, PC-88A has one, and D2EHPA has two. These oxygen atoms are significant as they have a free pair of electrons which the carbon atoms in the carbon chain do not have. The free pair of electrons on the oxygen atoms provide a unique coordination geometry to the central phosphorus atom, which will influence the coordination geometry of the extractant with the metal in the dimeric structure, and thus provide a unique selectivity towards certain metal coordination geometries. It is further hypothesised that the pair of free electrons will also enable hydrogen bonds, which may enhance the coordination complex stability from strong acidic media where a surplus of hydrogen ions are in solution. The oxygen atoms surrounding the central phosphorus atom therefore play a key role in the extractants’ selectivity towards metals, as the metals have significantly different coordination geometries and levels of hydration which influences their stability as metal-citrate complexes as well as metal-extractant complexes.
A study by Ma et al.34 compared the extraction performance of D2EHPA in kerosene on waste LIB leach solutions, one with a citric acid aqueous matrix and the other with a sulfuric acid aqueous matrix. The extraction efficiency of Mn rapidly increases as the pH is increased from 1 to 2 in sulfuric acid media, reaching near complete extraction at a pH of 2.2. Furthermore, as the pH is increased, the extraction efficiency of Co and Ni increases, reaching a maximum extraction of 70% Co and 55% Ni at a pH of 5. The metal extraction trends using D2EHPA in a citric acid leach matrix showed different extraction results, as Mn was extracted at a pH of 1 to 3.5, with near complete Mn extraction at a pH of 2.5. It was further found that extraction efficiency trends of Co and Ni as a function of pH were similar in citric acid media, but the overall extraction performance of both metals was much lower compared to sulfate media. The optimal Mn separation pH was identified as a pH of 1.5, which is much lower than the citric acid leach pH of 2.5 and therefore a strong acid like H2SO4 will be required to reduce the pH for such an extraction. Ma et al 34 exclusively used D2EHPA and did not indicate why Cyanex 272 and PC-88A were not used.
From the currently available literature, it is clear that the citric acid media has an influence on the metal separation as cobalt(II) and nickel(II) cannot be separated under weak acidic conditions from citrate media34, but can be separated under weak acidic conditions in sulfuric acid media38,39. This is supported by the fact that Cyanex 272 was developed for cobalt(II) separation from nickel(II) in sulfate media.32 The metals in reductive LIB leach solutions like Co(II), Li(I), Mn(II), and Ni(II) are known to complex with citric acid40 which could be responsible for the difference in extraction compared to other acidic media. However, no research has currently reported on why conventional phosphorus-based extractants perform differently for metal extraction from citrate systems compared to sulfate systems.
The oxygen atoms between the central phosphorus atom and its carbon chains are hypothesised to play a key role in the metal extraction, enabling the metals to be extracted under stronger acidic conditions in citrate media, and therefore phosphinic, phosphonic, and phosphoric extractants were investigated. Citrate has strong chelating properties and acts as a competing ligand during solvent extraction, enabling unique extraction characteristics. The objective of this study was to provide novel base knowledge for metal extraction from citrate media by characterising the extraction performance of LIB metals with Cyanex 272, PC-88A, and D2EHPA from a citrate pregnant leach solution (PLS) to determine the impact and possible advantages that their compositional differences may provide.
Materials and methods
Materials
Waste laptop batteries containing 18650-cells were collected from various manufacturers for the sample feed material. Anhydrous citric acid (99.8 wt.%) and hydrogen peroxide (50 wt.%) used in leaching of the LIB cathode material were supplied by Kimix (Cape Town, South Africa). The kerosene used as diluent for the solvent extraction tests and NaOH pellets (98 wt.%), dissolved and diluted to 10 M in distilled water for pH control, were also supplied by Kimix. The phosphinic extractant, Cyanex 272, was supplied
by Solvay (Pretoria, South Africa). The phosphonic extractant PC-88A (95 wt.%) was supplied by Henan Tianfu Chemical Co. Ltd (Zhengzhou, China) and the phosphoric extractant, D2EHPA (95 wt.%), was supplied by Industrial Analytical (Johannesburg, South Africa).
Preparation of the leach solution
The LIB active cathode material recovered from the waste 18650-cells was leached with 1.5 M citric acid and 2 vol.% H2O2 using a pulp density of 20 g/L at 95 °C for 20 min – the optimum leaching time determined experimentally. The leach solution was subsequently filtered with a vacuum filter to remove the remaining cathode powder residue. The PLS was stored, and a sample was taken before each solvent extraction test to determine the metal concentration in the PLS.
The spent LIB cathode powder was analysed using X-ray powder diffraction (XRD) and the results showed that the metal phase consisted of 15.8% LiCoO2 (LCO) and 84.2% LiNi0.4Mn0.45Co0.15O2 (NMC). The optimum leaching performance was confirmed with repeat experiments and an average leaching efficiency of 93% Al3+, 90% Co2+, 96% Li+, 94% Mn2+, and 94% Ni2+ was achieved. The average metal concentration and the associated standard error in the citric acid PLS produced is summarised in Table 1, where it is clear that Co2+, Ni2+, and Mn2+ are the major metals present with some minor traces of Al3+. The mass fraction of lithium is comparatively low due its low molar mass, however, the lithium accounts for 48% of the molar fraction.
Table 1: Average metal concentration (±standard error) in the pregnant leach solution (PLS)
Metal Concentration (mg/L)
Al 133.8 ± 1.5
Co 4604 ± 20
Li 1310 ± 6
Mn 2991 ± 12
Ni 4223 ± 18
Procedure
All the solvent extraction tests in this study used kerosene as diluent with 1.1 M extractant as the required extractant concentration for complete extraction was ~1.1 M (4 moles of extractant per M2+). Using a 1.1 M extractant concentration therefore enabled sufficient extractant to potentially extract all the metals from the leach solution, avoiding metals competing for the extractant, and allowing the extraction to be evaluated for the pH alone. All experiments were performed with a volumetric O/A ratio of 1 at 22±3 °C for 15 min with a total working volume of 120 mL. The experiments were performed by adding 60 mL of the PLS and 60 mL of the appropriate organic phase to a beaker on a magnetic stirrer. The solution was mixed at 750 rpm for 15 min and the pH of the aqueous solution was continually measured with a Hanna H11310 probe and adjusted to the desired value between a pH of 2 and 8, using 10 M NaOH or 1.5 M citric acid. After the experimental run was completed, the contents of the beaker were transferred to a separating funnel and the aqueous solution was drawn for analysis with an inductively coupled plasma optical emission spectrometer (ICP-OES).
Metal extraction and separation factor
The metal extraction efficiency (EE) was calculated with a mass balance as indicated Equation 1 using the metal concentration results obtained from the PLS before the extraction, the aqueous raffinate metal concentration after extraction, and the aqueous volume used in the tests.
Equation 1
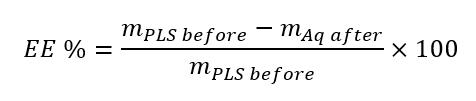
71 Volume 119| Number 1/2 January/February 2023 Research Article https://doi.org/10.17159/sajs.2023/11399
Effect of phosphorus-based extractants on metal separation Page 3 of 6
The distribution ratio (D) was determined for each metal (M) using Equation 2 and the metal concentration results obtained before and after each extraction.
Equation 2
The manganese separation factor over metal M (βMn/M) was calculated using Equation 3 and the distribution ratios of each metal.

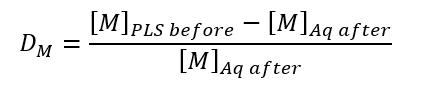
Equation 3
Results and discussion
The three phosphorus-based acidic extractants showed the capability to separate Mn2+ from the other metals due to the tetrahedral structure of the manganese(II) citrate complex19,27 which is favoured by these extractants. This selectivity for a tetrahedral coordination geometry is due to the coordination angles of the oxygen and/or carbon atoms that surround the central phosphorus atom and the presence of their free electron pairs. The metal extraction trends of the different phosphorusbased extractants are discussed below to evaluate the influence of their structural differences, specifically the oxygen atoms between the central phosphorus atom and the carbon chain.
Cyanex 272 pH dependence
The metal extraction efficiency of Cyanex 272, a phosphinic extractant, increases as the pH increases for all the metals in the PLS, as seen in Figure 4a. It was, however, clear that Cyanex 272 has an enhanced selectivity for the extraction of Mn2+ from the citrate media, resulting in the separation of Mn2+ from the other metals. The Mn2+ separation was confirmed in Figure 4b where the βMn/Co and βMn/Ni reached a maximum of 37 at a pH of 6. It was further observed that βMn/Li reached a maximum of 44 at a pH of 6 while βMn/Al was maximised to 56 at a pH of 6.5.
performance liquid chromatography (HPLC) analyses for tracing the movement of citrate ions in the stripped liquor showed inconclusive evidence. It is recommended that future studies evaluate the composition and structure of individual organometallic complexes, produced by extraction of a single metal from a high purity stream, to determine the influence of the citrate ligands on the metal extraction.
D2EHPA pH dependence
The phosphoric extractant D2EHPA showed notably different metal extraction trends from those of Cyanex 272, which is attributed to the oxygen atoms between the central phosphorus atom and the carbon chains on D2EHPA.
Figure 5 shows that the extraction efficiency of Co2+, Li+, and Ni2+ increases as the pH increases, similar to Cyanex 272. The main advantage D2EHPA provides is the selective extraction of Al3+ and Mn2+ under strong acidic conditions, as illustrated in Figure 5. This unique extraction provides a much better separation of Mn2+ compared to Cyanex 272 as all the other metals are extracted poorly under strong acidic conditions, greatly limiting the co-extraction. The separation of Al3+ and Mn2+ together is of little concern as it is known that aluminium hydroxide precipitates at a much lower pH than manganese(II).41 Due to the dilute quantity of Al3+ in the PLS, as summarised in Table 1, the separation of Mn2+ was investigated further.
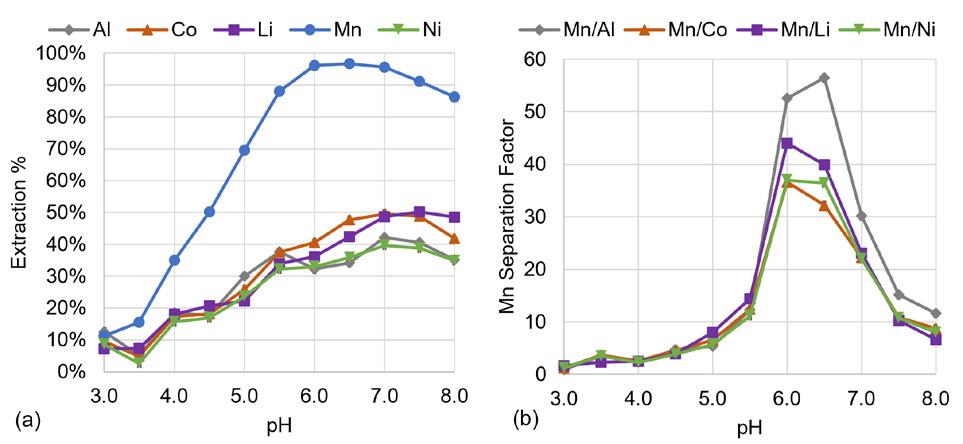
The improved Mn2+ separation of D2EHPA compared to Cyanex 272 was confirmed by the much higher Mn2+ separation factors observed in Figure 5b where βMn/Ni reached a maximum of 601 at a pH of 3 –more than 16 times larger than the maximum achieved with Cyanex 272 at a pH of 6. The βMn/Cowas second highest with D2EHPA, reaching a maximum of 191, while βMn/Li reached 118 at a pH of 3. Due to the sharp decrease in the Al3+ extraction efficiency between a pH of 2 and 3 the βMn/Al reached a maximum of 165 at a pH of 3.5.
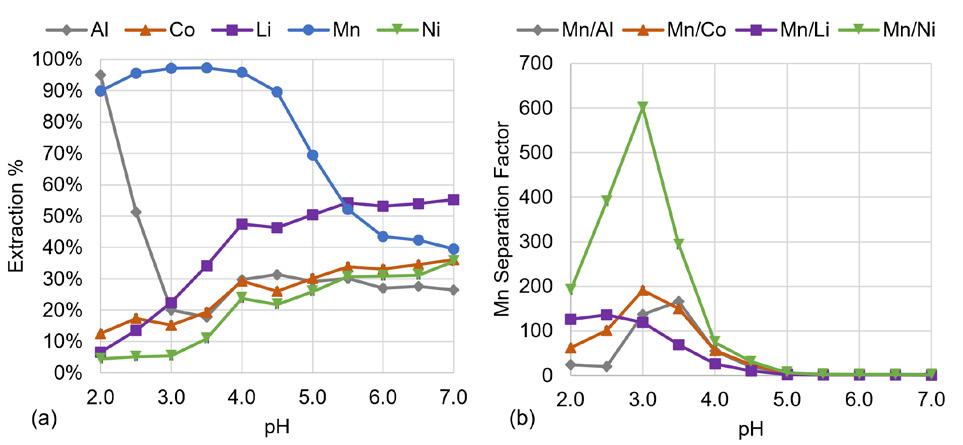
Furthermore, D2EHPA has a selectivity for Li+ over Co2+ and Ni2+ under weakly acidic conditions. This selectivity for Li+ over Co2+ and Ni2+ is also unique to D2EHPA as Figure 4a showed similar extraction efficiency trends for Co2+, Li+, and Ni2+ when using Cyanex 272. This could allow Li+ to be separated from Co2+ and Ni2+ in a subsequent novel lithium extraction, after Mn2+ and Al3+ have been removed. The selective extraction of Li+ over Co2+ and Ni2+ was attributed to its coordination number of 4 under weak acidic conditions23,26 and lithium’s hard base metal ion property which will coordinate preferentially with the hard oxygen donor atom of the extractants42
The metal extraction results illustrated in Figure 4a show considerable differences from those of Cyanex 272 in sulfuric acid, which was investigated by Kang et al 38 The most notable difference is the lack of Co2+ separation from Ni2+ under weak acidic conditions. The current study shows that Mn2+ is selectively extracted with Cyanex 272 from citric acid media, whereas Kang et al 38 found that Co2+ and Ni2+ is selectively extracted with Cyanex 272 from a sulfuric acid media at a pH of 6 and 8, respectively. The different metal extraction trends observed in Figure 4 are attributed to the citrate matrix, as Mn has the weakest stability compared to the Co and Ni in citrate media31, and could thus potentially be extracted from the citrate media the best. Furthermore, citrate-phosphorus extractant moieties could be pre-formed before binding to the metal ion which could also influence the extraction. Mn is the only transition metal with a tetrahedral coordination geometry in the citrate media, favoured by the phosphorus-based extractants, and the Mn citrate molecule could thus act as a substitute 8-membered ring when complexing with the two β carboxylic groups. Alternatively, the citrate molecule can act as a monomer in the dimeric structure, with the α carboxylic group bound to the Mn and the hydroxyl group coordinating with an extractant monomer. It is unclear whether metal ions are extracted from the citrate media or if the metal-citrate complexes are extracted as a whole, as high-
The metal extraction results of D2EHPA from a citric acid PLS show similar results to those of Ma et al 34 The Mn2+ extraction is observed to be nearly complete between a pH of 2.5 and 3.5, while the Co2+ and Ni2+ extraction trends were analogous in both studies. The extraction of Co2+ and Ni2+ are, however, considerably lower in this study, not exceeding 20% at a pH of 3.5, compared to Ma et al.34 who found that nearly 40% Co2+ and Ni2+ can be extracted at a pH of 3.5.
The high Co2+ and Ni2+ co-extraction observed in the study by Ma et al 34 may be attributed to excess stoichiometric amounts of D2EHPA in their study or it could also be attributed to the use of H2SO4 for pH control in the citric acid system. The influence of H2SO4 addition on the
72 Volume 119| Number 1/2 January/February 2023 Research Article https://doi.org/10.17159/sajs.2023/11399 Effect of phosphorus-based extractants on metal separation Page 4 of 6
Figure 4: Effect of pH on the (a) extraction efficiency and (b) Mn separation factor of Cyanex 272.
Figure 5: Effect of pH on the (a) extraction efficiency and (b) Mn separation factor of D2EHPA.
improved Co2+ and Ni2+ extraction from citrate media is likely due to the changes caused in the aqueous metal citrate complexes by the strong acid, as pH plays a major role in metal citrate complex structure, and the introduction of sulfate ligands. This is supported by the findings of a previous study that showed that Co2+ and Ni2+ are extracted favourably from sulfate media using D2EHPA.43 Furthermore, as Zhao et al 44 have shown, the 65% saponification of D2EHPA used by Ma et al 34 may be responsible for the Co2+ and Ni2+ extraction discrepancies, as in the current study we did not saponify the D2EHPA before use. This is due to the introduction of Na+ ions that coordinate with the extractant and will compete with the metals for coordination to the extractant.
PC-88A pH dependence
The structure of the phosphonic extractant PC-88A has a carbon chain similar to that of the phosphinic extractant Cyanex 272 (C8H17) and an oxygen between the carbon chain and the central phosphorus atom similar to D2EHPA (OC8H17). This has been reflected in the metal extraction efficiency trends of PC-88A illustrated in Figure 6a, which shows trends similar to both Cyanex 272 and D2EHPA.
Figure 6a shows that PC-88A selectively extracts Mn2+ from the PLS under weakly acidic conditions, as observed for Cyanex 272 in Figure 4a. The performance of the two extractants, PC-88A and Cyanex 272, are remarkably similar under weakly acidic conditions. The extraction of Mn2+ is maximised for both extractants at a pH of 6, with the only difference being that Li+ is extracted better with PC-88A compared to Cyanex 272. The ability to extract Li+ better than Co2+ and Ni2+ is a unique capability of D2EHPA. PC-88A has the capability to selectively extract Li+ from Co2+ and Ni2+ under weak acidic conditions but the co- Co2+ and Ni2+ extraction is high under weakly acidic conditions – a characteristic of Cyanex 272.
It is also observed in Figure 6a that Mn2+ and Al3+ can be separated from the PLS with PC-88A under strong acidic conditions, as previously observed for D2EHPA. The separation efficiency of Mn2+ with PC-88A under strong acidic conditions illustrated in Figure 6b is much lower compared to that obtained with D2EHPA as seen in Figure 5b. The metal extraction results of PC-88A thus highlight the balance PC-88A provides between D2EHPA and Cyanex 272 due to PC-88A having carbon chains resembling each of Cyanex 272 and D2EHPA.
stronger acidic conditions. This is evident from the Mn2+ extraction results which illustrate that Cyanex 272 separates Mn2+ best at a pH of 6, where the Mn separation from Al, Co, Li, and Ni is 53, 37, 44, and 37, respectively. Unlike Cyanex 272, D2EHPA has oxygen atoms between its carbon chains and its central phosphorus atom, and separated Mn2+ the best of all the extractants investigated. The best Mn2+ separation with D2EHPA was observed at a pH of 3 where the Mn separation from Al, Co, Li, and Ni is 137, 191, 119, and 601, respectively. PC-88A has carbon chains similar to those of both Cyanex 272 and D2EHPA, and its metal separation results show a balance between that of Cyanex 272 and D2EHPA, where Mn2+ was extracted best at a pH between 3 and 6. Both Mn2+ and Al3+ are selectively extracted best from a citric acid PLS under strong acidic conditions with D2EHPA, where the co-extraction of Co2+, Li+, and Ni2+ are minimised. This allows for efficient separation of Mn2+ and Al3+ due to the minimal co-extraction with D2EHPA compared to other extractants at a pH of 3.
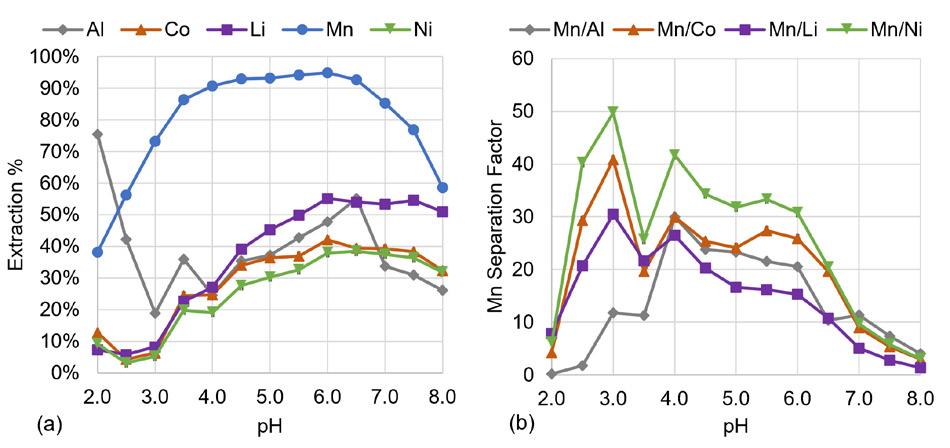
D2EHPA has the best capability of the three phosphorus-based acidic extractants to separate Li+ from Co2+ and Ni2+ under weakly acidic conditions, which Cyanex 272 cannot. The separation of Li+ should be investigated in a subsequent extraction after the Al3+ and Mn2+ have been separated from the PLS. This would enable the evaluation of D2EHPA’s selectivity for Li+ over Co2+ and Ni2+ without any interference of Mn2+ or Al3+, which D2EHPA is known to extract selectively.
It is recommended that future studies investigate the extracted complexes in the organic phase and formulate a mechanism of action for the extraction complex(es) to gain further data on the role of the citrate ion during extraction. The identification and quantification of these organometallic complexes are incredibly complex in multi-metal streams, such as the feed in this study, due to the several pKa values of citrate and the potential synergism of the citrate ions with the phosphorus-based extractants. It is therefore recommended that single metal citrate solutions be investigated to better understand the organometallic chemistry. The investigation of these organometallic complexes, relating the metal citrate complex structure to a mechanism of action for the extraction complex(es), transfer of citrate ions between the aqueous and organic phase during extraction/ stripping, and the stripping of the loaded organic phase, was not the focus of this study, but would be topics for future investigation.
Acknowledgements
We thank the Wilhelm Frank Trust for supporting this research project.
Competing interests
We have no competing interests to declare.
Authors’ contributions
The metal extraction from citric acid media using PC-88A observed in this study also greatly deviates from the metal extraction in sulfuric acid. Using PC-88A in sulfuric acid media, Zhao et al.44 found the pH50 of Mn2+ and Co2+ to be 4.15 and 4.75, respectively. However, in this study, the pH50 in citric acid media for Mn2+ was 2.1, while 50% Co2+ extraction was not achieved within a pH range of 2 to 8.
Conclusions
This study provides novel Al3+, Co2+, Li+, Mn2+, and Ni2+ extraction data from citric acid media for Cyanex 272 and PC-88A. The extraction performance of Cyanex 272, PC-88A, and D2EHPA were compared to determine the influence of their compositional differences on metal separation.
The metal extraction results obtained provide supporting evidence for the hypothesis that the oxygen atoms between the central phosphorus atom and the carbon chain enable the extraction of Al3+ and Mn2+ under
T.P. was responsible for conceptualisation of the article; conducted the experiments and subsequent analysis, and wrote the first draft. S.M.B. and A.P.v.W. were responsible for the data validation and curation as well as student supervision. R.C.L. was responsible for data analysis and curation. G.A. led and managed the project. All authors contributed to the writing of the final manuscript. S.M.B. and G.A. were responsible for sourcing funding for the project.
References
1. Richa K, Babbitt CW, Gaustad G, Wang X. A future perspective on lithiumion battery waste flows from electric vehicles. Resour Conserv Recycl. 2014;83:63–76. https://doi.org/10.1016/j.resconrec.2013.11.008
2. Natarajan S, Aravindan V. Burgeoning prospects of spent lithium-ion batteries in multifarious applications. Adv Energy Mater. 2018;8(33), Art. #1802303. https://doi.org/10.1002/aenm.201802303
3. Drabik E, Rizos V. Prospects for electric vehicle batteries in a circular economy. CEPS research report no. 2018/05. Brussels: Centre for European Policy Studies; 2018. p. 1–34.
4. Kang DHP, Chen M, Ogunseitan OA. Potential environmental and human health impacts of rechargeable lithium batteries in electronic waste. Environ Sci Technol. 2013;47(10):5495–5503. https://doi.org/10.1021/es400614y
73 Volume 119| Number 1/2 January/February 2023 Research Article
https://doi.org/10.17159/sajs.2023/11399
Figure 6: Effect of pH on the (a) extraction efficiency and (b) Mn separation factor of PC-88A.
Effect of phosphorus-based extractants on metal separation Page 5 of 6
5. Vezzini A. Manufacturers, materials and recycling technologies. In: Pistoia G, editor. Lithium-ion batteries: Advances and applications. Amsterdam: Elsevier; 2014. p. 529–551. https://doi.org/10.1016/B978-0-444-59513-3.00023-6
6. Huang B, Pan Z, Su X, An L. Recycling of lithium-ion batteries: Recent advances and perspectives. J Power Sources. 2018;399:274–286. https:// doi.org/10.1016/j.jpowsour.2018.07.116
7. Li L, Lu J, Ren Y, Zhang XX, Chen RJ, Wu F, et al. Ascorbic-acid-assisted recovery of cobalt and lithium from spent Li-ion batteries. J Power Sources. 2012;218:21–27. https://doi.org/10.1016/j.jpowsour.2012.06.068
8. Musariri B, Akdogan G, Dorfling C, Bradshaw S. Evaluating organic acids as alternative leaching reagents for metal recovery from lithium ion batteries. Miner Eng. 2019;137:108–117. https://doi.org/10.1016/j.mineng.2019.03.027
9. Chen X, Zhou T. Hydrometallurgical process for the recovery of metal values from spent lithium-ion batteries in citric acid media. Waste Manag Res J Sustain Circ Econ. 2014;32(11):1083–1093. https://doi. org/10.1177/0734242X14557380
10. Li L, Ge J, Wu F, Chen R, Chen S, Wu B. Recovery of cobalt and lithium from spent lithium ion batteries using organic citric acid as leachant. J Hazard Mater. 2010;176(1–3):288–293. https://doi.org/10.1016/j.jhazmat.2009.11.026
11. Heller A, Barkleit A, Foerstendorf H, Tsushima S, Heim K, Bernhard G. Curium(III) citrate speciation in biological systems: A europium(III) assisted spectroscopic and quantum chemical study. Dalt Trans. 2012;41(45):13969–13983. https://doi.org/10.1039/c2dt31480k
12. Apelblat A. Citric acid. Cham: Springer; 2014. http://link.springer. com/10.1007/978-3-319-11233-6
13. Martell AE, Sillen LG. Stability constants of metal-ion complexes. 2nd ed. London: London Chemistry Society; 1964.
14. Silva AMN, Kong X, Hider RC. Determination of the pKa value of the hydroxyl group in the α-hydroxycarboxylates citrate, malate and lactate by 13C NMR: Implications for metal coordination in biological systems. BioMetals. 2009;22(5):771–778. https://doi.org/10.1007/s10534-009-9224-5
15. Motekaitis RJ, Martell AE. Complexes of aluminum(III) with hydroxy carboxylic acids. Inorg Chem. 1984;23(1):18–23. https://doi.org/10.1021/ ic00169a006
16. Rajan KS, Mainer S, Rajan NL, Davis JM. Studies on the chelation of aluminum for neurobiological application. J Inorg Biochem. 1981;14(4):339–350. https://doi.org/10.1016/S0162-0134(00)80290-1
17. Jackson GE. Studies on the chelation of aluminium for biological application. S Afr J Chem. 1982;35(3):89–92. Available from: http://inis.iaea.org/search/ search.aspx?orig_q=RN:14769992
18. Zhang G, Yang G, Ma JS. Versatile framework solids constructed from divalent transition metals and citric acid: Syntheses, crystal structures, and thermal behaviors. Cryst Growth Des. 2006;6(2):375–381. https://doi.org/10.1021/ cg0503245
19. Wyrzykowski D, Chmurzyński L. Thermodynamics of citrate complexation with Mn2+, Co2+, Ni2+ and Zn2+ ions. J Therm Anal Calorim. 2010;102(1):61–64. https://doi.org/10.1007/s10973-009-0523-4
20. Zhou ZH, Deng YF, Wan HL. Structural diversities of cobalt(II) coordination polymers with citric acid. Cryst Growth Des. 2005;5(3):1109–1117. https:// doi.org/10.1021/cg0496282
21. Glusker JP, Van Der Helm D, Love WE, Dornberg M, Minkin JA, Johnson CK, et al. X-ray crystal analysis of the substrates of aconitase. VI. The structures of sodium and lithium dihydrogen citrates. Acta Crystallogr. 1965;19(4):561–572. https://doi.org/10.1107/S0365110X65003894
22. Oruch R, Elderbi MA, Khattab HA, Pryme IF, Lund A. Lithium: A review of pharmacology, clinical uses, and toxicity. Eur J Pharmacol. 2014;740:464–473. https://doi.org/10.1016/j.ejphar.2014.06.042
23. Rossi M, Rickles LF, Glusker JP. Trilithium citrate pentahydrate, C6H5O73−.3Li+.5H2O. Acta Crystallogr Sect C Cryst Struct Commun. 1983;39(8):987–990. https://doi.org/10.1107/S0108270183007106
24. Haussühl S, Jiyang W. Elastic properties of citric acid, citric acid hydrate, trilithium citrate tetrahydrate, trisodium citrate pentahydrate, and tripotassium citrate hydrate. Zeitschrift für Krist - Cryst Mater. 1999;214(2):85–89. https:// doi.org/10.1524/zkri.1999.214.2.85
25. Schreuer J, Haussühl S. The pseudo-orthorhombic crystal structure of monoclinic trilithium citrate tetrahydrate, Li3HOC(COO)(CH2COO)2· 4H2O. Zeitschrift für Krist - New Cryst Struct. 2000;215(3):369–370. https://doi. org/10.1515/ncrs-2000-0331
26. Rammohan A, Kaduk JA. Crystal structures of alkali metal (Group 1) citrate salts. Acta Crystallogr Sect B Struct Sci Cryst Eng Mater. 2018;74(2):239–252. https://doi.org/10.1107/S2052520618002330
27. Deng YF, Zhou ZH, Wan HL, Ng SW. Δ-Aqua-S-citrato(2-)manganese(II). Acta Crystallogr Sect E Struct. 2003;59(6):m310–m312. https://doi.org/10.1107/ S1600536803009383
28. Francis AJ, Dodge CJ, Gillow JB. Biodegradation of metal citrate complexes and implications for toxic-metal mobility. Nature. 1992;356(6365):140–142. https://doi.org/10.1038/356140a0
29. Hedwig GR, Liddle JR, Reeves RD. Complex formation of nickel(II) ions with citric acid in aqueous solution: A potentiometric and spectroscopic study. Aust J Chem. 1980;33(8):1685–1693. https://doi.org/10.1071/CH9801685
30. Zelenin OY. Interaction of the Ni2+ ion with citric acid in an aqueous solution. Russ J Coord Chem. 2007;33(5):346–350. https://doi.org/10.1134/ S1070328407050065
31. Li NC, Lindenbaum A, White JM. Some metal complexes of citric and tricarballylic acids. J Inorg Nucl Chem. 1959;12(1–2):122–128. https://doi. org/10.1016/0022-1902(59)80101-9
32. Flett DS. Solvent extraction in hydrometallurgy: The role of organophosphorus extractants. J Organomet Chem. 2005;690(10):2426–2438. https://doi. org/10.1016/j.jorganchem.2004.11.037
33. Wilson AM, Bailey PJ, Tasker PA, Turkington JR, Grant RA, Love JB. Solvent extraction: The coordination chemistry behind extractive metallurgy. Chem Soc Rev. 2014;43(1):123–134. https://doi.org/10.1039/C3CS60275C
34. Ma L, Nie Z, Xi X, Han X. Hydrometallurgy cobalt recovery from cobalt-bearing waste in sulphuric and citric acid systems. Hydrometallurgy. 2013;136(3):1–7. https://doi.org/10.1016/j.hydromet.2013.01.016
35. Chen X, Zhou T, Kong J, Fang H, Chen Y. Separation and recovery of metal values from leach liquor of waste lithium nickel cobalt manganese oxide based cathodes. Sep Purif Technol. 2015;141:76–83. https://doi.org/10.1016/j. seppur.2014.11.039
36. Chen X, Fan B, Xu L, Zhou T, Kong J. An atom-economic process for the recovery of high value-added metals from spent lithium-ion batteries. J Clean Prod. 2016;112:3562–3570. https://doi.org/10.1016/j.jclepro.2015.10.132
37. Kislik VS. Solvent extraction classical and novel approaches. Oxford: Elsevier; 2012.
38. Kang J, Senanayake G, Sohn J, Shin SM. Recovery of cobalt sulfate from spent lithium ion batteries by reductive leaching and solvent extraction with Cyanex 272. Hydrometallurgy. 2010;100(3-4):168–171. https://doi. org/10.1016/j.hydromet.2009.10.010
39. Chen X, Xu B, Zhou T, Liu D, Hu H, Fan S. Separation and recovery of metal values from leaching liquor of mixed-type of spent lithium-ion batteries. Sep Purif Technol. 2015;144:197–205. https://doi.org/10.1016/j.seppur.2014.11.039
40. Glusker JP. Citrate conformation and chelation: Enzymic implications. Acc Chem Res. 1980;13(10):345–352. https://doi.org/10.1021/ar50154a002
41. Joo SH, Shin DJ, Oh CH, Wang JP, Senanayake G, Shin SM. Selective extraction and separation of nickel from cobalt, manganese and lithium in pretreated leach liquors of ternary cathode material of spent lithium-ion batteries using synergism caused by Versatic 10 acid and LIX 84-I. Hydrometallurgy. 2016;159:65–74. https://doi.org/10.1016/j.hydromet.2015.10.012
42. Pearson RG. Hard and soft acids and bases. J Am Chem Soc. 1963;85(22):3533–3539. https://doi.org/10.1021/ja00905a001
43. Torkaman R, Asadollahzadeh M, Torab-Mostaedi M, Maragheh MG. Recovery of cobalt from spent lithium ion batteries by using acidic and basic extractants in solvent extraction process. Sep Purif Technol. 2017;186:318–325. https:// doi.org/10.1016/j.seppur.2017.06.023
44. Zhao JM, Shen XY, Deng FL, Wang FC, Wu Y, Liu HZ. Synergistic extraction and separation of valuable metals from waste cathodic material of lithium ion batteries using Cyanex 272 and PC-88A. Sep Purif Technol. 2011;78(3):345–351. https://doi.org/10.1016/j.seppur.2010.12.024
https://doi.org/10.17159/sajs.2023/11399
74 Volume 119| Number 1/2 January/February 2023 Research Article
Effect of phosphorus-based extractants on metal separation Page 6 of 6
AUTHORS:
Jason Bantjes1,2
Sonja Swanevelder3
Esme Jordaan3
Nancy A. Sampson4
Maria V. Petukhova4
Christine Lochner5
Dan J. Stein5,6
Ronald C. Kessler4
AFFILIATIONS:
1Alcohol, Tobacco and Other Drug Research Unit, South African Medical Research Council, Cape Town, South Africa
2Institute for Life Course Health Research, Department of Global Health, Stellenbosch University, Stellenbosch, South Africa
3Biostatistics Unit, South African Medical Research Council, Cape Town, South Africa
4Department of Health Care Policy, Harvard Medical School, Boston, Massachusetts, USA
5SAMRC Unit on Risk and Resilience in Mental Disorders, Department of Psychiatry, Stellenbosch University, Stellenbosch, South Africa
6Department of Psychiatry and Mental Health, University of Cape Town, Cape Town, South Africa
CORRESPONDENCE TO:
Jason Bantjes
EMAIL:
Jason.Bantjes@mrc.ac.za
DATES:
Received: 30 Mar. 2022
Revised: 24 Oct. 2022
Accepted: 10 Nov. 2022
Published: 31 Jan. 2023
HOW TO CITE:
Bantjes J, Swanevelder S, Jordaan E, Sampson NA, Petukhova MV, Lochner C, et al. COVID-19 and common mental disorders among university students in South Africa. S Afr J Sci. 2023;119(1/2), Art. #13594. https:// doi.org/10.17159/sajs.2023/13594
ARTICLE INCLUDES:
☒ Peer review
☒ Supplementary material
DATA AVAILABILITY:
☐ Open data set
☐ All data included
☒ On request from author(s)
☐ Not available
☐ Not applicable
EDITOR:
Floretta Boonzaier
KEYWORDS:
COVID-19, university students, South Africa, depression, anxiety, suicidal ideation
FUNDING:
South African Medical Research Council
COVID-19 and common mental disorders among university students in South Africa
COVID-19 has had far-reaching economic, social and health consequences, with vulnerable groups disproportionally affected. Even before the COVID-19 pandemic, concern was expressed about university students’ mental health, with global data suggesting students are more vulnerable than the general population to mental disorders. Yet, it is unclear what the pandemic’s impact has been on the mental health of students in South Africa. We examined the impact of COVID-19 on first-year students at two universities in South Africa by analysing changes in the prevalence and age-of-onset of three common mental disorders (namely major depressive episode, generalised anxiety disorder, and suicidal ideation) before and during the pandemic, and comparing these to changes between 2015 and 2017. Our analysis of cross-sectional survey data collected in 2015, 2017 and 2020 shows no clear or consistent pattern of increases in prevalence of common mental disorders following the start of the pandemic. Lifetime prevalence rates of common mental disorders among students have been steadily increasing since 2015, and where increases before and during COVID-19 were observed, they are not consistently larger than increases between 2015 and 2020. No significant changes were observed in the 12-month prevalence of common mental disorders before and during COVID-19, except for an increase in prevalence of depression at one institution, and a decrease in suicidal ideation at the other. Findings suggest that in the context of ongoing adversity and disruptions on South African university campuses in recent years, COVID-19 may be just one more stressor local students face and that its impact on student mental health may not have been as marked in South Africa compared to other regions.
Significance:
• This study is the first to explore COVID-19’s impact on university students’ mental health in South Africa, using data collected before and during the pandemic.
• High rates of psychopathology confirm the need for sustainable campus-based interventions to support student well-being.
• Rates of mental disorders among students have been increasing since 2015, and increases observed in 2020 were no larger than those observed in prior years.
• In the context of disruptions on university campuses in recent years, COVID-19 is just one more stressor for students, and its impact may not have been as marked in South Africa compared to other regions.
Introduction
The global COVID-19 pandemic that started in December 2019 has had far-reaching economic, educational, and mental health consequences, not least of all because of widespread and sustained restrictions on people’s movement, freedom, and ability to work. As with all pandemics, COVID-19 has exacerbated inequalities and disproportionally affected marginalised and vulnerable groups1, including young people in low- and middle-income countries (LMICs) whose education was severely disrupted as schools and universities closed their doors and moved to online teaching2. Increases in rates of depression and anxiety since the outbreak of COVID-19 have been documented in the general population3-5 and among university students6,7, although global suicide rates appear to have been largely unaffected so far8,9. However, many of the studies on mental health and COVID-19 have relied on cross-sectional data at a single point in time, with no direct comparisons to data collected in the same population and with the same methods before COVID-19. Understanding the impact of COVID-19 on the mental health of university students in LMICs is important to plan interventions to ameliorate the psychological consequences of the pandemic on higher education, particularly because academic performance is affected by students’ mental health.10 Promoting university students’ mental health (and hence educational retention and academic success) in the post-COVID-19 period will be integral to stimulating economic recovery, especially in LMICs where the economic fallout of the pandemic has been hard felt.11
Globally, universities have been increasingly concerned about the prevalence of common mental disorders and suicidal behaviour among undergraduate students even before COVID-19.12-14 One pre-COVID-19 survey of students from 19 universities across eight countries (Australia, Belgium, Germany, Mexico, Northern Ireland, South Africa, Spain, USA) reported 12-month prevalence rates of 35% for at least one common mental disorder among first-year students15, and 12-month prevalence rates for suicidal ideation, plan, and attempt of 17.2%, 8.8%, and 1.0%, respectively13 The prevalence of psychopathology among undergraduate students is partly attributed to psychosocial stressors associated with this developmental period (i.e. greater academic demands, leaving home for the first time, increased exposure to substances, and financial pressures) and the fact that the onset of mental disorders is typically in late adolescence or early adulthood. Depression, anxiety, and suicidal ideation are the most common symptoms of mental disorders reported by students and are associated with severe role impairment in academic and social functioning.16 Our earlier work in South Africa suggested that providing effective treatment to
© 2023. The Author(s). Published under a Creative Commons Attribution Licence.
https://doi.org/10.17159/sajs.2023/13594
75 Volume 119| Number 1/2 January/February 2023 Research Article
first-year students with major depressive disorder and/or attention deficit hyperactivity disorder could yield a 23.0% proportional reduction in prevalence of academic failure, highlighting the importance of promoting mental health as a strategy for raising educational attainment.17
There has been a marked increase in the incidence of depressive and anxiety disorders following the outbreak of COVID-19 in both the general population and among university students. An analysis of the best available global survey data with measurements of anxiety and depression both before and during the pandemic, using the Global Burden of Disease Study model, estimated an additional 53.2 million cases of depressive disorder and 76.2 million cases of anxiety disorder globally (equivalent to a 27.6% increase in depression and a 25.6% increase in anxiety disorders).4 Studies have also documented university students’ psychological distress during COVID-19 in many countries including the UK18, Poland19, China20, Delhi21, Columbia22 and Bangladesh23. However, many of these studies, particularly those conducted in LMICs21-23, have relied on cross-sectional data measuring symptom severity at a single point in time during the pandemic without making direct or meaningful comparisons to pre-COVID-19 assessments. The aim of this study was to investigate changes before and during COVID-19 in the12-month prevalence of major depressive episode (MDE), generalised anxiety disorder (GAD), and suicidal ideation among first-year university students in South Africa. We report on data collected at two universities in 2015, 2017 and 2020 using identical survey methods at each of the three timepoints, as part of the ongoing work of the World Health Organization’s World Mental Health Surveys International College Student Initiative (WMHS-ICS).24
Methods
The aim of this study was to investigate the impact of COVID-19 on the mental health of first-year university students in South Africa by:
(1) comparing changes in the prevalence of symptoms of three common mental disorders (i.e. MDE, GAD and suicidal ideation) as well as changes in the pattern of onset of these disorders at three time points (i.e. 2015, 2017 and 2020) and (2) establishing if any changes in the prevalence of these disorders might be a result of changes in the demographic profile of students between 2015 and 2020.
Data collection
Data were collected as part of a larger study of student mental healthcare needs in South Africa and in conjunction with the ongoing work of the WMHS-ICS.24 All first-year students at Stellenbosch University (SU) in 2015 (N=5338), 2017 (N=5163) and 2020 (N=5584), and the University of Cape Town (UCT) in 2017 (N=3662) and 2020 (N=5408), were invited via email (sent directly to students by the institution) to participate in an anonymous online survey, of which 2271 students completed the surveys. The 2020 data were collected between 14 April and 10 July 2020. To be included in the study, students had to be enrolled as first-year students at one of the participating universities and had to give informed consent.
Measures
The following data were collected via an online survey:
Sociodemographic characteristics
Participants were asked their age, parents’ level of education, whether they had a serious physical impairment, whether they suffered from any chronic illnesses, and how they identify in terms of gender, population group, and sexual orientation. We identified students as ‘first-generation students’ if neither of their parents had completed tertiary education. Students were identified as having a disability if they reported any serious physical impairment (e.g. vision, hearing, and movement impairment) or chronic health problem (e.g. asthma, diabetes, migraine, chronic pain disorder). For gender, students self-identified as female, male or gender non-conforming. In terms of population group students identified as black (i.e. black African, coloured or Asian) or white. A broad definition of ‘black’ was used to identify all students from
historically excluded population groups; the use of these categories is not intended to reify sociocultural constructs, but rather used with the aim of investigating ongoing social and economic disparities with access to health care, education, and employment opportunities in South Africa. Sexual orientation was dichotomised as heterosexual (i.e. no same sex attraction) or ‘sexual minority’ (i.e. lesbian, gay, bisexual, asexual or questioning).
Common mental disorders
We assessed the lifetime and 12-month prevalence and age of onset for MDE, GAD, and suicidal ideation using items adapted from the Composite International Diagnostic Interview Screening Scales (CIDI‐SC).25,26
The CIDI‐SC has good concordance with blinded clinical diagnoses based on the Structured Clinical Interview for DSM‐IV (SCID)27, with an area under the curve in the range 0.70–0.78.25,26 Suicidal ideation was assessed using a modified version of the Columbia Suicidal Severity Rating Scale (C-SSRS), which has demonstrated good convergent and divergent validity with other multi-informant suicidal ideation and behaviour scales used with adolescents, as well as showing high sensitivity and specificity for suicidal behaviour classifications compared with other behaviour scales and clinician evaluation.28 We assessed passive suicidal ideation (i.e. Did you ever in your life wish you were dead or would go to sleep and never wake up?) and active suicidal ideation (Did you ever in your life have thoughts of killing yourself?). Students who endorsed either of these items were identified as reporting suicidal ideation.
Data analysis
Data were weighted by population group and gender within each institution across each year to adjust for differences between survey respondents and the populations of the student body, and changes in the demographic profile of students between 2015 (SU only), 2017 (SU and UCT) and 2020 (SU and UCT). First, we calculated lifetime and 12-month prevalence estimates for MDE, GAD, suicidal ideation, and any of these three outcomes within each university across each year, as well as the lifetime cumulative and conditional incidence of each of the above separately before COVID-19 (2015 and 2017) and during COVID-19 (2020). Second, we estimated the 12-month persistence among prior lifetime cases before and during COVID-19 along with age of onset curves for each disorder. Finally, we used regression analysis to establish if any observed changes in prevalence rates were a function of changes in the demographic profile of students admitted to university over this period. The results of the regression analysis are reported as corrected odds ratios (i.e. risk ratios) with 95% confidence intervals (CIs) for the adjusted main effects. Alpha was set as 0.05 for all tests of significance.
Ethical clearance
Ethical clearance for the study was obtained from the Health Sciences Research Ethics Committees at SU and UCT. Institutional permission to contact students was also obtained prior to data collection.
Results
Sample characteristics
The sociodemographic characteristics for the sample of students who completed the survey (N=2271) and the population of all first-year students at each institution in 2015, 2017 and 2020 are presented as supplementary material (see Supplementary tables 1 and 2). Although the samples from both institutions in all three years consisted predominantly of students who identified as female and black (Supplementary tables 1 and 2), there were significant differences in the sociodemographic profiles of the population of students across the different years in both institutions (p<0.001). Consequently, prior to substantive analysis, the data were weighted by gender and population group for each institution separately across the three years, to adjust for the differences between the sample and the population and to control for changes in the demographic profile of the student body over time.
76 Volume 119| Number 1/2 January/February 2023 Research Article https://doi.org/10.17159/sajs.2023/13594 COVID-19 and student mental health in South Africa Page 2 of 10
Lifetime and 12-month prevalence of common mental disorders
The lifetime prevalence of MDE, GAD, suicidal ideation, and any of these three outcomes in each institution are shown in Table 1a (SU in 2015, 2017 and 2020) and Table 1b (UCT in 2017 and 2020). At SU between 2015 and 2017, there were significant increases in the lifetime prevalence of MDE (20.5% vs 27.4%, p=0.009) and suicidal ideation (42.9% vs 49.6%, p=0.035), but no changes for GAD and for any disorder (p>0.05). Between 2017 and 2020, the lifetime prevalence at SU increased significantly for all outcomes (MDE: 27.4% vs 47.6%, p<0.0001; GAD: 23.3% vs 29.6%, p=0.039; suicidal ideation: 49.6% vs 60.0%, p=0.003: any disorder: 57.8% vs 70.9%, p<0.0001). At UCT between 2017 and 2020, there were no significant changes in the lifetime prevalence for any of the outcomes we assessed (p>0.05). The 12-month prevalence of MDE, GAD, suicidal ideation and any of these outcomes is shown in Table 2a (for SU) and 2b (for UCT). Prevalence estimates for co-morbidity are presented as supplementary material (see Supplementary table 3). The 12-month prevalence at SU increased significantly between 2015 and 2017 for MDE (16.8% vs
24.4%, p=0.002), suicidal ideation (24.1% vs 36.9%, p<0.0001) and any disorder (36.6% vs 47.8%, p=0.0004), but not for GAD (p=0.076). By comparison, between 2017 and 2020, the only significant change in 12-month prevalence was for MDE (24.4% vs 40.3%, p<0.0001), with no changes for GAD, suicidal ideation, and any disorder (p>0.05). Between 2017 and 2020 at UCT, the 12-month prevalence did not change significantly for MDE, GAD or any disorder (p>0.05), and decreased significantly for suicidal ideation (48.9% to 36.0%, p=0.006).
The 12-month prevalence among lifetime cases (i.e. the proportional persistence) of MDE, GAD, suicidal ideation and any of these outcomes is shown in Table 3a (for SU) and 3b (for UCT). The proportional persistence between 2015 and 2017 at SU increased significantly for suicidal ideation (56.2% vs 74.4%, p<0.0001) and for any disorder (71.0% vs 82.7%, p=0.002), but did not change significantly for MDE or GAD (p>0.05). Between 2017 and 2020 at SU no significant increases were observed in the proportional persistence for any of the outcomes (p>0.05), although a significant reduction was observed in persistence of suicidal ideation (74.4% vs 54.4%, p<0.0001), and no significant reductions were observed for MDE, GAD, and any disorder (p>0.05).
†Weighted by population group and gender per institution *
Table 2: 12-Month prevalence of major depressive episode (MDE), generalised anxiety disorder (GAD) and suicidal ideation among the total sample of firstyear students at (a) Stellenbosch University and (b) University of Cape Town, by year†
†Weighted by population group and gender per institution *p
77 Volume 119| Number 1/2 January/February 2023 Research Article
https://doi.org/10.17159/sajs.2023/13594
COVID-19 and student mental health in South Africa Page 3 of 10
(a) 2015 (n=686) 2017 (n=440) 2020 (n=504) 2015 vs 2017 2017 vs 2020 n % SE n % SE n % SE X2(1) p X2(1) p MDE 140 20.5 1.549 121 27.4 2.221 240 47.6 2.401 7.283 0.009* 40.424 <.0001* GAD 138 20.2 1.529 103 23.3 2.110 149 29.6 2.127 1.582 0.221 4.681 0.039* Suicidal ideation 294 42.9 1.926 218 49.6 2.575 303 60.0 2.365 4.957 0.035* 10.312 0.003* Any 354 51.6 1.951 255 57.8 2.555 357 70.9 2.202 4.178 0.054 17.559 <0.0001* (b) 2017 (n=193) 2020 (n=448) 2017 vs 2020 n % SE n % SE X2(1) p MDE 80 41.7 3.917 224 50.0 2.683 3.750 0.083 GAD 134 69.3 3.577 307 68.5 2.422 0.038 0.858 Suicidal ideation 123 63.7 3.816 278 62.0 2.637 0.169 0.712 Any 140 72.4 3.532 326 72.7 2.470 0.006 0.945
Table 1: Lifetime prevalence of major depressive episode (MDE), generalised anxiety disorder (GAD) and suicidal ideation among the total sample of firstyear students at (a) Stellenbosch University and (b) University of Cape Town, by year†
p<0.05
(a) 2015 (n=686) 2017 (n=440) 2020 (n=504) 2015 vs 2017 2017 vs 2020 n % SE n % SE n % SE X2(1) p X2(1) p MDE 115 16.8 1.418 107 24.4 2.116 203 40.3 2.345 9.847 0.002* 26.718 <0.0001* GAD 123 17.9 1.459 98 22.3 2.0772 139 27.6 2.0798 3.310 0.076 3.538 0.072 Suicidal ideation 165 24.1 1.644 162 36.9 2.463 165 32.7 2.264 21.318 <0.0001* 1.840 0.208 Any 251 36.6 1.865 210 47.8 2.568 271 53.7 2.405 13.827 0.0004* 3.246 0.095 (b) 2017 (n=193) 2020 (n=448) 2017 vs 2020 n % SE n % SE X2(1) p MDE 77 39.9 3.897 203 45.3 2.650 1.573 0.260 GAD 57 29.7 3.542 133 29.7 2.379 0.000 0.993 Suicidal ideation 94 48.9 3.971 161 36.0 2.557 9.406 0.006* Any 123 63.7 3.809 262 58.5 2.674 1.531 0.266
<0.05
Table 4: 12-Month prevalence among lifetime cases as of 2 years ago for major depressive episode (MDE), generalised anxiety disorder (GAD) and suicidal ideation among the total sample of first-year students at (a) Stellenbosch University and (b) University of Cape Town, by year†
A similar pattern emerged at UCT between 2017 and 2020, with significant decreases for suicidal ideation (76.8% vs 58.0%, p=0.001) but no significant decreases for MDE, GAD, and any disorder (p>0.05).
The 12-month prevalence among lifetime cases as of 2 years ago (i.e. proportion of current cases with onset of symptoms 2 or more years previously) of MDE, GAD, suicidal ideation and any of these outcomes are shown in Table 4a (for SU) and 4b (for UCT). The proportion of 12-month cases with onset of symptoms 2 or more years previously increased significantly at SU between 2015 and 2017 for suicidal ideation (52.7% vs 70.7%, p<0.003) and for any disorder (69.8% vs 80.4%, p=0.011), but did not change significantly for MDE or GAD (p>0.05). Between 2017 and 2020 (i.e. before and after COVID-19), the proportion decreased significantly for suicidal ideation (70.7% vs 55.0%, p=0.002), and showed no significant changes for MDE, GAD, or any disorder (p>0.05). A very similar pattern was observed at UCT between 2017 and 2020 with a significant decrease observed for suicidal ideation
(75.5% vs 58.5%, p=0.006) and no significant changes observed for all other disorders (p>0.05).
Age of onset for common mental disorders
The age of onset distribution for MDE, GAD, suicidal ideation, and any of these three outcomes up to age 22 years across both institutions is shown in Figure 1 (SU), Figure 2 (UCT) and Figure 3 (UCT and SU pooled). The log-rank tests (Tukey–Kramer adjustment) show that the age of onset failure times for MDE, GAD, suicidal ideation, and any of these outcomes at SU (across 2015, 2017 and 2022) and UCT (2017 and 2020) are all significantly different from each other (p<0.0001). These curves show consistently that the age of onset for all disorders in both institutions was earlier in 2020 compared to 2017, and at SU the age of onset for all disorders was earlier in 2017 compared to 2020. These results demonstrate that over time students were developing symptoms at a younger and younger age, and that this contributed to the higher prevalence rates observed before and after COVID-19.
78 Volume 119| Number 1/2 January/February 2023 Research Article https://doi.org/10.17159/sajs.2023/13594 COVID-19 and student mental health in South Africa Page 4 of 10
(a) 2015 2017 2020 2015 vs 2017 2017 vs 2020 n % SE n % n % SE n % n % SE MDE 115 82.1 3.399 107 89.1 3.138 203 84.7 2.538 2.693 0.140 1.385 0.295 GAD 123 88.5 2.665 98 95.5 2.0478 139 93.3 2.067 3.902 0.0541 0.563 0.473 Suicidal ideation 165 56.2 2.940 162 74.4 3.247 165 54.4 3.070 18.114 <0.0001* 21.738 <0.0001* Any 251 71.0 2.472 210 82.7 2.637 271 75.7 2.464 11.214 0.002* 4.299 0.062 (b) 2017 2020 2017 vs 2020 n % SE n % SE n % MDE 77 95.7 2.199 203 90.5 2.213 2.324 0.139 GAD 57 96.6 2.367 133 94.4 2.082 0.508 0.511 Suicidal ideation 94 76.8 4.251 161 58.0 3.293 13.193 0.001* Any 123 88.0 3.034 262 80.4 2.508 3.981 0.076
Table 3: 12-Month prevalence among lifetime cases of major depressive episode (MDE), generalised anxiety disorder (GAD) and suicidal ideation among the total sample of first-year students at (a) Stellenbosch University and (b) University of Cape Town, by year†
population
and gender per institution
†Weighted by
group
*p<0.05
(a) 2015 2017 2020 2015 vs 2017 2017 vs 2020 n % SE n % n % SE n % n % SE MDE 96 81.1 3.806 96 89.5 3.329 173 84.4 2.776 3.303 0.107 1.638 0.262 GAD 101 89.7 2.860 74 94.1 2.643 107 93.3 2.250 1.239 0.280 0.050 0.828 Suicidal ideation 138 52.7 3.141 127 70.7 3.663 138 55.0 3.372 14.617 0.0003* 11.109 0.002* Any 226 69.8 2.617 175 80.4 2.979 246 78.4 2.488 7.652 0.011* 0.294 0.622 (b) 2017 2020 2017 vs 2020 n % SE n % SE n % MDE 54 95.7 2.598 180 91.4 2.231 1.236 0.277 GAD 74 94.1 2.643 107 93.3 2.250 0.050 0.828 Suicidal ideation 79 75.5 4.638 136 58.5 3.576 9.364 0.006* Any 102 87.2 3.311 243 83.2 2.460 1.084 0.346 †Weighted by population group and gender per institution *p<0.05
Figure 1: Age of onset curves up to age 22 for (a) major depressive episode (MDE), (b) generalised anxiety disorder (GAD), (c) suicidal ideation, and (d) any of these outcomes among firstyear students at Stellenbosch University in 2015, 2017 and 2020.
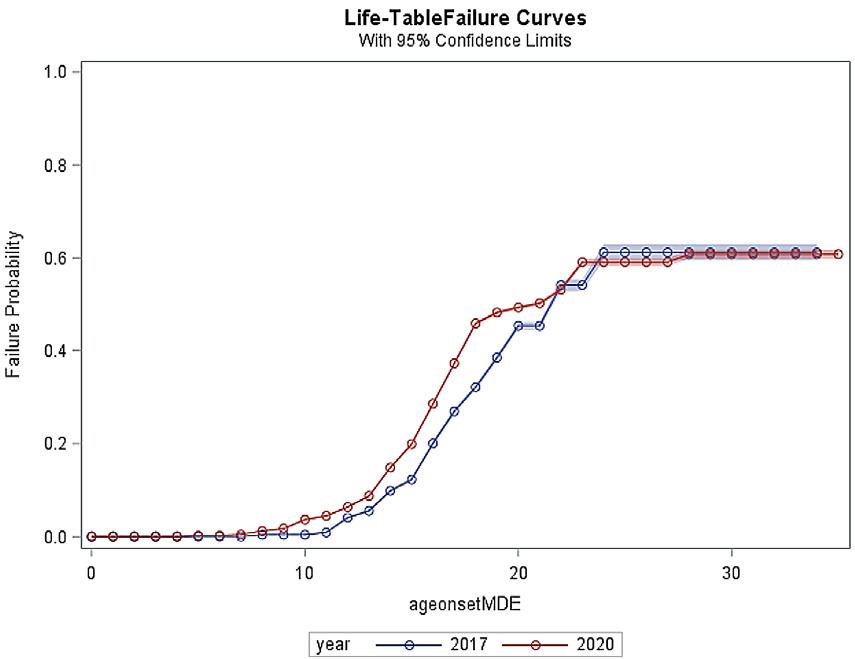
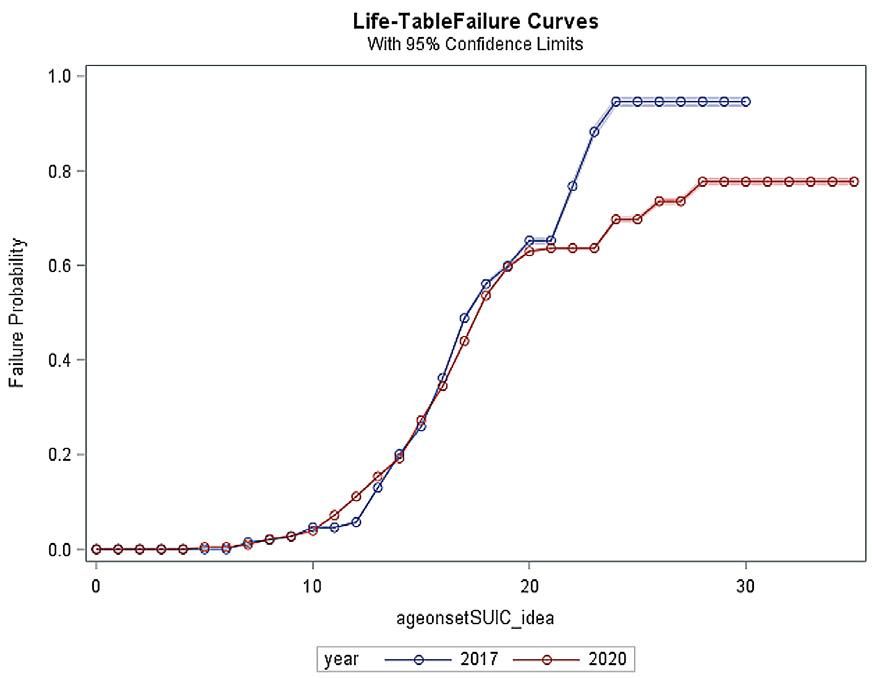
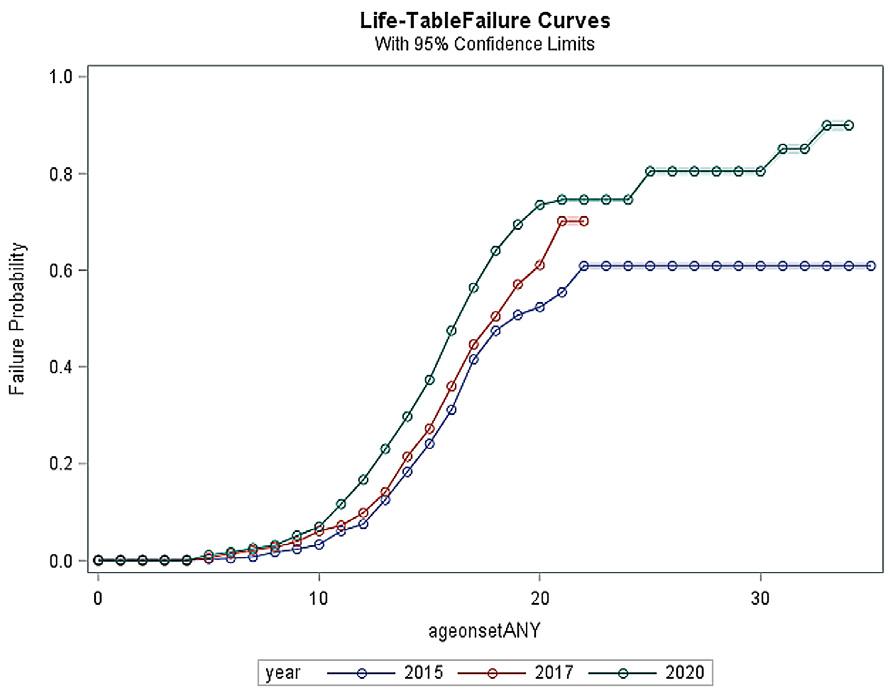
Figure 2: Age of onset curves up to age 24 for (a) major depressive episode (MDE), (b) generalised anxiety disorder (GAD), (c) suicidal ideation, and (d) any of these outcomes among firstyear students at University of Cape Town, for 2017 and 2020.
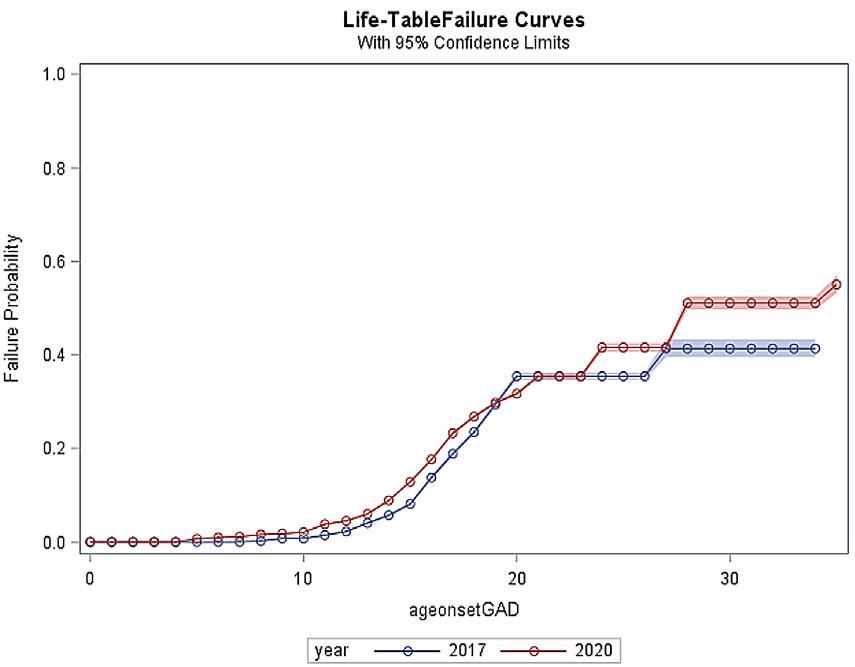
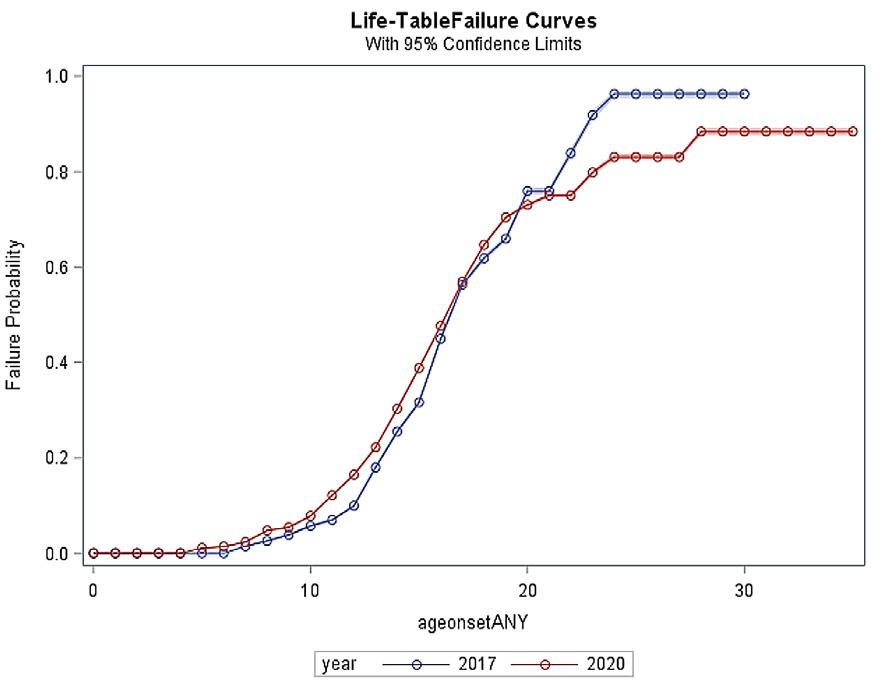
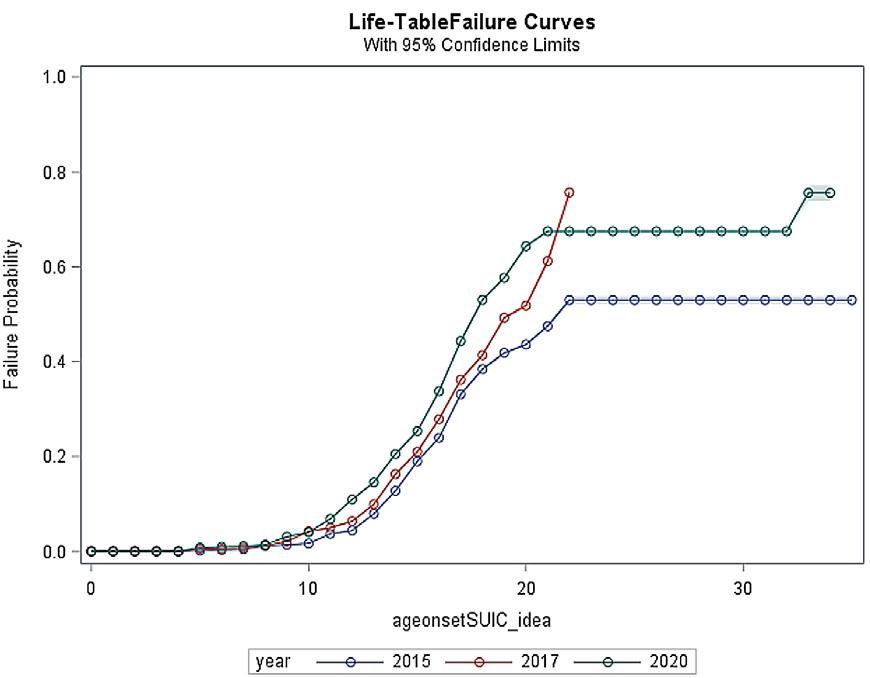
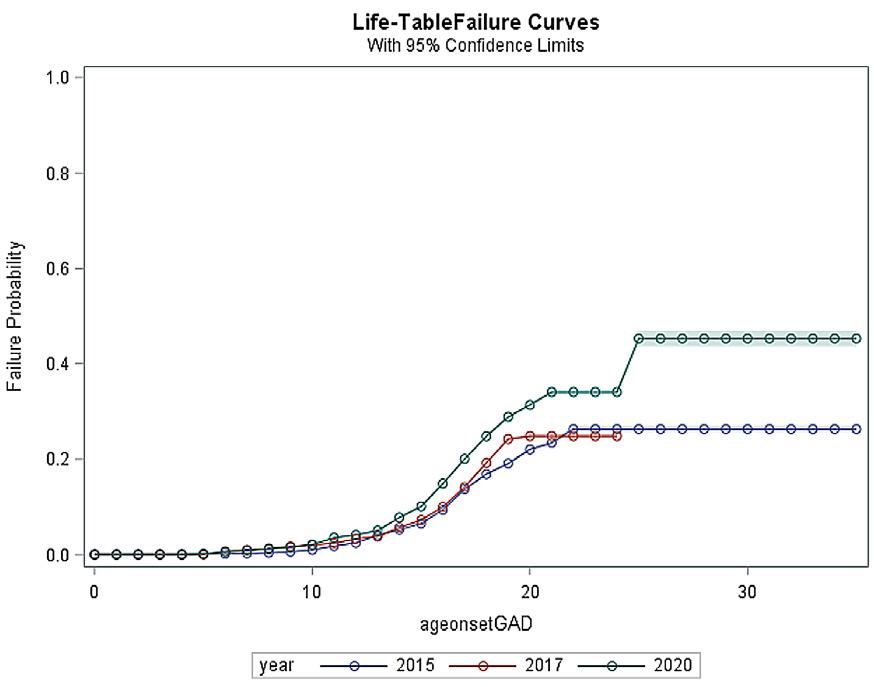
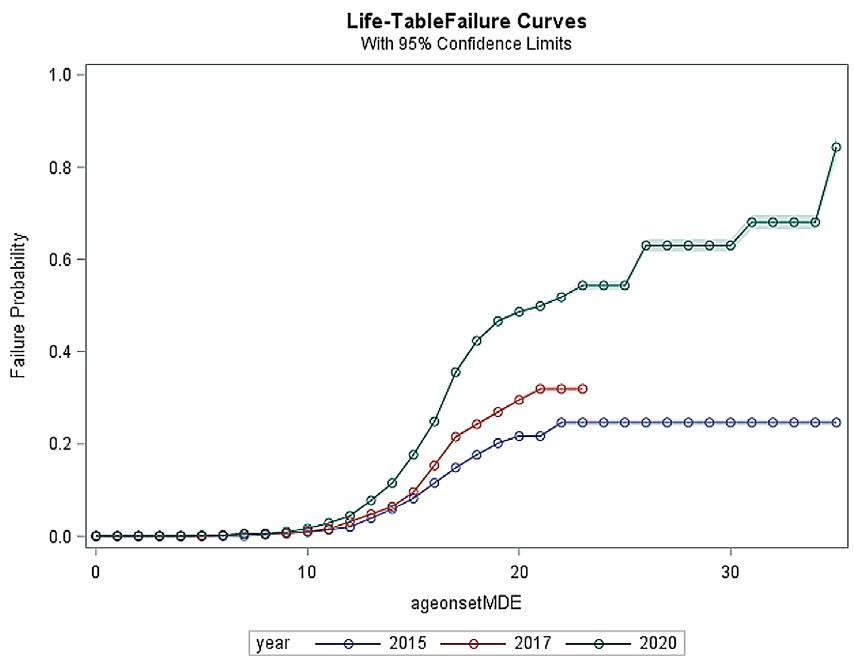
https://doi.org/10.17159/sajs.2023/13594
79 Volume 119| Number 1/2 January/February 2023 Research Article
a b c d
a c d b
COVID-19 and student mental health in South Africa Page 5 of 10
Figure 3: Age of onset curves up to age 24 for (a) major depressive episode (MDE), (b) generalised anxiety disorder (GAD), (c) suicidal ideation, and (d) any of these outcomes among first-year students at Stellenbosch University and University of Cape Town, before and after COVID-19.
Net effects controlling for demographic changes in student enrolment
Regression analysis was used to establish if the observed changes in prevalence estimates shown in Table 2 are a function of changes in the demographic composition of the students over time. Table 5 shows the analysis of net changes in lifetime prevalence as of 2 years prior for each of the outcomes, with Model 1 illustrating the gross effect over time and Model 2 including controls for changes in the sociodemographic profile of students. As seen in Table 5a, after controlling for changes in the demographic composition of the student body, there was a significant increase in the proportion of first-year students at SU already exhibiting symptoms of MDE before they arrived at university between 2015 and 2017 (RR=1.4, 95% CI=1.1–1.8) and between 2017 and 2020 (RR=1.8, 95% CI=1.5–2.1), with the changes observed between 2015 and 2017 not significantly different from changes between 2017 to 2020 (p=0.327). For GAD, the lifetime prevalence as of 2 years prior at SU showed no significant changes between 2015 and 2017 (RR=1.0, 95% CI=0.8–1.4) but increased significantly between 2017 and 2020 (RR=1.3, 95% CI=1.0–1.7), although again the change from 2015 to 2017 was not significantly different from the change between 2017 and 2020 (p=0.304). For suicidal ideation, no significant change was observed between 2015 and 2017 (RR=1.0, 95% CI=0.9–1.2) but a significant increase occurred between 2017 and 2020 (RR=1.2, 95% CI=1.1–1.4), although the change between 2015 and 2017 was not significantly different from the change between 2017 and 2020 (p=0.407). Finally, for any disorder, the change between 2015 and 2017 was not significant (RR=1.0, 95% CI=0.9–1.2), but did change significantly between 2017 and 2020 (RR=1.3, 95% CI=1.2–1.4), although again the change between 2015 and 2017 was not significantly different from the change between 2017 and 2020 (p=0.249).
As shown in Table 5b, at UCT the lifetime prevalence as of 2 years prior increased significantly between 2017 and 2020 for MDE (RR=1.4, 95% CI=1.1–1.8), but did not change significantly for GAD (RR=11.1, 95% CI=0.8–1.6), suicidal ideation (RR=0.9, 95% CI=0.7–1.1) or for any of these outcomes (RR=1.0, 95% CI=0.9–1.2) controlling for changes in demographic characteristics of students.
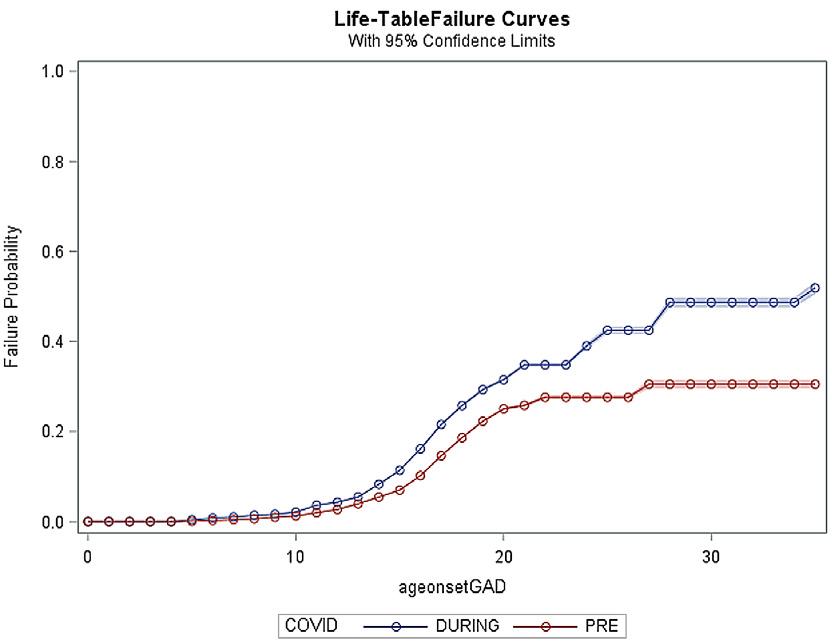
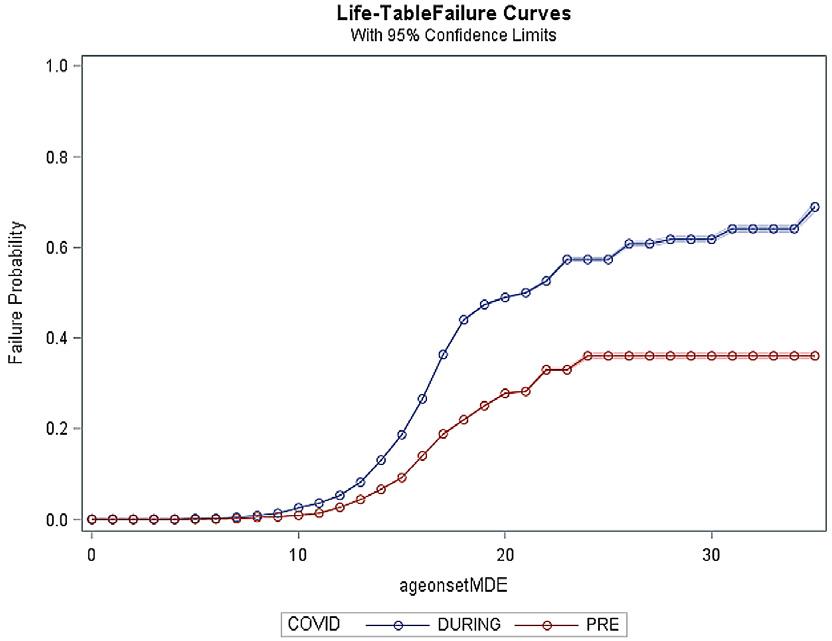
The regression analysis of the net effect of changes in 12-month prevalence among students with lifetime disorder as of 2 years ago, as well as the analysis of changes in 12-month prevalence among students without a lifetime disorder as of 2 years ago are provided as supplementary material (see Supplementary tables 4 and 5). At SU, the 12-month prevalence among lifetime cases as of 2 years prior for MDE and GAD did not change significantly between 2015 and 2017 or between 2017 and 2020, controlling for changes in demographic profile of the students. However, suicidal ideation increased significantly between 2015 and 2017 (RR=1.6, 95% CI=1.3–2.0) and decreased significantly between 2017 and 2020 (RR=0.6, 95% CI=0.4–0.9), while for any disorder there was a significant increase between 2015 and 2017 (RR=1.3, 95% CI=1.1–1.6) and no change between 2017 and 2020 (RR=1.0, 95% CI=0.7–1.3). A similar pattern was seen at UCT between 2017 and 2020, with no significant changes observed in the 12-month prevalence among students with a lifetime diagnosis as of 2 years prior, for MDE, GAD or any disorder, although a decrease was observed for suicidal ideation (RR=0.4, 95% CI=0.3–0.7).
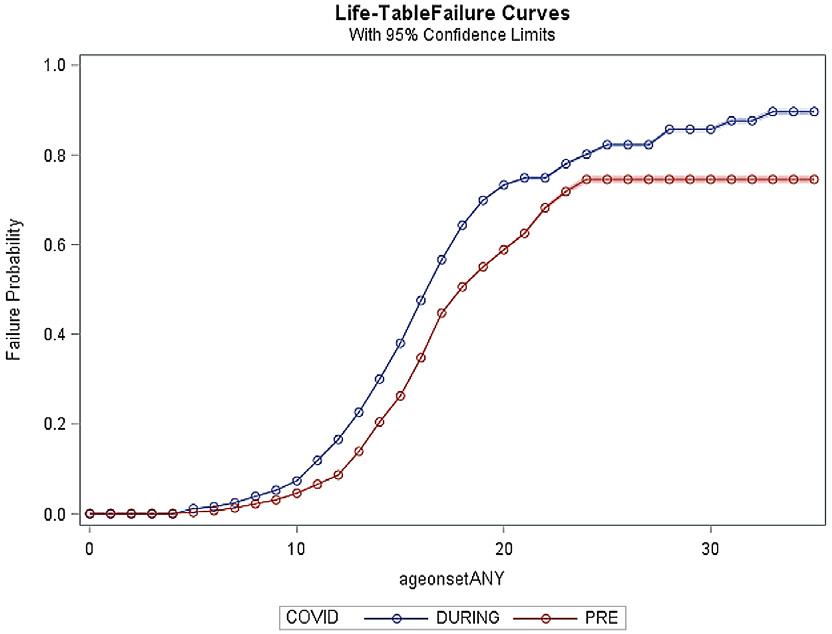
The 12-month prevalence among students without a lifetime diagnosis as of 2 years ago did not change at SU for MDE between 2015 and 2017 (RR=0.9, 95% CI=0.4–1.9), but increased significantly between 2017 and 2020 (RR=3.1, 95% CI=1.6–6.0) controlling for demographic changes in student composition. There were no significant changes for GAD between 2015 and 2017 (RR=1.6, 95% CI=0.8–2.9) or between 2017 and 2020 (RR=1.4, 95% CI=0.8–2.5), while suicidal ideation increased between 2015 and 2017 (RR=2.2, 95% CI=1.3–3.7) and did not change between 2017 and 2020 (RR=0.8, 95% CI=0.5–1.5). For any disorder, there was an increase between 2015 and 2017 (RR=2.5, 95% CI=1.5–4.2) but no change between 2017 and 2020 (RR=0.8, 95% CI=0.5–1.4). At UCT between 2017 and 2020 there were no significant changes in the 12-month prevalence among students without a lifetime diagnosis as of 2 years ago in any of the outscores, controlling for demographic changes.
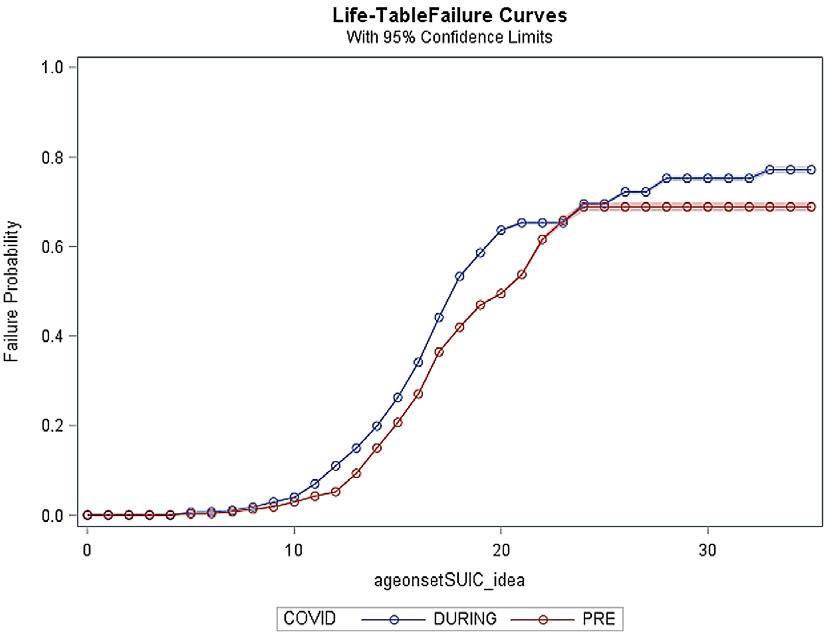
80 Volume 119| Number 1/2 January/February 2023 Research Article https://doi.org/10.17159/sajs.2023/13594 a c b
d
COVID-19 and student mental health in South Africa Page 6 of 10
81 Volume 119| Number 1/2 January/February 2023 Research Article https://doi.org/10.17159/sajs.2023/13594 COVID-19 and student mental health in South Africa Page 7 of 10 Table 5: Regression analysis of changes in lifetime prevalence as of 2 years prior among first-year students at (a) Stellenbosch University and (b) University of Cape Town (a) Major depressive episode Generalised anxiety disorder Suicidal ideation Any Model 1 Model 2 Model 1 Model 2 Model 1 Model 2 Model 1 Model 2 OR 95% CI aOR 95% CI Z-score ( p -value) † OR 95% CI aOR 95% CI Z-score ( p -value) † OR 95% CI aOR 95% CI Z-score ( p -value) † OR 95% CI aOR 95% CI Z-score ( p -value) † 2017 vs 2015 ‡ 1.412 1.114 1.760 1.410 1.101 1.773 1.092 0.832 1.411 1.038 0.778 1.363 1.098 0.911 1.235 1.053 0.888 1.226 1.052 0.918 1.186 1.029 0.889 1.169 2020 vs 2017 ‡ 1.671 1.387 1.972 1.757 1.456 2.071 0.979 (0.327) 1.271 0.975 1.626 1.337 1.019 1.716 1.029 (0.304) 1.218 1.048 1.387 1.244 1.068 1.418 0.830 (0.407) 1.255 1.118 1.384 1.298 1.158 1.427 1.153 (0.249) 2020 vs 2015 ‡ 2.36 1.985 2.754 2.478 2.070 2.905 1.388 1.097 1.729 1.393 1.089 1.751 1.302 1.142 1.462 1.313 1.143 1.483 1.32 1.193 1.44 1.344 1.21 1.469 Gender (female) 1.676 1.281 2.192 2.298 1.672 3.159 1.385 1.101 1.742 1.439 1.148 1.805 Population group (black) 0.869 0.663 1.140 0.682 0.508 0.914 1.197 0.945 1.516 1.033 0.814 1.311 First- generation students 1.031 0.787 1.351 1.465 1.111 1.932 1.015 0.802 1.285 1.021 0.807 1.292 LGBTQ 3.245 2.391 4.403 2.218 1.608 3.058 3.000 2.219 4.056 3.141 2.269 4.350 Disability 1.422 1.057 1.914 1.551 1.126 2.137 1.469 1.114 1.936 1.621 1.224 2.147 F 36.700 37.06 3.81 3.91 7.240 7.17 12.400 13.46 df 2 2 2 2 2 2 2 2 p <0.0001* <0.0001* 0.0223* 0.0202* 0.0007* 0.0008* <0.0001 <0.0001 (b) Major depressive episode Generalised anxiety disorder Suicidal ideation Any Model 1 Model 2 Model 1 Model 2 Model 1 Model 2 Model 1 Model 2 OR 95% CI aOR 95% CI OR 95% CI aOR 95% CI OR 95% CI aOR 95% CI OR 95% CI aOR 95% CI 2020 vs 2017 ‡ 1.5 1.2 1.8 1.4 1.1 1.8 1.2 0.9 1.6 1.1 0.8 1.6 1.0 0.8 1.1 0.9 0.7 1.1 1.1 0.9 1.2 1.0 0.9 1.2 Gender (female) 1.6 1.0 2.3 1.5 1.0 2.4 1.3 0.9 1.8 1.2 0.8 1.8 Population group (black) 0.7 0.5 1.0 0.5 0.3 0.8 1.0 0.7 1.5 0.8 0.5 1.1 First-generation students 0.8 0.6 1.2 1.4 0.9 2.1 0.8 0.6 1.2 1.1 0.7 1.7 LGBTQ 3.1 1.9 4.8 1.8 1.2 2.8 2.8 1.7 4.5 3.3 1.9 5.6 Disability 1.3 0.8 2.1 1.3 0.8 2.1 1.9 1.2 3.0 1.6 1.0 2.7 F 10.140 6.460 1.100 0.37 0.250 1.73 0.850 0.06 df 1 1 1 1 1 1 1 1 p 0.0015* 0.0113* 0.2948 0.5411 0.6158 0.1887 0.3556 0.8089 † Comparison of aRR for 2017 vs 2015 with 2020 vs 2017 ‡ Corrected ORs (i.e. risk ratios) * p <0.05
Discussion
We examined the impact of COVID-19 on the mental health of firstyear students at two universities in South Africa by analysing changes in the prevalence and onset of three common mental disorders before and during the outbreak of the global pandemic, and comparing these to the changes observed between 2015 and 2017. Our analysis of cross-sectional survey data collected at SU in 2015, 2017 and 2020, and from UCT in 2017, showed no consistent pattern of increases in the prevalence of MDE, GAD and suicidal ideation before and during the first two waves of COVID-19. There were no significant changes in the 12-month prevalence of common mental disorders at either institution before and after the outbreak of COVID-19, except for an increase in prevalence of MDE at SU and a decrease in suicidal ideation at UCT. Our data suggest that while COVID-19 had an impact on the mental health of some students, this impact was not consistently observed across both institutions or across all mental health outcomes, and, where increases were observed between 2017 and 2020, these were mostly no larger than increases previously observed between 2015 and 2017.
These survey data highlight the prevalence of common mental disorders among university students in South Africa and the need for effective and accessible campus-based interventions to promote student wellness. In 2020 the 12-month prevalence for any of the three common mental disorders we assessed was 53.7% and 58.5% at SU and UCT, respectively. MDE was the most common mental health problem reported in the past 12 months (SU: 40.3%; UCT:45.3%), followed by suicidal ideation (SU:32.7%; UCT: 36.0%) and GAD (SU: 27.6%; UCT: 29.7%). These prevalence rates are significantly higher than those observed in the general population29 and confirm the need for an urgent focus on developing scalable student mental health interventions in South Africa.
Between 2017 and 2020, across both institutions, the only significant increase in 12-month prevalence was for MDE at SU (24.4% vs 40.3%). All other outcomes remained unchanged or, in the case of suicidal ideation at UCT, significantly decreased (48.9% vs 36.0%). In contrast, between 2015 and 2017 significant increases were observed at SU for MDE (16.8 vs 24.4%), suicidal ideation (24.1% vs 36.9%), and for any of the outcomes (36.6% vs 47.8%). While lifetime prevalence did not increase between 2017 and 2020 for any of the outcomes at UCT, significant increases were observed at SU for lifetime MDE (27.4% vs 47.6%), GAD (23.3% vs 29.6%), suicidal ideation (49.6% vs 60.0%) and any outcome (57.8% vs 70.9%). Crucially, our findings show that where increases were observed in lifetime prevalence rates, these had started to increase before the outbreak of COVID-19. Furthermore, when adjusting for changes in the demographic profile of students over time, the increases in risk ratios between 2017 and 2020 were not consistently higher than the increases observed between 2015 and 2017, suggesting that some of the changes we observed can be attributed to increased enrolment among students with higher risk of mental disorder (i.e. female students).
To contextualise our findings, it is important to note that university students in South Africa face several serious challenges that pre-date COVID-19, including food insecurity, housing insecurity, and the stress associated with living in a country where violence, crime and trauma are endemic.30-34 In the context of these adversities, COVID-19 is just one more challenge among many. Furthermore, pandemics are not new to South Africa; the enduring HIV and TB syndemic have long affected the lives of many South Africans, including university students.35,36 Indeed, South Africa has the highest number of people living with HIV in the world, with infection rates of 20.4% among 15–49 year olds and an estimated 80 000 TB-related deaths each year.37,38 Local historical, health, and socioenvironmental factors have shaped the impact of COVID-19 in South Africa and hence also students’ experiences of the pandemic. 37 It is possible that growing up with the constant presence of multiple life-threatening infectious diseases may have de-sensitised some students to the psychological impact of COVID-19.
It is also important to note that between 2015 and 2017 university students across South Africa participated in mass protests as part of the #FeesMustFall movement39 that aimed, among other things, to resist increases in student fees and decolonise universities. These protests
disrupted learning at all South African universities, caused widespread property damage, and led to the cancelation of exams.40,41 The military and riot police were deployed to campuses and sometimes clashed violently with students, resulting in student deaths.42 The disruptions and trauma caused by these protests no doubt had a profound impact on student mental health and likely attributed to the high rates of mental disorders we observed in 2017, especially at UCT where the #FeesMustFall campaign was prolonged and intense. Given this political context in 2017, it is unsurprising that very few changes were observed in the prevalence of common mental disorders between 2017 and 2020, even though there was a global pandemic in this time.
There are also at least three other interpretations of our findings. Firstly, students may be more resilient than is assumed in much of the current student mental health literature, as has been pointed out by authors who have highlighted the dangers of the rise in ‘therapeutic education’ and the positioning of all students as patients in need of treatment.43 Secondly, diagnostic criteria for mental disorders do not capture all forms of psychological distress and suffering.44 It is possible that there are much higher numbers of students who were distressed by COVID-19 but do not meet the threshold for a disorder and are thus not included in our prevalence estimates. The model of the pandemic as a trauma that leads to psychopathology may not be the most appropriate way to conceptualise the impact of the pandemic on students, despite the widespread usage of the trauma model in this context.44 Thirdly, the data we collected in 2020 was collected between April and July (i.e. during the first waves of the pandemic) and this may have been too soon to capture the full impact of the pandemic on students’ mental health.
Limitations
This study is the first in South Africa to examine the impact of COVID-19 on the mental health of first-year university students using cross-sectional data at three timepoints, before and after COVID-19. As such it provides novel insights into the psychological impact of the global pandemic in a LMIC and helps to contextualise this impact within pre-existing high rates of psychological distress among students in South Africa. However, the study has several limitations. First, the low response rate could lead to bias in estimating trends. Nonetheless, the response rate did not change over time, reducing the plausibility of this accounting for lack of a trend. Second, there were important changes in prevalence rates before the pandemic, which makes it much more difficult than otherwise to evaluate pandemic effects. Third, the (non)-effects we observed are based on data collected in the first year of the pandemic and it is possible that effects may have increased in the following year. Finally, we considered data collected only from first-year students at two wellresourced universities in the Western Cape Province. It is possible that a different pattern would be observed among senior students and those attending rural and less well-resourced institutions.
Conclusion
COVID-19 has had far-reaching economic, social and health consequences across the globe, with vulnerable groups disproportionally affected. Concern has been expressed about the mental health of university students globally, even before the pandemic, with data suggesting students are more vulnerable than the general population to common mental disorders and that the prevalence of psychological distress has increased in the wake of COVID-19. Nonetheless our analysis of data collected from first-year students at two universities in South Africa before and during the pandemic suggests that there has not been a clear or consistent pattern of increases in prevalence of MDE, GAD or suicidal ideation, and that where increases are observed, they preceded the pandemic. These findings suggest that, in the context of ongoing adversity and disruptions on South African university campuses in recent years, COVID-19 may be just one more stressor that local students face and that its impact on student mental health may not be as marked in South Africa compared to in other regions.
Acknowledgements
We acknowledge the contributions of Elsie Breet, Wylene Saal and Janine Roos towards the data collection and data management for this project.
82 Volume 119| Number 1/2 January/February 2023 Research Article
https://doi.org/10.17159/sajs.2023/13594
COVID-19 and student mental health in South Africa Page 8 of 10
The work reported herein was made possible through funding by the South African Medical Research Council (SAMRC) through its Division of Research Capacity Development under the MCSP (awarded to J.B.). This research was also funded by the SAMRC Unit on Risk and Resilience in Mental Disorders. The content hereof is the sole responsibility of the authors and does not necessarily represent the official views of the SAMRC.
Competing interests
In the past 3 years, Dr Kessler was a consultant for Datastat Inc., Holmusk, RallyPoint Networks Inc., and Sage Therapeutics. He has stock options in Mirah, PYM, and Roga Sciences. There are no other interests to declare.
Authors’ contributions
J.B.: Data collection; data analysis; writing – the initial draft ; funding acquisition. S.S.: Data analysis; writing – revisions. E.J.: Data analysis; writing – revisions. N.A.S.: Data collection; writing – revisions. M.V.P.: Data collection. C.L.: Data collection; writing – revisions. D.J.S.: Data analysis; writing – revisions; project leadership. R.C.K.: Conceptualisation; methodology; data analysis; writing – the initial draft; project leadership.
References
1. Bambra C, Riordan R, Ford J, Matthews F. The COVID-19 pandemic and health inequalities. J Epidemiol Community Health. 2020;74(11):964–968. http://dx.doi.org/10.1136/jech-2020-214401
2. Banati P, Jones N, Youssef S. Intersecting vulnerabilities: The impacts of COVID-19 on the psycho-emotional lives of young people in low- and middleincome countries. Eur J Dev Res. 2020;32(5):1613–1638. https://doi. org/10.1057/s41287-020-00325-5
3. Bareeqa SB, Ahmed SI, Samar SS, Yasin W, Zehra S, Monese GM, et al. Prevalence of depression, anxiety and stress in China during COVID-19 pandemic: A systematic review with meta-analysis. Int J Psychiatry Med. 2021;56(4):210–227. https://doi.org/10.1177/0091217420978005
4. Taquet M, Holmes EA, Harrison PJ. Depression and anxiety disorders during the COVID-19 pandemic: Knowns and unknowns. The Lancet. 2021;398(10312):1665–1666. https://doi.org/10.1016/S0140-6736(21) 02221-2
5. Salari N, Hosseinian-Far A, Jalali R, Vaisi-Raygani A, Rasoulpoor S, Mohammadi M, et al. Prevalence of stress, anxiety, depression among the general population during the COVID-19 pandemic: A systematic review and meta-analysis. Global Health. 2020;16(1):57. https://doi.org/10.1186/s12992-020-00589-w
6. Son C, Hegde S, Smith A, Wang X, Sasangohar F. Effects of COVID-19 on college students’ mental health in the United States: Interview survey study. J Med Internet Res. 2020;22(9), e21279. https://doi.org/10.2196/21279
7. Wang C, Wen W, Zhang H, Ni J, Jiang J, Cheng Y, et al. Anxiety, depression, and stress prevalence among college students during the COVID-19 pandemic: A systematic review and meta-analysis. J Am Coll Health. 2021;1–8. https:// doi.org/10.1080/07448481.2021.1960849
8. Pirkis J, John A, Shin S, DelPozo-Banos M, Arya V, Analuisa-Aguilar P, et al. Suicide trends in the early months of the COVID-19 pandemic: An interrupted time-series analysis of preliminary data from 21 countries. Lancet Psychiatry. 2021;8(7):579–588. https://doi.org/10.1016/S2215-0366(21)00091-2
9. Pirkis J, Gunnell D, Shin S, del Pozo-Banos M, Arya V, Aguilar PA, et al. Suicide numbers during the first 9-15 months of the COVID-19 pandemic compared with pre-existing trends: An interrupted time series analysis in 33 countries. EClinicalMedicine. 2022;51, Art. #101573.
10. Bruffaerts R, Mortier P, Kiekens G, Auerbach RP, Cuijpers P, Demyttenaere K, et al. Mental health problems in college freshmen: Prevalence and academic functioning. J Affect Disord. 2018;225:97–103. https://doi.org/10.1016/j. jad.2017.07.044
11. Miguel E, Mobarak AM. The economics of the COVID-19 pandemic in poor countries. SSRN. 2021 Oct 11 [cited 2022 Jan 26]. https://doi.org/10.3386/ w29339
12. Auerbach RP, Alonso J, Axinn WG, Cuijpers P, Ebert DD, Green JG, et al. Mental disorders among college students in the World Health Organization World Mental Health Surveys. Psychol Med. 2016;46(14):2955–2970. https://doi.org/10.1017/S0033291716001665
13. Mortier P, Auerbach RP, Alonso J, Bantjes J, Benjet C, Cuijpers P, et al. Suicidal thoughts and behaviors among first-year college students: Results from the WMH-ICS project. J Am Acad Child Adolesc Psychiatry. 2018;57(4):263–273.e1.
14. Kiekens G, Hasking P, Bruffaerts R, Alonso J, Auerbach RP, Bantjes J, et al. Non-suicidal self-injury among first-year college students and its association with mental disorders: Results from the World Mental Health International College Student (WMH-ICS) initiative. Psychol Med. 2021:1–12. https://doi. org/10.1017/S0033291721002245
15. Auerbach RP, Mortier P, Bruffaerts R, Alonso J, Benjet C, Cuijpers P, et al. WHO World Mental Health Surveys International College Student Project: Prevalence and distribution of mental disorders. J Abnorm Psychol. 2018;127(7):623–638. https://doi.org/10.1037/abn0000362
16. Alonso J, Vilagut G, Mortier P, Auerbach RP, Bruffaerts R, Cuijpers P, et al. The role impairment associated with mental disorder risk profiles in the WHO World Mental Health International College Student Initiative. Int J Methods Psychiatr Res. 2019;28(2), e1750. https://doi.org/10.1002/mpr.1750
17. Bantjes J, Saal W, Gericke F, Lochner C, Roos J, Auerbach RP, et al. Mental health and academic failure among first-year university students in South Africa. S Afr J Psychol. 2020;51(3):396–408. https://doi.org/10.1177/0081246320963204
18. Savage MJ, James R, Magistro D, Donaldson J, Healy LC, Nevill M, et al. Mental health and movement behaviour during the COVID-19 pandemic in UK university students: Prospective cohort study. Ment Health Phys Act. 2020;19, Art. #100357. https://doi.org/10.1016/j.mhpa.2020.100357
19. Wieczorek T, Kołodziejczyk A, Ciułkowicz M, Maciaszek J, Zej Misiak B, Rymaszewska J, et al. Class of 2020 in Poland: Students’ mental health during the COVID-19 outbreak in an academic setting. Int J Environ Res Public Health. 2021;18(6), Art. #2884. https://doi.org/10.3390/ijerph18062884
20. Cao W, Fang Z, Hou G, Han M, Xu X, Dong J, et al. The psychological impact of the COVID-19 epidemic on college students in China. Psychiatr Res. 2020;287, Art. #112934. https://doi.org/10.1016/j.psychres.2020.112934
21. Chaturvedi K, Vishwakarma DK, Singh N. COVID-19 and its impact on education, social life and mental health of students: A survey. Child Youth Serv Rev. 2021;121, Art. #105866. https://doi.org/10.1016/j.childyouth.2020.105866
22. Martínez L, Valencia I, Trofimoff V. Subjective wellbeing and mental health during the COVID-19 pandemic: Data from three population groups in Colombia. Data Brief. 2020;32, Art. #106287. https://doi.org/10.1016/j.dib.2020.106287
23. Sayeed A, Kundu S, Al Banna MH, Hasan MT, Begum MR, Khan MSI. Mental health outcomes during the COVID-19 and perceptions towards the pandemic: Findings from a cross sectional study among Bangladeshi students. Child Youth Serv Rev. 2020;119, Art. #105658. https://doi.org/10.1016/j.child youth.2020.105658
24. Cuijpers P, Auerbach RP, Benjet C, Bruffaerts R, Ebert D, Karyotaki E, et al. Introduction to the special issue: The WHO World Mental Health International College Student (WMH-ICS) initiative. Int J Methods Psychiatr Res. 2019;28(2), e1762. https://doi.org/10.1002/mpr.1762
25. Kessler RC, Santiago PN, Colpe LJ, Dempsey CL, First MB, Heeringa SG, et al. Clinical reappraisal of the Composite International Diagnostic Interview Screening Scales (CIDI-SC) in the Army Study to assess risk and resilience in servicemembers (Army STARRS). Int J Methods Psychiatr Res. 2013;22(4):303–321. https://doi.org/10.1002/mpr.1398
26. Kessler RC, Calabrese JR, Farley PA, Gruber MJ, Jewell MA, Katon W, et al. Composite International Diagnostic Interview screening scales for DSM-IV anxiety and mood disorders. Psychol Med. 2013;43(8):1625–1637. https:// doi.org/10.1017/S0033291712002334
27. First MB, Gibbon M. The Structured Clinical Interview for DSM-IV Axis I Disorders (SCID-I) and the Structured Clinical Interview for DSM-IV Axis II Disorders (SCID-II). In: Hilsenroth MJ, Segal DL, Hersen M, editors. Comprehensive handbook of psychological assessment. Vol. 2: Personality assessment. Hoboken, NJ: John Wiley & Sons, Inc.; 2004. p. 134–143. Available from: https://psycnet.apa.org/record/2004-12821-011
28. Posner K, Brown GK, Stanley B, Brent DA, Yershova KV, Oquendo MA, et al. The Columbia-suicide severity rating scale: Initial validity and internal consistency findings from three multisite studies with adolescents and adults. Am J Psychiatr. 2011;168(12):1266–1277. https://doi.org/10.1176/appi.ajp.2011.10111704
29. Herman AA, Stein DJ, Seedat S, Heeringa SG, Moomal H, Williams DR. The South African Stress and Health (SASH) study: 12-month and lifetime prevalence of CMDs. S Afr Med J. 2009;99(5):339–344.
83 Volume 119| Number 1/2 January/February 2023 Research Article https://doi.org/10.17159/sajs.2023/13594
COVID-19 and student mental health in South Africa Page 9 of 10
30. Masipa T. South Africa’s transition to democracy and democratic consolidation: A reflection on socio-economic challenges. J Public Aff. 2018;18(4), e1713. https://doi.org/10.1002/pa.1713
31. Breetzke GD. Crime and spatiality in South African cities. In: Massey R, Gunter A, editors. Urban geography in South Africa. Cham: Springer; 2020. p. 155–172. https://doi.org/10.1007/978-3-030-25369-1_10
32. Cheteni P, Mah G, Yohane YK. Drug-related crime and poverty in South Africa. Cogent Econ Finance. 2018;6(1), Art. #1534528. https://doi.org/10.1080/2 3322039.2018.1534528
33. Beyene AS, Chojenta C, Roba HS, Melka AS, Loxton D. Gender-based violence among female youths in educational institutions of sub-Saharan Africa: A systematic review and meta-analysis. Syst Rev. 2019;8(1), e59. https://doi.org/10.1186/s13643-019-0969-9
34. Ukegbu P, Nwofia B, Ndudiri U, Uwakwe N, Uwaegbute A. Food insecurity and associated factors among university students. Food Nutr Bull. 2019;40(2):271–281. https://doi.org/10.1177/0379572119826464
35. Mthembu Z, Maharaj P, Rademeyer S. “I am aware of the risks, I am not changing my behaviour”: Risky sexual behaviour of university students in a high-HIV context. 2019;18(3):244–253. https://doi.org/10.2989/16085906. 2019.1655075
36. Evans D, Musakwa N, Nattey C, Bor J, Lönnermark E, Larshans C, et al. Knowledge, risk perception and access to healthcare services for HIV and tuberculosis among university students in Johannesburg, South Africa. S Afr J Child Health. 2018;12(Special Issue):S19–31. https://doi.org/10.7196/ SAJCH.2018.v12i2b.1525
37. Chakaya J, Khan M, Ntoumi F, Aklillu E, Fatima R, Mwaba P, et al. Global tuberculosis report 2020 – Reflections on the global TB burden, treatment and prevention efforts. Int J Infect Dis. 2021;113:S7–12. https://doi.org/10.1016/j. ijid.2021.02.107
38. TBFacts. TB in South Africa – high burden districts & strategic plan [webpage on the Internet]. No date [cited 2022 Mar 16]. Available from: https://tbfacts. org/tb-south-africa/
39. Hodes R. Questioning ‘Fees Must Fall.’ Afr Aff (Lond). 2017;116(462):140–150. https://doi.org/10.1093/afraf/adw072
40. Mavunga G. #FeesMustFall protests in South Africa: A critical realist analysis of selected newspaper articles. J Stud Aff Afr. 2019;7(1):81–99. https://doi. org/10.24085/jsaa.v7i1.3694
41. Shepherd N. After the #fall. 2020:565–579. https://doi.org/101080/ 1360481320201784579
42. Xaba W. Challenging Fanon: A Black radical feminist perspective on violence and the Fees Must Fall movement. 2017;31(3–4):96–104. https://doi.org/10 .1080/10130950.2017.1392786
43. Ecclestone K, Hayes D. The dangerous rise of therapeutic education. London: Routledge; 2008. https://doi.org/10.4324/9780203870563
44. Stein DJ, Wessely S. Mental disorders and COVID-19: Towards a precision public mental health approach. Eur Neuropsychopharmacol. 2022;58:42–43. https://doi.org/10.1016/j.euroneuro.2022.02.008
https://doi.org/10.17159/sajs.2023/13594
84 Volume 119| Number 1/2 January/February 2023 Research Article
COVID-19 and student mental health in South Africa Page 10 of 10
AUTHORS:
Justin Bradfield1
Stephan Woodborne2
Jeremy Hollmann3
Ian Dubery4
AFFILIATIONS:
1Palaeo-Research Institute, University of Johannesburg, Johannesburg, South Africa
2iThemba LABS, Johannesburg, South Africa
3Rock Art Research Institute, University of the Witwatersrand, Johannesburg, South Africa
4Research Centre for Plant Metabolomics and Department of Biochemistry, University of Johannesburg, Johannesburg, South Africa
CORRESPONDENCE TO:
Justin Bradfield
EMAIL: justinb@uj.ac.za
DATES:
Received: 30 Dec. 2021
Revised: 23 Aug. 2022
Accepted: 24 Aug. 2022
Published: 31 Jan. 2023
HOW TO CITE: Bradfield J, Woodborne S, Hollmann J, Dubery I. A 500-year-old medicine container discovered near Misgund, Eastern Cape, South Africa: Residue characterisation by GC-MS. S Afr J Sci. 2023;119(1/2), Art. #13011. https://doi.org/10.17159/ sajs.2023/13011
ARTICLE INCLUDES:
☒ Peer review
☐ Supplementary material
DATA AVAILABILITY:
☐ Open data set
☒ All data included
☐ On request from author(s)
☐ Not available
☐ Not applicable
EDITORS:
Margaret Avery
Jemma Finch
KEYWORDS:
traditional medicine, La vie D’Antan, medicine horn, lupeol, mono-methyl inositol
FUNDING:
None
A 500-year-old medicine container discovered near Misgund, Eastern Cape, South Africa: Residue characterisation by GC-MS
The chance discovery of a 500-year-old cattle-horn container in a painted rock shelter on the farm La vie D’Antan in the Eastern Cape Province of South Africa sheds new light on the antiquity of traditional medicines in the region. We report the micro-residue and GC-MS results of the solidified substance found inside the horn container. Several plant-based medicinal compounds were tentatively identified, of which mono-methyl inositol and lupeol are the most prevalent. Based on pharmacobotanical studies, we suggest the most probable ailments the medicine would have been used to treat and propose the most likely plants from which the ingredients were sourced. Apart from the rock art, whose contemporaneity has not been established, there is no associated archaeology from which to draw specific cultural associations. Although people clearly have been aware of the medicinal properties of plants for at least the last 200 000 years, this is, to our knowledge, the oldest evidence from southern Africa of a bespoke container that has been used to store multiple combined ingredients of medicinal application. The age of the contents of the horn container, however, could not be independently established, leaving open the possibility that the medicinal container and its contents may not be contemporaneous.
Significance:
• We present the oldest medicine container yet found in southern Africa combining two or more plant ingredients.
• The findings add to our knowledge of traditional Khoisan medicines and the antiquity of this traditional knowledge system.
Introduction
The presence of organic residues on archaeological artefacts invites curiosity. Trace amounts of residue recovered from stone and bone tools in ancient archaeological deposits have been shown through chemical analysis to have been part of adhesive and poison applications.1-3 In most cases, plant exudates have formed the basis of these applicative substances. The combustion of certain plants, chosen for their insecticidal properties, seems to have been deliberately carried out as a means to fumigate living areas from at least 200 ka.4 The understanding and harnessing of the chemical and pharmacological properties of plants and the ability to combine these into novel and complex recipes allowed humankind to successfully adapt to diverse environments. Whereas there is now a wide body of literature that explores some of these poison and adhesive recipes and their antiquity in southern Africa5-7, the same is not true for traditional medicines.
Traditional medicine continues to play an important role in much of Africa as a primary health service.8-10 Traditional medicine is highly adaptive and does not shy away from incorporating alien plant species or foreign pharmacopeia.8,11 The South African trade in medicinal plants has been valued at ZAR270 million annually, with the Eastern Cape Province alone accounting for 166 of the 700 plant species traded nationally.12 However, only 33 plant species traded in the Eastern Cape are pharmacologically efficacious, with the others being used to treat supernatural afflictions.12-15 Indeed, one of the principal functions of Khoisan traditional healers was to treat supernatural bewitchment.8,16,17 Medicine and culture were intimately entwined.
Most of our knowledge about traditional medicines is derived from early travelogues and ethnographic accounts, with older medicinal remedies being largely inferred from these.18,19 In the absence of archaeological evidence, it is difficult to know how far back in time these traditional medicines date, or indeed how traditional medicines may have changed over time. We do not know whether the use of certain plants has a greater antiquity than that of others, nor how pre-colonial medicines were administered, nor whether the plants that were used were always pharmacologically effective in the treatments for which they were administered. The presence of plants with medicinal properties in Middle Stone Age deposits20 suggests that people were aware of these properties, but gives no indication as to whether and to what extent different plant ingredients may have been combined to create applicative ointments or oral remedies.
A recent discovery in the Langkloof mountains of the Eastern Cape, South Africa, now provides the opportunity to learn about a possible medicinal ointment used by Khoi or San people 500 years ago. In 2020, a sealed cattle horn filled with an unknown substance was recovered from a farm that lies 40 km from the towns of Uniondale in the west and Plettenberg Bay in the south (Figure 1). Based on the orientation of the horn contents, this substance must have been in a liquid or gelatinous state when deposited, but had since hardened into a solid, tough, tacky mass. The substance is readily soluble in water, taking only a few minutes to reconstitute into a liquid state. In this paper, we present the results of a chemical analysis of the horn contents carried out using gas chromatography –mass spectrometry (GC-MS).
© 2023. The Author(s). Published under a Creative Commons Attribution Licence.
https://doi.org/10.17159/sajs.2023/13011
85 Volume 119| Number 1/2 January/February 2023 Research Article
Background
The cattle-horn container was recovered from a small, painted rock shelter (33°44’14.06”S; 23°34’37.63”E) on a privately owned farm, called La vie D’Antan, in the Eastern Cape. The farm is located 8 km from the small hamlet of Misgund and within 10 km of where the 2000-year-old Kouga mummy was discovered by Johan Binneman in 1999.21 The rock shelter is set in the Enon Formation conglomerate and is approximately 3.5 m deep and 3 m high, containing shallow floor deposit, only a few centimetres thick. The horn was capped with a rawhide lid and wrapped in a bundle of Boophane disticha leaves and grass (Figure 1). The leaves and grass were secured to the horn by twisted plant fibre rope. Boophane leaves are known for their antiseptic properties and may be the reason the horn has preserved so well. The only visible damage to the horn is the activity of dermestid beetles.22 The parcel had been exposed through animal activity and was removed by a visitor to the site to prevent further damage to it. Apart from a few undecorated ceramic pot shards scattered across the surface, the shelter contains no other artefacts nor any evidence of long-term occupation. The landscape surrounding the shelter abounds in various Helichrysum and Senecio species. Both plants are edible and widely used to brew tea and other beverages.23-25
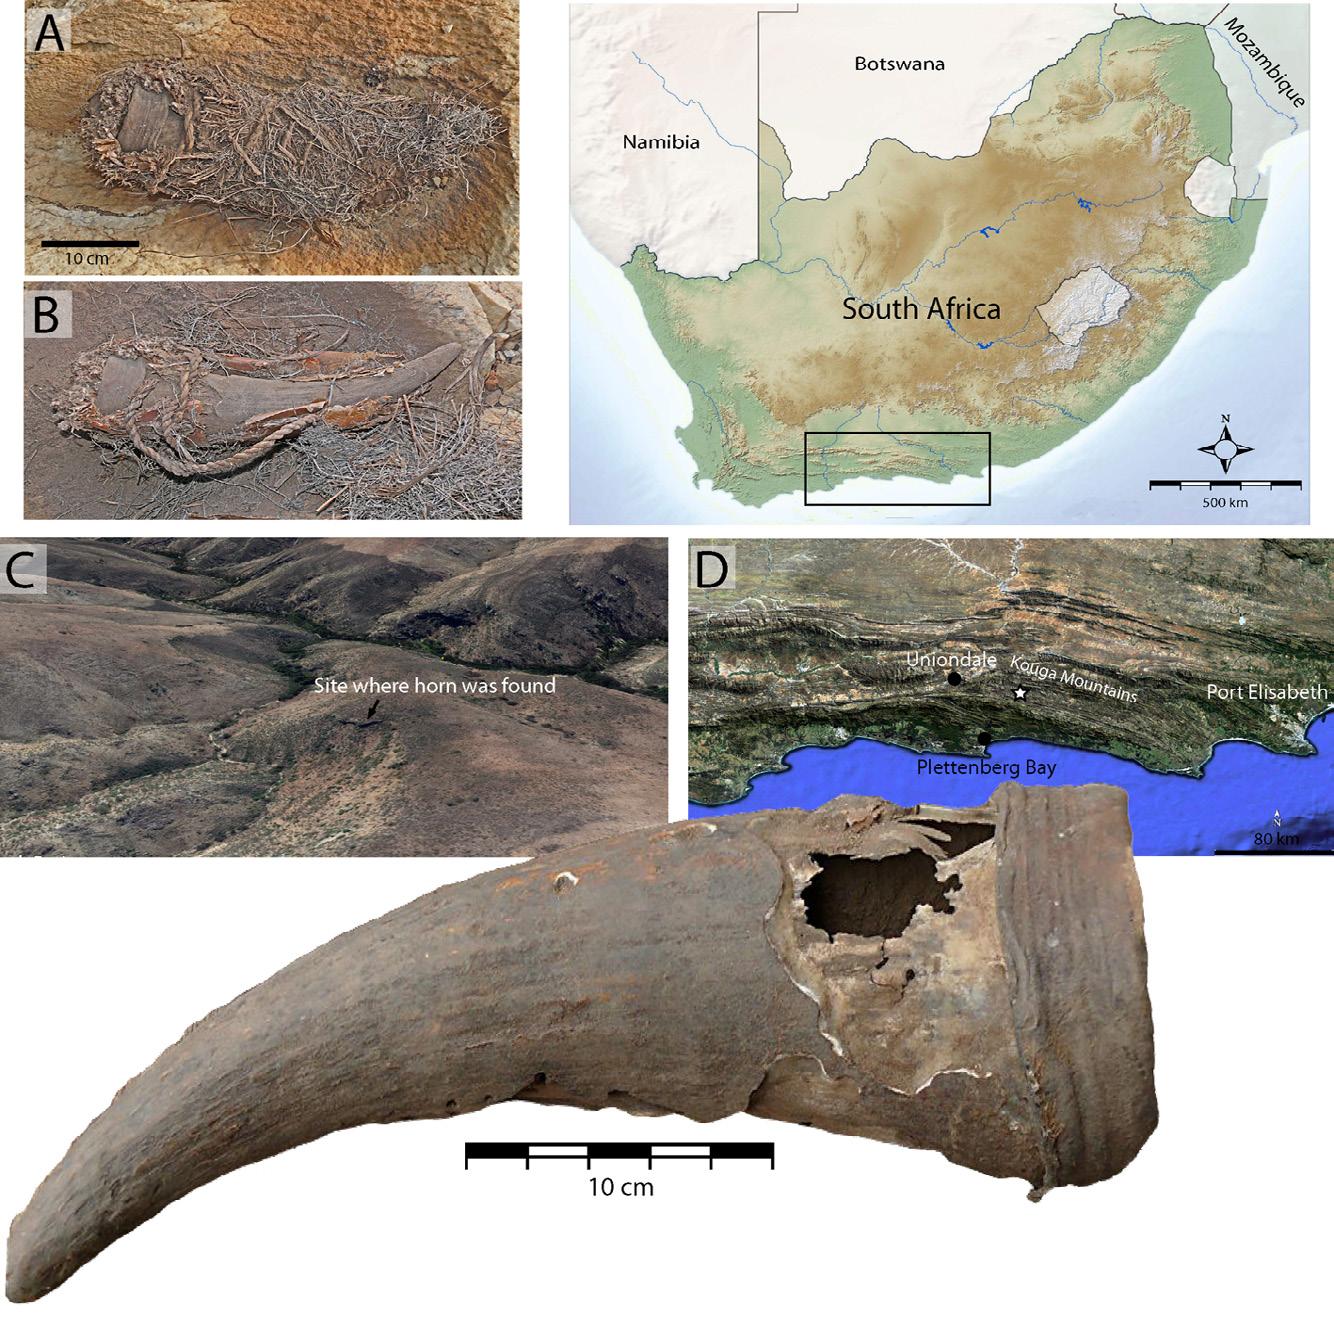
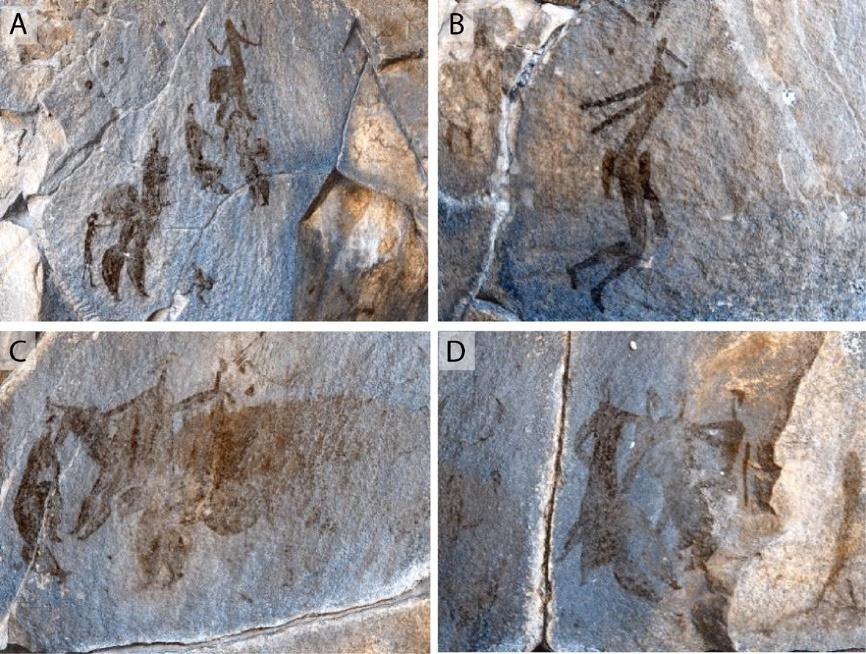
The rock surface inside the overhang comprises a conglomerate of numerous sandstone boulders. Approximately 20–30 rock paintings in varying shades of red and yellow ochre-based paint occur across the width of the overhang. The rock art was probably made with brushes (except the handprints). The subject matter – human figures with hunting equipment, one clearly preserved eland in an alcove, a partially preserved antelope and indeterminate animals, as well as handprints – is typical of the hunter-gatherer (San) rock art in the area. The preservation of the paintings is mostly poor with a few clearer images. No age determinations have been made on the paintings. There are two other rock art sites within a couple of kilometres of this shelter (Figure 2).
Prior to the 18th century, the region was inhabited by San huntergatherers and Khoi pastoralists, the latter of whom owned large herds of cattle and sheep.26 By 1775, the Langkloof region was occupied predominantly by Dutch farmers and Inqua Khoi. The Khoi and the few remaining San hunter-gatherers were by this time mainly employed as client herders on the Dutch farms. Although mixed San and Khoi descendants may have persisted in these mountains as fugitives and military absconders until as late as the 1880s27, the last independent San bands with a Later Stone Age economy were probably dispersed by the 1760s28-29. Not much is known about the last hunter-gatherers of the Langkloof. Stow30 alludes to them but defers description to a future book,
86 Volume 119| Number 1/2 January/February 2023 Research Article https://doi.org/10.17159/sajs.2023/13011 GC-MS characterisation of 500-year-old medicine container Page 2 of 8
Figure 2: Examples of rock art from La vie D’Antan and neighbouring sites. Images have been digitally enhanced using colour deconvolution. The original colour is a red hue.
Figure 1: The horn container after excavation (large inset) and at two stages of the recovery of the parcel: (A) the parcel tightly bundled with Boophane disticha leaves and grass, wrapped together with plant fibre rope and (B) partially unwrapped exposing the horn container. (C and D) The location of the rock shelter on the farm La vie D’Antan.
which he never wrote. Suffice it to say that the wider region contains ample evidence of Later Stone Age hunter-gatherer occupation spanning at least the last ten thousand years.27,31
The proximity of the La vie D’Antan rock shelter to the Kouga mummy site is intriguing. In 1999 the mummified remains of a 30–40-year-old man were found in the Kouga Mountains, which forms part of the Langkloof range. The remains were wrapped in Boophane disticha leaves and then covered in sticks and branches, possibly the remnants of a burial basket. Inside the burial pit had been placed some bulbs of the Babiana geophyte and marine shell beads. The grave was marked by a painted stone slab. The feet of the corpse had been bound with twisted plant fibre rope and the last joint of the left little finger had been amputated, as was customary in some San societies.32 The mummified remains returned a date of 1930±20 BP and, based on the height of the skeleton, it is thought to have belonged to a San rather than a Khoi individual.21,33 No cause of death was ascertained.
Horns are known to be used as medicine containers throughout Africa, although in the southern African context tortoise shell and ostrich eggshell are far more common for this purpose.34-36 Our knowledge of horn containers derives exclusively from the historical period. Several cattle-horn containers from the 19th century are preserved in museums around the world. Snuff containers made from decorated cattle horns collected in 1892 and attributed to the Shona and Sotho are housed in the British Museum.37 Two cattle-horn medicine containers, collected in 1871 from southern Tanzania and northern Zimbabwe, were donated to the Harvard Peabody Museum.38 A similar medicine horn collected between 1890 and 1930 from the Belgian Congo pops up on a JSTOR search of ethnographic collections in the UK, but no further information is available on this item. Certain San groups in the Kalahari and the Bemba in Zimbabwe used antelope horns as medicine containers. Duiker horns were favoured in the Kalahari to store medicine associated with witchcraft17, while the Bembe used different antelope horns to store different medicines, preferring duiker and bushbuck38. In neither case were special attributes attached to the horn container itself.
Methods
An initial micro-morphological assessment of the horn contents was carried out using a multi-capability Olympus BX51M light microscope under varying magnifications, ranging from 100x to 1000x. Microresidues taken from dry scrapings of the horn contents were observed under reflected light following established analytical protocols.39-44 Scrapings were taken up to a depth of 5 mm from the solidified substance. Next, a tiny sample was augered from the centre of the solidified substance up to a depth of 20 mm. The outer layer was discarded to reduce the influence of contaminants and the remainder of the sample was weighed out in 60-mg amounts into 2-mL Eppendorf tubes, into which was added 600 µL high-purity mass spectrometry grade organic solvents for extraction. These solvents were methanol, acetone and isopropanol (SpS, Romil, Cambridge, UK). The samples were vortexed and incubated at room temperature for 5 days to dissolve. However, not all of the original material dissolved. The methanol extract was brown and the acetone and isopropanol extracts light yellow. Extracts were analysed on a GC-MS QP2010 system (Shimadzu, Kyoto, Japan) equipped with an electron impact ion source and a single quadrupole mass analyser. A volume of 2 µL of the extracts was injected in splitless mode. The capillary column was a Restek Rtx 5 MS, diphenyl dimethyl polysiloxane column (30 m x 0.25 mm; 0.25 µm thickness) (Leco Africa, Kempton Park, South Africa). Analytes present in the extracts were separated with temperature gradient programming and detected with mass spectrometry. Chromatographic conditions were as follows: injection temperature: 250 °C; oven temperature: 50 °C, hold time 3 min; increase to 300 °C and hold time 5 min, increased at a rate of 25 °C/min; carrier gas: helium, flow rate 1.05 mL/min. The MS conditions were as follows: solvent cut of 2 min; detector voltage: 1.39 kV; ion source temp: 200 °C; interface temp: 250 °C. The MS data were acquired in scan mode over a 50–350 m/z range with a mass spectral acquisition
rate of 1111 u/s. Samples were analysed in triplicate and method blanks with methanol, acetone and isopropanol were included. Solvent blank chromatograms are displayed in Figure 3.
Figure 3: Gas chromatographic – mass spectrometric spectra of solvent/ method blanks. A common minor peak at a retention time of 10.09 min is found, tentatively identified (83–85% similar) as nonadecane (C19H40, MW 268, isopropanol) or trimethyl dodecane (C15H32, MW 212, acetone). Although the molecular weights (MW) differ, they share similar mass spectrometric spectra. These compounds have been identified in plants as natural products, but are most probably a plasticiser that leached from the Eppendorf tubes.
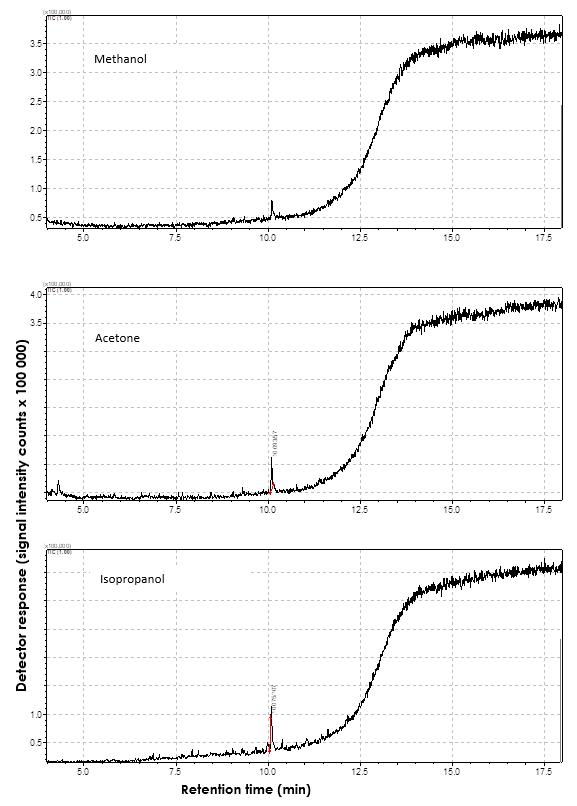
Data acquisition was by means of the GC-MS Solutions software (Shimadzu, Kyoto, Japan). Tentative organic compound identifications (annotations) were acquired by matching mass spectral data (mass quality cut-off criterion ≥80% for the main analytes) to the Wiley Registry / NIST library, ver. 8 (https://sciencesolutions.wiley.com; John Wiley & Sons, Hoboken, NJ, USA) as well as the Flavour & Fragrance Natural & Synthetic Compounds GC-MS library (FFNSC 2, Shimadzu, Kyoto, Japan). Chromatograms of the solvent-specific extracts are shown in Figure 4.
Results
A sample of the horn was removed for radiocarbon dating at iThemba Laboratories in Johannesburg. The sample returned a carbon age of 380±30 BP (IT-C-3711), which calibrates using the SHCal20 curve45 to AD 1461–1630. At this period, the only two groups known archaeologically to be living in the area were hunter-gatherers and Khoi herders. We attempted to date a sample of the contents of the horn to establish contemporaneity. Unfortunately, two attempts to date this sample proved unsuccessful due to insufficient carbon content.
87 Volume 119| Number 1/2 January/February 2023 Research Article https://doi.org/10.17159/sajs.2023/13011
GC-MS characterisation of 500-year-old medicine container Page 3 of 8
(signal intensity counts). Refer to Table 1 for description of the numbered peaks.
The micro-morphological residue analysis revealed many insectan remains and plant tissues (Figure 5A–K). The insectan residues were present only in the outer layers of the horn contents, which were exposed through destruction of the horn by dermestid beetles. Samples taken from deeper inside the horn contents revealed no insect or plant tissue, suggesting that these are contaminant residues and not purposely added ingredients. The insect remains are too fragmentary to identify to species, but most could have come from dermestid beetles. The presence of Lepidoptera wing scales, however, suggests that the horn was exposed for a period at some point prior to its removal from the site. The main content of the horn appears as a shiny, brown crystalline substance, which dissolves easily in water (Figure 5L–O). When dissolved, the solution emits a slight liquorice odour. There were no signs of any plant, animal or insect cellular structures in the solution.
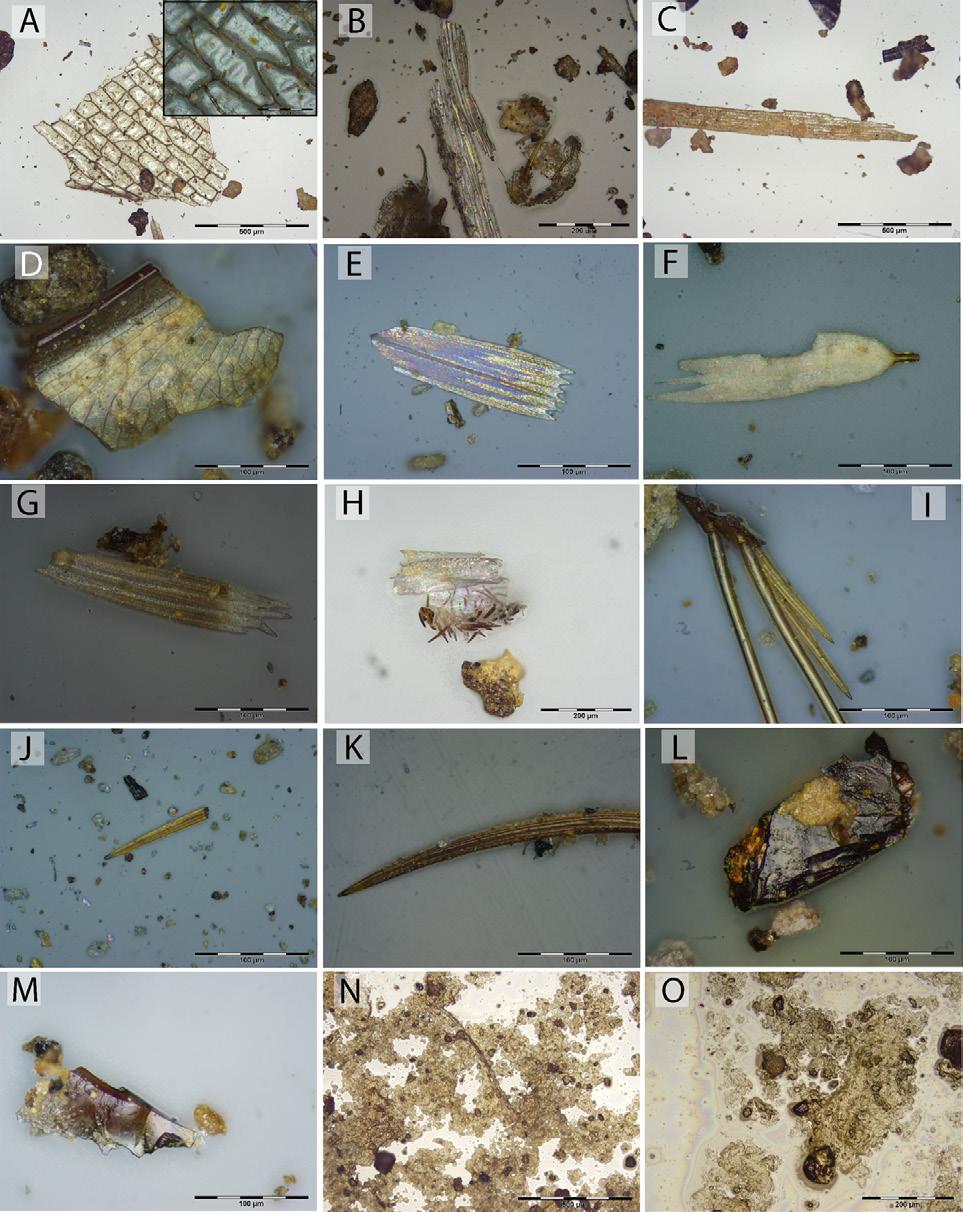
Table 1 presents the results of the GC-MS analysis. The main compounds detected were mono-methyl inositol (or isomers of pinitol) and lupeol. Table 1 also presents the percentages of these substances relative to the whole sample per solution (i.e. the percentage relative peak area of the total ion chromatogram), and the confidence levels expressed as the percentage match to the mass spectral library. The vast majority of the substance in the horn container consisted of mono-methyl inositol isomers (MoMe inositol). Trace compounds detected consisted of diand tri-terpenes, a sterol derivative and fatty acid methyl esters (Table 1). Interestingly, no volatile aromatic compounds that might account for the faint liquorice odour were identified in the extracts by GC-MS.
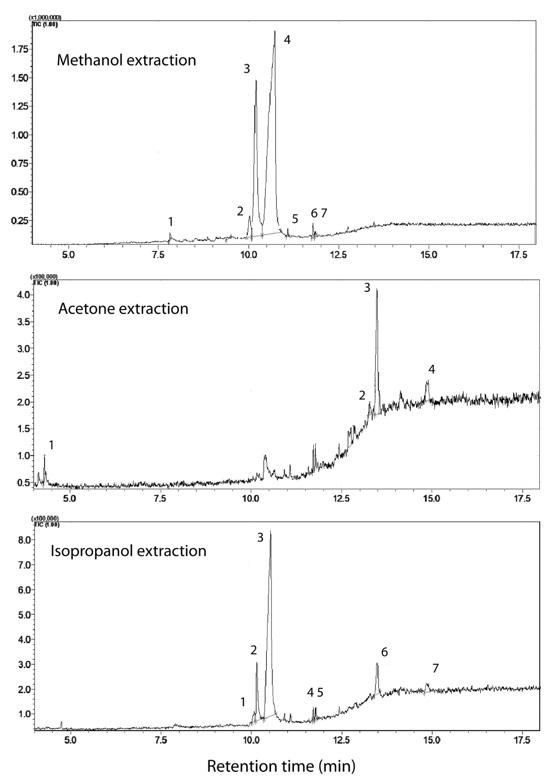
epithelial tissue – the glossy, reflective surface and absence of visible phytolith structures under ultraviolet light suggest insectan origin rather than plant; (B,C) elongated tissue structure, possible plant tracheids; (D) fragment of an insect wing; (E–G) Lepidoptera wing scales; (H–K) probable insect setae; (L,M) crystallinelooking fragments of the tacky main container residue; and (N,O) the solute of the tacky residue after dissolving in water. Note the absence of other obvious tissue structures.
Discussion
All of the tentatively identified organic compounds have medicinal applications. Inositol is a natural polysaccharide sugar found in a wide range of plants, including legumes, citrus fruit and various seeds.46,47 It is synthesised by the cell and used in the production of plasma lipo-proteins to aid cell growth. It has many medicinal applications including the control of diabetes, the treatment of high cholesterol, bronchopulmonary dysplasia and various mood disorders (it stimulates the production of serotonin and dopamine), and the amelioration of symptoms associated with polycystic ovarian syndrome.48-53 Inositol is considered a pharmacologically safe compound as it cannot be overdosed on, and there are few reported side effects from prolonged use, apart from nausea, headaches, and hypoglycaemia in extreme cases.47,48
Mono-methyl inositol and its isomer pinitol occur in several traditional medicinal plants found in the general study area, including Sutherlandia frutescens, Cyclopia intermedia, Lotonius laxa and Clitoria ternatea S. frutescens has strong antioxidant properties and was used by the Khoi for washing wounds and treating fevers and eye infections.19,22,54 It is also taken as a tonic to boost the immune system and to alleviate symptoms of rheumatism and pulmonary ailments.23,55 Several Euphorbia species containing inositol are used to treat similar conditions.23,56,57 C. ternatea contains a high concentration of mono-methyl inositol (39%). Although it is found in the study region58, its recorded medicinal use comes from Asia where it is used to treat sexually transmitted diseases and as an anti-anxiety medication.59
Lupeol is a pentacyclic triterpenoid occurring in a wide variety of fruits and vegetables, and is a common constituent of balsams, resins and waxes.60
88 Volume 119| Number 1/2 January/February 2023 Research Article https://doi.org/10.17159/sajs.2023/13011 GC-MS characterisation of 500-year-old medicine container Page 4 of 8
Figure 4: Gas chromatographic – mass spectrometric (GC-MS) profiles (total ion chromatograms) of analytes present in methanol, acetone, and isopropanol extracts of the substance in the horn container. The y-axis indicates the MS detector response
Figure 5: Micrographs showing (A) insectan
Table 1: Summarised results of the GC-MS analysis listing the prevalence of the identifiable compounds in each extract (methanol, acetone and isopropanol), the library mass spectral match level and the relative peak areas for each tentative identification according to the numbered peaks in Figure 4. Main compounds with a spectral match >80% and noteworthy peak areas are indicated in bold and italics.
aExpressed as percentage relative peak areas of the total ion chromatogram, t = trace amount CAS, Chemical Abstract Service registry numbers; NIST, National Institute of Standards and Technology; PubChem, database of chemical molecules – https://pubchem.ncbi.nlm.nih.gov/
Lupeol also occurs in several medicinal plants and is known for its anti-inflammatory and antimicrobial properties.61,62 In addition, it is increasingly being used in cancer treatments and antimalarial research owing to its antioxidant properties and the fact that it is pharmacologically safe, with little risk of ingestive overdosing.63-66
Lupeol occurs in several plants used medicinally in South Africa and elsewhere. Relevant to our study region it occurs in Ficus cordata, Asteracantha longifolia and several different Euphorbia species.23,60,67 A. longifolia is used by the Pedi (and in India, where it also occurs) mainly to treat rheumatism and urinary tract infections, but also for gout and jaundice and as an aphrodisiac.23,68
Kaurenoic acid is a diterpenoid present in the resin and sap of several plants and is highly effective against Gram-positive bacteria such as listeria, staphylococcus and streptococcus.57,69-71 It also exhibits protective
activity against liver damage.67 Kaurenoic acid is present in several plants in the study area, most commonly in Arctopus sp., Alepidea sp. and Aster bakeranus. The former was first recorded in 1770 as a Khoi medicine to treat gout, various infections and respiratory ailments.11,19,23,71 A. bakeranus is similarly thought to have been used for medicinal purposes by the Khoi, and is snuffed or ingested as treatment for venereal diseases and urinary tract infections11, although among the Zulu it is additionally used to treat chronic coughs and intestinal complaints72
Cyclolanostenol acetate or lanosterol is a tetracyclic triterpenoid that can be synthesised by animals and dicotyledonous plants, where it is the precursor to the synthesis of all plant steroids.73,74 Rafnia amplexicaulis, present in the study area and containing lanosterol, is reported to have been used as a tea to treat pulmonary issues23, although more recent
89 Volume 119| Number 1/2 January/February 2023 Research Article
https://doi.org/10.17159/sajs.2023/13011
GC-MS characterisation of 500-year-old medicine container Page 5 of 8
Solvent Spectral peaks Retention time (Rt) Molecular weight (g/mol) Molecular formula Tentative compound name (identifier numbers) Spectral match (%) Relative peak area (%)a Methanol 1 7.81 110.15 C7H10O 5-Methyl-5-hexen-3-yn-2-ol (CAS: 68017-33-4; NIST: 113139; PubChem: 144275) 75 t 2 10.02 192.17 C7H12O6 Quinic acid (CAS: 77-95-2; NIST: 1051817; PubChem: 6508) 89 t 3 10.20 194.18 C7H14O6 Mono-methyl (MOME) Inositol isomer I 89 25 4 10.72 194.18 C7H14O6 MOME Inositol isomer II (e.g. D-pinitol) (CAS: 484-68-4; NIST: 1051878; PubChem: 164619) 88 69 5 11.08 270.5 C17H34O2 Hexadecanoic acid, methyl ester (CAS: 112-39-0; NIST:
PubChem CID: 8181) 82 t 6 11.78 296.5 C19H36O2 7-Octadecenoic acid, methyl ester (CAS:
NIST:
PubChem CID:
88 t 7 11.84 328.5 C22H32O2 Spiro[androst-5-ene-17.1-cyclobutan]-2-one,
(CAS:
67 t Acetone 1 4.29 116.1 C6H12O2 Diacetone alcohol (2-Pentanone,
(CAS: 123-42-2; NIST:
PubChem:
89 t 2 13.27 330.5 C22H34O2 Kauren-19-yl-acetate / Kaur-16-en-18-yl acetate (CAS:
NIST: 27098) 50 t 3 13.48 426.7 C30H50O Lupeol (CAS: 545-47-1; NIST: 1053218; PubChem: 259846) 89 64 4 14.89 468.8 C32H52O2 Cycloartenol acetate / 9,19-cyclolanost-24-en-3-ol, acetate, (3,beta)(CAS: 1259-10-5; NIST: 286408; PubChem: 518616) 51 t Isopropanol 1 10.07 194.18 C7H14O6 MOME Inositol isomer I 65 t 2 10.14 194.18 C7H14O6 MOME Inositol isomer II 88 10 3 10.53 194.18 C7H14O6 MOME Inositol isomer III 89 76 4 11.72 214.39 C14H30O Myristyl alcohol / 1-Tetradecanol (CAS: 112-72-1; NIST: 22632; PubChem: 8209) 85 t 5 11.78 268.4 C17H32O2 7-Hexadecenoic acid, methyl ester, (Z)(CAS:
NIST: 1213500; PubChem: 14029831) 79 t 6 13.47 426.7 C30H50O Lupeol isomer I (CAS: 545-47-1; NIST: 1053218; PubChem: 259846) 84 6 7 14.85 426.7 C30H50O Lupeol isomer II 55 t
1211052;
57396-98-2;
43709;
5364440)
3-hydroxy-,
60534-16-9; NIST: 55793; PubChem: 534435)
4-Hydroxy-4-methyl-)
159868;
31256)
72150-74-4;
56875-67-3;
research states that it has no medicinal value but is used as a substitute for liquorice as it has a similar taste75
The three decanoic acids that were tentatively identified in the sample also have medicinal properties and are found in several plants in the study area. Hexadecane and octadecanoic acid both have antifungal, antibacterial and antioxidant properties.76 Hexadecanoic acid, together with lupeol, is used in antimalarial treatments.65 In its methyl palmitate form, hexadecane is found in several species of Clutia and Cyclopia and is taken orally for the treatment of colic and hepatitis, and applied topically as an anti-inflammatory and acaricide.23,57,77
While the tentatively identified organic compounds are present in a wide variety of plant genera, we can narrow down the likely plants that may have been used to constitute the substance in the cow-horn container by looking at which plants present in the area contain two or more of the tentatively identified compounds. Three species stand out. Corbichonia decumbens comprises 75% mono methyl inositol, 17% hexadecenoic acid and 16% octadecanoic acid.76 The plant is liquidised and drunk by the Zulus as an emetic.23 Glycyrrhiza glabra likewise contains high quantities of mono-methyl inositol (28%), octadecanoic acid (3.4%) and hexadecenoic acid (4.9%).78 Although thought to have been introduced by early European settlers it is used as a cough remedy in north Africa and as an anti-inflammatory in southern Africa.23,57 Another plant that occurs in the broader region and which contains several of the tentatively identified compounds (namely mono-methyl inositol, hexadecanoic acid and octadecanoic acid) is Macrotyloma uniflorum. Although it is not recorded as a medicinal plant in southern Africa, it is used in India as an antioxidant and to treat insulin resistance.79 Another promising plant candidate is Mikania sp., some species of which contain lupeol and kaurenoic acid. Certain Mikania sp. are used to treat snake bites and as a remedy for venereal sores.23,80
Conclusion
Based on our analysis, the horn contains a medicinal substance, composed of at least two plant ingredients. We cannot know for certain which plant species were used, but we can narrow down the list of potential candidates. The main compounds present in the container, mono-methyl inositol and lupeol, have a wide range of recorded medicinal applications, including the control of blood sugar and cholesterol levels, treatment of fevers, inflammation (including pulmonary) and urinary tract infections, and may be applied topically to treat infections. Indeed, rubbing ointment into subdermal cuts is one of the ways the San are known to have administered certain medicines.34 Both mono-methyl inositol and lupeol are pharmacologically safe compounds, meaning they can be ingested without risk of overdose. Both compounds stimulate the production of dopamine in the brain, with the former being used to treat anxiety47,48, and plants containing the latter being used as aphrodisiacs23
We do not know whether the medicine was intended to be ingested or used topically but based on the pharmacological literature it could have been used both ways. Of course, we must remember that not all traditional medicines were pharmacologically effective against the maladies they were intended to treat. Medicinal ingredients would be combined in any ratio and in any quantity and administered in any way deemed appropriate without necessarily being medicinally effective.34 Traditional medicines are conceptualised within and resonate in harmony with cultural world views.11 Witchcraft and a belief in the supernatural realm were and remain prominent cultural influences in many Khoisan and Bantu-speaker societies.15-17,65 Traditional healers are specialised individuals who treat both physical and spiritual ailments.
Ironically, neither of the two plants that currently abound in the vicinity of the rock shelter, namely Helichrysum sp. and Senecio sp., both of which have medicinal and spiritual properties known to traditional medicine11,15,23,75,81, are implicated in our GC-MS results (see references 82–84 for mass spectral information on these two species). Although speculative, it is perhaps worth noting that Helichrysum sp. has similar aromatic properties to Glycyrrhiza glabra and can be used as a substitute to foods.23 Given the faint liquorice odour it is possible that the medicine contained some Helichrysum. Although G. glabra is considered to be
a colonial introduction to South Africa we should remember that plants thought to be recent, foreign introductions have been identified in far older archaeological deposits.1 Nor should we discount the possibility that there could be other plants in the vicinity that contain some of the same medicinal compounds present in G. glabra, but whose pharmacology is as yet undocumented.
That the horn container was a valued item is evident by the way in which it was wrapped and securely bound in Boophane disticha leaves and grass. Boophane leaves have been used for millennia to preserve organic materials.85 Although we were unable to verify the contemporaneity of the horn and its contents, we consider it unlikely that the horn would have been handed down for more than two or three generations (or 40–60 years). The parcel seems to have been deliberately placed in the rock shelter with the intention of leaving it there for some time. Similar to the hunting kit found in Eland Cave in the Drakensberg, its owner never returned to collect it.86 Apart from the rock paintings there is little other archaeology present in the rock shelter, and nothing to indicate long-term occupation of the site.
To the best of our knowledge, the horn container from La vie D’Antan is the oldest medicine container yet found in southern Africa. Relative to earlier, the post-2000 BP period of the region saw more ephemeral occupation87, with the nearby excavated rock shelters of Boomplaas, Nelson Bay Cave and Matjes River having all been abandoned by the end of the first millennium AD27,88. We do not have enough information to attribute the horn container to either hunter-gatherers or Khoi pastoralists. While the paintings on the walls of La vie D’Antan are definitively San, we do not know whether they and the horn container are contemporary. That the horn container derived from domestic cattle does not necessarily suggest a Khoi origin. Hunter-gatherers are known to have possessed cattle under certain circumstances89 and could easily have obtained the horn through barter, theft or scavenging. Both 19th-century Khoi and San from the Western Cape shared a belief in a mythical animal known as the water bull, which bore a resemblance to domestic cattle and which was associated with, among other things, healing and whose horns were considered to have medicinal attributes.90 In the absence of archaeological deposits in the site, the medicine horn remains an isolated, chance discovery, but one which sheds new light on traditional medicines used in the Eastern Cape 500 years ago.
Acknowledgements
We thank Rodger Smith for bringing the horn container to our attention and for his meticulous recording of its recovery context. We also thank Frank Neumann, Marion Bamford, Christine Sievers, Rose Prevec, Martin Villet, Denis Brothers and Catherine Sale for their insights on the insect and plant tissues; Nombuso Buthelezi for performing the GC-MS analysis; and Marlize Lombard for the use of her library during lockdown. Two anonymous reviewers provided insightful comments that helped to improve the manuscript.
Competing interests
We have no competing interests to declare.
Authors’ contributions
J.B.: Conceptualisation; writing – the initial draft; writing – revisions; project leadership; project management. S.W.: Methodology; sample analysis; data analysis. J.H.: Validation; writing – the initial draft. I.D.: Methodology; sample analysis; data analysis; validation; data curation; writing – the initial draft; writing – revisions.
References
1. d’Errico F, Backwell L, Villa P, Deganog I, Lucejkog J, Bamford M, et al. Early evidence of San material culture represented by organic artefacts at Border Cave, South Africa. Proc Natl Acad Sci USA. 2012;109:13214–13219. https://doi.org/10.1073/pnas.1204213109
2. Charrié-Duhaut A, Porraz G, Cartwright CR, Igreja M, Connan J, Poggenpoel C. First molecular identification of a hafting adhesive in the late Howiesons Poort at Diepkloof rock shelter (Western Cape, South Africa). J Archaeol Sci. 2013;40(9):3506–3518. https://doi.org/10.1016/j.jas.2012.12.026
90 Volume 119| Number 1/2 January/February 2023 Research Article
https://doi.org/10.17159/sajs.2023/13011
GC-MS characterisation of 500-year-old medicine container Page 6 of 8
3. Wooding M, Bradfield J, Maharaj V, Koot D, Wadley L, Prinsloo L, et al. Report on biochemical detection methods of some plant-based arrow poisons used by San hunter-gatherers from southern Africa. S Afr J Sci. 2017;113, Art. #2016-0210. https://doi.org/10.17159/sajs.2017/20160210
4. Wadley L, Esteban I, de la Peña P, Wojcieszak M, Stratford D, Lennox S, et al. Fire and grass-bedding construction 200 thousand years ago at Border Cave, South Africa. Science. 2020;369:863–866. https://doi.org/10.1126/science. abc7239
5. Bradfield J, Wadley L, Lombard M. Southern African arrow poison recipes, their ingredients and implications for Stone Age archaeology. South Afr Human. 2015;27:29–66.
6. Wadley L, Trower G, Backwell L, d’Errico F. Traditional glue, adhesive and poison used for composite weapons by Ju/’hoan San in Nyae Nyae, Namibia. Implications for the evolution of hunting equipment in prehistory. PLoS ONE. 2015;10, e0140269. https://doi.org/10.1371/journal.pone.0140269
7. Chaboo C, Hitchcock R, Bradfield J, Wadley L. Beetle and plant arrow poisons of the San people of southern Africa. In: Wexler P, editor, Toxicology in antiquity. New York: Elsevier; 2019. p. 11–72. https://doi.org/10.1016/ B978-0-12-815339-0.00002-0
8. Du Toit B. Modern folk medicine in South Africa. S Afr J Ethnol. 1998;21(4):145–152.
9. Gulumian M, Yahaya E, Steenkamp V. African herbal remedies with antioxidant activity: A potential resource base for wound treatment. Evid Based Complement Alternat Med. 2018; e4089541. https://doi.org/10.1155/2018/4089541
10. Hendriks U. All eyes on the Khoi traditional healers in fight against Covid-19. SABC News. 14 June 2020 [cited 2021 Aug 01]. Available from: https:// www.sabcnews.com/sabcnews/all-eyes-on-the-khoi-traditional-healers-infight-against-covid-19/
11. Van Wyk B-E, Oudtshoorn B, Gericke N. Medicinal plants of South Africa. Pretoria: Briza Publications; 2002.
12. Dold A, Cocks M. The trade in medicinal plants in the Eastern Cape Province, South Africa. S Afr J Sci. 2002;98:589–597.
13. Soga JH. The Ama-Xhosa: Life and customs. Lovedale: Lovedale Press; 1931.
14. Ackerknecht E. Natural diseases and rational treatment in primitive medicine. Bull Hist Med. 1946;19:467–497.
15. Cocks M, Dold A. Cultural significance of biodiversity: The role of medicinal plants in urban African cultural practices in the Eastern Cape, South Africa. J Ethnobiol. 2006;26(1):60–82. https://doi.org/10.2993/0278-0771(2006) 26[60:CSOBTR]2.0.CO;2
16. Barnard A. Nharo Bushmen medicine and medicine men. Africa. 1979;49:68–80. https://doi.org/10.2307/1159506
17. Guenther M. “Not a Bushman Thing.” Witchcraft among the Bushmen and hunter-gatherers. Anthropos. 1992;87:83–107.
18. Low C. Khoisan medicine in history and practice. Quellen zur KhoisanForschung 20. Cologne: Rüdiger Köppe; 2008.
19. Van Wyk B-E. A review of Khoi-San and Cape Dutch medical ethnobotany. J Ethnopharmacol. 2008;119:331–341. https://doi.org/10.1016/j.jep.2008. 07.021
20. Wadley L, Sievers C, Bamford M, Goldberg P, Berna F, Miller C. Middle Stone Age bedding construction and settlement patterns at Sibudu, South Africa. Science. 2011;334(6061):1388–1391. https://doi.org/10.1126/science.1213317
21. Binneman J. Mummified human remains from the Kouga Mountain, Eastern Cape. The Digging Stick. 1999;16:1–12.
22. Thompson J, Martín-Vegab D, Buck L, Power R, Stoddart S, Malone C. Identification of dermestid beetle modification on Neolithic Maltese human bone: Implications for funerary practices at the Xemxija tombs. J Archaeol Sci Rep. 2018;22:123–131. https://doi.org/10.1016/j.jasrep.2018.09.016
23. Watt J, Breyer-Brandwijk M. The medicinal and poisonous plants of southern and eastern Africa. London: Livingstone; 1962.
24. Fox F, Young M. Food from the veld: Edible wild plants of southern Africa. Johannesburg: Delta Books; 1982.
25. Van Jaarsveld E, Van Wyk B-E, Smith G. Succulents of South Africa: A guide to regional diversity. Cape Town: Sunbird Books; 2000.
26. Schryver I. Journal kept by the Ensign Isaq Schryver on his journey to the Inquahase Hottentots. In: Moodie D, editor. The record. Cambridge: Cambridge University Press; 1838 [1689]. p. 433–440.
27. Deacon H. Where hunters gathered: A study of Stone Age people in the eastern Cape. South African Archaeological Society Monographs 1. Cape Town: South African Archaeological Society; 1976.
28. Sparrman A. A voyage to the Cape of Good Hope 1772 to 1776. Cape Town: Van Riebeek Society; 1975 [1786].
29. Thunberg C. Travels at the Cape of Good Hope. Cape Town: Van Riebeek Society; 1986 [1795].
30. Stow GW. The native races of South Africa: A history of the intrusion of the Hottentots and Bantu into the hunting grounds of the Bushmen, the aborigines of the country. London: Swan Sonnenschein and CO.; 1905.
31. Inskeep R. Nelson Bay Cave, Cape Province, South Africa: The Holocene levels. British Archaeological Reports International Series 351. Oxford: Archaeopress; 1987. https://doi.org/10.30861/9780860544647
32. Mitchell P, Plug I. Ritual mutilation in southern Africa. In: Wadley L, editor. Our gendered past. Johannesburg: Wits University Press; 1998. p. 135–166.
33. Steyn M, Binneman J, Loots M. The Kouga mummified human remains. S Afr Archaeol Bull. 2007;62:3–8.
34. Marshall L. The medicine dance of the ǃKung Bushmen. Africa: J Int Afr Inst. 1969;39:347–381. https://doi.org/10.2307/1157382
35. Marshall L. Nyae Nyae !Kung beliefs and rites. Cambridge, MA: Harvard University Press; 1999.
36. Lander F, Russell T. A southern African archaeological database of organic containers and materials, 800 cal BC to cal AD 1500: Possible implications for the transition from foraging to livestock-keeping. PLoS ONE. 2020;15(7), e0235226. https://doi.org/10.1371/journal.pone.0235226
37. Stephenson J. James Stephenson African art: Sotho tribe [webpage on the Internet]. No date [cited 2021 Aug 14]. Available from: www. stephensonafricanart.com/sotho-snuff-container
38. Moore JB. “Bwanga” among the Bemba. Africa: J Int Afr Inst. 1940;13:211–234. https://doi.org/10.2307/1156094
39. Cooper J, Nugent S. Tools on the surface: Residue and use-wear analyses of stone artefacts from Camooweal, northwest Queensland. In: Haslam M, Robertson G, Crowther A, Nugent S, Kirkwood L, editors. Archaeological science under a microscope: Studies in residue and ancient DNA analysis in honour of Thomas H. Terra Australis 30. Canberra: ANU E Press; 2006. p. 207–227.
40. Langejans G. Testing residues: An experimental approach [doctoral thesis]. Johannesburg: University of the Witwatersrand; 2009.
41. Langejans G. Remains of the day – preservation of organic micro-residues on stone tools. J Archaeol Sci. 2010;37:971–985. https://doi.org/10.1016/j. jas.2009.11.030
42. Lombard M, Wadley L. The morphological identification of micro-residues on stone tools using light microscopy: Progress and difficulties based on blind tests. J Archaeol Sci. 2007;34:155–165. https://doi.org/10.1016/j. jas.2006.04.008
43. Monnier G, Ladwig J, Porter S. Swept under the rug: The problem of unacknowledged ambiguity in lithic residue Identification. J Archaeol Sci. 2012;39:3284–3300. https://doi.org/10.1016/j.jas.2012.05.010
44. Bradfield J. Use-trace analysis on bone tools: A brief overview of four methodological approaches. S Afr Archaeol Bull. 2015;70:3–14.
45. Hogg A, Heaton T, Hua Q, Palmer J, Turney C, Southon J, et al. SHCal20 Southern hemisphere calibration, 0-55,000 years cal BP. Radiocarbon. 2020;62:759–778. https://doi.org/10.1017/RDC.2020.59
46. Ford C. Identification of inositols and their mono-O-methyl ethers by gasliquid chromatography. J Chromatography. 1985;333:167–170. https://doi. org/10.1016/S0021-9673(01)87336-2
47. Levine J, Barak Y, Gonzalves M, Szor H, Elizur A, Kofman O. Doubleblind, controlled trial of inositol treatment of depression. Am J Psychiatr. 1995;152(5):792–794. https://doi.org/10.1176/ajp.152.5.792
https://doi.org/10.17159/sajs.2023/13011
91 Volume 119| Number 1/2 January/February 2023 Research Article
GC-MS characterisation of 500-year-old medicine container Page 7 of 8
48. Palatnik A, Frolov K, Fux M, Benjamin J. Double-blind, controlled, crossover trial of inositol versus fluvoxamine for the treatment of panic disorder. J Clin Psychopharmacol. 2001;21(3):335–339. https://doi.org/10.1097/00004714200106000-00014
49. Iuorno MJ, Jakubowicz DJ, Baillargeon J-P. Effects of d-chiro-inositol in lean women with the polycystic ovary syndrome. Endocr Pract. 2002;8(6):417–423. https://doi.org/10.4158/EP.8.6.417
50. Sosenko I, Bancalari E. New developments in the pathogenesis and prevention of bronchopulmonary dysplasia. In: Bancalari E, editor. The newborn lung: Neonatology questions and controversies. 2nd ed. London: Elsevier; 2012. p. 246–264. https://doi.org/10.1016/B978-1-4377-2682-4.00010-X
51. Chiappelli J, Rowland L, Wijtenburg S. Evaluation of myo-inositol as a potential biomarker for depression in schizophrenia. Neuropsychopharmacology. 2015;40(9):2157–2164. https://doi.org/10.1038/npp.2015.57
52. Prakash P, Manivasagaperumal R. In-silico analysis of active compounds has potential inhibitors against diabetic. J Pharm Biol Sci. 2017;12:44–49.
53. Facchinetti F, Unfer V, Dewailly D, Kamenov Z, Diamanti-Kandarakis A, Laganà A, et al. Inositols in polycystic ovary syndrome: An overview on the advances. Trends Endocrinol Metabol. 2020;31:435–447. https://doi.org/10.1016/j. tem.2020.02.002
54. Xaba P, Notten A. Lessertia frutescens (L.) Goldblatt & J.C.Manning subsp. frutescens (= Sutherlandia frutescens (L.) R.Br.) [webpage on the Internet]. c2003 [cited 2021 Aug 14]. Available from: http://pza.sanbi.org/lessertiafrutescens
55. Van Wyk B-E, Albrecht C. A review of the taxonomy, ethnobotany, chemistry and pharmacology of Sutherlandia frutescens (Fabaceae). J Ethnopharmacol. 2008;119:620–629. https://doi.org/10.1016/j.jep.2008.08.003
56. Kamara B, Brand D, Brandt E, Joubert E. Phenolic metabolites from honey bush tea (Cyclopia subternata). J Agric Food Chem. 2004;52:5391–5395. https://doi.org/10.1021/jf040097z
57. Iwu M. Pharmacognostical profile of selected medicinal plants. In: Iwu M, editor. Handbook of African medicinal plants. London: CRC Press; 2014. p. 111–365. https://doi.org/10.1201/b16292
58. Nkonki T. Clitoria. In: Germishuizen G, Meyer N, editors. Plants of southern Africa: An annotated checklist. Pretoria: SANBI; 2003. p. 449.
59. Neda G, Rabeta M, Ong M. Chemical composition and antiproliferative properties of flowers of Clitoria ternatea. Int Food Res J. 2013;20(3):1229–1234.
60. Mbaveng A, Hamm R, Kuete V. Harmful and protective effects of terpenoids from African medicinal plants. In: Kuete V, editor. Toxicological survey of African medicinal plants. London: Elsevier; 2014. p. 557–576. https://doi. org/10.1016/B978-0-12-800018-2.00019-4
61. Wal W, Rai S. Biological activities of lupeol. Syst Rev Pharm. 2011;2(2):96–103. https://doi.org/10.4103/0975-8453.86298
62. Liu K, Zhang X, Xie L, Deng M, Chen H, Song J, et al. Lupeol and its derivatives as anticancer and anti-inflammatory agents: Molecular mechanisms and therapeutic efficacy. Pharmacol Res. 2021;164, Art. #105373. https://doi. org/10.1016/j.phrs.2020.105373
63. Saleem M. Lupeol, a novel anti-inflammatory and ani-cancer dietary triterpene. Cancer Lett. 2009;28:109–115. https://doi.org/10.1016/j.canlet.2009.04.033
64. He Y, Liu F, Zhang L, Wu Y, Hu B, Zhang Y, et al. Growth inhibition and apoptosis induced by lupeol, a dietary triterpene, in human hepatocellular carcinoma cells. Biol Pharmaceut Bull. 2011;34:517–522. https://doi.org/10.1248/bpb.34.517
65. Ngarivhume T, Klooster C, De Jong J, Van Der Westhuizen J. Medicinal plants used by traditional healers for the treatment of malaria in the Chipinge district in Zimbabwe. J Ethnopharmacol. 2015;159:224–237. https://doi. org/10.1016/j.jep.2014.11.011
66. Min T-R, Park H-J, Ha K-T, Chi G-Y, Cho Y-H. Suppression of EGFR/STAT3 activity by lupeol contributes to the induction of the apoptosis of human non small cell lung cancer cells. Int J Oncol. 2019;55:320–330. https://doi. org/10.3892/ijo.2019.4799
67. Neuwinger H. African ethnobotany: Poisons and drugs. London: Chapman & Hall; 1996.
68. Chauhan N, Dixit V. Asteracantha longifolia (L.) Nees, Acanthaceae: Chemistry, traditional, medicinal uses and its pharmacological activities – a review. Rev Bras Farmacogn. 2010;20(5):812–817. https://doi.org/10.1590/ S0102-695X2010005000022
69. Rezende M, Urzua A, Bortoluzzi AJ, Vásquez L. Variation of the antimicrobial activity of Pseudognaphalium vira vira (Asteraceae): Isolation and X-ray structure of ent-3beta-hydroxy-16-kauren-19-oic acid. J Ethnopharmacol. 2000;72(3):459–464. https://doi.org/10.1016/S0378-8741(00)00239-7
70. Torres-Bustos J, Farías L, Urzúa A, Mendoza L, Wilkens M. The diterpenoid ent16-kauren-19-oic acid acts as an uncoupler of the bacterial respiratory chain. Plant Medica. 2009;75:823–828. https://doi.org/10.1055/s-0029-1185437
71. Olivier D, Van Wyk B-E. The major diterpenoids of the genus Arctopus (Apiaceae) with notes on their chemotaxonomic and medicinal significance. S Afr J Bot. 2013;85:94–98. https://doi.org/10.1016/j.sajb.2013.01.002
72. Bryant A. Zulu medicine and medicine men. Ann Natal Mus. 1909;2:1–103.
73. Suzuki M, Xiang T, Ohyama K, Seki H, Saito K, Muranaka T. Lanosterol synthase in dicotyledonous plants. Plant Cell Physiol. 2006;47(5):565–571. https://doi.org/10.1093/pcp/pcj031
74. Shin S-J, Cho N-S, Lai Y-Z. Residual extractions in aspen kraft pulps and their impact on kappa number and klason lignin determination. J Wood Sci. 2007;53:494–497. https://doi.org/10.1007/s10086-007-0894-8
75. Van Wyk B-E, Gericke N. People’s plants. A guide to useful plants of southern Africa. Pretoria: Briza Publications; 2000.
76. Arora S, Saini M. Gas chromatography mass spectrometry profiling in methanolic and ethyl-acetate root and stem extract of Corbichonia decumbens (Forssk.) Exell from Thar Desert of Rajasthan, India. Pharmacognosy Res. 2021;9:48–52. https://doi.org/10.4103/pr.pr_62_17
77. Wang Y, Wang H, Shen J, Zhao L, Clarke S, Sun J, et al. Methyl palmitate, an acaricidal compound occurring in green walnut husks. J Econ Entomol. 2009;102(1):196–202. https://doi.org/10.1603/029.102.0128
78. Akhtar R, Shahzad A. Alginate encapsulation in Glycyrrhiza glabra L. with phyto-chemical profiling of root extracts of in vitro converted plants using GC-MS analysis. Asian Pac J Trop Biomed. 2017;10:855–861. https://doi. org/10.1016/j.apjtb.2017.09.010
79. Das S, Casudeva N, Sharma S. Chemical composition of ethanol extract of Macrotyloma uniflorum (Lam.) Verdc. using GC-MS spectroscopy. Org Med Chem Lett. 2014;4:13. https://doi.org/10.1186/s13588-014-0013-y
80. Nasciemento A, de Oliveira D. Kaurene diterpenes and other chemical constituents from Mikania stipulacea (M. Vahl) Willd. J Braz Chem Soc. 2001;12:552–555. https://doi.org/10.1590/S0103-50532001000400019
81. Albayrak S, Aksoy A, Sagdic O, Hamzaoglu E. Compositions, antioxidant and antimicrobial activities of Helichrysum (Asteraceae) species collected from Turkey. Food Chem. 2010;119:114–122. https://doi.org/10.1016/j. foodchem.2009.06.003
82. Arciniegas A, Pérez-Castorena A, Luis Villaseñor J, Romo de Vivara A. Chemical constituents of Senecio procumbens. J Mex Chem Soc. 2005;49:284–286.
83. Liu Y, Zong Z, Wang Y. Chemical constituents of Senecio vulgaris. Chin Trad Herb Drugs. 2010;41:1608–1612.
84. Hassin D, Khlifi D, Ferhout H, Raoelison E, Bouajila J. Curry plant (Helichrysum sp.) oils. In: Preedy V, editor. Essential oils in food preservation, flavor and safety. London: Academic Press; 2016. p. 395–403. https://doi.org/10.1016/ B978-0-12-416641-7.00044-4
85. Deacon H, Deacon J. Human beginnings in South Africa. Cape Town: David Philip; 1999.
86. Vinnicombe P. A Bushman hunting kit from the Natal Drakensberg. Ann Natal Mus. 1971;20:611–625.
87. Mitchell P. The archaeology of southern Africa. Cambridge: Cambridge University Press; 2002.
88. Deacon J. The Later Stone Age of southernmost Africa. Oxford: BAR Publishing; 1984. https://doi.org/10.30861/9780860542766
89. Sadr K. Invisible herders? The archaeology of Khoekhoe pastoralists. South Afr Humanities. 2008;20:179–203.
90. Hoff A. The water bull of the /Xam. S Afr Archaeol Bull. 1998;53:109–124. https://doi.org/10.2307/3889185
https://doi.org/10.17159/sajs.2023/13011
92 Volume 119| Number 1/2 January/February 2023 Research Article
GC-MS characterisation of 500-year-old medicine container Page 8 of 8
AUTHOR: Ian Moll1
AFFILIATION:
1Wits School of Education, University of the Witwatersrand, Johannesburg, South Africa
CORRESPONDENCE TO: Ian
Moll
EMAIL:
ian.moll@wits.ac.za
DATES:
Received: 07 Dec. 2021
Revised: 27 Apr. 2022
Accepted: 24 July 2022
Published: 24 Jan. 2023
HOW TO CITE:
Moll I. Why there is no technological revolution, let alone a ‘Fourth Industrial Revolution’. S Afr J Sci. 2023;119(1/2), Art. #12916. https:// doi.org/10.17159/sajs.2023/12916
ARTICLE INCLUDES:
☒ Peer review
☐ Supplementary material
DATA AVAILABILITY:
☐ Open data set

☐ All data included
☒ On request from author(s)
☐ Not available
☐ Not applicable
EDITOR: Michael Inggs
KEYWORDS:
digital, industrial revolution, technological revolution, information technology
FUNDING: None
Why there is no technological revolution, let alone a ‘Fourth Industrial Revolution’
We are told by the powerful that we live in, or are about to live in, a Fourth Industrial Revolution (4IR). Seemingly, this revolution is about deep-seated, rapid, digitally powered techno-scientific change. It is the age of smart machines; it is a new information technology (IT) revolution. However, in this article I suggest that examination of the history of technologies that are often held up to be proof of the 4IR, in fact shows that there is no contemporary technological revolution. The research methodology that I employ here is conceptual analysis and a focused review of literature on the history of particular technologies. An industrial revolution, as its three historical instances have demonstrated, is the fundamental transformation of every aspect of industrial society, including its geopolitical, cultural, macro-social, micro-social, economic and technological strata. It certainly entails a technological revolution, but it is more than just that. In this article, I am not concerned with the broader ensemble of socio-economic changes – it seems increasingly clear that the ‘brave new world’ of the 4IR is not really happening – but simply ask the question: is there currently a technological revolution? The answer seems to be that there is not.
Significance:
The significance of this study is that it challenges the mainstream notion of technological innovation and change, associated with the ‘Fourth Industrial Revolution’. It has implications for the way we think about technological and scientific revolutions.
Science, technology and the alleged 4IR
Talk of a ‘Fourth Industrial Revolution’ (4IR) is around us all the time. It seems to be about the way things just are. It is supposedly a full-scale human and social revolution, in which radical, fast-paced convergences of scientific and technological innovation in networked information technology (IT) dominate and transform every aspect of our lives. For a scientist, what sits underneath this is often an assumption that scientific progress is bound up with the computing power of ITs in scientific research methods and outputs. Indeed, there is hardly a science that does not employ the information processing capabilities of computers to do its work. And all sciences have in the last 30 years or so (at least) made dramatic advances in their scientific and technological knowledge bases on the basis of that computing power. So scientists quite easily accept that we live in an age of technological revolution. When someone like Klaus Schwab of the World Economic Forum tells us that “we are at the beginning of a revolution that is fundamentally changing the way we live, work, and relate to one another. In its scale, scope and complexity, what I consider to be the fourth industrial revolution is unlike anything humankind has experienced before” (my emphasis)1(p.7), then scientists might unthinkingly go along with that too.
However, scientists are not unthinking beings. So, let us pose the question: is contemporary IT innovation and convergence really revolutionising our technology, and our research problematics, in the way that we are told? In what follows, I suggest that this is not the case. The evidence that I will adduce in support of this claim comes from examination of the history and nature of technologies that are often put forward as proof of the dramatic arrival of a 4IR. I do not suggest that digital computing is not necessary, important, or even amazing in scientific research. I take that for granted. What I do want to question is the way we use the word ‘revolution’ to describe and understand our activities. On that score, I argue that we have not witnessed a ‘grand’, overall technological revolution in recent times. It is important that scientists and technologists understand this.
Some background
The annual World Economic Forum meeting in Davos is often described as the gathering of the world’s economic elites. Corporate heavyweights, heads of state, cutting-edge scientists, global intellectuals and their entourages gather to discuss ‘the next big thing’ in the exercise of global power. In 2016, Schwab famously introduced the world to the notion of the 4IR:
© 2023. The Author(s). Published under a Creative Commons Attribution Licence.
Research Article
We have yet to grasp fully the speed and breadth of this new revolution. Consider the unlimited possibilities of having billions of people connected by mobile devices, giving rise to unprecedented processing power, storage capabilities and knowledge access. Or think about the staggering confluence of emerging technology breakthroughs, covering wideranging fields such as artificial intelligence, robotics, the Internet of Things, autonomous vehicles, 3D printing, nanotechnology, biotechnology, materials science, energy storage and quantum computing, to name a few. Many of these innovations are in their infancy, but they are already reaching an inflection point in their development as they build on and amplify each other in a fusion of technologies across the physical, digital and biological worlds.1(p.8,9) He emphasised what he proclaimed to be the unprecedented speed, size and scope of the ‘4IR’, in relation to previous industrial revolutions. The velocity of change, he suggested, is exponential rather than linear; the combining of multiple technologies broader and deeper than ever before; and the systems impact is now total, across the whole of society and the world economy.1
https://doi.org/10.17159/sajs.2023/12916
93 Volume 119| Number 1/2 January/February 2023
Discussions on 4IR
However, Schwab’s claims are contentious, in relation to technology per se, and in relation to paradigmatic scientific revolutions that might be said to undergird technological change. Notably, Jeremy Rifkin, advisor to the European Union, the Chinese government, and the then German Chancellor, Angela Merkel, challenged Schwab immediately. Rifkin had been a prominent writer for more than 25 years on the digital technology revolution that commenced in the 1960s (the Third Industrial Revolution, or 3IR) and on possible future industrial revolutions.2 For reasons that will become obvious, he was not on the list of invitees to Davos in 2016. Rifkin pushed back against the claim that the fusion of technologies between the physical, digital and biological worlds is somehow qualitatively a new phenomenon. He argued that the very nature of digital technology is that it reduces communication “to pure information” organised in networks that work like complex, interactive ecosystems:
[It] is the interconnected nature of digitalization technology that allows us to penetrate borders and ‘blur the lines between the physical, digital, and biological spheres’. Digitalization’s modus operandi is ‘interconnectivity and network building.’ That’s what digitalization has been doing, with increasing sophistication, for several decades. This is what defines the very architecture of the Third Industrial Revolution.3
Rifkin went further, rejecting Schwab’s argument that an overall rapid increase in the velocity, scope and systems impact of new technologies implies a 4IR. He showed that it is the intrinsic interconnectedness of networked information technologies themselves, and the continuous, exponential decrease in digital technology costs, that produce changes in “velocity, scope, and systems impact”, and that this had been going on for more than 30 years. It was a misconception that Schwab saw this as a “new revolution”. Rifkin does not think that contemporary technology innovation in the networked information society constitutes a 4IR.
The ensuing debate has been prominent across society. The pivotal texts of Schwab (the leading global 4IR advocate)1 and Tshilidzi Marwala (the leading South African 4IR advocate)4 are replete with what they claim to be evidence of acute, rapid, systemic technological development – that is, a contemporary technological revolution. In their wake, numerous publications propagate the notion of a 4IR in technological terms. Books by Skilton and Hovsepian5, and by Marr6 are significant in this regard. There is unfortunately also a number of fanciful, rhetorical, science-fiction like evocations of a contemporary digital revolution that undermine their own cases, such as Kurzweil’s Singularity7, and that by Diamandis and Kotler that takes us on a “wild ride” (their own words) through “turbo-boosted” technological change in “swarms” of “tsunami-sized behemoths” that confront us with a “blitzkrieg” of technologies8(p.xi,8,10,117). Significant works that question the plausibility of a 4IR are those by Daub9, Edgerton10 and Morgan11, and my own occasional paper seeks to make a contribution in this regard12
Now it is not my intention here to tackle this debate in its broader context. I have argued elsewhere that this context is not so much about science and technology per se, but about the political and ideological intervention that Schwab sought to achieve at Davos 2016.13,14 If I may be permitted an indulgence, I would say that it is less about machines than about political machinations. However, both sets of protagonists accept that we live in an era of rapidly evolving technological innovation and change. My argument here is that, purely at the level of technology, there does not seem to be a case that there is such a phenomenon as a 4IR.
3IR or 4IR technologies?
Over the past few years, I have been researching the general beliefs that people have about the ‘4IR’ and technology.12(p.30-32) Amongst other procedures, I used the search term “fourth industrial revolution” on both the Google and Google Scholar search engines, to discover what people in general, and academics in particular, believed about technology in the ‘4IR’. I noted down every single ‘technology of the 4IR’ declared by some or other commentator, academic and non-academic alike, until the data were clearly saturated. In the process, I surveyed over 320 websites, and scanned some 150 digitised journal articles. I should note

here that a basic coding procedure for the analysis of qualitative data revealed no differences between the standard utterances of the online public at large, academic writers in general, and science and technology researchers. The technologies described by each of these groups of people were pretty much the same.
In July 2020, when I conducted a first survey, the terms internet of things, machine learning, robotics, artificial intelligence, big data, and automation were amongst the most frequently mentioned ‘technologies’. By August 2021, when I repeated the survey, the terms blockchain and cyber-physical systems had joined the list of the most ‘popular’ terms. Automation had waned somewhat. The reason for the increasing mentions of blockchain appears to be the growing trade in the cryptocurrency Bitcoin. The prominence of the notion of cyber-physical systems does not seem to be so easily explained by the contexts of its use on the Web. Automation is (perhaps a euphemism for) the displacement of humans by robots in the workplace, and so as people come to understand it more, it is subsumed under ‘robotics’.
It turns out that the way people use and understand all of these concepts as ‘technologies of the 4IR’ can be misleading. None of them is a groundbreaking invention of contemporary times. All of them were, and are, gradual evolutions of technology rooted in the defining technological transformations of the 3IR. I shall now make my case by examining each of them in depth.
Artificial intelligence
Artificial intelligence or AI is a field of knowledge and research that originated in the 1950s and that seeks to conceive, and sometimes to build, artificial animals including humans. It is somewhat disingenuous to describe AI as ‘a technology’. AI brings together such disciplines as cognitive science, philosophy, cognitive psychology, neuroscience, computer science, and information engineering. Among its central questions are, “Can a machine think?” and “Can a machine act like a human being?” In seeking to answer them, AI hypothesises a functional equivalency between human cognition and a computer program. It tries to understand the nature and limits of this putative identity between a machine on the one hand and a primate’s intelligence and action on the other. For example, AI researchers investigate whether information processing in a person and a machine are governed by the same kinds of rules in accessing, storing and retrieving information in memory processes. Or they ask if the ‘cognitive’ schemas that produce action in machines and humans can be understood to be equivalent. Often, AI researchers either build actual machines (such as robots) or write symbol-processing algorithms – there is a debate in the field about the extent to which either, or both, is necessary – to help them find answers to their research questions.
However, it is not the technology as such that interests AI researchers, but rather the ‘virtual machine’ that runs inside it. A ‘piece’ of AI is the mental model of an information-processing system that a programmer has in mind when writing a program that could run inside a machine.15(p.4) AI is not technology per se, but some of the knowledge it produces is continually applied in various technology fields, including software engineering, computer design and – most notably – machine intelligence. It is very much of the 3IR, having commenced with the advent of modern high-speed digital computers in the 1950s.16,17 To recognise that AI is a scientific field that has progressed rapidly in the past three decades does not warrant the claim of an AI ‘revolution’ or scientific paradigm shift in contemporary times.
Robotics
Robotics is the development of computerised machines that replicate human action. It has scientific and technological roots far back in the 3IR. As regards automation, the first digitally programmed industrial robot started work in a Connecticut foundry in 1961. In 1969, the Stanford Arm, a six-axis articulated robot was invented, able to follow arbitrary paths in space and widen the potential use of robots in industry. 1974 saw the world’s first electric, microcomputer-controlled, industrial robot installed in a Swedish factory. IRB6, as it was known, carried out welding, grinding and polishing functions in steel pipe production.
94 Volume 119| Number 1/2 January/February 2023 Research Article https://doi.org/10.17159/sajs.2023/12916 Discussions on 4IR: Why there is no technological revolution Page 2 of 6
It must be emphasised that the vast majority of industrial robots are ‘unintelligent’, fixed machines that carry out rudimentary manufacturing functions, such as welding or screwing on certain parts of a car or household appliance, on assembly lines. By the new millennium, some 750 000 were deployed globally, mainly in motor car and electronics factories. By 2022, there were over 3 million manufacturing robots, with just over 1 million units in China and some 412 000 in Japan.18
At the other end of the spectrum, there are relatively few ‘humanoid’ robots, mostly found in research contexts rather than the workplace. WABOT-1, the first anthropomorphic robot, appeared in Japan in 1973. Its technological focus was mainly on a bipedal limb control system enabling it to walk. It was also fitted with sensors and actuators to measure distances to objects and grip and move them, and was able to recognise basic spoken commands.19 Freddy I (1969–1971) and Freddy II (1973–1976) were Scottish experimental robots using an object-level robot programming language, allowing them to handle variations in object position, shape, and sensor noise. They both used video cameras and bump sensors to recognise objects, and Freddy II was augmented with a large vertical ‘hand’ that could grip objects once recognised. By 2020, the robot that is widely regarded to be the world’s most advanced humanoid, ASIMO, could walk, hop, run, jump, serve food and drinks, recognise moving objects, and respond to human gestures. However, it also uses sensor, actuator, bipedal and language processing technologies with a lineage straight back to WABOT-1, along with machine learning capabilities that have a similar technological ‘ancestry’.20
Up to the late 1970s, robots were tediously hand-programmed for every task they performed. By then, the burning research questions of robotics needed machine learning technology to inaugurate learning robots
The coming merging of the two technological spheres in the 1980s was inherent in the long-evolving technologies of the 3IR.
Machine learning
Computers process information, perhaps in the same way that cognitive scientists think that a human being does. So machine learning refers to the ability of computers to process digital information and act automatically on the basis of it, without explicit programming. The idea is that a computer can learn ‘from experience’, and improve its informationprocessing ability over time in autonomous fashion, by running algorithms to access and process data. The most ‘intelligent’ computers can be fed data, access it themselves, and ‘experience’ it via sophisticated sensors. Deep learning, an evolution of machine learning, creates an ‘artificial neural network’ that can learn and make basic decisions on its own.
These developments have a history deeply rooted in the 3IR. The term ‘machine learning’ was coined by Samuel, who invented a computer program to play draughts in the 1950s. In 1957, Rosenblatt combined Hebb’s psychological model of brain cell interaction with Samuel’s program to create Perceptron, which was the first artificial neural network able to learn patterns and shapes. In 1959, Widrow and Hoff created such a program to detect binary patterns. Let us also not forget that, in 1997, the IBM computer ‘Deep Blue’ beat the world chess champion.
An explosion in machine learning research and development took place in the 1980s, on the basis of research programmes that had started in the previous decade, like that of Marvin Minsky at MIT. The interest in neural network research at that time was not accidental. Advances in ‘very-large-scale’ computing enabled scientists to build machines with thousands of processors that could distribute computation over a large number of processing units running in parallel. ‘Artificial neural networks’ provided the theory that underpinned these developments.
At this time, the confluence of robotics and machine learning started to take shape. Not all machine learning is about robots. However, there was increasing demand by the 1980s for robots capable of doing things like identifying parts from a random selection, or maintaining ‘positional accuracy’ when objects shift about on assembly lines.
Benjamin Kuipers recollects that the serious questions of machine intelligence became: “How can a robot learn a cognitive map from its own experience of the environment?” and “How can an agent learn,
not just new knowledge within an existing ontology, but a new ontology it does not already possess?”21(p.243,261). Intellectually, this period was a high point in 3IR machine learning. Academics were consumed ln debate about ‘machine vision’ in robots, in which sensors (cameras, lasers, lidar, radar, etc.) detect and categorise aspects of their environment. In industry, machine learning algorithms in robots enabled 2D and 3D ‘object learning’. These robots made and acted on predictions using probabilistic reasoning algorithms coded into them. In business, robotic process automation –office automation technology in which robotic software replicates human actions to carry out business processes – evolved rapidly. In another applied research context, ‘assistive robots’ were built to process sensory information, and then act to help disabled and elderly people with everyday functions. By 2000, the evolution of natural language processing dating to the 1960s was being realised in early chatbots (the forebears of the robots with human voices ‘inside’ our cell phones today).
Machine learning has a deep and significant history in the 3IR, as does its mutual engagement with robotics.
Internet of Things
An Internet of Things (IoT) is a system of networked mechanical and digital devices with the ability to transfer data amongst themselves without human intervention. A proverbial case in one’s own home would be the digitised linking of an alarm clock, a coffee machine, a sound system booting up one’s favourite tracks, onscreen reminders of one’s appointments for the morning, and weather and traffic reports for the day, all connected via the Internet – a convergence in use of networks and devices that sounds revolutionary. However, it would appear that the technology is not new.
Obviously, the core technology of the IoT is the Internet. The iconic technological events of the 3IR have been the invention of the Internet and the World Wide Web (WWW, or simply ‘the Web’). The Internet was a 1969 project supported by the US Department of Defense that linked computers at a number of universities via standard telephone connections. Subsequently, Tim Berners-Lee built a document-linking structure on it, and most importantly, defined open standards for the exchange of information via the Internet. This structure consists of the all too familiar HTML, URL and HTTP computer codes. In 1991, Berners-Lee ‘went live’ with the first browser that used these standards to exchange hyperlinked data via the Internet, and inaugurated the WWW. It seems fair to say that, 30 years ago, the Internet consolidated the fundamental technological revolution of the 3IR.
The other major technology of the IoT is the combination of analogue to digital and digital to analogue converters (ADC; DAC) that link mechanical devices, via sensors and actuators, to the Internet. These first appeared in the 1960s. The first IoT was reputedly built in the early 1980s when techies at Carnegie-Mellon University installed micro-switches in a vending machine to check cooldrink availability from their desks. Perhaps the most significant piece of technology in the evolving IoT was Trumpet Winsock in 1994, which made it possible to attach PCs to Internet networks.
In the 2020s, it is clear that an IoT can radically beef up businesses and governments, by networking things like transportation, shipping, security, energy conservation and urban waste management, but their technology is definitively that of the 3IR.
Cyber-physical system
At first glance, cyber-physical systems (CPSs) appear to be well described as 21st-century technology. The term was coined in 2006 by scientists at the US National Science Foundation. In the contemporary world, CPS technology works in manufacturing, electricity supply, health care and transport, to name but some of its terrains. It is also prominent in implementing global change agendas, such as decarbonisation. Edward Lee describes it thus:
CPS connects strongly to the currently popular terms Internet of Things (IoT), Industry 4.0, the Industrial Internet, [etc.] … All of these reflect a vision of a technology that deeply connects
95 Volume 119| Number 1/2 January/February 2023 Research Article
https://doi.org/10.17159/sajs.2023/12916
Discussions on 4IR: Why there is no technological revolution Page 3 of 6
our physical world with our information world. [But] it does not directly reference either implementation approaches (e.g. the “Internet” in IoT) nor particular applications (e.g. “Industry” in Industry 4.0). It focuses instead on the fundamental intellectual problem of conjoining the engineering traditions of the cyber and the physical worlds.22(p.4838)
So it looks very much like CPS might be one of Schwab’s revolutionary disruptions.
However, this sense of what CPS is, is beguiling, as becomes clear when we start to unravel its technological roots. The key point is that a CPS is all about computational models. In this, it goes all the way back to Norbert Wiener’s work during World War II, designing technology to aim and fire anti-aircraft guns automatically. Although Wiener employed analogue control circuits and mechanical parts, and not digital computers, his mathematical principles were precursors to the digital feedback control loops found today in CPS. Wiener consolidated this control logic in his 1961 book, Cybernetics. From the 1960s, the development of the mathematical principles of cybernetics is evident in the history of what are known as embedded and hybrid systems in computer programming. In the 1960s, researchers at MIT developed the guidance system for the Apollo spacecraft, which employed the first example of a modern, concurrent, embedded computing program. The notion of hybrid systems, the interaction of digital controllers, sensors and actuators in dynamic physical systems, was widely researched in the 1990s. These are the significant predecessors of CPS in the expanding 3IR of the 20th century.
Big data
Big data storage, and its associated analytics, is technology that enables a massive coming together of information in extensive global networks, based on 3IR technology that has evolved over the past 60 years. Increasingly, vast databanks are processed by large organisations, like companies and governments, to plan and make strategic decisions. However, while the amount of digitised data today is unprecedented, the technology of data storage and analysis has in fact evolved in waves over many years:
It would be nice to think that each new innovation in data management is a fresh start and disconnected from the past. However … most new stages or waves of data management build on their predecessors. … Data management has to include technology advances in hardware, storage, networking, and computing models such as virtualization and cloud computing. … The data management waves over the past five decades have culminated in where we are today: the initiation of the big data era.23(p.10,11)
In the 1950s, the first computers stored data on magnetic disks in flat files with no structure. To understand information, ‘brute-force methods’ had to be applied. Then, in 1961, the silicon chip (or ‘integrated circuit’, still the basic building block of ‘big data’) provided for much larger, more efficient data storage and retrieval, and much smaller computers to do the job. Later, in the 1970s, relational databases imposed structure on data, in ‘ecosystems’ that helped classify and compare complex transactions. In 1976, the graphical entity-relationship database model defined data elements for any software system, thus adding deeper analytics to increase data usability. By the 1990s, as the sheer volume of data grew out of control, the data warehouse was developed. In the new millennium, cloud computing evolved as data warehousing was taken ‘off site’. Cloud computing is innovative, contemporary, on-demand data storage and computing power; one of its most important attributes is bringing together diverse data sets, such as climate records and social media messages, for purposes of analysis and decision-making.
The history of the emergence of ‘data’ as storage and analytics makes it quite clear that the ongoing emergence of what we now term ‘big data’ is a technology of the 3IR.
Blockchain
Blockchain is a database distributed across the nodes of a computer network. It stores information digitally, but differs from past databases in that it structures information in discrete ‘blocks’ rather than in tables. These blocks are closed when filled, and linked in a chain that constitutes a secure, shared, distributed ledger. The sequence of each block is irreversible – it is given an exact timestamp and a hash (a digital fingerprint or unique identifier). No block can be altered, and no new block can be inserted between two existing blocks in the chain. Each subsequent block strengthens the verification of the previous block and hence the entire blockchain. Data security is vastly increased.
The World Economic Forum and other 4IR buffs tell us that blockchain is one of the biggest advances of our time. They trot out a series of innovations in blockchain as evidence of a 21st-century ‘quiet revolution’: Bitcoin, ‘the first blockchain”; Ethereum, ‘little computer programs’ providing financial instruments within the blockchain system; ‘scaled blockchain’ which deploys and regulates required computing power from within the blocks themselves; and storage within blockchain of non-fungible tokens (things like artworks or intellectual property).
However, like CPS, this supposed revolution is beguiling. Blockchain technology did not begin with Bitcoin. At their most honest, 4IR adherents might admit that it dates to Haber and Stornetta’s specification of conditions for a cryptographically secured chain of blocks in 1991.24 If they bothered to read the work of these authors, they would realise that blockchain technology incorporates the Merkle-Damgård (M-D) hash function formulated in 1967, and formally validated in the 1980s. In particular, its iterative structure, in which a previous block’s hash is the input for the next block, is replicated in blockchain.25(p.129) They might also take note of the fact that the BBVA Foundation bestowed its Frontiers of Knowledge Award in the ‘ICTs’ category on Shafi Goldwasser, Silvio Micali, and their fellow computer scientists for their “fundamental contributions to modern cryptology”. The citation praises the Goldwasser–Micali (GM) crypto-protocols, defined in 1982, for providing “the underpinning for digital signatures, blockchains and crypto-currencies”26
So, once again, we encounter an alleged ‘4IR’ technology that is actually an evolving 3IR technology rooted deeply in the previous century.
Revolutionary technologies
The conclusion from these preceding discussions of proclaimed ‘4IR’ technologies is clear. None of them is a radical, groundbreaking invention of contemporary times. All of them were, and are, gradual evolutions of technology rooted in the defining technological transformations of the 3IR. This and similar evidence about most latter-day IT innovations calls into question claims that we are today in a period of dramatic technological revolution.12(p.32-39) However, it would be absurd to suggest that there are no technological innovations in our time that are revolutionary in their own context. One example is the first real-life ‘shadow hand’ in the terrain of bionics.27 This prosthetic hand translates electrical impulses from the brain into digital information that allows a person deliberately to use their robotic hand. Research programmes seeking to replicate the functionalities of bionic hands have expanded rapidly over the past two decades.28,29 However, as one might expect, they are focused on what Thomas Kuhn terms the normal science of a scientific paradigm, rather than scientific revolutions (paradigm shifts) that transcend specific research contexts.30
A similar situation prevails with respect to other prominent new, revolutionary 21st-century technologies, such as nanotechnology and autonomous vehicles.
Medical nanotechnology involves implanting microscopically small devices in humans to detect, monitor and treat various illnesses and impairments. Generally, scientists in this field do not construe it as
96 Volume 119| Number 1/2 January/February 2023 Research Article https://doi.org/10.17159/sajs.2023/12916 Discussions on 4IR: Why there is no technological revolution Page 4 of 6
technological revolution, but rather as “a new and promising route to extract reliable information” within a relatively stable, enduring research programme.31(p.1) So graphene-based brain implants that record low-frequency electrical activity to enable drug delivery and tissue engineering, are described cautiously by scientists as needing “accurate theoretical modelling of the interface between graphene and biological material” in order for them to advance.32 Elon Musk’s Neuralink, an envisaged brain-machine interface device, although hyped by many 4IR adherents as the epitome of a current revolution, is described extremely modestly by the scientists working on it: “further research studies are needed to move forward beyond speculation”33
Autonomous vehicles are prominent in the rhetoric of the ‘4IR technological revolution’. Yet the vehicle technology is not ready for deployment on public roads: “self-driving cars are already on the road, [but] operating only at lower speeds within small geofenced areas”34 The views of researchers are modest: “there still is no comprehensive answer on how to proactively implement safe driving”35. Despite the intelligent sensors, digital maps and Wi-Fi communications that can, in principle, put autonomous vehicles on public streets, the seemingly intractable requirement is that environmental modifications would need to be made to facilitate their deployment.36
It turns out that it is difficult to find an incipient technology of the immediate 21st century that is revolutionary, and construe it as a broader ‘technological revolution’, simply because such technologies are generally found in their own contexts of discovery and emergence, that is to say in the research contexts in which they appear. Because a particular technical invention is revolutionary in its own context of use, does not mean that it constitutes, or is part of, a broader technological revolution.
The convergence of technologies
Jamie Morgan points out that, in considering claims about a 4IR, “it is the confluence of technologies that is considered socially significant”11 Technologies in combination with each other create the potential for change, because they “represent an anticipated fundamental transformation”. This potential is real “in so far as individually all of the technology is either available in initial form or is something particular groups are working on somewhere in the world”14(p.374). Obviously, then, if a required range of innovations is not available, even revolutionary technologies do not constitute a technological revolution. The key issue on which the existence or otherwise of a technological revolution associated with a ‘4IR’ turns is not so much separate technologies in their own right, but rather the required converging of technologies.
We often hear claims that the 4IR “is based not on a single technology, but on the confluence of multiple developments and technologies”37. Similarly, that it is a “fusion of advances in artificial intelligence, robotics, the Internet of Things, 3D printing, genetic engineering, quantum computing, and other technologies”38 (all my emphases). In the first quotation from Schwab, he proclaimed “the staggering confluence of emerging technology breakthroughs”. There is very little evidence, however, of such grand, contemporary technological convergences in the current era.
A smaller-scale fusion of technologies is not necessarily the harbinger of a socially pervasive technological revolution. It is a truism to say that technologies converge, at many points in time and in any era. This occurs in multiple forms, in multiple ways, at multiple levels of complexity. For the most part, interacting machines and tools are commonplace in any production process. The robotic hand is one such example; another example of such convergence in its own context is that between robotics and machine learning in the 1980s. However, neither of these constituted an overall, fundamental technological revolution beyond the 3IR. The historian Hobsbawm’s words explaining why, through the multiple technological innovations of the two World Wars, there was no technological or industrial revolution, seem pertinent to the current context: “What they achieved was, by and large, an acceleration of change rather than a transformation”39(p.48)
Having made the case that there is no current, substantive technological revolution, it is important to recognise that there is nonetheless something significant happening at this moment in relation to the
Discussions on 4IR: Why there is no technological revolution Page 5 of 6
history of technological evolution. The ideology of the 4IR, construed by its mainstream ideologues as a technological revolution, has become hegemonic in the prevailing language of academia, business, politics and education.12,15 Joseph Stiglitz40 and other economists have identified the close coupling of neoliberalism, globalisation and the networked digital economy. However, while Stiglitz has suggested that “neoliberalism must be pronounced dead and buried”41 in the face of crises such as the global meltdown of 2008–2009, the waves of anti-globalisation and hostile populism sweeping through countries of the North, and the COVID-19 pandemic, the mainstream economic response of supranational states such as the IMF and the World Bank has sought to resuscitate neoliberal ideology42. It seems clear that the World Economic Forum intervention in 2016 is one way in which “neoliberal practice is able to resurface and show up in new and unexpected ways”43(p.1083). It has evidently been very successful.
Conclusion
There is no doubt that the pervasive digital convergences of the 3IR have constituted, and continue to constitute, an overall technological revolution, when considered in relation to the ‘industrial age’ brought about in the 2IR. There is also no doubt, on the evidence adduced in this article, that there is not a contemporary technological revolution. One thing to learn from this is that there is slippage in the way we use the term ‘revolution’ – linguists would call it a ‘floating signifier’. To say that a scientific or technological discovery is revolutionary, is not necessarily to say that we are living in a period of technological revolution, let alone a 4IR.
Competing interests
I have no competing interests to declare.
References
1. Schwab K. The Fourth Industrial Revolution. Geneva: World Economic Forum; 2016.
2. Rifkin J. The Third Industrial Revolution: How lateral power is transforming energy, the economy, and the world. New York: Palgrave MacMillan; 2011.
3. Rifkin J. The 2016 World Economic Forum misfires with its Fourth Industrial Revolution theme. Huffington Post. 2016 January 14. Available from: https:// www.huffpost.com/entry/the-2016-world-economic-f_b_8975326
4. Marwala T. Closing the gap: The Fourth Industrial Revolution in Africa. Johannesburg: Macmillan; 2020.
5. Skilton M, Hovsepian F. The 4th Industrial Revolution: Responding to the impact of artificial intelligence on business. Cham: Palgrave Macmillan; 2018. https://doi.org/10.1007/978-3-319-62479-2
6. Marr B. Artificial intelligence in practice. Chichester: Wiley; 2019.
7. Kurzweil R. The singularity is near: When humans transcend biology. New York: Viking; 2005.
8. Diamandis P, Kotler S. The future is faster than you think: how converging technologies are transforming business, industries, and our lives. New York: Simon & Schuster; 2020.
9. Daub A. What tech calls thinking: An inquiry into the intellectual bedrock of Silicon Valley. New York: Macmillan; 2020.
10. Edgerton D. The shock of the old: Technology and global history since 1900. London: Profile; 2008.
11. Morgan J. Will we work in twenty-first century capitalism? A critique of the fourth industrial revolution literature. Econ Soc. 2019;48(3):371–398. https://doi.org/10.1080/03085147.2019.1620027
12. Moll I. Debunking the myth of the Fourth Industrial Revolution. Occasional paper. Johannesburg: Centre for Researching Education and Labour (REAL), University of the Witwatersrand; 2022 March 31. https://doi.org/10.54223/ uniwitwatersrand-10539-32846
13. Moll I. The myth of the fourth industrial revolution. Theoria. 2021;68(167): 1–38. https://doi.org/10.3167/th.2021.6816701
14. Moll I. The fourth industrial revolution: A new ideology. Triplec. 2022;20(1):45–61. https://doi.org/10.31269/triplec.v20i1.1297
97 Volume 119| Number 1/2 January/February 2023 Research Article
https://doi.org/10.17159/sajs.2023/12916
15. Boden M. AI: Its nature and future. Oxford: Oxford University Press; 2016.
16. Turing A. Computing machinery and intelligence. Mind. 1950;59(236): 433–460. https://doi.org/10.1093/mind/LIX.236.433
17. McCarthy J, Minsky M, Rochester N, Shannon CE. A proposal for the Dartmouth Summer Research Project on Artificial Intelligence [document on the Internet]. c1955 [cited 2021 Dec 07]. Available from: http://raysolomonoff. com/dartmouth/boxa/dart564props.pdf
18. International Federation of Robotics. IFR Presents World Robotics Report 2021 [media release]. 2021 Oct 28. Available from: https://ifr.org/ifr-pressreleases/news/robot-sales-rise-again
19. Takanishi A. Historical perspective of humanoid robot research in Asia. In: Goswami A, Vadakkepat P, editors. Humanoid robotics: A reference. Dordrecht: Springer; 2019.
20. Sakagami Y, Watanabe R, Aoyama C, Matsunaga S, Higaki N, Fujimura K. The intelligent ASIMO: System overview and integration. In: Proceedings of the IEEE International Conference on Intelligent Robots and Systems, 2002 September 30 – October 04; Lausanne, Switzerland. New York: Institute of Electrical and Electronic Engineers; 2002. p. 2478–2483. https://doi. org/10.1109/IRDS.2002.1041641
21. Kuipers B. An intellectual history of the spatial semantic hierarchy. In: Jefferies M, Yeap W-K, editors. Robotics and cognitive approaches to spatial mapping. Berlin: Springer-Verlag; 2008.
22. Lee EA. The past, present and future of cyber-physical systems: A focus on models. Sensors. 2015;15:4837–4869. https://doi.org/10.3390/s150304837
23. Hurwitz J, Nugent A, Halper F, Kaufman M. Big data for dummies. Hoboken, NJ: Wiley; 2013.
24. Haber S, Stornetta WS. How to time-stamp a digital document. In: Menezes AJ, Vanstone SA, editors. Advances in cryptology-CRYPTO’ 90. Lecture Notes Computer Science vol. 537. Berlin: Springer; 1991. https://doi.org/10.1007/3540-38424-3_32
25. Halunen K, Vallivaara V, Karinsalo A. On the similarities between blockchains and Merkle-Damgård hash functions. In: Proceedings of the IEEE International Conference on Software Quality, Reliability and Security; 2018 July 16–20; Lisbon, Portugal. New York: Institute of Electrical and Electronic Engineers; 2018. p. 129–134. https://doi.org/10.1109/QRS-C.2018.00035
26. BBVA Foundation recognizes Goldwasser, Micali, Rivest and Shamir for enabling a secure digital society thanks to modern cryptography [media release]. 2018 January 16. Available from: https://www.frontiersofknowledgeawards-fbbva. es/noticias/bbva-foundation-frontiers-knowledge-award-goldwasser-micalirivest-shamir-cryptography/
27. Wits researchers interpret brainwaves to give amputees a hand. Daily Maverick. 26 November 2019. Available from: https://www.dailymaverick. co.za/article/2019-11-26-wits-researchers-interpret-brainwaves-to-giveamputees-a-hand/
Discussions on 4IR: Why there is no technological revolution
28. Basumatary H, Hazarika SM. State of the art in bionic hands. Trans Hum-Mach Syst. 2020;50(2):116–130. https://doi.org/0.1109/THMS.2020.2970740
29. Lundborg G. The hand and the brain. Cham: Springer Nature; 2014. https:// doi.org/10.1007/978-1-4471-5334-4
30. Kuhn T. The structure of scientific revolutions. Chicago, IL: University of Chicago Press; 1962.
31. López-Lorente AI, Valcárcel M. The third way in analytical nanoscience and nanotechnology: Involvement of nanotools and nanoanalytes in the same analytical process. Trends Anal Chem. 2016;75:1–9. https://doi.org/10.1016/j. trac.2015.06.011
32. Bramini M, Alberini G, Colombo E, Chiacchiaretta M, DiFrancesco M, MayaVetencourt JF, et al. Interfacing graphene-based materials with neural cells. Front Syst Neurosci. 2018;12. https://doi.org/10.3389/fnsys.2018.00012
33. Fiani B, Reardon T, Ayres B, Cline D, Sitto SR. An examination of prospective uses and future directions of Neuralink: The brain-machine interface. Cureus. 2021;13(3), Art. #14192. https://doi.org/10.7759/cureus.14192
34. Wardlaw C. When will self-driving cars be available? Car News. 2022 January 26. Available from: https://www.edmunds.com/car-news/when-will-selfdrivingcars-be-available.html
35. Zhao C, Li L, Pei X, Li Z, Wang F-Y, Wu X. A comparative study of state-ofthe-art driving strategies for autonomous vehicles. Acc Anal Prev. 2021;150, Art. #105937. https://doi.org/10.1016/j.aap.2020.105937
36. Ibañez-Guzmán J, Laugier C, Yoder JD, Thrun S. Autonomous driving: Context and state-of-the-art. In: Eskandarian A, editor. Handbook of intelligent vehicles. London: Springer; 2012. https://doi.org/10.1007/978-0-85729-085-4_50
37. Marwala T. Covid-19 has forced us into the fast lane of the 4IR super-highway. Daily Maverick. 2020 May 28. Available from: https://www.dailymaverick. co.za/opinionista/2020-05-28-covid-19-has-forced-us-into-the-fast-laneof-the-4ir-super-highway/#gsc.tab=0
38. McGinnis D. What is the fourth industrial revolution? [webpage on the Internet]. c2020 [cited 2021 Dec 07]. Available from: https://www.salesforce. com/blog/2018/12/what-is-the-fourth-industrial-revolution-4IR.html
39. Hobsbawm EJ. The age of extremes: The short twentieth century 1914-1991. London: Abacus; 1995.
40. Stiglitz J. The great divide: Unequal societies and what we can do about them. New York: Norton; 2015.
41. Stiglitz J. After neoliberalism. Project Syndicate. 2019 May 30. Available from: https://www.project-syndicate.org/commentary/after-neoliberalismprogressive-capitalism-by-joseph-e-stiglitz-2019-05
42. Ostry J, Loungani P, Furceri D. Neoliberalism: Oversold? Finance & Development. 2016;Jun:38–41. Available from: https://www.imf.org/external/ pubs/ft/fandd/2016/06/pdf/ostry.pdf
43. Aalbers M. Neoliberalism is dead… Long live neoliberalism! Int J Urban Reg Res. 2013;37(3):1083–1090. https://doi.org/10.1111/1468-2427.12065
https://doi.org/10.17159/sajs.2023/12916
98 Volume 119| Number 1/2 January/February 2023 Research Article
6 of 6
Page
AUTHOR: Tshilidzi Marwala1
AFFILIATION:
1Vice-Chancellor and Principal, University of Johannesburg, Johannesburg, South Africa
CORRESPONDENCE TO:
Tshilidzi Marwala
EMAIL: tmarwala@gmail.com
HOW TO CITE:
Marwala T. The Fourth Industrial Revolution has arrived. Comments on Moll (S Afr J Sci. 2023;119(1/2), Art. #12916). S Afr J Sci. 2023;119(1/2), Art. #15429. https:// doi.org/10.17159/sajs.2023/15429
ARTICLE INCLUDES:
☐ Peer review
☐ Supplementary material
KEYWORDS:
Fourth Industrial Revolution, digital technologies, COVID-19, higher education
PUBLISHED: 24 January 2023
The Fourth Industrial Revolution has arrived. Comments on Moll (S Afr J Sci. 2023;119(1/2), Art. #12916)
Significance:
This Commentary is a response to Moll (S Afr J Sci. 2023;119(1/2), Art. #12916) who refutes the Fourth Industrial Revolution (4IR) and its impact. As this Commentary demonstrates, there is a case to be made that the 4IR constitutes a revolution and that the limitation at the level of pure technology can be refuted as a revolution is based on its wider impact. While the 4IR can be classified as an evolution of the Third Industrial Revolution, its scale, scope and complexity denote a revolution of its own.
If there is any period one would desire to be born in, is it not the age of Revolution; when the old and the new stand side by side, and admit of being compared; when the energies of all men are searched by fear and by hope; when the historic glories of the old can be compensated by the rich possibilities of the new era?
Introduction
© 2023. The Author(s). Published under a Creative Commons Attribution Licence.
Ralph Waldo Emmerson1
In 2016, as Klaus Schwab took to the podium at the World Economic Forum, and alluded to his groundbreaking article2 in Foreign Affairs the year before, he was conjecturing about the trajectory of technology and the possibility of a Fourth Industrial Revolution (4IR). As he stated:
We stand on the brink of a technological revolution that will fundamentally alter the way we live, work, and relate to one another. In its scale, scope, and complexity, the transformation will be unlike anything humankind has experienced before. We do not yet know just how it will unfold, but one thing is clear: the response to it must be integrated and comprehensive, involving all stakeholders of the global polity, from the public and private sectors to academia and civil society.2
At the time, it was not clear what the implications of this revolution would be, if it would really unfold, and how this shift constituted a new revolution that would differ from the previous revolution. The pace of change in the last few years, however, has demonstrably been a revolution in action when we consider the breadth and scope of the shifts attributed to the 4IR – on a scale we have not seen before.
Long has there been debate over the 4IR. Are we on the brink of it? Are we firmly entrenched in it? Or is it simply a fictional concept like many of the science fiction novels that were popular in the 1980s? Theorists have teased out each of these arguments. The prolific use of artificial intelligence (AI) across sectors meant the 4IR was here, gaps and overlaps with the previous three industrial revolutions made it doubtful, or, in an echo of Aldous Huxley and many of his peers, the robots were taking over. Though I am being quite simplistic in dividing this argument into just three camps, it is a necessary precursor for our recent history. As the coronavirus outbreak unfolded in corners of Asia, it seemed to be quite similar to the SARS and MERS epidemics. Like the viruses that preceded it, there was little global panic, and it seemed likely that this virus would soon be contained, posing no real threat to the rest of the world. Singh et al.3 tracked how COVID-19 became a pandemic. This was a result of a convergence of factors – the virus spread with great speed; it arose in winter when pneumonia typically increases, making it hard to distinguish; it did not behave the same way as previous SARS viruses did and people experienced varied reactions; and it emerged at a time of increased travel to and from China. These factors were the perfect storm that would soon transform the world and arguably dismiss any conjecture about the 4IR. It certainly sped up the need to adapt to this revolution.
There are two main arguments to be made in response to Moll’s paper ‘Why there is no technological revolution, let alone a ‘Fourth Industrial Revolution’’4. Firstly, there is a clear demarcation between the Third Industrial Revolution (3IR) and 4IR, cementing the argument that the 4IR does constitute a new era. Moreover, the limitation of the conception of a revolution purely at the level of technology is not consistent with the term revolution. Secondly, the impact of the pandemic and the fundamental need to switch to remote systems in order to adapt to stringent lockdowns throughout the world, hastened the adoption of digital technologies. Additionally, the very unfolding of our response to the pandemic signified the 4IR in action. As this Commentary will demonstrate, the 4IR can be understood as a scientific paradigm shift in itself and the very nature of this scientific paradigm shift implies a revolution.
3IR versus 4IR
Important in the argument for the existence and impact of the 4IR is the distinction between this revolution and 3IR. The 3IR is, of course, also characterised by the use of information technology and digitisation but the transition through increased specialisation aimed at complex challenges distinguishes 4IR. The 3IR is the result of the emergence of semiconductors in the 1940s and 1950s and refers to the shift from analogue electronic and mechanical devices to digital devices. The 4IR, of course, builds on these technologies – much like the trajectory of previous industrial revolutions, albeit with closer common traits. It is a confluence of technologies that blur the lines between the various spheres: biological, physical and digital. The 3IR is preoccupied with digitising infrastructure
Commentary https://doi.org/10.17159/sajs.2023/15429
99 Volume 119| Number 1/2 January/February 2023
Discussions on 4IR
while 4IR constitutes reconstructing our infrastructure to be intelligent. The 3IR gave us computers, revolution automated production and digital computing while the 4IR gives us interactive computational forms, intelligent automation and quantum computing.5 The real distinction is that the 4IR can be likened to an intelligence revolution. We are anticipating that machine intelligence in this era will eventually exceed the intelligence of humans. This phenomenon is called the ‘singularity’. Shanahan states, “Some singularity theorists predict that if the field of AI continues to develop at its current dizzying rate, the singularity could come about in the middle of the present century.”6 This very possibility implies that we are in the midst of a new revolution. While there is an acknowledgement that the 4IR is emerging out of the 3IR, it is considered a revolution rather than simply a continuation based on the expected scale, pace and depth of its disruption. Lee and Lee7 argue that the technologies of the 4IR are not a ‘radical break’ from technologies of the 3IR but are evolutionary in nature. Lee and Lee further argue that, even if we limit our comparison of 3IR and 4IR technologies, it is apparent that 4IR technologies have a longer technological cycle time and are more scientifically based, based on diverse knowledge fields, implying more originality. This is a marked distinction from technologies of the 3IR. It can be argued that the 4IR represents a scientific paradigm shift. As Kuhn defined it, “A paradigm is a universally recognizable scientific achievement that, for a time, provides model problems and solutions to a community of practitioners.”8 This implies that the technologies of the 4IR represent a scientific revolution in itself. As Cunningham argues, we can understand the 4IR as a scientific paradigm shift not because of the technological characteristics “but because we cannot imagine what the social arrangements, institutions and regulations and the broader infrastructure will be needed in the new paradigm.”9 This very phenomenon constitutes another revolution. Moll argues that, following Schwab’s introduction of the 4IR into the public realm, there was opposition and scepticism from global leaders. However, the development of national and regional 4IR blueprints signifies that this is a shift that governments are taking seriously and that Schwab’s claims are no longer being dismissed. While Moll states that “purely at the level of technology, there does not seem to be a case that there is such a phenomenon as a 4IR”4(p.2), this is a limited view of our understanding of revolutions. Although the technology, in many instances, seems to be an evolution of 3IR technology, its impact is notable and important for this discussion.
The rise of the 4IR during the pandemic
The pandemic accelerated the use of 4IR technologies and their impact on various facets of society. This impact was multi-prong. In the shift towards remote working and living, the adoption of technology was swift. This moved beyond a reliance on connectivity as was indicative of 3IR. It entailed the adoption of AI, cloud computing, big data and 5G. As proponents of 4IR have asked, what would this shift have looked like a decade or more ago? In the higher education sector, for instance, the shift towards the 4IR was tangible. As far back as 2017, my colleague Bo Xing and I theorised about the impact of the 4IR on the sector. As we stated:
Given the 4IR, a new form of a university is emerging that does teaching, research and service in a different manner. This university is interdisciplinary, has virtual classrooms and laboratories, virtual libraries and virtual teachers. It does, however, not degrade educational experience but augments it.10
Online degrees were piloted, which was a marked shift when you consider that space constraints are one of the biggest hurdles to greater access. Elsewhere, we used technologies to create simulations as site visits were not possible. Through platforms such as blackboard, we are able to track the progress of our students, and this can even be done via mobile devices. Digital assistants have become more common for administrative purposes. The sector’s ability to adapt and the changes in our approach to education signified the very paradigm shift the 4IR
represents. Importantly, this was not confined to higher education, but was a shift that was apparent across all sectors and industries. Moreover, as countries scrambled to find solutions to combat COVID-19, 4IR technologies were heavily relied on. There is a host of examples of these technologies being leveraged in the fight against COVID-19. For example, AI was used to identify disease clusters, monitor cases, predict outbreaks, gauge the risk of mortality, as a diagnostic tool, and for studying the disease trend, amongst other developments. In the development of vaccines, algorithms were used to sift through data on potential adverse reactions. As more people have had to seek treatment, blockchain has been used to ensure data privacy and has been a tool in widening access.11 These are tangible shifts in our approach to the pandemic, which were not apparent in earlier iterations of the virus such as SARS and MERS.
Conclusion
The argument that the 4IR does not constitute a revolution is thus unfounded. Perhaps prior to the COVID-19 pandemic, an argument could have been made that we had not yet arrived. However, the sweeping changes, tangible shifts across sectors, and even the shifts in our own lives are representative of a revolution unfolding. As Moll acknowledges, “The ideology of the 4IR, construed by its mainstream ideologues as a technological revolution, has become hegemonic in the prevailing language of academia, business, politics and education.”4(p.5) This very phenomenon denotes another industrial revolution and represents the broader impact of the 4IR. To dismiss this phenomenon as by-product of these technological changes would be myopic. We are in the age of the Fourth Industrial Revolution.
References
1. American Rhetoric. Ralph Waldo Emerson address to the Phi Beta Kappa Society at Cambridge. c2017 [updated 2017 Dec 12; cited 2022 Oct 03]. Available from: https://www.americanrhetoric.com/speeches/ralphwaldo emersonphibetakappasocietyoration.htm
2. Schwab K. The Fourth Industrial Revolution. What it means and how to respond. Foreign Affairs. 12 December 2015 [cited 2022 Sep 30]. Available from: https:// www.foreignaffairs.com/articles/2015-12-12/fourth-industrial-revolution
3. Singh S, McNab C, Olson R, Bristol N, Nolan C, Bergstrøm E, et al. How an outbreak became a pandemic: A chronological analysis of crucial junctures and international obligations in the early months of the COVID-19 pandemic. Lancet. 2021;398(10316):2109–2124. https://doi.org/10.1016/S0140-6736 (21)01897-3
4. Moll I. Why there is no technological revolution, let alone a ‘Fourth Industrial Revolution’. S Afr J Sci. 2023;119(1/2), Art. #12916. https://doi. org/10.17159/sajs.2023/12916
5. Marwala T. Closing the gap: The Fourth Industrial Revolution in Africa. Johannesburg: Pan MacMillan; 2021.
6. Shanahan M. The technological singularity. Cambridge, MA: MIT Press; 2015. https://doi.org/10.7551/mitpress/10058.001.0001
7. Lee J, Lee K. Is the Fourth Industrial Revolution a continuation of the Third Industrial Revolution or something new under the sun? Analyzing technological regimes using US patent data. Ind Corp Chang. 2021;30(1):137–159. https:// doi.org/10.1093/icc/dtaa059
8. Kuhn TS. The structure of scientific revolutions. Chicago: University of Chicago Press; 1970.
9. Cunningham S. Is the Fourth Industrial Revolution a paradigm shift? Helvetas Mosaic. 27 June 2019 [cited 2022 Sep 30]. Available from: https://www. helvetas.org/en/eastern-europe/about-us/follow-us/helvetas-mosaic/article/ June2019/Is-the-Fourth-Industrial-Revolution-a-Paradigm-Shift-
10. Xing B, Marwala T. Implications of the Fourth Industrial Age on higher education. The Thinker. 2017;73(3):10–15.
11. Arora N, Banerjee A, Mangamoori L. The role of artificial intelligence in tackling COVID-19. Future Virol. 2020;15(11):717–724. https://doi.org/10.2217/fvl2020-0130
100 Volume 119| Number 1/2 January/February 2023
Discussions on 4IR: The Fourth Industrial Revolution has arrived Page 2 of 2
Commentary https://doi.org/10.17159/sajs.2023/15429
AUTHOR: Ntsibane Ntlatlapa1
AFFILIATION:
1Centre for the Fourth Industrial Revolution South Africa (C4IR South Africa), Pretoria, South Africa
CORRESPONDENCE TO: Ntsibane Ntlatlapa
EMAIL: nntlatlapa@csir.co.za
HOW TO CITE:
Ntlatlapa N. Defining the Fourth Industrial Revolution. Comments on Moll (S Afr J Sci. 2023;119(1/2), Art. #12916). S Afr J Sci. 2023;119(1/2), Art. #15436. https:// doi.org/10.17159/sajs.2023/15436
ARTICLE INCLUDES:
☐ Peer review
☐ Supplementary material
KEYWORDS: Fourth Industrial Revolution, 4IR definitions, fusion of technologies
PUBLISHED: 24 January 2023
Defining the Fourth Industrial Revolution. Comments on Moll (S Afr J Sci. 2023;119(1/2), Art. #12916)
Significance:
Moll (S Afr J Sci. 2023;119(1/2), Art. #12916) argues that we are not currently living in the Fourth Industrial Age (4IR). In this response to Moll, I contest that Moll’s argument does not correctly reflect the understanding or definition of the 4IR as presented in the pivotal texts of the leading global and South African 4IR advocates. I believe that, had Moll focused on the definition of the 4IR presented initially by Schwab, that is, around the fusion of technologies across the digital, physical and biological worlds, he could have come to a different conclusion about the Fourth Industrial Revolution.
On reading Moll’s article, ‘Why there is no technological revolution, let alone a ‘Fourth Industrial Revolution’1, my first impression is that there is a lack of precision in the language used in the article in general, with certain concepts seemingly assumed to have agreed or known definitions. The first example of this is the title itself, which, when read alone without delving into the content, leaves the reader with the feeling that the author argues that the existence of a technological revolution is a fallacy. This is not the case, as Moll clearly acknowledges the existence of three historical technological revolutions in the very first paragraph of the article. Moll then proceeds to provide a very good definition of an industrial revolution. Although Moll clearly does not question the existence of a technological revolution, he refutes the notion that the development typically associated with the Fourth Industrial Revolution (4IR) meets the criteria for an industrial revolution.
The second example of this lack of precision in the language is the confusion in the article on what the 4IR is. In the Abstract of the article, Moll states: “Seemingly, this revolution is about deep-seated, rapid, digitally powered techno-scientific change. It is the age of smart machines; it is a new information technology (IT) revolution”.1(p.1) If this was the only definition of 4IR that had been acknowledged in the article, I would absolutely agree that indeed it does not meet the criteria for an industrial revolution as per the definition given by the author and many others. The problem, however, is that Moll challenges what he calls the pivotal texts of Schwab2 (the leading global 4IR advocate) and Marwala3 (the leading South African 4IR advocate), both of whom use very different text to the above to define the 4IR. In Schwab’s definition provided in the article there is emphasis on the confluence of technologies and on fusion of technologies. The use of confluence and fusion runs through from the first definition used by the World Economic Forum in 2016 to the latest publications in 2022. It therefore follows that any authors who challenge the notion of the 4IR as introduced by Schwab must use this as a basis and not the mere application of individual technologies.
Moll’s argument follows a common trend of removing the confluence and fusion element in the discussion of 4IR application. Where he refers to the confluence and to the fusion of technologies, Moll comments that “a smallerscale fusion of technologies is not necessarily the harbinger of a socially pervasive technological revolution”1(p.5), but does not go further to examine the impact of the emerging fusion of physical and biological worlds such as the creation of artificial organs or the emerging fusion of the biological and digital worlds leading to understanding and even influencing brain activity, among many applications.
Moll’s argument also ends at technological innovations and does not consider other impacts of technological revolutions such as ethics and disruption to industries that lead to re-defining the world of work.
It is important to note that while the arguments made by Moll are seemingly based on a common but very narrow understanding of 4IR, they are correct in so far as the technologies he chose to analyse. Moll’s argument, however, does not correctly reflect the understanding or definition of the 4IR as presented in the pivotal texts of the leading global and South African advocates. I believe that, had Moll defined the 4IR in the manner presented by Schwab and focused his arguments on the fusion of technologies across the digital, physical and biological worlds, as opposed to focusing only on individual advanced IT technologies, then he could have come to a different conclusion about the Fourth Industrial Revolution.
References
1. Moll I. Why there is no technological revolution, let alone a ‘Fourth Industrial Revolution’. S Afr J Sci. 2023;119(1/2), Art. #12916. https://doi.org/10.17159/sajs.2023/12916
2. Schwab K. The Fourth Industrial Revolution. Geneva: World Economic Forum; 2016
3. Mar wala T. Closing the gap: The Fourth Industrial Revolution in Africa. Johannesburg: Macmillan; 2020.
© 2023. The Author(s). Published under a Creative Commons Attribution Licence.
Commentary https://doi.org/10.17159/sajs.2023/15436
101 Volume 119| Number 1/2 January/February 2023
Discussions on 4IR
