haematologica
Journal of the Ferrata Storti Foundation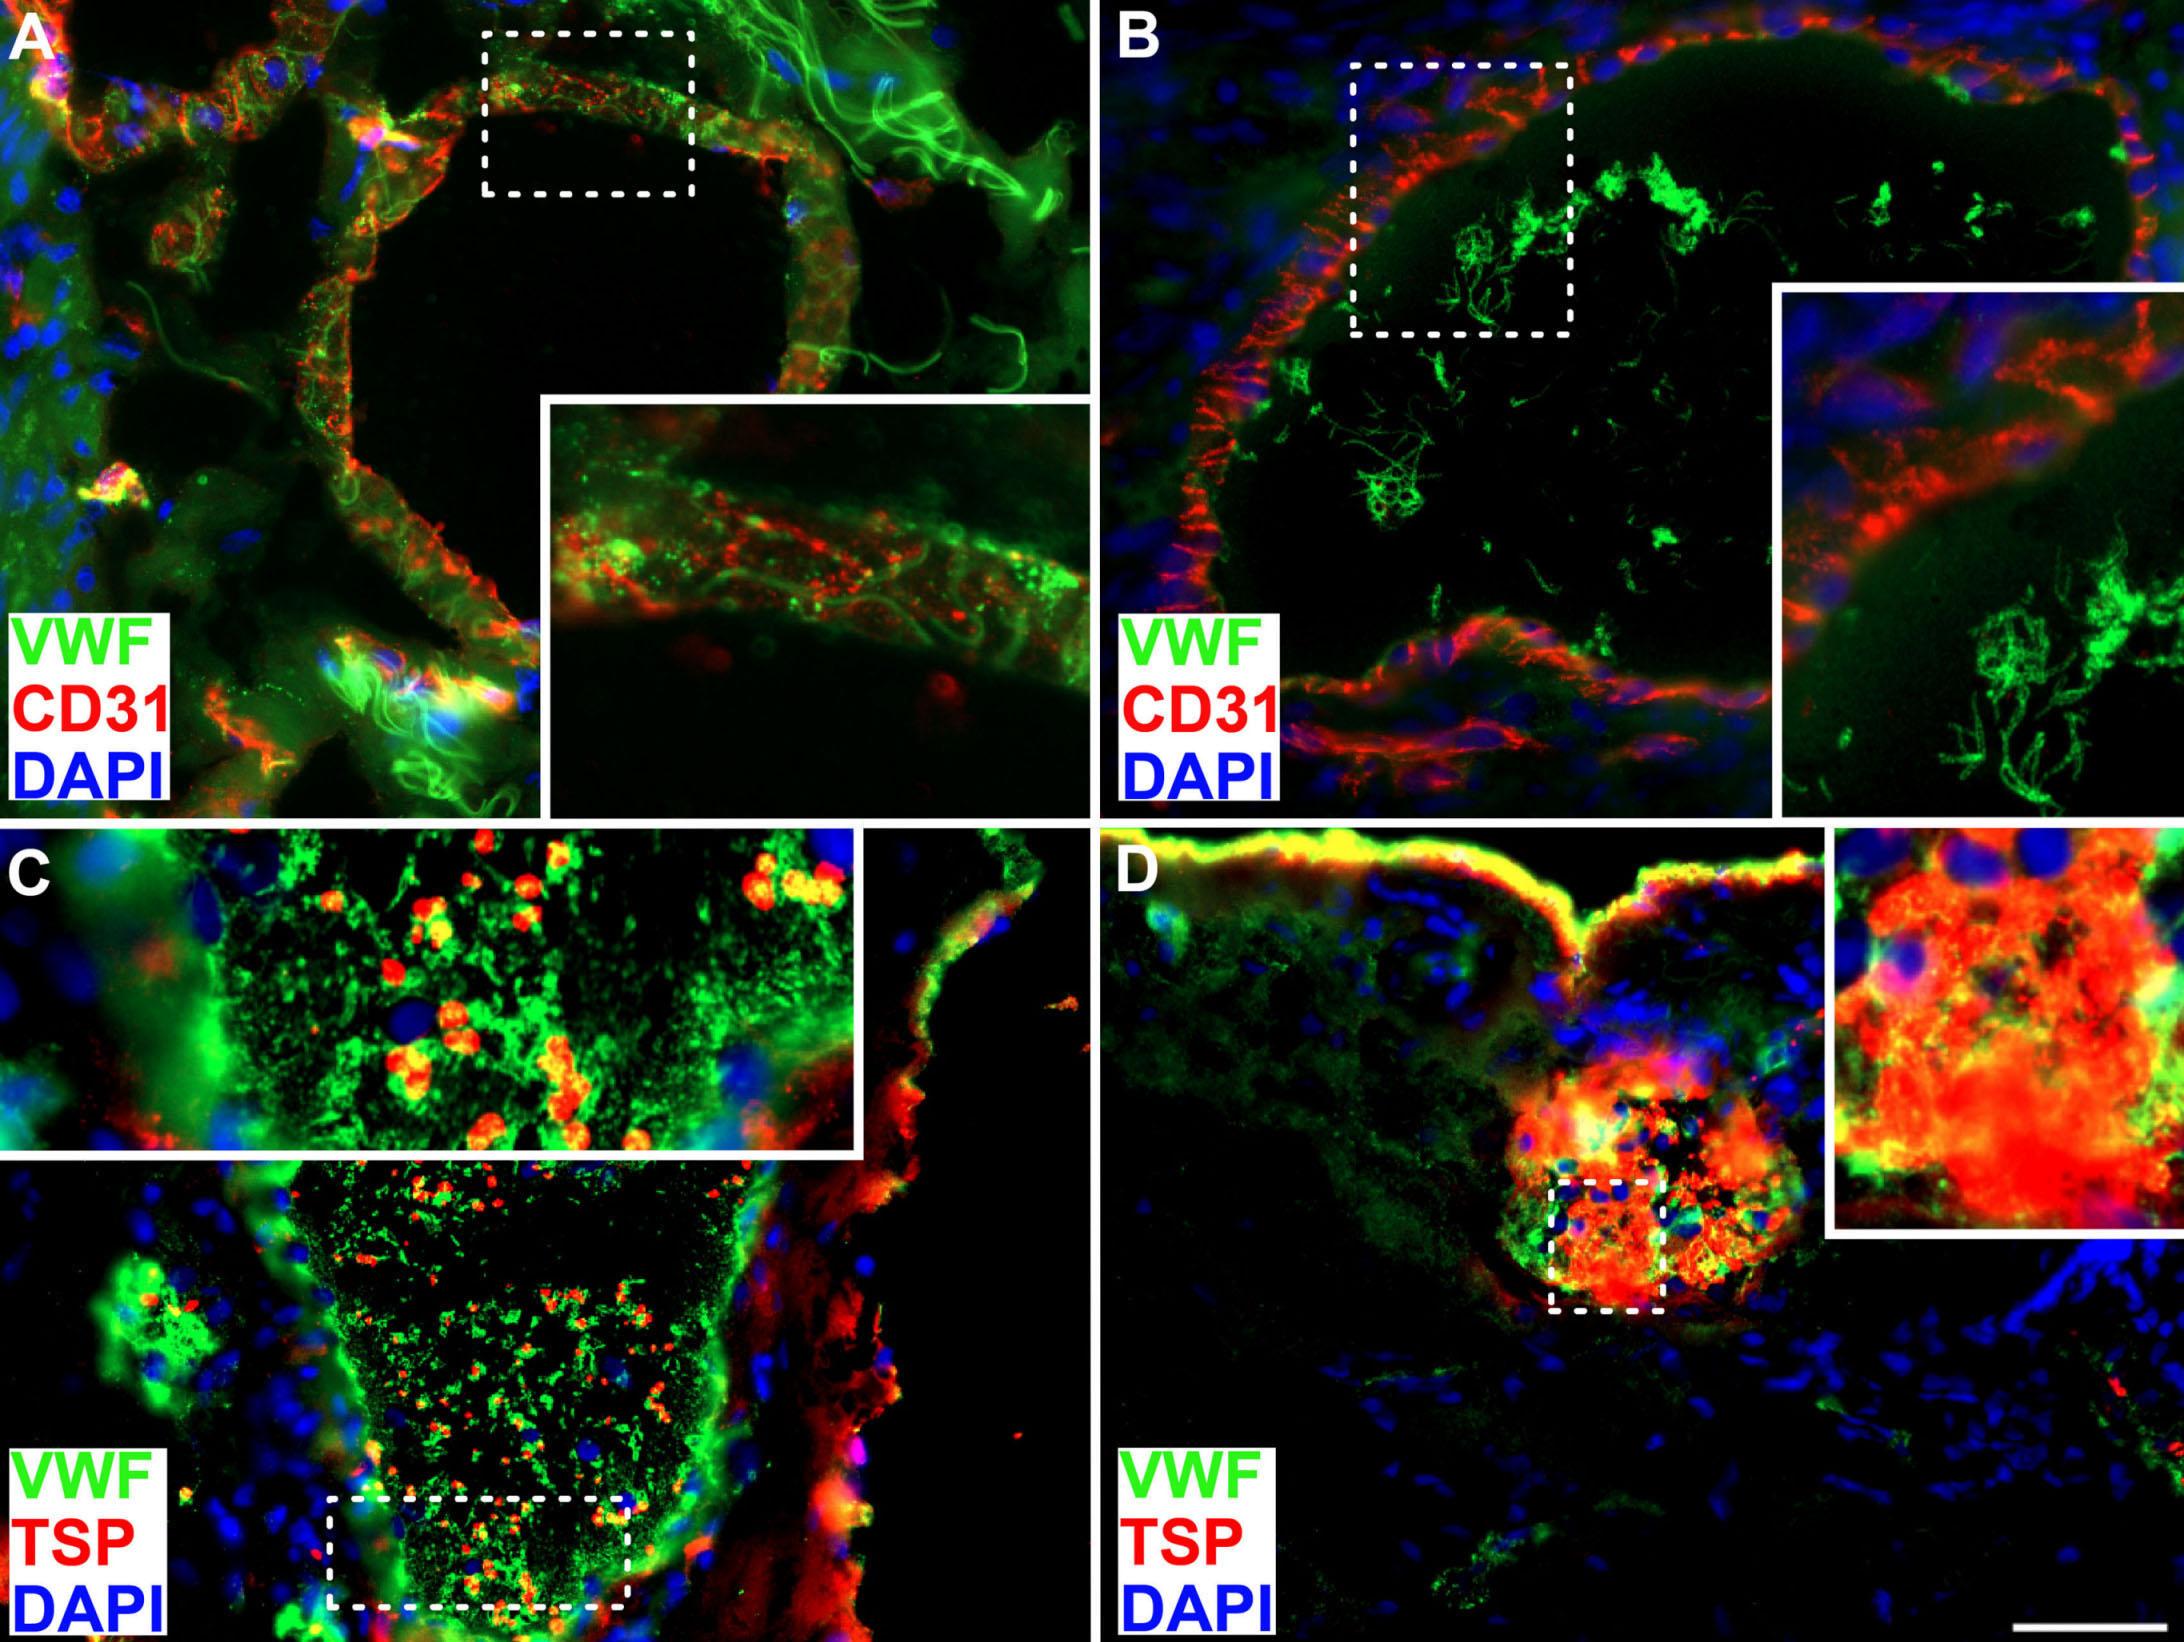

VOL. 108 JANUARY 2023
ISSN 0390 - 6078 haematologica.org

Image taken from the Letter to the Editor by Karampinis et al. in this issue.
1 A tribute to Fanconi: ‘clinical acumen still counts’
Austin G. Kulasekararaj and Shreyans Gandhi https://doi.org/10.3324/haematol.2022.280868
3 Molecular assessment and the current limits of post-transplant prognostication for chronic myelomonocytic leukemia
Christopher J. Gibson and John Koreth https://doi.org/10.3324/haematol.2022.280960
5 WT1 b’ing catenin into shape: a new interaction driving epigenetic plasticity in acute myeloid leukemia?
William Grey https://doi.org/10.3324/haematol.2022.281119
7 Nearly 70 years later: the continued unraveling of Castleman disease
Frits van Rhee https://doi.org/10.3324/haematol.2022.280902
9
Articles
22
PI3K inhibitors in chronic lymphocytic leukemia: where do we go from here?
Sigrid S. Skånland and Jennifer R. Brown https://doi.org/10.3324/haematol.2022.281266
Acute Myeloid Leukemia
COVID-19 in adult acute myeloid leukemia patients: a long-term follow-up study from the European Hematology Association survey (EPICOVIDEHA)
Francesco Marchesi et al. https://doi.org/10.3324/haematol.2022.280847
34
Acute Myeloid Leukemia
Characteristics and outcome of patients with acute myeloid leukemia and trisomy 4 Sabine Kayser et al.
https://doi.org/10.3324/haematol.2022.281137
42
Acute Myeloid Leukemia
Improved outcomes with “7+3” induction chemotherapy for acute myeloid leukemia over the past four decades: analysis of SWOG trial data
Megan Othus et al.
https://doi.org/10.3324/haematol.2022.280765
48
Acute Myeloid Leukemia
Analysis of rare driving events in pediatric acute myeloid leukemia
Sanne Noort et al.
https://doi.org/10.3324/haematol.2021.280250
61
Acute Myeloid Leukemia
Clinical and biological impact of ATP-binding cassette transporter activity in adult acute myeloid leukemia
Elise Sourdeau et al.
https://doi.org/10.3324/haematol.2022.280676
69 Bone Marrow Failure
Genotype-phenotype and outcome associations in patients with Fanconi anemia: the National Cancer Institute cohort
Burak Altintas et al.
https://doi.org/10.3324/haematol.2021.279981
83 Cell Therapy & Immunotherapy
The efficacy of combination treatment with elotuzumab and lenalidomide is dependent on crosstalk between natural killer cells, monocytes and myeloma cells
Kelden Richardson et al.
https://doi.org/10.3324/haematol.2021.279930
98
Cell Therapy & Immunotherapy
Allogeneic transplant following CAR T-cell therapy for large B-cell lymphoma
Joanna Zurko et al.
https://doi.org/10.3324/haematol.2022.281242
110
Cell Therapy & Immunotherapy
Axicabtagene ciloleucel compared to tisagenlecleucel for the treatment of aggressive B-cell lymphoma
Mi Kwon et al.
https://doi.org/10.3324/haematol.2022.280805
122 Chronic Myeloid Leukemia
RHOA-regulated IGFBP2 promotes invasion and drives progression of BCR-ABL1 chronic myeloid leukemia
Hualei Zhang et al. https://doi.org/10.3324/haematol.2022.280757
135
Iron Metabolism & Its Disorders
Comparative analysis of oral and intravenous iron therapy in rat models of inflammatory anemia and iron deficiency
Lara Valente de Souza et al. https://doi.org/10.3324/haematol.2022.281149
150
Myeloproliferative Disorders
The mutational landscape in chronic myelomonocytic leukemia and its impact on allogeneic hematopoietic cell transplantation outcomes: a Center for Blood and Marrow Transplantation Research (CIBMTR) analysis
Matthew Mei et al. https://doi.org/10.3324/haematol.2021.280203
161
Myelodysplastic Syndromes
Routine clinical parameters and laboratory testing predict therapy-related myeloid neoplasms after treatment for breast cancer
Giulia Petrone et al. https://doi.org/10.3324/haematol.2021.280437
171
Non-Hodgkin Lymphoma
Positron emission tomography-imaging assessment for guiding strategy in patients with relapsed/refractory large B-cell lymphoma receiving CAR T cells
Jean Galtier et al.
https://doi.org/10.3324/haematol.2021.280550
181
Non-Hodgkin Lymphoma
Monomorphic epitheliotropic intestinal T-cell lymphoma comprises morphologic and genomic heterogeneity impacting outcome
Luis Veloza et al.
https://doi.org/10.3324/haematol.2022.281226
196
Non-Hodgkin Lymphoma
In-depth characterization of intratumoral heterogeneity in refractory B-cell non-Hodgkin lymphoma through the lens of a Research Autopsy Program Keren Isaev et al. https://doi.org/10.3324/haematol.2022.280900
207
Non-Hodgkin Lymphoma
The lymph node transcriptome of unicentric and idiopathic multicentric Castleman disease Pedro Horna et al. https://doi.org/10.3324/haematol.2021.280370
219
Plasma Cell Disorders
Activation of long non-coding RNA NEAT1 leads to survival advantage of multiple myeloma cells by supporting a positive regulatory loop with DNA repair proteins Elisa Taiana et al. https://doi.org/10.3324/haematol.2022.281167
234
Response-adjusted regimen combining ruxolitinib, etoposide and dexamethasone (adRED) in adult patients with acute myeloid leukemia-associated hemophagocytic lymphohistiocytosis: a single-center pilot trial Grégoire Stalder et al. https://doi.org/10.3324/haematol.2022.281221
240
Treatment patterns and clinical outcomes of asciminib in a real-world multiresistant chronic myeloid leukemia patient population Camille C.B. Kockerols et al. https://doi.org/10.3324/haematol.2022.281386
245 Adverse karyotype subcategories in acute myeloid leukemia display significant differences in mutation composition and transplant-augmented survival Ayalew Tefferi et al. https://doi.org/10.3324/haematol.2022.281495
250
Mitigation of gastrointestinal graft versus-host disease with tocilizumab prophylaxis is accompanied by preservation of microbial diversity and attenuation of enterococcal domination Saurabh Chhabra et al. https://doi.org/10.3324/haematol.2022.281309
257
261
Clinical impact of clonal hematopoiesis on severe COVID-19 patients without canonical risk factors Chang Kyung Kang et al. https://doi.org/10.3324/haematol.2022.280621
Von Willebrand factor in the plasma and in the tumor tissue predicts cancer-associated thrombosis and mortality
Ioannis Karampinis et al. https://doi.org/10.3324/haematol.2022.281315
267
273
Rituximab therapy after pediatric hematopoietic stem cell transplantation can cause prolonged B-cell impairment and increases the risk for infections - a retrospective matched cohort study Michael Launspach et al. https://doi.org/10.3324/haematol.2022.281134
Contribution of measurable residual disease status to prediction accuracy of relapse and survival in adults with acute myeloid leukemia undergoing allogeneic hematopoietic cell transplantation
Eduardo Rodríguez-Arbolí et al. https://doi.org/10.3324/haematol.2022.281631
278 Donor cell-derived myelofibrosis relapse after allogeneic stem cell transplantation
Patrizia Chiusolo et al.
https://doi.org/10.3324/haematol.2022.281564
283 Crosstalk between b-catenin and WT1 signaling activity in acute myeloid leukemia
Megan Wagstaff et al.
https://doi.org/10.3324/haematol.2021.280294
290 Acute myeloid leukemia development soon after anti-CD19 chimeric antigen receptor T-cell infusion in a patient with refractory diffuse large B-cell lymphoma and pre-existing clonal hematopoiesis Lorenza Falini et al.
https://doi.org/10.3324/haematol.2022.281351
Correspondence: A.G. Kulasekararaj austin.kulasekararaj@nhs.net
Received: March 31, 2022.
Accepted: April 5, 2022.
Prepublished: April 14, 2022.
https://doi.org/10.3324/haematol.2022.280868
©2023 Ferrata Storti Foundation Published under a CC BY-NC license
“It is the doctor's privilege to pursue an occupation which is also his favourite pastime” Guido Fanconi (1892-1979): ‘a jack of all trades’1
Fanconi anemia (FA), a predominantly autosomal recessive disease, most frequently presents with bone marrow fail ure (BMF). Hematologic manifestations such as BMF, clonal evolution to myelodysplastic syndrome and acute myeloid leukemia,2 predominate in FA and can be the presenting feature or the most significant cause of morbidity and mortality.3 However, other manifestations in FA such as solid tumors, especially squamous cell carcinomas, as well as disorders of other organ/systems including renal, gas tro-intestinal, cardiac, endocrine and musculo-skeletal systems need specialist input and coordinated manage ment plans, as advances in treatments, such as hemato poietic stem cell transplantation in FA,4 become more successful and overall survival improves.
As with many ‘multigenic’ diseases, phenotypic and geno typic correlation needs to be better understood in order to predict the natural history and outcome of the disease. Chromosomal breakage analysis as a diagnostic tool for FA, is widely used but genotypic characterization is pro gressing rapidly and is much needed.
In this issue of Haematologica, Altintas et al. report on a large National Cancer Institute retrospective cohort of 203 patients, with nearly 50% harboring FANCA mutations.5 Genetic characterization of FA is based on whether there is an upstream (80%), ID complex (9-11%) or downstream (5-9%) defect and whether this results in a “null” or “hy pomorphic” variant. Interestingly, the data collected by Alt intas et al. were divided into those from patients ‘in the field’ (72%) (remote data collection through question naires) and patients in a clinic cohort (28%) (review at the National Institutes of Health clinical center) to associate patterns with phenotypic correlation and presentation. This demarcation into two cohorts was arbitrary and could have introduced ascertainment and assessment biases, especially in FA patients with subtle physical features, but paradoxically underscores the importance and necessity for more systematic and detailed assessment and was able to correlate genotype to phenotypic abnormalities in the clinical cohort.
Although the findings are largely confirmatory,6 the report

contains a lot of information from pioneers in the field of FA and updates the current knowledge regarding how FA genotype affects patients’ phenotypes including BMF, solid tumor development, pregnancy, and physical abnormal ities.
A few significant observations in this large cohort study have practical relevance and underpin the value of ter tiary/specialist centers with expertise in evaluation, screening, and future management strategies, including timing of hematopoietic stem cell transplant and exciting novel therapies.
All patients evaluated in the National Institutes of Health clinical center had physical abnormalities and interestingly only 5% (3/57) did not have pathogenic variants in the FA/BRCA DNA repair pathway, as compared to 22% in the field cohort. The counter argument to this is that patients with subtle features who remain undiagnosed into adult hood, are detected with additional anomalies and features of multi-system FA disease when reviewed in specialist centers.6
Although slightly less than a century has passed since the first clinical description of FA by Dr Guido Fanconi,7 the genomic revolution has expanded the repertoire of pathogenic mutations from 15 known FA genes in 20103 to at least 22 genes in the FA/BRCA DNA repair pathway in 2022. Although conventionally FA patients with muta tions in the upstream complex have fewer physical ab normalities and a milder phenotype compared to those with mutations in the ID complex, upon assessment at a tertiary center subtle abnormalities, not included in the VACTERL-H (Vertebral, Anal, Cardiac, Tracheo-esophageal fistula, Esophageal/duodenal atresia, Renal, Limb, Hydro cephalus)/PHENOS (Pigmentation, small Head, small Eyes, Neurologic, Otologic, Short stature) constellations of anomalies, were evident on physical assessment, es pecially in FANCA/FANCC patients. This clearly signi fi es the added value of comprehensive evaluation in a specialist center with multidisciplinary clinical, genetic and biological expertise, at least as a ‘one-stop’ clinic, with subsequent remote monitoring in the era of tele medicine, a practice strengthened by the COVID-19 pan demic.
BMF was present in 86% of the cohort, with an increased
1Department of Haematological Medicine, King's College Hospital NHS Foundation Trust and 2King’s College London, London, UKrisk of myelodysplastic syndrome/acute myeloid leukemia in FANCC cases. Clinical features and other tools to predict the development of BMF and clonal evolution are ex tremely helpful and aid in planning pre-emptive hemato poietic stem cell transplantation. The ability to predict early BMF in FA patients with PHENOS features, which in terestingly overlaps with the previously reported congenital abnormality score (CABS) and the well-described associ ation with absent radii, is valuable. Chromosomal abnor malities and also markers of clonal hematopoiesis, and their role in prediction models for BMF and development of myelodysplastic syndrome/acute myeloid leukemia in FA will become refined and redefined in the near future. The risk of development of solid cancers and metabolic/endocrine (mainly hypothyroidism) abnormal ities are well described in FA and can be a result of the disease and/or therapy, especially after hematopoietic stem cell transplantation. These risks are particularly im portant to include in a systematic algorithm for monitor ing.8,9
Some of the novel findings and interesting observations, which need further validation and biological explanation, are: (i) an increased risk of solid tumors in patients with FANCA variants involving exon 17-20, which is essential for nuclear localization; fertility preservation and ability to conceive for female patients with a c.3624C>T synonymous variant in the FANCA gene; (ii) clinical heterogeneity be tween FA siblings with identical variants; and (iii) lack of ‘hotspot’ mutations in FANCA compared to FANCD2
The age at diagnosis and at registration of the FA patients in the study by Altinas et al. was 5.4 and 11.2 years, re spectively, with the upper limit close to 60 years. No ad ditional correlation between age at presentation and
physical features was presented. This is critically important to evaluate in future studies and useful for hematologists caring for adults, who usually deal with non-syndromic diseases, as most of the inherited BMF syndromes, includ ing FA, which present in adulthood manifest with subtle physical features, less cytopenia and more solid cancers or lung/liver fibrosis, this last feature in the context of telemeropathies. It is possible, although only a speculation, that some of the cases of FA diagnosed in adulthood could be due to mutations in the upstream complex in view of the milder phenotype reported for the FANCA genotype in children and adolescents. Phenotype-genotype analyses will undoubtedly continue to develop and can help in pre dicting the natural history and multi-system manifesta tions of FA, including prognosis for counseling, and risk-stratified management strategies. These analyses have yet to achieve their maximum potential and, therefore, utility. The field and clinic cohort modeling that the authors developed in their study, as well as the description of the PHENOS phenotype, are steps in that direction. Mu tational diversity as well as inconsistent phenotypes do. however limit their utility to a certain extent. Large phenotype-genotype correlations in FA will help us to understand the natural history and biology of the dis ease and thereby advance the field of therapeutics which is evolving to correct BMF (gene therapy and gene edi ting),10,11 halt the progression of BMF (modulate endogenous aldehyde metabolites or microbiome)12 and restore stem cells (eltrombopag) while simultaneously using novel strat egies to prevent/treat solid cancers in FA.
No conflicts of interest to disclose.
1. Lobitz S, Velleuer E. Guido Fanconi (1892-1979): a jack of all trades. Nat Rev Cancer. 2006;6(11):893-898.
2. Peffault de Latour R, Soulier J. How I treat MDS and AML in Fanconi anemia. Blood. 2016;127(24):2971-2979.
3. Soulier J. Fanconi anemia. Hematology Am Soc Hematol Educ Program. 2011;2011:492-4977.
4. Bonfim C, Nichele S, Loth G, et al. Transplantation for Fanconi anaemia: lessons learned from Brazil. Lancet Haematol. 2022;9(3):e228-e236.
5. Altintas B, Giri N, McReynolds LJ, Best A, Alter BP. Genotypephenotype and outcome associations in patients with Fanconi anemia: the National Cancer Institute cohort. Haematologica. 2023;108(1):69-82.
6. Fiesco-Roa MO, Giri N, McReynolds LJ, Best AF, Alter BP. Genotype-phenotype associations in Fanconi anemia: a literature review. Blood Rev. 2019;37:100589.
7. Fanconi G. Familiäre infantile perniziosaartige Anämie
(perniziöses Blutbild und Konstitution). Jahrbuch Kinder. 1927;117:257-280.
8. Alter BP. Cancer in Fanconi anemia, 1927-2001. Cancer. 2003;97(2):425-440.
9. Alter BP, Giri N, Savage SA, Rosenberg PS. Cancer in the National Cancer Institute inherited bone marrow failure syndrome cohort after fifteen years of follow-up. Haematologica. 2018;103(1):30-39.
10. Rio P, Navarro S, Wang W, et al. Successful engraftment of genecorrected hematopoietic stem cells in non-conditioned patients with Fanconi anemia. Nat Med. 2019;25(9):1396-1401.
11. Shafqat S, Tariq E, Parnes AD, Dasouki MJ, Ahmed SO, Hashmi SK. Role of gene therapy in Fanconi anemia: a systematic and literature review with future directions. Hematol Oncol Stem Cell Ther. 2021;14(4):290-301.
12. Wang M, Dingler FA, Patel KJ. Genotoxic aldehydes in the hematopoietic system. Blood. 2022;139(14):2119-2129.
Correspondence: J. Koreth jkoreth@partners.org
Received: April 5, 2022. Accepted: April 12, 2022. Prepublished: April 21, 2022.
https://doi.org/10.3324/haematol.2022.280960
©2023 Ferrata Storti Foundation Published under a CC BY-NC license
Chronic myelomonocytic leukemia (CMML) is the best known and most thoroughly characterized myeloid overlap syn drome.1 It combines the disorganized hematopoiesis of mye lodysplastic syndromes with features of a myeloproliferative neoplasm, specifically an excess of monocytes. CMML has a broad prognostic heterogeneity but, like other myeloid stem cell disorders, it can only be cured by allogeneic hemato poietic cell transplantation.2 While CMML has clearly defined pathological criteria for di agnosis, it is a rare entity.3 Moreover, given its distinctive fea tures, it is often excluded from prospective clinical studies of both myelodysplastic syndromes and myeloprolifeartive neoplasms. As a result, our understanding of the biology and clinical behavior of CMML remains limited, particularly for pa tients who require a transplant. In this issue of Haematologica, Mei et al. present the largest molecular assessment of CMML patients undergoing hema topoietic cell transplantation published to date.4 Among 313
patients, they identified pathogenic somatic mutations in 93%. While there was substantial overlap with mutations re currently identified in other myeloid disorders, the spectrum and frequency of mutations in this cohort had distinctive fea tures. Compared with patients in a large study of myelodys plastic syndrome transplant recipients,5 CMML patients had more frequent mutations in ASXL1 (61% vs. 20%), TET2 (35% vs. 12%), SRSF2 (31% vs. 6%), and KRAS/NRAS (33% vs. 6%), and fewer mutations in TP53 (3% vs. 19%) and SF3B1 (3% vs. 10%). Compared with a different set of patients undergoing transplantation for myelofibrosis,6 CMML patients had less frequent mutations in JAK2 (6% vs. 62%), CALR (<1% vs. 16%), and MPL (<1% vs. 5%). These findings confirm that CMML has distinctive genetic features compared with other myeloid disorders, which likely contribute to both its myeloid lineage bias and its relatively poor prognosis. Even when incorporating non-molecular disease features, the rarity of CMML has precluded the publication of a single
The table shows the variables included in the MD Anderson Prognostic Scoring System (MDAPS),7 the Groupe Française de Myélodysplasies (GFM) system,8 the Mayo Molecular Model (MMM),9 the CMML-specific scoring system (CPSS),10 and the clinical/molecular CPSS (CPSS-Mol),11 as well as the year each system was published, and the number of patients (N) included in the respective training cohorts. Hb: hemoglobin; WBC: white blood cell; FAB: French-American-British classification; WHO: World Health Organization classification. aHemoglobin <12 g/dL (MDAPS), ≤10 g/dL (GFM, MMM), or transfusion dependency (CPSS, CPSS-Mol). bTotal WBC count ≥15x109/L (GFM) or ≥13x109/L (CPSS-Mol), absolute lymphocyte count ≥2.5x10⁹/L (MDAPS), or absolute monocyte count ≥10x109/L (MMM). cMarrow blasts ≥5% (CPSS-Mol) or 10% (MDAPS). dCMML-specific cytogenetics. eASXL1 mutations (GFM); ASXL1, NRAS, RUNX1, or SETBP1 mutations (CPSS-Mol)
definitive study of clinical outcomes. Consequently, at least five different prognostic scoring systems have been pro posed7–11 (Table 1). Each of these incorporates a different com bination of overlapping clinical and, in some cases, molecular features. None of these systems was developed in trans plant-only cohorts, and indeed Mei et al. found that both the Groupe Française de Myélodysplasies (GFM) and the Mayo Molecular Model (MMM) systems categorized a disproportion ate number of patients in this cohort as high-risk, thereby li miting those systems’ prognostic value in this setting. On the other hand, both the CMML-specific scoring system (CPSS), and the newer clinical/molecular CPSS (CPSS-Mol) systems retained prognostic value here, but primarily be cause they accurately predicted treatment-related mortality; both systems performed poorly in predicting post-transplant relapse. For the CPSS, the rate of relapse in the lower three risk groups was nearly identical. Although the rate of relapse was elevated for the high-risk group, this group comprised only 13 patients. For the CPSS-Mol, there was no appreciable association between risk group and the rate of relapse, which was highest in the intermediate-1 group and relatively similar in the low, intermediate-2, and high-risk groups. The limited prognostic capacity for post-transplant relapse may reflect the fact that both tools were developed to predict overall survival, not just relapse. It may also reflect the fact that both tools were trained on non-transplant cohorts and therefore may not include variables that are specifically prognostic in the setting of allogeneic transplantation. The combination of clinical and molecular disease features has proven to have powerful prognostic value in other mye loid diseases, and the authors reasonably hypothesized that the comprehensive molecular profiling of this cohort would improve the accuracy of existing prognostic tools. This proved not to be the case: the CPSS-Mol, which incorporates in formation regarding mutations in four genes that are prog
1. Arber DA, Orazi A, Hasserjian R, et al. The 2016 revision to the World Health Organization classification of myeloid neoplasms and acute leukemia. Blood. 2016;127(20):2391-2405.
2. Patnaik MM, Tefferi A. Chronic myelomonocytic leukemia: 2020 update on diagnosis, risk stratification and management. Am J Hematol. 2020;95(1):97-115.
3. Srour SA, Devesa SS, Morton LM, et al. Incidence and patient survival of myeloproliferative neoplasms and myelodysplastic/myeloproliferative neoplasms in the United States, 2001-12. Br J Haematol. 2016;174(3):382-396.
4. Mei M, Pillai S, Kim S, et al. The mutational landscape in chronic myelomonocytic leukemia and its impact on allogeneic hematopoietic cell transplantation outcomes: a Center for Blood and Marrow Transplantation Research (CIBMTR) analysis. Haematologica. 2023;108(1):150-160.
5. Lindsley RC, Saber W, Mar BG, et al. Prognostic mutations in myelodysplastic syndrome after stem-cell transplantation. N Engl J Med. 2017;376(6):536-547.
6. Gagelmann N, Ditschkowski M, Bogdanov R, et al. Comprehensive clinical-molecular transplant scoring system for
nostic in the non-transplant setting,10 was no better at pre dicting post-transplant outcomes than the CPSS. At face value this is counterintuitive.
On further consideration, however, this finding is not wholly surprising. In other myeloid neoplasms, mutations that confer high risk in unselected patients do not always retain prog nostic significance in transplant-only cohorts. This may re flect the higher average risk of patients who require transplantation, as well as the additional heterogeneity in troduced by the many clinical variables associated with transplantation. Alternatively, it may indicate that neoplasms with these mutations retain sensitivity to the graft-versus leukemia effect of transplantation, in contrast to other mu tations (such as TP53, which is rare in CMML) that confer a poor prognosis in both the transplant and non-transplant settings.
A central goal of retrospective risk-stratification studies is the generation of hypotheses to guide future clinical trials and treatment strategies, but there has been a disconcerting lack of agreement among previous studies of CMML transplant patients. No single existing prognostic system has proven consistently superior to the others, and while each has ef fectively stratified survival in some cohorts, none has been very accurate in predicting other outcomes, particularly re lapse. As a registry-based assessment, the current study has clear advantages over previous single- or even multi-institu tion studies. Nevertheless, there is still room for future larger collaborative studies to better refine post-transplant risk stratification for this rare, high-risk hematologic malignancy.
No conflicts of interest to disclose.
Both authors contributed equally.
myelofibrosis undergoing stem cell transplantation. Blood. 2019;133(20):2233-2242.
7. Onida F, Kantarjian HM, Smith TL, et al. Prognostic factors and scoring systems in chronic myelomonocytic leukemia: a retrospective analysis of 213 patients. Blood. 2002;99(3):840-849.
8. Itzykson R, Kosmider O, Renneville A, et al. Prognostic score including gene mutations in chronic myelomonocytic leukemia. J Clin Oncol. 2013;31(19):2428-2436.
9. Patnaik MM, Padron E, LaBorde RR, et al. Mayo prognostic model for WHO-defined chronic myelomonocytic leukemia: ASXL1 and spliceosome component mutations and outcomes. Leukemia. 2013;27(7):1504-1510.
10. Such E, Germing U, Malcovati L, et al. Development and validation of a prognostic scoring system for patients with chronic myelomonocytic leukemia. Blood. 2013;121(15):3005-3015.
11. Elena C, Gallì A, Such E, et al. Integrating clinical features and genetic lesions in the risk assessment of patients with chronic myelomonocytic leukemia. Blood. 2016;128(10):1408-1417.
Correspondence: W. Grey william.grey@york.ac.uk
Received: April 5, 2022.
Accepted: April 12, 2022.
Prepublished: April 21, 2022.
https://doi.org/10.3324/haematol.2022.281119
©2023 Ferrata Storti Foundation
Published under a CC BY-NC license
Acute myeloid leukemia (AML) is a heterogeneous disease of the hematopoietic system with a dismal prognosis. In deed, 2-year survival rates are as low as 5-15% in poorrisk older patients,1 highlighting the critical need to better understand disease biology and drive new therapeutic ap proaches. Epigenetic plasticity – especially in leukemic stem cells, the cancer stem cells of hematopoietic dis orders – has underpinned drug resistance and relapse, with b-catenin and Wnt signaling regularly reported as a key hub for this plasticity.2,3 In this issue of Haematologica, Wagstaff et al. report a crosstalk between b-catenin and another poor prognostic factor in AML, WT1, with reciprocal regulation of their re spective gene transcription functions and converging cel lular phenotypes.4 Indeed, modulation of either protein can result in Wnt signaling alterations, a critical pathway for balancing healthy hematopoietic stem cell function5 and drug resistance in AML leukemic stem cells.2,6–8 In 2019, Morgan et al. reported the first nuclear and cytoplasmic interactomes of b-catenin in AML,9 showing that b-cate nin-LEF1 interactions were relevant to DNA binding. The present study moves beyond b-catenin-DNA dynamics, finding that b-catenin interacts with a protein that has RNA binding capacity.10 Surprisingly, Wagstaff et al. report that this interaction can occur in the cytoplasm of AML cells, demonstrating that different nucleic acid targets de pend on the sub-cellular location. This is critically impor tant as the interaction between b-catenin and WT1 does not appear to be direct, and the authors hypothesize that it is through an intermediate DNA or RNA molecule. The majority of the b-catenin-WT1 interaction is Wnt-re sponsive and nuclear-localized in cell lines, suggesting that it only occurs in the presence of stabilized and nu clear translocated b-catenin. In contrast, in primary pa
tient AML samples, this interaction is both nuclear and cytoplasmic, potentially suggesting that the stabilization of b-catenin is more important than its nuclear transloca tion. Despite the discrepancy between cell line models and primary patient material, WT1 appears to be necess ary for b-catenin nuclear translocation, as in its absence there is minimal b-catenin nuclear localization. In agree ment with this, induction of clinically relevant WT1 muta tions in cell line models induced Wnt signaling in the absence of Wnt stimulation, demonstrating that the WT1 mutations present in patients may be driving b-catenin activity.
While perturbing WT1 clearly alters b-catenin activity, this appears to be reciprocal, in that the absence of b-catenin results in hyper-degradation of WT1, for which the authors hypothesize that b-catenin is actively protecting WT1 from degradation. To further complicate matters, proteosome inhibition downregulates WT1, presumably through feed back at the epigenetic level.11 This makes unpicking the re lationship between b-catenin and WT1 even more difficult and it would be interesting to find the intermediate partners required for b-catenin and WT1 interactions and how they vary in AML.
In a therapeutic context, there is potential for redundancy between b-catenin and WT1 targeting, as inhibition of a single target or pathway may be insufficient if the other molecule can compensate.12,13 Therefore, it will be inter esting to see in future work if leukemic stem cell drug re sistance conferred by b -catenin can be overcome by targeting WT1, and whether WT1-mutant AML has specific b-catenin-dependent vulnerabilities.
No conflicts of interest to disclose.
1. Roman E, Smith A, Appleton S, et al. Myeloid malignancies in the real-world: occurrence, progression and survival in the UK’s
population-based Haematological Malignancy Research Network 2004-15. Cancer Epidemiol. 2016;42:186-198.
William York Biomedical Research Institute, Department of Biology, University of York, York, UK2. Fong CY, Gilan O, Lam EYN, et al. BET inhibitor resistance emerges from leukaemia stem cells. Nature. 2015;525(7570):538-542.
3. Gibbons GS, Owens SR, Fearon ER, Nikolovska-Coleska Z. Regulation of Wnt signaling target gene expression by the histone methyltransferase DOT1L. ACS Chem Biol. 2015;10(1):109-114.
4. Wagstaff M, Tsaponina O, Caalim G, et al. Crosstalk between b catenin and WT1 signaling activity in acute myeloid leukemia. Haematologica. 2023;108(1):283-289.
5. Luis TC, Naber BAE, Roozen PPC, et al. Canonical wnt signaling regulates hematopoiesis in a dosage-dependent fashion. Cell Stem Cell. 2011;9(4):345-356.
6. Siriboonpiputtana T, Zeisig BB, Zarowiecki M, et al. Transcriptional memory of cells of origin overrides b catenin requirement of MLL cancer stem cells. EMBO J. 2017;36(21):3139-3155.
7. Zeisig BB, Fung TK, Zarowiecki M, et al. Functional reconstruction of human AML reveals stem cell origin and vulnerability of treatment-resistant MLL-rearranged leukemia.
Sci Transl Med. 2021;13(582):eabc4822.
8. Wang Y, Krivtsov AV, Sinha AU, et al. The Wnt/beta-catenin pathway is required for the development of leukemia stem cells in AML. Science. 2010;327(5973):1650-1653.
9. Morgan RG, Ridsdale J, Payne M, et al. LEF-1 drives aberrant b catenin nuclear localization in myeloid leukemia cells. Haematologica. 2019;104(7):1365-1377.
10. Toska E, Roberts SGE. Mechanisms of transcriptional regulation by WT1 (Wilms’ tumour 1). Biochem J. 2014;461(1):15-32.
11. Galimberti S, Canestraro M, Khan R, et al. Vorinostat and bortezomib significantly inhibit WT1 gene expression in MO7e and P39 cell lines. Leukemia. 2008;22(3):628-631.
12. Nishida S, Hosen N, Shirakata T, et al. AML1-ETO rapidly induces acute myeloblastic leukemia in cooperation with the Wilms tumor gene, WT1. Blood. 2006;107(8):3303-3312.
13. Zhou B, Jin X, Jin W, et al. WT1 facilitates the self-renewal of leukemia-initiating cells through the upregulation of BCL2L2: WT1-BCL2L2 axis as a new acute myeloid leukemia therapy target. J Transl Med. 2020;18(1):254.
Correspondence: F. van Rhee vanrheefrits@uams.edu
Received: April 12, 2022.
Accepted: April 19, 2022.
Prepublished: April 28, 2022.
https://doi.org/10.3324/haematol.2022.280902
©2023 Ferrata Storti Foundation
Published under a CC BY-NC license
Much progress has been made in our understanding of Castleman disease over the past 60-70 years since it was first described in 1954.1 Castleman disease is a heterogene ous group of lymph node disorders with shared pathologi cal findings. The histopathology of the disease spans a spectrum from, at one end, lymph nodes showing re gressed or atretic follicles with prominent follicular den dritic cell networks, expanded mantle zones consisting of small B-lymphocytes and prominent interfollicular hyalin ized vessels referred to as the hyaline vascular type. At the other end is the plasmacytic pathology characterized by increased numbers of hyperplastic follicles and marked in terfollicular plasmacytosis, also with increased vascularity. Clinically, a unicentric form of Castleman disease (UCD) affecting one lymph node station and a multicentric form (MCD) involving multiple lymph node areas have now been recognized. Patients with MCD often have inflammatory symptomatology driven by hyper-cytokinemia. There is a predilection for hyaline vascular pathology in UCD and plasmacytic findings in MCD, but there is considerable overlap. Cytokines and chemokines such as interleukin (IL)-6 and vascular endothelial growth factor (VEGF) play an important role in driving the phenotype of the idio pathic form of MCD (iMCD), but the cellular origins of these factors have not been identified. UCD is treated with sur gery and iMCD with antibodies that target IL6 with 33-50% of patients responding.2,3 These response rates underscore the notion that a better understanding of iMCD is sorely needed to improve the therapeutic options for all. UCD and iMCD have remained poorly understood dis orders in terms of molecular pathogenesis, cellular eti ology and signaling pathways. In this issue of Haematologica, Horna et al. report the first lymph node transcriptome analysis of UCD and iMCD supplemented by immunohistochemistry for CXCL13 and C4d, a marker of the classical complement pathway.4 Similar to the his topathology, the transcriptomes of UCD and iMCD have both common and distinct features. For instance, there was over-representation of genes involved in collagenous fibrosis in UCD and increased expression of proteasome
genes reflective of the increased plasmacytosis often seen in iMCD. iMCD lymph nodes showed upregulation of genes in the mammalian target of rapamycin (m-TOR) complex, consistent with recent findings that m-TOR is activated in multiple cell types in the interfollicular space in iMCD and the presence of a serum m-TOR proteomic signature.5
An unexpected shared feature of UCD and iMCD was the upregulation of the complement effector C3 and com ponents of the classical component pathway (UCD: C1S and C1R; iMCD C4 and C4B) suggesting that complement activation plays a role in the B-cell activation/plasma cell differentiation as well as the inflammatory response seen in Castleman disease. Immunohistochemistry showed that C4d was often, but not exclusively, located within or near follicular dendritic cells in regressed germinal centers as well as in mantle zones.
Expression of the CXCL13 chemokine was also increased in both UCD and iMCD, and CXCL13 was mostly localized to follicular dendritic cells. CXCL13 is one of the most up regulated chemo/cytokines in iMCD according to pro teomic studies.6 CXCL13 plays a role in the attraction and differentiation of B-lymphocytes, and helps to orchestrate the organization of the germinal center architecture and B-cell response. It seems likely that excess CXCL13 pro duced by follicular dendritic cells plays a critical role in abnormal B-cell follicle formation observed in Castleman disease.
A further common feature of UCD and iMCD histopathol ogy was the increased vascularity. Many patients with iMCD have elevated serum VEGF. Interestingly, the ex pression of the FL1 gene, which encodes for the vascular endothelial growth factor receptor 1 (VEGFR-1) was up regulated in both UCD and iMCD. Transcripts for the proangiogenic factor placental growth factor (PGF), which is a ligand for VEGFR-1, were also increased in both forms of Castleman disease. A not previously described feature in Castleman disease was upregulation of the apelin re ceptor (in UCD and MCD) as well as apelin (in UCD), which also serve to promote angiogenesis.
Myeloma Center, Winthrop P. Rockefeller Cancer Institute, University of Arkansas for Medical Sciences, Little Rock, AR, USAA recent study by Wing et al. examined the expression of immune-related genes in UCD and MCD lymph nodes.7 In common with the findings reported by Horna et al., there was overexpression of CXCL13 in both UCD and MCD. There was again increased representation of genes involved in the complement cascade, angiogenesis and VEGF signal ing. Increased expression of genes for extracellular matrix modification, suggesting stromal remodeling, was unique to UCD, whereas plasma-cell-related genes, genes in volved in cytokine signaling and inflammation (IL-1, IL-13 and IL-4) as well as enrichment for IL-6 pathway genes were specific to MCD. Common themes emerge from both datasets, including the importance of angiogenesis in Castleman disease, which is consistent with the vascular histopathology. The involvement of the complement pathway in Castleman disease raises the question of whether this could be a therapeutic target, especially in iMCD patients suffering from thrombotic micro-angiopathy and renal failure. Clearly, follicular dendritic cells play an important role in the pathogenesis of both UCD and MCD. A recent Japa nese study in a mouse model of iMCD showed that antiCXCL13 antibody was able to mitigate the inflammatory syndrome underscoring the notion that CXCL13 may be a novel therapeutic target (Kikushige, presented at the In
1. Castleman B, Towne VW. Case records of the Massachusetts General Hospital; weekly clinicopathological exercises; founded by Richard C. Cabot. N Engl J Med. 1954;251(10):396-400.
2. Nishimoto N, Kanakura Y, Aozasa K, et al. Humanized antiinterleukin-6 receptor antibody treatment of multicentric Castleman disease. Blood. 2005;106(8):2627-2632.
3. van Rhee F, Wong RS, Munshi N, et al. Siltuximab for multicentric Castleman's disease: a randomised, double-blind, placebocontrolled trial. Lancet Oncol. 2014;15(9):966-974.
4. Horna P, King RL, Jevremovic D, Fajgenbaum DC, Dispenzieri A. The lymph node transcriptome of idiopathic multicentric Castleman disease. Haematologica. 2023;108(1):207-218.
5 Pai RL, Japp AS, Gonzalez M, et al. Type I IFN response associated with mTOR activation in the TAFRO subtype of idiopathic
ternational Symposium on Castleman Disease, 2021). The cellular origin of IL-6 production has been challenged, with some suggesting that this cytokine is produced out side the lymph node compartment, consistent with the findings of Horna et al., while others have implicated lymph node B-lymphocytes, macrophages and follicular dendritic cells. The data from Wing et al. suggest that IL6 was present in CD31-positive endothelial cells, while VEGF was found in follicular dendritic cells and interfol licular M2 macrophages.
Overall, the present findings suggest potential alternative pathways, which can be targeted in non-responders to therapy against IL-6 by using anti-complement agents, anti-CXC13 monoclonal antibodies and molecules that bind VEGF and PGF. Other research has identified m-TOR and the JAK-STAT pathway as potential therapeutic tar gets. A clinical trial with the m-TOR inhibitor sirolimus is in progress (NCT03933904).8.9 It is encouraging to see that the veil over the enigma of Castleman disease is slowly lifting and that a more thorough understanding of this dis ease will likely result in better therapies in the near fu ture.
FVR sits on an advisory board for EUSA Pharmaceuticals.
multicentric Castleman disease. JCI Insight. 2020;5(9):e135031.
6. Pierson SK, Stonestrom AJ, Shilling D, et al. Plasma proteomics identifies a 'chemokine storm' in idiopathic multicentric Castleman disease. Am J Hematol. 2018;93(7):902-912.
7. Wing A, Xu J, Meng W, et al. Transcriptome and unique cytokine microenvironment of Castleman disease. Mod Pathol. 2022;35(4):451-461.
8. Fajgenbaum DC, Langan RA, Japp AS, et al. Identifying and targeting pathogenic PI3K/AKT/mTOR signaling in IL-6-blockaderefractory idiopathic multicentric Castleman disease. J Clin Invest. 2019;129(10):4451-4463.
9. Arenas DJ, Floess K, Kobrin D, et al. Increased mTOR activation in idiopathic multicentric Castleman disease. Blood. 2020;135(19):1673-1684.
1Department of Cancer Immunology, Institute for Cancer Research, Oslo University Hospital, Oslo, Norway; 2K. G. Jebsen Centre for B Cell Malignancies, Institute of Clinical Medicine, University of Oslo, Oslo, Norway; 3Department of Medical Oncology, Dana-Farber Cancer Institute, Boston, MA, USA and 4Harvard Medical School, Boston, MA, USA
Correspondence: S.S. Skånland, sigrid.skanland@ous-research.no
Received: April 16, 2022.
Accepted: July 21, 2022. Prepublished: July 28, 2022.
https://doi.org/10.3324/haematol.2022.281266
©2023 Ferrata Storti Foundation Published under a CC BY-NC license
Phosphatidylinositol 3-kinase (PI3K) inhibitors are effective in chronic lymphocytic leukemia (CLL). However, the severe toxicity profile associated with the first-generation inhibitors idelalisib and duvelisib, combined with the availability of other more tolerable agents, have limited their use. CLL is still considered incurable, and relapse after treatment, devel opment of resistance, and treatment intolerance are common. It is therefore of interest to optimize the administration of currently approved PI3K inhibitors and to develop next-generation agents to improve tolerability, so that this class of agents will be considered an effective and safe treatment option when needed. These efforts are reflected in the large number of emerging clinical trials with PI3K inhibitors in CLL. Current strategies to overcome treatment limitations include intermittent dosing, which is established for copanlisib and zandelisib and under investigation for duvelisib and parsaclisib. A second strategy is to combine the PI3K inhibitor with another novel agent, either as a continuous regimen or a fixedduration regimen, to deepen responses. In addition to these approaches, it is of interest to identify higher-resolution ac tionable biomarkers that can predict treatment responses and toxicity, and inform personalized treatment decisions. Here, we discuss the current status of PI3K inhibitors in CLL, factors limiting the use of currently approved PI3K inhibitors in CLL, current strategies to overcome these limitations, and where to go next.
Chronic lymphocytic leukemia (CLL) is a common B-cell malignancy with approximately 20,000 new cases ex pected in the USA in 2022.1 Targeted therapies were intro duced almost a decade ago and have rapidly and remarkably improved the management of CLL. While the disease typically responds well to the novel agents, expo sure to treatment will over time result in outgrowth of treatment-resistant cellular clones and most typically re sult in disease relapse. Multiple lines of therapy are there fore the rule in CLL management. How to sequence or combine novel therapies for optimal care and durable re mission are pressing research questions. Three classes of targeted therapies are currently ap proved for CLL: Bruton tyrosine kinase (BTK) inhibitors (ibrutinib and acalabrutinib), the B-cell lymphoma-2 (Bcl2) antagonist venetoclax, and phosphatidylinositol 3-ki nase (PI3K) inhibitors (idelalisib and duvelisib). While venetoclax and BTK inhibitors have positioned them
selves as effective and well-tolerated therapies in CLL (Box 1), PI3K inhibitors have experienced some setbacks because of unexpected toxicity. However, PI3K inhibitors are effective in CLL and are needed in the CLL therapy toolbox due to the incurable nature of the disease. Op timizing their use by developing more specific next-gen eration inhibitors, reducing toxicity and defining the ideal sequence or combination of therapies is therefore necessary to further improve CLL outcomes. In this re view article, we discuss the present status of PI3K in hibitors in CLL, factors limiting the use of currently approved PI3K inhibitors in CLL, strategies to overcome these limitations, and where to go next.
Class I PI3K consist of a regulatory unit (p85) in complex with a catalytic unit (p110). The catalytic unit exists as four

Box 1. Alternative targeted treatment
chronic
BTK inhibitors and venetoclax provide excellent alternative treatment options to PI3K inhibitors in all lines of therapy. The first-in-class covalent BTK inhibitor ibrutinib is approved by the European Medicines Agency (EMA) and the U.S. Food and Drug Administration (FDA) for both previously treated and untreated CLL, as a single agent and in combina tion with the CD20 antibodies obinutuzumab or rituximab. The next-generation BTK inhibitor acalabrutinib has fewer off target effects than ibrutinib,2 and was approved by the FDA for the treatment of CLL in 2019, and by the EMA as a monotherapy for previously treated CLL in 2020. Acalabrutinib and ibrutinib are being compared head-to-head in pre viously treated, high-risk CLL patients in the relapsed or refractory (R/R) setting (NCT02477696). At a median followup of 40.9 months, acalabrutinib and ibrutinib both showed a progression-free survival (PFS) of 38.4 months, while the incidence of all-grade atrial fibrillation was lower with acalabrutinib than with ibrutinib (9.4% vs. 16.0%, respect ively).3 Discontinuation due to adverse events occurred in 14.7% and 21.3% of the patients in the acalabrutinib and ibrutinib arms, respectively.3
Zanubrutinib, another covalent and selective next-generation BTK inhibitor, was approved by the FDA in 2019 for treat ment of patients with R/R mantle cell lymphoma. There are several ongoing studies with zanubrutinib in CLL, including the phase III ALPINE study, a head-to-head comparison with ibrutinib in R/R patients.4 The first interim analysis at a median follow-up of 12 months showed higher PFS (94.9% vs. 84.0%) and overall survival (OS) (97.0% vs. 92.7%) in the zanubrutinib arm. Atrial fibrillation/flutter was less frequent with zanubrutinib (2.5% vs. 10.1%), as were adverse events leading to study discontinuation (7.8% vs. 13.0%).4
A third generation of BTK inhibitors has been developed to overcome resistance to the covalent inhibitors. The most advanced non-covalent agents that inhibit both wild-type and C481S mutant BTK are pirtobrutinib5 and MK-1026.6 These agents have promising anti-tumor activity in CLL that has been treated with several lines of therapy, including with a covalent BTK inhibitor.
In addition to the expanding class of BTK inhibitors, venetoclax represents an effectiv e therapeutic option in CLL. It was first approved by the FDA in 2016 for previously treated CLL patients with del(17p). Based on the CLL14 study,7 venetoclax is now approved by the FDA and EMA for all patients with CLL. While studies such as the CLL17 trial (NCT04608318) compare different treatment options involving ibrutinib and vene toclax, direct comparisons of PI3K inhibitors to BTK inhibitors or venetoclax in prospective clinical trials are limited. The ASCEND trial compared treatment with a BTK inhibitor to PI3K inhibitor treatment by randomizing patients with R/R CLL to acalabrutinib or investigator’s choice of idelalisib + rituximab or bendamustine + rituximab (BR).8 The PFS was significantly longer in the acalabrutinib arm than in the other arm (not reached vs. 16.5 months) at a median fol low-up of 16.1 months. Grade ≥3 adv erse events were significantly more frequent in the idelalisib arm, with the most common being diarrhea (22%) and neutropenia (20%). This trial thus favored acalabrutinib over idelalisib + rituximab in this setting. Similarly, the BRUIN CLL-321 study (NCT04666038) will compare pirtobrutinib to investigator’s choice of idelalisib + rituximab or BR in CLL patients who have received previous treatment with at least one BTK inhibitor. Based on available evidence, the European Society of Medical Oncology (ESMO) guidelines generally recommend PI3K inhibitors in later line therapy than BTK inhibitors or venetoclax.9 However, a PI3K inhibitor may be preferred ahead of these therapies in patients with severe renal or heart disease, or with a significant risk of tumor lysis. This practice is followed for patients outside clinical trials. A retrospective study showed that only 9% of patients (81% treated outside a clinical trial, 19% treated on a clinical trial) received idelalisib as the first B-cell receptor inhibitor.10
isoforms; p110a, b, g, and d. p110a and p110b are ubiquitously expressed, while p110g and p110d are enriched in leuko cytes.11 p110d is highly expressed in CLL, and has therefore in particular been the focus of drug development efforts for this disease (Table 1). In 2014, the selective p110d inhibitor idelalisib was approved for use in CLL based on a doubleblind, placebo-controlled, randomized phase III study com paring idelalisib + the anti-CD20 antibody rituximab to placebo + rituximab in relapsed CLL.12 The patients enrolled on this trial had received a median of three previous drugs, which included rituximab, cyclophosphamide, fludarabine, bendamustine, and chlorambucil.12 The final follow-up of
the study demonstrated a median progression-free survival (PFS) of 20.3 months in patients initially assigned to the ide lalisib arm.13 The median overall survival (OS) was signifi cantly improved, with 40.6 months in the idelalisib arm versus 34.6 months in the placebo arm.13 Idelalisib has been shown to inhibit B-cell receptor signaling and to induce apoptosis in CLL cells.14-17 It is administered orally at a rec ommended dose of 150 mg twice a day. While idelalisib is effective, serious adverse autoimmune events limit treat ment.18,19 Of note, the Food and Drug Administration (FDA) accelerated approval of idelalisib for follicular lymphoma and small lymphocytic leukemia was voluntarily withdrawn
in 2022 by the developer due to inability to complete the confirmatory trial (Table 1).
The next-generation PI3K inhibitor duvelisib is an oral, dual p110g/d inhibitor (Table 1). It received FDA approval in 2018 for CLL patients who have received at least two prior ther apies. Approval by the European Medicines Agency (EMA) followed in 2021. The recommended dose is 25 mg twice a day. The indication was based on the phase III random ized DUO study of duvelisib versus the anti-CD20 antibody ofatumumab in patients with relapsed/refractory (R/R) CLL/small lymphocytic leukemia.20 One of the exclusion criteria was prior treatment with BTK or PI3Kd inhibitors.20 The median PFS was 13.3 months in the duvelisib arm and 9.9 months in the ofatumumab arm.20 The FDA acceler ated approval of duvelisib for follicular lymphoma was vol untarily withdrawn in 2022 by the developer due to their
inability to complete the confirmatory trial (Table 1). The p110d selective inhibitor umbralisib received FDA fasttrack approval status for CLL in combination with the antiCD20 antibody ublituximab in 2020, and was FDA approved for follicular lymphoma and marginal zone lym phoma in 2021 (Table 1). It is administered orally with a recommended dose of 800 mg once a day. The phase I study of umbralisib suggested that this drug is associated with fewer autoimmune-like toxicities than idelalisib and duvelisib.21 However, head-to-head randomized trials comparing the different PI3K inhibitors would be needed to test these findings and to evaluate the relative efficacy of the different agents. Updated OS data from the ran domized phase III UNITY-CLL trial showed an increasing imbalance in OS, and this led to the voluntary withdrawal of the pending Biologics License Application (BLA)/Sup
Table 1. Approved and investigational PI3K inhibitors in chronic lymphocytic leukemia.
Drug Isoform specificity Status in CLL (phase)
BGB-10188 p110d Investigational (phase I)
Buparlisib p110a/b/g/d Investigational (phase II)
Comments
Copanlisib p110a/b/g/d Investigational (phase II) FDA approved (2017) for FL after at least two prior systemic therapies
Duvelisib p110g/d EMA (2021) and FDA (2018) approved for CLL after at least two therapies
HMPL-689 p110d Investigational (phase I)
Idelalisib p110d EMA and FDA approved (2014) for relapsed CLL in combina tion with rituximab in patients for whom rituximab alone would be appropriate
Parsaclisib p110d Investigational (phase II)
Tenalisib p110g/d Investigational (phase II)
Umbralisib p110d Fast track FDA approval status (2020) for CLL in combination with anti-CD20 antibody (phase III)
Approved for SLL after at least two prior systemic therapies. FDA accelerated approval for FL volun tarily withdrawn by the developer due to inability to complete the confirmatory trial (2022)
FDA accelerated approval for FL and SLL volun tarily withdrawn by the developer due to inability to complete the confirmatory trial (2022)
YY-20394
p110d Investigational (phase I)
Zandelisib p110d Investigational (phase II)
FDA approved (2021) for FL and MZL. Voluntary withdrawal of the pending Biologics License Ap plication (BLA)/Supplemental New Drug Applica tion (sNDA) for the combination umbralisib + ublituximab (U2) for treatment of CLL based on updated overall survival data from the UNITY-CLL trial (2022). Umbralisib voluntarily withdrawn for sale for approved indications by the developer based on the withdrawal of the BLA and sNDA for U2 in CLL (2022)
FDA fast track designation (2020) for treatment of adult patients with R/R FL who have received at least two prior systemic therapies
Agents that have not been studied in clinical trials in chronic lymphocytic leukemia since the approval of idelalisib in 2014 are not shown. CLL: chronic lymphocytic leukemia; EMA: European Medicines Agency; FDA: Food and Drug Administration; FL: follicular lymphoma; MZL: marginal zone lymphoma; R/R: relapsed/refractory; SLL: small lymphocytic lymphoma.
plemental New Drug Application (sNDA) for the combina tion of umbralisib + ublituximab (U2) for the treatment of CLL in 2022.22,23 Umbralisib was also voluntarily withdrawn from sale for approved indications based on these events (Table 1).
Even with encouraging efficacy reports, the use of PI3K in hibitors in CLL has experienced setbacks. Barriers include the broad range of toxicities and safety warnings associ ated with these agents, which may deter clinicians who are unfamiliar with their management.24 Other classes of effective and more tolerable targeted therapies are avail able in CLL, and real-world data suggest that treatment with a PI3K inhibitor following venetoclax results in less durable remissions than when venetoclax is followed by a BTK inhibitor or cellular therapy.25 This further contributes to pushing PI3K inhibitors back in the treatment sequenc ing line.
Initial studies on the first-in-class PI3K inhibitor idelalisib showed encouraging efficacy, but serious toxicities also emerged, more frequent in frontline treatment than in the R/R setting. In a randomized, double-blind, placebo-con trolled phase III study evaluating the efficacy and safety of rituximab with or without idelalisib in R/R CLL, the seri ous adverse event rates were similar between the idelal isib and placebo arms (40% and 35%, respectively).12 However, the follow-up was short, and prolonged expo sure to idelalisib was later reported to increase the inci dence of all-grade and grade ≥3 diarrhea (46.4% and 16.4%), colitis (10.9% and 8.2%) and pneumonitis (10.0% and 6.4%).13
To evaluate idelalisib as initial therapy, a phase II study of idelalisib + rituximab in treatment-naïve older CLL pa tients was performed.26 The overall response rate was en couraging at 97%, and 100% in patients with TP53 aberrations. However, the frequency of adverse events was higher in this treatment-naïve population than in pre viously treated patients. For example, all-grade and grade ≥3 diarrhea and/or colitis occurred in 64% and 42% of the patients, respectively.26 A high frequency of serious ad verse events was also seen when idelalisib was given frontline in combination with the anti-CD20 antibody ofa tumumab.18 A follow-up outcome study showed that pa tients who stopped idelalisib due to toxicity (n=15) had a higher risk of subsequent disease progression than those who continued on therapy.27 However, no CLL-related deaths occurred, indicating that salvage treatment can be
effective in this setting. A recent study has shown that patients who developed grade ≥3 toxicity had higher re sponse rates and longer survival than those who did not have toxicity.28
The DUO trial, a randomized phase III study of duvelisib versus ofatumumab in R/R CLL, showed a similar toxicity profile for duvelisib as for idelalisib.20 The most common grade ≥3 adverse events in the duvelisib arm at a median overall follow-up of 22.4 months were neutropenia (30%), diarrhea (15%) and pneumonia (14%). The high incidence of adverse events associated with idelalisib and duvelisib has led to the addition of black box warnings for both agents.29,30
The broad range of toxicities associated with PI3K in hibitors does limit the use of these agents. In clinical trials with PI3K inhibitors in CLL, dose-reductions were per formed for up to 58% of the patients, while drug discon tinuation due to adverse events occurred in up to 39% of the cases.31 Toxicity and discontinuation rates are even higher outside clinical trials.32-35 A retrospective study of CLL patients treated with idelalisib + rituximab in the UK and Ireland (27 patients frontline, 83 R/R patients) showed that 87.3% of the patients discontinued idelalisib. The main reasons for discontinuation were adverse events (63% of frontline patients, 44.6% of R/R patients) and dis ease progression (3.7% of frontline patients, 20.5% of R/R patients). All-grade and grade ≥3 lower respiratory tract infection/pneumonia were reported in 34.5% and 19.1% of the patients, diarrhea in 30.9% and 6.4%, and colitis in 9.1% and 5.5% of the patients, respectively.35 Furthermore, a comparison of outcomes for CLL patients treated with idelalisib + rituximab in clinical trial participants versus Medicare beneficiaries in the USA showed that the latter group had a shorter median treatment duration (173 days vs. 473 days), higher treatment discontinuation (43.2% vs 18%), higher mortality rate (hazard ratio 1.40), and higher fatal infection rate per 100 person-years (18.4 vs. 9.8).34 Dose reduction was more frequent in trial participants than in Medicare beneficiaries (32.6% vs. 18%). Interest ingly, the number of Medicare beneficiary patients receiv ing idelalisib + rituximab treatment dropped by more than 60% during the first year following safety communications on risk of serious infections with idelalisib and the rec ommendation for prophylaxis in all idelalisib-treated pa tients.34 This underscores the need for easily available information on how to monitor and manage PI3K inhibitor toxicities.
Studies have shown that opportunistic infections can be caused by treatment with idelalisib combinations. Three phase III studies comparing BR or rituximab with or with out idelalisib in treatment-naïve CLL or R/R indolent Bcell non-Hodgkin lymphoma were halted due to excess
deaths and serious adverse events in the idelalisib arms, which were largely attributed to bacterial and opportun istic infections.36
Although an increased risk of opportunistic infections was reported for patients treated with idelalisib in combination with rituximab with or without bendamustine, these find ings led to the recommendation for Pneumocystis jirovecii pneumonia (PJP) and antiviral prophylaxis as well as cyto megalovirus monitoring in all patients treated with idelal isib.36 The risk of cytomegalovirus reactivation appears greatest with bendamustine-based combinations.37
Development of treatment resistance is a constant chal lenge for all types of cancer therapies. While resistance mechanisms to BTK inhibitors and venetoclax have been identified, revealing resistance mechanisms to PI3K in hibitors has proven more tedious.38 Initial whole-exome sequencing efforts on a PI3K inhibitor-resistant mouse model,39 as well as on samples from patients who prog ressed on idelalisib,40 did not identify mutations that could
explain the resistance mechanisms. However, more recent studies indicate activating mutations in MAPK pathway genes and upregulation of IGF1R as resistance mechan isms in CLL.41;42 These findings suggest a role for MEK/ERK inhibitors in CLL, which were indeed shown to be effective in idelalisib-resistant CLL cells.43 In the same study, it was shown that CLL cells from idelalisib-exposed patients dis played increased sensitivity to venetoclax.43 This is in agreement with a study on follicular lymphoma which showed that treatment with idelalisib induces sensitivity to Bcl-2 inhibitors,44 and a third study showing that treat ment with duvelisib sensitizes CLL cells to venetoclax in vitro. 45 Combinations involving PI3K inhibitors, MEK in hibitors and Bcl-2 inhibitors would therefore be of interest to explore in CLL. Indeed, ongoing trials are investigating combinations between venetoclax and the PI3K inhibitors idelalisib (NCT03639324), duvelisib (NCT03534323), and copanlisib (NCT04685915) in CLL (Table 2). Interestingly, ex vivo testing of idelalisib-resistant tumor cells has ident ified signatures that stratify responders and non-re sponders. A genetic signature was reported in follicular
Table 2. Select next-generation PI3K inhibitor trials in chronic lymphocytic leukemia with novel-novel combinations and/or alternative dosing schedules.
ClincialTrials.gov
NCT04282018 (phase I/II)
NCT04685915 (phase II)
NCT03886649 (phase I)
NCT03884998 (phase I)
NCT03961672 (phase II)
NCT03534323 (phase 1/2)
Primary outcome measurement Comment
BGB-10188 R/R BGB-10188 alone or with zanubrutinib Dosing, safety and tolerability
Copanlisib R/R Copanlisib + ibrutinib CR Adding a fixed duration of copanlisib to ibrutinib
Copanlisib R/R Copanlisib + venetoclax DLT
Copanlisib Transformed Copanlisib + nivolumab MTD
Duvelisib R/R Intermittent dosing PFS Three cycles of continuous dosing followed by intermittent dosing
Duvelisib R/R Duvelisib + venetoclax Dosing, PFS
NCT04809467 (phase I/II) topMIND Parsaclisib R/R Parsaclisib + tafasitamab
NCT04948788 (phase I/II)
NCT02914938 (phase I)
NCT05209308 (phase II)
CORAL
AE and DLT
YY-20394 R/R YY-20394 + SHR145 MTD or recom mended phase II dose
Zandelisib R/R Zandelisib alone or with rituximab or zanubrutinib
Zandelisib R/R Zandelisib + venetoclax + rituximab
Dosing, safety and tolerability
uMRD Intermittent dosing of zandelisib, initial phase I reduced dose of venetoclax
AE: adverse event; CR: complete remission; DLT: dose-limiting toxicities; MTD: maximum tolerated dose; PFS: progression-free survival; R/R: relapsed/refractory; uMRD: undetectable minimal residual disease
lymphoma,44 while a drug sensitivity profile was reported in CLL.17 Idelalisib treatment interferes with the CD40/CD40L pathway and induces downregulation of pro teins involved in communication between lymphoma cells and the tumor microenvironment. This leads to reduced microenvironmental support and inhibition of tumor cell proliferation.44 High response rates to idelalisib and co panlisib have been associated with high expression/acti vation of proteins in the PI3K pathway, and levels of raptor were significantly associated with response to the p110a/b/g/d inhibitor buparlisib.17,46-48 It will be of interest to test the predictive value of these biomarkers in pros pective clinical trials.
Toxicity is the main limiting factor to the use of currently approved PI3K inhibitors in CLL. Efforts are ongoing to overcome this limitation by developing more specific next-generation inhibitors (Figure 1) and to employ alter native combination or dosing regimens (Figure 2, Table 2). Below, we discuss the current strategies for PI3K inhibitors studied in clinical trials on CLL since the approval of ide lalisib in 2014.
Idelalisib
Findings from a retrospective observational study of clini cal outcomes of CLL patients treated with idelalisib + ri tuximab suggested that treatment benefit extended considerably beyond the treatment duration.35 While the median treatment duration in this study was 11.9 months, the median PFS and time to next treatment were 29.6 and 29.2 months, respectively. These findings may indicate benefit from fixed-duration therapy. It would therefore be
of interest to study intermittent or time-limited dosing of idelalisib in prospective clinical trials.
Umbralisib shows a much higher selectivity to p110 d relative to other p110 isoforms, such as idelalisib and du velisib, and has fewer off-targets.17,21 The phase I study in R/R CLL showed that it was well tolerated. The safety pro file was distinct from that of idelalisib and duvelisib, with fewer cases of grade 1-2 and grade 3 colitis (0% and 2%), diarrhea (40% and 3%), and pneumonia (2% and 6%) at a median follow-up of 133 days.21 Toxicities associated with idelalisib and duvelisib are thought to be immune-me diated, and ex vivo or in vivo treatment with these agents affects regulatory T-cell function and numbers.49-52 Inter estingly, treatment of Em-TCL1 CLL mice with umbralisib, as opposed to treatment with idelalisib or duvelisib, was shown to spare the regulatory T cells,53 suggesting a

Figure 1. PI3K inhibitors in clinical trials in chronic lymphocytic leukemia. Overview of the number of phase I, II, and III clinical trials with the indicated PI3K inhibitors in chronic lymphocytic leukemia (CLL) registered at ClinicalTrials.gov. Agents that have not been studied in clinical trials in CLL since the approval of idelalisib in 2014 were excluded from the analysis. PI3K inhibitors with European Medicines Agency/Food and Drug Administration approval in CLL are indicated with a star. *Excluding terminated or withdrawn trials.
Figure 2. Current strategies to overcome the limitations of PI3K inhibitors. The figure shows current strategies to overcome PI3K inhibitor limitations discussed in the main text, and indicates which strategies are employed for the different inhibitors. The color key indicates the p110 specificity of the inhibitors. CAR-T: chimeric antigen receptor T-cell; Bcl-2i: B-cell lymphoma-2 inhibitor; BTKi: Bruton tyrosine kinase inhibitor; PD-L1: programmed death ligand 1; Treg: regulatory T cell.

mechanism for the improved safety profile of umbralisib. Umbralisib in combination with ublituximab (U2) showed promising activity in a phase I trial in R/R CLL.54 Discon tinuation of treatment due to adverse events occurred in 13% of the patients, and dose reduction occurred in 15% of the patients.54 These initial results led to the random ized phase III UNITY-CLL trial of U2 versus obinutuzumab + chlorambucil in treatment-naïve and R/R CLL (Table 2).55
At a median follow-up of 36.2 months, PFS was signifi cantly longer in the U2 arm (31.9 months vs. 17.9 months). The favorable PFS was consistent in both treatment-naïve (38.5 months vs. 26.1 months) and R/R (19.5 months vs. 12.9 months) CLL patients.55 However, the choice to use obinutuzumab + chlorambucil in the control arm for R/R CLL was somewhat surprising since chemoimmunother apy is rarely used as salvage therapy for relapsed CLL.56 Typical PI3K inhibitor toxicities were reported, but at lower rates than observed with idelalisib or duvelisib (neutrope nia 30.6%, diarrhea 12.1%, colitis 3.4%, pneumonitis 2.9%).55 Umbralisib received fast track FDA approval status for CLL in combination with anti-CD20 antibody in 2020 (Table 1). However, the developer voluntarily withdrew the pending BLA/sNDA for the U2 combination for treatment of CLL based on updated OS data from the UNITY-CLL trial in 2022.22,23 Umbralisib was also voluntarily withdrawn from sale for approved indications by the developer based on the withdrawal of the BLA and sNDA for U2 in CLL the same year.
Zandelisib is a selective p110d inhibitor with longer p110d occupancy than idelalisib.57,58 A phase I study in healthy volunteers identified 60 mg once a day as the optimal dose, due to approximately 90% inhibition of basophil ac tivation.58 A phase Ib dose escalation study in follicular lymphoma and CLL/small lymphocytic leukemia showed that the most common adverse events had a delayed onset beyond cycle 2, as is typical of most PI3K immunemediated toxicities.59 These adverse events, which in cluded grade 3 diarrhea and rash, were reversible with drug interruption and/or corticosteroids. These findings motivated a phase I trial with intermittent dosing (7 days on/21 days off) after two continuous cycles (Figure 2).60 The rationale for the time off was based on the time it takes for regulatory T cells to repopulate (14 days), while the initial two cycles were used for tumor debulking. Pre liminary results indicate a reduced rate of delayed grade 3 adverse events with maintained efficacy on the inter mittent dosing schedule.60 TIDAL is a phase II study of in termittent dosing in patients with R/R follicular lymphoma (NCT03768505). Eligible patients must have received prior therapy with an anti-CD20 antibody and chemotherapy with an alkylating agent or purine analogue, and no prior PI3Kd therapy. The trial was originally designed to compare
continuous and intermittent dosing schedules,62 but has been revised to study only intermittent dosing. The phase III COASTAL study compares zandelisib + rituximab to im munochemotherapy in patients with relapsed (≥1 prior line of therapy) indolent non-Hodgkin lymphoma.63 Eligible pa tients must have received an anti-CD20 antibody com bined with chemotherapy or lenalidomide, and no prior PI3K inhibitor therapy. All patients in the zandelisib arm will be treated on the intermittent schedule (NCT04745832). In March 2020 the FDA granted zandelisib fast track designation for treatment of adult patients with R/R follicular lymphoma who have received at least two prior systemic therapies.
Parsaclisib is a potent and selective p110d inhibitor.63 Inter mittent dosing has been explored in a phase I trial in patients with R/R B-cell malignancies (Figure 2).64 Eligible patients had to have received one or more prior treatment regimens, excluding allogeneic hematopoietic stem cell transplant within the preceding 6 months and autologous hemato poietic stem cell transplant within the last 3 months. Pa tients received 20 mg of parsaclisib once a day for the first 9 weeks followed by 20 mg once a week to decrease lateonset adverse events. This design was based on a com parative pharmacokinetic/dynamic simulation with copanlisib.64,65 Encouragingly, there were no treatment dis continuations due to adverse events in the intermittent dos ing arm. Grade ≥3 adverse events were few (n=1 neutropenia, n=1 diarrhea). In the continuous treatment arm, discontinu ations were observed in 13% of the patients, and grade 4 neutropenia was reported in 6% of the patients. Taken to gether, this suggests that intermittent treatment with par saclisib is better tolerated than continuous treatment.
BGB-10188
BGB-10188 is a highly selective p110 d inhibitor.66 It has shown antitumor activity in B-cell lymphoma xenograft models, with an improved safety margin compared to other p110 d inhibitors.66 BGB-10188 is currently being studied as monotherapy and in combination with zanu brutinib and the humanized IgG4 anti-PD-1 antibody tis lelizumab in a phase I/II trial on R/R CLL (NCT04282018) (Table 2, Figure 2).
YY-20394
YY-20394 is a selective p110d inhibitor.67 A phase I clinical trial in patients with R/R B-cell hematologic malignancies documented a median PFS of 255 days.67 Eligible patients could not have experienced disease progression on prior PI3K d inhibitor therapy. A durable response of approxi mately 36 months was observed in a CLL patient. The most frequent grade ≥3 adverse events were neutropenia (44%), pneumonia (16%), and hyperuricemia (12%). Grade
1/2 diarrhea was reported in 8% of the patients.67 Based on this study, the recommended phase II dose was set at 80 mg once daily.67 Additional phase I studies are ongoing in R/R follicular non-Hodgkin lymphoma (NCT04370405), R/R peripheral T-cell lymphoma (NCT04108325), and R/R B-cell hematologic malignancies (NCT04279405). YY20394 is currently being studied in combination with the BTK inhibitor SHR145 in R/R B-cell non-Hodgkin lymphoma (NCT04948788) (Figure 2). Phase II trials with YY-20394 monotherapy are planned in patients with R/R follicular lymphoma (NCT04379167), R/R peripheral T/NK cell lym phoma (NCT04705090), and R/R thymic cancer (NCT04975061). A phase I/II trial on YY-20394 combined with GEMOX (gemcitabine and oxaliplatin) is planned for patients with R/R diffuse large B-cell lymphoma (NCT04500561).
HMPL-689 is a selective p110d inhibitor.68 A phase I dose escalation and expansion study with HMPL-689 in patients with R/R lymphoma is currently ongoing (NCT03786926). For eligible patients, standard-of-care treatment options should no longer exist, except for PI3Kd inhibitors. Results have not yet been reported. HMPL-689 is also being studied in patients with R/R marginal zone lymphoma and follicular lymphoma (NCT04849351). Eligible patients should not have received prior treatment with any PI3K or BTK inhibitor.
Intermittent dosing of duvelisib is being studied in the phase II TEMPO trial (NCT03961672) (Table 2), with the hy pothesis that this may reduce toxicity (Figure 2). Duvelisib will be administered continuously for three cycles, fol lowed by maintenance on days 1-2, 8-9, 15-16, 22-23 of each cycle in the absence of disease progression or un acceptable toxicity.
Tenalisib is a highly specific, orally available p110 g / d in hibitor with demonstrated anti-tumor activity in Hodgkin lymphoma cell line xenografts.69 In a phase I study in R/R hematologic malignancies, tenalisib was administered twice/thrice a day with a starting dose of 25 mg twice a day.70 Eligible patients had received at least one prior line of treatment, were unresponsive to standard therapy, and were not eligible for transplantation. Thirty-three of 35 en rolled patients completed a 28-day follow-up. The most frequently reported any-grade and grade ≥3 related ad verse events were diarrhea (6% and 3%), hypertriglyceride mia (6% and 3%), and nausea (9% and 0%).70 A phase I study of tenalisib in patients with R/R T-cell lymphoma applied a dosing scheme of 200 mg to 800 mg twice
daily.71 The most frequently reported adverse events were fatigue (44.8%), aspartate/alanine aminotransferase in crease (36.2%/34-5%), and diarrhea (32.8%).71 Phase II studies of tenalisib in R/R indolent non-Hodgkin lym phoma (NCT03711578) and R/R CLL (NCT04204057) have been completed. Tenalisib was administered at the dose of 800 mg twice daily in the latter two trials. In the study on CLL, eligible patients should have received at least one prior therapy, excluding a PI3K inhibitor. Publication of re sults is awaited.
Copanlisib
Copanlisib is a p110a/b/g/d inhibitor.72 It has been shown to be more effective at killing CLL cells than p110d selective inhibitors,17,73 and shows increased activity in tumor cells with aberrant activation of PI3K.72 It is effective both at continuous and intermittent dosing (Figure 2), and weekly dosing was shown to be sufficient to achieve sustained response in a xenograft model of non-small cell lung cancer.72 An intermittent schedule with copanlisib admin istered intravenously at 60 mg on days 1, 8, and 15 of a 28day cycle was applied in the phase II CHRONOS-1 study enrolling patients with both indolent and aggressive R/R malignant lymphomas.47 For patients with indolent nonHodgkin lymphoma, inclusion criteria included relapsed disease after prior treatment with two or more chemo therapy- or immunotherapy-based regimens, or disease refractory to two prior chemotherapy- and/or immuno therapy-based regimens. The reported median PFS was 390 days (indolent lymphoma) and 70 days (aggressive lymphoma), and the median duration of response was 390 days and 166 days, respectively. Common adverse events were hyperglycemia (57.1% and 23.8%), hypertension (54.8% and 40.5%), and diarrhea (40.5% and 4.8%).47 The unique toxicity profile is likely associated with the in hibition of p110a. Dose delays were reported for 74% of the patients with indolent lymphoma, of which 91% were due to adverse events. Most of the delays (55%) lasted <1 week. Dose reductions occurred in 26% (to 45 mg) and 7% (30 mg) of these patients.46 Encouragingly, the 2-year fol low-up of this study showed no evidence of an increased incidence or worsening of serious adverse events following longer treatment.74 Based on results from this trial, copan lisib was approved by the FDA in 2017 for the treatment of relapsed follicular lymphoma after at least two prior sys temic therapies.
The phase III CHRONOS-3 trial compares copanlisib + ri tuximab to placebo + rituximab in patients with relapsed indolent non-Hodgkin lymphoma.75 In this study, previous exposure to a PI3K inhibitor, except copanlisib, is accept able provided there is no resistance. Intolerance to PI3K inhibitors other than copanlisib is acceptable. At a median
follow-up of 19.2 months, the PFS was 21.5 months and 13.8 months in the copanlisib arm and control arm, re spectively. The most frequent grade ≥3 adverse events were hyperglycemia (56% and 8%) and hypertension (40% and 9%). This study demonstrates that copanlisib can be safely combined with rituximab.
The phase III CHRONOS-4 trial (NCT02626455) is evaluating the feasibility of combining copanlisib with standard chemoimmunotherapy (rituximab + bendamustine [BR, n=10 patients] or rituximab + cyclophosphamide, doxorubi cin, vincristine, prednisone [R-CHOP, n=11 patients]) in R/R indolent non-Hodgkin lymphoma.76 Previous exposure to a PI3K inhibitor, except copanlisib, is acceptable provided there was no resistance. The most common all-grade and grade ≥3 adverse events in the BR arm were neutropenia (80% and 50%), nausea (70% and 0%), decreased platelet count (60% and 10%), and hyperglycemia (60% and 50%).
In the R-CHOP arm they were hyperglycemia (82% and 64%), hypertension (73% and 64%), and neutropenia (64% and 64%).76 The objective response rates were 90% and 100% in the two treatment arms, respectively.76
Buparlisib is an orally available p110a/b/g/d inhibitor able to cross the blood-brain barrier.77 It has been shown to induce cell death in CLL cells more potently than p110d selective inhibitors.17,78 A phase II study of buparlisib in re lapsed non-Hodgkin lymphoma demonstrated overall re sponse rates between 11%-25%, depending on the indication.79 Eligible patients had received at least one prior therapy, with prior PI3K inhibitor excluded. The most common any-grade adverse events were hyperglycemia, fatigue, and nausea (all 36.1%), depression (29.2%), diar rhea (27.8%), and anxiety (25.0%). Grade ≥3 adverse events included hyperglycemia (11.1%) and neutropenia (5.6%).79 A phase II study of buparlisib in CLL reported a similar toxic ity profile.48 Eligible patients had received at least one prior systemic treatment, excluding buparlisib. Mood al terations associated with buparlisib treatment distinguish this agent from copanlisib. There are no active clinical studies on buparlisib in CLL.
As discussed above, early studies reported an increased risk of opportunistic infections among patients treated with idelalisib in combination with rituximab with or with out bendamustine. Current efforts are therefore aimed at identifying combination regimens that are safe or theor etically limit toxicity. Toxicities associated with idelalisib are thought to be im mune-mediated.31 Idelalisib may therefore pair well with chimeric antigen receptor (CAR) T cells (Figure 2). Treat ment with idelalisib during culturing of CAR T cells has been shown to increase T-cell viability and CD19-CAR ex
pression in both healthy donors and CLL patients, overall improving the CAR T-cell products.80 Similarly, duvelisib treatment can improve the efficacy of CAR T-cells for CLL (Figure 2).81 In vitro addition of duvelisib during production of CAR T cells resulted in a CAR T product (duv-CAR) with stem-like qualities and improved metabolic fitness, which induced faster elimination of CLL cells in a xenograft mouse model.81 This finding suggests a novel place for du velisib in CLL therapy. Another treatment strategy could be to combine PI3K in hibitors with a drug that counteracts their effects on T cells.82 Histone deacetylase inhibitors83,84 and proteasome inhibitors85,86 have been shown to enhance regulatory T cells, and could serve as potential partners for PI3K in hibitors. The proteasome inhibitor ixazomib had demon strated activity in an index case of relapsed CLL,87 and a phase I trial is evaluating the combination of duvelisib with either the histone deacetylase inhibitor romidepsin or the proteasome inhibitor bortezomib in R/R T-cell lymphomas (NCT02783625) (Figure 2).88 Combined treatment with ro midepsin + duvelisib resulted in lower rates of transamini tis compared to what was previously reported for duvelisib alone.88 Additional trials involve PI3K inhibitor + romid epsin combinations for the same indication (NCT03770000, tenalisib; NCT04774068, parsaclisib; NCT04233697, copanlisib, withdrawn since the investiga tor left the institution) (Figure 2). It would be of interest to study whether similar combinations are effective and well-tolerated in CLL as well. Idelalisib is also being studied in combination with the BTK inhibitor tirabrutinib, with or without obinutuzumab, in R/R CLL (NCT02457598, NCT02968563).89 The first re port on tirabrutinib + idelalisib demonstrated promising efficacy, but with the same complete response rate (7%) as that observed with tirabrutinib monotherapy.89 All pa tients (100%) in the tirabrutinib + idelalisib arm (n=14) ex perienced grade ≥3 laboratory abnormalities, including neutropenia (43%). Two of the patients developed grade 1-2 pneumonitis and one patient died.89 Other trials are studying combined treatment with duvelisib and veneto clax in R/R CLL (NCT03534323) (Table 2, Figure 2), the combination of zandelisib with rituximab, zanubrutinib and/or venetoclax in CLL (NCT02914938, NCT05209308) (Table 2, Figure 2), and several studies were initiated with U2-based combinations, but these were halted due to the updated OS data from UNITY-CLL. Time-limited or intermittent dosing schedules for PI3K in hibitor combinations are also being explored as an ap proach to limit toxicity (Figure 2). The phase Ib/IIa topMIND study is evaluating intermittent dosing of parsaclisib com bined with the anti-CD19 antibody tafasitamab in R/R CLL (NCT04809467) (Table 2), while a phase II trial (NCT04685915) is exploring a time-limited treatment with copanlisib to deepen the responses to ibrutinib. In addi
tion, a phase I trial (NCT03886649) is studying combined treatment with copanlisib + venetoclax (Figure 2), while another trial (NCT03884998) is currently evaluating copan lisib in combination with the PD-1 inhibitor nivolumab in transformed CLL (Table 2, Figure 2). The large number of clinical trials with copanlisib combinations in hematologic malignancies suggests that this agent is finding a home.90 Overall, it is hoped that these new combination ap proaches will provide more tolerable regimens compared to the initial idelalisib-based combinations.
Although the implementation of PI3K inhibitor-based regimens in CLL management has faced various chal lenges, efforts remain profuse to optimize their use and identify tolerable schedules and combinations. Both pa tient selection and optimized patient management can re duce risks. Autoimmune toxicity is less in older patients and those who are more heavily pretreated. Infectious toxicity can be managed by prophylactic treatment of neutropenia and Pneumocystis jirovecii pneumonia, and antiviral prophylaxis. Currently, PI3K inhibitors are best used after BTK inhibitors or venetoclax in the management of CLL, as per ESMO guidelines.9 It is important to note that PI3K inhibitors can generally be used in patients with severe cardiac or renal disease, which may influence their choice in selected patients. It is also important that new clinical trial designs better reflect current recommenda tions by including patients who have been exposed to sev eral lines of therapy, including targeted therapies and in some cases even a PI3K inhibitor. For the future, intermittent dosing schedules and next-gen eration inhibitors hold the promise of reduced autoimmune toxicity. There is currently most activity in developing nextgeneration p110d specific inhibitors, but the p110a/b/g/d in hibitor copanlisib is also finding its place. With the growing number of targeted therapies available and in development for CLL, the question becomes: how to choose the right therapy for the right patient at the right time? Current treatment guidelines for CLL are based on relatively generic biomarkers such as IGVH and TP53 mutational status.9 Higher-resolution patient stratification will be possible if biomarkers identified in pre-clinical studies can be validated in biomarker-driven clinical trials
and implemented in routine practice. In general, clinical trials of novel therapies should biobank samples dedi cated to functional analyses such as cell signaling profil ing, immune phenotyping, and ex vivo drug sensitivity testing, in addition to genetic profiling, to allow for identi fication of molecular signatures predictive of treatment responses, including tolerability.91 To develop truly predic tive prognostic markers in this heterogeneous disease, sharing of comprehensive clinical, genetic, and functional data from both clinical trials and real-world cohorts is necessary.92 Based on these data, maximally predictive models and minimal biomarker signatures can be devel oped to inform personalized treatment decisions. This ap proach to precision medicine is exemplified by the European Union-funded CLL-CLUE consortium.93 The goal is to maximize efficacy and minimize toxicity by matching the right therapy to the right patient at the right time.
SSS has received honoraria from AbbVie and AstraZeneca, and research support from BeiGene and TG Therapeutics. JRB has served as a consultant for AbbVie, Acerta/AstraZe neca, BeiGene, Bristol-Myers Squibb/Juno/Celgene, Catapult, Genentech/Roche, Eli Lilly, Janssen, MEI Pharma, Morphosys AG, Nextcea, Novartis, Pfizer, and Rigel; has received rese arch funding from Gilead, Loxo/Lilly, Verastem/SecuraBio, Sun, and TG Therapeutics; and has served on a data safety monitoring committee for Invectys. JRB has served as a con sultant for Abbvie, Acerta/Astra-Zeneca, BeiGene, Bristol Myers Squibb/Juno/Celgene, Catapult, Eli Lilly, Genentech/Roche, Grifols Worldwide Operations, Hutchmed, iOnctura, Janssen, Loxo, MEI Pharma, Morphosys AG, Next cea, Novartis, Numab Therapeutics, Pfizer, Pharmacyclics and Rigel; has received research funding from BeiGene, Gi lead, iOnctura, Loxo/Lilly, MEI Pharma, Verastem/SecuraBio, and TG Therapeutics; and has served on a data safety mo nitoring committee for Invectys.
SSS wrote the first version of the manuscript. Both authors read, revised and approved the final manuscript.
SSS is supported by the Research Council of Norway under the frames of ERA PerMed (project number 322898) and Di gital Life Norway (project number 294916). JRB is supported by NIH R01 CA 213442.
1. Siegel RL, Miller KD, Fuchs HE, Jemal A. Cancer statistics, 2022. CA Cancer J Clin. 2022;72(1):7-33.
2. Herman SEM, Montraveta A, Niemann CU, et al. The Bruton tyro sine kinase (BTK) inhibitor acalabrutinib demonstrates potent on-target effects and efficacy in two mouse models of chronic
lymphocytic leukemia. Clin Cancer Res. 2017;23(11):2831-2841.
3. Byrd JC, Hillmen P, Ghia P, et al. First results of a head-to-head trial of acalabrutinib in previously treated chronic lymphocytic leukemia. J Clin Oncol. 2021;39(15 Suppl):7500.
4. Hillmen P, Eichhorst B, Brown JR, et al. First interim analysis of
ALPINE study: results of a phase 3 randomized study of zanu brutinib vs ibrutinib in patients with relapsed/refractory chronic lymphocytic leukemia/small lymphocytic lymphoma. EHA Li brary. 2021;LB1900.
5. Mato AR, Shah NN, Jurczak W, et al. Pirtobrutinib in relapsed or refractory B-cell malignancies (BRUIN): a phase 1/2 study. Lan cet. 2021;397(10277):892-901.
6. Woyach J, Flinn I, Awan FT, et al. Preliminary efficacy and safety of MK-1026, a non-covalent inhibitor of wild-type and C481S mutated Bruton tyrosine kinase, in B-cell malignancies: a phase 2 dose expansion study. Blood. 2021;138(Suppl 1):392.
7. Fischer K, Al-Sawaf O, Bahlo J, et al. Venetoclax and obinutuzu mab in patients with CLL and coexisting conditions. N Engl J Med. 2019;380(23):2225-2236.
8. Ghia P, Pluda A, Wach M, et al. Acalabrutinib vs idelalisib plus ri tuximab (IDR) or bendamustine plus rituximab (BR) in relapsed/refractory (R/R) chronic lymphocytic leukemia (CLL): ASCEND final results. EHA Library. 2020;294979:S159.
9. Eichhorst B, Robak T, Montserrat E, et al. Chronic lymphocytic leukaemia: ESMO clinical practice guidelines for diagnosis, tre atment and follow-up. Ann Oncol. 2021;32(1):23-33.
10. Mato AR, Hill BT, Lamanna N, et al. Optimal sequencing of ibru tinib, idelalisib, and venetoclax in chronic lymphocytic leukemia: results from a multicenter study of 683 patients. Ann Oncol. 2017;28(5):1050-1056.
11. Vanhaesebroeck B, Perry MWD, Brown JR, André F, Okkenhaug K. PI3K inhibitors are finally coming of age. Nat Rev Drug Discov. 2021;20(10):741-769.
12. Furman RR, Sharman JP, Coutre SE, et al. Idelalisib and rituxi mab in relapsed chronic lymphocytic leukemia. N Engl J Med. 2014;370(11):997-1007.
13. Sharman JP, Coutre SE, Furman RR, et al. Final results of a ran domized, phase III study of rituximab with or without idelalisib followed by open-label idelalisib in patients with relapsed chro nic lymphocytic leukemia. J Clin Oncol. 2019;37(16):1391-1402.
14. Myhrvold IK, Cremaschi A, Hermansen JU, et al. Single cell pro filing of phospho-protein levels in chronic lymphocytic leuke mia. Oncotarget. 2018;9(10):9273-9284.
15. Skånland SS, Cremaschi A, Bendiksen H, et al. An in vitro assay for biomarker discovery and dose prediction applied to ibrutinib plus venetoclax treatment of CLL. Leukemia. 2020;34(2):478-487.
16. Herman SE, Gordon AL, Wagner AJ, et al. Phosphatidylinositol 3kinase-delta inhibitor CAL-101 shows promising preclinical acti vity in chronic lymphocytic leukemia by antagonizing intrinsic and extrinsic cellular survival signals. Blood. 2010;116(12):2078-2088.
17. Yin Y, Athanasiadis P, Karlsen L, et al. Functional testing to cha racterize and stratify PI3K inhibitor responses in chronic lym phocytic leukemia. Clin Cancer Res. 2022;28(20):4444-4455.
18. Lampson BL, Kasar SN, Matos TR, et al. Idelalisib given frontline for treatment of chronic lymphocytic leukemia causes fre quent immune-mediated hepatotoxicity. Blood. 2016;128(2):195-203.
19. Barr PM, Saylors GB, Spurgeon SE, et al. Phase 2 study of idela lisib and entospletinib: pneumonitis limits combination therapy in relapsed refractory CLL and NHL. Blood. 2016;127(20):2411-2415.
20. Flinn IW, Hillmen P, Montillo M, et al. The phase 3 DUO trial: du velisib vs ofatumumab in relapsed and refractory CLL/SLL. Blood. 2018;132(23):2446-2455.
21. Burris HA, III, Flinn IW, Patel MR et al. Umbralisib, a novel PI3Kdelta and casein kinase-1epsilon inhibitor, in relapsed or re fractory chronic lymphocytic leukaemia and lymphoma: an
open-label, phase 1, dose-escalation, first-in-human study. Lancet Oncol. 2018;19(4):486-496.
22. TG Therapeutics. TG Therapeutics Announces Voluntary Wi thdrawal of the BLA/sNDA for U2 to Treat Patients with CLL and SLL. https://ir.tgtherapeutics.com/news-releases/news-releasedetails/tg-therapeutics-announces-voluntary-withdrawal-bla snda-u2-treat. Accessed 15-4-2022.
23. Richardson NC, Kasamon Y, Pazdur R, Gormley N. The saga of PI3K inhibitors in haematological malignancies: survival is the ultimate safety endpoint. Lancet Oncol. 2022;23(5):563-566.
24. Patel K, Pagel JM. Exploring a future for PI3K inhibitors in chro nic lymphocytic leukemia. Curr Hematol Malig Rep. 2019;14(4):292-301.
25. Mato AR, Roeker LE, Jacobs R, et al. Assessment of the efficacy of therapies following venetoclax discontinuation in CLL reveals BTK inhibition as an effective strategy. Clin Cancer Res. 2020;26(14):3589-3596.
26. O'Brien SM, Lamanna N, Kipps TJ, et al. A phase 2 study of ide lalisib plus rituximab in treatment-naive older patients with chronic lymphocytic leukemia. Blood. 2015;126(25):2686-2694.
27. Thompson PA, Stingo F, Keating MJ, et al. Outcomes of patients with chronic lymphocytic leukemia treated with first-line idela lisib plus rituximab after cessation of treatment for toxicity. Cancer. 2016;122(16):2505-2511.
28. Wagner-Johnston ND, Sharman J, Furman RR, et al. Idelalisib immune-related toxicity is associated with improved treatment response. Leuk Lymphoma. 2021;62(12):2915-2920.
29. Zydelig (idelalisib) [package insert]. Gilead Science,Inc. 2018.
30. Copiktra (duvelisib) [package insert]. Verastem, Inc. 2018.
31. Hanlon A, Brander DM. Managing toxicities of phosphatidylinosi tol-3-kinase (PI3K) inhibitors. Hematology Am Soc Hematol Educ Program. 2020;2020(1):346-356.
32. Mato AR, Nabhan C, Barr PM, et al. Outcomes of CLL patients treated with sequential kinase inhibitor therapy: a real world ex perience. Blood. 2016;128(18):2199-2205.
33. Mato AR, Samp JC, Gauthier G, Terasawa E, Brander DM. Drivers of treatment patterns in patients with chronic lymphocytic leu kemia stopping ibrutinib or idelalisib therapies. Cancer Biol Ther. 2018;19(7):636-643.
34. Bird ST, Tian F, Flowers N, et al. Idelalisib for treatment of relap sed follicular lymphoma and chronic lymphocytic leukemia: a comparison of treatment outcomes in clinical trial participants vs medicare beneficiaries. JAMA Oncol. 2020;6(2):248-254.
35. Eyre TA, Preston G, Kagdi H, et al. A retrospective observational study to evaluate the clinical outcomes and routine manage ment of patients with chronic lymphocytic leukaemia treated with idelalisib and rituximab in the UK and Ireland (RETRO-idel). Br J Haematol. 2021;194(1):69-77.
36. Cheah CY, Fowler NH. Idelalisib in the management of lym phoma. Blood. 2016;128(3):331-336.
37. Zelenetz AD, Barrientos JC, Brown JR, et al. Idelalisib or placebo in combination with bendamustine and rituximab in patients with relapsed or refractory chronic lymphocytic leukaemia: in terim results from a phase 3, randomised, double-blind, pla cebo-controlled trial. Lancet Oncol. 2017;18(3):297-311.
38. Skånland SS, Mato AR. Overcoming resistance to targeted the rapies in chronic lymphocytic leukemia. Blood Adv. 2021;5(1):334-343.
39. Scheffold A, Jebaraj BMC, Tausch E, et al. In vivo modeling of resistance to PI3Kd inhibitor treatment using EµTCL1-Tg tumor transfer model. Blood 2016;128(22):190.
40. Ghia P, Ljungstrom V, Tausch E, et al. Whole-exome sequencing revealed no recurrent mutations within the PI3K pathway in re lapsed chronic lymphocytic leukemia patients progressing under
idelalisib treatment. Blood. 2016;128(22):2770.
41. Murali I, Kasar S, Naeem A, et al. Activation of the MAPK path way mediates resistance to PI3K inhibitors in chronic lymphocy tic leukemia. Blood. 2021;138(1):44-56.
42. Tausch E, Ljungström V, Agathangelidis A, et al. Secondary resi stance to idelalisib is characterized by upregulation of IGF1R ra ther than MAPK/ERK pathway mutations. Blood. 2022;139(22):3340-3344.
43. Melvold K, Giliberto M, Karlsen L, et al. Mcl-1 and Bcl-xL levels predict responsiveness to dual MEK/Bcl-2 inhibition in B-cell malignancies. Mol Oncol. 2022;16(5):1153-1170.
44. Serrat N, Guerrero-Hernández M, Matas-Céspedes A, et al. PI3Kdelta inhibition reshapes follicular lymphoma-immune mi croenvironment cross talk and unleashes the activity of veneto clax. Blood Adv. 2020;4(17):4217-4231.
45. Patel VM, Balakrishnan K, Douglas M, et al. Duvelisib treatment is associated with altered expression of apoptotic regulators that helps in sensitization of chronic lymphocytic leukemia cells to venetoclax (ABT-199). Leukemia. 2017;31(9):1872-1881.
46. Dreyling M, Santoro A, Mollica L, et al. Phosphatidylinositol 3-ki nase inhibition by copanlisib in relapsed or refractory indolent lymphoma. J Clin Oncol. 2017;35(35):3898-3905.
47. Dreyling M, Morschhauser F, Bouabdallah K, et al. Phase II study of copanlisib, a PI3K inhibitor, in relapsed or refractory, indolent or aggressive lymphoma. Ann Oncol. 2017;28(9):2169-2178.
48. Assouline S, Amrein L, Aloyz R, et al. IND.216: a phase II study of buparlisib and associated biomarkers, raptor and p70S6K, in pa tients with relapsed and refractory chronic lymphocytic leuke mia. Leuk Lymphoma. 2020;61(7):1653-1659.
49. Patton DT, Garden OA, Pearce WP, et al. Cutting edge: the pho sphoinositide 3-kinase p110 delta is critical for the function of CD4+CD25+Foxp3+ regulatory T cells. J Immunol. 2006;177(10):6598-6602.
50. Chellappa S, Kushekhar K, Munthe LA, et al. The PI3K p110delta isoform inhibitor idelalisib preferentially inhibits human regula tory T cell function. J Immunol. 2019;202(5):1397-1405.
51. Gadi D, Griffith A, Wang Z, et al. Idelalisib reduces regulatory T cells and activates T helper 17 cell differentiation in relapsed re fractory patients with chronic lymphocytic leukaemia. Br J Hae matol. 2022;197(2):207-211.
52. Gadi D, Griffith A, Tyekucheva S, et al. A T cell inflammatory phenotype is associated with autoimmune toxicity of the PI3K inhibitor duvelisib in chronic lymphocytic leukemia. Leukemia. 2022;36(3):723-732.
53. Maharaj K, Powers JJ, Achille A, et al. The dual PI3Kd/g inhibitor umbralisib exhibits unique immunomodulatory effects on CLL T cells. Blood Adv. 2020;4(13):3072-3084.
54. Lunning M, Vose J, Nastoupil L, et al. Ublituximab and umbrali sib in relapsed/refractory B-cell non-Hodgkin lymphoma and chronic lymphocytic leukemia. Blood. 2019;134(21):1811-1820.
55. Gribben JG, Jurczak W, Jacobs R, et al. Umbralisib plus ublituxi mab (U2) is superior to obinutuzumab plus chlorambucil (O+Chl) in patients with treatment naïve (TN) and relapsed/re fractory (R/R) chronic lymphocytic leukemia (CLL): results from the phase 3 Unity-CLL study [abstract]. Blood. 2020;136(Suppl 1):37-39.
56. Lampson BL, Brown JR. The evolving use of phosphatidylinositol 3-kinase inhibitors for the treatment of chronic lymphocytic leukemia. Hematol Oncol Clin North Am. 2021;35(4):807-826.
57. O'Farrell M, Ventura R, Tai A, et al. Preclinical characterization of PWT143, a novel selective and potent phosphatidylinositol 3-ki nase delta (PI3K delta) inhibitor with ex-vivo activity in hemato logic malignancies [abstract]. Blood. 2012;120(21):2907.
58. Moreno O, Butler T, Zann V, et al. Safety, pharmacokinetics, and
pharmacodynamics of ME-401, an oral, potent, and selective in hibitor of phosphatidylinositol 3-kinase P110d, following single ascending dose administration to healthy volunteers. Clin Ther. 2018;40(11):1855-1867.
59. Soumerai JD, Pagel JM, Jagadeesh D, et al. Initial results of a dose escalation study of a selective and structurally differentia ted PI3Kd inhibitor, ME-401, in relapsed/refractory (R/R) follicu lar lymphoma (FL) and chronic lymphocytic leukemia (CLL)/small lymphocytic lymphoma (SLL) J Clin Oncol. 2018;36(15 Suppl):7519.
60. Zelenetz A, Soumerai JD, Jagadeesh D, et al. Preliminary safety and efficacy results with an intermittent schedule of the PI3kd inhibitor ME-401 alone or in combination with rituximab for Bcell malignancies. Blood. 2018;132(Suppl 1):2893.
61. Zelenetz AD, Zinzani PL, Chan H, et al. ME-401-003 (TIDAL): a multicenter, randomized, double-blind, placebo-controlled, two-arm, phase 2 study of ME-401 investigating continuous and intermittent dosing schedules in patients with relapsed/refrac tory follicular lymphoma. Blood. 2019;134(Suppl 1):5244.
62. Jurczak W, Zinzani PL, Cunningham D, et al. Coastal: a phase 3 study of the PI3Kd inhibitor zandelisib with rituximab (R) versus immunochemotherapy in patients with relapsed indolent nonHodgkin's lymphoma (iNHL). Blood. 2021;138(Suppl 1):2430.
63. Shin N, Koblish H, Covington M, et al. INCB050465, a novel PI3Kd inhibitor, synergizes with PIM protein kinase inhibition to cause tumor regression in a model of DLBCL. Cancer Res. 2015;75(15 Suppl):2671.
64. Forero-Torres A, Ramchandren R, Yacoub A, et al. Parsaclisib, a potent and highly selective PI3Kd inhibitor, in patients with re lapsed or refractory B-cell malignancies. Blood. 2019;133(16):1742-1752.
65. Patnaik A, Appleman LJ, Tolcher AW, et al. First-in-human phase I study of copanlisib (BAY 80-6946), an intravenous pan-class I phosphatidylinositol 3-kinase inhibitor, in patients with advan ced solid tumors and non-Hodgkin's lymphomas. Ann Oncol. 2016;27(10):1928-1940.
66. Yang X, Yang X, Cui X, et al. BGB-10188, a highly selective PI3Kd inhibitor with improved safety profile and superior anti-tumor activities in vivo. Cancer Res. 2020;80(16 Suppl):664.
67. Jiang B, Qi J, Song Y, et al. Phase 1 clinical trial of the PI3Kd inhi bitor YY-20394 in patients with B-cell hematological malignan cies. J Hematol Oncol. 2021;14(1):130.
68. Lawrence T, Hahka-Kemppinen M, Cohen JB, Kania M. A phase 1 study of HMPL-689, a small molecule, highly selective, and po tent inhibitor of phosphoinositide 3 kinase-delta, in patients with relapsed or refractory lymphoma. Blood. 2020;136(Suppl):17-18.
69. Locatelli SL, Careddu G, Serio S, et al. Targeting cancer cells and tumor microenvironment in preclinical and clinical models of Hodgkin lymphoma using the dual PI3Kd/g inhibitor RP6530. Clin Cancer Res. 2019;25(3):1098-1112.
70. Carlo-Stella C, Delarue R, Scarfo L, et al. A first-in-human study of tenalisib (RP6530), a dual PI3Kd/g inhibitor, in patients with relapsed/refractory hematologic malignancies: results from the European study. Clin Lymphoma Myeloma Leuk. 2020;20(2):78-86.
71. Huen A, Haverkos BM, Zain J, et al. Phase I/Ib study of tenalisib (RP6530), a dual PI3Kd/g inhibitor in patients with relapsed/re fractory T-cell lymphoma. Cancers (Basel). 2020;12:2293.
72. Liu N, Rowley BR, Bull CO, et al. BAY 80-6946 is a highly selec tive intravenous PI3K inhibitor with potent p110a and p110d acti vities in tumor cell lines and xenograft models. Mol Cancer Ther. 2013;12(11):2319-2330.
73. Göckeritz E, Kerwien S, Baumann M, et al. Efficacy of phospha
tidylinositol-3 kinase inhibitors with diverse isoform selectivity profiles for inhibiting the survival of chronic lymphocytic leuke mia cells. Int J Cancer 2015;137(9):2234-2242.
74. Dreyling M, Santoro A, Mollica L, et al. Long-term safety and ef ficacy of the PI3K inhibitor copanlisib in patients with relapsed or refractory indolent lymphoma: 2-year follow-up of the CHRONOS-1 study. Am J Hematol. 2020;95(4):362-371.
75. Matasar MJ, Capra M, Özcan M, et al. Copanlisib plus rituximab versus placebo plus rituximab in patients with relapsed indo lent non-Hodgkin lymphoma (CHRONOS-3): a double-blind, ran domised, placebo-controlled, phase 3 trial. Lancet Oncol. 2021;22(5):678-689.
76. Matasar MJ, Dreyling M, Leppä S, et al. Feasibility of combining the phosphatidylinositol 3-kinase inhibitor copanlisib with ritu ximab-based immunochemotherapy in patients with relapsed indolent B-cell lymphoma. Clin Lymphoma Myeloma Leuk. 2021;21(11):e886-e894.
77. de Gooijer MC, Zhang P, Buil LCM, et al. Buparlisib is a brain pe netrable pan-PI3K inhibitor. Sci Rep. 2018;8(1):10784.
78. Amrein L, Shawi M, Grenier J, Aloyz R, Panasci L. The phosphati dylinositol-3 kinase I inhibitor BKM120 induces cell death in Bchronic lymphocytic leukemia cells in vitro. Int J Cancer. 2013;133(1):247-252.
79. Younes A, Salles G, Martinelli G, et al. Pan-phosphatidylinositol 3-kinase inhibition with buparlisib in patients with relapsed or refractory non-Hodgkin lymphoma. Haematologica. 2017;102(12):2104-2112.
80. Stock S, Übelhart R, Schubert ML, et al. Idelalisib for optimi zed CD19-specific chimeric antigen receptor T cells in chronic lymphocytic leukemia patients. Int J Cancer 2019;145(5):1312-1324.
81. Funk CR, Wang S, Chen KZ, et al. PI3Kd/g inhibition promotes human CART cell epigenetic and metabolic reprogramming to enhance antitumor cytotoxicity. Blood. 2022;139(4):523-537.
82. Brown JR. Phosphatidylinositol 3 kinase delta inhibitors: present and future. Cancer J. 2019;25(6):394-400.
83. Choi SW, Gatza E, Hou G, et al. Histone deacetylase inhibition regulates inflammation and enhances Tregs after allogeneic he matopoietic cell transplantation in humans. Blood. 2015;125(5):815-819.
84. Lucas JL, Mirshahpanah P, Haas-Stapleton E, et al. Induction of Foxp3+ regulatory T cells with histone deacetylase inhibitors. Cell Immunol. 2009;257(1-2):97-104.
85. Ramos TL, Garcia-Guerrero E, Caballero-Velazquez T, et al. De layed administration of ixazomib modifies the immune response and prevents chronic graft-versus-host disease. Bone Marrow Transplant. 2021;56(12):3049-3058.
86. Blanco B, Perez-Simon JA, Sanchez-Abarca LI, et al. Treatment with bortezomib of human CD4+ T cells preserves natural regu latory T cells and allows the emergence of a distinct suppressor T-cell population. Haematologica. 2009;94(7):975-983.
87. Skånland SS, Inngjerdingen M, Bendiksen H, et al. Functional te sting of relapsed chronic lymphocytic leukemia guides precision medicine and maps response and resistance mechanisms. An index case. Haematologica. 2022;107(8):1994-1998.
88. Horwitz SM, Nikitina A, Kotlov N et al. The combination of duve lisib and romidepsin (DR) is highly active against relapsed/re fractory peripheral T-cell lymphoma with low rates of transaminitis: final results and biomarker analysis [abstract]. Blood. 2021;39(Suppl 2):683.
89. Danilov AV, Herbaux C, Walter HS, et al. Phase Ib study of tira brutinib in combination with idelalisib or entospletinib in pre viously treated chronic lymphocytic leukemia. Clin Cancer Res. 2020;26(12):2810-2818.
90. Le T, Jerel D, Bryan LJ. Update on the role of copanlisib in he matologic malignancies. Ther Adv Hematol. 2021;12:20406207211006027.
91. Skånland SS, Karlsen L, Taskén K. B cell signaling pathwaysnew targets for precision medicine in CLL. Scand J Immunol. 2020;92(5):e12931.
92. Agius R, Parviz M, Niemann CU. Artificial intelligence models in chronic lymphocytic leukemia - recommendations toward state-of-the-art. Leuk Lymphoma. 2022;63(2):265-278.
93. Tailoring the targeted treatment of chronic lymphocytic leuke mia (CLL-CLUE). Available from: www.era-learn.eu/network-in formation/networks/era-permed/multidisciplinary-research-proj ects-on-personalised-medicine-2013-pre-clinical-research-bigdata-and-ict-implementation-and-user2019s-perspective/tailo ring-the-targeted-treatment-of-chronic-lymphocytic-leukemia. ERA-LEARN. 2021.
Francesco Marchesi,1* Jon Salmanton-García,2,3* Ziad Emarah,4 Klára Piukovics,5 Marcio Nucci,6 Alberto López-García,7 Zdeněk Ráčil,8 Francesca Farina,9 Marina Popova,10 Sofia Zompi,11 Ernesta Audisio,11 Marie-Pierre Ledoux,12 Luisa Verga,13,14 Barbora Weinbergerová,15 Tomas Szotkovski,16 Maria Gomes Da Silva,17 Nicola Fracchiolla,18 Nick De Jonge,19 Graham Collins,20 Monia Marchetti21 Gabriele Magliano22 Carolina García-Vidal23 Monika M. Biernat24 Jaap Van Doesum,25 Marina Machado,26 Fatih Demirkan,27 Murtadha Al-Khabori,28 Pavel Žák,29 Benjamín Víšek,29 Igor Stoma,30 Gustavo-Adolfo Méndez,31 Johan Maertens,32 Nina Khanna,33 Ildefonso Espigado,34 Giulia Dragonetti,35 Luana Fianchi,35 Maria Ilaria Del Principe,36 Alba Cabirta,37,38 Irati OrmazabalVélez,39 Ozren Jaksic,40 Caterina Buquicchio,41 Valentina Bonuomo,42 Josip Batinić,43,44,45 Ali S. Omrani,46 Sylvain Lamure,47 Olimpia Finizio,48 Noemí Fernández,49 Iker Falces-Romero,50 Ola Blennow,51 Rui Bergantim,52 Natasha Ali,53 Sein Win,54 Jens Van Praet,55 Maria Chiara Tisi,56 Ayten Shirinova,57 Martin Schönlein,58 Juergen Prattes,59 Monica Piedimonte,60 Verena Petzer,61 Milan Navrátil,62 Austin Kulasekararaj,63 Pavel Jindra,64 Jiří Sramek,65,66 Andreas Glenthøj,67 Rita Fazzi,68 Cristina De Ramón-Sánchez,69,70 Chiara Cattaneo,71 Maria Calbacho,72 Nathan C. Bahr,73 Shaimaa El-Ashwah,4 Raul Cordoba,7 Michaela Hanakova,8 Giovanni Paolo Maria Zambrotta,13 Giovanni Zambrotta,14 Mariarita Sciumè,18 Stephen Booth,20 Raquel Nunes Rodrigues,17 Maria Vittoria Sacchi,21 Nicole García-Poutón,23 Juan-Alberto Martín-González,74 Sofya Khostelidi,75 Stefanie Gräfe,76,2,3 Laman Rahimli,2,3 Emanuele Ammatuna,25 Alessandro Busca,11 Paolo Corradini,77 Martin Hoenigl,78,79,80 Nikolai Klimko,75 Philipp Koehler,2,3 Antonio Pagliuca,81 Francesco Passamonti,82 Oliver A. Cornely2,3,83,84# and Livio Pagano35,85#
Correspondence: J. SALMANTON-GARCÍA jon.salmanton-garcia@uk-koeln.de
Received: February 11, 2022.
Accepted: May 5, 2022. Prepublished: May 12, 2022.
https://doi.org/10.3324/haematol.2022.280847 ©2023 Ferrata Storti Foundation Published under a CC BY-NC license
1Hematology and Stem Cell Transplant Unit, IRCCS Regina Elena National Cancer Institute, Rome, Italy; 2University of Cologne, Faculty of Medicine and University Hospital Cologne, Cologne Excellence Cluster on Cellular Stress Responses in Aging-Associated Diseases (CECAD), Cologne, Germany; 3University of Cologne, Faculty of Medicine and University Hospital Cologne, Department I of Internal Medicine, Excellence Center for Medical Mycology (ECMM), Cologne, Germany; 4Oncology Center, Mansoura University, Mansoura, Egypt; 5Department of Internal Medicine, South Division Faculty of Medicine University of Szeged, Szeged, Hungary; 6Department of Internal Medicine, Federal University of Rio de Janeiro, Rio de Janeiro, Brazil; 7Fundacion Jimenez Diaz University Hospital, Health Research Institute IIS-FJD, Madrid, Spain; 8Institute of Hematology and Blood Transfusion, Prague, Czech Republic; 9IRCCS Ospedale San Raffaele, Milan, Italy; 10RM Gorbacheva Research Institute, Pavlov University, St. Petersburg, Russia; 11Stem Cell Transplant Center, AOU Citta' della Salute e della Scienza, Turin, Italy; 12Institut de Cancérologie Strasbourg Europe (ICANS), Strasbourg, France; 13Azienda Ospedaliera San Gerardo - Monza, Monza, Italy; 14Università MilanoBicocca, Milan, Italy; 15Department of Internal Medicine, Hematology and Oncology, University Hospital Brno, Brno, Czech Republic; 16University Hospital Olomouc, Olomouc, Czech Republic; 17Portuguese Institute of Oncology, Lisbon, Portugal; 18Hematology Unit, Fondazione IRCCS Ca' Granda Ospedale Maggiore Policlinico, Milan, Italy; 19Amsterdam UMC, location VUmc, Amsterdam, the Netherlands; 20Oxford University Hospitals, Oxford, UK; 21Azienda Ospedaliera Nazionale “SS. Antonio e Biagio e Cesare Arrigo”, Alessandria, Italy; 22ASST Grande Ospedale Metropolitano Niguarda, Milan, Italy; 23Department of Infectious Diseases, Hospital Clinic de Barcelona, University of Barcelona, IDIBAPS, Barcelona, Spain; 24Department of Haematology, Blood Neoplasms, and Bone Marrow Transplantation, Wroclaw Medical University, Wroclaw, Poland; 25University Medical Center Groningen, Groningen, the Netherlands; 26Clinical Microbiology and Infectious Diseases Department, Hospital General Universitario Gregorio Marañón, Madrid, Spain; 27Division of Hematology, Dokuz Eylul University, Izmir, Turkey; 28Sultan Qaboos University Hospital, Muscat, Oman; 29University Hospital Hradec Králové, Hradec Králové, Czech Republic; 30Gomel State Medical University, Gomel, Belarus; 31Hospital Escuela de Agudos Dr. Ramón Madariaga, Posadas, Argentina; 32Department of Microbiology, Immunology, and Transplantation, KULeuven and Department of Hematology, UZ Leuven, Leuven, Belgium; 33Division of Infectious Diseases and Hospital Epidemiology, and Department of Clinical Research, University and University Hospital of Basel, Basel, Switzerland; 34Department of Hematology, University Hospital Virgen Macarena - University Hospital Virgen del Rocío, Instituto de Biomedicina de Sevilla (IBIS/CSIC), Universidad de Sevilla, Seville, Spain; 35Hematology Unit, Fondazione Policlinico Universitario Agostino Gemelli - IRCCS, Rome, Italy; 36Hematology Unit, Department of Biomedicine and Prevention, Tor Vergata University of Rome, Italy; 37Departament de Medicina, Universitat Autònoma de Barcelona, Bellaterra, Spain; 38Department of Hematology, Vall d’Hebron Hospital Universitari, Experimental Hematology, Vall d’Hebron Institute of Oncology (VHIO), Vall d’Hebron Barcelona Hospital Campus, Barcelona, Spain; 39Complejo Hospitalario de Navarra, IruñaPamplona, Spain; 40University Hospital Dubrava, Zagreb, Croatia; 41Ematologia con Trapianto, Ospedale Dimiccoli Barletta, Barletta, Italy; 42Department of Medicine, Section of Hematology, University of Verona, Verona, Italy; 43Croatian Cooperative Group for Hematological Diseases (CROHEM), Zagreb, Croatia; 44Faculty of Medicine University of Zagreb, Zagreb, Croatia; 45University Hospital Centre Zagreb, Zagreb, Croatia; 46Hamad Medical Corporation, Division of Infectious Diseases, Doha, Qatar; 47Département d’Hématologie Clinique, CHU de Montpellier, UMRCNRS 5535, Universite de Montpellier, Montpellier, France; 48UOC Hematology, AORN Cardarelli, Naples, Italy; 49Hospital Universitario Marqués de Valdecilla, Santander, Spain; 50La Paz University Hospital, Madrid, Spain; 51Department of Infectious Diseases, Karolinska University Hospital, Stockholm, Sweden; 52Centro Hospitalar e Universitário São João, Porto, Portugal; 53Aga Khan University Hospital, Karachi, Pakistan;
54Department of Clinical Hematology, Yangon General Hospital, University of Medicine, Yangon, Myanmar; 55Department of Nephrology and Infectious Diseases, AZ Sint-Jan Brugge-Oostende AV, Brugge, Belgium; 56Ospedale San Bortolo, Vicenza, Italy; 57Azerbaijan Scientific Research Hematology and Transfusiology Institute, Baku, Azerbaijan; 58Department of Oncology, Hematology and Bone Marrow Transplantation with Section of Pneumology, University Medical Center Hamburg-Eppendorf, Hamburg, Germany; 59Medical University of Graz, Department for Infectious Diseases, Graz, Austria; 60AOU Sant'Andrea, Rome, Italy; 61Department of Hematology and Oncology, Medical University of Innsbruck, Innsbruck, Austria; 62Head of the ICU and Transplant Unit, Department of Hematooncology, University Hospital of Ostrava, Ostrava-Poruba, Czech Republic; 63King's College Hospital, London, UK; 64University Hospital Pilsen, Pilsen, Czech Republic; 65Department of Hematology and Oncology, University Hospital Pilsen, Pilsen, Czech Republic; 66Department of Histology and Embryology, Faculty of Medicine, Pilsen, Czech Republic; 67Department of Hematology, Copenhagen University Hospital - Rigshospitalet, Copenhagen, Denmark; 68AOUP - Azienda Ospedaliera Università Pisana - Cisanello, Pisa, Italy; 69Hematology Department, Hospital Universitario de Salamanca, Salamanca, Spain; 70IBSAL, Centro de Investigación del Cáncer-IBMCC (USAL-CSIC), Salamanca, Spain; 71Hematology Unit, ASST-Spedali Civili, Brescia, Italy; 72Hospital Universitario 12 de Octubre, Madrid, Spain; 73University of Kansas Medical Center, Kansas City, USA; 74Hospital Univesitario Virgen del Rocío, Seville, Spain; 75North-Western State Medical University named after Iliá Ilich Méchnikov, Saint-Petersburg, Russia; 76Universitätsklinikum Hamburg Eppendorf, Hamburg, Germany; 77University of Milan and Fondazione IRCCS Istituto Nazionale dei Tumori, Milan, Italy; 78Clinical and Translational FungalWorking Group, University of California San Diego, La Jolla, CA, USA; 79Division of Infectious Diseases and Global Public Health, Department of Medicine, University of California San Diego, San Diego, CA, USA; 80Division of Infectious Diseases, Department of Internal Medicine, Medical University of Graz, Graz, Austria; 81Department of Haematological Medicine, Kings College Hospital NHS Foundation Trust, London, UK; 82Department of Medicine and Surgery, University of Insubria and ASST Sette Laghi, Ospedale di Circolo of Varese, Varese, Italy; 83German Centre for Infection Research (DZIF), Partner Site Bonn-Cologne, Cologne, Germany; 84University of Cologne, Faculty of Medicine and University Hospital Cologne, Clinical Trials Centre Cologne (ZKS Köln), Cologne, Germany and 85Hematology Unit, Università Cattolica del Sacro Cuore, Rome, Italy
*FM and JSG contributed equally as co-first authors. #OAC and LP contributed equally as co-senior authors.
Patients with acute myeloid leukemia (AML) are at high risk of dying from coronavirus disease 2019 (COVID-19). The optimal management of AML patients with COVID-19 has not been established. Our multicenter study included 388 adult AML patients diagnosed with COVID-19 between February 2020 and October 2021. The vast majority were receiving or had received AML treatment in the preceding 3 months. COVID-19 was severe in 41.2% and critical in 21.1% of cases. The chemotherapeutic schedule was modified in 174 patients (44.8%), delayed in 68 and permanently discontinued in 106. After a median follow-up of 325 days, 180 patients (46.4%) had died; death was attributed to COVID-19 (43.3%), AML (26.1%) or to a combination of both (26.7%), whereas in 3.9% of cases the reason was unknown. Active disease, older age, and treatment discontinuation were associated with death, whereas AML treatment delay was protective. Seventy-nine patients had a simultaneous AML and COVID-19 diagnosis, with better survival when AML treatment could be delayed (80%; P<0.001). Overall survival in patients with a diagnosis of COVID-19 between January 2020 and August 2020 was significantly lower than that in patients diagnosed between September 2020 and February 2021 and between March 2021 and September 2021 (39.8% vs. 60% vs. 61.9%, respectively; P=0.006). COVID-19 in AML patients was associated with a high mortality rate and modifications of therapeutic algorithms. The best approach to improve survival was to delay AML treatment, whenever possible.
Acute myeloid leukemia (AML) is an aggressive hemato logic malignancy often requiring immediate chemotherapy because of a high risk of early disease-related lifethreatening complications including death.1 AML patients are severely immunocompromised, and infections are fre quently associated with both the disease-related weakened immunity and the aggressive chemotherapeutic regimen.2 Although viral infections are less relevant than bacterial and fungal infections, respiratory viruses may also affect AML patients, particularly during seasonal epi demics.3
Coronavirus disease 2019 (COVID-19), caused by severe acute respiratory syndrome coronavirus 2 (SARS-CoV-2), is associated with a severe clinical presentation in AML pa tients. Most of the studies performed in the pre-vaccine era reported mortality rates higher than 40%.4-8 The litera ture regarding COVID-19 in AML patients is limited to small cohorts,9-10 case reports and case series,10-14 expert opinions and consensus,13,15 or series reporting both patients with AML and acute lymphoblastic leukemia.16-17 Specific data on large cohorts of patients with long-term follow-up are, therefore, still lacking. To the best of our knowledge, there are still no evidence-based algorithms guiding clinicians to choose the best therapeutic approach and timing, par
ticularly in patients with a simultaneous diagnosis of AML and COVID-19. Thus, in order to establish the best therapeutic approach, we aimed to describe clinical features and long-term fol low-up of a large cohort of AML patients with COVID-19 registered in the EPICOVIDEHA registry, with a particular focus on patients with a concomitant diagnosis of AML and COVID-19.
This was an observational multicenter study of AML pa tients who developed COVID-19 between February 2020 and October 2021, with data from EPICOVIDEHA (registered with www.clinicaltrials.gov; ID NCT04733729), an inter national open web-based registry for hematologic malig nancies and COVID-19 patients initiated in February 2020 by members of the Infections in Hematology Scientific Working Group of the European Hematology Association (EHA). EPICOVIDEHA was approved by the local ethics committee of the Fondazione Policlinico Universitario Agostino Gemelli - IRCCS, Università Cattolica del Sacro Cuore of Rome, Italy (ID 3226). All consecutive AML pa tients diagnosed with COVID-19 were captured and regis tered in this web-based registry. The respective local ethics committee of each participating institution provided approval as appropriate. The methodology of EPICOVIDEHA has been described elsewhere.18 The electronic case report form is accessible online at www.clinicalsurveys.net (EFS Summer 2021, TIVIAN GmbH, Cologne, Germany).19 Each patient was reviewed and validated by infectious diseases and hematology experts. Inclusion criteria were: (i) active AML within the 5 years preceding the diagnosis of COVID19; (ii) age ≥18 years old; and (iii) a laboratory-based diag nosis of COVID-19. Patients’ conditions before COVID-19 (i.e., age, sex, AML status at COVID-19 diagnosis, comor bidities), AML clinical management, COVID-19 diagnosis and management, and outcome were also recorded. In formation regarding AML treatment modifications (i.e., delay or discontinuation) due to COVID-19, and the con tribution of the diagnosis of COVID-19 to AML relapse or status at the last day of follow-up was also collected. Status of the hematologic malignancy at the onset of COVID-19 and last follow-up was defined as active (onset, stable disease, refractory/resistant) or controlled (com plete response) based on reports from the respective par ticipating institution. COVID-19 severity was graded according to international standards as previously de scribed.4,20,21 Patients were divided in three groups accord ing to period of diagnosis: (i) January to August 2020 (first global wave of the pandemic); (ii) September 2020 to Feb ruary 2021 (diagnosed in the 2020-2021 New Year holiday
period); and (iii) March to September 2021 (diagnosed after SARS-CoV-2 vaccines became available). Patients with in complete data about COVID-19 diagnosis, AML treatment phase/disease status and date of last follow-up were ex cluded from the final analysis.
The primary objective of this study was to evaluate the epidemiology and outcome of AML patients with COVID19. Secondary objectives were to estimate the prevalence of disease severity, to describe the overall case-fatality rate, and to stratify patients according to their treatment phase (induction, consolidation, maintenance, palliative, reinduction), chemotherapeutic program modification due to COVID-19 (treatment discontinuation, delay or continu ation), and timing of COVID-19 diagnosis.
Categorical variables were described using frequencies and percentages, whereas continuous variables were ex pressed as median, interquartile range (IQR) and absolute range. A Cox regression hazard model was designed and run with variables considered to play a role in the mortality of AML patients with COVID-19, as previously described.4 A multivariable Cox regression model was calculated with the Wald backward method, and only those variables with P≤0.1 were displayed. Mortality was analyzed using KaplanMeier survival plots. A log-rank test was used to compare the survival probability of the patients included in the dif ferent models. A P-value ≤0.05 was considered statistically significant. SPSS v27.0 was employed for statistical ana lyses (SPSS, IBM Corp., Chicago, IL, USA).
Between February 2020 and October 2021, 556 consecu tive adult AML patients with confirmed SARS-CoV-2 infec tion were reported in the EPICOVIDEHA registry from 132 centers and 20 countries around the world. Out of these patients, 168 (30.2%) were excluded from this analysis be cause of missing data. In 25 cases (6.4%), a diagnosis of acute promyelocytic leukemia (APL) was reported. The demographic and clinical characteristics of the re maining 388 patients are shown in Table 1. Their median age was 59 years (IQR, 45-70) and there was a slight male predominance (52.6%). Most patients had at least one underlying comorbidity, with chronic heart disease (e.g., hypertension, obstructive arteriopathy, atrial fibrillation) being the most frequent, whereas 175 patients (45.1%) had comorbidities. At the time of the COVID-19 diagnosis, 196 patients (50.5%) had controlled AML, and 192 (49.5 %) had active disease, including 79 (20.4%) patients at the onset of their leukemia. Only 110 patients (28.3%) were not on
active treatment; of these 110 patients, only four were on best supportive care, 18 were at the disease onset, whereas the remaining cases were in complete remission or in off-treatment follow-up. Overall, 237 patients (64.6%) had received intensive chemotherapy and transplantation, which were the most common strategies immediately be fore COVID-19. The chemotherapeutic program was mod ified because of COVID-19 in 174 (44.8%) patients; in 106 (60.9%) it was discontinued permanently, whereas in the remaining 68 (39.1%) it was delayed and resumed at a
median of 1 month (IQR, 1-2) after the diagnosis of COVID19, once a negative SARS-CoV-2 swab had been docu mented. At COVID-19 onset, 71 (18.3%) and 53 (13.7%) patients had neutrophil and lymphocyte counts below 0.5x10⁹/L and 0.2x10⁹/L, respectively. Two hundred and twenty patients (56.7%) had pulmonary symptoms at the onset of COVID-19, mainly cough and dyspnea, 82 (21.1%) exhibited only extra-pulmonary symptoms and 86 (22.2%) were asymptomatic and diagnosed with COVID-19 after screening. As shown in Table 1, COVID-19 severity was criti
Table 1. Demographic and clinical features of 388 patients with acute myeloid leukemia at the time of COVID-19 diagnosis.
N %
N %
Sex
Female 184 47.4 Male 204 52.6
Age, years
Median (IQR) Range 59 (45-70) 18-89 Comorbidities 213 54.9
AML status at COVID-19 dia gnosis
Controlled disease 196 50.5 Complete remission 196 50.5 Active disease 192 49.5 Onset 79 20.4 Refractory/resistant 113 29.2 Last/ongoing treatment stra tegy before COVID-19
Treatment 367 94.6
Conventional chemotherapy 250 64.4 Last month 172 44.3 Last 3 months 46 11.9 >3 months 32 8.2 HSCT 72 18.6 Last month 8 2.1 Last 3 months 11 2.8 >3 months 53 13.7 Best supportive care 45 11.6 Last month 27 7.0 Last 3 months 9 2.3 >3 months 4 1.0 Not stated 5 1.3 No treatment 21 5.4
COVID-19 infection
Critical infection 82 21.1 Severe infection 160 41.2 Mild infection 69 17.9 Asymptomatic 77 19.8
COVID-19 diagnosis Swab 376 96.9 BAL+swab 5 1.3 Serology 4 1.0 BAL 3 0.8
Symptoms at COVID-19 onset
Pulmonary 144 37.1 Screening 86 22.2 Extrapulmonary 82 21.1 Pulmonary + extrapulmonary 76 19.6 Neutrophils, x 109/L ≤0.5 71 18.3 0.501-0.999 38 9.8 ≥1 203 52.3 Lymphocytes, x 109/L ≤0.2 0.201-0.499 ≥0.5
53 56 211
13.7 14.4 54.4
Stay during COVID-19 Admitted to hospital 293 75.5 Duration of stay in hospital, days Median (IQR) Range 17 (8-30) 1-210 Admitted to ICU 82 21.1 Duration of ICU stay, days Median (IQR) Range 10 (5-20) 1-111 Invasive MV 63 16.2 Non-invasive MV 19 4.9 At home 117 30.2 Outcome
Alive 208 53.6
Observation time, days Median (IQR) Range 325 (117-386) 3-639 Dead 180 46.4
Observation time, days Median (IQR) Range 20 (8-58) 0-528
Reason for death COVID-19 78 43.3 COVID-19 + HM 48 26.7 HM 47 26.1 Unknown reasons 7 3.9
COVID-19: coronavirus disease 2019; IQR: interquartile range; AML: acute myeloid leukemia; HSCT: hematopoietic stem cell transplantation; BAL: bronchoalveolar lavage; IQR: interquartile range; ICU: intensive care unit; MV: mechanical ventilation; HM: hematologic malignancy.
Figure 1. Flow-chart of registered patients with acute myeloid leukemia. For five patients, it is not known when they received their treatment. Numbers for the reasons of death may be super-additive. AML: acute myeloid leukemia; COVID-19: coronavirus disease 2019; EPICOVIDEHA; COVID-19 study of the European Hematology Association.

cal in 82 patients (21.1%), severe in 160 (41.2%), mild in 69 (17.9%), and asymptomatic in the remaining cases (19.8%). Overall, 293 patients (75.5%) were hospitalized during their SARS-CoV-2 infection for a median of 17 days (IQR, 8-30). Eighty-two patients (21.1%) were admitted to an intensive care unit for a median stay of 10 days (IQR, 5-20), 63 (76.8%) of whom required invasive mechanical ventilation. After a median follow-up of 325 days (IQR, 3-639), 180 pa tients (46.4%) had died. The reported primary reason for death was COVID-19 in 78 (43.3%) patients, AML in 47 (26.1%), a combination of both in 48 (26.7%) and unknown in seven patients (3.9%) (Table 1, Figure 1). The mortality rate of patients with ongoing or recent (<1 month before COVID-19 diagnosis) AML treatment, like those treated 1 to 3 months prior to their COVID-19 diagnosis, was signifi cantly higher than that of patients receiving treatment until 3 months or earlier before the diagnosis COVID-19 (P<0.001) (Figure 2). When considering AML patients whose last chemotherapy was administered within the month be fore the COVID-19 diagnosis, a higher mortality rate was observed in 68 (80.9%) patients who discontinued treat ment, regardless of the treatment phase (Figure 3). Of
note, patients who discontinued treatment were not dif ferent in terms of median age, but more often had at least one comorbidity and had a slightly but not statistically sig nificant worse clinical presentation of COVID-19. A signifi cantly lower overall mortality rate was observed in patients in whom chemotherapy was delayed (overall mortality rate: 18.4%, 9/49), as opposed to that of patients whose treat ment was not delayed (37.5%, 9/24) (P<0.001), with the only exception of the re-induction subgroup of patients (Figures 3 and 4). The overall mortality rate of patients in induction (67.1%, n=51) or re-induction (77.7%, n=28) was higher than that of patients receiving consolidation (20%, n=10) during the last month prior to COVID-19 (P<0.001). Interestingly, we did not find any statistically significant difference in terms of survival between patients in complete remission (off-treatment) and those in complete remission but under consolidation treatment (mortality rate: 20.2% vs. 24.1%; P=0.677). In the univariable analysis, several factors were associated with an increased mortality (Table 2): older age, previous comorbidities (i.e., chronic heart disease or renal impairment), active malignancy, critical COVID-19, or per manent AML treatment discontinuation. Contrariwise, hav
ing a neutrophil or lymphocyte count above 0.5x10⁹/L and 0.2x10⁹/L, respectively, AML treatment >3 months before COVID-19 diagnosis and AML treatment delay were associ ated with a reduced mortality. In the multivariable model, active disease (hazard ratio [HR]=4.197, 95% confidence in terval [95% CI]: 2.196-8.020; P<0.001), older age (HR=1.016,

95% CI: 1.004-1.028; P=0.012), and treatment discontinu ation (HR=4.417, 95% CI: 2.306-8.460; P<0.001) were associ ated with a higher mortality, as opposed to treatment delay, which was found to be protective (HR=0.367, 95% CI: 0.151-0.891; P=0.027). After a time-dependent analysis, it was observed that overall survival in patients diagnosed
Figure 2. Survival probability by timing of last received treatment. AML: acute myeloid leukemia; COVID-19: coronavirus disease 2019; tx: treatment.

Figure 4. Survival probability by modification of initial chemotherapeutic program due to COVID-19 diagnosis. COVID-19: coronavirus disease 2019; Tx: therapeutic program for acute myeloid leukemia.

with COVID-19 between January 2020 and August 2020 was significantly lower than that of patients who were di agnosed between September 2020 and February 2021 and between March 2021 and September 2021 (39.8% vs. 60% vs. 61.9%, respectively; P=0.006) (Online Supplementary Figure S2).
Table 3 presents the demographic and clinical features of the 79 patients with a simultaneous diagnosis of AML and COVID-19. In 18 patients (22.8%), COVID-19 was diagnosed before the start of induction, resulting in a treatment delay. Overall survival was higher among patients whose treat ment was delayed (80%) than among those whose treat ment was not delayed and not discontinued (64%) or was discontinued (6%) (P<0.001) (Table 3, Online Supplementary Figure S1). Finally, a separate sub-analysis was carried out focusing on AML patients receiving consolidation treat ment (Online Supplementary Figure S3), relapsed/refrac tory patients being given re-induction (Online Supplementary Figure S4) and patients in complete re mission (Online Supplementary Figure S5), confirming the better clinical outcome in patients in whom treatment was delayed.
There is a gap of knowledge regarding COVID-19 in AML pa tients, as the current evidence is restricted to small co
horts of patients, case reports/series, or expert opinions.917 This gap has made it difficult to establish the best strat egy to manage AML patients during the pandemic.22,23 Taken together, the current evidence suggests that AML patients often present with a severe clinical form of COVID-19, frequently with respiratory distress and a very high mortality rate, between 40 and 50% higher than that in the pre-vaccine era. Here we present, to the best of our knowledge, the largest survey of AML patients with COVID19, with 388 patients reported from 132 institutions, with a special focus on their long-term follow-up. The data presented in our manuscript confirm that AML patients frequently have a severe clinical presentation of COVID-19, mainly with respiratory symptoms, and a high rate of in tensive care unit admission, even among those with lowrisk AML (i.e., acute promyelocytic leukemia). Neutrophil and lymphocyte counts were not found to be significantly associated with mortality in our multivariable model. The potential role of neutropenia as a risk factor for death in AML is of particular relevance considering that impairment of neutrophil function is a typical feature of this malignancy. There are many studies addressing neu tropenia as a potential risk factor in COVID-19, but only four of them were able to support its role as a factor affecting survival.24-27 In particular, a recent study from the Memorial Sloan Kettering Cancer Center (New York, NY, USA) showed that neutropenia between 7 days immediately prior to and up to 28 days after SARS-CoV-2 diagnosis was associated
Table 2. Overall mortality predictors of death in patients with acute myeloid leukemia and COVID-19.
Univariable
Multivariable 95% CI 95% CI
P value HR Lower limit Upper limit P value HR Lower limit Upper limit Sex
Female
Male 0.403 1.135 0.844 1.526 Age <0.001 1.029 1.019 1.040 0.012 1.016 1.004 1.028 Comorbidities 0.001 1.699 1.251 2.308 0.437 0.831 0.520 1.326 AML status
Controlled disease Active disease <0.001 4.353 3.111 6.092 <0.001 4.197 2.196 8.020 COVID-19 infection
Asymptomatic Mild infection 0.370 0.770 0.435 1.363 0.566 0.804 0.382 1.694 Severe infection 0.454 1.187 0.758 1.857 0.812 1.073 0.600 1.920 Critical infection <0.001 3.624 2.306 5.696 0.249 1.417 0.783 2.565
Neutrophils, x 109/L
≤0.5
0.501-0.999 0.017 0.529 0.314 0.891 0.359 0.761 0.424 1.365 ≥1 <0.001 0.426 0.299 0.608 0.473 1.198 0.732 1.961 Lymphocytes, x 109/L ≤0.2
0.201-0.499 0.982 1.006 0.624 1.620 0.309 0.702 0.355 1.389 ≥0.5 0.009 0.581 0.388 0.872 0.144 0.661 0.379 1.152
In the last month
In the last 3 months 0.464 0.863 0.583 1.279 0.903 1.038 0.568 1.897 Chemotherapy ended > 3 months before COVID-19 <0.001 0.368 0.235 0.577 0.225 2.204 0.614 7.909
Not stated 0.291 0.346 0.048 2.479 0.566 1.916 0.208 17.667 Not applicable 0.955 1.018 0.548 1.892 0.819 0.891 0.333 2.386 AML treatment delay Tx NOT delayed and NOT discontinued Tx delayed but NOT discontinued 0.013 0.361 0.161 0.808 0.027 0.367 0.151 0.891 Tx discontinued <0.001 4.271 2.372 7.690 <0.001 4.417 2.306 8.460
Relapse after COVID-19 No
Yes, due to COVID-19 0.350 0.712 0.350 1.451 - - -Yes, NOT due to COVID-19 0.796 0.928 0.527 1.636 Unknown 0.182 1.746 0.770 3.958 95% CI: 95% confidence interval; HR: hazard ratio;; COVID-19, coronavirus disease 2019; AML: acute myeloid leukemia; Tx: therapeutic program for AML.
with an increased odds of death.27 In our study, severe neutropenia was found to be significantly associated with the risk of death in univariable analysis, but the association was lost in the multivariable model, suggesting that severe neutropenia may not be associated with death in AML pa tients developing COVID-19. In our study, we tried to establish the best therapeutic
strategy for AML patients with COVID-19. So far, the best therapeutic option for these patients and timing for treat ment initiation have been based only on expert opinions and consensus,22,23 given the lack of evidence-based algo rithms to guide clinicians. This is particularly relevant for treatment-naïve AML patients with a concomitant symp tomatic SARS-CoV-2 infection. The general recommenda
Table 3. Demographic and clinical features of 79 patients with acute myeloid leukemia at the onset of their malignancy at COVID19 diagnosis.
Overall (N=79)
No treatment before COVID-19 (N=18)
Induction treatment before start of COVID-19 (N=61)
N % N % N %
Sex
Female 35 44.3 10 55.6 25 41.0 Male 44 55.7 8 44.4 36 59.0
Age, years
Median (IQR) Range 65 (50-76) 18-88 66 (55-72) 18-88 65 (50-76) 19-86
Comorbidities 48 60.8 11 61.1 37 60.7
COVID-19 infection
Critical infection 23 29.1 3 16.7 20 32.8 Severe infection 36 45.6 8 44.4 28 45.9 Mild infection 10 12.7 4 22.2 6 9.8 Asymptomatic 10 12.7 3 16.7 7 11.5
COVID-19 diagnosis
Swab 76 96.2 18 100 58 95.1 BAL+swab 2 2.5 0 0 2 3.3 Serology 1 1.3 0 0 1 1.6
Pulmonary 39 49.4 9 50.0 30 49.2 Extrapulmonary 14 17.7 4 22.2 10 16.4 Pulmonary + extrapulmonary 13 16.5 2 11.1 11 18.0 Screening 13 16.5 3 16.7 10 16.4 Neutrophils, x109/L°
≤0.5 24 30.4 4 22.2 20 32.8 0.501-0.999 10 12.7 2 11.1 8 13.1 ≥1 34 43.0 9 50.0 25 41.0 Lymphocytes, x109/L° ≤0.2 11 13.9 1 5.6 10 16.4 0.201-0.499 11 13.9 2 11.1 9 14.8 ≥0.5 50 63.3 13 72.2 37 60.7
Stay during COVID-19
Admitted to hospital 73 92.4 15 83.3 58 95.1 Duration of stay in hospital, days Median (IQR) Range 20 (9-32) 2-106 14 (4-24) 2-86 22 (9-36) 3-106 Admitted to ICU 23 29.1 3 16.7 20 32.8 Duration of ICU stay, days Median (IQR) Range 7 (4-12) 1-32 5 (2-10) 2-10 7 (4-12) 1-32
Invasive mechanical ventilation 18 22.8 1 5.6 17 27.9 Non-invasive mechanical ventilation 4 5.1 0 0.0 4 6.6 At home 10 12.7 4 22.2 6 9.8
Outcome
Alive 26 32.9 8 44.4 18 29.5
Observation time, days Median (IQR) Range 266.5 (85-386) 11-613 266.5 (122-353) 44-613 277.5 (75-408) 11-601
Continued on following page.
Dead 53 67.1 10 55.6 43 70.5
Observation time, days Median (IQR) Range 19 (6.5-57) 0-528 14 (5-48) 0-528 21 (7-63) 0-331
COVID-19 20 37.7 3 30.0 17 39.5 COVID-19 + hematologic malignancy 16 30.2 4 40.0 12 27.9 Hematologic malignancy 17 32.1 3 30.0 14 32.6
°Data can be super additive. COVID-19: coronavirus disease 2019; IQR: interquartile range; BAL: bronchoalveolar lavage; ICU: intensive care unit.
tion for these patients has been to postpone all treatments not requiring urgent initiation, including a limitation of cytoreductive therapies if needed.22 Although the current dogma of considering AML a medical urgency is changing, as suggested by some recent studies,28 prompt treatment initiation is often recommended in routine practice, es pecially in patients with de novo or relapsed/refractory dis ease. Our data suggest that delayed treatment is the best therapeutic option for AML patients with COVID-19, as shown by a lower death rate when treatment was post poned. A Spanish group made a similar finding:9 in their co hort of 108 patients, a lower mortality rate was observed in patients in whom chemotherapy was delayed as com pared to the rate in those with or without treatment modi fication. However, their results were observed only in the univariable analysis. Our multivariable model confirmed that a delay in a chemotherapeutic program was associ ated with a reduced death rate, having a significant pro tective role (HR=0.367; P=0.027). Interestingly, even when focusing on patients with new-onset AML and COVID-19, we found a better overall survival in those patients in whom a delay in AML induction was possible. The negative impact of AML treatment discontinuation on the observed death rate in our multivariable analysis can be explained by the death of patients in whom the program was discon tinued. Contrary to other reports showing an increased mortality rate for patients treated with intensive chemo therapy,6,14,16 we did not detect significant differences be tween patients given different treatment schedules, including those based on demethylating agents. However, these data should be interpreted with caution, considering that these patients may have been older or less fit when their disease developed.
The overall mortality rate in our study was 46.4%, a value comparable to that in other publications.9,10 We found that COVID-19 was the primary or a main reason for death in most cases (70%), although we deliberately decided to focus our study on overall mortality rather than on attribu table mortality. Even though attributable mortality might seem more appropriate for evaluating the impact of an in fection in patients with a hematologic malignancy, it can also be more easily influenced by the subjective judgment
of the local physician, and consequently less reliable when used in a risk factor assessment. Conversely, the overall mortality rate is not influenced by subjective interpre tations and it is, therefore, more reliable for our study aim, even when the potential role of other confounding factors, e.g., primarily leukemia progression, is taken into account. We observed an increased mortality rate associated with age and active malignancy, in agreement with previously published data.4,9 In addition, comorbidities and sex did not have an impact on mortality rate, unlike in other studies,9,17 but consistent with the previously published study from the EPICOVIDEHA registry.4 Finally, we performed a time-dependent analysis, showing that the overall survival rate of patients diagnosed with COVID-19 from January to August 2020 was significantly lower than that of patients diagnosed more recently, con firming an improvement in the clinical outcome of AML pa tients throughout the different waves of the pandemic. These observations could be explained by a combination of factors, including improved management of the disease and detection of a larger number of asymptomatic/mild cases by screening programs. Although the current data on the SARS-CoV-2 pandemic show a progressive decrease of hospitalization and deaths in the overall population, pa tients with a hematologic malignancy remain a particularly high-risk population.
Our study has some limitations. First, those intrinsically linked to the initial project design. We did not request any details regarding the therapeutic approaches to COVID-19, as these were extremely heterogeneous and treatment recommendations changed quickly. Data on viral strains were only infrequently available and about one third of patients were excluded from the final analy sis because of missing information. In addition, only a very few cases from our cohort (n=7) were documented as breakthrough infections in fully vaccinated patients, which did not allow us to draw conclusion on vaccine ef fectiveness. Interestingly, this aspect was partially ad dressed by our previous preliminary data on vaccinated patients with a hematologic malignancy, which showed a mild decrease in mortality of vaccinated AML patients.29 Finally, it is not possible to exclude a potential selection
bias in patients, since AML patients who were able to delay treatment could have had less aggressive disease, whereas those who permanently discontinued the treat ment might have had serious COVID-19 complications, becoming unfit for further therapy.
In conclusion, our study shows that COVID-19 in AML pa tients poses a serious challenge, as it adds a layer of com plication which can lead to modified therapeutic algorithms. The mortality rate in this group of patients was very high, even taking into consideration the significant re duction over the course of the pandemic. According to our findings, the best approach to improve the survival of AML patients with COVID-19 seems to be to delay treatment for the hematologic malignancy, whenever possible.
No conflicts of interest to disclose.
LP was the principal investigator. FM, JSG and LP con tributed to the study design, study supervision, and data in terpretation and wrote the paper. AB, PC, MH, NK, PK, AP, FP, AOC and LP conceived the idea of the study. LP, JSG and FM did the statistical plan and analysis and interpreted the data. All the authors recruited participants and collected and interpreted data. All authors contributed to writing and reviewing the manuscript. All authors agreed to be account able for all aspects of the work in ensuring that questions related to the accuracy or integrity of any part of the work are appropriately investigated and resolved.
The authors thank all contributors for their great contribu tion to and support of the project during a pandemic situ ation and to Susann Blossfeld and Sebastian Rahn for their administrative and technical assistance.
EPICOVIDEHA has received funds from Optics COMMITTM (COVID-19 Unmet Medical Needs and Associated Research Extension) COVID-19 RFP program by Gilead Science, USA (Project 2020-8223). The funder of the study had no role in the study design, data analysis, interpretation, or writing of the report. All authors had full access to the data and had final responsibility for the decision to submit for pub lication.
Data will be available from the corresponding author upon reasonable request.
EPICOVIDEHA working group: Toni Valković , Alexandra Serris, Michail Samarkos, Lucia Prezioso, Christian Bjørn Poulsen, Jan Novák, Joseph Meletiadis, Panagiotis Tsirigotis, Anasta sia Antoniadou, Jorge Labrador, Chi Shan Kho, Federico Itri, Tomás-José González-López, Michelina Dargenio, Elena Busch, Ghaith Abu-Zeinah, Gianpaolo Nadali, Anna Nord lander, Gunay Aliyeva, Dominik Wolf, Ramón García-Sanz, Jenna Essame, Linda Katharina Karlsson, Moraima Jiménez, Jiří Mayer.
1. Döhner H, Estey E, Grimwade D, et al. Diagnosis and management of AML in adults: 2017 ELN recommendations from an international expert panel. Blood. 2017;129(4):424-447.
2. Ferrara F, Schiffer C. Acute myeloid leukaemia in adults. Lancet. 2013;381(9865):484-495.
3. Fontana L, Strasfeld L. Respiratory virus infections of the stem cell transplant recipient and the hematologic malignancy patient. Infect Dis Clin North Am. 2019;33(2):523-544.
4. Pagano L, Salmanton-García J, Marchesi F, et al. COVID-19 infection in adult patients with hematologic malignancies: a European Hematology Association survey (EPICOVIDEHA). J Hematol Oncol. 2021;14(1):168.
5. Passamonti F, Cattaneo C, Arcaini L, et al. Clinical characteristics and risk factors associated with COVID-19 severity in patients with hematological malignancies in Italy: a retrospective, multicentre, cohort study. Lancet Haematol. 2020;7(10):e737-e745.
6. García-Suárez J, de la Cruz J, Cedillo Á, et al. Impact of hematologic malignancy and type of cancer therapy on COVID19 severity and mortality: lessons from a large population-based registry study. J Hematol Oncol. 2020;13(1):133.
7. Vijenthira A, Gong IY, Fox TA, et al. Outcomes of patients with
hematologic malignancies and COVID-19: a systematic review and meta-analysis of 3377 patients. Blood. 2020;136(25):2881-2892.
8. Lee LYW, Cazier JB, Starkey T, et al. COVID-19 prevalence and mortality in patients with cancer and the effect of primary tumour subtype and patient demographics: a prospective cohort study. Lancet Oncol. 2020;21(10):1309-1316.
9. Palanques-Pastor T, Megías-Vericat JE, Martínez P, et al. Characteristics, clinical outcomes, and risk factors of SARSCOV-2 infection in adult acute myeloid leukemia patients: experience of the PETHEMA group. Leuk Lymphoma. 2021;62(12):2928-2938.
10. Fagundes EM, Neto NN, Caldas LM, et al. Mortality by COVID-19 in adults with acute myeloid leukemia: a survey with hematologists in Brazil. Ann Hematol 2021;101(4):923-925.
11. Ghandili S, Pfefferle S, Roedl K, et al. Challenges in treatment of patients with acute leukemia and COVID-19: a series of 12 patients. Blood Adv. 2020;4(23):5936-5941.
12. Taurino D, Frigeni M, Grassi A, et al. Concurrent diagnosis of acute myeloid leukemia and symptomatic COVID-19 infection: a case report successfully treated with azacitidine-venetoclax combination. Mediterr J Hematol Infect Dis. 2021;13(1):e2021057.
13. Ferrara F, Zappasodi P, Roncoroni E, Borlenghi E, Rossi G.
Impact of COVID-19 on the treatment of acute myeloid leukemia. Leukemia. 2020;34(8):2254-2256.
14. Núñez-Torrón C, García-Gutiérrez V, Tenorio-Núñez MC, MorenoJiménez G, López-Jiménez FJ, Herrera-Puente P. Poor outcome in patients with acute leukemia on intensive chemotherapy and COVID-19. Bone Marrow Transplant. 2021;56(1):267-269.
15. Singh S, Singh J, Paul D, Jain K. Treatment of acute leukemia during COVID-19: focused review of evidence. Clin Lymphoma Myeloma Leuk. 2021;21(5):289-294.
16. Demichelis-Gómez R, Alvarado-Ibarra M, Vasquez-Chávez J, et al. Treating acute leukemia during the COVID-19 pandemic in an environment with limited resources: a multicenter experience in four Latin American countries. JCO Glob Oncol. 2021;7:577-584.
17. Buyuktas D, Acar K, Sucak G, et al. COVID-19 infection in patients with acute leukemia: Istanbul experience. Al J Blood Res. 2021;11(4):427-437.
18. Salmanton-García J, Busca A, Cornely OA, et al. EPICOVIDEHA: a ready to use platform for epidemiological studies in hematological patients with COVID-19. Hemasphere. 2021;5(7):e612.
19. Tivian XI GmbH. Experience-management software. https://www.tivian.com/de/. Accessed December 28, 2021.
20. COVID-19 clinical management. Living guidance World Health Organization. January 15, 2021. WHO/2019-nCoV/clinical/2021.1.
21. Wu Z, McGoogan JM. Characteristics of and important lessons from the coronavirus disease 2019 (COVID-19) outbreak in China: summary of a report of 72 314 cases from the Chinese Center for Disease Control and Prevention. JAMA. 2020;323(13):1239-1242.
22. Zeidan AM, Boddu PC, Patnaik MM, et al. Special considerations
in the management of adult patients with acute leukaemias and myeloid neoplasms in the COVID-19 era: recommendations from a panel of international experts. Lancet Haematol. 2020;7(8):e601-e612.
23. Raza A, Assal A, Ali AM, Jurcic JG. Rewriting the rules for care of MDS and AML patients in the time of COVID-19. Leuk Res Rep. 2020;13:100201.
24. Yarza R, Bover M, Paredes D, et al. SARS-CoV-2 infection in cancer patients undergoing active treatment: analysis of clinical features and predictive factors for severe respiratory failure and death. Eur J Cancer. 2020;135:242-250.
25. Ljungman P, de la Camara R, Mikulska M, et al. COVID-19 and stem cell transplantation; results from an EBMT and GETH multicenter prospective survey. Leukemia. 2021;35(10):2885-2894.
26. Piñana JL, Martino R, García-García I, et al. Risk factors and outcome of COVID-19 in patients with hematological malignancies. Exp Hematol Oncol. 2020;9:21.
27. Stahl M, Narendra V, Jee J, et al. Neutropenia in adult acute myeloid leukemia patients represents a powerful risk factor for COVID-19 related mortality. Leuk Lymphoma. 2021;62(8):1940-1948.
28. Röllig C, Kramer M, Schliemann C, et al. Does time from diagnosis to treatment affect the prognosis of patients with newly diagnosed acute myeloid leukemia? Blood. 2020;136(7):823-830.
29. Pagano L, Salmanton-García J, Marchesi F, et al. COVID-19 in vaccinated adult patients with hematological malignancies. Preliminary results from EPICOVIDEHA. Blood. 2022;139(10):1588-1592.
Sabine Kayser,1,2 David Martínez-Cuadrón,3,4 Maher Hanoun,5 Friedrich Stölzel,6 Cristina Gil,7 H. Christian Reinhardt,5 Eliana Aguiar,8 Kerstin Schäfer-Eckart,9 Juan Miguel Bergua Burgues,10 Björn Steffen,11 Teresa Bernal,12 Stefan W. Krause,13 Rosalía Riaza,14 Christoph Schliemann,15 Jose Cervera,3,4 Martin Kaufmann,16 Laura Torres-Miñana,3,4 Mathias Hänel,17 Evelyn Acuña-Cruz,3,4 Edgar Jost,18 Jesus Lorenzo Algarra,19 Martina Crysandt,18 Lars Fransecky,20 Javier Cornago-Navascues,21 Sabrina Kraus,22 Joaquin Martinez-Lopez,23 Hermann Einsele,22 Dirk Niemann,24 Andreas Neubauer,25 Ruth Seggewiss-Bernhardt,26 Sebastian Scholl,27 Stefan A. Klein,28 Christoph Schmid,29 Markus Schaich,30 Martin SchmidtHieber,31 Sven Zukunft,6 Anthony D. Ho,32 Uwe Platzbecker,1 Claudia D. Baldus,20 Carsten Müller-Tidow,32 Christian Thiede,6 Martin Bornhäuser,6 Hubert Serve,11 Mark J. Levis,33 Pau Montesinos,3,4 Christoph Röllig6 and Richard F. Schlenk2,32,34
1Medical Clinic and Policlinic I, Hematology and Cellular Therapy, University Hospital Leipzig, Leipzig, Germany; 2NCT Trial Center, National Center of Tumor Diseases, German Cancer Research Center (DKFZ), Heidelberg, Germany; 3Hematology Department, Hospital Universitari i Politècnic, La Fe, València, Spain; 4CIBERONC, Instituto Carlos III, Madrid, Spain; 5Department of Hematology and Stem Cell Transplantation, University Hospital Essen, Essen, Germany; 6Department of Medicine I, University Hospital Carl-Gustav-Carus, Dresden, Dresden, Germany; 7Hospital General, Alicante, Spain; 8Clinical Haematology Department, Centro Hospitalar São João, Oporto, Portugal; 9Department of Internal Medicine 5, Paracelsus Medical Private University Nürnberg, Nürnberg, Germany; 10Hematology Department, Hospital San Pedro de Alcántara, Cáceres, Spain; 11Department of Internal Medicine II, University Hospital of Frankfurt Main, Frankfurt Main, Germany; 12Hospital Central de Asturias, Oviedo, Spain; 13Department of Internal Medicine 5 –Hematology/Oncology, University Hospital of Erlangen, Erlangen, Germany; 14Hematology Department, Hospital Universitario Severo Ochoa, Madrid, Spain; 15University Hospital Muenster, Muenster, Germany; 16Robert Bosch Hospital Stuttgart, Stuttgart, Germany; 17Klinikum Chemnitz, Chemnitz, Germany; 18Department of Hematology, Oncology, Hemostaseology, and Stem Cell Transplantation, Faculty of Medicine, University Hospital RWTH Aachen, Aachen, Germany; 19Hospital General de Albacete, Albacete, Spain; 20Department of Internal Medicine II, University Hospital of Kiel, Kiel, Germany; 21Fundación Jiménez Díaz, Madrid, Spain; 22Universitätsklinikum Würzburg, Würzburg, Germany; 23Hospital 12 de Octubre, Complutense University, CNIO, Madrid, Spain; 24Gemeinschaftsklinikum Mittelrhein gGmbH, Koblenz, Germany; 25Philipps University Marburg, and University Hospital Giessen and Marburg, Marburg, Germany; 26Medizinische Klinik V, Sozialstiftung Bamberg, Bamberg, Germany; 27Klinik für Innere Medizin II, Universitätsklinikum Jena, Jena, Germany; 28Department of Hematology and Oncology, University Hospital Mannheim, Heidelberg University, Mannheim, Germany; 29Department of Hematology and Oncology, Augsburg University Hospital, Augsburg, Germany; 30Department of Hematology, Oncology and Palliative Care, Rems-Murr-Hospital Winnenden, Winnenden, Germany; 31Department of Hematology and Oncology, Carl-Thiem-Klinikum, Cottbus, Germany; 32Department of Internal Medicine V, Heidelberg University Hospital, Heidelberg, Germany; 33Sidney Kimmel Comprehensive Cancer Center, Johns Hopkins University, Baltimore, MD, USA and 34Department of Medical Oncology, National Center for Tumor Diseases (NCT), Heidelberg University Hospital, Heidelberg, Germany.
Correspondence: S. Kayser s.kayser@dkfz-heidelberg.de
Received: March 28, 2022.
Accepted: May 30, 2022. Prepublished: June 9, 2022.
https://doi.org/10.3324/haematol.2022.281137
©2023 Ferrata Storti Foundation
Published under a CC BY-NC license
We retrospectively studied 125 patients with acute myeloid leukemia and trisomy 4 (median age at diagnosis, 58 years; range, 16-77 years) treated between 2000 and 2019 within a multicenter study. Trisomy 4 was the sole abnormality in 28 (22%) patients and additional abnormalities were present in 97 (78%) patients. Twenty-two (22%) and 15 (15%) of 101 tested patients harbored NPM1 and FLT3-ITD mutations. Two (3%) of 72 tested patients had double CEBPA mutations. Data on response to intensive anthracycline-based induction therapy were available for 119 patients. Complete remission was achieved in 67% (n=80) and the early death rate was 5% (n=6). Notably, patients with trisomy 4 as sole abnormality had
a complete remission rate of 89%. Allogeneic hematopoietic cell transplantation was performed in 40 (34%) patients, of whom 19 were transplanted in first complete remission. The median follow-up of the intensively treated cohort was 5.76 years (95% confidence interval [95% CI]: 2.99-7.61 years). The 5-year overall survival and relapse-free survival rates were 30% (95% CI: 22-41%) and 27% (95% CI: 18-41%), respectively. An Andersen-Gill regression model on overall survival re vealed that favorable-risk according to the European LeukemiaNet classification (hazard ratio [HR]=0.34; P=0.006) and trisomy 4 as sole abnormality (HR=0.41; P=0.01) were favorable factors, whereas age with a difference of 10 years (HR=1.15; P=0.11), female gender (HR=0.74; P=0.20) and allogeneic hematopoietic cell transplantation (HR=0.64; P=0.14) did not have an significant impact. In our cohort, patients with trisomy 4 as their sole abnormality had a high complete remission rate and favorable clinical outcome. Allogeneic hematopoietic cell transplantation did not seem to improve overall survival.
Trisomy 4 is a recurrent but very rare cytogenetic abnor mality reported in patients with acute myeloid leukemia (AML).1,2 In a large analysis on 5,876 younger adult AML patients treated in United Kingdom Medical Research Council trials, only 70 (1%) harbored trisomy 4.2 The prog nostic significance of this abnormality in AML patients is not clear. Informed clinical decision-making in situations in which cytogenetic analysis shows rare cytogenetic ab normalities has been hampered by a lack of consensus regarding the likely outcome of such patients. According to the National Comprehensive Cancer Network guide lines3 as well as the European LeukemiaNet (ELN) rec ommendations 4 AML patients with trisomy 4 in the absence of further abnormalities would be assigned to the intermediate-risk group. However, this risk group comprises a rather large and heterogeneous set of ab normalities, leaving the impact of this particular abnor mality on outcome unclear. Apart from the benefit of achieving greater consensus in cytogenetic classification, establishing the outcome associated with rare cytogen etic abnormalities is important, particularly given the re sults of a meta-analysis that has suggested that a relapse risk in excess of 35% can provide a useful work ing threshold to identify patients in whom allogeneic hematopoietic stem cell transplantation (HSCT) may confer a survival benefit.5
The prognosis of AML patients with trisomy 4 is contro versial. While data from some cohort analyses suggest that their outcome is comparable to that of AML patients with normal cytogenetics,2,6 others suggest a poorer out come7 compared to that of patients with intermediaterisk cytogenetics.8 While the rate of complete remission after intensive anthracycline and cytarabine–based com bination chemotherapy was comparable to that of pa tients with normal cytogenetics (87% vs. 90%; P=0.3) and the 10-year cumulative incidence of relapse rate was al most identical (49% vs. 54%; P=0.7), the 10-year overall survival rate was lower (16% vs. 38%; P=0.2).2 Allogeneic HSCT may improve survival if performed early in first complete remission. However, neither prospective clini
cal nor larger retrospective cohort studies are available to support these results.
Patients and treatment
Information on 125 adult patients with AML and trisomy 4 diagnosed between 2000 and 2019 (2000-2010, n=48; after 2010, n=77) was collected within a large, multi center international cohort (Study Alliance Leukemia [SAL], n=82; Programa Español de Tratamientos en Hematología [PETHEMA], n=40; Johns Hopkins University, Baltimore, n=3). Detailed case report forms (including in formation on baseline characteristics, chemotherapy, al logeneic HSCT, response, and survival) were collected from all participating centers. Inclusion criteria were adult AML patients with trisomy 4 and all patients who fulfilled these criteria were included by the participating groups/institutions. The diagnosis of AML was based on French-American-British Cooperative Group criteria, 9 and, after 2003, on revised International Working Group criteria.10 Chromosome banding was performed using standard techniques, and karyotypes were described ac cording to the International System for Human Cytogen etic Nomenclature.11 A complex karyotype was defined according to the 2017 ELN classification.4 FLT3 mutation screening for internal tandem duplications (ITD) and point mutations within the tyrosine kinase domain was carried out at each institution as previously described.12,13 Data collection and analysis were approved by the insti tutional review boards of the participating centers.
Of the 125 patients, 119 (95%) received intensive induc tion treatment either within clinical trials (n=46) or ac cording to local institutional standards (n=73). Treatment protocols for patients treated within the SAL (n=82) in cluded AML60+ (n=4),14 AML96 (n=12),15 AML2003 (n=21),16 and SORAML (n=2).17 Additionally, 43 patients were in cluded within the prospective SAL registry (NCT03188874). All patients from PETHEMA (n=40) were
included within the PETHEMA AML registry (NCT02607059).18 The treatment protocols for patients treated within the PETHEMA included LMA2007 (n=1; NCT01041040), LMA2010 (n=3; NCT01296178), LMA2017 (n=1), as well as the CALGB/Ratify trial (n=1).19 One patient from Johns Hopkins was included in a clinical trial and treated with ivosidenib, 20 the other two patients were treated according to local institutional standards. Induction therapy for the 73 patients treated according to local institutional standards consisted of the anthra cycline/cytarabine-based “7+3” regimen (n=66) or com parable intensive treatment (n=7). One of the 73 patients was treated with the “7+3” regimen in combination with gemtuzumab ozogamicin. Six (5%) of the 125 patients were treated non-intensively. Of those, three received azacitidine therapy, one ivoside nib and two patients were managed with best supportive care. Response was assessed according to International Working Group recommendations.10 All clinical studies were approved by the institutional review boards of the participating centers. All patients provided written in formed consent to participation in one of the treatment trials or to therapy according to local standards.
Survival endpoints, including overall survival, relapse-free survival, cumulative incidence of relapse and cumulative incidence of death in complete remission, were defined according to the revised recommendations of the Inter national Working Group.10 Comparisons of patients’ char acteristics were performed with the Kruskal-Wallis rank sum test for continuous variables and the Fisher exact test for categorical variables. To identify prognostic variables with respect to response to induction therapy a logistic regression model was used. Variables included ELN favor able-risk category, gender, trisomy 4 as sole abnormality, and age. The median follow-up time was computed using the reverse Kaplan-Meier estimate.21 The Kaplan-Meier method was used to estimate the distribution of relapsefree survival and overall survival.22 Confidence interval (CI) estimations for survival curves were based on the cumu lative hazard function using the Greenwood formula for variance estimation. Log-rank tests were employed to compare survival curves between groups. Cumulative inci dences of relapse and death and their standard errors were computed according to the method described by Gray23 and included only patients attaining complete re mission. The effect of allogeneic HSCT (including all trans planted patients) on overall survival as a time-dependent intervening event was tested in a multivariable AndersenGill model.24 Variables included in the model were ELN fa vorable-risk, gender, trisomy 4 as sole abnormality, age with a difference of 10 years as well as allogeneic HSCT. All statistical analyses were performed with the statistical
software environment R, version 3.3.1, using the R packages prodlim, version 1.5.7, and survival, version 2.39-5.25
Study cohort
Demographic and clinical data were collected from 125 pa tients diagnosed with AML and trisomy 4 between 2000 and 2019. Their median age was 58 years (range, 16-77 years) and 62 patients (50%) were female. Most of the pa tients had de novo AML (79%). The baseline characteristics of the study cohort are summarized in Table 1.
Table 1. Baseline characteristics of patients with acute myeloid leukemia and trisomy 4.
Number (total=125) %
Female gender 62 50
Median age 58 years range, 16-77 years Type of AML De novo Secondary AML Therapy-related AML Missing
99 15 8 3
36 59 19 11
Cytogenetics
Sole trisomy 4 Additional abnormalities ≥3 abnormalities Autosomal monosomies Monosomal karyotype# Trisomy 4 & trisomy 8 Trisomies only t(8;21) or inv(16)
Molecular genetics*
NPM1 mutated FLT3-ITD positive CEBPA double mutated
ELN risk group
Favorable Intermediate Unfavorable
28 97 68 20 18 43 23 10
22 15 2
27 29 66
29 47 15 9
79 12 6 2 ECOG PS 0 1 2 Missing
22 78
22 15 3
22 24 54
Value Range
Median WBC x109/L 4.8 0.4-255 Platelets x109/L 47 2-330 Hemoglobin, g/dL 9.1 4.9-16.6 Median BM blasts 77 1-100
Results may not add up to 100 due to rounding. #According to Breems et al.34 *Available for 101 (80%) patients. AML: acute myeloid leuke mia; BM: bone marrow; ECOG PS: Eastern Cooperative Oncology Group performance status; ELN: European LeukemiaNet; FLT3: fmsrelated tyrosine kinase 3; ITD: internal tandem duplication; WBC: white blood cell count.
According to cytogenetic analysis, trisomy 4 was the sole abnormality in 28 (22%) patients, whereas additional ab normalities were present in a non-complex karyotype in 29 (22.5%) patients, and in a complex karyotype in 68 (54.5%) patients. The most frequent additional abnor mality was trisomy 8 (n=43, 34.5%), karyotypes char acterized by trisomies only (n=23, 18.5%) and t(8;21) or inv(16) (core binding factor; n=10, 8%). A total of 101 pa tients (80%) underwent testing for NPM1 and FLT3 -ITD mutations. Of those, 22 (22%) and 15 (15%) harbored NPM1 and FLT3-ITD mutations, respectively. The FLT3-ITD allelic ratio was available for 12 (79%) of the ITD-positive patients and the median ratio was 0.66 (range, 0.01-1.43). Three (10%) of 29 patients with available data also har bored a FLT3-tyrosine kinase domain mutation. Two (3%) of 72 analyzed patients had double CEBPA mutations (Table 1). KIT mutational status was available for two of the ten patients with core binding factor leukemia; both were KIT wild-type. Next-generation sequencing data were available for a small subset of patients (12%, n=15/125). The gene panel included the following genes: ASXL1, ATRX, BCOR, BCORL1, CBL, CDKN2, CSF3R, CUX1, DNMT3A, FBXW7, GATA1, GATA2, IDH1, IDH2, IKZF, JAK2, KDM6A, KIT, KRAS, NOTCH1, NRAS, PDGFRA, PHF6, PTPN11, RAD21, RUNX1, SF3B1, SMC1A, SMC3, STAG2, TET2, TP53, U2AF1, WT1, ZRSR2, BRAF, CALR, CBL, ETV6, GNAS, HRAS, MPL, MYD88, PTEN, SETBP1 and SFRS2. When we grouped the mutations according to their function, the identified gene mutations were found in all functional groups. However, the mutational profile was dominated by mu tations in methylation-related genes (n=15; DNMT3A, n=4; IDH1/2 , n=2, each; TET2 , n=7), transcription factors ( RUNX1 , n=4), chromatin remodeling ( ASXL1 , n=2), RAS pathway (KRAS, n=1; NRAS, n=2) and tumor suppressors (n=3; WT1, TP53 and PHF6, n=1, each). Single mutations were found in EZH2 , FBXW7 , KDM6A , U2AF1 and ZRSR2 . None of the other genes was mutated.
Data on response to intensive induction therapy were available for all 119 patients. Eighty (67%) achieved a com plete remission after induction therapy. Early death oc curred in six (5%) patients. Six patients were treated less intensively because of higher age (median; 67.5 years; range, 31-77 years) or comorbidities. Among these patients, only one achieved a complete re mission, after 85 days of ivosidenib treatment. The patient is in an ongoing complete remission which has lasted more than 4 years so far. Cytogenetically, the patient had trisomy 4 as well as deletion of the long arm of chromosome 7. Mol ecularly, IDH1 and NPM1 mutations were detected.
All other patients died early (median, 2.4 months; range, 0.03-7.7 months).
Notably, patients with trisomy 4 as sole abnormality had a complete remission rate of 89% (n=25/28) and those with trisomy 4 in combination with t(8;21) or inv(16) of 100% (n=10/10).

There was no difference in the complete remission rate between FLT3 -ITD-positive (71%) and FLT3 -wildtype (68%) patients ( P =0.99). Univariable analysis revealed that trisomy 4 as sole abnormality (odds ratio [OR]=5.39; P =0.005) and NPM1 (OR=11.46; P =0.003) were favorable factors. A logistic regression model revealed that female gender (OR=2.60; P =0.03) and ELN favor able-risk (OR=12.84; P =0.02) were favorable factors and trisomy 4 as sole abnormality showed a tendency (OR=3.27; P =0.08) to be favorable.
Further therapy including intensive consolidation and allogeneic hematopoietic stem cell transplantation
Sixty-one (76%) of eighty intensively treated patients in first complete remission received intensive consolida tion chemotherapy consisting of high-dose cytarabine with or without additional chemotherapy. Nineteen (14%) patients proceeded to allogeneic HSCT in first complete remission with eight of the transplanted pa tients receiving consolidation chemotherapy prior to transplantation. There was no difference in baseline characteristics between patients proceeding to alloge neic HSCT in first complete remission and patients re ceiving consolidation chemotherapy, such as median white blood cell count ( P =0.42), median age ( P =0.08), NPM1 mutations ( P =0.99), FLT3 -ITD ( P =0.71) and ELNrisk classification ( P =0.60).
Among the patients consolidated with chemotherapy, relapses occurred in 35 and seven died of a treatmentrelated cause after consolidation. In patients consoli dated with allogeneic HSCT in first complete remission, ten patients relapsed and most of them died shortly
Figure 1. Kaplan-Meier plot of overall survival in intensively treated patients according to cytogenetic abnormality. +4 sole: trisomy 4 as sole cytogenetic abnormality; CBF: core binding factor.
thereafter (median, 3.3 months; range, 0-96.2 months). Only two patients survived beyond 1 year after relapse due to either a second allogeneic HSCT (n=1, survival after relapse, 96.2 months) or repetitive cycles of le nalidomide and azacitidine (n=1; survival after relapse, 25.7 months). Among those relapsing after chemother apy, allogeneic HSCT was performed in 21 patients.
Characteristics of patients undergoing allogeneic hematopoietic stem cell transplantation
Allogeneic HSCT was performed in 40 (32%) patients, of whom 19 were transplanted in first complete remission after induction therapy. Nine patients achieved com plete remission after salvage chemotherapy and went on to allogeneic HSCT; another 12 patients underwent allogeneic HSCT with active disease. Twelve patients re ceived myeloablative conditioning and 24 patients re duced-intensity conditioning (data were missing for 4 patients). The type of donor was matched related in eight cases, matched unrelated in 31 cases, and un known in one of the 40 patients.
The median survival of the non-intensively treated pa tients was 0.33 years. Only one patient treated with ivo sidenib survived more than 4 years. The median follow-up of the intensively treated cohort was 5.76 years (95% CI: 2.99-7.61 years). Five-year overall survival and relapse-free survival were 30% (95% CI: 22-41%) and 27% (95% CI: 1841%), respectively.
Overall survival rates were significantly higher in patients with core binding factor leukemia or patients with trisomy 4 as a sole abnormality as compared to those with tri somy 4 and all other abnormalities (Figure 1) (P<0.001). There was no difference between overall survival rates in patients with a complex karyotype, a complex karyotype

without monosomal karyotype or monosomal karyotype (Figure 2) (P=0.4). An Andersen-Gill model including al logeneic HSCT as a time-dependent covariable revealed ELN favorable-risk class (hazard ratio [HR]=0.34; P=0.006) and trisomy 4 as sole abnormality (HR=0.41; P=0.01) as fa vorable factors, whereas age with a difference of 10 years (HR=1.15; P=0.11), female sex (HR=0.74; P=0.20) and alloge neic HSCT (HR=0.64; P=0.14) had no significant impact. There was no difference in overall survival measured from the date of allogeneic HSCT if the patients proceeded to the transplant in first complete remission (n=19) or with active disease (n=21; P=0.60) (Figure 3). In patients achiev ing a first complete remission, the 5-year relapse-free survival was 19% (95% CI: 4-90%) for those patients pro ceeding to allogeneic HSCT (n=19) as compared to 28% (95% CI: 18-42%) for those who received consolidation chemotherapy (n=61).
There was not a significant difference in cumulative inci dence of relapse between patients proceeding to alloge neic HSCT and those who were treated with consolidation chemotherapy (P=0.60) (Figure 4). The same was true for cumulative incidence of death (P=0.13) (Figure 4).
The focus of our study was to characterize adult AML pa tients with trisomy 4 in an international, multicenter co hort study and compare outcomes according to treatment strategies, with a specific focus on the impact of alloge neic HSCT as compared to conventional chemotherapy on survival. Trisomy 4 is very rare, particularly as a sole ab normality.6,7,26 Its prognostic relevance has been de bated2,7,8 and its association with outcome remains unclear. We here present the largest cohort of 125 patients with trisomy 4 to date, of whom 119 were treated inten
Figure 2. Kaplan-Meier plot on overall survival in intensively treated patients according to cytogenetic abnormality including complex karyotype and monosomal karyo type. +4 sole: trisomy 4 as sole cytogenetic abnormality; CBF: core binding factor; CK: complex karyotype; MK: monosomal karyo type.
Figure 3. Overall survival after allogeneic hematopoietic stem cell transplantation according to remission status. Allo-HCT: allogeneic hematopoietic stem cell transplantation; CR1; first complete remission.


sively. In line with a previous publication,6 the complete remission rate was high in our cohort in those patients with trisomy 4 as a sole abnormality. Nevertheless, most patients relapsed, a fate which seems not to have been improved by allogeneic HSCT, suggesting that other treat ment approaches are needed to prolong survival. The only factors associated with prolonged survival were ELN fa vorable-risk classification and trisomy 4 as the sole ab normality, confirming the findings of Chilton et al.6 Secondary chromosome aberrations can be detected in more than three quarters of cases with trisomy 4. The most frequent secondary chromosome aberrations in our cohort were trisomy 8 and in roughly half of the cases a complex karyotype. In contrast to previous reports, we did not observe a high frequency of FLT3-ITD7 or NPM1 muta tions in our cohort.27 Although cKIT is located on chromo some 4q12, mutations in cKIT seem to be infrequent in patients with trisomy 4.7 Nevertheless, we cannot exclude KIT overexpression, as a result of chromosomal gain, which may contribute to leukemogenesis in these cases,
particularly in those with trisomy 4 as a sole abnormality. In a small subset of our patients, next-generation se quencing data were available. Regarding the molecular make-up, our data are in line with those of Bhatnagar et al.27 Besides NPM1 and FLT3, the most frequently mutated genes were TET2, RUNX1, DNMT3A and IDH1/2. In contrast to us, Bhatnagar et al. did not identify any case with an ASXL1 or WT1 mutation.27 To date, however, the pathogenic role of trisomy 4 per se in leukemogenesis is still unclear. An association of therapy-related AML and development of AML with trisomy 4 has been suggested,28 although not confirmed by others.7,29 We did not observe a high rate of patients with therapy-related AML in our cohort. Of note, allogeneic HSCT, particularly when performed in first complete remission, resulted in an equally high re lapse rate as that of patients receiving consolidation chemotherapy and did not improve outcome in our cohort based on an Andersen-Gill model taking into account the time dependency of allogeneic HSCT. This is in line with our recent findings in a cohort of AML patients character ized by trisomy 19.30 Nonetheless, this is in contrast to previous reports31-33 focusing on other trisomies such as +8, +11, +13 and +21 and may indicate that the outcomes of patients with trisomies need to be evaluated individ ually. However, we would like to emphasize that retro spectively collected data have serious limitations since the factors for allocating patients to allogeneic HSCT, such as co-morbidities, individual assessment of the treating physician, choice of conditioning, and availability of a donor, remain unknown; this limitation also needs to be taken into account when assesing the value of allogeneic HSCT in our series. Additionally, data from multicenter co hort studies potentially introduce biases related to enroll ment criteria for those studies, which may have excluded certain populations. In conclusion, patients with trisomy 4 are very hetero geneous, in particular with respect to cytogenetic and molecular abnormalities. In our cohort, patients with tri
Figure 4. Cumulative incidences of relapse and death according to treatment strategy. These analyses included only patients who attained complete remission. Allo-HCT: al logeneic hematopoietic stem cell transplan tation; CIR: cumulative incidence of relapse; CID: cumulative incidence of death.
somy 4 as their sole abnormality as well as those with tri somy 4 in combination with ELN favorable-risk genetics had a high complete remission rate and favorable clinical outcome. Considering the whole cohort, allogeneic HSCT appeared not to improve overall survival. The shortcom ings of retrospective cohort studies do, however, need to be taken into account.
No conflicts of interest to disclose.
SK and RFS were responsible for the concept of this paper, contributed to the literature search data collection, ana lyzed and interpreted data, and wrote the manuscript. DM-
1. Weber E, Nowotny H, Haas OA, Kasparu H, Grois N, Lutz D. Trisomy 4: a specific karyotype anomaly in primary and secondary acute myeloid leukemia Leukemia. 1990;4(3):219-221.
2. Grimwade D, Hills RK, Moorman AV, et al. Refinement of cytogenetic classification in acute myeloid leukemia: determination of prognostic significance of rare recurring chromosomal abnormalities among 5876 younger adult patients treated in the United Kingdom Medical Research Council trials. Blood. 2010;116(3):354-365.
3. O'Donnell MR, Tallman MS, Abboud CN, et al. Acute myeloid leukemia, version 3.2017, NCCN clinical practice guidelines in oncology. J Natl Compr Canc Netw. 2017;15(7):926-957.
4. Döhner H, Estey E, Grimwade D, et al. Diagnosis and management of AML in adults: 2017 ELN recommendations from an international expert panel. Blood. 2017;129(4):424-447.
5. Cornelissen JJ, van Putten WLJ, Verdonck LF, et al. Results of a HOVON/SAKK donor versus no-donor analysis of myeloablative HLA-identical sibling stem cell transplantation in first remission acute myeloid leukemia in young and middle-aged adults: benefits for whom? Blood. 2007;109(9):3658-3666.
6. Chilton L, Hills RK, Burnett AK, Harrison CJ. The prognostic significance of trisomy 4 in acute myeloid leukaemia is dependent on age and additional abnormalities. Leukemia. 2016;30(11):2264-2267.
7. Bains A, Lu G, Yao H, Luthra R, Medeiros LJ, Sargent RL. Molecular and clinicopathologic characterization of AML with isolated trisomy 4. Am J Clin Pathol. 2012; 137(3):387-394.
8. Gupta V, Minden MD, Yi QL, Brandwein J, Chun K. Prognostic significance of trisomy 4 as the sole cytogenetic abnormality in acute myeloid leukemia. Leuk Res. 2003;27(11):983-991.
9. Bennett JM, Catovsky D, Daniel MT, et al. Proposed revised criteria for the classification of acute myeloid leukemia. A report of the French-American-British Cooperative Group. Ann Intern Med. 1985;103(4):620-625.
10. Cheson BD, Bennett JM, Kopecky KJ, et al. Revised recommendations of the International Working Group for Diagnosis, Standardization of Response Criteria, Treatment Outcomes, and Reporting Standards for Therapeutic Trials in Acute Myeloid Leukemia. J Clin Oncol. 2003;21(24):4642-4649.
11. Mitelman F. ISCN: An International System for Human Cytogenetic Nomenclature. Basel, Switzerland: S. Karger; 1995.
C, MH, FS, CG, HCR, EA, KS-E, JMBB, BS, TB, SWK, RR, CS, JC, MK, LT-M, MH, EA-C, EJ, JLA, MC, LF, JC-N, SK, JM-L, HE, DN, AN, RS-B, SS, SAK, CS, MS, MS-H, SZ, ADH, UP, CDB, CM-T, MB, HS, ML, PM, and CR contributed patients and critically revised the manuscript. CTh performed research and critically revised the manuscript. All authors reviewed and approved the final manuscript.
We acknowledge support from Leipzig University for Open Access Publishing.
Questions regarding data sharing should be addressed to the corresponding author.
12. Yokota S, Kiyoi H, Nakao M, et al. Internal tandem duplication of the FLT3 gene is preferentially seen in acute myeloid leukemia and myelodysplastic syndrome among various hematological malignancies. A study on a large series of patients and cell lines. Leukemia. 1997;11(10):1605-1609.
13. Thiede C, Steudel C, Mohr B, et al. Analysis of FLT3-activating mutations in 979 patients with acute myelogenous leukemia: association with FAB subtypes and identification of subgroups with poor prognosis. Blood. 2002;99(12):4326-4335.
14. Röllig C, Kramer M, Gabrecht M, et al. Intermediate-dose cytarabine plus mitoxantrone versus standard-dose cytarabine plus daunorubicin for acute myeloid leukemia in elderly patients. Ann Oncol. 2018;29(4):973-978.
15. Röllig C, Thiede C, Gramatzki M, et al. A novel prognostic model in elderly patients with acute myeloid leukemia: results of 909 patients entered into the prospective AML96 trial. Blood. 2010;116(6):971-997.
16. Schaich M, Parmentier S, Kramer M, et al. High-dose cytarabine consolidation with or without additional amsacrine and mitoxantrone in acute myeloid leukemia: results of the prospective randomized AML2003 trial. J Clin Oncol. 2013;31(17):2094-2102.
17. Röllig C, Serve H, Hüttmann A, et al. Addition of sorafenib versus placebo to standard therapy in patients aged 60 years or younger with newly diagnosed acute myeloid leukaemia (SORAML): a multicentre, phase 2, randomised controlled trial. Lancet Oncol. 2015;16(16):1691-1699.
18. Paiva B, Vidriales MB, Sempere A, et al. Impact of measurable residual disease by decentralized flow cytometry: a PETHEMA real-world study in 1076 patients with acute myeloid leukemia. Leukemia. 2021;35(8):2358-2370.
19. Stone RM, Mandrekar SJ, Sanford BL, et al. Midostaurin plus chemotherapy for acute myeloid leukemia with a FLT3 mutation. N Engl J Med. 2017;377(5):454-464.
20. DiNardo CD, Stein EM, de Botton S, et al. Durable remissions with ivosidenib in IDH1-mutated relapsed or refractory AML. N Engl J Med. 2018;378(25):2386-2398.
21. Schemper M, Smith TL. A note on quantifying follow-up in studies of failure time. Control Clin Trials. 1996;17(4):343-346.
22. Kaplan E, Meier P. Nonparametric estimation from incomplete observations. J Am Stat Assoc. 1958;53(282):457-481.
23. Gray RJ. A class of k-sample tests for comparing the cumulative incidence of a competing risk. Ann Stat. 1988;16(3):1141-1154.
24. Andersen P, Gill RD. Cox’s regression model for counting processes: a large sample study. Ann Stat. 1982;10(4):1100-1120.
25. R Development Core Team. R: a language and environment for statistical computing. R Foundation for Statistical Computing. Vienna, Austria, 2014.
26. Lazarevic VL, Rosso A, Juliusson G, et al. Incidence and prognostic significance of isolated trisomies in adult acute myeloid leukemia: a population-based study from the Swedish AML registry. Eur J Haematol. 2017;98(5):493-500.
27. Bhatnagar B, Eisfeld AK, Jessica Kohlschmidt J, et al. Clinical and molecular characterization of patients with acute myeloid leukemia and sole trisomies of chromosomes 4, 8, 11, 13 or 21. Leukemia. 2020;34(2):358-368.
28. Sandberg AA, Morgan R, Sait SN, et al. Trisomy 4: an entity within acute nonlymphocytic leukemia. Cancer Genet Cytogenet. 1987;26(1):117-125.
29. Donti E, Maccari A, Tabilio A, Ardisia C, Campanari N, Donti GV. Trisomy 4 in acute nonlymphocytic leukemia. Report of two cases and review of the literature. Cancer Genet Cytogenet. 1992;60(2):195-197.
30. Kayser S, Martínez-Cuadrón D, Rodriguez-Veiga R, et al. Characteristics and outcome of patients with acute myeloid leukemia and trisomy 19. EHA Library. Kayser S. 06/10/22; 357408; P545
31. Farag SS, Archer KJ, Mrózek K, et al. Isolated trisomy of chromosomes 8, 11, 13 and 21 is an adverse prognostic factor in adults with de novo acute myeloid leukemia: results from Cancer and Leukemia Group B 8461. Int J Oncol. 2002;21(5):1041-1051.
32. Schaich M, Schlenk RF, Al-Ali HK, et al. Prognosis of acute myeloid leukemia patients up to 60 years of age exhibiting trisomy 8 within a non-complex karyotype: individual patient data-based meta-analysis of the German Acute Myeloid Leukemia Intergroup. Haematologica. 2007;92(6):763-770.
33. Chevallier P, Labopin M, Nagler A, et al. Outcome after allogeneic transplantation for adult acute myeloid leukemia patients exhibiting isolated or associated trisomy 8 chromosomal abnormality: a survey on behalf of the ALWP of the EBMT. Bone Marrow Transplant. 2009;44(9):589-594.
34. Breems DA, Van Putten WL, De Greef GE, et al. Monosomal karyotype in acute myeloid leukemia: a better indicator of poor prognosis than a complex karyotype. J Clin Oncol. 2008;26(29):4791-4797.
Megan Othus,1,2 Guillermo Garcia-Manero,3 John E. Godwin,4 James K. Weick,5 Frederick R. Appelbaum,2 Harry P. Erba6 and Elihu H. Estey2
1SWOG Cancer Research Network Statistical Center, Seattle, WA; 2Fred Hutchinson Cancer Research Center, Seattle, WA; 3MD Anderson Cancer Center, Houston, TX; 4Providence Oncology/Hematology Care Clinic, Portland, OR; 5VA Medical Center, North Palm Beach, FL and 6Duke University, Durham, NK, USA
Correspondence: M. Othus mothus@fredhutch.org
Received: January 27, 2022.
Accepted: July 6, 2022.
Prepublished: July 14, 2022.
https://doi.org/10.3324/haematol.2022.280765
©2023 Ferrata Storti Foundation Published under a CC BY-NC license
We have previously shown that complete response (CR) rates and overall survival of patients with acute myeloid leukemia have improved since the 1980s. However, we have not previously evaluated how the length of first CR (CR1) has changed over this time period. To address this, we analyzed 1,247 patients aged 65 or younger randomized to "7+3" arms from five SWOG studies: S8600 (n=530), S9031 (n=98), S9333 (n=57), S0106 (n=301), and S1203 (n=261). We evaluated length of CR1 and survival after relapse from CR1 over the four decades that these studies represent. Both length of CR1 and survival after relapse from CR1 have improved over the last four decades. The relative benefit associated with CR1 and the relative detriment associated with relapse have decreased over this period; while achieving CR1 and relapse from CR1 still have strong prognostic associations with outcomes, the magnitude of the association has decreased over time. Possible explanations for these patterns include higher CR rates with salvage therapies after relapse, more frequent use of hematopoietic cell transplant, and better supportive care.
We have previously shown that the early mortality, com plete remission (CR) rates, and overall survival of patients with acute myeloid leukemia (AML) treated with cytarabine (ara-C) and an anthracycline (“7+3” regimen) have improved since the 1980s.1 However, we have not previously evaluated how much of the increase in overall survival is due to longer duration of first complete remission (CR1) and how much is due to improved salvage therapies after first relapse, in cluding allogeneic hematopoietic cell transplantation (HCT). Understanding the relative contributions of these two ef fects should provide insight into the interpretation of past and current studies. This prompted us to evaluate AML clinical trials from the 1980s, 1990s, 2000s, and 2010s to examine whether the length of CR1 and survival after re lapse from CR1 have changed over time.
We analyzed 1,247 patients randomized to “7+3” arms in
five National Cancer Institute National Clinical Trials Net work clinical trials conducted by the SWOG Cancer Re search Network. We analyzed patients who were aged 65 and younger from SWOG studies (number of cases; en rollment decade): S8600 (n=530; 1980s), S9031 (n=98; 1990s), S9333 (n=57; 1990s), S0106 (n=301; 2000s), and S1203 (n=261; 2010s).2-6 S9031 and S9333 were analyzed together. In each trial, the “7+3” regimen was given per contemporary standard, which changed over time. In S8600, S9031, and S9333, the ara-C and daunorubicin doses were 200 mg/m 2 and 45 mg/m 2 respectively, in S0106 the doses were 100 mg/m2 and 60 mg/m2, and in S1203 the doses were 100 mg/m2 and 90 mg/m2. Consoli dation chemotherapy varied over time per contemporary practice, with protocols S9031 and S9333 specifying two cycles of consolidation therapy with ara-C and dauno rubicin doses of 200 mg/m2 and 45 mg/m2, respectively; protocols S0106 and S1203 speci fi ed three and four cycles, respectively, of 3,000 mg/m2 of ara-C and no dau norubicin; protocol S8600 included a consolidation ran domization between up to two cycles of the contemporary standard ara-C and daunorubicin doses of 200 mg/m2 and 45 mg/m 2 versus 2,000 mg/m2 and 30
ARTICLE - Better outcomes with "7+3" therapy for AML
mg/m2. HCT was not specified as a component of proto col therapy (with associated data collected) except in the most recent trial S1203. The institutional review boards of the participating institutions approved all protocols, and patients were treated according to the Declaration of Helsinki.
CR was defi ned morphologically and required full re covery of absolute neutrophil counts and platelets (>1x10⁹/L and >100x109/L, respectively).4 Overall survival was measured from the date of study registration/ran domization to date of death due to any cause; patients last known to be alive were censored at the date of last contact. Relapse-free survival was measured for patients who achieved CR from the date of CR to the first of re lapse from CR or death from any cause, with patients last known to be alive censored at the date of last contact. Time to relapse was measured for patients who achieved CR1 from the date of CR1 to relapse, with death without relapse considered a competing risk. Endpoints were not censored at the time of a transplant. Overall and relapsefree survival were estimated using the Kaplan-Meier method. Time to relapse was estimated by cumulative incidence curves and multivariable associations were evaluated by Fine and Gray subdistribution hazard models.7 Among patients who achieved CR1, the percent
Table 1. Summary of trials included in the analyses.
Factor
in CR1 without relapse was summarized at landmark times in 6-month increments between 6 months and 3 years after CR1. Time-dependent Cox regression models for overall survival and relapse-free survival were fitted with CR1 and relapse from CR1 as time-dependent co variates. Multivariable regression models included the following covariates (modeled quantitatively unless otherwise speci fi ed): age at study registration, gender (male vs . female), cytogenetic risk (favorable vs . inter mediate vs. high vs. missing), prestudy white blood cell counts, pre-study platelet counts, pre-study marrow blast percentages, secondary AML (vs. de novo AML), in dicator of receiving reinduction, and decade/study.
Characteristics of the cohorts Table 1 summarizes the patients’ characteristics from the studies as analyzed by decade. Trials S9031 and S9333 (completed in the 1990s) were restricted to patients aged 55 and older; the other studies included patients aged 18 and older. The proportion of patients with performance status 2 and higher has decreased over time, particularly comparing studies conducted in the 1980s and 1990s (S8600, S9031/S9333) with those conducted in the 2000s and 2010s (S0106, S1203). Patients with secondary AML
S8600 S9031/S9333 S0106 S1203 P value (N=530) (N=155) (N=301) (N=261)
Age in years, median (range) 43 (15-64) 61 (56-65) 45 (18-60) 46 (19-20) <0.001
Gender, N (%)
Female 247 (47) 69 (45) 147 (49) 131 (50) 0.65 Male 283 (53) 86 (55) 154 (51) 130 (5)
Performance status, N (%) 0-1 374 (73) 113 (75) 255 (85) 221 (85) <0.001 2-3 140 (27) 38 (25) 44 (15) 40 (15) WBCx109/L, median (range) 41 (0.4-416) 36 (0.7-274) 114 (7-9300) 110 (4-8500) 0.029
Platelet count x109/L, median (range) 78 (2-700) 82 (6-1200) 114 (7-9300) 110 (4-8500) 0.040 Marrow blasts, %, median (range) 67 (0-99) 61 (10-99) 62 (3-100) 57 (0-100) <0.001
Cytogenetic risk, N (%)
Favorable 9 (2) 5 (3) 42 (14) 28 (11) <0.001
Intermediate 56 (11) 67 (43) 126 (42) 168 (64)
Unfavorable 32 (6) 36 (23) 55 (18) 60 (23)
Missing 433 (82) 47 (30) 78 (26) 5 (2)
Secondary AML, N (%)
De novo 506 (95) 121 (78) 301 (100) 236 (90) <0.001 Secondary 24 (5) 34 (22) 0 25 (10)
Note: not all percentages add up to 100 due to rounding. WBC: white blood cells; AML: acute myeloid leukemia. Haematologica
were not eligible for S0106, which compared “7+3” to “7+3” plus gemtuzumab ozogamicin.
Overall survival after CR1 increased over the time period analyzed here (Figure 1), as demonstrated also by multi variable regression models (Table 2), with a multivariable hazard ratio (HR) of 0.43 (95% confidence interval [95% CI]: 0.34-0.53, P<0.0001) for patients treated since year 2000 compared to patients treated before year 2000. Among patients who achieved CR1, there were fewer re lapses and a longer time to relapse among patients treated since 2000 (Figure 2), also in multivariable regres sion models (Table 2), with a multivariable HR of 0.40 (95% CI: 0.31-0.51, P<0.0001) taking before year 2000 as the ref erence. Among patients who relapsed after CR1, those treated since year 2000 had a significantly longer overall survival after relapse compared to those treated before year 2000 (Figure 3), also in multivariable modeling (Table 2): HR=0.43, 95% CI: 0.34-0.52, P<0.0001. Figure 4 and Table 3 summarize the percentage of pa tients, from among the patients who achieved CR1, who were in continuous CR1 at the landmark times. In multi variable models (data not shown), the probability of being alive without relapse was higher at all landmark times for patients treated since year 2000 compared to patients treated before year 2000.
Over the four decades analyzed, achieving CR1 was associ ated with a large benefit in overall survival (HR=0.06, 95% CI: 0.04-0.10 before year 2000; HR=0.16, 95% CI: 0.11-0.23 since year 2000), although the magnitude of benefit was less extreme for patients treated since 2000 (in other words the HR for since year 2000 was significantly closer to 1 than the HR for before year 2000, interaction P=0.001). Similarly, relapsing from CR1 was associated with a large decrement in overall survival across all the decades ana lyzed (HR=16.6, 95% CI: 11.0-24.1 for before year 2000; HR=10.1, 95% CI: 7.0-14.7 for since year 2000), although there was some evidence that the magnitude of decre ment was less for patients treated since 2000 (in other words the HR for after 2000 was significantly closer to 1 than the HR for before 2000, interaction P=0.079).

In the cohorts of patients studied here, overall survival for AML improved drastically over the last four decades, and this improvement was observed in all the intermediate endpoints we evaluated: early death rates, CR1 rates, length of CR1/time to relapse, relapse rates, and overall
survival after relapse from CR1. Reasons for improved outcomes are plausibly related to higher chemotherapy doses,8-10 improved antibiotics, more use of allogeneic HCT,11,12 and incorporation of novel agents (including gemtuzumab ozogamicin and FLT3 inhibitors) in the upfront, refractory, and salvage settings. These same reasons for improved survival may also explain why the relative benefit of achieving CR1 and the relative decre ment from relapse from CR1 are less extreme among pa tients who were treated after year 2000 compared to
Figure 1. Overall survival after first complete remission by trial/decade.
Figure 2. Cumulative incidence of time to relapse by trial/decade. CR: complete remission.

outcomes with "7+3" therapy for AML
Table 2. Multivariable regression model results.
Cox regression model for OS after CR1 (N=1,181)
Covariate HR 95% CI P value
S0106/S1203 (ref = S8600/S9031/S9333) 0.42 (0.35-0.49) <0.001 Age 1.02 (1.01-1.02) <0.001
Male (ref = female) 1.09 (0.95-1.24) 0.24 PS 2-3 (ref = PS 0-1) 1.23 (1.05-1.45) 0.011
Secondary AML (ref = de novo) 1.14 (0.88-1.48) 0.32
Favorable cytogenetic risk (ref = intermediate) 0.42 (0.27-0.65) <0.001
Unfavorable cytogenetic risk (ref = intermediate) 2.38 (1.93-2.94) <0.0001
Missing cytogenetic risk (ref = intermediate) 1.09 (0.91-1.30) 0.36
Baseline WBC count 1.10 (0.98-1.23) 0.10
Baseline platelet count 1.01 (0.99-1.03) 0.33 Baseline marrow blast percentage 1.02 (0.99-1.05) 0.19
Subdistribution hazard model for relapse after CR1 (N=710)
Covariate HR 95% CI P value
S0106/S1203 (ref = S8600/S9031/S9333)
0.40 (0.31-0.51) <0.001 Age 1.00 (1.00-1.01) 0.33 Male (ref = female) 1.16 (0.96-1.40) 0.13 PS 2-3 (ref = PS 0-1) 1.03 (0.80-1.32) 0.84
Secondary AML (ref = de novo) 1.11 (0.72-1.69) 0.64
Favorable cytogenetic risk (ref = intermediate) 0.55 (0.35-0.87) 0.010
Unfavorable cytogenetic risk (ref = intermediate) 1.31 (0.89-1.92) 0.17
Missing cytogenetic risk (ref = intermediate) 0.95 (0.74-1.21) 0.66 Baseline WBC count 1.20 (0.99-1.46) 0.067 Baseline platelet count 1.00 (0.97-1.04) 0.84 Baseline marrow blast percentage 1.01 (0.97-1.05) 0.54
Cox regression model for OS after relapse from CR1 (N=789)
Covariate HR 95% CI P value S0106/S1203 (ref = S8600/S9031/S9333)
0.43 (0.34-0.53) <0.001 Age 1.02 (1.01-1.03) <0.001 Male (ref = female) 1.05 (0.88-1.25) 0.61 PS 2-3 (ref = PS 0-1) 1.11 (0.89-1.38) 0.36
Secondary AML (ref = de novo) 1.17 (0.82-0.66) 0.38 Favorable cytogenetic risk (ref = intermediate) 0.43 (0.27-0.69) <0.001
Unfavorable cytogenetic risk (ref = intermediate) 1.91 (1.44-2.53) <0.001 Missing cytogenetic risk (ref = intermediate) 1.07 (0.86-1.35) 0.53
Baseline WBC count 1.15 (0.97-1.36) 0.11
Baseline platelet count 1.01 (0.99-1.03) 0.53
Baseline marrow blast percentage 1.00 (0.96-1.03) 0.82
OS: overall survival; CR1: first complete remission; HR: hazard ratio; 95% CI: 95% confidence interval; PS: performance status; AML: acute myeloid leukemia; WBC: white blood cell.
patients treated before year 2000. We recognize that the lack of HCT data from older studies confounds these ana lyses, in particular the length of CR1. Without HCT data we cannot separate out the specific role of HCT in these changing trends over time. The characteristics of patients treated with the “7+3” regimen on these trials changed over time, even though
eligibility criteria were stable across time with the exception of age (as noted above in the Methods section) and second ary AML patients being ineligible for S0106. On average the proportion of lower-risk patients increased, possibly reflect ing the availability of less intense therapies, in particular azacitidine and decitibine after year 2000 and introducing the possibility of increased selection bias in later years. Al
Figure 3. Overall survival after relapse by trial/decade.


Table 3. Percentages of patients in continuous complete remission at landmark times after achieving first complete remission.
S8600 S9031/ S9333
S0106 S1203 P value
6 months 82 77 95 88 <0.001
1 year 57 62 75 82 <0.001
1.5 years 50 66 69 77 0.007
2 years 51 63 72 74 0.026
2.5 years 57 61 71 78 0.041
3 years 58 64 72 76 0.11
over time; doses of both drugs changed over time as noted in the Methods section. The multivariable analysis cannot adjust for factors perfectly confounded with study/decade, such as changes in doses of therapy, to tease out individual contributions.
Only since the 2000s have response criteria such as CR with incomplete platelet recovery, CR with incomplete hemato logic recovery, morphological leukemia-free state, and CR with partial hematologic recovery been introduced and it will be interesting to examine their effects on survival relative to that of CR as contemporary trials mature and longer-term analysis of their outcomes becomes feasible.13
No conflicts of interest to disclose.
MO designed research, analyzed the data, and wrote the paper. GGM, JEG, JKW, FRA, HPE, and EHE designed re search and wrote the paper.
The authors gratefully acknowledge the important con tributions of the late Dr. Stephen H. Petersdorf to SWOG and to study S0106.
Figure 4. Percentages of patients in continuous first complete remission over a 3-year period. CR: complete remission.
though we present regression results from multivariable models, these models can only account for the covariates that are available in the datasets analyzed. Notably, HCT rates increased over the period analyzed and this post-re mission therapy could not be analyzed statistically because rates of HCT were so low in the trials before year 2000 and data on HCT were not collected in the established trial forms. It should also be noted that “7+3” therapy changed
This investigation was supported in part by the following PHS/DHHS grants awarded by the National Cancer Insti tute, National Clinical Trials Network to SWOG: U10CA180888 (Principal Investigator, C.D. Blanke) and U10CA180819 (Principal Investigator, M. Leblanc).
The analyzed dataset can be requested following SWOG data-sharing procedures: https://www.swog.org/sites/de fault/files/docs/2019-12/Policy43_0.pdf. Questions may be directed to the author for correspondence.
1. Othus M, Kantarjian H, Petersdorf S, et al. Declining rates of treatment-related mortality in patients with newly diagnosed AML given ‘intense’ induction regimens: a report from SWOG and MD Anderson. Leukemia. 2014;28(2):289-292.
2. Weick JK, Kopecky KJ, Appelbaum FR, et al. A randomized investigation of high-dose versus standard-dose cytosine arabinoside with daunorubicin in patients with previously untreated acute myeloid leukemia: a Southwest Oncology Group study. Blood. 1996;88(8):2841-2851.
3. Godwin JE, Kopecky KJ, Head DR, et al. A double-blind placebocontrolled trial of granulocyte colony-stimulating factor in elderly patients with previously untreated acute myeloid leukemia: a Southwest Oncology Group study (9031). Blood. 1998;91(10):3607-3615.
4. Cheson BD, Bennett JM, Kopecky KJ, et al. Revised recommendations of the International Working Group for Diagnosis, Standardization of Response Criteria, Treatment Outcomes, and Reporting Standards for Therapeutic Trials in Acute Myeloid Leukemia. J Clin Oncol. 2003;21(24):4642-4649.
5. Petersdorf SH, Kopecky KJ, Slovak M, et al. A phase 3 study of gemtuzumab ozogamicin during induction and postconsolidation therapy in younger patients with acute myeloid leukemia. Blood. 2013;121(24):4854-4860.
6. Garcia-Manero G, Othus M, Pagel JM, et al. SWOG S1203: a randomized phase III study of standard cytarabine plus daunorubicin (7+3) therapy versus idarubicin with high dose cytarabine (IA) with or without vorinostat (IA+V) in younger
patients with previously untreated acute myeloid leukemia (AML). Blood. 2016;128(22):901.
7. Fine JP, Gray RJ. A proportional hazards model for the subdistribution of a competing risk. J Am Stat Assoc. 1999;94(446):496-509.
8. Fernandez HF, Sun Z, Yao X, et al. Anthracycline dose intensification in acute myeloid leukemia. N Engl J Med. 2009;361(26):1249-1259.
9. Rowe JM, Tallman MS. Intensifying induction therapy in acute myeloid leukemia: has a new standard of care emerged? Blood. 1997;90(6):2121-2126.
10. Büchner T, Urbanitz D, Hiddemann W, et al. Intensified induction and consolidation with or without maintenance chemotherapy for acute myeloid leukemia (AML): two multicenter studies of the German AML Cooperative Group. J Clin Oncol. 1985;3(12):1583-1589.
11. McDonald GB, Sandmaier BM, Mielcarek M, et al. Survival, nonrelapse mortality, and relapse-related mortality after allogeneic hematopoietic cell transplantation: comparing 2003–2007 versus 2013–2017 cohorts. Ann Intern Med. 2020;172(4):229-239.
12. Gooley TA, Chien JW, Pergam SA, et al. Reduced mortality after allogeneic hematopoietic-cell transplantation. N Engl J Med. 2010;363(22):2091-2101.
13. Döhner H, Estey E, Grimwade D, et al. Diagnosis and management of AML in adults: 2017 ELN recommendations from an international expert panel. Blood. 2017;129(4):424-447.
Sanne Noort,1 Jolieke van Oosterwijk,2 Jing Ma,3 Elizabeth A.R. Garfinkle,4 Stephanie Nance,4 Michael Walsh,3 Guangchun Song,3 Dirk Reinhardt,5 Martina Pigazzi,6 Franco Locatelli,7 Henrik Hasle,8 Jonas Abrahamsson,9 Marie Jarosova,10 Charikleia Kelaidi,11 Sophia Polychronopoulou,11 Marry M. van den Heuvel-Eibrink,1,12 Maarten Fornerod,13 Tanja A. Gruber4 and C. Michel Zwaan1,12
1Pediatric Oncology/Hematology, Erasmus MC-Sophia Children’s Hospital, Rotterdam, the Netherlands; 2US Biologic, Inc, Memphis, TN, USA; 3Department of Pathology, St. Jude Children's Research Hospital, Memphis, TN, USA; 4Department of Oncology, St. Jude Children's Research Hospital, Memphis, TN, USA; 5AML-BFM Study Group, Pediatric Hematology and Oncology, Essen, Germany; 6Women and Child Health Department, Hematology-Oncology Clinic and Lab, University of Padova, Padova, Italy; 7Italian Association of Pediatric Hematology and Oncology, University of Pavia, Pavia, Italy; 8Pediatrics and Adolescent Medicine, Aarhus University Hospital, Aarhus, Denmark; 9Nordic Society for Pediatric Hematology and Oncology, Department of Pediatrics, Institution for Clinical Sciences, Sahlgrenska Academy, University of Gothenburg, Gothenburg, Sweden; 10Center of Molecular Biology and Gene Therapy, Department of Internal Hematology and Oncology, Masaryk University Hospital, Brno, Czech Republic; 11Department of Pediatric Hematology and Oncology, “Aghia Sophia” Children’s Hospital, Athens, Greece; 12Princess Máxima Center for Pediatric Oncology, Utrecht, the Netherlands and 13Department of Cell Biology, Erasmus MC, Rotterdam, the Netherlands
Correspondence: C. M. Zwaan c.m.zwaan@erasmusmc.nl
Received: November 29, 2021.
Accepted: July 19, 2022.
Prepublished: July 28, 2022.
https://doi.org/10.3324/haematol.2021.280250
©2023 Ferrata Storti Foundation
Published under a CC BY-NC license
Elucidating genetic aberrations in pediatric acute myeloid leukemia (AML) provides insight in biology and may impact on risk-group stratification and clinical outcome. This study aimed to detect such aberrations in a selected series of samples without known (cyto)genetic aberration using molecular profiling. A cohort of 161 patients was selected from various study groups: DCOG, BFM, SJCRH, NOPHO and AEIOP. Samples were analyzed using RNA sequencing (n=152), whole exome (n=135) and/or whole genome sequencing (n=100). In 70 of 156 patients (45%), of whom RNA sequencing or whole genome sequencing was available, rearrangements were detected, 22 of which were novel; five involving ERG rearrangements and four NPM1 rearrangements. ERG rearrangements showed self-renewal capacity in vitro, and a distinct gene expression pattern. Gene set enrichment analysis of this cluster showed upregulation of gene sets derived from Ewing sarcoma, which was confirmed comparing gene expression profiles of AML and Ewing sarcoma. Furthermore, NPM1-rearranged cases showed cytoplasmic NPM1 localization and revealed HOXA/B gene overexpression, as described for NPM1 mutated cases. Single-gene mutations as identified in adult AML were rare. Patients had a median of 24 coding mutations (range, 7-159). Novel recurrent mutations were detected in UBTF (n=10), a regulator of RNA transcription. In 75% of patients an aberration with a prognostic impact could be detected. Therefore, we suggest these techniques need to become standard of care in diagnostics.
Acute myeloid leukemia (AML) is a rare disease in children. Over the last decades survival has reached a plateau with current event-free survival (EFS) rates of approximately 50-65% and overall survival (OS) over 70% using contem porary protocols.1-3 Currently, pediatric AML patients are treated with four or five courses of chemotherapy followed by hematopoietic stem cell transplantation in high risk cases.2 Treatment stratification is mainly based on early
treatment response and genetic abnormalities.4 Further chemotherapy intensification is not feasible as treatment toxicity results in a 5-10% mortality rate.5 Therefore, im proved treatment stratification or novel, preferably tar geted, therapeutic options are necessary.
Pediatric AML is a heterogeneous disease characterized by various type I and type II aberrations.6 Type I aberrations generally result in a proliferation advantage, such as mu tations in N/KRAS, and FLT3-ITD, which are not mutually exclusive.7,8 Type II aberrations generally result in a differ
entiation block, occur early in leukemic development and are mutually exclusive, such as KMT2A-rearrangements, RUNX1-RUNX1T1 and CBFB-MYH11. 9 Type II aberrations have been reported to be important predictors of outcome.7 In recent years, research focused on refining the risk group stratification and elucidating genetic aberrations in what was previously conceived as ‘(cyto-)genetically nor mal’ AML).7,10-12 For instance, Hollink et al. described cyto genetically cryptic NUP98-NSD1 rearrangements as a novel recurrent unfavorable prognostic rearrangement in pedi atric AML.12 Furthermore, De Rooij et al. used next-gener ation sequencing (NGS) to characterize non-DS acute megakaryoblastic leukemia (AMKL), a subtype of AML which is associated with a poor outcome,11 and identified HOX gene rearrangements with a favorable outcome. Translocations were found in approximately 82% of pedi atric AMKL patients.11 In adult AML, genomic profiling re vealed recurrent single gene mutations such as NPM1, CEBPA, RUNX1 and DNMT3A, which have distinct prog nostic significance.13 These single gene mutations are rare in children, further underlining that pediatric AML could be a primarily fusion-driven disease.14-16 Despite these ad vances, approximately 25% of pediatric AML patients still present with unknown somatic genetic abnormalities. In the current study, we aimed to identify novel driving oncogenic events in pediatric AML patients without a known type II aberration by karyotype and/or other mol ecular analysis. NGS, RNA sequencing (RNAseq), whole exome sequencing (WES) and whole genome sequencing (WGS), was performed on primary pediatric AML samples.
Patient selection Patients (n=161) were selected from five different study groups: St Jude Children’s Research Hospital (SJCRH), the Dutch Childhood Oncology Group (DCOG), the BerlinFrankfurt-Münster group (BFM), the Nordic Society of Pediatric Hematology and Oncology (NOPHO), and the As sociazione Italia di Ematologica e Oncologia Pediatrica (AIEOP) (Figure 1; Online Supplementary Table S1). Each re search group selected patients for this study according to their own diagnostic standard work-up (Online Supple mentary Appendix). This study was approved by the ethics committee of each research group.
Next-generation sequencing RNAseq, WGS and WES were performed as previously de scribed.11 Data has been published previously by Fornerod et al 17 Fusions detected by RNAseq or WGS were validated by reverse transcription polymerase chain reaction (RTPCR). Single nucletide variant (SNV) calls were considered valid if they were detected by at least two NGS tech
niques. Only Insertions and deletions in a genome (indels) with at least five reads in the AML sample and no reads in the germline sample were considered as valid muta tions, in samples where only WES or WGS was performed. If only one NGS technique was available, also SNV calls with at least five reads in the AML sample and no reads in the germline sample were considered as valid muta tions.
Gene expression analysis was performed as described previously.11 Briefly, fragments per kilobase of transcript per million mapped reads (FPKM) were used. Genes that were not expressed in any sample group were excluded from the final data matrix for downstream analysis, i.e., FPKM value >=0.5. Only mRNA was used in the analysis and mRNA encoded by sex-specific genes were excluded.11 Downstream analysis was performed using R, version 3.6.1. Differential gene expression was performed using Voom (Online Supplementary Appendix).18 For gene set enrich ment analysis (GSEA), genes were ranked based on t-stat istic and analyzed using the Broad Institute GSEA Desktop Application version 2.2.4.19,20
NPM1 immunofluorescence
NPM1 immunofluorescence was performed on cytospins of pediatric AML samples and one healthy control, using the anti-NPM1 antibody FC-61911 (Invitrogen, Paisley, UK) and DAPI to stain the nuclei (Online Supplementary Ap pendix).
For functional validation of novel aberrations, serial colony replating was performed. Lineage depleted bone marrow cells derived from 6-8 week old BL6 mice were prepared and transduced as previously described11 (Online Supple mentary Appendix).
Analysis were performed using R, version 3.6.1. All tests were 2-tailed, and a P value <0.05 was considered signifi cant. Complete remission (CR) was defined as <5% blasts in the bone marrow, with regeneration of trilineage hema topoiesis and no leukemic cells in cerebrospinal fluid or elsewhere. If a patient did not reach CR, treatment was considered a failure at day 0. Overall survival (OS) was cal culated from the day of diagnosis until the date of last follow-up or death from any cause. Event- free survival (EFS) was measured from the day of diagnosis to the date of the first event or the date of last follow-up. Events considered in this analysis were resistant disease, relapse, occurrence of secondary malignancy and death. KaplanMeyer curves for OS and EFS were calculated and plotted using the survival package in R.21
In total, 156 of 161 (97%) of analyzed patients had RNAseq and/or WGS data. Of these, fusion genes were identified in 71 patients (44%) (Table 1), confirming the high frequency of translocation events in pediatric AML. Due to the differ ent selection processes of the cohorts, several well-known drivers were detected that were not detected by the re
Figure 1. Flow diagram of the cohort selection. Patients from different cohorts were selected according to the research groups diagnostic procedures. Patient samples from SJCRH were selected based on karyo type analysis only, patient samples from DCOG and BFM were selected based on ka ryotype analysis and molecular analysis such as reverse transcription polymerase chain reaction (RT-PCR) and KMT2A splitfluorescence in situ hybridization analysis. NOPHO and AIEOP both provided samples from patients with a normal karyotype, of whom NOPHO excluded NPM1 mutated pa tients. In total 161 patients had good quality RNA sequencing (RNAseq) (n=152), whole exome sequencing (WES) (n=135) and/or whole genome sequencing (WGS) (n=100). SJCRH: St Jude Children’s Research Hospital; DCOG: Dutch Childhood Oncology Group; BFM: Berlin-Frankfurt-Münster Group; NOPHO: Nordic Society of Pediatric Hematol ogy and Oncology; AIEOP: Associazione Italia di Ematologica e Oncologia Pediatrica. FISH: Fluorescence in situ hybridization; mut: mu tated; rearr: rearrangement.
search groups using the conventional diagnostic cytogen etic screening methods, like CBFB-MYH11 (n=2), KMT2A re arrangements (n=23), and cryptic NUP98 rearrangements (n=12). Additionally, in 13 patients other rearrangements were identified: DEK-NUP214 in three patients, FUS-ERG (n=4), CREBBP-KAT6A (n=2), KMT2A-PTD (n=2) and en hancer hijacking of MECOM (n=2), leaving ultimately 21 pa tients (13%) with novel fusions that are either unique or have only been scarcely reported in the literature. These

rearrangements involved NPM1 (n=4), ETV6 (n=4), BCL11B (n=2) and GATA1 (n=2) (Table 1). One of the BCL11B re
arrangements involved enhancer highjacking detected through WGS, showing a translocation between chromo
Table 1. Characteristics of rearrangements detected in this cohort. This table depicts the characteristics of patients with rearrangements detected in this cohort.
Patients N Median age in years (range) FAB type M0 (%) M1 (%) M2 (%) M4 (%) M5 (%) M6 (%) NOS (%)
All patients 161 11.0 (0.3-21.3)** 9 (5.5) 42 (26) 30 (19) 28 (17) 32 (20) 4 (2.5) 18 (11)
KMT2A rearrangements 23 3.4 (0.3-15.6) 2 (9) 5 (22) 13 (56) 4 (13)
KMT2A-MLLT10 9 3.5 (0.4-13.0) 1 8
KMT2A-MLLT4 3 8.7 (3.1-14.6) 1 1 1
KMT2A-ELL 2 3.3 (0.4-6.2) 1 1
KMT2A-MLLT1 2 1.9 (0.3-3.4) 2
KMT2A-PTD 2 13.4 (11.2-15.6) 1 1
KMT2A-SEPT6 2 3.5 (1.6-5.3) 1 1 KMT2A-USP2 1 1.3 2 KMT2A-EPS15 1 2.1 1 KMT2A-MLLT3 1 2.1 1
NUP rearrangements 14 12.0 (1.8-19.9) 1 (7) 3 (21) 3 (21) 3 (21) 1 (7) 3 (21) NUP98-NSD1 8 12.9 (6.7-19.9) 2 3 1 2 DEK-NUP214 3 14.2 (11.5-14.3) 1 1 1 NUP98-KDM5A 2 6.0 (1.8-10.1) 1 1 NUP98-HOXA13 1 2.3 1
ERG rearrangements 6 8.0 (2.6-12.8) 1 (17) 1 (17) 3 (50) 1 (17)
FUS-ERG 4 5.5 (2.6-9.2) 1 2 1 FUS-FEV 1 12.8 1 EWSR1-ERG 1 8.7 1
NPM1 rearrangments 4 3.2 (0.7-3.4)* 1 (25) 1 (25) 1 (25) 1 (25) NPM1-CCDC28A 3 2.0 (0.7-3.2)* 1 1 1 NPM1-HAUS1 1 3.4 1
ETV6 rearrangements 4 7.2 (0.8-16.4) 1 (25) 2 (50) 1 (25) ETV6-SMARCA2 1 1.6 1 ETV6-MECOM 1 16.4 1 ETV6-LRP6 1 12.7 1 MNX1-ETV6 1 0.8 1
CREBBP-KAT6A 2 10.4 (1.5-19.3) 2 (100)
CBFB-MYH11 2 9.6 (3.0-16.3) 2 (100)
MECOM 2 6.0 (4.6-7.5) 1 (50) 1 (50)
BCL11B rearrangements 2 5.0 (3.8-6.2) 2 (100) BCL11B-ZEB2 1 6.2 1 BCL11B enhancer highjacking 1 3.8 1
GATA1 2 1.0 (0.6-1.3) 2 (100)
GATA1 deletion exon 2-4 1 1.3 1 MYB-GATA1 1 0.6 1
CBFA2T3-GLIS2 1 1.2 1 (100)
EWSR1-ZNF384 1 13.8 1 (100)
FOSB-KLF6 1 16.6 1 (100)
MED12-HOXA9 1 17.7 1 (100)
PICALM-MLLT10 1 11.0 1 (100)
PIM1-BRD1 1 10.6 1 (100) RUNX1-USP42 1 16.8 1 (100)
SFPQ-ZFP36L2 1 12.4 1 (100)
ZEB2-CTDSP1 1 11.5 1 (100)
PER2 1 1 (100)
*data missing for 1 patient, ** data missing for 2 patients.
some 8 and 14. The break point of chromosome 8 was in an intronic region of CCDC26, which is the same location of the t(3;8) translocation involving MECOM enhancer hi jacking.22 One of the genes closest to the genomic break point on chromosome 14 was BCL11B and displayed high gene expression, whereas other genes close to the ge nomic break point were not affected.
WES data was available for 134 of 161 (83%) patients and both WES and WGS data was available for 101 patients. As germline material was used as a reference, only so matic mutations were considered. The median number of mutations with functional consequences in coding re gions, i.e., changes in the amino acid composition of the protein, was 23.0 (range, 7-116) per patient. In total, 3,070 unique genes harbored mutations, of which 512 (17%) genes were mutated in at least two patients. Most of these recurrent mutations had been previously described, such as FLT3 (n=35, 27%), NRAS (n=25, 18%), CEBPA (n=22, 16%), WT1 (n=20, 15%), NPM1 (n=15, 10%), KRAS (n=9, 6%) and RUNX1 (n=8, 6%) (Figure 2A; Table 2). Single gene mutations commonly found in adult AML were rare in this cohort, i.e., IDH1 and IDH2 mutations both occurred in 3.0% of patients (4/134), ASXL1 in 2.2% (3/134), DNMT3A in 1.5% (2/134), TET2 in 1.5% (2/134), and EZH2 in 1.5% (2/134) of patients.
Novel recurrent mutations involved TTN (n=18, 13%), UBTF (n=10), 8%), TCHH (n=9, 7%) and SRA1 (n=9, 7%). As TTN and TCHH are large genes and are often mutated in a var iety of cancers without clinical consequences, these mu tations were not further analyzed. Mutations in the UBTF gene had not been previously de scribed in pediatric AML, but rearrangements involving this gene have been described in prostate cancer.23 All mutations detected in UBTF occurred in exon 13. In total, four patients had a tandem duplication, three patients had in frame deletions, of whom one also had a missense mutation, four patients had missense mutations and one patient had a mutation in the splice region. Patients with a mutation in UBTF had a median variant allele frequency (VAF) of 16.1 (range 10.2-35.6). In five of ten UBTF-mutated patients a mutation in WT1 was detected, and one patient had a concomitant CEBPA DM.
Another novel mutated gene in in nine pediatric AML cases was SRA1. Mutations occurred with a median VAF of 100 (range, 39-100), and all were missense mutations, and resulted in the same amino acid change (V110L). This mutation is registered in the COSMIC database and is predicted to be benign with SIFT and Polyphen scores of 0 (Online Supplementary Table S2).
A non-random association between several type I and
type II aberrations was detected (Figure 2A). As previously described, FLT3-ITD was associated with NPM1 mutations (9/35, 26%, P=0.001), and WT1 (8/35, 23%, P=0.047) mu tations.10 Furthermore, patients with mutations in CEBPA had a higher frequency of GATA2 mutations compared to the remaining cohort (27%, P<0.001). Of the patients with both CEBPA and GATA2 mutations, three concerned bial lelic CEBPA mutations and three monoallelic mutations ( Online Supplementary Figure S1 ). Another association was found between NPM1 mutations and mutations in RAD21 (3/15, 20%, P<0.001). A novel association was de tected between CEBPA mutations and mutations in KMT2C (n=3, 14%, P=0.002).
Both WES and WGS data were used to identify copy number alterations, such as chromosome 7 or 7q dele tions (n=5), chromosome 8 gain (n=5) and chromosome 5q loss (n=4) (Online Supplementary Figure S2). The most common copy number alteration in this cohort involved a gain of chromosome 1q (n=7). A focal deletion was de tected in chromosome 16 involving the CTCF gene in three patients, and one patient had a heterozygous deletion of chromosome 16q. Furthermore, WGS analysis identified chromotrypsis in chromosome 8, 12 and 19 in three indi vidual patients.
Unsupervised clustering, using T-SNE on 152 patients with RNAseq data, revealed six clusters (Figure 2B). As was previously described, KMT2A rearrangements and CREBBP-KAT6A clustered together.24 Furthermore, a large cluster containing 67 patients, was characterized by a high expression of HOXA/B genes. Aberrations such as NPM1 mutations and rearrangements (n=19), NUP98 rearrangements (n=10), DEK-NUP214 (n=3) and KMT2A rearrangements (n=5), were detected in this cluster, as reported before.12 Also mutations in WT1 (13/19, 68%) and FLT3 -ITD (23/35, 66%) were enriched in this cluster (Online Supplementary Figure S3). In total, six pa tients had both WT1 and FLT3 mutations, of which fi ve had no other rearrangement or mutation in NPM1 or CEBPA . Furthermore, this cluster appeared subdivided into two ‘subclusters’, which might be explained by the morphological subtype (FAB type), as one is enriched in granulocytic leukemias (FAB M1/M2) and the other in leukemias from myelo-monocytic origin (FAB M4/M5) (Online Supplementary Figure S4).
Although only double mutations of CEBPA have been de scribed to have a distinct gene expression pattern, in this cohort, both single (n=12) and double mutations (n=8) clustered together based on gene expression.25 In total, 18 of 20 CEBPA mutated cases with RNAseq data clus tered together. The two patients that clustered separately
B
Figure 2. Integrative analysis of mutations and gene expression. (A) Waterfall plot of recurrent mutations occurring in at least 4 patients, mutations occurring in less than 3 patients were excluded from this analysis. The plot was first ordered based on type II aberration. Rearrangements occurring less than 5-times were taken together. From FLT3 downward, genes were ordered based on the number of mutations that occurred. (B) t-distributed stochastic neighbor embedding (T-SNE )analysis using the top 200 most variant genes based on standard deviation of 153 patients with RNA-sequencing data. ITD: internal tandem repeat; rearr: rearrangement.

Table 2. Characteristics of mutations detected in this cohort. This table depicts the characteristics of mutations that occur in at least 8 patients in this cohort.
M0 (%) M1 (%) M2 (%) M4 (%) M5 (%) M6 (%) NOS (%)
FLT3 35 12.8 (0.4-21.2)* 1 (3) 9 (26) 4 (11) 11 (31) 6 (17) 5 (14)
NRAS 25 11.7 (0.4-19.9) 4 (16) 5 (20) 8 (32) 7 (28) 1 (4)
CEBPA 21 12.7 (3.9-21.3) 13 (62) 2 (9) 1 (5) 3 (14) 2 (10)
WT1 20 12.3 (3.9-19.9) 1 (5) 7 (35) 6 (26) 3 (15) 1 (5) 3 (15)
TTN 19 12.4 (0.7-19.9) 2 (11) 6 (32) 5 (26) 2 (10) 3 (16) 1 (5)
NPM1 15 13.9 (4.4-21.2) 2 (13) 4 (27) 5 (34) 2 (13) 2 (13)
UBTF 10 12.2 (4.0-16.4) 1 (10) 4 (40) 3 (30) 2 (20)
SRA1 9 11.9 (1.3-19.3) 1 (11) 3 (33) 3 (33) 2 (22)
TCHH 9 13.3 (3.9-16.6) 3 (33) 3 (33) 1 (11) 2 (22)
KRAS 9 2.1 (0.7-16.8) 1 (11) 1 (11) 2 (22) 5 (56)
RUNX1 8 13.1 (3.8-19.0) 5 (63) 2 (25) 1 (12)
had a single mutation in CEBPA and an additional NPM1 mutation.
Furthermore, a small cluster of nine samples could be de tected, which was enriched with ERG rearrangements. Of these nine patients that clustered together, four had a FUS-ERG rearrangement, one a FUS-FEV rearrangement and one a EWSR1-ERG rearrangement. The three other pa tients had an ETV6 rearrangement. A small ‘’cluster’’ consisted of only three samples of which two had a rearrangement involving GATA1.
The patients in the remaining cluster, carried various nonrecurrent rearrangements, including BCL11B rearrange ments (n=2), CBFB-MYH11 (n=2), ETV6-MECOM (n=1), KMT2A-MLLT10 (n=1), MECOM (n=1), NUP98-HOXA13 (n=1), SFPQ-ZFP36L2 (n=1), MED12-HOXA9 (n=1), PIM1-BRD1 (n=1), CBFA2T3-GLIS2 (n=1), PICALM-MLLT10 (n=1), RUNX1-USP42 (n=1).
Survival data was available of 151 of 161 patients (94%). Surviving patients had a median follow-up time of 6.7 years (range, 0.1-14.5). The entire cohort had a 5-year EFS of 50% (standard error [SE]=4%) and OS of 67% (SE=4%). When patients were stratified according to genetic aber ration, trends in differences in outcome were observed (Figure 3). Patients with CEBPA mutations and NPM1 mu tations or rearrangements had a 5-year EFS of 71% (SE=10%) and 82% (SE=5%), respectively, the 5-year OS rates were 89% (SE=7%) in both groups. In order to inves tigate survival of patients with CEBPA mutations, they were split up between single (n=9) and double mutations (n=9) (Online Supplementary Figure S5). Patients with CEBPA DM had no events or deaths, however, patents with CEPBA SM had an EFS of 56% (SE=16%) and OS of 80% (SE=12%). The difference in EFS between CEBPA SM and DM was significant (P=0.03). In contrast, patients with ERG rearrangements had a very poor outcome, i.e, all patients had an event within 2 years after diagnosis (1 refractory
disease, 4 relapses, 1 early death).
ERG rearrangements
ERG rearrangements were investigated in more detail as they were associated with a poor outcome. Patient char acteristics were verified by combining the current data with the TARGET cohort.10 The TARGET cohort contained seven pediatric patients with a rearrangement involving ERG or another ETS transcription factor of the ERG sub group, namely four FUS-ERG, two FUS-FEV and one FUSFLI1. Combining data confirmed the dismal outcome of these patients as in total 11 of 13 patients had an event, and ten of 13 died (Figure 4A). The three surviving patients had a relatively short median follow-up time of 2.6 months (range, 2.0-31) (Online Supplementary Table S3). Furthermore, the date of diagnosis was not significantly different from patients who died (P=0.17). Multivariable analysis was unfeasible due to the limited number of pa tients. WES and/or WGS data was available in nine of 13 patients. Recurrent mutations occurred in N/KRAS (4/9) and WT1 (2/9). No other genes were recurrently mutated. Differential gene expression analysis comparing ERG-re arranged AML to the remaining AML cohort revealed 1,034 significantly differentially expressed genes, of which 413 genes were upregulated and 621 genes were downregu lated (Online Supplementary Table S4). Performing GSEA revealed upregulation of gene sets derived from (embry onic) stem cells and Ewing sarcoma (Figure 4A; Online Supplementary Table 5 and 6). As GSEA of the cluster en riched for ERG rearrangements revealed upregulation of genes involved in Ewing sarcoma, gene expression was compared between AML and a historic Ewing sarcoma RNAseq dataset using the top 50 differentially expressed genes of ERG-rearranged AML versus other AML.26 Using hierarchical clustering, ERG-rearranged AML clustered closely to Ewing sarcoma samples and showed similar ex pression patterns, whereas other AML samples had op posing gene expression profiles (Figure 4B).
Figure 3. Patient outcome. (A) Event-free survival (EFS) and (B) overall survival (OS) of patients stratified by driving aberration. Aberrations that occur less than 5-times in this cohort have been combined with other rearrangements.

In order to investigate the transforming capacity of ERG rearrangements, FUS-ERG, FUS-FEV and EWSR1-ERG fusions were transduced into murine lineage depleted bone marrow cells and cultured using the colony-forming assay. FUS-ERG and EWSR1-ERG showed self-renewal ca pacity beyond the cells transduced with an empty vector. However, we could not demonstrate this for FUS-FEV (Fig ure 4B), suggesting a second hit might be needed for this rearrangement.
In total 21 patients had an event in NPM1, of whom 17 had a mutation and four had an NPM1-rearrangement (3 NPM1CCDC28A and 1 NPM1-HAUS1). Of the NPM1-rearranged cases, follow-up data was available for three patients, who were all alive at the last follow-up with a median fol low-up time of 3.5 years (range, 3.1-7.2).
Differential gene expression analysis comparing NPM1 mu tated and rearranged cases to the remaining cohort re vealed 1,437 significantly differentially expressed genes, of which 251 genes were upregulated and 1,186 genes were downregulated (Online Supplementary Table S7). When NPM1-mutated and NPM1-rearranged cases were separ ately compared to NPM1-wild-type patients, this revealed 421 and 113 differentially expressed genes, respectively (Online Supplementary Tables S8 and S9). GSEA revealed
upregulation of gene sets derived from NPM1 mutated AML for both NPM1-mutated and NPM1-rearranged gene sets (Figure 5A to C; Online Supplementary Tables S10 and S11). NPM1 mutations cause NPM1 retainment in the cytoplasm.27 In order to investigate whether NPM1 re arrangements also resulted in cytoplasmic NPM1, immu nofluorescent staining of NPM1 was performed on cytospins of primary AML patients with or without NPM1 mutations and rearrangements and compared to a sample of peripheral blood from a healthy donor. Cytoplasmic staining could be detected in AML samples with either NPM1 mutations or NPM1 rearrangements (Figure 5D), in contrast to NPM1-wild-type AML samples and healthy pe ripheral blood, where the staining was mainly localized in the nucleoli.
This collaborative study aimed to identify novel genetic aberrations in pediatric AML without known type 2 aber rations using routine clinical diagnostics, which varied among the participating collaborative groups in this study as they all used a slightly different approach to standard diagnostics. In approximately 45% of cases a rearrange ment could be detected, emphasizing the fusion driven
Figure 4. Characteristics of ERG-rearranged acute myeloid leukemia. (A) Survival curves combining data from Bolouri et al. and this cohort, comparing survival of ERG-rearranged acute myeloid leukemia (AML) to the remaining cohort. (B) Gene set enrichment analysis plots of gene sets derived from EWSR1-FLI1 targets and embryonic stem cells. (C) Hierarchical clustering of AML and Ewing sarcoma samples using the top 50 differentially expressed genes of ERG-rearranged AML vs. other AML (absolute log-fold change). Ewing sarcoma samples cluster together with ERG-rearranged AML. (D) Colony-forming assay of ERG and FEV rearrang ments detected in AML. NUP98-KDM5A was taken along as a positive control. Expression of EWSR1-ERG and FUS-ERG in murine lin- cells resulted in repetitive replating. EFS: event-free survival; OS: overall survival.

nature of pediatric AML, versus the relatively high fre quency of single-gene mutations in adult AML.28 Some were well-known recurrent events, such as KMT2A re arrangements, others were previously described and known as rare events in pediatric AML, such as DEKNUP214 and FUS-ERG. 29,30 Moreover, several novel or scarcely reported recurrent and some unique rearrange ments were detected, such as rearrangements involving BCL11B, GATA1 and ETV6. Of the patients without a known type II event, 30% (25/84) had a novel or unique re arrangement.
Besides rearrangements, WES and WGS detected a median of 24 coding mutations per patient, which is com parable to the mutational burden reported by Bolouri et al.10 In detail, we detected 502 recurrently mutated genes. Most of the recurrently mutated genes are well known, such as N/KRAS, WT1, CEBPA, NPM1 and FLT3. Novel recur rent mutations were detected in the UBTF (n=10) and SRA1 genes (n=9). SRA1 or Steroid Receptor RNA Activator 1 en codes both a protein and long non-coding RNA (lncRNA). The lncRNA acts as an RNA coactivator, and is associated with breast cancer, whereas the encoded protein SRAP is
involved in splicing and cell cycle regulation.31-33 As muta tions in SRA1 were predicted to be benign, we do not ex pect these mutations to be important pathogens. The UBTF gene on the other hand, encodes a protein which regulates mRNA transcription by RNA polymerase 1 or 2 and is associated with developmental neuroregression.34,35 UBTF has been described as a translocation partner of ETV1 or ETV4 in prostate cancer. Furthermore, depletion of UBTF is associated with DNA damage and ge nomic instability.36 However, there was no significant dif ference in the number of mutations between UBTF-mutated and wild-type cases. Patients with a mu tation in UBTF clustered in the cluster with high HOXA/B expression (n=9), except for a patient with a CEBPA DM and UBTF mutation. Five of these patients had an addi tional WT1 mutation, and one patient had a enhancher hi jacking of MECOM. It is unlikely that this mutation is a type II aberration as it occurs subclonally with variant allele frequencies between 10.2% and 35%. Both mutations have not been described by Bolouri et al. and their transform ing capacity is unknown.10 Due to the selection criteria of our cohort, patients with more rare aberrations and mu
B C
Figure 5. Characteristics of NPM1-rearranged acute myeloid leukemia. (A to C) Gene set enrichment analysis plots of gene sets upregulated in samples with an event in NPM1 compared to samples without an event in NPM1 (NPM1 wild-type [wt]), of which (A) depicts all NPM1 events (both rearrangements and mutations) vs NPM1 wt, (B) depicts NPM1 mutations vs NPM1 wt, and (C) depicts NPM1 rearrangements (NPM1r) vs NPM1 wt. (D). Cytospins of primary patient material stained with anti-NPM1. NPM1 is located in the nucleoli in healthy peripheral blood and in an acute myeloid leukemia (AML) sample with NPM1 wt, whereas it is localized in the cytoplasm in the NPM1-mutated and NPM1-rearranged AML samples.
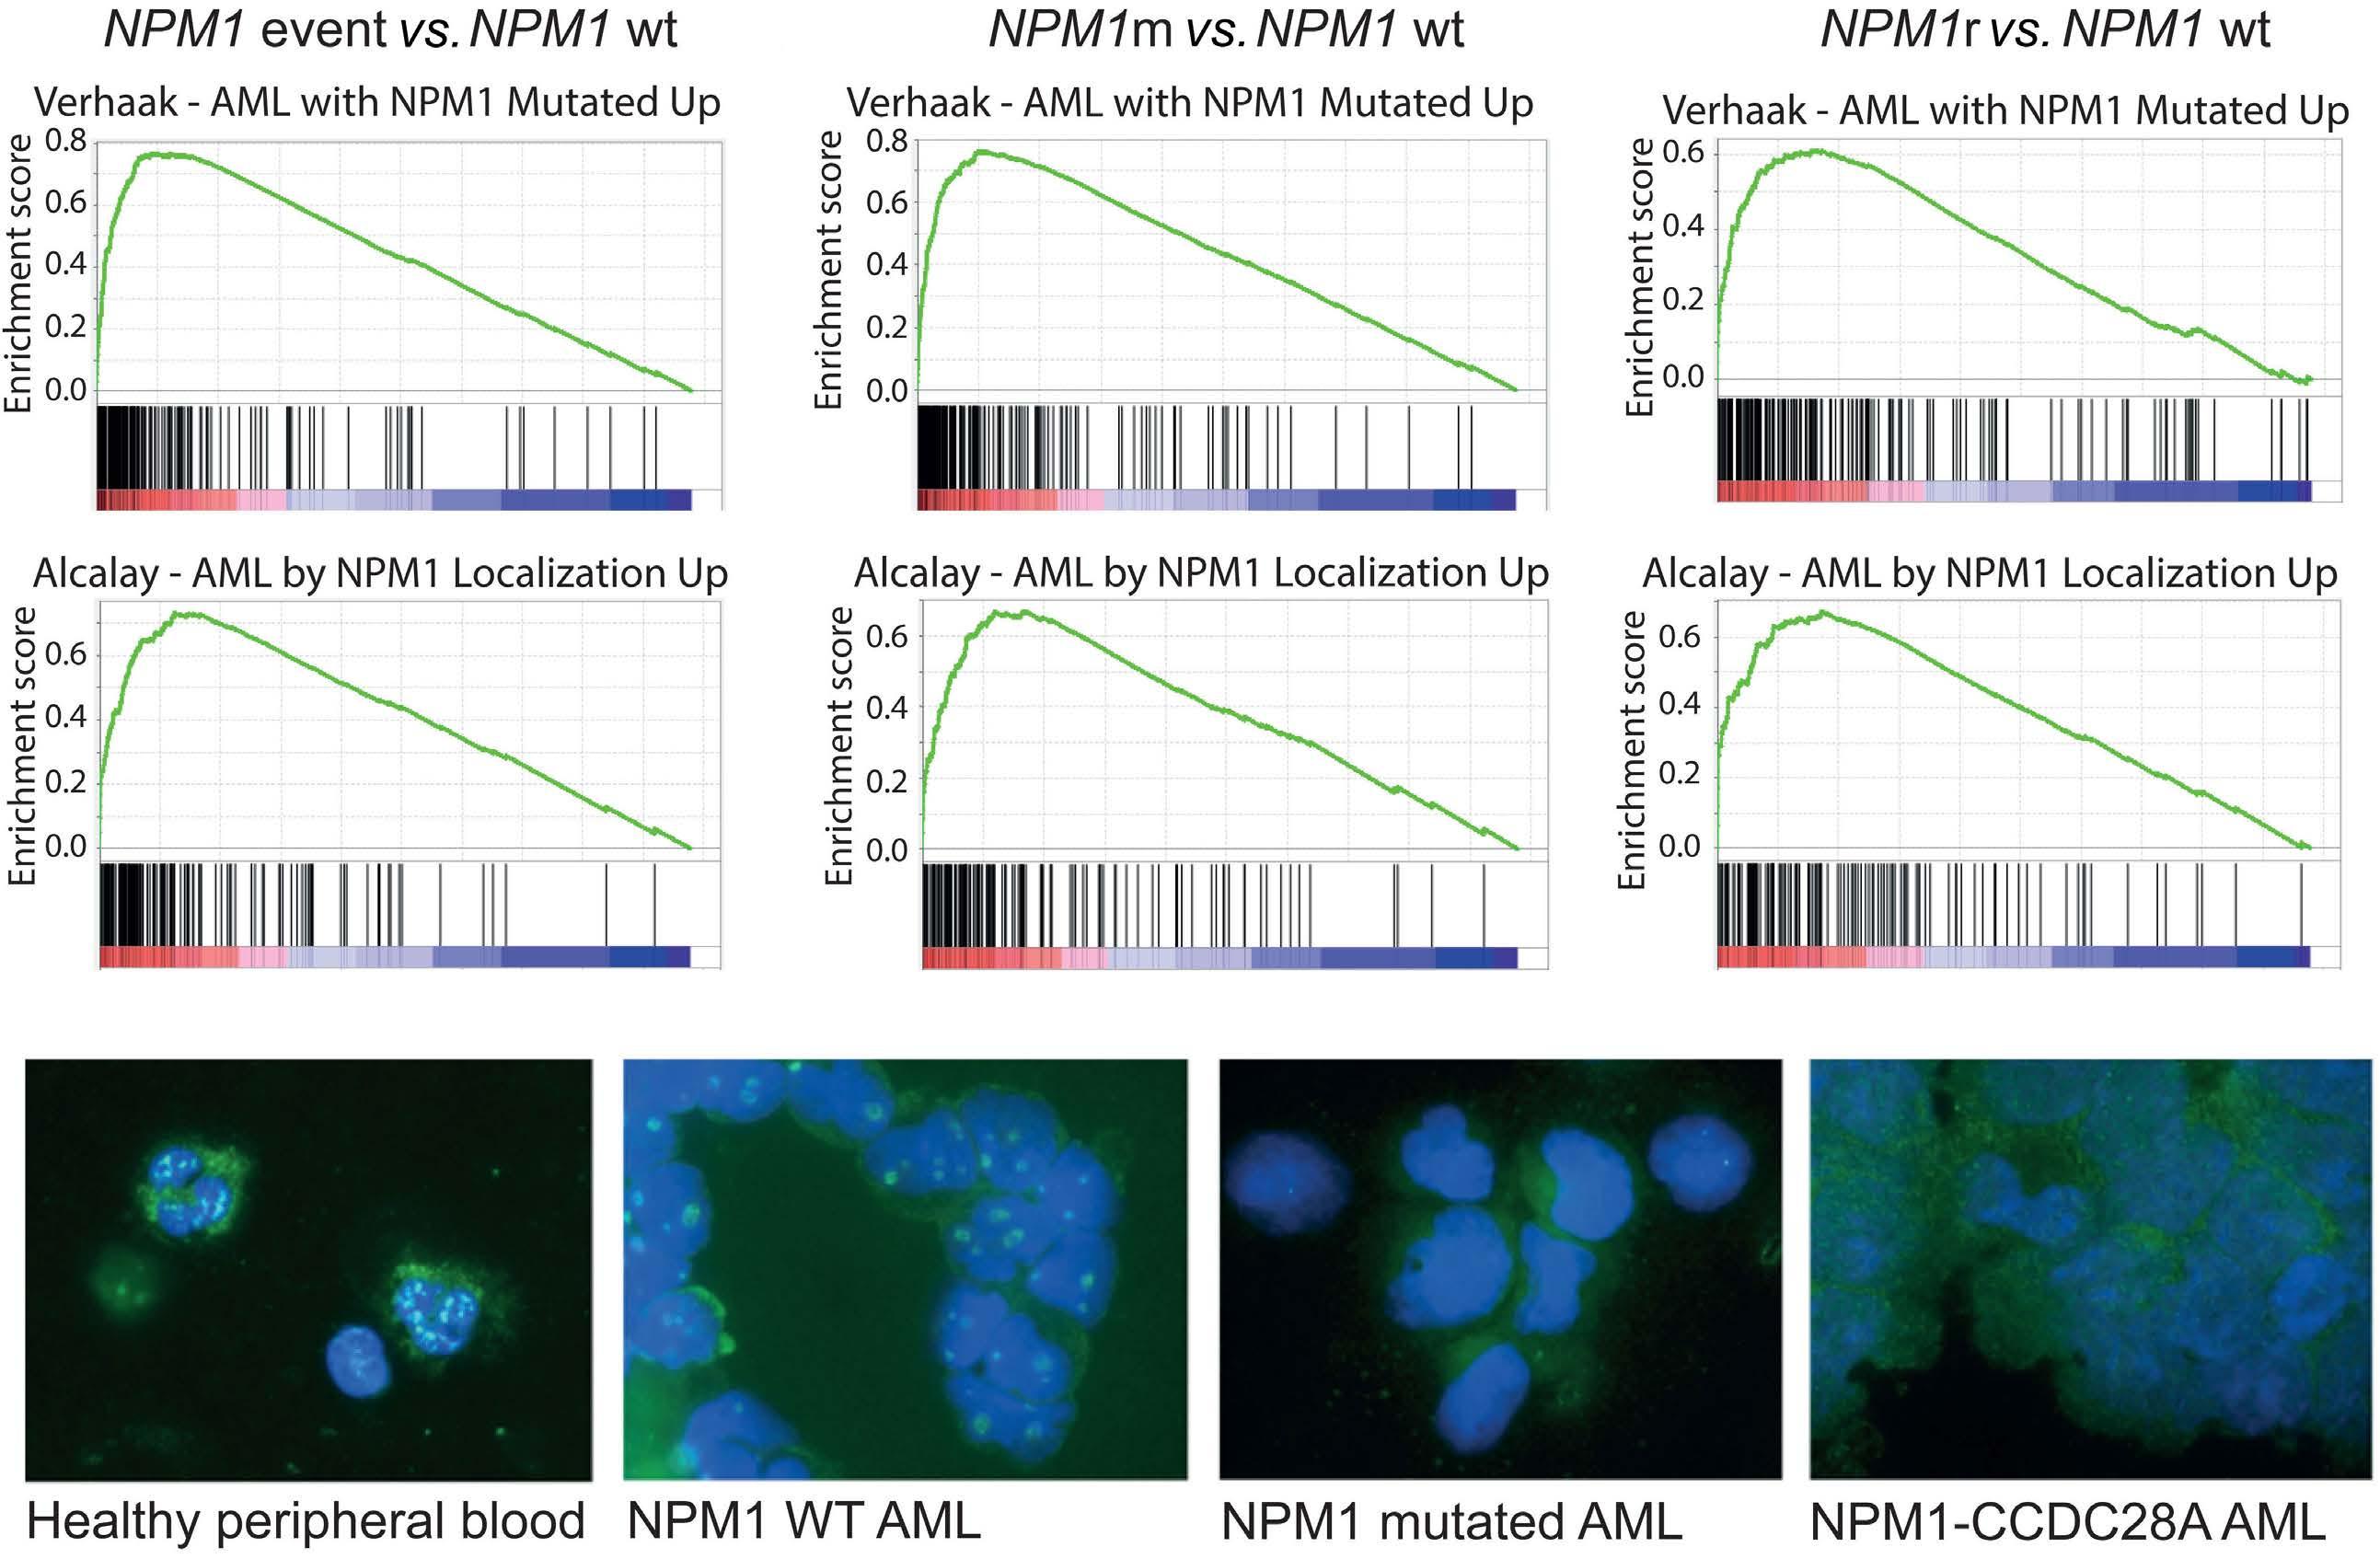
tations are enriched in this cohort, which may attribute to the detection of recurrent mutations that were not pre viously described by studies using the same technique. In contrast to previous studies, a similar gene expression pattern of CEBPA DM and SM was detected.25 However, in previous studies, CEBPA SM was associated with other type II aberrations such as NPM1 mutations, which could result in differences in gene expression.14,25 Furthermore, we did find a significant difference in EFS with a worse outcome in the CEBPA SM group, which was in contrast to a study by Tarlock et al., who found no difference in outcome between CEBPA SM and DM.37 However, our study was small with only nine patients in each group, whereas Tarlock et al. has a much larger study, and is po tentially more reliable. One patient subset was characterized by poor outcome, i.e., those with rearrangements in FUS-ERG (n=4), EWSR1ERG (n=1) and FUS-FEV (n=1). FUS-ERG-rearranged AML has been described as a group with a poor outcome be fore,29 which was reflected in this cohort and confirmed in the TARGET cohort by Bolouri et al. (Figure 4A).10 These rearrangements have also been described in Ewing sar coma.10,26,29,38 The fusion genes involved the transcription factor binding site of FUS or EWSR1, and the DNA binding site of ERG or FEV. The fact that FUS and EWSR1 are homologs and ERG and FEV, together with FLI1, belong to the same ETS subfamily, could explain why these re arrangements result in a similar gene expression pattern and cluster together in unsupervised clustering analysis (Figure 2B).39,40 GSEA revealed upregulation of pathways involved in stem cell development. This was expected as genes involved in these fusions are important for the regulation, development and self-renewal of hemato poietic stem cells.41-46
In addition, expression signatures previously described in Ewing sarcoma were upregulated, and all fusions in this group also occur in Ewing sarcoma. When combining RN seq data from AML and Ewing sarcoma patients, the ERG rearranged AML patients clustered together with Ewing sarcoma patients, whereas other AML patients clustered separately. This suggests that ERG-rearranged AML shares oncogenic pathways with Ewing sarcoma in contrast to other AML samples. Finding common ground between cancers can be useful for detecting novel therapeutic tar gets. Current chemotherapy protocols of AML and Ewing sarcoma are rather comparable, and not many additional novel therapeutic agents have proven to be effective.2,47,48 Another recurrent set of rearrangements included NPM1 rearrangements (n=4). We detected two different types of rearrangements: NPM1-CCDC28A (n=3) and NPM1-HAUS1 (n=1). Bolouri et al. also detected four patients with NPM1 fusions, i.e., NPM1-MLF1 10 All three NPM1-rearranged pa tients with survival data in our cohort were in CCR, whereas of the four NPM1-rearranged patients in the TAR
GET cohort, all patients relapsed and three patients sub sequently died. Therefore, the prognostic value of NPM1 rearrangements may be treatment or translocation partner dependent. The breakpoint of NPM1 in the re arrangements in our study was between exon 11 and exon 12. As mutations and rearrangements both result in dis ruption of exon 12 of NPM1, we hypothesized that both events could result in cytoplasmic retention of NPM1, driving leukemogenesis in these cases.27 Immunofluor escence of NPM1 showed that NPM1-CCDC28A result in cytoplasmic retention of NPM1 (Figure 5B). This has been previously shown for NPM1-HAUS1 as well, which makes it likely that NPM1 rearrangements and NPM1 mutants func tionally have a similar mechanism of action.49 Fur thermore, performing unsupervised clustering, all patients with an NPM1 event clustered in the large cluster which is characterized by upregulation of HOXA and HOXB, further underlining the conceivable similarities in onco genesis of NPM1 mutations and rearrangements. Rarer recurrent rearrangements involved BCL11B (n=2). BCL11B mutations and rearrangements are associated with T-ALL.50,51 In this cohort, one patient had a ZEB2-BCL11B rearrangement and in the other patient, enhancer hijack ing of BCL11B was detected. Both rearrangements led to high expression of BCL11B. This rearrangement has been described in adult AML before, but did not lead to selfrenewal capacity in CFU-GEM assay.52
One of the drawbacks of this study is that 37% of the cases that were included in the study had a known driving genetic aberration, such as a KMT2A rearrangement, which was dependent on what was considered the diagnostic standard of care in the participating collaborative groups. This shows the relevance of implementing more genomewide diagnostics, as for example karyotyping may appears not sufficient to detect all relevant fusions. Therefore, we suggest to implement NGS, i.e., RNAseq and WES, as stan dard of care in pediatric AML to readily detect driving aberrations, and stratify patients according to genetic events to improve outcome.5 Moreover, with the availabil ity of targeted agents such as menin inhibitors, it be comes relevant to readily identify all KMT2A and NUP98 rearrangements.
In 24% (n=39) of the patients in this study, despite NGS efforts, still no (potential) type II aberration could be identified. However, in eight of these 39 cases, only RN seq was performed, therefore, potentially driving single gene mutations could have been missed. As the muta tional burden in coding regions of the genome in pediatric AML is low, we anticipate that potentially non-coding mu tations may play an important role here, as well as epi genetic events.10,53
In conclusion, this study has characterized several novel and rare genetic aberrations occurring in pediatric AML. Some novel rearrangements, such as ERG rearrangements
should be considered high risk, whereas for others, such as NPM1 rearrangements this is not yet clear. Ideally for pediatric AML, diagnostics includes RNAseq when re sources allow it, as we demonstrated that this detects rare relevant fusion genes with prognostic implications.
No conflicts of interest to dislcose.
CMZ, TAG, MF and MMvdH-E designed the study. DR, MP, FL, HH, JA, MJ, CK, SP, CMZ contributed materials and clini
1. Rasche M, Zimmermann M, Borschel L, et al. Successes and challenges in the treatment of pediatric acute myeloid leukemia: a retrospective analysis of the AML-BFM trials from 1987 to 2012. Leukemia. 2018;32(10):2167-2177.
2. Zwaan CM, Kolb EA, Reinhardt D, et al. Collaborative efforts driving progress in pediatric acute myeloid leukemia. J Clin Oncol. 2015;33(27):2949-2962.
3. Rubnitz JE, Gibson B, Smith FO. Acute myeloid leukemia. Hematol Oncol Clin North Am. 2010;24(1):35-63.
4. Rubnitz JE. Current management of childhood acute myeloid leukemia. Paediatr Drugs. 2017;19(1):1-10.
5. Creutzig U, van den Heuvel-Eibrink MM, Gibson B, et al. Diagnosis and management of acute myeloid leukemia in children and adolescents: recommendations from an international expert panel. Blood. 2012;120(16):3187-3205.
6. Gilliland DG, Jordan CT, Felix CA. The molecular basis of leukemia. Hematology Am Soc Hematol Educ Program. 2004:80-97.
7. Balgobind BV, Hollink IH, Arentsen-Peters ST, et al. Integrative analysis of type-I and type-II aberrations underscores the genetic heterogeneity of pediatric acute myeloid leukemia. Haematologica. 2011;96(10):1478-1487.
8. Kelly LM, Gilliland DG. Genetics of myeloid leukemias. Annu Rev Genomics Hum Genet. 2002;3:179-198.
9. Welch JS, Ley TJ, Link DC, et al. The origin and evolution of mutations in acute myeloid leukemia. Cell. 2012;150(2):264-278.
10. Bolouri H, Farrar JE, Triche T, Jr., et al. The molecular landscape of pediatric acute myeloid leukemia reveals recurrent structural alterations and age-specific mutational interactions. Nat Med. 2018;24(1):103-112.
11. de Rooij JD, Branstetter C, Ma J, et al. Pediatric non-Down syndrome acute megakaryoblastic leukemia is characterized by distinct genomic subsets with varying outcomes. Nat Genet. 2017;49(3):451-456.
12. Hollink IH, van den Heuvel-Eibrink MM, Arentsen-Peters ST, et al. NUP98/NSD1 characterizes a novel poor prognostic group in acute myeloid leukemia with a distinct HOX gene expression pattern. Blood. 2011;118(13):3645-3656.
13. Tyner JW, Tognon CE, Bottomly D, et al. Functional genomic landscape of acute myeloid leukaemia. Nature. 2018;562(7728):526-531.
14. Hollink IH, van den Heuvel-Eibrink MM, Arentsen-Peters ST, et al. Characterization of CEBPA mutations and promoter hypermethylation in pediatric acute myeloid leukemia. Haematologica. 2011;96(3):384-392.
cal data. SN, MF, JM, MW and GS analyzed the data. SN, JvO and EARG performed experiments. SN and MF per formed statistical analysis . SN, MF, MMvdH-E and CMZ wrote the paper. CMZ, MF, MMvdH-E and TAG supervized the study and all co-authors performed critical review of the manuscript and gave their final approval.
Data for the sequenced samples in this study have been deposited to the St. Jude Cloud (www.stjude.cloud; ref. 33) and European Genome-phenome Archive (study ID EGAS00001004701).
15. Hollink IH, Zwaan CM, Zimmermann M, et al. Favorable prognostic impact of NPM1 gene mutations in childhood acute myeloid leukemia, with emphasis on cytogenetically normal AML. Leukemia. 2009;23(2):262-270.
16. Ho PA, Kutny MA, Alonzo TA, et al. Leukemic mutations in the methylation-associated genes DNMT3A and IDH2 are rare events in pediatric AML: a report from the Children's Oncology Group. Pediatr Blood Cancer. 2011;57(2):204-209.
17. Fornerod M, Ma J, Noort S, et al. Integrative genomic analysis of pediatric myeloid-related acute leukemias identifies novel subtypes andprognostic indicators. Blood Cancer Discov. 2021;2(6):586-599.
18. Law CW, Chen Y, Shi W, Smyth GK. Voom: precision weights unlock linear model analysis tools for RNA-seq read counts. Genome Biol. 2014;15(2):R29.
19. Subramanian A, Kuehn H, Gould J, Tamayo P, Mesirov JP. GSEAP: a desktop application for gene set enrichment analysis. Bioinformatics. 2007;23(23):3251-3253.
20. Subramanian A, Tamayo P, Mootha VK, et al. Gene set enrichment analysis: a knowledge-based approach for interpreting genome-wide expression profiles. Proc Natl Acad Sci U S A. 2005;102(43):15545-15550.
21. Therneau TM. A package for survival analysis in R. 2020. Available from: https://CRAN.R-project.org/package=survival.
22. Ottema S, Mulet-Lazaro R, Erpelinck-Verschueren C, et al. The leukemic oncogene EVI1 hijacks a MYC super-enhancer by CTCF-facilitated loops. Nat Commun. 2021;12(1):5679.
23. Barros-Silva JD, Paulo P, Bakken AC, et al. Novel 5' fusion partners of ETV1 and ETV4 in prostate cancer. Neoplasia. 2013;15(7):720-726.
24. Coenen EA, Zwaan CM, Reinhardt D, et al. Pediatric acute myeloid leukemia with t(8;16)(p11;p13), a distinct clinical and biological entity: a collaborative study by the InternationalBerlin-Frankfurt-Munster AML-study group. Blood. 2013;122(15):2704-2713.
25. Wouters BJ, Lowenberg B, Erpelinck-Verschueren CA, van Putten WL, Valk PJ, Delwel R. Double CEBPA mutations, but not single CEBPA mutations, define a subgroup of acute myeloid leukemia with a distinctive gene expression profile that is uniquely associated with a favorable outcome. Blood. 2009;113(13):3088-3091.
26. Crompton BD, Stewart C, Taylor-Weiner A, et al. The genomic landscape of pediatric Ewing sarcoma. Cancer Discov. 2014;4(11):1326-1341.
27. Heath EM, Chan SM, Minden MD, Murphy T, Shlush LI, Schimmer
AD. Biological and clinical consequences of NPM1 mutations in AML. Leukemia. 2017;31(4):798-807.
28. DiNardo CD, Cortes JE. Mutations in AML: prognostic and therapeutic implications. Hematology Am Soc Hematol Educ Program. 2016;2016(1):348-355.
29. Noort S, Zimmermann M, Reinhardt D, et al. Prognostic impact of t(16;21)(p11;q22) and t(16;21)(q24;q22) in pediatric AML: a retrospective study by the I-BFM Study Group. Blood. 2018;132(15):1584-1592.
30. Sandahl JD, Coenen EA, Forestier E, et al. t(6;9)(p22;q34)/DEKNUP214-rearranged pediatric myeloid leukemia: an international study of 62 patients. Haematologica. 2014;99(5):865-872.
31. Klinge CM. Non-coding RNAs in breast cancer: intracellular and intercellular communication. Noncoding RNA. 2018;4(4):40.
32. Leygue E. Steroid receptor RNA activator (SRA1): unusual bifaceted gene products with suspected relevance to breast cancer. Nucl Recept Signal. 2007;5:e006.
33. Sheng L, Ye L, Zhang D, Cawthorn WP, Xu B. New insights into the long non-coding RNA SRA: physiological functions and mechanisms of action. Front Med (Lausanne). 2018;5:244.
34. Edvardson S, Nicolae CM, Agrawal PB, et al. Heterozygous de novo UBTF gain-of-function variant is associated with neurodegeneration in childhood. Am J Hum Genet. 2017;101(2):267-273.
35. Toro C, Hori RT, Malicdan MCV, et al. A recurrent de novo missense mutation in UBTF causes developmental neuroregression. Hum Mol Genet. 2018;27(4):691-705.
36. Sanij E, Diesch J, Lesmana A, et al. A novel role for the Pol I transcription factor UBTF in maintaining genome stability through the regulation of highly transcribed Pol II genes. Genome Res. 2015;25(2):201-212.
37. Tarlock K, Lamble AJ, Wang YC, et al. CEBPA-bZip mutations are associated with favorable prognosis in de novo AML: a report from the Children's Oncology Group. Blood. 2021;138(13):1137-1147.
38. Shing DC, McMullan DJ, Roberts P, et al. FUS/ERG gene fusions in Ewing's tumors. Cancer Res. 2003;63(15):4568-4576.
39. Andersson MK, Stahlberg A, Arvidsson Y, et al. The multifunctional FUS, EWS and TAF15 proto-oncoproteins show cell type-specific expression patterns and involvement in cell spreading and stress response. BMC Cell Biol. 2008;9:37.
40. Oikawa T, Yamada T. Molecular biology of the Ets family of transcription factors. Gene. 2003;303:11-34.
41. Cho J, Shen H, Yu H, et al. Ewing sarcoma gene Ews regulates hematopoietic stem cell senescence. Blood. 2011;117(4):1156-1166.
42. Lee J, Nguyen PT, Shim HS, et al. EWSR1, a multifunctional protein, regulates cellular function and aging via genetic and epigenetic pathways. Biochim Biophys Acta Mol Basis Dis. 2019;1865(7):1938-1945.
43. Liu TH, Tang YJ, Huang Y, et al. Expression of the fetal hematopoiesis regulator FEV indicates leukemias of prenatal origin. Leukemia. 2017;31(5):1079-1086.
44. Ng AP, Loughran SJ, Metcalf D, et al. Erg is required for selfrenewal of hematopoietic stem cells during stress hematopoiesis in mice. Blood. 2011;118(9):2454-2461.
45. Sugawara T, Oguro H, Negishi M, et al. FET family protooncogene Fus contributes to self-renewal of hematopoietic stem cells. Exp Hematol. 2010;38(8):696-706.
46. Taoudi S, Bee T, Hilton A, et al. ERG dependence distinguishes developmental control of hematopoietic stem cell maintenance from hematopoietic specification. Genes Dev. 2011;25(3):251-262.
47. Grünewald TGP, Cidre-Aranaz F, Surdez D, et al. Ewing sarcoma. Nat Rev Dis Primers. 2018;4(1):5.
48. Whelan J, Le Deley MC, Dirksen U, et al. High-dose chemotherapy and blood autologous stem-cell rescue compared with standard chemotherapy in localized high-risk Ewing sarcoma: results of Euro-E.W.I.N.G.99 and Ewing-2008. J Clin Oncol. 2018;36(31):Jco2018782516.
49. Campregher PV, de Oliveira Pereira W, Lisboa B, et al. A novel mechanism of NPM1 cytoplasmic localization in acute myeloid leukemia: the recurrent gene fusion NPM1-HAUS1. Haematologica. 2016;101(7):e287-e290.
50. Kraszewska MD, Dawidowska M, Kosmalska M, et al. BCL11B, FLT3, NOTCH1 and FBXW7 mutation status in T-cell acute lymphoblastic leukemia patients. Blood Cells Mol Dis. 2013;50(1):33-38.
51. Przybylski GK, Dik WA, Wanzeck J, et al. Disruption of the BCL11B gene through inv(14)(q11.2q32.31) results in the expression of BCL11B-TRDC fusion transcripts and is associated with the absence of wild-type BCL11B transcripts in T-ALL. Leukemia. 2005;19(2):201-208.
52. Padella A, Simonetti G, Paciello G, et al. Novel and rare fusion transcripts involving transcription factors and tumor suppressor genes in acute myeloid leukemia. Cancers (Basel). 2019;11(12):1951.
53. Conway O'Brien E, Prideaux S, Chevassut T. The epigenetic landscape of acute myeloid leukemia. Adv Hematol. 2014;2014:103175.
Elise Sourdeau,1 Ludovic Suner,1 Mara Memoli,2 Alexis Genthon,2 Frédéric Feger,1 Lou Soret,1 Nasséra Abermil,1 Laurence Heuberger,3 Chrystele Bilhou-Nabera,1 Hélène Guermouche,1 Fabrizia Favale,1 Simona Lapusan,2 Michael Chaquin,1 Claire Hirschauer,4 Mohamad Mohty,2 Ollivier Legrand,2 François Delhommeau1# and Pierre Hirsch1#
1Sorbonne Université, INSERM, Centre de Recherche Saint-Antoine, CRSA, AP-HP, SIRIC CURAMUS, Hôpital Saint-Antoine, Service d’Hématologie Biologique, Paris, France; 2Sorbonne Université, INSERM, Centre de Recherche Saint-Antoine, CRSA, AP-HP, Hôpital Saint-Antoine, Service d’Hématologie Clinique et de Thérapie Cellulaire, Paris, France; 3Département de Médecine, Unité d’Hématologie, CHPF, Papeete, French Polynesia and 4Laboratoire de Biologie, CHPF, Papeete, French Polynesia
#FD and PH contributed equally as co-senior authors.
Correspondence: F. Delhommeau francois.delhommeau@aphp.fr
Received: January 31, 2022.
Accepted: July 25, 2022.
Prepublished: August 4, 2022.
https://doi.org/10.3324/haematol.2022.280676
©2023 Ferrata Storti Foundation
Published under a CC BY-NC license
Chemotherapy resistance is the main cause of treatment failure in acute myeloid leukemia (AML) and has been related to ATP-binding cassette (ABC) transporter activity. However, the links between ABC activity, immunophenotype, and mol ecular AML parameters have been poorly evaluated. Moreover, the prognostic value of ABC activity, when compared to new molecular markers, is unknown. Here we investigated the links between ABC activity, as evaluated by JC-1 +/- cyclo sporine A assay, and immunophenotypic, cytogenetic, molecular, and targeted next-generation sequencing features in 361 AML patients. High ABC activity was found in 164 patients and was significantly associated with less proliferating disease, an immature immunophenotype (expression of CD34, HLA-DR, CD117, CD13), and gene mutations defining AML as belonging to secondary-type ontogenic groups. Low ABC activity was associated with more mature myeloid differentiation (CD34 , cyMPO+, CD15+, CD33+) or monocytic commitment (CD64+, CD4+weak, CD14+), with NPM1 mutations, KMT2A rearrangements, and core-binding factor gene fusions, hallmarks of the de novo-type AML ontogeny. ABC activity was one of the major factors we identified using a random forest model for early prediction of AML ontogeny. In the 230 patients evaluated at diagnosis and intensively treated, high ABC activity was a predictive factor for primary resistance, and in multivariate analysis including full molecular data, an independent factor for event-free survival (P=0.0370). JC-1 +/- cyclosporine A assay could be used at diagnosis to predict AML ontogeny and to complete prognosis evaluation in addition to new mol ecular markers.
Acute myeloid leukemia (AML) is an aggressive malig nancy that emerges from the accumulation of chromo somal and genetic events in hematopoietic stem cells (HSC) or hematopoietic stem and progenitor cells (HSPC).1,2 Despite the recent unraveling of the mutational landscape of AML3,4 and our better understanding of its pathophysiologic impact, AML is still associated with poor treatment efficacy and dismal prognosis.3,4 A few genetic events like CEBPA bi-allelic mutations or chromosomal translocation involving the core-binding factor (CBF) are associated with good prognosis. Some other lesions like ASXL1 or RUNX1 mutations are associated with poor re sponse to treatment,5 and many events or combinations
of events still have a controversial value.4 Chemoresis tance of AML cells is one of the major causes of treat ment failure, but its mechanisms are not fully understood, and the precise functional links between ge nomic lesions and chemoresistance are not understood in most cases.
ATP-binding cassette (ABC) proteins, especially ABCB1 and ABCG2, are active transporters involved in the efflux of many xenobiotics,6–9 including anthracyclines, from HSPC. They are highly expressed and functional in normal HSC, where they play a major role in both detoxification and protection from perturbations of the normal HSC en vironment.10–12 ABC proteins can also be highly expressed and functional in AML cells, leading to direct chemore sistance.12–14 Among ABC proteins, ABCB1 expression and
activity has a well-known prognosis value in AML. Pa tients with high ABCB1 activity are more likely to experi ence primary chemoresistance, and have lower survival probabilities.15–19
The prognostic value of ABC protein expression or activity has been poorly explored in comparison with recent mol ecular markers, and the potential links between ABC ac tivity and other disease characteristics are not clearly described. Previous studies have shown that high ABCB1 activity is associated with a high expression of immuno phenotypic markers like CD34 or CD7, and a lack of CD33 expression.18,20,21 Specific molecular alterations have also been described in the case of high ABCB1 activity, like high BAALC expression, or absence of mutations in NPM1 or FLT3 18,20 This suggests that high ABCB1 activity could be a specific characteristic of AML with an early maturation blockade that is mostly associated with poor prognosis and low chemosensitivity.
The role of other ABC proteins in chemoresistance like ABCC1, ABCG1 or ABCG2 has also been described in AML,19,22–25 and the association with further molecular characteristics has not been clearly investigated. Although it was initially developed to study ABCB1 activity, the JC1 +/- cyclosporine A (CsA) assay also evaluates ABCG2 ac tivity, and might evaluate the pooled activity of ABC proteins (personal data), as CsA seems to be, at least in vitro, a very wide-spectrum ABC inhibitor.19
In order to further investigate the links between ABC ac tivity, genomic lesions, and differentiation markers, we analyzed molecular and immunophenotypic data from 361 adult AML patients and evaluated its potential prognostic value using the JC-1 assay.
We retrospectively included 361 patients diagnosed with AML between 2001 and 2020 at Saint-Antoine Hospital, Paris, with available results for ABC transporter activity. Blood and bone marrow (BM) samples were collected at the time of AML diagnosis or relapse after informed con sent in accordance with the Declaration of Helsinki and the local ethics committee of Saint-Antoine Hospital.
Flow cytometric analyses were performed on erythrocytelysed BM or blood samples. Data were acquired on FC500 or Navios cytometers and analyzed using CXP or Kaluza softwares (Beckman Coulter, Brea, CA). Information was available in 328 of 357 cases for CD34, CD117, CD33, CD13, CD64, HLA-DR, CD36, CD14, CD4, CD19, cyMPO, CD56, CD2 and cyCD3, and in 68 of 267 cases for cyCD79a, CD7, CD3, CD15, CD11b, CD22, CD10, CD5 and CD65.
Cytogenetic and genomic analyses
Cytogenetic and fluorescent in situ hybridization analyses were performed as already described.1 FLT3-ITD, NPM1 mutations, CEBPA mutations, CBFB-MYH11 and RUNX1RUNX1T1 were studied as already described.1,18 Next-gen eration sequencing (NGS) analysis was performed using panels of 41 or 122 genes as already described.1,26 For pa tients studied after 2019, libraries were obtained using Custom Myeloid Solution (SOPHiA GENETICS, Saint Sul pice, Switzerland) which were then sequenced using a MiSeq® sequencer (Illumina Inc.). Read alignment, variant calling, and annotation were performed using SOPHIA DDM® software 5.0.12 (SOPHiA GENETICS), with a 1% sen sitivity. Variants were checked using Integrative Genomics Viewer (IGV) software v2.3. Analysis was restricted to the 41 genes shared between the panels. All variants of un known significance with a variant allele frequency com patible with germline origin were excluded from the analyses.
ATP-binding cassette transporter functional assay JC-1 probe assay was performed as described pre viously.16,18 Briefly, cells were washed twice and resus pended in phosphate-buffered saline (PBS) containing 0.1 mM JC-1 monomer at a concentration of 500,000 cells/mL and incubated at 37°C for 15 minutes without or with a modulator (CsA, 2 mM) to assess ABC transporter activity. Cells were washed twice in cold PBS, and samples were analyzed. Cell fluorescence of the blasts was recorded on FC500 or Navios cytometers. In order to ensure that the analysis was performed on blast cells, we gated them ac cording to CD34 and/or CD117 expression, CD45 intensity and physical characteristics (forward and side scatter channels). JC-1 uptake, reflected by the differential dis tribution in the presence and in the absence of CsA, was expressed as the D value ranging from 0 (no difference) to 1 (no overlap) generated by the Kolmogorov-Smirnov test. A D value ≥0.60 was considered as high ABC protein functionality (ABChigh).16,18
Statistical analyses were performed using Fisher’s exact, Kruskall-Wallis, Mann-Whitney or Wilcoxon tests. Variable importance analysis was performed to rank variables by predictive power according to the Random Forest algo rithm. Complete remission (CR) was defined as recovery of morphologically normal BM and normal blood count, with no evidence of extramedullary disease. Event-free survival (EFS) was measured from diagnosis to either re lapse, absence of remission after one course of chemo therapy, or death with censure at time of allogeneic HSC transplantation. Overall survival (OS) was measured from the date of diagnosis to the date of death. Data was cen sored at last follow-up for patients still alive. Probabilities
of survival were evaluated with the Kaplan Meier method and differences between distributions were evaluated by the log-rank test. Multivariate Cox regression models were built including all variables with a P value <0.05 in univari ate analysis, and D JC-1 value. P values below 0.05 were considered as statistically significant. All statistical ana lyses were performed using R Software, Statview V5.0 (SAS institute) and GraphPad Prism 9.
Distinct acute myeloid leukemia characteristics according to ATP-binding cassette activity
Of the 361 patients in the study cohort, associations be tween ABC activity and other clinical or biological par
Table 1. Patients’ characteristics.
ameters were determined in 350 patients at the time of diagnosis, three after induction treatment failure, and eight at relapse.
Baseline patient characteristics are described in Table 1. Overall, 164 patients harbored a high ABC activity (ABChigh) and 197 had a low ABC activity (ABClow). Median age was 63 years (range, 15-91) and was not different between AB Chigh and ABClow groups. Leukocyte count was 7.3x10⁹/L and was significantly lower in patients with ABChigh than in those with ABClow (median 5.2 vs. 10.2, P=0.0203). BM blast count was significantly lower in ABChigh patients than in ABClow patients (39% vs. 55%, P=0.0006). Hemoglobin, pla telet, and neutrophil counts did not differ between the two groups.
One hundred and three patients were diagnosed with de novo AML (i.e., no previous hematological disease and no Total (N=361) Low ABC activity (N=197) High ABC activity (N=164) P value
Sex, Male/Female 193/169 103/94 89/75 0.7068
Median age in years (range) 63 (15-91) 62 (15-91) 64 (19-88) 0.1682
Age >60 years, N 194 101 93 0.3021
Median leukocyte, x109/L (range) 7.3 (0.5-440.3) 10.2 (0.5-344.0) 5.2 (0.5-440.3) 0.0203
Median hemoglobin, g/dL (range) 9.2 (3.2-14.6) 9.2 (3.2-14.6) 9.2 (4.9-14.3) 0.6121
Median platelets, x109/L (range) 58 (2-2210) 61 (2-1065) 57 (3-2210) 0.2958
Median neutrophils, x109/L (range) 0.9 (0-154,9) 1.1 (0.0-90.9) 0.8 (0.0-154.9) 0.1805
Medullary blast count, median (%) 47 (14-98) 55 (14-98) 39 (15-97) 0.0006
AML subtype (%) de novo AML, N (%) 193 (53) 119 (60) 74 (45) 0.0005 AML-MRC, N (%) 89 (25) 39 (20) 50 (30) 0.0022 AML post-MPN, N (%) 36 (10) 17 (9) 19 (12) 0.3201
Therapy-related AML, N (%) 29 (8) 16 (8) 13 (8) 0.8292
Acute biphenotypic leukemia, N (%) 3 (1) 2 (1) 1 (1) NA
Donor Cell Leukemia, N (%) 1 (0) 0 (0) 1 (1) NA AML post-AA, N (%) 2 (1) 0 (0) 2 (1) NA
AML relapse, N (%) 8 (2) 4 (2) 4 (2) NA
Cytogenetics risk group (N=346)
Favorable, N (%) 29 (8.5) 22 (12) 7 (5) 0.0179
Intermediate, N (%) 198 (57) 112 (59) 86 (55) 0.3434 Adverse, N (%) 119 (34.5) 56 (29) 63 (40) 0.0182
ABC: ATP-binding cassette; WBC: white blood cell; AML-MRC: acute myeloid leukemia with myelodysplasia-related changes; MPN: myelopro liferative neoplasms; AML post-AA: acute myeloid leukemia post aplastic anemia; NA: not applicable. P values <0.05 are in bold.
prior chemotherapy/radiotherapy). This group was associ ated with lower ABC activity compared to other AML sub types (median D value 0.50 vs. 0.62, P=0.0005). AML with myelodysplasia-related changes was diagnosed in 89 (25%) patients and associated with higher ABC activity when compared to other AML subtypes (median D value 0.68 vs. 0.55, P=0.0022). One hundred and twenty-nine (36%) patients harbored a normal karyotype. Favorable cytogenetics was identified in 29 (8%) patients and as sociated with ABClow (P=0.0179) whereas an adverse ka ryotype was identified in 119 (33%) patients and associated with ABChigh (P=0.0182).
Acute myeloid leukemia with high ATP-binding cassette activity has an immature phenotype JC-1 assay results and blasts phenotypes were evaluated in most samples. For some of the patients, information regarding cyCD79a, CD7, CD3, CD15, CD11b, CD22, CD10, CD5 and CD65 expression in leukemic cells were missing (see details in the Methods section and Online Supple mentary Table S1).
Expression of CD34, HLA-DR, CD117 (P<0.0001) and CD13 (P=0.0013) were more frequent in patients with ABChigh than in patients with ABClow (Figure 1). Conversely AML as sociated with ABClow had more frequent expression of cyMPO (P<0.0001), CD15 (P=0.0325), CD33 (P=0.0338), CD64 (P <0.0001), CD4 low intensity (P=0.0104), CD14

(P=0.0107), and CD65 (P=0.0122) than ABClow AML. Co-ex pression of a lymphoid marker among CD19, CD56 and CD7 was not associated with ABChigh nor with ABClow (On line Supplementary Table S1).
ATP-binding cassette activity discriminates de novotype acute myeloid leukemia from other ontogenic groups of acute myleoid leukemia
Concomitant ABC activity screening and cytogenetics analysis was available in 346 (96%) patients, NPM1 status in 351, FLT3-ITD status in 349, CEBPA status in 346 and full NGS data in 291 patients. Mutational data for patients with NGS evaluation are shown in a co-mutation table available in the Online Supplementary Figure S1. The median number of genes mutated per patient was two (range, 0-10). The most frequently observed mutations oc curred in DNMT3A (23%), FLT3 (22%), RUNX1 (20%), TET2 (17%), TP53 (17%), NPM1 (17%), NRAS (14%), ASXL1 (13%), IDH2 (13%) and IDH1 (10%). ABClow was significantly associated with the presence of KMT2A and CBF rearrangement, and with NPM1 and FLT3 (ITD or non-ITD) mutations, whereas ABChigh was signifi cantly associated with mutations in SF3B1, ASXL1, BCOR, STAG2, U2AF1, ZRSR2, RUNX1, CBL, JAK2 and DDX41 (Figure 2A; Online Supplementary Table S2). Consequently, we in vestigated ABC activity according to AML ontogeny, as de fined by Lindsley et al. in 201527: de novo AML specific
Figure 1. ATP-binding cassette activity according to the most relevant flow cyto metry markers. Violin plots showing the median and the interquartile range of ATPbinding cassette (ABC) activity. For each cytometry marker patient data is repre sented with low ABC activity on the left and high ABC activity on the right. *P<0.05; **P≤0.01; ***P≤0.001; ****P≤0.0001.
(with NPM1 mutations, KMT2A or CBF rearrangement), TP53-mutated AML, secondary AML specific (with ASXL1, BCOR, EZH2, SF3B1, SRSF2, STAG2, U2AF1 and ZRSR2 mu tations), pan-AML (i.e., other mutations).
ABC activity was lower in patients with de novo ontogeny (n=102) when compared to patients with TP53-mutated (n=47) or secondary AML specific ontogeny (n=77) (median D value +/- standard error of mean = 0.35+/-0.022, 0.75+/0.035, 0.78+/-0.027 respectively, P<0.0001) (Figure 2B). For AML diagnosis, cytology and flow cytometry results are quickly available in contrast to molecular mutations. We evaluated the importance of some data to predict de novo ontogeny using a random forest survival model. The top three parameters, ranked based on the mean de crease in Gini coefficient (a measure of homogeneity from 0 [homogeneous] to 1 [heterogeneous]), were percentages of cyMPO, CD34, and D JC-1 values (Online Supplementary Figure S2). ABC activity was one of the major factors we identified for early prediction of AML ontogeny. In order to confirm the association between gene muta tions and ABC proteins, we explored the expression levels of ABC genes known to be associated with prognosis in

AML and whose functionality is putatively tested with JC1 +/- CsA assay.19,28–30 We explored ABC gene expression according to gene mutational status in a previously pub lished series of 405 AML patients.31 ABCB1 expression was significantly lower in patients with NPM1 or FLT3 muta tions, and significantly higher in patients with CEBPA, TP53, GATA2, BCOR, SRSF2, JAK2 and BCORL1 mutations. ABCG2 expression was lower in patients with NPM1, FLT3 or DNMT3A mutations and higher in patients with TP53, PHF6, JAK2, CEBPA, GATA2, SRSF2, NF1, RUNX1 or BCOR mutations (Online Supplementary Table S3).
Prognostic value of ATP-binding cassette activity in heavily treated patients
Finally, we evaluated the prognostic value of ABC activity (considered as a continuous value) at diagnosis in 230 pa tients treated with intensive chemotherapy. Two hundred and sixteen patients received a 7+3 derived regimen (i.e., daunorubicin or idarubicin with addition of cytarabin) and 14 received gemtuzumab ozogamicin in addition to 7+3. Allogeneic HSC transplantation in the first complete re mission (CR1) or after induction failure was performed in
B
Figure 2. ATP-binding cassette activity is associated with acute myeloid leukemia ontogeny. (A) Frequency of cytogenetic or molecular lesions in the ATP-binding cassette low (ABClow) group (left-hand bars) and the ABChigh group (right-hand bars). Mutated genes and KMT2A and core-binding factor (CBF) rearrangements were grouped according to the ontogenic classification from Lindsley et al.27 Colors reflect ontogenic specificity of mutated genes and cytogenetic abnormalities: de novo acute myeloid leukemia (AML) specific (red), TP53-mutated AML (green), secondary AML specific (blue), pan-AML (yellow), and other genes not included in the Lindsley study, (burgundy). *P<0.05; **P≤0.01; ***P≤0.001; ****P≤0.0001. (B) Box-plot of D JC-1 values distribution between de novo AML, TP53-mutated and secondary AML specific groups. ****P≤0.0001
106 patients. Ninety patients had ABChigh and 140 had ABClow NGS analysis was available in 200 of 230 (87%) patients. After one induction course, 169 of 230 patients reached CR1 and 61 of 230 (26%) experienced treatment failure. As ex pected, treatment failure was associated with a higher median of ABC activity (D JC-1 median value +/- standard error of mean equal to 0.57+/-0.037 in patients with treat ment failure vs. 0.47+/-0.021, P=0.0224 in other patients). Other variables associated with induction failure were ad verse cytogenetics (P<0.0001), presence of mutations in ASXL1 (P=0.0002), PHF6 (P=0.0003), SETBP1 (P=0.0159), IDH2 (P=0.02), STAG2 (P=0.04) and absence of mutation in NPM1 (P=0.0014).
We then analyzed prognostic factors for EFS, with data censoring at the time of allogeneic HSC transplantation to focus only on chemotherapy effects. In univariate analysis, significant factors associated with shorter EFS were age (P=0.0059), poor cytogenetics (P<0.0001), and mutations in ASXL1 (P=0.0025), DNMT3A (P=0.0069), PHF6 (P<0.0001), U2AF1 (P=0.003), CBL (P=0.0004), SETBP1 (P<0.0001) and absence of CEBPA biallelic mutations (P=0.0269). There was a trend for ABC functionality to be associated with shorter EFS (P=0.09) (Online Supplementary Table S4). In multivari ate analysis, parameters significantly associated with shorter EFS were adverse karyotype (P<0.0001), mutations in ASXL1 (P=0.0359), DNMT3A (P=0.0008), U2AF1 (P=0.0211), PHF6 (P=0.0032), CBL (P=0.0330), SETBP1 (P<0.0001) and ABC activity (P=0.0370) (Figure 3; Online Supplementary Table S4).
ABC activity was not predictive for OS (data not shown). When restricting survival analysis to the 125 patients with
intermediate cytogenetics and full NGS data, ABC activity was neither predictive for EFS nor OS, but due to the lower number of patients and the high number of variables, the statistical power was limited.
ABC activity is a well-known prognostic factor in AML, but most studies on its prognostic impact were performed be fore the NGS era.15–19 Moreover, only a few studies compar ing flow cytometry characteristics and ABC activity have been published, most of them focusing only on CD34 status.18,20,21,24,32 Consequently, associations between ABC activity and most biologic disease parameters remain largely unknown.
Our study of 361 AML patients confirms that ABChigh is as sociated with lower blood leukocyte and BM blast counts.20 Likewise, the most proliferative diseases have lower ABC activity than other AML, as already described.20 These pro liferative features may be related to the lower incidence of FLT3 and NPM1 mutations and the higher frequency of TP53 or myelodysplastic syndrome-associated mutations in AB Chigh AML as observed in the present work and others.18–20,33 Moreover, we found that the other de novo ontogeny as sociated events – i.e., KMT2A, CBF, are correlated with AB Clow. Interestingly these events are also frequently associated with a high initial leukocyte count.34,35 In this study, ABClow AML had a significantly lower CD34 ex pression and were positive for markers of myeloid matura tion such as cyMPO, CD33, CD65 and CD15 or markers of

monocytic differentiation such as CD64, CD4+weak and CD14. These profiles suggest a late differentiation blockade, oc curring in progenitors already committed either to the gra nulocytic or to the monocytic lineage. Genetic events that define de novo ontogeny (i.e., NPM1 mutations, KMT2A re arrangements, and CBF gene fusions) are known to occur in differentiated granulocytic or myelomonocytic progen itors.34–36 Moreover, during physiological hematopoiesis, ABC proteins are mostly expressed in multipotent/immature progenitors and in HSC.10–12 Taken together these observa tions suggest that de novo AML develops from more differ entiated progenitors with lower expression of ABC proteins, and that the pathological re-acquisition of self-renewal ca pacities during the leukemogenesis process is not associ ated with the re-expression of the ABC proteins.
Conversely, ABChigh AML expressed mostly a CD34+/CD117+/HLA-DR+ phenotype with negative cyMPO, a combination of markers suggesting that leukemia initiating cells had been blocked very early during the myeloid dif ferentiation. ABChigh activity was associated with TP53 mu tations, with events that define secondary AML ontogeny (such as mutations in SF3B1, U2AF1 or ASXL1), and also with mutations in JAK2 or RUNX1, all events that are known to occur in early HSPC or HSC.37–39 This suggests that, in contrast with de novo AML, when leukemogenic events occur in HSC or in early progenitors, those cells could keep, among their stemness characteristics, their high ABC pro tein activity. Taken together, our results confirm that high ABC activity could be only a passenger characteristic re flecting a leukemogenesis process that occurred in HSC or early progenitors, as already suggested by other teams.20 High ABC activity is known to be associated with poor prog nosis in AML, and our data confirm lower remission rates and lower EFS probabilities in multivariate models in ABChigh patients. This chemoresistance could be due to other dis ease characteristics that we found to be associated with ABChigh like ASXL1 and RUNX15 mutations, or poor karyotype, rather than to a direct chemotherapy efflux mediated by ABC proteins. However, in our series, ABC activity remains an independent factor for EFS, in addition to other genetic alterations like poor cytogenetics and mutations in DNMT3A, ASXL1 or others, suggesting an intrinsic role for ABC activity. Conversely, our data do not show that the poor prognosis associated with secondary-type mutations (like
1. Hirsch P, Zhang Y, Tang R, et al. Genetic hierarchy and temporal variegation in the clonal history of acute myeloid leukaemia. Nat Commun. 2016;7:12475.
2. Döhner H, Weisdorf DJ, Bloomfield CD. Acute myeloid leukemia. N Engl J Med. 2015;373(12):1136-1152.
3. Ley T, Miller C, Ding L, et al. Genomic and epigenomic
SF3B1, U2AF1 or ASXL1) is only due to the higher level of ABC activity. However, our results suggest that ABC activity (as measured by JC-1 +/- CsA assay) could be a good surrogate marker for the presence of these mutations. Moreover, as this assay remains an independent prognostic factor for EFS, with a quickly available result, it could be performed systematically at diagnosis for a very fast and easy prog nostic evaluation. The value of ABC activity in HSC trans plantation decisions remains to be evaluated in further studies.
In AML, high activity of ABC proteins is associated with sec ondary or TP53 molecular ontogeny, and with an early blockade of differentiation of leukemic cells. ABC activity remains an independent prognostic marker for EFS after in tensive chemotherapy, using multivariate models consider ing full mutational data. JC-1 +/- CsA functional assay can be performed quickly in routine practice and could be used for prognostic evaluation, in addition to new molecular markers. These data should be confirmed in further studies.
No conflicts of interest to disclose.
ES, LSuner, FD and PH wrote the manuscript. LSuner, LSoret and FFeger performed flow cytometry analyses. NA, CBN and HG performed cytogenetic analyses. ES, FFavale, PH and FD performed molecular biology analyses. LSuner, MC, CH, and FD performed cytological analyses. MM, AG, SL, MMohty, LH and OL provided clinical data. ES and LSuner collected all the data. ES and PH performed statistical analyses. FD and PH supervised the research. All authors contributed to manu script revision and final approbation.
The authors would like to thank all patients who participated in this study.
The data that support the findings of this study are available from the corresponding author upon reasonable request.
landscapes of adult de novo acute myeloid leukemia. N Engl J Med. 2013;368(22):2059-2074.
4. Papaemmanuil E, Gerstung M, Bullinger L, et al. Genomic classification and prognosis in acute myeloid leukemia. N Engl J Med. 2016;374(23):2209-2221.
5. Döhner H, Estey E, Grimwade D, et al. Diagnosis and
management of AML in adults: 2017 ELN recommendations from an international expert panel. Blood. 2017;129(4):424-447.
6. Hamada H, Tsuruo T. Functional role for the 170- to 180-kDa glycoprotein specific to drug-resistant tumor cells as revealed by monoclonal antibodies. Proc Natl Acad Sci U S A. 1986;83(20):7785-7789.
7. Higgins CF, Hiles ID, Salmond GP, et al. A family of related ATPbinding subunits coupled to many distinct biological processes in bacteria. Nature. 1986;323(6087):448-450.
8. Ueda K, Cardarelli C, Gottesman MM, Pastan I. Expression of a full-length cDNA for the human “MDR1” gene confers resistance to colchicine, doxorubicin, and vinblastine. Proc Natl Acad Sci U S A. 1987;84(9):3004-3008.
9. Kartner N, Riordan JR, Ling V. Cell surface P-glycoprotein associated with multidrug resistance in mammalian cell lines. Science. 1983;221(4617):1285-1288.
10. Chaudhary PM, Roninson IB. Expression and activity of Pglycoprotein, a multidrug efflux pump, in human hematopoietic stem cells. Cell. 1991;66(1):85-94.
11. Tang L, Bergevoet SM, Gilissen C, et al. Hematopoietic stem cells exhibit a specific ABC transporter gene expression profile clearly distinct from other stem cells. BMC Pharmacol. 2010;10:12.
12. de Grouw EPLM, Raaijmakers MHGP, Boezeman JB, et al. Preferential expression of a high number of ATP binding cassette transporters in both normal and leukemic CD34+CD38- cells. Leukemia. 2006;20(4):750-754.
13. Campos L, Guyotat D, Archimbaud E, et al. Clinical significance of multidrug resistance P-glycoprotein expression on acute nonlymphoblastic leukemia cells at diagnosis. Blood. 1992;79(2):473-476.
14. Marie JP, Zittoun R, Sikic BI. Multidrug resistance (mdr1) gene expression in adult acute leukemias: correlations with treatment outcome and in vitro drug sensitivity. Blood. 1991;78(3):586-592.
15. Leith CP, Kopecky KJ, Godwin J, et al. Acute myeloid leukemia in the elderly: assessment of multidrug resistance (MDR1) and cytogenetics distinguishes biologic subgroups with remarkably distinct responses to standard chemotherapy. A Southwest Oncology Group study. Blood. 1997;89(9):3323-3329.
16. Legrand O, Perrot JY, Simonin G, Baudard M, Marie JP. JC-1: a very sensitive fluorescent probe to test Pgp activity in adult acute myeloid leukemia. Blood. 2001;97(2):502-508.
17. Legrand O, Simonin G, Perrot JY, Zittoun R, Marie JP. Pgp and MRP activities using calcein-AM are prognostic factors in adult acute myeloid leukemia patients. Blood. 1998;91(12):4480-4488.
18. Hirsch P, Tang R, Marzac C, et al. Prognostic impact of high ABC transporter activity in 111 adult acute myeloid leukemia patients with normal cytogenetics when compared to FLT3, NPM1, CEBPA and BAALC. Haematologica. 2012;97(2):241-245.
19. Marzac C, Garrido E, Tang R, et al. ATP Binding Cassette transporters associated with chemoresistance: transcriptional profiling in extreme cohorts and their prognostic impact in a cohort of 281 acute myeloid leukemia patients. Haematologica. 2011;96(9):1293-1301.
20. Boyer T, Gonzales F, Barthélémy A, et al. Clinical significance of ABCB1 in acute myeloid leukemia: a comprehensive study. 2019;11(9):1323.
21. Júnior LS da S, Soares V de L, Silva ASJ da, et al. P-glycoprotein and multidrug resistance-associated protein-1 expression in acute myeloid leukemia: Biological and prognosis implications. Int J Lab Hematol. 2020;42(5):594-603.
22. van der Kolk DM, Vellenga E, Scheffer GL, et al. Expression and activity of breast cancer resistance protein (BCRP) in de novo
and relapsed acute myeloid leukemia. Blood. 2002;99(10):3763-3770.
23. Benderra Z, Faussat A-M, Sayada L, et al. Breast cancer resistance protein and P-glycoprotein in 149 adult acute myeloid leukemias. Clin Cancer Res Off J Am Assoc Cancer Res. 2004;10(23):7896-7902.
24. Damiani D, Tiribelli M, Calistri E, et al. The prognostic value of P-glycoprotein (ABCB) and breast cancer resistance protein (ABCG2) in adults with de novo acute myeloid leukemia with normal karyotype. Haematologica. 2006;91(6):825-828.
25. Steinbach D, Lengemann J, Voigt A, Hermann J, Zintl F, Sauerbrey A. Response to chemotherapy and expression of the genes encoding the multidrug resistance-associated proteins MRP2, MRP3, MRP4, MRP5, and SMRP in childhood acute myeloid leukemia. Clin Cancer Res Off J Am Assoc Cancer Res. 2003;9(3):1083-1086.
26. Guermouche H, Ravalet N, Gallay N, et al. High prevalence of clonal hematopoiesis in the blood and bone marrow of healthy volunteers. Blood Adv. 2020;4(15):3550-3557.
27. Lindsley RC, Mar BG, Mazzola E, et al. Acute myeloid leukemia ontogeny is defined by distinct somatic mutations. Blood. 2015;125(9):1367-1376.
28. Strouse JJ, Ivnitski-Steele I, Waller A, et al. Fluorescent substrates for flow cytometric evaluation of efflux inhibition in ABCB1, ABCC1, and ABCG2 transporters. Anal Biochem. 2013;437(1):77-87.
29. Ni Z, Bikadi Z, Rosenberg MF, Mao Q. Structure and function of the human breast cancer resistance protein (BCRP/ABCG2). Curr Drug Metab. 2010;11(7):603-617.
30. Wolosin JM, Zamudio A, Wang Z. Application of JC1 for nontoxic isolation of cells with MDR transporter activity by flow cytometry. PLoS One. 2017;12(4):e0174905.
31. Tyner JW, Tognon CE, Bottomly D, et al. Functional genomic landscape of acute myeloid leukaemia. Nature. 2018;562(7728):526-531.
32. Raaijmakers MHGP, de Grouw EPLM, Heuver LHH, et al. Breast cancer resistance protein in drug resistance of primitive CD34+38- cells in acute myeloid leukemia. Clin Cancer Res Off J Am Assoc Cancer Res. 2005;11(6):2436-2444.
33. Marzac C, Teyssandier I, Calendini O, et al. Flt3 internal tandem duplication and P-glycoprotein functionality in 171 patients with acute myeloid leukemia. Clin Cancer Res Off J Am Assoc Cancer Res. 2006;12(23):7018-7024.
34. Schoch C, Schnittger S, Klaus M, Kern W, Hiddemann W, Haferlach T. AML with 11q23/MLL abnormalities as defined by the WHO classification: incidence, partner chromosomes, FAB subtype, age distribution, and prognostic impact in an unselected series of 1897 cytogenetically analyzed AML cases. Blood. 2003;102(7):2395-2402.
35. Appelbaum FR, Kopecky KJ, Tallman MS, et al. The clinical spectrum of adult acute myeloid leukaemia associated with core binding factor translocations. Br J Haematol. 2006;135(2):165-173.
36. Shlush LI, Zandi S, Mitchell A, et al. Identification of preleukaemic haematopoietic stem cells in acute leukaemia. Nature. 2014;506(7488):328-333.
37. Sood R, Kamikubo Y, Liu P. Role of RUNX1 in hematological malignancies. Blood. 2017;129(15):2070-2082.
38. Vassiliou GS. JAK2 V617F clonal disorders: fate or chance? Blood. 2016;128(8):1032-1033.
39. Genovese G, Kähler AK, Handsaker RE, et al. Clonal hematopoiesis and blood-cancer risk inferred from blood DNA sequence. N Engl J Med. 2014;371(26):2477-2487.
1Clinical Genetics Branch, Division of Cancer Epidemiology and Genetics, National Cancer Institute and 2Biostatistics Branch, Biometric Research Program, Division of Cancer Treatment and Diagnosis, National Cancer Institute, Bethesda, MD, USA
Correspondence: N. Giri girin@mail.nih.gov
Received: September 13, 2021.
Accepted: February 23, 2022. Prepublished: April 14, 2022.
https://doi.org/10.3324/haematol.2021.279981 ©2022 NIH (National Institutes of Health)
Fanconi anemia (FA) is caused by pathogenic variants in the FA/BRCA DNA repair pathway genes, and is characterized by congenital abnormalities, bone marrow failure and an increased risk of cancer. We conducted a genotype-phenotype and outcomes study of 203 patients with FA in our cohort. We compared across the genes, FA/BRCA DNA repair pathways (upstream, ID complex and downstream), and type of pathogenic variants (hypomorphic or null). We explored differences between the patients evaluated in our clinic (clinic cohort) and those who provided data remotely (field cohort). Patients with variants in the upstream complex pathway had less severe phenotype, lacking VACTERL-H (Vertebral, Anal, Cardiac, Tracheo-esophageal fistula, Esophageal/duodenal atresia, Renal, Limb, Hydrocephalus) association and/or PHENOS (Pig mentation, small Head, small Eyes, Neurologic, Otologic, Short stature) features. ID complex was associated with VAC TERL-H. The clinic cohort had more PHENOS features than the field cohort. PHENOS was associated with increased risk of bone marrow failure, and VACTERL-H with hypothyroidism. The cumulative incidences of severe bone marrow failure, solid tumors and leukemia as the first event were 70%, 20% and 6.5%, respectively. Head and neck and gynecological cancers were the most common solid tumors, with a further increased risk after hematopoietic cell transplantation. Among patients with FANCA, variants in exons 27-30 were associated with a higher frequency of solid tumors. Overall the median survival was 37 years; patients with leukemia or FANCD1/BRCA2 variants had the poorest survival. Patients with variants in the upstream complex had better survival than those with variants in ID or the downstream complex (P=0.001 and P=0.016, respectively). FA is phenotypically and genotypically heterogeneous; detailed characterization provides new in sights towards understanding this complex syndrome and guiding its clinical management.
Fanconi anemia (FA), a predominantly autosomal recessive genomic instability disorder, is the most common in herited bone marrow failure (BMF) syndrome. FA is char acterized by hypersensitivity to DNA cross-linking agents, specific congenital abnormalities, progressive BMF and predisposition to cancer, particularly head and neck squa mous cell carcinomas and acute myeloid leukemia (AML).1,2 Pathogenic variants in at least 22 genes have been identified in the FA/BRCA DNA repair pathway which func tions to remove DNA interstrand crosslinks. The involved genes are grouped according to their function in the path way as upstream (FANC-A, B, C, E, F, G, L, M and T), ID
(FANC-I and D2) and downstream complexes (FANC-D1, J, N, O, P, Q, R, S, U, V and W).3-5
Guido Fanconi reported the first cases of FA in 1927 in three brothers with microcephaly, short stature, skin hy perpigmentation, microorchidism and macrocytic anemia.6 Many other abnormalities affecting multiple organ systems have since been defined. Approximately 40% of FA cases have no physical abnormalities.7 Congenital anomalies commonly seen in FA are included in the VACTERL-H as sociation (Vertebral abnormalities, Anal atresia, Cardiac abnormalities, Tracheo-esophageal fistula, Esophageal or duodenal atresia, Renal abnormalities, upper Limb abnor malities and Hydrocephalus).8 We recently grouped six other common FA features into the acronym PHENOS
(skin Pigmentation abnormalities, small Head, small Eyes, structural central Nervous system abnormalities, Otologic abnormalities and Short stature), and found that patients with three or more of the eight VACTERL-H features fre quently had four or more PHENOS features.9 BMF in FA usually develops during the first decade of life and varies from mild to severe cytopenias requiring hematopoietic cell transplantation (HCT), or progression to myelodys plastic syndrome (MDS) or AML.10 Endocrine, metabolic and reproductive abnormalities have been reported in ap proximately 80% of patients11 and may be due to the syn drome and/or the treatment. Cohort studies investigating genotype-phenotype associ ations in FA have mostly been limited by patient numbers, and the findings across studies were not always consist ent due to the rarity of the syndrome and population dif ferences.12-16 Specific early cancers were reported in patients with pathogenic variants in FANCD1/BRCA2 and FANCN/PALB2 17-19
Our group previously reviewed the genotype-phenotype associations in FA from literature cases.7 We now explore genotype-phenotype and outcome associations in pa tients with FA enrolled in the National Cancer Institute (NCI) inherited BMF syndrome cohort according to the FA genes, mutation pathways and the type of pathogenic variants. We also investigate differences between the pa tients followed in the field versus those seen in our clinic. We hypothesized that there would be differences in phe notypes, hematologic, oncological, and endocrine out comes between patients enrolled in the field cohort and those seen in our clinic.
Patients with FA were enrolled in the NCI Institutional Re view Board-approved inherited BMF syndrome cohort study (clinicaltrials.gov identifier: NCT00027274) from Ja nuary 2002 through November 2020. Participants and/or their proxies signed written consent and medical record release forms. All individuals were initially enrolled in the “Field Cohort” (FC) and completed individual information questionnaires. A subset of patients was then evaluated at the National Institutes of Health Clinical Center and formed the “Clinic Cohort” (CC) (Figure 1A).2 Data on all participants (FC and CC) were abstracted from the indi vidual information questionnaires, biennial follow-up forms, medical records, and National Institutes of Health evaluations (for CC participants).
FA was diagnosed by an abnormal chromosomal breakage test and confirmed by genetic testing when possible. Physical abnormalities were grouped as VACTERL-H, PHE NOS and Other. The VACTERL-H association was defined by the presence of three or more of the eight features, and PHENOS as four or more of the six features. Other physical findings are described in Online Supplementary Table S1. Phenotypes not stated as present were con sidered absent.
BMF was defined by the presence of cytopenia for age20 and categorized as non-severe or severe (Table 1). Diag noses of MDS, AML and solid tumors were based on the review of medical records, personal or proxy reports. En docrine, metabolic, and gonadal problems including hor mone deficiencies, low bone mineral density, diabetes
Figure 1. Study flow chart. (A) The distribution of patients with Fanconi anemia (FA) in the field cohort and clinic cohort. Pheno type information was not available for seven patients in the field cohort. (B) The distribution of patients with FANCA variants ac cording to the location of the variants on the FANCA protein. *The sum of the numbers with BRCA1 interaction region, exons 27-30 and FAAP-20 binding domain variants exceeds 86 because some patients had variants in multiple regions of the FANCA protein.

mellitus, insulin resistance, dyslipidemia, abnormal body mass index, and infertility, were recorded.
The genetic variants were annotated using ANNOVAR,21 BayesDel22 and Human Splicing Finder.23 Variants were classified according to the 2015 American College of Medi cal Genetics and Genomics/Association for Molecular Pa thology guidelines24 with the modifications specified in the legend of Online Supplementary Table S2 Frameshift, nonsense, start loss or deletion of four or
Table 1. Patients’ demographics.
more nucleotides and splice site variants that were pre dicted to cause mis-splicing were classified as null. Mis sense, in-frame insertion/deletion and splice site variants causing a protein change were classified as hypomorphic. Patients with bi-allelic null variants were grouped as hav ing a “null” genotype, and those with one or both hypo morphic variants as having a “hypomorphic” genotype. Since FANCA was the most frequently affected gene, we investigated phenotype and outcome associations in pa
Number of patients 146 57 203 Sex (male : female) 66:80 22:35 0.4 88:115
Age at diagnosis, median (range) 5.4 (0-59.7) 5.3 (0-55.8) 0.5 5.4 (0-59.7) Age at enrollment, median (range) 11.1 (0-59.8) 14.7 (0.4-55.4) 0.1 11.2 (0-59.8)
Age at last follow-up, median (range) 15.7 (0.2-63.1) 25.2 (3.3-67.4) <0.001 17.1 (0.2-67.4)
Race, N (%)
White Asian Black or African/American American Indian/Alaska Native Mixed Unknown
BMF (N=198) Non-severe BMF Severe BMF
Abnormal cytogenetics (N=177) MDS (N=190) HCT (N=202) Median age at HCT (N=102) Somatic mosaicism (N=192)
Endocrine abnormality
Hypothyroidism (N=168) GH deficiency (N=149) Osteoporosis (N=132)
Metabolic abnormality
Diabetes mellitus (N=158) Dyslipidemia (N=80) Abnormal BMI (N=163)
Male reproductive (N=33) Female reproductive (N=52) Pregnancies (N=56)
99 (67.8) 8 (5.5) 4 (2.7) 1 (0.7) 4 (2.7) 30 (20.6)
122 (86.5) 34 (27.9) 88 (72.1) 22 (18.3) 17 (12.8) 71 (49) 8.6 (3.9-46.6) 1 (0.74)
33 (29.7) 18 (18) 8 (8.8)
17 (16.8) 9 (34.6) 43 (40.2)
13 (68.4) 18 (29.2) 10 (32.26)
51 (89.4) 1 (1.8) 1 (1.8) 0 4 (7) 0
48 (84.2) 12 (25) 36 (75) 23 (40.4) 10 (17.5) 32 (56.1) 10.2 (1.6-44.1) 4 (7.02)
24 (42.1) 14 (28.6) 9 (22)
6 (10.5) 21 (38.9) 20 (35.7)
5 (35.7) 20 (76.9) 4 (16)
0.001 0.45 1 1 0.2 <0.001
0.7 0.8 0.003 0.4 0.4 0.1 0.03
0.1 0.2 0.049
0.4 0.8 0.6
0.09 0.8 0.2
150 (73.9) 9 (4.4) 5 (2.5) 1 (0.5) 8 (3.9) 30 (14.8)
170 (85.9) 46 (27.1) 124 (72.9) 45 (25.4) 27 (14.2) 103 (51) 9.1 (1.6-46.6) 5 (2.6)
57 (33.9) 32 (21.5) 17 (12.9)
23 (14.6) 30 (37.5) 63 (38.7)
18 (54.6) 38 (73.1) 14 (25)
Ages are reported in years with median and range. Denominators were adjusted based on data availability. Bold and italicized values: significant differences. Bone marrow failure (BMF) was defined as hemoglobin less than standard for age, absolute neutrophil count <1,500 cells/mm3 and/or platelet count <150x109/L. Severe BMF was defined as hemoglobin level <8 g/dL, absolute neutrophil count <500 cells/mm3 and platelet count <30x109/L or BMF requiring chronic red blood cell or platelet transfusions (≥10 transfusions), androgen use or hematopoietic cell trans plant. Somatic mosaicism was considered when the chromosomal breakage test was normal in peripheral blood lymphocytes but increased in skin fibroblasts. Thyroid-stimulating hormone levels >4 mU/L were considered to indicate thyroid function abnormality. A diagnosis of growth hormone deficiency was included when an abnormal growth hormone stimulation test result was available. Osteoporosis was defined as an age-matched Z-score of less than -2 when a dual-energy X-ray absorptiometry (DEXA) report was available. The diagnosis of diabetes mellitus was based on medical records, and National Institutes of Health evaluations. Standard diagnostic criteria were used for defining insulin resistance, dyslipidemia and abnormal body mass index, as described earlier.38 N=number of patients with available data, n=number of patients with the defined feature/complication; HCT: hematopoietic cell transplant; MDS: myelodysplastic syndrome; GH: growth hormone; BMI: body mass index.
Field cohort N (%) Clinic cohort N (%) P-value Total N (%)anemia:
tients with FANCA variants, focusing on the location of variants on the FANCA protein (Figure 1B). FANCA variants were plotted using ProteinPaint.25 Patients with one or both variants in (i) the BRCA1 interaction region, (ii) the FAAP20-binding domain, and (iii) exons 27-30 (where we observed a clustering of variants), were compared with patients without variants in these regions. Analyses were performed using Stata 16 (StataCorp. TX, USA) and RStudio (RStudio, Boston, MA, USA). A two-sided Fisher exact test was used for frequency comparisons, the Mann-Whitney U test was used for continuous variables; P-values less than 0.05 were considered statistically sig nificant. The Bonferroni correction was applied for multiple comparisons. Cox regression models were used to estimate relative risks of clinical outcomes; weighted Cox models were used when the proportional hazards as sumption was violated, and average hazard ratios (AHR) are reported. A competing risk analysis for cumulative incidences of first adverse events (BMF leading to HCT or death, leukemia or solid tumors) was performed as de scribed previously.26 Survival probabilities were calculated
by the Kaplan-Meier method in the absence of competing risks with censoring at last follow-up; the log-rank test was used for comparisons.
The FA cohort included 203 patients, 146 in the FC and 57 in the CC (Figure 1A). Phenotype information was not available for seven FC participants. The genotype was known for 54 patients in the CC and 110 patients in the FC; for 19 patients in the FC, only the complementation groups were known, but no gene variants were reported. Demographics and clinical characteristics are summarized in Table 1. The sex distribution was similar in the FC and CC (P=0.4) with more females than males in each cohort. The median age at diagnosis of FA was 5.4 years and the median age at study enrollment was 11.2 years with no significant difference between the cohorts. The FC was younger than the CC at last follow-up with median ages

A
B
Figure 2. Distribution of patients according to genotypes, mutation pathways and type of variants in the field cohort and the clinic cohort.
of 15.7 and 25.2 years, respectively (P<0.001). Most pa tients self-reported as white in both cohorts. FANCA was the most frequently affected gene, observed in 98 patients. Fifty-three patients with FANCA had one or bi-allelic variants within or involving the BRCA1 inter action region of the FANCA protein, 21 had variants invol ving the FAAP20-binding domain and 45 had variants involving the region of exons 27-30 (Figure 1B). Patients with variants in FANCA accounted for 45% of the FC and 56% of the CC, followed by those with variants in FANCC, who accounted for 12% and 16%, respectively (Figure 2A). More than 80% of the variants were in the upstream com plex in both cohorts (Figure 2B). Genotypes were similarly distributed as hypomorphic or null in both the FC and CC among the 142 patients with available molecular diag noses (Figure 2C). The hypomorphic genotype was more common in FANCA (P=0.006) and the null genotype was more common in FANCC (P<0.001) (Online Supplementary Figure S1).
Physical abnormalities were identified in 133 of 139 (95.7%) FC and all CC patients (Figure 1). The VACTERL-H associ ation (≥3/8 features) was present in 23% of the FC and
35% of the CC (P=0.1). Vertebral abnormalities were more often recognized in CC patients (P<0.001). Other VACTERLH features were identified at similar frequencies in both cohorts (Figure 3). The most common abnormalities were upper limb (60%) and renal (35-37%) and the least com mon (<10%) were tracheo-esophageal fistula, hydroceph alus, and anal atresia (Figure 3). PHENOS features (≥4/6) were present in 56% of the CC and 33% of the FC (P=0.004). The most common findings were skin pigmentation abnormalities (68% in the FC, 82% in the CC; P=0.04), followed by small eyes (52% in the FC, 82% in the CC; P<0.001). Structural central nervous sys tem abnormalities were detected more often in the CC than in the FC (P<0.001). Other physical findings not part of VACTERL-H or PHENOS were also more common in the CC (Figure 3). VACTERL-H plus PHENOS was more fre quent in the CC (31.6% vs. 16.7%, P=0.02) and neither VAC TERL-H nor PHENOS was more frequent in the FC (60.1% vs. 40.4%, P=0.03) (Figure 3).
Physical abnormalities according to the gene, mutation pathway, and type of pathogenic variant Phenotype comparison across FA genes after Bonferroni correction revealed significant associations. All gene-spe
Figure 3. Physical abnormalities in field cohort patients versus clinic cohort patients. Blue: field cohort; orange: clinic cohort. Horizontal axis: types of abnormalities; vertical axis: percentage of patients with abnormalities. VACTERL-H: vertebral, anal, car diac, tracheo-esophageal fistula, esophageal or duodenal atresia, renal, upper limb, hydrocephalus; PHENOS: skin pigmentation, small head, small eyes, structural nervous system, otology, short stature; TEF: tracheo-esophageal fistula; FA: Fanconi anemia; GI: gastrointestinal. Comparisons were performed by the Fisher exact test, *P<0.05.

ARTICLE - Fanconi anemia: the NCI experience
Table 2. Association of specific abnormalities with gene, FA/BRCA DNA repair pathway and type of pathogenic variant.
Physical abnormality Gene Pathway Genotype A C D1 D2 E F G I J US ID DS Hypo Null
Vertebral
VACTERL-H
Anal + + Cardiac + TEF
Esophageal/duodenal atresia
RenalUpper imb - + Hydrocephalus + -
Skin pigmentation
Small head + + +
Small eyes
Nervous structural + + Otology
Short stature
Neurodevelopmental FA facies
Other abnormalities
Other face Other eye Palate Short neck Other GI
Male genital Female genital Lower limb
VACTERL-H + + PHENOS + +
VACTERL-H and PHENOS + + + VACTERL-H or PHENOS (≥1) + +
Neither VACTERL-H or PHENOS - + + -
*P < 0.0063
*P < 0.02 P < 0.05
(+) Positive association and (-) inverse association between the abnormality and the gene, FA/BRCA DNA repair pathway or type of variant. Field cohort highlighted in blue, clinic cohort in orange. *P-values after Bonferroni correction. VACTERL-H: vertebral, anal, cardiac, tracheoesophageal fistula (TEF), esophageal or duodenal atresia, renal, upper limb and hydrocephalus. PHENOS: skin pigmentation, small head, small eyes, structural nervous system, otology and short stature. GI: gastrointestinal. US: upstream complex, ID: ID complex, DS: downstream com plex. Hypo: hypomorphic genotype.
cific associations were isolated to either the FC or the CC, as the number of patients in each cohort varied (Table 2A). Patients with variants in the upstream complex pathway were least likely to have neurodevelopmental abnormal ities, VACTERL-H association, or the presence of at least
one of VACTERL-H or PHENOS in both the FC and the CC (P=0.01, P<0.001 and P<0.001, respectively). Variants in the ID complex were associated with VACTERL-H and most physical abnormalities in FC patients (Table 2B). The hy pomorphic genotype was associated with upper limb ab
normalities in the FC (Table 2C).
BMF developed in 170/198 patients (86%) at a median age of 6.6 years in the combined FC and CC (Table 1). Twentyeight percent of patients were dependent on transfusions and 24% received androgen therapy in either cohort. None of the four patients with FANCD1/BRCA2 had cytopenia. Cytogenetic abnormalities were reported in 40.4% of the CC and 18.3% of the FC patients (P=0.03). MDS was re ported in 27 patients at a median age of 15 years (range, 9.9-24.2) and AML in eight patients at a median age of 19 years (range, 12-60). A total of 103 (51%) patients received HCT with the frequency being similar in the FC and CC; 75.3% for severe BMF, 22.7% for cytogenetic abnormalities or MDS and 2% for AML.
A weighted multiple Cox regression model for BMF in cluded 133 patients with available data and excluded the four patients with FANCD1/BRCA2 due to lack of BMF. The analysis identified a higher risk of BMF in males than in females (AHR=1.65, 95% confidence interval [95% CI]: 1.12.6). The presence of PHENOS predicted a higher risk of BMF than absence (AHR=2.9, 95% CI: 1.7-4.95). Compared with patients with FANCA, patients with FANCC, G, I and J had a higher risk of BMF by the same age (Online Supple mentary Table S3A). A weighted Cox regression model for MDS that included 138 patients with available data showed that patients with FANCC (AHR=4.7, 95% CI: 1.55-
14.4) and FANCD1/BRCA2 gene variants (AHR=61, 95% CI: 4.4-848.9) were at higher risk of MDS than patients with FANCA (Online Supplementary Table S3B). The increased risk of MDS in FANCD1/BRCA2 was based on one out of the four patients with FANCD1/BRCA2 who received HCT for a diagnosis of hypocellular MDS associated with cytogenetic changes without antecedent pancytopenia.
Approximately 30% of the FC and 42% of the CC devel oped hypothyroidism at a median age of 7.2 and 13.9 years (P=0.005), respectively. Hypothyroidism predated HCT in 64% of cases. A weighted multiple Cox regression model for 139 patients with available data showed an increased risk of hypothyroidism in patients with prior HCT (AHR=11.1, 95% CI: 4.3-28.4), VACTERL-H association (AHR=4.7, 95% CI: 1.92-11.2), and variants in FANCD1, D2, G, I and J (Online Supplementary Table S4A).
Osteoporosis was more often reported in the CC than in the FC (P=0.049); median age was 23 years in both co horts. Growth hormone deficiency was reported in 28.6% of the CC and 18% of the FC patients and it was associ ated with HCT in 10% of cases. Diabetes mellitus devel oped in 17% of the FC and 10.5% of the CC; 11/23 of these patients had treatment-induced diabetes, 5/23 had type 1 diabetes and 7/23 had type 2 diabetes. Overall, 57% of patients with available data had insulin resistance, 38.7% had abnormal body mass index (19.6% were underweight,
Table 3. Types of malignancies seen in patients with Fanconi anemia.
Cancers
Field cohort (N= 139*)
Clinic cohort (N=57)
Median age at first cancer, years (range) Total observed (= 196*)
All sites 59 (32) 31 (16) 90 (48)
Solid tumors
Head and neck Vulva/vagina/cervix
Esophagus Brain Breast Anus Thyroid Lung Liver Lymphoma Bladder Unknown type
35 (22) 16 (10) 5 (4) 3 (3) 2 (2) 1 (1) 0 2 (2) 2 (2) 1 (1) 1 (1) 1 (1) 1 (1)
25 (14) 15 (8) 6 (5) 1 (1) 1 (1) 1 (1) 1 (1) 0 0 0 0 0 0
31 (2-58) 34.4 (15-44) 29.3 (23-36) 34.7 (33-38) 3.1 (2-5) 32 (30-34) 32.5 27 (23.5-30) 53 (48.5-57.5) 36.5 30 37.6 29.5
60 (36) 31 (18) 11 (9) 4 (4) 3 (3) 2 (2) 1 (1) 2 (2) 2 (2) 1 (1) 1 (1) 1 (1) 1 (1)
Leukemia 7 (7) 1 (1) 19 (12-60) 8 (8)
Skin cancers
Squamous cell carcinoma
Basal cell carcinoma Melanoma Unknown type
17 (8) 1 (1) 12 (6) 2 (2) 1 (1)
5 (3) 4 (3) 1 (1) 0 0
31 (11-41) 22 (11) 5 (4) 13 (7) 2 (2) 1 (1)
Patients with multiple cancers 35 (9) 22 (7) 57 (16) Data are presented as number of cancers (number of patients). *Cancer data were not available for seven patients in the field cohort.
11.7% overweight and 7.4% obese), and 14% had metabolic syndrome.
We previously described obstetric outcomes in seven women with FA.27 We now report 26 pregnancies in 14 women resulting in 20 live births (Online Supplementary Table S5). The median age at first pregnancy was 25 years (range, 19-32 years). Ten patients were FANCA cases; no tably, four of these patients had hypomorphic c.3624C>T (p.Ser1208=) synonymous variants and five had a null ge notype. The FA gene was unknown for four patients. A Cox regression analysis showed that patients with milder phe notype (no VACTERL-H or PHENOS) were more likely to become pregnant (HR=7.3, 95% CI: 1.003-52.9); prior HCT and the presence or severity of BMF were not significant predictors (Online Supplementary Table S4B).
Forty-eight of 196 patients (24.4%) developed at least one malignancy; eight had leukemia, 36 had solid tumors and 11 had skin cancers. Head and neck squamous cell carci noma was the most common solid tumor and developed at a median age of 34.4 years. The second most common was vulvar cancer, which developed at a median age of 29.3 years (Table 3).
Competing risk analyses of first adverse events showed a similar cumulative incidence of severe BMF leading to HCT or death in the FC (72%) and CC (67%) by the age of 60 years. Solid tumors developed in 18% of the FC and 24% of the CC by age 60 (P=0.7). The cumulative incidence of leukemia was 6% in the FC and 2.5% in the CC by age 30;

one patient in the FC developed AML in his 60s (Online Supplementary Figure S2). By the age of 70, the cumulative incidences of severe BMF, solid tumors and leukemia were 70.4%, 19.8% and 6.5%, respectively, in the combined co hort (Figure 4A). Patients who underwent HCT had an in creased risk of solid tumors with a hazard ratio of 4.6 (95% CI: 2.2-9.8) for transplanted versus non-transplanted patients (Figure 4B).
Solid tumors were seen in patients with FANCA, FANCC and FANCD1 variants. Brain tumors were exclusive to FANCD1/BRCA2 and developed at a median age of 3.1 years. Head and neck squamous cell carcinomas and vulvar/cer vical cancers in patients with FANCA and FANCC variants were seen with both hypomorphic and null genotypes. All four patients with esophageal cancer had FANCA null ge notype. FA genes for four of the eight leukemia patients were unknown; one had FANCA and three had FANCC (On line Supplementary Figure S3).
Further analysis of data from 86 patients with FANCA pa thogenic variants showed a significant association of solid tumors with variants within/involving exons 27-30. Fifteen of 45 patients (33.3%) with one or both single nucleotide variants/small insertion-deletions within exons 27-30 or multi-exon deletions covering this region developed solid tumors compared to three of 41 patients (7.3%) without a variant in this region (P=0.003). A Cox model adjusting for HCT status showed that patients with any pathogenic variant within/involving exons 27-30 appeared to have a higher risk of solid tumors (HR=6.2, 95% CI: 1.36-28.2) than patients without variants in this region, with a cumulative
Figure 4. Cumulative incidence of adverse events and increased cancer risk in patients with variants within/involving exons 2730 of FANCA. (A) Cumulative incidence of bone marrow failure leading to hematopoietic cell transplantation or death (red), acute myeloid leukemia (green) and solid tumors (blue) in the presence of competing risks. (B) Cumulative incidence of solid tumors by age in non-transplanted (solid line) and transplanted patients (dotted line) in the absence of competing risks. HCT: hemato poietic cell transplantation; AML: acute myeloid leukemia. (C) Cumulative incidence of solid tumors in patients with (green) and without (orange) variants within/involving exons 27-30 of FANCA protein. (D) Distribution of variants in the FANCA. Shaded areas; orange: BRCA1 interaction region;50 yellow: exons 27-30; blue: FAAP20-binding domain.51 Numbers in circles represent the number of alleles for each variant. Horizontal gray bars represent multi-exon deletions and colored circles represent single nucleotide variants/small indels. Red stars highlight the variants observed in patients who developed solid tumors.
incidence of 60% versus 25% by age 40 (Figure 4C). Phe notypes, BMF, endocrine outcomes and age at first cancer were not different. Cancer outcomes were similar among patients with either a single variant or both variants within exons 27-30. Individual variants are shown in Figure 4D.
Overall survival data were available for 200 patients. The median survival age was 37 years (95% CI: 34.7-43.1); 81% of patients were older than 18 years at last follow-up (Fig ure 5A). Patients with leukemia had a poorer survival (median age 17.7 years; range, 12.1-27.3) than patients with no leukemia (after exclusion of the patient who developed AML in his 60s) (Figure 5B).
The median survival of patients with FANCA variants was 43.4 years (95% CI: 36.5-49.5) and that of patients with
FANCC variants was 32.6 years (95% CI: 24.4-not avail able). Patients with FANCD1/BRCA2 variants had the poo rest survival (median 4.3 years) (Figure 5C). Patients with variants in upstream complex genes had a better survival (median survival age 39 years) than patients with variants in ID or downstream complex genes (P=0.001 and P=0.016, respectively) (Figure 5D). Survival among patients with hy pomorphic or null genotype was similar (Figure 5E).

This study of a large cohort of patients with FA provides a detailed assessment of physical abnormalities and clinical outcomes in relation to FA genes, mutation pathways and type of pathogenic variants.
Figure 5. Survival estimates in patients with Fanconi anemia. (A) Overall survival. The median survival age was 37 years, shown by the red line. (B) Survival according to the presence or absence of adverse events. The adverse event groups com pared were: no hematopoietic cell transplantation (HCT) or cancer (orange), HCT only (khaki), leukemia (green), solid tumor only (blue), and both HCT and solid tumor (purple). (C) Survival according to the gene involved. Genes involved in fewer than ten patients were grouped as other genes, except for FANCD1/BRCA2 (blue) with four patients. (D) Survival according to FA/BRCA DNA repair pathway: upstream (orange), ID (green), and downstream (blue). (E) Survival according to the type of pathogenic variant: null group (red) and hypomorphic group (blue). Survival curves were estimated using the Kaplan-Meier method. Comparisons between groups were made by the logrank test, P-values were adjusted using the Benjamini-Hoch berg method for multiple comparisons.

Almost all patients in our cohort (96.9%) had at least one physical abnormality; this is a higher percentage than in previous reports (60-90%).7,28,29 We corroborated our ear lier findings of a higher frequency of VACTERL-H associ ation in FA than that described in the literature cases.7,9 VACTERL-H features that cause functional compromise (cardiac anomaly, tracheo-esophageal fistula, esophageal, duodenal or anal atresia) or those that are generally rec ognized in early life (upper limb and renal abnormalities) were present at similar rates in the CC and FC partici pants. Vertebral anomalies and structural central nervous system abnormalities whose detection requires imaging
procedures were more frequently identified in the CC be cause baseline skeletal survey and brain magnetic reson ance imaging are part of the systematic evaluations of CC participants. Other PHENOS features such as skin pigmen tary changes and small eyes, which may escape recogni tion if not specifically looked for, were more often identified in the CC. Likewise, PHENOS (≥4/6 features) and PHENOS plus VACTERL-H (≥3/8 features) were more com mon in the CC and proportions in both cohorts were higher than in cases reported in the literature.7 This under scores the need for all patients with FA to have a full dys morphology evaluation upon diagnosis.
Our findings of milder phenotype in patients with up stream complex pathway variants, with less likelihood of VACTERL-H or PHENOS, is mainly a reflection of inclusion of patients with FANCA and FANCC variants who had fewer physical abnormalities than patients with variants in other gene groups. Consistent with the review of the literature cases, variants in the ID complex pathway were associ ated with a more severe phenotype (VACTERL-H) in both cohorts and the presence of at least one of VACTERL-H or PHENOS in the FC.7 However, unlike the literature cases, we found no significant association of VACTERL-H and se vere phenotype with null genotype.7 The results from the FC were more comparable with the literature cases, but data from the CC provided a more complete picture of the FA phenotype. The discrepancies between the literature cases and the NCI cohort are likely due to lack of variant details and phenotypes in patients within these groups and may be overcome by the development of a standard ized approach for systematic evaluation of all individuals with FA. This will facilitate international and trans-insti tutional comparisons, risk stratification, and genotypephenotype and outcome assessment of patients with this rare syndrome.
We identified a higher risk of BMF in patients with PHE NOS (≥4/6) whereas VACTERL-H (≥3/8) was not a signifi cant predictor of BMF. We previously noted abnormal radii as the strongest predictor of early BMF and developed a congenital abnormality score (CABS; between 0-5 based on the number of abnormalities in five categories: devel opmental delay, heart or lung, kidney, hearing and small head) to distinguish prognostic groups in patients with normal radii.30 The data from the German FA registry31 and the Israeli FA cohort29 indicated that CABS was a strong risk factor for BMF. Notably, two of the features of PHE NOS (hearing and small head) are included in CABS. Studies incorporating PHENOS (≥4/6) or individual PHE NOS features in prediction models may help in estimating BMF risk stratification and pre-emptive transplant deci sions in FA.32
The risk of MDS was increased in our patients with FANCC and FANCD1/BRCA2 compared with FANCA (Online Supple mentary Table S3). The increased risk of MDS in FANCD1/BRCA2 should be interpreted with caution as it was based on a single patient with hypocellular MDS. The cumulative incidence of AML as the first event as well as the median age at AML were similar to prior estimates.1,2,14 Clonal cytogenetic abnormalities and MDS were previously reported in FANCA, C, D1/BRCA2 and G groups.33,34 Frequent bone marrow evaluations in these groups may detect clonal changes and dysplasia earlier. Chromosomal aber rations and other somatic events in the genome may have prognostic importance and be clues to clonal hemato poiesis.33,35,36 Longitudinal studies characterizing somatic variants are needed to understand how variants drive
clonal hematopoiesis in FA and their association with leukemogenesis, as identified in Shwachman Diamond syndrome.37
The frequencies of endocrine, metabolic and reproductive abnormalities were similar to those in earlier re ports.11,27,38,39 We confirmed endocrine and metabolic dis turbances as long-term complications following HCT in FA patients, as previously described.40,41 The relationship be tween VACTERL-H, FA genes and hypothyroidism needs further study to be fully elucidated. Recently, dysregulated tryptophan metabolism and hyperserotonemia were pro posed as mechanisms of metabolic disturbances in FA.42 Larger studies with broader representation of various FA gene groups may provide mechanistic insights and identify gene-specific associations in metabolism. We noted that four of the ten women with FANCA variants who became pregnant had the c.3624C>T synonymous variant which causes aberrant splicing.43 It is possible that some resid ual protein function may be present with this variant and is sufficient for patients to conceive. Functional analysis of this variant will be important to understand its in vivo effect on FANCA protein. Here we updated cumulative incidence estimates of cancer.2 The cumulative incidence of solid tumors as the first event was similar to our earlier estimates, and con firmed the increased risk of solid tumors in transplanted patients.2,26 The most common solid tumors were head and neck squamous cell carcinomas and gynecological cancers followed by esophageal cancers (all esophageal cancers were in patients with null FANCA variants) (Online Supplementary Figure S3). Brain tumors remained exclus ive to the FANCD1/BRCA2 group. Despite the severe phe notype observed in the FANCD2 group, these patients were not at an increased risk of BMF compared with those in the FANCA group and did not develop cytogenetic ab normalities, MDS or cancer. In our cohort, among five pa tients with the c.2444G>A FANCD2 variant, two had early BMF and four had VACTERL-H plus PHENOS, in contrast with the report by Kalb et al. 44 in which mild phenotype and adult-onset BMF were described with this variant. This may be due to differences in the second allele af fecting outcomes. Further study of patients with this re current variant may uncover a unique phenotype in this group.
An interesting and novel finding from our study was the high frequency of solid tumors in patients with one or both FANCA variants within/involving the region of exons 27-30 when compared with that in patients who had no FANCA variant within/involving this region. The exon 27-30 region is within the C-terminal domain of the protein. FANCA forms a homodimer interacting through the C-ter minal domain to function and the C-terminal domain is crucial for nuclear localization of FANCA.45,46 After our data were locked in November 2020, we became aware of an
additional patient in our cohort who has developed a head and neck squamous cell carcinoma; this patient has a FANCA variant within the exon 27-30 region. Collaborative studies with more patients are needed to further investi gate the relevance of this finding. Functional analysis of variants in this region and other variants in trans would also provide insights into carcinogenesis in FA and may have implications for personalized cancer screening. We observed a significant variant heterogeneity in FANCA, whereas many variants were recurrent in FANCC and FANCD2. This could explain the complexity of establishing genotype-phenotype correlations in FA but may not be the only reason. Phenotypes and outcomes varied greatly even between affected siblings. With regard to this, we observed three FA patients with bi-allelic variants in one FA gene and a third variant in another FA gene. Investigat ing how additional variants contribute to disease may ex plain differences between patients with the same disease-causing FA variants. Tomaszowski et al. hypothes ized that FA is a polygenic disease demonstrating a FA phenotype with different affected FA genes.47 Studies on the combined effect of variants in FA and/or non-FA genes, as well as epigenetic regulations are needed. Most patients reached adulthood, with the median sur vival being 37 years, similar to that in our prior report.2 Pa tients with FANCA and FANCC variants had better survival than those with variants in other genes. Variants in the upstream complex pathway were associated with better survival. Patients with leukemia had the poorest survival. The outcomes of FA patients with AML has improved with improvements in HCT regimens and clinical care, although the overall survival remains around 40-50% and treatment toxicities and relapse rates are high.48,49
In summary, we have reported detailed phenotypes and outcomes in a large, prospectively followed FA cohort, consisting of both children and adults. We found signifi cant differences between the FC and the CC. We were li mited by patient and family reports on some outcomes and genotype data. Medical records for the FC were not as complete as those for the CC. There may be recent complications of which we were not aware, especially for FC patients as some had old records and may be less en gaged with the study. Variant classification was based on the existing literature and in silico predictions. More data and functional studies of variants may reveal further in formation.
1. Shimamura A, Alter BP. Pathophysiology and management of inherited bone marrow failure syndromes. Blood Rev. 2010;24(3):101-122.
2. Alter BP, Giri N, Savage SA, Rosenberg PS. Cancer in the National Cancer Institute inherited bone marrow failure syndrome cohort
Comprehensive investigations of physical phenotypes and clinical outcomes in centers experienced with FA will en hance our knowledge of FA, and increase the possibility of using phenotypes and genotypes to stratify risks of outcomes. Follow-up studies investigating finer molecular associations will provide opportunities for tailored risk es timates, surveillance strategies and treatment plans.
No conflicts of interest to disclose.
BA, NG, LJM and BPA designed the study, and established and curated the dataset; BA, NG, LJM, AB and BPA con tributed to the methodology; NG, LJM and BPA provided supervision; BA, NG and BPA analyzed and interpreted the data and drafted the manuscript; all authors contributed to revising the manuscript and approved the submitted version.
The authors are grateful to Dr. Jung Kim for her input on variant evaluation, Drs. Philip Rosenberg and Marena Nie wisch for their suggestions regarding cumulative incidence analyses, Dr. Maryam Rafati for her input on patients with unknown genotype and the research team at Westat Inc. for their help with medical records review and logistics. The authors would like to acknowledge the DCEG Cancer Ge nomics Research Laboratory Sequencing Group for provid ing whole exome sequencing data. We thank all participating patients and families who made this study possible, as well as referring clinicians for their contribu tions.
This research was supported in part by the intramural re search program of the Division of Cancer Epidemiology and Genetics, National Cancer Institute, National Institutes of Health, and by contract HHSN261201700004C with Westat, Inc.
De-identified clinical and genetic data are available, upon reasonable request, from Neelam Giri (girin@mail.nih.gov).
after fifteen years of follow-up. Haematologica. 2018;103(1):30-39.
3. Kottemann MC, Smogorzewska A. Fanconi anaemia and the repair of Watson and Crick DNA crosslinks. Nature. 2013;493(7432):356-363.
4. Taylor AMR, Rothblum-Oviatt C, Ellis NA, et al. Chromosome
instability syndromes. Nat Rev Dis Primers. 2019;5(1):64.
5. Datta A, Brosh RM Jr. Holding all the cards -how Fanconi anemia proteins deal with replication stress and preserve genomic stability. Genes (Basel). 2019;10(2):170.
6. Fanconi G. Familiäre infantile perniziosaartige Anämie (perniziöses Blutbild und Konstitution). Jahrbuch Kinder. 1927;117:257-280.
7. Fiesco-Roa MO, Giri N, McReynolds LJ, Best AF, Alter BP. Genotype-phenotype associations in Fanconi anemia: a literature review. Blood Rev. 2019;37:100589.
8. Solomon BD, Baker LA, Bear KA, et al. An approach to the identification of anomalies and etiologies in neonates with identified or suspected VACTERL (vertebral defects, anal atresia, tracheo-esophageal fistula with esophageal atresia, cardiac anomalies, renal anomalies, and limb anomalies) association. J Pediatr. 2014;164(3):451-457.
9. Alter BP, Giri N. Thinking of VACTERL-H? Rule out Fanconi anemia according to PHENOS. Am J Med Genet A. 2016;170(6):1520-1524.
10. Alter BP. Fanconi anemia and the development of leukemia. Best Pract Res Clin Haematol. 2014;27(3-4):214-221.
11. Rose SR, Myers KC, Rutter MM, et al. Endocrine phenotype of children and adults with Fanconi anemia. Pediatr Blood Cancer. 2012;59(4):690-696.
12. Gillio AP, Verlander PC, Batish SD, Giampietro PF, Auerbach AD. Phenotypic consequences of mutations in the Fanconi anemia FAC gene: an International Fanconi Anemia Registry study. Blood. 1997;90(1):105-110.
13. Faivre L, Guardiola P, Lewis C, et al. Association of complementation group and mutation type with clinical outcome in Fanconi anemia. European Fanconi Anemia Research Group. Blood. 2000;96(13):4064-4070.
14. Kutler DI, Singh B, Satagopan J, et al. A 20-year perspective on the International Fanconi Anemia Registry (IFAR). Blood. 2003;101(4):1249-1256.
15. Castella M, Pujol R, Callen E, et al. Origin, functional role, and clinical impact of Fanconi anemia FANCA mutations. Blood. 2011;117(14):3759-3769.
16. Bottega R, Nicchia E, Cappelli E, et al. Hypomorphic FANCA mutations correlate with mild mitochondrial and clinical phenotype in Fanconi anemia. Haematologica. 2018;103(3):417-426.
17. Wagner JE, Tolar J, Levran O, et al. Germline mutations in BRCA2: shared genetic susceptibility to breast cancer, early onset leukemia, and Fanconi anemia. Blood. 2004;103(8):3226-3229.
18. Alter BP, Rosenberg PS, Brody LC. Clinical and molecular features associated with biallelic mutations in FANCD1/BRCA2. J Med Genet. 2007;44(1):1-9.
19. Reid S, Schindler D, Hanenberg H, et al. Biallelic mutations in PALB2 cause Fanconi anemia subtype FA-N and predispose to childhood cancer. Nat Genet. 2007;39(2):162-164.
20. Orkin SH, Nathan DG, Ginsburg D, Look AT, Fisher DE, Lux S. Nathan and Oski's Hematology of Infancy and Childhood E-book: Elsevier Health Sciences. 2008.
21. Wang K, Li M, Hakonarson H. ANNOVAR: functional annotation of genetic variants from high-throughput sequencing data. Nucleic Acids Res. 2010;38(16):e164.
22. Feng BJ. PERCH: a unified framework for disease gene prioritization. Hum Mutat. 2017;38(3):243-251.
23. Desmet FO, Hamroun D, Lalande M, Collod-Beroud G, Claustres M, Beroud C. Human Splicing Finder: an online bioinformatics tool to predict splicing signals. Nucleic Acids Res. 2009;37(9):e67.
24. Richards S, Aziz N, Bale S, et al. Standards and guidelines for the interpretation of sequence variants: a joint consensus recommendation of the American College of Medical Genetics
and Genomics and the Association for Molecular Pathology. Genet Med. 2015;17(5):405-424.
25. Zhou X, Edmonson MN, Wilkinson MR, et al. Exploring genomic alteration in pediatric cancer using ProteinPaint. Nat Genet. 2016;48(1):4-6.
26. Rosenberg PS, Greene MH, Alter BP. Cancer incidence in persons with Fanconi anemia. Blood. 2003;101(3):822-826.
27. Giri N, Stratton P, Savage SA, Alter BP. Pregnancies in patients with inherited bone marrow failure syndromes in the NCI cohort. Blood. 2017;130(14):1674-1676.
28. Risitano AM, Marotta S, Calzone R, Grimaldi F, Zatterale A, RIAF Contributors. Twenty years of the Italian Fanconi Anemia Registry: where we stand and what remains to be learned. Haematologica. 2016;101(3):319-327.
29. Steinberg-Shemer O, Goldberg TA, Yacobovich J, et al. Characterization and genotype-phenotype correlation of patients with Fanconi anemia in a multi-ethnic population. Haematologica. 2020;105(7):1825-1834.
30. Rosenberg PS, Huang Y, Alter BP. Individualized risks of first adverse events in patients with Fanconi anemia. Blood. 2004;104(2):350-355.
31. Rosenberg PS, Alter BP, Ebell W. Cancer risks in Fanconi anemia: findings from the German Fanconi Anemia Registry. Haematologica. 2008;93(4):511-517.
32. Khan NE, Rosenberg PS, Alter BP. Preemptive bone marrow transplantation and event-free survival in Fanconi anemia. Biol Blood Marrow Transplant. 2016;22(10):1888-1892.
33. Tonnies H, Huber S, Kuhl JS, Gerlach A, Ebell W, Neitzel H. Clonal chromosomal aberrations in bone marrow cells of Fanconi anemia patients: gains of the chromosomal segment 3q26q29 as an adverse risk factor. Blood. 2003;101(10):3872-3874.
34. Mitchell R, Wagner JE, Hirsch B, DeFor TE, Zierhut H, MacMillan ML. Haematopoietic cell transplantation for acute leukaemia and advanced myelodysplastic syndrome in Fanconi anaemia. Br J Haematol. 2014;164(3):384-395.
35. Rochowski A, Olson SB, Alonzo TA, Gerbing RB, Lange BJ, Alter BP. Patients with Fanconi anemia and AML have different cytogenetic clones than de novo cases of AML. Pediatr Blood Cancer. 2012;59(5):922-924.
36. Chao MM, Thomay K, Goehring G, et al. Mutational spectrum of Fanconi anemia associated myeloid neoplasms. Klin Padiatr. 2017;229(6):329-334.
37. Kennedy AL, Myers KC, Bowman J, et al. Distinct genetic pathways define pre-malignant versus compensatory clonal hematopoiesis in Shwachman-Diamond syndrome. Nat Commun. 2021;12(1):1334.
38. Giri N, Batista DL, Alter BP, Stratakis CA. Endocrine abnormalities in patients with Fanconi anemia. J Clin Endocrinol Metab. 2007;92(7):2624-2631.
39. Elder DA, D'Alessio DA, Eyal O, et al. Abnormalities in glucose tolerance are common in children with Fanconi anemia and associated with impaired insulin secretion. Pediatr Blood Cancer. 2008;51(2):256-260.
40. Barnum JL, Petryk A, Zhang L, et al. Endocrinopathies, bone health, and insulin resistance in patients with Fanconi anemia after hematopoietic cell transplantation. Biol Blood Marrow Transplant. 2016;22(8):1487-1492.
41. Petryk A, Kanakatti Shankar R, Giri N, et al. Endocrine disorders in Fanconi anemia: recommendations for screening and treatment. J Clin Endocrinol Metab. 2015;100(3):803-811.
42. Bartlett AL, Romick-Rosendale L, Nelson A, et al. Tryptophan metabolism is dysregulated in individuals with Fanconi anemia. Blood Adv. 2021;5(1):250-261.
43. Ameziane N, Errami A, Leveille F, et al. Genetic subtyping of
Fanconi anemia by comprehensive mutation screening. Hum Mutat. 2008;29(1):159-166.
44. Kalb R, Neveling K, Hoehn H, et al. Hypomorphic mutations in the gene encoding a key Fanconi anemia protein, FANCD2, sustain a significant group of FA-D2 patients with severe phenotype. Am J Hum Genet. 2007;80(5):895-910.
45. Benitez A, Liu W, Palovcak A, et al. FANCA promotes DNA doublestrand break repair by catalyzing single-strand annealing and strand exchange. Mol Cell. 2018;71(4):621-628 e624.
46. Wang S, Wang R, Peralta C, Yaseen A, Pavletich NP. Structure of the FA core ubiquitin ligase closing the ID clamp on DNA. Nat Struct Mol Biol. 2021;28(3):300-309.
47. Tomaszowski K-H, Roy S, Keshvani C, et al. Polygenic mutations model the pleiotropic disease of Fanconi anemia. bioRxiv. 2020 Sept 01. doi:10.1101/2020.09.01.277038. [preprint, not peerreviewed]
48. Ebens CL, MacMillan ML, Wagner JE. Hematopoietic cell transplantation in Fanconi anemia: current evidence, challenges and recommendations. Expert Rev Hematol. 2017;10(1):81-97.
49. Giardino S, de Latour RP, Aljurf M, et al. Outcome of patients with Fanconi anemia developing myelodysplasia and acute leukemia who received allogeneic hematopoietic stem cell transplantation: a retrospective analysis on behalf of EBMT group. Am J Hematol. 2020;95(7):809-816.
50. Folias A, Matkovic M, Bruun D, et al. BRCA1 interacts directly with the Fanconi anemia protein FANCA. Hum Mol Genet. 2002;11(21):2591-2597.
51. Ali AM, Pradhan A, Singh TR, et al. FAAP20: a novel ubiquitinbinding FA nuclear core-complex protein required for functional integrity of the FA-BRCA DNA repair pathway. Blood. 2012;119(14):3285-3294.
Kelden Richardson,1 Simon P. Keam,2,3 Joe Jiang Zhu,1,3 Deborah Meyran,1,3 Criselle D’Souza,1,3 Sean Macdonald,1 Kerry Campbell,4 Michael Robbins,5° Natalie A. Bezman,6 Kirsten Todd,1 Hang Quach,7,8 David S. Ritchie,9 Simon J. Harrison,8,9 H. Miles Prince,1,8,9 Joseph A. Trapani,1,3 Misty R. Jenkins,8,10,11 Paul A. Beavis,1,3 Phillip K. Darcy1,3 and Paul J. Neeson1,3
1Cancer Immunology Program, Peter MacCallum Cancer Centre, Melbourne, Australia; 2Tumor Suppression and Cancer Sex Disparity Laboratory, Peter MacCallum Cancer Centre, Melbourne, Australia; 3Sir Peter MacCallum Department of Oncology, The University of Melbourne, Melbourne, Australia; 4Institute for Cancer Research, Fox Chase Cancer Center, Philadelphia, PA, USA; 5Translational Medicine, Bristol-Myers Squibb, Cambridge, MA, USA; 6Oncology Discovery Research, Bristol-Myers Squibb, Redwood City, CA, USA; 7Department of Haematology, St Vincent’s Hospital, Melbourne, Australia; 8Faculty of Medicine, The University of Melbourne, Melbourne, Australia; 9Clinical Haematology, Peter MacCallum Cancer Centre and Royal Melbourne Hospital, Melbourne, Australia; 10Immunology Division, Walter and Eliza Hall Institute, Melbourne, Australia and 11Institute for Molecular Science, La Trobe University, Bundoora, Australia
°Current address: io904 LLC, Jacksonville Beach, FL, USA
Correspondence: P. Neeson Paul.neeson@petermac.org
Received: October 4, 2021.
Accepted: June 21, 2022.
Prepublished: June 30, 2022.
https://doi.org/10.3324/haematol.2021.279930
©2023 Ferrata Storti Foundation
Published under a CC BY-NC license
Patients with refractory relapsed multiple myeloma respond to combination treatment with elotuzumab and lenalidomide. The mechanisms underlying this observation are not fully understood. Furthermore, biomarkers predictive of response have not been identified to date. To address these issues, we used a humanized myeloma mouse model and adoptive transfer of human natural killer (NK) cells to show that elotuzumab and lenalidomide treatment controlled myeloma growth, and this was mediated through CD16 on NK cells. In co-culture studies, we showed that peripheral blood mononuclear cells from a subset of patients with refractory relapsed multiple myeloma were effective killers of OPM2 myeloma cells when treated with elotuzumab and lenalidomide, and this was associated with significantly increased expression of CD54 on OPM2 cells. Furthermore, elotuzumab- and lenalidomide-induced OPM2 cell killing and increased OPM2 CD54 expression were dependent on both monocytes and NK cells, and these effects were not mediated by soluble factors alone. At the transcript level, elotuzumab and lenalidomide treatment significantly increased OPM2 myeloma cell expression of genes for trafficking and adhesion molecules, NK cell activation ligands and antigen presentation molecules. In conclusion, our findings suggest that multiple myeloma patients require elotuzumab- and lenalidomide-mediated upregulation of CD54 on autologous myeloma cells, in combination with NK cells and monocytes to mediate an effective anti-tumor response. Furthermore, our data suggest that increased myeloma cell CD54 expression levels could be a powerful predictive biomarker for response to elotuzumab and lenalidomide treatment.
Multiple myeloma (MM) is an incurable plasma cell malig nancy of the bone marrow and is the second most com mon hematologic malignancy in Western countries.1 To address the need for new and effective treatment options, monoclonal antibodies targeting myeloma cells have been investigated for their potential to treat MM and enhance current therapies.2 Elotuzumab is a humanized IgG1 anti
body that targets SLAMF7 (also known as CS1, CRACC or CD319), which is a homotypic adhesion molecule highly ex pressed on >90% of MM plasma cells.3,4 Elotuzumab exerts its cytotoxic effects by binding to SLAMF7 on the MM plasma (target) cell and in turn activating natural killer (NK) cells via their FcgRIII (CD16a), inducing antibody-dependent cell-mediated cytotoxicity of the target cell.3,4 SLAMF7 may also control cellular activation due to the cytoplasmic do main comprising an immunoreceptor tyrosine-based
switch motif. The presence of the adaptor protein EAT-2 allows transduction of an activation signal upon SLAMF7 ligation.5,6 NK cells express both SLAMF7 and EAT-2 and have shown enhanced activation and activity upon direct binding of elotuzumab to SLAMF7 expressed on NK cells.7 Patients with refractory relapsed MM (RRMM) treated with a combination elotuzumab, lenalidomide and dexametha sone in the ELOQUENT-2 clinical study showed improved objective response rates of 79% and improved overall sur vival compared to those treated with elotuzumab alone.810 Despite these encouraging outcomes, the mechanisms by which the combination of elotuzumab and lenalidomide improves disease control have not been resolved. Fur thermore, there is currently no reliable biomarker to pre dict which patients will respond to elotuzumab and lenalidomide with long-term remission. To address these issues, we explored NK cell functional responses and gene expression profile changes in un treated newly diagnosed and RRMM patients in the context of elotuzumab and lenalidomide treatment. We also ex plored whether other immune cell types were required to support the elotuzumab- and lenalidomide-induced in crease in myeloma cell cytotoxicity. Prior studies have shown that macrophages phagocytose myeloma targets in response to elotuzumab activation.11 However, it is also known that MM patients have an irregular monocyte popu lation with a high proportion of monocyte-like myeloid de rived suppressor cells in the peripheral blood and bone marrow.12 In this study, we explored whether monocytes were required for the elotuzumab- and lenalidomide-in duced increase in myeloma patients’ NK cell cytotoxic re sponses. We also investigated elotuzumab and lenalidomide treatment-induced changes in the myeloma cells at both the transcript and protein levels. Our study revealed for the first time the mechanisms through which elotuzumab and lenalidomide treatment acts, involving complex interactions between myeloma cells, NK cells and monocytes. In addition, our study revealed a novel poten tial predictive biomarker for the response to combination elotuzumab and lenalidomide treatment in patients with MM.
Jurkat (human T lymphoblast line, from the American Type Culture Collection), LCL (an Epstein-Barr virus-trans formed lymphoblastoid B-cell line) and human multiple myeloma cell lines, OPM-2 and RPMI8226.hSLAMF7 cells (Kerry Campbell, Fox Chase Cancer Center), were main tained in RPMI-1640 media (Gibco) supplemented with 10% (vol/vol) heat-inactivated fetal calf serum, 2 mM L-gluta mine, 100 U/mL penicillin, and 100 µg/mL streptomycin.
Healthy normal donor blood buffy coats were obtained from the Australian Red Cross Blood Service under ethics approval granted by the Peter MacCallum Cancer Centre Human Research and Ethics Committee (HREC# 01/14). Pe ripheral blood mononuclear cells (PBMC) were isolated by standard density gradient (Ficoll-Paque Plus, GE Health care Life Science). Blood samples from MM patients were obtained from either Peter MacCallum Cancer Centre pa tients enrolled in the LITVACC (newly diagnosed MM) or REVLITE (RRMM) clinical trials (trial numbers 12613000344796 and NCT00482261, respectively; details available at www.anzctr.gov.au) or directly from consenting patients, after approval from the Peter MacCallum Cancer Centre human ethics committee. The studies using pa tients’ PBMC were covered by Peter MacCallum Cancer Centre ethics committee approval (HREC# 11-51). PBMC were maintained in RPMI-1640 supplemented with 10% (vol/vol) heat-inactivated fetal calf serum, 2 mM Lglutamine, 1 mM sodium pyruvate, 100 µM non-essential amino acids, 50 µM 2-ME, 100 U/mL penicillin, and 100 µg/mL streptomycin containing 25 U/mL recombinant human (rh) interleukin (IL)-2.
Purification and culture of primary human natural killer cells
NK cells were isolated from human peripheral blood by negative selection using the MACS human NK Isolation Kit (130-092-657, Miltenyi) and LS columns (MACS, Miltenyi Biotec). NK cells were maintained at 106 cells/mL in RPMI1640 supplemented with 10% (vol/vol) heat-inactivated fetal calf serum, 2 mM L-glutamine, 1 mM sodium pyruvate, 100 µM non-essential amino acids, 50 µM 2-ME, 100 U/mL penicillin, and 100 µg/mL streptomycin containing 25 U/mL rhIL-2.
Expansion of natural killer cells
Purified NK cells were co-cultured with irradiated LCL and Jurkat feeder cells (100 Gy, X-RAD 320) at a 1:1:1 ratio and maintained in RPMI-1640 supplemented with 10% heat-in activated fetal calf serum, 10% heat-inactivated human AB-serum (Lonza), 2 mM L-glutamine, 1 mM sodium pyru vate, 100 µM non-essential amino acids, 50 µM 2-ME, 100 U/mL penicillin, 100 µg/mL streptomycin, 1000 U rhIL-2 and 50 ng/mL rhIL-15. Cell cultures were split, and cytokines were replenished every 2-3 days for 3-4 weeks.
Female NOD-scid IL2Rg-/- (NSG) mice were bred in-house and were inoculated with 2x10⁶ RPMI8226.hSLAMF7 cells in the lower right flank. Two doses of expanded human NK cells (1x10⁷ cells/dose) were transferred via intravenous in jection, 24 h apart, when tumors measured 10 mm2 in area (length x width, where length was the longest side of the tumor). Mice received exogenous cytokines (5x10⁵ U rhIL-2
and 2.5 µg rhIL-15) intraperitoneally and were treated with 5 mg/kg elotuzumab, 50 mg/kg lenalidomide, 5 mg/kg po malidomide or vehicle control, given intraperitoneally 3 times per week for 3 weeks. All in vivo experiments were approved by the Peter MacCallum Cancer Centre Animal Ethics Committee (AEEC number E602). In this humanized myeloma model, the human NK cells and myeloma cells (RPMI8226.hSLAMF7) were the only cells capable of re sponding to lenalidomide or pomalidomide via human cer eblon.13
The Online Supplementary Materials and Methods section includes details on cytotoxicity assays (flow cytometry and Cr-release), reagents and antibodies, cytokine bead array assays, immune cell depletion, RNA sequencing analysis, statistics and bioinformatics analyses.
Elotuzumab induces natural killer cell killing of myeloma targets and its effects are enhanced in vivo by lenalidomide
In prior clinical trials in patients with RRMM, compared to
treatment with elotuzumab alone, treatment with a com bination of elotuzumab and lenalidomide led to enhanced survival and disease control.9,10 In this study, we explored the mechanisms underlying these observations by first performing in vivo adoptive therapy of myeloma-bearing NSG mice in the presence of elotuzumab or elotuzumab and lenalidomide treatment. To do this, we developed a human NK cell expansion protocol based on prior studies14,15 (Figure 1A, Online Supplementary Figure S1). Ex panded (day 21) NK cells were CD56hiCD16+/- and the CD16+ subset expressed NK activation receptors (NKp30hiNkp44hiNKp46+NKG2D+), inhibitory receptors (KIR+NKG2AhiTIGIT+) and were CD69hi, indicating activation (Online Supplementary Figure S1A, B). Expanded NK cells induced significantly higher killing of OPM2 cells, in the presence or absence of elotuzumab, compared to day 0 NK cells (Online Supplementary Figure S1B). To assess the in vivo efficacy of elotuzumab and lenalidomide treatment, NSG mice were inoculated subcutaneously with human SLAMF7-expressing RPMI18226 (RPMI8226.hSLAMF7) mye loma cells. RPMI8226 cells are innately resistant to direct lenalidomide-induced cytotoxicity,13 allowing us to control for the effect of lenalidomide on NK activity. To explore the
Figure 1. Combined treatment with elotuzumab and lenalidomide enhances natural killer-cell anti-myeloma activity in vivo. Natural killer (NK) cells were isolated from healthy donor peripheral blood mononuclear cells by magnetic activated cell sorting (MACS). (A) Schematic outlining the expansion of NK cells before in vivo transfer. MACS-isolated NK cells were co-cultured with 100 Gy-irradiated Jurkat cells and Epstein-Barr virus-transformed lymphoblastic cells at a 1:1:1 ratio, and were passaged every 2-3 days for 21 days with 1000 U/mL interleukin 2 (IL2) and 50 ng/mL interleukin 15 (IL15). (B) Timeline for NK-cell adoptive transfer treatment of a humanized mouse myeloma model. NSG mice were injected subcutaneously with 2x10⁶ RPMI8226.hSLAMF7 tumor cells in the right flank. When tumors reached 10 mm2 (width x length), 10x106 expanded NK cells were transferred intravenously on day 0 and day 1. Mice received 5 mg/kg elotuzumab/ human IgG1 isotype control and 50 mg/kg le nalidomide/vehicle (12.5% dimethylsulfoxide), CS1.2-IgG1.1f (elotuzumab CD16a binding mutant) and 5x10⁴ U IL2 and 2.5 µg IL15 via intraperitoneal injection, three doses per week for 3 weeks. (C) Representative tumor growth curves (6 mice/group, N=3, two way analysis of variance, *P<0.05, ****P<0.0001). (D) Kaplan-Meier survival curve with data compiled from three experiments (log-rank test, ****P<0.0001, **P<0.01). MACS: magnetic activated cell sorting; Veh: vehicle; Elo: elotuzumab; Len: lenalidomide: Iso: human IgG1 isotype control.

importance of NK cell CD16 for the elotuzumab and lenali domide anti-tumor effect, we treated established tumors with expanded NK cells plus either elotuzumab or elotu zumab FcgR mutant (which does not bind CD16), in the presence or absence of lenalidomide (Figure 1B). The re sults showed that transferred NK cells and the combina tion of elotuzumab and lenalidomide treatment resulted in the most effective control of myeloma tumor growth and led to improved mouse survival, compared to NK cells treated with either lenalidomide or elotuzumab alone (Fig ure 1C, D). The transfer of NK cells along with elotuzumab FcgR mutant had no effect on the inhibition of tumor growth, indicating an important role for NK cell CD16 in tumor control mediated by elotuzumab (Figure 1C, D). Po malidomide is a second generation immunomodulatory drug,16 and elotuzumab and pomalidomide combination treatment mediated improved myeloma control in RRMM patients.17 We tested pomalidomide in combination with elotuzumab in our humanized myeloma NK cell adoptive therapy model. In this experiment, we treated myelomabearing mice with expanded NK cells, elotuzumab and le nalidomide or elotuzumab and pomalidomide (50 mg/kg lenalidomide vs. 5 mg/kg pomalidomide ). NSG mice treated with adoptively transferred NK cells and combined elotuzumab and lenalidomide or elotuzumab and pomal idomide had significantly better myeloma tumor control compared to those treated with NK cells and elotuzumab alone (Online Supplementary Figure S2). Taken together, the results indicate that elotuzumab combination treat ment with either lenalidomide or pomalidomide controlled myeloma tumor outgrowth via NK cell-mediated antibodydependent cell-mediated cytotoxicity and required NK-cell CD16 expression.
Natural killer cells from refractory relapsed multiple myeloma patients have divergent cytotoxic responses to combination elotuzumab and lenalidomide treatment
We previously showed that NK-cell cytotoxic function is poor in RRMM patients with advanced disease.18 We next explored whether RRMM NK cells can respond to elotuzu mab and lenalidomide treatment in vitro and kill myeloma cells. PBMC from healthy donors, newly diagnosed MM pa tients and RRMM patients were co-cultured with OPM2 tumor cells and treated with elotuzumab or elotuzumab and lenalidomide for 24 hours. Flow cytometry was used to assess PBMC phenotypes (Figure 2A), as well as the level of cytotoxicity directed towards OPM2 myeloma cells (Figure 2B). The cytotoxicity of PBMC from healthy donors and newly diagnosed MM patients increased in response to elotuzumab alone or elotuzumab and lenalidomide, but not with lenalidomide alone (Figure 2B). Interestingly, PBMC from 7/11 RRMM patients had very poor or no cyto toxic response to elotuzumab and elotuzumab and lenali domide treatment, but PBMC from the other 4/11 RRMM
patients showed significantly increased killing of OPM2 myeloma cells (Figure 2B). These samples are highlighted in red in Figure 2B and in the remainder of the figures of this work. With the exception of these highly cytotoxic RRMM PBMC, our results demonstrate the loss of NK-cell cytotoxic capacity on MM disease progression (Figure 2C, Online Supplementary Figure S3) and are consistent with our prior data.18
We next investigated potential biomarkers that identified RRMM patients with high versus low cytotoxic PBMC in order to stratify patients for elotuzumab and lenalidomide treatment. Loss of CD16 expression by NK cells indicates early activation via engagement with the antibody Fc do main, and this CD16 loss is mediated by ADAM-17.19 In the presence of OPM2 tumor cells plus elotuzumab and le nalidomide treatment, NK cells from healthy donors lost significantly more surface CD16 than those from newly di agnosed MM or RRMM patients (Figure 2D, Online Supple mentary Figure S3B, C). Supernatants taken from these co-cultures were then analyzed for interferon gamma (IFNg), tumor necrosis factor (TNF) (Figure 2E, F), MIP-1a, MIP-1b and RANTES (Online Supplementary Figure S4). IFNg and TNF levels were significantly increased in NK cells from healthy donors, compared to their levels in NK cells from newly diagnosed MM and RRMM patients, when PBMC and OPM2 cells were co-cultured and treated with elotuzumab, or elotuzumab and lenalidomide (Figure 2E, F). In the same co-culture system and with the same drug treatment combinations, similar data were observed for MIP-1a and MIP-1b (Online Supplementary Figure S4). In ad dition, PBMC from RRMM patients with a high cytotoxicity response against OPM2 cells also secreted high levels of RANTES (CCL5), the equivalent of that observed for PBMC from healthy donors (red triangles in Online Supplementary Figure S4).
To further identify differences in NK cell responses to elo tuzumab and lenalidomide treatments between healthy donors and MM patients, cell surface expression of CD54, CD107a and CD69 was measured and compared to that of untreated NK cells (by difference in mean fluorescence in tensity) (Figure 3A). CD54 (ICAM1) is a surface glycoprotein with an important role in NK cell adhesion to target cells. Upon activation, NK cell CD54 is upregulated and assists in the formation of the immune synapse through its en gagement with LFA1.20 In our co-culture assays, NK cells from healthy donors significantly upregulated CD54 in re sponse to elotuzumab alone, lenalidomide alone, and their combination, with the highest NK cell expression of CD54 resulting from treatment with the elotuzumab and lenali domide combination (Figure 3B). No significant difference in CD54 expression was observed between treatment groups in NK cells from newly diagnosed and RRMM pa tients (Figure 3B), and expression levels were significantly lower than those for healthy donor NK cells (Figure 3B).
Figure 2. Elotuzumab- and lenalidomide-induced anti-myeloma activity of peripheral blood mononuclear cells from healthy donors and myeloma patients. Peripheral blood mononuclear cells (PBMC) from healthy donors (HD, n=9), patients with newly di agnosed multiple myeloma (NDMM, n=12) or refractory relapsed multiple myeloma (RRMM, n=11) were co-cultured with CTV-labeled OPM2 cells at a 2:1 ratio for 24 hours in the presence of 10 µg/mL human IgG1 isotype control, 10 µM lenalidomide, 10 µg/mL elotuzumab or elotuzumab + lenalidomide. (A) Flow cytometry gating strategy identifying viable CTV-labeled OPM2 myeloma cells, natural killer (NK) cells and NK phenotype markers. (B) OPM2 cell killing data were compared within individual cohorts (HD, NDMM and RRMM) for different drug treatments across the 24-hour co-culture period. (repeated measure one-way analysis of variance [ANOVA]). (C) Flow cytometry analysis identified the number of OPM2 cells killed during the 24-hour period of co-culture. OPM2 killing data were compared between patient cohorts for individual drug treatments, and RRMM patients with high cytotoxicity are highlighted in red (two-way ANOVA, mean ± standard error of mean [SEM]). (D) HD, NDMM and RRMM patients’ NK cell CD16 expression changes in response to different drug treatments during the 24-hour co-culture (2-way ANOVA, mean ± SEM). (E, F) Supernatants from triplicate wells of PBMC and OPM2 co-cultures were taken at 24 hours for cytokine bead array analysis. The graphs show comparative changes between cohorts (HD, NDMM and RRMM patients) for (E) interferon gamma and (F) tumor necrosis factor secretion (two-way ANOVA, mean ± SEM). *P<0.05, **P<0.01, ***P<0.001, ****P<0.0001. FSC: for ward scatter; SSC: side scatter; Iso: human IgG1 isotype control; Elo: elotuzumab; Len: lenalidomide: IFN: interferon; TNF: tumor necrosis factor.

However, when myeloma cell death was significantly in creased, the RRMM patients’ NK cells (Figure 2B, high lighted in red) upregulated CD54 in response to elotuzumab and lenalidomide, with levels of expression similar to those for healthy donor NK cells. We therefore hypothesized that CD54 upregulation would increase NK cell cytotoxic potential and may serve as a biomarker for NK cell responsiveness to elotuzumab and lenalidomide therapy in the clinic. In contrast, NK cell CD69 and CD107a expression was not associated with increased killing of OPM2 myeloma cells. We found that the early activation
marker CD69 was significantly upregulated in response to elotuzumab in all three cohorts of patients (Figure 3C). However, elotuzumab-induced CD69 expression on NK cells from RRMM patients was significantly lower than that on NK cells from newly diagnosed MM patients and healthy donors, despite the divergence in RRMM NK cell cytotox icity. Additionally, treatment with lenalidomide reduced the expression of CD69 (Figure 3E). CD107a is a transmem brane protein expressed on secretory vesicles and tradi tionally serves as a marker for the exocytosis of cytolytic granules at the plasma membrane cell surface. Surpris

ARTICLE - Elo- and len-induced mechanisms of myeloma killing
K. Richardson et al.
Figure 3. Elotuzumab and lenalidomide treatment upregulated CD54 expression on natural killer cells. Peripheral blood mono nuclear cells were co-cultured for 24 hours with OPM2 target cells (2:1), 10 µg/mL elotuzumab and 10 µM lenalidomide then analyzed by flow cytometry. (A) Representative overlay histograms show elotuzumab + lenalidomide-induced upregulation of CD54, CD69 and CD107a expression on natural killer (NK) cells from healthy donors (HD). (B-E) CD54, CD69 and CD107a expression was compared between NK cells from HD, patients with newly diagnosed multiple myelom (NDMM) and patients with refractory relapsed multiple myeloma (RRMM) in response to elotuzumab, lenalidomide or elotuzumab + lenalidomide treatment. Each data point represents the change in mean fluorescence intensity from baseline expression. Red triangles correspond to RRMM patients with high cytotoxic activity, as shown in Figure 2B. (B-D) Comparison between patients’ cohorts for NK cell CD54, CD69 and CD107a expression changes induced by drug treatments (two-way analysis of variance [ANOVA], mean ± standard error of mean [SEM]). (E) Comparison within each cohort for NK cell CD54, CD69 and CD107a expression changes induced by different drug treatment(s) (repeated measures one-way ANOVA, mean ± SEM). *P<0.05, **P<0.01, ***P<0.001, ****P<0.0001. MFI: mean fluorescence intensity; Iso: human IgG1 isotype control; Elo: elotuzumab; Len: lenalidomide.
ingly, all patients’ NK cells were capable of elotuzumabinduced degranulation, with no significant difference ob served between cohorts (Figure 3D), regardless of the degree of cytotoxicity. This confirms recent data from Pazina et al 21 and suggests that in myeloma, NK cell de granulation, as measured surrogately by CD107a exposure, does not equate to myeloma target cell death. It was also observed that, as for CD69, the addition of lenalidomide resulted in reduced CD107a expression (Figure 3E). It is known that the interaction between CD54 and LFA1 is es sential for the microtubule-organizing center and lytic granules to polarize to the immune synapse between ef fector and target cells, prior to delivery and target cell death.22 While CD107a indicates degranulation in all samples, low levels of CD54, as seen in the poorly cyto toxic RRMM NK cell samples, may result in unpolarized, in direct secretion of lytic granules into the media instead of the target cells. There is prior evidence that this can in deed occur. In an in vitro model system, human NK cells degranulated when activated via NKG2D and 2B4 simulta neously but did not induce killing of target cells. Rather, target cell killing by NK cells required simultaneous CD11A, NKG2D and 2B4 co-receptor engagement.23
Natural killer cells from healthy donors and myeloma patients have distinct gene signatures in response to combination elotuzumab and lenalidomide treatment
To gain insight into the functional differences between NK cells derived from RRMM patients, we used whole tran scriptome RNA sequencing on sorted NK cells from either RRMM patients (RRMM24, RRMM26 and RRMM30) or healthy donors (HD231, HD234 and HD237) and explored changes which could explain our observations. Prior to NK cell sorting, RNA extraction, and whole-transcriptomic RNA sequencing, PBMC from healthy donors or patients were first treated with control immunoglobulin, lenalidomide, elotuzumab or the combination of lenalidomide plus elo tuzumab (n=3 subjects in each group) (Figure 4A). We also performed a cytotoxicity assay, using PBMC from the same healthy donor controls and myeloma patients, to simulta neously evaluate OPM2 myeloma cell killing (Figure 4B). Once again, we observed that healthy donor PBMC induced increased myeloma cell killing and responded more effec
tively to elotuzumab and lenalidomide treatment. To explore these differences at the transcriptional level, we first analyzed differential expression of genes to find genes upregulated by the different treatments. We ident ified that donor NK cells exhibited a large number of changes, particularly in response to elotuzumab alone and elotuzumab plus lenalidomide treatment (2,054-2,265 dif ferentially expressed genes), and fewer following lenalido mide treatment alone (144 differentially expressed genes) (Online Supplementary Figure S5A). Conversely, RRMM pa tients responded much less, with 22 differentially ex pressed genes following treatment with elotuzumab alone, or elotuzumab and lenalidomide treatment, and only one following lenalidomide treatment alone. Approximately half of these differentially expressed genes in RRMM were also conserved with healthy donors’ NK cells, indicating a shared molecular response to the treatments. Principle component analysis of the expression level of all genes showed that, despite variation between the donor sources, the treatments had predictable effects on healthy donor NK cells (Figure 4C). However, this was not observed in the RRMM patients’ NK cells, with no clear organized response to any of the treatments. We also observed that patients’ NK cells exhibited dramatically different expression pro files when directly compared (Online Supplementary Figure S5B) to healthy donors’ NK cells. We hypothesized that changes in canonical NK cell functional responses to the treatments were fundamentally different between NK cells from healthy donors and patients. To explore this, we used gene set enrichment analysis of canonical functional NK cell pathways and identified that patients’ NK cells were generally less stimulated by treatments but with little dif ference between the pathways (Online Supplementary Fig ure S5C). We next selected gene signatures of NK cytotoxicity or regulation of activation, and associated changes in the activity of these specific signatures, relative to control treatment, and the killing ability of the cognate NK cells, as shown in Figure 5A and B, respectively. The results demonstrated that healthy donor NK cells were overall more enriched for both cytotoxicity and activation functions compared to RRMM NK cells. However, the dif ferent treatments did not correlate with the overall stimu lation of either cytotoxic or regulation of activation gene
Figure 4. Transcriptomic
of natural killer cells
patients with refractory relapsed multiple myeloma reveals that these cells respond differently to elotuzumab and lenalidomide combination treatment. (A) Schematic overview of the experi mental RNA-sequencing strategy. Peripheral blood mononuclear cells (PBMC) from donors and patients (n=3 each group) were treated with lenalidomide, elotuzumab or their combination prior to fluorescence activated cell sorting of natural killer (NK) cells and whole-transcriptomic RNA sequencing. (B) OPM2 cell killing by PBMC from healthy donors and patients in the presence of isotype antibody, lenalidomide, elotuzumab, or elotuzumab + lenalidomide. (C) Principle component analysis of RNA expression in 24 samples of NK cells from healthy donors (circles: left panel) or patients with refractory relapsed multiple myeloma (triangles: right panel) following treatment. RRMM: refractory relapsed multiple myeloma; Iso: human IgG1 isotype control; Elo: elotuzumab; Len: lenalidomide; HD: healthy donor.
set enrichment scores. Finally, we compared the ex pression levels of the individual genes within the gene on tology regulation of NK cell activation pathways between healthy donors and RRMM patients (Figure 5C). We ob served that NK cells from RRMM patients exhibited differ ent expression patterns overall compared to NK cells from healthy donors, even in the absence of any treatment, sug gesting that NK cells from RRMM patients have fundamen tally different NK activation states. Despite this, elotuzumab treatment (either as monotherapy or in com bination) led to increased expression of many genes in this pathway. Interestingly, patient RRMM24 appeared not to exhibit this response to elotuzumab. In summary, elotu zumab and lenalidomide treatment induced expression of genes enriched in the cytotoxicity and activation pathways
in NK cells from healthy donors but not in those from RRMM patients.

Elotuzumab- and lenalidomide-induced upregulation of OPM2 cell CD54 requires natural killer cells and monocytes
We next explored the effect of elotuzumab and lenalido mide treatment on OPM2 myeloma target cells. When PBMC from healthy donors were co-cultured with OPM2 cells and various drugs, the OPM2 cells had significantly greater expression of CD54 when treated with elotuzumab and lenalidomide than when treated with elotuzumab alone (Figure 6A). Interestingly, this effect was also ob served in the RRMM patients’ PBMC with high levels of OPM2 killing (red triangles Figure 6A). Furthermore, OPM2
killing correlated with increased expression of CD54 on OPM2 target cells when co-cultured with RRMM patients’ PBMC in the context of elotuzumab and lenalidomide treatment (Figure 6B). CD11a was also upregulated on OPM2 cells in response to treatment with elotuzumab alone, and was further increased when combined treat ment with elotuzumab and lenalidomide was used, indica tive of similar mechanisms of regulation (Online Supplementary Figure S6). The presence of adhesion and activation molecules on effector and target cells is essen tial to form a stable immune synapse to enable effective killing. The upregulation of CD54, and its receptor CD11a, on both NK and target cells, particularly in response to elotuzumab and lenalidomide treatment, indicates greater potential for conjugate formation and activation. This is also consistent with observed levels of OPM2 cell killing by NK cells following combination therapy in RRMM pa tients in whom CD54 was robustly upregulated. The inflammatory cytokine TNF is known to increase CD54 expression on myeloma cells.24 In our study the greatest changes in expression of CD54 on OPM2 cells occurred fol lowing elotuzumab and lenalidomide treatment, and as TNF secretion was not further enhanced by lenalidomide
(Figure 2E, F), we hypothesized that additional mechan isms contributed to this effect.
To explore this further, we investigated which immune cell subsets were important for the induction of increased OPM2 myeloma cell killing and CD54/CD11a expression after elotuzumab and lenalidomide treatment. PBMC de pleted of specific cell subtypes were co-cultured with OPM2 target cells and treated with elotuzumab and lenali domide. Depletion of either CD8+ or CD4+ T cells had no effect on the level of OPM2 killing or on the expression of CD54 on both NK and OPM2 cells (Online Supplementary Figure S7). This was unexpected because lenalidomide is known to enhance IL2 secretion from CD4+ T cells, which in turn further activates NK cells.18 The greatest change to killing of OPM2 cells occurred when CD14+ monocytes were depleted (Figure 6C). Lack of CD14+ monocytes re duced the level of killing of OPM2 cells after treatment with elotuzumab and lenalidomide and also abrogated up regulation of CD54/CD11a on the tumor cells (Figure 6D, Online Supplementary Figure S8A). To investigate whether CD14+ cells were directly responsible for increased OPM2 CD54 and CD11a expression in response to elotuzumab and lenalidomide, CD14+ cells isolated from PBMC were co-cul
Figure 5. Natural killer cells from patients with refractory relapsed multiple myeloma have reduced gene signatures for cytotox icity, activation and impaired regulation of activation. Scatterplots comparing in vitro killing capacity for individual natural killer (NK) cell sources with normalized enrich ment scores for (A) KEGG Natural Killer Cell Mediated Cytotoxicity and (B) GO Regulation of Natural Killer Cell Activation. Colors indi cate three treatment groups: lenalidomide, elotuzumab, and elotuzumab + lenalido mide. Size indicates false discovery rate qvalue. All comparisons were made relative to isotype control treatment. Pearson cor relation coefficients and P values are indi cated. (C) Normalized z-score heatmap of GO:0032814: Regulation of NK cell activation pathway genes according to treatment for samples from both healthy donors and pa tients with refractory relapsed multiple myeloma. NES: normalized enrichment score; FDR: false discovery rate; Elo: elotu zumab; Len: lenalidomide; HD: healthy donor; RRMM: refractory relapsed multiple myeloma.

tured with OPM2 cells. This revealed that CD14+ cells alone did not induce an increase in OPM2 CD54/CD11a expression in the context of elotuzumab and lenalidomide treatment. However, low levels of OPM2 killing were observed, sup porting a role for monocytes in the killing of OPM2 cells (Figure 6E). Indeed antibody-dependent cellular phago cytosis has been described previously as a mechanism through which elotuzumab acts.11 When NK cells were de pleted from healthy donors’ PBMC, this reduced the overall
level of OPM2 cell killing and CD54/LFA1 expression on OPM2 cells after combined elotuzumab and lenalidomide treatment (Figure 6C, D). Furthermore, when NK cells alone were co-cultured with OPM2 cells and treated with elotuzumab and lenalidomide, OPM2 killing was signifi cantly increased compared to that induced by monocytes, but significantly less than that induced by whole PBMC (Figure 6E). This suggests that both monocytes and NK cells were required to induce optimal OPM2 myeloma cell
Figure 6. Elotuzumab and lenalidomide treatment upregulated CD54 on OPM2 cells and the treatment effects were dependent on both natural killer cells and monocytes. (A, B) Peripheral blood mononuclear cells (PBMC) and OPM2 cell co-cultures (2:1) were treated with elotuzumab and/or lenalidomide and analyzed via flow cytometry. Red data points indicate cells from refractory relapsed multiple myeloma (RRMM) patients with high cytotoxicity from Figure 2B. (A) Change in CD54 expression on OPM2 target cells when co-cultured with PBMC from healthy donors or RRMM patients, standardized to human IgG1 isotype control-treated cultures. (B) Pearson correlation between OPM2 CD54 expression change and RRMM cytotoxicity (R2 and P values are shown). (C, D) In the presence of elotuzumab and lenalidomide treatment OPM2 cells were co-cultured for 24 hours with either whole PBMC (PBMC:OPM2 2:1), PBMC depleted of CD14+ monocytes (PBMC CD14 ) or NK cells (PBMC CD56 ). The graphs show the number of OPM2 target cells killed (C), and the change in OPM2 target CD54 expression level (D). (E, F) OPM2 cells were co-cultured for 24 hours with either whole PBMC (PBMC:OPM2 2:1), isolated CD14+ cells (CD14), isolated NK cells (CD56) or CD14+ and NK cells (CD14+CD56). The graphs show the number of OPM2 target cells killed (E), and the change in OPM2 target CD54 expression level (F). Two-way analysis of variance, *P<0.05, **P<0.01, ***P<0.001, ****P<0.0001, n=3. MFI: mean fluorescence intensity; Iso: human IgG1 isotype control; Elo: elotuzumab; Len: lenalidomide.

killing following combination therapy. To further validate this, when NK cells were combined with CD14+ monocytes, complete recovery of elotuzumab- and lenalidomide-in duced target cell CD54/CD11a expression and target killing was observed, demonstrating crucial crosstalk between these cell types and the target OPM2 myeloma cells (Fig ure 6E, F, Online Supplementary Figure S8B). Finally, we observed that soluble mediators alone were unable to me diate these changes in CD54 expression on the OPM2 mye loma cells (Online Supplementary Figure S8C), so it can be inferred that increased OPM2 CD54 expression requires cell-to-cell interactions. These results imply that patients lacking functional monocytes may not benefit from this mechanism of elotuzumab + lenalidomide-induced prim ing of target cells for more efficient NK cell lysis.
Combination treatment with elotuzumab and lenalidomide stimulates cytokine and chemokine activity in OPM2 myeloma cells
Our analysis of transcriptional changes in RRMM patients’ NK cells (see Figures 4 and 5) suggests that neither cyto toxicity, nor NK activation pathways were more sensitive to the combination treatment with elotuzumab and lenali domide over elotuzumab alone. We therefore hypothes ized that differential responses among other cell types (i.e., tumor cells or monocytes) may be responsible for driving differences in killing capacity. We therefore compared the transcriptional response in these cells to that of healthy donor cells to identify differences between their responses that may explain our data. We performed whole transcrip tome analysis of NK cells, monocytes (CD14+) and OPM2 tumor cells sorted from healthy donor PBMC and OPM2 co-cultures treated with the three drug combinations (Fig ure 7A). We previously showed that elotuzumab and lenali domide treatment induced increased CD54 expression on both NK cells and OPM2 cells (Figures 3B and 6A). Here, we confirmed that elotuzumab and lenalidomide com bination treatment increased ICAM-1 expression on OPM2 cells over that produced by monotherapy, but this was not observed in monocytes (Figure 7B). We used an unbiased gene ontology enrichment strategy to identify novel path ways stimulated by the combination treatment. To use as input for pathway enrichment analysis, we first identified differentially expressed genes increased by each treatment (relative to control treatment) in the three cell types. The results, shown in Figure 7C, revealed that cells treated with elotuzumab alone, or elotuzumab and lenalidomide had the highest number of differentially expressed genes overall, but dramatically fewer differentially expressed genes were found in monocytes and OPM2 cells than in NK cells. In addition, many differentially expressed genes were unique to each cell type, suggesting that there are some unique effects that are dependent on the recipient cell. To further explore these differentially expressed
genes, we used ontological enrichment within the GO: Mol ecular Function database to identify novel functional changes in monocytes and OPM2 cells (Figure 8A, B, Online Supplementary Figure S9A, B). The results revealed that cytokine and chemokine pathways were increased in monocytes in response to both elotuzumab and combina tion treatment with elotuzumab and lenalidomide. Lenali domide alone did not have any significant effects. In contrast, OPM2 cells exhibited most significant changes in response to the combination only (shown in green), includ ing changes in the same cytokine- and chemokine-related pathways. Interestingly, we found that MHC class II path ways, mostly comprising HLA-related genes, were strongly upregulated by the combination treatment (Online Supple mentary Figure S9B).
As gene ontology analysis suggested that cytokine and chemokine expression is affected in both OPM2 and monocytes, we next explored the role of a custom list of NK receptors and ligands for expression differences in re sponse to the different treatments. The results, shown in Figure 8C, revealed that changes in these genes were ob served broadly in response to treatment with elotuzumab, or elotuzumab and lenalidomide, in monocytes, but only in response to the combination in OPM2 cells. This sug gests that combination treatment only had a significant impact on NK ligand/receptor pathways in OPM2 cells. To further identify the key genes involved, we inspected the significant genes for absolute expression change, and identified that CCL5, CXCL10 and CXCL11 responded spe cifically to combination treatment (Figure 8D, Online Sup plementary Figure S9D, E) and are known to be IFN-g-responsive genes.25 Many of the other genes also re sponded to combination treatment, but the response ap peared to be additive to the existing stimulation by elotuzumab alone. Considering all the data together, RNAsequencing analysis of myeloma cells (purified from elo tuzumab- and lenalidomide-treated PBMC co-cultures) showed significantly increased gene transcript levels for chemokines and receptors, adhesion molecules, MHC class II molecules and NK receptor ligands.
Patients with RRMM respond to combination treatment with elotuzumab and lenalidomide, with a reported overall response rate of 83% and 17% achieving durable re missions.8,9 Despite this, there are no reliable biomarkers to predict durable responses to combination treatment with elotuzumab and lenalidomide. In this study, we ex plored the mechanisms whereby combination elotuzumab and lenalidomide treatment is effective. To do this, we used PBMC collected from patients enrolled in two unique clinical trials on patients with newly diagnosed MM versus
Figure 7. Transcriptome analysis reveals that natural killer cells, monocytes and OPM2 myeloma cells change their gene expression differentially in response to drug treatments. (A) Schematic overview of the experimental RNA-sequencing strategy. Peripheral blood mononuclear cells from healthy donors (n=3) were treated with lenalidomide, elotuzumab or their combination prior to fluorescence activated sorting of natural killer cells (CD56+), monocytes (CD14+) and OPM2 cells and subsequent wholetranscriptomic RNA sequencing. (B) Dotplot of normalized ICAM-1 (CD54) expression in treatment groups in OPM2 cells and CD14+ monocytes. (C) Venn diagrams of overexpressed genes (log2 fold change >2; P value < 0.05) in each cell type and treatment group. PBMC: peripheral blood mononuclear cells; Control Ig and Iso: human IgG1 isotype control; Elo: elotuzumab; Len: lenalidomide, N.S.: not statistically significant; NK: natural killer.

RRMM. We identified a subset of RRMM patients whose PBMC killed myeloma targets and found that these pa tients had increased expression of adhesion molecules (CD11a/CD54) on myeloma cells. The killing of myeloma cells and increased CD54 expression on myeloma cells required the combination of NK cells and monocytes as effectors; the effects could not be produced by soluble factors alone (Online Supplementary Figure S10). The monocytes used in this study included classical (CD14++CD16 ) and intermediate (CD14++CD16+) monocytes.26 Prior mechanistic studies utilized healthy donor cells and showed that lenalidomide enhanced elotuzumab-induced myeloma antibody-dependent cellular cytotoxicity. This ef fect was associated with increased expression of the syn aptic adhesion molecule CD54 (ICAM-1) on both NK cells and myeloma cells.27 In another study, lenalidomide was shown to augment synaptic actin remodeling and reduce the threshold of NK cell activation. Lenalidomide de creased the EC50 for NK cell activation via CD16a and NKG2D stimulation, and also increased IFN-g production.28 Importantly, lenalidomide did not induce IFN-g production without concurrent NK cell stimulation, thus enhancing
clinical responses without inappropriate NK cell activation.28 However, because MM patients’ NK cells are dysfunctional18 it was not known whether their NK cells would respond to elotuzumab and lenalidomide treatment in the same manner as NK cells from healthy donors. Our work builds on these observations using patient-derived PBMC, demonstrating that when RRMM patients’ NK cells upregulated CD11a/CD54 this was associated with in creased myeloma killing and increased levels of TNF as well as IFN-g, MIP-1a and RANTES in the culture super natant. In RRMM patients with low myeloma cell killing, elotuzumab and lenalidomide treatment did not alter myeloma cell CD11a/CD54 expression or cytokine/chemo kine levels in the co-culture supernatant. As myeloma cells are known to express CD54 at low levels,18 we hypo thesize that this is a key immune escape mechanism. CD54 is important for immune effector cell adhesion with target cells and stabilizes the immune synapse enabling directed degranulation into the immune synapse.22 Our studies show that elotuzumab and lenalidomide treatment induced increased myeloma cell CD54 expression and that this was associated with increased killing by RRMM pa
tients’ PBMC. Thus, the expression of CD11a/CD54 on NK cells and myeloma cells in patients represents a potential new predictive biomarker for selecting responders to le nalidomide and elotuzumab therapy. In our investigations of underlying mechanisms of action of elotuzumab and lenalidomide combination therapy, we also performed RNA-sequencing analysis of purified NK cells, monocytes and myeloma cells from elotuzumaband lenalidomide-treated co-cultures. Interestingly, mye loma cells showed the highest number of differentially ex pressed genes in response to the combination treatment, whereas NK cells and monocytes responded better to single-agent elotuzumab therapy. We showed that the
myeloma cells upregulated genes for trafficking (CXCR3, CXCL10, CXCL11, CCR7, CCL5), adhesion (CD54), NK cell ac tivation ligand (CD155) and antigen presentation (MHC-II). The increased OPM2 CCL5 levels found by RNA-sequencing analysis are concordant with our data showing increased CCL5 (RANTES) in PBMC myeloma co-culture supernatant in response to elotuzumab and lenalidomide treatment. In conjunction with the data demonstrating upregulated CD54/CD11a on myeloma cells, this suggests that the com bination treatment restores adhesion between the NK cells and myeloma target cells thereby allowing more ef fective cell killing. Interestingly, the increased expression of chemokines and chemokine receptors may be impor
Figure 8. Ontological analysis reveals increased expression of effector cell trafficking signals, adhesion and MHC class II mol ecules in tumor cells in response to elotuzumab and lenalidomide combination therapy. (A, B) Ontological enrichment analysis within the GO: Molecular Functions database using overexpressed genesets for either monocytes (A) or OPM2 cells (B). Only sig nificantly enriched ontologies are shown (adjusted P value < 0.05). Genes contributing to each ontology are shown. No enrich ments for lenalidomide treatment were identified. (C) Heatmaps showing normalized relative mRNA expression of transcripts encoding chemokines, cytokines and receptors important for natural killer-cell activation and functionality on monocytes (left panel) and OPM2 cells (right panel). Arrows indicate significance for the elotuzumab + lenalidomide and elotuzumab treatment groups with direction of change indicated. (D) OPM2 cell log2 mRNA expression of genes showing significantly different expression when treated with the elotuzumab + lenalidomide combination versus elotuzumab treatment alone. GO: gene ontology; Iso: human IgG1 isotype control; Elo: elotuzumab; Len: lenalidomide; MHC: major histocompatibility complex.

tant for trafficking of immune effector cells to the mye loma cells. Finally, we show that the myeloma cells up regulate NK activating ligands (MICA) suggesting an additional mechanism for NK cell activation. Having revealed mechanisms of response to elotuzumab and lenalidomide treatment, we now know which immune cell types and molecular mechanisms should be targeted to potentially convert patients’ PBMC from low to high myeloma killing. We also propose a potential predictive biomarker in which a patient’s PBMC at baseline would be co-cultured with OPM2 myeloma cells, and increased OPM2 cell CD11a/CD54 expression would be associated with increased myeloma cell killing. NK cells from patients with RRMM are known to be dys functional18,29 and in our study the patients’ PBMC whose myeloma killing increased in response to elotuzumab and lenalidomide treatment also had enhanced NK cell func tion in the absence of treatment. NK cells from patients with monoclonal gammopathy of unknown significance and smoldering multiple myeloma are known to have better function than those from patients with newly diag nosed MM or RRMM.30 Therefore, applying elotuzumab and lenalidomide treatment earlier in myeloma disease (mono clonal gammopathy of unknown significance and smolder ing multiple myeloma), when NK cells are more responsive, would be more likely to produce a better anti-tumor re sponse and outcome. Alternatively, incorporating therapies that enhance NK cell function such as IL-1531 or that up regulate CD54 expression on NK cells and myeloma cells (e.g., TNF) could be useful.24 Monocytes are known to in duce myeloma cell antibody-dependent cellular phago cytosis in the context of elotuzumab treatment.11 A subset of RRMM patients is known to have increased aberrant monocytes/monocytic-monocyte-like myeloid-derived suppressor cells,12 which are less able than conventional monocytes to perform antibody-dependent cellular phagocytosis. In this context, inhibiting or depleting these suppressive monocyte-like myeloid-derived cells should generate a better anti-myeloma immune response along with elotuzumab and lenalidomide treatment.12 Finally, a more direct approach may involve a targeted therapy to specifically upregulate CD54 expression on immune effec tor cells and myeloma cells using next-generation immu nomodulatory drugs, the cereblon E3 ligase modulators.32 In summary, our mechanistic studies showed that: (i) in the presence of elotuzumab CD16 (FcgRIII) signaling is required for effective tumor cell killing by NK cells; (ii) RRMM patients’ NK cells have reduced cytotoxicity, as
1. Siegel RL, Miller KD, Jemal A. Cancer statistics, 2016. CA Cancer J Clin. 2016;66(1):7-30.
shown by lower activation and loss of CD16 expression; (iii) in the presence of elotuzumab + lenalidomide there is an association between increased adhesion molecule ex pression on the NK and target cells and the levels of target cell killing; (iv) monocytes may play a role in improving the efficacy of elotuzumab and/or lenalidomide treatment; and (v) elotuzumab + lenalidomide treatment induced a sig nificant increase in myeloma-derived chemokines for traf ficking of immune effectors to the tumor cells (Online Supplementary Figure S11). In conclusion, our findings indicate that increased CD54 expression on myeloma cells would be a useful predictive biomarker for response to elotuzumab and lenalidomide treatment. This could be evaluated in myeloma co-cul tures with patients’ PBMC treated with elotuzumab and lenalidomide. The mechanistic studies indicate that cross talk between NK cells, monocytes and myeloma cells is critical for this response.
PJN received research project funding from Roche Genen tech, Allergan, Compugen, Advaxis, MSD, and Crispr Thera peutics.
KJR designed and performed in vitro and in vivo studies, prepared figures, and wrote and edited the manuscript. SPK performed the bio-informatics analysis, prepared figures, and wrote and edited the manuscript. JJZ, DM, CDS, SM and KT performed experiments, and wrote and edited the manuscript. KC provided key research reagents, academic input and edited the manuscript. MR and NAB provided academic input into the project direction, and read and edited the manuscript. HQ, DSR, SJH and HMP all provided MM patients’ samples from their clinical trials, and read and edited the manuscript. JAT provided academic direction, and read and edited the manuscript. MRJ, PAB, PKD and PJN supervised the project direction, experiments and manuscript writing. PJN and HMP also provided financial support for the project.
PJN received research grant funding from Bristol-Myers Squibb for this study.
Data are available on reasonable request, as per our insti tute’s policy.
2. Varga C, Maglio M, Ghobrial IM, Richardson PG. Current use of monoclonal antibodies in the treatment of multiple myeloma.
Br J Haematol. 2018;181(4):447-459.
3. Hsi ED, Steinle R, Balasa B, et al. CS1, a potential new therapeutic antibody target for the treatment of multiple myeloma. Clin Cancer Res. 2008;14(9):2775-2784.
4. Tai Y-T, Dillon M, Song W, et al. Anti-CS1 humanized monoclonal antibody HuLuc63 inhibits myeloma cell adhesion and induces antibody-dependent cellular cytotoxicity in the bone marrow milieu. Blood. 2008;112(4):1329-1337.
5. Perez-Quintero LA, Roncagalli R, Guo H, Latour S, Davidson D, Veillette A. EAT-2, a SAP-like adaptor, controls NK cell activation through phospholipase Cgamma, Ca++, and Erk, leading to granule polarization. J Exp Med. 2014;211(4):727-742.
6. Tassi I, Colonna M. The cytotoxicity receptor CRACC (CS-1) recruits EAT-2 and activates the PI3K and phospholipase Cgamma signaling pathways in human NK cells. J Immunol. 2005;175(12):7996-8002.
7. Pazina T, MacFarlane AWT, Bernabei L, et al. Alterations of NK cell phenotype in the disease course of multiple myeloma. Cancers. 2021;13(2):226.
8. Lonial S, Dimopoulos M, Palumbo A, et al. Elotuzumab therapy for relapsed or refractory multiple myeloma. N Engl J Med. 2015;373(7):621-631.
9. Richardson PG, Jagannath S, Moreau P, et al. Elotuzumab in combination with lenalidomide and dexamethasone in patients with relapsed multiple myeloma: final phase 2 results from the randomised, open-label, phase 1b-2 dose-escalation study. Lancet Haematol. 2015;2(12):e516-527.
10. Zonder JA, Mohrbacher AF, Singhal S, et al. A phase 1, multicenter, open-label, dose escalation study of elotuzumab in patients with advanced multiple myeloma. Blood. 2012;120(3):552-559.
11. Kurdi AT, Glavey SV, Bezman NA, et al. Antibody dependent cellular phagocytosis by macrophages is a novel mechanism of action of elotuzumab. Mol Cancer Ther. 2018;17(7):1454-1463.
12. Malek E, de Lima M, Letterio JJ, et al. Myeloid-derived suppressor cells: the green light for myeloma immune escape. Blood Rev. 2016;30(5):341-348.
13. Lu G, Middleton RE, Sun H, et al. The myeloma drug lenalidomide promotes the cereblon-dependent destruction of Ikaros proteins. Science. 2014;343(6168):305-309.
14. Kim JR, Horton NC, Mathew SO, et al. CS1 (SLAMF7) inhibits production of proinflammatory cytokines by activated monocytes. Inflamm Res. 2013;62(8):765-772.
15. Lim SA, Kim TJ, Lee JE, et al. Ex vivo expansion of highly cytotoxic human NK cells by cocultivation with irradiated tumor cells for adoptive immunotherapy. Cancer Res. 2013;73(8):2598-2607.
16. Shortt J, Hsu AK, Johnstone RW. Thalidomide-analogue biology: immunological, molecular and epigenetic targets in cancer therapy. Oncogene. 2013;32(36):4191-4202.
17. Dimopoulos MA, Dytfeld D, Grosicki S, et al. Elotuzumab plus pomalidomide and dexamethasone for multiple myeloma. N Engl J Med. 2018;379(19):1811-1822.
18. Hsu AK, Quach H, Tai T, et al. The immunostimulatory effect of lenalidomide on NK-cell function is profoundly inhibited by concurrent dexamethasone therapy. Blood. 2011;117(5):1605-1613.
19. Romee R, Foley B, Lenvik T, et al. NK cell CD16 surface expression and function is regulated by a disintegrin and metalloprotease-17 (ADAM17). Blood. 2013;121(18):3599-3608.
20. Gross CC, Brzostowski JA, Liu D, Long EO. Tethering of intercellular adhesion molecule on target cells is required for LFA-1-dependent NK cell adhesion and granule polarization. J Immunol. 2010;185(5):2918-2926.
21. Pazina T, James AM, Colby KB, et al. Enhanced SLAMF7 homotypic interactions by elotuzumab improves NK cell killing of multiple myeloma. Cancer Immunol Res. 2019;7(10):1633-1646.
22. Bryceson YT, March ME, Barber DF, Ljunggren HG, Long EO. Cytolytic granule polarization and degranulation controlled by different receptors in resting NK cells. J Exp Med. 2005;202(7):1001-1012.
23. Bryceson YT, Ljunggren HG, Long EO. Minimal requirement for induction of natural cytotoxicity and intersection of activation signals by inhibitory receptors. Blood. 2009;114(13):2657-2666.
24. Hideshima T, Chauhan D, Schlossman R, Richardson P, Anderson KC. The role of tumor necrosis factor α in the pathophysiology of human multiple myeloma: therapeutic applications. Oncogene. 2001;20(33):4519-4527.
25. Castro F, Cardoso AP, Gonçalves RM, Serre K, Oliveira MJ. Interferon-gamma at the crossroads of tumor immune surveillance or evasion. Front Immunol. 2018;9:847.
26. Kapellos TS, Bonaguro L, Gemünd I, et al. Human monocyte subsets and phenotypes in major chronic inflammatory diseases. Front Immunol. 2019;10:2035.
27. Balasa B, Yun R, Belmar NA, et al. Elotuzumab enhances natural killer cell activation and myeloma cell killing through interleukin-2 and TNF-alpha pathways. Cancer Immunol Immunother. 2015;64(1):61-73.
28. Lagrue K, Carisey A, Morgan DJ, Chopra R, Davis DM. Lenalidomide augments actin remodeling and lowers NK-cell activation thresholds. Blood. 2015;126(1):50-60.
29. Pittari G, Vago L, Festuccia M, et al. Restoring natural killer cell immunity against multiple myeloma in the era of new drugs. Front Immunol. 2017;8:1444.
30. Fionda C, Stabile H, Molfetta R, et al. Translating the antimyeloma activity of natural killer cells into clinical application. Cancer Treat Rev. 2018;70:255-264.
31. Dubois S, Conlon KC, Müller JR, et al. IL15 infusion of cancer patients expands the subpopulation of cytotoxic CD56bright NK cells and increases NK-cell cytokine release capabilities. Cancer Immunol Res. 2017;5(10):929-938.
32. Hansen JD, Correa M, Nagy MA, et al. Discovery of CRBN E3 ligase modulator CC-92480 for the treatment of relapsed and refractory multiple myeloma. J Med Chem. 2020;63(13):6648-6676.
Joanna Zurko,1 Jeremy Ramdial,2 Mazyar Shadman,3 Sairah Ahmed,2 Aniko Szabo,1 Lorenzo Iovino,3 Ana Alarcon Tomas,4 Craig Sauter,4 Miguel-Angel Perales,4 Nirav. N. Shah,1 Utkarsh H. Acharya,5 Caron Jacobson,5 Robert J. Soiffer,5 Trent Wang,6 Krishna V. Komanduri,6 Samantha Jaglowski,7 Adam S. Kittai,7 Nathan Denlinger,7 Madiha Iqbal,8 Mohamed A. Kharfan-Dabaja,8 Ernesto Ayala,8 Julio Chavez,9 Michael Jain,9 Frederick L. Locke,9 Yazeed Samara,10 Lihua E. Budde,10 Matthew G. Mei,10 Alexandra Della Pia,11,12 Tatyana Feldman,11 Nausheen Ahmed,13 Ryan Jacobs,14 Nilanjan Ghosh,14 Bhagirathbhai Dholaria,15 Olalekan O. Oluwole,15 Brian Hess,16 Ayesha Hassan,1 Vaishalee P. Kenkre,1 Patrick Reagan,17 Farrukh Awan,18 Yago Nieto,2 Mehdi Hamadani19 and Alex F. Herrera10
1Medical College of Wisconsin, BMT and Cellular Therapy Program, Division of Hematology and Oncology, Milwaukee, WI, USA; 2The University of Texas MD Anderson Cancer Center, Department of Stem Cell Transplantation, Division of Cancer Medicine, Houston, TX; 3Fred Hutchinson Cancer Research Center and University of Washington, Seattle, WA; 4Memorial Sloan Kettering Cancer Center, New York, NY; 5Dana-Farber Cancer Institute, Department of Medical Oncology, Boston, MA; 6Sylvester Comprehensive Cancer Center, Division of Transplantation and Cellular Therapy, Miami, FL; 7Arthur G. James Cancer Hospital and Richard J. Solove Research Institute, The Ohio State University, Columbus, OH; 8Mayo Clinic, Division of Hematology-Oncology and Blood and Marrow Transplantation and Cellular Therapy Program, Jacksonville, FL; 9H. Lee Moffitt Cancer Center and Research Institute, Tampa, FL; 10City of Hope, Department of Hematology and Hematopoietic Cell Transplantation, Duarte, CA; 11John Theurer Cancer Center at Hackensack Meridian Health, NJ; 12Ernest Mario School of Pharmacy, Rutgers, The State University of New Jersey, Piscataway, NJ; 13University of Kansas Medical Center, Division of Hematologic Malignancies & Cellular Therapeutics, Westwood, KS; 14Levine Cancer Institute/Atrium Health, Charlotte, NC; 15Vanderbilt-Ingram Cancer Center, Division of Hematology and Oncology, Nashville, TN; 16Hollings Cancer Center, Medical University of South Carolina, Charleston, SC; 17Wilmot Cancer Institute, University of Rochester Medical Center, Rochester, NY; 18Harold C. Simmons Comprehensive Cancer Center, University of Texas Southwestern, Dallas, TX and 19Medical College of Wisconsin, BMT and Cellular Therapy Program, Division of Hematology and Oncology, Milwaukee, WI, USA
Correspondence: A. Herrera aherrera@coh.org
Received: April 13, 2022.
Accepted: July 6, 2022.
Prepublished: July 14, 2022.
https://doi.org/10.3324/haematol.2022.281242
©2023 Ferrata Storti Foundation
Published under a CC BY-NC license
Allogeneic hematopoietic cell transplantation (alloHCT) can potentially salvage large B-cell lymphoma (LBCL) patients ex periencing treatment failure after chimeric antigen receptor T-cell therapy (CAR T). Nonetheless, data on the efficacy and toxicities of alloHCT after receipt of CAR T are limited. We report a multicenter retrospective study assessing the safety, toxicities, and outcomes of alloHCT in LBCL patients following CAR T failure. Eighty-eight patients with relapsed, refractory LBCL received an alloHCT following anti-CD19 CAR T failure. The median number of lines of therapy between CAR T infusion and alloHCT was one (range, 0-7). Low intensity conditioning was used in 77% (n=68) and peripheral blood was the most common graft source (86%, n=76). The most common donor types were matched unrelated donor (39%), followed by ha ploidentical (30%) and matched related donor (26%). Median follow-up of survivors was 15 months (range, 1-72). One-year overall survival, progression-free survival, and graft-versus-host disease-free relapse-free survival were 59%, 45%, and 39% respectively. One-year non-relapse mortality and progression/relapse were 22% and 33% respectively. On multivariate analy sis, <2 lines of intervening therapy between CAR T and alloHCT and complete response at time of alloHCT were associated with better outcomes. In conclusion, alloHCT after CAR T failure can provide durable remissions in a subset of patients.
For patients with relapsed, refractory (R/R) large B-cell
lymphoma (LBCL), chimeric antigen receptor T-cell (CAR T) therapy produces high overall response rates (ORR) ranging from 52-83%;1-7 nonetheless, the durable re
mission rate is much lower at 30% to 40%.4,5 Outcomes for patients with disease progression after CAR T are poor, with a median overall survival (OS) from time of progress ive disease (PD) of less than 6 months.8,9 In patients with LBCL who have previously received or are ineligible for autologous hematopoietic cell transplanta tion (HCT), allogeneic HCT (alloHCT) has curative potential in selected patients. The 3-year progression-free survival (PFS) following alloHCT in patients with R/R LBCL is re ported at 36% to 38% in more recent series.10 Despite this, there are limited data on the efficacy and toxicities of al loHCT after receipt of CAR T therapy, limited to studies of fewer than ten patients.11,12 Therefore, whether patients who fail CAR T derive similar benefit with alloHCT and to whom to offer this modality to remains unknown. In smaller reports, a low proportion of patients make it to alloHCT,9,13 which could be a consequence of an inability to attain disease control or impaired functional status after CAR T failure. Nonetheless, as we continue to expand the arsenal of effective novel therapies for R/R LBCL,14-16 we may be able to better achieve disease control and offer alloHCT to a larger proportion of patients. Given these knowledge gaps, we conducted a multicenter retrospec tive study to evaluate the safety, toxicities, and outcomes of alloHCT after CAR T for patients with R/R LBCL. The primary objective of this study was to describe the 1year OS, PFS, graft-versus-host disease (GvHD)-free re lapse-free survival (GRFS), incidence of non-relapse mortality (NRM) and progression/relapse in R/R LBCL pa tients receiving alloHCT following anti-CD19 CAR T failure. The secondary objective was to determine patient-, dis ease- and treatment-related factors predicting favorable outcomes in these patients.
Study design and participants
Patients ≥18 years old with R/R LBCL treated with antiCD19 CAR T therapy between 2013-2021 that subsequently received an alloHCT were included in this retrospective, multicenter analysis. Eighteen United States academic medical centers participated in this analysis (Online Sup plementary Table S1). Patients treated with investigational CAR T therapy were included if it targeted the CD19 antigen. Patients who were in a durable complete re sponse (CR) following CAR T therapy, who then received an alloHCT either as a consolidation or for indications other than R/R LBCL were excluded. Patients with primary central nervous system (CNS) lymphoma were excluded. Data were collected from the electronic medical record of each institution via chart review by individual investi gators. Information collected included demographic and clinical characteristics, CAR T toxicities and responses,
post-CAR T treatment regimens, alloHCT treatment de tails, neutrophil and platelet recovery, and acute and chronic GvHD.
Cytokine release syndrome (CRS) and immune effector cell neurotoxicity syndrome (ICANS) were graded accord ing to institutional standards.17-20 Treatment responses were assessed by Lugano criteria21 by treating physicians at individual institutions without centralized review. Inde pendent institutional review board approval was obtained at each institution. The study was conducted in accord ance with the Declaration of Helsinki.
The co-primary endpoints of this analysis were PFS and OS after alloHCT. PFS was defined as the time from trans plant to disease progression/relapse or death. OS was de fined as the time from transplant to death. Patients without PFS/OS events were censored at the time of last contact. GRFS events were defined as the first event among grade III–IV acute GvHD and aGvHD, moderate/se vere chronic GvHD and cGvHD, relapse and death.10 Inci dence of NRM was defined as the time from transplant to death without progression/relapse. Progression/relapse was defined as progressive lymphoma after alloHCT or lymphoma recurrence after a CR with NRM considered as a competing risk. Surviving patients without progression/relapse were censored at the date of last fol low-up. Neutrophil and platelet recovery, aGvHD and cGvHD were graded using established consensus criteria.22-24 For neu trophil and platelet recovery, death without the event was considered a competing risk. Patients with no nadir were not included in the recovery analyses.
For all time-to-event outcomes patients were followed from day 0 of the alloHCT until the event of interest, last follow-up, or the administrative truncation time (Online Supplementary Table S2). Descriptive summaries were ob tained using the Kaplan-Meier method to estimate timespecific and median event time. In the presence of competing risks, the cumulative incidence was estimated using the Aalen-Johansen estimator. The effect of covari ates on outcomes was assessed using Cox regression for survival outcomes, and Fine-Gray regression in the pres ence of competing risks. Variables considered in model building for Cox model multivariate analysis are listed in the Online Supplementary Table S2. Variables significant at the 0.2 level in the univariable analysis were included in the multivariable model. Continuous variables were as sessed with Wilcoxon rank-sum testing and categorical values with Fisher’s exact test. Statistical analysis was completed in R 4.0.3 and GraphPad Prism 9.3.1. A twosided 0.05 significance level was used.
Ninety-four patients with R/R LBCL received an alloHCT following anti-CD19 CAR T. Six of these 94 patients re ceived an alloHCT while in a durable CR following anti-
CD19 CAR T and were excluded. We report findings on the remaining 88 patients with anti-CD19 CAR T failure. Demographic and clinical characteristics are described in Table 1. Median age at time of alloHCT was 54 years (range, 19-72). Most patients were male (n=63, 72%), White (n=58, 66%) and had de novo diffuse large B-cell lymphoma
Median follow-up, months (range) 15 (1-72) Age in years (range) 54 (19-72) Male sex 63 (72)
Race White Hispanic Black Asian American Indian or Alaska Native
De novo DLBCL
Transformed indolent lymphoma1 PMBL
High grade B-cell lymphoma, NOS
Table 1. Demographic and clinical characteristics of patients with large B-cell lymphoma receiving allogeneic transplantation after CAR T therapy.
58 (66) 18 (20) 6 (6.8) 5 (5.7) 1 (1.1)
52 (59) 23 (26) 8 (9.1) 5 (5.7)
Cell of origin2 Non-GCB 32 (42)
Double/triple hit3 9 (12) N lines of therapy prior to CAR T (range) 3 (1-7)
Best response to CAR T CR PR SD/PD
31 (35) 32 (36) 25 (29)
Time to relapse post-CAR T, days N (range)4 92 (7-527) N lines of therapy between CAR T and alloHCT (range) 1 (0-7)
Disease status prior to alloHCT CR PR SD/PD
Ann Arbor stage at time of CAR T progression/relapse5 1 2 3/4
45 (51) 22 (25) 21 (24)
26 (31) 9 (11) 48 (58)
Extranodal disease at time of CAR-T progression/relapse 49 (58) Days N between CAR T infusion and day 0 of alloHCT (range) 255 (63-753)
Conditioning regimen intensity
MAC 20 (23)
Graft source
Peripheral blood
Bone marrow
Cord
MUD
Haploidentical
MRD
MMUD Cord
CNI+MTX
TAC/MMF/PTCY Other
76 (86) 10 (11) 2 (2)
34 (39) 26 (30) 23 (26) 3 (3) 2 (2)
22 (25) 43 (49) 23 (26)
Histologic subtype, fluorescence in situ hybridization (FISH) studies, immunohis tochemistry (IHC), and cell of origin (ger minal center B-cell-like [GCB] and non-GCB) were assessed at diagnosis. Disease stage and extranodal involvement were determined at time of CAR T pro gression/relapse. 1Transformed indolent lymphoma category included one patient with Richter transformation of chronic lymphocytic leukemia/small lymphocytic lymphoma. 2Missing/not applicable: 11 pa tients. 3Unknown: 14 patients. 4Unknown: 8 patients. 5Missing: 5 patients. AlloHCT: allogeneic hematopoietic cell transplan tation; CAR T: chimeric antigen receptor T cell; CNI: calcineurin inhibitor; CR: com plete response; DLBCL: diffuse large Bcell lymphoma; GCB: germinal center B-cell like; HCT: hematopoietic cell trans plant; MAC: myeloablative conditioning; MMF: mycophenolate mofetil; MMUD: mismatched unrelated donor; MRD: matched related donor; MTX: methotre xate; MUD: matched unrelated donor; NMA/RIC: non-myeloablative/reduced in tensity conditioning; N: number; NOS: not otherwise specified; PD: progressive dis ease; PMBL: primary mediastinal B-cell lymphoma; PR: partial response; PTCY: post-transplant cyclophosphamide; SD: stable disease; TAC: tacrolimus. GvHD: graft-versus-host disease
(n=52, 59%). Twenty-two patients (25%) had an autologous HCT prior to CAR T. The most common CAR T construct re ceived was axicabtagene ciloleucel (n=59, 67%) followed by investigational anti-CD19 CAR T-cells (n=14, 16%), lisocab tagene maraleucel (n=11, 12%) and tisagenlecleucel (n=4, 5%). Following CAR T, rates of grade ≥III CRS were 2% (n=2) and grade ≥III ICANS were 17% (n=15). Best response to CAR T was CR in 35% (n=31), PR in 36% (n=32), and SD/PD in 28% (n=25). Median time between CAR T and alloHCT was 255 days (range, 63-753). The median number of lines of therapy between CAR T infusion and alloHCT was 1 (range, 0-7). Dis ease status at time of alloHCT was CR in 51% (n=45), PR in 25% (n=22) and SD/PD in 24% (n=21) of patients. RIC/NMA conditioning regimens were used in 77% (n=68) and periph eral blood was the most common graft source (86%, n=76). The most common donor types were matched unrelated donor (MUD) (39%), followed by haploidentical (30%) and MRD (26%). The most common GvHD prophylaxis regimen
was tacrolimus + mycophenolate mofetil + post-transplant cyclophosphamide (49%) followed by a calcineurin inhibitor + methotrexate (25%). Median follow-up of survivors was 15 months (range, 1-72).
Therapies given between CAR T infusion and allogeneic hematopoietic cell transplantation
The most common first-line treatment regimens (n=79) given as salvage following CAR T failure were: chemother apy (n=14, 18%), polatuzumab-based (n=14, 18%; n=13 re ceived polatuzumab + bendamustine + rituximab), radiation (n=10, 13%), checkpoint inhibitors (n=9, 11%) and CAR T/NK-cell therapy (n=8, 10%). Nine patients received no therapy for their active lymphoma between CAR T and alloHCT. The therapeutic procedure for all patients be tween CAR T and alloHCT is depicted in Figure 1. The most common regimens given across all lines between CAR T and alloHCT (n=142 treatment regimens) were chemother

Figure 1.
T-cell therapy
allogeneic hematopoietic cell trans plantation. Ab: antibody; alloHCT: allogeneic hematopoietic cell transplantation; CAR T: chimeric antigen receptor T-cell therapy; CR: complete remission; len: lenalidomide; n: number; NK: natural killer cell; ORR: overall response rate; PD-1: programmed cell death protein 1.
apy-based (n=31), polatuzumab-based (n=28), and radiation (n=18) (Online Supplementary Table S3). Polatuzumabbased regimens and chemotherapy-based regimens were the most common regimens to led to a CR prior to alloHCT across multiple lines (n=19 [42%] and n=10 [22%] respect ively; Online Supplementary Table S4). The ORR across multiple lines between CAR T and alloHCT for chemother apy was 60% (33% CR; n=31) and for polatuzumab + ben damustine + rituximab was 91% (71% CR; n=23).
Engraftment and graft versus-host disease
Median time to neutrophil recovery was 16 days (interquar tile range [IQR], 12-18) and median time to platelet recovery was 18 days (IQR, 11-25) (Online Supplementary Figure S1). Cumulative incidence of neutrophil recovery was 94% at 28 days (95% confidence interval [CI]: 89-99). Cumulative inci dence of platelet recovery at 100 days was 89% (95% CI: 83-96). There was one patient with primary graft failure. The cumulative incidence of grade II-IV and III-IV aGvHD were 34% (95% CI: 25-45) and 10% (95% CI: 5.6-19) at 100
days. The cumulative incidence of mild, moderate, and se vere cGvHD at 1-year was 16% (95% CI: 9.8-28), 7.8% (95% CI: 3.6-17), and 3.8% (95% CI: 1.3-12) respectively. The cumulative incidence of grade II-IV aGvHD at 100 days was 31% (95% CI: 20-49) for patients who received PTCy-based prophylaxis versus 36% (95% CI: 24-53) for patients who did not receive PTCy (Online Supplementary Figure S2). The cumulative incidence of cGvHD at 1-year was 37% (95% CI: 24-57) for patients receiving PTCy-based prophy laxis versus 24% (95% CI: 14-41) for those who did not (On line Supplementary Figure S2).
Twenty-three patients (26%) received a PD-1 inhibitor be tween CAR T and alloHCT across multiple lines with last dose of the PD-1 inhibitor a median of 167 days (range, 56527) before alloHCT. Seventeen of these patients (74%) re ceived post-transplant cyclophosphamide (PTCy) as part of their GvHD prophylaxis. There was no significant differ ence in the incidence of grade II-IV aGvHD and cGvHD whether patients received an PD-1 inhibitor between CART and alloHCT (Online Supplementary Table S5).
B
Figure 2. Survival outcomes, progression/relapse and non-relapse mortality in patients who underwent allogeneic hematopoietic cell transplantation after CAR T. (A) Overall survival, all patients. (B) Progression-free survival, all patients. (C) Graft-versus-host disease free, relapse-free survival (GRFS), all patients. (D) Non-relapse mortality and relapse/progression, all patients. AlloHCT: allogeneic hematopoietic cell transplantation.

Table 2. Univariate analysis outcomes after allogeneic hematopoietic cell transplantation.1
Overall survival HR 95% CI P
Race/ethnicity
White Hispanic Other 2.13 0.69 1.07-4.21 0.21-2.31
Lines of therapy between CAR T and alloHCT 0 1 2+ 0.45 0.94 0.18-1.10 0.39-2.29
Disease status prior to alloHCT CR
PR SD/PD 2.74 1.56 1.32-5.70 0.70-3.47
0.068
0.064
0.030
Progression-free survival HR 95% CI P
Lines of therapy between CAR T and alloHCT 0 1 2+ 0.64 1.14 0.27-1.51 0.49-2.66
Disease status prior to alloHCT CR PR SD/PD 2.08 1.61 1.09-3.95 0.81-3.19
0.16
0.074
Non-relapse mortality HR 95% CI P
Race/ethnicity White Hispanic Other 2.20 0.46 0.90-5.35 0.06-3.37
Lines of therapy between CAR T and alloHCT 0 1 2+ 1.63 3.68 0.23-11.8 0.55-24.8
Disease status prior to alloHCT CR PR SD/PD 2.39 0.80 0.94-6.05 0.22-2.92
Conditioning regimen intensity MAC RIC/NMA 0.51 0.20-1.28
0.12
0.12
0.10
0.15
1Depicted are only variables significant at the 0.2 level in the univariable analysis that were significant in the multivariable model. A list of all variables analyzed is included in the Online Supplementary Appendix. AlloHCT: allogeneic hematopoietic cell transplantation; CAR T: chimeric antigen receptor T-cell therapy; CI: confidence interval; CR: complete response; HR: hazard ratio; MAC: myeloablative conditioning; MMUD: mismatched unrelated donor; MRD: matched related donor; MUD: matched unrelated donor; NMA/RIC: non-myeloablative/reduced intensity conditioning; NRM: non-relapse mortality; PD: progressive disease; PR: partial response; SD: stable disease.
Allogeneic hematopoietic cell transplantation outcomes
Median OS was 21 months (95% CI: 12 months – not reached [NR]), and 1-year OS was 59% (95% CI: 49-72) for all patients (Figure 2A). Median PFS was 10 months (95% CI: 5.1-17), and 1-year PFS was 45% (95% CI: 35-57) (Figure 2B). Median GRFS was 5.7 months (95% CI: 4.1–12), and 1year GRFS was 39% (95% CI: 29-51) (Figure 2C). The inci dence of NRM at 1-year was 22% (95% CI: 15-33) (Figure 2D). The incidence of progression/relapse at 1-year was 33% (95% CI: 24-45) (Figure 2D).
Univariable analysis of allogeneic hematopoietic cell transplantation outcomes
On univariable analysis, disease status prior to alloHCT was predictive of OS, with patients in CR at time of al loHCT experiencing improved OS compared to patients in PR or SD/PD (P=0.03; Table 2; Online Supplementary Table S6). There were no significant predictors of PFS, NRM, GRFS, or progression/relapse on univariate analysis (Table 2; Online Supplementary Table S6).
Multivariable analysis of allogeneic hematopoietic cell transplantation outcomes
On multivariable analysis (MVA) (Table 3), predictors of in ferior OS included ≥2 lines of therapy between CAR T and alloHCT (HR 3.6, 95% CI: 1.00-13.1; P=0.02 vs. 0 lines), dis ease status of PR at time of alloHCT (HR 4.32, 95% CI: 1.61–11.6; P=0.01 vs. CR), and Hispanic ethnicity (HR 3.6,
95% CI: 1.5-8.5; P=0.01 vs. White). Predictors of inferior PFS included disease status of PR at time of alloHCT (HR 2.6, 95% CI: 1.3-5.4; P=0.03 vs. CR) and ≥2 lines of therapy be tween CAR T and alloHCT (HR 3.1, 95% CI: 1.1-8.5; P=0.02 vs. 0 lines). There were no significant predictors of pro gression/relapse or GRFS on MVA. A higher risk of NRM was seen with patients who received ≥2 lines of therapy
Table 3. Multivariate analysis outcomes after allogeneic hematopoietic cell transplantation.1
Overall survival
HR 95% CI P
Race/ethnicity
White Hispanic Other 3.58 0.78 1.51–8.52 0.22–2.80
Lines of therapy between CAR T and alloHCT 0 1 ≥2 1.12 3.63 0.39–3.23 1.00–13.1
Disease status prior to alloHCT CR PR SD/PD 4.32 1.85 1.61–11.6 0.73–4.70
0.01
0.02
0.01
Progression-free survival HR 95% CI P
Lines of therapy between CAR T and alloHCT 0 1 ≥2 1.34 3.12 0.53–3.42 1.14–8.53
Disease status prior to alloHCT CR PR SD/PD 2.61 2.05 1.27–5.37 0.99–4.26
Race/ethnicity
0.02
0.03
HR 95% CI P
0.04
White Hispanic Other 2.51 0.32 1.04–6.08 0.04–2.76
Lines of therapy between CAR T and alloHCT 0 1 ≥2 4.78 17.0 0.59–38.3 2.23-129
Disease status prior to alloHCT
CR PR SD/PD 4.02 0.87 1.63–9.89 0.22–3.45
Conditioning regimen
MAC RIC/NMA 0.25 0.10– 0.63
<0.001
0.008
0.004
1Variables only included in the table above if P value was significant at the <0.05 level on the multivariate analysis. No variables were significant for progression/relapse or graft-versus-host disease-free relapse free survival (GRFS). AlloHCT: allogeneic hematopoietic cell transplantation; CR: complete response; MAC: myeloablative conditioning; MRD: matched related donor; MTX: methotrexate; MUD: matched unrelated donor; NMA/RIC: non-myeloablative/reduced intensity conditioning; PD: progressive disease; PR: partial response; SD: stable disease.
between CAR T and alloHCT (HR 17.0, 95% CI: 2.2-12.9; P<0.001 vs. 0 lines), those in PR at time of alloHCT (HR 4.0, 95% CI: 1.6-9.9; P=0.008 vs. CR) and those with Hispanic ethnicity (HR 2.51, 95% CI: 1.04-6.08, P=0.04 vs. White). Pa tients receiving RIC/NMA conditioning regimens had a lower risk of NRM (HR 0.25, 95% CI: 0.10-0.63; P=0.004) than those receiving MAC regimens.
Impact of disease status at time of allogeneic hematopoietic cell transplantation
As noted above, there was a significant association be tween disease status at time of alloHCT and the end points of PFS, OS, and NRM on MVA. There were no significant differences in incidence of progression/relapse or GRFS based on disease status. For patients in CR ver sus PR versus SD/PD at time of alloHCT, 1-year OS was es timated at 67% (95% CI: 54-84) versus 37% (95% CI: 20-68) versus 64% (95% CI: 45-90) respectively (Figure 3A), 1-year PFS was estimated at 59% (95% CI :45-76) ver
sus 25% (95% CI: 11-56) versus 34% (95% CI: 18-64) (Figure 3B) and 1-year GRFS was estimated at 48% (95% CI: 3566) versus 20% (95% CI: 7.8-51) versus 36% (95% CI: 2065) (not depicted). For patients in CR versus PR versus SD/PD at time of alloHCT, the 1-year incidence of NRM was 9.0% (95% CI: 3.5-23) versus 28% (95% CI: 14-55) and 9.8% (95% CI: 2.6-37) (Figure 3C) and the 1-year incidence of progression/relapse was 24% (95% CI: 14-41) versus 36% (95% CI: 19-65) versus 51% (95% CI: 33-80) (Figure 3D). Demographic and clinical characteristics of patients in CR versus PR versus SD/PD at the time of transplant were overall similar (Online Supplementary Table S7). However, patients with SD/PD at time of alloHCT were significantly more likely to received myeloablative conditioning (MAC) versus patients in CR/PR (42.9% vs. 16.4%; P=0.02). Pa tients in CR versus PR/SD/PD were more likely to have re ceived ≥2 lines of therapy between CAR-T and alloHCT (53% vs. 30%; P=0.03) (Online Supplementary Table S7). Twenty-three percent (n=5) of patients in PR at time of
Figure 3. Survival outcomes, progression/relapse and non-relapse mortality based on disease status at time of allogeneic hema topoietic cell transplantation. (A) Overall survival, by disease status at allogeneic hematopoietic cell transplantation (alloHCT). (B) Progression-free survival, by disease status at alloHCT. (C) Non-relapse mortality, by disease status at alloHCT. (D) Progres sion/relapse, by disease status at alloHCT.

alloHCT and 19% (n=4) of patients with SD/PD at time of alloHCT received zero lines of therapy between CART and alloHCT (vs. 0% of those in CR at time of alloHCT). Survival and outcome curves by lines of therapy are de picted in Online Supplementary Figure S3 and survival out comes by both disease status and number of lines of therapy in Online Supplementary Figures S4 and S5. Pa tients who received zero lines of intervening therapy had a relatively low incidence of NRM at 1-year (0 lines: 15%, 95% CI: 2.6-86; 1 line: 14%, 95% CI: 6.9-30%; ≥2 lines: 34%, 95% CI: 21-56), but a high incidence of progression/re lapse at 1-year (0 lines: 56%, 95% CI: 31-100; 1 line: 24%, 95% CI: 14-42; ≥2 lines: 39%, 95% CI: 25-61) (Online Sup plementary Figure S3). Patients in CR at time of alloHCT after ≥2 lines of therapy between CAR T and alloHCT had markedly better PFS and OS than those in PR or SD/PD after ≥2 lines (Online Supplementary Figures S4 and S5).
At time of last follow-up, forty patients had died. Causes of death in descending order of prevalence included: in fection (n=14, 35%), progressive disease (n=12, 30%), re spiratory failure (n=4, 10%) GvHD (n=3, 7.5%), hepatic sinusoidal obstruction syndrome/venoocclusive disease (SOS/VOD) (n=2; 5%), unknown (n=2, 5%), thrombotic microangiopathy (n=1, 2.5%), pulmonary embolism (n=1, 2.5%), and anaphylaxis from a local anesthetic agent (n=1, 2.5%). Three of the 14 patients who died of infection spe cifically died of SARS-CoV-2.
In our study, alloHCT after CAR T therapy produced dur able responses at 1-year with similar safety and out comes to what has been observed in both modern and historical series of alloHCT for LBCL.10,25-28 Longer followup is needed to evaluate whether these outcomes will be durable. Engraftment, incidence of aGvHD at 100 days, and cGvHD at 1 year were similar to prior studies of al loHCT for LBCL.10,25,26 There were no unexpected or pro longed issues with hematopoiesis and no signal of increased GvHD or other unexpected complications. Predictors of OS, PFS, and NRM on MVA included number of lines of therapy between CAR T and alloHCT and dis ease status at time of alloHCT. Patients receiving two or more lines of therapy between CAR T and alloHCT had significantly worse outcomes, particularly if they did not achieve a CR prior to alloHCT. The reasons for this are un known but could be related to the cumulative toxicities of multiple therapies given the incidence of NRM at 1-year was higher in this cohort. Moreover, needing multiple lines of therapy post-CAR T to achieve a response could be reflective of a more treatment resistant disease phe
notype less likely to achieve durable remission after al loHCT.
Patients not in CR at time of alloHCT also had poorer OS, PFS and NRM on MVA. Inferior PFS was primarily driven by higher NRM rather than progression/relapse. Similar to our findings, disease status prior to alloHCT in patients with LBCL has been previously shown to be predictive of OS, PFS and NRM.27,28 Since our cohort was small, these fi ndings need validation, and this merits further study. Patients with Hispanic race/ethnicity had worse NRM and OS than their White, Black, or Asian counterparts. This is in line with prior large studies that have shown worse OS in Hispanic compared to non-Hispanic white patients in those receiving MRD alloHCT despite adjusting for clinical variables, although these studies did not consider socio economic or cultural variables.29,30
For this cohort of patients, polatuzumab-based regimens had the highest overall and CR rates between CAR T and alloHCT across multiple lines, although the significance of this finding is limited by an absence of data on treat ment regimens received in patients with CAR T failure considered for an allograft who did not undergo trans plantation (i.e., lack of a denominator). Response rates described here do not reflect the true response rates for these regimens in the post-CAR T failure setting (which are lower13) but rather, are reflective of a treatment sen sitive population that is able to proceed to alloHCT. Re cent data has shown higher overall response rates and longer PFS in patients receiving polaBR compared to chemotherapy in the first line following CAR T failure;13 therefore, the introduction of a novel immunotherapy may be preferable to using chemotherapy alone when trying to achieve disease control prior to alloHCT in pa tients with CAR T failure. Of the recently approved novel agents, no patients in this cohort received selinexor and only one patient received tafasitamab or loncastuximab tesirine between CAR T and alloHCT, likely related in part to the recent nature of these approvals (June 2020 and onward).
There were several important limitations to this analysis. Firstly, this was a multicenter retrospective analysis that focused only on patients who received an allograft. The true denominator (patients who failed CAR T and war ranted consideration for an allograft) was not captured in this study and therefore the clinical interpretation of treatment practices between CAR T and alloHCT should be viewed as hypothesis-generating. Secondly, the median follow-up of this study was relatively short (15 months) and longer follow-up is needed to determine the durabil ity of these remissions. Next, given the nature of this analysis, there was inherent heterogeneity of institutional practices, including the grading of CRS and ICANS.17-20 Lastly, we did not include correlative data such as CAR Tcell persistence (at relapse or following treatment for re
lapse) that might inform different treatment options such as bispecific antibodies or other immunotherapeutic ap proaches.
In conclusion, 1-year alloHCT outcomes following CAR T failure in patients with LBCL mirrors the outcomes of LBCL with alloHCT more generally. More long-term fol low-up is needed to confirm the durable remission rate and curative potential of alloHCT after CAR T failure. Out comes were worse in patients not in CR at time of alloHCT and in those receiving two or more lines of therapy be tween CAR T and alloHCT. Based on our study, transplanteligible patients who achieve a CR after CAR T failure should be considered for alloHCT.
MS reports consulting, advisory boards, steering commit tees or data safety monitoring committees of Abbvie, Ge nentech, AstraZeneca, Sound Biologics, Pharmacyclics, Beigene, Bristol Myers Squibb, Morphosys/Incyte, TG Thera peutics, Innate Pharma, Kite Pharma, Adaptive Biotech nologies, Epizyme, Eli Lilly, Adaptimmune, Mustang Bio, Regeneron, Merck and Atara Biotherapeutics. He has re ceived research funding from Mustang Bio, Celgene, Bristol Myers Squibb, Pharmacyclics , Gilead, Genentech, AbbVie, TG Therapeutics, Beigene, AstraZeneca, Sunesis, Atara Bio therapeutics, Genmab. SA reports research funding from Tessa Therapeutics, SeaGen, Merck, Xencor and is an ad visory committee member of Sanofi, SeaGen, Tessa Thera peutics; consults for Novartis, Myeloid Therapeutics, Servier. CS has served as a paid consultant on advisory boards for Juno Therapeutics, Sanofi-Genzyme, Spectrum Pharmaceuticals, Novartis, Genmab, Precision Biosciences, Kite/a Gilead Company, Celgene/BMS , Gamida Cell, Karyo pharm Therapeutics and GSK. He has received research funds for clinical trials from Juno Therapeutics, Celgene/BMS, Bristol-Myers Squibb, Precision Biosciences, Actinium Pharmaceuticals and Sanofi-Genzyme. MP re ports honoraria from Abbvie, Astellas, Bristol-Myers Squibb, Celgene, Equilium, Incyte, Karyopharm, Kite/Gilead, Merck, Miltenyi Biotec, MorphoSys, Novartis, Nektar Therapeutics, Omeros, OrcaBio, Takeda, and VectivBio AG, Vor Biopharma. He serves on DSMBs for Cidara Therapeutics, Medigene, Sellas Life Sciences, and Servier, and the scientific advisory board of NexImmune. He has ownership interests in Ne xImmune and Omeros. He has received research support for clinical trials from Incyte, Kite/Gilead, Miltenyi Biotec, and Novartis. NS reports participation on advisory boards and/or consultancy for Kite Pharma, TG therapeutics, Mil tenyi Biotec, Lily, Epizyme, Legend, Incyte, Novartis, and Umoja; speakers bureau with Incyte. He has received re search funding and honoraria from both Lily and Miltenyi Biotec. UA has received research funding from Genocea Therapeutics and consulting fees from Artiva Biothera peutics. CJ reports consultiancy for Kite/Gilead, Novartis,
BMS/Celgene, Nkarta, Precision Biosciences, Lonza, blue bird bio, Abbvie, Epizyme, Ipsen. He has received research funding from Kite/Gilead, Pfizer. RJS reports consultancy for Neovii, GSL Begring, Bluesphere Bio, Cugene, Takeda, Jasper, Jazz Pharmaceuticals, Precision Biosciences, Rheos Therapeutics. He report board of directors of Kiadis, Ne therlands; data safety monitoring board of Juno Thera peutics/ BMS/Celgene USA. He serves on the Career Development Award Committee of Gilead, USA and board of directors of NMPD – Be the Match, USA. KK reports ad hoc consultanty for Janssen, Novartis, Genentech/Roche, Kite, Takeda, Iovance, United Healthcare, Avacta Thera peutics, Kiadis. SJ reports research funding and advisory board for Kite, Novartis, Juno and advisory board for Takeda and CRISPR. AK reports consultancy for Abbvie, Bei gene, Bristol-Myers Squibb, and Janssen. JC reports to be an advisory board member of Kite and Novartis. MJ reports consultancy/advisory for Kite/Gilead, BMS, Takeda, Novar tis. He has received research funding from Kite/Gilead and Incyte. FL reports scienti fic advisory role with Allogene, Amgen, Bluebird Bio, BMS/Celgene, Calibr, Cellular Bio medicine Group, GammaDelta Therapeutics, Iovance, Kite Pharma, Janssen, Legend Biotech, Novartis, Sana, Takeda, Wugen, Umoja. He has received research funding from Kite Pharma (Institutional), Allogene (Institutional), Novartis (In stitutional), BlueBird Bio (Institutional), BMS (Institutional), National Cancer Institute, Leukemia and Lymphoma So ciety Patents, Royalties, Other Intellectual Property: several patents held by the institution in my name (unlicensed) in the field of cellular immunotherapy. He reports a consulting role for Cowen, EcoR1, Emerging Therapy Solutions, Gerson Lehrman Group (GLG) and education or editorial activity for Aptitude Health, ASH, BioPharma Communications CARE Education, Clinical Care Options Oncology, Imedex, Society for Immunotherapy of Cancer. MM reports research funding from BMS, Epizyme, TG therapeutics, Beigene, Incyte/Mor phosys, honorarium from CTI, EUSA speakers' bureau of In cyte. TF reports honoraria from AbbVie, BMS, Celgene, Janssen, Pharmacyclics, SeattleGenetics, Takeda, ADC Therapeutics, Astrazeneca, Daiichi Sakyo, Karyopharm, MorphoSys, KITE; advisory board for AbbVie, ADC Thera peutics, Astrazeneca, Daiichi Sakyo, Karyopharm, KITE, MorphoSys. RJ reports research funding from Pharmacyc lics, Teneobio, MEI Pharma, LOXO Oncology, and TG Thera peutics; consultancy/advisory role for SecuraBio, Genentech, Adaptive, TG Therapeutics, Morphosys; speakers bureau for Epizyme, Pharmacyclics, Janssen, AbbVie, TG Therapeutics, SecuraBio, Beigene and Astra Zeneca. NG reports AbbVie consultancy and speakers bureau; consultancy for Adaptive Biotech, ADC Thera peutics, Beigene Bristol Myers; consultancy, research fund ing, speakers bureau for Squibb; research funding from Genentech; consultancy for Genmab; consultancy and speakers bureau for Gilead/Kite; consultancy for Incyte;
consultancy and speakers Bureau for Janssen; consultancy, research funding, speakers bureau for Pharmacyclics; con sultancy and research funding from T G Therapeautics. BD reports institutional research funding from Takeda, Janssen, Angiocrine, Pfizer, Poseida, MEI, Orcabio; consul tancy/advisorfor Jazz, Gamida Cell, MJH BioScience, Arivan Research; editorship of Wiley, HemOnc.Org; employment by Vanderbilt University Medical Center. OO reports consul tancy and advisory board for Pfizer, Kite, Gilead, AbbVie, Janssen, TGR therapeutics, Novartis, curio science; institu tion funding fom Kite, Pfizer, Daichi Sankyo; honoraria from Pfizer and Gilead. BH reports speakers bureau of Bristol Myers Squib and advisory board of ADC Therapeutics. VK reports research funding from Novartis, MEI, and Celgene/BMS. PR reports consultancy for Kite Pharma and Research funding from SeaGen and Genentech. FA reports he has provided consultancy for Genentech, Astrazeneca, Abbvie, Janssen, Pharmacyclics, Gilead sciences, Kite pharma, Celgene, Kary opharm, MEI Pharma, Verastem, In cyte, Beigene, Johnson and Johnson, Dava Oncology, BMS, Merck, Cardinal Health, ADCT therapeutics, Epizyme. YN re ports board of advisors of Affimed; research funding from Affimed, Astra-Zeneca, Novartis, BioSecura. MH reports: consultancy for Incyte Corporation, ADC Therapeutics, Pharmacyclics, Omeros, Verastem, Genmab, Morphosys, Kite, Novartis and Kadmon; speaker’s bureau of Sanofi
1. Schuster SJ, Bishop MR, Tam CS, et al. Tisagenlecleucel in adult relapsed or refractory diffuse large B-cell lymphoma. N Engl J Med. 2019;380(1):45-56.
2. Neelapu SS, Locke FL, Bartlett NL, et al. Axicabtagene ciloleucel CAR T-cell therapy in refractory large B-cell lymphoma. N Engl J Med. 2017;377(26):2531-2544.
3. Abramson JS, Palomba ML, Gordon LI, et al. Lisocabtagene maraleucel for patients with relapsed or refractory large B-cell lymphomas (TRANSCEND NHL 001): a multicentre seamless design study. Lancet. 2020;396(10254):839-852.
4. Locke FL, Ghobadi A, Jacobson CA, et al. Long-term safety and activity of axicabtagene ciloleucel in refractory large B-cell lymphoma (ZUMA-1): a single-arm, multicentre, phase 1-2 trial. Lancet Oncol. 2019;20(1):31-42.
5. Schuster SJ, Tam CS, Borchmann P, et al. Long-term clinical outcomes of tisagenlecleucel in patients with relapsed or refractory aggressive B-cell lymphomas (JULIET): a multicentre, open-label, single-arm, phase 2 study. Lancet Oncol. 2021;22(10):1403-1415.
6. Jacobson CA, Hunter BD, Redd R, et al. Axicabtagene ciloleucel in the non-trial setting: outcomes and correlates of response, resistance, and toxicity. J Clin Oncol. 2020;38(27):3095-3106.
7. Nastoupil LJ, Jain MD, Feng L, et al. Standard-of-care axicabtagene ciloleucel for relapsed or refractory large B-cell lymphoma: results from the US Lymphoma CAR T Consortium. J Clin Oncol. 2020;38(27):3119-3128.
8. Vercellino L, Di Blasi R, Kanoun S, et al. Predictive factors of early progression after CAR T-cell therapy in relapsed/refractory
Genzyme, AstraZeneca, BeiGene, and ADC Therapeutics. AH reports research funding and consultancy from Bristol Myers Squibb, Genentech, Merck and Seattle Genetics; re search funding from KiTE Pharma, Gilead Sciences, Astra Zeneca, ADC Therapeutics; research funding and consultancy for Karyopharm, Takeda, Tubulis, Regeneron and Genmab. All other authors have no conflicts of interest to disclose.
JZ, AH, and MH conceived and designed the study and wrote the manuscript. AS completed statistical analysis. All authors collected clinical data, interpreted data, ap proved the manuscript and are accountable for all aspects of the work.
AFH was supported by the National Cancer Institute of the National Institutes of Health P50 CA107399-11A1, the Emmet and Toni Stephenson Leukemia and Lymphoma Society Scholar Award, and the Lymphoma Research Foundation Larry and Denise Mason Clinical Investigator Career Devel opment Award.
For original data, please contact the corresponding author.
diffuse large B-cell lymphoma. Blood Adv. 2020;4(22):5607-5615.
9. Spiegel JY, Dahiya S, Jain MD, et al. Outcomes of patients with large B-cell lymphoma progressing after axicabtagene ciloleucel therapy. Blood. 2021;137(13):1832-1835.
10. Dreger P, Sureda A, Ahn KW, et al. PTCy-based haploidentical vs matched related or unrelated donor reduced-intensity conditioning transplant for DLBCL. Blood Adv. 2019;3(3):360-369.
11. Shadman M, Gauthier J, Hay KA, et al. Safety of allogeneic hematopoietic cell transplant in adults after CD19-targeted CAR T-cell therapy. Blood Adv. 2019;3(20):3062-3069.
12. Spiegel JY, Dahiya S, Jain MD, et al. Outcomes of patients with large B-cell lymphoma progressing after axicabtagene ciloleucel. Blood. 2021;137(13):1832-1835.
13. Zurko JC, Epperla N, Nizamuddin I, et al. Outcomes and treatment patterns in patients with aggressive B-cell lymphoma after failure of anti-CD19 CAR T-cell therapy. Blood. 2021;138(Suppl 1):S884.
14. Caimi PF, Ai WZ, Alderuccio JP, et al. Efficacy and safety of loncastuximab tesirine (ADCT-402) in relapsed/refractory diffuse large B-cell lymphoma. Blood. 2020;136(Suppl 1):S35-37.
15. Salles G, Duell J, González Barca E, et al. Tafasitamab plus lenalidomide in relapsed or refractory diffuse large B-cell lymphoma (L-MIND): a multicentre, prospective, single-arm, phase 2 study. Lancet Oncol. 2020;21(7):978-988.
16. Sehn LH, Herrera AF, Flowers CR, et al. Polatuzumab vedotin in relapsed or refractory diffuse large B-cell lymphoma. J Clin Oncol. 2020;38(2):155-165.
17. Lee DW, Santomasso BD, Locke FL, et al. ASTCT consensus grading for cytokine release syndrome and neurologic toxicity asociated with immune effector cells. Biol Blood Marrow Transplant. 2019;25(4):625-638.
18. Lee DW, Gardner R, Porter DL, et al. Current concepts in the diagnosis and management of cytokine release syndrome. Blood. 2014;124(2):188-195.
19. Neelapu SS, Tummala S, Kebriaei P, et al. Chimeric antigen receptor T-cell therapy - assessment and management of toxicities. Nat Rev Clin Oncol. 2018;15(1):47-62.
20. Porter D, Frey N, Wood PA, Weng Y, Grupp SA. Grading of cytokine release syndrome associated with the CAR T cell therapy tisagenlecleucel. J Hematol Oncol. 2018;11(1):35.
21. Cheson BD, Fisher RI, Barrington SF, et al. Recommendations for initial evaluation, staging, and response assessment of Hodgkin and non-Hodgkin lymphoma: the Lugano classification. J Clin Oncol. 2014;32(27):3059-3068.
22. Harris AC, Young R, Devine S, et al. International, multicenter standardization of acute graft-versus-host disease clinical data collection: a report from the Mount Sinai Acute GvHD International Consortium. Biol Blood Marrow Transplant. 2016;22(1):4-10.
23. Jagasia MH, Greinix HT, Arora M, et al. National Institutes of Health Consensus Development Project on criteria for clinical trials in chronic graft-versus-host disease: I. The 2014 Diagnosis and Staging Working Group report. Biol Blood Marrow Transplant. 2015;21(3):389-401.e1.
24. Kharfan-Dabaja MA, Kumar A, Ayala E, et al. Standardizing definitions of hematopoietic recovery, graft rejection, graft
failure, poor graft function, and donor chimerism in allogeneic hematopoietic cell transplantation: a report on behalf of the American Society for Transplantation and Cellular Therapy. Transplant Cell Ther. 2021;27(8):642-649.
25. Hamadani M, Gopal AK, Pasquini M, et al. Allogeneic transplant and CAR-T therapy after autologous transplant failure in DLBCL: a noncomparative cohort analysis. Blood Adv. 2022;6(2):486-494.
26. Epperla N, Ahn KW, Khanal M, et al. Impact of reduced-intensity conditioning regimens on outcomes in diffuse large B cell lymphoma undergoing allogeneic transplantation. Transplant Cell Ther. 2021;27(1):58-66.
27. Bacher U, Klyuchnikov E, Le-Rademacher J, et al. Conditioning regimens for allotransplants for diffuse large B-cell lymphoma: myeloablative or reduced intensity? Blood. 2012;120(20):4256-4262.
28. Fenske TS, Ahn KW, Graff TM, et al. Allogeneic transplantation provides durable remission in a subset of DLBCL patients relapsing after autologous transplantation. Br J Haematol. 2016;174(2):235-248.
29. Serna DS, Lee SJ, Zhang MJ, et al. Trends in survival rates after allogeneic hematopoietic stem-cell transplantation for acute and chronic leukemia by ethnicity in the United States and Canada. J Clin Oncol. 2003;21(20):3754-3760.
30. Baker KS, Loberiza FR, Jr., Yu H, et al. Outcome of ethnic minorities with acute or chronic leukemia treated with hematopoietic stem-cell transplantation in the United States. J Clin Oncol. 2005;23(28):7032-7042.
Mi Kwon,1,2* Gloria Iacoboni,3,4* Juan Luis Reguera,5 Lucía López Corral,6 Rafael Hernani Morales,7 Valentín Ortiz-Maldonado,8 Manuel Guerreiro,9 Ana Carolina Caballero,10 María Luisa Guerra Domínguez,11 Jose Maria Sanchez Pina,12 Alberto Mussetti,13 Juan Manuel Sancho,14 Mariana Bastos-Oreiro,1,2 Eva Catala,3,4 Javier Delgado,5 Hugo Luzardo Henriquez,11 Jaime Sanz,9 María Calbacho,12 Rebeca Bailén,1,2 Cecilia Carpio,3,4 Jose Maria Ribera,14 Anna Sureda,13 Javier Briones,10 Juan Carlos Hernandez-Boluda,7 Nuria Martínez Cebrián,8 Jose Luis Diez Martin,1,2,15 Alejandro Martín6 and Pere Barba3,4 on behalf of GETH-TC (Spanish Group of Stem Cell Transplantation and Cell Therapy) and GELTAMO (Spanish Group of Lymphoma and Autologous Stem Cell Transplantation)
1Department of Hematology, Hospital General Universitario Gregorio Marañón, Madrid; 2Instituto de Investigación Sanitaria Gregorio Marañón, Madrid; 3Department of Hematology, Vall d’Hebron University Hospital, Experimental Hematology, Vall d’Hebron Institute of Oncology (VHIO), Vall d’Hebron Barcelona Hospital Campus, Barcelona; 4Department of Medicine, Universitat Autonoma de Barcelona, Bellaterra; 5Department of Hematology, Hospital Universitario Virgen del Rocío, Instituto de Biomedicina de Sevilla, Sevilla; 6Department of Hematology, Hospital Clínico Universitario de Salamanca, IBSAL, Salamanca; 7Department of Hematology, Hospital Clínico Universitario de Valencia, Instituto de Investigación Sanitaria INCLIVA, Valencia; 8Department of Hematology, Hospital Clínic, Barcelona; 9Department of Hematology, Hospital Universitario y Politécnico La Fe, Valencia; 10Department of Hematology, Hospital de la Santa Creu i Sant Pau, Barcelona; 11Department of Hematology, Hospital Universitario de Gran Canaria Doctor Negrín, Las Palmas de Gran Canaria; 12Department of Hematology, Hospital Universitario 12 de Octubre, Madrid; 13Department of Hematology, Hospital Duran i Reynals, Instituto Catalán de Oncología, Barcelona; 14Department of Hematology, Hospital Universitari Germans Trias i Pujol, Instituto Catalán de Oncología, Josep Carreras Research Institute, Badalona and 15Universidad Complutense de Madrid, Madrid, Spain
*MK and GI contributed equally as co-first authors.
Correspondence: M. Kwon mi.kwon@salud.madrid.org
Received: February 7, 2022.
Accepted: June 17, 2022.
Prepublished: June 30, 2022.
https://doi.org/10.3324/haematol.2022.280805
©2023 Ferrata Storti Foundation Published under a CC BY-NC license
Axicabtagene ciloleucel (axi-cel) and tisagenlecleucel (tisa-cel) are CD19-targeted chimeric antigen receptor (CAR) T cells approved for relapsed/refractory (R/R) large B-cell lymphoma (LBCL). We performed a retrospective study to evaluate safety and efficacy of axi-cel and tisa-cel outside the setting of a clinical trial. Data from consecutive patients with R/R LBCL who underwent apheresis for axi-cel or tisa-cel were retrospectively collected from 12 Spanish centers. A total of 307 patients underwent apheresis for axi-cel (n=152) and tisa-cel (n=155) from November 2018 to August 2021, of which 261 (85%) received a CAR T infusion (88% and 82%, respectively). Median time from apheresis to infusion was 41 days for axi-cel and 52 days for tisa-cel (P=0.006). None of the baseline characteristics were significantly different between both cohorts. Both cytokine release syndrome and neurologic events (NE) were more frequent in the axi-cel group (88% vs 73%, P=0.003, and 42% vs. 16%, P<0.001, respectively). Infections in the first 6 months post-infusion were also more com mon in patients treated with axi-cel (38% vs. 25%, P=0.033). Non-relapse mortality was not significantly different between the axi-cel and tisa-cel groups (7% and 4%, respectively, P=0.298). With a median follow-up of 9.2 months, median PFS and OS were 5.9 and 3 months, and 13.9 and 11.2 months for axi-cel and tisa-cel, respectively. The 12-month PFS and OS for axi-cel and tisa-cel were 41% and 33% (P=0.195), 51% and 47% (P=0.191), respectively. Factors associated with lower OS in the multivariate analysis were increased lactate dehydrogenase, ECOG ≥2 and progressive disease before lympho depletion. Safety and efficacy results in our real-world experience were comparable with those reported in the pivotal trials. Patients treated with axi-cel experienced more toxicity but similar non-relapse mortality compared with those re ceiving tisa-cel. Efficacy was not significantly different between both products.
Patients with relapsed or refractory (R/R) large B-cell lym phoma (LBCL) after two lines of therapy have a very poor outcome with currently available conventional therapies. Only a small proportion of patients will eventually achieve prolonged disease-free survival with subsequent treat ments.1,2 Axicabtagene ciloleucel (axi-cel) and tisagenle cleucel (tisa-cel) are CD19-targeted chimeric antigen receptors (CAR) T cells commercially available in Europe for R/R LBCL after two or more lines of systemic therapy. In the registration ZUMA-1 trial, 58% of patients who re ceived axi-cel achieved a complete response (CR), with a progression-free survival (PFS) at 24 months of 36%.3,4 The pivotal JULIET trial with tisa-cel showed a CR rate of 40%, with a PFS at 24 months of 33%.5,6 Several joint efforts among United States’ centers have shown similar overall real-world results to those obtained in the pivotal trials.7–9 However, European data is heterogenous, with 3-month CR rates ranging from 37% to 21% for axi-cel and 29% to 17% for tisa-cel.10,11,12,13,14 These differences may be explained by multiple factors including patient selection, countryspecific administrative issues and manufacturing turn around time, among others. Taking into account the absence of randomized trials comparing both products and the significant differences in patient inclusion criteria and trial design that preclude direct comparisons be tween the ZUMA-1 and JULIET results, mainly regarding patient selection and bridging strategies, there is scarce data available to guide product selection.15,16 We performed a multicenter, retrospective study to compare efficacy and safety results of axi-cel and tisa-cel in the real-world set ting.
Data from all consecutive patients who underwent apher esis for axi-cel or tisa-cel between November 2018 and August 2021 were retrospectively collected from elec tronical medical records at 12 Spanish institutions. Three centers contributed with patients treated only with tisacel (n=13). All treatments were approved after review of patients’ diagnoses and medical charts by a national ex pert panel of the Ministry of Health. Primary mediastinal lymphoma cases were excluded from this study since they were treated exclusively with axi-cel. Selection of axi-cel or tisa-cel did not follow predefined uniform criteria and was performed according to each centers’ guidelines. Pa tients included for safety and response analysis had a minimum post-infusion follow-up of 30 days and at least one imaging response assessment. Survival outcomes were assessed in all patients who underwent leukapher
esis (intention-to-treat analysis, ITT) and in patients who received a CAR T-cell infusion. All patients provided in formed consent for CAR T-cell therapy. The study was ap proved by the ethical committee of the Hospital General Universitario Gregorio Marañón and conducted in accord ance with the Declaration of Helsinki.
Patients received lymphodepleting chemotherapy with fludarabine (30 mg/m2 for axi-cel and 25 mg/m2 for tisacel) and cyclophosphamide (500 mg/m2 for axi-cel and 250 mg/m2 for tisa-cel) for 3 consecutive days. After 2 to 4 days of washout, patients received the CAR T-cell infu sion in a hospitalization regimen to guarantee a close monitoring of adverse events. Grading of cytokine release syndrome (CRS) and immune effector cell-associated neurotoxicity syndrome (ICANS) followed the American Society for Transplantation and Cellular Therapy (ASTCT) recommendations.17 Management of CRS and ICANS fol lowed local institutional guidelines, based on national guidelines.18 Briefly, tocilizumab was used for the treat ment of CRS grade ≥2, but considered in cases of persist ent CRS grade 1. Steroids were the second line for CRS if two to three doses of tocilizumab were unsuccessful. For ICANS, steroids were the first line of treatment (dexa methasone 10 mg 4 times each day [QID]), started at grade ≥2 and considered for cases of persistent grade 1. Severe ICANS was treated with anakinra or siltuximab as per local protocol. Tocilizumab was only considered in cases of concurrent CRS. For the reporting of other adverse events, Common Terminology Criteria for Adverse Events (CTCAE) version 5.0 was used. Infectious complications were treated following the Spanish consensus guidelines.19 In fection severity was classified as mild, moderate, severe, life-threatening, or fatal as previously established.20 All re ported cytopenias were recorded from salvage therapynaïve patients. All patients underwent a baseline positron emission tomography and computed tomography (PET/CT) scan immediately before the start of LD chemotherapy (after the last bridging regimen). Response assessment after CAR T-cell therapy was performed at 1, 3, 6, 12 and 18 months post-infusion and graded according to the 2014 Lugano recommendations.21
Overall response rate (ORR) was defined as the percen tage of patients who achieved a partial response (PR) or CR after CAR T-cell therapy. Progression-free survival (PFS) was defined as the time from apheresis (ITT popu lation) or CAR T-cell infusion until relapse, progression or death from any cause. Overall survival (OS) was defined as the time from apheresis (ITT) or CAR T-cell infusion until death of any cause. Duration of response (DOR) was defined as the time from CR or PR to relapse, progression
or death from any cause, whichever occurred first. Nonrelapse mortality (NRM) was defined as any death event not associated to relapse/progression since leukapheresis to last follow-up and computed as time-to-event out come.
Descriptive statistics included mean, standard deviation, median, range and interquartile range (IQR) for continuous variables, and percentages for categorical variables. Fisher’s exact test or Chi-squared test was used to evalu ate the association between two categorical variables. Comparability of the two groups (axi-cel and tisa-cel) for the main prognostic features was tested with t test or Mann-Whitney test. Kaplan-Meier method was used to es timate PFS and OS rates, including 95% confidence inter val (95% CI), and log-rank test was used to evaluate the difference in PFS or OS between patient groups. Cox pro portional hazards regression models were used for uni variable and multivariable analysis to include significant covariates. Variables with at least marginal association with PFS/OS from the univariable analysis (P<0.2) were in cluded in the initial multivariable model. A univariable and multivariable logistic regression model was performed to study the association with CRS and ICANS grade ≥3. A P value <0.05 was considered statistically significant. The data analyses were carried out using SPSS (IBM, SPSS Statistics for Windows, Version 25.0. Armonk, NY, USA).
Between November 2018 and August 2021, 307 patients with R/R LBCL underwent apheresis for axi-cel (n=152) and tisa-cel (n=155) in 12 centers, of which 261 (85%) re ceived a CAR T-cell infusion (n=134, 88% and n=127, 82%, respectively). The main reason for not receiving an infu sion was progressive disease in both groups (n=12, 66% in axi-cel and n=25, 89% in tisa-cel) (Online Supplementary Figure S1). Median time from apheresis to infusion was 41 days (interquartile range [IQR], 36-56) for axi-cel and 52 days (IQR, 46-63) for tisa-cel (P=0.006). Patient and disease characteristics at apheresis are shown in Table 1. Median age was 61 years (range, 23-79). The most frequent subtype was diffuse LBCL NOS (70%), followed by high grade B-cell lymphoma (15%) and trans formed follicular lymphoma (14%). Patient and disease characteristics at apheresis were similar for the axi-cel and tisa-cel cohorts (Table 1). Infused patients´ character istics are detailed in the Online Supplementray Table S1 Of the 261 infused patients, 210 (80%) received bridging therapy (BT) before infusion, chemotherapy-based in most cases (n=127, 60%; Online Supplementary Table S2A).
The proportion of patients who received BT before axi-cel and tisa-cel was similar (78% vs. 83%, respectively). Thirty (14%) patients achieved a response to BT (21 PR, 9 CR), most of them after chemotherapy (Online Supplementary Table S2B). Baseline characteristics at the time of lym phodepletion (LD) therapy were similar between patients treated with axi-cel and tisa-cel (Online Supplementary Table S1). Median follow-up from infusion for patients re ceiving axi-cel and tisa-cel was 8.2 months (IQR, 6-13.7) and 12.4 months (IQR, 6-20), respectively.
Cytokine release syndrome and immune effector cellassociated neurotoxicity syndrome
For all infused patients, any grade of CRS and ICANS oc curred in 211 (81%) and 78 (30%) patients. Median time to onset was 2 days for CRS (range, 0-10) and 7 days for ICANS (range, 2-65) (Table 2).
When comparing axi-cel and tisa-cel toxicity, frequency of all grade CRS but not severe (grade ≥3) CRS was higher in the axi-cel group (88% vs. 73%, P=0.003), (8% vs. 6%, P=0.637). Use of tocilizumab and corticosteroids for CRS was more common in axi-cel treated patients (Table 2).
Any grade and grade ≥3 ICANS were significantly more fre quent in the axi-cel group (42% vs. 16%, P<0.001, and 18% vs. 5%, P=0.001, respectively). Corticosteroids, siltuximab and tocilizumab for ICANS were also used more often in the axi-cel group (Table 2). There were no differences in times of onset and duration of CRS and ICANS between axi-cel ant tisa-cel (Table 2; Online Supplementary Figure S2). Macrophage activation syndrome (MAS) occurred in four patients, one treated with axi-cel and three with tisacel (one of them fatal).22
In the multivariable analysis, Eastern Cooperative Oncol ogy Group (ECOG) performance status (PS) score ≥2 at start of LD was the only factor associated with an in creased risk of CRS grade ≥3 (P=0.046). The use of axi-cel (P=0.027) and having received >2 prior lines of therapy (P=0.015) were associated with an increased risk of ICANS grade ≥3 (Table 3; Online Supplementary Table S3).
Among the 220 evaluable patients, neutropenia and thrombocytopenia grade 3-4 at 1 month after infusion were reported in 53 (24%) and 95 (43%) patients, respect ively. At 3 months post-infusion, of the 123 evaluable pa tients, these cytopenias persisted in 12 (10%) and 18 (15%), respectively. There were no significant differences in the rate of persistent cytopenias between patients treated with axi-cel and tisa-cel (Table 2). Eighty-three (32%) infused patients presented 91 infec tious episodes during the first 6 months after CAR T-cell infusion, mainly bacterial (n=54, 59%) followed by viral (n=31, 34%) and fungal (n=6, 7%). Six patients presented
human herpes virus 6 reactivation, all of them after axicel infusion. Two patients presented a SARS-CoV-2 infec tion during the first 6 months post-infusion, one of them
fatal. Of note, three additional patients died from SARSCoV-2 infection after 6 months ( Online Supplementary Table S4). In general, infections in the first 6 months post-
Table 1. Baseline patients and disease characteristics at apheresis.
Total ITT N=307
Axi-cel ITT N=152
Tisa-cel ITT N=155 P
Age in years, median (range) 61 (23-79) 59 (29-79) 62 (23-76) 0.078
Sex, N (%) Male 186 (61) 89 (59) 97 (63) 0.486
HCT-CI, N (%) 0-2 3 or more Not available
236 (77) 66 (21) 5 (2)
121 (80) 30 (19) 1 (1)
115 (74) 36 (23) 4 (3)
0.486
ECOG, N (%) 0-1 2-3 288 (94) 19 (6) 144 (95) 8 (5) 144 (93) 11 (7) 0.637
Histology, N (%)
DLBCL, NOS DH/TH HGBCL Transformed FL Transformed from other indolent
Cell of origin, N (%) GCB Non-GCB Unknown
214 (70) 45 (15) 43 (14) 5 (1)
173 (57) 90 (29) 44 (14)
114 (75) 20 (13) 17 (11) 1 (1)
84 (55) 41 (27) 27 (18)
100 (64) 25 (16) 26 (17) 4 (3)
89 (57) 49 (32) 17 (11)
0.178
0.697
Disease stage, N (%) I-II III-IV 73 (24) 234 (76) 35 (23) 117 (77) 38 (25) 117 (75) 0.789
R-IPI score, N (%) 0-2 3-5 NA
143 (46) 150 (49) 14 (5)
73 (48) 76 (50) 3 (2)
70 (45) 74 (48) 11 (7)
0.648 0.732
Bulky disease*, N (%) 75 (24) 40 (26) 35 (23) 0.688
Primary refractory, N (%) 178 (58) 90 (59) 88 (57) 0.729
Previous lines, median (range) 2 (2-7) 2 (2-6) 2 (2-7) 0.124
Prior ASCT, N (%) 88 (29) 45 (30) 43 (28) 0.801
Prior Allo-SCT, N (%) 3 (1) 1 (1) 2 (1) 1.000
Disease status, N (%)
Progressive disease Stable disease Partial response Complete response
276 (90) 21 (6) 9 (3) 1 (1)
138 (91) 10 (7) 4 (3) 0 (0)
138 (89) 11 (7) 5 (3) 1 (1)
1.000
LDH >ULN, N (%) 185 (60) 84 (54) 101 (66) 0.385
CRP >ULN, N (%) 154 (50) 62 (41) 92 (59) 0.105
Lymphocytes x103/μL, median (range) 0.9 (0.1-11) 0.88 (0.1-6.3) 0.9 (0.1-11.0) 0.711
Platelets x103/μL, median (range) 157 (11-1,000) 165 (27-1,000) 146 (11-523) 0.119
ITT: intention-to-treat; HCT-CI: hematopoietic cell transplantation-comorbidity index; DLBCL NOS: diffuse large B-cell lymphoma not otherwise specified; HGBCL: high grade B-cell lymphoma; FL: follicular lymphoma; GCB: germinal center B-cell like; R-IPI: revised international prognostic index; NA: not available; ASCT: autologous stem cell transplantation; LDH: lactate dehydrogenase; CRP: c-reactive protein; >ULN: upper limit of normal. *Bulky disease (>7 cm).
infusion were more frequent in patients treated with axicel than with tisa-cel (Table 2; Online Supplementary Table S4).
Hospitalization, intensive care unit admission and nonrelapse mortality
Median length of hospitalization was 22 days (IQR, 20-29) for the axi-cel cohort and 18 days (IQR, 14-22) for the tisacel cohort (P<0.001). Admission to the intensive care unit (ICU) was needed in 22% of patients in the axi-cel group and 15% in the tisa-cel group (P=0.154) with a median stay of 4 days (IQR, 2-7) and 3 days (IQR, 1-5), respectively (P<0.001).
Table 2. Safety analysis of infused patients.
All infused patients
N=261
Non-relapse mortality for all infused patients was 5% (Table 2) and similar between both groups (P=0.298). In the axi-cel cohort, nine patients (7%) died due to infection (2 bacterial, 1 SARS-CoV-2, 1 fungal, 1 not specified), ICANS (2), CRS (1) and tumor lysis syndrome (1). In the tisa-cel group, five patients (4%) died due to SARS-CoV-2 infection (2), CRS (1), ICANS (1) and MAS (1) (Online Supplementary Figure S3).
Among all infused patients, the ORR was 57% (38% CR, 19% PR) (Online Supplementary Figure S4). Thirteen (17%)
Axi-cel infused N=134
Tisa-cel infused N=127 P
CRS, N (%) CRS grade ≥3, N (%) 211 (81) 19 (7) 118 (88) 11 (8) 93 (73) 8 (6) 0.003 0.637
CRS onset day, median (range) 2 (0-10) 3 (0-10) 2 (0-10) 0.154
CRS duration days, median (range) 5 (1-35) 5 (1-15) 5 (1-35) 0.574
CRS treatment, N (%) Tocilizumab Steroids 120 (46) 52 (20) 81 (60) 41 (31) 39 (31) 11 (9) <0.001 <0.001
ICANS, N (%) ICANS grade ≥3, N (%) 78 (30) 30 (11) 57 (42) 24 (18) 21 (16) 6 (5) <0.001 0.001
ICANS onset day, median (range) 7 (2-65) 7 (2-65) 6 (2-35) 0.214 ICANS duration days, median (range) 4.5 (1-83) 4 (1-44) 7 (1-83) 0.119
ICANS treatment, N (%) Tocilizumab Steroids Anakinra Siltuximab
2 (1) 65 (25) 15 (6) 14 (5)
2 (1) 48 (36) 12 (9) 11 (8)
0 (0) 17 (13) 3 (2) 3 (2)
<0.001 <0.001 <0.001 <0.001 Hospitalization days, median (IQR) 20 (17-27) 22 (20-29) 18 (14-22) <0.001
ICU admission, N (%) median stay, days (IQR) 49 (18) 3 (2-7) 30 (22) 4 (2-7) 19 (15) 3 (1-5) 0.154 <0.001
Infections during first 6 months, N (%) 83 (32) 51 (38) 32 (25) 0.033
Persistent cytopenias by day 28, N (%)* Neutropenia grade 3-4 Thrombocytopenia grade 3-4 53 (24) 95 (43) 31 (28) 49 (47) 22 (19) 46 (40) 0.082 0.278
Persistent cytopenias by day 90, N (%)* Neutropenia grade 3-4 Thrombocytopenia grade 3-4 12 (10) 18 (15) 6 (10) 10 (16) 6 (10) 8 (13) 1.000 0.799
Persistent cytopenias by day 180, N (%)*
Neutropenia grade 3-4 Thrombocytopenia grade 3-4 2 (3) 4 (6) 1 (3) 3 (8) 1 (3) 1 (3) 1.000 0.625
Non-relapse mortality, N (%) 13 (5) 9 (7) 4 (3) 0.298
CRS: cytokine release syndrome; ICANS: immune effector cell-associated neurotoxicity syndrome; ICU: intensive care unit: *Evaluable patients: 220 at day 28, 123 at day 90, 66 at day 180.
patients in PR at 1 month converted to CR (10 at day 90 and 3 at day 180) and four (13%) patients in stable disease at 1 month achieved CR (3 at day 180 and 1 at 1 year). Median duration of response was 14.1 months (95% CI: 5.8 to not reached) for all infused patients and was not reached for those who achieved CR. In the axi-cel cohort, ORR was 60% (CR 42% and PR 18%) with a median DOR of 12.5 months (95% CI: 5.7 to not reached). In the tisa-cel group, ORR was 54% (n=68) (34% CR and 19% PR), with a median DOR of 14.1 months (95% CI: 2.5 to not reached). Median DOR was not significantly different between both cohorts (P=0.494).
Progression-free survival and overall survival In the ITT analysis, with a median follow-up of 9.2 months (IQR, 5-15), median PFS and OS were 4.8 months (95% CI: 4.5-5.6) and 11.7 months (95% CI: 10.2-14.3), respectively. The estimated 12-month PFS and OS were 34% (95% CI: 27-39) and 48% (95% CI: 41-54), respectively (Figure 1). Re garding each cohort, the 12-month PFS and OS for pa tients intended to be treated with axi-cel and tisa-cel were 41% and 27% (P=0.091), 50% and 45% (P=0.07) (On line Supplementary Figure S5), respectively.
Focusing on infused patients with axi-cel or tisa-cel, median PFS was 5.9 months and 3 months, respectively, and median OS was 13.9 months and 11.2 months, re spectively (Figure 1). The estimated 12-month PFS was 41% and 33% (P=0.195), and 12-month OS was 51% and
47% (P=0.191), respectively. Regarding factors with an impact on efficacy, an increased lactate dehydrogenase (LDH) before apheresis (P=0.003), ECOG PS ≥2 before LD therapy (P<0.001) and progressive disease before LD therapy (P=0.018) were associated with a worse PFS in the multivariable analysis (Table 4; Figure 2; Online Supplementary Table S3). Factors independently associated with a worse OS included high LDH at apher esis, (P=0.023), ECOG PS ≥2 at apheresis (P=0.021), pro gressive disease at apheresis (P=0.018) and ECOG PS ≥2 before LD therapy (P=0.001). Patients with very high LDH elevation (>2x upper limit of normal [ULN]) showed worse PFS (hazard ration [HR] 2.5, P <0.001) and OS (HR 2.1, P<0.001) than patients with mild (1-2x ULN) increase. Noteworthy, 15 of the 19 patients with EOCG PS > or =2 at the time of apheresis died, 13 due to disease progression (8 of them did not receive the CAR T infusion) and two due to toxicity.
We report herein one of the largest European cohort of patients with R/R aggressive B-cell lymphoma treated with commercial CAR T cells, including a detailed com parison between axi-cel and tisa-cel, which has been very little addressed in previous real-world studies.23,24,25,26
In our study, patient and disease characteristics at apher
Table 3. Factors significantly associated with cytokine release syndrome grade ≥3 and immune effector cell-associated neurotoxicity syndrome grade ≥3 in the logistic regression analysis of axicabtagene ciloleucel and tisagenlecleucel–treated patients.
CRS grade 3
OR (95% CI) P
ECOG PS at LD, 2-3 vs. 0-1 3.528 (1.021-12.186) 0.046
R-IPI at LD, 0-2 vs. >2 1.530 (0.419-5.590) 0.520
LDH at LD, >UNL vs. normal 2.978 (0.580-15.284) 0.191
ICANS grade 3
OR (95% CI) P
CAR T type axi-cel vs. tisa-cel 3.545 (1.156-10.870) 0.027
Number prior lines, >2 vs. 2 2.000 (1.150-3.503) 0.015
ECOG PS at LD, 2-3 vs. 0-1 1.812 (0.418-7.878) 0.427
R-IPI at LD, 0-2 vs. >2 2.414 (0.868-6.711) 0.091
OR: odds ratio; CRS: cytokine release syndrome; ECOG PS: Eastern Cooperative Group performance status; LD: lymphodepletion; R-IPI: revised international prognostic index; LDH: lactate dehydrogenase; ULN: upper limit of normal; ICANS: Immune effector cell-associated neurotoxicity syndrome; CI: confidence interval.
esis were similar between both cohorts, suggesting that CAR T selection was likely driven by other factors includ ing logistical aspects, manufacturing slot availability and expected turnaround time. More patients in the axi-cel group received the CAR T infusion, probably influenced by the shorter turnaround time. Although other possible un intended bias in product selection are yet to be identified, the fact that both populations were comparable, provides the opportunity to compare outcomes after treatment with axi-cel and tisa-cel from patients with similar fea tures.
In terms of toxicity, rates of CRS and ICANS were lower than the pivotal trials and in line with other contemporary real-world studies.3,5,7,9 A better understanding of these ad verse events together with an earlier administration of specific treatments (i.e., tocilizumab, steroids) could ex plain these lower rates. Notably, CRS and, especially, ICANS were more frequent and severe in patients treated
with axi-cel compared with tisa-cel. Accordingly, the use of tocilizumab, corticosteroids, and siltuximab was also more common in the former group. Patients who received axi-cel presented a longer median hospitalization, an in creased infection rate and a higher likelihood of being transferred to the ICU. Since prolonged neutropenia was similar in both cohorts, potential reasons which could jus tify the increased infection rate observed with axi-cel could be the rate of CRS, ICANS and the higher use of im munosuppressive therapies for these adverse events.27 Non-relapse mortality was similar to previous real-world studies in patients with R/R LBCL.7–9 Noteworthy, four pa tients died of SARS-CoV-2 infection, mostly in the early months of the pandemic and before the wide implemen tation of vaccines.27,28 Despite these relatively low numbers, our study highlights the significant morbidity burden of CAR T-cell therapies and the potential associ ated costs derived from health resource utilization which
Figure 1. Progression-free survival and overal survival of patients treated with axicabtagene ciloleucel and tisagenlecleucel. (A) Progression-free survival (PFS) from apheresis for the intention-to-treat (ITT) population. (B) Overall survival (OS) from apheresis for the ITT population. (C) PFS from infusion according to product infused. (D) OS from infusion according to product infused.

Table 4. Characteristics significantly associated with progression-free survival and overall survival in the multivariable analysis of axicabtagene ciloleucel and tisagenlecleucel–treated patients.
P
CAR T type, axi-cel vs. tisa-cel 0.888 (0.576-1.370) 0.592
Cell of origin, CGB vs. non-CGB 0.726 (0.460-1.147) 0.170
Primary Refractory, yes vs. no 1.371 (0.806-2.331) 0.244
Prior ASCT, yes vs. no 0.957 (0.550-1.666) 0.877
Disease status, PD vs. other 1.804 (1.096-3.507) 0.018
ECOG at apheresis, 2-3 vs. 0-1 0.731 (0.208-2.572) 0.626 Disease stage, III-IV vs. I-II 0.494 (0.159-1.539) 0.244
R-IPI at apheresis 1.156 (0.824-1.621) 0.402
Bulky size at apheresis, yes vs. no 0.770 (0.401-1.477) 0.431
LDH at apheresis, >UNL vs. normal 2.181 (1.303-3.651) 0.003
CRP at apheresis, >UNL vs. normal 1.489 (0.925-2.398) 0.101
Platelets at apheresis, x109 0.998 (0.995-1.001) 0.130
ECOG at LD, 2-3 vs. 0-1 5.446 (2.354-12.597) <0.001
HR (95% CI) P
ECOG at apheresis, 2-3 vs. 0-1 2.113 (1.122-3.980) 0.021
LDH at apheresis, >UNL vs. normal 1.809 (1.084-3.021) 0.023
Bridging therapy, yes vs. no 1.791 (0.817-3.930) 0.146 Disease status at LD, PD vs. other 2.561 (1.812-3.999) 0.018
Bulky (>7 cm) prior to LD, yes vs.no 1.495 (0.794-2.816) 0.212
Extranodal at LD >2 sites, yes vs. no 1.158 (0.951-1.411) 0.145
ECOG at LD, 2-3 vs. 0-1 4.306 (1.841-10.071) 0.001
R-IPI at LD 0.827 (0.476-1.437) 0.500
LDH at LD, >UNL vs. normal 1.304 (0.565-3.013) 0.581
CRP at LD, >UNL vs. normal 1.235 (0.455-3.353) 0.679
LDH at infusion, >UNL vs. normal 1.235 (0.520-2.938) 0.632
CRP at infusion, >UNL vs. normal 1.501 (0.487-4.629) 0.479
CRS grade 3-4, yes vs. no 1.939 (0.726-5.177) 0.186
CRS tocilizumab, yes vs. no 0.914 (0.539-1.548) 0.737
ICANS grade 3-4, yes vs. no 1.066 (0.316-3.589) 0.918
ICANS tocilizumab, yes vs. no 1.148 (0.462-2.852) 0.766
ICANS steroids, yes vs. no 1.090 (0.503-2.362) 0.827
HR: hazard ratio; GCB: germinal center B-cell like; ASTC: autologous stem cell transplantation; PD: progressive disease; ECOG PS: Eastern Cooperative Group performance status; R-IPI: revised international prognostic index; LD: lymphodepletion; LDH: lactate dehydrogenase; NA: not applicable (characteristic not a part of the multivariable-adjusted model for the listed outcome); ULN: upper limit of normal; CRP: c-re active protein.
need to be studied in more depth.29 Efforts should be made to decrease toxicity in future trials, including design of CAR T cells with an improved safety profile together with prophylactic or preemptive strategies for CRS and ICANS.30,31 Moreover, real-world studies like ours might help identify patients at high risk of developing severe ad verse events, improving patient selection and manage ment. Several models for predicting CAR T-cell related toxicity have been proposed. External validation of these models in independent cohorts is warranted to assess their implementation in routine clinical practice.32,33
Regarding efficacy, median PFS and OS in the ITT analysis were comparable to the pivotal trials, despite a longer
turnaround time in our study.3,5 Our results were also similar to other real-world data, albeit some differences in patients characteristics and logistical country-specific aspects.7–9,13,23 Both for the ITT and the infused population, PFS and OS were similar between axi-cel and tisa-cel. Noteworthy, there was a trend towards a higher PFS and OS in the ITT analysis in favor of the axi-cel cohort (PFS at 9 months 41% and 27%, P=0.091, and OS 67% vs. 54%, P=0.07). These trends could be explained by a shorter turnaround time in patients receiving axi-cel which could have led to slightly fitter population at the time of CAR T infusion. Also, the number of apheresed patients who fi nally did not receive the infusion was higher in the tisa-
cel group. Finally, complete responses were more fre quently seen in patients treated with axi-cel. Whether these trends towards higher PFS and OS are driven by a
different efficacy of each product, as suggested by differ ences on the results of the phase III clinical trials in sec ond-line therapy,34,35 or by patient selection and/or logistic
B
Figure 2. Progression-free survival and overall survival from CAR T-cell infusion stratified by prognostic factors. (A) Progression-free survival (PFS) by disease status at lym phodepletion. (B) PFS by lactate dehydrogenase (LDH) at leukapheresis. (C) PFS by LDH at lymphodepletion. (D) Overall survival (OS) by LDH at leukapheresis. (E) OS by Eastern Cooperative Group performance status (ECOG PS) at lymphodepletion.

reasons warrants further studies. Outstanding prognostic factors included LDH and ECOG PS, in line with previous reports.8,13,36,37 Even though the use of BT has been associ ated with worse outcomes, especially the use of systemic therapy,38 there is scarce data regarding the impact of dis ease status at time of LD therapy. In our study, progress ive disease as best response to BT was associated with a worse PFS. Noteworthy, more than half of our patients, without significant differences between both cohorts, had PD as best response to BT. Given the availability of novel therapies for LBCL, future studies should address the op timal bridging strategy for patients intending to receive a CAR T-cell infusion. Although patients with high LDH and progressive disease showed worse PFS, whether these cases should not be eligible for CAR T-cell therapy is ar guable, since these high-risk populations still performed better than with standard therapies.1,2 However, very few patients with very high LDH and ECOG PS score seemed to benefit from the therapy, highlighting the need of careful selection of patients harboring adverse prognostic factors. In all, our findings support the inclusion of selected pa tients with such baseline characteristics in prospective studies that would not only improve access but also better characterize the risk factors for safety and efficacy. There are some limitations to this study. The data was col lected retrospectively and some previously reported prog nostic factors were not collected in this dataset including albumin levels, total metabolic tumor volume and CAR Tcell kinetics.13,36,37 The patient population treated includes a relatively small proportion of high-risk patients in terms of comorbidity and performance status scores. Previous realworld reports showed superior results with axi-cel for pa tients who would had met eligibility criteria for the ZUMA-1 trial than those individuals that would have been ineligible.7 Further analysis to confirm our observations in patient populations with greater comorbidities are granted. In contrast, patients were infused in a small number of centers and treatment-related complications were man aged homogenously.19 Also, the CAR T therapy approval pro cess was carried out by a single national Expert Committee, ensuring uniform selection criteria of the patients.39 Given the lack of direct comparisons between CAR T-cell prod ucts within prospective randomized clinical trials, we con sider that retrospective comparisons can provide clinically meaningful insight to physicians managing these patients. In conclusion, safety and efficacy results in our real-world experience were comparable with those reported in the pivotal clinical trials. Patients treated with axi-cel experi enced more toxicity but similar non-relapse mortality compared with those receiving tisa-cel while efficacy was similar between both products.
MK has received honoraria from Gilead, Novartis, BMS and Pfizer. GI has received honoraria from BMS/Celgene, Gi lead, Novartis, Janssen, AstraZeneca, Abbvie and Roche. LLC has received honoraria from Gilead and Novartis, and research funding from Gilead. JB has received honoraria from Roche, Takeda, Celgene, Novartis, Gilead, and re search funding from Celgene, Roche. JS has received hon oraria from Kite and Novartis. MBO has received honoraria from Roche, Takeda, Kite, Novartis, Janssen, Incyte, and research funding from Roche. AM has received honoraria from Takeda, Novartis, BMS, MSD, and research funding from GILEAD. MG has received honoraria from Gilead and Novartis. AS has received honoraria from Takeda, BMS, MSD, Sanofi, Roche, Novartis, Gilead Kite, Janssen, Sanofi, consultancy fees from Takeda, BMS, MSD, Novartis, Janssen, Gilead Kite and speaker’s bureau for Takeda. JMS has received honoraria from Roche, Janssen, GileadKite, Novartis, BMS-Celgene, Takeda, Incyte, Lilly, Beigene. PB has received honoraria from Amgen, BMS, Gilead, In cyte, Jazz Pharmaceuticals, Miltenyi biotech, Novartis and Pfizer.
MK, GI and PB developed the concept, designed the study and wrote the manuscript. MK, GI, RB and PB collected and assembled data. All authors provided study materials or patients, analyzed and interpreted data, and approved the final version of the manuscript.
The authors thank the patients and their families for their participation in this study, and staff and nurses of all the hematology and transplant units for their care and con tributions to making this work possible. They thank Jose Maria Bellón from the Gregorio Marañón Institute of Health Research for data analysis. They thank Angel Cedillo from GETH-TC and GELTAMO for coordination and data collec tion support.
PS has received funding funding from the Carlos III (FIS) Health Institute PI16/01433 and PI21/00197, Asociación Es pañola contra el Cáncer (Ideas Semilla 2019) and a PERIS 2018-2020 grant from the Generalitat de Catalunya (BDNS357800).
The data that support the findings of this study are avail able from the corresponding author upon reasonable re quest.
1. Crump M, Neelapu SS, Farooq U, et al. Outcomes in refractory diffuse large B-cell lymphoma: results from the international SCHOLAR-1 study. Blood. 2017;130(16):1800-1808.
2. Van Den Neste E, Schmitz N, Mounier N, et al. Outcome of patients with relapsed diffuse large B-cell lymphoma who fail second-line salvage regimens in the International CORAL study. Bone Marrow Transplant. 2016;51(1):51-57.
3. Neelapu SS, Locke FL, Bartlett NL, et al. Axicabtagene ciloleucel CAR T-cell therapy in refractory large B-cell lymphoma. N Engl J Med. 2017;377(26):2531-2544.
4. Locke FL, Ghobadi A, Jacobson CA, et al. Long-term safety and activity of axicabtagene ciloleucel in refractory large B-cell lymphoma (ZUMA-1): a single-arm, multicentre, phase 1-2 trial. Lancet Oncol. 2019;20(1):31-42.
5. Schuster SJ, Bishop MR, Tam CS, et al. Tisagenlecleucel in adult relapsed or refractory diffuse large B-cell lymphoma. N Engl J Med. 2019;380(1):45-56.
6. Jaeger U, Bishop MR, Salles G, et al. Myc expression and tumorinfiltrating T cells are associated with response in patients (Pts) with relapsed/refractory diffuse large B-cell lymphoma (r/r DLBCL) treated with tisagenlecleucel in the Juliet Trial. Blood. 2020;136(Suppl 1):S48-49.
7. Nastoupil LJ, Jain MD, Feng L, et al. Standard-of-care axicabtagene ciloleucel for relapsed or refractory large B-cell lymphoma: results from the US Lymphoma CAR T Consortium. J Clin Oncol. 2020;38(27):3119-3128.
8. Jacobson CA, Hunter BD, Redd R, et al. Axicabtagene ciloleucel in the non-trial setting: outcomes and correlates of response, resistance, and toxicity. J Clin Oncol. 2020;38(27):3095-3106.
9. Pasquini MC, Hu Z-H, Curran K, et al. Real-world evidence of tisagenlecleucel for pediatric acute lymphoblastic leukemia and non-Hodgkin lymphoma. Blood Adv. 2020;4(21):5414-5424.
10. Kuhnl A, Roddie C, Martinez-Cibrian N, et al. Real-world data of high-grade lymphoma patients treated with CD19 CAR-T in England. Blood. 2019;134(Suppl 1):S767.
11. Bethge WA. Standard-of-care CAR-T cell therapy for large B-cell lymphoma: real world data Germany. Bone Marrow Transplantation. 2021;56(1):20.
12. Iacoboni G, Villacampa G, Martinez-Cibrian N, et al. Real-world evidence of tisagenlecleucel for the treatment of relapsed or refractory large B-cell lymphoma. Cancer Med. 2021;10(10):3214-3223.
13. Vercellino L, Di Blasi R, Kanoun S, et al. Predictive factors of early progression after CAR T-cell therapy in relapsed/refractory diffuse large B-cell lymphoma. Blood Adv. 2020;4(22):5607-5615.
14. Kwon M, Bailen R, Corral LL, et al. Real world of experience axicabtagene ciloleucel for the treatment of relapsed or refractory large B-cell lymphoma in Spain. Bone Marrow Transplant. 2021;56:37-39.
15. Oluwole OO, Jansen JP, Lin VW, et al. Comparing efficacy, safety, and preinfusion period of axicabtagene ciloleucel versus tisagenlecleucel in relapsed/Rrfractory large B cell lymphoma. Biol Blood Marrow Transplant. 2020;26(9):1581-1588.
16. Zhang J, Li J, Ma Q, et al. A review of two regulatory approved anti-CD19 CAR T-cell therapies in diffuse large B-cell lymphoma: why are indirect treatment comparisons not feasible? Adv Ther. 2020;37(7):3040-3058.
17. Lee DW, Santomasso BD, Locke FL, et al. ASTCT consensus grading for cytokine release syndrome and neurologic toxicity associated with immune effector cells. Biol Blood Marrow Transplant. 2019;25(4):625-638.
18. https://www.sanidad.gob.es/profesionales/farmacia/ pdf/20190508_Protocolo_manejo_efectos_adversos_CAR_T.pdf.
19. Los-Arcos I, Iacoboni G, Aguilar-Guisado M, et al. Recommendations for screening, monitoring, prevention, and prophylaxis of infections in adult and pediatric patients receiving CAR T-cell therapy: a position paper. Infection. 2021;49(2):215-231.
20. Young J-AH, Logan BR, Wu J, et al. Infections after transplantation of bone marrow or peripheral blood stem cells from unrelated donors. Biol Blood Marrow Transplant. 2016;22(2):359-370.
21. Cheson BD, Fisher RI, Barrington SF, et al. Recommendations for initial evaluation, staging, and response assessment of Hodgkin and non-Hodgkin lymphoma: the Lugano classification. J Clin Oncol. 2014;32(27):3059-3068.
22. Martín-Rojas RM, Gómez-Centurión I, Bailén R, et al. Hemophagocytic lymphohistiocytosis/macrophage activation syndrome (HLH/MAS) following treatment with tisagenlecleucel. Clin Case Rep. 2022;10(1):e05209.
23. Sesques P, Ferrant E, Safar V, et al. Commercial anti-CD19 CAR T cell therapy for patients with relapsed/refractory aggressive B cell lymphoma in a European center. Am J Hematol. 2020;95(11):1324-1333.
24. Bethge WA, Martus P, Schmitt M, et al. GLA/DRST real-world outcome analysis of CAR-T cell therapies for large B-cell lymphoma in Germany. Blood. 2022;140(4):349-358.
25. Riedell PA, Walling C, Nastoupil LJ, et al. A multicenter retrospective analysis of outcomes and toxicities with commercial axicabtagene ciloleucel and tisagenlecleucel for relapsed/refractory aggressive B-cell lymphomas. Biol Blood Marrow Transplant. 2020;26(Suppl 3):S41-42.
26. Gauthier J, Gazeau N, Hirayama AV, et al. Impact of CD19 CAR Tcell product type on outcomes in relapsed or refractory aggressive B-NHL. Blood. 2022;139(26):3722-3731.
27. Meir J, Abid MA, Abid MB. State of the CAR-T: risk of infections with chimeric antigen receptor T-cell therapy and determinants of SARS-CoV-2 vaccine responses. Transplant Cell Ther. 2021;27(12):973-987.
28. Spanjaart AM, Ljungman P, de La Camara R, et al. Poor outcome of patients with COVID-19 after CAR T-cell therapy for B-cell malignancies: results of a multicenter study on behalf of the European Society for Blood and Marrow Transplantation (EBMT) Infectious Diseases Working Party and the European Hematology Association (EHA) Lymphoma Group. Leukemia. 2021;35(12):3585-3588.
29. Maziarz RT, Yang H, Liu Q, et al. Real-world healthcare resource utilization and costs associated with tisagenlecleucel and axicabtagene ciloleucel among patients with diffuse large B-cell lymphoma: an analysis of hospital data in the United States. Leuk Lymphoma. 2022;0(0):1-11.
30. Roddie C, Dias J, O’Reilly MA, et al. Durable responses and low toxicity after fast off-rate CD19 chimeric antigen receptor-T therapy in adults with relapsed or refractory B-cell acute lymphoblastic leukemia. J Clin Oncol. 2021;39(30):3352-3363.
31. Oluwole OO, Bouabdallah K, Muñoz J, et al. Prophylactic corticosteroid use in patients receiving axicabtagene ciloleucel for large B-cell lymphoma. Br J Haematol. 2021;194(4):690-700.
32. Rejeski K, Perez A, Sesques P, et al. CAR-HEMATOTOX: a model for CAR T-cell-related hematologic toxicity in relapsed/refractory large B-cell lymphoma. Blood. 2021;138(24):2499-2513.
33. Pennisi M, Sanchez-Escamilla M, Flynn JR, et al. Modified EASIX predicts severe cytokine release syndrome and neurotoxicity after chimeric antigen receptor T cells. Blood Adv. 2021;5(17):3397-3406.
34. Bishop MR, Dickinson M, Purtill D, et al. Second-line tisagenlecleucel or standard care in aggressive B-cell lymphoma. N Engl J Med. 2022;386(7):629-639.
35. Locke FL, Miklos DB, Jacobson CA, et al. Axicabtagene ciloleucel as second-line therapy for large B-cell lymphoma. N Engl J Med. 2022;386(7):640-654.
36. Locke FL, Rossi JM, Neelapu SS, et al. Tumor burden, inflammation, and product attributes determine outcomes of axicabtagene ciloleucel in large B-cell lymphoma. Blood Adv.
2020;4(19):4898-4911.
37. Awasthi R, Pacaud L, Waldron E, et al. Tisagenlecleucel cellular kinetics, dose, and immunogenicity in relation to clinical factors in relapsed/refractory DLBCL. Blood Adv. 2020;4(3):560-572.
38. Pinnix CC, Gunther JR, Dabaja BS, et al. Bridging therapy prior to axicabtagene ciloleucel for relapsed/refractory large B-cell lymphoma. Blood Adv. 2020;4(13):2871-2883.
39. Carpio C, Iacoboni G, Villacampa G, et al. Selection process and causes of non-eligibility for CD19 CAR-T cell therapy in patients with relapsed/refractory aggressive B-cell non-Hodgkin lymphoma in a European center. Leuk Lymphoma. 2021;62(9):2288-2291.
Hualei Zhang,1,2 Baohuan Cai,2,3 Yun Liu,2,4 Yating Chong,2 Atsuko Matsunaga,2 Stephanie Fay Mori,2 Xuexiu Fang,2 Eiko Kitamura,2 Chang-Sheng Chang,2 Ping Wang,1 John K. Cowell2 and Tianxiang Hu2
1Department of Radiation Oncology, Tianjin Medical University Cancer Institute and Hospital, National Clinical Research Center for Cancer, Key Laboratory of Cancer Prevention and Therapy, Tianjin’s Clinical Research Center for Cancer, Tianjin, China; 2Georgia Cancer Center, Augusta University, Augusta, GA, USA; 3Department of Pediatrics, Tongji Hospital, Tongji Medical College, Huazhong University of Science and Technology, Wuhan, China and 4Department of Geriatrics, Union Hospital, Tongji Medical College, Huazhong University of Science and Technology, Wuhan, China.
Correspondence: J. K. Cowell jcowell@augusta.edu T. Hu
tihu@augusta.edu
Received: January 28, 2022.
Accepted: July 7, 2022. Prepublished: July 14, 2022.
https://doi.org/10.3324/haematol.2022.280757
©2023 Ferrata Storti Foundation Published under a CC BY-NC license
The Philadelphia 9;22 chromosome translocation has two common isoforms that are preferentially associated with distinct subtypes of leukemia. The p210 variant is the hallmark of chronic myeloid leukemia (CML) whereas p190 is frequently associated with B-cell acute lymphoblastic leukemia. The only sequence difference between the two isoforms is the guanidine exchange factor domain. This guanidine exchange factor is reported to activate RHO family GTPases in response to diverse extracellular stimuli. It is not clear whether and, if so, how RHOA contributes to progression of p210 CML. Here we show that knockout of RHOA in the K562 and KU812, p210-expressing cell lines leads to suppression of leukemogenesis in animal models in vivo. RNA-sequencing analysis of the mock control and null cells demonstrated a distinct change in the gene expression profile as a result of RHOA deletion, with significant downregulation of genes involved in cell activation and cell adhesion. Cellular analysis revealed that RHOA knockout leads to impaired cell adhesion and migration and, most importantly, the homing ability of leukemia cells to the bone marrow, which may be responsible for the attenuated leukemia progression. We also identified IGFBP2 as an important downstream target of RHOA. Further mechanistic investigation showed that RHOA activation leads to relocation of the serum response factor (SRF) into the nucleus, where it directly activates IGFBP2. Knockout of IGFBP2 in CML cells suppressed cell adhesion/invasion, as well as leukemogenesis in vivo. This elevated IGFBP2 expression was confirmed in primary CML samples. Thus, we demonstrate one mechanism whereby the RHOA-SRF-IGFBP2 signaling axis contributes to the development of leukemia in cells expressing the p210 BCR-ABL1 fusion kinase.
RHOA is a member of the large family of small GTPases which have diverse functions throughout biology.1 Binding to GDP represents an inactive conformation and activation is achieved through exchange with GTP. The transition be tween inactive and active forms is facilitated through binding to a guanidine exchange factor (GEF) motif, which is present in an equally diverse set of proteins.1 Activated GTPases serve as signaling intermediates from a variety of external stimuli to downstream effectors.2 RHOA has been most consistently implicated in cell movement through the association with actin cytoskeleton dynamics.3 Because of the central role of actin dynamics in the development and progression of cancer, RHOA has been implicated in invasion and metastasis as well as dif
ferentiation of stem cells.4,5 RHOA has also been sug gested to play a central role in cancer development, in which it has been implicated as both a tumor suppressor as well as an oncogene.6,7 Early studies involved transfec tion into normal fibroblasts which led to transformation,8 suggesting an oncogenic role. However, extensive studies involving a wide range of solid tumors failed to demon strate consistent amplifications or mutations,7 question ing the role of RHOA as an oncogene. In contrast, studies in subtypes of T-cell lymphomas identifi ed consistent mutations, some of which appear to be activating events and hence tumor promoting.9-11 Overall, it appears that the involvement of RHOA in cancer progression may be de pendent on the type of cancer cell. Indeed, we recently demonstrated a critical role for RHOA in the development of BCR-FGFR1-driven leukemias and lymphomas through
an interaction with the GEF domain in the BCR component of the fusion kinase.12 In this study, deletion of the GEF do main led to a more aggressive development of leukemia, suggesting RHOA activation plays a suppressive role in this model of B-cell acute lymphoblastic leukemia. The same GEF domain is present in the BCR-ABL1 fusion kinase as sociated with the Philadelphia, 9;22 chromosome transloca tion (Ph), which is present consistently in a subtype of chronic myelogenous leukemia (CML).13 Both Ph+ CML and the FGFR1-driven stem cell leukemia/lymphoma syndrome are considered to be derived from hematopoietic stem cells and share many similarities but how RHOA contributes to the development of BCR-ABL1-driven CML is not clear. The Ph 9;22 chromosome translocation results in the cre ation of a constitutively active chimeric BCR-ABL1 kinase that has two different variants depending on the position of the breakpoint on chromosome 9.14,15 The p210 isoform, which retains the BCR GEF domain and hence activates RHOA, is seen in ~95% cases of CML, which is a relatively benign leukemia.16 The p190 isoform is rarely seen in CML but is present in over 70% of cases of Ph+ B-cell acute lym phoblastic leukemia, which is an acute leukemia and has a far worse prognosis.17 In mouse models, p210 expression gives rise to a slowly progressing disease but when p190 is expressed, there is a short latency and acute development of B-cell leukemia.18,19 Cell line transformation assays re vealed that the GEF domain of p210 BCR-ABL1 activates RHOA and contributes to the transformed phenotype.20 Whether and, if so, how this GEF domain-regulated RHOA signaling contributes to CML progression remains elusive. In this study, we demonstrate that the deletion of RHOA in p210-expressing CML cells leads to suppression of leuke mogenesis in vivo, suggesting that RHOA is important for the development and progression of Ph+ CML. RNA-sequencing analysis of mock control (MC) and RHOA knockout (KO) K562 cells identified IGFBP2 as a primary target of RHOA and has been implicated in both cell adhesion and activation. Analy sis of gene expression data from human primary CML dem onstrated the same high level of IGFBP2 expression as that in normal donors. Loss of RHOA prevents activation and subcellular relocalization of the serum response factor (SRF) which, as a result, leads to downregulation of the IGFBP2 gene. Downregulation of the SRF-IGFBP2 axis sig naling cascade leads to suppression of cell adhesion and migration in CML cells and a decreased ability of the cells to home to the bone marrow. These studies suggest an on cogenic role for RHOA in the development of p210 BCRABL1-driven CML.
Cell proliferation was assessed using trypan blue exclusion
assays and cell viability was measured using the CellTiter Glo assay, western blotting, plasmid transfection, and quantitative reverse transcriptase polymerase chain reac tion (RT-PCR), following standard procedures that have been described previously.21,22 A summary of the antibodies used can be found in the Online Supplementary Methods. Luciferase assays were performed as described previously.23
Single-guide RNA used for locus-specific deletion of RHOA in CML cells were designed using CRISPR Targets Track on Genome Browser24 and are described in the Online Supple mentary Methods. Virus packing and single clone selection were performed as described previously.25
All animal experiments were performed under an approved protocol from the Augusta University Institutional Animal Care and Use Committee. Unless specified, 5×10⁶ cells were injected into the tail veins of 6- to 8-week-old female im mune deficient NSG mice. Engraftment of luciferase-ex pressing leukemia cells in the host mice was determined using the Caliper IVIS imaging systems as described pre viously.26 Homing studies were performed by flow analysis of GFP+ cells in the bone marrow cells from mice implanted 16 hours previously with various cell types.27
Cell adhesion and migration assays were performed as de scribed previously.27 For the IGFBP2 rescue experiment, 100 ng/mL recombinant human IGFBP2 protein (R&D Systems, #674-B2-025) were added to the growth medium prior to the cell adhesion and migration assays.
Chromatin immunoprecipitation quantitative polymerase chain reaction
Chromatin immunoprecipitation (ChIP) assays were per formed using a ChIP assay kit (Millipore) as described pre viously.23 In brief, chromatin was cross-linked with 1% formaldehyde for 10 min at room temperature, sheared to an average size of ~500 bp and then immunoprecipitated with an anti-SRF antibody (Cell Signaling, #5147). Details of the ChIP-quantitative polymerase chain reaction (qPCR) primers used are provided in the Online Supplementary Methods. Each immunoprecipitated DNA sample was quantified using qPCR and all ChIP-qPCR signals at the IGFBP2 locus were normalized to an IgG control to calculate relative fold enrichment.
For western blot assays, cytoplasmic and nuclear com ponents were isolated using the NE-PER nuclear and cytoplasmic extraction reagents (Thermo Scientific). For confocal microscopy, cells were first probed with an anti-
SRF antibody (Cell Signaling, #5147), then visualized with Alexa Fluor 488 goat anti-rabbit IgG secondary antibody (Abcam, ab150077).
Two MC clones and the RHOA KO C8 and C9 clones gen erated from K562 cells were harvested for RNA-sequenc ing analysis. Preparation of RNA, sequence analysis and gene set enrichment analysis were performed as de scribed previously.28
All statistical analyses were performed using the Student t test to determine whether the means of two datasets were significantly different from each other. Error bars represent standard deviations. Unless otherwise stated, in vitro assays were repeated in triplicate and in vivo ex periments involved cohorts of five mice. Kaplan-Meier statistical approaches were used to analyze differences in survival between different cohorts of mice.
RHOA knockout in BCR-ABL1-positive chronic myeloid leukemia cells has only a mild effect on cell proliferation/survival
In Ph+ leukemia, there are two major variants of the 9;22 translocation which generate either p190 or p210 variant proteins depending on the position of the translocation breakpoint.13 p210 is the hallmark of CML, whereas p190 occurs in the majority (70%) of cases of Ph+ B-cell acute lymphoblastic leukemia.17 The only sequence difference between p210 and p190 is the inclusion of the tandem double-homology, pleckstrin homology (DH-PH) domains in p210 which provide a GEF domain for activation of the RHOA GTPase, suggesting its potential contribution in the development of CML. Our recent study of the BCR-FGFR1 fusion kinase in stem cell leukemia/lymphoma syndrome demonstrated a role for the GEF domain in the BCR com ponent of the chimeric kinase in activating RHOA and in fluencing leukemia progression.12 To obtain a better understanding of the role of RHOA in the development of Ph+ CML, we created knockdown clones from two human, p210-expressing cell lines, K562 and KU812,29 using a double targeting CRISPR-Cas9 approach (Figure 1A). Both cell lines were first transduced with pCDH-CMV-NlucP2A-copGFP-T2A-Puro to co-express luciferase and GFP, and then transduced with lentiCRISPR v2 and both the sgRNA and Cas9 to generate the KO cell clones. Using this strategy, exons 2-4 were deleted and a series of RHOA null clones were identified using western blotting (Figure 1B). For further analysis, clones C8 and C9 were randomly se lected from K562 and cell proliferation assays showed
only small differences between the KO clones and the MC cells (Figure 1C, left). CellTiter Glo assays did not reveal any profound differences in cell survival between the MC and KO cells (Figure 1C, right). Similarly, RHOA was knocked out in KU812 cells and KO clones C7 and C15 also showed only marginal differences in cell proliferation or viability between the KO clones and the MC cell (Figure 1D, E). These observations demonstrate that RHOA has a relatively limited effect on BCR-ABL1-driven CML growth and survival.
When 1×10⁶ K562 KO C8 or C9 cells were xenografted into immune-compromised NSG mice, Kaplan-Meier analysis showed no mortality over a 150-day observation period, compared with the MC xenografted mice which all died within 56 days (Figure 2A). When the inoculated dose was increased to 5×10⁶ cells/mouse, although the median sur vival in the MC-cell group decreased from 52 days to 35 days, leukemia-free survival in the RHOA KO cell-engrafted mice was the same. Similarly, RHOA KO clones C7 and C15 from KU812 had a dramatic impact on survival compared with the MC cells. Although one mouse in the KO C7 cellengrafted cohort died late in the observation period, there was no evidences of leukemia at autopsy. Luminescence imaging of the xenografted animals using cells retrofitted to express luciferase showed extensive development of leukemia in the MC-cell-engrafted mice compared to the RHOA KO-cell-engrafted groups from both cell lines (Fig ure 2C, D). Quantitation of the luminescence signal in the mice as well as white blood cell counts also reflected the distinct disease progression in these mice (Figure 2C, D). Thus, while RHOA does not appear to dramatically affect cell proliferation or survival in this system, it has a pro found effect on leukemogenesis in vivo
RHOA knockout reduces expression levels of genes related to cell adhesion and activation
To investigate how RHOA expression might affect CML progression, we analyzed the underlying molecular effects of RHOA using RNA sequencing in a gene expression com parison between K562 MC cells and the two individual KO C8 and C9 clones (Figure 3A). Gene set enrichment analy sis of the differentially expressed genes identified changes in major biological functions which included both cell ac tivation and cell adhesion. Heatmap plots clearly show that most of the implicated genes were downregulated as a result of RHOA knockout (Figure 3B). RT-PCR analysis of a subset of genes in these groups (Figure 4A) confirmed the downregulation of IGFBP2, ASS1, IL20RB, ERBB3, MS4A3, CD24 ENPP3 and RNASET2 and upregulation of HSP90AA1 and SPTA1. The same changes in relative gene expression levels seen in the K562 KO cells were also seen in the RHOA KO cells derived from KU812 cells using
Figure 1. Generation of RHOA knockout clones and the effect of knockout on cell proliferation in vitro. (A) Overview of the CRISPR strategy to generate RHOA knockout shows the location of target regions within the gene flanking exons 2 and 4 and the proto spacer adjacent motif. (B) Western blot analysis of clones recovered following RHOA targeting in K562 cells identified six clones that are null for RHOA. (C) Trypan blue exclusion assays (n=3) over a 4-day proliferation period showed minor differences in cell growth between the mock control (MC) cells and cells from knockout (KO) clones C8 and C9. CellTiter Glo viability assays at day 3 also showed only a marginal difference in cell survival between the MC and KO cells (n=3). (D, E) In the same analysis of KO clones identified from the KU812 cells (D), there is only a minor difference in both cell proliferation and survival (E). Differences between the KO and MC cells were evaluated using the Student t test. *P<0.01, **P≤0.001, ns: not significant. PAM: protospacer adjacent motif.
quantitative RT-PCR. The reduced gene expression levels seen following RHOA depletion were further confirmed at the protein level using western blotting (Figure 4B).

In both cell lines, IGFBP2 was the most highly down regulated gene, suggesting an important role for this gene in the regulation of leukemogenesis. While a role for RHOA in leukemogenesis was suggested from the findings of the knockout studies, these were performed in highly evolved cell lines. The question therefore arises whether RHOA activation influences pri mary human CML development. To address this issue, we analyzed the GSE 47927 gene expression dataset that was derived from human CML patients’ samples (n=52) compared with cells from normal donor samples (n=15). Within the CML cases the samples were further analyzed by isolating various stem/progenitor cells from these leukemias. These included hematopoietic stem cells, common myeloid progenitors, granulocyte mono
cytic progenitors and megakaryocyte erythroid progen itors. Since we have shown that functional RHOA acti vates IGFBP2 expression, we further analyzed the expression of IGFBP2 in the various subpopulations of cells as a surrogate for RHOA activation. There was a sig nificant increase in expression levels in the overall leu kemic cell population (Figure 4C). Within the subgroups, highly significant increases were seen in the hemato poietic stem cells with less significant increases in the common myeloid progenitors and megakaryocyte ery throid progenitors. There was no difference in the gra nulocyte monocytic progenitor population. Although cytogenetic findings were not reported for the CML cases, since 95% of CML carry the p210 rearrangement, these data suggest that in human CML, RHOA activated by p210 upregulates expression of IGFBP2 and con tributes to CML progression, as observed in our cell line models.
Figure 2. RHOA knockout suppresses chronic myeloid
progression in vivo. (A) Kaplan-Meier survival analysis of mice xenografted with 1x10⁶ mock control (MC) cells or knockout (KO) K562 cells shows that those that received MC cells had a median survival of 52 days; none of the mice xenografted with the KO cells developed disease over the 150-day observation period. When the inoculum was increased to 5x10⁶ cells, while there was a reduction in the mean survival time to 35 days for recipients of the MC cells, there was no difference in survival for those that received the KO cells. (B) Similarly, for the KU812 cells, while the mean survival of mice in the MC group was 39 days, none of the mice injected with the KO cells developed of leukemia over the observation period. (C, D) This significant difference in disease development for K562 cells (C) and KU812 cells (D) could be vis ualized in mice using luminescence tracking which was mirrored by the relative levels of white blood cells in the peripheral blood at the time of sacrifice (N=5). Differences between the KO and MC cells were evaluated using the Student t test. *P<0.01, ***P≤0.0001, ****P=0.00001.

Since the gene set enrichment analysis defined cell acti vation and adhesion as the most significantly affected biological processes following deletion of RHOA, we ana lyzed these phenotypes in more depth. Adhesion was evaluated by plating 1x10⁵ GFP+ cells onto fibronectin frag ment, CH-296-coated plates as we have described pre viously.30 The number of cells was determined by counting GFP+ cells per unit area using ImageJ software (Figure 5A). Compared to the K562 MC cells, the RHOA KO clones, C8 and C9, showed significantly reduced adhesion properties.
In a similar comparison of migration through extracellular matrix, the RHOA KO cells showed a significantly reduced migration potential compared with the K562 MC cells (Fig ure 5B). Since it is possible that reduced cell invasion and migration may lead to a reduced ability of leukemic cells to home to the bone marrow, we used homing assays to compare the homing ability of MC and RHOA KO cells. When 5x10⁶ K562 MC cells were injected into the tail veins of NSG mice, the presence of GFP+ leukemic cells in the bone marrow 16 h after injection was signi ficantly in creased compared to the number of GFP+ cells following
C
Figure 3. RHOA knockout changes the gene expression profiles in K562 chronic myeloid leukemia cells. (A) Gene set enrichment analysis of RNA-sequencing data from K562 mock control (MC) or RHOA knockout (KO) clones (N=2) showed significant enrich ment of genes involved in cell adhesion and activation biological processes in the RHOA-expressing MC cells. Gene set enrichment analysis of RNA-sequencing data from K562 mock control (MC) or RHOA knockout (KO) clones (N=2) showed significant enrich ment of genes involved in cell adhesion and activation biological processes in the RHOA-expressing MC cells. (B) A comparison in expression changes of genes associated with cell adhesion is illustrated and predominantly shows significant downregulation in the KO cells. (C) Similarly genes involved in cell activation biological processes predominantly show significant downregulation in the KO cells. NES: normalized enrichment score; NOM p-values: nominal P values; FDR q-values: false discovery rate q values.

injection of KO C8 or C9 cells, demonstrating a reduced capacity for homing following RHOA KO (Figure 5C). These empirical observations provide support for the gene ex pression studies implicating RHOA in these two biological processes in CML leukemia cells and their contribution to leukemia progression.

RHOA regulates IGFBP2 expression in a serum response factor-dependent manner
The SRF regulates many genes involved in cell migration and adhesion,31 which are also the biological processes most significantly affected as a result of RHOA deletion. In
addition, RHOA has been shown to regulate gene ex pression, in part, through the regulation of the SRF tran scription factor.32 Both SRF and IGFBP2 have been shown to orchestrate cell motility and invasion phenotypes in dif ferent cancers.33,34 To determine whether the downregula tion of IGFBP2 in RHOA KO cells is dependent on SRF, we generated reporter constructs in the pGL3 vector contain ing the 1 kb fragment spanning the IGFBP2 promoter. In the absence of the promoter, SRF was unable to induce ex pression of luciferase. However, when the promoter region was present, luciferase activity increased in the presence of SRF, in a dose-dependent manner (Figure 6A). Thus, it
Figure 4. Detection of the expression levels of potential RHOA downstream targets in chronic myeloid leukemia cells and primary patients’ samples. (A) Quantitative reverse transcriptase polymerase chain reaction (RT-qPCR) analysis was used to verify dif ferential expression of several of the most highly downregulated and upregulated genes in K562 RHOA knockout (KO) cells com pared with mock control (MC) cells (N=3). Analysis of the same genes in the KU812 RHOA KO cells using RT-qPCR showed the same differential expression patterns. (B) The reduced expression levels for IGFBP2, IL20RB and CD24 were further confirmed using western blotting. (C) Analysis of the GSE47927 chronic myeloid leukemia (CML) dataset revealed a highly significant differ ence in IGFBP2 expression in CML samples (n=52) compared with normal controls (n=15). When cells from these CML cases were sub-fractionated into different stem/progenitor subpopulations, there was a highly significant increase in IGFBP2 expression in CML hematopoietic stem cells compared with normal counterparts. In similar comparisons, a significant increase in IGFBP2 ex pression was seen in common myeloid progenitors and megakaryocyte-erythroid progenitors but no difference was seen in gra nulocyte-monocytic progenitors. Statistical significance was established using the Student t test. **P≤0.001, ***P≤0.0001, ****P≤0.00001. HSC: hematopoietic stem cells; CMP: common myeloid progenitors; GMP: granulocyte-monocytic progenitors; MEP: megakaryocyte-erythroid progenitors.
appears that SRF can regulate IGFBP2 gene expression di rectly.
In addition, when SRF was overexpressed in BaF3 hema topoietic cells or NIH 3T3 cells, there was a proportional increase in IGFBP2 expression compared with the ex pression of cells transduced with the empty vector (Figure 6B). To further investigate how RHOA regulates SRF activ ity in leukemia, we treated both K562 and NIH3T3 cells with RHOA activator I. Following activation of RHOA, west ern blotting demonstrated an increased localization of SRF to the nucleus in K562 cells (Figure 6C), which could be visualized directly in adherent NIH 3T3 cells (Figure 6D). ChIP-qPCR analysis (Figure 6E) demonstrated direct binding of SRF to the IGFBP2 promoter region in K562 cells and its promoter occupancy was further enhanced when the cells were exposed to RHOA activator I in the culture medium. Thus, loss of RHOA activity in p210 BCRABL1-expressing CML cells leads to reduced IGFBP2 ex pression as a result of a reduced ability to promote SRF-mediated transcription activation.
IGFBP2 knockout can partially recapitulate the effects of RHOA knockout on chronic myeloid leukemia progression
IGFBP2 is a secreted protein and exerts its effect through controlling the distribution, function, and activity of insu lin-like growth factors (IGF) in the pericellular space, al though it also has IGF-independent mechanisms of action.35 Analysis of the culture medium recovered from MC K562 and KU812 cells expressing RHOA showed relatively high levels of IGFBP2 but these levels were dra matically reduced in KO cells derived from these two cell lines (Figure 7A). To determine whether the level of secre tion of IGFBP2 from these cells affects the adhesion and migration phenotypes, we introduced exogenous IGFBP2 into the culture medium of K562 KO C8 cells. While the KO cells showed a reduction in migration and adhesion compared with the MC cells, there was a significant in crease in the adhesion and migration potential of these cells after adding IGFBP2 to the culture medium (Figure 7B). To explore this effect further, we generated IGFBP2 KO clones (C5 and C11) from K562 cells using CRISPR (Fig
ure 7C). When these clones were subjected to migration and adhesion assays (Figure 7D), both phenotypes were significantly impaired, demonstrating the importance of IGFBP2 in the regulation of these phenotypes in CML cells. In vivo engraftment of these cells (Figure 6E) demon strated that, as a result of the IGFBP2 loss, there was a highly significant increase in survival in mice xenografted with the KO cells compared with the MC cells. These re sults were confirmed using luminescence imaging (Figure 6F) and white blood cell counts in the peripheral blood of the animals. Thus, IGFBP2 is clearly an important target of RHOA in the regulation of the oncogenic phenotype of BCR-ABL1-expressing leukemic cells.
RHOA has been associated with diverse aspects of cancer development and progression but whether it can be de scribed as an oncogene or a tumor suppressor gene has been an open question.1,6 In fibroblast transformation as says RHOA acted as an oncogene but activation deficient mutations did not.8 In murine studies, specific inactivation of RHOA did not support an oncogenic function in vivo Analysis of mutations in human cancer showed that RHOA is infrequently amplified and is often predicted to be de leted, suggesting a tumor suppressor function.7,31 Many of the mutations used to study RHOA function in vitro are not observed in human cancers and so their direct role in cancer development has been difficult to interpret.7 De spite the variable presence of RHOA mutations and am plifications in human solid tumors, consistent RHOA mutations predicted to be activating events have been found in certain T-cell and B-cell leukemias and lympho mas.9-11 In the specific example of Ph+ CML, we show that deletion of RHOA leads to suppression of leukemogenesis, favoring an oncogenic role in cells expressing the p210 BCR-ABL chimeric kinase harboring the GEF domain that activates RHOA. The role of RHOA in cancer development appears to be due both to actin cytoskeleton-initiated molecular signal ing and a direct role in regulating various aspects of cell
Figure 5. RHOA regulates the cell mobility of chronic myeloid leukemia cells. (A) K562 mock control (MC) and knockout (KO) C8 and C9 cells were plated on CH-296-coated plates (N=3) and after 24 hours randomly selected fields were photographed (N=5) and the number of attached cells per field was counted using ImageJ software, which showed a significant reduction in cell ad hesion for the KO cells. (B) Using transwell assays, there was a significant reduction in the number of cells migrating through the membrane for the KO cells compared with the MC cells. (C) For the homing assay, mice were xenografted with 5x10⁶ cells and, after 16 hours, the ratio of GFP+ cells in the bone marrow (BM) was determined using flow cytometry. There was a significant re duction in the number of KO cells homing to the BM compared with the number of MC cells. The scale bar in (A) represents 400 µm, with the same magnification for images in (A) and (B). Differences between the KO and MC cells were evaluated using the Student t test. ***P≤0.0001, ****P≤0.00001.

movement and invasion through interactions with the actin cytoskeleton machinery.1,4 Overall, however, the role of RHOA in cancer development appears to be cell con text-dependent, which may be further complicated by the differential availability of the various binding partners in different cell types. Our studies here define a clear role for RHOA in promoting leukemogenesis of Ph+ CML, since its knockout completely suppressed leukemogenesis in vivo. However, in our studies in stem cell leukemia/lym phoma syndrome driven by the BCR-FGFR1 chimeric ki nase, prevention of RHOA activation as a result of deletion of the GEF domain led to a more aggressive disease,12 further highlighting the contextual role of RHOA in differ ent cancer cell types.
While the mechanism by which RHOA influences the ma lignant phenotype is still emerging, in the CML cell model we describe, RHOA clearly has a profound influence on gene expression profiles and appears to activate many genes involved in cell migration and actin cytoskeleton in teractions. It was shown some time ago that activated RHOA is required for transcriptional activation by SRF32 and that this is facilitated by RHOA-dependent relocation of SRF into the nucleus. We now show that migration and invasion of CML cells are regulated by the SRF transcrip tion factor, which is well known to promote expression of genes involved in these phenotypes.31 IGFBP2 was the most highly affected gene resulting from RHOA knockout, which we now show is regulated directly by SRF in a
RHOA-dependent manner. IGFBP2 also directly influences cell migration and adhesion as well as homing of cells to the bone marrow.

Knockout of IGFBP2 led to impaired cell migration and ad hesion and improved survival in the CML animal model, implying a significant direct role in leukemogenesis. IGFBP2 is highly expressed in a broad range of cancers, including leukemias, and has become a valuable bio marker for poor outcome. In some cancer types IGFBP2 also promotes cell migration and invasion36 and the fact that it is regulated by SRF further demonstrates the close interaction to promote RHOA-mediated signaling. As a se creted protein, it serves its main function through binding
to IGF receptors to initiate signal transduction involved in oncogenesis and fetal development, although it has also been shown to signal through IGF-independent mechan isms.31 In cancers such as gliomas, it is recognized as an oncogene and potential target for therapy.35 In particular, IGFBP2 binds to integrins,37 which are involved in tumor progression, migration and metastasis. IGFBP2 is a pivotal regulator of the process of epithelial-mesenchymal tran sition through the PI3K/AKT axis and the NFKB pathway by activating PI3K/ATK and suppressing PTEN.36-38 The ob servations presented here confirm a direct role for IGFBP2 in the regulation of leukemia cell mobility which con tributes to leukemia progression. In addition, tumorigenic
Figure 6. RHOA activates IFGBP2 expression through serum response factor. (A) Luciferase expression analysis shows that in the presence of the IGFBP2 promoter there was an increase in activity that was proportional to the levels of serum response factor (SRF) transfected in the same cells. (B) When SRF was overexpressed in either NIH3T3 or BaF3 cells, there was a proportional increase in IGFBP2 expression. (C) When K562 cells were treated with RHOA activator I, levels of SRF declined in the cytoplasm but increased in the nucleus. The relative purity of the cytoplasmic and nuclear protein enrichment was demonstrated by the almost exclusive presence of proteins GAPDH (cytoplasm) and Lamin A (nucleus). (D) The same increased levels of SRF in the nucleus of adherent 3T3 cells following RHOA activation was seen using confocal microscopy. (E) Chromatin immunoprecipitation quantitative polymerase chain reaction analysis from K562 cells using primers P1, which target the IGFBP2 promoter region, showed occupancy of SRF on the IGFBP2 promoter (SRF-), which was increased when the cells were treated with the RHOA ac tivator (SRF+). In the same experimental model, no significant changes were seen in the downstream intron region defined by the P2 primers. The scale bar in (D) represents 50 µm. Differences between the knockout and matched control cells were evalu ated using the Student t test. Cells transduced with empty vector were used as the control for comparison in (B). *P<0.01, **P≤0.001, ***P≤0.0001, ****P≤0.00001, ns: not significant. MSCV: murine stem cell virus; EV: empty vector.
cell-derived IGFBP2 has also been shown to support in vitro and in vivo expansion of hematopoietic stem cells.3941 It appears therefore that IGFBP2 expression in the leukemia cells, through RHOA-SRF signaling, may also contribute to leukemia progression by influencing the bone marrow microenvironment and modulating hemato

poietic cells, concepts that are worthy of further investi gation. In our studies we focused on the role of RHOA in the de velopment of p210-expressing CML cells. While the struc tural loss of the GEF domain in p190-expressing leukemias precludes RHOA activation, these leukemias show a more
Figure 7. Knockout of IFGBP2 partially recapitulates the phenotype of RHOA loss. (A) Analysis of the supernatant from K562 C8 and KU812 C7 knockout (KO) cells when compared with the respective mock control (MC) cells, showed a dramatic reduction in IGFBP2 protein levels in the KO cell culture medium. (B) In migration and adhesion analysis, K562 KO C8 cells showed a reduction in both phenotypes compared with MC cells. When exogenous, recombinant IGFBP2 (rIGFBP2) was added to the culture medium, there was a significant increase in both phenotypes in the KO C8 cells. (C, D) CRISPR knockout of IGFBP2 in K562 cells generated two clones, C5 and C11 (C), which when subjected to migration and adhesion assays (D) showed reduced levels compared with MC cells. (E) When these cells were xenografted into NSG hosts, mice receiving KO clones C5 and C11 showed an increased sur vival compared with MC-engrafted mice. (F) This result was consistent with luminescence intensity in the mice after 28 days, which showed that the tumor burden was significantly reduced in the mice grafted with the KO C5 cells compared to that of mice engrafted with MC cells. White blood cell count at the time of sacrifice was also reduced in the mice grafted with KO C5 cells. The scale bars in (B) and (D) represent 400 µm, with the magnification for the images in (B) and (D) being the same. Dif ferences between the KO and MC cells were evaluated using the Student t test. Pairwise comparisons are indicated by the hori zontal lines. **P≤0.001, ***P≤0.0001, ****P ≤0.00001. CM: culture medium; WBC: white blood cells.
aggressive disease course. Here, we clearly demonstrate a critical disease-promoting role for RHOA in p210-ex pressing CML. With regard to leukemogenesis in p190-ex pressing cells, it appears that these cells have evolved other molecular oncogenic mechanisms that are indepen dent of RHOA function. Indeed, in gene expression studies comparing p190- and p210-expressing leukemias there was a significant difference in gene expression patterns.42 p190-expressing CML samples exhibited an upregulation of interferon, IL1R and p53 and hyperactivation of STAT1/JAK1, SRC and PAK1 signaling, all of which are re lated to aggressive cell growth. p190-expressing CML, al though rare, showed gene expression patterns similar to the p190-expressing acute lymphoblastic leukemia samples. In addition, using quantitative comparative pro teomics, strong differences in the interaction and cellular phosphoproteome were identified between p190- and p210-expressing cells in two different studies.43,44 Thus, it appears that the course of disease progression in cells expressing the variant Ph chromosome translocations is likely due to their different overall genetic signatures and that RHOA activation is specifically important on the background of the p210-directed genetic changes driving
1. Jaffe AB, Hall A. Rho GTPases: biochemistry and biology. Ann Rev Cell Dev Biol. 2005;21:247-269.
2. Thumkeo D, Watanabe S, Narumiya S. Physiological roles of Rho and Rho effectors in mammals. Eur J Cell Biol. 2013;92(10-11):303-315.
3. Ridley AJ, Hall A. The small GTP-binding protein rho regulates the assembly of focal adhesions and actin stress fibers in response to growth factors. Cell. 1992;70(3):389-399.
4. Lawson CD, Ridley AJ. Rho GTPase signaling complexes in cell migration and invasion. J Cell Biol. 2018;217(2):447-457.
5. Pedersen E, Brakebusch C. Rho GTPase function in development: how in vivo models change our view. Exp Cell Res. 2012;318(14):1779-1787.
6. Gilbert-Ross M, Marcus AI, Zhou W. RhoA, a novel tumor suppressor or oncogene as a therapeutic target? Genes Dis. 2015;2(1):2-3.
7. Svensmark JH, Brakebusch C. Rho GTPases in cancer: friend or foe? Oncogene. 2019;38(50):7447-7456.
8. Prendergast GC, Khosravi-Far R, Solski PA, Kurzawa H, Lebowitz PF, Der CJ. Critical role of Rho in cell transformation by oncogenic Ras. Oncogene. 1995;10(12):2289-2296.
9. Yoo HY, Sung MK, Lee SH, et al. A recurrent inactivating mutation in RHOA GTPase in angioimmunoblastic T cell lymphoma. Nat Genet. 2014;46(4):371-375.
10. Sakata-Yanagimoto M, Enami T, Yoshida K, et al. Somatic RHOA mutation in angioimmunoblastic T cell lymphoma. Nat Genet. 2014;46(2):171-175.
11. Palomero T, Couronné L, Khiabanian H, et al. Recurrent mutations in epigenetic regulators, RHOA and FYN kinase in peripheral T cell lymphomas. Nat Genet. 2014;46(2):166-170.
12. Hu T, Chong Y, Lu S, et al. Loss of the BCR-FGFR1 GEF domain
leukemogenesis. Disclosures
No conflicts of interest to disclose.
JKC and TH conceived and planned the experiments, which were performed by HZ, BC, YL, YC, AM, SFM, XF and TH. The RNA-sequencing assay was performed by EK and CSC. PW contributed to design of the experiment and data interpre tation. JKC and TH wrote the manuscript.
This research was conducted in part in the Georgia Cancer Center Shared Resources (Cores).
This work was supported by grant CA076167 (to JKC) from the National Institutes of Health, USA.
RNA-sequencing data are available from the correspond ing author upon request.
suppresses RHOA activation and enhances B-lymphomagenesis in mice. Cancer Res. 2019;79(1):114-124.
13. Quintás-Cardama A, Cortes J. Molecular biology of bcr-abl1positive chronic myeloid leukemia. Blood. 2009;113(8):1619-1623.
14. Pane F, Intrieri M, Quintarelli C, Izzo B, Muccioli GC, Salvatore F. BCR/ABL genes and leukemic phenotype: from molecular mechanisms to clinical correlations. Oncogene. 2002;21(56):8652-8667.
15. Wong S, Witte ON. The BCR-ABL story: bench to bedside and back. Annu Rev Immunol. 2004;22:247-306.
16. Baccarani M, Iacobucci I, Chiaretti S, et al. In Ph+BCRABL1(P210+) acute lymphoblastic leukemia the e13a2 (B2A2) transcript is prevalent. Leukemia. 2020;34(3):929-931.
17. Burmeister T, Schwartz S, Bartram CR, Gökbuget N, Hoelzer D, Thiel E; GMALL study group. Patients' age and BCR-ABL frequency in adult B-precursor ALL: a retrospective analysis from the GMALL study group. Blood. 2008;112(3):918-919.
18. Li S, Ilaria RL Jr, Million RP, Daley GQ, Van Etten RA. The P190, P210, and P230 forms of the BCR/ABL oncogene induce a similar chronic myeloid leukemia-like syndrome in mice but have different lymphoid leukemogenic activity. J Exp Med. 1999;189(9):1399-1412.
19. Kovacic B, Hoelbl A, Litos G, et al. Diverging fates of cells of origin in acute and chronic leukaemia. EMBO Mol Med. 2012;4(4):283-297.
20. Sahay S, Pannucci NL, Mahon GM, et al. The RhoGEF domain of p210 Bcr-Abl activates RhoA and is required for transformation. Oncogene. 2008;27(14):2064-2067.
21. Wang Z, Kim J, Teng Y, et al. Loss of ATF3 promotes hormoneinduced prostate carcinogenesis and the emergence of CK5+CK8+ epithelial cells. Oncogene. 2016;35(21):3555-3564.
22. Cowell JK, Qin H, Hu T, Wu Q, Bhole A, Ren M. Mutation in the FGFR1 tyrosine kinase domain or inactivation of PTEN is associated with acquired resistance to FGFR inhibitors in FGFR1-driven leukemia/lymphomas. Int J Cancer. 2017;141(9):1822-1829.
23. Hu T, Wu Q, Chong Y, et al. FGFR1 fusion kinase regulation of MYC expression drives development of stem cell leukemia/lymphoma syndrome. Leukemia. 2018;32(11):2363-2373.
24. Kent WJ, Sugnet CW, Furey TS, et al. The human genome browser at UCSC. Genome Res. 2002;12(6):996-1006.
25. Hu T, Pi W, Zhu X, et al. Long non-coding RNAs transcribed by ERV-9 LTR retrotransposon act in cis to modulate long-range LTR enhancer function. Nucleic Acids Res. 2017;45(8):4479-4492.
26. Piranlioglu R, Lee E, Ouzounova M, et al. Primary tumor-induced immunity eradicates disseminated tumor cells in syngeneic mouse model. Nat Commun. 2019;10:1430.
27. Taniguchi Ishikawa E, Chang KH, Nayak R, et al. Klf5 controls bone marrow homing of stem cells and progenitors through Rba5-mediated B1/b2-integrin trafficking. Nat Commun. 2013;4:1660.
28. Ren M, Qin H, Kitamura E, Cowell JK. Dysregulated signaling pathways in the development of CNTRL-FGFR1-induced myeloid and lymphoid malignancies associated with FGFR1 in human and mouse models. Blood. 2013;122(6):1007-1016.
29. Deregowska A, Pepek M, Pruszczyk K, Machnicki MM, Wnuk M, Stoklosa T. Differential regulation of telomeric complex by BCRABL1 kinase in human cellular models of chronic myeloid leukemia - from single cell analysis to next-generation sequencing. Genes. 2020;11(10):1145.
30. Hu T, Chong T, Lu S, McGuinness M, Williams DA, Cowell JK. RAC1/2 activation promotes FGFR1 driven leukemogenesis in stem cell leukemia/lymphoma syndrome. Haematologica. 2020;105(2):e68-e71.
31. Onuh JO, Qiu H. Serum response factor-cofactor interactions and their implications in disease. FEBS J. 2021;288(10):3120-3134.
32. Hill CS, Wynne J, Treisman R. The Rho family GTPases RhoA, Rac1, and CDC42Hs regulate transcriptional activation by SRF. Cell. 1995;81(7):1159-1170.
33. Ikeda T, Hikichi T, Miura H, et al. Srf destabilizes cellular identity
by suppressing cell-type-specific gene expression programs. Nat Commun. 2018;9(1):1387.
34. Chen X, Zheng J, Zou Y, Song C, Hu X, Zhang CC. IGF binding protein 2 is a cell-autonomous factor supporting survival and migration of acute leukemia cells. J Hematol Oncol. 2013;6(1):72.
35. Pickard A, McCance DJ. IGF-binding protein 2 - oncogene or tumor suppressor? Front Endocrinol. 2015;6:25.
36. Gao S, Sun Y, Zhang X, et al. IGFBP2 activates the NF-κB pathway to drive epithelial-mesenchymal transition and invasive character in pancreatic ductal adenocarcinoma. Cancer Res. 2016;76(22):6543-6554.
37. Wang GK, Hu L, Fuller GN, Zhang W. An interaction between insulin-like growth factor-binding protein 2 (IGFBP2) and integrin alpha5 is essential for IGFBP2-induced cell mobility. J Biol Chem. 2006;281(20):14085-14091.
38. Li T, Forbes ME, Fuller GN, Li J, Yang X, Zhang W. IGFBP2: integrative hub of developmental and oncogenic signaling network. Oncogene. 2020;39(11):2243-2257.
39. Huynh H, Iizuka S, Kaba M, et al. Insulin-like growth factorbinding protein 2 secreted by a tumorigenic cell line supports ex vivo expansion of mouse hematopoietic stem cells. Stem Cells. 2008;26(6):1628-1635.
40. Zhang CC, Kaba M, Iizuka S, Huynh H, Lodish HF. Angiopoietinlike 5 and IGFBP2 stimulate ex vivo expansion of human cord blood hematopoietic stem cells as assayed by NOD/SCID transplantation. Blood. 2008;111(7):3415-3423.
41. Huynh H, Zheng J, Umikawa M, et al. IGF binding protein 2 supports the survival and cycling of hematopoietic stem cells. Blood. 2011;118(12):3236-3243.
42. Adnan-Awad S, Kim D, Hohtari H, et al. Characterization of p190-Bcr-Abl chronic myeloid leukemia reveals specific signaling pathways and therapeutic targets. Leukemia. 2021;35(7):1964-1975.
43. Cutler JA, Tahir R, Sreenivasamurthy SK, et al. Differential signaling through p190 and p210 BCRABL fusion proteins revealed by interactome and phosphoproteome analysis. Leukemia. 2017;31(7):1513-1524.
44. Reckel S, Hamelin R, Georgeon S, et al. Differential signaling networks of Bcr–Abl p210 and p190 kinases in leukemia cells defined by functional proteomics. Leukemia. 2017;31(7):1502-1512.
Lara Valente de Souza,1,2 Alexander Hoffmann,1,2 Christine Fischer,1 Verena Petzer,1 Malte Asshoff,1 Igor Theurl,1 Piotr Tymoszuk,1 Markus Seifert,1,2 Natascha Brigo,1 Richard Hilbe,1 Egon Demetz,1 Laura Von Raffay,1 Sylvia Berger,1 Marina Barros-Pinkelnig1 and Guenter Weiss1,2
1Department of Internal Medicine II, Infectious Diseases, Immunology, Rheumatology and 2Christian Doppler Laboratory for Iron Metabolism and Anemia Research, Medical University of Innsbruck, Innsbruck, Austria.
Correspondence: G. Weiss guenter.weiss@i-med.ac.at
Received: March 29, 2022.
Accepted: June 29, 2022.
Prepublished: July 7, 2022.
https://doi.org/10.3324/haematol.2022.281149
©2023 Ferrata Storti Foundation
Published under a CC BY-NC license
Anemia is a major health issue and associated with increased morbidity. Iron deficiency anemia (IDA) is the most prevalent, followed by anemia of chronic disease (ACD). IDA and ACD often co-exist, challenging diagnosis and treatment. While iron supplementation is the first-line therapy for IDA, its optimal route of administration and the efficacy of different repletion strategies in ACD are elusive. Female Lewis rats were injected with group A streptococcal peptidoglycan-polysaccharide (PG-APS) to induce inflammatory arthritis with associated ACD and/or repeatedly phlebotomized and fed with a low iron diet to induce IDA, or a combination thereof (ACD/IDA). Iron was either supplemented by daily oral gavage of ferric maltol or by weekly intravenous (i.v.) injection of ferric carboxymaltose for up to 4 weeks. While both strategies reversed IDA, they remained ineffective to improve hemoglobin (Hb) levels in ACD, although oral iron showed slight amelioration of vari ous erythropoiesis-associated parameters. In contrast, both iron treatments significantly increased Hb in ACD/IDA. In ACD and ACD/IDA animals, i.v. iron administration resulted in iron trapping in liver and splenic macrophages, induction of ferritin expression and increased circulating levels of the iron hormone hepcidin and the inflammatory cytokine interleukin-6, while oral iron supplementation reduced interleukin-6 levels. Thus, oral and i.v. iron resulted in divergent effects on sys temic and tissue iron homeostasis and inflammation. Our results indicate that both iron supplements improve Hb in ACD/IDA, but are ineffective in ACD with pronounced inflammation, and that under the latter condition, i.v. iron is trapped in macrophages and may enhance inflammation.
Anemia is a major health issue and its prevalence reaches 30% of the world's population.1,2 Iron deficiency anemia (IDA) is the most prevalent form,3 followed by anemia of chronic disease (ACD), also known as anemia of inflam mation (AI).4,5 In many cases, ACD can be associated with IDA, mostly due to concomitant blood loss in association with chronic inflammatory disorders.2,4,6,7
Iron is necessary for numerous cellular functions and its reduced availability can lead to impaired metabolic activ ity and mitochondrial dysfunction. Opposing, iron overload can cause cellular malfunction by catalyzing toxic radical formation. In particular, iron is crucial for effective ery thropoiesis, as 25-30 mg is needed daily mainly for heme
biosynthesis to generate erythrocytes.8-10 Approximately 90% of iron used for this process originates from macro phages, responsible for engulfi ng senescent red blood cells (RBC) and redistributing the iron to the bone marrow (BM), whereas only 5-10% of the daily needs from iron are covered by dietary iron absorption in the duodenum in hu mans,2,11,12 while this number can reach 25% in healthy rats.13
Systemic iron homeostasis is controlled by the hepato cyte-derived peptide hepcidin (encoded by the gene Hamp). It binds to ferroportin (encoded by the gene Fpn1), the only known cellular iron exporter, leading to its lyso somal internalization and degradation.14 High plasma iron concentration but also inflammatory stimuli induce hep cidin production and diminishes Fpn1 expression, thereby
resulting in macrophage iron retention and reduced duo denal iron absorption.2-4 Hallmarks are low circulating iron and increased ferritin (FT) levels.15 Over time, inflamma tion-driven iron retention results in the development of ACD. In addition, negative effects of cytokines on erythroid progenitor cell differentiation, on the biological activity of the red cell hormone erythropoietin (EPO) and on the cir culatory half-life of erythrocyte further contribute to ACD development.4,16 In contrast, low iron availability inhibits hepcidin production and enables efficient dietary iron ab sorption and iron redistribution from macrophages.2,8,15 IDA develops due to absolute iron deficiency, resulting from blood losses and/or inadequate iron absorption.3,17 ACD is characterized as normochromic/normocytic, whereas IDA presents with a microcytic/hypochromic phenotype along with low circulating iron levels, reduced saturation of iron with transferrin (TSAT) and reduced FT.17-19 While IDA is the consequence of absolute or true iron deficiency, inflam mation-driven iron retention in macrophages causes functional iron deficiency, making the metal unavailable for erythropoietic progenitors. Thus, IDA and ACD have dif ferent pathophysiology and diagnostic hallmarks.2-4,18,20,21 A specific clinical challenge is to differentiate patients with ACD from those with ACD and combined true iron deficiency (ACD/IDA). This is of importance because these two specific groups of patients may need different ther apies.3,4,18 Although no single laboratory marker accurately provides a correct differential diagnosis, subjects with ACD/IDA have lower circulating hepcidin levels, lower he moglobin (Hb) reticulocyte content, a higher percentage of hypochromic RBC or an increased FT index as com pared to ACD individuals.18,19,21-23
The best approach towards anemia is to identify and treat its underlying cause. While in IDA iron supplementation is the treatment of choice to replenish depleted iron stores,17,18,24 the efficacy of this measure for the treatment of ACD is less clear. It may largely depend on the under lying disease and its inflammatory activity, the mode of iron administration and its potential off-target effects, es pecially considering that ACD may result from a defense strategy of the body to limit the availability of the nutrient iron to invading microbes or malignant cells.4,17,24-26
Iron can be therapeutically administrated either in oral or intravenous (i.v.) forms. In most cases of iron deficiency, oral iron supplementation is the first choice. However, gastrointestinal side effects may limit therapeutic adher ence and inflammation-driven hepcidin levels reduce duodenum iron absorption.2,4,15,27,28 In such situations, i.v. iron is the preferred treatment. Specifically, new carbo hydrate preparations enable higher single dose applica tions.7,17,18,24,29 However, iron carbohydrate complexes are primarily ingested by macrophages and the release of iron into the circulation via FPN1 is controlled by hepcidin,14,15,30 thereby trapping iron in macrophages in situations when
hepcidin levels are high. In order to systemically study the pharmacokinetics and therapeutic efficacy of iron supplementation in IDA, ACD and ACD/IDA, we performed a comparative analysis of oral iron therapy with ferric maltol (F. Maltol) and i.v. iron treat ment with ferric carboxymaltose (FCM), employing well established rat models.15,31,32
The animal experiments were approved by the Medical University of Innsbruck and the Austrian Federal Ministry of Science and Research (BMBWF-66.011/0138WF/V/3b/2016). We used a widely used model of IDA, ACD and a combination thereof employing 6-week-old female Lewis rats as previously described.15 For iron treatments we used either F. Maltol for oral iron supplementation or FCM for i.v. iron therapy, two clinically established drugs for therapy of iron deficiency. Further details are provided in the Online Supplementary Appendix.
Blood sample analysis and iron measurements, evaluation of tissue iron homeostasis and erythropoiesis Analysis of blood parameters, tissue iron homeostasis, and determination of erythropoietic activity was per formed as previously described and further information is given in the Online Supplementary Appendix. 32
Statistical analysis was carried out using GraphPad Prism version 8 for Windows (GraphPad Software). Data are presented as mean ± standard deviation (SD) unless otherwise specified. Significant differences between groups are specified in each figure legend and were de termined using either a one way ANOVA with Dunnet's multiple comparisons test, or two way ANOVA with Sidak's multiple comparisons test. The sample size for each ani mal experiment was estimated based on previous experi ence, usually with five animals per control group and five to eight animals per untreated and treatment groups. Ac cording to each experiment, rats were randomly assigned to the different groups. A P value <0.05 was used as the significance threshold.
Effects of oral and intravenous iron on systemic and tissue iron homeostasis, erythropoiesis and hemoglobin levels in iron deficiency anemia
We first investigated the therapeutic effects of iron sup plementation in the IDA model. Untreated IDA rats had the
major characteristics of IDA caused by low iron intake and blood loss, with microcytic and hypochromic anemia, low plasma iron and increased reticulocyte counts (Figure 1A to E), as compared to control animals. Supplementation of either oral or i.v. iron at both dosages had a comparable efficacy in ameliorating anemia at the end of the treat ment period resulting in normalization of Hb levels, red cell indices and plasma iron levels. In contrast, reticulo cyte counts were reduced as compared to untreated IDA animals, which is in line with therapeutic correction of anemia (Figure 1A to E). When evaluating erythroid pro genitor subpopulations in the BM, we found that the in crease of pro-erythroblasts in IDA rats was reversed by iron treatment, while orthochromatic erythroblasts were significantly higher in IDA and iron treated animals than in controls (Figure 1F). We then investigated iron homeostasis in the liver, duo denum and spleen. As expected, Hamp mRNA levels were significantly reduced in untreated IDA rats compared to
controls and increased upon iron supplementation (Figure 2A). Oral iron treatment resulted in significantly lower Hamp mRNA levels than in control animals. Intravenously iron-supplemented animals, specifically those which re ceived the higher dosage, presented with the highest Hamp expression, which even exceeded that of control animals (Figure 2A). The mRNA expression of the hepcidin modulator bone morphogenetic protein 6 (Bmp6)33 was reduced in IDA as compared to controls but increased with iron supplementation (Figure 7A). Similar trends were seen when measuring hepcidin levels in plasma, with sig nificant differences between control and rats treated with i.v. iron (Figure 2B). In parallel, plasma EPO levels were higher in IDA untreated animals and returned to control levels with iron supplementation (Figure 7B). While a re duction of liver iron content was evident in untreated IDA compared to control rats and iron levels returned to the value of controls in orally iron supplemented rats, we found a dose-dependent increase in liver iron concentra

Figure 1. Oral and intravenous
improve blood count parameters and bone marrow erythropoiesis in a rat model of iron deficiency anemia. (A) Hemoglobin (Hb) levels. (B) Mean corpuscular volume (MCV). (C) Mean corpuscular Hb con centration (MCHC). (D) Plasma iron measurement. (E) Reticulocytes were analyzed by flow cytometry. (F) Bone marrow popu lations consisting of: pro-erythroblasts (Pro-E; population I), basophilic erythroblasts (Baso-E; population II), polychromatic erythroblasts (Poly-E; population III), orthochromatic erythroblasts (Ortho-E; population IV) and mature red blood cells (RBC) (Mature RBC; population V) were analyzed by flow cytometry. One-way ANOVA with Dunnett’s multiple comparisons test between iron deficiency anemia (IDA) and all other groups was applied for panels (A to E). Two-way ANOVA with Dunnett’s multiple com parisons test for each population, between control and IDA groups with all groups was applied for panel (F). *P<0.05, **P<0.01, ***P<0.001, ****P<0.0001. #P<0.05. Results are shown as mean ± standard deviation. Results are from one representative ex periment with 5-8 animals per group. F Maltol: ferric maltol; FCM: ferric carboxymaltose.
tions following i.v. iron supplementation (Figure 2C). When studying the expression of essential iron metab olism genes in the liver, we found that Fpn1 mRNA levels were lower in IDA than in control animals, but slightly in creased with iron supplementation (Online Supplementary Figure S4C). Of note, while FPN1 protein levels were low in untreated IDA and control rats and did not increase with oral iron treatment, an induction was observed with
i.v. iron treatment (Figure 2C; Online Supplementary Figure S4F). A similar effect was observed for the iron storage protein FT, which increased with iron supplementation, most prominently with i.v. iron treatment (Figure 2C; On line Supplementary Figure S4G). These alterations of FPN1 and FT expression were in good association with respect ive changes in liver iron content (Figure 2C). The ex pression of nuclear receptor co-activator 4 (NCOA4)

Figure 2. Oral and more prominently intravenous iron supplementations increase hepcidin levels in the liver and iron concentration in the liver and spleen in a rat model of iron deficiency anemia. (A) Liver Hamp mRNA levels. (B) Hepcidin plasma levels at baseline and end of the observation period measured by enzyme-linked immunosorbent assay. (C) Liver iron concentration and protein expression measured by western blot (WB) of TFR1, NCOA4, FPN1 and FT; b actin (ACTB) was used as the house keeping protein. (D) Spleen iron concentration and protein expression measured by WB of TFR1, NCOA4, FPN1 and FT; b actin (ACTB) was used as the housekeeping protein. One-way ANOVA with Dunnett´s multiple comparisons test between control and iron deficiency anemia (IDA) against all other groups was applied for panel (A), and IDA against all other groups for panels (C and D). For results shown in (B), two-way ANOVA with Sidak´s multiple comparisons test was used for analyzing differences between baseline and end of the observation period of each group. *P<0.05, **P<0.01, ***P<0,001, ****P<0.0001. The same test was used to analyze differences at end of the experiment between control and IDA groups with all other groups. #P<0.05, ##P<0.01, ###P<0,001, ####P<0.0001. $$$$P<0.0001. Results are shown as mean ± standard deviation. Results are from 1 representative experiment with 5-8 animals per group. F Maltol: ferric maltol ; FCM: ferric carboxymaltose.
(encoded by the gene Ncoa4), which is the cargo receptor for the degradation of FT and re-utilization of stored iron in cells34 was insignificantly altered between the different groups (Figure 2C; Online Supplementary Figure S4B and E). Finally, transferrin receptor protein 1 (TFR1) (encoded by the gene Tfr1) mRNA and protein levels were signifi cantly increased in the IDA group and reduced by iron supplementation, being in line with the known regulation of this gene by iron deficiency and iron regulatory pro teins (Figure 2C; Online Supplementary Figure S4A and D). 8
We also measured the mRNA expression of the divalent metal transporter-1 (encoded by the gene Dmt1) in the duodenum, because it is the major iron transporter shutt ling dietary and orally supplemented iron from the intes tinal lumen into the enterocyte.35,36 Duodenal Dmt1 mRNA expression increased in untreated IDA as compared to other groups, and iron supplementation reduced Dmt1 mRNA levels to that found in controls (Online Supplemen tary Figure S3A).
We further analyzed the effects of IDA and iron supple mentation in the spleen, which largely consists of mac rophages involved in iron recycling and delivery for erythropoiesis.12 Accordingly, splenic iron concentration was reduced in IDA compared to controls but remained unchanged with oral iron supplementation (Figure 2D). Meanwhile, i.v. iron therapy resulted in a signi ficant in crease in splenic iron content being compatible with ac quisition and storage of iron-carbohydrate complexes within macrophages.2 This was paralleled by concomitant alterations of FT and FPN1 protein expression in IDA with and without different iron treatments, while Fpn1 mRNA levels did not change with iron supplementation (Figure 2D; Online Supplementary Figure S4J, M and N). NCOA4 protein levels and TFR1 protein and mRNA levels in creased with IDA, both indicative of increased iron needs, and returned to control levels with iron treatments (Fig ure 2D; Online Supplementary Figure S4H, I, K and L). Taken together, these results show that in the setting of IDA, oral and i.v. iron were equally effective in correcting anemia, but surplus i.v. iron was stored in the liver and spleen, presumably within macrophages.
Effects of oral and intravenous iron treatment on systemic and tissue iron homeostasis, erythropoiesis and hemoglobin levels in anemia of chronic disease
At the end of the treatment period, neither oral nor i.v. iron significantly changed Hb levels, MCV or MCHC as compared to untreated ACD animals (Figure 3A to C). Plasma iron levels were reduced in ACD and remained un changed following i.v. iron treatment, whereas oral iron therapy resulted in a slight but insignificant increase (Fig ure 3D). Of interest, oral iron supplementation approxi mated the number of reticulocytes to the control group, while for intravenously treated animals the reticulocyte counts were higher and comparable to untreated ACD ani mals (Figure 3E). In the BM, ACD rats and intravenously but not orally iron-supplemented animals had signifi cantly lower number of orthochromatic erythroblasts than control animals (Figure 3F).
We found that, at the end of the study period, Hamp mRNA expression in the liver was not significantly differ ent between control and untreated ACD animals. Oral iron treatment had no effect on Hamp levels, whereas i.v. iron therapy resulted in a significant increase in Hamp ex pression compared to the ACD group (Figure 4A). These changes were mirrored by hepcidin levels in plasma, which significantly increased with i.v. iron therapy over time (Figure 4B), being in line with higher liver iron content following i.v. therapy of ACD animals (Figure 4D). Interest ingly, mRNA Bmp6 expression was lower in the ACD-untreated animals than in the control groups and no differ ence was seen with iron supplementation (Figure 7C). Plasma EPO levels were higher in untreated and intra venously supplemented ACD compared to control ani mals, while reduced in the groups receiving oral iron (Figure 7D). Further, we also analyzed for changes in IL-6 levels, a marker of inflammation and major inducer of hepcidin expression.2 While IL-6 levels were increased but not different between the treatment groups at study initi ation, oral iron therapy significantly reduced plasma IL-6 levels. Meanwhile, they remained unchanged in untreated ACD rats over time, whereas they significantly increased in animals receiving higher i.v. iron (Figure 4C). In the liver, we did not observe obvious changes in the
Figure 3. Oral and especially intravenous iron supplementation do not ameliorate blood count parameters and bone marrow erythropoiesis in a rat model of anemia of chronic disease. (A) Hemoglobin (Hb) levels. (B) Mean corpuscular volume (MCV). (C) Mean corpuscular Hb concentration (MCHC). (D) Plasma iron concentration. (E) Reticulocytes were analyzed by flow cytometry. (F) Bone marrow populations consisting of proerythroblasts (Pro-E; population I), basophilic erythroblasts (Baso-E; population II), polychromatic erythroblasts (Poly-E; population III), orthochromatic erythroblasts (Ortho-E; population IV) and mature red blood cells (RBC) (Mature RBC; population V) were analyzed by flow cytometry. One-way ANOVA with Dunnett’s multiple com parisons test between anemia of chronic disease (ACD) and all other groups was applied for panels (A to E). Two-way ANOVA with Dunnett’s multiple comparisons test for each population, between control and all groups was applied for panel (F). *P<0.05, **P<0.01, ***P<0.001, ****P<0.0001. Results are shown as mean ± standard deviation. Results are from 1 representative experi ment with 5-8 animals per group. F Maltol: ferric maltol ; FCM: ferric carboxymaltose.
mRNA expression of Fpn1, Tfr1 or Ncoa4 (Online Supple mentary Figure S5A to C). Despite high hepcidin levels, FPN1 protein levels (Figure 4D; Online Supplementary Fig ure S5F) did not change with i.v. iron treatment, and TFR1 protein concentrations were higher in untreated ACD than in control animals as previously described15 (Figure 4D; Online Supplementary Figure S5D). NCOA4 protein ex pression showed no consistent regulation, whereas FT levels were higher with i.v. iron treatment than in un treated and orally iron supplemented ACD rats (Figure 4D; Online Supplementary Figure S5E and G). Dmt1 mRNA ex pression in the duodenum did not differ between the groups (Online Supplementary Figure S3B).
A similar trend was observed in the spleen, where i.v. iron treatment caused increased splenic iron concentrations and higher FT levels compared to all other groups (Figure 4E; Online Supplementary Figure S5N). In agreement with the effects of cytokines and hepcidin on FPN1 ex pression,14,37 we observed its reduction in untreated ACD compared to control rats (Figure 4E; Online Supplemen tary Figure S5J and M). Iron supplementation increased
FPN1 protein expression, which was most prominent with high i.v. iron treatment, that also resulted in reduced pro tein expression of the FT decay receptor NCOA4 (Figure 4E; Online Supplementary Figure S5J, L and M). Finally, Tfr1 mRNA and protein levels were higher in the ACD group and i.v. iron-treated animals than in controls or rats treated with oral iron therapy (Figure 4E; Online Supplementary Figure S5H and K).

These data indicate that with advanced inflammation, both oral and i.v. iron cannot improve Hb levels. However, we observed striking differences of oral versus i.v. iron therapy on systemic and tissue iron homeostasis.
Effects of oral and intravenous iron on systemic and tissue iron homeostasis, erythropoiesis, and hemoglobin levels in anemia of chronic disease/iron deficiency anemia
We then investigated the effects of iron supplementation in ACD rats with combined true iron deficiency (ACD/IDA). Compared to ACD, ACD/IDA rats had lower Hb, MCV, MCHC and plasma iron levels (Figure 5A to D), while reticulocyte
Figure 4. Intravenous but not oral iron supplementation increases inflammatory parameters in the liver, as well as iron concen tration in the liver and spleen in a rat model of anemia of chronic disease. (A) Hamp mRNA levels. (B) Plasma hepcidin and (C) interleukin-6 (IL-6) (values for healthy animals ranged from 15,4 pg/mL to 57,6 pg/mL) levels at baseline and end of the obser vation period measured by enzyme-linked immunosorbent assay. (D) Liver iron concentration and protein expression measured by western blot (WB) of TFR1, NCOA4, FPN1 and FT; b actin (ACTB) was used as the housekeeping protein. (I) Spleen iron con centration and protein expression measured by WB of TFR1, NCOA4, FPN1 and FT; b actin (ACTB) was used as the housekeeping protein. One-way ANOVA with Dunnett´s multiple comparisons test between ACD and all other groups was applied for results shown in (A, D and E). For results shown in (B and C), two-way ANOVA with Sidak´s multiple comparisons test was used for ana lyzing differences between baseline and end of the observation period of each group. *P<0.05, **P<0.01, ***P<0,001, ****P<0.0001. Two-way ANOVA with Sidak´s multiple comparisons test was used to analyze differences between ACD with all other groups at end of the experiment. #P<0.05, ##P<0.01, ###P<0,001, ####P<0.0001. Results are shown as mean ± standard deviation. Results are from one representative experiment with 5-8 animals per group. F Maltol: ferric maltol ; FCM: ferric carboxymaltose
counts were higher in the latter (Figure 5E). Animals that received oral and i.v. iron supplementation significantly improved Hb concentrations and MCV, but not MCHC, compared to untreated ACD/IDA animals (Figure 5A to C), while reticulocyte numbers were not different from un
treated ACD/IDA animals (Figure 5E). When analyzing the BM (Figure 5F), untreated ACD/IDA had higher amounts of pro-erythroblasts than all other groups, which were re duced with both iron treatments. Meanwhile, orthochro matic erythroblasts were higher in ACD/IDA and all

treatment groups than in ACD, except for the group sup plemented with high i.v. iron. Numbers of mature RBC were lower in ACD and ACD/IDA compared to the controls and not significantly changed by iron treatment (Figure 5F).
When analyzing for changes in iron homeostasis, we found that ACD/IDA animals had significantly lower Hamp mRNA expression and plasma hepcidin levels than control and ACD rats (Figure 6A and B), reconfirming published evi dence.15,38 Hepatic Hamp mRNA expression was higher in the ACD group and in ACD/IDA iron-supplemented animals (Figure 6A). Plasma hepcidin concentrations (Figure 6B) significantly increased in groups receiving i.v. iron, but not in orally iron-treated rats, when compared to baseline levels. This is paralleled by appropriate changes in liver iron concentrations (Figure 6D), being also significantly in creased with i.v. iron therapy (Figure 6B and D). Of note, we found no changes in hepatic Bmp6 mRNA expression

between the groups (Figure 7E). EPO plasma levels were higher in ACD/IDA untreated animals compared to control and ACD, and they decreased more significantly with oral than with i.v. iron treatment (Figure 7F). IL-6 plasma con centrations were not different between ACD and ACD/IDA animals. Of interest, compared to baseline values, IL-6 levels decreased with oral iron treatment, whereas they increased following i.v. iron therapy (Figure 6C).
When studying iron metabolism in the liver, we found that FT protein expression and FPN1 protein and mRNA levels increased with i.v. iron treatment (Figure 6D; Online Sup plementary Figure S6C, F and G). NCOA4 protein levels and mRNA were reduced in all anemia and treatment groups compared to controls (Figure 6D; Online Supplementary Figure S6B and E).
Duodenal Dmt1 mRNA expression was significantly in creased in ACD/IDA as compared to ACD and controls, but then significantly reduced by either form of iron therapy
F
Figure 5. Oral and intravenous iron supplementation improve blood count parameters and bone marrow erythropoiesis in a rat model of anemia of chronic disease combined with iron deficiency anemia. (A) Hemoglobin (Hb) levels. (B) Mean corpuscular volume (MCV). (C) Mean corpuscular Hb concentration (MCHC). (D) Plasma iron concentration. (E) Reticulocytes were analyzed by flow cytometry. (F) Bone marrow populations consisting of pro-erythroblasts (Pro-E; population I), basophilic erythroblasts (Baso-E; population II), polychromatic erythroblasts (Poly-E; population III), orthochromatic erythroblasts (Ortho-E; population IV) and mature red blood cells (RBC) (Mature RBC; population V) were analyzed by flow cytometry. One-way ANOVA with Dunnett’s multiple comparisons test between anemia of chronic disease combined with iron deficiency anemia (ACD/IDA) and all other groups was applied for panels (A to E). Two-way ANOVA with Dunnett’s multiple comparisons test for each population, between control, ACD and ACD/IDA with all groups was applied for panel (F). *P<0.05, **P<0.01, ***P<0.001, ****P<0.0001, #P<0.05, ##P<0.01, ###P<0.001, ####P<0.0001, §P<0.05. Results are shown as mean ± standard deviation. Results are from one representative experiment with 5-8 animals per group. F Maltol: ferric maltol ; FCM: ferric carboxymaltose
(Online Supplementary Figure S3C).
In the spleen, ACD/IDA rats presented with lower iron levels than untreated ACD animals, and iron supplemen tation increased iron contents, again most pronounced with high i.v. iron (Figure 6E). FPN1 protein expression was slightly lower in ACD and ACD/IDA when compared to con trols, but not significantly altered with iron treatment (Fig ure 6E; Online Supplementary Figure S6M). Iron stores, as
reflected by FT protein levels, increased with iron treat ment, being in line with data from determination of spleen iron content (Figure 6E; Online Supplementary Figure S6N). Taken together, these results show that in rats with ACD/IDA, both iron sources are capable of ameliorating anemia, but i.v. iron induces systemic hepcidin expression and IL-6 formation, along with iron deposition in the liver and spleen.

Figure 6. Intravenous iron supplementation increases inflammatory parameters and iron concentration in the liver, as well as iron concentration in the spleen, while oral iron supplementation decreases interleukin-6 levels in a rat model of anemia of chronic disease combined with iron deficiency anemia. (A) Hamp mRNA levels. (B) Plasma hepcidin and (C) interleukin-6 (IL-6) (values for healthy animals ranged from 15,4 pg/mL to 57,6 pg/mL) levels at baseline and end of the observation period measured by enzyme-linked immunosorbent assay. (D) Liver iron concentration and protein expression measured by western blot (WB) of TFR1, NCOA4, FPN1 and FT; b actin (ACTB) was used as the housekeeping protein. (I) Spleen iron concentration and protein ex pression measured by WB of TFR1, NCOA4, FPN1 and FT; b actin (ACTB) was used as the housekeeping protein. One-way ANOVA with Dunnett´s multiple comparisons test between anemia of chronic disease combined with iron deficiency anemia (ACD/IDA) and all other groups was applied for results shown in panels (A, D and E). For results shown in panels (B and C), two-way ANOVA with Sidak´s multiple comparisons test was used for analyzing differences between baseline and end of the observation period of each group. *P<0.05, **P<0.01, ***P<0,001, ****P<0.0001. The same test was used to analyze differences between ACD/IDA with other groups at end of the experiment. ####P<0.0001. Results are shown as mean ± standard deviation. Results are from 1 representative experiment with 5-8 animals per group.
Iron distribution in the liver and spleen differs depending on iron source and dose
We then analyzed for iron distribution in the liver (Figure 8; Online Supplementary Figure S8A to C) and spleen (On line Supplementary Figure S9) with Prussian blue staining. Further, we performed immunofluorescence in the liver to identify resident macrophages, known as Kupffer cells (Online Supplementary Figure S7).
The liver and spleen of untreated IDA and ACD/IDA groups were iron deficient, while untreated ACD controls showed iron retention within Kupffer cells in the liver and white pulp of the spleen, being compatible with macrophage iron accumulation due to inflammation (Figure 8; Online Supplementary Figure S9).
Oral iron supplementation in IDA animals results in the appearance of iron in hepatocytes, specifically in the F. Maltol high group. Intravenous iron therapy resulted in iron accumulation in Kupffer cells, compatible with uptake of iron-carbohydrate complexes by macrophages. Of inter est, iron was also found in hepatocytes with high dose i.v. therapy (Figure 8). In the spleen, i.v. administration led to iron accumulation in white and red pulp, while groups re ceiving F. Maltol had similar iron distribution to untreated animals (Online Supplementary Figure S9).
Orally iron-supplemented ACD groups presented with liver and spleen iron distribution comparable to untreated ACD rats (Figure 8; Online Supplementary Figure S9). ACD ani mals receiving i.v. iron loaded Kupffer cells, but no iron was detected in hepatocytes (Figure 8), while in the spleen iron was abundant in both red and white pulp (On line Supplementary Figure S9).
ACD/IDA animals receiving oral iron had higher liver and spleen iron concentrations, yet no iron accumulation in hepatocytes or Kupffer cells was detected, while in the spleen minute amounts of the metal were detectable in the white pulp. In contrast, iron accumulated dose-de pendently in Kupffer cells and splenic white and red pulp of ACD/IDA animals receiving i.v. iron (Figure 8; Online Sup plementary Figure S9).
These results show that i.v. but not oral iron supplemen tation leads to iron accumulation mainly in Kupffer cells in the liver and splenic white pulp macrophages, es
pecially in the presence of inflammation. Of note, in IDA, minute amounts of supplemented iron can also be de tected in hepatocytes irrespective of the route of iron ad ministration.
To our knowledge this is the first study providing a com parative preclinical analysis of the therapeutic efficacy of oral and i.v. iron preparations for the most common forms of anemia. While oral and i.v. iron supplementation are known to be efficient first-line treatments of IDA,3,18,25,27 which is also confirmed by our results, the efficacy of iron therapy is less well established in ACD and ACD/IDA. Specifically, the effects of concomitant inflammation on cellular iron transfer, tissue iron distribution and delivery of therapeutically substituted iron for erythroid progen itor cells remained largely elusive. During infl ammation, iron trapping in the reticuloen dothelial system is known to be an evolutionary impor tant immune defense strategy to withhold the nutrient iron from invading pathogens.8,9,39,40 In addition, inflam mation-driven hepcidin formation via its interaction with FPN1 impacts on iron absorption from the duodenum and iron recirculation from macrophages.2,4,8,14,15,41,42 As multiple factors positively, such as inflammation or iron loading, or negatively, such as hypoxia, anemia, erythropoietic hormones and iron deficiency, affect hepcidin expression, the net effect of iron supplementation in anemic individ uals with active inflammatory diseases is hard to predict. Moreover, it became evident, not only from different ani mal models but also from observational studies, that hi erarchic networks towards the regulation of hepcidin exist, indicating that anemia, iron deficiency and hypo xia-induced negative regulation may dominate over in fl ammation-induced hepcidin induction. 2,31,38 However, recent evidence also suggested that, in active tuberculo sis, the hormone erythroferrone is unable to suppress in flammation-driven hepcidin expression.43 Hence, it is not clear yet how inflammatory activity, the degree of anemia and iron availability impact on the therapeutic efficacy of
Figure 7. Oral iron supplementation in anemia of chronic disease combined or not with iron deficiency anemia decreases ery thropoietin levels, while Bmp6 mRNA expression increases in iron supplemented animals during iron deficiency anemia. (A) Liver Bmp6 in iron deficiency anemia (IDA) animals; Gusb was used as the housekeep ing gene. (B) Plasma erythropoietin (EPO) levels in IDA animals at baseline and end of the observation period measured by enzyme-linked immunosorbent assay (ELISA). (C) Liver Bmp6 in ACD animals; Gusb was used as the housekeeping gene. (D) Plasma EPO levels in anemia of chronic dis ease (ACD) animals at baseline and end of the observation period measured by ELISA. (E) Liver Bmp6 in ACD/IDA animals; Gus b was used as the housekeeping gene. (F) Plasma EPO levels in ACD/IDA animals at baseline and end of the observation period measured by ELISA. One-way ANOVA with Dunnett´s multiple comparisons test be tween untreated anemia groups IDA, ACD and ACD/IDA and all other groups was ap plied respectively for results shown in pa nels (A, C and E). For results shown in panels (B, D and F) two-way ANOVA with Sidak´s multiple comparisons test was used for analyzing differences between baseline and end of the observation period of each group. *P<0.05, **P<0.01, ***P<0,001, ****P<0.0001. The same test was used to analyze differences between untreated ane mia groups, respectively IDA, ACD and ACD/IDA, with other groups at end of the experiment. ##P<0.01, ###P<0.001, ####P<0.0001. Results are shown as mean ± standard deviation. Results are from 1 rep resentative experiment with 5-8 animals per group. F Maltol: ferric maltol ; FCM: ferric carboxymaltose.

oral or i.v. iron treatments. In order to study the principal efficacy of the treatments for replenishing iron stores, we first investigated non-in flamed rats suffering from IDA. We identified that both doses of oral and i.v. iron were efficient in reversing ane mia and reducing reticulocytosis. In addition, we found out that i.v. iron was partly stored in the liver and spleen,
which fits to ingestion of i.v. iron preparations by macro phages, whereas oral iron is absorbed in the intestine and delivered to different tissues.8 These differences in tissue iron distribution were also re flected by partly divergent effects of oral and i.v. iron on regulation of iron metabolism genes in the liver and spleen and tissue iron distribution (Figures 2C and D, 4D
ARTICLE - Oral and i.v. iron therapy in prevalent anemias
and E, 6D and E and 8; Online Supplementary Figure S9). When studying the effects of iron supplementation in ACD with high inflammatory activity, as evidenced by in creased levels of IL-6, we found no sustained amelior ation of Hb levels. Nonetheless, divergent metabolic effects of oral and i.v. iron were observed. Oral iron sup plementation resulted in reduction of inflammatory ac tivity, as refl ected by reduced IL-6 levels, increased plasma iron levels, but reduced reticulocyte counts com pared to untreated ACD and ACD animals receiving i.v. iron. This indicates at least minimal iron delivery to ery throid progenitor cells, as suggestive from the small in
crease in Hb levels, the increase of orthochromatic ery throid progenitors and mature RBC numbers in the BM with oral iron therapy over time. Accordingly, we observed reduction of EPO levels with oral iron treatment, suggest ing reduced peripheral hypoxia. While hepcidin concen trations in rats receiving oral iron therapy were unchanged, i.v. iron therapy resulted in increasing hepci din levels over time. This is in line with the observation that hepcidin is a negative predictor of erythrocyte iron incorporation.44 Previous studies have shown that duo denal iron absorption in the setting of inflammation is re duced due to the action of hepcidin on FPN1 in
Figure 8. Intravenous but not oral iron treatment leads to iron accumulation in Kupffer cells especially in the presence of in flammation. Liver sections were stained with Prussian blue for iron detection. Blue area corresponds to iron staining (black ar rows). Different animal models are shown perpendicularly, untreated and treatment groups horizontally. Scale bar, 50 µm. Results shown are from 1 representative experiment and 1 representative animal per group. An Olympus BX61VS slide-scanner equipped with a 20x objective with a numerical aperture of 0.75, and the OlyVIA software was used for image acquisition.

enterocytes.14,15 However, our results show that minute amounts of iron are absorbed, subsequently exerting bio logical effects on erythroid iron delivery, EPO formation and immune regulation.
As a critical hepcidin regulator, Bmp6 mRNA expression responded to iron treatment diminishing its values in IDA animals. However, its regulation of hepcidin was incon sistent in the presence of inflammation, most likely due to activation of inflammatory signaling pathways affecting the regulatory response of BMP expression to iron avail ability.33,45
This leads to the question of the possible mechanism underlying divergent effects of oral and i.v. iron on inflam matory activity. Iron can affect innate immune effector pathways including the formation of IL-6. While iron sup plementation to monocytes in vitro negatively impacted on LPS and interferon-γ inducible formation of IL-6 via inhibition of the STAT-1 activation pathway,46 i.v. iron ther apy caused immediate activation of NF-κB driven inflam matory pathways and induction of cytokine expression.47,48 The differences may be linked to contrasting spatio-tem poral cell and tissue distribution of oral versus i.v. iron. Oral iron is partly found in hepatocytes, whereas i.v. iron is phagocytosed and likely retained in macrophage endo somes (Figure 8). Of interest, the retention of i.v. iron in Kupffer cells and splenic macrophages was paralleled by an increase in FT expression and tissue iron levels. When analyzing FPN1 protein levels in liver and spleen, we found that they were increased following i.v. iron ther apy, although hepcidin levels were high. As this observa tion was paralleled by high FT and tissue iron levels, it can be suggested that FPN1 is upregulated transcrip tionally and translationally by stress response mechan isms to reduce intracellular iron overload.8
When studying the therapeutic efficacy of both iron for mulations in ACD/IDA animals, we found that both iron formulations were effective in ameliorating Hb levels and microcytosis (Figure 5A to C). While IL-6 levels were not different between ACD and ACD/IDA animals, hepcidin levels were lower in ACD/IDA, indicating that iron defi ciency and/or erythropoietic factors such as EPO or ery throferrone are dominating over the inflammation-induced activation of hepcidin.15,38,49
The lower hepcidin formation is in line with the observa tion of less iron retention in hepatic Kupffer cells in ACD/IDA animals treated with i.v. iron as compared to ACD animals with the same treatment (Figure 8), provid ing further evidence for the essential role of hepcidin in the control of iron egress from macrophages and iron de livery to erythroid progenitor cells. In parallel, an elegant human study demonstrated that iron release from mac rophages is more sensitive to alterations of hepcidin levels than duodenal iron absorption,28 which supports our observation of iron delivery from oral iron supple
ments into the body of ACD animals.
The duodenal increase in Dmt1 mRNA expression seen in IDA and ACD/IDA untreated animals is in agreement with its response to true iron deficiency.35,50 Of interest, in sub jects with ACD and ACD/IDA with iron treatment, we ob served no association of DMT1 levels with hepcidin concentrations, suggesting that in addition to hepcidin other mechanism such as infl ammatory cytokines, en terocyte iron content and/or hypoxia inducible factors af fect DMT1 expression.51-54
We also observed differences in erythroid progenitor cell differentiation between the different types of anemia. Strikingly, pro-erythroblast numbers were significantly in duced in IDA and ACD/IDA animals, but not in ACD rats suggesting that pro-erythroblast expansion is driven by iron deficiency rather than by reduced Hb levels, and that it is independent of inflammation, as it was comparable between IDA and ACD/IDA animals.
In summary, we provide evidence of differences in iron distribution and metabolic effects between oral and i.v. iron therapy. We also show that both iron therapies can ameliorate IDA and ACD/IDA, whereas they remain largely ineffective in correcting ACD in the setting of ongoing in flammatory activity, which is in line with the observation of therapeutic inefficacy of iron supplementation in in tensive care unit patients.55 Of note, i.v. iron is partly re tained in hepatic and splenic macrophages, which is paralleled by increased expression of hepcidin and IL-6, whereas oral iron supplementation was linked to reduced IL-6 formation and slightly ameliorated erythropoiesis. Whether our fi ndings are speci fi c for the iron sources used, i.e., F. Maltol and FCM, or also applies for other for mulations, remains to be shown. We hypothesize that iron-carbohydrate complexes like i.v. iron dextran and iron dextrin would have the same effect as FCM, and that the outcome seen with F. Maltol may be partially linked to its non-salt-based ferric iron formulation, but may also largely apply to other oral iron formulations. Of in terest, in our models oral iron was provided once daily and the question remains whether iron administration on alternate days could improve outcome.56
It raises the question whether physicians should be es pecially cautious when treating ACD associated with on going infl ammation and contemplate if patients will benefit from iron therapy in that setting.55
These contrasting therapeutic effects of iron treatment urge the identi fi cation of easy-to-use biomarkers that can clearly differentiate between ACD and ACD/IDA, in order to provide the best therapeutic effects in patients. It will also be of interest to see if combination treatment of ACD with erythropoiesis-stimulating agents can im prove iron delivery to erythroid progenitor cells by in creasing TFR1 expression, EPO signaling via Scribble or by reducing inflammatory activity.57-59
GW received honoraria for lectures and advisory board par ticipation from Vifor and Pharmacosmos , two manufac turers of iron compounds. GW is the director of the Christian Doppler Laboratory for Anemia and Iron Metab olism Research. IT consults for Kymab, Cambridge.
LVdS and GW planned and designed the project, analyzed and interpreted data and wrote the manuscript. LVdS, AH, CF, VP and MA did critical animal handling during the course of the experiments. LVdS, AH, CF, VP, MA, IT, PT, MS, NB, RH, ED, LvR, SB, MB-P performed experiments. GW was responsible for the supervision, conceptualization, and funding acquisition. All authors read and approved the final manuscript.
1. Kassebaum NJ, Collaborators GBDA. The global burden of anemia. Hematol Oncol Clin North Am. 2016;30(2):247-308.
2. Girelli D, Nemeth E, Swinkels DW. Hepcidin in the diagnosis of iron disorders. Blood. 2016;127(23):2809-2813.
3. Camaschella C. Iron deficiency. Blood. 2019;133(1):30-39.
4. Weiss G, Ganz T, Goodnough LT. Anemia of inflammation. Blood. 2019;133(1):40-50.
5. Steinbicker AU, Muckenthaler MU. Out of balance - systemic iron homeostasis in iron-related disorders. Nutrients. 2013;5(8):3034-3061.
6. Cappellini MD, Comin-Colet J, de Francisco A, et al. Iron deficiency across chronic inflammatory conditions: International expert opinion on definition, diagnosis, and management. Am J Hematol. 2017;92(10):1068-1078.
7. Weiss G, Gasche C. Pathogenesis and treatment of anemia in inflammatory bowel disease. Haematologica. 2010;95(2):175-178.
8. Muckenthaler MU, Rivella S, Hentze MW, et al. A red carpet for iron metabolism. Cell. 2017;168(3):344-361.
9. Valente de Souza L, Hoffmann A, Weiss G. Impact of bacterial infections on erythropoiesis. Expert Rev Anti Infect Ther. 2020;19(5):619-633.
10. Katsarou A, Pantopoulos K. Basics and principles of cellular and systemic iron homeostasis. Mol Aspects Med. 2020;75:100866.
11. Knutson MD, Vafa MR, Haile DJ, et al. Iron loading and erythrophagocytosis increase ferroportin 1 (FPN1) expression in J774 macrophages. Blood. 2003;102(12):4191-4197.
12. Theurl I, Hilgendorf I, Nairz M, et al. On-demand erythrocyte disposal and iron recycling requires transient macrophages in the liver. Nat Med. 2016;22(8):945-951.
13. Savin MA, Cook JD. Mucosal iron transport by rat intestine. Blood. 1980;56(6):1029-1035.
14. Nemeth E, Tuttle MS, Powelson J, et al. Hepcidin regulates cellular iron efflux by binding to ferroportin and inducing its internalization. Science. 2004;306(5704):2090-2093.
15. Theurl I, Aigner E, Theurl M, et al. Regulation of iron homeostasis in anemia of chronic disease and iron deficiency anemia: diagnostic and therapeutic implications. Blood. 2009;113(21):5277-5286.
16. Means RT, Jr. Recent developments in the anemia of chronic disease. Curr Hematol Rep. 2003;2(2):116-121.
The authors want to thank Patrizia Moser for her excellent work in preparing the histology slides.
This work was supported by the doctoral college project W1253 HOROS (to LVdS, AH, VP, NB, MB-P, GW), the Austrian Research Funds (FWF) Project P 28302 (IT), the “Verein zur Förderung von Forschung und Weiterbildung in Infektiologie und Immunologie, Innsbruck” (GW), the Christian Doppler Society, Austria (LVdS, AH, GW).
The data are available from the first author upon reason able request.
17. Camaschella C, Nai A, Silvestri L. Iron metabolism and iron disorders revisited in the hepcidin era. Haematologica. 2020;105(2):260-272.
18. Pasricha SR, Tye-Din J, Muckenthaler MU, et al. Iron deficiency. Lancet. 2021;397(10270):233-248.
19. Theurl I, Mattle V, Seifert M, et al. Dysregulated monocyte iron homeostasis and erythropoietin formation in patients with anemia of chronic disease. Blood. 2006;107(10):4142-4148.
20. Thomas DW, Hinchliffe RF, Briggs C, et al. Guideline for the laboratory diagnosis of functional iron deficiency. Br J Haematol. 2013;161(5):639-648.
21. Brugnara C, Mohandas N. Red cell indices in classification and treatment of anemias: from M.M. Wintrobes's original 1934 classification to the third millennium. Curr Opin Hematol. 2013;20(3):222-230.
22. van Santen S, de Mast Q, Oosting JD, et al. Hematologic parameters predicting a response to oral iron therapy in chronic inflammation. Haematologica. 2014;99(9):e171-173.
23. Weiss G. Anemia of chronic disorders: new diagnostic tools and new treatment strategies. Semin Hematol. 2015;52(4):313-320.
24. Lanser L, Fuchs D, Kurz K, et al. Physiology and inflammation driven pathophysiology of iron homeostasis-mechanistic insights into anemia of inflammation and its treatment. Nutrients. 2021;13(11):3732
25. Petzer V, Theurl I, Weiss G. Established and emerging concepts to treat imbalances of iron homeostasis in inflammatory diseases. Pharmaceuticals (Basel). 2018;11(4):135.
26. Torti SV, Torti FM. Iron: The cancer connection. Mol Aspects Med. 2020;75:100860.
27. Cappellini MD, Musallam KM, Taher AT. Iron deficiency anaemia revisited. J Intern Med. 2020;287(2):153-170.
28. Stoffel NU, Lazrak M, Bellitir S, et al. The opposing effects of acute inflammation and iron deficiency anemia on serum hepcidin and iron absorption in young women. Haematologica. 2019;104(6):1143-1149.
29. Auerbach M, Gafter-Gvili A, Macdougall IC. Intravenous iron: a framework for changing the management of iron deficiency. Lancet Haematol. 2020;7(4):e342-e350.
30. Koskenkorva-Frank TS, Weiss G, Koppenol WH, et al. The complex interplay of iron metabolism, reactive oxygen species,
ARTICLE - Oral and i.v. iron therapy in prevalent anemias
and reactive nitrogen species: insights into the potential of various iron therapies to induce oxidative and nitrosative stress. Free Radic Biol Med. 2013;65:1174-1194.
31. Theurl I, Schroll A, Nairz M, et al. Pathways for the regulation of hepcidin expression in anemia of chronic disease and iron deficiency anemia in vivo. Haematologica. 2011;96(12):1761-1769.
32. Petzer V, Tymoszuk P, Asshoff M, et al. A fully human anti-BMP6 antibody reduces the need for erythropoietin in rodent models of the anemia of chronic disease. Blood. 2020;136(9):1080-1090.
33. Andriopoulos B, Jr., Corradini E, Xia Y, et al. BMP6 is a key endogenous regulator of hepcidin expression and iron metabolism. Nat Genet. 2009;41(4):482-487.
34. Mancias JD, Wang X, Gygi SP, et al. Quantitative proteomics identifies NCOA4 as the cargo receptor mediating ferritinophagy. Nature. 2014;509(7498):105-109.
35. Gunshin H, Mackenzie B, Berger UV, et al. Cloning and characterization of a mammalian proton-coupled metal-ion transporter. Nature. 1997;388(6641):482-488.
36. Barrand MA, Callingham BA, Dobbin P, et al. Dissociation of a ferric maltol complex and its subsequent metabolism during absorption across the small intestine of the rat. Br J Pharmacol. 1991;102(3):723-729.
37. Ludwiczek S, Aigner E, Theurl I, et al. Cytokine-mediated regulation of iron transport in human monocytic cells. Blood. 2003;101(10):4148-4154.
38. Lasocki S, Millot S, Andrieu V, et al. Phlebotomies or erythropoietin injections allow mobilization of iron stores in a mouse model mimicking intensive care anemia. Crit Care Med. 2008;36(8):2388-2394.
39. Nairz M, Weiss G. Iron in infection and immunity. Mol Aspects Med. 2020;75:100864.
40. Ganz T, Nemeth E. Iron homeostasis in host defence and inflammation. Nat Rev Immunol. 2015;15(8):500-510.
41. Fillebeen C, Wilkinson N, Charlebois E, et al. Hepcidin-mediated hypoferremic response to acute inflammation requires a threshold of Bmp6/Hjv/Smad signaling. Blood. 2018;132(17):1829-1841.
42. Armitage AE, Eddowes LA, Gileadi U, et al. Hepcidin regulation by innate immune and infectious stimuli. Blood. 2011;118(15):4129-4139.
43. Cercamondi CI, Stoffel NU, Moretti D, et al. Iron homeostasis during anemia of inflammation: a prospective study of patients with tuberculosis. Blood. 2021;138(15):1293-1303.
44. Prentice AM, Doherty CP, Abrams SA, et al. Hepcidin is the major predictor of erythrocyte iron incorporation in anemic African children. Blood. 2012;119(8):1922-1928.
45. Roth MP, Meynard D, Coppin H. Regulators of hepcidin expression. Vitamin Horm. 2019;110:101-129.
46. Oexle H, Kaser A, Möst J, et al. Pathways for the regulation of interferon-gamma-inducible genes by iron in human monocytic cells. J Leukoc Biol. 2003;74(2):287-294.
47. Sonnweber T, Theurl I, Seifert M, et al. Impact of iron treatment on immune effector function and cellular iron status of circulating monocytes in dialysis patients. Nephrol Dail Transplant. 2011;26(3):977-987.
48. Poljak-Blazi M, Jaganjac M, Mustapic M, et al. Acute immunomodulatory effects of iron polyisomaltosate in rats. Immunobiology. 2009;214(2):121-128.
49. Arezes J, Foy N, McHugh K, et al. Erythroferrone inhibits the induction of hepcidin by BMP6. Blood. 2018;132(14):1473-1477.
50. Zoller H, Weiss G, Theurl I, et al. Expression of the duodenal iron transporters divalent-metal transporter 1 and ferroportin 1 in iron deficiency and iron overload. Gastroenterology. 2001;120(6):1412-1419.
51. Ludwiczek S, Theurl I, Artner-Dworzak E, et al. Duodenal HFE expression and hepcidin levels determine body iron homeostasis: modulation by genetic diversity and dietary iron availability. J Mol Med. 2004;82(6):373-382.
52. Renassia C, Peyssonnaux C. New insights into the links between hypoxia and iron homeostasis. Curr Opin Hematol. 2019;26(3):125-130.
53. Goetze O, Schmitt J, Spliethoff K, et al. Adaptation of iron transport and metabolism to acute high-altitude hypoxia in mountaineers. Hepatology. 2013;58(6):2153-2162.
54. Papanikolaou G, Pantopoulos K. Systemic iron homeostasis and erythropoiesis. IUBMB Life. 2017;69(6):399-413.
55. Litton E, Baker S, Erber WN, et al. Intravenous iron or placebo for anaemia in intensive care: the IRONMAN multicentre randomized blinded trial : a randomized trial of IV iron in critical illness. Intensive Care Med. 2016;42(11):1715-1722.
56. Stoffel NU, Zeder C, Brittenham GM, et al. Iron absorption from supplements is greater with alternate day than with consecutive day dosing in iron-deficient anemic women. Haematologica. 2020;105(5):1232-1239.
57. Khalil S, Delehanty L, Grado S, et al. Iron modulation of erythropoiesis is associated with Scribble-mediated control of the erythropoietin receptor. J Exp Med. 2018;215(2):661-679.
58. Weiss G, Houston T, Kastner S, et al. Regulation of cellular iron metabolism by erythropoietin: activation of iron-regulatory protein and upregulation of transferrin receptor expression in erythroid cells. Blood. 1997;89(2):680-687.
59. Nairz M, Schroll A, Moschen AR, et al. Erythropoietin contrastingly affects bacterial infection and experimental colitis by inhibiting nuclear factor-κB-inducible immune pathways. Immunity. 2011;34(1):61-74.
Matthew Mei,1* Raju Pillai,2* Soyoung Kim,3,4 Noel Estrada-Merly,4 Michelle Afkhami,2 Lixin Yang,2 Zhuo Meng,5 Muhammad Bilal Abid,6 Mahmoud Aljurf,7 Ulrike Bacher,8 Amer Beitinjaneh,9 Christopher Bredeson,10 Jean-Yves Cahn,11 Jan Cerny,12 Edward Copelan,13 Corey Cutler,14 Zachariah DeFilipp,15 Miguel Angel Diaz Perez,16 Nosha Farhadfar,17 César O. Freytes,18 Shahinaz M. Gadalla,19 Siddhartha Ganguly,20 Robert Peter Gale,21 Usama Gergis,22 Michael R. Grunwald,13 Betty K. Hamilton,23 Shahrukh Hashmi,24,25 Gerhard C. Hildebrandt,26 Hillard M. Lazarus,27 Mark Litzow,28 Reinhold Munker,29 Hemant S. Murthy,30 Sunita Nathan,31 Taiga Nishihori,32 Sagar S. Patel,33 David Rizzieri,34 Sachiko Seo,35 Mithun Vinod Shah,36 Melhem Solh,37 Leo F. Verdonck,38 Ravi Vij,39 Ronald M. Sobecks,40 Betul Oran,41 Bart L. Scott,42 Wael Saber4* and Ryotaro Nakamura1*
1Department of Hematology/HCT, City of Hope National Medical Center, Duarte, CA, USA; 2Department of Pathology, City of Hope, Duarte, CA, USA; 3Division of Biostatistics, Institute for Health and Equity, Medical College of Wisconsin, Milwaukee, WI, USA; 4CIBMTR® (Center for International Blood and Marrow Transplant Research), Department of Medicine, Medical College of Wisconsin, Milwaukee, WI, USA; 5Beckman Research Institute, City of Hope, Duarte, CA, USA; 6Divisions of Hematology/Oncology & Infectious Diseases, Department of Medicine, Medical College of Wisconsin, Milwaukee, WI, USA; 7Department of Oncology, King Faisal Specialist Hospital Center & Research, Riyadh, Saudi Arabia; 8Department of Hematology, Inselspital, Bern University Hospital, University of Bern, Bern, Switzerland; 9Division of Transplantation and Cellular Therapy, University of Miami Hospital and Clinics, Sylvester Comprehensive Cancer Center, Miami, Fl, USA; 10The Ottawa Hospital Transplant & Cellular Therapy Program, Ottawa, Ontario, Canada; 11Department of Hematology, CHU Grenoble Alpes, Université Grenoble Alpes, Grenoble, France; 12Division of Hematology/Oncology, Department of Medicine, University of Massachusetts Medical Center, Worcester, MA, USA; 13Department of Hematologic Oncology and Blood Disorders, Levine Cancer Institute, Atrium Health, Charlotte, NC, USA; 14Stem Cell Transplantation and Cellular Therapy, Dana-Farber Cancer Institute, Boston, MA, USA; 15Hematopoietic Cell Transplant and Cellular Therapy Program, Massachusetts General Hospital, Boston, MA, USA; 16Department of Hematology/Oncology, Hospital Infantil Universitario Niño Jesús, Madrid, Spain; 17Division of Hematology/Oncology, University of Florida College of Medicine, Gainesville, FL, USA; 18University of Texas Health Science Center at San Antonio, San Antonio, TX, USA; 19Divsion of Cancer Epidemiology & Genetics, NIH-NCI Clinical Genetics Branch, Rockville, MD, USA; 20Division of Hematological Malignancy and Cellular Therapeutics, University of Kansas Health System, Kansas City, KS, USA; 21Haematology Research Centre, Department of Immunology and Inflammation, Imperial College London, London, UK; 22Department of Medical Oncology, Division of Hematological Malignancies, Thomas Jefferson University, Philadelphia, PA USA; 23Blood & Marrow Transplant Program, Department of Hematology and Medical Oncology, Taussig Cancer Institute, Cleveland Clinic, Cleveland, OH, USA; 24Department of Internal Medicine, Mayo Clinic, Rochester, MN, USA; 25Department of Medicine, Sheikh Shakhbout Medical City, Abu Dhabi, United Arab Emirates; 26Markey Cancer Center, University of Kentucky, Lexington, KY, USA; 27University Hospitals Cleveland Medical Center, Case Western Reserve University, Cleveland, OH, USA; 28Division of Hematology and Transplant Center, Mayo Clinic Rochester, Rochester, MN, USA; 29Markey Cancer Center, University of Kentucky, Lexington, KY, USA; 30Division of Hematology-Oncology, Blood and Marrow Transplantation Program, Mayo Clinic, Jacksonville, FL, USA; 31Section of Bone Marrow Transplant and Cell Therapy, Rush University Medical Center, Chicago, IL, USA; 32Department of Blood & Marrow Transplant and Cellular Immunotherapy (BMT CI), Moffitt Cancer Center, Tampa, FL, USA; 33Blood and Marrow Transplant Program, Huntsman Cancer Institute, University of Utah, Salt Lake City, UT, USA; 34Novant Health Cancer Institute; Charlotte, NC, USA; 35Department of Hematology and Oncology, Dokkyo Medical University, Tochigi, Japan; 36Mayo Clinic, Rochester, MN, USA; 37The Blood and Marrow Transplant Group of Georgia, Northside Hospital, Atlanta, GA, USA; 38Department of Hematology/Oncology, Isala Clinic, Zwolle, The Netherlands; 39Division of Medical Oncology, Washington University School of Medicine, St. Louis, MO, USA; 40Cleveland Clinic, Cleveland, OH, USA; 41Department of Stem Cell Transplantation, Division of Cancer Medicine, The University of Texas MD Anderson Cancer Center, Houston, TX USA and 42Fred Hutchinson Cancer Research Center, Seattle, WA, USA
*MM, RP, WS and RN contributed equally to this work.
Correspondence: M. Mei mamei@coh.org
Received: November 15, 2021.
Accepted: March 9, 2022.
Prepublished: April 21, 2022.
https://doi.org/10.3324/haematol.2021.280203
©2023 Ferrata Storti Foundation Published under a CC BY-NC license
The mutational landscape in chronic myelomonocytic leukemia and its impact on allogeneic hematopoietic cell transplantation outcomes: a Center for Blood and Marrow Transplantation Research (CIBMTR)
Somatic mutations are recognized as an important prognostic factor in chronic myelomonocytic leukemia (CMML). How ever, limited data are available regarding their impact on outcomes after allogeneic hematopoietic cell transplantation (HCT). In this registry analysis conducted in collaboration with the Center for International Blood and Marrow Transplan tation Registry database/sample repository, we identified 313 adult patients with CMML (median age: 64 years, range, 2877) who underwent allogeneic HCT during 2001-2017 and had an available biospecimen in the form of a peripheral blood sample obtained prior to the start of conditioning. In multivariate analysis, a CMML-specific prognostic scoring system (CPSS) score of intermediate-2 (HR=1.46, P=0.049) or high (HR=3.22, P=0.0004) correlated significantly with overall survival. When the molecularly informed CPSS-Mol prognostic model was applied, a high CPSS-Mol score (HR=2 P=0.0079) cor related significantly with overall survival. The most common somatic mutations were in ASXL1 (62%), TET2 (35%), KRAS/NRAS (33% combined), and SRSF2 (31%). DNMT3A and TP53 mutations were associated with decreased overall sur vival (HR=1.70 [95% CI: 1.11-2.60], P=0.0147 and HR=2.72 [95% CI: 1.37-5.39], P=0.0042, respectively) while DNMT3A, JAK2, and TP53 mutations were associated with decreased disease-free survival (HR=1.66 [95% CI: 1.11-2.49], P=0.0138, HR=1.79 [95% CI: 1.06-3.03], P=0.0293, and HR=2.94 [95% CI: 1.50-5.79], P=0.0018, respectively). The only mutation associated with increased relapse was TP53 (HR=2.94, P=0.0201). Nonetheless, the impact of TP53 mutations specifically should be inter preted cautiously given their rarity in CMML. We calculated the goodness of fit measured by Harrell’s C-index for both the CPSS and CPSS-Mol, which were very similar. In summary, via registry data we have determined the mutational landscape in patients with CMML who underwent allogeneic HCT, and demonstrated an association between CPSS-Mol and transplant outcomes although without major improvement in the risk prediction beyond that provided by the CPSS.
Chronic myelomonocytic leukemia (CMML) is a clonal myeloid neoplasm sharing clinical and pathological fea tures of both myeloproliferative neoplasms and myelo dysplastic syndromes and is classified by the World Health Organization (WHO) in the category of myelodys plastic syndrome/myeloproliferative neoplasm.1 While rare with an annual incidence in the USA of 4.1 cases per 100,000 person-years, 2 it is nonetheless the most common of the adult-onset overlap myelodysplastic sydnrome/myeloproliferative neoplasm syndromes and occurs at a median age of 71-75 years.3 CMML has a het erogenous clinical course, with prognosis and risk of transformation to acute myeloid leukemia being de pendent on a number of clinical and molecular fac tors.4,5 At present, the optimal treatment of CMML is not well defined as systemic therapies such as hypomethyl ating agents exert a limited effect on the natural history of the disease, and overall survival (OS) remains poor. 69
Allogeneic hematopoietic cell transplantation (HCT) represents the only potentially curative treatment but is associated with high risks of morbidity and mortality. To date, transplant outcome data in CMML are limited to a few retrospective series mainly due to the relative rarity of the disease.10-16 The largest retrospective study in the literature of 513 patients was conducted by the European Group for Blood and Marrow Transplantation (EBMT), which demonstrated a 4-year OS of 33%.15 How ever, robust data regarding prognostic factors for al
logeneic HCT outcomes in CMML remain lacking. A pre vious analysis by the Center for International Blood and Marrow Transplant Research (CIBMTR) demonstrated that OS correlated with the CMML-specific Prognostic Scoring System (CPSS) score, although the CPSS was not predictive for relapse, disease-free survival (DFS) or non-relapse mortality, and its impact on OS was chiefly due to its effect on post-relapse survival.16 The impact of the MD Anderson Prognostic Score (MDAPS) on out comes following allogeneic HCT has been evaluated in two smaller studies, neither of which showed a signifi cant association with OS.17 Therefore, improved risk stratification for CMML patients considered for alloge neic HCT is still needed.
Among the multiple prognostic scores developed for CMML, three incorporate information on recurrent so matic mutations. These are the Groupe Francophone des Myélodysplasies (GFM) score, the Mayo Molecular Model (MMM), and the clinical/molecular CPSS (CPSSMol) score.18-20 While there are accumulating data re garding the impact of somatic mutations in a non-transplant setting, 21 limited data are available re garding the impact of somatic mutations or these mol ecularly informed prognostic models in CMML patients undergoing allogeneic HCT. Therefore, in this registry analysis conducted in collaboration with the CIBMTR database/sample repository, we sought to determine the landscape of somatic mutations in patients with CMML who underwent allogeneic HCT and their posttransplant outcomes, with an analysis of clinical and molecular prognostic factors.
The CIBMTR is a research collaboration between the Medical College of Wisconsin and the National Marrow Donor Program (NMDP)/Be the Match and consists of a voluntary network of more than 330 transplantation centers worldwide that contribute detailed data on al logeneic and autologous HCT to a centralized statistical center. Observational studies conducted by the CIBMTR are performed in compliance with all applicable federal regulations pertaining to the protection of human re search participants. Protected health information issued in the performance of such research is collected and maintained in CIBMTR’s capacity as a Public Health Auth ority under the Health Insurance Portability and Account ability Act Privacy Rule. Additional details regarding the data source are described elsewhere.22 Patients’ samples were obtained from the NMDP biospecimen repository.
Adult patients (age ≥18 years) with CMML who underwent allogeneic HCT during 2001-2017 and who had an available specimen in the NMDP biospecimen repository were in cluded in this analysis. Patients who received umbilical cord blood HCT, syngeneic HCT, or haploidentical HCT, or patients who experienced disease transformation to sec ondary acute myeloid leukemia at any time prior to al logeneic HCT were excluded (n=56).
The primary endpoint was OS, and secondary endpoints were DFS, relapse/progression, and treatment-related mortality (TRM). OS was defined as time to death from any cause, and DFS was defined as the time to relapse or death from any cause. TRM was defined as death from any cause in the first 28 days after transplantation, regardless of relapse status, or death beyond day 28 without disease recurrence; relapse was considered a competing event. Relapse/progression was reported by the transplantation centers. CPSS, CPSS-Mol, GFM, and MMM scores were calculated at the time of transplant per published refer ences.18,20,23,24
Descriptive statistics tables of patients including demo graphics, disease-related factors, and transplant-related factors were prepared. The median and range were listed for continuous variables. The total number of patients and the percentage of each subgroup were calculated for cat egorical variables. Probabilities of DFS and OS were cal culated using the Kaplan-Meier estimator, with the variance estimated by the Greenwood formula. Probabil ities of relapse and TRM were generated using cumulative
incidence estimates to accommodate competing risk events.
The primary objective of the study was to evaluate whether the CPSS-Mol score is associated with OS in al logeneic HCT patients. This was determined through multivariate Cox regression, with CPSS score adjusting for other clinical covariates. The proportional hazard of as sumptions was tested in the Cox regression model. Step wise selection was applied to the adjusting variables. The association of OS with other somatic mutations was examined using the log-rank test, and the P values were adjusted for multiple comparisons using the Holm proce dure.
The secondary objective was to examine whether the CPSS-Mol is more predictive than the CPSS score for transplant outcomes. We used the C-index to compare the CPSS-Mol and CPSS scores in predicting survival out comes and competing risk outcomes (relapse and TRM) using the SAS 9.4.25
Details of the mutation analysis are provided in the Online Supplementary Material.
We identified a total of 313 patients across 78 centers with CMML who met the inclusion criteria and had an available sample of peripheral blood collected immediately prior to the beginning of the conditioning regimen. A summary of their demographic information is given in Table 1 (full demographic information is provided in Online Supple mentary Table S1). The median age was 64 years (range, 28-77) and 69% of the patients were male. Splenomegaly was documented in 84 patients (27%), and 166 patients (53%) had CMML-0 at the time of allogeneic HCT, as de fined by WHO criteria. The majority of patients had 5% or fewer blasts both in the peripheral blood (82%) and bone marrow (71%). A hypomethylating agent (either 5-azacyti dine or decitabine) was given to 61% of patients prior to allogeneic HCT. Slightly more than half of the patients (54%, n=170) received a reduced-intensity conditioning regimen. Nearly half of the patients (45%, n=134) had a Hematopoietic Cell Transplantation Comorbidity Index (HCT-CI) of 3 or greater, and 41% of patients (n=128) had a Karnofsky Performance Score under 90%. The majority of patients received an allograft from a matched unrelated donor (76%, n=238) with the source of stem cells being peripheral blood (85%, n=267), and received tacrolimusbased graft-versus-host disease prophylaxis (81%, n=253) without in vivo T-cell depletion (60%, n=188). CPSS scores calculated at the time of transplantation were available
Table 1. Summary of baseline characteristics.
Patients’ characteristics
Total
Number of patients 313
Number of centers 78
Median age in years, (range) 64 (28-77) Age in years at HCT, N (%)
<50 50-59 60-69 ≥ 70
Sex, N (%)
33 (11) 75 (24) 165 (53) 40 (13)
Male Female 215 (69) 98 (31)
HCT-CI score, N (%) 0 1-2 ≥ 3 Not available / Before 2007
Disease-specific characteristics
CMML status: WHO criteria at transplant, N of patients (%)
CMML-0 (<2% blasts in PB and <5% blasts in BM)
CMML-1 (2–4% blasts in PB and/or 5–9% blasts in BM)
CMML-2 (5–19% blasts in PB, 10–19% blasts in BM)
Not reported
Therapy prior to HCT, N of patients (%)
Hypomethylating agent Chemotherapy Hypomethylating agent + chemotherapy Not reported
CPSS prior to transplant, N of patients (%) Low Intermediate-1 Intermediate-2 High Not reported
Transplant-related characteristics
55 (18) 67 (21) 134 (43) 57 (18)
166 (53) 62 (20) 27 (9) 58 (19)
190 (61) 10 (3) 27 (9) 86 (27)
91 (29) 77 (25) 96 (31) 14 (4) 35 (11)
Time from diagnosis to transplant, months 9 (<1-112)
Donor type, N of patients (%) Matched related Matched unrelated Mismatch unrelated Not reported
Conditioning intensity, N of patients (%) Myeloablating conditionig Reduced intensity conditioning Not reported
Year of transplant, N of patients (%) 2001-2011 2012-2014 2015-2017
20 (6) 238 (76) 52 (17) 3 (<1)
135 (43) 170 (54) 8 (3)
108 (35) 84 (27) 121 (39)
Median follow-up of survivors, months (range) 47 (3-192)
HCT: allogeneic hematopoietic cell transplantation; CI: comorbidity index; CMML: chronic myelomonocytic leukemia; WHO: World Health Or ganization PB; peripheral blood;; BM: bone marrow; CPSS: Chronic Myelomonocytic Leukemia-Specific Prognostic Scoring System.
for 89% (n=278) of the subjects, and the distribution of scores was as follows: low in 32.7% (n=91), intermediate1 in 27.7% (n=77), intermediate-2 in 34.5% (n=96), and high in 5% (n=14). The median follow-up was 47 months (range,
3-192 months).
Genetic characteristics and spectrum of mutations Of the 313 patients examined, 290 (93%) had at least one
pathogenic mutation identified in one of the assayed genes, and the median number of mutations was three (range, 0-10). The most common somatic mutations were in ASXL1 (61%), TET2 (35%), KRAS/NRAS (33% combined), and SRSF2 (31%). A TP53 mutation was found in ten pa tients (3%) (Online Supplementary Figure S1, Online Sup plementary Table S3). As previously reported,19,31 a significant association was found between TET2 and splicing factor gene mutations: 54 patients had co-occur ring TET2 and SRSF2 mutations and 71 patients had cooccurrence of mutations in TET2 and one or more of SRSF2, ZSRF2, U2AF1, and SF3B1 (Online Supplementary Figure S2). In the double mutant (TET2/splicing factor gene) cases, the variant allele frequency of TET2 was higher than that of the splicing factor gene in more cases (n=39) than the converse (variant allele frequency of splic ing factor gene greater than that of TET2, n=23), which suggests that TET2 mutations precede splicing factor mu tations in the majority of cases (Online Supplementary Figure S2). CPSS-Mol, GFM, and MMM scores were derived for 92% (n=287), 98% (n=306), and 95% (n=296) of sub jects, respectively. The distribution of patients according to the CPSS-Mol, GFM, and MMM scores is shown in Table 2. Distribution across risk classes by the CPSS and GFM is similar to what was reported in the original studies for both scoring systems,18,23 whereas patients in our cohort appeared to be significantly higher risk than those in the original studies for the CPSS-Mol and MMM, both of which were focused on non-transplant patients.18,20
We also examined the correlation between the mutational
Table 2. Molecularly informed prognostic scores for chronic myelomonocytic leukemia.
CPSS-Mol score prior to transplant
Low Intermediate-1 Intermediate-2 High Not reported
GFM score prior to transplant
Low (0-4) Intermediate (5-7) High (8-12) Not reported
MMM score prior to transplant
Low Intermediate-1 Intermediate-2 High Not reported
profile and disease phenotype. U2AF1 mutations were cor related with myelodysplastic CMML (white blood cell count ≥13×109/L) while myeloproliferative CMML (white blood cell count <13×109/L) was found to associated with mutations in ASXL1, EZH2, KIT, and SRSF2. A significant correlation was also found between mutational burden and both age and myeloproliferative CMML. (Online Sup plementary Table S4A). Positive interactions with the WHO subtype (CMML-0, -1, -2) were found with mutations in ASXL1, BCOR, BRAF, CEBPA, CSF3R, FLT3, GATA2, IDH1/2, NRAS, STAG2, and TET2 although relative frequencies were low for most of these except ASXL1, NRAS, and TET2 (On line Supplementary Table S4B).
On univariate analysis, both the CPSS and CPSS-Mol scores correlated significantly with 4-year OS, DFS, and TRM. Notably, neither scoring system was predictive for disease progression/relapse. Data for the univariate analy sis stratified by CPSS and CPSS-Mol scores are given in Table 3. Kaplan-Meier curves for OS and DFS, and cumu lative incidence curves for relapse and TRM, are displayed according to the CPSS score in Figure 1A-D, and according to the CPSS-Mol score in Figure 2A-D. According to the CPSS, the 4-year OS was 41.1% (95% CI: 29.5-53.3) for lowrisk, 36.5% (95% CI: 25.1-48.6) for intermediate-1-risk, 26.6% (95% CI: 17.1-37.2) for intermediate-2-risk, and 10.7% (95% CI: 0.1-34.7) for high-risk patients (P=0.029) (Figure 1A, Table 3). By CPSS-Mol score, the 4-year OS was 47.5% (95% CI: 31.1-64.1) for low-riks, 39.7% (95% CI: 25-55.4) for intermediate-1-risk, 37.6% (95% CI: 28.1-47.6) for inter mediate-2-risk, and 16% (95% CI:7.4-27) for high-risk pa tients (P =0.001) (Figure 1B, Table 4). Outcomes for the entire cohort are provided in Online Supplementary Table S5
N (%)
39 (12) 52 (17) 118 (38) 78 (25) 26 (8)
133 (42) 108 (35) 65 (21) 7 (2)
1 (<1) 13 (4) 62 (20) 220 (70) 17 (5)
CPSS-Mol: Clinical/Molecular Chronic Myelomonocytic LeukemiaSpecific Prognostic Scoring System; GFM, Groupe Francophone des Myélodysplasies; MMM, Mayo Molecular Model.
On multivariate analysis, a CPSS score of intermediate-2 or high correlated significantly with OS (CPSS score inter mediate-2: HR=1.46 [95% CI: 1.001-2.134], P=0.0494, CPSS score high: HR=3.22 [95% CI: 1.685-6.154], P=0.0004]) as did a higher HCT-CI (HCT-CI 1-2: HR=1.71 [95% CI: 1.022.86], P=0.0406, HCT-CI 3+, HR=2.05 [95% CI: 1.29-3.25], P=0.0024). A matched unrelated donor versus mismatched unrelated donor (HR=0.53 [95% CI: 0.67-0.76], P=0.0005) also significantly correlated with OS. A CPSS score of high correlated significantly with both DFS (HR=2.24 [95% CI: 1.20-4.19], P=0.012) and relapse/progression (HR=2.73 [95% CI: 1.25-5.99], P=0.012), and a CPSS score of intermediate2 (HR=1.93 [95% CI: 1.11-3.37], P=0.021) and number of mu tations (HR=1.17 [95% CI: 1.06-1.31], P=0.0031) were both correlated with TRM. A high CPSS-Mol score correlated significantly with OS (HR=2 [95% CI: 1.12-3.34], P=0.0079) and DFS (HR=1.73
Table 3. Univariable estimates for CPSS score at time of hematopoietic stem cell transplantation.
Low (N = 91)
Intermediate-1 (N = 77) Intermediate-2 (N = 96) High (N = 14)
Outcomes N Prob % (95% CI) N Prob % (95% CI) N Prob % (95% CI) N Prob % (95% CI) P value
Overall survival 100-day 4-year
Relapse 100-day 4-year
Treatment-related mortality 100-day 4-year
Disease-free survival 100-day 4-year
91 87.9 (80.5-93.8) 41.1 (29.5-53.3)
88 8 (3.2-14.5) 44.5 (33.6-55.8)
88 9.1 (4-16) 19.4 (11.5-28.7)
88 83 (74.4-90) 36.1 (25.7-47.2)
77 87 (78.6-93.5) 36.5 (25.1-48.6)
77 6.5 (2.1-13.1) 43.4 (32-55.2)
77 13 (6.4-21.4) 29.7 (19.6-40.8)
77 80.5 (71-88.5) 26.9 (17-38.1)
96 84.4 (76.5-90.9) 26.6 (17.1-37.2)
95 15.8 (9.2-23.9) 40.7 (30.7-51.2)
95 11.6 (5.9-18.8) 38.9 (28.5-49.9)
95 72.6 (63.2-81.1) 20.4 (12-30.3)
14 71.4 (46-91.2) 10.7 (0.1-34.7)
13 30.8 (8.8-58.9) 61.5 (31.1-87.7)
13 15.4 (1.4-40.3) 30.8 (8.6-59.3)
13 53.8 (27.5-79.1) 7.7 (0-27.6)
CPSS: Chronic Myelomonocytic Leukemia-Specific Prognostic Scoring System, 95% CI: 95% confidence interval.
[95% CI: 1.07-2.80], P=0.024) as did an HCT-CI score of three or more (HR=1.99 [95%CI: 1.26-3.14], P=0.003) and matched unrelated donor versus mismatched unrelated donor (HR=0.535 [95% CI: 0.37-0.77], P=0.0007). Finally, in termediate-1-risk and intermediate-2-risk CPSS-Mol scores were associated with lower TRM compared to a high-risk CPSS-Mol score (HR=0.32 for both, P=0.0078).
Results for the multivariate analyses incorporating the CPSS and CPSS-Mol scores are described in Online Sup plementary Table S7
We calculated the goodness-of-fit measure by Harrell’s C-index26 for both the CPSS and CPSS-Mol for all four out comes of interest. The C-index scores for the CPSS for OS, DFS, relapse, and TRM were 0.56, 0.55, 0.52, and 0.56, respectively. The C-index scores for the CPSS-Mol for OS, DFS, relapse, and TRM were 0.57, 0.55, 0.55, and 0.58, re spectively.
Given the high rates of TRM seen in the cohort, the causes of death were investigated further. Overall, 40% (n=68) of patients died due to the primary disease, whereas 15% (n=26) died of infection, 13% (n=23) from graft-versus-host disease, 13% (n=22) from organ failure, and 9% (n= 6) from other causes.
Full results of the multivariate analysis of the impact of somatic mutations on the primary and secondary end points are shown in Online Supplementary Table S6A-D. In multivariate analysis, DNMT3A and TP53 mutations cor related with decreased OS (HR=1.70 [95% CI: 1.11-2.60],
0.005 0.566 0.029
0.508 0.082 0.642
0.146 0.837 0.050
0.035 0.099 0.015
P=0.0147 and HR=2.72 [95% CI: 1.37-5.39], P=0.0042, re spectively) while DNMT3A, JAK2, and TP53 mutations were associated with decreased DFS (HR=1.66 [95% CI: 1.112.49], P=0.0138, HR=1.79 [95% CI: 1.06-3.03], P=0.0293, and HR=2.94 [95% CI: 1.50-5.79], P=0.0018, respectively). The only mutation associated with increased relapse was TP53 (HR=2.94 [95% CI: 1.18-7.28], P=0.0201). Finally, DNMT3A mutations were associated with increased TRM (HR=1.89 [95% CI: 1.03-3.44], P=0.039) whereas PTPN11 mutations were associated with decreased TRM (HR=0.21 [95% CI: 0.05-0.86], P=0.03).
Our data represent the largest study of CMML patients who underwent allogeneic HCT and who had a compre hensive somatic mutation analysis. The mutation land scape observed in our study was largely consistent with that of prior reports in CMML20,27 including the most com mon somatic mutations (ASXL1 , TET2, KRAS/NRAS, and SRSF2), with an association between TET2 and splicing factor gene mutations, and an association with clinical subtypes (U2AF1 mutations with myelodysplastic CMML, and ASXL1, EZH2, KIT, and SRSF2 mutations with myelo proliferative CMML.28 As expected, our transplant cohort had a greater proportion of patients with high-risk muta tions than cohorts in non-transplant studies as it was en riched for patients with ASXL1 mutations compared to historical data.29 Although the results were disappointing, especially in the CPSS and CPSS-Mol high-risk groups (4year OS of 10.7% and 16%, respectively), they are reflective of real-world data derived from a very high-risk popu lation. Also, 66% of patients were at least 60 years of age,
Figure 1. Univariate analysis of post-transplant outcomes by CPSS score. (A) Overall survival. (B) Disease-free survival. (C) Re lapse/progression. (D) Transplant-related mortality. CPSS: Chronic Myelomonocytic Leukemia-Specific Prognostic Scoring Sys tem.
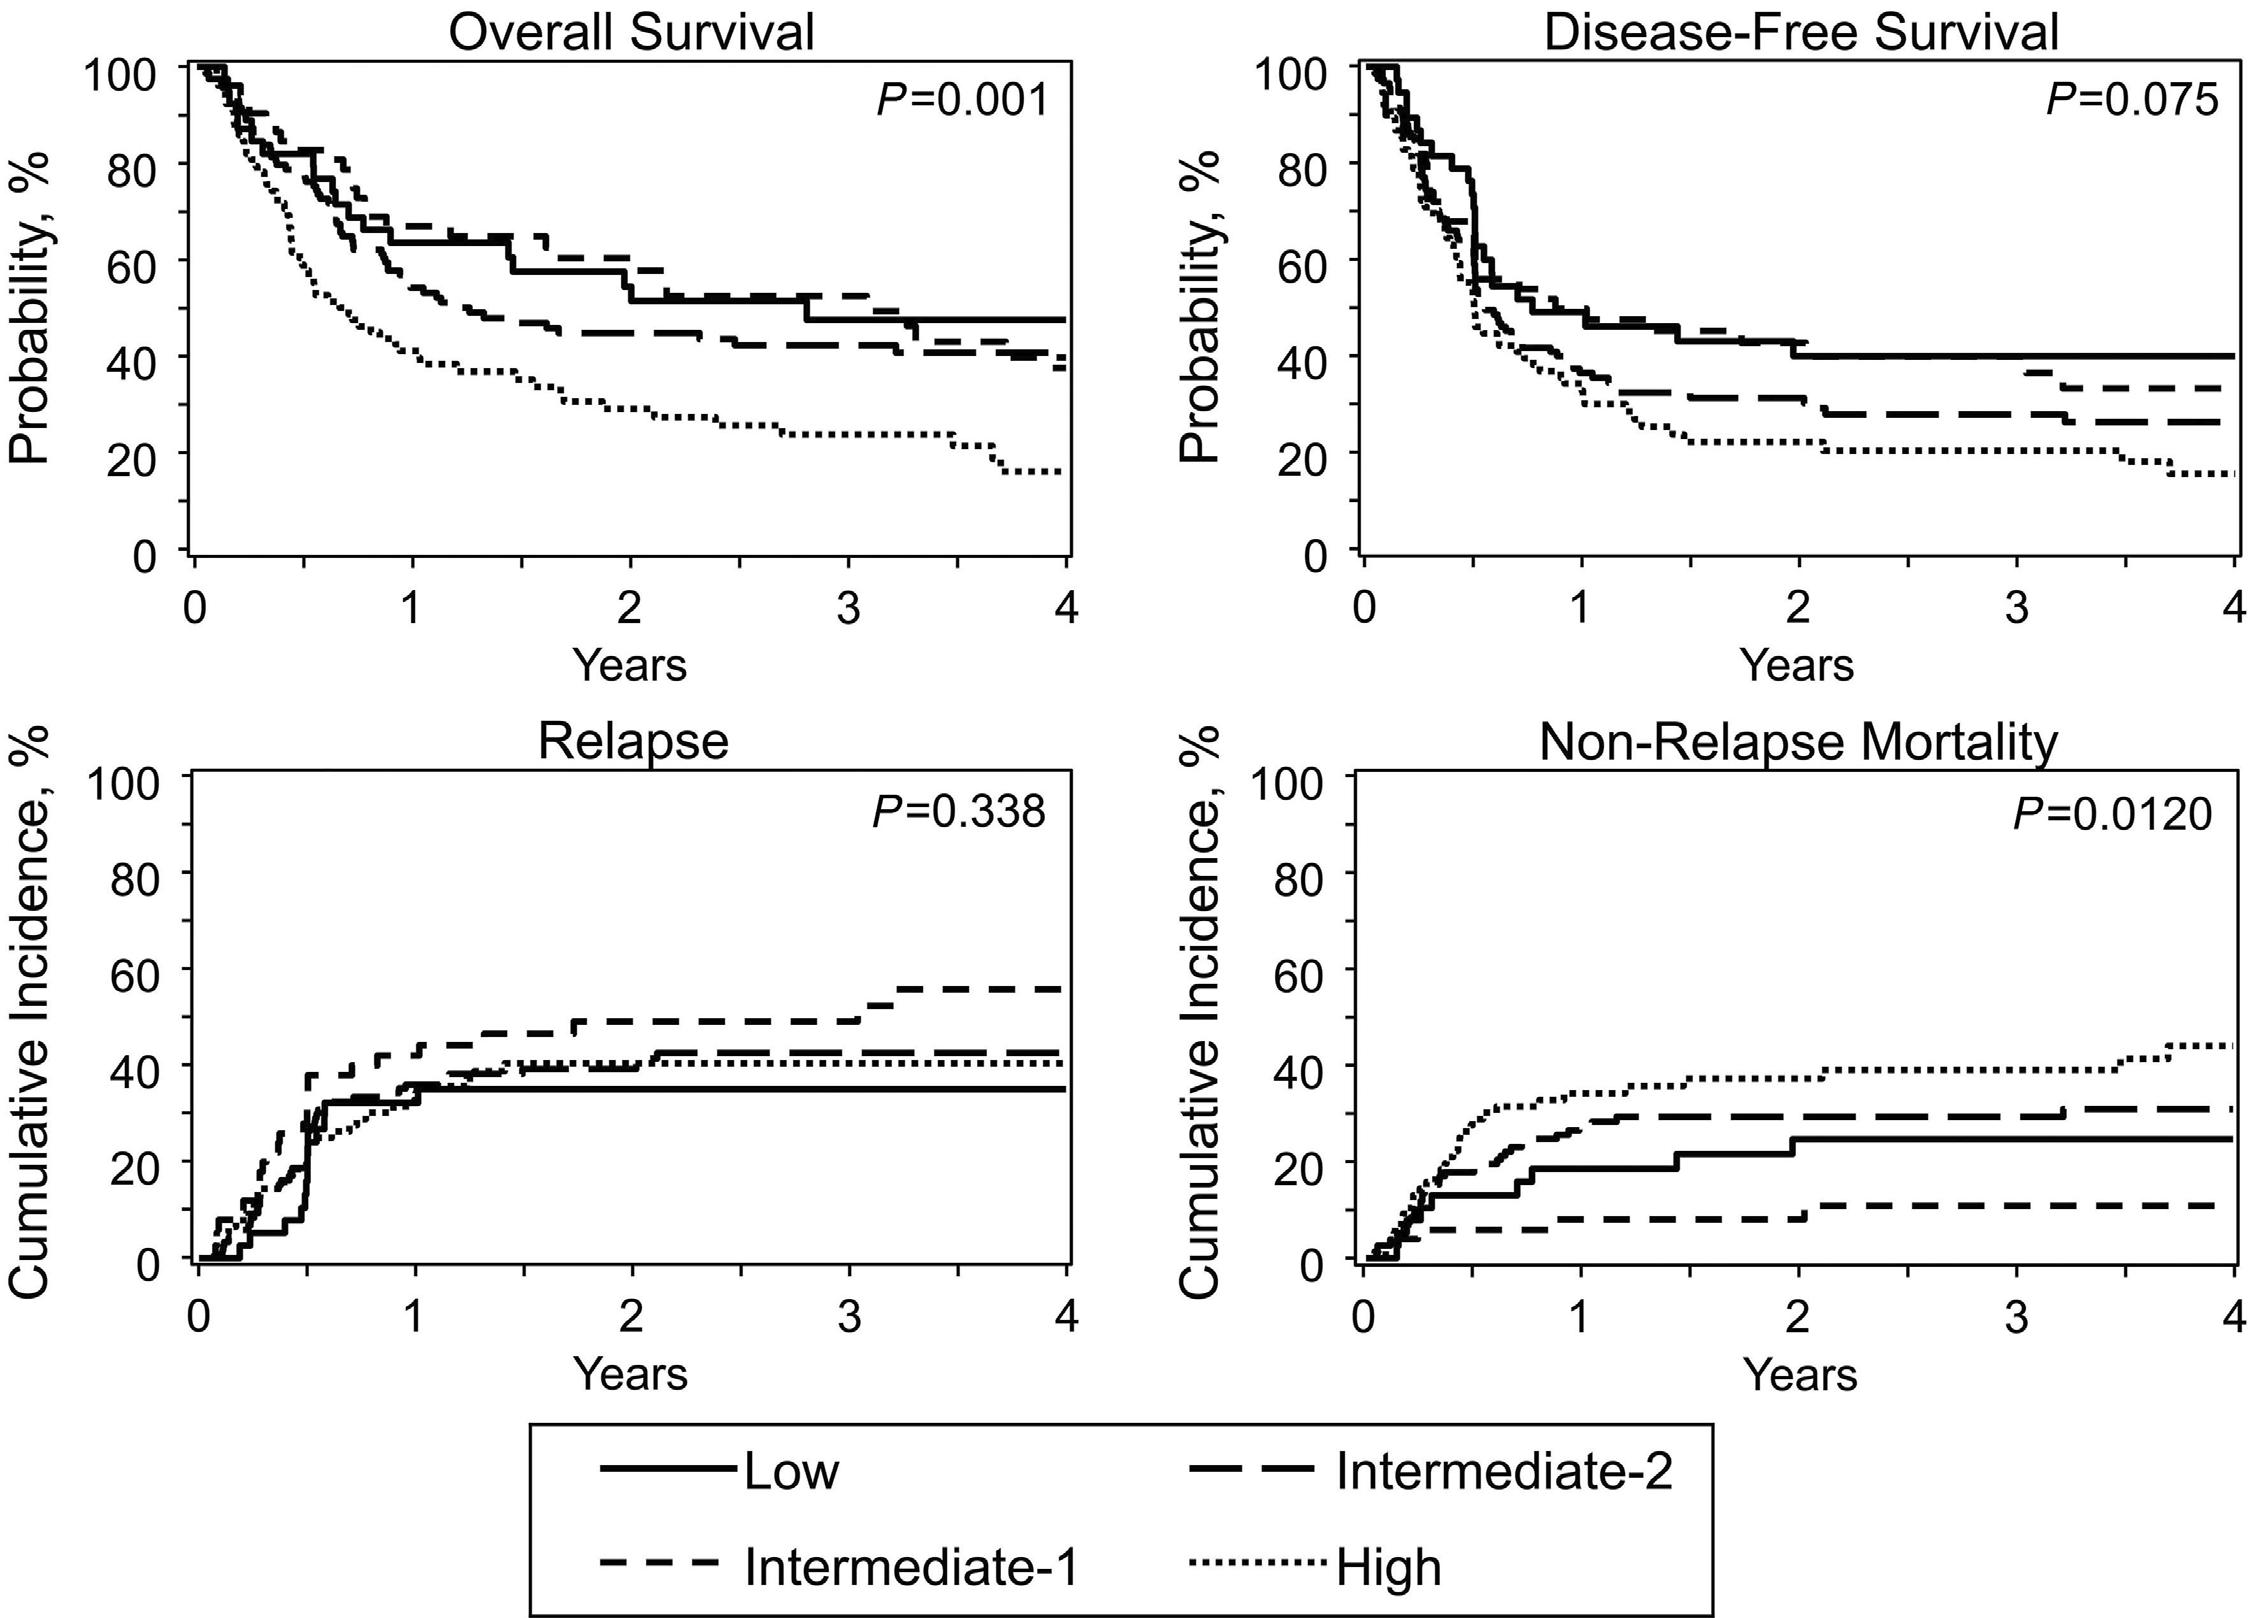
Figure 2. Univariate analysis of post-transplant outcomes by CPSS-Mol score. A) Overall survival. (B) Disease-free survival. (C) Relapse/progression. (D) Transplant-related mortality. CPSS-Mol: Chronic Myelomonocytic Leukemia-Specific Prognostic Scoring System Molecular.

ARTICLE - Impact of somatic mutations on HCT for CMML M.
41% had a Karnofsky Performance Score <90%, 43% had an HCT-CI of 3+, and only 6% received a graft from a matched sibling; all of these factors likely contributed to the overall high TRM in this study. We found both the CPSS and CPSS-Mol scores to be sig nificantly associated with post-allogeneic HCT OS and DFS. In contrast, the GFM and MMM scores correlated poorly with transplant outcomes. One interesting obser vation was the variable segregation of disease risk by the different models. The CPSS, CPSS-Mol, and MMM models each stratify patients into four risk groups, whereas the GFM has three risk groups. However, as stratified by the MMM, the overwhelming majority of patients had inter mediate-2 or high-risk disease (90% combined) with only one patient having low-risk disease and 4% (n=13) of pa tients having intermediate-1-risk disease; therefore, the MMM functionally stratified patients into two groups. Similarly, only 4% (n=13) of patients had high-risk disease by the CPSS whereas at least 10% of patients fell into each of the risk categories as defined by the CPSS-Mol and GFM scores.
In this study, we had hypothesized that the CPSS-Mol score, which incorporates the impact of four separate so matic mutations (ASXL1, NRAS, RUNX1, and SETBP1), would provide better prognostication than the CPSS score, which uses only clinical variables along with cytogenetic data. However, we found that there was no improvement in the prognostic model by having additional molecular data on the CPSS, as the C-index scores for the two models were not appreciably different and were under 0.7 for all out comes, indicative of relatively poor discriminatory value. In a prior CIBMTR analysis, the CPSS had correlated with OS but primarily exerted its effect through prolonged post-relapse survival.16 As such, we hypothesized that the
incorporation of molecular data in the form of the CPSSMol, which has been validated in the non-transplant set ting, would refine risk stratification for disease relapse, especially as patients with low and intermediate-1 CPSSMol scores have a very low risk of acute leukemic evol ution.20 However, this did not translate into a significantly diminished risk of post-transplant relapse: patients with CPSS-Mol low- and intermediate-1-risk disease had a relatively high 4-year incidence of relapse of 35.2% and 55.9%, respectively. We found that TRM correlated with both CPSS and CPSS-Mol scores here, which had not been seen in the earlier CIBMTR analysis on CMML;16 this is similar to what has been seen in myelofibrosis with an in creased Dynamic International Prognostic Scoring System (DIPPS) score being associated with increased TRM and may be reflective of other unknown biological correlates.30 While the overwhelming majority of patients with CMML have at least one recurrent somatic driver mutation,27 the spectrum of molecular mutations seen in CMML is more restricted than that in other myeloid disorders such as myelodysplastic syndrome or acute myeloid leukemia. It has been observed that the heterogeneity of clinical be havior is in excess of that predicted by the impact of so matic mutations alone, and the impact of somatic mutations in CMML may be less than in other diseases.31 The impact of acquired somatic mutations on post-trans plant outcomes in other myeloid malignancies has been previously examined. For instance, a study of 401 patients with myelodysplastic syndrome and secondary acute myeloid leukemia evolving out of prior myelodysplastic syndrome found that mutations in ASXL1, RUNX1, and TP53 were independently predictive of OS after allogeneic HCT.32 Another study of 234 patients with acute myeloid leukemia who were stratified by the European Leukemia
Table 4. Univariable estimates for CPSS-Mol score at time of hematopoietic stem cell transplantation.
Overall survival 100-day 4-year
Relapse 100-day 4-year
Treatment-related mortality 100-day 4-year
Disease-free survival 100-day 4-year
39 84.6 (71.8-94.1) 47.5 (31.1-64.1)
38 5.3 (0.5-14.6) 35.2 (20.5-51.5)
38 10.5 (2.8-22.3) 24.8 (12-40.3)
38 84.2 (71.1-93.9) 40 (24.8-56.3)
52 90.4 (81-96.8) 39.7 (25-55.4)
50 12 (4.5-22.5) 55.9 (40.4-70.7)
50 6 (1.1-14.3) 10.9 (3.5-21.9)
50 82 (70.3-91.3) 33.2 (19.7-48.3)
118 84.7 (77.7-90.6) 37.6 (28.1-47.6)
118 11 (6-17.3) 42.7 (33.5-52.1)
118 14.4 (8.7-21.3) 31.1 (22.6-40.2)
118 74.5 (66.3-82) 26.3 (18.2-35.3)
(95%
78 79.5 (69.9-87.7) 16 (7.4-27)
76 14.5 (7.5-23.3) 40.5 (29.4-52.1)
0.001 0.362 0.001
0.373 0.283 0.012
76 14.5 (7.5-23.3) 44 (32-56.5) 0.263 <0.001
76 71.1 (60.4-80.6) 15.5 (7.4-25.8)
CPSS-Mol: Chronic Myelomonocytic Leukemia-Specific Prognostic Scoring System Molecular, 95% CI: 95% confidence interval.
0.075 0.260 0.034
Net (ELN) risk classification, a system which includes only cytogenetic and molecular data, found that the ELN2017 risk class was highly correlated with post-allogeneic HCT outcomes; a TP53 mutation was found to confer an inde pendent negative effect even in the ELN2017 adverse-risk group.33 In contrast, the limited impact of molecular data in our study mirrors the results seen in myelofibrosis, in which none of the high molecular risk mutations (ASXL1, SRSF2, U2AF1, EZH2, or IDH1/2) was correlated with alloge neic HCT outcomes.34
Other groups have also examined the impact of muta tional status on allogeneic HCT outcomes in patients with CMML. In a single-center retrospective analysis from the University of Washington, 129 patients with CMML who underwent allogeneic HCT were analyzed, including 52 with comprehensive somatic mutation data. Mutations in NRAS, ATRX, and WT1 were associated with increased re lapse, and the latter two were associated with inferior survival, and an increasing number of mutations cor related with relapse as well.35 Another study of 70 CMML patients who underwent allogeneic HCT at the Mayo Clinic, 24 of whom had experienced prior transformation to acute myeloid leukemia, found no impact of mutational status on post-transplant outcomes.36 Finally, a recent ten-center study by Gagelman et al., evaluating 240 CMML patients who underwent allogeneic HCT, found that the CPSS-Mol, GFM, and MMM scores were all significantly associated with OS, whereas neither the CPSS nor the MDAPS correlated with OS.37 In this study, a CMML transplant-specific score was developed with incorporation of ASXL1 and/or NRAS mutation status, bone marrow blasts, and HCT-CI, which outperformed the existing prognostic models. We observed key differences between the cohort reported by Gagelmann et al . and ours. For instance, the distribution by WHO classification was dissimilar as CMML-0, -1, and -2 patients accounted for 53%, 20%, and 9% (19% not reported) of cases, re spectively, in our cohort, whereas the corresponding fig ures for the cohort studied by Gagelmann et al. were 10%, 50%, and 40%, respectively; this marked difference possibly resulted in the bone marrow blast percentage not being significantly associated with post-allogeneic HCT survival in our cohort. There were also important dif ferences in the genetic profiling of the two cohorts, as 62% of our patients had ASXL1 mutations (all nonsense) compared to 34.2% in the EBMT cohort. Our data need to be interpreted with caution given the limitations of this retrospective study. The clinical data are from the time immediately prior to transplantation, so they may have been affected by pre-allogeneic HCT ther apy, although hypomethylating agents do not appear to significantly alter the mutational landscape in CMML.9 The somatic mutations were analyzed from peripheral blood rather than bone marrow; however, there is excellent con
cordance between the two in chronic myeloid disorders.38 Additionally, the impact of individual somatic mutations might reflect other confounding variables; for instance, there is no clear biological basis for an association be tween DNMT3A mutations and increased TRM. Nonethe less, results are largely in keeping with existing data, suggesting that somatic mutations in CMML exert only a limited effect on post-allogeneic HCT outcomes. Future studies with characterization of structural variations, epi genetic profiling and transcriptomics including the con tribution of non-coding RNA as well as longitudinal analysis of molecular data at the time of relapse may pro vide additional insight into ways to decrease relapse. In summary, our registry data provided the mutational landscape in CMML patients undergoing allogeneic HCT, and demonstrated an association between CPSS-Mol score and transplant outcomes although this was driven by the CPSS without a significant contribution from the additional molecular data. While this study cannot answer the question as to whether a specific patient with CMML should undergo allogeneic HCT, the fact that allogeneic HCT outcomes are not greatly influenced by specific mol ecular mutations in CMML is relevant especially in centers lacking ready access to next-generation sequencing. On the other hand, given the favorable natural history of CPSS-Mol low- and intermediate-1 disease with low risk of evolution to acute myeloid leukemia, the decision to perform allogeneic HCT in these patients should be made very carefully. As allogeneic HCT outcomes are still poor in CMML, other molecular and hematologic data are needed to understand resistance mechanisms in this challenging disease, as well as to prevent post-allogeneic HCT relapse and decrease treatment toxicity.
MM reports payment or honoraria for speakers’ bureau from Incyte and honoraria from CTI, Janssen, EUSA, Mor phoSys, and Sanofi-Genzyme as well as research support from Bristol Myers Squibb, Incyte/MorphoSys, BeiGene, TG Therapeutics, and Epizyme. RP reports grant support from the Leukemia Research Foundation. JC reports consulting fees from Pfizer Inc., Amgen Inc., and Jazz Pharmaceuti cals; participation in a Data Safety Monitoring Board or Ad visory Board for AlloVir, Inc.; stocks or stock options from Actinium Pharmaceuticals, Bluebird Bio Inc., Dynavax Pharma, aTyr Pharma, Gamida-Cell, Viragen Therapeutics, Mustang Bio, Novavax, Ovid Therapeutics, Sorrento Thera peutics, TG Therapeutics, Vaxart Inc, and Veru Inc. SG re ports payment or honoraria for speakers’ bureaus from Seattle Genetics and Kite Pharma; and participation on Ad visory Boards of Janssen, Sanofi, BMS , and Astra Zeneca. RPG reports consulting fees from Ascentage Pharma Group, BeiGene, Ltd., Kite Pharms, Inc ., Fusion Pharma LLC, La Jolla Nano Medical Inc., MingSight Pharmaceuticals, Inc.,
Prolacta Bioscience, Inc., and CStone Pharmaceuticals, Inc; participation on a Data Safety Monitoring Board or Advisory Board for RakFond Foundation for Cancer Research Sup port and Antengene Biotech LLC; and stock or stock op tions in Celgene Corp. and StemRad Ltd. MRG reports consulting fees from AbbVie, Agios, Amgen, Astellas, Blue print Medicines, Bristol Myers Squibb, Cardinal Health, Daiichi Sankyo, Gamida-Cell, Gilead, Incyte, Invitae, Karius, Ono Pharmaceutical, Pfi zer, Premier, Sierra Oncology, Stemline, and Trovagene; stock or stock options in Med tronic; receipt of equipment, materials, drugs, medical writing, gifts, or other services from Incyte, Amgen, and Ge nentech/Roche; and research support from Incyte, Genen tech/Roche, and Janssen. TN reports research support to the institution from Novartis (for clinical trials), and from Karyopharm (for clinical trial drug supply). RMS reports participation on a Data CareDx Advisory board, but no re lation/conflicts with regards to this manuscript. BO reports research grants from Astex and AROG pharmaceuticals. RN reports grants or contracts from Helocyte and Miyarisan Pharmaceutical, consulting fees from Omeros, bluebird, Kadmon, NapaJen Pharma, and Magenta Therapeutics; support for attending meetings and/or travel from Kyowa Hakko Kirin and Alexion Pharmaceuticals; and research support unrelated to the work from Helocyte and Miyarisan Pharmaceutical. BLS reports compensation from Celgene and Alexion (advisor), funding from Novartis, payments from BMS (advisory committee), payment of honoraria for lectures, presentations, speakers’ bureaus, manuscript writing or educational events from Taiho Oncology Con sulting, and relationships with the American Society of Hematology (ASH) (government affairs committee).
Contributions MM, RN and WS designed the protocol; RP, MAfkhami, LY and ZM were responsible for the molecular analyses; SK and NE-M analyzed the data; MM, RN and WS wrote the article. All authors interpreted the data and revised the manuscript.
1. Arber DA, Orazi A, Hasserjian R, et al. The 2016 revision to the World Health Organization classification of myeloid neoplasms and acute leukemia. Blood. 2016;127(20):2391-2405.
2. Srour SA, Devesa SS, Morton LM, et al. Incidence and patient survival of myeloproliferative neoplasms and myelodysplastic/myeloproliferative neoplasms in the United States, 2001–12. Br J Haematol. 2016;174(3):382-396.
3. Rollison DE, Howlader N, Smith MT, et al. Epidemiology of myelodysplastic syndromes and chronic myeloproliferative disorders in the United States, 2001-2004, using data from the NAACCR and SEER programs. Blood. 2008;112(1):45-52.
4. Germing U, Kundgen A, Gattermann N. Risk assessment in
This work was supported by a Leukemia Research Founda tion grant (to MM). The CIBMTR is supported primarily by Public Health Service U24CA076518 from the National Cancer Institute, the National Heart, Lung and Blood Insti tute and the National Institute of Allergy and Infectious Diseases; HHSH250201700006C from the Health Resources and Services Administration; and N00014-20-1-2705 and N00014-20-1-2832 from the Office of Naval Research Sup port is also provided by Be the Match Foundation, the Medical College of Wisconsin, the National Marrow Donor Program, and from the following commercial entities: AbbVie; Accenture; Actinium Pharmaceuticals, Inc.; Adap tive Biotechnologies Corporation; Adienne SA; AlloVir, Inc.; Amgen Inc.; Astellas Pharma US Inc.; bluebird bio, inc.; Bristol Myers Squibb Co.; CareDx; CSL Behring; CytoSen Therapeutics, Inc.; Daiichi Sankyo Co., Ltd.; Eurofins Vira cor; ExCellThera; Fate Therapeutics; Gamida-Cell, Ltd.; Ge nentech Inc.; Gilead; GlaxoSmithKline; Incyte Corporation; Janssen/Johnson & Johnson; Jasper Therapeutics; Jazz Pharmaceuticals, Inc.; Karyopharm Therapeutics; Kiadis Pharma; Kite, a Gilead Company; Kyowa Kirin; Legend; Ma genta Therapeutics; Medac GmbH; Medexus; Merck & Co.; Millennium, the Takeda Oncology Co.; Miltenyi Biotec, Inc.; MorphoSys; Novartis Pharmaceuticals Corporation; Omeros Corporation; Oncopeptides, Inc.; Orca Biosystems, Inc.; Os sium Health, Inc.; Pfizer, Inc.; Pharmacyclics, LLC; Priothera; Sanofi-Genzyme; Seagen, Inc .; StemCyte; Takeda Pharmaceuticals; TScan; Vertex; Vor Biopharma; and Xenikos BV.
The CIBMTR supports accessibility of research in accord with the National Institutes of Health (NIH) Data Sharing Policy and the National Cancer Institute (NCI) Cancer Moonshot Public Access and Data Sharing Policy. The CIBMTR only releases de-identified datasets that comply with all relevant global regulations regarding privacy and confidentiality.
chronic myelomonocytic leukemia (CMML). Leuk Lymphoma. 2004;45(7):1311-1318.
5. Patnaik MM, Tefferi A. Chronic myelomonocytic leukemia: 2020 update on diagnosis, risk stratification and management. Am J Hematol. 2020;95(1):97-115.
6. Aribi A, Borthakur G, Ravandi F, et al. Activity of decitabine, a hypomethylating agent, in chronic myelomonocytic leukemia. Cancer. 2007;109(4):713-717.
7. Wijermans PW, Rüter B, Baer MR, Slack JL, Saba HI, Lübbert M. Efficacy of decitabine in the treatment of patients with chronic myelomonocytic leukemia (CMML). Leuk Res. 2008;32(4):587-591.
8. Braun T, Itzykson R, Renneville A, et al. Molecular predictors of response to decitabine in advanced chronic myelomonocytic leukemia: a phase 2 trial. Blood. 2011;118(14):3824-3831.
9. Merlevede J, Droin N, Qin T, et al. Mutation allele burden remains unchanged in chronic myelomonocytic leukaemia responding to hypomethylating agents. Nat Commun. 2016;7:10767.
10. Eissa H, Gooley TA, Sorror ML, et al. Allogeneic hematopoietic cell transplantation for chronic myelomonocytic leukemia: relapse-free survival is determined by karyotype and comorbidities. Biol Blood Marrow Transplant. 2011;17(6):908-915.
11. Elliott MA, Tefferi A, Hogan WJ, et al. Allogeneic stem cell transplantation and donor lymphocyte infusions for chronic myelomonocytic leukemia. Bone Marrow Transplant. 2006;37(11):1003-1008.
12. Kröger N, Zabelina T, Guardiola P, et al. Allogeneic stem cell transplantation of adult chronic myelomonocytic leukaemia. A report on behalf of the Chronic Leukaemia Working Party of the European Group for Blood and Marrow Transplantation (EBMT). Br J Haematol. 2002;118(1):67-73.
13. Ocheni S, Kröger N, Zabelina T, Zander AR, Bacher U. Outcome of allo-SCT for chronic myelomonocytic leukemia. Bone Marrow Transplant. 2009;43(8):659-661.
14. Park S, Labopin M, Yakoub-Agha I, et al. Allogeneic stem cell transplantation for chronic myelomonocytic leukemia: a report from the Societe Francaise de Greffe de Moelle et de Therapie Cellulaire. Eur J Haematol. 2013;90(5):355-364.
15. Symeonidis A, Biezen A, Wreede L, et al. Achievement of complete remission predicts outcome of allogeneic haematopoietic stem cell transplantation in patients with chronic myelomonocytic leukaemia. A study of the Chronic Malignancies Working Party of the European Group for Blood and Marrow Transplantation. Br J Haematol. 2015;171(2):239-246.
16. Liu HD, Ahn KW, Hu ZH, et al. Allogeneic hematopoietic cell transplantation for adult chronic myelomonocytic leukemia. Biol Blood Marrow Transplant. 2017;23(5):767-775.
17. Kerbauy DM, Chyou F, Gooley T, et al. Allogeneic hematopoietic cell transplantation for chronic myelomonocytic leukemia. Biol Blood Marrow Transplant. 2005;11(9):713-720.
18. Itzykson R, Kosmider O, Renneville A, et al. Prognostic score including gene mutations in chronic myelomonocytic leukemia. J Clin Oncol. 2013;31(19):2428-2436.
19. Patnaik MM, Padron E, LaBorde RR, et al. Mayo prognostic model for WHO-defined chronic myelomonocytic leukemia: ASXL1 and spliceosome component mutations and outcomes. Leukemia. 2013;27(7):1504-1510.
20. Elena C, Galli A, Such E, et al. Integrating clinical features and genetic lesions in the risk assessment of patients with chronic myelomonocytic leukemia. Blood. 2016;128(10):1408-1417.
21. Hunter A, Padron E. Genomic landscape and risk stratification in chronic myelomonocytic leukemia. Curr Hematol Malig Rep. 2021;16(3):247-255.
22. Horowitz M. The role of registries in facilitating clinical research in BMT: examples from the Center for International Blood and Marrow Transplant Research. Bone Marrow Transplant. 2008;42(Suppl 1):S1-s2.
23. Such E, Germing U, Malcovati L, et al. Development and
validation of a prognostic scoring system for patients with chronic myelomonocytic leukemia. Blood. 2013;121(15):3005-3015.
24. Wassie EA, Itzykson R, Lasho TL, et al. Molecular and prognostic correlates of cytogenetic abnormalities in chronic myelomonocytic leukemia: a Mayo Clinic-French Consortium study. Am J Hematol. 2014;89(12):1111-1115.
25. Wolbers M, Blanche P, Koller MT, Witteman JCM, Gerds TA. Concordance for prognostic models with competing risks. Biostatistics. 2014;15(3):526-539.
26. Harrell FE Jr, Califf RM, Pryor DB, Lee KL, Rosati RA. Evaluating the yield of medical tests. JAMA. 1982;247(18):2543-2546.
27. Patnaik MM, Tefferi A. Cytogenetic and molecular abnormalities in chronic myelomonocytic leukemia. Blood Cancer J. 2016;6(2):e393.
28. Patel BJ, Przychodzen B, Thota S, et al. Genomic determinants of chronic myelomonocytic leukemia. Leukemia. 2017;31(12):2815-2823.
29. Valent P, Orazi A, Savona MR, et al. Proposed diagnostic criteria for classical chronic myelomonocytic leukemia (CMML), CMML variants and pre-CMML conditions. Haematologica. 2019;104(10):1935-1949.
30. Scott BL, Gooley TA, Sorror ML, et al. The Dynamic International Prognostic Scoring System for myelofibrosis predicts outcomes after hematopoietic cell transplantation. Blood. 2012;119(11):2657-2664.
31. Ball M, List AF, Padron E. When clinical heterogeneity exceeds genetic heterogeneity: thinking outside the genomic box in chronic myelomonocytic leukemia. Blood. 2016;128(20):2381-2387.
32. Della Porta MG, Gallì A, Bacigalupo A, et al. Clinical effects of driver somatic mutations on the outcomes of patients with myelodysplastic syndromes treated with allogeneic hematopoietic stem-cell transplantation. J Clin Oncol. 2016;34(30):3627-3637.
33. Grimm J, Jentzsch M, Bill M, et al. Prognostic impact of the ELN2017 risk classification in patients with AML receiving allogeneic transplantation. Blood Adv. 2020;4(16):3864-3874.
34. Tamari R, Rapaport F, Zhang N, et al. Impact of high-molecularrisk mutations on transplantation outcomes in patients with myelofibrosis. Biol Blood Marrow Transplant. 2019;25(6):1142-1151.
35. Woo J, Choi DR, Storer BE, et al. Impact of clinical, cytogenetic, and molecular profiles on long-term survival after transplantation in patients with chronic myelomonocytic leukemia. Haematologica. 2020;105(3):652-660.
36. Pophali P, Matin A, Mangaonkar AA, et al. Prognostic impact and timing considerations for allogeneic hematopoietic stem cell transplantation in chronic myelomonocytic leukemia. Blood Cancer J. 2020;10(11):121-121.
37. Gagelmann N, Badbaran A, Beelen DW, et al. A prognostic score including mutation profile and clinical features for patients with CMML undergoing stem cell transplantation. Blood Adv. 2021;5(6):1760-1769.
38. Lucas F, Michaels PD, Wang D, Kim AS. Mutational analysis of hematologic neoplasms in 164 paired peripheral blood and bone marrow samples by next-generation sequencing. Blood Adv 2020;4(18):4362-4365.
Giulia Petrone,1*° Charles Gaulin,2* Andriy Derkach,3 Ashwin Kishtagari,4 Mark E. Robson,5 Rekha Parameswaran6# and Eytan M. Stein7#
1Department of Medicine, Mount Sinai Morningside and Mount Sinai West, New York, NY; 2Division of Hematology and Medical Oncology, Mayo Clinic, Phoenix, AZ; 3Department of Biostatistics and Epidemiology, Memorial Sloan Kettering Cancer Center, New York, NY; 4Division of Hematology and Oncology, Department of Medicine, Vanderbilt University Medical Center, Nashville, TN; 5Breast Medicine Service, Memorial Sloan Kettering Cancer Center, New York, NY; 6Division of Hematology, Memorial Sloan Kettering Cancer Center, New York, NY and 7Leukemia Service, Department of Medicine, Memorial Sloan Kettering Cancer Center, New York, NY, USA
°Current address: Division of Oncology, Washington Univ ersity School of Medicine, St. Louis, MO, USA
*GP and CG contributed equally as co-first authors. #RP and EMS contributed equally as co-senior authors.
Correspondence: E. M. Stein steine@mskcc.org
Received: December 27, 2021.
Accepted: June 20, 2022. Prepublished: June 30, 2022.
https://doi.org/10.3324/haematol.2021.280437 ©2023 Ferrata Storti Foundation
Published under a CC BY-NC license
We aim to identify predictors of therapy-related myeloid neoplasms (t-MN) in patients with breast cancer (BC) and cytope nias to determine the timing of bone marrow biopsy (BMBx). Patients with BC and cytopenias who were referred for BMBx between 2002-2018 were identified using the Memorial Sloan Kettering Cancer Center institutional database. Character istics associated with the risk of t-MN were evaluated by multivariable logistic regression and included in a predictive model. The average area under the receiver operating characteristic curve (AUC) was estimated by 5-fold cross-validation. Of the 206 BC patients who underwent BMBx included in our study, 107 had t-MN. By multivariable analysis, white blood cell count 4-11 K/mcL, absolute neutrophil count (ANC) ≥1.5 K/mcL, hemoglobin ≥12.2 g/dL, red cell distribution width 11.5-14.5%, the presence of bone metastasis and a time from BC diagnosis to BMBx <15 months significantly decreased the likelihood of t-MN. The average AUC was 0.88. We stratified our cohort by bone metastasis and by findings on periph eral smear. In both the subset without bone metastasis (n=159) and in the cohort with no blasts or dysplastic cells on peripheral smear (n=96) our variables had similar effects on the risk of t-MN. Among the 47 patients with bone metastasis, an ANC ≥1.5 K/mcL was the only variable associated with a decreased risk of t-MN. Our findings show that in patients with BC and unexplained cytopenias, clinical and laboratory parameters can predict t-MN and assist clinicians in deter mining the timing of a BMBx.
Therapy-related myelodysplastic syndrome (t-MDS) and therapy-related acute myeloid leukemia (t-AML) – collec tively known as therapy-related myeloid neoplasms (tMN) – are rare long-term complications of cytotoxic chemotherapy and radiotherapy for both solid tumors and hematologic malignancies (HM).1 The incidence of t-MN is higher after exposure to DNA-damaging agents, especially alkylators, topoisomerase II-inhibitors, and radiation, all commonly used for the adjuvant and neo-adjuvant treat
ment of breast cancer (BC).2,3 t-MN account for an esti mated 10% to 20% of all myeloid neoplasms, and are as sociated with high risk cytogenetic abnormalities, conveying a poorer prognosis than de novo MDS and AML. As overall BC survival improved over the last several dec ades, the incidence of t-MN has increased.2,4,5 t-MN occur at a rate of 0.6% to 1.8% after treatment for BC and the frequency increases between 5 and 10 years following in itial BC diagnosis.4,6-8 Given that there are currently more than 3.8 million women with a history of BC living in the United States, the burden of t-MN is significant.9
In routine clinical practice, a subset of patients presents to their breast oncologist with variable degrees of cytope nias months to years after completing adjuvant therapy. These cytopenias may be a result of prolonged myelosup pression from chemotherapy, newly metastatic BC infil trating the bone marrow, or t-MN. We hypothesized that routine clinical and laboratory parameters in patients with BC and cytopenias can predict the presence of t-MN, and serve as a screening tool to evaluate which patients are most likely to have a t-MN.
Data were collected using the Memorial Sloan Kettering Cancer Center (MSKCC) database. Medical records were reviewed under a retrospective observational research protocol approved by the MSKCC Institutional Review Board, in accordance with the Declaration of Helsinki.
Patients with BC diagnosed between January 2002 and December 2018 who were referred to the hematology clinic for evaluation of unexplained cytopenias and under went BMBx were included. Variables obtained comprised prior BC treatment, pre-existing bone metastasis, white blood cell (WBC) count, absolute neutrophil count (ANC), hemoglobin (Hgb) level, mean corpuscular volume (MCV), red cell distribution width (RDW), platelet (PLT) count, pe ripheral smear at the time of BMBx, and BMBx findings. The diagnosis of t-MN was determined by MSKCC pathol ogy reports that were categorized using the International Working Group criteria for MDS and AML. BC treatment was divided in categories: chemotherapy with radiother apy, only chemotherapy, only radiotherapy, only surgery. Pancytopenia was defined as WBC <4 K/mcL, Hgb <12.2 g/dL and PLT <100 K/mcL. We used an ANC cutoff of <1.5 K/mcL, corresponding to grade 1 severity of adverse ef fects per the CTCAE, and followed the National Cancer In stitute's criteria for anemia in women.10 We adopted the MSKCC laboratory normal range for WBC (4-11 K/mcL), MCV (82-98 fL) and RDW (11.5-14.5%). The follow-up period was heterogeneous as it was defined by the inter val from referral and chart review. Clinically relevant char acteristics and laboratory parameters were selected based on their reported association with t-MN 4,11-13 and assessed as predictors of t-MN.
Multivariable logistic regression with both-directional stepwise selection was used to determine the best pre dictors of t-MN. Starting model contained intercept and a variable leading to the smallest Akaike information cri terion (AIC) was selected at each step of the algorithm.
Final models that minimized AIC were selected. In order to explore associations between patient char acteristics and t-MN, we defined the multiplicative factor for the patient i as Ri =exp(∑p j=1 β^ j Χij), where Χij are se lected characteristics by the final model, and b^ j are esti mated log-odds ratios. The ratio of multiplicative factor Ri calculated for risk factors (Χi1…,Χip) to a multiplicative fac tor Rk calculated for risk factors (Χk1,…,Χkp), represents the change in odds of a patient i having t-MN compared to a patient k. Log-values of Ri called risk scores, Si =∑p j=1 b^ j Χij were calculated for each patient using the final model. For this scoring system, each variable was assigned a score by rounding b^ j to nearest integer. The average area under the receiver operating character istic curve (AUC) of the final predictive model was esti mated by 5-fold cross-validation. In each round of cross-validation, we applied the multivariable logistic re gression with the same stepwise selection to training data and estimated AUC on test data. The population was di vided by bone metastasis and by results of peripheral smear. The multivariable logistic regression with stepwise selection was applied to determine the best predictors of t-MN on the non-bone metastatic cohort (n=159) and on the smear negative cohort (n=96); univariate analysis was performed on the much smaller bone-metastatic subset (n=47).
A total of 359 patients with prior treatment for BC were referred to the MSKCC hematology clinic for the evalu ation of cytopenias and underwent a BMBx. One hundred and fifty-three patients were excluded from the study, primarily due to a prior diagnosis of a hematologic malig nancy or another solid tumor preceding their BC diagnosis, or if they had a diagnosis of a myeloproliferative neo plasm, lymphoma or multiple myeloma on the subsequent BMBx results (see CONSORT diagram). A total of 206 pa tients were included in the final analysis (Table 1).
Of the 206 patients, 137 received chemotherapy; the ma jority were exposed to an alkylating agent (58.7%) and to an agent targeting DNA-topoisomerase II (49.5%). A total of 142 patients received RT and 117 had hormone treat ment (see Online Supplementary Tables S1, S2 and S3). A total of 107 had BMBx findings consistent with a t-MN (crude incidence of 51%). Specifically, 47 patients were di agnosed with t-AML, 44 patients had t-MDS, and 16 pa tients had an initial diagnosis of t-MDS that evolved to t-AML during the follow-up period. Forty-five patients had BMBx findings of metastatic carcinoma compatible with a BC primary. One hundred and twenty-one patients died
Non-invasive prediction of t-MN
Table 1. Characteristics of the whole population.
Characteristics
Race, N (%)
Asian Black White Unknown
Age in years at BC Dx
All pts N=206
8 (3.8) 36 (17) 152 (73.7) 10 (4)
Pts without bone mets N=159 Pts with bone mets N=47
8 (5) 28 (17) 114 (71.7) 9 (5.7)
0 (0) 8 (17) 38 (80.8) 1 (2)
Median age (IQR) 56 (18) 57 (16) 53 (22.5)
Age in years at BMBx
Median age (IQR) 64.5 (17) 65 (16.5) 61 (23.5)
Latency between BC Dx and BMBx Median years (IQR) 5 (7) 5 (7) 4 (6)
BMBx findings, N (%) t-AML t-MDS t-MDS > t-AML Bone mets No abnormalities
47 (22.8) 44 (21) 16 (7.7) 45 (21.8) 54 (26)
45 (28) 43 (27) 14 (8.8) 8 (5) 47 (29.5)
2 (4) 1 (2) 2 (4) 37 (78) 5 (10)
Pts: patients; mets: metastasis; BC: breast cancer; Dx: diagnosis; BMBx: bone marrow biopsy; t-MDS: therapy-related myelodysplastic syn drome; t-AML: therapy-related acute myeloid leukemia; IQR: interquartile range.
during the study period and 17 were lost to follow-up. We evaluated the cytogenetics of patients diagnosed with tMN and found that 33 of them had a normal karyotype, 35 had a single chromosomal abnormality, 37 presented with multiple chromosomal aberrations and two had un known cytogenetics. Similar to prior studies,14-16 the most common abnormalities were deletion or loss of chromo somes 5 and 7 (21.5% and 13%, respectively), followed by trisomy of chromosome 8 and t(11q23), (13% and 9%, re spectively). As shown in the Online Supplementary Table S4, we observed that the use of alkylating agents was more frequently associated with deletions or loss of chro mosomes 5 and 7, while treatment with agents targeting DNA-topoisomerase II was associated with balanced translocations such as t(8;21) and t(11q23). In the univari ate analysis of the total cohort, we observed nine clinical variables with P values below 0.05 (see the Online Sup plementary Table S1). In particular, a WBC 4-11 K/mcL (P<0.0001), an ANC ≥1.5 K/mcL (P<0.0001), a Hgb level ≥12.2 g/dL ( P=0.0009), a MCV <98 (P=0.0001), a normal RDW (P= 0.0001), a PLT count ≥100 K/mcL (P=0.0075), the absence of dysplastic cells or blasts in the peripheral smear (P<0.0001), the presence of known bone metastasis (P<0.0001) and a time from BC diagnosis to BMBx of <15 months (P<0.0001) significantly decreased the likelihood of t-MN. No relationship was associated with race (P=0.27) and with a history of chemotherapy or radiotherapy (P=0.12). When we created our prediction model, we ex cluded the peripheral smear because 49 of 52 patients (94%) with blasts or dysplastic cells had a diagnosis of tMN and only three patients (6%) had a positive smear
without t-MN. Our final multivariable logistic model in cluded WBC, ANC, Hgb, RDW, the presence of bone meta stasis and a time from BC diagnosis to BMBx <15 months (Table 2). Figure 1A shows the distribution of risk scores for being diagnosed with t-MN in the whole cohort. The score ranges from -11 to 4, with score increase implying a higher risk of having t-MN. Patients diagnosed with t-MN had risk scores ranging between -5 and 4 and non-t-MN patients had risk scores ranging between -11 and 1. A post hoc value of -5 can be used as a cutoff and corresponds to 100% true positive rate and acceptable false positive rate of 50%, at our institution. The score also showed good discrimination between the two groups resulting in an average AUC of 0.88 (95% confidence interval [CI]: 0.85-0.91) (Figure 2A).
Analysis of the cohort stratified by bone metastasis
The cohort was stratified by the presence of bone meta stasis. A total of 159 patients did not have pre-existing bone metastasis and, in this subset, 102 patients were di agnosed with t-MN. Out of this group, 43 patients had tMDS, 45 patients were found to have t-AML, and 14 patients had initially t-MDS that evolved to t-AML during the follow-up period; finally, eight patients had BMBx findings revealing metastatic BC. The univariate analysis of this group showed similar results as the whole cohort (Online Supplementary Table 5S). A WBC 4-11 K/mcL, an ANC ≥1.5 K/mcL, a Hgb level ≥12.2 g/dL, a MCV <98, a nor mal RDW, a PLT count ≥100 K/mcL, a normal peripheral smear, and a time from diagnosis to BMBx of <15 months were associated with a decreased probability of being di
Table 2. Associations with the clinical characteristics selected for the final model based on the whole cohort.
Variable All pts N=206 Pts with t-MN N=107 (%) Pts without t-MN N=99 (%) OR (95% CI)* P Score
WBC
4-11 x 109/L <4 x 10⁹/L >11 x 109/L
87 87 31
29 (33) 53 (61) 24 (77)
58 (67) 34 (39) 7 (23)
1 0.41 (0.09-1.76) 10.91 (2.46-48.36)
0.0003 0 -1 2 ANC
<1.5 x 10⁹/L ≥1.5 x 10⁹/L 66 127 52 (79) 43 (34) 14 (21) 84 (66) 1 0.05 (0.01-0.23)
Hgb <12.2 g/dL ≥12.2 g/dL 163 42 94 (58) 12 (29) 69 (42) 30 (71) 1 0.14 (0.04-0.53)
RDW
11.5-14.5% >14.5% 51 131 12 (24) 74 (56) 39 (76) 57 (44) 1 3.1 (1.07-8.99)
Absent Present 159 47 102 (64) 5 (11) 57 (36) 42 (89) 1 0.03 (0.01-0.11)
Time from BC Dx to BMBx >15 months <15 months 166 38 97 (58) 8 (21) 69 (42) 30 (79) 1 0.16 (0.05-0.54)
0.0002 0 -3
0.0036 0 -2
0.038 0 1
<0.0001 0 -4
0.0031 0 -2
*Estimates from multivariable logistic regression with selected predictors in the model. Pts: patients; t-MN: therapy-related myeloid neo plasms; OR: odds ratio; CI: confidence interval; WBC: white blood cell; ANC: absolute neutrophil count; Hgb: hemoglobin; RDW: red cell dis tribution width; mets: metastasis; BC: breast cancer; Dx: diagnosis; BMBx: bone marrow biopsy.
agnosed with t-MN. Our final multivariable logistic model was also comparable to the final model selected in the whole cohort (Table 3). The scoring system obtained with the final statistically significant variables is shown in Fig ure 1B. The distribution ranges from -6 to 5 with higher scores conveying an increased risk of having t-MN. Pa tients with t-MN had a risk score ranging between -6 and 2 while non-t-MN patients had a score between -4 and 4. It was difficult to identify a cutoff in this cohort since there was a true positive rate of 100% and a high false positive rate of 80%, at our institution. The score showed good discrimination between the two groups resulting in an average AUC of 0.81 (95% CI: 0.72-0.9), Figure 2B. The subset with pre-existing bone metastasis consisted of 47 patients; five of them had a diagnosis of t-MN. The majority of the patients (78%, 37/47 patients) had BMBx findings consistent with metastatic BC. t-MDS was found in one patient, two had a diagnosis of t-AML and two pa tients had t-MDS that evolved to t-AML. In our univariate analysis (Online Supplementary Table S6), only an ANC ≥1.5 K/mcL was borderline significant (P=0.053). No risk score was calculated in this cohort.
Analysis of the cohort stratified by peripheral smear
Our cohort was stratified by the findings on the peripheral smear performed at the time of BMBx. We found 148 re ports and 52 of them were positive for blasts or dysplastic cells. The majority of patients with a positive smear had a diagnosis of t-MN (94%, P=0.0001), and only three pa
tients had BC bone metastasis instead. Since a positive smear was highly predictive of t-MN, we did not create a predictive model in this cohort.
Among the 96 patients with negative smear, 61% did not have a diagnosis of t-MN and 95% of patients without tMN had a normal peripheral smear (P=<0.0001). In the uni variate analysis of this group, a WBC 4-11 K/mcL, an ANC ≥1.5 K/mcL, a Hgb level ≥12.2 g/dL, a MCV <98, the pres ence of known bone metastasis and a time from diagnosis to BMBx of <15 months were correlated with a decreased probability of being diagnosed with t-MN (Online Supple mentary Table 7S). Table 4 illustrates the final variables selected by multivariable analysis and Figure 1C shows the score system obtained with these variables. The distribu tion ranges from -9 to 3; similarly to the whole cohort, in crease in scores conveyed a higher risk of having t-MN. Patients diagnosed with t-MN had risk scores ranging be tween -3 and 3 and non-t-MN patients had risk scores ranging between -9 and 3. A post hoc value of -3 can be used as a cutoff and corresponds to 100% true positive rate and acceptable false positive rate of 59%, at our in stitution. The score also showed good discrimination be tween the two groups resulting in an average AUC of 0.81 (95% CI: 0.69-0.92), see Figure 2C.
As the overall survival of BC improves, the incidence of t-
Figure 1. Scoring system obtained integrating the score assigned to each statistically significant variable to help determine a probability of having therapy-related myeloid neoplasms. (A) Distribution of risk scores in the whole cohort (n=206) for the pro bability of being diagnosed with therapy-related myeloid neoplasms (t-MN). The blue columns represent patients without t-MN, the red ones represent patients with t-MN and the purple columns show the overlap between the 2 cohorts. The score ranges from -11 to 4, with higher scores conveying a greater risk of having t-MN. Patients diagnosed with t-MN had risk scores ranging between -5 and 4 and non-t-MN patients had risk scores ranging between -11 and 1. A post hoc value of -5 can be used as a cutoff and corresponds to 100% true positive rate and acceptable false positive rate of 50%; at our institution. (B) Distribution of risk scores in the cohort without bone metastasis (n=159) for the probability of being diagnosed with t-MN. The distribution ranges from -6 to 5 with higher scores conveying an increased risk of having t-MN. Patients with t-MN had a risk score ranging between -6 and 2, while non-t-MN patients had a score between -4 and 4. It was difficult to identify a cutoff in this cohort since there was a true positive rate of 100% and a high false positive rate of 80%; at our institution. (C) Distribution of risk scores in the cohort with negative peripheral smear (n=96) for the probability of being diagnosed with t-MN. The distribution ranges from -9 to 3; increase in scores conveyed a higher risk of having t-MN. Patients diagnosed with t-MN had risk scores ranging between -3 and 3 and non-t-MN patients had risk scores ranging between -9 and 3. A post hoc value of -3 can be used as a cutoff and corresponds to 100% true positive rate and acceptable false positive rate of 59%; at our institution.

MN after treatment for BC continues to rise. In this study, we sought to identify predictors of t-MN in order to assist in the early diagnosis of t-MN and determine the best tim ing of BMBx in patients with new unexplained cytopenias and prior treatment for BC. It is known that specific fac tors are more often correlated with a higher risk of devel oping t-MN, especially high doses of chemotherapy, long duration of treatment, combination with radiotherapy and older age.17 However, because of the very complex nature of t-MN and of the acuity of t-AML, formulating predictive models can be challenging. Prior studies have tried to cre ate predictive models for the early diagnosis of t-MN using clonal hematopoiesis.18,19 Both Genovese and Takahashi20,21 found that age-related clonal hematopoiesis (ARCH) could
be used as a biomarker for prediction of AML because the presence of a myeloid clone, detected after treatment for the primary cancer, would increase the possibility of sub sequent t-MN. Nevertheless, to use ARCH as a predictive tool, a large number of patients need to be tested incur ring substantial costs. A good biomarker should be objec tively measured in a non-invasive fashion, it should be easy to obtain and inexpensive, in order to be used re peatedly and applied to a large population.22 To our knowl edge, this is the first study that uses only routine clinical and laboratory parameters as predictors of t-MN. When we analyzed the CBC obtained at the same time as the BMBx, we found a statistically significant association with both the WBC and the ANC and the probability of having
Non-invasive prediction of t-MN
Figure 2. Average receiver operating characteristic curves of the logistic model selected by both-directional stepwise logistic regression. Blue receiver operating characteristic (ROC) curve is estimated at each run of 5-fold cross-validation. Red ROC curve represents an average ROC curve obtained by fitting a smooth curve to the estimated blue ROC curves. (A) Average ROC curve for the whole cohort. (B) Average ROC curve for the subset without bone metastasis. (C) Average ROC curve for the subset with negative peripheral smear. AUC: average area under the receiver operating characteristic curve; AML: acute myeloid leukemia; MDS: myelodysplastic syndrome; Neg: negative; Mets: metastasis.
Table 3. Associations with the clinical characteristics selected for the final model based on the cohort without bone metastasis.
Variable Pts without bone mets N=159
Pts with t-MN N=102 (%)
Pts without t-MN N=57 (%) OR (95% CI)* P Score
WBC <4 x 10⁹/L >11 x 109/L 4-11 x 109/L
75 25 58
50 (67) 22 (88) 29 (50)
25 (33) 3 (12) 29 (50)
1 23.21 (2.71-199) 2.67 (0.61-11.8)
0.004 0 3 1 ANC <1.5 x 10⁹/L ≥1.5 x 10⁹/L 62 85 50 (81) 40 (47) 12 (19) 45 (53) 1 0.06 (0.01-0.31)
0.0007 0 -3 Hgb <12.2 g/dL ≥12.2 g/dL 124 34 89 (72) 12 (35) 35 (28) 22 (65) 1 0.16 (0.05-0.58)
RDW 11.5-14.5% >14.5% 45 92 12 (27) 69 (75) 33 (73) 23 (25) 1 3.07 (1.09-8.65)
Time from BC Dx to BMBx >15 months <15 months 129 28 92 (71) 8 (29) 37 (29) 20 (71) 1 0.19 (0.06-0.61)
0.0051 0 -2
0.034 0 1
0.0057 0 -2
*Estimates from multivariable logistic regression with selected predictors in the model. mets: metastasis; t-MN: therapy-related myeloid neoplasms; OR: odds ratio; CI: confidence interval; WBC: white blood cell; ANC: absolute neutrophil count; Hgb: hemoglobin; RDW: red cell distribution width; BC: breast cancer; Dx: diagnosis; BMBx: bone marrow biopsy.

- Non-invasive prediction of t-MN
a diagnosis of t-MN. In the analysis of the whole cohort, 58% and 85% of the patients without t-MN had a normal WBC count and an ANC ≥1.5 K/mcL, respectively. Similar results were observed in the subset of patients without pre-existing bone metastasis, where 51% and 79% of pa tients without t-MN had a WBC 4-11 K/mcL and an ANC ≥1.5 K/mcL, respectively. In the group with pre-existing bone metastasis, 95% of the patients without t-MN had an ANC ≥1.5 K/mcL. In this cohort, we did not find any statistically significant association with the rest of the variables, possibly due to the extremely small number of patients in this subgroup. Moreover, even though the ma jority of patients had anemia (79%),10 we observed that a Hgb ≥12.2 g/dL was more frequently associated with the absence of t-MN. Our findings differ from prior studies, in fact, both Jaiswal and Abelson23,24 found that patients with ARCH and pre-AML mutations had normal blood counts. The only difference they observed was a significantly raised RDW in patients at higher risk of progression to AML. However, a low WBC, ANC and hematocrit have been associated with an increased risk of development of MDS and AML, but no specific cutoff had been used to help identify a predictive tool.12,13,25 Finally, when we examined the MCV and RDW values, we found that 86% of the pa tients without t-MN had an MCV <98 and 76% of them had a normal RDW. These results echo the association be tween both macrocytosis and higher RDW and an in creased probability of developing AML and MDS already reported in previous studies.23,24,26,27 Our findings suggest that t-MN usually have subtle, but recognizable clinical
manifestations that can be useful to identify patients at risk.
Prior works have demonstrated an association between thrombocytopenia and risk of t-MN.12,13,28 Pagano29 and Li nassier25 found that at onset of t-AML, the average PLT count was 30-35 K/mcL. We used a cutoff PLT count of ≥100 K/mcL to better capture pathological conditions,30 and found a positive association with the likelihood of tMN in the whole cohort and in those without pre-existing bone metastasis. The prevalence of thrombocytopenia in t-MN can be related to the damage of bone marrow stem cells after chemotherapy and, due to their short lifespan, a low platelet count can be an early indication of t-MN. When we reviewed the peripheral smear of the whole co hort, we found that 95% of patients without t-MN had a normal smear. Similarly, in the cohort without bone meta stasis, 100% of patients without t-MN had normal findings in the smear. Only three patients without t-MN had pe ripheral blasts and were diagnosed with metastatic BC. This could be explained by the presence of leukoerythro blastosis and carcinocythemia associated with metastatic BC.31-33 Our study confirms that the presence of blasts and dysplastic cells in the peripheral smear of patients with t-MN is expected34,35 and represents another inexpensive tool to aid in the early diagnosis of t-MN. Consistent with previous studies, our results showed an association with the latency between the diagnosis of the two cancers. In both the whole cohort and the subcohorts of patients without pre-existing bone metastasis and with normal peripheral smear, we found a decreased preva
WBC 4-11 x 109/L <4 x 10⁹/L >11 x 109/L
44 41 10
9 (20) 22 (54) 5 (50)
35 (80) 19 (46) 5 (50)
1 1.7 (0.34-8.43) 12.63 (1.49-107.09)
0.053 0 1 3 ANC <1.5 x 10⁹/L ≥1.5 x 10⁹/L 26 68 18 (69) 17 (25) 8 (31) 51 (75) 1 0.19 (0.03-1.07)
0.060 0 -2 Hgb
<12.2 g/dL ≥12.2 g/dL 80 15 35 (44) 1 (7) 45 (56) 14 (93) 1 0.04 (0-0.43)
Time from BC Dx to BMBx <15 months >15 months 26 70 4 (15) 33 (47) 22 (85) 37 (53) 1 7.78 (1.76-34.46)
Bone mets Absent Present 69 27 35 (51) 2 (7) 34 (49) 25 (93) 1 0.04 (0.01-0.29)
0.009 0 -3
0.007 0 2
0.001 0 -3
*Estimates from multivariable logistic regression with selected predictors in the model. Pts: patients; mets: metastasis; t-MN: therapyrelated myeloid neoplasms; OR: odds ratio; CI: confidence interval; WBC: white blood cell; ANC: absolute neutrophil count; Hgb: hemoglobin; BC: breast cancer; Dx: diagnosis; BMBx: bone marrow biopsy. Haematologica
lence of t-MN if the time from the diagnosis of BC was less than 15 months (79%, 71% and 84% of the patients, respectively), with an average latency between BC diag nosis and BMBx of 5 years. This is in line with the wellknown time frame between treatment with both alkylating agents and topoisomerase II inhibitors and the risk of secondary leukemias. Similarly, prior works also found an increased incidence of t-AML between 12 months to 9 years following the treatment of BC that then declined after 10 years from the initial BC diagnosis.36-38 The carcinogenesis and increased risk for secondary ma lignancies associated with chemotherapy and radiother apy are well known.12,39-42 Unexpectedly, in our study population we did not find a relationship with chemother apy and radiotherapy. A possible explanation is the de creased use of leukemogenic agents such as melphalan in our population,43-45 but it might also be secondary to other factors including the small population studied and the follow-up duration.

When we analyzed the association between race and risk of developing t-MN, there was no statistical significance.
It needs to be specified that, due to small numbers of White Hispanic and Native American patients, they were included in the White race group. Nevertheless, similar data was discussed in a recent study on racial differences in secondary cancers that revealed a comparable elevated possibility of t-AML in BC patients among all races, with higher risk in Black and Asian/Pacific Islander women.46 Wei et al 38 observed an increased risk of secondary AML in White patients compared to other races. These findings highlight the need for further investigation on how genetic differences can influence the incidence of t-MN, but other factors such as social determinants of health also have to be considered.
In our analysis, we noted that patients with pre-existing bone metastasis were less likely to be diagnosed with tMN and more frequently had BC infiltrating the bone mar row. This finding is to be expected since bone is the most common site of metastasis in BC patients and the sub sequent carcinomatosis can cause myelosuppression and pancytopenia.32,47
Finally, we integrated all the clinical and laboratory par
Figure 3. CONSORT diagram. Chemo: chemotherapy; BMBx: bone marrow biopsy; MPN: myeloproliferative neoplasms; MM: multiple myeloma; t-MN: therapy re lated myeloid neoplasms.
ameters to build a scoring system and determine a proba bility of having t-MN (Figure 3). This risk score is a practical tool that can be easily applied in the outpatient setting during scheduled follow-up and aid the clinician in pre dicting which patients are at higher risk of t-MN. Similar prediction models were created by Niu at al.48 to assess the mortality risk in AML, and by Zhang et al.49 to predict lymph node metastasis in gastric cancer patients. It needs to be specified that we reported ad hoc cutoff points that correspond to the minimum score of t-AML/MDS diag nosed patients. A larger prospective study is needed to re liably estimate a clinically relevant threshold. A potential source of bias in this study includes the fact that our population only comprised patients referred to the hematology clinic, possibly because their breast oncologist sought further evaluation of the patient’s cytopenias. The criteria for referral were subjective and based solely on the judgment of the oncologist. At the same time, the decision whether to perform a BMBx was also determined by the evaluation of the hematologist. This most likely accounts for the extremely high incidence of t-MN that is inconsist ent with the incidence of 0.1% to 1.8% reported in prior works.2,8,50 Moreover, our study involves only the population of one center and may not be applicable to other centers. However, our risk score based on specific cutoff points is likely to be more generalizable (Figure 3).
In conclusion, to date no valid method exists to predict tMN in cytopenic patients previously treated for BC. Our findings suggest that clinical and laboratory parameters
1. Kroger N, Damon L, Zander AR, et al. Secondary acute leukemia following mitoxantrone-based high-dose chemotherapy for primary breast cancer patients. Bone Marrow Transplant. 2003;32(12):1153-1157.
2. Kaplan HG, Malmgren JA, Li CI, Calip GS. Age related risk of myelodysplastic syndrome and acute myeloid leukemia among breast cancer survivors. Breast Cancer Res Treat. 2013;142(3):629-636.
3. Rosenstock AS, Niu J, Giordano SH, Zhao H, Wolff AC, ChavezMacGregor M. Acute myeloid leukemia and myelodysplastic syndrome after adjuvant chemotherapy: a population-based study among older breast cancer patients. Cancer. 2018;124(5):899-906.
4. Font P. Myelodysplastic syndrome after breast cancer. The challenge of late complications in long-term survivors. Leuk Res. 2016;49:88-89.
5. Breast Cancer Incidence and Mortality—United States, 1992. JAMA. 1996;276(16):1293-1294.
6. Patt DA, Duan Z, Fang S, Hortobagyi GN, Giordano SH. Acute myeloid leukemia after adjuvant breast cancer therapy in older women: understanding risk. J Clin Oncol. 2007;25(25):3871-3876.
7. Wolff AC, Blackford AL, Visvanathan K, et al. Risk of marrow neoplasms after adjuvant breast cancer therapy: the national comprehensive cancer network experience. J Clin Oncol.
can be used to create a predictive model to identify pa tients at higher risk for t-MN and aid in the early diagnosis of t-MN. Since BC patients are commonly followed for many years after their initial diagnosis, we propose the im plementation of a screening tool, using the specific cutoffs that we adopted, as a novel inexpensive approach to ident ify patients at risk of t-MN and to determine the timing of a BMBx. Along with the need for prospective validation of our variables as predictive markers, further clinical appli cation of our model to a larger population is warranted. The future incorporation of evolving research on clonal hema topoiesis may further improve the accuracy of this model and assist in the early detection of t-MN.
No conflicts of interest to disclose.
GP performed research, data collection, analysis and wrote the manuscript. CG performed research and wrote the manuscript. AD performed data analysis and wrote the manuscript. AK collected data. MER reviewed the manu script. RP wrote the manuscript and supervised the study. EMS collected data, analyzed data, wrote the manuscript and supervised the study.
For original data, please contact the corresponding author
2015;33(4):340-348.
8. Padmanabhan A, Baker JA, Zirpoli G, et al. Acute myeloid leukemia and myelodysplastic syndrome following breast cancer: increased frequency of other cancers and of cancers in multiple family members. Leuk Res. 2008;32(12):1820-1823.
9. DeSantis CE, Ma J, Gaudet MM, et al. Breast cancer statistics, 2019. CA Cancer J Clin. 2019;69(6):438-451.
10. Rodgers GM, 3rd, Becker PS, Blinder M, et al. Cancer- and chemotherapy-induced anemia. J Natl Compr Canc Netw. 2012;10(5):628-653.
11. Michels SD, McKenna RW, Arthur DC, Brunning RD. Therapyrelated acute myeloid leukemia and myelodysplastic syndrome: a clinical and morphologic study of 65 cases. Blood. 1985;65(6):1364-1372.
12. Stone RM, Neuberg D, Soiffer R, et al. Myelodysplastic syndrome as a late complication following autologous bone marrow transplantation for non-Hodgkin's lymphoma. J Clin Oncol. 1994;12(12):2535-2542.
13. Chen Y, Estrov Z, Pierce S, et al. Myeloid neoplasms after breast cancer: "therapy-related" not an independent poor prognostic factor. Leuk Lymphoma. 2015;56(4):1012-1019.
14. Pedersen-Bjergaard J, Pedersen M, Roulston D, Philip P. Different genetic pathways in leukemogenesis for patients presenting with therapy-related myelodysplasia and therapyrelated acute myeloid leukemia. Blood. 1995;86(9):3542-3552.
15. Goel H, Rahul E, Gupta I, et al. Molecular and genomic landscapes in secondary & therapy related acute myeloid leukemia. Am J Blood Res. 2021;11(5):472-497.
16. Paulsson K, Säll T, Fioretos T, Mitelman F, Johansson B. The incidence of trisomy 8 as a sole chromosomal aberration in myeloid malignancies varies in relation to gender, age, prior iatrogenic genotoxic exposure, and morphology. Cancer Genet Cytogenet. 2001;130(2):160-165.
17. Steensma DP. Predicting therapy-related myeloid neoplasmsand preventing them? Lancet Oncol. 2017;18(1):11-13.
18. Gillis NK, Ball M, Zhang Q, et al. Clonal haemopoiesis and therapy-related myeloid malignancies in elderly patients: a proof-of-concept, case-control study. Lancet Oncol. 2017;18(1):112-121.
19. Shlush LI, Zandi S, Mitchell A, et al. Identification of preleukaemic haematopoietic stem cells in acute leukaemia. Nature. 2014;506(7488):328-333.
20. Genovese G, Kähler AK, Handsaker RE, et al. Clonal hematopoiesis and blood-cancer risk inferred from blood DNA sequence. N Engl J Med. 2014;371(26):2477-2487.
21. Takahashi K, Wang F, Kantarjian H, et al. Preleukaemic clonal haemopoiesis and risk of therapy-related myeloid neoplasms: a case-control study. Lancet Oncol. 2017;18(1):100-111.
22. Oldenhuis CN, Oosting SF, Gietema JA, de Vries EG. Prognostic versus predictive value of biomarkers in oncology. Eur J Cancer. 2008;44(7):946-953.
23. Jaiswal S, Fontanillas P, Flannick J, et al. Age-related clonal hematopoiesis associated with adverse outcomes. N Engl J Med. 2014;371(26):2488-2498.
24. Abelson S, Collord G, Ng SWK, et al. Prediction of acute myeloid leukaemia risk in healthy individuals. Nature. 2018;559(7714):400-404.
25. Linassier C, Barin C, Calais G, et al. Early secondary acute myelogenous leukemia in breast cancer patients after treatment with mitoxantrone, cyclophosphamide, fluorouracil and radiation therapy. Ann Oncol. 2000;11(10):1289-1294.
26. Vucinic V, Ruhnke L, Sockel K, et al. The diagnostic red blood cell distribution width as a prognostic factor in acute myeloid leukemia. Blood Adv. 2021;5(24):5584-5587.
27. Rauw J, Wells RA, Chesney A, Reis M, Zhang L, Buckstein R. Validation of a scoring system to establish the probability of myelodysplastic syndrome in patients with unexplained cytopenias or macrocytosis. Leuk Res. 2011;35(10):1335-1338.
28. Krishnan A, Bhatia S, Slovak ML, et al. Predictors of therapyrelated leukemia and myelodysplasia following autologous transplantation for lymphoma: an assessment of risk factors. Blood. 2000;95(5):1588-1593.
29. Pagano L, Pulsoni A, Mele L, et al. Acute myeloid leukemia in patients previously diagnosed with breast cancer: experience of the GIMEMA group. Ann Oncol. 2001;12(2):203-207.
30. Stasi R. How to approach thrombocytopenia. Hematology. 2012;2012(1):191-197.
31. Delsol G, Guiu-Godfrin B, Guiu M, Pris J, Corberand J, Fabre J. Leukoerythroblastosis and cancer frequency, prognosis, and physiopathologic significance. Cancer. 1979;44(3):1009-1013.
32. Kopp HG, Krauss K, Fehm T, et al. Symptomatic bone marrow involvement in breast cancer-clinical presentation, treatment, and prognosis: a single institution review of 22 cases. Anticancer Res. 2011;31(11):4025-4030.
33. Carey RW, Taft PD, Bennett JM, Kaufman S. Carcinocythemia (carcinoma cell leukemia). An acute leukemia-like picture due to metastatic carcinoma cells. Am J Med. 1976;60(2):273-278.
34. Tallman MS, Wang ES, Altman JK, et al. Acute Myeloid Leukemia, Version 3.2019, NCCN Clinical practice guidelines in
oncology. Journal of the National Comprehensive Cancer Network J Natl Compr Canc Netw. 2019;17(6):721-749.
35. Fenaux P, Haase D, Santini V, Sanz GF, Platzbecker U, Mey U. Myelodysplastic syndromes: ESMO Clinical Practice Guidelines for diagnosis, treatment and follow-up. Ann Oncol. 2021;32(2):142-156.
36. Morton LM, Dores GM, Tucker MA, et al. Evolving risk of therapyrelated acute myeloid leukemia following cancer chemotherapy among adults in the United States, 1975-2008. Blood. 2013;121(15):2996-3004.
37. Bhatia S. Therapy-related myelodysplasia and acute myeloid leukemia. Semin Oncol. 2013;40(6):666-675.
38. Wei JL, Jiang YZ, Shao ZM. Survival and chemotherapy-related risk of second primary malignancy in breast cancer patients: a SEER-based study. Int J Clin Oncol. 2019;24(8):934-940.
39. Saso R, Kulkarni S, Mitchell P, et al. Secondary myelodysplastic syndrome/acute myeloid leukaemia following mitoxantronebased therapy for breast carcinoma. Br J Cancer. 2000;83(1):91-94.
40. Chaplain G, Milan C, Sgro C, Carli PM, Bonithon-Kopp C. Increased risk of acute leukemia after adjuvant chemotherapy for breast cancer: a population-based study. J Clin Oncol. 2000;18(15):2836-2842.
41. Pedersen-Bjergaard J, Philip P, Larsen SO, et al. Therapy-related myelodysplasia and acute myeloid leukemia. Cytogenetic characteristics of 115 consecutive cases and risk in seven cohorts of patients treated intensively for malignant diseases in the Copenhagen series. Leukemia. 1993;7(12):1975-1986.
42. Sanford NN, Miao R, Wang H, et al. Characteristics and predictors for secondary leukemia and myelodysplastic syndrome in ewing and osteosarcoma survivors. Int J Radiat Oncol Biol Phys. 2019;103(1):52-61.
43. Tallman MS, Gray R, Bennett JM, et al. Leukemogenic potential of adjuvant chemotherapy for early-stage breast cancer: the Eastern Cooperative Oncology Group experience. J Clin Oncol. 1995;13(7):1557-1563.
44. Beadle G, Baade P, Fritschi L. Acute myeloid leukemia after breast cancer: a population-based comparison with hematological malignancies and other cancers. Ann Oncol. 2009;20(1):103-109.
45. Valagussa P, Moliterni A, Terenziani M, Zambetti M, Bonadonna G. Second malignancies following CMF-based adjuvant chemotherapy in resectable breast cancer. Ann Oncol. 1994;5(9):803-808.
46. Calip GS, Law EH, Ko NY. Racial and ethnic differences in risk of second primary cancers among breast cancer survivors. Breast Cancer Res Treat. 2015;151(3):687-696.
47. Weiss RB, Woolf SH, Demakos E, et al. Natural history of more than 20 years of node-positive primary breast carcinoma treated with cyclophosphamide, methotrexate, and fluorouracil-based adjuvant chemotherapy: a study by the Cancer and Leukemia Group B. J Clin Oncol. 2003;21(9):1825-1835.
48. Niu P, Yao B, Wei L, Zhu H, Fang C, Zhao Y. Construction of prognostic risk prediction model based on high-throughput sequencing expression profile data in childhood acute myeloid leukemia. Blood Cells Mol Dis. 2019;77:43-50.
49. Zhang Y, Liu Y, Zhang J, et al. Construction and external validation of a nomogram that predicts lymph node metastasis in early gastric cancer patients using preoperative parameters. Chin J Cancer Res. 2018;30(6):623-632.
50. Armand P, Kim HT, Mayer E, et al. Outcome of allo-SCT for women with MDS or AML occurring after breast cancer therapy. Bone Marrow Transplant. 2010;45(11):1611-1617.
Jean Galtier,1,2 Laetitia Vercellino,3 Loic Chartier,4 Pierre Olivier,5 Claire Tabouret-Viaud,6 Charles Mesguich,7 Roberta Di Blasi,2 Amandine Durand,8 Léo Raffy,7 François-Xavier Gros,9 Isabelle Madelaine,10 Veronique Meignin,11 Miryam Mebarki,12 Marie-Thérèse Rubio,13 Pierre Feugier,13 Olivier Casasnovas,8 Michel Meignan14 and Catherine Thieblemont1,2
1Université de Paris, Paris; 2Assistance Publique-Hôpitaux de Paris, Hôpital Saint-Louis, Hemato-oncologie, Paris; 3Assistance Publique-Hôpitaux de Paris, Hopital Saint-Louis, Medecine Nucléaire, Paris; 4LYSARC, Statistique, Pierre-Benite; 5Medecine Nucleaire Centre Hospitalier Universitaire Nancy, Nancy; 6Medecine Nucleaire, Centre Leclerc, Dijon; 7Medecine Nucléaire, Centre Hospitalier Universitaire de Bordeaux, Bordeaux; 8Service d'Hématologie Clinique, Centre Hospitalier Universitaire Dijon, INSERM UMR1231, Dijon; 9Service d’Hématologie Clinique, Centre Hospitalier Universitaire de Bordeaux, Bordeaux; 10Assistance Publique-Hôpitaux de Paris, Hôpital Saint-Louis, Pharmacie, Paris; 11Assistance Publique-Hôpitaux de Paris, Hôpital Saint-Louis, Service de Pathologie, Paris; 12Assistance Publique-Hôpitaux de Paris, Saint-Louis Hospital, Therapie Cellulaire, Paris; 13Hématologie, Centre Hospitalier Universitaire, Vandoeuvre-les-Nancy and 14LYSA-IM, Hopital Henri Mondor, Créteil, France
Correspondence: C. Thieblemont catherine.thieblemont@aphp.fr
Received: December 19, 2021.
Accepted: May 30, 2022. Prepublished: June 9, 2022.
https://doi.org/10.3324/haematol.2021.280550 ©2023 Ferrata Storti Foundation
Published under a CC BY-NC license
The aim of this study was to evaluate the prognostic impact of the F-fluorodeoxyglucose positron emission tomography response at 1 month (M1) and 3 months (M3) after anti-CD19 chimeric antigen receptor (CAR) T-cell therapy in a multicenter cohort of 160 patients with relapsed/refractory large B-cell lymphomas (R/R LBCL). In total, 119 (75%) patients reached M1 evaluation; 64 (53%, 64/119) had a complete response (CR); 91% were Deauville Score (DS) 1-3. Progressionfree survival (PFS) and overall survival (OS) were significantly worse in patients with DS-5 at M1, than in patients with DS 1-3 (PFS hazard ratio [HR]=6.37, 95% confidence interval [CI]: 3.5-11.5 vs. OS HR=3.79, 95% CI: 1.7-8.5) and DS-4 (PFS HR=11.99, 95% CI: 5.0-28.9 vs. OS HR=12.49, 95% CI: 2.8-55.8). The 1-year PFS rates were 78.9% (95% CI: 58.9-89.9) for DS-4 at M1, similar to 67.3% (95% CI: 51.8-78.8) for patients with DS 1-3 at M1, very different to 8.6% (95% CI: 1.8-22.4) for DS-5, respectively. Only eight of 30 (26%) patients with DS-4 progressed. Response at M3 evaluated in 90 (57%) patients was prognostic for PFS with lower discrimination (HR=3.28, 95% CI: 1.5-7.0; P=0.003) but did not predict OS (HR=0.61, 95% CI: 0.2-2.3; P=0.45). Patients with a high baseline total metabolic tumor volume (TMTV) >80 mL had worse PFS (HR=2.05, 95% CI: 1.2-3.5; P=0.009) and OS (HR=4.52, 95% CI: 2.5-8.1; P<0.001) than patients with low TMTV. Multivariable analyses identified baseline elevated lactate dehydrogenase, DS-5, CAR T cells at M1 for PFS and baseline elevated lactate de hydrogenase, TMTV >80 mL, and DS-5 at M1 for OS. In conclusion, baseline TMTV and response at M1 strongly predicts outcomes of patients with R/R LBCL undergoing CAR T-cell therapy.
CD19-specific chimeric antigenic receptor T cells (CAR T cells) showed impressive efficacy in relapsed and refrac tory aggressive large B-cell lymphoma (R/R LBCL), includ ing diffuse large B-cell lymphoma not otherwise specified (DLBCL-NOS), transformed follicular lymphoma (tFL), pri mary mediastinal B-cell lymphoma (PMBCL) or high grade B-cell lymphoma (HBGL) leading to their approval by US Food and Drug Administration (FDA) in 2017 and by Euro
pean Medicines Agency in 2018 with two products, axi cabtagene ciloleucel (axi-cel) and tisagenlecleucel (tisacel). In the pivotal trials JULIET,1 ZUMA-1,2,3 and TRANSCEND,4 evaluating lisocabtagene maraleucel re cently approved by the FDA, as well as in the academic experiences,5–7 complete response (CR) rates range from 40 to 65%. Around 60% of patients will ultimately progress or relapse with progression or relapse events occurring mostly during the first 3 months (M3). Several pretreat ment factors have been identified to be associated with
relapse or progression, such as elevated lacatate de hydrogenase (LDH), tumor burden measured either by the diameter of the biggest lesion on computerized to mography (CT)-scan or by the total metabolic tumor vol ume (TMTV) on positron emission tomography (PET)-CT, and more than one extranodal sites involved.6–9 However, little is known about the prognostic value of the response assessed by PET and its time course after CAR T-cell infusion. It has been shown in ZUMA-1 and JULIET trials that reaching complete metabolic response (CMR) or partial metabolic response (PMR) according to Lugano criteria M3 after infusion is predictive of sus tained response and had similar outcome.1,3 Although the median time to response is around 1 month (M1) in pivo tal trials and real-world experiences,1,2,4,7 the prognostic value of PET assessment after CAR T-cell infusion is under investigation,10 and the conversion rate of response from M1 to M3 post CAR T cells is not fully documented. In this study, we investigated the prognostic value of early metabolic response assessed at M1 and M3 after CAR T-cell infusion in a cohort of patients with R/R LBCL treated with anti-CD19 CAR T cells in four centers, the conversion rate of metabolic responses between M1 and M3, as well as the impact of the baseline TMTV on the PET early metabolic response M1 after CAR T-cell infu sion.
Study population and treatment
The study population included consecutive patients presenting with R/R aggressive B-cell lymphomas treated in four Lymphoma Study Association (LYSA) centers with anti-CD19 CAR T-cell therapy, tisa-cel or axi-cel between June 2018 and November 2020. Real-world data were retrospectively collected from the medical charts of these patients by the treating physicians. Histologic di agnoses were reviewed by expert pathologists (VM). Eligibility for CAR T-cell therapy required relapsed or re fractory disease after at least two lines of prior therapy. Bridging therapy was performed at the discretion of physicians. All patients had to perform baseline PET be fore the procedure of lymphodepletion and CAR T-cell infusion. Association of fludarabine and cyclophospha mide was uniformely used as lymphodepletion precon ditioning at the doses recommended for tisa-cel or axi-cel. Patients were discharged from hospital after 10 days if no serious toxicity occurred. Response assess ment was performed by clinical and imaging evaluation with CT-scan and PET-CT at M1 +/-5 days (M1 evaluation) and M3 +/- 5 days (M3 evaluation) after CAR T-cell infu sion in all patients, except patients with progression be fore time assessment considered as non-evaluable.
Analysis of PET-CT images was performed by expert nu clear medicine physicians (LV, PO, CT-V, and CM) to cal culate several parameters including the total metabolic tumor volume (TMTV) at baseline, the Deauville score (DS) and the ΔSUV max at M1 and M3.
The TMTV was computed using the 41% maximum stan dardized uptake value threshold method for each individ ual tumor lesion as reported.11
The DS was assessed as follows12 (i.e., 1: no uptake; 2: up take < mediastinum; 3: uptake > mediastinum but < liver; 4: uptake moderately higher > than liver; 5: uptake markedly higher than liver and/or new lesions). Scores 1, 2 and 3 are considered to represent CMR. Scores 4 and 5 are categorized as PMR, no metabolic response (NMR), stable metabolic disease (SMD), progressive metabolic disease (PMD) accordingly.
CR was assessed if a biopsy performed at the hot site scored DS-4 or DS-5 showed no tumoral infiltration, or in case of a calcified region within the tumoral site. Partial response (PR), stable disease (SD), and progressive dis ease PD were assessed based on the integration of PET data and radiological data.12
In order to assess the ΔSUV max between baseline and M1, the hottest tumor in any region or organ was used for comparison, even if its location differed from the initial hottest tumor in baseline PET-CT.13
Summary statistics (i.e., median, interquartile range [IQR], and percentages) are reported. PFS was measured from the date of CAR T-cell infusion to the date of death from any cause, disease relapse, or progression. Overall survival (OS) was calculated from the date of CAR T-cell infusion until the date of death from any cause. OS and PFS were estimated using the Kaplan-Meier method. Analyses of ΔSUV max used landmark at M1, with time-dependent area under the receiver operating characteristic curve computed to determine the best cut-off value to predict progression within the next 12 months. Multivariate analysis was performed using Cox pro portional hazard model stratified on the variable ‘center’ and adjusted on the CAR T-cell treatment. All P-values were 2sided, where P<0.05 were considered statistically significant. All statistical analyses were performed using SAS 9.3. This analysis was approved from the local ethics committee.
Between June 2018 and November 2020, 160 patients who received either axi-cel (n=95) or tisa-cel (n=65) were en rolled (Figure 1). Clinical and biological characteristics are reported in Table 1.
Figure 1. Flow-chart of the study population.
Thirty-nine patients (24%, 39/160) progressed during the first month and two patients (1%) withdrew their consent. These patients were not evaluable at the first metabolic evaluation (M1). Of the 119 remaining patients (75%) at M1, 64 patients (53%) were classified in CR: 58 patients scored DS 1-3, 5 patients scored DS-4 who had an aspect of calcification on the tumoral site or no tumoral infiltra tion at the biopsy, one patient scored DS-5 who had simi lar images at M1 and at the second metabolic evaluation (M3) or a biopsy confirming an histiocytosis infiltration. PR was observed in 39 patients (33%), 22 scored DS-4 and 17 scored DS-5. SD was considered in nine patients (8%): two scored DS-4 and seven scored DS-5. PD was ob served in seven patients (6%): one scored DS-4, six scored DS-5. Among the 31 patients scored DS-5 at M1, only one had new lesions.
The median (tumor SUVmax/liver SUVmax) ratio x 100 for DS5 at M1 was 603% (IQR, 434-748%). This was explained by a very high residual tumor uptake. Indeed their median SUV max was 20.8 (IQR, 15.2-25.4). We can see in the Table 2 that the lower value for DS-4 was 102.5%. This explains that some patients classifi ed DS-4 on the visual basis presented a good outcome. The median (tumor SUVmax/liver SUVmax) ratio for DS-4 patients was 177% (IQR, 148-227%).
Twenty-nine patients (18%, 29/160) progressed between M1 and M3. At M3, 90 patients (57%, 90/160) were evalu able for response. Among them, 64 of 90 (71%) were clas sified in CR: 58 scored DS 1-3, 5 scored DS-4, 1 scored DS-5. A PR was observed in 15 of 90 (17%): 12 patients scored DS-4 and three scored DS-5. No SD was observed.
A PD was observed in 11 of 90 (12%): all scored DS-5. The median (tumour SUVmax/liver SUVmax) ratio x 100 for DS-4 was 133% (IQR, 124-153%; range, 110-197%). The median (tumor SUVmax/liver SUVmax) ratio x 100 for DS-5 was 400% (IQR, 300-713%; range, 100-1349%).
Analyzing the conversion rate between M1 and M3, among the 39 patients in PR at M1, eight converted to CR includ ing five treated with axi-cel and three with tisa-cel, 15 stayed in PMR and 16 progressed. All patients in SD prog ressed. Most of patients in CR at M1 (56/64, 88%) did not progress.
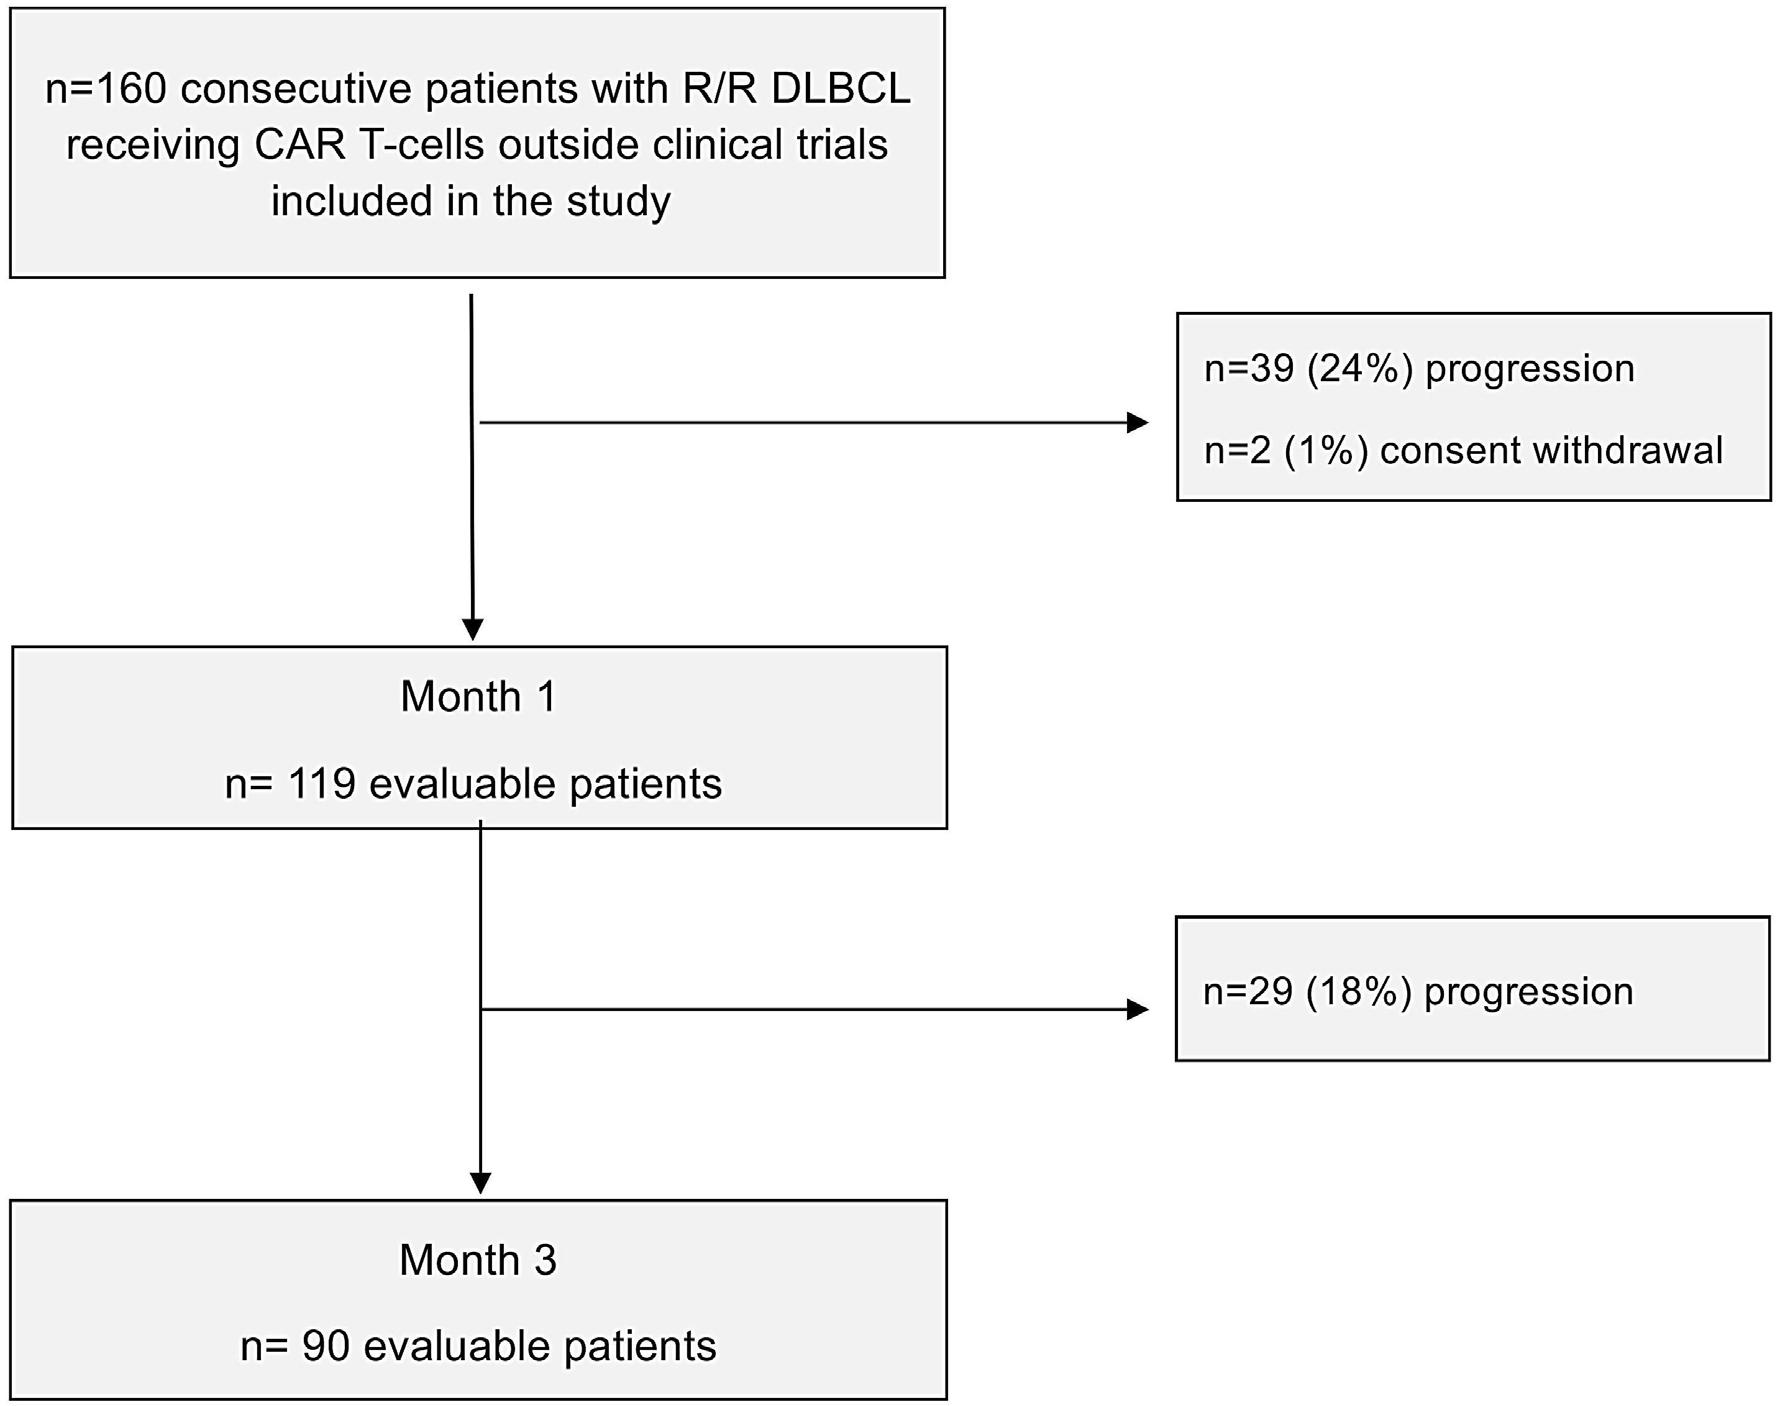
Outcome and survivals according to Deauville Score
With a median follow-up of 12.6 months, estimated 1 yearOS and PFS were 63.6% (95% CI: 54.7-71.2) and 41.5% (95% CI: 33.3-49.4), with median OS and PFS at 22.1 months and 4.6 months and respectively (Figure 2A and B).
For the patients achieving M1 assessment (n=119, 75%), PFS and OS were significantly worse in patients with DS5 at M1, than in patients with DS 1-3 (PFS HR=6.37, 95% CI: 3.5-11.5 vs. OS HR=3.79, 95% CI: 1.7-8.5) and DS-4 (PFS HR=11.99, 95% CI: 5.0-28.9 vs. OS HR=12.49, 95% CI:2.855.8) (Figure 2C and D). The 1-year PFS rates were 78.9% (95% CI: 58.9-89.9) for DS-4 at M1, similar to 67.3% (95% CI: 51.8-78.8) for patients with DS 1-3 at M1, very different to 8.6% (95% CI: 1.8-22.4) for DS-5, respectively. Among the 30 patients scored DS-4, only eight (26%) progressed. For the patients achieving M3 assessment, the patients scored DS-5 had a risk to failure evaluated at 81.2%. The 1-year PFS for patients with DS-5 at M3 was 18.8% com pared to 83.5% for patients DS 1/2/3/4 (HR=13.52, 95% CI: 5.9-31.0). No difference was observed for OS between DS
Table 1. Baseline characteristics.
All N=160
Patients reached M1 evaluation
No N=40 Yes N=119
P-value
Age in years, median (range) 63 (21-77) 64 (23-74) 63 (21-77) 0.76
Age > 60, N (%) 92 (58) 23 (58) 69 (58) 0.99 Male, N (%) 99 (62) 23 (58) 76 (63) 0.57
Lymphoma histologies, N (%) DLBCL GC Non-GC PMBL tFL
130 (81) 64 (40) 64 (40) 10 (6) 20 (13)
33 (83) 11 (28) 17 (43) 3 (8) 4 (10)
97 (81 53 (44) 47 (39) 7 (6) 16 (13)
0.73
Primary refractory, N (%) 118 (74) 36 (90) 82 (69) 0.011 Prior lines, median (range)* 3 (1-9) 3 (1-7) 2 (2-9) 0.042 Prior autograft, N (%) 35 (22) 5 (13) 30 (25) 0.12
ECOG PS, N (%)
0 – 1 2 3 – 4
130 (83) 18 (12) 9 (6)
25 (64) 7 (18) 7 (18)
105 (89) 11 (9) 2 (2)
Ann Arbor, N (%) Stage I – II Stage III -IV 38 (24) 120 (76) 4 (10) 36 (90) 34 (29) 84 (71)
IPI score, N (%) 0-1 low 2 low intermediate 3 high intermediate > 3 high
<0.001
0.016
48 (31) 42 (27) 40 (26) 24 (16)
4 (10) 6 (15) 15 (39) 14 (36)
44 (38) 36 (31) 25 (22) 10 (9)
<0.001
Extranodal sites, median (range)* 1 (0-8) 2 (0-8) 1 (0-7) <0.001 Extranodal sites ≥2, N (%) 47 (30) 23 (58) 24 (10) <0.001
Elevated LDH at D0, N (%) 64 (41) 27 (68) 37 (32) <0.001
CRP at DO, medan (range)* 17 (0-296) 37 (4-296) 12 (0-295) <0.001
CRP > 30 mg/L, N (%) 54 (34) 22 (56) 32 (27) 0.002
Progressive disease at infusion, N (%) 103 (64) 29 (73) 74 (62) 0.67
CAR T cells, N (%) Tisa-cel Axi-cel 65 (41) 95 (59) 24 (60) 16 (40) 41 (34) 79 (66)
0.005
PET0 – TMTV > 80 mL, N (%) 70 (44) 30 (75) 40 (33) <0.001
PETO-SUVmax, median (range)* 21,5 (0-54) 23,2 (7-46) 21,3 (0-54) 0.23 Bulky mass >10 cm, N (%) 33 (21) 12 (30) 21 (18) 0.11
*Median (min-max). M1: 1 month; DLBCL: diffuse large B-cell lymphoma; GC: germinal center; PMBL: primary mediastinal B-cell lymphoma; tFL: transformed follicular lymphoma; ECOG PS: Eastern Cooperative Oncology Group performance status; IPI: international prognistic index; LDH: lactate dehydrogenase; CRP: C-reactive protein; DO: day zero; PET0: positron emission tomography on day zero.
Table 2. The SUV value and the (tumour SUVmax/SUVliver max) ratio among the Deauville score categories at 1 month.
SUV (tumor SUVmax/SUVliver max) ratio %
Mean Median Min Max Mean Median Min Max
DS-1 0.21 0 0 1.57 8.4 0 0 62.8 DS-2 2.2 2.3 0.6 2.9 57.5 64.6 15.4 76.7 DS-3 3.3 3.3 1.7 4.6 90.2 89.2 63.0 137.5 DS-4 5.9 5.6 3.5 9.9 185.1 176.7 102.5 280.0 DS-5 22.1 20.8 7.6 48.1 663.3 602.9 271.4 1,717.9
1/2/3/4 and DS-5 (P=0.39). Among the 31 patients with a DS-5 at 1 month, 20 patients progressed before evaluation at M3. Nine more patients were observed with a DS-5 at M3. Most of them (7/8 78%) had a progression/relapse.
Prognostic value of ΔSUV max between positron emission tomography (PET) baseline and PET at 1 month and at 3 months
The best cutoff for PET-M1 was 70%.14,15 This cutoff was able to predict failure among patients with evaluable PETCT at M1. Patients with positive PET-M1 had a significant worse PFS than patients with negative PET-M1, with 1-year PFS of 35.1% versus 69.8% (HR=2.73, 95% CI: 1.6-4.7; P<0.001) (Figure 2E), and worse OS (1-year OS at 65.2% vs. 90.6% [HR=2.36, 95% CI: 1.0-5.3; P=0.032]) (Figure 2F). Pa tients with positive PET-M3 had a significant worse PFS than patients with negative PET-M3, with 1-year PFS of 48.7% versus 84.0% (HR=3.28, 95% CI: 1.5-7.0; P=0.003), but not for OS (HR=0.61, 95% CI: 0.2-2.3; P=0.45).
Seventy of the 160 (44%) patients presented a high base line TMTV (>80 mL). This parameter was associated with a higher risk of early progression (HR=4.93, 95% CI: 2.98.4; P<0.001). Among them, 29 (41%) progressed within 1 month and one patient had less than 1 month of followup without event. At M1, 15 were evaluated in CR: 14 scored DS 1-3 and one scored DS-4. Seventeen patients were evaluated in PR: seven scored in DS-4 and ten scored in DS-5. Five patients were evaluated in SD: one scored DS-4 and four scored in DS-5. Three patients were evaluated in PD. Of the 40 remaining patients with high TMTV, 19 (48%) progressed between M1 and M3. At M3, 21 were evaluated, either in CR (n=14): 14 scored DS 1-3, or in PR (n=6): five scored in DS-4 and one scored in DS-5, or in PD (n=1): one scored in DS-5.
Patients with high TMTV had worse PFS (HR=2.05, 95% CI: 1.2-3.5; P=0.009) and OS (HR=4.52, 95% CI: 2.5-8.1; P<0.001) than patients with low TMTV. The M1 PFS was 58.0% versus 89.9% for patients with low TMTV. The M3 PFS was 30.5% versus 78.7%. The 1-year PFS was 23.4% versus 55.7% (Figure 3). The response at M1 allowed to identify the patients that will relapse even if the baseline TMTV <80 mL was low. Among the 79 patients with low TMTV and metabolic response available at M1, 44 patients (56%) had DS 1-3, 20 patients (25%) had DS-4 and 15 pa tients (19%) had DS-5. Among the 15 patients with DS-5, 13 (87%) had a relapse/progression or death without pro gression.
We performed a multivariable analysis including the par ameters known to have a prognostic value at baseline
(elevated LDH, high TMTV, ≥2 extranodal sites), and the metabolic response at PET-M1 defined either using the DS (1-4 vs. 5), or ΔSUV max (<70 vs. ≥70).
Among the 160 patients, 38 patients (24%) had an early PFS events (<1 month) after CAR T-cell infusion. Patients with high TMTV (HR=2.55; 95% CI: 1.2-5.6; P=0.02), extra nodal sites ≥2 (HR=2.10; 95% CI: 1.0-4.3; P=0.045) and elevated LDH (HR=2.80, 95% CI: 1.3-6.0; P=0.008) were significantly associated to a worse early PFS (Table 3).
Among the 119 patients free of progression at M1, elevated LDH (HR=1.86, 95% CI: 1.0-3.4; P=0.043), DS-5 at M1 (HR=9.48, 95% CI: 5.0-18.0; P<0.001) and tisa-cel treat ment (HR=1.86, 95% CI: 1.0-3.3, P=0.038) were associated to a worse PFS (Table 4).
Patients with high TMTV (HR=4.66, 95% CI: 2.2-9.8; P<0.001), elevated LDH (HR=2.20, 95% CI: 1.1-4.4, P=0.025) and DS-5 at M1 (HR=6.84, 95% CI: 3.2-14.6; P<0.001) were associated to a worse OS (Table 5).
In this real-world multi-center cohort of 160 patients with R/R LBCL treated with anti-CD19 CAR T cells, we have shown that the metabolic response assessed by FDG PET/CT at 1 month (M1 evaluation), in the 75% of patients reaching this end point, was a strong prognosticator of outcome. PET/CT reported with Deauville criteria with a threshold for positivity set at DS-5 was prognostic of PFS and OS, the risk of PFS being, in the PET-positive patients (DS-5), seven times this observed in PET-negative patients (DS1-4). By contrast, when PET was reported by setting the positivity at DS-4 (bad responders when DS >3) at end of treatment according to Lugano recommendations, M1 evaluation failed to predict outcome. Among the 29 DS-4 patients, only seven had a bad outcome. The residual up take of the DS-4 patients was high with a median tumor SUVmax/liver SUVmax ratio of 177% ranging from 102.5% to 280%. However that feature is not predictive of a bad out come in most of these patients treated with CAR T cells. This suggests that the “residual uptake” is not equal to a residual tumoral activity, as it is observed in other lym phomas such as in DLBCL under R-CHOP treatment16,17 or Hodgkin lymphoma under frontline chemotherapy,18,19 and as well as in the context of immunotherapies in solid cancers.20,21 By contrast, the majority of patients who re lapsed or died in our study are in the DS-5 group (87% of DS-5 patients had a PFS event and 48% an OS event). These patients had an extremely high residual uptake with a median residual SUV max six times the liver SUV max . This suggests that events occur in this specific population for a certain level of residual uptake corresponding to the level suggested as the threshold of DS5, as underlined by another recent study.22 Is this observation related to im
Figure 2. Outcome of the patients. (A) Progression free-survival (PFS) and (B) overall survival (OS) of the 160 patients with re lapsed/refractory diffuse large B-cell lymphoma. (C) PFS according to Deauville score (DS) at 1 month (M1) evaluation (DS1-3 vs. DS-4 vs. DS-5). (D) OS according to DS at M1 evaluation (DS1-3 vs. DS-4 vs. DS-5). (E) PFS according to ΔSUV max (70%) between positron emission tomography on day zero (PET0) and PETM1. (F) OS according to ΔSUV max (70%) between PET0 and PETM1.

portant aggressiveness and proliferation of the lymphoma or a particular activity of the microenvironment? Further tumoral biological studies are warranted to answer this question. In this setting the ΔSUV max approach, with a cut off of 70% defined in populations of DLBCL where positive PET have large range of values of residual uptakes ranging from D-4 just over the liver to D-5 (2 to 3 times over the liver), leads to false-positive results. It does not keep its prognostic value in multivariate analysis. In this series the response evaluated by PET/CT at month 3 by the same approaches (M3 evaluation) in 57% of the group is prognostic of PFS although with lower discrimi nation between groups but does not predict OS. However, since the majority of these patients (64 patients) were in CMR at M1, M3 evaluation only impacts 17% of the initial group. Therefore, from our results, M1 evaluation seems the preferable slot of time for response assessment in these patients. In addition we have confirmed herein the strong prognostic value of the baseline metabolic tumor volume already reported by us and others7,23,24 as a tool to identify early progressors. Indeed, the high-risk category with TMTV >80 mL at baseline accounted for 70 patients among whom 41% progressed before the M1 evaluation and 11% were in stable or progressive response at M1. At M3, only 21 patients were evaluated, most of them in CMR. However, considering patients with low TMTV <80 mL at baseline (n=79, 49.4% of the cohort), metabolic assess ment at M1 based on DS allowed to early identify those that will relapse. 87% of the patients with low TMTV scored DS-5 at M1 will relapse or die. Therefore, metabolic response assessment allowed to predict the outcome of
patients whatever the characteristics at baseline, particu larly considering low or high TMTV. Thus, TMTV should be considered from our data most as a signal of risk of early progression.
Our data are in accordance with the results of previous series. In ZUMA-1 and JULIET trials, PR patients at M3 after CAR T-cell infusion seem to have an outcome com parable to CR patients, although the number of PR pa tients at M3 in these studies were very low (n=8 and n=6, respectively).1,3 In TRANSCEND trial, PR as best response is associated with lower PFS than CR.4 As reported in this study, metabolic response assessment at M1 allowed early discriminating patients with poor outcome, with high cor relation with M3 findings; this suggests not to delay the risk assessment in these patients, on order to propose al ternative or combined treatments.
The response rates as well as the patient outcome re ported here are in agreement with those reported in others large clinical trials and academic experiences of CAR T-cell therapy in patients with R/R LBCL. In ZUMA-13, JULIET1, and TRANSCEND4 trials and the recently reported real-world experiences,6,7,9 the overall response rates ranged from 52% to 82%, CR rates from 40% to 65%, and 1-year PFS was estimated around 45%. Similar results are presented here. In all the series, including our present series, progression after CAR T-cells therapy seems to be an early event after infusion in most of the cases, with a median time to progression of 35 days. Indeed 51% of the progressor patients from our study progressed within 1 month. The analysis of our series demonstrates that the best ORR is achieved within the first month after CAR T-
Figure 3. Progression-free survival considering the total metabolic tumor volume (TMTV) at baseline (high TMTV >80 mL or low TMTV <80 mL).

Table 3. Early progression-free survival analysis (<1 month).
N=160
Univariate
HR (95% CI)
P-value
Multivariable
HR (95% CI) P-value
TMTV >80 mL 5.27 (2.5-11.2) <0.001 3.44 (1.5-7.7) 0.003
Elevated LDH 4.64 (2.3-9.4) <0.001 2.69 (1.2-5.8) 0.012
Extranodal sites ≥2 3.69 (1.9-7.2) <0.001
CAR T tisa-cel (K) 2.10 (1.1-4.2) 0.032 1.76 (0.9-3.5) 0.11
PFS: progression-free survival; TMTV: total metabolic tumor volume; LDH: lactate dehydrogenase; CAR: chimeric antigen receptor; CI: con fidence interval; HR: hazard ratio; tis-cel: tisagenlecleucel.
Table 4. Progression-free survival analysis (≥1 month).
N=119
Univariate
PFS
Multivariable
HR (95% CI) P-value HR (95% CI) P-value
TMTV >80 mL 2.05 (1.2-3.5) 0.009
Elevated LDH 1.87 (1.1-3.3) 0.029 1.86 (1.0-3.4) 0.043
Extranodal sites ≥2 2.07 (1.1-3.9) 0.022
Deauville score 5 8.66 (4.7-16.0) <0.001 9.48 (5.0-18.0) <0.001
ΔSUV max ≤70% 3.06 (1.7-5.4) <0.001
CAR T tisa-cel (K) 1.50 (0.9-2.6) 0.158 1.86 (1.0-3.3) 0.038
PFS: progression-free survival; TMTV: total metabolic tumor volume; LDH: lactate dehydrogenase; CAR: chimeric antigen receptor; CI: con fidence interval; HR: hazard ratio; tis-cel: tisagenlecleucel.
Table 5. Overall survival analysis (≥1 month).
N=119 OS Univariate Multivariable HR (95% CI) P-value HR (95% CI) P-value
TMTV >80 mL 4.52 (2.5-8.1) <0.001 4.66 (2.2-9.8) <0.001
Elevated LDH 3.19 (1.8-5.6) <0.001 2.20 (1.1-4.4) 0.025 Extranodal sites ≥2 3.39 (1.9-6.0) <0.001 Deauville score 5 5.63 (2.5-13.0) <0.001 6.84 (3.2-14.6) <0.001
ΔSUV max ≤70% 3.36 (1.6-7.0) 0.001
CAR T tisa-cel (K) 2.26 (1.2-4.2) 0.009 1.66 (0.8-3.3) 0.16
OS: overall survival; TMTV: total metabolic tumor volume; LDH: lactate dehydrogenase; CAR: chimeric antigen recepetor; CI: confidence in terval; HR: hazard ratio; tis-cel: tisagenlecleucel.
cell infusion and with the current follow-up most patients achieving a CMR maintained the CT. Only a few of them (12%) will relapse past M1. In contrary, patients achieving only a PMR at M1 will either ultimately progress, almost half of them (42%), or stay in PMR (38%); only 20% of them will improve to CMR. None of the patients in SMD im proved in CMR.
Impact of quality of response according to DS on outcome
after CAR T-cell therapy in R/R disease has not been de scribed so far. We demonstrated in this study that the evaluation of the metabolic response at M1 is strongly as sociated with the outcome of the patients. Baseline factors which correlate with the tumor burden at time of infusion are major predictors of progression after CAR T-cells therapy. Pretreatment serum levels of LDH and proinflammatory markers, including IL-6 and fer
ritin, PS >1 before treatment are associated with increased risk of progression in several series.6,8 We and other have also shown that high TMTV, defined as a value of more than 80 mL, highly correlates with a high risk of early re lapse or progression.7,24 Moreover the spread of the dis ease evaluated by the involvement of more than ≥2 extranodal sites before infusion strongly correlates with early progression.7,25 In this study, we confirm all these parameters as prognosticators, some of them being inde pendently correlated to early failure, PFS, and OS. How ever, prognosis of high-risk patients at baseline who reached a metabolic response at M1 after infusion, evalu ate by DS, appears to have a better outcome than patients that do not reach a CMR at M1 even those with low TMTV. In the near future, these dynamic risk estimates will be further reinforced integrating not only the metabolic re sponse assessment by PET but also the evaluation of the minimal residual disease by circulating tumor DNA (ctDNA) on serial analyses.26,27
In conclusion, baseline TMTV and Deauville-based re sponse at M1 provide important information and are therefore recommended. In contrast, imaging at M3 does not yield prognostic information and could be eliminated unless there is strong clinical suspicion for recurrence.
RDB sits on the advisory board of and has received hon oraria from Gilead Sciences and Novartis. M-TR sits on the advisory board and has received honoraria from Gi lead, Novartis, BMS-Celgene and Takeda. F-XG has re ceived honoraria from Astellas and Kite/Gilead, consults and has an advisory role in Kite Gilead, Novartis, BMS, and has received travels funds from Jazz, Novartis, Kite/Gilead and Abbvie. PF consults and has an advisory
1. Schuster SJ, Bishop MR, Tam CS, et al. Tisagenlecleucel in adult relapsed or refractory diffuse large B-cell lymphoma. N Engl J Med. 2019;380(1):45-56.
2. Neelapu SS, Locke FL, Bartlett NL, et al. Axicabtagene ciloleucel CAR T-cell therapy in refractory large B-cell Lymphoma. N Engl J Med. 2017;377(26):2531-2544.
3. Locke FL, Ghobadi A, Jacobson CA, et al. Long-term safety and activity of axicabtagene ciloleucel in refractory large B-cell lymphoma (ZUMA-1): a single-arm, multicentre, phase 1-2 trial. Lancet Oncol. 2019;20(1):31-42.
4. Abramson JS, Palomba LM, Gordon LI, et al . Lisocabtagene maraleucel for patients with relapsed or refractory large B-cell lymphomas (TRANSCEND NHL 001): a multicentre seamless design study. Lancet. 2020;396(10254):839-852.
5. Pasquini MC, Hu Z-H, Curran K, et al. Real-world evidence of tisagenlecleucel for pediatric acute lymphoblastic leukemia and non-Hodgkin lymphoma. Blood Adv. 2020;4(21):5414-5424.
6. Nastoupil LJ, Jain MD, Feng L, et al. Standard-of-care
role, has received honoraria and travel funds from Roche/Genentech, Janssen, Gilead and Abbvie. VM sits on the advisory board of Eusapharma and Beigene. MM has received honoraria from Novartis, Kite/Gilead and Janssen. OC has received research funding from Roche, Takeda, Gilead, sits on the advisory board of and has re ceived honoraria from Celgene, Roche, Takeda, Gilead, BMS, Merck, Abbvie and Janssen outside the submitted work. CT has received honoraria from Roche, Amgen, Janssen, Celgene, Gilead Science/Kyte and Beigene, con sults and has an advisory role in Roche, Gilead Sciences, Janssen, Celgene, Novartis and Beigene, has received re search funding and travel expenses from Roche and No vartis. All other authors have no conflicts of interest to disclose.
JG, LV, MM and CT developed the study concept and de sign; JG, LC, LV, MM and CT wrote the manuscript. All authors provided materials or patients, collected, as sembled, analyzed and interpreted the data, gave the final approval of the manuscript and are accoutable for all as pects of the work.
The authors thank the patients and their families, and all the investigators and their staff involved in data collection and analyses. The authors also thank Henry Ortega for his excellent help with Figure 1B.
The datasets used and/or analyzed during the current study are available from the corresponding author on rea sonable request.
axicabtagene ciloleucel for relapsed or refractory large B-cell lymphoma: results from the US Lymphoma CAR T Consortium. J Clin Oncol. 2020;38(27):3119-3128.
7. Vercellino L, Di Blasi, R Kanoun S, et al. Predictive factors of early progression after CAR T-cell therapy in relapsed/refractory diffuse large B-cell lymphoma. Blood Adv. 2020;4(22):5607-5615.
8. Locke FL, Rossi JM, Neelapu SS, et al. Tumor burden, inflammation, and product attributes determine outcomes of axicabtagene ciloleucel in large B-cell lymphoma. Blood Adv. 2020;4(19):4898-4911.
9. Jacobson CA, Hunter BD, Redd R, et al. Axicabtagene ciloleucel in the non-trial setting: outcomes and correlates of response, resistance, and toxicity. J Clin Oncol. 2020;38(27):3095-3106.
10. Cohen D, Luttwak E, Beyar-Katz O, et al. [18F]FDG PET-CT in patients with DLBCL treated with CAR-T cell therapy: a practical approach of reporting pre- and post-treatment studies. Eur J Nucl Med Mol Imaging. 2021;49(3):953-962.
11. Vercellino L, Cottereau A-S, Casasnovas O, et al. High total
- PET-imaging in R/R LBCL after CAR T cells
metabolic tumor volume at baseline predicts survival independent of response to therapy. Blood. 2020;135(16):1396-1405.
12. Cheson BD, Fisher RI, Barrington SF, et al. Recommendations for initial evaluation, staging, and response assessment of Hodgkin and non-Hodgkin lymphoma: the Lugano classification. J Clin Oncol. 2014;32(27):3059-3068.
13. Lin C, Itti E, Haioun C, et al. Early 18F-FDG PET for prediction of prognosis in patients with diffuse large B-cell lymphoma: SUVbased assessment versus visual analysis. J Nucl Med. 2007;48(10):1626-1632.
14. Casasnovas R-O, Ysebaert L, Thieblemont C, et al. FDG-PETdriven consolidation strategy in diffuse large B-cell lymphoma: final results of a randomized phase 2 study. Blood. 2017;130(11):1315-1326.
15. Le Gouill S, Ghesquières H, Oberic L, et al. Obinutuzumab vs rituximab for advanced DLBCL: a PET-guided and randomized phase 3 study by LYSA. Blood. 2021;137(17):2307-2320.
16. Meignan M, Cottereau A-S. Interim PET in lymphoma: from Deauville to Peking criteria. On the road, again…. Leuk Lymphoma. 2018;59(3):523-525.
17. Toledano MN, Vera P, Tilly H, et al. Comparison of therapeutic evaluation criteria in FDG-PET/CT in patients with diffuse largecell B-cell lymphoma: prognostic impact of tumor/liver ratio. PLoS One. 2019;14(2):e0211649.
18. Johnson P, Federico M, Kirkwood A, et al. Adapted treatment guided by interim PET-CT scan in advanced Hodgkin’s lymphoma. N Engl J Med. 2016;374(25):2419-2429.
19. Casasnovas R-O, Bouabdallah R, Brice P, et al. PET-adapted treatment for newly diagnosed advanced Hodgkin lymphoma (AHL2011): a randomise multicentre, non-inferiority, phase 3
study. Lancet Oncol. 2019;20(2):202-215.
20. Dubreuil J, Salles G, Bozzetto J, et al. Usual and unusual pitfalls of 18F-FDG-PET/CT in lymphoma after treatment: a pictorial review. Nucl Med Commun. 2017;38(7):563-576.
21. Gibney GT, Zaemes J, Shand S, et al. PET/CT scan and biopsydriven approach for safe anti-PD-1 therapy discontinuation in patients with advanced melanoma. J Immunother Cancer. 2021;9(10):e002955.
22. Kuhnl A, Roddie C, Kirkwood AA, et al. Early FDG PET response predicts CAR-T failure in large B-cell lymphoma. Blood Adv. 2021;6(1):321-326.
23. Sesques P, Tordo J, Ferrant E, et al. Prognostic impact of 18FFDG PET/CT in patients with aggressive B-cell lymphoma treated with anti-CD19 chimeric antigen receptor T cells. Clin Nucl Med. 2021;46(8):627-634.
24. Dean EA, Mhaskar RS, Lu H, et al. High metabolic tumor volume is associated with decreased efficacy of axicabtagene ciloleucel in large B-cell lymphoma. Blood Adv. 2020;4(14):3268-3276.
25. Di Rocco A, Cuneo A, Di Rocco A, et al. Relapsed/refractory diffuse large B-cell lymphoma patients. A multicenter retrospective analysis of eligibility criteria for car-T cell therapy. Leuk Lymphoma. 2021;62(4):828-836.
26. Sworder B, Kurtz DM, Macaulay C, et al. Circulating DNA for molecular response prediction, characterization of resistance mechanisms and quantification of CAR T-cells during axicabtagene ciloleucel therapy. Blood. 2019;134(Suppl 1):S550.
27. Frank MJ, Hossain NM, Bukhari A, et al. Monitoring of circulating tumor DNA improves early relapse detection after axicabtagene ciloleucel infusion in large B-cell lymphoma: results of a prospective multi-institutional trial. J Clin Oncol. 2021;39(27):3034-3043.
Luis Veloza,1* Doriane Cavalieri,2* Edoardo Missiaglia,1 Albane Ledoux-Pilon,3 Bettina Bisig,1 Bruno Pereira,4 Christophe Bonnet,5 Elsa Poullot,6 Leticia Quintanilla-Martinez,7 Romain Dubois,8 Francisco Llamas-Gutierrez,9 Céline Bossard,10 Roland De Wind,11 Fanny Drieux,12 Juliette Fontaine,13 Marie Parrens,14 Jeremy Sandrini,15 Virginie Fataccioli,6,16 Marie-Hélène Delfau-Larue,16,17 Adrien Daniel,18 Faustine Lhomme,19 Lauriane Clément-Filliatre,20 François Lemonnier,16,21 Anne Cairoli,22 Pierre Morel,23 Sylvie Glaisner,24 Bertrand Joly,25 Abderrazak El Yamani,26 Kamel Laribi,27 Emmanuel Bachy,28 Reiner Siebert,29 David Vallois,1 Philippe Gaulard,6,16# Olivier Tournilhac2# and Laurence de Leval1#
1Institute of Pathology, Department of Laboratory Medicine and Pathology, Lausanne University Hospital and Lausanne University, Lausanne, Switzerland; 2Department of Hematology, University Hospital of Clermont-Ferrand, EA7453 CIC1405, Université Clermont Auvergne, Clermont-Ferrand, France; 3Department of Pathology, University Hospital of Clermont-Ferrand, Clermont-Ferrand, France; 4Clinical Research Direction, University Hospital of Clermont-Ferrand, Clermont-Ferrand, France; 5Department of Hematology, University Hospital Sart Tilman, Liège, Belgium; 6AP-HP, Henri Mondor Hospital, Pathology Department, Créteil, France; 7Institute of Pathology, University Hospital Tübingen, Eberhard Karls University of Tübingen, Tübingen, Germany; 8Department of Pathology, University Hospital of Lille, Lille, France; 9Department of Pathology, University Center Hospital, Rennes, France; 10Department of Pathology, CHU de Nantes, Nantes, France; 11Department of Pathology, Institute Jules Bordet, Bruxelles, Belgique; 12Service of Anatomical and Cytological Pathology, Center Henri Becquerel, Rouen, France; 13Multisite Pathology Institute, Hôpital Lyon Sud, Hospices Civils de Lyon, Pierre Bénite, France; 14Department of Pathology, CHU de Bordeaux, University of Bordeaux, Bordeaux, France; 15Department of Pathology, Le Mans Hospital Center, Le Mans, France; 16University Paris Est Créteil, INSERM, IMRB, Créteil, France; 17Department of Immunobiology and INSERM U955, Henri Mondor University Hospital, Créteil, France; 18Department of Hematology, University Hospital of Lille, Lille, France; 19Department of Hematology, University Hospital of Rennes, Hospital Pontchaillou, Rennes, France; 20Department of Oncology, Louis Pasteur Clinic, Essey-LèsNancy, France; 21AP-HP, Henri Mondor Hospital, Lymphoid Malignancies Unit, Créteil, France; 22Service of Hematology, Department of Oncology, Lausanne University, Hospital and Lausanne University, Lausanne, Switzerland; 23Department of Hematology, Hospital of Lens, Lens and Department of Hematology, University Hospital of Amiens, Amiens, France; 24Department of Hematology, Institute Curie, Hospital Rene Huguenin, Saint-Cloud, France; 25Department of Hematology, Sud-Francilien Hospital Center, Corbeil-Essonnes, France; 26Department of Hematology, Hospital Center of Blois, Blois, France; 27Department of Hematology, Hospital Center Le Mans, Le Mans, France; 28Department of Hematology, Center Hospitalier Lyon Sud and INSERM U1111, Pierre Bénite, France and 29Institute of Human Genetics, Ulm University and Ulm University Medical Center, Ulm, Germany
*LV and DC contributed equally as co-first authors. #PG, OT and LdL contributed equally as co-senior authors.
Correspondence: L. de Leval Laurence.deleval@chuv.ch
Received: April 12, 2022.
Accepted: June 9, 2022.
Prepublished: June 16, 2022.
https://doi.org/10.3324/haematol.2022.281226
©2023 Ferrata Storti Foundation
Published under a CC BY-NC license
Monomorphic epitheliotropic intestinal T-cell lymphoma (MEITL) is a rare aggressive T-cell lymphoma most reported in Asia. We performed a comprehensive clinical, pathological and genomic study of 71 European MEITL patients (36 males, 35 females, median age 67 years). The majority presented with gastrointestinal involvement and had emergency surgery, and 40% had stage IV disease. The tumors were morphologically classified into two groups: typical (58%) and atypical (i.e., non-monomorphic or with necrosis, angiotropism or starry-sky pattern) (42%), sharing a homogeneous immunophenotypic profile (CD3+ [98%] CD4- [94%] CD5- [97%] CD7+ [97%] CD8+ [90%] CD56+ [86%] CD103+ [80%]
ARTICLE - MEITL: genetic heterogeneity impacting outcome
cytotoxic marker+ [98%]) with more frequent expression of TCRgd (50%) than TCRab (32%). MYC expression (30% of cases) partly reflecting MYC gene locus alterations, correlated with non-monomorphic cytology. Almost all cases (97%) harbored deleterious mutation(s) and/or deletion of the SETD2 gene and 90% had defective H3K36 trimethylation. Other frequently mutated genes were STAT5B (57%), JAK3 (50%), TP53 (35%), JAK1 (12.5%), BCOR and ATM (11%). Both TP53 mutations and MYC expression correlated with atypical morphology. The median overall survival (OS) of 63 patients (43/63 only received chemotherapy after initial surgery) was 7.8 months. Multivariate analysis found a strong negative impact on outcome of MYC expression, TP53 mutation, STAT5B mutation and poor performance status while aberrant B-cell marker expression (20% of cases) correlated with better survival. In conclusion, MEITL is an aggressive disease with resistance to conventional therapy, predominantly characterized by driver gene alterations deregulating histone methylation and JAK/STAT signaling and encompasses genetic and morphologic variants associated with very high clinical risk.
Monomorphic epitheliotropic intestinal T-cell lymphoma (MEITL), formerly considered as a variant (type II) of en teropathy-associated T-cell lymphoma (EATL), is now rec ognized a separate entity based on distinct clinicopathological and epidemiological features, unre lated to celiac disease (CD).1 MEITL and EATL are both rare accounting together for less than 5% of peripheral T-cell lymphomas.2,3 Many published series describe hybrid co horts comprising MEITL and EATL.4-8 In Western countries, the incidence of MEITL is even lower than the incidence of EATL. In contrast, in Asia where CD essentially does not exist, MEITL is the most common type of primary gastro intestinal T-cell lymphoma.9-15 As opposed to EATL, MEITL is defined as a tumor composed of monomorphic medium-sized cells, with round nuclei and a rim of pale cytoplasm, typically show ing striking infiltration of intestinal epithelium and lacking necrosis or significant inflammation.1,16 EATL and MEITL have in common an activated cytotoxic T-cell immuno phenotype while distinctive MEITL features include ex pression of CD8 and CD56, negativity for CD30 and occasional CD20 expression.4-6, 8,10-14,17,18
The mutational landscape of MEITL encompasses fre quent activating mutations of the JAK/STAT signaling pathway mainly affecting STAT5B (33-65%), JAK3 (33-67%) and JAK1 (5-44%).7,18-23 Moreover, activating hotspot muta tions in the GNAI2 gene coding for guanine nucleotidebinding protein G(i), a -2 subunit have been reported in 21% of the cases in a study from Singapore.20 We reported highly recurrent (>90%) deleterious alterations in the SETD2 gene coding for SET Domain Containing 2, a histone lysine methyltransferase, which has been variably con firmed in subsequent studies.7,18,20,23
MEITL usually presents as a small bowel tumor often manifesting by perforation or obstruction, abdominal pain and weight loss. The disease follows an aggressive course with a median OS usually of less than 1 year (range, 6.514 months).6,8,9,13,18,24 No robust prognostic or predictive bio markers have been described to date.
Here, we studied a large series of 71 MEITL cases from Western Europe, performed histopathological assessment supplemented by extensive immunophenotyping, targeted fluorescence in situ hybridization (FISH) studies, and mu tational analysis of a selected 27-gene panel in 65 cases. We present a comprehensive analysis integrating the pathological and molecular features and their correlation to clinical outcome.
Seventy-one patients diagnosed with MEITL between 2005 and 2021 according to 2008 or 2017 World Health Or ganization classifications1,16 (69 diagnostic and 2 relapse samples, all routinely processed formalin-fixed paraffin embedding [FFPE] tissues) were collected through the Te nomic Consortium of the Lymphoma Study Association (LYSA)25 (n=65) and the University Hospital of Tübingen, Germany (n=6). Twenty-nine cases were included in a pre vious study.7 The clinical history and imaging studies were collected from the patients’ files by the treating phys icians. The study was approved by the Commission anto nale d’éthique de la recherche sur l’être humain (CER-VD, protocol 382/14), the Comité de Protection des Per sonnes-Ile-de-France IX (CPP08/009), and the Ethical Committee of the University of Tübingen (105/2013BO2) in accordance with the Declaration of Helsinki.
fl
scored into quartiles (<25%, 26-50%, 51-75%, 76-100%). For FISH evaluation of the SETD2 and MYC gene loci we used a homemade SETD2 probe7 and the commercial LSI MYC Dual Color Break Apart probe (8q24) (Abbott Molecu lar, Des Plaines, IL, USA) (Online Supplementary Appendix). Chromogenic slides were digitalized using a NanoZoomer S60 Digital slide scanner (Hamamatsu Photonics, Japan) at 40x magnification and evaluated using a digital image viewer system (TM-Microscopy, Telemis, Belgium). Mor phology, IHC and FISH results were recorded in a coded dataset (Online Supplementary Figure S1).
Sixty-five cases were examined by next-generation se quencing (NGS). Data were generated by whole-exome se quencing (WES) in 34 cases, including 14 previously reported,7 and by targeted deep sequencing (TDS) using a customized 27-gene panel relevant to T-cell lymphoma biology in 29 cases, or a 9-gene panel TDS assay7,26 in two cases. For WES, libraries from tumor and matched nontumor DNA, both extracted from FFPE tissues, were paired-end sequenced on a HiSeq 4000 instrument (Il lumina, San Diego, CA). For TDS, libraries of tumor DNA prepared with the KAPA HyperPlus kit (Roche, Pleasanton, CA) were target enriched by capture prior to sequencing on a MiSeq system (Illumina). After demultiplexing, align ment and duplicate removal, single nucleotide and indel variant calling was performed using three caller algo rithms VarScan (v2.4.4) and MuTect2 algorithm (GATK v4.1). For WES set, the variant call was restricted to the 27 genes of the TDS panel plus GNAI2.
Fisher’s exact or χ² tests were used to determine associ ations between morphological, immunophenotypical and genetic characteristics. Estimates of overall survival were constructed using the Kaplan-Meier method. Cox propor tional hazards regression model was used to investigate associated prognostic factors in univariate and multivari able analysis. In order to ensure the robustness of our re sults, the final model was validated by a two-step bootstrapping process. Results were expressed as ha zard-ratio (HR) and 95% confidence interval (CI). Statis tical analysis was performed using Stata software (version 15, StataCorp LP, College Station, US). The tests were twosided, with a type I error set at 5%. When appropriate, a correction of the type I error was applied to take into ac count multiple comparisons.
The 36 male and 35 female patients had a median age of
Table 1. Clinical and biological features of monomorphic epitheliotropic intestinal T-cell lymphoma at diagnosis.
Features
MEITL patients (N=71)
Median age, years (range) 67 (29-91)
Male, N (%) 36 (51%)
Medical History*
Prior coeliac disease Previous cancer Auto-immune disease
Symptom history** median duration, months (range) Abdominal pain Weight loss Fatigue Anorexia Diarrhea
Palpable abdominal mass or adenopathy
0/62 (0%) 6/62 (10%) 2/62 (3%)
<1m (0-20) 48/54 (89%) 34/54 (63%) 36/54 (67%) 28/54 (52%) 15/54 (28%) 10/54 (18%)
Acute event at presentation*** Bowel perforation Bowel obstruction
Lugano stage Stage I Stage II II.1 II.2 IIE Not specified Stage IV
27/56 (48%) 15/56 (27%) 14/56 (25%)
52/61 (85%) 43/61 (70%) 17/61 (28%) Performance Status 0-1 2 >2
20/60 (33%) 16/60 (27%) 9/60 (15%) 1/60 (2%) 3/60 (5%) 3/60 (5%) 24/60 (40%)
Elevated serum LDH 18/32 (56%)
Hypoalbuminemia (<35 g/L) 27/33 (82%)
Surgical management 59/63 (94%) No chemotherapy 19/62 (31%)
First-line regimens
CHOP-based (CHOP, CHOEP, Ro-CHOP, R-CHOP)
CHOP + IVE-MTX
Other treatments (COP, ACVBP, DDGP, radiotherapy)
Unknown
43/62 (69%) 32/43 (74%)
6/43 (14%) 4/43 (9%)
1/43 (2%)
First-line consolidation**** 9/43 (21%)
Response (at end of first line)
Complete response
Partial response Stable disease
Primary progression
Death with unknown status
Unknown
15/43 (35%) 4/43 (9%) 2/43 (5%) 20/43 (46%) 1/43 (2%) 1/43 (2%)
Progression/relapse after first-line 36/42 (86%)
Salvage treatment after progression/relapse 30/36 (83%) Salvage treatment consolidation 3/30 (10%)
Number of lines of treated patients: median, N (range) 1 (1-5)
MEITL: monomorphic epitheliotropic intestinal T-cell lymphoma; LDH: lactate dehydrogenase; PS: performance status; CHOP: cyclophosphamide, dox orubicin, vincristine, prednisone; CHOEP: cyclophosphamide, doxorubicin, vincristine, etoposide, prednisone; Ro-: Romidepsin; R-: Rituximab; IVE-MTX: ifosfamide, epirubicin, etoposide, methotrexate; COP: cyclophosphamide, vin cristine, prednisone; ACVBP: doxorubicin, cyclophosphamide, vindesine, bleomycin, prednisone; DDGP: cisplatin, dexamethasone, gemcitabine, and pegasparaginase ; auto-HCT: autologous hematopoietic cell transplantation; allo-HCT: allogeneic hematopoietic cell transplantation ; OS: overall survival. *Cancer cases: colorectal cancer (n=1), cutaneous T-cell lymphoma (n=1), es sential thrombocytemia (n=1), prostatic cancer (n=1), breast cancer (n=2). Autoimmune disease: autoimmune thyroiditis (n=1), giant cell arteritis (n=1). **Other symptoms not reported in the table included night sweats (n=5), pruritus (n=2), bleeding, pancreatitis, pleural effusion, pulmonary embolism, abdominal abscess, intestinal ulcers (n=1 for each). ***Patients with perfor ation occurring after the start of chemotherapy are not included. **** In cluding autoHCT (n=8) and alloHCT (n=1).
67 years (range, 29-91 years). Baseline clinical and biological features of 63 patients are presented in Table 1 and Online Supplementary Tables S2 and S3. All had gastrointestinal involvement, most often restricted to the small intestine (n=46/63, 73%) and most patients (52/61, 85%) presented with acute symptoms, mainly related to intestinal perfor ation and/or obstruction. According to the Lugano staging system: 33% (n=20) had only GI involvement (stage I), 27% (n=16) had local or abdominal lymph nodes (stage II), 40% (n=24) were stage IV with supradiaphragmatic lymph nodes or extradigestive/extranodal involvement, most commonly

pleuro-pulmonary (n=7), or hepatic (n=4).
The main histopathological features are summarized in Figure 1. The size of intestinal tumors ranged from 1.7 to 20 cm (median 6 cm). Except for one case with mainly mucosal involvement, 61 of 62 (98%) surgical specimens comprised a frequently ulcerated transmural central zone, perforated in 44 of 58 cases (76%), and showed lateral tumor extension predominant in the mucosa (peripheral zone)10,17 in 40 of 46 (87%) evaluable cases (Figure 2A).
Most intestinal cases (48/54, 89%) showed tumor epithe liotropism (Figure 1; Figure 2B, D and E). Morphology of other tumor locations with epitheliotropism in non-intes tinal sites are illustrated in the Online Supplementary Fig ure S2A to H and Figure 3J to L.
Most cases (53/71, 75%) showed classical monomorphic cytology, i.e., round and small/medium-sized tumor cells with little variation in nuclear size, slightly dispersed chro matin, inconspicuous nucleoli, and ample pale cytoplasm (Figure 2B and C). However, a significant proportion of
Figure 2. Typical monomorphic epitheliotropic intestinal T-cell lymphoma cases #30 (A to C) and #51 (D to L). (A) The intestinal tumor comprises a central transmural zone and a peripheral zone with intramucosal tumor spread. (B) The tumor cells are medium-sized and monomorphic with clear and ample cytoplasm and invade the epithelium of the crypts. (C) The tumor recur rence after 5 years shows an identical cytomorphology. (D) Intramucosal tumor spread is associated with shortening and widening of the villi. (E) Broadly expanded villi comprise a heavy epitheliotropic tumor cell infiltrate. (F) The tumor cells are strongly positive for CD3, (G) negative for CD5, (H) positive for CD8, (I) CD56, and (J) TCRb. (K) CD103 is strongly positive in the superficial intra mucosal tumor compartment and gradually decreases in the infiltrating part. (L) Lymphoma cells in the mucosa (upper part of panel figure) and submucosa (lower part of panel figure) are strongly and moderately positive for CD103. Original magnifications x10 (A), x40 (K), x100 (E), x125 (D), x400 (B, C, F to J, L).

Figure 3. Atypical monomorphic epitheliotropic intestinal T-cell lymphoma cases #31 (A to L), #15 (M) and #59 (N to O). (A) The tumor is composed of medium–sized pleomorphic cells and comprises scattered histiocytes with apoptotic debris. (B) A vein is infiltrated by lymphoma cells. (C) The lymphoma cells are weakly positive for TCRg. (D) FISH with SETD2 probe shows 1 red (SETD2) and 2 green (control) signals per nucleus, indicating deletion of 1 allele. (E) The lymphoma cells show strong nuclear positivity for H3K36me2 and (F) are completely negative for H3K36me3, while reactive histiocytes are positive. (G) The lymphoma cells are diffusely positive for TIA-1, (H) show a high Ki67 index (>80%), and (I) are strongly positive for p53. (J) A gastric biopsy performed during follow-up showed recurrent tumor with a more blastoid morphology, invading the glandular epithelium. (K) Post-mortem liver showed lymphoma infiltrating in the sinusoids and within hepatocytes. (L) A cytokeratin immunostains con firmed emperipolesis of lymphoma cells into hepatocytes. (M) This case features marked angiotropism and angioinvasion. (N) This tumor contains large necrotic areas in its invasive portion, and (O) is composed of pleomorphic large cells. Original mag nifications: x25 (N), x100 (B and M), ×400 (A, C, E to K, L, O), x630 (D).
 A B C
D E F
G H I
J K L
A B C
D E F
G H I
J K L
cases (18/71, 25%) showed either significant cellular pleo morphism, larger cell size, vesicular chromatin and/or prominent nucleoli (Figure 3A and O; Online Supplemen tary Figure S3D to F). A peculiar, atypical case (#66) had two distinct monomorphic and non-monomorphic com ponents (Online Supplementary Figure S4). Except for two non-monomorphic cases, which had abundant eosino phils and prominent plasma cells, all cases presented very few inflammatory cells. Mitoses were easily identified in most cases. While mitoses were easily identified in most cases, a small subset (7/71 cases, 10%), appeared as highgrade neoplasms with a “starry-sky” pattern or abundant apoptotic debris (Figure 3; Online Supplementary Figure S3A to C). Other unusual features were seen in a subset of cases: coagulative necrosis distinct from surface ulcer ation in 9 cases (Figure 3N), or focal or prominent angio tropism or angioinvasion of medium to large-sized blood vessels in 18 cases (Figure 3B and M), which were frequent among non-monomorphic cases (Online Supplementary Table S4). Overall, we distinguished two morphological groups of cases: typical tumors (n=41, 58%) and atypical tumors (n=30, 42%) featuring one or more atypical histo logical characteristic(s) (Figure 1; Table 2).
The immunophenotypic profiles are shown in Figure 1 and summarized in Table 2. Most cases had homogeneous and strong expression of CD3 (70/71, 99%) and CD7 (63/65, 97%). CD2 was positive in 32 of 66 cases (48%). Only two of 70 (3%) cases were CD5-positive. CD8 and CD56 were usually widely expressed, but with heterogeneous staining intensity. Most cases (55/71, 77%) were positive for both CD56 and CD8, nine of 71 (13%) were CD8+ CD56-, six of 71 (8%) were CD8- CD56+, and one case CD8- CD56-. Four cases, all CD8+ CD56+, were strongly CD4-positive. CD30 was negative in all cases (63/64, 98%), except in occa sional large, atypical cells in case #66 (Online Supplemen tary Figure S4). PD1 was negative in 20 of 20 tested cases. Most cases strongly expressed TIA1 in most tumor cells (65/68, 96%) (Figure 3G); but immunostains for granzyme B and perforin, positive in 50 of 66 cases (76%) and 39 of 62 cases (63%) respectively, were frequently weaker with often <50% positive tumor cells. Overall, 59 of 68 (87%) cases had an activated cytotoxic profile, 11 cases ex pressed TIA1 only and one case was negative for the three cytotoxic markers.
Half of cases (32/64, 50%) expressed TCRg and/or TCRd (TCRgd+), and 21 of 65 (32%) cases were positive for TCRb (TCR ab+). Sixty-two cases with contributory results for both TCR isoforms were classified as single positive for TCRgd (43%) (Figure 3C) or TCRab (24%) (Figure 2J), TCR silent (24%), or double positive (9%) (Online Supplemen tary Figure S3G to I).
Fifty-two of 65 cases (80%) were CD103-positive. Apart
from few cases homogeneously and intensely CD103positive, in most cases a gradient of staining was ob served from more intense and extensive in the intramucosal portion to weaker or negative in the deeper infiltrative part (Figure 2K to L).
Co-expression of CD20, usually by <50% of the tumor cells and weaker than in normal B cells, was observed in 12 of 67 (18%) cases. Four of 51 (8%) cases were CD79a+. Two cases co-expressed CD20 and CD79a (Online Supplemen tary Figure S3A to C), but lacked PAX5 and were positive for CD8, CD56 and cytotoxic markers. All 24 tested cases for PAX5 were negative. In total, 14 of 67 (20%) were Bcell marker-positive. Ki-67 proliferation index was >75% in most cases (38/68, 56%) (Figures 1 and 3H). All 68 cases tested for EBV by EBER-ISH were negative, and one case showed scattered reactive small (<1%) EBV-positive cells. There were no significant differences in the immunophe notypic profiles of atypical and typical cases (Table 2; On line Supplementary Table S4).
By NGS analysis (Online Supplementary Table S5; Figure 4A), we found a very high prevalence of SETD2 mutations in 59 of 65 cases (91%), with two mutations in 29 of 59 cases (49%) and three mutations in one case (#59) (Figure 4B). Of the 88 SETD2 mutations identified, 62 (27 non sense, 26 frameshift and 9 splice-sites) were likely gen erating a truncated non-functional protein and were distributed throughout the whole gene domains. More over, most of the 24 missense mutations clustered within the SET domain of the SETD2 protein or its proximity. No tably, the 24 cases analysed by both WES and TDS (this latter only on the tumor component) showed complete overlap, indicating absence of germline variants in this subset of patients. Heterozygous deletions of SETD2 were observed in nine of 57 (16%) cases evaluated by FISH, of which six had one or two concurrent SETD2 mutation(s), and three were SETD2 wild-type (Figure 3D). Overall, of 54 cases with complete NGS and FISH results for SETD2, 23 had one mutation or deletion, 29 had two or more alter ations and only two had no detectable alteration. These latter two cases (#6 and #49) were non-monomorphic, with a characteristic CD8+, CD56+, TCRgd+ cytotoxic phe notype, and harbored other mutations in the JAK/STAT pathway.
Immunohistochemistry was performed to assess the SETD2–H3K36me2–H3K36me3 axis at the protein level (Figure 1). Defective expression of SETD2 or H3K36me3 (IHC scores ≤6) were observed in 47 of 55 cases (85%) and 60 of 66 cases (91%), respectively. The correlation be tween SETD2 gene alterations and SETD2 protein ex pression (Figure 1) was concordant in 43 of 50 cases
(86%); six cases with SETD2 gene alteration had preserved SETD2 expression, and one case had defective protein ex pression and no detectable gene alteration. H3K36me3 IHC results were concordant with the SETD2 status, in 60 of 63 cases (95%) i.e., 58 cases had defective H3K36me3 trimethylation (H3K36me3 score ≤6) and altered SETD2,
and two cases with high H3K36me3 scores had no de tected SETD2 alteration. Only three cases, two with monoallelic alteration and one with double mutations of SEDT2, had high H3K36me3 scores. Thus, H3K36me3 IHC as a surrogate to identifying SETD2 gene alterations was highly sensitive (95%), and 100% specific (K=0.55, 95% CI:
All cases (N=71) Typical (N=41) Atypical (N=30) Adjusted P Morphology
Non-monomophic 18/71 (25.3%) 0/41 (0%) 18/30 (60%) <0.0001 * Necrosis 9/71 (12.6%) 0/41 (0%) 9/30 (30%) <0.0001 * Starry-sky/apoptosis 7/71(9.8%) 0/41 (0%) 7/30 (23.3%) 0.002 * Angiotropism 18/64 (28.1%) 0/37 (0%) 18/27 (66.6%) <0.0001 * Lack of epitheliotropism 6/54 (11.1%) 2/35 (5.7%) 4/19 (21.0%) 0.169
CD8 64/71 (90.1%) 37/41 (90.2%) 27/30 (90%) 1.000
CD56 61/71(85.9%) 33/41 (80.4%) 28/30 (93.3%) 0.174
CD3 70/71(98.5%) 40/41 (97.5%) 30/30 (100%) 1.000 CD2 32/66 (48.4%) 16/37 (43.2%) 16/29 (55.1%) 0.457
CD5 2/70 (2.8%) 2/40 (5%) 0/30 (0%) 0.503
CD7 63/65 (96.9%) 38/38 (100%) 25/27 (92.5%) 0.169 CD4 4/70 (5.7%) 2/41 (4.8%) 2/29 (6.8%) 1.000 CD103 52/65 (80%) 29/38 (76.3%) 23/27 (85.1%) 0.532 CD30 1/64 (1.5%) 0/37 (0%) 1/27 (3.7%) 0.422
TIA1 65/68 (95.5%) 38/41 (92.6%) 27/27 (100%) 0.271 Granzyme B 50/66 (75.7%) 27/38 (71.0%) 23/28 (82.1%) 0.388 Perforin 39/62 (62.9%) 23/36 (63.8%) 16/26 (61.5%) 1.000 CD20 12/67 (17.9%) 7/40 (17.5%) 5/27 (18.5%) 1.000 CD79a 4/51 (7.8%) 1/32(3.1%) 3/19 (15.7%) 0.140
SETD2 (score >8) 8/55 (14.5%) 5/33 (15.1%) 3/22 (13.6%) 1.00 H3K36me3 (score >8) 6/67 (8.9%) 4/38 (10.5%) 2/29 (6.8%) 0.69
TCRβ 21/65 (32.3%) 11/36 (30.5%) 10/29 (34.4%) 0.794 TCRγ/δ 32/64 (50%) 17/36 (47.2%) 15/28 (53.5%) 0.801
TCRαβ TCRγδ+ 27/62 (43.5%) 14/34 (41.1%) 13/28 (46.4%) 0.955
TCRαβ+TCRγδ 15/62 (24.1%) 8/34 (23.5%) 7/15 (46.6%)
TCRαβ+TCRγδ+ 5/62 (8.0%) 3/34 (8.8%) 2/28 (7.1%)
TCRαβ TCRγδ 15/62 (24.1%) 9/34 (26.4%) 15/62 (24.1%)
Ki-67 >50% 48/68 (70.5%) 24/39 (61.5%) 24/29 (82.7%) 0.066
MYC >25% 18/54 (33.3%) 5/30 (16.6%) 13/24 (54.1%) 0.008 p53 IHC mutated pattern 22/56 (39.2%) 6/31 (19.3%) 16/25 (64%) 0.001
Table 2. Morphological, immunophenotypical and molecular characteristics of typical and atypical groups. * Expected correlation (by definition). ICH: immunohistochemistry; TCR: T-cell receptor.
TP53 mutation 22/64 (34.3%) 6/36 (16.6%) 16/28 (57.1%) 0.001 MYC alteration 12/60 (20%) 5/33 (15.1%) 7/27 (25.9%) 0.345
SETD2 alteration 62/64 (96.8%) 36/36 (100%) 26/28 (92.8%) 0.188
STAT5B mutation 37/65 (56.9%) 20/37 (54.0%) 17/28 (60.7%) 0.622
JAK3 mutation 32/64 (50%) 19/36 (52.7%) 13/28 (46.4%) 0.801
0.11-0.99; P<0.015) (Figure 3E to F; Online Supplementary Figure S5)
The second most frequently mutated gene was STAT5B
featuring alterations in 37 of 65 cases (57%) (Figure 4). STAT5B mutations were all missense, single (n=31) or double (n=6). Most mutations (70%) occurred in the SH2 domain, including the hotspot N642H activating mutation in 21 patients.7 JAK3 mutations found in 32 of 64 cases

Figure 4.
(A) Heatmap repre sentation of mutations in a selected panel of genes examined by whole-exome sequencing and targeted deep sequencing in 65 monomorphic epitheliotropic intestinal T-cell lymphoma (MEITL) tumors. Patients are displayed as columns and mutations (named on the left) are coloured by the type of alteration. The percentage of mutated samples is represented on the right. First row shows the expression patterns of T-cell receptor (TCR) isoforms, second row shows the status of H3K36me3 trimethylation and third row displays the results of SETD2 fluorescence in situ hybridization (FISH) study. (B) Schematic representation of so matic mutations in SETD2 (top), STAT5B (central) and JAK3 (bottom) genes identified in this study. Domains of the protein are represented according to the Uniprot database (http://www.uniprot.org) in different colors. Exact positions of mutations found in MEITL cases are given, which are colored by the type of alteration.
(50%) included several activating variants clustered in the pseudokinase domain (such as A573V, M511I, R657W, K563_566del, P676R), and were single (n=29) or double (n=2). JAK1 mutations were identified in a smaller propor tion of cases (8/64, 12%). Mutations in STAT5B, JAK3 and JAK1 were not mutually exclusive. In all, 54 of 64 cases (84%) had mutations in at least one gene of the JAK/STAT pathway. Notably, STAT5B mutations showed significantly higher allele frequencies than JAK3 and SETD2 mutations, likely due to co-occurring loss-of-heterozygosity (LOH) or allelic imbalance events (Online Supplementary Figure S6). TP53 mutations were identified in 22 of 63 (35%) cases and, similar to STAT5B mutations, were also associated with a high-allele frequencies due to copy number losses or copy number neutral LOH events (Online Supplemen tary Figure S6). Remarkably, TP53 mutations occurred mostly among the atypical group (adjusted P=0.01, Fisher's exact test) (Table 2) and correlated with abnormal p53 IHC pattern – either overexpression (>50%) or uncommonly completely negative staining in 2 cases (adjusted P<0.001, Fisher's exact test) (Figures 1 and 3I; Online Supplemen tary Table S4).
Mutations in BCOR and ATM were found in 11% of cases each. Three of 34 cases (9%) carried somatic mutations in the GNAI2 gene; two in codon R179 previously de scribed,20 and one p.T182I mutation.
Twelve of 60 cases subjected to FISH (20%) had MYC gene locus alterations, i.e., copy gains in eight and breaks (re arrangements) in four cases. None of the cases with MYC copy gain was hyperploid (Online Supplementary Appen dix). Ten of the 12 cases with MYC gene alterations had >25% MYC protein-positive tumor cells by immunohisto chemistry. Overall, MYC expression was detected in 18 of 54 cases (33%), more frequently among non-monomor phic tumors (adjusted P=0.008, Table 2). Altered MYC status (by FISH or IHC) also tended to correlate with TP53 mutations (adjusted P=0.05 and 0.06, respectively), and nine cases harboured both TP53 mutations and MYC gene rearrangement (n=4) or copy gains (n=5) (Figure 1; Online Supplementary Figure S3D and F; Online Supplementary Table S4).
Treatments and outcomes of 63 patients are summarized in Table 1. Most patients (59/63, 93%) underwent surgery and tumor resection. Seventeen patients with no further treatment died within a median time of 1 month. Of 43 patients who received a first-line therapy, one died before assessment and 20 progressed on treatment. Nine of 28 patients aged ≤65 years received consolidation with hematopoietic cell transplantation either autologous (auto-HCT) (n=8) or allogeneic (allo-HCT) (n=1). The 36 pa
tients who relapsed following first-line therapy, often re ceived one (or less commonly more) salvage treatment (30/36) and all died, usually from disease progression (n=31).
After a median follow-up of 46 months (alive patients), median overall survival (OS) was 7.8 months (range, 0-71). One-year and 2-year OS were 31% and 15%, respectively. In univariate analysis of OS (Figure 5; Online Supplemen tary Table S6): age>70, enterostomy, poor performance status (PS) (>2), advanced Lugano stage (≥2), lack of com plete response to first-line therapy, atypical histology, MYC expression, and TP53 mutations were all significantly associated with inferior outcome. Conversely, B-cell marker expression was associated with a better prognosis. The multivariate analysis confirmed the independent im pact of TP53 mutations (P=0.005, hazard ratio [HR] =5.83), STAT5B mutations (P=0.007, HR=3.67), B-cell (CD20 and/or CD79a) marker expression (P=0.005, HR=0.15) and poor PS (P=<0.001, HR=7.58) on OS (Table 3; Online Supplementary Table S7).
Eight patients survived beyond 24 months (Online Supple mentary Table S8). They all had a good PS at diagnosis and underwent surgery. The seven patients who received chemotherapy (CHOP-based in 5) reached complete (6) or partial (1) response. Six cases were classified as typical and two as atypical, all lacked TP53 mutations, and MYC expression, and four of eight were CD20+. In a very long survivor patient (#31) who relapsed 5 years after initial di agnosis, the relapsing tumor was also analyzed and showed a morphology and mutation profile identical to the initial diagnosis, and a very similar phenotype apart from reduced CD56 expression at relapse.
This integrative clinical, histopathological and genetic analysis of 71 MEITL patients from Western Europe repre sents the largest study to date. Our findings confirm that MEITL shows a rather homo geneous CD3+, CD4-, CD5-, CD7+, CD8+, CD56+ activated cytotoxic immunophenotype.4,5,10-14,17,18 Most cases were CD8+ CD56+ and those negative for CD8 and/or CD56 (23%) did not show peculiar features. The distribution of TCR expression profiles is in line with the preferential gd T-cell derivation reported in several studies.4,5,11,17 In addi tion, TCRgd+ and TCRab+ tumors showed similar patho logical and mutational features, with no impact on outcome. Expression of CD103 (the a E subunit of the het erodimer integrin aEb7), which is characteristic of intrae pithelial lymphocytes of the small intestine and documented in T-cell lymphomas, particularly EATL,27 was positive in most cases, albeit with heterogeneous staining. CD103 expression could therefore represent an additional
Figure 5. Overall survival for monomorphic epitheliotropic intestinal T-cell lymphoma patients. (A) Overall survival (OS) in months of the all cohort; and according to (B) age at diagnosis, (C) performance status (PS) score, (D) Lugano stage at diagnosis, (E) the presence of atypical histological features, (F) cytological atypia, (G) TP53 mutational status, (H) STAT5B mutational status, (I) the concurrent presence of TP53 and STAT5B mutations and (J) MYC expression (>25% immunohistochemistry). Age in years. MEITL: monomorphic epitheliotropic intestinal T-cell lymphoma; # at risk: number at risk; mut: mutated; WT: wild-type.

diagnostic feature of MEITL. The mutational analyses reflect a very characteristic pat tern of alterations involving frequent somatic deleterious alterations of SETD2 (96%) and activation of JAK/STAT pathway gene(s), confirming our original discovery.7 More over, TP53 mutations and MYC deregulation occurred in a subset of cases. Intriguingly, while we also found 100% SETD2 alterations in nine of nine cases from Japan,23 a lower incidence of SETD2 mutations was reported in other series, being ~70% in 23 Northern American cases6 and 22% in 20 Chinese cases.18 Along with the notion of many tumor suppressor genes requiring biallelic inactivation,28 most cases had two SETD2 alterations, with no evidences of germline variants. Notably, cases with apparently only one genetic hit had similarly reduced H3K36me3 histone mark, alluding to other mechanisms at play. Since func tional studies have established the role of SETD2 ablation in driving experimental lymphomagenesis,29 our data sup port the key role of SETD2 inactivation in MEITL patho genesis. Conversely, mutations in other genes involved in DNA (and histone) methylation, in particular TET2 and DNMT3A, were distinctly rare or absent contrasting with other T-cell lymphoma entities.30,31 Thus, deregulated methylation of the H3K36 position represents the major epigenetic alteration in MEITL. For diagnostic purposes, NGS approaches interrogating the complete sequence of SETD2 gene are mandatory since mutations are dis tributed without hot spots. In addition, we recommend analyses for the detection of SETD2 locus loss or LOH. We showed that H3K36me3 IHC is an acceptable surrogate or complement to genotyping. We identified two groups of tumors with distinct morpho logical features: a typical group of monomorphic tumors (58%) and an atypical group of tumors (42%), non-mono morphic, or presenting features suggesting a more aggres sive biology. Some nuclear pleomorphism and large cell morphology have been recognized in Asian series but no association to clinical features or divergent immunophe notypes has been reported.10,11,13,14,16,17 Here, while both groups shared similar immunophenotype and heterogene ous T-cell lineage derivation, the atypical group had more
Table 3. Multivariate model of overall survival.
frequent MYC expression, TP53 alterations, and a shorter overall survival in univariate analysis. Thus, our novel find ings confirm and expand the notion that MEITL comprises a morphological spectrum, irrespective of ethnicity, in cluding an atypical subgroup with meaningful biological attributes, and clinical relevance. The recognition that MEITL may show pleomorphism, angiotropism, necrosis, high-grade features or inflammation, is important for pathologists and relevant to diagnosis. It implies to con sider atypical MEITL in the differential diagnosis of aggres sive pleomorphic intestinal T-cell tumors, including EATL, EBV-associated extranodal NK/T-cell lymphoma, and in testinal T-cell lymphoma, NOS, which can be performed by the integration of clinical, immunophenotypic, H3K36me trimethylation status and mutational profile. Median OS was only 7.8 months, on the lower end of the 7-15 months previously reported9,10,18,24,32 perhaps related to the older age of our population and to a late diagnosis by an abdominal complication in most patients. Among base line clinical parameters, univariate analysis found that age >70 years, PS >2 and Lugano stage ≥2 were associated with a worse prognosis. However, in multivariate analysis only PS >2 remained significantly associated with poor OS underlying the importance of patients’ fitness to survive initial disease presentation and treatment. In addition, our study revealed biomarkers of independent unfavorable prognostic significance including TP53 and STAT5B muta tions and MYC expression. TP53 alterations are wellknown determinants of chemoresistance and worse outcome in lymphoma patients in general, and specifically in T-cell lymphomas.33-36 Activating mutations of STAT5B mutations have an established role in T-cell lymphoma genesis;37 they are frequent in several types of – usually aggressive - lymphomas derived from gd or NK cells, and in a subset of T-large granular lymphocytic leukemias (TLGL)21,22,29,38,39 associated with a more aggressive behavior.38 Accordingly, we found a striking negative effect of con current TP53 and STAT5B mutations on survival. In MEITL, gains of 8q24 or MYC copy gains have been vari ably reported in 25-70% of cases,5,10,11,40 rare cases harbor ing MYC rearrangements have been described,10,19 and
N of patients=44 HR 95% CI P value B-cell marker expression (IHC) 0.15 0.05-0.46 0.001
TP53 mutation 4.86 1.75-13.5 0.002 STAT5B mutation 3.42 1.44-8.13 0.005 MYC expression > 25% (IHC) 3.06 1.33-7.04 0.009 Performance Status ≥2 6.46 2.44-17.1 <0.001
IHC: immunohistochemistry; CI: confidence interval; HR: hazard ratio. For multivariable analysis, the covariates were determined according to univariate results (P≤0.10) and to the clinical and biological relevance, restricted to 44 cases with available pretherapeutic features (Online Supplementary Table S7; Online Supplementary Statistical Methods).
around half of cases reportedly show MYC protein ex pression.5,15,19 We found MYC expression in one third of the cases, more frequently in atypical cases and in association with TP53 mutations. Nine cases had concurrent MYC and TP53 gene alterations, with six of seven patients dying within 5 months after diagnosis. The poor prognosis of pa tients with MYC plus TP53 abnormalities has been re ported in diffuse large B-cell lymphoma41 along with high-grade morphology and also in chronic lymphocytic leukemia.42 Thus, MYC and TP53 aberrations may play a role in MEITL pathogenesis and progression. In this study, chemoresistance to first-line CHOP-based polychemotherapy was high, even compared to other Tcell lymphomas,43 let alone that only two thirds of pa tients had attempted systemic treatment after surgery. Yet, very few patients achieved CR during salvage and all eventually died of treatment toxicity or lymphoma pro gression. Certainly, there is an unmet medical need to im prove treatment. Timely diagnosis and better supportive measures may help to reduce early mortality by improving the PS of MEITL patients and decrease toxicity of firstline therapy in a rapidly growing disease. CHOP-based polychemotherapy was mostly ineffective in our patients; therefore, alternative approaches are urgently needed. Remarkably, five of six patients treated with the ifosfam ide, etoposide, epirubicin and methotrexate (IVE-MTX) regimen followed by ASCT proposed for EATL reached CR, but only one survived >24 months.44 Of note, MEITL and hepatosplenic T-cell lymphoma (HSTL) are both aggres sive extranodal chemoresistant diseases, which share bio logical characteristics.29,45 Hence, non-CHOP first-line alternative polychemotherapy46 such as ICE (ifosfamide, carboplatin, etoposide) or IVAC (ifosfamide, etoposide, high-dose cytarabine) followed by systematic consolida tion, as recommended by the ESMO guidelines47 could also be valuable for MEITL. Encouraging results have been reported after first-line auto-HCT44,48 in both EATL and MEITL.24 Herein patients receiving first-line HCT had longer OS, but HCT had been offered to young patients achieving CR, hence pre-selecting patients with a better prognosis. Consolidation with allo-HCT has the best potential for re lapse prevention in T-cell lymphoma but its use is limited by its toxicity.49 In MEITL, allo-HCT could be recom mended even first-line in eligible patients. A better understanding of MEITL biology may open the path to innovative treatments beyond chemotherapy and transplantation. Particularly, the aberrant expression of Bcell markers, rare in T-cell lymphoma50 raises the question of therapies targeting CD20 or CD79, while the lack of CD30 expression discourages the use of brentuximab ve dotin. Given the frequent activation of the JAK-STAT path way the use of JAK inhibitors may be useful.29 The MEITL-hallmark loss of H3K36 trimethylation, confers high sensitivity to WEE1 kinase inhibitors,51 such as adavosertib,
which is developed in clinical trials for solid tumors and could be evaluated in MEITL.
No conflicts of interest to disclose.
LV reviewed morphological data, analyzed data, and wrote the manuscript. DC reviewed and interpreted clinical data and wrote the manuscript. EM analyzed and interpreted sequencing data and wrote the manuscript. BP analyzed data and supervised the statistical analysis. BB supervised FISH and TDS analyses. CB, AD, FL, LCF, FL, AC, PM, SG, BJ, AEY, KL, EB reviewed and interpreted clinical data. ALP, EP, LQM, RB, FRG, CB, RDW, FD, JF, MP, JS performed morpho logical diagnoses. MHDL contributed with molecular data of cases. VF supported material and data acquisition and collected data. RS reviewed and analyzed genomic data. DV performed research and analyzed the data. PG per formed morphological diagnoses , designed research, and analyzed data. OT reviewed and interpreted clinical data, designed research, and wrote the manuscript. LdL per formed morphological diagnoses, designed research, ob tained funding, analyzed data, and wrote the manuscript.
The work developed at the Institute of Pathology of Lau sanne, was supported by the histopathology, immunopath ology and molecular pathology facilities, and the digital pathology platform of the Institute. The authors would like to thank Dr Nathalie Piazzon and Mr Jean-Daniel Roman for assistance with data management, Mrs Catherine Chapuis for technical assistance, Dr Justine Bouilly and Dr Audrey Letourneau for analysis and interpretation of TDS data and Mrs Cloé Bregnard and Mónica Esteves De Azevedo for performing the FISH studies . They also thank Dr Amedeo Sciarra for his contribution to data coding, Dr Adamantia Kapopoulou and Mr Vimel Rattina for their con tribution in whole exome analysis and Mr Venkatesh Ka cherla in the preparation of Figure 4 panels. The authors are indebted to Mrs Julien Marquis and Johann Weber from the Lausanne Genomic Technologies Facility, Center for In tegrative Genomics of Lausanne Univ ersity where wholeexome sequencing was performed.
The authors would like to thank Drs Patrick Bruandet and Jacques Akpo-Allavo (Service de Pathologie CH Blois), Drs Florence Bloget and Damienne Declerck (Medipath, Avon), Drs François Lamarche and Caroline Ghighi (ACP, Abbeville), Drs Pierre Boyer and Jean Kapfer (CAP Orléans), Prof Luc Xerri (Service de Pathologie, IPC Marseille) and Dr Thérèse Rousset (Service de Pathologie, CHU Montpellier) for pro viding tumor material. Dr Olivier Dubroeucq (Institut Jean Godinot, Reims), Dr Bruno Villemagne (CHD Vendée), Dr Em manuelle Tchernonog (CHU de Montpellier), Dr Sara Bur
heterogeneity
cheri (CH Perpignan), Dr Sophie Rigaudeau (CH de Ver sailles), Pr Emmanuel Gyan (CHU de Tours), Dr Julie Abra ham (CHU de Limoges), Dr Emmanuel Fleck (CH de La Rochelle), Dr Eric Dupont (CH d’Agen), Dr Jean Galtier (CHU de Bordeaux), Dr Thibault Brotelle (CH d’Avignon), Pr Gandhi Damaj (CHU de Caen), Dr Serge Bologna (Centre d’oncolo gie de Gentilly), Dr Clémentine Sarkozy (Institut Gustave Roussy), Dr Marion Loirat (CH de Saint-Nazaire), Dr Valentin Letailleur (CHU de Nantes), Dr Pierre Englert (Hôpital Erasme, Bruxelles), Romane Muletier (CHU de ClermontFerrand), Dr Shota Tsiklauri (CH d’Aubenas), Dr Bernard Drenou (GHR Mulhouse Sud-Alsace), Dr Florian Bouclet (Centre Henri Becquerel, Rouen), Dr Robin Noël (Institut Paoli Calmettes, Marseille), Dr Patrick Mboungou (CH de Boulogne-Sur-Mer), Dr Abdallah Maakaroun (CH de
1. Jaffe ES, Chott A, Ott G, et al. Intestinal T-cell lymphoma. In Swerdlow SH, Campo E, Harris NL editors. WHO Classification of tumours of Haematopoietic and Lymphoid Tissues, revised 4th ed. Lyon, France: IARC Press; 2017. p372-80.
2. Vose J, Armitage J, Weisenburger D, International T-Cell Lymphoma Project. International peripheral T-cell and natural killer/T-cell lymphoma study: pathology findings and clinical outcomes. J Clin Oncol. 2008;26(25):4124-4130.
3. Laurent C, Baron M, Amara N, et al. Impact of expert pathologic review of lymphoma diagnosis: study of patients from the French Lymphopath Network. J Clin Oncol. 2017;35(18):2008-2017.
4. Chott A, Haedicke W, Mosberger I, et al. Most CD56+ intestinal lymphomas are CD8+CD5-T-cell lymphomas of monomorphic small to medium size histology. Am J Pathol. 1998;153(5):1483-1490.
5. Takeshita M, Nakamura S, Kikuma K, et al. Pathological and immunohistological findings and genetic aberrations of intestinal enteropathy-associated T cell lymphoma in Japan. Histopathology. 2011;58(3):395-407.
6. Moffitt AB, Ondrejka SL, McKinney M, et al. Enteropathyassociated T cell lymphoma subtypes are characterized by loss of function of SETD2. J Exp Med. 2017;214(5):1371-1386.
7. Roberti A, Dobay MP, Bisig B, et al. Type II enteropathyassociated T-cell lymphoma features a unique genomic profile with highly recurrent SETD2 alterations. Nat Commun. 2016;7:12602.
8. Delabie J, Holte H, Vose JM, et al. Enteropathy-associated T-cell lymphoma: clinical and histological findings from the international peripheral T-cell lymphoma project. Blood. 2011;118(1):148-155.
9. Tse E, Gill H, Loong F, et al. Type II enteropathy-associated Tcell lymphoma: a multicenter analysis from the Asia Lymphoma Study Group. Am J Hematol. 2012;87(7):663-668.
10. Tan SY, Chuang SS, Tang T, et al. Type II EATL (epitheliotropic intestinal T-cell lymphoma): a neoplasm of intra-epithelial Tcells with predominant CD8αα phenotype. Leukemia. 2013;27(8):1688-1696.
11. Tomita S, Kikuti YY, Carreras J, et al. Genomic and immunohistochemical profiles of enteropathy-associated T-cell lymphoma in Japan. Mod Pathol. 2015;28(10):1286-1296.
Bourges) and the Hospitals of Dieppe, Mont-de-Marsan, Sud Seine-et-Marne, the Clinique du Saint-Cœur, the Cli nique de l’Archette, the Polyclinique du Ternois are ac knowledged for providing clinical follow-up.
This work was supported by the grants KLS-4293-08-2017R to LDL of the Swiss Cancer Ligue and SNSF –31BL30_172718 to LDL of the Patholink and the Swiss Na tional Science Foundation.
Original data and protocols will be available to other in vestigators by request to corresponding author.
12. Sun J, Lu Z, Yang D, Chen J. Primary intestinal T-cell and NKcell lymphomas: a clinicopathological and molecular study from China focused on type II enteropathy-associated T-cell lymphoma and primary intestinal NK-cell lymphoma. Mod Pathol. 2011;24(7):983-992.
13. Ko YH, Karnan S, Kim KM, et al. Enteropathy-associated T-cell lymphoma-a clinicopathologic and array comparative genomic hybridization study. Hum Pathol. 2010;41(9):1231-1237.
14. Akiyama T, Okino T, Konishi H, et al. CD8+, CD56+ (natural killerlike) T-cell lymphoma involving the small intestine with no evidence of enteropathy: clinicopathology and molecular study of five Japanese patients. Pathol Int. 2008;58(10):626-634.
15. Kikuma K, Yamada K, Nakamura S, et al. Detailed clinicopathological characteristics and possible lymphomagenesis of type II intestinal enteropathy-associated T-cell lymphoma in Japan. Hum Pathol. 2014;45(6):1276-1284.
16. Tan SY, de Leval L. Monomorphic epitheliotropic intestinal T-cell lymphoma. In WHO Classification of Tumors Editorial Board. Digestive system tumours, revised 5th ed. Lyon, France: IARC Press; 2019. p390-2.
17. Chan JK, Chan AC, Cheuk W, et al. Type II enteropathyassociated T-cell lymphoma: a distinct aggressive lymphoma with frequent γδ T-cell receptor expression. Am J Surg Pathol. 2011;35(10):1557-1569.
18. Chen C, Gong Y, Yang Y, et al. Clinicopathological and molecular genomic features of monomorphic epitheliotropic intestinal Tcell lymphoma in the Chinese population: a study of 20 cases. Diagn Pathol. 2021;16(1):114.
19. Huang D, Lim JQ, Cheah DMZ, et al. Whole-genome sequencing reveals potent therapeutic strategy for monomorphic epitheliotropic intestinal T-cell lymphoma. Blood Adv. 2020;4(19):4769-4774.
20. Nairismägi ML, Tan J, Lim JQ, et al. JAK-STAT and G-proteincoupled receptor signaling pathways are frequently altered in epitheliotropic intestinal T-cell lymphoma. Leukemia. 2016;30(6):1311-1319.
21. Küçük C, Jiang B, Hu X, et al. Activating mutations of STAT5B and STAT3 in lymphomas derived from γδ T or NK cells. Nat Commun. 2015;6:6025.
22. Nicolae A, Xi L, Pham TH, et al. Mutations in the JAK/STAT and RAS signaling pathways are common in intestinal T-cell
lymphomas. Leukemia. 2016;30(11):2245-2247.
23. Tomita S, Kikuti YY, Carreras J, et al. Monomorphic epitheliotropic intestinal T-cell lymphoma in Asia frequently shows SETD2 alterations. Cancers (Basel). 2020;12(12).
24. Yi JH, Lee GW, Do YR, et al. Multicenter retrospective analysis of the clinicopathologic features of monomorphic epitheliotropic intestinal T-cell lymphoma. Ann Hematol. 2019;98(11):2541-2550.
25. de Leval L, Parrens M, Le Bras F, et al. Angioimmunoblastic Tcell lymphoma is the most common T-cell lymphoma in two distinct French information data sets. Haematologica. 2015;100(9):e361-364.
26. Lemonnier F, Dupuis J, Sujobert P, et al. Treatment with 5azacytidine induces a sustained response in patients with angioimmunoblastic T-cell lymphoma. Blood. 2018;132(21):2305-2309.
27. Morgan EA, Pihan GA, Said JW, et al. Profile of CD103 expression in T-cell neoplasms: immunoreactivity is not restricted to enteropathy-associated T-cell lymphoma. Am J Surg Pathol. 2014;38(11):1557-1570.
28. Paige AJ. Redefining tumour suppressor genes: exceptions to the two-hit hypothesis. Cell Mol Life Sci. 2003;60(10):2147-2163.
29. McKinney M, Moffitt AB, Gaulard P, et al. The genetic basis of hepatosplenic T-cell lymphoma. Cancer Discov. 2017;7(4):369-379.
30. Lemonnier F, Couronné L, Parrens M, et al. Recurrent TET2 mutations in peripheral T-cell lymphomas correlate with TFHlike features and adverse clinical parameters. Blood. 2012;120(7):1466-1469.
31. Couronné L, Bastard C, Bernard OA. TET2 and DNMT3A mutations in human T-cell lymphoma. N Engl J Med. 2012;366(1):95-96.
32. Haddad PA, Dadi N. Clinicopathologic determinants of survival in monomorphic epitheliotropic intestinal T-cell lymphoma (MEITL): analysis of a pooled database. Blood. 2020;136(Suppl 1):S28.
33. Young KH, Weisenburger DD, et al. Mutations in the DNA-binding codons of TP53, which are associated with decreased expression of TRAILreceptor-2, predict for poor survival in diffuse large B-cell lymphoma. Blood. 2007;110(13):4396-4405.
34. Chapuy B, Stewart C, Dunford AJ, et al. Molecular subtypes of diffuse large B cell lymphoma are associated with distinct pathogenic mechanisms and outcomes. Nat Med. 2018;24(5):679-690.
35. Kataoka K, Iwanaga M, Yasunaga JI, et al. Prognostic relevance of integrated genetic profiling in adult T-cell leukemia/lymphoma. Blood. 2018;131(2):215-225.
36. Watatani Y, Sato Y, Miyoshi H, et al. Molecular heterogeneity in peripheral T-cell lymphoma, not otherwise specified revealed by comprehensive genetic profiling. Leukemia. 2019;33(12):2867-2883.
37. Pham HTT, Maurer B, Prchal-Murphy M, et al. STAT5BN642H is a driver mutation for T cell neoplasia. J Clin Invest. 2018;128(1):387-401.
38. Rajala HL, Eldfors S, Kuusanmäki H, et al. Discovery of somatic STAT5b mutations in large granular lymphocytic leukemia. Blood. 2013;121(22):4541-4550.
39. López C, Bergmann AK, Paul U, et al. Genes encoding members of the JAK-STAT pathway or epigenetic regulators are recurrently mutated in T-cell prolymphocytic leukaemia. Br J Haematol. 2016;173(2):265-273.
40. Deleeuw RJ, Zettl A, Klinker E, et al. Whole-genome analysis and HLA genotyping of enteropathy-type T-cell lymphoma reveals 2 distinct lymphoma subtypes. Gastroenterology. 2007;132(5):1902-1911.
41. Deng M, Xu-Monette ZY, Pham LV, et al. Aggressive B-cell Lymphoma with MYC/TP53 dual alterations displays distinct clinicopathobiological features and response to novel targeted agents. Mol Cancer Res. 2021;19(2):249-260.
42. Chapiro E, Lesty C, Gabillaud C, et al. "Double-hit" chronic lymphocytic leukemia: An aggressive subgroup with 17p deletion and 8q24 gain. Am J Hematol. 2018;93(3):375-382.
43. Bachy E, Camus V, Thieblemont C, et al. Romidepsin plus CHOP versus CHOP in patients with previously untreated peripheral Tcell lymphoma: results of the Ro-CHOP phase III study (Conducted by LYSA). J Clin Oncol. 2022;40(3):242-251.
44. Sieniawski M, Angamuthu N, Boyd K, et al. Evaluation of enteropathy-associated T-cell lymphoma comparing standard therapies with a novel regimen including autologous stem cell transplantation. Blood. 2010;115(18):3664-3670.
45. Travert M, Huang Y, de Leval L, et al. Molecular features of hepatosplenic T-cell lymphoma unravels potential novel therapeutic targets. Blood. 2012;119(24):5795-5806.
46. Voss MH, Lunning MA, Maragulia JC, et al. Intensive induction chemotherapy followed by early high-dose therapy and hematopoietic stem cell transplantation results in improved outcome for patients with hepatosplenic T-cell lymphoma: a single institution experience. Clin Lymphoma Myeloma Leuk. 2013;13(1):8-14.
47. d'Amore F, Gaulard P, Trümper L, et al. ESMO Guidelines Committee. Peripheral T-cell lymphomas: ESMO Clinical Practice Guidelines for diagnosis, treatment and follow-up. Ann Oncol. 2015;26 Suppl 5:v108-115.
48. Jantunen E, Boumendil A, Finel H, et al. Autologous stem cell transplantation for enteropathy-associated T-cell lymphoma: a retrospective study by the EBMT. Blood. 2013;121(13):2529-2532.
49. Schmitz N, Truemper L, Bouabdallah K, et al. A randomized phase 3 trial of autologous vs allogeneic transplantation as part of first-line therapy in poor-risk peripheral T-NHL. Blood. 2021;137(19):2646-2656.
50. Blakolmer K, Vesely M, Kummer JA, Jurecka W, Mannhalter C, Chott A. Immunoreactivity of B-cell markers (CD79a, L26) in rare cases of extranodal cytotoxic peripheral T- (NK/T-) cell lymphomas. Mod Pathol. 2000;13(7):766-772.
51. Pfister SX, Markkanen E, Jiang Y, et al. Inhibiting WEE1 selectively kills histone H3K36me3-deficient cancers by dNTP starvation. Cancer Cell. 2015;28(5):557-568
Correspondence: R. Kridel robert.kridel@uhn.ca
Received: February 23, 2022.
Accepted: June 15, 2022.
Prepublished: June 23, 2022.
https://doi.org/10.3324/haematol.2022.280900
©2023 Ferrata Storti Foundation
Published under a CC BY-NC license
Intratumoral heterogeneity (ITH) provides the substrate for tumor evolution and treatment resistance, yet is remarkably understudied in lymphoma, due to the often limited amount of tissue that gets sampled during the routine diagnostic process, generally from a single nodal or extranodal site. Furthermore, the trajectory of how lymphoma, and especially non-Hodgkin lymphoma, spreads throughout the human body remains poorly understood. Here, we present a detailed characterization of ITH by applying whole-genome sequencing to spatially separated tumor samples harvested at the time of autopsy (n=24) and/or diagnosis (n=3) in three patients presenting with refractory B-cell non-Hodgkin lymphoma. Through deconvolution of bulk samples into clonal mixtures and inference of phylogenetic trees, we found evidence that polyclonal seeding underlies tumor dissemination in lymphoma. We identify mutation signatures associated with ancestral and descendant clones. In our series of patients with highly refractory lymphoma, the determinants of resistance were often harbored by founding clones, although there was also evidence of positive selection of driver mutations, likely under the influence of therapy. Lastly, we show that circulating tumor DNA is suitable for the detection of ancestral mutations but may miss a significant proportion of private mutations that can be detected in tissue. Our study clearly shows the existence of intricate patterns of regional and anatomical evolution that can only be disentangled through multi-regional tumor tissue profiling.
Intratumoral heterogeneity (ITH) is a fundamental hall mark of cancer and is recognized at all levels of the tumor ecosystem, encompassing genetic, epigenetic and meta bolic variation between individual cellular populations.1 The progressive acquisition of somatic alterations across the genome is a major determinant of tumor evolution, leading to clonal expansions under selective pressures such as antineoplastic therapy.2 A recent study from the Pan-Cancer Analysis of Whole Genomes (PCAWG) initiative identified almost universal evidence of ITH across 2,658 samples from 38 cancer types, with frequent evidence of both branching and linear evolution patterns.3 Lymphomas arise from the malignant transformation of normal lym phocytes and are accordingly classified among malig
nancies of the hematopoietic system. While bone marrow and peripheral blood involvement can be observed, the most common lymphoma types often present without a noticeable circulatory component and form tissue masses in lymph nodes and/or extranodal sites.4 Yet, unlike most solid malignancies where the site of primary disease is typically well defined and where modes of spread be tween the primary and metastatic sites have been eluci dated using multi-regional sequencing approaches,5,6 the knowledge about the modes of lymphoma dissemination remains limited. This observation stands in contrast to the other end of the evolutionary trajectory where under standing of the cellular origin of most lymphomas is in creasing and can be traced back to specific stages of Bor T-cell differentiation.7 While surgical biopsies are critically important for accu
Keren Isaev,1 Ting Liu,1 Mehran Bakhtiari,1 Kit Tong,1 Rashmi Goswami,2 Bernard Lam,3 Ilinca Lungu,3 Paul M. Krzyzanowski,3 Amit Oza,1 Neesha Dhani,1 Anca Prica,1 Michael Crump1 and Robert Kridel1 1Princess Margaret Cancer Center - University Health Network; 2Sunnybrook Health Sciences Center and 3Ontario Institute for Cancer Research, Toronto, ON, Canadarate diagnosis, larger surgical resections are not con sidered a part of the treatment strategy for lymphoma. This is in contrast to solid malignancies in which localized neoplasms are surgically removed, aiming to provide cure, with or without neoadjuvant or adjuvant therapies. As a result, the spatial distribution of subclones has been de scribed in solid tumors to a much more granular degree than in hematological malignancies. To date, only a few studies have explored multisite heterogeneity in lym phoma, at a relatively small scale, typically comparing no more than two tumor sites.8–11 One study reported the ap plication of whole-exome sequencing to 12 samples from one patient with extranodal NK/T-cell lymphoma.11 Overall, the full extent of spatial and temporal ITH largely remains to be uncovered in lymphoma. Herein, we propose to fill this knowledge gap by leveraging sample resources from an institutional Research Autopsy Program and applying state-of-the-art clonal deconvolution and phylogenetic reconstruction methods. Our goal was to provide an indepth description of ITH in patients with highly refrac tory/resistant lymphoma and to enhance our understanding of clonal dissemination in lymphoma.
An institutional Research Autopsy Program was open at our institution between 2014 and 2017 and enrolled 115 patients after informed consent was obtained. The pro gram, described in Bavi et al., was built on the integration of multiple interfaces (patient-physician, autopsy-pathol ogy, biospecimen-science), highlighting its integrated and collaborative nature.12 Four patients with refractory nonHodgkin lymphoma were enrolled: patient 1 with blastoid mantle cell lymphoma; patient 2 with primary mediastinal B-cell lymphoma; patient 3 with high-grade B-cell lym phoma with double hit (MYC and BCL2 translocations); and patient 4 with diffuse large B-cell lymphoma. Patient 4 was excluded from this study as this patient presented with neurolymphomatosis and no autopsy samples with sufficient quality and/or lymphoma involvement were available. This study was approved by the University Health Network (UHN) Research Ethics Board (CAPCR 166342).
A total of 12, 39 and 25 tissue samples were harvested at the time of autopsy for patients 1, 2 and 3, respectively, and stored in the UHN biobank as frozen tissue. After pa thology review of hematoxylin and eosin (H&E) sections cut from frozen tissue and exclusion of samples with low tumor content and/or necrosis, 3, 4 and 17 samples were available for DNA isolation. In addition, for patient 3, three
diagnostic formalin-fixed and paraffin-embedded tissue (FFPET) biopsies from the time of diagnosis were avail able. Samples are listed in the Online Supplementary Table S1. DNA was extracted from frozen tissue samples using the Qiagen AllPrep DNA/RNA kit, from FFPET samples using the Qiagen AllPrep DNA/RNA FFPE kit and from peripheral blood cells using the QIAamp DNA Mini Kit. The germline control samples were determined to be free of tumor cell contamination through the lack of am plifiable, patient-specific immunoglobulin gene rearrange ments.
Whole-genome sequencing and processing Paired end sequencing (2x150 base pairs) was performed using an Illumina HiSeqX. Reads were mapped to the hg19 reference genome using bwa-mem13 and duplicate reads were marked using Picard Tools, followed by local realign ment and base quality score recalibration using GATK (4.0.5.1).14 Somatic single nucleotide variants (SNV) and in sertions and deletions (indels) were called using Mutect215 in tumor-normal mode with default parameters following the best practice workflow.16 GnomAD population variants included in the GATK bundle were used as the germline resource. We also used Strelka (2.9.10)17 to call SNV and indels and merged the two sets of mutation calls to in clude only their intersection. Mutations found in ENCODE blacklisted regions were removed.18 Mutations were anno tated by Annovar.19 Additional filters were applied to re move mutations whose depth was lower than 60X (or 30X for FFPET samples), X and Y chromosome mutations, mu tations with a population allele frequency higher than 0.001, and mutations annotated by GnomAD and not also annotated in COSMIC.
In order to obtain detailed accounts of non-Hodgkin lym phoma (NHL) evolutionary trajectories, we collected samples from three patients who had been consented within the framework of an institutional Research Autopsy Program (Figures 1A, 3A and 5A).12 All three patients had aggressive clinical presentations with death resulting from primary refractory or early relapsing disease. Patient 1 was a 50-60 year-old female patient with a diagnosis of stage IV blastoid mantle cell lymphoma (MCL), achieving a par tial remission after six cycles of alternating R-CHOP/RDHAP, followed by autologous stem cell transplantation and rituximab maintenance. She experienced early central nervous system relapse, 5 months after stem cell trans plantation, treated with whole-brain radiation and in trathecal chemotherapy but ultimately died 1 year and 4 months after initial diagnosis. Patient 2 was a 20-30 year-
old male patient with a diagnosis of stage IIE primary re fractory mediastinal B-cell lymphoma (PMBCL) with bulk, treated with six cycles of R-CHOP but found to have re fractory disease on end-of-treatment positron emission tomography–computed tomography scan. He then re ceived one cycle of GDP without response, followed by radiation, pembrolizumab, further palliative radiation and single agent chemotherapy, before dying from lymphoma 1 year and 2 months after diagnosis. Patient 3 was a 5060-year old male patient with a diagnosis of stage IV highgrade B-cell lymphoma (HGBCL) with double hit rearrangement (BCL2 and MYC) and large bulk in the retro peritoneum, initially treated with one cycle of R-CHOP fol lowed by two cycles of DA-EPOCH-R without response, then treated with two cycles of GDP without response and followed by palliative radiation. This patient died within 6 months of diagnosis. All three patients had been treated at our institution before CAR T-cell therapy became widely available.
Whole-genome sequencing (WGS) was performed on a total of 27 tumor samples that included 24 cryopreserved

autopsy samples from patients 1 (n=3), 2 (n=4) and 3 (n=17), as well as three spatially separated biopsies from the time of diagnosis, available as FFPET blocks, from pa tient 3 (Online Supplementary Table S1). The average coverage was 66X ± 3.1 standard deviations (SD) and 46X ± 11.3 for cryopreserved and FFPET samples, respectively. In addition, peripheral blood mononuclear cells were se quenced for all three patients (average coverage 36X ± 1.8) (Online Supplementary Table S2). Plasma was available for all three patients and was used for targeted sequencing using a hybrid capture panel spanning 158 kB. The mean on target coverage for ctDNA was 4,632X in the uncol lapsed, de-duplicated bam files and 603X in the bam files with reads collapsed based on duplex consensus se quences and singleton correction.
Patient 1 Identification of somatic genetic alterations at the level of the whole genome In this patient with mantle cell lymphoma, the average number of somatic SNV and indels was 8,776 +/- 2,249
Figure 1. Overview of patient 1 (mantle cell lymphoma). (A) Spatially distinct tumor samples were collected from 3 tumor sites along with plasma and buffy coat. (B) High level overview of single nu cleotide variants/insertions and deletions (SNV/indels), copy number aberration (CNA) and structural variant (SV) counts across samples. Purity and Ploidy esti mates from Sequenza are shown. (C) Cir cos plot showing shared genetic aberrations. Chromosomes are shown in the outermost circle, followed by a track showing single nucleotide variants, a track showing copy number variation and finally structural variation shown in the innermost circle. (D) Plots showing the number of genetic events found in one or more samples. LOH: loss of heterozygos ity; TRANSLOC: translocation; DEL: dele tion; DUP: duplication; INS: insertion; MCL: mantle cell lymphoma. Panel (A) was created by BioRender.com.
SD per sample (Figure 1B). The average number of struc tural variants (SV) including larger insertions, deletions and translocations was 147 +/- 30 SD per sample. SNV, CNA and SV that were common to all samples (pu tatively ancestral) are shown in Figure 1C. The degree to which somatic alterations were shared across samples differed. The majority of mutations were private, i.e., ob served in just one sample (n=16,417, 83%, Figure 1D), while copy number gains affected most genes, with evi dence of whole-genome duplication in all samples (Fig ure 1B). We found a high confidence shared, i.e., putatively ancestral, splicing mutation in TP53 affecting the splice acceptor site of intron 4 ( Online Supplemen tary Table S3 ). This case also had a shared splicing mu tation involving FUBP1 , a gene that has previously been identified as a cancer-associated gene in chronic lym phocytic leukemia (CLL)20 as well as in an MCL case aris ing from underlying CLL. 21 As expected, the t(11:14) chromosomal translocation was found in all samples. We compared SNV and indels detected in ctDNA with mutation calls within matching genomic regions from WGS of tissue biopsies. In this patient, in whom the
number of mutations identified in the tumor samples was low, none of these mutations was found in ctDNA (0/2) (Figure 2A).
Phylogenetic tree and tumor clonal evolution reconstruction using spatially distinct samples In a first analysis of the evolutionary relationships be tween spatially separated tumor samples, using Treeomics, 22 we found clear evidence of branching evol ution ( Online Supplementary Figure 1A ). The majority of analyzed SNV (82%) were exclusive to individual samples, rather than shared. In order to delineate clonal origins across samples within a given patient, we com bined mutation (n=3,146, Online Supplementary Table S4 ), copy number and purity estimates using PycloneVI.23 We observed one founding clone (population 1) har boring driver gene mutations including TP53 (X126_splice) and FUBP1 (X642_splice) (Figure 2B). Popu lation 2 was prevalent in the Mediastinal_2 and Retro peritoneal samples while population 3 was only prevalent in Mediastinal_1 (Figure 2C; Online Supplemen tary Figure 1B ) and contained an EGFR (A786V) mutation.
Figure 2. In depth analysis of patient 1 mutations (mantle cell lymphoma). (A) The Venn diagram shows the number of mutations identified in either circulating tumor DNA (ctDNA) or any of the wholegenome sequencing (WGS) samples, and their overlap. The barplots show the count of mutations, based on whether they are detected in ctDNA or not (x axis), and based on whether they are de tected in WGS of tissue samples or not (coded by color). The analysis of WGS herein is restricted to the specific ge nomic regions covered by the ctDNA tar geted sequencing panel. (B) Clonal phylogeny tree, as inferred by pyclone and pairtree. Driver genes with mutations in specific subclones are labeled. (C) Subclonal population frequencies across samples, with each sample annotated by its clone diversity index (CDI) and clone mutation diversity index (CMDI).

Distribution of driver gene mutations and mutation signatures across clonal lineage trees
We analyzed driver mutations defined as those coding SNV that affected previously described driver genes in the lymphoma context, as well as those specific positions that are reported in the COSMIC database. The number of such mutations was low and ranged from zero to three across the three clonal populations (Online Supplementary Figure S1C). We associated COSMIC mutation signatures with cell populations identified through our phylogenetic analysis. Several mutation signatures were found to ac count for mutations in the dominant founding clone (population 1) including a grouped set consisting of SBS9 (somatic hypermutation in lymphoid cells) and SBS85 (ac tivation-induced cytidine deaminase [AID] in lymphoid cells) (Online Supplementary Figure S1D to E). While popu lations 2 and 3 contained far fewer mutations in this

analysis, population 2 also gained the SBS17a signature (related to SBS17b and chemotherapy treatment). Mean while, mutations in population 3 were only present in the Mediastinal_1 sample and were related primarily to the SBS86 signature. Overall, mutation signatures associated with chemotherapy treatment and somatic hypermutation were observed across all samples.
Patient 2
Identification of somatic genetic alterations at the level of the whole genome
In this patient with primary mediastinal B-cell lymphoma, the average number of all mutations was 373,288 +/6,482 and the average number of SV across samples was 89 +/- 18 per sample (Figure 3B). Unlike our observations for patient 1, the majority of mutations were shared across all four tumor samples analyzed (n=297,045, 59%) (Figure
Figure 3. Overview of patient 2 (primary mediastinal B-cell lym phoma). (A) Spatially distinct tumor samples were collected from 4 tumor sites along with plasma and buffy coat. (B) High level overview of single nucleotide variants/insertions and deletions (SNV/indels), copy number aberra tion (CNA) and structural variant (SV) counts across samples. Purity and Ploidy estimates from Se quenza are shown. (C) Circos plot showing shared genetic aberra tions. Chromosomes are shown in the outermost circle, followed by a track showing SNV, a track showing copy number variation and finally structural variation shown in the innermost circle. (D) Plots showing the number of gen etic events found in one or more samples. CNA: copy number aber ration; LOH: loss of heterozygos ity; TRANSLOC: translocation; DEL: deletion; DUP: duplication; INS: in sertion; PMBCL: primary mediasti nal B-cell lymphoma. Panel (A) was created by BioRender.com.
3C and D). On the contrary, a substantial fraction of genes was affected by CNA in only one of the four samples. Samples from this patient harbored very high numbers of SNV which made it more challenging to assign pathogenic roles to individual gene mutations (Online Supplementary Table S3). However, certain genes that are commonly al tered in B-cell lymphoma were mutated across all samples in this patient, including a nonsense mutation in ARID1A (Q74*), a recurrent hotspot mutation in B2M (X23_splice), a frameshift deletion in BCL10 (S167Lfs*6) and a splicing mu tation in TNFAIP3 (X99_splice). The number of mutations that overlapped between WGS and ctDNA was 24, repre senting 71% of all mutations detected in circulating tumor DNA (ctDNA) and an average of 49% (45-47%) of all muta tions found in the four tumor tissue biopsies (Figure 4A). Thus, a high percentage of ctDNA mutations was found across tumor samples. Further, the mutations present in ctDNA and in tissue based WGS were exclusively shared (24/24, 100%), compared to mutations present in WGS and not detected in ctDNA (17/46, 37%; chi-square P= 0.002).
Phylogenetic tree and tumor clonal evolution reconstruction using spatially distinct samples Using results from Treeomics,22 we observed a high per centage of coding SNV (69%) that were found in the trunk rather than in branches (Online Supplementary Figure S2A). A total of 22,402 mutations (Online Supplementary Table S4) were used for clonal phylogeny reconstruction using Pyclone-VI.23 We observed an ancestral clone (popu lation 1) with 13,385 mutations (60% of studied mutations) (Figure 4B). Population 2 emerged from the dominant clone with mutations including PRDM9 (R842H) before forming two phylogenetic clades, founded by populations 3 and 4, respectively. Population 5 descended from popu lation 3 and branched into populations 7 and 8. Population 7 was dominant in the adrenal gland and included muta tions in DNMT3A (T835M) and TFEB (R13W), while popu lation 8 was only found in the chest wall and contained DDX21 (A688T) and SOCS1 (S205N) mutations. Populations 6 and 9 descended from population 4, with population 9 further branching into population 10 found in the liver and
Figure 4. In depth analysis of pa tient 2 mutations (primary mediastinal B-cell lymphoma). (A) The Venn diagram shows the number of mutations identified in either circulating tumor DNA (ctDNA) whole-genome se quencing (WGS) samples, and their overlap. The barplots show the count of mutations, based on whether they are detected in ctDNA or not (x axis), and based on whether they are detected in WGS of tissue samples or not (coded by color). The analysis of WGS herein is restricted to the specific genomic regions covered by the ctDNA targeted sequencing panel. (B) Clonal phylogeny tree, as inferred by pyclone and pairtree. (C) Sub clonal population frequencies across samples, with each sample annotated by its clone diversity index (CDI) and clone mutation diversity index (CMDI).

the chest wall and population 11 found only in the mes enteric lymph node. At least three of the metastatic sites were composed of clones from both phylogenetic clades, suggesting polyphyletic dissemination (Figure 4C; Online Supplementary Figure S2B).

The vast majority of driver mutations was found in the an cestral clone (n=227 or 10% of coding mutations in this clone), although up to 23 additional driver and COSMIC mutations were found in descending clones (population 7, 8, 11 and 12) (Online Supplementary Figure S2C). Inter estingly, these cell populations were each found in only one sample: adrenal gland, chest wall, mesenteric lymph node and liver, respectively. Three sets of mutation sig natures contributed to mutation patterns in the founding clone (population 1) and most descending populations (Online Supplementary Figure S2D and E). These mutation signatures included SBS36;SBS35 (defective base excision
repair, including DNA damage due to reactive oxygen species), SBS9;SBS85 (somatic hypermutation and AIDinduced mutagenesis) and SBS15 (defective DNA mis match repair). Possibly, these signatures reflect the high number of mutations observed in this patient. Meanwhile, several signatures were only observed in some popu lations, including SBS11;SBS32 (alkylating agent treatment and prior treatment with azathioprine) which were only associated with population 10. Further, the SBS17b signa ture was found across multiple subclonal populations and not in the founding population and has been associated with chemotherapy treatment and damage through reac tive oxygen elements.
Identification of somatic genetic alterations at the level of the whole genome
In this patient with high-grade B-cell lymphoma and double hit of BCL2 and MYC, the average number of all mu tations per sample was 36,316 +/- 1,337 (Figure 5B). The
Figure 5. Overview of patient 3 (high-grade B-cell lymphoma). (A) Spatially distinct tumor samples were collected from 20 tumor sites (3 at diagnosis indicated in pink and 17 at autopsy) along with plasma and buffy coat. (B) High level overview of single nu cleotide variants/insertions and deletions (SNV/indels), copy number aberration (CNA) and structural variant (SV) counts across samples. Purity and Ploidy estimates from Sequenza are shown. (C) Circos plot showing shared genetic aberrations. Chromosomes are shown in the outermost circle, followed by a track showing SNV, a track showing copy number variation and finally structural variation shown in the innermost circle. (D) Plots showing the number of genetic events found in one or more samples. LOH: loss of heterozygosity; TRANSLOC: translocation; DEL: deletion; DUP: duplication; INS: insertion; HGBCL: high-grade B-cell lym phoma. Panel (A) was created by BioRender.com.
average number of SV was 56 +/- 13. Overall, translocations and deletions were more common than insertions and du plications. Most mutations were either private (n=25,805, 39%) or found across all samples (n=27,243, 41%) with a uniform spread of mutations across shared samples (Figure 5C and D). Similarly, most genes were either affected by a CNA in only one sample or in all samples from the patient, while most SV were private. All samples harbored an EZH2 mutation (A687V) and a KMT2D splice site mutation (Online Supplementary Table S3). Fifteen of 20 tumor samples (in cluding the diagnostic FFPET specimens) harbored an ad ditional indel in KMT2D (V2909fs). We identified a total of eight distinct gene mutations involving genes encoding linker histone H1 (HIST1H1B, HIST1H1C, HIST1H1D), found in eight to 20 of all tumor samples for this case. Additional mutations found in all samples included genes encoding proteins involved in signaling (IL4R: I242N; JAK2: V19A; FOXO1: W25G and SGK1: P85S, L149V, D167N and C824T). Moreover, ancestral mutations were identified in TNFRSF14 (C34R) and POU2F2 (T227A). Interestingly, five distinct TP53 SNV or indel were found and were private with the excep tion of one mutation found in three autopsy samples. None of the TP53 mutations was identified in the diagnostic FFPE samples. As expected, all samples from patient 3 harbored t(14:18) and MYC (non-immunoglobulin) translocations. The overlap of mutations between ctDNA and WGS consisted of a mean of 22 mutations (range, 20-25), with an average of 65% of these overlapping mutations detected in ctDNA (range, 59-74%) and an average of 52% (range, 47- 60%) of these mutations found in the tumor tissue samples (Figure 6A). Thus, the percentage of ctDNA mutations found in tis sue samples was higher than the percentage of mutations from tissue samples found in ctDNA. Further, the muta tions present in both ctDNA and WGS were more frequently shared than private, when compared to mutations de tected only in WGS (17/28, 61% vs. 10/49, 20%; chi-square P<0.001). Hence, these results show that capture-based targeted sequencing of ctDNA provides complementary in formation to multi-regional WGS and has a higher likeli hood of detecting clonal, rather than subclonal mutations.
Phylogenetic tree and tumor clonal evolution reconstruction using spatially distinct samples Patient 3 allowed for detailed analysis of spatial relation ships due to the number of available samples. Treeomics showed that the left breast and the left axilla diagnostic
samples formed early diverging branches in the phylogeny, where the former had a private PTEN (V175E) mutation and the latter had a private MYC (S388R) mutation (Online Sup plementary Figure S3A). Interestingly, the anatomically nearby axilla sample collected at autopsy also branched off earlier on with an acquired TP53 (V172G) mutation. The third diagnostic sample from the right neck formed a branch from the main phylogeny along with the sample collected from the cervical lymph node upon autopsy. Ad ditional diverging events led to one branch composed of the two kidney samples, adrenal gland and the spleen and one composed of the abdomen, cecum and inguinal region. Thus, the genetic profiles of the diagnostic samples were more similar to each other than to most autopsy samples. Moreover, these results reveal genetic relatedness between samples from spatially adjacent, but also between certain samples from distant sites and suggest a partial anatomical order in which lymphoma cells seeded throughout the body. For the Pyclone-VI analysis, we evaluated 12,024 mu tations across 20 samples (Figure 6B; Online Supplemen tary Table S4), revealing a founding clone (population 1) containing 6,240 mutations (52% of those analyzed) includ ing those in driver genes such as EZH2 (A687V), NFKB2 (A89V), SGK1 (P95S, L159V, D177N, A285V), and HIST1H1E (S104F, A164P, P201S, G103D). This ancestral population branched into population 2 and population 3 where the latter was only prevalent in the cervical lymph node samples from diagnosis and autopsy, suggesting spatial lo calization, and contained mutations in IL4R (F229C) and BRD4 (I146K). Population 4 and population 5 then diverged where the latter was prevalent only in the remaining two diagnostic samples and the axillary lymph node sample from autopsy. Population 4 further diverged into population 6 and population 7 with the former prevalent across all samples at varying levels and the latter found only in a sub set of samples. Population 6 diverged into three subclones (populations 8, 9 and 10) present at mutually exclusive spa tially distinct samples. The clone diversity index values were lowest in the three FFPE diagnostic samples as well as the autopsy samples from the axillary and cervical lymph nodes. These two autopsy sites had clonal composi tions that resembled the composition found in the diag nostic biopsies, with a predominance of either populations 3 or 5 based on laterality (right-sided samples composed of populations 3 and 6, and left-sided samples composed of populations 5 and 6) (Figure 6C and D; Online Supple
Figure 6. In depth analysis of patient 3 mutations (high-grade B-cell lymphoma). (A) The Venn diagram shows the number of mutations identified in either circulating tumor DNA (ctDNA) whole-genome sequencing (WGS) samples, and their overlap. The barplots show the count of mutations, based on whether they are detected in ctDNA or not (x axis), and based on whether they are detected in WGS of tissue samples or not (coded by color). The analysis of WGS herein is restricted to the specific genomic regions covered by the ctDNA targeted sequencing panel. (B) Clonal phylogeny tree, as inferred by pyclone and pairtree. Driver genes with mutations in specific subclones are labeled. (C) Subclonal population frequencies across samples, with each sample annotated by its clone diversity index (CDI) and clone mutation diversity index (CMDI).
mentary Figure S3B). The phylogenetic tree in this patient suggests that his lymphoma started in either the right cer vical or left axillary regions and subsequently spread to sites situated below the diaphragm. The clones that meta stasized to these infra-diaphragmatic sites were composed of population 4 or its descendants, and clonal mixtures were universally observed such that some sites were the result of polyphyletic seeding (e.g., left inguinal, bladder) and others arose from monophyletic dissemination (e.g., stomach, kidney). Our results thus illustrate that lymphoma can arise in a specific anatomical site, while metastatic dis
semination occurs through the outgrowth of descendant populations, with eventually every single tumor site being multiclonal.
Distribution of driver gene mutations and mutation signatures across clonal lineage trees
In this patient, we observed that the highest number of driver and COSMIC mutations (n=24, 13% of coding muta tions) were enriched in the ancestral clone (population 1) with, however, simultaneously several derivative clones (e.g., populations 8, 9, 10 and 11) also harboring up to eight

driver mutations (Online Supplementary Figure S3C). We observed several mutation signatures contributing to the dominant founding clone (population 1) including SBS9;SBS85 (somatic hypermutation and AID in lymphoid cells) which was also observed in the founding clones in the other two patients (Online Supplementary Figure 3D and E). This signature was observed in all other descendant populations in patient 3. Meanwhile several mutation sig natures were only observed in specific populations such as SBS86;SBS39;SBS13 (chemotherapy treatment and errorprone polymerases) which was associated with populations 7 and 11 and SBS2 (activity of AID/APOBEC) found in popu lation 7, prevalent only in a subset of patient samples in cluding the abdomen and cecum. Overall, while phylogenetically distinct populations exhibited unique sets of driver gene mutations, mutation signatures contributing to observed mutations were often similar across samples and related to somatic hypermutation and prior chemo therapy exposure.
Herein, we reconstructed the evolutionary histories of re fractory lymphoma in three patients enrolled into an in stitutional Research Autopsy Program. We deciphered the underlying clonal phylogenies and their relationships to individual genetic alterations and mutation signatures. There were differences between patients, particularly re lated to the number and type of genetic alterations, as well as mutation signatures. However, while the size of our patient cohort was small, we observed common alities across all three patients. We identi fi ed complex patterns of clonal spread, with all tumor sites containing multiple cohabitating clones and frequent occurrence of polyphyletic seeding underlying tumor cell dissemination. The three patients considered in this study were on the extreme end of treatment-resistant lymphoma and WGS revealed genetic alterations that are typically associated with poor outcome, such as TP53 mutations (patient 1), aberrations in DNA repair pathways (patient 2) and double-hit MYC and BCL2 translocations (patient 3). While most disease-driving genetic events were ancestral, sub clonal alterations represented potential substrates for positive selection by chemotherapy, including for example TP53 mutations in independent samples in pa tient 3. The majority of driver mutations were present at diagnosis in these cases with very poor responses to therapy, while also providing evidence of dynamic evol ution, possibly shaped by selective pressures exerted, for example, by therapy. The assessment of mutations in cell-free DNA identi fi ed a large proportion of ancestral mutations but also revealed that subclonal mutations can readily be missed when relying exclusively on ctDNA
analysis, as opposed to tissue-based sampling. The main limitation of our study is evidently its small sample size, with only three patients included with dif ferent lymphoma diagnoses. It may thus be challenging to generalize upon our findings at present time. Nonethe less, to the best of our knowledge, our description of multi-regional WGS, dissection of clonal dissemination patterns and integration with state-of-the-art ctDNA analysis provides one of the most refined descriptions of ITH in lymphoma to date. Our findings shed light on the evolutionary pathways underlying refractory disease and underscore that the genetic determinants of treatment resistance appear to be largely present at the time of di agnosis in those patients who present with rapid disease progression and/or primary refractory disease. Recently, Makishima et al. reported one patient with extranodal NK/T-cell lymphoma in which they performed WES of 12 tumor samples, including two samples from the time of autopsy.11 Similar to our observation, they found clear evi dence of spatial ITH. This observation was made despite the disseminated nature of this patient’s lymphoma, with evidence of intravascular invasion. However, most pre vious research aiming to describe ITH in lymphoma has been limited by scarce sampling, generally considering no more than two serial samples in a given patient.8,10,24–28 On the other hand, research autopsy programs are challeng ing to implement but offer access to potentially unrivaled tissue resources that can expand our understanding of tumor evolution.12,29 Notwithstanding the ethical and lo gistical challenges associated with research autopsy pro grams, systematic analysis of clonal trajectories in larger patient cohorts remains a compelling strategy to reveal generalized disease trends that could aid in improving clinical decisions.
No conflicts of interest to disclose.
KI analyzed and interpreted WGS data, and wrote the manu script. TL analyzed ctDNA data. MB and KT processed samples. RG performed pathology review. BL, IL and PML generated ctDNA data. AO, ND, AP and MC established the Rapid Autopsy Program and/or recruited patients. RK de signed the study, interpreted data, wrote the manuscript and provided general oversight of the project.
The authors wish to thank The Center for Applied Ge nomics, The Hospital for Sick Children, Toronto, Canada for assistance with WGS.
This research was supported by a New Idea Award from the
Leukemia and Lymphoma Society (8013-19) and a LargeScale Applied Research Project funded by Genome Canada and the Ontario Research Fund (271LYM). The Research Autopsy Program was generously funded and supported by the Princess Margaret Cancer Foundation.
1. Greaves M. Evolutionary determinants of cancer. Cancer Discov. 2015;5(8):806-820.
2. McGranahan N, Swanton C. Clonal heterogeneity and tumor evolution: past, Present, and the future. Cell. 2017;168(4):613-628.
3. Dentro SC, Leshchiner I, Haase K, et al. Characterizing genetic intra-tumor heterogeneity across 2,658 human cancer genomes. Cell. 2021;184(8):2239-2254.
4. Swerdlow SH, Campo E, Pileri SA, et al. The 2016 revision of the World Health Organization classification of lymphoid neoplasms. Blood. 2016;127(20):2375-2390.
5. Gerlinger M, Rowan AJ, Horswell S, et al. Intratumor heterogeneity and branched evolution revealed by multiregion sequencing. N Engl J Med. 2012;366(10):883-892.
6. McPherson A, Roth A, Laks E, et al. Divergent modes of clonal spread and intraperi-toneal mixing in high-grade serous ovarian cancer. Nat Genet. 2016;48(7):758-767.
7. Seifert M, Scholtysik R, Küppers R. Origin and pathogenesis of B cell lymphomas. Methods Mol Biol. 2019;1956:1-33.
8. Araf S, Wang J, Korfi K, et al. Genomic profiling reveals spatial intra-tumor heterogeneity in follicular lymphoma. Leukemia. 2018;32(5):1261-1265.
9. Haebe S, Shree T, Sathe A, et al. Single-cell analysis can define distinct evolution of tumor sites in follicular lymphoma. Blood. 2021;137(21):2869-2880.
10. Magnes T, Wagner S, Thorner AR, et al. Spatial heterogeneity in large resected diffuse large B-cell lymphoma bulks analysed by massively parallel sequencing of multiple synchronous biopsies. Cancers. 2021;13(4):650.
11. Makishima K, Suehara Y, Abe Y, et al. Intratumor heterogeneity of lymphoma identified by multiregion sequencing of autopsy samples. Cancer Sci. 2022;113(1):362-364.
12. Bavi P, Siva M, Abi-Saab T, et al. Developing a pan-cancer research autopsy programme. J Clin Pathol. 2019;72(10):689-695.
13. Li H. Aligning sequence reads, clone sequences and assembly contigs with BWA-MEM. arXiv. 2013 March. https://doi.org/10.48550/arXiv.1303.3997 [preprint, not peerreviewed]
14. DePristo MA, Banks E, Poplin R, et al. A framework for variation discovery and genotyping using next-generation DNA sequencing data. Nat Genet. 2011;43(5):491-498.
15. Benjamin D, Sato T, Cibulskis K, Getz G, Stewart C, Lichtenstein L. Calling somatic SNVs and indels with Mutect2. bioRxiv. 2019;861054. [preprint, not peer-reviewed]
WGS data for bulk tumor samples and ctDNA data have been deposited to the European Genome-Phenome Archive (EGAS00001005996). Qualified investigators will be able to access these data through a data-sharing agreement.
16. Website. https://gatk.broadinstitute.org/hc/enus/articles/360035889791?id=11136.
17. Kim S, Scheffler K, Halpern AL, et al. Strelka2: fast and accurate calling of germline and somatic variants. Nat Methods.2018;15(8):591-594.
18. Boyle-Lab. Blacklist/hg19-bla cklist.v2.bed.gz at master BoyleLab/Blacklist. https://github.com/Boyle-Lab/Blacklist (accessed November 27, 2021).
19. Wang K, Li M, Hakonarson H. ANNOVAR: functional annotation of genetic variants from high-throughput sequencing data. Nucleic Acids Res. 2010;38(16):e164.
20. Landau DA, Tausch E, Taylor-Weiner AN, et al. Mutations driving CLL and their evolution in progression and relapse. Nature. 2015;526(7574):525-530.
21. Klener P, Fronkova E, Berkova A, et al. Mantle cell lymphomavariant Richter syndrome: Detailed molecular-cytogenetic and backtracking analysis reveals slow evolution of a pre-MCL clone in parallel with CLL over several years. Int J Cancer. 2016;139(10):2252-2260.
22. Reiter JG, Makohon-Moore AP, Gerold JM, et al. Reconstructing metastatic seeding patterns of human cancers. Nat Commun. 2017;8:14114.
23. Gillis S, Roth A. PyClone-VI: scalable inference of clonal population structures using whole genome data. BMC Bioinformatics. 2020;21(1):571.
24. Isaev K, Ennishi D, Hilton L, et al. Molecular attributes underlying central nervous system and systemic relapse in diffuse large B-cell lymphoma. Haematologica. 2021;106(5):1466-1471.
25. Magnes T, Wagner S, Thorner AR, et al. Clonal evolution in diffuse large B-cell lymphoma with central nervous system recurrence. ESMO Open. 2021;6(1):100012.
26. Greenawalt DM, Liang WS, Saif S, et al. Comparative analysis of primary relapse/refractory DLBCL identifies shifts in mutation spectrum. Oncotarget. 2017;8(59):99237-99244.
27. Juskevicius D, Lorber T, Gsponer J, et al. Distinct genetic evolution patterns of relapsing diffuse large B-cell lymphoma revealed by genome-wide copy number aberration and targeted sequencing analysis. Leukemia. 2016;30(12):2385-2395.
28. Kridel R, Chan FC, Mottok A, et al. Histological transformation and progression in follicular lymphoma: a clonal evolution study. PLoS Med. 2016;13(12):e1002197.
29. Krook MA, Chen H-Z, Bonneville R, Allenby P, Roychowdhury S. Rapid research autopsy: piecing the puzzle of tumor heterogeneity. Trends Cancer Res. 2019;5(1):1-5.
Correspondence: P. Horna horna.pedro@mayo.edu
Received: November 16, 2021.
Accepted: March 9, 2022.
Prepublished: April 28, 2022.
https://doi.org/10.3324/haematol.2021.280370
©2023 Ferrata Storti Foundation
Published under a CC BY-NC license
Castleman disease is a polyclonal lymphoproliferative disorder characterized by unicentric or multicentric lymphadeno pathy with characteristic histomorphological features, in addition to variable inflammatory symptomatology. The molecular mechanisms and etiologies of unicentric Castleman disease (UCD) and idiopathic multicentric Castleman disease (iMCD) are poorly understood, and identification of targetable disease mediators remains an unmet clinical need. We performed whole exome sequencing on lymph node biopsies from patients with UCD and iMCD and compared the transcriptomic profiles to that of benign control lymph nodes. We identified significantly upregulated genes in UCD (n=443), iMCD (n=316) or both disease subtypes (n=51) and downregulated genes in UCD (n=321), iMCD (n=105) or both (n=10). The transcriptomes of UCD and iMCD showed enrichment and upregulation of elements of the complement cascade. By immunohistochem istry, C4d deposits indicative of complement activation were found to be present in UCD and iMCD, mostly within abnor mally regressed germinal centers, but also in association with plasma cell clusters, endothelial cells and stroma cell proliferations. Other enriched gene sets included collagen organization, S1P3 pathway and VEGFR pathway in UCD; and humoral response, oxidative phosphorylation and proteosome in iMCD. Analysis of cytokine transcripts showed upregu lation of CXCL13 but not IL6 in UCD and iMCD. Among angiogenic mediators, the VEGFR1 ligand placental growth factor (PGF) was upregulated in both disease subtypes. We hereby report for the first time the whole lymph node transcriptomes of UCD and iMCD, underscoring findings that could aid in the discovery of targetable disease mediators.
Castleman disease is a rare polyclonal lymphoproliferative disorder resulting in lymph node enlargement with char acteristic histopathological features, including germinal center atrophy, hypervasculature, concentric mantle zone hyperplasia, and paracortical plasmacytosis.1 Most pa tients (~75-85%) present with a localized lymphadeno pathy (unicentric Castleman disease, UCD) that typically resolves with surgical excision, while others (~15-25%) present with multifocal or systemic lymphadenopathy (multicentric Castleman disease, MCD) associated with clinical and laboratory features of a systemic inflamma tory response. A subset of cases of MCD is caused by un controlled human herpes virus-8 (HHV-8) infection, typically in the setting of human immunodeficiency virus co-infection (HHV-8-associated MCD),2 while other cases
are associated with a plasma cell proliferative disorder and a constellation of clinical and laboratory features known as POEMS syndrome (POEMS-associated MCD).3 The remaining cases of MCD have heterogeneous clinical manifestations and an unknown etiology (idiopathic multicentric Castleman disease, iMCD). The main unifying feature of Castleman disease is its characteristic lymph node histomorphology on microscopic examination, which can be subclassified into hyaline vascular (most common in UCD), plasmacytic (most common in MCD), and an in termediate or “mixed” variant.1,4
The cellular and molecular mechanisms of UCD and iMCD are poorly understood. Most evidence points to an inflam matory process mediated by interleukin (IL)-6, vascular endothelial growth factor (VEGF) and/or chemokines in iMCD,5,6 compared to a lymphoproliferative process likely mediated by dysregulated lymph node stromal cells in
1Division of Hematopathology, Mayo Clinic, Rochester, MN; 2Center for Cytokine Storm Treatment & Laboratory, University of Pennsylvania, Philadelphia, PA and 3Division of Hematology, Mayo Clinic, Rochester, MN, USAUCD. However, the etiology of these processes is com pletely unknown. A few studies have demonstrated the presence of low allele frequency, gene mutations and/or chromosomal abnormalities in a subset of patients with Castleman disease, suggestive of a low-level clonal pro liferative process most likely within the stromal cell com ponent.7-10 While most cases of UCD resolve with surgical excision alone, the treatment of iMCD relies on systemic immunomodulatory therapies aimed at controlling the in flammatory symptomatology. In particular, blockade of IL6 signaling with anti-IL6 (siltuximab) or anti-IL6 receptor (tocilizumab) antibodies has been shown to result in last ing symptomatic responses, and is currently recom mended as the main frontline therapeutic approach. However, two-thirds of patients with iMCD do not respond to anti-IL6 therapy11 suggesting a heterogeneous biology and the existence of undiscovered disease mediators. In deed, the lack of other targeted therapies for iMCD re mains an unmet clinical need, as this disease is often lifelong, prone to multiple relapses, and associated with significant morbidity and mortality. We report here for the first time the whole lymph node transcriptomes of UCD and iMCD, in order to generate in sights into the pathogenesis of this poorly understood disease and identify potential targets for novel therapeutic strategies.
Patients’ samples and histological
The laboratory information system at Mayo Clinic (Ro chester, MN, USA) was searched for excisional biopsies obtained as clinically indicated between 1992 and 2017, on which residual fresh-frozen tissue aliquots produced for ancillary testing were currently available. All diag nostic pathology material, clinical information and ancil lary test results were reviewed to select for cases with a confirmed diagnosis of UCD or iMCD, in addition to cases showing morphologically unremarkable lymph node tissue. We identified and studied 24 lymph node samples from 22 patients with UCD; and seven lymph nodes and one spleen sample from eight patients with iMCD. (Table 1, Online Supplementary Table S1 ). The spleen sample was included based on morphological features similar to those of lymph nodes with iMCD, and clustering of differentially expressed genes together with other iMCD cases (Online Supplementary Figure S1B). In addition, we identified 19 control lymph node samples with histomorphological features corresponding to those of unremarkable lymph node tissue, including common slight to moderate-sized germinal centers. These lymph node biopsies were obtained from patients with a history of carcinoma (n=3), lymphoma (n=3), autoimmunity (n=2),
orthopedic surgery (n=1), and unexplained lymphadeno pathy in the absence of a relevant clinical history (n=10) (Online Supplementary Table S1). Cryosections of frozen tissues stained with hematoxylin and eosin (H&E) were reviewed to confirm the specimens’ adequacy for exome sequencing. This study was approved by the Mayo Clinic Institutional Review Board.
Histomorphological features of Castleman disease on H&E-stained sections were independently graded by two hematopathologists (PH and RLK) from 0 (absent) to 3 (prominent), based on the five features included in the international diagnostic criteria for iMCD,4 in addition to three commonly encountered features in UCD (mantle zone hyperplasia, mantle zone rimming, and mantle zone twinning). Discrepant scoring between the two reviewers was averaged to the nearest integer number. None of the samples had morphological evidence of a dendritic or stromal cell neoplasm, although two cases of UCD showed marked stromal proliferation. All cases of iMCD met international diagnostic criteria,4 including lym phadenopathy in two or more lymph node stations, negativity for HHV-8 by immunohistochemistry for la tency-associated nuclear antigen (LANA-1), lack of im munoglobulin light chain-restriction on plasma cells by immunohistochemistry for kappa and lambda, no evi dence of an infectious, neoplastic or autoimmune pro cess; and consistent clinical, laboratory and imaging findings. Peripheral neuropathy was documented in only one patient (in the absence of a plasma cell proliferative disorder), and thrombocytopenia was present in another single patient who also had anasarca in the setting of cardiovascular comorbidities.
Total RNA was extracted from cryosections of residual O.C.T.-embedded/fresh-frozen biopsy aliquots, using miRNeasy Mini Kit (Qiagen, Germantown, MD, USA) and a QIAcube automated handler (Qiagen). RNA quality and concentration were assessed on an Agilent 2100 Bioana lyzer (Agilent Technologies, Santa Clara, CA, USA) and a NanoDrop 200 spectrophotometer (Thermo Fisher Scien tific, Waltham, MA, USA), respectively. cDNA libraries were prepared using TruSeq Stranded mRNA Sample Prep Kit (Illumina, San Diego, CA, USA), and quality was checked on an Agilent 2100 Bioanalyzer (Santa Clara, CA, USA) and Qubit 4 fluorometer (Invitrogen, Carlsbad, CA, USA). Libraries were amplified on an Illumina CBot auto mated cluster generator and sequenced as 100 X 2 paired end reads on an Illumina HiSeq 4000. Sequences were aligned using MAP-RSeq version 3.1.2 12 and processed with the Subread package 13 to produce normalized counts as fragments per kilobase of transcript per mil lion mapped fragments (FPKM) ( Online Supplementary Figure S1A).
Table 1. Demographic and histomorphological characteristics of the samples studied.
Control lymph node UCD
iMCD P value
Number 19 24 8
Age in years, mean ± SD 49 ± 21 46 ± 18 53 ± 11
Sex male : female 0.6:1 0.6:1 2.3:1
Location of tissue sampled, N (%)
Superficial Deep 15 (75) 4 (21) 6 (25) 18 (75) 7 (88) 1 (12) <0.001
Sampled tissue, N (%)
Cervical LN
Axillary LN Inguinal LN Mediastinal LN Abdominal LN Retroperitoneal LN Pelvic LN Other
Histological variant, N (%)
9 (47) 5 (26) 1 (5) 0 (0) 1 (5) 2 (11) 1 (5) 0 (0)
3 (13) 3 (13) 0 (0) 4 (17) 3 (13) 8 (33) 2 (8) 1 (4)
2 (25) 5 (63) 0 (10) 0 (0) 0 (0) 0 (0) 0 (0) 1 (13)
Hyaline vascular Plasmacytic or mixed 20 (83) 4 (17) 0 (0) 10 (100) <0.0001
Histological scoring [0-3], mean ± SD
Regressed GC
FDC prominence
Increased vascularity
Hyperplastic GC
Plasmacytosis
MZ hyperplasia MZ rimming MZ twinning
0.2 ± 0.4 0.0 ± 0.0 0.5 ± 0.7 1.3 ± 0.7 0.1 ± 0.3 0.1 ± 0.3 0.1 ± 0.3 0.1 ± 0.2
3.0 ± 0 1.9 ± 0.8 2.5 ± 0.6 0.5 ± 0.5 0.7 ± 1 2.0 ± 1 2.1 ± 0.9 1.9 ± 1.0
2.0 ± 0.9 1.0 ± 0.9 1.3 ± 1.0 1.6 ± 1.4 2.4 ± 0.5 1.0 ± 0.8 1.4 ± 1.4 0.5 ± 0.8
<0.0001 <0.0001 <0.0001 <0.001 <0.0001 <0.0001 <0.0001 <0.0001
Total histological score [0-24],mean (range) 1.5 (0-5) 14.6 (10-19) 11.1 (8-18) <0.0001
UCD: unicentric Castleman disease; iMCD: idiopathic mutlicentric Castleman disease; SD: standard deviation; LN: lymph node; GC: germinal center; FDC: follicular dendritic cell; MZ: mantle zone.
Analysis of differentially expressed genes and gene set en richment was performed using Qlucore Omics Explorer v. 3.7 (Qlucore, Lund, Sweden). A cutoff of 0.5 FPKM was ap plied to filter out rare transcripts, and expression values were log2-transformed. Differentially expressed genes were studied separately for UCD versus controls, and iMCD ver sus controls (two-sample t-test). P-values were adjusted for multiple testing using the Benjamini-Hochberg method,14 and genes with adjusted P-values below 0.01 (re sulting in q<0.05 for UCD, and q<0.1 for iMCD) and greater than a 2-fold change were considered as differentially ex pressed. The distribution of samples based on gene ex pression was visualized on a three-dimensional principal component analysis plot, after filtering out variables with low variance to reduce noise based on the previously re ported projection score.15 In addition, sample outliers were studied on a t-distributed stochastic neighbor embedding (t-SNE) plot of differentially expressed genes (3-group analysis of variance [ANOVA], P<0.001, q<0.01). Gene set enrichment analysis (GSEA)16 was performed sep
arately for UCD versus controls, and iMCD versus controls, using gene set permutation, a statistical significance of P<0.05 and q<0.05, and the following gene set lists down loaded from MSigDB (https://www.gsea-msigdb.org, ac cessed 08/18/2021): Hallmark gene sets, Kyoto Encyclopedia of Genes and Genomes (KEGG) pathways, Pathway Interaction Database (PID), Gene Ontology-Bio logical Process (GO-BP), and Gene Ontology-Molecular Function (GO-MF). In addition, differentially expressed genes corresponding to arbitrarily selected gene sets of interest were separately captured using a 2-fold change threshold and a statistical significance of P<0.05 (q<0.2).
Formalin-fixed/paraffin-embedded tissue sections were immunostained on a Benchmark XT autostainer (Ventana Medical Systems, Inc, Tucson, AZ, USA), using a primary anti-C4d rabbit polyclonal antibody (catalog #: 12-5000; American Research Products, Belmont, MA; USA) or a pri mary anti-CXCL13 mouse monoclonal antibody (clone 53610; R&D systems, Minneapolis, MN, USA), as previously described.17,18
Demographic, specimen and histomorphological char acteristics were compared between groups using one-way ANOVA for continuous variables, the χ2 test for most nom inal values, Fisher exact test for nominal values with small
samples, and Kruskal-Wallis test for ordinal variables. P values <0.05 were considered statistically significant. Statistical analyses and bar plots were performed on GraphPad Prism v. 9.1.0 (GraphPad Software, San Diego, CA, USA).

Figure 1. The gene expression profiles of unicentric and idiopathic multicentric Castleman lymphadenopathy are distinct from that of control lymph nodes. (A). Volcano plots showing divergent gene expression compared to that of control lymph nodes (control LN), for cases of unicentric Castleman disease (UCD, left) and idiopathic multicentric Castleman disease (iMCD, right) Dotted lines depict arbitrary thresholds for differential gene expression of 2-fold difference (vertical) and P<0.01 (horizontal). (B) Heatmap of differentially expressed genes displayed in a two-way hierarchical clustering arrangement. (C) Three-dimensional principal component analysis plot based on the expression of 1,027 highly variant genes across all samples. (D) Venn diagram of the number of differentially upregulated (upward arrow) or downregulated (downward arrow) genes in UCD, iMCD and both. (E) Top 20 upregulated genes in UCD (left), iMCD (right) and both (middle) based on Z-score, shown as non-redundant gene lists in alphabetical order.
The transcriptome of Castleman lymphadenopathy is distinct from that of control lymph nodes and differs between unicentric and multicentric disease Whole exome sequencing performed on frozen lymph nodes from patients with UCD and iMCD revealed statis tically significant differences in the expression of multiple genes, when compared to the expression in control lymph nodes (Figure 1). Overall, 443 and 316 genes were upregu lated (>2 fold, P<0.01) in UCD and iMCD, respectively, with 51 genes upregulated in both disease subtypes compared to controls. Similarly, 321 and 105 genes were downregu lated in UCD and iMCD, respectively, with ten genes downregulated in both disease subtypes (Figure 1D, E). Principal component analysis based on 1,027 highly variant genes across samples showed segregation of UCD, iMCD and control lymph node specimens, with few overlaps (Figure 1C). Thus, the transcriptomic profiles of lymph nodes from patients with UCD and iMCD were different from the profile of control lymph nodes, and also different from each other.

Gene sets enriched in UCD included collagen fibril organ ization and related pathways, in addition to the sphingo sine 1-phosphate receptor 3 (S1P3) pathway previously described as a mediator of fibrosis19 (Table 2, Online Sup
plementary Data S1). Genes related to cell cycle and DNA replication were underrepresented in UCD, perhaps due to the paucity of proliferating germinal center B-cells within the characteristically depleted B cell follicles. In iMCD, the transcriptome enrichment was dominated by gene sets with potential relationship to the commonly en countered plasmacytic infiltrates (humoral immune re sponse, proteosome, protein N-linked glycosylation)20,21 (Table 2), including elements of the electron transport chain possibly related to the known increased oxidative metabolism of plasma cells.22 The transcriptome of iMCD was also enriched for genes upregulated by mTOR com plex 1 activation, a signaling pathway central to protein synthesis, cellular proliferation and metabolism,23 recently identified to be upregulated in lymph nodes and enriched in serum proteins from patients with iMCD.24,25 Genes re lated to T-cell signaling were underrepresented in both UCD and iMCD.
Enrichment for elements of the complement cascade characterize both unicentric and multicentric Castleman lymphadenopathy. GSEA was consistent with upregulation of transcripts re lated to the complement cascade in both UCD and iMCD (Table 2). Genes that showed a greater than 2-fold in crease with statistical significance (P<0.05) included the
ARTICLE - The lymph node transcriptome of Castleman disease P. Horna et al.
Table 2. Selected pathways and gene ontologies enriched in the transcriptome of Castleman lymphadenopathy.
Disease subtype Trend Annotation
COMPLEMENT AND COAGULATION CASCADES
COLLAGEN FIBRIL ORGANIZATION
Unicentric
Up
Multicentric
Down
Up
Gene set NES
KEGG 2.11237
GOBP 2.09074
S1P S1P3 PATHWAY PID 2.05938
VEGFR SIGNALING PATHWAY GOBP 2.05778
T HELPER 17 CELL LINEAGE COMMITMENT
REGULATORY T CELL DIFFERENTIATION
GOBP -1.88912
GOBP -2.15572
CD8 TCR PATHWAY PID -2.16138
CELL CYCLE KEGG -2.42726
DNA REPLICATION KEGG -2.5918
HUMORAL IMMUNE RESPONSE GOBP 2.72929
RESPIRATORY ELECTRON TRANSPORT CHAIN GOBP 2.65332
PROTEIN N LINKED GLYCOSYLATION
GOBP 2.64169
OXIDATIVE PHOSPHORYLATION KEGG 2.59304
PROTEASOME KEGG 2.45512
COMPLEMENT AND COAGULATION CASCADES KEGG 2.25133
ANTIGEN PROCESSING AND PRESENTATION
GOBP 1.94522
MTORC1 SIGNALING HALLMARK 1.90294
INTERLEUKIN 1 MEDIATED SIGNALING PATHWAY GOBP 1.8716
Down T CELL RECEPTOR SIGNALING PATHWAY KEGG -2.32199
P<0.05 and q<0.05 for all enrichments. See Online Supplementary Data S1 for the complete list. NES: normalized enrichment score; KEGG: Kyoto Encyclopedia of Genes and Genomes; GOPB: Gene Ontology-Biological Process; PID: Pathway Interaction Database.
main complement effector C3 in both UCD and iMCD as well as core components of the classic complement pathway C1S and C1R in UCD, and C4A and C4B in iMCD (Figure 2A). C4BPA and CFH transcripts were also in creased in both unicentric and multicentric disease, the products of which are known regulators of the classical and alternative complement pathways, respectively. Other related fi ndings include upregulation of the in hibitors of plasminogenesis SERPINE1 (plasminogen acti vator inhibitor 1) and SERPINF2 ( a 2 antiplasmin) in unicentric disease, and SERPINA5 (protein C inhibitor) and A2M (a2 macroglobulin) in multicentric disease; with po tential to modulate the complement cascade given the role of plasmin as a complement regulator.26 Given the enrichment of the complement pathway via the whole transciptome, we sought to apply an orthogonal approach to confi rm complement activation in lymph node tissue and to identify sites of complement activa tion in UCD and iMCD. We performed immunohistochem istry on histological sections to detect C4d, an end-product of C4 commonly utilized as a biomarker of activation of the classical and/or lectin complement pathways. 27 Most control lymph nodes (14 of 19 cases, 74%) showed only faint to variable staining for C4d within
the dendritic cell meshworks of germinal centers (Figure 3A, D), while a subset of cases (n=4, 21%) showed strong staining within the light zone of germinal centers (Figure 3G). In contrast, most cases of UCD (14 of 24, 58%) showed strong expression of C4d within the regressed germinal centers and extending into the abnormally ex panded mantle zones in a “ fl ame-like” pattern (Figure 3B). One additional case of “stromal-rich” UCD showed strong C4d expression within abundant spindle-appear ing cells (likely stromal or dendritic cells) (Figure 3H), while two other cases showed C4d expression on en dothelial cells (Figure 3E) or clusters of plasma cells. Of the eight cases of iMCD studied, five (63%) showed strong C4d expression within germinal centers (with variable ex tension into mantle zones) (Figure 3C), one case showed strong expression within both germinal centers and para cortical plasma cell clusters (Figure 3I), and two cases showed scattered C4d-positive paracortical plasma cells only (Figure 3F). Overall, the fi ndings are suggestive of complement activation in both UCD and iMCD, mostly oc curring within or adjacent to the follicular dendritic cell processes of abnormal B-cell follicles, but also occa sionally in association with clusters of plasma cells, en dothelial cells or atypical stromal cell proliferations.
Upregulated immune-related transcripts in Castleman lymphadenopathy include CXCL13 and selected cytokines, but not interleukin-6
Given that cytokines are known to be upregulated in the serum of iMCD patients, we decided to investigate which cytokines had increased gene expression within the lymph node tissue (Figure 2B). The most distinctively upregu lated cytokine in UCD was SCG2 (secretogranin II), the precursor of the multifunctional protein secretoneurin which has chemotactic effects on leukocytes and fibro blasts.28 In iMCD, the most distinctively upregulated cyto kine was SPP1 (osteopontin), a multifunctional matricellular protein with pro-inflammatory properties on macrophages, dendritic and other immune cells.29-31 Un expectedly, IL6 transcripts were not increased in lymph nodes of UCD or iMCD patients compared to controls (P=0.5, fold change = 1.3, for both comparisons).
The B lymphocyte chemoattractant CXCL13 was upregu lated in both UCD and iMCD. To study the sites of CXCL13 production in the lymph node, we performed immunoh istochemistry for CXCL13 on histological sections. As pre viously described,18,32,33 CXCL13 expression in control lymph nodes was exclusively restricted to B-cell follicles, and present mostly on scattered lymphoid-appearing round
cells within reactive germinal centers, likely representing T follicular helper cells (Figure 3J), in addition to few spindle-appearing cells within the germinal centers and mantle zones, likely representing follicular dendritic cells. In contrast, CXCL13 staining in cases of UCD and iMCD showed expression mostly on the concentrically arranged follicular dendritic cells within regressed germinal centers, in addition to scattered follicular dendritic cells within expanded mantle zones (Figure 3K, L). A few T-fol licular helper cells within normal-appearing germinal centers in iMCD were also positive for CXCL13.
Upregulated angiogenic mediators in Castleman lymphadenopathy include VEGFR1 (FLT1) and its lesser known ligand placental growth factor
Given that increased vascularity is commonly observed in lymph nodes involved by UCD and iMCD (Table 1), and that serum VEGF is commonly increased in patients with iMCD,34 we decided to study the differential expression of genes related to angiogenesis in our cohort. Genes associ ated with the VEGF receptor (VEGFR) signaling pathway were enriched in UCD but not in iMCD (Table 2). In UCD, VEGFR1 (FLT1) and its lesser known ligand placental growth factor (PGF) were both differentially upregulated

Figure 2. The lymph node transcriptome of Castleman disease includes upregulation of elements of the complement cascade, and a distinct cytokine and angiogenic profile. Bar plots show upregulated or downregulated genes corresponding to selected gene sets in unicentric (upper plots) and multicentric (lower plots) Castleman disease, based on a greater than 2-fold difference and a statistical significance of P<0.001 (black bars), P<0.01 (gray bars) or P<0.05 (white bars). Genes upregulated or downregulated in both unicentric and multicentric disease are highlighted with (*). (A) “Complement and coagulation cascades” gene set from the Kyoto Encyclopedia of Genes and Genomes (KEGG). (B) “Cytokine activity” gene set (GO:0005125) from gene ontology (GO) analysis. (C) “Angiogenesis” gene set (GO:0001525) from GO analysis.

(Figure 2C). Of the two other VEGR1 ligands,35 VEGFA was significantly upregulated (P<0.05, q<0.1) but below the 2fold arbitrary threshold for differential expression (fold change =1.7), while VEGFB transcripts were not signifi cantly different from controls (P=0.09). In addition, apelin receptor (APLNR) and its ligand apelin (APLN), both impor tant mediators of pathological angiogenesis,36 were differ entially upregulated in UCD. In iMCD, PGF was also differentially upregulated (Figure 2C), and its receptor VEGFR1 was likewise significantly increased (P<0.05, q<0.1) but below the 2-fold arbitrary threshold for differential ex pression (fold change = 1.8). APLNR was also differentially upregulated in iMCD, but not its ligand APLN (P=0.3). Tran scripts for VEGFA and VEGFB were not significantly differ ent between iMCD and controls (P=0.1 and P=0.7, respectively). Overall, the findings mirrored the more prominent vascularity observed microscopically in UCD compared to iMCD (Table 1), with possible common angio genic pathways involving PGF/VEGFR1 and APLN/APLNR.
Here, we describe the transcriptome of lymph nodes from
patients with UCD and iMCD. Our study demonstrates that the transcriptome of Castleman lymphadenopathy is dis tinct from that of control lymph nodes, and different be tween unicentric and multicentric disease (Figure 1C). Many of these differences mirror the characteristic histo pathological features of Castleman lymphadenopathy, in cluding increased collagenous fibrosis, increased vascularity and a paucity of proliferating germinal center B cells in UCD; and paracortical plasmacytic infiltrates in iMCD (Table 2). The underrepresentation of genes associ ated with T-cell signaling in UCD and iMCD (Table 2) needs to be further studied, but is consistent with a histomor phology suggestive of abnormal B-cell and plasma cell im munity, in the absence of prominent T-cell infiltrates. We demonstrate that the transcriptomes of both UCD and iMCD are enriched for elements of the complement cas cade. For the first time, we showed that complement ac tivation in lymph nodes affected by Castleman disease occurs most commonly within the abnormally regressed germinal centers and expanded mantle zones. The com plement cascade plays a critical role in the normal func tion of germinal centers, which are known to be dysregulated in Castleman disease. Complement-coated antigens are captured and retained by follicular dendritic
cells expressing complement receptors 1 (CD35) and 2 (CD21), facilitating recognition by antigen-specific B-cell receptors expressed by germinal B cells. In addition, modulation of the cell surface complement regulators CD55 and CD59 by germinal center B cells results in pro duction of the complement-derived anaphylotoxins C3a and
C5a which are crucial for germinal center B-cell activation and differentiation towards plasma cells, while preventing the generation of the cytotoxic complement-derived mem brane attack complex.37 The increased transcription of com plement-related genes in Castleman lymphadenopathy and evidence of complement activation within the characteris
Figure 3. Histological localization of complement activation and CXCL13 production in lymph nodes involved by Castleman disease. In most control lymph nodes, immunohistochemistry for C4d (upper 3 rows) showed only focal and faint complement ac tivation within germinal centers (A, D), with a few cases showing more robust activation within the germinal center light zone (G). In contrast, most cases of unicentric Castleman disease (UCD) showed marked complement activation on germinal centers and extending into the mantle zone in a “flame-like” pattern (B). In addition, some UCD cases showed C4d staining on endothelial cells (E) and, rarely, on expanded stromal cells (H) or plasma cells (not shown). Similarly, most cases of idiopathic multicentric Castleman disease (iMCD) showed strong C4d staining within germinal centers (C), in addition to positive staining on small (F) or large (I) clusters of plasma cells in a subset of cases. Immunohistochemistry for CXCL13 in control lymph nodes predominantly highlighted small lymphocytes within and around germinal centers (T follicular helper cells) (J), in addition to a less conspicuous positivity on a few scattered spindle cells (follicular dendritic cells). In contrast, CXCL13 staining on regressed B-cell follicles in UCD (K) and iMCD (L) predominantly highlighted spindle cells (follicular dendritic cells) concentrically arranged within atrophic germinal centers and scattered throughout expanded mantle zones. Microphotographs were obtained at 100X (main) or 400x (insets) total magnification.

tically abnormal germinal centers raise the possibility of complement activation as a possible mediator of the in flammatory manifestations of UCD and iMCD. Interestingly, transcripts of the B-cell attracting chemo kine CXCL13 were increased in both UCD and iMCD. Im munohistochemistry localized this chemokine largely to follicular dendritic cells within the abnormal germinal centers. Our findings are consistent with a prior study showing that CXCL13 is the most upregulated blood chemokine during flares of iMCD, and that there is in creased tissue expression of CXCL13 in iMCD germinal centers.6 CXCL13 is essential for B-cell homing to germinal centers, and its increased production has been regarded as a biomarker of germinal center activity and devel opment of B-cell immunity.38 However, CXCL13 can also be produced by T follicular helper cells, which appear to be the predominant CXCL13-positive population in our control lymph nodes and other similar studies.33 In contrast, the characteristically abnormal B-cell follicles of Castleman disease appear to be largely devoid of CXCL13-positive T follicular helper cells, with most of the CXCL13 protein expression originating from follicular den dritic cells. Thus, increased B-cell homing to lymph nodes through upregulation of CXCL13 in addition to an abnormal balance of CXCL13 production by follicular dendritic cells versus T follicular helper cells could both be important factors in the pathogenesis of Castleman disease. We did not find increased IL6 transcripts on lymph nodes from patients with Castleman disease, compared to con trols. This finding was unexpected, as the inflammatory manifestations of Castleman disease are believed to be mediated at least in part by IL-6, based on several lines of evidence. High levels of serum IL-6 in patients with iMCD are associated with increased disease activity.34,39 In transgenic mice, overexpression of IL-640 or the HHV8-en coded vIL641 results in an extensive accumulation of poly typic plasma cells in lymph nodes and spleen, reminiscent of MCD. More decisively, therapeutic antibodies that block IL-6 (siltuximab) or its receptor (tocilixumab) have dem onstrated activity in controlling iMCD11,42,43 and are now ap proved as frontline therapies. However, the cellular and anatomic source of IL-6 production in Castleman disease remains controversial. Early studies using immunohisto chemistry on lymph node biopsies were suggestive of in creased IL-6 within germinal centers in only a subset of cases of UCD or iMCD.44,45 Subsequent immunohisto chemical studies did not find IL-6 within germinal centers but rather showed positive IL-6 staining on plasma cells or endothelial cells.46,47 More recent studies using a much more sensitive and specific in-situ hybridization assay on larger series of cases showed only minimal IL6 mRNA ex pression in lymph nodes or lung biopsies involved by iMCD, mainly on rare stromal cells and/or endothelial cells.48-50 Moreover, targeted next-generation sequencing
or real-time polymerase chain reaction on tissue biopsies involved by iMCD did not show increased IL6 transcripts compared to control tissues.48,50 Our findings are consist ent with the more recent evidence suggesting that IL-6 production might in fact not be increased within the en larged lymph nodes, but could perhaps originate from another compartment such as bone marrow, circulating inflammatory leukocytes,51 or endothelial cells.
Elevated serum VEGF levels are found in most patients with iMCD,34 and VEGF has been previously proposed as a mediator of the increased lymph node vascularity in both UCD and iMCD.52 In our study, VEFGA (VEGF) transcripts were only marginally increased in unicentric Castleman lymphadenopathy and not significantly increased in iMCD. Instead, we found that transcripts for FLT1 (VEGFR1) and its less known ligand PGF were significantly increased in lymph nodes from both UCD and iMCD. PGF was first de scribed as a placental angiogenic factor during embryogenesis, but was later shown to mediate angiogenesis in pathological inflammatory and ischemic processes in sev eral other organs.53 In addition, we found increased tran scripts of Apelin receptor (APLNR) in both disease subtypes, and increased APLN transcripts in unicentric disease only. Similar to PGF signaling through FLT1, the APLN/APLNR system has been described as in important mediator of angiogenesis in pathological processes.36 Thus, while systemic VEGF production might exert an ef fect on peripheral lymph nodes, our findings suggest that a role may exist for PGF/FLT1 and APLN/APLNR signaling as intrinsic angiogenic mediators in lymph nodes involved by Castleman disease. While finalizing this manuscript, a targeted sequencing study of 2,003 autoimmunity-related genes on formalinfixed/paraffin-embedded lymph nodes from patients with Castleman disease was published online.50 The results of this study include findings suggestive of enrichment for transcripts of the complement and coagulation cascades, in addition to no demonstrable increase in IL6 transcripts by targeted sequencing in Castleman disease compared to control lymph nodes. These unexpected findings are consistent with our results evaluating the entire transcrip tome on fresh-frozen lymph node specimens, further supporting our conclusions. Several limitations of our study need to be considered. First, we deliberately selected control lymph nodes with largely unremarkable cytomorphological features, in an at tempt to capture gene expression patterns in Castleman disease that were different from “normal”. Thus, we were not able to study gene expression findings specific to Castleman disease, and absent in reactive lymphadeno pathies with or without “Castleman-like” features. Sec ond, our focus on specific gene sets was largely biased by our current understanding of Castleman disease, raising the possibility of other important findings in our dataset
not mentioned in this report but of potential biological relevance. Last, the power to detect differences in gene transcripts on surgically excised specimens might be li mited by RNA degradation. In summary, we provide the first description of the lymph node transcriptomes in UCD and iMCD, based on a small cohort of cases. Our findings raise the possibility of pre viously unrecognized disease mediators as potential therapeutic targets, such as elements of the complement cascade, CXCL13, and angiogenic signaling through FLT1 and APLNR. Future studies testing the contribution of in dividual upregulated genes and overrepresented pathways will be critical to building a better understanding of the pathogenesis of Castleman disease.
DCF has received research funding from EUSA Pharma for the ACCELERATE Registry, received consulting fees from
1. Dispenzieri A, Fajgenbaum DC. Overview of Castleman disease. Blood. 2020;135(16):1353-1364.
2. Gonzalez-Farre B, Martinez D, Lopez-Guerra M, et al. HHV8related lymphoid proliferations: a broad spectrum of lesions from reactive lymphoid hyperplasia to overt lymphoma. Mod Pathol. 2017;30(5):745-760.
3. Dispenzieri A. POEMS syndrome: 2019 update on diagnosis, riskstratification, and management. Am J Hematol. 2019;94(7):812-827.
4. Fajgenbaum DC, Uldrick TS, Bagg A, et al. International, evidence-based consensus diagnostic criteria for HHV-8negative/idiopathic multicentric Castleman disease. Blood. 2017;129(12):1646-1657.
5. Fajgenbaum DC. Novel insights and therapeutic approaches in idiopathic multicentric Castleman disease. Blood. 2018;132(22):2323-2330.
6. Pierson SK, Stonestrom AJ, Shilling D, et al. Plasma proteomics identifies a 'chemokine storm' in idiopathic multicentric Castleman disease. Am J Hematol. 2018;93(7):902-912.
7. You L, Lin Q, Zhao J, Shi F, Young KH, Qian W. Whole-exome sequencing identifies novel somatic alterations associated with outcomes in idiopathic multicentric Castleman disease. Br J Haematol. 2020;188(5):e64-e67.
8. Li Z, Lan X, Li C, et al. Recurrent PDGFRB mutations in unicentric Castleman disease. Leukemia. 2019;33(4):1035-1038.
9. Nagy A, Bhaduri A, Shahmarvand N, et al. Next-generation sequencing of idiopathic multicentric and unicentric Castleman disease and follicular dendritic cell sarcomas. Blood Adv. 2018;2(5):481-491.
10. Chang KC, Wang YC, Hung LY, et al. Monoclonality and cytogenetic abnormalities in hyaline vascular Castleman disease. Mod Pathol. 2014;27(6):823-831.
11. van Rhee F, Wong RS, Munshi N, et al. Siltuximab for multicentric Castleman's disease: a randomised, double-blind, placebo-controlled trial. Lancet Oncol. 2014;15(9):966-974.
12. Kalari KR, Nair AA, Bhavsar JD, et al. MAP-RSeq: Mayo analysis pipeline for RNA sequencing. BMC Bioinformatics. 2014;15(1):224.
13. Liao Y, Smyth GK, Shi W. The Subread aligner: fast, accurate and
EUSA Pharma, and receiv ed study drug from Pfizer for a clinical trial of sirolimus in Castleman disease. DCF holds a provisional patent and a pending patent for the diagnosis and treatment of Castleman disease. The remaining authors have no conflicts of interest to disclose.
PH and AD designed the study; PH and RLK performed the histological review and selected the cases; PH analyzed the data and wrote the manuscript; AD, RLK, DCF and DJ con tributed to the data analysis design and edited the manu script; AD and DCF provided project support and expert knowledge.
RNA sequencing data are available through NCBI GEO: GSE195477.
scalable read mapping by seed-and-vote. Nucleic Acids Res. 2013;41(10):e108.
14. Benjamini Y, Hochberg Y. Controlling the false discovery rate: a practical and powerful approach to multiple testing. J R Stat Soc Series B Methodol. 1995;57(1):289-300.
15. Fontes M, Soneson C. The projection score--an evaluation criterion for variable subset selection in PCA visualization. BMC Bioinformatics. 2011;12(1):307.
16. Subramanian A, Tamayo P, Mootha VK, et al. Gene set enrichment analysis: a knowledge-based approach for interpreting genome-wide expression profiles. Proc Natl Acad Sci U S A. 2005;102(43):15545-15550.
17. Miller DV, Roden AC, Gamez JD, Tazelaar HD. Detection of C4d deposition in cardiac allografts: a comparative study of immunofluorescence and immunoperoxidase methods. Arch Pathol Lab Med. 2010;134(11):1679-1684.
18. Grogg KL, Attygalle AD, Macon WR, Remstein ED, Kurtin PJ, Dogan A. Expression of CXCL13, a chemokine highly upregulated in germinal center T-helper cells, distinguishes angioimmunoblastic T-cell lymphoma from peripheral T-cell lymphoma, unspecified. Mod Pathol. 2006;19(8):1101-1107.
19. Cartier A, Hla T. Sphingosine 1-phosphate: lipid signaling in pathology and therapy. Science. 2019;366(6463):eaar5551.
20. Cenci S. The proteasome in terminal plasma cell differentiation. Semin Hematol. 2012;49(3):215-222.
21. Jennewein MF, Alter G. The immunoregulatory roles of antibody glycosylation. Trends Immunol. 2017;38(5):358-372.
22. Price MJ, Patterson DG, Scharer CD, Boss JM. Progressive upregulation of oxidative metabolism facilitates plasmablast differentiation to a T-independent antigen. Cell Rep. 2018;23(11):3152-3159.
23. Saxton RA, Sabatini DM. mTOR Signaling in growth, metabolism, and disease. Cell. 2017;168(6):960-976.
24. Arenas DJ, Floess K, Kobrin D, et al. Increased mTOR activation in idiopathic multicentric Castleman disease. Blood. 2020;135(19):1673-1684.
25. Fajgenbaum DC, Langan RA, Japp AS, et al. Identifying and targeting pathogenic PI3K/AKT/mTOR signaling in IL-6-blockade-
refractory idiopathic multicentric Castleman disease. J Clin Invest. 2019;129(10):4451-4463.
26. Conway EM. Complement-coagulation connections. Blood Coagul Fibrinolysis. 2018;29(3):243-251.
27. Cohen D, Colvin RB, Daha MR, et al. Pros and cons for C4d as a biomarker. Kidney Int. 2012;81(7):628-639.
28. Wiedermann CJ. Secretoneurin: a functional neuropeptide in health and disease. Peptides. 2000;21(8):1289-1298.
29. Castello LM, Raineri D, Salmi L, et al. Osteopontin at the crossroads of inflammation and tumor progression. Mediators Inflamm. 2017;2017:4049098.
30. Lund SA, Giachelli CM, Scatena M. The role of osteopontin in inflammatory processes. J Cell Commun Signal. 2009;3(3-4):311-322.
31. Del Prete A, Scutera S, Sozzani S, Musso T. Role of osteopontin in dendritic cell shaping of immune responses. Cytokine Growth Factor Rev. 2019;50:19-28.
32. Vermi W, Lonardi S, Bosisio D, et al. Identification of CXCL13 as a new marker for follicular dendritic cell sarcoma. J Pathol. 2008;216(3):356-364.
33. Yu H, Shahsafaei A, Dorfman DM. Germinal-center T-helper-cell markers PD-1 and CXCL13 are both expressed by neoplastic cells in angioimmunoblastic T-cell lymphoma. Am J Clin Pathol. 2009;131(1):33-41.
34. Liu AY, Nabel CS, Finkelman BS, et al. Idiopathic multicentric Castleman's disease: a systematic literature review. Lancet Haematol. 2016;3(4):e163-175.
35. Rahimi N. VEGFR-1 and VEGFR-2: two non-identical twins with a unique physiognomy. Front Biosci. 2006;11:818-829.
36. Wu L, Chen L, Li L. Apelin/APJ system: a novel promising therapy target for pathological angiogenesis. Clin Chim Acta. 2017;466:78-84.
37. Cumpelik A, Heja D, Hu Y, et al. Dynamic regulation of B cell complement signaling is integral to germinal center responses. Nat Immunol. 2021;22(6):757-768.
38. Havenar-Daughton C, Lindqvist M, Heit A, et al. CXCL13 is a plasma biomarker of germinal center activity. Proc Natl Acad Sci U S A. 2016;113(10):2702-2707
39. Oksenhendler E, Carcelain G, Aoki Y, et al. High levels of human herpesvirus 8 viral load, human interleukin-6, interleukin-10, and C reactive protein correlate with exacerbation of multicentric castleman disease in HIV-infected patients. Blood. 2000;96(6):2069-2073.
40. Brandt SJ, Bodine DM, Dunbar CE, Nienhuis AW. Dysregulated interleukin 6 expression produces a syndrome resembling
Castleman's disease in mice. J Clin Invest. 1990;86(2):592-599.
41. Suthaus J, Stuhlmann-Laeisz C, Tompkins VS, et al. HHV-8encoded viral IL-6 collaborates with mouse IL-6 in the development of multicentric Castleman disease in mice. Blood. 2012;119(22):5173-5181.
42. Beck JT, Hsu SM, Wijdenes J, et al. Brief report: alleviation of systemic manifestations of Castleman's disease by monoclonal anti-interleukin-6 antibody. N Engl J Med. 1994;330(9):602-605.
43. Nishimoto N, Kanakura Y, Aozasa K, et al. Humanized antiinterleukin-6 receptor antibody treatment of multicentric Castleman disease. Blood. 2005;106(8):2627-2632.
44. Yoshizaki K, Matsuda T, Nishimoto N, et al. Pathogenic significance of interleukin-6 (IL-6/BSF-2) in Castleman's disease. Blood. 1989;74(4):1360-1367.
45. Leger-Ravet MB, Peuchmaur M, Devergne O, et al. Interleukin-6 gene expression in Castleman's disease. Blood. 1991;78(11):2923-2930.
46. Post GR, Bell RC, Rjoop A, Lobo RH, Yuan Y, Post SR. Diagnostic utility of interleukin-6 expression by immunohistochemistry in differentiating Castleman disease subtypes and reactive lymphadenopathies. Ann Clin Lab Sci. 2016;46(5):474-479.
47. Lai YM, Li M, Liu CL, et al. [Expression of interleukin-6 and its clinicopathological significance in Castleman's disease]. Zhonghua Xue Ye Xue Za Zhi. 2013;34(5):404-408.
48. Otani K, Inoue D, Fujikura K, et al. Idiopathic multicentric Castleman's disease: a clinicopathologic study in comparison with IgG4-related disease. Oncotarget. 2018;9(6):6691-6706.
49. Kinugawa Y, Uehara T, Iwaya M, et al. IL-6 expression helps distinguish Castleman's disease from IgG4-related disease in the lung. BMC Pulm Med. 2021;21(1):219.
50. Wing A, Xu J, Meng W, et al. Transcriptome and unique cytokine microenvironment of Castleman disease. Mod Pathol. 2022;35(4),451–461.
51. Ishiyama T, Nakamura S, Akimoto Y, et al. Immunodeficiency and IL-6 production by peripheral blood monocytes in multicentric Castleman's disease. Br J Haematol. 1994;86(3):483-489.
52. Nishi J, Maruyama I. Increased expression of vascular endothelial growth factor (VEGF) in Castleman's disease: proposed pathomechanism of vascular proliferation in the affected lymph node. Leuk Lymphoma. 2000;38(3-4):387-394.
53. Skoda M, Stangret A, Szukiewicz D. Fractalkine and placental growth factor: a duet of inflammation and angiogenesis in cardiovascular disorders. Cytokine Growth Factor Rev. 2018;39:116-123.
Elisa Taiana,1,2 Cecilia Bandini,3,4 Vanessa Katia Favasuli,1,2 Domenica Ronchetti,1,2 Ilaria Silvestris,1,2 Noemi Puccio,1,2 Katia Todoerti,1 Silvia Erratico,5,6 Domenica Giannandrea,7 Niccolò Bolli,1,2 Nicola Amodio,8 Alessia Ciarrocchi,9 Raffaella Chiaramonte,7 Yvan Torrente,6 Roberto Piva3,4 and Antonino Neri1,2°
1Hematology, Fondazione Cà Granda IRCCS Policlinico, Milan; 2Department of Oncology and Hemato-oncology, University of Milan, Milan; 3Department of Molecular Biotechnology and Health Sciences, University of Turin, Turin; 4Città Della Salute e della Scienza Hospital, Turin; 5Novystem Spa, Milan; 6Stem Cell Laboratory, Department of Pathophysiology and Transplantation, University of Milan, Centro Dino Ferrari, Unit of Neurology, Fondazione Cà Granda IRCCS Policlinico, Milan; 7Department of Health Sciences, University of Milan, Milan; 8Department of Experimental and Clinical Medicine, Magna Graecia University of Catanzaro, Catanzaro and 9Laboratory of Translational Research, Azienda Unità Sanitaria Locale-IRCCS Reggio Emilia, Reggio Emilia, Italy °Current address: Scientific Directorate, Azienda USL-IRCCS Reggio Emilia, Italy
Correspondence: E. Taiana elisa.taiana@unimi.it A. Neri antonino.neri@unimi.it
Received: March 31, 2022.
Accepted: September 1, 2022. Prepublished: September 8, 2022.
https://doi.org/10.3324/haematol.2022.281167
©2023 Ferrata Storti Foundation Published under a CC BY-NC license
Long non-coding RNA NEAT1 is the core structural component of the nuclear paraspeckle (PS) organelles and it has been found to be deregulated in multiple myeloma (MM) patients. Experimental evidence indicated that NEAT1 silencing negatively impacts proliferation and viability of MM cells, both in vitro and in vivo, suggesting a role in DNA damage repair (DDR). In order to elucidate the biological and molecular relevance of NEAT1 upregulation in MM disease we exploited the CRISPR/Cas9 synergistic activation mediator genome editing system to engineer the AMO-1 MM cell line and generate two clones that para-physiologically transactivate NEAT1 at different levels. NEAT1 overexpression is associated with oncogenic and prosurvival advantages in MM cells exposed to nutrient starvation or a hypoxic microenvironment, which are stressful conditions often associated with more aggressive disease phases. Furthermore, we highlighted the NEAT1 involvement in virtually all DDR processes through, at least, two different mechanisms. On one side NEAT1 positively regulates the posttranslational stabilization of essential PS proteins, which are involved in almost all DDR systems, thus increasing their availability within cells. On the other hand, NEAT1 plays a crucial role as a major regulator of a molecular axis that includes ATM and the catalytic subunit of DNA-PK kinase proteins, and their direct targets pRPA32 and pCHK2. Overall, we provided novel important insightsthe role of NEAT1 in supporting MM cells adaptation to stressful conditions by improving the maintenance of DNA integrity. Taken together, our results suggest that NEAT1, and probably PS organelles, could represent a potential therapeutic target for MM treatment.
Multiple myeloma (MM) is a malignant proliferation of bone marrow plasma cells (PC) characterized by a different clini cal course and a highly heterogeneous genetic background with both structural chromosomal alterations and specific gene mutations.1,2
Over the past decade, a causal relationship between the regulation of long non-coding RNA (lncRNA) and the patho
genesis of human cancers, including MM, has emerged from different functional studies.3-6 lncRNA participate in several biological processes, such as transcriptional gene regula tion, genomic integrity maintenance, cell differentiation and development.7
We have identified the nuclear paraspeckle assembly tran script 1 (NEAT1) as one of the abundantly expressed lncRNA in malignant PC compared to its normal counterpart,6,8,9 consistently with its high expression levels in many solid
Activation of long non-coding RNA NEAT1 leads to survival advantage of multiple myeloma cells by supporting a positive regulatory loop with DNA repair proteins
tumors.10 NEAT1 is a mono-exonic lncRNA, transcribed from the multiple endocrine neoplasia (MEN) type I locus, local ized on chromosome 11q13.11 Two different variants of NEAT1 exist and share an identical 5’ terminus: NEAT1_1, a shorter polyadenylated (polyA) isoform of 3.7 kb, and NEAT1_2, a longer isoform of 22.7 kb, lacking the polyA tail.12 NEAT1 has been demonstrated to be a fundamental structural com ponent of nuclear paraspeckles (PS), which are irregularly shaped compartments of the nuclear interchromatin space, considered as membraneless lncRNA-directed nuclear bodies involved in many different biological processes (see review9). Indeed, PS are able to regulated gene expression by editing and sequestering mRNA; in addition, PS can act as a molecular sponge for RNA binding proteins, not im pacting their functionality, but affecting their ability to in teract with their target genes. PS also contribute to promote microRNA (miRNA) processing; furthermore, the capability for NEAT1 to sponge many miRNA13 adds a further level of complexity to PS biology. Finally, PS are also in volved in stress response.9,14 Consistently with this function, we highlighted a pivotal role for NEAT1 in the maintenance of DNA integrity, through the regulation of the homologous recombination (HR) pathway, by demonstrating that NEAT1 depletion leads to a significant downregulation of genes and actives fractions of proteins involved in initial and crucial steps of the HR pathway.6 Moreover, our research group demonstrated that NEAT1 silencing negatively regulates pro liferation and viability of MM cells, both in vitro and in vivo 6 Despite the growing amount of data obtained by loss-offunction approaches, concerning the role of NEAT1 in the DNA damage repair (DDR) system and maintenance of ge nome integrity,6,14-16 the biological scenario underlying MM cells following NEAT1 overexpression remains virtually ab sent.
In recent years, different approaches of CRISPR/Cas9 ge nome editing system have been explored to induce gene activation17 or gene repression.18 In particular, the CRISPR/Cas9 synergistic activation mediator (SAM) system is a cutting-edge technique that uses MS2 bacteriophage coat proteins combined with p65 and HSF1 to para-physio logically induce the transcription of target genes without al tering the DNA sequence.19
Using this approach, we investigated the functional role of NEAT1 transactivation in human MM cell lines (HMCL). In particular, we established a relevant role for NEAT1 in DNA damage repair (DDR) molecular mechanisms through the upregulation of the two fundamental kinases, namely ATM and the catalytic subunit of DNA-PK (DNA-PKcs). Fur thermore, our data strongly indicate NEAT1 involvement in conferring survival advantage to MM cells exposed to stressful conditions such as nutrient starvation or hypoxic microenvironment, thus suggesting that the specific target ing of the PS backbone could be a promising novel strategy in MM treatment.
Full details of lentivirus production and in vitro transduction, plasmid constructs and cloning of single-guide RNA (sgRNA), quantitative real-time polymerase chain reaction (qRT-PCR), colony-forming assay, cell cycle analysis and apoptosis, immunofluorescence, RNA fluorescence in situ hybridization (FISH), gymnotic delivery, inhibitors and anti biotics, proteomic assays are provided in the Online Sup plementary Appendix. For all western blots, images of the whole membranes showing all bands, densitometry read ings and molecular weight markers are included in Online Supplementary Appendix.
AMO-1 was kindly provided by Dr C. Driessen (University of Tubingen, Germany). LP1, MM1.S, OPM2, and NCI-H929 were purchased from DSMZ, which certified authentication per formed by short tandem repeat DNA typing. All HMCL were immediately frozen and used from the original stock within 6 months. HMCL were cultured in RPMI-1640 medium (Gibco®, Life Technologies, Carlsbad, CA, USA) supple mented with 10% fetal bovine serum (FBS), 100 U/mL peni cillin, and 100 mg/mL streptomycin (Gibco®) at 37°C in 5% CO2 atmosphere, and routinely tested to rule out myco plasma contamination.
Hypoxia and HIF-1α stabilization
Hypoxia was induced by placing the cells for 24/48 hours (h) in a modular incubator chamber (Billups Rothenberg Inc., Del Mar, CA, USA) flushed with a mixture of 1% O2, 5% CO2 and 94% N2 at 37°C. In order to achieve oxygen-independent HIF-1a stabilization, cells were exposed to 100 mM CoCl2 for 24 h.20
Statistical significance of differences observed was deter mined by Student’s t-test analysis; differences were con sidered significant when P values were *P<0.05, **P<0.01 or ***P<0.001. All statistical analyses were performed using the Prism 5.0 software (GraphPad Software, Inc.)
Ethics approval and consent to participate
Written informed consent was obtained from all patients in accordance with the declaration of Helsinki. The study was approved by the Ethical Committee of the University of Milan (N°24/15, May 06 2015).
NEAT1 transactivation increases the amount of paraspeckles in multiple myeloma cells
In order to activate the endogenous expression of NEAT1 in
MM cells, we took advantage of the CRISPR/Cas9 SAM ge nome editing system. We first engineered the AMO-1 cell line to stably express the components of the CRISPR acti vation system (dCas9/ MS2-p65-HSF1) (Online Supplemen tary Figure S1A). Then, AMO-1 cells were individually transduced with three sgRNA targeting the NEAT1 promoter or a scramble sgRNA (Online Supplementary Table S1; Online Supplementary Figure S1B). qRT-PCR of selected cells dem onstrated that two of three NEAT1 targeting sgRNA induced significant NEAT1 transactivation (AMO-1N#5 and AMO-1N#8 cells) compared to the scramble condition (AMO-1SCR cells) (Figure 1A). Specific RNA FISH confirmed the sustained NEAT1 expression levels obtained in both targeted cell lines (Online Supplementary Figure S1C).

Since NEAT1 has been demonstrated to be the fundamen tal structural component of nuclear PS,9 we evaluated whether the increased NEAT1 transcription affects the ex pression of the essential PS proteins (PSP). Interestingly, NEAT1 overexpression was associated with a significant increase of NONO and SFPQ protein expression in AMO1N#5 and AMO-1N#8 cells (Figure 1B). Similarly, we detected also a moderate overexpression of the FUS protein, whose prion-like low complexity domain is required for the or ganization of a microscopically visible mature PS21 (Figure 1B; Online Supplementary Figure S2). However, PSP mRNA expression levels were not significantly modulated in AMO-1N#5 and AMO-1N#8 cells (Online Supplementary Figure S3A). This prompted us to investigate the role of NEAT1 in the regulation of PSP stability. In order to address this issue, we monitored the time course of NONO and FUS disappearance in the presence of the protein synthesis inhibitor cycloheximide (CHX). Our analysis indicated that the degradation rate of NONO and FUS was significantly
slower in NEAT1-transactivated AMO-1 cells (Figure 1C). Furthermore, neither NONO nor FUS completely dis appeared even after long CHX exposure (Online Supple mentary Figure S3B).
Finally, we evaluated if the stabilization of PSP induced by NEAT1 activation was associated with a positive modula tion of PS size and distribution in AMO-1 cells. Our ana lyses of AMO-1N#5 and AMO-1N#8 cells by confocal microscopy revealed that NEAT1 and NONO co-localized in PS organelles, whose number and size were increased compared to AMO-1SCR cells (Figure 1D).
NEAT1 transactivation provides a survival advantage to multiple myeloma cells cultured under stressful conditions
In order to evaluate whether MM cells could benefit from a survival advantage upon NEAT1 transactivation, we monitored the growth rate and viability of AMO-1N#5, AMO1N#8, and AMO-1SCR cells in physiological and stressful con ditions. In the first case, AMO-1N#5, AMO-1N#8 cell lines showed cell growth and viability similar to AMO-1SCR cells (Online Supplementary Figure S4A and B). We confirmed the absence of significant modulation in the cell cycle phase distributions and in the apoptotic rate by flow cyto metric analysis (Online Supplementary Figure S4C and D). Consistently, we also did not observe any change in the clonogenic potential (Online Supplementary Figure S4E). Based on NEAT1 involvement during cellular stress re sponse,9,14,22 we assessed the relevance of NEAT1 trans activation in stressful conditions, such as FBS starvation or hypoxia.
First, we assessed NEAT1 expression modulation under stressful conditions. Both total NEAT1 and NEAT1_2 iso
Figure 1. NEAT1 transactivation associates with increased paraspeckle protein expression levels. (A) Analyses of total NEAT1 and NEAT1_2 expression levels in NEAT1-transactivated AMO-1N#5 and AMO-1N#8 cell lines with respect to AMO-1SCR cells, based on the real-time quantitative polymerase chain reaction (qRT-PCR) approach described in the schematic representation. NEAT1 ex pression was expressed as 2 ΔΔCt relative to the scrambled (SRC) condition. *P<0.05 vs. SCR; ***P< 0.001 vs. SCR. (B) Western blot of NONO, SFPQ, and FUS in AMO-1SAM cells. GAPDH protein expression was included for protein loading normalization. (C) Effect of NEAT1 transactivation in the presence of the protein synthesis inhibitor cycloheximide (CHX) (100 mM) on the decay of NONO and FUS protein levels in AMO-1SCR and AMO-1N#8 cells at indicated time points. Actin protein expression was included for protein loading normalization. The densitometric analysis of immunoreactive bands is reported with respect to SCR condition in western blotting experiments. (D) Confocal microscopy results of NEAT1 specific RNA fluorescence in situ hybridization and NONO immunofluorescence in AMO-1SAM cells (scale bar 5µm).
form expression levels of AMO-1N#5, AMO-1N#8, and AMO1SCR cells cultured for 48 h at 1% FBS conditions resulted in a significant upregulation in comparison with the relative counterpart maintained in 10% FBS (Figure 2A), confirming that both variants are induced under stressful conditions. Interestingly, FBS starvation increased the fraction of the NEAT1_2 isoform (Figure 2B), which is known to be the fundamental structural scaffold for the biogenesis of PS organelles. Confocal microscopy analysis revealed that FBS starvation not only induced NEAT1 ex pression but also NONO protein expression, leading to an increase in the number of PS identifiable by co-localized signals (Figure 2C). Similar results were obtained by grow ing MM cells in a hypoxic microenvironment, resulting in a significant upregulation of both NEAT1 isoforms (Figure 3A), particularly of the fraction of NEAT1_2 long variant (Figure 3B). Moreover, in line with results obtained with serum starvation, the upregulation of NEAT1 upon hypoxia

positively correlated with the increase of NONO ex pression and the number and size of PS organelles (Figure 3C). Notably, the amount of PS and the fraction of the NEAT1_2 isoform returned to the levels observed in physiological conditions when normal FBS amounts and oxygen were restored (Figures 2C and 3D; Online Supple mentary Figure S5).
From a biological point of view, upon FBS starvation NEAT1-activated cells showed a significantly higher viabil ity as compared to AMO-1SCR cells (Figure 4A). This finding is supported also by a reduced plasmatic membrane in tegrity observed in AMO-1SCR compared to AMO-1N#5 and AMO-1N#8 (Online Supplementary Figure S6A) and by a cell cycle analysis that showed a higher percentage of cells distributed in sub G0/G1 phase (Figure 4B; Online Supple mentary Figure S6B). Additionally, the presence of a sig nificantly higher percentage of apoptotic cells (Figure 4C) in AMO-1SCR cells suggests also an anti-apoptotic role of
Figure 2. Fetal bovine serum starvation upregulates NEAT1 and increases paraspeckle numbers. (A) Real-time quantitative polymerase chain reaction (qRT-PCR) analyses of total NEAT1 and NEAT1_2 expression in AMO-1SAM cells maintained for 48 hours (h) in physiological fetal bovine serum (FBS)-culturing conditions (10% FBS) and in FBS-starving medium. NEAT1 expression was expressed as 2 ΔCt. (B) Percentage of NEAT1_2 variant contribution respect to total NEAT1 expression in AMO-1SAM cells maintained for 48 h in 10% FBS and in FBS-starving medium. (C) Confocal microscopy results of NEAT1-specific RNA fluorescence in situ hy bridization and NONO immunofluorescense in AMO-1 cells cultured for 48 h in 10% FBS, in FBS-starving medium, and upon re storing physiological 10% FBS-culturing conditions (scale bar 5µm).
NEAT1. Moreover, NEAT1 transactivation significantly in creased the clonogenic potential of MM cells cultured in the same conditions (Figure 4D). In detail, sustained
NEAT1 expression increased the number of colonies that also resulted to be larger, more structured and compact (Figure 4E; Online Supplementary Figure S6C).

Figure 3. Hypoxia upregulates NEAT1 and increases paraspeckle numbers. (A) Realtime quantitative polymerase chain reaction (qRT-PCR) analyses of total NEAT1 and NEAT1_2 expression in AMO-1SAM cells main tained for 48 hours (h) under normoxic and hypoxic microenvironment. NEAT1 expression was expressed as 2 ΔCt. (B) Percentage con tribution of NEAT1_2 respect to total NEAT1 expression in AMO-1SAM cells maintained for 48 h under normoxic and hypoxic micro environment. (C) Confocal microscopy re sults of NEAT1-specific RNA fluorescence in situ hybridization (RNA-FISH) and NONO im munofluorescence (IF) in AMO-1SAM cells cul tured for 48 h upon normoxic or hypoxic conditions (scale bar 5µm). (D) Confocal microscopy results of NEAT1-specific RNA FISH and NONO IF in AMO-1 cells cultured for 48 h upon normoxic, hypoxic conditions, and upon restoring physiological normoxic con ditions (scale bar 5µm).

In agreement with these biological data, in conditions of serum starvation, the active fraction of ERK1/2 and AKT proteins were upregulated in NEAT1-transactivated cells, displaying a higher increase in the more aggressive AMO1N#8 compared to AMO-1SCR cells (Figure 4F). Finally, we could observe a greater viability and modula tion of cell cycle phase distribution also in NEAT1-trans activated AMO-1 cells maintained in hypoxic conditions (Online Supplementary Figure S6D to F).

NEAT1 transactivation leads to the phosphorylation of RPA32 and CHK2 through a molecular mechanism dependent on ATM and DNA-PKcs We previously demonstrated NEAT1 involvement in the DDR system.6 With the aim of dissecting the molecular mechanisms associating NEAT1 with DNA repair pro cesses, we investigated RPA32 expression following NEAT1 transactivation. Specifically, western blot and confocal microscopy analy sis showed an upregulation of pRPA32 levels in NEAT1 transactivated cells compared to AMO-1SCR cells (Figure 5A and B; Online Supplementary Figure S7A), whereas the RPA32 total form remained unchanged at both protein (Figure 5A) and mRNA level (Online Supplementary Figure
S7B). Furthermore, AMO-1N#5 and AMO-1N#8 cells displayed increased levels of the active fraction of CHK2, another important player of the DDR system, whereas no signifi cant modulation of pCHK1 was detected (Figure 5C). In order to shed light on the possible mechanism by which NEAT1 leads to an increase of activated RPA32, we evalu ated the expression levels of the three main kinase pro teins responsible for its phosphorylation, i.e., ATM, ATR and DNA-PK.23 Our results showed that NEAT1 induction did not associate with significant modulations of ATM, ATR and PRKDC mRNA levels, ruling out a possible role of NEAT1 in the transcriptional regulation of these proteins (Online Supplementary Figure S7C). We also confirmed at protein level that NEAT1 transactivation did not induce a significant modulation of ATR and its activated form (Fig ure 5D), in line with the absence of modulation of its di rect target pCHK1. Conversely, ATM protein levels increased in AMO-1N#5 and AMO-1N#8 cells with respect to AMO-1SCR cells (Figure 5D), in agreement with the in creased pCHK2 and pRPA32 expression levels. Fur thermore, also DNA-PKcs showed a significant increase in NEAT1 activated cells compared to AMO1SCR cells (Figure 5D), data also confirmed by immunofluorescence (Figure 5E; Online Supplementary Figure S7D).
Figure 4. NEAT1 transactivation improves multiple myeloma cells survival and oncogenic potential in non-physiological culturing conditions. (A) Growth curve and viability of AMO-1SAM cells cultured for 72 hours (h) in fetal bovine serum (FBS)-starving con ditions. *P<0.05 vs. scrambled (SCR). (B) Cell cycle analysis by propidium iodide (PI) staining performed in AMO-1SAM cells after 48 h of culture in FBS-starving conditions; specific histograms representing the percentage of cells in sub G0/G1 are also shown. *P<0.05 vs. SCR. (C) Flow cytometric analysis of apoptosis in AMO-1SCR, AMO-1N#5 and AMO-1N#8 cultured for 72 h in FBS-starving conditions. (D) Colony formation assay performed on AMO-1SAM cultured for 31 days in FBS-starving conditions; representative pictures of colonies distribution at day 31 are also shown. (E) Representative pictures of colonies formed in AMO-1SCR, AMO-1N#5 and AMO-1N#8 24 days after seeding (10x magnification). (F) Werstern blot of pERK 1/2, ERK 1/2, pAKT, and AKT in AMO-1SAM cells after 48 h of culture in FBS-starving conditions. GAPDH protein expression was included for protein loading normalization. Per centage of pERK1/2 and pAKT with respect to total ERK1/2 and AKT (both normalized for GAPDH expression) is also shown.
Overall, our data are consistent with a signaling pathway downstream NEAT1 triggered through the increase of ATM and DNA-PKcs protein levels, which in turn trigger RPA32 and CHK2 activation via phosphorylation.
NEAT1-mediated activation of RPA32 is enhanced upon fetal bovine serum starvation in hypoxic conditions The evidence that FBS starvation positively modulates NEAT1 expression (Figure 2) prompted us to verify the outcome of FBS starvation on the molecular axis “NEAT1pRPA32”. For this purpose, we compared AMO-1SAM cells cultured in FBS-starving and physiological conditions. Interestingly, confocal microscopy analyses demon strated increased levels of both DNA-PKcs and its target pRPA32 in AMO-1SCR cells cultured in FBS-starving con ditions (Figure 6A), in line with a possible relationship be tween NEAT1/PS expression and DNA-PKcs activity. Of note, AMO-1N#5 and AMO-1 N#8 cells exposed to 1% FBS further increased the expression levels of pRPA32, DNAPKcs and ATM compared to AMO-1SCR, confirming the role of NEAT1 in triggering the mechanism that brings to RPA32 phosphorylation (Figure 6B).
Similarly, hypoxia, another condition that increases NEAT1 expression (Figure 3), resulted in DNA-PKcs levels higher than those observed in normoxic conditions, above all in both AMO-1N#5 and AMO-1N#8 cells compared to AMO-1SCR
cells (Figure 6C).
In order to further validate the effects of hypoxic stress, we investigated AMO-1SAM cells upon CoCl2 a treatment that chemically stabilizes HIF-1 transcription factor. Also in this case, we detected the overexpression of NEAT1 and NONO in association with the increase of both DNAPKcs and pRPA32 protein levels ( Online Supplementary Figure S8A). In agreement with the effects of hypoxic and FBS-starving conditions, the upregulation of DNA-PKcs upon CoCl2 treatment further increased in NEAT1-trans activated cells (Online Supplementary Figure S8B), which, at the same time, showed a higher viability and a lower percentage of apoptotic cells than AMO-1SCR cells (Online Supplementary Figure S8C and D).
With the aim of validating our data, we extended the study to other three HMCL (OPM2, MM1.S and LP1), based on the hypothesis that FBS-starving conditions could in duce NEAT1 expression. As expected, serum starvation in duced NEAT1 expression in all HMCL tested ( Online Supplementary Figure S9A), and we detected an increase of the NEAT1_2 variant contribution with respect to total NEAT1 expression ( Online Supplementary Figure S9B ). Moreover, western blot analysis demonstrated an in crease in the pRPA32 amount in FBS-starved cells com pared to cells maintained at normal FBS conditions (Online Supplementary Figure S9C). In agreement with our

Figure 5. NEAT1 transactivation upregulates proteins involved in the DNA repair process. (A) Western blot (WB) of pRPA32 and RPA32 in AMO-1SAM cells. (B) Confocal microscopy results of pRPA32 specific immunofluorecense (IF) in AMO-1SAM cells cultured under physiological culturing conditions (scale bar 5mm). (C) WB of pCHK2, CHK2, pCHK1, and CHK1 in AMO-1SAM cells. (D) WB of pATR, ATR, pATM, ATM, and DNA-PKcs in AMO-1SAM. The densitometric analysis of DNA-PKcs immunoreactive bands is reported with respect to the scrambled (SCR) condition. Furthermore, the percentage of the activated fraction of all proteins with respect to the relative total (tot) amount (both normalized for GAPDH expression) is reported. (E) Confocal microscopy results of DNAPKcs specific IF in AMO-1SAM cells cultured under physiological culturing conditions (scale bar 5mm).

model, DNA-PKcs and ATM protein levels increased in FBS-starved cells (Online Supplementary Figure S9C). Fi nally, also FUS protein was found to be overexpressed, likely enhancing PS assembling ( Online Supplementary Figure S9C).
The long NEAT1_2 variant is essential for the regulation of the DNA-PK, ATM/pRPA32 axis
In order to confirm the fundamental role of NEAT1 in the regulation of DNA-PKcs and ATM and the consequent
RPA32 activation, we evaluated the expression levels of both kinase proteins in AMO-1 and LP1 cells specifically silenced for NEAT1. As expected, the downregulation of both NEAT1 isoforms, obtained through the gymnotic de livery of the antisense LNA-gapmeR g#N1_E (Figure 7A), resulted in the reduction of the pRPA32 protein levels (Figure 7B). In addition, g#N1_E-silenced cells showed a significant reduction of both DNA-PKcs and ATM protein levels, thus confirming a pivotal role of NEAT1 in the regu lation of pRPA32 expression through a mechanism me
Figure 6. Multiple myeloma cells under stressful conditions overexpress NEAT1 and other proteins involved in the DNA repair process. (A) Confocal microscopy results of DNA-PKcs and pRPA32 specific immunofluorescence (IF) in AMO-1 cells cultured in physiological fetal bovine serum (FBS)-culturing condition (10% FBS) and in FBS-starving medium (scale bar 20µm). (B) Western blot (WB) analysis of pRPA32, RPA32, DNA-PKcs and ATM in AMO-1SAM cells after 48 hours (h) of culture in FBS- starving condition. GAPDH protein expression was included for protein loading normalization. Percentage of pRPA32 with respect to total (tot) RPA32 (both normalized for GAPDH expression) is also shown. (C) WB analysis of DNA-PKcs in AMO-1SAM cells after 48 h of culture in normoxic and hypoxic conditions. Actin protein expression was included for protein loading normalization. The densitometric analysis of immunoreactive bands is reported with respect to the scrambled (SCR) condition.

diated by DNA-PK and ATM (Figure 7B). Finally, in order to evaluate if the molecular effect of NEAT1 silencing was orchestrated mainly by the short and more abundant isoform of NEAT1 or by the long NEAT1_2 variant, we silenced AMO-1 and LP1 cells with an LNAgapmeR specific for the NEAT1_2 isoform (g#N1_G). Of note, the silencing of NEAT1_2 was sufficient to determine the downregulation of pRPA32 and of both DNA-PKcs, and ATM (Figure 7B).

The NEAT1/ pRPA32 positive axis is responsible for survival advantages of multiple myeloma cells Finally, we investigated whether the prosurvival effect ob served in NEAT1-transactivated cells cultured in nonphysiological conditions, such as FBS starvation, was supported, at least in part, by the novel identified NEAT1orchestrated molecular axis. Hence, we chemically inhibited ATM and DNA-PK activity in AMO-1SAM cells cultured in FBS-starving conditions, and evaluated the biological impact. As expected, in FBS star vation we found that pRPA32 levels in AMO-1N#8 were higher than in AMO-1SCR cells; however, the inhibition of both ATM and DNA-PK kinases led to the impairment of RPA32 phosphorylation in both cell lines (Online Supple mentary Figure S10A). In line with our hypothesis, the in
hibition of both ATM and DNA-PK resulted in a significant reduction of cell viability in AMO-1SCR and AMO-1N#8 starved cells, even more evident upon simultaneous inhibition of ATM and DNA-PK activities (Online Supplementary Figure S10B). Furthermore, FBS-starved cells clearly showed al terations of cell membrane integrity and membrane bleb bing in AMO-1SCR cells compared to NEAT1-transactivated cells. These characteristics are typical of apoptotic cells, in line with the higher level of mortality (Figure 8B; Online Supplementary Figure S10C). Interestingly, the same mor phological changes were detectable in FBS-starved AMO1SAM cells upon the simultaneous inhibition of ATM and DNA-PK (Figure 8A; Online Supplementary Figure S10C), in agreement with the significant decrease of cell viability. Moreover, the inhibition of ATM and DNA-PK was associ ated with a massive cytoplasmic vacuolization, more pro nounced upon simultaneous inhibition of both protein kinases, suggesting a suffering cell phenotype (Figure 8A; Online Supplementary Figure S10C).
Notably, NEAT1 silencing in the NCI-H929 cell line and in CD138+ purified primary PC also led to cytoplasmic va cuolization, even if to a lesser extent (Figure 8B), suggest ing that the molecular and biological effect observed upon NEAT1 silencing could be the result, at least in part, of the reduced activity of the NEAT1/ pRPA32 axis.
B
Figure 7. NEAT1 silencing downregulates proteins involved in the DNA repair process. (A) Scheme of LNA-gapmeR localization on NEAT1 transcript; real-time quantitative polymerase chain reaction (qRT-PCR) analyses of NEAT1 expression levels in AMO-1 and LP1 MM cell lines upon gymnotic delivery of g#N1_E or g#N1_G LNA-gapmeR. NEAT1 expression was expressed as 2 ΔCt. (B) Western blot analysis of pRPA32, RPA32, DNA-PKcs, and ATM in AMO-1 and LP1 cells after gymnotic delivery of NEAT1-targeting gapmeR (5 M). GAPDH protein expression was included for protein loading normalization. The densitometric analysis of DNA-PKcs and ATM immunoreactive bands is reported with respect to the scrambled (SCR) condition. Furthermore, the percentage of pRPA32 with respect to total RPA32 (both normalized for GAPDH expression) is also shown. tot: total.
We previously reported that NEAT1 expression in purified PC from MM patients is significantly higher than in the normal counterpart and that NEAT1 silencing negatively regulates proliferation and viability of MM cells, both in vitro and in vivo, by affecting the DNA damage cellular re sponse.6
PS are dynamic compartments in the nuclear interchro matin space. They respond to different stimuli including DNA damage. These pieces of evidence together with the function of NEAT1 in PS assembly, prompted us to inves tigate the mechanism underlying the protumoral effect of NEAT1 by studying how NEAT1 overexpression, observed in MM, can influence the activity of PS during DDR. In order to mimic the effect of NEAT1 overexpression in MM, we took advantage of two NEAT1-transactivated MM clones obtained by using the innovative CRISPR-Cas9 SAM gain of function approach.18
First, we demonstrated that the paraphysiological activa tion of NEAT1 is associated with a significant increase of the levels of essential PSP such as NONO, SFPQ, and FUS. In details, NEAT1 extends the half-life of these three PSP, thereby rising their availability within MM cells. Moreover, confocal microscopy analysis clearly showed that over expressed NEAT1 and NONO co-localize in PS organelles, whose number significantly augmented in NEAT1-trans activated cells, confirming previous data reporting that NEAT1 transcription is coupled with PS assembling.24 Im portantly, the three PSP are involved in virtually all DNA repair mechanisms (see review9). In particular, NONO/SFPQ creates a heterodimer that can associate with the major proteins of the non-homologous end-join ing (NHEJ) thus promoting their activity; SFPQ was re ported to be essential for HR pathway activation, by promoting the formation of D-loops during the homolo gous pairing recombination. Moreover, SFPQ can act as both activator and inhibitor of RAD51, exerting a tight regulation of HR pathway. FUS plays a fundamental role in both double-strand breaks (DSB), where its depletion leads to HR and NHEJ impairment, and single-strand brakes (SSB) repair, since it is recruited by PARP1 to pro mote the recruitment of base excision repair (BER) pro teins at the DNA damage site. Overall, this evidence, together with the fact that NEAT1 can be a direct target of the TP53 transcription factor,15 support the hypothesis of a functional contribution of NEAT1, and likely of PS, in the DDR pathway (Figure 8C).
Since PS are important in the cell response to different stimuli including stressful conditions, such as nutrient starvation and hypoxia, we investigated the role of NEAT1 in stressful culturing conditions. Our investigation estab lished that NEAT1 overexpression is crucial to sustain the growth and the survival potential of MM cells when main
tained in non-physiological culturing conditions. Indeed, hypoxia and nutrient starvation further induce NEAT1 ex pression in AMO-1SAM clones, which positively correlates with an increase of both PS numbers within cells and cell survival. In agreement with our data, NEAT1 upregulation under hypoxic condition has been already reported in he patocellular carcinoma and non-small cell lung cancer, where NEAT1 represents a target of the HIF-1 or HIF-2 transcription factors, respectively; also in this context, NEAT1 overexpression provides the cell with prosurvival and oncogenic properties.26,27 In MM cells as well, we found that the transactivation of NEAT1 not only guaran tees prosurvival advantages, but also increases their on cogenic potential, as demonstrated by the higher colony-forming potential obtained upon FBS-starving conditions, as well as the more structured colonies or ganization.
In line with the role of NEAT1 in supporting MM cell sur vival during FBS starvation, we observed the activation of ERK- and AKT-mediated cell survival pathways in cultured NEAT1-transactivated cells. Overall, these findings suggest that NEAT1 targeting may have great translational relevance since both serum star vation and hypoxia are typical stressful conditions for tumor cells in vivo and are often associated with more ag gressive tumor stages and mechanisms of chemoresis tance.
Based on the functional impact of NEAT1 both in the DDR pathways and in the growth and survival of MM cells when cultured in non-physiological conditions, we hypothesized that NEAT1 transactivation may induce survival advantage in MM cells under stressful conditions by improving DNA repair mechanisms. In agreement with this theory, we demonstrated that, along with the stabilization of NONO, SFPQ, and FUS, NEAT1 transactivation is associated with the overexpression of other two crucial proteins of the DDR system, DNA-PKcs and ATM, thus leading to the ac tivation of their target proteins RPA32 and CHK2 (Figure 5; Online Supplementary Figure S7). We validated the posi tive association between NEAT1 transcription levels and the expression of the DDR proteins in NEAT1-transactiv ated cells under stressful conditions; in fact, we showed that, similarly to NEAT1 expression levels, also DDR pro tein levels further increase in non-physiological culture conditions (Figure 6; Online Supplementary Figure S8). Fi nally, transactivated NEAT1 cells in stressful conditions also exhibit significantly greater viability (Online Supple mentary Figure S8), indicating a prosurvival and pro-on cogenic role of NEAT1-mediated axis in MM. The molecular circuit driven by NEAT1 and its crucial role for MM cell survival under stressful conditions was further validated by different approaches. First, we demonstrated that the chemical inhibition of ATM and/or DNA-PK in NEAT1-transactivated AMO-1SAM cells under stressful con
Figure 8. ATM and DNA-PK inhibitions abrogate NEAT1 prosurvival advantages. (A) Optical microscopy results of May Grun wald-Giemsa (MGG) staining ob tained in AMO-1SCR and AMO-1N#8 cells after 3 days of culture in fetal bovine serum (FBS)-starving conditions, in the presence for the last 24 hours (h) of ATM and DNA-PK inhibitors (100x magnifi cation). (B) Optical microscopy results of MGG staining obtained in NCI-H929 and CD138+ multiple myeloma (MM) primary cells after 3 days from the gymnotic de livery of NEAT1-targeting gapmeR (5 mM) (100x magnification). (C) Cartoon summarizing the mol ecular circuit driven by NEAT1 and its crucial role for MM cell survival under stressful con ditions. PC: plasma cells.
ditions significantly decreases cell viability and leads to cell morphological changes characterized by a massive cytoplasmic vacuolization (Figure 8; Online Supplementary Figure S10). In agreement with our observations, this pe culiar phenotype preceding cell death has been reported in osteosarcoma cells, upon ATR inhibition.27

In order to validate the obtained results, we verified NEAT1-mediated molecular axis in other HMCL, thus ex cluding a cell line specific effect. Indeed, serum-starving
conditions induce the upregulation of NEAT1, DNA-PK, ATM, and pRPA32 in OPM2, LP1, and MM1.S HMCL (Online Supplementary Figure S8). Furthermore, NEAT1 silencing in AMO-1 and LP1 negatively affects the expression levels of both DNA-PKcs and ATM protein kinases, and of the ac tive amount of RPA32 (Figure 7). Of note, NEAT1 silencing in the NCI-H929 cell line and in CD138+ purified primary PC leads to a pattern of cytoplasmic vacuolization similar to the phenotype obtained with the chemical inhibition of
ATM and/or DNA-PK (Figure 8B), suggesting that the mol ecular and biological effect highlighted upon NEAT1 si lencing could be the result, at least in part, of the reduced activity of DNA-PK and ATM on pRPA32. Taken together, our data indicate that the upregulation of ATM, DNA-PKcs, and pRPA32 could be considered a gen eral molecular response of MM cells to NEAT1 induction, which, in turn, could represent a survival advantage for MM cell facing adverse conditions (Figure 8C).
Interestingly, our results point out an important role for the long NEAT1_2 variant under stressful conditions; in fact, both in AMO-1SAM clones and in all HMCL tested, FBS starvation or hypoxia significantly increase the NEAT1_2 percentage with respect to total NEAT1 expression. This finding suggests that non-physiological conditions may shift NEAT1 transcription towards the long NEAT1_2 iso form, likely to assemble the PS needed to counteract the stressful conditions. In accordance with this evidence, the specific targeting of the long NEAT1_2 variant negatively affects the expression levels of both DNAPKcs and ATM protein kinases, and of the active amount of RPA32, suggesting that the structural scaffold of PS, and maybe PS themselves, should be considered master regulators of DNA damage response in MM cells. In conclusion, our study attributes a crucial role to NEAT1 overexpression in MM; pathological NEAT1 expression and the consequent deregulation of PS organelles availability, could represent an Achilles’ heel for MM PC survival. Im portantly, our data suggest that NEAT1 overexpression could be considered a generalized rescue mechanism for MM plasma cells under stressful conditions and strongly suggest that NEAT1 and PS targeting could be considered a novel promising strategy for innovative anti-MM ther apies for all subsets of MM patients.
No conflicts of interest to disclose.
1. Bolli N, Biancon G, Moarii M, et al. Analysis of the genomic landscape of multiple myeloma highlights novel prognostic markers and disease subgroups. Leukemia. 2018;32(12):2604-2616.
2. Munshi NC, Anderson KC. New strategies in the treatment of multiple myeloma. Clin Cancer Res. 2013;19(13):3337-3344.
3. Amodio N, Stamato MA, Juli G, et al. Drugging the lncRNA MALAT1 via LNA gapmeR ASO inhibits gene expression of proteasome subunits and triggers anti-multiple myeloma activity. Leukemia. 2018;32(9):1948-1957.
4. Huarte M. The emerging role of lncRNAs in cancer. Nature Med. 2015;21(11):1253-1261.
5. Morelli E, Gulla A, Rocca R, et al. The non-coding RNA landscape of plasma cell dyscrasias. Cancers. 2020;12(2):320.
6. Taiana E, Favasuli V, Ronchetti D, et al. Long non-coding RNA
ET, CB, VKF, IS, NP, and KT performed experiments and analyzed the data. ET, DG and IS performed cytofluor imetric experiments. ET and SE performed confocal analysis. NB, NA, AC, RC, YT, and RP provided critical evaluation of experimental data and of the manuscript. ET, AN, and DR conceived the study and wrote the manu script.
We thank Prof M. Gariboldi and Dr E. Marras for making the modular incubator chamber available.
This work was financially supported by grants from Asso ciazione Italiana Ricerca sul Cancro (AIRC) to AN (IG16722 and IG24365), to RC (IG20614), to RP (IG21585), and to NA (IG24449). NB is funded by the European Research Council under the European Union’s Horizon 2020 research and innovation program (grant agreement no. 817997). This study was partially funded by Italian Ministry of HealthCurrent research IRCCS 2023 (to AN and to NB). YT ac knowledges support by “Piattaforme cellulari per la Ricerca e lo Sviluppo di Terapie Avanzate in Life Science” - Fondo Europeo di Sviluppo Regionale 2014-2020. POR FESR 2014-2020. CB received a 2-year AIRC fellowship "Angela e Luciano Cenino" (id.24140); VKF and DG received a fellowship from the PhD program in Experimental Medi cine of Milan University.
The materials used and analyzed during the current study are available from the corresponding author on reason able request.
NEAT1 targeting impairs the DNA repair machinery and triggers anti-tumor activity in multiple myeloma. Leukemia. 2020;34(1):234-244.
7. Wang KC, Chang HY. Molecular mechanisms of long noncoding RNAs. Mol Cell. 2011;43(6):904-914.
8. Taiana E, Ronchetti D, Favasuli V, et al. Long non-coding RNA NEAT1 shows high expression unrelated to molecular features and clinical outcome in multiple myeloma. Haematologica. 2019;104(2):e72-e76.
9. Taiana E, Ronchetti D, Todoerti K, et al. LncRNA NEAT1 in paraspeckles: a structural scaffold for cellular DNA damage response systems? Noncoding RNA. 2020;6(3):26.
10. Yu X, Li Z, Zheng H, Chan MT, Wu WK. NEAT1: a novel cancerrelated long non-coding RNA. Cell Prolif. 2017;50(2):e12329.
11. Guru SC, Agarwal SK, Manickam P, et al. A transcript map for
ARTICLE - Activation of NEAT1
to survival advantage of MM cells E. Taiana et al.
the 2.8-Mb region containing the multiple endocrine neoplasia type 1 locus. Genome Res. 1997;7(7):725-735.
12. Naganuma T, Nakagawa S, Tanigawa A, et al. Alternative 3'-end processing of long noncoding RNA initiates construction of nuclear paraspeckles. EMBO J. 2012;31(20):4020-4034.
13. Li K, Yao T, Zhang Y, Li W, Wang Z. NEAT1 as a competing endogenous RNA in tumorigenesis of various cancers: role, mechanism and therapeutic potential. Int J Biol Sci. 2021;17(13):3428-3440.
14. Adriaens C, Marine JC. NEAT1-containing paraspeckles: central hubs in stress response and tumor formation. Cell Cycle. 2017;16(2):137-138.
15. Adriaens C, Standaert L, Barra J, et al. p53 induces formation of NEAT1 lncRNA-containing paraspeckles that modulate replication stress response and chemosensitivity. Nat Med. 2016;22(8):861-868.
16. Blume CJ, Hotz-Wagenblatt A, Hullein J, et al. p53-dependent non-coding RNA networks in chronic lymphocytic leukemia. Leukemia. 2015;29(10):2015-2023.
17. Maeder ML, Linder SJ, Cascio VM, et al. CRISPR RNA-guided activation of endogenous human genes. Nat Methods. 2013;10(10):977-979.
18. Qi LS, Larson MH, Gilbert LA, et al. Repurposing CRISPR as an RNA-guided platform for sequence-specific control of gene expression. Cell. 2013;152(5):1173-1183.
19. Konermann S, Brigham MD, Trevino AE, et al. Genome-scale transcriptional activation by an engineered CRISPR-Cas9 complex. Nature. 2015;517(7536):583-588.
20. Yuan Y, Hilliard G, Ferguson T, Millhorn DE. Cobalt inhibits the interaction between hypoxia-inducible factor-alpha and von Hippel-Lindau protein by direct binding to hypoxia-inducible factor-alpha. J Biol Chem. 2003;278(18):15911-15916.
21. Fox AH, Nakagawa S, Hirose T, Bond CS. Paraspeckles: where long noncoding RNA meets phase separation. Trends in Biochem Sci. 2018;43(2):124-135.
22. McCluggage F, Fox AH. Paraspeckle nuclear condensates: global sensors of cell stress? Bioessays. 2021;43(5):e2000245.
23. Byrne BM, Oakley GG. Replication protein A, the laxative that keeps DNA regular: the importance of RPA phosphorylation in maintaining genome stability. Semin Cell Dev Biol. 2019;86:112-120.
24. Mao YS, Sunwoo H, Zhang B, Spector DL. Direct visualization of the co-transcriptional assembly of a nuclear body by noncoding RNAs. Nat Cell Biol. 2011;13(1):95-101.
25. Kong X, Zhao Y, Li X, et al. Overexpression of HIF-2alphadependent NEAT1 promotes the progression of non-small cell lung cancer through miR-101-3p/SOX9/Wnt/beta-catenin signal pathway. Cell Physiol Biochem. 2019;52(3):368-381.
26. Zhang X, Kang Z, Xie X, et al. Silencing of HIF-1alpha inhibited the expression of lncRNA NEAT1 to suppress development of hepatocellular carcinoma under hypoxia. Am J Transl Res. 2020;12(7):3871-3883.
27. Li X, Dean DC, Cote GM, et al. Inhibition of ATR-Chk1 signaling blocks DNA double-strand-break repair and induces cytoplasmic vacuolization in metastatic osteosarcoma. Ther Adv Med Oncol. 2020;12:1758835920956900.
leads
ruxolitinib,
adult patients with acute myeloid leukemia-associated hemophagocytic lymphohistiocytosis: a single-center pilot trial
Secondary malignant hemophagocytic lymphohistiocyto sis (mal-HLH) can be diagnosed in up to 10% of patients with acute myleoid leukemia (AML) undergoing intensive chemotherapy (IC).1,2 The mechanisms implicated in AMLassociated HLH are unknown but other HLH subgroups are characterized by a large spectrum of cytokine-driven immune disorders such as interferon-g (IFN-g), interleukin (IL)-6, IL-10, IL-1b, and tumor necrosis factor-a (TNF-a).3 Mal-HLH has the worst prognosis of all HLH subgroups4 with a median survival of less than 2 months.5 Current recommendations for mal-HLH advocate the use of cor ticosteroids as first-line treatment with the addition of dose-adjusted etoposide (ETP) (50-150 mg/m2) in highly active HLH or in severe cases.5-7 The heterogeneity of malHLH prohibits a “one-size-fits-all protocol”.6 Recently, the use of therapies to attenuate hypercytokinemia has been reported with an encouraging clinical response obtained with other HLH subgroups.8-10 Ruxolitinib (RXT) has not yet been investigated as frontline therapy for AML-associated HLH, but some studies suggest its effectiveness in a mu rine model of HLH,11 in adults with non-malignant second ary HLH12 and for patients with lymphoma-associated hemophagocytic syndrome (LAHS) in combination with doxorubicin, ETP and dexamethasone (R-DED).13 We retrospectively investigated the cytokine profile of AML-associated HLH at diagnosis and during treatment, tested the efficacy and tolerability of a dose-adjusted ru xolitinib, ETP and dexamethasone (DEX) (adRED) regimen, in conjunction with IC, as frontline therapy for patients with newly diagnosed AML-associated HLH and investi gated the potential use of RXT as an ETP/DEX-sparing strategy. A per protocol (PP) analysis was realized without deviation from the protocol to avoid underestimating the benefit in patients who did not comply with the protocol. As reported before,10 only patients who received at least 14 days of regular RXT therapy were considered evaluable for the activity endpoints. The primary objective of this study was to assess whether the use of RXT for a short minimum duration of 2 weeks provides clinical benefit for our patients. The ethics committee of CHUV approved the study (2018-01391). Patients received a response-adjusted regimen combining ETP (50-150 mg/m2), RXT (10 mg twice a day with dose reduction for toxicity to a minimum of 5 mg a day or augmentation to a maximum of 20 mg twice
a day) and DEX (10 mg/day). Administration of ETP was twice a week for the first week, and then repeated based on the degree of cytopenia and the evolution of HLH par ameters. ETP was administered at a dose between 50 and 150 mg/m2, according to cytopenia and/or concomitant use of IC. DEX was administered at a dose of 10 mg a day and then progressively tapered according to the evolution of HLH.
Primary endpoints were the response of AML-associated HLH to treatment and assessment of the cytokine profile at HLH diagnosis. The best overall response was the best response recorded from the start of the treatment until disease progression or recurrence.10 Secondary endpoint was early mortality analysis at 2 months from the diag nosis of HLH, safety (only grade ≥3 adverse events [AE] have been reported in accordance with the CTCAE V5.0), duration of response, changes in biological and inflamma tory biomarkers between the levels at baseline and during treatment, and the possibility of undergoing an allogeneic hematopoietic stem cell transplant (alloHSCT). Between 2017, and 2021, in a series of 160 patients with AML, 11 patients had a diagnosis of HLH. Five patients were excluded: two patients with <169 Hscore14 points and <5 HLH-2004 criteria.15 One patient did not receive treat ment for leukemia or HLH because of age and comorbid ities. Two patients received less than 2 weeks of RXT due to gastrointestinal volvulus complicated by necrosis fol lowed by death and one due to death from septic shock and multiple strokes. We finally identified six HLH treated with adRED, four males and two females (Online Supple mentary Table S1). The median age was 52 years (range, 34-72 years). According to the ELN 2017 risk category for AML, five patients were in the adverse risk category, and one was in the intermediate risk category. Complex ka ryotype was present in two patients. Two patients har bored TP53 and two had FLT3-ITD mutations. HLH diagnosis was concomitant with initial AML diagnosis in two and with AML relapse in four patients. HLH diagnosis was made before initiation of IC in two and after in four patients. HLH diagnosis occurred during the first course of IC in five patients (induction regimen were respectively CLAG-IDA, CLAG, 7+3, FLAG, FLAG-IDA) and the second course of IC in one patient (7+3 followed by FLAG in the absence of a response at D21 to 7+3). All patients had at
least five of the eight HLH-2004 criteria for the diagnosis of HLH15 and an Hscore14 >169 (mean 247; range, 206-263). Prior to HLH treatment initiation, all patients had exten sive infectious work-up including blood and urine cul tures, viremia for Cytomegalovirus and Epstein-Barr virus, blood galactomannan and b d-glucan assay, and whole body computed tomography scan. Different treatments
for each patient are shown in Figure 1A. The overall re sponse rate of HLH was 100% (6/6), with 83.4% (5/6) in CR and 16.6% (1/6) in PR. Among the patients achieving a CR, 60% (3/5) maintained a CR condition for >2 months. In terestingly, the other two patients (2/5) required only one single ETP administration to maintain CR. The 2-month early mortality rate was 33% (2/6). Two patients died of a
Figure 1. Treatments and studies of the different biological hemophagocytic lymphohistiocytosis parameters in patients treated with adRED. (A) Treat ment timelines and changes in selected hemophagocytic lymphohistiocyto sis (HLH) parameters from day 0 (HLH diagnosis) and then every 2 weeks for 8 weeks or until death. Treatment with ruxolitinib (RXT) is shown in red, dexamethasone (DEX) is shown in green, intensive chemotherapy is shown in yellow and etoposide (ETP) administration is shown in blue, ferritin (µg/L), ALAT (U/L), sCD25 (pg/mL). (B) Assessment of cytokines from day 0 (HLH di agnosis) and then every 2 weeks for 8 weeks or until death. Heatmap of scaled picogram per microliter values. Columns (i.e., cytokines) are scaled to facilitate the comparison of the detected levels of the cytokines, which are color-coded from white to red (low to high levels of cytokines detected). The treatment timeline is described for each patient. (C) Correlation network analysis of the plasma cytokine and biological parameter concentrations. Color scale (blue-to-red) and thickness of lines connecting variables repre sent Pearson’s correlations. adRED: dose-adjusted ruxolitinib, ETP and DEX.

cause other than their HLH. The time to the best response to HLH was 1 week for all patients (Table 1). Concerning AML, five of six patients could be put into remission and three patients could undergo an alloHSCT. The evolution of classic biological parameters (ferritin, ASAT, sCD25) and cytokines over time is shown in Figure 1. As all patients received IC, cytopenia parameters were not reliable tools for following patients. The liver function, coagulation (D-dimers and fibrinogen), classic inflamma tory parameters (CRP, sCD25 and ferritin) and cytokines were changed favorably quickly within the first days fol lowing the adRED regimen. At diagnosis, the majority of patients exhibited high pro inflammatory cytokines levels of IL-6, IL-18, CXCL2, CXCL9, CXCL12, CXCL13, and IFN-g (Figure 1B). We noticed a cytokine profile characterized by a dominant TH1 cyto kine signature with the concomitant exhibition of multiple upstream and downstream HLH-related cytokines with no increase in cytokines or chemokines associated with a TH2 response. In responding patients, there was a de crease in proinflammatory cytokine IL-6-, IL-18-, IFN-g and IFN-g induced chemokines. When assessing the linear relationship between classic parameters and cytokine levels, we observed a significant positive correlation be tween ferritin and IL-8 (r=0.79, P=0.000482), CXCL10 (r=0.65, P=0.000798), CXCL13 (r=0.66, P=0.03842), CCL4 (r=0.58, P=0.000976) and sCD25 (r=0.69, P=0.000269). In addition, we observed a significantly lower level of CCL4 in the absence of splenomegaly (P=0.00106) or hepato megaly (P=0.0107) (Online Supplementary Figure S2).
In order to better characterize the network of biological parameters and the inflammatory cytokine/chemokinereceptor network in AML-related HLH, we performed cor relation network analysis. This analysis further supported the strong positive correlation between CXCL1, CXCL12, CXCL13, CCL2, CCL3, CCL4, CCL5, CXCL8 (IL-8), CXCL9, IL2R (sCD25), IL-6, IL-10, and IL-18, together with CRP, bili rubin, LDH, ferritin and ALAT. Strong negative correlations were observed between G-CSF and neutrophils and leu cocytes and between neutrophils and IL-7 and CCL2. No tably, the cytokines IL-6, IL10, CXCL13, CXCL1, CCL3, and CCL4 are located at the center of an intercorrelated cyto kine-inflammatory marker network with CRP, LDH and bilirubin. Our comprehensive correlation network analyses showed that IL-6 was located at the center of a cytokine network with IL-8, CXCL1 and CCL4 (Figure 1C). We performed a post hoc analysis to compare patients treated with RXT with that of a historical control group (n=5) treated with ETP/DEX without ruxolitinib. In the five historical control group patients, induction regimen were respectively CLAG, 7+3, 7+3, FLAG, FLAG. The 2-month early mortality rate was similar at 40% (2/5 patients) for the two groups (Table 1).
In the RXT group, the median cumulative dose of ETP and
DEX was significantly lower (287.5 mg/m2 vs. 750 mg/m2, P=0.0733, and 379 mg vs. 725 mg, P=0.0267) than that in the historical control group (Figure 2A). Regarding the im provement of classic parameters, the fold-decrease over time at days 7 and 14 of liver function tests, lactate dehydrogenase (LDH) (data not shown), ferritin, D-dimers (data not shown) and triglycerides was quickly favorable in the RXT group compared with the historical control group and not altered by the use of less ETP and DEX (Fig ure 2B). The differences in the classic parameter between time points of interest at day 0 and day 7 showed similar kinetics over time between the two treatment groups (On line Supplementary Figure S1).
Like in the historical control group, the cytopenia and co agulation parameters improved over time (Figures 2B), similarly to inflammatory markers (LDH, ferritin, sCD25 and cytokines) (Figure 1 and data not shown). Notably, the data indicate the presence of persistent clinical and bio logical improvements in the RXT group despite the use of significantly lower cumulative doses of ETP and DEX. As a result, treatment with RXT led to a reduction in both DEX and ETP cumulative doses by 38.3 and 52.2%, respectively, in comparison with the levels in the historical control group (Figure 2A).
Intergroup treatment type data comparisons of low/high doses of ETP/DEX for patients receiving RXT were per formed using Fisher’s exact test. Notably, 100% of patients receiving high ETP and DEX doses were present in the his torical control group versus only 33% and 17% in the RXT group, respectively (data not shown). The differences over time in the different parameter exhibited similar kinetics between the two low/high doses of ETP/DEX treatment groups (data not shown). Taken together, the data suggest that RXT could be an efficient ETP/DEX-sparing therapy. RXT was well tolerated. The duration of aplasia and infec tious episodes are summarized in (Table 1). In the adRED group, the tendency to infectious episodes (grade >3) was less frequent (20 vs. 26), and the duration of aplasia war shorter with a mean duration of 33 and 29.5 days between the start of HLH treatment and a thrombocyte count ≥ 50 G/L and a neutrophil count ≥ 0.5 G/L respectively versus 48 and 36 days in the historical control group, but the dif ference was not significant. This pilot study has a number of limitations, principally the retrospective aspect of this trial, small cohort size and monocentric design, the possible variability in physician judgment for starting ETP and DEX tapering and posology adaptation and some variability in chemotherapy regimen. Diagnostic criteria for HLH (HLH-2004 criteria, HScore) have been developed in cohorts that do not include HLH related to acute myeloid leukemia. Furthermore, the monitoring of cytopenias as parameters of diagnosis and response to treatment does not seem to be optimal in this particular population with bone marrow failure as
Table 1. Hemophagocytic lymphohistiocytosis-directed treatment and outcomes.
P1 P2 P3 P4 P5 P6 C1 C2 C3 C4 C5
Ruxolitinib, number of days/cumulative dose in mg 100/4,000 64/765 108/970 31/320 122/840 32/770
Etoposide, number of ad ministration/cumulative dose in mg/m2 8/800 9/925 5/250 4/325 4/200 2/150 8/1200 6/750 12/1,200 4/400 4/600
Dexamethasone, number of days/cumulative dose in mg 72/710 25/180 59/500 25/180 52/550 35/258 48/860 63/725 127/1,132 51/580 76/573
Follow-up after HLH diagnosis, days 114 252 40 125 576 46 48 1574 130 51 178
HLH response
Best response CR CR PR CR CR CR PR CR CR PR CR Time to best response, day 7 7 7 7 7 7 7 28 14 42 28 Best response duration, day 114 14 28 125 14 46 48 1574 130 51 178
Leukemia response
Leukemia remission yes yes no yes yes yes no yes no yes no Access to alloHSCT afterwards yes yes no no yes no no yes no no no Leukemia remission duration, day 114# 252 69 576 46 1574 51 Outcome at end of followup (0=Dead, 1=Alive) 0† 1 0‡ 0‡ 1 0♦ 0‡ 1 0‡ 1 0‡
Aplasia*, day Thrombocyte >=50x109/L 33 48 Thrombocyte >=100x109/L 43 48 Neutrophil >=0.5x10⁹/L 29.5 36 Neutrophil >=1x10⁹/L 31 36 Infections 20 26 Grade 3 16 24 Grade 4 4 2 Bacterial 12 16 Fungal 2 3 Viral 2 1 Germ not identified 4 6
HLH: hemophagocytic lymphohistiocytosis; P: patient; C: control; alloHSCT: allogeneic hematopoietic stem cell transplantation. Complete response (CR): no fever AND no organomegaly + ASAT diminution of at least 50% AND/OR ferritin diminution of at least 50%. Partial response (PR): no fever OR no organomegaly + ASAT diminution at least 25% AND/OR ferritin diminution at least 25%. Progressive disease (PD): fever and organomegaly + ASAT diminution <25% OR ferritin diminution <25%. Stable disease (SD): all other situations.*Days between the start of HLH treatment and an improvement in the blood count. †Transplant-related mortality. ‡ Leukemia progression.♦ Bleeding after transbronchial biopsy. #Death secondary to treatment-related mortality but still in leukemia remission.
sociated to leukemia and/or secondary to treatment. This highlights the need for new diagnostic and monitoring parameters. Accumulating studies suggest that inflamma tion may play an important role in many aspects of AML such as disease progression, chemoresistance, and mye losuppression.16 Furthermore, the use of cytokine assess
ment may be a promising field of exploration in the light of evidences reporting that some cytokines have favorable prognostic factors for survival in AML patients such as low levels of IL-6 and high levels of IL-10.17 These results sug gest that cytokine signatures may be reliable predictive biomarker for clinical evolution in AML patients. Con
Figure 2. Comparison of cumulative doses of etoposides, dexamethasone and hemophagocytic lymphohistiocytosis parameter evolution between the adRED population and a historical control population. (A) Median cumulative (cum) dose of etoposide (ETP) and dexamethasone (DEX) used in adRED and historical control patients. (B) Fold-decrease in levels of classic parameters at day 7 and day 14 in adRED-treated and historical control patients. adRED: dose-adjusted ruxolitinib, ETP and DEX.
sequently, a longitudinal assessment of the cytokines re pertoire in AML patients without HLH need to be explored and identified throughout the treatment and across AML subgroups.
In conclusion, this pilot study shows for the first time that the addition of RXT seems to be safe and an interesting therapeutic option for AML-associated HLH that could re duce the administered doses of DEX and ETP. These pre liminary data need to be confirmed prospectively in larger populations with multi-center studies.

Grégoire Stalder,1,2,3 Madeleine Suffiotti,4 Amandine Segot,1 Alessandra Noto,4 Giuseppe Pantaleo,3,4 Olivier Spertini1,3 and Michel Obeid3,4
1Service and Central Laboratory of Hematology, Lausanne University Hospital, Lausanne; 2Service of Hematology and Laboratory of Hematology, Institut Central des Hôpitaux, Hôpital du Valais, Sion and 3University of Lausanne, Lausanne and 4Division of Immunology and Allergy, Lausanne University Hospital, Lausanne, Switzerland
Correspondence: M. OBEID - michel.obeid@chuv.ch
https://doi.org/10.3324/haematol.2022.281221
Received: April 28, 2022. Accepted: September 1, 2022. Prepublished: September 8, 2022.
©2023 Ferrata Storti Foundation
Published under a CC BY-NC license
No conflicts of interest to disclose.
MO and OS conceived the study idea. GS, OS and MO had full access to all the data in the study and take responsibility for the integrity of the data and the accuracy of the data analysis. GS, MS, AN and MO prepared the figures and tables. GS, AS and MO collected the data. MS and AN did the statistical analyses. GS and MO wrote and prepared the manuscript. All authors participated in discussions and critically read the manuscript.
The authors thank the clinical diagnosis platform of the Immunology and Allergy Division and the Central Laboratory of Hematology for the collection and processing of samples.
Requests for access to research data should be sent to the corresponding author.
1. Delavigne K, Berard E, Bertoli S, et al. Hemophagocytic syndrome in patients with acute myeloid leukemia undergoing intensive chemotherapy. Haematologica. 2014;99(3):474-480.
2. Ramos-Casals M, Brito-Zeron P, Lopez-Guillermo A, Khamashta MA, Bosch X. Adult haemophagocytic syndrome. Lancet. 2014;383(9927):1503-1516.
3. Brisse E, Wouters CH, Matthys P. Hemophagocytic lymphohistiocytosis (HLH): a heterogeneous spectrum of cytokine-driven immune disorders. Cytokine Growth Factor Rev. 2015;26(3):263-280.
4. Parikh SA, Kapoor P, Letendre L, Kumar S, Wolanskyj AP. Prognostic factors and outcomes of adults with hemophagocytic lymphohistiocytosis. Mayo Clin Proc. 2014;89(4):484-492.
5. Daver N, McClain K, Allen CE, et al. A consensus review on malignancy-associated hemophagocytic lymphohistiocytosis in adults. Cancer. 2017;123(17):3229-3240.
6. La Rosee P, Horne A, Hines M, et al. Recommendations for the management of hemophagocytic lymphohistiocytosis in adults. Blood. 2019;133(23):2465-2477.
7. Setiadi A, Zoref-Lorenz A, Lee CY, Jordan MB, Chen LYC. Malignancy-associated haemophagocytic lymphohistiocytosis. Lancet Haematol. 2022;9(3):e217-e227.
8. Locatelli F, Jordan MB, Allen C, et al. Emapalumab in children with primary hemophagocytic lymphohistiocytosis. N Engl J Med. 2020;382(19):1811-1822.
9. Ozdemir BC, Latifyan S, Perreau M, et al. Cytokine-directed therapy with tocilizumab for immune checkpoint inhibitorrelated hemophagocytic lymphohistiocytosis. Ann Oncol.
2020;31(12):1775-1778.
10. Ahmed A, Merrill SA, Alsawah F, et al. Ruxolitinib in adult patients with secondary haemophagocytic lymphohistiocytosis: an open-label, single-centre, pilot trial. Lancet Haematol. 2019;6(12):e630-e637.
11. Albeituni S, Verbist KC, Tedrick PE, et al. Mechanisms of action of ruxolitinib in murine models of hemophagocytic lymphohistiocytosis. Blood. 2019;134(2):147-159.
12. Slostad J, Hoversten P, Haddox CL, Cisak K, Paludo J, Tefferi A. Ruxolitinib as first-line treatment in secondary hemophagocytic lymphohistiocytosis: a single patient experience. Am J Hematol. 2018;93(2):E47-E49.
13. Zhou L, Liu Y, Wen Z, et al. Ruxolitinib combined with doxorubicin, etoposide, and dexamethasone for the treatment of the lymphoma-associated hemophagocytic syndrome. J Cancer Res Clin Oncol. 2020;146(11):3063-3074.
14. Fardet L, Galicier L, Lambotte O, et al. Development and validation of the HScore, a score for the diagnosis of reactive hemophagocytic syndrome. Arthritis Rheumatol. 2014;66(9):2613-2620.
15. Henter JI, Horne A, Arico M, et al. HLH-2004: diagnostic and therapeutic guidelines for hemophagocytic lymphohistiocytosis. Pediatr Blood Cancer. 2007;48(2):124-131.
16. Recher C. Clinical implications of inflammation in acute myeloid leukemia. Front Oncol. 2021;11:623952.
17. Sanchez-Correa B, Bergua JM, Campos C, et al. Cytokine profiles in acute myeloid leukemia patients at diagnosis: survival is inversely correlated with IL-6 and directly correlated with IL-10 levels. Cytokine. 2013;61(3):885-891.
Asciminib is a potent first-in-class BCR::ABL1 inhibitor specifically targeting the ABL1 myristoyl pocket (STAMP). By virtue of not interacting with the ATP binding site, the drug maintains activity against chronic myeloid leukemia (CML) cells resistant to conventional tyrosine kinase in hibitors (TKI) caused by ABL1 kinase domain mutations. A phase I trial demonstrated promising results both in tol erability and treatment efficacy.1 In addition, a phase III trial (ASCEMBL) established a significant superiority of as ciminib compared to bosutinib with better molecular re sponse rates and a favorable safety profile in CML patients treated with at least two prior TKI.2 Currently, multiple phase II and III trials are ongoing, including the ASC4MORE and CMLXI trial assessing the combination of asciminib with imatinib and asciminib as first-line treat ment option.3,4 In the perspective of its emergent role in the CML treatment landscape, it is relevant to provide in sight in its real-world tolerability and efficacy. CML pa tients without further TKI treatment options are provided access to asciminib in the Early Access Programme (EAP) of Novartis in several countries including the Netherlands. We assessed real-world treatment patterns and outcomes of asciminib in the Dutch EAP patient cohort. We approached all hematologists treating CML patients with asciminib in the Dutch EAP (i.e., not in a clinical trial setting). Patients qualified for the EAP if (i) treated with at least two prior TKI and (ii) no other registered TKI were suitable due to severe comorbidities or known ABL1 ki nase domain mutations. Patients were included in our study if they consented and were older than 18 years. De ceased patients were included if they had not objected to the use of their medical information for scientific pur poses in the past. Treatment failure was defined as not reaching a complete cytogenetic response or BCR::ABL1 <1%IS (CCYR/MR2.0) (= primary), losing previously achieved CCyR/MR2.0 or MMR (= secondary) or progres sion to advanced-phase disease (AP/BC). Event-free sur vival (EFS) was defined as time from start of asciminib until progression to AP/BC or death. CML-related death was defined as death preceded by progression to AP/BC in the prior 3 months. Response to treatment was as sessed using the cumulative incidence competing risk (CICR) method considering the competing event of TKI discontinuation for any cause. Patients were only as sessed for response if asciminib exposure was longer than 1 month. The Medical Ethics Committee of the Amsterdam
University Medical Center approved this study. The study was conducted in accordance with the Declaration of Hel sinki.
Fifty-six CML patients from 14 medical centers had re ceived asciminib through the Dutch EAP at the time of in clusion. All hematologists agreed to participate and collected the relevant data from their patients. A total of 53 patients were included (Table 1). Patients were started on asciminib because of failure after having been on multiple TKI (43%), intolerance to multiple TKI (17%) or a combination of both (40%). Most patients (72%) had been exposed to at least three different types of TKI prior to asciminib (Online Supplementary Figure S1). Sixteen pa tients harbored a kinase domain mutation of whom 15 the T315I mutation and three a compound mutation. Six pa tients were in AP/BC when asciminib was started and six patients were treated with asciminib after an allogeneic hematopoietic stem cell transplantation (HSCT) of whom three also received asciminib prior to the HSCT. Of 38 pa tients previously treated with ponatinib, 15 (39%) had pri mary ponatinib failure and 27 (71%) discontinued ponatinib due to intolerance of whom 13 patients combined with treatment failure.
Median asciminib exposure time was 7 months (interquar tile range [IQR], 3-17). Chronic phase patients started with a dose of 40 mg twice daily (BID), with the exception of patients with a T315I mutation who immediately started with a dose of 200 mg BID as currently recommended based on the asciminib phase I results.1 Patients with ad vanced phase disease were also recommended to start a higher dose (varying from 160 to 200 mg BID). Frequently reported adverse events (AE) were cytopenia and folliculi tis, both of which were considered probably related to as ciminib and were generally manageable without dose modification (Online Supplementary Table S1). Four pa tients definitely discontinued asciminib due to persistent anemia and/or thrombocytopenia, of whom three also be cause of a failing response. Two vascular events were re ported: one recurrent TIA with multiple events prior to asciminib exposure, therefore classified as unlikely to be related; and one non ST-elevation myocardial infarction (NSTEMI) in a patient with a history of cardiovascular dis ease, but occurring at 9 days after the initiation of ascimi nib and therefore classified as possibly related.
Approximately one third of patients discontinued asciminib after a median exposure time of 4 months (n=18) (Table 1).
Table 1. Baseline characteristics and asciminib treatment characteristics of included chronic myeloid leukemia patients treated with asciminib in the Dutch Early Access Programme.
Baseline characteristics
Frequency (N=53) Proportion (%)
Male sex 30 57
Age at diagnosis in years, mean (SD) 51 (15)
Phase at diagnosis, CP / AP / BC 48 / 5 / 0 91 / 9 / 0
Prior TKI exposure type, IMA / NIL / DAS / BOS / PON 35 / 27 / 43 / 29 / 38 66 / 51 / 81 / 55 / 72
Prior TKI exposure number, 2 / 3 / 4 / 5 15 / 16 / 18 / 4 28 / 30 / 34 / 8
Pattern prior to asciminib
Intolerance / resistance / both Prior imatinib failure (primary + secondary) Prior ponatinib failure (primary + secondary) History of allogeneic HSCT
Best response prior to asciminib
No response, CHR, BCR::ABL1 >1% IS
BCR::ABL1 <1% IS but >0,1% IS
BCR::ABL1 <0,1% IS
9 / 23 / 21 26 (22+4) 22 (15+7) 6
17 12 24
17 / 43 / 40 93 (79+4)* 58 (39+18)* 11
32 23 45
Kinase domain mutations, all / T315I / compound 16 / 15 / 3 30 / 28 / 6
Asciminib treatment characteristics
Frequency (N=53) Proportion (%)
Dose at asciminib start, 40 mg BID / 200 mg BID / other 35 / 14 / 4 66 / 26 / 7 Phase at asciminib start, CP / AP / BC 47 / 3 / 3 89 / 6 / 6
No response, CHR, BCR::ABL1 >1% IS BCR::ABL1 <1%IS but >0,1% IS BCR::ABL1 <0,1% IS
Discontinuation of asciminib, total Failure / intolerance / both / other Primary failure Secondary failure
34 7 12
18 12 / 1 / 3 / 2** 11 4
64 13 23
34 23 / 2 / 6 / 4 21 8
Best response prior to asciminib is defined as best response to any tyrosine kinase inhibitor (TKI) treatment line prior to asciminib start. Pro portions are calculated with the total number of patients (n=53) as denominator, if not stated otherwise. *Denominators are the total of imatinib-treated (n=35) or ponatinib-treated (n=38) patients; **1 patient was treated temporarily prior to HSCT, the other patient was treated with asciminib post hematopoietic stem cell transplantation (HSCT) and successfully discontinued asciminib after persistent deep molecular response. CP: chronic phase; AP: accelerated phase; BC: blast crisis; IMA: imatinib; NIL: nilotinib; DAS: dasatinib; BOS: bosutinib; PON: po natinib; CHR: complete hematological response; BID: twice daily; IS: International Scale.
The main reason for discontinuation was treatment failure. Eleven patients had primary treatment failure, of whom three also had intolerance for asciminib; four patients had secondary treatment failure. Only one patient discontinued asciminib solely based on intolerance, experiencing per sistent CTC grade 3 cytopenia. In chronic-phase (CP) patients without prior HSCT (n=44), the CI of maintaining or reaching MR2.0 and MMR were 60% and 42% by 6 months, respectively (Figure 1). In pa tients without MR2.0 (n=25) or MMR (n=32) at baseline, the CI of reaching these responses were 30% and 21% by 6 months, respectively. The overall best achieved response was MR2.0 and MMR in 66% and 45% of patients, respect ively (Figure 2A). Figure 2B presents the evolution of mol
ecular response and discontinuation at different points in time. Of 32 patients without MMR at baseline, 21 patients (66%) had an improvement in response, defined as a BCR::ABL1 decline of at least one-log (n=17) or a complete hematological response (CHR) if not present at baseline (n=4). The proportion of CP patients in CHR improved from 80% at baseline to 91% with asciminib. Three CP patients progressed to AP/BC, six proceeded to HSCT and three eventually died of a CML-related cause. Of note, in CP patients with primary ponatinib failure (n=10), only one achieved MR2.0 and none of them achieved MMR. Moreover, to date six patients discontinued asciminib because of failure with a median treatment dur ation of 4 months. Better responses were observed in case
Figure 1. Cumulative incidences of MR1.0 (BCR::ABL1 <10% IS), MR2.0 (BCR::ABL1 <1% IS), MMR (BCR::ABL1 <0,1% IS), MR4.0 (BCR::ABL1 <0,01% IS) in 44 chronic-phase chronic myeloid leukemia patients during asciminib treatment. A cumulative incidence competing risk (CICR) method was used for this re sponse analysis, with asciminib discon tinuation of any cause as competing event. IS: International Scale.
of secondary ponatinib failure (n=5): 80% regained MR2.0 and 40% reached MMR. In case of ponatinib discontinu ation due to intolerance most patients were already in MR2.0 (13/16, 81%) or MMR (10/16, 63%) at the start of as ciminib and maintained this response. Three of these 16 patients deepened their response by one-log or more. Twelve CP patients harbored the T315I or compound mu tation and most of them (n=8) were already in MR4.0 at asciminib initiation. In the remaining four, only one achieved MR2.0, none achieved MMR and all eventually discontinued asciminib due to failure (Online Supplemen tary Figure S2A).
Of six patients in AP/BC at the start of asciminib, four had primary asciminib failure and only one patient is currently still on asciminib after 5 months of treatment without HSCT (Online Supplementary Figure S2B). Three AP/BC pa tients were temporarily treated with asciminib before pro ceeding to a HSCT; two achieved or maintained a CHR with a slight decrease in BCR::ABL1 during asciminib treatment. However, only one maintained this response until HSCT. Three AP/BC patients died, all from a CML-related cause. One CML-AP patient, known with a compound mutation (T315I and Y253H), was treated with both ponatinib and asciminib. This resulted in a BCR::ABL1 decrease from 78% to 86% IS, however accompanied with grade 3 thrombo cytopenia. After 4 months, this patient discontinued the combination treatment because of an increase in BCR::ABL1 and persistent thrombocytopenia. He proceeded to HSCT in December 2021 and was in MMR at the time of
analysis.
Six patients were treated with asciminib because of re fractory disease post HSCT (Online Supplementary Figure S2C). One patient achieved MR2.0 at a single time point, however progressed to BC and died shortly after. The other five reachieved and maintained at least M2.0, three reached MR5.0 of whom one eventually discontinued as ciminib.
In the whole cohort, OS and EFS were 87% and 81%, with a median time to event or lost-to-follow-up of 12 months. Seven patients died, all from a CML-related cause. Our results demonstrate that asciminib is a well-tolerated novel CML treatment option with adequate response rates, even in heavily pretreated patients. Only one patient dis continued asciminib solely due to intolerance. The majority of CP patients had at least a one-log improvement in their molecular response, 60% reached or maintained MR2.0 by 6 months and 44% reached or maintained MMR by 12 months. These results are promising, especially in the con text of poor responses observed in patients treated with other TKI in third line and beyond.5 Interestingly, in our co hort, only one patient (10%) with primary ponatinib resis tance achieved MR2.0. This compares poorly to the remaining CP patients with an overall MR2.0 rate of 79% (P<0.001). Most of the patients with a prior ponatinib re sistance were treated with an asciminib dose of 40 mg BID. As dosages up to 200 mg BID have been recom mended for patients harboring the T315I mutation, it seems warranted to explore if higher dosages would also

yield better results in primary ponatinib-resistant patients. Of note, limited responses were seen in CML-CP patients who were primary refractory to ponatinib (both in the presence or absence of the T315I mutation) and in patients with advanced phase CML. Presumably, BCR::ABL1-inde pendent resistance mechanisms play an important role in this TKI refractoriness. More clinical data are needed to assess if earlier use of asciminib in CML patients that fail to respond to current kinase domain targeting TKI may prevent the development of asciminib resistance. Our study supports the efficacy and tolerability in a realworld setting among heavily pretreated CML patients and with its favorable toxicity profile, asciminib is emerging as a valuable treatment option for CML patients with intoler ance to current TKI.
Figure 2. Overall best achieved response in chronic-phase patients, presented as proportions (%) in all patients and in patients without the respective response at baseline. CHR: complete hematological response; IS: Inter national Scale.

Blijlevens,3 Saskia K. Klein,4 Laura G.M. van Hussen-Daenen,5 Gwendolyn G.Y. van Gorkom,6 Willem M. Smit,7 Peter van Balen,8 Bart J. Biemond,9 Marjan J. Cruijsen,10 Maarten F. Corsten,11 Peter A.W. te Boekhorst,12 Harry R. Koene,13 Geerte L. van Sluis,14 Jan J. Cornelissen12 and Peter E. Westerweel1
1Department of Internal Medicine, Albert Schweitzer Hospital, Dordrecht; 2Department of Hematology, Amsterdam University Medical Centers, location VUMC, Amsterdam; 3Department of Hematology, Radboud University Medical Center, Nijmegen; 4Department of Hematology, University Medical Center Groningen, Groningen; 5Department of Hematology, University Medical Center Utrecht, Utrecht; 6Department of Hematology, Maastricht University Medical Center, Maastricht; 7Department of Hematology, Medisch Spectrum Twente, Enschede; 8Department of Hematology, Leiden University Medical Center, Leiden; 9Department of Hematology, Amsterdam University Medical Center, location AMC, Amsterdam; 10Department of Hematology, Catharina Hospital, Eindhoven; 11Department of Hematology, Meander Medical Center, Amersfoort; 12Department of Hematology, Erasmus University Medical Center, Rotterdam; 13Department of Hematology, St.-Antonius Hospital,
Nieuwegein and 14Department of Hematology, Isala Hospital, Zwolle, the Netherlands
Correspondence: C.C.B. KOCKEROLS - c.c.b.kockerols@asz.nl
https://doi.org/10.3324/haematol.2022.281386
Received: May 10, 2022.
Accepted: September 2, 2022. Prepublished: September 8, 2022.
©2023 Ferrata Storti Foundation
Published under a CC BY-NC license
1. Hughes TP, Mauro MJ, Cortes JE, et al. Asciminib in chronic myeloid leukemia after ABL kinase inhibitor failure. N Engl J Med. 2019;381(24):2315-2326.
2. Rea D, Mauro MJ, Boquimpani C, et al. A phase 3, open-label, randomized study of asciminib, a STAMP inhibitor, vs bosutinib in CML after 2 or more prior TKIs. Blood. 2021;138(21):2031-2041.
3. ASC4MORE trial. Available at:
No conflicts of interest to disclose.
PW, JJ and CK conceptualized and coordinated the study. All authors collected the data of their consenting patients. CK curated, analyzed and visualized the data, and wrote the first draft of the manuscript. All authors revised and approved the final version of the manuscript.
statement Data can be made available on request.
https://clinicaltrials.gov/ct2/show/NCT03578367
4. CMLXI trial. Available at: https://clinicaltrials.gov/ct2/show/NCT03906292.
5. Cortes J, Lang F. Third-line therapy for chronic myeloid leukemia: current status and future directions. J Hematol Oncol. 2021;14(1):44-49.
The 2017 European LeukemiaNet (ELN) genetic risk strat ification for acute myeloid leukemia (AML) considers three cytogenetic categories: favorable, intermediate, and ad verse karyotype (AK);1 the latter includes t(6;9)(p23;q34.1), DEK-NUP214; t(v;11q23.3), KMT2A rearranged; t(9;22) (q34.1;q11.2), BCR-ABL1; inv(3)(q21.3q26.2)/t(3;3)(q21.3; q26.2), GATA2, MECOM(EVI1); 5; del(5q); 7; 17; abn(17p); and complex (CK) or monosomal (MK) karyotype.1 CK was defined as three or more unrelated abnormalities that do not include t(8;21), inv(16)/t(16;16), t(9;11), t(v;11q23,3), t(6;9), or inv(3)/t(3;3)/t(9;22)(q34.1;q11.2). MK was defined by the presence of an autosomal monosomy, in associ ation with at least one additional autosomal monosomy or structural chromosome abnormality, other than those defining core binding factor (CBF) AML or acute promye
locytic leukemia.1 The prognostic heterogeneity among ELN-2017 AK subgroups was reiterated in a recent study that suggested classifying inv(3)(q21.3q26.2)/t(3;3)(q21.3; q26.2), TP53 and/or 17p abnormalities, and CK, as “very adverse-risk”.2
The primary objective of the current study was to seek out differences in outcome prediction and mutation com position among ELN-2017 AK subcategories for AML. Our study population was recruited from Mayo Clinic data bases following approval from Institutional Review Board and documentation of newly diagnosed AML treated with intensive induction chemotherapy. The latter typically consisted of “7+3” regimens, with a minority of patients receiving, in addition, midostaurin or other drugs, depend ing the mutation type; patients induced with less inten
Table 1. Presenting clinical and laboratory characteristics of 189 acute myeloid leukemia (AML) patients with European LeukemiaNet adverse karyotype; a separate cohort of 325 AML patients with normal karyotype is included as a reference; rare adverse variants included inv(3)/t(3;3);i(17) and 17(p) abnormalities. P value provided is for comparisons among adverse karyotype categories. CR/Cri: complete remission with incomplete hematologic recovery.
Variables Monosomal N=103 Complex N=36
Rare adverse variants N=5
-7 N=9 -5/5qN=7 t(v;11q23.3) N=13 t(6;9) N=8 t(9;22) N=8 P value
Normal karyotype N=325
Median age (range), years 61 (24-79) 63 (23-78) 62 (44-74) 65 (27-67) 60 (40-81) 57 (22-69) 40 (20-58) 50 (26-73) 0.0002 60 (18-82) Males, N (%) 55 (53) 23 (64) 3 (60) 6 (67) 5 (71) 8 (61) 2 (25) 5 (62) 0.6 186 (57)
AML subtype, N (%) Primary Secondary Therapy-related
40 (39) 53 (51) 10 (10)
14 (39) 16 (44) 6 (17) 1 (20) 4 (80) 0
4 (44) 4 (44) 1 (12)
3 (43) 3 (43) 1 (14)
13 (100) 0 0
7 (87) 1 (13) 0
4 (50) 4 (50) 0 0.001 248 (76) 55 (17) 22 (7)
Median leukocytes x109/L (range) 3.2 (0.2-169) 7.5 (0.7-113) 6.7 (1.7-59.6) 7.8 (1.2-137) 1.8 (0.5-44) 9.1 (0.9-76.4) 11.4 (2-40) 68.9 (1-144) 0.01 14.6 (0.3-350)
Median platelets x109/L (range) 39 (3-431) 50 (7-223) 77 (54-112) 22 (5-943) 70 (10-178) 66 (25-298) 46 (28-85) 87 (36-432) 0.3 64 (3-471)
FLT3-ITD; mutated/tested, N (%) 0/34 (0) 0/15 (0) 0/1 (0) 0/4 (0) 0/3 (0) 0/5 (0) 7/7 (100) 0/1 (0) <0.0001 73/220 (33)
TP53, mutated/tested (%) 8/13 (62) 3/6 (50) 0/0 (0) 0/2 (0) 0/0 (0) 0/2 (0) 0/3 (0) 0/0 (0) 0.04 1/78 (1) CR/CRi, N (%) 55 (53) 22 (61) 3 (60) 6 (67) 5 (71) 11 (85) 8 (100) 6 (75) 0.04 285 (88)
Transplanted, N (%) 30 (29) 8 (22) 1 (20) 4 (44) 3 (43) 8 (61) 6 (75) 2 (25) 0.04 104 (32) Deaths, N (%) 96 (93) 34 (94) 5 (100) 7 (78) 6 (86) 7 (54) 2 (25) 4 (50) <0.0001 190 (58)
sive regimens, such as hypomethylating agents with or without venetoclax, were excluded. Consolidation chemo therapy often utilized high-dose cytarabine. Treatment period spanned from January 2004 through August 2020 and follow-up information was updated as of April 2022. Conventional criteria were used to diagnose AML, assign cytogenetic risk category, and classify treatment re sponse.1,3 Survival analyses were performed without cen soring for allogeneic hematopoietic stem cell transplant (AHSCT). Conventional methods were used for cytogenetic and molecular studies, including next-generation se quencing (NGS).4 Statistical analysis was performed using JMP Pro 16.0.0 software package, SAS Institute, Cary, NC. We recruited 189 intensively treated AML patients (median age 61 years; 57% males) with ELN-2017 AK, from a data base of 758 intensively treated AML cases. Our operational hierarchy of AK group designation was i) MK excluding CBF abnormalities (n=103); ii) CK, not including MK, t(8;21), inv(16)/t(16;16), t(9;11), t(v;11q23.3), t(6;9), inv(3)/t(3;3) or t(9;22) (n=36); iii) non-monosomal karyotype with specific adverse variants (n=50). The latter included t(9;22) (n=8); t(6;9) (n=8); rare adverse variants (RAV), including two cases of inv(3), one of t(3;3), one of isochromosome 17, and one of 17(p) abnormalities (n=5); t(v;11q23.3), excluding t(9;11) (n=13); -5/5q- (n=7); and monosomy 7 (n=9). With regards to cases with t(9;22), in order to minimize ambi guity of disease definition,5 we included all cases regard
less of antecedent history of chronic myeloid leukemia (CML). Of note, 96 (93%) of the 103 patients with MK har bored ≥3 abnormalities. The number of informative pa tients for FLT3-ITD mutation was 70 (7 mutated), NPM1 58 (3 mutated), CEBPA 44 (3 mutated), TP53 26 (11 mutated), DNMT3A 25 (3 mutated), RUNX1 25 (1 mutated), ASXL1 25 (2 mutated), IDH1 25 (none mutated), and IDH2 25 (1 mu tated).

Comparison of our operational seven AK subcategories showed the following differences (Table 1): i) age distribu tion; <60 years 100% for t(6;9), 75% for t(9;22), 69% for t(v;11q23.3), and 20-43% for others (P=0.002); ii) AML sub type distribution; primary AML 100% for t(v;11q23.3), 88% for t(6;9), and 20-50% for others; iii) FLT3-ITD mutations; 100% for t(6;9) and 0% for all others (P<0.001); iv) TP53 mutations; 62% for MK, 50% for CK, and 0% for all others (P=0.04); v) achievement of complete remission with in complete hematologic recovery (CR/CRi): 100% for t(6;9), 85% for t(v;11q23.3), 53% for MK, and 60-75% for others (P=0.04); vi) documentation of AHSCT; 75% for t(6;9), 62% for t(v;11q23.3), and 20-44% for others (P=0.04). AHSCT in CR1 was documented in 75% for t(6;9), 54% in t(v;11q23.3), and 22-43% in others (P=0.02). Additional information on phenotype and mutation comparisons is outlined in Table 1, which also includes a comparator arm of 325 patients with normal karyotype (NK). After a median follow-up of 9.7 months (range, 0.2-191),
Figure 1. Overall survival of 189 intensively treated Mayo Clinic patients with newly diagnosed acute myeloid leukemia (not in cluding promyelocytic), stratified by European LeukemiaNet (ELN) adverse karyotype subcategories. RAV: rare adverse variants; MK: monosomal karyotype; CK: complex karyotype; NK: normal karyotype (survival analysis did not censor for allogeneic hema topoietic stem cell transplant).
161 (85%) deaths, 57 relapses (49% of those achieving CR/CRi), and 62 (33%) AHSCT, including 56 in CR1, were documented. The 30-day mortality overall was 7% (13/189) with no significant difference between the AK subcat egories (P=0.2). The 60-day mortality overall was 12% (22/189); the corresponding percentages were 19% for MK, 14% for -5/del(5q), 6% for CK, and otherwise 0% for all the remaining AK categories (P=0.02). In age-adjusted multi variable analysis, using NK-AML as a reference, survival was adversely affected by MK (hazard ratio n [HR] 3.8, 95% confidence interval [CI]: 2.9-4.8; P<0.001), CK (HR 3.1, 95% CI: 2.1-4.4; P<0.001), and RAV (HR 5.6, 95% CI: 2.3-13.7; P<0.001); in addition, borderline significance for adverse outcome was also noted for monosomy 7 (P=0.06) and -5/5q- (P=0.09). On the other hand, there was no differ ence in survival between NK-AML and t(6;9) (P=0.43), t(9;22) (P=0.95) or t(v;11q23.3) (P=0.67). There was also no difference in survival between MK versus RAV (P=0.39), MK versus CK (P=0.31), CK versus RAV (P=0.21), or -5/5q versus
monosomy 7 (P=0.97). Comparative survival data are depicted in Figure 1 and identify AML with t(6;9), t(9;22) or t(v;11q23.3) as having superior survival, compared to AML with MK, CK, RAV, -5/5q- or monosomy 7. In multivariable analysis, addi tional prognostic contribution, to that of AK cytogenetic risk stratification, was not evident for any AML subtype (P=0.12), NPM1 (0.32), or TP53 (P=0.71) mutations, but was evident for FLT3-ITD mutation (P=0.04); the latter was sustained when analysis was adjusted for age (P=0.01). Similarly, the presence of TP53 mutation, in patients with MK or CK, did not appear to further influence survival (Fig ure 2A). The relatively favorable survival data in patients with t(6;9), t(9;22) or t(v;11q23.3) was attributed to their younger age distribution and significantly higher utilization of AHSCT (Figure 2B); it should be noted that 14 of 21 pa tients with these translocations received AHSCT, including 13 in CR1. On the other hand, although AHSCT also im proved survival in patients with MK/CK (Figure 2C), it was
Figure 2. Overall survival data in 189 intensively treated acute myeloid leukemia patients with adverse karyotype. (A) survival data in a subset of 19 patients expressing monosomal or complex karyotype and stratified by TP53 mutation status; (B) survival data in a subset of 29 patients expressing t(6;9), t(9;22) or t(v;11q23) and stratified by documentation of allogeneic hematopoietic stem cell transplant (AHSCT); (C) survival data in a subset of 139 patients expressing monosomal or complex karyotype and stratified by documentation of AHSCT; (D) survival data in a separate cohort of 325 intensively treated patients with acute myeloid leukemia and expressing normal karyotype and stratified by documentation of AHSCT.

not as effective as it was in the setting of t(6;9), t(9;22) or t(v;11q23.3) (Figure 2B) or NK (Figure 2D). Among 62 AK pa tients who received AHSCT, 26 (42%) experienced posttransplant relapse, including 18 (60%) of 30 with MK, two (25%) of eight with CK, three (38%) of eight with t(v;11q23.3), none of six with t(6;9), one (25%) of four with monosomy 7, one (33%) of three with -5/5q-, none of two with t(9;22), and one (100%) of one with RAV (P=0.02).
The current study highlights significant differences in phenotype and mutation composition among ELN-2017 AK subcategories and confirms the value of AHSCT in secur ing long-term survival in patients with t(6;9)(p23;q34.1) or t(v;11q23.3), excluding t(9;11)(p21.3;q23.3) abnormalities.
The AHSCT-enabled survival data in patients with t(6;9) or t(v;11q23.3) were superior to those seen in patients with MK/CK and did not appear to be inferior to that expected in the setting of NK; of note, only three of our eight pa tients with AML-t(6;9) received FLT3 inhibitor as part of their induction. Similar observations regarding the value of AHSCT in overcoming the otherwise poor prognosis in t(6;9)-AML were also previously reported.6,7 In a recent study, younger patients with t(9;11)(p22;q23)/KMT2AMLLT3 (considered ELN intermediate-risk) had better out comes and different mutational composition, compared to patients with other 11q23/KMT2A rearrangements, sug gesting prognostic influence from the specific KMT2A fusion partner.8 In the current study, the KMT2A re arrangements included t(11;19)(q23;p13.1)/KMT2A-ELL (n=5), t(6;11)(q27;q23)/AF6/KMT2A (n=3), del(11)(q21q23-25) (n=2), and others (n=3), with AHSCT-enabled survival data that appeared to be similar to that seen in NK-AML (see above), as has been noted in another recent study;9 of note, disruption of KMT2A in the two cases with del(11)(q21q23-25) was not confirmed but their exclusion from survival analysis did not affect the overall results. We were pleasantly surprised by the favorable survival data in our eight AML patients with t(9;22)(q34.1;q11.2), which included four with antecedent CML. We are cogni zant of the 2016 World Health Organization criteria for t(9;22)-AML, which requires absence of evidence for an underlying CML or AML with recurrent genetic aberra tions.10 However, ongoing challenges in clearly distinguish ing de novo from blast phase CML remain5,11 and, accordingly, for the purposes of the current study, we in cluded all cases of t(9;22)-AML, with or without anteced ent CML. Regardless, our observations suggest that long-term survival is a possibility in t(9;22)-AML, in the context of contemporary treatment strategies. In contrast to previous reports,12 our observations suggest the prog nostic contribution of TP53 mutations in AML might be fully accounted for by its close association with MK/CK.
Whether or not further accounting for TP53 allelic state modifies our observations is yet to be determined.13,14 Un like the case with t(6;9)(p23;q34.1) or t(v;11q23.3), AHSCT alone might not always secure durable remission in AML patients with MK/CK, although it currently remains the preferred treatment option. Finally, we recognize the relatively small number of informative cases for specific mutation categories, which makes it difficult to draw de finitive conclusions on the outcome and advised treat ment approach for these groups.
Ayalew Tefferi,1 Amritpal Singh,1 Naseema Gangat,1 Aref Al-Kali,1 Hassan Alkhateeb,1 Mithun Shah,1 Mrinal S. Patnaik,1 Michelle A. Elliott,1 William J. Hogan,1 Mark R. Litzow,1 Alexandra WolanskyjSpinner,1 Christopher C. Hook,1 Abhishek Mangaonkar,1 David Viswanatha,2 Dong Chen,2 Animesh Pardanani,1 Kebede H. Begna1 and Rhett P. Ketterling2
1Division of Hematology, Mayo Clinic and 2Division of Hematopathology, Departments of Medicine and Laboratory Medicine, Mayo Clinic, Rochester, MN, USA
Correspondence:
A. TEFFERI - tefferi.ayalew@mayo.edu R. P. KETTERLING - ketterling.rhett@mayo.edu
https://doi.org/10.3324/haematol.2022.281495
Received: May 30, 2022. Accepted: September 2, 2022. Prepublished: September 8, 2022.
©2023 Ferrata Storti Foundation Published under a CC BY-NC license
No conflicts of interest to disclose.
AT, RK, and KHB participated in writing the paper, data analysis and interpretation, and abstraction of patient data. All authors participated in patient care, abstraction of patient data, laboratory result interpretation or data analysis. All authors reviewed and approved the manuscript.
Data-sharing statement Data is available on request.
1. Dohner H, Estey E, Grimwade D, et al. Diagnosis and management of AML in adults: 2017 ELN recommendations from an international expert panel. Blood. 2017;129(4):424-447.
2. Bataller A, Garrido A, Guijarro F, et al. European LeukemiaNet 2017 risk stratification for acute myeloid leukemia: validation in a risk-adapted protocol. Blood Adv. 2022;6(4):1193-1206.
3. Grimwade D, Hills RK, Moorman AV, et al. Refinement of cytogenetic classification in acute myeloid leukemia: determination of prognostic significance of rare recurring chromosomal abnormalities among 5876 younger adult patients treated in the United Kingdom Medical Research Council trials. Blood. 2010;116(3):354-365.
4. He R, Devine DJ, Tu ZJ, et al. Hybridization capture-based next generation sequencing reliably detects FLT3 mutations and classifies FLT3-internal tandem duplication allelic ratio in acute myeloid leukemia: a comparative study to standard fragment analysis. Mod Pathol. 2020;33(3):334-343.
5. Neuendorff NR, Hemmati P, Arnold R, et al. BCR-ABL(+) acute myeloid leukemia: are we always dealing with a high-risk disease? Blood Adv. 2018;2(12):1409-1411.
6. Ishiyama K, Takami A, Kanda Y, et al. Allogeneic hematopoietic stem cell transplantation for acute myeloid leukemia with t(6;9)(p23;q34) dramatically improves the patient prognosis: a matched-pair analysis. Leukemia. 2012;26(3):461-464.
7. Kayser S, Hills RK, Luskin MR, et al. Allogeneic hematopoietic cell transplantation improves outcome of adults with t(6;9) acute myeloid leukemia: results from an international
collaborative study. Haematologica. 2020;105(1):161-169.
8. Bill M, Mrozek K, Kohlschmidt J, et al. Mutational landscape and clinical outcome of patients with de novo acute myeloid leukemia and rearrangements involving 11q23/KMT2A. Proc Natl Acad Sci U S A. 2020;117(42):26340-26346.
9. Issa GC, Zarka J, Sasaki K, et al. Predictors of outcomes in adults with acute myeloid leukemia and KMT2A rearrangements. Blood Cancer J. 2021;11(9):162.
10. Arber DA, Orazi A, Hasserjian R, et al. The 2016 revision to the World Health Organization classification of myeloid neoplasms and acute leukemia. Blood. 2016;127(20):2391-2405.
11. Neuendorff NR, Burmeister T, Dorken B, Westermann J. BCRABL-positive acute myeloid leukemia: a new entity? Analysis of clinical and molecular features. Ann Hematol. 2016;95(8):1211-1221.
12. Rucker FG, Schlenk RF, Bullinger L, et al. TP53 alterations in acute myeloid leukemia with complex karyotype correlate with specific copy number alterations, monosomal karyotype, and dismal outcome. Blood. 2012;119(9):2114-2121.
13. Bernard E, Nannya Y, Hasserjian RP, et al. Implications of TP53 allelic state for genome stability, clinical presentation and outcomes in myelodysplastic syndromes. Nat Med. 2020;26(10):1549-1556.
14. Grob T, Al Hinai ASA, Sanders MA, et al. Molecular characterization of mutant TP53 acute myeloid leukemia and high-risk myelodysplastic syndrome. Blood. 2022;139(15):2347-2354.
Graft-versus-host disease (GvHD) of the gastrointestinal (GI) tract is a major driver of morbidity and mortality after allogeneic hematopoietic stem cell transplantation (HSCT).1 Profound alterations in intestinal microbiota com position are reproducibly observed in HSCT with an at tendant loss of diversity and a shift from anaerobes to facultative aerobes.2,3 Enrichment of Enterococcus is a characteristic feature of transplant-associated dysbiosis that predisposes patients to subsequent bacteremia and GvHD.4-6 Patterns of microbial disruption have been shown to be consistent across different transplant centers and geographic locations, indicative of a stereotypical micro bial community response during transplantation even across different patterns of antibiotic use.7 Therefore, strategies to maintain diversity and remodel the intestinal microbiome offer the potential to attenuate the severity of this disease;8 however, to date, there are no proven strategies to prevent dysbiosis in allogeneic HSCT recipi ents. In this report, we administered tocilizumab as ad junctive GvHD prophylaxis to patients at high risk for the development of GI-tract disease to assess the effect on transplant outcomes and on microbial diversity and com position.
This was a phase II study (clinicaltrials gov. Identifier: NCT03699631) in which the primary endpoint was the pro bability of GvHD-free/relapse-free survival (GRFS)9 after matched related/unrelated donor peripheral blood alloge neic HSCT in patients that received busulfan-based mye loablative conditioning. GvHD prophylaxis consisted of tacrolimus and methotrexate plus tocilizumab adminis tered on days -1 and day +100. The 12-months GRFS was compared to a prespecified historical control value of 20% at a one-sided 5% significance level.9 Patients were eli gible if they were >18 years of age and had a diagnosis of acute leukemia, chronic myelogenous leukemia, myelo proliferative disease, or myelodysplasia with <5% marrow blasts; and had a 10/10 matched sibling or 8/8 matched unrelated donor. Between November 21, 2018, and Feb ruary 12, 2020, 29 patients were enrolled. The demo graphic data for this population is detailed in the Online Supplementary Table S1. All patients received a first dose of tocilizumab on day -1. Twenty-six patients were treated with a second dose at a median of 99 days post transplan tation (range, 86-114 days). Three patients did not receive a second dose; one due to relapse prior to day 100, one de
veloped grade 3-4 acute GvHD which triggered the GRFS endpoint, and the last patient refused due to concerns about acquiring SARS-CoV2 infection during outpatient to cilizumab administration. Median follow-up for surviving patients was 20.6 months (range, 14.4-29.2 months). There were no cases of primary graft failure. The median time to engraftment was 16 days (range, 13-26 days) for neutrophils and 19 days (range, 10-35 days) for platelets. The cumulative incidence of grades 2-4 acute GvHD at day 180 (using Harris criteria)10 was 10.5% (95% confidence in terval [CI]: 2.6-24.9) (Figure 1A), whereas the incidence of grades 3-4 acute GvHD was 7.0% (95% CI: 1.2-20.4) (Figure 1B). One patient had grade 2 acute GvHD due to stage 3 skin involvement. Two patients developed grade 3 acute GvHD; one that involved the lower GI tract and another with stage 2 liver and biopsy-proven upper GI involvement. There were no other cases of lower GI-tract involvement within the first 12 months. Four of 29 patients developed bacteremia within the first 100 days (i.e., Escherichia coli, Capnocytophaga sputigena, Streptococcus oralis, and En terococcus faecalis). The cumulative incidence of overall chronic GvHD (using NIH consensus criteria)11 was 64.8% (95% CI: 42.4-80.3) (Figure 1C), whereas the incidence of severe chronic GvHD was 7.7% (95% CI: 1.3-22.1) at 12 months (Figure 1D). Organ involvement in the 17 patients who developed chronic GvHD consisted of liver (n=10), mouth (n=7), eyes (n=5), skin (n=4), lung (n=1), genital (n=1), and joints (n=1). The cumulative incidence of relapse was 10.3% (95% CI: 2.5-24.6) at 1 year (Figure 1E). Non-relapse mortality was 3.4% (95% CI: 0.2-15.3) at 12 months and oc curred in one patient due to bronchiolitis obliterans (Figure 1F). Overall survival and relapse-free survival were identical at 12 months (86.2%; 95% CI: 67.3-94.6) (Figure 1G and H). The probability of GRFS at 1 year was 37.9% (95% CI: 20.954.9) which was significantly higher than the prespecified historical rate of 20% (P=0.023), indicating that the primary end point of the trial was met (Figure 1I).
In order to examine fecal microbial composition, we com pared evaluable stool samples from trial participants (toci) with those from an observational cohort at Memorial Sloan Kettering Cancer Center (MSKCC) (control). The control population was assembled from demographically matched patients who contributed fecal samples while receiving an unmodified peripheral blood stem cell transplant following myeloablative conditioning with Flu/BU4 and received ta
Mitigation of gastrointestinal graft-versus-host disease with tocilizumab prophylaxis is accompanied by preservation of microbial diversity and attenuation of enterococcal domination
F
Figure 1. Transplant outcomes in patients that received graft versus-host disease prophylaxis with tocilizumab. (A and B) Cumulative incidences of grades 2-4 (A) and 3-4 (B) acute graft-versus-host disease (GvHD). (C and D) Cumulative incidences of mild-severe and severe chronic GvHD. (E) Cumulative incidence of relapse. (F) Cumulative incidence of non-relapse mortality. (G and H) Probability of overall survival (G) and relapse-free survival (H). (I) Probability of GvHD-free/relapse-free survival (GRFS). Dotted line denotes the prespecified historical control rate of 20%.

crolimus and methotrexate as sole GvHD prophylaxis (On line Supplementary Table S2). A comparison of baseline microbiomes demonstrated that a diversity was signifi cantly lower in toci patients prior to transplantation (Figure 2A). We then examined the relative baseline abundances of bacteria from four genera of interest (Blautia, Enterococcus, Eschericia, and Akkermansia) that were selected based on prior studies which have described associations for Blautia with lower rates of GvHD-related mortality,12 Enterococcus
as a driver of GvHD in humans and murine recipients,4.6 Escherichia as a cause of bloodstream infections in pa tients,5,13 and Akkermansia as an emergent bacterium in mouse models of GvHD.14 We observed that the toci cohort had a lower abundance of genus Blautia and Enterococcus, whereas there was a higher abundance of Akkermansia and Eschericia (Figure 2B). Principal-coordinate analysis (PCoA) of global composition revealed that variation along the first coordinate was attributable primarily to the control cohort

Figure 2. Microbial diversity and composition in tocilizumab and control cohorts. (A) Baseline a diversity, as measured by the inverse Simpson index, in study patients that received toci vs. microbiome controls. Baseline samples were collected between day -7 and day -1. (B) Baseline abundance plots of Akkermansia, Blautia, Enterococcus, and Escherichia coli in these 2 cohorts. (C). Principal-coordinate analysis of Bray-Curtis dissimilarities between samples in which each point is a fecal sample. Samples from toci recipients are largely on the left-hand side of the graph, while samples from the microbiome control are spread throughout the principal-coordinate space. (D) Ordination data from (C) split by specified time windows illustrating the dynamics of fecal compositional shifts along the PC1 axis. In box plots depicted in (B and D), the horizontal line in each box represents the median, the lower and upper boundaries of the boxes the interquartile range, and the end of the whisker lines the minimum and maximum values within 1.5 times the interquartile range. (E) a diversity plot over time in tocilizumab recipients compared with microbiome controls. A generalized estimating equation (GEE) was used to compare the a diversity trends, revealing significant differences between groups both in terms of the trajectory over time (P=0.0005) and the more linear response shape in the toci cohort (P=0.001). Each point is a fecal sample; the curves are smoothed averages, and the gray shading are 95% confidence intervals. See the Online Supplementary Table S3 for a summary of the GEE model. (F) Fold change in relative abundances, compared to baseline, of selected genera are plotted and depicted. Each point represents a sample; curves are smoothed averages and shaded areas show 95% confidence intervals. For each fold-change analysis, we considered only patients with detectable abundances of the indicated feature at baseline. (G) Taxa contributing to domination events in samples from the 2 cohorts. Total stacked-bar height shows the fraction of samples in 7-day bins exhibiting >30% domination by a single amplicon sequence variant (ASV), and the color shows the dominating ASV’s taxonomy according to the color scheme shown below in (H). (H) Taxonomic composition of all samples is presented as stacked bar graphs and color coded according to the scheme described in Peled et al.11 Samples are ordered by hierarchical clustering of the b diversity matrix for each cohort. (A and B) Control cohort includes 38 samples from 38 unique patients, toci cohort includes 19 samples from 19 unique patients. (C to H) Control cohort considers 308 samples from 38 unique patients; toci cohort considers 82 samples from 19 unique patients. Statistics: *P<0.05; **P<0.01; ***P<0.001.
(Figure 2C). Subsetting this PCoA plot by time intervals demonstrated that at baseline, samples from both the toci and control cohorts clustered at lower values of PCo1. A shift to the right of the plot, (i.e., higher values of PCo1) were observed over time more prominently among control (blue) than toci (red) samples, particularly at days 7 and 14 (Figure 2D).
Loss of a diversity in the first 2 weeks was significantly more rapid in the control cohort compared to toci pa tients (Figure 2E). This was statistically significant as early as day 0 and thereafter at weekly intervals. Examination of temporal alterations in specific taxonomic groups of in terest revealed a significant reduction in Blautia in both cohorts; however, this relative decline occurred at earlier time points in control patients (Figure 2F). In addition, Ak kermansia which had higher baseline abundance in toci patients (Figure 2A) further increased by week 3, whereas fold change was unaltered in the control cohort. Most no tably, enterococcal domination was observed in approxi mately a third of control patients but was absent in the toci population (Figure 2G, dark green). The differences in domination patterns are illustrated in stacked barplots of taxonomic composition, where frequent dominations by Enterococci (dark green) and Streptococci (light green) were observed in the control patients; in contrast Akker mansia dominations were commonly observed in the toci cohort (Figures 2G and H, light blue).
Given the known association between antibiotic exposure and microbiome injury in HSCT,4,5,7,14 we examined the possibility that differences in the incidence of febrile neu tropenia might explain this observation since the onset of febrile neutropenia triggers additional antibiotic adminis tration. We observed that the cumulative incidence of feb rile neutropenia between the two cohorts was
comparable (Figure 3A), and that differences in α diversity trends (Figure 2E) remained statistically significant even when samples collected after onset of febrile neutropenia were excluded (P=0.001) (Figure 3B). Moreover, the right ward shift observed in the PCoA plot (Figure 2D) was not attributable solely to samples collected after the onset of febrile neutropenia (Figure 3C). We also explored individ ual taxa that exhibited relative expansions or contractions in multivariable models that highlighted an expansion of Enterococcus in the control cohort relative to the toci co hort (Online Supplementary Figure S1A). In a separate model that considered exposures to antibiotic classes common between the two cohorts, many associations were observed, as expected, between antibiotics and spe cific taxa (Online Supplementary Figure S1B). The number and percent of patients exposed to each antibiotic class are tabulated in the Online Supplementary Figure S1C
This study demonstrated that tocilizumab prophylaxis was associated with a low incidence of GI-tract GvHD as only one of 29 patients developed lower tract disease within the first year, providing evidence that IL-6 inhibition suppresses inflammation in the GI tract. We hypothesized that attenuation of intestinal inflammation by IL-6 block ade would mitigate the microbiome injury that accom panies allogeneic HSCT. Although the control cohort was assembled post hoc from patients at another center, transplant characteristics were well-matched with trial participants, and samples from both centers were cen trally sequenced and computationally analyzed. Even though baseline diversity was higher in the control cohort, the loss of diversity was significantly attenuated in tocil izumab-treated patients. The dramatic shifts in global microbiome composition that has been well described in allogeneic HSCT recipients2,7 was observed in the control
Figure 2. Mitigation of microbiome injury by tocilizumab is not attributable to differences in febrile neutropenia. (A) Cumulative incidence of febrile neutropenia (F&N) in the 2 cohorts. The time of origin was set to hematopoietic stem cell transplantation (HSCT) day -6 (approximate time of conditioning start) to accommodate an event that occurred prior to cell infusion. (B) The trajectories in a diversity over time remained significantly different in the 2 cohorts even when excluding samples collected after onset of F&N (GEE model, P=0.001). (C) The PCoA plot in Figure 2D is repeated, now color-coded to indicate timing of sample collection relative to F&N. The positions on the horizontal axis of samples collected after F&N were indistinct from those collected prior to fever onset or from patients who never developed F&N; this was the case in the day -14 and day -21-time bins in both the cohorts (Wilcoxon P>0.2 for all 4 comparisons).

cohort, but to a markedly lesser extent in tocilizumab re cipients. Importantly, we saw little evidence of entero coccal dominance and only one case of enterococcal bacteremia in tocilizumab-treated patients. This con trasted with the control cohort in which enterococcal domination occurred in approximately 30% of recipients, consistent with previous observations in a much larger patient population at this same institution.7 Interestingly, phylogenetic analysis revealed a preponderance of Akker mansia, whose presence has been shown to increase the production of antimicrobial metabolites and proliferation of intestinal stem cells,15 suggesting a potential salutary role in preserving intestinal barrier function.
In summary, we conclude that an extended course of to cilizumab administration is effective for the prevention of
lower GI-tract GvHD, and that loss of microbial diversity and enterococcal domination is attenuated in tocilizumabtreated recipients. Thus, GvHD prophylaxis with adjunctive tocilizumab represents a possible therapeutic approach for remodeling the intestinal microbiome and preventing the emergence of potentially pathogenic organisms.
Saurabh Chhabra,1 Aniko Szabo,2* Annelie Clurman,3* Katelynn McShane,4 Nicholas Waters,3 Daniel Eastwood,2 Lisa Samanas,5 Teng Fei,6 Gabriel Armijo,3 Sameen Abedin,1 Walter Longo,1 Parameswaran Hari,1 Mehdi Hamadani,1 Nirav N. Shah,1 Lyndsey Runaas,1 James H.
Jerkins,1 Marcel van den Brink,7 Jonathan U. Peled7# and William R. Drobyski1#
1Bone Marrow Transplant and Cellular Therapy Program, Department of Medicine, Medical College of Wisconsin, Milwaukee, WI; 2Division of Biostatistics, Institute for Health and Equity, Medical College of Wisconsin, Milwaukee, WI; 3Department of Immunology, Sloan Kettering Institute, Memorial Sloan Kettering Cancer Center, New York, NY; 4Cancer Center Clinical Trials Office, Medical College of Wisconsin, Milwaukee, WI; 5Department of Pharmacy, Froedtert Health, Milwaukee, WI; 6Department of Epidemiology and Biostatistics, Memorial Sloan Kettering Cancer Center, New York, NY and 7Adult Bone Marrow Transplantation Service, Department of Medicine, Memorial Sloan Kettering Cancer Center, Weill Cornell Medical College, New York, NY, USA
*AS and AC contributed equally as co-second authors. #JUP and WRD contributed equally as co-senior authors.
Correspondence:
S.CHHABRA - schhabra@mcw.edu W. DROBYSKI - wdrobysk@mcw.edu https://doi.org/10.3324/haematol.2022.281309
Received: May 5, 2022. Accepted: September 9, 2022. Prepublished: September 15, 2022.
©2023 Ferrata Storti Foundation
Published under a CC BY-NC license
JUP is a member of the Parker Institute for Cancer Immunotherapy. SC reports institutional research funding from Janssen, Amgen, Sanofi, Syndax, BMS, and honoraria from GSK and Sanofi. SA receives research funding from AltruBio Inc and Actinium Pharmaceuticals; consulting for AbbVie and Amgen; and honoraria from Stemline Therapeutics. PH reports consulting honoraria from Bristol Myers Squibb, Janssen, Glaxo Smith Kline, Takeda, Incyte, and Kadmon. MH reports research support/funding from Takeda Pharmaceutical, ADC Therapeutics, Spectrum Pharmaceuticals, and Astellas Pharma; consultancy from Incyte Corporation, ADC Therapeutics, Omeros, Verastem, MorphoSys, Kite, Genmab, SeaGen, Gamida Cell, Novartis, and Legend Biotech. MH also serves on the Speaker’s Bureau for Sanofi Genzyme, AstraZeneca, BeiGene, and ADC Therapeutics, as well as the Data Safety Monitoring Committee for Myeloid Therapeutics, Inc. NNS reports participation on advisory boards and/or consultancy for Kite Pharma, TG
therapeutics, Miltenyi Biotec, Lily, Epizyme, Legend, Incyte, Novartis, and Umoja and is on the speaker’s bureau with Incyte. NNS has also received research funding and honoraria from both Lily and Miltenyi Biotec and has Scientific Advisory Board membership for Tundra Therapeutics. JJ reports consulting fees from Omeros. MvdB has received research support and stock options from Seres Therapeutics and stock options from Notch Therapeutics and Pluto Therapeutics; he has received royalties from Wolters Kluwer; has consulted, received honorarium from or participated in advisory boards for Seres Therapeutics, Vor Biopharma, WindMIL Therapeutics, Rheos Medicines, Merck & Co, Inc., Magenta Therapeutics, Frazier Healthcare Partners, Nektar Therapeutics, Notch Therapeutics, Forty Seven Inc., Ceramedix, Lygenesis, Pluto Therapeutics, GlaskoSmithKline, Da Volterra, Vor Biopharma, Novartis (Spouse), Synthekine (Spouse), and Beigene (Spouse); he has IP Licensing with Seres Therapeutics and Juno Therapeutics; and holds a fiduciary role on the Foundation Board of DKMS (a nonprofit organization). MSK has institutional financial interests relative to Seres Therapeutics. JUP reports research funding, intellectual property fees, and travel reimbursement from Seres Therapeutics, and consulting fees from DaVolterra, CSL Behring, and from MaaT Pharma. JUP serves on an Advisory board of and holds equity in Postbiotics Plus Research. JUP has filed intellectual property applications related to the microbiome (reference numbers #62/843,849, #62/977,908, and #15/756,845). Memorial Sloan Kettering Cancer Center (MSK) has financial interests relative to Seres Therapeutics. WRD receives research funding from Sun Pharmaceuticals.
SC designed the study, enrolled patients on the trial, provided clinical care of patients in the study, analyzed data, and wrote the paper. AS and DE provided statistical analysis. KM and LS assisted in the acquisition of data. SA, WL, PNH, MH, NNS, LR and JHJ enrolled patients on the trial, provided clinical care of patients, and edited the paper. AC, NW, GA, TF, JUP and MvdB performed microbiome computational analyses and edited the paper. WRD designed the study, provided clinical care, analyzed data, and wrote the paper.
This research was supported by funding from K08 HL143189 (to JUP), and the MSKCC Cancer Center Core Grant NCI P30 CA008748 (to JUP). This research was also supported by the Parker Institute for Cancer Immunotherapy at Memorial Sloan Kettering Cancer Center.
Data can be obtained by contacting the corresponding author WD.
1. Zeiser R, Socie G, Blazar BR. Pathogenesis of acute graftversus-host disease: from intestinal microbiota alterations to donor T cell activation. Br J Haematol. 2016;175(2):191-207.
2. Taur Y, Jenq RR, Perales MA, et al. The effects of intestinal tract bacterial diversity on mortality following allogeneic hematopoietic stem cell transplantation. Blood. 2014;124(7):1174-1182.
3. Shono Y, van den Brink MRM. Gut microbiota injury in allogeneic hematopoietic stem cell transplantation. Nat Rev Cancer. 2018;18(5):283-295.
4. Ubeda C, Taur Y, Jenq RR, et al. Vancomycin-resistant enterococcus domination of intestinal microbiota is enabled by antibiotic treatment in mice and preceded by blood stream invasion in humans. J Clin Invest. 2010; 120(12):4332-4341.
5. Taur Y, Xavier JB, Lipuma L, et al. Intestinal domination and the risk of bacteremia in patients undergoing allogeneic hematopoietic stem cell transplantation. Clin Infect Dis. 2012;55(7):905-914.
6. Vydra J, Shanley RM, George I, et al. Enterococcal bacteremia is associated with increased risk of mortality in recipients of allogeneic hematopoietic stem cell transplantation. Clin Infect Dis. 2012;55(6):764-770.
7. Peled JU, Gomes ALC, Devlin SM, et al. Microbiota as predictor of mortality in allogeneic hematopoietic cell transplantation. New Engl J Med. 2020;382(9):822-834.
8. Docampo MD, Auletta JJ, Jenq RR. Emerging influence of the intestinal microbiota during allogeneic hematopoietic cell transplantation: control the gut and the body will follow. Biol
Blood Marrow Transplant. 2015;21(8):1360-1366.
9. Holtan S, DeFor TE, Lazaryan A, et al. Composite end point of graft versus host disease-free, relapse-free survival after allogeneic hematopoietic cell transplantation. Blood. 2015;125(8):1333-1338.
10. Harris AC, Young R, Devine S, et al. International multi-center standardization of acute graft versus host disease clinical data collection: a report from the MAGIC consortium. Biol Blood Marrow Transplant. 2016;22(1):4-10.
11. Jagasia MH, Greinix HT, Arora M, et al. National Institutes of Health Consensus development project on criteria for clinical trials in chronic graft versus host disease: I. The 2014 diagnosis and staging working group report. Biol Blood Marrow Transplant. 2015;21(3):389-401.
12. Jenq RR, Taur Y, Devlin SM, et al. Intestinal Blautia is associated with reduced death from graft versus host disease. Biol Blood Marrow Transplant. 2015;21(8):1373-1383.
13. Stoma I, Littmann ER, Peled JU, et al. Compositional flux within the intestinal microbiota and risk for blood stream infection with gram negative bacteria. Clin Infect Dis. 2021;73(11):e4627-e4635.
14. Shono Y, Docampo MD, Peled JU, et al. Increased GVHD-related mortality with broad-spectrum antibiotic use after allogeneic hematopoietic stem cell transplantation in human patients and mice. Sci Transl Med. 2016;8(339):339ra71.
15. Kim S, Shin YC, Kim TY, et al. Mucin degrader Akkermansia muciniphilia accelerates intestinal stem cell-mediated epithelial development. Gut Microbes. 2021;13(1):e1892441.
Clonal hematopoiesis of indeterminate potential (CHIP) refers to a population of myeloid stem cells with acquired gene mutations, but does not fulfill the diagnostic criteria for hematologic malignancy.1 There is growing evidence supporting the role of CHIP mutations in altered immune function through effector cells such as monocytes/mac rophages and their dysregulated cytokine/chemokine ex pression.2,3 Since the immunopathogenesis of such an adverse outcome of CHIP largely shares that of severe COVID-19,4 such as high levels of circulating pronflamma tory cytokines or dysregulated monocytes and macro phages,5,6 several previous studies have examined whether CHIP might contribute to the progression of COVID-19.7-9 However, due to the weak significance of association or lack of stratified analysis, it is still unknown whether the presence of CHIP in previously healthy COVID-19 patients has a clinical impact on the disease severity. In this study, we aimed to verify the clinical implications of CHIP in COVID-19 severity, especially in patients without canonical clinical risk factors for severe COVID-19 by analyzing clini cal and laboratory characteristics using clustering and statistical examinations including interaction term. In order to investigate the clinical impact of CHIP on COVID-19 severity, a total of 243 laboratory-confirmed COVID-19 patients between February 2020 and January 2021 in four tertiary hospitals in the Republic of Korea were analyzed according to the severity of COVID-19 and the presence of CHIP (Figure 1A). Informed consent was waived or obtained with the approval of Institutional Re view Boards (IRB) of four respective hospitals (IRB Nos. 2003-141-1110, B-2006/616-409, 2008-050, 2020-04-069001, and IRB-21-269). The severity of COVID-19 was strat ified with an ordinal scale 1 to 8 with some modifications.10,11 Cases with the highest ordinal scale 3 (need for supplementary oxygen therapy via nasal can nula) or more were classified as severe COVID-19, while others were classified with mild ones.10-12 The presence of CHIP was determined by sequencing 44 target genes de fined as CHIP genes based on the previous studies.13 A variant allele frequency4,14 of more than 2% was set as the cut-off. Among the patients, 50 patients had CHIP (20.6%) (Online Supplementary Table S1). The most commonly mu tated gene was DNMT3A (24 variants), followed by TET2 (11 variants) and ASXL1 (7 variants).
After distinguishing COVID-19 severity and the presence of CHIP, we collected clinical, laboratory, and radiological characteristics of the patients. Those characteristics in cluded body mass index (BMI), presence of comorbidities such as diabetes mellitus (DM), hypertension, the concen
tration of hematopoietic cells, and chest X-ray score quantified by deep-learning-based method (http://tisepx.com/; TiSepX COVID-19, MEDICALIP, Korea). A part (112/243) of the clinical information of the patients on demographics, underlying diseases, the severity of COVID19, and the presence or absence of CHIP (7 variables among 19 which used in the below clustering analysis) was pre viously included in the report by Bolton et al.7
The baseline characteristics of the patients are shown in the Online Supplementary Table S1. The median age was 72 (interquartile range [IQR], 62—81) and 65 (IQR, 52—75) years in patients with or without CHIP, respectively, as consistent with a common aging-related property of CHIP. In patients with or without CHIP, 80.0% (40/50) and 63.7% (123/193) of patients underwent severe COVID-19, respectively. None of the patients in the present study had a history or current hematologic malignancy.
In order to precisely examine the clinical impact of CHIP in patients with COVID-19, we conducted a clustering analysis with t-Stochastic Neighbor Embedding (t-SNE) for baseline characteristics and examined the distribution of CHIP among clusters (Figure 1B). All continuous clinical informa tion was transformed into a range of 0 to 1 using a logistic function, and comorbidity status was dichotomized into 0 and 1 for absence and presence. Dimension reduction steps were subsequently applied to the converted data, including distance metric, correlation, and principal component analysis. Patients were then projected on the t-SNE plane. Based on a Monte Carlo reference-based consensus clus tering (M3C) algorithm,15 patients were grouped into eight different clusters. The clustering analysis well categorized patients according to the COVID-19 severity. Cluster S1 to S5 comprises severe cases since these clusters were marked by representative clinical, laboratory, and radiologi cal properties such as higher ordinal scales, peak C-reac tive protein levels in serum, and peak chest X-ray scores than cluster M1 to M3 (unpaired t-test, adjusted P<0.001) (Figure 1C; Online Supplementary Figure S1A).
In order to further characterize the clinical characteristics of individual severe clusters, we investigated the presence or absence of comorbidities for severe clusters S1 to S5 (Figure 1D). Based on the prediction of COVID-19 severity through logistic regression only with putative risk factors (Online Supplementary Figure S1B), we focused on DM, CHIP, and hypertension in downstream analysis. For each severe cluster, we examined the enrichment of CHIP compared to the canonical risk factors including DM and hypertension. Cluster S2, S4, and S1 were characterized by the presence of hypertension, DM or both risk factors, respectively (Figure
1D). Interestingly, cluster S3 tended to have a significantly higher rate of CHIP than other risk factors (11/24, 45.8% vs. 0/24, 0.0%; chi-squared test, P=5.93e-4) (Figure 1D). The presence of a particular type of severe cases enriched by CHIP without canonical risk factors led us to hypothes ize that CHIP may contribute to severe COVID-19 in its own way. In order to test the statistical significance of the im pact of CHIP on COVID-19 severity in patients without co
morbidities, we stratified all patients by the presence of any of the prevalent canonical risk factors such as DM, hy pertension, and BMI ≥30.0. When adjusted for age and sex, the risk of severe COVID-19 tended to be higher in CHIP (+) patients than in CHIP (-) patients in the canonical risk factor-absent subgroup (adjusted odds ratio 7.35; 95% confidence interval [CI]: 1.71-9.38e+07, permutation P=5.5e-3) (Table 1). In order to examine the significance of
Figure 1. Clustering analysis for clinical characteristics of severe COVID-19. (A) Overview of the study design. (B) Clustered patients on the t-SNE plane based on clinical characteristics. Total 243 patients were projected to the t-SNE plane with the converted clinical data. Eight distinct clusters were identified using a M3C algorithm named S1 (n=30), S2 (n=43), S3 (n=24), S4 (n=12), S5 (n=21), M1 (n=52), M2 (n=27) and M3 (n=34). Each dot indicates individual patients with different shapes. Triangle, with clonal hematopoiesis of indeterminate potential (CHIP). Circle, without CHIP. (C) Boxplots showing 9 representative clinical characteristics between Mild and Severe groups. For the boxplots, the box represents the interquartile range (IQR) and the whiskers correspond to the highest and lowest points within 1.5 × IQR. Statistical significance was examined using an unpaired t-test (*adjusted P<0.05, **adjusted P<0.01 and ***adjusted P<0.001). The color indicates the identity of clusters and groups. Sev: Severe group. Mild: Mild group. (D) Bar plots showing fractions of patients with diabetes mellitus, hypertension, or CHIP for clusters S1 to S5. Color indicates the identity of a cluster.

such a difference in CHIP effects along with the canonical risk factors, we formally tested the interaction effects by using a logistic regression. The difference takes a per mutation P value of 0.01, suggesting statistically signifi cant difference in CHIP effects between two groups. The results of patient clustering and statistical evidence indi cate that CHIP is an independent risk factor for severe COVID-19 in patients without canonical risk factors. Bolton et al. recently reported that CHIP is significantly as sociated with severe COVID-19,7 especially in patients carrying non-putative driver mutations. However, they could only identify a modest statistically meaningful as sociation between COVID-19 severity and the presence of CHIP. Duployez et al. showed a higher prevalence of CHIP in severe COVID-19 patients than in age-matched hemato logic malignancy-free cohorts, but they did not show that CHIP affects the rate of orotracheal intubation or death.8 In another study conducted by Hameister et al. involving 102 hospitalized patients with COVID-19, the presence of CHIP was not associated with severe COVID-19.9 However, the study lacked a stratified analysis or an adjustment for possible interactions. By analyzing thorough clinical, radio logical, and laboratory characteristics, as well as the pres ence of CHIP, we successfully clarified that there is a distinct CHIP-driven severe COVID-19 subgroup defined as patients without canonical risk factors. Several issues may warrant prudence in the interpretation of the results of the present study. First, we arbitrarily in troduced a composite term canonical risk factors with prevalent underlying diseases to examine the interaction between clinical risk factors and CHIP. Second, the propor tion of severe COVID-19 was high in the present study since it was conducted in tertiary hospitals in Korea. In conclusion, by coupling the clustering method to com plemented statistical analysis, our study demonstrated that CHIP is an independent risk factor for COVID-19, es pecially in patients without canonical risk factors. Our findings might provide a better understanding of the pre viously unexplained exacerbation of clinical conditions for COVID-19 patients without canonical risk factors.
Chang Kyung Kang,1* Baekgyu Choi,2* Sugyeong Kim,3 Choong Hyun Sun,3 Soon Ho Yoon,4 Kyukwang Kim,2 Euijin Chang,1 Jongtak Jung,1,5 Pyoeng Gyun Choe,1 Wan Beom Park,1 Eu Suk Kim,1,5 Hong Bin Kim,1,5 Nam Joong Kim,1 Myoung-don Oh,1 Hogune Im,3 Joohae Kim,6 Yong Hoon Lee,7 Jaehee Lee,7 Hyonho Chun,8 Youngil Koh,1,3 Ji Yeon Lee,6# Joon Ho Moon,7# Kyoung-Ho Song1,5# and Inkyung Jung2#
1Department of Internal Medicine, Seoul National University College of Medicine, Seoul; 2Department of Biological Sciences, Korea Advanced
Table 1. A significant interaction between clonal hematopoiesis of indeterminate potential and canonical risk factors for severe COVID-19.
Incidence of severe COVID-19 aOR (95% CI)† CHIP (+) CHIP (-)
Total, N (%) 40/50 (80.0) 123/193 (63.7) 1.24 (0.55-3.41) Canonical risk factor (+), N (%) 25/34 (73.5) 89/122 (73.0) 0.69 (0.26-2.06)
Canonical risk factor (-), N (%) 15/16 (93.8) 34/71 (47.9) 7.35 (1.71-9.38e+07)
†Adjusted for age and sex. CHIP: clonal hematopoiesis of indeter minate potential; aOR: adjusted odds ratio; CI: confidence interval obtained from 10,000 bootstrap results. Canonical risk factors are body mass index ≥ 30.0, diabetes mellitus and hypertension. If the patient has at least 1 canonical risk factor, it is allocated to a present, and if not, regarded as an absent group.
Institute of Science and Technology (KAIST), Daejeon; 3Genome Opinion Inc., Seoul; 4Department of Radiology, Seoul National University College of Medicine, Seoul; 5Department of Internal Medicine, Seoul National University Bundang Hospital, Seongnam; 6Division of Pulmonary and Critical Care Medicine, Department of Internal Medicine, National Medical Center, Seoul; 7Department of Internal Medicine, Kyungpook National University Hospital, School of Medicine, Kyungpook National University, Daegu and 8Department of Mathematical Sciences, Korea Advanced Institute of Science and Technology (KAIST), Daejeon, Republic of Korea
*CKK and BC contributed equally as co-first authors. #JYL, JHM, K-HS and IJ contributed equally as co-senior authors.
Correspondence:
J.Y. LEE - fulgeo@nmc.or.kr
J. H. MOON - jhmoon@knu.ac.kr K. H. SONG - khsongmd@gmail.com I. JUNG - ijung@kaist.ac.kr
https://doi.org/10.3324/haematol.2022.280621
Received: January 3, 2022.
Accepted: September 9, 2022. Prepublished: September 15, 2022.
©2023 Ferrata Storti Foundation Published under a CC BY-NC license
YK is a CEO of GenomeOpinion. SK, CS and HI are employed by GenomeOpinion. All other authors have no conflicts of interest to disclose.
CKK, BC, YK and IJ conceived the study. CKK, BC, SK, CS, SHY and KK performed data analysis. CKK, EC, JJ, PGC, WBP, ESK, HBK, NJK, M-dO, HI, JK, YHL, JL, JYL, JHM and K-HS contributed to the collection of clinical information and samples. CKK, BC, HC, YK
and IJ contributed to data interpretation. CKK and BC prepared the manuscript with assistance from YK and IJ. All authors read and commented on the manuscript and approved it for submission.
We thank all our laboratory members for their support and critical suggestions throughout this work. Genome opinion provided the study team with targeted panel (LifeEx© CH panel) sequencing and CHIP variant analysis and technical insights for variant analysis.
This work was funded by the SUHF Fellowship (to IJ) and the
1. Steensma DP, Bejar R, Jaiswal S, et al. Clonal hematopoiesis of indeterminate potential and its distinction from myelodysplastic syndromes. Blood. 2015;126(1):9-16.
2. Jaiswal S, Natarajan P, Silver AJ, et al. Clonal hematopoiesis and risk of atherosclerotic cardiovascular disease. N Engl J Med. 2017;377(2):111-121.
3. Jaiswal S, Libby P. Clonal haematopoiesis: connecting ageing and inflammation in cardiovascular disease. Nat Rev Cardiol. 2020;17(3):137-144.
4. Jaiswal S, Ebert BL. Clonal hematopoiesis in human aging and disease. Science. 2019;366(6465):eaan4673.
5. Mehta P, McAuley DF, Brown M, et al. COVID-19: consider cytokine storm syndromes and immunosuppression. Lancet. 2020;395(10229):1033-1034.
6. Merad M, Martin JC. Pathological inflammation in patients with COVID-19: a key role for monocytes and macrophages. Nat Rev Immunol. 2020;20(6):355-362.
7. Bolton KL, Koh Y, Foote MB, et al. Clonal hematopoiesis is associated with risk of severe Covid-19. Nat Commun. 2021;12(1):5975.
8. Duployez N, Demonchy J, Berthon C, et al. Clinico-biological features and clonal hematopoiesis in patients with severe
Ministry of Science and ICT through the National Research Foundation in the Republic of Korea (NRF-2020R1A2C4001464 to IJ).
We support data-sharing of individual participant data. The individual participant data that underlie the results reported in this article (text, Tables, Figures and Online Supplementary Appendix) will be shared after deidentification. The raw data will be available for 1 year after the publication of this article. Researchers who provide a scientifically sound proposal will be allowed access to the individual participant data. We used publicly available software for all analysis and followed standardized processes. No custom code was used for analysis in the study.
COVID-19. Cancers (Basel). 2020;12(7):1992.
9. Hameister E, Stolz SM, Fuhrer Y, et al. Clonal hematopoiesis in hospitalized elderly patients with COVID-19. Hemasphere. 2020;4(4):e453.
10. Kalil AC, Patterson TF, Mehta AK, et al. Baricitinib plus remdesivir for hospitalized adults with Covid-19. N Engl J Med. 2021;384(9):795-807.
11. Sung HK, Kim JY, Heo J, et al. Clinical course and outcomes of 3,060 patients with Coronavirus disease 2019 in Korea, JanuaryMay 2020. J Korean Med Sci. 2020;35(30):e280.
12. Wu Z, McGoogan JM. Characteristics of and important lessons from the Coronavirus disease 2019 (COVID-19) outbreak in China: summary of a report of 72314 cases from the Chinese Center for Disease Control and Prevention. JAMA. 2020;323(13):1239-1242.
13. Niroula A, Sekar A, Murakami MA, et al. Distinction of lymphoid and myeloid clonal hematopoiesis. Nat Med. 2021;27(11):1921-1927.
14. Steensma DP. Clinical consequences of clonal hematopoiesis of indeterminate potential. Blood Adv. 2018;2(22):3404-3410.
15. John CR, Watson D, Russ D, et al. M3C: Monte Carlo referencebased consensus clustering. Sci Rep. 2020;10(1):1816.
Cancer-associated thrombosis (CAT) is a well-known complication of malignant tumors and is associated with faster tumor progression and worse prognosis.1-3 A prom ising candidate to serve as thrombogenic marker in tumor progression is von Willebrand factor (VWF). VWF multimers mediate intravascular platelet adhesion and activation and might be therefore responsible not only for thrombotic vessel occlusion, but also for the development of metastases.4,5 The aim of the study was the assessment of the prognostic value of VWF and ADAMTS-13, an enzyme that cleaves and inactivates VWF multimers, in patients with malignant tumors. To this end, we analyzed VWF and ADAMTS-13 in blood samples and explored the association between venous thromboembolism (VTE), dis ease progression and tumor-related death. In order to substantiate an impact of VWF in platelet binding and vessel occlusion, we compared intratumoral VWF distribu tion and VWF-dependent platelet accumulation with peri tumoral regions. There was an evident correlation between increased plasmatic VWF levels and VWF-me diated platelet aggregations in the tumor microenviron ment, CAT and cancer-related mortality. The novelty of this study is the correlation of blood-based markers with the occurrence of ultra-large VWF multimers mediating platelet aggregation in tumor and peritumoral tissue. This opens a novel field of investigations for the development of prognostic biomarkers and innovative therapeutic con cepts.
This study (clinicaltrails gov. Identifier: 2012-293N-MA, date: June 19, 2012) included 194 patients diagnosed with cancer between January 2013 and September 2018 at the University Medical Center Mannheim. Healthy volunteers and patients with non-metastatic basal-cell carcinoma (BCC) were used as control. None of the included BCC pa tients developed metastases or VTE. All procedures were performed with written informed consent from all partici pants in accordance with the Declaration of Helsinki. The protocols received approval by the ethics committee. In clusion criteria were: (i) a confirmed diagnosis of cancer according to the American Joint Committee on Cancer tumor staging and classification, (ii) histologic confirma tion of diagnosis, and (iii) at least 18 years of age. Adult patients undergoing surgery in curative intent for colo rectal, esophagogastric and lung cancer were included. Exclusion criteria were the presence of an autoimmune disease, hepatitis B or C and previous therapeutic anti coagulation.
VWF levels and ADAMTS-13 activity were analyzed in so dium citrate plasma samples as described.4 Local con formation changes of VWF in tumor tissue compared with peritumoral regions, defined by a board-certified pathol ogist (TG) and separated from the tumor by at least 5-10 mm, were analyzed by immunofluorescence. Rabbit antihuman VWF (DakoCytomation, RRID:AB_2315602), mouse anti-human thrombospondin (Laboratory Vision, RRID:AB_61137), mouse anti-human CD31 (DakoCyto mation, RRID:AB_2114471), FITC-conjugated goat anti-rab bit (BD Pharmingen, RRID:AB_395212) and Alexa 555-conjugated goat anti-mouse (IgG; Invitrogen, RRID:AB_141822) were used. For comparison of two groups the two-sided Student´s t-test, and for multiple groups one-way ANOVA (Kruskal-Wallis H test) with the Wilcoxon post hoc test was used. Correlation coefficients were cal culated with Spearman analysis. Survival was analyzed using Kaplan-Meier analysis and compared using log-rank (Mantel-Cox) test. Results of the Cox models are displayed as hazard ratio (HR) and the 95% confidence interval (95% CI). The cutoff values were selected by optimizing the logrank statistics. *P≤0.05 was considered as significant dif ference. Baseline characteristics of the study population are shown in Table 1. There was no significant correlation between plasmatic VWF concentrations and age neither in the con trol group (R=0.18; P=0.13) nor in tumor patients (R=0.13; P=0.14). Plasma VWF levels did not differ between female and male study participants. In the healthy control popu lation, the mean VWF level (ng/mL) was 11,519.4±6,261.3 and in patients with BCC it was 14,730.2±10,537.4. Patients with gastric, esophageal, colorectal, and pancreatic cancer had signi fi cantly higher VWF values compared with the control group (Figure 1A). Mean plasmatic VWF levels (ng/mL) were 19,551.5±14,029.1 for patients with colorectal, 27,236.1±14,476.8 for patients with gastric cancer, 25,555.5±10,340.7 for esophageal tumors and 37,041.5±14,641.2 for patients with pancreatic tumors (Table 1). Among patients diagnosed with colorectal, gas tric, esophageal, and pancreatic cancer, a significant re duction of ADAMTS-13 activity was observed (Figure 1A; Table 1). Consequently, a significantly inverse correlation (Spearman's ρ=-0.41; P≤0.001) between VWF values and ADAMTS-13 activity was reflected by a high VWF / ADAMTS13 ratio (Figure 1B). In contrast, blood VWF was not elev ated in patients with lung tumors associated with increased ADAMTS-13 activities (Figure 1A; P≤0.05).
Table 1. Demographic, clinical and laboratory characteristics of the study population, plasma levels of von Willebrand factor and ADAMTS-13 activity.
Control (N=56) BCC (N=39)
Colorectal (N=39)
Stomach (N=37) Esophagus (N=52) Pancreas (N=13) Lung (N=14) Total (N=250)
Mean (SD) 46.4 (13.5) 70.3 (11.6) 67.0 (12.2) 63.0 (14.1) 63.8 (10.4) 71.9 (8.1) 66.6 (8.8) 62.8 (14.3)
Sex, N (%)
F 24 (42.9) 18 (46.2) 17 (43.6) 12 (32.4) 9 (17.3) 2 (15.4) 7 (50.0) 89 (35.6) M 32 (57.1) 21 (53.8) 22 (56.4) 25 (67.6) 43 (82.7) 11 (84.6) 7 (50.0) 161 (64.4)
UICC, N (%)
na 2 (3.8) 1 (7.7) 1(7.1) 4 (2.6)
0 na na 0 (0.0) 4 (10.8) 5 (9.6) 0 (0.0) 0 (0.0) 9 (5.8) I-II na na 19 (48.7) 12 (32.4) 8 (15.4) 11 (84.6) 7 (50.0) 57(36.8) III-IV na na 20 (51.3) 21 (56.8) 37 (71.2) 1 (7.7) 6 (42.9) 85 (54.8)
VTE, N (%)
0 na na 33 (84.6) 31 (83.8) 33 (63.5) 9 (69.2) 8 (57.1) 114 (73.5) 1 na na 6 (15.4)% 6 (16.2) 19 (36.5) 4 (30.8) 6 (42.9) 41 (26.5)
VWF, ng/mL, mean (SD) 11,519.4 (6,261.3) 14,730.2 (10,537.4) 19,551.5 (14,029.1) 27,236.1 (14,476.8) 25,555.5 (10,340.7) 37,041.5 (14,641.2) 16,976.4 (13,326.8) 20,151.6 (13,337.2)
ADAMTS-13, %, mean (SD) 100.0 (18.1) 92.3 (26.7) 87.5 (20.8) 77.5 (19.6) 60.8 (33.4) 75.7 (31.1) 111.7 (24.6) 84.8 (29.1)
ADAMTS-13: a disintegrinlike and metalloproteinase with thrombospondin type I repeats 13; SD: standard deviation; VWF: von Willebrand factor; M: male; F: female; VTE: venous thromboembolism.
Next, the VWF / ADAMTS-13 ratio was analyzed in tumor patients of all tumor stages. Patients were divided into three groups depending on the stage of the disease - ad vanced disease (stage III and stage IV), localized disease (stage I and stage II) and neoplastic in situ tumors (stage 0). As shown in the Online Supplementary Figure S1, VWF levels in stage I and II and stage III and IV patients were signifi cantly elevated. Importantly, the highest levels of the VWF / ADAMTS-13 ratio were measured in patients with in situ lesions (stage 0) and reveal increased sys temic VWF levels combined with reduced plasmatic ADAMTS-13 activity in early disease stages (Online Sup plementary Figure S1).
A telephone-based follow-up period of 6 years revealed that 26.5% (41/155) of the patients with cancer had devel oped a thromboembolic complication. In particular, VTE occurred in 15.4% of patients with colorectal cancers, in 16.2% with gastric tumors, in 30.8% with pancreatic tu mors, in 36.5% of the patients with esophageal malig nancies and in 42.9 % of patients with lung cancer (Table 1). In Cox regression analyses, patients with VTE were at higher risk of death compared with patients without thrombotic complications (Figure 1C; HR: 2.027; 95% CI: 1.2-3.424; P=0.007). The VWF / ADAMTS-13 ratio was higher in patients diagnosed with VTE when compared to cancer patients without the occurrence of VTE (Figure 1D). For analysis of overall survival (OS) according to plasmatic VWF levels or ADAMTS-13 activity patients were separated into two groups according to their plasmatic VWF concen trations or ADAMTS-13 activity. Both, elevated VWF levels and reduced ADAMTS-13 activity (Online Supplementary Figure S2) were clearly associated with shorter OS. Con
sequently, as determined by the Kaplan-Maier method shown in Figure 1E the 25th survival percentile of patients with a low VWF / ADAMTS-13 ratio (VWF / ADAMTS-13 <1.83) was 1,656 days compared to 448 days of patients with a high VWF / ADAMTS-13 ratio (VWF / ADAMTS-13 ≥1.83). Thus, elevated plasmatic VWF concentrations and reduced ADAMTS-13 activities may serve as prognostic marker for tumor patients (HR: 2.712; 95% CI: 1.459-5.04; P=0.001). Finally, we evaluated whether elevated plasmatic VWF was related to intratumoral VWF networks mediating platelet aggregation (Figure 2; Online Supplementary Fig ure S3). Histological analyses demonstrated that VWF is mainly restricted to endothelial cells within the blood vessel wall in non-activated endothelial cells (Figure 2A). Blood vessels with endothelial cell activation and sub sequent VWF secretion were identified by intraluminal VWF fibers (≥ 5 mm) mediating platelet binding and aggre gation (Figure 2B to D). As displayed in Figure 2E we cal culated the relative increase of intratumoral vessels with VWF fibers in relation to blood vessels within peritumoral tissue. We detected that tumor entities with a low micro environmental VWF network formation, such as colorectal (13.5%) or lung (10.4%) cancer, were associated with relatively low plasmatic VWF / ADAMTS-13 values (Figure 1). A gradual increase in luminal VWF network formation occurring in esophageal (18.4%), gastric (25.3%), and pan creatic cancer (26.4%) was statistically significant and was increased in patients with VTE (Figure 2F). Importantly, in creased levels of VWF fibers in the tumor tissue were as sociated with a reduced OS (Figure 2G; P=0.013). The first aim of the current study was to evaluate if sys temic VWF levels and ADAMTS-13 activity could serve as
Figure 1. Plasmatic von Willebrand factor levels and ADAMTS-13 activity correlate with the occurrence of venous thromboembolism and a reduced overall survival in tumor patients. (A) Comparison of tumor patients with healthy controls and basal-cell carcinoma (BCC) according to relative plasmatic von Willebrand factor (VWF) levels and ADAMTS-13 activity and (B) the VWF / ADAMTS-13 ratio. Data are presented as box blots showing the median; **P≤0.01; ***P≤0.001; ****P≤0.0001. (C) Kaplan-Meier analysis for overall survival (OS) in years of 155 tumor patients according to the occurrence of venous thromboembolism (VTE) (with VTE n=41, without VTE n=114). (D) Comparison of plasmatic VWF / ADAMTS-13 ratio of tumor patients according to the occurrence of VTE. Data are presented as box blots showing the median of 155 tumor patients; *P≤0.05. (E) Kaplan-Meier analysis for OS in years of 155 tumor patients according to elevated and non-elevated plasmatic VWF / ADAMTS-13 ratio (cutoff, 1.83).

prognostic biomarkers in malignancy. A signifi cant in crease of both the plasmatic VWF and the VWF / ADAMTS13 ratio was observed in tumor patients, in contrast to healthy control or BCC. Data obtained from tumor patients are in line with our observations showing that elevated serum concentrations of VWF are associated with de creased ADAMTS-13 activities resulting in a high VWF / ADAMTS-13 ratio.6-8 Interestingly enough, we detected no change in the systemic VWF concentration and VWF / ADAMTS-13 ratio in subjects with lung cancer compared to control. While this observation is in agreement with a previous study in patients with non-small-cell lung cancer,9 other studies report elevated VWF levels,10 an in creased VWF / ADAMTS-13 ratio, and reduced ADAMTS-13
activities.11 It remains to be explored whether VWF and its degradation by ADAMTS-13 contribute to lung cancer pro gression.
Next, we analyzed changes in the VWF / ADAMTS-13 ratio to examine the association between VWF and tumor pro gression. In our study, the VWF / ADAMTS-13 ratio was not directly correlated with the disease stages. Interestingly, patients with precancerous lesions, demonstrated even higher values compared to patients with metastatic dis ease. Imbalances of VWF and ADAMTS-13 have been as sociated with the development of hepatocellular carcinoma in cirrhotic patients12 and could thus imply the use as a non-invasive biomarker for early detection of ma lignancy.

Figure 2. Von Willebrand factor fibers in the tumor tissue promote platelet aggregation and correlate with the occurrence of venous thrombosis and reduced overall survival. Consecutive cryosections (10 mm) of primary colorectal tumors and peritumoral regions were stained for von Willebrand factor (VWF) (green), CD 31 (red) or thrombospondin (TSP) (red) and DAPI (blue). (A) Representative images demonstrate that VWF is located in the vessel wall of quiescent endothelium. (B) Representative images demonstrate that the secretion of VWF from activated endothelial cells correlates with luminal VWF fibers. (C) Luminal VWF fibers promote platelet binding and (D) platelet aggregation (scale bar: 50 mm). (E) The relative percentage of vessels with luminal VWF fibers (defined as fibers with a length of ≥5 mm) in peritumoral tissue was plotted against VWF fiber-containing blood vessels within the primary tumor. (F) Comparison of the relative percentage of vessels with luminal VWF fibers (peritumoral – tumoral) in patients with and without the occurrence of venous thromboembolism (VTE). Data are presented as box blots showing the median; *P≤0.05; **P≤0.01; ***P≤0.001. (G) Kaplan-Meier analysis for overall survival (OS) in years of tumor patients according to the relative VWF fiber formation (%) in the tumor tissue (cutoff, 19.63).
In order to analyze whether there is an association be tween a high VWF / ADAMTS-13 ratio and thrombotic complications, we performed a follow-up of 6 years after the initial blood sampling. Consistent with previous examinations indicating that coagulation is a prognostic parameter for cancer-related mortality,13-15 our data show that a high VWF / ADAMTS-13 ratio is associated with VTE and a worse prognosis for patients. The procoagulant VWF is a key candidate for cancer-related VTE and meta stasis, because in the blood stream stretched VWF multimers mediate platelet binding and aggregation.4,5 We found a higher amount of VWF multimers in tumor samples promoting platelet binding and thrombotic vessel occlusions. In summary, our data support the con cept that VWF multimers represent the pathophysiolog ical link between the thrombotic risk and tumor progression. Thus, plasma VWF and the ADAMTS-13 ac tivity in combination with histological VWF changes in the tumor microenvironment could help to predict tumor progression and CAT. This is the first prospective study on the prognostic sig nificance of VWF in cancer patients. As it was shown that AB0 blood group and anti-tumor therapy are predictive for the development of VTE,3,16 the correlation with VWF should be assessed in larger scale studies in order to es tablish the link between cancer and thrombosis.
Ioannis Karampinis,1* Kai Nowak,2* Julian Koett,3* Christian Mess,3 Laura Wagner,4 Timo Gaiser,5 Frank Thomas Mayer,6 Lukas Goertz,7 Stefan Werner Schneider3 and Alexander Thomas Bauer3,8
1Division of Thoracic Surgery, Academic Thoracic Center Mainz, Johannes Gutenberg University Mainz, Mainz; 2Department of Surgery, RoMed Klinikum Rosenheim, Rosenheim; 3Department of Dermatology and Venereology, University Medical Center Hamburg-Eppendorf, Hamburg; 4Center for Trauma Surgery, Orthopedics and Hand Surgery, Hospital Worms, Worms; 5Institute of Pathology, Medical Faculty Mannheim, University of Heidelberg, Mannheim; 6Department of
Dermatology and Venereology, University Hospital Frankfurt, Frankfurt; 7Department of Neuroradiology, University Hospital of Cologne, Cologne and 8Experimental Dermatology, Department of Dermatology, Venereology, and Allergy, Medical Faculty Mannheim, University of Heidelberg, Mannheim, Germany
*IK, KN and JK contributed equally as co-first authors. Correspondence: A.T. BAUER - a.bauer@uke.de
https://doi.org/10.3324/haematol.2022.281315
Received: April 28, 2022. Accepted: September 9, 2022. Prepublished: September 22, 2022.
©2023 Ferrata Storti Foundation Published under a CC BY-NC license
No conflicts of interest to disclose.
IK, KN and JK performed experiments and generated data. CM performed statistical analyses, prepared figures and contributed to writing of the manuscript. LS, TG, FTM, LG and SWS discussed and analyzed data. ATB contributed to all experiments and wrote the manuscript.
This work was supported by the grant from the Deutsche Forschungsgemeinschaft (German Research Council) RTG2099 “Hallmarks of Skin Cancer” (to JK, ATB, SWS) and the Erich und Gertrud Roggenbuck-Stiftung (to ATB).
The authors thank Sabine Vidal-y-Si and Natalia Halter for technical assistance.
Original data will be made available upon request.
1. Mulder FI, Horvath-Puho E, van Es N, et al. Venous thromboembolism in cancer patients: a population-based cohort study. Blood. 2021;137(14):1959-1969.
2. Wang TF, Li A, Garcia D. Managing thrombosis in cancer patients. Res Pract Thromb Haemost. 2018;2(3):429-438.
3. Bauer AT, Gorzelanny C, Gebhardt C, Pantel K, Schneider SW. Interplay between coagulation and inflammation in cancer: Limitations and therapeutic opportunities. Cancer Treat Rev. 2022;102:102322.
4. Bauer AT, Suckau J, Frank K, et al. Von Willebrand factor fibers promote cancer-associated platelet aggregation in malignant melanoma of mice and humans. Blood. 2015;125(20):3153-3163.
5. Goertz L, Schneider SW, Desch A, et al. Heparins that block VEGFA-mediated von Willebrand factor fiber generation are potent inhibitors of hematogenous but not lymphatic metastasis. Oncotarget. 2016;7(42):68527-68545.
6. Bohm M, Gerlach R, Beecken WD, et al. ADAMTS-13 activity in patients with brain and prostate tumors is mildly reduced, but not correlated to stage of malignancy and metastasis. Thromb Res. 2003;111(1-2):33-37.
7. Koo BH, Oh D, Chung SY, et al. Deficiency of von Willebrand factorcleaving protease activity in the plasma of malignant patients. Thromb Res. 2002;105(6):471-476.
8. Mannucci PM, Karimi M, Mosalaei A, Canciani MT, Peyvandi F. Patients with localized and disseminated tumors have reduced but measurable levels of ADAMTS-13 (von Willebrand factor cleaving protease). Haematologica. 2003;88(4):454-458.
9. Martini F, Ferroni P, Guadagni F, et al. Plasma von Willebrand factor antigen levels in non-small cell lung cancer patients. Anticancer Res. 2005;25(1B):403-407.
10. Obermeier HL, Riedl J, Ay C, et al. The role of ADAMTS-13 and von Willebrand factor in cancer patients: results from the Vienna Cancer and Thrombosis Study. Res Pract Thromb Haemost. 2019;3(3):503-514.
11. Guo R, Yang J, Liu X, Wu J, Chen Y. Increased von Willebrand factor over decreased ADAMTS-13 activity is associated with poor prognosis in patients with advanced non-small-cell lung cancer. J Clin Lab Anal. 2018;32(1):e22219.
12. Takaya H, Namisaki T, Kitade M, et al. VWF/ADAMTS13 ratio as a potential biomarker for early detection of hepatocellular carcinoma. BMC Gastroenterol. 2019;19(1):167.
13. Chew HK, Wun T, Harvey D, Zhou H, White RH. Incidence of venous thromboembolism and its effect on survival among patients with common cancers. Arch Intern Med. 2006;166(4):458-464.
14. Ay C, Dunkler D, Pirker R, et al. High D-dimer levels are associated with poor prognosis in cancer patients. Haematologica. 2012;97(8):1158-1164.
15. Sorensen HT, Mellemkjaer L, Olsen JH, Baron JA. Prognosis of cancers associated with venous thromboembolism. N Engl J Med. 2000;343(25):1846-1850.
16. Englisch C, Moik F, Nopp S, et al. ABO blood group type and risk of venous thromboembolism in patients with cancer. Blood Adv. 2022 Apr 13. doi: 10.1182/bloodadvances.2021006283. [Epub ahead of print]
Rituximab, the monoclonal antibody directed against CD20, is established in treatment regimens against CD20+ non-Hodgkin lymphomas and is used increasingly in re fractory systemic autoimmune disorders.1-4 Besides, it is applied as treatment in patients with Epstein-Barr virus (EBV) infection/reactivation, post-transplant lymphopro liferative disease (PTLD) and autoimmune complications following hematopoietic stem cell transplantation (HSCT).5-8 Documentation of immunological consequences and impact on immune reconstitution in pediatric HSCT patients is, however, sparse. Previously published studies on small cohorts suggest delayed B-cell recovery, need for prolonged immunoglobulin substitution and an in creased risk for secondary infections.9,10 In order to further elucidate rituximab implications in this setting, we per formed a retrospective analysis of 44 pediatric patients who received allogeneic HSCT in our center between 2015 and 2020, and who were treated with rituximab within 365 days after HSCT. We compared this cohort with matched HSCT patients who didn’t receive rituximab within 4 weeks before, or after HSCT. Despite similar overall sur vival, we observed that rituximab therapy significantly de layed B-cell recovery, extended immunoglobulin deficiency and led to longer rehospitalization durations and more bacterial infections despite immunoglobulin re placement therapy. In a subgroup (9 patients, 38%), we observed prolonged immunoglobulin deficiency >365 days after rituximab treatment, suggesting that rituximab har bors a significant risk for prolonged B-cell impairment. Rituximab patients were matched in a best-match ap proach with control patients. For matching, eight trans plant-relevant parameters from the Joint Accreditation Committee of the International Society for Cellular Ther apy and the European Group for Blood and Marrow Trans plantation (JACIE) essential data list were chosen. The pool of possible matches was then filtered for one par ameter after another which led to high correct-match rates for top priority parameters (HSCT matching 100%; graft source 95%) but lower success in low-priority par ameters (Figure 1A). After matching, the control group showed a longer cumulative observation duration. This can be explained by a more frequent use of rituximab in later years. No difference in the overall outcome was ob served (Figure 1B; Online Supplementary Table S1A). Most
patients received the first rituximab dose before day +100 (82%) and indication for initiating rituximab treatment was mainly EBV infection/reactivation (41 patients, 84%) (On line Supplementary Table S1B). Analysis of EBV blood level development showed that rituximab was highly effective against EBV infection with 95% treatment success (Figure 1C; Online Supplementary Table S1B). Both patients who did not respond completely, developed PTLD. In total, PTLD occurred in 6.1% (3/49) of patients with EBV levels >2,000 copies/mL measured via polymerase chain reac tion (PCR) and all three patients had received preemptive rituximab treatment (rituximab 7.9% [3/38] vs. control 0% [0/11]; P>0.99) (Table 1A). At the same time, we observed that rituximab patients generally were at a higher PTLD risk due to significantly earlier EBV infection/reactivation after HSCT and higher maximal viral loads (Figure 1C and D).11 The EBV level at the start of rituximab treatment, however, was quite variable (0-1,770,000 copies/mL). For 14 (37%) patients, rituximab treatment was initiated at an EBV load <10,000 copies/mL. The 11 control patients (25%) with EBV infection/reactivation (all <20,000 copies/mL) were treated with ganciclovir and/or foscarnet only, and all resolved their EBV reactivations. Regarding immune re constitution, our data shows that rituximab treatment de layed B-cell recovery by a median of 162 days (day +282 [range, 43–716] vs. day +120 [range, 36–645]; hazard ratio 2.2; P=0.008) and led to significantly lower B-cell numbers and B-cell to T-cell ratios at day +365. However, by day +720, the majority of patients had recovered to similar Bcell levels (Figure 2A to D; Online Supplementary Figure S1; Table 1A; Online Supplementary Table S1C). In order to evaluate B-cell damage beyond normal B-cell count re covery, we analyzed immunoglobulin levels and IgG sub stitution dependence. Rituximab treatment led to reaching IgG blood levels >5g/L without IgG substitution significantly later (median day +278 [range 4– 1,095] vs day +118 [range, 4-722]; hazard ratio 4.2; P<0.001) and the last documented IgG substitution happened significantly later (median day +254 [range, 0-1,095] vs. +109 [range, 0324]; hazard ratio 6.25; P<0.001). While IgG recovery and B-cell recovery coincided in both groups (rituximab: last IgG recovery median day +278 and B-cell recovery +282; control: day +118 and +120), significant differences in IgM levels were still measurable even 2 years after HSCT,
pediatric hematopoietic stem cell transplantation can cause prolonged B-cell impairment and increases the risk for infections - a retrospective matched cohort study
Figure 1. Rituximab treatment is efficient for patients with high Epstein-Barr virus viral load after hematopoietic stem cell trans plantation but cutoff viral load for rituximab treatment initiation is unclear. (A) Graphical overview of matching success for dif ferent matching categories. From highest matching priority to lowest: hematopoietic stem cell transplantation (HSTC) matching (matched unrelated donor, matched sibling donor or mismatch related donor), graft source (bone marrow or peripheral blood stem cells [PBSC]), HSCT received (number of HSCT received before + 1), exact diagnosis, malignancy (benign or malign disease as indication for HSCT), graft manipulation, sex and age group (<1, 1-5, 6-11, 12-17, 18+ years) (Online Supplementary Table S1A). (B) Kaplan-Mayer survival curves and log-rank test for cumulative incidence of drop out events (relapse, non-relapse-related mortality, rejection and retransplantation). (C) Epstein-Barr virus (EBV) copy number/mL EDTA blood development over time in patients with EBV infections (n=38) from the rituximab (RTX) and control (Ctrl) groups (n=11) relative to the date of the first ri tuximab dose in the RTX group or the first peak in the Ctrl group. The median time points of the 2nd, 3rd and 4th RTX doses were marked with dotted lines for the RTX group. (D) Maximal EBV load after HSCT in copies/mL EDTA blood in RTX and Ctrl groups. (E) Depiction of patient numbers for which RTX treatment was initiated at <10,000 or <3,000 EBV copies/mL in the RTX group or where the peak was <10,000 or <3,000 EBV copies/mL in the Ctrl group. dHSCT: HSCT treatment timeline day (d0 = day of HSCT). Significance levels: ***P<0.001; **P<0.01; *P<0.05; n.s.: not significant

pointing towards a prolonged impairment not only of Bcell numbers but also function (Online Supplementary Fig ure S1A; Table 1A). Additionally, we evaluated the question
of a correlation between “rituximab doses received” and “rituximab initiation time point” with primary endpoints, but no correlation could be found (Online Supplementary
Figure S2A). Investigating secondary complications, we found a significantly higher cumulative duration of rehos pitalizations in the rituximab group (median 20 vs. 9 days). In line, we noted significantly more non-EBV viral infec tions in the rituximab group, but as this was true inde pendently from rituximab initiation, we suggest a general

increased risk for viral infections in the rituximab group (Table 1A; Online Supplementary Table S1D). However, de spite similar use of myelotoxic antiviral agents (e.g., fos carnet) after rituximab treatment initiation, we found significantly more neutropenia relapses, initiations of in travenous antibiotic treatment and a higher rate of pa
Figure 2. B-cell recovery and function is impeded by rituximab treatment after pediatric hematopoietic stem cell transplantation. (A and B) T-cell (CD3+) and B-cell (CD19+) recovery over time after hematopoietic stem cell transplantation (HSCT) for rituximab (RTX) and control (Ctrl) groups depicted as mean and standard error of mean per group and day after HSCT. Patients were allo cated to either RTX or Ctrl group for each time point depending on RTX therapy initiation and a time and group matched mixed model analysis was computed in R version 1.4.1717 (R foundation) for group comparison. (C, E and F) Inverse Kaplan-Meier curves depicting the rate of patients at a certain time point that achieved either (C) B-cell reconstitution, (E) IgG levels >5 g/L without IgG substitution or (F) receiving no more IgG substitutions for RTX or control groups. (D) Comparison of the elapsed time to Bcell recovery after the last dose of RTX was administered in the RTX group and the elapsed time until B-cell recovery after a time point identical to the time point of the last RTX dose for each individual matched patient for the Ctrl group. Data depicted as single patient values and median. dHSCT: HSCT treatment timeline day (d0 = day of HSCT), BW: body weight. Significance levels: ***P<0.001; **P<0.01; *P<0.05; n.s.: not significant.
tients who had positive bacterial blood culture findings (17 [39%] vs. 6 [14%]) after rituximab therapy. While we saw no difference regarding acute graft-versus-host dis ease (GvHD) incidence, that necessitated systemic treat
Table 1. Comparison of study cohorts.
ment, moderate-severe chronic GvHD only occured in the rituximab group (5 [11%]). Four of these patients had re ceived rituximab before GvHD onset or steroid treatment. A possible explanation could be that these patients were
Rituximab (N=44) Control (N=44) P valuea
Patients with EBV who developed PTLD, N (%) 3/38 (7.9) 0/11 (0) >0.99
B-cell count at day 365, N/nL (range)b 0.2 (0-1.3) 0.5 (0.1-2.0) 0.0003
B-cell to T-cell ratio at day 365 (range)b 0.2 (0-1.1) 0.4 (0-1.0) 0.0005
B-cell recovery, days after HSCT (range)b 282 (43-716) 120 (36-645) 0.0001
Time to B-cell recovery after last RTX (Ctrl: equivalent time point), days (range)b 211 (13-658) 37 (0-479) <0.0001
IgG serum level at day 365, g/L (range)b 6.2 (1.3-14) 9.1 (3.2 -22) 0.03
IgM serum level at day 365, g/L (range)b at day 730, g/L (range)b 0.5 (0.1-1.7) 0.6 (0.2-1.1) 0.8 (0.2-3.6) 0.9 (0.3-2.7) 0.0002 0.01
Last IgG substitution, days after HSCT (range)b 254 (0-1,095) 109 (0-324) <0.0001
Cumulative rehospitalization duration, days (range)b
Before first RTX After first RTX
Patients with any non-EBV viral infection (>2,000 copies/mL in blood), N (%)
Before first RTX After first RTX
Initiations of intravenous antibiotic treatment (range)b Before first RTX After first RTX
Patients with positive blood cultures, N (%)
Before first RTX After first RTX
20 (1-293) 3 (2-293) 16 (1-141)
28 (63.6) 23 (52.3) 9 (20.5)
3 (1-14) 1 (0-5) 1 (0-11)
26 (59.1) 15 (34.1) 17 (38.6)
9 (1-107) 6 (1-22) 9 (1-107)
16 (36.4) 15 (34.1) 5 (11.4)
1 (1-6) 1 (0-3) 0 (0-6)
13 (29.55) 11 (25.0) 6 (13.64)
0.0123 0.77 0.033
0.008 0.08 0.22
0.0004 0.049 0.006
0.021 0.5 0.029
Moderate - severe chronic GvHD, N (%) 5 (11.4) 0 (0) 0.025
B - Prolonged B-cell damage subgroup characteristics PBD (N=9) RTX-Ctrl (N=15) P valuea
Time until EBV viral load drops below <50% of value at RTX initiation (Ctrl: 1st peak), days (range)b 1 (1-2) 2 (1-42) 0.049 B-cell recovery, days after HSCT (range)b 471 (50-716) 301 (43-460) 0.026
Time to B-cell recovery after last RTX, days (range)b 306 (144-658) 214 (127-350) 0.029
IgG level day 365, g/L (range)b 6.0 (2.2-9.7) 9.0 (3.0-14) 0.025 IgM level day 365, g/L (range)b 0.1 (0.1-0.5) 0.6 (0.4-1.0) <0.0001 Cumulative IgG dose, g/kg BW (range)b 7.9 (1.0-28) 0.9 (0.02-3.8) 0.0002 IgG substitution after B-cell recovery, N (%) 6 (66.7) 3 (20) 0.036
Rehospitalizations per patient (range)b,c
Before first RTX After first RTX
Initiations of intravenous antibiotic treatment (range)b
Before first RTX After first RTX
5 (0-34) 0 (0-1) 4 (0-34)
4 (1-14) 2 (1-3) 2 (1-11)
1 (0-9) 0 (0-3) 1 (0-8)
2 (1-4) 1 (0-3) 1 (0-3)
0.036 0.56 0.021
0.034 0.053 0.04
aIn order to compare cohorts the Wilcoxon signed rank test was used for continuous data and the McNemar test for binary data. When matching was impossible, the Mann-Whitney U and Fishers exact tests were used. Test statistics were created using SPSS version 28.0 (IBM SPSS Statistics, Armonk, USA), GraphPad PRISM 8 & 9 (GraphPad Software, San Diego, USA).bMedian (range), crehospitalizations for rituximab application only were not included. EBV: Epstein-Barr virus; PTLD: post-transplant lymphoproliferative disease; RTX: rituximab; Ctrl: control (group); HSCT: hematopoietic stem cell transplantation; GvHD: graft-versus-host disease; PBD: prolonged B-cell damage (subgroup); RTXCtrl: non-PBD rituximab control group (patients from rituximab group that were observed longer than 365 days after initiation of rituximab treatment).
multimorbid patients with a high coincidence of compli cations (Table 1A; Online Supplementary Table S1D). We then followed previous reports of prolonged B-cell impair ment after rituximab treatment in non-HSCT-related situ ations.4,10,12 Out of 24 patients who were observed longer than 365 days after rituximab treatment ended, we ident ified nine (38%) who had unresolved immunoglobulin deficiency. We compared these patients (i.e., the pro longed B-cell damage group [PBD]) to the other 15 and found that B-cell recovery and function were severely im peded in the PBD group (Online Supplementary Figure S2B to D; Table 1B; Online Supplementary Table S1E). Three (33%) PBD patients had unmeasurable B-cells counts at day +365. Regarding prolonged functional impairment, we observed significantly lower IgG and IgM levels despite re ceiving more IgG substitutions and significantly more PBD patients received IgG substitutions after B-cell recovery. They also developed more complications after initiation of rituximab treatment as suggested by significantly more rehospitalizations, a higher rate of non-EBV viral infections and more initiations of intravenous antibiotic treatments. Apart from significantly faster rituximab therapy response and a tendency towards younger age (8 years [range, 219] vs. 12 years [range, 4-21]), no significant differences were found when looking for possible risk factors (Online Supplementary Figure S2; Table 1B; Online Supplementary Table S1E). Follow-up on IgG substitution beyond the ob servation period on 06/30/2022 showed that three of the nine PBD patients had become independent of IgG sub stitutions. This leaves six (25%) patients with a prolonged B-cell damage with continuous dependence on IgG sub stitutions beyond 2 years after HSCT. A complication that has so far been described only in case reports.9,10 Although age, graft manipulation and cGvHD mismatches create potential bias as immune reconstitution influenc ing confounders, our study confirms for the first time in a large pediatric cohort that rituximab therapy <365 days after HSCT leads to a delay in B-cell recovery of both Bcell numbers and function.5,9,12,13 In line with Ottaviano et al., who observed prolonged hypogammaglobinemia after rituximab treatment in a non-HSCT-related setting, the faster rituximab therapy response in the PBD subgroup supports the hypothesis of an increased rituximab sensi tivity at the time point of first rituximab application.4 This also fits with our finding that B-cell impairment did not correlate with the number of rituximab doses received. Regarding secondary infections, our results clearly point towards an increased risk for secondary bacterial infec tions after rituximab initiation which is in line with Petro poulou et al., although no increase in mortality could be observed in our pediatric cohort.14 In contrast to the find ings of Arai et al., we could not confirm a decreased al loimmunity after rituximab treatment.6 We conclude that rituximab harbors a significant risk for prolonged B-cell
impairment and bacterial infections when administered shortly after HSCT. It remains unclear whether regular IgG substitution can completely mitigate the adverse side ef fects, but similar overall survival suggests that IgG sub stitution and appropriate treatment of complications can compensate the damage. We postulate that rituximab treatment within 365 days after HSCT poses a 20-40% risk to develop especially prolonged B-cell impairment. This risk should be discussed in a shared decision-making pro cess with caretakers when considering initiation of rituxi mab treatment. In order to propose a solution for prolonged B-cell impairment, donor stem cell boosts could be evaluated further in cases without GvHD.9 Our findings furthermore support the need to research factors predisposing for rituximab sensitivity. Exact determination of each patients risk to develop prolonged B-cell damage after rituximab therapy could help to identify those pa tients that could qualify for an alternative treatment, e.g., EBV-specific T-cell transfer.15 Finally, we urge physicians to carefully consider the initial indication for rituximab treatment and recommend to generally not start rituxi mab therapy too early at low EBV levels, but instead to monitor EBV levels daily in these situations.
Michael Launspach,1,2,3,4 Dennis Temel,1 Emily Ohlendorf,1,2 Felix Zirngibl,1,2 Bianca Materne,5 Lena Oevermann,1,2 Hedwig E. Deubzer,1,2,3,4 Anton G. Henssen,1,2,3,4,6 Annette Künkele,1,2,3,4 Patrick Hundsdörfer,1,7 Horst von Bernuth,2,8,9,10 Axel Pruß,11 Angelika Eggert,1,2,3,4 Arend von Stackelberg,1,2 Peter Lang12 and Johannes H. Schulte1,2,3,4
1Department of Pediatric Oncology and Hematology, CharitéUniversitätsmedizin Berlin, Berlin; 2Berlin Institute of Health at Charité - Universitätsmedizin Berlin, Berlin; 3The German Cancer Consortium (DKTK), Partner Site Berlin, Berlin; 4The German Cancer Research Center (DKFZ), Heidelberg; 5Institute of Biometry and Clinical Epidemiology, Charité - Universitätsmedizin Berlin, Berlin; 6Experimental and Clinical Research Center, Max Delbrück Center for Molecular Medicine and Charité - Universitätsmedizin Berlin, Berlin; 7Department of Pediatrics, Helios Klinikum BerlinBuch, Berlin; 8Deparment of Pediatric Respiratory Medicine, Immunology and Critical Care Medicine, CharitéUniversitätsmedizin Berlin, Berlin; 9Labor Berlin - Charité Vivantes GmbH, Department of Immunology, Berlin; 10Berlin-Brandenburg Center for Regenerative Therapies (BCRT), CharitéUniversitätsmedizin Berlin, Berlin; 11Institute of Transfusion Medicine, Charité - Universitätsmedizin Berlin, Berlin and 12Department of Hematology/Oncology and General Pediatrics, Children’s University Hospital, University of Tuebingen, Tuebingen, Germany
Correspondence:
M. LAUNSPACH - michael.launspach@charite.de
https://doi.org/10.3324/haematol.2022.281134
Received: April 10, 2022. Accepted: September 13, 2022. Prepublished: September 22, 2022.
©2023 Ferrata Storti Foundation Published under a CC BY-NC license
No conflicts of interest to disclose.
ML conceptualized the study, collected and analyzed data and prepared the manuscript. DT collected and analyzed data and prepared the manuscript. EO collected data and reviewed the manuscript. BM performed the mixed-model and fine and grey analysis, gave input on statistical aspects and possible sources of bias and reviewed the manuscript. FZ, LO, HED, AGH, AK, PH, HvB, AE, AvS and PL participated in designing the study, discussing the
1. Glass B, Hasenkamp J, Wulf G, et al. Rituximab after lymphomadirected conditioning and allogeneic stem-cell transplantation for relapsed and refractory aggressive non-Hodgkin lymphoma (DSHNHL R3): an open-label, randomised, phase 2 trial. Lancet Oncol. 2014;5(7):757-766.
2. Salles G, Barrett M, Foà R, et al. Rituximab in B-cell hematologic malignancies: a review of 20 years of clinical experience. Adv Ther. 2017;34(10):2232-2273.
3. Berghen N, Vulsteke JB, Westhovens R, Lenaerts J, De Langhe E. Rituximab in systemic autoimmune rheumatic diseases: indications and practical use. Acta Clin Belg. 2019;4(4):272-279.
4. Ottaviano G, Marinoni M, Graziani S, et al. Rituximab unveils hypogammaglobulinemia and immunodeficiency in children with autoimmune cytopenia. J Allergy Clin Immunol Pract. 2020;8(1):273-282.
5. Choquet S, Leblond V, Herbrecht R, et al. Efficacy and safety of rituximab in B-cell post-transplantation lymphoproliferative disorders: results of a prospective multicenter phase 2 study. Blood. 2006;107(8):3053-3057.
6. Arai S, Sahaf B, Narasimhan B, et al. Prophylactic rituximab after allogeneic transplantation decreases B-cell alloimmunity with low chronic GVHD incidence. Blood. 2012;119(25):6145-6154.
7. Kim BK, Kang HJ, Hong KT, et al. Successful preemptive therapy with single-dose rituximab for Epstein-Barr virus infection to prevent post-transplant lymphoproliferative disease after pediatric hematopoietic stem cell transplantation. Transpl Infect Dis. 2019;21(6):e13182.
8. Solomon SR, Sizemore CA, Ridgeway M, et al. Safety and efficacy
data and reviewed the manuscript. AP contributed data and reviewed the manuscript. JHS conceptualized the study and reviewed the data, results and manuscript. All authors have read and agreed to the published version of the manuscript.
The authors would like to thank Karin Pretzel for collecting and providing blood transfusion related data. The authors would like to thank Kathy Astrahantseff for proofreading the manuscript.
ML is participant in the BIH Charité Clinician Scientist Program funded by the Charité - Universitätsmedizin Berlin & the Berlin Institute of Health (BIH).
HED and AK are participants in the BIH Charité Advanced Clinician Scientist Pilot program funded by the Charité - Universitätsmedizin Berlin and the Berlin Institute of Health (BIH).
All data collected and analyzed in this study as well as detailed test statistics can be received upon request. This excludes data that falls under data privacy restrictions (e.g., exact date of transplantation).
of rituximab-based first line treatment of chronic GVHD. Bone Marrow Transplant. 2019;54(8):1218-1226.
9. Masjosthusmann K, Ehlert K, Eing BR, et al. Delay in Blymphocyte recovery and function following rituximab for EBV-associated lymphoproliferative disease early post-allogeneic hematopoietic SCT. Bone Marrow Transplant. 2009;43(9):679-684.
10. Luterbacher F, Bernard F, Baleydier F, Ranza E, Jandus P, Blanchard-Rohner G. Case report: persistent hypogammaglobulinemia more than 10 years after rituximab given post-HSCT. Front Immunol. 2021;12:773853.
11. Gulley ML, Tang W. Using Epstein-Barr viral load assays to diagnose, monitor, and prevent posttransplant lymphoproliferative disorder. Clin Microbiol Rev. 2010;23(2):350-366.
12. Labrosse R, Barmettler S, Derfalvi B, et al. Rituximab-induced hypogammaglobulinemia and infection risk in pediatric patients. J Allergy Clin Immunol. 2021;148(2):523-532.
13. Faye A, Quartier P, Reguerre Y, et al. Chimaeric anti-CD20 monoclonal antibody (rituximab) in post-transplant Blymphoproliferative disorder following stem cell transplantation in children. Br J Haematol. 2001;115(1):112-118.
14. Petropoulou AD, Porcher R, Peffault de Latour R, et al. Increased infection rate after preemptive rituximab treatment for EpsteinBarr virus reactivation after allogeneic hematopoietic stem-cell transplantation. Transplantation. 2012;94(8):879-883.
15. Qian C, Wang Y, Reppel L,et al. Viral-specific T-cell transfer from HSCT donor for the treatment of viral infections or diseases after HSCT. Bone Marrow Transplant. 2018 Feb;53(2):114-122.
Measurable residual disease (MRD) before allogeneic hema topoietic cell transplantation (HCT) is strongly associated with relapse risk and survival in acute myeloid leukemia (AML).1-4 However, association is not prediction.5,6 In associ ation studies, inferences about a risk factor (e.g., MRD) are made at the population level, not the individual patient level.6,7 This difference is important because, for clinical deci sion-making, we are most interested in predicting outcomes for a particular patient. This ability is evaluated with classifi cation models. Good association is usually necessary but not sufficient for good classification. The degree to which MRD data improve post-HCT outcome prediction in adults with AML is unknown.
In order to address this, we studied all adults ≥18 years with AML who received a first allograft while in first or second re mission between 4/2006 and 5/2021 and underwent bone marrow MRD testing by multiparameter (10-color) flow cyto metry (MFC) before and approximately 1 month after HCT.8 The MRD assay methodology has remained essentially un changed throughout the study period, with stable assay per formance over time.8 MRD was identified using a “difference from normal” approach, with the assay detecting MRD in most cases to a level of 0.1% and in progressively smaller subsets of patients as the level of MRD decreases below that level.8 Disease risk and treatment response was assessed via 2017 European LeukemiaNet (ELN) criteria9 except that re lapse was defined as emergence of >5% blasts by morphol ogy or MFC in blood or marrow, emergence of cytogenetic abnormalities seen previously, or presence/emergence of any level of disease if leading to therapeutic intervention.8 Our retrospective analysis was approved by the Fred Hutch’s In stitutional Review Board. Data follow-up was current as of February 10, 2022. Overall survival (OS) and relapse-free survival (RFS) were es timated using the Kaplan-Meier method. Probabilities of re lapse and non-relapse mortality (NRM) were summarized using cumulative-incidence estimates, with death without prior relapse considered a competing risk for relapse and re lapse being a competing risk for NRM. Following our previous approach8 and supported by findings from restricted cubic spline models and maximally selected rank statistics (Online Supplementary Figure S1), any detectable level of MRD was considered positive. We used Cox regression to assess the association between OS or RFS and covariates of interest,
whereas cause-specific Cox regression models were used for relapse and NRM in the setting of competing risks. We used the C-statistic to quantify a model’s ability to predict outcomes, with values of 0.6-0.7, 0.7-0.8, and 0.8-0.9 con sidered as poor, fair, and good. Statistical analyses were per formed using R (http://www.r-project.org).
We identified 979 patients for study inclusion (Table 1). Four hundred and sixty deaths, 308 relapses, and 193 NRM events contributed to estimates for relapse, OS, RFS, and NRM with a median (range) follow-up after HCT among survivors of 62 (3-182) months. Compared to adults without MRD, those with MRD had a significantly increased relapse risk (hazard ratio [HR]: 4.28, 95% confidence interval [CI]: 3.40-5.40, P<0.001), shorter RFS (HR: 3.11, 95% CI: 2.57-3.76, P<0.001), and shorter OS (HR: 2.65, 95% CI: 2.18-3.23, P<0.001). Besides pre-HCT MRD status, several other factors were associated with re lapse, RFS, OS, and/or NRM (Online Supplementary Table S1). We then assessed the ability of covariates to predict relapse, RFS, and OS in individual patients. In univariate analyses, preHCT MRD status was the strongest (albeit poor) individual predictor for relapse, RFS, and OS (C-statistics: 0.64 [relapse], 0.60 [RFS], 0.59 [OS]; Table 2). Comparable results were ob tained with the ELN-recommended ≥0.1% MRD positivity threshold (C-statistics: 0.61, 0.58, 0.57). A basic multivariable model that included age, cytogenetic risk at diagnosis, re mission number, time between most recent remission and HCT, Karnofsky score, neutrophil recovery before HCT, con ditioning intensity, and secondary AML status yielded C-stat istics of 0.64, 0.62, and 0.62 for relapse, RFS, and OS (Table 2). Inclusion of pre-HCT cytogenetic data (normalized vs. not normalized for patients presenting with abnormal karyo types), which we very recently found to provide comple mentary information to flow cytometric MRD data despite its low sensitivity,10 improved models only minimally, yielding Cstatistics of 0.66, 0.63, and 0.63 for relapse, RFS, and OS. The prediction accuracy could be further improved when in formation from pre-HCT MRD testing was included (C-stat istics of 0.70, 0.66, and 0.65 for relapse, RFS, and OS; C-statistics using ELN cut-off: 0.70, 0.67, 0.65). In contrast, once the pre-HCT MRD status was included, adding pre-HCT cytogenetic data did not further improve the models’ predic tive ability (Table 2).
In our models for relapse, RFS, and OS, we identified a sig nificant interaction between pre-HCT MRD status and con
allogeneic
Table 1. Demographic and clinical characteristics of the study cohorts.
Pre-HCT MRD cohort (N=979)
Peri-HCT MRD dynamics cohort (N=926)
Median age at HCT in years (range) 55 (18-81) 55 (18-81)
Male sex, N (%) 525 (54) 495 (53)
Median WBC at diagnosis, x 109/L (range) 8 (0-348) 8 (0-348)
2017 ELN cytogenetic risk*, N (%)
Favorable 72 (7) 68 (7)
Intermediate 618 (63) 590 (64) Adverse 251 (26) 231 (25)
Missing/Not reported 38 (4) 37 (4)
2017 ELN cytogenetic/molecular risk, N (%)
Favorable 171 (17) 164 (18)
Intermediate 87 (9) 83 (9) Adverse 128 (13) 121 (13) Missing/Not reported 593 (61) 558 (60)
NPM1 mutational status at diagnosis, N (%)
Positive 142 (15) 134 (14) Negative 441 (45) 422 (46) Missing/Not reported 396 (40) 370 (40)
FLT3-ITD mutational status at diagnosis, N (%)
Positive 172 (18) 162 (17)
Negative 451 (46) 429 (46) Missing/Not reported 356 (36) 335 (36)
Secondary AML**, N (%) 257 (26) 239 (26)
Disease status at HCT, N (%)
First remission 747 (76) 708 (76)
Second remission 232 (24) 218 (24)
Median remission duration before HCT, days (range) 98 (7-788) 98 (7-788)
Recovered ANC before HCT***, N (%) 885 (90) 840 (91)
Recovered platelet count before HCT***, N (%) 691 (71) 656 (71)
Recovered peripheral blood counts before HCT***, N (%) 680 (69) 646 (70)
Pre-HCT Cytogenetics HCT, N (%)
Normalized karyotype 387 (40) 363 (39) Abnormal karyotype 161 (16) 151 (16) Non-informative karyotype**** 431 (44) 412 (44)
Pre-HCT MRD status, N (%)
MRDpos 191 (20) 186 (20) MRDneg 788 (80) 740 (80)
Post-HCT MRD status day +20-40, N (%)
MRDpos 71 (7) 50 (5) MRDneg 876 (89) 876 (95) Not available 32 (3)
Peri-HCT MRD dynamics, N (%)
MRDpos/MRDpos 50 (5) 50 (5)
MRDpos/MRDneg 136 (14) 136 (15) MRDneg/MRDneg 740 (76) 740 (80) MRDneg/MRDpos 21 (2)
Not available 32 (3)
Karnofsky score, % (range) 90 (40-100) 90 (50-100)
HCT Comorbidity Index, N (%)
0-1 339 (35) 324 (35)
2-3 347 (35) 334 (36) ≥4 293 (30) 268 (29)
Conditioning intensity, N (%)
MAC 583 (60) 558 (60) Non-MAC 396 (40) 368 (40)
Continued on following page.
HLA matching, N (%)
HLA-identical related donor 227 (23) 219 (24)
HLA-matched unrelated donor 482 (49) 456 (49) 1-2 allele/antigen mismatched unrelated donor 101 (10) 95 (10)
HLA-haploidentical donor 37 (4) 34 (4)
UCB 132 (13) 122 (13)
Source of stem cells, N (%)
PB 766 (78) 728 (79) BM 81 (8) 76 (8) UCB 132 (13) 122 (13)
GvHD prophylaxis, N (%)
CNI + MMF ± sirolimus 473 (48) 444 (48) CNI + MTX ± other 370 (38) 352 (38) PTCy 122 (12) 116 (13) Other 14 (1) 14 (2)
*Risk stratification according to the presence of cytogenetic abnormalities only. **Secondary AML was defined as disease following an antecedent hematologic disorder or treatment with systemic chemotherapy, radiotherapy, or both for a different disorder. ***ANC ≥1,000/mL and platelets ≥100,000/mL. ****Normal cytogenetics in cytogenetically normal AML or missing cytogenetics at diagnosis. AML: acute myeloid leukemia; ANC: absolute neutrophil count; BM: bone marrow; CNI: calcineurin inhibitor; ELN: European LeukemiaNet; HCT: hematopoietic cell transplantation; MAC: myeloablative conditioning; MMF: mycophenolate mofetil; MRD: measurable residual disease; MTX: methotrexate; PB: peripheral blood; PTCy: post transplantation cyclophosphamide; UCB: umbilical cord blood; WBC: total white blood cell count. GvHD: graft-versus-host disease.
ditioning intensity, with similar outcomes for MRD-positive patients across regimens but better outcomes for MRDnegative patients with myeloablative conditioning. However, including this interaction term in models only minimally im proved the predictive performance for relapse (C-statistic 0.71 vs. 0.70) but not for RFS or OS. Currently, there is focus on pre-HCT testing because of the perceived value in using data for decision-making regarding use/not use of allogeneic HCT and specifics of the allograft ing approach. However, there is interest in MRD-directed post-HCT interventions, for which early post-HCT MRD data could be useful. That is because our recent data indicated that, across conditioning intensities, combined use of preHCT MRD data and early post-HCT MRD data, obtained 2040 days after HCT (“peri-HCT MRD dynamics”), improves risk assessment over isolated pre-HCT MRD assessments and identifies four groups of patients with distinct clinical out comes.8 We therefore performed a second set of analyses, restricting the dataset to 926 patients with pre- and early post-HCT MRD data available (Table 1). Patients in the MRDneg/MRDpos group (n=21) were excluded from these models due to unstable hazard ratio estimates caused by most patients in the subgroup having relapsed by time 0 of the relapse and RFS measurements. In day +40 landmark analyses, peri-HCT MRD dynamics were strongly associated with relapse, RFS, and OS and, weakly, with NRM; as in the entire cohort, several other factors were associated with re lapse, RFS, OS, and/or NRM in this patient subset (Online Supplementary Table S2). In univariate models, peri-HCT MRD dynamics were equally accurate as pre-HCT MRD data for the prediction of relapse (C-statistic=0.70), RFS (C-stat istic=0.63), and OS (C-statistic=0.61; Table 2). Likewise, Cstatistic values in multivariable models remained unchanged when data on peri-HCT MRD dynamics rather
than pre-HCT MRD status were included (0.71, 0.68, and 0.67 for the prediction of relapse, RFS, and OS).
We previously reported that detailed molecular data mod estly improve the prediction of therapeutic resistance or survival in adults receiving intensive AML chemotherapy.11
We therefore considered that refined cytogenetic/molecular risk categorization could improve post-HCT outcome pre diction. As a limitation of our dataset, molecular data suffi cient for risk classification based on ELN 2017 criteria were only available for 260 patients in the more recent period since 2016 when extended molecular profiling became rou tine at our institution. In this latter subset, the addition of ELN 2017 cytogenetic/molecular disease risk to a multivari able model including pre-HCT MRD status yielded C-stat istics of 0.70, 0.69 and 0.68 for relapse, RFS and OS.
Decision-making in most areas of medicine, including HCT, entails important uncertainties.12 While MRD data increased the accuracy of outcome prediction in our cohort, our find ing of C-statistics not exceeding 0.71 for relapse, 0.68 for RFS, and 0.67 for OS highlights that our ability to predict important outcomes in adults with AML undergoing alloge neic HCT is limited even with MRD information available. This is reminiscent of findings we obtained when building multivariable models to predict outcomes after intensive AML chemotherapy.13 With this, our data caution against over-reliance on MRD data (or any other routine clinical in formation) to guide decision-making and prognostication in individual AML patients considered for allografting or postHCT interventions.
Several reasons may underlie the modest contribution of MRD data to post-HCT outcome prediction. First, there are inherent limitations to MRD testing that can result in patient misclassification.14 Second, it is conceivable that MRD used as a binary readout rather than continuous biomarker could
Table 2. C-statistics for univariate and multivariate Cox regression analyses.
Relapse RFS OS Relapse RFS OS
Pre-HCT MRD status 0.64 0.60 0.59 0.66 0.62 0.60 Post-HCT MRD status day +20-40 0.57 0.55 0.54 Peri-HCT MRD dynamics 0.67 0.63 0.61 2017 ELN cytogenetic risk at diagnosis* 0.59 0.56 0.55 0.59 0.56 0.55 Pre-HCT cytogenetics** 0.57 0.56 0.56 0.57 0.57 0.57 Age at HCT 0.55 0.57 0.57 0.53 0.57 0.57 Time between CR and HCT 0.55 0.52 0.52 0.55 0.53 0.52 Conditioning (MAC vs. non-MAC) 0.54 0.56 0.55 0.52 0.55 0.55 Karnofsky score 0.54 0.55 0.55 0.54 0.55 0.55
NPM1 mutational status at diagnosis 0.54 0.53 0.53 0.55 0.52 0.53
FLT3-ITD mutational status at diagnosis 0.54 0.52 0.51 0.54 0.51 0.50 Disease status at HCT (CR2 vs. CR1) 0.53 0.53 0.53 0.53 0.53 0.53 ANC recovery before HCT 0.52 0.52 0.52 0.52 0.52 0.52 Secondary AML*** (vs. de novo) 0.52 0.52 0.52 0.52 0.52 0.52
Basic covariates**** 0.64 0.62 0.62 0.64 0.62 0.63 Basic covariates + NPM1/FLT3-ITD mutational status at diagnosis 0.64 0.62 0.62 0.64 0.62 0.63
Basic covariates + pre-HCT cytogenetics 0.66 0.63 0.63 0.65 0.64 0.64 Basic covariates + pre-HCT MRD status 0.69 0.66 0.65 0.70 0.68 0.66 Basic covariates + pre-HCT cytogenetics + pre-HCT MRD status 0.70 0.66 0.65 0.71 0.68 0.67
Basic covariates + pre-HCT cytogenetics + post-HCT MRD status day +20-40 0.67 0.66 0.65 Basic covariates + pre-HCT cytogen etics** + peri-HCT MRD dynamics 0.71 0.68 0.67
*Risk stratification according to the presence of cytogenetic abnormalities only. **Abnormal vs. normalized vs. missing/non-informative. ***Secondary AML was defined as disease following an antecedent hematologic disorder or treatment with systemic chemotherapy, radiotherapy, or both for a different disorder. ****Age at HCT, 2017 ELN cytogenetic risk at diagnosis (favorable vs. intermediate vs. adverse vs. unknown), remission (first vs. second), time between most recent CR and HCT, Karnofsky score, recovery of ANC before HCT to 1,000/mL (yes vs. no), conditioning intensity (MAC vs. non-MAC), secondary AML (vs. de novo). AML: acute myeloid leukemia; ANC: absolute neutrophil count; CR: complete remission; ELN: European LeukemiaNet; HCT: hematopoietic cell transplantation; MAC: myeloablative conditioning; MRD: measurable residual disease; OS: overall survival; RFS: relapse-free survival.
decrease prediction accuracy. However, we explored this through non-linear modeling of relationships between MRD and post-HCT endpoints with cubic spline functions and did not find noticeable differences in relapse or survival risks across MRD levels. This suggests the consideration of any detectable level of MRD as positive did not negatively impact models’ predictive accuracies. Third, since different MRD test modalities provide complementary rather than congruent prognostic information,15 the incorporation of molecular MRD data may improve outcome prediction. Un fortunately, molecular MRD testing was not routine part of the pre-HCT evaluation in the study period. Fourth, because of the lack of detailed molecular data, we could not assess a possible interaction between MRD and genetic/molecular disease risk. Fifth, NRM represents a major contribution to mortality after allogeneic HCT. Imperfectly accounted for in
competing risks analyses, NRM events may interfere with the ability to predict relapse and survival outcomes with MRD data. Lastly, sustained AML remission after allogeneic HCT largely depends on graft-versus-leukemia effects. PreHCT and early post-HCT MRD primarily measure AML sen sitivity to prior chemotherapy and conditioning regimens and may not predict immune-mediated eradication of leu kemic cells. The identification of robust immune biomarkers predicting graft-versus-leukemia effects after allogeneic HCT could help refine relapse risk stratification.
Eduardo Rodríguez-Arbolí,1,2 Megan Othus,3 Corentin Orvain,1 Lucas C.
Pre-HCT MRD cohort (N=979) Peri-HCT MRD dynamics cohort (N=926)Zarling,4 Brenda M. Sandmaier,1,5 Filippo Milano,1,5 Gary Schoch,1 Chris Davis,1 H. Joachim Deeg,1,5 Frederick R. Appelbaum,1,5 Rainer Storb1,5 and Roland B. Walter1,6,7,8
1Clinical Research Division, Fred Hutchinson Cancer Center, Seattle, WA, USA; 2Department of Hematology, Hospital Universitario Virgen del Rocío, Instituto de Biomedicina de Sevilla (IBIS/CSIC/CIBERONC), University of Seville, Seville, Spain; 3Public Health Science Division, Fred Hutchinson Cancer Center, Seattle, WA, USA; 4Department of Medicine, Residency Program, University of Washington, Seattle, WA, USA; 5Department of Medicine, Division of Medical Oncology, University of Washington, Seattle, WA, USA; 6Department of Medicine, Division of Hematology, University of Washington, Seattle, WA, USA; 7Department of Laboratory Medicine and Pathology, University of Washington, Seattle, WA, USA and 8Department of Epidemiology, University of Washington, Seattle, WA, USA.
Correspondence: R.B. WALTER - rwalter@fredhutch.org
https://doi.org/10.3324/haematol.2022.281631
Received: June 26, 2022. Accepted: September 14, 2022. Prepublished: September 22, 2022.
©2023 Ferrata Storti Foundation
Published under a CC BY-NC license
1. Hourigan CS, Gale RP, Gormley NJ, Ossenkoppele GJ, Walter RB. Measurable residual disease testing in acute myeloid leukaemia. Leukemia. 2017;31(7):1482-1490.
2. Short NJ, Zhou S, Fu C, et al. Impact of measurable residual disease on survival outcomes in patients with acute myeloid leukemia: a meta-analysis. JAMA Oncol. 2020;6(12):1890-1899.
3. Heuser M, Freeman SD, Ossenkoppele GJ, et al. 2021 Update on MRD in acute myeloid leukemia: a consensus document from the European LeukemiaNet MRD Working Party. Blood. 2021;138(26):2753-2767.
4. Hourigan CS, Dillon LW, Gui G, et al. Pre-MEASURE: multicenter evaluation of the prognostic significance of measurable residual disease testing prior to allogeneic transplantation for adult patients with AML in first remission. J Clin Oncol. 2022;40(16 Suppl):7006.
5. Kattan MW. Judging new markers by their ability to improve predictive accuracy. J Natl Cancer Inst. 2003;95(9):634-635.
6. Feng Z. Classification versus association models: should the same methods apply? Scand J Clin Lab Invest Suppl. 2010;242:53-58.
7. Walter RB, Estey EH. Selection of initial therapy for newlydiagnosed adult acute myeloid leukemia: limitations of predictive models. Blood Rev. 2020;44:100679.
8. Paras G, Morsink LM, Othus M, et al. Conditioning intensity and peritransplant flow cytometric MRD dynamics in adult AML. Blood. 2022;139(11):1694-1706.
No conflicts of interest to disclose.
ERA contributed to the collection and assembly of data, data analyses and interpretation, and drafting of the manuscript. MO conducted all statistical analyses and participated in data interpretation and drafting of the manuscript. CO, LCZ, GS, and CD contributed to the collection and assembly of data. BMS, FM, HJD, FRA and RS contributed to the provision of study material, patient recruitment, and acquisition of data. RBW conceptualized and designed this study and participated in data analysis and interpretation and drafting of the manuscript. All authors revised the manuscript critically and gave final approval to submit for publication.
The authors acknowledge the excellent care provided by the physicians and nurses of the HCT teams, the staff in the Long-Term Follow-up office at the Fred Hutchinson Cancer Center, and the patients for participating in our research protocols.
Research reported in this publication was supported by grants P01CA078902, P01-CA018029, and P30-CA015704 from the National Cancer Institute/National Institutes of Health (NCI/NIH), Bethesda, MD, USA.
Original data can be made available upon request to the corresponding author.
9. Döhner H, Estey E, Grimwade D, et al. Diagnosis and management of AML in adults: 2017 ELN recommendations from an international expert panel. Blood. 2017;129(4):424-447.
10. Orvain C, Wilson JA, Fang M, et al. Relative impact of residual cytogenetic abnormalities and flow cytometric measurable residual disease on outcome after allogeneic hematopoeitic cell transplantation in adult acute myeloid leukemia. Haematologica. 2022 Aug 4. doi: 10.3324/haematol.2022.281585. [Epub ahead of print]
11. Walter RB, Othus M, Paietta EM, et al. Effect of genetic profiling on prediction of therapeutic resistance and survival in adult acute myeloid leukemia. Leukemia. 2015;29(10):2104-2107.
12. Dhawale T, Steuten LM, Deeg HJ. Uncertainty of physicians and patients in medical decision making. Biol Blood Marrow Transplant. 2017;23(6):865-869.
13. Othus M, Wood BL, Stirewalt DL, et al. Effect of measurable ('minimal') residual disease (MRD) information on prediction of relapse and survival in adult acute myeloid leukemia. Leukemia. 2016;30(10):2080-2083.
14. Othus M, Gale RP, Hourigan CS, Walter RB. Statistics and measurable residual disease (MRD) testing: uses and abuses in hematopoietic cell transplantation. Bone Marrow Transplant. 2020;55(5):843-850.
15. Jongen-Lavrencic M, Grob T, Hanekamp D, et al. Molecular minimal residual disease in acute myeloid leukemia. N Engl J Med. 2018;378(13):1189-1199.
Primary myelofibrosis (PMF) is a rare myeloproliferative neoplasm characterized by clonal proliferation of mature myeloid lineages derived from stem cells (erythrocytes, leukocytes and magakaryocytes) with variable megakaryo cyte atypia associated with reticulin and / or collagen bone marrow (BM) fibrosis, osteosclerosis, ineffective ery thropoiesis, angiogenesis, extramedullary hematopoiesis and abnormal expression of cytokines.
Allogeneic hemopoietic stem cell transplantation (al loHSCT) is currently the only curative approach for pa tients with myelofibrosis, and for this reason the number of allografts for these indications have been growing over the past years.
Unfortunately relapse of myelofibrosis (MF) after an al loHSCT occurs in 10-40% of cases: patients usually pres ent with a declining donor chimerism, and a reappearance of driver mutations if present; BM biopsy is usually con sistent with typical megakaryocyte abnormalities and stromal fibrosis. Ultimately BM cells exhibit progressive loss of donor chimerism, and the relapse is therefore of recipient origin. Here we report two allografted MF pa tients who relapsed in donor cells.
Case 1: A 58-year-old male patient with triple negative myelofibrosis, heavy transfusion burden and with no hematological malignancies present in the family. He was transplanted with BM hematopoietic stem cells from his 32-year-old haploidentical son in February 2016. The con ditioning used was thiotepa 10 mg/kg, busulfan 6.4 mg/kg and fludarabine 150 mg/m2 (TBF). Graft-versus-host dis ease (GvHD) prophylaxis was post-transplant cyclophos phamide (PTCY) 50 mg, cyclosporin A and mycophenolate. The patient engrafted and exhibited 100% donor chim erism, without GvHD. His blood counts were normal thereafter. In January 2019 he experienced a gradual de cline in blood counts and a BM biopsy was unremarkable. A new BM biopsy in March 2019 showed initial return of BM fibrosis with megakaryocyte abnormalities: chimerism was full donor (100% donor). In January 2020 a BM biopsy showed an evident return of fibrosis and megakariocyte abnormalities; the patient was anemic and thrombocyto penic and required red cell and platelet transfusions again. He received a second alloHSCT from another ha ploidentical donor, but he remained cytopenic: chimerism showed full second donor chimerism on day +60, but then there was a gradual return to first donor chimerism and relapse. He died of progressive disease in March 2022. Therefore the (first) donor relapse dominated also after the second transplant.
Next-generation sequencing (NGS) was performed before transplant and identified a mutation in SF3B1 (variant al lele frequency [VAF] 8%; at relapse the latter was not present, but NGS identified a polymorphism in IDH2 c.315C>T, p.(Gly105=) which was not present prior to transplant.
Case 2: A 60-year-old female patient with CALR1-positive MF, with complex cytogenetics (del6, del7, del13). A first degree relative had chronic lymphocytic leukemia (CLL) and a second degree relative had acute myeloid leukemia (AML). She received peripheral blood alloHSCT from her 48- year-old HLA-identical sister, in September 2018, with the same conditioning regimen (TBF) and GvHD prophy laxis as in case 1. Engraftment was rapid and complete: 6 months later the patient showed 100% donor chimerism: CALR1-negative, 46 XX. In March 2021 the patient became pancytopenic, with elevated lactate dehydrogenase >1,000 IU/L, and a BM biopsy showed relapse of myelofibrosis with MF3. The patient remained CALR1-negative and showed 100% donor chimerism and normal 46 XX cyto genetics. She underwent a second alloHSCT from an un related donor and died of transplant-associated microangiopathy.
NGS before transplant identified CALR as the only muta tion which was not present at relapse. Donor chimerism was studied in unfractionated BM mononuclear cells (MNC), and in colony-forming unit granulocyte/ erythroid/ macrophage/ megakaryocyte colonies (CFU-GEMM), gra nulocyte macrophage colonies (CFU-GM), and erythroid colonies (CFU-E) isolated from peripheral blood. In addi tion, we analyzed the donor chimerism on mesenchymal cells from BM and in circulating endothelial progenitor cells. Results from these studies highlighted a full donor chimerism in MNC BM cells, CFU-GM, CFU-GEMM, CFU-E and CD3+ selected T cells. Endothelial and mesenchymal cells remained of recipient origin (Figures 1 and 2). Endothelial colony-forming cell (ECFC) assay was per formed according to Ingram et al 1 After 2 days, non-ad herent cells were removed and residual adherent cells were grown in EGM-2 medium for 21 days, with medium replacement every 3 days. Well-circumscribed monolayers of cells with cobblestone appearance, growing from day 9 to day 21, were counted as ECFC. Mesenchymal stromal cells (MSC) were isolated from BM samples as previously described.2
CFU assay on peripheral blood and BM MNC were per formed as previously reported. After 2 weeks, colonies were enumerated according to their morphology as burst-
Figure 1. Chimerism analysis of donor and patient 1 before transplant. After transplant (day +30) the proportion of donor chim erism was 98,9% on 12 evaluable microsatellites. At the time of relapse the proportion of donor chimerism on unfractionated bone marrow cells was 98.1% on 12 evaluable microsatellites.

forming unit erythroid (BFU-E), CFU-GM and CFU-GEMM.3 The different CFU were collected and stored at -20°C for chimerism studies. We compared the chimerism pattern in all donor and pa tient samples: patients’ and donors’ baseline, follow-up after transplant, at relapse, on CFU-GM, CFU-GEMM, ECFC and MSC. As previously described, chimerism was as sessed by polymerase chain reaction analysis of short tandem repeats (STR). The proportion of donor recipient chimerism was calculated using the PowerPlex Fusion System (Promega srl, Italy) on 24 STR loci. Full-donor chimerism (F-DC) was defined as having >95% donor al leles.4
Recurrence of disease in donor cells have been described as a rare entity in acute leukemia. Several characteristics have been described like lower incidence in sex-matched transplantation, variable latency between alloHSCT and recurrence of disease, higher prevalence in transplant from family donors as compared from unrelated donors, a donor age older than the recipient, conditioning regimen including TBI.5 A survey from the European Society of Blood and Marrow Transplantation has estimated a preva
lence of donor relapse of 80.5 cases per 100,000 trans plants, and a cumulative incidence of 0.067%, 0.132% and 0.363%, respectively, at 5, 10, and 25 years after alloHSCT,6 but perhaps the real incidence of relapse in donor cells is underestimated. Its diagnosis depends on the demonstra tion of the donor origin of neoplastic cells. Due to the het erogeneity of the diseases the most used approach is the indirect demonstration of donor derivation through the confirmation of full-donor chimerism performed by STR analysis. This approach has some limitations related to the low sensitivity of the method. In fact despite its ap plicability to both sex-matched and -mismatched trans plants, in practice, the co-amplification of alleles generally reduces the detection sensitivity of current STR polymerase chain reaction techniques to almost 1% of the minor component. Therefore, STR would not be able to detect residual recipient hematopoiesis, but a morpho logical relapse involves, if not the totality, a large propor tion of cells in excess of the detection limit of STR and is, hence, easily detectable by STR. We present here two cases of MF who relapsed in donor cells. The marker used to identify donor cells, was chim
Figure 2. Chimerism analysis of in vitro colonies from patient 1. Donor short tandem repeats (STR) were detected in different cell colonies (CFU-GM 99.7%, CFU-GEMM 99.4%, BFU-E 99.6%, and CD3+ 98.1% [not shown]). The proportion of donor STR in en dothelial colony-forming cell (ECFC) colonies was 1.8% and 2.8% for mesenchymal stromal cell (MSC) colonies. CFU: clonyforming unit; CFU-GM: CFU granulocyte macrophage; BFU-E: burst-forming unit erythroid; CFU-GEMM: CFU granulocyte/ erythroid/ macrophage/ megakaryocyte.

erism performed by STR; indeed the first patient was a triple-negative MF, and the second patient relapsed with out the original CALR mutations or the original complex cytogenetics. We could prove 100% donor chimerism in all cell lineages grown in cell culture (GM, GEMM, erythroid), and in CD3+ selected cells, whereas mesenchymal and endothelial colonies remained of recipient origin. Both pa tients had a hematologic relapse, with systemic symp toms and progression, which ultimately lead to a fatal outcome. Both donors remain healthy with normal blood counts years after donation. The pathogenesis of relapse in donor cells remains poorly understood: genetic predisposition, viral transfection, a permissive BM microenvironment and defective immuno surveillance, have all been hypothesized. A genetic pre
disposition could be the reason for the relapse in the sec ond patient who had two relatives with leukemia. In ad dition, in the setting of MF, an intriguing factor could be an abnormal microenvironment, leading to a neoplastic transformation of donor hematopoietic stem cells. Epi genetic changes in the BM microenvironment, which lead to b catenin activation and disease progression of MDS, have been described.7 Aldoss et al.8 speculated that the BM microenvironment plays an important role in main taining homeostasis of hematopoietic stem cells. More over preclinical studies have demonstrated that changes in marrow BM mesenchymal stem cells, stromal cells, en dothelial cells, adipocytes, osteogenic cells, and osteo blasts, have been associated with the onset or progression of leukemia, as well as with chemotherapy
resistance.9-13 Some studies have shown JAK2-positive en dothelial cells,14 while others have not,15 suggesting we still do not understand the cause-effect relationship of the microenvironment and the myeloproliferative neoplasm.
In our two patients the microenvironment was of host ori gin. Thus a defective (permissive) microenvironment may induce or allow leukemic transformation also in healthy normal donor cells.
To our knowledge, these are the first two MF patients re ported with a relapse in donor cells, compared to several cases reported for acute leukemia.6 One reason for the discrepancy could be that MF remains a rare indication (2-5% of allogeneic transplants), and, with a 0.13% inci dence of donor relapse at 10 years, the number of longterm surviving MF patients, may still be not numerous enough. On the other hand, the number of allografted MF patients is rapidly increasing, and more cases may be de tected in the future: for this reason we should continue to study chimerism, in case of reappearance of driver mu tations or hematologic relapse in MF after an alloHSCT.
Patrizia Chiusolo,1,2 Nicoletta Orlando,1 Sabrina Giammarco,1 Monica Rossi,1,2 Elisabetta Metafuni,1 Salvatore Leotta,3 Giuseppe Milone,3 Caterina Giovanna Valentini,1 Maria Bianchi,1 Filippo Frioni,2 Claudio Pellegrino,2 Federica Sorà,1,2 Luigi Maria Larocca,4 Simona Sica,1,2 Andrea Bacigalupo1,2 and Luciana Teofili1,2
1Dipartimento di Diagnostica per Immagini, Radioterapia Oncologica ed Ematologia, Fondazione Policlinico Universitario A. Gemelli IRCCS, Rome; 2Sezione di Ematologia, Dipartimento di Scienze Radiologiche
1. Ingram DA, Mead LE, Tanaka H, et al. Identification of a novel hierarchy of endothelial progenitor cells using human peripheral and umbilical cord blood. Blood. 2004;104(9):2752-2760.
2. Le Blanc K, Frassoni F, Ball L, et al. Mesenchymal stem cells for treatment of steroid-resistant, severe, acute graft-versus-host disease: a phase II study. Lancet. 2008;371(9624):1579-1586.
3. Iachininoto MG, Camisa V, Leone L, et al. Effects of exposure to gradient magnetic fields emitted by nuclear magnetic resonance devices on clonogenic potential and proliferation of human hematopoietic stem cells. Bioelectromagnetics. 2016;37(4):201-211.
4. Chiusolo P, Bregante S, Giammarco S, et al. Full donor chimerism after allogeneic hematopoietic stem cells transplant for myelofibrosis: the role of the conditioning regimen. Am J Hematol. 2021;96(2):234-240.
5. Wang E, Hutchinson CB, Huang Q, et al. Donor cell-derived leukemias/ myelodyspastic neoplasms in allogeneic
ed Ematologiche, Università Cattolica del Sacro Cuore, Rome; 3Clinica Ematologica, Universita’ di Catania, Catania and 4Dipartimento di Scienze della salute della donna, del bambino e di sanità pubblica, Fondazione Policlinico Universitario A. Gemelli IRCCS, Rome, Italy
Correspondence: A. BACIGALUPO - andrea.bacigalupo@unicatt.it
https://doi.org/10.3324/haematol.2022.281564
Received: June 8, 2022. Accepted: September 15, 2022. Prepublished: September 22, 2022.
©2023 Ferrata Storti Foundation Published under a CC BY-NC license
No conflicts of interest to disclose.
Contributions
PC, LT and AB designed the work. NO, SG, MR and LMR performed research and analyzed data. EM, SL, GM, CGV, MB, FF, CP, FS and SS treated the patients. PC, LT and AB wrote the paper and all coauthors critically reviewed the manuscript and gave their final approval.
This study was supported by Associazione Italiana Ricerca sul Cancro (to AB).
Data regarding these two patients, are available on request to the corresponding author.
hematopoietic stem cell transplant recipients. a clinicopathologic study of 10 cases and a comprehensive review of the literature. Am J Clin Pathol. 2011;135(4):525-540.
6. Engel N, Rovo A, Badoglio M, et al. European experience and risk factor analysis of donor cell-derived leukaemias/ MDS following haematopoietic cell transplantation. Leukemia. 2019;33(2):508-517.
7. Bhagat TD, Chen S, Bartenstein M, et al. Epigenetically aberrant stroma in MDS propagates disease via Wnt/β Catenin activation. Cancer Res. 2017;77(18):4846-4857.
8. Aldoss I, Song JY, Curtin PT, Forman SJ. Multiple donor-derived leukemias in a recipient of allogeneic hematopoietic cell transplantation for myeloid malignancy. Blood Adv. 2020;4(19):4798-4801.
9. Varricchio L and Hoffman R. Megakaryocytes are regulators of the tumor microenvironment and malignant hematopoietic progenitor cells in myelofibrosis. Front Oncol. 2022;12:906698.
10. Battula VL, Le PM, Sun JC, et al. AML-induced osteogenic differentiation in mesenchymal stromal cells supports leukemia growth. JCI Insight. 2017;2(13):e90036.
11. Ishikawa F, Yoshida S, Saito Y, et al. Chemotherapy-resistant human AML stem cells home to and engraft within the bonemarrow endosteal region. Nat Biotechnol. 2007;25(11):1315-1321.
12. Colmone A, Amorim M, Pontier AL, Wang S, Jablonski E, Sipkins DA. Leukemic cells create bone marrow niches that disrupt the behavior of normal hematopoietic progenitor cells. Science. 2008;322(5909):1861-1865.
13. Raaijmakers MH, Mukherjee S, Guo S, et al. Bone progenitor
dysfunction induces myelodysplasia and secondary leukaemia. Nature. 2010;464(7290):852-857.
14. Teofili L, Martini M, Iachininoto MG, et al. Endothelial progenitor cells are clonal and exhibit the JAK2(V617F) mutation in a subset of thrombotic patients with Ph-negative myeloproliferative neoplasms. Blood. 2011;117(9):2700-2707.
15. Piaggio G, Rosti V, Corselli M, et al. Endothelial colony-forming cells from patients with chronic myeloproliferative disorders lack the disease-specific molecular clonality marker. Blood. 2009;114(14):3127-3130.

Acute myeloid leukemia (AML) affects around 3,200 people annually in the UK (Cancer Research UK statistics, accessed May 2021) and is a significant health burden. New targeted therapies in AML are showing promising ef ficacy but further novel treatments are required which target specific molecular aberrations, reduce toxicity, and induce long-lasting remissions. One such molecular target of considerable interest given its frequent dysregulation in AML is Wnt/b-catenin signaling. b-Catenin is the central mediator of Wnt signaling and is frequently overexpressed in AML in which it is associated with poor prognosis.1 Wnt/b-catenin is also known to drive the emergence and maintenance of leukemia stem cells in AML.2 Protein interactions are critical to the stability, localization and activity of b-catenin, and we recently per formed the first proteomic analyses of the b-catenin in teractome in myeloid cells.3 This study identified Wilms
tumor protein (WT1) as a putative novel interaction partner in myeloid cells.3 WT1 is also overexpressed and mutated in AML, in which it confers inferior survival,4,5 yet the interplay between these two signaling proteins has not been examined previously within a hematopoietic context.
In order to idenitfy appropriate cell lines in which to study b -catenin:WT1 interplay we first performed a screen of myeloid cell lines to examine b-catenin and WT1 protein expression. We observed a statistically significant correla tion between b -catenin and WT1 expression across 16 myeloid cell lines, with 50% (8/16) co-expressing b-cate nin and WT1 to varying degrees (Figure 1A, B). There was no particular association of this correlation with cell line morphology or genotype. To validate the interaction be tween b-catenin and WT1 we perfomed the reciprocal WT1 co-immunoprecipitation (Co-IP) in one of the b
Figure 1. Association between b-catenin and WT1 in myeloid cell lines. (A) Immunoblot of myeloid leukemia cell lines showing the relative level of b-catenin (~92 kDa) and WT1 (~50 kDa) protein, with b-actin (42 kDa) used to assess protein loading. (B) Summary scatter plot showing the correlation (Spearman rank R=0.62, P<0.01) between relative b-catenin and WT1 protein expression in myeloid cell lines (normalized to b-actin expression within the cell line). (C) Immunoblots showing the level of b catenin protein present in WT1 co-immunoprecipitation (Co-IP) derived from HEL whole cell lysate under basal (DMSO), pharmacologically induced (5 mM CHIR99021) and naturally induced (1 mg/mL rWNT3A) Wnt signaling conditions. (D) Immunoblot showing the level of b-catenin protein present in WT1 Co-IP derived from HEL nuclear lysate under basal (DMSO) versus induced (5 mM CHIR99021) Wnt signaling conditions. (E) Agarose gel electrophoresis showing the stability of total RNA in K562, HEL and KG-1 cell lysates ± 5 mM CHIR99021 treated overnight ± 20 mg/mL RNaseA prior to WT1 Co-IP analysis. Immunoblots showing the level of b-catenin protein present in WT1 Co-IP derived from (F) K562, (G) HEL and (H) KG-1 cells ± 5 mM CHIR99021 and ± 20 mg/mL RNaseA. All immunoblots shown are representative of 3 independent biological replicates. WC: whole cell: ID: immunodepleted lysate; Nuc: nuclear; DMSO: dimethylsulfoxide.

catenin/WT1 co-expressing cell lines (HEL) and confirmed the interaction under basal conditions (with dimethylsulf oxide [DMSO] or phosphate-buffered saline/bovine serum albumin), pharmacologically activated (with CHIR99021; a GSK3 b inhibitor), and naturally activated (with recom binant rWNT3A) Wnt signaling conditions (Figure 1C). We further validated the interaction in two other myeloid cell lines (KG-1 and K562) (Online Supplementary Figure S1A)
and confirmed that this interaction also occurs in the nu cleus (Figure 1D). WT1 is an RNA-binding protein,6 and b catenin has also been shown to bind RNA,7 so to confirm this interaction was not indirect via RNA binding we re peated WT1 Co-IP (with or without CHIR99021) after first confirming complete digestion of RNA through RNase A pre-treatment of cell lysates (Figure 1E). As shown in Fig ure 1F-H, the b-catenin:WT1 interaction remained in K562,
HEL and KG-1 cells under both basal (DMSO) and stimu lated (CHIR99021) Wnt signaling. We further wanted to as certain whether this protein interaction was direct using recombinant versions of purified b-catenin and WT1 pro tein but failed to detect any association (Online Supple mentary Figure S1B, C). This suggested that perhaps the interaction is mediated through a post-translational modi fication, common partners such as WTX,8 or cellular struc tures like DNA, given their well-documented roles in transcription.
To examine the subcellular location of the b-catenin:WT1 interaction we performed co-localization studies using confocal laser scanning microscopy. Using KG-1, K562 and HL60 cell lines, we observed that WT1 is mainly a nuclear protein with some co-localization with b-catenin (mainly cytosolic) during basal Wnt signaling. However, a signifi cant increase in the co-localization of b-catenin and WT1 signal was observed in the nucleus during stimulated Wnt signaling in all three cell lines (Figure 2A, B) including NB4 and HEL cells (Online Supplementary Figure S1D). To evalu ate the clinical relevance of this protein interaction we examined b-catenin and WT1 expression across a panel of primary AML patients’ samples by immunoblotting. The pa tients’ clinical details are provided in Online Supplementary Table S1. We observed that approximately one-third (9/30) of this cohort co-overexpressed both proteins relative to normal CD34+ cord blood-derived hematopoietic stem and progenitor cells (Figure 2C) – a similar frequency of coex pression to that observed in myeloid cell lines (Figure 1A). We detected b-catenin expression in hematopoietic stem and progenitor cells in keeping with the protein’s self-re newal role in this context,9 but WT1 was undetectable, as expected, given that only 1.2% of the CD34+ HSPC pool are estimated to express this protein.10 Overall, we observed WT1 overexpression in around 47% (14/30) of our AML pa tients’ blast screen, consistent with previous estimates of high WT1 overexpression in this disease.5 As with the cell line correlation, there was no obvious association of this co-expression with any particular clinical characteristic. From this screen we performed nuclear/cytosol fraction ation on selected AML samples co-overexpressing both proteins and observed high levels of both proteins in the nucleus and cytoplasm, including the presence of the ac tive (non-phosphorylated) form of b-catenin (Figure 2D). This would indicate that the b-catenin:WT1 interaction has the potential to be cytoplasmic or nuclear in primary AML patients’ blasts as we previously showed in HEL cells.3 We further used an AML patient’s sample (#4) which expressed high levels of both proteins (and for which ample viable cel lular material was available) to perform WT1 Co-IP and con firmed the b-catenin:WT1 interaction by immunoblot (Figure 2E). Finally, we performed a single tandem mass tag-labeled mass spectrometric analysis of the b-catenin interactome (using b-catenin Co-IP vs. IgG Co-IP) in the highest b-catenin expressing AML patient’s sample (#1) and revealed an approximately 70% enrichment of WT1 in the
nucleus (Online Supplementary Table S2 – full interactome available via https://www.biorxiv.org/content/10.1101/2021.11.06.467095v2). Taken together, these data demonstrate for the first time that b-catenin and WT1 interact in both myeloid cell lines and primary AML samples.
Given that both Wnt and WT1 signaling have been heavily implicated in AML and that crosstalk has been identified in other contexts,11 we wanted to assess the potential signal ing interplay between these two proteins in AML cells. Using KG-1 cells (an AML cell line expressing both proteins that could tolerate WT1 knockdown) we knocked down WT1 in KG-1 cells using two different shRNA sequences and ob served a consistent reduction in the b-catenin nuclear lo calization capacity (Figure 3A). This corresponded with a significant reduction in basal, pharmacologically activated (with CHIR99021), and naturally activated (with rWNT3A) Wnt signaling output using the b-catenin activated reporter system (Figure 3B-D). This supports previous studies dem onstrating cooperation between WT1 and Wnt signaling in other systems.12
WT1 mutations are frequent in AML, presenting in approxi mately 10% of cases but the impact on Wnt/b-catenin-sig naling has not previously been investigated.5 Using doxycycline-inducible mutant WT1 expression constructs (a kind gift from Constanze Bonifer)4 we examined the im pact of WT1 mutations on b-catenin expression and T-cell factor activity using frequently reported WT1 mutations. These variants include frameshift mutations to exons 8 and 9, which truncate the protein at different Zn2+ finger do mains.5 The presence of these mutations has recently been found to significantly increase the growth and clonogenicity of AML cells as well as decrease apoptosis.4 Using KG-1 cells we confirmed the expression of the truncated WT1 mutant proteins following exposure to doxycycline, with the exon 8 mutant expressed more abundantly than the exon 9 mutant (Figure 3E). The presence of both mutations resulted in increased expression of the endogenous wildtype WT1 as reported previously,13 and also a concomitant increase in total b-catenin expression (Figure 3E). Examin ation of Wnt signaling output using the b-catenin activated reporter showed that both WT1 mutants significantly aug mented T-cell factor activity (Figure 3F, G). These are the first studies to examine Wnt signaling in the context of WT1 mutations in AML and suggest that the presence of WT1 mutations in AML cells can augment Wnt signaling activa tion.
To complement these studies, we also performed the re ciprocal experiments to examine the effect of b-catenin knockdown on WT1 expression and signaling activity. Using both shRNA and CRISPR/Cas9 we successfully reduced b catenin in AML cell lines able to tolerate its loss; i.e., both KG-1 and NB4 (Figure 3H). Only a short-term shRNA ap proach was possible in HEL cells, due to the lethality of b catenin loss in these cells. In all cell lines we observed a dramatic decrease in total WT1 protein level (Figure 3H) in
Figure 2. Co-localization and clinical relevance of the b-catenin:WT1 interaction. (A) Representative confocal laser scanning microscopy Z-sections showing b-catenin and WT1 subcellular localization in KG-1, K562 and HL60 cells ± 5 mM CHIR99021. Phase (gray), WT1 (red), b-catenin (green), DAPI (blue) and merged WT1/b-catenin images are shown. Data shown are representative of 20 individual cells derived from three independent experiments, white scale bar indicates 5 mm. (B) Correlation between b-catenin and WT1 signal in KG-1, K562 and HL60 cells ± 5 mM CHIR99021, as determined by the Pearson correlation coefficient (-1 = inverse correlation, 0 = no correlation, +1 = positive correlation). All data represent mean ± 1 standard deviation as determined from a minimum of three independent experiments each containing a minimum of 20 cells per field. Statistical significance is denoted by *P<0.05 and **P<0.01 as deduced from a Student t-test. (C) Immunoblot screen of 30 primary samples from patients with acute myeloid leukemia (AML) showing the relative level of b-catenin and WT1 protein; *denotes samples overexpressing both WT1 and b catenin relative to levels in cord blood-derived mononuclear cells (CB MNC) and a CD34+ enriched fraction (CB CD34+) pooled from five independent cord blood samples. X = void sample as deduced from b-actin value used to assess protein loading. (D) Immunoblot showing total b-catenin, active b-catenin and WT1 localization in selected AML patients’ samples co-overexpressing both b-catenin and WT1 (from the initial screen). Lamin A/C and GAPDH indicate the purity/loading of the nuclear [N] and cytosol [C] fractions. (E) Immunoblot showing the level of b-catenin protein present in WT1 Co-IP from primary AML sample from patient #4 of the sample screen. AML: acute myeloid leukemia; PCC: Pearson correlation coefficient; ID: immunodepleted lysate; N: nuclear fraction; C: cytosolic fraction; Co-IP: co-immunoprecipitation.

response to b-catenin loss. Like b-catenin, WT1 protein is ubiquitinated and regulated by the proteasome,14 therefore we hypothesized that the resultant WT1 loss upon b-cate nin reduction might be a result of b-catenin protecting WT1 from proteasome-mediated degradation. However, treat ment of both NB4 and KG-1 cells harboring b-catenin knockdown with the proteasome inhibitor MG132 failed to
restore WT1 protein level, and instead reduced stability further (Online Supplementary Figure S1E). The loss of WT1 following proteasome inhibition has been reported pre viously in the context of the treatment of myeloid cells with bortezomib which targeted WT1 transcripts.15 Finally, to as sess the impact of b-catenin on WT1 signaling activity we used quantitative reverse transcriptase polymerase chain

Figure 3. Crosstalk between Wnt and WT1 signaling in acute myeloid leukemia cells. (A) Immunoblot showing total b-catenin and WT1 subcellular localization in KG-1 cells lentivirally transduced with two different WT1 shRNA ± 5 mM CHIR99021. Lamin A/C and a-tubulin indicate the purity/loading of the nuclear [N] and cytosol [C] fractions, respectively. (B) Representative flow cytometric histograms showing the intensity of the TCF-dependent expression of Venus Yellow Fluorescent Protein (YFP) from the b-catenin activated reporter (BAR) or negative control ‘found unresponsive’ BAR (fuBAR; containing mutated promoter binding sites) in KG1 cells ± WT1 shRNA ± 5 mM CHIR99021 or ± 1 mg/mL rWNT3A. The fuBAR (dashed), non-targeting control shRNA (gray filled), and two WT1 shRNA (blue or red) histograms are shown. Summary graphs showing the median fluorescence intensity (MFI) generated from the BAR/fuBAR in KG-1 cells ± WT1 shRNA and (C) ± 5 mM CHIR99021 or (D) ± 1 mg/mL rWNT3A. (E) Immunoblot showing total b-catenin and WT1 protein in doxycycline-treated KG-1 cells expressing empty pCW57.1 vector, or pCW57.1 containing inducible exon 8 and exon 9 truncating mutations of WT1. The arrow indicates the position of mutant WT1 protein and b-actin was used to assess protein loading. (F) Representative flow cytometric histograms showing the MFI of fuBAR/BAR in doxycycline-treated KG-1 cells expressing empty pCW57.1 vector, or pCW57.1 containing inducible exon 8 or exon 9 WT1 mutations following treatment with 5 mM CHIR99021. The fuBAR (dashed), empty pCW57.1 (gray filled), pCW57.1 exon 8 mutant WT1 (blue) and pCW57.1 exon 9 mutant WT1 (red) histograms are shown. (G) Summary graph showing the MFI generated by BAR/fuBAR from doxycycline-treated KG-1 cells expressing empty pCW57.1 vector, or pCW57.1 containing inducible exon 8 or exon 9 WT1 mutations following treatment with 5 mM CHIR99021. (H) Immunoblot showing total b-catenin and WT1 protein in KG-1, NB4 and HEL cells following lentiviral transduction with either b-catenin shRNA or CRISPR/Cas9 targeting b-catenin alongside matched respective controls. b-Actin was used to assess protein loading. (I, J) Summary graphs showing the fold change in WT1 target gene mRNA expression as assessed by quantitative reverse transcriptase polymerase chain reaction analysis in (I) NB4 and (J) KG-1 cells expressing either b-catenin shRNA or CRISPR/Cas9. Fold change is relative to matched respective controls (dashed line) and overall expression was normalized to the housekeeping gene b-actin (ACTB). All data represent mean ± 1 standard deviation (n=3). Statistical significance is denoted by *P<0.05, **P<0.01, ***P<0.001 and ****P<0.0001 as deduced from a Student t-test. Data shown are representative of three independent biological replicates. DMSO: dimethylsulfoxide; TCF/LEF: T-cell factor/lymphoid enhancer factor; PBS/BSA: phosphate-buffered saline/bovine serum albumin.
reaction analysis to examine the mRNA expression of a panel of previously identified WT1 target genes, including WT1, AREG, JUNB, BAK1 and ETS1, 6 which were previously validated in KG-1 cells (Online Supplementary Figure S1F). In both NB4 and KG-1 cells we observed a significant re duction in all WT1 target genes assessed (except for ETS1 in NB4 cells; data not shown), including WT1 mRNA itself, upon either shRNA or CRISPR/Cas9-mediated b-catenin knockdown (Figure 3I, J). This suggests b -catenin-me diated regulation of WT1 expression is at least in part tran scriptionally driven. WT1 or its targets have not previously been identified as direct Wnt target genes (https://web.stanford.edu/group/nusselab/cgi-bin/wnt/tar get_genes); however, very few such studies have been per formed in a hematopoietic context, and our original study did not detect the b-catenin:WT1 interaction in colorectal cancer cells meaning this association could be highly con text dependent.3 To our knowledge, this is the first report of b-catenin-mediated regulation of WT1 expression/activity in AML. Like b-catenin,1 WT1 is overexpressed in AML where it confers inferior prognosis,4,5 and also similarly to b-cate

nin,2 WT1 cooperates with common genetic aberrations in AML, such as t(8;21) RUNX1:RUNX1T116 and t(9;11) MLL:AF914 to promote leukemogenesis. The results of this study, and previous studies suggesting functional overlap, raise the in triguing possibility of cooperation between these two fre quently dysregulated proteins in AML. Such findings could be important for informing novel therapeutic strategies for targeting these oncoproteins in myeloid malignancies.
Megan Wagstaff,1 Olga Tsaponina,1 Gilian Caalim,1 Hayley Greenfield,1 Leanne Milton-Harris,1 Erika J. Mancini,1 Allison Blair,2,3 Kate J. Heesom,4 Alex Tonks,5 Richard L. Darley,5 Stefan G Roberts3 and Rhys G. Morgan1
1School of Life Sciences, University of Sussex, Brighton; 2Bristol Institute for Transfusion Sciences, NHS Blood & Transplant Filton, Bristol; 3School of Cellular & Molecular Medicine, University of
Bristol, Bristol; 4University of Bristol Proteomics Facility, Bristol and 5Division of Cancer & Genetics, School of Medicine, Cardiff University, Cardiff, UK
Correspondence: RHYS G. MORGAN - rhys.morgan@sussex.ac.uk
https://doi.org/10.3324/haematol.2021.280294
Received: November 5, 2021. Accepted: March 25, 2022. Prepublished: April 21, 2022.
©2023 Ferrata Storti Foundation
Published under a CC BY-NC license
No conflicts of interest to disclosure.
MW performed experiments, analyzed data and co-wrote the manuscript. OT assisted with experiments and managed laboratory work and GC acquired flow cytometry data. HG performed and offered guidance in qRT-PCR experiments. LH and EM provided reagents and guidance for recombinant protein experiments while AB provided primary AML samples. KJ directed and performed mass spectrometry analyses. AT and RLD supplied reagents, expression constructs and
1. Ysebaert L, Chicanne G, Demur C, et al. Expression of beta-catenin by acute myeloid leukemia cells predicts enhanced clonogenic capacities and poor prognosis. Leukemia. 2006;20(7):1211-1216.
2. Wang Y, Krivtsov AV, Sinha AU, et al. The Wnt/beta-catenin pathway is required for the development of leukemia stem cells in AML. Science. 2010;327(5973):1650-1653.
3. Morgan RG, Ridsdale J, Payne M, et al. LEF-1 drives aberrant betacatenin nuclear localization in myeloid leukemia cells. Haematologica. 2019;104(7):1365-1377.
4. Potluri S, Assi SA, Chin PS, et al. Isoform-specific and signalingdependent propagation of acute myeloid leukemia by Wilms tumor 1. Cell Rep. 2021;35(3):109010.
5. Rampal R, Figueroa ME. Wilms tumor 1 mutations in the pathogenesis of acute myeloid leukemia. Haematologica. 2016;101(6):672-679.
6. Toska E, Roberts SG. Mechanisms of transcriptional regulation by WT1 (Wilms' tumour 1). Biochem J. 2014;461(1):15-32.
7. Lee HK, Kwak HY, Hur J, et al. Beta-catenin regulates multiple steps of RNA metabolism as revealed by the RNA aptamer in colon cancer cells. Cancer Res. 2007;67(19):9315-9321.
8. Major MB, Camp ND, Berndt JD, et al. Wilms tumor suppressor WTX negatively regulates WNT/beta-catenin signaling. Science. 2007;316(5827):1043-1046.
9. Reya T, Duncan AW, Ailles L, et al. A role for Wnt signalling in selfrenewal of haematopoietic stem cells. Nature. 2003;423(6938):409-414.
experimental guidance, and SGR supplied WT1 reagents and directed experiments. RGM performed experiments, analyzed data, co-wrote the manuscript and provided project direction.
We are grateful to Luke Ames, Dr Sandeep Potluri and Professor Constanze Bonifer for the kind sharing of inducible mutant WT1 expression vectors. Special thanks to Dr Paraskevi Diamanti (University of Bristol) for collecting AML patients’ samples and Lizzy Hoole (Institute for Child Life & Health, UHBristol & Weston NHS Foundation Trust) for supplying clinical data. Thanks to the midwives and clinical research nurses at Brighton & Sussex University Hospitals NHS Trust, including Raquel Akieme and Caroline Humphreys, for the collection of human umbilical cord blood. We are indebted to the patients and their families who gave consent for their cells to be used for our research. In loving memory of Dr Stephen Hare, a treasured colleague, researcher, teacher, friend, husband, and father taken too soon.
This work was funded by a Kay Kendall Leukaemia Fund Junior Fellowship (RM; KKL1051) and a University of Sussex, School of Life Sciences PhD studentship (MW).
Data-sharing statement: All data are available in the Online Supplementary Files and further data or methodology is available upon reasonable request.
10. Hosen N, Sonoda Y, Oji Y, et al. Very low frequencies of human normal CD34+ haematopoietic progenitor cells express the Wilms' tumour gene WT1 at levels similar to those in leukaemia cells. Br J Haematol. 2002;116(2):409-420.
11. Kim MK, McGarry TJ, Broin PO, Flatow JM, Golden AA, Licht JD. An integrated genome screen identifies the Wnt signaling pathway as a major target of WT1. Proc Natl Acad Sci U S A. 2009;106(27):11154-11159.
12. Paris ND, Coles GL, Ackerman KG. Wt1 and beta-catenin cooperatively regulate diaphragm development in the mouse. Dev Biol. 2015;407(1):40-56.
13. Abbas S, Erpelinck-Verschueren CA, Goudswaard CS, Lowenberg B, Valk PJ. Mutant Wilms' tumor 1 (WT1) mRNA with premature termination codons in acute myeloid leukemia (AML) is sensitive to nonsense-mediated RNA decay (NMD). Leukemia. 2010;24(3):660-663.
14. Zhou B, Jin X, Jin W, et al. WT1 facilitates the self-renewal of leukemia-initiating cells through the upregulation of BCL2L2: WT1BCL2L2 axis as a new acute myeloid leukemia therapy target. J Transl Med. 2020;18(1):254.
15. Galimberti S, Canestraro M, Khan R, et al. Vorinostat and bortezomib significantly inhibit WT1 gene expression in MO7-e and P39 cell lines. Leukemia. 2008;22(3):628-631.
16. Nishida S, Hosen N, Shirakata T, et al. AML1-ETO rapidly induces acute myeloblastic leukemia in cooperation with the Wilms tumor gene, WT1. Blood. 2006;107(8):3303-3312.
a patient with refractory diffuse large B-cell lymphoma and pre-existing clonal hematopoiesis
Immunotherapy with CD19-directed chimeric antigen re ceptor (CAR) T cells (tisagenlecleucel, axicabtagene and lisocabtagene) has revolutionized the treatment of de novo and transformed relapsed/refractory (R/R) diffuse large B-cell lymphoma (DLBCL), inducing long-term com plete response (CR) in about 40% of cases.1-3
The majority of patients candidate to CD19 directed CAR T cells for R/R DLBCL have been previously exposed to many anti-tumor agents, including chemotherapy drugs, conjugated monoclonal antibodies and radiation, admin istered to achieve CR during the course of the disease or as a bridging therapy to CAR T-cell infusion. Chemo-radio therapy is well known to exert a genotoxic effect favoring the occurrence of secondary tumors, including myelodys plastic syndrome (MDS) and acute myeloid leukemia (AML).4 Myeloid malignancies have been so far occa sionally reported after CD19-directed CAR T-cell therapy of B-cell acute lymphoblastic leukemia (B-ALL). They in clude the lineage switch of MLL-rearranged B-ALL into a clonally related AML under the immune pressure of antiCD19 CAR T cells5 or the development of a clonally unre lated new myeloid neoplasm.6 On the other hand, no information on the development of myeloid neoplasms in DLBCL patients treated with CD19-directed CAR T cells is to our knowledge available. Here, we present the first case of AML developing soon after CAR T-cell infusion in an R/R DLBCL patient. A 69-year-old women was diagnosed with a follicular lym phoma, grade 2 in 2016. A positron emission tomography/computerized tomography (PET/CT) scan showed involvement of almost all superficial, thoracic and abdominal lymph nodes (LN), the presence of two subcu taneous nodules and a pleural effusion, while a bone mar row (BM) biopsy showed no involvement of the BM. The blood cell count (BCC) was: white blood cells (WBC) 17.690/mm3 (neuthrophils 83%), hemoglobin (Hb) 14 g/dL platelets 459.000/mm3. She received six cycles of benda mustine plus rituximab, achieving a near CR (persistence of a few neck LN). Three months later, she relapsed in all nodal and extranodal sites initially involved by the disease. A new LN biopsy revealed DLBCL transformed from fol licular lymphoma, without MYC, BCL2 and BCL6 re arrangements. Therefore, the patient underwent six cycles of R-COMP plus prophylaxis for central nervous system-
CNS involvement, achieving a CR that only lasted 3 months. Then, she received one cycle of R-DHAOX (rituxi mab, dexamethasone, cytarabine and oxaliplatin) followed by collection of hematopoietic stem cells (HSC) and auto logous stem cell transplantation (ASCT) using FEAM (fote mustine, etoposide, cytarabine and melphalan) as conditioning regimen. This resulted into a CR but, 5 months later, the PET/CT scan showed reappearance of the disease in all nodal and extranodal sites. The patient started with lenalinomide (10 mg/day for 3 weeks) plus prednisone, achieving CR after five cycles. The BCC in No vember 2018 was: WBC 7.000/ mm3 (neuthrophils 78%), Hb 11.7 g/dL, platelets 115.000/mm3. She proceeded with ad ditional four cycles of lenalidomide plus prednisone that were stopped because of severe pancytopenia. The BM biopsy, performed 1 month after lenalidomide discontinu ation, showed an hypocellular marrow consistent with previous myelotoxic therapy but no neoplastic infiltration. However, disease progression in all nodal and extranodal sites was documented at PET/TC scan. A submandibular LN biopsy (June 2019) showed development of DLBCL ex pressing all B-cell markers, including CD19. The patient started again lenalidomide plus steroids achieving a CR that lasted about 1.5 years. In March 2021, PET/CT showed again disease progression (Figure 1A). Thus, the patient was regarded as eligible for CD19-directed CAR T cells and leukapheresis was performed. The blood cell count was: WBC 2.380/mm3 (neuthrophils 60%), Hb 11.2 g/dL, pla telets 69.000/mm3. The BM biopsy showed hypocellular marrow that was interpreted as due to previous therapies. As bridging therapy to CAR T cells, she received HAM regimen (mitoxantrone and cytarabine) followed by rein fusion of autologous HSC achieving partial remission. In the following months, several episodes of cytomegalovi rus (CMV) reactivation prevented to proceed with CAR Tcell infusion and therefore in July 2021 we decided to control the disease through a total lymphoid radiation (TLI) for 5 days. In particular, all the main nodal station received 15 Gy in ten fractions. A simultaneous integrated boost (2 Gy up to 20 Gy) was delivered to the active dis ease.
In August 2021, the BCC was: WBC 4.310/mm3 (neuthro phils 56%), Hb 10.6 g/dL, platelets 80.000/mm3 and the BM biopsy showed hypocellular marrow without clear
or neurotoxicity was recorded. CD19 CAR T-cell expansion was detectable by flow-cytometry from day 7 to 21. PET/CT scan performed at 1 and 3 months after CAR T cells showed CR (Figure 1B). Due to persistent severe pan cytopenia resulting from lymphodepleting therapy (WBC CASE REPORT
Figure 1. Positron emission tomography/computerized tomography scan and bone marrow examination before and after chimeric antigen receptor T-cell infusion. (A and B) Positron emission tomography/computerized tomography (FDG-PET/CT) scan coronal maximum intensity projection (MIP) images before leukapheresis with avid uptake of abdominal lymph nodes (A) and 3 months after CD19-directed chimeric antigen receptor (CAR) T-cell therapy (B), showing metabolic complete response of diffuse large Bcell lymphoma (DLBCL). (C) Bone marrow (BM) biopsy taken before CAR T-cell infusion showing an hypocellular marrow without leukemic infiltration (hematoxylin and eosin staining; magnification x400). (D) The same sample as (C) showing only rare CD34+ cells within the normal range (red arrow); vessel endothelial cells serve as positive control (black arrow) (immunoperoxidase, diaminobenzidine; magnification x200). (E) BM biopsy taken 2 months after CAR T-cell infusion showing hypocellular marrow in filtrated by CD34+ leukemic cells (red arrows); vessel endothelial cells serve as positive control (black arrows) (immunoperoxi dase, diaminobenzidine; magnification x200). (F) BM smear 2 months after CAR T-cell infusion showing myeloid blasts exhibiting erythrophagocytosis (black arrows) (May-Grunwald-Giemsa staining, magnification x400).

450/mm3, Hb 8 g/dL, platelets 6.000/mm3 on 27/10/21) lasting 60 days after CAR T-cell infusion and requiring transfusion support, a new BM biopsy and aspirate was performed that showed hypocellular marrow infiltrated by 40-50% blast cells with myelomonocytic appearance ex pressing CD34 (Figure 1E), myeloperoxidase and CD68, and frequently exhibiting erythrophagocytosis (Figure 1F). No normal or neoplastic B cells were detected in the BM by flow cytometry and immunohistochemistry. Cytogenetic analysis showed a complex karyotype: 45,xx,-7, del(11)(p15) [8]/46,idem, t(2;19) (p12;q13.3)[6] /46,XX[3]. Targeted se quencing detected mutations of the following genes: DNMT3A V626GfsTer4 (variant allele frequency [VAF] 46.2%), RUNX1 splicing-site mutation (VAF 16.8%) and mis sense mutation N136K (VAF 9.2%), and PPM1D S453* (VAF 1.4%). Targeted sequencing of stored DNA from the BM samples taken before CAR T-cell therapy showed the presence of the PPM1D mutation but not RUNX1 mutations (Figure 2). We also retrospectively analyzed the kariotype from a BM aspirate taken in March 2021, which already showed the following karyotype: 45,XX,-7, del(11)(p15)[8]/46,XX[12]. Given the diagnosis of AML, while
in CR for DLBCL, we decided to start the patient on 5Azacitidine plus venetoclax a bridge to a potential allo genic SCT. However, venetoclax was stopped after the first cycle due to persistent pancytopenia and a BM evaluation performed after two cycles of 5-Azacitidine showed AML persistence. After four cycles of 5-Azacitidine pancytope nia continues while the patient is still in complete re mission for DLBCL at 6 months from CAR T-cell therapy. Our patient showed persistent severe pancytopenia after CAR T-cell therapy. Pancytopenia of various degree fre quently occurs in the first 1-3 months after infusion of CD19-directed CAR T cells and may be ascribed to several conditions, including bridging and/or lymphodepletive therapy administered before CAR T cells, cytokine release by CAR T cells, BM involvement by lymphoma or leukemia, BM failure related to drugs other than CAR T cells and/or infectious complications (e.g., CMV).7-8 Among these causes, BM pancytopenia due to BM involvement by lym phoma was unlikely in our patient because it was never documented during the previous 5 years of the disease. Similarly, no infectious complications could be recorded after CAR T cells. Instead, myelotoxicity due to bridging
Figure 2. Clonal evolution from clonal hematopoiesis to therapy related acute myeloid leukemia. The fish plot shows the inferred clonal evolution pattern based on targeted sequencing. The phylogenetic trees visualize the estimated order of mutation ac quisition and the proportion of subclones with a different combination of mutations at each time point. The PPM1D mutation has been depicted as presumptively subclonal within the DNMT3A-mutant preleukemic clone, but its low variant allele frequency (VAF) would be compatible also with the existence of a separate PPM1D-mutant chromatin immunoprecipitation clone indepen dent from (i.e., outside of) the DNMT3A-mutant preleukemic clone. RUNX1 missense mutation has been presumptuously depicted as subclonal within the RUNX1 splice site mutant leukemic clone. R-BENDA: rituximab, bendamustine; R-CMP: rituximab, cyclo fosfamide, non-pegylated liposomal doxorubicin, prednisone; R-DHAOX: rituximab, high dose ARAc, oxaliplatin; ASCT, preceded by fotemustine, etoposide, ARAc and melphalan; R-lenalidomide: rituximab-lenalidomide; HAM: high dose ARA-C and mitoxan trone; TLI: total lymphonodal irradiation.

chemoradiotherapy (HAM regimen and TLI) could have played a role in the persistent pancytopenia of our pa tient. In order to discriminate between these possibilities, we performed a BM biopsy 60 days after CAR T-cell ther apy, that surprisingly revealed AML with complex karyo type, including monosomy 7. This diagnosis was in a way unexpected since a BM biopsy taken just before CAR Tcell infusion showed no evidence of MDS/AML. The pathogenesis of AML in our case remains unclear. Clonal expansion of CAR T cells due to unintentional len tiviral vector mediated insertion of the CAR transgene in the TET2 or ABL gene has been reported.9,10 However, the possibility that AML could have developed following un intentional insertion of the CAR transgene into AML-as sociated genes in a contaminating HSC during manufacturing was excluded by flow cytometry, showing CAR expression only on T lymphocytes inside all periph eral blood population, thereby excluding the presence of any possible circulating CAR-positive myeloid cells. Ac cording to the World Health Organization classification of myeloid neoplasms, the leukemia in our patient was con sistent with a therapy-related AML (t-AML), due to the previous history of chemo-radiotherapy and the complex karyotype. t-MDS/AML has been ascribed for a long time to DNA mutations and chromosome breakage induced in HSC by ionizing radiation and/or genotoxic drugs (e.g., al kylating agents or topoisomerase 2 inhibitors). Instead, it is now clearly emerging that these stressors of hemato poiesis can promote expansion of pre-existing mutant clones driven by clonal hematopoiesis (CH).11 CH has been reported in 48% of patients receiving CAR Tcell therapy for B-cell non-Hodgkin lymphomas or multiple myeloma but, unlike CH found in patients pre-ASCT,12 it was not associated with a worse survival, including increased risk of death from t-MDS/AML.13 Mutations of DNA damage response genes TP53 and PPM1D, typically observed in therapy-related CH,14 were not detected in our patient since TP53 was germline while the PPM1D mutation, despite de veloping (at a VAF 1.1%) before leukemia onset, remained at a similar low frequency (VAF 1.4%) at leukemia onset with out seeding the tumor clone (which had RUNX1 mutations at higher VAF up to 16.8%). In contrast, CH in our patient was mainly driven by DNMT3A that was already present in 2016, at the time of lymphoma diagnosis. DNMT3A driven CH has been shown to be by itself predictor for AML de velopment.11,14 In contrast, RUNX1 mutations were detected for the first time in the BM sample taken 2 months after CAR T cells, pointing to RUNX1 mutations as drivers in pro moting t-AML in our patient,15 probably through cooperation with deletion of monosomy 7. As there was no evidence of AML in the BM taken just before CAR T-cell infusion, we hypothesize that AML may have developed as consequence of the immunosuppression related to lymphodepletion preCAR T-cell infusion, although we cannot exclude that it
could be related to previous multiple genotoxic treatments (e.g., anthracyclines, radiotherapy or ASCT). However, studies of similar cases are required to better clarify this issue. For the time being, we recommend CD34 immunos taining as well as next-generation sequencing and cyto genetic analysis in the BM of heavily pretreated DLBCL patients before CAR T therapy, especially if they show evi dence of cytopenia than can be erroneously interpreted as BM hypoplasia related to previous therapy. Considering the higher risk to develop t-AML, such patients should be care fully evaluated in order to decide if they could be excluded from CAR T-cell therapy favoring immunotherapy ap proaches not requiring lymphodepletion, as bispecific or drug-conjugated antibodies.
Lorenza Falini,1* Alessandra Venanzi,1* Valentina Tini,1 Alessandra Innocente,1 Stelvio Ballanti,1 Simonetta Saldi,2 Silvio Sivolella,3 Antonio Pierini,1 Cynthia Aristei,2 Enrico Tiacci,1 Vincenzo Maria Perriello1# and Brunangelo Falini1#
1Institute of Hematology, Department of Medicine and Surgery, Center for Hemato-Oncological Research (CREO), University of Perugia, Perugia; 2Radiation Oncology Section, Department of Medicine and Surgery, University of Perugia, Perugia and 3Nuclear Medicine, Foligno Hospital, Foligno, Italy
*LF and AV contributed equally as co-first authors. #VMP and BF contributed equally as co-senior authors.
Correspondence: B. FALINI brunangelo.falini@unipg.it
https://doi.org/10.3324/haematol.2022.281351
Received: May 3, 2022. Accepted: July 15, 2022. Prepublished: July 28, 2022.
©2023 Ferrata Storti Foundation Published under a CC BY-NC license
No conflicts of interest to disclose.
LF, VMP, ET and BF conceived and designed the study. LF, AI, SB, SS, AP and VMP managed the patient. VMP and BF carried out the pathological analysis. AV and VT carried out the NGS analysis. SS and CA carried out the radiotherapy. VMP and BF wrote the manuscript. CA and BF approved the final draft of the manuscript.
We thank Prof Stefano Lazzi for performing FISH analysis on lymph node biopsy.
1. Neelapu SS, Locke FL, Bartlett NL, et al. Axicabtagene Ciloleucel CAR T-cell therapy in refractory large B-cell lymphoma. N Engl J Med. 2017;377(26):2531-2544.
2. Schuster SJ, Bishop MR, Tam CS, et al. Tisagenlecleucel in adult relapsed or refractory diffuse large B-cell lymphoma. N Engl J Med. 2019;380(1):45-56.
3. Abramson JS, Palomba ML, Gordon LI, et al. Lisocabtagene maraleucel for patients with relapsed or refractory large B-cell lymphomas (TRANSCEND NHL 001): a multicentre seamless design study. Lancet. 2020;396(10254):839-852.
4. McNerney ME, Godley LA, Le Beau MM. Therapy-related myeloid neoplasms: when genetics and environment collide. Nat Rev Cancer. 2017;17(9):513-527.
5. Gardner R, Wu D, Cherian S, et al. Acquisition of a CD19negative myeloid phenotype allows immune escape of MLL-rearranged B-ALL from CD19 CAR-T-cell therapy. Blood. 2016;127(20):2406-2410.
6. Mo G, Wang HW, Talleur AC, et al. Diagnostic approach to the evaluation of myeloid malignancies following CAR T-cell therapy in B-cell acute lymphoblastic leukemia. J Immunother Cancer. 2020;8(2):e001563.
7. Fried S, Avigdor A, Bielorai B, et al. Early and late hematologic toxicity following CD19 CAR-T cells. Bone Marrow Transplant. 2019;54(10):1643-1650.
8. Jain T, Knezevic A, Pennisi M, et al. Hematopoietic recovery in patients receiving chimeric antigen receptor T-cell therapy for
The data that support the findings of this study are available from the corresponding author, upon reasonable request.
hematologic malignancies. Blood Adv. 2020;4(15):3776-3787.
9. Fraietta JA, Nobles CL, Sammons MA, et al. Disruption of TET2 promotes the therapeutic efficacy of CD19-targeted T cells. Nature. 2018;558(7709):307-312.
10. Shah NN, Qin H, Yates B, et al. Clonal expansion of CAR T cells harboring lentivector integration in the CBL gene following antiCD22 CAR T-cell therapy. Blood Adv. 2019;3(15):2317-2322.
11. Walter MJ, Shen D, Ding L, et al. Clonal architecture of secondary acute myeloid leukemia. N Engl J Med. 2012;366(12):1090-1098.
12. Husby S, Favero F, Nielsen C, et al. Clinical impact of clonal hematopoiesis in patients with lymphoma undergoing ASCT: a national population-based cohort study. Leukemia. 2020;34(12):3256-3268.
13. Miller PG, Sperling AS, Brea EJ, et al. Clonal hematopoiesis in patients receiving chimeric antigen receptor T-cell therapy. Blood Adv. 2021;5(15):2982-2986.
14. Bolton KL, Ptashkin RN, Gao T, et al. Cancer therapy shapes the fitness landscape of clonal hematopoiesis. Nat Genet. 2020;52(11):1219-1226.
15. Christiansen DH, Andersen MK, Pedersen-Bjergaard J. Mutations of AML1 are common in therapy-related myelodysplasia following therapy with alkylating agents and are significantly associated with deletion or loss of chromosome arm 7q and with subsequent leukemic transformation. Blood. 2004;104(5):1474-1481.
