Scholarly Research In Progress
Volume 6 • November 2022
Table of contents
2 Neuroscience of Obesity: Pathogenesis of a Disease Influenced by the Environment

Yash Adroja
11 An Analysis of the Association Between Trump’s Presidency and Health-Seeking Behaviors of African Americans in the United States
Adeola A. Animasahun, Ashley M. Nunez, and Rachelle F. Jean
17 Prevalence and Intervention of Childhood Obesity: A Literature Review Tiffany I. Atabansi
24 Bipolar Disorder: A Brief Literature Review of Diagnostic Issues, Epidemiology, and Potential Causes
Latasha S. Adams, Kennedy S. Camara, Danielle G. Fuller, and Adline P. Sarpong
33 A Qualitative Analysis of Goal Orientation Theory in Pre-clinical Medical Students
Irene Y. Cho, Katelyn A. Young, Sarah A. Hayek, and Rebecca L. Hoffman
41 The Molecular, Neurological, and Clinical Features of Diffuse Intrinsic Pontine Glioma
Kristen M. Denniston, Alexandra P. Dickson, Alexandra S. Fitzsimmons, Gabrielle M. Verbeke-O'Boyle, and Brian J. Piper
47 Changes in Fentanyl Distribution in California
Miah V. Dugan, Ali H. Shah, Trinidy R. Anthony, Rafiat Famosa, and Brian J. Piper
54 Do Patient Characteristics Affect Appointment No-Show Rates?
Irene J. Ganahl and Kim Kovalick
60 Tay-Sachs Disease: Causes and Treatments Brittany Kemp
66 The Relationship Between Socioeconomic Status and Opioid Usage During Pregnancy in the United States
Mahshid A. Karimi, Brittany A. Kemp, Esosa E. Kest, and Anna P. Kleopoulos
70 Effects of Prenatal Toluene Exposure on Fetal Development: A Review
Mahshid A. Karimi, Brittany A. Kemp, and Esosa E. Kest
76 The Effect of the COVID-19 Pandemic on the Mental Health of Health Care Workers: A Systematic Review Emily L. Hunsinger, Alexandra A. Mahoney, Jullie T. Makhoul, Riley R. McDonnell, and Chase M. Minnich
Incidence of Food Insecurity in Rural and Urban Counties in Pennsylvania Nala J. Mckie, Sarah A. Omoyugbo, Ahquasia N. Ramsay, Toyo A. Adebayo, and Andrew Chew 90 Analysis of Fluvoxamine Usage Amid COVID-19 Among Medicaid Patients Janet T. Nguyen, Amal M. Madar, and Brian J. Piper 93 The Short- and Long-term Effects of SportsRelated Concussions: A Literature Review Victoria M. O’Kane
Investigating Associations and Outcomes of Vaccines with Guillain-Barré Syndrome: A Review Daniel S. Ehlers, Gulnar K. Jhaj, Leann N. Seidel, and Saishravan S. Shyamsundar
The Response of Health Professional Education to Climate Change: A Narrative Review Brooke N. Stevens, Faika T. Ambrin, Devon DellaValla, Janet T. Nguyen, Amal M. Madar, and Terevid M. Ahlakor
The Effects of Chronic Stress on Neuroanatomy and Cognitive Function Niki K. Viradia, Jesica M. Godinez Paredes, and Syed A. Hassan
113
121
122
123
124
81
98
108
2023 Summer Research Immersion Program
Medical Research Honors Program
Finding your way: Opportunities for student funding
Cover art submissions
A message from the editor-in-chief

As the Journal of Scholarly Research in Progress (SCRIP) enters its sixth year of publication, I would like to offer thanks to our readers, our contributors, our faculty reviewers, and our student editors for their continued support of the journal and its mission: to promote and disseminate student scholarly activity at Geisinger Commonwealth School of Medicine. Those submitting authors who have had their work accepted should be proud of their achievement. I would also like to acknowledge our library team for their tremendous support of our students’ research needs and to thank members of our marketing, communications, and design team who play a pivotal role in SCRIP’s final production and who help to ensure the quality of the published articles.
Since its launch in 2017, SCRIP has published 160 original articles authored by medical and graduate students as GCSOM using a single blind, peer-review process by faculty. This process provides student authors an opportunity to improve their research to a publishable level while simultaneously supporting development of their scientific writing skills and confidence. Indeed, in a recent survey that assessed GCSOM students’ experience and motivation to publish, SCRIP participants indicated that they were more confident in writing manuscripts, submitting articles, and navigating the publication process/peer review process. Among SCRIP participants, 45% of respondents said improving their career path was their main motivation to publish, while 25% did so because they thought it was an important skill to learn; moreover, each year a growing number of SCRIP participants go on to submit their manuscript for publication in a mainstream journal. Thus, SCRIP serves as an important medium for trainee scholarship, providing an opportunity for students to engage in the publication process while facilitating the development of writing skills and dissemination of generated scientific knowledge.
Suggestions from our contributors and readers to further develop and/or improve the journal are more than welcome. If you would like to share your thoughts, email me at slobo@som.geisinger.edu. Lastly, I would like to take this opportunity to invite students who have an interest in being involved in the editorial work of the journal. It is a great way to build your academic scholarship portfolio, and this helps to ensure the journal’s growth and sustainability. Potential candidates should send their updated CV (that includes all relevant research and/ or creative scholarship experience; all relevant writing, editing, or peer critique experience) to scrip@som.geisinger.edu with the subject "Application for Student Editor."
Sincerely,
Sonia Lobo, PhD Editor-in-Chief

Student editors
Saishravan Shyamsundar, MBS Class of 2022
Christopher Manko, MD Class of 2025
Niraj Vyas, MD Class of 2024
Jaclyn Podd, MD Class of 2024
Vaibhav Sharma, Class of 2022
Marketing, Communications, and Design
Jessica L. Martin, Managing Editor
Geisinger Marketing & Communications
Heather M. Davis, MFA Director, Marketing & Communications
Elizabeth Zygmunt Director of Public Relations and Media
Shannon Lesniak Graphic Designer
Acknowledgments
The SCRIP would not be possible without the contributions of faculty and student volunteers committed to the review and assessment of submitted articles. Their feedback provides student authors with an opportunity to strengthen their writing and to respond to critiques. We gratefully acknowledge the following faculty members for their support in providing peer review.
Mark White, MD
Tierney Lyons, MLS
Mushfiq Tarafder, PhD Reema Persad-Clem, PhD Kathleen Doane, PhD
Amanda Caleb, PhD
Igor Danelisen, MD, MSc, PhD, MBA
John A. Arnott, PhD
Brian Piper, PhD
Cyamatare Felix Rwabukwisi, MD, MPH Youssef Soliman, MD, PhD
William McLaughlin, PhD Greg Shanower, PhD
Office of Research & Scholarship MSB, Suite 2024, 2nd Floor West 570-504-9662
Sonia Lobo, PhD, RYT
Associate Dean for Research & Scholarship Professor of Biochemistry
Michele Lemoncelli
Administrative Assistant to the Associate Dean for Research & Scholarship Tracey Pratt, MPH Grants Specialist
Adam Blannard, MS Manager, Research Education Resources
Laura E. Mayeski MT(ASCP), MHA Manager, Research Compliance
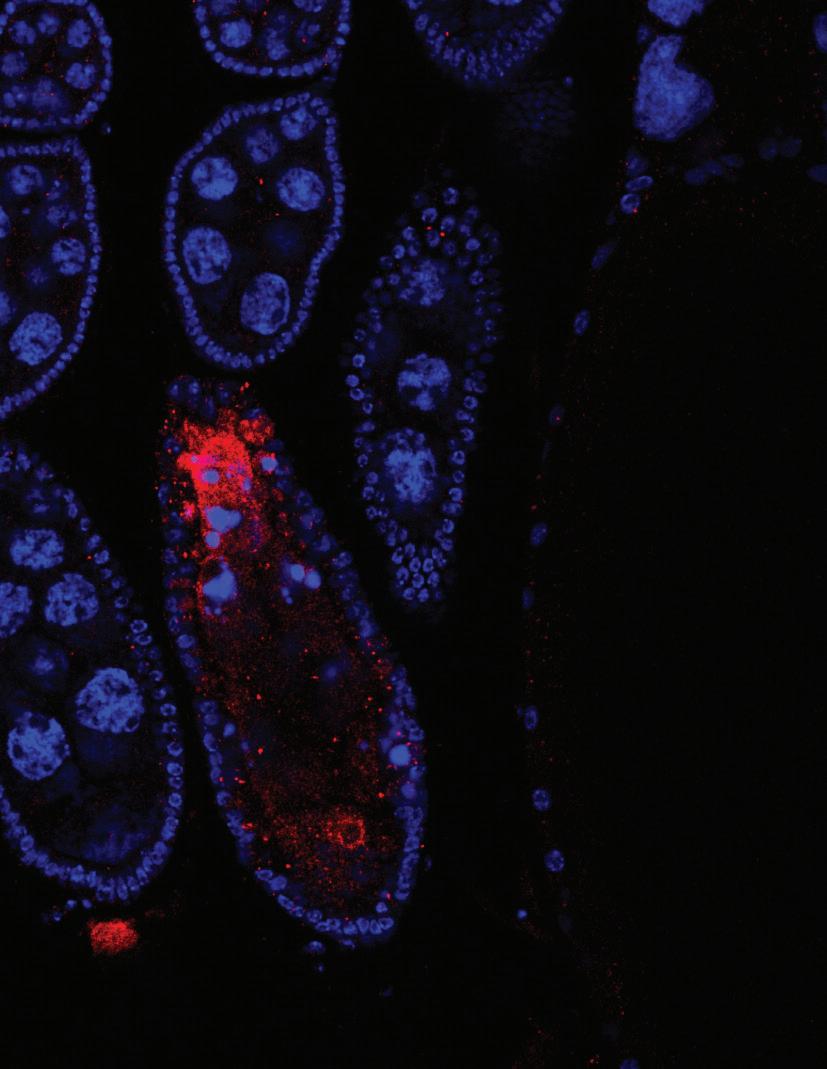
On the cover: The image represents Drosophila female ovarioles removed from a CRISPR Cas9 generated knockout of a long noncoding RNA known as CR44017. The ovarioles were removed from a homozygous lethal mutant line that contains a CRISPR Cas9 induced deletion inside the CR44017 gene. The ovarioles were stained with a dye that identifies nuclear DNA (DAPI; in blue) and incubated with an antibody that recognizes activated Caspase 3 (in red). We detect apoptosis occurring in stages 6 and 7 in a small percentage of ovarioles in this mutant fly line that is above normal background.

Scholarly Progress
1
Neuroscience of Obesity: Pathogenesis of a Disease Influenced by the Environment
Yash Adroja1*
1Geisinger Commonwealth School of Medicine, Scranton, PA 18509
*Master of Biomedical Sciences Program
Correspondence: yadroja@som.geisinger.edu
Abstract
Over the last several decades, worldwide obesity rates have been increasing at an alarming rate. Obesity is a complex multifaceted disease that can increase one’s risk of developing Type 2 diabetes, cardiovascular disease, and atherosclerosis. While it is understood that energy balance from the laws of physics dictate fluctuations in weight gain, more attention has been given to the drivers behind obesity from a neuroscience perspective in recent years. The current food environment provides a venue of hyperpalatable, cheap, and accessible foods to populations that are particularly in areas of low socioeconomic status. Sugar-sweetened beverages (SSBs) compose a majority of added sugars and excess calories in the American diet and present health concerns such as nonalcoholic fatty liver disease. The composition of items in this obesogenic food environment can notably play a role in altering subcortical activity related to pleasure associated with food. Key modulators in this phenomenon include leptin, ghrelin, cortisol, and the hypothalamic-pituitary-adrenal (HPA) axis. Additionally, chronic stress and mental illness are important to address as they can further disrupt the key modulators mentioned. Disruption in these hormones is associated with increased obesity through various epidemiological research. Despite the three macronutrients carbohydrates, fat, and protein, which each distinctly impact the brain, a substantial number of randomized controlled trials (RCTs) exist showing that when total energy intake is accounted for, weight loss is produced. As a result, obesity drugs on the market that facilitate weight loss work on the brain to help control total energy intake. Understanding the subcortical and environmental impacts of the obesity crisis can help physicians, registered dietitians, and the layperson navigate evidence-based methods to slow down the drastic rise in adiposity seen in contemporary society.
Introduction
Obesity is a complex multifactorial disease that is characterized by excess adiposity that can promote metabolic health issues. Since 1975, worldwide obesity rates have nearly tripled and by 2050, it is estimated that 60% and 50% of male and female adults, respectively, will develop obesity (1, 2). Currently, obesity is screened for using body mass index (BMI), a useful tool at the population level to recognize BMI patterns. BMI is simply an individual’s mass in kilograms divided by their height in meters. While a good tool at the population level, BMI has its limitations. Factors such as waist-to-height ratio, location of adiposity, and race/ethnicity must be considered. For instance, visceral fat located abdominally around vital organs can increase one’s risk of developing Type 2 diabetes, atherosclerosis, and cardiovascular disease (3). Additionally, South Asians have a
greater risk of developing obesity-related complications at a lower BMI compared to other ethnicities (4). Due to this, it is critical to appreciate the intricacies and the multifaceted nature of obesity.
Recently, more attention has been given to the drivers behind obesity from a neuroscientific lens. It has been established that the principle of energy balance as a law of physics dictates weight gain and weight loss (5). This fundamental principle states that a net positive energy balance will result in accumulation of weight, while a net negative energy balance will result in weight loss because energy must be conserved. However, recent literature has aimed to expand on this principle by examining the biological drivers of weight gain. The energy balance model of obesity proposes that the brain is the primary organ responsible for body weight regulation through complex interactions with the food environment and external signals (6). When discussing excess food intake, socioeconomic constraints must also be addressed. An obesogenic food environment that consists of cheap, accessible, hyperpalatable foods can be seen as one explanation for the obesity epidemic (7–10). These environments tend to be abundant in areas with low socioeconomic status and can contribute to excess energy intake through the presence of more unhealthy foods. The food environment is simply the composition of food that is accessible and available in a particular area. Residing in an area with deprived socioeconomic status is a factor that is associated with many obesogenic behaviors (7). The food environment is speculated to play a role in the brain and obesity as well through the human reward system; the mechanism at play here results in increased food intake and circulating fuels (6). In adolescents, consistent exposure to television advertisements of food commercials affects the striatum (11) and these commercials also results in greater neural activation in the nucleus accumbens and caudate nucleus, predicting an increased consumption of calories (12). After a one-year follow-up, there was an increase in BMI, suggesting that the food environment can play a subcortical role in driving the increase in obesity rates.
Moreover, the purpose of this review was to highlight several neurobiological factors in humans that are contributing to the advancement of obesity in modern society. The current food environment, along with other factors, plays a role on our energy intake over time. Additionally, this review sought to address controversies surrounding macronutrient distribution impacting weight loss. This review examined the sophisticated nature of factors that influence obesity, including but not limited to the environment, hedonic feeding, subcortical effects, and mental health. Ultimately, this paper can benefit those working with patients in a healthcare setting as well as the average person trying to improve their health. The reason for this
Scholarly Research In Progress • Vol. 6, November 2022
2
proposed benefit is due to taking a detailed view into the many pathologies and causes of obesity that can present differently depending on the person.
Methods
A comprehensive literature search was completed exclusively through PubMed to locate literature related to obesity and neuroscience. A combination of terms including obesity, neuroscience, BMI, brain, environment, hedonic feeding, subcortical, and reward were utilized with the Boolean operators “AND” and “OR.” Additionally, references of selected articles were examined to ensure a thorough representation of the literature.
Discussion
Sugar-sweetened beverages
The World Health Organization (WHO) has an adamant stance on reducing the consumption of added sugar in the diet. The WHO strongly recommends that total energy intake from free sugars be less than 10% in adults and children (13). This means for someone consuming a 2,500-calorie diet, free sugar intake should be no more than 250 calories daily. Sugar-sweetened beverages (SSBs) are very accessible and heavily marketed in the current food environment and come in forms such as soft drinks and fruit juices (14). Since SSBs are devoid of fiber, offer little nutritive value, and are easily overconsumed, there is discussion about the role of these products in society. SSBs are the leading source of added sugars in the United States (15). The overconsumption of these products is strongly associated with poor metabolic outcomes such as cardiovascular disease, non-alcoholic fatty liver disease, and cancer (16–18). Because metabolic disease is such a pervasive public health issue, recent efforts have been made to utilize a “tax” on these products to deter frequent consumption and have been successful (19).
It is clear that besides contributing to excess caloric intake, SSBs also play a role in the brain. For instance, a randomized controlled trial (RCT) assigned one arm of the study to consume SSBs for 21 days and measured functional magnetic resonance imaging (fMRI) scans of the brain as well as behaviors related to hedonic feeding (20). There was an increase in oxygen utilization by the striatum shown in the fMRI readings as well as reports of pleasure. This pleasurable feeling can potentially explain why individuals are drawn to hyperpalatable foods due to the strong reward response produced (21). In the striatum, the main function of neurons is to participate in movement and reward (22). There have been several documented cases of increased striatum activation in individuals with obesity compared to those without (11, 23–25). The interaction is just one of many brain interactions related to the food environment that can explain why individuals are likely to overeat.
SSBs are associated with poor health outcomes (16–18); therefore, there has been a recent push to urge consumers to switch to using non-nutritive sweeteners (NNS). NNS have little to no energy content and are much sweeter than regular table sugar (26). As a result, it is believed that substituting NNS in place of SSBs can help reduce the intake of added sugar in the diet. There is controversy surrounding NNS, also commonly known as artificial sweeteners (AS). Some evidence
suggests that intake of one particular AS, aspartame, can induce neurobiological impairments and gut dysbiosis (27); however, the overwhelming evidence suggests AS are safe and valuable to consume when trying to reduce sugar intake (28–31).
From a mechanistic point of view, this reasoning is sound, as swapping SSB for NNS can help one lower their overall energy intake, therefore avoiding the metabolic consequences of added sugars. A counterpoint supporting the consumption of AS suggests that the human outcomes associated with AS far outweigh the plausible mechanisms related to the neuroendocrine control of appetite, satiety, and cravings (32). While AS correlate with obesity and other adiposity-based chronic diseases, this is more so a result of confounding variables incorrectly blaming AS for the increase in obesity (32). Ultimately, the health outcomes from reducing sugar intake can go a long way. Primarily, this is accomplished by reduction of calories aiding in maintaining weight loss.
How chronic stress can impact obesity
Physical and psychological stress is a normal aspect of life (33). It is normal to experience a degree of stress in events which will activate the sympathetic nervous system. The human body will compensate by releasing the catecholamines epinephrine and norepinephrine; epinephrine specifically can provide glucose in the bloodstream in this stressful scenario for defensive action (34). While acute stress is normal and vital to life, chronic stress can trigger neurobiological actions that contribute to alterations in the hypothalamic-pituitary-adrenal (HPA) axis (35). There is compelling evidence that suggests chronic stress can contribute to enhanced interest in fatty and sweet foods (36). Hyperpalatable foods tend to be high in both fat and carbohydrates; as a result, stress can influence an individual’s tendency to be in a state of positive energy balance.
It is believed these foods alter the mesolimbic dopamine reward system by increasing glucocorticoids in the body (36–38). One important glucocorticoid related to obesity and involved in the stress response is cortisol (39). In adult men with visceral obesity, elevated morning cortisol has been identified, further suggesting that the HPA axis is a critical component in the stress response and obesity (40). While morning cortisol is normally highest according to the circadian rhythm, subjects in the study with less visceral fat did not show comparable awakening cortisol levels. This points to the strong impact of visceral adiposity. It is important to remember that visceral adiposity is harmful to internal organs and has also been shown to be a strong predictor of insulin resistance (3, 41–45). Chronic stress can also result in disrupted sleep patterns which independently elevate cortisol levels (46). Stressful situations such as low socioeconomic class are shown to deprive sleep and impair regular function of the HPA axis (47). As a direct result, neuroendocrine regulation can be impaired because of a drastic chronic state of increased cortisol. Furthermore, recent literature substantiates the hypothesis between poor sleep and obesity (48). It was noted that individuals with better sleep health had greater associations with decreased obesity in this particular investigation.
Ghrelin is colloquially referred to as the hunger hormone; however, it has several intricate functions in food intake, growth hormone release, and adipose deposition (49). This hormone is related to energy balance and is elevated during acute
Neuroscience of Obesity: Pathogenesis of a Disease Influenced by the Environment
3
Neuroscience of Obesity: Pathogenesis of a Disease Influenced by the Environment
and chronic stress (50). The properties of ghrelin have been explored in the brain relating to food reward, the HPA axis, and regulation of appetite related to dopamine (51–54). Specifically, in the brain, ghrelin increases food intake by stimulating the synthesis of neuropeptide Y and agouti-related protein (55). Several studies have examined the role of ghrelin in mice and have found ghrelin resistance in obese mice (56–58); however, rodent data is often inapplicable to humans. In overweight humans, higher levels of ghrelin were linearly associated with increased caloric intake (59). This suggests that these individuals have stronger cravings for hyperpalatable foods and have greater tendencies to display hedonic behaviors toward food. Additionally, there has been replication of higher ghrelin in individuals who consume food products high in fat and carbohydrate; however, it is notable that in these subjects there were lower levels of leptin (60). Leptin is a hormone that is related to long-term energy balance (61). When there are low levels of leptin, our body gets a signal that invokes a feeling of hunger, further contributing to excess energy intake (62–63). Leptin and ghrelin together have been found to increase food cue reactivity which is related to physiological responses to the activation of human reward systems (64). The current food environment that is rich in hyperpalatable foods can contribute to the fluctuating levels of leptin and ghrelin in humans (7–10). The role of these hormones in obesity at a cellular level is still under investigation (65).
Mental health and obesity
An individual’s mental health can be shaped by social, environmental, and economic conditions (66–68). Notably, people who suffer from poor mental health and intellectual disabilities experience excess mortality compared to the general population (69). Additionally, excess adiposity is one risk factor for all-cause mortality (70). Recently in the United Kingdom, a sample of 3.6 million adults demonstrated a J-shaped association between increased BMI and excess mortality (71). Therefore, the relationship between mental health and obesity is an important consideration when examining the obesity epidemic.
Depression, also known as major depressive disorder (MDD) is a mental health disorder that affects 350 million people globally (72). The mechanisms of MDD can be further clarified through neuroscience literature. Neuroscience has become a pivotal resource for scientists and researchers to understand the connection between depression and obesity (73). When it comes to body weight regulation, the brain has neural circuits that have been shown to control energy intake in response to food environments (5). One can think of these circuits as ways to control food intake through different responses to several hormones including dopamine. Hall and colleagues acknowledge the concept of brain circuits is novel and that different responses in these circuits are being evaluated in mouse models (6). For instance, the brain circuits will be used to test the intervention of a high-fat diet compared to a highcarbohydrate diet. There is also data that show the neural adaptations in these circuits can explain associations between depression and obesity (74–75). Furthermore, it can be hypothesized that there are subcortical effects in obesity and depression that are similar. In fact, depression has been linked
to decreased gray volume in regions such as the left precentral gyrus, hippocampus, insula, and cerebellum (76–79). Similarly, obesity is associated with a loss of gray matter (80). Gray matter makes up the outer layer of the brain, constitutes the greatest number of neural cells in the cerebellum, and plays a crucial role in everyday function in humans (81–82). Dysfunction and atrophy in this area can possibly explain the relationship between obesity and depression. The alteration in critical brain regions may also explain hedonic eating patterns, or eating simply for pleasure. Higher gray matter volume is shown to increase one’s ability to moderate and control food intake (83). When conditions such as obesity and depression deteriorate gray matter in the brain, the ability to moderate food intake is diminished and there is an inclination toward foods that are more palatable and elicit a potent reward response (21). This subcortical alteration can ultimately drive an individual to consume excess calories over time, which will result in a positive energy balance, contributing to weight gain.
The question that naturally arises from this discussion is “How can I prevent mental illness to improve the quality of my life?” That being said, there are no current data that show mentalhealth–related complications can be entirely prevented or cured, even with contemporary pharmacological therapies (84). Therefore, the best option is to manage these symptoms through a combination of effective medical therapies as well as lifestyle interventions. It should be noted that regardless of these types of interventions, there is a chance that these mental illnesses cannot be prevented due to hereditary components. Recent systematic reviews and meta-analyses show strong evidence for aerobic and resistance exercise in managing mild depression and depressive symptoms in adolescents and adults (85–86). There are several plausible mechanisms that are at play here. One outcome of resistance training is the increase in gray matter thickness and cognition in those who resistance trained twice a week for 26 weeks (87). While the human outcome data show positive benefit from resistance training, the mechanisms are not completely understood but most likely exert their effect through cellular and molecular interactions with lactate, tumor necrosis factor alpha, brain-derived neutrophic factor, and insulin-like growth factor-1 (88). Like resistance training, aerobic exercise is also shown to increase white and gray matter in the brain (89). One mechanism related to the benefits of exercise can be seen through the release of myokines, notably interleukin-6 in rodents (90). Further research is needed to fully understand how exercise contributes to positive health outcomes from a mechanistic and molecular standpoint; however, there is a clear benefit shown from exercise to combat depressive symptoms in the human outcome data.
Ultimately, the best option to combat mental illness and obesity could be through guided stress-management programs. A randomized controlled trial looking at outcomes related to BMI, depression, and stress showed significant decreases in stress and depression as well as the adoption of a healthier dietary pattern (91). Similar programs conducted both in person and online showed comparable benefits (92-95). The crossover between depression and obesity is complex and must be addressed from a subcortical perspective to be effectively targeted.
4
Macronutrient impact on the brain
The three common macronutrients are protein, carbohydrates, and fat. These nutrients go through various metabolic pathways to provide our body with energy. Dietary fat provides nine calories per gram while protein and carbohydrates each provide four calories per gram (96). The impact of these macronutrients on human and in vivo systems has been meticulously studied from the perspective of the brain. It should be noted that there are different forms of dietary fat, such as saturated, polyunsaturated, monounsaturated, and trans, each of which have unique health implications in the literature. For instance, a diet rich in saturated fat has been shown to increase low-density lipoprotein (LDL) cholesterol and reductions in LDL cholesterol are paramount in reducing combined cardiovascular events (97). Additionally, LDL cholesterol has been shown in mendelian randomization trials to be a strong predictor of cardiovascular disease (98). This controlled data even allows for causality to be inferred, which cannot be done through various epidemiological studies. Animal models show that the intake of high dietary fat, particularly saturated fat, can alter brain neurochemistry in the hypothalamus (99–102). The hypothalamus has a main function in controlling appetite and maintaining homeostasis; hence, it is plausible that higher dietary intake of fat can affect this system to drive one to hyper-consume calories.
Carbohydrates serve as the brain’s preferred source of energy. When discussing carbohydrates, specificity is required, as there are multiple types of carbohydrates such as readily digestible refined carbohydrates compared to fiber, which the body cannot metabolize. Refined carbohydrates tend to be processed and stripped of vital nutrients and are associated with altering the serotonin pathway in mice which can contribute to hedonic feeding patterns (103). In humans, excessive refined carbohydrate consumption is linked to poor hippocampal function and disruption of the mesolimbic and prefrontal reward pathways (104). However, it is unclear whether reverse causality is at play here. Refined carbohydrates tend to be hyperpalatable and are packaged in foods that also contain a large quantity of fat, therefore making the item more rewarding. The excess consumption of total energy may better explain the alterations in reward processing; however, further research is needed. On the other hand, fiber is a carbohydrate that cannot be broken down and moves food through the digestive system. Fiber has arguably the strongest evidence supporting its consumption through several meta-analyses and cohort studies associating fiber consumption with reduced all-cause mortality in a dose dependent manner (105–109). Epidemiological research shows that fiber is associated with a lower overall body weight (110). This can potentially be attributed to the satiety
Neuroscience
of Obesity: Pathogenesis of a Disease Influenced by the Environment
Figure 1. Flow chart describing consequences of environmental factors related to obesity Obesogenic environment Influences subcortical behavior, resulting in increased energy consumption through ad libitum feeding Hyperpalatable foods Alter mesolimbic reward system in humans Chronic stress Deviation from regular ghrelin, leptin and cortisol levels in the body Inability to moderate energy intake Anti-obesity drugs Psychologically aid in helping the brain control total energy intake Sugarsweetened beverages Readily available liquid calories with little to no nutritional value 5
Neuroscience of Obesity: Pathogenesis of a Disease Influenced by the Environment
effect it provides. While the mechanisms for fiber’s positive effects are still being studied, it is suspected that there is a relationship to the gut-brain axis and fermentative metabolism (111).
Protein is an important molecule and is involved in several processes in the body. In hypocaloric diets, the increased consumption of protein helps individuals with obesity maintain weight loss (112). This can potentially be attributed to the thermic effect of food protein provides, although this impact is relatively small. Additionally, higher-protein diets are more readily accepted into normal food culture, which can make these diets easier to adhere to (113). Protein signaling is believed to operate through the vagal nerve and include gastric hormones (114). While additional research is needed on the significance of protein mechanistically, there are a few things certain regarding macronutrients as a whole. Energy balance will dictate weight gain or weight loss (5), which is seen in closely controlled trials. Regardless of the macronutrient composition, a net energy deficit will result in weight loss. In a meta-analysis of 53 RCTs, there was no evidence that showed significant changes in body weight in the long term when total energy is controlled for (115). This trial included dietary patterns that were higher in fat as well as dietary patterns that were lower in fat and various macronutrients. It is worth acknowledging that subcortical effects related to feeding can make this process more difficult as shown by the neuroscientific research (11–12, 21–23, 35, 36)
Conclusion
Obesity is a disease that is driven by a chronic shift in energy balance. The current food environment makes hyperpalatable foods readily available that can work on the brain to drive overconsumption. As the rates of obesity continue to rise, it is imperative to find evidence-based solutions to combat the epidemic. The human reward system can be shifted specifically through leptin and ghrelin as a result of the obesogenic food environment (64). Within this environment, SSBs continue to pose problems to metabolic health. In addition to provoking behaviors associated with hedonic feeding (20), SSBs continue to be the leading source of added sugars in the United States (15). Replacing these beverages with NNS and focusing on overall dietary patterns that provide satiety can help reduce overconsumption of calories. Socioeconomic status must also be acknowledged. Low socioeconomic status is associated with impairing the HPA axis (47). This can make it more difficult for an individual to control energy intake because of internal hormonal cues. The low socioeconomic status can also result in periods of chronic stress which disrupt healthy sleep patterns (46). A major concern for areas that have a high proportion of individuals with low socioeconomic status is the presence of food deserts, which limit access to healthy foods in these communities (116). As expected, this will result in more hyperpalatable foods that are cheap, accessible, and easily overconsumed.
Contemporary medicine has produced anti-obesity drugs that have shown promise. One example of a drug that is commonly prescribed to patients with obesity is semaglutide. Semaglutide has been demonstrated to result in lower ad libitum caloric intake compared to placebo in the literature (117). The mechanisms of semaglutide seem to work in the brain by
decreasing preference for energy-dense foods that provide low satiety (117). This can be an effective way in reducing overall energy intake and fighting the obesity epidemic. A recent genome-wide association study has shown that food-liking and preference can largely be influenced by genetic variations and biology (118). While more research needs to be completed, the cutting-edge research in genetics will potentially advance our understanding of the impact the food environment has on the brain in the future.
In closing, the relationship between hedonic feeding in the obesity epidemic is largely environmentally driven and complex in nature. This can be seen in Figure 1. Major issues that must be addressed include the obesogenic food environment and mental illness that can manifest in stress. The stigma behind obesity can also hurt an individual’s psychological and physical well-being and must be addressed (119). Efforts made toward combating these issues will be promising and can change the tide of the ongoing obesity crisis across the globe.
Acknowledgments
I would like to thank Dr. Brian Piper for his generous feedback and suggestions on this manuscript. Additionally, I would like to thank Iris Johnston for allowing me to access articles swiftly through the school library.
Disclosures
The author has no financial relationship with a commercial entity producing healthcare related products and/or service. There are no other relevant disclosures to be made.
References
1. NCD Risk Factor Collaboration. Trends in adult bodymass index in 200 countries from 1975 to 2014: A pooled analysis of 1698 population-based measurement studies with 19· 2 million participants. Lancet 2016;2;387(10026):1377-96.
2. Agha M, Agha R. The rising prevalence of obesity: Part A: Impact on public health. Int J Surg Oncol (NY) 2017;2(7):e17.
3. Neeland IJ, Ross R, Després JP, Matsuzawa Y, Yamashita S, Shai I, et al. Visceral and ectopic fat, atherosclerosis, and cardiometabolic disease: A position statement. Lancet Diabetes Endocrinol. 2019;7(9):715-25.
4. Misra A. Ethnic-specific criteria for classification of body mass index: A perspective for Asian Indians and American Diabetes Association position statement. Diabetes Technol Ther. 2015;17(9):667-71.
5. Hall KD, Heymsfield SB, Kemnitz JW, Klein S, Schoeller DA, Speakman JR. Energy balance and its components: Implications for body weight regulation. Am J Clin Nutr 2012;95(4):989-94.
6. Hall KD, Farooqi IS, Friedman JM, Klein S, Loos RJ, Mangelsdorf DJ, et al. The energy balance model of obesity: Beyond calories in, calories out. Am J Clin Nutr 2022;115(5):1243-54.
6
Neuroscience of Obesity: Pathogenesis of a Disease Influenced by the Environment
7. Glanz K, Sallis JF, Saelens BE, Frank LD. Healthy nutrition environments: Concepts and measures. Am J Health Promot. 2005;19(5):330-3.
8. Story M, Kaphingst KM, Robinson-O'Brien R, Glanz K. Creating healthy food and eating environments: Policy and environmental approaches. Annu Rev Public Health 2008;29:253-72.
9. Giskes K, van Lenthe F, Avendano-Pabon M, Brug J. A systematic review of environmental factors and obesogenic dietary intakes among adults: Are we getting closer to understanding obesogenic environments? Obes Rev. 2011;12(5):e95-106.
10. Papas MA, Alberg AJ, Ewing R, Helzlsouer KJ, Gary TL, Klassen AC. The built environment and obesity. Epidemiol Rev. 2007;29(1):129-43.
11. Yokum S, Gearhardt AN, Harris JL, Brownell KD, Stice E. Individual differences in striatum activity to food commercials predict weight gain in adolescents. Obesity (Silver Spring). 2014;22(12):2544-51.
12. Gearhardt AN, Yokum S, Harris JL, Epstein LH, Lumeng JC. Neural response to fast food commercials in adolescents predicts intake. Am J Clin Nutr 2020;111(3):493-502.
13. Breda J, Jewell J, Keller A. The importance of the World Health Organization sugar guidelines for dental health and obesity prevention. Caries Res. 2019;53(2):149-52.
14. Malik VS, Schulze MB, Hu FB. Intake of sugar-sweetened beverages and weight gain: A systematic review. Am J Clin Nutr. 2006;84(2):274-88.
15. Chevinski JR, Lee SH, Blanck HM, Park S. Peer Reviewed: Prevalence of self-reported intake of sugar-sweetened beverages among US adults in 50 states and the District of Columbia, 2010 and 2015. Prev Chronic Dis 2021;18E35.
16. Yin J, Zhu Y, Malik V, Li X, Peng X, Zhang FF, et al. Intake of sugar-sweetened and low-calorie sweetened beverages and risk of cardiovascular disease: A meta-analysis and systematic review. Adv Nutr. 2021;12(1):89-101.
17. Jensen T, Abdelmalek MF, Sullivan S, Nadeau KJ, Green M, Roncal C, et al. Fructose and sugar: A major mediator of non-alcoholic fatty liver disease. J Hepatol 2018;68(5):1063-75.
18. Debras C, Chazelas E, Srour B, Kesse-Guyot E, Julia C, Zelek L, et al. Total and added sugar intakes, sugar types, and cancer risk: Results from the prospective NutriNetSanté cohort. Am J Clin Nutr. 2020;112(5):1267-79.
19. Bleich SN, Lawman HG, LeVasseur MT, Yan J, Mitra N, Lowery CM, et al. The association of a sweetened beverage tax with changes in beverage prices and purchases at independent stores: Study compares changes in sweetened beverage prices and purchases before and twelve months after tax implementation, at small, independent stores in Philadelphia. Health Aff (Millwood). 2020;39(7):1130-9.
20. Burger KS. Frontostriatal and behavioral adaptations to daily sugar-sweetened beverage intake: A randomized controlled trial. Am J Clin Nutr. 2017;105(3):555-63.
21. Johnson F, Wardle J. Variety, palatability, and obesity. Adv Nutr. 2014;5(6):851-9.
22. Hollerman JR, Tremblay L, Schultz W. Involvement of basal ganglia and orbitofrontal cortex in goal-directed behavior. Prog Brain Res. 2000;126:193-215.
23. Rothemund Y, Preuschhof C, Bohner G, Bauknecht HC, Klingebiel R, Flor H, et al. Differential activation of the dorsal striatum by high-calorie visual food stimuli in obese individuals. Neuroimage. 2007;37(2):410-21.
24. Stoeckel LE, Weller RE, Cook III EW, Twieg DB, Knowlton RC, Cox JE. Widespread reward-system activation in obese women in response to pictures of high-calorie foods. Neuroimage. 2008;41(2):636-47.
25. Stice E, Yokum S, Burger KS, Epstein LH, Small DM. Youth at risk for obesity show greater activation of striatal and somatosensory regions to food. J Neurosci 2011;31(12):4360-6.
26. Liauchonak I, Qorri B, Dawoud F, Riat Y, Szewczuk MR. Non-nutritive sweeteners and their implications on the development of metabolic syndrome. Nutrients 2019;11(3):644.
27. Choudhary AK, Lee YY. The debate over neurotransmitter interaction in aspartame usage. J Clin Neurosci. 2018;56:715.
28. Ahmad SY, Friel J, Mackay D. The effects of non-nutritive artificial sweeteners, aspartame and sucralose, on the gut microbiome in healthy adults: Secondary outcomes of a randomized double-blinded crossover clinical trial. Nutrients. 2020;12(11):3408.
29. Thomson P, Santibanez R, Aguirre C, Galgani JE, Garrido D. Short-term impact of sucralose consumption on the metabolic response and gut microbiome of healthy adults. Br J Nutr. 2019;122(8):856-62.
30. Nichol AD, Holle MJ, An R. Glycemic impact of nonnutritive sweeteners: A systematic review and metaanalysis of randomized controlled trials. Eur J Clin Nutr 2018;72(6):796-804.
31. Laviada-Molina H, Molina-Segui F, Pérez-Gaxiola G, Cuello-García C, Arjona-Villicaña R, Espinosa-Marrón A, et al. Effects of nonnutritive sweeteners on body weight and BMI in diverse clinical contexts: Systematic review and meta-analysis. Obes Rev. 2020;21(7):e13020.
32. Nadolsky KZ. Counterpoint: Artificial sweeteners for obesity—better than sugary alternatives; potentially a solution. Endocr Pract. 2021;27(10):1056-61.
33. Van der Valk ES, Savas M, van Rossum EF. Stress and obesity: Are there more susceptible individuals? Curr Obes Rep. 2018;7(2):193-203.
34. Gunnar M, Quevedo K. The neurobiology of stress and development. Annu Rev Psychol. 2007;58:145-73.
7
Neuroscience of Obesity: Pathogenesis of a Disease Influenced by the Environment
35. Yau YH, Potenza MN. Stress and eating behaviors. Minerva Endocrinol. 2013;38(3):255.
36. Adam TC, Epel ES. Stress, eating and the reward system. Physiol Behav. 2007;91(4):449-58.
37. Lopez SA, Flagel SB. A proposed role for glucocorticoids in mediating dopamine-dependent cue-reward learning. Stress. 2021;24(2):154-67.
38. Parnaudeau S, Dongelmans ML, Turiault M, Ambroggi F, Delbes AS, Cansell C, et al. Glucocorticoid receptor gene inactivation in dopamine-innervated areas selectively decreases behavioral responses to amphetamine. Front Behav Neurosci. 2014;8:35.
39. Xiao Y, Liu D, Cline MA, Gilbert ER. Chronic stress, epigenetics, and adipose tissue metabolism in the obese state. Nutr Metab (Lond). 2020;17(1):1-6.
40. Therrien F, Drapeau V, Lalonde J, Lupien SJ, Beaulieu S, Tremblay A, et al. Awakening cortisol response in lean, obese, and reduced obese individuals: Effect of gender and fat distribution. Obesity (Silver Spring) 2007;15(2):377-85.
41. Usui C, Asaka M, Kawano H, Aoyama T, Ishijima T, Sakamoto S, et al. Visceral fat is a strong predictor of insulin resistance regardless of cardiorespiratory fitness in non-diabetic people. J Nutr Sci Vitaminol (Tokyo) 2010;56(2):109-16.
42. de Mutsert R, Gast K, Widya R, de Koning E, Jazet I, Lamb H, et al. Associations of abdominal subcutaneous and visceral fat with insulin resistance and secretion differ between men and women: The Netherlands epidemiology of obesity study. Metab Syndr Relat Disord. 2018;16(1):5463.
43. Hocking S, Samocha-Bonet D, Milner KL, Greenfield JR, Chisholm DJ. Adiposity and insulin resistance in humans: The role of the different tissue and cellular lipid depots. Endocr Rev. 2013;34(4):463-500.
44. Miyazaki Y, DeFronzo RA. Visceral fat dominant distribution in male type 2 diabetic patients is closely related to hepatic insulin resistance, irrespective of body type. Cardiovasc Diabetol. 2009;8(1):1-9.
45. Gabriely I, Ma XH, Yang XM, Atzmon G, Rajala MW, Berg AH, et al. Removal of visceral fat prevents insulin resistance and glucose intolerance of aging: An adipokinemediated process? Diabetes. 2002;51(10):2951-8.
46. Leproult R, Copinschi G, Buxton O, Van Cauter E. Sleep loss results in an elevation of cortisol levels the next evening. Sleep. 1997;20(10):865-70.
47. Hirotsu C, Tufik S, Andersen ML. Interactions between sleep, stress, and metabolism: From physiological to pathological conditions. Sleep Sci. 2015;8(3):143-52.
48. Kline CE, Chasens ER, Bizhanova Z, Sereika SM, Buysse DJ, Imes CC, et al. The association between sleep health and weight change during a 12-month behavioral weight loss intervention. Int J Obes (Lond). 2021;45(3):639-49.
49. Pradhan G, Samson SL, Sun Y. Ghrelin: Much more than a hunger hormone. Curr Opin Clin Nutr Metab Care 2013;16(6):619.
50. Abizaid A. Stress and obesity: The ghrelin connection. J Neuroendocrinol. 2019;31(7):e12693.
51. Menzies JR, Skibicka KP, Dickson SL, Leng G. Neural substrates underlying interactions between appetite stress and reward. Obes Facts. 2012;5(2):208-20.
52. Schellekens H, Dinan TG, Cryan JF. Ghrelin at the interface of obesity and reward. Vitam Horm 2013;91:285-323.
53. Spencer SJ, Emmerzaal TL, Kozicz T, Andrews ZB. Ghrelin’s role in the hypothalamic-pituitary-adrenal axis stress response: Implications for mood disorders. Biol Psychiatry. 2015;78(1):19-27.
54. Abizaid A. Ghrelin and dopamine: New insights on the peripheral regulation of appetite. J Neuroendocrinol 2009;21(9):787-93.
55. Gil-Campos M, Aguilera CM, Canete R, Gil A. Ghrelin: A hormone regulating food intake and energy homeostasis. Br J Nutr. 2006;96(2):201-26.
56. Briggs DI, Enriori PJ, Lemus MB, Cowley MA, Andrews ZB. Diet-induced obesity causes ghrelin resistance in arcuate NPY/AgRP neurons. Endocrinology. 2010;151(10):474555.
57. Briggs DI, Lockie SH, Wu Q, Lemus MB, Stark R, Andrews ZB. Calorie-restricted weight loss reverses high-fat dietinduced ghrelin resistance, which contributes to rebound weight gain in a ghrelin-dependent manner. Endocrinology 2013;154(2):709-17.
58. Finger BC, Dinan TG, Cryan JF. Diet-induced obesity blunts the behavioural effects of ghrelin: Studies in a mouse-progressive ratio task. Psychopharmacology (Berl). 2012;220(1):173-81.
59. Buss J, Havel PJ, Epel E, Lin J, Blackburn E, Daubenmier J. Associations of ghrelin with eating behaviors, stress, metabolic factors, and telomere length among overweight and obese women: Preliminary evidence of attenuated ghrelin effects in obesity? Appetite. 2014;76:84-94.
60. Kong A, Neuhouser ML, Xiao L, Ulrich CM, McTiernan A, Foster-Schubert KE. Higher habitual intake of dietary fat and carbohydrates are associated with lower leptin and higher ghrelin concentrations in overweight and obese postmenopausal women with elevated insulin levels. Nutr Res. 2009;29(11):768-76.
61. Klok MD, Jakobsdottir S, Drent ML. The role of leptin and ghrelin in the regulation of food intake and body weight in humans: A review. Obes Rev. 2007;8(1):21-34.
62. Ahima RS. Revisiting leptin’s role in obesity and weight loss. J Clin Invest. 2008;118(7):2380-3.
63. Keim NL, Stern JS, Havel PJ. Relation between circulating leptin concentrations and appetite during a prolonged, moderate energy deficit in women. Am J Clin Nutr 1998;68(4):794-801.
64. Wever MC, van Meer F, Charbonnier L, Crabtree DR, Buosi W, Giannopoulou A, et al. Associations between ghrelin and leptin and neural food cue reactivity in a fasted and sated state. NeuroImage. 2021;240:118374.
8
Neuroscience of Obesity: Pathogenesis of a Disease Influenced by the Environment
65. Cui H, López M, Rahmouni K. The cellular and molecular bases of leptin and ghrelin resistance in obesity. Nat Rev Endocrinol. 2017;13(6):338-51.
66. Allen J, Balfour R, Bell R, Marmot M. Social determinants of mental health. Int Rev Psychiatry. 2014;26(4):392-407.
67. Macintyre A, Ferris D, Gonçalves B, Quinn N. What has economics got to do with it? The impact of socioeconomic factors on mental health and the case for collective action. Palgrave Commun. 2018;4(1):1-5.
68. Alegría M, NeMoyer A, Falgàs Bagué I, Wang Y, Alvarez K. Social determinants of mental health: Where we are and where we need to go. Curr Psychiatry Rep. 2018;20(11):13.
69. Das-Munshi J, Chang CK, Bakolis I, Broadbent M, Dregan A, Hotopf M, et al. All-cause and cause-specific mortality in people with mental disorders and intellectual disabilities, before and during the COVID-19 pandemic: Cohort study. Lancet Reg Health Eur. 2021;11:100228.
70. Tobias DK, Hu FB. The association between BMI and mortality: Implications for obesity prevention. Lancet Diabetes Endocrinol. 2018;6(12):916-7.
71. Bhaskaran K, dos-Santos-Silva I, Leon DA, Douglas IJ, Smeeth L. Association of BMI with overall and causespecific mortality: A population-based cohort study of 3.6 million adults in the UK. Lancet Diabetes Endocrinol 2018;6(12):944-53.
72. Blasco BV, García-Jiménez J, Bodoano I, Gutiérrez-Rojas L. Obesity and depression: Its prevalence and influence as a prognostic factor: A systematic review. Psychiatry Investig. 2020;17(8):715.
73. Robles B, Kuo T, Galván A. Understanding the neuroscience underpinnings of obesity and depression: Implications for policy development and public health practice. Front Public Health. 2021;9.
74. Hidese S, Ota M, Matsuo J, Ishida I, Hiraishi M, Yoshida S, et al. Association of obesity with cognitive function and brain structure in patients with major depressive disorder. J Affect Disord. 2018;225:188-94.
75. Milaneschi Y, Simmons WK, van Rossum EF, Penninx BW. Depression and obesity: Evidence of shared biological mechanisms. Mol Psychiatry. 2019;24(1):18-33.
76. Zhang X, Yao S, Zhu X, Wang X, Zhu X, Zhong M. Gray matter volume abnormalities in individuals with cognitive vulnerability to depression: A voxel-based morphometry study. J Affect Disord. 2012;136(3):443-52.
77. Cheng YQ, Xu J, Chai P, Li HJ, Luo CR, Yang T, et al. Brain volume alteration and the correlations with the clinical characteristics in drug-naive first-episode MDD patients: A voxel-based morphometry study. Neurosci Lett 2010;480(1):30-4.
78. Lai CH, Wu YT. Frontal-insula gray matter deficits in firstepisode medication-naive patients with major depressive disorder. J Affect Disord. 2014;160:74-9.
79. Peng J, Liu J, Nie B, Li Y, Shan B, Wang G, et al. Cerebral and cerebellar gray matter reduction in first-episode
patients with major depressive disorder: A voxel-based morphometry study. Eur J Radiol. 2011;80(2):395-9.
80. Herrmann MJ, Tesar AK, Beier J, Berg M, Warrings B. Grey matter alterations in obesity: A meta-analysis of whole-brain studies. Obes Rev. 2019;20(3):464-71.
81. Dolz J, Desrosiers C, Wang L, Yuan J, Shen D, Ayed IB. Deep CNN ensembles and suggestive annotations for infant brain MRI segmentation. Comput Med Imaging Graph. 2020;79:101660.
82. Lee SH, Lee PH, Liang HJ, Tang CH, Chen TF, Cheng TJ, et al. Brain lipid profiles in the spontaneously hypertensive rat after subchronic real-world exposure to ambient fine particulate matter. Sci Total Environ. 2020;707:135603.
83. Yao L, Li W, Dai Z, Dong C. Eating behavior associated with gray matter volume alternations: A voxel based morphometry study. Appetite. 2016;96:572-9.
84. Ivanov I, Schwartz JM. Why psychotropic drugs don't cure mental illness—but should they? Front Psychiatry 2021:133.
85. Wegner M, Amatriain-Fernández S, Kaulitzky A, MurilloRodriguez E, Machado S, Budde H. Systematic review of meta-analyses: Exercise effects on depression in children and adolescents. Front Psychiatry. 2020;11:81.
86. Wang X, Cai ZD, Jiang WT, Fang YY, Sun WX, Wang X. Systematic review and meta-analysis of the effects of exercise on depression in adolescents. Child Adolesc Psychiatry Ment Health. 2022;16(1):1-9.
87. Suo C, Singh MF, Gates N, Wen W, Sachdev P, Brodaty H, et al. Therapeutically relevant structural and functional mechanisms triggered by physical and cognitive exercise. Mol Psychiatry. 2016;21(11):1633-42.
88. Herold F, Törpel A, Schega L, Müller NG. Functional and/ or structural brain changes in response to resistance exercises and resistance training lead to cognitive improvements–a systematic review. Eur Rev Aging Phys Act. 2019;16(1):1-33.
89. Colcombe SJ, Erickson KI, Scalf PE, Kim JS, Prakash R, McAuley E, et al. Aerobic exercise training increases brain volume in aging humans. J Gerontol A Biol Sci Med Sci 2006;61(11):1166-70.
90. Funk JA, Gohlke J, Kraft AD, McPherson CA, Collins JB, Harry GJ. Voluntary exercise protects hippocampal neurons from trimethyltin injury: Possible role of interleukin-6 to modulate tumor necrosis factor receptor-mediated neurotoxicity. Brain Behav Immun 2011;25(6):1063-77.
91. Xenaki N, Bacopoulou F, Kokkinos A, Nicolaides NC, Chrousos GP, Darviri C. Impact of a stress management program on weight loss, mental health and lifestyle in adults with obesity: A randomized controlled trial. J Mol Biochem. 2018;7(2):78.
92. Stavrou S, Nicolaides NC, Papageorgiou I, Papadopoulou P, Terzioglou E, Chrousos GP, et al. The effectiveness of a stress-management intervention program in the management of overweight and obesity in childhood and adolescence. J Mol Biochem. 2016;5(2):63.
9
Neuroscience of Obesity: Pathogenesis of a Disease Influenced by the Environment
93. Emmanouil CC, Pervanidou P, Charmandari E, Darviri C, Chrousos GP. The effectiveness of a health promotion and stress-management intervention program in a sample of obese children and adolescents. Hormones (Athens) 2018;17(3):405-13.
94. Antwi FA, Fazylova N, Garcon MC, Lopez L, Rubiano R, Slyer JT. Effectiveness of web-based programs on the reduction of childhood obesity in school-aged children: A systematic review. JBI Libr Syst Rev. 2013;11(6):1-44.
95. Paltoglou G, Chrousos GP, Bacopoulou F. Stress management as an effective complementary therapeutic strategy for weight loss in children and adolescents with obesity: A systematic review of randomized controlled trials. Children (Basel). 2021;8(8):670.
96. Akoh CC, Decker EA. Lipid-based fat substitutes. Crit Rev Food Sci Nutr. 1995;35(5):405-30.
97. Kris-Etherton PM, Petersen K, Van Horn L. Convincing evidence supports reducing saturated fat to decrease cardiovascular disease risk. BMJ Nutr Prev Health 2018;1(1):23.
98. Tan YD, Xiao P, Guda C. In-depth mendelian randomization analysis of causal factors for coronary artery disease. Sci Rep. 2020;10(1):1-3.
99. Barson JR, Karatayev O, Gaysinskaya V, Chang GQ, Leibowitz SF. Effect of dietary fatty acid composition on food intake, triglycerides, and hypothalamic peptides. Regul Pept. 2012;173(1-3):13-20.
100. Bellinger LL, Bernardis LL. The dorsomedial hypothalamic nucleus and its role in ingestive behavior and body weight regulation: Lessons learned from lesioning studies. Physiol Behav. 2002;76(3):431-42.
101. Morris MJ, Beilharz JE, Maniam J, Reichelt AC, Westbrook RF. Why is obesity such a problem in the 21st century? The intersection of palatable food, cues and reward pathways, stress, and cognition. Neurosci Biobehav Rev. 2015;58:36-45.
102. Barson JR, Morganstern I, Leibowitz SF. Similarities in hypothalamic and mesocorticolimbic circuits regulating the overconsumption of food and alcohol. Physiol Behav 2011;104(1):128-37.
103. Spadaro PA, Naug HL, Du Toit EF, Donner D, Colson NJ. A refined high carbohydrate diet is associated with changes in the serotonin pathway and visceral obesity. Genet Res (Camb). 2015;97.
104. Hawkins MA, Keirns NG, Helms Z. Carbohydrates and cognitive function. Curr Opin Clin Nutr Metab Care 2018;21(4):302-7.
105. Yang Y, Zhao LG, Wu QJ, Ma X, Xiang YB. Association between dietary fiber and lower risk of all-cause mortality: A meta-analysis of cohort studies. Am J Epidemiol 2015;181(2):83-91.
106. Katagiri R, Goto A, Sawada N, Yamaji T, Iwasaki M, Noda M, et al. Dietary fiber intake and total and cause-specific mortality: The Japan Public Health Center-based prospective study. Am J Clin Nutr. 2020;111(5):1027-35.
107. Kwon YJ, Lee HS, Park GE, Lee JW. Association between dietary fiber intake and all-cause and cardiovascular mortality in middle aged and elderly adults with chronic kidney disease. Front Nutr. 2022;9:863391.
108. Kim Y, Je Y. Dietary fibre intake and mortality from cardiovascular disease and all cancers: A meta-analysis of prospective cohort studies. Arch Cardiovasc Dis 2016;109(1):39-54.
109. Li S, Flint A, Pai JK, Forman JP, Hu FB, Willett WC, et al. Dietary fiber intake and mortality among survivors of myocardial infarction: Prospective cohort study. BMJ. 2014;348:g2659
110. Clark MJ, Slavin JL. The effect of fiber on satiety and food intake: A systematic review. J Am Coll Nutr 2013;32(3):200-11.
111. Barber TM, Valsamakis G, Mastorakos G, Hanson P, Kyrou I, Randeva HS, et al. Dietary influences on the microbiota–gut–brain axis. Int J Mol Sci. 2021;22(7):3502.
112. Astrup A, Raben A, Geiker N. The role of higher protein diets in weight control and obesity-related comorbidities. Int J Obes (Lond). 2015;39(5):721-6.
113. McConnon A, Horgan GW, Lawton C, Stubbs J, Shepherd R, Astrup A, et al. Experience and acceptability of diets of varying protein content and glycemic index in an obese cohort: Results from the Diogenes trial. Eur J Clin Nutr 2013;67(9):990-5.
114. Davidenko O, Darcel N, Fromentin G, Tome D. Control of protein and energy intake-brain mechanisms. Eur J Clin Nutr. 2013;67(5):455-61.
115. Tobias DK, Chen M, Manson JE, Ludwig DS, Willett W, Hu FB. Effect of low-fat diet interventions versus other diet interventions on long-term weight change in adults: A systematic review and meta-analysis. Lancet Diabetes Endocrinol. 2015;3(12):968-79.
116. Kelli HM, Kim JH, Samman Tahhan A, Liu C, Ko YA, Hammadah M, et al. Living in food deserts and adverse cardiovascular outcomes in patients with cardiovascular disease. J Am Heart Assoc. 2019;8(4):e010694.
117. Blundell J, Finlayson G, Axelsen M, Flint A, Gibbons C, Kvist T, et al. Effects of once-weekly semaglutide on appetite, energy intake, control of eating, food preference and body weight in subjects with obesity. Diabetes Obes Metab. 2017;19(9):1242-51.
118. May-Wilson S, Matoba N, Wade K, Hottenga JJ, Concas MP, Mangino M, et al. Large-scale genomewide association study of food liking reveals genetic determinants and genetic correlations with distinct neurophysiological traits. Nat Commun. 2021;13:2743.
119. Puhl RM, Heuer CA. Obesity stigma: Important considerations for public health. Am J Public Health 2010;100(6):1019-28.
10
An Analysis of the Association Between Trump’s Presidency and Health-Seeking Behaviors of African
Americans in the United States
Adeola A. Animasahun1*, Ashley M. Nunez1*, and Rachelle F. Jean1*
1Geisinger Commonwealth School of Medicine, Scranton, PA 18509
*Master of Biomedical Sciences Program
Correspondence: aanimasahun@som.geisinger.edu
Abstract
Background: Slavery legally ended over 150 years ago, yet African Americans are still oppressed. The lingering effects of systemic and institutional racism are still present in all walks of life, especially in healthcare. As a result, Black patients have historically been less likely to seek preventive care and subsequently reported lower health outcomes compared to their white counterparts. The election of Donald Trump in 2016 created a wider gap in healthcare disparities. This study aimed to investigate whether there was any association between Trump’s racist rhetoric and the health-seeking behaviors of Black patients. We explored whether the number of Black patients that reported not having a primary care physician (PCP) changed and how online search history trends researching Black physicians have also changed.
Methods: This study utilized datasets from the Behavioral Risk Factor Surveillance System (BRFSS) and Google Trends. A logistic regression analysis was then performed to determine if race was a significant predictor for our predetermined health indicators.
Results: GoogleTrends data does support increased popularity of the search term “black doctor near me” from 2015 to 2018, supporting our hypothesis. The results from the logistic regression analysis showed that race was significant in 9 out of our 11 health indicators.
Conclusion: Despite decades of work to minimize healthcare disparities, this study has demonstrated how much more still needs to be done. It has shown how the intersection of seemingly unrelated issues, such as politics and health, as described in this study, can drastically impact health outcomes. This study highlights the importance of targeted and equitable programming to ensure quality care for all, that can withstand political and social pressures.
Introduction
In recent years, there has been an unprecedented focus on racial inequalities, racially based brutality, and a heightened sense of racial divide within this country (1). The Black community has attempted to push back against instances of disparity and racism, as seen through the extensive activity and support of the Black Lives Matter movements. For years, Black patients have reported feeling ignored by physicians; previous research discusses how prejudice exists in medicine, with physicians treating pain management differently depending on race, due to their implicit bias and beliefs (2). It has been established that distrust of physicians is prevalent among Black patients and has been correlated to not having
a regular healthcare provider (3). Black individuals are less likely to visit office-based physicians (4) despite reporting poor health outcomes and overall health status (5). In light of this information, recent studies show that Black patients tend to have better health outcomes and place more trust in their physicians when their physicians are of the same race, which ultimately “improves medical compliance and quality of care” (6–7). It is important to identify any changes in health-seeking behaviors — such as if the desire to seek treatment from physicians of the same race has increased — to understand how to provide better care for Black patients.
According to the Federal Bureau of Investigation (FBI) Uniform Crime Reporting, hate crimes can be defined as “a committed criminal offense which is motivated, in whole or in part, by the offender’s bias(es) against a race, religion, disability, sexual orientation, ethnicity, gender, or a gender identity” (8). The increase in racial tensions can be attributed to the divisive and racist rhetoric incited by Trump’s presidency (7). Since his election in 2016, there has been approximately a 20% rise in hate crime incidents (9–10). Black patients have often turned away from preventive care due to perceived racial discrimination, which past researchers have associated with a range of adverse health outcomes (11). While factors contributing to these disparities have been identified, very little research describes how racially charged events, such as Trump’s presidency, have increased mistrust in the healthcare system, mainly for Black patients (5). Specific actions by the Trump administration, such as trying to repeal Obamacare or at least restrict some of its functions, along with its initial inaction with the COVID-19 pandemic, ultimately led to millions of Americans losing health insurance, all of which has caused minority populations to be disproportionately affected by the virus (12–14). A January 2020 poll showed that 65% of Black adults reported individual acts of discrimination as a personal obstacle to seeking care (4) and 83% of Black adults believed racism had become a bigger issue in the United States (U.S.) since Trump started his presidency (15). These studies have shown that prejudiced remarks made by President Trump led to the harboring of negative sentiments and rhetoric aimed at minority groups, such as Black individuals (7, 16). The change in racial attitudes seen today has forced Black people to become more intentional about the care they seek.
This study aimed to determine whether the increasing racial tensions from 2015 to 2018 impacted health-seeking behaviors of Black patients. The first hypothesis for this study was that there would be an increase in search term hits for “a black doctor near me” from 2015 to 2018. The second hypothesis was that race would strongly predict various health indicators.
Scholarly Research In Progress • Vol. 6, November 2022
11
Methods Participants
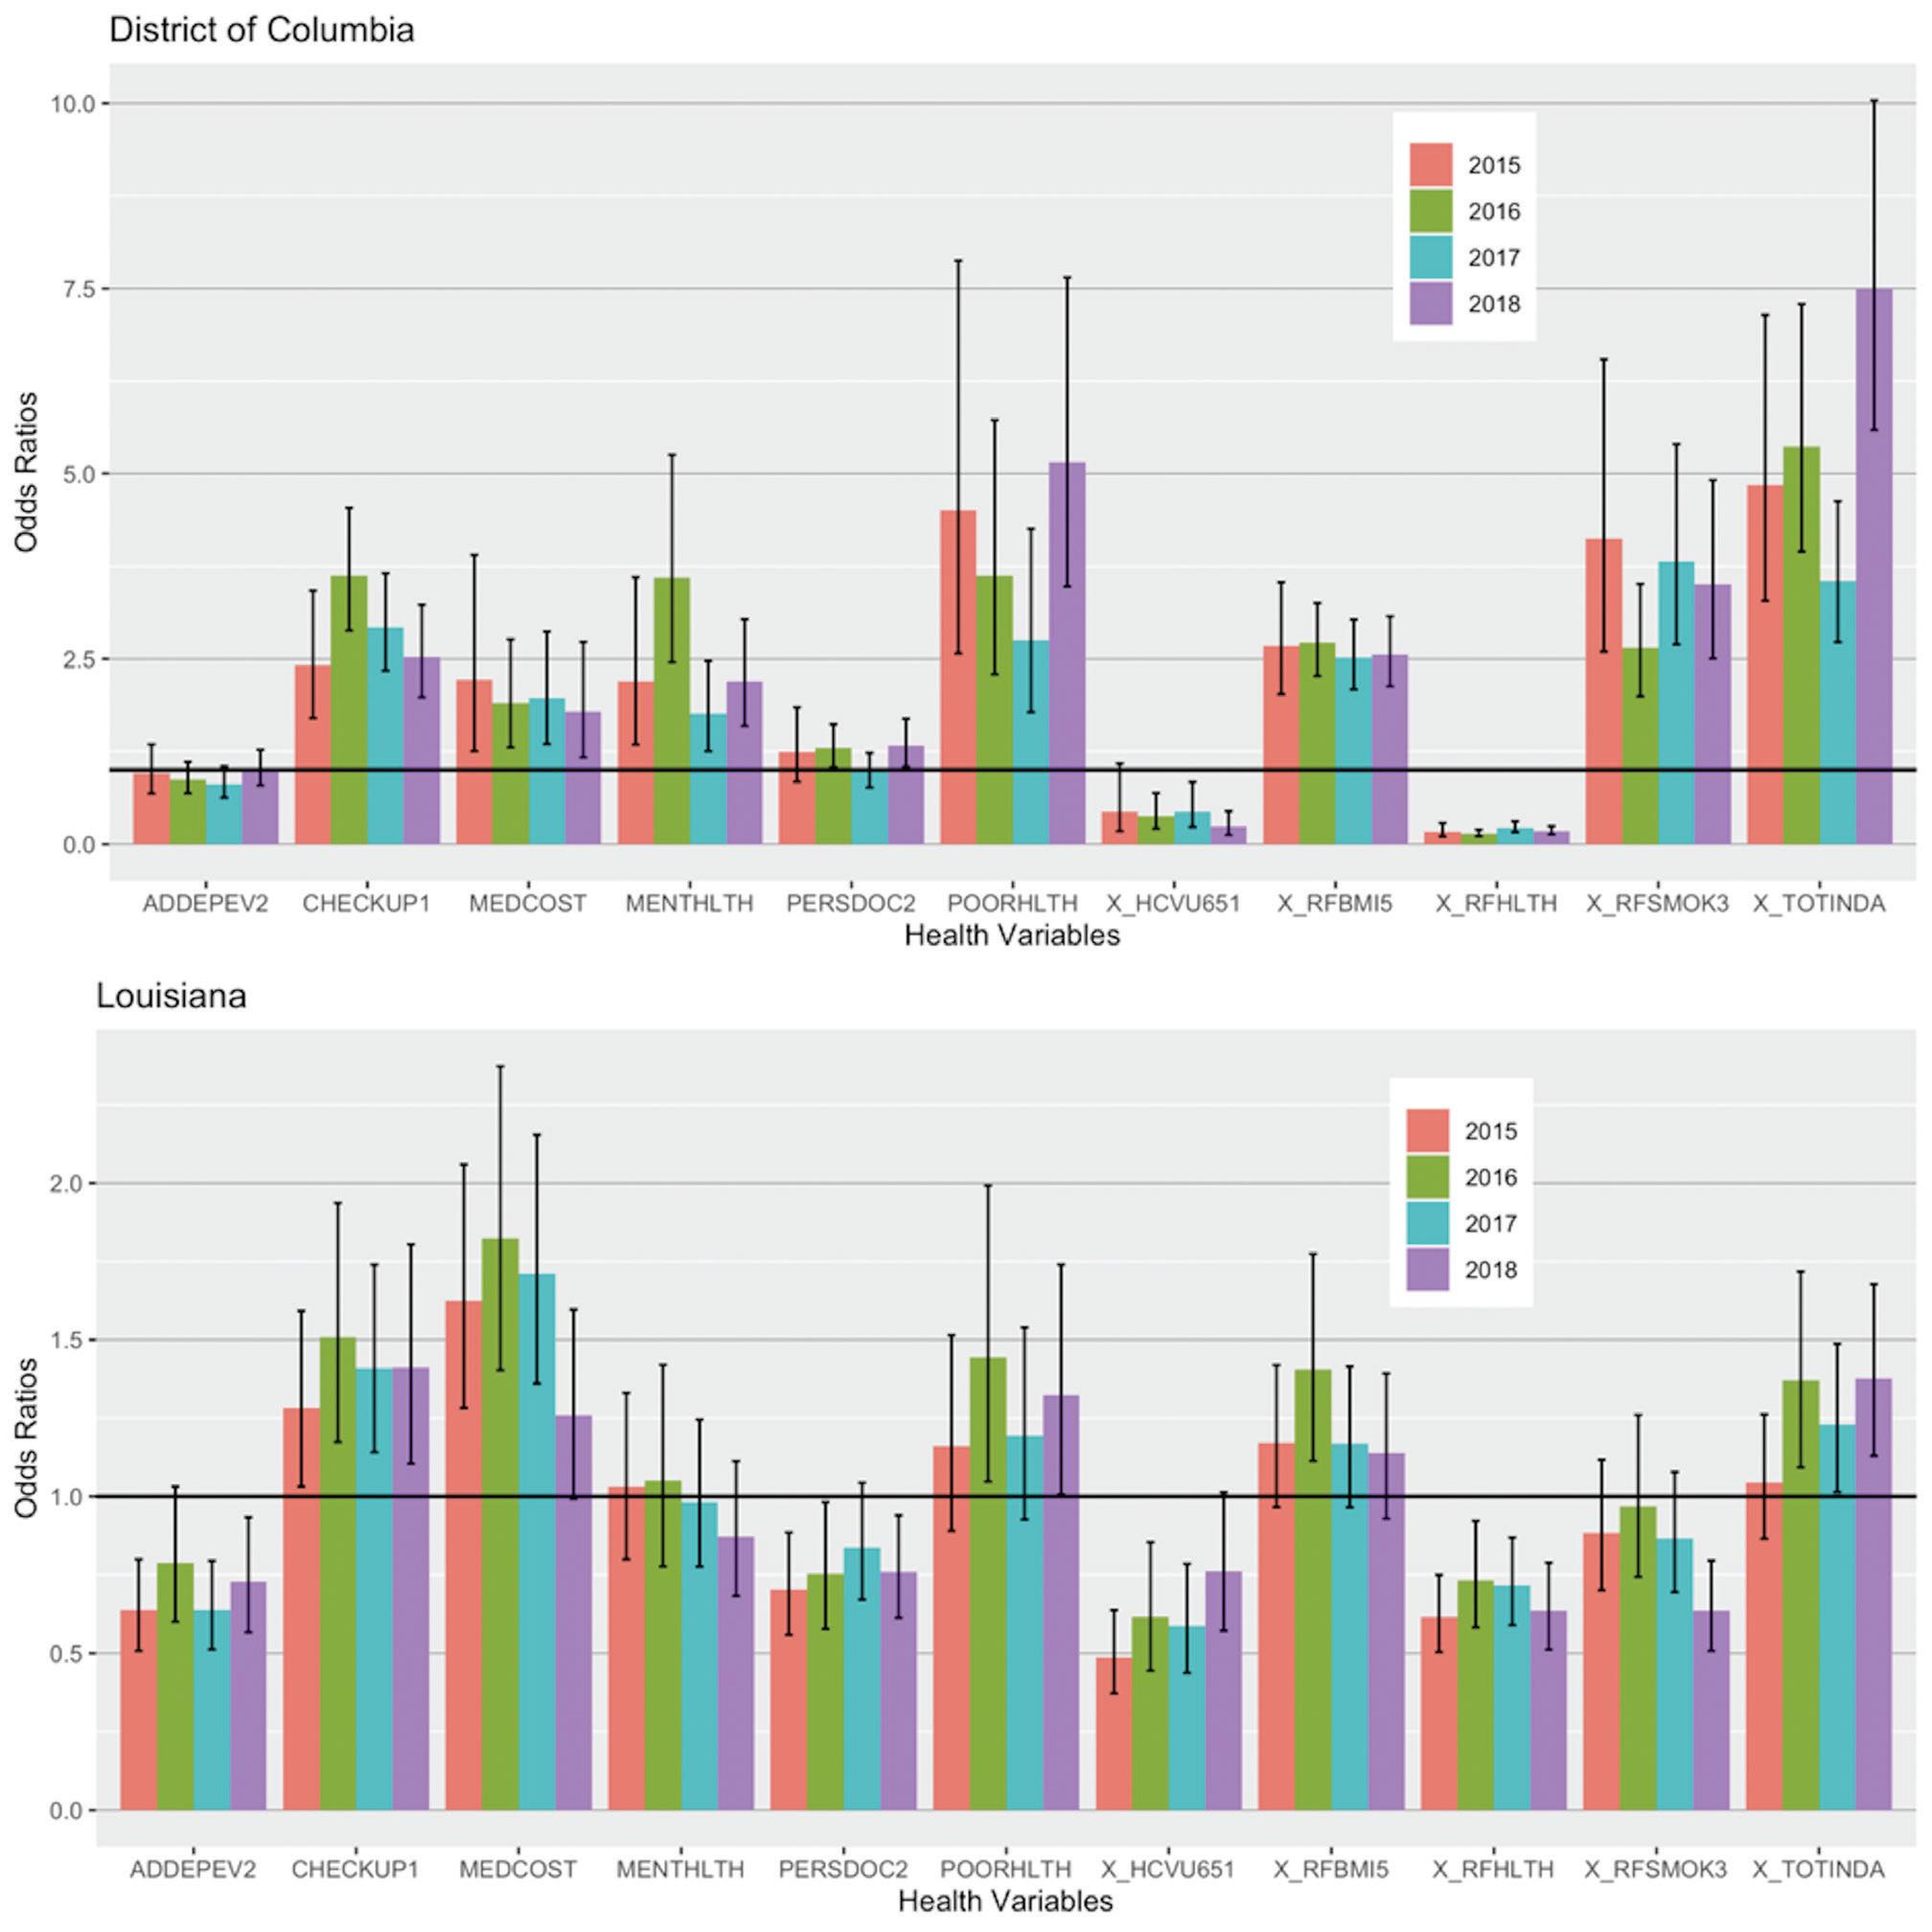
The Centers for Disease Control and Prevention’s (CDC) Behavioral Risk Factor Surveillance System (BRFSS) is the world’s “largest continuously conducted health survey system” (17). These annual telephone surveys collect information on United States (U.S.) residents about their health-seeking behaviors and current health conditions. The source population included adult individuals who identified as Black, non-Hispanic, and individuals who identified as White, non-Hispanic, to the BRFSS questionnaire. Respondents that reported being mixed-raced were excluded. Each dataset for every year the survey was conducted, differed between states depending on the additional health modules they chose to include, if any. To keep the health indicators consistent, the target population was chosen from states listed on the BRFSS website as having the same health modules analyzed and included the same health indicators, from 2015 to 2018, contained within the datafile “LLCP” (Combined Land Line and Cell Phone data). Thus, the target population for this study consisted of all adult White and African American individuals living in two different states with opposing political views, the District of Columbia (DC) and Louisiana, with Trump having a much higher approval rating in Louisiana compared to DC (18). The study population size (n) meeting the above criteria was 32,195 across all four study years (17).
Procedures
Secondary data analysis in this study was drawn from the BRFSS and Google Trends datasets. Data from Google Trends was used to observe changes in the popularity of searches for “black doctors near me” from 2015 to 2018, to serve as a method of measuring health-seeking behaviors. The BRFSS dataset was used to observe changes over time in the number of Black patients who reported not having a primary care physician (PCP). The outcome was measured as the number of Black individuals who reported not having a PCP per 100,000 individuals per comparison year per state. The data from the study has been de-identified, so there is minimal risk to participants. This study underwent review by the Geisinger IRB Committee at the start of the Community Health Research 2 course of the Master of Biomedical Sciences (MBS) program at the Geisinger Commonwealth School of Medicine and was exempt.
Data analysis
A table was generated utilizing the BRFSS data on responses from Black participants on the health indicators listed in Table 1. The study analyzed any overall changes, such as overall decline or increase in the number of Black patients without PCPs and any changes in overall health and other health indicators between the years 2015 and 2018. Data that met the study’s timeline and criteria were selected to compare any observed changes over time. A logistic regression analysis was performed
ADDEPEV2
CHECKUP1
MEDCOST
MENTHLTH
(Ever told) you have a depressive disorder (including depression, major depression, dysthymia, or minor depression)?
About how long has it been since you last visited a doctor for a routine checkup?
No Yes
Over a year ago Once within the past year
Was there a time in the past 12 months when you needed to see a doctor but could not because of cost? No Yes
Now thinking about your mental health, which includes stress, depression and problems with emotions, for how many days during the last 30 days was your mental health not good?
Less than 14 days 14 days or greater
PERSDOC2 Do you have one person you think of as your personal doctor or health care provider? No or unsure At least 1
POORHLTH
X_HCVU651
X-RFBMI5
X_RFHLTH
X_RFSMOK3
X_TOTINDA
During the past 30 days, for about how many days did poor physical or mental health keep you from doing your usual activites, such as self-care, work or recreation?
Respondents aged 18–64 who have any form of health care coverage
Adults who have a body mass index greater than 25 (overweight or obese)
Adults with good or better health
Adults who are current smokers
Adults who reported doing physical activity or exercise during the past 30 days other than their regular job
Less than 14 days 14 days or greater
Not covered Covered
No – BMI less than 25 but greater than 12 Yes – BMI greater than 25
Fair or poor health Good or better health
No – not a currect smoker Yes – a current smoker
No – no physical activity or exercise in the last 30 days Yes – had physical activity or exercise
Table 1. List of all 11 health indicators utilized for the logistic regression analysis. Also included are the expanded health variable questions, reference value, and comparison value.
Trump’s Presidency and Health-Seeking Behaviors of African Americans in the United States
Variable Question Reference value Comparison X_RACE Race/ethnicity categories White only, non-Hispanic Black only, non-Hispanic
12
to determine any effect of race on various health indicators from 2015 to 2018.
We used GraphPad Prism version 9.0.0 for macOS, R 4.1.2 (macOS), Excel (MacOS), Numbers (macOS), and GoogleSheets to perform our statistical analyses and generate our figures. We highlighted the change in Google search trends through GoogleTrends and illustrated the trend as shown in Figures 1 and 2.
Results
A total of 32,195 responses from individuals that participated in the BRFSS questionnaire across DC and Louisiana from the years 2015 to 2018 and fitted the inclusion criteria were retained. The total sample size of 32,195 was made up of 7,890 responses from 2015, 8,139 responses from 2016, 7,761 responses from 2017 and 8,405 responses from 2018. All responses were from individuals that lived in DC and Louisiana, identifying as “nonHispanic Black” or “non-Hispanic White.”
Google Trends was utilized to monitor the popularity of searches for the term “black doctor near me” over time. Since GoogleTrends data represents search interest relative to the highest point on the chart for the given region and time, the period between Jan. 1, 2015, and Dec. 31, 2018, was selected. A value for the popularity of the search term is given each week in the selected time frame. The popularity of the search term steadily increased between 2015 and 2018, as seen in the running average (Figure 1) calculated with GoogleSheets (19). The average popularity for each year was fitted to a regression line which showed a significant increase (F=46.25, p=<0.0001) from 2015 to 2018 (Figure 2).
The number of all Black Americans in each state who reported having a PCP for each year between 2015 and 2018, among several other health indicators, were compared using logistic regression analysis. Regression testing suggested Black people were 0.75 times less likely than whites to have a personal doctor in Louisiana, which was statistically significant in 2015, 2016, and 2018 (p = 0.00271, 0.036, 0.014,
respectively). In DC, Black people were 1.3 times more likely to report having a personal doctor than White people, although this was only significant in 2016 and 2018 (p = 0.0228 and 0.021, respectively) (Figure 3). The odds of demonstrating negative health-seeking behaviors followed a similar trend in both DC and Louisiana. For instance, Black individuals in DC
Figure 1. The Running Weekly Average of “Black doctor near me” searches from January 2015 to December 2018.
Figure 2. The Number of Searches for “Black doctor near me” from January 2015 to December 2018. The average popularity for the search term “black doctor near me” for each year was calculated, plotted, and fitted to a regression line.

 Trump’s Presidency and Health-Seeking Behaviors of African Americans in the United States
13
Odds ratios
District of Columbia
Odds ratios
District of Columbia
Health variables
Health variables
Figure 3. The Odds Ratios and their Corresponding 95% Confidence Interval (CI) of 11 Health Indicators from DC and Louisiana between 2015–2018 Showing the Odds of Black People Having the Specified Health Indicator, Compared to their White Counterparts1. The horizontal line represents null value. A 95% CI bar that crosses this horizontal line indicates that the associated odds ratio is not statistically significant.
From left to right, "ADDEPEV2" - Ever told you had a depressive disorder? (Yes); "CHECKUP1" - About how long has it been since your last routine checkup? (within the past 12 months); "MEDCOST" - Was there a time in the past 12 months when you needed to see a doctor but could not due to cost? (Yes); "MENTHLTH" - How many days in the past month was your mental health not good? (14 days or greater); "PERSDOC2" - Is there someone you think of as your personal care doctor? (Yes, at least one); "POORHLTH" - How many days within the past month did poor physical or mental health prevent you from doing your normal activities? (14 days or greater); or createn, a nuvubol- hesor "X HCVU651" - Respondents aged 18 64 with any form of health care (Covered); "X RFBMI5" Adults with a BMI over 25 (Yes, greater than 25 - overweight or obese); "X_RFHLTH" - Adults who report good or better health. (Yes); "X RESMOK3" - Adults who are current smokers. (Yes); "X TOTINDA" - Adults who report doing physical activity outside of work. (Yes).
 Trump’s Presidency and Health-Seeking Behaviors of African Americans in the United States
14
and Louisiana were less likely to report good or better overall health, less likely to have health insurance, and more likely to skip out on doctor visits due to cost, compared to their White counterparts (Figure 3).
Discussion
Our data suggest that there were significant changes observed in negative health-seeking behaviors in Black Americans between the years 2015 to 2018. GoogleTrends data does support increased popularity for the search term “black doctor near me” from the years 2015 to 2018, supporting our hypothesis. This suggests that between those years, individuals within the U.S. were particularly interested in locating Black physicians for care. Race was a clear and significant predictor for the majority of the health indicators, which confirms previous research describing differences in care based on race (2–4, 9). Trump’s presidency was used as context to explain these results simply because of the racist rhetoric his term promoted (6, 20). As a result, Black people were more inclined to find a doctor of similar background (Figures 1 and 2). Although there were significant increases in these searches, the same trend was not seen in the number of Black people reporting a personal doctor, which is attributed to insurance coverage, cost, and transportation, among many other factors (14). When President Barack Obama first enacted the Affordable Care Act, it aimed to minimize the significant disparities present in healthcare coverage among the different races and ethnicities. However, once Trump took office, some of his policies negatively targeted the Affordable Care Act, causing many to lose coverage and preventing many more from getting coverage (13, 15, 21) — the effects of which were quite immediate, with Black people being significantly less likely to have healthcare coverage in a more progressive area (DC) and even in a more conservative area (Louisiana) (Figure 3).
There are several limitations that have been identified within the study model outlined here. Limitations in using Google Trends data have been identified, such that it is not the only search mechanism patients used to locate a Black PCP. Searches for “a black doctor near me” might be made by individuals that do not align with the population meeting the inclusion criteria for this study. In addition, GoogleTrends data cannot determine each individual’s reasoning behind completing the search. Furthermore, the BRFSS dataset does not gather information from every resident of each state, which may alter the accuracy of representation for results. However, BRFSS has incorporated raking to weight data according to known proportions of race and age in a population (17). Lastly, by only evaluating two states in the U.S., it may have made the findings of this study less generalizable to all Black people in the U.S.
The basis of this study and similar studies explores the implications of racially motivated biases across the U.S. on medical mistrust in Black patients (3, 5). Further continuation of this study would be necessary to target specific demographics within the Black community that has been affected the most by unconscious bias. The logistic regression analysis performed earlier can be expanded to include other predictors besides race, such as age, education, income, employment, metropolitan status, etc., along with any interactions between them. Studies (5, 9, 11) such as the one presented here could allow the development of community-level interventions by focusing on
building trust and lessening the experience of discrimination during physician-patient encounters. One way to improve this is to suggest that physicians get more involved in the communities that they serve, learn about the disparities experienced by Black patients, and build rapport with the community, as suggested by previous polling (1). Another possible intervention would include creating community programs to educate Black patients and the community about resources on local Black providers that they are comfortable with. Programs optimized for cell phones could also be installed that teach Black patients how to be active participants in the management of their care to harbor positive health-seeking behaviors. Future quantitative and qualitative studies would benefit by gathering primary data from participants who directly experienced instances of bias in the medical setting. Data from participants who have personally experienced discrimination in patient-physician interactions would be best to evaluate the causative implications of bias on health-seeking behaviors and its effects on patients’ trust in physicians. Extensive intervention is required to effectively minimize the impact of unconscious bias and blatant racism in our fractured healthcare system to ensure quality care for all.
Acknowledgments
This research paper would not have been possible without the amazing support of my supervisor, Dr. Brian Piper. His vast knowledge and attention to detail have been my motivation to keep my work on track despite all the hurdles we jumped through, to ultimately reach a final draft. Dr. Reema PersadClem not only has been a great advisor but also helped my team and me develop a thoughtful research question that was near and dear to our hearts. Iris Johnston was a great resource for my team in our initial database search.
Disclosures
No conflicts of interest.
References
1. KFF/the undefeated survey on race and health - main findings [Internet]. KFF. 2020 [cited 2022 Jan 26]. Available from: https://www.kff.org/report-section/kff-theundefeated-survey-on-race-and-health-main-findings/
2. James SA. The strangest of all encounters: racial and ethnic discrimination in US health care. Cad Saude Publica 2017;33Suppl 1(Suppl 1):e00104416.
3. Arnett MJ, Thorpe RJ Jr, Gaskin DJ, Bowie JV, LaVeist TA. Race, medical mistrust, and segregation in primary care as usual source of care: Findings from the Exploring Health Disparities in Integrated Communities study. J Urban Health. 2016;93(3):456–67.
4. Hoffman KM, Trawalter S, Axt JR, Oliver MN. Racial bias in pain assessment and treatment recommendations, and false beliefs about biological differences between blacks and whites. Proc Natl Acad Sci U S A. 2016;113(16):4296–301.
5. Alsan M, Garrick O, Graziani G. Does diversity matter for health? Experimental evidence from Oakland. Am Econ Rev 2019;109(12):4071–111.
Trump’s Presidency and Health-Seeking Behaviors of African Americans in the United States
15
6. Luqman M. The Trump effect: Impacts of political rhetoric on minorities and America’s image. 2018.
7. Williamson V, Gelfand I. Trump and racism: What do the data say? [Internet]. Brookings. 2019 [cited 2022 Jan 26]. Available from: https://www.brookings.edu/blog/ fixgov/2019/08/14/trump-and-racism-what-do-the-datasay/
8. Hate crime [Internet]. Federal Bureau of Investigation. 2018 [cited 2022 Jan 26]. Available from: https://www.fbi. gov/services/cjis/ucr/hate-crime
9. Meints SM, Cortes A, Morais CA, Edwards RR. Racial and ethnic differences in the experience and treatment of noncancer pain. Pain Manag. 2019;9(3):317–34.
10. NAACP sees continued rise in hate crimes legacy of Trump’s racism [Internet]. The Miami Times. 2018 [cited 2022 Jan 26]. Available from: https://www. miamitimesonline.com/news/naacp-sees-continued-risein-hate-crimes-legacy-of-trumps-racism/article_56d9cbba83a4-11e8-8ac3-1378827c6379.html
11. Stepanikova I, Oates GR. Perceived discrimination and privilege in health care: The role of socioeconomic status and race. Am J Prev Med. 2017;52(1S1):S86–94.
12. Talamantes E, Aguilar-Gaxiola S. Perspective: POTUS Trump's executive orders - implications for immigrants and health care. Ethn Dis. 2017 Spring;27(2):121–4.
13. Thompson FJ. Six ways Trump has sabotaged the Affordable Care Act [Internet]. Brookings. 2020 [cited 2022 Jan 26]. Available from: https://www.brookings.edu/ blog/fixgov/2020/10/09/six-ways-trump-has-sabotagedthe-affordable-care-act/
14. Holmes Jr. L, Enwere M, Williams J, Ogundele B, Chavan P, Piccoli T, et al. Black-White risk differentials in COVID-19 (SARS-COV2) transmission, mortality and case fatality in the United States: Translational epidemiologic perspective and challenges. Int J Environ Res Public Health 2020;17(12):4322.
15. Mastroianni B. In Trump’s first 3 years, 2 million Americans lost healthcare, thousands died prematurely [Internet]. Healthline Media. 2020 [cited 2022 Jan 26]. Available from: https://www.healthline.com/health-news/intrumps-first-3-years-2-million-americans-lost-healthcarethousands-died-prematurely
16. Washington Post-Ipsos poll of black Americans, Jan. 2-8, 2020. [cited 2022 Jan 26]; Available from: https://www. washingtonpost.com/context/washington-post-ipsos-pollof-african-americans-jan-2-8-2020/a41b5691-e181-4cdabb88-7b31935103d9/
17. Centers for Disease Control and Prevention (CDC). Behavioral Risk Factor Surveillance System Survey Data. Atlanta, Georgia: U.S. Department of Health and Human Services, Centers for Disease Control and Prevention, [2015-2018].
18. Trump approval rating by state 2022 [Internet]. Worldpopulationreview.com. [cited 2022 Feb 8]. Available from: https://worldpopulationreview.com/state-rankings/ trump-approval-rating-by-state Alcindor Y. Is Trump’s strategy of stoking racial tensions succeeding? PBS NewsHour; 2020.
19. Google Sheets - create and edit spreadsheets online, for free. [Internet]. Google. Google; [cited 2021Mar6]. Health coverage by race and ethnicity, 2010-2019 [Internet]. KFF. 2021 [cited 2022 Feb 10]. Available from: https://www. kff.org/racial-equity-and-health-policy/issue-brief/healthcoverage-by-race-and-ethnicity/
20. Schaffner BF. Follow the racist? The consequences of Trump’s expressions of prejudice for mass rhetoric [Internet]. Ashford.zone. [cited 2022 Jan 26]. Available from: https://www.ashford.zone/images/2018/09/ followtheracist_v2.pdf
21. Health coverage by race and ethnicity, 2010-2019 [Internet]. KFF. 2021 [cited 2022 Feb 10]. Available from: https://www.kff.org/racial-equity-and-health-policy/issuebrief/health-coverage-by-race-and-ethnicity/
Trump’s Presidency and Health-Seeking Behaviors of African Americans in the United States
16
Prevalence and Intervention of Childhood Obesity: A Literature Review
Tiffany I. Atabansi1†
1Geisinger
†Doctor
Commonwealth School of Medicine, Scranton, PA 18509
of Medicine Program
Correspondence: tatabansi@som.geisinger.edu
Abstract
Obesity is a prevailing epidemic that affects all demographics, including children and adolescents. The long-term effects of obesity, if left unmanaged, can be life-threatening. Obesity is a gateway condition to diseases associated with high morbidity and mortality rates, such as cardiovascular disease and Type 2 diabetes. Children and adolescents are currently experiencing earlier exposure to these diseases. Research has attributed this high rate to various factors including nutrient deficient diets, lack of physical activity, and lower socioeconomic status. This study aimed to critically analyze the leading causes of pediatric obesity and evaluate the efficacy of intervention strategies. A comprehensive understanding of these factors and strategies can facilitate the generation of more efficacious measures in reducing the prevalence and consequences of childhood obesity.
Introduction
Childhood obesity is one of the most serious public health challenges of the 21st century (1). For children and adolescents aged 2–19 years in 2017–2020, the prevalence of obesity was 19.7% and affected about 14.7 million children and adolescents in the United States (U.S.) (2). Overweight and obese children are likely to maintain their status into adulthood and are at higher risk for developing chronic diseases such as hypertension, dyslipidemia, Type 2 diabetes, cardiovascular disease, stroke, gallbladder diseases, osteoarthritis, sleep apnea and respiratory problems, and certain cancers (1). Obesity and the diseases listed above are considered diseases of affluence, also commonly referred to as lifestyle diseases. The included diseases are all chronic noncommunicable diseases that are thought to be a result of increasing wealth and ease of life in society (3). Many lifestyle diseases have a significant association with obesity, with children and adolescents being diagnosed earlier within their lifetime than previous generations. Type 2 diabetes mellitus was a rare occurrence in children and adolescents, but in the mid-1990s there was an observed increase of Type 2 diabetes worldwide in this young age group (4). This is the case particularly in the U.S. with the majority of the children being obese, and in some regions of the U.S., Type 2 diabetes mellitus is as frequent as Type 1 diabetes mellitus in adolescents (4). This exemplifies the correlation and gravity between obesity and lifestyle diseases.
Recently, there has been a reported decline or plateau in childhood obesity (5, 6), but the youth generation still has a shorter life expectancy than the generations before. Obesity has been shown to have a substantial negative effect on longevity, reducing the length of life of people who are severely obese by an estimated 5 to 20 years (7). There is an increased correlation between low socioeconomic status (SES) and lifestyle diseases.
Low socioeconomic families are more likely to be food insecure, resulting in the consumption of foods low in nutrient density and high in caloric value. Minority populations make up a significant amount of the low socioeconomic population in the U.S. Significant disparities in obesity prevalence persist among racial/ethnic groups and by SES, with more Hispanic and non-Hispanic Black youth being obese compared to their non-Hispanic white and non-Hispanic Asian counterparts (2, 5). Obesity can affect other areas of a child’s life beyond physical health. Psychological and intellectual development are at risk too. Obese children are a target for bullying. This affects their mental health, which creates space for the onset of depression, eating disorders, or suicide. The absence of a well-balanced diet alters the ability to learn. Due to these health consequences, early intervention is critical for this population. The purpose of this review is to critically examine the factors contributing to pediatric obesity and evaluate the efficacy of intervention strategies proposed to combat it.
Methods
A thorough review of the literature was conducted in search of childhood obesity prevalence and intervention. The initial search utilized Google Scholar, PubMed, ClinicalKey, and Elsevier databases. Research articles were deemed valid and credible for involvement as they were published in peer-reviewed journals and sourced from respectable databases. Articles’ publication dates range from 2012 to 2021. Additionally, The U.S. Department of Agriculture Dietary Guidelines for Americans 9th edition was referenced. Keywords phrases searched included childhood obesity, diet, socioeconomic status, nutritional requirements, diseases of affluence, physical activity, and intervention.
Discussion
Causes of obesity
Over the years, the cause of obesity has been simplified to total calorie intake surpassing calorie expenditure. Although this may be factual, it is more complex. Caloric imbalances have been exacerbated by obesogenic behaviors and environments, i.e., conditions that are highly correlated with excess weight gain (8, 9). The most common obesogenic behaviors are high consumption of sugar sweetened beverages and low-nutrient, high saturated fat foods, low levels of physical activity and high levels of sedentary behaviors, increased screen time, and shortened sleep duration (9). Larger portion sizes and increased frequency of meals and snacks also contribute to an obesogenic environment. These conditions are influenced by various factors, one notably being genetics. There is increasing research exploring genetic predisposition to obesity. Some studies have
Scholarly Research In Progress • Vol. 6, November 2022
17
Prevalence and Intervention of Childhood Obesity: A Literature Review
found that body mass index (BMI) is 25–40% heritable (10). The monogenic model of obesity explains that obesity is mainly due to mutations within the leptin/melanocortin pathway (Figure 1) in the hypothalamus that is necessary for the regulation of food intake, satiety, body weight, and energy metabolism (11).
This is rare in comparison to the polygenic model of obesity, which is a compilation of multiple genetic variants and is a result of the interplay between genetic susceptibility and the environment (11). In fewer cases, obesity is a secondary effect of diseases such as Prader-Willi Syndrome or hypothyroidism. Environmental factors such as school policies, demographics, and parents’ work-related demands further influence eating and activity behaviors (10). Alongside socioeconomic status, there are socio-cultural factors that influence the risk of obesity. Eating behaviors develop early on and young children learn to eat through their direct experience with food and observing others eating around them (11). This illustrates that obesity is multifaceted, and a simple equation does not sufficiently summarize its complexity.
Nutrition and lifestyle
The nutritional requirements of children differ greatly from those of adults. At ages critical for growth, it is important that children receive the necessary nutrients to develop, and this can be accomplished with diets balanced in protein, fats, and carbohydrates. These food groups contain vital components that assist in the prevention of acquiring obesity and other related lifestyle diseases; however, with the prevalence of fast-food industries, sugary beverages, and snacks, the diet of many children and adolescents has become calorie dense. The Dietary Guidelines for Americans recommend that children between 2–18 years of age consume 2 to 3 cups of fruits and vegetables per day, but most of the youth population does not meet this requirement, as the actual consumption rate is closer to 0.7 to 1.8 cups (12). This is a significant difference, suggesting that many children and adolescents do not consume even the recommended minimum of fruit and vegetables. Aune et al. analyzed 95 studies that evaluated fruit and vegetable intake in relation to cardiovascular disease, total cancer, and all-cause
mortality. It was concluded that fruit and vegetable intakes were associated with a reduced risk of the aforementioned diseases; specifically, there was an 8–16% reduction in the relative risk (RR) of coronary heart disease, 13–18% reduction in the RR of stroke, 8–13% reduction in the RR of cardiovascular disease, 3–4% reduction in the RR of total cancer and 10–15% reduction in the RR of all-cause mortality for each 200 g/day increment in intake of fruits, vegetables, and fruits and vegetables combined (13). In the nonlinear models, there were 16%, 28%, 22%, 13%, and 27% reductions in the RR of coronary heart disease, stroke, cardiovascular disease, total cancer, and all-cause mortality, respectively, for an intake of 500 g of fruits and vegetables per day vs 0–40 g/day, whereas an intake of 800 g/day was associated with 24%, 33%, 28%, 14% and 31% reductions in the RR, respectively (13). Another study suggested vegetable intake alone is more important than fruit consumption, because vegetables have a greater protective effect than fruit; reducing death by 16% per each daily portion compared to 4% for fruit (14). Vegetable intake is low possibly due to their strong or bitter taste, unfamiliar texture, low energy density, and lack of availability/accessibility (14). Adequate fruit and vegetable consumption are essential components of a healthy diet with significant benefits and preventive power. Implementing these eating behaviors during childhood and adolescence can delay the onset and disrupt the progression of lifestyle diseases. However, there is increased consumption of fruit juices. Most juices are highly acidic, provide minimal roughage, and contain added sugar. There are contradicting recommendations for added sugar consumption, making it difficult to accurately assess the tolerable amount to consume. According to the 2015–2020 Dietary Guidelines, the total daily consumption of added sugars should be limited to less than 10% of calories per day from the age of 2 years (12). The Institute of Medicine recommends that added sugar is less than 25% of total calories, whereas the World Health Organization (WHO) recommends limiting added sugars to less than 100 calories for women and 150 calories daily for men (15). Studies have shown that individuals who consume higher amounts of added sugars, especially sugar-sweetened beverages, tend to gain more weight and have a higher risk of obesity (15). One 12-ounce can of Coke contains 120 calories from added sugar; there is even more sugar in energy drinks, and children and adolescents are the main consumers of these products. This illustrates that recommended sugar intake limits are easily reachable and likely surpassed daily due to added sugars.
A major component of added sugar is fructose, and recent studies strongly suggest that excessive fructose intake and metabolism contribute to obesity. Fructose can be metabolized into fat. Glucose and fructose are dietary sugars with the same caloric value, but they differ in the way they are metabolized in the body (16). When ingested, glucose is used directly to provide energy to tissues such as the brain and muscles, and any residual glucose is converted to glycogen and stored in the liver. However, through the polyol pathway, glucose can also be converted to fructose (Figure 2).
This mechanism also takes place in the liver, and with the presence of the enzyme ketohexokinase, fructose is converted to fructose 1-phosphate. Fructose 1-phosphate can bypass a major regulatory step in glycolysis that generates fructose

18
Figure 1. Leptin/melanocortin pathway. Adapted from (26).
ROS
Inactive alcohols Toxic aldehydes

Aldose reductase Sorbitol dehydrogenase
Glycative stress
Osmotic stress
NADH/NAD+ Reductive stress
Electrolyte imbalance & hydration and membrane damage
1, 6-bisphosphate through the action of the energy-sensitive enzyme phosphofructokinase (16). In the absence of feedback inhibition, fructose is used to generate fat, unfettered by the cellular controls that prevent unrestrained lipid synthesis from glucose (16). Fructose can also be introduced directly into the diet and therefore, is not limited to an alternative pathway of glucose metabolism. The two major sources of fructose are sucrose (table sugar), which consists of 50% fructose and 50% glucose, and high-fructose corn syrup, which has varying fructose content, from 42% in pastries to 55–65% in fountain drinks (17). The combination of direct intake of fructose and glucose metabolism to fructose increases the total amount of fructose that can be converted to fatty acids. Diets high in fructose can cause excess fat accumulation in the liver, leading to liver disorders like fatty liver disease, steatohepatitis, and ultimately cirrhosis (16). Nonalcoholic fatty liver disease (NAFLD) is the most common liver disease in children and adults and is a hepatic manifestation of obesity and metabolic syndrome (17). This disease is strongly associated with fructose ingestion (17). Thus, total caloric intake is an important factor in obesity and its correlated consequences; however, where the calories are coming from may be even more significant.
In addition to nutrition, lifestyle patterns also contribute to the manifestation of obesity. Lifestyle patterns include physical activity, sedentary behaviors, and sociocultural influences. Physical activity has decreased with the increased use of cars, buses, and other labor-saving devices (8). People are experiencing prolonged periods of inactivity through jobs that require being stationary at a desk for extended periods of time. This applies to children too, as they are seated most of the day during school, and after-school extracurricular activities that do not include sports and even extend to their homes as they
do their assignments. Sedentary behaviors are the behaviors we engage in once we are inactive. With the advancement of technology, leisure time is spent watching television, playing video games, and browsing the internet. Most of these activities are accompanied by eating. It is difficult to keep track of what is consumed when the attention is primarily elsewhere. To a lesser degree, in some households, food is used as a reward or punishment, which could also influence dietary patterns.
Socioeconomic status
Diseases of affluence are all chronic non-communicable diseases that are thought to be a result of increasing wealth and ease of life in society (3). Included in this category are obesity, cardiovascular disease, Type 2 diabetes, dyslipidemia, hypertension, certain cancers, and respiratory diseases. These diseases have a greater impact on poorer vulnerable populations. Vulnerable populations are those with a greaterthan-average risk of developing health problems by virtue of their marginalized socio-cultural status, their limited access to economic resources, or their personal characteristics (18). Based on this definition of a vulnerable population children in the United States belonging to minority/ethnic groups and low socioeconomic status are considered a vulnerable population (18). Obesity prevalence increased by 10% for all U.S. children, whereas obesity increased by 23–33% for children in low-education, low-income, and higher-unemployment households in 2003–2007 (19). This may seem contradictory because it is described as a result of the increasing wealth in society. However, increasing wealth in society brings about an abundance of food that is cheap and of low quality with minimal nutrition, and people of low SES are most susceptible to consuming these high-density foods. Low SES families typically
Prevalence and Intervention of Childhood Obesity: A Literature Review
Figure 2. Polyol pathway and various pathogenic factors involved in diabetic complications arising from obesity. Adapted from (27).
Glucose Sorbitol Fructose NADPH Oxidative stress
NADPH NADP+ GSSG GSH 19
NAD+ NADH
are food insecure and/or live in a food desert. They are also at risk because they have limited access to healthcare, are uneducated in matters related to lifestyle diseases, and usually have lower-income jobs that require more time to secure financial stability. Low-income families are less likely to realize that their child is overweight and/or intervene in the child's eating and activity behaviors (19).
Childhood obesity can start as early as infancy for children of disadvantaged backgrounds. Breastfed children have a lower risk for obesity. Various studies have found that breastfeeding provides a protective effect against excessive childhood weight gain (20), but mothers of low SES are less likely to breastfeed. A study was conducted with the aim of highlighting the primary maternal-related pathways through which socioeconomic disadvantage influences early childhood obesity (20). The maternal-related pathways included infant feeding practices and maternal characteristics. Observed infant feeding practices were breastfeeding, formula feeding, early solid food introduction, and infants put to bed with a bottle. The maternal characteristics were weight, mental health, and smoking. The sample consisted of 8,030 children based on the data from the Early Childhood Longitudinal Study of children from 9 months to kindergarten age. Family SES was measured by a composite scale consisting of household income, parental education, and occupational prestige created by the National Center for Educational Statistics, which served as a strong predictor of early childhood outcomes (20). The children were weighed at 9 months and 24 months. Their measurements were compared to the growth charts provided by the Centers for Disease Control and Prevention. A value marked within the 98th percentile at 24 months was an indication of childhood obesity. The other metric used was the child’s BMI at the 95th percentile. After 24 months, approximately 10% of the children were obese. Formula-fed infants had a higher percentage of obesity after 6 months (11.7% compared to 5.6%), being put to bed with a bottle (40% compared to 9%), and early introduction to solid foods (29% compared to 9%). Households with higher SES and breastfeeding were less likely to engage in these feeding practices and exhibited healthier feeding patterns. In conclusion, infants from socioeconomically disadvantaged backgrounds experienced several risk factors starting at birth that put them on a trajectory towards early childhood obesity (20). A follow-up of these children into adolescence could provide more information about these effects on childhood obesity and assist in designing effective interventions.
Rogers et al. (19) studied the relationship between childhood obesity, low SES, and race/ethnicity. This study assessed whether race/ethnicity remained an independent predictor of childhood obesity when accounting for variations in SES (low-income) among communities in Massachusetts (19).
The cohort included 111,799 students in grades 1, 4, 7, and 10 from 68 school districts. BMI was calculated for each student and the percentage of students who were overweight or obese was compared with the percentage of students in each district who were eligible for free/reduced-price lunch, received transitional aid, or were eligible for food stamps (19). Overweight or obese children ranged between 9.6% and 42%, with a mean prevalence of 32%, and low-income status among Massachusetts school districts varied from 2.4% to as high as 69.5%, with a mean prevalence of 27%. Multiple regression
models demonstrated that districts’ low-income status was strongly associated with overweight/obese status (19). Race/ ethnicity was not statistically significant when community income was factored in. Therefore, in Massachusetts, race/ ethnicity was independent of low SES and childhood obesity manifestation. Studies conducted on a state-by-state basis, are important for formulating more targeted intervention strategies. Generalized strategies are useful, but more can be achieved when considering the characteristics of each community.
Food security means access by all people at all times to quality food for an active, healthy life. In contrast, food insecurity implies a limited ability to secure adequate food due to insufficient household resources (21). In addition to consumption of a diet high in fat and energy value, children from food-insecure backgrounds may engage in binge eating as an adaptive response to episodic food shortages (22). A study was conducted to analyze the relationship between household food insecurity with and without hunger in infancy and childhood. It should be noted that currently, food insecurity with or without hunger is referred to low food insecurity or very low food insecurity, respectively. This study consisted of 28,335 children from diverse backgrounds with low SES. These children participated in the Special Supplemental Nutrition Program for Women, Infants, and Children (WIC) in Massachusetts between 2001 and 2006. WIC provides federal grants to states for supplemental foods, healthcare referrals, and nutrition education for low-income pregnant, breastfeeding, and nonbreastfeeding postpartum women, and to infants and children up to age 5 who are found to be at nutritional risk (22). The child’s anthropometrics were measured every 6 months by a WIC representative or by the child’s pediatrician who reported to the organization. These values were used to calculate BMI to assess the risk of obesity. Food security was measured based on the parent/caretaker responses to a four-question subscale of the 18-item Core Food Security Module. The four items on the subscale addressed the aspects of not having enough money to buy food for a balanced meal, adults cutting the size of or skipping meals, adult frequency of cutting or skipping meals, and adults not eating for a whole day (22). Based on those responses the families were categorized as food secure, food insecure with hunger, and food insecure without hunger. Other variants considered in this analysis were maternal weight, pre-pregnancy weight, age, and education. The data at the first infant visit was compared to the last child visit, which is between 2 and 5 years of age. About a quarter of the infants lived in households with some food insecurity, and 5.7% of that quarter were living in food insecure households with hunger. At their child visit, 23% of the children lived in households with some food insecurity, with 4.6% living in households with food insecurity with hunger (22). At the end of the study, about 17% of the children were obese. Households that had continuous food insecurity without hunger were associated with 22% greater odds of childhood obesity compared to households that are predominately food secure. Maternal pre-pregnancy weight was also a significant factor in the findings, as infants of overweight or obese mothers had a 65% greater risk for obesity. In conclusion, the results suggest that persistent household food insecurity without hunger is prospectively related to childhood obesity, but that the association depends on the maternal weight status (22).
Prevalence and Intervention of Childhood Obesity: A Literature Review
20
Although many studies support the association between childhood obesity and food insecurity, a few studies have reported contradictory results. These studies add to the complexity of addressing pediatric obesity. For example, Gunderson et al. (23) found no association between childhood obesity and food insecurity. This study used multiple measures for the indication and assessment of childhood obesity compared to other studies that relied primarily on BMI. This approach was based upon our knowledge that excessive body fat is the pathology associated with obesity, and it cannot be measured directly using BMI since BMI does not distinguish between mass in the form of fat, lean tissue, or bone (23). This study included 2,516 children between the ages of 8 and 17 years from households below 200% of the poverty line, which suggests food insecurity according to the National Health and Nutrition Examination Survey (NHANES). The metrics used to classify obesity were BMI, waist circumference (WC), triceps skinfold thickness (TSF), trunk fat mass, and whole-body fat percentage. Food insecurity was measured using a method created by the U.S. Department of Agriculture (USDA). It consists of 18 questions from the Core Food Security module described in the study. The following results were attained: 18% of children were considered obese via BMI assessments, 21% via WC, 15% via TSF thickness, 30% via trunk fat mass, and 45% via body fat (23). Food insecurity status was cross-examined with these dimensions, and it was concluded that food-insecure children were no more likely to be obese than their food-secure counterparts (23). Additional research can be done to include these other measurements that indicate childhood obesity. In this same study, it was deemed significant to note that food insecurity and obesity often coexist in low-income children, because depending on the obesity measure and subsample assessed, 12–57% of food-insecure children were also obese (23).
Intervention
Due to the complexity of childhood obesity, intervention can be challenging. Effective solutions need to be easily applicable to the public, but also adaptable to populations based on their unique characteristics. This approach would produce results that address the high prevalence of child obesity.
One study proposed federal policy as an agent of change. Federal policy can impact a broad scope of people, making it a powerful resource. This study aimed to assess the impact of three federal policies on childhood obesity prevalence in 2032, after 20 years of implementation (5). Microsimulation models based on demographic and behavioral variables were used to project the efficacy of the policies. The sample consisted of simulated school-aged children, 6 to 12 years of age, and adolescents, 13 to 18 years of age. BMI and overall changes in the percentage of overweight or obese children were used as the chief form of evaluation. The policies implemented were afterschool physical activity (PA) programs, sugar-sweetened beverage (SSB) excise tax, and a ban on fast food television targeting children. Through initial observation, it was found that over one-quarter of children get the recommended one hour of daily PA, whereas only 1 in 5 adolescents do, and approximately one-third of the simulated youth consume SSBs at least twice per day (32.3%) and fast food at least twice a week (35.4%) (5). The microsimulation predicted the following results—afterschool PA programs would increase the number of children and
adolescents who met the daily PA recommendation by 7.7% and 7.4%, respectively; a $0.01/ounce SSB excise tax would reduce the number of children and adolescents consuming two or more SSBs per day by 11.4% and 16.6%, respectively; and the number of children eating two or more fast food meals per week would drop by almost 20% and for adolescents by 18% (5). In conclusion, these policies would be effective measures in reducing childhood obesity prevalence by 2032.
Another intervention is through educational programs that enlighten parents or caretakers on childhood obesity. One study used motivational interviewing (MI) delivered by primary care providers (PCP) and dietary counseling by registered dieticians (RD) to reduce pediatric obesity. MI is a patient-centered communication style that uses specific techniques such as reflective listening, autonomy support, shared decision-making, and eliciting change talk (24). Forty-two practices from the Pediatric Research in Office Settings Network of the American Academy of Pediatrics were randomly assigned to one of three groups. Group 1 (usual care) measured BMI percentile at baseline and at 1- and 2-year follow-up and provided routine care by the PCP, as well as standard educational materials for parents (24). Group 2 consisted of only PCPs and had similar components to group 1 with the addition of training in motivational interviewing and behavior therapy. Group 3 consisted of both PCPs and RDs. It had similar components to the other groups with the addition of motivational interviewbased counseling from a trained RD linked to the practice. BMI was the primary metric used to evaluate the intervention. At a 2-year follow-up, the adjusted BMI percentile was 90.3, 88.1, and 87.1 for usual care (group 1), group 2, and group 3, respectively (24). The results indicated that overweight children whose parents received MI counseling from their PCPs supplemented by RD counseling showed a significant reduction in BMI percentile over 2 years compared with children whose parents received usual care (24). The net difference in BMI reduction between these two groups was 3.1 BMI percentile units, which is a significant difference. This strategy yielded outcomes that strongly suggest that MI and dietary counseling are effective intervention approaches.
Media significantly influences the eating behaviors of children and adolescents and hence can be used to promote healthier eating habits. Many of the food products passively advertised in children’s media lack nutritional value and the consumption patterns shown can have potentially harmful effects on the eating behavior of children (25). Often in children’s movies and television shows, times of enjoyment, fun, or happiness are associated with eating “fun foods” such as pizza, ice cream, candy, hot dogs, etc. These foods are high in saturated fats, salt, and sugar (HFSS). Likewise, these same foods are also used when the mood of the child needs to be lifted, commonly following a scene where the child was noticeably sad at the dinner table avoidably pushing around their vegetables. This can create a dangerous association between food perception and eating behavior. In addition, food consumption on social media platforms, such as YouTube, is often portrayed in a rather extreme and distorted manner. For example, so called Mukbang videos (loosely based on the Korean translation for “eating broadcast”) typically showcase the overeating of large quantities of food (25). Media has been used to promote an obesogenic environment, but more cautious regulated
Prevalence and Intervention of Childhood Obesity: A Literature Review
21
Prevalence and Intervention of Childhood Obesity: A Literature Review
efforts can assist in its reversal. Folkvord et al. detail that most published studies focused on decreasing the reinforcing values of HFSS foods, but state it is also important to explore the potential of reinforcing healthier foods and assessing whether there is a long-term impact. A recent overarching theoretical model has been developed to explain and predict how the food promotion of fruits and vegetables works. It uses an eclectic synthesis of existing theoretical models from different disciplines and recent empirical evidence (25). The four basic assumptions of this model are that: 1) By increasing the reinforcing value of fruit and vegetables through effective food promotion techniques; 2) a reciprocal relation with eating behaviors occurs, that, in time; 3) leads to a normalization of the intake of fruits and vegetables, and lastly; 4) individual and contextual factors determine individual and contextual factors determine individual susceptibility to food promotion and food acceptance (25). This is a burgeoning area of research with great potential to alter pediatric consumption practices.
Conclusion
In the U.S. the increase in the incidence of childhood obesity has declined; however, prevalence is still high with a significant risk of lifestyle diseases and morbidity. A major attributing factor to childhood obesity prevalence is the inadequate consumption of fruits and vegetables and the increased intake of foods high in fat, salt, and sugar. Further, low physical activity, sedentary lifestyles, shortened sleep duration, and media have also contributed to an obesogenic environment. Other factors such as genetics, sociocultural factors, and socioeconomic status also influence childhood obesity. A promising area of research for intervention is in children’s media, being that we are in a more advanced technological era that will only progress further. Federal policy intervention is also a promising starting point because of the potentially large outreach that can be achieved. This would most notably assist vulnerable populations of low socioeconomic status and populations that are battling food insecurity. Educational programs should be at the foundation of all strategies. Awareness creates opportunities for children and adolescents to learn healthy habits that can be implemented long-term into adulthood. As more research and intervention strategies are conducted, the multifactorial characteristic of childhood obesity needs to be continually assessed. Strategies that target and address multiple factors may provide the most beneficial outcomes.
Acknowledgments
I am immensely grateful to Darina Lazarova, PhD, for her guidance on the earlier versions of the manuscript.
Disclosures
The author declares that she has no relevant or financial interests related to the research described in this paper.
References
1. Wang Y, Lim H. The global childhood obesity epidemic and the association between socio-economic status and childhood obesity. International Review of Psychiatry. 2012 Jun 1;24(3):176-88.
2. Stierman B, Afful J, Carroll MD, Chen TC, Davy O, Fink S, Fryar CD, Gu Q, Hales CM, Hughes JP, Ostchega Y. National Health and Nutrition Examination Survey 2017–March 2020 Prepandemic Data Files Development of Files and Prevalence Estimates for Selected Health Outcomes.
3. Diseases of affluence. Articles of the world. Available at http://www.articleworld.org/index.php/Diseases_of_ affluence.
4. Reinehr T. Type 2 diabetes mellitus in children and adolescents. World Journal of Diabetes. 2013 Dec 12;4(6):270.
5. Kristensen AH, Flottemesch TJ, Maciosek MV, Jenson J, Barclay G, Ashe M, Sanchez EJ, Story M, Teutsch SM, Brownson RC. Reducing childhood obesity through US federal policy: a microsimulation analysis. American journal of Preventive Medicine. 2014 Nov 1;47(5):604-12.
6. Cunningham SA, Kramer MR, Narayan KM. Incidence of childhood obesity in the United States. N Engl J Med. 2014 Jan 30;370:403-11.
7. Olshansky SJ, Passaro DJ, Hershow RC, Layden J, Carnes BA, Brody J, Hayflick L, Butler RN, Allison DB, Ludwig DS. A potential decline in life expectancy in the United States in the 21st century. N Engl J Med. 2005 Mar 17;352(11):1138-45.
8. Lanigan J, Tee L, Brandreth R. Childhood obesity. Medicine 2019 Mar 1;47(3):190-4.
9. Smith JD, Fu E, Kobayashi M. Prevention and management of childhood obesity and its psychological and health comorbidities. Annual review of clinical psychology. 2020 May 5;16:351.
10. Sahoo K, Sahoo B, Choudhury AK, Sofi NY, Kumar R, Bhadoria AS. Childhood obesity: causes and consequences. Journal of family medicine and primary care. 2015 Apr;4(2):187.
11. Kansra AR, Lakkunarajah S, Jay MS. Childhood and adolescent obesity: a review. Frontiers in Pediatrics. 2021 Jan 12;8:581461.
12. U.S. Department of Agriculture and U.S. Department of Health and Human Services. Dietary Guidelines for Americans, 2020-2025. 9th Edition. December 2020.
13. Aune D, Giovannucci E, Boffetta P, Fadnes LT, Keum N, Norat T, Greenwood DC, Riboli E, Vatten LJ, Tonstad S. Fruit and vegetable intake and the risk of cardiovascular disease, total cancer and all-cause mortality—a systematic review and dose-response meta-analysis of prospective studies. International Journal of Epidemiology. 2017 Jun 1;46(3):1029-56.
14. Nekitsing C, Blundell-Birtill P, Cockroft JE, Hetherington MM. Systematic review and meta-analysis of strategies to increase vegetable consumption in preschool children aged 2–5 years. Appetite. 2018 Aug 1;127:138-54.
15. Yang Q, Zhang Z, Gregg EW, Flanders WD, Merritt R, Hu FB. Added sugar intake and cardiovascular diseases mortality among US adults. JAMA Internal Medicine. 2014 Apr 1;174(4):516-24.
22
16. Costas LA, Lewis CC. Nature. 2013; 502, 181–182.
17. Ishimoto T, Lanaspa MA, Rivard CJ, Roncal-Jimenez CA, Orlicky DJ, Cicerchi C, McMahan RH, Abdelmalek MF, Rosen HR, Jackman MR, MacLean PS. High-fat and high-sucrose (western) diet induces steatohepatitis that is dependent on fructokinase. Hepatology. 2013 Nov;58(5):1632-43.
18. Hutapea KM. Disparities in Childhood Obesity in Low Socioeconomic Status and Racial/Ethnic Populations: An analytical literature review. In Abstract Proceedings International Scholars Conference 2019 Dec 18 (Vol. 7, No. 1, pp. 685-694).
19. Rogers R, Eagle TF, Sheetz A, Woodward A, Leibowitz R, Song M, Sylvester R, Corriveau N, Kline-Rogers E, Jiang Q, Jackson EA. The relationship between childhood obesity, low socioeconomic status, and race/ethnicity: lessons from Massachusetts. Childhood Obesity. 2015 Dec 1;11(6):6915.
20. Gibbs BG, Forste R. Socioeconomic status, infant feeding practices and early childhood obesity. Pediatric Obesity 2014 Apr;9(2):135-46.
21. Pan L, Sherry B, Njai R, Blanck HM. Food insecurity is associated with obesity among US adults in 12 states.
Journal of the Academy of Nutrition and Dietetics. 2012 Sep 1;112(9):1403-9.
22. Metallinos-Katsaras E, Must A, Gorman K. A longitudinal study of food insecurity on obesity in preschool children.
Journal of the Academy of Nutrition and Dietetics. 2012 Dec 1;112(12):1949-58.
23. Gundersen C, Garasky S, Lohman BJ. Food insecurity is not associated with childhood obesity as assessed using multiple measures of obesity. The Journal of Nutrition. 2009 Jun 1;139(6):1173-8.
24. Resnicow K, McMaster F, Bocian A, Harris D, Zhou Y, Snetselaar L, Schwartz R, Myers E, Gotlieb J, Foster J, Hollinger D. Motivational interviewing and dietary counseling for obesity in primary care: an RCT. Pediatrics 2015 Apr;135(4):649-57.
25. Folkvord F, Naderer B, Coates A, Boyland E. Promoting Fruit and Vegetable Consumption for Childhood Obesity Prevention. Nutrients. 2021 Dec 29;14(1):157.
26. Gelen V, Kükürt A, Şengül E, Devecı HA. Leptin and Its Role in Oxidative Stress and Apoptosis: An Overview. Role of Obesity in Human Health and Disease. 2021 Nov 26:143.
27. Singh Grewal A, Bhardwaj S, Pandita D, Lather V, Singh Sekhon B. Updates on aldose reductase inhibitors for management of diabetic complications and non-diabetic diseases. Mini Reviews in Medicinal Chemistry. 2016 Jan 1;16(2):120-62.)
Prevalence
and Intervention of Childhood Obesity: A Literature Review
23
Bipolar Disorder: A Brief Literature Review of Diagnostic Issues, Epidemiology, and Potential Causes
Latasha S. Adams1*‡, Kennedy S. Camara1*‡, Danielle G. Fuller1*‡, and Adline P. Sarpong1*‡
1Geisinger Commonwealth School of Medicine, Scranton, PA 18509
*Master of Biomedical Sciences Program
‡Authors contributed equally Correspondence: kcamara@som.geisinger.edu
Abstract
Bipolar disorder (BD) is a complex mental disorder that has multiple modes of causality. In this brief review, we used PubMed and Google Scholar databases to conduct an analysis that focuses on the epidemiology, genetics, aberrant developmental processes, environmental influences, and diagnostic criteria of BD. Diagnosis of BD is often associated with several psychiatric disorders. SNPs located in genes, such as CACNA1C and ODZ4 identified by several studies are potential contributors to the etiology of BD. Aberrant neurodevelopmental processes, such as the brain sulcation are shown to be different between the subtypes of BD. Environmental influences including life stressors, substance misuse, smoking, influenza, and the current COVID-19 pandemic have also played a substantial role in individuals developing BD. The goal of this manuscript is to educate the public on current research of possible etiologies and casual factors of BD. This study can be used by others in the science community as a guide for the signs, symptoms, causes, and therapeutic care of BD.
Introduction
BD is a mental disorder that leads to mood instability and changes energy, concentration, behavior, and sleep (1). Four types of BD exist: BD I, BD II, cyclothymic disorder (cyclothymia), and BD not otherwise specified (9). Each BD category is defined by a different manic episode or pattern. BD-I is a manic episode that lasts at least 7 days and can require hospitalization (7). BD-II is hypomanic with depressive episodes (7). If BD-II lasts for at least 2 years, it is then classified as a cyclothymic disorder (2). Unspecified BD does not meet criteria for major depression, BD-I, BD-II, or cyclothymia (i.e., less than one week of manic symptoms without psychosis or hospitalization) (1, 5, 8, 9).
BD has no significant preference for race or ethnicity (14, 16). However, BD does show an onset preference for age and is most common in patients younger than 25 years (14). The mean age for the onset of BD-I is 18 years, and 22 years in BD-II (14). The onset of BD tends to occur later in women than men, and women more often have a seasonal pattern of mood disturbance (14). Although the course and clinical features of BD differ between women and men, there is no evidence that gender affects treatment response to mood stabilizers (17). Existing comorbidities, such as migraines or anxiety, can prefer one sex over another (18 19). For example, the pathophysiologic intersection between migraine headaches and BD may be examined in women with a past medical history of
migraine. Combined therapy can impact mood outcomes and treatment effectiveness (18, 20).
BD is a complex disorder that is inflicted heavily by trauma, climate, social support, infection/illness, genetics, epidemiology, and health (2). BD’s clinical and etiological effects have both genetic and environmental factors that influence the subsequent prevalence and/or prevention of the disorder (4).
A better understanding of the complex intersection between genomics, life events, and the disease is warranted (2, 15).
Though the research in this field exhibits methodological challenges, the best genetic and environmental data has been obtained through diagnostic interviews based on the Diagnostic and Statistical Manual of Mental Disorders-5 (DSM-5) and International Classification of Diseases (ICD-10) standards (6 7).
In this literature review, we summarize and discuss research on the diagnostic criteria and impact of environmental factors, genetics, and neurobiological and epidemiological characteristics on the clinical course of BD.
Methods
A literature review was conducted using PubMed and Google Scholar databases utilizing the following key terms: bipolar disorder, bipolar depression, bipolar treatment, types of bipolar disorder, psychosis, mania, depression, mental health disorders, genetics and bipolar disorder, bipolar disorder comorbidities. These terms were included due to their relevance to bipolar disorder. No date range or journal exclusion was applied.
Discussion
Diagnosis of BD-I
vs BD-II
It has been demonstrated that the creation of new self- and clinician-administered rating measures can improve the early identification of clinical characteristics in individuals with BD (22). Similar to this, a person's unique traits such as weight and lifestyle are extremely important in determining the underlying clinical diagnosis of BD (21). Medical comorbidities like obesity are just one of several external factors that contribute to the development of BD (23). According to the literature (25), there is a correlation between having BD and being overweight or obese. A significant number of patients in obese populations are affected by this metabolic condition, which ultimately lowers the quality of life. Endocrine abnormalities, dysregulation of the sympathetic nervous system, behavioral tendencies, and physical inactivity are shown to be shared risk factors between BD and metabolic syndrome (25). In addition to the above,
Scholarly Research In Progress • Vol. 6, November 2022
24
stress and related neuroendocrine alterations can be another set of factors linked to BD (26).
The use of medications by BD patients contributes to their disease pathology. For instance, certain drugs may have an impact on brain neurotransmitters as well as brain communication systems, which can result in manic-depressive disorder (26). This establishes a link as to why popular pharmaceutical therapies for BD may increase patients' medical burdens, resulting in weight gain and metabolic abnormalities (25). In BD patients, preventing and treating medical comorbidities lowers mortality and morbidity from the physical illness while also accelerating the course of the manicdepressive mental disorder (27).
BD-I
BD-I usually has at least one depressive episode which differentiates it from its subgroup (23). In perhaps 12–17% of cases, BD is not recognized until there is a mood “switch” into hypomania or mania, either spontaneously or with exposure to a mood-elevating substance (28). However, epidemiological findings from the Swedish national quality assurance register indicate that BD-I is the most stable sub-diagnostic group compared to BD-II and cyclothymic disorders (29). According to our research, BD-I requires medication that protects against mannerisms in which round-the-clock care is often necessary (29). Switch rates (also described as the transition from one mania to another) associated with antidepressant use is much higher in BD-I vs BD-II disorders relative to untreated individuals (30). When BD-I patients switch into excited states, they develop either full mania 45% of the time or hypomania 55% of the time (30). This study illustrates that the enhanced state of BD aids in the progression of psychosis in almost 95% of patients when antidepressants are administered. The moodstabilizing treatment is determined by the dominant polarity behavior demonstrated by patients who display affective and emotional outbursts (29). Medical evidence has indicated that it is common for patients to change bipolar underdiagnoses (BD-I to BD-II and vice versa), which reveals uncertainty in the diagnosis.
BD-II
BD-II is diagnosed in individuals experiencing several protracted depressive episodes and at least one hypomanic episode, but no manic episodes (23). Until 27 years ago, BD-II was the outlier of psychiatric disorders — long recognized and referred to in the literature, but not a “real disorder” (24). Medical literature suggests that BD-II is especially difficult to diagnose accurately because of the lack of differentiation of this disorder from recurrent unipolar depression (recurrent depressive episodes; 24). In fact, unipolar depression is the most frequent misdiagnosis associated with BD-II patients who, by definition, never experience an episode of mania (31). Therefore, clinical depression is predominantly associated with BD-II far more than BD-I (32). BD-II patients who have a treatment-emergent affective switch (TEAS) develop hypomania 95% of the time (30). The TEAS phenomenon illustrates how antidepressants cause people to experience hypomania/mania. It is widely acknowledged as the first antidepressant for BD. This data suggests that there is a different clinical profile for BD-II and
that it has a different susceptibility to the induction of mania (24). Furthermore, within the last few years, a debate has arisen on the validity and utility of BD-II as a diagnostic category. Some authors have suggested its elimination as a disorder category (now termed an existential crisis), while others support its continued inclusion in their diagnostic systems (33–39).
Misdiagnosing BD type I or II as unipolar depression results in many potential deleterious consequences. This includes the prescription of inappropriate drugs, such as antidepressants in the absence of a mood-stabilizing drug, which might lead to switching to mania, and ultimately, poor clinical and functional outcomes and high healthcare costs (40 41). Studies revealed that earlier-aged BD patients with an illness prior to BD are characterized by a lower rate of response to antidepressant medication. In contrast, multiple studies in the literature found that a higher rate of switching into mania or hypomania was found to be correlated with a higher switch risk (40). Now researchers question the treatment of bipolar depression with antidepressants due to insufficient data supporting their use.
Epidemiology of BD
The age of onset for BD-I and BD-II differs. For BD-I, the age of onset is between 17 and 25 years, while BD-II is slightly higher (46). Several epidemiological studies have reported the prevalence of BD-I to be around 1% (42–46, 49). In a large cross-sectional study involving 61,392 adults from 11 countries, the lifetime prevalence of BD-I was 0.6%, BD-II was 0.4%, and cyclothymia was 1.4%, providing a worldwide prevalence of 2.4% (45). Compared to international populations, the U.S. has the highest prevalence of BD (45, 47). Differences in international prevalence rates of BD have not been determined (48 49). Psychiatric comorbidities are common in patients with BD. In one study assessing 9,282 English-speaking respondents to a mental health survey, 97.7% of those diagnosed with BD reported comorbidities for other psychiatric disorders, such as anxiety disorders, impulsive control disorders, and substance misuse (14).
Disorders that affect the CNS, like BD, seem to have sex differences in prevalence and incidence rates (50). Incidence rates of BD are equal among males and females; however, males are more likely to have BD-I, whereas females are more likely to have BD-II (50 51). Some studies have reported these sex differences between BD-I and BD-II to be from steroidal hormonal dysregulation in some females (52–54). Knowledge of the epidemiology of BD can help with preventative care and enable clinicians to identify who may be more suspectable to this disorder (46). Understanding the risk and causal factors for BD can lead to early intervention of treatment for individuals and the population (46). Individually, BD patients can receive adequate follow-up care and proper medication dosing, which will enhance patient quality care (46). This will aid in implementing preventative care in suspectable populations leading to the improvement of overall mental health.
Genetics and BD
Although not included as diagnostic criteria in the DSM-5-TR, genetics can play a critical role in explaining the pathophysiology of many psychiatric disorders (55). Evidence for this comes
Bipolar Disorder: A Brief Literature Review of Diagnostic Issues, Epidemiology, and Potential Causes
25
Bipolar Disorder: A Brief Literature Review of Diagnostic Issues, Epidemiology, and Potential Causes
from twin studies, which have identified a causal genetic link with manifestation of BD disease. Several studies have illustrated concordance rates to be higher among monozygotic twins than in dizygotic twins, with heritability estimates of 60–85% (55–58). Although this evidence is promising, heritability alone cannot explain it all. Current research has focused on identifying specific genes involved in the pathophysiology of BD. Genome-wide association studies (GWAS), which assess the association between specific genetic loci variations with diseases, have identified multiple genes and single nucleotide polymorphisms (4, 11, 59) correlated to BD.
SNPs and BD
There are many common DNA variants whose effects are too small to detect individually but contribute to the risk of BD when analyzed together (3). The first study to use GWAS showed several genes involved in BD and researchers of this study were the first to believe BD may be polygenic (61). Years later, studies with larger sample sizes, with over 40,000 cases, have reported identifying over 35 different loci associated with BD (60, 62–64); providing supporting evidence of BD being polygenic. Each study found unique genetic loci but featured common SNPs in the genes CACNA1C and ODZ4 (61–65). CACNA1C is a gene that encodes calcium ion channels, which brings calcium into the cell (59). The SNPs for CACNA1C and ODZ4 are rs1006737 and rs12576775, respectively (3). Both variants for CACNA1C and ODZ4 are in the intronic region of the gene (3). Since the SNP is not located in the gene coding region, researchers theorized that the SNP for CACNA1C may be involved in gene expression (3). Research is still needed in this area to understand how rs1006737 influences the development of BD. In addition to BD, the ODZ4 gene is associated with other disorders, like autism spectrum and major depressive disorder (3). This gene has different functional roles in neuronal development and in the amygdala (1, 75). ODZ4 has a role in the proliferation and differentiation of oligodendrocytes, which are myelinating cells of neurons (3). In the amygdala, ODZ4 has a key role in reward processing (75). Future research is required to recognize how rs12576775 impacts the progression of BD.
Protein mutations impacting BD
Mutations in proteins associated with BD can also be a major causal factor of BD (66). Recent evidence reported de novo mutations found in genes in BD patients, EHD1, MACF1, and ANT1, were positively correlated with mood changes and serotonergic activity associated with BD (69 70). In one study, behavioral analyses on heterozygous conditional knockout mice (mouse models that have an inactivated gene of interest) of loss of function mutations in ANT1 showed diminished impulsivity (70). Researchers found serotonin turnover increased in the nucleus accumbens in this heterozygous loss of function ANT1 conditional knockout mice (70). Investigators suggested that heterozygous loss of function ANT1 causes dysfunction in serotonin activity and decreases impulsivity, resulting in a risk of developing BD (70). The mechanism for understanding how the loss of function ANT1 causes dysfunction in serotonin activity is an area for future research.
Signaling pathways and BD
Several investigations indicated signaling pathways are dysregulated in individuals with BD (63, 68–70). The Wnt signaling pathway plays a key role in the pathogenesis of BD (71, 74). In one study, researchers assessed whole genome microarrays on monozygotic twins with BD (72). Using ontology analyses, researchers found an upregulation in Wnt signaling pathways in BD patients (72). Investigations on why there is a difference in signaling pathways in BD patients is still needed. Moreover, in addition to identifying genes and mutations associated with BD, targeting signaling pathways can provide clinical and therapeutic advancements.
Aberrant brain structures and neurodevelopmental processes influencing BD
Brain magnetic resonance imaging (MRI) studies have shown conflicting evidence between the volume sizes of the hippocampus, amygdala, and thalamus between healthy controls and BD patients. Some studies reported patients with BD had small volume differences in the hippocampus, amygdala, and thalamus (77 78). These differences were not seen when comparing BD-I and BD-II patients (77). In an older study, researchers used positron emission tomography to measure blood flow and glucose metabolism of the prefrontal cortex (79). Investigators found the anterior cingulate cortex, which is the area of the brain important for attention and mood regulation, had reduced blood flow and glucose metabolism in patients with major depressive disorder and BD (79). Unlike the imaging results mentioned above, one study found through MRI that BD patients had larger amygdala volumes than healthy controls (80). Although there are conflicting results, these studies do show that there is a difference in the anatomical structure of the brain in individuals with BD compared to normal controls (76).
Aberrant neurodevelopmental processes can be a contributing risk factor for individuals with early onset of BD or with comorbidities of schizophrenia (81). Brain sulcation is a neurodevelopmental process, which reflects the folding of the cerebral surface. This process starts at the 10th gestational week and ends in the fetal brain during week 44 (82). The sulcal index refers to how buried the cortex is and is known as an indirect marker for early neurodevelopmental processes (82). To identify if there are changes in cortical folding between early-onset BD-I, BD-II with psychotic symptoms, and healthy controls, MRIs were performed, and sulcation indexes were determined (82). Researchers found that cortical folding was determined to be vastly different in patients with early-onset BD and psychotic BD (82). Specifically, patients with early-onset BD had an increased local sulcal index in the right prefrontal dorsolateral area and psychotic BD patients had a lower local sulcal index in the left superior parietal cortex (82). There is not enough current literature to appreciate why these differences occur in these two subtypes of BD. Future research in analyzing these neurodevelopmental processes in BD patients can aid in the development of better therapeutic care and improve patient outcomes.
26
Environmental influences of BD
Genetic transmission has been the primary component in BD etiology. However, the complexities of BD suggest other factors. BD exhibits variant penetrance effects, with clinical manifestations differing from one person to the next (83, 84). The diversity in clinical presentation and outcomes of BD suggest there are also environmental factors to be considered. There has been a wide variety of research (83–109) investigating the impact of environmental factors on BD onset. These factors include perinatal and prenatal exposures, alcohol, smoking, substance misuse, life stressors, physical environment, and COVID-19. Furthermore, research (83–109) suggests that these factors also play a role in how BD presents and progresses in individuals throughout their lives.
Prenatal exposures, perinatal exposures, and BD
There is limited literature on prenatal and perinatal exposures to alcohol and teratogenic chemicals in the etiology of BD onset in offspring. However, studies (85–91) suggest that some prenatal and perinatal factors including oxytocin, influenza, smoking, and fetal alcohol exposure, may play a role in BD onset.
Oxytocin
One study (85) explored exogenous oxytocin and BD. Their results showed an approximately two-fold increased risk of BD in offspring whose mothers received exogenous oxytocin to induce labor. Oxytocin is thought to disrupt GABA signaling leading to changes in nerve firing patterns like those with BD (85). With limited literature on the impact of oxytocin on BD onset, further research would help clarify the association.
Influenza
Studies (86 87) explored gestational influenza exposure as a possible risk factor for BD. Using a case-control study, one study (86) found a significant approximate four-fold increase (p=0.003) in BD onset following maternal influenza exposure during pregnancy. Additionally, another study (87) found a significant (p<0.001) five-fold increase in BD risk but only with psychotic additions, including hallucinations, delusions, and disturbing thoughts. On the contrary, the study (87) found no significant association between maternal influenza exposure and BD risk in offspring alone.
Alcohol
One of the most common disabling outcomes of prenatal alcohol exposure is fetal alcohol syndrome disorder (FASD). Studies show (88–91) that FASD typically co-occurs with mood disorders, including BD. In Canada, a study (89) tested 62 individuals with FASD. Amongst those, 92% were diagnosed with a mental health disorder, BD included. Surprisingly, a direct association between alcohol consumption in pregnant women and BD onset in offspring has not been investigated. Despite this, studies (88, 90–91) have concluded that prenatal alcohol exposure was associated with greater psychopathology and adverse physical health consequences in offspring.
Smoking
Smoking in pregnant women has been explored in the etiology of BD in their offspring. While there is limited research concerning perinatal substance exposure and BD, a study (92) discovered that mothers who smoked during pregnancy compared to those who did not have higher rates of psychopathology, with results showing a two-fold greater risk for BD in offspring prenatally exposed to smoking. Their results (92) were consistent and did not vary in smoking quantity, only revealing smoking during pregnancy as the one significant predictor for BD onset in offspring. Still, there is not substantial research out there regarding the potential risk of BD onset in offspring due to maternal smoking while pregnant.
Life stressors and BD
The role of early development environments has been widely explored in BD expression. Childhood trauma (CT) is more prevalent in those with BD than those without (83–84, 93). Along with more severe symptoms, CT can contribute to the early onset of BD. Studies reveal BD linkage to individuals with multiple childhood traumas (83, 93, 95–96). According to a study (93), more than half of their BD subjects recorded CTs. Consistent results (93–94) reported more frequent and more severe forms of CT in BD individuals than those without BD, with early exposure increases the risks of BD expression. CT concerning parenting psychopathy and maltreatment was reported as preexisting conditions for individuals experiencing BD episodes (94–95), with negative parenting styles contributing to BD and depressive disorder (94–95). In addition to CT, familial disruption, defined as any household structure outside of two parents, increases the risk of BD diagnosis and a higher prevalence of associated manifestations (83, 98). Familial disruption showed an increased risk of BD diagnosis with a 37% prevalence, showing significance (HR 1.69; 95% CI 1.51-1.89, HR 2.91; 95% CI 2.60-3.25) as a single exposure and under multiple exposures (98). Also, family relationships in individuals with BD pose the risk of minor improvement and shorter remission when under trauma and heightened chronic stress (83).
Substance misuse and BD Studies (84, 99–101) show substance use as a risk factor for BD onset, heightened associated symptoms, more severe course of illness, higher rates of violence and suicide, and varying manifestations. Substance use disorder (SUD) can be a symptom of BD, which allows for misdiagnosis as SUD becomes the primary diagnosis rather than BD. BD co-occurs with SUD, further complicating the effects of BD (100 101). Consistent with the previous studies mentioned (84, 99, 101), literature (100) reported that patients in a BD onset group were more likely to have a SUD, and another reported an estimated 56% lifetime prevalence of SUD for individuals with BD (101). SUD, including alcoholism, cannabis use, opioid, and amphetamine use, has been observed in the daily lives of individuals before the development of BD, which suggests it may be a risk factor for BD (84, 99). The bidirectional mechanism of substance misuse increases manic symptoms and depression symptoms in individuals with BD (101).
Bipolar Disorder: A Brief Literature Review of Diagnostic Issues, Epidemiology, and Potential Causes
27
Physical environment and BD
There is limited understanding of how the physical environment may play a role in the etiology of BD. However, research (102 103) suggests it may significantly impact the onset of BD. Literature (102) defined physical environment as the physical compartments of one’s environment, including air quality, water supply, climate, and landscape. In addition to the physical environment, weather conditions, including the impact of sunlight and population, were also explored as risk factors in BD onset (102). According to a 2019 study (102), air quality, or the degree to which the air is pollutant-free measured by the environmental quality index (EQI), was the strongest predictor for BD, with the worst air quality associated with a 27% increase in BD rate (p=<10-4). Additionally, the study (102) discovered that the most populated counties had a BD rate increase of 16.4% (p=0.0044) than that of less populated counties. A study (103) also examined the impact of sunlight on the age of BD onset. Their results showed an inverse relationship between the maximum monthly increase in sunlight and onset, concluding that the higher the monthly increase in sunlight, the younger the age of onset (103).
COVID-19 and BD
While there is not much evidence that COVID-19 effects the onset of BD, people with primary BD are at a higher risk of the effects of COVID-19 than people without BD. Studies (104 105) found COVID-19 related stressors to play a role in heightening the symptoms manifested in individuals with BD. Isolation, restrictions, and lifestyle changes, including economic impacts at the hands of COVID-19, were observed. Compared to individuals without BD, BD patients were discovered to have augmented symptoms, including worsening cognitive symptoms, anxiety, and sleep disturbance (104, 106–107). Additional augmented symptoms included depressive episodes and an increase in the risk of relapse (104). A longitudinal study (108) found higher levels of mood and anxiety symptoms sustained through May 2020 of the COVID-19 pandemic, with individuals with BD having higher persisting levels of disruption than those without BD. On the contrary, other findings (108) showed no increase in symptom severity. Another finding was that utilization of mental health services significantly decreased during the pandemic as more restrictions and a world shutdown were in effect (108–109). BD patients' hospitalizations increased during a pandemic compared to BD hospitalizations pre-pandemic (104–105).
Conclusion
BD is a psychiatric disorder with multiple causalities and a lifetime prevalence of 1.5%. Key areas of research still lie in genetics, aberrant brain structural and developmental processes, and environmental components influencing BD. SNPs located in CACNA1C and ODZ4 genes, protein mutations, and signaling pathways were identified as potential contributors to the etiology of BD. Evidence suggests that individuals with early-onset BD and those with comorbidities of schizophrenia have different cortical folding patterns. Several environmental factors including life stressors, substance misuse, influenza, prenatal chemical exposure, patients’ physical environment, and the current COVID-19 pandemic have also
influenced BD. Future research is needed to use these modes of causalities for the development of more effective and more targeted therapeutic approaches and the promotion of preventative care.
Acknowledgments
We thank Raskirth Singh, MBS, and Brian J. Piper, PhD, for their guidance and assessment throughout the writing process. We also thank Amy Houck from Library Services at Geisinger Commonwealth School of Medicine for her assistance in the research process.
Disclosures
The authors have no financial interests or personal relationships that would be considered conflicts of interests.
References
1. Bipolar disorder. National Institute of Mental Health. U.S. Department of Health and Human Services; 2020. https://www.nimh.nih.gov/health/topics/bipolar-disorder
2. Aldinger F, Schulze TG. Environmental factors, life events, and trauma in the course of bipolar disorder. Psych Clin Neurosci. 2016;71(1):6–17. doi:10.1111/pcn.12433
3. Kerner B. Genetics of bipolar disorder. App Clin Genet 2014; 7:33-42. doi: 10.2147/TACG.S39297
4. Charney AW, Ruderfer DM, Stahl EA, Moran JL, Chambert K, Belliveau RA, et al. Evidence for genetic heterogeneity between clinical subtypes of bipolar disorder. Translational Psych. 2017;7(1). doi:10.1038/ tp.2016.242
5. Heun R, Maier W. The distinction of bipolar II disorder from bipolar I and recurrent unipolar depression: Results of a controlled family study. Acta Psych Scandi 1993;87(4):279-84.
6. American Psychiatric Association DS, American Psychiatric Association. Diagnostic and statistical manual of mental disorders: DSM-5-TR. Washington, DC: American psychiatric association; 2022.
7. World Health Organization. The ICD-10 classification of mental and behavioural disorders: Clinical descriptions and diagnostic guidelines. World Health Organization; 1992.
8. Neff AP, Marzani G. Bipolar disorders: A review. Am Fam Physician. 2012;85(5):483-93.
9. Phillips ML, Kupfer DJ. Bipolar disorder diagnosis: Challenges and future directions. Lancet 2013;381(9878):1663-71.
10. Andreasen NC, Grove WM, Coryell WH, Endicott J, Clayton PJ. Bipolar versus unipolar and primary versus secondary affective disorder: Which diagnosis takes precedence? J Affect Disor. 1988;15(1):69-80.
11. Kelsoe JR. Arguments for the genetic basis of the bipolar spectrum. J Affect Disor. 2003;73(1-2):183-97.
Bipolar Disorder: A Brief Literature Review of Diagnostic Issues, Epidemiology, and Potential Causes
28
Bipolar Disorder: A Brief Literature Review of Diagnostic Issues, Epidemiology, and Potential Causes
12. Pavuluri MN. Effects of early intervention on the course of bipolar disorder: Theories and realities. Curr Psychiatry Rep. 2010;12(6):490-8.
13. Uher R, Pallaskorpi S, Suominen K, Mantere O, Pavlova B, Isometsä E. Clinical course predicts long-term outcomes in bipolar disorder. Psych Med. 2019;49(7):1109-17.
14. Merikangas KR, Akiskal HS, Angst J, Greenberg PE, Hirschfeld RM, Petukhova M, et al. Lifetime and 12-month prevalence of bipolar spectrum disorder in the National Comorbidity Survey replication. Arch Gen Psychiatry 2007;64(5):543-52.
15. Barnett JH, Smoller JW. The genetics of bipolar disorder. Neuroscience. 2009;164(1):331–343
16. Perrotta G. Bipolar disorder: Definition, differential diagnosis, clinical contexts and therapeutic approaches. J Neurosurg. 2019;5. doi:10.31579/2578-8868 /097
17. Arnold LM. Gender differences in bipolar disorder. Psych Clinics. 2003;26(3):595-620.
18. Saunders EF, Nazir R, Kamali M, Ryan KA, Evans S, Langenecker S, et al. Gender differences, clinical correlates, and longitudinal outcome of bipolar disorder with comorbid migraine. J Clin Psych. 2014;75(5):7630.
19. Spoorthy MS, Chakrabarti S, Grover S. Comorbidity of bipolar and anxiety disorders: An overview of trends in research. World J Psychiatry. 2019;9(1):7.
20. Duan J, Yang R, Lu W, Zhao L, Hu S, Hu C. Comorbid Bipolar Disorder and Migraine: From mechanisms to treatment. Front Psychiatry. 2021:1523.
21. Findling RL, Stepanova E, Youngstrom EA, Young AS. Progress in diagnosis and treatment of bipolar disorder among children and adolescents: An international perspective. Evid Based Ment Health. 2018;21(4):177181. doi:10.1136/eb-2018-102912
22. Goodwin FK, Redfield Jamison K. Manic-depressive illness. Bipolar disorders and recurrent depression. New York: Oxford University Press; 2007.
23. Phillips ML, Kupfer DJ. Bipolar disorder diagnosis: Challenges and future directions. Lancet 2013;381(9878):1663-1671.
24. Gitlin M, Malhi GS. The existential crisis of bipolar II disorder. Int J Bipolar Disord. 2020;8(1):5. doi:10.1186/ s40345-019-0175-7
25. Fagiolini A, Chengappa KN, Soreca I, Chang J. Bipolar disorder and the metabolic syndrome: causal factors, psychiatric outcomes and economic burden. CNS Drugs. 2008;22(8):655-669. doi:10.2165/00023210200822080-00004
26. Gruenberg A. Manic-depressive illness: bipolar disorders and recurrent depression, second edition. By FK Goodwin, KR Jamison. Psych Med. 2008;38(1):147-148. doi:10.1017/S0033291707001936
27. Thompson WK, Kupfer DJ, Fagiolini A, Scott JA, Frank E. Prevalence and clinical correlates of medical comorbidities in patients with bipolar I disorder: analysis of acute-phase data from a randomized controlled trial. J Clin Psychiatry. 2006;67(5):783-788. doi:10.4088/jcp. v67n0512
28. Baldessarini RJ, Vázquez GH, Tondo L. Bipolar depression: A major unsolved challenge. Int J Bipolar Disord 2020;8(1):1. doi:10.1186/s40345-019-0160-1
29. Larsson F, Kardell M, Pålsson E, Landén M. Bipolar disorder type 1 was the most stable bipolar subdiagnosis. Lakartidningen. 2021; 118:20153.
30. Bond DJ, Noronha MM, Kauer-Sant’Anna M, Lam RW, Yatham LN. Antidepressant-associated mood elevation in bipolar I disorder compared with bipolar I disorder and major depressive disorder: A systematic review and metaanalysis. J Clin Psychol. 2008;69(10):1589–1601.
31. Hirschfeld RM, Lewis L, Vornik LA. Perceptions and impact of bipolar disorder: How far have we really come? Results of the national depressive and manic-depressive association 2000 survey of individuals with bipolar disorder. J Clin Psychiatry. 2003;64(2):161–74.
32. Judd LL, Akiskal HS, Schettler PJ, et al. A prospective investigation of the natural history of the long-term weekly symptomatic status of bipolar II disorder. Arch Gen Psychol. 2003;60(3):261–269. doi: 10.1001/ archpsyc.60.3.261
33. Malhi GS, Bell E. Fake views: Cyclothymia—a dithering disorder? Aust N Z J Psychiatry. 2019;53(8):818-821. doi: 10.1177/0004867419867764.
34. Ha K, Ha TH, Hong KS. Bipolar I and bipolar II: It’s time for something new for a better understanding and classification of bipolar disorders. Can J Psychiatry 2019;64(8):548–549.
35. Nierenberg AA. Bipolar II disorder is not a myth. Can J Psychiatry. 2019;64(8):537–540. doi: 10.1177/0706743719852096.
36. Ostacher MJ. Bipolar II should only exist if we can actually study treatments of it otherwise, what purpose does it serve? Bipolar Disord. 2017;20(4):395–396. doi: 10.1111/ bdi.12628.
37. Vieta E. Bipolar II disorder: Frequent, valid, and reliable. Can J Psychiatry. 2019;64(8):541–543. doi: 10.1177/0706743719855040.
38. Post RM. Bipolar II: Comments on its validity and utility. Bipolar Disord. 2018;20(3):280–281. doi: 10.1111/ bdi.12607.
39. Schaffer A. Why bipolar II disorder does not deserve its status as the overlooked middle child. Bipolar Disord 2018;20(4):397–398.
40. Valenti M, Pacchiarotti I, Bonnin CM, Rosa AR, Popovic D, Nivoli AM, et al. Risk factors for antidepressant-related switch to mania. J Clin Psychiatry. 2012;73(2): e271–76. doi: 10.4088/JCP.11m07166.
29
Bipolar Disorder: A Brief Literature Review of Diagnostic Issues, Epidemiology, and Potential Causes
41. Baldessarini RJ, Salvatore P, Khalsa HM, et al. Morbidity in 303 first-episode bipolar I disorder patients. Bipolar Disord. 2010;12(3):264–270.
42. Bebbington P, Ramana R. The epidemiology of bipolar affective disorder. Soc Psychiatry Psychiatr Epidemiol. 1995;30(6):279-292.
43. Merikangas KR, Cui L, Kattan G, Carlson GA, Youngstrom EA, Angst J. Mania with and without depression in a community sample of US adolescents. Arch Gen Psychiatry 2012;69(9):943-51.
44. Pini S, De Queiroz V, Pagnin D, Pezawas L, Angst J, Cassano GB, et al. Prevalence and burden of bipolar disorders in European countries. Eur Neuropsychophamacol. 2005;15(4):425-434.
45. Merikangas KR, Jin R, He JP, Kessler RC, Lee S, Sampson NA, et al. Prevalence and correlates of bipolar spectrum disorder in the world mental health survey initiative. Arch Gen Psychiatry. 2011;68(3):241-251.
46. Rowland TA, Marwaha S. Epidemiology and risk factors for bipolar disorder. Ther Adv Psychopharmacol 2018;8(9):251-269
47. Grant BF, Stinson FS, Hasin DS, Dawson DA, Chou SP, Ruan WJ, et al. Prevalence, correlates, and comorbidity of bipolar I disorder and axis I and II disorders: Results from the national epidemiologic survey on alcohol and related conditions. J Clin Psychiatry. 2005;66(10):15387.
48. Johnson KR, Johnson SL. Cross-national prevalence and cultural correlates of bipolar I disorder. Soc Psychiatry Psychiatr Epidemiol. 2014; 49(7):1111-1117.
49. Clemente AS, Diniz BS, Nicolato R, Kapczinski FP, Soares JC, Firmo JO, et al. Bipolar disorder prevalence: A systematic review and meta-analysis of the literature. Braz J Psychiatry. 2015;37(2):155-161.
50. Gogos A, Ney LJ, Seymour N, Van Rheenen TE, Felmingham KL. Sex differences in schizophrenia, bipolar disorder, and post-traumatic stress disorder: Are gonadal hormones the link? Br J Pharmacol. 2019;176(21):41194135.
51. Diflorio A, Jones I. Is sex important? Gender differences in bipolar disorder. Int Rev Psychiatry. 2010;22(5):437-452.
52. Sher L, Grunebaum MF, Sullivan GM, Burke AK, Cooper TB, Mann JJ, et al. Testosterone levels in suicide attempters with bipolar disorder. J Psychiatr Res 2012;46(10):1267-1271.
53. Sher L, Grunebaum MF, Sullivan GM, Burke AK, Cooper TB, Mann JJ, et al. Association of testosterone levels and future suicide attempts in females with bipolar disorder. J Affect Disord. 2014; 166:98-102.
54. Vaskinn A, Sundet K, Simonsen C, Hellvin T, Melle I, Andreassen OA. Sex differences in neuropsychological performance and social functioning in schizophrenia and bipolar disorder. Neuropsychology. 2011; 25(4): 499-510.
55. McGuffin P, Rijsdijk F, Andrew M, Sham P, Katz R, Cardno A. The heritability of bipolar affective disorder and the genetic relationship to unipolar depression. Arch Gen Psychiatry. 2003; 60(5): 497-502.
56. Kieseppa T, Partonen T, Haukka J, Kaprio J, Lonnqvist J. High concordance of bipolar I disorder in a nationwide sample of twins. Am J Psychiatry. 2004:161(10):18141821.
57. Song J, Bergen SE, Kuja-Halkola R, Larsson H, Landen M, Lichtenstein P. Bipolar disorder and its relation to major psychiatric disorders: A family-based study in the Swedish population. Bipolar Disord. 2015; 17(2):184-193.
58. Bienvenu OJ, Davydow DS, Kendler KS. Psychiatric 'diseases' versus behavioral disorders and degree of genetic influence. Psychol Med. 2011;41(1):33-40.
59. Zhang C, Xiao X, Li T, Li M. Translational genomics and beyond in bipolar disorder. Mol Psychiatry 2021;26(1):186-202
60. Sklar P, Smoller JW, Fan J, Ferreira MAR, Perlis RH, Chambert K, et al. Whole-genome study of bipolar disorder. Mol Psychiatry. 2008; 13: 558-569
61. Baum AE, Akula N, Cabanero M, Cardona I, Corona W, Klemens B, et al. A genome-wide association study implicates diacylglycerol kinase eta (DGKH) and several other genes in the etiology of bipolar disorder. Mol. Psychiatry. 2008;13(2):197–207.
62. Stahl EA, Breen G, Forstner AJ, McQuillin A, Ripke S, Trubetskoy V, et al. Genome-wide association study identifies 30 loci associated with bipolar disorder. Nat Genet. 2019;51(5):793-803.
63. Mullins N, Forstner AJ, O’Connell KS, Coombes B, Coleman JR, Qiao Z, et al. Genome-wide association study of more than 40,000 bipolar disorder cases provides new insights into the underlying biology. Nat Genet 2021;53(6):817-829. doi: 10.1038/s41588-021-008574.
64. Cross-Disorder Group of the Psychiatric Genomics Consortium. Identification of risk loci with shared effects on five major psychiatric disorders: A genome-wide analysis. Lancet. 2013;381(9875):1371-1379.
65. Gershon ES, Grennan K, Busnello J, Badner JA, Ovsiew F, Memon S, et al. A rare mutation of CACNA1C in a patient with bipolar disorder, and decreased gene expression associated with a bipolar-associated common SNP of CACNA1C in brain. Mol Psychiatry. 2014;19(8):890-894
66. Jia X, Goes FS, Locke AE, Palmer D, Wang W, CohenWoods S, et al. Investigating rare pathogenic/likely pathogenic exonic variation in bipolar disorder. Mol Psychiatry. 2021;26(9):5239–5250.doi.org/10.1038/ s41380-020-01006-9
67. Kenny EM, Cormican P, Furlong S, Heron E, Kenny G, Fahey C, et al. Excess of rare novel loss-of-function variants in synaptic genes in schizophrenia and autism spectrum disorders. Mol Psychiatry. 2014;19(8):872-879. doi:10.1038/mp.2013.127
68. Kataoka M, Matoba N, Sawada T, Kazuno AA, Ishiwata M, Fujii K, et al. Exome sequencing for bipolar disorder points to roles of de novo loss-of-function and protein-altering mutations. Mol Psychiatry. 2016;21(7):885-893.
30
Bipolar Disorder: A Brief Literature Review of Diagnostic Issues, Epidemiology, and Potential Causes
69. Nakamura T, Nakajima K, Kobayashi Y, Itohara S, Kasahara T, Tsuboi T, et al. Functional and behavioral effects of de novo mutations in calcium-related genes in patients with bipolar disorder. Hum Mol Genet. 2021; 30(19):1851–1862 doi.org/10.1093/hmg/ddab152
70. Kato TM, Kubota-Sakashita M, Fujimori-Tonou N, Saitow F, Fuke S, Masuda A. Ant1 mutant mice bridge the mitochondrial and serotonergic dysfunctions in bipolar disorder. Mol Psychiatry. 2018;23(10): 2039-2049
71. Muneer A. Wnt and GSK3 signaling pathways in bipolar disorder: Clinical and therapeutic implications. Clin Psychopharmacol Neurosci. 2017;15(2):100-114. doi: 10.9758/cpn.2017.15.2.100
72. Matigian N, Windus L, Smith H, Filippich C, Pantelis C, McGrath C, et al. Expression profiling in monozygotic twins discordant for bipolar disorder reveals dysregulation of the WNT signaling pathway. Mol Psychiatry. 2007;12(9):815-825. doi:10.1038/ sj.mp.4001998
73. Valvezan AJ, Klein PS. GSK-3 and Wnt signaling in neurogenesis and bipolar disorder. Front Mol Neurosci 2012;5: 1-13. doi: 10.3389/fnmol.2012.00001.
74. Cole AR. Glycogen synthase kinase 3 substrates in mood disorders and schizophrenia. FEBS J. 2013; 280(21): 5213-5227. doi: 10.1111/febs.12407.
75. Heinrich A, Lourdusamy A, Tzschoppe J, Vollstädt-Klein S, Bühler M, Steiner S, et al. The risk variant in ODZ 4 for bipolar disorder impacts on amygdala activation during reward processing. Bipolar Disord. 2013;15(4):440-445.
76. Harrison PJ, Colburne L, Harrison CH. The neuropathology of bipolar disorder: Systematic review and meta-analysis. Mol Psychiatry. 2020; 25(8):17871808.
77. Hibar DP, Westlye LT, van Erp TG, Rasmussen J, Leonardo CD, Faskowitz J, et al. Subcortical volumetric abnormalities in bipolar disorder. Mol Psychiatry. 2016; 12:1710–1716.
78. Hibar DP, Westlye LT, Doan NT, Jahanshad N, Cheung JW, Ching CRK, et al. Cortical abnormalities in bipolar disorder: An MRI analysis of 6503 individuals from the ENIGMA Bipolar Disorder Working Group. Mol Psychiatry. 2018; 4:932–942.
79. Drevets WC, Price JL, Simpson JR, Todd RD, Reich T, Vannier M, et al. Subgenual prefrontal cortex abnormalities in mood disorders. Nature. 1997; 386(6627):824-827.
80. Altshuler LL, Bartzokis G, Grieder T, Curran J, Mintz J. Amygdala enlargement in bipolar disorder and hippocampal reduction in schizophrenia: An MRI study demonstrating neuroanatomic specificity. Arch Gen Psychiatry. 1998; 55(7): 663- 664
81. Kloiber S, Rosenblat JD, Husain MI, Ortiz A, Berk M, Quevedo J, et al. Neurodevelopmental pathways in bipolar disorder. Neurosci Biobehav Rev. 2020. 112: 213226
82. Sarrazin S, Cachia A, Hozer F, McDonald C, Emsell L, Cannon DM, et al. Neurodevelopmental subtypes of bipolar disorder are related to cortical folding patterns: An international multicenter study. Bipolar Disord. 2018; 20(8): 721-732
83. Kim EY, Miklowitz DJ, Biuckians A, Mullen K. Life stress and the course of early-onset bipolar disorder. J Affect Disord. 2007;99(1-3):37-44.
84. Tijssen MJ, Van Os J, Wittchen HU, Lieb R, Beesdo K, Wichers M. Risk factors predicting onset and persistence of subthreshold expression of bipolar psychopathology among youth from the community. Acta Psychiatr Scand 2010;122(3):255-266.
85. Freedman D, Brown AS, Shen L, Schaefer CA. Perinatal oxytocin increases the risk of offspring bipolar disorder and childhood cognitive impairment. Journal of Affective Disorders. 2015 Mar;173:65-72.
86. Parboosing R, Bao Y, Shen L, Schaefer CA, Brown AS. Gestational Influenza and Bipolar Disorder in Adult Offspring. JAMA Psychiatry. 2013 Jul 1;70(7):677.
87. Canetta SE, Bao Y, Co MDT, Ennis FA, Cruz J, Terajima M, et al. Serological Documentation of Maternal Influenza Exposure and Bipolar Disorder in Adult Offspring. AJP 2014 May;171(5):557-63.
88. Lees B, Mewton L, Jacobus J, Valadez EA, Stapinski LA, Teesson M, et al. Association of Prenatal Alcohol Exposure With Psychological, Behavioral, and Neurodevelopmental Outcomes in Children From the Adolescent Brain Cognitive Development Study. Am J Psychiatry. 2020 11 1;177(11):1060-72.
89. Rasmussen C, Andrew G, Zwaigenbaum L, Tough S. Neurobehavioural outcomes of children with fetal alcohol spectrum disorders: A Canadian perspective. Paediatr Child Health. 2008 Mar;13(3):185-91.
90. Lees B, Mewton L, Jacobus J, Valadez EA, Stapinski LA, Teesson M, et al. Association of Prenatal Alcohol Exposure With Psychological, Behavioral, and Neurodevelopmental Outcomes in Children From the Adolescent Brain Cognitive Development Study. AJP. 2020 Nov 1;177(11):1060-72.
91. Easey KE, Dyer ML, Timpson NJ, Munafò MR. Prenatal alcohol exposure and offspring mental health: A systematic review. Drug Alcohol Depend. 2019 04 1;197:344-53.
92. Talati A, Bao Y, Kaufman J, Shen L, Schaefer CA, Brown AS. Maternal Smoking During Pregnancy and Bipolar Disorder in Offspring. AJP. 2013 Oct;170(10):1178-85.
93. Etain B, Mathieu F, Henry C, Raust A, Roy I, Germain A, et al. Preferential association between childhood emotional abuse and bipolar disorder. J Trauma Stress 2010;23(3):376-383.
94. Alloy LB, Abramson LY, Smith JM, Gibb BE, Neeren AM. Role of parenting and maltreatment histories in unipolar and bipolar mood disorders: Mediation by cognitive vulnerability to depression. Clin Child Fam Psychol Rev 2006;9(1):23-64.
31
Bipolar Disorder: A Brief Literature Review of Diagnostic Issues, Epidemiology, and Potential Causes
95. Menculini G, Balducci PM, Attademo L, Bernardini F, Moretti P, Tortorella A. Environmental risk factors for bipolar disorders and high-risk states in adolescence: A systematic review. Medicina (Kaunas). 2020;56(12): E689.
96. Garno JL, Goldberg JF, Ramirez PM, Ritzler BA. Impact of childhood abuse on the clinical course of bipolar disorder. Br J Psychiatry. 2005; 186:121-125.
97. Agnew-Blais J, Danese A. Childhood maltreatment and unfavourable clinical outcomes in bipolar disorder: A systematic review and meta-analysis. Lancet Psychiatry 2016;3(4):342-349.
98. Bergink V, Larsen JT, Hillegers MH, Dahl SK, Stevens H, Mortensen PB, et al. Childhood adverse life events and parental psychopathology as risk factors for bipolar disorder. Transl Psychiatry. 2016;6(10): e929. doi: 10.1038/tp.2016.201.
99. Feingold D, Weiser M, Rehm J, Lev-Ran S. The association between cannabis use and mood disorders: A longitudinal study. J Affect Disord. 2015; 172:211-218.
100. Cerullo MA, Strakowski SM. The prevalence and significance of substance use disorders in bipolar type I and II disorder. Subst Abuse Treat Prev Policy. 2007; 2:29. doi: 10.1186/1747-597X-2-29.
101. Preuss UW, Schaefer M, Born C, Grunze H. Bipolar disorder and comorbid use of illicit substances. Medicina (Kaunas). 2021;57(11):1256. doi: 10.3390/ medicina57111256.
102. Khan A, Plana-Ripoll O, Antonsen S, Brandt J, Geels C, Landecker H, et al. Environmental pollution is associated with increased risk of psychiatric disorders in the US and Denmark. PLoS Biol. 2019;17(8): e3000353. doi: 10.1371/journal.pbio.3000353
103. Bauer M, Glenn T, Alda M, Andreassen OA, Ardau R, Bellivier F, et al. Impact of sunlight on the age of onset of bipolar disorder. Bipolar Disord. 2012;14(6):654-63.
104. Carta MG, Ouali U, Perra A, Ben Cheikh Ahmed A, Boe L, Aissa A, et al. Living with bipolar disorder in the time of Covid-19: Biorhythms during the severe lockdown in Cagliari, Italy, and the moderate lockdown in Tunis, Tunisia. Front Psychiatry. 2021; 12:634765. doi: 10.3389/ fpsyt.2021.634765.
105. Fornaro M, De Prisco M, Billeci M, Ermini E, Young AH, Lafer B, et al. Implications of the COVID-19 pandemic for people with bipolar disorders: A scoping review. J Affect Disord. 2021;295:740-751.
106. Koenders M, Mesbah R, Spijker A, Boere E, de Leeuw M, van Hemert B, et al. Effects of the COVID-19 pandemic in a preexisting longitudinal study of patients with recently diagnosed bipolar disorder: Indications for increases in manic symptoms. Brain Behav. 2021;11(11): e2326. doi: 10.1002/brb3.2326.
107. Sperling JD, Dalkner N, Berndt C, Fleischmann E, Ratzenhofer M, Martini J, et al. Physical health profile and associated behavior during the COVID-19 pandemic in patients with bipolar disorder. Front Psychiatry. 2021; 12:759694. doi: 10.3389/fpsyt.2021.759694.
108. Yocum AK, Zhai Y, McInnis MG, Han P. Covid-19 pandemic and lockdown impacts: A description in a longitudinal study of bipolar disorder. J Affect Disord 2021; 282:1226-1233.
109. Stefana A, Youngstrom EA, Chen J, Hinshaw S, Maxwell V, Michalak E, et al. The COVID-19 pandemic is a crisis and opportunity for bipolar disorder. Bipolar Disord 2020;22(6):641-643.
32
A Qualitative Analysis of Goal Orientation Theory in Pre-clinical Medical Students
Irene Y. Cho1†, Katelyn A. Young², Sarah A. Hayek², and Rebecca L. Hoffman² ¹Geisinger Commonwealth School of Medicine, Scranton, PA 18509 ²Department of Surgery, Geisinger Medical Center, Danville, PA 17822 †Doctor of Medicine Program
Correspondence: icho@som.geisinger.edu
Abstract
Background: Goal orientation (GO) is a construct which describes domains of motivation in learning. While the end goal of proficiency is the same, the means to attain this differ. Some learners achieve proficiency through a desire for mastery (MG), while others focus on outperforming others (performance approach, PAP) or on avoiding failure (performance avoid, PAV). The aim of this study was to understand how GO theory manifested in pre-clinical medical students.
Methods: A thematic analysis was performed by conducting interviews virtually with pre-clinical students (first- and secondyear students, n=10) from an Association of American Medical Colleges (AAMC)-accredited allopathic U.S. medical school. Questions were asked to assess student responses to feelings of achievement and failure in their medical school experiences. Fully anonymized transcripts underwent a hybrid a priori and emergent coding procedure.
Results: Analysis revealed 12 subthemes under three main domains pertaining to the preclinical medical student experience. Students showed highest expressions in Mastery, Performance Approach, then Performance Avoid. Feelings of MG and PAV manifested in a more traditional sense and involved conscientious switching, whereas PAP presented in more diverse subdomains such as reliance on peer support through accountability, a “One Team” approach (the belief that peers are working as a team and led by the desire for everyone to succeed), or a “One Person” approach (the belief that peers are competitors and led by the desire to achieve the best future residency/faculty position).
Conclusion: These findings provide evidence that manifestations of GO constructs are dynamic in individuals and largely context dependent. Within each domain, selfefficacy was shown to be the most common determinant on the dominant motivation profiles expressed by individuals. GO should be further analyzed in clinical students to understand the effect of the clinical learning environment on educational motivation in medical students.
Introduction
In the 1980s, goal orientation (GO) was developed to describe the social-cognitive processes that fuel motivation in adolescent learners, namely, the adaptive (mastery) and maladaptive (performance) patterns of achievement (1). Mastery goals (MG) are focused on achieving individual competency, whereas performance goals are led by the desire to demonstrate competency among or for others. While students that set mastery goals demonstrate higher preferences for challenge
and academic risk-taking, those who set performance goals experience negative influences on learning and achievement (2 3).
There are two separate patterns within the performance domain: performance approach (PAP) and performance avoid (PAV). In PAP, individuals strive toward competency by their desire to display ability among their peers. In PAV, individuals strive towards competency through their desire to avoid looking incompetent (4).
To understand which GOs are associated with positive and negative outcomes in advanced learners, studies have utilized variable-oriented, mixed-methods approaches with Likert scales to compare self-reported motivation goals with learning outcomes (3, 5). In 2004, an Academic Motivation Scale survey administered to undergraduate medical students in Brazil found that students that scored higher in autonomous motivation and practiced mastery orientation tended to utilize metacognitive studying strategies involving meaning orientation and reflection in learning (6 7).
Though the relationship between GO and learning outcomes is well described in lower-level learners, there is little known about how GO can develop with student ability to overcome unforeseen academic challenges (8–10). Motivation influences the study habits and learning strategy efficacy of future physicians. This study takes a first-person oriented approach to better understand and predict how GO manifests in preclinical medical students. Through individual interviews of first- and second-year medical students attending a hybrid virtual/inperson curriculum due to the COVID-19 pandemic, we sought to characterize the factors influencing motivation profile switching and dominance.
Methods
Two hundred and twenty-nine students that had just completed their first and second pre-clinical medical school years from Geisinger Commonwealth School of Medicine were invited to complete an interview about “Goal Orientation in Medical Students” in June 2021. Recruitment began through a mass email sent out to the first- and second-year classes. To reduce bias in the interview answers, except for the recruitment stage, the co-investigators had no direct contact with potential or confirmed participants and were blinded to identifying data. All interviews were conducted via the Zoom video conferencing application by a project manager (KY). No authors had conflicts of interest with Geisinger Commonwealth School of Medicine. Interviews were conducted on a rolling basis over a two-month period between June and August 2021. Approval
Scholarly Research In Progress • Vol. 6, November 2022
33
A Qualitative Analysis of Goal Orientation Theory in Pre-clinical Medical Students
was granted to Geisinger Medical Center by the Institutional Review Board prior to recruitment of participants. Participants were compensated with a $10 gift card. Informed consent was obtained.
There were two main topics covered by the interview questions. One set of questions assessed general motivation, with a specific slant on GO subtype, such as: What motivates you to achieve in your current role as a medical student? What (GOs) do you see yourself practicing more and is it different from what is a stronger motivator for you? Another set of questions assessed the educational environment of the most recent academic year on student learning habits, such as: How has the COVID virtual learning environment influenced your motivation? How does flipped classroom model and responsibility to come to class prepared affect your motivation to study? These questions were adapted from previous studies and are the first set of open-ended questions administered from GO theory (11). A total of 14 questions were asked with opportunity for elaboration via follow-up questions as needed.
The interviews each took an average of 40 minutes. They were transcribed, deidentified, and entered into the qualitative data analysis application Dedoose for coding (12). Demographic information collected included student’s ethnicity, gender, age, specialty interests, and Myers-Briggs profile (13). These data allowed the authors to ensure a diverse demographic was interviewed (Table 1).
Data collection and analysis
Anonymous interview transcriptions were analyzed utilizing a hybrid a priori method of coding, where root codes were established from GO Theory main subtypes (MG, PAV, PAP) and novel root and subordinate codes were gradually added to capture emergent themes in new transcriptions. To achieve intercoder reliability, following rounds of independent interview transcript coding, the principal investigator (RH) and coinvestigator (IC) met weekly to review excerpts and discuss their corresponding codes. New and old codes were added, redefined, or merged with preexisting codes to match evolving data patterns. Using grounded theory guided by GO, and after all the transcriptions were coded, data were re-modeled using memoing to regroup and draw subtheme connections corresponding to each GO domain.
Results
Overall, thematic saturation was achieved after 10 interviews from 7 first-year students and 3 second-year students. There were 7 women and 3 men ranging in age from 23 to 27 years old (Table 1). Out of 244 excerpts, >117 excerpts were coded under MG, >46 under PAP, and >34 under PAV. Some excerpts were coded to more than one orientation or subtheme, and each interviewee was seen to exhibit several orientations even with their response to a single situation (Table 2). The interviews produced a thematic hierarchy of 12 subthemes (Figures 1-3): five subthemes (grouped subordinate codes) emerged under the MG, four subthemes emerged under PAV, and three subthemes emerged under PAV.
Mastery goal orientation themes
Relatability to oneself (MG)
This was the most dominant motivational subtheme seen in preclinical medical students. It stems from a desire to reciprocate the connection felt to another person or topic. This relatability was primarily led by personal interests, but heavily inspired by a human connection or novel academic discovery.
The desire to go beyond and to master that material, because you see that the professors care not only about their subject, but about you as well. (Interview 1)
This comment referred to the student’s Gross Anatomy Lab experience, one of the few in-person courses offered. COVID-19 restrictions increased communication barriers as students learned in a predominantly virtual environment. They expressed decreased relatability while viewing prerecorded lectures. When this shortage of human interaction was compounded by depressed academic interest, students showed polarized conscientious switching to a PAV subtheme (Context Dependent).
Future patients/applicability for others (MG)
This subtheme was seen as the desire to help patients and minimize knowledge gaps in future career goal achievement. Students with medical experiences outside of school referred to them as motivators and reminders of future responsibility. These included a relative with illness, memorable patient cases, and physician mentor commitment to service. For students with specialties in mind, several medical curriculum milestones were discussed as building blocks to achieving their future career goals: Step 1 examination, extracurricular roles, and Block examinations. Succeeding in these landmarks were seen as crucial to maintaining a specified career trajectory. This presents as a mastery subtype because students challenge themselves to go beyond what is required when the focus of their attention exceeds their present obligations.
I try to remind myself that there are future patients waiting for me to finish my training and…do good for them. (Interview 3)
Self-competition (MG)
This subtheme describes when learners aim to outdo their previous achievements with each new challenge. In response to the question: What happens to your motivation when you get a bad grade/review? These students described feeling more motivated knowing that they could improve by reflecting on their mistakes. Participants saw self-assessment as a tool for improvement and recovered from failures through augmented self-expectations. This trait was observed to be innate or acquired by educational experiences prior to medical school. You can get by with putting in minimal effort just to pass, but are you really going to be happy with what you've done at the end of the day? (Interview 2)
“Intercession”: Timing and adaptability in students (MG)
This subtheme emerged under coding excerpts on student reactions to prerecorded vs live lectures. The students that preferred prerecorded lectures expressed that the ability to
34
A Qualitative Analysis of Goal Orientation Theory in Pre-clinical Medical Students
control lecture speed and take extended study breaks helped to rejuvenate their level of energy and passion. This was comparable to students that experienced renewed motivation after an extended break between blocks. A “block” is an academic layout where exams are given and review is conducted by system (i.e., renal block, heme block). In extensive blocks without breaks, students reported feeling burnt out and were more likely to resort to PAV (Context Dependent) orientation.
I’ve given myself the time and space to process what I’m feeling…and I’m motivated to never feel that way again. (Interview 1)
Love of learning (MG)
This subtheme describes motivation fueled by the enjoyment felt from the process of learning and understanding a topic. Some learners expressed this with a broad range of subjects, while other learners expressed this only with topics of interest. Learners in this category are guided by genuine interest and reviewed details extending outside class material.
If it seems relevant or interesting to my field, I'll be excited for it. (Interview 2)
Performance approach orientation themes
Self-consciousness (PAP)
This subtheme is defined as self-awareness that occurs with self-comparison to peers. Although most allopathic medical schools are adopting pass/fail curriculums, self-consciousness persists in students comparing their grades to the class average and in discussing learning styles and study resources with peers. The insecurity that developed from these interactions motivated students to modify their performance.
Excerpt
My friends make fun of me... they're like, 'You still haven't reviewed it, are you sure?' They're lighthearted jokes but more worried for me. And then I'm like, 'Oh man, should I have actually done this earlier?' (16)
Table 1: Summary of participant demographics (n=10)
Goal orientation
PAP: Self-consciousness
PAV: Fear of disappointing self/others or the "Imposter Syndrome Effect"
Description
The awareness of self that is elevated when around others and compared against others
Imposter Syndrome Effect: Difficulty with accepting achievements makes it easier for students to accept that they have avoided failure
Abbreviations: I6, Interview 6; PAP, Performace Approach; PAV, Performace Avoid
Table 2: Example of subtheme expression demonstrating several orientations to a single situation
Gender Female 7 Male 3 Age
Range 23-27 Mean 24.6
One 7 Two 3 Ethnicity European-American 6 Asian 3 Hispanic 1 Specialty(ies)
Emergency Medicine 4
3
2
1
1
(y)
Completed years of medical school
of interest
Combined Internal Medicine and Pediatrics
Oncology
Internal Medicine
Family Medicine
Cardiology 1 Pathology 1 Dermatology 1 Myers Briggs* Extroversion vs. introversion 4:5 Intuition vs. sensing 2:7 Feeling vs. thinking 2:7 Judging vs. perceiving 8:1 *n=1 missing
35
To reciprocate the connection felt from or to another person or topic.
Depending on the context it can fluctuate a learner from Mastery or PAV.
"The desire to go beyond and to master that material, because you see that the professors care not only about their subject, but about you as well."
The desire to be able to help future patients and to minimize uninformed decision-making in achieving career goals.
To outdo one's previous achievement when presented with a new challenge.
Ability to take extended breaks from studies to rejuvenate energy and passion for topic.
Depending on the context it can fluctuate learner from MG to PAV.
Fueled by the enjoyment felt by the process of learning/understanding a topic (can be shared through social interaction involving topic).
"I try to remind myself that there are future patients waiting for me to finish my training and... do good for them."
"You can get by with putting in minimal effort just to pass, but are you really going to be happy with what you've done at the end of the day?"
"I've given myself the time and space to process what I'm feeling... and I'm motivated to never feel that way again."
"If it seems relevant or interesting to my field, I'll be excited for it."
Figure 1: Mastery subthemes
If I'm below average or like just a little bit above average, I'm like ugh, that wasn't too good… I feel so self-conscious just by comparing myself to the class in general. (Interview 5)
Accountability (PAP)
This was seen in group settings where learners displayed competence to each other. Both parties have an expectation and desire to succeed together, creating a synergistic learning environment where learners are motivated to perform their best individually and as a group.
(Colleagues) can motivate you to do better… interacting with another person is more high yield…one party is creating the question and the other is trying to understand what the question is asking for and trying to get the answer. (Interview 10)
“One Team” approach (PAP)
This subtheme describes the belief that peers are working as a team and led by the desire for everyone to succeed. The sense of camaraderie from this mindset allows individuals to take failures less personally and stay positive throughout the learning process.
People around you that you're supposed to be collaborating with… a lot of them are going through the same thing that I'm going through…It's reassuring to me that maybe I'm not doing something wrong. (Interview 2)
“One Person” approach (PAP)
In contrast to the above subtheme, the One Person subtheme describes the belief that peers are competitors. This view places pressure on individual performance and the ability to outperform their peers. The motivation presents as a heightened sense of competition in group settings.
Qualitative
Goal
Pre-clinical
A
Analysis of
Orientation Theory in
Medical Students
*Size of first column subtheme boxes correlate to their observed prevalence. Mastery a. Relatability to oneself* b. Future patients/ applicability for others c. Self-competition d. "Intercession:" Timing and adaptability in students e. Love of learning 36
A Qualitative Analysis of Goal Orientation Theory in Pre-clinical Medical Students
Performance approach
The awareness of self that is elevated when around others and compared against others Peer support where learners display competence to each other.
"If I'm below average or like just a little bit above average, I'm like, 'Ugh, you know, that wasn't too good...' I feel so self-conscious just by comparing myself to the class in general."
"(Colleagues) can motivate you to do better... interacting with another person is more high yield... one party is creating the question and the other is trying to understand what the question is asking for and trying to get an answer."
The belief that peers are working as a team and/ or led by the desire for everyone to succeed.
"People around you that you're supposed to be collaborating with... a lot of them are going through the same thing that I'm going through... it's reassuring to know that maybe I'm not doing something wrong."
The belief that peers are competitors and/or led by the desire to be the best among peers or achieve the best future residency/ faculty position.
"I was with other peers... I wanted to make sure I was on top of my game and just be able to answer all their (faculty's) questions."
I was with other peers…I wanted to make sure I was on top of my game and just be able to answer all their (faculty) questions. (Interview 7)
Performance avoid orientation themes
Fear of disappointing self/others or the “Imposter Syndrome Effect” (PAV)
This subtheme describes the protective mechanism whereby an individual (the imposter) has difficulty with accepting achievements as products of their own efforts; they believe that they have merely just avoided failure. This mindset forces the learner to compare their competency to an unrealistic standard set by their self-judgment and self-consciousness. Instead of learning for the sake of learning, students struggle to avoid failure.
The last thing you want to do is get here, finally be able to say that you were in medical school and then fail out. (Interview 1)
“Immediacy”: prioritizing in a high pressure/workload environment (PAV)
Desperation serves as a motivator when students must complete a task under a heavy workload or time pressure. Students choose to meet minimum passing requirements over mastering material. This is preferred when students feel they are unable to meet a timeline. They default to the option of passing rather than rising to meet a higher personal or external standard.
When there's a lot of material and it's hard to organize … okay, let's just make sure I not fail this part of the course. (Interview 3)
Context dependent on topic/learning environment (PAV) Students were more likely to resort to PAV orientation when there was a lack of breaks in between learning, interest or relevance in the topic being covered, or relatability to the lecturer.
Figure 2: Performance approach subthemes
*Size of first column subtheme boxes correlate to their observed prevalence. a. Selfconsciousness* b. Accountability c. "One Team" approach d. "One Person" approach
37
Performance avoid
Imposter Syndrome Effect: Difficulty with accepting achievements makes it easier for students to accept they've avoided failure.
Comes into play when student feels the need to complete task under the pressure of time or high workload (influenced by COVID and new pass/fail curriculum).
Context dependent/information applicability: Time, lecturer, interest in topic. Depending on the context, it can fluctuate a learner from Master or PAV.
*Size of first column subtheme boxes correlate to their observed prevalence.
"The last thing you want to do is get here, finally be able to say that you were in medical school, and then fail out."
"When there's a lot of material and it's hard to organize... okay let's just make sure I not fail this part of the course.."
"Neuroscience was very clinically relevant... so I know I need it and I'll use it in the future versus some biochemistry exams, it would be mastering it to 70% so that I don't fail and I could move on."
Neuroscience was very clinically relevant... so I know I need it and use it in the future vs some biochemistry exams, it would be mastering it to 70% so that I don't fail.
(Interview 5)
Discussion
This qualitative study on the manifestations of GO in pre-clinical medical students demonstrates that GO constructs are dynamic and largely context dependent and that mastery is predominant in preclinical medical students. Interestingly, across all three GO domains, the highest subtheme expressions relate to self-image. These include Relatability to Oneself (MG), Self-consciousness (PAP), and Fear of Disappointing Self/Others (PAV). These results suggest that self-concept and self-efficacy have a greater impact on motivation orientation than environmental and social influences. Self-concept is the general view of oneself. Selfefficacy is confidence in one’s ability to face future challenges and serves as a precursor for self-concept development (14, 15).
These results connect goal orientation theory with selfdetermination theory by showing that participants with high self-efficacy and an internal locus of control are more likely to express mastery orientation (16). Participants with external loci are more likely to consider their performance in context of
others, which aligns with the performance orientation types. It is also notable that participants with low self-efficacy more commonly experience imposter syndrome by attributing achievement to forces outside their control (PAV: Fear of Disappointing Self/Others or the "Imposter Syndrome Effect”). Despite the influence of self-efficacy in achievement, few educational interventional studies have successfully examined this experience in medical students (17). This is primarily due to incomplete understanding of the conceptual underpinnings of self-efficacy and validity measurements in academic settings (17). Past studies reviewing self-efficacy in the context of motivation were centered around sports performance. A 1991 study of male runners showed that at competitive track races, athletes assessing their self-efficacy by peer comparison had a more accurate representation of their performance outcome than those focused on self-competition (18). However, peer comparison appeared to undermine self-efficacy. These findings exhibit the duality of performance outcome accuracy and negative self-confidence associated with performance-based orientations. Similarly in PAV subtheme “Immediacy,” students pressured to meet an approaching deadline preferred PAV over MG to attain time-sensitive goals. Students chose to meet minimum requirements over fully learning material when they perceived time as a scare resource. Though both orientations, PAV, and MG, may lead to similar short-term results, the
A Qualitative Analysis of Goal Orientation Theory in Pre-clinical Medical Students
Figure 3: Performance avoid subthemes
a. Fear of disappointing self/others or the "Imposter Syndrome Effect"*
b.
"Immediacy:" prioritizing in a high pressure/workload environment
c.
Context dependent by topic/learning environment
38
A Qualitative Analysis of Goal Orientation Theory in Pre-clinical Medical Students
mounting cognitive effects of each orientation on student selfefficacy can spell out the difference between success and failure in the long-term.
Unlike a race in which there is immediate feedback on tasks, the medical curriculum is focused on building resiliency in students over time. The knowledge and confidence to take on patient cases in the ward requires sturdy cognitive performance. Therefore, when considering the value of self-efficacy for preclinical students, forming a self-concept that is more future-oriented and focused on long-term growth (MG: Future Patients/Applicability for Others) is likely more sustainable to maintaining student motivation than one that is influenced by immediate environmental factors (PAV: “Immediacy:” Prioritizing in a high pressure/workload environment).
In a 1993 study of competitive swimmers, labels of efficacy were randomly assigned. It found that congruence between learning habits and self-concept decreased mental distress in goal achievement (19). Likewise, medical students that expressed fears of failure (PAV) exhibited low self-confidence in their ability to successfully prepare for exams despite the absence of past failures. These students experienced decreased self-efficacy and increased mental distress through imposter syndrome and anxiety toward negative feedback.
The present study also describes the orientation switching that occurs in pre-clinical medical students. Both consciously and unconsciously, learners fluctuated between Mastery (MG: Relatability to Oneself, “Intercession:” Timing and Adaptability in Students) and Performance Avoid (PAV: Context Dependent by Topic/Learning Environment) depending on the learning environment. Though both orientations lead to competency, mastery orientations are associated with positive, higher metacognitive learning habits and challenge-seeking behavior (2). Performance Avoid orientations are associated with self-protective behaviors that impede optimal learning (20). It is possible that this polarizing switch is a form of burnout seen with suboptimal learning style or incompatible learning environment. Therefore, educational interventions should focus on addressing factors that appeal to MG expression such as increasing the availability of breaks between blocks, facilitating lecturer/learner interactions, and emphasizing clinically relevant portions of a lesson.
According to the 2020–2021 data from the Liaison Committee on Medical Education, over 80% of medical schools within Canada and the U.S. have adopted pass-fail curriculums for pre-clerkship course grading (21). These changes are made to minimize stress from grade point averages as measurements of success and rank (22). However, defining the minimum passing requirements allows students to avoid failure (PAV) instead of striving beyond what is required (MG). Because PAV is associated with negative learning habits, it is worth following the prolonged effects of this curriculum change on individual coping mechanisms and motivation.
This study is limited to data from students at a single institution. Therefore, results may be biased by the educational curriculum specific to Geisinger Commonwealth School of Medicine (2020–2021). However, by focusing on the non-clinical experiences of the pre-clinical curriculum, we hoped to minimize this bias as the curriculum is similar to that of other American medical schools. Additionally, attitudes and experiences may
have been heavily influenced by the learning environment unique to experiences from the COVID-19 pandemic. Future studies will investigate the manifestations of GO in clerkship (third- and fourth-year) medical students, given the unique pressures of learning in the clinical environment. In addition, we seek to develop a novel instrument to measure GO patterns in all medical students to gain a greater understanding regarding the relationship of GO patterns with the clinical learning environment, wellness, burnout rates, and influence on specialty choice.
Conclusion
By analyzing individual responses to achievement and failure in education, this study has provided a unique insight into intrinsic motivation using the goal orientation framework in pre-clinical medical students. Mastery vs. performance achievement goals are influenced by context-dependent self-efficacy. Moving forward, we would like to examine the learning environment contribution to the goal orientation mindset as well as methods to maximize learning efficacy and minimize maladaptive strategies.
References
1. Dweck CS. Motivational processes affecting learning. American Psychologist. 1986;41(10):1040-8.
2. Schunk DH, Meece JL. Student perceptions in the classroom. Hillsdale, N.J.: L. Erlbaum; 1992. xiii, 363 p. p.
3. Dupeyrat C, Mariné C. Implicit theories of intelligence, goal orientation, cognitive engagement, and achievement: a test of Dweck’s model with returning to school adults. Contemporary Educational Psychology. 2005;30:43-59.
4. Brophy J. Goal theorists should move on from performance goals. Educational Psychologist. 2005;40(3):167-76.
5. Sobral D. Learner's motivation in medical studies: use of the academic motivation scale. Psicologia: Teoria e Pesquisa 2003;19:25-31.
6. Sobral DT. What kind of motivation drives medical students' learning quests? Medical Education 2004;38(9):950-7.
7. Archer J. Achievement goals as a measure of motivation in university students. Contemporary Educational Psychology 1994;19(4):430-46.
8. Usán Supervía P, Salavera Bordás C, Murillo Lorente V. Psychological analysis among goal orientation, emotional intelligence and academic burnout in middle school students. International Journal of Environmental Research and Public Health. 2020;17(21).
9. Usán Supervía P, Salavera Bordás C. Burnout, goal orientation and academic performance in adolescent students. International Journal of Environmental Research and Public Health. 2020;17(18).
10. Usán P, Salavera C, Teruel P. School motivation, goal orientation and academic performance in secondary education students. Psychology Research and Behavior Management. 2019;12:877-87.
39
A Qualitative Analysis of Goal Orientation Theory in Pre-clinical Medical Students
11. Midgley C, Maehr M, Hruda L, Anderman E, Anderman L, Freeman K, et al. The Patterns of Adaptive Learning Scales (PALS) 2000. 2000.
12. Dedoose. 9.0.17 ed. Los Angeles, CA: SocioCultural Research Consultants, LLC 2021. p. web application for managing, analyzing, and presenting qualitative and mixed method research data.
13. Briggs KC. Myers-Briggs type indicator. Form G: Palo Alto, Calif. : Consulting Psychologists Press, [1987] ©1987; 1987.
14. Bandura A. On the functional properties of perceived selfefficacy revisited. Sage Publications Sage CA: Los Angeles, CA; 2012.
15. Bong M, Skaalvik EM. Academic self-concept and selfefficacy: how different are they really? Educational Psychology Review. 2003;15(1):1-40.
16. Kusurkar R, ten Cate O. AM last page: Education is not filling a bucket, but lighting a fire: self-determination theory and motivation in medical students. Academic Medicine 2013;88(6):904.
17. Klassen RM, Klassen JRL. Self-efficacy beliefs of medical students: a critical review. Perspectives on Medical Education. 2018;7(2):76-82.
18. Martin JJ, Gill DL. The relationship among competitive orientation, sport-confidence, self-efficacy, anxiety, and performance. Journal of Sport & Exercise Psychology 1991;13(2):149-59.
19. Miller M. Efficacy strength and performance in competitive swimmers of different skill levels. International Journal of Sport Psychology. 1993;24(3):284-96.
20. Licht BG, Dweck CS. Determinants of academic achievement: the interaction of children's achievement orientations with skill area. Developmental Psychology 1984;20(4):628-36.
21. LCME Annual Medical School Questionnaire Part II, 20162017 through 2020-2021.
22. Ange B, Wood EA, Thomas A, Wallach PM. Differences in medical students' academic performance between a pass/ fail and tiered grading system. Southern Medical Journal 2018;111(11):683-7.
40
The Molecular, Neurological, and Clinical Features of Diffuse Intrinsic Pontine Glioma
Kristen M. Denniston1*‡, Alexandra P. Dickson1*‡, Alexandra S. Fitzsimmons1*‡ , Gabrielle M. Verbeke-O'Boyle1*‡, and Brian J. Piper¹
¹Geisinger Commonwealth School of Medicine, Scranton, PA 18509
*Master of Biomedical Sciences Program
‡Authors contributed equally
Correspondence: adickson@som.geisinger.edu
Abstract
Diffuse intrinsic pontine glioma (DIPG) is recognized as a pediatric brainstem cancer with a 0% survival rate. On a molecular basis, DIPG commonly results from mutations in histone H3, specifically a mutation in the H3K27M gene, that promotes tumorigenesis and results in presentation of this fatal brainstem tumor. DIPG is challenging to treat, as surgical intervention is inefficacious due to the location where the glioma resides. To date, traditional treatments such as radiation, chemotherapy, and immunotherapy have not increased survival rates and have only been successful at relieving symptoms. Future therapeutic approaches such as proton beam radiation, chimeric antigen receptor T cell (CAR-T) immunotherapy, and alternative epigenetic pharmaceuticals are under investigation for potential benefits. Various clinical trials have also explored these treatment procedures to discover potential increases in survival rates in both animal and human studies. In this review, we will evaluate the pathology and molecular characteristics of DIPG and the current and future approaches to DIPG treatment, and we will discuss clinical trials that have been completed to develop successful treatment options.
Introduction
Diffuse intrinsic pontine glioma (DIPG) is a rare and fatal pediatric brainstem cancer with 200–300 new cases introduced in the United States (U.S.) each year (1, 2). From the onset of symptoms and diagnosis, children are typically given 8 to 14 months to live (2). With the anatomical region of DIPG being the brainstem, specifically the pons, there are currently no successful treatment options, resulting in a 0% survival rate (3). The aggressive symptoms of DIPG, occurring in those aged 5 to 10 years old, rapidly diminish the quality of life and result in most children receiving palliative care just 4 months after their initial diagnosis (4).
Methods
The primary source for article selection was the PubMed electronic database. The team reviewed appropriate free articles between the years 2012 and 2022 using keywords or search terms such as “DIPG,” “pediatric,” “glioma,” “brain tumor,” “clinical trial,” “CAR-T,” “pons,” “radiation therapy,” “histone mutation,” and “treatment.” Articles and authors were individually evaluated for quality by the team, and reference lists were used to find further relevant studies. Only studies evaluating children 0–18 years of age with diffuse intrinsic pontine glioma were used. Studies including patients with DIPG over the age of 18 were excluded.
Discussion
Clinical presentation
In DIPG, the tumor within the pons causes patients to present with brainstem dysfunction or cerebrospinal fluid obstruction including cranial nerve (CN) palsies, long tract signs, and ataxia (Figure 1) (5–7). Typically, the first symptom that presents is abducens nerve palsy that results in esotropia or diplopia. Following CN palsy, other common symptoms include difficulty walking, loss of balance, weakness, clumsiness, limited eye movements, and an asymmetric smile (5, 7). Some of the long tract signs that occur are increased tone, hyperreflexia, clonus, and the presence of a Babinski reflex. Symptoms of increased intracranial pressure can present in some patients due to the hydrocephalus caused by the expansion of the pons. Other symptoms such as behavioral changes, night terrors, and school difficulties have also been reported (5).
Figure 1: This MRI shows the region of the brain in which DIPG tumors develop. ©2019. St. Jude Children’s Research Hospital, a not-for-profit, section 501(c)(3). All rights reserved. Unauthorized use prohibited. Email together@stjude.org to request permission to use or reproduce this work.

Scholarly Research In Progress • Vol. 6, November 2022
41
Pathology and molecular characteristics
Based on the guidelines from the World Health Organization, DIPG can be classified as a grade II, III or IV tumor either by biopsy or autopsy (8). The tumor invades white and gray matter structures of the brain, and the majority have necrosis, mitotic figures, and microvascular proliferation (9).
The current theory about DIPG is that it results from mutations in histone H3 (9–11). The H3 family of histones are made up of H3.1, H3.2, and H3.3, which are all structurally and functionally related. The histones, along with their numerous chaperones, are important for allowing dynamic availability to specific genomic loci (12). H3.3 is encoded by both the H3F3A and H3F3B genes, while H3.1 is encoded by multiple genes. The mutation that appears in 70–84% of DIPG is the H3K27M mutation, which results in lysine being changed to methionine at K27 (9, 10). There has been some evidence showing an association between the histologic grade of the tumor and the presence of the H3.3 mutation. However, the H3K27M mutation can still be found in DIPG with grades II, III, or IV tumors (13). The position of this missense mutation disrupts the highly conserved N-terminal of the protein, which negatively affects the epigenetic regulation of gene expression (14). In addition, it can affect the nucleosome structure and its interactions with transcription factors. Research has found that this specific mutation, K27M, is a gain of function mutation that blocks the activity of the polycomb repressive complex 2, which plays a role in chromatin remodeling and epigenetic silencing of genes (PRC 2) (10, 15). While the mutant H3 variants are not high in number in DIPG cells, they do employ a dominant-negative effect that initiates histone trimethylation or dimethylation of all H3K27 in all H3 variants and the wildtypes (1, 16). The dominant-negative effect results in upregulation of gene expression at loci with the loss of H3K27me3. Conversely, genomic loci that gain the H3K27me3 have decreased expression of the accompanying genes, which some researchers believe contributes to tumorigenesis (16, 17). Also, H2K27me3 is found increasingly more within brain regions that also have H3K4 trimethylated, which usually promotes active gene transcription. The genes with both marks are said to be “bivalent” because they have both active and silent marks, which is also found to be involved in oncogenic pathways (1, 16).
While the H3K27M has been found to increase cell proliferation, research has shown that the mutation alone is not able to produce DIPG (18). Instead, the mutation must be accompanied by PDGFRA overexpression or TP53 loss to result in tumorigenesis. Combinations of the three mutations were studied to determine which had the greatest effect on tumorigenesis. Having all three mutations lead to the transformation of mouse neural stem cells into tumors, which had similar gene expression to that of human DIPG cells (18, 19). Additionally, not only does H3K27M initiate the formation of DIPG, but it is also required for maintenance of the formed tumors. Studies found that deletion of the mutation in DIPG tumor cells had negligible effect on cell growth in vitro, but inhibited tumorigenesis when implanted in mice (18, 20–21). Other mutations, like overexpression of the c-Met pathway and MYCN amplifications, found in autopsy samples of DIPG patients are topics of ongoing research to determine their part in tumorigenesis (8).
Current and future approaches to DIPG treatment Radiation
Current treatments for DIPG enhance one’s quality of life by temporarily relieving symptoms, but future advancements are necessary to prolong the life expectancy of patients diagnosed with DIPG (28). Radiation therapy (RT) is a standard treatment used for DIPG (28–29) and utilizes a 6-week regimen (28) of X-rays to deliver photons, or energy, to the glioma and damage cancerous cells and prevent tumor growth (30). While RT has been the only treatment known to alter the natural progression of DIPG, (31) improving 70–80% of a patient’s symptoms (2), this treatment does not prolong survival rate appreciably (28–29) and can leave patients with debilitating side effects from radiation toxicity (2, 29). Photon beam radiation therapy (PBT) may be a safer approach to treating DIPG (32). PBT is a promising treatment for primary gliomas, as it substitutes photons with protons to deliver less radiation to deep tissues surrounding the cancerous tumor and yields improved survival rates versus traditional RT practices (32). While the use of PBT is encouraging, more research and clinical trials are needed to thoroughly assess the risks and benefits (33).
Chemotherapy
Another common approach to treating DIPG is chemotherapy. Chemotherapy inhibits cell proliferation and tumor metastasis (34) by administering (usually intravenously or orally) drugs that kill cancer cells (34). Much like RT, chemotherapy does not extend a patient’s survival rate, which could be due to this treatment’s lack of penetration through the bloodbrain barrier (BBB) (34–35). As a treatment for DIPG, chemotherapy presents many complications. Tumor cells carry ABC transporters, also known as ATP binding cassette efflux transporters (36). Specifically, tumor cells carry ABC1. ABC1 is a P-glycoprotein responsible for multidrug resistance that is expressed in both tumor cells and at the BBB (36). With the ABC1 transporters at the blood brain barrier, 60% of drugs, including those used in chemotherapy treatments, are recognized and are unable to get past the BBB (36). Tumor cells that carry ABC1 transporters proliferate in the blood-brain tumor barrier (BBTB), which makes most gliomas difficult to target with chemotherapeutic drugs (37). The BBTB is the BBB that has been altered by pathological conditions, like DIPG. The BBTB disrupts the BBB and allows for minimal chemotherapeutic drugs to pass, however, not enough to significantly decrease tumor growth and proliferation (37). Due to DIPG being an extremely invasive tumor, areas that are unable to be reached by chemotherapeutic agents are constantly proliferating (36). This results in areas outside of the glioma becoming chemoresistant due to the increased number of tumor cells, and subsequently, an increased number of ABC1 transporters (36–37). Because of the chemoresistance of the BBB, as well as the increasing resistance as tumor cells proliferate, chemotherapy has not been as effective as many have hoped.
A traditional form of chemotherapy, intra-arterial (IA) chemotherapy, requires the use of a catheter to be inserted into the femoral artery (38). A microcatheter is then inserted to explore the blood vessels of interest (34) and chemotherapeutic agents are directly administered in concentrated doses to the cancerous region (31). By directly delivering chemotherapeutic
The Molecular, Neurological, and Clinical Features of Diffuse Intrinsic Pontine Glioma
42
agents to the glioma by the arterial system, side effects from chemotherapy toxicity can be bypassed (31). An experimental chemotherapeutic strategy for DIPG treatment that also has selective targeting actions is convection-enhanced delivery (CED) (38). CED can bypass the BBB and increase tumor uptake of chemotherapeutic agents (38) and can do so efficiently by utilizing hydrostatic pressure to drive fluid flow instead of relying on passive diffusion (39). A 2019 study conducted with an in vitro experiment that explored the potential benefits of CED by administering tumorigenesis pathway inhibitors to patient and mouse derived cell lines (40). Results from this investigation indicate that CED with these chemotherapeutic agents successfully inhibits growth of DIPG cells in vitro to ultimately prolongs survival (40). More pre-clinical trials are necessary to be completed before thoroughly assessing potential benefits of this procedure, but CED seems to be a promising treatment.
A meta-analysis (41) conducted from 1987 to 2005 consisted of an accumulation of DIPG investigations regarding its characteristic of being inoperable and potential alternative chemotherapy therapeutics. The first experiment analyzed the use of chemo-radiotherapy in which the progression of disease was observed by MRI and the average survival of 12 months was documented (41). The second study was an intensive high-dose course of chemotherapy (which involved chemotherapeutics such as cisplatin/etoposide, cyclophosphamide, vincristine, and methotrexate) and a subsequent course of myelosuppressive chemotherapeutics, radiation, and maintenance chemotherapy (41). The first four patients followed the chemotherapy schedule outlined within this report, but the use of immunosuppressants severely intensified present or novel neurological deficits in each case (41). Most patients in this study died due to tumor progression, with the average survival age being 13 months (41). La Madrid et al. examined the combinatorial immunotherapy treatment of cisplatin and etoposide followed by isotretinoin before, during, and after focal irradiation (41). This treatment was well-tolerated by the patients, with no significant adverse events disclosed, and the average survival of each patient was 12 months (41). La Madrid et al. explored the effects of intravenous vinorelbine before, during, and after irradiation (41). Vinorelbine was administered in a saline solution with anti-nausea medications and given before infusion and disease progression was observed by MRI (41). Multiple patients developed multiple transient episodes of monolateral peripheral facial nerve palsy during treatment, but these symptoms subsided after infusion (41). While the average survival rate was 9 months, this specific investigation did involve two patients who survived without disease progression for a maximum of 48 months after treatment (41).
CAR-T immunotherapy
While novel chemotherapy and radiation procedures may prove to be effective DIPG treatments, a specific form of immunotherapy called chimeric antigen receptor therapy (CAR-T) may offer promise in the future. Immunotherapy has been a long-established method to treat cancerous tumors (42), DIPG has special challenges that a clinician administering treatment must consider (42). Since the brainstem controls important functions for daily life, any therapies given to DIPG patients must limit the destruction and inflammation of healthy
tissue around the glioma (42). In CAR-T, T-cells are collected from the patient’s bloodstream and are genetically engineered to express an artificial receptor for monoclonal antibodies that bind to cancer cell antigens before being infused back into the patient (43). By undergoing CAR-T cell infusion, the patient’s T cells have antitumor characteristics that help fight glioma progression with little to no effect on non-cancerous cells (44). Even though most reports utilizing CAR-T cells for pediatric tumors are xenograft studies or phase one clinical trials (45), this form of immunotherapy gives clinicians hope for finding treatments that allow DIPG patients to have longer survival rates (45).
Future epigenetic alternatives
Since 80% of DIPG cases possess the H3K27M mutation as their underlying pathology (46), scientists are looking to the current advancements of epigenetics as an option to prolong patient lifespans (46). Histone methylase and demethylase inhibitors are being utilized to hinder H3K27M-expressing DIPG cells and brainstem gliomas (46). Even though these approaches may seem promising, epigenetic modifications have been found to be unsuccessful at treating other central nervous system gliomas (47). The lack of function from these treatments could be due to off target activity and the lack of effective drug concentrations in the central nervous system (47).
Clinical trials
While there are many ongoing clinical trials testing different treatments to be used for children with DIPG, there are many complications that limit safe treatment options. Because the glioma is located in the pons of the brainstem, surgical removal is not possible (22). The pons is responsible for many regulatory functions and removing a glioma from the pons could result in morbidity and mortality (23). In most brain tumors, normal brain tissue can be easily separated from the abnormal tissue; however, with DIPG, the tumor cells diffuse within the normal brain tissue, making it difficult to separate the normal from the abnormal tissue (24). Surgical removal of the glioma would risk the possibility of removing healthy, normal brain tissue (24). For similar reasons, biopsies are a controversial procedure in DIPG. There is, however, evidence that suggests stereotactic biopsy is the safest and now most-used method of retracting a sample from the glioma cells (25). Stereotactic biopsies are a more precise way of conducting a regular biopsy procedure. With the use of magnetic resonance imaging (MRI) or X-ray to detect a specific location, a stereotactic biopsy decreases the risk of affecting nearby areas of the brain (26). Some physicians, however, concluded that due to the risk of hemorrhage and other complications, biopsies are just as dangerous as surgical removal of a glioma (27).
Clinicaltrials.gov has been documenting trials since 2000 and is the world's largest registry provided by the United States National Library of Medicine. It is a database consisting of publicly and privately funded clinical trials on a wide range of diseases and conditions conducted worldwide. It provides the ability to track journal articles disclosing results in medical literature (48–50). A report published in 2019 reviewed the clinicaltrials.gov database for all possible interventional clinical trials that included DIPG as a diagnosis of primary investigation. A notable finding from this article pertains to Burzynski Research Institute, which registered phase III trials assessing
The Molecular, Neurological, and Clinical Features of Diffuse Intrinsic Pontine Glioma
43
The Molecular, Neurological, and Clinical Features of Diffuse Intrinsic Pontine Glioma
the effectiveness of antineoplaston therapy and RT versus RT alone. As of 2019, antineoplastons were not approved by the U.S. Food and Drug Administration (FDA) to prevent or treat any disease. In addition, no randomized controlled trials showing effectiveness of antineoplaston therapy have been published in the literature at the time of publication in 2019. Even though the outcomes of the trials have been nonsignificant, they only make up approximately one-tenth of all clinical trials registered on clinicaltrials.gov. This report shows that retrospection provides a unique view of the definition of failure. The definition of failure is dynamic. Although many clinical trials have not proven that an intervention can impact the DIPG prognosis, such findings inform clinicians of what not to investigate in the future (48).
In 2008 (51), it seemed that RT was the only treatment that provided any benefit to children with DIPG. However, even with potential radiation benefits, the average survival of these patients is usually never more than 9 months (51). A prospective trial was performed using a BSG-98 protocol which utilized frontline chemotherapy alongside hematotoxic and nonhematotoxic cycles with the intent to delay the need for RT until the glioma progressed (51). Each cycle included three courses which were delivered monthly. The first course involved 1,3-bis(2-chloroethyl)-1-nitrosoureacisplatin while the second and third courses consisted of high-dose methotrexate (51). A historical cohort receiving local RT served as controls for this study. A significant increase in average survival spans with participants in the BSG-98 protocol (throughout the span of 17 months) compared to those in the historical controls (throughout the span of 9 months) was observed (51). The BSG98 protocol led to significant findings, but issues arose due to costs from infection and hospitalization of patients (51).
An investigation (52) evaluated the antitumor effects of Delta24-RGD in pediatric high-grade glioma (pHGG) and DIPG models. Pediatric high-grade gliomas comprise approximately 8% to 12% of all primary CNS tumors, are characterized by aggressive clinical behavior, and account for significant morbidity and mortality among children with brain tumors (52). Oncolytic virotherapy is an up-and-coming treatment using oncolytic viruses. This specific therapy is used because it selectively infects and damages cancerous tissues. Delta24-RGD is a replication-competent adenovirus produced to replicate tumor cells with an abnormal RB (tumor suppressing) pathway and has been proven safe and effective in adult gliomas (53). This research showed that Delta-24-RGD had a significant antitumor effect in vitro in a panel of cell lines and in vivo in pHGG and DIPG orthotopic immunosuppressed and immunocompetent non-human animal models (52–55).
Conclusion
DIPG makes up approximately 10% to 15% of all pediatric brain tumors, and more than 90% of children with DIPG die within 2 years of disease onset (47). Despite subtle advancements in DIPG molecular characterization, effective treatments have yet to be discovered (19) and current therapies have adverse side effects. With limited treatment options available, there is a critical need for continued retrospection to ensure that future efforts in clinical research are justified and poised for maximal impact and discovery (48). Although there have been many
clinical trials involving DIPG treatments, there still has been no apparent improvement in the prognosis. Fortunately, future trials have triggered a recent burst of enthusiasm. Projects are emerging worldwide, as we can see that they may benefit from coordination and collaboration. The knowledge surrounding DIPG biology is increasing and translating this newfound understanding of the disease into clinical trials (along with utilizing the latest drug distribution methods) may eventually lead to more effective treatments in the future (38,56,57).
Disclosures
None disclosed.
References
1. Johung TB, Monje M. Diffuse Intrinsic Pontine Glioma: New pathophysiological insights and emerging therapeutic targets. Curr Neuropharmacol. 2017;15(1):88.
2. Vanan MI, Eisenstat DD. DIPG in children – What can we learn from the past? Front Oncol. 2015;5:237.
3. Pellot JE, de Jesus O. Diffuse intrinsic pontine glioma. Treasure Island (Fl): StatPearls Publishing; 2021.
4. Hasan F, Weingarten K, Rapoport A, Bouffet E, Bartels U. End-of-life care of children with diffuse intrinsic pontine glioma. J Neurooncol. 2018;138(1):147–53.
5. Warren KE. Diffuse intrinsic pontine glioma: Poised for progress. Front Oncol. 2012;2:205.
6. Hennika T, Becher OJ. Diffuse intrinsic pontine glioma: Time for cautious optimism. J Child Neurol 2016;31(12):1377–85.
7. Grimm SA, Chamberlain MC. Brainstem glioma: A review. Curr Neurol Neurosci Rep. 2013;13(5):346.
8. Green AL, Kieran MW. Pediatric brainstem gliomas: New understanding leads to potential new treatments for two very different tumors. Curr Oncol Rep. 2015;17(3):436.
9. Buczkowicz P, Hawkins C. Pathology, molecular genetics, and epigenetics of diffuse intrinsic pontine glioma. Front Oncol. 2015;5:147.
10. Rashed WM, Maher E, Adel M, Saber O, Zaghloul MS. Pediatric diffuse intrinsic pontine glioma: Where do we stand? Cancer Metastasis Rev. 2019;38(4):759–70.
11. Mueller S, Taitt JM, Villanueva-Meyer JE, Bonner ER, Nejo T, Lulla RR, et al. Mass cytometry detects H3.3K27Mspecific vaccine responses in diffuse midline glioma. J Clin Invest. 2020;130(12):6325–37.
12. Ray-Gallet D, Almouzni G. The histone H3 family and its deposition pathways. Adv Exp Med Biol. 2021;1283:17–42.
13. Buczkowicz P, Bartels U, Bouffet E, Becher O, Hawkins C. Histopathological spectrum of paediatric diffuse intrinsic pontine glioma: Diagnostic and therapeutic implications. Acta Neuropathol. 2014;128(4):573–81.
14. Schroeder KM, Hoeman CM, Becher OJ. Children are not just little adults: Recent advances in understanding of diffuse intrinsic pontine glioma biology. Pediatr Res 2014;75(1):205–9.
44
15. Lewis PW, Müller MM, Koletsky MS, Cordero F, Lin S, Banaszynski LA, et al. Inhibition of PRC2 activity by a gainof-function H3 mutation found in pediatric glioblastoma. Science. 2013;340(6134):857–61.
16. Bender S, Tang Y, Lindroth AM, Hovestady V, Jones DTW, Kool M, et al. Reduced H3K27me3 and DNA hypomethylation are major drivers of gene expression in K27M mutant pediatric high-grade gliomas. Cancer Cell 2013;24(5):660-72.
17. Chan KM, Fang D, Gan H, Hashizume R, Yu C, Schroeder M, et al. The histone H3.3K27M mutation in pediatric glioma reprograms H3K27 methylation and gene expression. Genes Dev. 2013;27(9):985–90.
18. Zhang X, Zhang Z. Onco-histone mutations in diffuse intrinsic pontine glioma. Trends Cancer. 2019;5(12):799808.
19. Mohammad F, Weissmann S, Leblanc B, Pandey DP, Højfeldt JW, Comet I, et al. EZH2 is a potential therapeutic target for H3K27M-mutant pediatric gliomas. Nat Med 2017;23(4):483–92.
20. Harutyunyan AS, Krug B, Chen H, Papillon-Cavanagh S, Zeinieh M, de Jay N, et al. H3K27M induces defective chromatin spread of PRC2-mediated repressive H3K27me2/me3 and is essential for glioma tumorigenesis. Nat Commun. 2019;10(1):1262.
21. Silveira AB, Kasper LH, Fan Y, Jin H, Wu G, Shaw TI, et al. H3.3 K27M depletion increases differentiation and extends latency of diffuse intrinsic pontine glioma growth in vivo. Acta Neuropathol. 2019;137(4):637–55.
22. Gallitto M, Lazarev S, Wasserman I, Stafford JM, Wolden SL, Terezakis SA, et al. Role of radiation therapy in the management of diffuse intrinsic pontine glioma: A systematic review. Adv Radiat Oncol. 2019;4(3):520–31.
23. Sager O, Dinçoğlan F, Demiral S, Uysal B, Gamsız H, Ozcan F, et al. Radiation therapy (RT) for diffuse intrinsic pontine glioma (DIPG) in children: Semantic scholar. Arch. Cancer Res. 2018;6(3):14.
24. Maani EV, Maani CV. Radiation Therapy. Treasure Island (Fl): StatPearls Publishing; 2021.
25. Cohen KJ, Jones A, Raabe E, Pearl M. Highly selective intraarterial chemotherapy for the treatment of progressive diffuse intrinsic pontine gliomas (DIPG). Neurooncol. 2014;16(suppl_3):iii29–iii29.
26. Jhaveri J, Cheng E, Tian S, Buchwald Z, Chowdhary M, Liu Y, et al. Proton vs. photon radiation therapy for primary gliomas: An analysis of the national cancer data base. Front Oncol. 2018;8:440.
27. Chambrelant I, Eber J, Antoni D, Burckel H, Noël G, Auvergne R, et al. Proton therapy and gliomas: A systematic review. Radiation. 2021;1(3):218–33.
28. Amjad MT, Chidharla A, Kasi A. Cancer chemotherapy. Treasure Island (Fl): StatPearls Publishing; 2021.
29. Green AL, Flannery P, Hankinson TC, O’Neill B, Amani V, DeSisto J, et al. Preclinical and clinical investigation of intratumoral chemotherapy pharmacokinetics in DIPG using gemcitabine. Neurooncol Adv. 2020;2(1):vdaa021.
30. van Tellingen O, Yetkin-Arik B, de Gooijer MC, Wesseling P, Wurdinger T, de Vries HE. Overcoming the blood-brain tumor barrier for effective glioblastoma treatment. Drug Resist Updat. 2015;19:1–12.
31. Wang D, Wang C, Wang L, Chen Y. A comprehensive review in improving delivery of small-molecule chemotherapeutic agents overcoming the blood-brain/brain tumor barriers for glioblastoma treatment. Drug Deliv. 2019;26(1):551–65.
32. Shi M, Sanche L. Convection-enhanced delivery in malignant aliomas: A review of toxicity and efficacy. J Oncol. 2019;2019:9342796.
33. Stine CA, Munson JM. Convection-enhanced delivery: Connection to and impact of interstitial fluid flow. Front Oncol. 2019;9:966.
34. Chang R, Tosi U, Voronina J, Adeuyan O, Wu LY, Schweitzer ME, et al. Combined targeting of PI3K and MEK effector pathways via CED for DIPG therapy. Neurooncol Adv 2019;1(1):1–11.
35. Massimino M, Spreafico F, Biassoni V, Simonetti F, Riva D, Trecate G, et al. Diffuse pontine gliomas in children: Changing strategies, changing results? A mono-institutional 20-year experience. J Neurooncol. 2008;87(3):355–61.
36. Schuelke MR, Wongthida P, Thompson J, Kottke T, Driscoll CB, Huff AL, et al. Diverse immunotherapies can effectively treat syngeneic brainstem tumors in the absence of overt toxicity. J Immunother Cancer. 2019;7(1):1–13.
37. Graham C, Hewitson R, Pagliuca A, Benjamin R. Cancer immunotherapy with CAR-T cells - behold the future. Clin Med (Lond). 2018;18(4):324–8.
38. Mount CW, Majzner RG, Sundaresh S, Arnold EP, Kadapakkam M, Haile S, et al. Potent antitumor efficacy of anti-GD2 CAR T cells in H3-K27M + diffuse midline gliomas. Nat Med. 2018;24(5):572–9.
39. Patterson JD, Henson JC, Breese RO, Bielamowicz KJ, Rodriguez A. CAR T cell therapy for pediatric brain tumors. Front Oncol. 2020;10:1582.
40. Long W, Yi Y, Chen S, Cao Q, Zhao W, Liu Q. Potential new therapies for pediatric diffuse intrinsic pontine glioma. Front Pharmacol. 2017;8:495.
41. la Madrid AM, Hashizume R, Kieran MW. Future clinical trials in DIPG: Bringing epigenetics to the clinic. Front Oncol. 2015;5:148.
42. DIPG: Diffuse intrinsic pontine glioma [Internet]. Weill Cornell Brain and Spine Center. https:// weillcornellbrainandspine.org/condition/diffuse-intrinsicpontine-glioma-dipg. 2021.
43. Mathew RK, Rutka JT. Diffuse intrinsic pontine glioma: Clinical features, molecular genetics, and novel targeted therapeutics. J Korean Neurosurg Soc. 2018;61(3):343-351.
44. Handler MH. Surgical options with DIPG [Internet]. DIPG. org. 2012.
45. Williams JR, Young CC, Vitanza NA, Mcgrath M, Feroze AH, Browd SR, et al. Progress in diffuse intrinsic pontine glioma: Advocating for stereotactic biopsy in the standard of care. Neurosurg Focus. 2020;48(1):E4.
The Molecular, Neurological, and Clinical Features of Diffuse Intrinsic Pontine Glioma
45
The Molecular, Neurological, and Clinical Features of Diffuse Intrinsic Pontine Glioma
46. Chen CC, Hsu PW, Erich Wu TW, Lee ST, Chang CN, Wei K chen, et al. Stereotactic brain biopsy: Single center retrospective analysis of complications. Clin Neurol Neurosurg. 2009;111(10):835–9..
47. Qin F, Huang Z, Dong Q, Xu X, Lu T, Chen J, et al. Stereotactic biopsy for lesions in brainstem and deep brain: A single-center experience of 72 cases. Braz J Med Biol Res 2021;54(8):e11335.
48. Rechberger JS, Lu VM, Zhang L, Power EA, Daniels DJ. Clinical trials for diffuse intrinsic pontine glioma: The current state of affairs. Childs Nerv Syst. 2020;36(1):39–46.
49. Huser V, Cimino JJ. Linking ClinicalTrials.gov and PubMed to track results of interventional human clinical trials. PloS One. 2013;8(7):e68409.
50. Pfiffner PB, Oh JW, Miller TA, Mandl KD. ClinicalTrials. gov as a data source for semi-automated point-of-care trial eligibility screening. PloS One. 2014;9(10):e111055.
51. Hargrave D, Bartels U, Bouffet E. Diffuse brainstem glioma in children: Critical review of clinical trials. Lancet Oncol 2006;7(3):241–8.
52. Frappaz D, Schell M, Thiesse P, Marec-Bérard P, Mottolese C, Perol D, et al. Preradiation chemotherapy may improve survival in pediatric diffuse intrinsic brainstem gliomas: Final results of BSG 98 prospective trial. Neuro Oncol 2008;10(4):599–607.
53. Martínez-Vélez N, Garcia-Moure M, Marigil M, GonzálezHuarriz M, Puigdelloses M, Gallego Pérez-Larraya J, et al. The oncolytic virus Delta-24-RGD elicits an antitumor effect in pediatric glioma and DIPG mouse models. Nat Commun. 2019;10(1):2235.
54. Jiang H, Clise-Dwyer K, Ruisaard KE, Fan X, Tian W, Gumin J, et al. Delta-24-RGD oncolytic adenovirus elicits antiglioma immunity in an immunocompetent mouse model. PloS One. 2014;9(5):e974707.
55. Fangusaro J. Pediatric high grade glioma: A review and update on tumor clinical characteristics and biology. Front Oncol. 2012;2:105.
56. Russell SJ, Peng KW, Bell JC. Oncolytic virotherapy. Nat Biotechnol. 2012;30(7):658–70.
57. Bartels U, Hawkins C, Vézina G, Kun L, Souweidane M, Bouffet E. Proceedings of the diffuse intrinsic pontine glioma (DIPG) Toronto think tank: Advancing basic and translational research and cooperation in DIPG. J Neurooncol. 2011;105(1):119–25.
58. Jansen MHA, van Vuurden DG, Vandertop WP, Kaspers GJL. Diffuse intrinsic pontine gliomas: A systematic update on clinical trials and biology. Cancer Treat Rev 2012;38(1):27–35.
46
Changes in Fentanyl Distribution in California
Miah V. Dugan1*‡, Ali H. Shah1*‡, Trinidy R. Anthony1*‡, Rafiat Famosa1*‡, and Brian J. Piper¹
¹Geisinger Commonwealth School of Medicine, Scranton, PA 18509
*Master of Biomedical Sciences Program
‡Authors contributed equally Correspondence: mdugan@som.geisinger.edu
Abstract
Background: Fentanyl is a synthetic opioid that is commonly given as a medication to alleviate pain. This drug can be administered through multiple routes, hence making it easy to exploit at high rates. Due to the flexibility in which it can be taken, it increases the ease of both access and use. The purpose of this study was to analyze trends in the distribution of fentanyl and its formulations across Medicaid enrollees in California and among the 3-digit registrant zip codes in California over the period of pre-pandemic (2018–2019) to the early stages of the COVID-19 pandemic (2020).
Methods: Using the Automated Reports and Consolidated Ordering System (ARCOS), the distribution of fentanyl across California was compiled from 2018 to 2020. Utilizing ARCOS, the number of individuals within the source population who lived in one of California’s many zip codes was observed. To analyze the fentanyl distribution trend, we used Google Sheets, GraphPad Prism (Version 9.3.0 [463]), and Microsoft 365 Excel. These were helpful to organize the Medicaid, ARCOS data, and as well as to create graphs. The Medicaid database was used to compile the number of fentanyl formulations prescribed from 2018 to 2020 across California.
Results: The analyses from both databases provided insight into the difference in fentanyl distribution in California from the years 2018 to 2020. After looking further into the many 3-digit registrant zip codes as well as Medicaid enrollees, it was found that there was a decrease in the distribution of fentanyl and its formulations. Additionally, it was found that the distribution of fentanyl as a medication by business activities also decreased from 2018 to 2020.
Conclusion: The results indicate that there was more fentanyl being distributed and prescribed before the pandemic (2018–2019). On the other hand, when we considered the effects of the pandemic, during 2020, there was quite a drastic decrease in the amount of fentanyl being prescribed and distributed to those living in California and those enrolled in Medicaid.
Introduction
Fentanyl and its analogs are lipid-soluble opioids, first synthesized 70 years ago in the 1950s (1). Fentanyl is an opioid agonist that acts on the u-opioid receptor while producing analgesia. This opioid is 50 to 100 times stronger than morphine. A minuscule dose, such as 100 micrograms, can produce pain relief equal to 10 mg of morphine. Its properties and pharmacokinetics differ widely from other drugs. It is mainly used as a sedative for post-surgical patients, epilepsy patients, and patients with renal failure. It is also used to treat chronic pain patients who have developed a tolerance for other drugs.
Fentanyl can be administered in many ways such as intravenously, intramuscularly, transdermally, intranasally, and intrathecally (2). From pre-COVID-19 (2018–2019) to the period of early COVID-19 (2020), there was a change in the illicit use of fentanyl and its derivatives as well as its distribution. There were also changes in the distribution and use of fentanyl, there has been a great increase in the prescription and manufacturing of illegal fentanyl (3). Due to these issues, the dependence on opioids has also increased. The overprescription of opioids has been one of the contributors to this crisis adding to many states limiting the prescription amounts of opioids, like fentanyl, restrictions in the prescription, and mandating the use of a program to monitor use (3).
Another study used was the urine drug test results before COVID-19 (November 2019 – March 2020) and during COVID-19 (March 2020 – July 2020). They found that there was a large correlation between fentanyl drug use that increased from 3.80% to 7.32% from before the pandemic to during the national emergency (4). Fentanyl is primarily responsible for overdose deaths across the United States, and this can be in part due to the prescription of opioids for pain. However, the pandemic has brought on an increase in opioid use (5). Using the ARCOS and Medicaid databases, we looked at changes in the fentanyl distribution in Medicaid recipients in California.
California is the state of choice to study primarily because of its significance in death rates in the state. Along with this, California is the largest state in the country by population. Having California as the state of choice gave us the ability to have a wide variety of data to discuss throughout our research. In the state of California, laws were implemented to decrease the rate of prescriptions of fentanyl. Law AB 1751 makes it more difficult to receive opioids in different states while law AB 2789 will require physicians to write electronic prescriptions (6).
The rate of overdoses due to synthetic opioids like fentanyl and fentanyl analogs increased over 16% from 2018 to 2019 and increased from 2020 to 2021 (7). There was a gap in understanding why there was a spike in fentanyl. Previous studies from 2021 reported those who use drugs containing fentanyl tend to smoke it more often. There was a change in the demand and supply chain for fentanyl since 2010, leading to a shift from 2018 to 2019 from injecting opioids to smoking fentanyl in California. This shift was due to the convenience of smoking the opioid rather than injecting it. Between 20182020, preliminary data from the CDC indicated a continuous rise in opioid morbidity (7).
In 2020, there was a staggering increase in the use of fentanyl, if this continues, it will surpass the highest point of use, which
Scholarly Research In Progress • Vol. 6, November 2022
47
Changes in Fentanyl Distribution in California
was in 2016. Although fentanyl prescription has declined over time, the death rate of this opioid continues to increase (8). Another study in 2021, indicated that the rate of overdose in California increased by 49% between 2019 to 2020 (9). During this time, there were greater than projected overdose deaths in California amongst all racial and ethnic groups. In particular, the largest increase was seen in the Black community. This is likely related to systematic bias in the healthcare system regarding prescribed opioids and disparities in access to healthcare (10). This may be due to the lack of accessibility to healthcare resources and rehabilitation centers within these communities, thus leading to increased stress levels.
Other studies have reported that individuals who misuse fentanyl often experience a withdrawal effect when the opioid is unavailable. This could be a contributing factor to the increase in demand (11). Given that fentanyl is known for its potency and the harmful effects after its use, the drug continues to be known as a misused substance (3). This would allow us to explore the effect of current interventions used to combat this ongoing issue. The increase in the instances of fentanyl overdoses and fatalities is a direct result of illicit drug use. The rates continue to increase even though the number of prescriptions decreases because users are accessing opioids illegally from drug dealers that smuggle them from countries like China, Mexico, and India (12).
Methods Database
We used fentanyl prescription data from the Medicaid database in California. The Medicaid database includes the outpatient drug utilization data for Medicaid enrollees in each state from the start of the drug rebate program (13). Other studies that used Medicaid showed a regional difference in the distribution of fentanyl from 2010 to 2019 (3). From the Automated Reports and Consolidated Ordering System (ARCOS), we used the fentanyl distribution by zip code within California for the years 2018 to 2020. Also, we used the retail purchases for fentanyl in grams by the business activity in California for the years 2018 to 2020 from the ARCOS database. The ARCOS database provides the distribution history of controlled drugs in the United States from the DEA (14). ARCOS provides a detailed overview of drug distribution by 3-digit zip code and business activity in the United States. Other studies that used ARCOS showed an overall decrease in distributed licit fentanyl from 2010 to 2019 and a decrease in fentanyl distribution by 17.9% from 2016 to 2017 (15,16). Our use of databases has helped find data collection specific to fentanyl and its analogs when determining the number of prescriptions given to those who are Medicaid patients; however, the use of outside sources has been beneficial to gaining an outside perspective (16). The purpose of this study was to examine how the distribution of fentanyl impacted Medicaid recipients in California from 2018 to 2020.
Participants
The source population from the ARCOS database included individuals residing in one of the 57 zip codes in California. The target population included residents in one of the 3-digit zip codes of California who were distributed fentanyl. To further
study changes in fentanyl distribution, the source population included Medicaid enrollees, and we focused on fentanyl users in the state of California. The target population consisted of Medicaid enrollees in California who were prescribed fentanyl. All individuals enrolled in Medicaid from 2018 to 2020 were included in this study. Persons that did not match our inclusion criteria for Medicaid and ARCOS were excluded from this analysis.
Procedures
To determine the changes in fentanyl distribution in Medicaid users in California from 2018 to 2020, data was collected and sorted yearly from Medicaid. The number of prescriptions for each formulation was assessed through the state drug utilization Medicaid database from 2018 to 2020. Medicaid provides statistics for Medicaid enrollees and outpatient drug prescriptions in each state yearly. Any blank prescription values were replaced with zero.
To further analyze the distribution of fentanyl in California, data was collected from the ARCOS database from 2018 to 2020. The total number of prescriptions of fentanyl per 3-digit zip code in California was organized quarterly from 2018 to 2020. We assessed the total number of grams of fentanyl base distributed amongst pharmacies, hospitals, practitioners, teaching institutions, mid-level practitioners, and narcotic treatment programs.
Statistics
We calculated the change in the percentage of fentanyl prescriptions from 2018 to 2020 (Table 1). To display the change in percentages of fentanyl prescriptions, we used a line graph and table to illustrate the data set collected from Medicaid. Along with the use of the Medicaid data, we also used data from the ARCOS database to see the amount of controlled use of the substance fentanyl in grams across the various zip codes in California. We performed a 95% confidence interval to evaluate if there was a significant difference between the means of the data, by determining if the p-value ≤0.05.
The variables included in the analysis of Medicaid patients were the number of prescriptions prescribed, fentanyl formulations, number of quarters, and the years 2018, 2019, and 2020. For ARCOS, the variables used were the total grams of fentanyl distributed to California’s various 3-digit zip codes, total grams of fentanyl by its drug code to California, the quarterly drug distribution for California per 100,000 population, and the cumulative drug distribution to California per 100,000 population. Data were collected by each quarter (1–4), for each of our desired years (2018–2020) to evaluate the changes from the pre-COVID-19 pandemic to the early stage of the COVID-19 pandemic (Figure 2).
To see the evident variations in the distribution of fentanyl, we created a visual representation of the sum of distributions for each 3-digit registrant zip code within California for each year (Figure 3). This was done to see how the distribution of fentanyl varied across each zip code within each year.
GraphPad Prism (Version 9.3.0 [463]) and Microsoft 365 Excel were used for the statistical analysis and graphs. These programs were used to generate graphs and perform analyses. We formulated a heat map of the various zip codes of California
48
to show how the corresponding zip codes for California correlate to the total amount of fentanyl distributed in grams (Figure 4). Business activity was measured to show the different amounts of fentanyl being distributed from various types of businesses.
Results and Discussion
Table 1 demonstrates the change in the percentage of prescriptions given to those enrolled in Medicaid in California from 2018 to 2020. There is a clear decrease in the total number of prescriptions for each of the fentanyl formulations. The percentage difference in the number of prescribed formulations of fentanyl is also shown in Table 1. In addition, we incorporated the values for the 95% lower and higher

Changes in Fentanyl Distribution in California
confidence intervals to show the significance of our data. After analyzing the data, the decrease in fentanyl prescription could be due to the possibility that it is overused in various ways.
Figure 1 shows the decrease in the total number of fentanyl prescriptions for those enrolled in Medicaid for these years.
Figure 2 demonstrates the total retail distribution of the drug base fentanyl as a sum by the 3-registrant zip codes within California. This shows the total amount of fentanyl that was distributed to each zip code during all three years (2018–2020).
Figure 2 distinguishes zip codes that received a large amount of fentanyl compared to those that received much less.
Figure 3 shows the sum of fentanyl distribution for each of the three years and the evident transitions for fentanyl that was dispersed. This data analysis was also done for the state of
 Figure 1. Number of fentanyl prescriptions prescribed for Medicaid patients in California from 2018 to 2020.
Table 1. Changes in prescribed fentanyl prescriptions to Medicaid enrollees in California from 2018 to 2020.
Figure 1. Number of fentanyl prescriptions prescribed for Medicaid patients in California from 2018 to 2020.
Table 1. Changes in prescribed fentanyl prescriptions to Medicaid enrollees in California from 2018 to 2020.
49
California and by each 3-digit zip code. The heat map shown in Figure 4 displays the total amount of fentanyl allocated within the state of California by each of the zip codes for 2018 to 2020.

Figure 5 shows the business activity behind the distribution of fentanyl in California for the years 2018 to 2020. There is an apparent decrease in the distribution of fentanyl within California during these years in multiple business activities. This figure includes the amount of fentanyl distributed as a total in grams. The limitations to our study include not having the most recent data from 2021 due to factors such as the ongoing
pandemic. This analysis does not account for those who are not enrolled in Medicaid and the data was in a de-identified form.
Based on our findings, there was an increased distribution of fentanyl as well as the prescription of fentanyl and its formulations within the year 2018, which led to a decrease in the year 2019. Subsequently, once the pandemic began in 2020, there was a decrease in the same areas of analysis within California. Thus, the trend of decreasing distribution and prescription of fentanyl and its formulations occurred all within the year 2020.
Changes in Fentanyl Distribution in California
50
Figure 2. Total retail distribution of fentanyl drug base as a sum in California by zip code from 2018 to 2020 according to Automated Reports and Consolidated Ordering System.
Figure 3. Retail distribution of fentanyl drug base as a sum in California by zip code for each year of 2018, 2019, and 2020 according to Automated Reports and Consolidated Ordering System.

Changes in Fentanyl Distribution in California
51
Conclusion
Our analysis concluded that there was a decrease in the distribution of fentanyl and the prescribing of fentanyl and its formulations. Even so, there was a spike in the prescription of fentanyl c formulation in 2019. Moreover, the geographical distinction is important in understanding the fentanyl distribution and prescription trends in California. The 3-digit zip code 945, Oakland, had the highest distribution of fentanyl for 2018, 2019, and 2020. The trend of decreasing distribution and prescription of fentanyl and its formulations can be seen as a possible correlation to the COVID-19 pandemic.

Acknowledgments
The authors would like to thank Amy Houck for her extensive help in finding resources that fit our project’s main purpose.
Disclosures
BJP was part of an osteoarthritis team from 2019–2021 supported by Pfizer and Eli Lilly. The other authors disclose no conflicts of interest.
Figure 4. Heat map of total fentanyl distribution in California by zip code from 2018 to 2020 according to Automated Reports and Consolidated Ordering System.
Figure 5. Total distribution of fentanyl in California by business activity.

Changes in Fentanyl Distribution in California
52
References
1. Stanley TH. Fentanyl. J Pain Symptom Manage. 2005;29(5 Suppl):S67-71. Available from: https://pubmed-ncbi-nlmnih-gov.gcsom.idm.oclc.org/15907648/
2. Ramos-Matos C, Bistas K, Lopez-Ojeda W. Fentanyl [Internet]. Ncbi.nlm.nih.gov. 2022 [cited 27 May 2022]. Available from: https://www.ncbi.nlm.nih.gov/books/ NBK459275/
3. Stemrich RA, Weber JV, McCall KL, Piper BJ. Pronounced declines in dispensed licit fentanyl, but not fentanyl derivatives. Res Social Adm Pharm. 2022 Jun;18(6):30463051. doi: 10.1016/j.sapharm.2021.08.001. Epub 2021 Aug 3.
4. Wainwright JJ, Mikre M, Whitley P, Dawson E, Huskey A, Lukowiak A, et al. Analysis of drug test results before and after the US Declaration of a National Emergency Concerning the COVID-19 outbreak. JAMA 2020;324(16):1674-7. Available from: https://pubmedncbi-nlm-nih-gov.gcsom.idm.oclc.org/32945855/
5. Ciccarone D. The rise of illicit fentanyls, stimulants and the fourth wave of the opioid overdose crisis. Curr Opin Psychiatry. 2021;34(4):344-50. Available from: https:// pubmed.ncbi.nlm.nih.gov/33965972/
6. Caiola S. Here are California's new laws to address the state's opioid crisis [Internet]. CapRadio. 2019 [cited 2022Jul18]. Available from: https://www.capradio.org/ articles/2019/01/16/here-are-californias-new-laws-toaddress-the-states-opioid-crisis/
7. Kral AH, Lambdin BH, Browne EN, Wenger LD, Bluthenthal RN, Zibbell JE, et al. Transition from injecting opioids to smoking fentanyl in San Francisco, California. Drug Alcohol Depend. 2021;227:109003. Available from: https:// pubmed-ncbi-nlm-nih-gov.gcsom.idm.oclc.org/34482046/
8. Manchikanti L, Vanaparthy R, Atluri S, Sachdeva H, Kaye AD, Hirsch JA. COVID-19 and the Opioid Epidemic: Two Public Health Emergencies That Intersect With Chronic Pain. Pain Ther. 2021;10(1):269-86. Available from: https:// pubmed.ncbi.nlm.nih.gov/33718982/
9. Friedman J, Hansen H, Bluthenthal RN, Harawa N, Jordan A, Beletsky L. Growing racial/ethnic disparities in overdose mortality before and during the COVID-19 pandemic in California. Prev Med. 2021;153:106845. Available from: https://www.ncbi.nlm.nih.gov/pmc/articles/PMC8521065/
10. Kelley MA, Lucas J, Stewart E, Goldman D, Doctor JN. Opioid-related deaths before and after COVID-19 stay-at-home orders in Los Angeles County. Drug Alcohol Dependence. 2021;228:109028. Available from: https:// pubmed.ncbi.nlm.nih.gov/34500239/
11. Blackwood CA, Cadet JL. COVID-19 Pandemic and fentanyl use disorder in African Americans. Front Neurosci 2021;15:707386. Available from: https://pubmed-ncbinlm-nih-gov.gcsom.idm.oclc.org/34489626/
12. Intelligence Program DEA. Fentanyl flow to the United States [Internet]. DEA. 2020 [cited 2022Jul19]. Available from: https://www.dea.gov/ documents/2020/2020-03/2020-03-06/fentanyl-flowunited-states
13. Medicaid State Drug Utilization Data [Internet]. 1991 [cited 17 February 2022]. Available from: https://www. medicaid.gov/medicaid/prescription-drugs/state-drugutilization-data/index.html.
14. ARCOS: Automation of Reports & Consolidated Orders System [Internet]. Department of Justice, Drug Enforcement Administration, 1980. 1980 [cited 17 February 2022]. Available from: https://www.deadiversion. usdoj.gov/arcos/index.html.
15. Collins LK, Pande LJ, Chung DY, Nichols SD, McCall KL, Piper BJ. Trends in the medical supply of fentanyl and fentanyl analogues: United States, 2006 to 2017. Prev Med 2019;123:95-100. Available from: https://www.ncbi.nlm. nih.gov/pmc/articles/PMC8529416/
16. Young SD, Zhang Q, Zhou J, Pacula RL. Internet search and medicaid prescription drug data as predictors of opioid emergency department visits. NPJ Digit Med. 2021;4(1):21. Available from: https://pubmed-ncbi-nlm-nih-gov.gcsom. idm.oclc.org/33574500/
Changes in Fentanyl Distribution in California
53
Do Patient Characteristics Affect Appointment No-Show Rates?
Irene J. Ganahl1† and Kim Kovalick²
¹Geisinger Commonwealth School of Medicine, Scranton, PA 18509
²Geisinger South Wilkes-Barre, Wilkes-Barre, PA 18765
†Doctor of Medicine Program
Correspondence: iganahl@som.geisinger.edu
Abstract
It is essential to ensure patients consistently show up for their appointments to fulfill primary care’s goal of continuity of care and appropriate care of the community they serve, i.e., population health. This study investigates why some Geisinger patients are unable to make their appointments, and what characteristics of the patient population contribute to the no-show rate. A total of 262 patients identified as a “no-show” for their appointment during a 30-day period were contacted via phone and asked why they were unable to make their appointment. Patient data for consenting patients (n=103) were collected via Epic, an electronic health record server. The most common reasons for missed appointments were forgetting, transportation, work, and forgetting due to life circumstances. Among those patients who consented to participate, most identified as female, single, and White (n=41) or Black (n=32); and most had Geisinger Health Plan insurance or elapsed insurance status. The most common missed appointments were morning appointments (from 8–11:59 a.m.). Patients who miss appointments are often forgotten by, or “lost” within the healthcare system. Important care gaps can be identified via follow-up with patients who miss appointments and can lead to initiatives that ultimately improve healthcare access.
Introduction
When you think of a “doctor,” what comes to mind? Maybe you think of Meredith Grey from the popular TV show Grey’s Anatomy. Maybe you think of the surgeon who performed your appendectomy a year ago. For many, the classic picture of a doctor is their primary care physician (PCP) — the dependable physician whom you can see once a year or more often, when needed, who asks about how you have been feeling; does a complete physical exam, including listening to your heart and lungs; reviews your medications; educates you about preventive testing that may be due; and remembers that the last time you saw them, you had just gotten a dog. There is a reason why PCPs fit the classic description of a doctor. It is because primary care is the foundation of medicine. In the United States, there are more than 135 medical specialties and subspecialties (1). Out of the 860.4 million physician office visits made in 2018, 51.2% of those visits were to primary care (2).
What is primary care? And if there are so many specialties in the healthcare system, why is primary care necessary? The World Health Organization (WHO) defines primary care as a “whole-of-society” approach which aims to serve all people throughout their lifetime in all aspects of health, including not just physical health, but social and mental health as well (3). While family medicine used to be the main primary care specialty, specialties such as general internal medicine, general pediatrics, adolescent medicine, and geriatric medicine are now
included (4). Primary care serves as a patient’s entry point into health care (5). A patient, regardless of if they have a specific health concern or not, can see their PCP, who can then address and track the patient’s health, provide preventive healthcare such as screenings and vaccines, and refer the patient to other specialties. Essentially, if health care were a wheel, the PCP sits at the hub of the wheel with the patient and serves as the patient’s home base for health services. If the patient requires more specialized treatment, specialty physicians, sitting at the spokes of the wheel, can be utilized.
The importance of primary care has been recognized and well documented. The WHO’s Alma-Ata Declaration of 1978 identified primary healthcare as an essential component of achieving the WHO’s goal of “Healthcare for All” (6). In this declaration, the WHO called for government, both national and local, to formulate and enact plans to support and strengthen primary care (6). More recently, access to primary care was noted as an essential component of the Healthy People 2030 goals under the “Health Care Access and Quality” domain (7). The WHO has even deemed primary care as “the most efficient and effective way to achieve health for all” (3). Primary care utilization has been associated with decreased hospitalizations and emergency room use, as well as better health outcomes and lower health care cost (8). Furthermore, effective primary care has been shown to increase health equity (8–9).
Despite the well-documented and supported importance of primary healthcare, total number of visits to PCPs is falling and the number of adults with no PCP visits is rising (10). Additionally, in 2020 more than 80 million American lived in a primary care health professional shortage area (HPSA), with almost 40% of those 80 million Americans residing in rural areas (11). These trends make it essential to examine where the efforts to support primary care are lacking and what more can be done to bring what has been documented as a positive force on people’s health to more people.
Effective primary care requires consistent longitudinal care. This allows providers and patients to develop relationships over time (12). An essential component of providing consistent longitudinal care is ensuring patients come to their appointments. When patients are unable to make their appointments, the purpose and benefits of primary care are disrupted (13). For this reason, it is essential to identify and address reasons why a patient may not be able to make their appointments so that the benefits of primary care can be reaped. While some appointments are canceled ahead of time, others result in a no-show. This is when a patient does not come to their appointment without canceling ahead of time. This research will focus on elucidating the barriers to healthcare that the patients of Geisinger South Wilkes-Barre (SWB) Primary Care face through investigating the reasons why patients miss appointments.
Scholarly Research In Progress • Vol. 6, November 2022
54
Geisinger SWB Primary Care is an outpatient primary care residency clinic in northeastern Pennsylvania, a state where most counties have been identified as primary care HPSAs (11). This clinic has been identified as having a high no-show rate of 21%, compared to the Geisinger systemwide no-show rate goal of less than 5%. For this reason, patients from Geisinger SWB Primary Care were contacted as participants for this research.
Located in south Wilkes-Barre in Luzerne County, Geisinger SWB serves patients from across northeastern Pennsylvania. Luzerne County has a population of 326,053 over 890 square miles (14). In addition to being a county identified as having a primary care HPSA, the median income is $53,194, compared to the United States median income of $64,944, and 15.1% of the population is under the poverty level, compared to 11.4% across the United States (14). Additionally, 20.2% of the population is over the age of 65, compared to 16.5% across the United States (14). These statistics represent barriers to healthcare that identify Luzerne County as a place where effective primary care could have a positive impact on its citizens.
As part of the Geisinger system, patients of Geisinger SWB have access to PCPs, a pharmacist, Geisinger at Home services, case managers, a behavioral case manager, and community health assistants. Geisinger is committed to primary care and has made efforts to reduce the primary care shortage by implementing the Abigail Geisinger Scholars program at the Geisinger Commonwealth School of Medicine, a program which rewards students who decide to pursue a career in primary care by forgiving a year’s worth of tuition for every year the student returns to Geisinger to work post-residency.
Quality of care can be assessed through a variety of factors such as clinical quality and insurance coverage (8). And while research has been conducted to investigate barriers to healthcare, much of this research has focused on variables that can be quantified such as wait times and demographics of the patient population. Furthermore, very little research has focused directly on contacting patients who have missed appointments and interviewing them due to the time-intensive nature of this type of research and the little time busy primary care offices must devote to this type of research. Given the nature and ultimate goal of primary care, patient-centered quality measures should be utilized (8). This research is part of the vanguard of new research that focuses on patient-centered quality measures rather than disease-specific ones.
This research asked the question “Are there patient characteristics that are common among patients who no-show at the Geisinger SWB Primary Care clinic?” The research additionally asks “Why do patients miss their appointments?”
The goal of this descriptive study was to gain an understanding of why patients are unable to make their appointments and identify potential barriers to primary healthcare access in order to provide concrete and actionable ways to improve health care delivery services. The data will be used to direct future initiatives to better help patients access the quality health care they deserve.
Institutional Review Board (IRB) approval was attained before the data collection process and can be referenced via IRB approval number 2021-0444. The study was conducted in accordance with the relevant guidelines and regulations outlined by the IRB.
Methods
Data was collected from appointments scheduled at Geisinger SWB Primary Care between June 21, 2021, and July 21, 2021. Participants over the age of 18 years old who missed their appointment during this time were contacted for participation, and data from consenting patients were collected for this research. The data collection was two-fold and included data collected from phone interviews with patients and data from an electronic health record system, Epic.
Phone interviews
Patients who were over the age of 18 and had missed their appointment during the data collection period, were identified using the Epic scheduling tool and called by a researcher. If the patient answered the phone, a script, which was approved by the Internal Review Board, was read. After being introduced to the study, patients had the opportunity to consent to or decline participating in the study. Consenting patients were then asked about why they were unable to make their appointment, and these responses were recorded in a spreadsheet and coded into categories (i.e., work, transportation, childcare). Along with the coded response, a brief description of the response was recorded to verify correct category placement with another researcher.
Participants who did not answer the first call were called back once. If they consented to participate, their answers and data were included, and if they denied or did not answer the second call, they were not included. To preserve patient privacy, no voice mails were left and information about the reason for the call was only given to the patient themselves and not to any other person who answered the call. During the fourth week of the study, the researchers gained access to a Language Line card, and at this point patients who did not speak English as their primary language were contacted and consenting participants were included. In these instances, all communication occurred via a trained medical interpreter.
At the end of the call, each participant was asked if they would like the appointment rescheduled. Patients who wanted to reschedule their appointments were forwarded to the front desk staff or to the clinic manager, who then reached out to the patient. If the patient identified transportation as a barrier to healthcare, the researcher provided resources, found using Neighborly, depending on the patient’s needs (15).
A form was completed for each participant called, whether they consented to participate or not, which included the date of the calls and a brief description of the conversation. These forms were subsequently scanned into the patient’s chart to record any communication with a patient, to be used as a reference in case the patient called back with questions, and to ensure proper follow-up if needed. This follow-up included referral to case manager or physician and appointment rescheduling.
Epic
Data regarding appointments during the data collection period was collected via Epic. This process included first going back through the clinic’s schedule via Epic and identifying missed appointments. Once a missed appointment was identified,
Do Patient Characteristics Affect Appointment No-Show Rates?
55
Do Patient Characteristics Affect Appointment No-Show Rates?
information regarding the appointment, also collected via Epic, was recorded in Excel.
• Total number of appointments (both adult and child)

• Total number of no-shows (both adult and child)
• Day of the week of appointments and no-shows
• Nurse appointments and no-shows
• Pharmacist appointments and no-shows
• Time of day of no-shows (separated into early morning, 8–9:59 a.m.; late morning, 10–11:59 a.m.; early afternoon, 12–1:59 p.m.; late afternoon, 2–4 p.m.)
Additional information was collected from consenting participants from patient charts via Epic. All information was deidentified and recorded in Excel.
• Age
• Behavioral case manager status
• Case manager status
• Distance in miles from SWB clinic
• Doctor for appointment
• Gender
• Insurance type
• Language
• Living situation (i.e., married, single, divorced)
• MyGeisinger use
• No-show rate (at SWB and at all other facilities)
• Race
• Seeing a different doctor from their primary care physician
This data was recorded in a spreadsheet and secured on password-protected computers in the SWB clinic.
Analysis
The goal of this study was to answer the question “Who is missing their appointments?” Therefore, a descriptive analysis was used to identify if certain characteristics were more common among patients who no-show.
Results
Over the data collection period, there were 294 missed appointments out of 1,363 total appointments. This demonstrated a no-show rate of 22% (Table 1). Two hundred sixty-two patients who had missed their appointments and met the eligibility requirements were contacted. Of those 262 patients, 103 consented to participate. Most of the missed appointments were return appointments, scheduled for Monday, and in the late morning (Figures 1, 2, 3).
Demographics
The sample was primarily female, English-speaking, white, and single (Figures 4, 5, 6, 7).
Telephone interview
The most common reasons for missed appointments were forgetting the appointment, transportation, and conflicts with work (Figure 8).
Other patient information
The most common insurance plan among the sample was Geisinger Health Plan Family insurance (Figure 9). Additionally, more than half of the patients who missed appointments were
Table 1. Appointments and no-shows during the data collection period
Table 2. Missed appointments by MyGeisinger use, distance from SWB clinic, PCP, case manager status, and days from schedule to appointment
Appointment type
Figure 1. Missed appointments by appointment type


scheduled to see a physician that was not their primary care physician (Table 2). Most patients had access to MyGeisinger, a patient portal (Table 2). The average distance from the clinic was 4.34 (5.55) miles (Table 2). Very few patients had a behavioral or nurse case manager (Table 2).
Conclusion
This research found that at the Geisinger SWB facility, patients who missed appointments were primarily female, Englishspeaking, white, and single; and that most missed appointments occurred on Mondays. Other research has also demonstrated non-married patients to be at a higher rate of no-show and higher no-show rates on Monday (17). However, our data is not consistent with research that has shown male patients and patients of ethnic minorities to be more likely to no-show (17). These findings warrant future research into why these discrepancies exist.
56
Gender identification Language Race
This research investigated why Geisinger SWB patients were unable to make their appointments. Specifically, the research asked if there are characteristics that are common among patients who no-show. Twenty-three variables were examined to identify barriers to health care this patient population faces. The data suggests several methods that could improve patient access to primary care and identifies specific patients that could benefit the most from these efforts. The effectiveness of these recommendations should be investigated in future research.


Efforts to improve the no-show rate should include patient education and transportation assistance. Patient education should focus on the importance of primary care and preventive medicine. During the telephone interview, some patients reported they did not want to be seen by residents, as they
were not “real doctors.” As Geisinger SWB is a resident clinic, education regarding the qualifications of residents and their role in the health care team is imperative. Additionally, patients who chronically no-show should be educated on the effects of missing appointments, as the literature has determined a previous history of missing appointments to be associated with missing appointments in the future (17). Patient education is already being put into action by on-site access teams and should be continued.
Additionally, transportation assistance should be included in improvement efforts. Patients should be asked about their transportation status to identify patients who could benefit from transportation resources such as the Senior Lottery Program, Luzerne County Transportation Authority Medical
Do Patient Characteristics Affect Appointment No-Show Rates?
Figure 2. Missed appointments averaged by day of the week. Figure 3. Missed appointments by time of day.
Figure 4. Missed appointments by gender Figure 5. Missed appointments by language Figure 6. Missed appointments by race
Day of week Time of day
57
Relationship status
Reasons for missed appointments
Insurance type
Assistance Transportation, and Neighborly. Nurse case managers should also be utilized as a resource, as they have the best knowledge of available transportation assistance programs. These recommendations should be focused toward patients that this research has identified as “at a high risk” for missing appointments. These would be patients who identify as female and live alone. Additionally, patients with Geisinger Health Plan Family insurance were identified as missing the most appointments compared to other insurance plans. Because this clinic is a Geisinger facility, this suggests a potential for an incentive plan in which patients with GHP Family insurance are rewarded for making their appointments. This would lead to less no-shows and better health care for patients.
This research identified many important care gaps. However, as the first research of this type conducted at this clinic, there were limitations that should inform future work in this subject. First, there were many variables that would be important to examine, however, there was insufficient data in Epic. Examples of these variables included education level, employment status, food insecurity, financial resource strain, and sexual orientation. Additionally, due to the constraints of the IRB approved for this study, the data analysis was unable to link variables to each other for risk of including identifiable information. Therefore, future research should include this type of data analysis. Future research should also focus on comparing data from patients who miss appointments to patients who make their appointments, to more clearly elucidate the characteristics of patients who no-show.
One of the challenges faced during the data collection process was time. Each call, including follow-up, when necessary, took a significant amount of time. Additionally, data collected via Epic was collected by manual chart review. Primary care offices are very busy and lack the time required to complete this type of research. Therefore, without a dedicated researcher, this research would be difficult to carry out.
Perhaps the most striking finding of this research is the importance of patient follow-up. Of the 103 participants, 55 (53%) requested a rescheduled appointment. And of those 55, 26 (25%) appointments were rescheduled during the data collection period. Following up with patients who miss appointments is an important strategy to make up lost appointments.
An additional importance of follow-up was made clear through speaking with patients. During the data collection period, researchers spoke to a patient who was in acute distress and transferred to their physician for care. Another patient was identified as moved to a nursing home. Patients were referred to their case managers or to their physicians and received resources for transportation. What would have happened to these patients had no one called? Through following up with


Do Patient Characteristics Affect Appointment No-Show Rates?
Figure 7. Missed appointments by relationship status Figure 8. Reasons for missed appointments
58
Figure 9. Missed appointments by insurance coverage
patients who miss appointments, especially through phone calls, clinics can get a better understanding of the patient population they serve and care for patients who may have otherwise been lost in the system. Additionally, this type of research has the added benefit of making patients feel heard and giving them a voice in their care.
The number of medical students choosing to specialize in primary care is declining and it is expected that by 2033 there will be a shortage of PCPs (16). While this shortage will be felt by everyone, it will be especially detrimental for rural populations. This makes addressing the findings of this research even more imperative. It will be essential to address the actionable items suggested in this paper to not only improve the number of patients utilizing primary care, but to improve how patients are utilizing primary care.
Acknowledgments
The authors would like to acknowledge John Jurosky, clinic site manager at Geisinger SWB Primary Care, as well as the providers and staff at Geisinger Primary Care SWB: Colleena Jenceleski (case manager), Dr. Elise Mester, Jamela James (front desk), Jennifer Antall (community health assistant), Kathleen Coyle (Geisinger at Home), Kathleen Pedley (nurse), Katrina O’Day-Berish (behavioral health case manager), Theresa Shrader (nurse), Shantese Wilson Ward (front desk), and Dr. William Barker.
Disclosures
The authors have no disclosures. Funding for the research was part of the Geisinger Commonwealth School of Medicine Summer Research Immersion Program.
References
1. AAMC. Specialty profiles [Internet]. Careers in Medicine; 2022 [cited 2022 April 24]. Available from: https://www.aamc.org/cim/explore-options/specialtyprofiles#:~:text=Begin%20your%20specialty%20 exploration%20by,nearly%2040%20specialties%20in%20 Canada.
2. Santo L, Okeyode T. National Ambulatory Medical Care Survey: 2018 National Summary Tables. Available from: https://www.cdc.gov/nchs/data/ahcd/namcs_summary/ 2018-namcs-web-tables-508.pdf.
3. WHO. Primary health care [Internet]. World Health Organization; 2022. [cited 2022 April 24]. Available from: https://www.who.int/health-topics/primary-healthcare#tab=tab_1.
4. Dalen JE, Ryan KJ, Alpert JS. Where have the generalists gone? They became specialists, then subspecialists. The American Journal of Medicine. 2017;130(7):766–768.
5. AAFP. Primary care [Internet]. American Academy of Family Physicians; 2022. [cited 2022, April 24]. Available from: https://www.aafp.org/about/policies/all/primarycare.html.
6. International Conference on Primary Health Care. Declaration of Alma-Ata. WHO Chron. 1978 Nov;32(11):428-30. Available from: https://cdn.who. int/media/docs/default-source/documents/almaatadeclaration-en.pdf?sfvrsn=7b3c2167_2.
7. Healthy People 2030. Access to primary care [Internet]. U.S Department of Health and Human Services, ODPHP; 2022. [cited 2022 April 24]. Available from: https://health. gov/healthypeople/priority-areas/social-determinantshealth/literature-summaries/access-primary-care.
8. Shi L. The impact of primary care: a focused review. Scientifica (Cairo). 2012;2012:22 p.
9. Starfield B, Shi L, Macinko, J. Contribution of Primary Care to Health Systems and Health. Milbank Q. 2005 Oct 03; 83:457-502.
10. Ganguli I, Shi Z, Orav EJ, Rao A, Ray KN, Mehrotra A. Declining use of primary care among commercially insured adults in the United States, 2008–2016. Ann Intern Med 2020;172(4):240–247.
11. HRSA. Shortage areas [Internet]. 2020. [cited 2022 April 24]. Available from: https://data.hrsa.gov/topics/healthworkforce/shortage-areas.
12. O’Neill B, Ferrer R, O’Brien P, Watt G, Gottlieb L, Pinto A, et al. Improving equity through primary care: Proceedings of the 2019 Toronto International Conference on Quality in Primary Care. Ann Fam Med. 2020 Jul;18(4):364-369.
13. Kaplan-Lewis E, Percac-Lima S. No-Show to primary care appointments: Why patients do not come. J Prim Care & Community Health. 2013 October;251-255.
14. US Census Bureau. QuickFacts: United States; Luzerne County [Internet]. 2021. [cited 2022 April 24]. Available from: https://www.census.gov/quickfacts/fact/table/ US,luzernecountypennsylvania/PST045221.
15. Neighborly. https://www.neighborlypa.org/.
16. AAMC. The Complexities of Physician Supply and Demand: Projections From 2018 to 2033. [Internet]. June 2020. Available from: https://www.aamc.org/system/ files/2020-06/stratcomm-aamc-physician-workforceprojections-june-2020.pdf
17. Dantas LF, Fleck, JL, Cyrino Oliveira FL, Hamacher, S. Noshows in appointment scheduling – a systematic literature review. Health Policy. 2018 April;122(4):412-421.
Do Patient Characteristics Affect Appointment No-Show Rates?
59
Tay-Sachs Disease: Causes and Treatments
Brittany Kemp1*
¹Geisinger Commonwealth School of Medicine, Scranton, PA 18509
*Master of Biomedical Sciences Program
Correspondence: britkemp9@gmail.com
Abstract
Tay-Sachs disease (TSD) is a rare autosomal recessive neurodegenerative disease. It is one of several lysosomal storage disorders. Neurodegeneration results from disordered lipid metabolism that causes a buildup of GM2 gangliosides in the central nervous system (CNS). The three forms of TSD, infantile, juvenile, and late-onset, are classified by the amount of residual activity of the enzyme β-hexosaminidase A (HEX A) and can be caused by over 100 different mutations. TSD has a low prevalence in the general population. It is therefore a lesserknown disease in communities that do not frequently encounter affected individuals. There are currently no treatments or cure for any of the three forms of TSD. The aim of this review is to summarize and discuss current studies that investigate potential treatments for TSD to determine where future studies should be focused. Two databases, Medline and EBSCOhost, were used to search the literature for articles that were published between 2000 and 2021. Several animal models, such as mice and sheep, have been used to analyze the effects of bone marrow transplantation and gene therapies using different vectors. Stem cell transplantation, pyrimethamine, modification of protein quality control mechanisms, and a modified amino acid have been tested in vitro in human cells or in a small cohort of patients. The rarity of this disease and the many mutations that cause it present challenges to testing potential treatments on larger groups of patients. Several gene therapy delivery systems and administration of L-acetyl-leucine have shown promising results that could lead to more widely available therapies if successful in more patients.
Introduction
TSD is one of several lysosomal storage disorders, and is closely related to another lysosomal storage disorder, Sandhoff disease. TSD is caused by a mutation in the HEXA gene, which codes for the α-subunit of β-hexosaminidase A (HEX A) and is inherited in an autosomal recessive manner. TSD is commonly studied with Sandhoff disease because Sandhoff disease is caused by a mutation in the β-subunit of HEX A. Both TSD and Sandhoff disease are the main forms of GM2 gangliosidosis. There are currently over 100 mutations identified that cause TSD and impact the function of the α-subunit of HEX A (1). β-hexosaminidase A is a heterodimeric lysosomal protein that breaks down GM2 gangliosides. Without this enzyme, GM2 gangliosides build up in lysosomes of the brain and nerve cells. This buildup results in neurological decline and progression of symptoms as patients age. The age of onset and severity of TSD symptoms is determined by the mutation’s effect on the α-subunit of HEX A. Therefore, the three forms of TSD are characterized based on the amount of residual HEX A activity. Infantile TSD is the classical form of TSD in which patients have very low or no HEX A activity. The physiological effects
of the buildup of GM2 gangliosides in the brain and nerve cell lysosomes can be recognized in the patient’s first 3 to 6 months of life. The patient’s symptoms begin with progressive weakness that results in a loss of motor skills as well as a lack of visual attentiveness. Patients begin experiencing seizures within their first or second year of life as the amount of GM2 gangliosides building up increases. Death typically occurs around ages 2 to 3 years, although survival has been recorded up to 5 to 7 years.
Juvenile TSD is characterized by symptoms that appear around 2 years of age. Until the age of 2, patients reach normal developmental milestones because they have more residual HEX A activity than infantile TSD patients. Once the levels of built up GM2 ganglioside reach disease levels, the developmental milestones previously reached are slowly lost. Patients walk with an abnormal gait and have difficulty with speech. By age 10, patients have more severe symptoms such as dysphagia and seizures. Death occurs before or around age 20 for these patients.
Late-onset TSD occurs in individuals who have a less severe mutation in HEXA resulting in a higher residual HEX A activity than infantile or juvenile TSD patients. This delays their neurological decline and onset of symptoms. Patients with late-onset TSD typically begin showing TSD symptoms in their late teens or young adult years. Many of the same symptoms of decline are present for these patients including muscle weakness, abnormal gait, and speech difficulties.
There is currently no cure for any of the three forms of TSD. Several animal models have been used to identify possible treatments such as using bone marrow stromal cells (2) and several forms of gene therapy (3–5) for treating or slowing the progression of TSD. Other treatment methods have been tested in vitro using human cells or on a small cohort of TSD patients. These include the use of hematopoietic stem cell transplantation (6–7), administration of pyrimethamine (8–9), and manipulation of cellular quality control mechanisms (10) to increase HEX A activity. Application of a modified amino acid (11–12) was proposed as a therapy to protect cells of the cerebellum from damage due to the buildup of GM2 gangliosides.
In 2018, TSD treatment methods were presented by Soloveyeva et al., but more potential treatments have since emerged (13). The purpose of this review is to present previous and current attempts at finding a treatment method for TSD as well as to highlight methods that will be explored in future studies. Table 1 summarizes the treatment method and primary outcomes of each study examined in this review.
Methods
Two databases were used to retrieve articles for this review, Medline and EBSCOhost. Medline was used first and resulted in seven articles. Three keywords were used to search on
Scholarly Research In Progress • Vol. 6, November 2022
60
Tay-Sachs Disease: Causes and Treatments
Therapy Primary outcome Reference
Bone marrow transplant Proper association of Hex A with Hex B in transduced BMSCs. Hydrolysis of GM2 ganglioside by transduced BMSCs.
Gene therapy All sheep treated with AAV vector containing HEXA and HEXB cDNA showed delayed onset or prevention of clinical signs of TSD.
Gene therapy AAV vector was able to be detected in small amounts in the brain indicating that it crossed the blood brain barrier. Increases in both MUG and MUGS activity was indicated for the Hex M construct in the liver and brain of treated SD mice.
Gene therapy Hex M was distributed in the brain and liver of treated TSD and SD mice. However, a B and T cell immune response was mounted against the Hex M construct as well as the AAV vector.
Enzyme replacement Supraphysiological MUG and MUGS activity was achieved in NCs of SD mice when transduced with bicistronic LV and persisted upon NPCs differentiation. Transduced fibroblasts from a SD patient were able to clear GM2 ganglioside.
Enzyme replacement Symptoms of a long-standing tremor, gait ataxia, speech stammer, and swallowing problems were resolved in a patient with late-onset TSD. Following treatment, his symptoms had decreased to only an occasional mild tremor. Eight years after treatment was administered, his cells retained full donor chimerism.
Pharmacological chaperone
Pharmacological chaperone
Endogenous chaperone manipulation
Martino et al. (2)
Gray-Edward et al. (3)
Ou et al. (4)
Kot et al. (5)
Ornaghi et al. (6)
Stepien et al. (7)
Low doses of PYR administered to late-onset TSD patients was able to increase leukocyte Hex A activity. Clarke et al. (8)
Administration of PYR can increase Hex A activity in patients with late-onset TSD. Optimal doses should be determined on an individual basis to prevent decreasing of biochemical effects.
Modulating components of cell’s intrinsic ERAD pathway can increase cellular Hex A activity by promoting proper mutant α-subunit folding.
Neuroprotection Acetyl-DL-leucine was able to reduce gait variability during slow walking in patients with cerebellar ataxia.
Table 1. Primary outcomes of therapeutic approaches for TSD treatment.
this database: Tay-Sachs, Tay-Sachs disease, and treatment. Searches were first narrowed to the date range of 2000–2021 and were further narrowed to 2010–2021 to decrease the number of search results and include more relevant articles. EBSCOhost was searched using four keywords: Tay-Sachs, Tay-Sachs disease, treatment, and GM2-gangliosidosis. The date range was narrowed to include only articles from 2010–2021, as this resulted in the most relevant articles from the first database. Searches on EBSCOhost resulted in six articles that are discussed in this review. No journal exclusion was applied when searching either database.
Animal Studies
Bone Marrow Transplant
Several animal models have been used for studying both Sandhoff disease and TSD. Martino et al. (2) studied TSD mice to determine if their bone marrow stromal cells (BMSCs) could be transduced with a Molony leukemia retroviral vector encoding the α-subunit of human HEXA in order to restore enzyme function. This methodology was used because the enzymatic defect must be corrected for cells of the CNS which has presented as a challenge for other treatment approaches. BMSCs were chosen because they have been found to produce circulating progenitors that can repopulate nonhemopoietic tissues. Therefore, they could potentially carry gene therapies to these tissues and, in the case of TSD, restore enzyme
Osher et al. (9)
Derish et al. (10)
Schniepp et al. (12)
function. Several important conclusions can be made based upon findings from this study. First, the strategy used resulted in proper association between the α-subunit and β-subunit of HEX A without the formation of the undesired HEX S (αα) protein product. Upon further analysis, the HEX A protein formed when using transduced HEXA sequence displayed kinetic and thermal stability properties like the HEX A obtained from wild-type fibroblasts. Second, transduced cells from TSD mice were able to hydrolyze GM2 ganglioside that reached their lysosomes while non-transduced cells from TSD mice had accumulation of GM2 ganglioside in vitro. One limitation of using mice as a TSD model for in vivo studies, is that they have an alternative method for breaking down GM2 gangliosides preventing them from showing signs of neurological disease in the same manner as humans (3).
Gene Therapy
Gray-Edwards et al. (3) used sheep instead of mice as a model for TSD to evaluate the potential of the adeno-associated virus (AAV) as a vector for administering gene therapy. Sheep were used because they are the only experimental model for TSD that show clinical signs of the disease in a manner like affected humans. Additionally, the sheep’s CNS more closely resembles the size and complexity of the human CNS when compared to other models. Another advantage of this animal model is that it could uncover possible treatment limitations that would arise in humans; however, these limitations would not arise in other
61
Disease: Causes and Treatments
animal models. In this study, the AAV vector was administered intracranially at 2 to 4 months of age. The vector was injected into a single lateral ventricle and bilaterally into the thalamus. These injection sites were chosen to distribute the vector into both the cerebellum and the cerebral cortex. All sheep treated with the AAV vector showed a delayed onset or prevention of clinical signs of TSD. The lifespan was also increased by up to 50% when compared to untreated sheep. Sheep treated with α-subunit and β-subunit cDNA-containing vectors exhibited the most clearance of the sialic acid component of GM2 gangliosides in many CNS areas except for the midbrain. Delivery to the spinal cord and cerebellum revealed a limitation of the delivery based on AAV vector. In both areas, storage of GM2 gangliosides remained equal to or surpassed the levels in untreated sheep. Other locations of injection will need to be studied to determine how deliver the AAV vector more effectively to the spinal cord and cerebellum.
AAV was also used as a vector delivery method for the CRISPR system to form edited hepatocytes in Sandhoff mice. The vector delivered cDNA encoding a modified α-subunit incorporating partial β-subunit sequence, yielding, the protein product identified as HEX M. Delivery of this modified sequence allowed Ou et al. (4) to overcome difficulties presented by packaging both HEXA and HEXB in the same vector and also reduced the cost from using separate vectors containing individual subunit sequences. Additionally, usage of HEX M allows for the potential treatment of both TSD and Sandhoff disease using the same vector. Following treatment of Sandhoff mice with the AAV vector containing HEX M and CRISPR machinery, the amount of GM2 gangliosides was significantly reduced in the liver, heart, and spleen. However, the GM2 gangliosides in the brain were not significantly reduced. 4-methylumbelliferyl-6-sulfa2-acetoamido-2-deoxy-β-D-glucopyranoside potassium salt (MUGS) and 4-methylumbelliferyl N-acetyl-β-D-glucosaminide (MUG) activities were measured to determine the amount of HEX activity in each of the four tissues of treated mice in comparison to normal and untreated mice. MUG and MUGS activities in the liver, heart, and spleen increased above the activity of both untreated and normal mice. Additionally, the MUG and MUGS activity in the brain of treated mice was significantly increased when compared to untreated mice. Therefore, a small amount of HEX M was able to cross the blood-brain barrier. Kot et al. (5) identified and investigated a potential limitation of introducing HEX M due to it being a hybrid variant of native subunits of the HEX A protein. Patients who do not express the native HEX A or HEX B protein could have an immune response to the HEX M protein. When the human-derived HEX M enzyme was expressed in both TSD and Sandhoff disease mice a T and B cell immune response was triggered. The immune response reported in this study indicates the need for immunomodulatory gene therapy to be used for long-term treatment of diseases such as TSD and Sandhoff disease.
Ornaghi et al. (6) identified another potential treatment for TSD and Sandhoff disease using a different vector delivery system. The bicistronic lentiviral vectors (LV) were found to be able to transduce human neurons and glia as well as CD34+ hematopoietic stem/progenitor cells (HSPCs). The efficacy of these bicistronic LVs to transduce neural stem/progenitor cells
(NPCs) of Sandhoff mice was tested first. The NPCs were not functionally impacted by transduction as indicated by the ability to proliferate, self-renew, and maintain multipotency after LV transduction. The expression of both α- and β-subunits of HEX A was detected in transduced cells. Exogenous expression of these subunits did not alter the endogenous expression of HEXA or HEXB genes. Furthermore, supraphysiological MUG- and MUGS-related enzyme activity was produced; this activity persisted through the differentiation of NPCs to neurons and glia. One advantage of administering bicistronic LVs is that a half dose was required when compared to the necessary dosage for monocistronic LVs. Another suggested advantage of using bicistronic LVs is that they drive stoichiometric expression of the α- and β-subunits unlike monocistronic LVs. Stoichiometric expression of the α- and β-subunits can be beneficial for preventing the unwanted formation of HEX S.
Human Clinical Trials
Stem Cell Therapy
The usage of bicistronic LVs to effectively and safely reconstitute HEX A activity in vitro for human neuron/glial cells and CD34+ HSPCs was also evaluated by Ornaghi et al. (6). iPSC-derived neural progeny and CD34+ HSPCs were both successfully transduced with the bicistronic LVs and were able to produce functional HEX A. Fibroblasts from a human Sandhoff disease patient were then transduced with the bicistronic LV to test whether enzymatic activity for clearing stored GM2 gangliosides could be rescued in these cells. The composition of α- and β-subunits expressed was comparable to the un-transduced healthy donor fibroblast composition of subunits. GM2 ganglioside storage was cleared in the transduced fibroblasts indicating the efficacy of this treatment in patient-derived cells. The larger cargo capacity of LVs allows genes for both the α- and β-subunits to be delivered in one vector. This could potentially overcome the issue presented when using an AAV vector as well as the HEX M construct (5).
One patient with late-onset TSD was found to have been successfully treated with HSPC transplantation as described by Stepien et al. (7). At 15 years of age the patient was given a bone marrow transplant from a healthy matched-sibling donor. The patient described in this study had a long-standing tremor since age 7 in addition to gait ataxia, a speech stammer, swallowing problems, and neurological deterioration prior to treatment. The patient was diagnosed with a deficiency in HEX A consistent with late-onset TSD. Two attempts for treating his tremor were made using first propranolol and then primidone, but both were eventually stopped due to lack of effectiveness and side effects respectively. Stepien et al. (7) indicated that the patient’s neurological regression was stabilized postHSPC transplantation. Eight years after the transplant was performed, the patient had only mild tremors in his upper limbs and occasionally in his body, with MRI scans showing no further progression when compared to scans done prior to transplantation. Additionally, at age 23 the patient retained full donor chimerism with his white cell HEX A levels comparable to normal control levels and a reduction in GM2 ganglioside in circulation. Further testing on this treatment method is needed, but it marks potential progress in treating one of the forms of TSD.
Tay-Sachs
62
Tay-Sachs Disease: Causes and Treatments
Cellular Quality Control Manipulation
The drug pyrimethamine (PYR) was studied as another potential treatment for late-onset TSD. Pyrimethamine is a pharmacological chaperone (PC) that binds and stabilizes its target enzyme by maintaining the native folded conformation. PYR inhibits its target enzyme better in the neutral pH of the endoplasmic reticulum (ER) rather than in the acidic environment of the lysosome. PYR is currently approved for the treatment of some malaria and toxoplasmosis infections. Clarke et al. (8) examined the clinical benefit of administering PYR to patients with late-onset TSD and Sandhoff disease in doses similar to those used for treating parasitic diseases. When given in low doses (25 mg/day), all 8 subjects in this study tolerated the drug well. When the dosage was raised from 50 to 75 mg per day all but one of the subjects showed significant adverse neurological side-effects. Two noteworthy conclusions can be drawn from this study. Three subjects exhibited definitive increases in HEX A levels when compared with their baseline levels, and no inhibition of HEX A activity was indicated even at the highest plasma PYR level. Further studies need to be performed to fully evaluate the efficacy of PYR as a treatment method for TSD and Sandhoff disease. None of the patients were able to reach the maximum dosage of 100 mg due to adverse side effects developing on the intermediate doses (50–75 mg/day). This study also showed the importance of monitoring plasma PYR levels as the relationship between plasma PYR levels and dosage is highly variable between different subjects. Another study by Osher et al. (9) also
assessed whether pyrimethamine could be used to increase HEX A activity in late-onset TSD patients. The dosing for this study began at a lower dose of only 6.25 mg and increased up to 75 mg daily. Participants in this study showed some doserelated increase in HEX A activity, but the dose varied markedly between subjects and doses beyond the optimal resulted in a decline in HEX A activity. The researchers were also unable to rule out if the maximal rise in HEX A activity was due to the dose or if it was time-related. Some participants in this study also experienced negative side effects such as nausea, vertigo, and vomiting; however, serum PYR was not measured, and these symptoms occurred at different dosages for different participants. The study results suggest that PYR administration at low doses or for a short period can increase HEX A activity in late-onset TSD patients, but high doses and/or long-term usage of PYR is associated with negative side effects. The investigators proposed further studies to be performed to evaluate different dosing regimens for treatment of late-onset TSD with PYR.
Derish et al. (10) studied two HEX A α-subunit mutants that are both degraded through the endoplasmic reticulumassociated degradation (ERAD) pathway shown in Figure 1. This study evaluated how manipulating endoplasmic reticulum (ER) quality control could impact folding and lysosomal expression of HEX A. It was first confirmed that both E482K and G269S mutations caused misfolding of the α-subunit and its subsequent degradation through the ERAD pathway. Next, several ER quality control mechanisms were manipulated with the objective to properly fold the α-subunit, prevent its
Figure 1. Model for manipulation of the endoplasmic reticulum-associated degradation pathway to treat Tay-Sachs Disease. HEX A α is translocated into the ER where it is cotranslationally glycosylated, then folded in the calreticulin/calnexin cycle. Upon proper folding, α and β subunits dimerize and are packaged for export to the Golgi. Stalling, caused by either the G269S or E482K mutation, glycan trimming begins the subunit’s disposal. Kifunensine blocks glycan trimming, preventing disposal. Chaperones BiP and OS-9 escort the misfolded α-subunit to the retrotranslocon formed by SEL1L and Hrd1 for removal from the ER. Cytosolic PNGase removes glycans prior to degradation by the proteosome (10).

63
Tay-Sachs Disease: Causes and Treatments
degradation, increase HEX A secretion, and increase lysosomal HEX A activity. First, cells were incubated with kifunensine, a mannosidase inhibitor. It was hypothesized that more correctly folded α-subunit mutants would be formed when given longer time to properly fold. The degradation of both E482K and G269S was decreased; however, the number of secreted molecules was not significantly increased for either mutant. Calreticulin (CRT), a major ER-resident chaperone for glycoproteins, was studied next to determine if it could prevent E482K from ERAD recognition. This was done by overexpressing CRT in some cells. Cells treated to overexpress CRT showed delayed identification of the E482K mutant by ERAD when compared to cells not treated with CRT and cells transduced with mutant, inactive H153A CRT. Finally, chemical chaperones were studied to determine their ability to stabilize G269S to increase its activity. The G269S mutant was chosen because some active forms of this α-subunit can escape ER quality control. Trimethylamine N-oxide (TMAO) and glutamic acid both were able to significantly increase HEX A activity when administered to patient fibroblasts. Since upregulation of G269S alone does not increase HEX A activity, it was proposed that TMAO and glutamic acid were able to promote proper folding of this mutant. Due to the many different mutations that cause TSD, ERAD manipulation needs to be studied in the context of more mutants to determine the full potential of this treatment approach.
Neuroprotection
Fields et al. (11) identified N-acetyl-L-leucine, a modified amino acid, as a potential therapy for treating three rare neurodegenerative diseases one of which was GM2gangliosidosis. The rationale for utilizing N-acetyl-L-leucine for treatment of these diseases is based on its potential to protect cells of the cerebellum by reducing neuroinflammation, and therefore, preventing neurodegeneration. Previously, the racemic mixture of N-acetyl-leucine was determined to be well tolerated by TSD and Sandhoff disease patients. Racemic N-acetyl-DL-leucine was studied by Schniepp et al. (12) for its ability to reduce cerebellar ataxia in patients. The patients of this study had cerebellar ataxia that was either sporadic or hereditary. The patients in did not have TSD, although cerebellar ataxia is one of the symptoms for juvenile and lateonset TSD. Participants in this study showed improvements in gait variability during slow walking, the stability of which is potentially reliant on the cerebellum for sensory integration. Based on the demonstrated ability of N-acetyl-DL-leucine to improve cerebellum function through measuring improvement in ataxia, Fields et al. (11) created a protocol for using N-acetylL-leucine as a therapy for GM2-gangliosidosis including both TSD and Sandhoff disease. Only the L-enantiomer was proposed for use in this protocol because the L-enantiomer was found to be the only pharmacologically active form. Recruitment for the trial using this protocol was delayed due to the COVID-19 pandemic, but it was planned to resume during 2021.
Conclusion
It is difficult to study potential treatments for TSD as well as many other autosomal recessive diseases because of how rare they are in the population as evidenced by the small number of patients in human trials. Increasing awareness of this disease in populations that have a lower rate of prevalence could be
one way of increasing the number of participants in clinical trials. This could also allow for each proposed treatment approach to be studied in the context of many different causative mutations. Due to the many mutations that cause TSD, and the variable phenotypes caused by these mutations, several treatment methods may need to be investigated for a patient to determine the best personalized approach. The increasing prevalence of genetic screenings could also aid in earlier detection of TSD. Screening for mutations prior to neurological decline could allow for earlier intervention once there is an approved preventative therapeutic. Many of the treatment methods detailed in this review need to undergo more rigorous testing to determine proper dosing and avoid adverse side effects. Distributing working enzyme into all necessary areas of the brain is the largest hurdle that must be overcome with all the vector delivery systems. Once a vector is determined to distribute effectively in the brain, combining enzyme replacement therapy with the neuroprotective effects of L-acetyl-leucine should be a focus in future studies. The neuroprotective effects of this modified amino acid could increase the effectiveness of enzyme replacement on slowing neurological decline.
Acknowledgments
I would like to thank Dr. Darina Lazarova for her assistance throughout writing this review.
Disclosures
The author has no conflicts of interest to declare.
References
1. Mistri M, Datar C, Sheth F, Gupta S, Sheth J. Identification of novel mutations in HEXA gene in children affected with Tay-Sachs disease from India. Mol Cytogenet. 2014;7.
2. Martino S, Cavalieri C, Emiliani C, Dolcetta D, Angelis MGCD, Chigorno V, et al. Restoration of the GM2 Ganglioside Metabolism in Bone Marrow–Derived Stromal Cells from Tay-Sachs Disease Animal Model. Neurochem Res. 2002;27.
3. Gray-Edwards HL, Randle AN, Maitland SA, Benatti HR, Hubbard SM, Canning PF, et al. Adeno-Associated Virus Gene Therapy in a Sheep Model of Tay-Sachs Disease. Hum Gene Ther. 2018;29(3):14.
4. Ou L, Przybilla MJ, Tăbăran A-F, Overn P, O’Sullivan MG, Jiang X, et al. A novel gene editing system to treat both Tay–Sachs and Sandhoff diseases. Gene Ther. 2020;27:10.
5. Kot S, Karumuthil-Melethil S, Woodley E, Zaric V, Thompson P, Chen Z, et al. Investigating Immune Responses to the scAAV9-HEXM Gene Therapy Treatment in Tay-Sachs Disease and Sandhoff Disease Mouse Models. Int J Mol Sci. 2021;22.
6. Ornaghi F, Sala D, Tedeschi F, Maffia MC, Bazzucchi M, Morena F, et al. Novel bicistronic lentiviral vectors correct β-Hexosaminidase deficiency in neural and hematopoietic stem cells and progeny: implications for in vivo and ex vivo gene therapy of GM2 gangliosidosis. Neurobiol Dis 2020;134.
64
Tay-Sachs Disease: Causes and Treatments
7. Stepien KM, Lum SH, Wraith JE, Hendriksz CJ, Church HJ, Priestman D, et al. Haematopoietic Stem Cell Transplantation Arrests the Progression of Neurodegenerative Disease in Late-Onset Tay-Sachs Disease. JIMD Rep. 2017;41.
8. Clarke JTR, Mahuran DJ, Sathe S, Kolodny EH, Rigat BA, Raiman JA, et al. An open-label Phase I/II clinical trial of pyrimethamine for the treatment of patients affected with chronic GM2 gangliosidosis (Tay-Sachs or Sandhoff variants). Mol Genet Metab. 2011;102(1):6.
9. Osher E, Fattal-Valevski A, Sagie L, Urshanski N, AmirLevi Y, Katzburg S, et al. Pyrimethamine increases β-hexosaminidase A activity in patients with Late Onset Tay Sachs. Mol Genet Metab. 2011;102(3):8.
10. Derish D, Iwamoto Y, Argon Y. Tay-Sachs disease mutations in HEXA target the α chain of hexosaminidase A to endoplasmic reticulum–associated degradation. Mol Biol Cell. 2016;27.
11. Fields T, Patterson M, Bremova-Ertl T, Belcher G, Billington I, Churchill GC, et al. A master protocol to investigate a novel therapy acetyl-L-leucine for three ultra-rare neurodegenerative diseases: Niemann-Pick type C, the GM2 gangliosidoses, and ataxia telangiectasia. Trials 2021;22(1):15.
12. Schniepp R, Strupp M, Wuehr M, Jahn K, Dieterich M, Brandt T, et al. Acetyl-DL-leucine improves gait variability in patients with cerebellar ataxia—a case series. Cerebellum Ataxias. 2016;3(8).
13. Solovyeva VV, Shaimardanova AA, Chulpanova DS, Kitaeva KV, Chakrabarti L, Rizvanov AA. New Approaches to TaySachs Disease Therapy. Front Physiol. 2018;9.
65
The Relationship Between Socioeconomic Status and Opioid Usage During Pregnancy in the United States
Mahshid A. Karimi1*, Brittany A. Kemp1*, Esosa E. Kest1*, and Anna P. Kleopoulos1* ¹Geisinger Commonwealth School of Medicine, Scranton, PA 18509
*Master of Biomedical Sciences Program
Correspondence: akarimi314@gmail.com, britkemp9@gmail.com, esosakest@gmail.com, annakleop@gmail.com
Abstract
Opioid usage in the United States (U.S.) is an intensifying issue. There is limited research on the effects of opioid use in pregnant individuals. Opioids are commonly prescribed to treat moderate to severe pain, but many individuals misuse opioids due to their addictive euphoric nature. Common opioids include fentanyl and heroin as well as prescription opioids such as oxycodone and hydrocodone. Side effects of opioid use include shallow breathing, slurred speech, nausea, and constipation. Opioids produce similar effects to morphine, a powerful and highly addictive prescription narcotic administered for pain relief. Many negative effects arise when opioids are misused. Opioid use during pregnancy can cause problems to the mother and neonate that include maternal death, premature births, neonatal abstinence syndrome, and neonatal deaths. Lowerincome individuals are more likely to misuse opioids than the general U.S. population. We examined the relationship between opioid usage and poverty level during pregnancy in the U.S. on individuals 12–44 years of age using data from the 2019 National Survey on Drug Use and Health. A chi-square test was used to determine whether there was a statistically significant difference in opioid usage between income groups. Our findings demonstrate that opioid misuse during pregnancy is related to poverty level, and that women in 200%+ poverty levels are less likely to misuse opioids when compared with those in 100% poverty level. The findings from this study indicate the need for better prevention measures before and during pregnancy to decrease the misuse of opioids during pregnancy in individuals living at the federal poverty level to create better health outcomes for mothers and their neonates.
Introduction
Opioid use is at an all-time high in the United States (U.S.); 3 million U.S. citizens currently have an opioid use disorder (OUD) (1). Opioid use during pregnancy is a growing problem in society. According to 2019 self-reported data, 7% of women reported using opioids during pregnancy (2). Of the women who self-reported, 1 in 5 reported that they abused opioids (3). An increase in prescribing opioid medications has led to an increase in misuse since opioids are highly addictive. Opioid usage impacts both neonatal and maternal health outcomes. The use of opioids by the mother may lead to stillbirth, specific birth defects, neonatal abstinence syndrome (NAS), or poor fetal growth (4). NAS occurs when newborns experience withdrawal from the opioids that they were exposed to while in the womb (2). The short-term withdrawal signs in the newborn include seizures, sleep problems, irritability, tremors, hyperactive reflexes, vomiting, and loose stool (5). Infants that were exposed to opioids during gestation are more prone to birth defects (5). These infants may also be born prior to full term (6). The
chances of these babies being re-hospitalized within 30 days of being born are heightened (5). There are also long-term developmental effects that occur to babies exposed to opioids during gestation. These developmental effects include speech delays or language disability. Centers for Disease Control and Prevention (CDC) research has found an increase in withdrawal symptoms of babies with opioid-related diagnoses. Over the time period from 2010 to 2017, withdrawal symptoms in babies born to mothers that used opioids during pregnancy increased by 82% (7).
The American College of Obstetricians and Gynecologists (ACOG) recommendations indicate a multidisciplinary approach with no criminal sanctions in assisting women and infants through the pregnancy opioid crisis (8). However, this may be inadequate based on the recent rapid rise in cases. Previous literature reviews have identified two potential contributors to the growing rate of opioid use in pregnant women aged 12–44: gaps in knowledge and the application of non-pharmaceutical methods for management (6). Addressing the social, behavioral, and cognitive requirements of pregnant women with OUD could be an important component of an appropriate strategy for closing the gap and reducing harmful effects on mothers and their children. (6). Current screening methods for opioid use in pregnant women could be underestimating the actual usage rates, making the OUD problem seem less prevalent in communities that are suffering (9). There is a need for more evidence to support guidelines of substance use disorder management, as it is the most effective treatment and screening in women of reproductive age (9). Our research aims to establish an association between opioid use and poverty status by measuring the demand for action in the enhancement over overall health of disadvantaged pregnant women ages 12–44 in the U.S. Women who are at highest risk will be more readily identified, benefiting the mother and fetus. Women are unlikely to honestly report opioid use during pregnancy to physicians, so while self-reported data is unreliable, it could be more accurate. Several years of data from the NSDUH have been used in the observation of opioid abuse and treatment options. Results were used in an analysis of trends in opioid use during pregnancy between 2006 and 2014 (8). As advised by the ACOG, there needs to be more evaluation of negative outcomes of opioid usage during pregnancy (8).
Emerging data suggests that there has been an increase in opioid usage during pregnancy (3). A review in 2018 identified that 7.5% of pregnancies were associated with significant opioid misuse (10). This was derived from a data set that included 11,656 deliveries among 9,690 unique women (10). ACOG illustrated the dramatic escalation of OUD during pregnancy, paralleling the pandemic through definition and the subsequent role of OB-GYN and other obstetric care providers. They
Scholarly Research In Progress • Vol. 6, November 2022
66
shared an evaluation regarding the safety of opioid use during pregnancy in women across all racial, ethnic, and socioeconomic groups, and the importance of screening for substance use as part of primary comprehensive care. ACOG concluded and recommended universal screening and demanded for differentiation between opioid use in the context of medical care, opioid misuse, and untreated OUD with an emphasis on NAS (8). However, in a more recent study, it was suggested that the current screening for opioid usage in pregnant women could be underestimating the actual usage rates (9). Despite this, another study in 2014 found a substantial increase in both NAS and maternal OUD (11). Across all of these findings, it was demonstrated that opioid-using pregnant women were more likely to experience higher rates of depression, anxiety, and other chronic medical conditions (4). Usage of opioids was also correlated to increased chances of threatened preterm labor, early-onset delivery, poor fetal growth, and stillbirth (12). Many gaps exist within knowledge, application of non-pharmaceutical methods for management, and data collection, which has led to inconclusive evidence regarding opioid use in pregnant women (4). Our study seeks to examine the impact of poverty level on opioid use for pregnant women in the U.S. This would allow us to elucidate the importance of continued knowledge regarding overall health outcomes within our given population set. These findings could shed light on socioeconomic groups of pregnant individuals at increased risk or OUD, and thus at increased need of screening and treatment during pregnancy and postpartum.
Methods
Study design and participants
We examined data from the 2019 NSDUH (13). This survey is conducted yearly in all 50 U.S. states as well as the District of Columbia to provide information on health-related issues in the U.S. including drug use (13). NSDUH data was acquired for all participants and then separated into pregnant and non-pregnant individuals between the ages of 12–44 years across the U.S. Our inclusion criteria required women who were pregnant and between the ages 12–44 years. Males, transgender individuals, females outside of the 12- to 44-yearold age range, and non-pregnant individuals were excluded. Opioid usage among the participants was stratified based on poverty level. We examined the measured rates of occurrence of opioid use by pregnant women ages 12–44 years and compared opioid usage of pregnant women at different poverty levels. The three poverty levels were categorized as income at the federal poverty level (100%), income up to two times the federal poverty level (100–200%), or income greater than two times the federal poverty level (200%+). The exposure was measured as poverty level and the outcome was determined as opioid use.
Statistical analysis
Chi-square tests of homogeneity were performed using IBM Statistical Package for Social Sciences Statistics version 28.0.0.0 for Windows 10. These tests were performed to determine statistically significant differences between the three poverty level groups. Statistical differences were reported if p was < 0.05. The chi-square test is advantageous to use because it makes no assumptions about the population distribution and is best used for large datasets.
Results
Of the 56,136 survey participants, there were a total of 649 pregnant women, and 33 of them had used opioids within the past month (5.08%). An estimated 1 out of 20 pregnant women admitted to opioid misuse. Table 1 shows opioid usage by poverty levels with usage expressed based on the total number of pregnant women. Opioid misuse occurred in 12 (8.2%) of 146 pregnant women at 100% poverty level, 9 (5.1%) of 176 pregnant women at 100–200%, and 12 (3.7%) of 327 pregnant women at 200%+ poverty level. Those at 100% poverty level were 1.6 and 2.2 times more likely to use opioids than those at 100–200 and 200%+ levels respectively. Comparatively, those at ≥200% poverty level were 55% less likely to use opioids than those at ≤200% poverty level. Figure 1 shows the percentage distribution of participants that misused opioids among the different poverty levels.
We used 2-by-2 chi-square tests of homogeneity (α=0.05) to determine whether there was a difference between the 100% and 100–200% groups, the 100–200% and 200%+ groups, and the 100% and 200%+ groups. Comparison between the 100% and 200%+ groups resulted in a statistically significant difference (4.337, 0.037). Thus, our analysis showed that opioid misuse during pregnancy is related to poverty level and that women in 200%+ poverty levels are less likely to misuse opioids compared with those at 100% poverty level.
100% 134 (91.8%) 12 (8.2%) 100-200% 167 (94.9%) 9 (5.1%) 200%+ 315 (96.3%) 12 (3.7%)
The Relationship Between Socioeconomic Status and Opioid Usage During Pregnancy in the United States
Figure 1. Percentage distribution of participants that used opioids Table 1. Opioid usage by poverty level for pregnant individuals Poverty level No opioid misuse Opioid misuse
10 8 6 4 2 0 100%
67
100-200% 200%+ Poverty level Percentages Opioid misuse
Discussion
Our study provides insight into the relationship between poverty and opioid use in pregnancy. We noted a trend for decreasing use with individuals whose income was farther above the federal poverty level and a statistically significant difference between women at 100% and 200%+ poverty levels.
Poverty and OUDs can each profoundly impact health outcomes concerning the pregnant mother and child: together they create a much greater detrimental effect. Poverty alone during pregnancy can affect women's ability to receive proper nutrition and access to social and other resources to promote her health and well-being, therefore, creating “exposure to stressful conditions with fewer resources to cope” (14). This high-level stress occurs when there is exposure to an overwhelming situation that exceeds the individual’s ability to cope (15). This may partly explain the relationship between poverty during pregnancy and opioid use.
Addressing the opioid crisis should include addressing poverty in pregnancy. Providing support systems that include housing, food, community outreach, reproductive services, mentoring programs, counseling, and referral to health services can help break this cycle. This should also include referral and connections with medication-assisted treatment and rehabilitative programs that promote a better understanding of underlying behavior (16).
The screening methods used by the 2019 NSDUH survey may have underestimated the actual opioid usage rates in pregnant women. We recommend empowering communities with the development of easy-to-use validated assessment tools that target vulnerable women living in poverty to break the trend. This should be followed by a referral for services. Additionally, newborns and children carry the burden of pregnant women’s addiction. We also propose that early intervention services be implemented and directed at newborns to optimize their growth and development.
Our study was limited by how the data was organized by the survey. The data could have been separated in the initial survey by only "below" and "above" poverty level, thus separating the 100–200% group into the 100% (below) and 200% (above). Another limitation is that the data source relied on self-reporting opioid use. This may indicate the report was underestimated and could have included sampling bias. Sampling neighborhoods based on socioeconomic status could have provided a more accurate picture. Therefore, more research is needed in areas that address multiple contributing factors which lead to the continuing cycle of drug use among pregnant women to strengthen existing programs.
Opioid use during pregnancy carries a high price tag such as maternal deaths, fetal deaths, prematurity, and poor growth and development in the child. Strategic programs aimed at breaking the cycle will better protect mothers and potentially save the lives of more babies. Our study could lead to mandatory screenings, the development of new campaigns to indicate the prevalence of the OUD in pregnant women and show the demand for action on this public health concern. New programs of intervention, feedback, advice, and referral to treatment have the potential to improve maternal and fetal outcomes (8).
Conclusion
We examined the relationship between socioeconomic status, as defined by poverty level, and opioid misuse in pregnant women aged 12–44 in the U.S. We determined that there was a statistically significant correlation between socioeconomic status and opioid misuse among pregnant women at 100% and 200%+ poverty levels. This finding demonstrates the need to create tailored solutions aimed at eliminating or reducing poverty during pregnancy as well as providing resources for maternal and fetal wellbeing. Future research could focus on comparing various areas stratified by socioeconomic status. Our findings suggest that more primary prevention, evidence-based treatment, recovery support, and harm reduction is necessary for pregnant women, specifically in areas where residents live at or below the federal poverty level.
Acknowledgments
We would like to express our gratitude to our faculty member mentor Dr. Brian Piper. We would also like to express our acknowledgments to Lauren Stuart and Catherine Klein for contributing to the initial versions of our paper.
Disclosure
The authors declare that there were no relevant or material financial interests that relate to the research described in this paper. There were no conflicts of interest.
References
1. Ecker J, Abuhamad A, Hill W, Bailit J, Bateman BT, Berghella V, et al. Substance use disorders in pregnancy: Clinical, ethical, and research imperatives of the opioid epidemic: a report of a joint workshop of the Society for MaternalFetal Medicine, American College of Obstetricians and Gynecologists, and American Society of Addiction Medicine. Am J Obstet Gynecol. 2019;221(1):B5–28.
2. Terplan M. Opioid use, misuse, and addiction in pregnancy and postpartum. Protocols for high-risk pregnancies. An evidence-based approach. 2020:15–20.
3. Hensley L, Sulo S, Kozmic S, Parilla BV. Opioid addiction in pregnancy: Does depression negatively impact adherence with prenatal care? J Addict Med. 2018;12(1):61–4.
4. Whiteman VE, Salemi JL, Mogos MF, Cain MA, Aliyu MH, Salihu HM. Maternal opioid drug use during pregnancy and its impact on perinatal morbidity, mortality, and the costs of medical care in the United States. J Pregnancy 2014;2014:906723.
5. Zaoutis LB, Chiang VW, Hoffman RJ, Sharma AN. Comprehensive Pediatric Hospital Medicine. Elsevier 2007:1140–3.
6. Tobon AL, Habecker E, Forray A. Opioid Use in Pregnancy. Curr Psychiatry Rep. 2019;21(12):118–28.
7. Keough L, Fantasia HC. Pharmacologic Treatment of Opioid Addiction During Pregnancy. Nurs Womens Health 2017;21(34–44).
The Relationship Between Socioeconomic Status and Opioid Usage During Pregnancy in the United States
68
8. Opioid Use and Opioid Use Disorder in Pregnancy. [Available from: https://www.acog.org/clinical/clinicalguidance/committee-opinion/articles/2017/08/opioid-useand-opioid-use-disorder-in-pregnancy]
9. Rausgaard NLK, Ibsen IO, Jørgensen JS, Lamont RF, Ravn P. Management and monitoring of opioid use in pregnancy. Acta Obstet Gynecol Scand. 2020;99(1):7–15.
10. Elliott TE, Frail CK, Pawloski PA, Thomas AJ, Werner AM, Rossom RC. Opioid use during pregnancy, observations of opioid use, and secular trend from 2006 to 2014 at HealthPartners medical group. Clin J Pain. 2018;34(8):707–12.
11. Hirai AH, Ko JY, Owens PL, Stocks C, Patrick SW. Neonatal abstinence syndrome and maternal opioid-related diagnoses in the US, 2010-2017. JAMA. 2021;325(2):146–55.
12. Wei R, Curtin LR, Arias E, Anderson RN. U.S. decennial life tables for 1999-2001: Methodology of the United States life tables. Natl Vital Stat Rep. 2008;57(4):1–9.
13. National survey on drug use and health 2019. [Available from: https://www.datafiles.samhsa.gov/dataset/nationalsurvey-drug-use-and-health-2019-nsduh-2019-ds0001]
14. Braveman P, Marchi K, Egerter S, Kim S, Metzler M, Stancil T, et al. Poverty, near-poverty, and hardship around the time of pregnancy. Matern Child Health J. 2010;14(1):20–35.
15. MacLean RR, Armstrong JL, Sofuoglu M. Stress and opioid use disorder: A systematic review. Addict Behav 2019;98:106010.
16. Ghertner R, Groves L. The opioid crisis and economic opportunity: Geographic and economic trends. [Available from: https://aspe.hhs.gov/sites/default/files/private/ pdf/259261/ASPEEconomicOpportunityOpioidCrisis.pdf]
The Relationship Between Socioeconomic Status and Opioid Usage During Pregnancy in the United States
69
Effects of Prenatal Toluene Exposure on Fetal Development: A Review
Mahshid A. Karimi1*, Brittany A. Kemp
1*
, and Esosa E. Kest1*
¹Geisinger Commonwealth School of Medicine, Scranton, PA 18509
*Master of Biomedical Sciences Program
Correspondence: britkemp9@gmail.com
Abstract
Inhalant misuse is a growing public health concern, particularly among adolescents and females of childbearing age. Toluene is a volatile organic solvent that is used in many industries and is prevalent in consumer products. Due to the lipophilic nature of toluene, it can readily diffuse across the placenta, which lends to its potential as a teratogen when inhaled by pregnant individuals. Toluene inhalation can occur through incidental occupational exposure and intentional misuse by inhalation of vapors from toluene-containing products done to achieve intoxication. This literature review was conducted using PubMed, EbscoHOST, and Google Scholar databases to summarize the neurological and physical effects of prenatal toluene exposure on fetal development evaluated at several stages of life. The teratogenic effects of toluene exposure to fetuses have been documented in animal models, rodents, and rabbits, as well as in humans. Experiments performed on rodents have determined a wide range of physical and neurological defects due to toluene exposure. Some physical defects include growth restrictions, premature delivery, and congenital malformations. Neurological defects include but are not limited to demyelination and dysfunction of the cerebellum, cerebral cortex, and subcortical regions of the brain. These defects lead to problems with growth and neurological disorders in the form of delayed motor skill development, poor memory, and poor cognitive function. Rodent studies have also established the neuroprotective effects of phytochemicals, melatonin, and omega-3 fatty acids. Rabbits have also been used to model toxicologic endpoints that would be seen in larger animals and humans. Rabbit models revealed the importance of administering toluene in concentrations at a level that mirrored human binging to understand the potential fetal impacts. Rabbits injected with high concentrations of toluene had structural damages to several brain regions and decreased levels of several important central nervous system (CNS) factors. Toluene’s neurological effects on the human brain are similar to those seen in rodents and rabbits. Our review highlights the importance of public health intervention to curb the detrimental effects of intentional and unintentional toluene exposure.
Introduction
Toluene is an organic solvent that is prevalent in many industries. It is used in gasoline, adhesives, inks, fabric dyes, and as an extraction solvent for some pharmaceutical and cosmetics as well as many other consumer products (1–4). Toluene is a clear, colorless, volatile aromatic hydrocarbon with a half-life of 3.4 hours in human blood (1, 5). One of the dangers of toluene is brought about by its chemical structure, shown in Figure 1, which makes it lipophilic. This allows it to enter the blood
after inhalation and in pregnant women, toluene can cross the placenta to enter fetal blood circulation (6). Due to the ubiquity of toluene usage in making consumer products, many individuals could be exposed to the vapors during their daily work. The prevalence of toluene and ease of accessibility makes it a target for inhalant misuse.
Inhalant abuse is common among adolescents and young adults aged 18–25 as an easily accessed and relatively inexpensive means for achieving intoxication. This age group falls within prime childbearing years for women (3, 7). The percentage of high school-aged girls who reported they had “ever used inhalants'' was 10%, which surpassed males at 7.9% (6, 8). With increasing exposure of females to toluene and other volatile substances through inhalant abuse while in childbearing ages, it is important to understand the potential effects on fetal neurodevelopment. The focus of this review was on the neurodevelopmental effects of toluene on fetuses whose mothers are exposed to toluene while pregnant.
Methods
Three databases were used to retrieve articles for use in this literature review: PubMed, EbscoHOST, and Google Scholar. The following key terms were used to find relevant articles: prenatal, toluene, teratogen, and neurological. No date range or journal exclusion was applied. The chemical structure was made in ChemDraw version 19.0.0.
Discussion
Toluene exposure in rats
Physical defects of toluene exposure
Several case studies using rodents, rats and mice, show that exposure to toluene through inhalation can negatively affect maternal health and fetal development (3, 9–11). These investigations have helped foster a better understanding of the toxic effects of toluene exposure alone versus its synergistic
Figure 1. Toluene Chemical Structure. Molecular Formula: C6H5CH3, PubChemCID: 1140, IUPAC name: methylbenzene (5)
Scholarly Research In Progress • Vol. 6, November 2022
CH3 70
Effects of Prenatal Toluene Exposure on Fetal Development: A Review
effects with other factors like stress (12). Toluene and stress during pregnancy lead to a reduction in dams’ body weight gain (12). Additionally, their pups showed decreased appetite and physical defects such as musculoskeletal malformations including missing digits and craniofacial abnormalities (13–14). The appetite suppressing effect of toluene leading to failure to thrive over a prolonged time has been demonstrated in many rat studies (15–18). Adverse effects pertaining to affected animal fetuses include growth restriction, premature delivery, and congenital malformations (3, 7, 19–21).
Neurological and neurobehavioral effects of toluene exposure
Physical defects due to toluene exposure led to poor cognitive and motor skill development (3, 7, 19–21). Neuronal damage with resultant cognitive and learning disabilities were key findings in dam studies with toluene exposure. Toluene toxicity leads to detrimental effects in postnatal development (22–23). This can be partly explained by the observed neuronal cell death in neonatal rats (22). Neuropathological studies using methods such as TUNEL staining, DNA-laddering, and caspase-3 activity have led to a greater understanding of the histological effects of toluene (22). Findings include decreased apoptotic activity occurring in the cerebellum and hippocampus (22). Toluene embryopathy could occur due to the arrested neurogenesis process (24) and its negative impact on the somatosensory cortex (7, 24–25). Toluene causes changes in brain synaptic formation (26) leading to poor visual perception and disorders of learning processes (27–28). Toluene also leads to a reduction in the density of synapsin and densin, two novel proteins abundant in the forebrain and cerebellum. This result could explain toluene’s suppressive effect on glutamatergic synapses in hippocampal neurons (24).
The Morris water maze was mainly used in rat studies as a behavioral procedure to observe spatial learning and memory skills (29). The maze was designed with four different starting points from which the time it took to find a hidden platform was measured (29). The learning process included training the rats through the maze consecutively for a few days until their performance was stable. The memory phase occurred five weeks later, when the rats were tested again for their ability to complete the maze. In each trial, there were four imaginary starting points arranged in a pseudorandom sequence; north, south, east, and west. The rats were directed into one of the starting points to complete the trial by reaching the hidden platform.
Rats prenatally exposed to toluene showed signs of impaired cognitive function based on their ability to complete the Morris water maze (29, 30). Additionally, male offspring had mid-frequency hearing loss within the range of 8–20 kHz (30). The Morris water maze was used in another investigation completed in 2017 to evaluate if prenatal toluene exposure impaired maze performance in adolescent rats (6). Rats exposed prenatally to 12,000 ppm toluene struggled to find the platform during reversal learning. An explanation for this finding is that toluene exposure damaged long-term spatial memory (6). A contradictory study, however, determined that prenatal 6,000 ppm toluene exposure for 30 minutes twice daily from gestation day 8 through gestation day 20 impaired short-term memory which was evaluated by using an object recognition
test (31). Rats in this report also did not appear to have physical malformations (31).
Neuroprotective and regenerative effects of phytochemicals, melatonin, and omega-3 fatty acids
While several experiments have shown the detrimental neurological effects of toluene exposure in rats, specific studies have shed some light on possible treatments for toluene neurotoxicity. Findings from multiple studies highlight the neuroprotective and possible regenerative properties of Nigella sativa (NG), derived thymoquinone (TQ), melatonin, and omega-3 fatty acids following toluene exposure (32–37). NG is a black seed which comes from the plant family Ranunculaceae and contains fixed oils and volatile oils such as TQ. Studies have identified some healing properties of the extract of NG which can aid in bronchodilation, immune modulation, hepatoprotection, antihistamine effects, and neuroprotection (32). TQ is an active ingredient from the volatile oil in NG which has also proved to reduce cellular damage and toxicity in vital organs (32).
Specifically, there are several beneficial effects of NG and derived TQ on neurodegeneration affecting the hippocampus of rats exposed to toluene. One study demonstrated the beneficial effects of TQ and NG used rats that inhaled 3,000 ppm toluene over 12 weeks (32). The control group was not treated with NG and TQ. The treated group received TQ and NG orally through gastric intubation at a dosage of 400 mg/ kg per body weight and 50 mg/kg, respectively (32). Tissue sampling showed distorted nerve cells in the untreated group versus no significant distortion in the treated group. Additionally, the control group showed destroyed endoplasmic reticulum, swollen mitochondria, and chromatin disorganization in the hippocampal neurons. Treatment with NS and TQ was able to reduce the immunoreactivity of degenerating neurons from exposure to toluene (32, 33). TQ can also help neuronal injury and leads to remarkable morphological improvement on neurodegeneration of the frontal cortex (34). Histopathological findings showed that in the TQ treated group, there were still irregular chromatin clumps and swollen mitochondria in neurons, but there was an improvement in degenerative changes in the cytoplasm and nuclei of neuronal cells affected by toluene exposure (34). The control group had an increased number of apoptotic neurons in frontal cortex tissues compared to the rats that were treated with TQ.
Another possible treatment examined the effectiveness of omega-3 fatty acids in preventing toluene-induced neurotoxicity in the prefrontal cortex. Adult male Wistar rats were divided into three groups. The first group was the control group that did not receive toluene or treatment. The second group was the untreated group which was intraperitoneally injected with a dose of 500 mg/kg per day of toluene. The third group being the treated group received the same amount of toluene as the second group and was additionally treated with a dosage of 0.4 g/kg per day of omega 3 fatty acids via intragastric gavage (35). Omega-3 fatty acids are known for their antioxidant properties and important role in improving the function of the brain. The second group, the untreated toluene-exposed rats, had shrinkage of neuron bodies, detachments in pia mater, and increased hemorrhage. In the omega-3 fatty acid treated group, overall morphologic structure improved from the detrimental
71
Effects of Prenatal Toluene Exposure on Fetal Development: A Review
exposure of toluene, with no detachments in pia mater or bleeding. Antioxidant enzyme glutathione peroxidase (GSH-Px) was reported to be high in the omega-3 fatty acid treated group, which is a possible explanation for the prevention of tolueneinduced neurotoxicity (35).
Melatonin is another treatment that has been shown to prevent neuronal damage, including dendritic impairment, from toluene exposure (36). To model these effects, rats were put under deep ether anesthesia in which their brains were dissected out and stained using the Golgi-Cox-Sholl procedure (36). Golgi-Cox staining is an essential method used for visualizing dendritic branching patterns which help to identify morphologic changes to neurons. Results showed that the rats exposed to 5,000–6,000 ppm toluene vapors had decreased dendritic size and branching. For the treated group of rats that received intraperitoneal administration of 0.5–10 mg/kg melatonin after exposure to toluene, dendritic impairment was prevented. Another finding from this group was that frontal neurons had a 33%–40% increase in dendritic size and branching compared to the untreated group (36). This same pattern was also identified for dendritic size and branching in the parietal and occipital neurons. The ability of melatonin to prevent neuronal damage, specifically dendritic impairment, due to toluene exposure was significant. Melatonin also can protect the CNS by reducing reactive gliosis (37). Reactive gliosis is a reaction of damaged astrocytes and neurons from exposure to harmful chemicals such as toluene (37–38). Collectively, data has shown that melatonin provides antioxidant protection against neurotoxic chemicals by enhancing the activity of glial cells that protect and provide support to neurons (37).
Toluene exposure in rabbits
To strengthen the predictive potential of exposing animal models to toluene prenatally, it is important to compare rodent (mouse or rat) and non-rodent (rabbit) species (39–40). Rabbits have an added advantage in that they are the smallest, least expensive animal model that still allows for measuring toxicologic endpoints that would be evaluated in larger animals or humans (40). Prenatal toxicity of toluene was studied in artificially inseminated female Himalayan rabbits which are known to be sensitive to teratogenic substances (39). Rabbits were exposed to either 0, 30, 100, or 500 ppm of toluene for 6 hours per day from days 6 to 18 post-insemination. Although differences between the toluene-exposed and control groups were not found, maternal toxicity was not observed which is a potential limitation of this study. Teratology studies on several animals, including rabbits, were reviewed to understand the relationship between embryo-fetal mortality and fetal malformations with maternal toxicity (41). Fetal malformations in rabbits were associated with maternal toxicity and those malformations were rare or absent when maternal toxicity did not occur. Additionally, there is potential that the rabbit experiment published in 1992 did not adequately represent the concentrations of toluene human fetuses experience when their mother inhales toluene recreationally (39). Women who abuse toluene can inhale up to 15,000 ppm in one binge episode (3).
In 2017 rabbits were again used as a model to determine the detrimental effects of toluene on different regions of the brain (42). A single dose of 876 mg/kg (99.9%) toluene solution was intraperitoneally administered. The specific regions of focus
were the prefrontal cortex, hippocampus, hypothalamus, substantia nigra, and entorhinal cortex. A significantly increased level of tumor necrosis factor-alpha (TNF-α) was identified when comparing the toluene-exposed and control groups in each of the brain structures. Additionally, levels of several factors were significantly decreased in the tolueneexposed group versus the control group: dopamine serum levels from the substantia nigra, nerve growth factor (NGF) from hippocampal neurons, and glial fibrillary acidic protein (GFAP) from astrocytes. The brain tissue of rabbits exposed to toluene also had distinct damage that differed from a normal structure. There were areas of abscess formation, gliosis, and perivascular demyelination in the brain cortex. The nuclei of oligodendrocytes were also malformed and cells with dispersed borders were identified. Structural damage was also identified in the sequential neurons of the hippocampus for tolueneexposed rabbits.
Effects of toluene on humans
Fetal developmental effects
In humans, many effects have been documented for fetuses exposed to toluene during gestation. Toluene “abuse” by pregnant women has been documented to result in embryopathy and malformations as well as perinatal death (2). More specifically, toluene-exposed infants presented with craniofacial abnormalities and dysmorphology of the body (2, 43). Craniofacial abnormalities can include deep-set eyes, low set ears, a small face, and micrognathia (3, 44–45). The craniofacial abnormalities are thought to occur due to either abnormal differentiation and migration of neural crest cells or increased embryonic cell death (43–44). Similar to rodents and rabbits (7, 42), toluene exposure in humans can cause microcephaly, demyelination, and dysfunction of many brain areas like the cerebellum and cerebral cortex (43, 45). Preterm delivery was also related to toluene and benzene exposure during gestation (2, 43, 46). Postnatally, children whose mothers abused toluene during their gestation exhibited growth retardation and developmental delays (44–45).
Neurobehavioral effects
Many detrimental neurobehavioral effects arise as a result of toluene exposure. Toluene is known to cause neurotoxicity, which can negatively affect the liver, renal system, and nervous system (47–50). When high levels of toluene around 10,000 –30,000 ppm were introduced into the body, consequences such as ataxia, a lack of coordination, and unconsciousness occurred (47, 49). There are many case reports that highlight toluene’s destructive effects (48, 50). The CNS of 20 patients was found to have toxicity, in all cases following the misuse of toluene (48). Each of these individuals suffered indelible effects such as acute encephalopathy, personality impairment, and cerebellar ataxia as a consequence of their misuse (50). In another report, a 33-year-old man who was documented to have been exposed to toluene inhalation over 14 years while working in an aircraft-manufacturing company was shown to have cerebellar degeneration and permanent damage to his CNS (50). Both of these studies are consistent with evidence that validates that toluene affects white matter, periventricular, and subcortical regions of the brain (47, 49). These long-lasting neurological effects result in numerous deficits that include but are not
72
Effects of Prenatal Toluene Exposure on Fetal Development: A Review
limited to memory loss, attention deficiency, lack of speed, executive functioning, and language impairments (47, 49).
Public health policies and educational programs
In Japan, pregnant women who hold occupations in house renovation and decoration are regularly exposed to harmful paints and dyes. These chemicals increased the risk of their offspring having congenital heart disease (CHD), limb defects, cleft lip/palate, and even gastrointestinal obstructions (41, 51–53). Likewise, women who work in cosmetology, such as nail technicians and hairdressers, were found to have increased birth defects, specifically CHD and oral clefts (41, 51–52). With proper handling precautions and ventilation in the workplace, risks of inhaling an amount of toluene that would be harmful can be minimized (2–3). However, organic solvents like toluene, benzene, and xylene are typically abused through inhalation. This repeated, intentional binging on high concentrations of toluene can lead to very high concentrations in the blood (2–3). Education regarding toluene exposure, use, and toxicity can aid in the development of public health awareness (11, 49). Currently, the Occupational Safety and Health Administration (OSHA) has recommendations on how to reduce exposure. When handling this chemical, they advise individuals to follow instructions and safety precautions provided by the manufacturer (52, 54–55). They also suggest that when adequate ventilation cannot be ensured, usage of this chemical should be avoided entirely. These limits have been set by OSHA to prevent any detrimental long-term effects on the nervous system that may occur as a result of exposure. Likewise, the importance of risk assessment is taken into consideration for safety.
The German Commission for the Investigation of Health Hazards of Chemical Compounds evaluated toluene in workrelated areas to assess reproductive and developmental toxicity (56). By conducting their evaluations, they were able to provide a maximum workplace concentration (MAK) value that determined the rate at which prenatal toxic effects are not to be expected, despite its use (56). The MAK value was determined as 50 ml toluene/m3 and therefore was classified as Pregnancy Risk Group C where no prenatal toxic effects were to be expected. There have also been alternative policies such as propositions implemented for consumer education. States such as California are required by proposition 65 to include warnings to their consumers, workers, and other personnel regarding significant exposure to chemicals that have the possibility of being carcinogenic, increasing the risk of birth defects, or other reproductive harm (54, 57). Toluene is one of these chemicals which must be listed on supplies containing it since significant exposure while pregnant may lead to developmental delays.
Among the few initiatives targeting toluene misuse, there is a 12-step program and outpatient dependency treatment strategy which were implemented for public education (57). These programs include diverse techniques to help individuals continue abstinence and maintain healthy long-term recovery (57). The purpose is to provide education regarding neurological damages associated with misuse and to also supply health care providers with enhanced screening measurements that are centered around reproductive health (57). More states and organizations should be required by law to implement
these practices to ensure proper education is being delivered to both consumers and patients. They should also be held accountable for maintaining a safe work environment by preventing incidental inhalation of dangerous volatile chemicals. By providing reliable resources and giving recommendations, departments can implement long-term protocols that prioritize the health and safety of their workers, especially for pregnant females.
Conclusion
Misuse of volatile organic solvents like toluene is a growing public health concern specifically among adolescents and females of childbearing age. This is due to its detrimental physical and neurological effects on a fetus in utero. In addition to intentional misuse, toluene inhalation can occur through incidental occupational exposure, making it even more urgent to document toluene’s teratogenic effects. Animal studies have shown negative effects from in utero exposure that extend through adolescence. In studies on both rodents and rabbits, structural damage was indicated in several brain areas such as the cerebellum, cerebral cortex, and subcortical regions. However, phytochemicals, melatonin, and omega-3 fatty acids have shown promise for protecting against and reversing the damaging neurological effects of toluene. A strategic prevention framework should be built on the following: public health education to promote awareness, policies to prevent or limit workplace exposures, and tailored interventions directed at current misusers to protect both pregnant women and their children. Longitudinal studies in humans looking at exposure in utero through adulthood will help fill the knowledge gap and aid in designing a tailored approach to decrease the prevalence of birth defects due to fetal toluene exposure.
Acknowledgments
We would like to express our gratitude to our faculty member, Dr. Brian Piper. We would also like to express our gratitude to the library staff at Geisinger Commonwealth School of Medicine for all of their assistance in accessing primary resources.
References
1. Roberts LG, Bevans AC, Schreiner CA. Developmental and reproductive toxicity evaluation of toluene vapor in the rat: I. Reproductive toxicity. Reprod Toxicol. 2003;17(6):649-58.
2. Hannigan JH, Bowen SE. Reproductive toxicology and teratology of abused toluene. Syst Biol Reprod Med 2010;56(2):184-200.
3. Bowen SE, Hannigan JH. Developmental toxicity of prenatal exposure to toluene. AAPS J. 2006;8(2):19-24.
4. Cruz SL, Rivera-García MT, Woodward JJ. Review of toluene action: Clinical evidence, animal studies and molecular targets. J Drug Alcohol Res. 2014;3:8.
5. Compound Summary Toluene [Internet]. [cited January 25, 2022]. Available from: https://pubchem.ncbi.nlm.nih.gov/ compound/toluene.
6. Callan SP, Hannigan JH, Bowen SE. Prenatal toluene exposure impairs performance in the Morris Water Maze in adolescent rats. Neuroscience. 2017;342:180-7.
73
7. Gospe SM, Zhou SS. Prenatal exposure to toluene results in abnormal neurogenesis and migration in rat somatosensory cortex. Pediatr Res. 2000;47(3):362-8.
8. Results from the 2013 National Survey on Drug Use and Health: Summary of national findings. NSDUH Series H-48, HHS Publication No(SMA) 14-4863. 2014:1-143.
9. Chang M, Lee D, Park H, Ha M, Hong Y-C, Kim Y, et al. Prenatal TVOCs exposure negatively influences postnatal neurobehavioral development. Sci Total Environ 2018;618:977-81.
10. Bowen SE, Batis JC, Mohammadi MH, Hannigan JH. Abuse pattern of gestational toluene exposure and early postnatal development in rats. Neurotoxicol Teratol. 2005;27(1):10516.
11. Tin-Tin-Win-Shwe, Yamamoto S, Nakajima D, Furuyama A, Fukushima A, Ahmed S, et al. Modulation of neurological related allergic reaction in mice exposed to low-level toluene. Toxicol Appl Pharmacol. 2007;222(1):17-24.
12. Soberanes-Chávez P, López-Rubalcava C, Gortari Pd, Cruz SL. Exposure to toluene and stress during pregnancy impairs pups' growth and dams' lactation. Neurotoxicol Teratol. 2013;40:9-16.
13. Warner R, Ritchie HE, Woodman P, Oakes D, Pourghasem M. The effect of prenatal exposure to a repeat high dose of toluene in the fetal rat. Reprod Toxicol. 2008;26(3-4):26772.
14. Roberts LG, Nicolich MJ, Schreiner CA. Developmental and reproductive toxicity evaluation of toluene vapor in the rat: II. Developmental toxicity. Reprod Toxicol. 2007;23(4):52131.
15. Jarosz PA, Fata E, Bowen SE, Jen K-LC, Coscina DV. Effects of abuse pattern of gestational toluene exposure on metabolism, feeding and body composition. Physiol Behav 2007;93(4-5):984-93.
16. Sidney M. Gospe J, Saeed DB, Zhou SS, Zeman FJ. The effects of high-dose toluene on embryonic development in the rat. Pediatr Res.1994;36(6):811-5.
17. Jr. SMG, Zhou SS, Saeed DB, Zeman FJ. Development of a rat model of toluene-abuse embryopathy. Pediatr Res 1996;40:82-7.
18. Tyl R, Neeper-Bradley T, Fisher L, Dodd D, Pritts I, Losco P, et al. Two-generation reproductive toxicity study of inhaled toluene diisocyanate vapor in CD rats. Toxicol Sci 1999;52(2):258-68.
19. Sosedova LM, Vokina VA, Kapustina EA. Contribution of fetal programming in the formation of cognitive impairments induced by lead poisoning in white rats. Bull Exp Biol Med. 2019;166(5):617-21.
20. Jones HE, Balster RL. Neurobehavioral consequences of intermittent prenatal exposure to high concentrations of toluene. Neurotoxicol Teratol. 1997;19(4):305-13.
21. Hudák A, Ungváry G. Embryotoxic effects of benzene and its methyl derivatives: toluene, xylene. Toxicology 1978;11:55-63.
22. Ladefoged O, Hougaard KS, Hass U, Sorensen IK, Lund SP, Svendsen GW, et al. Effects of combined prenatal stress and toluene exposure on apoptotic neurodegeneration in cerebellum and hippocampus of rats. Basic Clin Pharmacol Toxicol. 2004;94(4):169-76.
23. Edelfors S, Hass U, Hougaard KS. Changes in markers of oxidative stress and membrane properties in synaptosomes from rats exposed prenatally to toluene. Pharmacol Toxicol 2002;90(1):26-31.
24. Lin H-M, Liu C-Y, Jow G-M, Tang C-Y. Toluene disrupts synaptogenesis in cultured hippocampal neurons. Toxicol Lett. 2009;184(2):90-6.
25. Jr SMG, Zhou SS. Toluene abuse embryopathy: Longitudinal neurodevelopmental effects of prenatal exposure to toluene in rats. Reprod Toxicol. 1998;12(2):11926.
26. Museridze DP, Tsaishvili TS, Svanidze IK, Gedevanishvli NS, Didimova EV, Gvinadze NN, et al. Effect of toluene intoxication on spatial behavior and learning of rats within early stages of postnatal development. Neurophysiology 2010;42:118-23.
27. Nylen P, Larsby B, Johnson A-C, Eriksson B, Höglund G, Tham R. Vestibular -oculomotor, opto-oculomotor and visual function in the rat after long-term inhalation exposure to toluene. Acta Oto-Laryngol. 1990;111(1):3643.
28. Malloul H, Mahdani FM, Bennis M, Ba-M’hamed S. Prenatal exposure to paint thinner alters postnatal development and behavior in mice. Front Behav Neurosci. 2017;11.
29. Hougaard KS, Andersen MB, Hansen AM, Hass U, Werge T, Lund SP. Effects of prenatal exposure to chronic mild stress and toluene in rats. Neurotoxicol Teratol. 2005;27(1):15367.
30. Hougaard KS, Hass U, Lunda SP, Simonsen L. Effects of prenatal exposure to toluene on postnatal development and behavior in rats. Neurotoxicol Teratol. 1999;21(3):24150.
31. Lopez-Rubalcava C, Chavez-Alvarez K, Huerta-Rivas AG, Paez-Martınez N, Bowen SE, Cruz SL. Long-term behavioral consequences of prenatal binge toluene exposure in adolescent rats. J Drug Alcohol Res. 2014;3:9.
32. Kanter M. Nigella sativa and derived thymoquinone prevents hippocampal neurodegeneration after chronic toluene exposure in rats. Neurochem Res. 2007;33:579-88.
33. Kanter M. Protective effects of Nigella sativa on the neuronal injury in frontal cortex and brain stem after chronic toluene exposure. Neurochem Res. 2008;33:22419.
34. 34. Kanter M. Protective effects of thymoquinone on the neuronal injury in frontal cortex after chronic toluene exposure. J Mol Histol. 2011;42:39-46.
35. Meydan S, Altas M, Nacar A, Ozturk OH, Tas U, Zarasiz I, et al. The protective effects of omega-3 fatty acid against toluene-induced neurotoxicity in prefrontal cortex of rats. Hum Exp Toxicol. 2012;31(11):1179-85.
Effects of Prenatal Toluene Exposure on Fetal Development: A Review
74
Effects of Prenatal Toluene Exposure on Fetal Development: A Review
36. Pascual R, Zamora-León SP, Pérez N, Rojas T, Rojo A, Salinas MJ, et al. Melatonin ameliorates neocortical neuronal dendritic impairment induced by toluene inhalation in the rat. Exp Toxicol Pathol. 2011;63(5):467-71.
37. Baydas G, Reiter RJ, Nedzvetskii VS, AbdullahYaşar, Tuzcu M, Ozveren F, et al. Melatonin protects the central nervous system of rats against toluene-containing thinner intoxication by reducing reactive gliosis. Toxicol Lett 2003;137(3):169-74.
38. Kanter M. Protective effects of quercetine on the neuronal injury in frontal cortex after chronic toluene exposure. Toxicol Ind Health. 2012;29(7):643-51.
39. Klimisch HJ, Hellwig J, Hofmann A. Studies on the prenatal toxicity of toluene in rabbits following inhalation exposure and proposal of a pregnancy guidance value. Arch Toxicol 1992;66(6):373-81.
40. Foote R, Carney E. The rabbit as a model for reproductive and developmental toxicity studies. Reprod Toxicol 2000;14(6):477-93.
41. Khera KS. Maternal toxicity: A possible etiological factor in embryo-fetal deaths and fetal malformations of rodentrabbit species. Teratology. 1985;31(1):129-53.
42. Demir M, Cicek M, Eser N, Yoldaş A, Sısman T. Effects of acute toluene toxicity on different regions of rabbit brain. Anal Cell Pathol. 2017;2017.
43. Pearson MA, Rimsza ME, Hoyme HE, Seaver LH. Toluene embryopathy: Delineation of the phenotype and comparison with fetal alcohol syndrome. Pediatrics 1994;93(2):211-5.
44. Hersh JH. Toluene embryopathy: two new cases. J Med Genet. 1989;26(5):333-7.
45. Christopher M. Filley M, William Halliday M, B. K. Kleinschmidt-Demasters M. The effects of toluene on the central nervous system. J Neuropathol Exp Neurol 2004;63(1):1-12.
46. Santos DAAD, Nascimento LFC. Maternal exposure to benzene and toluene and preterm birth. A longitudinal study. Sao Paulo Med J. 2019;137(6):486-90.
47. Benignus VA. Neurobehavioral effects of toluene: A review. Neurobehav Toxicol Teratol. 1981;3(4):407-15.
48. King MD. Neurological sequelae of toluene abuse. Hum Toxicol. 1982;1(3):281-7.
49. Yücel M, Takagi M, Walterfang M, Lubman DI. Toluene misuse and long-term harms: A systematic review of the neuropsychological and neuroimaging literature. Neurosci Biobehav Rev. 2008;32(5):910-26.
50. Knox JW, Nelson JR. Permanent encephalopathy from toluene inhalation. N Engl J Med. 1966;275(26):1494-6.
51. Motoki N, Inaba Y, Shibazaki T, Misawa Y, Ohira S, Kanai M, et al. Maternal exposure to housing renovation during pregnancy and risk of offspring with congenital malformation: The Japan environment and children’s study. Sci Rep. 2019;9:1-8.
52. Siegel MR, Rocheleau CM, Broadwater K, Santiago-Colón A, Johnson CY, Herdt ML, et al. Maternal occupation as a nail technician or hairdresser during pregnancy and birth defects, National Birth Defects Prevention Study, 1997–2011. Occup Environ Med. 2021;79(1):17-23.
53. A.Bukowski J. Review of the epidemiological evidence relating toluene to reproductive outcomes. Regul Toxicol Pharmacol. 2001;33(2):147-56.
54. Assessment OoEHH. Toluene 2022 [Available from: https://www.p65warnings.ca.gov/fact-sheets/toluene.]
55. Administration OSH. Toluene [Available from: https:// www.osha.gov/toluene].
56. Weistenhöfer W, Schriever-Schwemmer G, Drexler H, Hartwig A, Commission M. The MAK Collection for Occupational Health and Safety 2021: Wiley-VCH; 2021.
57. Clark CTM, Richards EMP, MD, Antoine DGIM, Chisolm MSM. Perinatal toluene use associated risks and considerations. Addict Disord Their Treat. 2011;10(1):1-5.
75
The Effect of the COVID-19 Pandemic on the Mental Health of Health Care Workers: A Systematic Review
Emily L. Hunsinger1*‡, Alexandra A. Mahoney1*‡, Jullie T. Makhoul1*‡, Riley R. McDonnell1‡ , and Chase M. Minnich1*‡
¹Geisinger Commonwealth School of Medicine, Scranton, PA 18509
*Master of Biomedical Science Program
‡Authors contributed equally Correspondence: amahoney@som.geisinger.edu
Abstract
Health care workers (HCWs) continue to be the primary frontline workers treating patients during the COVID-19 pandemic, and consequently, their mental health has been affected. This study aimed to examine the prevalence of mental health issues experienced by HCWs as a result of their exposure to stressors caused by the pandemic. Prior to the pandemic, burnout and mental health have affected the turnover rate for HCWs, so meeting the workforce needs throughout a pandemic may be even more challenging and further increase the turnover rate. On account of these downstream effects, we also addressed the efficacy of interventions already in place to evaluate and address the mental health of HCWs. We searched the e-databases MEDLINE, PubMed, and PsychInfo to identify studies from 2019 to 2021 pertaining to HCWs' mental health during the COVID-19 pandemic, specifically from the United States. In addition, studies related to the HCWs’ work environment and the overall effects of COVID-19 were included. We assessed the risk of bias and screened each study. We also interpreted data based on symptoms or diagnoses of mental health issues, including comparisons before and after the pandemic. Furthermore, we evaluated treatments and policies implemented for the mental health of HCWs. The investigation demonstrated that there are significant mental health effects observed in frontline HCWs, and new interventions and policies should be administered to prevent, treat, and evaluate these issues. Certain demographics within the HCW population are further impacted and may require additional or alternative treatments. As a result, it is integral to our healthcare system and to society to understand the impact of the pandemic on HCWs’ mental health and to implement effective support and treatment policies for HCWs.
Introduction
The COVID-19 pandemic has stretched the healthcare field to its limits, accounting for over 6,274,000 deaths and 522,000,000 confirmed cases globally (1). In the United States (U.S.) alone, there have been over 82,000,000 cases and nearly 1,000,000 deaths (1). As a result, pandemic conditions have increased the demand for health care workers (HCWs) (1). HCWs can be defined as all individuals who work with patients in a medical setting (2). Frontline HCWs are specifically defined as those who directly treat patients in acute medical settings and have been called on to increase their workload during the COVID-19 pandemic due to the high patient demand (2). Amid the spreading of the disease in 206 countries, HCWs remain the primary population involved in treating the disease (3). The rise in deaths and cases, along with the lack of treatment and protective gear early on, affected the mental health of
HCWs treating patients on the front lines (4). Furthermore, the uncertainty of the quality and quantity of personal protective equipment (PPE) heightened the impact of stress on HCWs, primarily due to the changing guidelines of what PPE is safe and effective (4). In addition, HCWs were expected to work long hours with the constant risk of being infected and transmitting the disease to their families (4). Though the mortality rate for COVID-19 is 2%, it has a higher transmission rate and a higher mortality rate than the related diseases severe acute respiratory syndrome (SARS) and Middle East respiratory syndrome (MERS) combined (3). By proximity, HCWs are much more vulnerable to the disease and witness great travesties during pandemics, exposing them to physical and psychological stressors (5). Following the 2003 SARS outbreak, the anxiety felt by HCWs rose due to an increase in illnesses and deaths of the colleagues of these HCWs (5). As a result, HCWs experienced heightened anxiety and were reluctant to work, significantly impacting the healthcare system, as the demand for HCWs sharply increased (5). Due to these demanding situations, the pandemic has extensively affected the mental health of HCWs (6). The increasing number of suspected and confirmed cases, deaths, overwhelming workload, lack of PPE, widespread media coverage, and inadequate support, have contributed to HCWs’ psychological effects (6). As HCWs continue to treat patients with COVID-19, they have faced, and continue to face, multiple mental health issues, including depression, anxiety, insomnia, and post-traumatic stress disorder (PTSD) (7). PTSD is defined as experiencing a particular event that incites distressing memories, ultimately leading to the development of various depression and/or anxiety related symptoms (8).
As we continue to feel the effects of the COVID-19 pandemic, there is need for research to examine the long-term impacts of isolation and factors attributable to the pandemic. Because the pandemic is still ongoing, this study does not address the gap completely, but aims to answer this question using evidence from published studies. One gap in the literature is the specific effect of the pandemic on mental health in HCWs, particularly in the U.S. Both clinical and non-clinical employees have experienced negative effects on their mental health during the pandemic (9). This has been tied mainly to the change in the workplace environment (9). Prior to the pandemic, a key area of interest was physician burnout (10). Data from the beginning of the pandemic revealed that about half of physicians in practice were affected by burnout (10). Previous studies have demonstrated that occupational stress was consistently due to large numbers of patients, stress in giving care and fulfilling responsibilities as a physician (10). However, no studies have examined these topics in the context of the COVID-19
Scholarly Research In Progress • Vol. 6, November 2022
76
The Effect of the COVID-19 Pandemic on the Mental Health of Health Care Workers: A Systematic Review
pandemic. Additionally, it has been found that mental health is a key factor in high turnover of medical physicians in addition to HCWs as a whole (11). Early in the COVID-19 pandemic, PTSD symptoms in HCWs were observed, stemming from the high death rates witnessed by HCWs and the mentally taxing environments (7). HCWs in some regions have worked through two pandemics in the past two decades caused by highly infectious respiratory illnesses (7). Previous research on past pandemics has highlighted the necessity of addressing the mental health toll of the pandemic on HCW (12). The arduous conditions imposed by the pandemic requires a thorough investigation into the effects of COVID-19 on HCW mental health, in order to treat our current HCWs, prevent future mental health issues in HCWs, and develop policies for future outbreaks and similar situations. This investigation aimed to explore the extent to which the COVID-19 pandemic has affected the mental health of HCWs. An overview of how HCWs have experienced changes in mental health as a result of the COVID-19 pandemic and the accompanying stressors is provided; further, these findings are compared to baseline data and the efficacy of implemented interventions on addressing mental health in HCWs is evaluated.
Methods
Protocol
A systematic review of studies published in PubMed and PsychInfo was conducted to understand how the mental health of HCWs were affected by the COVID-19 pandemic. MEDLINE was used to construct our systematic review. MEDLINE is published by the National Center for Biotechnology and specializes in articles pertaining to the life sciences and has a specific focus on biomedicine (13). MEDLINE is published by the National Center for Biotechnology Information and has been used since 1966 (13).
Our inclusion criteria consisted of peer-reviewed literature examining the effect of the COVID-19 pandemic on HCWs, specifically analyzing the effects on HCWs in the U.S. Our exclusion criteria were publications in languages other than English. We limited our search from 2019 through 2021 and included all types of studies. After the search was conducted and possible sources were identified, a rigid screening process was used. By utilizing a pre-specified robust search strategy, we aimed to reduce potential screening bias in our review. The study was deemed exempt from IRB review.
Data exploration and inferential statistics
We used a qualitative approach to identify key concepts and summarized them in relation to the search query. Our goal was to identify and summarize relevant details, such as prevalence of mental illness symptoms reported among HCWs, and before-and-after comparisons from individual investigations. We integrated conclusions from relevant sources into a focused project regarding the effect of the COVID-19 pandemic on the mental health of HCWs in the U.S., as well as the consequences of these effects. Additionally, we evaluated the efficacy of implemented interventions as a separate, but related, issue. As such, we conducted a two-pronged investigation to integrate the evidence for each piece into a more usable, accessible, source, displaying the data in a comprehensive conclusion for decision makers. Because we conducted a systematic review,
the use of quantitative statistical analysis was not applicable to our research.
Results
Quality assessment
A combined total of 124 citations were identified from the database searches after removal of duplicates. Sixty-two papers met the eligibility criteria and reported information for quality appraisal and data extraction. Most of the included studies were assessed as being of high risk of bias (n = 26/62), or of “some concern” (n = 18/62). Ten studies were assessed as low risk of bias. Studies that were considered as high risk or of “some concern” showed shortcomings due to either their randomization process, deviations from their intended interventions, missing outcome data, their measurement of outcomes, or selective reporting.
Observation of anxiety and depression symptoms in HCWs
Twenty-nine studies specifically examined the incidence of anxiety and depression on HCWs. Of the 29 articles, 17 conducted original research in the form of surveys, 9 were meta-analyses, 2 were editorials, and 1 was a mixed method study. All 17 surveys used some form of the Patient Health Questionnaire (PHQ) to assess depression and/or anxiety. Out of the 29 studies, 14 used the GAD-7, and 2 used the GAD-2 assessment to assess anxiety. The meta-analyses overall showed an increase in anxiety and depression for HCWs (3, 21, 23–24), but Smallwood et al. found that there was no difference in the mental health of HCWs and the public for anxiety, depression, and insomnia (21). However, there was a higher prevalence of suicidal thoughts and ideation in HCWs (18, 39, 42) compared to the general population. The systematic reviews also showed a high prevalence of anxious and depressive symptoms in HCWs, along with sleep disturbances (4, 14, 39, 41).
Observation of PTSD symptoms in HCWs
Seven studies specifically reported the presence of PTSD symptoms in HCWs (25, 27, 29, 34, 36–37, 41). Three studies utilized versions of the impact of events scale (27, 36, 38), three studies used the PTSD checklist-5 (30, 43, 39), and one employed the primary care posttraumatic stress disorder screen (25) to assess PTSD symptoms. These methods of evaluation were effective choices because they allowed the assessment of the impact of pandemic stressors on mental health (specifically PTSD symptoms) in a time-sensitive manner. PTSD symptoms were significantly correlated with other characteristic signs of distress such as substance abuse, as HCWs who reported experiencing PTSD symptoms correlated with having at least five drinks in a day (25).
Elevated percentages of HCWs reporting symptoms of PTSD corresponded with higher burnout rates (27, 30, 43). PTSD symptoms were exceptional among psychiatric considerations due to their strength of correlation with occupational stressors in addition to their relation to adverse occupational outcomes. Demoralization was the factor most strongly correlated with PTSD symptoms (39). Hendrickson et al. also demonstrated a significant relationship between PTSD and thoughts of self-harm or suicide. HCWs in direct contact with COVID patients, particularly patients suffering from severe disease, are at greater risk of experiencing PTSD symptoms than their
77
The Effect of the COVID-19 Pandemic on the Mental Health of Health Care Workers: A Systematic Review
coworkers (27, 36, 38, 43). Most (73.3%) critical care nurses reported mild to severe PTSD symptoms during and after caring for COVID patients (38). PTSD symptoms may be particularly important for early detection to decrease occurrences of adverse personal and occupational effects (39).
Interventions
Numerous studies have been published in the past two years providing evidence of the COVID-19 pandemic’s effect on the mental health of frontline HCWs. Of the studies that met our inclusion criteria, 8 explicitly mentioned the need for some form of intervention. Three of these studies did not provide specifics regarding what the intervention should be, and two others provided broad suggestions of better stress management. Three of the 8 studies suggested a need for a digital or virtual way to improve mental health of HCWs. While these studies merely defined the need for intervention, 4 publications were aimed at studying specific interventions to improve mental health in health care during the COVID-19 pandemic.
The first was a systematic review of 31 intervention-based studies of mental health, but only studies designed during the COVID-19 pandemic were included. Three important themes of improving mental health during the pandemic emerged from these studies: harm prevention, illness-focused mental health management, and promoting positivity (48). The study detailed by Kelly et al. utilized an experimental design to test an e-learning digital solution to improve HCWs’ well-being (49). A total of 474 healthcare workers were included in the study's results, which showed that their training tool improved resiliency and well-being scores with 95% confidence (49). Another investigation by Bureau et al. examined a digital intervention to improve mental health through cognitivebehavioral therapy (50). A total of 10 HCWs participated, which included nurses, a social worker, a medical student, and various other members of the interprofessional healthcare team. After utilizing the digital tool, phone interviews and surveys were used to assess the success of the intervention. Based on qualitatively positive feedback from the subjects, the website was deemed successful, but in a self-described convenience sample of only 10 participants (50). The final publication is a systematic review of various psychological support interventions and their usefulness during outbreak conditions. Of the 12,104 studies included in the review, only 4 were conducted during the COVID-19 pandemic with HCWs, while many others related to past outbreaks of infection in varying populations. Two separate investigations, performed by Bureau et al. and Doherty et al., tested interventions that were delivered remotely, in the form of a digital app or website (50–51). While they concluded that the digital interventions show some effectiveness, more longitudinal studies will need to be performed on larger sample sizes to determine their true utility (51). All told, 3 of the 4 intervention studies examined digital forms of intervention.
Discussion
As evidenced by the literature, there are measurable impacts on the mental health of HCWs across the globe, resulting in varying degrees of burnout. Regarding anxiety and depression, 3 studies indicated there was a higher prevalence of suicidal thoughts and ideation amongst HCWs, and 4 studies noted
a higher prevalence of depressive and anxious symptoms in HCWs. These symptoms often worsened with influxes in the patient population, which have become increasingly common as the COVID-19 variants have emerged and spread. The combination of elevated number of deaths and emergencies prompted by the COVID-19 pandemic contributed to the development of psychiatric symptoms in some HCWs and exacerbated existing conditions in others. Seven studies documented the presence of PTSD symptoms in HCWs through screenings, which revealed that workers with direct contact with COVID-19 patients were at greater risk of developing PTSD. Development of PTSD, anxiety, depression, and insomnia can lead to burnout and substance abuse if left untreated. Several intervention studies have been conducted for treatment of anxiety, depression, and PTSD in HCWs. These studies demonstrated some effectiveness of digital tools to address the mental health of HCWs. However, they all cite significant limitations in the way they were conducted, namely with the utilization of small convenience samples of the population, in addition to publication bias and region/country specificity. There were also limitations that were not mentioned by the papers that relate to restrictions posed by the pandemic, which narrowed their choices of methods to study. Limiting the type of intervention solely to digital methods, while informative, also limits the assumptions that can be made about interventions more broadly.
Future studies should use a more varied approach to their designs, assessing more traditional therapies to gauge the effectiveness of those resources as well. To address future occurrences of burnout, the healthcare field must ensure that there are measures to protect the well-being and mental health of their employees. Through preventive measures and intervention at the individual level, there may be ways to decrease the prevalence of depression and anxiety among HCWs and limit the lasting impacts of trauma.
Conclusion
In conclusion, numerous studies have demonstrated an increase in mental health symptoms (anxiety, depression, sleep disturbances, and PTSD) among HCWs during the COVID-19 pandemic. Several investigations have proposed specific interventions that can be implemented to improve the mental health symptoms. As the COVID-19 pandemic progresses and HCWs continue to experience stressors, it is essential for researchers and policy makers to better understand the impact on the mental health of the health care workforce and address the unmet psychological needs.
Disclosures
The authors have no relevant disclosures.
References
1. WHO Coronavirus (COVID-19) Dashboard [Internet]. Available from: https://covid19.who.int
2. Marvaldi M, Mallet J, Dubertret C, Moro MR, Guessoum SB. Anxiety, depression, trauma-related, and sleep disorders among healthcare workers during the COVID-19 pandemic: A systematic review and meta-analysis. Neurosci & Biobehav Rev. 2021 Jul 1;126:252–64.
78
The Effect of the COVID-19 Pandemic on the Mental Health of Health Care Workers: A Systematic Review
3. Spoorthy MS, Pratapa SK, Mahant S. Mental health problems faced by healthcare workers due to the COVID-19 pandemic–A review. J Psychiatr. 2020 Jun 1;51:102119.
4. De Kock JH, Latham HA, Leslie SJ, Grindle M, Munoz S-A, Ellis L, et al. A rapid review of the impact of COVID-19 on the mental health of healthcare workers: Implications for supporting psychological well-being. BMC Public Health 2021 Dec;21(1):104.
5. Schwartz J, King C-C, Yen M-Y. Protecting healthcare workers during the coronavirus disease 2019 (COVID-19) outbreak: Lessons from Taiwan’s severe acute respiratory syndrome response. Clin Infect Dis. 2020 Jul 28;71(15):858–60.
6. Lai J, Ma S, Wang Y, Cai Z, Hu J, Wei N, et al. Factors associated with mental health outcomes among health care workers exposed to coronavirus disease 2019. JAMA Netw Open. 2020 Mar 23;3(3):e203976.
7. Hall H. The effect of the COVID-19 pandemic on healthcare workers’ mental health. J Aging Phys Act. 2020 Jul;33(7):45–8.
8. Bryant RA. Post-traumatic stress disorder: a state-of-theart review of evidence and challenges. World Psychiatry 2019 Oct;18(3):259–69.
9. Evanoff BA, Strickland JR, Dale AM, Hayibor L, Page E, Duncan JG, et al. Work-related and personal factors associated with mental well-being during the COVID-19 response: Survey of health care and other workers. J Med Internet Res. 2020 Aug 25;22(8):e21366
10. Yates SW. Physician stress and burnout. Am J Med. 2020 Feb;133(2):160–4.
11. Willard-Grace R, Knox M, Huang B, Hammer H, Kivlahan C, Grumbach K. Burnout and health care workforce turnover. Ann Fam Med. 2019 Jan;17(1):36–41.
12. Preti E, Di Mattei V, Perego G, Ferrari F, Mazzetti M, Taranto P, et al. The psychological impact of epidemic and pandemic outbreaks on healthcare workers: Rapid review of the evidence. Curr Psychiatry Rep. 2020 Jul 10;22(8):43.
13. MEDLINE Overview [Internet]. U.S. National Library of Medicine. Available from: https://www.nlm.nih.gov/ medline/medline_overview.html
14. Pappa S, Ntella V, Giannakas T, Giannakoulis VG, Papoutsi E, Katsaounou P. Prevalence of depression, anxiety, and insomnia among healthcare workers during the COVID-19 pandemic: A systematic review and meta-analysis. Brain Behav Immun. 2020 Aug 1;88:901–7.
15. Walton M, Murray E, Christian MD. Mental health care for medical staff and affiliated healthcare workers during the COVID-19 pandemic. Eur Heart J Acute Cardiovasc Care 2020 Apr 1;9(3):241–7.
16. Page MJ, McKenzie JE, Bossuyt PM, Boutron I, Hoffmann TC, Mulrow CD, et al. The PRISMA 2020 statement: An updated guideline for reporting systematic reviews. BMJBrit Med J. 2021 March 29;372:n71.
17. Peccoralo LA, Pietrzak RH, Feingold JH, Syed S, Chan CC, Murrough JW, et al. A prospective cohort study of the
psychological consequences of the COVID-19 pandemic on frontline healthcare workers in New York City. Int Arch Occup Environ Health. 2022 Jan 22.
18. Phiri P, Ramakrishnan R, Rathod S, Elliot K, Thayanandan T, Sandle N, et al. An evaluation of the mental health impact of SARS-CoV-2 on patients, general public and healthcare professionals: A systematic review and meta-analysis. EClinicalMedicine. 2021;34:100806.
19. Almeida M, DeCavalcante G. Burnout and the mental health impact of COVID-19 in anesthesiologists: A call to action. J Clin Anesth. 2021;68:110084.
20. Miguel-Puga JA, Cooper-Bribiesca D, Avelar-Garnica FJ, Sanchez-Hurtado LA, Colin-Martínez T, Espinosa-Poblano E, et al. Burnout, depersonalization, and anxiety contribute to post-traumatic stress in frontline health workers at COVID-19 patient care, a follow-up study. Brain Behav 2021 Mar;11(3):e02007.
21. Smallwood N, Harrex W, Rees M, Willis K, Bennett CM. COVID-19 infection and the broader impacts of the pandemic on healthcare workers. Respirology. 2022 Jan 19; 1-16.
22. Coleman JR, Abdelsattar JM, Glocker RJ, Carmichael H, Vigneshwar NG, Ryan R, et al. COVID-19 pandemic and the lived experience of surgical residents, fellows, and earlycareer surgeons in the American College of Surgeons. J Am Coll Surg. 2021;232(2):119-135.e20.
23. Sugg MM, Runkle JD, Andersen L, Weiser J, Michael KD. Crisis response among essential workers and their children during the COVID-19 pandemic. Prev Med. 2021 Dec;153:106852.
24. Saragih ID, Tonapa SI, Saragih IS, Advani S, Batubara SO, Suarilah I, et al. Global prevalence of mental health problems among healthcare workers during the Covid-19 pandemic: A systematic review and meta-analysis. Int J Nurs Stud. 2021 Sep;121:104002.
25. Young KP, Kolcz DL, O’Sullivan DM, Ferrand J, Fried J, Robinson K. Health care workers’ mental health and quality of life during COVID-19: Results from a mid-pandemic, national survey. Psychiatr Serv. 2021 Feb 1;72(2):122–8.
26. Van Wert MJ, Gandhi S, Gupta I, Singh A, Eid SM, Haroon Burhanullah M, et al. Healthcare worker mental health after the initial peak of the COVID-19 pandemic: A US medical center cross-sectional survey. J Gen Intern Med 2022 Jan 6.
27. Triana G, Forero PA. Impact of COVID-19 on the mental health of radiologists. Clin Imaging. 2021;76:60.
28. Greenberg N, Weston D, Hall C, Caulfield T, Williamson V, Fong K. Mental health of staff working in intensive care during Covid-19. Occup Med (Lond). 2021 Apr 9;71(2):62–7.
29. Dale LP, Cuffe SP, Sambuco N, Guastello AD, Leon KG, Nunez LV, et al. Morally distressing experiences, moral injury, and burnout in Florida healthcare providers during the COVID-19 pandemic. Int J Environ Res Public Health 2021 Nov 24;18(23):12319.
79
30. Salgado de Snyder VN, Villatoro AP, McDaniel MD, Ocegueda AS, Garcia D, Parra-Medina D. Occupational stress and mental health among healthcare workers serving socially vulnerable populations during the COVID-19 pandemic. Front Public Health. 2021;9:782846.
31. Schechter-Finkelstein T, Plenert E, La Rosa J, McLean J, Chiang KY, Krueger J, et al. Pediatric hematology/ oncology healthcare professional emotional health during COVID-19. Cancer Med. 2021;10(20):7144–51.
32. Shechter A, Diaz F, Moise N, Anstey DE, Ye S, Agarwal S, et al. Psychological distress, coping behaviors, and preferences for support among New York healthcare workers during the COVID-19 pandemic. Gen Hosp Psychiatry. 2020 Oct;66:1–8.
33. Kim SC, Sloan C, Chechel L, Redila M, Ferguson J. Severe burnout and poor mental health among healthcare workers 6 months after COVID-19 pandemic declaration: What can we learn for future emergencies? J Nurs Adm. 2021 Nov 1;51(11):554–60.
34. Bryant-Genevier J, Rao CY, Lopes-Cardozo B, Kone A, Rose C, Thomas I, et al. Symptoms of depression, anxiety, post-traumatic stress disorder, and suicidal ideation among state, tribal, local, and territorial public health workers during the COVID-19 pandemic - United States, MarchApril 2021. MMWR Morb Mortal Wkly Rep. 2021 Dec 3;70(48):1680–5.
35. Kaufmann PG, Havens DS, Mensinger JL, Bradley PK, Brom HM, Copel LC, et al. The COVID-19 study of healthcare and support personnel (CHAMPS): Protocol for a longitudinal observational study. JMIR Res Protoc. 2021 Oct 7;10(10):e30757.
36. Crowe S, Howard AF, Vanderspank-Wright B, Gillis P, McLeod F, Penner C, Haljan G. The effect of COVID-19 pandemic on the mental health of Canadian critical care nurses providing patient care during the early phase pandemic: A mixed method study. Intensive Crit Care Nurs 2021 Apr 1;63:102999.
37. Hendrickson RC, Slevin RA, Hoerster KD, Chang BP, Sano E, McCall CA, et al. The impact of the COVID-19 pandemic on mental health, occupational functioning, and professional retention among health care workers and first responders. J Gen Intern Med. 2021 Dec 16;1–12.
38. Hurst KT, Ballard ED, Anderson GE, Greenstein DK, Cavanaugh GW, Dwyer E, et al. The mental health impact of contact with COVID-19 patients on healthcare workers in the United States. Psychiatry Res. 2021 Dec 25;308:114359.
39. Vizheh M, Qorbani M, Arzaghi SM, Muhidin S, Javanmard Z, Esmaeili M. The mental health of healthcare workers in the COVID-19 pandemic: A systematic review. J Diabetes Metab Disord. 2020 Oct 26;19(2):1967–78.
40. Spilg EG, Rushton CH, Phillips JL, Kendzerska T, Saad M, Gifford W, et al. The new frontline: exploring the links between moral distress, moral resilience and mental health in healthcare workers during the COVID-19 pandemic. BMC Psychiatry. 2022 Jan 6;22(1):19.
41. Sahebi A, Nejati-Zarnaqi B, Moayedi S, Yousefi K, Torres M, Golitaleb M. The prevalence of anxiety and depression among healthcare workers during the COVID-19 pandemic: An umbrella review of meta-analyses. Prog Neuropsychopharmacol Biol Psychiatry. 2021;107:110247.
42. Murata S, Rezeppa T, Thoma B, Marengo L, Krancevich K, Chiyka E, et al. The psychiatric sequelae of the COVID-19 pandemic in adolescents, adults, and health care workers. Depress Anxiety. 2021;38(2):233–46.
43. Norman SB, Feingold JH, Kaye-Kauderer H, Kaplan CA, Hurtado A, Kachadourian L, Feder A, Murrough JW, Charney D, Southwick SM, Ripp J. Moral distress in frontline healthcare workers in the initial epicenter of the COVID-19 pandemic in the United States: Relationship to PTSD symptoms, burnout, and psychosocial functioning. Depress Anxiety. 2021 Oct;38(10):1007-17.
44. Leng M, Wei L, Shi X, Cao G, Wei Y, Xu H, et al. Mental distress and influencing factors in nurses caring for patients with COVID-19. Nurs Crit Care. 2021 Mar;26(2):94–101.
45. Korkut S. Research on the frequency of post-traumatic stress disorder in healthcare workers during the COVID-19 pandemic. Ir J Med Sci. 2021 Dec.
46. Eyles E, Moran P, Okolie C, Dekel D, Macleod-Hall C, Webb RT, et al. Systematic review of the impact of the COVID-19 pandemic on suicidal behaviour amongst health and social care workers across the world. J Affect Disord Rep. 2021 Dec;6:100271.
47. Manchia M, Gathier AW, Yapici-Eser H, Schmidt MV, de Quervain D, van Amelsvoort T, et al. The impact of the prolonged COVID-19 pandemic on stress resilience and mental health: A critical review across waves. Eur Neuropsychopharmacol. 2021 Oct 29;55:22–83.
48. David E, DePierro JM, Marin DB, Sharma V, Charney DS, Katz CL. COVID-19 pandemic support programs for healthcare workers and implications for occupational mental health: A narrative review. Psychiatr Q. 2021 Oct 4.
49. Kelly F, Uys M, Bezuidenhout D, Mullane SL, Bristol C. Improving healthcare worker resilience and well-being during COVID-19 using a self-directed e-learning intervention. Front Psychol. 2021;12:748133.
50. Bureau R, Bemmouna D, Faria CGF, Goethals A-AC, Douhet F, Mengin AC, et al. My health too: Investigating the feasibility and the acceptability of an internet-based cognitive-behavioral therapy program developed for healthcare workers. Front Psychol. 2021;12:760678.
51. Doherty A, Benedetto V, Harris C, Boland P, Christian DL, Hill J, et al. The effectiveness of psychological support interventions for those exposed to mass infectious disease outbreaks: a systematic review. BMC Psychiatry. 2021 Nov 24;21(1):592.
The Effect of the COVID-19 Pandemic on the Mental Health of Health Care Workers: A Systematic Review
80
Incidence of Food Insecurity in Rural and Urban Counties in Pennsylvania
Nala J. Mckie1*, Sarah A. Omoyugbo1*, Ahquasia N. Ramsay1*, Toyo A. Adebayo1*, and Andrew Chew2
1Geisinger Commonwealth School of Medicine, Scranton, PA 18509
2The Institute for Public Policy and Economic Development in PA, Scranton, PA 18503
Correspondence: nmckie@som.geisinger.edu
Abstract
Food insecurity is influenced by multiple determinants including socioeconomic status, and the Supplemental Nutrition Assistance Program (SNAP) was established to bridge the nutritional gap between low- and high-income households. Food insecurity continues to be a growing disparity among rural and urban communities in the country. Few studies analyze both rural and urban food insecurity, and none do so at the state or county levels. Therefore, we sought to understand the impact of socioeconomic factors on food insecurity in urban and rural households at the state and county levels. We examined urban and rural counties in Pennsylvania (PA), a state with moderate food insecurity rates that are consistently below the national average. We expected that the rate of food insecurity in rural counties would be higher than in urban counties. We measured the incidence of food insecurity among rural and urban households in PA. We used the predicted trends produced by the United States Department of Agriculture Economic Research Service (USDA ERS), based on surveys given to individuals living in rural areas. We analyzed the USDA ERS data to compare the levels of food insecurity, considering the data for low and very low food security in rural counties in PA.
To measure food insecurity in the urban counties, we used data provided by the hunger-relief organization Feeding America.
To assess the relationship between food insecurity between rural and urban counties, we examined the data provided by census.gov in the following categories: income, household size, family determinants (head-of-household), and government assistance. These determinants were analyzed in comparison to food insecurity from the years 2015 to 2019 in both rural and urban households. Based on our data analysis between rural and urban areas, SNAP alone is not sufficient to address levels of food insecurity in rural areas. We found that about 1 in 7 rural households receive SNAP benefits compared to about 1 in 11 urban households. Yet the food insecurity rates were still higher in rural counties than in urban counties, at 11.82% and 10.76%, respectively. Overall, more households with women heads of household receive SNAP than households with men heads of households at the county, state, and national levels. Lastly, the average income in rural counties is over $10,000 less than the average in urban counties, and almost $10,000 less than the state average. Hopefully, these results will instill a sense of urgency that will influence new policies to support both rural and urban households in different capacities to decrease the food security gap among American households. Since PA tends to be below the national average for food insecurity, we hope that this will prompt action in above-average states as well.
Introduction
Food insecurity is measured as a lack of access to nutritious food, eating food past the expiration date, and purchasing inexpensive and unhealthy foods (1). Food insecurity tends to impact households that have one of the following characteristics the most: children under the age of 6, women as head-ofhousehold, adults living alone or with disabilities, Black and Hispanic households, and low-income households (2). Healthy eating options are expensive when compared to fast food. People who struggle financially are inclined to consume more fast food than normal. This diet regularly can have an increased risk of chronic diseases such as obesity, high blood pressure, heart disease, and diabetes. Some studies have shown that food insecurity is associated with decreased nutrient intake, leading to increased rates of mental health problems and depression, diabetes, hypertension, and hyperlipidemia (3–4). Racial and ethnic minorities are 1.5 to 2.0 times more likely than whites to have most of the major chronic diseases (5). This, when paired with a low-nutrient diet, can exacerbate chronic diseases. Processed foods such as ramen, which are high in calories and nutrient-deficient, are cheaper and more abundant compared to nutrient-rich foods like vegetables, fruits, and lean meats. This disproportion of high-quality and nutrient-rich foods can lead to Supplemental Nutrition Assistance Program (SNAP) participants with higher health risks (6). As mentioned above, food insecurity can also affect the psychological well-being of a person. Depression and irritability exacerbated the emotional strain parents already faced, ultimately creating an emotional disconnect with their children (7). The United States (U.S.) began SNAP to help the nutrition disparity in low-income families. Interventions, such as SNAP and various government assistance programs, have been used to reduce food insecurity. While these programs are helpful to some, not everyone who needs them is qualified to receive the benefits because they do not meet certain thresholds.
Rural and urban areas present specific and unique problems to those that reside in these communities, ranging from healthcare to socioeconomic factors. Understanding and recognizing the existence of these rural and urban disparities and where they intersect with one another is the first step toward creating proactive solutions to remedy the problem. We sought to understand the impact of socioeconomic factors on food insecurity in urban and rural households in Pennsylvania (PA) from 2015 to 2019.
Many households in rural and urban populations experience food insecurity, but this can be attributed to myriad reasons, such as socioeconomic status, household characteristics, and
Scholarly Research In Progress • Vol. 6, November 2022
81
government assistance, among others (8). PA ranks highly concerning food security rates when compared to other states, and it is consistently below the national food insecurity rate (9). Yet in 2019, the state of PA reported a food insecurity rate of 10.6% with an average meal cost of $3.17 and an annual food budget shortfall of $733,806,000 (9). The margins previously mentioned are astounding, and underlying factors like county size, population density, and income status should be considered. For example, food insecurity rates are more prevalent in rural areas. Food insecurity affects about 52% of people living in rural areas in comparison to 24% of people in urban counties (10). Rural communities also face the challenges of low-wage employment opportunities and higher rates of unemployment and underemployment (11). Government food assistance programs including SNAP, the Special Supplemental Nutrition Program for Women, Infants, and Children (WIC), and the National School Lunch Program (NSLP) are more likely to be used by households facing food insecurity (12). Approximately 59% of households experiencing food insecurity reported having participated in one or more of these programs (13). Though the U.S. government has social programs in place for food-insecure households, research indicates that these programs are unable to meet the needs of the population (6).
A study from Cambridge University found that if maximum SNAP benefit levels increased to the average cost of a meal for low-income food-secure households, then food insecurity among households receiving SNAP benefits would decrease by 50.9% (18). Previous research suggests that increasing awareness of food insecurity has led to policy changes that improved overall health outcomes (4). We hope that these outcomes will prompt policy changes that would allocate government benefits more efficiently and reduce the levels of food insecurity in PA counties.
Methods
Participants
Our research population was rural households and urban households. All individuals who were residents of PA as reported by the Census Bureau’s American Community Survey from 2015 to 2019 (19–23) were eligible for inclusion (Table 1). Rural and urban county designations were established using the criteria of population density provided by the Center for rural PA (Table 2) (24).
Procedures
We performed a secondary data analysis using U.S. Census Bureau and USDA ERS data to understand how household food insecurity differed between urban and rural counties in PA. In the data from the census website, we calculated the total
Rural Urban
Adams Armstrong Bedford Blair Bradford Butler Cambria Cameron Carbon Centre Clarion Clearfield Clinton Columbia Crawford Elk Fayette Forest Franklin Fulton Greene Huntingdon Indiana Jefferson
Studies focus on rural or urban food insecurity, but few evaluate both. Interactive maps and databases indicate differences in the number of individuals that experience food insecurity in rural and urban counties (14–15). However, no recent studies have examined these differences at the state and local levels. The Household Food Security annual report from the USDA ERS reports the percentage of food-insecure households within metropolitan areas as 10.4% and in nonmetropolitan areas as 11.6%, nationally (16). We desired to utilize the most recent data available to determine how food insecurity may currently affect PA counties. Once we analyzed the differences in food insecurity for urban and rural areas at the county level, we examined factors that might influence food insecurity: household size, head of household, income, and government assistance. We found that there were several disparities that significantly impacted rural counties and may be contributing factors to the disparities in food insecurity between the two county types. A study done on urban and rural counties examined how rural and urban designation affected the distribution of government benefits (17). SNAP distribution was higher in rural areas than urban areas considering data from 2001 to 2014. Also, there was twice as much food coverage from food providers and food banks in nonmetropolitan areas when compared to metropolitan areas (17). The objective of this study was to determine the results of SNAP distribution and other benefits for PA counties using recent data.
Juniata Lawrence Lycoming McKean Mercer Mifflin Monroe Montour Northumberland Perry Pike Potter Schuylkill Snyder Somerset Sullivan Susquehanna Tioga Union Venango Warren Washington Wayne Wyoming
Allegheny Beaver Berks Bucks Chester Cumberland Dauphin Delaware Erie
Lackawanna Lancaster Lebanon Lehigh Luzerne Montgomery Northampton Philadelphia Westmoreland York
Table 1: Rural and Urban County designation as determined by the Center for Rural PA (24).
Years Total population
Total households
Rural 2015-2019 3,398,256 1,360,119 Urban 2015-2019 9,393,274 3,649,956
Table 2: Total population and households from the years 2015–2019 for both urban and rural counties (19-23).
Incidence of Food Insecurity in Rural and Urban Counties in Pennsylvania
82 82
amount of recipients of government assistance over averaged over 5 years (2015–2019) for each county designation, resulting in a percentage value. We created a bar graph to depict our findings for all factors. We requested data by county from Feeding America on food insecurity and costs.
Data analysis
Our goal was to measure the relationship between the incidence of food insecurity in rural counties of PA versus urban counties of PA along with factors that might influence food insecurity, such as income (poverty data), receiving government assistance, household size and head of household (male or female). Our statistical analysis included unpaired t-tests to determine a significant difference between our two factors, food insecurity in the urban counties versus rural counties. We used central tendency as our descriptive analysis to measure the mean of food insecurity in selected urban vs. rural counties between the years 2015–2019. The central tendency analysis summarizes and accurately provides a description of the data with only one value (25). The confidence interval was used to make inferences about the underlying population using different estimations and sample statistics (26). The dependent variable we are testing for is food insecurity among the counties; and the independent variables include various socioeconomic factors such as income, enrollment in government assistance programs, household size, and head of household. We used Prism to calculate the unpaired t-test from the data collected from the American Community Survey on the Census Bureau.
Results
Figure 1 shows the average population of the rural and urban counties in PA from the years 2015–2019 and a chart of an unpaired t-test analysis of rural versus urban counties. The standard deviation in urban counties is significantly higher than in rural counties and the reason for this is because urban counties have a much larger population size.
Figure 2 above depicts the average number of households in both rural and urban counties in PA from 2015 to 2019. We calculated the average of the two and found that the average number of households in rural counties was about 28,335 and the number of urban counties was 194,368 over 5 years. The second part of Figure 2 depicts the unpaired t-test analysis of the number of households in urban counties of PA versus rural counties of PA. From the t-test, we found that the difference between the two is statistically significant, confirming that rural counties have a lower average number of households than urban counties.
Figure 3 represents the average number of individuals that are considered food insecure by the data obtained from Feeding America for the years 2015–2019 (27–31) after taking a 5-year average for each county. We then calculated the average of these values for both rural and urban counties. We found that rural counties had an average of 8,314 individuals experiencing food insecurity over those 5 years. We also found that urban counties had an average of 57,150 individuals experiencing food insecurity over the same 5-year span. The second part of the figure depicts the t-test we conducted for the values we calculated. From the t-test, we determined that the difference between the average of the two county types was extremely statistically significant. This suggests that there is a significantly
larger amount, on average, of individuals who are food insecure in urban counties when compared to rural counties. However, we expected this result due to the large difference in the population of rural and urban counties in PA.
Figure 4 depicts the average percentage of individuals in PA that are considered food insecure by the data obtained from Feeding America for the years 2015–2019 (27–31) after taking a 5-year average for each county. We then calculated the average of the values found for both rural and urban counties. We found that an average of 11.82% of rural PA experienced food insecurity from 2015 to 2019. We also found that an average of 10.76% of individuals in urban counties experienced food insecurity over the same 5-year period. Though it was only a little over a 1% difference, we found that this difference was statistically significant from the t-test that we conducted.
Figure 5 depicts the average median income for rural and urban counties and the overall average median income for the state of PA. It was calculated from the data provided that the average median income for rural, urban, and the state of PA was $53,363, $66,385, and $61,744, respectively. A t-test was performed for rural versus urban counties to determine the difference between the median household income. It was concluded that there was significance between the counties.
Figure 6 displays the gender of the head of households in both rural and urban PA from the years 2015–2019. In rural counties, 6,962 households were led by women, while 5,041 households were led by men. For the urban counties, 56,906 households were led by women, while 34,679 households had a man as the head of household. The data was determined by adding the total households that were led by men, and households led by women from both rural and urban counties and dividing by the number of counties to give us an average. From the years 2015–2019, most households were led by women in PA.
Figure 7 displays the households by gender surveyed for SNAP in rural and urban PA from the years 2015–2019. In rural counties, 2,747 households led by women were surveyed for SNAP, while 1,360 households were surveyed for SNAP that had a male head of the house. For the urban counties, 24,334 households were surveyed that were led by women, while 8,829 households were surveyed that had a man as the head of household. The data was determined by adding the total surveyed households that were led by men, and surveyed households led by women from both rural and urban counties and dividing by the number of counties to give us an average. From the years 2015–2019, most households surveyed for SNAP were led by women in PA.
Figure 8 displays the households by gender receiving SNAP in rural and urban PA from the years 2015–2019. In rural counties, 1,057 households were run by women that received SNAP, while 309 households received SNAP that had a male head of the house. For the urban counties, 9,187 households were recipients of SNAP which were led by women, while 1,988 households received SNAP that had a man as the head of household. The data was determined by adding the total recipients of SNAP households that were led by men, and recipients of SNAP households run by women from both rural and urban counties and dividing by the number of counties to give us an average. From the years 2015–2019, most households that received SNAP were led by women in PA.
Incidence of Food Insecurity in Rural and Urban Counties in Pennsylvania
83
Incidence of Food Insecurity in Rural and Urban Counties in Pennsylvania
Urban and rural counties in Pennsylvania
Figure 1. A) The average number of individuals in rural and urban PA. B) Unpaired t-test Analysis of Population in Urban vs. Rural Counties.


Urban and rural counties in Pennsylvania
Urban and rural counties in Pennsylvania
Figure 2. A) The average number of households in rural and urban counties. B) Unpaired t-test Analysis of the Number of Households in Urban vs. Rural Counties.
Figure 3. A) The average number of food insecure individuals in urban and rural PA. B) Unpaired t-test Analysis of Food Insecure Individuals in Urban vs. Rural Counties.
Urban and rural counties in Pennsylvania
Rural and urban PA and US

Figure 4. A) The average percentage of food insecure individuals in urban and rural PA. B) Unpaired t-test Analysis of the Percentage of Food Insecure Individuals in Urban vs. Rural Counties.
Figure 5. A) The average median household income for the state of PA, urban PA, and rural PA. B) Unpaired t-test Analysis of Median Household Income in Urban vs. Rural Counties.
Figure 6. The average number of heads of household by gender in rural and urban PA.

84
Gender of head of household
Gender of households surveyed
Figure 7. The average number of households surveyed for SNAP by gender of the head of household in rural and urban PA.

Gender of households receiving SNAP
Figure 8. The average number of households receiving SNAP by gender of the head of household in rural and urban PA.
Rural and urban PA and the US
Gender of households receiving SNAP


Figure 9. The average percent of male versus female heads of households receiving SNAP benefits.
Figure 9 depicts the average percentage of households receiving SNAP benefits. It was calculated utilizing the 5-year averages available from the USDA ERS from 2015–2019. We calculated the quotient of the data for households receiving SNAP benefits by the total number of households surveyed for this socioeconomic factor. We then took the average of both rural and urban counties to compare male heads of households and female heads of households. The percentages provide a comparison for male and female heads of households, as well as urban versus rural heads of households, as opposed to the average number of household recipients (Figure 8). From this data, we found that in rural counties, on average, over 15% more households with SNAP recipients have female heads of household. In urban counties, on average, 13.62% more households with SNAP recipients have a female head of household. We also found that rural counties had a larger percentage of SNAP recipients than urban counties, and a larger percentage of households with female heads of households received SNAP than households with male heads of households.
Figure 10. A) The average number of households receiving SNAP in rural and urban counties in PA. B) Unpaired t-test Analysis of the Number of Households Receiving SNAP in Urban vs. Rural Counties.
Figure 10 depicts the average number of households receiving SNAP benefits in urban counties and rural counties for the years 2015–2019. The total average of households in rural counties receiving SNAP benefits was 3,919. The average was determined by taking the sum of households receiving SNAP in the rural counties and dividing the number of counties. The total number of households in urban counties receiving SNAP benefits was 17,856. The average was determined by the number of households that received SNAP divided by the total number of urban counties. Utilizing the data from Figure 2, we have found that, on average, about 1 in 7 households in rural counties receive SNAP while about 1 in 11 urban households receive SNAP.
Figure 11 depicts the number of individuals over the age of 60 years of age and under 60 years of age in urban and rural PA during the years 2015–2019. In rural counties, 1,422 households over 60 years of age received SNAP benefits and 9,305 households received SNAP benefits in urban counties. Two thousand seven hundred twenty-four households under 60
Incidence
of Food Insecurity in Rural and Urban Counties in Pennsylvania
85
years of age in rural and 18,841 households in urban counties received SNAP benefits. The data was established by adding the total amounts of households receiving SNAP benefits from 60 years and over and 60 years and under from each both rural and urban counties and dividing the number of counties to get the average. Utilizing the data from Figure 2, we found that, on average, about 1 in 20 rural households and about 1 in 21 urban households have recipients of SNAP over 60 years old. Also, on average, about 1 in 10 households in both rural and urban counties have recipients of SNAP under 60 years old.
Discussion
We expected that, on average, the rate of food insecurity would be greater in rural counties when compared to urban counties. We found that, on average, the rate of food insecurity in rural and urban PA was 11.82% and 10.76%, respectively. This is a significant finding that shows the stark contrast in the initial interpretation of the number versus the percentage of individuals who are food insecure in rural and urban counties and the interpretation once the influence of population size was removed. Figures 3 and 4 highlight the importance of making the data equivalent to interpret the true outcomes within these two different categories.
The t-test results in Figures 1–5 and 10 indicate that there was a significant difference overall when comparing the socioeconomic factors and food insecurity between rural and urban counties such as the average numbers for households receiving SNAP, food-insecure individuals, and households in rural and urban PA. This is because rural counties have a much lower population than urban, with a population difference of 423,586 from the years 2015–2019. The results also revealed that female heads of households received more SNAP benefits in both urban and rural counties as compared to male heads of households. However, there are more female-led households than male-led households in both rural and urban PA. Thus, more female-led households would be food insecure which leads to more female-led households receiving SNAP benefits. Female households overall in the United States received more SNAP than male households,

which implies women are more dependent on food stamps than men. Women are also able to get into the WIC program, which provides women that are either pregnant, breastfeeding, or up to 6 months postpartum and children up to the age of 5 that are deemed a nutrition risk resources to obtain nutritious foods (37). Women can access this program concurrently with SNAP, but men are not given access to this program for themselves, so even more women may be dependent on these resources than we examined (37–38). So perhaps having the disruption of pay due to pregnancy and care after birth may make women more likely to seek out these resources.
Another thing to take into account is that, on average, females make less than males, which may make female-led households have to stretch their resources that much more, leading them to seek out financial aid for food (39). Therefore, male-led households may be less in need of these resources from the beginning. We found that the average per person household size for female heads of household in urban areas taken from a five-year estimate from 2015–2019 was 3.18 versus 3.15 for males (40). In rural counties, it was 3.08 for the females and 3.11 for the males (40). Though this figure is lower in rural counties for female heads of household, it is important to note again that most households, as well as female lead households, in PA are in urban counties. This may mean that having that extra person every few households takes a toll on a woman’s income if she is the sole provider. Addressing the potential differences in pay between these two types of leaders in the household, and the way that pay is granted during maternity leave, may be the first step in changing the demographics of who needs these governmental resources. Income has also been a major determinant of food insecurity. We found that the average income in rural counties is over $10,000 less than the average in urban counties, and almost $10,000 less than the state average. After analyzing the data in this project between rural and urban areas, it is important to recognize that SNAP alone is not sufficient to address levels of food insecurity in rural areas. SNAP restrictions on income and savings can lead to people who could really benefit from the utilization of these resources on the outside, looking in (41).
For example, a requirement from SNAP is that a household cannot have more than $2,500 in cash or a bank account (41). However, the requirements do not specify that there are different cash allowances for different household sizes (41). So, it is easy to see how a little over $2,500 for groceries can go a lot further for a single person than for a family of four. Also, if either household size had to rely solely on this amount of money, or a little bit more, for their groceries, they would be out of savings for any other possible expenses that may arise. Also, in PA, SNAP is usually only certified for 12 months and requires a 6-month report for any changes in income (42). This means that any fluctuations in pay may make someone who is not on a salary, does odd jobs, or is picking up extra shifts for a few months’ ineligible, putting them just over the threshold.
SNAP does allow for some helpful deductions, like a 20% deduction from earned income, a standard deduction, deductions if there are elderly members of the household,
Incidence of Food Insecurity in Rural and Urban Counties in Pennsylvania
Figure 11. The average number of household recipients of SNAP over and under 60 years of age in rural and urban PA
86
Age of households receiving SNAP
and a deduction if shelter costs are more than half of the household’s income after all deductions (41). Given that we found that the average median gross income for rural and urban counties was $53,363 and $66,385, respectively, the average per person household size was 2.37 and 2.47 respectively, and the standard housing expense for a family of three in 2022 was found to be $1,703 and $2,115, respectively, most of the households in both rural and urban PA, even under the median household income, would not qualify for SNAP even after the deductions (40–41, 43–44). Addressing these disparities and shortcomings will likely aid in addressing the gap in food security.
Access and distance continue to be a large barrier in foodinsecure households. When analyzing the Food Access Research Atlas provided by the USDA, we see that, in 2019, tracts where a significant number or share of residents is more than 1 mile (urban) or 10 miles (rural) from the nearest supermarket and tracts in which more than 100 households have no access to a vehicle and are more than 1/2 mile from the nearest supermarket, or a significant number or share of residents are more than 20 miles from the nearest supermarket are concentrated in urban counties (45). However, when paired with low-income status, tracts with low access at 1 and 10 miles and low vehicle access are concentrated primarily in rural counties (45). This data suggests that it will likely be beneficial to implement new strategies to address food insecurity in rural and urban areas. This can potentially appear as government initiatives to increase food access and healthy food awareness in rural areas so that SNAP benefits can be used on fresher foods, or an increase in SNAP benefits or an income supplement to encourage the purchase of healthier foods in rural areas, which are notoriously more expensive than processed and nutritionally poor foods. Yet we recognize that there are different challenges for each setting that may require different methods of implementation; urban areas may require solutions such as more stores with nutrient-dense food, while rural communities may require solutions such as food pantries and food banks in closer proximity, since these are potentially hours away and may require automobiles.
We aim to bring awareness to the issue of food insecurity at the state and county levels. We hope that these outcomes will prompt policy changes that would allocate government benefits more efficiently and reduce the levels of food insecurity in PA counties. Lastly, we hope this will help to find alternative ways to address food insecurity considering individual and household characteristics. Our goal is that these results will instill a sense of urgency that will influence new policies to support both rural and urban households in different capacities to decrease the food security gap among American households. We believe that this in-depth examination of food insecurity at the state level has revealed the urgency for more studies of this kind.
According to Feeding America, PA is consistently among the lowest 25 states regarding food insecurity rates (27–31). The food insecurity rate in PA is also consistently below the national food insecurity rate (9). The food insecurity rates from 2015–2019 in PA were 13.1%, 12.5%, 12.0%, 10.9%, and 10.6% respectively (27–31). The food insecurity rates in the United States from 2015–2019, taken from an average of state insecurity rates (including the District of Columbia), were
13.7%, 13.0%, 12.6%, 12.2%, and 11.7% respectively (27–31). The findings from this study highlight significant disparities in PA, a state below the median. Thus, we propose that there likely will be similar findings in states consistently above the median. If we can analyze the disparities at the state level, as we have done for PA, and suggest methods for states to successfully address the findings by implementing new policies, this can be a guide for other governments to act in their own states.
One way that this study can be improved is by using primary sources for the data instead of secondary data analysis. A limitation of this study is that, based on the data we analyzed, further studies would need to be completed to determine the best way to tackle food insecurity between urban and rural counties. Another limitation would be that we were not able to access the data relating to the COVID-19 pandemic given the timing of updates for the databases that we used. Comparing our data from the years 2015–2019 to the years 2020–2021 could give us insight into the impact of the COVID-19 pandemic. These would be areas to further explore in future studies.
References
1. Kimani ME, Sarr M, Cuffee Y, Liu C, Webster NS. Associations of race/ethnicity and food insecurity with covid-19 infection rates across US counties. JAMA network open. American Medical Association; 2021. Available from: https://www.ncbi.nlm.nih.gov/pmc/articles/PMC8188266/
2. Leddy AM, Weiser SD, Palar K, Seligman H. A conceptual model for understanding the rapid covid-19-related increase in food insecurity and its impact on health and Healthcare. The American Journal of Clinical Nutrition Oxford University Press; 2020. Available from: https:// www.ncbi.nlm.nih.gov/pmc/articles/PMC7454255/
3. Christine M. Olson Ph.D., RD, Kendra Anderson BS, RD, Elizabeth Kiss, Ph.D., Frances C. Lawrence, Ph.D. Sharon B. Seiling. Factors protecting against and contributing to food insecurity among Rural families. Family Economics and Nutrition Review. 2004 Winter. Available from: Gale Academic OneFile, link.gale.com/apps/doc/A122458829/ AONE?u=nysl_oweb&sid=googleScholar&xid=c8889daa
4. Gundersen C, A C-J, Ziliak JP, C G, SL C, HA E-M, et al. Food insecurity and Health Outcomes: Health Affairs Journal. Health Affairs. 2015. Available from: https://www. healthaffairs.org/doi/10.1377/hlthaff.2015.0645
5. Price JH, Khubchandani J, McKinney M, Braun R. Racial/ ethnic disparities in chronic diseases of youths and access to healthcare in the United States. BioMed research international. Hindawi Publishing Corporation; 2013. Available from: https://www.ncbi.nlm.nih.gov/pmc/articles/ PMC3794652/
6. DeWitt E, Gillespie R, Norman-Burgdolf H, Cardarelli KM, Slone S, Gustafson A. Rural SNAP participants and food insecurity: How can communities leverage resources to meet the growing food insecurity status of Rural and lowincome residents?. Int J Environ Res Public Health. MDPI; 2020. Available from: https://www.ncbi.nlm.nih.gov/pmc/ articles/PMC7504289/
Incidence of Food Insecurity in Rural and Urban Counties in Pennsylvania
87 87
7. Steimle S, Gassman-Pines A, Johnson AD, Hines CT, Ryan RM. Understanding patterns of food insecurity and family well-being amid the Covid-19 pandemic using Daily Surveys. Society for Research in Child Development. John Wiley & Sons, Ltd; 2021. Available from: https://srcd. onlinelibrary.wiley.com/doi/10.1111/cdev.13659
8. Jung NM, Bairros FSde, Pattussi MP, Pauli S, Neutzling MB. Gender differences in the prevalence of household food insecurity: A systematic review and meta-analysis: Public health nutrition. Cambridge Core. Cambridge University Press; 2016. Available from: https://www cambridge org/co re/journals/public health nutrition/article/gender differen ces in the prevalence of household food insecurity a sys tematic review and metaanalysis/B3B0DE2E04C0413E4 8267E63B400EC36
9. Map the meal gap data: Food Insecurity in PA. Feeding America. Available from: https://www.feedingamerica.org/ research/map-the-meal-gap/by-county
10. Milano M. Urban, subUrban and Rural areas-which area suffers the most?. Food Insecurity Solutions for America. Serving Food Solutions. Available from: http:// servingfoodsolutions.com/the-problem/location/UrbansubUrban-and-Rural/
11. Hunger in Rural communities. Feeding America. Available from: https://www.feedingamerica.org/hunger-in-america/ Rural-hunger-facts
12. Pazzaglia G, Christaldi J. An exploration of the influences contributing to food insecurity in Chester County, PAJoanne Christaldi, Gina Pazzaglia, 2020. SAGE Journals 2018. Available from: https://journals sagepub com/doi/full /10 1177/1524839918801588?casa token= 3xcQPjKXb kAAAAA%3A8OI4yauAZNTmUSBbP2YPoh996GK0Br3C m nYQr7L638yjc0VfmOb rnWpsZIFTAPXKzrD9W0fj 6
13. Coleman-Jensen A, Singh A, Gregory CA, Rabbitt MP. Household food security in the United States in 2015. USDA ERS. 2016. Available from: https://www ers usda gov /publications/pub details/ ?pubid=79760
14. Food Insecurity in PA. County Health Rankings & Roadmaps. Available from: https://www countyhealthrank ings org/app/PA/2021/measure/factors/139/data?sort=s c 0
15. Piontak JR, Schulman MD. Food Insecurity in Rural America. SAGE Journals. 2014. Available from: https://journ als sagepub com/doi/full/10 1177/1536504214545766
16. Alisha C-J, Rabbitt MP, Gregory CA, Singh A. Household Food Security in the United States in 2020. U.S. Department of Agriculture Economic Research Service. 2021. Available from: https://www ers usda gov/webdocs/p ublications/102076/err 298 pdf
17. Gundersen C, Dewey A, Hake M, Engelhard E, Crumbaugh AS. Food insecurity across the Rural-Urban divide: Are counties in need being reached by charitable food assistance?. SAGE Journals. 2017. Available from: https://journals sagepub com/doi/full/10 1177/00027162 17710172?casa token=GSyJYgctUQIAAAAA%3AHHspKt 5rNp6AXumlUByiNuqzUkFiaSZBH7AsQVSf7qORoFBUq
TXmy HbcjjR3iLnXYIUI mXJqn06Q
18. Gundersen C, Waxman E, Crumbaugh AS. An examination of the adequacy of Supplemental Nutrition Assistance Program (SNAP) benefit levels: Impacts on food insecurity: Agricultural and Resource Economics Review. Cambridge Core. Cambridge University Press; 2019. Available from: h ttps://www cambridge org/core/journals/agricultural and r esource economics review/article/an examination of the a dequacy of supplemental nutrition assistance program sn ap benefit levels impacts on food insecurity/59160A1F2 A28CFA2DB686516C144B388
19. Public Assistance Income Or Food Stamps/Snap In The Past 12 Months For Households. Explore census data. American Community Survey; 2015. Available from: https://data.census.gov/cedsci/table?q=food+insecurity+in +Philadelphia+city%2C+PA&g=0400000US42%2C42%2 40500000 0500000US42027&y=2015&d=ACS+1 Year+ Estimates+Detailed+Tables&tid=ACSDT1Y2015 B19058
20. Public Assistance Income Or Food Stamps/Snap In The Past 12 Months For Households. Explore census data. American Community Survey; 2016. Available from: https://data census gov/cedsci/table?q=food+insecurity+in +Philadelphia+city%2C+PA&g=0400000US42%2C4 2%240500000 0500000US42027&y=2016&d =ACS+1 Year+Estimates+Detailed+Tables&tid=ACS DT1Y2016 B19058
21. Public Assistance Income Or Food Stamps/Snap In The Past 12 Months For Households. Explore census data. American Community Survey; 2017. Available from: https://data census gov/cedsci/table?q=food+insecurity+in +Philadelphia+city%2C+PA&g=0400000US42%2C42%2 40500000 0500000US42027&y=2017&d=ACS+1 Year+ Estimates+Detailed+Tables&tid=ACSDT1Y2017 B09010
22. Public Assistance Income Or Food Stamps/Snap In The Past 12 Months For Households. Explore census data. American Community Survey; 2018. Available from: https://data census gov/cedsci/table?q=food%20insecurity %20in%20Philadelphia%20city,%20PA&g=0400000US42, 42%240500000 0500000US42027&y=2018&d=ACS%2 01 Year%20Estimates%20Detailed%20Tables&tid=ACSD T1Y2018 B19058
23. Public Assistance Income Or Food Stamps/Snap In The Past 12 Months For Households. Explore census data. American Community Survey; 2019. Available from: https://data census gov/cedsci/table?q=food+insecurity+in +Philadelphia+city%2C+PA&g=0400000US42%2C4 2%240500000 0500000US42027&y=2019&d =ACS+1 Year+Estimates+Detailed+Tables&tid=ACS DT1Y2019 B19058
24. Rural Urban definitions. Rural Urban Definitions - Center for Rural PA. Available from: https://www Rural pa gov/data /Rural Urban definitions
25. Manikandan S. Measures of central tendency: The mean. Journal of Pharmacology & pharmacotherapeutics. Medknow Publications Pvt Ltd; 2011. Available from: https://www ncbi nlm nih gov/pmc/articles/PMC3127352/
26. Hazra A. Using the confidence interval confidently. Journal of Thoracic Disease. AME Publishing Company; 2017. Available from: https://www ncbi nlm nih gov/pmc/articles/ PMC5723800/
Incidence of Food Insecurity in Rural and Urban Counties in Pennsylvania
88
27. Gundersen, C., A. Dewey, A. Crumbaugh, M. Kato & E. Engelhard. Map the Meal Gap 2017: A Report on County and Congressional District Food Insecurity and County Food Cost in the United States in 2015. Feeding America, 2017.
28. Gundersen, C., A. Dewey, A. Crumbaugh, M. Kato & E. Engelhard. Map the Meal Gap 2017: A Report on County and Congressional District Food Insecurity and County Food Cost in the United States in 2016. Feeding America, 2018.
29. Gundersen, C., A. Dewey, E. Engelhard, M. Strayer & L. Lapinski. Map the Meal Gap 2020: A Report on County and Congressional District Food Insecurity and County Food Cost in the United States in 2018. Feeding America, 2020.
30. Gundersen, C., A. Dewey, M. Kato, A. Crumbaugh & M. Strayer. Map the Meal Gap 2019: A Report on County and Congressional District Food Insecurity and County Food Cost in the United States in 2017. Feeding America, 2019.
31. Gundersen, C., Strayer, M., Dewey, A., Hake, M., & Engelhard, E. (2021). Map the Meal Gap 2021: An Analysis of County and Congressional District Food Insecurity and County Food Cost in the United States in 2019. Feeding America.
32. Bureau USC. American Community survey 5-year data (2009-2019). Census.gov. 2021. Available from: https://ww w census gov/data/developers/data sets/acs 5year html
33. Coleman-Jensen A, Rabbitt MP, Gregory CA, Singh A. Household food security in the United States in 2020. USDA. Available from: https://www ers usda gov/webdocs/ publications/102076/err 298 summary pdf?v=8456 8
34. Go to the atlas. USDA ERS - Go to the Atlas. Available from: https://www.ers.usda.gov/data-products/foodenvironment-atlas/go-to-the-atlas/
35. Key Statistics & Graphics. USDA ERS - Key Statistics & Graphics. 2021. Available from: https://www ers usda gov/t opics/food nutrition assistance/food security in the us/ke y statistics graphics/
36. T test calculator. GraphPad. GraphPad Software. Available from: https://www.graphpad.com/quickcalcs/ttest1/
37. WIC eligibility requirements. Food and Nutrition Service U.S. Department of Agriculture. 2022. Available from: https://www fns usda gov/wic/wic eligibility requirements
38. Learn the Difference Between SNAP and WIC Programs. 2021. Available from: https://www.benefits.gov/news/ article/439
39. Bureau USC. Women consistently earn less than men. Census.gov. 2022. Available from: https://www census gov/ library/stories/2022/01/gender pay gap widens as wome n age html#:~:text=According%20to%20the%20QWI%20 data%20based%20on%20unemployment,men%20and%2 0that%20pay%20gap%20increased%20with%20age
40. Bureau USC. United States Census Bureau - American Community Survey. S1101: HOUSEHOLDS AND FAMILIES - 2019: ACS 5-Year Estimates Subject Tables. Available from: https://data census gov/cedsci/table?q=hou sehold+size&g=0100000US 0400000US42%2C42%240 500000&tid=ACSST5Y2019 S1101&moe=false
41. Snap eligibility. Food and Nutrition Service U.S. Department of Agriculture. 2021. Available from: https:// www.fns.usda.gov/snap/recipient/eligibility
42. Wolf T. 2020.6.23 TWW USDA SNAP Notice. Department of Human Services. 2020. Available from: https://www.dhs pa gov/about/Documents/DHS%20Executive%20Comm unications/2020 6 23%20TWW%20USDA%20SNAP%20 Notice pdf#:~:text=SNAP%20households%20are%20cer tified%20for%20a%20set%20period,impacts%20eligibilit y%2C%20the%20SNAP%20benefits%20are%20still%20 adjusted
43. PA - Local Standards: Housing and Utilities. Internal Revenue Service. 2022. Available from: https://www.irs. gov/businesses/small-businesses-self-employed/PA-localstandards-housing-and-utilities
44. Cost of living adjustment (cola) information. Food and Nutrition Service U.S. Department of Agriculture. 2022. Available from: https://www.fns.usda.gov/snap/allotment/ COLA
45. Food Access Research Atlas. USDA ERS - Food Access Research Atlas. Available from: https://www.ers.usda.gov/ data-products/food-access-research-atlas
Incidence of Food Insecurity in Rural and Urban Counties in Pennsylvania
89
Analysis of Fluvoxamine Usage Amid COVID-19 Among Medicaid Patients
Janet T. Nguyen1*, Amal M. Madar1*, and Brian J. Piper1
¹Geisinger Commonwealth School of Medicine, Scranton, PA 18509
*Master of Biomedical Sciences Program
Correspondence: jtnguy17@asu.edu
Abstract
Background: Coronavirus took the lives of many around the world, and there have been many efforts to understand the mechanism of this disease. Fluvoxamine is a selective serotonin reuptake inhibitor (SSRI) but has many other mechanisms of action. Some researchers believe it is responsible for therapeutic efficacy for COVID-19. The rationale for examining fluvoxamine stems from the surge of prescription rates, from which we can infer that this drug is efficacious for COVID-19. The primary objective of this study is to review changes in the usage of fluvoxamine over time.
Methods: We searched the Medicaid State Drug Utilization Database and United States (U.S.) Census Bureau database. Quantified data was represented by drug use by state.
Results: Examination of Medicaid claims identified a rise in use of anti-inflammatory selective serotonin reuptake inhibitors during COVID-19. States like New York displayed greater fluvoxamine prescriptions due to deduced factors such as higher population density and being a high migrant destination.
Conclusion: From 2019 to 2021, during the height of the COVID pandemic, the use of fluvoxamine had an upwards trend among all 50 states and the District of Columbia. We sought to analyze fluvoxamine usage to discover a possible treatment option to provide infected patients with an outlet of support to alleviate symptoms of future diseases like COVID-19.
Introduction
The severe acute respiratory syndrome coronavirus 2 (SARSCOV-2), also known as COVID-19, has had a worldwide impact. In March 2020, the United States (U.S.) declared a national health emergency for COVID-19 (1). According to the Centers for Disease Control and Prevention (CDC), as of May 26, 2022, the total number of COVID-19 cases since 2020 is 83.4 million. Similarly, the total number of deaths due to COVID-19, as of May 26, 2022, has reached 1 million (2).
Initially, there were no available treatment options for COVID-19. Researchers experimented with many drugs and their antiviral properties. Monoclonal antibodies seemed to stop working as new COVID-19 variants emerged (3). Researchers discovered SSRIs increased chances of survival for patients with COVID-19 (4). Some SSRIs, such as paroxetine, had minimal success of 8% effectiveness in treatment of COVID-19 (5). The usage of fluvoxamine was 26% more effective than other SSRIs in helping patients (4).
The focus of this study was to examine changes in fluvoxamine usage since the pandemic. Fluvoxamine is a well-tolerated SSRI with strong anti-inflammatory properties that is used to treat individuals with obsessive compulsive disorder (OCD)
among other illnesses (6). Due to fluvoxamine being a highly potent sigma-1 agonist receptor which significantly reduces inflammation, this has been extremely beneficial in aiding in the recovery of COVID-19 patients (7). To date, there have been three randomized controlled trials conducted examining fluvoxamine and its use in COVID patients. The first double-blind, placebo-controlled, randomized clinical trial found that there was no significant clinical deterioration in COVID patients who took fluvoxamine, whereas patients in the placebo group experienced notable clinical deterioration (8). Although investigations completed thus far note that fluvoxamine is promising in the treatment of early stages of COVID-19, more randomized control trial studies are needed to further understand the role this drug has in treatment of SARS-COV-2. Evidence shows there was a statistical difference with fluvoxamine usage versus placebo to combat COVID-19 symptoms. The objective of this report was to examine the changes in fluvoxamine prescribed to Medicaid patients.
Methods
Participants
Medicaid enrollees in all 50 states and the District of Columbia were examined for years 2019, 2020, and 2021. The Medicaid State Drug Utilization Database (SDUD) dataset was utilized to collect data. Medicaid eligibility varies by each state. To meet the Medicaid criteria, individuals generally must be confirmed as pregnant, resource limited, or of low income (9).
Procedures
Prescriptions were obtained from the Medicaid SDUD and U.S. Census Bureau population database (10–11). The Medicaid SDUD collects quarterly data with annual updates. The most recent data made accessible to the public was from February 2022. To view statistical information, SDUD datasets of specified years were downloaded onto an Excel spreadsheet. There were 15 columns. Data included managed care organizations, state, national drug code, labeler code, product code, package size, year, quarter, suppression used, product name, unit prescription, units reimbursed, total amount reimbursed, Medicaid amount reimbursed, and non-Medicaid amount reimbursed. We used the state and unit prescription columns to gather data. We initially searched for fluvoxamine, then its trade names of fluvox, luvox CR, faverin, and fluvoxin under product name. Only fluvox yielded results with this search strategy. This gave us the ability to compare amounts of fluvoxamine dispensed throughout the U.S. for individuals using Medicaid. Some data was missing due to the transition from the SDUD to the new platform of Medicaid Drug Program system (MDP). Quarters 2, 3, and 4 for the year 2021 will be
Scholarly Research In Progress • Vol. 6, November 2022
90
made available in early 2022. We extracted estimated population totals per state from the population and housing unit estimate datasets from the U.S. Census Bureau.


Data analysis
Heatmaps and bar graphs were used to observe where fluvoxamine was being prescribed throughout the country and during what year. Geographical heatmaps from JMP statistical software were used to quantify specific states where the most fluvoxamine was prescribed. Areas of deep red indicate higher prescription rates.

Results
Each year fluvoxamine prescriptions fluctuated from 2019 to 2021 for Medicaid enrollees. Pre-pandemic, fluvoxamine was used similarly throughout the U.S. In 2019, fluvoxamine prescriptions totaled 374,334 throughout the country (10). The number of prescriptions in 2020 increased considerably to 398,035 (6.3%) (10). During 2021 there was a dramatic increase in prescriptions of fluvoxamine to 101,433 for quarter 1 in certain parts of the country (10). Certain states were omitted due to a small or absent record of fluvoxamine prescriptions. Omitted states had a value of 0. New York had the highest number of written prescriptions, totaling 24,507 during the pandemic as opposed to pre-pandemic of 22,500 (Figure 1 and 2, respectively). In 2021, New York nearly reached 7,000 prescriptions, totaling 6,576 in quarter 1 (Figure 3). Wyoming had the least number of fluvoxamine prescriptions written. Southern and northeastern regions of the U.S. had a significantly higher number of prescriptions for Medicaid enrollees compared to the Pacific Northwest and north-central regions.
Discussion
Fluvoxamine is primarily used as a treatment for OCD, depression, and anxiety disorders but it was widely used in the U.S. during the pandemic. It is unclear on how many prescriptions were given to patients diagnosed with mental disorders versus those who were using the prescription for COVID-19. However, it has a positive effect on patients who had mild to moderate COVID-19 symptoms (5-7). This could possibly explain the increase of prescriptions throughout the U.S. A major finding in this study shows that fluvoxamine has become a valuable drug during the national health crisis.


Analysis of Fluvoxamine Usage Amid COVID-19 Among Medicaid Patients

Figure 1. 2019 state-level heatmap of fluvoxamine in quarter 1 to 4. Total number of fluvoxamine prescriptions dispensed by each state from Medicaid agencies.
Figure 2. 2020 state-level heatmap of fluvoxamine in quarter 1 to 4. Total number of fluvoxamine prescriptions dispensed increased significantly from 2019.
Figure 3. 2021 state-level heatmap of fluvoxamine in quarter 1. Quarter 2 and 3 is unavailable due transition of reporting State Drug Utilization Database (SDUD) to the new Medicaid Drug Program system (MDP). Total number of fluvoxamine prescriptions dispensed by each state from Medicaid agencies.
91
One major limitation of this study was that only the Medicaid database was used to search fluvoxamine. The limitation to using Medicaid as the core database is that each state has unique set guidelines within the federal law to determine whether certain individuals are eligible for Medicaid. Thus, participants recorded on the SDUD will vary and are inconsistent in selection. Additionally, Medicaid enrollees may have difficulty finding a healthcare provider that accepts their healthcare insurance. Even if patients manage to find a provider that accepts their insurance, providers, especially mental health providers, struggle to meet the demands of patients, thereby generating a long waitlist before patients can see their provider amid COVID-19. When less Medicaid enrollees are being seen, this impacts the amount of fluvoxamine prescribed during and after COVID-19. For future research, this project could incorporate multiple databases for a more complete representation of drug utilization associated with the pandemic.
Conclusion
Since COVID-19, there has been a pattern of increasing fluvoxamine distribution in all 50 states and the District of Columbia with Medicaid. This SSRI shows promising treatment for COVID-19 symptoms. The state with the lowest prescription rate was Wyoming with prescription utilization of 29 in 2019, 13 in 2020, and 0 for the first quarter in 2021. As predicted, New York had the largest usage of 24,507 prescriptions administered for outpatient Medicaid patients in 2020 compared to before the pandemic of 22,809 in 2019. Then 6,576 fluvoxamine prescriptions in the first quarter of 2021. We hypothesize this increase shows that fluvoxamine may have been utilized as either a form of treatment for COVID-19 patients or treatment for a spike of OCD symptoms due to associated stress from the virus.
Acknowledgments
This project was graciously supported by Geisinger Commonwealth School of Medicine.
We wish to thank Jonique Depina, MS, for her guidance with the development of this project.
Disclosures
BJP is part of an osteoarthritis research team funded by Pfizer and Eli Lilly. The other authors have no disclosures.
References
1. Biden, JR. Notice on the Continuation of the National Emergency Concerning the Coronavirus Disease 2019 (COVID-19) Pandemic. The White House. 2021 Feb 24. Available from: https://www.whitehouse.gov/briefingroom/presidential-actions/2021/02/24/notice-on-thecontinuation-of-the-national-emergency-concerning-thecoronavirus-disease-2019-covid-19-pandemic/
2. Centers for Disease Control and Prevention, COVID Data Tracker. United States COVID-19 Cases, Deaths, and Laboratory Testing (NAATs) by State, Territory, and Jurisdiction. 2022. Available from: https://covid.cdc.gov/ covid-data-tracker/#cases_casesper100klast7days
3. Brobst B, Borger J. Benefits and risks of administering monoclonal antibody therapy for coronavirus (COVID-19). StatPearls Publishing. 2022 Apr 28. Available from: https:// www.ncbi.nlm.nih.gov/books/NBK574507/
4. Kurtzman L. Covid Patients on SSRI antidepressants are less likely to die, USCF-Stanford study finds. University of California Publishing. 2021 Nov 15. Available from : https://www.ucsf.edu/news/2021/11/421771/covidpatients-ssri-antidepressants-are-less-likely-die-ucsfstanford-study#:~:text=A%20large%20analysis%20of%20 health,than%20a%20matched%20control%20group
5. Oskotsky T, Maric I, Tang A, Oskotsky B, Wong R, Aghaeepour N, et al. Mortality risk among patients with COVID-19 Prescribed Selective Serotonin Reuptake inhibitor antidepressants. JAMA Network Open 2021 Nov 15. Doi: 10.1001/jamanetworkopen.2021.33090. Available from: https://jamanetwork.com/journals/ jamanetworkopen/fullarticle/2786136
6. Lenze EJ, Mattar C, Zorumski CF, Stevens A, Schweiger J, Nicol GE, et.al. Fluvoxamine vs placebo and clinical deterioration in outpatients with symptomatic COVID-19: A randomized clinical trial. JAMA. 2020 Dec 8. 324(22): 2292-2300. Available from: https://pubmed-ncbi-nlm-nihgov.gcsom.idm.oclc.org/33180097/
7. Mueller JK, Riederer P, Muller WE. Neuropsychiatric drugs against COVID-19: What is the clinical evidence? Lancet Global Health. 2022. doi: 10.1055/a-1717-2381. Avalible from https://pubmed-ncbi-nlm-nih-gov.gcsom.idm.oclc. org/35079985/
8. Sukhatme VP, Reiersen AM, Vayttaden SJ, Sukhatme VV. Fluvoxamine: A review of its mechanism of action and its role in COVID-19. Front Pharmacol. 2021. Apr 20.12:652688. DOI: 0.3389/fphar.2021.652688. Available from: https://pubmed-ncbi-nlm-nih-gov.gcsom.idm.oclc. org/33959018/
9. Centers for Medicare & Medicaid Services. Eligibility. 2021. Available from: https://www.medicaid.gov/medicaid/ eligibility/index.html
10. Centers for Medicare & Medicaid Services. State Drug Utilization Data. 2021. Available from: https://www. medicaid.gov/medicaid/prescription-drugs/state-drugutilization-data/index.html
11. U.S. Department of Commerce: United States Census Bureau. Population and Housing Unit Estimates Datasets. 2021. Available from:https://www.census.gov/programssurveys/popest/data/data-sets.All.List_1725564412.html
Analysis of Fluvoxamine Usage Amid COVID-19 Among Medicaid Patients
92
The Short- and Long-term Effects of Sports-Related Concussions: A Literature Review
Victoria M. O’Kane1*
¹Geisinger
Commonwealth School of Medicine, Scranton, PA 18509
*Master of Biomedical Sciences Program
Correspondence: vokane@som.geisinger.edu
Abstract
Concussions are one of the most common injuries in sports, particularly contact sports. Public interest in the effects of sports-related concussions has grown over the last 10 to 20 years, and policy changes have occurred as the result. The aim of this literature review was to identify the short- and long-term effects of sports-related concussions and consequently, the policy changes that have occurred in organized sports. Analysis of the literature suggests that sports-related concussions have had a significant impact on individuals in the short term, including academic performance after injury, as well as in the long term, putting them an increased risk for cognitive impairment, Alzheimer’s disease (AD), and depression. More research is necessary to identify recent epidemiological data concerning sports-related concussion incidence, treatment, and prevention.
Introduction
Participation in organized sports is often encouraged for young people because of the social and physical health benefits it provides; however, many of the more popular sports carry a high risk of injury. Sports-related concussions account for a significant proportion of all sports injuries (5–9%), with an estimated 1 million to 4 million sports-related concussions sustained each year within the United States, as per the CDC. Although not all mild traumatic brain injuries (mTBIs) qualify as concussions, all concussions are considered mTBIs (1).
Full-contact sports, such as football, soccer, and ice hockey, are more likely to result in concussions compared to non-contact sports, such as volleyball and swimming (2). Research now indicates that most sports-related concussions sustained in men’s sports are through player contact, whereas equipment or apparatus contact is the leading cause of those sustained in women’s sports (3). Numerous studies have noted that axonal injury is a potential biological mechanism for mTBIs (4–5). Upon sustaining a concussive brain injury, rapid depolarization occurs due to the disruption of cell membranes and axonal stretching. The release of several neurotransmitters follows, and the reestablishment of ionic balances depletes energy stores and presents at the clinical level as post-concussive symptoms (5).
The 5th international conference on concussion in sport, held in Berlin in October of 2016, modified its previous definition of a sports-related concussion to include the consensus that the acute clinical signs and symptoms of such injury reflect more of a functional disturbance opposed to a structural injury that can be view using neuroimaging (6). Despite this decision, subsequent studies have continued to find strong evidence to support the use of several imaging techniques in identifying structural damage after mTBIs (7–8). The objectives of this
review are to explore the short- and long-term effects of sportsrelated concussions and the policy changes in collegiate and professional sports organizations resulting from this growing body of knowledge.
Methods
An examination of the literature was conducted to identify the short- and long-term effects of concussions incurred from participation in organized sports. Potential articles were identified using Google Scholar, as well as from access granted through the Geisinger Commonwealth School of Medicine Library online. Keywords screened for included: sports + concussion, traumatic brain injury. The goal was to focus on new findings from articles published within the last 10 years that would build upon findings from five-year-old studies; however, articles published within the last 20 years were included to piece together a more complete picture.
Results
The short-term symptoms and effects of sports-related concussions
Most findings related to the short-term effects of sports-related concussions are from the adolescent to young-adult population, since youths are more frequently involved in organized sports compared to adults (2). Head impact exposure data collected from a single season of high school varsity football suggests that even when concussions are not clinically diagnosed, cumulative head impacts during this time period can still result in changes to the brain (9). Diffusion tensor imaging (DTI) has revealed widespread white matter microstructure changes in post-concussive adolescents up to two months after injury (10). One specific area of white matter that is more sensitive to loss of structural integrity due to sports-related concussions, as detected by DTI, is the area in the superior temporal lobe that contains projection fibers connecting the medial geniculate body of the thalamus to the primary auditory cortex (11). As such, severe damage to this area would likely translate into auditory or vestibular impairment, however, deficits in balance and cognition are not always observable immediately after or even up to 24 hours after a high-impact concussion (12). In contrast to these observations, it has also been claimed that trauma to the corpus callosum caused by falx cerebri displacement from lateral impacts may have a significant impact on an individual after a mTBI, however, evidence suggests that different impacts and mechanisms of injury can result in injury to many different brain structures (13).
High school athletes with a history of concussions are more than nine times more likely than athletes with no concussions to have multiple acute symptoms of concussion on the field
Scholarly Research In Progress • Vol. 6, November 2022
93
immediately following an additional head impact (14). The most common symptoms of concussions include headaches and dizziness, and the same electrophysiological deficits have been found in both symptomatic and asymptomatic concussed athletes (1, 15). Tests of attention, concentration, processing speed, and mental flexibility produce worse, or impaired, results for youth athletes with a recent concussion compared to those either without or with a history of one previous but not recent concussion, demonstrating how the effects of sports-related concussions remain even after acute symptoms resolve. These same studies have also shown no distinction between youth athletes who have sustained a sports-related concussion within the last week and those who have a history of two or more previous concussions without current resulting physical or cognitive dysfunction (16).
The severity of a concussion, as studied in high school football, is not only determined by one force or the location of impact, but rather a combination of rotational acceleration, linear acceleration, and the location of impact, with “blindside” impacts producing the greatest risk of concussion (17). Although there is still debate about the precise pathophysiology of concussions, there is strong evidence supporting a window of recovery in which a subsequent mTBI will cumulatively affect the metabolic depression observed in the brain (18). While the use of mouthguards reduces the overall risk of orofacial injuries, their effect on concussion incidence is not as strong (19). Examination of brains from teenage athletes who died between one day and four months after sustaining impact concussions in contact sports revealed numerous post-traumatic pathologies consistent with microvascular injury, blood-brain barrier (BBB) disruption, and secondary neuroinflammation, with one case meeting the diagnosis criteria for early-stage chronic traumatic encephalopathy (CTE) (20). This finding is especially significant since CTE can only be diagnosed by autopsy after death, and as a result, is more often associated with much older adults.
For many years, studies of sports-related concussions focused more on male athletes than female athletes, however, in recent years, studies have expanded to look at both populations.
Female athletes experience higher rates of sports-related concussions than male athletes when looking at sports that have teams for both sexes (21). Additionally, female athletes have longer recovery times (21–22). Despite strong evidence supporting these sex-linked differences, the explanation has proven much more diverse. One proposed theory is that estrogen has a neuroprotective effect in males but not in females; however, there is still a need to explore this theory further (23).
The long-term effects of sports-related
concussions
There is a considerable body of evidence to support that the effects of sports-related concussions also do not resolve with the conclusion of a person’s involvement in organized sports. Synaptic plasticity is compromised in athletes with a history of multiple sports-related concussions and the risk for cognitive impairment increases with each cumulative concussion after a certain threshold (24–25). As a result, an individual who sustains multiple concussions in their youth is at a significant risk for long-term damage. In addition, the NCAA Concussion
Study found that collegiate athletes with a history of at least three concussions had a risk of future concussions three times
greater than athletes with no previous concussions (26). The more concussions an individual sustains, the more likely they are to both sustain additional hits and increase the severity of their long-term impact.
Younger age of first exposure to American football correlates with worse executive function and behavioral regulation later in life, as well as increased odds for clinical depression (27). Similarly, the number of sports-related concussions was determined to be a good predictor for symptoms of common mental disorders later in life (28). However, other data shows the cognitive and motor system changes observed in retired athletes who sustained their last sports-related concussion more than 30 years ago were very similar to those found in athletes 3 years post-concussion (29). Another study found that regardless of the time since the last concussion was sustained, the duration of the cortical silent period under transcranial magnetic stimulation (TMS) was significantly prolonged in athletes with a history of concussions, signifying an inhibition of motor cortex neurons (30). This increase in intracortical inhibition disrupts the normal balance needed for typical function. Athletes with a history of multiple sports-related concussions were measured to have significantly increased GABA-induced intracortical inhibition, which correlated with their degree of altered plasticity (24).
Data from retired professional football players with a history of concussion, especially recurrent concussion, suggest this type of TBI may be a risk factor for late-life memory impairment and AD (31). Not only is there an increased prevalence of mild cognitive impairment (MCI) and dementia among aging retired NFL players with cognitive deficits compared to players without cognitive deficits, but there is an increase in the prevalence of depression correlated with white matter dysfunction in those retired players compared to the same age group in the general population (32–33).
The total structural impact of sports-related concussions on the brain often cannot be evaluated until after death. Postmortem evaluation of brains from former NFL players revealed nearly all the samples studied had frequently severe CTE pathology (34). The changes in white matter associated with combined aging and sports-related concussions include anomalies affecting major inter- and intra-hemispheric, as well as projection fiber tracts. The degenerative effects of aging are likely increased by the structural injuries of sports-related concussions (35). Retired athletes with a history of sports-related concussions have previously been found to have enlarged ventricles compared to those with no concussions, suggesting an impairment in cerebrospinal fluid (CSF) circulation (36).
Policy changes in response to these effects
It is now widely accepted that sports-related concussions can have detrimental effects, even if those specific changes are still being understood. The first concussion statute, the Lystedt Law, was enacted in 2009 because of the unfortunate and catastrophic injury sustained by a middle school football player allowed to return to play after he had a concussion earlier in the game (37). Over the next 5 years, similar laws were implemented in all U.S. states (37). More recently, there has been considerable focus on implementing concussion policies at the collegiate and professional levels.
The Short- and Long-term Effects of Sports-Related Concussions: A Literature Review
94
The NCAA enacted its Concussion Policy and Legislation in 2010, requiring all member institutions to have a concussion management plan (38). The Division I Concussion Safety Review Process was initiated in 2015 and requires member schools to submit their concussion safety protocol for review by a committee (39). While athletes might benefit more from the implementation of a single concussion policy across all NCAA member teams or more consistency in the contents of the various protocols, there is currently more of a focus on ensuring all schools have a plan in place.
The NBA concussion protocol, implemented in 2011, must be followed by all teams and is enforced by the league. Players, coaches, and medical staff are provided with concussion education and players who have sustained a concussion are required to meet several criteria before returning to play. These criteria include presenting without concussion-related symptoms, evaluation by a physician, and completion of a stepwise exercise protocol without the return of symptoms (40).
The NFL concussion protocol was implemented in 2009, updated in 2014, and similar to the NBA, all NFL teams must follow the overarching rules enforced by the league (41). The NFL has reported an overall decline in concussion rates over the last several seasons (42). Despite initial evidence supporting the efficacy of these concussion reduction strategies, there is still a strong need for updated data on the incidence of sports-related concussions across all collegiate and professional sports to draw conclusions about the efficacy of these policies.
Conclusion
The symptoms of sports-related concussions present during the acute phase of injury, however, even after these resolve, chronic or long-term effects may develop. The severity of long-term effects increases with repeated head impacts, and the risk of future impacts increases with each successive injury. While the immediate impacts of a sports-related concussion mostly affect a person’s physical presentation or cognition temporarily, a history of sports-related concussions puts a former athlete at higher risk for AD and depression later in life. Collegiate and professional sports organizations, such as the NCAA, NBA, and NFL, have implemented new concussion protocols or policies over the last several years, but it remains to be seen whether enough has been done to improve or mitigate not only the short-term, but also the long-term effects of sports-related concussions. To determine the best course of treatment, more research is necessary to identify the specific physiological mechanisms of sports-related concussions. For now, the best strategy is prevention.
Disclosures
The author has no relevant financial or other competing interests to disclose.
References
1. Harmon KG, Drezner J, Gammons M, Guskiewicz K, Halstead M, Herring S, et al. American medical society for sports medicine position statement: Concussion in sport. Clin J Sport Med. 2013 Jan [cited 2021 Nov 24]23(1):1-18. Available from: https://journals.lww.com/cjsportsmed/
fulltext/2013/01000/American_Society_for_Sports_ Medicine.1.aspx
2. Semple BD, Lee S, Sadjadi R, Fritz N, Carlson J, Griep C, et al. Repetitive concussions in adolescent athletes - translating clinical and experimental research into perspectives on rehabilitation strategies. Front Neurol 2015 Apr [cited 2021 Nov 24]6(69):1-16. Available from: https://www.frontiersin.org/articles/10.3389/ fneur.2015.00069/full DOI: 10.3389/fneur.2015.00069
3. Chandran A, Boltz AJ, Morris SN, Robison HJ, Nedimyer AK, Collins CL, et al. Epidemiology of concussions in national collegiate athletic association (NCAA) sports: 2014/15-2018/19. Am J Sports Med. 2021 Dec [cited 2022 Jun 28]50(2):526-536. Available from: https://journals. sagepub.com/doi/abs/10.1177/03635465211060340 DOI: 10.1177/03635465211060340
4. Ledreux A, Pryhoda MK, Gorgens K, Shelburne K, Gilmore A, Linseman DA, et al. Assessment of long-term effects of sports-related concussions: biological mechanisms and exosomal biomarkers. Front Neurosci. 2020 Jul [cited 2022 Jun 28]14:761. Available from: https://www.frontiersin. org/articles/10.3389/fnins.2020.00761/full DOI: 10.3389/fnins.2020.00761.
5. Barkhoudarian G, Hovda DA, Giza CC. The molecular pathophysiology of concussive brain injury - an update. Phys Med Rehabil Clin N Am. 2016 [cited 2021 Nov 24]27:373393. Available from: https://www.pmr.theclinics.com/ article/S1047-9651(16)00004-8/abstract DOI: http:// dx.doi.org/10.1016/j.pmr.2016.01.003
6. McCrory P, Meeuwisse W, Dvorak J, Aubry M, Bailes J, Broglio S, et al. Consensus statement on concussion in sport - the 5th international conference on concussion in sport held in Berlin, October 2016. Br J Sports Med. 2017 Mar [cited 2021 Nov 24]51(11):838-847. Available from: https://bjsm.bmj.com/content/51/11/838?source=post_ page DOI: 10.1136/bjsports-2017-097699
7. Marklund N, Vedung F, Lubberink M, Tegner Y, Johansson J, Blennow K, et al. Tau aggregation and increased neuroinflammation in athletes after sports-related concussions and in traumatic brain injury patients - a PET/ MR study. Neuroimage Clin. 2021 Apr [cited 2022 Jun 28]30:102665. Available from: https://www.sciencedirect. com/science/article/pii/S2213158221001091 DOI: 10.1016/j.nicl.2021.102665.
8. Latini F, Fahlstrom M, Vedung F, Stensson S, Larsson E-M, Lubberink M, et al. Refined analysis of chronic white matter changes after traumatic brain injury and repeated sports-related concussions: of use in targeted rehabilitative approaches?. J Clin Med. 2022 Jan [cited 2022 Jun 28]11(2):358. Available from: https://www.mdpi. com/2077-0383/11/2/358 DOI: 10.3390/jcm11020358
9. Davenport EM, Whitlow CT, Urban JE, Espeland MA, Jung Y, Rosenbaum DA, et al. Abnormal white matter integrity related to head impact exposure in a season of high school varsity football. J Neurotrauma. 2014 Oct [cited 2021 Nov 24]31:1617-1624. Available from: https://www.liebertpub. com/doi/10.1089%2Fneu.2013.3233 DOI: 10.1089/ neu.2013.3233
The Short- and Long-term Effects of Sports-Related Concussions: A Literature Review
95
10. Virji-Babul N, Borich MR, Makan N, Moore T, Frew K, Emery CA, et al. Diffusion tensor imaging of sports-related concussion in adolescents. Pediatr Neurol. 2013 [cited 2021 Nov 24]48:23-29. Available from: https://www$0 kscienc edirect$0~kcom/science/article/pii/S0887899412004158 ?casa token=wf0PnjLIsqAAAAAA:7Rb2UlCYWuNGQQFe PL5jyw5WoU DQuAwD7CZgEVz0Hh OikVtBSdWdeQN 8iynrkbz6iiYffqn Q DOI: http://dx$0~kdoi$0~korg/10$0~ k1016/j$0~kpediatrneurol$0~k2012$0~k09$0~k005
11. Cubon VA, Putukian M, Boyer C, Dettwiler A. A diffusion tensor imaging study on the white matter skeleton in individuals with sports-related concussion. J Neurotrauma 2011 Feb [cited 2021 Nov 24]28:189-201. Available from: https://www$0~kliebertpub$0~kcom/doi/abs/10$0~k108 9/neu$0~k2010$0~k1430 DOI: 10$0~k1089/neu$0~k2 010$0~k1430
12. McCaffrey MA, Mihalik JP, Crowell DH, Shields EW, Guskiewicz KM. Measurement of head impacts in collegiate football players: Clinical measures of concussion after high- and low-magnitude impacts. J Neurosurg. 2007 Dec [cited 2021 Nov 24]61(6):1236-1243. Available from: https://academic$0~koup$0~kcom/neurosurgery/article a bstract/61/6/1229/2558611 DOI: 10$0~k1227/01$0~k neu$0~k0000280153$0~k11614$0~k69
13. Hernandez F, Giodrano C, Goubran M, Parivash S, Grant G, Zeineh M, et al. Lateral impacts correlate with falx cerebri displacement and corpus callosum trauma in sports-related concussions. Biomech Model Mechanobiol. 2019 Mar [cited 2022 Jun 28]18(3):631-649. Available from: https://link sp ringer com/article/10 1007/s10237 018 01106 0 DOI: 1 0 1007/s10237 018 01106 0
14. Collins MW, Lovell MR, Iverson GL, Cantu RC, Maroon JC, Field M. Cumulative effects of concussion in high school athletes. J Neurosurg. 2002 Nov [cited 2021 Nov 24]51(5):1175-1181. Available from: https://academic oup com/neurosurgery/article abstract/51/5/1175/2744207 DOI: 10 1227/01 neu 0000031572 99927 93
15. Gosselin N, Thériault M, Leclerc S, Montplaisir J, Lassonde M. Neurophysiological anomalies in symptomatic and asymptomatic concussed athletes. J Neurosurg. 2006 Jun [cited 2021 Nov 24]58(6):1151-1161. Available from: htt ps://academic oup com/neurosurgery/article abstract/58/ 6/1151/2555208 DOI: 10 1227/01 neu 0000215953 44 097 FA
16. Moser RS, Schatz P, Jordan BD. Prolonged effects of concussion in high school athletes. J Neurosurg. 2005 Aug [cited 2021 Nov 24]57(2)300-306. Available from: https:// academic oup com/neurosurgery/article abstract/57/2/30 0/2744413 DOI: 10 1227/01 neu 0000166663 98616 e4
17. Broglio SP, Schnebel B, Sosnoff JJ, Shin S, Feng X, He X, et al. Biomechanical properties of concussions in high school football. Med Sci Sports Exerc. 2010 [cited 2021 Nov 24]42(11):2064-2071. Available from: https://www ncbi nl m nih gov/pmc/articles/PMC2943536/ DOI: 10 1249/mss 0b013e3181dd9156
18. Prins ML, Alexander D, Giza CC, Hovda DA. Repeated mild traumatic brain injury: Mechanisms of cerebral vulnerability. J Neurotrauma. 2012 Dec [cited 2022 Jun
28]30(1):30-38. Available from: https://www liebertpub co m/doi/10 1089/neu 2012 2399 DOI: https://doi org/10 10 89/neu 2012 2399
19. Knapik JJ, Hoedebecke BL, Rogers GG, Sharp MA, Marshall SW. Effectiveness of mouthguards for the prevention of orofacial injuries and concussions in sports: systematic review and meta-analysis. Sports Med. 2019 May [cited 2022 Jun 28]49(8):1217-1232. Available from: https://link springer com/article/10 1007/s40279 019 01121 w DOI: 10 1007/s40279 019 01121 w
20. Tagge CA, Fisher AM, Minaeva OV, Gaudreau-Balderrama A, Moncaster JA, Zhang X-L, et al. Concussion, microvascular injury, and early tauopathy in young athletes after impact head injury and an impact concussion mouse model. Brain. 2018 [cited 2021 Nov 24]141:422-458. Available from: https://academic oup com/brain/article abs tract/141/2/422/4815697 DOI: 10 1093/brain/awx350
21. Rizzone KH, Ackerman KE. Female athlete and sportsrelated concussions. Clin Sports Med. 2021 Jan [cited 2022 Jun 28]40(1):133-145. DOI: 10.1016/j.csm/2020.08.006
22. Thomas DJ, Coxe K, Li H, Pommering TL, Young JA, Smith GA, et al. Length of recovery from sports-related concussions in pediatric patients treated at concussion clinics. Clin J Sport Med. 2018 Jan [cited 2022 Jun 28]28(1):56-63. Available from: https://journals lww com/c jsportsmed/Abstract/2018/01000/Length of Recovery F rom Sports Related Concussions 8 aspx DOI: 10 1097/JS M 0000000000000413
23. Emerson CS, Headrick JP, Vink R. Estrogen improves biochemical and neurologic outcome following traumatic brain injury in male rate, but not in females. Brain Res. 1993 Apr [cited 2022 Jun 28]608(1):95-100. Available from: htt ps://www sciencedirect com/science/article/abs/pii/00068 9939390778L DOI: 10 1016/0006 8993(93(90778 I
24. Beaumont LD, Tremblay S, Poirier J, Lassonde M, Théoret H. Altered bidirectional plasticity and reduced implicit motor learning in concussed athletes. Cereb Cortex. 2012 Jan [cited 2021 Nov 24]22:112-121. Available from: https: //academic oup com/cercor/article abstract/22/1/112/365 823 DOI: 10 1093/cercor/bhr096
25. Montenigro PH, Alosco ML, Martin BM, Daneshvar DH, Mez J, Chaisson CE, et al. Cumulative head impact exposure predicts later-life depression, apathy, executive dysfunction, and cognitive impairment in former high school and college football players. J Neurotrauma. 2017 Jan [cited 2021 Nov 24]34:328-340. Available from: https: //www liebertpub com/doi/abs/10 1089/neu 2016 4413 D OI: 10 1089/neu 2016 4413
26. Guskiewicz KM, McCrea M, Marshall SW, Cantu RC, Randolph C, Barr W, et al. Cumulative effects associated with recurrent concussion in collegiate football players: The NCAA concussion study. JAMA. 2003 Nov [cited 2021 Nov 24]290(19):2549-2555. Available from: https://jaman etwork com/journals/jama/article abstract/197667
27. Alosco ML, Kasimis AB, Stamm JM, Chua AS, Baugh CM, Daneshvar DH, et al. Age of first exposure to American football and long-term neuropsychiatric and cognitive outcomes. Transl Psychiatry. 2017 Sep [cited 2021 Nov
The Short- and Long-term Effects of Sports-Related Concussions: A Literature Review
96
24]7:1-8. Available from: https://www nature com/article s/tp2017197?dom=pscau&src=syn DOI: 10 1038/tp 201 7 197
28. Gouttebarge V, Aoki H, Lambert M, Stewart W, Kerkhoffs G. A history of concussions is associated with symptoms of common mental disorders in former male professional athletes across a range of sports. Phys Sportsmed. 2017 Nov [cited 2022 Jun 28]45(4):443-449. Available from: https:/ /www.tandfonline.com/doi/full/10.1080/00913847.2017 1376572 DOI: https://doi org/10 1080/00913847 2017 1376572
29. Beaumont LD, Théoret H, Mongeon D, Messier J, Leclerc S, Tremblay S, et al. Brain function decline in healthy retired athletes who sustained their last sports concussion in early adulthood. Brain. 2009 Jan [cited 2021 Nov 24]132:695708. Available from: https://academic oup com/brain/artic le abstract/132/3/695/340580 DOI: 10 1093/brain/awn 347
30. Beaumont LD, Lassonde M, Leclerc S, Théoret H. Longterm and cumulative effects of sports concussion on motor cortex inhibition. J Neurosurg. 2007 Aug [cited 2021 Nov 24]61(2):329-337. Available from: https://academic oup co m/neurosurgery/article abstract/61/2/329/2556353 DOI: 10 1227/01 neu 0000280000 03578 b6
31. Guskiewicz KM, Marshall SW, Bailes J, McCrea M, Cantu RC, Randolph C, et al. Association between recurrent concussion and late-life cognitive impairment in retired professional football players. J Neurosurg. 2005 Oct [cited 2021 Nov 24]57(4):719-726. Available from: https://acade mic oup com/neurosurgery/article abstract/57/4/719/377 5312 DOI: 10 1227/01 neu 0000175725 75780 dd
32. Hart Jr J, Kraut MA, Womack KB, Strain J, Didehbani N, Bartz E, et al. Neuroimaging of cognitive dysfunction and depression in aging retired national football league players: A cross-sectional study. JAMA Neurol. 2013 Jan [cited 2021 Nov 24]70(3):326-335. Available from: https://jamanetwo rk com/journals/jamaneurology/article abstract/1555584 DOI: 10 1001/2013 jamaneurol 340
33. Strain J, Didehbani N, Cullum CM, Mansinghani S, Conover H, Kraut MA, et al. Depressive symptoms and white matter dysfunction in retired NFL players with concussion history. Neurology. 2013 Jul [cited 2021 Nov 24]81:25-32. Available from: https://n.neurology.org/content/81/1/25. short
34. Mez J, Daneshvar DH, Kiernan PT, Abdolmohammadi B, Alvarez VE, Huber BR, et al. Clinicopathological evaluation of chronic traumatic encephalopathy in players of American football. JAMA. 2017 Jul [cited 2021 Nov 24]318(4):360370. Available from: https://jamanetwork com/journals/jam a/fullarticle/2645104/ DOI: 10 1001/jama 2017 8334
35. Tremblay S, Henry LC, Bedetti C, Larson-Dupuis C, Gagnon J-F, Evans AC, et al. Diffuse white matter tract abnormalities in clinically normal ageing retired athletes with a history of sports-related concussions. Brain. 2014 Sep [cited 2021 Nov 24]137:2997-3011. Available from: h ttps://academic oup com/brain/article abstract/137/11/29 97/2390714 DOI: 10 1093/brain/awu236
36. Tremblay S, Beaumont LD, Henry LC, Boulanger Y, Evans AC, Bourgouin P, et al. Sports concussions and aging: A neuroimaging investigation. Cereb Cortex. 2013 May [cited 2021 Nov 24]23:1159-1166. Available from: https://acad emic oup com/cercor/article abstract/23/5/1159/802748 DOI: 10 1093/cercor/bhs102
37. Kim S, Connaughton DP, Spengler J, Lee JH. Legislative efforts to reduce concussions in youth sports: an analysis of state concussion statutes. J Legal Aspects Sport. 2017 [cited 2022 Jun 28]27:162-186. Available from: https://heinonlin e org/HOL/Page?handle=hein journals/jlas27&div=14&g s ent=1&casa token=ETPxE k7 t4AAAAA:LKO7V1AYQIbu oztGpVyDyd61mLEjPUGhBpYz7XURCxYAxbsEAPJ2I8oH jQAYzDmxDbUuZ VgvA&collection=journals DOI: https:// doi org/10 1123 jlas 2016 0007
38. Buckley TA, Baugh CM, Meehan WP, DiFabio MS. Concussion management plan compliance: A study of NCAA Power 5 Conference schools. Orthop J Sports Med 2017 Apr [cited 2022 Jun 28]5(4):2325967117702606. Available from: https://journals sagepub com/doi/full/10 1 177/2325967117702606 DOI: 10 1177/23259671177 02606
39. NCAA [Internet]. United States: NCAA; 2022. Concussion safety protocol management; 2022 [cited 2022 May 23]. Available from: https://www ncaa org/sports/2016/7/20/c oncussion safety protocol management aspx
40. Cochrane GD, Owen M, Ackerson JD, Hale MH, Gould S. Exploration of US men’s professional sport organization concussion policies. Phys Sportsmed. 2017 Mar [cited 2022 Jun 28]45(2):178-183. Available from: https://www tandfo nline com/doi/abs/10 1080/00913847 2017 1305875?ca sa token=z9ThAUl770IAAAAA%3AOz4BAaPiYWYZjSZC MARByjnTXpWMj9VAz fuClWMwCThGYHjKxZAAnLAA e96hj3FFAQoYqo9EjwhlWm &journalCode=ipsm20 DOI: https://doi org/10 1080/00913847 2017 1305875
41. Mack CD, Solomon G, Covassin T, Theodore N, Cardenas J, Sills A. Epidemiology of concussion in the National Football League, 2015-2019. Sports Health. 2021 Oct [cited 2022 Jun 28]13(5):423-430. Available from: https://journals sag epub com/doi/abs/10 1177/19417381211011446 DOI: 1 0 1177/19417381211011446
42. NFL [Internet]. United States: National Football League; 2022. Transcript: End-of-season health & safety briefing, Feb. 7, 2022; Feb 2022 [cited 2022 May 23]. Available from: https://www nfl com/playerhealthandsafety/resourc es/press releases/media briefing transcript end of seaso n health safety briefing feb 7 2022
The Short- and Long-term Effects of Sports-Related Concussions: A Literature Review
97
Investigating Associations and Outcomes of Vaccines with Guillain-Barré Syndrome: A Review
Daniel S. Ehlers1*‡, Gulnar K. Jhaj1*‡, Leann N. Seidel1*‡, and Saishravan S. Shyamsundar1*‡
¹Geisinger Commonwealth School of Medicine, 525 Pine St., Scranton, PA 18510
*Master of Biomedical Sciences Program
‡Authors contributed equally Correspondence: shyamsundar.sai@gmail.com
Abstract
Guillain-Barré syndrome (GBS) is a debilitating autoimmune disease that causes demyelination of neurons. This impacts neurotransmission and can lead to muscle impairments. If this disease is not diagnosed and treated, it can be detrimental to an individual’s quality of life. Over the past several years, there have been growing concerns of vaccines leading to the onset of GBS. We performed a literature search in PubMed to determine whether there is an association between GBS and several vaccine types, including influenza, hepatitis B, measles-mumpsrubella (MMR), and coronavirus disease of 2019 (COVID-19) vaccines. Overall, most studies concluded that these vaccine types do not exacerbate GBS onset among recipients. We determined that the risk associated with GBS was a rare event, and most studies advocated that administration of a vaccine had a much greater benefit than an associated risk. Based on our review, there were no studies that indicated an elevated risk of GBS after vaccinations. In conclusion, this analysis may contribute to reducing vaccine hesitancy that is prevalent in society.
Introduction
The Centers for Disease Control and Prevention (CDC) reports that the incidence of Guillain-Barré syndrome (GBS) worldwide is not as common as one may think (1). The incidence of this disease is approximately 1 in 100,000, with around 3,000 individuals in the United States (U.S.) being affected annually (1–4). However, though rare, GBS can impact the quality of life of individuals of various ages (2, 5–8).
GBS is an autoimmune disease in which the body’s immune system starts producing antibodies in order to attack itself (9–11). The main target of these antibodies are the body’s own nerves and more specifically, the myelin sheath that surrounds these neurons (9–11). The myelin sheath is a fundamental aspect of neurotransmission and acts as an electrical insulator (9). When an action potential is propagated throughout the axon, the myelin sheath prevents current leakage and works to help maintain a high conduction velocity for the action potential to propagate and trigger an effector response (12–13). In unmyelinated neurons, however, one can observe a decrease in the overall conduction velocity (14). Existing literature has suggested structural similarity of the pathogen to the immune system along with a bacterial infection as two possible explanations as to the possible causes of GBS (10–11, 15). For the case of structural similarity, the literature has suggested that the immune system is responding to molecules or even microorganisms that may have morphological and structural similarities to the myelin sheath (15). These structural
similarities may prevent the innate or adaptive immune systems from differentiating between the two and so the body may end up attacking itself in the outcome (15). Another plausible explanation for GBS could be linked to the bacterial infection caused by Campylobacter jejuni (10–11, 15). The prevalence of this bacteria within the body could be attributed to eating foods that are contaminated, which eventually causes the pathophysiology and symptoms observed in GBS (15).
GBS symptoms are like those for other neurological disorders, ranging from weakness and tingling sensation that begins in the lower extremities and gradually progresses to the upper extremities (2, 16–17). The manifestations of the disease may begin to worsen over time and may lead to partial or complete muscle paralysis (2, 16–17). Though rare, GBS is still considered a life-threatening disease with a mortality rate between approximately 3% and 13% (18). The diagnosis is completed through a nerve conduction test, electromyography (EMG) studies, or through analyzing cerebrospinal fluid (CSF) to look for any increased levels of proteins using a lumbar puncture (2, 19–21). Unfortunately, there is no effective cure for GBS (20). However, symptoms may be managed through a variety of ways such as using non-steroidal anti-inflammatory drugs, carbamazepine, or gabapentin (22–24). Other forms of treatment include the use of plasmapheresis and intravenous immunoglobulin therapy (IVIG) (22, 25–26).
Over the past several years, it has been reported that GBS can occur after vaccine administration (27). This concern has further contributed to the growing vaccine hesitancy (28). The objective of this literature review was to determine the association between GBS with several different types of vaccines.
Methods
We conducted a literature search using PubMed and an online search engine, Google, to identify studies that discuss any association between vaccines and GBS onset. Particularly, we focused our search on four broad categories. These include any association between GBS with influenza vaccines, hepatitis B vaccines, measles-mumps-rubella vaccines (MMR), or coronavirus disease of 2019 (COVID-19) vaccines. We did not utilize any Medical Subject Headings (MeSH) terms or establish any inclusion or exclusion parameters for our search.
Discussion
Vaccine overview
Vaccines have been a vital tool in protecting individuals and communities from infectious diseases for hundreds of years (29,
Scholarly Research In Progress • Vol. 6, November 2022
98
30–32). Vaccines have a long history and go as far back as Edward Jenner’s initial work with addressing smallpox, a disease that ravaged many parts of the world for many years (32–34). Edward Jenner found that individuals affected by cowpox were offered protection against smallpox (35). This was because the antigens developed during a cowpox infection were structurally like that of smallpox and as a result, the body was able to defend against smallpox if it encountered the infection again in the future (36). This provided the basis for understanding more about the body’s humoral response (37–38). Edward Jenner’s work opened the doors for further vaccine development and its widespread global use (33).
It is important to mention that the immune system can be subcategorized into the innate and adaptive immune system (39). The innate immune system provides the initial response to a pathogen, while the adaptive immune response requires multiple days to occur (39). However, the response is usually more pronounced than that of the innate immune system (39). The idea of the body’s own immune system reacting to structurally similar antigens, such as Edward Jenner’s observation of the cowpox and smallpox viruses, highlights the concept of crossreactivity (39-40). Figure 1 shows the concept of cross reaction and how the adaptive immune system can remember the specificity of a previously encountered antigen in order to mount a stronger immune response for all subsequent infections (36, 39–40).
Since the advent of the live-attenuated smallpox vaccine, several other vaccines have been developed such as inactivated, capsular polysaccharide, protein-based and more recently genetically engineered vaccines (12, 41). Throughout time, outbreaks of polio, hepatitis, chickenpox, and influenza have led scientists to find innovative ways to activate the body’s immune system through these different vaccines (41).
B
Structurally Similar
CELL-MEDIATED IMMUNITY
Bacteriophage A enclosing virus
Cross Reactivity Dendritic Cell
Antigen Binding Site
MHC 1 MHC 2
Bacteriophage B enclosing virus
MHC 1 Pathway
Cross Presentation
MHC 2 Pathway
Antigen Binding Site
CD8+ T Cell (Cytotoxic) CD4+ T Cell (Helper)
β Chain of TCR
α Chain of TCR
*T Cell Activation*
β Chain of TCR
α Chain of TCR


*MHC = Major Histocompatibility Complex
*TCR = T Cell Receptor
HUMORAL IMMUNITY
Bacteriophage A enclosing virus
Structurally Similar
Cross Reactivity B Cell
Antigen Binding Site Clonal Expansion
*B Cell Activation*
Bacteriophage B enclosing virus
Light Chain of BCR Heavy Chain of BCR
Secreted Antibodies
*BCR = B Cell Receptor
Figure 1: Specificity of the adaptive immune response in antigen recognition of two structurally similar pathogens (39). (A) Cell-mediated immunity involves cytotoxic T-cells (CD8+) and helper T-cells (CD4+) (39). There are two main pathways involved for antigen presentation: major histocompatibility complex (MHC I) and/or major histocompatibility complex (MHC II) (39). The antigens are presented to T-cells by these complexes through professional antigen presenting cells such as dendritic cells (39). (B) Humoral immunity is an antibody response to a pathogen (39). Once an antigen is recognized, B-cells can differentiate into plasma cells, undergo clonal expansion, and begin to secrete antibodies to neutralize an infiltrated pathogen (39). Note: Not all signaling molecules and cellular mechanisms are depicted in this figure and were not drawn to scale. Image was adapted from (39).
One valuable aspect of vaccines compared to other options at a physician’s disposal is that they go beyond positively impacting the health of the person receiving it (42). They also provide protection to any interactions that a vaccinated person may have by decreasing the rate of transmission among individuals (42). Vaccine development can take a decade or longer, as it undergoes meticulous safety and efficacy monitoring through animal and then human trials before it becomes available to the public (43). Even after widespread distribution of the vaccine, efficacy and adverse events are still monitored among
the general population (43). In this review, we focused on inactivated vaccines, subunit vaccines, live-attenuated vaccines, as well as messenger RNA (mRNA) vaccines, and explored any causal risk associated with GBS onset (41).
GBS and influenza vaccines
A link between GBS and vaccines first arose during the swine flu vaccination effort in 1976 (44). A small rise in cases was seen among those who received the vaccine, with roughly one GBS instance seen for every 100,000 people vaccinated (44). Since this time, the association between influenza vaccines
Investigating
Associations and Outcomes of Vaccines with Guillain-Barré Syndrome: A Review
A
99
Investigating Associations and Outcomes of Vaccines with Guillain-Barré Syndrome: A Review
and GBS has remained inconsistent (44). One study monitored the occurrence of GBS during the H1N1 vaccination initiative in 2009 (44). Surveillance of 23 million vaccinated people revealed the risk of GBS doubled during the 6 weeks succeeding the inactivated influenza vaccine. However, findings were not statistically significant (44). This was an expected finding. Influenza is a known source of GBS, and the vaccine’s function is to stop influenza infection, so by preventing infection the vaccine was also preventing any possible emergence of GBS (44). It is also unclear whether the connection between GBS and the H1N1 vaccine was a result of unrevealed H1N1 infections as this vaccine was being administered at a time where infections were widespread (44). Possible similarities between the 2009 H1N1 and 1976 swine flu vaccines could have also led to the belief of an association (44).
The data from the Vaccine Safety Datalink (VSD) concluded that GBS was notably linked to the monovalent inactivated vaccine (MIV) compared to the seasonal trivalent inactivated influenza vaccines (TIV) during 2009–2010 (45). MIV and TIV both contain an identical H1N1 antigen (45). In this particular study, five of the nine GBS cases which occurred in the 6 weeks succeeding an MIV were individuals that had a respiratory infection noted in their medical documentation inside 1 month prior to GBS onset, contrasted by one of eight cases succeeding TIV (45). However, it is important to note the MIV availability stated in the VSD conflicted with the height of a wave of the H1N1 pandemic in October 2009, with the administration of TIV in 2009–2010 mainly occurring prior to this wave possibly leading to prejudiced positive linkage between GBS and 2009–2010 MIV (45). This study examined the linkage between both GBS and administration of MIV and TIV, and the linkage between GBS and medically assisted infections, modifying for MIV or TIV reception (45). Vaccinations occurring in the risk window were defined as the 1 to 42 days before onset of GBS; those in the 43 to 49 days were considered a null interval to give a supplemental week for possible cases occurring during the primary risk window (45). Vaccinations occurring in the 50 through 126 days before emergence of GBS were the control interval. Cases with previous infections were defined as those occurring in the 1 to 42 days before emergence of GBS that experienced a medically assisted respiratory, gastrointestinal, or viral infection (45).
Over 1 million and 2 million MIV and TIV doses were administered, respectively, and over 3 million medically assisted infections were recorded among patients, including over 180,000 influenza infections (45). Noted in the 6 weeks prior to emergence of GBS were 18 cases that had received a vaccine and 44 cases with medically assisted infections. In three of these cases, both exposures occurred in the risk interval and received a diagnosis of acute respiratory infections (45). Four cases also had manifestations of respiratory illnesses, such as bronchitis and cold, which occurred in the risk interval before emergence of GBS (45). Of the 18 individuals that received a vaccination in the risk interval before GBS onset, seven experienced manifestations of a respiratory illness of which three were medically assisted (45). Although statistical significance was not identified between GBS and MIV or TIV, there was a significant relation between GBS and respiratory infection (45).
In a similar study involving data from VSD and Medicare patients, the association between GBS and the high-dose
inactivated influenza vaccine (IIV3-HD) was examined during the 2018–19 flu season (46). IIV3-HD is given to those 65 and older due to the increased influenza antigens that aid in preventing hospitalizations and deaths (46). A weekly rapid cycle analysis was performed by the VSD to observe the emergence of GBS among individuals 65 and older in the 6 weeks after receiving the vaccine (46). In the Medicare data, an exposure was designated as the patient’s main influenza vaccine amidst the examination time frame, while an incident GBS case was designated as a patient who received the vaccine that had been discharged from the hospital with a diagnosis in the 1 to 84 days post-vaccination (46). This study identified primary and secondary risk windows as the 8 to 21 and 1 to 42 days after a vaccination respectively, and days 43 to 84 as the control window (46). In the early flu season during late 2018, over 600,000 doses of IIV3-HD were administered according to the VSD, with five GBS cases recorded within the risk window versus zero in the control window (46). In the late flu season during April 2019, eight GBS cases were noted in the risk windows and one case within the control window (46). The Medicare early-season examination for IIV3-HD revealed 16 GBS cases in the primary risk window (Odds Ratio [OR], 1.85; 95% Confidence Interval [CI], 0.99-3.44), and 34 in the secondary risk window (OR, 1.31; 95% CI, 0.78-2.18) with 26 GBS claims in the control windows (46). The end-of-season examination for IIV3-HD revealed 18 GBS cases in the primary risk window (OR, 1.64; 95% CI, 0.92-2.91) and 37 claims in the secondary risk window (OR, 1.12; 95% CI, 0.70-1.79) with 33 GBS claims in the control windows (46). Both data source examinations revealed no statistical significance of an elevated risk of GBS following a IIV3-HD vaccine with a p-value greater than 0.05 (46). The overall findings along with the calculated OR indicated the risk between emergence of GBS after a IIV3HD vaccination in 2018-19 was low and analogous to prior flu seasons, and the advantages of receiving the vaccine were more than enough to rule out the possibility of GBS emergence (46).
Both studies found that the relationship between GBS and influenza vaccinations were not significant, therefore a correlation or association between the two cannot be concluded (45–46). A recorded meta-analysis depicted roughly one GBS case per 1 million vaccine receivers and about 17 GBS cases per 1 million influenza infections, indicating that vaccinations diminish the possibility of GBS emergence (47).
GBS and hepatitis B vaccines
The hepatitis B vaccine falls under the larger category of subunit vaccines (41). Compared to the inactivated vaccine, subunit vaccines utilize parts of an antigen to trigger an immune response by the body (48). However, more specifically, the hepatitis B vaccine is considered a recombinant vaccine type (a subcategory of subunit vaccine) (41, 48). Hepatitis B has a high prevalence rate and affects upward of 300 million individuals globally (49–53). Serious complications can lead to liver damage (50, 54). Fortunately, due to improvements in immunizations, awareness, medical care, and access, the age-adjusted mortality rate has been reduced over the years to about 0.42 for every 100,000 individuals as of 2019 (55–56). Similar to an influenza vaccination, the concern of developing GBS after a hepatitis B vaccine is also of public interest (57). Interestingly, this concern is not new but can be dated back
100
several decades (58). A case report from India detailed that a 3-year old female with no relevant past medical history developed acute onset of extremity weakness after receiving the hepatitis B vaccine one day prior (58). The patient had neurological and psychomotor deficits (58). The clinical findings that were reported were consistent with the presentation of GBS (58–61). The patient showed gradual improvement after being placed on a course of steroidal medications (58). Through their discussion, the authors were not able to pinpoint an exact reasoning as to why this patient developed GBS-like symptoms after vaccination and suggested that more research may be needed to establish causality (58).
It was also important for us to explore if there were any occurrences of GBS after hepatitis B vaccination for the adult population. A 52-year-old female had GBS-like symptoms around 10 weeks after hepatitis B vaccination (62). The patient had a past medical history of renal dysfunction and presented with characteristic neurological deficits as well as abdominal pain (62). Serological tests indicated abnormal findings while EMG as well as nerve conduction tests were not performed on the patient due to worsening symptoms (62). The patient died several months later due to septic shock (62). Following an in-depth literature review of prior work, the authors concluded that GBS onset was a rare adverse event (62). However, the authors advocated that the benefits of the vaccine were greater than any associated risk (62).
Like the Vaccine Safety Datalink study for influenza vaccinations, another study utilized the Vaccine Adverse Event Reporting System (VAERS) to look at GBS occurrence after all types of vaccination between 1990 and 2005 (45, 63). In this 15-year period, out of a total of 1,000 GBS cases, 632 GBS cases were identified after influenza vaccination and occurred during the risk window (63). For this study, the risk window was defined as 6 weeks after vaccination (63). Comparatively, during the same time period, only 94 GBS cases were identified due to a hepatitis B vaccine with a majority also occurring in the same risk window (63). Mortality rate after GBS onset was higher among influenza vaccine recipients, whereas hepatitis B vaccine recipients had a slightly higher percentage of disability (63). However, the authors noted that both mortality and disability rates caused by vaccinations were comparable to the general population affected by GBS (63).
It was surprising to note, however, that in our PubMed search, we did not find other relevant studies that explored hepatitis B vaccine and GBS further with surveillance data. The most recent study that we found completed a nested case-control study in three Chinese cities from 2011 to 2015 (64). No significant increase in risk for GBS in the pediatric population (OR, 0.94; 95% CI, 0.54–1.62) and the adult population (OR, 1.09; 95% CI, 0.88–1.32) was found after vaccination, including against hepatitis B (64). From our search, we were not able to find any age differences that would exacerbate GBS onset. It would be beneficial if future studies investigated whether geographical or ethnic differences contribute to the prevalence of GBS after hepatitis B vaccinations.
GBS and measles-mumps-rubella vaccines
The measles-mumps-rubella (MMR) vaccine is a trivalent, liveattenuated vaccine administered to individuals beginning in the 1970s (41, 65). After extensive outreach and education of the
diseases and vaccines, measles cases were reduced by 80% in 1981 compared to the previous year (66). This was attributed in part to a two-dose vaccination regimen with the first vaccine being administered between 12 and 15 months of age and the second dose between 4 and 6 years of age (67). Like the abovementioned vaccines, the question of whether the MMR vaccine is associated with an increased risk of GBS is worth asking given the dramatic impact GBS can have on an individual’s life. A retrospective study conducted in Finland evaluated the risk of GBS and the MMR vaccine using data from 630,000 vaccine recipients from 1982 through 1986 (68). The target population was represented by 24 patients diagnosed with GBS, of which 20 patients were administered the MMR vaccine (68). This represents no statistically significant difference between administration of the MMR vaccine and the typical incidence of GBS (68). Of note, respiratory or gastrointestinal infections were present in 83% of the 24 patients prior to the diagnosis of GBS, which is in line with other reported cases (68).
Data involving post-mass vaccination campaigns can be utilized to test the association between MMR vaccines and GBS (69). One such study drew the number of GBS cases from the Poliomyelitis Eradication Surveillance System of the Pan American Health Organization in which 73 million children received the measles immunization between 1990 and 1994 in the countries of Argentina, Brazil, Chile, and Colombia (69). The number of GBS cases was 2,296, indicating there was no significant increase in GBS cases versus the expected (69). A similar outcome was observed in Turkey during a mass vaccination campaign where 325,000 individuals were administered measles vaccines (70). An incidence of 0.615 per 100,000 doses was detected which was believed to be coincidental (70). Again, during a vaccination campaign in Iran from 2002 to 2004, GBS incidence rates ranged between 0.65 to 0.76 per 100,000 individuals, which was not a significant increase (71).
The U.S. Institute of Medicine has stated there is not enough evidence to either accept or reject a causal relationship between MMR vaccination and GBS (72). Additional studies involving many individuals could highlight a potential link between the MMR vaccine and GBS. The MMR vaccine has proved to be effective in reducing the incidence of infectious diseases specifically, 96% effective against measles, 86% effective against mumps and 95% effective against rubella (73). While each individual should consult with their healthcare provider prior to receiving a vaccination, it was also important for us to assess the risks of not receiving a vaccination. Measles is a highly contagious disease — so much so that an estimated 90% of individuals in close proximity to the infected individual will become infected (74). Given the current data, we do not feel the use of MMR vaccines should be reduced due to a concern of developing GBS.
GBS and COVID-19 vaccines
Coronavirus disease of 2019, widely known as COVID-19, is a disease caused by the agent SARS-CoV-2 (75). SARS-CoV-2 has been identified as a severe acute respiratory syndrome coronavirus (76). SARS-CoV-2 is spread primarily by droplets, and it has impacted lives around the world by causing millions of infections and deaths (75, 77). At the end of 2020, two mRNA vaccines became available in the U.S. and other countries for
Investigating Associations and Outcomes of Vaccines with Guillain-Barré Syndrome: A Review
101
Investigating Associations and Outcomes of Vaccines with Guillain-Barré Syndrome: A Review
protection against COVID-19. These two vaccines were the Pfizer-BioNTech and Moderna vaccines. This was the first time mRNA vaccines were authorized for use; however, this technology had been under development since the late 1970s (78). There were challenges to developing mRNA vaccines, which included that mRNA was too prone to degradation, its production was too expensive, the ubiquitous presence of ribonucleases, and the lack of scalability (77–78). However, companies such as BioNTech and Moderna had already been developing mRNA vaccines and therapeutics for other diseases and cancers when COVID-19 struck. These two companies were able to develop, conduct clinical trials, and gain emergency use authorization within a year’s time for mRNA vaccines for COVID-19 (78).
Such mRNA vaccines can be considered gene-based vaccines because an RNA vector is delivered to a host cell, which will then express the RNA to produce antigens that will then cause an immune response (77). These mRNA vaccines contain sequences that encode a form of the SARS-CoV-2 spike, S, protein, which induces an adaptive immune response against an antigen (77–78). The mRNA is injected intramuscularly, and it is taken up by muscle cells via endocytosis (77). Once inside the cell, the mRNA is translated and S proteins form (77). Some S protein will be presented on the plasma membrane of cells, or it is secreted out of the cell (77). However, most of the S protein will be degraded by the endosome-derived proteasome where the fragments will be presented to CD8+ cells via MHC I molecules (77). Antigen presenting cells (APC) will be attracted to the muscles and these will help present the S protein antigens by MHC II molecules to CD4+ cells (77). However, mRNA vaccines also involve the humoral immune response by activating B cells, which will either form memory B cells or antibody-secreting plasma cells (77). Antibodies that are secreted from plasma cells are circulating and will look for their antigen in the body (77). If the antibody finds its specific antigen, then it will bind to it to neutralize it so it cannot infect cells (77).
There are other vaccines that have been approved for use against COVID-19. These vaccines include Johnson & Johnson, Novavax, and Oxford-AstraZeneca (79). These three other vaccines are not mRNA vaccines. The Johnson & Johnson and Oxford-AstraZeneca vaccines operate similarly to previously developed vaccines for other diseases; they contain an adenovirus as a shell that carries the genetic code for the S protein to the cells, and once inside the cells, S protein is made, and the immune system responds (79). Novavax is different, as it contains the S protein of SARS-CoV-2 as a nanoparticle, which can elicit an immune response (79). Administration with any of the five vaccines can cause side effects such as injection site pain, muscle pain, headaches, fever, nausea, tiredness, and chills and normally these side effects last a few days (79). More severe side effects in the mRNA vaccines include myocarditis, inflammation of the heart muscle, and pericarditis, inflammation of the outer lining of the heart, in adolescents and young adults (79). In July 2021, the FDA attached a warning to the Johnson & Johnson vaccine that there is an increased risk of GBS with the Johnson & Johnson vaccine (79). This warning came after approximately 100 suspected cases of GBS were identified among 12.8 million people who received the Johnson & Johnson vaccine (80). These cases were reported through the Vaccine Adverse Event Reporting System (VAERS); 95 of the cases
were serious and required hospitalization and only one death was reported (80). Most of the cases occurred within 42 days after administration of the Johnson & Johnson vaccine, and these cases were more frequent in men, and many of the men were over 50 years old (79–80). However, the FDA stated that even though there is an increased risk of GBS with the Johnson & Johnson vaccine, it was insufficient to establish a causal relationship (80). The Johnson & Johnson vaccine also has an FDA attached warning to it regarding the risk of blood clots (79).
The Oxford-AstraZeneca vaccine also has a warning attached to it regarding the risk of blood clots with low blood platelets, which can occur within two weeks of receiving the vaccine (79). The Oxford-AstraZeneca COVID-19 vaccine was also found to have an increased risk of GBS after vaccination, which led to the European Medicines Agency (EMA) to attach a warning to the Oxford-AstraZeneca COVID-19 vaccine in September 2021 (80–81). This warning was added after 833 cases of GBS were reported with the Oxford-AstraZeneca COVID-19 vaccine worldwide by July 31, 2021 (81). By July 25, 2021, approximately 592 million doses of the Oxford-AstraZeneca COVID-19 vaccine were given worldwide (81). The EMA’s Pharmacovigilance Risk Assessment Committee (PRAC) concluded that a causal relationship between the OxfordAstraZeneca COVID-19 vaccine and GBS should be considered at least a reasonable possibility (81). The EMA PRAC listed GBS as very rare for the Oxford-AstraZeneca COVID-19 vaccine, which is the lowest frequency category that can be given, meaning it occurs in less than 1 in 10,000 people (81).
A study conducted in three districts of Kerala, India over a 4-week period from mid-March 2021 to mid-April 2021 found that seven patients developed GBS within 2 weeks of receiving their first dose of the AstraZeneca COVID-19 vaccine (82). The subjects were mostly female, with a ratio of female to male of six to one and they were in their fifth to seventh decades of life (82). All patients progressed to areflexic quadriplegia, had bilateral facial paresis, and six of the seven patients required mechanical ventilation (82). Additionally, four subjects developed other cranial neuropathies, including abducens palsy and trigeminal sensory nerve involvement (82). The researchers reported that the incidence of GBS in India was approximately 6 to 40 cases per million per year (82). Since the study was conducted over a 4-week period, the researchers broke this down into cases per 4-week period. Out of the 1.2 million people administered with the AstraZeneca COVID-19 vaccine in three districts of Kerala, India, the expected cases of GBS in a 4-week period was between 0.58 and four cases (82). Seeing seven cases in 1.2 million people is a 1.4- to 10-fold rise in the incidence of GBS (82). The study found that there was a risk of 5.8 per million, which could be considered relatively low, however, even with a risk of developing GBS, the benefits of vaccinations outweigh the risk (82).
Another investigation performed in the United Kingdom also included the AstraZeneca vaccine. In this investigation, four cases of GBS were reported, each having bifacial weakness with paresthesia and symptoms occurred 11 to 22 days after vaccination (83). The investigators presented that the typical occurrence of GBS is less than four cases per month (83). Even though a risk for developing GBS is seen, it is difficult to describe a causal relationship (83). The investigators did provide
102
Investigating Associations and Outcomes of Vaccines with Guillain-Barré Syndrome: A Review
a hypothesis on why vaccines can lead to the development of GBS. They hypothesized that the generation of host antibodies could cross-react with proteins present in peripheral myelin (83). These antibodies could be in response to the S protein, however, a less specific immune response, such as what is seen in vaccines that use adenovirus was also possible (83).
Vaccine Study Identifier
Salmon DA et al (2021)
Influenza
MMR
Greene SK et al (2013)
Perez Vilar S et al (2021)
COVID 19
The SARS-CoV-2 S protein can bind to sialic acid-containing glycoproteins and gangliosides on cell surfaces (83). Antibody cross-reactivity of the S protein and peripheral nerve glycolipids may be involved in the pathogenesis of GBS, either from the COVID-19 vaccine or an infection of COVID-19 (83).
Principal Findings
Observance of GBS cases among those who received the H1N1 vaccine concluded statistically insignificant results (44). While the risk of GBS appeared to double in the six weeks following the vaccine, the authors anticipated this result as influenza is a known cause of GBS (44). The vaccine’s function was to suppress influenza infection, and by doing this it was also suppressing emergence of GBS (44).
Data collected from the VSD depicted GBS was linked to MIV versus TIV during 2009 2010 (45). The study also examined the relationship between GBS and medically assisted infections (45). A majority of patients who had an emergence of GBS and received MIV or TIV were also found to have had recent infections (45). While no significance was found between GBS and MIV or TIV, it was proven between GBS and respiratory infection (45).
The authors used VSD and Medicare data to analyze the relationship between GBS and IIV3 HD in 2018 2019 (46) Medicare early and end of season examinations followed IIV3 HD showed no statistical significance with p values higher than 0.05 in both periods (46).
Kakar A et al. (1997) The authors discussed the association between hepatitis B vaccination and GBS onset in a three year old female in India who developed acute onset extremity weakness (58). They concluded that GBS is a rare adverse event and suggested more research may be needed to establish causality (58)
Khamaisi M et al. (2004)
Souayah N et al. (2009)
A literature review in the case of a 52 year old female who presented with GBS like neurological deficits ten weeks post hepatitis B vaccination revealed that the GBS onset was a rare adverse event (62) The authors recommended that the benefits of vaccine administration outweighed any associated risks (62).
Using the Vaccine Adverse Event Reporting System between 1990 2005, 632 GBS cases that occurred after influenza vaccination and 94 cases that occurred after hepatitis B vaccination were identified (63). GBS related mortality or disability rates post vaccinations were comparable to the general population affected by GBS (63).
Chen Y et al. (2020) In a nested case control study in three Chinese cities from 2011 2015, no significant increase in GBS cases for the pediatric population (OR, 0.94; 95% CI, 0.54 1.62) and adult population (OR, 1.09; 95% CI, 0.88 1.32) post vaccination were found (64).
Patja A et al. (2001) A retrospective study using hospital discharge diagnoses and vaccination data in Finland found no causal association between MMR vaccine administration and GBS (68) Those diagnosed with GBS developed symptoms between 80 days and several years after receiving a vaccine, greater than the risk period of 6 weeks (68).
da Silveira CM et al. (1997) The frequency of GBS cases were observed by the Poliomyelitis Eradication Surveillance System of the Pan American Health Organization during a five year period in which 73 million children took part in a mass measles vaccination campaign (69) No statistically significant association was found between measles vaccination and GBS (69).
Koturoglu G S et al (2008)
Esteghamati A et al. (2008)
A national measles vaccination campaign in Turkey vaccinated 325,000 individuals leading to two cases of GBS (70) This calculates to an incidence of 0.615 per 100,000 cases prompting the authors to list the association as coincidental (70).
The incidence of GBS cases of five fourteen year olds in Iran during an MMR vaccination campaign were evaluated by the national surveillance system (71). Incidence rates over the three year period ranged from 0.65 to 0.76 per 100,000 population (71). No statistically observable increase of GBS cases were noted during or after the MMR vaccination campaign (71).
Maramattom BV et al. (2021)
The frequency of GBS with the AstraZeneca vaccine was found to be 1.4 to ten fold higher than the expected rate of developing GBS in Kerala, India (82). All cases had bilateral facial paresis, which usually occurs in less than 20% of GBS cases (82). However, the benefits of vaccination outweigh the risk of developing this relatively rare outcome (82).
Allen CM et al. (2021) In the United Kingdom, four cases of GBS were reported after the AstraZeneca vaccine, and the typical occurrence is less than four cases (83). The researchers did suggest monitoring bifacial weakness with paresthesias post SARS CoV 2 vaccination (83).
Woo EJ et al. (2021) Following vaccination with the Johnson & Johnson COVID vaccine, 130 presumptive GBS cases were reported in the United States (84). It was found that the rate ratio was increased for both the 21 day and 42 day risk windows, except for adults aged 18 29 years old (84). Although these findings suggest a potentially small, but statistically significant risk of developing GBS post vaccination with Johnson & Johnson, this risk is far smaller than the risk of COVID 19 infection (84).
García Grimshaw M et al. (2021) In Mexico, the observed incidence of GBS post vaccination with Pfizer was 0.18 per 100,000 administered doses, while the reported incidence of GBS is between 0.2 to 0.71 per 100,000 per year (85). Four out of the seven cases reported did have GI or systemic infections, which could have also caused the development of GBS (85). Due to these concurrent infectious triggers being present, there was a lack of mechanistic connection between mRNA vaccines and GBS (85).
Table 1: Summary of principal findings of different studies investigating vaccination outcomes and GBS onset (44–46, 58, 62–64, 68–71, 82–85).
Hepatitis B
103
Associations and Outcomes of Vaccines with Guillain-Barré Syndrome: A Review
An additional study examined patients who received the Johnson & Johnson COVID-19 vaccine in the U.S. from Feb. 27, 2021, through July 24, 2021, using VAERS to monitor GBS cases in those who received the vaccine (84). The researchers identified 130 cases of presumptive GBS after receiving the Johnson & Johnson vaccine in this time period (84). Most of the cases were males, and most were younger than 65 years old (84). Most of the cases occurred within 21 days postvaccination, and almost all of the cases occurred within 42 days post-vaccination, with a majority of the cases being severe (84). The investigators did list other items that could have caused GBS in some patients, such as other illnesses in these patients or comorbidities in patients, however, there were no concomitant vaccines (84). Except for adults aged 18–29 years old, the respective rate ratio was found to be increased for both the 21-day and 42-day risk windows (84). These researchers also stated that even though these findings suggest a potentially small, but statistically significant risk for GBS following vaccination with the Johnson & Johnson COVID-19 vaccine, this risk was far smaller than the risk of COVID-19 infection (84).
In Mexico, Pfizer-BioNTech’s COVID-19 vaccine and the risk of GBS during the period from Dec. 24, 2020, to March 19, 2021, was analyzed (85). During this time, 3,890,250 people received at least one dose of the Pfizer-BioNTech vaccine (85). Of these approximately 3.9 million vaccines, only seven cases of GBS post vaccination were reported (85). All of these cases occurred after the first dose (85). This led to an observed incidence of 0.18 per 100,000 administered doses of the vaccine (85). The reported incidence of GBS in Mexico was 0.2 to 0.71 per 100,000 per year (85). The authors did report that four of the cases did have a previous gastrointestinal or systemic infection (85). While the researchers did see a slight increased risk of developing GBS after Pfizer-BioNTech vaccination, it was stated that in most cases concurrent infectious triggers were detected, which could have been the cause of the development of GBS rather than due to the vaccine (85). Due to concurrent infectious triggers being present, there was a lack of a mechanistic connection between mRNA vaccines and GBS (85). Collectively, the studies reviewed regarding COVID-19 vaccines and GBS development indicated a slight increased risk, however, a causal relationship between the two was not established (82–85). Certain vaccines seem to have an increased risk of developing GBS post-vaccination, which include the Johnson & Johnson and AstraZeneca COVID-19 vaccines (82–84). While GBS and the mRNA vaccines, specifically the Pfizer-BioNTech mRNA vaccine, were examined, it was found that they are not likely to have an increased risk of GBS onset after vaccination due to the concurrent infectious triggers that were found in most of the cases reported in that analysis (85). All studies analyzed in this review stated that the risk of GBS onset from COVID-19 vaccines were small and the benefits of being protected from COVID-19 far outweigh the risks of GBS development (82–85). Table 1 summarizes the principal findings of all the studies for the different vaccine types that were discussed (44–46, 58, 62–64, 68–71, 82–85).
Conclusion
Our objective was to determine if there were any associations between vaccine types and GBS onset. Our search on influenza, hepatitis B, MMR, and COVID-19 vaccines concluded there was no elevated risk of GBS onset among vaccinated individuals. Increased surveillance of vaccination efforts may reveal differing results regarding emergence of GBS, but based on a current review of the literature, the advantages of receiving each vaccine exceed the minimal to no risk of onset. Although more research is required in this area, these findings should aid in decreasing vaccine hesitancy among individuals, which has become a major talking point in our present society. Some limitations of this review include broad inclusion and exclusion criteria along with possible search bias. Both limitations could have impacted the results that were obtained. Future iterations of this rapid review should include a more comprehensive review with finer, specified search parameters to provide an additional long-term and global analysis that would allow for a more thorough understanding of the GBS-vaccine correlation.
Acknowledgments
The authors would like to thank Brian J. Piper PhD, MS, and our teaching assistant Raskirth Singh, MBS, for their feedback, support and guidance. We would also like to thank Michael A. Sulzinski, PhD, for providing us with the fundamental knowledge of immunology.
Disclosures
The authors do not report any disclosures.
References
1. Guillain-Barré syndrome [Internet]. Centers for Disease Control and Prevention. 2019. [cited 2022 Feb 15]. Available from: https://www.cdc.gov/campylobacter/ guillain-barre.html
2. Guillain-Barré syndrome [Internet]. Johns Hopkins Medicine. [cited 2022 Feb 15]. Available from: https:// www.hopkinsmedicine.org/health/conditions-anddiseases/guillainbarr-syndrome
3. Bragazzi NL, Kolahi AA, Nejadghaderi SA, Lochner P, Brigo F, Naldi A, et al. Global, regional, and national burden of Guillain-Barré syndrome and its underlying causes from 1990 to 2019. J Neuroinflammation. 2021;18(1):264. doi:10.1186/s12974-021-02319-4
4. McGrogan A, Madle GC, Seaman HE, de Vries CS. The epidemiology of Guillain-Barré syndrome worldwide. A systematic literature review. Neuroepidemiology 2009;32(2):150-163. doi:10.1159/000184748
5. Darweesh SK, Polinder S, Mulder MJ, Baena CP, van Leeuwen N, Franco OH, et al. Health-related quality of life in Guillain-Barré syndrome patients: A systematic review. J Peripher Nerv Syst. 2014;19(1):24-35. doi:10.1111/ jns5.12051
Investigating
104
Investigating Associations and Outcomes of Vaccines with Guillain-Barré Syndrome: A Review
6. Mataloun SE, Lazzaretto B, Batista K, Campos C, Orra S, Annes M, et al. Guillain–Barré syndrome affects the quality of life after discharge from the ICU. Crit Care 2009;13(Suppl 3):P57. doi:10.1186/cc7859
7. Roodbol J, de Wit MC, Aarsen FK, Catsman-Berrevoets CE, Jacobs BC. Long-term outcome of Guillain-Barré syndrome in children. J Peripher Nerv Syst. 2014;19(2):121126. doi:10.1111/jns5.12068
8. Willison HJ, Jacobs BC, van Doorn PA. GuillainBarré syndrome. Lancet. 2016;388(10045):717-727. doi:10.1016/S0140-6736(16)00339-1
9. Pluta RM, Lynm C, Golub RM. JAMA patient page. GuillainBarré syndrome. JAMA. 2011;305(3):319. doi:10.1001/ jama.305.3.319
10. Dash S, Pai AR, Kamath U, Rao P. Pathophysiology and diagnosis of Guillain-Barré syndrome - challenges and needs. Int J Neurosci. 2015;125(4):235-240. doi:10.3109/0 0207454.2014.913588
11. Guillain-Barré syndrome: Medlineplus genetics [Internet]. MedlinePlus. 2020. [cited 2022 Feb 26]. Available from: https://medlineplus.gov/genetics/condition/guillain-barresyndrome/
12. Suminaite D, Lyons DA, Livesey MR. Myelinated axon physiology and regulation of neural circuit function. Glia 2019;67(11):2050-2062. doi:10.1002/glia.23665
13. Seidl AH. Regulation of conduction time along axons. Neuroscience. 2014;276:126-134. doi:10.1016/j. neuroscience.2013.06.047
14. Arcilla CK, Tadi P. Neuroanatomy, unmyelinated nerve fibers [Internet]. StatPearls. Treasure Island (FL): StatPearls Publishing. 2022. Available from: https://www. ncbi.nlm.nih.gov/books/NBK554461/
15. Guillain-Barré Syndrome fact sheet [Internet]. National Institute of Neurological Disorders and Stroke. U.S. Department of Health and Human Services. [cited 2022 Feb 15]. Available from: https://www.ninds.nih.gov/ Disorders/Patient-Caregiver-Education/Fact-Sheets/ Guillain-Barr%C3%A9-Syndrome-Fact-Sheet
16. Leonhard SE, Mandarakas MR, Gondim FAA, Bateman K, Ferreira MLB, Cornblath DR, et al. Diagnosis and management of Guillain-Barré syndrome in ten steps. Nat Rev Neurol. 2019;15(11):671-683. doi:10.1038/s41582019-0250-9
17. Ansar V, Valadi N. Guillain-Barré syndrome. Prim Care 2015;42(2):189-193. doi:10.1016/j.pop.2015.01.001
18. van den Berg B, Bunschoten C, van Doorn PA, Jacobs BC. Mortality in Guillain-Barre syndrome. Neurology. 2013;80(18):1650-1654. doi:10.1212/ WNL.0b013e3182904fcc
19. Rath J, Schober B, Zulehner G, Grisold A, Krenn M, Cetin H, et al. Nerve conduction studies in GuillainBarré syndrome: Influence of timing and value of repeated measurements. J Neurol Sci. 2021;420:117267. doi:10.1016/j.jns.2020.117267
20. Guillain-Barre syndrome [Internet]. Mayo Clinic. Mayo Foundation for Medical Education and Research. 2021. [cited 2022 Feb 15]. Available from: https://www. mayoclinic.org/diseases-conditions/guillain-barresyndrome/diagnosis-treatment/drc-20363006
21. Fokke C, van den Berg B, Drenthen J, Walgaard C, van Doorn PA, Jacobs BC. Diagnosis of Guillain-Barré syndrome and validation of Brighton criteria. Brain 2014;137(Pt 1):33-43. doi:10.1093/brain/awt285
22. Walling AD, Dickson G. Guillain-Barré syndrome. Am Fam Physician. 2013;87(3):191-197
23. Liu J, Wang LN, McNicol ED. Pharmacological treatment for pain in Guillain-Barré syndrome. Cochrane Database Syst Rev. 2015;2015(4):CD009950. doi:10.1002/14651858. CD009950.pub3
24. Pandey CK, Raza M, Tripathi M, Navkar DV, Kumar A, Singh UK. The comparative evaluation of gabapentin and carbamazepine for pain management in GuillainBarré syndrome patients in the intensive care unit. Anesth Analg. 2005;101(1): doi:10.1213/01. ANE.0000152186.89020.36
25. van Doorn PA, Kuitwaard K, Walgaard C, van Koningsveld R, Ruts L, Jacobs BC. IVIG treatment and prognosis in Guillain-Barré syndrome. J Clin Immunol. 2010;30 Suppl 1(Suppl 1):S74-S78. doi:10.1007/s10875-010-9407-4
26. Harel M, Shoenfeld Y. Intravenous immunoglobulin and Guillain-Barré syndrome. Clin Rev Allergy Immunol 2005;29(3):281-287. doi:10.1385/CRIAI:29:3:281
27. GBS (Guillain-Barré syndrome) and vaccines [Internet]. Centers for Disease Control and Prevention. 2021. [cited 2022 Feb 28]. Available from: https://www.cdc.gov/ vaccinesafety/concerns/guillain-barre-syndrome.html
28. García-Grimshaw M, Michel-Chávez A, Vera-Zertuche JM, Galnares-Olalde JA, Hernández-Vanegas LE, FigueroaCucurachi M, et al. Guillain-Barré syndrome is infrequent among recipients of the BNT162b2 mRNA COVID-19 vaccine. Clin Immunol. 2021;230:108818. doi:10.1016/j. clim.2021.108818
29. Plotkin S. History of vaccination. Proc Natl Acad Sci U S A. 2014;111(34):12283-12287. doi:10.1073/ pnas.1400472111
30. Hajj Hussein I, Chams N, Chams S, El Sayegh S, Badran R, Raad M, et al. Vaccines through centuries: Major cornerstones of global health. Front Public Health 2015;3:269. doi:10.3389/fpubh.2015.00269
31. Greenwood B. The contribution of vaccination to global health: past, present and future. Philos Trans R Soc Lond B Biol Sci. 2014;369(1645):20130433. doi:10.1098/ rstb.2013.0433
32. Iwasaki A, Omer SB. Why and How Vaccines Work. Cell 2020;183(2):290-295. doi:10.1016/j.cell.2020.09.040
33. Riedel S. Edward Jenner and the history of smallpox and vaccination. Proc (Bayl Univ Med Cent). 2005;18(1):21-25. doi:10.1080/08998280.2005.11928028
105
Investigating Associations and Outcomes of Vaccines with Guillain-Barré Syndrome: A Review
34. Voigt EA, Kennedy RB, Poland GA. Defending against smallpox: A focus on vaccines. Expert Rev Vaccines 2016;15(9):1197-1211. doi:10.1080/14760584.2016.1 175305
35. Smith KA. Edward Jenner and the smallpox vaccine. Front Immunol. 2011;2:21. doi:10.3389/fimmu.2011.00021
36. Edward Jenner and the development of the first modern vaccine [Internet]. VBI Vaccines. 2021. [cited 2022 Feb 26]. Available from: https://www.vbivaccines.com/evlpplatform/edward-jenner-and-the-first-modern-vaccine/
37. Slike BM, Creegan M, Marovich M, Ngauy V. Humoral immunity to primary smallpox vaccination: Impact of childhood versus adult immunization on vaccinia vector vaccine development in military populations. PLoS One. 2017;12(1):e0169247. doi:10.1371/journal. pone.0169247
38. Janeway Jr. CA, Travers P, Walport M, et al. Immunobiology: The immune system in health and disease [Internet]. 5th edition. New York: Garland Science. 2001. Chapter 9. The humoral immune response. [cited 2022 Feb 26].
39. Abbas AK, Lichtman AH, Pillai S, Baker DL. Basic immunology: Functions and disorders of the immune system 2020; 73-118. Philadelphia: Elsevier
40. Frank SA. Immunology and evolution of infectious disease [Internet]. Princeton (NJ): Princeton University Press. 2002. Chapter 4. Specificity and cross-reactivity. [cited 2022 Feb 26]. Available from: https://www.ncbi.nlm.nih. gov/books/NBK2396/
41. Vaccine types [Internet]. HHS.gov. US Department of Health and Human Services. 2021. [cited 2022 Feb 15]. Available from: https://www.hhs.gov/immunization/basics/ types/index.html
42. Doherty M, Buchy P, Standaert B, Giaquinto C, PradoCohrs D. Vaccine impact: Benefits for human health. Vaccine. 2016;34(52):6707-6714. doi: 10.1016/j. vaccine.2016.10.025.
43. Han S. Clinical vaccine development. Clin Exp Vaccine Res 2015;4(1):46-53. doi:10.7774/cevr.2015.4.1.46
44. Salmon DA, Dudley MZ, Carleton BC. Guillain-Barré syndrome following influenza vaccines affords opportunity to improve vaccine confidence. JID. 2021;223: 355-8. doi: 10.1093/infdis/jiaa544
45. Greene SK, Rett MD, Vellozzi C, Li L, Kulldorff M, Marcy SM, et al. Guillain-Barré syndrome, influenza vaccination, and antecedent respiratory and gastrointestinal infections: A case-centered analysis in the Vaccine Safety Datalink, 2009-2011. PLoS One. 2013;8(6):e67185. doi:10.1371/ journal.pone.0067185
46. Perez-Vilar S, Hu M, Weintraub E, Arya D, Lufkin B, Myers T, et al. Guillain-Barré syndrome after high-dose influenza vaccine administration in the United States, 2018-2019 Season. J Infect Dis. 2021;223(3):416-425. doi:10.1093/ infdis/jiaa543
47. Guillain-Barre syndrome and vaccines: The risks and recommendations [Internet]. Children’s Hospital of Philadelphia. 2021. [cited 2022 Feb 27]. Available from: https://www.chop.edu/news/feature-article-guillain-barrsyndrome-gbs-vaccines-risks-and-recommendations
48. Vaccine types [Internet]. National Institute of Allergy and Infectious Diseases. [cited 2022 Feb 26]. Available from: https://www.niaid.nih.gov/research/vaccine-types
49. Hou J, Liu Z, Gu F. Epidemiology and prevention of hepatitis B virus infection. Int J Med Sci. 2005;2(1):50-57. doi:10.7150/ijms.2.50
50. Liang TJ. Hepatitis B: The virus and disease. Hepatology 2009;49(5 Suppl):S13-S21. doi:10.1002/hep.22881
51. Nelson NP, Easterbrook PJ, McMahon BJ. Epidemiology of hepatitis B virus infection and impact of vaccination on disease [published correction appears in Clin Liver Dis. 2017;21(2):xiii]. Clin Liver Dis. 2016;20(4):607-628. doi:10.1016/j.cld.2016.06.006
52. Shepard CW, Simard EP, Finelli L, Fiore AE, Bell BP. Hepatitis B virus infection: Epidemiology and vaccination. Epidemiol Rev. 2006;28:112-125. doi:10.1093/epirev/ mxj009
53. Lim JK, Nguyen MH, Kim WR, Gish R, Perumalswami P, Jacobson IM. Prevalence of chronic hepatitis B virus infection in the United States. Am J Gastroenterol. 2020;115(9):1429-1438. doi:10.14309/ ajg.0000000000000651
54. Tang LSY, Covert E, Wilson E, Kottilil S. Chronic hepatitis B infection: A review [published correction appears in JAMA 2018;320(11):1202]. JAMA. 2018;319(17):1802-1813. doi:10.1001/jama.2018.3795
55. Ott JJ, Stevens GA, Groeger J, Wiersma ST. Global epidemiology of hepatitis B virus infection: New estimates of age-specific HBsAg seroprevalence and endemicity. Vaccine. 2012;30(12):2212-2219. doi:10.1016/j. vaccine.2011.12.116
56. National progress report 2025 goal: Reduce HBV deaths [Internet]. Centers for Disease Control and Prevention. 2021. [cited 2022 Feb 26]. Available from: https://www.cdc.gov/hepatitis/policy/NPR/2021/ NationalProgressReport-HepB-ReduceDeaths.htm
57. The Children's Hospital of Philadelphia. Feature article - Guillain-Barré syndrome (GBS) & vaccines: The risks and recommendations [Internet]. Children's Hospital of Philadelphia. 2021. [cited 2022 Feb 26]. Available from: https://www.chop.edu/news/feature-article-guillain-barrsyndrome-gbs-vaccines-risks-and-recommendations
58. Kakar A, Sethi PK. Guillain Barre syndrome associated with hepatitis B vaccination. Indian J Pediatr. 1997;64(5):710712. doi:10.1007/BF02726131
59. Head VA, Wakerley BR. Guillain-Barré syndrome in general practice: Clinical features suggestive of early diagnosis. Br J Gen Pract. 2016;66(645):218-219. doi:10.3399/ bjgp16X684733
106
Investigating Associations and Outcomes of Vaccines with Guillain-Barré Syndrome: A Review
60. van den Berg B, Walgaard C, Drenthen J, Fokke C, Jacobs BC, van Doorn PA. Guillain-Barré syndrome: Pathogenesis, diagnosis, treatment and prognosis. Nat Rev Neurol 2014;10(8):469-482. doi:10.1038/nrneurol.2014.121
61. Guillain-Barre syndrome [Internet]. Mayo Clinic. 2021. [cited 2022 Feb 28]. Available from: https://www. mayoclinic.org/diseases-conditions/guillain-barresyndrome/symptoms-causes/syc-20362793
62. Khamaisi M, Shoenfeld Y, Orbach H. Guillain-Barré syndrome following hepatitis B vaccination. Clin Exp Rheumatol. 2004;22(6):767-770
63. Souayah N, Nasar A, Suri MF, Qureshi AI. Guillain-Barré syndrome after vaccination in United States: Data from the Centers for Disease Control and Prevention/Food and Drug Administration Vaccine Adverse Event Reporting System (1990-2005). J Clin Neuromuscul Dis. 2009;11(1):16. doi:10.1097/CND.0b013e3181aaa968
64. Chen Y, Zhang J, Chu X, Xu Y, Ma F. Vaccines and the risk of Guillain-Barré syndrome. Eur J Epidemiol. 2020;35(4):363370. doi:10.1007/s10654-019-00596-1
65. Ross, Christian H. The measles, mumps, and rubella (MMR) Vaccine [Internet]. Embryo Project Encyclopedia. ISSN: 1940-5030. 2017. [cited 2022 Feb 27]. Available from: http://embryo.asu.edu/handle/10776/11462
66. History of measles [Internet]. Centers for Disease Control and Prevention. 2020. [cited 2022 Feb 27]. Available from: https://www.cdc.gov/measles/about/history.html
67. Measles, mumps, and rubella (MMR) vaccination: What everyone should know [Internet]. Centers for Disease Control and Prevention. 2021. [cited 2022 Feb 27]. Available from: https://www.cdc.gov/vaccines/vpd/mmr/ public/index.html
68. Patja A, Paunio M, Kinnunen E, Junttila O, Hovi T, Peltola H. Risk of Guillain-Barré syndrome after measles-mumpsrubella vaccination. J Pediatr. 2001;138(2):250-254. doi:10.1067/mpd.2001.111165
69. da Silveira CM, Salisbury DM, de Quadros CA. Measles vaccination and Guillain-Barré syndrome. Lancet. 1997;349(9044):14-16. doi:10.1016/s01406736(96)07408-9
70. Koturoglu G, Kurugol Z, Tekgul H, Ozcan T, Dizdarer C. Two cases of Guillain-Barré syndrome during measles elimination campaign in Izmir. Minerva Pediatr 2008;60(6):1455-1457. PMID: 18971907
71. Esteghamati A, Gouya MM, Keshtkar AA, Mahoney F. Relationship between occurrence of Guillain-Barre syndrome and mass campaign of measles and rubella immunization in Iranian 5-14 years old children. Vaccine. 2008;26(39):5058-5061. doi:10.1016/j. vaccine.2008.07.014
72. Principi N, Esposito S. Vaccine-preventable diseases, vaccines and Guillain-Barre' syndrome. Vaccine. 2019;37(37):5544-5550. doi:10.1016/j. vaccine.2018.05.119
73. Di Pietrantonj C, Rivetti A, Marchione P, Debalini MG, Demicheli V. Vaccines for measles, mumps, rubella, and varicella in children. Cochrane Database Syst Rev 2020;4(4):CD004407. doi:10.1002/14651858. CD004407.pub4
74. Vaccines for measles [Internet]. Centers for Disease Control and Prevention. 2021. [cited 2022 Feb 27]. Available from: https://www.cdc.gov/measles/vaccination. html
75. Balkhair AA. COVID-19 pandemic: A new chapter in the history of infectious diseases. Oman Med J. 2020;35(2):e123. doi: 10.5001/omj.2020.41
76. Hasöksüz M, Kiliç S, Saraç F. Coronaviruses and SARSCoV-2. Turk J Med Sci. 2020;50(SI-1):549-56. doi: 10.3906/ sag-2004-127
77. Park JW, Lagniton PN, Liu Y, Xu RH. mRNA vaccines for COVID-19: What, why and how. Int J Biol Sci 2021;17(6):1446. doi: 10.7150/ijbs.59233
78. Dolgin E. The tangled history of mRNA vaccines. Nature 2021;597(7876):318-24. doi: 10.1038/d41586-02102483-w
79. Katella K. Comparing the COVID-19 vaccines: How are they different? [Internet]. Yale Medicine. 2022. [cited 2022 Feb 28]. Available from: https://www.yalemedicine.org/ news/covid-19-vaccine-comparison
80. Katella K. J&J vaccine and Guillain-Barré syndrome: Information on the FDA warning [Internet]. Yale Medicine. 2021. [cited 2022 Feb 28]. Available from: https://www. yalemedicine.org/news/covid-vaccine-guillain-barresyndrome
81. European Medicines Agency. Covid-19 vaccine safety update - VAXZEVRIA, AstraZeneca AB [Internet]. European Medicines Agency. 2021. [cited 2022 Apr 22]. Available from: https://www.ema.europa.eu/en/documents/ covid-19-vaccine-safety-update/covid-19-vaccinesafety-update-vaxzevria-previously-covid-19-vaccineastrazeneca-6-october-2021_en.pdf
82. Maramattom BV, Krishnan P, Paul R, Padmanabhan S, Cherukudal Vishnu Nampoothiri S, Syed AA, et al. GuillainBarré syndrome following ChAdOx1-S/nCoV-19 vaccine. Ann Neurol. 2021;90(2):312-4. doi: 10.1002/ana.26143
83. Allen CM, Ramsamy S, Tarr AW, Tighe PJ, Irving WL, Tanasescu R, et al. Guillain–Barré syndrome variant occurring after SARS-CoV-2 vaccination. Ann Neurol 2021;90(2):315-8. doi: 10.1002/ana.26144
84. Woo EJ, Mba-Jonas A, Dimova RB, Alimchandani M, Zinderman CE, Nair N. Association of receipt of the Ad26. COV2. S COVID-19 vaccine with presumptive Guillain-Barré syndrome, February-July 2021. JAMA 2021;326(16):1606-13. doi:10.1001/jama.2021.16496
85. García-Grimshaw M, Michel-Chávez A, Vera-Zertuche JM, Galnares-Olalde JA, Hernández-Vanegas LE, FigueroaCucurachi M, et al. Guillain-Barré syndrome is infrequent among recipients of the BNT162b2 mRNA COVID-19 vaccine. Clin Immunol. 2021;230:108818. doi: 10.1016/j. clim.2021.108818
107
The Response of Health Professional Education to Climate Change: A Narrative Review
Brooke N. Stevens1*, Faika T. Ambrin1*, Devon DellaValla1*, Janet T. Nguyen1*, Amal M. Madar1* , and Terevid M. Ahlakor1*
¹Geisinger Commonwealth School of Medicine, Scranton, PA 18509
*Master of Biomedical Sciences Program
Correspondence: brooke.n.stevens@gmail.com
Abstract
Background: Climate change poses an increasingly severe threat to human health. Health care professionals and medical educators are in a unique position to provide impactful information on the health complications posed by climate change to their patient populations. We conducted a narrative review to characterize how climate change has been addressed by health professional schools. We sought to find the scope of climate-health awareness at health professional institutions as well as how climate-related implementations have changed or developed over time.
Methods: We searched PubMed as our primary database. We vetted health professional schools for curricular and sustainability campaigns such as recycling and sustainability campaigns, rationing use of energy and/or water, management of waste and/or pollution, transportation initiatives, or other initiatives to reduce or offset their carbon footprint. In addition to medical schools, we included schools of nursing, pharmacy, dentistry, nurse practitioner, optometry, osteopathy, podiatry, and chiropractic medicine. All levels of screening were done in duplicate. The results were summarized qualitatively.
Results: A select number of schools have implemented an elective course or two on climate-health and sustainability. We found several schools showing an awareness of climaterelated issues through sustainability initiatives. A larger theme was that of the “call to action,” alerting the community to the increasing risk of climate-related health complications in patient populations.
Conclusion: By implementing more climate-health related curricula into higher health education, future health care providers will be better equipped to provide better care for communities impacted by climate change. The awareness of climate-related health issues has increased, although few institutions have implemented curricular changes or other sustainability initiatives into their programs.
Introduction
Climate change has increasingly been recognized as a global threat leading to damaging effects on human health. The 2020 Lancet Countdown on health and climate change indicated a rise in unhealthy diets and transmission of climate-sensitive infectious diseases in relation to environmental degradation (1). For example, from 2018 to 2020, malaria transmission in mountainous regions was 38.7% higher due to increasing temperatures eroding altitude barriers that once protected against malaria transmission (1). Additionally, lightning strikes, arid conditions, and consequent wildfires have been on the
rise. Firefighters and people living where wildfires commonly occur are subjected to direct and indirect health hazards such as burns, heat stroke, dehydration, smoke inhalation, PTSD, insomnia, and depression (2–3). In the context of health care, out of 2.5 million hospitalizations, patients recorded with cardiovascular events were identified as Medicare recipients (>65 years of age) who resided within 200 km of large wildfires of hazardous particulate matter caused by large wildfires (2). Climate-related issues exacerbate the debilitated health of the aging demographic, with a gradual increase in heat-related mortality for those 65 years of age and older (1). From an ecological lens, climate change can not only have deleterious effects on ecosystems but is also marked by temperature deregulation, which increases the likelihood of disease transmission between animals and humans. The increasing abundance of pollutants such as carbon monoxide, particulate matter, or sulfate particles from fuel combustion have placed more people at risk for developing respiratory illness, cardiovascular disease, or even cerebrovascular illness, and cancer (4–5). While temperature levels continue to rise globally, Europe and vulnerable regions in the eastern Mediterranean have sustained approximately 10% heat rise over the last three decades (1). Formulating protocols with assistance of public health guidelines for such circumstances can aid communities to recover or increase robust protection from climate-related events. The World Health Organization (WHO) estimated the annual death from air pollution to be approximately 7 million people per year (6). This does not include other causes of mortality associated with climate change such as heat and toxic related exposures, food insecurity, and mental health problems (7). As a central part of health care prevention and response efforts, the medical community is beginning to acknowledge and understand its role in addressing climate-related effects on the health of patients and communities (8).
A common misconception is that climate change is more of an environmental rather than a medical issue. In early September 2021, the same editorial was published in more than 200 medical and health journals. The editorial called the world to action to combat climate change (9). Despite an increasing focus in medical journals like The Lancet, the educational response to climate change by the United States (U.S.) health care system has been limited (1). Medical professionals have an obligation to become better educated on mitigating adverse health effects on patients. Health professional schools can equip communities to properly handle physiological ailments caused by exposure pathways. Currently, there is an ongoing effort to enforce climate-related coursework in medical education, but problems arise as students are unable to understand foundational concepts and professors struggle to properly convey relevant
Scholarly Research In Progress • Vol. 6, November 2022
108
information (10). Medical students at institutions like Emory University have voiced their concerns for lack of education in this regard and have become leading pioneers in bringing awareness to climate-health and its effects (11). The effective implementation of climate-related educational practices by the medical community can lead to the delivery of medical services that are coherent with the environmental conditions affecting patients, thus prompting our investigation. Although climate change continues to be of concern, medical schools around the world have also been slow to respond to this health care threat (6). There appears to be a knowledge gap regarding climate change in all stages of medical education. A study published in 2021 surveyed practicing physicians and other health care professionals on different topics related to climate change (12). Although 95% of the health care professionals surveyed acknowledged that climate change is an ongoing crisis, approximately 41% stated that they haven’t educated the public about climate change as they are unaware of the full scope of the topic (12). A 2019 systematic review of peer-reviewed literature also showed that while health practitioners and other health care professionals are aware of their duty to advocate and educate on climate change, efforts to do so are fragmented and insufficient (13). While there was a strong emphasis for educational strategies (92%) and developing curricula to teach future providers about climate change, the initiative to implement these changes is still under progress (13). If medical professionals can be better educated on climate-health and its effects, they can better respond to and educate individuals in their communities about the ongoing crisis. Having limited knowledge of how health science schools have been responding to climate change, our team aimed to dive deeper into this topic. Physicians, along with other health care providers, have been encouraged to become educated about climate change and its effect on human health. To effectively treat a population that is increasingly falling victim to environmental dangers, it is imperative to prepare health professionals for the evolving challenges posed by climate change. Therefore, health science institutions and continuing medical education providers should incorporate climate change–related coursework into curricula (14).
The greatest population at risk of climate-health related complications are working-class individuals and those that are below the poverty line (2). Those living in poverty have difficulty recovering from climate change related events. For instance, those who rely on agriculture or fishing as a main food source are greatly affected by natural disasters, such as droughts and hurricanes (15). In particular, African American patients tend to suffer from injuries due to severe flooding and develop chronic illnesses from air pollutants (16). The lack of knowledge surrounding climate change as it relates to medical practice impairs a provider’s ability to recognize and anticipate conditions that may be a result of the patient’s surroundings, thereby resulting in a less impactful treatment plan. Bridging clinical practice and climate-health awareness will most benefit patients who are directly exposed to climate change, as well as guide health care professionals in building progressive models of medical care. Research and education in this area can potentially have a significant, long-term, community-based effect that will improve health outcomes. Currently, medical schools are realizing that there is a deficit in institutional efforts
and educational materials to train future medical professionals on how to respond to climate change–related health threats (17). Thorough assessment of how we can adopt beneficial lesson plans and curricular resources, will lead us in the direction of progress. For instance, providing specific learning objectives on how to diagnose and manage climate-related conditions can help students understand the relationship between climate change and health outcomes. Student assessments on skills like clinic energy audits can improve both human and planetary health (8). Implementing curricula will aid students develop critical thinking strategies, multidisciplinary perspectives, and public health literacy which are essential skills for future physicians to have when operating in a changing environment (3). By analyzing this gap, the medical community will directly benefit in being able to identify next steps in educating students about climate change and in turn leading to well-informed patient care.
In this narrative review, we sought to identify the prevalence of climate-health-related initiatives being implemented at health professional educational institutions and their associated health systems. Specifically, we pursued the following questions: Are health professional schools addressing climate change with curricular changes and other sustainability initiatives such as recycling and sustainability campaigns, rationing use of energy and/or water, management of waste and/or pollution, transportation initiatives, or other initiatives to reduce or offset their carbon footprint? Have health professional institutions voiced their awareness of climate-related health issues with a “call to action”? How have climate-related measures undertaken by health professional schools changed over the years? Determining the scope of climate change awareness within health professional institutions and the climate management strategies the institutions have or will be implementing will inform climate-health initiatives to ultimately combat climaterelated health complications in patient populations. Further, the information gathered will assist the health professional community in making decisions about climate-health curriculum implementation and other sustainability initiatives on their campuses.
Methods
To explore this topic, peer-reviewed reports were characterized in English from 1999 to 2021. We chose to start with 1999 for a date range due to the limited climate change-related material prior to 1999. We searched for terms synonymous with climate change, global warming, planetary health, programs, courses, and curriculum. We met again during the charting process to include search terms that captured the sustainability initiatives related to climate change. The PubMed database was queried for these terms. We did not search any gray literature and did not do any hand searching. The regions we searched included primarily the United States as well as Western Europe. In our study, Western Europe is defined as any European country west of Germany and Austria, including Mediterranean countries and regions such as Greece and Cyprus respectively.
We included studies related to schools of medicine, nursing, pharmacy, dentistry, nurse practitioner, optometry, osteopathy, podiatry, physician assistant, physical therapy, occupational therapy, and chiropractic medicine, and public health. We
The Response of Health Professional Education to Climate Change: A Narrative Review
109
excluded studies on veterinary medicine as we are interested in the effects climate change education would have on the health of humans. As we wanted to keep the aims of this review closely associated with medical education and health professionals with prescribing authority, we excluded studies related to undergraduate and K–12 programs. We showed the selection of the articles using a flow chart (Figure 1). The final protocol was registered prospectively with the Open Science Framework.
Citations for all articles reviewed were stored in EndNote. Articles were vetted by title and abstract to identify those relevant to the study. This initial review was completed in duplicate. Articles were then advanced to full-text review, which was also conducted in duplicate. Next, articles were coded by the type of initiatives that implementations were proposed by the educational institutions. Implementations were defined as the addition of climate change material into curriculum; this also included proactive implementations such as recycling and sustainability campaigns, rationing use of energy and/or water, management of waste and/or pollution, transportation initiatives, or other initiatives to reduce or offset their carbon footprint. We illustrated the number of relevant articles published annually and frequency of the previously described curricular and sustainability implementations with figures generated using GraphPad Prism (Figure 2). Individual sources of evidence are presented as well as a synthesis of the results (Figure 3).
Results
During the screening process, 530 articles were identified. After duplicates were removed, 39 articles were advanced to full-text screening. Those that failed the title and abstract screening usually did not contain any information about climate change or health education. Articles that did not pass the full-text screening largely did not include any sort of implementation. Although “calls to action” were recorded, they were not included in the synthesis if they did not include one of the aforementioned implementations. For data extraction, 19 articles were moved forward and included in the synthesis if they contained any sort of implementation (Figure 1).
An overarching theme we found in the literature was a “call to action” and other similar editorial pieces. These were not necessarily reporting implementations or curricular changes but instead reported on the need for such changes. Additionally, we found the most practiced implementation was that of curricular changes. Institutions such as Stanford University, the University of Minnesota Medical School, Carle Illinois College of Medicine, and the Icahn School of Medicine at Mount Sinai have developed curricular material aimed at tackling climate change–related health complications and increasing awareness of such complications (6). However, these courses have been incorporated into the curricula as electives and were not required at any of the mentioned institutions.
Discussion
A theme that emerged from the literature was that of cutting carbon emissions from health care systems. According to The New York Times, the health care industry accounts for 5% of carbon emissions globally; if it were a country, it would be the
Total articles identified (n = 530)
Articles after duplicates removed (n = 340)

Articles assessed for full-text eligibility (n = 39)
Articles included in qualitative synthesis (n = 19)
Databases searched: Pubmed
Abstracts excluded (n = 301)
Full-text excluded (n = 14)
Figure 1. Selection flowchart denoting number of articles passing each stage of charting process.
Figure 2. Frequency of the implementations found within articles qualifying for full-text review.
fifth-largest producer of carbon emissions (19). In answering our question about whether health professional schools are addressing climate change with curricular and other sustainability measures, our results indicate that there has been little movement. A handful of schools have been proactive about implementing elective courses for their students but
 The Response of Health Professional Education to Climate Change: A Narrative Review
110
Figure 3. The number of “calls to action” with and without an accompanying implementation described in the article including “letter to the editor” publications.


have offered little in the way of an incorporation into the overall required curriculum. The implementation of curricular changes takes time, resources, and energy. This may be a major reason for the delay in health professional schools developing robust climate-sensitive protocols to match the quickly worsening climate condition. Nevertheless, as cited earlier in our paper, the health effects of worsening planetary health are daunting and as a result, we expected to see more substantive documentation of initiatives taking place.
For the limitations of this project, a major limitation we faced was the fact that institutions could be implementing proactive measures but have not published any literature describing such an implementation. For example, an institution could have a longstanding recycling program but make no mention of it in any sort of literature. A second limitation was that we decided to not conduct a gray literature search. We acknowledge that there may have been key omissions of useful initiatives in the implementation of climate-health in medical curricula. A proposed gray literature search through the websites of respective medical schools to find any potentially sustainability initiatives was proposed but ultimately scrapped. Due to time constraints, we had to make several decisions in an attempt to optimize our search. Searching gray literature would be a recommended step for further research. We chose just one database, PubMed, to search at this time rather than the several we would have liked to utilize. It may also be the case that some of the climate-related curricula being implemented by institutions are simply not published in papers, thereby preventing us from quantifying such actions. In the future, this research could be expanded upon in several ways. First, we covered a narrow range of literature pertaining to the U.S. and Western Europe. Any further research could encompass the rest of the world in addition to the locations we researched.
Second, we only used a single database to conduct our search. As we continue our research, we intend to search more extensive databases such as EMBASE, which may provide a more holistic search of the literature.
Conclusions

Our results indicated that curricular changes were the most frequent implementation that was noted in the literature. From our findings, this appears to be the most prevalent means of addressing the increasing issue of climate change in the medical community. Additionally, the number of articles seemed to sharply increase in the last three years. This would signify the increased awareness of climate-related health implications. Our project objective was to explore how health care professional schools are adapting to climate-change. From our analysis, we can conclude that health professional schools agree that they play a role in mitigating climate-related health impacts. While schools have been implementing some programs, such as elective courses, we hope to see more institutions creating courses that educate and train professionals to better address the overlap of health and environmental factors. Still, there have been numerous health-related organizations stating “call to action” plans which emphasize the urgency of handling climate change in the medical sphere. Our results show that the current state of health care is gradually moving toward better readiness for issues stemming from climate change. We hope our research emphasizes the importance of including climate in future discussions relating to health and medicine and provides an outline of what has been done so far at an organizational level. Other notable implementations have been made by a proactive group of medical students. Hampshire et al. have made strides when it comes to quantifying the efforts of medical schools to be more environmentally cognizant. The group of medical students at the University of California, San Francisco (UCSF) has created a scorecard initiative to grade medical schools around North America and the British Isles on their environmental implementations. This initiative took place over the course of two years with surprising results. The pooled North American schools received an overall score of B-, with a C in the curriculum and an A- in the research categories (20). This shows that medical schools are aware of the environmental implications on human health but have yet to take those first steps to enact implementations that will lessen the impact of poor planetary health on community health. The results of our review support that conclusion. Very little literature was uncovered in the search. While it is exciting to be at the forefront of this relatively novel topic of research, we must reiterate the importance of acknowledging the impact of planetary health on human health.
Acknowledgments
This paper and the research behind it would not be possible without the support of our mentors, Dr. Michael Gionfriddo and Dr. Reema Persad-Clem. Their guidance and attention to detail has been inspiring and indispensable while completing this project. Dr. Brian Piper and Elizabeth Kuchinski have also shared invaluable information and resources to aid us in this endeavor.
The
Response of Health Professional Education to Climate Change: A Narrative Review
111
Disclosures
We have no financial conflicts of interest to disclose for this research.
References
1. Watts N, Amann M, Arnell N, Ayeb-Karlsson S, Beagley J, Belesova K, et al. The 2020 report of The Lancet Countdown on health and climate change: responding to converging crises. Lancet [Internet]. 2021;397(10269):129–70.
2. Xu R, Yu P, Abramson MJ, Johnston FH, Samet JM, Bell ML, et al. Wildfires, global climate change, and human health. N Engl J Med [Internet]. 2020;383(22):2173–81.
3. Wellbery C, Sheffield P, Timmireddy K, Sarfaty M, Teherani A, Fallar R. It’s time for medical schools to introduce climate change into their curricula. Acad Med [Internet]. 2018;93(12):1774–7.
4. Smith KR, Woodward A, Campbell-Lendrum D, Chadee DD, Honda Y, Liu Q. Human Health: Impacts, Adaptation, and Co-Benefits. In: Climate Change 2014-Impacts, Adaptation and Vulnerability: Part A: Global and Sectoral Aspects. Cambridge University Press; 2015. p. 709–54.
5. Nogueira LM, Yabroff KR, Bernstein A. Climate change and cancer. CA: a cancer journal for clinicians. 2020;70:239–44.
6. Goshua A, Gomez J, Erny B, Burke M, Luby S, Sokolow S, et al. Addressing climate change and its effects on human health: A call to action for medical schools: A call to action for medical schools. Acad Med [Internet]. 2021;96(3):324–8.
7. Philipsborn RP, Sheffield P, White A, Osta A, Anderson MS, Bernstein A. Climate change and the practice of medicine: Essentials for resident education: Essentials for resident education. Acad Med [Internet]. 2021;96(3):355–67.
8. Maxwell J, Blashki G. Teaching about climate change in medical education: An opportunity. J Public Health Res [Internet]. 2016;5(1):673.
9. Atwoli L, Baqui AH, Benfield T, Bosurgi R, Godlee F, Hancocks S, et al. Call for emergency action to limit global temperature increases, restore biodiversity, and protect health. Lancet Reg Health Am [Internet]. 2021;2(100070):100070.
10. Osama T, Brindley D, Majeed A, Murray KA, Shah H, Toumazos M, et al. Teaching the relationship between health and climate change: a systematic scoping review protocol. BMJ Open [Internet]. 2018;8(5):e020330.
11. Rabin BM, Laney EB, Philipsborn RP. The unique role of medical students in catalyzing climate change education. J Med Educ Curric Dev [Internet]. 2020;7.
12. Kotcher J, Maibach E, Miller J, Campbell E, Alqodmani L, Maiero M, et al. Views of health professionals on climate change and health: a multinational survey study. Lancet Planet Health [Internet]. 2021;5(5):e316–23.
13. Graham R, Compton J, Meador K. A systematic review of peer-reviewed literature authored by medical professionals regarding US biomedicine’s role in responding to climate change. Prev Med Rep [Internet]. 2019;13:132–8.
14. Crowley RA, Health and Public Policy Committee of the American College of Physicians. Climate change and health: A position paper of the American College of physicians. Ann Intern Med [Internet]. 2016;164(9):608–10.
15. Leichenko R, Silva JA. Climate change and poverty: vulnerability, impacts, and alleviation strategies: Climate change and poverty. Wiley Interdiscip Rev Clim Change [Internet]. 2014;5(4):539–56.
16. Sarfaty M, Mitchell M, Bloodhart B, Maibach EW. A survey of African American physicians on the health effects of climate change. Int J Environ Res Public Health [Internet]. 2014;11(12):12473–85.
17. Howard B. Climate change in the curriculum [Internet]. AAMC. 2019. Available from: https://www.aamc.org/newsinsights/climate-change-curriculum
18. Tricco AC, Lillie E, Zarin W, O’Brien KK, Colquhoun H, Levac D, et al. PRISMA extension for Scoping Reviews (PRISMA-ScR): Checklist and explanation. Ann Intern Med [Internet]. 2018;169(7):467–73.
19. Choi-Schagrin W. More than 40 nations pledge to cut emissions from their health industries. The New York Times. New York Times. 2021 Dec 1;
20. Hampshire K, Islam N, Kissel B, Chase H, Gundling K. The Planetary Health Report Card: a student-led initiative to inspire planetary health in medical schools. The Lancet Planetary Health. 2022.
The Response of Health Professional Education to Climate Change: A Narrative Review
112
The Effects of Chronic Stress on Neuroanatomy and Cognitive Function
Niki K. Viradia1*, Jesica M. Godinez Paredes1*, and Syed A. Hassan1*
1Geisinger Commonwealth School of Medicine, Scranton, PA 18509
*Master of Biomedical Sciences Program
Correspondence: nviradia@som.geisinger.edu; jgodinez@som.geisinger.edu; shassan@som.geisinger.edu
Abstract
Stress plays a central role in functioning for all life forms. As humans, we experience stress in a multitude of ways through various types of stimuli. Due to the constancy of stressors in our lives, the nervous system has learned to allosterically adapt to the stimuli, but when the body cannot adapt, chronic stress can have morphological and degenerative impacts on neuroanatomy and cognitive function that may or may not be reversible. This literature review aimed to identify the specific neuroanatomical structures impacted most by the long-term effects of chronic stress and the subsequent relationship the morphological changes had on cognitive function in rodent models. We examined articles published from PubMed, Google Scholar, and Science Direct, while focusing the search on anatomical and neurodegenerative effects associated with chronic stress stimuli. The degenerative effects of various types of simulated physiological chronic stress showed the most impact on neurogenesis and neuronal development, brain plasticity, and spatial learning and memory with association to the hippocampus. The hippocampus, amygdala, prefrontal cortex, and hypothalamic-pituitary-adrenal axis (HPA) all had reversible and non-reversible morphological alterations, which also had a direct impact on the brain’s cognitive abilities. While studies regarding chronic stress are still being conducted, future research may be able to further highlight why stressful stimuli can particularly impact these structures and the tangential impacts that it may have on related or adjacent structures.
Introduction
Chronic stress has become a commonplace occurrence from the constant pressures of the evolving world. Stress is categorized as any intrinsic or extrinsic stimulus that evokes a biological response, with the compensatory responses to these stimuli labeled as stress responses (1). Stressors can have an influence and impact on psychosocial health, physiological health, and even how the body maintains homeostasis (2). While the central nervous system is primed to produce integrated coping responses, it is the autonomic nervous system that engages in the fight, flight, or coping mechanisms that help the body adjust and adapt to the stressful stimuli that it may encounter (3). Some stress may be instantaneous, but if the stimuli persist over a long period of time, it is generally referred to as chronic stress. How an individual reacts to the strain that long-exposed stimuli pose can affect both mental and physical health, with chronic stress having a more permanent effect on the body than short term stressors (4). Additionally, the time course of stress responses can be measured by the neuroendocrine and behavioral responses of the body, which can identify how destabilizing the stimulus makes the stress manageable or
harmful (1). How the stressors are processed, in turn, can take a remarkable toll on the development and functioning of the brain and nervous systems.
The brain plays a key integratory role in processing stimuli in the adaptation to stress. Stress and stimuli, however, are information that stimulate behavioral and physiological responsiveness between the brain and other systemic functions (4). Beyond the acute responses to stress that life may pose, allostatic load is considered the integral feature of chronic stress that leads to degenerative effects (5). Allostatic load includes innate and adaptive processes that help to maintain homeostasis through mediator chemical messengers like adrenaline and cortisol (6). With allostatic load comes the heightened wear and tear on the central and peripheral nervous systems, even down to the cellular level (7–8). In this systematic review, we identify key neurological structural changes that may be induced by chronic stress and put into context how these changes can impact behavioral or mental health as well.
Methods
We examined relevant articles from 1950 to 2021 and focused our search on the effects of chronic stress in cognitive function in associated structures in the brain. We used a combination of terms including chronic stress, stress, aging, spatial learning, brain plasticity, neuronal degeneration, hippocampus, amygdala, and prefrontal cortex, and used the Boolean operators AND and OR. We searched three electronic databases (Google Scholar, PubMed, and ScienceDirect) using keywords, backwards, and forward searches to achieve higher quality literature search following the Preferred Reporting Item for Systematic Review and Meta-Analysis Protocols (PRISMA-P) guidelines (Figure 1). We excluded publications that were not in English, did not follow information systems (IS) framework and were not peer reviewed.
Discussion
Neuronal deterioration
Stress is the body’s normal response to stimuli. All organisms have a physiological response to stress, and in humans, stress begins from embryogenesis and continues throughout adulthood (9). During a period of chronic stress, the body physiologically accommodates to the stressor, as high levels of glucocorticoids are released into the bloodstream in a fightor-flight response. Physiological stress is divided into three different categories: developmental stress, environmental stress, and aging (9). Developmental stress includes any changes during embryogenesis that can be influenced by nutrient availability, oxygen, and exposure to chemicals during
Scholarly Research In Progress • Vol. 6, November 2022
113
development. Environmental stress is the physiological accommodation our bodies have to external environmental cues, from changes in weather to exposure to pollution and ultraviolet radiation, among others. Finally, as we become older, our cells can lose the ability to fight pathogens, protect against reactive oxygen species, and regenerate as they are affected by telomerase activity (9). Therefore, physiological stress is an accumulation of external stimuli that influence internal cues for our bodies to adapt. By understanding stress as a component of our lives, it is important to acknowledge its impact on the body, especially the brain, as neurons are nonregenerative and form part of the control center of the nervous system.
The impact of stress at the cellular level has been investigated for more than 40 years. Initially, researchers looked at neuronal response in the model organism C. elegans and discovered the change of processing information in response to hypoxiaenvironmental stress (9–10). Neuronal cells consume 20% of glucose in the body and rely on high amounts of oxygen to generate adenosine 5'-triphosphate (ATP) during aerobic glycolysis to maintain cellular and physiological processes (11). In hypoxic or low oxygen states, there can be phenotypic changes to the brain that alter relay mechanisms (11). Factor-1 hypoxia inducible factor (HIF-1) senses low oxygen levels in neurons and induces transcriptional changes to
maintain homeostasis in the brain by targeting angiogenesis, erythropoiesis, cell death and energy metabolism (12). An analysis done with mouse models found phenotypic changes in neuronal plasticity, reduction in dendrite migration, and axonal guidance through HIF-1 response (9).
From a young age, we are exposed to ultraviolet (UV) rays from the sun. As we age, our cells accumulate cellular DNA damage from UV-B and UV-A rays. It is commonly thought that excessive exposure to UV radiation affects only epithelial cells and melanocytes, causing skin cancers. However, UV radiation affects neuronal cells similarly, inducing nuclear and mitochondrial damage (9). In normal cells throughout the body, UV-induced DNA damage causes cell checkpoint inhibition during the cell cycle to accommodate polymerase repair systems. Neuronal cells also undergo checkpoint inhibition, but this process has been correlated with early cell death and low response to other environmental stress (9). Research found that DNA damage in neuronal cells due to reactive oxygen species (ROS) has a role in advancement of neurodegenerative diseases, such as Alzheimer’s and Parkinson’s disease (13). Accumulation of ROS suppresses DNA repair and calcium cycling in electrical impulses which can lead to disease (12). Although neurodegenerative disorders are more relevant in connection to aging, it is important to note the environmental stress factors contribute to cell death. Investigations performed in mice in laboratory-controlled environments found that synaptic density in the olfactory bulbs decreases with age (9). In aging humans, there is a loss of neuronal density in the cerebral cortex that manifests as memory impairments associated with neurodegeneration.
It is part of human nature to encounter stressful situations. Our bodies have developed a fight-or-flight response as a form of adaptation, and it can lead to increased levels of anxiety and depression. Long-term, stressful situations can change the brain morphology in the prefrontal cortex, ultimately affecting the limbic system (14). Gamma aminobutyric acid (GABA) acts on GABA receptors, inhibiting cAMP and the release of calcium. An increased imbalance of GABA is associated with anxiety and depression. An experimental study in animal models for depression that measured GABA imbalance during chronic stress, observed the effect in the cortex (13). During long periods of chronic stress, there were fewer active GABAergic neurons, increased glial cell pathologies, and reduced orbitofrontal cortex volume (13–14). In the long term, fewer GABAergic neurons affect the way we respond to stress, impacting the responsiveness of the amygdala which is responsible for emotional processing (15). The decrease of GABA in the amygdala leads to excitability and further increases the stress-induced response in the hypothalamus.
Another study measured chronic stress expression of the polysialylated form of the neural cell adhesion molecule (PSANCAM) (16). This molecule was used to track molecular and morphological changes of the inhibitory amygdala interneurons associated with GABA (16). Fewer dendritic arborization of interneurons and PSA-NCAM expression were found to be associated with decreased neuroplasticity (17–18).
Brain plasticity
While the effect of chronic stress can lead to behavioral, neuroendocrine, and autonomic changes, persistent negative

The Effects of Chronic Stress on Neuroanatomy and Cognitive Function
114
Figure 1. PRISMA Flow Diagram. Adapted from (77)
stimuli can also alter the brain’s innate plasticity (19). Brain plasticity can be described as the development of neuronal synapse, neuronal connections, and the contribution to brain development. Brain development is widely examined using mouse models, and it has been noted that brain structure differs in individuals, influenced by genetic and environmental components such as diet, hormones, chemical exposure, and stress (20). There are seven different stages of brain development and brain plasticity from cell birth during prenatal embryogenesis to cell death and synaptic pruning. During neurogenesis, approximately 250,000 neurons are created per minute (20). These newly created neuronal cells migrate to their destination of major brain structures with the support of glial cells and astrocytes forming the brain cortex (20). At their target locations, neuronal cells grow and create synapses to form the neural crest (20). Cell pruning is a stage of brain development and neural plasticity. It balances neurogenesis and the synapse formation and is a way for the brain to create sensory pathway formation. At this stage stress influences the rate of neuronal cell death and synapse remodeling.
Brain plasticity is ubiquitously involved in our behavior, and it is known that synapse modeling is responsible for human behavior. Plasticity is directly influenced by external and internal factors — the development of neural synapses is dependent on experience, time, and age, and therefore can vary from person to person at various life stages (20). In mouse model studies, the effect of stress on brain plasticity at early age showed decreased spinal density and neuronal length in the prefrontal
and occipital cortex, whereas in adults, there was a decrease in mass in both in the prefrontal cortex and an increase in mass in the occipital cortex (21). Although this area of investigation allows for more research, it is important to note the influence of stress at different stages of neural plasticity and its impact in major brain areas.

Along with the dendritic spines of neurons, the structures that are commonly associated with brain plasticity include the prefrontal cortex, HPA, amygdala, and hippocampus (Figure 2) (22). Chronic stress can affect any of these structures in a way that alters the long-term potentiation abilities of the brain (23). The HPA axis is responsible for the interactions between the hypothalamus, pituitary gland, and adrenal glands (24). This axis is central to homeostatic processes, stress response, energy metabolism, and generalized neuropsychiatric functions via modulation by glucocorticoids (25). As the main regulator of the HPA axis, the brain is an etiological link between stress and HPA dysregulation when stress-induced plasticity affects the glucocorticoid release and regulation of the neural circuitry of the HPA axis (25). Glucocorticoids, in particular corticotropin-releasing hormone (CRH) released from the hypothalamic paraventricular nucleus, subsequently release the neurotransmitters GABA, glutamate, and norepinephrine (26). All three are involved in the body’s fight-or-flight response to stress, and when the body is dealing with excessive or chronic stressors, the HPA axis is forced into overdrive which can overwhelm the brain from forming the neural circuitry required for optimal brain plasticity (27).
Figure 2. Schematic interpretation of the regulation of the HPA axis when presented with chronic stress. Stress is interpreted by the brain in the prefrontal lobe along with the hypothalamic-pituitary-adrenal axis. The input of stress triggers the hypothalamus to release corticotropin-releasing hormone (CRH) via positive feedback to the anterior pituitary gland, which releases adrenocorticotropic hormone (ACTH) via positive feedback to the adrenal cortex. The adrenal glands will eventually release cortisol, a stress hormone, which will send negative feedback signals to the pituitary gland and hypothalamus, respectively.
The Effects of Chronic Stress on Neuroanatomy and Cognitive Function
115
The Effects of Chronic Stress on Neuroanatomy and Cognitive Function
The amygdala is responsible for the way we react to emotional stressors and external stimuli (19). During periods of chronic stress, the amygdala is hyperactivated and further stimuli is enough to generate an activation of the limbic system leading to depression and anxiety (19). Amygdala activation, through basolateral pathways, is responsible for the creation of memories (28). This memory consolidation can be different based on the stimuli (28). The basolateral intrinsic pathway is responsible for the excitatory response of the limbic system, and in vivo experiments found that during prolonged periods of stress the basolateral amygdala becomes hyper-excited and shows a reduction in GABA receptor response (28). Chronic stress in the basolateral amygdala is also correlated to increased dendritic arborization and spine density in neurons, alongside increased levels of glucocorticoid levels in the blood (29). Additionally, a feedback mechanism increased excitation in the brain was also observed, producing morphological changes in the brain, and maladaptive responses relating to anxiety and hypervigilance to cope with chronic stress stimuli (30).
The prefrontal cortex oversees cognitive control, major decision-making, comprehending external stimuli, memory formation, and emotional regulation (32). During the fight-orflight response, the prefrontal cortex can analyze the situation and formulate an appropriate response to the situation (31). During executive decision making, it is also responsible for modulating the amygdala and hippocampus (33). The stimuli and activation of the prefrontal cortex creates synapses to improve the response control of the brain, and during long periods of stress, decreased activity of the prefrontal cortex is associated with cognitive impairment and cognitive deficits (31). These maladaptive responses are predominantly correlated to HPA dysregulation (31). Although these are underlying brain functioning systems, the response to chronic stress varies among people, due to genetics, hormones, sex, and social characteristics (34).
Hippocampal degeneration and cognitive function
Spatial memory, according to cognitive psychology and neuroscience, is a form of memory that is used for the recording and recall of information, formation and assimilation of semantic memories, and the creation and storage of schematic spatial maps (35). The hippocampus and the adjacent medial temporal lobe are the two structures that are imperative for declarative memory; however, the functional distinctions from the hippocampus and lobe have not yet been conclusively determined (36). The hippocampus is crucial for allocentric spatial memory, which allows humans to remember spatial locations despite shifts in viewpoint (36). Electrophysiological examinations in rodents have been used to examine the modalities of hippocampal processing in the spatial domain, and consequently, have also been used to determine the effects that chronic stress has on these key parts of the brain (37). Rodent models have also helped identify the hippocampus proper, dentate gyrus, subicular complex, and the perirhinal, entorhinal, and parahippocampal cortices as parts that have been linked to degeneration when subjected to chronic stress (38–39).
Converging evidence from several rodent model reports have shown that over time, applied chronic stress impairs spatial reference memory while transiently impacting spatial working memory (40). Long-term exposure to stress, or even
glucocorticoids produced by the adrenal cortex in response to stress, has been documented to show altered hippocampal neurochemistry, neurogenesis, neuronal morphology, neuronal apoptosis, and even neuronal excitability (41). One consideration with animal model studies is that chronic stress was previously assumed to be the direct cause of hippocampal degeneration (42). While hippocampal degradation was later proved to be affiliated with chronic stress, some study assumptions were based on the structural changes being permanent, largely ignoring the plasticity of the brain (43). Rodent models have been favored extensively in this field because of the ability to carefully control the timing and nature of the stress exposure (44). Rodents were primarily tested on radial arm mazes, T-shaped mazes, or conventional water mazes, with the motivation being to escape the maze for a food reward (45).
Chronic stress in rodent models that incorporated restraint procedures, with mesh barriers in mazes, caused CA3 neuronal dendritic retraction without disrupting motor ability and motivation to explore mazes (46). The functional significance of these findings was that chronic stress created consistent yet reversible changes on the dendritic branches of the CA3 neurons in which the dendritic branches’ length and numbers both decreased (47). The CA3 hippocampal neurons assist with pattern completion and the generation of sharp-wave ripples (SPW-Rs) that are cognitive biomarkers for episodic memory, planning, and transferring compressed waking neuronal sequences (48). During the generation of the SPWRs, the pyramidal CA3 neurons are activated and produce spatiotemporally structured input patterns that are processed by efferent dendrites (49). These input patterns are then translated into output patterns after the dendritic integration in thin CA3 pyramidal cells using glucocorticoid release via uncaging, which merges the input signal for further processing (49). The combined glucocorticoid release and dendritic length shortening are thought to disrupt the hypothalamic-pituitaryadrenal (HPA) axis, which creates dysregulated glucocorticoid release and subsequently impairs spatial memory (47).
Another study conducted on male rats that were placed in a mixed-sex environment visible burrow system showed that innately formed dominance hierarchies led both the dominant and subordinate rats to show stress-related behavioral, endocrine, and neurochemical changes (50). The chronic stress, which was psychosocial in nature, caused a morphological atrophy on the Golgi apparatus of CA3 pyramidal neurons in the hippocampus while also decreasing serotonin binding to the dendritic receptors of these neurons (50). The dendritic retraction, decreased serotonin binding, and increased dysfunctional glucocorticoid release were observed during chronic stress induced studies which caused behavioral detriment on spatial learning and memory (51). It can be theorized that a link between these diminishing structural changes impacts how the brain processes and retains cognitive information.
When testing rodents through the water maze, a common trend that also emerged was that the effects of chronic stress on spatial learning impairments was reversible (52). Chronic stress is thought to impact various memory domains, but it is still relatively unknown if all the memory domains can fully recover (53). However, in terms of reference and working
116
memories, when mice were exposed to immediate stress versus time delayed stress, the group with delayed stress showed fewer errors in the two previously stated memory domains (54). The stressors were applied as wire-mesh barriers and deemed to be psychosocial in nature (55). The rodents that were in the delayed stressor group also displayed better working and reference memories of the maze, indicating that the CA3 dendritic retraction had been restored to some degree (55–56). The degenerative effects of chronic stress in rodents improving after a post stress recovery period is extremely promising in terms of application to human health, as it could potentially be analogous for those dealing with or recovering from cognitive decline due to long-term stress.
Psychiatric effects
Due to the degenerative and impedimentary ramifications of chronic stress, the human body innately and allosterically adapts to whatever situation is being encountered (57). When faced with any physical or psychological stimuli that deviates the body from homeostasis, a stress response is mediated by the activation of the sympathetic-adreno-medullary axis (57). With that activation come larger systemic adaptations that are engaged to protect the body from harm as much as possible. Chronic stress has long been linked to maladaptive reactions such as depression and other physiological issues, beyond just cognitive impairment (58). One of the major effects of chronic stress is the impact it can have on mental health. There is a broad scale overlap with neuroscience and psychiatry that has been established, as both rely heavily on neurology and its sequential behavioral effects. Major depressive disorder is one of the common mental disorders that is profoundly affected by chronic stress. A study has found that the physiopathology underlying depression can be linked to the degenerative structural alterations made when the body is dealing with long-term stressors (59). Another investigation linked how the dendritic retraction points from hippocampal neurons may be critical sites for chronic stress induced depression, in addition to the basal lateral amygdala (60). Chronic stress has also been known to manifest with depressive and anxiety symptoms while eliciting neurological syndromes that are mistaken for psychiatric conditions (61). One study found the ventral CA1 neurons and the basal lateral amygdala to play such an integral role to mediating the effects of chronic stress, that stimulation of that area via chemogenetics or administration of cannabidiol could reduce the effects altogether, thus alleviating the depressive-like behaviors in mice (62). The complex nature between neuroscience and behavioral psychiatry and psychology is not yet fully understood. Future investigation should focus on finding methods of bolstering the critical neurological sites against the impact of chronic stress stimuli.
In addition to eliciting psychiatric conditions, chronic stress has also been deemed a risk factor for the development of Alzheimer’s disease (63). As microglia play a major role in provoking immunity reflexes and homeostasis in the central nervous system, they can be heavily impacted by chronic stress (63). Researchers have found that repeated exposure to chronic stressors creates a higher risk of developing neurodegenerative diseases like Alzheimer’s, due to the stimulation of reactive microgliosis, in which microglia undergo abnormal morphology in attempts to steer the body back towards homeostasis via synaptic remodeling (64). Exposure to mild forms of chronic
psychosocial stress can fully transform normal microglial phenotypes to full-fledged Alzheimer’s phenotypes in rat models (65). With chronic stress being linked to various systemic disorders and morphological changes, it is important to consider some of the different sources of chronic stress and the cognitive issues that they may cause.
Proposed therapies
Effective therapies and treatment techniques for stress management are varied, ranging from physical behavioral changes to ingestion of certain metabolites including antioxidants and vitamins (66). Cognitive behavioral therapy and mindfulness are effective strategies for dealing with long-term effects of burnout, stress, and post-traumatic stress disorders in both children and adults (67). Cognitive behavioral therapy helps to reduce mental health concerns by reframing thought processes and mindful behavioral changes (68). It has also been suggested that chronic psychological stressors can be combated with exercise. A study on the physiological shortening of telomeres due to chronic stress found that exercise had a buffering relationship with telomere length (69–70). Individuals that participated in rigorous exercise when dealing with highstress situations were protected against aversive memory impairment and oxidative damage (71). Another study has also found that saffron and crocin could be promising target treatments for Alzheimer’s disease and chronic stress-related disorders (72). While these proposed therapies have been relatively effective, there may be limitations that could impact their benefits. Cognitive behavioral therapy, for example, has limits on its efficacy in which some patients may not be able to successfully cope with their stressors using its methods without additional aid (73). Patients may also not be able to partake in physical exercise due to various other circumstances ranging from other health issues to socioeconomic factors, as well. Future study could potentially highlight additional lifestyle and behavioral changes that patients could integrate seamlessly into their current daily routines, however, the difficulties of finding such a solution may be onerous.
Conclusion
Chronic stress, which ranges from psychosocial to physiological forms, can be identified as a stressful stimulus that persists over an extended period of time. Stress responses will cause the body to alter its behavioral, autonomic, or neuroendocrine functionalities to cope with the perceived threats of the stressful stimulus in an attempt to regain homeostasis (74). The human body has evolved to adapt allosterically, but when stress is applied frequently and is prolonged, the body is subjected to degenerative and dysregulated effects. Based on our review of the literature, chronic stress can impair spatial learning and retention memory, create maladaptive changes in terms of brain plasticity, and trigger divergent neuronal remodeling and impede neurogenesis (75–76). However, there are more physiological changes that may be associated with chronic stress beyond neuroanatomy and cognitive function.
Chronic stress is a pervasive presence in many patients. In the future, scientists could expand on the therapies that individuals can use daily to dispel its harmful effects beyond pharmacological treatments. Clinical experiments using rodent models have been effective in determining the physiological
The Effects of Chronic Stress on Neuroanatomy and Cognitive Function
117
The Effects of Chronic Stress on Neuroanatomy and Cognitive Function
effects of chronic stress and could also be beneficial for testing new therapeutic modalities. Research in genotypic resilience against stress could be an interesting way to learn more about how humans deal with allostatic loads and stressful stimuli, as well.
Disclosures
The authors declares that they have no relevant or material financial interests that relate to the research described in this paper.
Acknowledgements
The authors would like to acknowledge Dr. Sonia Lobo and the Geisinger Commonwealth School of Medicine Library staff for their revision and resource assistance.
References
1. Yaribeygi H, Panahi Y, Sahraei H, Johnston TP, Sahebkar A. The impact of stress on body function: A review. Exlci J 2017;16:1057-1072.
2. Schneiderman N, Ironson G, Siegel SD. Stress and health: Psychological, behavioral, and biological determinants. Annu Rev Clin Psychol. 2005;1:607-28.
3. Won E, Kim YK. Stress, the autonomic nervous system, and the immune-kynurenine pathway in the etiology of depression. Curr Neuropharmacol. 2016;14(7):665-73.
4. Baum A. Stress, intrusive imagery, and chronic distress. Health Psychol. 1990;9(6):653-75.
5. Dhabhar FS. The short-term stress response - mother nature's mechanism for enhancing protection and performance under conditions of threat, challenge, and opportunity. Front Neuroendocrinol. 2018;49:175-192.
6. McEwen BS. Physiology and neurobiology of stress and adaptation: Central role of the brain. Physiol Rev. 2007;87(3):873-904.
7. McEwen BS. Stressed or stressed out: what is the difference? J Psychiatry Neurosci. 2005; 30(5):315-8.
8. Schulz KH, Heesen C, Gold SM. The concept of allostasis and allostatic load: psychoneuroimmunological findings. Psychother Psychosom Med Psychol. 2005;55(11):452-61.
9. Kagias K, Nehammer C, Pocock R. Neuronal responses to physiological stress. Front Genet. 2012;3:222.
10. White JG, Southgate E, Thomson JN, Brenner S. The structure of the nervous system of the nematode Caenorhabditis elegans. Philos Trans R Soc Lond B Biol Sci 1986;314(1165):1-340.
11. Mergenthaler P, Lindauer U, Dienel GA, Meisel A. Sugar for the brain: The role of glucose in physiological and pathological brain function. Trends Neurosci. 2013;10:58797.
12. Sharp FR, Bernaudin M. HIF1 and oxygen sensing in the brain. Nat Rev Neurosci. 2004;5(6):437-48.
13. Lovell MA, Markesbery WR. Oxidative DNA damage in mild cognitive impairment and late-stage Alzheimer's disease Nucleic Acids Res. 2007;35(22):7497-504.
14. Varga Z, Csabai D, Miseta A, Wiborg O, Czéh B. Chronic stress affects the number of GABAergic neurons in the orbitofrontal cortex of rats. Behav Brain Res 2017;316:104-114.
15. Roozendaal B, McEwen BS, Chattarji S. Stress, memory and the amygdala. Nat Rev Neurosci. 2009;10(6):423-33.
16. Lupien SJ, Maheu F, Tu M, Fiocco A, Schramek TE. The effects of stress and stress hormones on human cognition: implications for the field of brain and cognition. Brain Cogn 2007;65(3):209-37.
17. Gilabert-Juan J, Castillo-Gomez E, Pérez-Rando M, Moltó MD, Nacher J. Chronic stress induces changes in the structure of interneurons and in the expression of molecules related to neuronal structural plasticity and inhibitory neurotransmission in the amygdala of adult mice. Exp Neurol. 2011;232(1):33-40.
18. Lupien SJ, Juster RP, Raymond C, Marin MF. The effects of chronic stress on the human brain: from neurotoxicity, to vulnerability, to opportunity. Front Neuroendocrinol 2018;49:91-105.
19. Adamec R, Hebert M, Blundell J, Mervis RF. Dendritic morphology of amygdala and hippocampal neurons in more and less predator stress responsive rats and more and less spontaneously anxious handled controls. Behav Brain Res 2012;226(1):133-46.
20. Kolb B, Gibb R. Brain plasticity and behaviour in the developing brain. J Can Acad Child Adolesc Psychiatry 2011;20(4):265-76.
21. Chen Y, Dubé CM, Rice CJ, Baram TZ. Rapid loss of dendritic spines after stress involves derangement of spine dynamics by corticotropin-releasing hormone. J Neurosci. 2008;12;28(11):2903-11.
22. Geinisman Y. Structural synaptic modifications associated with hippocampal LTP and behavioral learning. Cereb Cortex. 2000;10:952-62.
23. Stranahan AM, Lee K, Mattson MP. Central mechanisms of HPA axis regulation by voluntary exercise. Neuromolecular Med. 2008;10(2):118-27.
24. Miller WL. The hypothalamic-pituitary-adrenal axis: a brief history. Horm Res Paediatr. 2018;89(4):212-223.
25. MacDougall-Shackleton SA, Bonier F, Romero LM, Moore IT. Glucocorticoids and "stress" are not synonymous. Integr Org Biol. 2019;13:1.
26. Levy BH, Tasker JG. Synaptic regulation of the hypothalamic-pituitary-adrenal axis and its modulation by glucocorticoids and stress. Front Cell Neurosci. 2012;11:624.
27. Kim JJ, Lee HJ, Han JS, Packard MG. Amygdala is critical for stress-induced modulation of hippocampal long-term potentiation and learning. J Neurosci. 2001;21(14):5222-8.
118
28. Kim JJ, Koo JW, Lee HJ, Han JS. Amygdalar inactivation blocks stress-induced impairments in hippocampal long-term potentiation and spatial memory. J Neurosci 2005;25(6):1532-9.
29. Jan YN, Jan LY. Branching out: Mechanisms of dendritic arborization. Nat Rev Neurosci. 2010;11(5):316-28.
30. Garcia R. Stress, hippocampal plasticity, and spatial learning. Synapse. 2001;40(3):180-3.
31. Van Eden CG, Buijs RM. Functional neuroanatomy of the prefrontal cortex: autonomic interactions. Prog Brain Res 2000;126:49-62
32. Kozlowska K, Walker P, McLean L, Carrive P. Fear and the defense cascade: Clinical implications and management. Harv Rev Psychiatry. 2015;23(4):263-87.
33. Kraynak TE, Marsland AL, Wager TD, Gianaros PJ. Functional neuroanatomy of peripheral inflammatory physiology: A meta-analysis of human neuroimaging studies. Neurosci Biobehav Rev. 2018;94:76-92.
34. Herman JP. Neural control of chronic stress adaptation. Front Behav Neurosci. 2013;7:61.
35. Moscovitch M, Nadel L, Winocur G, Gilboa A, Rosenbaum RS. The cognitive neuroscience of remote episodic, semantic and spatial memory. Curr Opin Neurobiol 2006;16(2):179-90.
36. Shrager Y, Bayley PJ, Bontempi B, Hopkins RO, Squire LR. Spatial memory and the human hippocampus. Proc Natl Acad Sci USA. 2007 Feb 20;104(8):2961-6.
37. Bird CM, Burgess N. The hippocampus and memory: Insights from spatial processing. Nat Rev Neurosci. 2008;9(3):182-94.
38. Squire LR, Zola-Morgan S. The medial temporal lobe memory system. Science. 1991;253(5026):1380-6.
39. Lavenex P, Amaral DG. Hippocampal-neocortical interaction: A hierarchy of associativity. Hippocampus 2000;10(4):420-30.
40. Conrad CD. A critical review of chronic stress effects on spatial learning and memory. Prog Neuropsychopharmacol Biol Psychiatry. 2010;34(5):742-55.
41. Bremner JD. Stress and brain atrophy. CNS Neurol Disord Drug Targets. 2006;5(5):503–12.
42. Bowman RE. Stress-induced changes in spatial memory are sexually differentiated and vary across the lifespan. J Neuroendocrinol. 2005;17(8):526-35.
43. Muller RU, Stead M, Pach J. The hippocampus as a cognitive graph. J Gen Physiol. 1996;107(6):663-94.
44. Luine V, Villegas M, Martinez C, McEwen BS. Repeated stress causes reversible impairments of spatial memory performance. Brain Res. 1994;639:167–70.
45. Kleen JK, Sitomer MT, Killeen PR, Conrad CD. Chronic stress impairs spatial memory and motivation for reward without disrupting motor ability and motivation to explore. Behav Neurosci. 2006;120(4):842–51.
46. Conrad CD. What is the functional significance of chronic stress-induced CA3 dendritic retraction within the hippocampus? Behav Cogn Neurosci Rev. 2006;5(1):41-60.
47. Buzsáki G. Hippocampal sharp wave-ripple: A cognitive biomarker for episodic memory and planning. Hippocampus. 2015;25(10):1073-188.
48. Makara JK, Magee JC. Variable dendritic integration in hippocampal CA3 pyramidal neurons. Neuron 2013;80(6):1438-50.
49. Conrad CD, Ortiz JB, Judd JM. Chronic stress and hippocampal dendritic complexity: Methodological and functional considerations. Physiol Behav. 2017;178:66-81.
50. Christian KM, Miracle AD, Wellman CL, Nakazawa K. Chronic stress-induced hippocampal dendritic retraction requires CA3 NMDA receptors. Neuroscience 2011;174:26-36.
51. McKittrick CR, Magariños AM, Blanchard DC, Blanchard RJ, McEwen BS, Sakai RR. Chronic social stress reduces dendritic arbors in CA3 of hippocampus and decreases binding to serotonin transporter sites. Synapse 2000;36(2):85-94.
52. Hoffman AN, Krigbaum A, Ortiz JB, Mika A, Hutchinson KM, Bimonte-Nelson HA, et. al. Recovery after chronic stress within spatial reference and working memory domains: Correspondence with hippocampal morphology. Eur J Neurosci. 2011;34(6):1023-30.
53. Diamond DM, Park CR, Heman KL, Rose GM. Exposing rats to a predator impairs spatial working memory in the radial arm water maze. Hippocampus. 1999;9(5):542-52.
54. Ding JX, Rudak PT, Inoue W, Haeryfar SMM. Physical restraint mouse models to assess immune responses under stress with or without habituation. STAR Protoc 2021;2(4):100838.
55. Ortiz JB, Mathewson CM, Hoffman AN, Hanavan PD, Terwilliger EF, Conrad CD. Hippocampal brain-derived neurotrophic factor mediates recovery from chronic stressinduced spatial reference memory deficits. Eur J Neurosci 2014;40(9):3351-62.
56. Sun DS, Zhong G, Cao HX, Hu Y, Hong XY, Li T, et. al. Repeated restraint stress led to cognitive dysfunction by NMDA receptor-mediated hippocampal CA3 dendritic spine impairments in juvenile sprague-dawley rats. Front Mol Neurosci. 2020;13:552787.
57. Selye H. Stress and the general adaptation syndrome. Br Med J. 1950;1(4667):1383-92.
58. Tamashiro KL, Sakai RR, Shively CA, Karatsoreos IN, Reagan LP. Chronic stress, metabolism, and metabolic syndrome. Stress. 2011;14(5):468-74.
59. Breslau N, Davis GC. Chronic stress and major depression. Arch Gen Psychiatry. 1986;43(4):309-14.
60. Ma H, Li C, Wang J, Zhang X, Li M, Zhang R, et. al. Amygdala-hippocampal innervation modulates stress-induced depressive-like behaviors through AMPA receptors. Proc Natl Acad Sci USA 2021;118(6):2019409118.
The Effects of Chronic Stress on Neuroanatomy and Cognitive Function
119
The Effects of Chronic Stress on Neuroanatomy and Cognitive Function
61. Butler C, Zeman AZ. Neurological syndromes which can be mistaken for psychiatric conditions. J Neurol Neurosurg Psychiatry. 2005;76.
62. Yi ES, Oh S, Lee JK, Leem YH. Chronic stress-induced dendritic reorganization and abundance of synaptosomal PKA-dependent CP-AMPA receptor in the basolateral amygdala in a mouse model of depression. Biochem Biophys Res Commun. 2017;486(3):671-678.
63. Bisht K, Sharma K, Tremblay MÈ. Chronic stress as a risk factor for Alzheimer's disease: Roles of microglia-mediated synaptic remodeling, inflammation, and oxidative stress. Neurobiol Stress. 2018;9:9-21.
64. Alkadhi KA. Chronic psychosocial stress exposes Alzheimer's disease phenotype in a novel at-risk model. Front Biosci (Elite Ed). 2012;4(1):214-29.
65. Steptoe A, Feldman PJ. Neighborhood problems as sources of chronic stress: development of a measure of neighborhood problems, and associations with socioeconomic status and health. Ann Behav Med 2001;23(3):177-85.
66. Yau YH, Potenza MN. Stress and eating behaviors. Minerva Endocrinol. 2013 Sep;38(3):255-67.
67. Bienertova-Vasku J, Lenart P, Scheringer M. Eustress and distress: Neither good nor bad, but rather the same? Bioessays. 2020;42(7):1900238.
68. Anclair M, Lappalainen R, Muotka J, Hiltunen AJ. Cognitive behavioural therapy and mindfulness for stress and burnout: A waiting list controlled pilot study comparing treatments for parents of children with chronic conditions. Scand J Caring Sci. 2018;32(1):389-396.
69. Rayan A, Ahmad M. Effectiveness of mindfulness-based interventions on quality of life and positive reappraisal coping among parents of children with autism spectrum disorder. Res Dev Disabil. 2016;55:185-96.
70. Puterman E, Lin J, Blackburn E, O'Donovan A, Adler N, Epel E. The power of exercise: buffering the effect of chronic stress on telomere length. PLoS One. 2010;26;5(5):e10837.
71. Dos Santos TM, Kolling J, Siebert C, Biasibetti H, Bertó CG, Grun LK, et. al. Effects of previous physical exercise to chronic stress on long-term aversive memory and oxidative stress in amygdala and hippocampus of rats. Int J Dev Neurosci. 2017;56:58-67.
72. Saeedi M, Rashidy-Pour A. Association between chronic stress and Alzheimer's disease: Therapeutic effects of saffron. Biomed Pharmacother. 2021;133:110995.
73. Hofmann SG, Asnaani A, Vonk IJ, Sawyer AT, Fang A. The efficacy of cognitive behavioral therapy: A review of metaanalyses. Cognit Ther Res. 2012;36(5):427-440.
74. Radley J, Morilak D, Viau V, Campeau S. Chronic stress and brain plasticity: Mechanisms underlying adaptive and maladaptive changes and implications for stress-related CNS disorders. Neurosci Biobehav Rev. 2015;58:79-91.
75. Theall KP, Brett ZH, Shirtcliff EA, Dunn EC, Drury SS. Neighborhood disorder and telomeres: Connecting children's exposure to community level stress and cellular response. Soc Sci Med. 2013;85:50-8.
76. Schetter CD, Dolbier C. Resilience in the context of chronic stress and health in adults. Soc Personal Psychol Compass 2011;5(9):634-652.
77. Page MJ, McKenzie JE, Bossuyt PM, Boutron I, Hoffmann TC, Mulrow CD, et al.The PRISMA 2020 statement: An updated guideline for reporting systematic reviews. PLoS Med. 2021;18(3):e1003583.
120
2023 Summer Research Immersion Program
Each summer the Geisinger Commonwealth School of Medicine Summer Research Immersion Program (SRIP) brings together first year medical students for an opportunity to gain research experience in basic science, clinical science, public/community health, behavioral health, or medical education under the guidance of a research mentor. The summer research experience includes a $2,500 educational stipend. At the end of the program, students present their research in a poster session.

In addition to research, SRIP students participate in a variety of complementary enrichment activities:
• GCSOM and Geisinger faculty research seminars
• GCSOM Grand Rounds and clinical seminars at our hospital partners
• Special events or conferences related to your research topic
• Clinical exposure
• Scientific writing & communication workshops
SRIP program goals:
• Provide students with an immersive research experience under a mentor’s guidance
• Enhance students’ knowledge of the scope and types of research relevant to improving health in the region, nationally, and globally
• Provide research opportunities that span the translational continuum from laboratory based biomedical studies to clinical and public health research conducted with community partners
• Engage students in peer learning and networking
• Enhance students’ skills in oral and written scholarship
Program dates:
SRIP 2023 will be an eight-week program held June 5 – July 28, 2023.
Program deadlines:
Application release date: Dec. 2, 2022 Application submission deadline: Feb. 6, 2023
For more information, contact: Sonia Lobo, PhD SRIP Program Administrator Associate Dean for Research & Scholarship slobo01@som.geisinger.edu Elizabeth Kuchinski, MPH SRIP Director ekuchinski@som.geisinger.edu
Scholarly Research In Progress • Vol. 6, November 2022
121
Medical Research Honors Program
Current first-year medical students are eligible to join the Medical Research Honors Program (MRHP). With a mentor’s guidance, you will drive this long-term, thesis focused research experience. By completing the requirements while remaining in good academic standing, you’ll graduate with an honors distinction.

Through the MRHP, you will:
• Advance fundamental scientific knowledge
• Stand apart in competitive residency application fields
• Refine scholarly communication
• Gain a mindset of continual growth and learning
To complete this four-year program, you must submit a research project proposal, write a thesis, and deliver an oral defense. You will also write abstracts, present posters, and publish findings while building towards your thesis defense. Your research experience is guided by a research mentor, a thesis advisory committee, and the program director. We encourage you to participate in the Summer Research Immersion Program as well.
Application packet must include:
• MRHP application form
• Letter of support from research mentor
• CV
• Acknowledgment of mentor’s expectations
• Project proposal: project title, specific aims, hypothesis, background, preliminary data (if available)
Be a mentor
If you would be willing to have a medical student work with you on a long-term, thesis driven research project, email us at mrhp@som.geisinger.edu or scan the QR code to sign up and add your project information.

Questions about the MRHP program or mentoring?
Contact:
Sonia Lobo, PhD Associate Dean for Research and Scholarship slobo@som.geisinger.edu
Adam Blannard, MS Program Manager ablannard@som.geisinger.edu
Application
Monday, April 24, 2023
deadline:
122
Finding your way: Opportunities for student funding

You can find assistance in searching for funding opportunities specifically designed for students at the Office of Research and Scholarship. Funding opportunities may include support for fellowships, internships, research, programming, and collaboration.
The Office of Research and Scholarship can help you locate and qualify funding opportunities as well as assist in application preparation, budgeting, and editing. We are here to help you every step of the way! School policy requires that student applications are submitted by our office, so please call or stop by early in the proposal development process so that we can work with you to meet your deadline.
The Office of Research and Scholarship is also available to provide general guidance on topics like proposal writing basics and the fundamentals of grant management.
GCSOM Student Research Awards (SRAs)

The Office of Research and Scholarship is pleased to announce the availability of funds for the 2022 academic year to support student research projects in the areas of basic or clinical science, public/community health, behavioral health, and medical education research. The proposed project must be under the supervision of a faculty mentor and be endorsed by the Office of Research and Scholarship. The proposed project period must be no longer than 6 months and conclude by Dec. 1, 2023. The maximum award for each project is $2000. Funds
cannot be requested for stipends, tuition, travel, or wages for the student or faculty mentor. Indirect costs to the sponsoring institution are not allowed. SRAs are intended to foster student scholarship and lead to a tangible deliverable such as an abstract for submission to a regional/national meeting or a manuscript for publication in SCRIP and/or a peer-reviewed journal. SRA applications will be due May 1, 2023, at 11:59 p.m. EST. If you're interested in applying, contact Tracey Pratt, MPH, or studentresearch@som.geisinger.edu.
Contact information:
Tracey Pratt, MPH Grants Specialist
Office of Research and Scholarship
Phone: 570-558-3955
Internal extension: 5335 Email: tpratt@som.geisinger.edu
123
Cover art submissions

This year’s call for SCRIP cover art yielded several creative and noteworthy submissions from our talented students which are showcased below. The image chosen for the SCRIP cover was submitted by Nayoung Lee, MD Class of 2025, and features staining of female ovarioles removed from a CRISPR Cas9 homozygous lethal mutant Drosophila line. The staining detected apoptosis occurring in stage 6 and 7 in a small percentage of ovarioles in this mutant fly line.

1A 1B 124
Erica Kuo, MD Class of 2026
A) An infertile American Robin's egg that has likely been thrown out of the nest by the mother and now lies broken on the ground. The remnants have become a place to feed for the nearby ants.
B) A busy bee at work. A honeybee pollinating one of the many flowers.
Johan Diaz, MD Class of 2023
Satellites in the Red Sky. Rare platelet satellitism encountered in a patient treated with broadly neutralizing antibodies

Maria Tian, MBS July 2022

This image was taken using fluorescent microscopy. The image displays the wing disc of Drosophila melanogaster after antibody staining. The bright regions show where the gene, Shroom, is expressed. This successful stain helped the lab develop therapy plans with the goal to treat spina bifida in infants.

Rianna Haniff, MD Class of 2025
During my biochemistry lab at the University of Florida, we collected soil samples throughout Florida and tested them for anti-bacterial activity against E. coli BAS849. Pictured here is a Streptomyces culture that was extracted from a soil sample taken from Fukahatchee Strand State Park. Unfortunately, the bacteria from this soil showed no characteristics of a B-lactamase inhibitor and, therefore, did not have any anti-bacterial activity.
Dayna Picozzo, MBS March 2022
Life Feeds on Life. Venus flytrap conquers fly! This was handdrawn and colored.

Shane Conklin, MD Class of 2026
The design for this submission revolves around medicinal plants that grow in Pennsylvania. The image includes plants such as allium, comfrey, lavender, rosemary, dandelion, Echinacea, yarrow, and pokeweed. Each of these plants has an interesting use in medicine, most notably pokeweed, because unlike most other medicinal plants, this plant is poisonous. One of the medicinal uses of this plant is to induce vomiting.

5 2 6 3 4 6 5 4 3 2 1
525 Pine St. Scranton, PA 18509 570-504-7000 geisinger.edu/gcsom studentresearch@som.geisinger.edu
 From left: Tyler Bielinski, McKinley Carey, and Carly Sheffer received Excellence in Research Awards for their outstanding abstract submissions at the 2022 Summer Research Symposium.

