the Creative Commons Attribution 4.0 License.
the Creative Commons Attribution 4.0 License.
 | 04 Mar 2024
Flood risk assessment for Indian sub-continental river basins
Urmin Vegad
Yadu Pokhrel
Floods are among India's most frequently occurring natural disasters, which disrupt all aspects of socio-economic well-being. A large population is affected by floods, which leave their footprints through human mortality, migration, and damage to agriculture and infrastructure, during almost every summer monsoon season in India. Despite the massive imprints of floods, sub-basin level flood risk assessment is still in its infancy and requires advancements. Using hydrological and hydrodynamic models, we reconstructed sub-basin level observed floods for the 1901–2020 period. Our modeling framework includes the influence of 51 major reservoirs that affect flow variability and flood inundation. Sub-basins in the Ganga and Brahmaputra river basins witnessed substantial flood inundation extent during the worst flood in the observational record. Major floods in the sub-basins of the Ganga and Brahmaputra occur during the late summer monsoon season (August–September). While the Beas, Brahmani, upper Satluj, upper Godavari, middle and lower Krishna, and Vashishti are among the sub-basins influenced by the presence of dams on downstream flood dynamics, the Beas, Brahmani, Ravi, and lower Satluj sub-basins are the most impacted by floods and the presence of dams. Bhagirathi, Gandak, Kosi, lower Brahmaputra, and Ghaghara are India's sub-basins with the highest flood risk. Our findings have implications for flood risk assessment and mitigation in India.
- Article
(14485 KB) - Full-text XML
-
Supplement
(4794 KB) - BibTeX
- EndNote


Flood risk to both natural and human systems is projected to increase due to climate change (IPCC, 2014, 2022). Extreme weather and climate extremes have increased under the warming climate, leading to an increased frequency of natural hazards like floods, droughts, heat waves, cyclones, and heavy rains. Hydroclimatic extremes affect humans and infrastructure (Eidsvig et al., 2017; Peduzzi et al., 2009). Due to high vulnerability and lower adaptive capacity, developing countries are often the most impacted by extreme weather events. Furthermore, developing countries usually take longer to recover from the hazards due to low climate resilience. Globally, floods are among the most devastating natural hazards (Ghosh and Kar, 2018). Among all flood types, riverine floods occur most frequently (Kimuli et al., 2021) and often cause substantial damage to agriculture and infrastructure. A considerable fraction of the population and infrastructure are exposed to flooding, which will also increase due to the projected increase in the magnitude and frequency of floods (Winsemius et al., 2018).
The increase in flood magnitude due to the warming climate has resulted in considerable economic losses (C. M. R. Mateo et al., 2014; Willner et al., 2018). The total financial loss will likely increase by 17 % globally in the next 20 years due to climate change (Willner et al., 2018). Besides agriculture, floods significantly affect the built environment and transportation infrastructure (Kalantari et al., 2014). For instance, more than 7 % of road and railway assets globally are exposed to a 100-year return period flood (Koks et al., 2019). In Asia, about 75 % of the population is exposed to riverine floods (Varis et al., 2022). India falls among the top 10 most flood-affected countries in Asia and the Pacific (Kimuli et al., 2021). In addition, India is among the top 10 countries that have experienced the highest human mortality due to floods. Considerable population exposure, climate change, and rapid growth and development in flood-prone areas contribute to increased losses from floods.
In India, state administration takes decisions to mitigate floods while the central government provides financial aid under severe conditions (Jain et al., 2017). The state authorities develop action plans to minimize flood damage. Therefore, identifying the regions with higher flood risk is essential for planning and mitigation. Flood impacts can be quantified according to the affected population, gross domestic product (GDP), and agricultural practices (Ward et al., 2013). The flood risk assessment framework suggested by the Intergovernmental Panel on Climate Change (IPCC) has been extensively applied at the regional and global scales (Allen et al., 2016; IPCC, 2014; Roy et al., 2021). The risk can be quantified as a function of vulnerability, hazard, and exposure (IPCC, 2014). To control the risk, reducing vulnerability is considered a short- to mid-term goal (Mishra et al., 2022), while reducing hazards and exposure are long-term goals (Birkmann and Welle, 2015). Flood risk assessment can assist in identifying the regions at high risk due to higher vulnerability, hazard, and exposure, which can be used for developing a framework, methodology, and guidelines for flood mitigation and damage assessment.
A flood risk assessment performed on a global scale may not help in identifying the flood risk-prone regions at a country scale due to the coarser spatial resolution (Bernhofen et al., 2022). Due to complex geomorphological characteristics and diverse climatic conditions, India is considered a relatively high flood-risk region (Hochrainer-Stigler et al., 2021). Therefore, estimating flood risk on a finer scale (e.g., sub-basin level) is essential for reliable flood risk assessment. There have been studies on regional or river basin scales (Allen et al., 2016; Ghosh and Kar, 2018; Roy et al., 2021); however, those do not provide flood risk at a sub-basin scale in India. In addition, the impact assessment of floods on transport infrastructure (rail and road infrastructures) still needs to be improved in the country (Pathak et al., 2020; Singh et al., 2018). In addition, the role of dams and reservoirs in flood risk assessment should be addressed (Hirabayashi et al., 2013; Yamazaki et al., 2018). Dams and reservoirs considerably influence streamflow variability and can attenuate flood peaks (Dang et al., 2020; Vu et al., 2022; Zajac et al., 2017). In contrast, dam operations and decisions can also worsen the flood situation in the downstream regions. For instance, recent flooding in Kerala and Chennai was partly attributed to reservoir operations (Mishra and Shah, 2018). India has more than 5300 large dams regulating river flow (NRLD, 2017), affecting ecosystems, natural resources, and livelihoods (Acreman, 2000). Reservoirs impact the flow regulation, magnitude, timing, and extent of flooding in the downstream regions. Therefore, flood risk assessment without considering the role of reservoirs can be inappropriate in the basins that are highly affected by the presence of dams.
We use the H08 (Hanasaki et al., 2018) global hydrological model combined with the CaMa-Flood (Yamazaki et al., 2011) model for the sub-basin level flood risk assessment in India considering the role of reservoirs. The CaMa-Flood model combined with the H08 model has been used for several river basins globally (Boulange et al., 2021; Mateo et al., 2013). The CaMa-Flood model performs well in simulating flood dynamics (Chaudhari and Pokhrel, 2022; Dang et al., 2022; Gaur and Gaur, 2018; Hirabayashi et al., 2013, 2021; Yamazaki et al., 2018; Yang et al., 2019). The CaMa-Flood model takes runoff as input simulated from any hydrological model and can simulate flood depth and inundation. In India, almost all the major rivers are influenced by reservoirs (Lehner et al., 2011). Therefore, the major questions that we address are as follows: (1) How does the flood risk vary at the sub-basin level in India during the 1901–2020 period? (2) Which are the sub-basins where the presence of reservoirs considerably influences the flood risk? To address these questions, we use long-term observations (1901–2020) from the India Meteorological Department (IMD) along with a hydrological modeling framework.
2.1 Datasets
We used observed gridded precipitation (Pai et al., 2014) and daily maximum and minimum temperatures (Srivastava et al., 2009) from the India Meteorological Department (IMD). We obtained gridded daily precipitation at 0.25° from IMD for the 1901–2020 period that was developed using station-based rainfall observations from more than 6900 gauge stations (Pai et al., 2014). The gridded rainfall product has been widely used for hydrological studies (Kushwaha et al., 2021; Shah and Mishra, 2016) and it captures the key features of the summer monsoon variability and orographic rainfall over the Western Ghats and foothills of the Himalayas. We obtained daily 1° gridded maximum and minimum temperatures from IMD (Srivastava et al., 2009). The gridded temperature dataset is developed using observations from 395 stations located across India. Bilinear interpolation was used to convert the 1° gridded temperature to 0.25° resolution to make it consistent with the gridded precipitation. For the regions outside India, we obtained observational meteorological datasets (rainfall and temperature) at 0.25° from Princeton University (Sheffield et al., 2006). Gridded datasets from Sheffield et al. (2006) compare well against the IMD observations and have been used in hydrological applications in India (Shah and Mishra, 2016).
Observed daily streamflow at gauge stations and reservoir live storage were obtained from India Water Resources Information System (India-WRIS). We considered the influence of 51 major reservoirs located in different river basins to examine the impact of reservoirs on floods using the CaMa-Flood model (Fig. S1 in the Supplement). The information of dams was obtained from the National Register of Large Dams (NRLD) (Table S1 in the Supplement). We used the global surface water (GSW) extent to estimate flood occurrences at a monthly timescale (Pekel et al., 2016). Simulated flood occurrences during the period of the GSW database (1985–2020) were used to validate the performance of the hydrological model in simulating flood extent (Pekel et al., 2016). In addition, we obtained reported flood details from the Emergency Events Database (EM-DAT; http://www.emdat.be/, last access: 2 December 2023) and Dartmouth Flood Observatory (DFO; http://floodobservatory.colorado.edu/, last access: 2 December 2023). EM-DAT is developed by the Centre for Research on the Epidemiology of Disasters (CRED), while the University of Colorado manages DFO. We used population data from global human settlement layers (GHSL) to estimate flood exposure. Finally, we used roadway and railway network data to assess the impact of floods on the infrastructure.
2.2 H08 and CaMa-Flood combined model
We used the H08 (Hanasaki et al., 2018) global hydrological model to simulate hydrological variables. The H08 is a distributed global water resource model comprising six sub-models: land surface hydrology, river routing, reservoir operation, crop growth, environmental flow, and water abstraction. The model estimates baseflow using a leaky bucket method, while runoff is calculated based on saturation excess non-linear flow (Hanasaki et al., 2008). The H08 model can be run separately or combined with any hydrodynamic model to perform flow routing. The H08 model uses precipitation, air temperature, shortwave and longwave radiations, wind speed, surface pressure, and specific humidity as input meteorological forcing. Soil parameters for the H08 model were obtained from the Harmonized World Soil Database (HWSD). We forced the H08 model with the input meteorological forcing at 0.25° spatial and daily temporal resolution. We combined the H08 land surface model with the CaMa-Flood model. The CaMa-Flood model has been previously combined with the H08 model to obtain flood inundation estimates (C. M. Mateo et al., 2014).
The CaMa-Flood (version 4.1) is a hydrodynamic model (Yamazaki et al., 2011) that simulates river–floodplain dynamics (Yamazaki et al., 2013). The CaMa-Flood model has been extensively used for better performance in simulating discharge and flood peaks (Zhao et al., 2017). The CaMa-Flood model considers the role of dams and reservoirs for streamflow and flood inundation simulations (Chaudhari and Pokhrel, 2022; C. M. Mateo et al., 2014; Pokhrel et al., 2018). We ran the CaMa-Flood model at a finer spatial resolution (0.1°) using the H08-simulated runoff (0.25°) as input. We calibrated the combined model (H08 and CaMa-Flood) for India's 18 major river basins for at least one gauge station each, considering the influence of 51 major dams. The gauge stations were selected in the farthest downstream of the river basin based on the availability of observed streamflow. The influence of reservoir operations was simulated using the CaMa-Flood model and evaluated against the observed daily live reservoir storage.
Large-scale global hydrological models do not perfectly capture the observed trends and variations as these are often not well calibrated at the river basin scale (Krysanova et al., 2018). The H08 model performs well when calibrated at the river basin scale rather than coarser domains such as climate zones (Chuphal and Mishra, 2023; Yoshida et al., 2022). Here, we manually calibrated the H08 model by adjusting four key parameters, which considerably influence streamflow for each river basin, including single-layer soil depth, gamma, bulk transfer coefficient, and tau (Hanasaki et al., 2008; Raghav and Eldho, 2023). A more detailed discussion about the calibration parameters of H08 are discussed in Dangar and Mishra (2021). Different sets of combinations of calibration parameters within a range were used to calibrate the H08 model. The employed sets of parameters for the 18 river basins in the Indian sub-continent are listed in Table S2. The calibrated parameters account for the effect of human interventions because the model calibration is performed against the observed streamflow rather than the naturalized streamflow (Duc Dang et al., 2020). We evaluated the model performance using the coefficient of determination (R2) and Nash–Sutcliffe efficiency (NSE) for daily streamflow and reservoir live storage. In addition, we compared the simulated and satellite-based observed flood occurrences. The satellite-based flood occurrence is calculated using the GSW dataset (Pekel et al., 2016), available for the 1984–2020 period. We forced the well-calibrated combined (H08 and CaMa-Flood) models with observed meteorological forcing from the India Meteorological Department (IMD) at 0.25° spatial resolution to conduct simulations from 1901 to 2020. The H08 model-simulated runoff is used in CaMa-Flood to rout flood dynamics at 6 arcmin (0.1°). We generated the flood depth maps for the historical worst flood at the sub-basin level. The worst flood is based on the highest magnitude of river flow observed at the sub-basin outlet. The generated flood depths at 6 arcmin (0.1°) were further downscaled to 1 arcmin (∼0.185 km) resolution using the downscaling module available within the CaMa-Flood.
We used the C-ratio (Nilsson et al., 2005; Zajac et al., 2017) to assess the potential impact of dams along a river. The C-ratio is an identifier calculated as the ratio of total maximum storage capacity of the upstream reservoirs to the mean annual discharge at a gauge station in the downstream region (Zajac et al., 2017; Nilsson et al., 2005). We calculated the C-ratio at the outlets of each sub-basin that is influenced by the presence of dams. A C-ratio of less than 0.5 indicates that the sub-basin is minimally affected by the presence of dams. Furthermore, to identify sub-basins susceptible to flood inundation resulting from dam operations, we multiplied the percentage of the flooded area in each sub-basin by its corresponding C-ratio. This enabled us to identify the sub-basins that experience substantial flood inundation and are considerably impacted by the presence of reservoirs. Finally, we estimated the exposed rail and road infrastructures affected by floods. The flooded area overlapped the road and railway network to estimate the network length affected by floods in a sub-basin. We considered the flooded area of the observed worst flood. The sub-basins with the highest rail and road infrastructures exposure to floods were identified.
2.3 Risk assessment
We estimated flood risk using hazard, exposure, and vulnerability based on the common framework adopted by the United Nations in the Global Assessment Reports of the United Nations Office for Disaster Risk Reduction (United Nations International Strategy for Disaster Reduction Secretariat, Geneva, 2011, 2013). A similar framework was used in previous studies for flood risk assessments (Winsemius et al., 2013; C. M. R. Mateo et al., 2014; Tanoue et al., 2021). We multiplied the normalized values of hazard, exposure, and vulnerability to estimate the risk as
The flood risk assessment can help identify the hotspots and prioritize climate adaptation (de Moel et al., 2015). Among the three components, vulnerability is a degree of damage to a particular object at flood risk with a specified amount and present on a scale from 0 to 1. We obtained the vulnerability index for each district from the “Climate Vulnerability Assessment for Adaptation Planning in India Using a Common Framework”, a report developed by the Department of Science and Technology (https://dst.gov.in/sites/default/files/Full Report (1).pdf, last access: 2 December 2023). The vulnerability of each district is calculated using 14 indicators, each with equal weight. The indicators capture both sensitivity and adaptive capacity. We estimated the vulnerability index of each sub-basin by taking the spatial mean of the vulnerability of the districts falling into the sub-basins. Exposure is termed as assets and population in a flood-exposed area resulting in flood damage (Marchand et al., 2022). The population dataset is a critical component in performing exposure estimation. The exposure is defined as the fraction of the population exposed to the flood extent (Smith et al., 2019). We completed the flood exposure estimate using the GHSL population dataset (Joint Research Centre (JRC) et al., 2021), which is available at a resolution of 30 arcsec for 1975, 1990, 2000, 2014, and 2015. We used the population data for the year 2015 throughout this study. We rescaled the population data to 6 arcmin to make it consistent with the flooded area simulated from the combined model. We estimated the hazard as the exceedance probability of a flooded area exceeding half of the historical maximum flooded area in the past 50 years. We used normalized vulnerability, exposure, and hazard to estimate the risk.
3.1 Calibration and evaluation of hydrological models
We calibrated and evaluated the performance of the H08 and CaMa-Flood combined models against the observed daily streamflow (Fig. 1). Due to the unavailability of daily observed streamflow for the three transboundary river basins (Indus, Ganga, and Brahmaputra), we used observed monthly streamflow to calibrate the model. In addition, we evaluated the model performance for daily live storage of the 51 reservoirs after the calibration against the observed flow (Fig. 1). The model exhibited good skills (R2>0.6 and NSE>0.6) for almost all the river basins except Cauvery, east coast, northeast coast, and Sabarmati. The model also performed well with NSE greater than 0.6 for more than 80 % of the selected reservoirs in simulating daily live storage for the selected reservoirs. We estimated the bias and timing error in simulating peak discharge at all the selected gauge stations (Fig. S2). We calculated the bias in the model-simulated annual maximum streamflow against the observed annual maximum streamflow for the time periods for which observations are available. We excluded the transboundary rivers (Ganga, Brahmaputra, and Indus) as timing error (in days) could not be estimated due to the unavailability of daily observed flow. While other gauge stations exhibited moderate bias, gauge stations in the Cauvery, Sabarmati, and Mahi river basins show a considerable dry bias. Contrary to several other stations where the mean timing error was below two days, the Sabarmati River basin displayed a comparatively higher mean timing error. The relatively poor performance of the model in these river basins can be attributed to the lack of long-term observations as well as substantial human interventions, which can affect the observed flow.
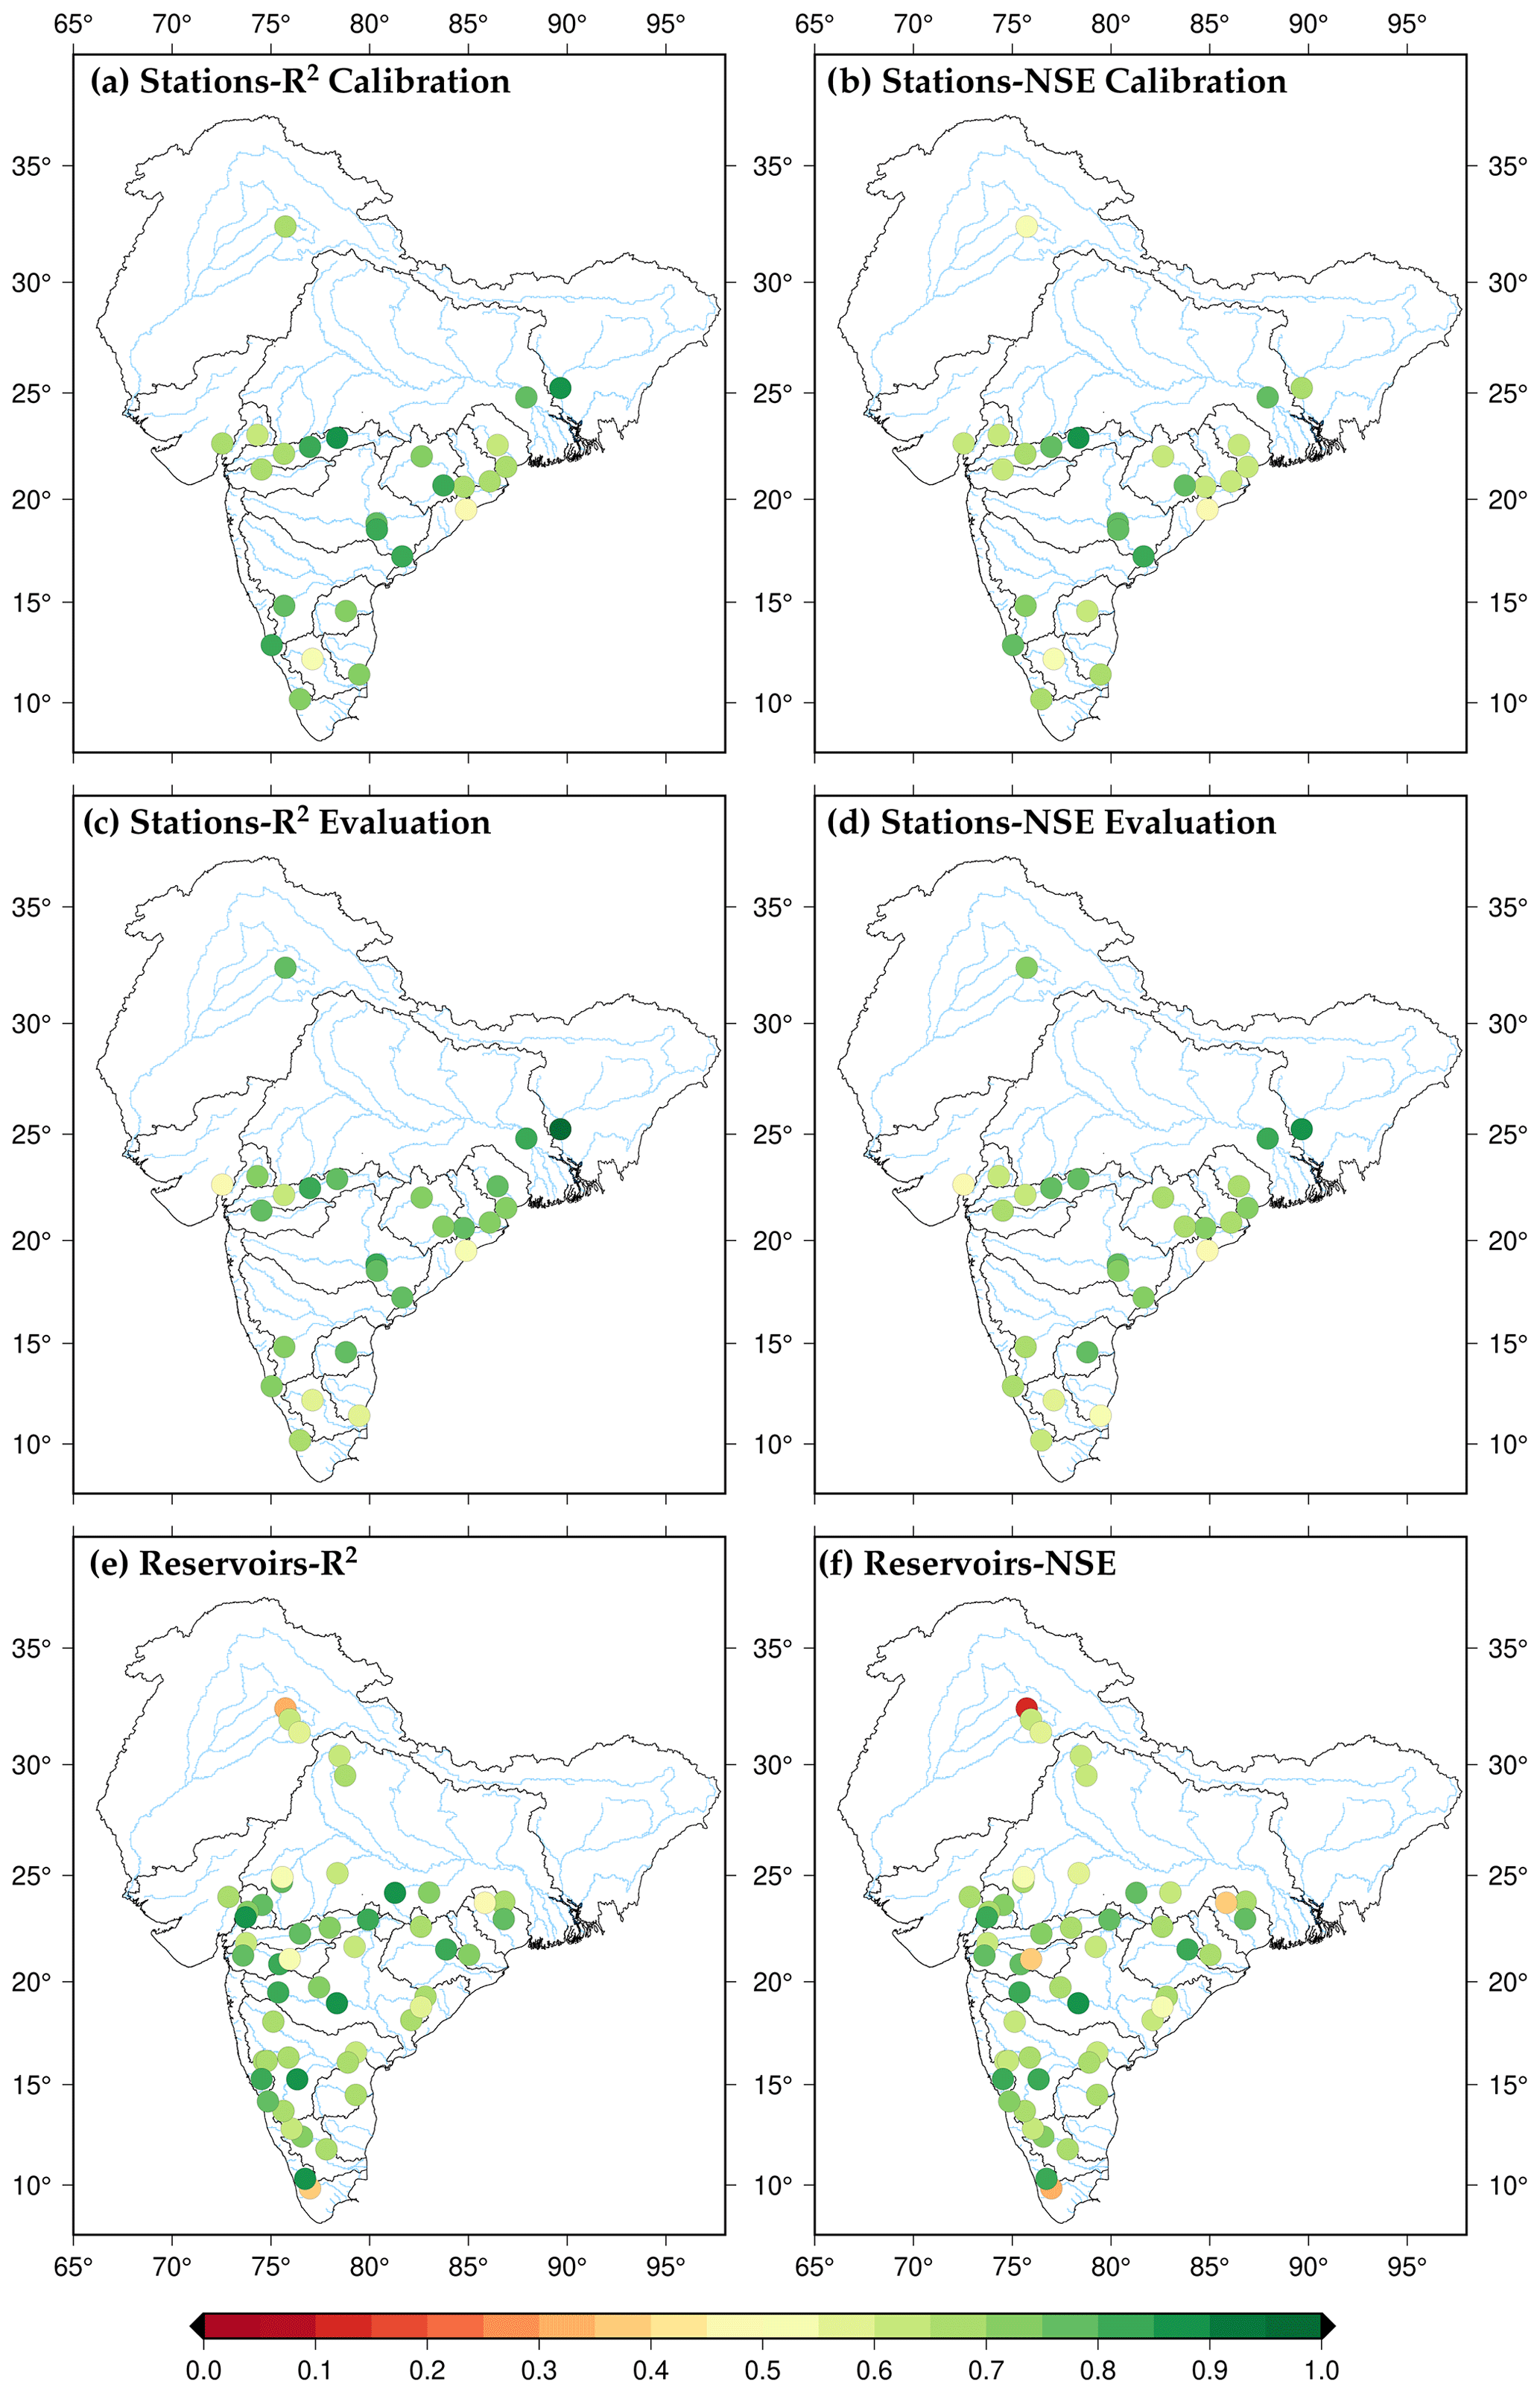
Figure 1Calibration and evaluation of the combined model for daily river flow and reservoir storage at gauge stations and daily live storage of reservoirs.
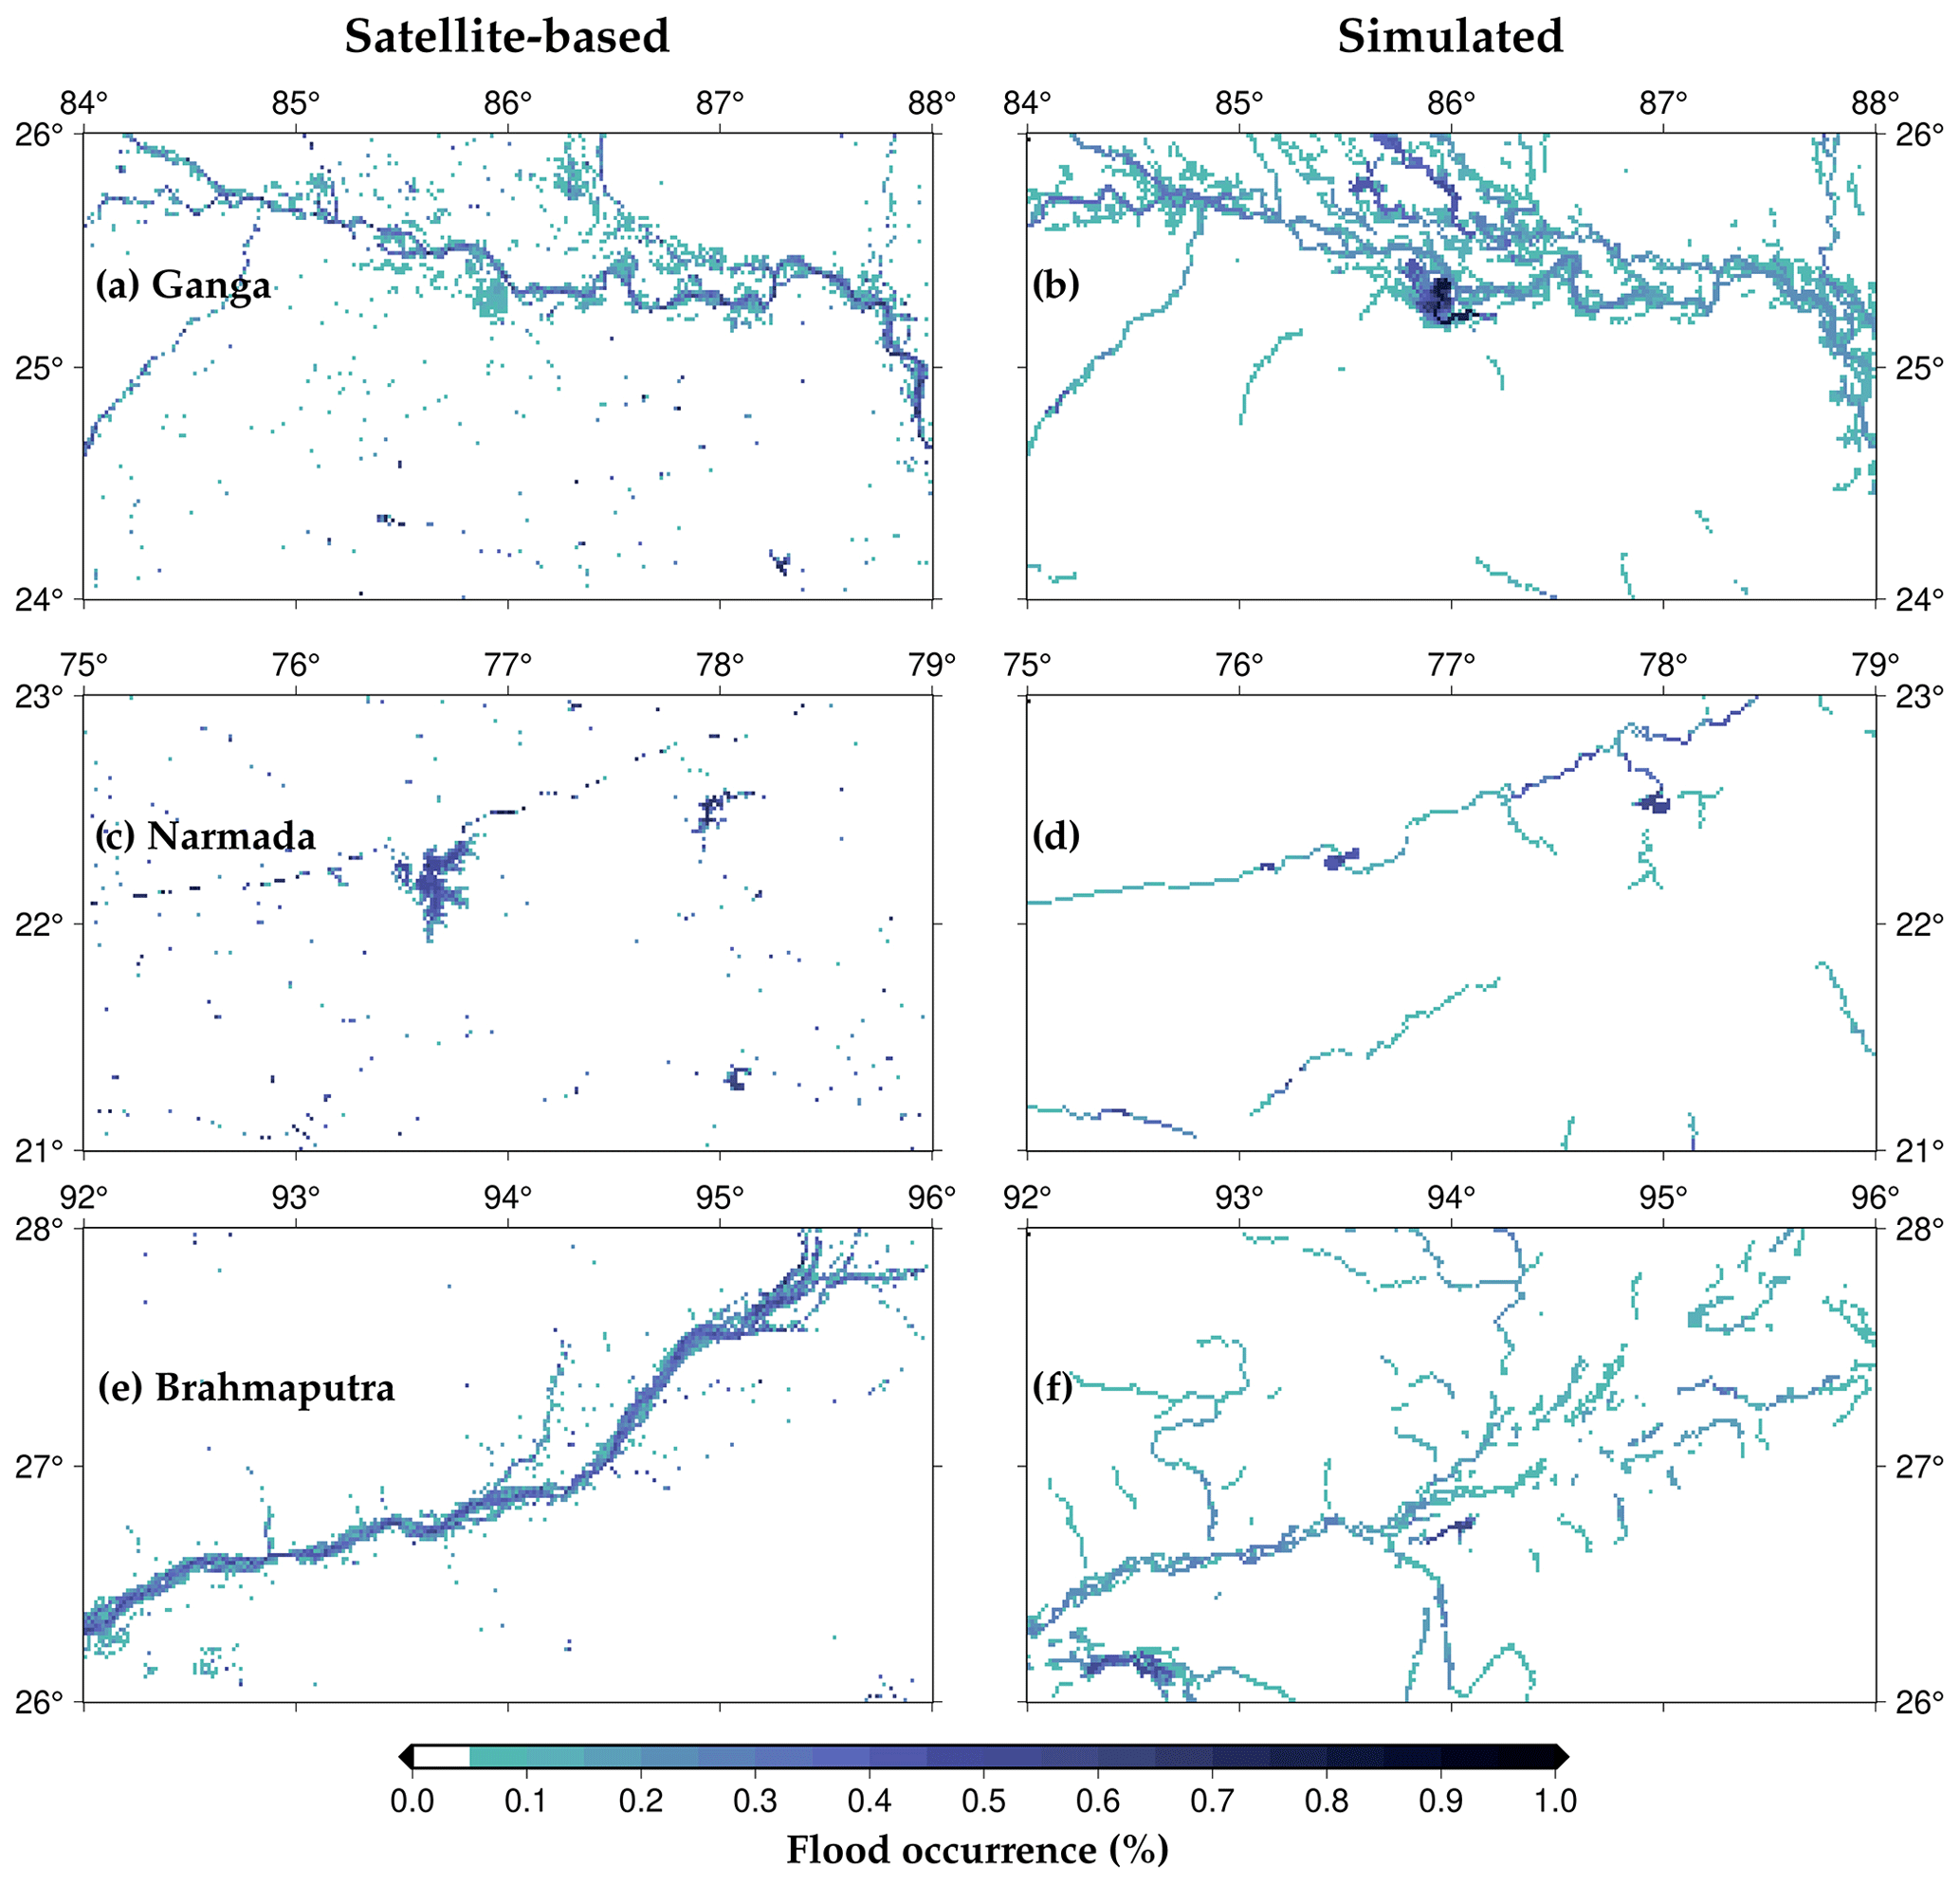
Figure 2Simulated flood occurrences compared with satellite-based flood occurrences for different regions in the Ganga, Narmada, and Brahmaputra river basins.
We compared model-simulated and satellite-based observed flood occurrence for the 1984–2020 period (Fig. 2). In addition, we compared the model-simulated flood events against Sentinel-1 SAR and MODIS satellite-based imagery for a few flood events based on the satellite data availability (Figs. 3, S3, and S4). We found that the model-simulated flood extent captures the satellite-based flood extent. However, we note that the model overestimated the flood extent in the Ganga River basin and underestimated it in the Brahmaputra River basin, thus showing a non-systematic bias. Moreover, a considerable difference in the flood extent based on the two satellite datasets was observed, which highlights the observational uncertainty in the estimation of flood extent. In general, the model exhibits satisfactory performance in simulating flood extent against the satellite-based observations. However, the model overestimates flood extent in the Ganga River basin, which could be attributed to the influence of cloud contamination and dense vegetation cover on satellite-based flood estimates (Chaudhari and Pokhrel, 2022). On the other hand, the model underestimates the flood occurrence in the upstream region of the Brahmaputra River. This could be due to limitations in model parameterization, as observed flow is limited in the transboundary river basins. Despite the good performance against the observed streamflow, the simulated flood extent has a considerable bias, which can be attributed to satellite-based flood extent mapping limitations and the model's ability to capture the flood extent accurately. The model-simulated flood extent shows a good agreement against the reported flood from EM-DAT and DFO databases (Fig. S5). In addition, the simulated flood extent also showed a good agreement with the reported flood in cities in the Brahmaputra and Ganga river basins. Given the limitation in the streamflow and flood extent observations, the hydrological models perform satisfactorily and can be used for the sub-basin level risk assessment.
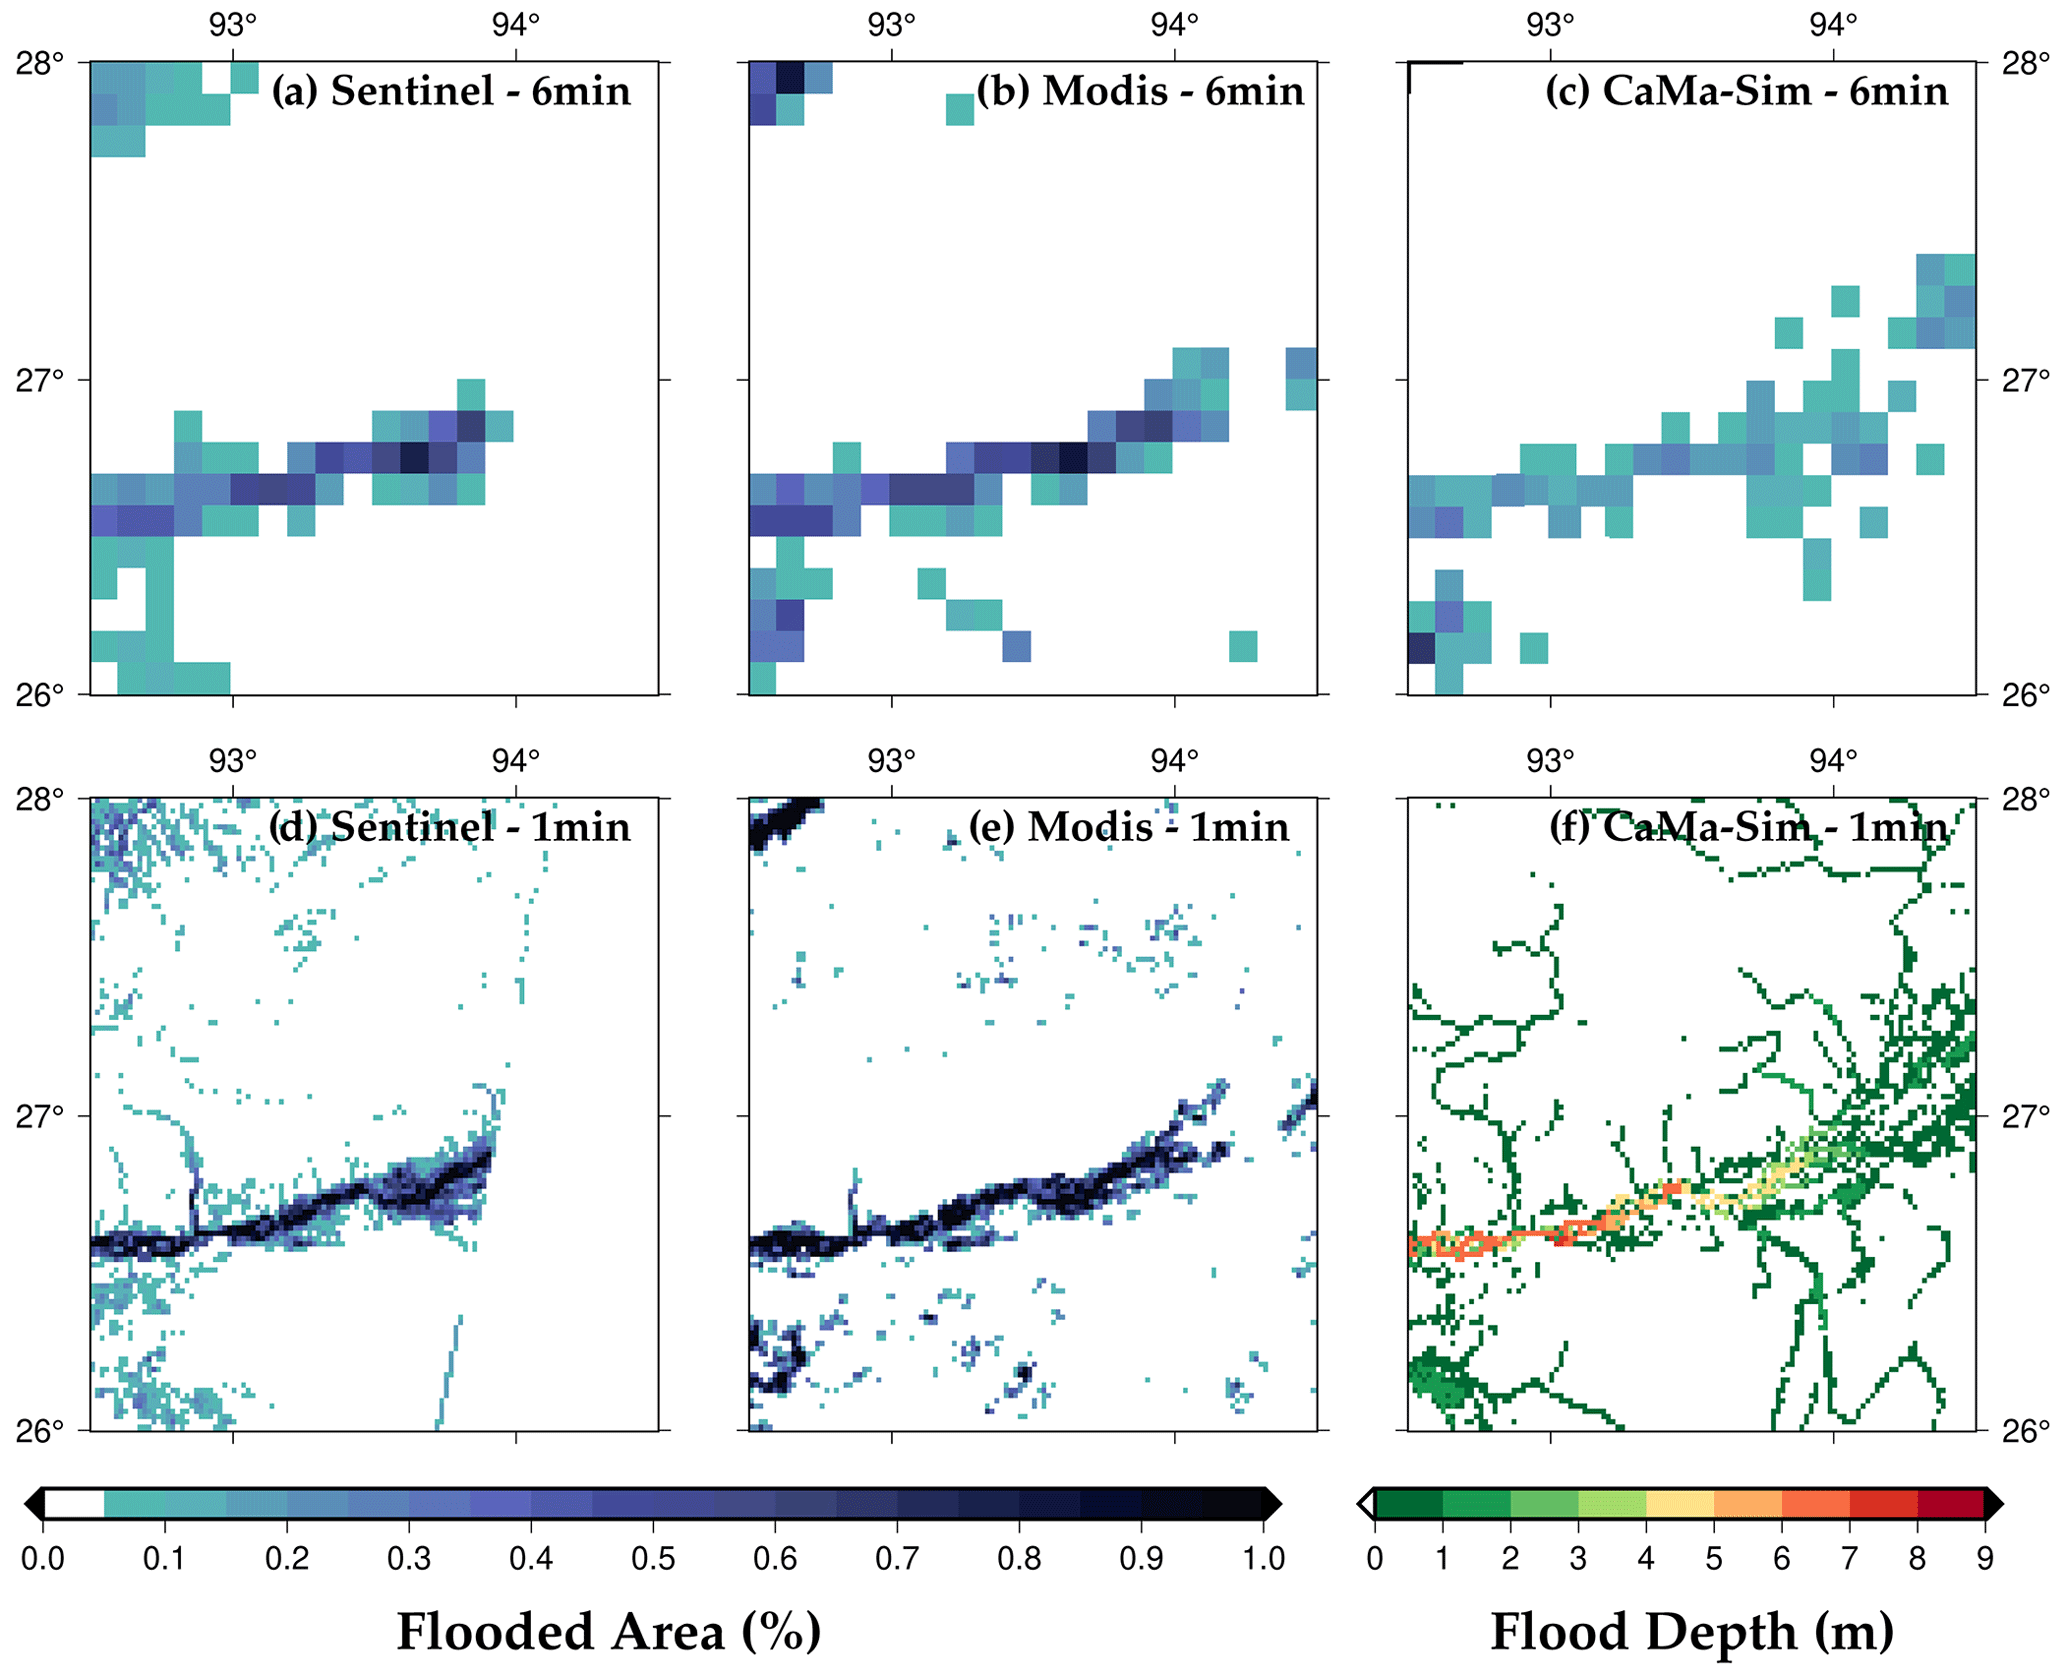
Figure 3Simulated flood extent compared with Sentinel-1 SAR and MODIS satellite-based flood extent for the 2016 flood event in the Brahmaputra River.
3.2 Estimation of the observed flood extent
Next, we reconstructed the flood inundation for the observed worst flood for each sub-basin for the 1901–2020 period in India. The inundation extent for the worst flood can help us identify the sub-basins with highest flood risk. We estimated flood depth and inundated area for each sub-basin for the worst flood during the past 120 years (Fig. 4). In addition, we identified the occurrence of the worst flood at the sub-basin level during the 1901–2020 period. We highlighted 10 sub-basins that experienced the highest fractional area affected by the worst flood. Sub-basins in the Ganga and Brahmaputra rivers are among the most highly influenced by the worst flood. For instance, the Ghaghra, Kosi, Bhagirathi, Gandak, Gomti, lower Sabarmati, upper Yamuna, Ramganga, and Baitarani sub-basins had the highest fractional area affected by the worst flood during 1901–2020 (Fig. 4). The fractional area of sub-basins in the semi-arid western India is less affected compared with those located in the Ganga River basin. For example, the lower Sabarmati sub-basin of the Sabarmati River basin is among the sub-basins that are highly influenced by the observed worst flood. We also find that the worst flood in the same year did not affect all the sub-basins within a river basin (Fig. S6). For instance, all the highly influenced sub-basins experienced the worst flood in different years in the Ganga River basin (Fig. 4). Most of the top flood-affected sub-basins experienced floods during August–September in the summer monsoon season. Overall, the flood extent due to the worst flood is substantially greater in the sub-basins of the Ganga and Brahmaputra river basins compared with other basins in India (Fig. 4). The Ganga River basin also has the highest population density among all the basins in the Indian sub-continent, which makes it vulnerable to floods.
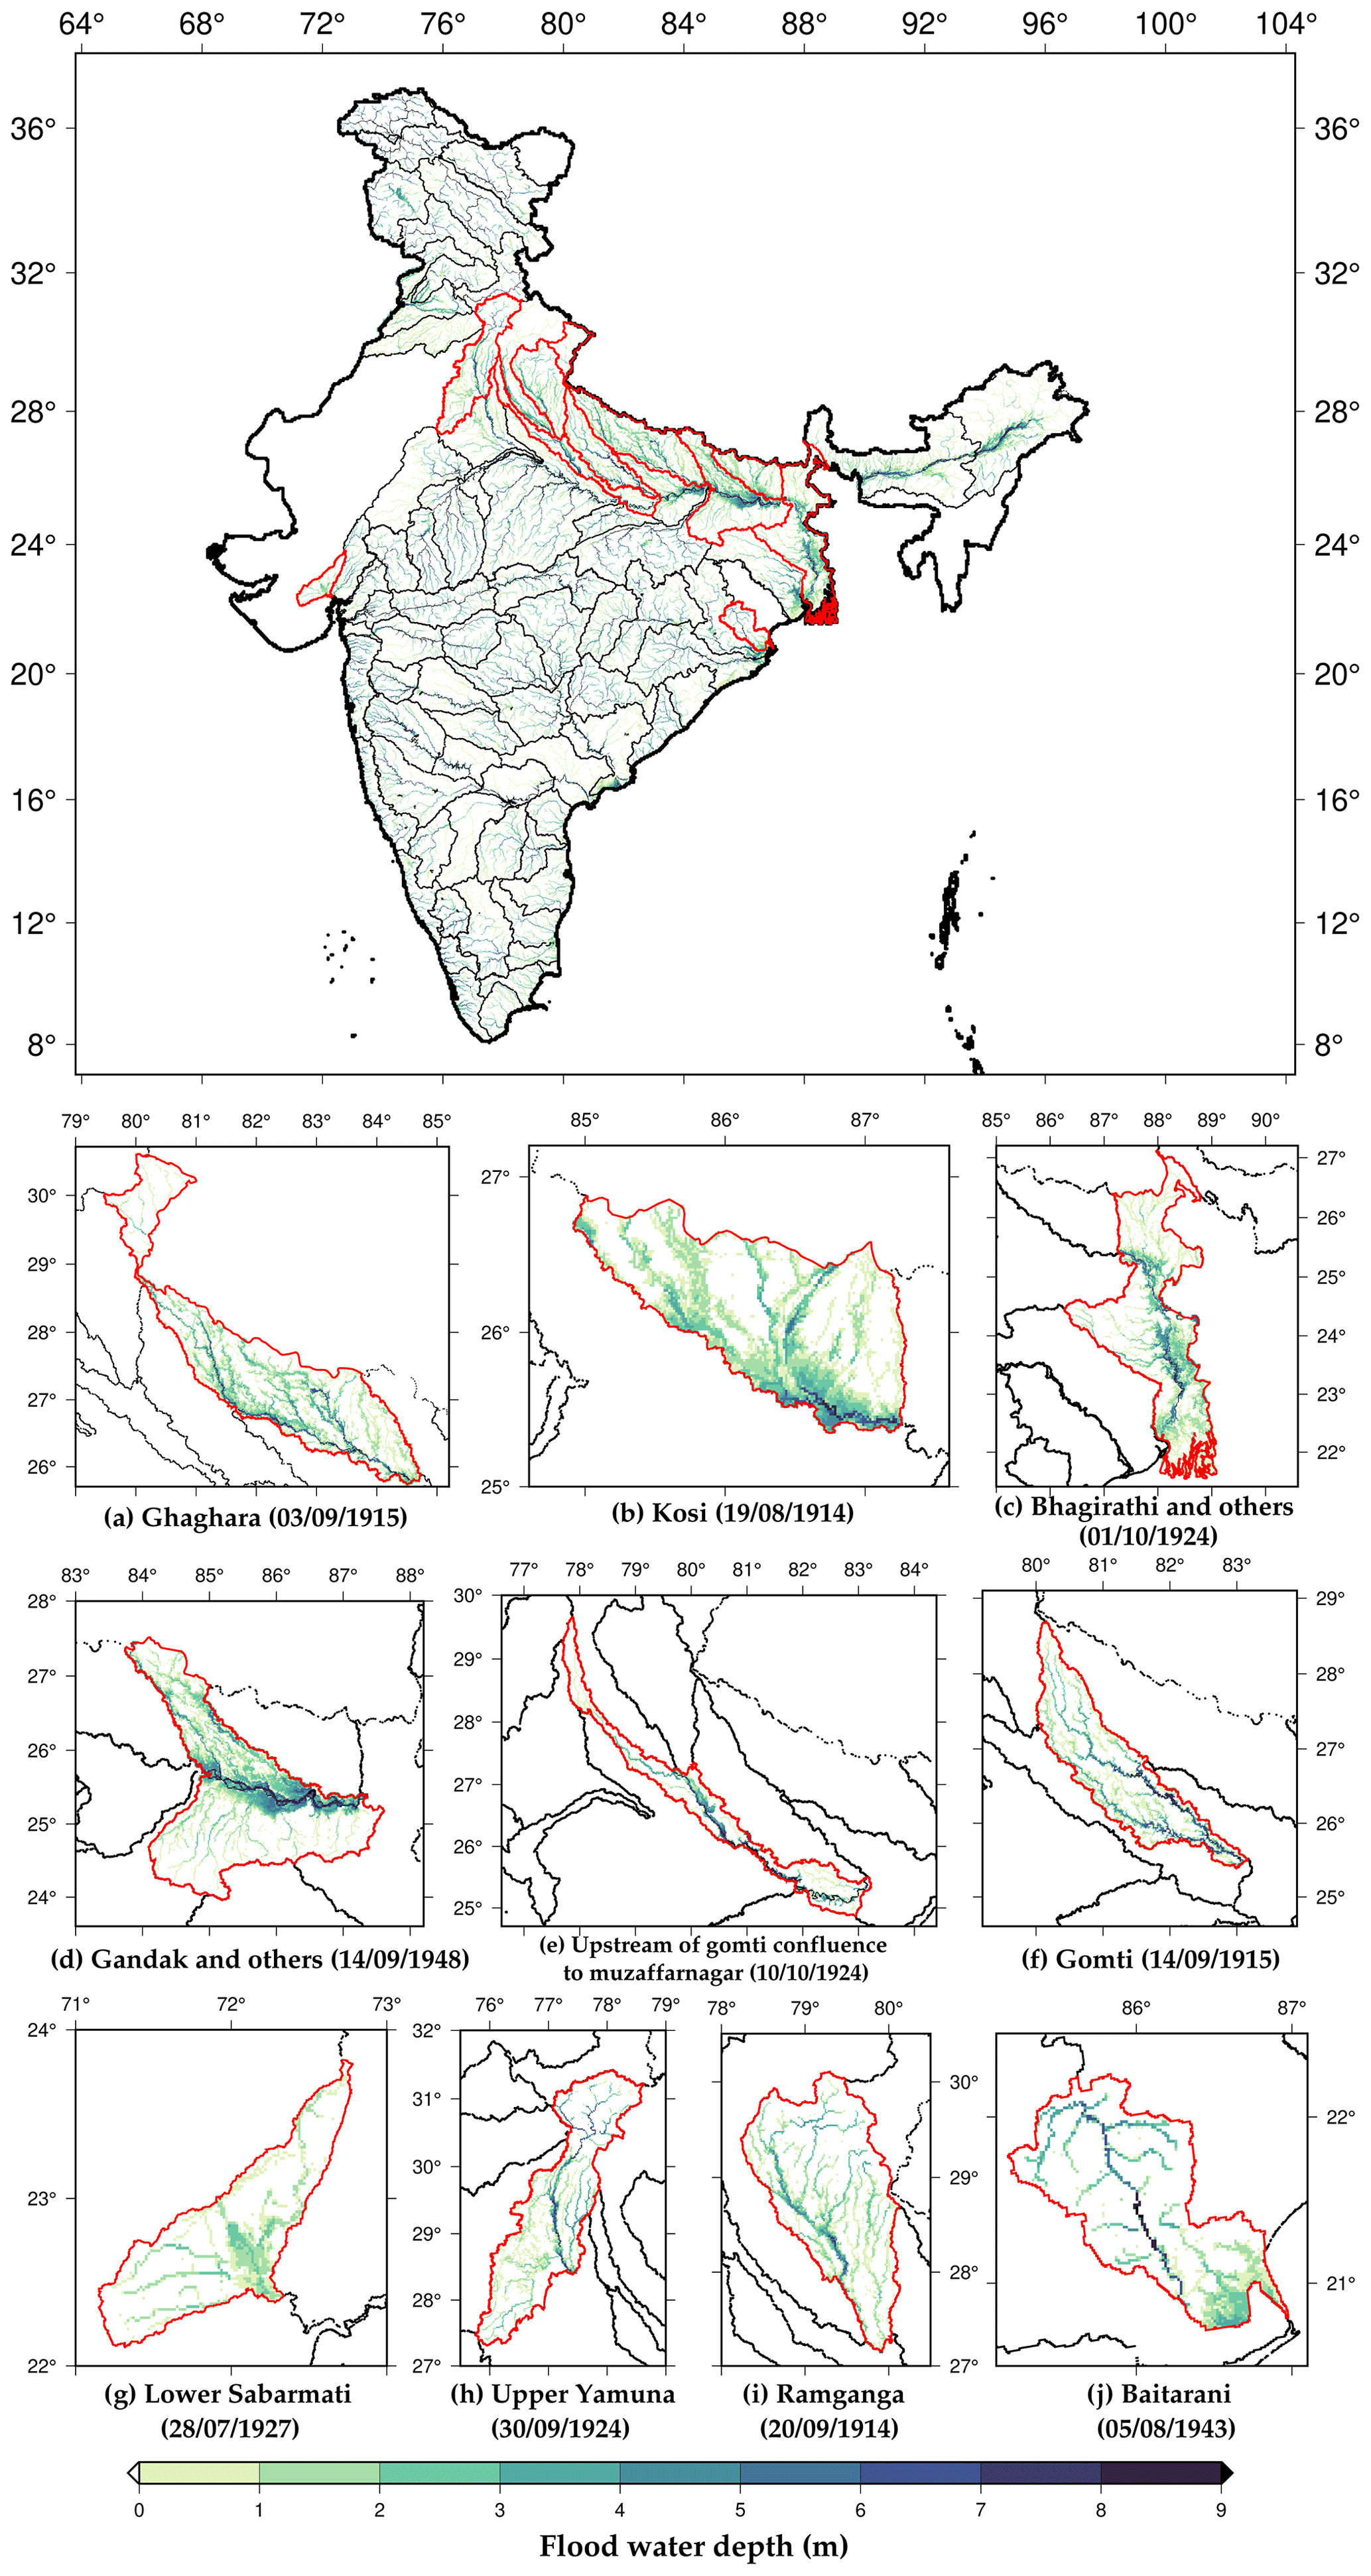
Figure 4Flood depth map for the observed worst flood for each sub-basin, highlighting the sub-basins with maximum flood inundated area (%): (a) Ghaghara – Ganga River basin, (b) Kosi – Ganga River basin, (c) Bhagirathi and others – Ganga River basin, (d) Gandak and others – Ganga River basin, (e) upstream of the Gomti confluence to Muzaffarnagar – Ganga River basin, (f) Gomti – Ganga River basin, (g) lower Sabarmati – Sabarmati River basin, (h) upper Yamuna – Ganga River basin, (i) Ramganga – Ganga River basin, and (j) Baitarani – Brahmani River basin.
Next, we examined the precipitation, streamflow, and flood-affected area (%) for the 10 sub-basins that had the highest fractional flood-affected area for the worst flood during 1901–2020 (Fig. 5). As floods mostly occur during the summer monsoon season in India (Nanditha and Mishra, 2021; Mishra et al., 2022), we examined the temporal variability in precipitation and streamflow, during the monsoon season of the worst flood year. Nanditha and Mishra (2022) reported that multi-day precipitation is India's most robust driver of floods. Moreover, extreme precipitation and wet-antecedent conditions trigger floods in India (Nanditha and Mishra, 2022). We find that the Ghaghara sub-basin of the Ganga River experienced the worst flood in September 1915, affecting more than 10 000 km2 area of the sub-basin. A multi-day rainfall in late August and early September (1915) caused the worst flood in the basin. The Kosi sub-basin of the Ganga River experienced the worst flood in August 1914, which affected more than 5000 km2 of the basin (Fig. 5). Similarly, Bhagirathi and other sub-basins in the Ganga River basin were affected by the worst flood in late September 1924, which inundated more than 12 000 km2 of the sub-basin. Similarly, the Gandak and Gomti river basins experienced the worst floods in 1948 and 1915, respectively. Our results agree with the information presented in previous studies (Fredrick, 2017; Joshi, 2014; Singh et al., 2021; Agarwal and Narain, 1991; Mishra, 2015): we find that most of the sub-basins of the Ganga River basin are prone to large extents of flood inundation. Moreover, the worst floods in most sub-basins were caused by multi-day precipitation, a prominent driver of floods in the Indian sub-continental river basins (Fig. 5).
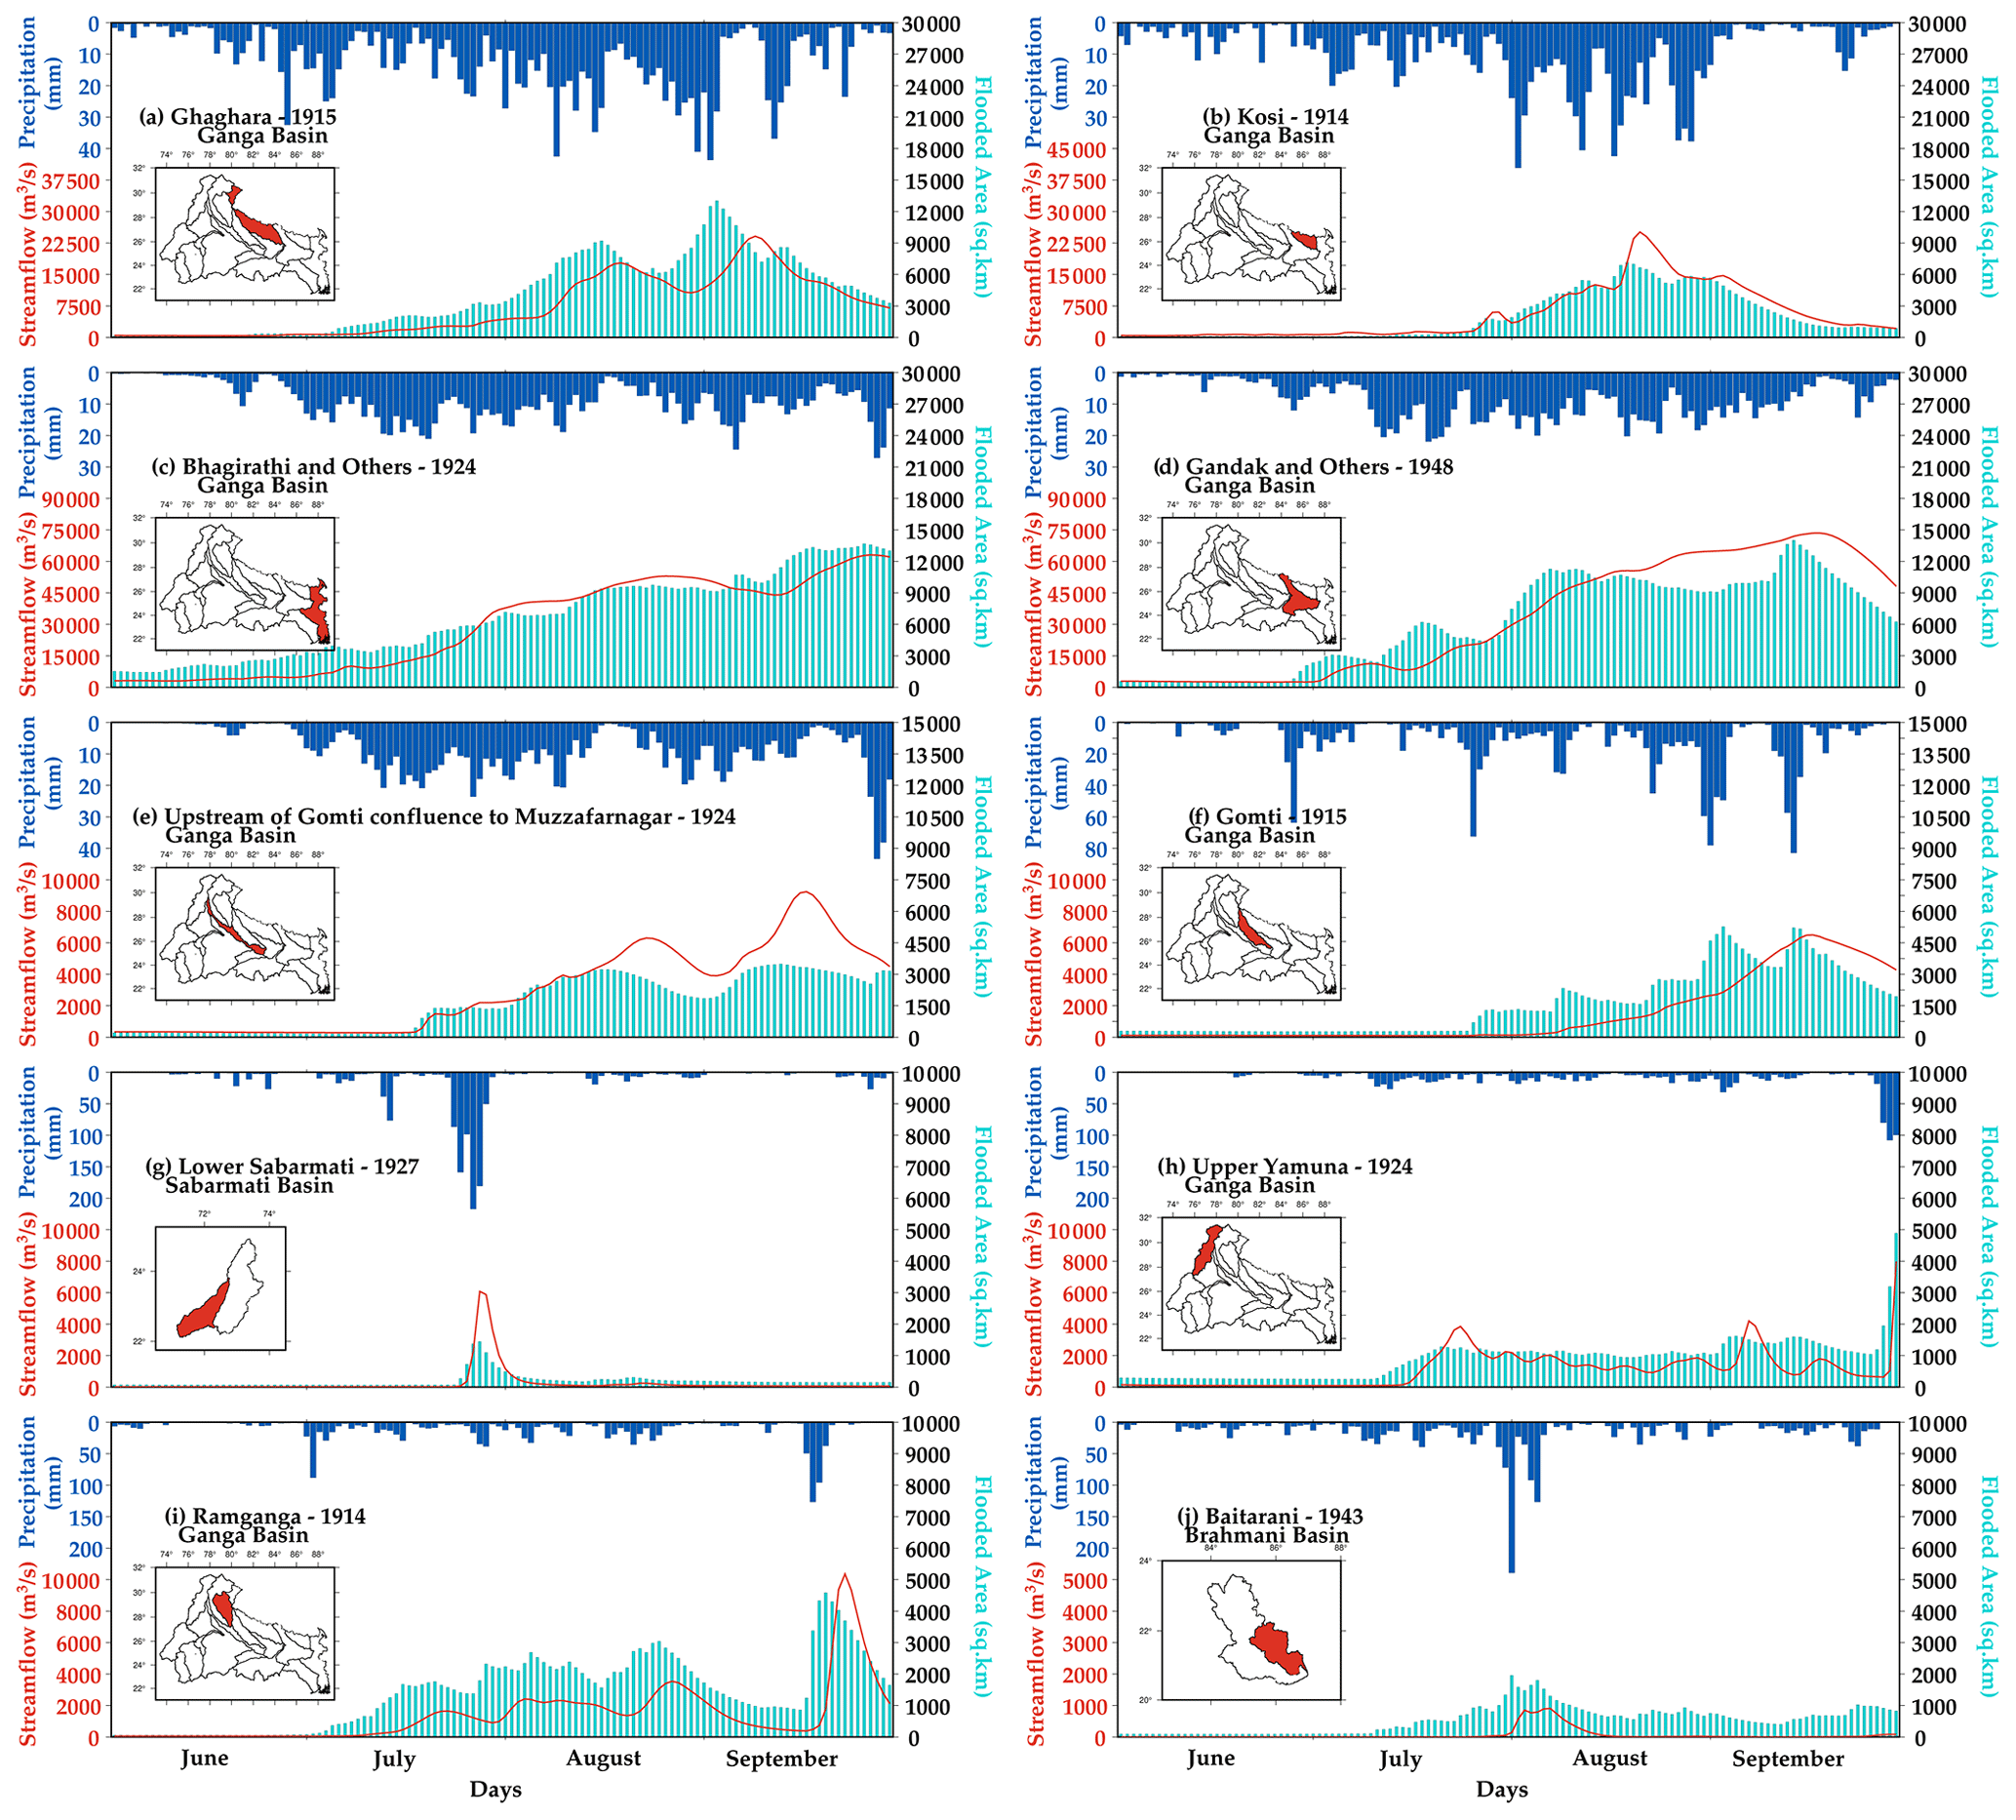
Figure 5Daily upstream precipitation (in mm; blue), the H08 model-simulated streamflow (red) at the sub-basin outlet (in m3 s−1), and flooded area (in km2; green) for the summer monsoon (June–September) period of the corresponding worst flood year: (a) Ghaghara – Ganga River basin, (b) Kosi – Ganga River basin, (c) Bhagirathi and others – Ganga River basin, (d) Gandak and others – Ganga River basin, (e) upstream of the Gomti confluence to Muzaffarnagar – Ganga River basin, (f) Gomti – Ganga River basin, (g) lower Sabarmati – Sabarmati River basin, (h) upper Yamuna – Ganga River basin, (i) Ramganga – Ganga River basin, and (j) Baitarani – Brahmani River basin.
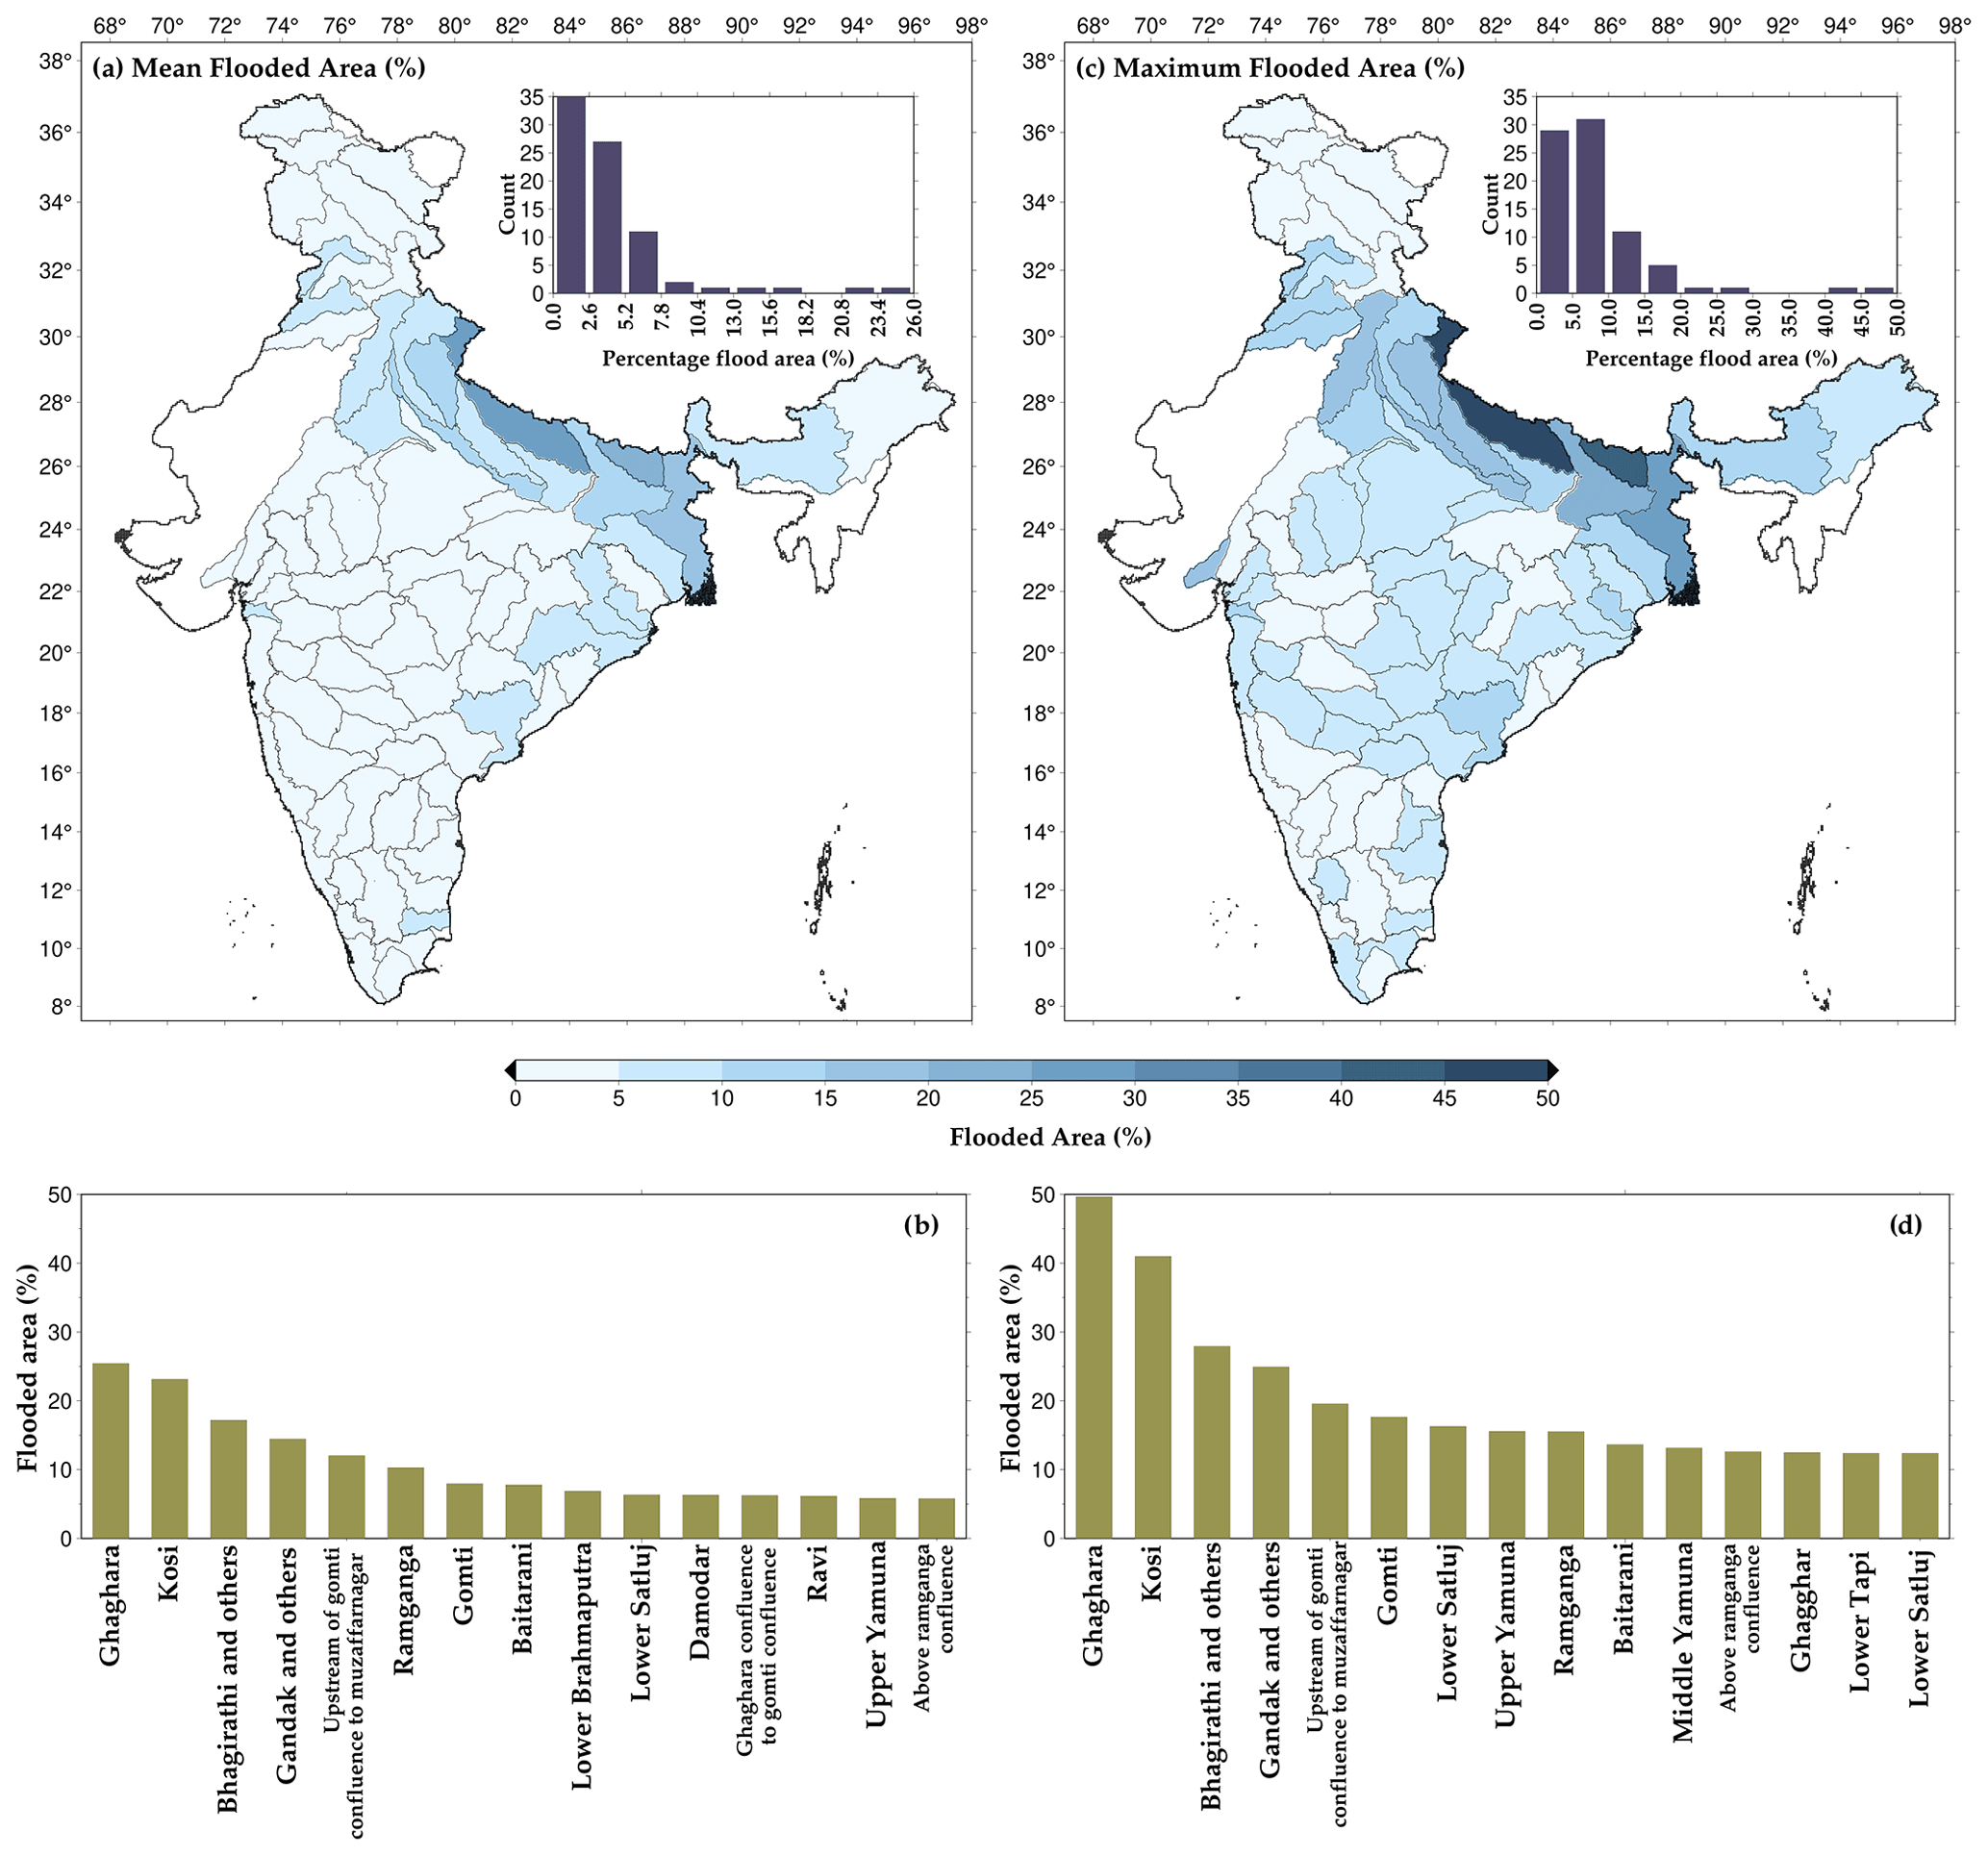
Figure 6Panel (a) shows the mean of annual maximum flooded area (percentage) between 1901 and 2020, as well as the overall distribution. Panel (b) highlights the top 15 sub-basins. Panel (c) shows the historical maximum flooded area (percentage) and the overall distribution. Panel (d) highlights the top 15 sub-basins.
To further examine flood-affected areas at the sub-basin level, we estimated the mean annual maximum flooded area (Fig. 6a) and historical maximum flooded area using the H08 and CaMa-Flood combined model (Fig. 6b). Most of the highly flooded sub-basins are in the Ganga River basin. While the mean annual maximum flooded area for the top flood-affected sub-basins ranged between 10 % and 15 %, their maximum flooded area varied between 30 % and 40 %. Other than sub-basins from the Ganga River basin, Baitarani, lower Tapi, lower Godavari, Brahmani, and lower Mahanadi also showed a considerable mean flooded area during the 1901–1920 period. In the case of the maximum flooded area, the Gandak, Kosi, and Ghaghara confluences to the Gomti confluence sub-basins exhibited more than 20 % flooded area. Sub-basins from the other river basins, such as lower Tapi, lower Narmada, Baitarani, and lower Satluj, are in the top 15 sub-basins with the highest flooded area. The sub-basins in the Ganga and Brahmaputra rivers are the most flood affected. Moreover, the Ganga and Brahmaputra rivers experience the highest floods among all the river basins (Mohanty et al., 2020; Mohapatra and Singh, 2003).
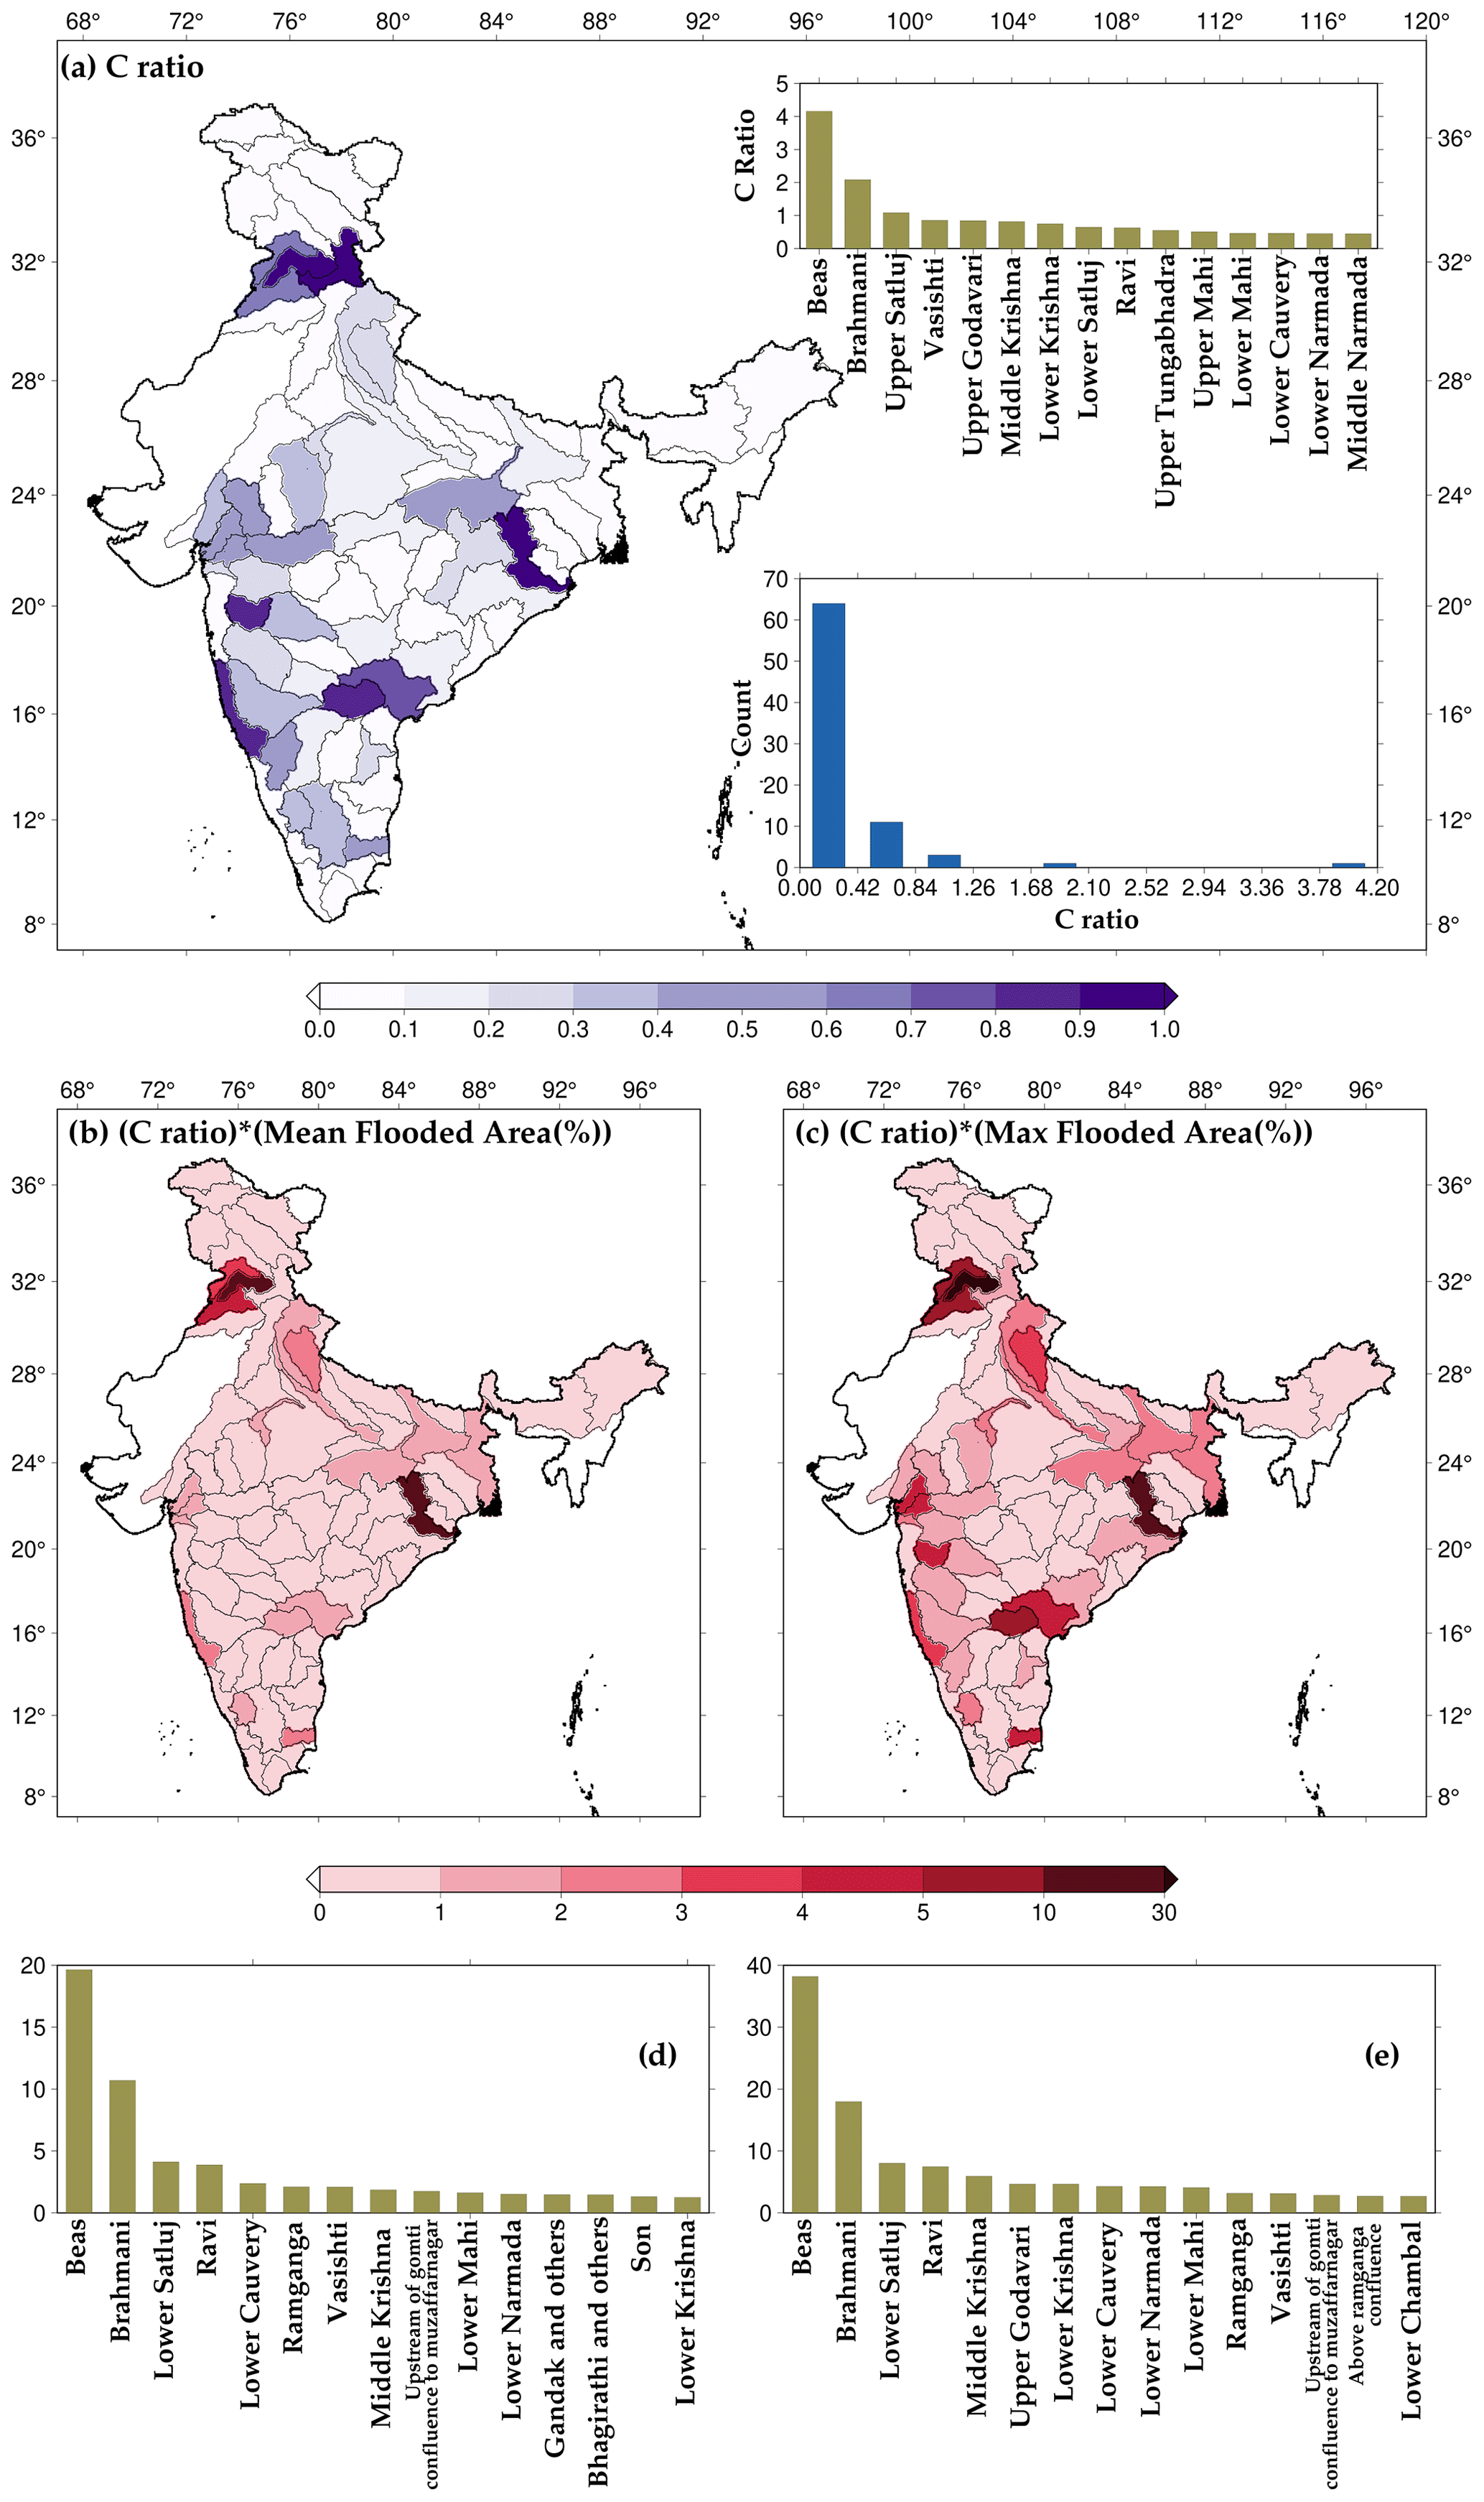
Figure 7(a) C-ratio for sub-basins, top 15 sub-basins based on the C-ratio in India, and the frequency distribution of sub-basins based on C-ratio values, (b) mean of annual maximum flooded area (%) multiplied by the C-ratio, (c) maximum flooded area (%) multiplied by the C-ratio, (d) top 15 sub-basins shown in panel (b), and (e) top 15 sub-basins shown in panel (c).
3.3 Influence of reservoirs on flood extent
We selected and considered 51 major reservoirs to examine their influence on flood risk based on the availability of the observed storage data. We estimated C-ratio for each sub-basin considering the river flow at the outlet to investigate the impact of reservoirs on streamflow. C-ratio can vary between zero and infinity, and higher values indicate the prominent effect of dams on river flow. We identified sub-basins with a greater influence on dams based on the C-ratio. We found that Beas, Brahmani, upper Satluj, upper Godavari, middle and lower Krishna, and Vashishti are among the most influenced by the dams. Beas sub-basin has the highest C-ratio (4.16) among all the sub-basins in the Indian sub-continent (Fig. 7a). Of the 80 sub-basins, only 11 have a C-ratio greater than 0.5, and 64 have a C-ratio between 0 and 0.42 (Fig. 7a). We considered only 51 major reservoirs in our analysis; however, there are several major and minor dams for which observed data are unavailable. Therefore, the influence of reservoirs based on the C-ratio might need to be considered. However, our analysis indicates that dams in a few sub-basins can significantly alter river flow and flood risk. For instance, dams effectively alter extreme flows' timing, duration, and frequency (Mittal et al., 2016). The C-ratio alone may not effectively capture the influence of dams on floods; therefore, we multiplied the fractional area affected by floods and the C-ratio for each sub-basin. For instance, if a sub-basin is considerably affected by dams and has a large flood extent, the value of the multiplied ratio will be higher. The multiplier ratio can effectively identify the sub-basins with high flood-affected areas and flow regulated by the reservoirs. We find that the Beas, Brahmani, Ravi, and lower Satluj sub-basins are highly affected by floods and the presence of reservoirs. Overall, the sub-basins with a higher C-ratio and the highest flood-affected area are across the Indian sub-continent. Central India has sub-basins that are relatively less affected by floods and the presence of dams.
3.4 Sub-basin level flood risk assessment
Next, we identified the roads (national highways) and railway exposure to riverine floods for each sub-basin. Climate change will adversely affect rail and road networks (Hooper and Chapman, 2012; Padhra, 2022). A considerable length of roads is affected due to surface flooding resulting from high-intensity rain (Koks et al., 2019). Therefore, we examined the impact of floods on rail and road infrastructures in India. We estimated the length of the road and railway network potentially affected by the worst flood that occurred during 1901–2020. We overlapped the road and rail network on the flooded area and estimated the network length exposed to floods (Fig. 8a and b). The estimated length for each sub-basin was normalized between zero and one (Fig. 8c and d). We found that the road network can be the most affected by the floods in the Gandak, Kosi, and Ghaghara confluence to the Gomti confluence in the Ganga River basin. On the other hand, a considerable part of the rail network can be affected by floods in the Son, Kosi, and upper Yamuna sub-basins. Moreover, in the Bhagirathi and Gandak river basins, more than 50 km of road network falls in the flood-prone regions (Fig. 8e). There are 10 sub-basins in which more than 20 km of road network falls in flood-prone areas of India. Similarly, over 20km of the rail network is in the flood-affected areas of the four sub-basins (upper Yamuna, Son, Kosi, and Brahmani) (Fig. 8f).
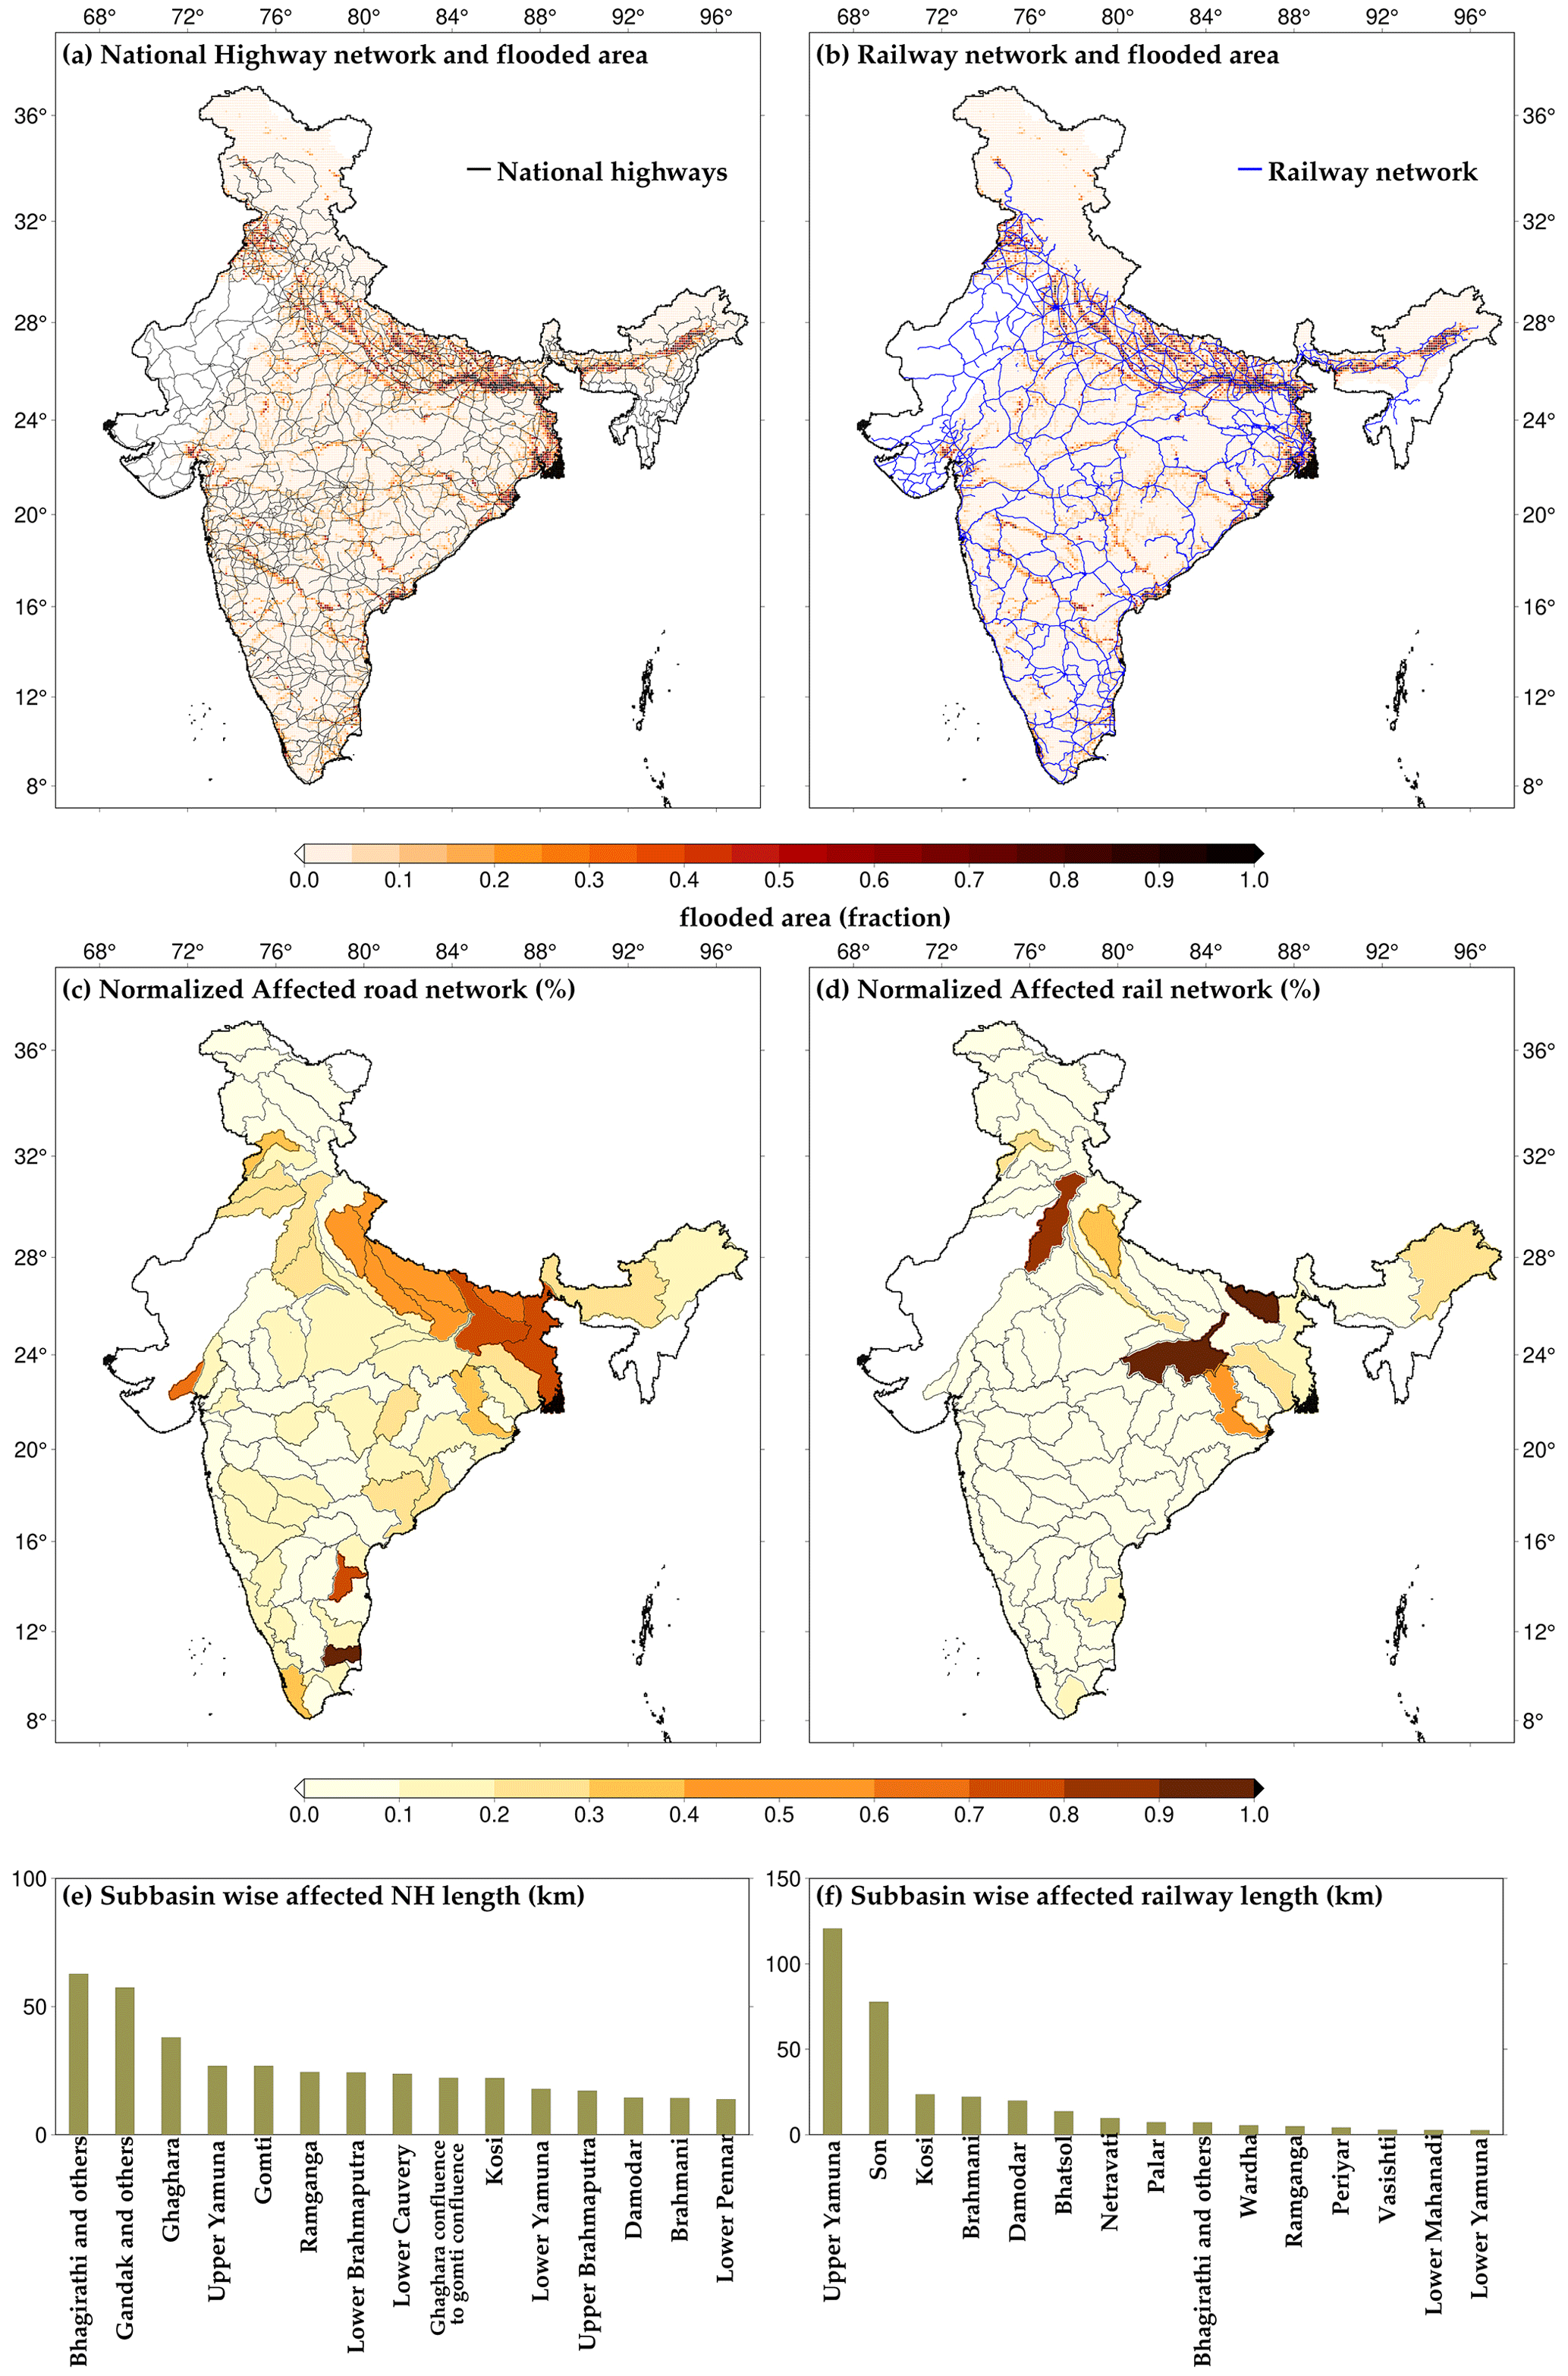
Figure 8Flood impacts on road and railway infrastructures: (a, b) national highway network and railway network overlapped on the flooded area in the worst flood cases, (c, d) sub-basin-wise normalized flood-affected road and railway networks (percentage), and (e, f) the top 15 sub-basins with the most affected national highways and railway length (in km).
Finally, we estimated sub-basin level flood risk using normalized vulnerability, hazard, and exposure (Fig. 9). Vulnerability for each sub-basin in India was assessed using the national vulnerability assessment data available at the district level. We estimated hazard probability considering 50 % of the inundated area for the worst flood as a benchmark. The likelihood of flood inundated areas in a sub-basin exceeding the benchmark was used in the risk assessment. Similarly, we used the worst flood extent and gridded population data to estimate flood exposure. The sub-basins in north–central India have a relatively higher vulnerability calculated using the socio-economic indicators. The vulnerability is relatively lower in northern India and the Western Ghats. The Kosi, Gandak, and Damodar sub-basins have the highest vulnerability. We find that hazard probability is higher in the sub-basins of Brahmaputra, rivers in the Western Ghats, and a few sub-basins of the Indus River basin (Fig. 9b). For instance, the upper Satluj, Chenab, and Jhelum sub-basins of the Indus River have higher hazard probability. Other than the Western Ghats, most sub-basins in peninsular India have relatively lesser hazard probability. Exposure, which represents the fraction of the population affected by flood under the worst flood scenario, is higher in the Indo-Gangetic Plain. Apart from the sub-basins of the Ganga River basin, the lower Brahmaputra, lower Godavari, and Baitarani sub-basins show higher exposure. Therefore, the Ganga and Brahmaputra river basins are the highest flood-prone river basins and have high flood exposure. Rentschler et al. (2022) also reported that the highest population exposure due to floods is in Uttar Pradesh, Bihar, and West Bengal, which is part of the Ganga River basin.
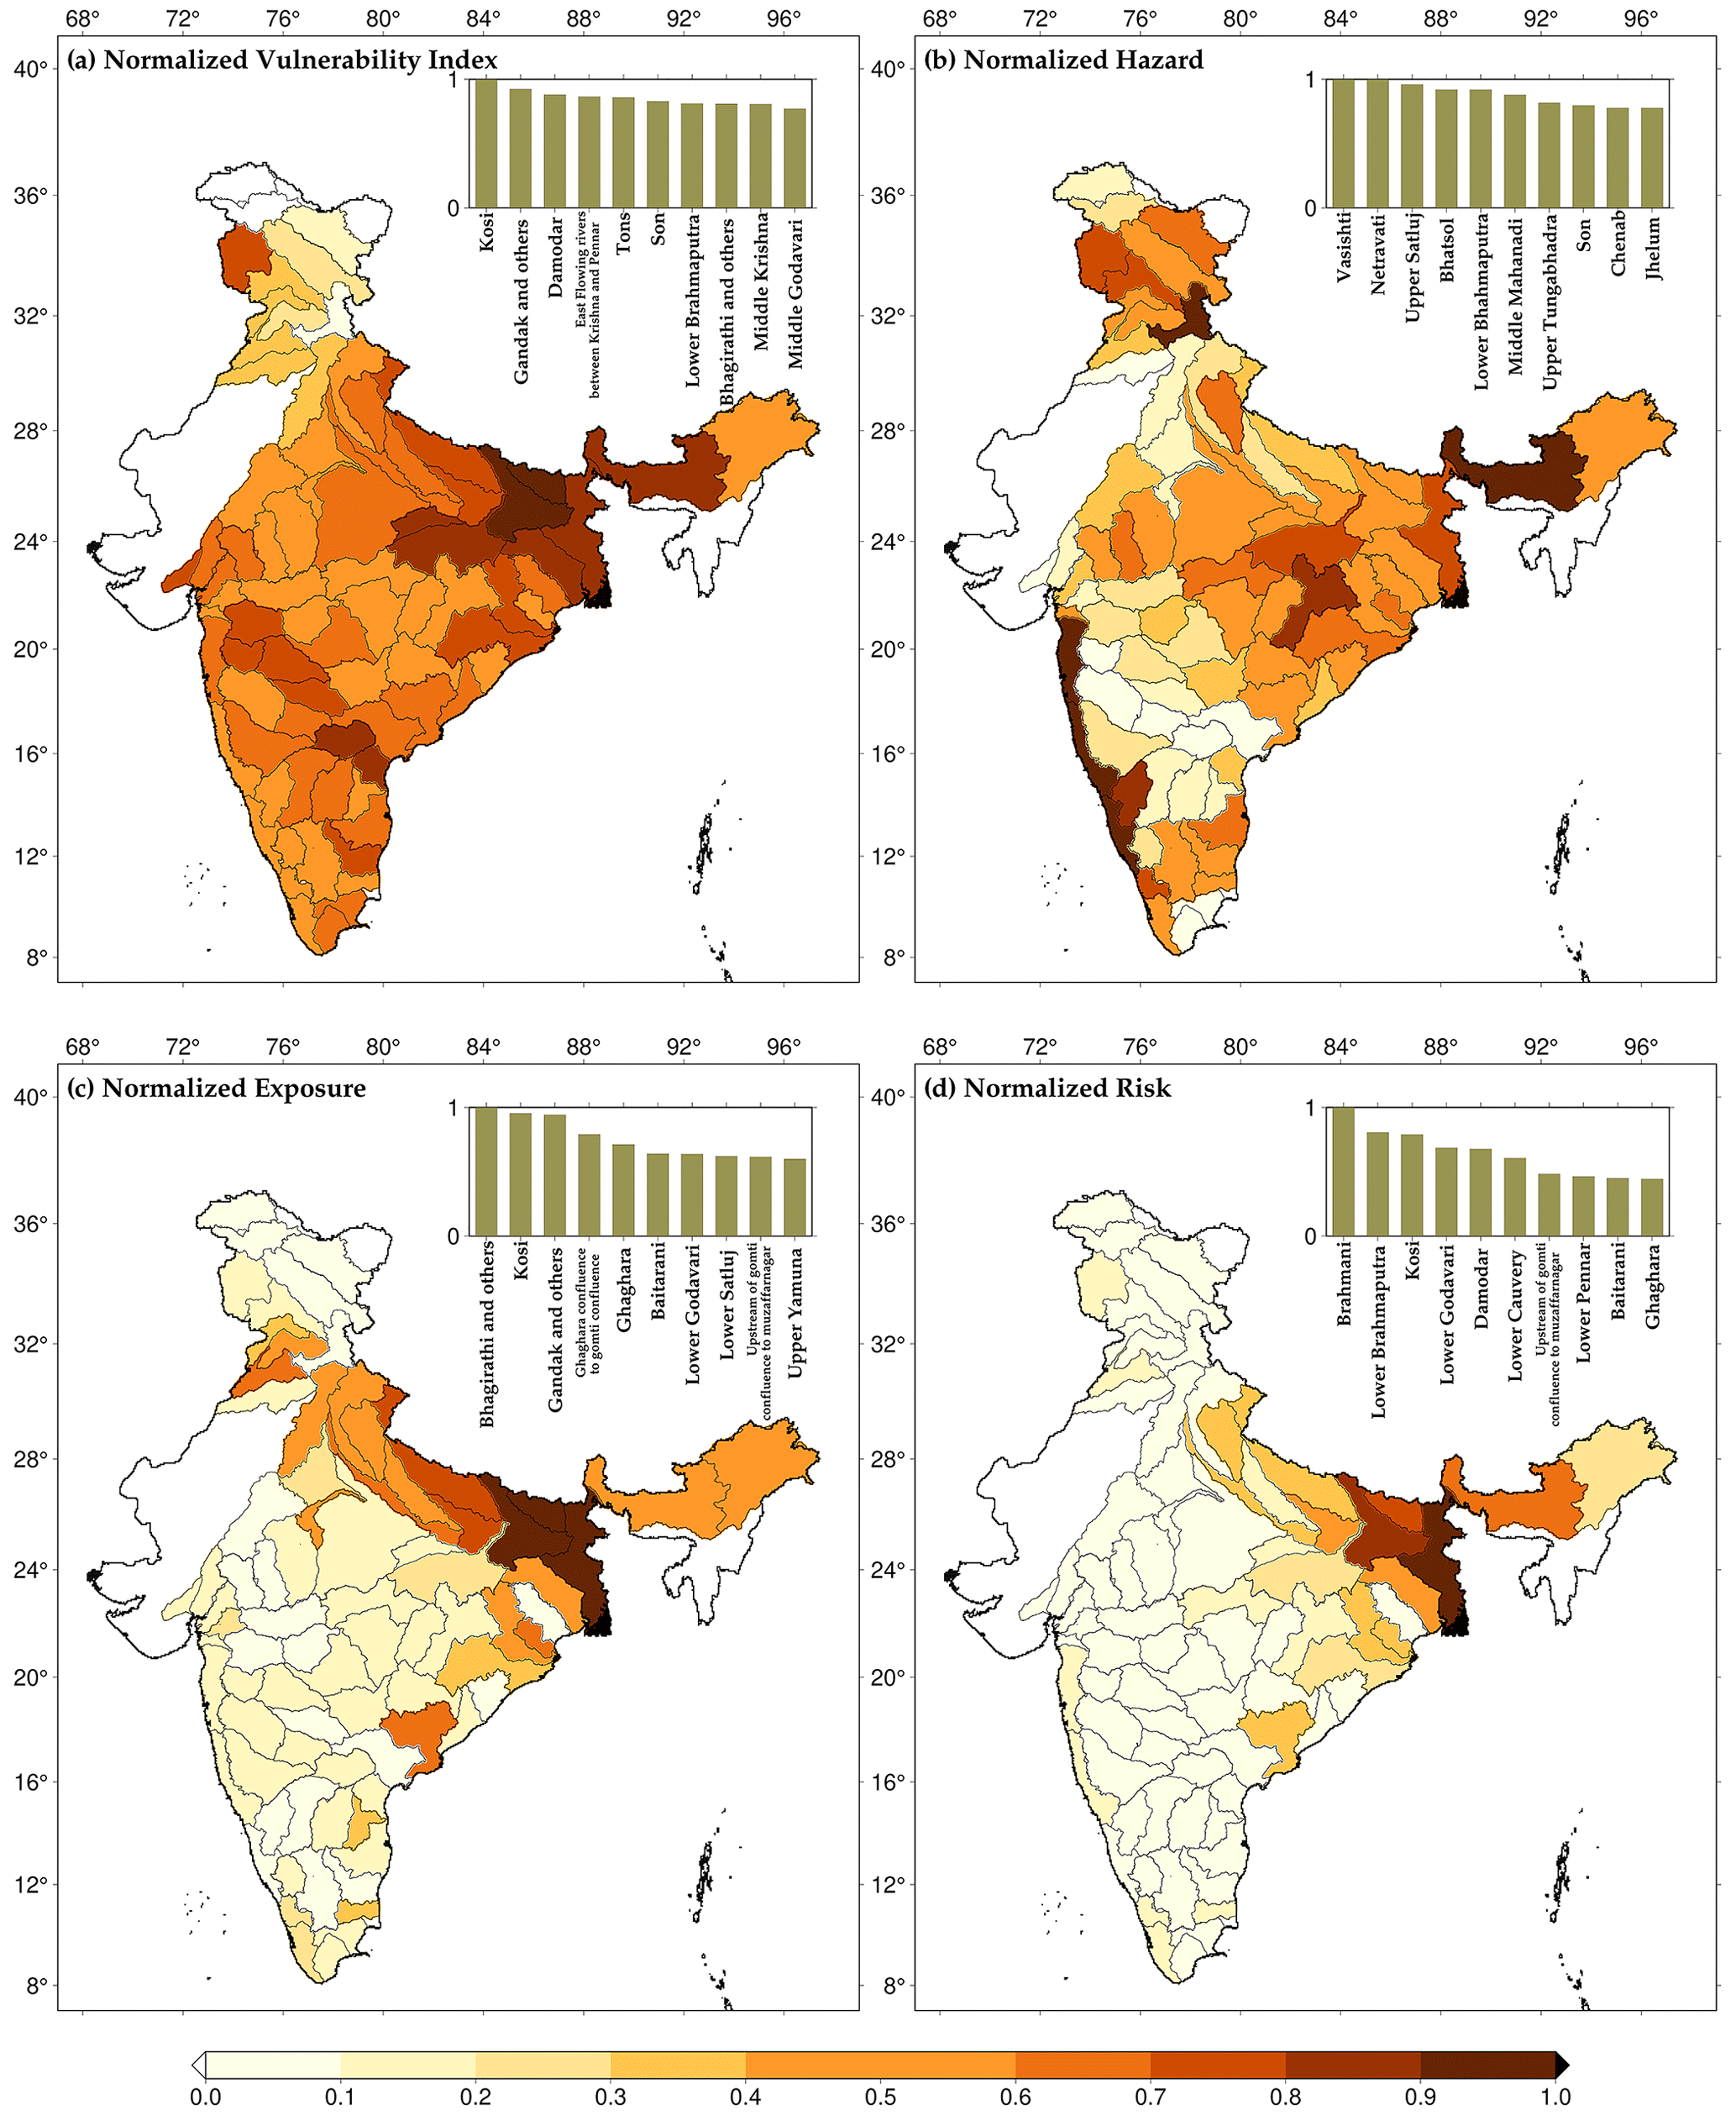
Figure 9Sub-basin level (a) normalized vulnerability index, (b) normalized hazard, (c) normalized exposure, and (d) normalized risk. The top 10 sub-basins are highlighted as bars in the insets.
We estimated the flood risk for each sub-basin, a collective representation of vulnerability, hazard, and exposure. As expected, the flood risk is higher in the Ganga and Brahmaputra river basins compared with other parts of the country. The higher flood risk in these basins can be attributed to higher vulnerability, hazard probability, and exposure. For instance, Bhagirathi, Gandak, Kosi, lower Brahmaputra, and Ghaghra are the sub-basins with the highest flood risk in India (Fig. 9d). Despite the higher hazard probability in the sub-basins of the Indus and west coast river basins, the overall flood risk is considerably lower than that of the sub-basins of the Ganga and Brahmaputra river basins primarily due to less vulnerability and exposure. Our results show that flood risk in some of the sub-basins of the Ganga and Brahmaputra river basins can be reduced by reducing the vulnerability.
Flood risk mapping is essential for risk reduction and developing mitigation measures. Flood risk will likely increase due to increased hazard probability and exposure (Ali et al., 2019). Hirabayashi et al. (2013) showed that a warmer climate would increase the risk of floods on a global scale. In India also, floods are expected to become more likely under the warming climate. For instance, Ali et al. (2019) reported that multi-day floods are projected to rise faster than single-day flood events. The projected rise in the flood frequency in India can be attributed to increased extreme precipitation under the warming climate (Mukherjee et al., 2018). Observational studies have also concluded that there has been a considerable rise in extreme precipitation, which is linked to the warming climate, in India during the summer monsoon season (Roxy et al., 2017). While the warming climate is directly linked to the increased frequency of extreme precipitation, its association with riverine floods is not straightforward. For instance, Nanditha and Mishra (2021, 2022) reported that multi-day precipitation on the wet-antecedent conditions is one of the most favorable drivers of the riverine floods in India.
While mapping the flood risk at appropriate spatial resolution is complex and challenging, it is vital for disaster risk reduction. Flood inundation mapping that provides the spatial extent of flooding is crucial as the first responders use it during a flood emergency (Apel et al., 2009). There are several approaches to mapping flood inundation (Teng et al., 2017). Various hydrological models have been employed for conducting flood risk assessments at a global scale (Gu et al., 2020; Dottori et al., 2018; Tabari et al., 2021). For instance, Dottori et al. (2018) used the H08 model combined with the CaMa-Flood model to estimate losses resulting from river flooding at the country level. Additionally, the LISFLOOD model (van der Knijff et al., 2010) at 5 km spatial resolution was used to estimate the river flood risk in Europe (Alfieri et al., 2018). Flood risk assessment at relatively larger scales are conducted using the coarse resolution land surface hydrological models. The objective of these large-scale flood risk assessments is to identify regions that are flood-prone (Dottori et al., 2018; Gu et al., 2020; Tabari et al., 2021). On the other hand, high-resolution flood inundation mapping is needed to understand the local flood risk and damage caused to infrastructure. For the analysis of flood inundation during a particular flood at a local scale, high-resolution models, such as HEC-RAS and Mike FLOOD, can be employed (Nguyen et al., 2016; Khalaj et al., 2021). High-resolution flood risk mapping requires comprehensive information of high-resolution topography, cross-sections of channels, and data associated with structural measures of flood protection. However, the smallest sub-basin considered in our study has more than 5000 km2 area (Fig. S7), while most sub-basins have an area between 10 000 and 50 000 km2, with lower Yamuna being the largest sub-basin, with an area of 124 867.19 km2. Therefore, the performance of our modeling framework against the satellite and other observations can be considered satisfactory to provide a sub-basin scale flood risk assessment. Moreover, we used hydrodynamic modeling to develop long-term flood inundation maps for the Indian sub-basins. The long-term data (1901–2020) provide us with a record of several floods, which can help in robust estimates of flood risk in different sub-basins.
While high-resolution models are suitable for event-specific finer-level flood assessments, their feasibility diminishes in studies involving large-scale flood inundation over longer durations (Yamazaki et al., 2018). Creating high-resolution flood inundation maps based on hydrodynamic modeling is computationally expensive (Dottori et al., 2016) for a large domain like India. In addition, higher-resolution flood risk mapping that can be used at the local scale for decision-making requires accurate terrain information and river cross-section datasets that are not available. For instance, freely available digital elevation models (DEMs) can be too coarse to resolve the flood inundation and depth variability at a local scale (Dey et al., 2022; Cook and Merwade, 2009). The uncertainties within hydrological outputs can primarily arise due to inaccuracies in both input data and model parameterization (Poulin et al., 2011). Inaccuracies in input meteorological data may stem from disparate sources, leading to errors in spatial and temporal interpolation (Brown and Heuvelink, 2005). Similarly, model parameterization errors, which involve assigning values to parameters governing diverse hydrological processes, can emerge during the calibration process (Laiolo et al., 2015). Moreover, there are uncertainties originating from utilizing long-term flood occurrence data to assess flood mapping capabilities. Our modeling framework, which considers the influence of reservoirs, provides sub-basin scale flood inundation extent as our aim was to provide a long-term assessment of flood extent at the country scale. Additionally, downscaling of flood depths introduces biases as coarse-scale information is translated to the local scale (He et al., 2021), which might have considerable deviations from the actual observed flood extent. Given these limitations, our findings provide valuable information based on the long-term record developed using model simulations that can be used for the regional-scale policy development for flood mitigation. Cloud cover during the summer monsoon, when most floods occur in India (Nanditha et al., 2022), hinders the utility of satellite data for flood inundation mapping. We calibrated and evaluated our H08 and CaMa-Flood combined modeling framework using the observed flow, reservoir storage, and satellite-based inundation. However, all these datasets available from the in situ network or satellites are prone to errors and uncertainty (Stephens et al., 2012; Di Baldassarre and Montanari, 2009; Teng et al., 2017). We used the C-ratio as an indicator to quantify the influence of dams on streamflow. However, the C-ratio may not fully capture the complexities and variations in the impacts of reservoir operations. Furthermore, in the case of run-of-the-river dams, the C-ratio may overestimate the downstream hydrological impacts. Therefore, the C-ratio may not solely capture the downstream hydrological effects resulting from dams. Nevertheless, it provides preliminary information on the potential dam influence on the downstream flow.
India has implemented several flood risk mitigation measures at multiple government levels. The construction of embankments along rivers is a common flood risk mitigation measure in India. These embankments help contain the floodwaters within the river channels and protect nearby areas from inundation (NDMA, 2016). The Central Water Commission (CWC) in India operates a network of flood forecasting stations that collect real-time data on rainfall and water levels to forecast floods and issue warnings to vulnerable communities. Notwithstanding the considerable investments and flood-control measures, India has witnessed substantial mortality, human migration, and economic loss. Flood mortality has increased mainly because of increased frequency, not necessarily due to increased flood intensity (Hu et al., 2018). About 3 % of the total geographical area of India is affected by floods every year that cause damage to agriculture and infrastructure. The top 10 floods that occurred during 1985–2015 caused the mortality of more than 1000 people, and more than 35 million people were displaced due to floods between 2000 and 2004 (Dartmouth Flood Observatory). The recent riverine floods in Uttarakhand (July 2023) and Kerala (October 2021 and August 2018) highlighted the growing flood risk in India, which warrants the need for flood mitigation. The recent flood (August 2022) in Pakistan caused an estimated loss of USD 30 billion. Both structural and non-structural measures are required for flood mitigation (Nanditha and Mishra, 2021). Our risk assessment provides policy implications towards reducing vulnerability to reduce flood risk. Moreover, a sub-basin level ensemble forecast is needed for early flood warnings in the sub-basins with higher flood risk.
Based on our findings, the following conclusions can be made:
-
The coupled hydrological and hydrodynamic modeling framework based on the H08 and CaMa-Flood combined model was used to estimate flood risk assessment in India. The hydrological modeling framework performed well against the observed flow, reservoir storage, and satellite-based flood inundation. The role of 51 major reservoirs was considered in flood risk assessment based on the long-term simulations for the 1901–2020 period.
-
The sub-basins in the Ganga and Brahmaputra river basins experienced the most significant flood extent during the worst floods over 1901–2020. Similarly, the mean annual maximum flood extent is higher for the sub-basins in the two major transboundary river basins (e.g., Ganga and Brahmaputra). The worst floods affected different sub-basins on the two main flood-affected river basins in different years. Major floods in the flood-prone sub-basins of the Ganga and Brahmaputra river basins occur during the summer monsoon season, especially during the August–September period.
-
The sub-basins with a more prominent influence of dams based on the C-ratio were identified. The Beas, Brahmani, upper Satluj, upper Godavari, middle and lower Krishna, and Vashishti sub-basins are among the most influenced by dams. Moreover, Beas, Brahmani, Ravi, and lower Satluj sub-basins are among the most affected by floods and the presence of reservoirs.
-
Flood risk is higher in the Ganga and Brahmaputra river basins compared with other parts of the country. The higher flood risk in the two transboundary river basins can be attributed to higher vulnerability, hazard probability, and exposure. Bhagirathi, Gandak, Kosi, lower Brahmaputra, and Ghaghra are India's sub-basins with the highest flood risk.
All the datasets used in this study can be obtained from the corresponding author.
The supplement related to this article is available online at: https://doi.org/10.5194/hess-28-1107-2024-supplement.
VM designed the study. UV conducted the analysis and wrote the first draft. All the authors contributed to the writing and discussion.
The contact author has declared that none of the authors has any competing interests.
Publisher's note: Copernicus Publications remains neutral with regard to jurisdictional claims made in the text, published maps, institutional affiliations, or any other geographical representation in this paper. While Copernicus Publications makes every effort to include appropriate place names, the final responsibility lies with the authors.
This article is part of the special issue “Representation of water infrastructures in large-scale hydrological and Earth system models”. It is not associated with a conference.
The authors acknowledge the data availability from the India Meteorological Department (IMD) and India-WRIS. We acknowledge the database availability from EM-DAT (http://www.emdat.be/; last access: 2 December 2023) and DFO (http://floodobservatory.colorado.edu; last access: 2 December 2023), population data from GHSL (https://sedac.ciesin.columbia.edu/data/set/ghsl-population-built-up-estimates-degree-urban-smod; last access: 2 December 2023), and vulnerability assessment data from DST (https://dst.gov.in/sites/default/files/Full Report (1).pdf; last access: 2 December 2023).
This work was supported by the Monsoon Mission, Ministry of Earth Sciences (MoES), India and a major research and development program (MRDP) from the Department of Science and Technology (DST).
This paper was edited by Jia Yi Ng and reviewed by three anonymous referees.
Acreman, M.: Managed Flood Releases from Reservoirs: Issues and Guidance, Centre for Ecology and Hydrology, Wallingford, UK, https://sswm.info/sites/default/files/reference_attachments/ACREMAN 2000 Managed Flood Releases from Reservoirs.pdf (last access: 2 December 2023), 2000.
Agarwal, A. and Narain, S.: Floods, flood plains and environmental myths, Centre for Science and Environment, https://cdn.downtoearth.org.in/dte/userfiles/images/soe3_20130618.pdf (last access: 2 December 2023) 1991.
Alfieri, L., Dottori, F., Betts, R., Salamon, P., and Feyen, L.: Multi-Model Projections of River Flood Risk in Europe under Global Warming, Climate, 6, 6, https://doi.org/10.3390/CLI6010006, 2018.
Ali, H., Modi, P., and Mishra, V.: Increased flood risk in Indian sub-continent under the warming climate, Weather Clim. Extrem., 25, 100212, https://doi.org/10.1016/J.WACE.2019.100212, 2019.
Allen, S. K., Linsbauer, A., Randhawa, S. S., Huggel, C., Rana, P., and Kumari, A.: Glacial lake outburst flood risk in Himachal Pradesh, India: an integrative and anticipatory approach considering current and future threats, Nat. Hazards, 84, 1741–1763, https://doi.org/10.1007/s11069-016-2511-x, 2016.
Apel, H., Aronica, G. T., Kreibich, H., and Thieken, A. H.: Flood risk analyses – How detailed do we need to be?, Nat, Hazards, 49, 79–98, https://doi.org/10.1007/s11069-008-9277-8, 2009.
Bernhofen, M. V., Cooper, S., Trigg, M., Mdee, A., Carr, A., Bhave, A., Solano-Correa, Y. T., Pencue-Fierro, E. L., Teferi, E., Haile, A. T., Yusop, Z., Alias, N. E., Sa'adi, Z., Bin Ramzan, M. A., Dhanya, C. T., and Shukla, P.: The Role of Global Data Sets for Riverine Flood Risk Management at National Scales, Water Resour. Res., 58, e2021WR031555, https://doi.org/10.1029/2021wr031555, 2022.
Birkmann, J. and Welle, T.: Assessing the risk of loss and damage: Exposure, vulnerability and risk to climate-related hazards for different country classifications, Int. J. Global Warm., 8, 191–212, https://doi.org/10.1504/IJGW.2015.071963, 2015.
Boulange, J., Hanasaki, N., Yamazaki, D., and Pokhrel, Y.: Role of dams in reducing global flood exposure under climate change, Nat. Commun., 12, 417, https://doi.org/10.1038/s41467-020-20704-0, 2021.
Brown, J. D. and Heuvelink, G. B. M.: Assessing Uncertainty Propagation through Physically Based Models of Soil Water Flow and Solute Transport, Encyclopedia of Hydrological Sciences, https://doi.org/10.1002/0470848944.HSA081, 2005.
Chaudhari, S. and Pokhrel, Y.: Alteration of River Flow and Flood Dynamics by Existing and Planned Hydropower Dams in the Amazon River Basin, Water Resour. Res,. 58, e2021WR030555, https://doi.org/10.1029/2021WR030555, 2022.
Chuphal, D. S. and Mishra, V.: Hydrological model-based streamflow reconstruction for Indian sub-continental river basins, 1951–2021, Sci. Data, 10, 1–11, https://doi.org/10.1038/s41597-023-02618-w, 2023.
Cook, A. and Merwade, V.: Effect of topographic data, geometric configuration and modeling approach on flood inundation mapping, J. Hydrol., 377, 131–142, https://doi.org/10.1016/J.JHYDROL.2009.08.015, 2009.
Dang, H., Pokhrel, Y., Shin, S., Stelly, J., Ahlquist, D., and Du Bui, D.: Hydrologic balance and inundation dynamics of Southeast Asia's largest inland lake altered by hydropower dams in the Mekong River basin, Sci. Total Environ., 831, 154833, https://doi.org/10.1016/J.SCITOTENV.2022.154833, 2022.
Dang, T. D., Chowdhury, A. F. M. K., and Galelli, S.: On the representation of water reservoir storage and operations in large-scale hydrological models: implications on model parameterization and climate change impact assessments, Hydrol. Earth Syst. Sci., 24, 397–416, https://doi.org/10.5194/hess-24-397-2020, 2020.
Dangar, S. and Mishra, V.: Natural and anthropogenic drivers of the lost groundwater from the Ganga River basin, Environ. Res. Lett., 16, 114009, https://doi.org/10.1088/1748-9326/ac2ceb, 2021.
de Moel, H., Jongman, B., Kreibich, H., Merz, B., Penning-Rowsell, E., and Ward, P. J.: Flood risk assessments at different spatial scales, Mitig. Adapt. Strateg. Global Change, 20, 865–890, https://doi.org/10.1007/s11027-015-9654-z, 2015.
Dey, S., Saksena, S., Winter, D., Merwade, V., and McMillan, S.: Incorporating Network Scale River Bathymetry to Improve Characterization of Fluvial Processes in Flood Modeling, Water Resour. Res., 58, e2020WR029521, https://doi.org/10.1029/2020WR029521, 2022.
Di Baldassarre, G. and Montanari, A.: Uncertainty in river discharge observations: A quantitative analysis, Hydrol. Earth Syst. Sci., 13, 913–921, https://doi.org/10.5194/hess-13-913-2009, 2009.
Dottori, F., Salamon, P., Bianchi, A., Alfieri, L., Hirpa, F. A., and Feyen, L.: Development and evaluation of a framework for global flood hazard mapping, Adv. Water Resour., 94, 87–102, https://doi.org/10.1016/J.ADVWATRES.2016.05.002, 2016.
Dottori, F., Szewczyk, W., Ciscar, J. C., Zhao, F., Alfieri, L., Hirabayashi, Y., Bianchi, A., Mongelli, I., Frieler, K., Betts, R. A., and Feyen, L.: Increased human and economic losses from river flooding with anthropogenic warming, Nat. Clim. Change, 8, 781–786, https://doi.org/10.1038/s41558-018-0257-z, 2018.
Duc Dang, T., Kamal Chowdhury, A. F. M., and Galelli, S.: On the representation of water reservoir storage and operations in large-scale hydrological models: Implications on model parameterization and climate change impact assessments, Hydrol. Earth Syst. Sci., 24, 397–416, https://doi.org/10.5194/hess-24-397-2020, 2020.
Eidsvig, U. M. K., Kristensen, K., and Vangelsten, B. V.: Assessing the risk posed by natural hazards to infrastructures, Nat. Hazards Earth Syst. Sci., 17, 481–504, https://doi.org/10.5194/nhess-17-481-2017, 2017.
Fredrick, O.: Excavators allege debris was used to bury storey in Chhatar Manzil, Hindustan Times, https://www.hindustantimes.com/lucknow/excavators-allege-debris-was-used-to-bury-storey-in-chhatar (last access: 2 December 2023), 19 May 2017.
Gaur, A. and Gaur, A.: Future Changes in Flood Hazards across Canada under a Changing Climate, Water, 10, 1441, https://doi.org/10.3390/w10101441, 2018.
Ghosh, A. and Kar, S. K.: Application of analytical hierarchy process (AHP) for flood risk assessment: a case study in Malda district of West Bengal, India, Nat. Hazards, 94, 349–368, https://doi.org/10.1007/s11069-018-3392-y, 2018.
Gu, X., Zhang, Q., Li, J., Chen, D., Singh, V. P., Zhang, Y., Liu, J., Shen, Z., and Yu, H.: Impacts of anthropogenic warming and uneven regional socio-economic development on global river flood risk, J. Hydrol., 590, 125262, https://doi.org/10.1016/j.jhydrol.2020.125262, 2020.
Hanasaki, N., Kanae, S., Oki, T., Masuda, K., Motoya, K., Shirakawa, N., Shen, Y., and Tanaka, K.: An integrated model for the assessment of global water resources – Part 1: Model description and input meteorological forcing, Hydrol. Earth Syst. Sci., 12, 1007–1025, https://doi.org/10.5194/hess-12-1007-2008, 2008.
Hanasaki, N., Yoshikawa, S., Pokhrel, Y., and Kanae, S.: A global hydrological simulation to specify the sources of water used by humans, Hydrol. Earth Syst. Sci., 22, 789–817, https://doi.org/10.5194/hess-22-789-2018, 2018.
He, X., Bryant, B. P., Moran, T., Mach, K. J., Wei, Z., and Freyberg, D. L.: Climate-informed hydrologic modeling and policy typology to guide managed aquifer recharge, Sci. Adv., 7, 6025–6046, https://doi.org/10.1126/sciadv.abe6025, 2021.
Hirabayashi, Y., Mahendran, R., Koirala, S., Konoshima, L., Yamazaki, D., Watanabe, S., Kim, H., and Kanae, S.: Global flood risk under climate change, Nat. Clim. Change, 3, 816–821, https://doi.org/10.1038/nclimate1911, 2013.
Hirabayashi, Y., Tanoue, M., Sasaki, O., Zhou, X., and Yamazaki, D.: Global exposure to flooding from the new CMIP6 climate model projections, Sci. Rep., 11, 3740, https://doi.org/10.1038/s41598-021-83279-w, 2021.
Hochrainer-Stigler, S., Schinko, T., Hof, A., and Ward, P. J.: Adaptive risk management strategies for governments under future climate and socioeconomic change: An application to riverine flood risk at the global level, Environ. Sci. Policy, 125, 10–20, https://doi.org/10.1016/j.envsci.2021.08.010, 2021.
Hooper, E. and Chapman, L.: The impacts of climate change on national road and rail networks, in: Transport and Sustainability, vol. 2, Emerald Group Publishing Ltd., 105–136, https://doi.org/10.1108/S2044-9941(2012)0000002008, 2012.
Hu, P., Zhang, Q., Shi, P., Chen, B., and Fang, J.: Flood-induced mortality across the globe: Spatiotemporal pattern and influencing factors, Sci. Total Environ., 643, 171–182, https://doi.org/10.1016/J.SCITOTENV.2018.06.197, 2018.
IPCC: Climate Change 2014: Synthesis Report, in: Contribution of Working Groups I, II, and III to the Fifth Assessment Report of the Intergovernmental Panel on Climate Change, Geneva, Switzerland, IPCC, Geneva, Switzerland, https://www.ipcc.ch/report/ar5/syr/ (last access: 2 December 2023), 2014.
IPCC: Climate Change 2022: Impacts, Adaptation and Vulnerability, Cambridge University Press, Cambridge, UK and New York, USA, 3–33, https://www.ipcc.ch/report/ar6/wg2/ (last access: 2 December 2023), 2022.
Jain, G., Singh, C., Coelho, K., and Malladi, T.: Long-term implications of humanitarian responses The case of Chennai, IIED – International Institute for Environment and Development, London, https://www.iied.org/10840iied (last access: 2 December 2023), 2017.
Joint Research Centre (JRC), European Commission and Center for International Earth Science Information Network (CIESIN), and Columbia University: Global Human Settlement Layer: Population and Built-Up Estimates, and Degree of Urbanization Settlement Model Grid, NASA Socioeconomic Data and Applications Center (SEDAC), Palisades, NY, https://doi.org/10.7927/h4154f0w, 2021.
Joshi, V.: Have we learnt from past floods? Clearly not!, Hindustan Times (Lucknow), https://www.pressreader.com/india/hindustan-times-lucknow/20140914/281646778342401 (last access: 2 December 2023), 14 September 2014.
Kalantari, Z., Briel, A., Lyon, S. W., Olofsson, B., and Folkeson, L.: On the utilization of hydrological modelling for road drainage design under climate and land use change, Sci. Total Environ., 475, 97–103, https://doi.org/10.1016/J.SCITOTENV.2013.12.114, 2014.
Khalaj, M. R., Noor, H., and Dastranj, A.: Investigation and simulation of flood inundation hazard in urban areas in Iran, Geoenviron. Disast., 8, 1–13, https://doi.org/10.1186/s40677-021-00191-1, 2021.
Kimuli, J. B., Di, B., Zhang, R., Wu, S., Li, J., and Yin, W.: A multisource trend analysis of floods in Asia-Pacific 1990–2018: Implications for climate change in sustainable development goals, Int. J. Disast. Risk Reduct., 59, 102237, https://doi.org/10.1016/j.ijdrr.2021.102237, 2021.
Koks, E. E., Rozenberg, J., Zorn, C., Tariverdi, M., Vousdoukas, M., Fraser, S. A., Hall, J. W., and Hallegatte, S.: A global multi-hazard risk analysis of road and railway infrastructure assets, Nat. Commun., 10, 2677, https://doi.org/10.1038/s41467-019-10442-3, 2019.
Krysanova, V., Donnelly, C., Gelfan, A., Gerten, D., Arheimer, B., Hattermann, F., and Kundzewicz, Z. W.: How the performance of hydrological models relates to credibility of projections under climate change, Hydrolog. Sci. J., 63, 696–720, https://doi.org/10.1080/02626667.2018.1446214, 2018.
Kushwaha, A. P., Tiwari, A. D., Dangar, S., Shah, H., Mahto, S. S., and Mishra, V.: Multimodel assessment of water budget in Indian sub-continental river basins, J. Hydrol., 603, 126977, https://doi.org/10.1016/J.JHYDROL.2021.126977, 2021.
Laiolo, P., Gabellani, S., Campo, L., Cenci, L., Silvestro, F., Delogu, F., Boni, G., Rudari, R., Puca, S., and Pisani, A. R.: Assimilation of remote sensing observations into a continuous distributed hydrological model: Impacts on the hydrologic cycle, in: International Geoscience and Remote Sensing Symposium (IGARSS), 26–31 July 2015, Milan, Italy, 1308–1311, https://doi.org/10.1109/IGARSS.2015.7326015, 2015.
Lehner, B., Liermann, C. R., Revenga, C., Vörömsmarty, C., Fekete, B., Crouzet, P., Döll, P., Endejan, M., Frenken, K., Magome, J., Nilsson, C., Robertson, J. C., Rödel, R., Sindorf, N., and Wisser, D.: High-resolution mapping of the world's reservoirs and dams for sustainable river-flow management, Front. Ecol. Environ., 9, 494–502, https://doi.org/10.1890/100125, 2011.
Marchand, M., Dahm, R., Buurman, J., Sethurathinam, S., and Sprengers, C.: Flood protection by embankments in the Brahmani–Baitarani river basin, India: a risk-based approach, Int. J. Water Resour. Dev., 38, 242–261, https://doi.org/10.1080/07900627.2021.1899899, 2022.
Mateo, C. M., Hanasaki, N., Komori, D., and Tanaka, K.: Assessing the impacts of reservoir operation to floodplain inundation by combining hydrological, reservoir management, and hydrodynamic models, Water Resour. Res., 50, 7245–7266, https://doi.org/10.1002/2013WR014845, 2014.
Mateo, C. M. R., Hanasaki, N., Komori, D., Yoshimura, K., Kiguchi, M., Champathong, A., Yamazaki, D., Sukhapunnaphan, T., and Oki, T.: A simulation study on modifying reservoir operation rules: Tradeoffs between flood mitigation and water supply, IAHS-AISH Proc. Rep., 362, 33–40, 2013.
Mateo, C. M. R., Hanasaki, N., Komori, D., Yoshimura, K., Kiguchi, M., Champathong, A., Yamazaki, D., Sukhapunnaphan, T., and Oki, T.: Flood risk and climate change: global and regional perspectives, Hydrolog. Sci. J., 59, 1–28, https://doi.org/10.1080/02626667.2013.857411, 2014.
Mishra, D. K.: 1948 Floods in Bihar-2 Inaugural flood after Independence – Official Version of Floods and its Aftermath, SANDRP, https://sandrp.in/2015/03/10/1948-floods-in-bihar-2-inaugural-flood-after-independence (last access: 2 December 2023), 10 March 2015.
Mishra, V. and Shah, H. L.: Hydroclimatological Perspective of the Kerala Flood of 2018, J. Geol. Soc. India, 92, 645–650, https://doi.org/10.1007/s12594-018-1079-3, 2018.
Mishra, V., Tiwari, A. D., and Kumar, R.: Warming climate and ENSO variability enhance the risk of sequential extremes in India, One Earth, 5, 1250–1259, https://doi.org/10.1016/J.ONEEAR.2022.10.013, 2022.
Mittal, N., Bhave, A. G., Mishra, A., and Singh, R.: Impact of human intervention and climate change on natural flow regime, Water Resour. Manage., 30, 685–699, https://doi.org/10.1007/s11269-015-1185-6, 2016.
Mohanty, M. P., Mudgil, S., and Karmakar, S.: Flood management in India: A focussed review on the current status and future challenges, Int. J. Disast. Risk Reduct., 49, 101660, https://doi.org/10.1016/j.ijdrr.2020.101660, 2020.
Mohapatra, P. K. and Singh, R. D.: Flood management in India, Nat. Hazards, 28, 131–143, https://doi.org/10.1177/0019556120120109, 2003.
Mukherjee, S., Aadhar, S., Stone, D., and Mishra, V.: Increase in extreme precipitation events under anthropogenic warming in India, Weather Clim. Extrem., 20, 45–53, https://doi.org/10.1016/J.WACE.2018.03.005, 2018.
Nanditha, J. S. and Mishra, V.: On the need of ensemble flood forecast in India, Water Secur., 12, 100086, https://doi.org/10.1016/J.WASEC.2021.100086, 2021.
Nanditha, J. S. and Mishra, V.: Multiday Precipitation Is a Prominent Driver of Floods in Indian River Basins, Water Resour. Res., 58, e2022WR032723, https://doi.org/10.1029/2022WR032723, 2022.
Nanditha, J. S., Kushwaha, A. P., Singh, R., Malik, I., Solanki, H., Singh Chupal, D., Dangar, S., Shwarup Mahto, S., Mishra, V., Vegad, U., Chuphal, D. S., and Mahto, S. S.: The Pakistan flood of August 2022: causes and implications, ESS Open Archive, https://doi.org/10.1002/ESSOAR.10512560.1, 2022.
NDMA – National Disaster Management Authority: Annual report of 2016–2017, https://ndma.gov.in/sites/default/files/PDF/Reports/ENG-2016-17-AR.pdf (last access: 2 December 2023), 2016.
Nguyen, P., Thorstensen, A., Sorooshian, S., Hsu, K., AghaKouchak, A., Sanders, B., Koren, V., Cui, Z., and Smith, M.: A high resolution coupled hydrologic–hydraulic model (HiResFlood-UCI) for flash flood modeling, J. Hydrol., 541, 401–420, https://doi.org/10.1016/J.JHYDROL.2015.10.047, 2016.
Nilsson, C., Catherine, A. R., Reidy, A., Dynesius, M., and Revenga, C.: Fragmentation and Flow Regulation of the World's Large River Systems, Science, 308, 405–408, https://doi.org/10.1126/science.1107887, 2005.
NRLD – National Register of Large Dams: Central Water Commission (CWC), Ministry of Water Resources, Government of India, http://cwc.gov.in/sites/default/files/NRLD_04012017.pdf (last access: 4 October 2022), 2017.
Padhra, A.: Tourism in India and the Impact of Weather and Climate, in: Indian Tourism, Emerald Publishing Limited, 187–197, https://doi.org/10.1108/978-1-80262-937-820221013, 2022.
Pai, D. S., Sridhar, L., Rajeevan, M., Sreejith, O. P., Satbhai, N. S., and Mukhopadhyay, B.: Development of a new high spatial resolution (0.25°×0.25°) long period (1901–2010) daily gridded rainfall data set over India and its comparison with existing data sets over the region, Mausam, 65, 1–18, 2014.
Pathak, S., Liu, M., Jato-Espino, D., and Zevenbergen, C.: Social, economic and environmental assessment of urban sub-catchment flood risks using a multi-criteria approach: A case study in Mumbai City, India, J. Hydrol., 591, 125216, https://doi.org/10.1016/J.JHYDROL.2020.125216, 2020.
Peduzzi, P., Dao, H., Herold, C., and Mouton, F.: Assessing global exposure and vulnerability towards natural hazards: the Disaster Risk Index, Nat. Hazards Earth Syst. Sci., 9, 1149–1159, https://doi.org/10.5194/nhess-9-1149-2009, 2009.
Pekel, J. F., Cottam, A., Gorelick, N., and Belward, A. S.: High-resolution mapping of global surface water and its long-term changes, Nature, 540, 418–422, https://doi.org/10.1038/nature20584, 2016.
Pokhrel, Y., Shin, S., Lin, Z., Yamazaki, D., and Qi, J.: Potential Disruption of Flood Dynamics in the Lower Mekong River Basin Due to Upstream Flow Regulation, Sci. Rep., 8, 17767, https://doi.org/10.1038/s41598-018-35823-4, 2018.
Poulin, A., Brissette, F., Leconte, R., Arsenault, R., and Malo, J. S.: Uncertainty of hydrological modelling in climate change impact studies in a Canadian, snow-dominated river basin, J. Hydrol., 409, 626–636, https://doi.org/10.1016/J.JHYDROL.2011.08.057, 2011.
Raghav, P. and Eldho, T. I.: Investigations on the hydrological impacts of climate change on a river basin using macroscale model H08, J. Earth Syst. Sci., 132, 1–23, https://doi.org/10.1007/s12040-023-02102-4, 2023.
Rentschler, J., Salhab, M., and Jafino, B. A.: Flood exposure and poverty in 188 countries, Nat. Commun., 13, 3527, https://doi.org/10.1038/s41467-022-30727-4, 2022.
Roxy, M. K., Ghosh, S., Pathak, A., Athulya, R., Mujumdar, M., Murtugudde, R., Terray, P., and Rajeevan, M.: A threefold rise in widespread extreme rain events over central India, Nat. Commun., 8, 708, https://doi.org/10.1038/s41467-017-00744-9, 2017.
Roy, B., Khan, M. S. M., Saiful Islam, A. K. M., Khan, M. J. U., and Mohammed, K.: Integrated flood risk assessment of the arial khan river under changing climate using ipcc ar5 risk framework, J. Water Clim. Change, 12, 3421–3447, https://doi.org/10.2166/wcc.2021.341, 2021.
Shah, H. L. and Mishra, V.: Hydrologic Changes in Indian Subcontinental River Basins (1901–2012), J. Hydrometeorol., 17, 2667–2687, https://doi.org/10.1175/JHM-D-15-0231.1, 2016.
Sheffield, J., Goteti, G., and Wood, E. F.: Development of a 50-Year High-Resolution Global Dataset of Meteorological Forcings for Land Surface Modeling, J. Climate, 19, 3088–3111, https://doi.org/10.1175/JCLI3790.1, 2006.
Singh, A., Mani, M., and Vishnoi, R. K.: Tehri Dam – A Savior from Climate Change Led Extreme Events, INCOLD J., 10, 44–50, 2021.
Singh, P., Sinha, V. S. P., Vijhani, A., and Pahuja, N.: Vulnerability assessment of urban road network from urban flood, Int. J. Disast. Risk Reduct., 28, 237–250, https://doi.org/10.1016/J.IJDRR.2018.03.017, 2018.
Smith, A., Bates, P. D., Wing, O., Sampson, C., Quinn, N., and Neal, J.: New estimates of flood exposure in developing countries using high-resolution population data, Nat Commun, 10, 1814, https://doi.org/10.1038/s41467-019-09282-y, 2019.
Srivastava, A. K., Rajeevan, M., and Kshirsagar, S. R.: Development of a high resolution daily gridded temperature data set (1969–2005) for the Indian region, Atmos. Sci. Lett., 10, 249–254, https://doi.org/10.1002/asl.232, 2009.
Stephens, E. M., Bates, P. D., Freer, J. E., and Mason, D. C.: The impact of uncertainty in satellite data on the assessment of flood inundation models, J. Hydrol., 414–415, 162–173, https://doi.org/10.1016/J.JHYDROL.2011.10.040, 2012.
Tabari, H., Hosseinzadehtalaei, P., Thiery, W., and Willems, P.: Amplified Drought and Flood Risk Under Future Socioeconomic and Climatic Change, Earths Future, 9, e2021EF002295, https://doi.org/10.1029/2021EF002295, 2021.
Tanoue, M., Taguchi, R., Alifu, H., and Hirabayashi, Y.: Residual flood damage under intensive adaptation, Nat. Clim. Change, 11, 823–826, https://doi.org/10.1038/s41558-021-01158-8, 2021
Teng, J., Jakeman, A. J., Vaze, J., Croke, B. F. W., Dutta, D., and Kim, S.: Flood inundation modelling: A review of methods, recent advances and uncertainty analysis, Environ. Model. Softw., 90, 201–216, https://doi.org/10.1016/J.ENVSOFT.2017.01.006, 2017.
United Nations International Strategy for Disaster Reduction Secretariat: Global Assessment Report on Disaster Risk Reduction: Revealing Risk, Redefining Development, United Nations International Strategy for Disaster Reduction Secretariat, Geneva, https://www.undp.org/publications/2011-global-assessment-report-disaster-risk-reduction
United Nations International Strategy for Disaster Reduction Secretariat: Global Assessment Report on Disaster Risk Reduction 2013, From Shared Risk to Shared Value: the Business Case for Disaster Risk Reduction, United Nations International Strategy for Disaster Reduction Secretariat, Geneva, https://www.undrr.org/publication/global-assessment-report-disaster-risk-reduction-2013 (last access: 26 December 2022), 2013.
van der Knijff, J. M., Younis, J., and de Roo, A. P. J.: LISFLOOD: a GIS-based distributed model for river basin scale water balance and flood simulation, Int. J. Geogr. Inform. Sci., 24, 189–212, https://doi.org/10.1080/13658810802549154, 2010.
Varis, O., Taka, M., and Tortajada, C.: Global human exposure to urban riverine floods and storms, River, 1, 80–90, https://doi.org/10.1002/rvr2.1, 2022.
Vu, D. T., Dang, T. D., Galelli, S., and Hossain, F.: Satellite observations reveal 13 years of reservoir filling strategies, operating rules, and hydrological alterations in the Upper Mekong River basin, Hydrol. Earth Syst. Sci., 26, 2345–2364, https://doi.org/10.5194/hess-26-2345-2022, 2022.
Ward, P. J., Jongman, B., Weiland, F. S., Bouwman, A., Van Beek, R., Bierkens, M. F. P., Ligtvoet, W., and Winsemius, H. C.: Assessing flood risk at the global scale: Model setup, results, and sensitivity, Environ. Res. Lett., 8, 044019, https://doi.org/10.1088/1748-9326/8/4/044019, 2013.
Willner, S. N., Otto, C., and Levermann, A.: Global economic response to river floods, Nat. Clim. Change, 8, 594–598, https://doi.org/10.1038/s41558-018-0173-2, 2018.
Winsemius, H. C., van Beek, L. P. H., Jongman, B., Ward, P. J., and Bouwman, A.: A framework for global river flood risk assessments, Hydrol. Earth Syst. Sci., 17, 1871–1892, https://doi.org/10.5194/hess-17-1871-2013, 2013.
Winsemius, H. C., Jongman, B., Veldkamp, T. I. E., Hallegatte, S., Bangalore, M., and Ward, P. J.: Disaster risk, climate change, and poverty: Assessing the global exposure of poor people to floods and droughts, Environ. Dev. Econ., 23, 328–348, https://doi.org/10.1017/S1355770X17000444, 2018.
Yamazaki, D., Kanae, S., Kim, H., and Oki, T.: A physically based description of floodplain inundation dynamics in a global river routing model, Water Resour. Res., 47, 1–21, https://doi.org/10.1029/2010WR009726, 2011.
Yamazaki, D., De Almeida, G. A. M., and Bates, P. D.: Improving computational efficiency in global river models by implementing the local inertial flow equation and a vector-based river network map, Water Resour. Res., 49, 7221–7235, https://doi.org/10.1002/wrcr.20552, 2013.
Yamazaki, D., Watanabe, S., and Hirabayashi, Y.: Global Flood Risk Modeling and Projections of Climate Change Impacts, Geophys. Monogr. Ser., 233, 185–203, https://doi.org/10.1002/9781119217886.CH11, 2018.
Yang, T., Sun, F., Gentine, P., Liu, W., Wang, H., Yin, J., Du, M., and Liu, C.: Evaluation and machine learning improvement of global hydrological model-based flood simulations, Environ. Res. Lett., 14, 114027, https://doi.org/10.1088/1748-9326/ab4d5e, 2019.
Yoshida, T., Hanasaki, N., Nishina, K., Boulange, J., Okada, M., and Troch, P. A.: Inference of Parameters for a Global Hydrological Model: Identifiability and Predictive Uncertainties of Climate-Based Parameters, Water Resour. Res., 58, e2021WR030660, https://doi.org/10.1029/2021WR030660, 2022.
Zajac, Z., Revilla-Romero, B., Salamon, P., Burek, P., Hirpa, F., and Beck, H.: The impact of lake and reservoir parameterization on global streamflow simulation, J. Hydrol., 548, 552–568, https://doi.org/10.1016/j.jhydrol.2017.03.022, 2017.
Zhao, F., Veldkamp, T. I. E., Frieler, K., Schewe, J., Ostberg, S., Willner, S., Schauberger, B., Gosling, S. N., Schmied, H. M., Portmann, F. T., Leng, G., Huang, M., Liu, X., Tang, Q., Hanasaki, N., Biemans, H., Gerten, D., Satoh, Y., Pokhrel, Y., Stacke, T., Ciais, P., Chang, J., Ducharne, A., Guimberteau, M., Wada, Y., Kim, H., and Yamazaki, D.: The critical role of the routing scheme in simulating peak river discharge in global hydrological models, Environ. Res. Lett., 12, 075003, https://doi.org/10.1088/1748-9326/aa7250, 2017.