Low-level repressive histone marks fine-tune gene transcription in neural stem cells
- Life Sciences Institute, University of Michigan-Ann Arbor, United States
- Centre for Neural Circuits and Behaviour, University of Oxford, United Kingdom
- Department of Biomolecular Chemistry, University of Wisconsin-Madison, United States
- Department of Cell and Developmental Biology, University of Michigan Medical School, United States
- Division of Genetic Medicine, Department of Internal Medicine, University of Michigan Medical School, United States
- Rogel Cancer Center, University of Michigan Medical School, United States
Abstract
Coordinated regulation of gene activity by transcriptional and translational mechanisms poise stem cells for a timely cell-state transition during differentiation. Although important for all stemness-to-differentiation transitions, mechanistic understanding of the fine-tuning of gene transcription is lacking due to the compensatory effect of translational control. We used intermediate neural progenitor (INP) identity commitment to define the mechanisms that fine-tune stemness gene transcription in fly neural stem cells (neuroblasts). We demonstrate that the transcription factor FruitlessC (FruC) binds cis-regulatory elements of most genes uniquely transcribed in neuroblasts. Loss of fruC function alone has no effect on INP commitment but drives INP dedifferentiation when translational control is reduced. FruC negatively regulates gene expression by promoting low-level enrichment of the repressive histone mark H3K27me3 in gene cis-regulatory regions. Identical to fruC loss-of-function, reducing Polycomb Repressive Complex 2 activity increases stemness gene activity. We propose low-level H3K27me3 enrichment fine-tunes gene transcription in stem cells, a mechanism likely conserved from flies to humans.
Editor's evaluation
This is an important study that defines the role of the FruC transcription factor in key developmental decisions during neurogenesis in Drosophila. The authors combine genetics and genomic profiling to provide convincing evidence that FruC-regulated gene expression is correlated with changes in repressive histone marks. This study will be of wide general interest to the developmental biology field.
https://doi.org/10.7554/eLife.86127.sa0eLife digest
From neurons to sperm, our bodies are formed of a range of cells tailored to perform a unique role. However, organisms also host small reservoirs of unspecialized ‘stem cells’ that retain the ability to become different kinds of cells. When these stem cells divide, one daughter cell remains a stem cell while the other undergoes a series of changes that allows it to mature into a specific cell type.
This ‘differentiation’ process involves quickly switching off the stem cell programme, the set of genes that give a cell the ability to keep dividing while maintaining an unspecialized state. Failure to do so can result in the differentiating cell reverting towards its initial state and multiplying uncontrollably, which can lead to tumours and other health problems. While scientists have a good understanding of how the stem cell programme is turned off during differentiation, controlling these genes is a balancing act that starts even before division: if the program is over-active in the ‘mother’ stem cell, for instance, the systems that switch it off in its daughter can become overwhelmed. The mechanisms presiding over these steps are less well-understood.
To address this knowledge gap, Rajan, Anhezini et al. set out to determine how stem cells present in the brains of fruit flies could control the level of activity of their own stem cell programme. RNA sequencing and other genetic analyses revealed that a protein unique to these cells, called Fruitless, was responsible for decreasing the activity of the programme.
Biochemical experiments then showed that Fruitless performed this role by attaching a small amount of chemical modifications (called methyl groups) to the proteins that ‘package’ the DNA near genes involved in the stem cell programme. High levels of methyl groups present near a gene will switch off this sequence completely; however, the amount of methyl groups that Fruitless helped to deposit is multiple folds lower. Consequently, Fruitless ‘fine-tunes’ the activity of the stem cell programme instead, dampening it just enough to stop it from overpowering the ‘off’ mechanism that would take place later in the daughter cell.
These results shed new light on how stem cells behave – and how our bodies stop them from proliferating uncontrollably. In the future, Rajan, Anhezini et al. hope that this work will help to understand and treat diseases caused by defective stem cell differentiation.
Introduction
Expression of genes that promote stemness or differentiation must be properly controlled in stem cells to allow their progeny to transition through various intermediate stages of cell fate specification in a timely fashion (Pollen et al., 2015; Bhaduri et al., 2021; Michki et al., 2021; Ruan et al., 2021; Dillon et al., 2022). Exceedingly high levels of stemness gene transcripts that promote an undifferentiated state in stem cells can overwhelm translational control that downregulates their activity in stem cell progeny and perturb timely onset of differentiation (San-Juán and Baonza, 2011; Xiao et al., 2012; Zacharioudaki et al., 2012; Zhu et al., 2012; Larson et al., 2021; Ohtsuka and Kageyama, 2021). Conversely, excessive transcription of differentiation genes that instill biases toward terminal cellular functions in stem cells can overcome the mechanisms that uncouple these transcripts from the translational machinery and prematurely deplete the stem cell pool (Lennox et al., 2018; Baser et al., 2019; de Rooij et al., 2019; Marques et al., 2023). Thus, fine-tuning stemness and differentiation gene transcription in stem cells minimizes inappropriate gene activity that could result in developmental anomalies. Coordinated regulation of stemness and differentiation gene activity in stem cells by transcriptional and translational control poise stem cell progeny for a timely cell-state transition during differentiation (Ables et al., 2011; Koch et al., 2013; Kobayashi and Kageyama, 2014; Bigas and Porcheri, 2018; Rajan et al., 2021). Mechanistic investigation of the fine-tuning of stemness and differentiation gene transcription in vivo is challenging due to the compensatory effect of translational control, a lack of sensitized functional readouts, and a lack of insight into relevant transcription factors.
Neuroblast lineages of the fly larval brain provide an excellent in vivo paradigm for mechanistic investigation of gene regulation during developmental transitions because the cell-type hierarchy is well-characterized at functional and molecular levels (Janssens and Lee, 2014; Homem et al., 2015; Doe, 2017). A larval brain lobe contains approximately 100 neuroblasts, and each neuroblast asymmetrically divides every 60–90 min, regenerating itself and producing a sibling progeny that commits to generating differentiated cell types. Most of these neuroblasts are type I, which generate a ganglion mother cell (GMC) in every division. A GMC undergoes terminal division to produce two neurons. Eight neuroblasts are type II, which invariably generate an immature intermediate neural progenitor (immature INP) in every division (Bello et al., 2008; Boone and Doe, 2008; Bowman et al., 2008). An immature INP initiates INP commitment 60 min after asymmetric neuroblast division (Janssens et al., 2017). An immature INP initially lacks Asense (Ase) protein expression and upregulates Ase as it progresses through INP commitment. Once INP commitment is complete, an Ase+ immature INP transitions into an INP and asymmetrically divides 5–6 times to generate more than a dozen differentiated cells, including neurons and glia (Viktorin et al., 2011; Bayraktar and Doe, 2013). All type II neuroblast lineage cell types in larval brains can be unambiguously identified based on functional characteristics and protein marker expression. Single-cell RNA-sequencing (scRNA-seq) of sorted, fluorescently labeled INPs and their differentiating progeny from wild-type brain tissue has led to the discovery of many new genes that contribute to the generation of diverse differentiated cell types during neurogenesis (Michki et al., 2021). This wealth of information on the type II neuroblast lineage allows for mechanistic investigations of precise spatiotemporal regulation of gene expression during developmental transitions.
A multilayered gene regulation system ensures timely onset of INP commitment in immature INPs by coordinately terminating Notch signaling activity (Komori et al., 2018). Activated Notch signaling drives the expression of downstream-effector genes deadpan (dpn) and Enhancer of (splitz)mγ (E(spl)mγ), which promote stemness in type II neuroblasts by poising activation of the master regulator of INP commitment earmuff (erm) (San-Juán and Baonza, 2011; Xiao et al., 2012; Zacharioudaki et al., 2012; Zhu et al., 2012; Zacharioudaki et al., 2016). During asymmetric neuroblast division, the basal protein Numb and Brain tumor (Brat) exclusively segregate into immature INPs, where they terminate Notch signaling activity and promote the timely onset of Erm expression (Bello et al., 2006; Betschinger et al., 2006; Lee et al., 2006a; Lee et al., 2006b; Wang et al., 2006). Numb is a conserved Notch inhibitor and prevents continual Notch activation in immature INPs (Frise et al., 1996; Zhong et al., 1996; Lee et al., 2006a; Wang et al., 2006; Wirtz-Peitz et al., 2008). Asymmetric segregation of the RNA-binding protein Brat is facilitated by its adapter protein Miranda, which releases Brat from the cortex of immature INPs, allowing Brat to promote decay of Notch downstream-effector gene transcripts and thus initiate differentiation (Loedige et al., 2014; Laver et al., 2015; Loedige et al., 2015; Komori et al., 2018; Reichardt et al., 2018). Complete loss of numb or brat function leads to unrestrained activation of Notch signaling in immature INPs driving them to revert into type II neuroblasts leading to a severe supernumerary neuroblast phenotype. Similarly, increased levels of activated Notch or Notch transcriptional target gene expression in immature INPs can drastically enhance the moderate supernumerary neuroblast phenotype in brat- or numb-hypomorphic brains (Xiao et al., 2012; Janssens et al., 2014; Komori et al., 2014b; Komori et al., 2018; Larson et al., 2021). Collectively, these findings suggest that precise transcriptional control of Notch and Notch target gene expression levels during asymmetric neuroblast division is essential, safeguarding the generation of neurons that are required for neuronal circuit formation in adult brains.
We defined the fine-tuning of stemness gene transcription as a function that is mild enough to not effect INP commitment when lost alone but enough to enhance immature INP reversion to supernumerary neuroblasts induced by decreased post-transcriptional control of stemness gene expression. We established three key criteria to identify regulators which fine-tune stemness gene transcription in neuroblasts, (1) an established role in transcriptional regulation, for example a DNA-binding transcription factor, (2) clear expression in neuroblasts with no protein expression in immature INPs, and (3) acts as a negative regulator of its targets. From a type II neuroblast lineage-specific single-cell gene transcriptomic atlas, we found that fruitless (fru) mRNAs are detected in type I & II neuroblasts but not in their differentiating progeny. One specific Zn-finger containing isoform of Fru (FruC) is exclusively expressed in all neuroblasts. FruC binds cis-regulatory elements of most genes uniquely transcribed in type II neuroblasts, including Notch and Notch downstream-effector genes that promote stemness in neuroblasts. A modest increase in Notch or Notch downstream gene expression induced by loss of fruC function alone has no effect on INP commitment, but enhances immature INP reversion to type II neuroblasts in numb- and brat-hypomorphic brains. To establish how FruC might fine-tune gene transcription in neuroblasts, we examined the distribution of established histone modifications in the presence or absence of fruC. We surprisingly found FruC-dependent low-level enrichment of the repressive histone marker H3K27me3 in most FruC-bound peaks in genes uniquely transcribed in type II neuroblasts including Notch and its downstream-effector genes. The Polycomb Repressive Complex 2 (PRC2) subunits are enriched in FruC-bound peaks in genes uniquely transcribed in type II neuroblasts, and reduced PRC2 function enhances the supernumerary neuroblast phenotype in numb-hypomorphic brains, identical to fruC loss-of-function. We conclude that the FruC-PRC2-H3K27me3 molecular pathway fine-tunes stemness gene expression in neuroblasts by promoting low-level H3K27me3 enrichment in their cis-regulatory elements. The mechanism by which PRC2-H3K27me3 fine-tune stem cell gene expression will likely be relevant throughout metazoans.
Results
A gene expression atlas captures dynamic changes throughout type II neuroblast lineages
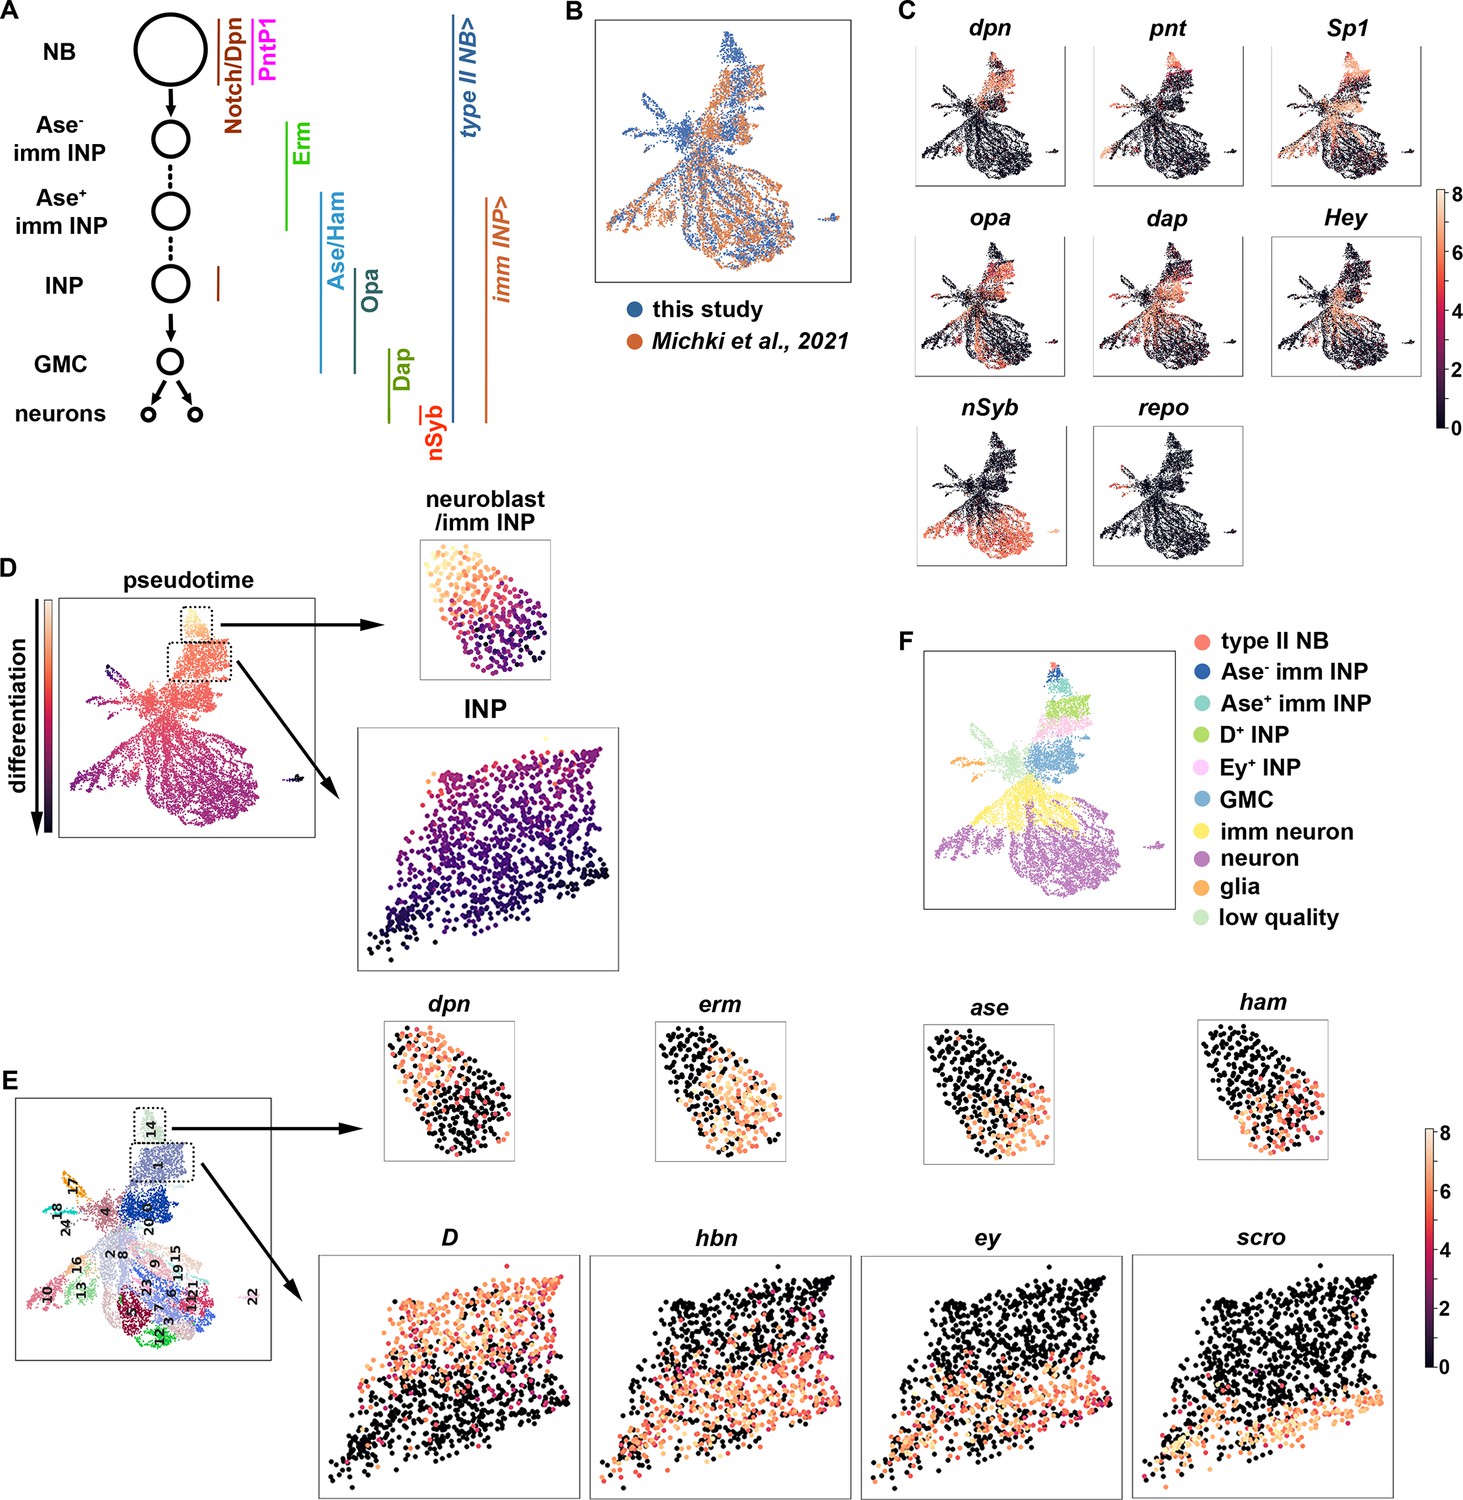
To identify regulators of gene transcription during asymmetric neuroblast division, we constructed a single-cell gene transcription atlas that encompasses all cell types in the type II neuroblast lineage in larval brains. We fluorescently labeled all cell types in the lineage in wild-type third-instar larval brains, sorted positively labeled cells by flow cytometry, and performed single-cell RNA-sequencing (scRNA-seq) using a 10x genomic platform (Figure 1A; Figure 1—figure supplement 1A). This new dataset displays high levels of correlation to our previously published scRNA-seq dataset which were limited to INPs and their progeny. The harmonization of these two datasets results in a gene transcription atlas of the type II neuroblast lineage consisting of over 11,000 cells (Figure 1B). Based on the expression of known cell identity genes, we were able to observe clusters consisting of type II neuroblasts (dpn+,pnt+), INPs (dpn+,opa+), GMCs (dap+,hey-), immature neurons (dap+,hey+), mature neurons (hey-,nSyb+), and glia (repo+) (Figure 1C). The UMAP positions of these clusters match well with the results of pseudo-time analyses from a starter cell that was positive for dpn, pnt, and RFP transcripts (Figure 1D). Leiden clustering of the data was able to capture these major cell types (Figure 1E), and quality control metrics showed most clusters captured on average 1.5 k genes and showed low mitochondrial gene expression (Figure 1—figure supplement 1B). Thus, the harmonized scRNA-seq dataset captures molecularly and functionally defined stages of differentiation in the type II neuroblast lineage (Figure 1F).
Figure 1 with 1 supplement see all
A single-cell gene expression atlas of type II neuroblast lineages.
(A) Summary illustration of gene and Gal4 driver expression patterns in the type II neuroblast lineage. The type II NB Gal4 driver: Wor-Gal4,Ase-Gal80. imm INP driver: R9D11-Gal4. (B) Harmonization of the scRNA-seq dataset from the entire type II neuroblast (NB) lineage generated in this study (blue) and our previously published scRNA-seq dataset which were limited to INPs and their progeny (orange). The genotype of larval brains used for scRNA-seq in this study: UAS-dcr2; Wor-Gal4, Ase-Gal80; UAS-RFP::stinger. (C) UMAPs of known cell-type-specific marker genes. Color intensity indicated scaled (log1p) gene expression value. (D) Pseudotime analysis starting from cells enriched for dpn, pnt, and RFP transcripts. (E) Left: Leiden clustering of the scRNA-seq atlas. Right: Representative UMAPs of dynamically expressed transcription factors from clusters 14 (NBs and immature INPs) and 1 (INPs). Color intensity indicated scaled (log1p) gene expression value. (F) Annotated gene expression atlas of a wild-type type II neuroblast lineage.
To determine whether the new scRNA-seq dataset encompasses neuroblast progeny undergoing dynamic changes in cell identity during differentiation, we examined transcripts that were transiently expressed in neuroblast progeny undergoing INP commitment or asymmetric INP division. We found that cluster 14 contains type II neuroblasts (dpn+,erm-,ase-,ham-), Ase- immature INPs (dpn-,erm+,ase-,ham-) and Ase+ immature INPs (dpn-,erm-,ase+,ham+) (Figure 1E), which are well-defined rapidly changing transcriptional states during INP commitment (Xiao et al., 2012; Janssens et al., 2014; Rives-Quinto et al., 2020). Furthermore, cluster 1 contains proliferating INPs that express known differential temporal transcription factors (Bayraktar and Doe, 2013; Tang et al., 2022), including young INPs (D+,hbn-,ey-,scro-) and old INPs (D-,hbn+,ey+,scro+) (Figure 1E). These data led us to conclude that the type II neuroblast lineage gene transcription atlas captures neuroblast progeny undergoing dynamic changes in cell identity during differentiation (Figure 1F).
FruC negatively regulates stemness gene expression in neuroblasts
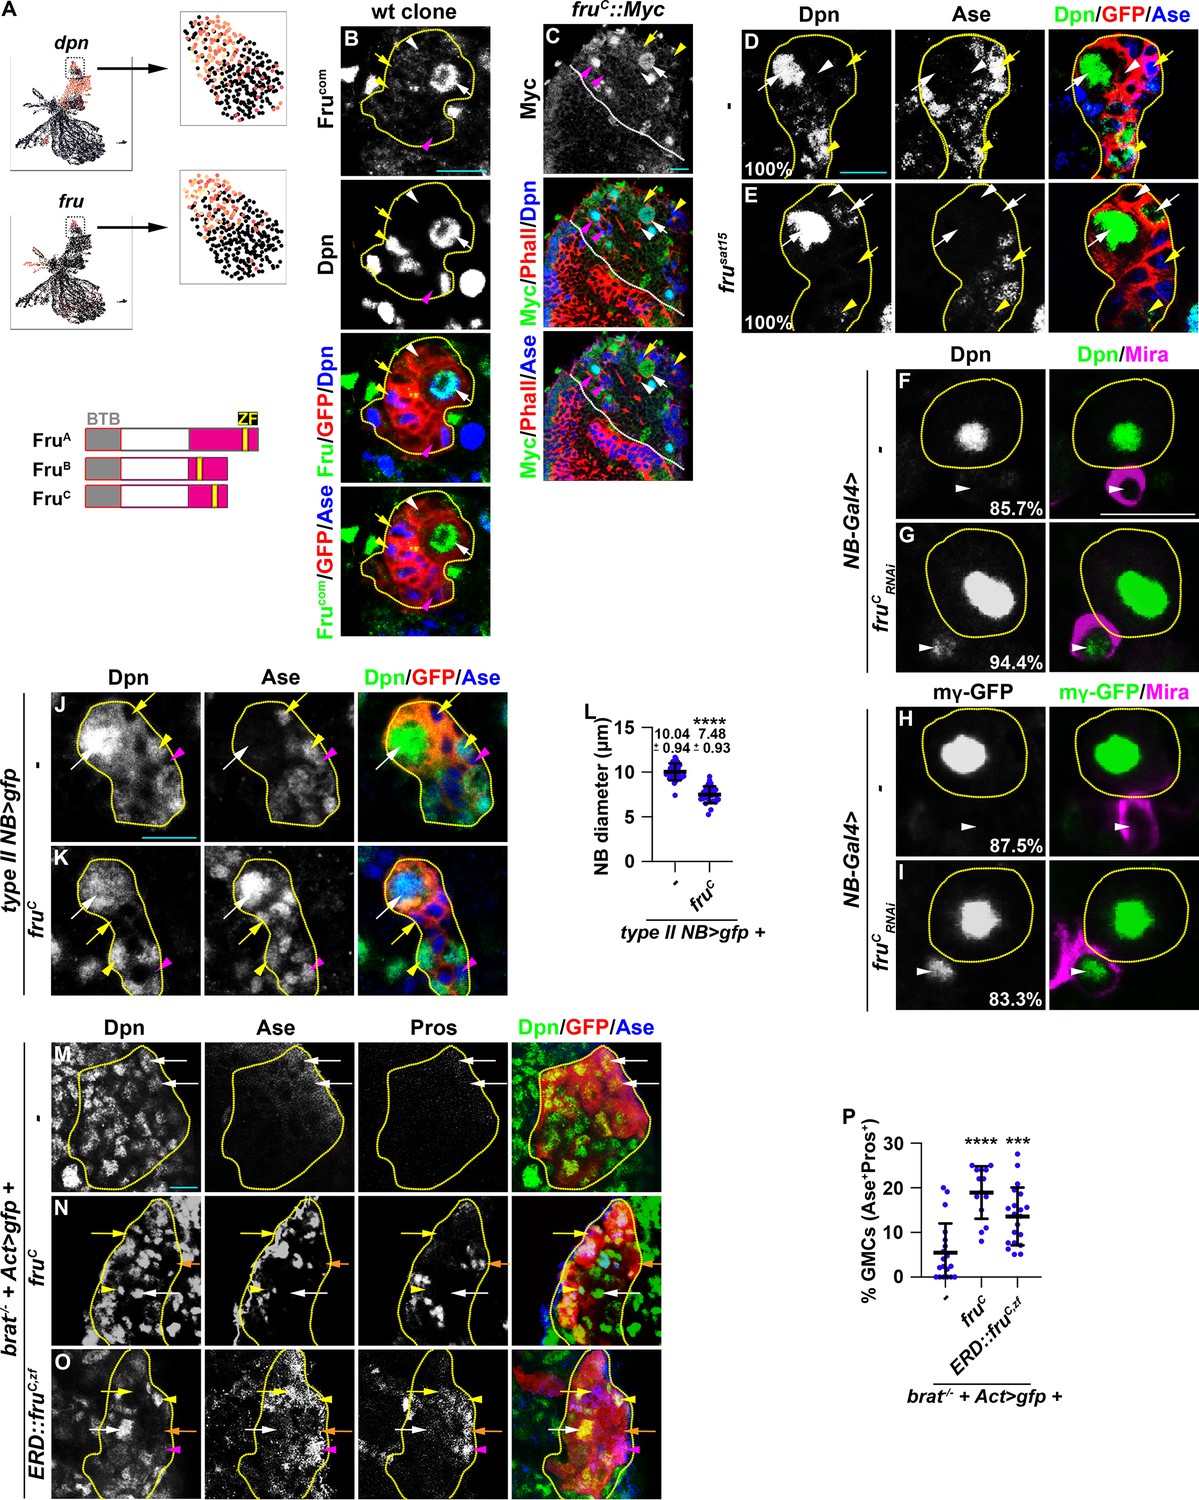
We hypothesized that regulators that fine-tune stemness gene expression in neuroblasts should (1) be transcription factors, (2) be exclusively expressed in type II neuroblasts, and (3) negatively regulate gene transcription. We searched for candidate genes that fulfill these criteria in the cluster 14 of the type II neuroblast lineage gene transcription atlas. dpn serves as a positive control because its transcripts are highly enriched in type II neuroblasts and rapidly degraded in Ase- immature INPs, allowing us to distinguish neuroblasts from immature INPs (Figure 2A–B). We found the expression of fru mirrors dpn expression, with transcript levels high in type II neuroblasts but lower in Ase- immature INPs (Figure 2A). fru is a pleiotropic gene with at least two major functions: one that controls male sexual behavior and another that is essential for viability in both sexes (Goodwin and Hobert, 2021). fru transcripts are alternatively spliced into multiple isoforms that encode putative transcription factors containing a common BTB (protein-protein interaction) N-terminal domain and one of four C-terminal zinc-finger DNA-binding domains (Dalton et al., 2013; Neville et al., 2014; von Philipsborn et al., 2014; Figure 2A). We used the Fru-common antibody that recognizes all isoforms to determine the spatial expression pattern of Fru protein in green fluorescent protein (GFP)-marked wild-type neuroblast clones. We detected Fru in neuroblasts but found that Fru is rapidly downregulated in their differentiating progeny in type I and II lineages (Figure 2B). To determine which Fru isoform is expressed in neuroblasts, we examined the expression of isoform-specific fru::Myc tagged allele where a Myc epitope is knocked into the C-terminus of the FruA, FruB, or FruC coding region (von Philipsborn et al., 2014). While FruA::Myc and FruB::Myc appear to be ubiquitously expressed at low levels, FruC::Myc is specifically expressed in both types of neuroblasts but not in their differentiating progeny, including immature INPs, INPs, and GMCs (Figure 2C, Figure 2—figure supplement 1A–B). These data indicate that FruC is the predominant Fru isoform expressed in neuroblasts.
Figure 2 with 1 supplement see all
Fruc functions through transcriptional repression to regulate stemness gene expression.
(A) Top: fru and dpn mRNAs are highly enriched in neuroblasts in cluster 14 of the scRNA-seq dataset, but only dpn mRNAs are detected in INPs in cluster 1. Bottom: Domains in Fru protein isoforms. ZF: zinc-finger DNA-binding domain. (B) Fru protein is detected in the neuroblast but not in INPs in a GFP-marked type II neuroblast lineage clone. The genotype used in this experiment is Elav-Gal4,UAS-mCD8::GFP,hs-flp; FRT82B,Tub-Gal80/FRT82B. (C) Endogenously expressed FruC tagged by a Myc epitope (fruC::Myc) is detected in type I and II neuroblasts but not in their differentiating progeny. (D–E) Immature INPs in GFP-marked wild-type type II neuroblast clones never show detectable Dpn expression (100%). 1–2 Ase- immature INP per fru-null (frusat15) type II neuroblast clone show detectable Dpn expression (100%). The genotype in this experiment is Elav-Gal4,UAS-mCD8::GFP,hs-flp; FRT82B,Tub-Gal80/FRT82B,fruSat15. (F–I) The newborn immature INP marked by cortical Miranda staining show undetectable Dpn and E(spl)mγ::GFP expression in the majority of wild-type clones (85.7%). Reducing fruC function leads to ectopic Dpn and E(spl)mγ::GFP expression in the newborn immature INP in most type II neuroblast lineages (94.4%). NB-Gal4: Wor-Gal4. (J–L) Type II neuroblasts overexpressing Fruc display characteristics of differentiation including a reduced cell diameter and aberrant Ase expression. Quantification of the cell diameter is shown in L. (type II NB>: Wor-Gal4, Ase-Gal80). (M–P) Overexpressing full-length Fruc or a constitutive transcriptional repressor form of FruC (Fruc,zf::ERD) is sufficient to partially restore differentiation in brat-null type II neuroblast clones (brat11/Df(2 L)Exel8040,hs-flp; Act5C-Gal4>FRT > FRT>UAS-GFP/UAS-fruC or ERD::fruC,zf). The percentage of GMCs per clone is shown in P. Yellow dashed line encircles a type II neuroblast lineage. White dotted line separates optic lobe from brain. white arrow: type II neuroblast; white arrowhead: Ase- immature INP; yellow arrow: Ase+ immature INP; yellow arrowhead: INP; magenta arrow: type I neuroblast; magenta arrowhead: GMC. Scale bars: 10 μm. p-values: ***<0.0005, and ****<0.00005.
To define the function of Fru in neuroblasts, we assessed the identity of cells in the GFP-marked mosaic clones derived from single type II neuroblasts. The wild-type neuroblast clone always contains a single neuroblast that can be uniquely identified by cell size (10–12 μm in diameter) and marker expression (Dpn+Ase-) as well as 6–8 smaller, Dpn- immature INPs (Figure 2D). The neuroblast clone carrying deletion of the fru locus (fru-/-) contains a single identifiable neuroblast but frequently contains multiple Ase- immature INPs with detectable Dpn expression (Figure 2E). Over 80% of newborn immature INPs (marked by intense cortical Mira expression) generated by fruC-mutant type II neuroblasts ectopically express Dpn and E(spl)mγ while less than 15% of newborn immature INPs generated by wild-type neuroblasts expressed these genes (Figure 2F–I). These results support a model in which loss of fruC function increases the expression of Notch downstream-effector genes that promote stemness in neuroblasts. Consistently, type II neuroblasts overexpressing FruC prematurely initiate INP commitment, as indicated by a reduced cell diameter and precocious Ase expression (Figure 2J–L). Thus, loss of fruC function increases stemness gene expression whereas gain of fruC decreases stemness gene expression during asymmetric neuroblast division.
To determine whether FruC negatively regulates the transcription of stemness genes in type II neuroblasts, we overexpressed wild-type FruC in GFP-marked neuroblast lineage clones in brat-null brains. Ectopic translation of Notch downstream-effector gene transcripts that promote stemness in neuroblasts drives immature INP reversion to supernumerary type II neuroblasts at the expense of differentiating cell types in brat-null brains (Loedige et al., 2015; Komori et al., 2018; Reichardt et al., 2018). Control clones in brat-null brains contain mostly type II neuroblasts and few differentiating cells that include Ase+ immature INPs, INPs, and GMCs (Figure 2M and P). By contrast, overexpressing full-length FruC increases the number of INPs, GMCs, and differentiating neurons (Ase-Pros+) in brat-null neuroblast clones (Figure 2N and P). This result indicates that FruC overexpression is sufficient to partially restore differentiation in brat-null brains. To test if Fruc restores differentiation by promoting transcriptional repression, we generated fly lines carrying the UAS-fruC,zf::ERD transgene that encodes the zinc-finger DNA-binding motif of FruC fused in frame with the Engrail Repressor Domain. The ERD domain is well conserved in multiple classes of homeodomain proteins as well as many transcriptional repressors across the bilaterian divide and binds to the Groucho co-repressor protein to exert its repressor function (Smith and Jaynes, 1996; Jiménez et al., 1997; Bürglin and Affolter, 2016). Several previously published studies have used this strategy to demonstrate that neurogenetic transcription factors exert transcriptional repression function in neuroblasts (Xiao et al., 2012; Janssens et al., 2014; Bahrampour et al., 2017; Rives-Quinto et al., 2020). Similar to full-length FruC overexpression, overexpressing FruC,zf::ERD was also sufficient to partially restore differentiation in brat-null brains (Figure 2O–P). Thus, we conclude that FruC negatively regulates stemness gene expression in type II neuroblasts.
Fruc binds cis-regulatory elements of the majority of genes uniquely transcribed in neuroblasts
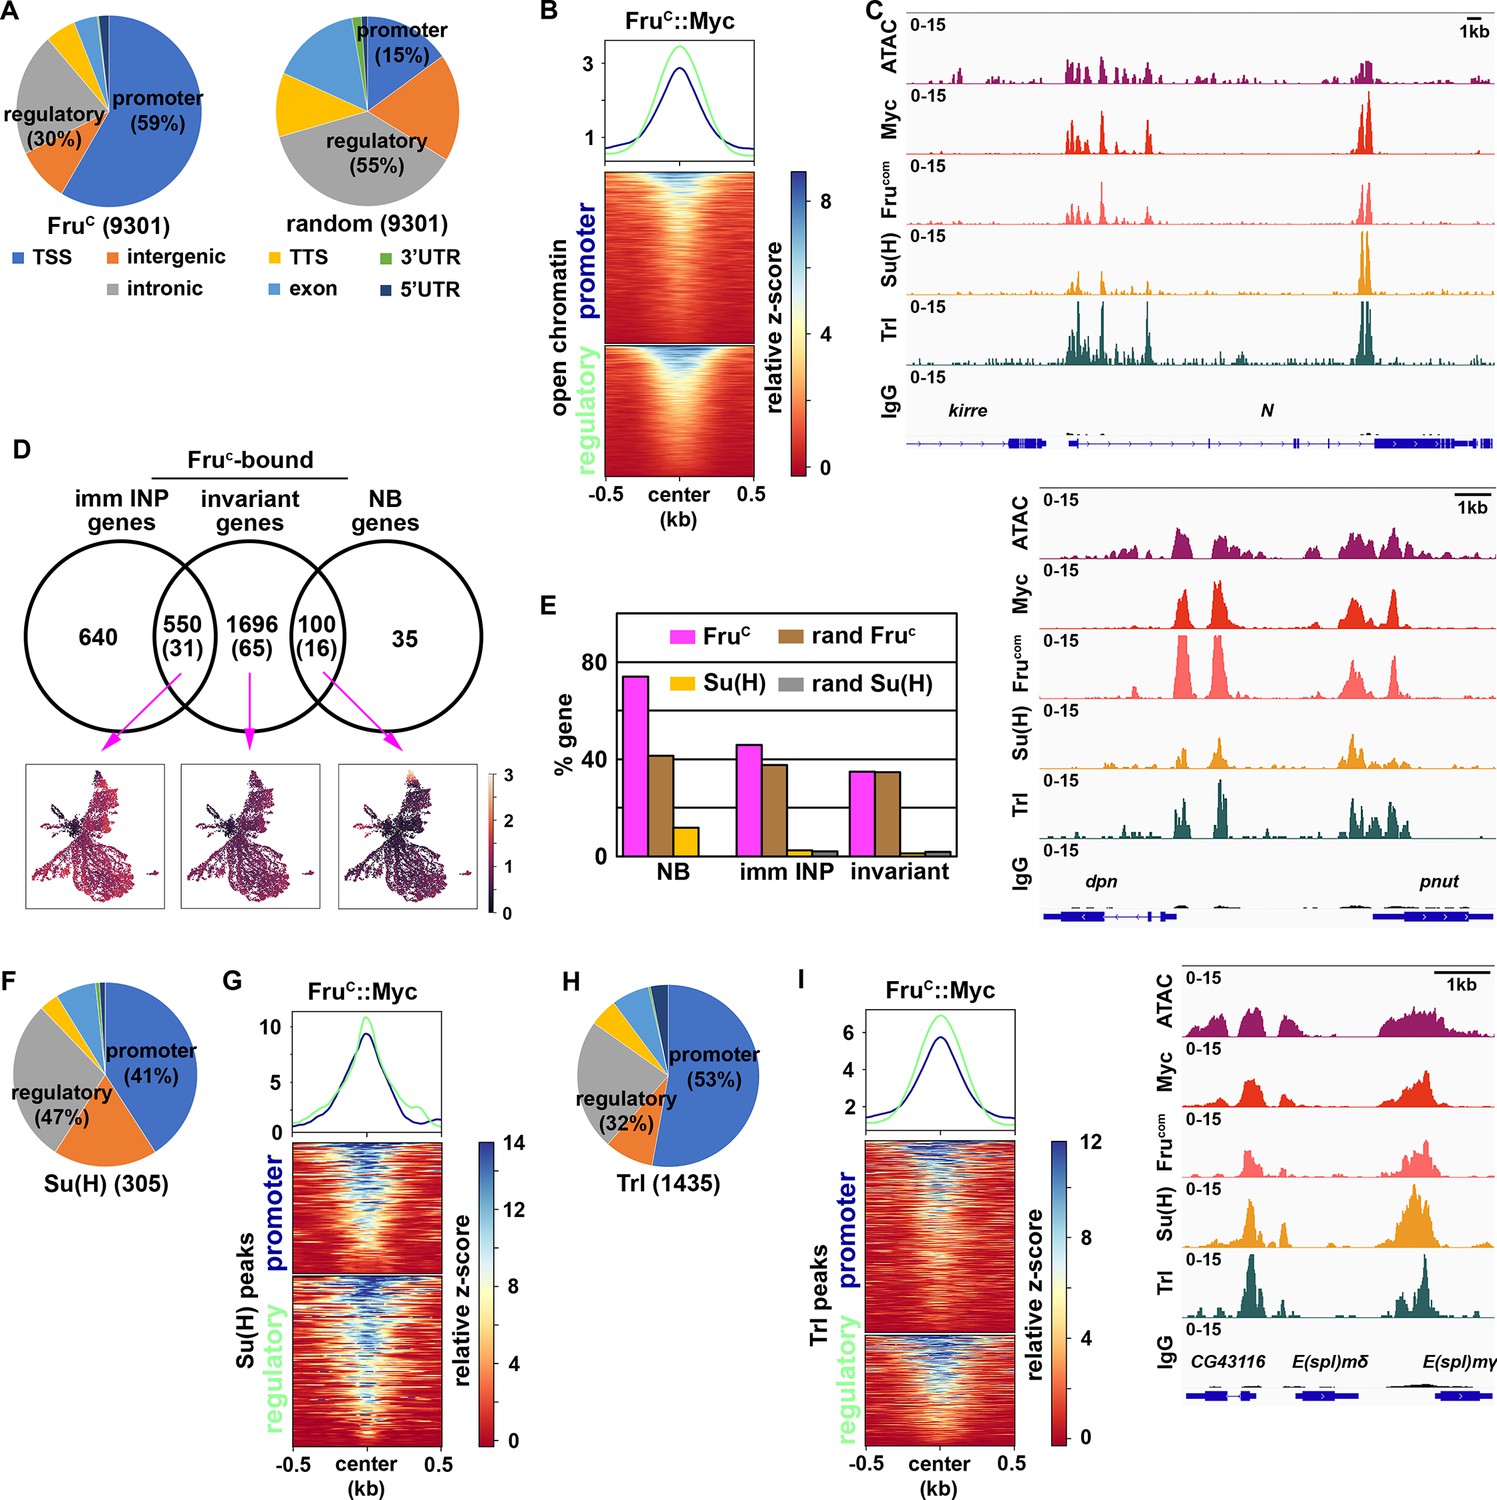
If FruC directly represses stemness gene expression, FruC should bind their cis-regulatory elements. To identify FruC-bound regions in neuroblasts, we applied a protocol of Cleavage Under Targets and Release Using Nuclease (CUT&RUN) to brain extracts from dissected third-instar brat-null larvae homozygous for the fruC::Myc knock-in allele. brat-null brains accumulate thousands of supernumerary type II neuroblasts at the expense of INPs and provide a biologically relevant source of type II neuroblast-specific chromatin (Komori et al., 2014a; Janssens et al., 2017; Komori et al., 2018; Rives-Quinto et al., 2020; Larson et al., 2021). We used a specific antibody against the Myc epitope or the Fru-common antibody to confirm that FruC::Myc is detected in all supernumerary type II neuroblasts in brat-null brains homozygous for fruC::Myc (Figure 3—figure supplement 1A). We determined the genome-wide occupancy of FruC::Myc in type II neuroblasts using the Myc antibody and Fru-common antibody, and found that FruC::Myc binding patterns revealed by these two antibodies are highly correlated (Figure 3—figure supplement 1B; Pearson correlation = 0.94). FruC binds 9301 regions in type II neuroblasts (Figure 3A). Overall, 59% of FruC-bound regions are promoters whereas 29% are enhancers in the intergenic and intronic regions (Figure 3A). By contrast, 15% of randomized control regions are promoters and 55% are enhancers (Figure 3A). 50.1% of FruC-bound regions in promoters and enhancers overlap with regions of accessible chromatin (Larson et al., 2021; Figure 3B). Consistent with the finding that FruC negatively regulates stemness gene expression, FruC binds promoters and neuroblast-specific enhancers of Notch, dpn, E(spl)mγ, klumpfuss (klu) and tailless (tll) that were previously shown to maintain type II neuroblasts in an undifferentiated state (Figure 3C; Figure 3—figure supplement 1C). Based on our scRNA-seq data, we classified genes as NB genes, imm INP genes, or invariant genes expressed throughout the lineage based on differential expression within cluster 14 (Figure 1E; Supplementary file 2). Seventy-four percent of genes uniquely transcribed in type II neuroblasts (NB genes) are bound by FruC whereas 41% of these genes are in randomized control (Figure 3D–E). By contrast, the percentage of FruC-bound genes transcribed in immature INPs or throughout the type II neuroblast lineage is similar to random control (Figure 3D–E). Because stemness gene transcripts are highly enriched in type II neuroblasts, these results suggest that FruC preferentially binds cis-regulatory elements of stemness genes.
Figure 3 with 1 supplement see all
Fruc preferentially binds regulatory elements of genes uniquely expressed in neuroblasts.
(A) Genomic binding distribution of FruC-bound peaks (total # of peaks shown in parentheses) from CUT&RUN or random (set of Fruc peaks shuffled to randomly determined places in the genome) in type II neuroblast-enriched chromatin from brat-null brains (brat11/Df(2L)Exel8040). Fruc preferentially binds promoters. (B) Heatmap is centered on promoters or regulatory regions showing accessible chromatin as defined by ATAC-seq with 500 bp flanking regions and ordered by signal intensity of Fruc::Myc binding. (C) Representative z score-normalized genome browser tracks showing regions with accessible chromatin (ATAC-seq) and bound by Fruc::Myc (detected by the Myc antibody or FruCOM antibody), Su(H), Trl, or IgG at Notch, dpn, and E(spl)mγ loci. (D) Genes in cluster 14 from the scRNA-seq dataset were separated into neuroblast-enriched genes (right), immature INP-enriched genes (left), and invariant genes. The middle circle is the set of genes bound by Fruc or Su(H) (shown in parentheses). UMAPs show gene enrichment score for Fruc-bound genes uniquely expressed in neuroblasts (right), uniquely expressed in immature INPs (left), and ubiquitously expressed (invariant genes) (middle). (E) Percentage of genes defined in D bound by either Fruc, Su(H), random Fruc peaks, or random Su(H) peaks (set of Su(H) peaks shuffled to randomly determined places in the genome). (F–G) Genomic binding distribution of identified Su(H)-bound peaks (total # of peaks shown in parentheses) from CUT&RUN in type II neuroblast-enriched chromatin. Heatmap is centered on promoters or regulatory regions and ordered by signal intensity of Su(H) binding. (H–I) Genomic binding distribution of identified Trl-bound peaks (total # of peaks shown in parentheses) from CUT&RUN in type II neuroblast-enriched chromatin. Heatmap is centered on promoters or regulatory regions and ordered by signal intensity of Trl binding.
A mechanism by which FruC can negatively regulate stemness gene expression levels is to modulate the activity of the Notch transcriptional activator complex activity. Using Affymetrix GeneChip, a previous study demonstrated that the Notch transcriptional activator complex binds 595 regions in 185 transcribed genes in neuroblasts (log2 FC >0.5) including dpn, E(spl)mγ, klu, and tll (Zacharioudaki et al., 2016). To precisely identify Notch-bound peaks in type II neuroblasts, we used a specific antibody against the DNA-binding subunit of the Notch transcriptional activator complex, Suppressor of Hairless (Su(H)), to perform a CUT&RUN assay on brain lysate form third-instar brat-null larvae homozygous for fruC::Myc. Prior to the genomic study, we validated the specificity of the Su(H) antibody in vivo by performing immunofluorescent staining of brat-null larvae homozygous for fruC::Myc. We observed co-expression of Su(H) and Dpn in thousands of supernumerary type II neuroblasts in brat-null brains (Figure 3—figure supplement 1D). Because dpn is directly activated by Notch in many cell types, including neuroblasts, this result confirms that the Su(H) antibody can detect activated Notch activity. We found that Su(H) binds 305 regions in 112 genes in type II neuroblasts, and that Su(H)-bound regions are predominantly in promoters and enhancers (Figure 3F). Twelve percent of NB genes are bound by Su(H) compared to 0% of these gene in a randomized control (Figure 3D–E). By contrast, the percentage of Su(H) bound genes transcribed in immature INPs or throughout the type II neuroblast lineage are similar to random control. Overall, 95.2% of Su(H)-bound promoters and 90.8% of Su(H)-bound enhancers overlap with FruC-bound peaks (Figure 3G). These peaks include the promoters of Notch, dpn, E(spl)mγ, klu and tll as well as the enhancers that drive their expression in neuroblasts (Figure 3C; Figure 3—figure supplement 1C). Our data support a model that FruC regulates Notch pathway gene expression by occupying functionally relevant regulatory elements bound by Notch in type II neuroblasts.
De novo motif discovery identified a sequence bound by the transcription factor Trithorax-like (Trl), also known as GAGA factor, is significantly enriched in both FruC-bound promoters and enhancers (Figure 3—figure supplement 1E). The Trl motif was previously found to be the most significantly enriched in FruC-associated genomic regions in the larval nervous system (Neville et al., 2014). Trl, like Fru, is a member of the BTB-Zn-finger transcription factor family which heterodimerize with other BTB-domain-containing factors to regulate gene transcription (Bonchuk et al., 2022). Trl is an evolutionarily conserved multifaceted transcription factor that regulates diverse biological processes by interacting with a wide variety of proteins including PRC2 complex components (Lomaev et al., 2017; Chetverina et al., 2021; Srivastava et al., 2018). Although the Trl motif is generally enriched at promoters, enrichment of this motif in FruC-bound promoters and enhancers suggest that FruC might function together with Trl to negatively regulate gene transcription in type II neuroblasts. We examined whether Trl indeed binds FruC-bound regions in type II neuroblasts using a specific antibody against Trl (Judd et al., 2021). We validated the specificity of the Trl antibody in vivo by performing immunofluorescent staining of brat-null larvae homozygous for fruC::Myc. We found that Trl is highly enriched in the nuclei of thousands of supernumerary type II neuroblasts marked by Dpn expression (Figure 3—figure supplement 1F). We used the Trl antibody to perform a CUT&RUN assay on brain lysate from third-instar brat-null larvae homozygous for fruC::Myc. We identified 1435 Trl-bound regions, including promoters and enhancers, in type II neuroblasts (Figure 3H). In total, 85.4% of Trl-bound promoters and 87.8% of Trl-bound enhancers overlapped with FruC-bound regions including Notch, dpn, E(spl)mγ, klu and tll loci (Figure 3C and I; Figure 3—figure supplement 1C). These data suggest that FruC may function together with Trl to regulate the transcription of stemness genes in neuroblasts.
FruC fine-tunes the transcription of Notch pathway genes during asymmetric neuroblast division
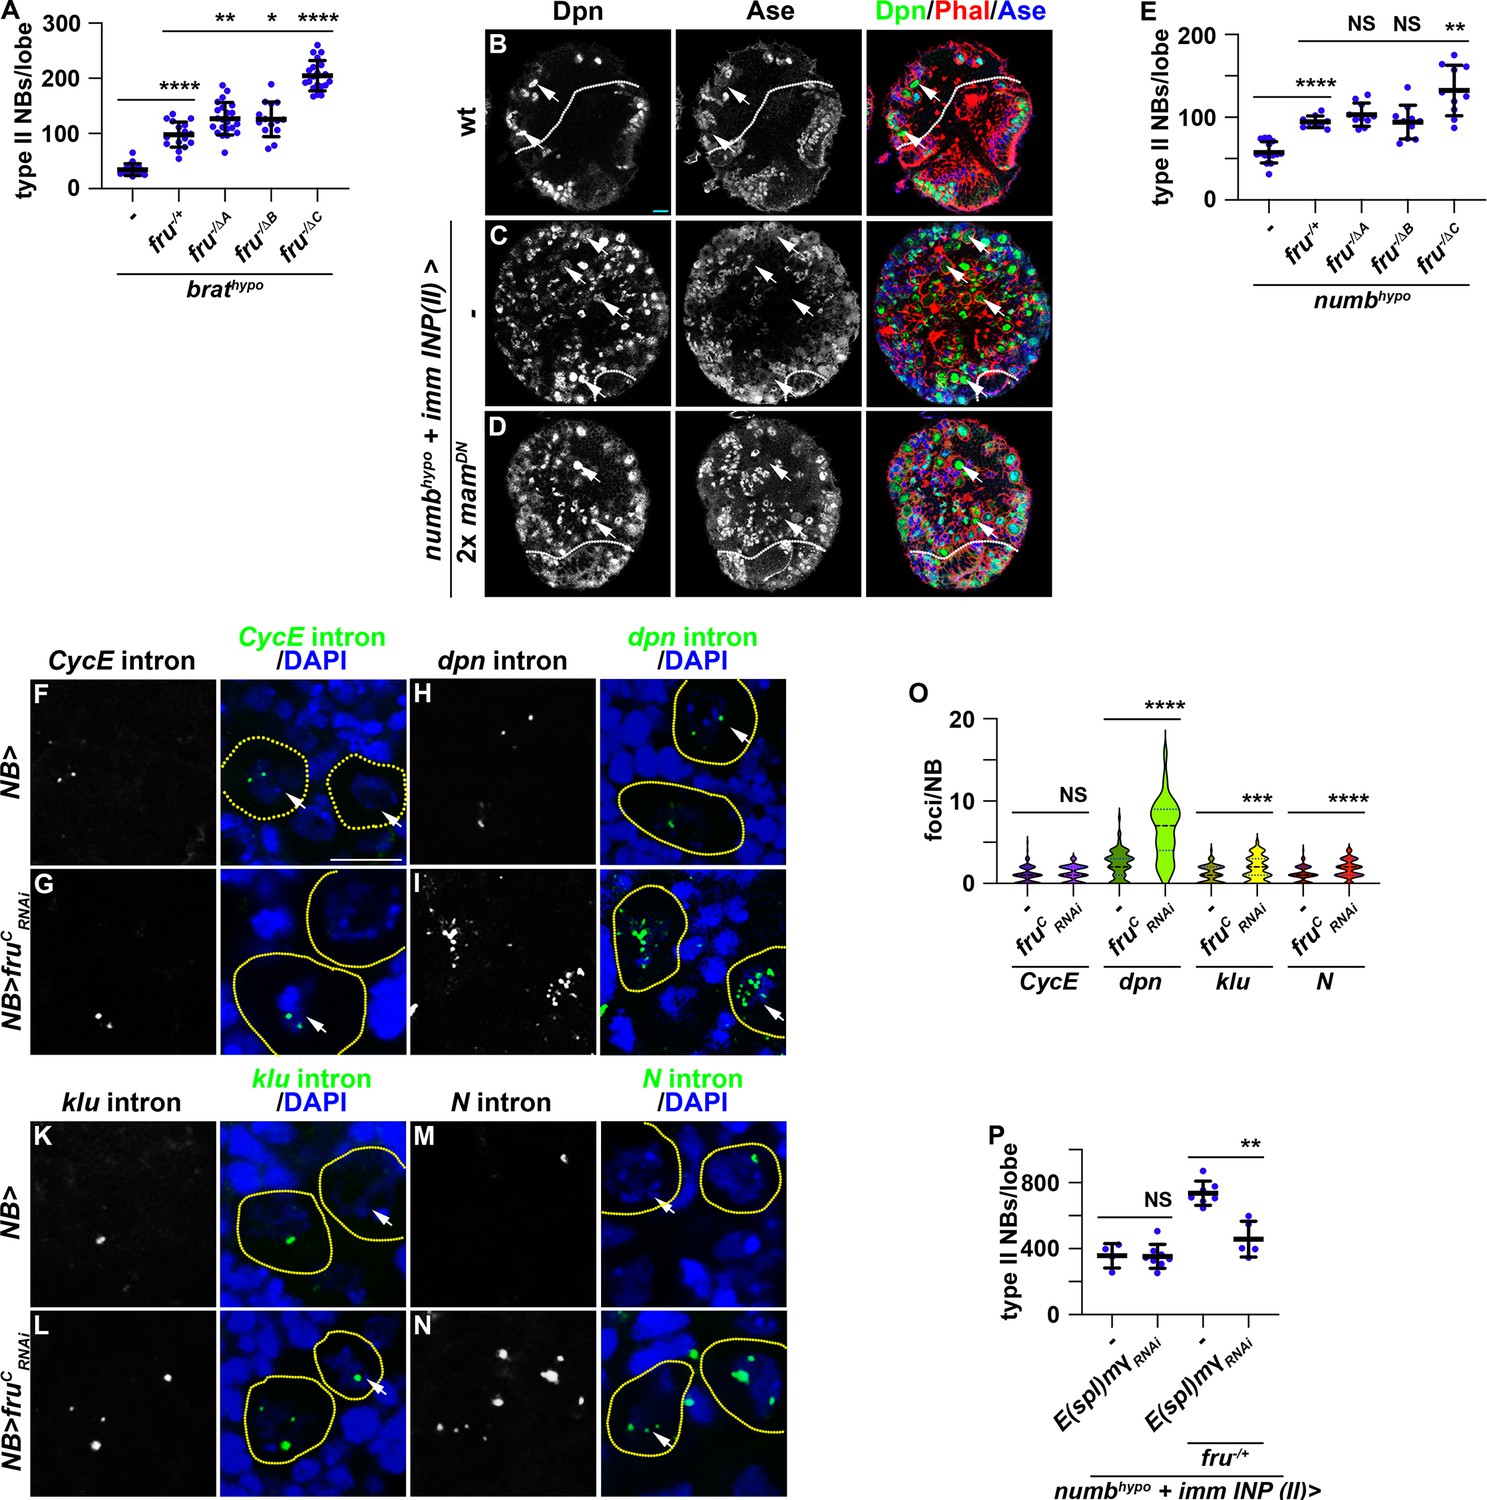
Loss- and gain-of-function of fruC mildly alters the expression of Notch downstream-effector genes that promote stemness in neuroblasts (Figure 2). Thus, FruC likely fine-tunes Notch signaling activity levels that balance neuroblast maintenance and INP commitment during neuroblast asymmetric division. To functionally validate the role of FruC in fine-tuning Notch pathway activity expression, we tested whether loss of fruC function can enhance the supernumerary neuroblast phenotype in brat-hypomorphic (brathypo) brains. Immature INPs revert to supernumerary type II neuroblasts at low frequency due to a modest increase in Notch downstream-effector gene expression in brathypo brains (Komori et al., 2018). Consistent with the finding that reduced fru function increases Notch downstream-effector protein levels in immature INPs, the heterozygosity of a fru deletion (fru-/+) enhances the supernumerary neuroblast phenotype in brathypo brains (Figure 4A; Figure 4—figure supplement 1A–B). Furthermore, brathypo brains lacking fruC function displayed greater than a twofold increase in supernumerary neuroblasts compared with brathypo brains heterozygous for a fru deletion (Figure 4A; Figure 4—figure supplement 1C–E). These data support our model that loss of fruC function increases Notch pathway activity levels during asymmetric neuroblast division.
Figure 4 with 1 supplement see all
Reduced fru function increases Notch pathway gene transcription.
(A) Loss of fruC function (fruΔC/Aj96u3) enhances the supernumerary neuroblast phenotype in brathypo (bratDG19310/11) brains heterozygous for a fru deletion (fruAj96u3/+), but loss of fruA (fruΔA/Aj96u3) or fruB (fruΔB/Aj96u3) function does not. (B–D) Overexpressing two copies of dominant-negative mam transgenes in immature INPs partially suppresses the supernumerary neuroblast phenotype in numbhypo (numbex112/15) brains. The genotype used in this experiment is numbEx112/R9D11-Gal4,numb15 or numbEx112/R9D11-Gal4,numb15; UAS-mamDN/UAS-mamDN. (E) Loss of fruC function (fruΔC/Aj96u3) enhances the supernumerary neuroblast phenotype in numbhypo brains heterozygous for a fru deletion (fruAj96u3/+), but loss of fruA (fruΔA/Aj96u3) or fruB (fruΔB/Aj96u3) function does not. (F–N) sm-FISH using intron probes confirms increased Notch and Notch target gene (dpn and klu) transcription in fruC-mutant neuroblasts comparing with control neuroblasts. CycE nascent transcripts serve as a control because CycE is not a Notch target gene, and CycE transcription is unaffected by fruC knockdown. The genotype used in this experiments is Wor-Gal4 or Wor-Gal4/UAS-fruCRNAi (O) Quantification of Notch, dpn, klu and CycE nascent transcript foci in control versus fruC-mutant neuroblasts. sm-FISH signals were counted in 8 dorsal-most neuroblasts (>6 μm in diameter) per brain lobe. CycE: 1±0.97 (n=128 neuroblasts) in control; 1.16±0.91 (n=96 neuroblasts) in fruCRNAi. dpn: 2.33±1.65 (n=88 neuroblasts) in control; 6.52±3.55 (n=104 neuroblasts) in frucRNAi. klu: 1.12±1.01 (n=80 neuroblasts) in control; 1.79±1.43 (n=112 neuroblasts) in frucRNAi. Notch: 1.06±0.88 (n=112 neuroblasts) in control; 1.77±1.07 (n=104 neuroblasts) in frucRNAi. (P) Knocking down E(spl)mγ function by RNAi in immature INPs suppresses increased supernumerary formation in numbhypo brains heterozygous for fru while having no effect on numbhypo brains alone. The genotypes used in this experiment are numbEx112/R9D11-Gal4,numb15; UAS-E(spl)mγRNAi/+ or numbEx112/R9D11-Gal4,numb15; UAS-E(spl)mγRNAi/fruAj96u3/+. White dashed line separates brain from the optic lobe. Yellow dashed line encircles a neuroblast. white arrow: type II neuroblast. Scale bars: 10 μm. p-value: NS: non-significant, *<0.05, **<0.005, ***<0.0005, and ****<0.00005.
Because FruC occupies enhancers relevant to the cell-type-specific expression of Notch and Notch downstream-effector genes in type II neuroblasts (Figure 3), we assessed whether FruC fine-tunes the expression of Notch signaling pathway components during asymmetric neuroblast division. Proteolytic cleavage of the extracellular domain and the transmembrane fragment releases the Notch intracellular domain to form a transcriptional activator complex by binding Su(H) and Mastermind (Mam) (Bray and Gomez-Lamarca, 2018). Asymmetric segregation of Numb into immature INPs inhibits continual Notch activation and terminates Notch-activated transcription of its downstream-effector genes. numb-hypomorphic (numbhypo) animals carrying the numbEx allele in trans with a numb-null allele (numb15) contain more than 100 type II neuroblasts per brain lobe compared with 8 per lobe in wild-type animals (Figure 4B–C; Figure 4—figure supplement 1F–G). Antagonizing Notch-activated gene transcription by overexpressing a dominant negative form of Mam (MamDN) in immature INPs suppressed the supernumerary neuroblast phenotype in numbhypo brains (Figure 4C–D; Figure 4—figure supplement 1G). Thus, the supernumerary type II neuroblast phenotype in numbhypo brains provides a direct functional readout of activated Notch levels during asymmetric neuroblast division. The heterozygosity of a fru deletion alone did not affect INP commitment in immature INPs but led to a twofold increase in supernumerary neuroblasts in numbhypo brains (Figure 4E; Figure 4—figure supplement 1H–I). Complete loss of fruC function (fru-/ΔC) led to increased supernumerary neuroblast formation in numbhypo brains compared with fru-/+ (Figure 4E; Figure 4—figure supplement 1J–L). These results suggest that loss of fruC function increases Notch-activated gene expression in mitotic neuroblasts, and support a model that FruC fine-tunes the transcription of Notch downstream-effector genes in neuroblasts.
To quantitatively evaluate whether FruC fine-tunes Notch and Notch downstream-effector gene transcription in neuroblasts, we performed single-molecule fluorescent in-situ hybridization (sm-FISH) using intron probes to these transcripts in larval brains overexpressing a fruCRNAi transgene. Intron probes detect nascent transcripts allowing for quantitative measurement of gene transcription in the physiological context. Because Cyclin E (CycE) is not a Notch target, its nascent transcript levels should not be affected by alerted Notch signaling and serve as control in this experiment. Consistently, the number of CycE nascent transcript foci in neuroblasts appears statistically indistinguishable between control brains carrying only the Gal4 driver or brains overexpressing fruCRNAi (Figure 4F–G and O). By contrast, the number of Notch, dpn and klu nascent transcript foci is significantly higher in fruC knockdown brains than in control brains (Figure 4H–O). E(spl)mγ was exempted from this analysis because its open reading frame contains a single exon. These results strongly suggest that reduced fruC function increases Notch and Notch downstream-effector gene transcription levels in neuroblasts. Consistent with this interpretation, knocking down the function of E(spl)mγ by RNAi strongly suppressed increased supernumerary neuroblast formation in numbhypo brains heterozygous for fru while not effecting the baseline supernumerary neuroblast phenotype in numbhypo brains (Figure 4P). The dpnRNAi transgene was exempted from this analysis because of off-target effect. This result provides functional support of our model that reducing fruC function increases Notch target gene transcription in neuroblasts. Thus, we conclude that FruC fine-tunes Notch and Notch downstream-effector gene expression during asymmetric neuroblast division.
FruC fine-tunes gene expression by promoting low-level H3K27me3 enrichment
To define the mechanisms by which FruC fine-tunes Notch pathway gene transcription in mitotic neuroblasts, we compared genome-wide patterns of histone marks by CUT&RUN in brat-null brains carrying a fru-/ΔC allelic combination (fruC-null) with that of brat-null brains alone (control) (Figure 5—figure supplement 1A–B). We used a 500 bp sliding window to search for regions that show changes in histone mark levels with a Q-value <0.05 in fruC-null brains relative to control brains. We first focused on acetylated lysine 27 on histone H3 (H3K27ac) because a previous study suggested that FruC functions through Histone deacetylase 1 (Hdac1) to regulate gene transcription during specification of sexually dimorphic neurons (Ito et al., 2012). If FruC fine-tunes Notch, dpn and E(spl)mγ transcription in type II neuroblasts by promoting deacetylation of H3K27 at their promoters and neuroblast-specific enhancers, these loci should display higher H3K27ac levels in fruC-null brains than in control brains. 14.2% (4139 kB / 29,065 kB) of the regions with statistically significant changes in H3K27ac levels genome-wide displayed greater than twofold increase in this histone mark in fruC-null brains while 0.4% (130 kB / 29,065 kB) of these regions showed greater than twofold decrease (Figure 5—figure supplement 1C). 3.4% (306 kB / 8,870 kB) of FruC-bound regions showed greater than 2-fold increase in H3K27ac levels in fruC-null brains, and these regions did not include the cis-regulatory elements and the bodies of Notch, dpn and E(spl)mγ (Figure 5A; Figure 5—figure supplement 1D–E). Thus, loss of fruC function did not significantly increase the number of FruC-bound loci with greater than 2-fold increase in H3K27ac comparing with the genome overall. We conclude that H3K27 deacetylation likely plays a minor role in FruC-mediated fine-tuning of target gene transcription.
Figure 5 with 1 supplement see all
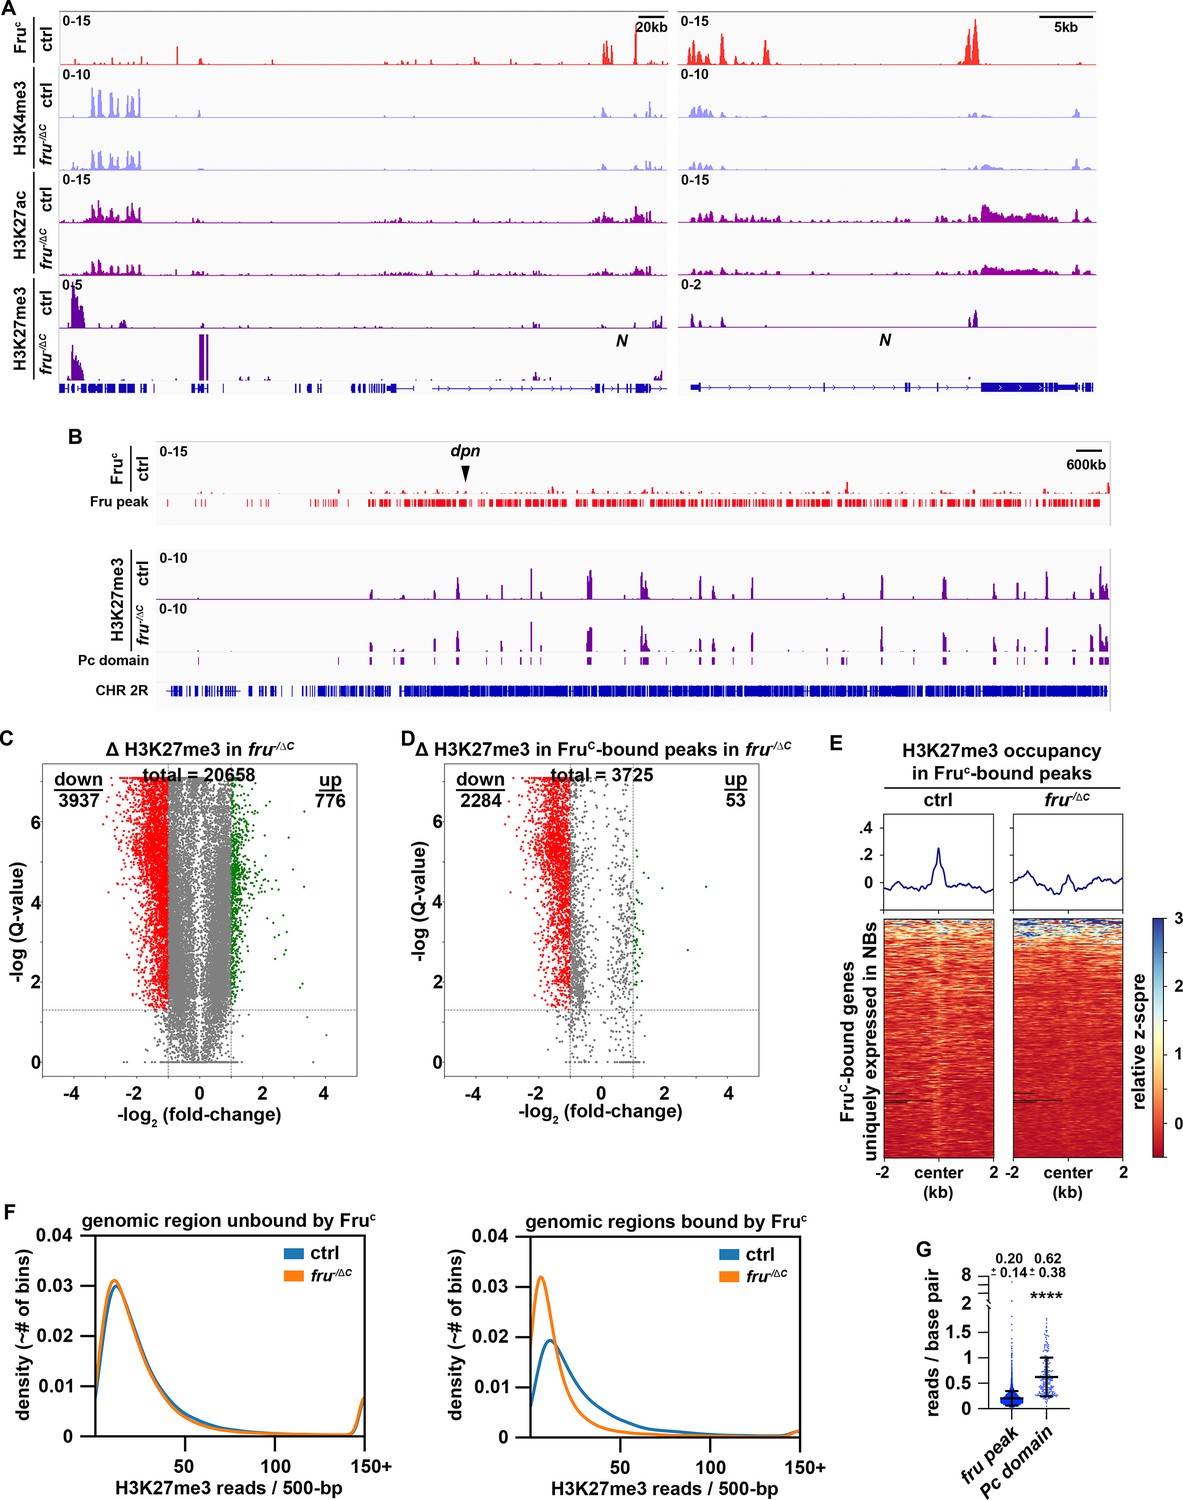
Low levels of H3K27me3 are enriched in FruC-bound regions.
(A) Representative z score-normalized genome browser tracks showing FruC-binding and the enrichment of H3K4me3, H3K27ac, and H3K27me3 at the Notch locus in type II neuroblasts in control (brat11/Df(2L)Exel8040) or fruC-null (brat11/Df(2L)Exel8040; fruΔC/Aj96u3) brains. Left: Zoomed-out images showing nearest heterochromatin domains. Right: Zoomed-in images showing enrichment of histone marks in FruC-bound regions. (B) Representative z score-normalized genome browser track showing FruC-binding and the H3K27me3 throughout the chromosome arm 2 R in type II neuroblasts in control or fruC-null brains. Fru peaks are shown along with Pc domain regions called on data using similar strategy as previously used to call canonical Pc domains (Brown et al., 2018). (C) Volcano plot showing fold-change of H3K27me3 signal in overall genomic regions in fruC-null brains versus control brains. (D) Volcano plot showing fold-change of H3K27me3 signal in regions bound by Fruc in fruC-null brains versus control brains. (E) Heatmaps are centered on Fruc summits with 2 kb flanking regions in genes uniquely transcribed in type II neuroblasts in control or fruC-null brains and ordered by signal intensity of H3K27me3 enrichment calculated from TMM-normalized tracks. (F) Left: Density plots showing proportion of all 500 bp regions in the genome not bound by Fruc covered by different amounts of H3K27me3 reads in fruC-null brains vs control brains. Right: Density plots showing proportion of all 500 bp Fruc bound regions covered by different amounts of H3K27me3 reads in fruC-null brains vs control brains. (G) Dotplot representing coverage of each Fruc peak not in Pc domains vs coverage of each Pc domain. The horizontal line in the volcano plot represents -log10(0.05)=1.301. All genes above this line have a FDR <0.05.
H3K4me3 is a chromatin mark associated with the promoters of actively transcribed genes (Cenik and Shilatifard, 2021). If FruC fine-tunes Notch, dpn and E(spl)mγ transcription in type II neuroblasts by promoting demethylation of H3K4 at their promoters, these loci should display higher H3K4me3 levels in fruC-null brains than in control brains. 26.7% (8788 kB / 32,939 kB) of the regions with statistically significant changes in H3K4me3 levels genome-wide displayed greater than twofold increase in fruC-null brains while 4.2% (1391 kB / 32,939 kB) of these regions showed greater than 2-fold decrease (Figure 5—figure supplement 1F). 7.45% (831 kB / 11,149 kB) of FruC-bound regions showed greater than 2-fold increase in this histone mark in fruC-null brains, and these regions did not include the promoters and the bodies of Notch, dpn, and E(spl)mγ (Figure 5A; Figure 5—figure supplement 1D and G). Thus, loss of fruC function did not significantly increase the number of FruC-bound loci with greater than twofold increase in H3K4me3 comparing with the genome overall. We conclude that H3K4 demethylation unlikely plays a role in FruC-mediating fine-tuning of gene transcription.
High levels of H3K27me3 are associated with inactive enhancers and the body of repressed genes (Laugesen et al., 2019; Piunti and Shilatifard, 2021). Low H3K27me3 levels occur in active loci in human and mouse embryonic stem cells but are generally regarded as noise (Mikkelsen et al., 2007; Pan et al., 2007). If FruC fine-tunes Notch, dpn and E(spl)mγ transcription in type II neuroblasts by promoting trimethylation of H3K27 at their neuroblast-specific enhancers, these loci should display lower H3K27me3 levels in fruC-null brains than in control brains. High levels of H3K27me3 are deposited in broad domains that are frequently referred to as Polycomb domains (Pc domains) (Brown et al., 2018). Pc domains rarely overlapped with FruC-bound loci and did not appear to be disrupted in fruC-null brains (Figure 5B). 5.7% (1429 kB / 24,888 kB) of the regions with statistically significant changes in H3K27me3 levels displayed greater than twofold increase in fruC-null brains and 18.1% (4510 kB / 24,888 kB) of these regions showed greater than 2-fold decrease (Figure 5C). Importantly, 43.3% (2748 kB / 6,340 kB) of FruC-bound regions showed greater than twofold decrease in this histone mark in fruC-null brains (Figure 5D–E; Figure 5—figure supplement 1H). Thus, loss of fruC function significantly increases the number of FruC-bound loci with greater than twofold decrease in H3K27me3 comparing with the genome overall. We conclude that H3K27 trimethylation likely plays an important role in FruC-mediating fine-tuning of gene transcription.
H3K27me3 levels at FruC-bound peaks including Notch and Notch downstream-effector gene loci appear significantly lower than those in Pc domains in control brains suggesting that FruC fine-tunes gene transcription by promoting low levels of H3K27me3 enrichment (Figure 5A–B; Figure 5—figure supplement 1D). To unbiasedly assess H3K27me3 levels at FruC-bound peaks, we compared the distribution of H3K27me3 reads in 500 bp bins throughout the genome versus FruC-bound peaks. The distribution of reads throughout the genome does not appreciably change between fruC-null brains and control brains (Figure 5F). Consistent with FruC promoting H3K27me3 deposition at regions bound by FruC, there are many more bins that overlapped with FruC-bound peaks containing a reduced number of reads in fruC-null brains comparing with control brains (Figure 5F). We compared the coverage (reads/bp) of H3K27me3 in FruC-bound peaks to canonically defined Pc domains in neuroblasts, and found that Fruc peaks had 3-fold less coverage of H3K27me3 than canonical Pc domains (Figure 5G). These results indicate that FruC fine-tunes gene transcription by promoting low levels of H3K27me3 enrichment.
PRC2 fine-tunes gene expression during asymmetric neuroblast division
PRC2 is thought to be the only enzymatic complex that catalyzes H3K27me3 deposition (Laugesen et al., 2019; Piunti and Shilatifard, 2021). If FruC functions through low levels of H3K27me3 enrichment to finely tune Notch, dpn, and E(spl)mγ expression in mitotic neuroblasts, PRC2 core components should be enriched in FruC-bound peaks in type II neuroblasts and reducing PRC2 activity should enhance the supernumerary neuroblast phenotype in numbhypo brains, identical to the result obtained by reducing fru function. Suppressor of zeste 12 (Su(z)12) and Chromatin assembly factor 1, p55 subunit (abbreviated as Caf-1) are two of the PRC2 core components. We performed CUT&RUN in control brains to determine whether regions enriched with Su(z)12 and Caf-1 overlap with FruC-bound peaks. We found that FruC-bound cis-regulatory elements in Notch, dpn, and E(spl)mγ display enrichment of Su(z)12 and Caf-1 (Figure 6A). Furthermore, most FruC-bound peaks in genes uniquely transcribed in type II neuroblasts show Su(z)12 and Caf-1 enrichment (Figure 6B). Similarly, most FruC-bound peaks in genes transcribed throughout the type II neuroblast lineage also shows Su(z)12 and Caf-1 enrichment (Figure 6C). These data support our model that FruC functions through low levels of H3K27me3 enrichment to finely tune gene transcription in type II neuroblasts. Reducing PRC2 function alone does not lead to supernumerary neuroblast formation but strongly enhances the supernumerary neuroblast phenotype in numbhypo brains, identical to the results obtained by reducing fru function (Figure 6D–G; Figure 4—figure supplement 1A). Thus, reducing PRC2 activity increases activated Notch during asymmetric neuroblast division. These data led us to propose that FruC functions together with PRC2 to finely tune gene expression in mitotic neuroblasts by promoting low-level enrichment of repressive histone marks in cis-regulatory elements.
Figure 6
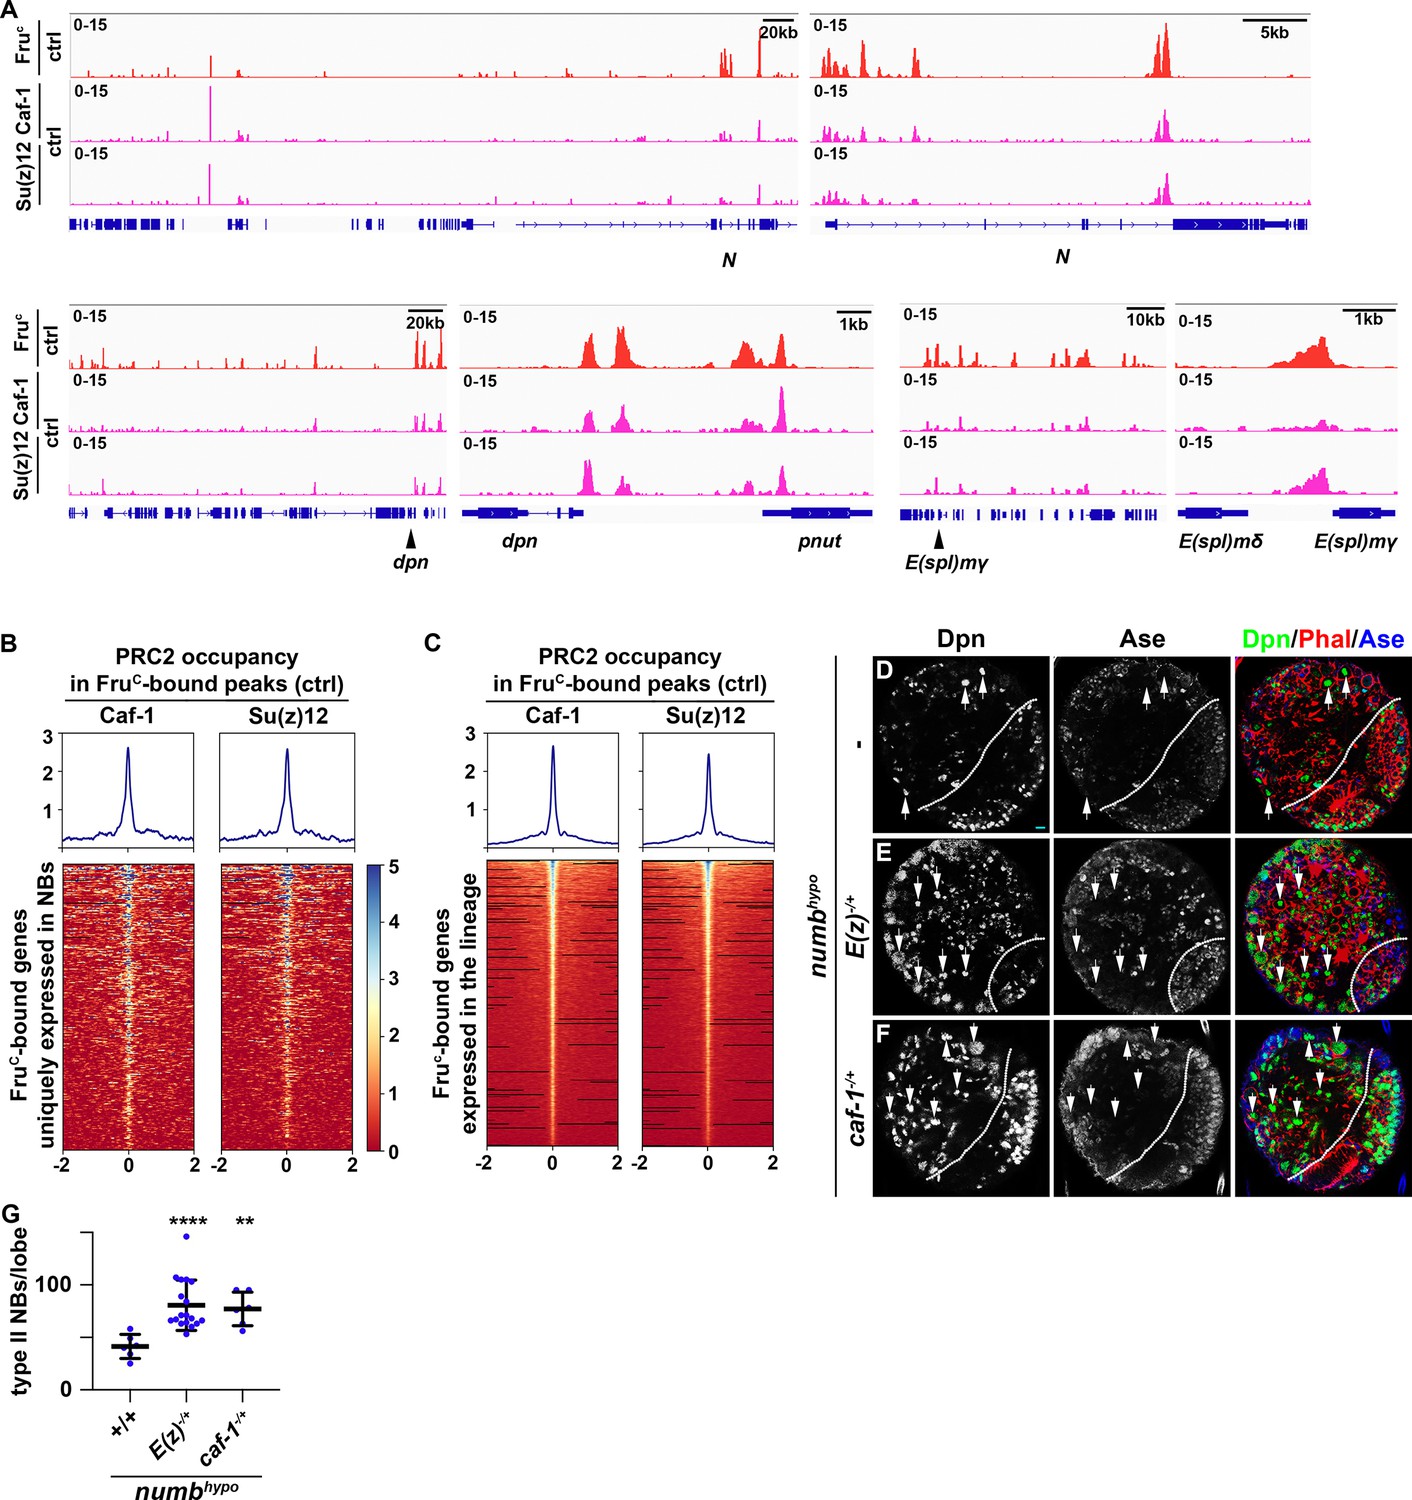
PRC2 subunits bind a high percentage of neuroblast-specific genes.
(A) Representative z score-normalized genome browser tracks showing regions bound by FruC, Su(z)12, and Caf-1 in type II neuroblasts in control (brat11/Df(2L)Exel8040) brains. Left: Zoomed-out images of the loci. Right: Zoomed-in images showing enrichment of PRC2 subunits in FruC-bound regions. (B–C) Heatmaps are centered on Fruc summits with 2 kb flanking regions in genes uniquely transcribed in type II neuroblasts in control brains and ordered by average signal intensity of Caf-1 and Su(z)12. Heatmap intensity is calculated from z score-normalized tracks. (D–F) The heterozygosity of E(z) (E(z)731/+) or Caf-1 (Caf-1short/+) enhances the supernumerary neuroblast phenotype in numbhypo (numbex112/15) brains. (G) Quantification of total type II neuroblasts per brain lobe in numbhypo (numbex112/15) brain alone or heterozygous for E(z) (E(z)731/+) or Caf-1 (Caf-1short/+).Scale bars: 10 μm.
Discussion
Regulation of gene expression requires transcription factors and their associated chromatin-modifying activity, and a lack of insights into relevant transcription factors has precluded mechanistic investigations of gene expression by fine-tuning. By taking advantage of the well-established cell type hierarchy and sensitized genetic backgrounds in the type II neuroblast lineage, we demonstrated FruC fine-tunes gene expression in neuroblasts. By focusing on the Notch signaling pathway in type II neuroblasts, we have been able to define generalizable mechanisms by which FruC finely tunes gene expression levels using loss- and gain-of-function analyses. Our data indicate that FruC likely functions together with PRC2 to dampen the expression of specific genes in mitotic neuroblasts by promoting low levels of H3K27me3 enrichment at their enhancers and promoters (Figure 7). We propose that local low-level enrichment of repressive histone marks can act to fine-tune gene expression.
Figure 7
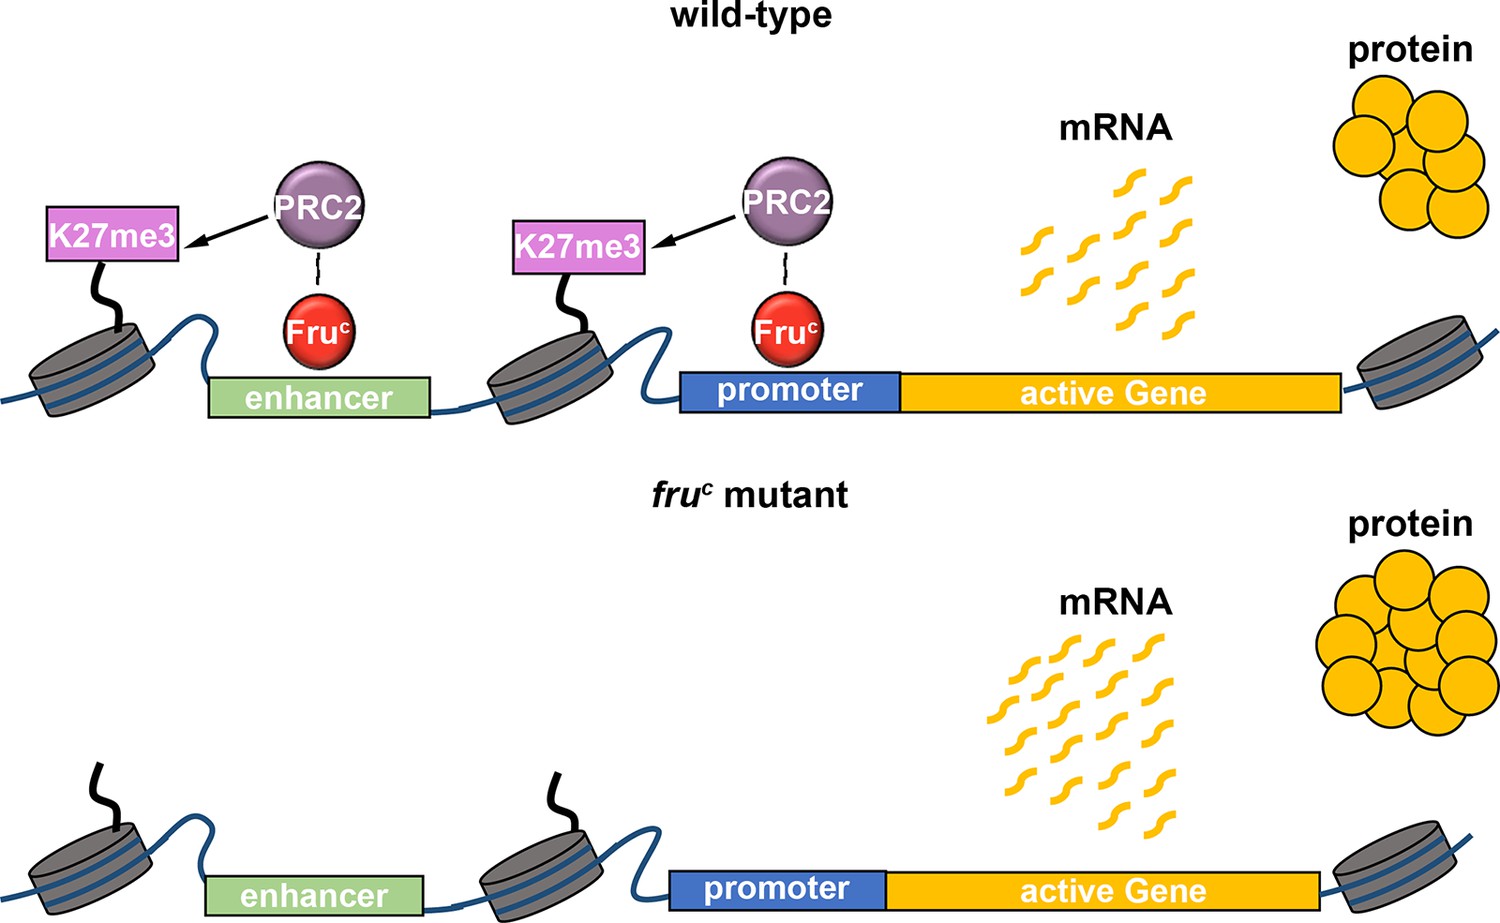
FruC likely functions together with PRC2 to dampen the expression of stemness genes by promoting low levels of H3K27me3 at their cis-regulatory elements.
Loss of fruC functions leads to reduced repressive histone marks and increased stemness gene expression in neuroblasts.
Fru is a multifaceted transcriptional regulator of gene expression
Fru protein isoforms have been detected in many cell types in flies (Ito et al., 1996; Ryner et al., 1996; Djiane et al., 2013; Michki et al., 2021; Zhou et al., 2021; Dillon et al., 2022; Xu et al., 2022). The role of Fru in stem cell differentiation remained undefined. Studies linking Fru isoform-specific DNA-binding across the genome with Fru function have been confounded by multiple issues. These include the co-expression of multiple isoforms with different binding specificities within the same cell types, as well as the heterogeneity and scarcity of cell types which express Fru within the central brain, where male-specific Fru isoforms (FruM) have been most intensely studied (Goodwin and Hobert, 2021). In this study, the identification of FruC as the sole isoform expressed in type II neuroblasts along with the use of brat-null brains, which are highly enrich for these neuroblasts, has enabled the study of FruC genomic binding in a defined cell type where it is known to be expressed. By using gene activity in the Notch pathway as an in vivo functional readout, we have now been able to link genomic and genetic evidence to identify a clear role for FruC in negatively regulating the expression of FruC-target genes during asymmetric neuroblast division (Figures 3 and 4). Our data strongly correlate the downregulation of Notch and Notch downstream-effector gene activity by FruC to PRC2-mediated low-level enrichment of H3K27me3 (Figures 5 and 6). This mechanistic correlation appears to be broadly applicable to genes that promote stemness or prime differentiation in neuroblasts (Figure 3D and E). These data led us to propose a model in which FruC functions together with PRC2 to fine-tune the expression of genes by promoting low-level enrichment of H3K27me3 at their cis-regulatory elements. Transcriptomic analyses have revealed that fru transcripts are enriched in fly renal stem cells in which Notch signaling plays an important role in regulating their stemness (Xu et al., 2022). We speculate that the mechanisms we have described in this study might be applicable to the regulation of gene expression in the renal stem cell lineage. It will also be interesting to investigate whether the male-specific FruMC isoform, having the same DNA-binding specificity, utilizes a similar mechanism to regulate the multitude of developmental programs throughout the brain that contribute to a sexually dimorphic nervous system.
Mechanisms that fine-tune gene transcription
What mechanisms allow transcriptional factors to promote inactivation of gene transcription vs. the fine-tuning of their expression? In the type II neuroblast lineage, transcription factors Erm and Hamlet (Ham) function together with histone deacetylases to sequentially inactivate type II neuroblast functionality genes including tll and pointed during INP commitment (Weng et al., 2010; Zhu et al., 2011; Eroglu et al., 2014; Janssens et al., 2014; Koe et al., 2014; Xie et al., 2016; Hakes and Brand, 2020; Rives-Quinto et al., 2020). In erm- or ham-null brains, Notch reactivation ectopically activates type II neuroblast functionality gene expression in INPs, driving their reversion into supernumerary neuroblasts. Importantly, mis-expressing either gene overrides activated Notch activity in neuroblasts, and drives them to prematurely differentiate into neurons. Thus, Erm- and Ham-associated histone deacetylation can robustly counteract activity of the Notch transcriptional activator complex and inactivate Notch downstream-effector gene transcription. In contrast to Erm and Ham, FruC appears to reduce activity of the Notch transcriptional activator complex instead. Loss of fruC function modestly increases Notch activity in mitotic type II neuroblasts leading to moderately higher levels of Notch activity and Notch downstream-effector gene expression in immature INPs (Figure 4A and E). Ectopic Notch activity in immature INPs due to loss of fruC function can be efficiently buffered by the multilayered gene control mechanism and does not perturb the onset of INP commitment (Figure 2F–I). Furthermore, neuroblasts continually overexpressing FruC for 72 hours maintained their identities, despite displaying a reduced cell diameter and expressing markers that are typically diagnostic of Ase+ immature INPs (Figure 2J–L). These results suggest that FruC dampens rather than overrides activated Notch activity and are consistent with the findings that FruC-bound regions displaying little changes in histone acetylation levels between fruC-null and control neuroblasts (Figure 4—figure supplement 1C–D). Thus, transcriptional repressors that inactivate gene transcription render the activity of transcriptional activators ineffective, whereas transcriptional repressors that fine-tune gene expression dampen their activity.
A key follow-up question on a proposed role for FruC in fine-tuning gene expression in neuroblasts is the mechanistic link between this transcriptional repressor and the dampening of gene transcription. A previous study suggested that Fru functions through Heterochromatin protein 1a (Hp1a) to promote gene repression during the specification of sexually dimorphic neurons (Ito et al., 2012). Hp1a catalyzes deposition of the H3K9me3 mark (Eissenberg and Elgin, 2014). FruC-bound genes in neuroblasts display undetectable levels of H3K9me3, and knocking down hp1a function did not enhance the supernumerary neuroblast phenotype in numbhypo brains (data not presented). Thus, it is unlikely that FruC finely tunes gene transcription by promoting H3K9me3 enrichment. A small subset of FruC-bound peaks showed increased enrichment of H3K27ac in neuroblasts in fruC-null brains compared with control brains (Figure 4—figure supplement 1D). However, FruC overexpression mildly reduces activity of the Notch transcriptional activator complex in neuroblasts (Figure 2J–L). Thus, histone deacetylation appears to play a minor role in FruC-mediated fine-tuning of gene expression in neuroblasts. Most peaks that displayed statistically significantly reduced H3K27me3 levels in fruC-null neuroblasts compared with control neuroblasts are bound by FruC (Figure 5E). Many FruC-bound peaks displayed the enrichment of PRC2 subunits, Su(z)12 and Caf-1, and reduced PRC2 function enhanced the supernumerary neuroblast phenotype in numbhypo brains (Figure 6D–G; Figure 5—figure supplement 1A). These results strongly suggest a model in which low-level enrichment of H3K27me3 in cis-regulatory elements of FruC-bound genes fine-tunes their expression in neuroblasts (Figure 7).
PRC2 fine-tunes gene transcription during developmental transitions
A counterintuitive finding from this study is the role for PRC2 and low levels of H3K27me3 enrichment in fine-tuning active gene transcription in type II neuroblasts. PRC2 is thought to be the only complex that deposits the H3K27me3 repressive histone mark and functions to repress gene transcription (Laugesen et al., 2019; Morgan and Shilatifard, 2020; Piunti and Shilatifard, 2021). PRC2 subunits and H3K27me3 are enriched in many active genes in various cell types, including embryonic stem cells and quiescent B cells in mice and human differentiating erythroid cells (Brookes et al., 2012; Frangini et al., 2013; Kaneko et al., 2013; Morey et al., 2013; Xu et al., 2015; Giner-Laguarda and Vidal, 2020; Ochiai et al., 2020). However, the functional significance of their occupancies in active gene loci in vertebrate cells remains unclear due to a lack of sensitized functional readouts and a lack of insight regarding transcription factors for their recruitment. Several similarities exist between these vertebrate cell types and fly type II neuroblasts. First, both vertebrate and fly cells are poised to undergo a cell-state transition. Second, the pattern of PRC2 subunit occupancy in cis-regulatory elements of active vertebrate and fly genes appears as discrete peaks that are also enriched with low levels of H3K27me3. Building on the functional evidence collected in vivo, we propose that FruC functions together with PRC2 to fine-tune the expression of genes that promote stemness or prime differentiation by promoting low-level enrichment of H3K27me3 in their cis-regulatory elements in type II neuroblasts (Figure 7). Thus, PRC2-mediated low-level enrichment of H3K27me3 we have described in this study should be broadly applicable to the fine-tuned gene activity attained by dampening transcription during binary cell fate specification and cell-state transitions in vertebrates.
An important question arising from our proposed model relates to how FruC functions together with PRC2 to dampen gene transcription in neuroblasts. Studies in vertebrates have shown that loss of PRC2 activity mildly increases gene transcription levels, suggesting that PRC2 likely dampens gene transcription (Morey et al., 2013; Pherson et al., 2017). A separate study suggested a possible link between PRC2 and transcriptional bursts (Ochiai et al., 2020). The transcriptional activator complex binding to promoters affects burst sizes, whereas their binding to enhancers control burst frequencies (Larsson et al., 2019). The dwell time of the transcriptional activator complex bound to cis-regulatory elements directly affects the frequency, duration, and amplitude of transcriptional bursts. For example, chromatin immunoprecipitation and live-cell imaging of fly embryos have suggested that the Su(H) occupancy time at cis-regulatory elements of Notch downstream-effector genes increases upon Notch activation (Gomez-Lamarca et al., 2018). Our genomic data indicate that Su(H)-bound regions in Notch and Notch downstream-effector genes that promote stemness in neuroblasts are bound by FruC and are enriched for low levels of H3K27me3 and PRC2 subunits (Figures 3F–G–5A, 6A). These observations suggest that FruC and PRC2 might fine-tune expression of Notch pathway components by modulating transcriptional bursts in these loci. Examining levels of Su(H) enrichment at FruC-bound peaks in Notch pathway component loci in fruC-null neuroblasts relative to control neuroblasts will enable the testing of this model.
Materials and methods
Key resources table
| Reagent type (species) or resource | Designation | Source or reference | Identifiers | Additional information |
|---|---|---|---|---|
| Genetic reagent (D. melanogaster) | P{GawB}numbNP2301 | Kyoto Drosophila Stock Center | 104153 | |
| Genetic reagent (D. melanogaster) | numbex115 | This study | see "Fly genetics and transgenes" in Material and Methods | |
| Genetic reagent (D. melanogaster) | fruA::Myc | von Philipsborn et al., 2014 | ||
| Genetic reagent (D. melanogaster) | fruB::Myc | von Philipsborn et al., 2014 | ||
| Genetic reagent (D. melanogaster) | fruC::Myc | von Philipsborn et al., 2014 | ||
| Genetic reagent (D. melanogaster) | brat11 | Arama et al., 2000 | stock #: 97265 | |
| Genetic reagent (D. melanogaster) | bratDG19310 | Xiao et al., 2012 | ||
| Genetic reagent (D. melanogaster) | Df(2 L)Exel8040 | Bloomington Drosophila Stock Center | stock #: 7847 | |
| Genetic reagent (D. melanogaster) | numb15 | Berdnik et al., 2002 | ||
| Genetic reagent (D. melanogaster) | frusat15 | Ito et al., 1996 | ||
| Genetic reagent (D. melanogaster) | fruAJ96u3 | Song et al., 2002 | ||
| Genetic reagent (D. melanogaster) | fruΔA | Neville et al., 2014 | ||
| Genetic reagent (D. melanogaster) | fruΔB | Neville et al., 2014 | ||
| Genetic reagent (D. melanogaster) | fruΔC | Billeter et al., 2006 | ||
| Genetic reagent (D. melanogaster) | E(z)731 | Anderson et al., 2011 | ||
| Genetic reagent (D. melanogaster) | Caf-1short | Anderson et al., 2011 | ||
| Genetic reagent (D. melanogaster) | UAS-fruC::Myc | This study | see "Fly genetics and transgenes" in Material and Methods | |
| Genetic reagent (D. melanogaster) | UAS-fruC::ERD::Myc | This study | see "Fly genetics and transgenes" in Material and Methods | |
| Genetic reagent (D. melanogaster) | UAS-dcr2; Wor-Gal4, Ase-Gal80; UAS-Stinger::RFP | Reichardt et al., 2018 | ||
| Genetic reagent (D. melanogaster) | P{GawB}elavC155, P{UAS-mCD8::GFP.L}Ptp4ELL4, P{hsFLP}1 | Bloomington Drosophila Stock Center | stock #: 5146 | |
| Genetic reagent (D. melanogaster) | P{GAL4-Act5C(FRT.CD2).P}S | Bloomington Drosophila Stock Center | stock #: 4780 | |
| Genetic reagent (D. melanogaster) | y[1] w[*]; P{ry[+t7.2]=neoFRT}82B P{w[+mC]=tubP-GAL80}LL3 | Bloomington Drosophila Stock Center | stock #: 5135 | |
| Genetic reagent (D. melanogaster) | w[1118]; P{y[+t7.7] w[+mC]=GMR9D11-GAL4}attP2 | Bloomington Drosophila Stock Center | stock #: 40731 | |
| Genetic reagent (D. melanogaster) | UAS-E(spl)mγRNAi | Bloomington Drosophila Stock Center | stock #: 25978 | |
| Antibody | anti-GFP (chicken polyclonal) | Aves Labs | Cat# GFP-1010 RRID:AB_2307313 | IF (1:2000) |
| Antibody | anti-Ase (rabbit polyclonal) | Weng et al., 2010 | IF (1:400) | |
| Antibody | anti-FruCOM (rabbit polyclonal) | Ito et al., 2012 | IF (1:500) CUT-&-RUN (1 μl) | |
| Antibody | anti-Trl (rabbit polyclonal) | Judd et al., 2021 | IF (1:500) CUT-&-RUN (1 μl) | |
| Antibody | anti-cMyc (mouse polyclonal) | Sigma | SKU: M4439 | IF (1:200) |
| Antibody | anti-Su(H) (mouse polyclonal) | Santa Cruz | SKU: 398453 | IF (1:100), |
| Antibody | anti-Pros (mouse monoclonal) | Lee et al., 2006a | IF (1:500) | |
| Antibody | anti-dpn (rat monoclonal, ascite) | Weng et al., 2010 | IF (1:1000) | |
| Antibody | anti-Mira (rat monoclonal) | Lee et al., 2006a | IF (1:100) | |
| Antibody | anti-cMyc (goat polyclonal) | Abcam | Cat#: ab9132 | CUT-&-RUN (1 μl) |
| Antibody | anti-Caf-1 (rabbit polyclonal) | Tyler et al., 1996 | CUT-&-RUN (1 μl) | |
| Antibody | anti-Su(z)12 (rabbit polyclonal) | Loubière et al., 2016 | CUT-&-RUN (1 μl) | |
| Antibody | anti-IgG (rabbit polyclonal) | EpiCypher | CUT-&-RUN (1 μl) | |
| Antibody | anti-H3K9me3 (rabbit polyclonal) | Abcam | Cat#: ab8898 | CUT-&-RUN (1 μl) |
| Antibody | anti-H3K4me3 (rabbit polyclonal) | Active Motif | Cat#: 39159 | CUT-&-RUN (1 μl) |
| Antibody | anti-H3K27me3 (rabbit polyclonal) | Sigma Aldrich | Cat#: 07–449 | CUT-&-RUN (1 μl) |
| Antibody | anti-H3K27ac (rabbit polyclonal) | Active Motif | Cat#: 39136 | CUT-&-RUN (1 μl) |
| Chemical compound | Rhodamine Phalloidin | Invitrogen | Cat#: R415 | IF (1:100) |
| Chemical compound | Alexa Fluor Plus 405 Phalloidin | Invitrogen | Cat#: A30104 | |
| Chemical compound | DRAQ5 | Abcam | Cat#: ab108410 | |
| Chemical compound | Papain | Millipore Sigma | Cat#: P4762-25MG | |
| Chemical compound | Collagenase type I | Millipore Sigma | Cat#: SCR103 | |
| Chemical compound | E-64 | Millipore Sigma | Cat#: E3132-1MG | |
| Chemical compound | Fetal Bovine Serum | Millipore Sigma | Cat#: F0926-50ML | |
| Chemical compound | Schneider’s Media | Millipore Sigma | Cat#: S0146-500ML | |
| Chemical compound | ProLong Gold Antifade Mountant | Invitrogen | Cat#: P36930 | |
| Chemical compound | ProLong Gold Antifade Mountant with DNA Stain DAPI | Invitrogen | Cat#: P36935 | |
| Chemical compound | Agencourt AMPure XP - 5 mL | Beckman Coulter | Cat#: A63880 | |
| Chemical compound | Sodium butyrate | Sigma Aldrich | Cat#: B5887 | |
| Commercial assay or kit | 10x chromium v3 single-cell gene expression kit | 10x Genomics | Cat# 1000154 | |
| Commercial assay or kit | B1-labeled HCR RNA-FISH intron probe (Notch) | Molecular Instruments, Inc | dm6, chrX: 3159233–3163479 | |
| Commercial assay or kit | B1-labeled HCR RNA-FISH intron probe (dpn) | Molecular Instruments, Inc | dm6, chr2R: 8230502–8231599 & 8231694–8231923 | |
| Commercial assay or kit | B1-labeled HCR RNA-FISH intron probe (klu) | Molecular Instruments, Inc | dm6, chr3L: 10985072–10996227 | |
| Commercial assay or kit | B1-labeled HCR RNA-FISH intron probe (CycE) | Molecular Instruments, Inc | dm6, chr2L: 15731785–15737628 | |
| Commercial assay or kit | HCR RNA-FISH amplifiers | Molecular Instruments, Inc | ||
| Commercial assay or kit | CUTANA ChIC/CUT&RUN Kit | Epicypher | SKU: 14–1048 | |
| Commercial assay or kit | NEBNext Ultra II DNA Library Prep Kit for Illumina | New England Biolabs | Cat#: E7645L | |
| Commercial assay or kit | NEBNext Multiplex Oligos for Illumina (96 Unique Dual Index Primer Pairs) | New England Biolabs | Cat#: E6440L | |
| Software, algorithm | Script Files | This Study | GITHUB | |
| Software, algorithm | Cell Ranger (6.0.1) | 10x Genomics | RRID:SCR_017344 | |
| Software, algorithm | Fiji/ImageJ | Schindelin et al., 2012 | RRID:SCR_002285 https://fiji.sc/ | |
| Software, algorithm | scanpy scRNA-seq analysis software | Wolf et al., 2018 | RRID:SCR_018139 | |
| Software, algorithm | Harmony | Korsunsky et al., 2019 | ||
| Software, algorithm | Bioinfokit | Renesh Bedre, 2020, March 5 | ||
| Software, algorithm | Matplotlib | https://zenodo.org/badge/ https://doi.org/10.5281/zenodo.592536.svg | RRID:SCR_008624 | |
| Software, algorithm | Seaborn | https://doi.org/10.21105/joss.03021 | RRID:SCR_018132 | |
| Software, algorithm | FastQC | Wingett and Andrews, 2018 | RRID:SCR_014583 | |
| Software, algorithm | cutadapt | Martin, 2011 | RRID: SCR_011841 | |
| Software, algorithm | Samtools | Li et al., 2009 | RRID: SCR_002105 | |
| Software, algorithm | MACS2 | Zhang et al., 2008 | RRID: SCR_013291 | |
| Software, algorithm | CUT-RUNTools-2.0 | Yu et al., 2021 | ||
| Software, algorithm | bedtools | Quinlan and Hall, 2010 | RRID: SCR_008848 | |
| Software, algorithm | HOMER | Heinz et al., 2010 | RRID: SCR_010881 | |
| Software, algorithm | deeptools | Ramírez et al., 2016 | RRID: SCR_016366 | |
| Software, algorithm | Integrative Genomics Viewer | Robinson et al., 2011 | RRID: SCR_011793 | |
| Software, algorithm | GoPeaks | Yashar et al., 2022 | ||
| Software, algorithm | SICER | Zang et al., 2009 | RRID:SCR_010843 | |
| Software, algorithm | featureCounts | Liao et al., 2014 | RRID: SCR_012919 | |
| Software, algorithm | EdgeR | Robinson et al., 2010 | RRID: SCR_012802 | |
| Software, algorithm | diffReps | Shen et al., 2013 | RRID:SCR_010873 | |
| Software, algorithm | iCisTarget | Imrichová et al., 2015 | ||
| Software, algorithm | XSTREME | Grant and Bailey, 2021 | RRID:SCR_001783 | |
| Software, algorithm | LAS AF | Leica Microsystems | RRID:SCR_013673 |
Fly genetics and transgenes
Request a detailed protocolFly crosses were carried out in 6-oz plastic bottles at 25 °C, and eggs were collected in apple caps in 8 hr intervals (4 hr for scRNA-seq). Newly hatched larvae were genotyped by presence or absence of the balancer chromosome CyO,Act-GFP and/or TM6B,Tb and cultured on caps containing cornmeal Drosophila culturing media for 96 hr. For GAL4 based overexpression or knock down experiments, larvae were shifted to 33 °C after eclosion to induce transgene expression via suppression of tub-Gal80ts.
Larvae for MARCM analyses (Lee and Luo, 2001) were genotyped after eclosion and allowed to grow at 25 °C for 24 hr. Corn meal caps containing larvae were then placed in a 37 °C water bath for 90 min to induce clones. Heat-shocked larvae were allowed to recover and grow at 25 °C for 72 hr prior to dissection.
For CUT&RUN experiments, fly crosses were carried out in 30oz fly condos, and eggs were collected on 10 mm apple caps in 12 hr intervals. Newly hatched larvae were genotyped and cultured on corn meal caps for ~5–6 days.
The following transgenic lines were generated in this study: UAS-fruC::Myc and UAS-ERD::fruCzf::Myc. The DNA fragments were cloned into p{UAST}attB. The transgenic fly lines were generated via φC31 integrase-mediated transgenesis (Bischof and Basler, 2008). numbEX112 alleles were generated by imprecise excision of P{GawB}numbNP2301, which was inserted at a P-element juxtaposed to the transcription start site of the numb gene. The excised regions were determined by PCR followed by sequencing.
Immunofluorescent staining and antibodies
Request a detailed protocolLarvae brains were dissected in phosphate buffered saline (PBS) and fixed in 100 mM PIPES (pH 6.9), 1 mM EGTA, 0.3% Triton X-100 and 1 mM MgSO4 containing 4% formaldehyde for 23 min. Fixed brain samples were washed with PBST containing PBS and 0.3% Triton X-100. After removing fixation solution, samples were incubated with primary antibodies for 3 hrs at room temperature. After 3 hr, samples were washed with PBST and then incubated with secondary antibodies overnight at 4 °C. The next day, samples were washed with PBST and equilibrated in ProLong Gold antifade mount (Thermo Fisher Scientific). Antibodies used in this study include chicken anti-GFP (1:2000; Aves Labs, SKU 1020), rabbit anti-Ase (1:400) (Weng et al., 2010), rabbit anti-FruCOM (1:500; D. Yamamoto), rabbit anti-Trl (1:500; J.T. Lis), mouse anti-cMyc (1:200; Sigma, SKU: M4439), mouse anti-Su(H) (1:100; Santa Cruz, SKU: 398453), mouse anti-Pros (1:500) (Lee et al., 2006c), rat anti-Dpn (1:1000) (Weng et al., 2010), and rat anti-Mira (1:100) (Lee et al., 2006c). Secondary antibodies were from Jackson ImmunoResearch Inc and Thermo Fisher Scientific. We used rhodamine phalloidin or Alexa Fluor Plus 405 phallloidin (ThermoFisher Scientific) to visualize cortical actin. Confocal images were acquired on a Leica SP5 scanning confocal microscope (Leica Microsystems Inc) using a 63 x glycerol immersion objective, as z-stacks with 1.51 µm thickness. Images were taken at 1.5 x zoom for whole lobe, or 3/5 x zoom for single neuroblasts/single clonal lineages.
Hybridization chain reaction (HCR) and immunofluorescent staining
Request a detailed protocolmRNA signals in the larval brain were developed by performing in situ HCR v3.087. We modified the protocol of in situ HCR v3.0 to combine immunofluorescent staining of the larval brain. Third instar larval brains were dissected in PBS and fixed in 100 mM PIPES (pH 6.9), 1 mM EGTA, 0.3% Triton X-100 and 1 mM MgSO4 containing 4% formaldehyde for 23 min. Fixed brain samples were washed with PBST containing PBS and 0.3% Triton X-100. After removing fix solution, samples were pre-hybridized with hybridization buffer (10% formamide, 5×SSC, 0.3% Triton X-100 and 10% dextran sulfate) at 37 °C for 1 hr. Prehybridized samples were mixed with 5 nM Sp-1 mRNA HCR probe (Molecular Instruments, Los Angeles, CA) and incubated at 37 °C overnight. After hybridization, samples were washed with washing buffer (10% formamide, 5×SSC, 0.3% Triton X-100) and then incubated with amplification buffer (5×SSC, 0.3% Triton X-100 and 10% dextran sulfate) at 25 °C for 30 min. During washing period, imager hairpins (Molecular Instruments, Los Angeles, CA) were denatured at 95 °C for 2 mins. Once samples were equilibrated in amplification buffer, samples were mixed with 3 µM of denatured imager hairpins and incubated at 25 °C for overnight. The next day, samples were washed with PBST and then re fixed in 100 mM PIPES (pH = 6.9), 1 mM EGTA, 0.3% Triton X-100 and 1 mM MgSO4 containing 4% formaldehyde for 15 min to initiate immunofluorescent staining procedures.
Quantification and statistical analyses
Request a detailed protocolAll biological replicates were independently collected and processed. The observers were blind to the genotypes. All brain samples, except those damaged during processing, will be included in data analyses. Only one brain lobe per brain was imaged to ensure measurement biological variability. Cell types were counted by the imager taker based on the presence of expected markers and cell size (NB:>7 µm diameter; type II NB: Dpn+,Ase-; GMC: Pros+,Ase+) for cells that were outside of the optic lobe region (identified by morphology). All statistical analyses were performed using a two-tailed Student’s t-test, and p-values <0.05, <0.005, <0.0005, and <0.00005 are indicated by (*), (**), (***) and (****), respectively in figures. GraphPad Prism was used to generate dot-plots.
For newborn immature INP identification, Dpn protein was used to identify the type II neuroblast and Mira was used to identify the newly born immature INP nucleus. Pixel intensities of the proteins of interest were measured in the nucleus of the type II neuroblast and corresponding newly born immature INP using ImageJ software. The relative pixel intensity of the protein of interest in the immature INP was taken in relation to the pixel intensity in the type II neuroblast. All biological replicates were independently collected and processed.
For smFISH data quantification, brain lobes were stained for DAPI using ProLong Gold antifade mount with DAPI (ThermoFisher Scientific). The top 8 most dorsal neuroblasts were selected from individual brain lobes from distinct brains by cell size and morphology. Fluroescent smFISH foci which overlapped with the nuclear DAPI stain were counted if they were larger than 3 µm in diameter in the z-axis direction (persist for more than 2 slices).
scRNA-seq of the type II neuroblast lineage
Request a detailed protocolUAS-dcr2; Wor-gal4, Ase-gal80; UAS-RFP::stinger larval brains (n=50) were dissected 96 hr after larval hatching in ice cold Rinaldini’s solution during a 45 min interval. Dissected brains were transferred to Eppendorf tubes containing 30 µL of Rinaldini’s solution. A total of 10 µL of 20 mg/mL papain, 10 µL of 20 mg/mL type-1 collagenase, and 1 µL of 15 µM ZnCl was added to the tube. Additional Rinaldini’s solution was added to adjust the final volume to be 100 µL. The tube was mixed gently by flicking, and them incubated on a heat block at 37 °C for 1 hr, while covered with aluminum foil. During this incubation, the tube was flicked for mixing every 10 min.
After the 1 hr incubation, 5 µL of 100 µM E-64 was added to stop the papain digestion. Samples were incubated on ice for 2 min, and then centrifuged for 3 min at 500 g. Supernatant was carefully removed, and chemical dissociated brains were resuspended in 100 µL Schneider’s media with 10% fetal bovine serum (FBS). Mechanical dissociation was performed by setting a P100 pipette to 70 µL and titrating 30 times at a frequency of ~1 Hz. After titration, cells were diluted with 400 µL Schneider’s media with 10% FBS, bringing the total volume to 500 µL. A total of 1 µL of DRAQ5 DNA stain (Thermo Fisher Scientific) was added to label cells apart from debris.
A Sony MA900 FACS machine was used to select for RFP+, DRAQ5 + cells. Cells were sorted into a 1.5 mL Eppendorf tube prefilled with 100 µL of Schneider’s media with 10% FBS. Approximately 30,000 RFP+, DRAQ5 events were sorted. Cells were transported on ice to the University of Michigan’s Advanced Genomics Core and were loaded for 10x Chromium V3 sequencing following the manufacturer’s instructions.
The mRNA was subsequently reverse-transcribed, amplified, and sequenced on an IlluminaNovaSeq-6000 chip (University of Michigan Advanced Genomics Core). Then, 151 bp paired-end sequencing was performed, with a target of 100,000 reads/cell.
Data analysis for scRNA-seq
Request a detailed protocolReads were mapped using Cell Ranger (6.0.1) to the Drosophila genome assembly provided by ENSEMBL, build BDGP6.32, with DsRed (Genbank: AY490568) added to the genome.
Downstream scRNA-seq analyses was performed using SCANPY (Wolf et al., 2018). Count matrices were concatenated between our dataset and previously published previously published scRNA-seq data generated from INPs and downstream progeny of the type II lineage (Michki et al., 2021). The top 2,000 highly variable genes were identified, and then principal component analysis was performed using these highly variable genes with 50 components. The dataset was then harmonized using Harmony (Korsunsky et al., 2019), and completed in four iterations. Neighborhood identification was computed with k=20, and then UMAP (Becht et al., 2018) was performed using a spectral embedding of the graph. Finally, clusters were identified using the Leiden algorithm (Traag et al., 2019), with a resolution of 1. Cell-type annotation was performed by further clustering of clusters 1 and 14, and labeling was performed based on known marker genes.
Pseudotime analysis was performed by calculating the diffusion pseudotime (Haghverdi et al., 2016) trajectory implementation in SCANPY, using an initial root cell selected as dpn+, pnt+, DsRed+ and visually based on UMAP (ID: ‘CATTCTAAGCAACTTC-1-0’).
Differential expression analysis for genes between neuroblasts and immature INPs was completed by separating cluster 14 using Leiden with a resolution of 0.3. SCANPY’s rank_gene_groups was used with method=‘t-test-overestim_var’ to determine log-fold changes and adjusted p-values of expressed genes. Differentially expressed genes were defined as having |Fold Change|>2 and adjusted -value <0.05, and invariant genes were defined as having |Fold Change|<2. Bioinfokit (Renesh Bedre, 2020, March 5) was used to generate the volcano plot figure.
CUT&RUN on neuroblast-enriched brains
Request a detailed protocolbrat11/Df; fruC::Myc (control) or brat11/Df; fruΔC/Aj96u3 (fruΔC/-) larval brains were dissected in 45 min time windows in PBS and transferred to 0.5 mL Eppendorf tubes. Dissected brains were then collected at the bottom of the tube, and supernatant was removed. CUTANA ChIC/CUT&RUN (Epicypher) was performed per the manufacturer’s protocol, with modifications. Brains were resuspended in 100 µL wash buffer, and then homogenized by ~30–50 passes of a Dounce homogenizer. Homogenized samples were transferred to a 1.5 mL Eppendorf tube, and then the cells were pelleted by centrifugation (600 g for 3 min). Next, then pellets were processed using the CUT&RUN kit. A total of 0.5 ng of antibody was used per sample, (or 0.5 µL if antibody concentration was unknown). A total of 0.5 ng of Escherichia coli spike-in DNA was added into each sample as a spike-in control.
For control brains, antibodies used were goat anti-cMyc (Abcam, ab9132), mouse anti-Su(H), rabbit anti-Trl, rabbit anti-Caf-1 (Gift from J. Kadonaga, Tyler et al., 1996), rabbit anti-Su(z)12 (Gift from G. Cavalli, Loubière et al., 2016), rabbit anti-IgG (Epicypher), and rabbit anti-H3K9me3 (Abcam, ab8898). For both control and fru-/- brains, antibodies used were rabbit anti-H3K4me3 (Active Motif: 39159), rabbit anti-H3K27me3 (Sigma Aldrich, 07–449), and rabbit anti-H3K27ac (Active Motif: 39136). A total of 50 brains were collected for transcription factor samples and 25 brains were collected for histone mark samples. All samples were performed in duplicate. Samples targeting acetylation had 100 mM of sodium butyrate (Sigma Aldrich) added to all buffers. Samples using mouse antibodies underwent an additional antibody incubation step, where samples were washed 2 x with cell permeabilization buffer after primary antibody incubation, and then were incubated for 1 hr with 0.5 ng of rabbit anti-mouse IgG (Abcam, ab46540).
Fragmented DNA was diluted to 50 µL in 0.1 x TE and library prepped using the NEBNext Ultra II DNA Library Prep Kit for Illumina (E7645) with NEBNext Multiplex Oligos for Illumina (E6440) per the manufacturer’s protocol with modifications. The adaptor was diluted 1:25, and bead clean-up steps were performed using 1.1 x AMPure Beads without size selection. The PCR cycle was modified to match specifications provided by the CUTANA ChIC/CUT&RUN kit. DNA was eluted in 20 µL 0.1 x TE.
DNA samples were assessed for concentration and quality on an Agilent TapeStation. Samples with greater than 1% adaptor underwent an additional round of bead cleanup. Samples that passed quality control were sequenced on an IlluminaNovaSeq-6000 chip (University of Michigan Advanced Genomics Core). Then, 151 bp paired end sequencing was performed, with a target of at least 10,000,000 reads per replicate.
CUT&RUN data analysis
Request a detailed protocolRead quality was checked using FastQC (Wingett and Andrews, 2018). Reads were trimmed using cutadapt (Martin, 2011), and aligned to BDGP6.32 using bowtie2 (Langmead and Salzberg, 2012) with the flags –local, --very-sensitive, --no-mixed, --no-discordant -dovetail, and -I 10 -X 1000. Samtools (Li et al., 2009) was used to convert file formats and to mark fragments less than 120 bp.
For transcription factor samples, only reads with a fragment size <120 bp were kept for downstream analysis. Peaks were called individually on each replicate by MACS version 2 (Zhang et al., 2008), using parameters specified in CUT&RUNTools2 (Yu et al., 2021), and then merged using bedtools (Quinlan and Hall, 2010). Downstream analyses were carried out with both Fruc::Myc and FruCOM peak sets and showed similar results. The data shown in heatmaps use the Fruc::Myc peakset. For Fruc peaks, only high confidence peaks (-log10(Q-value) >100) were kept for downstream analysis. MACS2 was similarly used to call peaks on H3K9me3 samples, and high confidence peaks (-log10(Q-value) >100) were merged using bedtools merge -d 3000. We then blacklisted our transcription factor peak sets against H3K9me3 peaks to remove heterochromatin regions from the downstream analysis. High signal and low mappability regions defined by the ENCODE Blacklist (Amemiya et al., 2019) were also removed using bedtools. A random peak set was generated by calling bedtools shuffle on the Fruc::Myc peakset, to generate a background control that covered the same number of regions and same number of bp’s as Fruc::Myc peakset but at new randomly determined genomic loci. An additional random peak set was generated using the same method, but starting with Su(H) peaks.
Peak sets were annotated using HOMER (Heinz et al., 2010), which was used to determine the genomic distribution of the transcription factors and genes associated with each peak. Regulatory regions were defined as peaks in either intronic or intergenic regions. FruC -bound genes were determined as genes that had a Fruc::Myc peak annotated as being associated to that gene. These peaks were also classified as immature INP-enriched, invariant, or neuroblast enriched peaks based on their corresponding gene’s classification from our single-cell data. This same process was repeated for the randomized peak sets.
Bigwig files for transcription factors were generated using deeptools (Ramírez et al., 2016) bamCoverage with flags --ignoreDuplicates --maxFragmentLength 120 --normalizeUsing RPKM. Correlation between Fruc::Myc and FruCOM was calculated using deeptools mutiBigWigSummary with default parameters. Correlation was plotted on log-log axes using deeptools plotCorrelation with the flag --log1p and otherwise default parameters. Bigwig tracks were visualized using the Integrative Genomics Viewer (IGV) (Robinson et al., 2011). For data visualization, z score-normalized bigwigs were generated by subtracting the mean read coverage (counts) from the merged replicate read counts in 10 bp bins across the entire genome and dividing by the standard deviation (Larson et al., 2021). Heatmaps for Fruc::Myc signal at open chromatin regions, Su(H) peaks, and Trl peaks were generated using deeptools. Heatmaps for Su(z)12 and Caf-1 were generated at Fruc peaks which are associated with neuroblast enriched genes and for all Fruc peaks.
TMM (Trimmed Mean of M-Values) normalization was performed on histone mark samples to accurately account for differences in library composition and sequencing depth. First, peaks were called on control samples against IgG using GoPeaks (Yashar et al., 2022). featureCounts (Liao et al., 2014) was then used to count reads from each replicate inside the peaks for each histone mark across control and fru-/- samples. EdgeR (Robinson et al., 2010) calcNormFactors (method = TMM) was called on each histone mark count matrix, and the final normalization factor was calculated as 1,000,000/(normFactor * number of reads in peaks). Bigwig files were generated for individual replicates by using deeptools bamcoverage on aligned bam files with the --scaleFactor equal to the final normalization factor that was calculated. Bigwigs were then merged using deeptools bigWigCompare, and z score bigwig files for histone marks were generated and visualized in IGV. Heatmaps for H3K27me3 between control (brat-/-) and (brat-/-; fruΔC/-) were generated at Fruc peaks which are associated with neuroblast enriched genes and for all Fruc peaks.
Differential enrichment for each histone marks between control (brat-/-) and (brat-/-; fruΔC/-) was performed using diffReps (Shen et al., 2013) with a 500 bp sliding window and otherwise default parameters. Bins which overlapped with Fruc::Myc peaks were marked as Fruc bound. Volcano plots showing -Log10(pval-adj) vs Log2FoldChange were visualized using bioinfokit (Renesh Bedre, 2020).
Bash code was used to generate a bed file which covered the genome in 500 bP bins. These bins were intersected with bedtools to determine bins that were bound or unbound by Fruc::Myc peaks. H3K27me3 bam files from control and fruΔC/- were subset using bash and samtools to contain 10 million fragments each. Reads in Fru bound or unbound bins were then counted using bedtools multicov on the subset bam files. Density plots of reads / bin were visualized in Python using matplotlib and seaborn (https://doi.org/10.21105/joss.03021).
For H3K27me3 control data, canonical Polycomb domains were called using SICER (Zang et al., 2009) with parameters -w 500 f 0 -egf 0.7 g 2000 based on a previous study of Polycomb domains (Brown et al., 2018). Peaks that had a score higher than 500 from SICER, and were larger than 3 k-bp were kept, and merged across peaks within 10 k-bp and between replicates. Bedtools was used to determine Fruc::Myc peaks outside of Polycomb domains. Finalized regions were quantified by counting number of reads from H3K27me3 control brains in respective regions using featureCounts. Afterwards, reads in each region were normalized by region length, and average number of reads was calculated across replicates.
Motif analyses
Request a detailed protocolMotifs were searched for within +/-100 b p of FruCOM for Drosophila position weight matricies (PWMs) using iCisTarget (Imrichová et al., 2015) with default parameters. Analyses were run using all FruCOM peaks, or only FruCOM peaks associated with promoters or regulatory regions, and the top motif was selected for further analysis. The top motif found using all peaks and using regulatory peaks was the same. The normalized enrichment score NES, [AUC-µ]/σ was recorded for the motifs. Motif PWMs were obtained and motif locations in the genome were calculated using HOMER scanMotifGenomeWide with a log odd detection threshold of 8. FruCOM and random peaks were extended by +/-200 bp and the percent of peaks containing motifs was calculated. De novo motif searching was attempted using XSTREME (Grant and Bailey, 2021) and HOMER, but no motifs were confidently identified.
Data availability
Sequencing data have been deposited in GEO under accession codes GSE218257. All quantifications are provided in Supplementary File 1. All analysis code used has been deposited in GitHub (copy archived at Rajan et al., 2023).
-
NCBI Gene Expression OmnibusID GSE218257. Low-level repressive histone marks fine-tune stemness gene transcription in neural stem cells.
-
NCBI Gene Expression OmnibusID GSE153723. The molecular landscape of neural differentiation in the developing Drosophila brain revealed by targeted scRNA-seq and multi-informatic analysis.
-
NCBI Gene Expression OmnibusID GSE150931. Cell-type-specific chromatin occupancy by the pioneer factor Zelda drives key developmental transitions in Drosophila.
References
-
Not(ch) just development: Notch signalling in the adult brainNature Reviews. Neuroscience 12:269–283.https://doi.org/10.1038/nrn3024
-
Dimensionality reduction for visualizing single-cell data using UMAPNature Biotechnology 37:38–44.https://doi.org/10.1038/nbt.4314
-
Notch and stem cellsAdvances in Experimental Medicine and Biology 1066:235–263.https://doi.org/10.1007/978-3-319-89512-3_12
-
Recombinases and their use in gene activation, gene inactivation, and transgenesisMethods in Molecular Biology 420:175–195.https://doi.org/10.1007/978-1-59745-583-1_10
-
Identification of Drosophila type II neuroblast lineages containing transit amplifying ganglion mother cellsDevelopmental Neurobiology 68:1185–1195.https://doi.org/10.1002/dneu.20648
-
Notch after cleavageCurrent Opinion in Cell Biology 51:103–109.https://doi.org/10.1016/j.ceb.2017.12.008
-
COMPASS and SWI/SNF complexes in development and diseaseNature Reviews. Genetics 22:38–58.https://doi.org/10.1038/s41576-020-0278-0
-
GAGA factor: a multifunctional pioneering chromatin proteinCellular and Molecular Life Sciences 78:4125–4141.https://doi.org/10.1007/s00018-021-03776-z
-
Post-transcriptional regulation in hematopoiesis: RNA binding proteins take controlBiochemistry and Cell Biology = Biochimie et Biologie Cellulaire 97:10–20.https://doi.org/10.1139/bcb-2017-0310
-
Dissecting the mechanisms of notch induced hyperplasiaThe EMBO Journal 32:60–71.https://doi.org/10.1038/emboj.2012.326
-
Temporal patterning in the Drosophila CNSAnnual Review of Cell and Developmental Biology 33:219–240.https://doi.org/10.1146/annurev-cellbio-111315-125210
-
HP1A: a structural chromosomal protein regulating transcriptionTrends in Genetics 30:103–110.https://doi.org/10.1016/j.tig.2014.01.002
-
Molecular mechanisms of sexually dimorphic nervous system patterning in flies and wormsAnnual Review of Cell and Developmental Biology 37:519–547.https://doi.org/10.1146/annurev-cellbio-120319-115237
-
Diffusion pseudotime robustly reconstructs lineage branchingNature Methods 13:845–848.https://doi.org/10.1038/nmeth.3971
-
Proliferation control in neural stem and progenitor cellsNature Reviews. Neuroscience 16:647–659.https://doi.org/10.1038/nrn4021
-
i-cisTarget 2015 update: generalized cis-regulatory enrichment analysis in human, mouse and flyNucleic Acids Research 43:W57–W64.https://doi.org/10.1093/nar/gkv395
-
It takes two to tango, a dance between the cells of origin and cancer stem cells in the Drosophila larval brainSeminars in Cell & Developmental Biology 28:63–69.https://doi.org/10.1016/j.semcdb.2014.03.006
-
Prc2 binds active promoters and contacts nascent Rnas in embryonic stem cellsNature Structural & Molecular Biology 20:1258–1264.https://doi.org/10.1038/nsmb.2700
-
Expression dynamics and functions of hes factors in development and diseasesCurrent Topics in Developmental Biology 110:263–283.https://doi.org/10.1016/B978-0-12-405943-6.00007-5
-
Fast gapped-read alignment with bowtie 2Nature Methods 9:357–359.https://doi.org/10.1038/nmeth.1923
-
Mosaic analysis with a repressible cell marker (MARCM) for Drosophila neural developmentTrends in Neurosciences 24:251–254.https://doi.org/10.1016/s0166-2236(00)01791-4
-
The sequence alignment/map format and SAMtoolsBioinformatics 25:2078–2079.https://doi.org/10.1093/bioinformatics/btp352
-
Polycomb repressive complex 1 modifies transcription of active genesScience Advances 3:e1700944.https://doi.org/10.1126/sciadv.1700944
-
The roles of polycomb repressive complexes in mammalian development and cancerNature Reviews. Molecular Cell Biology 22:326–345.https://doi.org/10.1038/s41580-021-00341-1
-
Regulation of neural stem cell competency and commitment during indirect neurogenesisInternational Journal of Molecular Sciences 22:12871.https://doi.org/10.3390/ijms222312871
-
SoftwareRepository of code scripts, version swh:1:rev:26a30c49d149f698b78a24732680e7b2b29b5292Software Heritage.
-
Deeptools2: a next generation web server for deep-sequencing data analysisNucleic Acids Research 44:W160–W165.https://doi.org/10.1093/nar/gkw257
-
Fiji: an open-source platform for biological-image analysisNature Methods 9:676–682.https://doi.org/10.1038/nmeth.2019
-
Vertebrate GAF/Thpok: emerging functions in chromatin architecture and transcriptional regulationCellular and Molecular Life Sciences 75:623–633.https://doi.org/10.1007/s00018-017-2633-7
-
The P55 subunit of Drosophila chromatin assembly factor 1 is homologous to a histone deacetylase-associated proteinMolecular and Cellular Biology 16:6149–6159.https://doi.org/10.1128/MCB.16.11.6149
-
Aurora-A acts as a tumor suppressor and regulates self-renewal of Drosophila neuroblastsGenes & Development 20:3453–3463.https://doi.org/10.1101/gad.1487506
-
Model-based analysis of chip-Seq (MACS)Genome Biology 9:R137.https://doi.org/10.1186/gb-2008-9-9-r137
Article and author information
Author details
Melissa M Harrison

Funding
National Institute of Neurological Disorders and Stroke (R01NS107496)
- Cheng-Yu Lee
National Institute of Neurological Disorders and Stroke (R01NS111647)
- Melissa M Harrison
Wellcome Trust (106189/Z/14/Z)
- Stephen F Goodwin
The funders had no role in study design, data collection and interpretation, or the decision to submit the work for publication. For the purpose of Open Access, the authors have applied a CC BY public copyright license to any Author Accepted Manuscript version arising from this submission.
Acknowledgements
We thank Drs. G Cavalli, J Kadonaga, J Lis, and D Yamamoto for providing us with reagents. We thank the Advance Genomics Core and the Flow Cytometry core for technical assistance. We thank Drs. N Michki and Y Li for technical advice and assistance on the single-cell RNA sequencing experiment. We thank Drs. Chris Q Doe and Derek H Janssen and members of the Lee lab for helpful discussions, and Science Editors Network for editing the manuscript. We thank the Bloomington Drosophila Stock Center, Kyoto Stock Center, and the Vienna Drosophila RNAi Center for fly stocks. We thank BestGene Inc and GenetiVision Corp. for generating the transgenic fly lines. This work is supported by NIH grants R01NS107496 and R01NS111647. SFG and MN are supported by a Wellcome Trust Senior Investigator Award (106189/Z/14/Z) to SFG.
Version history
- Preprint posted: November 18, 2022 (view preprint)
- Received: January 11, 2023
- Accepted: June 11, 2023
- Accepted Manuscript published: June 14, 2023 (version 1)
- Version of Record published: July 13, 2023 (version 2)
Copyright
© 2023, Rajan, Anhezini et al.
This article is distributed under the terms of the Creative Commons Attribution License, which permits unrestricted use and redistribution provided that the original author and source are credited.
Metrics
-
- 1,370
- views
-
- 141
- downloads
-
- 0
- citations
Views, downloads and citations are aggregated across all versions of this paper published by eLife.
Download links
A two-part list of links to download the article, or parts of the article, in various formats.
Downloads (link to download the article as PDF)
Open citations (links to open the citations from this article in various online reference manager services)
Cite this article (links to download the citations from this article in formats compatible with various reference manager tools)
Low-level repressive histone marks fine-tune gene transcription in neural stem cells
eLife 12:e86127.
https://doi.org/10.7554/eLife.86127
Further reading
-
- Developmental Biology
Inhibitory G alpha (GNAI or Gαi) proteins are critical for the polarized morphogenesis of sensory hair cells and for hearing. The extent and nature of their actual contributions remains unclear, however, as previous studies did not investigate all GNAI proteins and included non-physiological approaches. Pertussis toxin can downregulate functionally redundant GNAI1, GNAI2, GNAI3, and GNAO proteins, but may also induce unrelated defects. Here, we directly and systematically determine the role(s) of each individual GNAI protein in mouse auditory hair cells. GNAI2 and GNAI3 are similarly polarized at the hair cell apex with their binding partner G protein signaling modulator 2 (GPSM2), whereas GNAI1 and GNAO are not detected. In Gnai3 mutants, GNAI2 progressively fails to fully occupy the sub-cellular compartments where GNAI3 is missing. In contrast, GNAI3 can fully compensate for the loss of GNAI2 and is essential for hair bundle morphogenesis and auditory function. Simultaneous inactivation of Gnai2 and Gnai3 recapitulates for the first time two distinct types of defects only observed so far with pertussis toxin: (1) a delay or failure of the basal body to migrate off-center in prospective hair cells, and (2) a reversal in the orientation of some hair cell types. We conclude that GNAI proteins are critical for hair cells to break planar symmetry and to orient properly before GNAI2/3 regulate hair bundle morphogenesis with GPSM2.
-
- Computational and Systems Biology
- Developmental Biology
Organisms utilize gene regulatory networks (GRN) to make fate decisions, but the regulatory mechanisms of transcription factors (TF) in GRNs are exceedingly intricate. A longstanding question in this field is how these tangled interactions synergistically contribute to decision-making procedures. To comprehensively understand the role of regulatory logic in cell fate decisions, we constructed a logic-incorporated GRN model and examined its behavior under two distinct driving forces (noise-driven and signal-driven). Under the noise-driven mode, we distilled the relationship among fate bias, regulatory logic, and noise profile. Under the signal-driven mode, we bridged regulatory logic and progression-accuracy trade-off, and uncovered distinctive trajectories of reprogramming influenced by logic motifs. In differentiation, we characterized a special logic-dependent priming stage by the solution landscape. Finally, we applied our findings to decipher three biological instances: hematopoiesis, embryogenesis, and trans-differentiation. Orthogonal to the classical analysis of expression profile, we harnessed noise patterns to construct the GRN corresponding to fate transition. Our work presents a generalizable framework for top-down fate-decision studies and a practical approach to the taxonomy of cell fate decisions.


