Differentiated glioma cell-derived fibromodulin activates integrin-dependent Notch signaling in endothelial cells to promote tumor angiogenesis and growth
- Department of Microbiology and Cell Biology, Indian Institute of Science Bangalore, India
- School of Neurobiology, Biochemistry and Biophysics, The George S. Wise Faculty of Life Sciences, Israel
- Institut de Génomique Fonctionnelle, Université de Montpellier, CNRS, INSERM, France
- Sagol School of Neuroscience, Tel Aviv University, Israel
Figures
Figure 1 with 3 supplements

Quantitative proteomics shows a higher abundance of fibromodulin under the control of TGF-β signaling in the differentiated glioma cell (DGC) secretome.
(A) Volcano plot depicting relative protein abundance in glioma stem-like cell (GSC) (MGG4, MGG6, and MGG8) vs. their corresponding DGC conditioned media (CM). The black dots represent the nonsignificant proteins (p>0.05), while the red (higher abundance in GSC CM) and green (lower abundance in GSC CM) dots represent the significant ones (p<0.05) with a log2 fold change cutoff of >0.58 or <−0.58. (B) Venn diagram showing the relationship between proteins upregulated in DGC CM and annotated extracellular matrix (ECM) proteoglycans. Of the common proteins shown below, fibromodulin (FMOD) exhibits the highest DGC/GSC ratio (indicated by the more intense red color). (C) Label-free quantification (LFQ) of FMOD, expressed as log2 fold change in GSCs vs. DGCs CM. (D) RT-qPCR analysis shows upregulation of FMOD transcript in DGCs (red bars) compared to GSCs (blue bars). (E) Western blotting shows the presence of higher amounts of intracellular FMOD in DGCs compared with corresponding GSCs. (F) Western blotting shows the presence of higher amounts of FMOD in the DGC CM compared to GSC CM (top panel). Equal loading of the proteins assessed by Ponceau Red staining (bottom panel). (G) RT-qPCR analysis shows a reduction of FMOD transcript level in DGCs, but not in GSCs, upon treatment with SB431542 (10 μM), a TGF-β inhibitor. Red bars indicate FMOD expression, and blue bars represent TGM2 (a bonafide TGF-β pathway target gene) expression. (H) Western blotting shows the reduction of FMOD protein level in DGCs, but not in GSCs, upon treatment with SB431542 (10 μM) (intracellular, top, and secreted, bottom). Equal loading of the secreted proteins assessed by Ponceau Red staining. (I) Western blotting shows higher expression of pSAMD2 in DGCs than in GSCs, which is reduced by SB431542 treatment. (J) RT-qPCR shows significantly higher fold enrichment of pSMAD2 in the FMOD promoter, which is inhibited upon SB431542 treatment (10 μM). For panels (C), (D), (G), and (J), n=3, and p-value is calculated by unpaired t-test with Welch’s correction. p-Value <0.05 is considered significant with *, **, and *** representing p-values <0.05, 0.01, and 0.001, respectively.
-
Figure 1—source data 1
Source data used to generate Figure 1A.
- https://cdn.elifesciences.org/articles/78972/elife-78972-fig1-data1-v3.zip
-
Figure 1—source data 2
Source data used to generate Figure 1B.
- https://cdn.elifesciences.org/articles/78972/elife-78972-fig1-data2-v3.zip
-
Figure 1—source data 3
Source data used to generate Figure 1C.
- https://cdn.elifesciences.org/articles/78972/elife-78972-fig1-data3-v3.zip
-
Figure 1—source data 4
Source data used to generate Figure 1D.
- https://cdn.elifesciences.org/articles/78972/elife-78972-fig1-data4-v3.zip
-
Figure 1—source data 5
Source data used to generate Figure 1E, F, H, I.
- https://cdn.elifesciences.org/articles/78972/elife-78972-fig1-data5-v3.zip
-
Figure 1—source data 6
Source data used to generate Figure 1G.
- https://cdn.elifesciences.org/articles/78972/elife-78972-fig1-data6-v3.zip
-
Figure 1—source data 7
Source data used to generate Figure 1J.
- https://cdn.elifesciences.org/articles/78972/elife-78972-fig1-data7-v3.zip
-
Figure 1—source data 8
TGF-β is activated in glioblastoma (GBM) over normal samples in multiple datasets.
The table shows the gene set enrichment analysisGene Set Enrichment Analysis (GSEA) output, indicating significant positive enrichment of multiple TGF-β-related gene sets in GBM over normal in multiple publicly available datasets. Darker to lighter red indicates the highest to lowest normalized enrichment score (NES), while the symbol '%' and green color indicate the significant gene sets p-Value <0.05 is considered significant. NA, not available.
- https://cdn.elifesciences.org/articles/78972/elife-78972-fig1-data8-v3.zip
-
Figure 1—source data 9
Source data used to generate Figure 1—source data 8.
- https://cdn.elifesciences.org/articles/78972/elife-78972-fig1-data9-v3.zip
-
Figure 1—source data 10
Mesenchymal gene expression signature and TGF-β signaling pathway are enriched in differentiated glioma cells (DGCs).
Gene Set Variance Analysis (GSVA) output indicates the molecular subtypes of the glioma stem-like cells (GSCs) and DGCs of MGG4, MGG6, and MGG8 (each in triplicates). The darkest red indicates the highest GSVA value for a subtype indicating the highest enrichment in that particular sample, with decreasing color intensity indicating a lower enrichment of the subtypes. The table also shows the GSVA score for the TGF-β hallmark gene set from MSigDb across the multiple data sets. The darkest red depicts the highest enrichment, and gradual lighter colors indicate gradually decreasing enrichment.
- https://cdn.elifesciences.org/articles/78972/elife-78972-fig1-data10-v3.zip
-
Figure 1—source data 11
Source data used to generate Figure 1—source data 10.
- https://cdn.elifesciences.org/articles/78972/elife-78972-fig1-data11-v3.zip
Figure 1—figure supplement 1

Gene Ontology (GO) analysis of differentially abundant proteins in glioma stem-like cell (GSC) and differentiated glioma cell (DGC) conditioned medium (CM).
(A) Output of GO analysis of proteins exhibiting higher abundance in the GSC CM. (B) Output of GO analysis of proteins exhibiting higher abundance in DGC CM. The enrichment factor (plotted on the X-axis) is calculated by log (q-value). The q-value is a modified Fisher’s exact p-value provided by the UniProt Database for annotation, visualization, and integrated discovery enrichment analysis.
-
Figure 1—figure supplement 1—source data 1
Source data used to generate Figure 1, Figure 1—figure supplement 1A B.
- https://cdn.elifesciences.org/articles/78972/elife-78972-fig1-figsupp1-data1-v3.zip
Figure 1—figure supplement 2
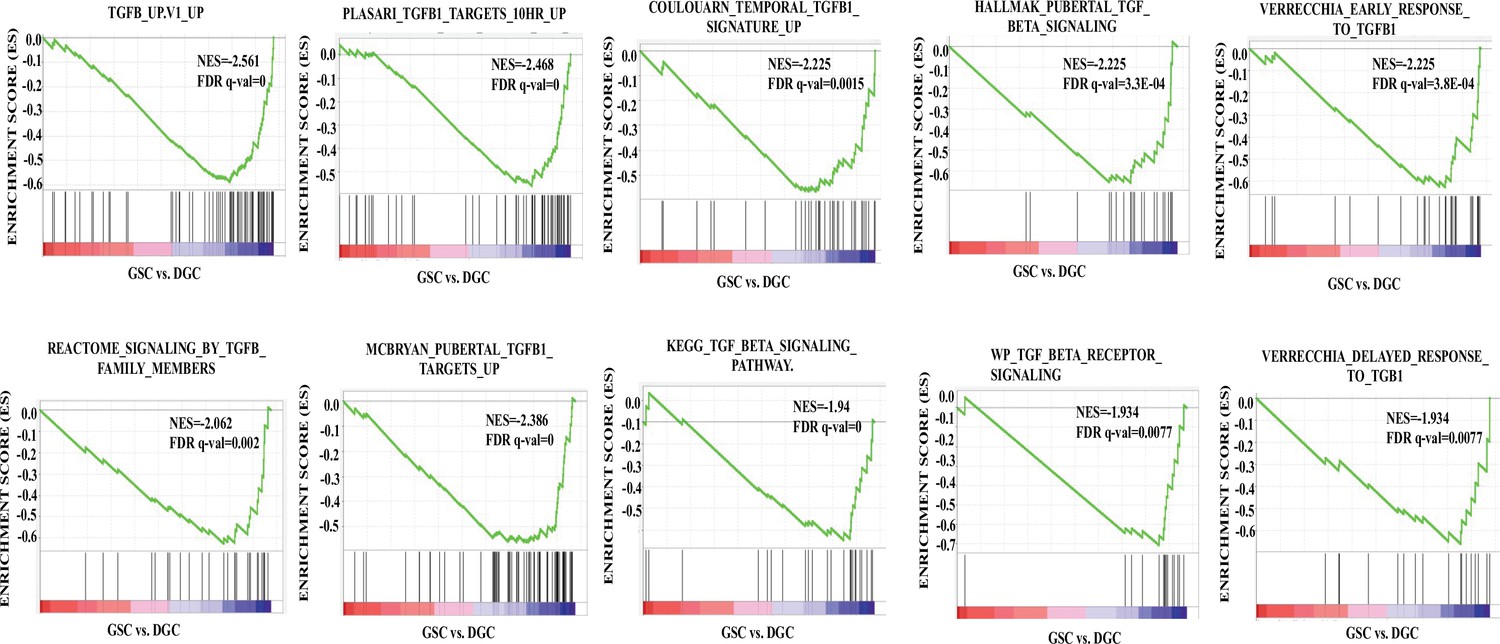
The TGF-β pathway is activated in differentiated glioma cells (DGCs) over glioma stem-like cells (GSCs).
Gene set enrichment analysis (GSEA) output, represented by the enrichment plots, shows a significant negative enrichment of multiple TGF-β-related gene sets in GSCs compared to DGCs, suggesting activated TGF-β signaling in the DGCs. The depicted gene sets have a positive normalized enrichment score (NES) and significant false discovery rate (FDR) q-value, and p-value.
-
Figure 1—figure supplement 2—source data 1
Source data used to generate Figure 1—figure supplement 2.
- https://cdn.elifesciences.org/articles/78972/elife-78972-fig1-figsupp2-data1-v3.zip
Figure 1—figure supplement 3

Fibromodulin (FMOD) expression and TGF-β signaling activation are significantly higher in mesenchymal glioblastoma (GBM) than in other subtypes.
(A) Box plots show significantly higher FMOD transcript levels in mesenchymal GBM samples over the other subtypes in the TCGA Agilent dataset. (B) Box plots show significantly higher enrichment of the TGF-β hallmark gene set from MSigDb in mesenchymal GBM samples over the other subtypes in the TCGA Agilent dataset. **** indicates the ANOVA p-value for (A) and (B). (C) Quantification of normalized relative luciferase units per second (RLU/s) of SBE-Luc transfected in MGG8-DGCs treated with DMSO or SB431542 (10 μM). (D) Quantification of normalized RLU/s of FMOD promoter Luc transfected in MGG8-DGCs treated with DMSO or SB431542 (10 μM). For panels (C) and (D), n=2, and p-values are calculated by unpaired t-test with Welch’s correction are indicated. p-Value <0.05 is considered significant with *, **, and *** representing p-values <0.05, 0.01, and 0.001, respectively.
-
Figure 1—figure supplement 3—source data 1
Source data used to generate Figure 1—figure supplement 3A–D.
- https://cdn.elifesciences.org/articles/78972/elife-78972-fig1-figsupp3-data1-v3.zip
Figure 2 with 7 supplements
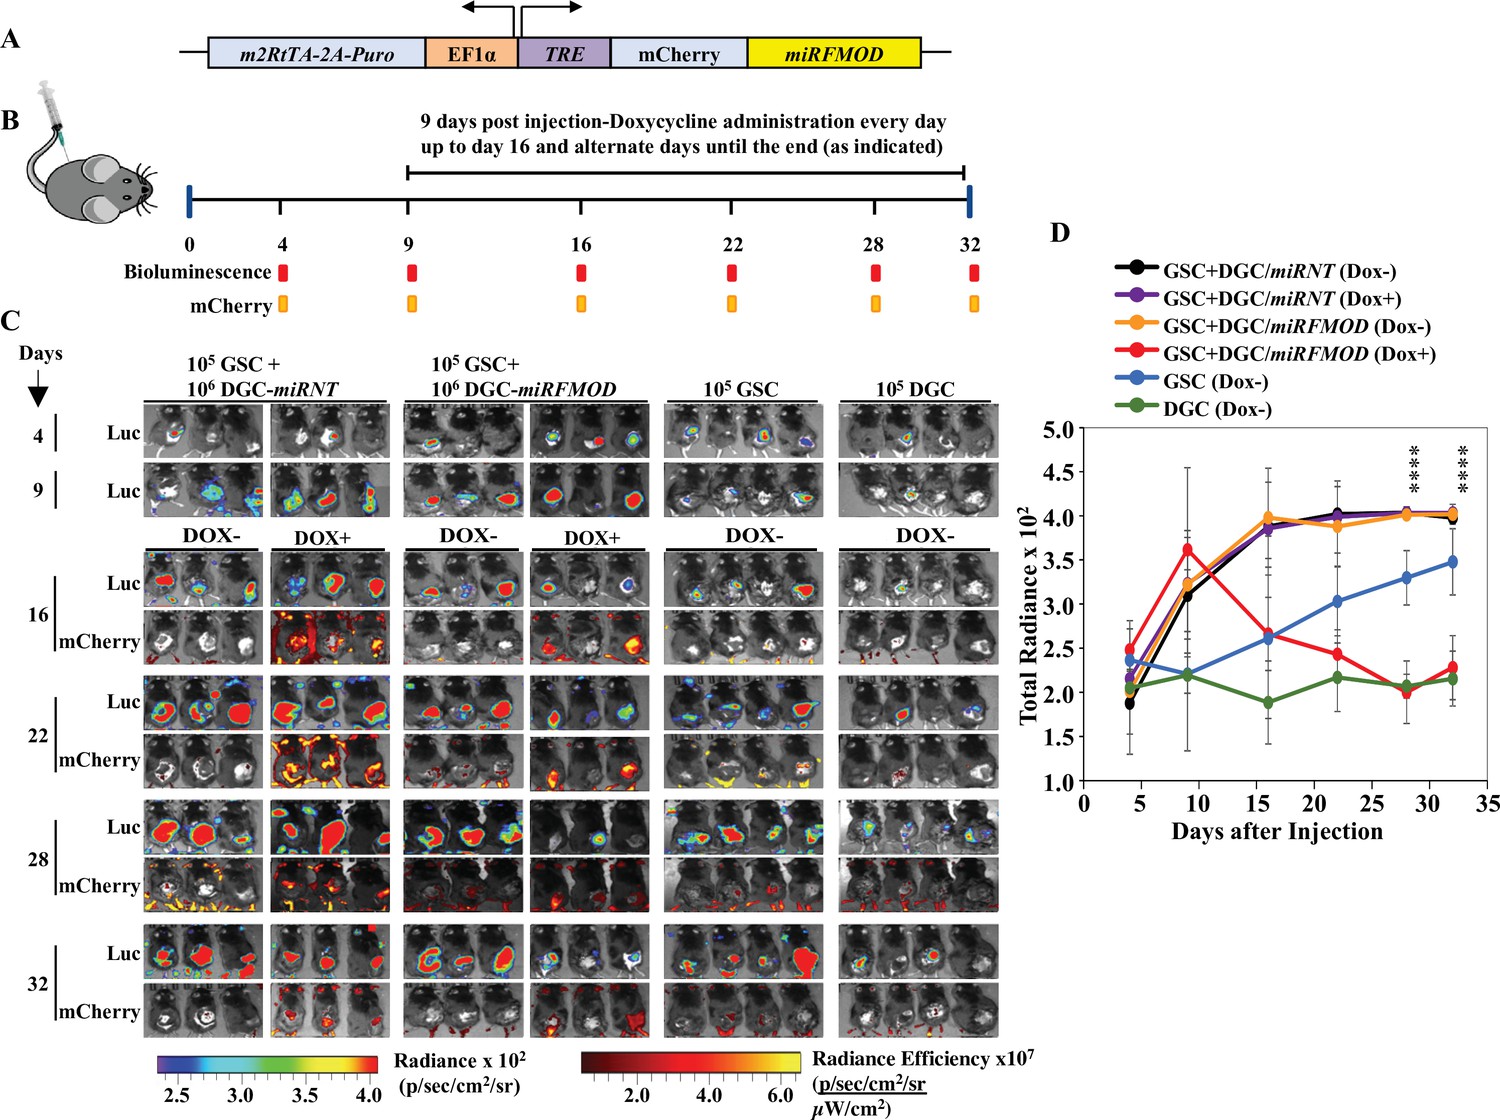
Differentiated glioma cell (DGC)-secreted fibromodulin (FMOD) is essential for tumor growth initiated by glioma stem-like cells (GSCs) in vivo in a co-implantation experiment.
(A) Diagram of the inducible shFMOD lentiviral construct. (B) Schema depicts the GSC-DGC co-implantation experiment in C57BL/6 mice (n = 5 per group). Mice were injected subcutaneously with a combination of DBT-Luc-GSCs and DBT-Luc-DGCs transduced with either miRNT (nontargeting) or miRFMOD lentiviruses. To induce miRNT or miRFMOD (and mCherry), mice received doxycycline (100 µl of 1 mg/ml per animal) as intraperitoneal injections at indicated times. The control groups were only injected with DBT-Luc-GSCs or DBT-Luc-DGCs and did not receive doxycycline. (C) In vivo imaging of the injected mice shows tumor growth over time by bioluminescence and mCherry fluorescence, according to the timeline shown in (B). (D) Quantification of the total radiance. The different colors represent the different groups of animals. Significant differences between each of the groups were calculated using ANOVA. The p-values for days 28 and 32 are shown. A detailed comparison of the p-values between different groups is provided in Supplementary file 2.
-
Figure 2—source data 1
Source data used to generate Figure 2C.
- https://cdn.elifesciences.org/articles/78972/elife-78972-fig2-data1-v3.zip
-
Figure 2—source data 2
Source data used to generate Figure 2D.
- https://cdn.elifesciences.org/articles/78972/elife-78972-fig2-data2-v3.zip
Figure 2—figure supplement 1
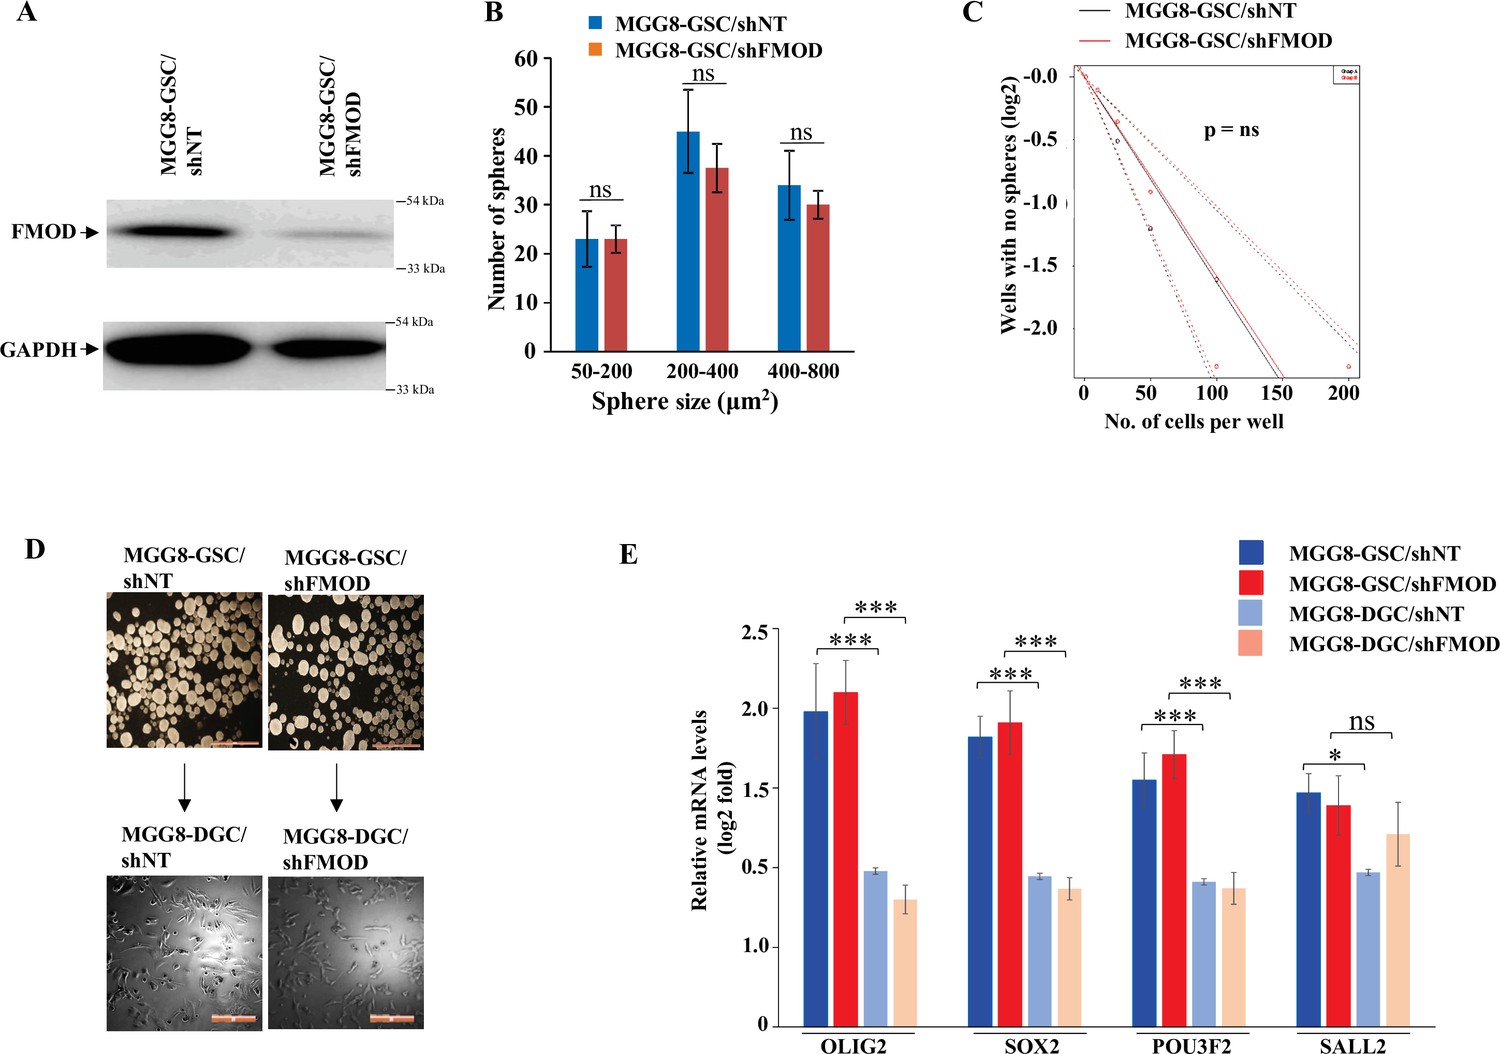
Fibromodulin (FMOD) does not play a role in glioma stem-like cell (GSC) neurosphere formation/maintenance and differentiation in human GSCs.
(A) Western blotting shows FMOD protein levels in MGG8-GSC/shNT and MGG8-GSC/shFMOD cells. (B) Quantification of the number of neurospheres formed by MGG8-GSC/shNT and MGG8/shFMOD cells (spheres are divided into different sizes, 50–200, 200–440, and 400–800 μm2). (C) Limiting dilution assay output shows the neurosphere-forming capacity of MGG8-GSC/shNT (black line) and MGG8-GSC/shFMOD (red line) cells. (D) Representative images of neurospheres formed and differentiated monolayers by MGG8-GSC/shNT and MGG8-GSC/shFMOD cells. Magnification = ×4, scale bar = 200 μm. (E) RT-qPCR analysis shows the transcript levels of the four GSC reprogramming factors, OLIG2, SOX2, POU3F2, and SALL2 in MGG8-GSC/shNT (solid blue), MGG8-GSC/shFMOD (solid red), MGG8-DGC/shNT (striped blue), and MGG8-DGC/shFMOD (striped red) cells. For panels (B) and (E), n=3 and p-value calculated by unpaired t-test with Welch’s correction, are indicated. p-Value <0.05 is considered significant with *, **, and *** representing p-values <0.05, 0.01, and 0.001, respectively. ns, nonsignificance.
-
Figure 2—figure supplement 1—source data 1
Source data used to generate Figure 2—figure supplement 1A–E.
- https://cdn.elifesciences.org/articles/78972/elife-78972-fig2-figsupp1-data1-v3.zip
Figure 2—figure supplement 2

Difference in the level of fibromodulin (FMOD) expression between glioma stem-like cell (GSC) and differentiated glioma cell (DGC) of mouse glioma cell line AGR53 and confirmation of efficient conditional knockdown.
(A) RT-qPCR analysis shows FMOD transcript levels in AGR53-GSCs and AGR53-DGCs. (B) Western blotting shows intracellular FMOD protein levels in AGR53-GSCs and AGR53-DGCs. (C) Western blotting shows secreted FMOD protein levels in AGR53-GSCs and AGR53-DGCs. Ponceau staining is done to ensure equal loading. (D) RT-qPCR shows FMOD transcript levels in AGR53-DGC/miRNT and AGR53-DGC/miRFMOD cells, with or without doxycycline. (E) Western blotting shows FMOD protein levels in AGR53-DGC/miRNT and AGR53-DGC/miRFMOD cells, with or without doxycycline. For panels (A) and (D), n=2,and p-value calculated by unpaired t-test with Welch’s correction, are indicated. p-Value <0.05 is considered significant with *, **, and *** representing p-values <0.05, 0.01, and 0.001, respectively. ns, nonsignificance.
-
Figure 2—figure supplement 2—source data 1
Source data used to generate Figure 2—figure supplement 2A–E.
- https://cdn.elifesciences.org/articles/78972/elife-78972-fig2-figsupp2-data1-v3.zip
Figure 2—figure supplement 3
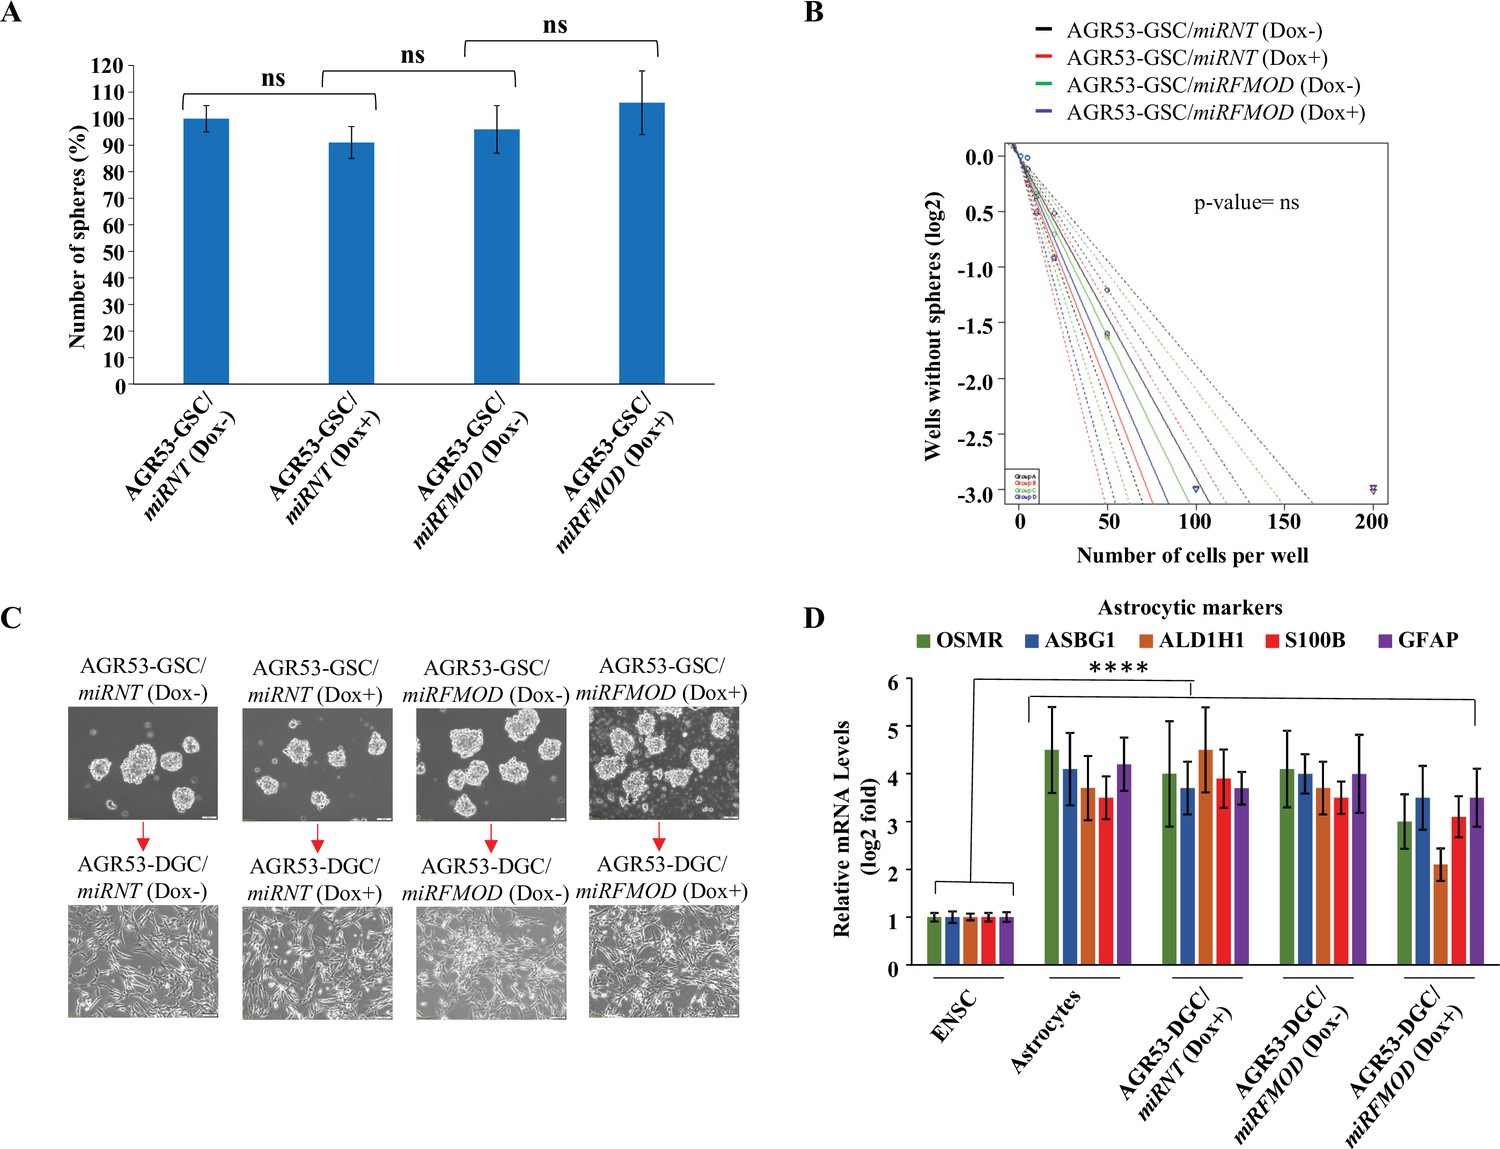
Fibromodulin (FMOD) does not play a role in glioma stem-like cell (GSC) neurosphere formation and differentiation in murine GSCs.
(A) Quantification of the number of neurospheres formed by AGR53-GSC/miRNT and AGR53-GSC/miRFMOD cells with or without doxycycline treatment. (B) Limiting dilution assay output shows the neurosphere-forming capacity of AGR53-GSC/miRNT and AGR53-GSC/miRFMOD cells with or without doxycycline treatment. (C) Representative images of neurospheres formed by AGR53-GSC/miRNT and AGR53-GSC/miRFMOD cells with or without doxycycline treatment. Magnification = ×10, scale bar = 200 μm. (D) RT-qPCR analysis shows astrocytic marker transcript levels in AGR53-GSC/miRNT and AGR53-GSC/miRFMOD cells, with or without doxycycline treatment. Embryonic neuronal stem cells (ENSCs) were used as a negative control, and normal human astrocytes were used as a positive control. For panels (A) and (D), n=3, and p-value calculated by unpaired t-test with Welch’s correction, are indicated. p-Value <0.05 is considered significant with *, **, and *** representing p-values <0.05, 0.01, and 0.001, respectively. ns, nonsignificance.
-
Figure 2—figure supplement 3—source data 1
Source data used to generate Figure 2—figure supplement 3A–D.
- https://cdn.elifesciences.org/articles/78972/elife-78972-fig2-figsupp3-data1-v3.zip
Figure 2—figure supplement 4

Fibromodulin (FMOD) does not play a role in glioma stem-like cell (GSC) differentiation and reprogramming of murine GSCs.
(A) Representative images of neurospheres formed by AGR53-DGC/miRNT and AGR53-DGC/miRFMOD cells with or without doxycycline treatment. Magnification = ×4, scale bar = 100 μm. (B) RT-qPCR analysis shows the transcript levels of stem cell markers in AGR53-DGC/miRNT and AGR53-DGC/miRFMOD cells, with or without doxycycline treatment. Embryonic neuronal stem cells (ENSCs) were used as a positive control, and normal human astrocytes were used as a negative control. For panel (B), n=2, and p-value calculated by unpaired t-test with Welch’s correction, are indicated. p-Value <0.05 is considered significant with *, **, and *** representing p-values <0.05, 0.01, and 0.001, respectively. ns, nonsignificance.
-
Figure 2—figure supplement 4—source data 1
Source data used to generate Figure 2—figure supplement 4A B.
- https://cdn.elifesciences.org/articles/78972/elife-78972-fig2-figsupp4-data1-v3.zip
Figure 2—figure supplement 5
Validation of fibromodulin (FMOD) levels and knockdown in DBT-Luc mouse glioma cell line.
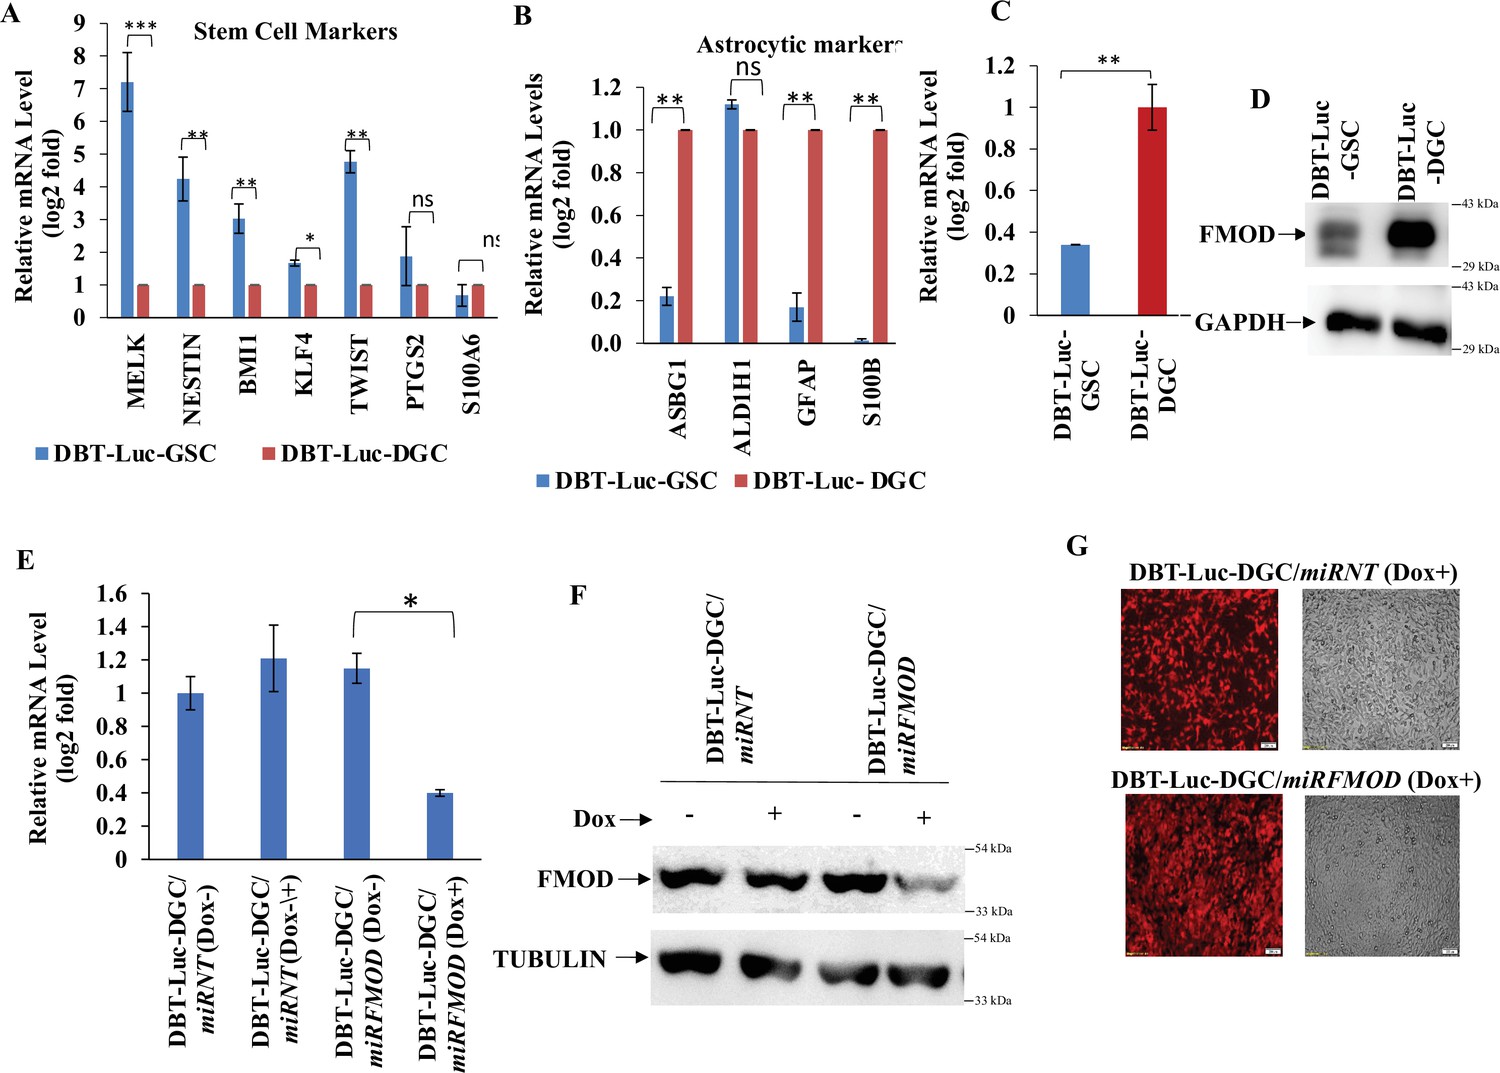
(A) RT-qPCR analysis shows the transcript levels of stem cell markers in DBT-Luc-GSCs and DBT-Luc-DGCs. (B) RT-qPCR analysis shows the transcript levels of astrocytic cell markers in DBT-Luc-GSCs and DBT-Luc-DGCs. (C) RT-qPCR analysis shows FMOD transcript levels in DBT-Luc-GSCs and DBT-Luc-DGCs. (D) Western blotting shows FMOD protein levels in DBT-Luc-GSCs and DBT-Luc-DGCs. (E) RT-qPCR analysis shows FMOD transcript levels in DBT-Luc-DGC/miRNT and DBT-Luc-DGC/miRFMOD cells, with or without doxycycline treatment. (F) Western blotting shows FMOD protein levels in DBT-Luc-DGC/miRNT and DBT-Luc-DGC/miRFMOD cells, with or without doxycycline treatment. (G) Confocal microscopy analysis shows mCherry expression (indicated by red) in DBT-Luc-DGC/miRNT and DBT-Luc-DGC/miRFMOD cells with doxycycline treatment. Magnification = ×4, scale bar = 200 μm. For panels (A), (B), (C), and (E), n=3 and p-value calculated by unpaired t-test with Welch’s correction, are indicated. p-Value <0.05 is considered significant with *, **, and *** representing p-values less than 0.05, 0.01, and 0.001, respectively. ns, nonsignificance.
-
Figure 2—figure supplement 5—source data 1
Source data used to generate Figure 2—figure supplement 5A–G.
- https://cdn.elifesciences.org/articles/78972/elife-78972-fig2-figsupp5-data1-v3.zip
Figure 2—figure supplement 6

Fibromodulin (FMOD) does not have a role in the de-differentiation of differentiated glioma cells (DGCs) to glioma stem-like cells (GSCs).
(A) Western blotting shows FMOD protein levels in U251-DGC/shNT and U251-DGC/shFMOD cells. (B) Representative images and quantification of monolayer cells and neurospheres formed by U251-DGC/shNT and U251-DGC/shFMOD cells. (C) Limiting dilution assay output shows the neurosphere-forming capacity of U251-DGC/shNT (black line) and U251-DGC/shFMOD (red line) cells. (D) RT-qPCR analysis shows the transcript levels of the four GSC reprogramming factors, OLIG2, SOX2, POU3F2, and SALL2, in U251-DGC/shNT (solid blue), U251-DGC/shFMOD (solid red), U251-GSC/shNT (striped blue), and U251-GSC/shFMOD (striped red) cells. For panels (B) and (D), n=3, and p-value calculated by unpaired t-test with Welch’s correction, are indicated. p-Value <0.05 is considered significant with *, **, and *** representing p-values <0.05, 0.01, and 0.001 respectively. ns, nonsignificance.
-
Figure 2—figure supplement 6—source data 1
Source data used to generate Figure 2—figure supplement 6A–D.
- https://cdn.elifesciences.org/articles/78972/elife-78972-fig2-figsupp6-data1-v3.zip
Figure 2—figure supplement 7
Induction with doxycycline reduces fibromodulin (FMOD) level in mice injected with DBT-GSC-Luc+DBT-DGC-Luc/miRFMOD cells.
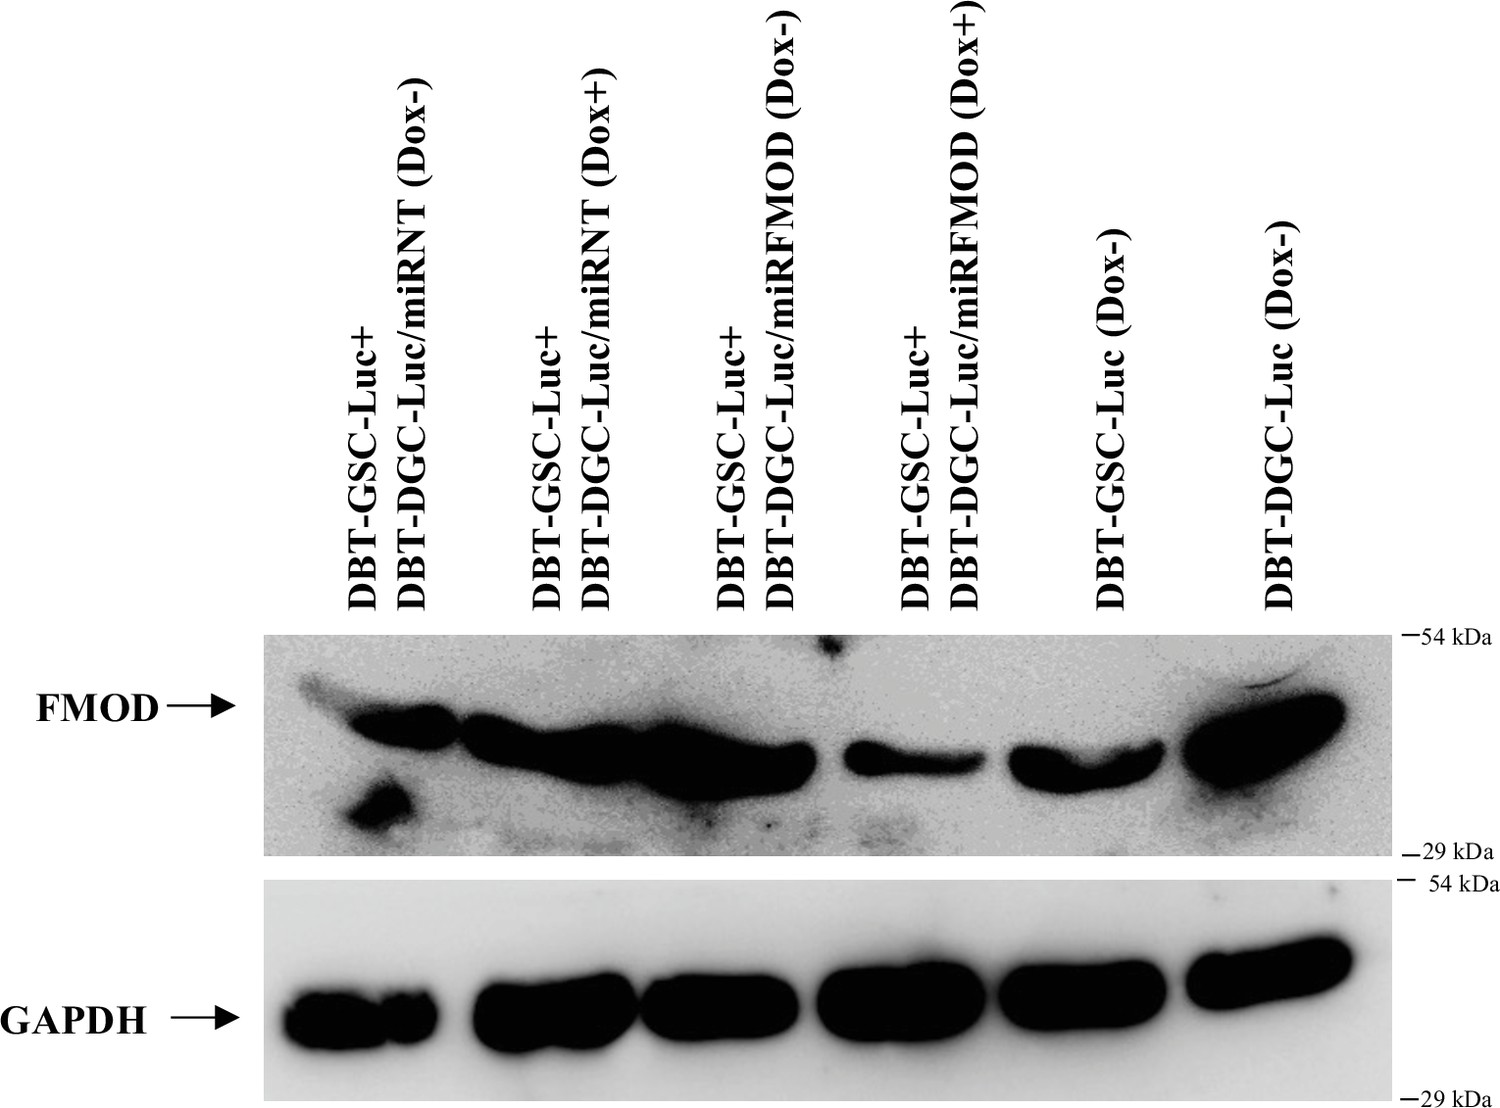
Western blotting shows FMOD protein levels in the subcutaneous tumors formed by DBT-GSC-Luc+DBT-DGC-Luc/miRNT and DBT-GSC-Luc+DBT-DGC-Luc/miRFMOD cells after administering doxycycline at regular intervals to the mice and in tumors formed by DBT-Luc-GSCs and DBT-Luc-DGCs, without doxycycline treatment.
-
Figure 2—figure supplement 7—source data 1
Source data used to generate Figure 2—figure supplement 7.
- https://cdn.elifesciences.org/articles/78972/elife-78972-fig2-figsupp7-data1-v3.zip
Figure 3 with 3 supplements
Differentiated glioma cell (DGC)-secreted fibromodulin (FMOD) promotes angiogenesis of host-derived and tumor-derived endothelial cells.
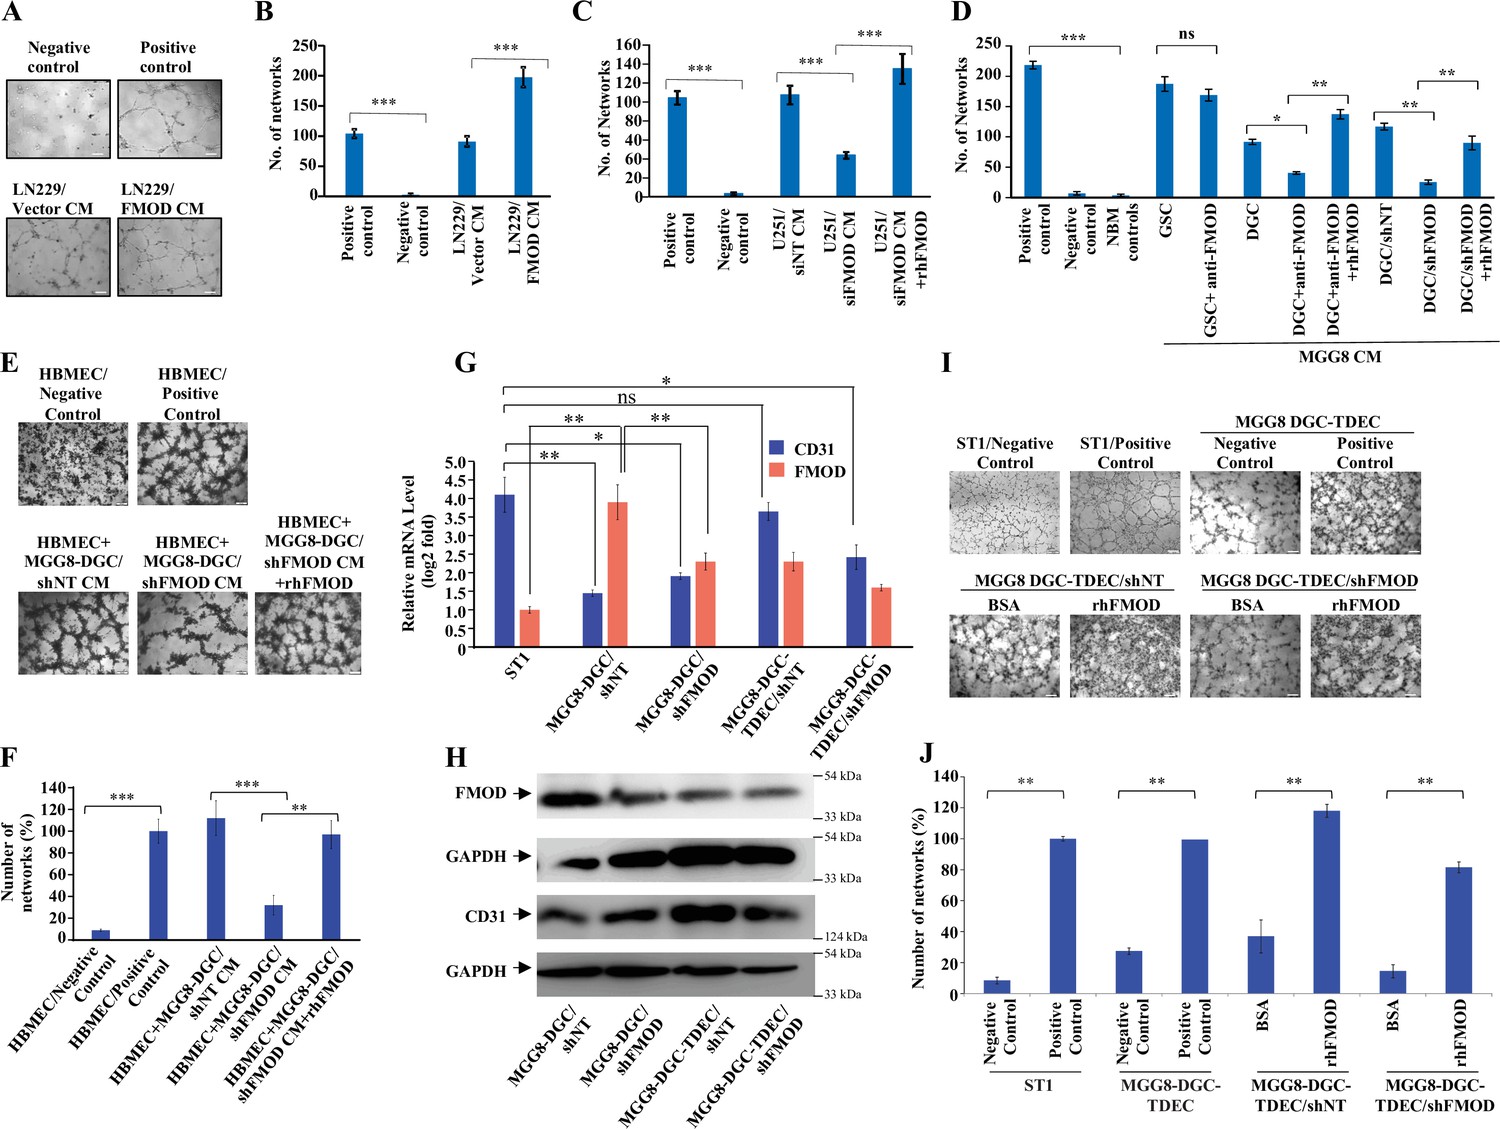
(A) Representative images of in vitro network formation by ST1 cells treated with conditioned medium (CM) of LN229/Vector CM and LN229/FMOD. In the positive control condition (top right), cells are plated in complete endothelial cell media (M199) supplemented with endothelial cell growth factors (ECGS) and 20% fetal bovine serum (FBS), and in the negative control (top left), cells are plated in incomplete M199 (without serum and ECGS). Networks formed by ST1 cells treated with CM of LN229/Vector (left bottom) and LN229/FMOD (right bottom). Magnification = ×10, scale bar = 100 μm. (B) Quantification of the number of complete networks formed in (A). (C) Quantification of the number of networks formed by ST1 cells treated with CM of U251-DGC/siNT, U251-DGC/siFMOD, and U251-DGC/siFMOD + rhFMOD (400 nM) cells. (D) Quantification of the number of networks formed by ST1 cells treated with CM of MGG8-GSC, MGG8-DGC, MGG8-DGC/shNT, and MGG8-DGC/shFMOD supplemented with anti-FMOD or rhFMOD (400 nM) as indicated. (E) Representative images of in vitro network formation by primary human brain-derived microvascular endothelial cells (HBMECs). In the positive control condition (top right), HBMEC cells are plated in complete endothelial cell media (M199) supplemented with ECGS and 20% FBS, and in the negative control (top left), cells are plated in incomplete M199 without serum and ECGS. Networks formed by HBMEC cells treated with CM of MGG8-DGC/shNT, MGG8-DGC/shFMOD, and MGG8-DGC/shFMOD + rhFMOD (400 nM). Magnification = ×4, scale bar = 200 μm. (F) Quantification of the number of complete networks formed in (E). (G) RT-qPCR analysis showing transcript levels of CD31 (blue bars) and FMOD (orange bars) in ST1, MGG8-DGC/shNT, MGG8-DGC/shFMOD, MGG8-DGC-TDEC/shNT, and MGG8-DGC-TDEC/shFMOD cells. (H) Western blotting shows FMOD and CD31 protein levels in MGG8-DGC/shNT, MGG8-DGC/shFMOD, MGG8-DGC-TDEC/shNT, and MGG8-DGC-TDEC/shFMOD cells. (I) Representative images of in vitro network formation by ST1, MGG8-DGC-TDEC/shNT, and MGG8-DGC-TDEC/shFMOD upon bovine serum albumin (BSA) and rhFMOD (400 nM) treatments. Top panels: in the positive control conditions, ST1 or MGG8-DGC-TDEC cells are plated in complete endothelial cell media (M199) supplemented with ECGS and 20% FBS, and in the negative control conditions, ST1 or MGG8-DGC-TDEC cells are plated in incomplete M199 (without serum and ECGS). Bottom panels: networks formed by HBMEC cells treated with CM of MGG8-DGC-TDEC/shNT and MGG8-DGC-TDEC/shFMOD supplemented with either BSA or rhFMOD (400 nM). Magnification = ×4, scale bar = 200 μm. (J) Quantification of the number of complete networks formed in (I). For panels (B–D), (F), (G), and (J), n=3 and p-values were calculated by unpaired t-test with Welch’s correction. p-Value <0.05 was considered significant with *, **, and *** representing p-values <0.05, 0.01, and 0.001, respectively. ns, nonsignificance.
-
Figure 3—source data 1
Source data used to generate Figure 3A.
- https://cdn.elifesciences.org/articles/78972/elife-78972-fig3-data1-v3.zip
-
Figure 3—source data 2
Source data used to generate Figure 3B.
- https://cdn.elifesciences.org/articles/78972/elife-78972-fig3-data2-v3.zip
-
Figure 3—source data 3
Source data used to generate Figure 3C.
- https://cdn.elifesciences.org/articles/78972/elife-78972-fig3-data3-v3.zip
-
Figure 3—source data 4
Source data used to generate Figure 3D.
- https://cdn.elifesciences.org/articles/78972/elife-78972-fig3-data4-v3.zip
-
Figure 3—source data 5
Source data used to generate Figure 3E.
- https://cdn.elifesciences.org/articles/78972/elife-78972-fig3-data5-v3.zip
-
Figure 3—source data 6
Source data used to generate Figure 3F.
- https://cdn.elifesciences.org/articles/78972/elife-78972-fig3-data6-v3.zip
-
Figure 3—source data 7
Source data used to generate Figure 3G.
- https://cdn.elifesciences.org/articles/78972/elife-78972-fig3-data7-v3.zip
-
Figure 3—source data 8
Source data used to generate Figure 3H.
- https://cdn.elifesciences.org/articles/78972/elife-78972-fig3-data8-v3.zip
-
Figure 3—source data 9
Source data used to generate Figure 3.
- https://cdn.elifesciences.org/articles/78972/elife-78972-fig3-data9-v3.zip
-
Figure 3—source data 10
Source data used to generate Figure 3J.
- https://cdn.elifesciences.org/articles/78972/elife-78972-fig3-data10-v3.zip
Figure 3—figure supplement 1

Differentiated glioma cell (DGC)-secreted fibromodulin (FMOD) induces angiogenesis by endothelial cells of various origins.
(A) Representative images of in vitro network formation by ST1 cells treated with conditioned medium (CM) of U251-DGC/siNT, U251-DGC/siFMOD, and U251-DGC/siFMOD + rhFMOD (400 nM) cells. In the positive control condition (top second), cells are plated in complete endothelial cell media (M199) supplemented with endothelial cell growth factors (ECGS) and 20% fetal bovine serum (FBS), and in the negative control (top first), cells are plated in incomplete M199 (without serum and ECGS). Networks formed by ST1 cells treated with CM of U251-DGC/siNT, U251-DGC/siFMOD, and U251-DGC/siFMOD + rhFMOD (400 nM) cells. Magnification = ×10, scale bar = 100 μm. (B) Representative images and quantification of in vitro network formation by ST1 cells treated with CM of U251-DGC/shNT and U251-DGC/siFMOD cells. (C) Representative images and quantification of in vitro network formation by ST1 cells treated with incomplete M199 and bovine serum albumin (BSA), supplemented with anti-FMOD or IgG and incomplete M199 and rhFMOD (400 nM), supplemented with anti-FMOD or IgG. Magnification = ×10, scale bar = 100 μm. (D) Quantification of the number of networks formed by ST1 cells treated with CMs from MGG4, MGG6, and MGG8 GSCs and their corresponding DGCs. (E) Representative images and quantification of in vitro network formation by ST1 cells treated with CM of MGG8-DGC/siNT cells or with that of CM from MGG8-DGC/siFMOD cells, supplemented with either BSA or rhFMOD (400 nM). For panels (B–E), n=3, and p-values were calculated by unpaired t-test with Welch’s correction, are indicated. p-Value <0.05 is considered significant with *, **, and *** representing p-values <0.05, 0.01, and 0.001, respectively.
-
Figure 3—figure supplement 1—source data 1
Source data used to generate Figure 3—figure supplement 1A–E .
- https://cdn.elifesciences.org/articles/78972/elife-78972-fig3-figsupp1-data1-v3.zip
Figure 3—figure supplement 2
Fibromodulin (FMOD) induces migration and invasion, but not the proliferation of endothelial cells.
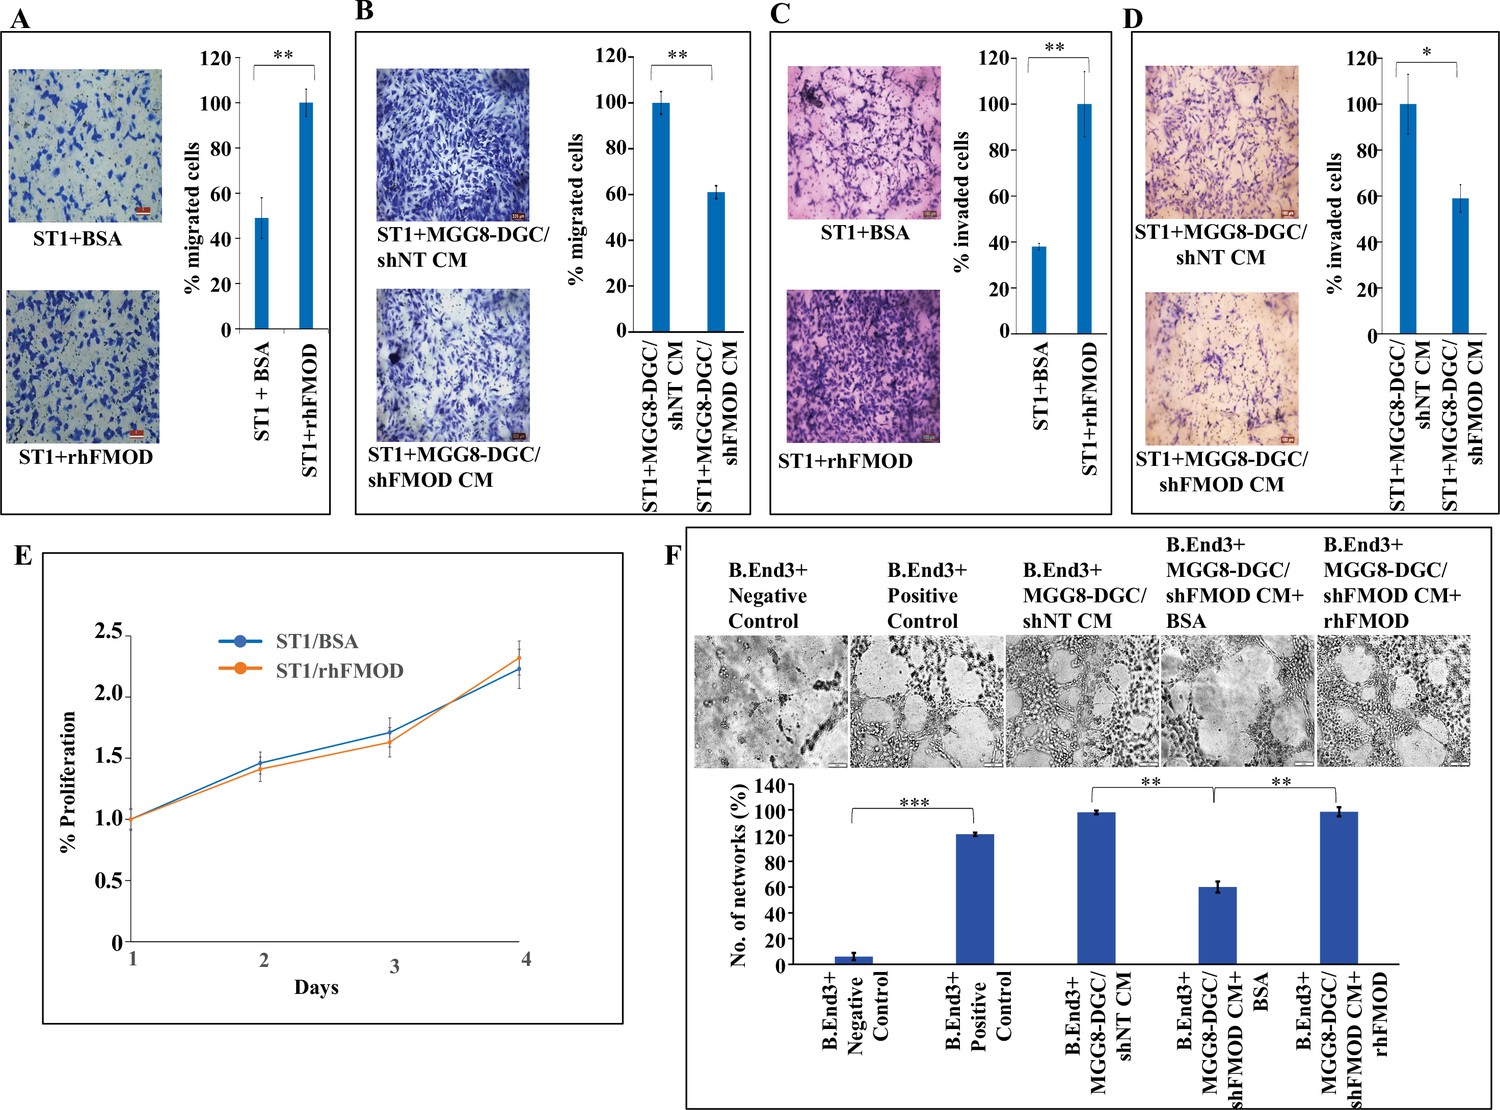
(A) Representative images (left) and quantification (right) from Boyden chamber assay show migration of ST1 cells treated with either rhFMOD (400 nM) or bovine serum albumin (BSA). Magnification = ×10, scale bar = 100 μm. (B) Representative images (left) and quantification (right) from Boyden chamber assay show migration of ST1 cells treated with conditioned medium (CM) from MGG8-DGC/shFMOD cells. Magnification = ×10, scale bar = 100 μm. (C) Representative images (left) and quantification (right) from Boyden chamber assay show invasion of ST1 cells treated with either rhFMOD (400 nM) or BSA. Magnification = ×10, scale bar = 100 μm. (D) Representative images (left) and quantification (right) from Boyden chamber assay show invasion of ST1 cells treated with CM from MGG8-DGC/shFMOD cells. Magnification = ×10, scale bar = 100 μm. (E) MTT cell proliferation assay shows proliferation of ST1 cells treated with either BSA or rhFMOD over a period of 96 hr. (F) Representative images (top) and quantification (bottom) of the number of networks formed by immortalized mouse brain-derived endothelial cells, B.End3, upon treatment with CM from MGG8-DGC/shNT, MGG8-DGC/shFMOD, MGG8-DGC/shFMOD + rhFMOD (400 nM). For all the panels, n=3, and p-values were calculated by unpaired t-test with Welch’s correction, are indicated. p-Value <0.05 is considered significant with *, **, and *** representing p-values <0.05, 0.01, and 0.001, respectively. ns, nonsignificant.
-
Figure 3—figure supplement 2—source data 1
Source data to generate Figure 3—figure supplement 2A–F.
- https://cdn.elifesciences.org/articles/78972/elife-78972-fig3-figsupp2-data1-v3.zip
Figure 3—figure supplement 3

Fibromodulin (FMOD) induces glioblastoma (GBM) cells to undergo transdifferentiation.
(A) RT-qPCR analysis shows the transcript levels of CD31(blue bars) and FMOD (orange bars) in ST1 cells, U87, and U87-TDECs. (B) Western blotting shows FMOD and CD31 protein levels in ST1, U87, and U87-TDECs. (C) Representative images of in vitro network formation by U87 and U87 TDECs upon bovine serum albumin (BSA) and rhFMOD treatments. Magnification = ×10, scale bar = 100 μm. (D) Quantification of the number of networks formed in (C). For panels (A) and (D), n=3,and p-values were calculated by unpaired t-test with Welch’s correction, are indicated. p-Value <0.05 is considered significant with *, **, and *** representing p-values <0.05, 0.01, and 0.001, respectively. ns, nonsignificant.
-
Figure 3—figure supplement 3—source data 1
Source data used to generate Figure 3—figure supplement 3A–D.
- https://cdn.elifesciences.org/articles/78972/elife-78972-fig3-figsupp3-data1-v3.zip
Figure 4 with 7 supplements
Integrin/FAK/Src/JAG1-dependent Notch pathway activation in endothelial cells mediates fibromodulin (FMOD)-induced angiogenesis.
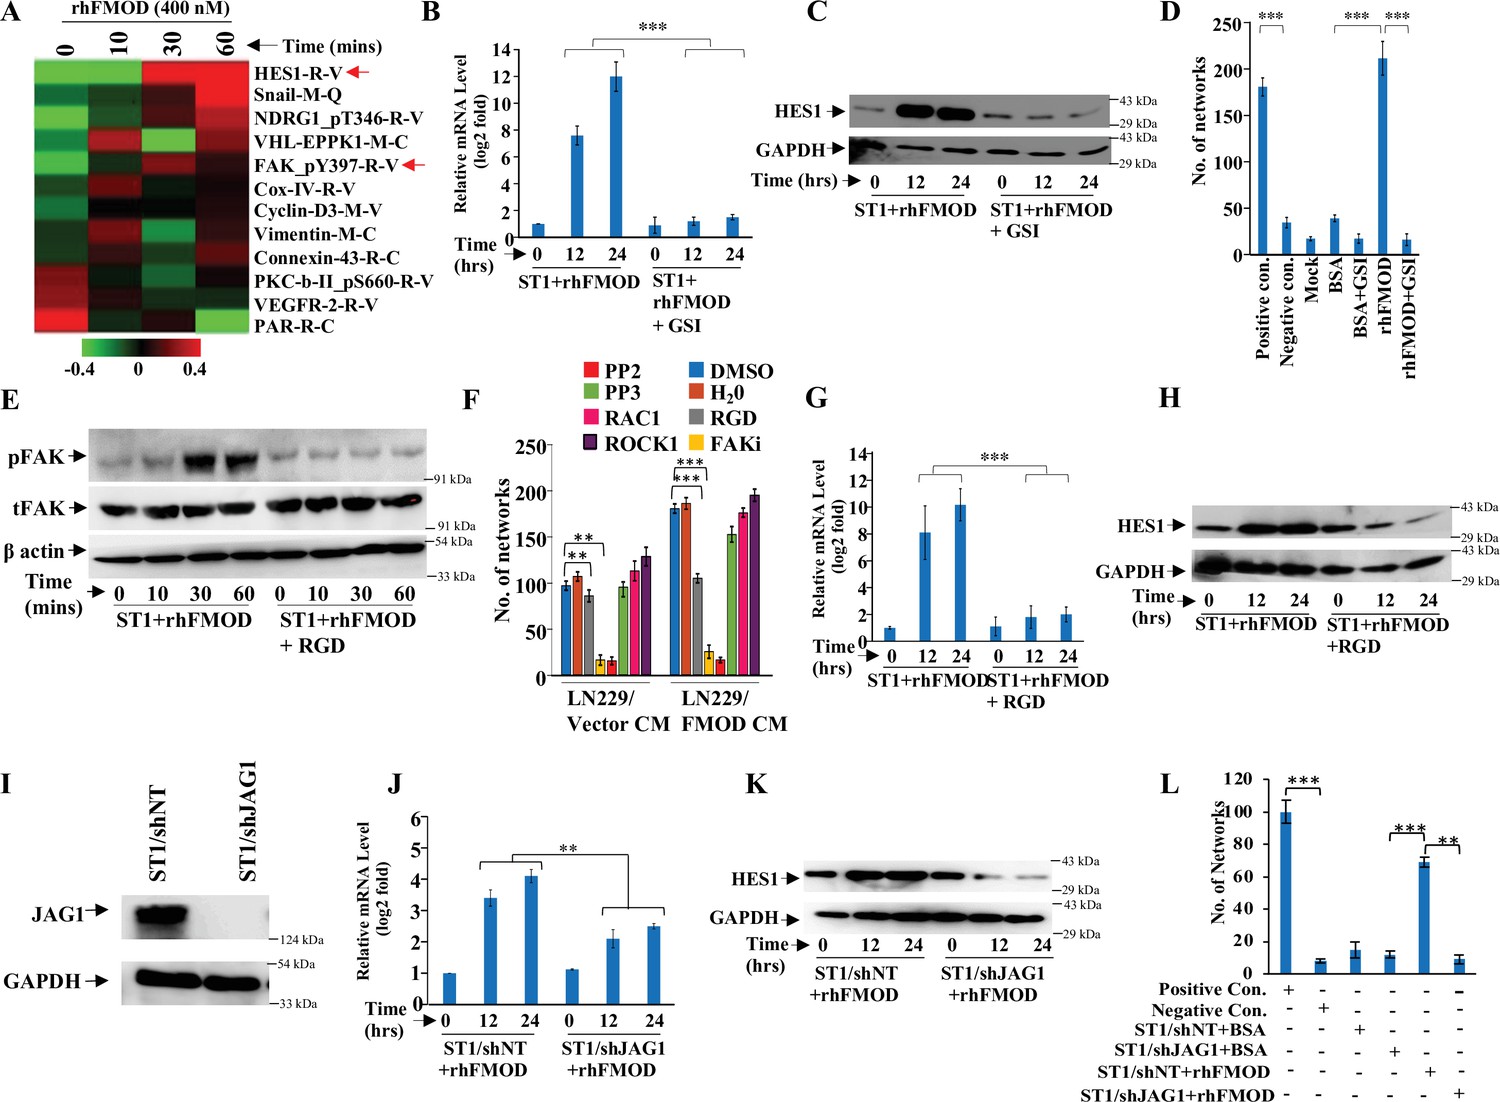
(A) Heatmap showing differentially regulated (log2 fold change >/<0.2) proteins in ST1 cells treated with vehicle or rhFMOD (400 nM) for 10, 30, and 60 min, assessed by reverse phase protein array (RPPA). Red and green depict upregulated and downregulated proteins, respectively. The red arrows indicate HES1 and pFAK proteins. (B) RT-qPCR analysis shows HES1 transcript levels in ST1 cells treated with rhFMOD (400 nM) with or without gamma-secretase inhibitor (GSI; 10 μM). (C) Western blotting shows HES1 protein levels in ST1 cells treated with rhFMOD (400 nM) with or without GSI (10 μM). (D) Quantification of the number of networks formed by ST1 cells treated with rhFMOD (400 nM) with or without GSI (10 μM). (E) Western blotting shows phospho-FAK levels in ST1 cells treated with rhFMOD (400 nM) with or without RGD peptide (10 μM). (F) Quantification of the number of networks formed by ST1 cells pretreated with indicated small-molecule inhibitors (PP2 [10 μM], PP3 [10 μM], and PF573228 [FAK inhibitor; 10 μM], H1152 [ROCK1 inhibitor; 0.5 mM], and Rac1 inhibitor [10 μM]) followed by incubation with conditioned medium (CM) of LN229/Vector or LN229/FMOD cells. (G) RT-qPCR analysis shows HES1 transcript levels in ST1 cells treated with rhFMOD (400 nM) with or without RGD peptide (10 μM). (H) Western blotting shows HES1 protein levels in ST1 cells treated with rhFMOD (400 nM) with or without RGD peptide (10 μM). (I) Western blotting shows JAG1 protein levels in ST1/shNT and ST1/shJAG1 cells. (J) RT-qPCR analysis shows HES1 transcript levels in ST1/shNT and ST1/shJAG1 cells treated with rhFMOD (400 nM). (K) Western blotting shows HES1 protein levels in ST1/shNT and ST1/shJAG1 cells treated with rhFMOD (400 nM). (L) Quantification of the number of networks formed by ST1/shNT and ST1/shJAG1 cells treated with bovine serum albumin (BSA) or rhFMOD (400 nM). For panels (B), (D), (F), (G), (J), and (L), n=3, and the p-values were calculated by unpaired t-test with Welch’s correction are indicated. p-Value <0.05 was considered significant with *, **, and *** representing p-values <0.05, 0.01, and 0.001, respectively.
-
Figure 4—source data 1
Source data used to generate Figure 4A.
- https://cdn.elifesciences.org/articles/78972/elife-78972-fig4-data1-v3.zip
-
Figure 4—source data 2
Source data used to generate Figure 4B.
- https://cdn.elifesciences.org/articles/78972/elife-78972-fig4-data2-v3.zip
-
Figure 4—source data 3
Source data used to generate Figure 4C, E, H, I.
- https://cdn.elifesciences.org/articles/78972/elife-78972-fig4-data3-v3.zip
-
Figure 4—source data 4
Source data used to generate Figure 4D.
- https://cdn.elifesciences.org/articles/78972/elife-78972-fig4-data4-v3.zip
-
Figure 4—source data 5
Source data used to generate Figure 4F.
- https://cdn.elifesciences.org/articles/78972/elife-78972-fig4-data5-v3.zip
-
Figure 4—source data 6
Source data used to generate Figure 4G.
- https://cdn.elifesciences.org/articles/78972/elife-78972-fig4-data6-v3.zip
-
Figure 4—source data 7
Source data used to generate Figure 4J.
- https://cdn.elifesciences.org/articles/78972/elife-78972-fig4-data7-v3.zip
-
Figure 4—source data 8
Source data used to generate Figure 4K.
- https://cdn.elifesciences.org/articles/78972/elife-78972-fig4-data8-v3.zip
-
Figure 4—source data 9
Source data used to generate Figure 4L.
- https://cdn.elifesciences.org/articles/78972/elife-78972-fig4-data9-v3.zip
Figure 4—figure supplement 1
Fibromodulin (FMOD) induces activation of Notch signaling in endothelial cells.
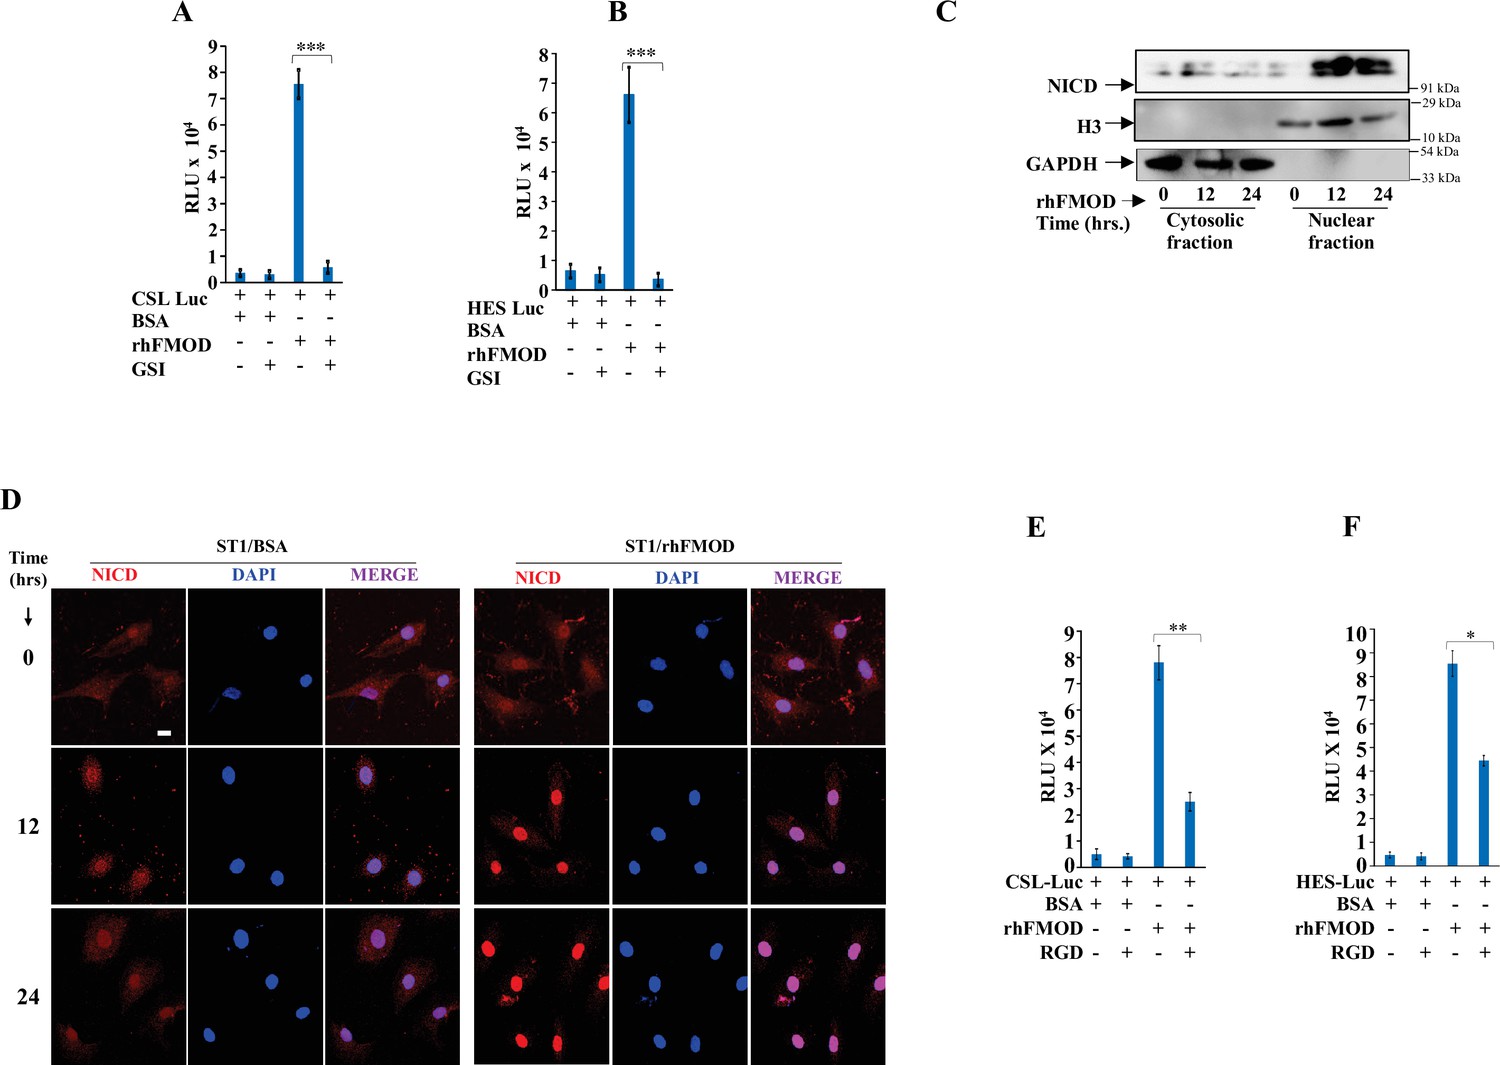
(A) Quantification of normalized relative luciferase units per second (RLU/s) of CSL-Luc (Notch pathway-dependent reporter luciferase construct) and (B) HES-Luc (Notch pathway-dependent reporter [HES1 promoter] luciferase construct), transfected in ST1 cells and then treated with either rhFMOD or bovine serum albumin (BSA), each with or without gamma-secretase inhibitor (GSI) (10 μM). (C) Western blotting shows the protein levels of NICD, H3, and GAPDH (housekeeping) in the membrane and cytosolic fractions of ST1 cells treated with rhFMOD (400 nM). (D) Confocal microscopy analysis shows NICD protein levels in the cytoplasm and nuclei of the ST1 cells treated with either BSA or rhFMOD (400 nM) over days. (E) Quantification of normalized relative luciferase units per second (RLU/s) of CSL-Luc (Notch pathway-dependent reporter luciferase construct) and (B) HES-Luc (Notch pathway-dependent reporter [HES1 promoter] luciferase construct), transfected in ST1 cells, and then treated with either rhFMOD or BSA, each with or without RGD peptide (10 μM). For panels (A), (B), (E), and (F), n=3, and p-values were calculated by unpaired t-test with Welch’s correction, are indicated. p-Value <0.05 is considered significant with *, **, and *** representing p-values <0.05, 0.01, and 0.001, respectively. ns, nonsignificant.
-
Figure 4—figure supplement 1—source data 1
Source data used to generate Figure 4—figure supplement 1A–F.
- https://cdn.elifesciences.org/articles/78972/elife-78972-fig4-figsupp1-data1-v3.zip
Figure 4—figure supplement 2
ST1 cells stably expressing NICD are independent of fibromodulin (FMOD) in forming angiogenic networks.
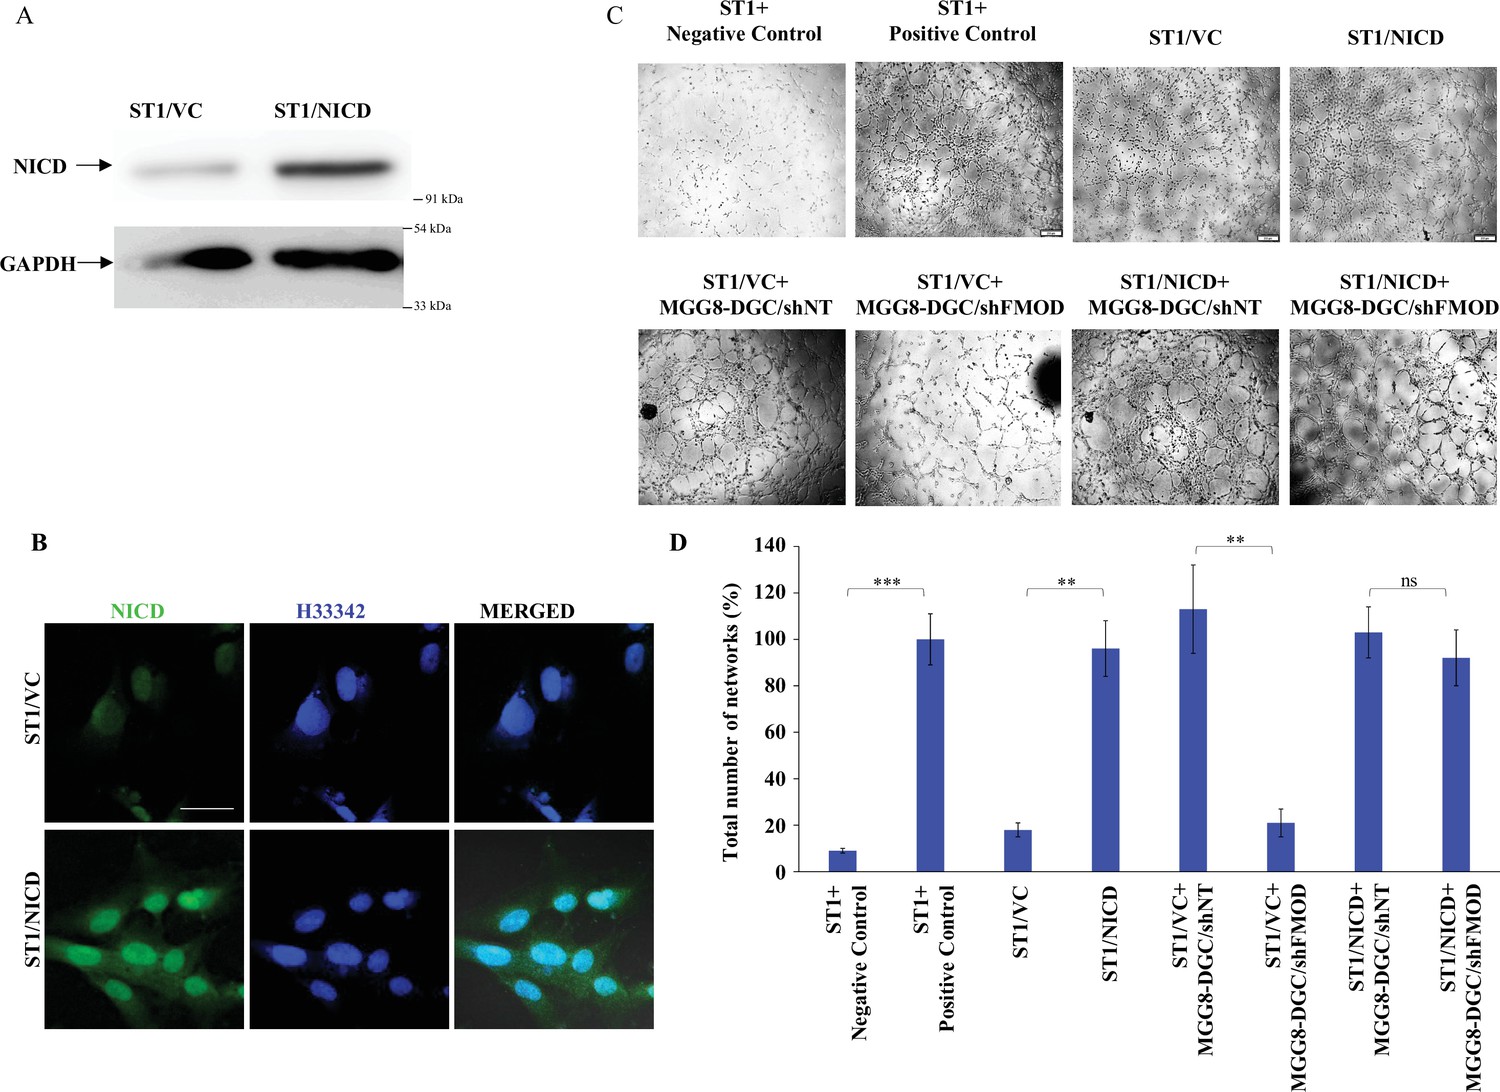
(A) Western blotting shows NICD protein levels in ST1/Vector control and ST1/NICD cells. (B) Confocal microscopy analysis shows the expression of NICD (green) in ST1/Vector control and ST1/NICD. Blue indicates H33342 (stains nuclei). Magnification = ×63, scale bar = 20 μm. (C) Representative images of networks formed by ST1/Vector control and ST1/NICD cells treated with conditioned medium (CM) from MGG8-DGC/shNT and MGG8-DGC/shFMOD cells. In the positive control condition, cells are plated in complete endothelial cell media (M199) supplemented with endothelial cell growth factors (ECGS) and 20% fetal bovine serum (FBS), and in the negative control, cells are plated in incomplete M199 (without serum and ECGS). (D) Quantification of the number of networks formed in (C). For panel (D), n=3, and p-values were calculated by unpaired t-test with Welch’s correction, are indicated. p-Value <0.05 is considered significant with *, **, and *** representing p-values <0.05, 0.01, and 0.001, respectively. ns, nonsignificant.
-
Figure 4—figure supplement 2—source data 1
Source data used to generate Figure 4—figure supplement 2A–D.
- https://cdn.elifesciences.org/articles/78972/elife-78972-fig4-figsupp2-data1-v3.zip
Figure 4—figure supplement 3
Fibromodulin (FMOD)–type I collagen interaction is crucial for FMOD-mediated activation of downstream signaling pathways.
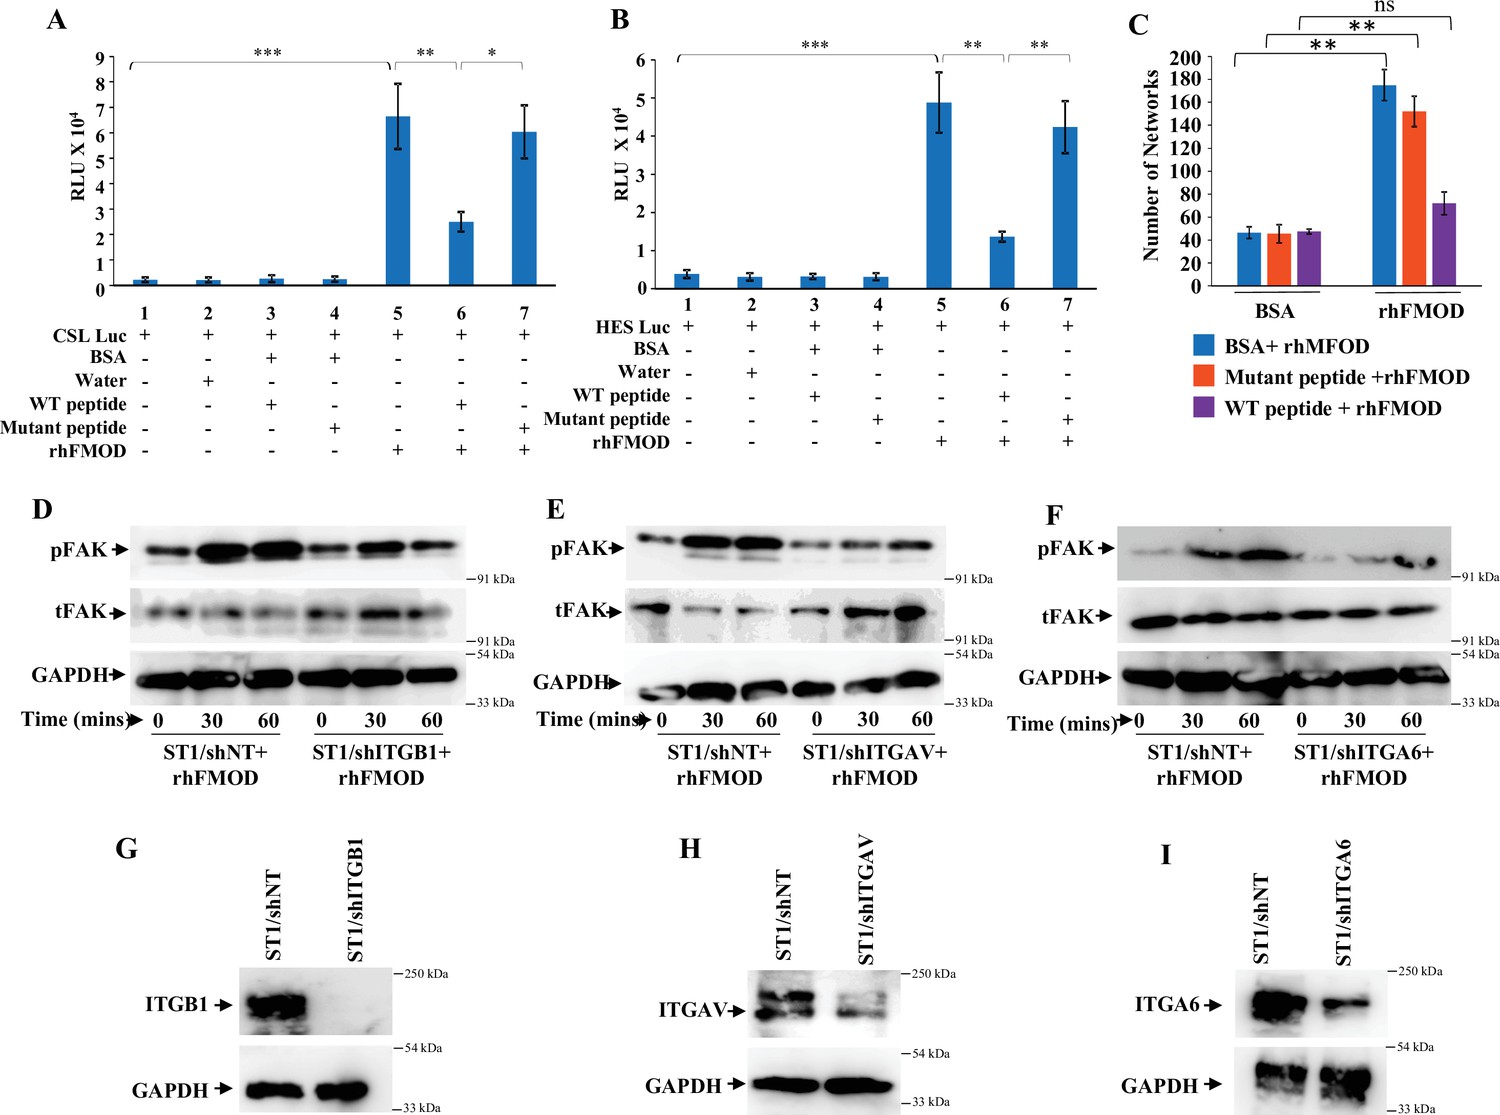
(A) Quantification of normalized relative luciferase units per second (RLU/s) of CSL-Luc (Notch pathway-dependent reporter luciferase construct) and (B) HES-Luc (Notch pathway-dependent reporter [HES1 promoter] luciferase construct), transfected in ST1 cells, which are pretreated with the wildtype (WT peptide) or the mutant (Mut) peptide, and then incubated with either bovine serum albumin (BSA) or rhFMOD (400 nM). (C) Quantification of the number of networks formed by ST1 cells pretreated with the WT peptide or the Mut peptide and then incubated with either BSA or rhFMOD (400 nM). (D) Western blotting shows phospho-FAK and total FAK protein levels in ST1/shNT and ST/shITGB1 cells treated with rhFMOD (400 nM). (E) Western blotting shows phospho-FAK and total FAK protein levels in ST1/shNT and ST/shITGAV cells treated with rhFMOD (400 nM). (F) Western blotting shows phospho-FAK and total FAK protein levels in ST1/shNT and ST/shITGA6 cells treated with rhFMOD (400 nM). (G) Western blotting shows ITGB1 protein levels in ST1/shNT and ST/shITGB1 cells. (H) Western blotting shows ITGAV protein levels in ST1/shNT and ST/shITAV cells. (I) Western blotting shows ITGA6 protein levels in ST1/shNT and ST/shITGA6 cells. For panels (A–C), n=3, and p-values were calculated by unpaired t-test with Welch’s correction, are indicated. p-Value <0.05 is considered significant with *, **, and *** representing p-values <0.05, 0.01, and 0.001, respectively. ns, nonsignificance.
-
Figure 4—figure supplement 3—source data 1
Source data used to generate Figure 4—figure supplement 3A–I.
- https://cdn.elifesciences.org/articles/78972/elife-78972-fig4-figsupp3-data1-v3.zip
Figure 4—figure supplement 4
Fibromodulin (FMOD)-mediated activation of Integrin-dependent Notch signaling in endothelial cells involves the integrin pathway downstream molecules FAK and Src.
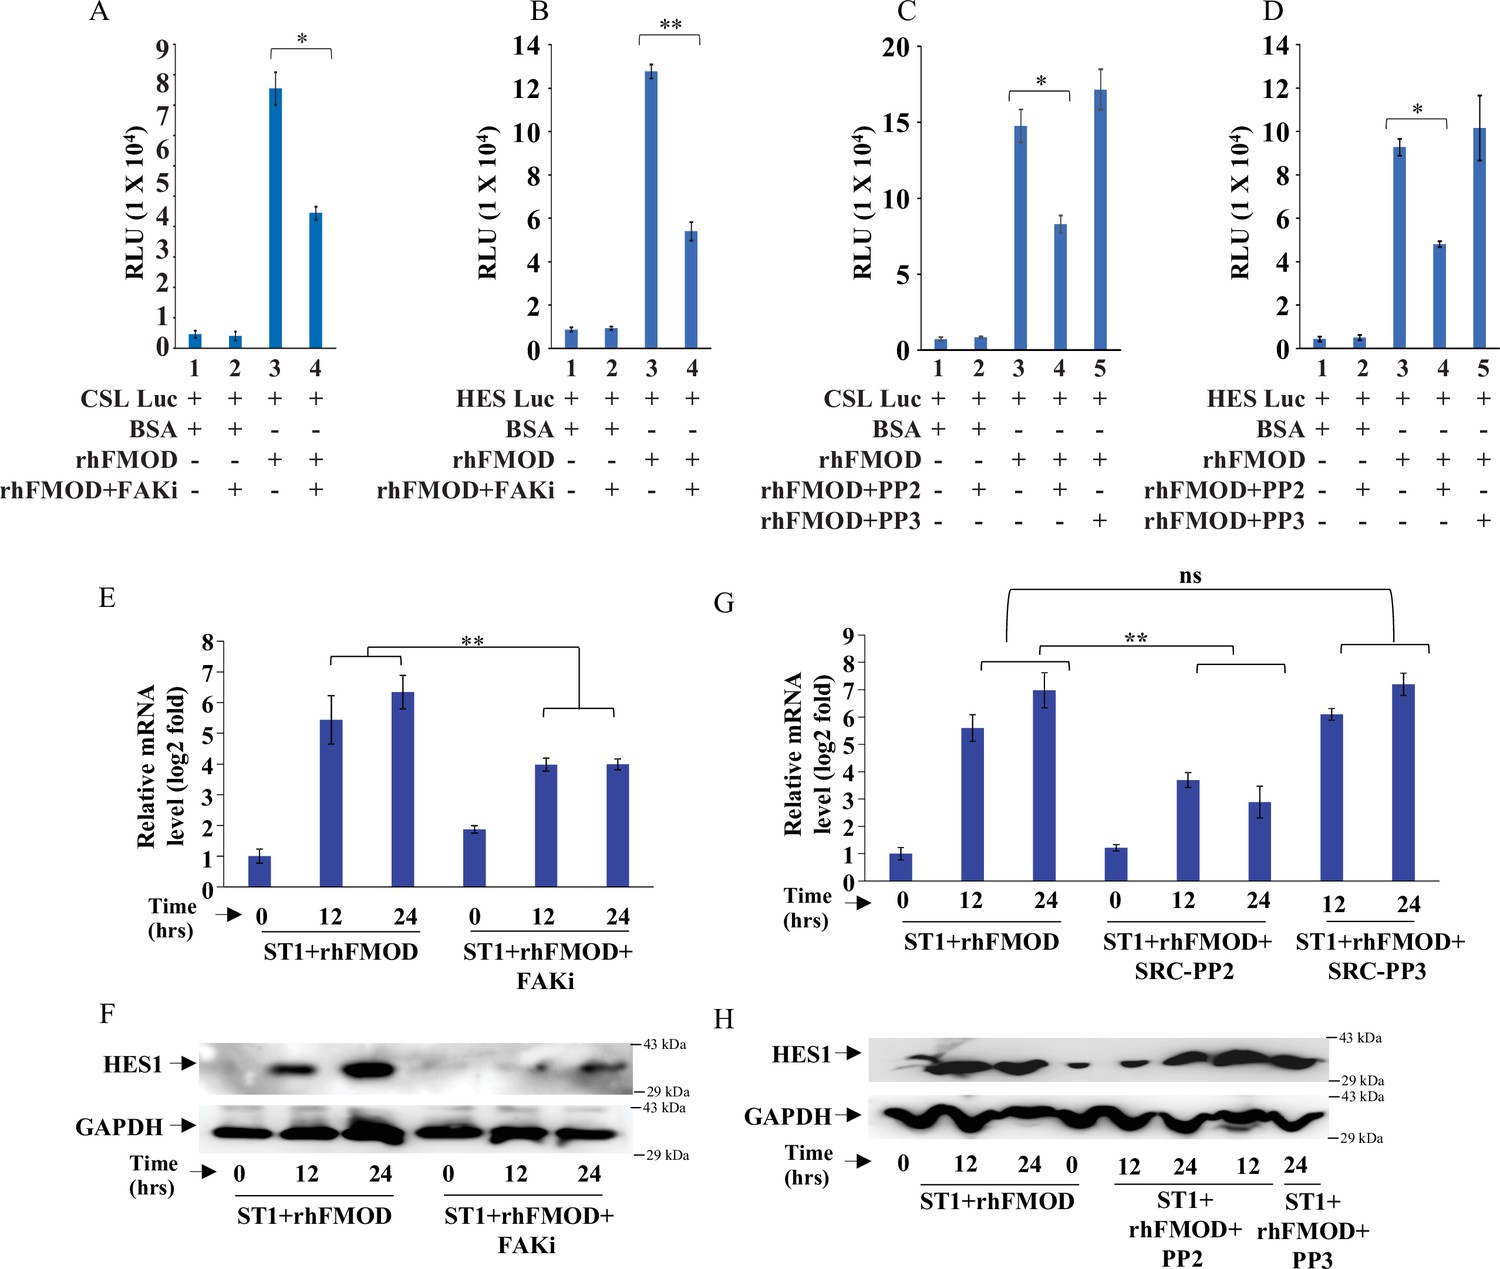
(A) Quantification of normalized relative luciferase units per second (RLU/s) of CSL-Luc (Notch pathway-dependent reporter luciferase construct) and (B) HES-Luc (Notch pathway-dependent reporter [HES1 promoter] luciferase construct), transfected in ST1 cells pretreated with PF573228 (FAK inhibitor; 10 μM), and then incubated with bovine serum albumin (BSA) or rhFMOD (400 nM). (C) Quantification of normalized RLU/s of CSL-Luc (Notch pathway-dependent reporter luciferase construct) and (D) HES-Luc (Notch pathway-dependent reporter [HES1 promoter] luciferase construct), transfected in ST1 cells pretreated with PP2 (Src inhibitor, 10 μM), and PP3 (inactive structural analog to PP2, 10 μM) and then incubated with BSA or rhFMOD (400 nM). (E) RT-qPCR analysis shows HES1 transcript levels in ST1 cells pretreated with PF573228 (FAK inhibitor; 10 μM) and then incubated with BSA or rhFMOD (400 nM). (F) Western blotting shows HES1 protein levels in ST1 cells pretreated with PF573228 (FAK inhibitor; 10 μM) and then incubated with BSA or rhFMOD (400 nM). (G) RT-qPCR analysis shows HES1 transcript levels in ST1 cells pretreated with PP2 (Src inhibitor, 10 μM) and PP3 (inactive structural analog to PP2, 10 μM) and then incubated with BSA or rhFMOD (400 nM). (H) Western blotting shows HES1 protein levels in ST1 cells pretreated with PP2 (Src inhibitor, 10 μM) and PP3 (inactive structural analog to PP2, 10 μM) and then incubated with BSA or rhFMOD (400 nM). For panels (A–E) and (G), n=3, and p-values were calculated by unpaired t-test with Welch’s correction, are indicated. p-Value <0.05 is considered significant with *, **, and *** representing p-values <0.05, 0.01, and 0.001 respectively. ns, nonsignificance.
-
Figure 4—figure supplement 4—source data 1
Source data used to generate Figure 4—figure supplement 4A–H.
- https://cdn.elifesciences.org/articles/78972/elife-78972-fig4-figsupp4-data1-v3.zip
Figure 4—figure supplement 5
Fibromodulin (FMOD)-mediated crosstalk of integrin and Notch signaling pathways occurs via JAG1 upregulation.
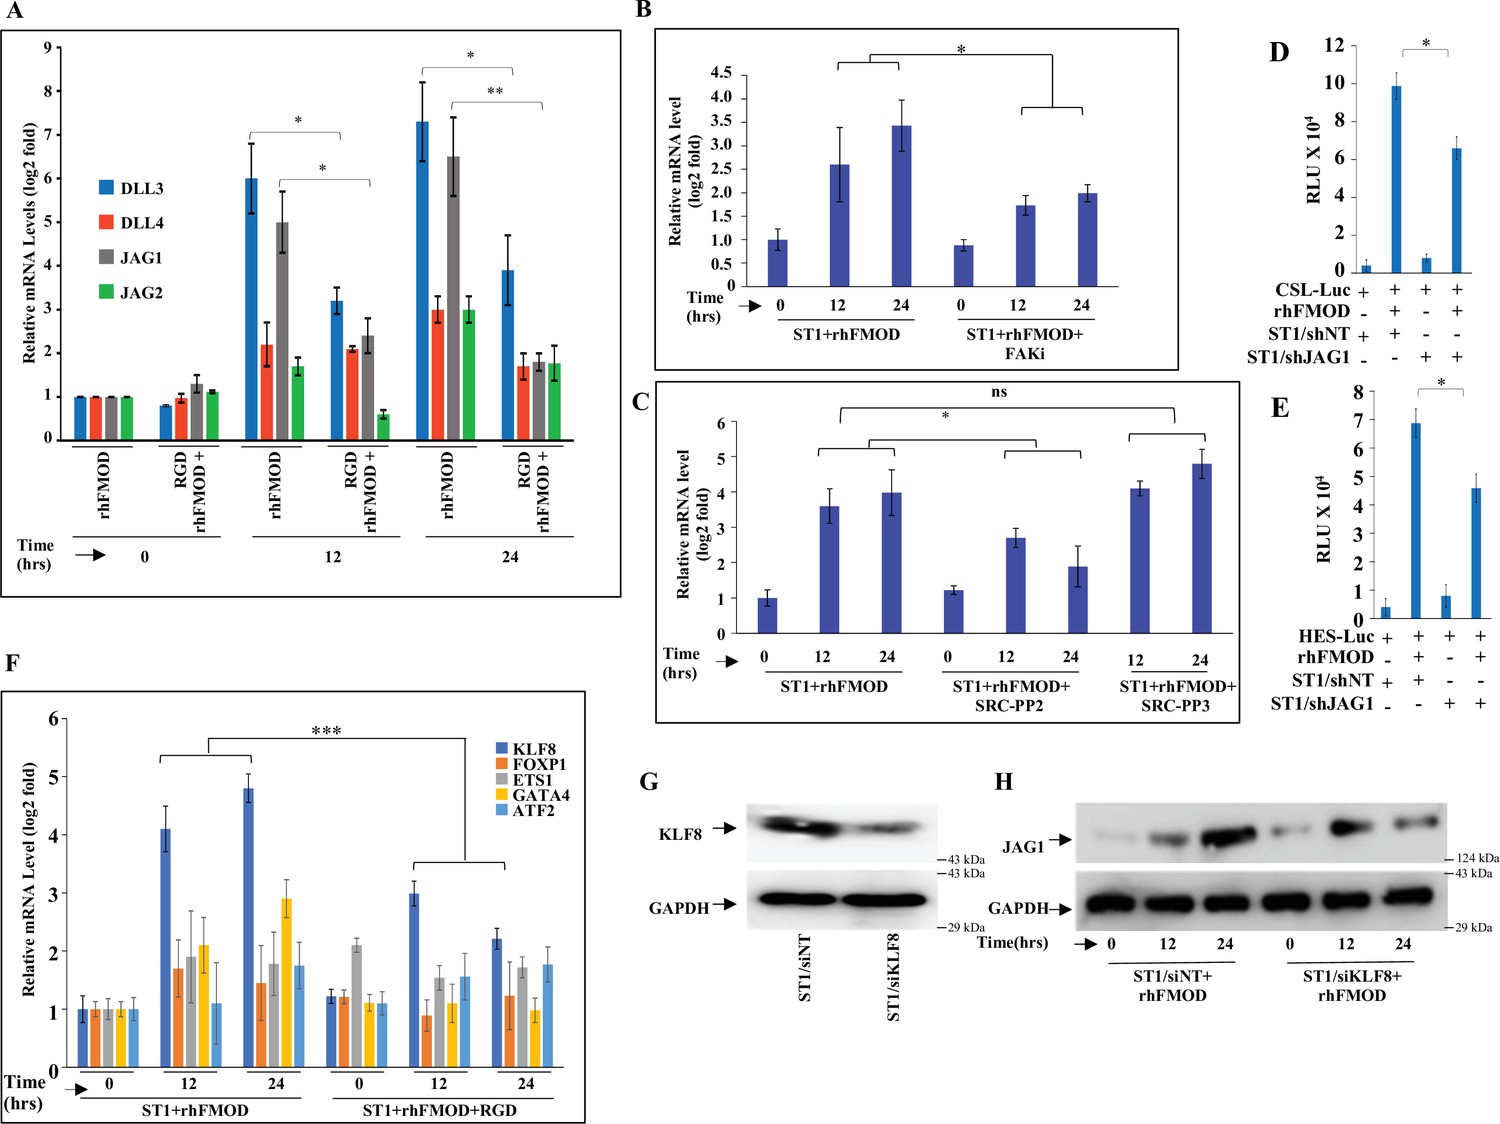
(A) RT-qPCR analysis shows the transcript levels of SLL1, DLL3, JAG1, and JAG2 in ST1 cells pretreated with RGD peptide (10 μM) and then incubated with bovine serum albumin (BSA) or rhFMOD (400 nM). (B) RT-qPCR analysis shows the transcript levels of JAG1 in ST1 cells pretreated with PF573228 (FAK inhibitor; 10 μM) and then incubated with BSA or rhFMOD (400 nM). (C) RT-qPCR analysis shows the transcript levels of JAG1 in ST1 cells pretreated with PP2 (Src inhibitor, 10 μM) and PP3 (inactive structural analog to PP2, 10 μM), and then incubated with BSA or rhFMOD (400 nM). (D) Quantification of normalized relative luciferase units per second (RLU/s) of CSL-Luc (Notch pathway-dependent reporter luciferase construct) and (E) HES-Luc (Notch pathway-dependent reporter [HES1 promoter] luciferase construct), transfected in ST1/shNT and ST1/shJAG1 cells incubated with rhFMOD (400 nM). (F) RT-qPCR analysis shows the transcript levels of KLF8, FOXP1, ETS1, GATA4, and ATF2 in ST1 cells pretreated with RGD peptide (10 μM) and then incubated rhFMOD (400 nM). (G) Western blotting shows KLF8 protein levels in ST1/shNT and ST1/shKLF8 cells. (H) Western blotting shows JAG1 protein levels in ST1/shNT and ST1/shKLF8 cells incubated with rhFMOD (400 nM). For panels (A–F), n=3, and p-values were calculated by unpaired t-test with Welch’s correction, are indicated. p-Value <0.05 is considered significant with *, **, and *** representing p-values <0.05, 0.01, and 0.001, respectively.
-
Figure 4—figure supplement 5—source data 1
Source data used to generate Figure 4—figure supplement 5A–H.
- https://cdn.elifesciences.org/articles/78972/elife-78972-fig4-figsupp5-data1-v3.zip
Figure 4—figure supplement 6

Clinical relevance of the FMOD-JAG1-HES1 signaling.
(A) Dot plots show fibromodulin (FMOD) transcript levels in glioblastoma (GBM) samples over normal samples across multiple publicly available datasets. (B) Dot plots show HES1 transcript levels in GBM samples over normal samples across multiple publicly available datasets. (C) Dot plots show JAG1 transcript levels in GBM samples over normal samples across multiple publicly available datasets. (D) Correlation between transcript levels of FMOD and HES1 across multiple publicly available datasets. (E) Correlation between transcript levels of FMOD and JAG1 across multiple publicly available datasets. Data for JAG1 are not available in the dataset CCGA-RNA-Seq. For panels (A–C), significance was calculated using an unpaired t-test. The correlation coefficient was calculated using Pearson’s correlation coefficient test for panels (D) and (E). p-Value <0.05 is considered significant with *, **, ***, and **** representing p-values <0.05, 0.01, 0.001, and 0.00001, respectively.
-
Figure 4—figure supplement 6—source data 1
Source data used to generate Figure 4—figure supplement 6A–E.
- https://cdn.elifesciences.org/articles/78972/elife-78972-fig4-figsupp6-data1-v3.zip
Figure 4—figure supplement 7
Clinical relevance of the FMOD-JAG1-HES1 signaling.
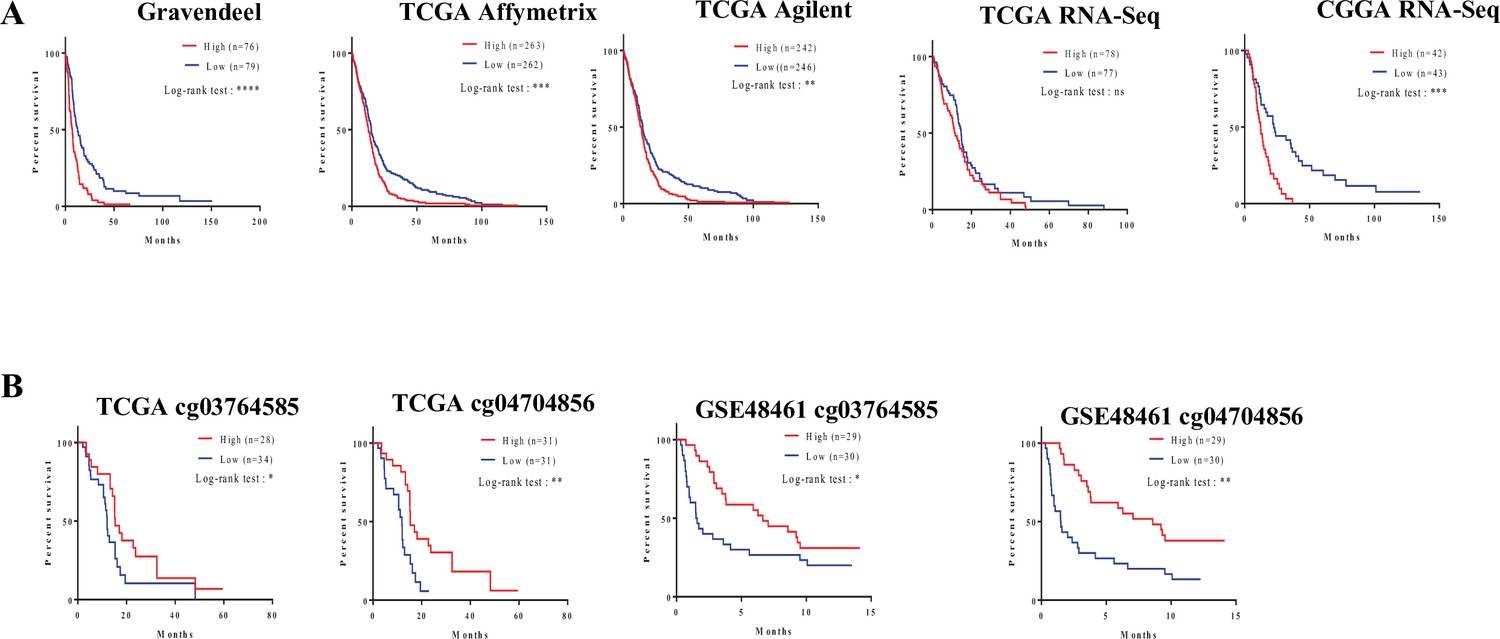
(A) Survival analysis using transcript levels of fibromodulin (FMOD) in multiple publicly available datasets. High FMOD mRNA levels (red lines) in patients show poorer survival than low FMOD patients (blue lines) in multiple publicly available datasets. (B) FMOD promoter hypomethylation (in CpGs cg03764585 and cg04704856) in patients shows poorer survival than low patients with FMOD promoter hypermethylation in multiple publicly available datasets. Significance was calculated using the log-rank test. p-Value <0.05 is considered significant.
-
Figure 4—figure supplement 7—source data 1
Source data used to generate Figure 4—figure supplement 7A B.
- https://cdn.elifesciences.org/articles/78972/elife-78972-fig4-figsupp7-data1-v3.zip
Figure 5 with 1 supplement

Conditional silencing of fibromodulin (FMOD) in differentiated glioma cells (DGCs) formed de novo by glioma stem-like cell (GSC)-initiated tumors inhibits tumor growth.
(A) Schema depicts the timeline of the intracranial orthotopic mouse glioma model using murine glioma stem cells (AGR53-GSC) in C57BL/6 mice (n = 10 per group). Mice were injected with AGR53-GSCs (1 × 10⁵ cells per animal) transduced with either miRNT (nontargeting) or miRFMOD lentiviruses. Tumors were allowed to grow till day 13 and then miRNT or miRFMOD (and mCherry) were induced by doxycycline (100 µl of 1 mg/ml per animal) intraperitoneal injections at indicated times. Note that in vitro characterization shows that the highest knockdown of FMOD was obtained on the seventh day after doxycycline administration. First, in vivo imaging for mCherry expression depicting tumor size was done on day 21 post-injection, followed by imaging at regular intervals (as noted by the orange marks). (B) In vivo fluorescence (mCherry) imaging of mice injected with either AGR53-GSC/miRNT or AGR53-GSC/miRFMOD cells as per the timeline shown in (A). (C) The radiance efficiency for each time point in the two groups of animals as indicated was plotted. (D) Kaplan–Meier graph showing the survival of mice bearing tumors formed by AGR53-GSC/miRNT (Dox+) and AGR53-GSC/miRFMOD (Dox+) cells. (E) Hematoxylin and eosin staining shows a larger tumor (depicted by dark blue color due to extremely high cell density) in mice brain injected with AGR53-GSC/miRNT (Dox+) cells (top) compared to that of AGR53-GSC/miRFMOD (Dox+) cells (bottom). Magnification = ×0.8. (F) Confocal microscopy analysis showing FMOD expression in brains of mice injected with AGR53-GSC/miRNT (Dox+) and AGR53-GSC/miRFMOD (Dox+) cells. Red indicates FMOD, and blue indicates H33342 (stains nuclei). The merged images are shown for representation. Magnification = ×20, scale bar = 50 μm. (G) Brain sections showing areas of fluorescence (GFP, mCherry, and DAPI) for both AGR53-GSC/miRNT (Dox+) (left panel) and AGR53-GSC/miRFMOD (Dox+) (right panel) groups of animals. Note that the AGR53 cell line stably expresses GFP while mCherry expression is induced upon doxycycline addition. On day 13, prior to the administration of doxycycline, both AGR53-GSC/miRNT (left) and AGR53-GSC/miRFMOD (right) do not have any mCherry expression but have almost similar GFP expression. However, over time after the onset of doxycycline administration, both mCherry and GFP expression decreased in the miRFMOD group but not in the miRNT group. Merged images show an overlap of GFP and mCherry-positive tumor areas. Magnification = ×20, scale bar = 50 μm. For panel (C), the p-value was calculated by unpaired t-test with Welch’s correction, and for (D), the p-value was calculated by log-rank test. p-Value <0.05 was considered significant with *, **, and *** representing p-values <0.05, 0.01, and 0.001, respectively.
-
Figure 5—source data 1
Source data used to generate Figure 5B.
- https://cdn.elifesciences.org/articles/78972/elife-78972-fig5-data1-v3.zip
-
Figure 5—source data 2
Source data used to generate Figure 5C.
- https://cdn.elifesciences.org/articles/78972/elife-78972-fig5-data2-v3.zip
-
Figure 5—source data 3
Source data used to generate Figure 5D.
- https://cdn.elifesciences.org/articles/78972/elife-78972-fig5-data3-v3.zip
-
Figure 5—source data 4
Source data used to generate Figure 5E.
- https://cdn.elifesciences.org/articles/78972/elife-78972-fig5-data4-v3.zip
-
Figure 5—source data 5
Source data used to generate Figure 5F.
- https://cdn.elifesciences.org/articles/78972/elife-78972-fig5-data5-v3.zip
-
Figure 5—source data 6
Source data used to generate Figure 5G.
- https://cdn.elifesciences.org/articles/78972/elife-78972-fig5-data6-v3.zip
Figure 5—figure supplement 1
Conditional silencing of fibromodulin (FMOD) in differentiated glioma cells (DGCs) formed de novo by glioma stem-like cell (GSC)-initiated tumors inhibits tumor growth in a murine glioma model.
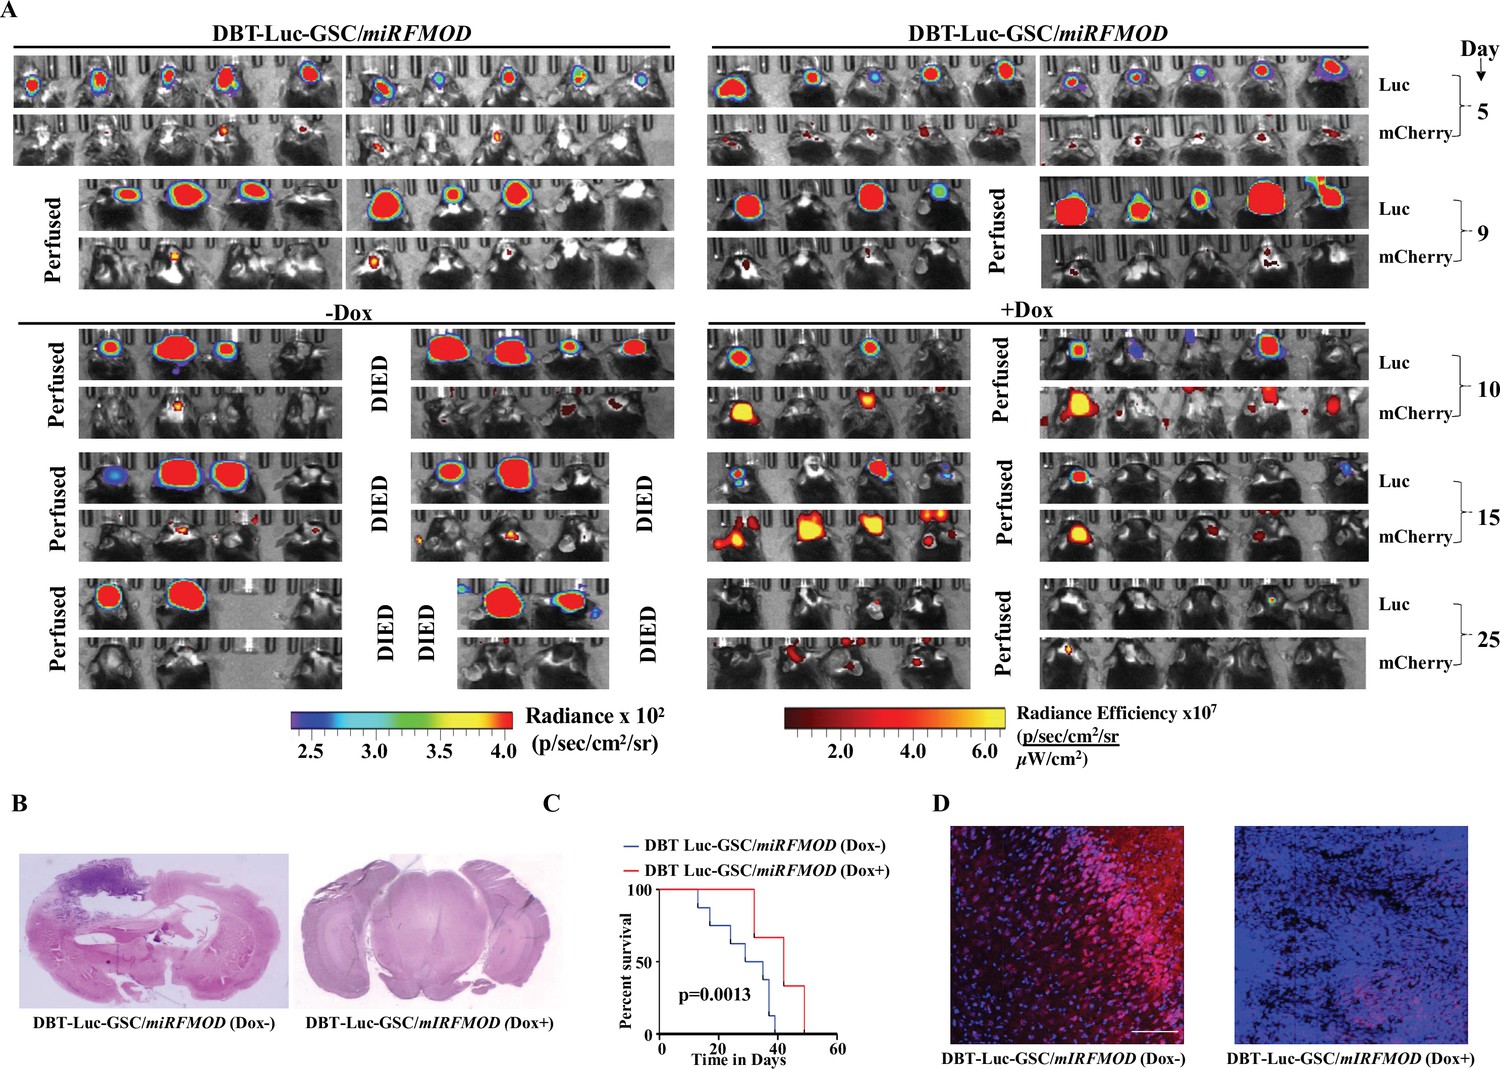
(A) In vivo bioluminescence and fluorescence (mCherry) imaging of mice injected with DBT-Luc-GSC/miRFMOD cells (1 × 10⁵ cells per animal) in intracranial orthotopic mouse glioma model in C57BL/6 mice (n = 10 per group, total two groups). Tumors were allowed to grow till day 9, and then miRFMOD (and mCherry) were induced by doxycycline (100 µl of 1 mg/ml per animal) intraperitoneal injections in one group of miRFMOD mice (right). First, in vivo imaging for bioluminescence and mCherry expression depicting tumor size was done on day 5, followed by imaging at regular intervals. (B) Hematoxylin and eosin staining shows a larger tumor (depicted by dark blue color due to extremely high cell density) in mice brain injected with DBT-Luc-GSC/miRFMOD (Dox-) cells (left) compared to that of DBT-Luc-GSC/miRFMOD (Dox+) cells (right). Magnification = ×0.8. (C) Kaplan–Meier graph showing the survival of mice bearing tumors formed by DBT-Luc-GSC/miRFMOD (Dox-) and DBT-Luc-GSC/miRFMOD (Dox+) cells. (D) Confocal microscopy analysis showing FMOD expression in brains of mice injected with DBT-Luc-GSC/miRFMOD (Dox-) and DBT-Luc-GSC/miRFMOD (Dox+). Red indicates FMOD, and blue indicates H33342 (stains nuclei). The merged images are shown for representation. Magnification = ×20, scale bar = 50 μm. For panel (C), the p-value was calculated by the log-rank test. p-Value <0.05 was considered significant with *, **, and *** representing p-values <0.05, 0.01, and 0.001, respectively.
-
Figure 5—figure supplement 1—source data 1
Source data used to generate Figure 5—figure supplement 1.
- https://cdn.elifesciences.org/articles/78972/elife-78972-fig5-figsupp1-data1-v3.zip
Figure 6 with 1 supplement
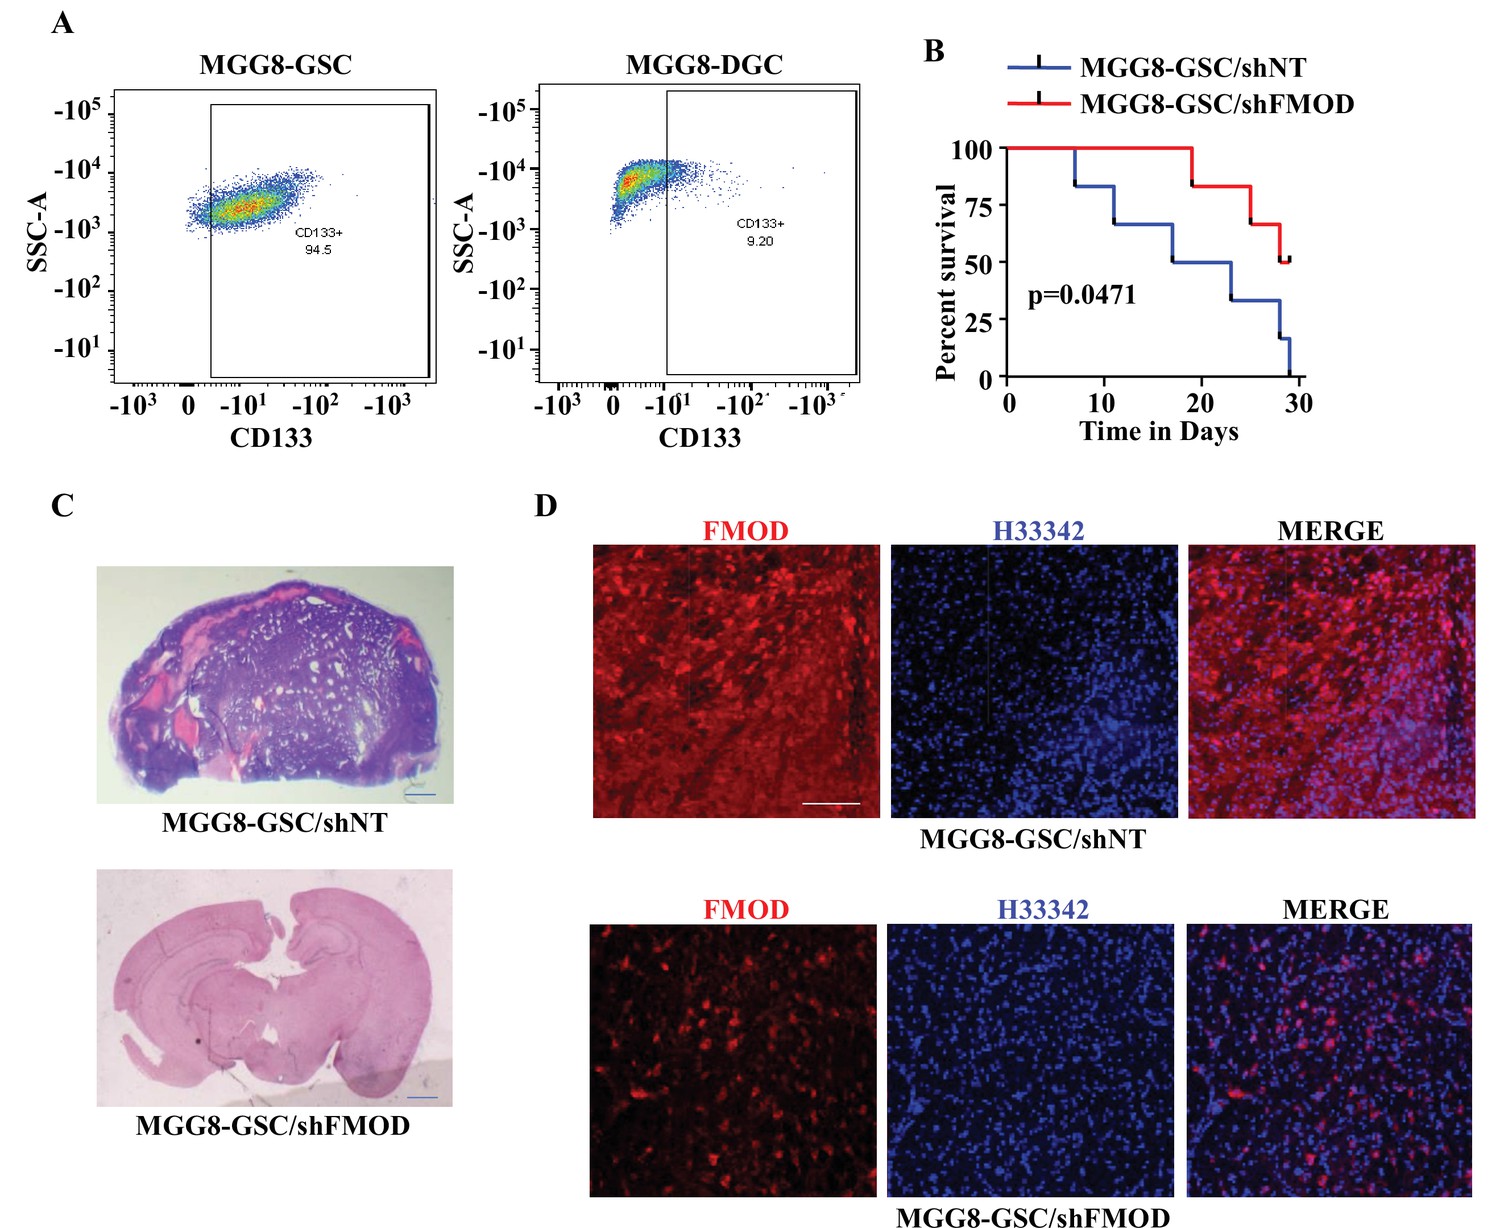
Growth of human glioma stem-like cell (GSC)-initiated tumors requires secreted fibromodulin (FMOD).
(A) Flow cytometry analysis shows the relative levels of CD133-positive cells in MGG8-GSCs compared to MGG8-DGCs. (B) Kaplan–Meier graph shows the survival of mice (n = 10 per group) injected intracranially with MGG8-GSC/shNT or MGG8-GSC/shFMOD cells (1 × 10⁵ cells per animal). (C) Hematoxylin and eosin staining shows a larger tumor (depicted by dark blue color due to high cell density) in mice brain injected with MGG8-GSC/shNT cells (top) compared to that of MGG8-GSC/shFMOD cells (bottom). Magnification = ×0.8. (D) Confocal microscopy analysis shows FMOD expression in brains of mice injected with MGG8-GSC/shNT (top panel) and MGG8-GSC/shFMOD (bottom panel) cells. Red indicates FMOD, and blue indicates H33342 (stains nuclei). Magnification = ×20, scale bar = 50 μm. Statistical significance for panel (B) was calculated using the log-rank test. p-Value <0.05 is considered significant.
-
Figure 6—source data 1
Source data used to generate Figure 6A.
- https://cdn.elifesciences.org/articles/78972/elife-78972-fig6-data1-v3.zip
-
Figure 6—source data 2
Source data used to generate Figure 6B.
- https://cdn.elifesciences.org/articles/78972/elife-78972-fig6-data2-v3.zip
-
Figure 6—source data 3
Source data used to generate Figure 6C.
- https://cdn.elifesciences.org/articles/78972/elife-78972-fig6-data3-v3.zip
-
Figure 6—source data 4
Source data used to generate Figure 6D.
- https://cdn.elifesciences.org/articles/78972/elife-78972-fig6-data4-v3.zip
Figure 6—figure supplement 1

Growth of human glioblastoma (GBM) cell-initiated tumors requires secreted fibromodulin (FMOD).
(A) In vivo bioluminescence imaging of two groups (n = 5 per group) of mice (NIH nu/nu) injected with either U251/shNT or U251/shFMOD cells (2.5 × 10⁶ cells per animal). (B) The total radiance for each time points in the two groups of animals, as indicated, was plotted. (C) Kaplan–Meier graph showing the survival of mice bearing tumors formed by U251/shNT or U251/shFMOD cells. (D) Hematoxylin and eosin staining shows a larger tumor (depicted by dark blue color due to high cell density) in mice brain injected with U251/shNT cells (left) compared to that of U251/shFMOD cells (right). Magnification = ×0.8. (E) Confocal microscopy analysis showing FMOD expression in brains of mice injected with U251/shNT and U251/shFMOD cells. Red indicates FMOD, and blue indicates H33342 (stains nuclei). The merged images are shown for representation. Magnification = ×20, scale bar = 50 μm. For panel (B), the p-value using an unpaired t-test with Welch’s correction, and for panel (C), p-value was calculated using the log-rank test. p-Value <0.05 was considered significant, with *, **, and *** representing p-values <0.05, 0.01, and 0.001, respectively. ns, nonsignificance.
-
Figure 6—figure supplement 1—source data 1
Source data used to generate Figure 6—figure supplement 1.
- https://cdn.elifesciences.org/articles/78972/elife-78972-fig6-figsupp1-data1-v3.zip
Figure 7 with 5 supplements
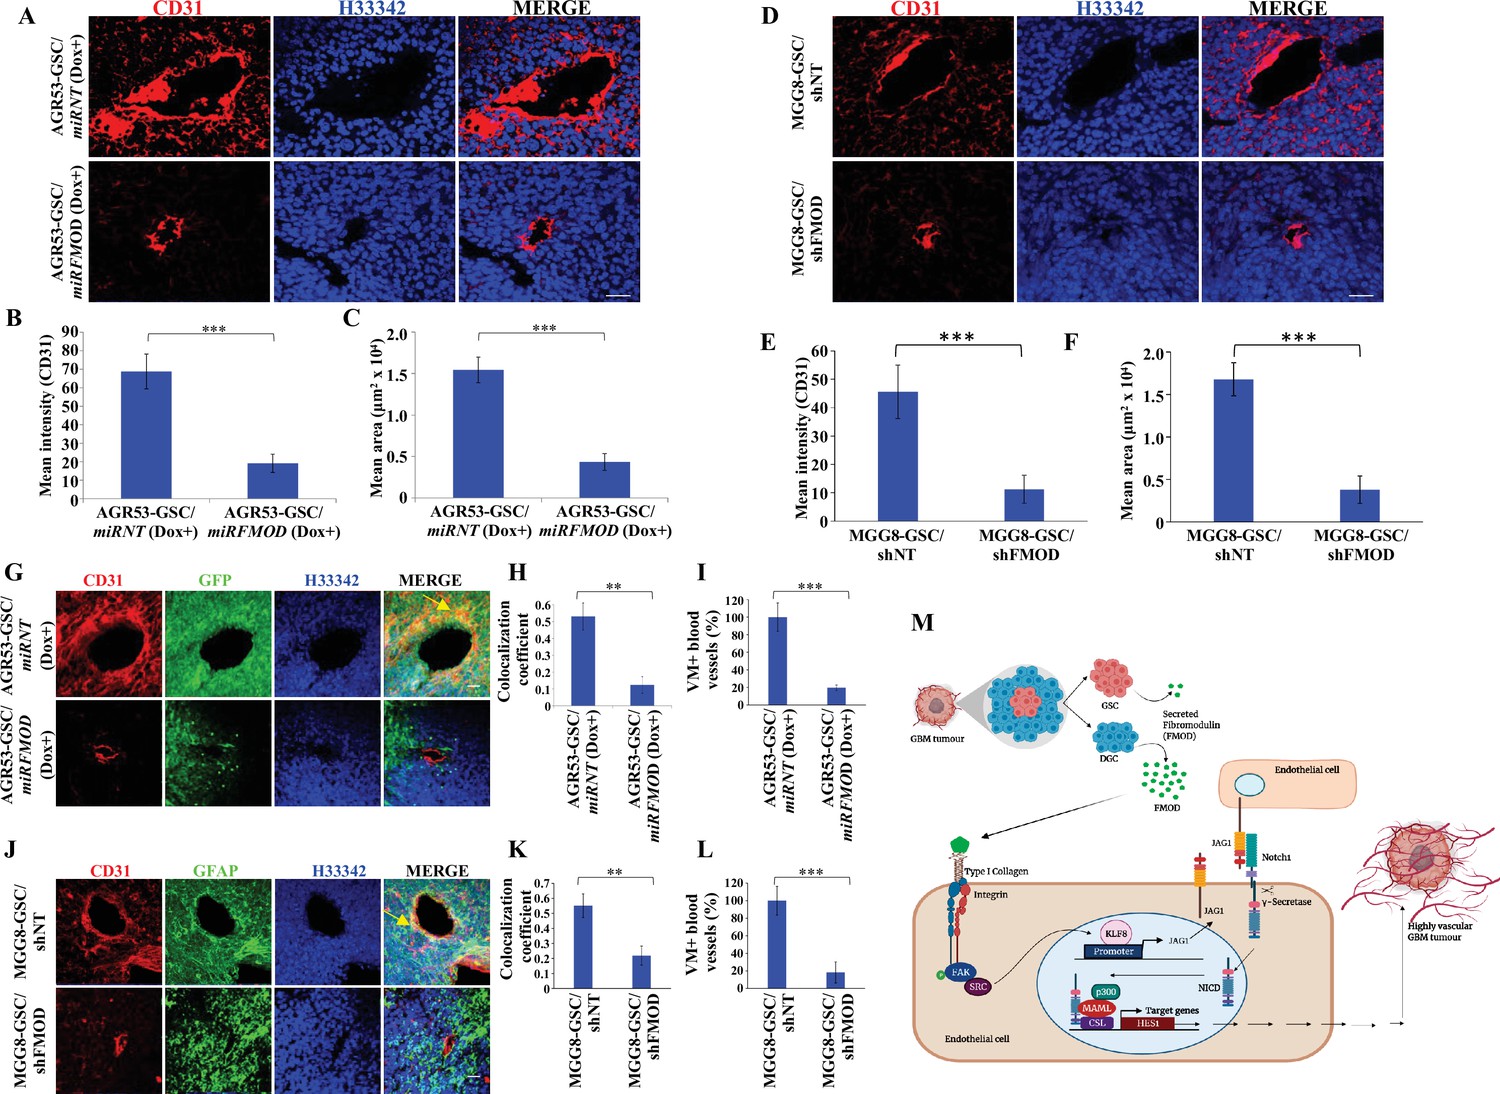
Reduced angiogenesis is characteristic of tumors initiated by fibromodulin (FMOD)-silenced glioma cells.
(A) Confocal microscopy analysis shows CD31 expression in brain tumor sections of mice injected with AGR53-GSC/miRNT or AGR53-GSC/miRFMOD cells after doxycycline administration to the mice. Red indicates CD31, and blue indicates H33342 (stains nuclei). Magnification = ×20, scale bar = 50 μm.(B) Quantification of the mean fluorescence intensity of CD31 in brain tumor sections of mice injected with AGR53-GSC/miRNT or AGR53-GSC/miRFMOD cells after doxycycline administration to the mice. (C) Quantification of the mean area of blood vessels in brain tumor sections of mice injected with AGR53-GSC/miRNT or AGR53-GSC/miRFMOD cells after doxycycline administration to the mice. (D) Confocal microscopy analysis showing CD31 expression in brain tumor sections of mice injected with MGG8-GSC/shNT or MGG8-GSC/shFMOD cells. Red indicates CD31, and blue indicates H33342 (stains nuclei). Magnification = ×20, scale bar = 50 μm. (E) Quantification of the mean fluorescence intensity of CD31 in brain tumor sections of mice injected with MGG8-GSC/shNT or MGG8-GSC/shFMOD cells. (F) Quantification of the mean area of blood vessels in brain tumor sections of mice injected with MGG8-GSC/shNT or MGG8-GSC/shFMOD cells. (G) Confocal microscopy analysis showing CD31 and GFP expression in brain tumor sections of mice injected with AGR53-GSC/miRNT or AGR53-GSC/miRFMOD cells after doxycycline administration to the mice. Red indicates CD31, green indicates GFP, and blue indicates H33342 (stains nuclei). The yellow arrow indicates the region exhibiting colocalization of CD31 and GFP. Magnification = ×20, scale bar = 50 μm. (H) Quantification of the colocalization coefficient of CD31 and GFP staining in the brain tumor sections of mice injected with AGR53-GSC/miRNT and AGR53-GSC/miRFMOD cells after doxycycline injection to the mice. (I) The number of blood vessels with co-staining of CD31 and GFP was quantified in brain tumor sections of mice injected with AGR53-GSC/miRNT and AGR53-GSC/miRFMOD cells after doxycycline injection to the mice and plotted. (J) Confocal microscopy analysis showing CD31 and GFAP expression in brain tumor sections of mice injected with MGG8-GSC/shNT or MGG8-GSC/shFMOD cells. Red indicates CD31, green indicates GFAP, and blue indicates H33342 (stains nuclei). The yellow arrow indicates the region exhibiting colocalization of CD31 and GFAP. Magnification = ×20, scale bar = 50 μm. (K) Quantification of the colocalization coefficient of CD31 and GFAP staining in the brain tumor sections of mice injected with MGG8-GSC/shNT and MGG8-GSC/shFMOD cells. (L) The number of blood vessels with co-staining of CD31 and GFAP was quantified in brain tumor sections of mice injected with MGG8-GSC/shNT and MGG8-GSC/shFMOD cells and plotted. (M) A model depicting the functional interactions between different cell types in glioblastoma (GBM) tumors, which comprise a small proportion of glioma stem-like cells (GSCs), a massive number of differentiated glioma cells (DGCs), and stromal cells. FMOD, primarily secreted by DGCs, upregulates JAG1 through the activation of integrin signaling in endothelial cells. The higher expression of JAG1 causes the activation of the Notch signaling pathway, which results in the transcriptional upregulation of HES1 in endothelial cells. The integrin-dependent Notch pathway activation promotes angiogenesis and vascular mimicry, leading to glioma tumor growth. For panels (B), (C), (E), (F), (H), (I), (K), and (L), n=5, and p-value was calculated using an unpaired t-test with Welch’s correction. p-Value <0.05 was considered significant, with *, **, and *** representing p-values <0.05, 0.01, and 0.001, respectively.
-
Figure 7—source data 1
Source data used to generate Figure 7A.
- https://cdn.elifesciences.org/articles/78972/elife-78972-fig7-data1-v3.zip
-
Figure 7—source data 2
Source data used to generate Figure 7B, C, H, I.
- https://cdn.elifesciences.org/articles/78972/elife-78972-fig7-data2-v3.zip
-
Figure 7—source data 3
Source data used to generate Figure 7D.
- https://cdn.elifesciences.org/articles/78972/elife-78972-fig7-data3-v3.zip
-
Figure 7—source data 4
Source data used to generate Figure 7E, F, K, L.
- https://cdn.elifesciences.org/articles/78972/elife-78972-fig7-data4-v3.zip
-
Figure 7—source data 5
Source data used to generate Figure 7G.
- https://cdn.elifesciences.org/articles/78972/elife-78972-fig7-data5-v3.zip
-
Figure 7—source data 6
Source data used to generate Figure 7J.
- https://cdn.elifesciences.org/articles/78972/elife-78972-fig7-data6-v3.zip
-
Figure 7—source data 7
Source data used to generate Figure 7M.
- https://cdn.elifesciences.org/articles/78972/elife-78972-fig7-data7-v3.zip
Figure 7—figure supplement 1
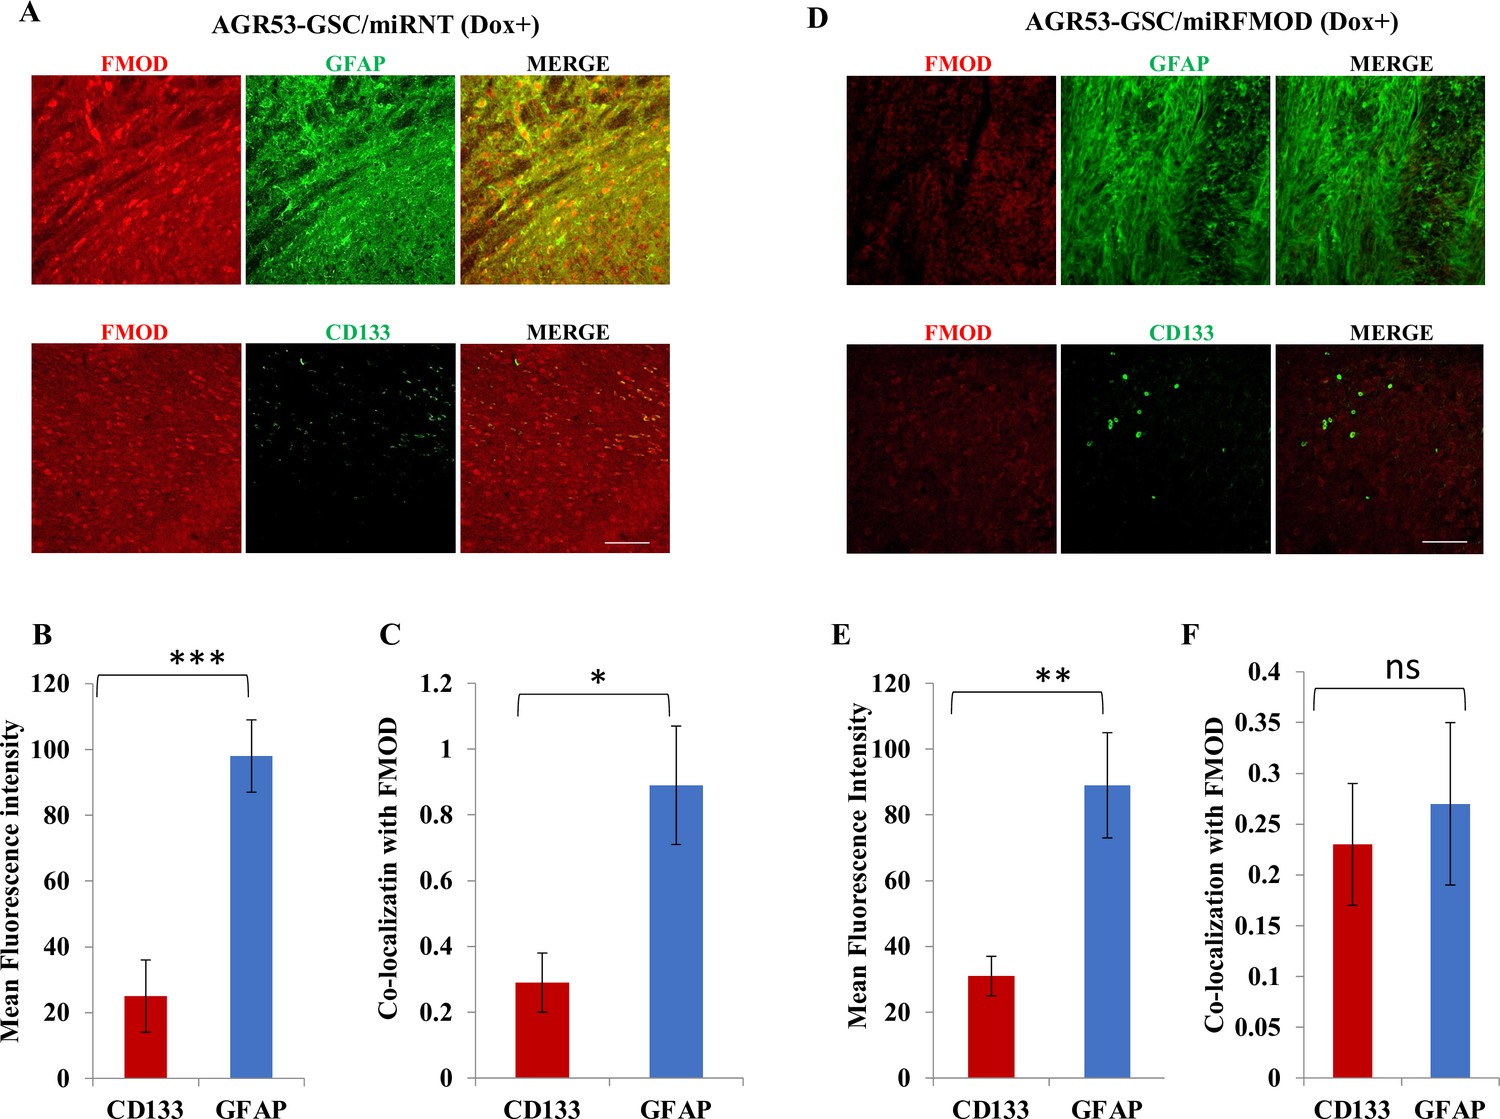
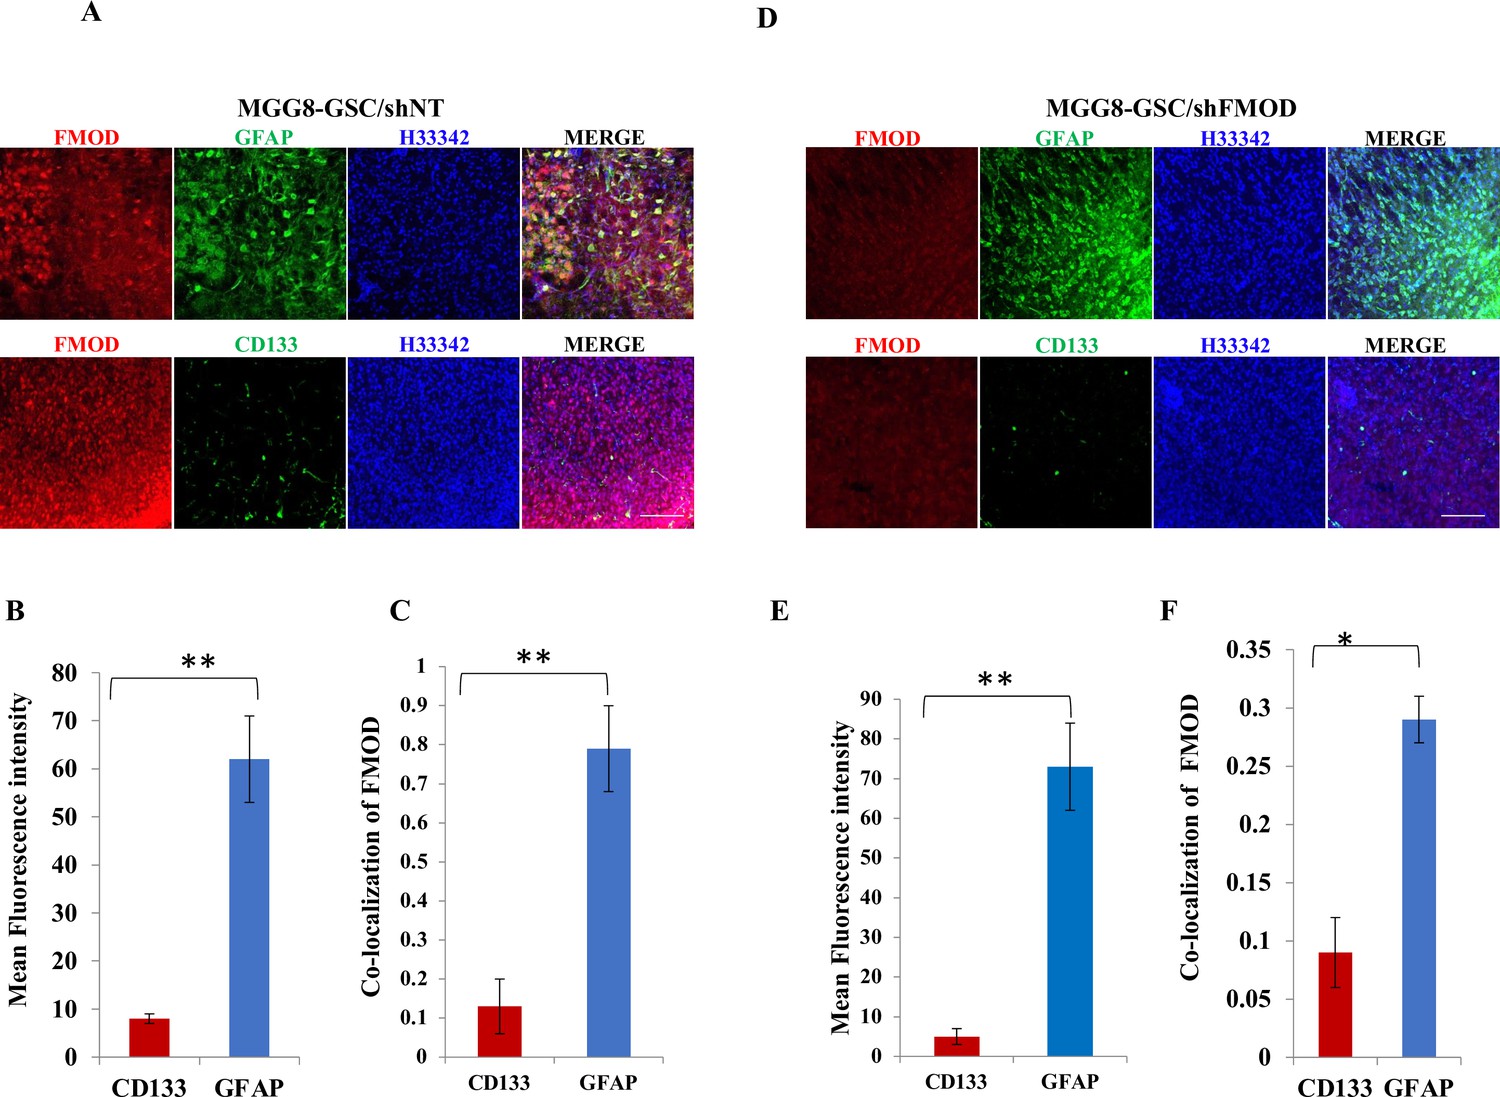
Fibromodulin (FMOD) silencing does not hamper the differentiation potential of tumor cells in murine glioma models.
(A) Confocal microscopy analysis of brain tumor sections of mice injected with AGR53-GSC/miRNT cells after the mice were administered with doxycycline. Red indicates FMOD, and green indicates GFAP (top panel). Confocal microscopy analysis of brain tumor sections of mice injected with AGR53-GSC/miRNT cells after the mice were administered with doxycycline. Red indicates FMOD, and green indicates CD133 (bottom panel). Magnification = ×20, scale = 100 μm. (B) Quantification of mean fluorescent intensity of GFAP and CD133 in brain tumor sections of mice injected with AGR53-GSC/miRNT cells after the mice were administered with doxycycline. (C) Quantification of the colocalization coefficient of FMOD with CD31 and GFP in the brain tumor sections of mice injected with AGR53-GSC/miRNT cells after the mice were administered with doxycycline. (D) Confocal microscopy analysis of brain tumor sections of mice injected with AGR53-GSC/miRFMOD cells after the mice were administered with doxycycline. Red indicates FMOD, and green indicates GFAP (top panel). Confocal microscopy analysis of brain tumor sections of mice injected AGR53-GSC/miRFMOD cells after the mice were administered with doxycycline. Red indicates FMOD, and green indicates CD133 (bottom panel). Magnification = ×20, scale bar = 100 μm. (E) Quantification of mean fluorescent intensity of GFAP and CD133 in brain tumor sections of mice injected with AGR53-GSC/miRFMOD cells after the mice were administered with doxycycline. (F) Quantification of the colocalization coefficient of FMOD with CD31 and GFP in the brain tumor sections of mice injected with AGR53-GSC/miRFMOD cells after the mice were administered with doxycycline. For panels (B), (C), (E), and (F), n=5, and the p-value was calculated by Student’s t-test. p-Value <0.05 was considered significant with *, **, and *** representing p-values <0.05, 0.01, and 0.001, respectively. ns, nonsignificance.
-
Figure 7—figure supplement 1—source data 1
Source data used to generate Figure 7—figure supplement 1A–F.
- https://cdn.elifesciences.org/articles/78972/elife-78972-fig7-figsupp1-data1-v3.zip
Figure 7—figure supplement 2
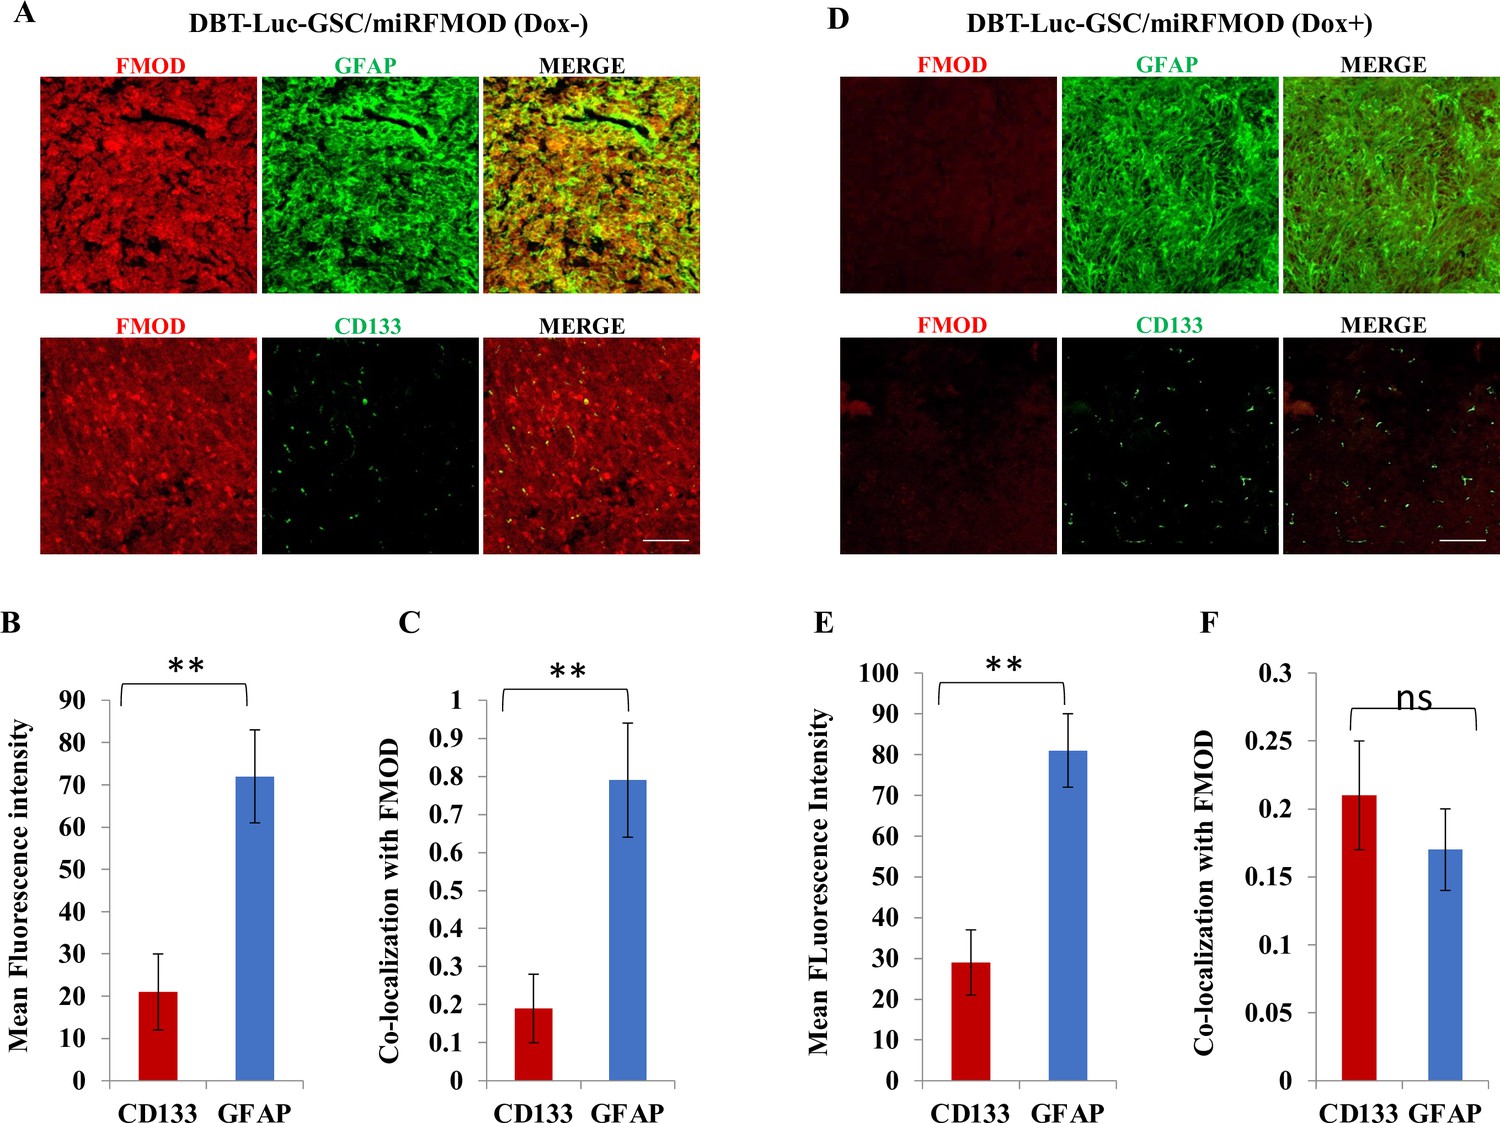
Fibromodulin (FMOD) silencing does not hamper the differentiation potential of tumor cells in murine glioma models.
(A) Confocal microscopy analysis of brain tumor sections of mice injected with DBT-Luc-GSC/miRFMOD cells before the mice were administered with doxycycline. Red indicates FMOD, and green indicates GFAP (top panel). Confocal microscopy analysis of brain tumor sections of mice injected with DBT-Luc-GSC/miRFMOD cells before the mice were administered with doxycycline. Red indicates FMOD, and green indicates CD133 (bottom panel). Magnification = ×2 0, scale bar = 100 μm. (B) Quantification of mean fluorescent intensity of GFAP and CD133 in brain tumor sections of mice injected with DBT-Luc-GSC/miRFMOD cells before the mice were administered doxycycline. (C) Quantification of the colocalization coefficient of FMOD with CD31 and GFP in the brain tumor sections of mice injected with DBT-Luc-GSC/miRFMOD cells before the mice were administered with doxycycline. (D) Confocal microscopy analysis of brain tumor sections of mice injected with DBT-Luc-GSC/miRFMOD cells after the mice were administered with doxycycline. Red indicates FMOD, and green indicates GFAP (top panel). Confocal microscopy analysis of brain tumor sections of mice injected DBT-Luc-GSC/miRFMOD cells after the mice were administered with doxycycline. Red indicates FMOD, and green indicates CD133 (bottom panel). Magnification = ×20, scale bar = 100 μm. (E) Quantification of mean fluorescent intensity of GFAP and CD133 in brain tumor sections of mice injected with DBT-Luc-GSC/miRFMOD cells after the mice were administered with doxycycline. (F) Quantification of the colocalization coefficient of FMOD with CD31 and GFP in the brain tumor sections of mice injected with DBT-Luc-GSC/miRFMOD cells after the mice were administered doxycycline. For panels (B), (C), (E), and (F), n=5, and the p-value was calculated by Student’s t-test. p-Value <0.05 was considered significant with *, **, and *** representing p-values <0.05, 0.01, and 0.001, respectively. ns, nonsignificance.
-
Figure 7—figure supplement 2—source data 1
Source data used to generate Figure 7—figure supplement 2A–F.
- https://cdn.elifesciences.org/articles/78972/elife-78972-fig7-figsupp2-data1-v3.zip
Figure 7—figure supplement 3
Fibromodulin (FMOD) silencing does not hamper the differentiation potential of tumor cells.
(A) Confocal microscopy analysis of brain tumor sections of mice injected with MGG8/shNT. Red indicates FMOD, green indicates GFAP, and blue indicates H33342 (stains nuclei) (top panel). Confocal microscopy analysis of brain tumor sections of mice injected with MGG8/shNT. Red indicates FMOD, green indicates CD133, and blue indicates H33342 (stains nuclei) (bottom panel). Magnification = ×20, scale bar = 100 μm. (B) Quantification of mean fluorescent intensity of GFAP and CD133 in brain tumor sections of mice injected with DBT-Luc-GSC/miRFMOD cells before the mice were administered doxycycline. (C) Quantification of the colocalization coefficient of FMOD with CD31 and GFP in the brain tumor sections of mice injected with MGG8/shNT cells. (D) Confocal microscopy analysis of brain tumor sections of mice injected with MGG8/shFMOD cells. Red indicates FMOD, green indicates GFAP, and blue indicates H33342 (stains nuclei) (top panel). Confocal microscopy analysis of brain tumor sections of mice injected MGG8/shFMOD cells. Red indicates FMOD, green indicates CD133, and blue indicates H33342 (stains nuclei) (bottom panel). Magnification = ×20, scale bar = 100 μm. (E) Quantification of mean fluorescent intensity of GFAP and CD133 in brain tumor sections of mice injected with MGG8/shFMOD cell. (F) Quantification of the colocalization coefficient of FMOD with CD31 and GFP in the brain tumor sections of mice injected with MGG8/shFMOD cells. For panels (B), (C), (E), and (F), n=5, and the p-value was calculated by Student’s t-test. p-Value <0.05 was considered significant with *, **, and *** representing p-values <0.05, 0.01, and 0.001, respectively. ns, nonsignificance.
-
Figure 7—figure supplement 3—source data 1
Source data used to generate Figure 7—figure supplement 3A–F .
- https://cdn.elifesciences.org/articles/78972/elife-78972-fig7-figsupp3-data1-v3.zip
Figure 7—figure supplement 4
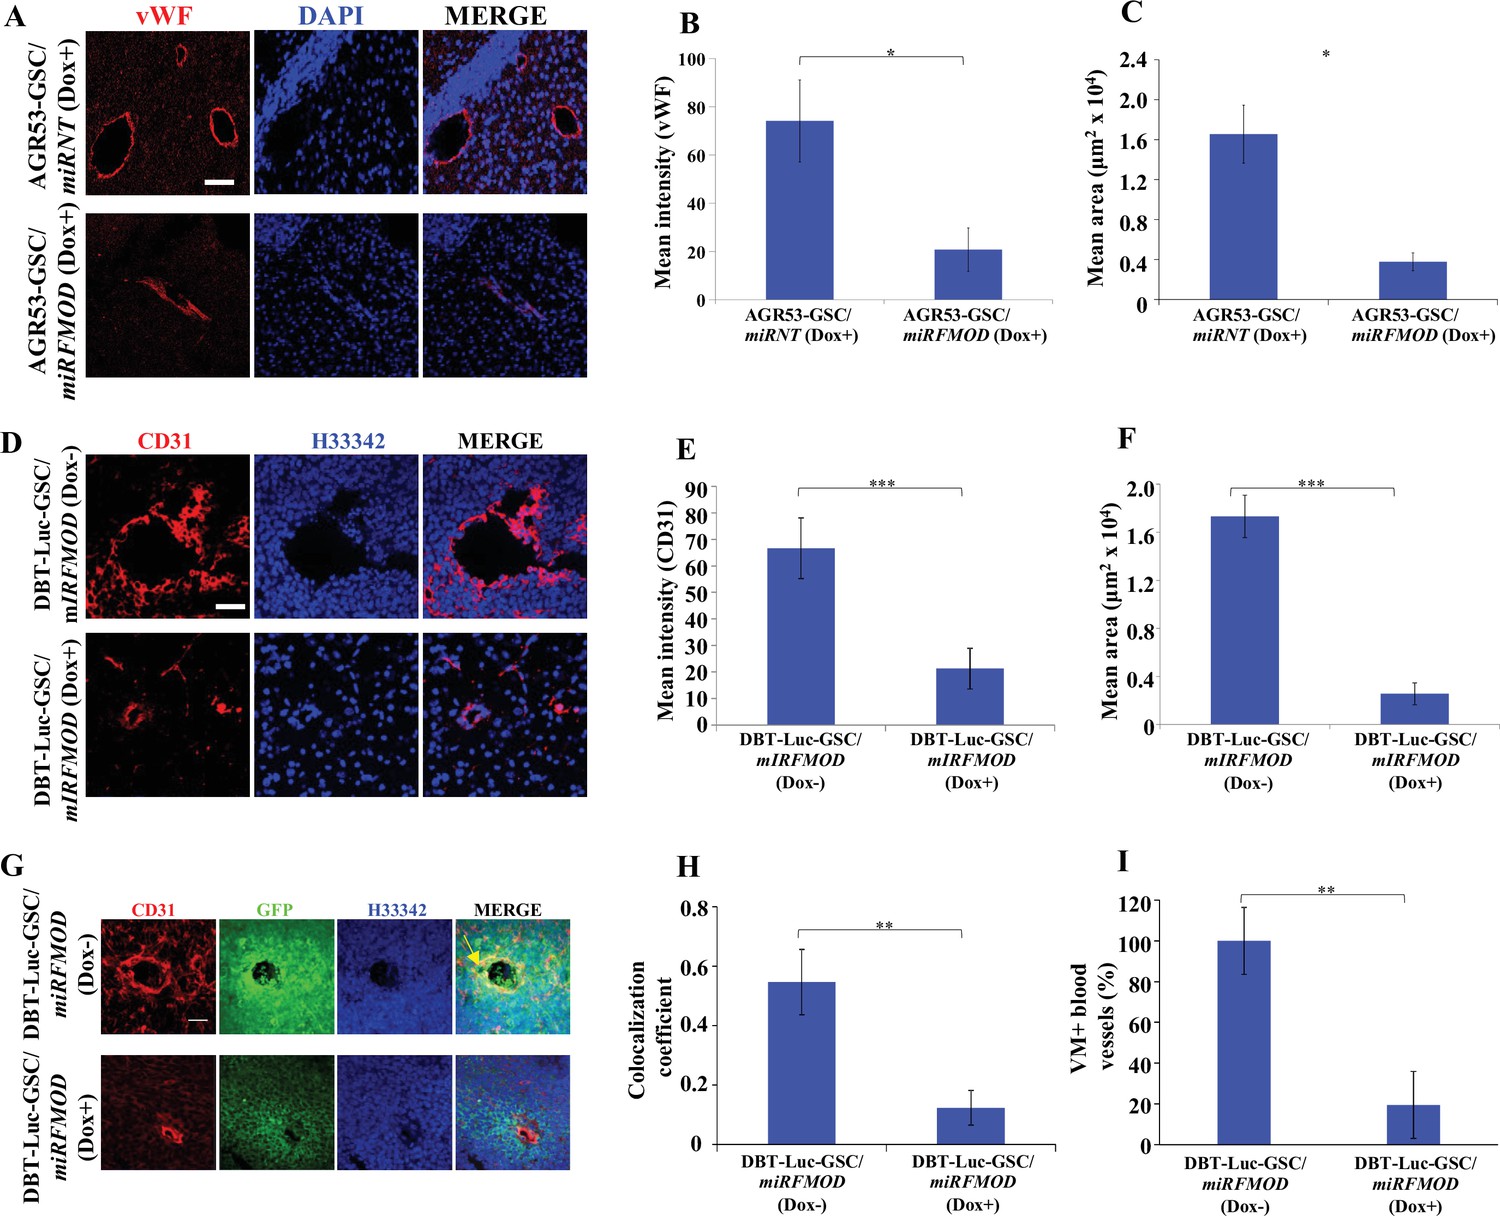
Fibromodulin (FMOD) silencing affects angiogenesis and vascular mimicry in vivo.
(A) Confocal microscopy analysis shows von Willebrand factor (vWF) expression in the brain tumor sections of mice injected with AGR53-GSC/miRNT (top panel) and AGR53-GSC/miRFMOD cells (bottom panel) after doxycycline administration. Red indicates vWF, and blue indicates DAPI (stains nuclei). (B) Quantification of mean fluorescent intensity of vWF in brain tumor sections of mice injected with AGR53-GSC/miRNT and AGR53-GSC/miRFMOD cells after doxycycline administration. (C) Quantification of mean average area of blood vessels in brain tumor sections of mice injected with AGR53-GSC/miRNT and AGR53-GSC/miRFMOD cells after doxycycline administration. (D) Confocal microscopy analysis shows CD31 expression in the brain tumor sections of mice injected with DBT-Luc-GSC/miRFMOD cells before (top panel) and after (bottom panel) doxycycline administration. Red indicates CD31, and blue indicates H33342 (stains nuclei). (E) Quantification of mean fluorescent intensity of CD31 in brain tumor sections of mice injected with DBT-Luc-GSC/miRFMOD cells before and after doxycycline administration. (F) Quantification of mean average area of blood vessels in brain tumor sections of mice injected with DBT-Luc-GSC/miRFMOD cells before and after doxycycline administration. (G) Confocal microscopy analysis shows CD31 and GFP expression in the brain tumor sections of mice injected with DBT-Luc-GSC/miRFMOD cells before (top panel) and after (bottom panel) doxycycline administration. Red indicates CD31, green indicates GFP, and blue indicates H33342 (stains nuclei). (H) Quantification of colocalization coefficient of CD31 and GFP staining in brain tumor sections of mice injected with DBT-Luc-GSC/miRFMOD cells before and after doxycycline administration. (I) The number of blood vessels with co-staining of CD31 and GFP was quantified in brain tumor sections of mice injected with DBT-Luc-GSC/miRFMOD cells before and after doxycycline administration. For panels (B), (C), (E), (F), (H), and (I) n=5, and p-values were calculated by Student’s t-test. p-Value <0.05 was considered significant with *, **, and *** representing p-values <0.05, 0.01, and 0.001, respectively.
-
Figure 7—figure supplement 4—source data 1
Source data used to generate Figure 7—figure supplement 4A–I.
- https://cdn.elifesciences.org/articles/78972/elife-78972-fig7-figsupp4-data1-v3.zip
Figure 7—figure supplement 5
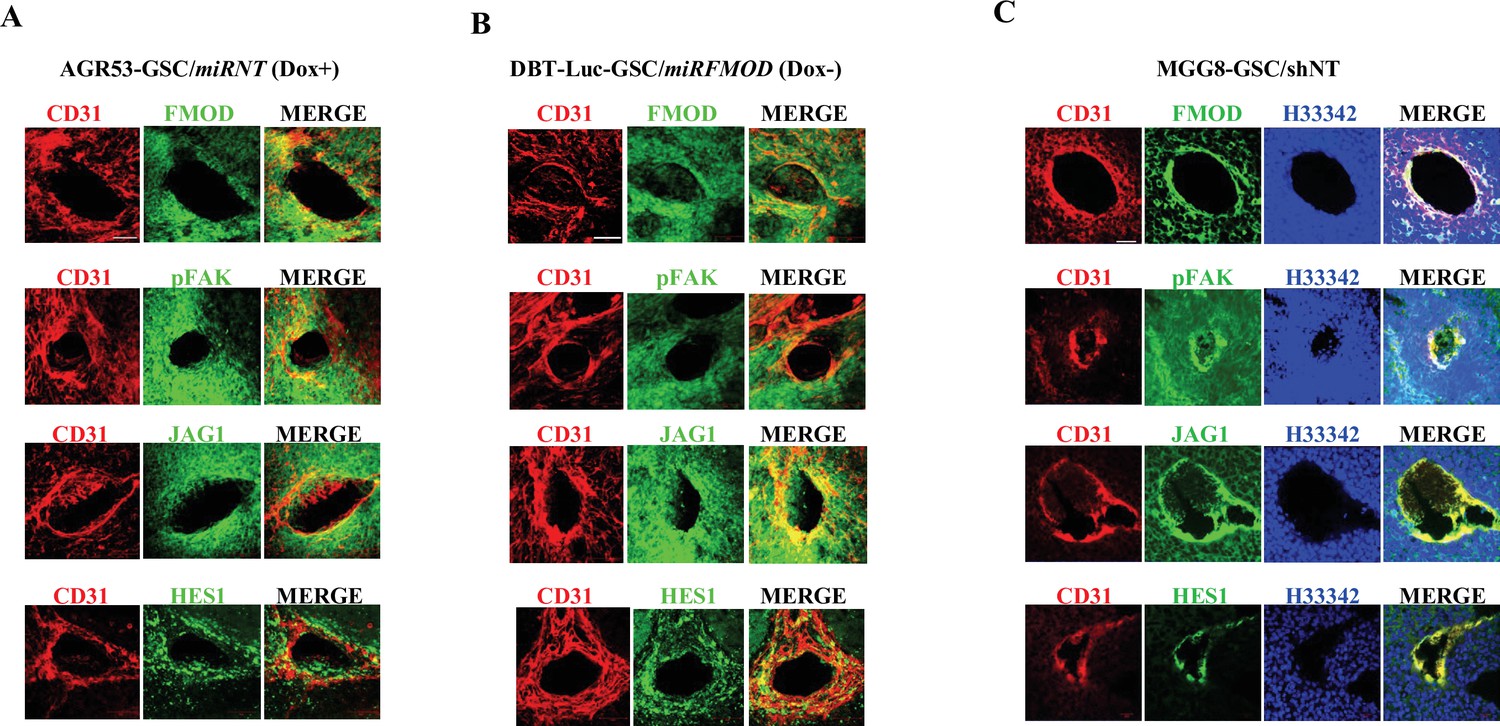
Fibromodulin (FMOD)-dependent activation of the integrin-FAK-JAG1-HES1 signaling axis is maintained in vivo.
(A) Confocal microscopy analysis showing the expression of CD31 and FMOD (top panel), CD31 and pFAK (second panel), CD31 and JAG1 (third panel), and CD31 and HES1 (bottom panel) in brain tumor sections of mice injected with AGR53-GSC/miRNT cells after doxycycline administration. Red indicates CD31, and green indicates FMOD (top panel), pFAK (second panel), JAG1 (third panel), and HES1 (bottom panel). (B) Confocal microscopy analysis showing the expression of CD31 and FMOD (top panel), CD31 and pFAK (second panel), CD31 and JAG1 (third panel), and CD31 and HES1 (bottom panel) in brain tumor sections of mice injected with DBT-Luc-GSC/miRFMOD cells before doxycycline administration. Red indicates CD31, and green indicates FMOD (top panel), pFAK (second panel), JAG1 (third panel), and HES1 (bottom panel). (C) Confocal microscopy analysis showing the expression of CD31 and FMOD (top panel), CD31 and pFAK (second panel), CD31 and JAG1 (third panel), and CD31 and HES1 (bottom panel) in brain tumor sections of mice injected with MGG8/shNT cells. Red indicates CD31, green indicates FMOD (top panel), pFAK (second panel), JAG1 (third panel), and HES1 (bottom panel), and blue indicates H33342 (stains nuclei).
-
Figure 7—figure supplement 5—source data 1
Source data used to generate Figure 7—figure supplement 5.
- https://cdn.elifesciences.org/articles/78972/elife-78972-fig7-figsupp5-data1-v3.zip
Author response image 1

Co-localization of BMDPC marker CD34 and endothelial marker CD31 in blood vessels.
A. Co-localization of the two markers in tumor sections of MGG8-GSC/shNT. B. Co-localization of the two markers in MGG8-GSC/shFMOD tumor sections. Yellow regions in the merged image of MGG8-GSC/shNT tumor section depicts the co-localization of CD34 and CD31. Scale = 50 µm, Magnification = 40X.
Author response image 2
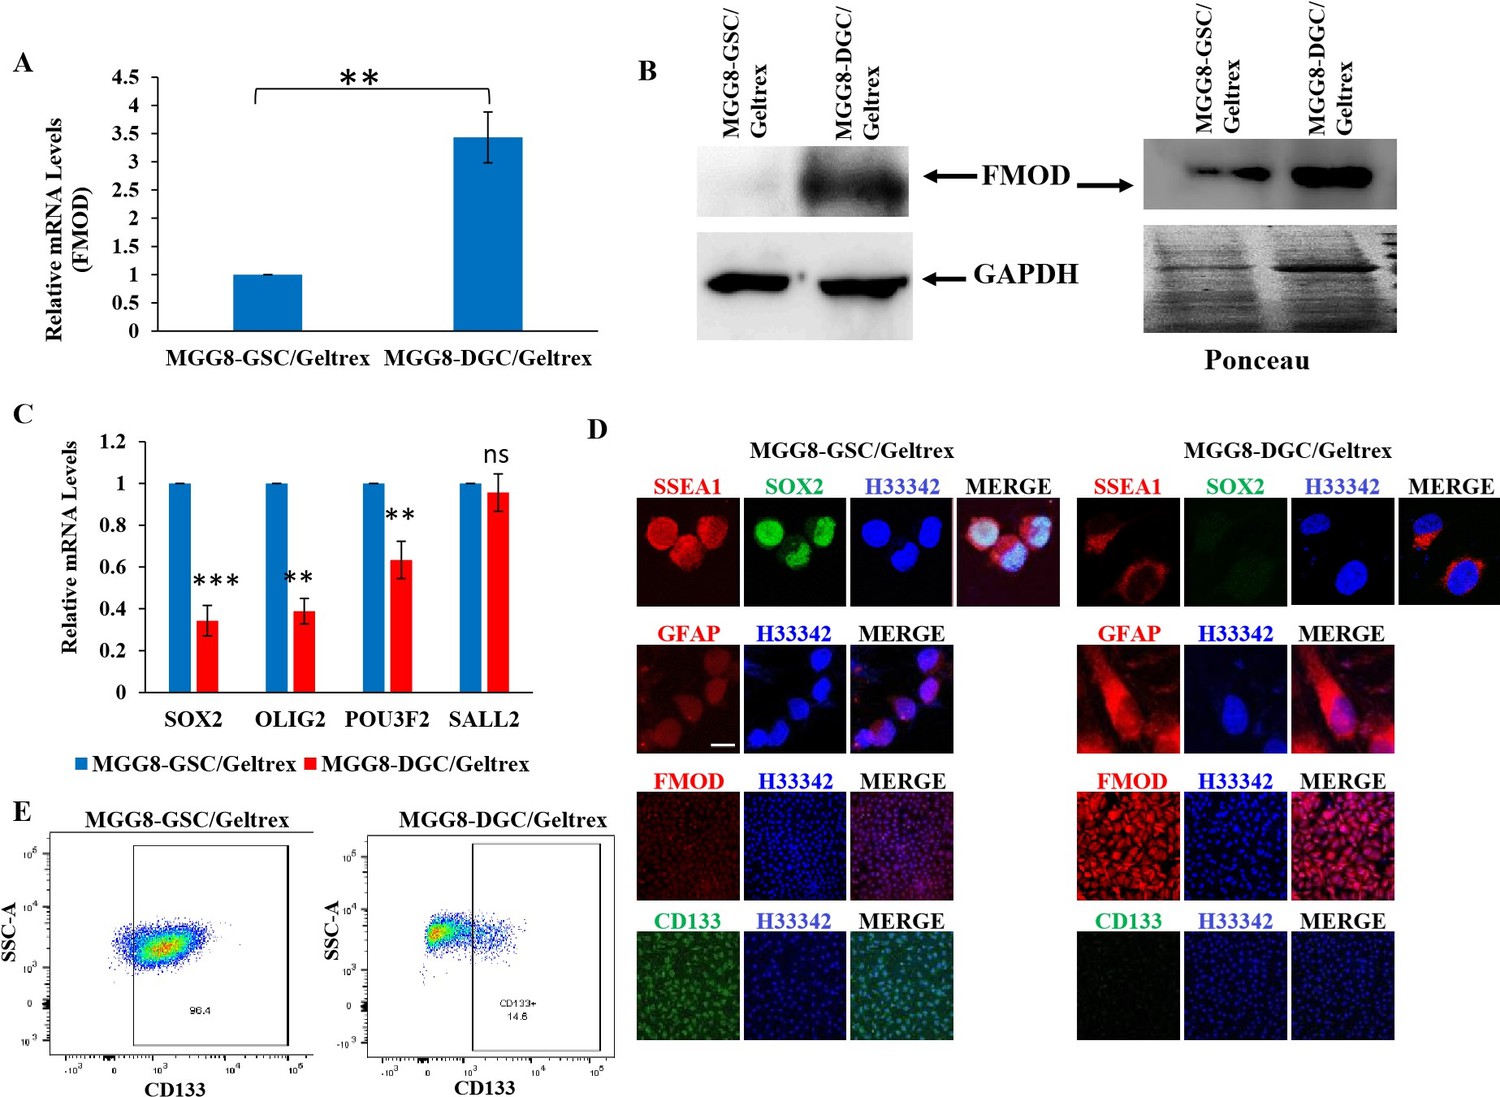
Figure 2: GSCs and DGCs grown as adherent cultures retain expression of their unique markers.
A. Real-time qRT-PCR analysis showing FMOD mRNA upregulation in DGCs over GSCs. B. Western blotting showing FMOD protein overexpression, both in the total cellular proteome (left) and the secretome (right) of DGCs vs. GSCs. C. Real-time qRT-PCR analysis showing downregulated expression of four reprogramming factors in DGCs compared with GSCs. D. Expression of SSEA1, FMOD, CD133, and GFAP in GSCs vs. DGCs in adherent conditions. E. Flow cytometry analysis showing and enrichment of CD133-positive cells in the GSC cultures compared with DGC cultures.
Tables
Appendix 2—key resources table
| Reagent type (species) or resource | Designation | Source or reference | Identifiers | Additional information |
|---|---|---|---|---|
| Antibody | Anti-FMOD (rabbit polyclonal) | Abgent | Cat# AP9243b; RRID:AB_10612142 | WB (1:2000) |
| Antibody | Anti-FAK (rabbit polyclonal) | Cell Signaling Technology | Cat#T9026; RRID: AB_477593 RRID:AB_2269034 | WB (1:1000) |
| Antibody | Anti-phospho FAK (Tyr397) (rabbit polyclonal) | Cell Signaling Technology | Cat# 3283; RRID:AB_2173659 | WB (1:500) |
| Antibody | Anti-GAPDH (mouse monoclonal) unconjugated, clone GAPDH-71.1 | Sigma-Aldrich | Cat# G8795; RRID:AB_1078991 | WB (1:20,000) |
| Antibody | Anti-actin (mouse beta monoclonal), horseradish peroxidase conjugated, clone AC-15 | Sigma-Aldrich | Cat# A3854; RRID:AB_262011 | WB (1:20,000) |
| Antibody | Anti-HES1 (D6P2U) (rabbit monoclonal) | Cell Signaling Technology | Cat# 11988; RRID:AB_2728766 | WB, IHC (1:1000) |
| Antibody | Anti-Von Willebrand factor (rabbit polyclonal) | Abcam | Cat# ab6994; RRID:AB_305689 | IHC (1:2000) |
| Antibody | Anti-CD31 (mouse monoclonal) | Cell Signaling Technology | Cat# 89C2; RRID:AB_2160882 | IHC (1:200) |
| Antibody | Anti-Jagged1 (rabbit monoclonal) | Cell Signaling Technology | Cat# 70109; RRID:AB_2799774 | IHC (1:200) WB (1:1000) |
| Antibody | Anti-FMOD (rabbit polyclonal) | Invitrogen | Cat# PA5-26250; RRID:AB_2543750 | IHC (1:100) WB (1:1000) |
| Antibody | Anti-CD133 (rabbit monoclonal) | Abcam | Cat# ab216323; RRID:AB_2847920 | Flow cytometry (1:100) |
| Antibody | Anti-Prom1 (mouse monoclonal) | Invitrogen | Cat# MA1-219; RRID:AB_2725113 | IHC (1:100) |
| Antibody | Anti-SOX2 (rabbit monoclonal) | Cell Signaling Technology | Cat# 3579; RRID:AB_2195767 | IHC (1:100) |
| Antibody | Anti-GFAP (mouse monoclonal) | Abcam | Cat# ab279290; RRID:AB_1209224 | ICC (1:200) |
| Antibody | Anti-GFAP (rabbit polyclonal) | Abcam | Cat# ab7260; RRID:AB_305808 | IHC (1:200) |
| Antibody | Anti-NOTCH1 (rabbit polyclonal) | Invitrogen | Cat# PA5-99448; RRID:AB_2818381 | WB (1:200) |
| Antibody | Anti-SMAD2 (rabbit monoclonal) | Cell Signaling Technology | Cat# 5339; RRID:AB_10626777 | WB (1:1000) |
| Antibody | Anti-pSMAD2 (rabbit monoclonal) | Cell Signaling Technology | Cat# 18338; RRID:AB_2798798 | WB (1:1000) |
| Antibody | Integrin beta-1 (rabbit monoclonal) | Cell Signaling Technology | Cat# 9699; RRID:AB_11178800 | WB (1:1000) |
| Antibody | Anti-integrin alpha-V (rabbit monoclonal) | Cell Signaling Technology | Cat# 4711; RRID:AB_2128178 | WB (1:1000) |
| Antibody | Anti-integrin alpha 6 (rabbbit monoclonal) | Abcam | Cat# ab18155 | WB (1:500) |
| Antibody | KLF8 antibody (rabbit polyclonal) | Abcam | Cat# ab168527 | WB (1:500) |
| Antibody | Goat anti-mouse HRP conjugate (mouse polyclonal) | Bio-Rad | Cat# 170-5047; RRID:AB_11125753 | WB (1:5000) Secondary antibody |
| Antibody | Goat anti-rabbit (H+L) HRP conjugate (rabbit polyclonal) | Invitrogen | Cat# 31460; RRID:AB_228341 | WB (1:5000) Secondary antibody |
| Antibody | Goat anti-mouse IgG (H+L), Alexa Fluor 488 (mouse polyclonal) | Invitrogen | Cat# A-11029; RRID:AB_138404 | IHC and ICC (1:500) Secondary antibody |
| Antibody | Goat anti-rabbit IgG (H+L), Alexa Fluor 488 (rabbit polyclonal) | Invitrogen | Cat# A-11034; RRID:AB_2576217 | IHC and ICC (1:500) Secondary antibody |
| Antibody | Goat anti-mouse IgG (H+L), Alexa Fluor 594 (mouse polyclonal) | Invitrogen | Cat# A-11032; RRID:AB_2534091 | IHC and ICC (1:500) Secondary antibody |
| Antibody | Goat anti-rabbit IgG (H+L), Alexa Fluor 594 (rabbit polyclonal) | Invitrogen | Cat# A-11037; RRID:AB_2534095 | IHC and ICC (1:500) Secondary antibody |
| Antibody | Goat anti-rabbit IgG (H+L), Alexa Fluor 405 Plus (rabbit polyclonal) | Invitrogen | Cat# A48254; RRID:AB_2890548 | IHC and ICC (1:500) Secondary antibody |
| Antibody | Goat anti-mouse IgG (H+L), Alexa Fluor 405 Plus (mouse polyclonal) | Invitrogen | Cat# A48255; RRID:AB_2890536 | IHC and ICC (1:500) Secondary antibody |
| Biological sample (Mus musculus) | Healthy adult C57BL/6 brain tissue | This paper | N/A | Female, whole brain, isolated from the mice after perfusion for sectioning; check ‘Cryo-sectioning of fixed mouse brain’ section |
| Biological sample (M. musculus) | GBM adult C57BL/6 brain tissue | This paper | N/A | Female, whole brain, isolated from the mice after perfusion for sectioning; check ‘Cryo-sectioning of fixed mouse brain’ section |
| Biological sample (M. musculus) | NU/J Healthy adult nude mice brain tissue | This paper | N/A | Female, whole brain, isolated from the mice after perfusion for sectioning; check ‘Cryo-sectioning of fixed mouse brain’ section |
| Biological sample (M. musculus) | NU/J GBM adult nude mice brain tissue | This paper | N/A | Female, whole brain, isolated from the mice after perfusion for sectioning; check ‘Cryo-sectioning of fixed mouse brain’ section |
| Biological sample (M. musculus) | GBM adult C57BL/6 subcutaneous tumor tissue | This paper | N/A | Female, whole brain, isolated from the mice after perfusion for sectioning; check ‘Cryo-sectioning of fixed mouse brain’ section |
| Chemical compound, drug | ℽ-Secretase inhibitor (GSI) | Merck | 565750 | N/A |
| Chemical compound, drug | RGD peptide (integrin inhibitor) | Sigma-Aldrich | A8052; CAS# 99896-85-2 | N/A |
| Chemical compound, drug | FAK inhibitor (PF-573228) | Sigma-Aldrich | PZ0117; CAS# 869288-64-2 | N/A |
| Chemical compound, drug | PP2 (Src inhibitor) | Sigma-Aldrich | P0042; CAS# 172889-27-9 | N/A |
| Chemical compound, drug | PP3 (negative control, structural analog of PP2) | Sigma-Aldrich | 529574; CAS# 5334-30-5 | N/A |
| Chemical compound, drug | ROCK1 inhibitor | Sigma-Aldrich | 555550; CAS# 871543-07-6 | N/A |
| Chemical compound, drug | RAC1 inhibitor | Sigma-Aldrich | 553502; CAS# 1177865-17-6 | N/A |
| Chemical compound, drug | TGF-β-R1 inhibitor (SB431542) | Sigma-Aldrich | 616464; CAS# 301836-41-9 | N/A |
| Peptide, recombinant protein | Fibromodulin (FMOD) (NM_002023) human | Origene | CAT# TP306534 | Recombinant protein |
| Peptide, recombinant protein | FMOD wild-type peptide (RLDGNEIKR) | Cellmano Biotech Limited, China | N/A | Peptide, custom made upon order |
| Peptide, recombinant protein | FMOD mutant peptide (RLDGNQIMR) | Cellmano Biotech Limited, China | N/A | Peptide, custom made upon order |
| Cell line (Homo sapiens) | LN229 | The American Type Culture Collection | #CRL-2611; RRID:CVCL_0393 | N/A |
| Cell line (H. sapiens) | U251-MG | European Collection of Authenticated Cell Cultures | #09063001; RRID:CVCL_0021 | N/A |
| Cell line (H. sapiens) | MGG4, MGG6. MGG8 | Kind gift from Dr. Wakimoto, Massachusetts General Hospital, Boston, USA | N/A | N/A |
| Cell line (M. musculus) | AGR-53 | Kind gift from Dr. Dinorah Friedmann-Morvinski, Tel Aviv University, Israel | N/A | N/A |
| Cell line (M. musculus) | DBT-Luc | Kind gift from Dr. Dinesh Thotala, Washington University in St. Louis, St Louis, MO, USA | N/A | N/A |
| Cell line (H. sapiens) | ST1 (human pulmonary microvascular endothelial cells [HPMECs]) | Kind gift from Dr. Ron Unger, Johannes Gutenberg University, Germany. | N/A | N/A |
| Cell line (H. sapiens) | Human brain-derived microvascular endothelial cells (HBMECs) | Cell Biologics, USA | #H-6023 | Primary Cell Line |
| Cell line (M. musculus) | B.End3 mouse brain-derived immortalized endothelial cells | The American Type Culture Collection | #CRL-2299; RRID:CVCL_0170 | N/A |
| Cell line (H. sapiens) | U87-MG | European Collection of Authenticated Cell Cultures | #89081402; RRID:CVCL_0022 | N/A |
| Genetic reagent (M. musculus) | C57BL/6J | The Jackson Laboratory | JAX:000664; RRID:IMSR_JAX:000664 | Female, 6–8 weeks old |
| Genetic reagent (M. musculus) | NU/J (athymic nude) | The Jackson Laboratory | JAX 002019; RRID:IMSR_JAX:002019 | Female, 6–8 weeks old |
| Recombinant DNA reagent | RAR3G (TetOn) | Dr. Dinorah Friedmann-Morvinski, Tel Aviv University | N/A | Plasmid |
| Recombinant DNA reagent | FMOD overexpression construct in the pcMV-entry backbone | Origene | #LY419579 | Plasmid |
| Recombinant DNA reagent | CSL Luc | Prof. Thomas Kandesch, Department of Genetics, University of Pennsylvania School of Medicine | N/A | Plasmid |
| Recombinant DNA reagent | pHes1(2.5k)-luc | Addgene | Cat# 43806 | Plasmid |
| Recombinant DNA reagent | NICD pCMV Neo/intracellular domain of human Notch1 (NIC-1) | Prof. Thomas Kandesch, Department of Genetics, University of Pennsylvania School of Medicine | N/A | Plasmid |
| Recombinant DNA reagent | pMD2.G | Dr. G.S. Rao, Indian Institute of Science | N/A | Plasmid |
| Recombinant DNA reagent | psPAX2 | Dr. G.S. Rao, Indian Institute of Science | N/A | Plasmid |
| Recombinant DNA reagent | VSVG | Dr. Dinorah Friedmann-Morvinski, Tel Aviv University | N/A | Plasmid |
| Recombinant DNA reagent | pREV | Dr. Dinorah Friedmann-Morvinski, Tel Aviv University | N/A | Plasmid |
| Recombinant DNA reagent | pMDL | Dr. Dinorah Friedmann-Morvinski, Tel Aviv University | N/A | Plasmid |
| Software, algorithm | ImageJ | ImageJ (http://imagej.nih.gov/ij/) | RRID:SCR_003070 | N/A |
| Software, algorithm | MaxQuant software package | MaxQuant (https://www.maxquant.org/) | RRID:SCR_014485 | V 1.5.5.1 |
| Software, algorithm | Zen Black from Zeiss | Zen Black (https://www.zeiss.com/microscopy/int/products/microscope-software/zen.html) | RRID:SCR_018163 | N/A |
| Software, algorithm | GraphPad Prism | GraphPad Software (https://www.graphpad.com) | RRID:SCR_002798 | Version 6.01 for Windows |
| Software, algorithm | FlowJo | FlowJo (https://www.flowjo.com/solutions/flowjo) | RRID:SCR_008520 | 9.9.6 and v10 |
| Other | Harris Hematoxylin | Merck | 6159380051046 | Histological stain |
| Other | Eosin Y | SDFCL | 44027G25 | Histological stain |
| Other | Reverse phase protein array (RPPA) | https://www.mdanderson.org/research/research-resources/core-facilities/functional-proteomics-rppa-core.html | RRID:SCR_016649 | M.D. Anderson Cancer Center, University of Texas, USA |
Additional files
-
Supplementary file 1
List of proteins exhibiting significantly different abundance in glioma stem-like cell (GSC) and differentiated glioma cell (DGC) secretomes.
- https://cdn.elifesciences.org/articles/78972/elife-78972-supp1-v3.xlsx
-
Supplementary file 2
List of significantly depleted gene sets from gene set enrichment analysis in glioma stem-like cell (GSC) vs. differentiated glioma cell (DGC) RNA-Seq Data (GSE54792).
- https://cdn.elifesciences.org/articles/78972/elife-78972-supp2-v3.xlsx
-
Supplementary file 3
ANOVA values between the different groups of the in vivo co-implantation mouse model experiment.
- https://cdn.elifesciences.org/articles/78972/elife-78972-supp3-v3.xlsx
-
Supplementary file 4
List of primers, shRNA clones, and inhibitors used in the study.
(A) List of primers used in this study. (B) List of shRNAs used in the study; all IDs are of Sigma TRC whole-genome shRNA library. (C) List of inhibitors.
- https://cdn.elifesciences.org/articles/78972/elife-78972-supp4-v3.xlsx
-
MDAR checklist
- https://cdn.elifesciences.org/articles/78972/elife-78972-mdarchecklist1-v3.pdf
-
Source data 1
Raw images for blots of figures and figure supplements.
- https://cdn.elifesciences.org/articles/78972/elife-78972-data1-v3.pdf
Download links
A two-part list of links to download the article, or parts of the article, in various formats.
Downloads (link to download the article as PDF)
Open citations (links to open the citations from this article in various online reference manager services)
Cite this article (links to download the citations from this article in formats compatible with various reference manager tools)
Differentiated glioma cell-derived fibromodulin activates integrin-dependent Notch signaling in endothelial cells to promote tumor angiogenesis and growth
eLife 11:e78972.
https://doi.org/10.7554/eLife.78972


