To better understand the scope and impact of new residential development in the city of Denver, CARTA, the Center for Advanced Research in Traditional Architecture at the University of Colorado Denver, has undertaken a study to document and analyze all new residential construction in the City of Denver from the beginning of 2014.
As Denver emerged from the 2008 recession, the city did so with a clear-eyed plan for its future: Blueprint Denver. Released in 2002 to supplement the city’s 2000 Comprehensive Plan, Blueprint Denver called for “a balanced, multi-modal transportation system, land use that accommodates future growth, and open space throughout the city,” according to Denver Community Planning and Development. Perhaps most critical to the changes evident in Denver’s development today are the “Areas of Change” and “Areas of Stability” identified in Blueprint Denver, as well as the transit-oriented development goals.
Blueprint Denver aimed to focus most new development “to areas of change; areas that will benefit from, and thrive on, an infusion of population, economic activity and investment.” Now, some 15 years on, as we are beginning to see Blueprint Denver’s paper-based vision take built form, we can measure ways that these “Areas of Change” have benefited, and who has benefited, or not, from changes in the demographics, density, intensity of building, open space, land value, and more. Blueprint Denver is currently being updated through the Denveright initiative.
Following the goals of Blueprint Denver, in 2010 the city adopted a new form-based, or as the city calls it, a context-based, zoning code. Form-based zoning codes are considered to be an advance over the old use-based zoning, which segregated uses and contributed to the sprawl of America’s autocentric and unwalkable built environment. The Form-Based Codes Institute defines form-based codes as “a land development regulation that fosters predictable built results and a high-quality public realm by using physical form (rather than separation of uses) as the organizing principle for the code.” [Emphasis added].
CARTA is founded on the premise that traditional urban and architectural patterns and forms have evolved over time, through the earned wisdom and cumulative experience that our building traditions represent, and have led to the creation of some of our highest quality public realms in large cities such as Chicago, New York, and San Francisco as well as small ones like Annapolis, Charleston, and Savannah. Denver itself has the City Beautiful as well as the traditional urban and architectural patterns and forms to thank for its beloved landscaped streets and pathways, its diverse neighborhood characters from LoDo to Baker, and much more. A question this study aims to address is whether Denver’s form-based, or context-based, zoning code is fostering a high-quality public realm, and if not, are there regulatory or advisory mechanisms which can.
Denver has moved into this unprecedented phase of growth with a number of factors impacting new development: Blueprint Denver, a new form-based zoning code, pent up demand for housing newcomers, increasing land values, buyer expectations of larger homes for smaller households, density as a goal, Colorado’s construction defects law’s chilling impact on condominium construction, projects so large they require institutional financing, nationally-based architects building similar products in different markets, greater reliance on technologies like SketchUp to design, and many more, the impacts of which can only now be seen. This ongoing study seeks to document these changes and analyze their impact on the quality of Denver’s urbanism, architecture, landscape, environmental quality, economy, and culture.
In our initial phase of study has included data gathering and documentation of changes in Denver. Utilizing publicly available records, we have gathered data on all residential new building permits from the City of Denver, mapped those permits, and analyzed the permit data itself for number of permits issued, number of units permitted, and total valuation of each building permit type for the entire city of Denver.
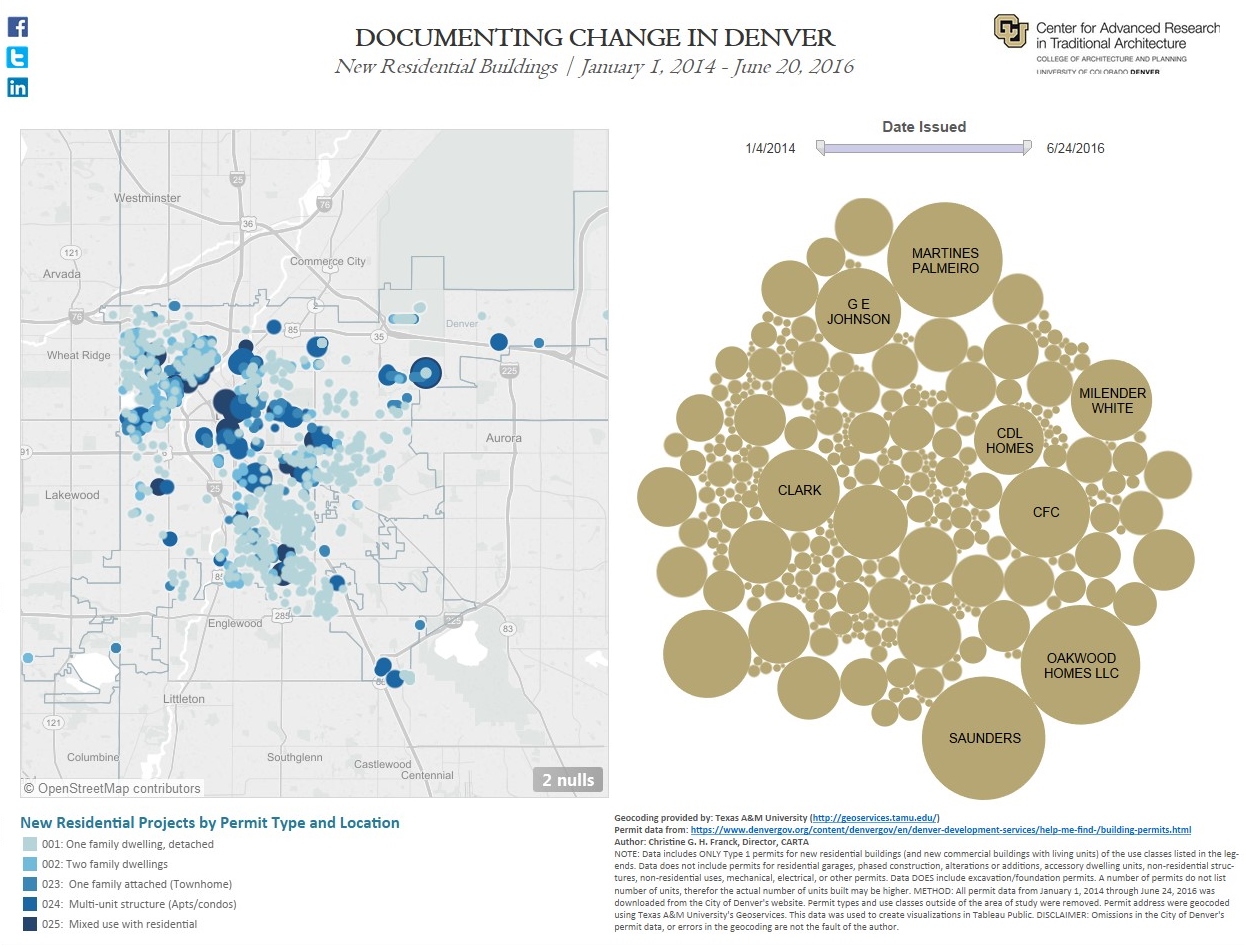
Our dataset and study is limited to Type 1R and 1C permits, which are general residential and commercial construction permits for new building construction. Among Type 1C permits, our data is limited to those with a residential use. Hence, our study only includes: One family dwellings, detached; Two family dwellings (duplexes); One family dwellings, attached; Multi-unit structures on one parcel (apartments/condos); and Mixed-used structures with any living units. We have not included alterations and additions, though we recognize these too can bring significant change. Nor did we include the very few ADUs (Accessory Dwelling Units) permitted in the period of study. Additionally, we have excluded all of the licensed trade permits, garage permits, and miscellaneous other permits like shoring permits, which are also needed for nearly every new residential building that is built. Limiting our data to the residential new building construction permits is a useful way of identifying only new residential buildings, but by excluding all of the permits, and their valuation, required to build each new dwelling, the valuation numbers cited in our study do not reflect the total valuation of a new dwelling.

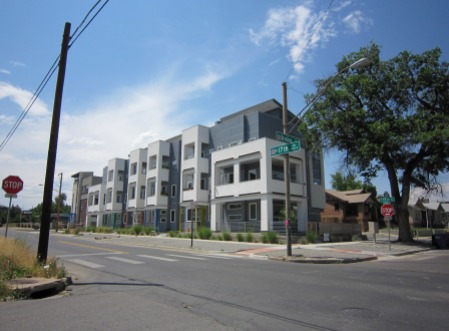
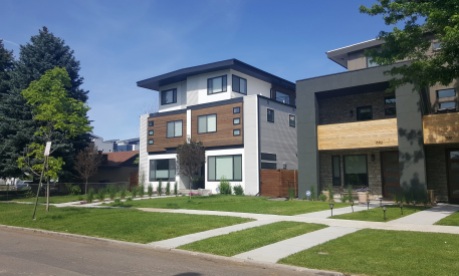
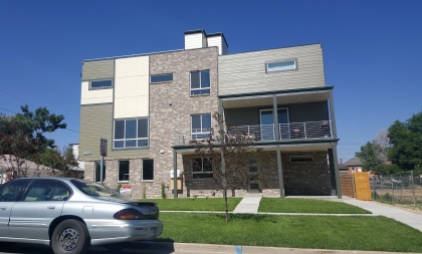
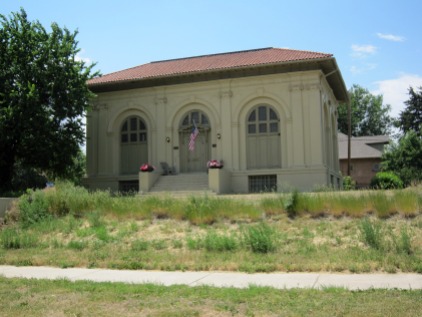
Additionally, to study the impact of change in one particular neighborhood, we have completed a photographic survey of the current conditions of existing and new residential construction for the West Colfax neighborhood and a small portion (south of West 20th Avenue) of the Sloan’s Lake neighborhood. This area includes the site of the former St. Anthony’s hospital and was designated an “Area of Change” in the 2010 Blueprint Denver vision of the City of Denver. For this neighborhood we have also conducted a block-by-block analysis of the forms of the new buildings and their interaction with the public realm, which we will release in later updates to this report.
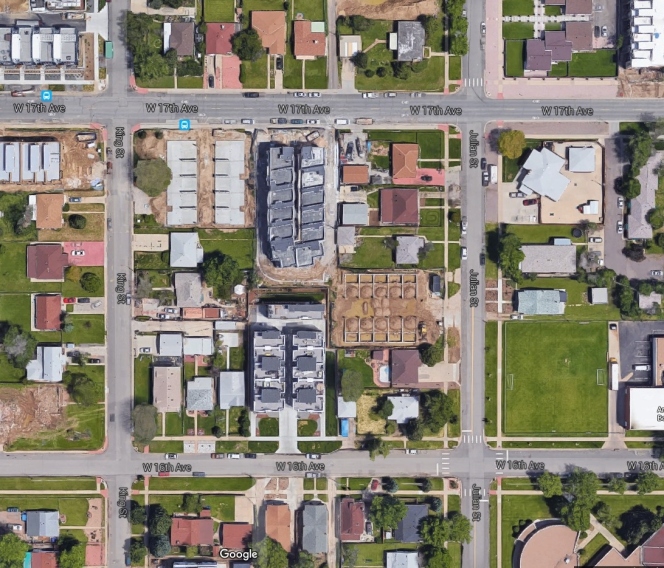
One revelation of this study has been the discovery that the square shaped blocks with H-shaped alleys in West Colfax and portions of Sloan’s Lake and Jefferson Park, occurring from east of Lowell Boulevard, north of West Colfax, west of Federal Boulevard, Clay
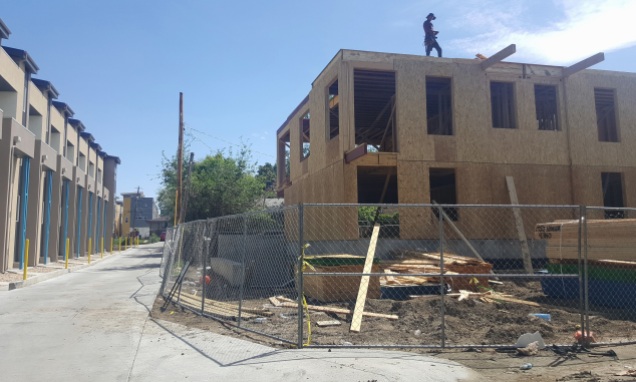
Street, and Bryant Street, and south of West 26th Avenue are blocks where many of the slothouse form of townhouses are being squeezed deep into these large blocks. Many of these blocks’ lots were underutilized, as our photographic survey of the new conditions matched to historic Google street views shows.
The period of study is from January 1, 2014 through the end of June 2016, and photography documenting the neighborhood was taken throughout the summer of 2016. We aim to update the underlying data back to 2012 to capture a full five year period and the years most directly related to the recovery from the recession.
The data studied is displayed on the interactive map below. Each marker represents a Type 1R or 1C (with living units) permit. Detailed permit information appears in the pop-up window for each marker. As mentioned above, note that the valuation included reflects only the valuation of the building permit, it does not include the valuation of other permits required for the completion of a dwelling, such as the licensed trades, foundation work, garage buildings, etc. Also note that the geolocation of the markers is based on the permitted addresses, and are uncorrected. Texas A&M University’s Geoservices provided the latitude and longitude coordinates for each address in the database, allowing for mapping to Google maps, however, the coordinates have varying degrees of precision, so some markers will appear on the block rather than on the exact parcel ID.
The photographic survey of the West Colfax and a small portion of the southeastern Sloan’s Lake neighborhoods is included below. Our next steps will be to analyze the changes in Denver’s urban and architectural character, which we will share here.
Feedback and questions are welcome.
Christine G. H. Franck, Director, CARTA, Center for Advanced Research in Traditional Architecture at the University of Colorado Denver
New Development and Existing Context North of West Colfax Avenue
Note: Omissions in the City of Denver’s permit data, or errors in the geocoding are not the fault of the author. A number of permit records in the city’s data do not list the number of units, therefore the actual number of units built may be higher. All permit data from January 1, 2014 through June 24, 2016 was downloaded from the City of Denver’s website. Non-residential permits and permit types and use classes outside of the area of study were removed. Permit address were geocoded using Texas A&M University’s Geoservices.
Part II of our study will analyze the nature of the changes in the West Colfax neighborhood.




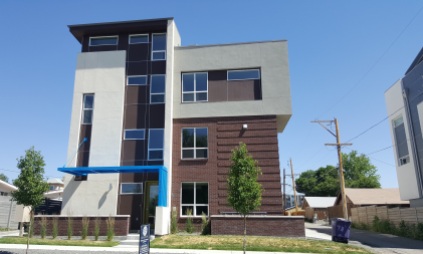








My friends in Portland and Seattle are even talking about “Fugly” Denver architecture. What happened to community pride?
LikeLike