
Optimizing cardiac CT angiography minimum detectable difference via Taguchi’s dynamic algorithm, a V-shaped line gauge, and three PMMA phantoms
Abstract
BACKGROUND:
Radiologists widely use the minimum detectable difference (MDD) concept for inspecting the imaging quality and quantify the spatial resolution of scans.
OBJECTIVE:
This study adopted Taguchi’s dynamic algorithm to optimize the MDD of cardiac CT angiography (CTA) using a V-shaped line gauge and three PMMA phantoms (50, 70, and 90 kg).
METHODS:
The phantoms were customized in compliance with the ICRU-48 report, whereas the V-shaped line gauge was indigenous to solidify the cardiac CTA scan image quality by two adjacent peaks along the V-shaped slit. Accordingly, the six factors A-F assigned in this study were A (kVp), B (mAs), C (CT pitch), D (FOV), E (iDose), and F (reconstruction filter). Since each factor could have two or three levels, eighteen groups of factor combinations were organized according to Taguchi’s dynamic algorithm. Three welltrained radiologists ranked the CTA scan images three times for three different phantoms. Thus, 27 (3
RESULTS:
Minimizing the cross-interactions among factors, the optimal factor combination was found to be as follows: A (100 kVp), B (600 mAs), C (pitch 0.200 mm), D (FOV 280 mm), E (iDose 5), and F (filter XCA). The respective MDD values were 2.15, 2.32, and 1.87 mm for 50, 70, and 90 kg phantoms, respectively. The MDD of the 90 kg phantom had the most precise spatial resolution, while that of the 70 kg phantom was the worst.
CONCLUSION:
The Taguchi static and dynamic optimization algorithms were compared, and the latter’s superiority was substantiated.
1.Introduction
This study optimized the minimum detectable difference (MDD) of cardiac CT angiography (CTA) using three (50, 70, and 90 kg) PMMA phantoms and a V-shaped line gauge according to Taguchi’s dynamic algorithm. Radiologists widely use the MDD concept for inspecting the imaging quality and quantify the spatial resolution of scans [1, 2, 3, 4, 5]. The MDD advantage over the conventional line pair per cm approach can be solidified in many aspects because MDD accounts for the distance between two adjacent peaks from SPECT (single-photon emission computed tomography) profile and the accompanied FWHM (full width of half maximum) of peaks.
The imaging quality of scans in medical facilities, such as X-ray, cardiac bi-plane X-ray, CT, CTA, mammography, and a gamma camera, is vital for the accurate diagnosis. Therefore, multiple techniques have been introduced to upgrade the spatial resolution, compromising the high quality of the acquired images and an acceptable exposed dose required for their provision [6, 7, 8, 9, 10, 11, 12, 13]. Taguchi’s optimization analysis became an assessable technique in providing quantified data for optimization due to its user-friendly and reliable realization. In contrast, Taguchi’s dynamic algorithm is seldom applied in clinical approaches because the dynamic scenario has its inherent limitation in empirical preset. Specifically, the surveyed target (either a phantom or a gauge) needs to be replaced to compose the dynamic scenario. The target replacement via the dynamic algorithm is mandatory in evaluating the quality sensitivity [14], which is a required index to justify the dynamic quality characteristic.
In this study, the V-shaped gauge was placed into three PMMA phantoms with various geometrical sizes and weights, namely 50, 70, or 90 kg to evaluate the MDD in clinical cardiac CTA scans. The V-shaped gauge had to be scanned 18 times via Taguchi’s dynamic algorithm to collect the images for optimizing them via conversion by MATLAB and plotting by the ORIGIN default program to obtain the MDD. The unique quality characteristic of sensitivity in the dynamic algorithm was interpreted for different scenarios to satisfy the special consideration of the cardiac CTA technique.
2.Materials and methods
2.1Orthogonal array
The unique feature of Taguchi’s algorithm is that it not only optimizes assigned factors from a particular dataset but also identifies and ranks factors influencing the main variable. The six factors for cardiac CTA scan protocol were kVp, mAs, pitch (the distance of table travel per a 360
Table 1
Taguchi suggests the standard L
| Group | Factor | |||||
| A | B | C | D | E | F | |
| 1 | 1 | 1 | 1 | 1 | 1 | 1 |
| 2 | 1 | 1 | 2 | 2 | 2 | 2 |
| 3 | 1 | 1 | 3 | 3 | 3 | 3 |
| 4 | 1 | 2 | 1 | 1 | 2 | 2 |
| 5 | 1 | 2 | 2 | 2 | 3 | 3 |
| 6 | 1 | 2 | 3 | 3 | 1 | 1 |
| 7 | 1 | 3 | 1 | 2 | 1 | 3 |
| 8 | 1 | 3 | 2 | 3 | 2 | 1 |
| 9 | 1 | 3 | 3 | 1 | 3 | 2 |
| 10 | 2 | 1 | 1 | 3 | 3 | 2 |
| 11 | 2 | 1 | 2 | 1 | 1 | 3 |
| 12 | 2 | 1 | 3 | 2 | 2 | 1 |
| 13 | 2 | 2 | 1 | 2 | 3 | 1 |
| 14 | 2 | 2 | 2 | 3 | 1 | 2 |
| 15 | 2 | 2 | 3 | 1 | 2 | 3 |
| 16 | 2 | 3 | 1 | 3 | 2 | 3 |
| 17 | 2 | 3 | 2 | 1 | 3 | 1 |
| 18 | 2 | 3 | 3 | 2 | 1 | 2 |
Table 2
The six factors of cardiac CTA scan protocol, every factor having two or three levels as recommended by the Taguchi L
| Factor | Level 1 | Level 2 | Level 3 |
|---|---|---|---|
| (A) kVp | 100 | 120 | |
| (B) mAs | 600 | 700 | 800 |
| (C) Pitch (mm) | 0.126 | 0.150 | 0.200 |
| (D) FOV (mm) | 220 | 250 | 280 |
| (E) iDOse | 3 | 4 | 5 |
| (F) Reconstruction Filter | XCC | XCB | XCA |
2.2Taguchi’s dynamic algorithm
Unlike the static preset in Taguchi’s optimization, the dynamic one is reputed for its strong flexibility in satisfying various conditions in a clinical environment. The unique definition of sensitivity (
(1)
(2)
(3)
where
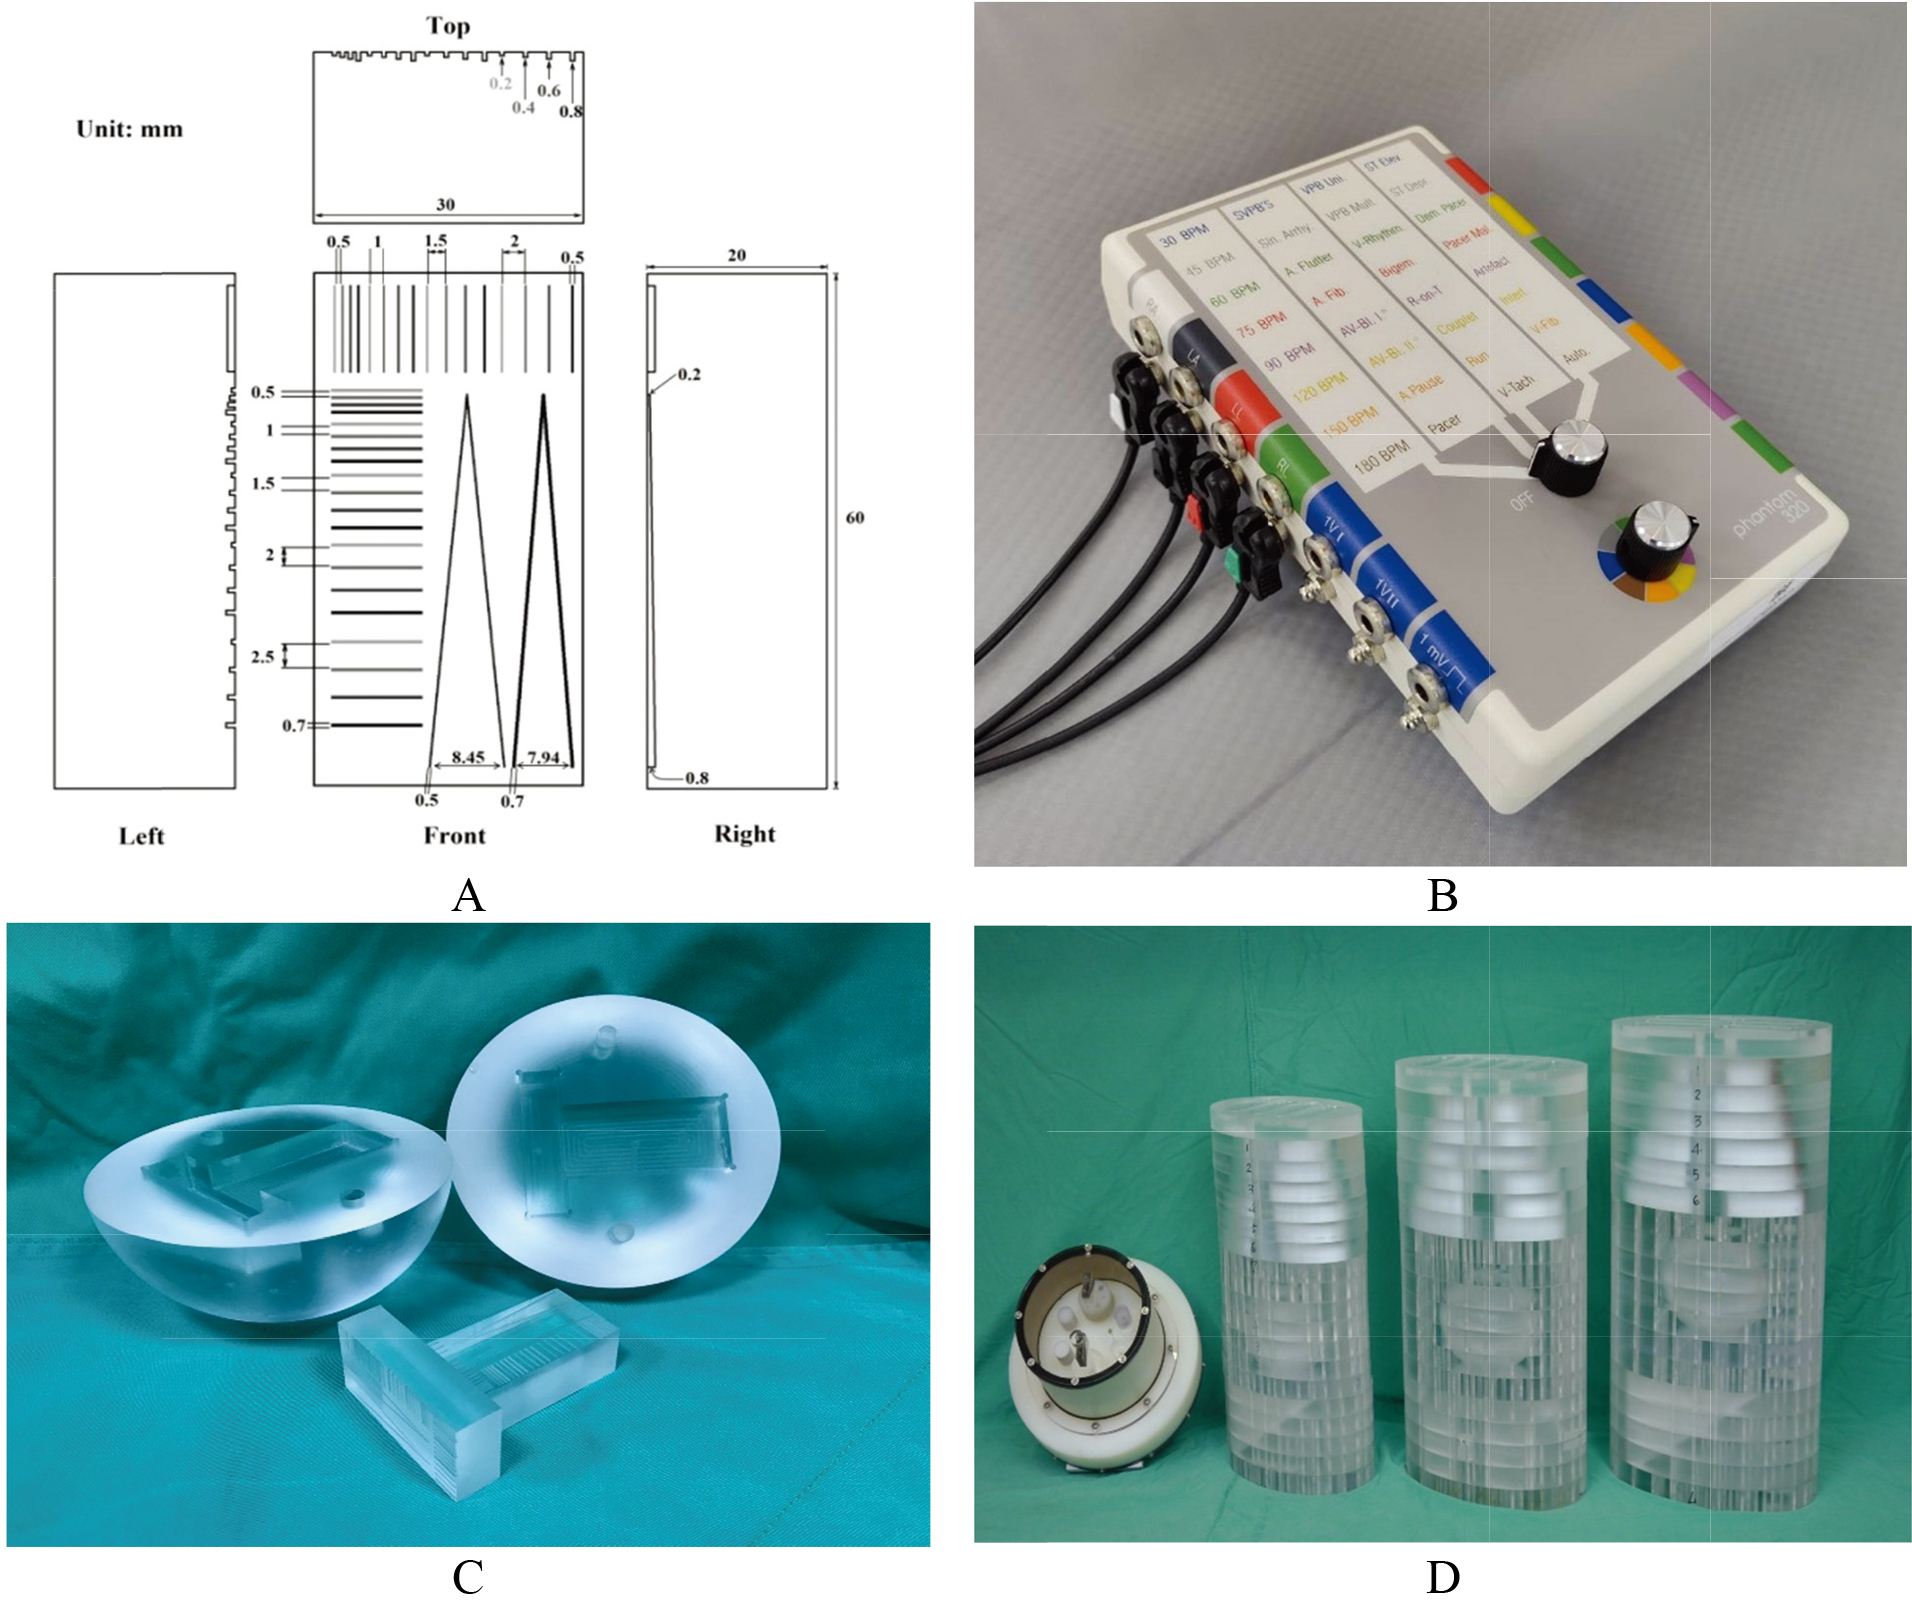
Figure 1.
(A) implies a special-made V-shaped line gauge with 20 mm-high, 60 mm-long, and 30 mm-wide cuboid. In contrast, the two V-shaped lines had 0.5 or 0.7 widths, and the slit depth changed from 0.2 mm in the top to 0.8 mm in the bottom. The quantified survey focused on the left V-shaped line with a 0.5 mm width to justify the MDD in this measurement, (B) the commercial 320 ECG simulator was adopted to synchronize the CTA scanning frequency and simulated 60 BPM (beats per min.), (C) the tightly-composed cardiac ball with two vertical and horizontal V-shaped line gauges, and (D) three cardiac balls were placed into the 50, 70, and 90 kg PMMA phantoms, respectively.
2.3A V-shaped line gauge and PMMA phantoms
Figure 1A depicts a specially made V-shaped line gauge with 20 mm-high, 60 mm-long, and 30 mm-wide cuboid. As shown, the two V-shaped lines had 0.5 or 0.7 widths, and the slit depth gradually changed from 0.2 mm in the top to 0.8 mm in the bottom. Specifically, the top two lines were preset to barely contacted each other with a shallow slit of 0.2 mm depth only. In contrast, the gap between the two lines became 8.45 mm (for the 0.5 mmwide slit) or 7.94 mm (for the 0.7 mm-wide slit) in 0.8 mm-deep at the bottom. The quantified survey focused on the left V-shaped line with a 0.5 mm width to solidify the MDD in this measurement, (B) A commercial 320 ECG simulator was adopted to synchronize CTA scanning frequency and the simulated 60 BPM (beats per min.), (C) the tightly-composed cardiac ball with two vertical and horizontal V-shaped line gauges and (D) three cardiac balls were placed into the 50, 70, and 90 kg PMMA phantoms, respectively. The PMMA phantoms were revised according to the original ICRU-48 report [16]. In addition, a commercial phantom (model 4550-122-01471) for Philip Brilliance CT (model 128-sliced Philips Ingenuity) was also put aside for size comparing.
2.4The MDD definition and application
The minimum detectable distance (MDD) between two peak centers was determined via the revised Student’s
(4)
where
Figure 2.
(A) two peaks were recognized as fully separated; (B) two peaks scarcely passed the Student’s
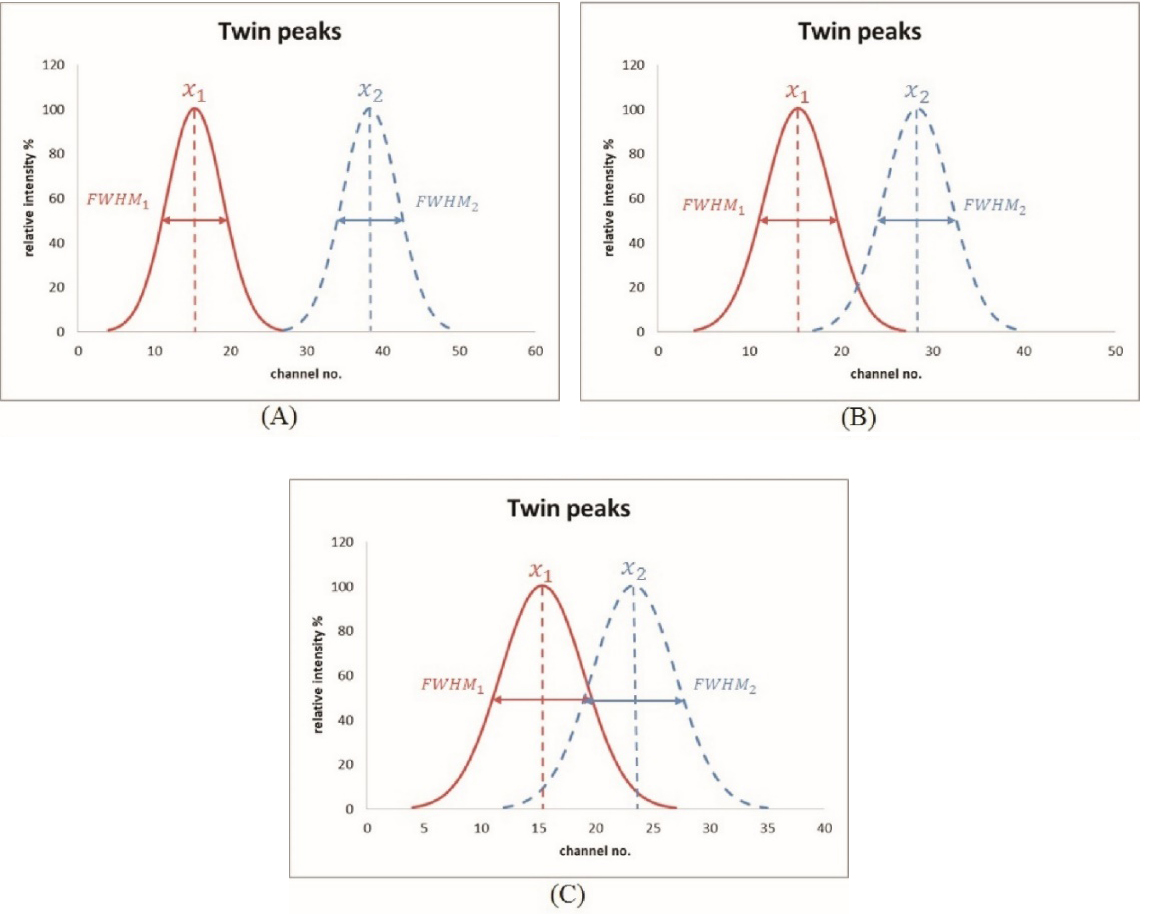
The MDD evaluation from two adjacent peaks via the specific V-shaped slit was performed by a gradual changing of the valley edge of two peaks and a quantitative assessment of the originally designed edge width. Unlike V-shaped water phantoms used in nuclear medicine examinations [18], the 0.5 mm-deep V-shaped slit (cf. Fig. 1A) provided the finest edge between line pairs to
2.5Cardiac CTA scan and ranking
The imaging quality of the cardiac CT scan protocol was simulated by the V-shaped line gauge, as shown in Fig. 1A. To survey the gauge images’ quality, each slit was infused contrast media solution (
3.Results
3.1Taguchi’s optimization
Figure 3 shows typical V-shaped line gauge images from cardiac CTA scans of 18 groups in the 70 kg PMMA phantom Since those obtained via 50 or 90 kg ones were quite similar, they were omitted for brevity. Some of them had low contrast ratios, being too bright or too dark to identify the V-shape. Table 3 lists the raw data obtained from the practical survey of CTA images. Each viewer ranked the 18 images three times for three different phantom sizes; thus, a total of 486 (3
Table 3
Each viewer ranked the 18 images three times for three different phantom sizes; thus, a total of 486 (3
| Group. | 50 kg | 70 kg | 90 kg | Beta | Stdev | S/N | ||||||||||||||||||||||||
|---|---|---|---|---|---|---|---|---|---|---|---|---|---|---|---|---|---|---|---|---|---|---|---|---|---|---|---|---|---|---|
| Viewer1 | Viewer2 | Viewer3 | Viewer1 | Viewer2 | Viewer3 | Viewer1 | Viewer2 | Viewer3 | ||||||||||||||||||||||
| # 1 | # 2 | # 3 | # 1 | # 2 | # 3 | # 1 | # 2 | # 3 | # 1 | # 2 | # 3 | # 1 | # 2 | # 3 | # 1 | # 2 | # 3 | # 1 | # 2 | # 3 | # 1 | # 2 | # 3 | # 1 | # 2 | # 3 | ||||
| 1 | 18 | 18 | 18 | 17 | 17 | 18 | 18 | 18 | 18 | 12 | 11 | 12 | 9 | 9 | 10 | 16 | 16 | 16 | 14 | 14 | 14 | 5 | 1 | 1 | 6 | 6 | 6 | 0.21 | 13.08 | |
| 2 | 12 | 13 | 14 | 14 | 10 | 11 | 13 | 12 | 13 | 14 | 9 | 11 | 15 | 15 | 14 | 3 | 11 | 11 | 6 | 5 | 5 | 6 | 8 | 8 | 9 | 8 | 7 | 0.15 | 10.51 | |
| 3 | 4 | 4 | 3 | 8 | 3 | 3 | 5 | 4 | 5 | 2 | 2 | 2 | 2 | 1 | 2 | 11 | 3 | 3 | 3 | 2 | 4 | 1 | 6 | 6 | 3 | 4 | 4 | 0.05 | 4.22 | 13.93 |
| 4 | 13 | 12 | 12 | 12 | 14 | 14 | 12 | 10 | 11 | 11 | 15 | 10 | 11 | 11 | 11 | 10 | 10 | 10 | 9 | 10 | 8 | 14 | 14 | 14 | 14 | 14 | 14 | 0.13 | 11.89 | |
| 5 | 6 | 7 | 7 | 6 | 4 | 4 | 8 | 13 | 10 | 6 | 6 | 6 | 1 | 2 | 1 | 5 | 5 | 5 | 5 | 6 | 7 | 8 | 3 | 3 | 5 | 5 | 5 | 0.09 | 5.85 | 5.72 |
| 6 | 16 | 17 | 15 | 16 | 16 | 16 | 17 | 17 | 17 | 15 | 16 | 14 | 16 | 14 | 15 | 4 | 18 | 4 | 17 | 16 | 17 | 7 | 10 | 10 | 10 | 10 | 10 | 0.12 | 14.30 | |
| 7 | 9 | 9 | 10 | 7 | 8 | 8 | 7 | 7 | 7 | 8 | 8 | 9 | 12 | 12 | 12 | 14 | 4 | 15 | 13 | 12 | 12 | 9 | 11 | 11 | 7 | 11 | 12 | 0.14 | 9.80 | |
| 8 | 15 | 15 | 16 | 18 | 18 | 17 | 14 | 15 | 14 | 17 | 17 | 17 | 14 | 17 | 17 | 18 | 15 | 18 | 16 | 15 | 16 | 13 | 15 | 15 | 15 | 15 | 16 | 0.20 | 15.59 | |
| 9 | 17 | 16 | 17 | 15 | 15 | 15 | 16 | 16 | 16 | 18 | 18 | 18 | 18 | 18 | 18 | 15 | 14 | 14 | 18 | 18 | 18 | 16 | 16 | 16 | 18 | 18 | 17 | 0.18 | 16.50 | |
| 10 | 8 | 8 | 8 | 4 | 6 | 6 | 3 | 3 | 3 | 7 | 7 | 8 | 4 | 4 | 4 | 7 | 7 | 7 | 4 | 4 | 3 | 10 | 4 | 4 | 4 | 3 | 2 | 0.06 | 5.59 | 8.85 |
| 11 | 2 | 2 | 2 | 2 | 2 | 2 | 1 | 1 | 1 | 4 | 4 | 4 | 3 | 3 | 3 | 12 | 12 | 12 | 2 | 1 | 2 | 4 | 2 | 2 | 2 | 2 | 3 | 0.09 | 4.31 | 8.38 |
| 12 | 11 | 11 | 11 | 11 | 12 | 12 | 10 | 9 | 9 | 9 | 12 | 15 | 17 | 16 | 16 | 13 | 13 | 13 | 15 | 13 | 15 | 15 | 12 | 13 | 8 | 7 | 8 | 0.14 | 12.21 | |
| 13 | 10 | 10 | 9 | 10 | 13 | 10 | 11 | 11 | 12 | 13 | 13 | 13 | 10 | 10 | 9 | 1 | 2 | 1 | 7 | 7 | 6 | 11 | 9 | 9 | 11 | 9 | 9 | 0.07 | 9.73 | 3.14 |
| 14 | 5 | 5 | 5 | 3 | 9 | 7 | 6 | 6 | 6 | 5 | 5 | 5 | 7 | 6 | 5 | 6 | 1 | 2 | 8 | 9 | 10 | 12 | 13 | 12 | 12 | 12 | 11 | 0.05 | 7.92 | 8.74 |
| 15 | 3 | 1 | 4 | 5 | 7 | 5 | 4 | 5 | 4 | 3 | 3 | 3 | 6 | 7 | 7 | 2 | 17 | 17 | 10 | 8 | 9 | 3 | 7 | 7 | 13 | 13 | 13 | 0.14 | 7.68 | |
| 16 | 1 | 3 | 1 | 1 | 1 | 1 | 2 | 2 | 2 | 1 | 1 | 1 | 5 | 5 | 6 | 17 | 8 | 6 | 1 | 3 | 1 | 2 | 5 | 5 | 1 | 1 | 1 | 0.05 | 4.54 | 12.48 |
| 17 | 14 | 14 | 13 | 9 | 11 | 13 | 15 | 14 | 15 | 16 | 10 | 16 | 13 | 13 | 13 | 8 | 6 | 8 | 12 | 17 | 13 | 18 | 18 | 18 | 17 | 17 | 18 | 0.14 | 14.00 | |
| 18 | 7 | 6 | 6 | 13 | 5 | 9 | 9 | 8 | 8 | 10 | 14 | 7 | 8 | 8 | 8 | 9 | 9 | 9 | 11 | 11 | 11 | 17 | 17 | 17 | 16 | 16 | 15 | 0.11 | 11.11 | |
Figure 3.
Typical V-shaped line gauge images from cardiac CTA scans of 18 groups in the 70 kg PMMA phantom. Since those obtained via 50 or 90 kg ones were quite similar, they were omitted for brevity.
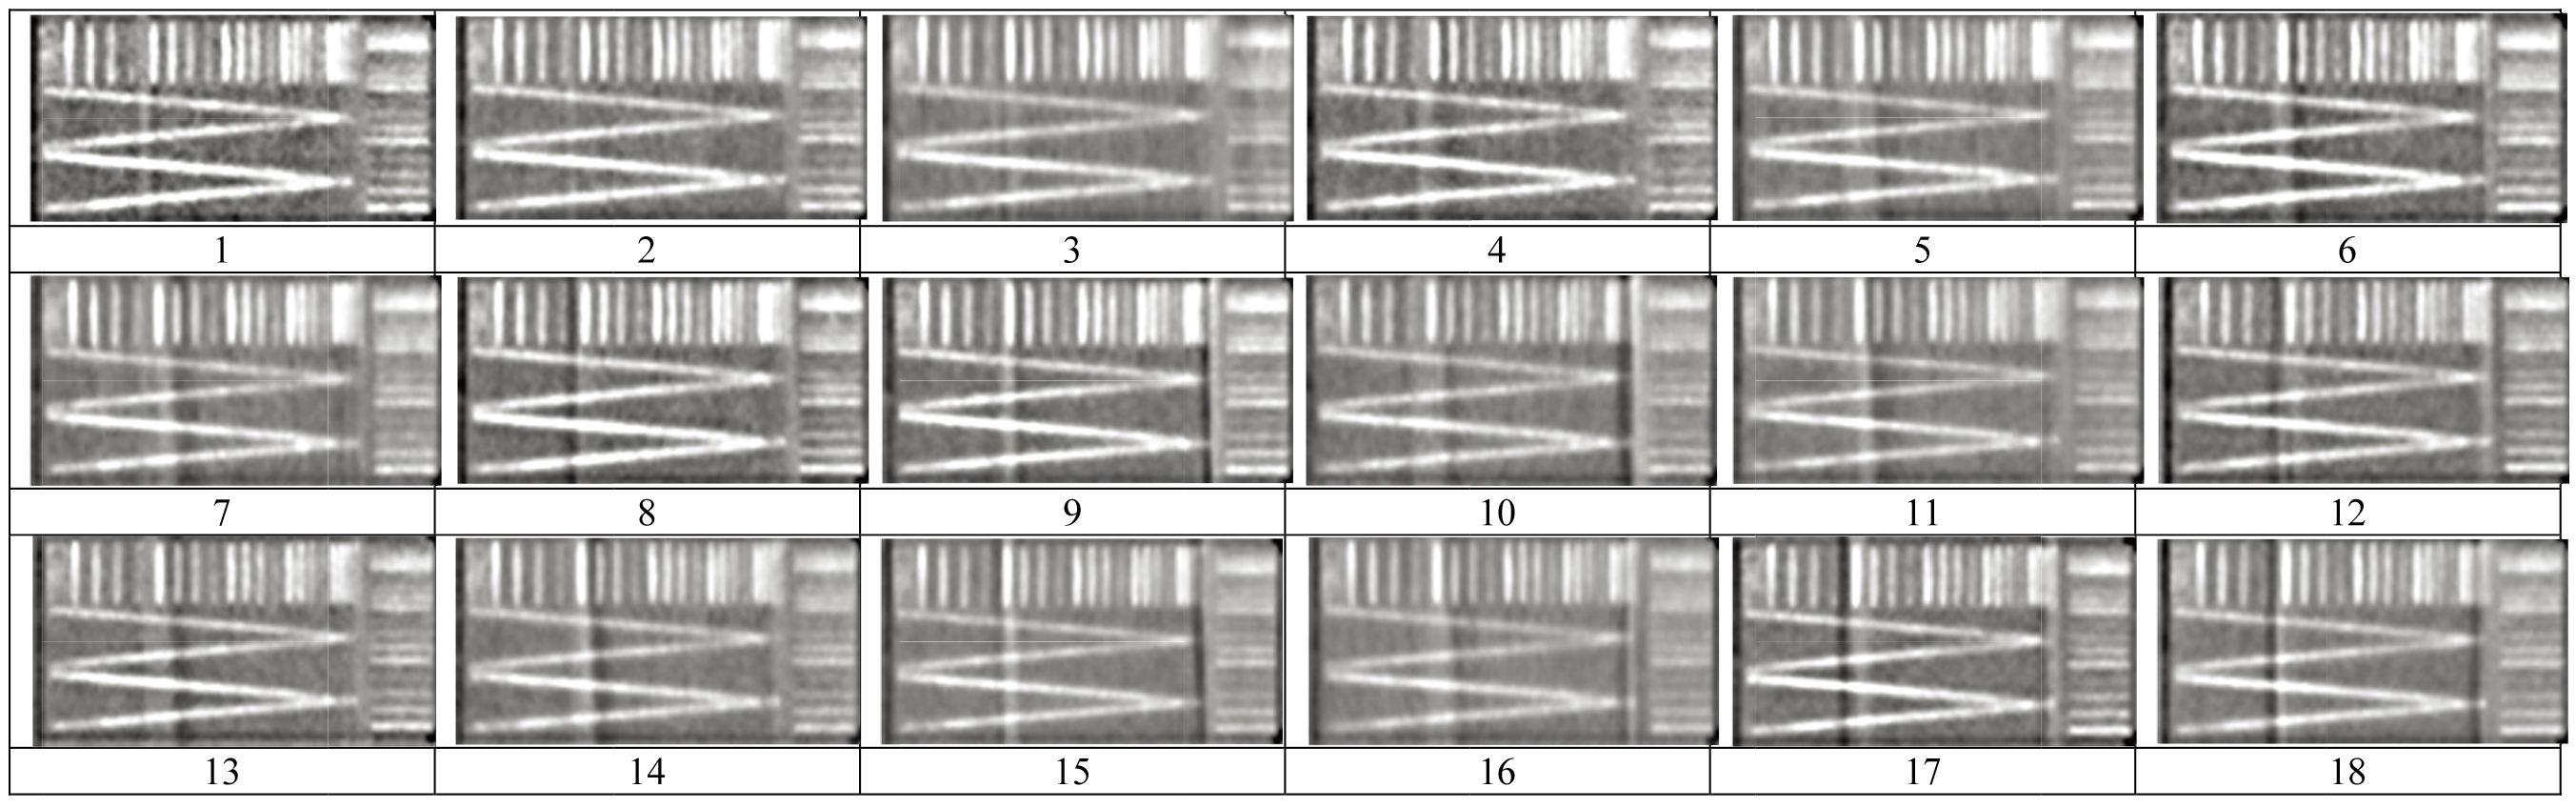
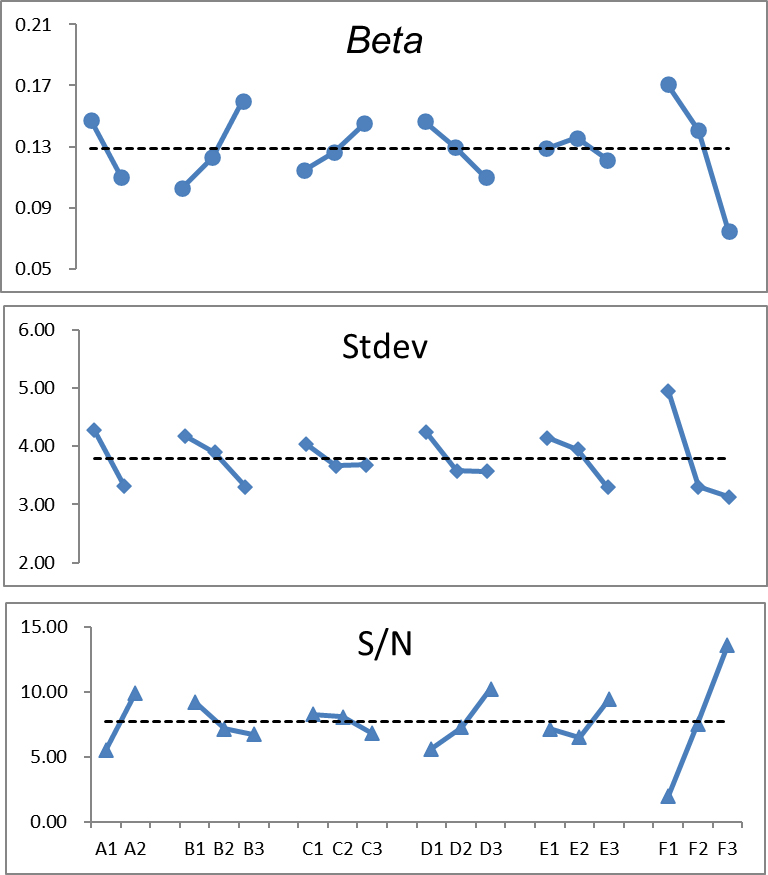
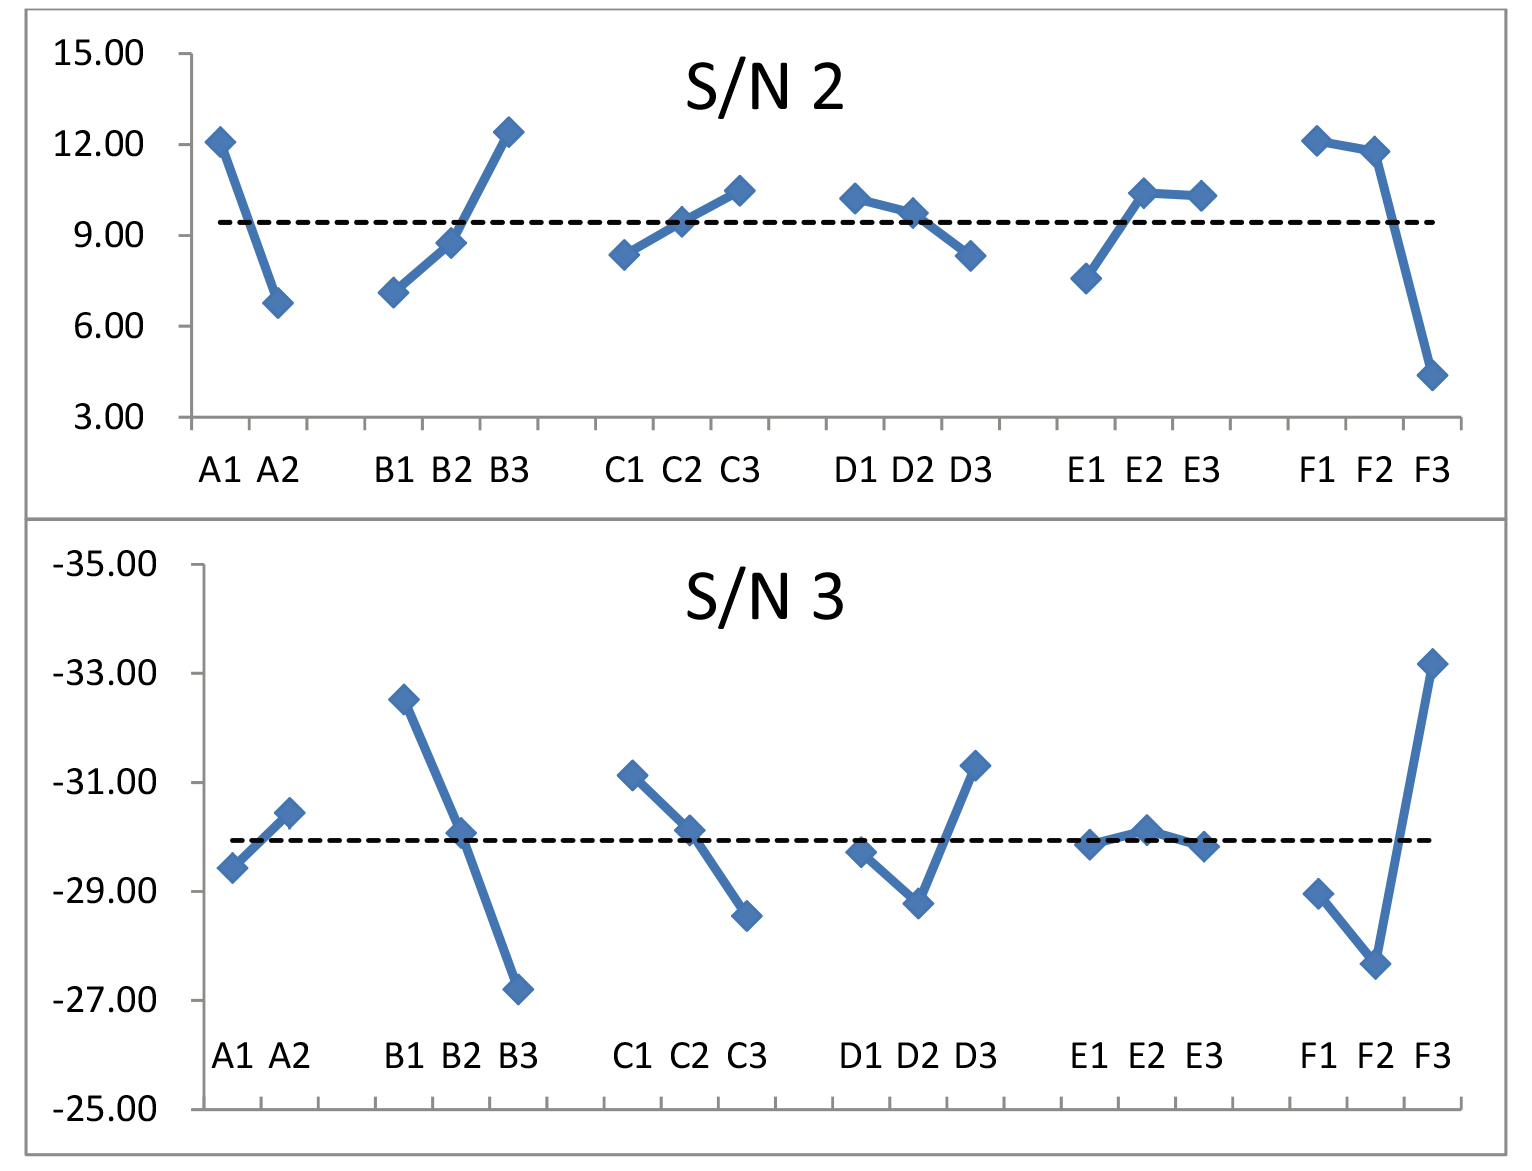
Figure 4.
The beta, stdev, and S/N exhibited strong fluctuations. Theoretically, low beta and stdev values and high S/N provide the best expectation.
3.2MDD of PMMA phantoms with various weights
Table 4
The revised Student’s
| MDD |
| |||
|---|---|---|---|---|
| 50 kg 2.15 mm | Pass |
| Fail |
|
| 70 kg 2.32 mm | Pass |
| Fail: |
|
| 90 kg 1.87 mm | Pass |
| Fail: |
|
Table 4 shows the revised Student’s
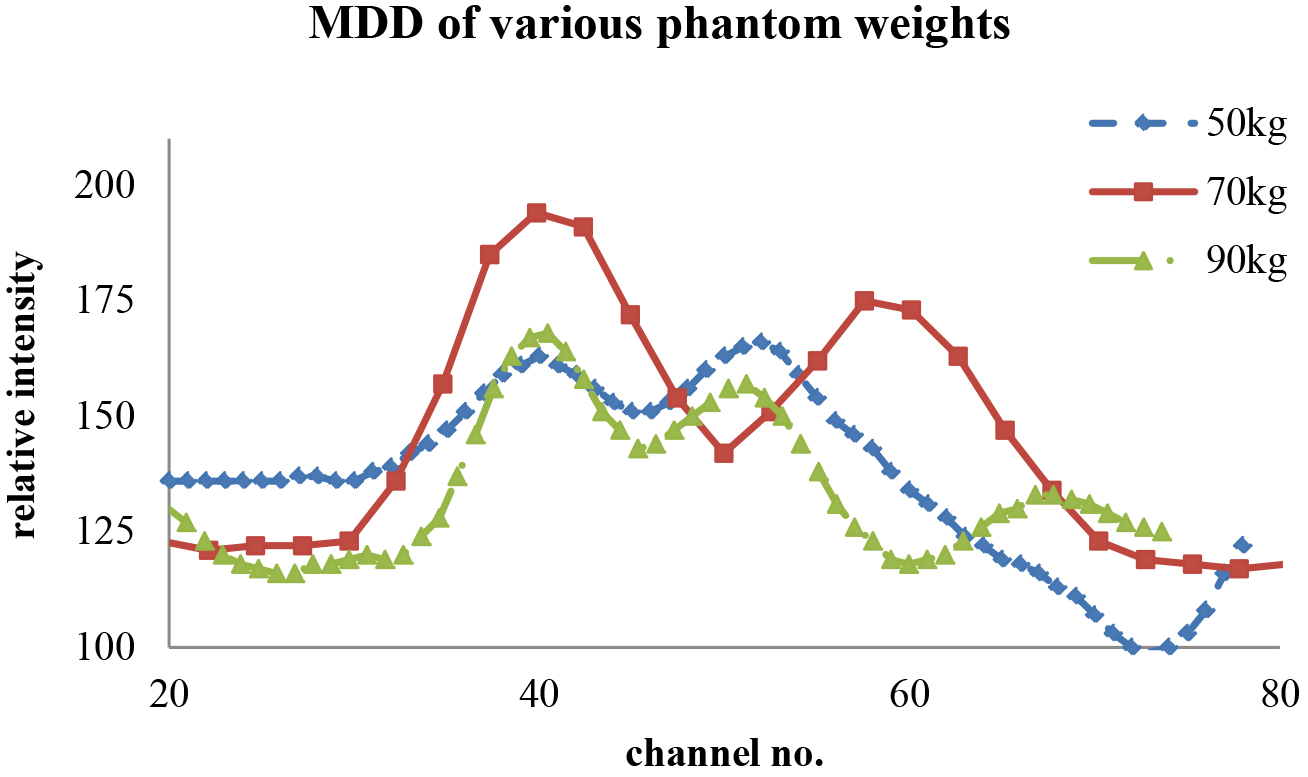
Figure 5.
The line-cut SPECT profile from the V-shaped line gauge for various phantom weights that just passed the Student’s
4.Discussion
4.1The ANOVA analytical result
Static Taguchi’s optimization requires the ANOVA analysis to discriminate dominant and minor factors via the variance analysis. In contrast, for dynamic Taguchi’s one, the ANOVA is optional because the integrated performance is dominated by the unique quality characteristic of dynamic analysis, namely sensitivity [15]. However, by checking the sum of squared variances for various phantom weights, one can get a deeper insight into the fluctuation patterns. Consider the following parameters:
(5)
(6)
(7)
where
Table 5
A significantly different distribution of
| Factor | DOF | 50 kg | 70 kg | 90 kg | |||
|---|---|---|---|---|---|---|---|
| SS | Contri % | SS | Contri % | SS | Contri % | ||
| A | 1 | 1200.50 | 27.53% | 352.60 | 8.09% | 53.39 | 1.22% |
| B | 2 | 74.04 | 1.70% | 400.70 | 9.19% | 1217.37 | 27.92% |
| C | 2 | 12.33 | 0.28% | 79.15 | 1.82% | 381.59 | 8.75% |
| D | 2 | 184.11 | 4.22% | 194.70 | 4.47% | 213.37 | 4.89% |
| E | 2 | 0.48 | 0.01% | 198.04 | 4.54% | 5.59 | 0.13% |
| F | 2 | 2481.33 | 56.90% | 1112.11 | 25.50% | 1268.04 | 29.08% |
| Others | 6 | 67.04 | 1.54% | 279.20 | 6.40% | 334.04 | 7.66% |
| Error | 144 | 340.67 | 7.81% | 1744.00 | 40.00% | 887.11 | 20.34% |
| Total | 161 | 4360.50 | 100.00% | 4360.50 | 100.00% | 4360.50 | 100.00% |
Table 5 presents a significantly different distribution of
4.2Sensitivity in the dynamic algorithm
As the unique quality characteristic of Taguchi’s dynamic algorithm, sensitivity can be customized and revised according to different perspectives. For most dynamic studies, high sensitivity is always preferable [8, 13, 19]. However, the sensitivity has a different interpretation in this study because the sensitivity implies the imaging quality versus various phantoms’ weights. Thus, an insensible quality characteristic is preferable for radiologists in routine cardiac CTA scans. Accordingly, the parameter S/N (
(8)
(9)
where avg is the total average of all ranked scores from three viewers and three phantoms’ weights (cf. Table 3, 3
4.3Dynamic algorithm superiority over the static one in Taguchi’s suggestion
In the typical static preset case, the original phantom configuration remains unchanged. In the dynamic one, the original phantom can be replaced by others of different sizes to match the real situation in routine work. The dynamic algorithm’s unique sensitivity (
5.Conclusions
The MDD of cardiac CT angiography (CTA) was optimized using three (50, 70, and 90 kg) PMMA phantoms and a V-shaped line gauge according to Taguchi’s dynamic algorithm. As the unique feature of the dynamic algorithm, sensitivity was redefined to satisfy the preset scenario, i.e., an insensible quality characteristic was favored in facing various patients’ weights for routine cardiac CTA diagnosis. Eighteen combinations of six factors were organized according to Taguchi’s optimization analysis, whereas the dynamic algorithm was realized by changing the phantom sizes/weights to derive the sensitivity. A revised S/N (dB) parameter was adopted to find the optimal factor combination of cardiac CTA to have the finest MDD of V-shaped line gauge. The results were A1 (100 kVp), B1 (600 mAs), C3 (pitch 0.200 mm), D3 (FOV 280 mm), E3 (iDose 5), and F3 (filter XCA). The derived MDD values were 2.15, 2.32, and 1.87 mm for 50, 70, and 90 kg PMMA phantoms. The static and dynamic optimization algorithms were compared, and the latter’s superiority was substantiated.
Acknowledgments
The authors highly appreciate the financial support of this study by the Ministry of Science and Technology of the Republic of China (contract no. MOST 110-2221-E-166-001) and the Taichung Armed Forces General Hospital in Taiwan (contract no. TCAFGH-D-110034).
Conflict of interest
None to report.
References
[1] | Pan LF, Erdene E, Pan LK. Optimization of the imaging quality of 64-slice CT acquisition protocol using Taguchi analysis: A phantom study, Bio-Medical Materials and Engineering, (2015) ; 26: : s1651-1658. |
[2] | Kittipayak S, Pan LF, Chiang FT, et al. The optimization of the single photon emission computed tomography image quality via taguchi analysis: A feasibility study of a V-shaped phantom, J. Medical Imaging and Health Informatics, (2017) ; 7: (1): 143-148. |
[3] | Pan LF, Wu KY, Chen KL, et al. Taguchi method-based optimization of the minimum detectable difference of a cardiac X-ray imaging system using a precise line pair gauge, JMMB, (2019) ; 19: (7): 1940030. |
[4] | Peng BR, Kittipayak S, Pan LF, et al. Optimizing the minimum detectable difference of computed tomography scanned images via the Taguchi analysis: A feasibility study with an indigenous hepatic phantom and a line group gauge, JMMB, (2019) ; 19: (8): 1940048. |
[5] | Lee TM, Lin CC, Peng BR, et al. Integration of Taguchi analysis with phantom and innovative gauges: Optimization of the CT scan protocol for peripheral arterial occlusive disease (PAOD) syndrome, JMMB, (2020) ; 20: (9): 2040005. |
[6] | Yeh DM, Chang PJ, Pan LK. The optimum Ga-67-citrate gamma camera imaging quality factors as first calculated and shown by the Taguchi’s analysis, Hell J Nucl Med, (2013) ; 16: (1): 25-32. |
[7] | Huang CK, Wu J, Cheng KY, et al. Optimization of Imaging parameters for SPECT scans of [99mTc]TRODAT-1 using taguchi analysis, PLOS ONE, (2015) ; 10: (3): e011381. doi: 10.1371/journal.pone.0113817. |
[8] | Chen CY, Liu KC, Chen HH, et al. Optimizing the TLD-100 readout system for various radiotherapy beam doses using the Taguchi methodology, Applied Radiation Isotopes, (2010) ; 68: : 481-488. |
[9] | Yeh DM, Wang TH, Pan LK. Evaluating the quality characteristics of TLD-100T and TLD-100H exposed to diagnostic X-rays and 64 multislice CT using Taguchi’s quality loss function, Radiation Measurement, (2015) ; 80: : 17-22. |
[10] | Chiang FT, Chu KH, Chen CY, et al. Taguchi’s analysis to optimize descending aortography for patent ductus arteriosus, with clinical verification, Hellenic Journal of Nuclear Medicine, (2016) ; 19: (2): 118-123. |
[11] | Chen CY, Pan LF, Chiang FT, et al. Optimizing quality of digital mammographic imaging using Taguchi analysis with an ACR accreditation phantom, Bioengineered, (2016) ; 7: (4): 226-234. |
[12] | Pan LF, Chu KH, Sher HF, et al. Optimizing left anterior oblique (LAO) caudal imaging in coronary angiography using the Taguchi method: A phantom study with clinical verification, The International Journal of Cardiovascular Imaging, (2017) ; 33: (9): 1287-1295. |
[13] | Pan LF, Le Y, Yen YC, et al. Optimizing the TLD-100H readout system under various radioactive I-131 doses via the revised Taguchi dynamic quality loss function, JMMB, (2020) ; 20: (10): 2040024. |
[14] | Schoepf UJ. CT of the Heart, 2 |
[15] | Roy RK. A primer on the Taguchi method, 2 |
[16] | White DR, Buckland-Wright JC, Griffith RV, et al. Phantoms and computational models in therapy, diagnosis and protection, ICRU Report 48, (1992) ; 25: (1). doi: 10.1093/jicru/os25.1.Report48. |
[17] | Kenny DA, Mannetti L, Pierro A, et al. The statistical analysis of data from small groups, J Personal Soc Psychol, (2002) ; 83: (1): 126-137. |
[18] | Chang CF, Chen CF, Wang TH, et al. Semi-quantification of the minimum detectable difference of gamma camera SPET for four radionuclides via an innovative PMMA phantom with a V-shaped slit: Interpretation of a feasibility study, HJNM, (2019) ; 22: (1): 7-14. |
[19] | Kuo HN, Yi JE, Chen CH, et al. Taguchi dynamic analysis application to computer tomography number-mass density linear dependence optimization, Computer Assisted Surgery, (2017) ; 22: (s1): 45-53. |

