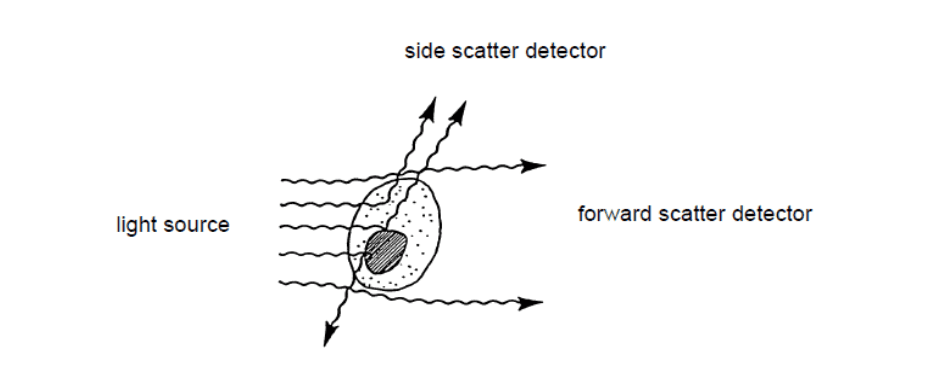
Figure 2: Light scattering when the laser beam illuminates a cell in a flow cytometer[1]
When the laser light illuminates the sample cells, it ricochets in different directions depending on their physical properties.
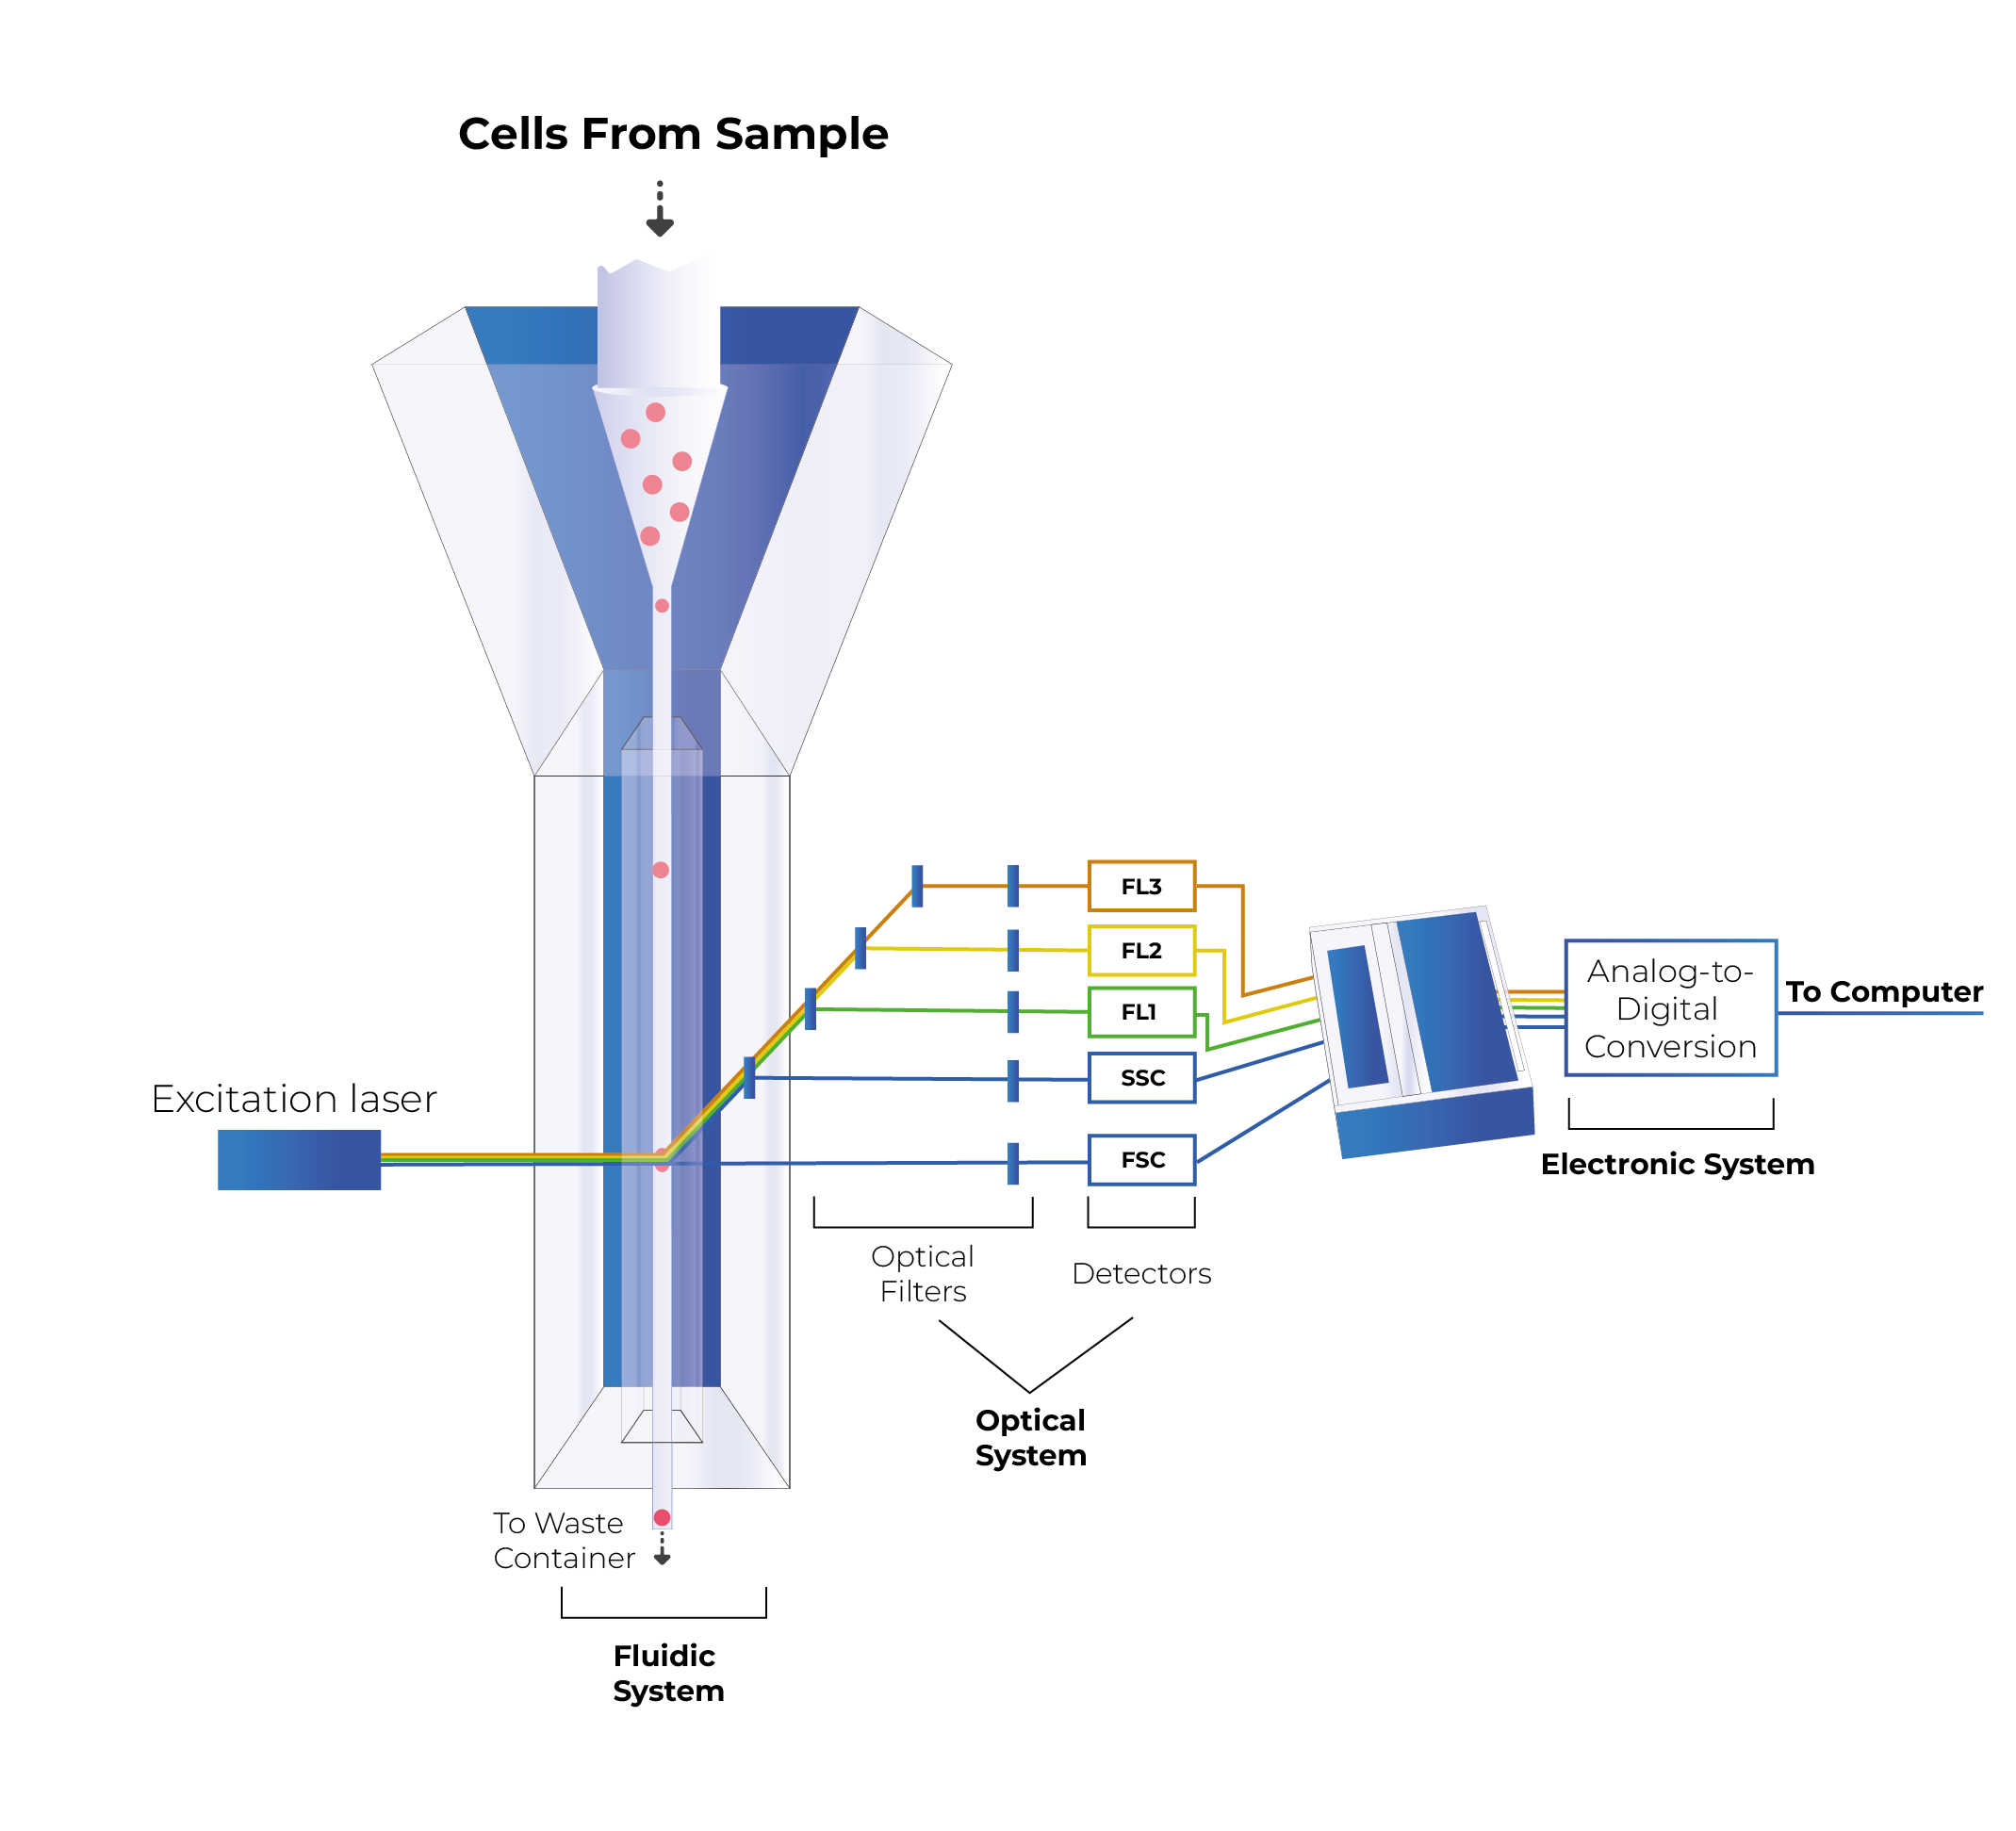
Forward scatter lights (FSC) refers to the diffracted light, while the refracted light is called side scatter lights (SSC). FSC is generally used to determine the surface size or area of the cells; while SSC typically reflects the particle’s internal complexity.[1]
Fluorescence
In addition to light scattering, the laser beam can excite the electrons of a fluorochrome, which is used to stain or interact with the sample cells. Soon after excitation, the electrons revert to their ground states, emitting fluorescent light with a wavelength that is longer than that of laser light.
Each fluorochrome can absorb a specific range of light, called the excitation spectra. However, most absorption occurs with very narrow light wavelengths represented by the peak spectra. Thus, the laser light used for fluorophore excitation should be closest to the peak excitation spectra of the target fluorochrome.[2]
Fluorochromes for flow cytometry can be fluorescent dyes or antibodies conjugated with fluorophores. Notable fluorochromes for flow cytometry include:[1,2]
4’-6-diamino-2-phenylindole or DAPI
Binds to the double-stranded DNA of non-viable cells. In flow cytometry, DAPI is often used in cell cycle analysis and cell death evaluation.
Is a protein isolated from red algae, which absorbs light at the maximum wavelength of 650nm and emits light at the maximum wavelength of 660 nm. It is typically conjugated to a specific antibody, which is used to detect the target proteins or cells.
In addition, two different fluorophores can be covalently linked, turning into tandem dyes. They act as a Förster resonance energy transfer (FRET) pair where the laser excites one fluorophore, which donates its emitted light to the other fluorophore whose excitation spectra overlap with the donor’s emission spectra.[2]
Flow Cytometry vs. Fluorescence Microscopy
Both flow cytometry and fluorescent microscopy rely on internal optic systems for measurement and analysis, they are different in their sample inputs and readouts.
Fluorescent microscopy is an imaging technique so its samples are not necessarily suspended in fluid. For example, cell suspension and tissue sections can be live-imaged when stained with fluorescent dyes or fluorescent-labeled antibodies without necessarily having to fix the cells.[4]
Another stark contrast between the two techniques is the readouts. The results of fluorescent microscopy are qualitative comprising images that reveal information such as cell morphology and protein localization. In flow cytometry, the outputs are quantitative, yielding values such as counts and signal intensity, including the mean or median fluorescence intensity or mfi.[7]
To learn more about fluorescence microscopes and how the different types, check out our article on fluorescence microscopy!

Figure 3: Flow Cytometry vs. Fluorescence Microscopy
Applications and Specialized Flow Cytometry
The high-throughout nature of flow cytometry is highly advantageous for routine analysis and clinical diagnosis. Advances in laser technology, fluorescent dyes, and proteins have improved flow cytometry instrumentation which improves the technique’s performance and capabilities.[2-3,5]
Notably, fluorescence-activated cell sorting (FACS) is a type of specialized cytometer that also acts as a cell sorter. With FACS, a subpopulation of cells in the samples can be sorted after they have been detected by the laser beams. It enables users to purify cells from samples for detailed analysis.[3]
Examples of notable applications and flow cytometry applications and modified systems include:[5]
DNA Content Analysis
Flow cytometers can accurately determine DNA content present in cells stained with nucleic acid-staining dyes. This is applicable for DNA-based analysis such as the DNA ploidy and cell cycle analysis (CPT® code 88182), which are used for cancer diagnosis and prognosis.[5-6]
Hematological Immunophenotyping
Flow cytometers can analyze components in blood samples, including red blood cells, leukocytes, and platelets.
For instance, the presence of rhesus antigen proteins (RhD) on the surface of the red blood cells can be detected and quantified by flow cytometers. The analysis is essential for physicians to determine whether and when RhD- mothers need to receive Rho(D) immune globulin (RhIG) which prevents RhD isoimmunization.[5]
Similarly, leukocytes can also be profiled by flow cytometers after red blood cells are lysed, and the remaining white blood cells are isolated.[4,7]
Flow Cytometry Analysis and Interpretation
Typical flow cytometry analysis consists of the following steps:
Analysis Design and Controls
The characteristics of target cells and analysis objectives must be deliberated in the study design. This typically includes choosing the appropriate laser lines, fluorochromes, and the values of parameters used in the analysis.
One major theme in analysis design is choosing appropriate controls, which in flow cytometry can be categorized into the following:
involve how the instrument is set up, optimized, and maintained. It usually includes setting up and calibrating the laser alignment, laser time delay, laser sensitivity, and voltage setup for the PMT.
PMT voltage setup can be achieved by (i) setting a quadrant gate that designates readouts from cells with low signals (i.e. unstained cells) as off-scale, (ii) selecting the optical peak from the plot between different voltages and their Coefficient of Variance (CV) where the detector is most sensitive to the fluorochrome of choice, or (iii) by calculating the value from the Standard Deviation of Electronic Noise obtained from the regression line of a plot between the electric noise CV and voltage range.[8-9]
Specificity or gating controls
Are established by creating cytometry gates that define positive cell subpopulations and by correcting the compensation value for all fluorochromes in the analysis. Gating controls are meant to reduce noises from laser excitation, non-specific staining, and autofluorescence, which are keys to distinguishing positive cells from negative ones.[8]
Gating controls are usually created after a cytometry run where outlier data points are eliminated using known properties of a single cell such as size and granularity. In many cases, a gate can be drawn upon a group of subpopulations so that the analysis can be focused on the cells of interest.[1, 8-9]
Additionally, appropriate controls must be included in each cytometry run to help set compensation values and establish cytometry gates. For instance, cell samples incubated with antibodies against antigens that are absent from the target cell surface, or isotope controls, will help determine fluorophore signals generated from nonspecific antibody binding.[8-9]
Illustrate how biological differences are reflected in flow cytometry data, for example, normal vs. diseased or viable vs. non-viable cells. They enable users to draw biologically relevant interpretations for samples.[8]
In general, flow cytometry samples are prepared in medium fluid shortly before the run. Tissue sections or cell suspensions are collected and washed several times to disaggregate the cells. Cells are subsequently stained by fluorescent dyes or antibodies.
If flow cytometry targets intracellular components, cells must be permeabilized to allow antibodies or staining dyes to penetrate the cell membrane. This is achieved by mixing cells with a fixation buffer that contains a fixative such as alcohols and aldehydes.
Another reason to fix the cells is to preserve the stained cells when flow cytometry cannot be immediately performed. Cells fixed in the alcohol-based buffer can be kept for up to 2 weeks in the fridge or 2 months in the freezer. Since aldehydes can cause cell autofluorescence, the fixation buffer must be removed, and the cells must be rinsed and suspended in another buffer because of storage. In this case, the fixed cell samples are stored in the fridge to prevent ice crystal formation.[1, 8-9]
Data Analysis and Interpretation
Readouts obtained from flow cytometry are quantitative. They are numbers, that the computer uses to compute and store in a standard FCS format.
During flow cytometry, single parameter data such as FSC and SSC are displayed as histograms of signal values against the number of events. Multiple parameters are shown as two- or three-dimensional graphs, or dot plots, which can be marked into quadrants based on the population subclasses. Each quadrant represents a group of cells possessing similar characteristics. Customarily, the lower-left quadrant displays data points of cells that are negative for all parameters, while the upper-right shows data points for cells that are positive for all parameters.
Apart from the histograms and graphs, raw values from a flow cytometry run are collected by the computer and compiled in a spreadsheet. The data can be exported for additional statistical analysis, which can provide information for the biological question of interest.[1]
References
- Introduction to Flow Cytometry: A Learning Guide, Becton, Dickinson,, and Company, December 2002,
- Manohar, S., Shah, P., and Nair, A. “Flow Cytometry: principles, applications and recent advances” Bioanalysis, 2021(13:3), pp. 181-198.
- Picot, J., et al. “Flow cytometry: retrospective, fundamentals and recent instrumentation.” Cytotechnology, 2012(64:2), pp. 109-130.
- Bocsi, J., et al. “Automated four-color analysis of leukocytes by scanning fluorescence microscopy using quantum dots” Cytometry Part A, 2006(69:3), pp. 131-4.
- Brown, M. & Wittwer, C. “Flow Cytometry: Principles and Clinical Applications in Hematology” Clinical Chemistry, 2000(46:8), pp. 1221-1229.
- Billing and Coding: Flow Cytometry, Centers for Medicare & Medicaid Services, October 2022
- Einwallner, E., et al. “Lysis matters: Red cell lysis with FACS Lyse affects the flow cytometric enumeration of circulating leukemic blasts” Journal of Immunological Methods, 2013(390), pp. 127–132.
- Cossarizza, A., et al. “Guidelines for the use of flow cytometry and cell sorting in immunological studies (third edition)” European Journal of Immunology, 2021(51), pp. 2708-3145
- Maecker HT. & Trotter, J. “Flow Cytometry Controls, Instrument Setup, and the Determination of Positivity” Cytometry Part A, 2006(69A), pp. 1037-1042