
Chapter 1. Observability service introduction
With the observability service enabled, you can use Red Hat Advanced Cluster Management for Kubernetes to gain insight about and optimize your managed clusters. This information can save cost and prevent unnecessary events.
1.1. Observing environments
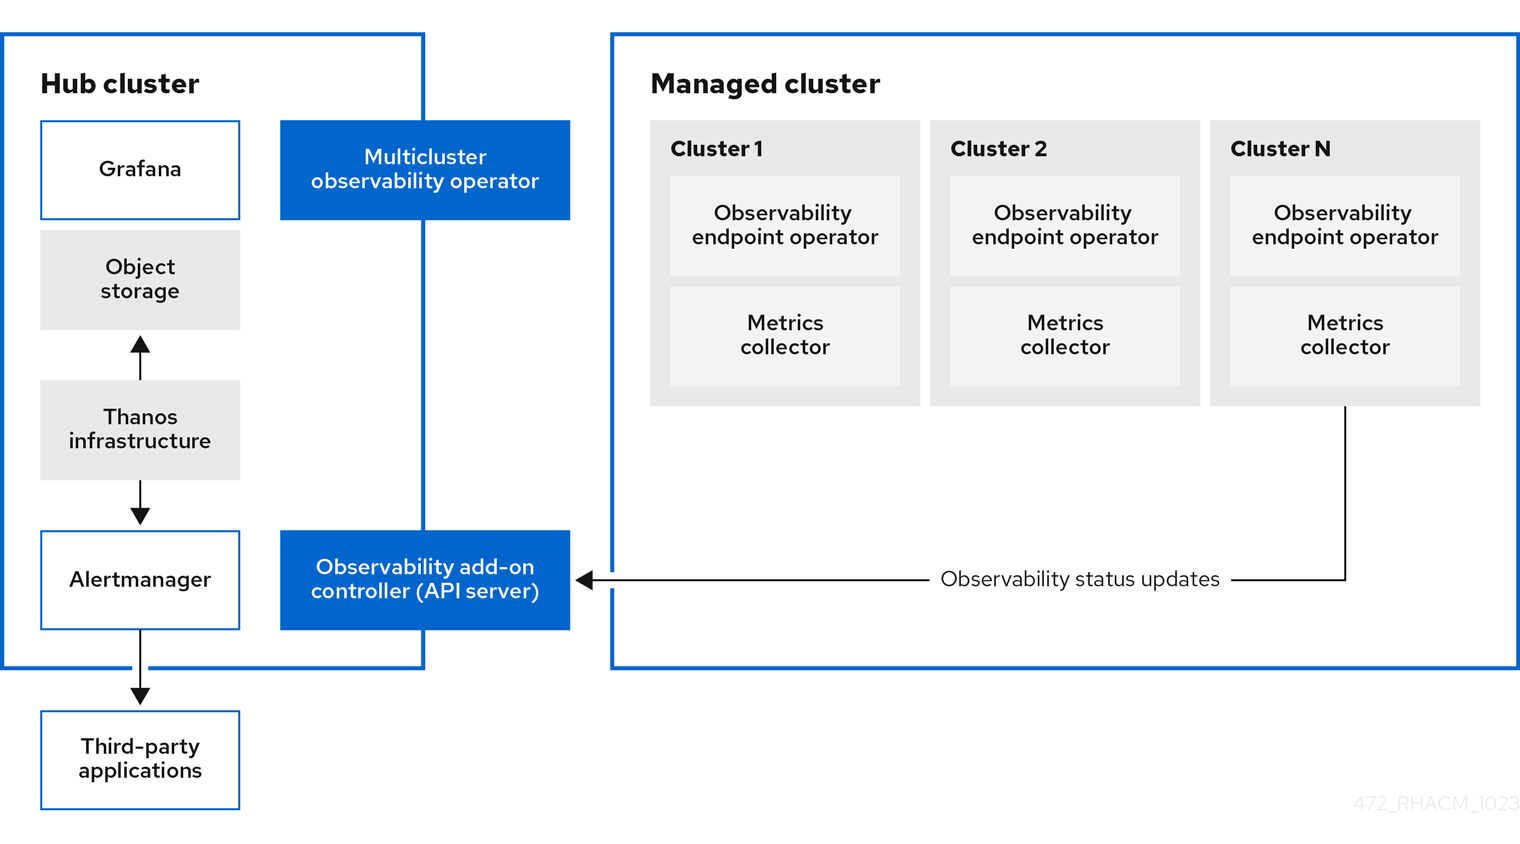
You can use Red Hat Advanced Cluster Management for Kubernetes to gain insight and optimize your managed clusters. Enable the observability service operator, multicluster-observability-operator, on your hub cluster to monitor the health of your managed clusters. Learn about the architecture for the multicluster observability service in the following sections.
1.1.1. Observability service
By default, observability is included with the product installation, but not enabled. Due to the requirement for persistent storage, the observability service is not enabled by default. See the Support section for observability.
When the service is enabled, the observability-endpoint-operator is automatically deployed to each imported or created cluster. This controller collects the data from Red Hat OpenShift Container Platform Prometheus, then sends it to the Red Hat Advanced Cluster Management hub cluster. If the hub cluster imports itself as the local-cluster, observability is also enabled on it and metrics are collected from the hub cluster.
The observability service deploys an instance of Prometheus Alertmanager, which enables alerts to be forwarded with third-party applications. It also includes an instance of Grafana to enable data visualization with dashboards (static) or data exploration. Red Hat Advanced Cluster Management supports version 8.5.20 of Grafana. You can also design your Grafana dashboard. For more information, see Designing your Grafana dashboard. You can customize the observability service by creating custom recording rules or alerting rules.
1.1.2. Support
- Red Hat Advanced Cluster Management is tested with and fully supported by Red Hat OpenShift Data Foundation (formerly Red Hat OpenShift Container Storage).
- Red Hat Advanced Cluster Management supports the function of the multicluster observability operator on user-provided third-party object storage that is S3 API compatible. The observability service uses Thanos supported, stable object stores.
- Red Hat Advanced Cluster Management use commercial, reasonable efforts to assist in the identification of the root cause. If a support ticket is raised and the root cause has been determined to be a result of the customer-provided S3 compatible object storage, then the issue must be resolved using the customer support channels.
- Red Hat Advanced Cluster Management does not commit to fix support tickets raised by customers, where the root cause identified is the S3 compatible object storage provider.
1.1.3. Metric types
By default, OpenShift Container Platform sends metrics to Red Hat using the Telemetry service. The acm_managed_cluster_info is available with Red Hat Advanced Cluster Management and is included with telemetry, but is not displayed on the Red Hat Advanced Cluster Management Observe environments overview dashboard.
View the following table of metric types that are supported by the framework:
Table 1.1. Parameter table
| Metric name | Metric type | Labels/tags | Status |
|---|---|---|---|
|
| Gauge |
| Stable |
|
| Histogram | None | Stable. Read Governance metric for more details. |
|
| Histogram | None | Stable. Refer to Governance metric for more details. |
|
| Histogram | None | Stable. Read Governance metric for more details. |
|
| Gauge |
| Stable. Review Governance metric for more details. |
|
| Gauge |
| Stable. Read Managing insight _PolicyReports_ for more details. |
|
| Counter | None | Stable. See the Search components section in the Searching in the console introduction documentation. |
|
| Histogram | None | Stable. See the Search components section in the Searching in the console introduction documentation. |
|
| Histogram | None | Stable. See the Search components section in the Searching in the console introduction documentation. |
|
| Counter | None | Stable. See the Search components section in the Searching in the console introduction documentation. |
|
| Histogram | None | Stable. See the Search components section in the Searching in the console introduction documentation. |
|
| Gauge | None | Stable. See the Search components section in the Searching in the console introduction documentation. |
|
| Histogram | None | Stable. See the Search components section in the Searching in the console introduction documentation. |
1.1.4. Observability pod capacity requests
Observability components require 2701mCPU and 11972Mi memory to install the observability service. The following table is a list of the pod capacity requests for five managed clusters with observability-addons enabled:
Table 1.2. Observability pod capacity requests
| Deployment or StatefulSet | Container name | CPU (mCPU) | Memory (Mi) | Replicas | Pod total CPU | Pod total memory |
|---|---|---|---|---|---|---|
| observability-alertmanager | alertmanager | 4 | 200 | 3 | 12 | 600 |
| config-reloader | 4 | 25 | 3 | 12 | 75 | |
| alertmanager-proxy | 1 | 20 | 3 | 3 | 60 | |
| observability-grafana | grafana | 4 | 100 | 2 | 8 | 200 |
| grafana-dashboard-loader | 4 | 50 | 2 | 8 | 100 | |
| observability-observatorium-api | observatorium-api | 20 | 128 | 2 | 40 | 256 |
| observability-observatorium-operator | observatorium-operator | 100 | 100 | 1 | 10 | 50 |
| observability-rbac-query-proxy | rbac-query-proxy | 20 | 100 | 2 | 40 | 200 |
| oauth-proxy | 1 | 20 | 2 | 2 | 40 | |
| observability-thanos-compact | thanos-compact | 100 | 512 | 1 | 100 | 512 |
| observability-thanos-query | thanos-query | 300 | 1024 | 2 | 600 | 2048 |
| observability-thanos-query-frontend | thanos-query-frontend | 100 | 256 | 2 | 200 | 512 |
| observability-thanos-query-frontend-memcached | memcached | 45 | 128 | 3 | 135 | 384 |
| exporter | 5 | 50 | 3 | 15 | 150 | |
| observability-thanos-receive-controller | thanos-receive-controller | 4 | 32 | 1 | 4 | 32 |
| observability-thanos-receive-default | thanos-receive | 300 | 512 | 3 | 900 | 1536 |
| observability-thanos-rule | thanos-rule | 50 | 512 | 3 | 150 | 1536 |
| configmap-reloader | 4 | 25 | 3 | 12 | 75 | |
| observability-thanos-store-memcached | memcached | 45 | 128 | 3 | 135 | 384 |
| exporter | 5 | 50 | 3 | 15 | 150 | |
| observability-thanos-store-shard | thanos-store | 100 | 1024 | 3 | 300 | 3072 |
1.1.5. Persistent stores used in the observability service
Important: Do not use the local storage operator or a storage class that uses local volumes for persistent storage. You can lose data if the pod relaunched on a different node after a restart. When this happens, the pod can no longer access the local storage on the node. Be sure that you can access the persistent volumes of the receive and rules pods to avoid data loss.
When you install Red Hat Advanced Cluster Management the following persistent volumes (PV) must be created so that Persistent Volume Claims (PVC) can attach to it automatically. As a reminder, you must define a storage class in the MultiClusterObservability custom resource when there is no default storage class specified or you want to use a non-default storage class to host the PVs. It is recommended to use Block Storage, similar to what Prometheus uses. Also each replica of alertmanager, thanos-compactor, thanos-ruler, thanos-receive-default and thanos-store-shard must have its own PV. View the following table:
Table 1.3. Table list of persistent volumes
| Persistent volume name | Purpose |
| alertmanager |
Alertmanager stores the |
| thanos-compact | The compactor needs local disk space to store intermediate data for its processing, as well as bucket state cache. The required space depends on the size of the underlying blocks. The compactor must have enough space to download all of the source blocks, then build the compacted blocks on the disk. On-disk data is safe to delete between restarts and should be the first attempt to get crash-looping compactors unstuck. However, it is recommended to give the compactor persistent disks in order to effectively use bucket state cache in between restarts. |
| thanos-rule |
The thanos ruler evaluates Prometheus recording and alerting rules against a chosen query API by issuing queries at a fixed interval. Rule results are written back to the disk in the Prometheus 2.0 storage format. The amount of hours or days of data retained in this stateful set was fixed in the API version |
| thanos-receive-default |
Thanos receiver accepts incoming data (Prometheus remote-write requests) and writes these into a local instance of the Prometheus TSDB. Periodically (every 2 hours), TSDB blocks are uploaded to the object storage for long term storage and compaction. The amount of hours or days of data retained in this stateful set, which acts a local cache was fixed in API Version |
| thanos-store-shard | It acts primarily as an API gateway and therefore does not need a significant amount of local disk space. It joins a Thanos cluster on startup and advertises the data it can access. It keeps a small amount of information about all remote blocks on local disk and keeps it in sync with the bucket. This data is generally safe to delete across restarts at the cost of increased startup times. |
Note: The time series historical data is stored in object stores. Thanos uses object storage as the primary storage for metrics and metadata related to them. For more details about the object storage and downsampling, see Enabling observability service.
1.1.6. Additional resources
- For more information about enabling observability, read Enabling observability service.
- Read Customizing observability to learn how to configure the observability service, view metrics and other data.
- Read Using Grafana dashboards.
- Learn from the OpenShift Container Platform documentation what types of metrics are collected and sent using telemetry. See Information collected by Telemetry for information.
- Refer to Governance metric for details.
- Read Managing insight PolicyReports.
- Refer to Prometheus recording rules.
- Also refer to Prometheus alerting rules.
- Return to Searching in the console introduction.
1.2. Enabling observability service
Monitor the health of your managed clusters with the observability service (multicluster-observability-operator).
Required access: Cluster administrator, the open-cluster-management:cluster-manager-admin role, or S3 administrator.
1.2.1. Prerequisites
- You must install Red Hat Advanced Cluster Management for Kubernetes. See Installing while connected online for more information.
-
You must define a storage class in the
MultiClusterObservabilitycustom resource, if there is no default storage class specified. - Direct network access to the hub cluster is required. Network access to load balancers and proxies are not supported. For more information, see Networking.
You must configure an object store to create a storage solution. Red Hat Advanced Cluster Management supports the following cloud providers with stable object stores:
- Amazon Web Services S3 (AWS S3)
- Red Hat Ceph (S3 compatible API)
- Google Cloud Storage
- Azure storage
- Red Hat OpenShift Data Foundation, formerly known as Red Hat OpenShift Container Storage
Red Hat OpenShift on IBM (ROKS)
Important: When you configure your object store, ensure that you meet the encryption requirements that are necessary when sensitive data is persisted. The observability service uses Thanos supported, stable object stores.
1.2.2. Enabling observability from the command line
Enable the observability service by creating a MultiClusterObservability custom resource instance. Before you enable observability, see Observability pod capacity requests for more information.
Note:
-
When observability is enabled or disabled on OpenShift Container Platform managed clusters that are managed by Red Hat Advanced Cluster Management, the observability endpoint operator updates the
cluster-monitoring-configconfig map by adding additionalalertmanagerconfiguration that automatically restarts the local Prometheus. -
The observability endpoint operator updates the
cluster-monitoring-configconfig map by adding additionalalertmanagerconfigurations that automatically restart the local Prometheus. Therefore, when you insert thealertmanagerconfiguration in the OpenShift Container Platform managed cluster, the configuration removes the settings that relate to the retention of the Prometheus metrics.
Complete the following steps to enable the observability service:
- Log in to your Red Hat Advanced Cluster Management hub cluster.
Create a namespace for the observability service with the following command:
oc create namespace open-cluster-management-observability
Generate your pull-secret. If Red Hat Advanced Cluster Management is installed in the
open-cluster-managementnamespace, run the following command:DOCKER_CONFIG_JSON=`oc extract secret/multiclusterhub-operator-pull-secret -n open-cluster-management --to=-`
If the
multiclusterhub-operator-pull-secretis not defined in the namespace, copy thepull-secretfrom theopenshift-confignamespace into theopen-cluster-management-observabilitynamespace. Run the following command:DOCKER_CONFIG_JSON=`oc extract secret/pull-secret -n openshift-config --to=-`
Then, create the pull-secret in the
open-cluster-management-observabilitynamespace, run the following command:oc create secret generic multiclusterhub-operator-pull-secret \ -n open-cluster-management-observability \ --from-literal=.dockerconfigjson="$DOCKER_CONFIG_JSON" \ --type=kubernetes.io/dockerconfigjsonImportant: If you modify the global pull secret for your cluster by using the OpenShift Container Platform documentation, be sure to also update the global pull secret in the observability namespace. See Updating the global pull secret for more details.
Create a secret for your object storage for your cloud provider. Your secret must contain the credentials to your storage solution. For example, run the following command:
oc create -f thanos-object-storage.yaml -n open-cluster-management-observability
View the following examples of secrets for the supported object stores:
For Amazon S3 or S3 compatible, your secret might resemble the following file:
apiVersion: v1 kind: Secret metadata: name: thanos-object-storage namespace: open-cluster-management-observability type: Opaque stringData: thanos.yaml: | type: s3 config: bucket: YOUR_S3_BUCKET endpoint: YOUR_S3_ENDPOINT 1 insecure: true access_key: YOUR_ACCESS_KEY secret_key: YOUR_SECRET_KEY- 1
- Enter the URL without the protocol. Enter the URL for your Amazon S3 endpoint that might resemble the following URL:
example.redhat.com:443.
For more details, see the Amazon Simple Storage Service user guide.
For Google, your secret might resemble the following file:
apiVersion: v1
kind: Secret
metadata:
  name: thanos-object-storage
  namespace: open-cluster-management-observability
type: Opaque
stringData:
  thanos.yaml: |
    type: GCS
    config:
      bucket: YOUR_GCS_BUCKET
      service_account: YOUR_SERVICE_ACCOUNT
For more details, see Google Cloud Storage.
For Azure your secret might resemble the following file:
apiVersion: v1 kind: Secret metadata: name: thanos-object-storage namespace: open-cluster-management-observability type: Opaque stringData: thanos.yaml: | type: AZURE config: storage_account: YOUR_STORAGE_ACCT storage_account_key: YOUR_STORAGE_KEY container: YOUR_CONTAINER endpoint: blob.core.windows.net 1 max_retries: 0- 1
- If you use the
msi_resourcepath, the endpoint authentication is complete by using the system-assigned managed identity. Your value must resemble the following endpoint:https://<storage-account-name>.blob.core.windows.net.
If you use the
user_assigned_idpath, endpoint authentication is complete by using the user-assigned managed identity. When you use theuser_assigned_id, themsi_resourceendpoint default value ishttps:<storage_account>.<endpoint>. For more details, see Azure Storage documentation.Note: If you use Azure as an object storage for a Red Hat OpenShift Container Platform cluster, the storage account associated with the cluster is not supported. You must create a new storage account.
For Red Hat OpenShift Data Foundation, your secret might resemble the following file:
apiVersion: v1 kind: Secret metadata: name: thanos-object-storage namespace: open-cluster-management-observability type: Opaque stringData: thanos.yaml: | type: s3 config: bucket: YOUR_RH_DATA_FOUNDATION_BUCKET endpoint: YOUR_RH_DATA_FOUNDATION_ENDPOINT 1 insecure: false access_key: YOUR_RH_DATA_FOUNDATION_ACCESS_KEY secret_key: YOUR_RH_DATA_FOUNDATION_SECRET_KEY- 1
- Enter the URL without the protocol. Enter the URL for your Red Hat OpenShift Data Foundation endpoint that might resemble the following URL:
example.redhat.com:443.
For more details, see Red Hat OpenShift Data Foundation.
For Red Hat OpenShift on IBM (ROKS), your secret might resemble the following file:
apiVersion: v1 kind: Secret metadata: name: thanos-object-storage namespace: open-cluster-management-observability type: Opaque stringData: thanos.yaml: | type: s3 config: bucket: YOUR_ROKS_S3_BUCKET endpoint: YOUR_ROKS_S3_ENDPOINT 1 insecure: true access_key: YOUR_ROKS_ACCESS_KEY secret_key: YOUR_ROKS_SECRET_KEY- 1
- Enter the URL without the protocol. Enter the URL for your Red Hat OpenShift Data Foundation endpoint that might resemble the following URL:
example.redhat.com:443.
For more details, follow the IBM Cloud documentation, Cloud Object Storage. Be sure to use the service credentials to connect with the object storage. For more details, follow the IBM Cloud documentation, Cloud Object Store and Service Credentials.
For Amazon S3 or S3 compatible storage, you can also use short term, limited-privilege credentials generated with AWS Security Token Service (AWS STS). Refer to AWS Security Token Service documentation for more details.
Generating access keys using AWS Security Service require the following additional steps:
- Create an IAM policy that limits access to an S3 bucket.
- Create an IAM role with a trust policy to generate JWT tokens for OpenShift Container Platform service accounts.
- Specify annotations for the observability service accounts that requires access to the S3 bucket. You can find an example of how observability on Red Hat OpenShift Service on AWS (ROSA) cluster can be configured to work with AWS STS tokens in the Set environment step. See Red Hat OpenShift Service on AWS (ROSA) for more details, along with ROSA with STS explained for an in-depth description of the requirements and setup to use STS tokens.
1.2.2.1. Generating access keys using the AWS Security Service
Complete the following steps to generate access keys using the AWS Security Service:
Set up the AWS environment. Run the following commands:
export POLICY_VERSION=$(date +"%m-%d-%y")
export TRUST_POLICY_VERSION=$(date +"%m-%d-%y")
export CLUSTER_NAME=<my-cluster>
export S3_BUCKET=$CLUSTER_NAME-acm-observability
export REGION=us-east-2
export NAMESPACE=open-cluster-management-observability
export SA=tbd
export SCRATCH_DIR=/tmp/scratch
export OIDC_PROVIDER=$(oc get authentication.config.openshift.io cluster -o json | jq -r .spec.serviceAccountIssuer| sed -e "s/^https:\/\///")
export AWS_ACCOUNT_ID=$(aws sts get-caller-identity --query Account --output text)
export AWS_PAGER=""
rm -rf $SCRATCH_DIR
mkdir -p $SCRATCH_DIR
Create an S3 bucket with the following command:
aws s3 mb s3://$S3_BUCKET
Create a
s3-policyJSON file for access to your S3 bucket. Run the following command:{ "Version": "$POLICY_VERSION", "Statement": [ { "Sid": "Statement", "Effect": "Allow", "Action": [ "s3:ListBucket", "s3:GetObject", "s3:DeleteObject", "s3:PutObject", "s3:PutObjectAcl", "s3:CreateBucket", "s3:DeleteBucket" ], "Resource": [ "arn:aws:s3:::$S3_BUCKET/*", "arn:aws:s3:::$S3_BUCKET" ] } ] }Apply the policy with the following command:
S3_POLICY=$(aws iam create-policy --policy-name $CLUSTER_NAME-acm-obs \
--policy-document file://$SCRATCH_DIR/s3-policy.json \
--query 'Policy.Arn' --output text)
echo $S3_POLICY
Create a
TrustPolicyJSON file. Run the following command:{ "Version": "$TRUST_POLICY_VERSION", "Statement": [ { "Effect": "Allow", "Principal": { "Federated": "arn:aws:iam::${AWS_ACCOUNT_ID}:oidc-provider/${OIDC_PROVIDER}" }, "Action": "sts:AssumeRoleWithWebIdentity", "Condition": { "StringEquals": { "${OIDC_PROVIDER}:sub": [ "system:serviceaccount:${NAMESPACE}:observability-thanos-query", "system:serviceaccount:${NAMESPACE}:observability-thanos-store-shard", "system:serviceaccount:${NAMESPACE}:observability-thanos-compact" "system:serviceaccount:${NAMESPACE}:observability-thanos-rule", "system:serviceaccount:${NAMESPACE}:observability-thanos-receive", ] } } } ] }Create a role for AWS Prometheus and CloudWatch with the following command:
S3_ROLE=$(aws iam create-role \
  --role-name "$CLUSTER_NAME-acm-obs-s3" \
  --assume-role-policy-document file://$SCRATCH_DIR/TrustPolicy.json \
  --query "Role.Arn" --output text)
echo $S3_ROLE
Attach the policies to the role. Run the following command:
aws iam attach-role-policy \
  --role-name "$CLUSTER_NAME-acm-obs-s3" \
  --policy-arn $S3_POLICY
Your secret might resemble the following file. The
configsection specifiessignature_version2: falseand does not specifyaccess_keyandsecret_key:apiVersion: v1 kind: Secret metadata: name: thanos-object-storage namespace: open-cluster-management-observability type: Opaque stringData: thanos.yaml: | type: s3 config: bucket: $S3_BUCKET endpoint: s3.$REGION.amazonaws.com signature_version2: false
-
Specify service account annotations when you the
MultiClusterObservabilitycustom resource as described in Creating the MultiClusterObservability custom resource section. You can retrieve the S3 access key and secret key for your cloud providers with the following commands. You must decode, edit, and encode your
base64string in the secret:YOUR_CLOUD_PROVIDER_ACCESS_KEY=$(oc -n open-cluster-management-observability get secret <object-storage-secret> -o jsonpath="{.data.thanos\.yaml}" | base64 --decode | grep access_key | awk '{print $2}') echo $ACCESS_KEY YOUR_CLOUD_PROVIDER_SECRET_KEY=$(oc -n open-cluster-management-observability get secret <object-storage-secret> -o jsonpath="{.data.thanos\.yaml}" | base64 --decode | grep secret_key | awk '{print $2}') echo $SECRET_KEYVerify that observability is enabled by checking the pods for the following deployments and stateful sets. You might receive the following information:
observability-thanos-query (deployment)
observability-thanos-compact (statefulset)
observability-thanos-receive-default  (statefulset)
observability-thanos-rule   (statefulset)
observability-thanos-store-shard-x  (statefulsets)
1.2.3. Creating the MultiClusterObservability custom resource
Use the MultiClusterObservability custom resource to specify the persistent volume storage size for various components. You must set the storage size during the initial creation of the MultiClusterObservability custom resource. When you update the storage size values post-deployment, changes take effect only if the storage class supports dynamic volume expansion. For more information, see Expanding persistent volumes from the Red Hat OpenShift Container Platform documentation.
Complete the following steps to create the MultiClusterObservability custom resource on your hub cluster:
Create the
MultiClusterObservabilitycustom resource YAML file namedmulticlusterobservability_cr.yaml.View the following default YAML file for observability:
apiVersion: observability.open-cluster-management.io/v1beta2
kind: MultiClusterObservability
metadata:
  name: observability
spec:
  observabilityAddonSpec: {}
  storageConfig:
    metricObjectStorage:
      name: thanos-object-storage
      key: thanos.yaml
You might want to modify the value for the
retentionConfigparameter in theadvancedsection. For more information, see Thanos Downsampling resolution and retention. Depending on the number of managed clusters, you might want to update the amount of storage for stateful sets. If your S3 bucket is configured to use STS tokens, annotate the service accounts to use STS with S3 role. View the following configuration:spec: advanced: compact: serviceAccountAnnotations: eks.amazonaws.com/role-arn: $S3_ROLE store: serviceAccountAnnotations: eks.amazonaws.com/role-arn: $S3_ROLE rule: serviceAccountAnnotations: eks.amazonaws.com/role-arn: $S3_ROLE receive: serviceAccountAnnotations: eks.amazonaws.com/role-arn: $S3_ROLE query: serviceAccountAnnotations: eks.amazonaws.com/role-arn: $S3_ROLESee Observability API for more information.
To deploy on infrastructure machine sets, you must set a label for your set by updating the
nodeSelectorin theMultiClusterObservabilityYAML. Your YAML might resemble the following content:nodeSelector: node-role.kubernetes.io/infra:For more information, see Creating infrastructure machine sets.
Apply the observability YAML to your cluster by running the following command:
oc apply -f multiclusterobservability_cr.yaml
All the pods in
open-cluster-management-observabilitynamespace for Thanos, Grafana and Alertmanager are created. All the managed clusters connected to the Red Hat Advanced Cluster Management hub cluster are enabled to send metrics back to the Red Hat Advanced Cluster Management Observability service.Validate that the observability service is enabled and the data is populated by launching the Grafana dashboards. Click the Grafana link that is near the console header, from either the console Overview page or the Clusters page.
Note: If you want to exclude specific managed clusters from collecting the observability data, add the following cluster label to your clusters:
observability: disabled.
The observability service is enabled. After you enable the observability service, the following functions are initiated:
- All the alert managers from the managed clusters are forwarded to the Red Hat Advanced Cluster Management hub cluster.
All the managed clusters that are connected to the Red Hat Advanced Cluster Management hub cluster are enabled to send alerts back to the Red Hat Advanced Cluster Management observability service. You can configure the Red Hat Advanced Cluster Management Alertmanager to take care of deduplicating, grouping, and routing the alerts to the correct receiver integration such as email, PagerDuty, or OpsGenie. You can also handle silencing and inhibition of the alerts.
Note: Alert forwarding to the Red Hat Advanced Cluster Management hub cluster feature is only supported by managed clusters with Red Hat OpenShift Container Platform version 4.8 or later. After you install Red Hat Advanced Cluster Management with observability enabled, alerts from OpenShift Container Platform v4.8 and later are automatically forwarded to the hub cluster. See Forwarding alerts to learn more.
-
Access the OpenShift Container Platform 3.11 Grafana dashboards with the following URL:
https://$ACM_URL/grafana/dashboards. Select the folder named OCP 3.11 to view the OpenShift Container Platform 3.11 dashboards.
-
Access the OpenShift Container Platform 3.11 Grafana dashboards with the following URL:
1.2.4. Enabling observability from the Red Hat OpenShift Container Platform console
Optionally, you can enable observability from the Red Hat OpenShift Container Platform console, create a project named open-cluster-management-observability. Be sure to create an image pull-secret named, multiclusterhub-operator-pull-secret in the open-cluster-management-observability project.
Create your object storage secret named, thanos-object-storage in the open-cluster-management-observability project. Enter the object storage secret details, then click Create. See step four of the Enabling observability section to view an example of a secret.
Create the MultiClusterObservability custom resource instance. When you receive the following message, the observability service is enabled successfully from OpenShift Container Platform: Observability components are deployed and running.
1.2.4.1. Verifying the Thanos version
Verify the Thanos version from the command line interface (CLI). After Thanos is deployed on your cluster, verify the Thanos version from the command line interface (CLI).
After you log in to your hub cluster, run the following command in the observability pods to receive the Thanos version:
thanos --version
The Thanos version is displayed.
1.2.4.2. Using the external metric query
Observability provides an external API for metrics to be queried through the OpenShift route, rbac-query-proxy. View the following tasks to use rbac-query-proxy route:
You can get the details of the route with the following command:
oc get route rbac-query-proxy -n open-cluster-management-observability
-
To access the
rbac-query-proxyroute, you must have an OpenShift OAuth access token. The token should be associated with a user or service account, which has permission to get namespaces. For more information, see Managing user-owned OAuth access tokens. Get the default CA certificate and store the content of the key
tls.crtin a local file. Run the following command:oc -n openshift-ingress get secret router-certs-default -o jsonpath="{.data.tls\.crt}" | base64 -d > ca.crtRun the following command to query metrics:
curl --cacert ./ca.crt -H "Authorization: Bearer {TOKEN}" https://{PROXY_ROUTE_URL}/api/v1/query?query={QUERY_EXPRESSION}Note: The
QUERY_EXPRESSIONis the standard Prometheus query expression. For example, query the metricscluster_infrastructure_providerby replacing the URL in the previously mentioned command with the following URL:https://{PROXY_ROUTE_URL}/api/v1/query?query=cluster_infrastructure_provider. For more details, see Querying Prometheus.Run the following command to create
proxy-byo-caandproxy-byo-certsecrets using the generated certificates:oc -n open-cluster-management-observability create secret tls proxy-byo-ca --cert ./ca.crt --key ./ca.key oc -n open-cluster-management-observability create secret tls proxy-byo-cert --cert ./ingress.crt --key ./ingress.key
1.2.4.3. Dynamic metrics for single-node OpenShift clusters
Dynamic metrics collection supports automatic metric collection based on certain conditions. By default, a SNO cluster does not collect pod and container resource metrics. Once a SNO cluster reaches a specific level of resource consumption, the defined granular metrics are collected dynamically. When the cluster resource consumption is consistently less than the threshold for a period of time, granular metric collection stops.
The metrics are collected dynamically based on the conditions on the managed cluster specified by a collection rule. Because these metrics are collected dynamically, the following Red Hat Advanced Cluster Management Grafana dashboards do not display any data. When a collection rule is activated and the corresponding metrics are collected, the following panels display data for the duration of the time that the collection rule is initiated:
- Kubernetes/Compute Resources/Namespace (Pods)
- Kubernetes/Compute Resources/Namespace (Workloads)
- Kubernetes/Compute Resources/Nodes (Pods)
- Kubernetes/Compute Resources/Pod
- Kubernetes/Compute Resources/Workload
A collection rule includes the following conditions:
- A set of metrics to collect dynamically.
- Conditions written as a PromQL expression.
-
A time interval for the collection, which must be set to
true. - A match expression to select clusters where the collect rule must be evaluated.
By default, collection rules are evaluated continuously on managed clusters every 30 seconds, or at a specific time interval. The lowest value between the collection interval and time interval takes precedence. Once the collection rule condition persists for the duration specified by the for attribute, the collection rule starts and the metrics specified by the rule are automatically collected on the managed cluster. Metrics collection stops automatically after the collection rule condition no longer exists on the managed cluster, at least 15 minutes after it starts.
The collection rules are grouped together as a parameter section named collect_rules, where it can be enabled or disabled as a group. Red Hat Advanced Cluster Management installation includes the collection rule group, SNOResourceUsage with two default collection rules: HighCPUUsage and HighMemoryUsage. The HighCPUUsage collection rule begins when the node CPU usage exceeds 70%. The HighMemoryUsage collection rule begins if the overall memory utilization of the SNO cluster exceeds 70% of the available node memory. Currently, the previously mentioned thresholds are fixed and cannot be changed. When a collection rule begins for more than the interval specified by the for attribute, the system automatically starts collecting the metrics that are specified in the dynamic_metrics section.
View the list of dynamic metrics that from the collect_rules section, in the following YAML file:
collect_rules:
  - group: SNOResourceUsage
    annotations:
      description: >
        By default, a SNO cluster does not collect pod and container resource metrics. Once a SNO cluster
        reaches a level of resource consumption, these granular metrics are collected dynamically.
        When the cluster resource consumption is consistently less than the threshold for a period of time,
        collection of the granular metrics stops.
    selector:
      matchExpressions:
        - key: clusterType
          operator: In
          values: ["SNO"]
    rules:
    - collect: SNOHighCPUUsage
      annotations:
        description: >
          Collects the dynamic metrics specified if the cluster cpu usage is constantly more than 70% for 2 minutes
      expr: (1 - avg(rate(node_cpu_seconds_total{mode=\"idle\"}[5m]))) * 100 > 70
      for: 2m
      dynamic_metrics:
        names:
          - container_cpu_cfs_periods_total
          - container_cpu_cfs_throttled_periods_total
          - kube_pod_container_resource_limits
          - kube_pod_container_resource_requests
          - namespace_workload_pod:kube_pod_owner:relabel
          - node_namespace_pod_container:container_cpu_usage_seconds_total:sum_irate
          - node_namespace_pod_container:container_cpu_usage_seconds_total:sum_rate
    - collect: SNOHighMemoryUsage
      annotations:
        description: >
          Collects the dynamic metrics specified if the cluster memory usage is constantly more than 70% for 2 minutes
      expr: (1 - sum(:node_memory_MemAvailable_bytes:sum) / sum(kube_node_status_allocatable{resource=\"memory\"})) * 100 > 70
      for: 2m
      dynamic_metrics:
        names:
          - kube_pod_container_resource_limits
          - kube_pod_container_resource_requests
          - namespace_workload_pod:kube_pod_owner:relabel
        matches:
          - __name__="container_memory_cache",container!=""
          - __name__="container_memory_rss",container!=""
          - __name__="container_memory_swap",container!=""
          - __name__="container_memory_working_set_bytes",container!=""
A collect_rules.group can be disabled in the custom-allowlist as shown in the following example. When a collect_rules.group is disabled, metrics collection reverts to the previous behavior. These metrics are collected at regularly, specified intervals:
collect_rules:
  - group: -SNOResourceUsage
The data is only displayed in Grafana when the rule is initiated.
1.2.5. Disabling observability
To disable the observability service, uninstall the observability resource. From the OpenShift Container Platform console navigation, select Operators > Installed Operators > Advanced Cluster Manager for Kubernetes. Remove the MultiClusterObservability custom resource.
To learn more about customizing the observability service, see Customizing observability.