

Sourcebook of Criminal Justice Statistics, 1983 - Bureau of Justice ...
Sourcebook of Criminal Justice Statistics, 1983 - Bureau of Justice ...
Sourcebook of Criminal Justice Statistics, 1983 - Bureau of Justice ...

You also want an ePaper? Increase the reach of your titles
YUMPU automatically turns print PDFs into web optimized ePapers that Google loves.
u.s. Department <strong>of</strong> <strong>Justice</strong><strong>Bureau</strong> <strong>of</strong> <strong>Justice</strong> <strong>Statistics</strong>, \U.S. Department <strong>of</strong> <strong>Justice</strong>Nationallnstitule <strong>of</strong> <strong>Justice</strong>This document has been reproduced exactly as received from theperson or organization originating it. Points <strong>of</strong> view or opinions stated9"~dBOO}7in this document are those <strong>of</strong> the authors and do not necessarily -represent the <strong>of</strong>ficial position or policies <strong>of</strong> the National Institute <strong>of</strong>",<strong>Justice</strong>. ..J.j ~.' .B' 00 K~..Ito the National <strong>Criminal</strong> <strong>Justice</strong> Reference Service (NCJRS). .,Permission to reproduce this copyrighted material has been .,g;anted byU. S. DEPARTMENT OF .IIISTICEBUREAU OF JUSTICE STATISTICS'Further reproduction outside <strong>of</strong> the NCJRS system requires permission<strong>of</strong> the copyright owner.SOURCEBOOKOF CRIMINAL JUSTICE STATISTICS -<strong>1983</strong>SOURCEBOOKSOURCEBOOK::j~40U'I~ ., .' , .N)~ .. ~ .. C:~ E~}".~ , BiD' 'l. 0'>""" .... ,. Oc'D'. ..~ '~I" 1>:.\, ' :;i!O~~!~'::~" '. :>0. ,> ,', o"",,,!,", K'i:~GP_ ,. . ~ '~l' _\oi~ , _ "'",,,'. > " .' -,~ []) LU~CClEI85(Q)(Q) OC, ~ 11 liD) /R}E TO) r{\'J 0' 1:fY~ ~ tV l&~'C lliJ\0J~ ll~'...,
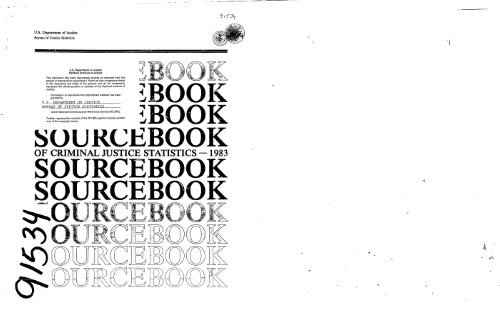
--~- ~ ... ---Figure AAn overview <strong>of</strong> data included in the Sour.-:ebool .. <strong>of</strong> <strong>Criminal</strong> <strong>Justice</strong> <strong>Statistics</strong>NOTE: This figure Iuu b-en odapuJ from lhe Presidenr~ u,mmwion on LaU' En/orremenlaruiAdminLstration <strong>of</strong> JUliia 10 indicate arms In Ihl! atmln.aJ ju:stice .s)":stem for u,hick dataha,~ been Indudtd In lhe Souro:bo
________ n~'·••SOURCEBOOKOF CRIMINAL JUSTICE STAI'lSTICS - <strong>1983</strong>Edited byEdward J. BrownTimothy J. FlanaganMaureen McLeodBob LangworthyErnest F. KellerEdmund F. McGarrellTheodore P. SkotnickiAnn L. PastoreSharleen BritteHMarjorie J. JonesKim SchoonmakerAssociate EditorAssistant EditorAssistant EditorAssistant EditorManaging EditorEditorial AssistantEditorial AssistantStatistical TypistThe Michael J. Hindelang<strong>Criminal</strong> <strong>Justice</strong> Research CenterAlbany, New YorkThis project was supported by Grant No. 81-BJ-CX-K013 (S2) awarded to The MichaelJ. Hindelang <strong>Criminal</strong> <strong>Justice</strong> Research Center, Albany, New York, by the U.S.Department <strong>of</strong> <strong>Justice</strong> and is currently supported by the <strong>Bureau</strong> <strong>of</strong> <strong>Justice</strong> <strong>Statistics</strong>,U.S. Department <strong>of</strong> <strong>Justice</strong>, under the <strong>Justice</strong> System Improvement Act <strong>of</strong> 1979; theproject, entitled "Utilization <strong>of</strong> <strong>Criminal</strong> <strong>Justice</strong> <strong>Statistics</strong>," is being directed byTimothy J. Flanagan and Edward J. Brown and is being monitored for the <strong>Bureau</strong> <strong>of</strong><strong>Justice</strong> <strong>Statistics</strong> by Sue A. Lindgren. Points <strong>of</strong> view or opinions stated in thisdocument are those <strong>of</strong> the editors and do not necessarily represent the <strong>of</strong>ficial positionor policies <strong>of</strong> the U.S. Department <strong>of</strong> <strong>Justice</strong>.The <strong>Bureau</strong> <strong>of</strong> <strong>Justice</strong> <strong>Statistics</strong> authorizes any person to reproduce, publish,translate, or otherwise use ail or any part <strong>of</strong> the copyrighted material in thispublication, with the exception <strong>of</strong> those items indicating that they are copyrighted byor reprinted by permission <strong>of</strong> any source otherthan The Michael J. Hindelang <strong>Criminal</strong><strong>Justice</strong> Research Center.4\Copyright 1984 by The Michael J. Hlndelang <strong>Criminal</strong> <strong>Justice</strong> Research CenterU.S. DEPARTMENT OF JUSTICE<strong>Bureau</strong> <strong>of</strong> <strong>Justice</strong> <strong>Statistics</strong>NCJ-91534o ,
------~-----------------------------------~'--------------Preface"u.s. DEPARTMENT CF JUSTI CE<strong>Bureau</strong> <strong>of</strong> <strong>Justice</strong> <strong>Statistics</strong>Steven R. Schlesinger, DirectorBenjamin H. Renshaw, III, Deputy DirectorJeffrey L Sedgwick, Deputy DirectorCharles R. Kindermann, Assistan't DirectorNational BranchSUGGESTED CITATICNEdward J. Brown, Timothy J. Flanagan, and MaureenMcLeod, eds., <strong>Sourcebook</strong> <strong>of</strong> <strong>Criminal</strong> <strong>Justice</strong> <strong>Statistics</strong> -<strong>1983</strong>. U.S. Department <strong>of</strong> J'.!stice, <strong>Bureau</strong> <strong>of</strong> <strong>Justice</strong><strong>Statistics</strong>. Washington, D.C.: U.S. Government Printing Office,~ 1984. ____________________________________________________________________ JUbrar). <strong>of</strong> Congress Cataloging in Publication DataUlited States. Department <strong>of</strong> <strong>Justice</strong>, <strong>Bureau</strong> <strong>of</strong> <strong>Justice</strong> <strong>Statistics</strong>.<strong>Sourcebook</strong> <strong>of</strong> <strong>Criminal</strong> <strong>Justice</strong> <strong>Statistics</strong> <strong>1983</strong>, by Edward J.Brown (and others).''Report no. SD-SB-II."I. <strong>Criminal</strong> statistics--United States. 2. <strong>Criminal</strong> justice,administration <strong>of</strong>--United States--<strong>Statistics</strong>. 3. Corrections--UnitedStates--<strong>Statistics</strong>.J. Author. II. Title.~ I 'ThIs is the eleventh annual edition <strong>of</strong> theSOURCEBOOK OF CRIMINAL JUSTICESTATISTICS. The rationale underlying thedevelopment <strong>of</strong> this compendium is as importanttoday as it was II years ago when the firstedition was prepared. Briefly, it was felt thatdespite a growing sophistication in the generalarea <strong>of</strong> criminal justice data bases andstati,stical information systems, many <strong>of</strong> thesestatistics were not widely known, much lessutilized, by those in the criminal justice field.,In part, this situation is due to the functionalfragmentation <strong>of</strong> the many components <strong>of</strong> thecriminal justice system in the United States.<strong>Criminal</strong> justice statistical information isroutinely collected by thousands <strong>of</strong> Federal,State, and local agencies, but systemat i caggregation <strong>of</strong> these data at the national' levelis impeded by definitional, jurisdictional, andhistorical barriers. In addition, budgetaryconstraints and reallocation <strong>of</strong> limited agencyfunds has in some cases diminished access tostatistical data because the collection anddissemination <strong>of</strong> this information has beencurtailed. Therefore, the primary goal <strong>of</strong> theSOURCEBOOK OF CRIMINAL JUSTICESTATISTICS has been to bring together into asingle, comprehensive, reference volumeexisti'ng nationwide statistical data <strong>of</strong> interestto the broad criminal justice community. Assuch, SOURCEBOOK staff have made aconcerted effort to identify published andunpublished materials that span agency,governmenta I, and funct i ona II y-spec ifi cboundari es. The di ssemi nat i on <strong>of</strong> t hisinformation in an easy-to-use single volumeformat is intended to make these data avai lableto users in an economical manner.The data included in this compilation arealmost exclusively nationwide in scope. Ininstances where information is avai lable onlyfor groups <strong>of</strong> cities, States, and jurisdictions,these data are included if the topic representsan area <strong>of</strong> important substantive concern tothe criminal justice field. Whenever possible,nationwide data are displayed by regions,States, or cities, both to enhance the uti Iity <strong>of</strong>the information for local decisionmakers and t<strong>of</strong>acilitate comparative analyses. An effort hasbeen made to focus on State and local datarather than on Federal data because Federalagencies handle only a small portion <strong>of</strong> crimerelatedtransactions, and these Federaltransact ions may not be representative <strong>of</strong> thevolume and nature <strong>of</strong> criminal justicetransactions at other levels <strong>of</strong> government.However, data relating to the FederalGovernment are <strong>of</strong>ten presented in theSOLRCEB()()
<strong>Sourcebook</strong> <strong>of</strong> <strong>Criminal</strong> <strong>Justice</strong> <strong>Statistics</strong> 198:>.. -Nation, report on the estimated number andrate <strong>of</strong> personal and household victimizations.These data are supplemented by a variety<strong>of</strong> data derived from self-report surveys ondrug and alcohol use, and other illegalactivities that are reported by severalorganizations. Agencies with specialized lawenforcement functions, such as the Securitiesand Exchange Commission, Postal InspectionService, Drug Enforcement Administration,Secret Service, and others collect limitedstatistical information on case processing andagency activities. In addition, privateorganizations such as the Association <strong>of</strong>American Railroads, American HumaneAssociation, and National Education Associationpublish data on various forms <strong>of</strong> illegal activityrelated to their organizational purposes.Information on personnel andexpenditures for the criminal justice system isfound in a variet)1 <strong>of</strong> sources. Governmentpubl ications, such as the Budget <strong>of</strong> theUnited States Government and agency annualreports, provide data on expenditures forcriminal justice-related activities. The <strong>Bureau</strong><strong>of</strong> <strong>Justice</strong> <strong>Statistics</strong>' publication, <strong>Justice</strong>Expenditure and Employment Data in theU.S., compiles data on criminal justice agencypersonnel, payroll, and expenditure. Variousspecial surveys, such as the Census <strong>of</strong> StateCorrectional Facilities, contain informationon personnel, source <strong>of</strong> funding, andexpenditures for these segments <strong>of</strong> the criminaljustice system. These sources are augmentedby surveys conducted by the i\JOtional Centerfor State Courts, the National Counc i I onCrime and Delinquency, the AmericanCorrectional Association, the National Sheriff'sAssociation, and other groups.Data on clearance and arrest rates arereported primarily in the FBI's Crime in theUnited States. In addition, agencies such asthe Drug Enforcement Administration,Immigration and Naturalization Service, andothers collect data on clearances and arrestsin cases under their jurisdiction.Court-related data for the Federalsystem come from the Administrative Office <strong>of</strong>the U.S. Courts and the Federal Prison System.Although no uniform standardized courtrepor1ing system (comparable to the UniformCrime Reporting Program) currently exists atthe State level, the <strong>Bureau</strong> <strong>of</strong> <strong>Justice</strong><strong>Statistics</strong>' publication, State Court Caseload<strong>Statistics</strong>, contains State-by-State informationrelating to the activities <strong>of</strong> State courts.Data on probation systems are providedby the Administrative Office <strong>of</strong> the U.S. Courtsand the National Probation Reports programiv<strong>of</strong> the National Council on Crime andDelinquency. Information on persons incorrectional institutions is found in a number <strong>of</strong>sources, including the Prisoners in State andFederal Institutions series publ ished by the<strong>Bureau</strong> <strong>of</strong> <strong>Justice</strong> <strong>Statistics</strong>. Information onFederal prisoners is available in the annualStatistical Report <strong>of</strong> the Federal PrisonSystem. In addition to these sources, data onprison populations and characteristics <strong>of</strong>correctional facilities and inmates are providedby surveys conducted by the AmericanCorrectional Association and numerous privateresearch groups and individual researchers.Detailed information on inmates executed andon death row is published annually by the U.S •Department <strong>of</strong> <strong>Justice</strong>, <strong>Bureau</strong> <strong>of</strong> <strong>Justice</strong><strong>Statistics</strong> series on Capital Punishmf,mt.<strong>Statistics</strong> on parole services arecollected and reported by the Unifc)rm ParoleReports program <strong>of</strong> the National Council onCrime and Delinquency, and by the AmericanCorrectional Association, and the U.S. ParoleCommissi on. Discharges from State andFederal correctional facilities are reported inthe Prisoners in State and FederalInstitutions series issued by the <strong>Bureau</strong> <strong>of</strong><strong>Justice</strong> <strong>Statistics</strong>.In the juvenile ju~ !:ice system, data on<strong>of</strong>fenses and on j uven i I es taken into custodyare reported by the Federal <strong>Bureau</strong> <strong>of</strong>Investigation's Crime in the United States.Data on the volume <strong>of</strong> cases disposed <strong>of</strong> byjuvenile courts are provided in Delinquency1980 by the National Center for Juven i Ie<strong>Justice</strong>.Juvenile correctional data are providedby a number <strong>of</strong> sources. The Children inCustody series issued by the Office <strong>of</strong> Juvenile<strong>Justice</strong> and Delinquency Prevention <strong>of</strong> the U.S.Department <strong>of</strong> <strong>Justice</strong> reports data on thenumber <strong>of</strong> juveniles held in public and privatejuvenile correctional facilities. Data on theestimated number <strong>of</strong> juveniles confined in localjails are reported in the Survey <strong>of</strong> JailI nmates, published by the U.S. Department <strong>of</strong><strong>Justice</strong>. To date there is no nationwidereporting system that collects data on parole("aftercare") outcome for juveniles.Information regarding public opinion oncriminal justice issues is obtained from avariety <strong>of</strong> groups such as The Gallup Poll, LouisHarris and Associates, the National OpinionResearch Center, the ABC-W\Jshington PostPoll, and the N3C News/Associated Press Pollas well as a variety <strong>of</strong> governmental agenciesand conmissions. Topics examined in theseopinion surveys include fear <strong>of</strong> crime andvictimization, public attitudes about crime andIII'~!II· 1Prefaceits ca~ses, the performance <strong>of</strong> law enforcementage,ncles and the U.S. Supreme Court, capital<strong>Justice</strong> data are (a) lacking in a number <strong>of</strong>punlshn:ent, and gun ownership and gun control.Important areas; (b) uneven in terms <strong>of</strong> qualityFigures A and B provide theand comprehensiveness; and, (c) not uniformlyS0l!RC~~OOK uS,er, with an idea <strong>of</strong> theco!lected at the Federal, State, and localavaJla?Jllty <strong>of</strong> criminal justice data from a !evels o~ government. For more deta i ledsystemic perspective. In Figure A, the flowchart~rl~inally published by the President'sI~formatlon on the contents <strong>of</strong> the sourcesdiscussed above and on criminal justice dataCon:m,lsslo!", on Law Enforcement andSources generally, readers are advised toAdministration <strong>of</strong> <strong>Justice</strong> in 1967 has beenconsult the Annotated List <strong>of</strong> Sources andReferences in this volume.adapted to indicate where data are avai lableand where gaps exist. In this figure, asterisksOrganization <strong>of</strong> the SOlRCEBOO
Figure AAn overview <strong>of</strong> dala included in Ihe <strong>Sourcebook</strong> <strong>of</strong> Crimin.1 JUlllice Stali.,iclI.'VOTE TIt~ )~gU(f haJ bNn aJaplN /rom ,Ar ?,,.,uc!rn"" C"mmt.uwn on Lall En/o,rrmrnl aMtfdmtni1tratwn <strong>of</strong> JlUlu~ to ,nJ,rOlt' dIm., In ,A,. r",nlMI JIJlhf't lHUm /01" .,/urla daloh.al.,. bffn IndlJdtd In liar Sourf't'bool 'Thr~ alta., a,t' mar£rJ "flit oMr,..,,) , I'Slryc 'M("mllLol JUSl'~ hraJltJj(l In thu l'I(Ult. lltt' traJ,., rna\ 'tIn 10 ,Ia,. tndt'~ at 1M tM0/ ,Ia,. £'urrt'boo! 10 l()("Quo ,,.In'Onl dQlaCrime and lawPoliceEmployment·Expend,lure'Payroll'Agency Characlerlsllcs'ProSKull<strong>of</strong>lEmploymenl'Expendllure'Fayroll'Agency Characlerostlcs'DefenseCourtsEmploymenl'Expendlluro'Payroll'Agency Characlensllcs'C~I1~e dismissed-Acquilled •Conec:llonllEmployment·ExpendIture'Payroll'Agency Charactero.llcs'Olfen.ekriown Copolice'Unsolvedor nol,muled-<strong>Criminal</strong>victimization--=: .....Sell-reportedcriminalaCIIYtly'SllIluioryprovIsions·Attitudesconcerningcrime andjustIce'Q3":;'2.t...OoJlo'syslrll' ~~.~o....;;;-+ifOul 01 syslrmSma ....... : P"..idrnl a • (Aammi ... ~on on u •. EHrOrn"lIM"nland AdNlinililralaon <strong>of</strong> Jar.ti",_Tltr t:Jt.II,..,..,. ul CriM,. ill • ,..,.,..,. .w.-;rl,. ...... AhiJt«lon.. D.C:I .~ C;'nrmmrnl Prinli~ UlliN". 1967 •• pp. I. 9.\..oo
Figure B An overview <strong>of</strong> detelncluded In the SOURCEBOOK OF CRIMINAL JUSTICE STATISTICS, u.lng teble <strong>of</strong> content. entrle.NfJ'9k&~"a'Ou3'K"::~~~"J:I~I~~S,'i:.~~~I~ :~;70,:;;r Indlcale. Ihe .ecl/on <strong>of</strong> Ihe~:CRIME AND LAW(1) Expenditures, employment, and payroll lorcriminal jusllce acllvilies(i) Slatutory sentence enhancements lor useand possession at a firearm or other deadlyweapon(1) Characterlsllcs 01 privacy legislation(t) Characterlsllcs 01 gun controlleglslahon(1) Decriminalization 01 public Intoxication(1) Statutmy provisions relDted to alcohol useand driving(1) Characteristics 01 marihuana legislation(2) Attitudes toward extent 01 crime(2) Attitudes toward .afety In the home(2) Attitudes toward salety on the streets(2) Fear <strong>of</strong> crime(2) Availability and desirability <strong>of</strong> crime-watchprograms(2) Crime prevention precautions employed(2) Attitudes toward selected soclallssu.s(2) Attitudes toward selected Juvenile crimeIssues(2) Attitudes toward causes <strong>of</strong> crime(2) Attitudes toward statements about crime(2) Attitudes toward methods 01 dealing withcrime(2) Attitudes toward legalization 01 abortion(2) Attitudes toward wiretapping(2) Gun ownership(2) Attitudes toward gun controt(2) Attitudes toward and knowledge 01 chiliabuse, wlte abuse, or abuse 01 the elderly(2) Attitudes toward the use and effect 01 drugsand alcoh"l(2) Attitudes toward logallzallon 01 marihuana(2) Attitudes toward forblddh,g the sale <strong>of</strong>alcohol(2) AUitudes toward stricter drunk driving laws(2) Altitudes toward pornography(3) Estimated number <strong>of</strong> personal, household,and business victimizations(3) Estimated percentage <strong>of</strong> non-roported personaland househOld victimizations(3) Estimated rate 01 personal and househotdvictimizations(3) Estimated number <strong>of</strong> personal and householdInCidents, by specltic Incident characteristics(3) Estimated number 01 personal vicllmlzations,by spacUle Incident characteristics(3) Estlmat.d rate and number 01 householdvictimizations(3) Changes I,.,ates 01 personal and householdvlcllmizr,uons between 1913 and 1981(3) Househo',dstouched by crime between 1975and 1982(3) Child abuse, characteristics 01 reports,victims, and perpetrators(3) Esllmated numberol personal .,cllmlzations<strong>of</strong> teachers(3) Seriousness 01 high school mlsbehav:orproblems as seen by administrators andstudents, 1980(3) Reported alcohol USA(3) Reported drug use among adults andyoulh(3) Olfenses known to the police(3) Offenses In U,S, park areas(3) Murders known to the police(3) Robberies known to the police(3) Aggravaled assaults known to the pollee(3) Burglaries known to the police(3) Larcenies known to the police(3) Violations 01 Federal bank robbery stalules(3) Motor vehicle thefts known to the police(3) Property loss due to selected crImes(3) Federal <strong>of</strong>ficers kIlled and assaulled(3) Law enlorcement olticers killed(3) Persons Idenllfled as killing law anforcement<strong>of</strong>ficers(3) Assaults on law enlorcement olticers(3) Drug thefts and Illegal drug prices(3) Bombing InCident" known to the police(3) Estimated number 01 fires, civilian toredeaths, and value <strong>of</strong> property loss due toincendiary or suspicious lires(3) International terrorist incidents against U.S,Citizens and property(3) Hijacklngs and other criminal acts relaledto air transportation(3) Crime Insurance policies, claims, and losses(3) Offenses against railroadsPOLICE(1) Employment and payroll for pollee services(2) Attitudes toward performance <strong>of</strong> police(2) PubliC calls lor police services(2) Attitudes toward permitting police to strike(4) Arrests, national estimate.(4) Number and rate <strong>of</strong> arrests(4) Characteristics 01 persons arrested(4) Arrests In cities(4) Arrests in suburban ar68!J(4) Arrests In rural areas(4) Arrest lotes(4) Clearance ,ateR(4) Arrests lor atcor.ol:related <strong>of</strong>fenses(4) Arrests, sell-repon data(4) Juvenlle<strong>of</strong>fenderstaken Into police custody(4) Arrests lor drug taw Violations(4) Drug seizures(4) Seizures by the U,S. Customs Service(4) Solzures by the U,S. Coast Guard(4) Activities 01 the U,S, Secret Service(4) Aliens deported from the United Slates(4) Arrests for <strong>of</strong>fenses against railroads(5) CrlmlnallnvestigaUons by Ihe U.S, PostelInspection ServicePROSECUTtON AND DEFENSE(1) Expenditures, workload, employment, setectodreqUirements, and payroll lor dolenseactivities(1) Employ"'~nt and payroll lor legal servicesand prosecution at-tlvltles(5) Requests lor ImmunIty by Federal prosocutors(5) Cases argued and pending In U,S. Allorney.'<strong>of</strong>fices(5) Antitrust cases flied in U.S. District Courts(5) Cases relerred to Ihe U,S. Department 01_ <strong>Justice</strong> lor prasecutlon by the Securltle3and Exchange Commission(5) Prosecutions <strong>of</strong> violations 01 Immigrationand nationality laws(5) Prosecution. <strong>of</strong> corrupt public ottlclatsCOURTS(1) Expenditures, emptoyment, payroll, andsalaries 01 Federat Judicial and courtadmlnlslratlve personn.1(1) Workload 01 the Federat Judiciary(1) Characterlstlcs;,:t presidential appoinleesto Federal judgeships(t) E~r.~~1~~I~:i :~rJI~r.~ent, and payroll for(1) Qualification reqUirements, salaries, selectionprocess, and terms 01 <strong>of</strong>fice 01 trialand appellate judges(1) Expenditures lor and ulillration 01 grandand pellt Jurors(1) Statutory provisions governing waiver 01Juveniles 10 criminal court(1) Provisions lor consideration 01 criminalbehavior In pretrial release decisions(2) PubliC conlideMe In the U,S, SupremaCourt(2) Attitudes toward severity 01 courts(2) Attitudes toward court delay and Judicialdiscretion(5) Cases filed In State courts(5) Delinquency cases disposed 01 by juvenilecourts(5) Court-authorized Interception <strong>of</strong> wire ororal communication(5) Cases flied in U.S, Olstrlot Courts(5) DI'posllions and sentences 01 delendantscharged with drug faw vlotatlons In U.S,District Courts(5) Defendants disposed 01 In U,S, DlslrlctCourts(5) Sentences 01 dol end ants Imprisoned lormarihuana vlolallons in U,S, DIstrict couns(5) Prlsonerpelillons flied In U,S, District Courts(5) Appeals tiled In U,S, Couns 01 Appeals(5) Petitions lor writ 01 certiorari to the U.S,Su;:.:"me Courtl~l 5f:~~~:~I~;~el~~~~I~~ri~:1~~~~ cases(5) Dispositions <strong>of</strong> arrests by the U,S SecretService(5) Mililary:Army personnel tried and convicted inU,S, Army General and Special CourtsMartIalAir Force person net tried and convicted InU,S, Air Force c:.~ner.1 .nd SpoclatCourts-M.rtlBlNavy and Marine Corps pe'sonnel triedro~p~08:~~tr";l ~~d ~:ec~amo~~~-~~~ra~Coast Guard personnel tried in U,S. CoastGuard Special COllrts·Martial(5) DIspositions 01 persons arrested for<strong>of</strong>fensesagainst railroadsCORRECTtONS(1) Expenditure., emptoyment, and payroll lorcorrectional activities(1) En'ployment, worktoad, and, salaries iorprobation/parole ottlcers(1) Characteristics 01 public and private Juvenilelacilitle., slaff, and reSidents(1) Characteristics 01 U,S,jalls(1) Employment 01 and salaries lor State correctlonatottlcers(1) Unionization 01 Stat. correctional olflcers(1) Characteristics 01 adult correctional andpre-release lacllitles(1) MMtal health staff and servlcu In adultcorrectional facilities(1) Workload 01 US, Parote Commissionhearing examiners(1) Representation at parole conslcloratlon andrevocation hoarlngs(1) Ullllzation <strong>of</strong> drug abuse treatment .erviceunits(1) Statutory regulations on delnstltutlonallz.tion <strong>of</strong> Juveniles(1) Slatutory proviSIOns lor parole eligibility(2) Altitudes toward permitting prison guardsto strike(2) Attitudes toward delorrent effect <strong>of</strong> prisonsentences(2) Altltudas toward purpo.esol Imprisonment(2) Altitudes toward prison construction(21 Attltu~es toward capital pllnlshment(6) Persons under correctional supervision(6) Movement 01 the probatior, population(6) Persons under supervision 01 the FoderalProbation System(6) Drug users admitted to lederally-fundeddrug abuse treatment programs(6) Characlerlstlcs <strong>of</strong> residents 01 public andprivate juvenile custody lacilities(6) Estimated number 01 jail Inmates(6) State prisoners in locat Jails because 01overcrowding(6) Prisoners tn. rata <strong>of</strong> incarceration for.admissions tat and movement at pnsonersIn State And Federal Institutions(6) Characteristics 01 inmates In State correctlonat(acitllles(6) Prisoners and drugs(6) Prisoners and alcohol(6) Prisoners In education programs(6) Movement 01 prisoners in, admissions to,and releases from Federal correctionalfacllilies(6) Population 01 U,S Army, U,S NaYl'., andU.S. Marine Corps correctional laclloties(6) Releases Irom Stale and Federal Institutions(6) Movement 01 prisoners paroled and condlilonallyreleased Irom State and FederatInstitutions(6) Deaths among prisoners under the jurisdlclion<strong>of</strong> State and Federal correctionalauthorities(6) Capotal punishment:Prisoners under sentence <strong>of</strong> deathState and Foderal prisoners flxecuted4'(I)0'n(I)t,\..4I,
--~---jIReliabi lity <strong>of</strong> the dataEach year the staff <strong>of</strong> the SaJRCEBOOKreviews hundreds <strong>of</strong> research reports, journals,books, annual agency reports, and othersources to select data for SOURCEBOOK.Initially, the material is reviewed to determinewhether the subject matter is appropriate andconsistent with the purpose <strong>of</strong> theSOlRCEBOO
--------- - --Svurcebook <strong>of</strong> <strong>Criminal</strong> <strong>Justice</strong> <strong>Statistics</strong> <strong>1983</strong>Guide to symbols used ,'n tables"Annotated sources and publishers listAnother aid developed to encourage use<strong>of</strong> the data sources presented in theSOURCEBOOK is the annotations <strong>of</strong> sourcesused in the compilation. Publications fromwhich tables or figures have been taken forpresentation in the SOLRCEBOO< are describedin these annotations. These surrmaries, whichappear before the Appendices, include standardbi bl i ographi c information, plus additionalelements such as periodicity <strong>of</strong> the publication,dates <strong>of</strong> tabular information appearing in thesource (many sources, even annual reports,contain data for a number <strong>of</strong> years), a shortsumnary <strong>of</strong> the contents <strong>of</strong> the source, and alisting <strong>of</strong> tables and figures in SOvRCEBOO
---~~- -------~------Acknow ledgmentsThe production <strong>of</strong> each annual edition <strong>of</strong>SOURCEBOOK involves the cooperation andassistance <strong>of</strong> many" persons. The editors aregrateful to all <strong>of</strong> these people, both within andoutside our immediate staff, who assisted inthis volume.We especially appreciate the cooperation<strong>of</strong> agencies that contributed the statisticaldata that is the raw material <strong>of</strong> SOLRCEB()()K.I n man y cases, agency personnel providedinvaluable help by releasing pre-publicationcopies <strong>of</strong> materials, assisting SOURCEBc:xJ
- - .. "-- - ~------~ ------------ContentsPagePrefaceiiiGuide to symbols used in tablesAcknowledgmentsxixiiiList <strong>of</strong> figures and tables and list <strong>of</strong> figure and table equivalents xviiSection I: Characteristics <strong>of</strong> the <strong>Criminal</strong> <strong>Justice</strong> Systems 1Expenditures, employrnent, and payroll for criminal justice~~~ 2Employment and poyrall for police services 38Expenditures, workload, employment, selected requirements,and poyroll for defense activities 54Employment and payroll for legal services and prosecutionactivities 62Expenditures, employment, payroll, and salaries <strong>of</strong> Federaljudicial and court administrative personnel 70Workload <strong>of</strong> the Federal judiciary 74Expenditures, employment, and payroll for State judicialactivities 79Qualification requirements, salaries, selection process, andterms <strong>of</strong> <strong>of</strong>fice <strong>of</strong> trial and appellate Judges 93Expenditures for and utilization <strong>of</strong> grand and petit jurors 101Expencitures, employment, and payroll for correctionalactivities 109Employment, workload, and salaries for probation/parole<strong>of</strong>ficers 118Characteristics <strong>of</strong> public and private juvenile facilities,staff, and residents 119Characteristics <strong>of</strong> U.S. jails 127U1ionization <strong>of</strong> jail staff 130Characteristics <strong>of</strong> adult co~rectional and pre-releasefacilities 131Workload <strong>of</strong> U.S. Parole Comnisslon hearing examiners 147Representation at parole consideration and revocationhearings 148Utilization <strong>of</strong> drug abuse treatment service units 149Statutory provisions governing waiver <strong>of</strong> juveniles tocriminal court 150Provisions for consideration <strong>of</strong> criminal behavior inpretrial release decisions 155Statutory sentence enhancements for use and possession <strong>of</strong> afirearm or other dean! weapon 161Statutory prOVisions for ,Xlrole eligibility 164Characteristics <strong>of</strong> privacy legislation 171Characteristics <strong>of</strong> gun control legislation 174Decriminalization <strong>of</strong> public intoxicationl77Statutory prOVisions related to alcohol use and driving 178Characteristics <strong>of</strong> marihuana legislation 184Development <strong>of</strong> oifender-based transaction statistics systems 188Section 2: Public Attitudes Toward Crime and <strong>Criminal</strong><strong>Justice</strong>-Related Topics 189Attitudes toward extent <strong>of</strong> crimeAttitudes toward safety in the home190194Attitudes toward safety on the streets 196Fear <strong>of</strong> crime 200Availability and desirability <strong>of</strong> crime-watch programs 208Crime prevention meosures emplo)'c!d 210Attitudes toward selected social issues 213Attitudes toward selected juvenile crime issues 220Attitudes toward causes <strong>of</strong> crime 229Attitudes toword statements about crime 231Attitudes toward methods <strong>of</strong> dealing with crime 239Attitudes toward legalization <strong>of</strong> abortion 240Attitudes toward Wiretapping 241Attitudes toward performance <strong>of</strong> police 242Public calls for police services 247Attitudes toward permitting police to strike 249Attitudes toward permitting prison guards t" strike 251Attitudes toward poli;:e use <strong>of</strong> force 252Public confidence in the U.S. Supreme Court 254Attitudes toward severity <strong>of</strong> courts 256Attitudes toward court delay and judicial discretion 259Attitudes toward deterrent effect <strong>of</strong> prison sentences 260Attitudes toward purposes <strong>of</strong> Imprisonment 261Attitudes toward prison construction 268Attitudes toward capital punishmentGun ownership273279Attitudes toward gun control 282Attitudes toward and knowledge <strong>of</strong> child abuse, wife abuse,or abuse <strong>of</strong> the elderly 291Attitudes toward the use and effect <strong>of</strong> drugs and alcohol 292Attitudes toward legalization <strong>of</strong> marihuanaAttitudes toward forbidding the sale <strong>of</strong> alcohol294298Attitudes toward stricter drunk driving laws 300Attitudes toward pornography 301PageSection 3: Nature and Distribution <strong>of</strong> Known Offenses 305Estimated number <strong>of</strong> personal, household, and businessvictimizations 307Estimated percentage <strong>of</strong> non-reported personal and househaldvictimizations 307Estimated rate <strong>of</strong> personal and household victimizations 320Estimated number <strong>of</strong> personal and household Incidents, byspecific incident characteristicsEstimated number <strong>of</strong> personal victimizations, by specific335Incident characteristics 341Estimated rate and number <strong>of</strong> household victimizations 346Changes in rates <strong>of</strong> personal and household victimizationsbetween 1973 and 1981 351t-buseholds touched by crime between 1975 and 1982 351Child abuse, characteristics <strong>of</strong> reports, victims, andperpetrators 355Estimated number <strong>of</strong> personal victimizations <strong>of</strong> teachers 357Seriousness <strong>of</strong> high school misbehavior problems as seen byadministrators and stUdents 357Reported alcohol use 359Reported drug use among adults and youth 360Offense.s known to the police 370Offenses In U.S. park areas 389Murders known to the police 390Robberies known to the police 395Aggravated assaults known to the police 396Burglaries known to the police 397Larcenies known to the police 397Violations <strong>of</strong> Federal bank robbery statutesMotor vehicle thefts known to the police398399Property loss due to selected crimes 400Federal <strong>of</strong>ficers killed and ossaulted 401Law enforcement <strong>of</strong>ficers killed 402Persons identified as killing law enforcement <strong>of</strong>ficers 403Assaults on law enforce-nent <strong>of</strong>ficers 404Drug thefts and Illegal drug prices 405Bambino incidents known to the police 406Estimated number <strong>of</strong> fires, civilian fire deaths, and value<strong>of</strong> property Ic,~ dlJe to incendiary or susplclaus fires 409International terrorist incidents against U.S. citizens andproperty 409Hijackings and other criminal acts related to airtransportation 410Crime insurance policies, claims, and losses 411Offenses agoinst railroads 412Section 4: Characteristics and Distribution <strong>of</strong> PersonsArrested 413Arrests, national estimates 415twrnber and rate <strong>of</strong> arrests 416Characteristics <strong>of</strong> ~rsons arrestedArrests in cities421436Arrests In suburban areas 440Arrests In rural areas 444Arrest rates 448Clearance rates 451Arrests for alcohol-related <strong>of</strong>fenses 461Arrests, self-report dataJuvenile <strong>of</strong>fenders taken Info police custody463464Arrests for drug law violations 466Drug seizures 466Seizures by the U.S. Customs Service 466Seizures by the U.S. Coast Guard 469Activities <strong>of</strong> the U.S. Secret Service 470Aliens deported from the U1lted States 471Arrests for <strong>of</strong>fenses against railroads 472Section 5: Judicial Processing <strong>of</strong> Defendants 473Cases filed In State courts 474Delinquency cases disposed <strong>of</strong> by juvenile courts 477Requests for Immunity by Federal prosecutors 481Court-authorized interception <strong>of</strong> wire or oral comnunlcatioll 482Cases argued and pending In U.S. Attorneys' <strong>of</strong>fices 490Cases flied In U.S. District Courts 492Dispositions and sentences <strong>of</strong> defendants charged with druglaw violations In U.S. District CourtsDefendants disposed <strong>of</strong> In U.S. District Courts496499Sentences <strong>of</strong> defend:mts imprisoned for marihuana violationsIn U.S. District Courts 512Prisoner petitions flied In U.S. District Courts 513Appeals flied In U.S. Courts <strong>of</strong> Appeals 516Petltlons for writ <strong>of</strong> certiorari fo the U.S. Supreme CourtExecutive clemency applications519521Dispositions In criminal tax frClud cases 521..\xv
,"<strong>Criminal</strong> investigations by the U.S. Postal InspectionServiceAntitrust cases filed In U.S. District CourtsCases referred to the U.S. Department <strong>of</strong> Just I ce forprosecution by the Securities and Exchange CommissionProsecutions <strong>of</strong> violations <strong>of</strong> immigration and nationalitylawsDispositions <strong>of</strong> arrests by the U.S. Secret ServiceProsecutions <strong>of</strong> corrupt public <strong>of</strong>ficialsArmy personnel tried and convicted in U.S. Army General andSpecial Courts-MartialAir Force personnel tried and convicted in U.S. Air ForceGeneral and Special Courts-MartialN:lvy and Marine Corps personnel tried and convicted in U.S.Navy and Marine Corps General and Special CourtsMartialCoast Guard personnel tried in U.S. Coast Guard SpecialCourts-MortlalDispositions <strong>of</strong> persons arrested for <strong>of</strong>fenses againstrailroadsSection 6: Persons Under Correctionol SupervisionPersons under correctional supervisionMovement <strong>of</strong> the probation populationPersons under supervision <strong>of</strong> the Federal Probation SystemDrug users admitted to federally-funded drug abuse treatmentprogramsCharacteristics <strong>of</strong> residents <strong>of</strong> public and private juvenilecustody facilitiesEstimated number <strong>of</strong> jail inmatesState prisoners in local jails because <strong>of</strong> overcrowdingPrisoners in, rate <strong>of</strong> incarceration for, admissions to, andmovement <strong>of</strong> prisoners in State and Federal institutionsCharacteristics <strong>of</strong> inmates in State correctional facilitiesPrisoners and drugsPrisoners and alcoholPrisoners in education programsMovement <strong>of</strong> prisoners in, admissions to, and releases fromFederal correctional facilitiesPopulation <strong>of</strong> U.S. Army, U.S. Air Force, U.S. N:lvy, and U.S.Marine Corps correctional foci IitiesReleases from State and Federal institutionsMovement <strong>of</strong> prisoners paroled and conditionally releasedfrom State and Federal institutionsDeaths among prisoners under the jurisdiction <strong>of</strong> State andFederal correctional authoritiesPrisoners under sentence <strong>of</strong> deathState and Federal prisoners executedAnnotated list <strong>of</strong> sourcesAddresses <strong>of</strong> publishers<strong>Sourcebook</strong> <strong>of</strong> <strong>Criminal</strong> <strong>Justice</strong> <strong>Statistics</strong> <strong>1983</strong>Page522526527528530532533533536538540543544545550557561564564565573577580584585590593594601602613619631AppendicesI Expenditure and Employment Data for the <strong>Criminal</strong>Jus,tice System--Survey methodology and definitions<strong>of</strong> terms2 Crime in the United States--Definitions <strong>of</strong> terms3 Children in Custody--Data collection procedures anddefinitions <strong>of</strong> terms4 Survey <strong>of</strong> Delinquency Prevention Programs--Surveymethodology5 Report <strong>of</strong> the U.S. Parole Commlssion--Paroleguidelines and definitions <strong>of</strong> terms6 Privacy and Security <strong>of</strong> <strong>Criminal</strong> HistoryInforrnation--Definitions <strong>of</strong> terms7 Public opinion survey sompling procedures8 ABC Ne\¥S Crime Poll9 'he Figgie Report on Fe(lr <strong>of</strong> Crime: AmericaAfrald--Survey method"~'Dgy and definitions <strong>of</strong>termsI 0 Student Drug Use in America, 1975- I 982--Surveymethodology and definitions <strong>of</strong> termsI I National Crime Survey--Data collection proceduresand definitions <strong>of</strong> terms12 National Analysis <strong>of</strong> Official Child Neglect andAbuse Reporting--Study methodology13 Discipline, Order and Student gehavior inAmerican High Schools--Survey methodology anddefinitions <strong>of</strong> terms14 National Survey on Drug Abuse: 1982--Surveymethodology and definitions <strong>of</strong> termsIS Delinquency 1975, 1976, 1977, 1978, 1979, 1980-Survey methodology and definitions <strong>of</strong> terms16 Probation in the United States--Definltion5 <strong>of</strong> termsand survey methodology17 Parole in the United States--Definitions <strong>of</strong> termsand survey methodology18 Client Oriented Data Acquisition Process (CODAP),1981 Annual Data--Survey methodology anddefinitions <strong>of</strong> terms19 Prisoners in State and Federal Institutions onDecember 31, 1981--Survey met hodo logy anddefinitions <strong>of</strong> terms20 Federol Prison System--Statistical Report, FiscalYear 1980IndexEvaluation formPage635637640643645646647648652653654655658660661663665667669671675677695List <strong>of</strong> figures and tables and list <strong>of</strong> figure and table equivalentsTo aid users who are interested in making comparisons with data contained in the 1982 So.RCEBOO
Figure3.12 Estimated rate (per 100,000 persons 12 years<strong>of</strong> age or older) <strong>of</strong> personal victimization, by type<strong>of</strong> victimization and race <strong>of</strong> victim, U,ited States,19BI3.13 Estimated rate (per 100,000 persons 12 years<strong>of</strong> age or older) <strong>of</strong> personal victimization, by type<strong>of</strong> victimization and age <strong>of</strong> victim, U,ited States,19813.14 Percent <strong>of</strong> "households touched by crimes <strong>of</strong>high concern" during the last 12 months, by race <strong>of</strong>head <strong>of</strong> household, family income, and place <strong>of</strong>residence, U,lted States, 1982<strong>Sourcebook</strong> <strong>of</strong> <strong>Criminal</strong> <strong>Justice</strong> <strong>Statistics</strong> 19B3Page3283303533.15 Percent <strong>of</strong> "households touched by crime"during the last 12 month~, by type <strong>of</strong> victimization,U,ited States, 1975-B2 3533.16 Victims <strong>of</strong> child abuse or neglect, by age andsex, 24 jurisdictions, 19B I 3553.17 Perpetrators <strong>of</strong> child abuse or neglect, by age 356and sex, 22 jurisdictions, 19B I3.IB Reported cocaine use and most recent useamong high school seniors, U,ited States, 1975-B2 3613.19 Reported morihuana use and use in P
<strong>Sourcebook</strong> <strong>of</strong> <strong>Criminal</strong> <strong>Justice</strong> <strong>Statistics</strong> <strong>1983</strong>List <strong>of</strong> Figures and TablesTableFig. 1.7 Duties performed by magistrates in U.S.District Courts, year ending June 30, 19821.24 Annual salaries <strong>of</strong> Federal judges, by jurlicial<strong>of</strong>fice, as <strong>of</strong> December 19821.2S Direct current expenditures for State judicialactivities, by type <strong>of</strong> activity and State, fiscalyear 197511.26 Employment and payroll for State and localjudicial activities, by State and level <strong>of</strong>government, October 1971-October 19791.27 Authorized judges in trial courts, by trial courtlevel and jurisdiction, 19801.28 Judges, by type <strong>of</strong> court and State, July I,19821.29 Number and term <strong>of</strong> judges <strong>of</strong> appellate andmajor trial courts, by type <strong>of</strong> court andjurisdiction, 19811.30 Low trained and loy State court judges, byState, 19811.31 Selected qualification requirements <strong>of</strong> judges <strong>of</strong>appell ate and trial courts <strong>of</strong> general jurisdiction,by type <strong>of</strong> court and jurisdiction, 1981Page777879808889909293Equivalenttallie numberin 1982SQRCEBOO
TableFig. 2.6 Respondents taking precautions againstbeing victimized when going out, by type <strong>of</strong>precaution taken, United States, 19802.19 Respondents' concerns about public issues,United States, selected years 1974-822.20 Attitudes toward the most important problemfacing the country, Untied States, 1980-832.21 Attitudes toward the most important problemfacing the country, by demographic characteristics,United States, 19822.22 Attitudes toward violent crime as one <strong>of</strong> thebiggest problems '1 respondent's neighborhood, bydemographic charo~,'eristics, United States, 1982Fig. 2.7 Respondents agreeing that too little isspent on selected problems in the country, UnitedStates, selected years 1973-822.23 Attitudes toward the level <strong>of</strong> spending to haltthe rising crime rate, by demographiccharacteristics, United States, 1973-78, 1980, and19822.24 Respondents reporting whether they would tendto avoid groups <strong>of</strong> teenagers on the street, bydemographic characteristics, United States, 19822.25 Attitudes toward statements about juvenilecrime, United States, 19822.26 Attitudes toward the statement that the moinpurpose <strong>of</strong> the juvenile court system should betreatment and rehabilitation, by demographiccharacteristics, United States, 19822.27 Attitudes toward the statement that courts aretoo lenient on juveniles found guilty <strong>of</strong> seriouscrimes, by demographic characteristics, UnitedStates, 19822.28 At~itudes toward the statement that the rate<strong>of</strong> serious juvenile crime is increasing, bydemographic characteristics, United States, 19822.29 Attitudes toward the statement thatcommitting juveniles to correctional institutionsdeters other youth from committing crime, bydemographic characteristics, United States, 19822.30 Attitudes toward the statement that juvenilestatus <strong>of</strong>fenses should be handled by agencies otherthan the juvenile court system, by demographiccharacteristics, United States, 19822.31 Attitudes toward the statement that increasingyouth employment opportunities could reduceserious crime, by demographic characteristics,United States, 19822.32 Attitudes toward the statement that thejuvenile crime problem is not as serious as mostpeople say, by demographic characteristics, UnitedStates, 19822.33 Attitudes toward the statement that notenough money and resources are being spent toprevent juvenile crime, by demographiccharacteristics, United States, 19822.34 Attitudes toward causes <strong>of</strong> increasing crime,United States, 19812.35 Reasons given for increased level <strong>of</strong> crime byrespondents who believe crime has increased intheir community, by demographic characteristics,United States, 19812.36 Attitudes toward statements about crime,United States, 19822.37 Attitudes toward the statement that chancesare good persons who spend time in jail will notcommit more crimes, by dem~.9raphiccharacteristics, United States, 1982 ','<strong>Sourcebook</strong> <strong>of</strong> Criminol <strong>Justice</strong> <strong>Statistics</strong> <strong>1983</strong>Equivalenttable numberin 1982Page So..RCEBOO
------_.----. _._-List <strong>of</strong> Figures and Tables<strong>Sourcebook</strong> <strong>of</strong> <strong>Criminal</strong> <strong>Justice</strong> <strong>Statistics</strong> <strong>1983</strong>Equivalenttable numberin 1982Table Page SQRCEBOO< Table Page2.89 Respondents reporting a firearm in their home,by a:'llographic characteristics, United States,selected years 1973-82 2802.90 Respondents reporting a firearm in their home,by type <strong>of</strong> firearm and demographic chcracteristics,U,ited States, 198228r2.91 Respandents reporting ownership <strong>of</strong> a firearm, i..by demographic characteristics, United States,1980 and 1982 2812.92 Attitudes toward a law forbidding ownership <strong>of</strong>pistols and revolvers except by police and otherauthorized persons, by demographic characteristics,United States, 1975 and 1979-81 282Fig. 2.17 Attitudes toward a Federal law requiringthat all handguns be registered by Federalauthorities, U,ited States, 1975 and 1978-80 2832.93 Attitudes toward a law requiring a policepermit prior to gun purchase, by demographiccharacteristics, U,ited States, 1972-77, 1980, and1982 2842.94 Attitudes toward requiring a permit beforepurchasing a handgun, by gun ownership, UnitedStates, 1,81 2862.95 Attitudes toward a law requiring a waitingperiod before a gun can be purchased, by.r.emographic characteristics, U,ited States, 1981 2862.% Attitudes toward a law requiring 0 waitingperiod before a gun can be purchased, by attitudestoward a ban on handgun possession, United States,I~I ~72.97 Attitudes toward a law requiring a person toobtain a license to carry a gun outside <strong>of</strong> home, bydemographic characteristics and gun ownership,U,ited States, 1975, 1980, and 1981 2882.98 Attitudes toward change in laws covering sale<strong>of</strong> handguns, by demographic chcractedstics, andgun ownership, United States, 1975, 1980, and 1981 2892.99 Attitudes toward a law making it illegal taimprt gun parts from other nations, bydemographic characteristics, U,ited States, 1981 2902.100 Attitudes toward the effect <strong>of</strong> stricter guncontrol laws on the numb~r <strong>of</strong> murders, by gunownership, United States, ,981 2902.101 Attitudes toward the sentencing <strong>of</strong> criminalswho carry a gun during the commission <strong>of</strong> a crime,U,ited States, 1981 2902.102 Respondents who report knowing victims <strong>of</strong>child abuse, wife obuse, or abuse <strong>of</strong> the elderly, bydemographic characteristics and type <strong>of</strong> victim,U,ited States, 1981 2912.103 Respondents rating the problems <strong>of</strong> childa9use, wife abuse, and C'buse <strong>of</strong> the elderly as veryserious, by demographic characteristics, UnitedStates, 1981 2912.104 Respondents reporting whether they knowsomeone who uses drugs, by type <strong>of</strong> drug, UnitedStates, 1978 and 1982 2922. /05 Attitudes toward dangerousness <strong>of</strong> the use <strong>of</strong>drugs, b}' type <strong>of</strong> drug, United States, 1978 and1982 2922.106 High schc,ol seniors' perceptions <strong>of</strong> theharmfulness <strong>of</strong> drug use, by type <strong>of</strong> drug andfrequency <strong>of</strong> u~e, United States, 1975-82 2932.107 High school senio~s' perceptions <strong>of</strong> availability<strong>of</strong> drugs, by type <strong>of</strong> drug, United States, 1975-82 2942.65*Fig, 2.18*2.582.59*2.60*2.61*2.62*2.63*2.64*2.66*2.67*2.68*2.69*2.712.722.108 High school seniors favoring prohibition <strong>of</strong>drug use, by type <strong>of</strong> drug and place <strong>of</strong> use, U,itedStates, 1975-82 2942.109 Attitudes toward legalization <strong>of</strong> marihuanause, by demographic characteristics, t'nited States,selected years 1973-80 295Fig. 2.18 Respondents favoring the legalization <strong>of</strong>marihuana use,...,U,ited States, selected years 1%9-80 2962.110 Attitudes toward the legalization <strong>of</strong>possession <strong>of</strong> small amounts <strong>of</strong> marihUana, bydemographic characteristics, U,ited States, 1982 297Fig. 2.19 Respondents favoring a law fo'rbidding thesale <strong>of</strong> alcoholic beverages, U,ited States, selectedyears 1936-81 2982.111 Attitudes toward a law forbidding the sale <strong>of</strong>beer, wine, and liquor, by demographiccharacteristics, U,ited States, 1981 2992.1 12 Respondents favoring stricter drunk drivinglaws and mandatory jai I sentences for first<strong>of</strong>fenders, by region, United States, 1982 3002.113 Attitudes toward pornographic materiallea~ing.; to rape, by demographic characteristics,U,ited States, selected years 1973-80 3012.114 Attitudes toward laws regulating thedistribution <strong>of</strong> pornography, by demographiccharacteristics, United States, selected years1973-80 302Equivalenttable numberin 1982SQRCEBCO
<strong>Sourcebook</strong> <strong>of</strong> <strong>Criminal</strong> <strong>Justice</strong> <strong>Statistics</strong> <strong>1983</strong>Equivalenttable numberin 1982Table Page SC\.RCEBOO< Table Page3.35 N.Jmber and percent <strong>of</strong> "households touched bycrime" during the lost 12 months, by type <strong>of</strong>.victimizotio." lklited States, 1975-82 3513.36 Percent <strong>of</strong> "households touched by crime"during the lost 12 months, b)' race <strong>of</strong> head <strong>of</strong>household, family income, and place <strong>of</strong> residence,lhited States, 1982 3523.37 Respondents reporting being victimized duringthe lost 12 months, by <strong>of</strong>fense, United States,selected years 1972-83 352Fig. 3.14 Percent <strong>of</strong> "households touched by crimes<strong>of</strong> high concern" during the lost 12 months, by race<strong>of</strong> head <strong>of</strong> househ
------~-~~--------------------r:Table<strong>Sourcebook</strong> <strong>of</strong> <strong>Criminal</strong> <strong>Justice</strong> <strong>Statistics</strong> <strong>1983</strong>Page4.5 Arrests, by <strong>of</strong>fense charged and sex, UnitedStates, 1981 427Fig. 4.4 Arrests for violent crimes, by <strong>of</strong>fensecharged and sex, United States, 198 I 428Fig. 4.5 Arrests for property crimes, by <strong>of</strong>fensecharged and sex, United States, 198 I 4294.6 Arrests, by <strong>of</strong>fense charged, sex, and age group,United States, 19BO and 1981 430~. 7 Arrests, by <strong>of</strong>fense charged, age group, andrace, United States, 1981 431Fig. 4.6 Arrests for violent crimes, by <strong>of</strong>fensecharged and race, United States, 1981 434Fig. 4.7 Arrests for property crimes, by <strong>of</strong>fensecharged and race, United States, 19B I 4354.8 Arrests i" cities, by <strong>of</strong>fense charged and sex,1981 4364.9 Arrests in cities, by <strong>of</strong>fense charged, age group,and race, 1981 4374.10 Arrests in suburban areas, by <strong>of</strong>fense chargedand sex, 1981 4404.11 Arrests in suburban areas, by <strong>of</strong>fense charged,age group, and race, 198 I 4414.12 Arrests in rural counties, by <strong>of</strong>fense chargedand sex, 1981 4444.13 Arrests in rural counties, by <strong>of</strong>fense charged,age group, and race, 19B I 445Fig. 4.8 Arrest rates (per 100,000 inhabitants) forall <strong>of</strong>fenses, by extent <strong>of</strong> urbanization, 1972-8 i 4484.14 Arrest rates (per 100,000 inhabitants) forviolent crimes, by <strong>of</strong>fense charged and region,1970-81 448Fig. 4.9 Arrest rates (per 100,000 inhabitants) forviolent crimes, by <strong>of</strong>fense charged and region, 1981 4494.15 Arrest rates (per 10U,000 inhabitants) forproperty crimes, by <strong>of</strong>fense charged and region,1970-81 450Fig. 4.10 Arrest rates (per 100,000 inhabitants) for'property crimes, by <strong>of</strong>fense charged and region,1981 4504.16 Offenses known to police and percent clearedby arrest, by <strong>of</strong>fense and size <strong>of</strong> place, 1981 451Fig. 4.11 Percent <strong>of</strong> <strong>of</strong>fenses known to police thatwere cleared by arrest, by <strong>of</strong>fense, United States,1981 453Fig. 4.12 Percent <strong>of</strong> <strong>of</strong>fenses known to police thatwere cleared by arrest, by type <strong>of</strong> <strong>of</strong>fense, UnitedStates, 1980 and 1981 454Fig. 4.13 Percent <strong>of</strong> <strong>of</strong>fenses known to police thatwere cleared by arrest, by extent <strong>of</strong> urbanization,United States, 1972-81 455Fig. 4.14 Percent <strong>of</strong> violent crimes known to policethat were cleared by arrest, by extent <strong>of</strong>urbanization, United States, 1972-81"'"5Fig. 4.15 Percent <strong>of</strong> property crimes known topolice that were cleared by arrest, by extent <strong>of</strong>urbanization, United States, 1972-81 4574.17 Number <strong>of</strong> <strong>of</strong>fenses known to police that werecleared by arrest and percent <strong>of</strong> <strong>of</strong>fenses clearedby arrest <strong>of</strong> persons under 18 years <strong>of</strong> age, by<strong>of</strong>fense and size <strong>of</strong> place, 1981 458Equivalenttable numberin 1982SQRCEBOO
---------- - -- ~----------------------------"<strong>Sourcebook</strong> <strong>of</strong> <strong>Criminal</strong> <strong>Justice</strong> Statlsllcs <strong>1983</strong>Equivalenttable numberIn 1982Table Page 5O..RCEBOO< Table Page5.36 Antitrust cases flied In U.S. District Courts, bytype <strong>of</strong> case, years ending June 30, 1960-82 526 5.33Fig. 5.12 <strong>Criminal</strong> proceedings In cases referred bythe Securities and Exchange Commission to theU.S. Department <strong>of</strong> <strong>Justice</strong> for prosecution, fiscalyears 1968-81 527 Fig. 5.135.37 Prosecutions for violations <strong>of</strong> U.S. Immigrationand nationality laws, by type <strong>of</strong> case, type <strong>of</strong>disposition, and aggregate fines and imprisonmentImposed, fiscal years 1968-8 I 528 5.345.38 Convictions for violations <strong>of</strong> U.S. l;nnlgrat/onand nationality laws, by <strong>of</strong>fense, fiscal year,~ 1970-81 528 5.355.39 Investigative activity <strong>of</strong> the U.S. SecretService, fiscal years 1972-82 530 5.365.40 Forged check and forged bond cases receivedand cia led by the U.S. Secret Service, fiscal years1973-81 530 5.375.41 Dispositions <strong>of</strong> arrests by the U.S. SecretService, fiscal years 1974-82 532 5.385.42 Persons Indicted, awaiting trial on Dec. 31,and convicted <strong>of</strong> <strong>of</strong>fenses Involving abuse <strong>of</strong> public<strong>of</strong>fice, by level <strong>of</strong> government, 197U-82 532 5.395.43 kmy personnel tried and percent convicted InGeneral and Special (BCD) Courts-Martial, by typeaf personnel, fiscal years 1971-82 533 5.405.44 Air Force personnel tried and percentconvicted In General and Special Courts-Martial,by type <strong>of</strong> court and personnel, 1971-82 533 5.435.45 Air Force personnel tried and percent pleadingguilty to all charges entered In General andSpecial Courts-Martial, by type <strong>of</strong> court, 1971-82 534 5.445.46 Air Force personnel convicted In General andSpecial Courts-Martial, by type <strong>of</strong> disposition andcourt, 1971-82 5355.47 Novy and Marine Corps personnel tried andpercent convicted In General and Special CourtsMartial, by type <strong>of</strong> personnel, fiscal years 1971-82 5365.48 Navy and Marine Corps personnel tried andguilty pleas entered In General and Special (BCD)Courts-Martial, by type <strong>of</strong> court and guilty plea,fiscal years 1971-82 5365.49 Novy and Morine Corps personnel dispased <strong>of</strong> InGeneral and Special (BCD) Courts-Martial, by type<strong>of</strong> personnel and disposition, fiscal years 1971-82 5375.50 Coast Guard personnel tried in General, Special(BCD), and Summary Courts-Martial, by type <strong>of</strong>court, fiscal years 1966-82 5385.51 Coast Guard personnel convicted In Special(BCD) Courts-Martial. by type <strong>of</strong> disposition, fiscalyears 1978-82 5385.52 Offenses involved in Coast Guard Special(BCD) Courts-Martial, fiscal years 1970-82 5395.53 Dispositions <strong>of</strong> persons arrested for <strong>of</strong>fensesagainst railroads, by <strong>of</strong>fense, Unit~d States andCanada, 1978-82 ' 540Section 6:TablePersons Under Correctional SupervisionFig. 6.1 Persons under correctional supervision, bytype <strong>of</strong> supervision, on Dec. 31, 198 I 5445.455.465.475.485.495.505.515.52Equivalenttable numberIn 1982Page 5O..RCEBOO
--------------------. ----------~<strong>Sourcebook</strong> <strong>of</strong> <strong>Criminal</strong> <strong>Justice</strong> <strong>Statistics</strong> <strong>1983</strong>Equivalenttable numberin 1982Table Page So..RCEBOO< Table6.54 Deaths among !:mtenced prisoners under the 6.60 Movement <strong>of</strong> prisoners under sentence <strong>of</strong> death,jurisdiction <strong>of</strong> State and Federal correctional United States, 1968-81authorities, by cause <strong>of</strong> death, sex, region, andjurisdiction, 1981 601 6.54 6.61 Movement <strong>of</strong> prisoners under sentence <strong>of</strong> death,by race and <strong>of</strong>fense, United States, 19816.55 Prisoners under sentence <strong>of</strong> death, by race orethnicity and jurisdiction, on Apr. 20, <strong>1983</strong> 602 6.55 6.62 Pri~oners removed from death row, by currentstatus, region, and jurisdiction, 1981Fig. 6.12 Prisoners under sentence <strong>of</strong> death, byjurisdiction, an Dec. 31, 1981 603 Fig. 6.15 6.63 Prisoners removed from death row, by method<strong>of</strong> removal, region, and jurisdiction, 19816.56 Prisoners under sentence <strong>of</strong> death, by race,<strong>of</strong>fense, region, and jurisdic~".''', "n Dec. 31, 1981 604 6.56 6.64 Prisoners executed under civil authority, byregioP3nd jurisdiction, 1930-81Fig. 6.13 Characteristics <strong>of</strong> prisoners undersentence <strong>of</strong> death, United States, on Dec. 31, 1981 605 Fig. 6.16 under civil authority,Fig. 6.15 Prisoners executedUnited States, 1930-81Fig. 6.14 Prisoners under sentence <strong>of</strong> death, by priorfelony history, United States, on Dec. 31, 1981 606 Fig. 6.17 6.65racePrisoners executed under civil authority, byand <strong>of</strong>fense, United States, 1930-816.57 Prisoners received from court under sentence<strong>of</strong> death, by race, region, and jurisdiction, 1981 607 6.57 6.66 Prisoners executed under civil authority, byrace, <strong>of</strong>fense, region, and Jurisdiction, 1930-81(aggregate)6.58 Prisoners received from (:ourt under sentence<strong>of</strong> death, by age, legal status at time <strong>of</strong> arrest,6.586.59 Movement <strong>of</strong> prisoners under sentence <strong>of</strong> deathby(aggregate)race and <strong>of</strong>fense, United States, 1930-81and region, United States, 1981 608 Fig. 6.16 Prisoners executed under civil author lty,and status <strong>of</strong> death penalty statutes, by region andjurisdiction, 1981 609 6.59States, 1930-816.67authority,Female prisoners executed under civilby <strong>of</strong>fense, race, and jurisdiction, Unitp.dPage610610611612613614615616617618Equivalenttable numberin 1982S
- ...... - ~r---~---------~--------~~---Saurcebook <strong>of</strong> <strong>Criminal</strong> <strong>Justice</strong> <strong>Statistics</strong> <strong>1983</strong>Agure 1.1 <strong>Criminal</strong> justice expenditures <strong>of</strong> Federal, State, and local governments, by type <strong>of</strong> activity, United States,fiscal years 1971 and 1979f\OTE: This survey <strong>of</strong> expenditure and employment Is conductedannllally by the U.S. <strong>Bureau</strong> <strong>of</strong> the Census for the U.S.Department <strong>of</strong> <strong>Justice</strong>, <strong>Bureau</strong> <strong>of</strong> <strong>Justice</strong> <strong>Statistics</strong>. Ingen,llral, six categories <strong>of</strong> activity are covered: policeprarl!ctlon, judicial, legal services and prosecution, publicdefense, corrections, and ather. Data are collected for threelevels <strong>of</strong> government: Federal, State, and local. Lccalgovernment coverage includes all county governments, allmunicipalities having a 1977 population <strong>of</strong> 10,000 or more,and a sample <strong>of</strong> remaining cities and townships under 10,000population. The survey ponel was ct.l!Tlprlsed, therefore, <strong>of</strong>the Federal Government, the 50 State governments, and11,835 local governments (3,040 coooty governments, 6,728municipalities, and 2,067 townships).Because all State and county governments weresurveyed, data relating to them are not subject to sCllll>lingerror (l.e., variations that might result if a different samplewere used). However, data reported for local governmentsare estimates that are subject to sampling error. Localgovernment estimate. are aCC1Ira\'e (at the 95 percent level<strong>of</strong> confidence) to within three-quarters <strong>of</strong> I percent <strong>of</strong> thetotals that would have been expected if all local governments Iwere surveyed,$14.0Field compilation and mall canvass methods were usedto obtain the data and were supplemented by reference to avariety <strong>of</strong> published government documents such as budgets,financial statements, and audit reports. Expenditure data aregenerally for the fisc') I year. For the Federal Government,fiscal year 1979 refers to the period beginning Oct. I, 1978and endinq Sept. 30, 1979; State expenditure data cover thefiscal y,-,cr ending June 30, 1979, except for New York (Mar.31, 1979i, Texas (Aug. 31, 1979), and Alabama and Michigan(SePT. 30, 1979). For local governments, the 1979 fiscalyears reported are those that closed between July I, 1978and June 30, 1979; most municipalities and counties endedthe Ir fiscal years on Dec. 31, 1978 or June 30, 1979.~Ioyment data are for October 1~79, for all levels <strong>of</strong>government. The 1979 data ore preliminary figures; revisions<strong>of</strong> these duta will appear in the following publication: U.S.Deportment <strong>of</strong> <strong>Justice</strong>, <strong>Bureau</strong> <strong>of</strong> <strong>Justice</strong> <strong>Statistics</strong>, <strong>Justice</strong>Ex nditure a~d 10 nt in the U.S. 1979, NCJ:t16'4ITas angton, D ••: vernment nnting Office, 1993).For details <strong>of</strong> survey methodology and definitions <strong>of</strong> terms,see Appendix I.I~Ii"Characteristics <strong>of</strong> the Crimlnai <strong>Justice</strong> SystemsAgurrt 1.2 Expenditures f:lr criminal justice activities, by level <strong>of</strong> governmentand type <strong>of</strong> activity, United States, fiscal year 1979f\OTE: See NJTE, Figure 1.1. For survey methodology alld definitions <strong>of</strong> terms, seeAppendix I.Other criminal <strong>Justice</strong>$723 million(18.3%)Corrections$393 million _(9.9%)Public defense$240 million(6.1%)Legal services /"'"and prosecution .,/'$276 million(7.0%)Federal Government$3,951 mllilonllPolice protection$1,950 million(49.4%)JUdicial$370 mlilion(9.4%)$12.0$10.001971~1979Other criminal <strong>Justice</strong>$589 mll1i0n(7.0%)State government$8,418 million_Police protection$2,149 million(25.5%)~.!!0"C-0II)c~iIi$8.0$6.0$4.0Corrections$3,771 million -(44.8%)Public defense$128 million(1.5%)Judicial$1,328 mililon(15.8%)Legal servicesand prosecution$453 million(&.4%)$2.0$0.0Policeprotection0.1 $0.4Judicial Legal services Public Corrections OtheranddefensecriminalprosecutionjusticeSaurce: Agure provided to SO-.RCEBOO
---------------------.-~---<strong>Sourcebook</strong> <strong>of</strong> <strong>Criminal</strong> <strong>Justice</strong> <strong>Statistics</strong> <strong>1983</strong>Characteristics <strong>of</strong> the <strong>Criminal</strong> <strong>Justice</strong> SystemsTable 1.1 Total direct expenditures, and direct expenditures for State and local criminal justice activities, by type <strong>of</strong> activity,State, and level <strong>of</strong> government, fiscal year 1777!'OTE: See !'OTE, Figure 1.1. For survey methodology and definitions <strong>of</strong> direct expenditure and otherterms, see Appendix I.(Dollar anounts in thou~ds.- represents zero or rounds to zero.)State and level <strong>of</strong> goverrment OState!i-Iocal, totalS.,tesLoc...:'- totalCoum;,;;.;:MunicipalitiesAlabamaStateLocal, totalCountiesMunicipalitiesAlaskaStateLocal, totalBoroughsMuniCipalitiesArizonaStateLocal, totalCountiesMunicipalitiesArkansasStateLocal, totalCountiesMunicipalitiesCaliforniaStateLocal, totalCountiesMunicipalitiesColoradoStateLocal, totalCountiesMunicipalitiesConnecticutStateLocal, totalMunicipalitiesDelawareStateLocal, totalCountiesMunicipalitiesDistrict <strong>of</strong> ColuniliaStateLocal, totalMunicipalitiesFloridaStateLocal, totalCountiesMuni~ipalitiesGeorgiaStateLocal, totalCountiesMunicipalitiesSee footnotes at end <strong>of</strong> table.PopulatlOClIn bthousands216,332XXXX3,690XXXX407XXXX2,296XXXX2,144XXXX21,896XXXX2,617XXXX3,108XXX582XXXX690XXX8,452XXXX5,048XXXXTotalexp~~~~~rec$242, 264,OUO124,540,000117,728,00046,422,OUO71,309,0003,295,0002,246,0001,049,000331,000717,0001,858,0001,053,000806,000260,000546,0002,473,0001,255,0001,218,000538,000680,0001,752,0001,195,000557,000270,000287,00025,853,00011,594,00014,258,0008,363,0005,8%,0002,795,0001,488,0001,307,000474,000833,0004,260,0001,975,0002,285,0002,285,000679,000517,000162,00089,00074,0001,791,0001,791,0001,791,0007,597,0003,565,0004,032,0002,106,0001,926,0004,265,0002,733,0001,532,000702,000830,000Totul criminaljustice s~temercent<strong>of</strong> totaldirectexpendi-Amount ture$22,601,9767,345,57015,256,4066,045,2399,211,167252,417105,569146,84852,47294,376110,39277,70432,6883,45229,235326,29399,084227,209101,935125,274109,57844,73164,84730,58534,2623,071,563716,9732,354,5901,371,282983,308284,475114,536169,93945,345124,594287,565140,309147,256147,25672,34949,68922,6609,60013,060215,929215,929215,929984,640378,842605,798322,297283,501408,847149,494259,353145,749113,6039.35.913.013.012.97.74.714.015.913.25.97.44.11.35.413.27.918.718.918.46.33.711.611.311.911.96.216.516.416.710.27.713.09.615.06.87.16.46.410.79.614.010.817.612.112.112.113.010.615.015.314.79.65.516.920.813.7Police protectionPercent<strong>of</strong> totalcriminaljusticeAmount system$11,863,5471,987,8359,875,7122,031,7287,843,984134,60628,737105,86921,14784,72253,26826,11927,1492,45124,699185,47741,864143,61330,777112,83658,68116,13942,54212,92029,6221,510,828267,2921,243,536351,690891,846144,21022,468121,74221,608100,135172,91533,523139,392139,39233,90714,41719,4907,610II ,880102,983102,983IO:l,983492,65565,581427,074170,452256,622198,80241,041157,76159,64998,11352.527.164.733.685.253.327.272.140.389.848.333.683.171.084.556.842.363.230.290.153.636.165.642.286.549.237.352.825.690.750.719.671.647.780.460.123.994.794.746.929.086.079.391.047.747.747.750.017.370.552.990.548.627.560.840.986.4JudicialPercent<strong>of</strong> totalcriminaljusticeAmount system$3,019,1651,206,9841,812,1811,429,173383,00841,13228,21312,9199,9372,98216,61316,563505036,7345,47531,25925,1876,07213,4783,9679,5117,5851,926355,71841,047314,671299,66915,00140,23529,13011,1052,6728,43331,99130,2631,7281,72812,75610,6012,1551,58457122,65222,65222,652126,02041,46584,55577 ,9006,65556,98411,05045,93441,1724,76313.416.411.923.64.216.326.78.818.93.215.021.30.20.211.35.513.824.74.812.38.914.724.85.611.65.713.421.91.514.125.46.55.96.811.121.61.21.217.621.39.516.54.410.510.510.512.810.914.024.22.313.97.417.728.24.2Legal servicesand prosecutionPercent<strong>of</strong> totalcriminaljusticeAmount system$1,382,186428,791953,395576,762376,63312,8287,2335,5953,5032,09214,4609,8344,6261,0023,62422,3155,14717,16811,9445,2245,1271,1244,0032,9081,096259,32240,383218,939171,91047,02923,0204,62418,39611,2237,17313,9029,5944,3084,3083,0952,1699263455816,4826,4826,48251,23834,30416,9348,5048,43018,2216,41611,8058,0593,7466.15.86.29.54.15.16.93.86.72.213.112.714.229.012.46.85.27.611.74.24.72.56.29.53.28.45.69.312.54.88.14.010.824.85.84.86.82.92.94.34.44.13.64.43.03.03.05.29.12.82.63.04.54.34.65.53.3Public defensePercent<strong>of</strong> totalcriminaljusticeAmount system$357,030118,012239,018195,40843,6101,9461,5154311482832,6142,6146,0986,0985,8852138071679167')11279,5925,240711,35270,1844,1684,6424,620221663,9443,6752692691,0821,02359596,0026,0026,00219,67915,1844,4954,417783,1303622,7682,5951731.61.61.63.20.50.81.40.3D.30.32.43.41.92.75.80.20.7(d)1.22.20.32.60.73.25.10.41.64.0(d)(d)(d)1.42.60.20.21.52.10.30.62.82.82.82.04.00.71.4(d)0.80.21.11.80.2CorrectionsPercent<strong>of</strong> totalcriminaljusticeAmount system$5,632,5033,478,3492,154,1541,653,258500,89656,75136,57220,17916,0494,13022,57621,84972772774,18445,47028,71428,08962528,85621,7667,0905,9221,168824,108351,988472,120451,91820,20368,16652,26715,8999,0046,89561,37860,987391391.20,38420,38477 ,39677 ,39677 ,396275,332212,48462,84853,1469,702126,35586,62939,72633,8305,89524.947.414.127.35.422.534.613.730.64.4;W.528.12.22.522.745.912.627.60.526.348.710.919.43.426.849.120.133.02.124.045.69.419.95.521.343.50.30.328.241.035.835.835.828.056.110.416.53.430.957.915.323.25.2Othercriminal justicePercent<strong>of</strong> totalcriminaljusticeAmount system$347,545125,599221,946158,91063,0365,1543,2991,8551,6881678617251361361,4851,128357533042,6291,71991057233841,99411,02330,97125,9115,0614,2031,4272,7768221,9533,'1342,2671,1671,1671,1261,0953132841441441419,7179,8249,8937,8772,0155,3543,9961,3584449141.51.71.52.60.72.03.11.33.20.20.80.90.40.50.51.10.20.10.22.43.81.41.91.01.41.51.31.90.51.51.21.61.81.61.21.60.80.81.62.20.1(1'1)0.20.20.20.22.02.61.62.40.71.32.70.50.30.845
------------- - ~------~-----~--------------------------<strong>Sourcebook</strong> <strong>of</strong> <strong>Criminal</strong> <strong>Justice</strong> <strong>Statistics</strong> <strong>1983</strong>Characteristics <strong>of</strong> the <strong>Criminal</strong> <strong>Justice</strong> SystemsTable 1.1 Total direct expenditures, and direct expenditures for State and local criminal justice activities, by type <strong>of</strong> activity,State, and level <strong>of</strong> goverrvnent, fiscal year 1979--Continued(Dollar amounts in thousands •. - represents zero or rounds to zero.)Total criminalLegal servicesJudicialjustice system Police protectionand prose cut Ion OtherPercentPublic defense CorrectionsPercent Percent PercentPercentcrlmlngl lustlce<strong>of</strong> total <strong>of</strong> total Percent<strong>of</strong> total <strong>of</strong> total Percentcriminal <strong>of</strong> totalcriminal<strong>of</strong> totalPopulation Total direct criminal <strong>of</strong> totaljustice criminaljusticecriminalin b direct expendi- justice Amountcriminals stem AmountjusticeState and level <strong>of</strong> governrnent a s stem Amountjusticethousands expenditure c .Amount ture Amount system s stem Amountjusticest t$45,381Minnesota 3,97513.2$4,679,000 $342,988 7.3 $171,412 50.0$26,77813,3567.813.9$7,4165,6292.25.9$88,508State25.8X 2,468,000 96,144 3.9 33,221 34.6$3,49332,0251.013.0928 1.0 41,208Local, total 21,149 8.6 6,48842.9X 2,211,000 246,844 11.2 138,191 56.01,80231,9541.923.8 14,2242.610.647,300 19.2Counties X 1,095,000 134,425 12.3 34,544 25.71,691 0.771 0.16,455 4.8 46,580Municipalities 6,925 6.2 3334.7X 1,116,000 112,420 10.1 103,647 92.2 (d) 6677210.50.6 1,024 0.915,753Mississippi 2,38912.12,207,000 130,530 5.9 71,380 54.76,2044,7474.88.29203,5360.76.134,892 26.7State 1,381X 1,402,000 57,644 4.1 21,916 38.0 1.111,006 15.1 2,668 3.726,28192045.6Local, total X 805,000 72,886 9.1 49,464 67.9 1.31,164 2.09,890 31.3 1,525 4.88,611 11.8Counties X 485,000 31,639 6.5 11,749 37.1217 0.31,115 2.7875 2.8 7,402 23.4Municipalities X 319,000 41,247 12.9 37,716 91.41,143 2.8 45 0.1 m1,2090.6;>2.9 18 (d)t 51,566Missouri13.14,801 3,696,000 393,986 10.7 234,680 59.618,18519,2444.617.03,0312,8030.8 84,481 21.4State 2.5 2,710 2.42,043 0.5.1. X 2,202,000 112,995 5.1 36,856 32.6 32,322 11.5 15,382 5.550,79832145.0Local, total X 1,495,000 280,991 18.8 197,824 70.4584 0.520,705 23.8 8,4400.19.733,683 12.0Counties 32 (d)1,459X 395,000 87,057 22.0 36,137 41.5 0.511,617 6.0 6r942 3.621,440 24.6Municipalities 302X 1,100,000 193,933 17.6 161,687 83.4 288 0.1 12,2430.36.3 1,156 0.67,192Montana 76112.0872,000 60,121 6.9 30,418 50.64,2032,0597.08.46761,2721.15.216,218 27.0State1,415X 542,000 24,382 4.5 7,774 31.9 2.45,133 14.4632,9310.3 12,221 50.1Local, total 8.2 613 1.7993X 330,000 35,739 10.8 22,644 63.4 4.14,493 20.9 2,286 10.63,997 11.2Counties 597 2.8422X 162,000 21,531 13.3 9,824 45.6 1.2640 4.5 645 3,910 18.2Municipalities 422X 167,000 14,208 8.5 12,821 90.2 4.5 16 0.1 872.00.615,472Nebraska 1,56112.71,451,000 122,220 8.4 59,731 48.97,5997,6086.214.51,2S5 1.01,200 2.337,2% 30.5State X 837,000 52,316 6.3 14,341 27.4866 0.77,864 11.3 6,399 9.228,7971,25555.0Local, totol X 614,000 69,904 11.4 45,390 64.9 1.8370 0.75,812 19.4 4,483 14.98,499 12.2COl.'aties X 254,000 30,032 11.8 10,349 34.5496 0.72,053 5.11,255 /:.21,916 4.87,865Municipalities26.2X 360,000 39,872 11.1 35,041 87.92686340.91.6 228 0.614,743Nevada 63312.9922,000 114,487 12.4 53,818 47.08,9292,4047.87.42,0451,8381.85.733,995 29.7State X 452,000 32,519 7.2 7,875 24.2957 0.812,339 15.12717,0910.8 19,752 60.7Local, total 8.7 1,774 2.2379X 470,000 81,968 17.4 45,943 56.0 1.2Ii9,928 16.3 5,523 9.114,2431,77417.4Counties 578X 312,000 60,899 19.5 29,910 49.10.72,411 11.4 1,5682.97.413,186 21.7Municipalities 578X 158,000 21,069 13.3 16,033 76.1 0.9!(d) 1,057 5.0/, 7,269New I-bnpshire11.4849 868,000 63,519 7.3i37,235 58.62,8172,1664.49.3668 1.1 14,614I 1,317 5.7 23.0State X 513,000 23,258 4.5 8,977 38.6916 1.45,103 12.76251,5002.7 9,543 41.0Local, total 630X 355,000 40,261 11.3 28,258 70.2 ~ 3.7 43 0.12.73,206 31.1 560 5.45,071/1312.6Counties286X 48,000 10,322 21.5 1,887 18.3 II 0.71,897 6.3 0.4940 3.14,607 44.6Municipalities X 307,000 29,939 9.8 26,371 88.119 0.2ij 463 1.5 267 0.9120,341New Jersey 7,32913.48,457,000 898,200 10.6 509,527 56.765,38332,4547.3 19,045 2.1 178,573Ii14.3 13,230 5.8 18,57719.9State 8.25,331X 3,789,000 226,799 6.0 74,078 32.70.687,887 13.1 52,153f!7.887,895 38.8Local, total 468 0.1565X 4,668,000 671,401 14.4 435,449 64.9 0.265,547 28.11 38,508 16.790,678 13.5Counties 196 0.14,766X 1,916,000 231,168 12.1 32,759 14.20.722,340 5.11113,645 90,643 39.2Municipalities 3,515X 2,752,000 440,233 16.0 402,690 91.5 3.1 272 0.1 351.5.' (d) 1,252 0.312,861New Mexico11.01,190 1,403,000 116,845 8.3 58,283 49.99,50910,6088.1 2,789 2.4 28,567State17.9j'7,367 12.5 24.4 4,836X 978,000 59,111 6.0 14,394 24.4 4.12,253 3.92,7062,1424.63.719,682Local, total 8333.30.14,354X 426,000 57,734 13.6 43,889 76.0 7.4576 3.3 556 3.28,885Counties15.4 482X 109,000 17,375 15.9 9,700 55.80.8[ 1,677 4.2 1,585 3.96,169Municipalities 8335.50.2374X 317,000 40,359 12.7 34,190 84.72,7162.26.7 108if0.3485,179New York 17,92415.728,865,000 3,094,028 10.7 1,695,139 54.8183,995I; 416,9025.942.542,334 1.4 642,105State 49,212 5.0 10,08920.81.045,275X 9,122,000 981,158 10.8 123,115 12.5 1.568,277 3.2 134,783 6.4359,104Local, total 32,24536.61.522,736X 19,743,000 2,112,870 10.7 1,572,024 74.4 2.324,378 5.3 38,688 8.4283,001Counties 13,21913.42.922,539X 5,044,000 461,377 9.1 259,576 56.3 1.143,899 2.7 96,096 5.8121,676Municipalities 19,02626.4X 14,700,000 1,651,493 11.2 1,312,448 7').51.23,839161,3240.89.8 18,699 1.1See footnotes at end <strong>of</strong> table.!i~~III8 9
-~~~~~~- ---- _. --,-------- .,.. "<strong>Sourcebook</strong> <strong>of</strong> <strong>Criminal</strong> <strong>Justice</strong> Stati~tics <strong>1983</strong>Characteristics <strong>of</strong> the <strong>Criminal</strong> <strong>Justice</strong> SystemsTable 1.1 Total direct expenditures, and direct expenditures for State and local criminal justice activities", -by type <strong>of</strong> activity,State, and level <strong>of</strong> government, fiscal year 1979--Continued(Dollar amounts in thousands. - represents zero or rounds to zero.)'State and level <strong>of</strong> gavernment aNorth CarolinaStateLocai, totalCountiesMunicipalitiesNorth DakotaStateLocal, totalCountiesMunicipalitiesOhioStateLocal, totalCountiesMunicipalitiesOklahomaStateLocal, totaiCountiesMunicipalitiesOregonStateLocal, totalCountiesMunicipalitiesPennsylvaniaSTateLocal, totalCountiesMunicipalitiesRhode IslandStaleLocal, totalMunicipalitiesSouth CarolinaStateLocal, totalCountiesMUnicipalitiesSouth DakotaStateLocal, totalCountiesMunicipalitiesTennesseeStateLocal, totalCountiesMunicipalitiesTexasStateLocal, totalCountiesMunicipalitiesUtahStateLocal, totalCountiesMunicipalitiesVermontStateLocal, totalCountiesMunicipalitiesSee footnotes at end <strong>of</strong> table.Populationinthousands b5,525XXXX653XXXX10,701XXXX2,811XXXX2,376XXXX11,785XXXX935XXX2,876XXXX689XXXX4,299XXXX12,830XXXX1,268XXXX483XXXXTotaldirectexpenditure c$6,767,0003,045,0003,722,0002,896,000826,000768,000531,000237,00089,000148,0009,487,0004,958,0004,529,0001,964,0002,565,0002,651,0001,741,000910,000247,000663,0002,867,0001,795,0001,072,000529,000544,00010,326,0006,371,0003,955,0001,210,0002,745,0001,444,000828,000616,000617,0002,522,0001,794,000729,000483,000246,000733,000518,000214,00090,000124,0004,995,0002,241,0002,754,0001,348,0001,406,00010,321,0006,171,0004,151,0001,355,0002,796,0001,300,000917,000384,OUO185,000199,000558,000450,000109,0001,000108,000Total I:riminaljustice systemPercent<strong>of</strong> totaldirectexpendi-Amount ture$418,911 6.2233,779 7.7185,132 5.074,959 2.6110,174 13.339,669 5.213,220 2.526,1149 11.212,910 14.513,538 9.1871,657 9.2212,299 4.3659,358 14.6253,388 12.9405,970 15.8203,446 7.7100,932 5.8102,514 11.326,836 10.975,678 11.4282,246 9.8102,416 5.7179,830 16.8109,420 20.770,410 12.91,055,979 10.2292,914 4.6763,065 19.3202,689 16.8560,375 20.490,557 6.350,426 6.140,131 6.540,131 6.5210,902 8.4102,898 5.7108,004 14.864,194 13.343,810 17.845,498 6.223,310 4.522,188 10.410,572 11.711,616 9.4341,557 6.8118,916 5.3222,641 8.194,762 7.0127,879 9.1969,407 9.4234,421 3.8734,986 17.7308,619 22.8426,367 15.2112,560 8.746,610 5.165,950 17.228,066 15.237,884 19.038,315 6.928,7819,5346.48.79178,61791.78.0Police protectionPercent<strong>of</strong> totalcriminaljusticeAmount system$195,492 46.745,262 19.4150,230 81.142,645 56.9107,585 97.721,277 53.63,697 28.017,580 66.55,043 39.112,536 n.6449,041 51.555,454 26.1393,587 59.758,228 23.0335,359 82.699,899 49.125,034 24.874,865 73.07,794 29.067,071 88.6128,286 45.529,842 29.198,444 54.734,126 31.264,317 91.3564,644 53.5117,738 40.2446,906 58.619,871 9.8427,035 76.249,450 54.610,661 21.138,789 96.738,789 96.7106,690 50.636,496 35.570,194 65.029,382 45.840,812 93.223,910 52.66,778 29.117,132 77.26,056 57.311,076 95.4158,630 46.422,407 18.8136,223 61.228,555 30.1107,669 84.2537,736 55.585,919 36.7451,817 61.567,620 21.9384,197 90.161,965 55.117,828 38.244,137 66.913,015 46.431,121 82.115,799 41.27,356 25.68,443 88.6249 27.18,195 95.1.!\1IIIIIJudicialPercent<strong>of</strong> totaicriminaljusticeAmount system$50,69340,41610,27710,215636,5462,0734,4734,029445134,08715,298118,78986,01832,77122,5479,20513,34210,6852,65734,4988,94225,55623,6901,866162,15437,836124,31873,47250,84712,78212,45033233230,0617,36222,69921,4511,2487,0705,9331,1371,1231343,33710,95232,38524,7827,603137,76318,746119,017101,19317,82414,6405,3199,3214,5324,7885,6525,034618609812.117.35.613.60.116.515.716.931.23.315.47.218.033.98.111.19.113.039.83.512.28.714.221.72.715.412.916.336.29.114.124.70.80.814.37.221.033.42.8i5.525.55.110.60.112.79.214.526.25.914.28.016.232.84.213.011.414.116.112.614.817.56.566.50.1Legal servicesand prosecutionPercent<strong>of</strong> totalcriminal<strong>Justice</strong>Amount system$25,437 6.121,343 9.14,094 2.21,934 2.62,160 2.03,191 8.01,071 8.12,120 8.01,691 13.1428 3.250,211 5.813,096 6.237,115 5.620,810 8.216,305 4.011,5856,8095.76.74,7761,8524.76.92,924 3.927,252 9.713,088 12.814,164 7.910,976 10.03,188 4.554,371 !.i. I15,422 5.338,949 5.119,480 9.619,468 3.53,776 4.22,768 5.51,008 2.51,008 2.59,443 4.55,547 5.43,896 3.63,043 4.7854 1.93,967 8.71,805 7.72,162 9.71,686 15.9476 4.114,776 4.310,204 8.64,572 2.11,751 1.82,821 2.256,927 5.911,280 4.845,647 6.233,222 10.812,425 2.97,771 6.92,347 5.05,424 8.23,806 13.61,618 4.32,245 5.91,828 6.4417 4.45 0.5412 4.8Public defensePercent<strong>of</strong> totalcriminaljusticeAmount system$6,021 1.45,956 2.565 (d)40 0.124 (d)339 0.9339 1.3334 2.65 (d)11,313 1.31,091 0.510,222 1.69,519 3.8702 0.21,135 0.61,1359311.13.5203 0.36,114 2.2379 0.45,735 3.25,572 5.1162 0.211,872 1.111,872 1.66,883 3.44,989 0.9816 0.9816 1.61,781 0.8801 0.8980 0.9974 1.56 Cd)486 1.1486 2.2486 4.6(d)3,884 1.12,306 1.91,578 0.71,058 1.1519 0.49,309 1.0152 0.19,157 1.29,082 2.975 (d)1,005 0.91,005 1.5981 3.523 0.11,223 3.21,221 4.22 (d)2 (d)CorrectionsPercent<strong>of</strong> totalcriminal<strong>Justice</strong>Amount system$134,759 32.2117,307 50.217,452 9.417,256 23.0196 0.26,831 17.24,895 37.01,936 7.31,813 14.0123 0.9209,951 24.1125,732 59.284,219 12.867,712 26.716,507 4.167,359 33.159,216 58.78,143 7.95,566 20.72,577 3.483,085 29.448,597 47.534,488 19.234,424 31.564 0.1255,007 24.1115,780 39.5139,227 18.282,140 40.557,086 10.222,648 25.022,648 44.960,779 28.851,352 49.99,427 8.78,566 13.3861 2.09,734 21.48,490 36.41,244 5.61,193 11.351 0.498,439 28.871,843 60.426,596 11.917,836 18.88,760 6.9203,993 21.0116,378 49.687,615 11.979,279 25.78,336 2.024,615 21.920,019 43.04,596 7.04,502 16.094 0.212,479 32.612,425 43.254 0.654 5.9Othercriminai justicePercent<strong>of</strong> totalcriminaljusticeAmount system$6,509 1.63,495 1.53,014 1.62,869 3.8145 0.11,484 3.71,484 11.217,055 2.01,628 0.815,427 2.311,101 4.44,326 1.1920 0.5668 0.7252 0.27 (d)245 0.33,012 1.11,568 1.51,444 0.8631 0.6813 1.27,931 0.86,138 2.11,793 0.2844 0.4949 0.21,0851,0831.22.12 (d)2 (d)2,147 1.01,340 1.3807 0.7778 1.229 0.1332 0.7304 1.328 0.128 0.322,491 6.61,204 1.021,287 9.620,781 21.9507 0.423,6'791,9462.40.821,73318,2233.05.93,510 0.82,565 2.31,097 2.41,468 2.21,229 4.4239 0.6917 2.4917 3.2Cd)(d)1011
<strong>Sourcebook</strong> <strong>of</strong> <strong>Criminal</strong> <strong>Justice</strong> <strong>Statistics</strong> <strong>1983</strong>Characteristics <strong>of</strong> the <strong>Criminal</strong> <strong>Justice</strong> SystemsTable 1.1 Total direct expenditures, and direct expenditures for State and local criminal justice activities, by type <strong>of</strong> activity,State, and level <strong>of</strong> government, fiscal year 1979--Continued(Dollar amounts in thousands. - represents zero or rounds to zero.)PopUlationState and level <strong>of</strong> government a in bthousandsVirginia 5,148StateXLocal, totalXCountiesXMunicipalitiesXWashington 3,668StateXLor.al, totalXCountiesXMunicipalitiesXWest Virginia 1,859StateXLocal, totalXCountiesXMunicipalitiesXWisconsin 4,651StateXLocal, totalXCountiesXMunicipalitiesXWyoming 406StateXLocal, totalXCountiesXMunicipalitiesXaOata for municipalities, and the local governments totals thatinclude municipal data, are estimates subject to sampling variation;data for counties (boroughs, parishes) are based on a canvass <strong>of</strong> allcounty governments and therefore are not subject to samplingvariat~on.Estimoted papulation <strong>of</strong> States as <strong>of</strong> July I, 1977 is derivedTotal criminal<strong>Justice</strong> s1ptem Police E!rotectlonercentPercent<strong>of</strong> total<strong>of</strong> totalTotal direct crim!naldirect expendl- justiceeXE!endlture c Amount ture Amount system$6,915,000 $466,909 6.8 $208,945 44.83,349,000 211,017 6.3 51,013 24.23,566,000 255,892 7.2 157,932 61.71,877 ,000 110,866 5.9 68,521 61.81,689,000 145,026 8.6 89,410 61.74,247,000 372,851 8.8 180,878 48.52,826,000 129,315 4.6 38,314 29.61,421,000 243,536 17.1 142,564 58.5616,000 132,693 21.5 46,749 35.2805,000 110,843 13.8 95,816 86.41,915,000 102,587 5.4 54,681 53.31,539,000 53,779 3.5 21,177 39.4376,000 48,808 13.0 35,504 68.6147,000 23,%6 16.3 10,021 41.8229,000 24,842 10.8 23,483 94.55,912,000 407,676 6.9 216,469 53.12,642,000 128,147 4.9 24,688 19.33,271,000 279,529 8.5 191,71l1 68.61,377,000 128,450 9.3 48,226 37.51,894,000 151,079 8.0 143,555 95.0594,000 50,784 8.5 24,652 48.5360,000 24,051 6.7 5,218 21.7234,000 26,733 11.4 19,434 72.7136,000 12,312 9.1 6,376 51.897,000 14,421 14.9 13,0:;8 90.5from U.S. <strong>Bureau</strong> <strong>of</strong> the Census, Current Population Reports, SeriesP-25,~. 7901.The relation <strong>of</strong> criminal justice total expenditure to totalgeneral expenditure Is based on data for general purpase governmentsonly and does not Include data for State-operated liquor stores,IndepEtP,dent school districts, or special districts.Less than half the unit <strong>of</strong> measurement shown.Source: Table provided to Sa.RCEBOO< st<strong>of</strong>f by the U.S. Deportment <strong>of</strong> <strong>Justice</strong>, <strong>Bureau</strong> <strong>of</strong> <strong>Justice</strong> <strong>Statistics</strong>.JudicialPercent<strong>of</strong> totalcriminaljusticeAmounts~tem$55,165 11.827,414 13.027,751 10.811,875 10.715,875 10.943,382 11.67,641 5.935,741 14.729,939 22.65,803 5.2I)17,788 17.3li 12,063 22.4Ii 5,725 11.7,j 5,339 22.3! 386 1.6I47,101 11.614,080 11.033,021 11.831,448 24.51,573 1.0-I~\>"*!IIrifI'I I5,110 10.12,027 8.43,083 11.52,491 20.2593 4.1Legal servicesOtherand prosecution Public defense Corrections criminal <strong>Justice</strong>Percent Percent percent Percent<strong>of</strong> total <strong>of</strong> total <strong>of</strong> total <strong>of</strong> totalcriminal criminal criminal crlm1naljustice <strong>Justice</strong> justice justice,Amount s)::stem Amount s~tem Amount s~tem Amount s~tem$17,930 3.8 $7,295 1.6 $168,458 36.1 $9,117 2.03,177 1.5 6,942 3.3 119,426 56.6 3,045 1.414,753 5.B 353 0.1 49,032 19.2 6,072 2.46,567 5.9 170 0.2 21,560 19.4 2,172 2.08,186 5.6 183 0.1 27,472 18.9 3,900 2.726,172 7.0 8,744 2.3 107,638 28.9 6,036 1.69,478 7.3 618 0.5 71,899 55.6 ! ,365 1.116,694 6.9 8,126 3.3 35,739 14.7 4,671 1.9II ,503 8.7 7,325 5.5 33,286 25.1 3,892 2.95,191 4.7 802 0.7 2,454 2.2 779 0.76,660 6.5 1,580 1.5 20,556 20.0 1,323 1.32,721 5.1 1,541 2.9 15,051 28.0 1,226 2.33,939 8.1 39 0.1 5,505 11.3 97 0.23,203 13.4 38 0.2 5,306 22.1 59 0.2735 3.0 I (d) 199 0.8 38 0.228,507 7.0 8,606 2.1 95,515 23.4 11,479 2.810,794 8.4 4,140 3.2 70,873 55.3 3,572 2.817,713 6.3 4,466 1.6 24,642 8.8 7,907 2.811,892 9.3 4,431 3.4 24,550 19.1 7,904 6.25,821 3.9 35 (d) 92 0.1 3 (d)3,357 6.6 698 1.4 16,483 32.5 484 1.01,175 4.9 574 2.4 14,573 60.6 484 2.02,182 8.2 124 0.5 1,910 7.11,590 12.9 124 1.0 1,732 14.1592 4.1 179 1.212II'" I:\1II11r IIIiIII,I: I1I,IIIIIIi'fIIII,IIIII 1II ~~ \ 1
Characteristics <strong>of</strong> the <strong>Criminal</strong> <strong>Justice</strong> SystemsFigure 1.3 <strong>Criminal</strong> justice full-time equivalent employment for Federal, State, and local governments, by type <strong>of</strong> activity, UnitedStates, fiscal years 1971 and 1979f\OTE: See f\OTE, Figure 1.1. For survey methodology and definitions <strong>of</strong> terms, see Appendix I.Thousands <strong>of</strong> full-timeequivalent employees800654rzJ 19710 1979 2779policeprotectionJudicialLegal servicesandprosecutionPublicdefenseCorrectionsOthercriminaljusticeSource: Figure provided to SQ..RCEB
--------- -' -- - -'-- ----~------------------------ -------~--------~-<strong>Sourcebook</strong> <strong>of</strong> Crimi no I <strong>Justice</strong> <strong>Statistics</strong> <strong>1983</strong>Table 1.2 <strong>Criminal</strong> justice expenditures <strong>of</strong> the Federal Government, by type <strong>of</strong> activity and expenditure, fiscal years 1971-79f'DTE: See N:)TE, Figure 1.1. For surve}' methodology and definitions <strong>of</strong> direct expenditure and other terms, see Appendix I.(Dollar amounts in thousands.- represents zero or rounds to zero.)Characterhtlcs <strong>of</strong> the <strong>Criminal</strong> <strong>Justice</strong> SystemsAmountPercent Increase or decrease (-)1971 1972 197:1 1974 1975 1976 1977 1978 1971T~ee <strong>of</strong> activlt~ and ex~nditure 1971 1972 1973 1974 1975 1976 1977 1978 1979 to to to to to to to to to1972 1973 1974 1975 1976 1977 1978 1979 1979Total criminal justice system $1,448,335 a $1,876,345 a $2,260,099 a $2,601,959 a $3,018,566 $3,322,073 $3,601,647 $3,834,607 $3,950,686Direct expenditure 1,214,857 a 1,502,463 a 1,650,881 a 1,859, 113 a 2,187,875 2,/150,229 2,778,710 3,122,290 3,269,381Intergovernmental expenditure 233,478 a 373, 882 a 609,218 a 742,846 a 830,691 871,844 822,937 712,317 681,305Police protection 804,514 963,108 1,089,873 1,224,586 1,464,244 1,615,714 1,771,922 1,959,305 1,949,899Direct expenditure 803,600 962,149 1,088,854 1,221,510 1,460,625 1,611,640 1,765,420 1,951,786 1,948,268Intergovernmental expenditure 914 959 1,019 3,076 3,619 4,074 6,502 7,519 1,631Judicial 134,020 179,099 118,359 136,135 165,332 219,445 21)9,626 321,373 369,509Direct expenditure 134,020 179,099 118,359 136,135 165,332 219,445 289,626 321,373 369,509Intergovernmental expenditureLegal services and prosecution 88,748 107,071 123,494 117,798 177,275 149,402 185,604 220,058 275,897Direct expenditure 88,748 107,071 123,494 117,798 177,275 149,402 185,604 215,525 265,898Intergovernmental expenditure 4,533 9,999Pub Ii c defense 61,095 80,237 50,436 91,629 87,017 103,718 140,452 209,060 240,232Direct expenditure 61,095 80,237 90,436 91,629 87,017 103,718 140,452 209,060 240,232Intergovernmental expenditureCorrections 121,258 146,491 189,096 237,300 243,113 285,973 338,400 375,802 392,589Direct expenditure 110,801 133,272 170,854 214,529 216,778 256,352 298,718 337,174 353,961Intergovernmental expenditure 10,457 13,219 18,242 22,771 26,335 29,621 39,682 38,628 38,628Other criminal justice 238,700 a 400, 339 a 648,84l a 794,511 a 881,585 947,821 875,643 749,009 722,560Direct expenditure 16,593 a 40,635 a 58,884 a 77,512 a 80,848 109,672 98,890 87,372 91,513Intergovernmental exeenditure 222 1 107 a 359 I 704 a 589 1 957 a 716 1999 a 800 1 737 838,149 776,753 661,637 631,04:'aFederal Government data for "total criminal justice system" and"other criminal justice" total expenditure, direct expenditure, andintergovernmental expenditure for fiscal years 1971, 1972, 1973, and1974 have been revised.Source: Table provided to So...RCEBOO< staff by the U.S. Department <strong>of</strong> <strong>Justice</strong>, <strong>Bureau</strong> <strong>of</strong> <strong>Justice</strong> <strong>Statistics</strong>.29.6 20.S 15.1 160 10.1 8.4 6.5 3.1 172.823.7 9.9 12.6 17.7 12.0 13.4 12.4 4.7 169.160.1 62.9 21.9 11.8 5.0 -5.6 -13.4 -4.4 191.819.7 13.2 12.4 19.6 10.3 9.7 10.6 -0.5 142.419.7 13.2 12.2 19.6 10.3 9.5 8.6 -0,2 142.44.9 6.3 201.9 17.7 12.6 59.6 15.6 -78.3 78.433.6 -33.9 15.0 21.4 32.7 32.0 11.0 15.0 175.733.6 -33.9 15.0 21.4 32.7 32.0 11.0 14.9 175.7X X X X X X X X X20.6 15.3 -4,6 50,5 -15.7 24.2 18.6 25.4 210.920.6 15.3 :'4.6 50.5 -15.7 24.2 16.1 23.4 199.6X X X X X X X 120.6 X31.3 12.7 1.3 -5.0 19.2 35.4 48.8 14.9 293.231.3 12.7 1.3 -5.0 IlI.2 35.4 48.8 14.9 293.2X X X X X X X X X20.8 29.1 25.5 2.4 17.6 18.3 11.1) 4.5 223.820.3 28.2 25.6 1.0 18.3 16.5 12.9 5.0 219.526.3 3tJ.0 24.8 15.7 12.5 34.0 -2.6 0.0 269.467.7 62.1 22.4 11.0 7.5 -7.6 -14.5 -3.5 202.7144.!:! 44.9 31.6 4.3 35.7 -9.8 -11.6 4.7 451.561.9 64.0 21.5 11.7 4.7 -7.3 -1I1.C -4.6 184.11617
------ ----- - -- - ---- - ----------------------------------_." .. --<strong>Sourcebook</strong> <strong>of</strong> <strong>Criminal</strong> <strong>Justice</strong> <strong>Statistics</strong> <strong>1983</strong>Characteristics <strong>of</strong> the <strong>Criminal</strong> <strong>Justice</strong> SystemsTable 1.3 <strong>Criminal</strong> justice employment and payroll for the Federal Government, by type <strong>of</strong> activl1y, October 1971-October 1979f\OTE: See f\OTE, Figure 1.1. For survey methodology and defln:tions <strong>of</strong> terms, see Appendix I.(Dollar amounts in thOlJsands)October October October October October October October October OctoberType <strong>of</strong> actlvit~ 1971 1972 1973 12Z!! Ins 1216 1211 1216 1212Total criminal justice system:Total employees 78,133 86,733 88,560 95,252 97,623 100,771 101,547 105,376 106,276Full-time employees 77,118 84,702 86,739 93,234 95,465 99,016 99,479 102,722 102,428Full-time equivalent employees 77,523 85,222 87,139 93,755 96,136 99,553 100,088 103,678 103,214October payroll $83,457 $100,367 $113,552 $130,802 $145,110 $159,726 $170,004 $184,202 $192,773Police protection:Total employees 56,972 62,126 64,880 69,420 70,087 72,301 72,455 75,182 75,519Full-time employees 56,199 61,117 63,786 68,257 68,924 71,207 71,130 73,559 72,750Full-time equivalent employees 56,528 61,393 63,996 68,504 69,196 71,421 71,433 73,993 73,152October payroll $59,231 $70,777 $82,367 $94,705 $102,289 $113,497 $122,380 $128,182 $133,516Judicial:Total employees 7,487 8,837 6,360 6,804 7,351 7,578 8,216 8,321 8, IS:!Full-time employees 7,389 8,404 6,254 6,700 7,238 7,473 8,131 8,229 8,051Full-time equivalent ernj:loyec;J 7,421 8,517 6,277 6,734 7,278 7,531 8,165 8,289 8,0';6October payroll $8,748 $10,935 $9,:)19 $10,517 $13,118 $13,733 $15,363 $17,474 $16,108Legal services and prosecution:Total employees 5,644 6,249 6,649 7,091 7,323 7,008 7,147 7,811 8,027Full-time employees '·.~35 5,944 6,333 6,74'1 6,992 6,821 6,864 7,325 7,576Full-time equivalent employees 5,638 6,015 6,395 6,845 7,099 6,928 6,930 7,558 7,824October payroll $6,842 $7,619 $9,022 $10,422 $11,270 $12,427 $12,954 $14,940 $15,985Public defense:Total employees 52 88 109 154 185 219 230 230 562Full-time employees 52 88 109 154 185 219 230 230 498Full-time equivalent employees 52 88 109 154 185 219 230 230 520October payroll $87 $100 $153 $222 $315 $407 $468 $468 $1,076Corrections:Total employees 7,223 8,019 9,076 10,126 10,894 11,869 11,875 12,192 12,327Full-time employees 7,103 7,895 8,897 9,893 10,647 11,634 II ,626 II ,937 12,087Full-time equivalent employees 7,140 7,929 8,969 9,967 10,707 11,717 11,760 12,055 12,088October payroll $7,692 $9,396 $10,887 $12,885 $15,693 $16,938 $16,279 $17,497 $22,996Other criminal justice:Total employees 755 1,414 1,486 1,657 1,783 1,796 1,624 1,742 1,688Full-time employees 740 1,254 1,360 1,481 1,479 1,662 1,498 1,544 1,466Full-time equivalent employees 744 1,280 1,393 1,551 1,671 1,737 1,570 1,655 1,564October payroll $857 ~11!l40 ~1,804 ~2.051 ~21425 sz,m SZ.S6Q SZ,212 $3,022Source: Table provided to S
---- -- --~------~ ---rl.<strong>Sourcebook</strong> <strong>of</strong> <strong>Criminal</strong> <strong>Justice</strong> <strong>Statistics</strong> 1963Table 1.4 <strong>Criminal</strong> justice expenditures <strong>of</strong> State governments, by type <strong>of</strong> activity and expenditure, fiscal years 1971-79!'OlE: See !'OlE, Figure 1.1. For survey methodology and definitions <strong>of</strong> direct expenditure and other terms, see Appendix I.(Dollar amounts in thousands)T)!~ <strong>of</strong> activit)! and ex!!!!ndlture 1971 1972 1973 1974 1975 1976 1977 1976 1979Total criminal justice system $2,920,751 $3,341,507 $3,655,356 $4,536,957 0 $5,321,376 $5,966,650 $6,689,474 $7,544,251 $6,418,065Direct expenditure 2,681,419 2,946,091 3,303,608 3,890,570 0 4,612,373 5,204,226 5,812,353 6,666,192 7,345,570Intergovernmental expenditure 239,332 393,416 551,74!l 646,3!l7 709,005 782,424 677,121 656,059 1,072,495Police protection 932,234 1,048,094 1,187,470 1,362,931 1,577 ,869 1,769,471 1,963,975 2,016,228 2,149,256Direct expenditure 873,493 992,801 1,132,266 1,306,455 1,512,130 1,696,460 1,799,725 1,692,127 1,987,635Intergovernmental expenditure 56,741 55,293 55,162 74,476 65,759 93,011 164,250 124,101 161,423Judicial 326,650 371,01 / 1 419,247 475,992 561,291 663,066 735,629 1,150,265 1,327,545Direct expenditure 313,717 346,29U 365,619 439,456 497,660 565,151 650,559 1,012,899 1,206,984Intergovernmental expenditure 13,133 24,724 33,628 36,536 63,631 77,917 65,270 137,366 120,561Legol services ond prosecution 109,494 127,679 145,605 181,537 219,247 253,591 314,472 400,367 453,001Direct expenditure 107,799 124,959 143,417 178,355 215,997 247,723 296,758 365,783 426,791Intergovernmental expenditure 1,695 2,920 2,3!l6 3,182 3,250 5,666 17,714 14,564 24,210Public defense 17,266 25,571 41,630 58,055 73,127 76,622 90,393 109,294 127,B92Direct expenditure 16,491 23,963 37,029 51,683 65,481 70,139 76,365 97,956 118,012Intergovernmental e~penditure 775 1,608 4,BO! 6,372 7,646 8,463 12,028 11,338 9,860Corrections 1,387,331 1,467,524 1,613,049 1,895,434 2,291,749 2,51l9,609 2,974,890 3,341,200 3,771,194Direct expenditure 1,323,104 1,377,776 1,533,920 1,812,529 2,193,000 2,474,763 2,847,020 3,176,963 3,478,349Intergoverrvnental expenditure 64,227 89,748 79,129 82,905 96,749 114,626 127,670 164,237 292,645Other criminal justice 147,576 301,425 447,955 543,008 c 596,075 612,269 609,915 526,697 569,175Direct expenditure 46,815 62,302 71,335 100,092 0 126,105 129,970 139,926 122,464 125,599Intergovernmental expenditure 100,761 219,123 376,620 442,916 469,970 462,319 469,989 404,433 463,576~vised.AmountSource: Table provided to SCl.RCEBal< st<strong>of</strong>f by the U.S. Deportment <strong>of</strong> <strong>Justice</strong>, <strong>Bureau</strong> <strong>of</strong> <strong>Justice</strong> <strong>Statistics</strong>.Characteristics <strong>of</strong> the <strong>Criminal</strong> <strong>Justice</strong> SystClrTlS= 1971 eecccot lDeCeaSe g1972 d!:L::[!lcse (-1to1973 1974 1975to1976 19771972 to to to19761973to 19711974 1975 1976 to to1977 to197814.4 197915.419799.917.7 012.117.3 017.8 0 12.518.6 0 11.7 12.864.411.640.2 17.112.8 11.7 15.1188.29.7 10.4 12.19.8 173.9-2.412.4 25.313.3 348.113.716.514.014.115.613.4 9.8-5.915.6 12,22.7 6.6-0.2 6.1130.535.0 -11.7 41.45.176.65.1 127.6-24.413.5 30.113.0174.810.413.511.417.914.018.113.211.0 56.388.3 17.6 11.215.436.0306.28.6 74.2 22.555.79.419.2 284.761.116.8-12.214.0818.015.924.5L4.820.B 15.724.4 21.124.0 27.372.313.1-IB.2 33.214.7 19.8 30.0313.72.1 80.6 201.9II. I 297.8-17.748.166.063.51,328.345.338.8 26.054.5 39.67.526.715.0 20.9107.517.0198.5640.732.77.120.011.710.925.041.820.5 615.6-5.75.8 -12.99.91,174.84.117.511.320.918.213.021.014.9 12.339.712.9-11.8 12.8 15.0 11.6171.84.8 19.1 16.3 9.511.4 162.928.4104.3 78.348.6356.021.275.8 0 -13.310.1 040.3 0 2.428.0 0 -0.4 -13.6117.5 11.871.9 17.61.5 7.7 -12.5299.26.1 2.6 -2.62.6-13.9168.314.6 360.12021
<strong>Sourcebook</strong> <strong>of</strong> <strong>Criminal</strong> <strong>Justice</strong> <strong>Statistics</strong> <strong>1983</strong>Characteristics <strong>of</strong> the <strong>Criminal</strong> <strong>Justice</strong> SystemsTable 1.5 <strong>Criminal</strong> justice employment and payroll for State governments, by type <strong>of</strong> acth'lty, October 197 I-October 1979N)TE: See N)TE, Figure 1.1. For survey methodology and definitions <strong>of</strong> terms, see Appendix I.(Dollar amounts in thousands)October October Oc b Percent increase or decrease-1971 to 1972 toto er October October OctoberOctober OctoberOctober 1913 to 1974 to 1975 to 1976 toOctoberOctober1977 to 1978 to1972 ~tober October October October 1971 toOctober October October October October October October October October 1973974 1975 1976 1977October October OctoberT~ <strong>of</strong> actlvit~ 1971 1972 1973 1974 1975 1976 1977 1978 19791978 1979 1979Total crimInal justice system: 5.0 8.8 8.7 4.4Total eIT1'loyees 211,785 222,273 241,765 262,735 274,319 283,049 310,358 322,046 340,459 5.6 6.4 3.28.79.6 3.85.2 4.2 3.9 5.79.4 60.8Full-time eIT1'loyees 202,508 213,869 227,f10 247,356 257,633 267,685 292,772 303,950 323,223 7.2 8.7 3.815.0 4.2 3.5 9.66.3 59.6Full-tIme equivalent eIT1'loyees 205,859 216,603 232,299 252,588 263,208 272,488 298,571 310,554 328,237 15.4 15.4 11.3 II. I4.018.95.7 59.4October payroll $164,719 $189,390 $218,554 $252,214 $280,593 $311 ,636 $370,396 $438,357 $464,558 18.3 6.0 182.0Police protectIon: 8.1 12.7 9.9 3.1Total employees 72,609 78,482 88,465 97,224 100,272 97,887 101,068 98,651 99,301 8.8 7.5 9.5-2.4 3.2 -2.4 0.78.7 2.8 -0.3 3.236.8Full-time eIT1'loyees 67,986 73,963 79,475 87,026 89,428 89,175 92,065 89,977 90,779 8.3 10.0 2.9 -2.3-1.70.9 33.5Full-time equIvalent eIT1'loyees 69,375 75,397 81,634 89,822 92,445 90,884 93,674 92,443 91,595 24.3 17 .6 14.6 3.110.5 8.1-1.310.1-0.9 32.0October payroll $52,800 $65,622 $77,140 $88,426 $97,737 $105,620 $116,294 $153,798 $130,915 32.2 -14.9 147.9Judicial: 2.3 12.3 4.1 7.5Total eIT1'loyees 20,562 21,026 23,602 24,560 26,402 28,535 38,910 43,625 49,443 2.7 8.7 8. !4.036.47.112.1 13.3 140.5Full-time eIT1'loyees 19,466 19,987 21,726 22,582 24,183 25,629 34,937 39,448 45,654 2.6 12.8 6.04.236.3 12.9 15.73.0 6.8 7.6 35.7 134.5Full-time equivalent eIT1'loyees 19,856 20,372 22,977 23,939 25,578 27,516 37,337 41,642 48,052 22.3 13.8 12.5 11.514.5 15.436.9142.0October payroll $23,175 $23,8711 $29,201 $33,220 $37,372 $42,786 $58,566 $6B,050 $87,129 16.2 2B.0 276.0Legal services ond prosecution: 10.8 14.1 11.7 6.0Total eIT1'loyees B,765 9,714 II,OB2 12,381 13,122 13,665 15,5B4 18,974 20,737 12.0 13.9 15.24.1 14.0 21.8 9.311.1 4.8 B.7 12.7136.6Full-time eIT1'loyees 7,766 8,695 9,905 II ,40B 11,950 12,9!14 14,627 17,596 19,210 16.1 12.3 20.3 9.217.7 4.7 7.2 13.9147.4Full-time equivalent eIT1'loyees 8,133 9,035 10,490 11,776 12,334 13,227 15,068 18,212 19,961 23.1 16.6 15.0 20.912.99.6 145.4October payroll $8,037 $9,461 $11 ,64B $13,579 $15,615 $17,623 $23,147 $27,334 $32,499 31.3 IB.I IB.9 304.4Public defense: 39.0 50.9 25.4 -4.0 11.9Total eIT1'loyees 1,030 1,432 2,161 2,710 2,602 2,912 3,245 3,256 3,7B8 43.B 49.9 21.3 11.4-2.2 0.311.616.3 267.8Full-time eIT1'loyees 961 1,3B2 2,071 2,575 2,51B 2,B09 3,005 3,121 3,607 42.7 49.5 24.9 7.0-3.03.960.6 11.6 15.611.7275.3Full-time equivalent eIT1'loyees 9B5 1,406 2,102 2,625 2,547 2,843 3,175 3,159 3,659 59.1 31.5 3.6 IB.5-0.5 15.8 271.5October payroll $878 $1,410 $2,244 $2,950 $3,057 $3,624 $4,376 $4,724 $5,855 20.B B.o 23.9 566.9Corrections: 1.5 4.2 B.O 4.9Total eIT1'loyees 107,317 IOB,968 113,503 122,560 128,523 136,400 147,695 153,770 162,946 2.3 4.0 6.1B.O 11.7B.3 4.1 6.0 51.BFull-time employees 104,882 107,250 111,536 120,519 126,196 133,520 144,420 150,148 159,80B 1.6 4.1 8.05.B B.2 4.010.36.4 52.1110.24.B 5.9Full-time equivalent employees 106,045 107,785 112,176 121,160 126,933 134,420 145,552 151,40B 160,77B 15.8 B.311.3 4.011.9 6.2IB.251.6October payroll $78,64B $B6,710 $95,565 $110,710 $123,252 $137,928 $163,079 $179,654 $202,562 10.2 12.B 157.6Other criminal justice: 76.5 11.4 II.B 3.0Total employees 1,502 2,651 2,952 3,300 3,39B 3,650 3,856 3,770 4,244 79.1 II.B 7.412.05.6 -2.2 12.678.0 3.4 6.3 4.2182.6Full-time employees 1,447 2,592 2,B97 3,246 3,358 3,56B 3,713 3,660 4,165 12.0 11.8 3.2 -1.66.713.B 187.BFull-time equivalent eIT1'loyees 1,465 2,608 2,920 3,266 3,371 3,599 3,766 3,690 4,192 95.5 19.4 20.B 4.77.0 13.B-2.021.713.6 IB6.1October payroll $1,181 $2,309 $2,756 $3,329 $3,561 $4,054 $4,934 $4,797 $5,599 -2.B 16.7 374.1Source: Table provided to SOLRCEBOO< staff by the U.S. Department <strong>of</strong> <strong>Justice</strong>, <strong>Bureau</strong> <strong>of</strong> <strong>Justice</strong> :;tatlstics.22 23
~~---------- ---~----------~----------------------------<strong>Sourcebook</strong> <strong>of</strong> <strong>Criminal</strong> <strong>Justice</strong> <strong>Statistics</strong> <strong>1983</strong>Table 1.6 <strong>Criminal</strong> justice expenditures o( local governments, by type <strong>of</strong> activity and expenditure, fiscal years 1971-79I'OTE: See I'OTE, Figure 1.1. For survey methodology and definitions <strong>of</strong> direct expenditure and other terms, see Appendix I.(The local governments data are estimates subject to sampling variation. Dollar amounts In thousands.)Characteristics <strong>of</strong> the <strong>Criminal</strong> <strong>Justice</strong> SystemsAmountPercent Increase o[ dec[eg~~ {-}1971 1972 1973 1974 1975 1976 1977 1978 1971Type <strong>of</strong> activity and expenditure 1971 1972 1973 1974 1975 1976 1977 1978 1979 ta to to to to to to to to1972 1973 1974 1975 1976 1977 1978 1979 1979Total criminal justice system $6,662,697 $7,324,585 $8,094,225 $9,129,864 $10,501,604 $12,068,308 $13,027,249 $14,456,003 $15,401,230Direct expenditure 6,620,807 7,281,248 8,052,232 9,092,370 10,448,612 12,026,954 12,982,693 14,321,513 15,256,406 9.9 10.5 12.8 15.0 14.9 7.9 11.0 6.5 131.2Intergovernmental expenditure 75,545 91,261 90,249 115,395 144,501 133,855 164,728 295,356 300,839 10.0 10.6 12.9 14.9 15.1 7.9 10.3 6.5 130.420.8 -1.1 27.9 25.2 -7.4 23.1 79.3 1.9 298.2Police protection 4,489,045 4,978,854 5,405,423 5,984,077 6,817,005 7,723,588 8,304,366 9,281,149 9,882,079Direct expenditure 4,4!l7,825 4,948,354 5,403,036 5,981,711 6,813,407 7,720,144 8,299,730 9,276,280 9,875,712 10.9 8.6 10.7 13.9 13.3 7.5 11.8 6.5 120.1Intergovernmental expenditure 21,327 30,500 32,697 52,985 611,620 59,390 80,908 96,279 109,720 10.3 9.2 10.7 13.9 13.3 7.5 11.8 6.5 120.143.0 7.2 62.0 22.0 -8.1 36.2 19.0 14.0 414.5Judicial 912,310 973,918 1,082,257 1,227,391 1,412,763 1,633,645 1,707,783 1,823,223 1,902,528Direct expenditure 910,545 965,260 1,075,479 1,222,562 1,404,672 1,623,876 1,698,066 1,732,949 1,812,181 6.8 11.1 13.4 15. i 15.6 4.5 6.8 4.3 108.5Intergovernmental expenditure 5,561 8,65!l 13,824 11,729 17,226 18,123 22,583 118,381 103,023 6.0 11.4 13.7 14.9 15.6 4.6 2.1 4.6 99.055.7 59.7 -15.1 46.9 5.2 24.6 424.2 -13.0 1,752.6Legal services and prosecution 295,415 350,150 398,783 476,793 542,440 653,502 745,585 862,094 956,979Direct expenditure 294,779 348,351 396,899 474,609 539,854 650,804 742,982 858,551 953,395 18.5 13.9 19.6 13.8 20.5 14.1 15.6 11.0 223.9Intergovernmental expenditure 787 1,799 2,553 2,627 2,967 3,142 3,354 4,537 4,424 18.2 13.9 19.6 13.7 20.6 14.2 15.6 11.0 223.4128.6 41.9 2.9 12.9 5.9 6.7 35.3 -2.5 462.1Public defense 50,969 63,573 79,283 101,445 127,938 157,364 185,151 216,824 239,159Direct expenditure 50,961 63,430 79,240 101,281 127,772 157,245 184,937 216,719 239,018 24.7 24.7 28.0 26.1 23.0 17.7 17.1 10.3 369.2Intergovernmental expenditure 123 143 257 522 545 1,279 1,243 2,152 1,916 24.5 24.9 27.8 26.2 23.1 17.6 17.2 10.3 369.016.3 79.7 103.1 4.4 134.7 -2.8 73.1 -11.0 1,457.7Corrections 895,420 961,338 1,066,000 1,240,815 1,471,470 1,678,879 1,814,539 2,030,722 2,196,646Direct expenditure 857,168 911,282 1,035,434 1,213,338 1,433,535 1,654,377 1,788,329 2,008,574 2,154,154 7.4 10.9 16.4 18.6 14.1 8.1 11.9 8.2 145.3Intergovernmental expenditure 47,425 50,056 40,275 46,456 58,170 49,547 53,338 58,369 77,924 6.3 13.6 17.2 18.1 15.4 8.1 12.3 7.2 151.35.5 -19.5 15.3 25.2 -14.8 7.7 9.4 33.5 64.3Other criminal justice 19,538 44,676 62,478 99,343 129,988 221,329 267,825 241,992 223,839Direct expenditure 19,529 44,571 62,144 98,869 129,372 220,508 268,649 228,440 221,946 128.7 39.8 59.0 30.8 70.3 21.9 -9.6 -7.5 1,045.7Intergovernmental eX2enditure 321 105 643 1 1 076 1 1 007 2 1 374 3 1 302 15 1 63!l 3,833 128.2 39.4 59.1 30.9 70.4 21.8 -15.0 -2.8 1,036.5-67.3 512.4 67.3 -6.4 135.7 39.1 373.6 -75.5 1.094.1Source: Table provided to Sa..RCEBOO< staff by the U.S. Department <strong>of</strong> <strong>Justice</strong>, <strong>Bureau</strong> <strong>of</strong> <strong>Justice</strong> <strong>Statistics</strong>."iid'I2425
--------------------------------------------------------- --------------------------------------------------------------------<strong>Sourcebook</strong> <strong>of</strong> <strong>Criminal</strong> <strong>Justice</strong> <strong>Statistics</strong> <strong>1983</strong>Charocteristics <strong>of</strong> the <strong>Criminal</strong> <strong>Justice</strong> Systems.Table 1.7 <strong>Criminal</strong> justice employment and payroll for local governments, by type <strong>of</strong> activity, October 1971-October 1979N)TE: See N)TE, Figure 1.1. For survey methodology and definitions <strong>of</strong> terms, see Appendix I.(The locai governments data are estimates subject to sampling variation. Dollar amounts in thousands.)October October October October October October October OctoberType <strong>of</strong> activity 1971 t972 1973 1974 1975 1976 1977 1978Total criminal justice system:Total employees 639,555 666,525 693,791 735,622 756,627 764,442 785,872 800,730Full-time employees 556,381 575,042 601,834 639,640 671,407 683,049 707,847 718,557Full-time equivalent employees 578,394 596,480 625,871 664,862 691,159 707,891 733,121 742,898October1979828,296724,879745,812October payroll $466,697 $514,984 $580,070 $660,088 $733,169 $805,719 $886,401 $915,734 $1,024,616Police protection:Total er:-.ployees 445,933 456,055 470,258 486,936 499,159 500,536 512,358 523,206 526,272Full-time employees 391,506 400,608 418,385 438,926 453,969 456,750 469,733 478,103 480,544Full-time equivalent employees 402,691 410,765 429,512 449,587 463,404 466,042 479,908 489,514 488,832October payroll $333,258 $364,878 $411 ,364 $462,481 $508,862 $553,750 $607,473 $626,241 $708,845Judicial:Total employees 89,505 96,107 100,564 109,730 117,781 114,998 115,774 111,263 111,639Full-time employees 73,636 76,749 79,732 87,315 96,519 94,667 97,669 92,354 92,436Full-time equivalent employees 79,852 82,797 86,236 94,456 99,132 102,442 105,044 99,305 99,589October payroll $56,775 $62,821 $69,396 $81,080 $90,632 $97,948 $104,989 $101,466 $107,872Legol services and prosecution:Total employees 30,211 34,607 37,050 39,110 40,958 43,304 45,596 49,152 49,330Full-time employees 23,487 25,794 26,829 29,217 31,381 34,668 37,811 40,542 42,835Full-time equivalent employees 25,954 28,739 30,419 33,598 35,931 39,153 41,904 43,464 45,404October payroll $23,043 $26,849 $30,308 $35,584 $40,810 $47,050 $53,633 $59,014 $66,139Public defense:Total employees 2,936 3,431 3,717 3,823 3,860 4,492 4,987 5,194 5,205Full-time employees 2,141 2,334 2,585 2,926 3,318 3,707 4,176 4,595 4,586Full-time equivalent employees 2,473 2,662 2,967 3,340 3,625 4,193 4,699 4,879 4,902October payro II $2,474 $2,857 $3,331 $4,029 $4,841 $5,790 $7,375 $7,337 $8,316Corrections:Total employees 70,279 74,773 80,522 94,108 92,592 98,107 103,015 107,594 109,525Full-time employees 64,973 68,145 72,739 79,494 84,109 90,471 94,686 99,382 101,156Full-time equivalent employees 66,776 70,079 75,134 82,070 86,880 93,156 97,676 102,040 103,683October payroll $50,470 $56,193 $63,953 $74,867 $85,690 $98,024 $108,566 $117,713 $129,689Other criminal justice:Total employees 691 1,552 1,680 1,915 2,277 3,005 4,142 4,321 26,325Full-time employees 638 1,412 1,564 1,762 2, III 2,819 3,772 3,581 3,322Full-time equivalent employees 648 1,438 1,603 1,811 2,187 2,905 3,870 3,696 3,402October payroll $677 $1,386 $1,718 $2,017 $2,333 $3,157 $4,365 $3,963 $3,755Source: Tobie provided to 5O..RCEBOO< staff by the U.S. Deportment <strong>of</strong> <strong>Justice</strong>, Bureou <strong>of</strong> <strong>Justice</strong> <strong>Statistics</strong>.!IfIIOctober October~1971 to 197.2 toOctober Octoberil 1972 1973~I 4.2 4.13.4 \t73. I 4.910.3 12.62.3 3. I2.3 4.42.0 4.69.5 12.77.4 4.64.2 3.93.7 4.210.6 10.514.6 7.19.8 4.010.7 5.816.5 12.916.9 8.39.0 10.87.6 11.515.5 16.66.4 7.74.9 6.74.9 7.211.3 13.8124.6 8.2121.3 10.8121.9 11.5104.7 4.0Percent increase or decrease (_)October October October October OCtober OCtober OCtober1973 to 1974 to 1975 to 1976 to 1977 to 1978 to 1971 toOctober October October October October October October1974 1975 1976 1977 1978 1979 19796.0 2.9 1.0 2.8 1.9 3.4 29.56.3 5.0 1.7 3.6 1.5 0.9 30.36.2 4.0 2.4 3.6 1.3 0.4 28.913.8 11.1 9.9 10.0 3.3 I 1.9 119.53.5 2.5 0.3 2.4 2. I 0.6 18.04.9 3.4 0.6 2.8 1.8 0.5 22.74.7 3.1 0.6 3.0 2.0 -0. I 21.412.4 10.0 8.8 9.7 3.1 13.2 112.79.1 7.3 -2.4 0.7 -3.9 0.3 24.79.5 10.5 -1.9 3.2 -5.4 0.1 25.59.5 4.9 3.3 2.5 -5.5 0.3 24.716.8 11.8 8.1 7.2 -3.4 6.3 90.05.6 4.7 5.7 5.3 7.8 0.4 63.38.9 7.4 10.5 9.1 7.2 5.7 82.410.4 6.9 9.0 7.0 3.7 4.5 74.917.4 14.7 15.3 14.0 10.0 12.1 187.02.9 1.0 16.4 11.0 4.2 0.2 77.313.2 13.4 11.7 12.7 10.0 -0.2 114.212.6 8.5 15.7 12.1 3.8 0.5 98.221.0 20.2 19.6 27.4 -0.5 13.3 236.116.9 -1.6 6.0 5.0 4.4 1.8 55.89.3 5.8 7.6 4.7 5.0 1.8 55.79.2 5.9 7.2 4.9 4.4 1.6 55.317.1 14.5 14.4 10.8 8.4 10.2 157.014.0 18.9 32.0 37.8 4.3 509.2 3,709.712.7 19.8 33.5 33.8 -5.1 -7.2 420.713.0 20.8 32.8 33.2 -4.5 -8.0 425.019.1 14.0 35.3 38.3 -9.2 -5.2 454.726
-------------- - ---~---~--------~-----------------------------------------<strong>Sourcebook</strong> <strong>of</strong> <strong>Criminal</strong> <strong>Justice</strong> <strong>Statistics</strong> <strong>1983</strong>Table 1.8 E:nployment and poyroll for State and local criminal justice activities, by State and level <strong>of</strong> government, October 1971-October 197'State andlevel <strong>of</strong> goverrvnentStates-local, totalStatesLocal, totalCountiesMunicipalitiesAlabamaStateLocal, totalCountiesMunicipalitiesAlaskaStateLocal, totalBoroughsMunicipalitiesArizonaStateLocal, totalCountiesMunicipalitiesArkansasStateLocal, totalCountiesMunicipalitiesCaliforniaStateLocal, totalCountiesMunicipalitiesColoradoStateLocal, totalCountiesMunicipalitiesConnecticutStateLocal, totalMunicipalitiesDelawareStateLocal, totalCountiesMunlcipalitic""District <strong>of</strong> Columbia:Local, totalFloridoStateLocal, totalCountiesMunicipalitiesGeorgiaStateLocal, totalCountie3MunicipalitiesI-bwaiiStateLocal, totalCountiesMunicipalities!'OTE: See !'OTE, Figure 1.1. For additional data on police protection, publicdefense, legal services and prosecution, judicial, and correctional activities, seeTables 1.11, 1.19, 1.20, 1.26, and 1.40, respectively. For survey methodology andd'..finitions <strong>of</strong> tenms, see Appendix I.OctoberFull-timeequivalentell'9loyment784,250205,856578,394193,011385,3839,2062,5016,7052,5014,2041,6671,178489224677,6282,1095,5192,5592,9604,4541,1753,2799472,33295,94821,21074,73840,40434,3348,0183,1574,8611,2173,644II ,0334,8346,1996,1992,57S1,6079683186509,70730,4777,95122,52610,97511,55114,7%3,87310,9235,1595,7643,5701,Q652,5055421,963See footnotes at end <strong>of</strong> table.1971Octoberpayroll$634,283167,587466,697142,942323,7535,6041,6973,9331,4192,5141,8951,435460194415,7151,6824,0841,6942,3902,3976961,7011~301,27195,84820,77575,38539,40835,9776,0282,4653,5637412,8169,1954,0485,1485,1481,9031,2376661904768,98821,3445,68615,$647,3498,3159,1882,5096,7153,0263,6883,0009082,0934711,622(Dollar amounts in thousands)Emploxment nnd payroll a--;""",,...;Oc~to!:!!b~e:!..r..JI~9.!..c72!:.-_ October 1973 October 1974Full-time Full-time Full-timeequivalent October equivalent October equivalent Octoberenyloyment payroll employment payroll emploxment payroll813,083216,603596,480204,966391,5149,5922,4707,1222,5454,5771,9451,390555175388,2741,9476,3272,9273,4005,0371,2763,7611,24S'2,512102,08324,55177,53242,55534,'.1778,8963,4335,4631,2194,24410,6764,5356,1416,1412,8601,8471,01332668710,1843l:,7039,60223,101II ,38111,72015,4804,52710,9535,2645,6893,4899442,5456511,894$704,377189,390514,984161,108353,8746,2051,7844,4211,5602,8612,4731,878595215746,7151,7085,0062,0742,9322,8068581,9485541,394107,99624,67383,32343,97739,3467,0632,7964,2677463,5209,6043,9985,6065,6062,3611,56679425254210,,,8124,7327,62817,1047,8759,22910,5443,4607,0853,2723,P!33,0553742,1815161,66528858,158232,299625,859219,894405.96510,2402,6647,5762,8494,7271,9531,41853518517',5192,4907,029:J,2563,7735,2711,3283,9431,2102,733105,94724,94581,00244,95836,0449,8923,6506,2421,4154,82711,4305,0756,3556,3552,8381,8729662776899,87236,76612,42324,34312,40111,94217,7565,30012,4566,0346,4223,5379882,5496721,877$798,624218,55451)0,070185,103394,9676,9292,1154,8141,7553,0592,2131,639574275478,2412,2565,9852,5163,4703,1759782,1976081,589120,18327,47792,70549,50143,2058,3423,2685,0749104,16410,4334,4455,9895,9892,3301,54478722855910,11031,204II ,OJ320,1729,77910,39212,7774,0758,7024,1314,5713,5161,0222,4946031,892917,450252,588664,862239,171425,69111,3283,0738,2553,0685,1872,IG81,4606482162710,3152,6977,b183,7183,9004,9351,5203,4151,2272,188113,18026,97686,20448,80937,39511,2873,9127,3751,6525,72311,7365,4916,2456,2452,7411,90683528754810,68141,00714,35726,65017,71313,n719,4885,79213,6966,6017,0953,4651,(1302,4356011,834$912,303252,214660,088216,430443,6598,4332,4565,9772,0743,9033,0332,0919423551079,8822,6757,2073,2803,9273,2251,1712,0546801,374136,60631,494105,11357,48447,62910,5703,9006,6701,1975,47311,8615,3896,4726,4722,6211,77884430454012,51338,05013,90124,14910,60813,54115,1084,80710,3024,8475,4543,8671,1412,725;132,013October 1975Full-timeequivalent OctQberenyloxment payroll954,379 $1,013,76Z263,208 280,593691,159 733,169257,592 251,535433,567 481,63412,1173,3438,6933,4245,2692,3041,649655864711,0772,8658,2124,0034,2095,6871,7093,9781,6322,346116,21426,00390,21151,35338,85812,1604,0638,0971,9386,15911,8795,4916,3886,3883,1282,1161,0123406729,35343,37015,49727,87313,53614,33721,0676,44314,6247,2557,3693,6241,0502,5745931,9819,8583,0656,7932,5114,2833,8652,8541,0111499611,1483,0668,0823,7514,3314,06B1,4392,6291,0181,611152,78933,240119,54966,75152,79812,8214,7138,1081,5746,53412,4875,5746,9136,9133,1042,0741,03036666412,32441,60414,09727,50712,62314,88416,9105,36711,5435,6475,8964,1901.2602,9296952,234r\IOctober 1976Full-timeequivalent Octoberenyloxment payroll980,37' $1,117,355272,488 311,636707,891 805,719272,541 281,773435,350 523,94612,396 10,8093,582 3,3868,814 7,4233,598 2,9485,216 4,4752,541 4,7271,911 3,604630 1,12312 25618 1,098II ,905 13,8283,026 3,3808,879 10,4484,410 4,6314,469 5,8176,172 4,5971,852 1,6184,320 2,9791,758 1,1812,562 1,798119,910 170,924fl26,251 36,82193,659 134,10354,776 75,41038,883 58,693IiI'i 12,558 14,144!4,235 5,2058,323 8,939112,159 1,9716,164 6,968I'I:11,886 13,036I:5,480 5,5106,406 7,527L6,406 7,527ii !3,245 3,5112,187 2,3521,058 1,160388 460670 699IIIi8,865 12,869II46,204 46,70011,IJ6,359 16,13329,845 30,56814,286 13,612II15,559 16,955Itii22,052 19,257,)6,816 6,590h15,236 12,667I 7,76e 6,3767,470 6,291J4,059 5,2421,457 1,8852,602 3,357~621K8181,981 2,540i IEmployment and payroll aOctober 1977 October 1978Full-timeFull-timeequivalent October equivalent Octoberemploxment payr'.) II emplOYment payroll1,031,642 $1,256,797298,571 370,398733,121 886,401287,760 327,053445,361 559,34712,9534,0068,9473,1565,7912,7731,9947793174812,5773,3789,1994,5054,6946,8192,1884,6311,8722,759123,58226$91196,67155,83640,83512,6444,0808,5642,3326,23212,7746,2706,5046,5043,3632,2961,0673926758,64847,38116,80330,57815,47015,10823,2567,50915,7478,1537,5944,2131,5532,6606891,97112,7974,7188,0792,7145,3645,4313,9141,517861,43115,2734,13511,1384,9576,1815,5251,8803,6451,3152,330194,83940,948153,89189,91363,97714,9315,2439,4882,2937,19515,4787,2988,1808,1803,7922,5571,23449573914,09052,85319,42033,43216,03117,40121,1237,28013,8447,1676,6765,6311,9403,6919742,717Characteristics .<strong>of</strong> the <strong>Criminal</strong> <strong>Justice</strong> Systems1,053,452 $1,345,224310,554 406,896742,898 '38,328295,970 343,125446,928 595,20214,5435,0529,4913,3986,0932,8061,9848221081213,3513,7089,643l,,7534,8906,6821,9234,7592,0022,757119,72025,35894,36254,54939,81313,0674,4458,6222,5356,08712,8456,2326,6136,6133,5272,1~501,0773777008,70548,94817,73931,20916,73614,47323,1347,48515,6498,2537,3964,3721,6062,7667162,05015,4845,9689,5163,2466,2695,8074,0371,769261,74317,8n4,66513,2075,8107,3975,7851,9983,7871,4672,320!85,56541,472144,09380,44563,64817,0186,22710,7912,7508,04016,5497,8198,7308,7304,1852,8491,33649184515,49358,68521,47937,20619,34817 ,85824,1248,98215,1418,0347,1076,1202,1903,9301,0152,915October 1979Full-timeequivalent b Octoberemployment pa.Y!2lL291,074,636 $1,489,174328,237 464,558745,812 1,024,616300,378 373,026445,513 651,59014,9355,2529,7063,2896,4192,9452,0269185586314,261,4,02810,1954,9935,2027,1712,2354,9812,3152,669122,12726,33195,02755,19639,8Z613,1284,0389,0932,8326,26112,9386,2336,7136,7173,6782,5961,0834046798,82851,27218,84632,45417,22615,22323,9998,01516,0048,6607,3434,5181,6852,8337002,13316,8816,70410,1763,3336,8436,7314,4172,3141542,16019,7745,36914,4056,4147,9916,6582,3874,2711,8432,428209,L3447,379161,85489,93871,91618,8956,66512,2303,2079,02318,5908,7699,8219,8214,5603,1511,40854786114,90065,16924,97340,19620,17520,02026,1059,74916,3568,6647,6925,9382,1583,7809862,793
<strong>Sourcebook</strong> <strong>of</strong> <strong>Criminal</strong> <strong>Justice</strong> Statlstlcl <strong>1983</strong>Table 1.8 Employment and payroll for State and local criminal justice activities, by State and level <strong>of</strong> government, October I
~~~~~~~---- - -- -<strong>Sourcebook</strong> <strong>of</strong> CrimInal <strong>Justice</strong> <strong>Statistics</strong> <strong>1983</strong>Table 1.8 Employment and payroll for State and local criminal justice activities, by State and level <strong>of</strong> government, October 1971-October 15I79--CantinuedState andlevel <strong>of</strong> governmentMissouriStateLocal, totalCc-untIesMunicipalitiesMontanaStateLocal, totalCountiesMunicipalitiesNebraskaStateLocal, totalCountiesMunicipalitiesNe"'JdaStt.'teLac\11, totalCountiesMunicipalitiesNew HampshireStateLocal, totalCountiesMunidpalitiesNew JerseyStateLocal, totalCountiesMunicipalitiesNew MexicoStatel,ocal, totalCountiesMunicipalitiesNew YorkStateLocal, totalCountiesMunicipalitiesI'brth CarolinoStateLocol, totalCountiesMunicipalitiesI'brth DakotaStateLocal, totalCountiesMunicipalitiesOhioStateLocal, totalCountiesMunicipalitiesOklahomaStateLocal, totalCountiesMunicipalitiesOregonStateLocal, totalCountiesMunicipalitiesOctober 1971Full-timeequivalent Octoberemployment payroll17,5113,74513,7663,65010,1162,3678651,5028456574,3381,2823,0561,1351,9213,1456472,4981,3351,1632,0115601,4512451,20632,9896,63726,3528,07218,2803,5631,5891,9744291,54510,25623,86086,39617,71068,68616,4648,5797,8852,4525,4331,6294411,18853065634,2838,44125,8429,21616,6268,2482,7935,4551,7693,6867,9062,5805,3262,5292,797$11,1232,4998,6402,1456,4!151,4166018154004152,9539232,0536101,4432,5745791,9951,0319641,40541199414984527,7986,26621,5326,26015,2722,2241,0001,224235990106,84522,22884,61815,25669,36110,5795,6884,8911,3223,5691,04032771326844524,8556,48618,5955,63212,9644,8051,8282,9789232,0556,3222,2394,0931,8562,238See footnotes at end <strong>of</strong> table.(Dollar amounts in thousands)OctoberFull-timeequivalentemployment17,5594,16413,3953,6659,7302,5409281,6129306824,7711,4423,3291,1972,1323,4697222,7471,4921,2552,3196601,6593341,32535,6497,46028,1899,10119,0883,9851,8762,1094631,646106,26119,41086,8SI18,37468,41716,8188,8987,9202,5205,4001,6634311,23254868436,2419,61926,6229,43717,1858,4543,4405,0141,2853,7298,2782,8285,4502,8262,6241972Octoberpayroll$12,5462,8679,6792,2817,3981,5856599264754513,3441,0362,3087341,5743,1436902,4541,'2051,2491,7315471,18420598031,8817,00524,8757,56517,3102,6761,2251,4512501,201113,67521,77891,89617,48574,41111,4416,3215,1201,4853,6351,10131878229548728,9268,09320,8336,13514,6994,9712,1942,7776582,11516,9962,5504,4462,1852,261Employment and payroll aOctober 1973Full-timeequi valent Octoberemployment payroll3218,3754,42113,9543,88410,0702,6589681,6909986924,9721,6953,2771,1282,1493,4917612,7301,9577732,4887021,7862981,48836,7787,80128,9779,84719,1304,2661,8502,4165381,878111,74120,25191,49019,88771,60317,64451,1588,4862,8385,6481,7484631,28558370238,59510,07028,52510,23018,2959,0463,6085,4381,4433,9958,6472,8585,7893,0272,162$14,4073,40711,0012,5508,4511,8747411,1336295043,8191,3532,4667661,7003,4177772,6411,8667741,8945941,3001871,11334,9707,97826,9918,27818,7123,0231,3051,7183291,389131,33123,933107,39919,78887,61113,0297,0415,9881,8284,1601,20935685334251133,1479,03124,1167,23616,8795,9792,4923,4878082,6797,7892,7805,0092,5482,461October 1974Full-timeequivalentOctoberemploymentpayroll19,7114,76314,9484AOI10,5472,8271,0061,8211,0557665,2441,8623,3821,1972,1853,8098242,9852,1268592,5287521,7763381,43839,6498,55731,09210,39120,7014,5752,0352,5406061,934115,43822,43293,00620,44772,55919,59510,2039,3923,1686,2241,8195081,31162968241,84710,40431,44310,97420,4699,6~93,8835,7861,5364,2509,3043,1946,1103,1722,938$16,3733,99112,3823,1309,2522,16386131,2956985984,2811,6002,6818511,8304,0818953,1862,2729142,1197311,3882361,15240,4749,38031,0949,71921,3763,6011,5512,0494221,627145,39327,623117,77022,25395,51715,9258,7267,1992,2404,9591,38742895940155838,33110,14928,1818; 19419,9876,8982,8814,0178n3,1259,0843,2235,8612,9212,940October 1975Full-timeequivalentOctoberemploymentpayroll20,6004,73115,8694,86611,0032,9119112,0001,1978035,6591,9503,7091,4112,2984,2219603,2612,3638982,7798751,9044131,49141,0988,52832,57011,13821,4324,9192,3062,6136401,973113,25923,11990,14021,09769,04321,13310,86910,2643,6006,6641,8985451,35367368043,79010,39933,39111,36322,02810,4914,4796,0121,5804,43251,9733,4456,5283,5692,959$17,4584,24013,2193,5829,6372,5259631,5628716915,0871,8493,2381,1352,1034,7671,1123,6552,6181,0372,4618731,5873091,27844,2519,31934,932II ,25223,6804,1401,9602,1804511,729146,32629,431116,89524,64892,24717,4629,3128, ISO2,5985,5521,6355221,11348562844,80011,47833,3229,22424,0988,2163,7164,5001,0293,47110,7863,9016,8853,6843,201-----_. ------------------------------------Characteristics <strong>of</strong> the <strong>Criminal</strong> <strong>Justice</strong> SystemslI,jIIIii! OctoberFull-timeequivalentemployment20,8444,97215,8724,81611,0563,0989512,1471,3118365,6892,0013,6881,5382,1504,3861,0663,3202,4228982,9238872,0364781,55842,0849,15132,93311,80421,12:;5,2352,4582,7777082,069110,62223,38487,23820,92966,30921,69611,15910,5373,7706,7671,9725511,42171470743,48110,21833,26312,33120,93210,9054,6006,3051,6694,63610,3153,6426,6733,6872,9861976Octoberpayroll$18,9454,80114,1443,82610,3182,8671,0411,8251,0557705,4832,0903,3941,2682,1265,3571,4003,9572,8951,0632,7418871,8543831,47147,93810,93936,99912,32724,6724,9052,5132,3915541,838155,09230,057125,03525,31:1799,64819,91810,9718,9472,9276,0201,8325891,24354170243,80310,88332,92010,33622,5849,1984,0895,1091,1054,00411,7984,5407,2583,8713,387Employment and payroll aOctober 1977OctoberFull-timeFull-timeequivalent October equivalentemployment payroll employment22,2955,51116,7845,06511,7193,3861,1232,2631,3928715,9362,1333,8031,6212,1825,0441,2053,8392,8729673,0871,0022,0854461,63945,017-9,95735,05512,95622,0995,6972,6073,0908252,265117,79933,29684,50320,30264,20122,88211,93410,9483,9437,0052,0515931,45871774144,28710,70733,58013,47520,105II ,3964,6496,7471,8014,94611,4033,9447,4594,1483,311$21,8105,18816,6234,28712,3363,3761,3152,0611,2148486,4572,4414,0151,6792,3366,2741,5014,7723,5221,2503,1241,1062,0183781,64054,27212,19642,07613,81128,2655,5252,6732,8516872,164172,86646,204126,66227,10699,55621,98011,93910,0413,3356,7062,0716711,40160S79549,27613,62735,64712,23523,41310,5324,15845,8481,2794,56913,7775,1078,6714,6414,.02922,4185,32817,0905,37011,7203,5521,2062,3461,4082386,0662,2193,8471,6232,2244,9931,2693,7242,6871,0373,2511,1192,1324381,69446,92810,02136,90713,78223,1256,1142,8203,2948272,467119,06135,04884,01318,80265,21123,82012,67611,1444,1706,9742,0846141,47071775348,25710,81637,44114,54022,90111,5154,8066,7091,8124,89711,8674,0167,8514,6103,2411978Octoberpayroll$24,3496,11618,2324,96413,2693,6861,4712,2151,2409756,5752,3774,1991,5762,6226,6651,6844,9813,5251,4573,5681,3392,2294241,80659,37313,37645,99715,58230,4146,2173,1093,1087092,400176,32851,066125,26227,09098,17124,70213,77210,9303,7457,1862,2627511,51066584555,17215,03540,13614,38925,74811,5895,0906,4991,4595,04015,4195,5959,8245,4364,38833October 1979Full-timeequivalent b Octoberemploymentpayroll22,7425,58617,1795,58711,5833,5001,1512,3641,4499156,6432,5474,1071,7432,3645,3651,3554,0112,9241,0873,4661,1752,3014921,83246,69510,26636,46614,18922,3446,4503,0293,4268842,544118,87236,96282,40519,25863,12024,66013,12011,5534,4737,0802,1645971,57781576446,04610,68634,97614,75620,22212,4035,4217,0041,8505,15712,0273,9628,0694,7133,358$26,6047,01019,5945,48314,1113,8011,4752,3261,3319957,9783,1714,8071,7413,0667,6511,9815,6704,0911,5794,0981,4712,627SIS2,11263,04414,70048,3 1416,89231,4527,2153,5133,7028662,837197,95758,449139,50829,663109,84527,46115,41712,0444,2367,8072,4717661,70581888758,65815,04043,61915,69527,92413,4066,0677,3391,6975,64217,1435,93411,2086,1985,010--------_. ""-'
---------~~----~----------------<strong>Sourcebook</strong> <strong>of</strong> <strong>Criminal</strong> <strong>Justice</strong> <strong>Statistics</strong> <strong>1983</strong>(Table 1.8 Employment and payroll for State and local criminal justice activities, by State and level <strong>of</strong> government, October 1971-October 1979--Continued{Dollar amounts in thousands}State andlevel <strong>of</strong> governmentPennsylvaniaStateLocal, totalCountiesMunicipalitiesRhode IslandStateLocal, totalMunicipalitiesSouth CarolinaStateLocal, totalCountiesMunicipalitiesSouth DakotaStateLocal, totalCountiesMunicipalitiesTennesseeStateLocal, totalCountiesMunicipalitiesTexasStateLocal, totalCountiesMunicipalitiesUtahStateLocal, totalCountiesMunicipalitiesVermontStateLocal, totalCountiesMunicipalitiesVirginiaStateLocal, totalCountiesMunicipalitiesWashingtonStateLocal, totalCountiesMunicipalitiesWest VirginiaStateLocal, totalCountiesMunicipalitiesWisconsinStateLocal, totalCountiesMunicipalitiesWyomingStateLocal, totalCountiesMunicipalitiesOctober 1971Full-timeeqUivalent Octoberemployment payroll40,2609,4783U,7826,84323,9393,1371,1961,9411,9417,1892,5294,6602,4622,1981,6905531,137470667II ,5713,3858,1862,4965,69034,6937,2C~27,' 1010,13717,2933,0001,1411,8596431,2161,456990466246414,7685,7319,0372,9176,12012,3524,3188,0343,4804,5543,8851,5032,3821,1161,26615,4773,92211,5554,1607,3951,170454716302414$32,8U78,25624,5513,9592U,5912,3899341,4551,4554,2441,6412,6041,3221,2819983776212443777,0972,1184,9601,4273,55322,3584,62317,7906,07311,7172,0678441,2234267971,070775294I29310,1463,9646,2332,1674,04710,0963,58!i6,5542,5184,0362,1376771,26856070812,6403,5799,1323,1545,978703298405165240OctoberFull-timeequivalentemployment42,96010,69932,2617,81224,4493,3101,2782,0322,0327,9802,7955,1852,7752,4101,7895511,23850773111,8783,5818,2972,5745,72334,9717,06727,90410,50617,3983,2761,1632,1137931,3201,5941,0445501253815,6486,2729,3763,0466,33012,6994,3528,3474,0704,2773,9931,5002,4931,2031,29016,5734,82711,7464,3237,4231,2624647983464521972Octoberpayroll$37,50610,05127,4554,79722,6582,7141,1271,5871,5874,8481,0882,9601,5951,3651,1434077362924457,6122,3615,2511,5603,69124,2085,15119,0576,50412,5522,3368991,4385319061,262915348634211,3654 r 5416,8432,3734,47010,6643,6407,0243,0843,9402,4049401,46563682914,3714,19110,1803,5396,641aData for municipalities, and the local governments totals thatinclude municipal data, are estimates subject to sampling variation;786322464186278Employment and payroll aOctober 1973 ~:-:-:--+Oc!l;.t!l;0!Qbe~r::...L19u7.!1:4_ _-=-"....,~Oc~to~b~e!....r ....!1~9!..:7 5~' _Full-time Full-time 'rull-tlmeequivalent October equivalent October equivalent Octoberemployment payroll employment payroll employment payroll44,67410,85533,7698,52825,2413,4041,3692,0352,0358,3983,1095,£892,7362,5531,7975161,28154174012,9893,9968,9932,9166,07739,1728,90530,26711,87318,3943,6021,3112,2919361,3551,6381,092546II53516,1197,0219,0982,9936,10513,2264,2558,9714,4174,5544,3101,6272,6831,2731,41016,1144,46811,6464,2757,3711,403507896406490$41,24111,77429,4665,50823,9583,1251,3791,7451,7455,5232,2203,3031,6951,6081,2504278233344898,9932,8246,1691,6634,30729,1266,93322,1947,88514,3092,7631,0661,6756501,0251,383984398639213,2495,9037,3462,6324,71411,7763,8047,9713,5764,3962,7461,0721,67372195314,9404,46810,4523,6646,78993638455322832447,728II ,06636,6629,12027,5423,6241,5852,0392,0399,2273,5665,6612,9322,7291,9185U81,41060180914,7074,20510,5023,4347,06842,96610,39232,57413,11619,4563,9071,4192,4861,0711,4171,6451,0955502452616,7806,6599,9213,4566,46513,9494,3789,5714,8054,7664,8451,8502,9951,5491,44616,9064,57012,3364,6127,7261,535561974432542$46,22713,12233,1066,46526,6413,4261,6631,7631,7636,7282,7653,9632,0321,9311,44748796039157011,4023,3688,0342,3855,64934,1738,24525,9289,37716,5523,2631,3061,9577891,1681,4341,0184161340316,0547,4368,6183,2355,38313,4244,1899,2354,2355,0003,3151,3241,992940I,OS216,6694,68211,9874,1677,8211,08845863024538548,560II ,26637,31210,30527,0073,6241,5542,0702,07Q10,5254,3116,2143,2692,9452,1639801,20344276115,4224,281:111,1343,7877,34745,40010,70834,69214,13720,5554,2281,4962,7321,1171,6151,6831,112571245472U,2329,27210,9604,1706,79013,8664,5469,3205,0364,2644,8421,8932,9491,4411,50817,5434,66112,8625,0007,8621,7196011,118527591$51,45613,88037,5767,73929,8363,7041,7611,9431,9438,2193,7184,5012,3382,1631,87688599138U61113,0623,8729,1692,8266,36340,50310,28230,22110,85919,3623,9921,5552,4371,0071,43U1,5331,0624711445718,9958,96010,0353,9586,07715,0734,99510,0794,9175,1613,6331,4442,1899221,26718,2615,04913,2124,7698,4431,408563844354491data for counties {boroughs, parishes} are based an a canvass <strong>of</strong> allcounty governments and therefore are not subject to samplingSource: Table provided to SO-RCEBCO< staff by the U.S. Department <strong>of</strong> <strong>Justice</strong>, <strong>Bureau</strong> <strong>of</strong> <strong>Justice</strong> <strong>Statistics</strong>.34I'1,!" I,jI~I'iijI!,IIiIIjiII!1, ii! JIIIiil 'II.!it!j I: 'II .11 IIIIIII'IIIfII,'irIIu 1)October 1976Full-timeequivalent Octoberemployment payroll50,01611,35138,66510,83127,8343,9191,7262,1932,19311,2234,6406,5833,5623,0212,4141,1891,22550671916,U484,61:17II ,3613,9287,43346,97110,62636,34515,23521,1104,6901,6713,0191,2951,7241,7991,1766235257121,7619,59712,1644,8517,31314,7444,57210,1725,3004,8725,2432,0703,1731,5601,61317,9734,70213,2715,1798,0921,8626121,250601649$56,79715,29U41,5088,8U732,7014,2921,9592,3332,3339,3374,1605,1562,7632,3932,0401,04199937562414,0454,2789,7673,1666,6UI46,04312,04333,99912,48721,5124,7341,9332,8021,2391,5631,6651,1675183548321,OUO9,183II ,8165,0606,75717,1955,42311,7725,6676,1044,2951,8482,4471,0451,4022U,5215,62114,9005,4479,4541,6886701,018448570Employment and payroll aOctober 1977 October 1978Full-timeFull-timeequivalent October equivalent Octoberemployment payroll employment payroll50,922II ,54139,361II ,09828,2834,2021,8782,3242,32411,9804,8466,9323,6563,2762,2979861,31152079117,7285,883I I ,8454,0437,80251,456I 1,46939,98717,53822,4494,91 I1,7843,1271,3811,7461,8991,2006995164822,9329,96412,9685,2797,68Y15,5995,04210,5575,4565,1015,9132,6843,2291,6211,60818,6644,89013,7745,4918,2832,0366491,347683704$58,59016,52442,0669,72732,3385,1012,4392,6622,66210,2004,5965,6042,9242,6802,1401,0141,12641371317,1846,172II ,0123,5227,49051,99212,44639,54615,33824,2085,3782,1793,2UO1,4261,7712,0151,3606353460U24,47111,22413,2475,81 I7,43619,4346,43712,9976,2686,1285,1672,5382,6291,2161,41422,6776,20116,4766,06910,3871,9597501,209530679Characteristics <strong>of</strong> the <strong>Criminal</strong> <strong>Justice</strong> Systems50,73612,46138,27511,91126,3644,3261,9992,3272,32712,5195,4077,1123,7693,3432,3671,0761,29151377818,4755,75312,7224,S268,19652,471II ,23041,24118,36522,8765,2821,6863,3961,4641,9321,9031,2866174956824,18610,41513,7715,7118,06016,5225,436II ,0865,9635,1236,0102,7283,2821,6191,66318,9675,?2913,7385,7268,0122,1726711,501737764variat~on.Amoullts do not odd precisely 10 totals due to rounding.$65,68417 ,82247,86210,92836,9345,6352,8032,8322,83211,7745,4786,2973,2723,0242,4741,2781,19542876818,6196,06312,5374,1778,36U58,86712,71346,15417,54128,6136,5512,5124,0401,6182,4222,0971,4876103557526,49611,49615.0016;7318,27022,1737,23614,9377,5517,3875,8372,8003,0371,4111,62624,8517,19717,6546,80410,8492,3368641,473658815October 1979Full-timeeqUivalent b Octoberemployment payroll51,23712,27039,00212,15126,9524,3062,0212,2902,29012,9295,7637,2093,9433,2672,5421,190I ,35~56679218,2925,68912,6294,9177,71154,89311,07043,89119,43624,4725,3351,8553,4971,4902,0061,8771,2336505859225,01011,32613,6625,6238,05816,6225,39911,1916,2024,9876,1902,7953,4061,6941,71019,5605,56013,7155,8147,9062,4087641,651797856$72,92218,55254,37112,06942,3025,9463,0522,8942,89414,7687,9656,8033,7393,0642,6861,3571,32949763219,8026,40013,4024,7888,61467,84614,37953,46819,61633,8527,1072,7244,3821,8132,5692,2691,6076624761529,14612,79316,3537,0299,32525,2748,44516,8298,5208,3086,4193,0993,3201,4651,85527,0168,24911:1,7667,536II ,2302,9421,0431,898892I ,007
----.... ....--.-. ~"'-.~<strong>Sourcebook</strong> <strong>of</strong> Criminol <strong>Justice</strong> <strong>Statistics</strong> 19!!3Table 1.9 Federal criminal justice budget authorities and outlays, fiscal year 1982 (actual) and <strong>1983</strong>-86 (estimated)NJTE: These data are from the budget submitted by President Reagan to Congress in February<strong>1983</strong>. The budget authority (actual or estimated) for each fisca I year inc I udesappropriations for that year, as well as for future years, that have been approved byCongress. The outlays (actual or estimated) for the corresponding year are funded portlallyby the budget authority and partially through unspent funds allocated in previous years."OJtlays" are defined as values <strong>of</strong> checks Issued, interest accrued on public debt, or otherpoyments made, and net <strong>of</strong> refunds and reimbursements.(In millions <strong>of</strong> dollars)1982 actual <strong>1983</strong> estimate 1984 estimate 12~S e~t!mateBudget Budget Budget BudgetT:Z:!2e <strong>of</strong> 2rogram authorit:z: OJtla:!s authorit:! OJtla~s author1t:! OJtla:ts authori!:! ~ iutla:!sFederal law enforcementactivities, total $2,658 $2,529 $3,045 $3,017 $3,348 $3,276 $3,269 $3,246Organized crime drug enforcement0 128 104 106 i03 82 87NJrcotics violation investigation 283 ° 265 3iO 305 331 324 341 336Other investigation 733 697 798 801 1,001 966 963 975Alcohol, tobacco, and firearmsinvestigation i42 137 147 145 157 155 157 155Border enforcement activities 974 933 1,067 1,064 1,118 1,096 1,104 1,07!!Protection and other activities 204 i98 249 244 282 276 267 262Other enforcerT1P'lt 323 299 345 353 354 354 355 353Federal litigative and judicialactivities, tatal 1,529 1,516 1,685 1,669 1,592 1,592 1,601 1,580Civil and criminal prasecution andrepresentation 553 541 604 592 65!! 646 678 667Federal judicial activities 735 716 840 835 931, 924 923 913Representation <strong>of</strong> indigents incivil cases 241 259 241 242 0 21 0 0Federal correctional activities 423 364 404 424 523 466 531 494<strong>Criminal</strong> justice assistance, total 140 294 137 189 165 184 165 189Existing law 140 294 137 189 72 148 73 97Proposed legislation 0 0 0 0 92 36 92 92Deductions for <strong>of</strong>fsetting receipts -32 -32 -26 -26 -26 -26 -26 -26Total 4,718 4,671 5,245 5,273 5,602 5,491 5,541 5,4831986 estimateBudgetauthorlt:t Q!1!la~~$3,255 $3,22280 79346 340926 938160 1581,122 1,095265 259357 3541,628 1,607688 676941 930°0496 53176 13173 732 58-26 -265,429 5,464Source: Executive Office <strong>of</strong> the President, Office <strong>of</strong> Management and Budl1et, Budget <strong>of</strong> the Ulited States Government, Fiscal Year1984 (Washington, D.C.: U.S. Government Printing Office, <strong>1983</strong>), chap. 5, p. ~:;8. Table adapted by SCLRCEI30CK staff.I'I 4Ii11ItIiI,I\:Il.f'.11Characteristics <strong>of</strong> the <strong>Criminal</strong> <strong>Justice</strong> SystemsTable 1.10 Allocation <strong>of</strong> Office <strong>of</strong> <strong>Justice</strong> Assistance, Research, and <strong>Statistics</strong>(OJARS) funds, by type <strong>of</strong> budget activity, fiscal years 1980-83NJTE: The <strong>Justice</strong> System Improvement Act <strong>of</strong> 1979 authorized the establishment <strong>of</strong> theOffice <strong>of</strong> <strong>Justice</strong> Assistance, Research, and <strong>Statistics</strong> (OJARS) as the successor agencyto the Law Enforcement Assistance Administration (LEM). This new body isresponsible for coordinating the activities <strong>of</strong> its component bureaus. Research andstatistical activities are to be conducted by the National Institute <strong>of</strong> <strong>Justice</strong> (NIJ) andthe <strong>Bureau</strong> <strong>of</strong> <strong>Justice</strong> <strong>Statistics</strong> (BJS), respectively.Type <strong>of</strong> I;:-;dget activityTotalJuvenile justice formula grants<strong>Criminal</strong> justice formula grants (Part D)NJtlonal priority grants (Part E)General criminal justice grants (Part F)Training, totalEducational developmentProsecutor trainingGeneral criminal justice trainingCrime prevention programsJvvenile justice programs, totalSpecial emphasisJuvenile <strong>Justice</strong> InstituteTechnical assistanceConcentration <strong>of</strong> Federal effortsPublic S<strong>of</strong>ety Officers' Benefits Program(In thousands <strong>of</strong> dollars)Executive direction and control, Office <strong>of</strong>Juvenile <strong>Justice</strong> and Delinquency PreventionExecutive direction and control, Office <strong>of</strong><strong>Justice</strong> Assistance, Research, and <strong>Statistics</strong>Administrative services, Office <strong>of</strong> <strong>Justice</strong>Assistance, Research and <strong>Statistics</strong>/LawEnforcement Assistance AdministrationExecutive direction and control, LawEnforcement Assistance AdministrationResearch, evaluation, and demonstrationprograms<strong>Justice</strong> statistical programsExecutive direction and control, NJtionalInstitute <strong>of</strong> <strong>Justice</strong>Executive direction and control, <strong>Bureau</strong> <strong>of</strong><strong>Justice</strong> <strong>Statistics</strong>1980$486,46363,750239,23429,90429,9052,5285002501,77810,00036,25021,25011,0do3,0001,00010,00010,28510,839°25,00015,0003,768°1981 1982 <strong>1983</strong>$144,397 $128,554 $125,52360,819 43,095 43,0950° 0° °36,250 24,505 24,50521,250 14,365 14,36511,000 7,436 7,4363,000 2,028 1,8041,000 676 90012,500 10,131 10,8002,535 2,400 2,400° ° °12,140 9,623 7,588° °10,545 16,767 17,60312,742 13,875 14,5682,996 2,908 3,3951,370 1,450 1,569Source: Table provided to 5a...RCEB()()< st<strong>of</strong>f by the U.S. Department <strong>of</strong> <strong>Justice</strong>,Office <strong>of</strong> <strong>Justice</strong> Assistance, Research, and <strong>Statistics</strong>.036III:!I1~1.1
<strong>Sourcebook</strong> <strong>of</strong> Criminol <strong>Justice</strong> Stotistics <strong>1983</strong>Table 1.11 Employment and payroll for State and local police protection activities, by State and level <strong>of</strong> government, October 1971-October 1979I'OTE: See I'OTE, Figure 1.1. For data required to compute percentages based ontotal criminal justice full-time equivalent employees and total criminal justicepayroll, see Table 1.8. For survey methodology and definitions <strong>of</strong> terrns, seeAppendix I.r1fCharacteristics <strong>of</strong> the <strong>Criminal</strong> <strong>Justice</strong> SystemsState andlevel <strong>of</strong> governmentStates-local, totalStatesLocal, totalCountiesMunicipalitiesAlabamoStateLocal, totalCountiesMunicipalitiesAlaskaStateLocal, totalBoroughsMunicipalitiesArizonaStateLocal, totalCountiesMunicipalitiesArkansasStateLocal, totalCountiesMunicipalitiesCaliforniaStateLocal, totalCountiesMunicipalitiesColoradoStateLocal, totalCountiesMunicipalitiesConnecticutStateLocal, totalMunicipalitiesDelawareStafl)LocolI, totalCountiesMunicipalitiesDistrict <strong>of</strong> Columbia:Local, totalFloridaStateLocal, totalCountiesMunicipalitiesGeorgiaStateLocal, totalCountiesMunicipalitiesHawaiiStateLocal, totalCountiesMunicipalitiesOctober 1971Full-timeequivalent Octoberemployment payroll472,06369,372402,69168,847333,8445,8451,1164,7298423,8877443803643644,5521,0233,5298962,6333,1435802,5634542,10953,525?,57043,95512,10331,8524,3938013,5927022,8907,1241,0896,0356,0351,3295397901876035,93S16,8282,12914,6994,%69,7338,1539617,1921,8905,3022,351342,3174%1,821See footnotes at end <strong>of</strong> table.COollar amounts in thousands. - represents or rounds to zero.)$388,92655,668333,25852,588280,6703,5537322,8215062,3158284763523523,6058352,7716372,1341,6343191,3151901,12553,7798,43845,341!2,08733,2543,2235932,6303992,2305,9429205,0215,0219463835631254385,41712,0651,45610,6093,5037,1065,1546674,4861,1203,3661,922241,8984201,478OctoberFull-timeequivalentemployment486,16275,397410,76572,547338,2186,2381,1145,1248884,2369455274184185,0861,0184,0681,0383,0303,3895812,8085472,26155,913II ,06344,85012,49332,3575,0108254,1857113,4747, III1,1345,9775,9771,430607823m6266,34917,9982,46715,5315,40310,1288,6451,4177,2282,0325,1962,380302,3506051,7451972Octoberpayroll$430,50065,622364,87858,667306,2113,9907773,2145762,6371,1286924354354,3469773,3697562,6131,8363661,4702321,23860,27510,62049,65513,24336,4123,9516573,2944072,8876,4539865,4685,4681,2145436711814906,50513,9682,02611,9423,8578,0855,8661,1504,7161,2413,4751,999231,9774691,507EmplOYment and payroll aOctober 1973 October 1974Full-timeFull-timeeqUivalent October equivalent Octoberemployment payroll emplOYment payroll511,14681,634429,51278,949350,5636,4371,1535,2849444,3409975894084085,7291,3094,4201,0313,3893,5996082,9915442,44757,98311,57146,41212,97933,4335,7189024,8168293,9877,3731,2176,1566,1561,4266218051786275,74418,9032,27816,6256,05510,5709,8751,5548,3212,4745,8472,373332,3506151,725$488,50477,140411,36469,177342,1874,3439083,4356232,8121,0746354394395,1621,2223,9408243,1172,0834181,6642611,40367,19412,12855,06614,98640,0804,7127863,9265043,4216,8891,0805,8085,8081,1915156761695075,87416,7252,09314,6325,2409,3927,0661,2265,8401,6954,1451,267272,21105~11,709539,40989,822449,58783,068366,5197,1321,3285,8041,0564,7481,03249553725356,0801,3744,7061,1623,5443,2327092,5235611,96260,00312,18347,82013,25034,5706,8211,0865,73591S4,8207,4241,3466,0786,0781,3126476651824836,13221,7952,58019,2156,69612,51910,9931,7469,2472,7276,5202,233102,2235421,681$550,90788,426462,48178,360384,1015,3661,0414,3257603,5651,5467507%37936,0421,3994,6431,0773,5662,0505241,5262961,22974,00213,21860,78416,67144,1136,1539655,1886254,5637,5771,2706,3076,3071,3076136932294647,54720,8522,52918,3235,95112,3718,4541,4566,9981,9975,0012,46792,4586371,821October 1975Full-timeequivalent OctoberemplOYment payrol/555,84992,445463,40489,273374,1317,5201,5056,0151,1314,8841,15658956735646,5521,4985,0541,2343,8203,4937122,7816952,08661,38911,68549,70413,76635,9387,0849496,1359725,1637,5561,3466,2106,2101,5056878182215975,49223,2853,04620,2397,35112,88812,1232,2409,8833,1916,6922,43462,4285511,877$606,59997,737508,86290,874417,9886,0941,2954,7998423,9571,9821,09189138B86,7201,6015,1191,1943,9252,4575971,8604271,433BI,87613,7266B,15019,3354B,8157,3421,0676,2757775,498B,1371,4036,7336,7331,5266688582735B57,05323,9902,78921,2017,55513,6469,6401,8087,8322,5165,3152,72852,7236352,088OctoberFull-timeequivalent, employment556,92690,884466,04291,817374,2257,48B1,5035,9851,1994,7861,20665854845446,7301,5015,2291,1924,0373,7%8122,9847072,27761,520II ,86149,65913,88435,7757,114%06,1541,0315,1237,5541,3606,1946,1941,4936488452535924,%824,3232,98821,3357,56313,77212,3592,26510,0943,3306,7642,503942,409531I,B7B1976Octoberpayroll$659,370105,620553,75099,632454,1186,4B81,3235,1651,0334,1322,3941,4059B959848,3611,/116,6491,3395,3102,7566872,0694711,59B91,09315,87775,21621,09154,1257,B241,1126,7129055,807B,6151,3107,3057,3051,688721%73436247,33126,1912,99123,2007,84715,35310,7682,3268,4422,7635,6793,1861083,0796972,3BIEmployment gnd pgyrol/ aOctober 1977 October 1978Full-timeFull-timeequivalent October equivalent Octoberemployment payroll employment payroll573,58293,674479,90B96,635383,2738,1851,5356,6501,2735,3771,3476646B3256587,0231,6005,4231,2664,1574,048831,3,2147702,44462,74511,19551,55014,10537,4457,2901,0226,2661,11165,1627,7161,4186,2986,2981,4996498502506004,78324,6493,125;:1,5247,86213,66212,8672,44110,4263,5376,8B92,537%2,4415781,863$723,767116,294607,473122,434485,0407,8451,7046,1411,1504,9912,7991,4561,343691,2748,9881,9767,0121,4375,5753,3727342,6385442,094106,49515,59290,90332,0085B,8948,2191,1917,0281,0655,9639,7451,7917,9547,9541,852B211,0323716607,91028,5883,52825,0599,07315,987II ,6882,4159,2133,1606,0533,4861193,3678182,5495B1,95792,4434B9,51499,889389,6258,4691,526-6,9431,2955,6481,40B67473447307,3371,6095,7281,3154,4134,1018553,2468612,38560,IM99,4~150,64814,07836,5707,2319896.2421; 1865,0567,8251,4446,3BI6,3811,6197298902586324,63725,3713,41521,956B,76713,18912,5122,24510,2673,6486,6192,6411022,5396091,930$771,172122,337648,835124,757524,0788,9761,8777,0991,3315,7693,0891,4881,60161,59610,6852,1808,5051,7336,7723,5078562,6516212,030%,32114,66081,66123,12758,5349,3541,3378,0171,2656,75210,4912,0288,4638,4632,0789461,1333727618,05332,1004,01128,08911,65B16,43112,7572,74010,0173,6716,3453,6901323,5588482,710October 1979Full-timeequivalent b Octoberemployment payroll5BO,26991,595488,832103,255385,5988,6051,4507,1561,4065,7501,408604804427627,6651,5876,0781,4214,6574,2339043,3319722,36161,63210,97650,65814,22436,4337,4871,0036,4821,3135,1718,0231,4996,5246,5291,6397498902746164,80226,1603,17422,9858,97914,00712,4852,08310,4053,7816,6242,6981222,5765732,003$839,760130,915708,845137,404571,4419,5771,7997,7781,5376,2413,6261,5402,0861141,97311,6172,3519,2662,0427,2243,8759472,9287672,161108,20517,69290,51324,47066,04410,7031,6719,0321,4897,542II ,8732,2899,5849,5842,2191,0311,1894177728,37434,0793,84430,23511,71518,52013,3082,45B10,8513,9296,9213,5331423,3918022,5893839
(<strong>Sourcebook</strong> <strong>of</strong> <strong>Criminal</strong> <strong>Justice</strong> Statisti~s <strong>1983</strong>Table 1.11 Employment and payroll for State and local police protection activities, by State anCi level <strong>of</strong> government, October 1971-October 1979--Continued(Dollar amounts in thousands. - represents or rounds to zero,)State andlevel <strong>of</strong> governmentIdahoStateLocal, totalCountiesMunicipalitiesIllinoisStateLocal, totalCountiesMunicipalitiesIndianaStateLocal, totalCountiesMunicipalitiesIowaStateLocal, totalCountiesMunicipalitiesKansasStateLocal, totalCountiesMunicipalitiesKentuckyStateLocal, totalCountiesMunicipalitiesLouisianaStateLocal, totalParishesMunicipalitiesMaineStateLocal, totalCountiesMunicipalitiesMarylandStateLocal, totalCountiesMunicipalitiesMassachusettsStateLocal, totalCountiesM'JnicipalitiesMichiganStateLocal, totalCountiesMunicipalitiesMinnesotaStateLocal, totalCountiesMunicipalitiesMississippiStateLocal, totalCountiesMunicipalitiesOctober 1971Full-timeequivalent Octoberemployment payroll1,3712541,11739172630,2113,09427,1171,95025,1678,4241,5016,9239885,9354,5981,1413,4575592,8984,0456623,3836002,7834,8111,1423,6698972,7728,6511,1977,4542,5594,8951,6654061,2591171,14210,8881,8329,0563,58!!5,46814,7331,26213,4712313,44819,1732,6!!116,4921,98414,5086,2901,0065,2841,1034,1813,7139012,8124452,367$84517367217749629,1792,89326,2861,53324,7535,8351,0744,7615704,1903,0547!!52,2683431,9262,4965291,9672941,6743,0798092,2705661,7045,1087724,3361,6072,7291,032254778627167,4491,4396,0103,0262,98412,3391,13111,2071611,19118,3782,76515,6131,60214,0115,2587594,4998483,6512,0285651,4632441,219See footnotes at end <strong>of</strong> table.OctoberFull-timeequivalentemployment1,4532531,20041378730,3923,16427,2282,41924,8099,0001,4677,5331,0906,4434,4771,0603,4176002,8174,3746883,6866803,0064,9361,3033,6339322,7018,5801,2527,3282,5834,7451,8555201,3351231,21210,9452,1278,8183,5305,28814,9351,36113,5742413,55020,1742,84917,3252,21715,1086,6308845,7461,1794,5673,8919612,93058~2,3411972Octoberpayroll$86517968520048530,4453,16627,2781,91425,3646,4241,2245,2006594,5413,1497802,3703761,9932,7845122,2723391,9333,4911,0242,4676341,8325,4658254,6401,58031)601;1:39376863677969,5131,9517,5613,3284,23413,5311,20912,3221712,30520,4083,17817,2301,94415,2875,8618185,,)43"1314,'1122,2446571,5873471,24040EmplOYment and pgy.ollaOctober 1973Full-timeequivalent Octoberemployment payroll1,5513041,24743681132,0773,33728,7402,63526,1059,666 •1,6937,9731,1926,7814,7591,0673,6926992,9934,5656653,9008023,0985,4991,4414,0589493,1099,9752,0717,9042,6505,2541,9305131,4171471,27011,1752,2018,9743,7215,25315,8732,25713,6162413,59220,8283,14417,6842,35915,3256,8798006,0791,2964,7833,9791,0272,9525912,361$98022076023652433,6953,82129,8752,15827,7177,1431,4045,7397614,9783,6249122,7124732,2383,0575332,5244182,1064,3251,1743,1517502,4016,4691,4535,0161,9023,1141,3734059688987910,3312,1508,1813,7884,39215,6202,20813,4121913,39423,9623,67620,2852,18018,1056,4188315,5871,0724,5142,4837571,7263811,345October 1974Full-time(.quivalentOctoberemploymentpayroll1,7092861,42351890532,6023,51329,0892,69926,39010,1821,9288,2541,2287,0264,8628504,0127793,2334,6037513,8527563,0965,9511,5134,4381,1053,33310,7402,3918,3493,0115,3381,9875761,4111581,25311,7132,4099,3044,1205,18415,9382,43513,5033613,46721,5713,32518,2462,61615,6307,2861,1026,1841,3854,7994,2431,1313,1126532,459$1,23527396129666536,0693,87!!32,1902,39629,7958,1161,7476,3698295,5414,0118713,1405552,5863,3826292,7534452,3074,8051,2213,5848622,7227,6301,7285,9022,0713,8311,5394691,07010196912,0702,6089,4614,7144,74816,9442,48014,4633214,43225,3453,89421,4512,60118,8507,4131,2546,1591,2344,9252,9059601,9444191,526October 1975Full-timeequivalentemployment1,7792801,49955994033,3013,53229,7693,11326,65610,5472,0208,5271,3707,1575,0749314,1438643,2794;92!!7644,1649103,2546,7811,8404,9411,2743,66711,5702,9198,6513,0155,6362,2517091,5421911,35112,3602,5029,8584,2955,56317,0892,43414,6553814,61722,6303,44219,1882,97516,2137,5371,1206,4171,4664,9514,2991,0973,2027052,497Octoberpayroll$1,4012781,12335976440,3554,12536,2302,91333,3179,1961,9857,2101,0386,1734,5809913,5896922,8973,9357353,2016002,6006,0511,7824,2691,0503,2199,5222,3467,1762,1914,9851,8065071,2991321,16713,3802,92410,4564,9955,46219,0192,55116,4693316,43628,5634,13524,4283,15721,2718,1151,3286,7881,4485,3403,2291,0142,2154741,740iiIi)1U'Iil!H~!"Characteristics <strong>of</strong> the <strong>Criminal</strong> <strong>Justice</strong> Systems= October 1976 EmplOYment and payroll aOctober 1977 Octobe II"ull-tlmeeqUivalentemploymentOctoberpayrollFull-time Full-time r 978equivalent October eqUivalent Oct beemplovn-nt pa II 0 r, .. ~ yro employment payrollOctober 1979FUll-timeeqUivalent b Octoberemploymentpayroll1,9833221,6616401,021$1,6533231,3304408902,1323381,7947491,045$2,0393661,6746/11,0622,245/,871,7587501,008$2,3355711,76i•6631,1012,2174491,7697491,019$2,5195741,9457351,21134,8163,57131,2453,26427,98143,4274,35739,0693,22434,4723,47530,99747,2614,32342,93835,3133,66531,64853,2235,83647,38735,6283,70231,92854,7105,85748,85310,7992,0778,7221,4597,2635,2351,0984,1379303,2075,1327344,3981,0343,3646,8641,9414,9231,3193,60411,9412,8089,1333,2355,8982,1585641,5941731,42112,1/ I2,5539,5584,5125,04616,9822,33014,6524014,61222,1003,44818,6522,90515,7477,4311,0906,3411,4914,8504,4281,0903,3387452,59335,8459,8802,1617,7191,1866,5335,1911,2843,9078063,1024,4237553,6697192,9506,6162,1574,4601,2123,24710,5662,4038,1632,4185,7451,8884921,3951211,27515,5493,01512,5355,7216,81320,7932,78618,0073617,97132,4834,73727,7463,44924,2968,9891,3777,6121,6145,9983,4301,0052,42554l1,8843,30327,6941/,1872,3278,8601,5227,3385,6541,2194,4359973,4385,2587874,4711,0983,3736,8471,9064,9411,3533,5881/ ,4972,3709,1273,1186,0092,3146061,7082321,47612,3992,8159,5844,6004,98417,1622,28414,8784514,83324,1553,56820,5873,06817,5197,7401,0876,6531,6155,0384,7161,1/63,6008892,7/13,52039,41711,0012,5348,4671,2557,2126,3381,7894,5499353,6154,8438404,0038223,1806,9612,0744,8871,3963,49010,3642,5367,8292,8774,9522,1906261,5651801,38515,5793,67811,9016,2035,69822,2942,89519,3994019,36035,6826,06229,6193,97325,646/I ,3171,6089,7093,0326,6773,884I, /I I2,7723,32628,32210,7122,1068,6061,4137,1935,6291,2044,4259863,4395,1968214,3751,0383,3377,0011,8935,1081,4903,61812,9173,2929,6253,3476,2782,2705351,7352401,49512,2942,8199,4754,5314,94417,0172,33914,6784614,63223,2053,93419,2713,30815,9637,3448876,4571,6244,8334,8081,2053,6033,89443,4931/ ,4862,5788,9081,3097.',5996,4411,6394,8021,0123,7905,2429324,3108743,4367,8792,3125,5681,6753,89311,8203,3508,4703,0855,3862,3846171,7662021,56416,6553,80112,8536,8436,01023,3942,89120,5035020,45238,1676,52531,6424,45027,1!/210,4711,5128,9591,9836,9764,3201,2553,0653,34428,587/I ,3142,2229,0961,5997,4985,7641,2104,5591,0843,4765,4328/14,6221,1893,4337,1201,8595,2671,4333,83411,5511,8339,8173,2756,4102,2185011,7212291,49812,7352,9049,8314,9824,85116,7302,24014,4904614,45123,0713,69619,3743,39715,9947,8101,2056,6051,7084,9004,25644,59612,8192,9979,8221,5438,2797,1561,7575,3991,1754,2245,8969734,!/231,1163,8078,6882,9195,7691,5734,19611,8522,2539,5993,2396,3592,4696301,8392091,63118,8904,10614,7848,4196,36525,7213,20222,5195322,46540,8576,37934,4785,07929,39812,0621,95110,1112,3977,7136492,1238942,71)97102,3554,8711,0803,7958302,9674,7191,2093,5096752,83541
<strong>Sourcebook</strong> <strong>of</strong> <strong>Criminal</strong> <strong>Justice</strong> Stotlst!cs I ~83Table 1.11 Employment and payroll for !Hatoe and local police protection activities, by State and level <strong>of</strong> government, October I ~71-October I ~7~--Continued(Dollar amounts in thousands. - repre~entsor rounds to zero.)State andlevel <strong>of</strong> governmentMissouriStateLocal, totalCountiesMunicipalitiesMontanoStateLocal, totalCountiesMunicipalitiesNebraskaStateLocal, totalCountiesMunicipalitiesNevadaStateLocal, totalCountiesMunicipalitieslew HampshireStateLocal, totalCountiesMunicipalitiesNew JerseyStateLocal, totalCountiesMunicipalitiesNew Mexico,)tateLocal, totalCountiesMunicipalitiesNew YOrkStateLocal, totalCountiesMunicipalitiesNorth CarolinaStateLocal, totalCountiesMunicipalitiesNorih DakotaStateLocal, totalCountiesMUi1icipaiitiesOhioStateLocal, totalCountiesMunicipalitiesOklahomaStateLocal, totalCountiesMunicipalitif~sOregonStateLocal, totalCountiesMunicipalitiesOctober I ~71Full-timeeqL:lvalent OctoberemploymenTpayrollII ,6461,54410,1021,3208,782I ,34~3141,0354346012,58~4572,1323871,7451,856163I ,6~36511,0421,3722001,172601,11220,2172,22817,9891,09216,8~72,208515I ,6~32~51,39868,6406,04762,593~,01653,5778,~~51,9057,0901,7175,373~4514180417862618,8012,48816,3132,4~513,8184,889%93,9205213,3~94,28~9473,3428502,4n$7,5051,0846,4218335,5887762005762013751,8273211,5062051,3011,5051391,366514852~571428153378117,5542,29515,26082814,431I ,3~33471,04716588168,0625,23162,8318,30154,5295,85~1,3674,4~2%93,5245~88~50~9241714,450I ,~0812,5421,58610,9562,7306062,1242721,8533,4647862,678684I ,~~4See footnotes at end <strong>of</strong> table.OctoberFUll-timeequivalentemployment11,0701,617~,4531,3768,0771,4213391,0824566262,~085582,350417I ,~331,98016~1,811732I ,07~1,5232621,261611,20021,6052,84518,760I, ISO17,6102,4646771,7873311,45667,B175,41762,400~,34853,0528,8651,7537,1121,7935,31997814483418365119,2752,57916,6%2,42014,2765,1501,2163,~345473,3874,3109843,326%02,3661~72Octoberpayroll$8,36~1,2357,133~2B6,20688122265~2494102,0373~71,6402351,4051,8241511,6745881,086I, 15~227~3241B~I19,8772,7~017,08792816,1591,6904361,2551851,07073,3515,65167,6999,49258,2086,0461,3674,6791,1043,5756519156010345716,3722,17914,1931,66512,5282,9467862,1612821,8793,6808282,8518042,048EmplOYment and payroll aOctober 1973Full-timeequivalent Octoberemployment payroll4211,4631,6479,8161,5028,3141,4853521,1334936402,88254B2,334432I ,~021,9791~71,7821,1686141,7323041,4287~I ,34~21,8302,87418,~561,27617,6802,6926822,0103911,61~71,3075,76665,54110,40655,1359,5851,9637,6222,0355,587I ,02~15187820867020,5922,}7417,8182,60715,2115,5281,2834,2455913,6544,8071,1373,6701,1182,S52$:1,4661,3148,1521,0527,I':J1,04625878832~4602,2004471,754264I ,4~0I ,~972221,7761,1536221,2792371,04153~8821,8103,02618,7841,05817,7251,9214741,4472461,20186,8127,0~879,71411,07468,6417,07~1,6175,4621,3654,0~771110460712548218,8602,51716,3431,97514,3683,6899552,7343212,4134,3681,0423,3251,0242,302October 1~74FUll-timeequivalentOctoberemplo)llT1entpayroll12,1821174410,4381,633ti,~51,5463501,1%4887082,~405602,3804551,9252,10520~1,8961,2226741,7243111,413III1,30223,3533,21820,1351,25118,8842,871n~2,1424681,67472,0246,66565,3S~~,~8155,37810,6572,4448,2132,0496,1641,03215787523264322,8542,~711~,8832,71517,1685,84~1,4404,40~5963,8135,1531,2623,8~11,1642,727$10,6701,581~,08~1,2687,8221,17528~8863345512,3~15021,88~2~71,5922,31122~2,0811,3557261,4152~31,1227~1,04324,7063,44521,2621,13120,1302,3025371,7653311,43493,~477,75486, 1~411,76574,42~8,6~02,3046,3861,4944,8927~612467214852422,0~82,82519,2732,16417.IO~4,1861,0753, III3442,71,75,1521,2183,9341,1652,768October 1~75Full-timeequlvolp.ntOctoberemplOYmentpayroll12,51~1,41311,1061,8549,2521,54525~1,28(.56~\7223,1065872,51~4552,0642,2372212,0161,3107061,7803541,426841,34224,1463,23420,9121,4941~,4183,0388182,2205431,67769,4326,56362,86~10,04752,82211,2972,4858,8122,2246,5881,04315389025064024,2772,87721,40()2,B0218,5986,0191,5054,5145313,9835,2771,2314,0461,3352,711$IO,~771,341~,6371,4668,1711,3282631,06543662~2,8105922,2183531,8652,5662472,3191,488831I ,58~3571,232711,16127,2413,51723,7241,49922,2252,5456831,8623~11,47192,0768,15783,91912,76571,1549,4122,3057,1071,6475,46092014~7721835B~26,4583,18423,2742,36420,~IO4,6451,2423,40331~3,0845,9751,4064,56~1,5782,~91OctoberFull-timeequivalentemployment12,5261,40311,1231,815~,3081,7182861,4326607723,1316452,4865621,9242,314315I ,99~1,30~6~01,8433431,5001121,38824,0513,29220,7591,5451~,2143,1548482,3065521,75465,8706,4445~,4269,8224~,60411,2322,3838,8492,1836,666I ,07~16391625366323,0382,72420,3142,97917,3856,2531,5824,6715154,1565,3~01,3234,0671,3102,7171976Octoberpayroll$11,%81,64510,3231,5328,7~11,5513051,2465367103,0166862,3314461,8842,8453772,4681,6378301,7523381,414861,32828,8463,98324,8631,71623,1472,77~7732,0064531,55397,4607,9058~,55512,87176,68410,1352,4697,6671,7575,9101,04219285018966224,9143,03821,8752,70119,17ll5,3861,4673,9193353,5846,3671,6504,7171,5683,150Characteristics <strong>of</strong> the <strong>Criminal</strong> <strong>Justice</strong> SystemsEmployment ond payroll aOctober 1977 October October 197~1~78Full-tIme Full-time Full-timeequivalent October equivalent October equivalent b Octoberemployment payroll employme=n"-t--"p.;:;aYt..:;r..:;o.:,:.II_..:;e;.:.m:.:;.p:..::lo""yme=n.:..;t_-,,p..:;at..:;yr..:;o=..1113,4251,73011,6951,845~,8501,8393.571,4826857~73,3377582,57~630I ,94~2,4813282,IS31,4257281,9183361,5821041,47825,1543,42621,7281,69520,0333,33683~2,4~75971,90064,7336,20058,533~,98048,55312,1582,672~,4862,5566,9301,14116997228269022,2072,6821~,5253,14416,3816,6501,5755,0755954,4805,8301,3344,4961,5102,986$14,0661,83312,2331,66510,5681,8154131,4026177843,4938952,5985342,0643,2314152,8151,868~481,9804041,575921,48432,7484,34828,400l,tlB326,5173,1958512,3445271,81799,5778,75190,82614,09376,73311,6932,8728,8212,2166,6051,1611949662397272tl,1603,47622,6843,04319,6416,1191,6044,5164074,1097,4311,8605,5711,8553,71613,4821,74911,7331,9339,8001,8263341,49261l8203,2606482,61263~1,9732,3543062,0481,2877612,0224081,61410~1,50525,29~3·,58222,7171,63921,0783,5338862,6475872,06070,5~46,41764,17710,19853,97~11,7142,201~,5132,6176,896I, 16~192~7727070725,1422,63622,5063,24819,2586,6271,6614,9665694,3975,8911,2984,5931,5BO3,013$15,2942,06213,2321,88911,3431,8633821,4816188633,7417852,~576312,3263,3354132,9221,8221,1002,2074:81,7291051,62535,0724,71030,3621,83828,5243,4719682,5035211,982108,4478,9569~,49116,43283,05912,0462,5779,46~2,4057,064I ,27~2371,04125478728,8223,75125,0723,45321 ,61~6,7661,8134,9544264,5286,1101,8BO6,2312,1084,1234313,4641,73511,7292,0619,6691,8723511,5226858393,4967162,7826962,0882,5563082,2481,4408082,1644241,7421281,62625,6503,56522,0851,75920,3243,4657962,6696092,06165,8886,37859,50~10,14949,37312,1512,2789,8752,8627,0131,1861851,00029870322,5042,61119,8~73,29716,6156,5081,2915,2515834,6345,9521,2024,7511,626J,125$16,4642,18914,2752,22212,0532,0144281,5866609264,3~39873,4066752,7303,7534513,3022,0981,2042,5655352,0301341,89636,8585,04631,8112,32629,4863,8729162,9566752,331116,2459,590106,65517,85688,80013,2702,81710,4532,7567,6971,3652441,2122991322:.; ,j883,99527,3933,73123,6627,1411,5705,5715105,0619,0241,9677,0582,349ll,708
-----~---------------------.-'------ -Sourceboqk <strong>of</strong> <strong>Criminal</strong> <strong>Justice</strong> <strong>Statistics</strong> <strong>1983</strong>Character.istics <strong>of</strong> the <strong>Criminal</strong> <strong>Justice</strong> SystemsTable 1.11 Employment and payroll for State and local police protection activities, by State and le\'el <strong>of</strong> government, October 1971-October 1979--Continued (Dollar amounts in thousands. - repres~nts or rounds to zero.)Employment and oayroll a"-:-:::=-___--::o---:---:-=-=-~-October 1973 _ October 1974 October 19751971 1972 Full-time Full-time Full-timeState and equivalent October equivalent O:.\\ober equivalent October-,1~e.!Cve~l...!o~f~o:!:ve~r.!.!nmen~C!.!t~_.....::=~~.!!::!!--=~!!-'-:::.!!I!!~=~.....t:::.£;~,---"em~!!:lo:.,3972,8846,5133,2931,1202,1726071,56514,6361,21813,4183,01810,4001,4143241,091346745October 1979Full-timeequivalent b Octoberemployment payroll4527,7415,09122,6511,25921,4292,6344292,2072,2077,0091,9805,0301,9483,0821,3972911,1083427679,3931,1828,2111,8606,35331,6844,99026,7004,69722,0183,2577132,5457991,7451,0024016051658911,7992,7729,0283,5535,4748,2471,702",5442,1454,3993,3491,0262,3256d91,63911,1971,09310,1042,4927,6151,4062221,185415770$43,5478,07335,4741,39334,0813,5877912,7972,7977,0972,2814,8611,9292,8871,4633581,10430180410,3461,3878,9591,7827,17741,3775,92235,4554,50730,9484,3271,0333,2941,0332,2911,255633622II61014,5193,275II ,2444,7136,53213,4842,80010,6833,2407,4443,6371,2242,4136271,78615,7031,51114,1933,42510,7681,7213211,400482918
<strong>Sourcebook</strong> <strong>of</strong> Criminol <strong>Justice</strong> <strong>Statistics</strong> <strong>1983</strong>a by geographic division and size <strong>of</strong> place,a inhabitanls) <strong>of</strong> full-time police employees,Table 1.12 Number and rate (per 1,00on Oct. 31, 1981d d (U S Department <strong>of</strong> <strong>Justice</strong>, FederalII dully by the FBI Uniform Crime pay are also exclu :. : • ime Reporting Handbook!\OTE: These data are co ecte. ann alice employees" includes both Burea~ <strong>of</strong> Inves~g.at~s' ~~~~~~r Printing Office, 1978), pp.Reporting Progr~m •. .'tulI~r;iorees police <strong>of</strong>ficers include all (Washington, D••• .; ployees who were on the payrollpolice <strong>of</strong>ficers an CIVI Ian I th full arrest powers." This77 -81.) These d ata are ,or em"full-time, sworn pers,!nne ~~d or rotection duties (e.g., on Oct. 31, 19BI. d fi d the range <strong>of</strong> valuesexcludes persons perform)lnghgu not paid from police funds. The "interquartile range" is e Ine as s in a distribution.school crossing guar~s w 0 are. such as clerks, radio"Civilian employees Include per_o nsthat includes the middle 59 percent °hf'dh&v~~i~ens see Appendix 2.h' s etc" Persons For a list <strong>of</strong> States In geogrop I ,h t maids stenographers, mec anlc ,. hdispotc ers, me e~ d' luded Employees on leave witnot poid from police fun sore exc •~ 1981 estirnated population)Population groupGroup V Group viGroup ; Group II Group III Group IV (1,578 cities, (6,223 cities,(57 cities, {114 cities, (289 cities, (607 cities, 10,000 to under250,000 100,000 to 50,000 to 25,000 toTotal24,999; 10,000;and over; 249,999; 99,999; 49,99~;(8,868 cities;population populationpopulation population population populationpopulation24,725,000) 23,286,000)41 ,638,000) 16,756,000) 19,717,000) 20,824,000)146,946,000Geogrophic divisionTotal: 8,868 cities;population 146,946,000:Number <strong>of</strong> police employeesAverage number <strong>of</strong> employeesper 1,000 inhabitantsInterquartile rangeNew EnglGad: 618 cities;population 1,-,,'.128,000:NJrnber <strong>of</strong> police employeesAverage number <strong>of</strong> employeesper 1,000 inhabitantsInterquartile rangeMiddle Atlantic: 1,810 cities;population 29,121,000:I'lmber <strong>of</strong> police employeesAverage number <strong>of</strong> employeesper 1,000 inhabitantsInterquartik rongeEast j\brth Central: 1,61l9 cities;population 28,415,000:!'Unber <strong>of</strong> police employeesAverage nLmber <strong>of</strong> employeesper 1,000 inhabitantsInterquartile rangeWest North Central: 704 cities;population 10,046,000:Number <strong>of</strong> police employeesAverage number <strong>of</strong> employeesper 1,000 InhabitantsInterquartile rangeSouth Atlantic: 1,372 cities;population 16,194,000:f\l.mber <strong>of</strong> police employeesAverage number <strong>of</strong> employeesper 1,000 inhabitantsInterquartile rangeEast South Central: 667 cities;population 6,!!96,000:f\l.mber <strong>of</strong> police employeesAverage number <strong>of</strong> employeesper 1,000 InhobitantsInterquartile rangeWest South Centrol: 874 cities;population 16,324,000:NJrnber <strong>of</strong> police employeesAverage number <strong>of</strong> employeesper 1,000 InhabitantsInterquartile rangeMountain: 487 cities;population 7,714,000:Nu-nber <strong>of</strong> police employeesAverage number <strong>of</strong> employeesper 1,000 inhabHantsInterquartile ran,gePacific: 647 cities;population 21,308,000:!'Unber <strong>of</strong> police employeesAverage number <strong>of</strong> employeesper 1,000 inhabitantsInterquartlle ronge366,690 138,3862.5 3.31.6-2.8 2.3-3.424,591 1,9352.3 3.41.6-2.3 (b)80,57!! 40,2632.1l 4.11.0-2.4 3.6-4.570,245 28,2352.5 3.91.5-2.4 2.8-4.221,975 6,8372.2 3.21.5-2.4 2.2-4.449,526 14,6873.1 3.72.2-3.B 2.6-5.117,013 4,4742.5 2.61.9-3.3 2.4-2.835,332 14,0532.2 2.41.6-2.6 2.0-2.719,164 6,8112.5 2.91.8-3.5 2.4-3.148,266 21,0912,) 2.71.8-2.' 2.1-3.039,2492.31.9-2.73,3993.12.8-3.44,6!!93.12.3-3.85,1832.22.0-2.52,3052.11.8-2.57,7282.62.2-3.12,5492.42.2-2.74,1162.01.7-2.32,9562.42.0-2.86,3241.91.7-2.141,2832.11.7-2.46,0922.32.1-2.57,1592.31.7-2.78,2142.01.7-2.31,7591.71.6-1.94,5992.92.5-3.74192.32.1.,2.44,0291.91.8-2.11,6751.81.5-2.27,3371.91.6-2.142,3572.01.6-2.44,5772.0I. B-2.37,9242.31.5-2.68,4911.81.5-2.22,7161.71.4-1.95,5772.52.2-2.92,3172,li2.1-2.72,5571.81.5-2.22,5932.21.8-2.45,6051.91.6-2.050,4232.01.6-2.45,5592.01.7-2.2II ,0222.01.4-2.410,4191.91.5-2.33,9682.01.6-2.46,3782.82.3-3.12,6152.21.9-2.64,7471.91.6-2.21,7602.21.7-2.754,9922.41.5-3.13,0291.91.3-2.49,5211.80.9-2.39,7032.21.5-2.64,3902.11.5-2.510,5573.32.1-4.04,6392.6I. 9-3.55,8302.41.6-2.93,3692.91.8-3.73,9543.02.1-3.5Characteristics <strong>of</strong> the <strong>Criminal</strong> <strong>Justice</strong> SystemsTable 1.12 Number and rate (per 1,000 inhabitants) <strong>of</strong> full-time police employees,a by geographic division and size <strong>of</strong> place,on Oct. 31, 1981--ContinuedGeographic divisionSuburban: c 5,078 agencies;population 84,400,000:Nl.mber <strong>of</strong> police employeesAverage number <strong>of</strong> employeesper 1,000 inhabitantsInterquartile rangeCounty: 2,809 agencies;population 70,898,000:!\Unber <strong>of</strong> police employeesAverage number <strong>of</strong> employeesper 1,000 inhabitantsInterquartile rangeTotal(8,868 cities;populotion146,946,000i87, III2.21.4-2.7135,3201.90.8-1.9Group I(57 cities,250,000and over;population41.638,000)glncludes civilians.cOnly one city this size In geographic division.Includes suburban city and county law enforcementagencies within metropolitan areas. Excludes core cities.Suburban cities and counties are also included in other qroups.xXXXXXGroup II(114 cities,100,000 to249,999;popUlation16.756.000)XXXXXXGroup III Group IV(289 cities, (607 cities,50,000 to 25,000 to99,999; 49,999;population population19,717,000) 20.824,000)XXXX:rth Central: 1,689 cities;population 28,415,000:NJmber <strong>of</strong> poll ce <strong>of</strong>ficersAverage number <strong>of</strong> <strong>of</strong>ficersper 1,000 inhClbltantsInterquartlle rangeWest N:>rth Central: 704 cities;pcpulatlon 10,046,000:NJmber <strong>of</strong> police <strong>of</strong>ficersAverage number <strong>of</strong> <strong>of</strong>ficersper 1,000 InhobltantsInterquartlle rangeSouth Atluntic: 1,372 cities;population 16,194,000:!\Unber <strong>of</strong> police <strong>of</strong>ficersAverage number <strong>of</strong> <strong>of</strong>ficersper 1,000 InhabitantsInterquartlle rangeTotal(8,868 cities;population146,946,000)297,3242.01.3-2. '321,4162.01.4-2.068,6992.41.0-2.158,7052.11.3-2.017,3981.71.3-1.939,5972.41.9-3.1(1981 estimated population)GToup I(57 cities,250,000and over;popUlation41 ,638,000)111,7742.71.8-2.81,5952.8(a)33,5313.43.0-4.124,1333.42.3-3.75,2762.51.8-3.111,9063.01.9-3.8GToup II(114 cities,100,000 to249,999;popUlation16,756,000)31,1561.91.5-2.12,9202.72.6-3.04,0862.72.0-3.24,3711.81.6-2.11,7021.51.4-1.86,0362.01.9-2.3Group I oup I V(289 cities, (607 cities,50,000 to 25,000 to99,999; 49,999;population population19,717 ,000) 20,824,000)33,3711.71.4-2.05,3662.01.8-2.16,1681.91.5-2.46,7811.61.3-1.91,4521.41.2-1.63,4932.21.9-2.534,6271.71.3-2.04,1191.81.6-2.16,8692.01.3-2.3~,9631.51.2-1.82,1951.31.1-1.54,4892.01.7-2.3Q"oup V(1,578 cities,10,000 to24,999;popUlation24,725,000)41,6481.71.3-2.04,8961.71.5-1.99,6371.71.2-2.18,5111.51.3-1.83,1701.61.3-1.95,1582.21.9-2.6XXXXXXGroupVl(6,223 citiesunder10,000;population23,286,000)44,7481.91.3-2.52,5201.61.1-1.98,4081.60.9-2.07,9461.81.3-2.13,6031.71.4-2.08,5152.71.9-3.4
Table 1.13 Number and rateOct. 31, 1981--Contlnued<strong>Sourcebook</strong> <strong>of</strong> <strong>Criminal</strong> <strong>Justice</strong> <strong>Statistics</strong> <strong>1983</strong>(per 1,000 Inhabitants) <strong>of</strong> full-time police <strong>of</strong>ficers, by geographic division and size <strong>of</strong> place, onPoQulotlon grouQGroup I Group II Group III Group IV Group V Group VI(57 cities, (f 14 cities, (289 cities, (607 cities, (1,578 cities, (6,223 citiesTotal 250,000 100,000 to 50,000 to 25,000 to 10,000 to under(B,868 cities; and over; 249,999; 99,999; 49,999; 24,999; 10,000;population population population population population populatior, populationGeo!1ra~hlc division 146,946,000) 41,638,000) 16,756,000) 19,717,000) 20,824,000) 24,725,000) 23,286,000)Characteristics <strong>of</strong> the, <strong>Criminal</strong> <strong>Justice</strong> SystemsTable 1.14 Full-time police employees, by sex and size <strong>of</strong> place, on Oct. 31, 1981N)TE: See N)TE, Table 1.12.(11,677 agencies; 1981 estimated population 217,844,000)Total ~lice ~Io~ees Police <strong>of</strong>ficers (sworn) Other eolice emelol::eesPercent Percent Percent Percent Percen! PercentPo~ulation grou2 Total male female Total ma~e female TotalEast South Centra!: 667 cities;male femalepopulation 6,8%,000:Total agencies 502,010 82.1 17.9 398,064 94.5 5.5N..mber <strong>of</strong> police <strong>of</strong>ficers103,946 34.8 6~.213,611 3,597 1,947 341 1,857 2,190 3,679Average number <strong>of</strong> <strong>of</strong>ficersTotal cities 366,690 83.7 16.3 297,324 95.6 4.4 69,366 32.7per 1,000 inhabitants 2.0 2.167.31.8 1.9 1.9 1.8 2.1Interquartile range 1.1-2.6 1.9-2.3 1.7-2.1 1.7-2.0 1.7-2.2 1.6-2.2 1.6-2.7 Group I:West South Central: 874 cities;population 16,324,000:N..mber <strong>of</strong> police <strong>of</strong>ficersAverage numbE:r <strong>of</strong> <strong>of</strong>ficers27,812 10,933 3,279 3,248 2,027 3,809 4,516Total (250,000 inhabitants and over) 138,386 83.6 16.4 111,774 94.3 5.7 26,612 39.1 60.91,000,000 inhabitants and over 69,069 85.9 14.1 56,588 95.0 5.0 12,481 44.5 55.5500,000 to 999,999 inhabitants 36,522 82.8 17.2 29,351 93.8 6.2 7,171 37.7 62.3250,000 to 499,999 inhobitants 32,795 79.8 20.2 25,835 93 • .1 6.9 6,960 30.7 69.3per 1,000 Inhabitants 1.7 1.3 1.6 1.5 1.5 1.6 1.9 Group II:Interquartile range 1.3-2.0 1.6~2.1 1.3-1.9 1.4-1.7 1.2-1.6 1.3-1.8 1.3-2.2 100,000 to 249,999 inhobitant.- 39,249 81.3 18.7 31,156 95.2 4.8 8,093 27.9 72.1MalJllf!liflf 437 cities;Group III:poP'i,otk'fl 7,714,000:50,000 to 99,999 inhabitants 41,283 84.0 16.0 33,371 %.7 3.3 7,912 30.5N.irl,oor <strong>of</strong> police <strong>of</strong>ficers69.514,292 5,058 2,195 1,217 1,906 1,328 2,588Average m.mber <strong>of</strong> <strong>of</strong>ficersGroup IV:per 1,000 inhabitants 1.9 2.1 1.8 1.3 1.6 1.7 2.225,000 to 49,999 Inhabitants 42,357 63.9 16.0 34,627 %.8 3.2 7,730 26.4lnterquartile range 1.5-2.673.61.8-2.4 1.6-2.2 1.2-1.5 1.4-1.8 1.4-2.2 1.6-2.8Group V:Pacific: 647 cities;10,000 to 24,999 inhabitants 50,423 ·84.6 15.4 41,648 %.8 3.2 8,775population 21,308,000:26.8 73.2N..mber <strong>of</strong> police <strong>of</strong>ficers 35 t 794 15,745 4,620 5,305 4,202 2,949 2,973Group VI:Average number <strong>of</strong> <strong>of</strong>ficersU1der 10,000 inhabitants 54,992 84.5 15.5 44,748 %.6 3.4 10,244per 1,000 Inhabitants31.51.7 2.068.51.4 1.4 1.4 1.5 2.2Interquartile range 1.4-2.3 1.7-2.4 1.2-1.6 1.2-1.5 1.2-1.5 1.3-1.8 1.7-2.8 Suburban counties 97,173 78.1 21.9 72,224 91.4 8.6 24,949 39.5 60.5Suburban: b 5,078 agencies;populaTion 84,400,000:N..mber <strong>of</strong> police <strong>of</strong>ficers 146,518 X X X X X XAveroge number <strong>of</strong> <strong>of</strong>ficersper 1,000 inhabitants 1.7 X X X X X XInterquartile range 1.2-2.2 X X X X X XCounty: 2,809 agencies;population 70,898,000:N..mber <strong>of</strong> police <strong>of</strong>ficers 100,740 X X X X X XAverage number <strong>of</strong> <strong>of</strong>ficersper 1,000 inhabitants 1.4 X X X X X XInterguartile range 0.6-1.4 X X X ~ ~ ~~Q,IY one city this size in geographic division.Includes suburban city and county law enforcementagencies within metropolitan areas. Excludes core cities.Suburban cities and counties are also included in other groups.Rural counti(:s 38,147 77.0 23.0 28,516 90.1 9.9 9,631 38.0 62.0Suburban area a 187,111 81.5 18.5 146,518 94.4 5.6 40,593 34.9 65.1alncludes suburban city and county law enforcement aqencieswithin metropolitan areas. Excludes core cities. Suburban cities andcounties are also included in other groups.Source: U.S. Department <strong>of</strong> <strong>Justice</strong>, Federal <strong>Bureau</strong> <strong>of</strong> InvestIgation, Crime in the U1ited States 1981 (Washington, D.C.:U.S. Government Printing Office, 1982), p. 239, Table 69.' ,Source: U.S. Department <strong>of</strong> <strong>Justice</strong>, Federal <strong>Bureau</strong> <strong>of</strong> Investigation, Crime in the U1lted States, 1981 (Washington, D.C.:Government Printing Office, 1982), p. 238.U.S.48
-----~-~-~--------------~--~---------.--~~.. ~ .. ~.<strong>Sourcebook</strong> <strong>of</strong> Criminol <strong>Justice</strong> Stotlstics <strong>1983</strong>Characteristics <strong>of</strong> the <strong>Criminal</strong> <strong>Justice</strong> Systems1981 Table 1.15 Percent distribution <strong>of</strong> personnel in municipal police departments serving populations <strong>of</strong> 100,000 or more, by unit <strong>of</strong>1.4 Percent distribution <strong>of</strong> full-time police employees, by sex, United States, on Oct. 31,Figureassignment and city, 1981i'OTE: See i'OTE, Table 1.12. i'OTE: The data below are from a survey conducted during 1981 <strong>of</strong> low this tabl.-. This table includes data for three consolidated cityenforcementagencies serving populations <strong>of</strong> 100,000 or more. The counties (Davidson-Nashville, Tenn.; Jacksonville-Duval, Flo.;(11,677 agencies; 1981 estimated population 217,844,000)survey was moiled to approximately 185 agencies. Fully or partially Lexington-Fayette, Ky.).completed questionnaires were returned by 122 agencies. Of the 122 The Source notes that the st<strong>of</strong>f that compiled the survey ''madereturned questionnaires, 24 responses were not used In this table no effort to verify the accuracy <strong>of</strong> the Information provided by thebecause 7 respondents were county low enforcement agencies and 17 responding agencies" and cautions that "the information provided byTotal = 502,010 municipal agencies foiled to provide the information necessary for the agencies moy vary considerably In Its precision" (pp. 2, 3).0Male = 412,150 Ooerational unitso~dmloi~t[ativ~ uolbTech-ResearchOther 7.2%Other nlcal Com- In- and Per- OtherFemale = 89,860Municipal police(36,173)Tac- Detec- opera- ser- m or,;ca- ternal develap- Re- Chief's son- adminisde20rtmentPatrol Traffic tical tive Youth Vice tions vices *It)OS <strong>of</strong>fairs ~nt cords <strong>of</strong>fice nel trati(lnI Akron, Ohio 45.9 11.9 1.2 15.4 2.2 2.0 2.2 3.2 7.3 0.0 0.2 3.6 1.0 0.2 3.6Albuquerque, N.M. 39.2 2.5 4.9 13.8 1.3 0.8 5.5 0.7 8.3 0.8 0.8 10.0 2.8 1.7 6.11Alexondria, Va. 41l.1 5.0 3.1 6.8 0.6 3.4 8.1 0.0 6.7 0.9 1.6 6.5 0.3 1.6 5.3Other 13.5% Allentown, Po. 51.0 5.8 0.0 6.3 4.2 3.7 1.6 5.3 9.0 0.0 0.5 1.6 1.0 2.1 7.9(67,773) Anchorage, Ala I. 45.7 8.0 0.0 13.5 2.2 0.3 3.7 2.PI 8.9 O,Q 0.0 8.9 2.2 1.2 2.8- Ann Arbor, Mich. 56.7 0.0 0.0 11.7 0.0 0.0 7.2 0 •. 0 11.1 0.0 0.0 4.4 2.2 1.7 5.6Arlington, Tex. 49.8 6.3 0.0 9.1 1.2 2.8 2.4 9.9 9.9 0.4 0.8 2.8 0.8 0.4 3.6Aurora, Colo. 43.3 4.6 3.3 12.4 0.0 3.6 2.6 14.3 1.6 1.3 1.0 9.8 2.3 0.0 0.0Baltimore, Md. 51l.1 5.4 7.7 6.6 1.6 0.6 0.5 4.1 5.2 0.9 1.2 4.3 0.2 1.3 2.4Baton Rouge, La. 40.0 9.4 0.0 15.1 2.0 0.0 1.4 5 ,') 10.0 0.6 0.3 10.8 0.5 1.8 2.2Berkeley, Calif. 38.6 8.1 0.0 10.6 3.7 1.6 0.0 0.0 9.4 0.8 0.4 16.3 4.1 5.7 0.8sworn 4.4%Birmingham, Alo. 48.4 1.0 5.3 6.9 5.4 3.3 4.4 13.0 5.; 1.1 0.5 2.1 1.3 0.4 1.4(21,894) Baise, Ida. 57.6 8.7 0.0 8.1 5.8 0.0 8.7 0.6 0.0 0.6 2.3 0.0 0.0 0.6 7.0Cambridge, Mass. 58.8 4.1 0.0 3.2 0.9 0.9 14.6 0.9 4.1 1.2 0.9 2.0 5.8 0.0 2.6Chattanooga, Tenn. 51.8 3.3 0.0 5.7 1.8 3.7 0.0 3.1 9.4 0.8 0.6 6.9 3.3 0.8 8.8(Percent a )Chesopeoke, Vo. 54.1 4.7 0.0 7.7 4.3 3.9 0.0 4.7 10.3 1.3 0.9 3.4 1.3 0.9 2.6Chico go, III. 54.7 6.4 4.9 8.2 3.5 1.0 1.8 7.1 3.1 0.7 0.2 3.1 0.1 0.4 4.6Cincinnati, Ohio 65.2 0.9 0.0 6.2 2.1 2.9 1.7 0.2 6.9 0.4 4.1 5.6 0.9 2.4 0.5Clevelond, Ohio 42.3 7.6 1.0 5.0 0.3 1.5 7.4 0.8 11.2 0.1 0.1 3.0 0.4 0.3 25.9Colorado Springs, Colo. 45.4 7.9 6.4 11.4 1.8 0.5 4.1 1.3 4.8 0.2 0.2 9.1 0.8 0.0 6.1Columbus, Ga. 57.7 2.5 2.3 14.4 3.5 3.3 0.0 0.2 5.8 1.0 0.0 6.0 1.5 1.8 0.0Columbus, Ohio 43.4 5.2 2.3 9.9 2.2 1.7 9.0 0.1 7.3 0.6 0.7 3.6 0.3 4.2 9.3Sworn 74.9%Corpus Christi, Tex. 50.2 4.8 0.0 9.5 1.9 4.4 2.7 6.3 0.0 0.5 0.2 9.0 2.2 0.0 8.2(376,170) Dallas, Tex. 45.4 7.4 3.5 6.3 3.0 2.4 16.2 0.0 5.9 0.5 0.7 4.6 0.7 1.2 2.1DaVenport, lowt'l 36.3 24.1 2.8 6.1 3.8 1.9 2,4 5.2 5.2 0.5 1.4 6.6 2.8 0.0 0.9.,:>Davidson-Nlshvllle, Tenn. 33.8 0.0 10.4 7.8 3.8 2.7 1.6 8.4 3.7 0.9 0.8 3.7 0.4 0.9 21.2~ Denver, Colo. 39.6 8.9 0.0 11.8 6.6 2.3 0.0 10.9 4.7 0.9 0.3 3.6 0.3 0.8 9.3~ Des Moines, Iowa 33.5 6.6 4.8 11.2 3.7 4.2 10.8 2.4 7.3 0.7 1.1 7.9 0.7 1.3 3.7I, 'j Detroit, Mich. 41.8 1.4 2.7 14.5 1.8 1.0 7.2 9.4 5.0 1.6 1.0 0.8 3.4 3.0 5.4Flint, Mich. 39.1 8.2 1.0 10.2 0.0 4.2 18.3 7.4 1.7 0.5 0.0 7.9 1.5 0.0 0.0f r r C !me in the Ulited States, 1981~~Source: U.S. Department <strong>of</strong> Justic~, ~eder~~ureoI9~ I )Inves 2~~ IO~~bl~ 69. Figure constructed by Fort Lauderdale, Fla.)i 39.9 5.6 2.9 15.1 0.0 5.8 5.9 0.2 10.9 0.5 1.2 8.3 1.4 0.8 1.5(Washington, D.C.:U.S. Governmen1 Printing Ice, , p. ,I;Fort Worth, Tex. 56.2 12.1 2.2 20.0 1.6 8.0 0.0 0.0 0.0 0.0 0.0 0.0 0.0 0.0 0.0saRCEBOO< staff. I, Fresno, Calif. 39.4 5.2 1.4 14.4 0.0 3.2 3.4 2.8 8.0 0.4 2.r. 9.4 1.2 0.6 8.6I' Garden Grove, Colif. 40.9 3.8 0.0 12.0 3.8 3.4 2.9 3.4 10.6 0.5 1.4 9.6 1.0 0.5 6.2j Garlond, Tex. 45.4 3.5 2.5 9.6 2.5 2.0 2.5 0.5 9.1 0.5 0.5 7.6 2.0 4.6 7.1.. '50Grand Rapids, Mich. 61.0 2.8 0.0 18.5 0.0 4.5 0.0 0.7 0.0 0.0 1.0 5.6 0.7 0.0 5.2I: Greensboro, N.C. 37.9 6.0 6.5 11.0 3.5 4.2 8.2 0.0 0.0 1.2 1.5 15.2 1.5 2.0 1.2i-kmpton, Va. 41.8 4.3 0.0 19.4 0.0 U.O 3.4 0.9 13.4 0.4 1.7 7.3 4.3 0.9 2.2!-hrtford, Conn. 42.0 6.1 7.4 6.1 '.7 4.6 2.4 6.9 7.1 1.3 0.9 4.8 1.1 0.6 7.1Hialeah, Fla. 30.3 6.8 3.3 10.1 ~ 2.7 2.7 0.0 12.8 1.8 0.9 12.5 2.4 0.0 12.8\iIf~"~\1!-hllywood, Fla. 41..2 5.0 3.7 7.4 2.2 5.7 4.7 5.0 12.2 0.5 4.7 2.S 2.0 0.7 1.5!-huston, Tex. 41.3 2.3 0.0 7.9 2..7 1.4 1.6 4.9 1.4 0.5 1.0 2.7 1.7 4.8 25.9\!M.intington Beach, Calif. 36.8 9.9 0.0 13.5 0.0 1.6 9.2 3.0 7.6 0.3 1.3 10.2 2.6 1.0 3.0Ii Jocksonville-Duval, Fla. 32.4 3.1 0.8 7.1 0.5 2.0 39.6 0.0 5.2 0.4 0.7 3.7 1.2 0.5 2.8Jersey City, N.J. 72.1 0.0 5.1 9.5 1.3 0.0 0.5 0.1 3.6 0.3 1.5 3.9 0.3 0.1 1.8~Kansas City, Mo.,40.1 8.4 0.0 17.2 0.0 0.0 0.0 15.4 3.3 1.0 1.1 3.4 0.7 1.6 7.7~ Lokewood, Colo. 40.4 0.0 0.0 14.1 3.2 2.9 2.9 3.6 9.8 1.1 1.1 7.6 1.8 0.7 10.8I; 1 I_ansing, Mich. 41.3 7.3 0.0 10.6 0.0 0.0 6.4 1.4 14.0 0.6 2.2 8.7 2.0 1.7 3.9II IT Las Vegas, Nev. 33.8 4.7 2.6 7.2 1.8 1.0 0.0 3.5 6.5 0.3 1.1 6.7 0.4 0.8 29.7l!Lexington-Foyette, Ky.II40.7 11.3 0.0 10.8 3.1 2.6 4.0 5.9 9.6 0.7 1.9 6.8 0.9 0.5 1.2r II~ ~Long Beach, Calif."..",41.0 9.6 0.0 10.2 5.3 3.8 7.3 1.9 7.0 0.5 .".'-' 7.2 2.2 2.2 1.9II~Lubbock, Tex. 56.5 6.3 2.3 11.6 6.0 0.0 0.0 1.0 5.0 0.3 I.j 6.3 1.7 0.0 1.7Ii Macon, Ga. 48.3 11.2 0.0 15.2 0.0 2.2 1.9 1.5 8.6 0.7 ~'" 3.4 0.4 0.0 6.3Il~Madison, Wise.H46.6 7.0 4.6 9.2 3.8 2.2 1.1 3.5 7.3 0.0 u ... ~ 4.9 3.0 0.8 5.4Miami, Fla.~40.0 4.9 1.1 11.3 4.6 1.9 1.3 4.2 9.3 1.6 1.0 4.4 3.6 6.4 4.11IIMinneapolis, Minn. 54.1 3.0 3.8 9.8 5.2 3.4 0.2 0.0 2.8 0.7 0.4 11.3 0.6 3.3 1.2IIIIMontgomery, Alo. 35.8 14.1 0.0 18.7 9.3 0.0 2.5 0.0 0.0 1.6 0.0 14.4 2.7 0.0 0.9d New Haven, Conn. 47.7 5.4 0.0 9.3 4.4 0.0 2.3 7.2 7.0 1.2 1.9 4.4 1.9 0.2 7.2~n ~New York, N.Y. 64.8 1.6 0.0 8.1 0.0 2.6 3.5 0.0 3.1 0.4 0.0 0.0 0.1 7.8 7.9,I I'III:!Newport News, Va. 49.1 5.0 3.9 18.6 3.2 1.4 0.0 0.0 7.5 0.7 1.4 4.3 1.1 0.0 3.6j! 51\:
~-~- ~-...--~ -- ~ ---,~-------. -.<strong>Sourcebook</strong> <strong>of</strong> <strong>Criminal</strong> <strong>Justice</strong> <strong>Statistics</strong> <strong>1983</strong>Table 1.15 Percent distribution <strong>of</strong> personnel In municipal pallce departments serving populations <strong>of</strong> 100,00 or more, by unit <strong>of</strong>assignment and city, 1981--ContlnuedAcinlnlstratlve unitsOperational units1'ech-ResearchOther nical Com- In- and Per- OtherMunlcipol policeToc- Detec- opero- ser- rmnlco- ternal develop- Re- Chief's san- a
u __ ~ "'" ~ __<strong>Sourcebook</strong> <strong>of</strong> <strong>Criminal</strong> <strong>Justice</strong> <strong>Statistics</strong> <strong>1983</strong>Table 1.19 Employment and payroll for State and local public defense activities, by State and level <strong>of</strong> government, October 1971-October 1979 (\[)TE: See (\[)TE, Figure 1.1. For data required to compute percentages based ontotal criminal justice full-time equivalent employees and total criminal <strong>Justice</strong>payroll, see Table 1.8. For survey methodology and c;lefinitlons <strong>of</strong> terms, seeAppendix I.(Dollar amounts in thousands. - represents or rounds to zero.)t>'·'1State andlevel <strong>of</strong> gov~rnment1971 1972October 1974 October 1975Full-timeFull-timeequivalent October equivalent Octobere!!floyment 2 a l roil e!!flo~nt 2a l roilStates-local, total 3,458 $3,351 4,068 $4,267 5,069 $5,575 5,965 $6,979 6,172 $7,898States 985 878 1,406 1,410 2,102 2,244 2,625 2,950 2,547 3,057tocal, total 2,473 2,474 2,662 2,857 2,967 3,331 3,340 4,029 3,625 4,841Counties 2,259 2,281 2,503 2,700 2,822 3,180 3,16i 3,849 3,423 4,629Municipalities 214 193 159 155 145 151 179 180 202 212Alabama I I I I 6 5 7 5 3 24 3 3 3StateI 2 2 4 2 3 2Local, total(c) 2 I 3 2 3 2CountiesI I (c) I IMunicipalitiesAlaska 20 30 2~ 51 23 40 39 62 40 78State 20 30 29 51 23 40 39 62 40 713(c)Local, totalBoroughs(c)MunicipalitiesArizona 65 67 64 69 92 106 118 147 146 185StateLocal, total 65 67 64 69 92 106 118 147 146 185Counties 65 67 64 69 91 106 117 147 145 184I I I I I IMunicipalities13 10 34 26 24 22 19 2t.ArkansasIIState13 10 34 26 23 21 19 22Local, total13 10 34 26 23 21 19 22Counties(c)MunicipalitiesCalifornia 1,138 1,507 1,231 1,726 1,337 1,975 1,438 2,279 ! ,564 2,676StateLocal, total 1,138 1,507 1,231 1,726 1,337 1,975 1,438 2,279 1,564 2,676Counties 1,099 1,447 1,186 1,661 1,287 1,894 1,385 2,193 1,500 2,575Municipalities 39 61 45 65 50 81 53 86 64 101Colorado 100 95 101 117 118 145 152 159 125 179Stott: 99 94 107 117 118 145 152 159 125 179(c)Local, total I I(clCounties I IMunicipalitiesConnecticut 114 97 65 73 59 7(, 93 116 89 127State 114 ')7 62 70 57 74 91 114 89 1273 3 2 2 2 2Local, totalMunicipolities3 3 2 2 2 2Delaware 23 17 17 17 25 25 29 27 33 34State 23 17 17 17 25 25 29 27 33 34Local, totalCountiesMunicipalitiesDistrict <strong>of</strong> Columbia:Local, total 65 50Florida 350 237 361 347 559 571 671 705 675 721State 210 151 305 311 538 559 649 680 650 695Local, total 140 86 56 35 21 18 28 25 25 26Counties 102 64 50 30 19 17 21 19 20 22Municipalities 38 22 6 5 2 2 7 6 5 4Georgia 20 16 38 32 47 50 63 60 52 613 3 3 3 6 6StateLocal, total 20 16 38 32 44 46 60 57 46 55Counties 19 15 38 32 37 40 56 52 39 49Municipalities I 2 7 6 4 5 7 6Hawaii 22 23 26 28 30 33 40 4S 46 67State 22 23 26 28 30 33 40 45 46 67Local, totalCountiesMunir.:ipalitiesIdaho 20 10 20 10 27 14 23 14 25 21StateLocal, total 20 10 20 10 27 14 23 14 25 21Counties 20 10 20 10 27 14 23 14 25 21(c)(clMunicipalitiesIllinois 220 194 232 208 387 405 474 510 506 613'. ..~71 91 93 106 97 116StateLocal, total 220 194 232 208 310 313 381 404 409 497Counties 220 194 231 208 309 312 381 404 407 496MunicipalitiesI I I I 2 I ..See footnotes at end <strong>of</strong> table.540,w,'\(i,'\...
-- ..... -,-.--..-... ~~----r; __ 'r''.~\, Ioo
-- - .~----.-----.--,~ ""'" ,-Characteristics <strong>of</strong> the <strong>Criminal</strong> <strong>Justice</strong> SystemsbEmPlo~nt and [!a:lroll aOCto6er 1976 Octaber 1977 October 1978 October 1979_Full-time Full-time Full-time Full-timeequivalent October equivalent October equivalent October equivalent b Octoberemployment payroll employmeflt payroll emeloyment eayroll emeloyment payroll~7,036 $9,414 7,874 $11,751 8,038 $12,062 8,550 $14,1712,843 3,624 3,175 4,37f 3,159 4,724 3,659 5,8554,193 5,790 L~,699 7,375 4,879 7,337 4,902 8,3163,974 5,539 4,441 7,058 4,543 6,824 4,493 7,741219 251 258 317 336 513 414 5753 4 2 4 6 8 12 15I 2 2 4 9 133 4 I 2 4 4 4 22 2 2 2 I II 2 I 2 2 ! 4 I47 99 51 III 51 107 50 12047 99 51 III 51 107 50 120159 233 150 239 161 291 137 273159 233 150 239 161 291 137 273155 227 148 238 160 289 137 2734 6 2 I I 236 37 27 29 30 35 48 6336 37 27 29 30 35 48 6333 3:l 22 24 24 28 45 603 4 5 5 6 7 3 31,677 3,052 1,946 3,676 1,908 3,759 1,981 4,46450 72 137 235 141 286 133 3401,627 2,980 1,809 3,44 1 1,767 3,473 1,847 4.1241,561 2,864 1,701 3,274 1,694 3,331 1,734 3,93766 115 108 167 73 142 113 187138 204 136 In 149 242 154 253137 204 136 In 149 242 154 253IIII108 140 128 183 132 210 141 252108 140 128 183 132 210 141 252 '\ ~I'~ 1I)32 37 34 42 41 56 47 67 " q32 37 34 42 41 56 47 66 IfIIIit",. ,I I :1!106 185 117 In jTl7 813 789 1,059 843 1,206 889 1,459 >I687 771 735 1,003 786 1,142 848 1,408 40 42 54 55 57 64 41 5132 34 54 55 55 60I41 518 8 2 4t!72 75 65 78 64 77 99 1317 7 10 12 14 17 22 23 il65 67;)55 66 50 60 78 10861 62 50 'j60 42 47 70 964 5 5 6 8 12 7 12li51 74 57 73 53 74 57 80 II51 74 57Ii73 53 74 57 80II29 25 25 24 36 36 33 39II11 ...4\~29 25 25 24 36 36 33 3929 25 25 24 36 36 33 39! ~626 809 727 970 746 1,108 740 1,159 I85 104 85 107 99 134..99 140541 705 642 863 647 975 640 1,019540 705 642 863 647 975 640 1,0191"Q\55
---..0lIl, - -~,..--- -- - - ----~--~----~-----------------<strong>Sourcebook</strong> <strong>of</strong> <strong>Criminal</strong> <strong>Justice</strong> <strong>Statistics</strong> <strong>1983</strong>Characteristics <strong>of</strong> the <strong>Criminal</strong> <strong>Justice</strong> SystemsTable 1.19 Employment and payroll for State and local public defense activities, by State and level <strong>of</strong> goverrvnent, October H111-October I 979--Continued(Dollar amounts in thousands. - represents or rounds to zero.)State andlevel <strong>of</strong> governmentIndianaStateLocal, totalCot;ntiesMunicipalitiesIowaStateLocal, totalCountiesMunicipalitiesKansasStateLocal, totalBuroughsMunicipalitiesKentuckyStateLocal, totalCountiesMunicipJlitiesLouisianaStateLocal, totalParishesMunicipalitiesMoineStateLocal, totalCountiesMunicipalitiesMarylandStateLocal, totalCountiesMunicipalitiesMassachusettsStateLocal, totalCountiesMunicipalitiesMichiganStateLocal, totalCountiesMunicipalitiesMinnesotaStateLocal, totalCountiesMunicipaliteisM';ssissippiStateLocal, totalCountiesMunicipalitiesMissouriStateLocol, totalCountiesMunicipalitiesMontanoStateLocal, totalCountiesMunicipalitiesNebraskaStateLccal, totalCountieS'MunicipalitiesNevadaStateLocal, totalCountiesMunicipalitiesNew I--bmpshireStateLocal, totalCountiesMunicipalitiesOctober 1971Full-timeequivalent Octoberemplo~nt payroll52 $368 744 2940 244 65 35 35 321 II10 6II 5II 524 1824 1824 1812 II12 II12 II74 6074 59a 48 48 442 295 537 2433 224 239 3539 3510 929 25II 7II 7II 721 1921 1921 1936 3536 3536 35222October 1972Full-timeequivalent Octoberemployment payroll83 $5612 971 4750 3521 II16 1516 1516 1521 1410 7II 6II 65 45 45 439 2639 269 530 225 35 35 3198 196i;;J 1935 35 385 7485 7473 4740 2433 2333 23(c)45 339 836 2435 24II32 56323056552 I38 3638836830 2810 610 610 635 3135 3135 30(c)45 474 441 4241 42(c)(c)(c)(c)Emplo)lT1'!ent and payroll aOctober 1973 October 1974Full-timeFull-timeequivalent October equivalent Octoberemployment payroll employment payroll11415998316171717201466412516164343934I234233II12412465303535631053531010821021022222224545455144747$78136556912121214104(c)3725II112828523I244244(c)(c)117117623S27274893838(c)55419898(c)(c)171717(c)444444(c)5955454(c)(c)(c)(c)13519116843220202018153361352626464615312222492491581481010129834645I10410949420201281021002II222221I4949496255757$971879631616If.'16141122473017173131922I31331316515610101481093938I9610868616161339796III151515I5858587977373October .1975Full-timeequivalent Octoberemployment payroll116 $10222 2294 8075 6219 1818 2118 2118 21151415141158 5642 4416 1216 1262 4662 4612 750 39271 368270 3671 III175 184132 14243 4343 43161 219104 15057 6853 644 4108 14010 II98 12998 1299 59 54 35 298 9898 9715 1515 1515 1544 6844 6844 6864 956 1058 8558 85October 1976Full-timeequivalent Octoberemployment payroll18028152120324646462216633704723237474225226826533198150484893375655I142101321321818/53IO~104II11IIII5555556986161$1502912299234646462117422735617176565;w45357355222091624747127616665I20913197197151513210610422101010636363107129595Employment and payroll aOctober 1977October 1978Full-timeFull-timeequivalent October equivalent Octoberemployment payroll employment payroll165351301291353535241866675710107427222502672643320415054549139525111951418118141413651231232211111163636380107072$175461291281434343241955696088744712149383380222221784444160709(1891294192752752525232125122339997171711241510910914738109lOBI4646462017337574I1787712249283283158135232394405453118622164164161613311911910101056565677106767$;64511131126060602321328381I188147322524264262121823030139697069I29932267267151514212712710101076767612916113113October 1979Full-timeequivalent b Octoberemployment payroll18927167124444343431616737373738652952951171178440444312122618418416161431'?2119431313136262628897979333$20640166134325959592121949484849754544541631631387663621383403423421818162151151IIIIII87878716516149149333See footnotes at end <strong>of</strong> table.5657
~~~~~~- -~~ --- - ----~~----~--'<strong>Sourcebook</strong> <strong>of</strong> <strong>Criminal</strong> <strong>Justice</strong> <strong>Statistics</strong> <strong>1983</strong>Table 1.19 Employment and payroll for State and local public
-----------------------------------------------------------------------------------<strong>Sourcebook</strong> <strong>of</strong> <strong>Criminal</strong> <strong>Justice</strong> <strong>Statistics</strong> <strong>1983</strong>Characteristics <strong>of</strong> the <strong>Criminal</strong> <strong>Justice</strong> SystemsTable 1.19 Employment and payroll for State and local public defense activities, by State and level <strong>of</strong> government. October 1971~October I 979--Contillued(Dollar amounts in thousands. - represents or rounds to zero.)!;.[)J{llo)m!lnt and e9)!roll aElU!lllXJDl:Dt gD!:! J;lg)!rllll aOctober 1971 October 1972 October 1973 October 1974 October 1975 October 1976 Ocillb!:r 1211 Q£tober 1978 October 1979Full-time Full-time Full-time Full-time Full-time Full-time Full-time Full-time Full-timeState and equivalent October equivalent October equivalent October equivalent October equivalent October equivalent October equivalent October equivalent October equivalent b Octoberlevel <strong>of</strong> government em210~nt 2!!~roll em2lo~ent ~~roll emplo~ent ~yroll e~loyrnent payroll employment payroll emplo~nt 2!!~roll ~Io~nt 2!!~roll emElo~nt E!£!~oll ~Io~nt 2!!~roll. -----~Vermont 9 $9 4 $4 36 $38 46 $46 44 $50 56 $62 45 $55State 9 9 4 4 36 38 46 46 114 50 56 62 45 55Local, totalCountiesIMunicipalitiesVirginia (c) II 10 II 9 17 III20 25 22 28 27 3420 21State II 10 II 9 II II 19 21 17 22 19 27 27 34Local,total (c) 6 I 3 2 3 2Counties (c) I IMunicipalities (c) 6 I 2 I 3 2Washington 23 $16 28 $23 32 26 39 41 51 53 Ii 58 68 61 75 71 93 65 101State "Locol, totol 23 16 28 23 32 26 39 41 51 53 I, "58 68 61 75 71 93 65 101Counties 23 16 2tl 23 32 26 39 41 51 53 I: 511 68 61 75 70 92 65 101Municipalities 2 I (c) Ii I I IWest Virginia I 2 I2 I 2 3State Ii2 3Local, total I 2 I: 2Counties I 2 Ii 2Municipalities(c)IIWisconsin 8 9 17 II 21 19 19 20 20 26 I;28 35 68 85 95 132 236 370State 2 3 4 It 13 15 14 16 13 17 j' 22 30 34 46 75 109 235 370Local, total 6 6 13 7 8 4 5 4 7 9 II 6 6 34 39 20 23 I ICounties 6 6 13 7 8 4 5 4 7 96 6 31 36 16 17 I IMunicipalities 3 2114 6Wyoming 2 4 2 4 2 3 3 14 10 I 17 15 4 4 4 6 36 40State ! 36 40ILocal, total 2 4 2 4 2 3 3 14 10 17 15 4 4 4 6Counties 2 4 2 4 2 3 3 14 10 17 15 II 4 It 6Municipalitit'..$abata for municipalities, ond the lot:al governments totals that data for counties (boroughs, porlshes) are bosed on a canvass <strong>of</strong> all variatj,on.include municipal data, are estimates subject to sampling vQriation; county governments and therefore are not subject to sampling cAmounts do not add precisely to total due to rounding.Less than half the unlt <strong>of</strong> measurement shown.Source: Table provicJ.~'CI to SOlRCEBCO< staff by the U.S. Department <strong>of</strong> <strong>Justice</strong>, <strong>Bureau</strong> <strong>of</strong> <strong>Justice</strong> <strong>Statistics</strong>.
-<strong>Sourcebook</strong> <strong>of</strong> <strong>Criminal</strong> <strong>Justice</strong> <strong>Statistics</strong> <strong>1983</strong>Characteristics <strong>of</strong> the <strong>Criminal</strong> Jui:tice SystemsTable 1.20 Employment and payroll for legal services and prose,cutlon activities, by State and level <strong>of</strong> government, October 1971-October 1979NJTE: See NJTE, Figure 1.1. For data required to compute percentag()s based ontotal criminal justice full-time equivalent employees and total crLnlnal justic~payroll, see Table 1.8. For survey methodology and definitions <strong>of</strong> terms, seeAppendix I.(Dollar amounts in thousands. - represents or rounds to zero.)Employment gnd Payroll aOctober 1971 October 1972 October 1973 October 1974Full-time Full-time Full-timeFull-timeState and equivalent October equivalent October equivalent October equivalent October..:1=.ev:..:e:.:...1.:::o:,..f 2:go:.:v.:::e:.:.rn::.:me=nt=--_--:::em.::lp~lo::.!yme~::..:.nt;___.Jpa~y:..:ro:.:.:Il'__.=errp~l;:.oyme~:;.:n:,..t _LPt1:;Jyc,:.ro;::,:I:...1.-...:e:;.:mp:r::,:lpymentpayroll employment payrollStates-local, totalStatesLocal, totalCountiesMunicipalitiesAlabamoStateLocal, totalCountiesMunicipalitiesAlaskaStateLocal, totalBoroughsMunicipalitiesArizonaStateLocal, totalCountiesMunicipalitiesArkansasStateLocal, totalCountiesMunicipalitiesCalift1rl",iaStateLocal, totalCountiesMunicipalitiesColoradoStateLocal, totalCountiesMunicipalitiesConnecticutStateLocal, totalMunicipalitiesDelawareStateLocal, totalCountiesMunicipalitiesDistrict <strong>of</strong> Columbia:Local, totalFloridaStateLocal, totalCountiesMunicipalitiesGeorgiaStateLocal, totolCountiesMunicipalities!-lawai!StateLocal, totalCountiesMunicipalities34,0878,13325,95416,1029,8522529715510847146·102442222378463322181141534610760475,3726484,7243,6141,1104793444524619946435810610685543112191611,29952777250426850814935930455189771122983See footnotes at end <strong>of</strong> table.$31,0798,03723,04313,9939,050228112116665020816345192635945315201114124477741366,2076865,5214,2271,2944103237820017844935990907047238161821,0394395993702304541802742235120976133399437,7749,03528,73917,65611,083335117218153651721234~1732424503742391351744512969605,9297365,1934,0151,178522404822552273632351281288453319221731,36859477449627850013736330558190761142985$36,3119,46126,84916,06210,787282131151935825619264214441355358222137136488843457,0766196,2564,8301,4264484340419720337'1265IIIIII8254287212171,2696156544022524821932892365321878140361056240,90910,49030,41918,90711,512401146255156991601015918415027011322891432084816096646,3567475,6094,4061,20359963536281255387238149149986731II201811,7071,28342416725756815441432886197731243688$41,95611,64830,30818,44111,8663261641629073231158732746522764452891561715311868508,0038617,1425,5841,558541824592162434022631391399568278192511,7711,329442182260590218372287862761011755312245,37411,77633,59821,11212,486424166258157101187133541935586884983471511905313782557,2249426,2825,0211,2616431,06.03360243431282149149112753712251791,9111,48043115527662217344935495no931273889$49,16313,57935,58422,19813,386382188194110843332458832566831065773931841686110765429,7461,1888,5586,7521,80664147594322272523373150150128RS4310332612,1011,6044971773196752644113129931212918360123October 1975Full-timeequivalent Octoberemployment payroll48,26512,33435,93123,26112,67049118930221092179128515ij66228753538115426362201l44577,4916686,8235,4871,336869152717427290450304146146125844113281621,9101,539371128243667178489390:192158013531104$56,42515,61540,81026,17214,6385072552521648837229181II70770121649452197233771551134211,1791,09710,0827,9592,122956241715379336543392151151139914714342712,0571,58647017829274928646336110231311719650146I 'I11II:IfII iiOctober 1276Full-timeequivalent Octoberemployment payroll52,38013,22739,15325,6!!013,4735571973602421181991613883073712960844116727441233170638,7057747,9316,4781,453979140!!39535304466330136136136983!!12261722,0401,6164241622627091!l45254398625210115148103$64,67317,62347,05030,43316,61755226928320083432350822062')771648125712412294
.~------~--------------------------<strong>Sourcebook</strong> <strong>of</strong> <strong>Criminal</strong> <strong>Justice</strong> <strong>Statistics</strong> <strong>1983</strong>Characteristics <strong>of</strong> the <strong>Criminal</strong> <strong>Justice</strong> SystemsTable 1.20 Employment and payroll for legal services ant! prosecution activities, by State and level <strong>of</strong> government, October 1971-October 1979--ContinuedState andlevel <strong>of</strong> governmentIdahoStateLocal, totalCountiesMunicipalitiesIllinoisStateLocal, totalCountiesMunicipalitiesIndianaStateLocal, totalCountiesMunicipalitiesIowaStateLocal, totalCountiesMunicipalitiesKansasStateLocal, totalCountiesMunicipalitiesKentuckyStateLocal, totalCountiesMunicipalitiesLouisianaStateLocal, totalParishesMunicipalitiesMoineStateLocol, totalCountiesMunicipalitiesMarylandStateLocal, totalCountiesMunicipalitiesMassachusettsStateLocal, totalCountiesMunicipalitiesMichiganStateLocal, totalCountiesMunicipalities(Dollar amounts in thousands. - represents or rounds to zero.)Employment and poyroli OOctober 1971 October 1972 October 1973 October 1974FUll-timeFull-timeFull-timeFull-timeequivalent October equivalent October equivalent October equivalent Octoberemployment payroll employment payroll emplOYment payroll emplo)l!T!ent payroll1413210988211,9795761,40396543877.6lJ3523330193359483112426935927332236962978221512986613237376192184613724II135496248725523262925737270302i,1I4186928663265Minnesota 507State 59Local, total 448Counties 293Municipalities 155Mississippi 164State 82Local, total 82Counties 56Municipa,liti p .s 26See footnotes at end <strong>of</strong> table.$94296547181,6834431,24085338747116630516713825647210154562292520413568174331418258394184210991104936134952275447223224492216275472281,24125398870628246152409257152126735333201683613294382,1015631,5381,06047886227658633325337661315243724741273472451023025424815890727247480257223987523101362069551291260697279418943241,2362061,03075127956588477296181183781057728$115348053271,863,4561,40797842959323935417917428157224160653491372131337922556169102675202302901441477661145106309054027926257324432970258l,j692981,07177030116427137105321,9815041,4,71,0494289252976283672614297635326291513128385274III35759298203958343225122722401219130!416702736293482817843264581143441,2902251,065790275555 66796 105458 562273 352186 210151 19579 9372 10241 6231 4064$115249164281,9974861,5111,084427710293416218<strong>1983</strong>76912862038238713725016188272542171407762428933515617998901961274995654354300681293387873001,5933261,2679233446971235743272471609664362819132159121382,3396571,6821,205477989303686396290446873592788157714643130312844371372230142919361558296262141103382018749876623692938993525471633841,5892601,329918411670965743831912501011499554$1453211280322,3225221,8001,34445674231(}4332322014171103082317744513431020111036278284171113731358373177196120942610168771167614173448113214901383522,0113771,6351,137498738122616396220212117955343October 1975Full-timeequivalent Octoberemplo)l!T!ent payroll207 $17237 43170 129136 9934 302,249 2,497555 5481,694 1,9491,256 1,460438 4891,007 839325 353682 485378 253304 233488 500102 137386 364303 28083 83622 526151 153471 372335 254136 1186061814252751501,0144036113322791359738201883610173542431192932i60B1874211,6873041,3831,083300746816654731922591021571035453718635223411889644644922023013710928II171,0691409305304009503545961734222,3034481,8551,4214348801127685262412361241126546IijI !~iI~·1October 1976Full-timeequivalent Octoberemployment payroll261 $23260 TI.201 160163 12438 362,510 3,025642 7231,868 2,3021,45H 1,797410 5061,061 974299 363762 611478 351284 260510 556III 148399 408323 32376 84632 579159 16H473 411358 295115 116567984692971721,0774316463443021399&4126IS8611067554592969793626171994181,7043121,3921,08430880513H667491176256102154110445051293762421349904875032382651451133216161,1411479945934011,125496629191;4352,5035201,9831,5084751,0732108636192452461331136944October 197L October 1978Full-timeFull-timeequivalent October equivalent Octoberemployment payroll employment payroll28676210178322,6246391,9851,5754101,2353548815483335671324353518469816353531161496311894422991431,2764608163844321561124425199301088225103121,0594046552194361,8183391,4791,159320987210777559218269106163IUO63$298107191157343,5757302,8462,3U45421,1504427083943146642054593609967211144883421467693014683301381,1745186612933681821433917221,29916S~1,1346894441,2626006621984643,0607882,2711,7405311,3873511,036738298256149107614629876222189332,77361132,0901,6644261,19730H88957431555712143636571671165506399107578251327250771,1793508294054241841265841179/01368345243101,0754815941953991,8633841,4791,1942851,13021391773518225211313910039$341121221182393,7808462,9342,3455891,212457755455301729195534427107689200490344145639325314221921,2045186873243632201695229231,4252201,2057604451,3647126521974543,2497H22,467l,n65401,7083751,3331,01931431819612279436SOctober 1979Full-timeequivalent b Octoberemployment payroll290 $36779 132213 235181 19631 3&2,805 3,948661 8712,145 3,0781,680 2,443463 6341,416 1,412361 525995 887660 523340 364633 845133 216504 629414 49888 131742 849207 261537 588409 430123 1581,183911284199821,196350804420401875140., 735 ..ilO169771728064703351,3441,022328452821,9314311,5011,1683191,205264943741204278m15893621,4461,1652811781031,2344857493294202521975534211,7462971,4499445061,9081,502405383683,5039022,6011,9606412,0295171,5121,1483643512011507773
,.n<strong>Sourcebook</strong> <strong>of</strong> Crimil''Jl <strong>Justice</strong> <strong>Statistics</strong> 19B3Table 1.20 Employment and payroll for legal services and prosecution activities, by State and level <strong>of</strong> government, October 1')71-October 1979--Contlnued(Dollar amounts In thousands. - represents or rounds to zero.)State andlevel <strong>of</strong> governmentMissouriStateLocal, totalCountiesMUnicipalitiesMontanaStateLocal, totalCountiesMunicipalitiesNebraskaStateLocal, totalCountiesMunicipalitiesNevadaStateLocal, totalCountiesMunicipalitiesNew HampshireStateLocal, totalCountiesMunicipalitiesNew JerseyStateLocal, totalCountiesMunicipalitiesNew MexicoStateLocal, totalCountiesMunicipalitiesNew YorkStateLocal, totalCountiesMunicipalitiesNJrth CarolinaStateLocal, totalCountiesMunicipalitiesNJrth DakotaStateLocal, totalCountiesMunicipalitiesOhioStateLocal, totalCountiesMunicipalitiesOklahomaStateLocal, totalCountiesMunic::lpalitiesOregonStateLocal, totalCountiesMunicipalitiesOctober 1971Full-timeequivalent Octoberemployment payroll62066554119235IB64713911524260162441766B212371751433253302312II1,63220B1,4241,094330162130322304,51B1,0073,5111,2402,27129B23761214013725112102101,5112911,220623597613333280191B9542IB93S3270B3$4925643621B21B1073672551720319IB41166821046163127374630177101,4272321,195949246142112303274,5401,2373,3031,1562,14632727354173BB9216756II1,181236'444614B347226420913474b..8120527620769See footnotes ot end <strong>of</strong> table.October 1972Full-timeequivalentOctoberemploymentpayroll7007362736925820749158135233043027419777262422201675366343220122,0993761,7231,399324200IS!!423394,6731,0313,6421,2B32,35935B266922864134291059510i,7384081,330687643523373150491016362473B931079$5375648224423B117407B601725733223139B4261542071525566363015152,15136B1,7831,322461153113404365,0611,3133,7481,3532,395385311752253942B6654121,4023551,047522525425315110268557325232125170Erroloyment and payroll aOctober 1973 " October 1974Full-time-Full-timeequivalent October equivalent Octoberemployment payroll employment payroll6677376697406291203521511292232030290213772724722516B5775413415192,2983771,9211,550371224169558475,0651,0903,9751,4222,5533402489237551434010393101,9154681,44775669150138112019101677247430341B9$645745712862B5133419172192B63824716186300642371746272432912172,2684571,8101,511300184133516455,8371,4B34,3541,5162,83B438342963660lOB406959101,7254561,26B6456244303251041094665277387304B4B5174777
"<strong>Sourcebook</strong> <strong>of</strong> <strong>Criminal</strong> <strong>Justice</strong> <strong>Statistics</strong> <strong>1983</strong>Table 1.20 Employment ond poyroll for legol services and prosecution activities, by State and level <strong>of</strong> government, October 1971-October 1979--Cantinued(Dollar amounts in thousands. - represents or rounds to zero.)EmploYment and payroll aOctober 1971October 1972 October 1973 October 1974October 1975Full-timeFull-timeFull-timeFull-timeFull-timeState andequivalent October equivalent October equivalent October equivalent October equivalent Octoberlevel <strong>of</strong> government emploYment payroll employrrent payroll employment payroll employment payroll employment payrollPennsylVaniaStateLocal, totalCountiesMunicipalitiesRhode IslandStateLocal, totalMunicipalitiesSouth CarolinaStateLocal, totalCountiesMunicipalitiesSouth DakotaStateLocal, totalCountiesMUnicipalitiesTennesseeStateLocal, totalCountiesMUnicipalitiesTexasStateLocal, totalCountiesMunicipalitiesUtahStateLocal, totalCountiesMunicipalitiesVermontStateLocal, totalCountiesMunicipalitiesVirginiaStateLocal, totalCountiesMunicipalitiesWashingtonStateLocal, totalCountiesMunicipalitiesWest VirginiaStateLllcal, totalCountiesMunicipalitiesWisconsinStateLocal, totalCountiesMunicipalitiesWyomingStateLocal, totalCountiesMunicipalities1,5322281,304762542763541411074067481911813105921333019913158731,8422851,5571,153404169739662346559664861273591402196832174663211452085115713720671156515322193728645212$1,15418896650046553262127884048311768II5746II29218710541641,4692781,191845346138637550256561554211442771001786492414082701381394594"1915642157485292193508423392,0012141,787877910934746461466482631912513112981436821115765921,8932851,6081,1504582068B11879396565.5421493931462477402235173591582285317515718736133603361242889796316$1,6621801,4826128697343313112768594217811269571232220411848701,6043231,282889393171779565306161(c)(c)50317432912020973925548432915516251III961571716255533422152943339aData for municipalities, and the local governments toto Is thatinclude municipal data, are estimates subject to sampling variation;Source:1,9672791,688951737III62494917582936726172521209624394234160561042,1083301,7781,2785002175915811048756788683313370200170779214565388177254551991673273013959136622511222907119$1,7252841,44169674591553636149836647201133677601742527914548971,9043751,5291,0874422076514110041837588679342338151187819266553373180192551371152276317458936622280265443II2,0812171,8041,0647401236954542088911992271845612810325437257180641162,3234!4I ,~091,3975122557817712354807466647201446235211830220610421189283602231982581514866741325414146956926$1,8863031,58384274110663434317783947!2313B51876819507338169571122,1634081,7561,25150426394169121498681666962584381962429222986254291962326217014822874197677432245103475642142,3083201,9881,164824129785151235102133102312006913110922451257194741202,5403712,1691,647522253701831354B79763367519248327520884424460043216827457217IB928855163692454238134291058025$2,14B3841,764950814134914343253136117902716769988018547363185711132,6165622,0531,t:8B565303972061545289B54480927B5312572741,06134371B497221226571691442598722476350026311239735519data for counties (boroughs, parishes) are based on a canva~s <strong>of</strong> a IIcounty governments and therefore are not subject to samplingTable provided to SaRCEBOO< st<strong>of</strong>f by the U.S. Deportment <strong>of</strong> <strong>Justice</strong>, <strong>Bureau</strong> <strong>of</strong> <strong>Justice</strong> <strong>Statistics</strong>.681IrIIIIiI,il J!l Iii! 1:1't;j} 'IIi""1\ Ii11 l'i1/ :111 IIIj1/ II~[IIll, t1~IIIi'II[11Ii(!I:~ IOCtoberFull-timeequivalentemplorment2,2163121,9041,150754IB9137525227312115212131276JI~413211517512304208771312,6704352,2351,7095262397116812246827752366389574309265916255661,',
---..ot- ~-..--- -- ~ - ----~~------ ------- -----~-------~<strong>Sourcebook</strong> <strong>of</strong> <strong>Criminal</strong> <strong>Justice</strong> Stotlstlcs I ~83Table 1.21 Appropriations for the Federal judiciary, fiscal year 1982I\OTEI The data presented exclude appropriations for the Supreme Court <strong>of</strong> the lkllted States.(,Ar."iOlliit:l In thousands <strong>of</strong> dollars)SupplementalaEEloerlatlons TotalAnnual Pay budgetAPeroerlation accounts aeeroeriatlons cost Other authorltl::Court <strong>of</strong> Customs and Patent Appeals:Salaries and expenses$1,~50 $58 0 $2,008Court <strong>of</strong> International Trade:Salaries and expenses 5,200 86 0 5,286Court <strong>of</strong> Claims:Salaries and expenses 5,~00 270 0 6,170Courts <strong>of</strong> Appeals, District Courts,and other Judicial services636,350 ~,420 $1,500 667,270Solarles <strong>of</strong> judges 5~,400 2,~00b 0 62,300Salaries <strong>of</strong> supporting personnel 263,400 IZ.~OO 0 276,300[Rfender services (<strong>Criminal</strong> <strong>Justice</strong> Act) 26,500 670 1,500 28,670Fees <strong>of</strong> jurors and conmlssloners 43,500 -4,500 0 3~,00OExpenses <strong>of</strong> operation andmaintenance <strong>of</strong> the courtsBankruptcy courts, salaries and55,600 0 0 55,600expenses81,200 3,500 0 84,700Services for drug dependent <strong>of</strong>fenders 3,750 Dc 0 3,750Space and facilities 123,000 -6,050 0 116,950r-1\I1I1lJ'iiII1I1Characteristics <strong>of</strong> the <strong>Criminal</strong> <strong>Justice</strong> SystemsA~re 1.5 Expenditures for Federal courts, by type <strong>of</strong> expense, fiscal year 1982!\oTE: This figure presents data for the U.S. Courts <strong>of</strong> Appeals, U.S. District Courts, and U.S.Bankruptcy Courts. The "National courts" category Includes the U.S. Court <strong>of</strong> Claims, U.S. Court<strong>of</strong> Customs and Patent Appeals, and U.S. Court <strong>of</strong> International Trade. Financial Information ontht' U.S. Supreme Court Is not presented in this figure.Salaries <strong>of</strong> magistratesand staff - 4%Administrative Office andFederal Judicial Center - 4%Defender services(<strong>Criminal</strong> <strong>Justice</strong> Act) - 4%Fees <strong>of</strong> jurorsand commissioners· - 5%Expenses <strong>of</strong> operationand maintenance <strong>of</strong> thecourts-8%(Total budget=$70~,254,ooO)National courts - 2%Salaries <strong>of</strong> supportingpersonnel - 24%Administrative Office, U.S. Courts:Salaries and expenses 20,000 750 0 20,750Feder J' Judicial Center:Salaries and expenses 7,600 170 0 7,770Total $6~7,000 $10,754 $1,500 $70~,254alncludes $500(,:;' transferred from the appropriation "spoce and facilities."blncludes $iO 500 000 transferred from the appropriations "fees <strong>of</strong> jurors andccnmi sioners" and ";pac~ and facilities." , ...~Transferred to the appropriations "salaries <strong>of</strong> judges" ($50,C;J0) ana "salaries <strong>of</strong>supporting personnel" ($6,000,000).Saurce' Administrative Office <strong>of</strong> the United States Courts, 1982 Annual Re;rt <strong>of</strong> theDirector (W~shington, D.C.: Administrative Office <strong>of</strong> the United States Courts, I 3), p. 52.fISalaries <strong>of</strong> judges - 9%Salaries <strong>of</strong> probation<strong>of</strong>ficers and staff - 11 %Salaries and expensesbankruptcy courtsjudges -12%Space and facilities(includes furnitureand furnishings) - 17'1IJ:1:i L1)I'Sourcel Mnlnlstratlve Office <strong>of</strong> the United States Courts, n,e United States Courts: A Pictorial Summar~ for theTwelve Month Period Ended June 3~1~82 (Washington, D.C.: Administrative Office <strong>of</strong> tile United States Courts, I~ 2), p. 21.Flgure OdOptea by SdRcEBOd< st •rII:! ;j 1f 1II!IUII70I{I;!71
------------ - -- -"\I'<strong>Sourcebook</strong> <strong>of</strong> Criminol <strong>Justice</strong> <strong>Statistics</strong> 19tHTobie 1.22 Judicial and administrative personnel <strong>of</strong> the Federal courts, by type <strong>of</strong> activity, years ending June 30, 1972-82f\OTE:This table does not include the U.S. Supreme Court justices or staff.Type <strong>of</strong> activity 1972 1973 ~19~7~4 __ ~19~75~ __ ~1~97~6~ __ ~19~7~7 . ___ 1~9~78~ __ ~I~Sl7~9~ __ uI9~8~0 __ ~1~98~1~ __ ~19~8~2_Characteristics <strong>of</strong> the <strong>Criminal</strong> <strong>Justice</strong> Svste , msFigure 1.1> Selected personnel <strong>of</strong> the Federal courts, years ending June 30, 1972-82f\OTE: "Judges" include active judges in Federal ' I d' .judges who have retired or resigned are not Includ~d.u t, Istnct, special, and territorial courts;Total personnel a 8,123 8,5929,371 10,082 11,217 11,82! 12,279 12,563 14,01114,606 15,328Number,-Judges, total 658Circuit 91DistrictSpecial courts38821Territorial courts 4Retired/resignedCircuit executives1544Staff to circuit executivesDistrict executivesI66093384204159886679537821416998Staff to district executivesSecretaries to judges 506 532 547 568 533 510 544 528Secretary-law clerks to judges I I I I I ISecretaries to retired judges 112 129 120 128 155 153 140 139Court (staff) secretaries N!\ N!\ N!\ N!\ 41 56 62 126Law clerks to judges 554 541 586 638 607 598 689 697Law clerks to retired judges 84 109 113 105 124 148 160 159Senior staff attorneysSupervisory staff attorneysN!\N!\N!\N!\N!\N!\N!\N!\N!\N!\N!\N!\Nt>.N!\II8Staff attorneys N!\ N!\ N!\ N!\ N!\ N!\ N!\ I 17Scnior law clerks N!\ N!\ N!\ N!\ 32 II IICourt (staff) law clerks N!\ N\ N!\ N!\ 20 80 73 17Total personnel for clerks'66796383214163910<strong>of</strong>ficesMembers <strong>of</strong> probation staffs,1,864 1,952 2,140 2,246 2,557 2,788 2,917 2,717 2,836 2,966 3,016total 1,078 1,342 1,868 2,375 2,630 2,853 2,902 2,886 2,888 2,842 2,72S1Probation <strong>of</strong>ficersProbotion <strong>of</strong>ficers'618 784 1,124 1,423 1,522 1,632 1,673 1,664 1,673 1,649 1,610assistants bPretrial services <strong>of</strong>ficersN!\XN!\XN!\XN!\X1979308630913010035SIS10911582ClerksMembers <strong>of</strong> bankruptcy staffs,460 558 744 952 1,010 1,105 I, lOB 1,092 1,085 1,092 1,022total 1,086 1,102 1,056 1,006 1,294 1,305 1,250 1,569 2,197 2,436 2,804Judges 203 20 I 212 210 224 228 232 236 235 237 236Secretaries to judges 198 209Law clerks to bankruptcyjudge5 210 222ClerksU.S. magistrates8835189015141,8445177964521,0704501,0774541,0184551,3334441,9624391,7914412,137451St<strong>of</strong>f to U.S. magistrates 137 162 193 21 I 285 298 325 358 403 X XSecretaries to magistrates 69 211Legal assistants tomagistratesClerical assistants to108magistratesFederal public defenders159 119and assistantsStaff to Federal public43 56 72 94 I II 124 136 138 138 148 154defendersCourt criers (including court41 45 69 90 118 121 139 135 143 153 147crier-law clerks) 401 410 430 442 435 411 436 411 28 34 51Court reporters 410 403 399 394 390 403 443 461 523 536 547Court reporter/secretaries I I I I I I I I ISupporting personnel <strong>of</strong> thesoecial courtsMiscellaneous personnel in222 227 212 216 220 222 219 223 235 225 215the District <strong>of</strong> Columbia 83 57 26 30 23 24 20 10 10 I 2Messengers 15 14 10 10 9 8 7 5 10 39 14LibrariansNJrses34334336339340348348351352I37I62InterpretersTemporary emergency Court9 10 9 10 12 12 13 14 17 2B 30<strong>of</strong> AppealsMembers <strong>of</strong> the staff <strong>of</strong> theN!\ N!\ N!\ N!\ 5 3 5 8 10 8 4Administrative OfficeMembers <strong>of</strong> the staff <strong>of</strong> the25B 272 279 337 437 408 444 473 497 521 513Federal Judicial CenterMembErs <strong>of</strong> the Judicial PanelN!\ N!\ N!\ N!\ (c) 98 117 129 136 119 100on Multidistrict Litigation II 10 10 10 10Jury Commissioner's staff 4 4 4 4 4Speedy Trial Planning GroupsReporters 2 71 59Land commis "l ;ers 194 212Jury commissl, !::Ie'!irs~__________ =-____ -==-____-==____.....:=-____-=.:=--____-=.::.____--=:.:..____-='--__---'::.:...____--LI,,2________3"'8_6609437521416691566387373193IBI10II6789538120317910157019439720318710188241264812031949258701421611,106160II811782512547221320485092115301,5347657808601254841942289472394130471,5221548698~ iIi:'I'~ I, II!1.8001.6001.4001.000800600400/./--'///////.,//............................1973//////.....--.........----------~ ~ ...... ......._----- - ---- Proballon <strong>of</strong>ficers-- --................... ~ .................................................... .1976 1977Year ending June 30---------1978 1979.....1980............................ JudgesU,S. magistratesFederal public defenders---- - - and assistantsI1981,1982apermanent and temporary personnel are included in thetotals bPosition was created by the Speedy Trial Act <strong>of</strong> 1974.c ln 1976, this total was included In the "members <strong>of</strong> theAdministrative Office" total.Source: Administrative Office <strong>of</strong> the United States Courts, Annual Report <strong>of</strong> the Director, 1973, pp. VII-3, VII-4; 1974, pp. III_I,111-2; 1975, pp. V-2, V-3; 1977 (Preliminary Report), p. 27; 1978 (Preliminary Report), pp. 18, 19; 1979, pp. 22, 23; 1980,p:-iSl; ISl81, p.20; 1982, p. 34 (Washington, D.C.: Administrative Office <strong>of</strong>the United States Courts). Table adapted by SCLRCtBOO< staff.---7273
------~. ---------------------------_. ",.,<strong>Sourcebook</strong> <strong>of</strong> ,<strong>Criminal</strong> <strong>Justice</strong> <strong>Statistics</strong> <strong>1983</strong>Characteristics <strong>of</strong> the <strong>Criminal</strong> <strong>Justice</strong> SystemsTobie 1.23 <strong>Criminal</strong> cases filed per judgeship in U.S. District Courts, by district, years ending June 30, 1969-82TobIe 1.23 <strong>Criminal</strong> cases filed per judgeship In U.S. District Courts, years ending June 30, 1969-82--Continuedt-OTE: The Federal courts are organized into II geographiccircuits. Each circuit consists <strong>of</strong> a number <strong>of</strong> District Courts,which are the trial courts, and a Court <strong>of</strong> Appeals, which hearsappeals taken from other courts. There is also a separateDistrict Court and Court <strong>of</strong> Appeals for the District <strong>of</strong> CollXnbia.Q, Oct. I, 1981 the number <strong>of</strong> U.S. District Court Circuitswas increased from 10 to II. The new circuit was created by theremoval <strong>of</strong> Alabama, Florida, and Georgia from the Fifth Circuitand the reorganization <strong>of</strong> these courts Into the Eleventh Circuit.Beginning with the year ending June 30, 1976, U.S. DistrictCourts have reported the number <strong>of</strong> minor <strong>of</strong>fense cases filed inthe Federal courts in addition to the number <strong>of</strong> felonies andmisdemeanors above the minor <strong>of</strong>fense level (<strong>of</strong>fenses Involvingpenalties that do not exceed I year Imprisonment or a fine <strong>of</strong>more than $1,000). This additional reporting resulted from theSpeedy Trial Act <strong>of</strong> 1974 (Public Law 93-619), which required thecourts to maintain records on all <strong>of</strong>fenses above the petty <strong>of</strong>fenselevel (<strong>of</strong>fenses involving penalties that do not exceed 6 monthsIncarceration and/or a fine <strong>of</strong> not mare than $50U). Because themajority <strong>of</strong> miner <strong>of</strong>fense cases are handled by magistrates inFederal courts and because this report is primarily a statisticalstatement reflecting the workload per authorized judgeship, theminor <strong>of</strong>fense cases have been excluded from the 1976-79 data byDistrict 1969 1970 i971 1972 1973 1974FIRST CIRCUITMaine 57 93 143 126 91 89Massachusetts 53 69 90 108 62 63New I-bnpshire 57 90 80 74 65 48Rhode Island 41 39 41 59 57 63Puerto Rico 128 80 59 136 87 62SEC(N) CIRCUITConnecticut 66 66 72 85 90 91New York:N:>rth 72 74 79 154 122 84East 58 72 144 158 126 99South 42 34 50 55 46 42West 84 67 65 81 196 109Vermont 16 29 32 51 49 69THIRD CIRCUITDelaware 23 24 26 43 37 32New Jersey 70 54 78 79 75 57Pfmnsylvanla:East 33 35 42 38 37 37Middle 50 41 39 4H 58 68West 39 32 29 33 31 38Virgin Islands 227 134 III 163 120 133FCXRTH CIRCUITMaryland 109 71 71 90 91 101N:>rth Carolina:East 149 118 100 117 107 121Middle 138 131 155 175 192 174West 155 149 152 178 120 141South Carolina 65 62 66 97 78 92Virginia:East 129 131 161 163 151 159West 77 86 120 120 110 127West Virginia:N:>rth 1U9 112 89 76 73 57South 122 77 85 70 70 74the Administrative Office <strong>of</strong> the United States Courts. Theexclusion <strong>of</strong> these cases from the workload statistics hm beendone In an effort to make- the 1976-79 data mare ~able toprevious years' data that did not Include most minor <strong>of</strong>fensecases. In 1979, the Federlll Magistrates Act (Public Law 96-82)expanded the authority <strong>of</strong> magistrates to dispose <strong>of</strong> allmisdemeanors. To reflect the workload per authorized judgeship,the 1980-82 data exclude aU cases below the felony level.Data for 1979 are provided In two columns In order toreflect the efforts <strong>of</strong> individual judges before and after theenactment <strong>of</strong> the Qmlbus Judgeship Act (Public Law 95-486),which became effective Oct. 20, 1978. Because the Increase Inauthorized judgeships became effective midway through the yearand most <strong>of</strong> the nrlwly authorized positions were not filled byJune 30, 1979, COITVlutations based only on the newly authorizedjudgeships do not give an accurate Indication <strong>of</strong> the efforts <strong>of</strong>individuai Judges.The sharp decline in criminal cases flied in the Canol Zoneafter 1979 resulted from the passage <strong>of</strong> the Panana Canal Act <strong>of</strong>1979 (Public Law 96-70), signed Sept. 27, 1979. This informationwas provided to 5O.RCEBOO< staff by the Administrative Office<strong>of</strong> the United States Courts, Statistical Analysis and ReportsDivision.1975 1976 19771031005677928564994995536470414938192124104206158116180162469680784149717665954776404753394633245991251641338114111046101746230466852678343624145662954301998213415410169102967084807040356241616535502819482529321948511513310155837949627358492187375761356221184818332515764104III105515770385336342521372938553562211839182025564969747032433538293132122231252740294620173615201916639595260344030362828371937424033523045341434173216124l&S393858384829332419822332156032362945285424II32193519159so5652573951282824i Iii.~n~II11II~UJ!, j1 ,DistrictFIFTH CIRCUITAlabama:N:>rthMiddleSouthFlorida:N:>rthMiddleSouthGeorgia:N:>rthMiddleSouthLOUisiana:EastMiddleWestMississippi:N:>rthSouthTexas:N:>rthEastSouthWestCanal ZoneSIXTH CIRCUITKentucky:EastWestMichigan:EastWestOhio:N:>rthSouthTennessee:EastMiddleWestSEVENTH CIRCUITIllinois:N:>rthEast aSouth aCentral aIndiana:N:>rthSouthWisconsin:EastWestEIG-fTH CIRCUITArkansas:EastWestIowa:N:>rthSouthMinnesotaMiss?!Jr!:EastWestNebraskaN:>rth DakotaSouth Dakota1969 1970136 88126 125113 48102 125109 9691 77167 102107 157233 18860 56X XIII 16778 6643 56III 10396 55273 291448 417103 128200 14599 7879 8855 8167 10496 8195 122123 135119 10369 484!1 9381 94X X59 8482 10152 6670 14199 14570 5852 3756 6757 8397 7578 8992 7557 3767 81See footnote at end <strong>of</strong> table.19719511648127113III10315813859X966952994637438418715966102791136990126867310090X83120591411074054ll61061031096742961972 1973107 96ISS 16167 70124 132112 III134 130126 12314IJ 127179 15263 69102 9765 6643 6247 56119 10969 55'*11 202674 287296 295187 212108 117144 166176 162125 11394 7289 98149 144102 9173 7488 13189 89X X95 120110 9073 99140 94137 13844 4568 4476 85187 10277 97142 13970 7458 3970 1281974 1975 1976109 128 145121 147 11762 78 80124 105 102112 106 87120 120 119121 106 84125 106 86143 285 34066 83 4796 86 7771 104 12350 73 4032 40 35112 113 10063 58 57140 135 159250 220 153384 409 322184 178 93116 116 117162 172 140105 141 1319~ 100 9457 77 7592 70 55163 157 13274 65 5765 62 6881 104 74104 74 46X X X124 150 10786 74 6266 90 53112 90 98133 171 12842 59 4259 80 5395 107 101% 97 6178 96 67177 307 7370 72 4678 50 59159 211 200197714488837081115851161097710453575110664141161275901221181207967718461596847X8054709012534906174825848701731919Before the After theQmibus OnnlbvsJudge- Judgeshipship1978 Act Act 1980 19811979Before the After theOnnibus OnnibusJudge- Judgeshipship1978 Act Act 1980132 83133 5154 4571 5790 5882 8066 4667 '.$775 6241 3085 3346 3436 3638 16100 7446 49166 157190 133240 21781 69154 7678 5496 7161 3763 4948 38121 8772 7242 4796 X52 54X 6161 4351 3453 6159 79123 10244 3741 2788 10965 5557 4567 5644 4052 5199 7.847 3834 4645 3338 2938 3747 5125 2737 4041 3121 2117 1727 2436 1916 1749 4337 3196 86110 85217 4431 2676 5541 2935 1830 2641 3337 5257 5572 8137 22XX54 4741 3732 2927 2246 2939 3651 4237 3227 3365 2937 3236 3337 3140 3751 3652 5919813938363234622940222013252633433910585624542929273932508126X614725333638352936424132292749691982XXXXXXXXX19162434306539113978286131372639596810234X495733304034433043433845372950667475
<strong>Sourcebook</strong> <strong>of</strong> <strong>Criminal</strong> <strong>Justice</strong> <strong>Statistics</strong> <strong>1983</strong>Table 1.23 <strong>Criminal</strong> cases filed per judgeship in U.S. District Caurts, by district, years ending June 30, 1969-82--Continued1979Before the After theQnnibus OmlbusJudge- JudgeshipshipDistrict 1969 1970 1971 1972 1973 1974 1975 1976 1977 1978 Act Act 1980 1981 1982NINTH CIRCUITAlaska 76 74 77 125 122 153 117 85 78 54 28 28 35 28 34Arizona 210 214 286 290 305 246 274 252 221 158 124 77 62 69 55California:North 98 82 III 131 75 ~3 75 59 66 47 34 31 31 25 35East 206 221 321 303 323 :::J9 400 288 178 167 104 52 54 52 68Central 152 134 137 141 136 109 124 109 98 81 62 58 58 65 55South 1,460 565 470 374 409 502 479 286 197 141 142 101 87 110 108bHawaii 57 97 81 92 98 83 80 12 304 52 112 57 34 29 36Idaho 80 63 55 47 49 51 67 57 70 71 66 66 42 41 45Montana 104 105 103 108 99 77 87 96 107 100 75 75 66 78 64Nevada 146 122 95 102 97 119 130 130 98 66 63 42 45 63 51Oregon 107 133 96 106 86 86 104 84 90 73 71 43 39 31 24Washington:.East 62 104 101 64 98 84 141 84 107 101 93 70 72 69 82West 96 104 122 127 132 132 161 117 112 !O) ~J 1 64 52 4';1 53Guam 32 51 60 52 63 104 34 32 24 50 77 77 55 52 73Norther't MarianaIslands X X X X X X X X X 7 17 17 16 24 24TENTH CIRCUITColorado 148 91 81 103 100 129 101 73 87 77 66 43 42 29 33Kansas 88 112 113 110 114 112 106 112 99 82 52 41 36 47 46New Mexico 157 III 99 101 166 129 128 101 85 96 '13 54 41 46 38Oklahoma:North 69 100 72 128 94 106 120 116 96 88 71 44 44 30 44East 67 43 45 37 50 47 39 40 55 56 58 58 48 36 53West 82 128 95 118 94 84 95 81 103 70 76 55 47 40 74Utah 83 68 51 79 54 57 72 75 74 59 65 43 43 42 43Wyoming 69 158 173 140 113 115 133 107 143 122 75 75 81 78 60ELEVENTH CIRCUITiC.!:Jboma:North X X X X X X X X X X X X X X 44Middle X X X X X X X X X X X X X X 38South X X X X X X X X X X X X X X 5UFlorida:North X X X X X X X X X X X X X X 37Middle X X X X X X X X X X X X X X 39South X X X X X X X X X X X X X X 65Georgia:North X X X X X X X X X X X X X X 43Middle X X X X X X X X X X X X X X 47South X X X X X X X X X X X X X X 42District <strong>of</strong> Coh.mbia 147 144 154 174 89 56 59 56 53 48 50 50 39 32 29aOn Apr. I, 1979, as a result <strong>of</strong> the enactment <strong>of</strong> Public blncluded in the criminal statistics for this district areLaw 95-409, the Central District Court <strong>of</strong> Illinois was numerous traffic <strong>of</strong>fense cases that are classified as misdemeanorsestablished, the Eastern District Court <strong>of</strong> Illinois was eliminated, above the minor <strong>of</strong>fense level. In most districts similar cases areand the Southern District Caurt <strong>of</strong> Illinois underwent extensive classiged as minor <strong>of</strong>fenses and are excluded from this report.reorganization. Consequently, data collected for the Southern Public Low 95-157 established the District Court <strong>of</strong> theDistrict Caurt after this dote are not comparable with data Northern Mariana Islands on Nov. 8, 1977. Court was convenedcollected prior to this date. on Jan. 9, 1978.Source: Administrative Office <strong>of</strong> the United States Courts, Manog!!ment <strong>Statistics</strong> for United States Cour~1974, 1978, 1979 .. and1982 (Washington, D.C.: Administrative Office <strong>of</strong> the United States Courts). Table constructed by S
~~-- ~-----~ ---~ ------ -----------------~------<strong>Sourcebook</strong> <strong>of</strong> <strong>Criminal</strong> <strong>Justice</strong> <strong>Statistics</strong> <strong>1983</strong>Characteristics <strong>of</strong> the <strong>Criminal</strong> <strong>Justice</strong> Systems~Table 1.24 Annual salaries <strong>of</strong> Federal judges, by judicialTable 1.25 Direct current expenditures for State judicial activities, by type <strong>of</strong> activity and State,<strong>of</strong>fice, os <strong>of</strong> December 1982 fiscal year 1979I'OTE' The forme:r U.S. Court <strong>of</strong> Claims and U.S. Court <strong>of</strong> Customs!'OTE: See !'OTE, Figure 1.1. For survey methodology and definitions <strong>of</strong> direct current expendituresand Potent Appeals have been reorganized Into the new U.S. and other terms, see Appendix I.Courts <strong>of</strong> Appeals for the Federal Circuit. The Federal Circuithas the same legal status as the 12 Courts <strong>of</strong> Appeals which are (Dollar amounts in thousands. - represents zero or rounds to zero.)organized on geographical lines. The Federal Courts \Improvement Act <strong>of</strong> 1982 also established a U.S. Claims Court,IAoeellate courtswhich Is composed In part <strong>of</strong> the former commissioners <strong>of</strong> the oldTotalInter-Court <strong>of</strong> Claims. direct mediate Courts <strong>of</strong> Courts <strong>of</strong>current Courts <strong>of</strong> appellateAnnualgeneral limited Mlscel-IIState a exeendltures Total last resort courts jurisdiction jurisdiction laneousJudicial <strong>of</strong>ficesalgryTotal $1,187,485$100,700Ii$135,325 $62,666 $72,659 $420,534 $246,499 $357,603Chief <strong>Justice</strong> <strong>of</strong> the United StatesI: Alabamo 27,324 2,035 1,146 889 18,048 4,142 3,099Associate <strong>Justice</strong>s <strong>of</strong> the Supreme I, Alaska 16,347 1,107 1,107 8,879 1,416 4,945C~.lUrt <strong>of</strong> the United States 96,700I: Arizona 5,294 3,519 1,930 1,589 1,484 291Arkansas77 ,3003,900 628 628 2,883 389Circuit judges, U.S. Courts <strong>of</strong> Appeals California 40,799 12,530 2,758 9,772 23,349 4,920~Judges, U.S. District Courts 73,100 Colorado 28,723 1,544 647 897 17,492 1,286 2,810Connecticut 28,73973,100904 904 22 170 5,710Judges, U.S. Court <strong>of</strong> International Trade Delaware 10,381 450 450 2,459 6,277 1,195Florida 40,447 4,820 1,188 3,632 24,053 9,484 2,090Judges, U.S. Claims Court 65,200 Georgia 11,012 2,904 1,450 1,454 6,689 1,419IiU.S. bankruptcy judges 63,600 IHawaII 12,213 775 775 4,123 5,137 2,178IIdaho63,600 i4,796 627 627 3,300 869U.S. magistrates (full-time)IllinoisI49,687 9,420 2,889 6,531 28,117 445 11,705\ ~ Indiana 8,464 2,234 779 1,455 5,358 872Source: Table adopted by sa...RCEBOO
<strong>Sourcebook</strong> <strong>of</strong> <strong>Criminal</strong> <strong>Justice</strong> <strong>Statistics</strong> <strong>1983</strong>Characteristics <strong>of</strong> the <strong>Criminal</strong> <strong>Justice</strong> SystemsTable 1.26 Employment and payroll for State and local judicial activities, by State and level <strong>of</strong> government, October 1971-0ctober1979/\oTE: See /\OTE, Figure 1.1. For data required to compute percentages based ontotol criminal justice full-time equivalent employees and total criminal justicepayroll, see Table 1.8. For survey methodology and definitions <strong>of</strong> terms, seeAppendix I.State andlevel <strong>of</strong> governmentStates-local, totalStatesLocal, toto ICountiesMunicipalitiesAlabomoStateLocal, toto ICountiesMunicipalitiesAlaskaStateLocal, totalBoroughsMunicipalitiesArizonaStateLocal, totalCountiesMunicipalitiesArkansosStateLocal, totalCountiesMunicipalitiesCaliforniaStateLocal, totalCountie.'\MunicipalitiesColoradoStateLocal, totalCountiesMunicipalitiesConnecticutStateLocal, totalMunicipalitiesDelawareStateLocal, totalCountiesMunicipalitiesDistrict <strong>of</strong> Columbia:Local, totalFloridaStateLocal, totalCountiesMunicipalitiesGeorgiaStateLocal, totalCountiesMunicipalitiesHawaiiStateLocal, totalCountiesMunicipalitiesOctoberFull-timeequivalentemployment99,70819,85679,85256,42123,/f311,6663321,3341,21711736833632321,2392819588041544778139C2761209,0307638,2677,7325351,3188784401203201,2011,200II545398147119288944,5923504,2423,3628802,2072481,9591,73222756356:'(Dollar omounts in thousands. - represents or rounds to zero.)Employment and payroll a1971OctoberOctober 1973 1974OctoberFull-timeFull-timeFull-timeOctober equivalent October Octoberequivalent equivalent Octoberpayroll employment payroll employment payroll employment payroll$79,95023,17556,77537,94718,8281,080354752683694153942121786279559457102316105212134778,9731,6647,6207,0545651,01971730271231999997II3682888057239223,3955902,8122,2195931,3942441,1861,019167433433103,16920,37282,79758,88023,9171,3862091,1771,07510235233616161,2181181,100933167680905904521389,7557678,9888,4465421,4591,0424179232597096733621462159120397934,4263494,0773,4006772,2223571,8651,619246450450$86,70023,87862,82142,.43820,3831,0022907126436947045812128381227165881284051252802017910,3941,4528,9428,3495931,16885831056254831829224673729564318233,4055872,8192,3284911,5823591,2231,0116177411411109,21322,97786,23661,81424,4221,5942581,3361,20912737735324241,3131291,1849941905808349736013710,4557989,6579,0955621,5241,077447853621,1941,1895561648613088429945,6741,1924,4823,92t'i5562,2673781,8891,646243479479$98,59729,20169,36947,18222,2141,1153098067218445143219191,0111658466931533921352571728511,7501,67910,0719,4226491,320967353562971,0731,069444803958451331,0654,9241,8313,0932,7213711,7494301,3191,131188474474118,39523,93994,45668,72725,7291,6902961,3941,23216239437123231,3991321,267I ,07~1885688548336411912,17083511,33510,7415941,5721,067505944111,0361,0315558745413393401,0045,6401,3014,3393,7625772,4614102,0511,801250503503$114,30033,22081,08056,42524,6551,2513419107911195024R320201,1601899718071633981392591906814,4291,94012,48811,8046841,6861,249437633741,0571,0544450239510764431,1785,1701,9783,1922,7724202,0164821,5351,335200528528OCtober 1975Full-timeeqUivalent Octoberemployment payroll124,71225,57899,13272,76126,3711,8033261,4761,344132462456661,4831451,3381,1272117098862149113012,93290612,02611,4525741,6921,0826101804301,1251,121446~15492153106479175,3891,1604,2293,6305992,4783422,1361,881255534534$128,00437,37290,63264,48826,1441,5284281,100994106709703551,3152271,0899011875401553852988716,8402,34714,49313,7887051,8121,2585541474071,1741,1695561048512580451,1845,2241,9613,2632,7864772,2355091,7261,498228604604OctoberFull-timeequivalentemployment129,95827,516i02,44275,94126,5011,9323631,5691,412157538534441,5961641,4321,23220071813158745413313,46293812,52411,9775471,7511,1466051664391,1151,11233711536175123527735,8031,1854,6183,9986202,b733682,3052,0352705945941976Octoberpayroll$llI0,73442,78697,94870,65427,2941,7374761,2611,135126'06903221,5612551,3061,1062006282383'13019018,7902,66716,12315,3907332,0311,112'60214114541,1421,13744738587151104461,1845,7072,04'3,6583,1445142,5095731,'361,696240752752Emoloyment and payroll aOctober 1977 October 1978Full-timeFull-timeequivalent October equivalent Octoberemployment payroll employment payroll142,38137,337105,04478,85126,1931,54760594277217054i539221,6851661,5191,252267777III66651415214,6651,23713,42912,8006291,8251,19862716111661,5101,504667695'0m13/487736,1171,26'4,84!l4,4104382,9034102,4932,222271658658$163,55458,566104,98977,41127,5771,7861,009777649129944942331,7422841,4581,202256661208453342III20,7542,82517,92917 ,0299002,1931,5396541594951,6861,67888770611158III471,2346,7382,6434,0953,7113832,8726502,2221,977245843843140,94741,64299,30578,74820,5572,1811,326855696159539538I1,6931781,5151,261254773103670117020014,28697613,31012,7106001,6911,1135781444341,5681,5165252741594147107408106,2251,3274,8984,4984003,0034322,5712,293278680680$169,51668,050101,46679,80321,6632,3021,4948086181911,0061,00/,331,8693011,5671,28528268422346132413720,3702,99917,37116,5238482,1851,5396461504961,7711,715S656807658150103471,3327,3252,9214,4044,0153893,2297672,4632,1'1272912912October 1979Full-timeequivalent b Octoberemployment payroll148,46148,05299,58977,54522,0602,4521,541949652295574573I1,91920/f1,6751,37529977311469655114515,0~61,00913,27812,6596191,6041,0265871/174381,4411,431IIIf)764605159118418656,4701,4715,0274,6583643,2064132,7972,483313681681$195,00187,129107,87284,47523,3982,841f2,0118336252081,0661,064222,2383811,8571,50135780826254642412124,0133,32220,69119,7259662,4821,7797031595431,9561,9441212899730169116541,4998,2783,4434,8344,4423923,5177742,7432,416327837837See footnotes at end <strong>of</strong> table.8081
<strong>Sourcebook</strong> <strong>of</strong> CrimiMi <strong>Justice</strong> <strong>Statistics</strong> <strong>1983</strong>Table 1.26 Employment and payroll for State and local judicial activities, by State and level <strong>of</strong> government, October 197 I-OctoberI 979--Continued(Dollar amounts in thousands. - represents or rounds to zero.)October 197 I October 1972Full-timeFull-timeState andlevel <strong>of</strong> governmentequivalent Octoberemployment payrollequivalentOctoberemploymentpayrollIdahoStateLocal, totalCouflfiesMunicipalitiesillinoisStateLocal, totalCountiesMunic,palitiesIndic!'laStateLocal, totalCountiesMunicipalitiesIowaStateLocal, totalCountiesMunicipalitiesKansasStateLocal, totalCountiesMunicipalitiesKentuckyStateLocal, totalCountiesMunicipalitiesLouisianaStateLocal, totalParishesMunicipalitiesMaineState'Local, t'JtalCour,tiesMunicipalities30674232216166,OB81,20B4,BBO4,B7010I,B572401,61799B619994123B71605266B9515B737651B6933162771675962,3393711,96BBB3I,OB5296151145145Maryle'::! 1,703StateB27Local, totalB76Counties 413Municipalities 463Massachusetts 2,533State 459Local, total 2,074Counties 1,31BMunicipalities 756Michigan 5,056State 466Local, total 4,590Counties 3,525Municipalities 1,065Minnesota 1,210State 122Local, totalI,OBBCounties 937Municipalities 151Mississippi4BBState 94Local, total39:'Countie'l 334Municipalities 60See footnotes at end <strong>of</strong> table.$IBBB610291II4,B59I,B563,1433,13B51,133352B394B93506BO17B503333170576IBB3BB3335564422641B351671,306403~52399553IB912563631,42179762429B3262,1595051,6541,0016534,1269073,3622,5747BB1,066207BB4759125350i3B2121773534B131217201166,2061,2324,9744,96B61,9422681,6741,120554RB6i327545112439461657B!670IIIB331746595561032,245359I,BB61,025B61304179125125(c)1,703B93BIO44B3622,B9B5042,3941,535B595,1394614,67B3,4471,2311,3391241,2151,10111456210246043624$276IBI95B5105,3341,9703,3643,36041,26133792461530B62719443327216160B197411339726022453562BO761,4574221,0355265101961415555(c)1,4B5B6062636126S2,5525232,0301,2397904,561B053,7552,7819741,2642411,0239!B10539114924222616. Erreloyment and payroll aOctober 1973 (}:tober 1974Full-timeequivalentOctoberenJ)loyment payroll36615521120475,9461,2B34,6634,65762,0:3427B1,756I,OB766982B6613673070B221,04717BB69758III1,19929490579B1072,3523681,9849301,054337IB3154153I1,9479899585633952,9215332,3B81,6187705,2355154,7203,5411,1791,4401351,3051,20410154710044738463$291193989345,5562,1283,4283,42261,3773541,02462240170524745B4461270621948740978850317533449831,6234291,1955776181471747473I1,8791,0857944933012,7916142,1771,3897885,1339214,2063,1621,0431,4292~'1,1 ,,'1,04010840914826022436Full-timeequivalentOctoberenJ)loyrnentpayroll414166248241.,6,3361,3285,0084,995132,2233051,9181,1807381,047225822812101,2171801,037B931441,2631411,1229991232,5723232,2491,2311,01836620016616422,1161,0591,0576653923,2535742,6791,846B335,6085255,0833,8241,2591,5471271,4201,3487262710752046951$35922713212846,1272,2763,8513,84381,5303771,1537104439674035645595871254617521979782577216211001,9434621,48280667(.2761918583I2,1741,2329426143293,3087202,5871,7028855,.,799!l584,8413,6361,2051,5692611,3081,22980522In32529431Full-timeequivalentOctoberenJ)loymentpayroll45418027427136,4581,3735,0855,051342,3082942,0141,3266881,1422299139131,3341911,1431,0001431,6042841,3201,0822382,6643452,3191,2221,09735720814914722,1341,0981,0366334033,48B6002,8881,90798!5,9255905,3354,1111,2241,6851391,5461,542475411663857563$41025415615427,1432,8934,2504,223271,7694591,3108624491,1914687237231,0402967446431011,3484239257431822,IOB4941,6148527622932118280I2,4161,3901,0266413B53,5787362,a421,8171,02!=6,4901,0865,4044,1371,2671,9373051,6311,628362522140436242----~~---------------------------------------------[i\1IiIi(I"IIIiIi'I~IIII'uI!":Ii~~II;f,j~"IIIIII! IOctober 1976Full-fin'l1lequivalentOctoberemploymentpayroll438165273255186,6231,5625,0615,031302,6493872,2621,5417211,1602419199191,3982171,1811,0351461,58438U1,2049B32212,9593742,5851,3181,267:J5~274787B2,0611,14092152U4013,4596322,827I,B629656,1186585,4604,2221,2381,7171441,5731,57382911771265260$440262178164147,2793,IU94,1704,145252,1645981,5661,0605061,2855177697691,14431B8267111151,4685978717001712,6978201,87795891931226547472,6341,6699655644013,6948172,8771,8221,0557,1991,3225,8774,4911,3862,0873041,7831,7B371522549044149Characteristics <strong>of</strong> the Criminc,1 <strong>Justice</strong> SystemsEmployment and payroli OOctober 1977OctoberFuJl-tin'l1lFuJl-tin'l1lequivalent October, equivalentemployment payroll employment520172348329196,6121,42:.15,2505,217333,0264682,5581,7558031,:lI;O2411,0991,09721,7162981,4181,2651532,05B3291,7291,4902392,97137B2,5931,3301,26333026070702,2261,1891,0376423953,77:'6483,1271,8B!1,2466,5086235,8854,5!JD1,3051,8181611,6571,6401785812373564689$519283236221157,7372,9524,7854,757282,4136271,7861,22556i1,7117101,00299931,5065099968761201,8965:.161,3691,1761932,e798871,9921,06292932427648482,7171,5721,1467264204,3038873,4162,0211,3958,0761,4006,6775,1851,4912,3634091,9541,949576023852145368557173384366187,2151,6055,6105,584262,9744102;5641,85U7141,3592411,1181,1181,7343231,4111,2491622,1351,804331271603,2652653,0001,7611,2394383469291I2,2501,1641,0866794074,1977723,4252,2631,1626,7177325,985h,75,;!1,2261,9733321,6411,6418001276735351~8197BOctoberpayroll$620340280264168,7313,40(;5,3255,3ll2:.132,5966761,9201,3795411,7556551,1001,1001,5685451,0238911322,152i ,893260200603,6121,1402,4721,4621,0094794186160I2,7301,4861,2448214235,0571,1823,8752,5401,3358,8321,5717,26!3,6231,6382,8459581,8871,88788833455445598October 1979FUll-timeequivalent b October'employmentpayroll83564179390374156,9341,6515,3575,332253,2674252,6601,9447151,4422461,1501,1502,0791,6384512432102,3172,003314243703,4546032,8791,6831,1963913059595I2,4521,1891,2628633984,7354,0826574392177,0987746,2044,9231,2761,9833331,6591,659812157691587104$686360327312159,5554,1535,4025,376262,9628592,1031,5225811,9017271,1741,1742,0671,6883802091712,9152,614301228733,8261,2622,5641,4921,072hl53466968I3,3951,8361,5591,1124476,8146,1856304302008,4671,7406,7265,0161,7103,1291,0182, III2, III988364624532~I
---- ~------~--~- -..---<strong>Sourcebook</strong> <strong>of</strong> <strong>Criminal</strong> <strong>Justice</strong> <strong>Statistics</strong> <strong>1983</strong>Characteristics <strong>of</strong> the <strong>Criminal</strong> <strong>Justice</strong> SystemsTable 1.26 Employment and payroll far State and local judicial activities, by Stat~ and level <strong>of</strong> government, October 1971-0ctoberI !m1--Continued(Dollar amounts in thousands. - represents or rounds to zero.)Employment and payroll aOctober 1971October 1972October 1973October 1974October 1975FUll-timeFull-timeFull-timeFull-timeFull-timeState andequivalent October equivalent October equivalent October equivalent October equivalent Octoberlevel <strong>of</strong> government employment payroll employment payroll employment payroll employment payroll employment payrollPennsylvaniaStateLocal, totalCountiesMunicipalitiesRhode IslandStateLocal, totalMunicipalitiesSouth CarolinaStateLocal, totalCountiesMunicipalitiesSouth DakotaStateLocal, totalCountiesMunicipclitiesTennesseeStateLocal, totalCountiesMUnicipalitiesTexasStateLocal" totalCountiesMunicipalitiesUtahStateLocal, j'otalCountiesMunicipalitiesVermontStateLocal, totalCountiesMunicipalitiesVirginiaStateLocal, totalCountiesMunicipalitiesWashingtonStateLocal, totalCountiesMunicipalitiesWest VirginiaStateLocal, totalCountiesMunicipalities6,8429345,9083,2502,6584354043131796587387003818130151131201,4642221,2428943484,7724364,3363,58375326711615139112165164II2,0495291,5203781,1421,4172041,2139902234599536435113$5,1251,1563,9691,7902,17830128516165299243841226130458674121,0042297765232533,1646202,5992,164434202110922468140123-III1,37250491625965798424178664514129610719718987,2111,0636,1483,6712,4774153902525943598848434120235167146211,6922681,4241,0044204,9634204,5433,7358082761091674012718017010101,8916011,2904448461,4862071,2791,0342455199042940821$5,6461,3734,2732,1152,158352337141463089541505361584910994151,1582569026202823,3976452,7522,267485224116109258315414855(c)1,3784828953125841,134221914743171337106232220II7,7961,0296,7673,9262,8414544213333946638838305320039161136251,8993101,5891,1344555,4164304,9864,137849360110250115135179172771,760936824388436$6,8551,7815,0742,3822,6923923721919667101566524421706011092181,3522851,0677343334,0357723,2632,7175462881281606496173170441,6141,0205942893051,583 1,304214 2571,369 1,0471,090 850279 197499 35491 124408 229379 21429 15Wisconsin 1,627 1,344 1,693 1,452 1,652 1,540 1,729 1,717 1,886 1,991State 423 622 394 506 405 588 413 632 424 700Local, total 1,204 791 1,299 945 1,247 952 1,316 1,086 1,462 1,291Counties 1,161 756 1,210 903 1,178 908 1,262 1,044 1,407 1,249Municipalities 43 35 89 42 69 43 54 42 55 42Wyoming 127 86 145 104 165 131 183 139 216 182State 39 44 39 50 46 70 47 71 50 81Local, total 88 42 106 54 119 61 136 68 166 101Counties 79 35 91 46 102 51 115 57 139 84~c~i~pa~l~it~ie=s _________ 29 ______ ~7~ ____ ~1~5 ______-J8L-____ ~IL7 ______ ~I~QL_ _____'21L____ ~I~I ____ 2~7L_ ___ ~IA6 __aDate for municipalities, and the local governments totals thatinclude municipal data, are estimates subject to sampling variation;Source:8,3391,0707,2694,0633,20648144734341,159881,0719888325143208177312,1533121,8411,2915506,2004475,7534,82293137211325910915019718017171,9201,0318894734161,7032241,4791,2172626789358556124$7,6631,8875,7752,6903,08646344221218891277637026021977143125181,8274711,3569284284,7907864,0043,38062432113518682104195186991,8601,1896723623101,4912811,2101,004205484128356339178,9811,0857,8964,5453,35147843840401,253871,1661,0729439237616162,1993221,8771,3595186,5674586,1095,0821,02750511638919919017415618182,4381,3971,0415684731,7192271,4921,2632296739657754730$8,3981,9216,4773,1943,2834894642525968132836768684323389493I1,9674951,4731,0464275,5699624,6073,869738451161290152138181170IIII2,3761,5058714953761,7133431,3701,14222847812835032920data for counties (boroughs, parishes) are based on a canvass <strong>of</strong> a IIcounty governments and therefore are not subject to samplingTable provided to SOlRCEBOO< staff by the U.S. Department <strong>of</strong> <strong>Justice</strong>, <strong>Bureau</strong> <strong>of</strong> <strong>Justice</strong> <strong>Statistics</strong>.86I ~tLt\ 1 ,,~11'IIjiIOctoberFull-timeequivalentemployment9,1311,1327,99911,7103,28952448737371,2831161,1671,071964504262423I2,2823501,9321,4185147,2274676,7605,6911,06957512045525120419716631312,7971,6241,1736894841,8052511,5541,321233818216602572301,9154121,5031,4247924551194160341976Octoberpayroll$9,6192,3397,2803,5873,69355553025251,1171919268487837835919182,2316041,6271,1724556,3961,0275,3694,531838547182365211!5320118121212,7941,7611,0326373961,8993691,5301,304227692307385362232,1917181,4731,410642108512510520Employment and pqyrol\aQctqber 1977Qctober 1978Full-timeFull-timeequivalent October equivalent Octoberemployment payroll employment payroll8,5181,1337,3854,7752,61056353429291,3692641,1051,01392409404552,3043941,9101,4214898,4515557,8966,7161,18052914338623515120617531312,5071,4491,0585674911,8742821,5921,3172751,083619464420442,0514251,6261,5231032686320516243$9,2012,3156,3863,8373,04966063723231,1'8343881;577966427422552,4046841,7201,2644577,9521,3096,6435,67596!l58322735520814724422321212,8141,8699455214242,1554491,7061,424283964661303270332,3907611,6291,54584238104134100348,6001,1197,4814,9342,54763860929291,4722881,1841,083101303300332,5704122,1581,6375218,5235717,9526,7141,23861120740422717721518629292,6031,6499545174372,135343 ...1,7921,4873051,089632457416412,0884881,6001,511892846521917544variat~on.cAmounts do not add precisely to total due to rounding.Less than half the unit <strong>of</strong> measurement shown.$9,6862,3897,2984,1823,11676774523231,474493980892fl9398396222,8527712,0821,5455378,6921,3837,3096,2171,09272835837022514526424222222,9702,02691145364082,5285291,9991,66.53351,028702326293332,7471,0491,6981,6011942771251511183487Octqber 1979Full-timeequivalent b Octoberemployment payroll8,7681,1417,6545,0832,60264661632331,5412941,3081,206102410401972,6054072,2081,7144939,0875908,5547,0911,46462320542923319622718841412,5761,4631,1085505592,1973371,8221,5292931,136673470431382,3955011,6051,518902917821817149$10,5552,3788,1774,5923,58686183130301,7475551,1921,097%431424773,1188262,2921,7565369,8011,5798,2216,8461,37579739440322517729025634343,2992,1361,1635815822,9126262,2861,9153721,121782339310292,9911,1551,8351,7369936514621817642
_______ -"U~
<strong>Sourcebook</strong> <strong>of</strong> <strong>Criminal</strong> <strong>Justice</strong> <strong>Statistics</strong> <strong>1983</strong>Table 1.29 Number and term <strong>of</strong> judges <strong>of</strong> appellate and mojor trial courts, by type <strong>of</strong> court and jurisdiction, 1981JurisdictionAlabamaAlaskaArizonaArkansasCaliforniaColoradoConnecticutDelawareFloridaGeorgiaNJTE:Court <strong>of</strong>last resortSupreme CourtSupreme CourtSupreme CourtSupreme CourtSupreme CourtSupreme CourtSupreme CourtSupreme CourtSupreme CourtSupreme CourtThese data were collected through 0 mail survey conducted by the Council <strong>of</strong> State Goverrvnents.NJmber <strong>of</strong>judges9557776 a577Term(inyears)Appellate courts61068121081266Intermediateappellate courtCourt <strong>of</strong> <strong>Criminal</strong> AppealsCourt <strong>of</strong> Civil AppealsXCourt <strong>of</strong> AppealsCourt <strong>of</strong> AppealsCourts <strong>of</strong> AppealCo~'rt <strong>of</strong> AppealsXXDistrict courts <strong>of</strong> appealCourt <strong>of</strong> AppealsNJmber <strong>of</strong>judges53X1565910XX459Term(Inyears)66X68128XX66Majortrial courtsCircuit courtsHawaii Supreme Court 510 Intermediate Appellate Court 3 10 Circuit courtsIdahoSupreme Court 56 Court <strong>of</strong> Appeals 3Illinois Supreme Court 710 Appellate Court 34 b 6 District courts10 Circuit courtsIndiana Supreme Court 5 10 Court <strong>of</strong> Appeals 12 10 Circuit courtsSuperior courtsCounty courtsIowa Supreme Court 9 8 Court <strong>of</strong> Appeals 5 6 District CourtI
<strong>Sourcebook</strong> <strong>of</strong> <strong>Criminal</strong> <strong>Justice</strong> <strong>Statistics</strong> <strong>1983</strong>Table 1.30 Low trained and loy State court judges, by State, 1981StateAlabanaAlaskaArizonaArkansasCaliforniaColoradoConnecticutDelawareDistrict <strong>of</strong> ColunbiaFloridaGeorgiaI-bwaliIdahoIllinoisIndic.naIowaKansasKentuckyLouisianaMaineMarylandMossachl/settsMichiganMinnesotaMississippiN:>TE: These data are from a telephone survey <strong>of</strong> State judicial education <strong>of</strong>ficers or Statecourt acministrators conducted between !'bvember 1980 and January 1981. The data belowInclude all judges in the State, from local judges to the State's highest appellate courtjudges, except os noted in footnotes.Law trainedjudges436681421741,241410 c19039525192475182726317228 c15123529242204280562225167Loyjudges69 04811678 bo73c ,d5g e74c,fo29 g620 c ,ho22.3'4483c ,j373 c ,ko685 co69o130c, I1 m644 naThesl~ are probate judges. There are approximately 400loy magistrates performing minor court-related duties servingmunic~1 and general jurisdiction courts.Does nt)t include police and city court judges, about whomno infarmation was obtained.dEstimated.Includes 23 (<strong>of</strong> 109) county court judges and on estimated50 (o~ 250) municipal court judges.Fifty-nlml <strong>of</strong> Connecticut's 130 probate judges are loyjudges; the remaining 71 are low trained and included in thatcol~.Includes 20 alderman's court judges who mayor may not belawye~ and' 54 justices <strong>of</strong> the peace.County court judges still sitting due to "grandfather"claus1iDoes not include 1,164 non-certified justices <strong>of</strong> the peaceand 435 municipol, police and mayor's court judges, <strong>of</strong> whom 35to 40.percent are law'yers.'In Illinois, 3 loy circuit court judges are still sitting due toa "grandfather" clause.JOf 166 part-tim.~ magistrates, approximately one-half arenon-I~wyers.Includes 73 magistrate judges and approximately 300municipal court judges, lTl
.~f'I<strong>Sourcebook</strong> <strong>of</strong> <strong>Criminal</strong> <strong>Justice</strong> <strong>Statistics</strong> <strong>1983</strong>Characteristics <strong>of</strong> the <strong>Criminal</strong> <strong>Justice</strong> SystelllSTable 1.31 Selected qualification requirements <strong>of</strong> judges <strong>of</strong> appellate and trial courts <strong>of</strong> general jurlsdlctl'ln, by type <strong>of</strong> court andJurisdiction, 1981--ContinuedaMember <strong>of</strong> or admitted to bar. Alabama--lIcensed to practice In low, but must be on elector <strong>of</strong> the cOlmty <strong>of</strong> appointment, less thanlaw If' the State. Connecticut, Illinois, Nebraska, New Jersey, New 72 years <strong>of</strong> age, and retire upon attaining that age.York, Virginia, Washlngton--sha!l not engage In private practice.o <strong>Justice</strong>s <strong>of</strong> supreme court, judges <strong>of</strong> court <strong>of</strong> appeals, districtMontana, Virginia, Washington (for appellate courts), Wlsconsln- court judges, and district associate Judges, at time <strong>of</strong> appointment,must bp. <strong>of</strong> an age which will permit them to serve an Initial and onemem"f,r <strong>of</strong> bar at least 5 years.For court <strong>of</strong> appeals, 5 years.regular term before reaching age 72. Magistrates must be <strong>of</strong> an agecFor court <strong>of</strong> appeals.that will permit them to serve a full term <strong>of</strong> <strong>of</strong>fice before reaching agedGood character. Maryland-.. lntegrlty and wisdom.72.PDlstrict and associate district judges must be regularly admittedeState citizenship.fThere must be one judge 1))sldlng In each <strong>of</strong> State's three to the bar; district magistrate judges need not be admitted to the bar,countl~s.gNo more than three justices can be <strong>of</strong> same major politicalpartYhat least two <strong>Justice</strong>s must be <strong>of</strong> other major political party.No mQre than bare majority <strong>of</strong> Judgea can be <strong>of</strong> same majorpolitical partYI remainder <strong>of</strong> judges must be <strong>of</strong> other major polltlc-alparty, Supreme Court, Intermediate appellate court, and circuit courtjudges must be II censed to practice law for at least I ° yearspreceding nomination <strong>of</strong> <strong>of</strong>fice.J!:ihall not engage In practice <strong>of</strong> law or run for or hold any other<strong>of</strong>fice or position <strong>of</strong> pr<strong>of</strong>it under the Lhlted States, the State, or ItspOlltlCfeI subdivisions during judicial t~rm.Qualified voter. Nevada--quallfled elector In State for supremecourt <strong>Justice</strong>s; In State and district for trial court judges. Oregon-qualified elector In county <strong>of</strong> residence for court <strong>of</strong> appeals judges.Wisconsln--quollfled elec10r for 10 days In the jur!sdlctlon <strong>of</strong> the <strong>of</strong>ficefor wblch the judge Is running.~udges must be under 70 at time <strong>of</strong> election or appointment.Member <strong>of</strong> State bar 10 years, or 5 yea's a tilal judge.npart-tlme Judicial magistrates not required to be learneobut If not they must be certified b~ the supreme court as qualified toserve.qSobrlety <strong>of</strong> manner.rRequlred number <strong>of</strong> years as qualified voter.sin Nebraska.~esldence or principal law <strong>of</strong>fice In State.Does not apply to persons elected to or serving In such capacitybefOrE" Jan. I, 1981.Associate district judges required to be licensed to practice Inthe SWte; 2 years <strong>of</strong> practice required; age not specified.Shall continue to be licensed attorney while holding. <strong>of</strong>fice.xMust be pronounced qualified by the Legislative ScreeningConml.ttee.YThlrty years for judges <strong>of</strong> court <strong>of</strong> appeals and court <strong>of</strong> criminalappea!J;.~Ive out <strong>of</strong> 10 years preceding appointment.aaShall not seek or accept non-Judicial elective <strong>of</strong>fice, or holdany other <strong>of</strong>fice <strong>of</strong> public trust, or engage In any other IncOl'll'atlbleactlvlbb' Sha II have practiced law In State at least i year ImmediatelypreC'edlng election or appointment.Source: The Council <strong>of</strong> State Governments, The Book <strong>of</strong> the States 1982-83 (Lexington, Ky.: The Covncll <strong>of</strong> State Governments, 1987.), pp.258, 259. Table adapted by Sa.RCEBOO< staff. Reprinted by permission.94IitIIIi(I "IIIIIIIIII1\Iii!IIi ~IIiitIiIITable 1.32 Salaries <strong>of</strong> judges <strong>of</strong> appellate and general trial courts, and date <strong>of</strong> last salary changeby type <strong>of</strong> court and jurisdiction, as <strong>of</strong> Nov. 30, 1982'NOTE: The salarle~ ~eported for the highest appellate courts refer to salaries paid to associate justices, notchief justices. NatIonal overages for the highest appellate and general h ial courts are based on figures forthe 50 States. Fpr Intermediate appellate courts, the average Is based on the 32 States that have suchcourts. All averages are based on the lowest salary <strong>of</strong> the range or on salaries without supplements.Salaries Including supplements are shown In parentheses Immediately beneath the figures for State-paidsalaries. Supplements may Include poyments for travel and other business expenses and locally authorizedsalary Increments.'JurisdictionT)::Qe <strong>of</strong> courtHighest Intermediate General Dote <strong>of</strong>appellate appellate trial lost salarycourt court court changeAlabama $58,000 $57,000 $48,000 4/27/82(67,200)Alaska 77,760 72,564 70,116 1/16/82to 88,646 to 82,386Arizona47,500 45,500 43,500 1/1/79Arkansas50,373 48,617 46,860 7/1/82California77,226 72,401 63,267 1/1/82Colorado55,600 51,152 47,260 1/1/82Connecticut 50,800 X 43,402 1/1/82to 46,936Delaware 56,600 X 53,200 7/1/82Florida 65,805 59,385 56,710 9/1/82Georgia 55,462 54,860 46,419 7/1/82(65,471)Hawaii 53,460 51,,975 50,490 7/1/82Idaho 47,300 46,300 45,300 7/1/82Illinois 66,500 61,500 53,000 7/ 1/82to 58,000Indiana 47,244 47,244 :>.9,932 10/1/82(50,244) (50,244) to 42,182Iowa57,100 54,200 50,700 7/l/82Kansas 50,588 48,458 46,860 8/1/82Kentucky 54,537 52,311 50,085 7/1/82Louisiana 66,566 63,367 60,169 9/1/81Moine 40,392 X 39,760 7/1/82Maryland 62,500 60,000 58,000 7/1/82Massachusetts 59,000 53,000 50,725 1/1/82Michigan 69,000 66,240 37,950 1/1/82(65,418)Minnesota 56,000 X 48,000 7/1/80Mlsl.lsslppl 46,000 X 41,000 7/1/78Mls~ouri 51,840 49,290 46,740 8/13/82Montana47,023 X 45,841 7/1/82Nebraska48,315 X 44,382 1/1/81Nevada 47,250 X 43,000 1/1/81New Hampshire 47,513 X 46,270 7/3/81New Jersey 78,000 75,000 70,000 1/19/82New Mexico 55,000 52,000 49,300 7/1/82New York 110,892 69,657 65,163 7/22/82North Carolina 57,012 53,976 47,928 1/1/82North Dakota 53,900 X 50,600 7/ I /82Ohio 5B,{l00 54,000 40,000 1/1/82Oklahoma 59, 13~to 50,50055,440 36,%0to 49,2807/I/B2Oregon 53,30B 52,039 4B,356 4/1/81Pennsylvania 64,500 62,500 55,000 12/1/80Rhode Island 49,186 X 46,567 6/28/81to 59,023 to 55,880South Carolina 58,944 X 58,944 8/14/81South Dakota 46,900 X 43,750 7/1/82Tennessee 65,000 l'i2,500 60,000 9/1/82Texas 71,400 60,100 50,900 9/1/82(70,.~00) (69,400)50,000 X 45,000 7/1/82Utah'1errront 45,100 X 42,900 7/1/82Virginia 61,400 X 57,000 7/1/82Washington 51,500 4B,IOO 44,700 7/1/80West Virginia 49,000 X 45,000 7/1/81Wisconsin 56,016 51,372 49,176 8/1/80Wyoming 63,500 X 61,000 1/ I /82Notional average 56,819 5';,626 49,704 XDistrict <strong>of</strong> Columbia 66,870 X 63,270 11/1/81Federal System 93,000 74,300 70,300 10/1 /81American Samoa 64,191 X X 7/15/81PJ.Jerto Rico 36,000 X 24,000 7/1/79to 30,000Virgin IslandsXX 52,000 10/I/BI• Source: Notional Ceilter for State Courts, surve6'f <strong>of</strong> Judicial Salaries, Vol. 8, No. 3 (Williamsburg, Va.:NatIonal Center far State Courts, 1982), p. 6. To Ie adapted by SOURCEBOOK staff. Reprinted bypermission.
--.-,- ~ .,--,____.__ ,~. _.r_Characteristics <strong>of</strong> the <strong>Criminal</strong> <strong>Justice</strong> Systems<strong>Sourcebook</strong> <strong>of</strong> <strong>Criminal</strong> <strong>Justice</strong> Staiistics <strong>1983</strong>Table 1.33 Method <strong>of</strong> selection and length <strong>of</strong> initial and retention terms <strong>of</strong> the highest appellate court justices, by State,as <strong>of</strong> October 1980!'OTE: These data were complied through a survey <strong>of</strong> Statestatutes: they were then verified by personnel <strong>of</strong> the!>merican Judicature :)ociety In each State."Partisan electian" refers to elections in which thejudicial candidates' names appear on the ballot wi~h theirrespective party labels; "nonpartisan electien" refers to thesituation when no party labels are attached ~o Judicialcandidates' names an the ballot. 'Retention election" refersto an election in which a judge runs unopposed on the ballotand the electorate votes solely on the question <strong>of</strong> hiscontinuation in <strong>of</strong>fice. In the retention. election, the judgeStateAlabamaAlaskaArizonaArkansasCaliforniaColoradoConnecticutDelawareFloridaGeorgiaHawaiiIdahoIllinoisIndic.naIowaMethod aInitial selectionPartisan electionNominating commissionNominating commissionPartisan electionAppointed Iiy governorNominating commissionAppointed by legislatureNominating commissionNominating commissionPartisan electionNominating commissionN:>npartisan electionPartisan electionNominating commissionI'bninating commission:UllIn6 yearsUntil next generai eiectionbut not less than 3 yearslkltil next general ell!!ctionbut not less than 2 years8 yearslkltil next general electionlkltil next general electionbut not less than 2 years8 years12 yearslkltil next general electioncut not less than I year6 years10 years6 years10 yearslkltil next general el ectionbut not less than 2 yearsUntil next general electionbut not less than I yearmust win a majority <strong>of</strong> the vote in order te serve a full termexcept in Illinois which requires 60 percent (Source, p. 6 andinformation provided by the authors). "Nominatingcommission" refers to the nonpartisan body, composed <strong>of</strong>lawyers and nonlawyers, which actively recruits, screens, andnominafes prospective judicial candidates to the executive forappointment. "Initial selection" is defined as theconstitutional or statutory method by which judges areselectecl for a full term <strong>of</strong> <strong>of</strong>fice. 'Retention" refers to themethod used to select judges for subsequent terms <strong>of</strong> <strong>of</strong>fice.MethodPartisan electionRetention electionRetention electionPartisan electionRetention electionRetention electionRetentionReappointment by legislatureReappointment by governorRetention electionPartisan electionReappointment by commissionj\bnpartisan electionRetention electionRetention electionRetention electionTerm(in years)6106812108126610610108Table 1.33 Method <strong>of</strong> selection and length <strong>of</strong> Initial and retention terms <strong>of</strong> the highest appellate court justices, by State,as <strong>of</strong> October 1980--ContinuedInitial selectionState Method a TermVirginiaWashingtonWest VirginiaWisconsinWyomingAppointed by legislaturej\bnpartisan electionPartisan electionj\bnportlsan electionNominating corrrnissiona In States that use nominating commissions, the governorrnake~ the appointment.c The highest State court is named the Court <strong>of</strong> Appeals.The appointment requires the approval <strong>of</strong> the electedexecutive council.12 years6 years12 years10 yearslkltil next general electionbut not less than I yearMethodRetentionReappointment by legislaturej\bnpartisan electionPartisan electionj\bnpartlsan electionRetention electionterm(in years)dOklahama and Texas have twa courts <strong>of</strong> fi no Ijurisdiction: the sUpreme court, which has final civilJurisdiction; and the court <strong>of</strong> criminal appeals, which has finalcriminal jurisdiction.Source: Larry C. Berlmer icon Judicature Society, 1980), pp. 18-21. Reprinted by permission.12612108KansasNominating commissionKentucky j\bnpartisan electionLouisiana j\bnpartisan electionMaine b Appointed by governorMarylandI~inating corrrnissionlkltiJ next general electionbut not less than I year8 years10 years7 yearslJntil next general electionbut not less than I :tearRetention electionj\bnpartisan electionN:>nportisan electionReappointment by governorRetention election6810710MassachusettsMichiganMinnesotaMississippiMissouriNominating commissionj\bnpartisan electionj\bnpartisan electionPartisan electionI'bninating commissionLife ~enure8 years;; years8 yearslkltil next general electionbut not less than I yearXN:>npartisan electionj\bnpClrtisan electionPartisan electionRetention electionX86812I't\ontonaNebraskaj\bnportisan electionNominating commission8 yearsUntil next general electionbut not less than 3 yearsj\bnpartisan election, but ifunopposed, ,,'tention electionRetention el".clion86NevadaNew HampshireNew Jerseyj\bnpartisan electionAppointed by governor cAppointed by governor6 yearsLife tenure7 yearsj\bnpartisan electionXReappointment by governorLife6XtenureNew MexigoNew Yorkl-brth Carolinaj\brth DakotaOhioOklahoma dOregonPennsylVaniaRhode IslandSouth CarolinaPartisan electionNominating commissionPartisan electionj\bnpartisan electionj\bnpartisan electionNominating commissionj\bnpartisan electionPartisan electionAppointed by legislatureAppointed by legislature8 years14 years8 years10 years6 yearslkltil next general electionbut not less than I ~Aar6 years10 yearsLife tenure10 yearsPartisan electionReappointment by governorPartisan electionj\bnpartlsan electionN:>npartisan electionRetention electionN:>npartisan electionRetention electionXReappoin tment by legislature814810;;6610X10South DakotaTenneaseeTexasUtahVermontj\bnportisan electionPartisan electionPartisan electionj\bnpartisan electionNominating corrrnission8 years8 years6 years10 years6 yearsRetention electionPartisan electionPartisan electionj\bnpartisan election, but ifunopposed, retention electionAutomatic retention unlesslegislature votes toremove judge886106See footnotes at end <strong>of</strong> table.97
Characteristics <strong>of</strong> the <strong>Criminal</strong> <strong>Justice</strong> Systems<strong>Sourcebook</strong> <strong>of</strong> <strong>Criminal</strong> <strong>Justice</strong> <strong>Statistics</strong> <strong>1983</strong>Tobie 1.34 Method <strong>of</strong> selection and length <strong>of</strong> initial and retention terms <strong>of</strong> intermediate appellate court judges in 32States, as <strong>of</strong> October 1980!'OTE:See !'OTE, Tobie 1.33. States not listed do not how, intermediate appellate courts.Initial selec:tionRetentionTermState Methad a Term Method (in years)Alabama b Partisan election 6 years Partisan election 6Alaska Nominating commission lkltil next general election Retention election 8but not less than 3 yearsArizona Nominating commission lkltil next general election Retention election 6but not less than 2 yearsArkansas Partisan election 8 years Partisan election8California Appointed by governor lkltil next general election Retention election 12Colorado Nominating commission lkltil next general election Retention election 8but not less than 2 yearsFlorida Nominating commission lkltil next general electionbut not less than I yearRetention election 6Georgia Partisan election 6 years Partisan election6I-bwail Nominating commission 10 years Reappointment by commission 10Idaho i'bnpartisan election 6 years i'bnpartisan election 6Illinois Partisan election 10 years Retention election 10Indiana Nominating commission lkltil next general election Retention election 10but not less than 2 yearsIowa Nominating commission lkltil :lext g;ln"lral election Retention election 6but not less than I yearKansas Nominating commission lkltil next general electionbut not less than I yearRetention election 4Kentucky i'bnportisan election 8 yearsi'bnportisan election 8Louisiana i'bnportisan election 10 years I\bnpartisan election 10Maryland Nominating commission lkltil next general election Retent!on election 10but not less than I yearMassachusetts Nominating commission life tenure X XMichigan i'bnpartisan election 6 years I\bnpartisan election 6Missouri Nominctlng commission U1til next general election Retention election 12but not less than I yearNew Jersey Appointed by governor 7 years Reappointment by governor life tenureNew Mexico Partisan election 8 years Partisan election 8New York Nominating commission 5 years Reappointment by governor 5i'brth Carolina Partisan election 8 years Partisan election 8Ohio i'bnpartisan election 6 years i'bnpartisan election 6Oklahama i'bnpartisan dection 6 years i'bnportisan election 6Oregon c i'bnpartisan election 6 years i'bnportisan election 6Pennsylva'!ja Partisan election 10 years Retention election 10Tennessee Nominating commission U1ti1 the biennial general Retention election 8election but not lessthan 30 daysTexas Partisan election 6 yearsPartisan election 6Washington i'bnpartlson election 6 years i'bnpartlsan election 6Wisconsin i'bnportisan election 6 years i'bnportisan election 6a ln States that use nominating commissions, tne governormoke~ the appointment.Alabama and Tennessee have two intermediate appellatecourts: the court <strong>of</strong> civil appeals, which has civil jurisdiction;and the court <strong>of</strong> criminal (Jppeals, which has criminaljurisdiction. The selection process is the some for both.Provisions (Chicago: American Judicature Society,98(""Pennsylvania has two intermediate appellate courts: thesuperior court and the conmonwealth court. The selectionprocess is the same for both.A Com endlum <strong>of</strong>.\!i:'dIt!j)j"iI~itdJ'I'"IiII'IliIIIiI',dJiH1/ tilHfi11!JItLitIlI!IIIiIiijIIIIII1111/iI'I:II;1 ')1i\'I\!IiIIi!Table 1.35 Methad <strong>of</strong> selection and length <strong>of</strong> Initial and retention terms <strong>of</strong> general jurisdiction court judges, by State aridnome <strong>of</strong> court, as <strong>of</strong> October 1980State/ncvne<strong>of</strong> cou:' ,5)Alaboma:Circuit courtAlaska:Superior courtArizona: bSuperior courtArkansas:Circuit courtCalifornia:Superior courtColorado:District courtConnecticut:Superior courtDelaware:Superior courtFlorida:Circuit courtGeorgia:Superior courtI-bwail:Circuit courtIdaho:District courtillinois:Circuit courtIndiana:Circuit courtSuperior courtlawaIDistrict courtKansas:District courtKentucky:Circuit courtLouisiana:District courtOrleans Parishdistrict courtMaine:Superior courtMaryland:Circuit courtSupreme Gell1ch <strong>of</strong>NJTEI See !'OTE, Table 1.33. Courts <strong>of</strong> general jurisdiction are defined as haVing unlimitedcivil and criminal jurisdiction (Lorry C. Berkson, "Judicial Selection In the United States: ASpecial Report," Judicature 64 (October 1980), p. 178).Initial selectionMethod a Term MethodPartisan election 6 years Partisan electionNominating commission U1tll next general election Retention electionbut not less than 3 yearsNominating commission Until next general election Retention electionbut not less than 2 yearsPartisan election 4 years Partisan electionRetentioni'bnpartlsan election 6 years i'bnpartlsan electionunless county electorsunless county electorsopt for nominatingopt ior nominatingcommissioncommissionNominating commissionUntil next general eiectionbut not less than 2 yearsRetention electionAppointed by legislature 8 years Reappointment by legislatureNominating commission i2 years Reappointment by governori'bnportisan election 6 years i'bnpartlsan electionPartisan election 4 years C Partisan electionNominating commission 10 years Reappointment by commissioni'bnpartisan election 4 years i'bnpartisan electionPartisan elect land 6 years Retention electionPartisan electlon e6 yearsPartisan election fPartisan electlon g 6 years Partisan electionNominating commissionU1tll next general electionbut not less than I yearRetentior, electionNominating commission h U1t11 next general election Retention election li'bnpartlsan election 8 years i'bnpartlsan electioni'bnpartlsan election 6 years i'bnpartisan electioni'bnpartlsan election 6 years i'bnpartisan elo.ctionAppointed by governor 7 years Reappointment by governorNominating commissionU1tll biennial electioni'bnpartisan electionBaltimore CityMassachusetts:i'bmlnating commission U1tll biennial election i'bnpartisan electionTrial Court <strong>of</strong>ConmonwealthMichigan:Nominath~g conmlsslon life tenure XCircuit court i'bnpartlsan election 6 years i'bnpartlsan electionRecorder'S court i'bnpartisan election 6 years i'bnportisan electionMinnesota:District court i'bnpartlsan election 6 years i'bnpartisan electionMississippi:Circuit court Partisan election4 yearsPartisan electionMissouri:Circuit court Partisan electlonl 6 yearsk Partisan election lMontana:District court i'bnpartisan election 6 years i'bnpartisan election, but ifunopposed, retention electionNebraska:District court Nominating commission U1til next general election Retention electionbut not less than 3 yearsNevada:District court i'bnpartlsan election 6 years Nonpartisan electionNew I-bmpshlre\Superior court Appointed by governo~ Life tenure XNew Jersey:Superior court Appointed by governor 7 years Reappointment by governorNew MexIco:District court Partisan election IS years Partisan electionSee footnotes at end <strong>of</strong> table.99Term(in years)6644661046666486671515X66646 k666Xlife tenure6
I',\-<strong>Sourcebook</strong> <strong>of</strong>' <strong>Criminal</strong> <strong>Justice</strong> <strong>Statistics</strong> 15183Table 1.35 Method <strong>of</strong> selection and length <strong>of</strong> initial and retention terms <strong>of</strong> general jurisdiction court judges, by State andname <strong>of</strong> court, as <strong>of</strong> October 1980--ContinuedState/name<strong>of</strong> court(s)Methad aInitial selectionNew York:Supreme court Partisan elect ionNorth Carolina:Superior court Partisan election nNarth Dakota:District court Nonpartisan electionOhio:Common pleas court Nonpartisan electionOklahomo:District court Nonpartisan electionOregon:Circuit court Nonpartisan electionPennsylvania:Common pleas court Partisan electionRhode Island:Superior court Appointed by governorSouth Carolina:Circuit court Appointed by legislatureSouth Dakota:Circuit court Nonpartisan electionTennessee:Circuit court Partisan electionTexas:District court Partisan electionUtah:District court Nonpartisan electionVermont:Superior courtNominating commissionTerm14 years8 years6 years6 years4 yeal's6 years10 :,earsLife tenure6 years8 years8 years4 years6 years6 yearsVirginia:Circuit court Appointed by legislature 8 yearsWashington:Superior court Nonpartisan election 4 yearsWest Virginia:Circuit court Partisan election8 yearsWisconsin:Circuit court Nonpartisan election 6 yeorsWyoming:District court Nominating
f'<strong>Sourcebook</strong> <strong>of</strong> <strong>Criminal</strong> <strong>Justice</strong> <strong>Statistics</strong> <strong>1983</strong>Table 1.36 Selected characteristics <strong>of</strong> grand jll ~ ies, by jllrisdictlon, 1980--ContinuedJurisdictionillinoisIndianaIowaKansasKentuckyLouisianaMaineMarylandMassachusettsMlchigclnMississippiMissouriMontonaNebraskaNevadaNew HampshireSelection processRandom selection from theregistered voter list,followed by questioning aboutthe time InvolvedRandom selection from votersregistration list supplementedwith other lists such asutility customers, propertytaxpayers, State Income taxpayers and othersRandom selection from lists <strong>of</strong>regl stered Yoters, taxassessment lists, motorvehicle operators, licenseslists, and othersRandom selection from the lI~t<strong>of</strong> registered voters and/ol'census listRandom selection frorn voterregistration lists ondcurrent property tax rollsDiscretion, exercised bycitizen jury commissionRandom selection from voterregistration lists followedby questioning by 0 judge andthe district attorneyRandom selection from yoterregistration lists screenedto see who can spare the timeRandom selection: 35 names aredrawn from the trial jurylist, which Is assembled bydiscretion; then a judgeselects 23 personsRandom selection from the list<strong>of</strong> registered votersRondom selection from the list<strong>of</strong> registered voters (separatelist mointained)Random selection from voterregistration listsRandomly selected names arescreened carefully by thejudges who make the finalselectionRandom selecoian from tax rollsRandom selection <strong>of</strong> 40 namesfrom the list <strong>of</strong> actllal orregistered voters, and fromthat list <strong>of</strong> 40, 16 are pickedby the judge and jllrycommissionerRandom selection, then screenedas to willingness to serveRandom selection from the trialjury list, which is assembledby the discretion <strong>of</strong> town<strong>of</strong>ficialsSize23 (20 onsupplementalpanel)6715121213 to 232323Number <strong>of</strong>grand jurorsneeded toIndict125512912121213 to 17 9(also I-person(j udge) grandjuries)16 to 23 1615 to 2012II16172312910121212Scope <strong>of</strong>activities<strong>Criminal</strong> indictments andinvestigations <strong>of</strong> <strong>of</strong>ficialmisconductMajor felony cases<strong>Criminal</strong> Indictments,investigations <strong>of</strong> prisons,conduct <strong>of</strong> public <strong>of</strong>ficials,highwaysAll public <strong>of</strong>fenses<strong>Criminal</strong> IndictmentsIs a grand jury indictmentessential for all felonyprosecutions (unlesswaived by the accused)?<strong>Criminal</strong> IndictmentsYes (but only for capital<strong>of</strong>fenses)<strong>Criminal</strong> Indictments. In Yes (except where a statutoryCumberland County (Portland) exception Is created)the grand jury serves for Iyear and meets for 5-10 days3 times a year<strong>Criminal</strong> Indictments and NoInspects government agencies.It meets every day for 4months<strong>Criminal</strong> IndictmentsYes<strong>Criminal</strong> Indictments(infrequently) andInvestigations<strong>Criminal</strong> Indictments,investigations <strong>of</strong> prisons andpublic <strong>of</strong>ficials<strong>Criminal</strong> indictmentsand Investigations <strong>of</strong> localgovernmental affairs<strong>Criminal</strong> indictments,investigations, Inspections,inquiries Into governmentalfiscal matters<strong>Criminal</strong> indictments,investigations, public<strong>of</strong>ficials, prisons<strong>Criminal</strong> indictments,county Jail<strong>Criminal</strong> Indictments andInvestigations <strong>of</strong> localgovernmental affairs<strong>Criminal</strong> Indictments andinvestigations <strong>of</strong> subversiveactivities. Meets about 4days every 2-3 monthsYesYesNoYesNoNoNoNoNoYes1j'\'I,I,II[:rI',11Ii[,Characteristics <strong>of</strong> the <strong>Criminal</strong> <strong>Justice</strong> SystemsTable 1.36 Selected characteristics <strong>of</strong> grand juries, by jurisdiction, 1980--ContlnuedJurisdiction Selection process SizeNew Jersey Random selection from the list 23<strong>of</strong> registered voters. Statuteauthorizes statewide grandJuriesNew Mexico Random selection from the voter 12registration list followed byquestioning by a judgeNew York Specially selected from persons 16 to 23who have been qualified astrial jurors ar.d who passa pallce InvestigationNorth Carolina Random selection from 'Voterregistrations, tax rolls, and12 to 18other sources deemed to bereliableNorth Dakota Random selection from lists <strong>of</strong> 8 to IIactual voters, holders <strong>of</strong>driver's licenses, IItllltycustomers, and propertytaxpayersellio Random selection from theregistered voter list9followed by questioningOklahoma Varies by county 12Oregon Random selection from list 7<strong>of</strong> registered votersPennsylvania Selected from voterregistration lists, andsometimes interviewed byjur}' clerk and jury mastersRhode Island Random selection from voterregistration list followed byan Interview. Statewide grandjuries are authorizedSouth Carolioo Discretion, exercised by ajury commission composed <strong>of</strong>civil sen antsSouth Dakota Random selection from the list<strong>of</strong> registered votersTemasseeTexasUtahRandom selection from the trialjury lists, which are compiledby jury commissioners withoutguidelines. The same personmoy serve as foreperson forseveral Y:larsDiscretion exercised by citizenjury commissioners, appointedby a judgeRandom selection fiOffi the<strong>of</strong>ficial register <strong>of</strong> votersand other lists proscribedby the Utah Supreme Court15 to 2313 to 23186 to 813127N.xnbE'f <strong>of</strong>grand jurorsneeded toIndictScopeactivities12 <strong>Criminal</strong> Indictments,investigations8 <strong>Criminal</strong> indictments,investigations. In BernalilloCounty (Albuquerque) grandjuries rTl
<strong>Sourcebook</strong> <strong>of</strong> Crimi no I <strong>Justice</strong> Stotislics <strong>1983</strong>Table 1.36 Selected characteristics <strong>of</strong> grand juries, by jurisdiction, 1980--ContinuedJurisdictionVermontVirginiaWashingtonWest VirginiaWisconsinWyomingDistrict <strong>of</strong>ColumbiaPuerto RicoSelection processRandom selection from thelatest census enumeration,telephone directories,election records, and othergeneral sources <strong>of</strong> namesJudges choose namesRandom selection from voterregistration listDiscretion, exercised by a2-member citizen jurycommission (representingthe 2 major political parties)Names selected by jurycommissioners and thenscreened by jUdges. InMilwaukee County, randomselection from the registeredvoter listRandom selection from thevoter registration list.Statewide grand juries canbe assembledRandom selection from the list<strong>of</strong> registered voters, followedby questioning by a judge andsometimes by the U.S. AttorneyDiscretion by court-appointedjury commissioners18Size5 to 712 to 17161712 to 162312 to 15Number <strong>of</strong>grand jurorsneeded toindict94Scope <strong>of</strong>activities12 <strong>Criminal</strong> indictments3/4 <strong>of</strong>panel121212<strong>Criminal</strong> indictments;investigates conditions thatpromote criminal activitiesand misfeasance <strong>of</strong>governmental authority<strong>Criminal</strong> indictments andInvestigations <strong>of</strong>governmental affairs<strong>Criminal</strong> indictments<strong>Criminal</strong> indictments<strong>Criminal</strong> indictments,inspections, invl'.stigatians<strong>Criminal</strong> indictments. Servesat least 2 months. Frequently9 or 10 are operating at onceIs a grand jury Indictmentessential for all felonyprosecutions (unlesswaived b the accused)?Yes (but only for <strong>of</strong>fensespunishable by death or lifeimprisonment)YesYesMajorityvote<strong>Criminal</strong> indictments andinvesrigations <strong>of</strong> governmentYes<strong>of</strong>ficials and activitiesYes (for all crimes with apotential sentence <strong>of</strong> a yearor more)Source: Conference <strong>of</strong> State Court Administrators and Nationol Center for Stare Courts, State Court Organization 1980, U.S. Deportment<strong>of</strong> <strong>Justice</strong>, <strong>Bureau</strong> <strong>of</strong> <strong>Justice</strong> <strong>Statistics</strong> (Washington, D.C.: U.S. Government Printing Office, 1982), pp. 108-) 13. Reprinted by permission.Characteristics <strong>of</strong> the <strong>Criminal</strong> <strong>Justice</strong> SystemsFlgure 1.8 dl . U S District C our t s, by type <strong>of</strong> juror and expenditure, year ending JuneJuror expen tures an •• t d by the prosecution and~J~~rm~~~n~h~~h~~ s t~:a;o~;;~~I~t:.~cd~~~;~~t~::~~~~~I~ft :J~t7Y~;~~y ~~i I b~~ n~:r~in~~ ~~~:~:~h:~Ji~h~~!~~::~:e:SY:~i~J\~set~~:s~ J~r~~~laIS ~::i:;}~!~~~~fY~:;~~!~i~:~~~~~~~ ;~~~rd~:,et~ltd f om a group <strong>of</strong> those aval a eI d d fter the vOir dire processJurors are se ed f r this Initial group, some will be exc u d Her the voir dire process are~~~~o~i~~cJ~der rooa~h by the"OJUt~g~;, e~p~~~1~~~:s ~~~I~d: ~~~!ilan~ous payments for the comforttill Id an attendance fee. es and conven pa I ence 0 f both petit and grand Jurors.Total Juror Expenditures: $38,897,800Grand Juror Expenditures: 10,542,300Petit Juror Expenditures: 28,355,500Attendance - 48.5%Subsistence - 3.6%Attendance - 17.0%30, 1982Subsistence - 3.1%Mileage - 6.3%Other - 0.6%Other -4.3%Mileage -16.6%f e <strong>of</strong> the United States Courts,Source: A~miUnisstr~~~~n~nl~ Printing Office, <strong>1983</strong>), p. 20.{Washington, D.C.. ••l1982 ~~~~~~~WL~~~~~~'~e~in~Un~it~e~d~S~ta~t~e~sD~i~st~r~ic~t~C~o~u~rt~sGrand and Petit Juror ervlc104
--'~--~---------------_..."'.".,..,.Characteristics <strong>of</strong> the Crimi no I <strong>Justice</strong> SystemsTable 1.37 Grand jury and grand juror utilization In U.S. District Courts, years ending June 30, i975-82/'OTE: See /'OTE, Figure 1.8. In this table, data for 1975 through 1977 are for 94 DistrictCourts and data for 1978 through 1982 are for 95 District Courts."Grand jurorsond 'urlesTotal number <strong>of</strong>:Sessions convenedJurors in session!-burs In sessionAverage number <strong>of</strong>:Jurors per session 19.9!-burs per session 5.3Total number <strong>of</strong> grand juries:In existence 570Impaneled 291Discharged 2661975 1976 1977Years ending June 301978 1979 1980 19817,846 8,404 8,849 8,929 9,791 10,338 10,5197 10,508156,167 167,185 175,687 176,459 194,168 206,627 219,860 210,21341,421 44,765 47,094 46,739 50,896 54,163 58,278 55,56919.95.319.95.319.85.219.&5.220.05.220.05.3Percentchange19821982. over 1981-4.4-4.4-4.620.0 0.05.3 0.0603 641 659 674301699298738321739 0.1311260312303328295 286309 -5.8288 308 325 5.5Source: Administrative Office <strong>of</strong> the United States Courts, Annual Report af the Director, 1981 (Washington,D.C.: Administrative Office <strong>of</strong> the United States Courts, 1981), p. 7; and 1982 Grand and Petit Juror Service inUnited States District Courts (Washington, D.C.: U.S. Government Printing Office, <strong>1983</strong>), p. I. Table constructedby SOCRCESOO< stOff.!S4 ,o ,Preceding page blank
--------------------------------------------------------------.---------!I,Characterl~tlcs<strong>of</strong> the Crlminol <strong>Justice</strong> Systems<strong>Sourcebook</strong> <strong>of</strong> <strong>Criminal</strong> <strong>Justice</strong> <strong>Statistics</strong> <strong>1983</strong>Ta~~~rl.13;79Dlrectcurrent expenditures for State correctional activities, by type <strong>of</strong> activity and State, fiscal.Table 1.38 Petit juror utilization In U.S. District Courts, years ending June 30, 1971-82!'OTE: See !'OTE, Figure 1.8. In this table, data for 1971 are for 93 District Courts; 1972 through1977 data are for 9', District Courts; and 1978 through 1982 data are for 95 District Courts."Travel stu,vs" refers to Jurors who are In transit. The "Juror Usage Index" Is the averagenumber <strong>of</strong> jurors on hand for each jury trial day; It Is calculated by dividing the total ntxnber <strong>of</strong>available jurors by the total number <strong>of</strong> Jury trial days.Years ending June 30Petit jurors 1971 1972 1973 1974 1975 1976 1977 1978 1979 1980Total available 512,553 547,821 573,150 540,628 546,627 592,594 584,122 570,523 565,617 605,547Selected or serving 277,878 304,178 324,038 315,419 328,445 356,%1 352,940 345,372 334,765 368,710Percent 54.2 55.5 56.5 58.3 60.1 60.2 60.4 60.5 59.2 60.9Challenged 66,314 79,501 86,520 82,152 88,228 92,727 90,693 88,103 91,575 92,110Percent 12.9 14.5 15.1 15.2 16.1 15.6 15.5 15.5 16.2 15.2N:>t selected,serving orchallenged--Total 168,361 164,142 162,592 143,057 129,954 142,916 140,489 137,048 139,277 144,727Percent 32.8 30.0 28.4 26.5 23.8 24.1 24.1 24.0 24.6 23.9Travel status (a) (a) (a) (a) (a) (a) (a) (a) (a) 4,582Percent (a) (a) (a) (a) (a) (a) (a) (a) (a) 0.8Jury trial days 21,990 26,176 28,425 28,274 28,293 30,032 29,875 29,238 28,851 32,159<strong>Criminal</strong> 11,999 14,615 16,791 16,426 15,818 17,818 16,945 16,084 15,171 15,649Percent 54.6 55.8 59.1 58.1 55.9 59.3 56.7 55.0 52.6 48.7Civil 9,991 11,561 11,634 11,848 12,475 12,214 12,930 13,154 13,680 16,510Percent 45.4 44.2 40.9 41.9 44.1 40.7 43.3 45.0 47.4 51.3Juror Usage Index 23.31 20.96 20.16 19.12 19.32 19.73 19.55 19.51 19.60 18.83Percentchange19821981 1982 over 1981648,n9 631,606 -2.7396,746 388,979 -2.061.1 61.6 X100,041 98,657 -1.415.4 15.6 X152,142 143,970 -5.423.4 22.8 X5,078 5,572 9.70.8 0.9 X35,596 35,263 -0.915,925 15,587 -2.144.7 44.2 X19,671 19,676 0.055.3 55.8 X18.23 17.91 -1.8aThe jurors in travel status are included in the category <strong>of</strong> jurorsnot selected, serving or challenged.Source: Administrative Office <strong>of</strong> the United States Courts, Annual Re~rt <strong>of</strong> the Director, 1980 p. 6; 1981, p. 6 (Washington, D.C.:Administrative Office <strong>of</strong> the thlted States Courts>; and 1982 Grand and Petit juror ervice In Lhlted States Drstrlct c'ii'iirts (Washington, D.C.: U.S.Government Printing Office, <strong>1983</strong>), p. 11. Table constructed by ~BOO< staff.t'II!IIi~PIIIiii~,iq~~~liNJJ~ ~~he~:~:I;~!e ~~~n~f; i~rvey methodology and definitions <strong>of</strong> direct current expenditures(Dollar amounts !n thousands. - represents 7.ero or rounds to zero.)Total direct lo:;ili\.1tloo~ Corrections Probation,State a current For For Other and admlnls- parole MlscelexeendltureTotal For men women Juveniles combined tratlon and pard~n laneousTotal 3,170,250 2,500,987 1,624,389 92,016 563,561 221,021 177,264 385,959 106,040Alabama 36,097 30,065 21,659 1,620 6,606 180 2,439 3,593Alaska 20,868 17 ,201 4,783 768 5,711 5,939 982 2,685Arizona 38,038 30,908 24,773 1,482 4,653958 3,925 2,247Arkansas 16,636 15,183 8,353 805 6,025 393 890 170California336,764 275,882 162,370 9,134 79,069 25,309 17,985 39,021 3,!I76Colorado 41,430 27,100 16,733 1,005 9,362 1,586 12,744Connecticut 55,983 38,998 27,891 2,483 5,787 2,837 3,866 9,666 3,453DelawGle 17,335 10,035 7,115 380 2,5403,056 1,599 2,645Florida 188,541 138,305 96,381 6,455 21,200 14,269 20,902 26,027 3,307Georgia 80,491 49,648 32,622 2,213 14,813 5,801 12,062 12,980Hawaii 14,693 10,813 2,268 1,584 6,961 655 3,064 161Idaho 9,69U 6,145 3,555 89 1,693 808 613 2,932I Hinols139,126 116,402 86,196 3,631 23,530 3,045 9,056 8,127 5,541Indiana 52,429 43,062 30,058 1,564 10,175 3,265 2,872 2,Oll5 2,410Iowa 38,6/!9 :l1),~57 18,82( 891 6,147 4,798 891 3,717 3.384Kansas 31,716 29,464 17,880 1,31-5 7,558 2,711 740 1,413 99Kentucky 42,291 33:,67.7 18,894 1,353 II ,810 1,570 2,129 4,337 2,198Louisiana 66,049 52,2dl 36,785 1,181 12,240 2,075 4,634 9,134Maine 12,087 10,536 3,8563,725 2,955 96 1,159 296Maryland 113,/~71 80,608 50,674 2,085 22,290 5,559 3,031 22,556 7,276Massachusetts 82,145 64,628 28,932 19,608 16,088 5,345 7,126 5,046Mi-:hlgan 156,329 125,588 99,940 4,267 16,975 4,406 5,920 16,440 8,381Minnesota 40,690 31,488 22,301 981 5,711 2,495 2,356 2,780 4,066Mississippi 19,906 15,208 3583,337 11,513 2,202 2,4%Missouri 45,898 32,489 22,5148,727 1,248 3,652 9,652 105Montana 12,069 10,098 3,087 7,011 53 1,610 308Nebraska 19,796 13,426 9,644 981 2,801 590 2,568 3,212Nevada 19,157 15,028 10,431 579 3,222 796 1,231 2,787 IIINew I-bmpshire 9,084 7,4137 3,814 2,397 1,276 1,561 36New Jersey 86,801 74,075 36,441 10,214 27,420 7,414 5,312New W.exica 17,497 12,882 7,978 lOB 3,754 1,042 974 3,641New York 334,995 283,880 2:06,748 9,064 47,732 20,336 18,686 27,138 5,291N:>rth Carolina 115,761 88,7"7 74,096 2,118 11,091 1,442 5,650 15,088 6,276N:>rth Dakota 4,664 4,1061,501 2,605 558Ohio 120,684 103,004 56,643 4,385 29,689 12,287 5,959 11,193 528Oklahoma 46,039 34,362 19,623 1,517 11.659 1,563 1,385 8,715 1,577Oregon 45,831 36,994 19,066 866 15,339 1,723 1,559 7,21 I 67Pennsylvania 113,826 96,067 60,590 3,332 21,551 10,594 11,591 6,168Rhode Island 16,360 11,278 8,889 454 1,9351,557 2,709 816South Carolina 49,397 39,267 22,185 9,204 7,8763,669 5,985 476South Dakoto 7,903 6,284 3,672 224 2,388167 1,422 30Tennessee 55,909 49,020 32,843 1,448 11,942 2,787 1,193 5,193 503Texas101,427 85,158 62,383 4,296 18,4796,390 9,674 205Utah 19,292 12,567 1,634 376 2,620 7,937 454 6,271Vermont 11,369 5,716 3,517 1,175 1,024 415 4,333 905Virginia 109,676 80,843 66,895 3,214 10,734 8,721 15,05& 5,054Washlngto;~ 65,592 52,688 33,398 2,956 16,3342,597 9,na 579West Virginia 14,100 I I ,521 7,002 463 4,056729 1,794 56Wisconsin 68,612 41,999 27,952 2,430 8,470 3,147 5,437 14,975 6,201WyorrJng 7,057 6,169 3,233 299 2,637 274 614a Data are based on a field compilation from records <strong>of</strong> each State government.Source: Table provided to 5O..RCEBOO< s taff b y th e US •• DEportment <strong>of</strong> <strong>Justice</strong>, <strong>Bureau</strong> <strong>of</strong> <strong>Justice</strong> <strong>Statistics</strong>.{},., .
'<strong>Sourcebook</strong> <strong>of</strong> <strong>Criminal</strong> <strong>Justice</strong> <strong>Statistics</strong> <strong>1983</strong>Table 1.40 Employment and payroll for State and local carrectional activities, by State and level <strong>of</strong> government, October 1971-October1979State andlevel <strong>of</strong> governmentStates-local, totalStatesLocal, totalCountiesMunicipalitiesAlabamoStateLocal, totalCountiesMunicipalitiesAlaskaStateLocal, totalBoroughsMunicipalitiesArizal.aStateLocal, totalCountiesMUnicipalitiesArkansasStateLocal, totalCountiesMunicipalitiesCaliforniaStateLocal, totalCountiesMunicipalitiesColoradoStateLocal, totalCountiesMunicipalitiesConnecticutStateLocal, totalMunicipalitiesDelawareStateLocal, totalCountiesMunicipalitiesNJTE: See NJTE, Figure 1.1. For data required to compute percentages based ontotal criminal justice full-time equivalent employees and total criminal justicepayroll, see Table 1.8. For survey methodology and definitions <strong>of</strong> terms, se~Appendix I.(Dollar amounts in thousands. - represents or rounds f6 zero.)Employment and payroll aOctober 1971Full-timeOctober 1972Full-timeOctober 1973Full-timeOctober 1974Full-timeequivalent October equivalent October equivalent October ~quivalent Octoberemployment payroll employment payroll employment payroll employment payroll172,821106,04566,77649,26117,5151,42593948633315338033545451,374745629576536654522131575626,75410,15916,59515,8027931,7101,3273831482352,0582,0481010583583$129,11978,64850,47036,021l14,442730486244163814013643737881512;)693343531321598653325,2669,92515,34214,5437991,2651,012253761771,6601,65466493493177,864107,78570,07953,01417,0651,5901,00358741417344237072721,450744706649577615432181655329,03911,89117,14816,3108381,7781,3993791612182,0872,087690690$142,9051l6,71056,19340,95815,2358925633302349555947683831,0205394814374440530699673228,32911,68716,64315,1l068361,3601,101259871721,8061,806565565187,298112,17675,12256,90518,2171,7631,06669753616138534144441,845950895847488215602611768529,58911,71417,87517,0947811,9101,4704402172232,3122,312654654$159,51895,56563,95346,74217,2111,1036954093199040336043431,40376164260141479348132805131,03912,69118,34817,5288201,6011,2683331312021,9071,907522522203,230121,16082,07062,48219,5882,0361,24379362017344541233332,0991,0701,0291,013168926432491975231,99612,80719,18918,3218682,0531,5355182802382,7032,7012261:33683$185,577110,71074,86755,02719,8401,39385054441113257153437371,811943868856135614201411073435,76814,91320,85519,9638921,8841,41134411842582,5422,53933637637October 1275Full-timeequivalent Octoberemployment pam!.lL213,813126,93386,88067,94218,9382,1711,28189073615445542431312,2371,1031,1341,115191,1487923562837332,57212,70419,86819,0148542,3311,7026293532762,5932,593791791$208,942123,;!5285,/.9064,1171:32I,:~131,15761,104263450812570166733332, Ito1,0751,0351,018177665602061574939,91416,01723,89622,9389592,4531,8965562642922,4462,446760760!'\/1jlI:I:!Characteristics <strong>of</strong> the Criminai <strong>Justice</strong> SystemsEmployment and pgyrpllaOctober /976 October 19i'7 October 19Z11 October 1979Full-time Full-time Full-time Full-timeequivalent October equivalent October equivalent October equivalent b October_em--,-p_lo..;.yrne __ nt_...:po--,-y_ro_I_1 _e_mc:.p.;..lo..:.yrne...;..:..:.;n.:.;t......:PD=y.:.;ro:.:I.:.;1--.:em=p:;;lo:.!yrne=:.:nt:... .. -"pa~yr..:o.:.:.II_.;:em::.:.:!:p""lo"-yrne=n.:.:.t'-..J:pa:.:L:yrc::o~1I227,576134,42093,15673,79619,3602,3711,48288974314653349340402,6291,2001,4291,31l1481,2798134663808634,24012,59021,65020,7129382,4741,8026724102622,5382,53355831831$235,952137,92898,02474,27023,753!,9731,271703571:312486281449492,6241,2031,4211,377448835972862275944,35616,83227,52426,31l71,1372,8022,1566463472992,4512,44655844844243,248145,55297,69677,61:3220,0142,6271,5831,04488416058754641412,8661,4351,4311,376551,6361,1374994118833,74913,30420,44519,5109352,2811,5447374512862,8432,83855872872$271,645163,079108,56682,01:3726,4792,4581,5998597101501,00694857573,1201,6191,5011,451491,/448193242626347,64320,49327,15026,0001,1502,7702,0347364093283,1163,11066904904253,448151,408102,04081,01521,0253,2761,8831,3931,16722652249626263,1781,6941,4841,452321,3968795174281:3932,02412,49019,53418,6299052,91/2,0019105923182,6692,66455944944$297,367179,654117,71390,29027,4233,3622,0971,2661,05021693390231313,5731,8591,7141,676381,1728033692977247,41~20,09027,32926,1431,1863,7212,7819405513893,1913,185661,0041,004264,363160,778103,68382,12021,6213,1281,8691,26198028155851939393,5372,0231,5131,480341,/651,0985714789432,64912,75319,90518,9949102,6751,6471,0296983322,6312,6221091,0481,048$332,250202,562129,6a997,64832,0403,3912,1901,2029192831,0851,03253534,0242,2881,7361,695411,4551,0294263458153,25823,39629,86228,5351,3273,6952,5711,1246924323,2863,27710101,1331,133-------_.-. - .~District <strong>of</strong> Columbia:Local, totalFloridaStateLocal, totalCountiesMunicipalitiesGeorgiaStateLocal, totalCountiesMunicipalitiesHawaiiStateLocal, totalCountiesMunicipalities2,6257,3674,6982,6692,0376323,8%2,5031,3931,2141794343587617592,3904,5723,0191,5531,1883652,1641,4127526491034003376213492,8508,4725,8312,6412,0316104,0502,5931,4571,2691884323518117642,9175,6744,0371,6371,2563812,5611,73682471710838432064II532,9229,8277,0652,7622,2195434,9703,1831,7C71,5482394443608420642,8837,1165,1571,9591,6033573,2942,1701,1249781454503717918613,33310,8168,2742,5421,9995435,3153,4271,8881,6622264533726117643,4869,0587,0352,0241,6154093,8672,5661,3011,1511504944128212692,741II ,8619,0222,8392,2685715,6953,6372,0581,753305380371993,7669,3626,9852,3771,9374404,1582,7131,4451,222223454446882,93213,0239,8123,2112,3728396,1643,9492,2151,88932663759740404,00011,2748,4232,8512,1666854,9993,3241,6751,42425278874047472,87813,1899,8853,3042,6456596,5764,3942,1821,86431865061139394,59413,0039,8493,1532,~;~5,4943,7421,7521,49825475170249492,92213,71610,3/03,4062,8225846,6974,5052,1921,80239062858345455,43714,20910,7423,4672,8755916,9174,9761,94/1,59834384578461612,81114,49210,9433,5502,9965547,2555,1102,1521,85829473568451514,37216,60512,7533,8523,2286247,8565,8781,9781,6952839428826060See footnotes at end <strong>of</strong> table.110
<strong>Sourcebook</strong> <strong>of</strong> <strong>Criminal</strong> <strong>Justice</strong> <strong>Statistics</strong> <strong>1983</strong>Table 1.40 Employment and payroll for State and local correctional activities, by State and level <strong>of</strong> government, October 1971-OctoberI 979 __ ContlnuedOctober 1975OCtober (911 _6:roger 1272Oct r 1973 October 1974Full-timeFull-timeFull-timeequivalentOctoberStote andlevel <strong>of</strong> governmentIdahoStateLocal, totalCountiesMunicipalitiesillinoisStateLocal, totalCountiesMunicipalitiesIndianaStateLocal, totalCountiesMunicipalitiesIowaStateLocal, totalCountiesMunicipalitiesKansasS~ateLocal, totolCountiesMunicipalitiesKentuckyStateL-Qcal, totalCountiesMunicipalitiesLouisianaStateLocal, totalParishesMunicipalitiesMaineStateLocal, totalCountiesMunicipalitiesMarylandStateLocal, totalCountiesMunicipalitiesMassachusettsStateLocal, totalCountiesMunicipal;tiesMichiganStateLocal, totalCountiesMunicipalitiesMinnesotaStateLocal, totalCountiesMunicipalitiesMississippiStateLocal, totalCountiesMunicipalitiesFull-timeequivalentemployment425360656327,1614,9592,2022,165373,0421,9991,0435425011,5631,13442942452,3792,045334297371,7101,487223201222,3951,58281330850S7376291081085,0954,3367593204394,6703,0161,6541,2354195,5753,1782,3972,0633342,6701,5341,1369441925954851107238Ful:-timeequivalente 10 nt$2532233029I5,2133,6341,5791,549291.8121,23457827130797975222722341,4451,28016514323903784120106141,29286742515926643938851513,8963,3855122362763,7722,5871,1858253604,9242,9631,9611,6752872,0841,132952776176297242553421458369898547,3914,9102,4812,459222,8281,8569726443281,5081,11539338942,208I ,~I; I297252451,7631,332431403282,5561,74281441739775164111010645,3234,5088154064094,7092,8951,8141,3634515,7823,1322,6502,3542962,6711,8118607798176057818210280See footnotes at end <strong>of</strong> table.equivalent Octoberequivalente 10 nt roll e 10 nt$293245484625,8654,0311,8341,815201,8181,2575603562041,05984321621141,3261,171ISS127281,048819229210191,4991,070429214215529474555324,9024,1367673334333,8832,3151,5681,1664025,2283,0132,215!,9452702,2831,536747671753973118645405424411019746,8774,5022,3752,337383,0241,869I, ISS8363191,5491,13141841262,3001,945355290651,9711,458513462513,0432,09594842252678567211310945,3564,6527043333714,9663,1001,8661,4414255,9033,1432,7602,4642962,5441,4941,05011297575927754173123SO$346292545226,3404,3801,9601,931292,0851,3976884852021,20996424524051,4451,241204159451,3581,040318279391,8381,289549248301583519646125,0414,4545862843034,3122,5781,7341,3014335,8503,3102,5402,2293112,3141,3619538777655847384572746936410510237,4374,7672,6702,654163,2841,9691,3158804351,8061,27153552782,5702,114456400562,0321,448584517673,1462,1391,0074905178066681381385,5224,6838394004395,2733,1872,0861,6404466,6133,3123,3012,9703312,6351,4421,1931,118751,12292419814256$337276615926,8554,6682,1862,175122,4611,5988635662ge1,4171,06135634971,694IA2Z272233391,3891,011377332452,1551,48666930336663154883835,5594,7737863674194,9372,8852,0521,5834696,7543,5383,2172,8533632,5001,3291,1711,089826885811077433onf53139413713527,9144,9812,9332,923103,4802,0721,4089774312,0051,377628617II2,7132,194519484352,2861,5257616201413,6392,4661,1735785957806391411415,8004,8229784854935,3813,0852,2961,7605367,4203,6593,7613,3614002,8481,5241,3241,24975I ,21~93328023248$4203348685I7,6245,1022,5222,51662,8271,8479806613191,8141,30750749982,0111,682328302261,7541,2245304271032,8231,95986438647862152992926,1135,1769374874505,2782,9502,3271,7655628,0634,1463,9173,4584592,7791,3871,3931,31380836669167(3632October 1976Full-timeequivalentOctoberemploymentpayroll60247113112568,8045,1803,6243,61863,6212,0651,556I, I IS4412,1451,409736698382,6982,176522482402,3511,5138387141244,2243,0211,20363!j567760610ISOISO6,0284,9601,0685645045,7143,3622,3521,8075457,8834,0493,8343,4643702,8821,5241,3581,334241,27797630124853$57448688854tl,9595,5253,4343,42953,3222,1051,2178563622, I 181,416702658442, ISS1,791364333312,0761,4576205191013,4302,5149164284886175141021026,5975,4191,1786245546,2743,8502,4241,8515729,1804,8484,3323,8764573,4151,8771,5381,50632865611418114536Characteristics <strong>of</strong> the <strong>Criminal</strong> <strong>Justice</strong> SystemsEmployment and pcyroll aOctober 1977 October 1978Full-timeFull-timeequivalent October equivalent Octoberemployment payroll employment payroll673508165151169,4895,7123,7773,760173,9272,3101,6171,1694482,4701,546924889352,9852,292693647462,7561,6641,0929261665,1043,5301,5747388368366401961966,4585,3281,1306045265,7243,3362,3881,8705189,5225,4014,1213,6644573,2331,6331,6001,590101,4531,07837529976$632501131126410,2736,3663,9073,892IS3,7472,4761,2718953772,7851,937848807412,4341,955479447322,1941,3368587191344,9253,5531,3725548187766291461467,2936,0941,1996715286,5123,8052,7072,10859913,7928,3755,4174,8215964,1272,2041,9241,91671,08083824219151725529196194210,8256,2474,5784,56994,1322,4361,6961,1625342,4381,572866833332,3861,730656607493,1211,8501,2711,1181535,3213,5801,7418259168706781921926,3125,1231,1896675226,34113,6872,6622,06260010,2245,8484,3763,9574193,4741,8191,6551,640IS1,7071,259448361184$726551176174212,3037,4854,8184,807II4,2302,8551,375~OO4752,6771,795881840422,1351,602533496362,7091,6291,0809411395,.1823,6361,546663883849699ISOISO7,8006,3921,4087976117,3664,2203,1462,42871814,0548,4355,6194,9796404,4922,3972,0962,079161,30198231825266October 1979Full-timeequivalent b Octoberemploymentpayroll1137135221901882II ,2946,9364,3614,339234,5782,9211,6671,2084622,4271,608822790322,4611,868596566303,1582,2059527881645,9204,0941,8318489859487262282286,7025,4051,2968064915,8364,3841,4521,08237010,7746,5744,2013,7684333,6411,8341,8081,798101,8181,32350042277$741553188186213,8318,7555,J765,058185,1103,5961,5141,0564582,8821,968913868462,4251,916510481283,4142,4269888231646,6174,7891,8287121,1161,0528541981989,0567,3381,7181,0456737,1335,3631,7701,33543514,9519,1875,7645,1056595,1592,6392,5192,51181,6401,25638431668
------ ~---~-----~-----~<strong>Sourcebook</strong> <strong>of</strong> <strong>Criminal</strong> <strong>Justice</strong> <strong>Statistics</strong> I ~83Table 1.40 Employment and payroll for State and local correctional activities, by State and level <strong>of</strong> government, October 1971-OctoberI 979--Contlnued(Dollar amounts In thousands. - represents or rounds to zero.)State andlevel <strong>of</strong> goverrvnentMissouriStateLocal, totalCountiesMunicipalitiesMontanaStateLocal, totalCountiesMunicipalitiesNebraskaStateLocal, totalCountiesMunicipalitiesNevadaStateLocal, totalCountiesMunicipalitiesNew HanpshireStateLocal, totalCountiesMunicipalitiesNew JerseyStateLocal, totalCountiesMunicipalitiesNew MexicoStateLocal, toto!Countiel!MunicipalitiesNew YorkStateLocal, totalCountiesMunicipalitiesN:lrth CarolinaStateLocal, totalCountiesMunicipalitiesN:lrth DakotaStateLocal, totalCountiesMunicipalitiesun;';1StateLocal, totalCountiesMunicipalitiesOklahomaStateLocal, totalCountiesMunicipalitiesOregonStateLocal, totalCountiesMunicipalitiesto r ~Full-timeequivalent Octoberemployment payroll2,8331,6301,203742461538437101~56823689134117177673~836~32346367256III100II6,3833,2433,1403,13377806241561025425,7~715,12410,6734,3676,3064,~8~4,377612612267215524~37,5635,2202,3431,7665771,4651,08138430183I ,~901,26272864385$1,6509167354243113292795046448341667551360732528224438226158686085,0252,6602,3642,360440431786454121,87413,1818,6933,0535,6403,0052,722283283174152232025,1633,6561,5071,108399726523203148551,50798152645175See footnotes at end <strong>of</strong> table.Octo erFull-timeequivalentemployment3,2291,7441,48576B717556455101n8870707163146178424184243616345427717715BI~6,5733,OB23,4913,4B56802633169lOB6120,51210,632~,B804,5595,3215,3324,7445SS5835233In413838,8BI6,2462,6352,1205151,7591,4353242221022,0941,3~470064357~ 2Octoberpayroll$1,896~469504485023492~4544~5533427106~I157213673542946028318~9481135,4062,5532,8532,84~446~3B287464120,21411,490B,7243,5015,2233,4913, 1~72942~1315112~22I~36,83~5,0641,7751,34642~846666180115651,7021,172530478523,4671,8471,6208487725874B5102~48909669240203378764454313~734425274151130217, II~3,2523,8673,863482359023310412921,73310,99910,7344,8301145,9045,3004,6826186126259205545139,1556,4272,7282,1266021,9271,526401311902,0601,23682480222$2,2371,1151,1225365B64083446559663946517414331~).., ..i ,-03B938835533296206~I73185,%22,8633,0993,09635343B814653~322,33611,79910,5373,9276,6103,6823,3413413373156125312B37,5625,5262,0351,5005361,004753250183681,780I ,O~O6~067813to rFull-timeequivalentOctoberemploymentpayroll3,6691,9721,69794475360~490II~11541,0227802422162695847748144041457311146126207,7003,39B4,3024,2B71583561721B~712123,550II ,~5911,5915,2136,3785,9055,1967097027296247494639,4476,3893,0582,4765822,0041,6034012981032,2481,427821812~$2,5721,3121,2596456154633B2817747735~018216023963475488446423632719379137,0783,3403,7373,73175~3445147569226,02613,66412,3634,6277,7354,6204,1804404364208178302738,3195,~522,3681,8165521,212~42271186842,0361,2837527457to rFull-timeequivalenterrployment4,0302,2171,8131,059754665507158143151,210859351307441,11057253849345561374187167207,~953,3624,6334,605288606582026613623,28412,29~10,9855,4715,5146,5635,7228418365336274675939,9036,4763,4272,8206072,5332,108425346792,4721,631841832~Octoberpayroll$2,9741,6311,34373360961550011510510964684281238421,2176375805305044732112610917::,6403,2744,3664,347196475111363310327,34814,46812,8805,2877,5935,1874,644543540325821543403~.6956,7902,9052,2676381,80~1,511297232662,5001,633867857101IIIIIiIItI i!Iil!IiI'iiIiIirIIIiI:I,I:II;iiIIIi1LI 'i;ilI'/'f)I!'IIi/1Iif I"H/111!JI"1 !I:October 1976Full-timeequivalentOctoberemploymentpayroll4,1382,4021,7361,024712700536164151:161,233852381351301,14559555050743596371225202238,7343,7275,0074,979281,01174626512813723,10212,47010,6325,3815,2516,8726,0008728675368276929210,1666,4023,7643,1406242,6072,113494399952,6381,67796192536$3,229I,B371,39277761568355712612151,088805284254301,37475562056455505331174152228,7993,9124,8884,870188316421897611329,01714,99114,0265,5218,5055,9435,3565B7584330523570709,5246,3213,2032,5406631,9281,5863412637~2,8201,85296894127Characteristics <strong>of</strong> the <strong>Criminal</strong> JUstice SystemsEmplOYment and payroll aOctober 1977October 197BFul~-timeFull-timeeqUivalent October eqUivalent Octoberemployment payroll employment payroll4,4562,6561,8011,07772484161722421771,260862398368301,39169769464450691481210180309,5844,0235,5615,505561,14681433215218025,32214,59710,7255,6125,1137,1966,323873868537229'J8281I11,2846,.7674,5173,8386792,7162,201515429862,9991,9091,0901,03555$3,6272,07B1,54984970084466018517951,195868327301261,60779481475064624452172142309,9954,3325,5535,50647I,OJ47612529415833,68718,15615,5316,1479,3B46,6546,01563963633372736462I12,2658,1104,1553,3587972,2181,835383304793,2492,0691,1791,130504,3602,11591,9011,150751939709230212181,4031,0163B7330571,412791621556657525342181774110,1644,1755,9895,972171,14281033215617626,51214,98911,5235,7725,7517,9666,992~74969539B287III1047i I ,4336,8044,6293,9876422,7182,1795394301093,0651,9431,1221,1139$4,1262,3391,7871,0367511,01781320418B161,245906338287521,743967776690857955922031643911,35'/5,0466,3116,297141,1148272871091783~, 10120,19614,9066,7798,1277,9387,17376576233943019384813,4408,7634,6773,8927852,3531,8535003861143,7282,3561,3721,36210115October 1979Full-timeequivalent b OctoberemplOYmentpayroll4,7632,6832,0821,33275386B65222121921,7151,278441383581,5698756~4644507935732201843710,2174,0756,1456,1451,41399941420021528,56816,26312,2765,8776,4168,1987,1861,0221,0184394260135129711,4306,5964,8514,1876673,7113,1665444241203,2401,9411,2991,2972$4,7242,7172,0071,22378497076720320121,8251,421404339642,0901,165925859668956552412004012,0255,1776,8486,8481,4491,06538415822639,27819,63619,6427,16712,4758,9468,08386386144152821331231013,8398,5705,2694,4068623,5793,0265534221314,1562,4941,6621,6583
--~--- ~-~~~~------------. - ~--.--- - - - -Characteristics <strong>of</strong> the <strong>Criminal</strong> <strong>Justice</strong> Systems<strong>Sourcebook</strong> <strong>of</strong> <strong>Criminal</strong> <strong>Justice</strong> <strong>Statistics</strong> <strong>1983</strong>Table 1.40 Employment and payroll for State and local correctional activities, by State and level <strong>of</strong> government, October 1971-OctoberI 979--Continued(Dollar amounts in thousands. - represents or rounds to zero.)State andlevel <strong>of</strong> governmentPennsylvaniaStateLocal, totalCountiesMunicipalitiesRhode IslandStateLocal, totalMUnicipalitiesSouth CarolinaStateLocal, totalCountiesMUnicipalitiesSouth DakotaStateLocal, totalCountiesMunicipalitiesTennesseeStateLocal, totalCountiesMunicipalitiesTexasStateLocal, totalCountiesMUnicipalitiesUtahStateLocal, totalCountiesMunicipalitiesVermontStateLocal, totalCounties.MunicipalitiesVirginiaStateLocal, totalCountiesMunicipalitiesWashingtonStateLocal, totalCountiesMunicipalitiesWest VirginiaStateLocal, totalCountiesMunicipalitiesWisconsinStateLocal, totalCountiesMunicipalitiesWyomingStateLocal, totalCountiesMunicipalitiesOctober 1971FUll-timeequivalent Octoberemp!oyment payroll6,5923,2693,3231,9981,3254404402,0241,35467064030341265767242,6651,9666995561436,5653,8982,6672,3005676124991131134394354I33,3202,5357853174683,5102,59791377513898373624724523,1882,3658238232922395345Q$4,8092,3542,4561,1261,3:193903901,07777230629016188154353321,4221,019403317863,6012,0941,5071,3042043973415656333330221,9811,5484341782562,6862,30165554011544334310099I2,6251,96865765714812028235October 1972Full-timeequivalent Octoberemployment payroll7,8553,9463,9092,3181,5915195192,2671,57669166031329242878432,8442,0158296731566,4513,6792,7722,4323406835521311314384383,7322,7221,0103756353,7182,4271,2911,15913286762823923723,3622,52583683631325459509$6,<strong>1983</strong>,1992,9991,4141,5854584581,31096534533016198157414021,6081,137471381903,9212,2851,6361,4352024573867171418418(c)(c)2,4311,8306012313712,7731,875898785113454335119118I3,0092,292717717aDota for mUnicipalities, and the local governmenl·s totals thatinclude municipal data, are estimates subject to sampling variation;16714030246Employment and payroll aOctober 1973Full-timeOctober 1974Full-timeequivalent Octoberemployment payrollequivalentemploymentOctoberpayroll8,1393,9444,1952,5431,6525635632,3451,7156305973333222410810443,2782,2471,0316843477,1814,0803,1012,777324767587180179I437435224,0922,9581,1343997353,6972,3691,3281,19313594967627327123,3402,550790790309260493712- $6,9963,7173,2791,6281,6515655651,4911,150340320212221606!5922,0351,3886474082404,6962,7211,9751,741233544441103102(c)352351II2,9762,2187582994592,9281,932996866130519379140139I3,1692,436732732176150271978,7394,0084,7312,7971,9347397392,6162,04856853137312214989623,5702,3791,1918233687,4604,1243,3363,0193179016532482462420418225,4304,1591,2714887833,8512,4081,4431,362811,040744296295I3,5712,65791491434228854504$7,9804,1433,8381,9801,8587907901,7841,4/15338314242291705958I2,3661,5628035362675,2302,8902,3402,090250701549152151I350349II3,8622,9329303745573,2882,1121,1761,09581617459158157I3,4862,64084784721918732294October 1975Full-timeequivalent Octoberemployment payroll9,2994,0545,2453,2112,0346946943,1442,514630567633312666564I3,7542,4641,2909133777,9274,2033,7243,288436904699205201442241843I5,7354,2291,5066118953,9552,4571,4981,445531,004759245244I3,7872,740J,0471,0473502866451!3$8,8924,3424,5502,4462,1047877872,3631,987376332452582193938I2,804! ,8129326372956,4583,6042,8542,44241282066115915723493472II4,8183,6881,1314516803,8592,4871,3721,30369631486145144I3,8092,812998998264221443112data for counties (boroughs, parishes) are based on a canvass <strong>of</strong> a IIcounty governments and therefore are not subject to samplingSource: Table provided to S
-----------~-~---~-------<strong>Sourcebook</strong> <strong>of</strong> Criminol <strong>Justice</strong> <strong>Statistics</strong> <strong>1983</strong>Table 1.41 Workload <strong>of</strong> Federal probation <strong>of</strong>ficers, years ending June 30, 1972-82NJTE: Persons under supervision <strong>of</strong> the FederalProbation System include persons pi aced onprobation--either by U.S. District Courts, U.S.magistrates, or at the request <strong>of</strong> U.S. attorneys(deferred prosecution)--and Federal <strong>of</strong>fendersreleased from confinement on parole ormandatary release. A Federal prisoner is eligiblefor mandatory release when the prisoner hasserved the full term <strong>of</strong> imprisonment less "goodtime"allowances. If the <strong>of</strong>fender has earnedmore than 180 days <strong>of</strong> "good-time" credit,supervision (as if on parole) is for that period inexcess <strong>of</strong> 180 days. If "good-time" is less than180 days, release occurs without supervision.OfficersYears Probation required forending <strong>of</strong>ficer Presentence presentenceJune 30 positions investigations Investigation1972 549 27,558 2151973 717 29,736 2321974 1,057 29,492 2301975 1,377 31,740 2481976 1,452 32,193 2521977 1,578 26,678 2321978 1,604 27,278 2131979 1,604 27,409 2141980 1,604 23,961 1871981 1,534 24,957 1951982 I ,534 27,463 215The number <strong>of</strong> <strong>of</strong>ficers required forpresentence investi got Ions was der i ved bydividing the number <strong>of</strong> presentence inVestigationsby 128, which according to a time study is thenumber <strong>of</strong> presentence investigations one <strong>of</strong>ficercould produce in I year. The number <strong>of</strong> <strong>of</strong>ficersavailable for supervision was derived bysubtracting the number <strong>of</strong> <strong>of</strong>ficere required forpresentence investigations from the number <strong>of</strong>probation <strong>of</strong>ficer positions. (This explanationwas provided by the Administrative Office <strong>of</strong> theLhited States Courts, Division <strong>of</strong> Probation.)OfficersAverageavailable forsupervisionSupervisioncasessupervisioncases per <strong>of</strong>ficer334 49,023 147485 54,346 1/2827 59,615 721,129 64,261 571,200 64,246 541,346 64,427 481,391 66,681 481,390 66,087 481;417 64,450 451,339 59,016 441,319 58,373 44Source: Administrative Office <strong>of</strong> the United States Courts, Annual Report <strong>of</strong> the Director, 1977(Preliminary Report), p. 19; 1981, p. 14, Table 17; 1982, p. 19, Table 19 (Washington, D.C.:Administrative Office <strong>of</strong> the Unitec!States Courts). Table adapted by S.Nt>. Nt>. N'-\Collateral investigation foranother district8,470 9,203 11,932 14,526 16,483 17,476 16,506 16,836 18,502 21,233Preliminary investigation toassist U.S. cttorney632 862 953 1,645 2,022 2,137 3,102 2,006 2,167 2,158Postsentence investigationfor institution553 658 650 746 1,043 1,661 1,252 988 1,012 919Pretransfer investigation(probation and parole)7,650 8,603 9,870 10,583 10,568 10,073 9,944 9,561 8,928 8,256Alleged violation investigation(probation and parole)5,895 6,630 8,581 10,351 10,810 10,813 II ,421 12,347 12,584 12,241Prerelease invE'.stigation for aFederal or military institution 6,780 6,%5 8,805 7,1/2 7,089 8,3% 9,092 9,883 8,097 6,9%Special investigation regardinga prisoner in confinement2,921 4,628 6,010 5,085 5,478 5,838 4,932 5,684 6,021 5,755Furlough and work-release reportsfor <strong>Bureau</strong> <strong>of</strong> Prisons institutions 556 1,140 2,770 3,175 5,460 5,721 6,239 5,925 5,920 5,301Parole supervision reports5,187 5,895 7,030 12,931 8,846 8,828 17,284 21,824 23,066 21,898Parole revocation hearing reports 965 1,127 1,320 1,732 1,188 1,254 1,834 1,522 1,884 1,')09BailNt>. Nt>. Nt>. Nt>. Nt>. Nt>. 1,036 921 1,639 I,SI3Collateral bailNt>.Nt>.Nt>. Nt>.Nt>.Nt>. 192 220 502 1142Source: Administrative Office <strong>of</strong> the United States Courts, Annual Report <strong>of</strong> the Director, 1974, p. VII-3; 1976 (PreliminaryReport), p. 16; 1978 (Preliminary Report), p. 16; 1980, p. IS, Table 18; 1981, p~ 14, Table 18; 1982, p. 20 (Washington, D.C.:Administrative Office <strong>of</strong> the United States Caurts):-Table adapted by S
<strong>Sourcebook</strong> <strong>of</strong> <strong>Criminal</strong> <strong>Justice</strong> Stotlstlc~ <strong>1983</strong>Characteristics <strong>of</strong> the Cr/mln!:'! <strong>Justice</strong> SystemsTable 1.44 Selected characteristics <strong>of</strong> public juvenile custody facilities, by type <strong>of</strong>Table 1.45 Resi.d:nts, facilities, personnel, and per capita expenditures <strong>of</strong> public juvenilecustody focllJfles, by State, on Dec. 31, I!J77 and 1979facility, United States, on Dec. 31, 1977 and 1979!'OTE: See !'OTE, Table 1.43. For a description <strong>of</strong> data collection procedures and definitions <strong>of</strong>!'OTE: See !'OTE, Table 1.43. The classification <strong>of</strong> "physical environment" was first used Interms, see Appendix 3.the 1977 and 1979 censuses. It was determined by responses to questions on the degree <strong>of</strong>residents' access to the community and the extent <strong>of</strong> In-house physical and staff controls. APer capitamajority <strong>of</strong> facilities Identified In earlier censuses as detention centers, diagnostic centers,Residents Facilities Personnel eXllenditures aor training schools, and a significant proportion <strong>of</strong> ranches, fall Into the "Institutional"State 1977 1979 1~177 1979 1977 1979 1977 1979category. Most <strong>of</strong> those previously Identified as shelters or group homes, as well as someranches, are classified as "open." For a description <strong>of</strong> data collection procedures and Ulited States, total 44,096 43,234 992 1,015 61,060 61,108 $14,123 $16,509definitions <strong>of</strong> terms, see Appendix 3.Alabama 474 656 21Tll2e <strong>of</strong>26 694 905 12,561 13,133facllit~All facilities Short-term Long-term Alaska 131 142 2 2 129 127 24,759 29,159Selected characteristics 1977 1979 1977 1979 1977 1979 Arizono 653 574 17 18 527!772 13,183 15,191Arkansas 423 313 10 9 397 428 12,038 14,715Number <strong>of</strong> facilities, total 992 1,015 448 464 544 551 California 8,287 8,834 1/4 1/3 15,941 16,516 15,163 15,147[IColorado 779 627 13 14 513 580 11,984 13,388Physical environment:Institutional facilities 596 609 396 402 200 207 ~Connel'ticut 235 245 4 4 377 372 24,131 31,539Open facilities 396 406 52 62 344 344Delaware 213 206 5 5 281 169 19,298 14,124!iDistrict <strong>of</strong> Columbia 567 434 13 14 446 421 13,528 16,376Florida 2,026 2,012 50 52 1,892 1,8U7 10,691 13,555Frequency <strong>of</strong> community access:IIDaily or almast daily 313 305 59 71 254 234IIWeekly or less frequently 265 310 51 81 213 229Georgia 1,194 1,156 26 23 1,213 1,199 10,264 12,392~Never 414 400 338 312 77 88 Hawaii 103 124 3 4 136 133 16,946 18,898!IIdaho 128 195 2 2 156 165 20,080 17,923Illinois 1,208 1,175 25 24 1,826 1,944 17 ,588 20,464Security level:Strict 228 291 202 235 26 56 Indiana I,OOt! 1,094 17 16 1,206 1,015 1/ ,217 Ii ,523\1Medium 390 313 192 164 198 149 )11\Minimal or none 374 411 54 65 320 346 Iowa 409 387 14 12 553 563 18,012 21,137Kansas 627 664 14 13 801 823 15,013 20,040IINumber <strong>of</strong> personnel, total 61,060 61,108 22,150 22,622 38,910 38,486Kentucky 635 718 23 38 1,063 698 1/ ,052 12,079Louisiana 923 1,017 13 13 1,415 1,033 I 1,786 14,948~Maine 157 181 I I 230 269 13,397 20,170Status:~Payroll 46,840 48,018 !6,863 17,614 29,977 30,404 I,Nonpayroll 3,014 2,974 1,648 1,653 1,366 1,321Maryland 962 987 15 15 1,144 1,093 12,796 13,204Conmunity volunteer 11,206 10,116 3,639 3,355 7,567 6,761 Massachusetts 180 114 9 10 283 291 20,800 27,917I[~Michigan 1,8tl4 1,800 49 50 2,216 2,341 17,281 21,626\ Minnesota 626 715 21 23 952 983 17,695 18,196Mississippi 364 359 7 10 343 602 7,210 11,863asstaff.Missouri 1,130 1,002 55 50 1,523 1,256 II ,011 14,613Montana 242 176 8 7 289 199 13,562 20,176Nebraska 242 231 4 5 256 292 12,260 17,285Nevada 347 370 6 8 283 317 13,920 15,687New Hampshire 164 18i! I I 154 180 13,600 17,003New Jersey 1,094 1,388 43 50 1,860 2,254 15,894 18,624New Mexico' 370 326 4 7 267 294 9,333 11,640New York 1,545 1,395 95 55 3,01/ 2,723 2i, I iO 30,262North Carolina 868 733 15 23 934 1,194 10,306 14,774North Dakota 116 102 6 6 128 130 12,599 18,323Ohio 2,717 2,577 49 55 3,752 4,336 14,567 15,139Oklahoma 918 617 10 II 1,086 1,053 14,016 24,663Oregon 769 825 II 13 955 767 14,659 16,746Pennsylvania 1,087 1,138 31 28 1,640 1,726 22,689 24,772Rhode Island 91 86 2 2 20t! 178 29,377 39,942South Corullna 595 623 8 9 866 750 7,238 9,309South Dakota 182 135 5 5 149 136 9,891 13,193Tennessee 1,323 1,125 17 27 1,182 1,372 8,981 13,072Texas 1,952 1,713 30 30 2,443 1,734 12,506 13,391Utah 233 227 9 10 472 296 16,011 18,762Vermant 98 0 I 0 lOt! 0 13,632 XVirginia 1,348 1,400 40 51 1,745 1,933 II ,216 16,022\\r~~~~i\gtun i, i r7 1,025 32 30 1,797 1,581 17,314 24,889West Virginia 331 256 10 9 341 290 8,472 11,507Wisconsin 8t!7 676 10 10 775 733 1/ ,944 18,241Wyoming 134 177 2 2 102 105 9,497 11,421aBased on average dally popUlation.Source: U.S. Deportment <strong>of</strong> <strong>Justice</strong>, Office <strong>of</strong> Juvenile <strong>Justice</strong> and Delinquency PreventionChildren In CUstodl 1977-1979 1 A Rercrrt on the 1977 and 1979 Censuses <strong>of</strong> Public and Privat~Juvenile Detention" correctlcnal6 an Shelter Facllit)~s (Draft) (Washington, D.C.: U.S.Department <strong>of</strong> Just ce, 1992). Ta Ie adapted by SMCEBGo< staff,120
-----~---~~~. -'""".-=-./}Characteristics <strong>of</strong> the <strong>Criminal</strong> <strong>Justice</strong> Systems<strong>Sourcebook</strong> <strong>of</strong> <strong>Criminal</strong> <strong>Justice</strong> <strong>Statistics</strong> <strong>1983</strong>Table '1.46 Selected characteristics <strong>of</strong> private juvenile CUstody facilities,Ulited States, 1974, 1975, 1977, and 1979Table 1.48 Residents, facilities, personnel, and per capita expenditures <strong>of</strong> private juvenilecustody facilities, by State, on Dec. 31, 1977 and 1979NJTE: See NJTE, Table 1.43. For a description <strong>of</strong> data collection procedures and definitions <strong>of</strong>terms, see AppendiX 3.NJTE: See NJTE, Table 1.43. For a description <strong>of</strong> data collection proceduresPer capitaand definitions <strong>of</strong> terms, see AppendiX 3.--.B!l~lg!illJb Eocilities ~[~!llJlJel ~c;!jturesaState 1977 1979 1977 1979 1977 1979 1977. __.!1l2..Sefected characteristics 1974 1975 1977 1979U,lted States, total 29,070 28,688 1,600 1,561 30,918 32,921 $12,269 $15,377f\lJrnber <strong>of</strong> facilities, total 1,337 1,277 1,600 1,561Short-term 76 66 126 75Alabama 140 132 15 20 174 184 5,284 10,082Long-term 1,261 1,211 1,474 1,486Alaska 163 231 15 16 204 242 23,~IS 23,767Arizona 731 644 38 28 746 718 13,307 21,272Facility occupancy rateArkansas 373 588 19 27 402 489 4,523 10,223(percent <strong>of</strong> facllities):a~California 3,916 3,932 286 250 3,913 4,6c)7 13,353 16,533Occupied less then 70 percent21 21 20 22Occupied 70 to 100 percent 72 (b) 78 76~ Colorado 665 554 32 27 667 544 10,382 12,930Occupied more than 100 percent 7 (b) 2 2Connecticut 3~1ij369 27 21 410 363 II ,891 12,812DelawareG()l'lImber <strong>of</strong> personnel, total 28,612 27,651 30,918 32,921il District <strong>of</strong> Columbia 35 ° (b) ° 3 (b) ° 47 ° (b) ° (b) (b)Full-time 20,600 N\ 22,381 23,538~ Florida 724 728 36 30 592 588 9,201 11,736Part-time 8,012 N\ 8,537 9,383IIGeorgiaIi301 263 12 10 266I276 6,81i3 9,185Juveniles per full-timeHawalf 58 21 5 3 88 30 26,4'28 14,715staff member 1.5 N\ 1.3 1.2Idaho 106 112 7 6 159 165 1/ ,861 16,542Illinois 944 516 20 12 1,069 601 15,e-06 17,374Expenditures (In thousandsIndiana 822 954 29 44 573 886 8, j'89 I 1,332<strong>of</strong> dollars), total$294,036 $273,644 $384,327 $465,214 ijCapital $25,905 $19,173 $21,008 $25,933Iowa 319 434II30 44 366 638 13,824 21,013Operating $268,131 $254,471 $363,319 $439,281Kansas 646 761 55 64 615 826 10,486 I 1,058, Kentucky 283 234 II 12 393 418 6,031 8,897°~Per capita ogerating costLouisiana 331 407 16 17 268 314 7,,720 11,673(in dollars) $8,543 $9,516 $12,269 $15,377I Maine 324 282 17 18 172 189 7,843 8,751f\lJmber <strong>of</strong> admissions a 53,661 56,708 67,045 69,507!Maryland 588 570 44 41 714 739 le',866 12,528Massachusetts 678 687 40 4/~ 953 1,083 1;),541 17,430f\lJmber <strong>of</strong> departures a 47,471 50,986 61,571 64,574Michigan 1,092 919 49 36 1,227 1,197 1'5,631 20,115Minnesota 916 71:::: 85 62 980 875 12,872 15,810Average Mississippi dail~ number169 89 9 5 86 59 4,314 6,780<strong>of</strong> residents31,384 26,740 29 1 611 28,566I Missouri!587 515 26 23 663 664 12,205 15,360aBased on all residents (juvenile and adult).Montana 152 115 10 9 h37 149 8,756 15,885bData are not available for this specific category; 79 percent <strong>of</strong> allNebraska 489 514 II II 520 510 9,825 15,674Nevad\~privat2 facilities had an occupancy rate <strong>of</strong> 70 percent or greater.(b) 91 (b)I!7 (b) 95 5,476 (b)Based on average daily number <strong>of</strong> residents.New Hampshire 162 218 6 9 I/O 147 7,307 11,734ISource: U.S. Department <strong>of</strong> <strong>Justice</strong>, Office <strong>of</strong> Juvenile <strong>Justice</strong> andNew Jelrsey 255 427 20 17 347 505 13,059 15,764Delinquency Prevention, Children in Custody 1977-1979, A Repart on the 1977!'Jew Me,xlco 324 240 16 14 230 211 6,239 8,844and 1979 Censuses <strong>of</strong> Public and Private Juvenile Detention! Correctional! andNew York 3,427 3,319 III 149 4,564 4,913 18,652 21,790Shelter Facilities (Draft) (Washington, D.C.: U.S. Department <strong>of</strong> <strong>Justice</strong>,l\brth Carolina 403 471 31 44 379 564 9,052 12,1171982). Table adapted by SOURCEBOOK staff.North Dakota 115 91 7 6 III 107 10,030 21,165Table 1.47 Selected characteristics <strong>of</strong> private juvenile custody facilities, by tYP6 <strong>of</strong>facility, Ulited States, on Dec. 31, 1977 and 1979Ohio 1,240 1,193 76 66 1,400 I ,30/~ 11,901 16,%1Oklahomo 572 647 39 35 626 623 8,573 II ,004Oregon 443 414 39 33 555 6/.4 12,229 16,753PennsylVania 1,673 2,137 57 69 1,998 2,506 15,456 15,103Rhode Island 73 121 6 II 72 Illb 8,827 12,742NJTE: See NJTES, Tables 1.43 and 1.44. For a description <strong>of</strong> data collection procedures anddefinitions <strong>of</strong> terms, see Appendix 3.South Carolina 121 144 9 8 108 125 6,916 8,532South Dakota 287 235 19 17 227 242 9,080 11,751TennesseeI:il2e <strong>of</strong> 201 fgcilit~420 9 24 224 367 8,194 9,973All facilities Short-term Long-term,_:/Texas 1,564 1,405 47 39 1,051 1,086 6,891 10,751Selected characteristics 1977 1979 1977 1979 1977 1979UtahI! 163 211 16 15 157 167 7,136 9,770'jNJrnber <strong>of</strong> facilities, total 1,600 1,561 126 75 1,474 1,486 Vermont'I109 140 10 13 174 152 8,720 14,923!IVirginia 263 213 9 6 209 210 10,116 14,063Physical environment: WashingtonI941,)605 74 46 860 560 8,875 10,441Institutional facilities 206 174 16 14 190 160 West Virginia 20 30 6 6I i46 48 10,841 10,155Open facilities 1,394 1,387 110 61 1,284 1,326Wisconsin 628 597 42 45 896 843 16,236 20,630:1 Wyomlng (b) (b)! __ l~L (b) (b) (b) (b) (b)'1Frequency <strong>of</strong> comnunity access:Daily or almost daily 1,260 1,244 101 53 1,15> 1,191 :1bBased on average daily population.Weekly or less frequently 312 283 16 16 296 2(j7 i'Dato not shown to preserve confidentiality;{Never 28 34 9 6 19 28 guarantees; data are Included, however, in total:; entries.Security level:~~"Strict 55 42 5 5 50 37Medium 395 333 26 15 J69 318Minlmol or none 1,150 1,186 95 55 1,055 1,1311\I,tiJmber <strong>of</strong> personnel, total 30,918 32,921 1,803 1,089 29,115 31,832 PStatus:PayrollII26,030 27,821 1,162 853 24,868 26,968I'bnpayroll 2,232 2,421 263 143 1,%9 2,278IiComnunity volunteer 2,656 2,679 378 93 2,278 2,5B6\1IiSource: U.S. Department <strong>of</strong> <strong>Justice</strong>, Office <strong>of</strong> Juvenile <strong>Justice</strong> and DelinquencyI'Prevention, Children in Custod 1977-1979 ARe rt on the 1977 and 1979 Censuses <strong>of</strong> 11Public and Private uvenile Detention(Washington, D.C.: U.S. Department l Correctiona ! an S e ter acilities ra t 0 <strong>Justice</strong>, (992). Table adapted by SMCEBOOKstaff.II122d11~~I) 'i!IJ123
nCharacteristics <strong>of</strong> the <strong>Criminal</strong> <strong>Justice</strong> Systems<strong>Sourcebook</strong> <strong>of</strong> <strong>Criminal</strong> <strong>Justice</strong> <strong>Statistics</strong> <strong>1983</strong>Table 1.49 Number and percent <strong>of</strong> delinquency prevention programs providing variousservices, by type <strong>of</strong> service, Unlted'States, 1970 and 1981--ContinuedTobie 1.49 Number and percent <strong>of</strong> delinquency prevention programs provldinp various Delinguenc~ Erevention Erogramsservices, by type <strong>of</strong> service, United States, 1979 and 1981 1979 surva>' Inll survey(N:489)(N:248)ai'OTE: These data were collected through surveys <strong>of</strong> delinquency prevention programs NJlT\ber <strong>of</strong> Percent <strong>of</strong> N..mber <strong>of</strong> Percent <strong>of</strong>conducted in 19-79 and 1981 by the National Center for the Assessment <strong>of</strong> Delinquent programs programs prograro'lS programsBehavior and Its Prevention, Center for Law and <strong>Justice</strong>, Uliverslty <strong>of</strong> Washington, Seattle, <strong>of</strong>fe~ln% <strong>of</strong>fe~inB <strong>of</strong>fer}n% <strong>of</strong>fe~in!bWashington. The 1979 sample consisted <strong>of</strong> 494 delinquency prevention programs and the Service category service service service service1981 semple consisted <strong>of</strong> 254 programs. For information on the methodology <strong>of</strong> the study,see Appendix 4.Crisis intervention (includes 24 hourhotline, outreach teams, flying squads,DeHnguenc~ erevention erogroms emergency counseling services)1979 surva>' 1981 survey(N:489} (N:248}a One-to-one group links with conventional46 9.4 38 15.3I\Lmber <strong>of</strong> Percent <strong>of</strong> l\Lmber <strong>of</strong> Percent <strong>of</strong>adults (includes programs like Bigprograms programs progroms progroms Brothers/Big Sisters; Partners;<strong>of</strong>fe~in% <strong>of</strong>fering <strong>of</strong>fer.in% <strong>of</strong>fe~in% Friends) 45 9.2 36 14.5Service category service service service serviceIndividually poced learning programAffective or life skills education{Individual student works for self at(includes values clarification, own poce) 56 1/.4 22 8.9decisionmaking, problem solving,corrmunicatlon) 175 35.8 96 38.7Family subst;< .. le care (e.g., fosterhomes, adoption services, Uily care,Counseling (casework with individualsrespite care, temporary residentialand groups--exc!uding family care--not a runaway sh,!Jterl 39 7.9 39 15.7counseling or therapy) 149 30.5 102 41.1Student work opportunity as port <strong>of</strong> aConventional group activitiesschool program (e.g., work study lobs(including arts and crafts, drama,and student internship for schol..iindoor sports--not including out <strong>of</strong> credit) 36 7.4 33 13.3doors recreational activities) 144 29.4 59 23.8Training school teachers to provideTraditional classroom approach toservices <strong>of</strong> this program 50 10.2 19 7.7acadenlic skill development (includingremedial education, preparation forBehavioral modification, contingencyGED, literacy education, collegecontracting, social learning usepreparation, tutoring--not by peers) 125 25.6 62 25.0 <strong>of</strong> rewards 44 9.0 17 6.8Interagency collalx.ration (in~ludesDevelopment and disseminotlon <strong>of</strong> resourceinteragency team I ir multideportmental materials (if primor)' function) 25 5.1 30 12.1program in forge agency; includesalso coordination and planning) 121 24.7 65 26.2 Provision uf private sector job 27 5.5 28 11.3Job training, job skills development,Employment support services (includesteacl>ing en1Ployability skills 1/7 23.9 67 27.0 manitoring, follow-up, counselingwith people on the job--not priorParent or femily training/education to placen1Cnt) 25 5.1 28 11.3(porent education, family strengthening,corrmunicatlon skills, problem solving) 100 20.4 40 16.1 Preventing school dropouts, encouragingschool completion 27 5.5 24 9.7Increased interaction with convention\llpeers; cross-aged tutoring or teaching;Job development (includes solicitation <strong>of</strong>peer counseling 92 18.8 46 18.5 business to hire youth; job creation) 20 4.1 27 10.9Femily counseling or therapy (includesExperience-based career education;multiple family counseling) 69 14.1 64 25.8 exposure to the world <strong>of</strong> work throughthe schools or program to aid careerProvision <strong>of</strong> spe(;ialized information education and decisioomoking 18 3.7 27 10.9(e.g., information on the law or andrug use/abuse) to progrem porticiponts 97 !9.8 26 10.5 Health prOO1Otlon or support 34 6.94.4Training and technical assistance toMoral or citizenship education (includesother pr<strong>of</strong>essionals or agencies 80 16.3 31 12.5 education to develop conventional socialvalues, e.g., work ethic andInformation and referral service 71 14.5 40 16.1citizenship; law-related education) 30 6.1 14 5.6General comnunity education not focusedParent involvement in providing servicesonly on porticipant youth or parentsand/or running the program (not asas target:; (e.g., dn;g-related clients) 37 7.6 6 2.4education; I'lw-related education;corrmunity crime resistance education) 73 14.9 33 13.3 Out <strong>of</strong> doors recreatio:"lal activities{e.g., Outward Bound, camping programs,Drug/ alcohol focu!ed services (does notstress/challenge programs, Wildernessinclude detox) 74 15.1 26 10.5 programs) 19 3.9 19 7.7EnhCJC'~i,~-J youth participation and powerfor yout:U excluding school involvementRunaway shelter,s 25 5.1 13 5.2(behavioral contracting, involvementin corrmunity councils or boards,Parent support groups 24 4.9 13 5.2legislation or policy to enhance youthPower enhancen1Cnt for studenis in thepower or role) 76 15.5 22 8.9 classroom or concerning school-widedecisions (e.g., student InvolvementProvision <strong>of</strong> public sector, corrmunlty,in school governance and policy making;or government subsidized Jobs 64 13.0 31 12.5 school curricullXTl planning; schoolAlternative education: seporote facility 57 11.6 33 13.3Jol:- referrals, job linkages, jobplacen1Cnt in jobs not subsidized bygovernment funds 37 7.6 50 20.2See footnotes at end <strong>of</strong> table.124leadership roles; setting schooldrug policy) 27 5.5 8 3.2See footnotes at end <strong>of</strong> table.12S"
--------------------<strong>Sourcebook</strong> <strong>of</strong> <strong>Criminal</strong> <strong>Justice</strong> <strong>Statistics</strong> <strong>1983</strong>Table 1.49 Number and percent <strong>of</strong> delinquency prevention programs providing variousservices, by type <strong>of</strong> service, United States, 1979 and 1981--ContinuedService categoryDelinguenc:l (;!reventlan erogrQ!m1979 survW198 I sur'6ey(N=489)(N=248)Number <strong>of</strong> Percent <strong>of</strong> NJmber <strong>of</strong> Percent <strong>of</strong>programs programs programs progroms<strong>of</strong>ferlnq, <strong>of</strong>fering <strong>of</strong>fer.ln% <strong>of</strong>fe~in%service service service serviceStudent Involvement in decisionsaffecting self (Includes participationin selectlngcurriculum, InvolvementsIn discipline and grievance procedures,mastery learning) 17 3.5 17 6.8Low student/teacher ratio (under 21:1) 20 4.1 12 4.8Adult working with pre-existing naturalyouth peer groups (inclUdes detachedgang workers and street workers) 21 4.3 9 3.6Neighborhood organization for selfdetermination, Improvement/development 18 3.7 II 4.4Special services for minorities (e.g.,bilingual counselors, native culturestudy groups) 12 2.4 16 6.4Volunteer Job, unpaid work experience(no school credit) 19 3.9 9 3.6Private business/foundation involvementin delivery <strong>of</strong> services (not funding) 16 3.3 8 3.2Alternative education: supplementary,in traditional schO>lI 15 3.1 9 3.6Child obuse and neglect services outside<strong>of</strong> the school, including family violenceservices 6 1.2 17 6.8Target hardening (e.g., vandalism watch,security precautions, block watch,neighborhood patrols, operation 10) 14 2.9 6 2.4Reuniting families 20 4.1 N!>. N!>.Police school liaison 13 2.6 6 2.4Expasure to consequences <strong>of</strong> crime(e.g., jail visits, police lectures,lifer's progro:ns) 8 1.6 8 3.2In-school discipline program (e.g.,in-school suspension) as on alternativeto regular suspension or involvement<strong>of</strong> the juvenile authorities 9 1,8 2 0.8Performance bosed grading (selfas baseline) 9 1.8 0.4Home/school liaison (home-based rewardp~ograms, child development specialist,school-based child abuse and neglectteams) NO. N!>. 2 0.8aMisslng data on services for II programs; 5 from the 1979 survey and 6 from the 1981surve:{;Total exceeds N and percent total exceeds 100.0 because programs typically <strong>of</strong>fermore than one service.Source: Table provided to SOURCEBOOK staff by the Natll.nal Center for theAssessment <strong>of</strong> Delinquent Behavior and Its Prevention, Center for Low and <strong>Justice</strong>,U1iversity <strong>of</strong> Washington, Seattle, Washington. Table adapted by SD.-RCEBOO< staff.1261[I.,1i'\1III1\IiI!IIIiIfIiII)1IIIidljIiIIIIIII11rIIIIIIII1IIiL'Characteristics <strong>of</strong> the <strong>Criminal</strong> <strong>Justice</strong> SystemsAgure 1.9 Dote <strong>of</strong> jail construction, by decade, United States, 1800-1979I'OTE: The data below are from a survey <strong>of</strong> sheriffs conducted between September 1981 and April1982. Questionnaires were mailed to all 3,042 sheriffs listed In the National Sheriffs' Associationdirectory, to other Identifiable county institutions operated as county departments <strong>of</strong> corrections,to city sheriffs, and to larger city jails. The 2,664 completed and returned questionnaires areestimated to represent a response rate In excess <strong>of</strong> 80 percent, Size <strong>of</strong> jail was reported by2,452 <strong>of</strong> the respondents. Therefore, the size <strong>of</strong> jail subcategories do not sum to 2,664, the totalfor all Jails.A jail was defined by the Source as "a place where a person is confined after arrest toremain there in a pre-trial status unless he is bonded out or released on his own recognizance,etc.; after his adjudication by the courts, he can be returned to this some facility to serve asentence" (Source, p. 10).Percents do not add to 100 due to multiple responses. Data have been revised fromoriginal presentation through information provided ,by the Source.Not included in this figure are 108 jails constructed during the ! 980's and 291 jails that didnot complete this portion <strong>of</strong> the survey. The percents were computed on the basis <strong>of</strong> 2,265 jailsthat responded to this survey item and that indicated that jail construction occurred between1800 and 1979.1800 to 1809 (N =7)1810 to 1819 (N =2)1820 to 1829 (N =4)1830 to 1839 (N = 8)1840 to 1849 (N =4)1850 to 1859 (N =20)1860 to 1869 (N = 19)c:0 '-n 1870 to 1879 (N =5e)2iii~c:0 1880 to 1889 (N = 56)u'0Q) 1890 to 1899(N = 86)"0IIIUQ)1900 to 1909019iO to 1919(N=2,265)Percent <strong>of</strong> jails0 10 20 30I I I,'I(N =87)"\(N=110)1920 to 1929 J (N = 151)1930 to 1939 J (N = 264)1940 to 1949 (N = 85)1950 to 1959 I (N = 276)1960 to 1969 I (N = 390)1970 to 1979/JJ(N = 640)Source: Kenneth E. Kerle and Francis R. Ford, The S\tate <strong>of</strong> Our Nation's Jails 1982(Washington, D.C.: National Sheriffs' Association, 1982), p. 79. Figure constructed bysa..RCEBOO< staff. Reprinted by permission.
_______ ~, r-ri_ ,'_<strong>Sourcebook</strong> <strong>of</strong> <strong>Criminal</strong> <strong>Justice</strong> <strong>Statistics</strong> <strong>1983</strong>Characteristics <strong>of</strong> the <strong>Criminal</strong> <strong>Justice</strong> Systems"Table 1.50 .Percent <strong>of</strong> jails contracting with other jurisdictions tohouse pnsoners, by size <strong>of</strong> jail, lklited States, 1981-82/\oTE: See f\OTE, Figure 1.9.multiple responses.Reason forcontractingOvercrowdingProtective custodySpecial prisonersInadequate housingfor juvenilesInadequate housingfor femalesAlljails(N=2,664)6.925.924.127.627.5Percents do not add to 100 due to(Percent)Size <strong>of</strong> jailI to 17 to16 beds(N=640)30 beds(N=597)11.723.026.443.340.28.927.625.332.333.8(N=2,452)31 to 63 beds62 beds and larger(N=603) (N=612)4.129.724.525.723.74.131.526.615.218.8. ~urc~: Kenneth E. Kerle and Francis R. Ford, The State <strong>of</strong> OJrNotion s Jails 1982 (Washington, D.C.: Notional SheriffS' Association1982), pp • .' 77-179. Table adopted by 5O..RCEBOO< st<strong>of</strong>f. Reprintedby permission.Table 1.5.' Perce.nt <strong>of</strong> jails using selected hiring practices toscreen Job applicants, by size <strong>of</strong> jail, United States, 1981-82 Table ... 52 Perce~t. ~f jails with designated space for particularf\OTE: See NOTE, Figure 1.9. Percents do not add to 100 due tomultiple responses.(Percent)~e~vlces. or actlvlhes, by type <strong>of</strong> service or activity and size <strong>of</strong>Jail, Umted States, 1981-82f\OTE: See NOTE, Figure 1.9. Percents do not add to 100 due tomUltiple responses.Table 1.53 Percent <strong>of</strong> jails providing selected services andfacilities, by size <strong>of</strong> jail, Ulited States, 1981-82f\OTE: See f\OTE, Figure 1.9. Percents do not add to 100 due tomultiple responses.Serviceor foci lit)'Education:General EducationalDiploma (GED) 29.1Adult BasicEducation 14.4Vocational training 8.0Job placement 15.7Counseling:Substance abuse(Percent)Size <strong>of</strong> jail (N=2,452)All I to 17 to 31 to 63 bedsjails 16 beds 30 beds 62 beds and larger(N=2,664) (N=640) (N=597) (N=603) (N=612)38. IPersonal 49.6GroupChaplain assigned toJail:Yes 41.3No 45.2No response 13.514.44.13.09.229.539.28.423.965.310.824.37.74.713.733.249.116.438.751.99.432.014.89.616.741.652.925.946.647.95.554.935.917.527.659.272.143.367.327.94.7Table 1.54 Percent <strong>of</strong> jails in which inmates are supervised by<strong>of</strong>ficers <strong>of</strong> the opposite sex, by size <strong>of</strong> jail and sex <strong>of</strong> <strong>of</strong>ficers,United States, 1981-82/\oTE: See NOTE, Figure 1.9. Percents may not add to 100 due torounding.Female <strong>of</strong>ficers:Supervise maleinmatesDo not supervisemale inmatesNo answerMale <strong>of</strong>ficers:Supervise femaleinmatesDo not supervisefemale InmatesNo answerAlljails(N=2,664)29.757.313.034.6(Percent)Size <strong>of</strong> lail (N=2,452)I to 17 to 31 to 63 beds16 beds 30 beds 62 beds and larger(N=640) (N=597) (N=603) (N=612)39.554.26.335.327.664.38.037.923.568.77.841.035.957.76.434.050.814.655.69.152.99.250.48.657.88.2Source: Kenneth E. Kerle and Francis R. Ford, The State <strong>of</strong> OJrNotion's Jails 1982 (Washington, D.C.: Notional SheriffS' ASsociation,1982), pp. 139-141. Table adapted by SCLRCEBOO< staff. Reprintedby permission.HiringpracticePsychologica! testingBackground checkLie detector testPhysical testingWritten testingOral reviewOtherAlljails(N=2.61i4)1.978.28.634.128.879.76.8Size <strong>of</strong> jailI to 17 to16 beds 30 beds(N=640) (N=597)1.6 2.073.6 82.94.125.221.178.85.33.030.323.183.46.0(N=2,452)31 to 63 beds62 beds and larger(N=603) (N=612)2.0 2.585.6 92.57.337.034.286.77.622.954.245.991.710.0. ~urc~: Kenneth E. Kerle and Francis R. Ford, The State <strong>of</strong> OJrNotion s Jails 1982 (Washington, D.C.: Notional Sheriffs' Association1982), pp •. 117-119. Table adapted by 5O..RCEBOO< staff. Reprintedby permission.Service oractivityDrunk tankLibraryContact visitationAlljails(N=2,664)12.725.627.9OJtdoar recreation 28.6Dining room 17.8Counseling/education 29.2Indoor recreationDay roomVocationalMedical serviceConjugal visitation25.1145.07.135.15.9(Percent)Size <strong>of</strong> jailI to 17 to16 beds(N=640)30 beds(N=597)8.8 14.710.825.314.513.814.216.136.61.712.85.020.128.124.116.821.821.343.723.58.4(N=2,452)31 to 63 beds62 beds and larger(N=603) (N=612)16.1 15.525.926.729.913.431.227.946.66.337.57.653.454.932.459.343.666.217 .876.63.6Other services andfacilities:InfirmaryDental servicesInitial medicalscreeningMedical history16.635.241.62.718.625.927.55.729.035.335.813.938.141.841.648.964.574.273.9Psychiatric services 34.5 18.0 27.5 40.0 62.7Secure wards 24.5 14.1 22.3 29.0 39.5Indoor recreation 34.9 26.7 33.7 37.0 52.1OJtdoor recreation 29.8 17.2 25.3 30.2 54.9Source: Kenneth E. Kerle and Francis R. Ford, The State <strong>of</strong> OJrNotion's Jails 1982 (Washington, D.C.: Notional SheriffS' ASsociation,1982), pp. 193-197, 199, 200, 203, 204, 207-211. Table adapted bySCLRCEBOO< staff. Reprinted by permission.Source: Kenneth E. Kerle and Francis R. Ford The State <strong>of</strong> OJrNotion's Jails 1982 (Washington, D.C.: Notional Sh~riffS' ASSOCiation1982), pp •. 97-101. Table adopted by 5O..RCEBOO< staff. Reprintedby permission.128129
---------------------------------------<strong>Sourcebook</strong> <strong>of</strong> <strong>Criminal</strong> <strong>Justice</strong> <strong>Statistics</strong> i9B3Ttlble 1.55 Jails supenlised by jail st<strong>of</strong>f 24 hours a day and lessthan 24 hours a day" by size <strong>of</strong> jail, United States, 198'1-82!'OTE: See !'OTE, Figure 1.9. Percents may not odd to 100 due torounding.24 hour supervisil~nLess than 24 hoursupervisionNJ answer(Percent)Size <strong>of</strong> jail (N:2.452)All I to 17 to 31 to 63 bedsjailG 16 beds 30 beds 62 beds and larger(N:2,6611) (N=640) (N:597) (N:603) (N:612)79.4B.I12.578.4i4.B6.7BI.2iO.4B.4B6.27.06.B93.6Source: Kenneth E. Kerle and Francis R. Ford, The State <strong>of</strong> OurNation's Jails 19B2 (Washington, D.C.: National Sherifi'Si'""ASsociation,1962), pp. 143, 144. Tobie adopted by S
<strong>Sourcebook</strong> <strong>of</strong> <strong>Criminal</strong> <strong>Justice</strong> <strong>Statistics</strong> 19113Table 1.58 State correctional facilities and Irwnates, by type <strong>of</strong> facility, security-level, region, and State, 1979Region and Statel,klited States, totall'brtheastMaineNew HampshireVermontMassachusettsRhode IslandConnecticutNew YorkNew JerseyPennsylvanial'brth CentralOhioIndianaIllinoisMichiganWisconsinMinnesotaIowaMissouril'brth DakotaSouth DakotaNebraskaKansasSouthDelawareMarylandDistrict <strong>of</strong> CohxnbiaVirginiaWest Virginial'brth CarolinaSouth CarolinaGeorgiaFloridaKentuckyTennesseeAlabamaMississippiArkansasLouisianaOklahomaTexasWestMontanaIdahoWyomingColoradoNew MexicoArizonaUtahNevadaWashingtonOregonCaliforniaAlaskaHawaii/\oTE: See /\OTE, Table 1.57.All focllitiesConfinement facilitiesCommunity-basedfacilitiesInmatesFocll- Facll- f\bt class- FacilitiesInmates ities Total Maximum Medium Minimum ifled Other Itles Inmates791 274,563115536196103392415713162140167159228840561884278432257710132110772117114233959561210329941,6206842993762,7127413,83119,4265,9197,63261,68213,3625,67211 ,62714,0183,3532,0302,2025,1892355871,1932,214128,7531,3707,9612,2458,2961,26314,7327,0619,45119,5543,6806,5223,8322,3893,0156,6114,48126,29042,5087038014822,2411,5113,2779931,5473,8842,97522,745592757568 263,553 109,738 98,189 51,193 3,616853I61351030891011010122510587224629251353847323183910897571117902337252596309740,7006372813762,4536733,83119,1995,8907,36059,39913,2785,43111,21913,3473,1681,9871,9605,0122355871,0292,146121,7081,3257,4292,0708,0501,21113,9316,2209,03317,6813,6806,0243,2152,3102,8056,6113,82326,29041,7467038014822,1891,2993,1979171,5323,7812,87922,64559272919,63038220957982851,06510,2333,5043,24823,0803,1192,9473,5656,0221,4021,0168282,34218641135289054,7111932,0868092,6091441,3041,3834,1538,5167801,3464261,2782,4451,1291,33124,77912,317335407331,1291641,4131693052,2042,1433,654256lOS14,9331682331321,2091082,6647,5892392,59123,7877,9351,6455,1583,5501,1688279361,4274017525567142,0497943,9131,0893,9769076,6642,1173,2635,2342,1333,9361,825o2653,2131,6681,05217,420187201309442.8987582249296325712,3152002684,86987281133861231021,3771,3691,28411 ,3401,5317362,1283,7755881441961,2329I41558523,6421431,4271671,4541245,8662,5739793,8667677369581,032952,172824.45911,3421381931404962371,0264902989456796,4651301051,040o3613119o778941,183693103368oIoo11oo7o728187o1136971477764o66o97o66543oo122oo34o2115250817228o4738o1439o9o578835o561Io2oooII223 11,0/0Source: U.S. Department <strong>of</strong> <strong>Justice</strong>, <strong>Bureau</strong> <strong>of</strong> <strong>Justice</strong> <strong>Statistics</strong>, Prisons and Prisoners, Bulletin NCJ-806517(Washington, D.C.: U.S. Department <strong>of</strong> <strong>Justice</strong>, 1982), p. 3.1323022o6Io3I1556369IS6272o42113I5343119738o51232o10o24o2343I342o29204718X25968X227292722,28384241408671185442177XX164687,04545532175246S28018414181,873X49861779210X658X762XXX5221280761510396100X28I:I:I'/:I'"I-II,IiIi'iIIIIII,I~11IiIII, ilCharacteristics <strong>of</strong> the <strong>Criminal</strong> <strong>Justice</strong> SystemsTab~e 1.5~ Number <strong>of</strong> post-secondary institutions providingeu I!cd~ttl!,n Plra0796rams to correctional institutions byj res IC lon, " and 1982 '/\OTE: The data below were gathered from a survey <strong>of</strong> central?ffice-. correctl~nal ~ducatian administrators, in both adult andi)uyenlie hagen~les, In eoch <strong>of</strong> the States, the Federal <strong>Bureau</strong> <strong>of</strong>mons! t. e District <strong>of</strong> Co!umbia, and Puerto Rico. The survetWa; o'Jglnal!y conducted In 1981 but the results were verifie~~n k up d ted In a second survey conducted in 1982. Southa ~I~a Id not respond to the survey. The 1976 data are basedon en B. Emmert, Offender Assistance Programs Operated b~-Secondary Institutions <strong>of</strong> Education (Washington 0 C~rlcan ASsociation <strong>of</strong> Community and Junior Colleges '107'6)"pp. Index 1-6. ,,, ,JurisdictionTotalAlabamaAlaskaArizonaArkansasCaliforniaColoradoConnecticutDelawareDistrict <strong>of</strong> ColumbiaFloridaGeorgiaHawaiiIdahoIllinoisIndianaIowaKansasKentuckyLOUisianaM"ineMarylandMassachusettsMichig..,nMinnesotaMississippiMissouriMontanoNebraskaI-.JevadaNew HampshireNew JerseyNew MexicoNew Yorkl'brth Carolinal'brth DakotaOhioOklahomoOregonPennsylvaniaPuerto RicoRhode IslandSouth CarolinaTennesseeTexasUtahVermontVirginiaWashingtonWest VirginiaWisconsinWyomingFederal <strong>Bureau</strong> <strong>of</strong> Prisons1976224IIo4o20673I133Io9I244233I48o5IoIo8I1713o7955oIII13o9/034o(0)19823474I32144IoI177II1726635I651312I2II44442055494I7Io2492o49I4256a -d The 1976 figures included Federal <strong>Bureau</strong> <strong>of</strong> Prisons postse~n ary programs by jurisdiction. The Federal <strong>Bureau</strong> c.;fPrISons programs are reported separately for 1982.~urce: Bruce I. Wolford and John F. littlefield, "An~dam;rat:o~ <strong>of</strong> Post-Secondary Institutions that Provideth uC'983 na rograrns for the Incarcerated," paper presented atSane Ant rneeTting af the Academy <strong>of</strong> <strong>Criminal</strong> <strong>Justice</strong> Sciencesonlo, exas, 25 M arch <strong>1983</strong>, Table 8. '133I\ietchange67-7I-I2-6-2-6-3o44oI8I42-I3-23494I-3oI34-4334242-5-42I-II3-42o-5-I-2o2N\
[!r-·I<strong>Sourcebook</strong> <strong>of</strong> <strong>Criminal</strong> <strong>Justice</strong> <strong>Statistics</strong> I ~83 I Characteristics <strong>of</strong> the <strong>Criminal</strong> <strong>Justice</strong> SystemsI JTable 1.60 Characteristics <strong>of</strong> State prison Industries, by Jurisdiction, 1~82ITable 1.60 Characteristics <strong>of</strong> State prison industries, by jurisdictlan, I ~82--Continuedi'OTEI This Information was collected through a survey mailed to the departments <strong>of</strong> correction In I. Sale <strong>of</strong>the SO States, the District <strong>of</strong> Columbia, Puerto Rico, and the Federal <strong>Bureau</strong> <strong>of</strong> Prisons. Theproducts outsideLength <strong>of</strong>survey was conducted In May, june, and July 1982. Four 1Jurisdlctions~-Connectlcut, Maryland,lTypes <strong>of</strong> State institutional work dayNevada, and Ohlo-~dld not respond to the survey. Guam reported having no State operated prison Jurisuiction oEerated Erlson industries aEE9ratus Inmate Eal! \hours)Industry. The Source presents the Information as submitted by the responding agencies. (\battempt Is made by the Source to verify the information received. IdahoCarpentry, upholstery, auto body, Yes Yes; 20 to 60 7, data processing, farming, dairy,cents/hour.Sale <strong>of</strong> meat cutting, sheet metal, sign Has startedproducts outsideLength <strong>of</strong>shopTypes <strong>of</strong> State \"piece workInstitutional work daypay" whichJurisdiction operated prison Industries apparatus Inmate pay (hours) 1 equals up toiAlabama Auto togs, metal fabrication,$2.50/hourYes Yes; 10 to 25 8construction,printing, <strong>of</strong>fice remade furniture, ling, cents/hour illinois Forming, meat processing, milk Yes Yes; on 6\frozen food and can processing, restoration, processing, furniture hygiene products, repair and productionslaughterhouse and meatincentive,clothing, mattresses and linens,preparation, data processing,average wagesdata entry, highway signs, are $65 to~Jrment factory, catfish security furniture, janitorialoperation$70/manthequiprr.Emt, cigarettes, fuelalcohol, laundry, tire recappingAlaska Legislation establishing the X X XI'Indiana Metal signs, many types <strong>of</strong> Yes Yes; 50 cents 5 1/2ti. program has recently been passed. furniture, beds and bedding, to $I.IO/day •At this time the Deportment <strong>of</strong> brooms and brushes, buildingCorrections Is In a planningA few shopsisupplies, institutional clothing,mode, defining problems andare on11' soap productsprioritiesIncentive pay[i luwa Housekeeping/laundry supplies,YesArizona Metal fabrication, wood products,Yes; 24 centsYes Yes; 10 to 50 84 to 8tire recapping, sign~, textiles to $2.65/hourprinting, silk screening, cents/hourl' and garments, wood furniture,agriculture, garment, mattress,<strong>of</strong>fice furniture, metal furniture,pillow manufactureIiprinting, metal stamping, woodIiand metal restorationArkansas Duplicating operation, solar Yes, to tax 8panel and hot water systems, supported IIKansas Paint, furniture repair, y~:school bus/fire truckagenciesYes; 40 cents 4 to 6c!othlng, soap, tarm productsrestoration, garment factory,to $1.05/hourfurniture restoration, ~Kentucky Furniture, clothing, metal Yesinstitutional mattressesYes; 10 to 32 5lockers, shelVing, soap plant,cents/hourupholstery shop, tire recapping,graphic artsCalifornia Approximately 24 industrial Yes Yes; overage 6enterprises in 10 Institutions,40 cents/hourLouisiana License plates, mattresses, brooms Noplus 3 dairies, 3 farms, and IYes; incentive 8and rrops, pillows, signs,orchard. Products include woodpay rangesdentures and bridge work, denimand metal desks and otherfIfrom 2 to 20garments, soap, cleaners, meatfurniture, clothing IncludingI!cents/hourprocessingjeans, shirts, socks, shoes, etc. I:Moine Print shop, upholstery shop, YesColorado Agriculture, construction, food Yes Yes; 7 to 2SYes; pr<strong>of</strong>it6 1/2~2 1/2furniture refinishing, woodproducts, printing, signs, cents/hourshoring onto 7 workingseWing, lumber, vehiclegoodsmaintenance, and other generalproducedservices ,Massachusetts License plates, furniture, y~~ Yes; 50 cents 6 1/2printing, clothing, flags, signs,District <strong>of</strong> Gorment shop, print and screen Yes Yes; up to 66 5 1/2foundry products, decals,Columbia process, metal fabrication, cents/hour, micr<strong>of</strong>ilming, canvas goods,furniture, laundry, tire retread plus production mattresses, reupholstering, metalbonusgoods, brushes and broomsMichigan FurnitUre, clothing, shoes, YesDelaware Furniture refurbishing andYes; overageYes Yes; 15 to 60 6 7 1/2textiles, signs, decals, licenserefinishing, reupholstery, metalannual wagecents/hour plates, wood and metal products,beds and tables, hog programin fiscaliaundry services, machine and year 1~81maintenance departmentsFlorida Livestock, produce, food Yeswas $1,100No 8processing, plants, apparel,per manmetal/wood/bricks, bookbinding, Minnesota Metai products, bus Yesrenovateci vehicies, tireYes; Nt\ 71reconditioning, plastic assembly,recapping, Insecticides, othertire recapping, computermiscellaneouscomponent assembly, printing,5 1/2~telephone refurbishing, woodGeorgia Offset and screen printing, wood Yesproducts, upholstery, keypunch,furniture, upholstery operations, to 6Imetal and wood furniture, licensemetal products, concreteplates, mattresses, engraving andproducts, garments, chemicalIfsilk screeningproducts, auto tags ,IMississippi Janitorial supplies, book bindery,Howall Print shopYesYes; 30 to 60 7 7graphic arts, farming operation,cents/hourfiberglass plant, plastic signshop, metal container repair shop!1I~I 1I!!to $I.OO/hourMissouri Clothing, dry cleaning, license Yes Yesi variable, 6 1/2( tags and validation stickers, up to 37shoes, janitorial products, woodcents/hour, furnitUre, laundry, metalrshelving and furniture, highwaysigns, printing, data entry134 135
.--.'?'~.~"""',",I<strong>Sourcebook</strong> <strong>of</strong> CriQ11naI <strong>Justice</strong> <strong>Statistics</strong> <strong>1983</strong>Characteristics <strong>of</strong> the <strong>Criminal</strong> <strong>Justice</strong> SystemsTable 1.60 Characteristics <strong>of</strong> State p:-ison industries, by jurisdiction, I 982--ContinuedTable 1.60 Characteristics <strong>of</strong> State prison Industries, by j')rlsdlctlon, I 982--ContlnuedSale <strong>of</strong>products outsideSale <strong>of</strong>Length <strong>of</strong>Type <strong>of</strong> Stateproducts outside Length <strong>of</strong>institutional work dayJurisdiction operated prison industriesTypes <strong>of</strong> State institutional work dayapporatus Inmate pay (hours)Jurisdiction oeerated erlson Industries C1el?!!ratus Inmate ~al:: (llOurs)Montana Upholstery, furniture, printing, Yes, have Yes; SI.IO/day 6wood products statutorySouth Carolinaplu~ bonusRefurbishing wood and t\b Yes; $15.75 7 1/2authoritybased on'uphoisterlng products, mattresses,every 2 weeksbut markets pr<strong>of</strong>its infurniture, janitorial supplies,are notneW wood products, signs,~omedevelopedindustriesbookbindery, metal products,at this timeapparel plantNebraska Wood and metal furniture, soap and Yes Yes; 35 to 70 6 1/2floor cleaning slJpplies, licensecents/hourplates, printing, reconditionedfurniture, garment shop, mattressesSouth Dakota License plates, furniture, book Yes Yes; maximum 6bindery, sl gn shop, farm<strong>of</strong> $3.30/dayoperation producing pork, beefand dairy productsNew Hampshire Farm (producing dairy, meat, and Yes Yes; 85 centsTennessee Signs, furnl~ore,5print shop, soap, Yes, to any Yes; 25 10 50 8vegetable products), print shop,to $1.85/dayclothing, paint, license plates private, cents/hourwood products, auto garage,non-pr<strong>of</strong>it orplate shop, screen printing,StClte agencyengraving, computer data entry,auto paint and body, forestTexCls Soap and detergent, tire recClpping, Yes 8productsgarment, highway signs, map andbroom, dump truck bed, textileNew Jersey Auto tags, brushes/maps, Yes; 22 to 52 mill, bus repair, dentoi lab,5 to 6mattresses, beds/bedding, sheetshoes, woodworking, me~alcents/hour,signs,metal products, shelving, soap/pluscardboard boxes, license plates,janitorial supplies, clothing,possiblemattresses, validation stk-kers,signs, furniture, knit/socks,bonusesplastic sign foctorles, recordstextilescunverslon facility, metolfabrication plant, furnitureNew Mexico Sign shop, auto body, tag plant, t\b Yes; 20 to 50 refinishing plant7print shop, furniture manufactUre,cents/hourfarmingUtah Sign shop, print $hop, uphlstery Yes Yes; 37 to 63 7shop, carpentry, plate plant,cents/hourINew York Auto body and rTl€'chanical, cardboard Yes Yes; NA machine shop, metal shop, farm,6cartons, drafting, electronics,hog operation, meat processing,!foundry, garments, laminate/, dairyIIengraving <strong>of</strong> signs, mattresses, !metals, opticai, paint brushes,Vermont L1cens~ tags, signs, decals, silk Yes; 20 cents 8povement markings, pl(;!t1c bags,Iscreen, sawmill, creosote treated to $I.OO/hourprinting, silk screen and si9"5,guardrails and railroad ties,snow fence, soap products,dairy farm, <strong>of</strong>fset printing, r.ewupholstery and refinishing, woods~and refinished furnitureand plasticsVir~lnlaII Wood products, metal prodUcts, Yes Yes; paid on 5 i/2t\brth Carolina Metai, textile, printing, Yes Yes; 40 cenJs 8printing, sewing, data processingincentivefurniture, soap, farming,to $I.OO/day-based onlaundries, cieanlng products11sales.Averaget\brth Dakota I-brdwood products factory, sign Yes Yes; up to7!$59/manthfactory, upholstered productsWashington"$I.SO/haurPrinting, furniture, metal Yes Yes; 30 cents 7factory, welded products, chemicalproducts, signs, dairy products,to $I.OO/hourproducts, agricuiture (beef,micr<strong>of</strong>ilming, furnituredairy, swine, and field crops),refinishing, fiat goods,plastic products, transportation,upholsterywarehouse, manpower services forState and local governmentWest Virginia :..icerue plates, metal fabrication, Yes; $IS to7entitiesIisigns, decals, printing,$28/manth,engraving, audio visual repair,plus bonus <strong>of</strong>Oklahoma Micr<strong>of</strong>ilm, boxes, canned goods, Yes Yes; it is auto repair, braille books,7up toUpnolstery, furniture, furniturebased onclothing, outdoor wood furniture$30/manthrenovation, garments, signs,production,printing, draperies, mattresses,and averagesWisconsin Industries computer center, Yes, to Yes; 20 cents 7 1/2metal fabrication, meat$33/manthIndustries business afflce, metal tax-supported to $3.3S/hourprocessing, agriculture operationsfurnitUre, sign Industry, printandshop, metal stomping IndUstry,~/Jx-axemptOregon Wooden furniture, metal shop, Yes Yes; $1.00 wood products Industry, Industries7I,"ganlzatlonsupholstery shop, storm windows,to $3.00/daydistribution center, graphics,auto shop, laundryfabrics, Oakhill Graphics, photolab, Taycheedah Bindery, salesPennsylvania Industrial and agricultural Yes, to Yes; 14 to 34 6 to 7products are produced, including government~cent s/hour,Wyoming License plotes, mattress shop, Yes; 10 to 50 8wooden and metal furniture, soaps agencies and pluslaundry and tailor shops, printedcer;~s/hourand detergents, printed products, entitles productionmaterials, shoe shop, garmentmattresses, clothing, te)ttiles, receiving tax bonusesshop, sign shopc<strong>of</strong>fee and tea, shoes, cardboard funds, such ranging framcontainers, beef, pork and dairy as school 10 to 50Puerto Rico Office furniture, textiles, t\b Yes; $1.00 to 7 1/2products districts cents/hourprinting$4.00/dayRhode Island Printing plants, upholstery, Yes Yes; $1.00 toFederal <strong>Bureau</strong>6Data entry and computer Yes, to Yes; 40 cents 7 1/2carpentry, wood refinishing,$2.00/day<strong>of</strong> Prisons progronmlng, printing, signs, Federal to $I.OO/hourgarments, auto registration plates,drafting, electronics, metal-:lgencles andhorticultural programs, formfurniture, hardware, and shelving, departmentsprogramshoes and brushes, textiles,woods and elastics5
- _. - -------~--...;--~"-"----- ---Characteristics <strong>of</strong> the <strong>Criminal</strong> <strong>Justice</strong> Systems<strong>Sourcebook</strong> <strong>of</strong> <strong>Criminal</strong> <strong>Justice</strong> <strong>Statistics</strong> <strong>1983</strong>Table 1.61 Volunteer programs in correctional systems, by selected characteristics and jurisdiction, 1982JurisdictlonAlabamaAlaskaArizonaArkansasCaliforniaColoradoConnecticutDelawareFloridaGeorgiaVolunteerprogram IndepartmentYesYesYesYesYesYesYesYesYesSae footnotes at end <strong>of</strong> table.N:>TE: This information was collected through a survey mailed to the departments <strong>of</strong> corrections Inthe 50 States, the District <strong>of</strong> Columbia, Guam, Puerto Rico, and the Fecieral <strong>Bureau</strong> <strong>of</strong> Prisons.The survey was conducted In late 1982. Ten jurisdictions did not respond to the survey: theDistrict <strong>of</strong> Columbia, Illinois, Indiana, Kansas, Louisiana, Ohio, Puerto Rlc:.u, Texcs, Vermant andWest Virginia. The Source presents the information as submitted by the responrllng agencies. NJattempt is made by the Source to verify the Information received.Administered by whom?Alabama Volunteers in Corre
~~--....--,..-- --~I<strong>Sourcebook</strong> <strong>of</strong> <strong>Criminal</strong> <strong>Justice</strong> <strong>Statistics</strong> <strong>1983</strong>CharacteristIcs <strong>of</strong> the Crlmlr.o! <strong>Justice</strong> SystemsTable 1.61 Volunteer programs In correctional systems, by selected characteristics and jurisdiction, 1982--ContlnuedN.Jmber <strong>of</strong>Volunteerregistered volunteersprogram In in deportment Typical volunteerJurisdictlonl_.-::d!::e:tp.::ar~t~me.::::n~t_::.A::dm::.:::in:.::i:::s!:te::.r.::ed::....:b::.!y:.....::w:.:.h::om:.:::? _____.:.I-b.::..:.w:....::or::.e:.....;v:.:o.:.lu::.n.:..:t_=ee=r:.:s~re:.:c::.r_=u.:..:lt.:.ed::.?:...._.:.7!../.:.:I/:...:8:.:1_-.:.7!../.:.;I/.:.8:..:2~_--=d.:.u.:.ti_e.:..s_a_n_d_s_e_r_v_ic_e_s____I-bwaiiIdahoYesYesBy central Deportment <strong>of</strong>Corrections <strong>of</strong>fice.B}' individual institutions.Most by Volunteer ServicesAdministrator; through freenewspaper ods, letters to collegeinstructors, referral from othervolunteers.By coordinator ond word <strong>of</strong> mauth;some recruited from Boise StateU,iversity.342Tutoring In literacy and advancedsubjects, arts and cr<strong>of</strong>tsinstruction, AlcoholicsAnonymous, Bible study.One-to-one counseling f(jrmarrIage, religious, alcohol,drugs, education programs, etc.Is orientationtraining requiredfor all volunteers?Yes; handbook and guidelines aregIven 10 each. Supervisor isexpected to provIde essentialsregarding the specificinstitution and Inmate(s) thevoluniller will be working with.Yes; 40 hours per year.IowaYesIndividual institutions--thosewith volunteer programs havevolunteer directors who reportto the Worden or Superintendent.Through other volunteers, or bythe volunteer director who makespresentations to groups,indiViduals, colleges, veteran'sorganizations, etc.2,339Various, including AlcoholIcsAnonymous, sports activities,religioUS groups, hobbyand art groups, musicalperformances, survivalskill training, volunteercounselors.Yes; all volunteers are requiredto attend a two-hour orientationat the institutIon rhey willwork at (some as staff) and abackground check is also runon them.KentuckyYesWe are In the process <strong>of</strong>reorganizing the VolunteerProgram. The individualInstitutions and probation andparole districts administerown volunteer programs.Through the media, and via civicand church groups.(c)In the Institutions, typicallyserve as friend and contact withthe communIty for inmate(s); inthe fIeld, assist wIth employmentor other personal .-eeds.Yes; orientatIon and training isprovided by each institution andeach probation or poroledIstrict.NlClineYesCentral <strong>of</strong>fice <strong>of</strong> Deportment <strong>of</strong>Corrections has a VolunteerService Coordinator, butindividual institutions/divisionsare responsible for themanagement <strong>of</strong> their respectivevolunteer programs.Media, word <strong>of</strong> mauth, throughcivic/religious organizations,agreements with voluntoryorganizations such as AlcoholicsAnonymous, RSVP, FosterGrandparents.(d)DIrect servic.::s such as tutoring,counselIng, recreation. Indirectservices such as publicrelatIons, committees,specIal/seasonal projects.Administrative services such asclerical, program development.Contributive services, Includingthose who contribute maney,materials, equipment to thedeportment.Yes; general orientation regardingcorrections and particularinstitution; specific trainIngrelative to volunteer's jobassignment.MarylandYesCentral Department <strong>of</strong> Corrections<strong>of</strong>fice, Chief <strong>of</strong> VolunteerPrograms, who falls underDirector <strong>of</strong> Program Services.Word <strong>of</strong> mouth, mastly. Inplanning stages is a specialfocus recruitment campaign inwhich volunteer activitycoordinators and chief do active,specialized recruiting based onwritten volunteer positiondescriptions--this implementedJanuary <strong>1983</strong>.ReligioUS services and activities,indIvidual relIgIous counseling,self-help groups like AlcoholicsAnonymous, Seventh Step, Jaycees,others.Yes; all require securityorientation <strong>of</strong> I to 4 hours andsome formal training for specialskills needed Is provided at thistime. By March <strong>1983</strong> training maybe provided based on skillsrequired for positions, and on anas-requested basis by volunteer.MassachusettsYesSeveral individual volunteerprograms at several institutionsore in the process <strong>of</strong> beingcentrally coordinated. This willbe a 6 to 12 manth planningdevelopment process that startedOct. 15, 1982.Each institution has its ownrecruitment process.f\bcentralregIstrationprocess.Bible study, Alcoholics Anonymous,volunteers may provide Informalcounseling and act as links tothe communIty.f\b; presently there is nocentralized orIentation orprogram for volunteers, however,one such program is beingdesigned. Some institutions doprovide various forms.MichiganYesAdministered from central <strong>of</strong>ficeby Assistant for Prisoner Affairs.We use media, volunteer localactIon committees, volunteerscontact us, unIversities andschools.2,000 0 CounselIng, religioUS,educational, job placementassistance.Yes; provide a summary <strong>of</strong> our newemployee training program,approximately 12 hours.MinnesotaMississippiMissauriMontanoYesl..cYesEach <strong>of</strong> the institutionsadmInIsters its own volunteerprograms to meet own needs.xThere is Central Officecoordination for entire programstatewide.xLocal interest seems to be presentwithout extensive recruitmentefforts. News releases sent tolocal papers, presentatIons tocommunIty groups and just word <strong>of</strong>mauth communications are themain recruitment methods.xPrimarily word <strong>of</strong> mauth.x5000 One-on-one Inmate volunteerfriendship meeting thwugh aprivate program called AmIcus,and custody volunteers comprisethe largest numbers <strong>of</strong>volunteers.xX535 One-to-one, group counseling,nurse aIde traIning, assertiontrainIng, tutors, correspondence,fine arts, socIal organizations,therapeutic organizations,relIgIous programs, recreatIon,clerIcal.xXl1,I I'HI,IIYes; VOl ies according to volunteerasslgr,ment.XYes; volunteers attend a six-hourgeneral orientation, plus anadditional two hours provided bythe institution.XSee footnotes at end <strong>of</strong> table.140141
.~. ---..ot--~.....--- -- ~------_._-_. '-<strong>Sourcebook</strong> <strong>of</strong> Crlminol <strong>Justice</strong> <strong>Statistics</strong> <strong>1983</strong>Table 1.61 Volunteer programs in correctional systems, by selected characteristics and jurisdiction, 1982--ContinuedVolunteerprogram inJurisdiction department Administered by whom?NebraskaNevadoNew i-hmpshireNew Jersey.New MexicoNew YorkNJrth CarolinaNJrth DakotaOklahomaOregonPennsylvaniaYesYesYesYesYesYesYesYesYesYesYesSee footnotes at end <strong>of</strong> table.By individual institutions.Senior Chaplain oversees program.New I-hmpshire has no Deportment<strong>of</strong> Corrections--VolunteerProgram, as are all services,administered by the State Prison.By individual institutions andBureou <strong>of</strong> Parole.The programs involving volunteersare adm;nistered out <strong>of</strong> central<strong>of</strong>fice, with individualinstitution contact persons.Four Regional Coordinatorssupervise 24 local Supervisors.Overall coordination <strong>of</strong> thevolunteer program is theresponsibility <strong>of</strong> the programconsultant. The program withinthe divisions is theresponsibility <strong>of</strong> the AssistantDirector for Program Services.State Penitentiary (which iiiDepartment <strong>of</strong> Corrections)administers program.Generally administered by eachfacility with only loose indirectCentral Office supervision. Thereis a new pilot/demonstrationproject being planned to set! whatsuch a program con do. There willbe one project at 0 CommunityTreatment Center, a Probation andParole District Office, and a(prison) co;rr~ctional center.Individual institutic>ns and FieldService regions admhister andmaintain their own programs.Centrally directed via policyrequirements.Coordinator <strong>of</strong> CommunityResources. Central Department <strong>of</strong>Corrections.f\lmber <strong>of</strong>registered volunteersIn departmentI-hw are volunteers recruited? 7/ I /81-7/1 /82Through universities,organizations, churches, word <strong>of</strong>mouth.Speaking engagements, word <strong>of</strong>mouth by other volunteers, activerecruitment.Potential volunteer fills outrequest form; he then must beapproved by the division head.Usually through public speakingengagements at service clubsand church groups.Usually by other volunteers, or byst<strong>of</strong>f soliciting assistance insome project.After a facility needs assessment,volunteers are recruited to meetthe qualifications <strong>of</strong> individualjob descriptions. Mass recruitingis discouraged. Staff and irmatevolunteers are utilized. Alsohave contacts through localcommunity groups, colleges,Voluntary Action Centers, etc.Various methods, includingone-to-one contact, media,speec;,es to groups (such aschurches, classes) and othervolunteers.Most contact institutions andrequest to provide theirservices. Many volunteer afterthe Warden or Director <strong>of</strong>Prograrm let needs be knownthrough speeches, press,workshops, etc.By staff contacts with theirpr<strong>of</strong>essional counterparts Incolleges, uniVersities, and atother State agencies. Generally,they are recruited by themselves.Public speaking engagements,student practicum programs, anddirect inquiry from generalpublic.Via Deputy for Treatment at localinstitution or Coordinator <strong>of</strong>Conmunity Resources at central<strong>of</strong>fice.142325(e)971871,700Typical volunteerduties and servicesMany meet individually or ingroups with Inmates Insideinstitutions.Chapel services, Bible studies,counseling, porole programs andsupport groups.Religious, counseling,educational.Visitation, teaching (tutoringand crafts), some churches workon community plocements forparolees.Many teach special classes,provide tutoring, visiting,entertainment, teach aboutvarious cultural practices, suchas N:1tive American inmates.Tutoring, pre-release services,religious programs, educational,vocational, arts and cr<strong>of</strong>ts,theatre, counseling, cl)lturalprograms, special events, specialprojects.Instruction (as In tutoring, artsand cr<strong>of</strong>ts), <strong>of</strong>fice assistance,recreation, prison libraries,speaking to Inmates, organizedgroups who provide services (forexample Jaycees, AlcoholicsAnonymous), religious activities,employment /residence assistance,transportation, others.Friends program, Bible studygroups, counseling, hobbyvolunteers, art instruction,remedial reading, lecturepersonnel, etc.Counseling.Wide range from teaching tocounseling and/or transporting <strong>of</strong>certain custody Inmates andclients.Provide tutoring--instruction Inreading, art, music, Bible study,etc. ond provide othereducational and/or therapeuticprogramning.II !IiIII;I,iI.I'IJ'IiIIr1;III,Ii!1i\I! iLI:l'IiI:IiIIs orientationtraining requiredfor all volunteers?Yes; all volunteers are providedorientation to the system, theinstitution, and the Irmates.Yes; three-hour training programprovided by training <strong>of</strong>ficer.Yes; the coordinator providesorientation to rules <strong>of</strong> theinstitution and the role <strong>of</strong> thevolunteer.Yes; policy and procedure requirethat volunteers be givenorientation to the institution,training In irmate lifestyle,etc. Volunteers may attendappropriate sessions at theTraining Academy.Yes; orientation includes a tour<strong>of</strong> the facility, a meeting withthe person responsible forsupervision, an explanation <strong>of</strong>the rules and regulations,specifi-: training would bedesigned by the area in which thevolunteer will be working.Yes; all receive orientation tothe volunteer program, rules andregulations for the Division, andinformation about the unit inwhich they will be assigned.Y~s; all volunteers. are given anorientation training sessionspelling out expectations, rules,regulations, and guidelines <strong>of</strong>what we are trying to accomplish.YesYes; a minimum <strong>of</strong> 8 hoursorientation to polfcy andprocedures, job duties andresponsibilities, ond internalcommunication is required priorto assignment t" any volunteerduty.Yesi all volunteers are required tohave ot least two hours <strong>of</strong>instruction provided by thetrainlna coordinator <strong>of</strong> the localinstitution. Volllnteers are alsoprovided with materials whichadvise and educate the volunteersrelative to institutional rules,etc.Characteristics <strong>of</strong> the <strong>Criminal</strong> <strong>Justice</strong> Systems
~-~ - -~,..--- ------~----------------------~~~------------~, -' ,~.i<strong>Sourcebook</strong> <strong>of</strong> <strong>Criminal</strong> <strong>Justice</strong> <strong>Statistics</strong> <strong>1983</strong>Characteristics <strong>of</strong> the <strong>Criminal</strong> <strong>Justice</strong> SystemsTable 1.61 Volunteer programs In corr-ectional systems, by selected choracterlstlcs and jurisdiction, 1982--ContinuedVolunteerprogram inJurisdiction deportment Administered by whom?Rhode IslandSouth CarolinaSouth DakotaTennesseeUtahVirginiaWashingtonWisconsinWyomingGuamFederal <strong>Bureau</strong><strong>of</strong> ~(isonsYesYesYesYesYesYesYesYesN:>YesYesCentral Department <strong>of</strong> Corrections<strong>of</strong>fice with support fromstatewide comnission forvolunteer services.Each individual institution isresponsible for developing andcoordinating its own volunteerprogram. Central <strong>of</strong>fice maintainsagency record keeping anddisperses pertinent infotmt:!tion.Penitentiary.We have a State Director, 8regional coordinators, and ast<strong>of</strong>f person in each institutionassigned to volunteer services.Coordinated by central <strong>of</strong>fice;administered by individualsections.Central Deportment <strong>of</strong> Corrections<strong>of</strong>fice administers; however, ineach institution or agency branchutilizing volunteers, there is acoordinator who oversees the use<strong>of</strong> volunteers.There is a Comnunity Illvo!vementProgram at the central <strong>of</strong>fice todevelop policy, provide technicalassistance, and monitor facilityprograms, but primaryadministration tokes place atthe facility level.N:> central administration at thispoint, although it has beendiscussed. Programs are monitoredby eacn individual Institutionor unit. Although centralDepartmE:nt <strong>of</strong> Correctitlns doesnot sponsor or direct suchprograms, we do encourage andaccept a variety <strong>of</strong> volunteerprograms, and do monitor theiractivities.xCentral Deportment <strong>of</strong> Corrections<strong>of</strong>fice.Program administered by eachInstitution. An overall policystateroent governs theimplementation <strong>of</strong> the volunteerprograms.NJrnber <strong>of</strong>registered volunteersIn departmentHow ore volunteers recruited? 7 II /81-7 II /82Through use <strong>of</strong> statewidecomnission as well as newspaperods.~st approach the agency aboutinvolvement, such as churchgroups. We are just beginningto be active in recruitment <strong>of</strong>volunteers and \'.:>Iunteerservices. Each institutionrecruits to fill its own needs.From local, area and regionalchurches.Word <strong>of</strong> mouth, speakingengagements, advertisements, etc.(f)1,985Advertising, coordination with 1,027civic and religious groups.Approximately 70 percent arerecruited simply by word <strong>of</strong>mouth; no "shotgun" recruiting.Generally called "unpoid staff"rather than "volunteers." Allregular service volunteers have ajob description. Volunteerpositions are filled like poidst<strong>of</strong>f positions--have a specificneed, find right perse>n for thejob. Also utiliZe student internsthrough local universities.Most are from local religiousorganizations. Interns arerecruited from colleges anduniversities, some volunteersare recruited from serviceorganizations. A few programshove recT\liting flyers and usenewspoJjerli.(g)(h)Volunteer IJrganizations do 600 0own recruiting.xUsually referrals from the 4lkliverslty <strong>of</strong> Guam socialsc!~nces are receiVed.Often by Institutional chaplainsand speaking engagements.2,S:nXTypical volunteerduties and servicesVolunteer Court Aides, pre-releasetrainers, training academyconsultant, planners, studentinterns, other.Religious activities, AlcoholicsAnonymous, Individual and groupcOl.ln~eling, arts and cr<strong>of</strong>ts,one-to-one visitation program,comnunity group lectures.Rilgulor visits, lectures, attendI pecial events, appear at paroleh"arings, be present on dischargedol'!.Assume s~lective case loads,counseling, transporting clientsto appointments, etc. Onewell-established, well-receivedprogram is the ''Family HorneEvening Program."Tutors, religiOUS, one-to-oneadvocates, many more. Occasionalvolunteers include rock bondswho come in for one show, other"special event" people, someclergy people.Furlough sponsors, religiousservices, one-to-one guidedfriendships, Interns from paroleand probation are typical.Most activities focus onone-to-one counseling/support.xInitial Interviews, casepre§!mtgtlgns befgre comnlttees,research work.Marriage enrichment seminars,Bible study, religious services.bApproximate figure.d 100 indiViduals, plus 250 organizations.There were a to,tol <strong>of</strong> 255,616 volunteer hours put in during~Divislon <strong>of</strong> Prlsons--2,583; Division <strong>of</strong> Probatlon--2,400.flscal,!.ear 1982.N:> definite number, on average <strong>of</strong> 1,340 per month.• N.imbers are not compiled.Source: Contact, Inc., Corrections Compendium (Lillcoln, Neb.: Contact, Inc., April <strong>1983</strong>), pp. 6-11. Table adapted by SClLRCEBOO< st<strong>of</strong>f.Reprinted by permission.144Is orientationtraining requiredfor all volunteers?Yes; required orientation includesoverview <strong>of</strong> basic operations andgoals <strong>of</strong> department, securitymatters, familiarization withother department staff, areas <strong>of</strong>responsibility and lines <strong>of</strong>comnunicatlon.N:>; orientation is given to thoseWho are reQulllr volunteers.Special groups and events notgiven orientation.Yes; a series <strong>of</strong> orientationmeetings about the progran andguidelines before match is made.Yes; all volunteers must receiveat least 6 hours <strong>of</strong> trainingbefore certification.Yes; upon entering the correctionssystem, 01/ volunteers receiveorientation as to agency policiesand expectations.Yes; 01/ volunteers receiveorientation and training. Theintensity <strong>of</strong> the training dependliupon whether they are regularservice or one-time volunteers.Yes; It varies. Interns receivethe most extensive orientationand training on on ongoing basis.Some facilities have slidepresentations and handout <strong>of</strong>rules and regUlations.Yes; althcv.::,jh not yet formolizedall volunteers to institutions 'do receive some orientation;we do not provide training.XYes; given a complete briefinggn obJeGti\!es <strong>of</strong> correctiOi"iSand practical procedures.Yes; all recp.lve general overviewand familiarization, and morespecific orientation/trainingfor the duties they will perform.g4,023 regular service (on-going) volUnteers' 2 016 occ' IvolunWers. " aSlonoM?nthly averages: prlsons--I,600, adult probation and porole--50,work/t/,alnlng release--600-I,OOU.145
<strong>Sourcebook</strong> <strong>of</strong> <strong>Criminal</strong> <strong>Justice</strong> <strong>Statistics</strong> <strong>1983</strong>I:TCibie 1.62 Characteristics <strong>of</strong> State paroling authorities, by Jurisdiction, 1982 I:/\oTE: This information was collected through a mail survey sent ,to the director <strong>of</strong> eoch Statedeportment <strong>of</strong> corrections. Questionnaires may have been forwarded to anoth~r <strong>of</strong>fice.NJrnber <strong>of</strong>Administrator <strong>of</strong> Independent board Full-timeJurisdiction I\kune <strong>of</strong> agenc~ [!arole field services agenc:t merrbers boardAlabama Boord <strong>of</strong> Pordons and Paroies Board <strong>of</strong> Pardons and Paroles Yes 3 YesAlaska Boord <strong>of</strong> Parole Divi~Jon <strong>of</strong> Corrections Yes 5 f\bArizona Board <strong>of</strong> Pardons and Paroies Deportment <strong>of</strong> Corrections YP.s 5 Yes IjArkansas Board <strong>of</strong> Pardons and Paroles Deportment <strong>of</strong> Corrections Yes 5 f\b jCalifornia Boord <strong>of</strong> Prison Terms Deportment <strong>of</strong> Corrections Yes 9 YesfiColorado Boord <strong>of</strong> Parole Division <strong>of</strong> Corrmunity Services Yes 5 Ye& 1'JConnecticut Boord <strong>of</strong> Parole Deportment <strong>of</strong> Corrections Yes II f\b :iDeiaware Boord <strong>of</strong> Parole Deportment <strong>of</strong> Correction Yes 5 No a ~District <strong>of</strong> Coll.KTlbia Boord <strong>of</strong> Parole Deportment <strong>of</strong> Corrections Yes 3 YesFlorida Parole and Probation Deportment <strong>of</strong> Corrections Yes 7 YesIiCommissionGeorgia Boord <strong>of</strong> Pardons and Parole Deportment <strong>of</strong> OffenderRehabilitation Yes 5 Ye~~Howaii Paroling Authority Paroling Authority Yes 3 f\bIdaho Corrmission for Pardons and Department <strong>of</strong> Corrections Yes 5 f\bParoleIIIllinois Prisoner Review Board Department <strong>of</strong> Corrections Yes 10 Yes11Indiana Parole Boord Deportment <strong>of</strong> Corrections Yes 5 YesI!Iowa Boord <strong>of</strong> Parole Deportment <strong>of</strong> Social Services Yes 7 f\b IiKansas Adult Parole Authority Deportment <strong>of</strong> Corrections Yes 5 Yes "JiKentucky Parole Boord Corrections Cabinet Yes 5 YesLouisiana Boord <strong>of</strong> Parole Deportment <strong>of</strong> Corrections Yes 5 YesI!Moine Parole Board Deportment <strong>of</strong> Corrections Yes 5 f\b IiUMaryiand Paroie Commission Deportment <strong>of</strong> Public Safety iand Correctionoi Services No 7 Yes~:1Mossochusetts Parole Boord Porole Board Yes 7 YesMichigon Porole Boord Deportment <strong>of</strong> Corrections f\b 7 YesMinnesota Department <strong>of</strong> Correcti%,s, ~Office <strong>of</strong> Aduit Re!ease Department <strong>of</strong> Corrections f\b 4 No a !Mississippi Parole Board Deportment <strong>of</strong> Corrections Yes 5 f\baIMissouri and Parole Board <strong>of</strong> Probation Board <strong>of</strong> Probation and Parole Yes 3 YesMontana Board <strong>of</strong> Pardons Department <strong>of</strong> Institutions Yes 3 f\bNebraska Board <strong>of</strong> Parole Department <strong>of</strong> CorrectionalServicesNevada Board <strong>of</strong> Parole Deportment <strong>of</strong> Parole andNo 5 No cCorrmissioners Probation Yes 3 YesNew Hornpshire Boord <strong>of</strong> Porole Board <strong>of</strong> Porole Yes 3 f\b,New Jersey Porole Board Deportment <strong>of</strong> Corrections Yes 7 Yes ~New tv'.cxico Parole Boord Corrections Deportment Yes 3 Yes i~New York Boord <strong>of</strong> Parole Division <strong>of</strong> Parole Yl'.!s 12 YesNorth Carolina Parole Commission Department <strong>of</strong> Correction Yes 5 Yes~North Dakota Porole Boord Parole and Probation Deportment Yes 3 NoI,ilOhio Adult Parole Authority Deportment <strong>of</strong> RehabilitationIIand Correction No 7 Yes I,Oklahoma Pardon and Parole Board Department <strong>of</strong> Corrections Yes 5 f\b IjOregon Board <strong>of</strong> Parole Corrections Division Yes 5 YesIPennsylvania Board <strong>of</strong> Probation (md Board <strong>of</strong> Probation and Parole Yes 5 Yes :;ParoleRhode Island Parole Board Deportment <strong>of</strong> Corrections Yes .5 NoSouth Carolina Parole ond Corrmunity Parole and CommunityCorrections Board Corrections Board Yes 7 NoSouth DakotCi Board <strong>of</strong> Pardons and Paroles Office <strong>of</strong> Correctional Services Yes 3 f\bTennessee Boord <strong>of</strong> Paroles Boord <strong>of</strong> Paroles Yes 5 YesTexas Boord <strong>of</strong> Pardons and Paroles Boord <strong>of</strong> Pardons and Paroles dYes 3 YesUtah Board <strong>of</strong> Pardon ond Parole Division <strong>of</strong> Corrections No 5 f\bIi1/iIr'-----~---., . "-.rIiI,~IiIIiTable 1.63 U.S. Parole Commission hearing examiner workload,1978-81Charocteristics <strong>of</strong> the Criminol <strong>Justice</strong> Systemsby type <strong>of</strong> hearing or record review and region, fiscal years/\OTE: The hearing examiner's worklood cons'stperson hearing, the <strong>of</strong>feilder appears before J the o~:~-person hearings and record reviews. At in in-~onslderatlon. At a record review, only information min~r ian~ ~an hintro~uce additional information forome data reported as hearings were actuall r~on a ne I~ t e prisoner's case file is considered.concurrent Federal and State sentences in a Stat~' c~rd revle~s ~ecause the prisoner was servingparole dote procedures, "one-third heorings" and " mrtltu~on'l With Implementation <strong>of</strong> presumptiveFor defln!tions <strong>of</strong> initial hearin one- h rev, ew ear ngs" hav,c be?" phased out.terms, and 0 list <strong>of</strong> States in region;; see h,~~n~i~o~~g, stotutory reView i mterim hearing, and otherPre-hearing/ StatutoryTotoipresumptiveInitiaireview/ Insti-Re ion decisionsdote recordheorininterim Locol tutional!'eview hearin revocotion revocationTotol: hearin hearing Other1978 23,305 11,98019791,04422,9184,57411,8721,002 1,946141618 X198024021,8864,57810,3792,004 310 1,53510937 366723IS8127518,5405,4787,7881,790 131,771X1,0% 3074,480 3661,579 319X2,0421,095 393Northeost:>: 369 2,039 3651978 4,441 2,1031979 181 1,0174,515 2,199197 404198026 1291,018 393X 454,507287 782,260 38 1% 2171981 0 1,051 322 314,0513321,620 3 245 65X 1,104 32092 32X417286 85XSoutheast: 46 416 721978 5,'126 2,9251979 2125,3901,197 2062,879 30557 1841980 1,104 387X 455,880345 552,991 844253 1011981 464,6521,4992,143399 0 423273 83X 1,145 28341 49X 499189 125XNorth Centrol:64 577 1041978 4,959 2,5311979 2384,9738902,546245 460 91198035 1,027 520X 544,253310 1401,887 III4161 921981 1,030 385 843,706309 881,340 X9844207 134391 109X 236417 71XSouth Central: 121 429 511978 3,370 1,9351979 1283,6305861,80091 235II 991980X 253,1317561,402227 43 2261531152411981 I 868 228 462,986320 331,422 0X 751177 26195 33X 34518151West:X 21 333 361978 4,809 2,4861979 2854,4108842,448 39290 115 X1980 714,115673I ,83~34367174 481981 I 1,030 72 683,145387 381,263 XI636194 73 % 364 61284 102~Vermont Boord <strong>of</strong> Parole Deportment <strong>of</strong> Corrections Yes 5 f\bVirginIa Parole Bv"Ord Deportment <strong>of</strong> CorrectIons Yes 5 YesWashington Boord <strong>of</strong> Prison Terms Deportment <strong>of</strong> Corrections Yes 7 Yesand ParolesWest Virginia Board <strong>of</strong> Probation and Parole Deportment <strong>of</strong> Corrections Yes 3 YesIiWisconsin Parole Boord Department <strong>of</strong> Health and f:Social Services No 9 Yes nWyoming Adult Prlrole Boord Deportment <strong>of</strong> Probation Yes 3 f\b II'and Paro:e li "Federal Parole (~orrmission Federal District Courts Yes 9 yes ~"aThe chairman serves full-time; members serve cThe chairman and two members servp. full-time; ~port-lime. two ~ers serve port-time. IiMinnesota Corrections Board was legi~latively ius a nine-member Parole Corrmlsslon. )1ab?lished on June 30, 1982.nSource: American Correctionai Assor.Jation, <strong>1983</strong> Director11Institutions "lAgencies ond Paroling Authorities (College or ,tReprinted by permission. ,:
<strong>Sourcebook</strong> <strong>of</strong> <strong>Criminal</strong> <strong>Justice</strong> <strong>Statistics</strong> <strong>1983</strong>Table 1.64 Parole revocation hearings conducted by hearing examiners <strong>of</strong> the U.S.Parole Conmission, by type <strong>of</strong> revocation hearing and region, fiscal years 1977-81!'OTE: See !'OTE, Table 1.63. If probable cause for revocation is established at thepreliminary local hearing, the parolee moy be returned to the Institution to await the finalrevocation heoring. A preliminory local hearing is not necessary if the parolee has beenconvicted <strong>of</strong> a crime c:omnitted while under supervision.Data for 1978 have been revised from earlier reports by the Source.For definitions <strong>of</strong> terms and a Ii~t <strong>of</strong> States in regions, see Appendix 5.Tl::~e <strong>of</strong> revocation hearingPreliminarr local hearingFinal revocation hearingRegion 1977 197B 1979 1980 1981 1977 1978 1979 1980Total 230 240 275 319 369 1,772 1,535 1,771 2,042Northeast 46 45 31 32 46 330 287 332 417Southeast 20 45 46 49 64 348 345 423 499f\.'?rth Central 44 54 84 109 121 36B 310 309 417SoLlth Central 44 25 46 33 21 292 226 320 345West 76 71 68 96 117 434 367 387 36419812,039Source: U.S. Department <strong>of</strong> <strong>Justice</strong>, U.S. Parole Comnission, ~rt <strong>of</strong> the U.S. ParoleCorrrnission, October I, 1976 to September 30, 1978, p. 17, Tables I-G and I-H; October la197B to SepteiTlber 30, 1980, p. 19 (Washington, D.C.: U.S. Department <strong>of</strong> <strong>Justice</strong>); onSh~ldon Adetberg, "Workload and Decision Trends: Statistical Highlights (Fiscal Years 1979-1981 )," Report 32, U.S. Parole Corrrnission, 1982. (Mimeographed.) P. I. Table adopted byS
--""'1,- ~,.--- --_'M~II!tlT'-~'r.·. - _...r. _O~~'.-.-,"'--~"-.. ::'J..:'"\._....:~~.:;.- ..,~----."l\\, I\
-- -- --------------------------------------------------------~------------------.---------------------------------Characteristics <strong>of</strong> the <strong>Criminal</strong> <strong>Justice</strong> SystemsTable 1.66 Number, total funding, budgeted capacity, and utilization rate <strong>of</strong> drug abuse treatmentunits, by jurisdiction, on Sept. 3D, 1982NJTE: These data WE:re collected through the NationlllDrug and Alcoholism Treatment Utilization Survey{NDATUS}. Prior to 1979, the survey included onlythose facilities involved in the treatment <strong>of</strong> drugabuse; expansion <strong>of</strong> the survey to include olcoholismtreatment units reflects a Joint effort between theNational Institute on Drug Abuse (NI DA) and theNational Institute on Alcohol Abuse and Alcoholism{NlMA}. Other agencies that cooperate in thesurvey are the Food and Drug Administration, theVeterans Administration, and each <strong>of</strong> the Stateagencies responsible for drug abuse and alcoholismprograms.A trea1ment unit is defined as a "facilityhaving (I) a formal structured arrangement for drugabuse treatment using drug-specified personnel, (2)a designated portion <strong>of</strong> the facility (or resources)for treatment services, ond (3) on allocated budgetfor such treatment services." Of the 3,018treatment units, 1,514 provided only drug abusetreatment services, ond 1,504 provided both drugabuse and alcoholism treatment."Budgeted capacity" is defined as the maximumnumber <strong>of</strong> clients a unit can treat. ''Utilizationrate" is the number <strong>of</strong> actual clients in treatmentdivided by the budgeted treatment capacity. "Totalfunding" includes all sources <strong>of</strong> funding for ali units.The funding data are not based on audits and shouldbe considered estimates.This information was provided by the Source.l.JurisdictionNumber <strong>of</strong>drug abusetreatmentunitsTotal Total Utilizationfunding {in budgeted rate (per 100thousands treatment budgeted<strong>of</strong> dollars)a c02acit~ capacity)Total 3,018$533,631 196,289 88.3Alabama 22Alaska 12Arkonsas 84Arizona 14California 282Colorado 32Connecti!:ut 65Delaware 8District <strong>of</strong> Columbia 21Florida 94Georgia 73Hawaii 7Idaho 9illinois 70Indiana 33Iowa 43Kansas 43Kentucky 106Louisiana 79Maine 16Maryland 78Massachusetts 78Michigan 106Minnesota 36Mississippi 47Missouri 21Montana 8Nebraska 18Nevada 24New Hampshire 17New Jersey 85New Mexico 29NE:w York 368North Carolina 35North DakOTa 10Ohio 125Oklahoma 22Oregon 27Pen~ylvania 115Rhode Island 13South Carolino 43South Dakota 14Tennessee 68Texas 131Utah 29Vermont 20Virginia 40Washington 52West Virginia 16Wisconsin 112Wyoming 9GJomIPuerto Rico 107Virgin IslandsI1,821 1,068 94.31,046 146 91.87,720 4,236 73.8825 596 61.169,046 24,331 8!i.95,353 1,952 97.012,799 3,158 94.2847 355 95.87,193 3,343 106.315,355 ~ 7,331 79.018,561 3,308 78.21,707 350 90.3300 238 51.314,784 5,599 87.24,313 1,309 77.23,423 795 50.24,623 1,360 63.83,338 1,575 65.37,161 4,833 85.0. 619 270 83.014,612 6,428 96.510,009 3,251 89.620,552 6,935 83.95,477 1,301 77.71,130 985 58.13,578 1,363 98.2708 283 101.81,552 648 90.31,590 783 91.81,895 370 83.218,028 8,252 91.84,226 1,859 89.0151,253 47,383 98.22,791 1,592 68.2357 300 94.020,804 8,103 85.81,501 521 71.82,514 1,130 93.824,595 7,480 100.52,188 896 94.92,583 1,266 94.9573 521 27.35,574 j ,742 68.417 ,997 8,568 84.82,572 '1,121 97.8851 356 79.28,802 2,918 90.56,695 2,491 90.0895 876 71.99,832 2,836 63.4634 494 63.457 30 53.36,237 7,044 79.7133 10 60.0'..,,' w.aDetaii may not add to total due to rounding.Source: Table adapted by saRCEBOa< staff from tables provided by U.S. Department <strong>of</strong> Health an·iH.nnan Services, National Institute on Drug Abuse.o\149
- -~--~--~-~~-------~----------Table 1.67<strong>Sourcebook</strong> <strong>of</strong> <strong>Criminal</strong> <strong>Justice</strong> <strong>Statistics</strong> <strong>1983</strong>Statutory provisions governing waiver o~ juveniles to criminal court, by Statef\OTE: These data were collected through a review <strong>of</strong>statutes and juvenile courts' rules <strong>of</strong> the 50 Statesand the District <strong>of</strong> Columbia. "Waiver" is theprocedure by which COUl-t jurisdiction is determined fora youth whose alleged conduct, if committed by onadult, would constitute a crime. Waiver, also referredto as transfer or certification, generally involvesremoval <strong>of</strong> a case from the jurisdiction <strong>of</strong> the juvenilecourt to that <strong>of</strong> the criminal court. I-hwever, in someStates the criminal court exercises initial jurisdictionover a case and may waive or transfer jurisdictionback to the juvenile court. States may also have acombination <strong>of</strong> these waiver provisions; depending onthe age <strong>of</strong> the alleged affender and/or the <strong>of</strong>fense, thecase may be transferred to or from criminal caurt.This table presents information only for provisionsgoverning the waiver <strong>of</strong> youth from juvenile tocriminal court; far informatian an provisions relatingto transfers from criminal court, see Source. Thewaiver decision is usually made after a hearing and isbased upon criteria specified by statute; see Tabie1.68 for a detailed presentation <strong>of</strong> this material.StateAlabamaAlaskaArizonaArkansasCaliforniaColoradoConnecticutDelawareDistrict <strong>of</strong>ColumbiaFloridaGeorgiaI-hwaiiIdahoIllinoisIndianaIowaKansasStatutescurrentas <strong>of</strong>198119811982198019791982198U1980198119811981198019811981198019811980Minimumageat whichallowed(in years)14Any age15151614141414161516 g18 g141413151615131014161416See faotnotes at end <strong>of</strong> table.Mentallyill orretardedt:hild maybe: waived(b)YY(j)YCourtYYYYYYY(d)(e)YYYYYYoY(J)YYYThree States--Nebraska, New York, andVermant--have no waiver plovisions <strong>of</strong> this type. InNebraska, the juvenile and criminal courts haveconcurrent jurisdiction over certain cases ond theprosecutor decides in which court to file the case,thus making the waiver determinoticn. All threeStates permit waiver to the JUVenile court f'0m thecriminal court. These data reflect the langl>;cept case referredby criminal court under42 sec. 6355 (d)(e)Indictable <strong>of</strong>fenseMurder and rapeFelony or misdemeanorNon:;Murder, ma~slaughter, rape,robbery With deadly weaponkidnaping ,Crime or public <strong>of</strong>fenseFelonyFelonyOffenses punishable byimprisonmentNoneClass A felony or attempt,assault 2nd, extortion 1stindecent Uberties, ,kidnaping 2nd, rope 2nd,
--~--~----~-~--------- ~Table 1.67<strong>Sourcebook</strong> <strong>of</strong> <strong>Criminal</strong> <strong>Justice</strong> <strong>Statistics</strong> <strong>1983</strong>Stai'utory provisions governing waiver tlf juveniles to criminal cOllTt, by State--ContinuedWaiverMinimum Mentallyage ill orStatutes at which retarded At discretion <strong>of</strong>current allowed child mayState as <strong>of</strong> (in years) be waived Couri Prosecutor Child Restricted to certgin crime(s)West Virginia 1980 Any age Y16 Y16Wisconsin 1981 16 (aa) (ob)Wyoming 1981 An~ age (ac) (ad)~May mave for or request woiver.Unclear.cDistrict attorney may refuse criminal case bynot filing an informotion within 5 days, in which casethe jUJ.enile ce',rt retains jurisdiction.No discretion, "court sholl tran'.fer ...:t.~No discretion, "transfer hearing shall be held."Unless incompetent to participate inproceedings, but child must then be "committed" to 0men tab hospitol.For youth aged 16 years or older, <strong>of</strong>fenses underthe jurisdiction <strong>of</strong> the juvenile court do not includemurder, rape, burglary 1st, robbery while armed, orassault with intent to commit such an <strong>of</strong>fense.Offenders alleged to have committed such <strong>of</strong>fenses donot face waiver proceedings; the criminal courtalrea'lr has exclusive jurisdiction over them.. Child and parent may demand.!Shall move for or request waiver.~t if committable.I Child and counsel may C:c:lIOnd waiver.;Jhe court "shall waive unless ..."On own motion or petition <strong>of</strong> State's attorney.nCourt refers to prosecutor who d';!cides whetherto prosecute.°Up to 21 years <strong>of</strong> age and within juvenilecourt'~ continuing jurisdiction.May move for or request waiver if over 17 years<strong>of</strong> age.qTwo sections <strong>of</strong> the statutes delineate theseprovisions; each section stipulates different criteriaand findings for the waiver decision; see Table 1.68.Treason, murder, robbery withdeadly weapon, kidnaping,arson 1st, sexual assault1st, a second violent felonyor a third felonyViolent felony or secondfelonyAny crimeyZ(a) (0) Stote criminal law(ad)Crimesr Waiver is mandatory for capital <strong>of</strong>fenses.slf over 17 years <strong>of</strong> age.tCansideration given to juvenile's ability todistin~uish right from wrong.Pei1tioner may request that family courttransfer cas'! to general sessions. If request denied,peii!ianer ma:f appeal to circuit court which may, inits discretion, exercise general sessions' jurisdiction orrelinquish jurisdiction to family court.vMandatory transfer if child is charged with afelony and has been previously tried as an adult andconvicted <strong>of</strong> a felony.wMay make motion for waiver; if court decidesto retain jurisdiction and the crime is punishable bydeath or more than 20 years' imprisonment, thedecision to retain can be appealed.xMay elect with consent <strong>of</strong> counsel.YWaiver hearing must be held unless waived bycourt, parties, and coun~el.z~hild may demand for any crime.a Whether the child is mentally ill ordevel~ntally disabled is a factor to be considered.Judge ma~' move for or request waiver ifhe/she remoVE'S himself/herself fram futureprocee'i\ings.Q Only if reasonable grounds to believe child notsubject to commitment to (, mental health/mentalretardaJion institution.a County attorney makes initial decisionswhether to file in juvenile court or criminal court.Thereafter, either court may decide to tronsfer to theother.Source: Thomas S. Vereb and John '_. fiJtzler, Juveniles as <strong>Criminal</strong>s: 1981 Statutes Analysis, PreliminaryDraft (Pi ttsburgh: National Center for Juvenile <strong>Justice</strong>, 1981), Table I. Table adapted by SOJRCEB()()< staff.Reprinted by permission.Table 1.68Choracteristics <strong>of</strong> the <strong>Criminal</strong> <strong>Justice</strong> SystemsStatutory provisions governing hearings and criteria for waiver <strong>of</strong> juveniles to criminal court, by StateI\OTE: See I\OTE, T
~~--~~--~-----~ ----<strong>Sourcebook</strong> <strong>of</strong> <strong>Criminal</strong> <strong>Justice</strong> <strong>Statistics</strong> <strong>1983</strong>Table 1.68 Statutory pl"ovisions governing hearings and criteria for waiver <strong>of</strong> juveniles to criminal court, by State-Canrinued~Iess waived.Ulclear.cWritten findings required.dRequired only where a youth is charged with acloss A felony or this is the second serious juvenile<strong>of</strong>fens~.Statute requires a showing as to both aspects-non-af.7nability to treatment and need to protect society.Unclear; statutory language requires a "fullir.vest~ation and hearing."For those 10 years or older and charged wi thmurder, or 16 years or older charged with a closs A or Bfelony, the court sholl waive "unless It would be in thebest interests <strong>of</strong> the child and <strong>of</strong> the welfare and safety <strong>of</strong>the cV{Tlunity for him to remain in the juvenile system.". Guardian ad litem.!Minutes.~f requested or ordered by the court.Only one or the other rt'quired--non-amenability totreat~nt or need to protect society.Procedures and criteria differ by court. The youthcourt requires a hearing, with notice and counsel, and arecord with reasons for the transfer. The criteria are:non-amenability to treatment or need to protect society;probable couse must exist to believe the alleged youthcommitted the oct. In the family court the low requiresonly a "full investigation" before waiver. There are notprovisions for other procedures or criteria to use inmaking the waiver decision aside from the charge filedagainst a youth.l11yerbatim recording.nStatute requires showing as to each aspect--nonamenabilityto treatment and need to protect soc:lety andreaso'bable grounds to believe <strong>of</strong>fender committeei oct.Unclear; statute requires "full investigation" only.PFor those chargt1d with murder or certain violentfelonies, the court must "consider" non-amenability totreatment in the transfer decision; for all others who arealleged to have committed other felonies, the court musthave a showing as to non-amenability to treatment andthe need to protect society.~on request.r For those charged with murder or rape there Is noprovision governing the procedures to be followed Inmaking the waiver decision; for youth 16 years or oldercharged with other felonies or a misdemeanor, the statuterequires a ''full investigation."sNo explicit criteria to be used in the waiverdecision for youth charged with murder or rope; for allothers potentially subject to waiver, the statute requiresa prote showing <strong>of</strong> non-amenability to treatment and/or need tot society and a criminal charge.1N:Jt required if <strong>of</strong>fense charged is armed robbery,rope, {J.r murder.Statutory language provides only, "best interest <strong>of</strong>the juvenile or public."VStatute authorizes court to transfer upon"consideration <strong>of</strong> the child's mental and physicalcondition, maturity, emotional attitude, home or familyenvironment, school experience, and similar personalfoctorQl if there is probable couse."Probable cause alone is sufficient for transfer ifthe alleged crime Is treason, murder, robbery with adeadly weapon, kidnaping, orson 1st, or sexual assault 1st.Source: Thomas S. Vereb and .John L Hutzler, Juveniles as <strong>Criminal</strong>s: 1981 Statutes Analysis, Preliminary Draft(Pittsburgh: Notional Center for Juvenile <strong>Justice</strong>, 198 I ), Table I. Table adopted by sa.RCEBOO< st<strong>of</strong>f. Reprinted bypermission.IIi~ili'IiI)Iifl/(ItTa~!e 0: '~rlrrl;J~lansfor consideration <strong>of</strong> potentially dangerous~~~t~~~~!r:I~la:;eq~E:~~~~t~~~~t~r~~:~~~n~~~~t o:uFe~~er~~e~~~tr:aj~criminal or dangerous activity In the t I ,t s I potential for futUreFederal Government and States not IIs~~d hare ease ~eclslon. The"Crime control" refers t h ave no suc" provisions.dangerous behavior by a persoon twheochontrobl <strong>of</strong> violent, Illegal, or, as een arrested. ThisPrOVisionsCertain crimes excludedfrom automatic bolleligibilityCharacteristics <strong>of</strong> the <strong>Criminal</strong> JUstice SystemsIt!''''~::I...0u.....It! 0VI '''' c 0 OJ .....,.. It! .,..It!It! It!~ ... 'Q ... VIIt! C VIU It!'" ~ ~'" 0 c 'Q~ ... '''' .,.. 0 C.Q VI N It! .,.. 0 .... .;:,....It! ~ E' '''' .~'"''''"" ,.... ,.... I- ... ... VI 0 ~ :0 '"It! 00 ,....OJ..: u u OJ Q It!is' G:,.... Ct!> :l: ..... .....y y yPurpose <strong>of</strong> hail stafl!sto be appearanceand safety y y y y y y yCrime control factorsmay be consideredIn release decision yo y y yConditions <strong>of</strong> release mayInclude those related tocrime control y y y y y y yPrior convictions limitright to boily y y y yDefendant's release lTlCly berevoked upon evidence thata new crime was committed y y y yDefendant's right to boilIs limited for <strong>of</strong>fenseallegedly committedon release y y..Pretrial detention mayy ybe Imposed for crimecentrol purposes y y y y y y ya"CrIme control" purpose may not be Intendedthat appears to meet definition <strong>of</strong> cntegory. •despite statuteor criminal behavior In pretrial release deCisions, by jurisdiction,definition encompasses States where c Ir;f~~~~~#~#:J~~f!i~:~~~:~i:~jg~~d~idangerousness. (Source. p. 4.) s on e grounds <strong>of</strong> predictedVI It! It!.... c C.... .,.. 'Q .,..OJ0.l3e c VI'0U 0.l3 .,..~ ...'" OJCVI'" '" ...It! It! OJ"'.scu ..... U Q It!VI .... .,..It! 0 11'1 0'1''''VI'QVI ..c c ~ >- ..c OJ ..c ..c COJC C CVIVIIt!U....C .Q 'Q .... .... C It! ..c ''''0>~''''~ iii 0 ::I ::I C..cE"u;: i:OJ OJ )(0 ..c 0 0'Q ::I C It!C ..c It! 0It!,....U 0'1 VI VIIt! "- OJ J!~~ ~yz .'::: Z Z Z 0: Vl Vl ~ ~y11'1.l3VIOJ'''' .f: :;::. > >y y y y y yyy y y y y y yy y y y yy y y y y yy y y y y ySource: Elizabeth Goynes "T I f SServices Resource Ce t W h( YPo ogy () tote Lows which Permit the Conslderatlo f DServices Resource Ce~t:~: as mgton. D.C., 1982. (Mimeographed.) Appendix B; and d~t~ pr~v1~:~ I~ t~;. ~cetEr~~~,,;ease Decision," Pretrialo vvr. O\.h.,
<strong>Sourcebook</strong> <strong>of</strong> <strong>Criminal</strong> <strong>Justice</strong> <strong>Statistics</strong> <strong>1983</strong>Table 1.70 Statutory provisions for felony classification schemes and sentence enhancements for habitual criminals, by State, as <strong>of</strong>May 1981NJTE: These data were collected by an analysis <strong>of</strong> the State statutes.For a number <strong>of</strong> States the statutory review was supplemented bytelephone interviews with individuals in various State judicial andexecutive agencies."Felony classification scheme" refers to a statutorily devisedsystem by which felony crimes are assigned to specific classes andpenalties are assigned to each <strong>of</strong> the classes. "SentenceStateAlabamaArizona bArkansas cCalifornia dColorado eConnecticut fDelawareDistrict <strong>of</strong>Columbic gFloridaGeorgiaStatutory felonyclassification schemeMurder: death, life withoutparoleClass A: life to 99 yearsmaximum; 10 year minimumClass B: 20 year maximum;2 year minimumClass C: 10 year maximum;I year and I day minimumMurder: 20 to 99 yearsKidnaping: 5 to 99 yearsClass A: up to 20 yearsClass B: up to 10 yearsClass C: up to 5 yearsClass I (murder): death/lifeClass 2: 7 yearsClass 3: 5 yt:>arsClass 4: 4 yearsClass 5: 2 yearsClass 6: 18 manthsClass A: 5 to 50 yearsClass B: 3 to 20 yearsClass C: 2 to 10 yearsClass D: not to exceed5 yearsPenalties prescribed for<strong>of</strong>fenses individuallyClass I: life/deathClass II: 8 to 12 yearsClass III: 4 to 8 yearsClr;ss 1\': 2 to 4 yearsC:~ss V: I to 2 yearsCapitol felony: life/deathClass A (arson murder): lifewithout paroleClass A (murder): 25 yearsto lifeClass A: 10 to 25 yearsClass B: I to 20 yearsClass C: I to 10 yearsClass A: lifeClass B: 3 to 30 yearsClass C: 2 to 20 yearsClass D: 10 yearsClass E: 7 yearsPenalties prescribed for<strong>of</strong>fenses individuallyCapital felonies: lifeor deathUfe felony: 30 yearsto lifeI st degree: 0 to 30 yearsor life2nd degree: 0 to 15 years3rd degree: 0 to 5 yearsPenalties prescribed for<strong>of</strong>fenses individuallySee footnotes at end <strong>of</strong> table.enhancement for habitual criminals" refers to increases In penaltiesfor repeat <strong>of</strong>fenders.A "presumptive sentence" Is a legislatively established "typical"sentence for each class <strong>of</strong> <strong>of</strong>fenses that must be imposed unlessmitigating or aggravating circumstances exist. If such circumstancesdo exist, the court may Increase or decrease the "typical" sentencewithin a narrow range <strong>of</strong> years as specified by statute (Scurce, p. 4).Sentence enhancement provisionsI hree or mareOne prior felony conviction Two prior felany convictions prior felony convictionsMinimum: 15 yearsMaximum: life to 99 yearsClass A sentenceClass B sentence10 years presumptive sentence4 years presumptiVe sentence2 years presumptive sentenceUp to 3 times presumptivesentenceUp to 2 times presumptivesentenceI to 3 years additionalterm, depending on <strong>of</strong>fenseSentenced as Class A or nexthigher <strong>of</strong>fense class,depending upon <strong>of</strong>fenseUfe (for specified <strong>of</strong>fenses)Up to twice prescribedsentence(\bneMaximum prescribed by law156Life or 99 yearsMinimum: 15 yearsM
~-~-------------------------_--__________ ---_____--=c_______ _<strong>Sourcebook</strong> <strong>of</strong> CrimInal <strong>Justice</strong> <strong>Statistics</strong> ! 983Characteristics <strong>of</strong> the <strong>Criminal</strong> <strong>Justice</strong> SystemsTable 1.70 Statutory provisions for felony classification schemes and sentence enhancements for habitual criminals, by State, as <strong>of</strong>May 1~81--ContinuedTable 1.70 Statutory provisions for felollY classification schemes andMay I ~81--Cantlnuedsentence enhancements for habitual criminals, by Stet-e, as <strong>of</strong>Statutory felony.:So,:.t.=.at:.,:e:..-_____....=.:..:clqsslflcatlon schemeNebraskaNevadaNew HampshireNew Jerse/Ne'" MexicoNew YorkSNorth CarolinaNorth Dakota tOklahomoPenaltl"!s prescribed for<strong>of</strong>fenses IndividuallyPenalties prescribed for<strong>of</strong>fenses I"dlvltli.l
-------~----------------------------------, ---<strong>Sourcebook</strong> <strong>of</strong> <strong>Criminal</strong> <strong>Justice</strong> <strong>Statistics</strong> 19B3Table 1.70 Statutory provisions for felony classification schemes and sentence enhancements for habitual criminals, by State, as <strong>of</strong>May 1981--ContinuedStateWest Virginia YWisconsir. zWyomingSentence enhancement provisio'un2.s __....,.;--_______Statutory felonyThree or mareclassification scheme One prior felony conviction Two prior felony convictions i'rror felcny convictionsPenalty prescribed for<strong>of</strong>fenses individuallyClass A: lifeClass B: up to 20 yearsClass C: up to 10 yearsClass D: up to 5 yearsClass E: up to 2 yearsPl1rlalty prescribed for<strong>of</strong>fenses individually5 years additional Life, with 15 years mInimlXnservice before paroleeligibilityUp to 10 years additionalUp to 6 years additional~ior <strong>of</strong>fense must have occurred within past 7 years.Prior <strong>of</strong>fense must have been committed wIthin past 10 years.cWith two or mare previous convIctions, <strong>of</strong>fender ineligible forparoledEither prior or current <strong>of</strong>fense must be "violent" felony.ePrior felony convictions must be wIthIn past 10 years. Appliesonly If. current felony is sentenceable to at least S years maximlXn.Special prOVisions for crImes against the elderly and sexualassauI~ with deadly weapon.j\bt mandatory.~Applicable only to "forcible" felony convictIons.Ilf 10 years have passed since prior conviction, addItional termcan be reduced by up to 25 years.~plies to Class C and D <strong>of</strong>fenders only.All prior <strong>of</strong>fenders must serve minimum <strong>of</strong> 10 years prior toparol; eligibility.Current <strong>of</strong>fense must be committed withIn 5 years <strong>of</strong> expIration<strong>of</strong> prior sentence.mApplies only to "crimes <strong>of</strong> violence.""Prior sentences must have been at least 3 years each.o Applies only to sex <strong>of</strong>fenses; prior convictions alsoreflected in guidelines sentence."Past convictIon must be within past 5 years.qCurrent <strong>of</strong>fense must be within 5 years <strong>of</strong> release for prior<strong>of</strong>fens~.PrIor convictions must be within past 10 years.sPrior felony convictions must be for violent crime wIthin past10 ye?rs.Prior convIctions must be Class B or above, or one Class Band tYJo lower felonies.Discretionary with court.vProsecutor has discretion regarding decisIon to prosecute ashabitu~1 <strong>of</strong>fender.DecIsion to sentence <strong>of</strong>fender as habitual <strong>of</strong>fender isdiscretionary with court; indictment must also show previousconvic;Jions and give notice to <strong>of</strong>fender <strong>of</strong> habitual <strong>of</strong>fender status."Prior convictions relate only to parole eligIbility.Ylmposition <strong>of</strong> habitual <strong>of</strong>fender provIsions require districtattorney to file with court prior to sentencing Information settingforth 9rior convictions and sentences.'Prior convictions must be within 5 years.Source: Caroline S. Cooper, Debra Kelley, and Sharon Larson,State Felony Code Provisions (Washington, D.C.: The tmerican Lklivers;::it~y::.,~;;,;,,;r;~~:::rr:::;,.::;,:;=,::;.;~,~:::;.'*;;,;.;.
------------<strong>Sourcebook</strong> <strong>of</strong> <strong>Criminal</strong> <strong>Justice</strong> <strong>Statistics</strong> <strong>1983</strong>Characteristics <strong>of</strong> the <strong>Criminal</strong> <strong>Justice</strong> SystemsTable 1.71 Statutory provisions for ~entence enhancements for use and possession <strong>of</strong> afirearm or other deadly weapon, by State, as <strong>of</strong> May 1981--ContinuedStateSentence enhancementNebraska3 to 10 years additional cNevadaTerm <strong>of</strong> i01grisonment equal to and in addition to term for crimecommittedNew Hampshire Mandatory minimum with no parole or probation cNew Jersey Possession <strong>of</strong> deadly weapon other than firearm or explosiveduring commission <strong>of</strong> felony is 3rd degree <strong>of</strong>fensePosse5sion <strong>of</strong> firearm or explosives dL1ring cOllTTlission <strong>of</strong> felonyis punishable as 2nd degree: <strong>of</strong>fense, sentence to run concurrentlyor consecutively within discretion <strong>of</strong> courtNew Mexico i'bn-capita! felony: basic sentence prescribed increased by I year,ilcn-suspendable; 2nd conviction: 3 years increose non-suspendableNew YorkPossession during Closs B <strong>of</strong>fense: 6 to 25 years CPossession during Class C <strong>of</strong>fense: 4.5 to 15 years C(\brth Carolina Use <strong>of</strong> firearm while committing felony: 7 year minimum if prior felon(\brth Dakota During Class A or B felony: the minimum or a 4 year term must beimposed, non-suspendable; .During Class C felony: 2 year minimum'Ohio(\b specific provisionOklahoma(\b specific provisionOregon1st conviction: minimum <strong>of</strong> 5 y(1ars~ .2nd conviction: minimum <strong>of</strong> 10 )Iear~3rd conviction: minimum <strong>of</strong> 30 yearsPennsylvania Additional term up to 5 years which may run concurrently orconsecutively within discretion <strong>of</strong> courtRhode Island 1st conviction: term not less than 2 years nor greater thar, IU years;C2nd conviction: 5 to 20 years;C3rd corNictlon: 10 years to life term cSouth Carolina 1st conviction: additional term <strong>of</strong> imll[lsonment not greater thmI year or a fine <strong>of</strong> $1,000, or both;2nd conviction: additional term <strong>of</strong> imprisonment not greater than 2 years;k3rd and subsequent c9{'viction: additional term <strong>of</strong> imprisonment notgreater than 5 yearsSouth Dakota 1st conviction: 3rd class felony, penalty il"posed is consecutiveto sentence imposed for principal felony;2nd or subsequent conviction: treat as 1st class felony;1Concealment <strong>of</strong> weapon with intent to commit felony is Closs 5 felonylTennesseePossession <strong>of</strong> firearm: 2 to 5 years consecutive with sentence forprincipal <strong>of</strong>fense;Use <strong>of</strong> firearm:1st conviction: 5 years, non-suspendoble;2nd conviction: 10 years, non-suspendableTexasPenalty imposed is for next higher <strong>of</strong>fense than principal <strong>of</strong>fense cUtahPossession durh:!) 1st and 2nd degree felonies: I to 5 years;Possession during 3rd degree felony: 5 to 15 years;Prior conviction: 5 to 15 yearsVermont(\b specific provisionsVirginia1st conviction: use or display constitutes Class 6 felony, I to5 years andlor $1,000 fineWashington1st conviction: 5 year mandatory minimum, non-suspendable;c2nd conviction: 7.5 years mandatory minimum, non-suspendablei c3rd convic,)on: IS year minimum, non-suspendable cWest Virginia Offender must serve at least 3 years or maximum term imposed,whichever is less, before becoming eligible for porole conslderation cWisconsinClass A: up to life, additional term up to 5 years CClass B: up to 20 years, additional term up to 5 years CClass C: up to 10 years, additional term up to 5 yeartClass 0: up to 5 years, additional term up to 4 yeorsCloss E: up to 2 years, additional term up to 3 years CWyoming1st conviction: additional term <strong>of</strong> imprisonment up to 10 yearsh;________ 2nd conviction: additional term <strong>of</strong> imprisonment up to 20 yearsFootnotes follow on next page.162~IiI/I~~II11I',Table 1.71 Statutory provisions for sentence enhancements for us", and possession <strong>of</strong> afirearm or other deadly weapon, by State, as <strong>of</strong> May 1981--ContlnuedGApplies to first <strong>of</strong>fenders Involved InClaas be <strong>of</strong>fense.cApplies to deadly weapons.~lIe$ to firearms.Applies If <strong>of</strong>fender convicted <strong>of</strong>prevloj' felony within last 10 years.Applies to certain weapons, asspeclfr.d•Applies to use <strong>of</strong> handgun; consideredl:eporfe <strong>of</strong>fense.Applies to possession <strong>of</strong> deadly weapon,163Including flreorm, during commission <strong>of</strong> afelonYI\I Applies to use <strong>of</strong> dangerous weapon.Applies to ulle <strong>of</strong> dangerous weaponwhile jcommlttlng affer-se.I/'fplles to us!: or threat to use firearm.Applies to possession <strong>of</strong> firearm duringcomm~slan m a felony.Applies to possession <strong>of</strong> firearm otherthan IW,chlne gun or short shotgun.Applies to possession <strong>of</strong> firearm.
---~-- ------~-----------------------~--------16<strong>Sourcebook</strong> <strong>of</strong> <strong>Criminal</strong> <strong>Justice</strong> <strong>Statistics</strong> <strong>1983</strong>Characteristics <strong>of</strong> the <strong>Criminal</strong> <strong>Justice</strong> SystemsTable 1.72 Statutory provisions. for parole eligibility and sentence reduction, by State, as <strong>of</strong>May 1781Table 1.72 Statutory provislon:s for parole eligibility and sentence reduction, by State, as <strong>of</strong>May 1781--Continued!'OTE: See !'OTE, Table 1.70. "Good time" i!1 time subtra.::ted from a sentence <strong>of</strong> imprisonment by prisonauthorities as a result <strong>of</strong> good behavior on the part <strong>of</strong> a prisoner.StateAlabanaAlaskaArizonaArkansasCaliforniaColoradoConnecticutDelawareDistrict <strong>of</strong>ColurrbiaProvisions for parole e~bilitY1/3 <strong>of</strong> sentenceor 10 years,whichever isless1/3 <strong>of</strong> term1/2 or 2/3 <strong>of</strong>sentence,depending onsentenceWithindiscretion <strong>of</strong>parole boordto release es../timeExpiration <strong>of</strong>sentence minusgood timeTerm to beserved infull minusgood timeEffective JulyI, 1981,parole wasabolished1/3 <strong>of</strong> sentenceless good timeExpiration <strong>of</strong>minirromDeath sentenceconrnuted to life:15 yearsLife: 25 yearsLklless minimum term,nandatory, first<strong>of</strong>fenders releasedat any timeSecond <strong>of</strong>fenders:1/3 <strong>of</strong> sentenceminus good timeSubsequent<strong>of</strong>fenders: 1/2 <strong>of</strong>sentenceMandatory minimummust be servedin fullProvisions for sentence reductionsGood timeClass I: 75 daysfor every 30 daysservedCloss I I: 40 daysfor every 30 daysservedClass III: 20 daysfor every 30 daysservedCloss IV:ineligibleI day for every 3days servedClass I: I day forevery 2 doysservedCloss II: I day forevery 3 daysservedCloss I: 10 daysper monthCloss II: 5 daysper monthCloss III:ineligible1/3 reduction <strong>of</strong>term for goodconduct orparticipation inprison programs15 days per monthFor a sentence upto 5 years: 10days for eachmonth served;For a sentencegreater than 5years: 12 days foreoch month served1st year <strong>of</strong>sentence: 5 daysper month;2nd year: 7 daysper month;3rd year: 9 daysper month;Subsequent years:10 days per monthSentence <strong>of</strong> I to 3years: 6 days permonth;3 to 5 years: 7days per month;5 to 10 years: 8days per month;Over 10 years: 10days per monthOther30 days annually fora blood donation3 days per month formeritorious conductfor first year; eachsucceeding year 5days per monthAll <strong>of</strong>fendersreleased '180 daysprior to expiration<strong>of</strong> termMeritorious conduct:10 days per monthadditionalMeritoriousperformance:additional 15 daysper 6 monthsPrison industry:I day for every 7consecutive days;Meritorious conduct:up to 120 daysdeductions from termParticipation Inrehabilitativeprison programs:additional 5 doysper month11I'Ii11nfi~IiIIl'v,l!IjII~I~I~/fij1JIIStateFlorldoGeorgiaI--bwaiiIdaholilimisIndianalawaKansasKentuckyProvisions for parole eligibilitySpecialGenero.lprovisionsParoleguldp.lineshave beendeveloped thatestablishpresumptiVereleose datesbosed onseriousness <strong>of</strong><strong>of</strong>fense1/3 <strong>of</strong> sentenceWithindiscretion <strong>of</strong>parole boardLlf~ terms orterms greaterthan 30 year:.,:10 years;Less than lifeor 30 yearterms: 5 yearsor 1/3 term,whichever IslessService <strong>of</strong> termIn full minusgood timeService <strong>of</strong> termIn full minusgood timeBoord mayrelease at anytime;Individual moybe required toserve term Infull minusonly good timeFollowingservice <strong>of</strong>minimum termless goodtime earnedParole boardmay release<strong>of</strong>fender atany timeLife: 2S yearsProvisions for sentence reductionsGood time1st and 2nd year <strong>of</strong>sentence: 3 daysper month;3rd and 4th year:6 days per month;Subsequent years:9 days per monthI st year: I month;2nd year: 2 months;Subsequent years:3 months; N:>tapplicable to lifesentences10 days maximum forevery month served(except for lifesentences where nogood time applies)Some must serve I to 3 yearmandatory minimums sentences: 6 daysper month;3 to S yearsentences: 7 Joysper month;5 to 10 yearsentences: 8 daysper month;10 years or mare:10 days per monthCloss A: Governormust ccmmute to aterm <strong>of</strong> years;review within 5yearsForcible felonies,previousconviction: 1/2maximum imposedI day for each dayservedCloss I: I day foreach day served;Closs II: I day forevery 2 daysserved;Class III: no goodtimeI st year: I month;2nd year: 2 months;3rd year: 3 months;4th year: 4 months;5th year: S months;Subsequent years:G monthsCloss A requiring I st year <strong>of</strong>life: I S years imprisonment: 2must be served; if months applied t<strong>of</strong>irearm used, must reduce minimum andserve minimum term maximum;or sentenced as 2nd year: 4 monthshabitual criminal applied to reduceminimum andmoxlmum;3rd and subsequentyears: 6 monthsapplied to reduceminimum andmaximumN:>t more thon 10days per monthOtherI day for every day<strong>of</strong> productive work;6 days per month forthose unable to workbut use time well;I to 6 days per monthfor no violationsin post 6 monthsAdditional 5 daysper month formeritorious conductTrust~e: additional10 days per monthMeritorious goodtime: additional30 daysAdditional 5 daysper month formeritorious conductor performance <strong>of</strong>duties
<strong>Sourcebook</strong> <strong>of</strong> <strong>Criminal</strong> <strong>Justice</strong> StatIstics <strong>1983</strong>,Table 1.72 Statutory provisions for parole eligibility and sentence reductIon, by State, as <strong>of</strong>May I 981--ContInuedProvIsions. for I2aroIe eligibIlIt:r:ProvIsions for s!:ntence reductionsSpecIalState General erovIsions Good timeUTher.. ~i ICharacteristics\l\I<strong>of</strong> the <strong>Criminal</strong> JustIce SystemsTable 1.72 Statutory provisIons for parole eligibility and sentence reduction, by State, as <strong>of</strong>May 1981--ContInuedProvisions for earole eligibilit:r:Provisions for sentence reductionsSpecialState General erovisions Good time OtherLouIsIana 1/3 <strong>of</strong> sentence I st <strong>of</strong>fenders with CredIt for time I MontanaJless than 5 yearsI /3 <strong>of</strong> sentence Dangerousserved in custody ',\.. MedIum I: 10 daysor I yearEducational programs:sentence: anytime <strong>of</strong>fenders: 1/2~t per month;(nondangerous13 days per month;prIor to 1/3 <strong>of</strong><strong>of</strong> sentence Medium II: 13 days<strong>of</strong>fenders)Self-improvementterm;\per month; activities: 3 daysLife: IneligIble jeMedium III: (after per monthunless termI year), 15 dayscommuted to aper morythfixed perIod <strong>of</strong>!NebraskayearsIExpIration <strong>of</strong> I st year: 2 months;minimum termAdditional 5 days2nd year: 2 months;I:mInus goodper month forMoine No parole; 10 days per month Additional 2 days3rd year: 3 months; I timeperformance <strong>of</strong>service <strong>of</strong>Subsequent years: dutiesper month forterm in fullperformonce <strong>of</strong>4 monthsminus goodwork duties Nevadatime1/3 <strong>of</strong> sentence 1st 2 years:or I year,Certain credIts as2 months; parole board mayMaryland 1/5 <strong>of</strong> term Life: 15 years I whIchever is5 days for each Additional 5 days2nd 2 years: grant! greater 4 months;Subsequent years:. month per month formerItorious conductand special work;5 months for eachno more than 5 daysyear servedper monthNew Hcrnpshire Service <strong>of</strong> Life: 18 years 90 days for eachminimum termMeritorious conduct:Massachusetts Violent Certain crimes 4 months to 364minus good time;Illork, educationalyear <strong>of</strong> minimummInus good5 additional daysLife for murder I: term <strong>of</strong> service against minimum and--------~ .. ~~<strong>of</strong>fenders must require service <strong>of</strong> days: 2.5 days progra:ns permitserve 2/3 <strong>of</strong> a minimum <strong>of</strong> 2timeper month;40 years minusreduction <strong>of</strong> up tomaximum term;minimum years 2 to 3 years: 7.5good time7.5 days per monthAdditional 4 dayssentence Offenders serving days per month; servedagainst minimum andNon=violent life terms for 3 to 4 years: 10 Confinement in prison1\maximum term for<strong>of</strong>fenders must crimes other than days per month; camp: 2.5 days per each blood donationserve 1/3 <strong>of</strong>New JerseyI st or 2nd degreeAnytIme within Offense classesl~ or more years: month;One day for everyminimum murder eligibledIscretion <strong>of</strong>12.5 days perI and 2 have a10 days <strong>of</strong>f sentence5 days served butsentence for parole hearing ~parole boardmonthfixed mInImum cannot reduce CIfor I pint blood II<strong>of</strong>ter servingunless mInimum term to be serveddonationmondatory minimum15 yearsterm imposed prIor to paroleconsideratIonMichigan Expiration <strong>of</strong>New Mexic:oMandatory minimumService <strong>of</strong>I st and 2nd year:Life: 30 years None, as <strong>of</strong>term In fullMerItorious conduct:minimum term must be served 5 days per month; July 1979minus good10 days per month;minus good in full 3rd and 4th year: ccnductSupport-service work:time6 days per month;o to 5 days per5th and 6th year:month;7 days per month;Industrial good time:7th to 9th year:o to 10 days per9 days per month;month;10th to 14th year:Extra-industrial10 days per month;good tIme:15th to 19th year:o to 10 days12 days JJt!r month;additionalOver 20 years:New York Followingper month15 days per month Up to 1/3 reductionexpIration <strong>of</strong> <strong>of</strong> moximum termMinnesota Expiration <strong>of</strong> Life: 20 years;mInImum termI day for everysentence Life with previous 2 days servedminus goodNorth Carolinamurder conviction:For felony I day for eachconmIttedAddItional reductionstime25 yearsday In custodyafter July I,may be awarded for1981: 90 dayswork, education,Mississippi I year after I st year: 3 days Additional 30 days beforeetc.admission to per month;prison systemper year within expiratIon <strong>of</strong>2nd year: 4 dayswithindiscretion <strong>of</strong> term mInusper month;discretion <strong>of</strong>superintendent good time3rd year: 5 daysparole boardNorth Dakota AnytIme withinper mor.th; Sentence <strong>of</strong> I to 3discretIon <strong>of</strong>Meritorious conduct:4th year: 6 days years: 6 days perparole boardadditional 2 daysper month;month; per month5th year: 7 daysSentence <strong>of</strong> 3 to 5Missouri 1/2 <strong>of</strong> term; Nondangerousno one sholl <strong>of</strong>fenders: 1/4 <strong>of</strong>serve more term;than 2/3 <strong>of</strong> Life: 30 yearsterm166per month;years: 7 days per6th year: 8 daysmonth;per month;Sentence <strong>of</strong> 3 to 107th year: 9 daysyears: 8 days perper month;month;8th year: 10 daysSentence <strong>of</strong> 10per month;years or more: 109th year: II daysdays per monthper month;CllIo Expiration <strong>of</strong>Over 10 years: 15CapItol <strong>of</strong>fense: I year: 5 daysmInimum termdays per monthIS years per month;minus good 2 years: 6 daystImeper month;3 years: 8 daysper month;4 years: 9 daysper month;5 years: 10 daysper month167
,.Characteristics <strong>of</strong> the <strong>Criminal</strong> <strong>Justice</strong> SystemsTable 1.72 Statutory provisions for parole eligibility and sentence reduction, by State, as <strong>of</strong>Mily I!lSI--ContinuedStateOklahomaOregonPennsylvaniaRhode IslandSouth CarolinaSouth DakotaTennesseeProvisions for parole eligibilityProvisions for sentence reductionsSpecialGeneral provisions Good timeOther1/3 <strong>of</strong> minimllinterm <strong>of</strong> anindeterminatesentence (ordeterminate ifapplicable)Anytime withindiscretion <strong>of</strong>parole boardMaximum term <strong>of</strong>confinementgreater than 2 years:eligible followingexpiration <strong>of</strong>minimum term;Niaximum term <strong>of</strong>confinement less than2 years: eligible anytime prior to expiration<strong>of</strong> minimum termFollowingservice <strong>of</strong>1/3 <strong>of</strong> termSentence lessthan 30 years:service <strong>of</strong> 1/3<strong>of</strong> term;Sentencegreater than30 years:service <strong>of</strong>at least10 years;Review after1/4 <strong>of</strong> termI st <strong>of</strong>fender:1/4 <strong>of</strong> term;2nd <strong>of</strong>fender:1/2 <strong>of</strong> term;Subsequent<strong>of</strong>fender: 3/4<strong>of</strong> term (notapplicableto lifesentences)Minimum termor at leastI yearFor those convicted<strong>of</strong> "aggravatedmurder": 20 to 30year service <strong>of</strong>term as specifiedby statute;Judge may recommendfor any felony aminimum term to beserved and paroleboard must respectthis, except withaffirmative vote<strong>of</strong> 4 board membersLife term ordesignatedhCibitual ,;riminal:service: af atleast 10 yearsFirst <strong>of</strong>fenders:service <strong>of</strong>minimum (1/4<strong>of</strong> term)Class X: followingservice <strong>of</strong> 40percent <strong>of</strong>mandatory sentence168No automaticstatutorygood timeI day f~r every2 days servedNo statutorygood timeNo statutorygood timePermitted bystatuteTo be determinedwithin discretion<strong>of</strong> Governor andon recommendation<strong>of</strong> parole boardClass I: 30 daysper month;Class II: 22 daysper month;Class III: 10 daysper month;Class IV: no credit(Class X andrepeat <strong>of</strong>fenders)I day for every dayenrolled ineducational orvocational trainingprograms; 20 days<strong>of</strong>f <strong>of</strong> sentence forevery blood donation(4 donations maximumper year)Prison industryor certifiededucationalprograms: I st year:I day for every 15days; 1st to 5thyear: I day forevery 7 days;subsequent years:I day for every5 daysPrison agriculture:I st year: I day forevery 10 days;subsequent years:I day for every6 daysWork camp:I st year: I day forevery 6 days;subsequent years:I day for every4 daysEan~
Characteristics <strong>of</strong> the <strong>Criminal</strong> <strong>Justice</strong> SystemsCharacteristics <strong>of</strong> the <strong>Criminal</strong> <strong>Justice</strong> SystemsTable 1.73 State and Federal privacy statutes, by type <strong>of</strong> information regulated and jurisdiction, as <strong>of</strong> 1982Table 1.72 Statutory provisions for parole eligibilityMay 1981--CantinuedStateWyomingProvisions for parole eligibilitySpecialGeneralprovisionsAnytime withinthe discretion<strong>of</strong> the paroleboardand sentence reduction, by State, as <strong>of</strong>provisions for sentence reductionsGood timeDiscretionaryaccording toparole board--noautomaticstatutory goodtimeOtherN::lTE: This Information was compiled from a survey <strong>of</strong> State and Federallaws. All States have constitutionai provisions similar to the first andfourth arrendments to the U.S. Constitution. Although only a few havewritten into their State constitutions specific language protecting theri ght to privacy, many hove statutes protecting one or mare specificareas <strong>of</strong> privacy."Privacy statutes" refers to statutes or sections <strong>of</strong> a State'sconstitution indicating a general or specific right to privacy.''Privileged cOTTmunication" refers to information that is private because<strong>of</strong> a particular relationship (e.g., corrmunication between a person anda psychologist or clergyman). Because <strong>of</strong> the univel'sal nature <strong>of</strong>lawyer-client and husband-wife privilege, these statutes have not beenincluded in the section on privilege.Type <strong>of</strong> information regulated-II d Sh on Larson Judicial and Executive Discretion inSource: Caroline S. Caope.r, ~e~~a tKer:, el~n~nCodearProvisians '(Washington, D.C.: The kOerlcanthe Sentencing Process; AnaIXSI\~ dO ~ debY SQ...RCEBOOs-.:.:t:co '"YYYYYYYY(c)YYYy(c)(c)YYa>.~t,.,s a>::IU.EoUYYYYYYYYYYYYYYYYyYYYYYYYYYYYYYYYYYYY h(a)y- (a,b)yY (a)YYYYYYYYYYYYYYYYYYYYYYYY(a)V IY(a)(a)Y(a,b)YY(a)(a)Y(a)YYYYYYYyYYYYYYYYYYYYYYYYYYYYYYYYYYYYYYYYYYYYYYYYYYYYYYYYYYYYYYYYYYYYYYYYYYYYYYYYYYYYyYYYYYYYYYYYYYYYYYYYYYYYYYYYYYy'iYYYYYYYYYYYYYYYYYYYYYYYYYYYYYYYYYYYYYYYYYYYYYYYYYYYYYYYYYYYYYYYYYYYYYYYYYYYYYYYYYYYYYYYYYYYYYYYYYYYYYYYYYYYYYYYYYYYYYYYYYYYYYYYYYYYYYYYYYYYYYYYYYYYYYYYYYYYYYYYYYYYYYYYYYYYYYYYYYYYYYYYYYYYYYYyYYYbFair Information Practices A#s.Locoi ordinance within the State.CSignificant court decision affecting privacy.,~~rr.~~~~,r..;~:'=::~~~~~~~2.....!1~9!!.!.81(Washington, D.C.: Privacy Journal, 1981), p. 2; and data
,~<strong>Sourcebook</strong> <strong>of</strong> <strong>Criminal</strong> <strong>Justice</strong> <strong>Statistics</strong> <strong>1983</strong>Table 1.74 Statutes and regulations an the privacy and security <strong>of</strong> criminal history Information, by jurisdiction, 01 <strong>of</strong> July 1~81Characteristics <strong>of</strong> the <strong>Criminal</strong> Ju~tlceSystems,-Type <strong>of</strong> legislationState regulatory authorityPrivacy and security councilRegulation <strong>of</strong> disseminationRight to inspectRight to challengeJudicial review <strong>of</strong> challenged informationPurging <strong>of</strong> informaticn:N:lO-convictionConvictionSealing <strong>of</strong> information:Non-convict ionConvictionRemoval <strong>of</strong> disqualificationsRight to state non-existence <strong>of</strong> a recordResearch accessAccuracy and completenessDedicationCivil remedies<strong>Criminal</strong> penaltiesPublic recordsSeparation <strong>of</strong> filesRegulation <strong>of</strong> intelligence information:CollectionDisseminationSecurityTransaction logsTraining <strong>of</strong> employeesListing <strong>of</strong> information systemsFreedom <strong>of</strong> information/open records:includes criminal justice informationExcludes criminal justice informationCentral State repositoryy y y y y y y yyyy y y y y y y yy y y y y y y y yy y y y y y yy y y yy y y y yy y y y yy y y y yy y y y y yy y y yy y yy y yy y y y y y y y yyy y y y y y yy y y y y y y yy y y y y y y y yyy yy y y y yy y y y y yy y y y y yy y y yy yy yyy y y yy y y y y y y ySource: U.S. Deportment <strong>of</strong> <strong>Justice</strong>, <strong>Bureau</strong> <strong>of</strong> ,<strong>Justice</strong> <strong>Statistics</strong>, Privac and SecuritLegislation, 1981 Supplement (Washington, D.C.: U.S. Government Printti~ng9iOff~ic~e~,~9~f.lpp.:.:.r.F-1ir.~;i8~icio~lfjSf~rn~~m7t~~~~yyyyyyyyyyyyyyyyyyyyyyyyyyyyyyyyyyyyyyyyyyyyyyyyyyyyyyyyo.c~....yyyyyyyyyyyyyyyyyyyyyyyyyyyyyyyyyyyyyyyyyyyyyyyyyyyyyyyyyyyyyyyyyyyyyyyyyyyyyyyyyyyyyyyyyyyyyyyyyyyyyyyyyyyyyyyyyyyyyyyyyy£QI'" ::0.curaIII'":lyyyyyyyyyyyyyyyyyyyyyyyy:loIII,~ QI.c u c:E !Ey yyy yy yyyyyyyyyyyyyyyyyyyyyyyyyyyy'0.c....'"III'"i:yyyyy'S:::0oi: '"yyyyyyyyyyyyyyyyyrac:lc~yyyyyyyyyyyyyyyra.>
------- -- - -- -<strong>Sourcebook</strong> <strong>of</strong> <strong>Criminal</strong> <strong>Justice</strong> Statistic~ <strong>1983</strong>Table 1.75 Firearms manufactured in the United States, by type <strong>of</strong> firearm, fiscal years 1973-81/\oTE: These data were provided by federally-licensed firearms manufacturers. The figures donot Include firearms manufactured for use by the military. The data presented for yearsprior to and Including 1976 coincide with former Federal fiscal years. The transition quarterrefers to the period July I, 1976 to Sept. 30, 1976. The fiscal year for the FederalGovernment Is now from Oct. I to Sept. 30.li!ndgunsI.ong gunsTotal Total Shotguns andTotal handguns Pistols Revolvers long guns Rifles COfT'blnatlon guns1973 4,844,565 1,734,154 564,919 1,169,235 3,110,411 1,830,285 1,280,1261974 5,639,601 1,714,989 398,606 1,316,383 3,924,612 2,099,372 1,825,2401975 5,767,820 2,023,601 456,182 1,567,419 3,744,219 2,123,166 1,621,0531976 5,345,179 1,832,785 455,167 1,377,618 3,393,209 2,091,797 1,301,412Transitionquarter 1,234,606 431,120 96,269 334,851 803,486 494,294 309,1921977 5,015,963 1,868,062 452,667 I ,~\15,395 3,147,901 1,922,858 1,225,0431978 4,865,537 1,888,660 463,426 1,1125,234 2,976,877 1,781,001 1,195,8761979 5,322,998 2,126,017 612,918 1,513,099 3,196,981 1,877,890 1,319,0911980 5,646,218 2,370,714 765,522 j ,605, 192 3,275,504 1,936,094 1,339,4101981 5,773,791 2,537,231 835,169 1,702,062 3,236,560 1,680,945 1,555,615Source: Table adapted by So..RCEBOO< steff from tables provided by the U.S. Department <strong>of</strong> theTreasury, <strong>Bureau</strong> <strong>of</strong> Alcohol, Tobacco and Firearms.~I,I;(:IIi!.i:I:I:U~IiIi1 ,iIIIIIIjIt~ij~IiIIIirCharacteristics af the <strong>Criminal</strong> <strong>Justice</strong> SystemsTa~le dl.76 ~tatutory restrictions on the purcha~e carryingan guns, y State, as <strong>of</strong> March 1982 ' ,and ownership <strong>of</strong>/\oTE: Th~~e data were camp lied by th Notl I Rltl .Actian. In addltlan to State laws ~he ~r~a • "e AsSOCiation's Institute for Legislativepo.'~sslan and Interstate transpartatl~n <strong>of</strong> frrel.l~:e~:ale, al~ I;; ber~ln circumstances, theAct <strong>of</strong> 1968 and Title VII <strong>of</strong> the Onnlbus Crime C t e iegud a ; f y t e Federal Gun Controland localities mey have their own flrear d' on ro an . a e Streets Act. Also, citiesThe Source notes that StatE! firearms la::: ::e I~~b.ce~ I~ afddltlon to Federal and State laws.statutes and ordinances, as well as local law ~ Jec 0 t requ~t change. State and localfor full text and meaning <strong>of</strong> statutory provlslo en orcemen aut rltles, should be consultedThe Source defines "canstitutlonul prove !"Is." b I'Connecticut State constitution as an ex~~ol Yf ~~lngb Article I, Section 15 <strong>of</strong> theconstitutions <strong>of</strong> meny States. It reads: "Every p.; a h e a.s h C feature conjalned In thehimself and the State."CI Izen as a ng t to bear arms In defense <strong>of</strong>St('lte ~~Purchase Carrying OwnersfiiQ....cQI.... III .....'0QIt-1:'0 .~ ",B .....0",C:'C ~~ ~ ",u"'0 QIQlo'"QI t- t-.... ..........e. cc Ucc';;;ct- QI QI .... 0C"'"' '"OQl0 lilt- Ut-IIIe. U0III· ... C... e.c ....0", .... .... o~ 0'0 U'o 00.... .c: QI QIQI",.s ....OQlQl ..... '0 UUQlU....cf ...,:0..-. "''''"' ....UC"' .....lilt- c· QI .,....,...COl-.....QI::10.,....,... -b.uC .... eO .... .,;, QI ..... ..... .... .........J;"~ III t- .... I-Qle.;.,...."'>' III~!!o Vl QI ~~,~:galt-.0 01-->u 0· ... w c.Alabcmc y y yo yAlaskayyArizonayArkansasyvbCalifornia y~yy y yColaradoyConnecticut yy yYy yDelawareyyyFlorida 'f 'f 'fy yGeorgiayyI-klwall yyy yyyy yIdahoyyillinois yyy ydyva yIndianayy yy y ylawayyyy yKansasyKentuckyyyLouisianayfyYyMaineyyMaryland yy yyy yMassachusetts y yMichigan yyyyyMinnesotay0 ~yMiSSissippiY YYy yMissouri yyyyMontanayy yNebraskayNevada0New I-klmpshlre yi yNew Jersey y y y~w MexicoY Y YyNew York yyy yy yNorth Carolina yyyyNorth Dakotayy yOhio y1 ~1yOklahomayyOregonyyy yPennsylvania yy yy yoRhode Island yy yYy ySouth Carolinayyy yTennessee yyy vbTexasvbyy yUtahyVermont 0 y,k y yVirginia'r'f 'fYWashington yYyyy yo yWest Virginiayyy yWisconsin yyWyomingy yDistrict <strong>of</strong>yColumbia yl yl yl yl ylFootnotes follow on next page.
------------<strong>Sourcebook</strong> <strong>of</strong> <strong>Criminal</strong> <strong>Justice</strong> <strong>Statistics</strong> <strong>1983</strong>Table 1.76 Statutory restrictions on tne • p,urc d h asa, carrying', and ownership <strong>of</strong>handguns, by State, as <strong>of</strong> March 1932--ContmueaUcense to carry in a vehicle eitheropenlv or concealed.'OAr kansas prohibits carrying "w,ith (!purpose to employ it as 0 weapon agams! 0person." Tennessee prohibits carrying "Withthe intent to go armed."cCertain cities or counties.dChicogo only.eLoaded.fNew Orleans only.g~ndguns must be presented t~ thecity cilief <strong>of</strong> police or cou~ty shenff toobtain a certificate <strong>of</strong> inspection.npermission to carry concealed maybe granted by county sheriff on writtenapplication.iPermit required for purchase by afelon..I thJSome municipalities contro epossession, sale, transfer or carrying <strong>of</strong>handg'uns, e.g., Cleveland and Columbusrequire a police permit for purchasei To!ed~requires a handgun owner's identification,Cincinnati requires application forpurchose." 'thKprohibits carrying a firearm WIthe intent or purpose <strong>of</strong> injuring a~other."IApplies an!y to pre-registeredfirearms. N:> new handguns (;an be broughtinto the city.Source: Ta bl e provi 'd e d t 0 S"" VUf> IOCE"'OOK C. staff by the National Rifle Association,Institute for Legislative Action.!II,iII 1I !ICharacteristics <strong>of</strong> the <strong>Criminal</strong> <strong>Justice</strong> Sysk .. 11SFigure 1.10 Laws decriminalizing public intoxication, by State, as <strong>of</strong> December 1981f\OTE: Laws decriminalizing public intoxication prescribe that intoxicated persons should not besubjected to criminal prosecution solely because <strong>of</strong> their alcohol consumption or Intoxicatedappearance. A person who appears to be incapacitated by alcohoi may be taken into protectivethesecustodylawsbyisthenotpolicean arrest.or other authorized <strong>of</strong>ficial; taking persor.~ into protective custody under-w,c::,HAWAII
"<strong>Sourcebook</strong> <strong>of</strong> <strong>Criminal</strong> <strong>Justice</strong> <strong>Statistics</strong> <strong>1983</strong>Tabla 1.77 Statutory provIsions authorizing blood alcohol concentration tests for personssuspected <strong>of</strong> driving while intoxicoted, and sanctions for refusal to take such tests, byjurisdictionf\OTE: These data were collected through a review <strong>of</strong> the stotutory provisions <strong>of</strong> the 50 States, theDistrict <strong>of</strong> Columbia, and Puerto Rico. Statutes are current as <strong>of</strong> mid-1982, the time at whichthe latest State Code Supplements were available. The blood alcohol concentration level <strong>of</strong>persons suspected <strong>of</strong> driving while intoxicated is generally determined through the administration<strong>of</strong> either preliminary breath tests or chemical blood, breath, or urine tests. ''Preliminary breathtests" are administered at the site <strong>of</strong> a traffic stop and arf~ used for screening purposes Indetermining the need to arrest and the need to conduct further ~Iood alcohol concentration tests."Chemical tests," authorized under "implied consent lows," are typically administered after arrest(see table for exceptions) and are used to obtain admissible evidence <strong>of</strong> intoxication (U.S.Depgrtment <strong>of</strong> Transportation, National Highway Traffic Safety Administration, Alcohol andHi hwa Safet Lows: A Notional Overview 1981 (Washington, D.C.: U.S. Government PrintingOffice, 98 ,pp. , ,9. "Implied consent aws" provide that "any person who operates a motorvehicle upon a public highway is deemed to have given consent to a chemical test or tests <strong>of</strong> hisor her blood, breath, or urine for the purpose <strong>of</strong> determining the blood alcoholic content" (U.S.Deportment <strong>of</strong> Transportation, Notional Highway Traffic Safety Administration, Alcohol andHi hwa 5afet Lows: A Notional Overview 1981 (Washington, D.C.: U.S. Government Printingo ice, Il, p. 9. "Crimina sanctions" refer to fines and/or jail sentences whereas"administrative licensing action" refers to suspension or revocation <strong>of</strong> license.In the table, a "5" indicates that such a provision is provided expressly by statute. Statutesshould be consulted for the full text and meaning <strong>of</strong> specific provisions.JurisdictionAlabamaAlaskaArizonaArkansasCaliforniaColoradoConnecticutDelawareDistrict <strong>of</strong>ColumbiaFloridaStatutoryauthorizationSPreliminary breath testImpliedSonctions for refusalto submit topreliminar~reath testA inlstrative Arrestlicensing required<strong>Criminal</strong> action for consentYesYesYesYesYesYesYesNlYesYesconsent chemical testSonctions for refusalto take impliedconsent chemical testAdlTunistrafivelicensing<strong>Criminal</strong>SactionSSSS55555SIIiII~Characteristics <strong>of</strong> the <strong>Criminal</strong> <strong>Justice</strong> SystemsTable 1.77 Statutory prilvisions autho iz' bl dSuspected <strong>of</strong> driving while intoxica~e(i"~nd 00 a1: ohol f concentration tests for personsjurisdicfion--Continued ,sanc Ions or refusal to take such tests, byJurisdictionNew JerseyNew MexicoNew Yorkf\brth Carolinaf\brth DakotaOhioOclahomaOregonPennsylvaniaPuerto RicoRhode IslandSouth CarolinaSouth DakotaTennesseeTexasUtahVermontVirginiaWashingtonWest VirginiaWisconsi.'WYomingStatutoryauthorizationSSSS5S55Preliminary breath testSanctions for refusalto submit topreliminary breath testAdministrative<strong>Criminal</strong>5licenSingactionablmplled.c.~lmlted to drivers involved in accidents.U1clear, Individual may be subject to penalties.SArrestrequiredfor consentYesYesYesYesYesYesYesYesNJYesYesYesYesYesYesYesNlYesYesYesYesYesImplied consent chemical testSonctions for refusalto take impliedconsent chemical testAdministrativelicensing<strong>Criminal</strong> actionSS5SSSSSSSSSS555SSS55SSSSS5S5GeorgiaHawaiiIdahoIllinoisIndianaSYesYesYesYesYes55SS5IowaKansasKentuckyLouisianaMaineSYesYesYesYesNlS5S55MarylandMassachusettsMichiganMinnesotaMississippiSSSSSYesYesYesNlYesSSSS55MissouriMontanoNebraskaNevadaNew HampshireSSYesYesYesYesYesS555S5SSee footnote at end <strong>of</strong> table.
--- ~..-----~~ ~~--.-------.~~- .-~.<strong>Sourcebook</strong> <strong>of</strong> <strong>Criminal</strong> <strong>Justice</strong> <strong>Statistics</strong> <strong>1983</strong>Table 1.78 Statutory provisions requiring blood alcoholconcentration tests for victil1l!i <strong>of</strong> fatal traffic accidents, byjurisdictionI\()TE: See I\()TE, Table 1.77. In the table, a "5" indicates that such aprovision is provided expressly by statute. Statutes should beconsulted for the full text and meaning <strong>of</strong> specific provisions.JurisdictionAlabamoAlaskoArizonaArkansasCaliforniaColoradoConnecticutDelawareDistrict <strong>of</strong> ColumbiaFloridaGeorgiaHawaiiIdahoIllinoisIndianaIowaKansasKentuckyLouisianaMaineMarylandMassachusettsMichiganMinnesotaMississippiMissouriMontanaNebraskaNevadaNew Harli).shireNew JerseyNew MexicoNew YorkNorth CarolinaNorth DakotaOhioOklahomaOregonPennsylvaniaPuerto RicoRhode IslandSouth CarolinaSouth DakotaTennesseeTexasUtahVermantVirginiaWashingtonWest VirginiaWisconsinWyomingLows requiring blood alcohol t~ts on personskilled in traffic occidentsBlood alcohol concentration testgiven to following persons (ifkilled in occident)StatutoryVehiclerequirement Driver passenger Pedestrians55555555555555555555555555555555555555555555555555sb55555555sb55555555se5sC555555555555(a)55555(a)555sd5555se(a)5555(fl5(h)5(a)55555sb555555sesc55555(n5sg(h)555a Implied.b If driver dies within 4 hours <strong>of</strong> accident.~ If 16 years or older and dies within 4 hours <strong>of</strong> accident.If 16 years or older.{If 13 years <strong>of</strong> age and dies within 5 hours <strong>of</strong> accident.;£iscretionary•Adults only.hUnclear, probably yes.Source: U.S. Department <strong>of</strong> Transportation, Notional HighwayTraffic Safety Administration, Digest <strong>of</strong> State Alcohol-Highway SafetyRelated Le~isl ation, Januar~ <strong>1983</strong> (Washington, D.C.: U.S.DepartlT\cr\t 0 Transportation, 19 3), pp. 3-10--3-310. Table adaptedby saRCEBOOK staff. .i'jI iij~iIHCharacteristics <strong>of</strong> the <strong>Criminal</strong> <strong>Justice</strong> SystemsTable 1.79 <strong>Criminal</strong> sanctions, administrative licensing actions, and relafed actions for driving while intoxicated <strong>of</strong>fenses,by jurisdictionI\()TE: See NOTE, Table 1.77. "The sanctions listed forconvictions <strong>of</strong> alcohol driving <strong>of</strong>fenses ... are those specified bystatute. If a sanction is not specified by law ..., it Is notlisted" (Source, p. 1-2). "Term <strong>of</strong> imprisonment" refers to bothjail sentences and prison sentences. "The term 'mandatorysanction' means a sanction for which statutory law specificallyforbids a court from suspending or otherwise preventing theimposition <strong>of</strong> a certain minimum jail term or a fixed fineamount" (Source, p. 1-2). ''Pre-conviction licensing action"refers to provisions which enable the State licensing agency to<strong>Criminal</strong> sanctionssuspend a license prior to conviction based on blood alcoholconcentration level. "Mandatory minimum term <strong>of</strong> withdrawal"refers to a mandatory minimum term <strong>of</strong> either licensesuspension or revocation. Because <strong>of</strong> variation among thejurisdictions within categories <strong>of</strong> sanctions, e.g., terms <strong>of</strong>imprisonment or amounts <strong>of</strong> fines, the Source document as wellas individual jurisdictions' stotutes shOUld be consulted. In thetable, a "5" indicates that such a provision is providedexpressly by statute.Administrativelicensing actionsOther actions~ ~co...,OJcE E E QJ E...- c E E (l.)~c ~ u C ~3: ora ~ Eo~~ o~ 0;; CO~ o~~ 4:);' ClQJ -ggCor- C So. oo4J s.. C"C mO 0> ~0r-~ Os 5. Os ~ c :z ~ a Os :s g ~ 2; ~~ ~ ~ ~~ ~o~ t> ~ ~ 0; ~ .~o~ ~oi ~~ g~ E:Z o!§OJ:~lI-o 0'4- 0 ~ Cor- t/).j..J Olf- r--QJ °r-QJQ)U _Ot/) 4-JO ...." C ...., at/) era 4-JO oS 04JE.;.JC ...-cor- ra ra ~ or- us:: QJU ra ..c...., ra4-J ...... ra uoE~ -gI: ~ ~~ ~ ...." J,~ ~g -gt: 8re gre raUJ :cu~:isdi~c~t~io~n~~~ __.~____ ~~~~ ______ ~~~ __ ~~~~ _______
<strong>Sourcebook</strong> <strong>of</strong> <strong>Criminal</strong> <strong>Justice</strong> <strong>Statistics</strong> 19S3Table I.SO Statutory provisions related to alcohol use and driving, by jurisdictionI'OTE: See I'OTE, Table 1.77. The evidentiary weight given to bload alcC"1CJI concentrationlevels generally falls into one <strong>of</strong> two categories. ''Presumption at 0.10 percent" indicatesthat such a level <strong>of</strong> blood alcohol concentration creates a presumption <strong>of</strong> intoxication in acourt <strong>of</strong> law. "Illegal per se at 0.10 percent" indicates that such a level <strong>of</strong> blood alcoholconcentration is considered conclusive evidence <strong>of</strong> intoxication in a court <strong>of</strong> law. Statutoryprovisions <strong>of</strong> several jurisdictions treat the 0.10 percent level as both presumptive andillegal per se evidence <strong>of</strong> driving under th: influence. ,This appears t~ be the res~lt <strong>of</strong>States having adopted one <strong>of</strong> the standards without amending statutes which had previouslyauthorized the other standard. In such cases, the actual statutes should be consulted forclarification. "Open container laws" refer to laws prohibiting The possession <strong>of</strong> apencontainers <strong>of</strong> alcoholic beverages in the passenger compartment <strong>of</strong> a motor vehicle. "Dramshop lows" refer to laws which make owners <strong>of</strong> drinking establl~~ments civill~ l!a~le f~rserving alcohol to an intoxicated patron who th~n ~oes out and Injures anot~er ~ndlvldu
-------~ ~ ---.--------, .-,~Characteristics <strong>of</strong> the <strong>Criminal</strong> <strong>Justice</strong> Systems<strong>Sourcebook</strong> <strong>of</strong> <strong>Criminal</strong> <strong>Justice</strong> <strong>Statistics</strong> <strong>1983</strong>Table 1.81 Characteristics <strong>of</strong> marihuana laws, by jurisdiction, as <strong>of</strong> April <strong>1983</strong>--ContinuedTable 1.81 Characteristics <strong>of</strong> marihuana laws, by jurisdiction, as <strong>of</strong> April <strong>1983</strong>JurisdictionAlabo:naAlaskaArizonaArkansasCaliforniaDelawareFloridaGeorgiaHawaiiIdahoIllinoisIndianalawoI\OTE: The data below were compiled from a review <strong>of</strong> Federal and State marihuana statutes. TheSource indicates that no changes have been made in the laws since the 1982 statutory review.AnountUp to 2.2 pounds--personaluseUp to 2.2 pound~--not forpersonal use2.2 to 2,000 pounds2,000 to 10,000 poundsMore than 10,000 poundsAny amount, personal use, inhomeAny amount, personal use, notin publicUp to I ounce, in publicSmoking marihuana in publicMore than I ounce, personaluse, in publicAny amount, personal use, incar, plane, or by personunder 18 yearsMore than I aunce, not forpersonal useAny amount~r~Ot~a~ulc~unceaUp to I ounceMore than I ouncePossessionFirst <strong>of</strong>fenseSecond <strong>of</strong>fenseImprisonment Fine Imprisonment Fine(years) (dollars) (years) (dollars)o to I2 to 153 to 155 to 1515Le9l1o to 25o to I2 to 10o to 6 rros.Colorado Up to I ounce, not in publicUp to I ounce, in public 0 to 15 daysMore than I ounce0 to IConnecticut Up to 4 ouncesto IMore than 4 ounces o to 5More than 2.2 poundsAny amauntUp to 20 gmms20 grams to 100 poundsI UU to 2,000 pounds2,000 to 10,000 poundsMore than 10,000 poundsUp to I ounceI ounce to 100 pounds100 to 2,000 pounds2,000 to 10,000 poundsMore than 10,000 poundsUp to I ounceI to 2 ounces2 ounces to 2.2 pound:;More than 2.2 poundsUp to 3 ouncesMore than 3 ouncesUp to 2.5 grams2.5 to 10 gramsI U to 30 grams30 to 500 gramsMore than 500 gram~Up ta 30 gramsMore than 30 gramsAny amountUp to I ounceMore than I ounce$1,00025,00025,00050,000200,000Le9l1o to 100o to 100o ta 1,000o to 1,000o to 1,00020,0001.5 0 to 150,000o to 5o to 2o to Io to 53 to 305 to 3015 to 30o to II to 105 to 107 to 1015o to 30 daysto Io to Io to 5o to Io to 5o to 30 dayso to 6 rros.o to II to 32 to 5o to Io to 2o to 6 rros.1,00010,000o to 100500o to 1001005001,0002,0002,0005001,0005,00025,00050,000200,0001,00025,00050,000200,000suo1,0001,0005,0001,00010,0005005001,00010,00010,0005,00010,0001,0002 to 152 to 303 to 305 to 3015 to 30Le9l1o to life$25,00050,00050,000100,000400,000le9l1o to 100o to 100to 1,000o to 1,000o to 1,00025,0001.5 to 3 0 to 150,000o to 5 10,0002 to 10 10,000o to 100CultivationImprisonment Fine(years) (dollars)2 to 152 to 153 to 155 to 1515Le9l 1XN:\$25,00025,00025,0005U,000200,000Le9l1o to 100o to 100XI'Ao to 1,000o to 25 20,0002 to 102 to 10o to 6 rros. 500 16 rros. to 3o to 100o to 15 daysIOUo to 2 500 to 1,000o to 5o to 10o to 10o to 7o to Io to 53 to 305 to 3015 to 30I ta 10I to 105 to 107 to 1015o to 30 dayso to Io to Io to 5o to 2o to 10o to 30 dayso to 6 rros.o ta 32 to 52 to 5to 2o to 2Oto 18rros.3,0005,0005,0005001,0005,00025,00050,0002OU,00025,00050,000200,0005001,0001,0005,0002,00020,000suo50010,00010,00010,00010,00010,0003,000I to 14I to 14I to 14o to 2o to 25 to 20o to 10o to 5o to 53 to 305 to 301.5 to 30I to 10I to 105 to 107 to 1015o to 30 dayso to I1.5 0 ta 150,000o to Io to.5to 5o to 5o to 6 rros.o to II to 32 to 53 to 7to Io to 2o to 6 rros.o to 510,00010,000o to IOU1,0001,0001,0001,0001,0001,000 to10,0005,0005,00025,00050,000200,00025,00050,000200,0005001,0001,0005,00015,00015,0005001,00010,00010,00010,0005,00010,000Kansas Any amounto to I 2,500 I to 10Kentucky Any amounto to 90 days250 o to 90 cloys 250 o to 500See footnotes at end <strong>of</strong> table.1,0001,000SaleImprisonment(years)2 to 152 to 153 to 155 to 1515XXN:\XXXo to 252 to 102 to 102 to 42 to 4I to 14I to 14I to 14o to 7o to 75 to 20o to 10o to 5o to 53 to 305 to 3015 to 30I to 10I to 105 to 107 to 1015to Io to Io to 5o to 5to 5o to 5o to 6 rros.o to II to 32 to 53 to 7to Io to 2o to 6 rros.o to 55,000 o to Ib 2,srxf I to 20o to IFine(dollars)$25,00025,00025,0005U,000200,000XXN:\XXX25,0007 0 to 150,00010,00010,0001,0001,0001,0001,0001,0001,000 to10,0005,0005,00025,00050,000200,00025,00050,000200,0001,0001,0005,0005,00015,00015,000SUO1,00010,00010,00010,0005,00010,000\,0001,00010,000500PossessionFi rs t <strong>of</strong>fenseSecond <strong>of</strong>fenseImprisonment Fine Imprisonment FineJurisdiction Anount (years) (dollars) (years) (dollars)LauisianaMaineMarylandMassachusettsMichiganMinnesotaMississippiMissouriMantanaNebraskaNevadaNewHampshireUp to 100 pounds100 to 2,000 pounds2,000 to 10,000 poundsMore than 10,000 poundsUp to 1.5 ounces, personaluse1.5 ounces to 2 pounds c2 to 1,000 pounds cMore than 1,000 pounds co to 6 rros.5 to 1010 to 1515 to 20Any amount, personal use 0 to IAny amount, not for personal 0 to 5useMore than 100 pounds imported 0 to 25into the StateUp to 50 pounds(d)50 to 100 pounds (d)100 to 2,000 pounds (d)2,000 to 10,000 pounds (d)More than 10,000 poundsAny amountUp to 1.5 ouncesMore than 1.5 ounces(d)o to Io to 3Up to I ounce, not in vehicleUp to I ounce, in vehicle 0 to 90 daysI ounce to I kilogram 0 to 3More than I kilogram3 eUp to 35 gramsMore than 35 gramsUp to 60 gramsMore than 60 gramsUp to I ounceI ounce to I poundMore than I poundUp to I ounce by a personunder 21 yearsAny amaunt, ather agesUp to I poundMore than I poundNew Jersey Up to 25 gramsMore than 25 gramsNew Mexico Up to I aunceI to 8 ounces8 ounces to 100 poundsMore than 100 poundsNew YorkNorthCarolinaUp to 25 grams, in private25 grams to 2 ounces, or 2ounces in public2 to 4 ounces4 to 8 ounces8 ounces to I poundI to 10 poundsMore than 10 poundsUp to I ounceI ounce to 50 pounds50 to 100 pounds100 to 2,000 pounds2,000 to 10,000 poundsMore than 10,000 poundsNorth Up to 0.5 ounce, not inDakota vehicle0.5 to I ounce, or up toI ounce in vehicle____ More than I ounceSee footnotes at end <strong>of</strong> table.o to Io to 5o to Io to 5o to 7 dayso to 5o to 6o to 6to Io to 7o to 6 rros.o to 5o to 15 daysto Io to 53o to 3 rros.o to Io to Io to 4o to 7o to 15o to 5o to 571435o to 30 dayso to Io to 5$50025,00050,000200,000o to 2001,00015,00050,000(d)(d)(d)(d)(d)o to 55 to 1010 to 1515 to 2Uo to 2o to 10o to 50o to 6 rros.o to 6 rros.o to 6 rros.o to 6 rros.o to 6 rros.1,000 o to 2o to 100 0 to 90 days3,000 0 to 6100 to 2505003,00010,0001,0001,0001,0001005001,0005,0001,0002,000SUO15,00050 to 100100 to 1,0005,f.XJOo to 10,000o to 1005001,0001,0001005,0005,00025,00050,000200,0005001,0005,0005 to 60 dayso to 180 dayso to ~to 5o to 5to 3o to 5to 5 dayso to 7 dayso TO .5I to 6I to 10o to 7o to 15o to 6 rros.o to 5$2,00025,00050,000200,000o to 2002,00030,000100,0005005005005005002,0002,0006,0002501,0006,00020,0001,0001,0001,000200500iO,OOO5,00020,0002,0002,00050015,000o to 1100 to 1,000o to I 100 to 1,000I to 5 5,0009 0 to 10,000o to 3 rros.to Ito Ito 4o to 7o to 15o to 5o to 571435o to 60 dayso to 2o to 5185o to 2005001,0001,0001005,0005,0()025,00050,000200,0001,0002,0005,000CultivationImprisonment Fine(years) (dollars)o to 105 to 1010 to 1515 to 20o to Io to 5o to 10o to Io to 5X$15,00025,00050,000200,OO()o to 2001,0002,50010,0001,00015,000Xo to 2 5,000Ie 500 to 10,0003 e 2,500 to50,000~ 5,000 to50,000IcF 20,000 to200,000o to 4o to 5o to 5to 10to 10o to 10o to 10o to 5o to 5to lifeto Ii feo to 5Q to 5o to 5I to 15I to 15o to 15o to 15o to 5o to 59999to Io to Ito Io to Io to 4° to 7o to 15o ta 5o to 571435o ta 10o to 10o to 102,00015,00015,00015,00015,00015,00015,000 .1,0001,00010,00010,00010,0005,0005,0002,0002,00015,00015,000to 10,000to 10,000to 10,000o to 10,0001,0001,0001,0001,0001005,0005,00025,00050,000200,00010,00010,00010,000SaleImprisonment(years)o to 105 to 1010 to 1515 ta 20Xto Io to 5o to 10Xo to 5o to 25Fine(dollars)$15,00025,00050,000200,000X1,0002,50010,000X15,00050,000to 2 5,000Ie 500 to 10,000:f 2,500 to50,0003 e 5,000 to50,000I (f 20,000 to200,000o to 4to 5o to 5to 20to 20o to 203 to 205 to life5 to Ii feI to Ii feI to lifeo to 20o to 20o to 20I to 15I to 15o to 15o to 15o to 5o to 5o to 18 rros.Oto 18rros.Oto 18rros.o to 18rros.o to Io to 4to 4to 7o to 7to 15o to 15o to 5o to 5o to ,571435o to 10o to 10o to 102,00015,00015,00030,00030,00030,00030,00010,000IU,ooo10,0005,0005,0002,0002,00')15,00015,000to 5,000to 5,000to 5,000o to 5,0001,0005,0005,0005,00025,00050,000200,00010,00010,00010,000
------"'--~ ,'~- =--<strong>Sourcebook</strong> <strong>of</strong> <strong>Criminal</strong> <strong>Justice</strong> <strong>Statistics</strong> <strong>1983</strong>Characteristics <strong>of</strong> the <strong>Criminal</strong> <strong>Justice</strong> SystemsTable 1.81 Characteristics <strong>of</strong> marihuanalaws, by jurisdiction, as <strong>of</strong> April <strong>1983</strong>--ContlnuedPossessionFirst <strong>of</strong>fense Second <strong>of</strong>fense Cultivation SaleImprisonment Fine Imprisonment Fine Imprisonment Fine Imprisonment FineJurisdiction Amount (years) (dollars) (years) (dollars) (years) (dollars) (years) (dollars)Ohio ~ to 100 grams $0 to 100 $0 to 100 611'Os. to 5 $2,500 611'Os. to 5 $2,500100 to 200 grams o to 30 days 250 o to 30 days 250 611'Os. to 5 2,500 6 rros. to 5 2,500200 to 600 grams 6 rros. to 5 2,500 I to 10 5,000 I to 10 5,000 I to 10 5,000/WJre than 600 grams I to 10 5,000 2 to 15 7,500 2 to 15 7,500 2 to 15 7,500Oklahoma MY amount o to I 2 to 10 2 to 10 5,000 2 to 10 5,000Oregon ~ to I ounceo to 100 o to 100 o to 10 2,500 o to 10 2,500/WJre than I ounce o to 10 2,500 o to 10 2,500 o to 10 2,500 o to 10 2,500Pennsylvania ~ to 30 grams o to 30 days 500 o to 30 days 500 o to 5 15,000 o to 5 15,000/WJre than 30 grams o to I 5,000 o to 3 25,000 o to 5 25,000 o to 5 25,000Rhode Island MY amount o to I 500 o to 2 1,000 o to 30 50,000 o to 30 50,000South ~ to I ounce o to 30 days 100 to 200 to I 200 to 1,000 to 5 5,000 to 5 5,0001,000 o to I 2,000 o to 5 5,000 o to 5 5,000Carolina/WJre than I ounce10 to 100 pounds c I to 10 10,000 I to 10 10,000c5 to 25 25,000 5 to 25 25,000100 to 2,000 pounds2,000 to 10,000 pounds c 10 to 25 50,000 10 to 25 50,00015 to 30 200,000 15 to 30 200,000/WJre than 10,000 pounds cSouth Dakota Up to I ounce o to 30 days 100 o to 30 days 100 o tu 3U days 100 o to I 1,000I to 8 ounces o to I 1,000 o to I 1,000 o to I 1,000 o to 2 2,0008 ounces to I pound o to I 1,000 o to I 1,000 o to I 1,000 o to 5 5,000/WJre than I pound o to 2 2,000 o to 2 2,000 o to 2 2,000 o to 5 5,000Tennessee ~ to 0.5 ounce o to I 1,000 I to 2 I to 5 3,000 o to I 1,000/WJre than 0.5 OUr}ce o to I 1,000 I to 2 I to 5 3,000 I to 5 3,000Texas ~ to 2 ounces o to 180 1,000 30 to 180 1,000 o to 180 1,000 2 to 10 5,000days days days2 to 4 ounces o to I 2,000 90 days to I 2,000 o to I 2,000 2 to 10 5,0004 ounces to 50 pounds 2 to 10 5,000 2 to 20 10,000 2 to 10 5,000 2 to 10 5,000/WJre than 50 pounds (f) 500,000 (f) 500,000 (n 500,000 (f) 500,000Utah My amount o to 6 rros. 299 o to I 1,000 o to 5 5,000 o to 5 5,000Vermant ~ to 0.5 ounce o to 6 rYos. 500 o to 2 2,000 o to 5 5,000 o to 5 5,0000.5 to 2 ounces o t.? 3 3,000 o to 3 3,000 o to 5 5,000 o to 5 5,000/WJre than 2 ounces o to 5 5,000 o to 5 5,000 o to 5 5,000 o to 5 5,000Virginia ~ to 0.5 ounce o to 30 days :00 o to I 1,000 o to 30 days 500 o to I 1,0000.5 ounce to 5 pounds o to 30 days 500 o to I 1,000 o to 30 days 500 o to 10 1,000/WJre than 5 pounds o to 30 days 500 o to I 1,000 5 to 30 5 to 30Washington Up to 40 grams o to 90 days 250 o to 90 days 250 o to 5 10,000 o to 5 10,000/WJre than 40 grams o to 5 10,000 o to 10 10,000 o to 5 10,000 o to 5 10,000West Virgin!o Myamount g 3 to 6 rros. 1,000 311'Os. to I 2,000 I to 5 15,000 I to 5 15,000Wisconsin MY amount o to 30 days 500 o to 30 days 500 o to 5 15,000 o to 5 15,000Wyoming MY amount o to 611'05. 1,000 o to I 2,000 o to 6 rros. 1,000 o to 10 10,000District <strong>of</strong>ColWlbia !>roy a-nount o to I 100 to 1,000 o to 10 500 to 5,000 o to I 100 to 1,000 o to I 100 to 1,000Federal I-\.,yamount o to I 5,000 o to 2 10,000~ to 1,000 pounds/WJre than I ,000 pounds:{>resumed to be not for personal use.Second <strong>of</strong>fense: I to 10 years and $5,000.~esumed to be for sale.obetion.Source:o to 5 15,000 o to 5 15,000o to 15 125,000 o to 15 I 25!000iMandatory.\Jp to life.gFor possession <strong>of</strong> less than 15 grams, the presumption is againstintent to distribute. One can get a conditional discharge.Table provided to SCl-.RCEBOO< st<strong>of</strong>f by the Notional Organization for the Reform <strong>of</strong> /WJrijuana Laws.II:!StateAlaskaMaxlmt.m fineImposed$100California $100Colorador$100MaineMinnesota 100Mississippi 250Nebraska100New York100(\brth Caroll no ~IOOOhio100Oregon$100Maximum amount passe~.edMY amount In private forpersonal ~se or I ounceIn publicI ounceI ounceMY amount b for personal useI 1/2 ouncesI ounceI ounce25 grams (approximately7/8 ounce)1 ounce100 grams (approximately3 1/2 ounces)I ounceaThe Supreme Court <strong>of</strong> Alaska ruled in 1975that the constitutional right <strong>of</strong> privacy protectsthe pc'Ssesslon <strong>of</strong> marihuana for personal use In thehome by adults. This decision invalidates the $100fine for simple possession In the home.Classification <strong>of</strong> <strong>of</strong>fenseCivilMlsdemeanor--no permanentcriminal recordClass 2 petty <strong>of</strong>fense--nocriminal recordCivilCivilCivilCivilVlolation--no criminalrecordMinor misdemeanorMinor mlsdemeanor--nocriminal ~ecordCivilEffective dateSept. 2, 1975Jan. I, 1976July I, 1975Mar. I, 1976Apr. 10, 1976July I, 1977July I, 1978July 29, 1977July I, 1977(\bv. 22, 1975Oct: 5! 1973b There Is a rebuttable presumption thatpossession <strong>of</strong> less than I 1/2 ounces is for personaluse and possession <strong>of</strong> more than I 1/2 ouncesIndicates on Intent to distribute.Laws.Source: Table provided to SCl-.RCEBOO< staff by the (\btianol Organization for the Reform 'j( Marijuana186187
-----~---~-~--~-~----------------------- ~--.~--<strong>Sourcebook</strong> <strong>of</strong> <strong>Criminal</strong> JL'stice <strong>Statistics</strong> <strong>1983</strong>riITable 1.83 Development <strong>of</strong> statewld-: <strong>of</strong>fender-based transaction statistics systems, by system status, component status, and State,September 1980f\OTE: The data below were collected from a survey <strong>of</strong> State directors <strong>of</strong>statistical analysis centers or criminal justice councils. All Statesexcept Kentucky, Tennessee, Texas, and Vermont responded to thesurvey.Offender-based transaction statistics (OBTS) systems are datacollection systems designed to track the movement <strong>of</strong> an <strong>of</strong>fender frompoint <strong>of</strong> Initial entry Into the criminal justice system to final departurefrom the criminal justice system. The Source cautions ''that while astate moy have Indicated a particular segment <strong>of</strong> their system wasoperational the link or tie In to OOTS moy riot be established" (Source,p. 53).The terms "Planning," "Design," "Development," "Implementation,"and "Operational" Indicate a system development sequence. In theearliest stages <strong>of</strong> system development, system "planning" and studyoccurs. This is followed by a period <strong>of</strong> system "design," which in turnis followed by a "development" and testing phase, an "implementation"phase, and finally a fully "operational" phase.AlabamaAlaskaArizonaArkansasCaliforniaCalorcJdoConnelcticutDelaY/areDistdct <strong>of</strong>ColvmbiaFloridaGeoqliaHawaiiIdahclIllinoisIndianaIowaKansasLauisianaMaineMarylandMassachusettsMichiganMinnesataMississippiMissouriMontanaNebraskaNevadaNew i-PmpshireNew JerseyNew MexicoNew YQrkNorth Carolinaf\kJrth DakotaOhioOklahomaOregonPennsylvaniaRhode IslandSouth CarolinaSouth DakotaUtahVirginiaWashingtonWest VirginiaWisconsinWyomingMaintaining,developing,or planninga statewideOB"!"!j sYltemNoYesYesYesYesYesYesYesYesNoYesYesNoYesNoYesYes(c)YesYesYesYesYesNoNoNoYesNoNoYesYesYesNoNoYesYesYesYesYesYesNoYesYesNoYesYesYesPolleeIdentificatlon/fingerprint ArrestXNt>.ImplementationNt>.OperationalXNt>.ImplementationOperationalOperationalXNt>.ImplementationPlanningOperationalOperational Operational OperationalImplementation Implementation No plansOperational Operational Deve~opmentDesignXOperationalOperationalXOperationalXImplementationOperationalXPlanningDesignPlanningNt>.OperationalXXXPlanningXXOperationalNt>.OperatianalXXOperationalOperationalOperationalPlanningDesignOperationalXOperationalOperationalXNt>.OperationalImplementationDesignXOperationalOperationalXOperation..!1XImplementationImplementationXPlanningDesignPlanningOperationalOperationalXXXPlanningXXOperationalPlanningOperationalXXOperationalOperationalOperationalPlanningDesignOperationalXOperationalOperationalXNt>.OperationalImplementationStatus af OBTS system componentsCorrectionsState custody/LocalProsecutorparole paroleOperationalXDevdopmentOperationalXOperationalXImplementationPlanningXPlanningNt;PlanningDesignOperationalXXXPlannii1gXXOperationalNt>.PlanningXXNo plansOperationalNt>.No plansPlanningDesignXNt>.OperationalXNt>.OperationalImplementationXNt>.ImplementationOperationalOperationalXNt>.ImplementationOperationalPlanningOperational Operational Nt>.Development Implementation (b)Design/Development Development (b)Nt>.XDevelopmentOperationalXOperationalXImplementationPlanningXPlanningOperationalPlanningDesignOperationalXXXPlanningXXOperationalDesignOperationalXXOperationalOperationalOperationalOperationalPlanning/DesignDesign/OperationalXOperationalOperationalXNt>.OperationalImplementationOperatianalXDevelapmentOperationalXOperationalXOperationalImplementationXDevelopmentPlanningPlanningOperationalNt>.XXXNo plansXXOperationalOperationalOperatianalXXOperatianalImplementationOperatlon~1OperationalPlanningOperotlonolXOperotlonalOperationalXNt>.PlanningImplementationXNt>.ImplementationNt>.PlanningOperationalXDevelopmentNt>.XOperationalXPlanningPlanningXPlanningPlanningPlanningOperationalNt>.XXXNo plansXXOperationalPlanningNo plansXXNo plansNo plansNt>.OperationalNo plansPlanning:.(b)ImplementationProbatlanXNt>.ImplementationNt>.PlanningPlanningImplementationDevelopmentDevelopmentOperationalXOperationalXPlanningDesignXDevelopmentPlanningPlanningNo plansNt>.XXXNo plansXXOperationalDesignOperationalXXPlanningPlanningNt>.OperationalPlanningOperationalXOperationalOperationalXNt>.OperationalDevelopmentSection 2:PUBLIC ATTITUDES TOWARD CRIME AND CRIMINAL JUSTICE-RELATED TOPICSA large number <strong>of</strong> surveys <strong>of</strong> publicopinion, on a variety <strong>of</strong> criminal justice topics,are conducted anrJudUy in the United States.Many <strong>of</strong> these surveys are conducted by publicopinion researchers in connection with politicalcampaigns or in general social surveys; othersare conducted for governmental agencies orcomnissions concerned with specific problemareas: The reports <strong>of</strong> these surveys arepresented in this section. In addition,mach i ne -readab Ie data pro vi ded by theNational Opinion Research Center from itsGeneral Social Surveys were tabulated bySOlRCEBOO< staff and are included in thisedition, as are tables produced from the ABCNews Poll on crime, provided to SOLRCEBOOKby the <strong>Criminal</strong> <strong>Justice</strong> Archive andInformation Network <strong>of</strong> the Inter-universityConsortium for Political and Social Research.The majority <strong>of</strong> the opinion surveysconta i ned in this section drew samples <strong>of</strong>households designed to be representative <strong>of</strong>households in the continental United States.Respondents were then selected from thesehouseholds and interviewed. For a description<strong>of</strong> the general survey sampling procedures <strong>of</strong>The Gallup Poll, the National Opinion ResearchCenter, Louis H:lrris and Associates, the ABCNews-Washington Post Poll, and the N3C Newsand The Associated Press Poll, see .A.ppendix 7.A detailed description <strong>of</strong> a large survey oncrime, the ABC News Crime Poll, is presentedin Appendix 8.The wide range <strong>of</strong> topics examined inthese opinion surveys includes fear <strong>of</strong> crimeand victimization; public attitudes about crimeand its causes; the relative seriousne~s <strong>of</strong>crime as a social problem; juvenile crime;neighborhood crime-watch programs;performance <strong>of</strong> law enforcement and the U.S.Supreme Court; sentencing and the deathpenalty; the dangerousness and effects <strong>of</strong> drugsand alcohol; gun ownership and gun control;abuse <strong>of</strong> children, spouses, and the elderly;prison reform and construction; and thelegalization <strong>of</strong> various <strong>of</strong>fenses.The survey results are generally brokendown by background characterist ics <strong>of</strong>respondents--such as race, sex, age, andincome--enabling comparisons across importantsocial dimensions. Finally, because some <strong>of</strong> thesame questions have been asked repeatedl y bya given source over the years, many trendtables have been constructed by SOlRCEBOOKstaff and are presented in this section.aSome States have separate data element segments for their courts It is no\'::.d In the table as lower court stage <strong>of</strong>lower and upper courts. Other Stal'es either have only one trial court devel~nent/upper court stage <strong>of</strong> development.or only include upper court dispositions on their OOTS file. For thisNo local parole component to the criminal justice system.table the responses on the stages <strong>of</strong> development for lower and uppercLauisiana was in the process <strong>of</strong> implementing an OOTS sY!ltt'r;..court are listed under the broader category "court". If a State During the summer <strong>of</strong> 1980, activities associated with OBTSspecified different stages <strong>of</strong> development for their lower and upper development were terminated.Source: Rita Folan, Status <strong>of</strong> Offender-Based Transaction <strong>Statistics</strong> (OOTS) SysLem Devel<strong>of</strong>?!ll!tnt in 'the States (Washington, D.C.:<strong>Justice</strong> <strong>Statistics</strong> Association, Inc., 1981), pp. 16, 54. Table adapted by S
<strong>Sourcebook</strong> <strong>of</strong> <strong>Criminal</strong> <strong>Justice</strong> S;atlstics 19B3Table 2.1 Attitudes toward the trend <strong>of</strong> the crime rate in the country,by demographic characteristics, United States, 1982'f\OTE: The data below are from a telephone survey <strong>of</strong> 2,464 persons 18 yearsand older conducted by ABC News during the period Dec. 7-18, 19B1. For adiscussian <strong>of</strong> public apinion survey sompllng procedures, see Appendi)( 7. Fordetailed infarmation an this survey, see Appendix 8.Question: "Just your best guess, would you say that the crime rate inthis country is gving up, going doV{n or what?"(Percent a )NO opinion,Going Abl.'ut b Going refusedu~ the same down ta answerNotional 83 10 bSex:Male BO 12 7Female 87 8 4Race, ethnicity:White B2 II 6 IBlack 91 5 4 0Hispanic 86 7 7 0Education:College 80 12 6 2High school 85 9 5 (c)Grade schoal 86 7 6 IEmployment status:Full-time employed 81 12 6 IPart-time emplayed 84 8 7 IU1employed 86 8 5 ILaid <strong>of</strong>f n 8 0 0Retired !l4 9 5 2Full-time homemaker 88 7 4 (c)Student 82 12 5 01"'000 00' ow, 76 14 8 I20;UOO ta ~29 ,999 86 9 4 I12,000 to 19,999 84 9 6 I8,000 to $ I 1,999 !l6 9 5 (c)Under $8,000 89 5 5 IIncome:Ag~;J.; to 24 years 82 10 8 (c)25 to 2' years 84 10 5 I30 to 49 yeors 84 10 6 (c)50 to 64 years 81 12 5 26S years and older B4 9 5 2Community size:Large city 84 8 7 ISuburb 80 12 6 ISmall town 85 10 5 (c)Rural 83 10 6 2Region:Northeast 84 10 5 \c)Midwest 82 12 6SouthI83 9 7WestI82 10 6 2Neighborhood racial characteristics:.'!.vstly ar all white 82 II 6 IRacially mixed 87 7 6 IMostly ar all black 88 4 8 0Neighborhood age structure:Mostly younger than 35 years 85 10 5 (c)Mostly between 35 and 55 years 81 II 7 IMostly older than 55 years 87 8 4 IMixed! all ages 83 10 6 IbPercents rnay not add to 100 due to rounding.Respondents volunteered this response.cLess than or equal to 0.5 percent.Source: Table constructed by Sa...RCEBOO
--~- ~-..-------------- - -- ~<strong>Sourcebook</strong> <strong>of</strong> <strong>Criminal</strong> <strong>Justice</strong> <strong>Statistics</strong> <strong>1983</strong>Public Attitudes Toward Crime ~nd<strong>Criminal</strong> <strong>Justice</strong>-Related TopicsJ Table 2.2 Attitudes toward changes in the level <strong>of</strong> crime in own areo compared to 0 yeor ago, by demogrophic characteristics, UnitedStates, 1981, 1982, and <strong>1983</strong>I\OTE: For a discussion <strong>of</strong> public opinion survey sampling procedures, se" Appendix 7.Question: "Is thtlre more crime in this area them there was a year ago, or less?"(Percent)1981 1982 <strong>1983</strong>No I\b NOMore Less Same opinion More Less Same opinion More Less Same opinionNotional 54 8 29 9 47 17 288 37 17 36 10Table 2.3 Attitudes toward the trend in the amount <strong>of</strong> violent crime inthe respondent's neighborhood, by demographic characteristicsUnited States, 1982'NJTE: See NJTE, Table 2.1. For a discussion <strong>of</strong> public opinion survey samplingprocedures, see Appendix 7. For detailed Information on this survey seeAppendix 8.'Question: "And what about the neighborhood where you live wouldyou say thot violent crime is going up or going down or what?" '(Percent a )No opinion,Going About b Going refusedup the same down to answerSex:Notional 23 53 21 3Male 61 9 30 10 43 16 32 9 33 19 41 7Female 56 7 28 9 52 17 24 7 41 16 32 II Sex:Male 22 55 20 2Race:Female 25 50 22 4White 54 8 29 9 47 16 29 8 35 17 38 10Nonwhite 48 12 26 14 49 23 21 7 49 19 25 7 Race, ethnicity:White 22 55 20 3Education:Black 33 36 30 :lCollege 50 9 30 II 42 18 29 II 30 18 39 13Hispanic 28 41 29 2High school 54 9 29 8 50 17 26 7 38 18 35 9Grade school 59 4 25 12 51 i3 30 6 48 13 32 7 Education:College 22 56 20 3Occupation:High school 25 51 22 3Pr<strong>of</strong>essional and business 50 8 32 10 41 17 32 10 31 19 40 10Grade school 22 48 23 7Clerical and sales 52 12 25 II 44 19 25 12 41 14 34 IIManual workers 55 9 18 8 50 18 25 7 36 19 34 IIEmployment status:Non labor force 56 7 27 10 54 13 27 6 43 16 35 6Full-time employed 21 56 20 3Part-time employed 2S 48 25 2Income:Unemployed 33 46 18 2$25,000 and over 51 8 34 7 45 17 31 7 30 19 42 9Laid <strong>of</strong>f 25 61 14 0~20,000 to ~24,999 56 7 32 5 46 21 25 8 37 17 36 10Retired 20 54 20 615,000 to 19,999 54 9 25 12 47 19 27 7 34 21 37 8Full-time homemaker 31 48 18 3~10,000 to $14,999 52 9 29 10 51 14 28 7 39 15 36 10Student 27 34 36 45,000 to $9,999 59 7 25 9 47 16 26 II 51 II 28 10Under $5,000 50 9 26 15 60 10 23 7 45 20 32 3 Income:Age: 1".000 ood o~'20 57 20 320,000 to $29,999 23 54 21 2Total under 30 years 47 II 31 II 44 18 27 II 38 18 30 1412,000 to $19,999 22 56 20 318 to 24 years 46 12 32 10 45 17 27 II 42 13 30 158,000 to $11,999 28 47 22 325 to 29 years 50 10 28 12 43 20 27 10 33 24 31 12Under $H,OOo 32 40 22 630 to 49 years 54 8 28 iO 48 15 29 8 35 16 41 850 years and older 58 6 28 8 49 17 28 6 38 18 36 8Age:50 to 64 years I\)C>. Nt>. Nt>. Nt>. 46 21 28 5 35 18 37 1018 to 24 years 26 42 30 265 years and older Nt>. Nt>. Nt>. Nt>. 54 13 27 6 43 19 34 425 to 29 years 26 51 21 230 to 49 years 22 56 20 3City size:50 to 64 years 23 58 16 31,000,000 and over 51 7 30 12 49 19 25 7 40 13 38 965 years and older 19 55 21 6500,000 to 999,999 44 13 32 II 42 21 28 9 29 24 32 1550,000 ta 499,999 53 9 29 9 43 17 30 10 37 24 31 8CClI1'1'"rnnity size:2,500 to 49,999 65 a 18 9 55 15 24 6 40 17 36 7Large city 27 47 22 4Under 2,500, rural 54 7 32 7 50 14 29 7 37 12 41 10Suburb 22 56 21 2Small town 23 53 21 3Region:Rural 2:.! 55 20 3East 54 7 29 10 118 17 28 7 37 19 36 8Midwest 45 II 37 7 43 15 36 6 31 14 44 IIRegion:South 56 8 24 12 51 15 26 8 45 17 31 7(\Drtheast 23 54 19 4West 63 8 22 7 50 20 19 II 34 20 32 14Midwest 20 57 21 2South 24 49 23 4Religion:West 26 54 19 2Protestant 54 9 28 9 48 16 27 9 38 17 35 10Catholic 53 8 30 9 49 18 28 5 38 21 34 7 Neighborhood racial characteristics:Mostly or all white 21 56 20 3Politics:Racially mixed 34 42 20 3Republican 57 7 28 8 42 18 33 7 36 20 35 9Mostly or all black 28 43 30 0Democrat 54 9 27 10 52 17 25 6 39 17 35 9Independent 50 8 32 10 47 15 27 II 36 16 39 9 Neighborhood age structure:Mostly younger than 35 years 20 50 26 3Source: George H. Go II up, The Gollup Report, Report (\D. 187, p. 6; Report No. 200, p. 20; Report (\D. 210, p. 9 (Princeton, N.J.: The GollupMostly between 35 and 55 years 20 59 20 2Poll). Table adapted by Sa...RCEBOOK staff. Reprinted by permission.Mostly older than 55 years 24 54 18 4Mixed, all ages 25 51 21 3~ercents may not add to 100 due to rounding.Respondents volunteered this response.i,;,Source: Table constructed by Sa...RCEB()()< staff from data providedby ~he ABC News Poll; data were made available through the <strong>Criminal</strong><strong>Justice</strong> Archive and Information Network, Inter-university Consortium forPolitical and Social Research.192193
,,i<strong>Sourcebook</strong> <strong>of</strong> <strong>Criminal</strong> <strong>Justice</strong> <strong>Statistics</strong> 19113Figure 2.2 Respondents reporting feeling uns<strong>of</strong>e in their homes at night, United States, selected years 1972-83f\OTE: For a discussion <strong>of</strong> public opinion survey sampling procedures, see Appendix 7.Question: ''l-bw about at home at night--do you feel safe and secure, or not?"Percent feeling unsafe2520 19151051516 16o~~~------------~--------~------------------~--~1972 1975 1977 1981 <strong>1983</strong>Source: Geotge H. Gallup, The Gallup Report, Report /'lb. 210 (Princeton, N.J.: The Gallup Pull, March <strong>1983</strong>), p. 8.Figure constructed by sa.RCEBOO< stOff. Reprinted by permission.I'!Public Attitudes Toward Crime and <strong>Criminal</strong> <strong>Justice</strong>-Related TopicsTable 2.4 Respondents reporting feeling unsafe at home atnight, by demographic characteriatlcs, United States,1975, 1977, 1981, and <strong>1983</strong>f\OTEI For a discussion <strong>of</strong> public opinion survey samplingprocedUres, see Appendix 7.QuestIon: "How abol,'t at horne at nlght--do you foel safeand secure, or not?"(Percent feeling unsafe)1975 1977 1981 <strong>1983</strong>Notional 19 15 16 16Sex:Mole 13 12 12 IIFemale 25 18 19 20Race:White 17 14 16 14Nonwhite 33 25 20 23Education:College 13 9 13 13High school 19 17 16 17Grode schoo I 25 22 20 17Occupation:Pr<strong>of</strong>essional and business 13 8 13 14Clerical and sales 20 14 12 19Manual workers 20 16 17 14Nonlaber force 22 22 18 17Income:Nl\ Nl\ 12 121'5'000 20,000 '"' to r4,999 ON"'Nl\ Nl\ 13 1215,000 to 19,999 Nl\ Nl\ 15 2010,000 to 14,999 Nl\ Nl\ 17 145,000 to $9,999 Nl\ Nl\ 21 21Under $5,000 Nl\ Nl\ 17 18Age:Total under 30 years 21 16 17 16III to 24 years 20 17 18 1625 to 29 years 22 14 15 1730 to 49 years 18 /I 15 1650 years and older 19 18 16 1450 to 64 years Nl\ Nl\ Nl\ 1265 years and older Nl\ Nl\ Nl\ 16City size:1,000,000 and over 27 13 21 21500,000 to 999,999 19 15 Iv 1450,000 to 499,999 17 17 16 162,500 to 49,999 17 15 16 16Under 2,500, rural 17 15 14 12Region:East 20 14 13 17Midwest 18 15 16 10South 21 17 15 19West 16 13 22 15Religion:Protestant 1'9 16 14 14Catholic 19 15 17 16Politics:Republlc.:an 15 12 12 15Democrat 20 17 18 17Independent 20 15 17 13Source: George H. Gallup, The Gallup Opinion Index, Report No.124, p. 17; Report /\b. 154, p. 30 (Princeton, N.J.: The Gallup Poll);and George H. Gallup, The Gallup Report( Report /\b. 187, p. 7; Report/\b. 210, p. 8 (Princeton, NOJ.: The Gal up Poll). Table adopted byS
----------- - -- -<strong>Sourcebook</strong> <strong>of</strong> <strong>Criminal</strong> <strong>Justice</strong> <strong>Statistics</strong> <strong>1983</strong>Figure 2.3 Respondents reporting fear <strong>of</strong> walking alone at night within a mile <strong>of</strong> residence, United States, selected years 1965-83!\oTE: For a discussion <strong>of</strong> public opinion survey sampling procedures, see Appendix 7.Question: "Is there any area right around here--that is, within a mile--where you would be afraid to walk alone at night?"Percent afraid45 4540 422031O~~~--~r-------------'-------~----~----~----~--~-'1965 1967 1972 1975 1977 1979 1981 1982<strong>1983</strong>Source: George H. Gallup, The Gallup Report, Report No. 210 (Princeton, N.J.:constructed by 5O.RCEBOO< st<strong>of</strong>f. Reprinted by permission.The Gallup Poll, March <strong>1983</strong>), p. 6.FigureII !I !11I ! iI Ji~ijnPublic Attitudes Toward Crime and <strong>Criminal</strong> <strong>Justice</strong>-Related TopicsTable 2.5 Respondents reporting fear <strong>of</strong> walking alone at night within a mile <strong>of</strong>residence, by demographic characteristics, United States, selected years 1967-83!\oTE: For a discussion <strong>of</strong> public opinion survey sampling procedures, see Appendix 7.QUestion: "Is there any area right around here--that is, within a mile--where youwould be afraid to walk alone at night?"(Percent responding yes)1967 1972 1975 1979 1981 1982 <strong>1983</strong>Notional 31 42 45 42 45 48 45Sex:MoleFemale1644226026632557286231642662Race:WhiteNonwhite2946424843574057455247544358EducatiCln:College 29 42 42 36 39 48 43High school 31 42 45 44 47 47 45Grode school 33 46 50 48 52 50 48Occupation:Pr<strong>of</strong>essional and business 32 39 40 40 42 46 38Clerical and sales 40 46 51 45 46 48 51Manual workers 31 41 43 40 45 44 42Nonlabor force N\ N\ 54 51 51 62 55Income:N\ N\ N\ 32 41 43 371"'000 20,UOO "0' to $24,999 "'"' N\ N\ Nt>. 33 43 48 3915,000 to ~19,999 N\ Nt>. Nt>. 38 41 45 4710,000 to 14,999 Nt>. N\ Nt>. 44 46 54 455,000 to $9,999 N\ N\ Nt>. 52 49 52 50Under $5,000 N\ Nt>. Nt>. 55 56 51 60Age:Total under 30 years N\ Nt>. 43 44 43 44 4518 to 24 years I'.1t.. 41 44 45 43 44 4525 to 29 years N\ 37 42 42 41 45 4430 to 49 years 30 38 42 32 42 40 3950 years and older 33 48 50 49 50 57 5050 to 64 years Nt>. Nt>. Nt>. Nt>. Nt>. 51 4765 years and older N\ Nt>. Nt>. N\ Nt>. 65 54City size:I,OOO,OUO and over Nt>. Nt>. N\ Nt>. 55 57 56500,000 to 999,999 40 0 48 0 58 0 52 0 49 54 4950,00U to 499,999 38 51 59 50 52 53 542,500 to 49,999 22 40 45 38 43 50 40Under 2,500, rural 21 28 28 25 33 31 29Region:East 32 42 47 42 48 45 47Midwest 26 34 39 36 36 41 38South 34 52 48 46 47 50 44West 32 41 49 44 53 58 53Religion:Protestant 30 42 44 44 43 49 4SCatholic 30 42 46 39 50 48 47Politics:Republican 26 46 43 41 41 45 41Democrat 34 47 48 46 52 54 50Independent 29 33 43 37 41 51 40°For this survey, this city size category was 500,000 and over.Source: George H. Gallup, The GaIlU~ Opinion Index, Rerort No. 172 (Princeton, N.J.:The Gallup Poll, November 1979), p. 22; on George H. Gallup, The Gallup Report, Report No.187, p. 7; Report No. 200, p. 21; Report No. 210, p. 6 (Princeton, N.J.: The Gallup Poll).Table adapted by Sa..RCEBOO< st<strong>of</strong>f. Reprinted by permission.196197
Source: George H. Gallup, The Gallup Report, Report No.210 (Princeton, N.J.: The Gollup Poll, Morch <strong>1983</strong>), p. 7.Reprinted b}' permission.4,\,Preceding page blank199
200------~--------------------------'-------------------~~ - -~-<strong>Sourcebook</strong> <strong>of</strong> <strong>Criminal</strong> <strong>Justice</strong> <strong>Statistics</strong> <strong>1983</strong>Public Attitudes Toward Crime and <strong>Criminal</strong> <strong>Justice</strong>-Related TopicslaDle 2.7 Respondents reporting that they worry about being the victim <strong>of</strong> a crime or that they have been the victim <strong>of</strong> a crime in thelast year, by type <strong>of</strong> crime and demographic chgracterlstics, United States, 1982!\oTE: See !\oTE, Table 2.1. The "percent who worry" are those who the last year. The murder victimization question asked if a closeindicated that they worry a "great deal" or a "good amount." The relative had been murdered in the last year. For a discussion <strong>of</strong> public"percent victimized" are those who indicated that they were victim~ opinion survey sampling procedures, see Appendix 7. For detailedduring the last year. The questions regarding rape were asked only <strong>of</strong> information on this survey, see Appendix 8.Women. Of the 1,051 wcmen iii the survey, 3 I'eported being raped inQuestions: "I'm going to mention some things that worry some people a great deal and others not very much. After each, please tell mewhether it worries you a great deai, a good amount, not very much or not at all. First, how much do you worry about (Read statement)? Do youworry a great deal, a good amount, not very much or not at all?"''Has that ever happened to you?" If yes, "Did that happen within the last year, that Is between last December and now, or was it longer agothan that?"(Percent)Have your car or Have your Being robbed Being Injured. by a Being injured by aproperty vandalized home burglarized on the street robber on the street burglar at homePercent Percent Percent Percent Percent Percent Percent Percent Percent Percentwho victimized who victimized who victimized who victimized who victimizedworry in last year worry in last year worry in last year worry in last year worry In last yearNational 45 16 46 5 31 2 29 31 (a)Sex:Male 1,2 17 40 4 24 2 21 I 21 (a)Female 49 15 53 5 40 2 40 (a) 44 IRace, ethnicity:White 43 15 43 4 28 2 26 (a) 28 (a)Black 60 26 64 10 52 2 50 I 50 (a)Hispanic 54 16 67 6 45 4 45 I 59 IBeing raped Being murderedPercent <strong>of</strong> wom-PercentPercent en who have Percent whose relative<strong>of</strong> women been victims who was a victim_~I~() worry In last year worry in last year~,5 B 22X X 15 245 B 30 I43 B 18 I62 B 42 360 B 45 7Education:43College 40 18 41 6 25 3 21 I 25 IB 14IHigh school 50 15 50 4 36 2 36 (a) 36 (a) 47 B 28 2Grade school 42 9 49 2 43 I 34 I 39480B 31 2Employment status:Full-time emplo,'ed 44 17 43 5 27 2 25 I 27 IPart-time employed 49 19 46 6 32 3 31 (a) 30 IU,employed 48 20 52 5 39 I 40 0 42 0Laid <strong>of</strong>f 42 14 42 0 33 0 28 3 36 0Retired 40 9 46 3 37 3 32 I 34 IFull-time homemoker 49 14 55 3 39 I 37 (a) 43 0Student 56 23 46 9 34 5 23 0 34 01",000 """ "."'40 19 41 6 26 3 22 (a) 24 (a)Income:20,000 to ~29,999 43 16 43 4 27 I 25 (a) 27 I12,000 to 19,999 47 14 45 3 30 I 30 I 30 08,000 to $11,999 54 17 53 5 40 3 42 I 42 IU,der $8,000 48 16 54 7 43 3 39 I 47 I47 B 18 I45 B 25 369 B 33 369 B 26 631 B 21 041 B 27 070 B 25 440 B 15 I45 B 18 246 B 23 I51 B 30 347 B 34 3Age:18 to 24 years 59 23 50 5 31653 30 (a) 33 (a)B 28 325 to 29 years 45 20 114 6 30 3 2654I 29 IB 21 230 to 49 years 42 17 44 6 28 2 27 I 28 (a) 44 B 20 I50 to 64 years 44 II 47 3 33 I 31 (a) 3237IB 19 I65 years and older 38 10 43 3 36 3 33 I 3534IB 22 (a)Community size:Large city 52 22 54 7 41 5 37 2 37 (a)Suburb 47 19 49 5 34 2 29 (a) 33 ISmall town 42 13 41 5 27 2 27 (a) 28 (a)Rural 37 II 38 2 24 (a) 23 (a) 26 (a)Region:N:>rtheast S2 17 53 5 40 3 37 2 37 (a)Midwest 42 16 40 4 24 2 26 (a) 27 ISouth 42 16 46 4 33 2 28 (a) 31 (a)West 44 15 43 7 26 2 24 (a) 30 (a)Neighborhood racial characteristics:Mostly or all white 41 14 42 4 27 2 25 (a) 27 IRacially mixed 58 22 59 7 42 3 42 1 44 (a)Mostly or all black 62 29 63 10 55 3 .55 3 48 INeighborhood age structure:Mostly younger than 35 years 44 21 39 5 26 2 22 0 23 (a)Mostly between 35 and 55 years 48 16 47 4 28 2 27 (a) 31 (a)Mostly older than 55 years 40 13 39 6 36 3 30 0 31 0Mixed, all ages 44 16 46 5 32 2 30 I 32 IaLess than or equal to 0.5 percent.Source: Table constructed by SOlRCEBCO< staff from data provided by the ABC News Poll; data were mode available through the <strong>Criminal</strong><strong>Justice</strong> Archive and Information Network, Inter-university Consortium for Political and Social Research.53 B 26 I50 B 22 I40 B 20 237 B 19 249 B 29 I38 B 17 I46 B 21 2119 B 20 I42 B 18 I53 B 33 365 B 40 I48 B 14 I43 B 21 141 B 17 246 B 23 I
----~------~~--~----------~--------______.~.__* ,,,,, __ 4"'"Public Attitudes Toward Crime and <strong>Criminal</strong> <strong>Justice</strong>-Related Topics<strong>Sourcebook</strong> <strong>of</strong> Crlminol <strong>Justice</strong> Stotistics <strong>1983</strong>Table 2.8 Respondents rating their chance <strong>of</strong> being a victim <strong>of</strong> a violent crime,by demographic characteristics, United States, 1982NJTE: See NOTE, Tablo 2.1. For a discussion <strong>of</strong> public opinion survey samplingprocedures, see Appendix 7. For detailed information on this survey, see Appendix 8.Question: ''How would you rate the chances <strong>of</strong> your being the victim <strong>of</strong> a violentcrime someday--would you soy you are very likely to be a victim <strong>of</strong> a violent crime,somewhat likely to be a victim, somewhat unlikely or very unlikely?"(Percent a )N> opinion;Very Somewhat Somewhat Very refusedlikel)::: likel)::: un Ii ke I)::: unlikel)::: to answerI\k1tional 6 26 34 31 3Sex:Male 6 21, 36 32 2Female 6 30 32 28 4Race, ethnlclty:White 5 26 35 32 3Black 14 31 30 22 4Hispanic 12 26 29 30 3EducatIon:Col/elle 4 26 38 29 2High .5chool 6 28 32 31 3Grade school 10 14 23 47 7Employment status:Full-time employed5 28 35 30 2Part-time employed 5 28 40 25 IUnemployed 8 24 35 31 2Laid <strong>of</strong>f 6 25 33 36 0Retired 6 17 28 42 7Full-time homemaker 5 31 32 28 4Student 12 36 38 14 01"''''' ood 0."Income:5 25 37 32 I20,000 to ~29,999 4 28 36 29 212,000 to 151,95151 7 26 35 251 38,000 to $11,51951 7 27 32 29 5Ulder $8,000 8 23 28 36 5Age:18 to 24 years 6 31 40 22 (b)25 to 251 years 4 31 38 25 230 to 451 years 6 28 35 30 250 to 64 years 6 23 32 35 465 years and older 6 16 27 43 8Conmunity size:Large city 8 33 32 23 4Suburb 5 30 38 25 2Small town 5 21 35 36 3Rural 6 24 30 38 3Region:Northeast 6 30 33 26 4Midwest 4 24 36 34 2South 7 :15 35 31 3West 5 29 33 30 3Neighborhood racial characteristics:Mostly or all white 5 25 36 32 2Racially mixed 10 30 30 26 4Mostly or all black JO 36 31 20 3Neighborhood age structure:Mostly younger than 35 years 5 27 43 24 (b)Mostly between 35 and 55 years 6 27 36 29 2Mostly older than 55 years 7 19 251 40 5lV'ixed, all ages 5 27 33 31 3~ercents may not add to 100 due to rounding.Less than or equal to 0.5 percent.Source: Table constructed by SOLRCEBClCX< staff from data provided by the ABCNews Poll' data were mode available through the <strong>Criminal</strong> <strong>Justice</strong> Archive andInformatlo~ Network, Inter-unlversi1y Consortium for Political and Social Research.Table 2.51 Fear <strong>of</strong> specific criminal victimization and general fear<strong>of</strong> crime, by demographic characteristics, United States, 1980N::>TE: The findings reported below result f:om a random digit dialtelephone survey conducted during April and May 15180 <strong>of</strong> 1,047 adultsin the Ulited States. The resulting survey was weighted to moreclosely approximate the general adult population, 18 years and cIder, Inboth sex and income characteristics.The concrete fear index Is a Guttman scale measuring how <strong>of</strong>tena person worries specifically about being the victim <strong>of</strong> murder, sexualassault, mugging, knifing, beating, or armed robbery. Answers to each<strong>of</strong> the six ques lions that formed the concrete fear index were scored 0If the response was "rarely" or "never" ond I If the response was"frequently" or "sometimes," for a poss!ble score <strong>of</strong> 6. The concretefear Index score was then classified as "high" If It was 3 to 6 and''moderate to low" if less thon 3.The formless fear Index Is a Guttman scale measuring thefrequency <strong>of</strong> nonspecific worry about safety In one's home.neighborhood, and larger community. Answers to each <strong>of</strong> th~1 sixquestions that formed the formless fear index were scored a If theresponse was "very safe" or "somewhat safe" and I If the response was"somewhat unsafe" or "very unsafe," for a possible score <strong>of</strong> 6. Theformlt>:'s fear Index score was then classified as "high" If it was 3 to 6and ''moderate to low" If it was less than 3.For further discussion <strong>of</strong> the survey and Indices, see Appendix 9.NationalSex:MaleFemaleRace:WhiteBlackEducation:College gradll(]teHigh school graduateor some collegeLess than high school gradUateOccupation:Owner, manager, pr<strong>of</strong>essionalWhite collarBlue collarIncome:$26,000 ona over$11,000 to $.l5,51519Ulder $11,000Age:18 to 29 years30 to 351 years40 to 49 years50 to 59 years60 year s und olderCommunity size:Large citySmall citySuburbRuralRegion:EastMidwestSouthWestMorltal status:MarriedDivorced, widowed, separotedSingleEmployment status:Full-timeOther(Percent)Level <strong>of</strong>concrete fearModerateHigh to low413446404846413542364340404349463440335241393136434339394345413959665460525459655864576060575154666067485516169645757616157555961Level <strong>of</strong>formless feorModerateHigh to lowSource: Research and Forecasts, Inc., The Fig~le Report on Fear<strong>of</strong> Crime: America Afraid (Willoughby, Ohio: Flgglenterncltlonal, Inc.,1980), pp. 30, 32-34, 42-44, 49, 51, 53, 54. Table cldapted bySOLRCEBOO< staff. Reprinted by permission.37264834483835453427442633493630344143543330313448333044637452665262655566735674675164706659574667706966526770562Q3
--~ ~ ,.---~------ ----- - -~-----~ ---~ iIj<strong>Sourcebook</strong> <strong>of</strong> <strong>Criminal</strong> <strong>Justice</strong> <strong>Statistics</strong> <strong>1983</strong>Agure 2.4 Reported fear <strong>of</strong> being murdered, robbed, or assaulted, United States, 1980J'.OTE: See J'.OTE, Table 2.9. This figure presents the percent <strong>of</strong> respondents answering "frequently"or "sometimes." For further discussion <strong>of</strong> the survey, see Appendix 9.Question: "l-bw <strong>of</strong>ten do you worry about the folloWing things (getting murdered, getting robbed, getting beaten up):frequently, sometimes, rarely, never?"(Percent)IiIiuIinI' ,I~hIi~Public Attitudes Toward Crime and <strong>Criminal</strong> <strong>Justice</strong>-Related TopicsTable 2:1.0 Attitudes toward the attention giVen to crime stories ontelevIsion news, by demographic characteristics, United States, 1982J'.OTE: See J'.OTE, Table 2.1. For a discussion <strong>of</strong> public opinion surve som lin~~~~~~~e:., see Appendix 7. For detailed information on this s~rvey; se~st I Quebstlon: :'00 you think television news gives too much attention toor es a out cnme, nnt enough attention or what?"(Percent a )o 5 10 15 20 25No opinion,Too Aboub Not refusedmuch right enough to answerNotional 51 29 18 2GettingmurderedGettingrobbedGettingbeaten upSource: Research and Forecasts, Inc., The Figgie Report on Fear <strong>of</strong> Crime: America Afraid (Willoughby, Ohio: FiggieInternational, Inc., 198U), p. 251. Fig,ure constructed by SCLRCEBOO< staff. Reprinted by permission.24Sex:Male 50Female 28 19 253 29 16 3Race, ethnlcity:White53Black 29 15 233Hispanic26 39 242 30 27 IEducation:Co/lege54High school32 12 250Grade school26 22 244 23 27 7Employment status:FUll-time employed 52Part-time employed30 16 248Unemployed28 20 339Laid <strong>of</strong>f29 31 I351Retired50 8 359Full-time homemaker21 16 455Student26 15 429 50 21 0Income:1",000 ~d "." 56 30 13 220,000 to ~29,99912,OUO to 19,9998,000 to $11,999Under $8,00UAge:52 32 14 251 27 21 247 26 26 241 25 25 10I~1J18 to 24 years 34 3/125 to 29 years30 I4630 to 49 years34 17 3535U to 64 years29 16 2596526years and older14 263 20 12 4Community size:Large city 46Suburb30 22 354Small town29 15 352Rural27 19 252 31 14 3Region:tI INortheast 57Midwest24 16 2South51 31 14 346West29 23 25/~ 30 13 2Neighborhood racialcharacteristics:204I I'Ii:1II iII: i(1 II!Mostly or all white 53 29R~clally mixed15 242 27Mostly or all black29 244 24 30 2Neighborhood age' structure:Mostly younger than 35 years 40 41Mostly between 35 and 55 years 17 253 27Mostly older than 55 years 18 260Mixed, all ages26 12 251 28 18 3~ercents may not add to 100 due to rounding.Respondents volunteered this response.Source: Table constructed by SQRCEBOO< staff from data provided b theABC News Pol,l; data were made available through the <strong>Criminal</strong> <strong>Justice</strong> Ar{hlve~~~e~;:;h.rmatlon Network, Inter-university Consortium for Political and Social205\,
<strong>Sourcebook</strong> <strong>of</strong> <strong>Criminal</strong> <strong>Justice</strong> <strong>Statistics</strong> <strong>1983</strong>..Table 2.11 Fear <strong>of</strong> crime, by frequency <strong>of</strong> exposure to mediacoverage <strong>of</strong> crime stories, United States, 1980I'OTE: See I'OTE, Table /..;1. For further discussion <strong>of</strong> the survey andindices, see Append;.< 9.Question: "How <strong>of</strong>ten do you {read articles about violent crimein the newspaper, see reports <strong>of</strong> violent crime on TV)?"(Percent)Level <strong>of</strong>concrete fearModerateHigh to lowFrequency <strong>of</strong> reading aboutviolent crime in newspapers:DailyLess than daily46335467Frequency <strong>of</strong> seeing reports <strong>of</strong>violent crime on television:DailyLess than daill43355765Level <strong>of</strong>formless fearModerateHigh to low63 3762 3837 6337 63Source: Research and Forecasts, Inc., The Figgie Report onFeor <strong>of</strong> Crime: America Afraid (Willoughby, Ohio: Figgie International,Inc., 1980), pp. 38, 39, 58. Table adapted by S
--~- ~-...----~,.~··t~,-_,=':""'"Public Attitudes Toward Crime and <strong>Criminal</strong> <strong>Justice</strong>-Related Topics<strong>Sourcebook</strong> <strong>of</strong> <strong>Criminal</strong> <strong>Justice</strong> <strong>Statistics</strong> <strong>1983</strong>Table 2.15 Respondents reporting a desire for a crime-watchprogram in their own neighborhood and inte1~st in joining aTable 2.14 Awareness <strong>of</strong> neighborhood crime-watch programs program, by demographic characieristics, United States, 1982and existence <strong>of</strong> these programs in own neighborhood, bydemographic characteristics, United States, 1982f\OTE: The following questions were asked <strong>of</strong> respondents who hadheard <strong>of</strong> or read about neighborhood crime-watch programs andf\OTE: For a discussion <strong>of</strong> public opinion survey samplingwho said there were no such programs in their neighborhood. Seeprocedures, see Appendix 7.Table 2.14 for the screen questions. For a discussion <strong>of</strong> publicopinion survey sampling procedures, see Appendix 7.Questions: "Have you heard or read about a communityprogram called crime-watch (or neighborhood watch)?"Questions: "Would you like to see such a program in yourIf yes: "Do you happen to know If there is a crime-watchneighborhood, or not?"program In your neighborhood?""Would you, yourself, be Interested In joining such a program,or not?"(Percent)(Percent)HOveheard <strong>of</strong> Existence <strong>of</strong> neighborhoodWould likeor read crime-watch programto have a Interested in joining aabout Yes, NO, there Don'tcrime-watch crime-watch [!rogram,coE!ro!)ram there is Is not knowprogram in theNoneighborhood Yes No opinionNotional 72 17 60 23Notional 82 81 13 6Sex:Male 76 15 60 25SeX:Female 69 18 60 22Male 17 81 13 6Female 87 82 12 6Rlce:White 75 16 61 23Race:Nonwhite 58 22 48 30White 82 82 13 5Nonwhite 86 72 13 15Education:College 81 19 55 26Education:High school 71 15 61 24College 79 84 9 7Grade school 60 17 68 15High school 84 82 14 4Grade school 80 71 15 14Occupation:Pr<strong>of</strong>essional and business 81 19 55 26Occupation:Clerical and sales 67 14 57 29Pr<strong>of</strong>essional and business 81 87 8 5Manual workers 69 18 61 21Clerical and sales 92 82 II 7Nonlabor force 71 15 62 23Manual workers 84 83 14 3Nonlabor force 84 74 16 10Income:80 19 59 22Income:1"'000 20,000 ~25,OOO and over 79 89 8 3on' to r4,999 """76 21 58 2115,000 to 19,999 79 18 59 2320,000 to ~24,999 81 17 17 610,000 to 14,999 69 II 63 26fS,!lOO to 19,999 81 82 14 45,000 to $9,999 60 II' 65 2410,000 to ,,14,999 79 79 14 7Ulder $5,000 64 14 54 325,000 to $9,9.99 87 82 15 3lklder $5,000 90 17 II 12Age:Total under 30 years 68 12 57 31Age:18 to 24 years 66 Total under 30 years 85 84 15II 54 35I25 to 29 years 71 13 61 2618 to 24 years 82 84 15 I30 to 49 years 17 1925 to 29 years61 2087 83 15 2Total 50 years and older 72 1830 to 49 years61 2181 84 9 750 to 64 years 17 18 63Total- 50 years and older 82 771915 865 years and older 67 18 5850 to 64 years2482 86 10 465 years and older 81 64 23 13City size:1,000,000 and over 60 26 46City size:28500,000 to 999,999 80 17 561,000,000 and over2781 65 21 1450,000 to 499,999 80 19 47 34500,000 to 999,999 n 81 18 12,500 t'1 49,999 66 II50,000 to 499,999 89 86 II 372 17lklder :t,500, rural 75 II 782,500 to 49,999 83 82 14 4IIlklder 2,500, rural 74 85 8 7Region:East 64 19 61 20Region:Midwest 69 16 65 19East 74 76 19 5South 77 16 64Midwest 75 172012 IIWest 89 15 48 37South 91 89 8 3West 89 78 16 6Religion:Protestant 17 16 64 20Religion:Catholic 66 16 59 25Protestant 82 84 II 5Catholic 83 78 13 9Politics:Repub!ican 75 22 51:! 20Politics:Democrat 70 17 61Republican2278 78 16 6Inde[!endent 76 II 62Demacrat 86 85 9276IndeE!endent 78 79 15 6Source: George H. Gallup, The Gallu~ ReflOrt Report No. 200(Princeton, N.J.: The Gallup Poll, May 19 2), p. ~2. Reprinted bySaurce: George H. Gallup, The Gallu Re[!ort, Report No. 200(Princeton, N.J.: The Gallup Poll, May 19~),gpermission.p. 13. Reprinted bypermission.209
--------------<strong>Sourcebook</strong> <strong>of</strong> <strong>Criminal</strong> <strong>Justice</strong> <strong>Statistics</strong> <strong>1983</strong>~Public Attitudes Toward Crime and <strong>Criminal</strong> <strong>Justice</strong>-Related TopicsTable 2.16 Respondents reporting crime prevention measures they employ, by demographic characteristics, United States, 1981Table 2.17 Respondents taking precautions for protecting theirI'OTE: Less than one-half <strong>of</strong> I percent <strong>of</strong> respondents gave no answers. For ahames, by type <strong>of</strong> precaution taken, and level and type <strong>of</strong>discussion <strong>of</strong> public opinion survey sampling procedures, see Appendix 7. fear, Uhited States, 1980Question: "Listed on this card are some things people do because <strong>of</strong> their concern over crime. Please tell me which, If any, <strong>of</strong> theseyou, yourself, do, or have done."(Percent a )NOmE: See NOTE, Table 2.9. For further discussion <strong>of</strong>and indices, see Appendix 9.Question: '00 you protect your hCTe by •Let neigh- Belong to (Percent ref-ponding yes)Carry Installed bors localKeep Have Mace, Installed Lock burglar- know N:lt walk crime Level <strong>of</strong>Carry lights on trained other burglar doors at pro<strong>of</strong> when alone at Carry watchLevel <strong>of</strong>IBought Other concrete fearwhistle at night dog reE!ellant alarm night locksformless fearawa~ night weaE!2n grouJ:! ,[gun measures b N:lne Moderate Moderateii Type <strong>of</strong> precaution High to lowN:ltional 5 46 20 7 5HighIl4 13 55 20 II 5to low16 8 8 Having extra locks on your doors? 28Sex:26 62 44Engraving your valuables withMale 2 39 20 7 5 83 12 50 10 14 5I 19 7some sort <strong>of</strong> identification?1038Female 7 52 21 8 5 85 14 60 28 7 435 37 35~ 12 8Always keeping the doors locked, 7when you go out? 91Race:84 92!84Always identifying people beforeWhite 5 46 20 7 5 85 13 57 20· II 4 I 16letting them in?8 790N:mwhite 284'a 19 7 8 73 10 41 14 10 891 8314 5Having bars on some <strong>of</strong>15your windows? 10 6 II 5Having a burglar alarm? 17Education:14 18 14Owning a gun? 48College 7 54 18 9 6 85 17 61 17 12 854 42 57High school 5 46 21 7 5 84 II 55 20 II 316 II 5IS 6 8 Source: Research and Forecasts, Inc., The Figgie ReE!ort on FearGrade school I 30 22 4 4 80 II 41 21 9 2I16 9 IS<strong>of</strong> Crime: America Afraid (Willoughby, Ohio: Figgie International, Inc.,I1980!, pp. 91, 100. Table adapted by SOlRCEBOO< staff. Reprinted byOccupation:permission.Pr<strong>of</strong>essional and business 6 53 19 7 6 87 14 61 22 9 9Clerical and sales 3 54 21 10 4 96 22 64 23 16 414 10 5Manual workers 4 45 21 7 5 83 II 52 18 15 4IS 3 2N:lnlabor force 6 33 19 5 4 79 13 51 19 5 318 8 912 6 13Income:1",000 ood~, 6 57 20 7 6 92 17 65 19 9 820,000 to r4,999 2 53 26 7 4 86 12 59 19 20 3IS II I15,000 to 19,999 7 47 19 9 5 85 10 60 21 13 4 17 8 610,000 to 14,999 3 43 22 7 5 82 15 53 21 12 3 18 8 85,000 to $9,999 4 36 16 8 6 76 12 48 19 II 4 20 6 IIUnder $5,000 5 32 15 2 3 76 5 30 17 5 4 14 5 137 8 20Age:Total under 30 years 5 52 18 10 5 85 9 46 21 16 318 to 24 years 3 54 19 10 4 85 10 41 21 15 318 7 725 to 29 years 8 49 16 10 6 86 9 54 20 17 3 16 5 730 to 49 years 4 48 22 7 6 83 13 59 18 12 7 22 10 7SO years and older 5 39 21 5 5 84 16 58 20 7 4 13 8 8IS 9 10City size:1,000,000 and over 7 49 20 5 6 78 16 47 24 8 6500,000 to 999,999 2 51 20 10 7 85 23 64 18 12 29 II 1650,000 to 499,999 7 49 23 10 6 86 15 59 25 14 69 8 !'.2,500 to 49,9~9 4 46 19 6 4 90 6 60 24 10 416 7 ~Under 2,500, rural 3 39 18 6 3 81 9 51 10 II 418 9 421 6 9Region:East 4 48 17 8 6 82 12 52 15 10 3Midwest 5 44 22 7 3 86 10 55 17 6 38 8 12South 4 40 20 7 5 84 12 52 21 16 813 7 7West 8 54 24 6 6 82 20 64 26 13 624 5 718 12 8Religion:Protestant 4 45 19 7 5 84 14 56 19 12 5Catholic 6 47 22 6 6 82 13 53 22 9 418 8 8II 9 10Politics:Republican 6 51 21 7 5 88 15 67 20 12 6 •Democrat 4 46 23 7 6 79 13 51 22 10 416 8 4IndeE!endent 5 43 17 8 3 88 II 52 16 13 5 14 8 1216 7 7~Totals add to more than 100 percent due to multiple responses.Follow-up question asked: "Are there any things not an this card that youor your family are doing to protect your residence or person against crime?"Source: George H. Gallup, The GalluE! Report , Report N:l.permission.187 (Princeton, N.J.: The Gallup Poll, April 1981), pp. 12, 13. Reprinted bythe survey210
---------f1<strong>Sourcebook</strong> <strong>of</strong> <strong>Criminal</strong> <strong>Justice</strong> <strong>Statistics</strong> <strong>1983</strong>Figure 2.5 Respondents taking precautions for protecting their homes, by type <strong>of</strong> precaution token, United States, 1980NJTE: See NJTE, Table 2.9. For further discussion <strong>of</strong> the survey, see Appendix 9.Question: "Do you protect your home by ..."(Percent responding yes)Public Attitudes Toward Crime and Griminal <strong>Justice</strong>-Related :ropicsFigure 2.6 Respondents taking precautions against being victimized when going out, by type <strong>of</strong> precaution token, United States,1980NJTE: See NJTE, Tabie 2.9. This figure presents the percent <strong>of</strong> respondef'\ts answering ''most <strong>of</strong> thetime" and "sometimes." For further discussion <strong>of</strong> the survey, see Appendix 9.(Percent)Always keeping the doorslocked when you go out?When riding or sitting In acar. do you keep the cardoors locked to keepIn!ruders out?70Always Identifying peoplebefore letting them In?Do you dress plainly toavoid drawing allentlon?Owning a gun?Do you telephone back to afriend or relative 10 sayyou've arrived safe at home?Having extra lockson your doors?Do you plan your routa toavoid potentially dangerousplaces?Engraving your valuables withsome sort <strong>of</strong> Identification?Having a burglar alarm?Having bars on some<strong>of</strong> your windows?When you go out after dark.do you get somoone 10 gowith you because <strong>of</strong> crime?Do you take something with youat night that could be used forprotection - like a dog, whistle,knife or gun?Source: Research and Forecasts, Inc., The Figgie Report on Feor <strong>of</strong> Crime: America Afraid (Willoughby, Ohio: Figgie International,Inc., 1980), p. 84. Figure constructed by SCJ...RCEBOO< staff. Reprinted by permission.Table 2.18 Respondents taking precautions against beingvictimized when going out, by type <strong>of</strong> precaution token, andlevel and type <strong>of</strong> fear, United States, 1980NJTE: See NJTE, Table 2.9. For each <strong>of</strong> the specific precautions listed,respondents were asked whether they took this measure "rnost <strong>of</strong> thetime," "sometimes," or "never/almost never." The table presents onlythe percent <strong>of</strong> answers that were ''most <strong>of</strong> the time." For furtherdiscussion <strong>of</strong> the survey and indices, see Appendix 9.(Percent taking precaution ''most <strong>of</strong> the time")Level <strong>of</strong> Level <strong>of</strong>concrete fear formless fearModerate ModerateType <strong>of</strong> precaution High to low High to lowWhen you go out after dark, doyou get someone to go withyou because <strong>of</strong> crime? 48 26 63 20Do you plan your route to avoidpotentially dangerous ploces? 70 35 71 37When riding or sitting in a cor,do you keep the cor doors lockedto kep.p intruders out? 83 63 84 64Do you dress plainly to ovoiddrawing attention? 74 52 77 52Do you telephone bock to afriend or relative to soyyou've arrived safe at home? 70 55 72 54Do you toke something with youat night that could be usedfor protection--Iike a dog,whistle, knife or gun? 33 22 33 23Source: Research and Forecasts, Inc., The Figgie Report on Fear<strong>of</strong> Crime: America Afraid (Willoughby, Ohio: Figgie International, Inc.,(980), pp. 90, 91. Table adopted by 5O..RCEBClCK st<strong>of</strong>f. Reprinted bypermission.~IIIIgIiI~!r,~Ii[1IIIIjIII',IifSource: Research and Forecasts, Inc., Thec2Zgie Report on Fear <strong>of</strong> Crime: America Afraid (Willoughby, Ohio: Figgie International, Inc.,1980), p. 83. Figure constructed by SOLRCE8 stOff. Reprinted by permission.Table 2.19 Respondents' concerns about public issues, lklited States, selectedyears 1974-82NJTE: The data below were .collected by the ROlJar Organization. These surveys wereconducted in January <strong>of</strong> the year noted.Question; ''Here is a list <strong>of</strong> things people have told us they are concerned abouttoday. Would you read over tllat list and then tell me which two or three youpersonally arti' most concerned about today?"(Percent a )1974 1975 1976 1977 1979 1981 1982Inflation and high prices 56 58 44 48 63 56 53Crime and lawlessness 30 34 40 40 31 35 37Money enough to Ii¥e rightand pay the bills 25 30 26 28 31 31 29The fuel and energy crisis 46 27 22 31 25 30 17The way the courts are run 20 22 30 27 23 24 25A recession and rising unemployment 15 33 20 19 20 24 34Our relations with foreign countries 18 10 13 9 !5 19 21Wrongdoing by elected government<strong>of</strong>ficials 40 26 32 22 24 18 17Getting into another war 7 II 10 8 9 18 16Drug abuse 23 20 24 21 14 16 17The way young paople think and oct 10 14 15 17 14 14 12Pollution <strong>of</strong> air and water 12 II Ii 13 10 10 7Alcoholism (b) (b) 6 7 6 7 7bPercenb odd to more than 100 due to multiple responses.Concern was not listed.Source: "Opinion Roundup," Public ~inion 5(February/March 1982), p. 33. Tableadopted by 5O..RCEBOa< st<strong>of</strong>f. Reprinte by permission.?
--~-~~~~---------'---Public Attitudes Toward Crime and <strong>Criminal</strong> <strong>Justice</strong>-Related TopIcs<strong>Sourcebook</strong> <strong>of</strong> <strong>Criminal</strong> <strong>Justice</strong> <strong>Statistics</strong> 15183Table 2.21 Attitudes toward the most Important problem facing the country, by demographic characteristics, United States,1!l82.2.20 Attitudes towC1rd the mostImportant problem facing the country, United States, 1!l80-83Table/'OTE: For a discussion <strong>of</strong> public opinion survey sllll'9ling procedures, see AppendIx 7.Question: "What do you think is the most Important problem facing this country today?"(Percent O )Sept. N:lv. Jan. 30- May Oct. Jan. Apr. June Aug. Oct. Apr.July8-11, 2-5, 11-14, 13-16, 15-18, 15-18,11-14, 12-15, 7-1~ Feb. 2, 8-11, 2-5,15182 15182 15182 1518315180 l5I80 15180 15181 15181 15181 15182 1518253 73 551 52 451 24c 26 23 c18 18 cHigh cost <strong>of</strong> living; Inflation 56 6115 151 28 42 38 c 45 61 54Unemployment; recession 15 16 /I 85 3 3Nt>. Nt>. Nt>. Nt>. Nt>. 6 7 7 5Reagan budget cuts4 2 4 3 5 3 3 3 2 2International problems 4 513 3 3 22 2 4 2 5 4 5 3Crime 4 5 5 10 6 3 /IFear <strong>of</strong> war 2 3 2 2 33 4 3 45 3 Nil.. 2 5 4 4 3Moral decline in society 4 5 5 4 53 Nt>. I 4 4 3Excessive government spending 3Nt>. Nt>. Nt>. Nt>. Nil..Energy problems 6 4 4 5 5 2 2Nt>. Nt>.2 2 2 I 3 4 I Nt>. Nt>. Nt>.Defense3 2 2 2 I Nt>. Nt>. 2 3 Nt>.Dissatisfaction with government 8 6Nt>. Nt>. 7 10 8 4 2High interest rate Nt>. Nt>. Nt>. Nt>. Nt>./I 16 lid 8Nt>. Nt>. Nt>. Nt>. Nt>. Nt>. IIEconomy (general) Nt>. 2 3 3 I Nt>.Nt>. Nt>. Nil.. Nt>. Nt>. Nt>. Nil..Recession/depression 8 6 2 5151 7 13 5 17 7 5 10Ali other 2 2 2 3 2 J.3 2 4 3 3 2N:l opinionaTotals add to mare than 100 percent because <strong>of</strong> multipie responses.cu,empioyment only; recession is reported separately.ilRespondents were handed a list <strong>of</strong> categories 10 choose from,dRespondents who answered the "economy in general" were asked"what specific economic problem do you mean?"unlike previous and subsequent questions, which were open-end.f\b 1518 27' R t No 206 p 23 (Princeton, N.J.: The Gallup Poll); and George H.Source: George H. C!allup, The Ga~up '2iOWl rt 'p R i,POJ:Gallup, The Gallup Poll (Princeton, NOJ.: he up 0, ay, ,..8 15lEhf' p 2 1aWe ad~pted by SOLRCEBOO< staff. Reprinted by permission."NJTE: The data for this table were collected Oct. 15-18, 15182. Categories reported by less than 2percent <strong>of</strong> respondents were military budget cuts, recessIon, energy problems, national defense, allothers, and no opinion. For a discussion <strong>of</strong> public opinion survey sampling procedUres, seeAppendix 7.Question: ''What do you think is the most important problem facing this couniry today?"(Percent a )EXcesSive bissatis-The High govern- Reagan faction Fear MoralUnem- econ- Interest ment budget with <strong>of</strong> decline In Foreignplo~nt Inflation oml:: rates spendln2 cuts government war Crime socletl:: relationsNational 61 18 II 4 4 3 3 3 3 3 2Sex:Mole 551 18 12 4 5 2 3 3 3 3 3Female 64 17 II 3 2 4 2 3 2 3 IRace:White 61 18 II 4 4 3 3 3 2 3 2f\bnwhite 551 15 II 2 I 7 I 3 5 3 2Education:College 55 16 15 6 6 4 2 3 2 4 7.High school 65 18 12 3 3 3 3 4 3 2 2Grade school 551 18 3 2 2 5 2 2 4 5 2Region:East 61 18 II 3 4 5 2 2 3 2 2Midwest 70 13 II 3 2 3 2 3 2 5 2South 56 21 12 4 4 4 3 3 3 3 2West 56 18 12 4 4 I 3 6 2 2 IAge:Total under 30 years 58 18 /I 3 4 3 3 5 I 3 I18 to 24 years 57 17 51 2 3 4 4 8 (b) 2 I25 to 251 years 551 20 15 3 7 I 2 I 3 4 I30 to 451 years 63 151 15 5 4 3 2 2 3 4 2Total SO years and older 62 16 8 4 2 4 3 3 4 3 250 to 64 yeors 63 17 !1 4 2 3 2 3 4 3 265 years and older 61 15 7 3 3 5 4 2 4 ). 2Income:551 151 14 4 5 2 2 3 3 3 21'5'000 20,000 ,,' to 0",' 24,515151 63 17 /I 8 2 (b) (b) I 2 5 I15,000 to ~ 151,515151 61 15 12 3 4 5 4 2 4 3 210,000 to 14,515151 63 17 13 5 4 2 5 4 2 2 25,000 to $9,51519 64 17 7 I 4 4 2 5 5 3 2Under $5,000 60 151 5 2 I 51 4 I I I 3Politics:Republican 54 151 13 4 8 I I 3 2 4 2Democrat 68 15 10 3 I 5 3 2 4 2 2Independent 58 19 13 5 3 2 3 5 2 4 2Religion:Protestant 61 17 12 4 4 3 3 4 3 4 2Catholic 65 17 Ii 4 3 4 2 3 3 2 IOccupation:Pr<strong>of</strong>essional and business 54 18 13 6 5 4 2 3 2 4 3Clerical and sales 65 16 12 6 :.I 2 I 3 3 6 IManual workers 66 151 12 3 3 2 2 2 3 3 INanlabor force 63 12 !I 2 3 6 4 3 4 3 3City size:1,000,000 and over 65 17 10 3 2 3 I 4 4 3 4500,000 to ?519,5I5151 62 13 51 3 3 3 3 2 2 I I50,000 to tI 5l5l,5151!1 58 18 15 4 4 5 5 2 2 3 I2,500 to 451,5151!1 66 17 II 2 5 23 2 3 (b)u,g!:[ 2,~OQ, [u[91 59 20 10 ~ ~ J 2 Ii J Ii 2bTotlJI adds to mare than 100 percent due to rnu!tljili! re=r'nnses.Less than I percent."~Source: George H. Gallup, The Gallup Report, Report N:l. 206 (Princeton, N.J.: The Gallup Pall, N:lvember 15182), pp. 22, 23.Reprinted by permIssion.215
<strong>Sourcebook</strong> <strong>of</strong> <strong>Criminal</strong> <strong>Justice</strong> <strong>Statistics</strong> <strong>1983</strong>Table 2.22 Attitudes toward violent crime as (me <strong>of</strong> the biggestproblems In respondent's neighborhood, by demographiccharacteristics, United States, 1982)\OTE: See I'OTE, Tobie 2.1. For a discussion <strong>of</strong> public opinion- survey samplingprocedures, see Appendix 7. For detailed infarmotlan on this survey, seeAppendix 8.Question: "Again thinking <strong>of</strong> your own neighborhood, would you soythat violent crime Is one <strong>of</strong> the biggest problems In your neighborhood, OM<strong>of</strong> Its smollest problems or what?"(Percent a )One Somewhere One<strong>of</strong> the between <strong>of</strong> the No opinion,biggest big a~d smollest refusederoblems smoll eroblems to answerNotional 10 12 77Sex:Mole 9 1'0 80Female II 14 74Race, ethniclty:White 9 II 79 IBlack 20 15 63 IHisponlc 14 12 71 2Education:College 8 II 80 IHigh school II 13 76 IGrade school 18 6 71 5Employment status:Full-time employed 8 II 79 IPort-time employed 12 13 74 IU,employed II 10 78 ILaid <strong>of</strong>f II 22 64 3Retired 10 9 78 3Full-time homemaker 15 14 69 0Student 7 16 77 0Income:ro,OOO and over 1 II 81 I20,000 to ~29,999 9 10 80 I12,000 to 19,999 (.I 13 77 28,000 to $11,999 II 14 74 2U,der $8,000 ;10 12 68 IAge:18 to 24 years II 12 76 (c)25 to 29 years 10 II 78 I30 to 49 years 10 12 78 I50 to 64 years 10 13 76 I65 years and older 10 9 78 3Community size:Lorge city 15 17 66 2Suburb ~ 13 76 ISrooll town 8 8 82 IRural 9 8 82 IRegion:Northeast II 15 73 IMidwest 7 10 82 (c)South II 10 78 IWest 10 13 75 3Neighborhood racial characteristics:Mostly 01' all white 7 10 81Racially mixed 19 18 62Mostly or all black 24 19 56Neighborhood age structure:Mostly younger than 35 years 12 10 76 2Mostly between 35 and 55 years 8 9 82 IMostly older than 55 years 8 14 76 2Mixed, all ages 10 12 76 Itrercents moy no,t add to 100 due to rounding.cRespondents volunteered this response.Less than or equal to 0.5 percent.Source: Table constructed by 5O..RCEBOO< staff from data provided by theABC News Poll; dalla were mode available through the <strong>Criminal</strong> <strong>Justice</strong> Archiveand Information ~twork. Inter-university Consortium for Political and SocialResearch.,"III ! I\I!IIII1II)IrIPublic Attitudes Toward Crime and <strong>Criminal</strong> <strong>Justice</strong>-Related TopicsAgure 2.7 Respondents agreeln th t ryears 1973-82 g a too Ittle Is spent on selected problems In the country, Un'ltedN1TE: For a discussion <strong>of</strong> public opinion survey sampling procedures, see Appendix 7.States, selectedto n Question: "We are faced with mony probiems In this countr~~~~~i;;' o~r tt:b~~~b~~, rf;t f~~~t~ O~~r;;d (~;:bre:Joa::ilw;:;3n~J~~c;;~a~hl~~ ~~~::lls~~~~n~r t~~e=~i;:'~;y !:it;~• . 0 muc, 00 ttle, or about the right amount onSource:...cCI>~CI>a.8070605040~~----......" " '--- ..".2010 •o..... .."...... - .."."'"......... _---...,.-"ii ~-Ir----'r-----------r-------__ ~1973 1974 197511976 1977 1978 19801982---. Halting the riSing crime rate-- Dealing with drug addiction•• - • - Improving the Nation's education system- - - Improving the conditions <strong>of</strong> Blacks--- WelfareFigure constructed b 5a.RCEBOO
---------------------<strong>Sourcebook</strong> <strong>of</strong> <strong>Criminal</strong> <strong>Justice</strong> <strong>Statistics</strong> <strong>1983</strong>Public Attitudes Toward Crime and <strong>Criminal</strong> <strong>Justice</strong>-Related TopicsTable 2.l3 Attitudes toward the level <strong>of</strong> spending to halt the rising crime rate, by demographic characteristics, United States, 1973-78,1980, and 1982f\OTE: For a discussion <strong>of</strong> public opinion survey sompling procedures, see Appendix 7.Question: 'We are faced with many problems in this country, none <strong>of</strong> which can be solved easily or inexpensively. I'm going to name some <strong>of</strong>these problems, ,and for each one I'd like you to tell me whether you think we're spending too much money on it, too little money, or about the rightamount. First (halting the rising crime rate) are we spending too much, too little, or about the right amount on (halting the rising crime rate)?"(Percent a )TotalSex:MaleFemoleRace:WhiteBlack/otherEducation:CollegeHigh schoolGr'ade schoolOccupation:Pr<strong>of</strong>essional and businessClericalManualFarmerIncome:15,000 and over10,000 to $14,9997,000 to ~9'9995,000 to 6,99913,000 to 4,999Under $3,000Age:18 to 20 years21 to 29 years30 to 49 years50 years and olderRegion:(\brtheastMidwestSouthWestReligion:ProtestantCatholicJewish(\bnePolitics:RepublicanDemocratIndependentToolittle6565646466646661646764616466646266648159666568666458646871546167651973About Too Don't Tooright much know little252425252229242126242331302525251921123424212424223024242134272225573544464363344678344624675356Opercents moy not add to 100 due to rounding.4466386846II6666457696336975757525864676667667365686665706852687163716155556468696870646367686857666865Aboutright2325222417262318242423282421302228253829241822222228222527282422241974Toomuch5555535953517II54567235653655445465Don'tknow54656648645343324135447547362o10646Toolittle666566666563695863716650706467636159716265686669646265717855656863AbOutright2323232422262224251923302325222822252629251823222425232317282123241975Toomuch6745874766410556478I566645862o10945Don'tknow6476545II646103665108I54856756447557Toolittle666467666762696465686747686965596858646766657164676066707350676863Aboutright2124192214261921231919372123222418192224231819241727211815332220221976Toomuch8888II897779106691081485810679988412689DOn'tknow546585495646424768643735745485546Toolittle66 2264 2468 2166 2364 2062 2971 1958 216~ 2471 2265 2154 2366 2473 1964 2461 2364 1662 2169 2768 2567 2363 2068 2466 2164 2266 2265 2269 2071 II50 3457 2970 1966 221977About Tooright much6846845124489655987o458377565o9666Don'tknowToolittle6 64 255 63 267 65 256 64 268 69 ;:"5 62 295 67 2310 61 256 62 294 67 246 66 2314 56 244 66 244 66 256 64 277 67 2612 57 2810 59 214 65 303 63 264 65 269 64 235 66 246 65 246 66 267 58 286 65 245 65 2617 69 178 60 297 62 2tl5 66 246 64 24m8About Tooright, much6856576565746562413566767566677666Don'tknowToolittle19801987About Too Don't Too About Too Don'tright much kno':: little right much know4 69 21 63 66 23 75 71 19 54 68 22 64 79 13 63 66 25 44 72 19 69 66 18 84 69 21 64 74 19 55 68 21 716 56 24 63 70 22 54 72 20 j3 68 21 85 68 21 4II 64 19 127 68 10 10o 64 27 45 74 21 42 68 23 56 67 19 84 72 18 63 69 21 74 71 19 68 62 26 65 69 21 62 71 20 67 72 12 :34 64 25 55 68 20 104 70 22 45 68 20 6I; 72 18:; 71 195 72 185 71 192 74 154 72 193 75 178 60 214 72 182 76 175 70 1915 50 313 74 182 73 183 72 207 64 235 67 1712 61 195 89 92 71 224 73 196 70 183 72 183 71 195 73 187 70 194 71 193 74 1812 78 II7 65 243 69 204 75 166 69 20574576465461256356725555547543874552654341253583458107o33746445483445Source: Table constructed by SCA..RCEBOO< staff from data provided by the (\btional Opinion Re.I'·'llarch Center; data were made available throughthe Roper Public Opinion Research Center.IIIIi219
----------- -- ~<strong>Sourcebook</strong> <strong>of</strong> <strong>Criminal</strong> <strong>Justice</strong> <strong>Statistics</strong> <strong>1983</strong>Public Attitudes Toward Crime and <strong>Criminal</strong> <strong>Justice</strong>-Related TopicsTable 2.24 Respondents reporting whether they would tend toovoid groups <strong>of</strong> teenagers on the street, by demographiccharacteristics, United States, 1982!\oTE: See !\oTE, Table 2.1. For a discussion <strong>of</strong> public opinion surveysampling procedures, see Appendix 7. For detailed information onthis survey, see Appendix 8.Question: "If you sow a group <strong>of</strong> teenagers on a street cornerwould you tend to ovoid walking post them or not?"NotionalSex:MoleFemaleRoce, ethnicity:WhiteBlockHispanicEducation:CollegeHigh schoolGrode schoolEmployment status:Full-time employedPort-time employedUnemployedLaid <strong>of</strong>fRetiredFull-time homemakerStudentIncome:30,000 and over20,000 to $29,99912,000 to $19,99918,000 to $1 1,999Under $8,000Age:18 to 24 years25 to 29 years30 to 49 years50 to 64 years65 years and olderComnunity size:Lorge citySuburbSmall townRuralRegion:NortheastMidwestSouthWest(Percent a )Neighborhood racial characteristics:Mostly or all whiteRacially mixedMostlj' or all blockNeighborhood age structure:Mostly younger than 35 yearsMostly between 35 and 55 yearsMostly older than 55 yearsMixed, all agesNo opinion,Would Would nOT refusedovoid ovoid to answer40275H39465136435335404436485741323941524939423542515238373642403839384750373841415972416052496356446459556449405967605746496057655646476162625759605961524761625758Opercents may not odd to 100 due to rounding.Source: Table constructed by sa..RCEBOO< st<strong>of</strong>f from dataprovided by the ABC News Poll; data were ma"de available throughthe <strong>Criminal</strong> <strong>Justice</strong> Archive and Information Network, InteruniversityConsortium for Political and Social Research.I3oI22IIIo32oII2I2IIII32II2II22II32I2ITable 2.25 Attitudes toward statements about juvenile crime, UnitedStates, 1982!\oTE: The data below are from a telephone survey <strong>of</strong> 1,002 persons 18 years<strong>of</strong> age and older living in private households in the continental UnitedStates. The survey was conducted by the Opinion Research Corporationduring the period between Mar. 26, 1982 and Apr. 5, 1982.Question: ''Now I'm going to read you a series <strong>of</strong> statements aboutjuvenile crime. I'd like you to tell me whether you agree strongly, agreesomewhat, disagree somewhat, or disagree strongly with each <strong>of</strong> thesestatements."The rooin purpose <strong>of</strong> the juvenilecourt system should be to treatond rehabilitate rather than punishThe juvenile courts are too lenienton juveniles found guilty <strong>of</strong> seriouscrimesT"ere has been a steady andalarming increase in the rate<strong>of</strong> serious juvenile crimeComnitting juveniles to correctionalinstitutions serves as a deterrentto other youths from conmittingcrimesYouths who ore runoways, habitualtruants, and youths in conflict withtheir parents should not be hondledby the juvenile court system, butby other conmunity agenciesIncreosing employment opportunitiesfor youths could prevent a lot <strong>of</strong>serious crimesThe juvenile crime problem is notreally as serious as most peopleare saying it isNot enough money and resourcesare being spent on trying toprevent crimes by juvenilesAgree Agree Disagree Disagreestrongly somewhat somewhat strongly45 28 13 1052 26 563 24 523 34 20 1630 31 18 1267 22 5 46 9 20 6135 26 15 10Opercents do not total 100 because the "no opinion" and "no response"alternatives were excluded.Source: Hubert H. Humphrey Institute <strong>of</strong> Public Affairs, Publ icAttitudes Toward Youth Crime, Working paper (Minneapolis, Minn.: HiDertH. Humphrey Institute <strong>of</strong> Public Affairs, 1982). Table adopted bySc:l..RCEBOO< st<strong>of</strong>f. Reprinted by permission.-- JTable 2.26 Attitudes toward the statement that the moin purpose <strong>of</strong> the juvenile court system should betreatment and rehabilitation, by demographic charact~ristics, United States, 1982NJTE: See !\oTE, Table 2.25. The States comprising each region are as follows: Northeast--Connecticut, Moine,Massachusetts, New Hampshire, New Jersey, New York, Pennsylvania, Rhode Island, Vermont; North Central--Illinois,Indiana, Iowa, Kansas, Michigan, Minnesota, Missouri, Nebraska, North Dakota, Ohio, South Dakota, Wisconsin; South-Alabama, Arkansas, Delaware, District <strong>of</strong> Columbia, Florida, Georgia, Kentucky, Louisiana, Maryland, Mississippi, NorthCarolina, Oklahoma, South Carolina, Tennessee, Texas, Virginia, West Virginia; West--Arizana, California, Colorado,Idaho, Montano, Nevada, New Mexico, Oregon, Utah, Washington, Wyaming.Question: "I'd like you to tell me whether you agree strongly, agree somewhat, disagree somewhat, or disagreestrongly with each <strong>of</strong> the statements.""The main purpose <strong>of</strong> the juvenile court system shOUld be to treat and rehabilitate rather than punish."TotalSex:MoleFemaleRace:'.... hlteBlock! otherEducation:High school, incompleteHigh school, graduateCollege, incompleteCollege, graduateOccupation:Pr<strong>of</strong>essional, manager, ownerSoles ond clericalBlue collarHousehold income:Under $15,000$15,000 to $24,999$25,000 and over$25,000 to $34,999$35,000 and overAge:Under 35 years18 to 24 years25 to 34 years35 to 44 years45 to 64 years65 years and olderComnunity size:NonmetroMetro:50,000 to 999,9991,000,000 and overRegion:North':lostNorth CentralSouthWestI-klme ownership:OwnRentHousehold size:I or 2 people3 or 4 people5 people and mareMarital status:MarriedNot marriedEmployment status:EmployedEmployed femaleNot employedNot employed femaleHead <strong>of</strong> household:MoleFemaleNumber <strong>of</strong>respondents1,0024995038711231673571902852921202212372153972521454291472821812461335513411102192603311927022%4414081486583416402653622384321~40(Percent)Agreestrongly45424844524744484342414847474343454445434847if I4545424348415145464542524545444647494248Agreesomewhat28302629262525303231332229272931253130322425302927282632292427302831212632292628273026Disagreesomewhat131312138II1481415131210151415131314131213II13121212121410131213121313121314II91312DisagreestronglY10II91010II1210810101387II101287913IIII9II141751010II81010II127IIII97129No opinion!no responseSource: Hubert H. Humphrey Institute <strong>of</strong> Public Affairs, Public Attitudes Toward Youth Crime, Working paper(Minneapolis, Minn.: Hubert H. Humph~ey Institute <strong>of</strong> Public Affairs, 1982). Table adopted by SOLRCEBOO< st<strong>of</strong>f.Reprin~ed by permission.-.,445446543235643I544334745423654445344335835
--------------------------------------.. - ---Public Attitudes Toward Crime and <strong>Criminal</strong> <strong>Justice</strong>-Reloted Topics., <strong>Sourcebook</strong> <strong>of</strong> <strong>Criminal</strong> <strong>Justice</strong> Statlstlc~ I !l831., Table 2.28 Attitud'rs toward the statement that the rate <strong>of</strong> serious juvenile crime is increasing, by;. Table 2.27 Attitudes toward the statement that courts are too lenient on juvenile. found guilty <strong>of</strong> demographic characteristics, United States;, 1982serious crimes, by demographic charact,erlstlcs, United State., 1982N)TE: See N)TES, Tables 2.25 and 2.26.N)TEI See N)TES, Tables 2.25 and 2.26.Question: "I'd like you to tell me whether you agree strongly, agree somewhat, disagree somewhat, orQuestion: "I'd like you to tell me whether you agree strongly, agree somewhat, disagree SOIl1!!what, ordisagree strongly with each <strong>of</strong> the statements."disagree strongly with each <strong>of</strong> the statements." t "There has been a steady and alarming increase in the rate <strong>of</strong> serious juvenile crime.""The juvenile courts are too lenient on Juveniles found guilty <strong>of</strong> serious crimes." I)(Percent)(Percent)iINJrnber <strong>of</strong> Agree Agree Disagree Disagree No opinion/NJmber <strong>of</strong> Agree Agree Disagree Disagree I'b oplnlonl res~ndents strongl:l somewhot somewhot strongl:l no reseonserespondents strongly somewhat somewhat strongly no responseTotal 1,002 63 24 5 7Total 1,002 52 26 9 5 8Sex:Sex:Male 499 60 28 5 6Male 499 55 24 9 5 7 Female 503 66 21 5 7Female 503 49 28 9 5 9Rac(!:Race:White 871 62 25 5 I 7White 871 52 27 8 4 9 IBlack/ other 123 71 16 8 3 2Black/ other 123 56 18 II 9 6Education:Education: High school, Incomplete 167 68 22 3 2 5High school, incomplete 167 57 23 7 6 7 High school, graduate 357 63 24 6 I 6High school, graduate 357 55 26 8 4 7 College, incomplete 190 61 25 8 0 6College, incomplete 190 51 25 II 4 9 College, graduate 285 61 25 4 I 9College, graduate 285 47 29 10 4 10Occupation:Occupation: Pr<strong>of</strong>essional, manager, owner 292 62 26 5 (a) 7Pr<strong>of</strong>essional, manager, owner 292 55 23 10 3 9 Sales and clerical 120 65 24 3 0 8Sales and clerical 120 48 33 8 7 4 Blue collar 221 61 24 6 3 6Blue collar 221 50 27 10 6 7Household income:Household income: lklder $15,000 237 66 22 5 3 4Under $15,000 237 53 2~:5 7 8 7 ~ I 5,000 to $24,~m 215 62 27 6 0 5~ I 5,000 to $24,999 215 55 28 6 3 8 25,000 and over 397 63 23 5 2 725,000 and over 397 51 28 II 3 7 ~25,000 to $34,:m; 252 63 24 5 2 6~25,000 to $34,999 252 55 2!r 9 4 7 35,000 and over 145 64 23 5 I 735,000 and over 145 44 33 14 I 8Age:Age: lklder 35 years 429 56 29 7 I 7Under 35 years 429 44 32 II 5 8 18 to 24 years 147 50 33 8 I 8III to 24 years 147 44 34 12 6 4 25 to 34 years 282 59 27 6 I 725 to 34 years 282 44 31 II 4 10 35 to 44 years 181 60 26 5 3 r;35 to 44 years 181 58 21 7 4 10 45 to 64 yeors 246 72 18 3 I 645 to 64 years 246 58 24 8 3 7 65 years and older 133 70 20 4 I 565 years and older 133 62 19 5 6 8Community size:Community size: Nc>nmetro 551 64 23 5 7Nonmetro 551 53 28 9 3 7 Metro:Metro: 50,000 to 999,999 341 62 26 5 2 550,000 to 999,999 341 51 24 9 6 10 1,000,000 and over 110 62 26 6 0 61,000,000 and over 110 55 22 10 6 7Region:Region: Northeast 219 67 26 2 I 4Northeast 219 55 24 9 5 7 North Central 260 52 31 7 2 8North Central 260 54 24 10 4 II South 331 65 22 5 I 7South 331 51 26 10 5 8 West 192 68 18 7 0 7West 192 48 32 7 3 10Home ownership:Home ownership: Own 702 63 24 5 7Own 702 53 26 9 4 8 Rent 296 62 25 6 6Rent 296 52 25 9 5 9Household size:Household size: I or 2 people 441 67 21 4 I 7I or 2 people 441 55 22 9 5 9 3 or 4 peo~;e 408 60 27 5 2 63 or 4 people 408 51 30 8 4 7 5 people Ilnd more 148 59 26 8 2 55 people and more 148 47 26 12 5 10Marital status:Morltal status: Married 658 64 23 5 2 6Married 658 53 27 9 3 8 Not married 341 61 26 6 I 6Not married 341 51 25 9 6 9Employment status:Employment status: Employed 640 62 25 5 I 7Employed 640 52 26 9 5 8 Employed female 265 67 20 4 I 8Employed female 265 46 31 10 6 7 Not employed 362 63 23 6 2 6Not employed 362 54 26 8 3 9 Not employed female 238 64 22 6 2 6!'bt employed femole 238 53 25 8 2 12Head -<strong>of</strong> household:Head <strong>of</strong> household: Male 432 61 27 5 6Male 432 56 23 9 4 8 Female !i!iO 66 21 5 ZFemale 440 50 27 9 4 10~aless than .0.5 percent.Source: Hubert H. Humphrey Institute <strong>of</strong> Public Affairs, Public Attitudes Toward Youth Crime, Workingpaper (Minneapolis, Minn.: Hubert H. Humphrey Institute <strong>of</strong> Public Affairs, 1982). Table adapted bySource: Hubert H. Humphrey Institute <strong>of</strong> Public Affairs, Public Attitudes Toword Youth Crime, WorkingSCLRCEBOO< staff. Reprinted by permission.paper (Minneapolis, Minn.: Hubert H. Humphrey Institute <strong>of</strong> Public Affairs, 19112). Table adapted bySOLRCEBOO< staff. Reprinted by permission.J1I!223
--- --".(~, .... ,,~~~-)~ .Public Attitudes Toward Crime and <strong>Criminal</strong> <strong>Justice</strong>-Related Topics<strong>Sourcebook</strong> <strong>of</strong> <strong>Criminal</strong> <strong>Justice</strong> <strong>Statistics</strong> <strong>1983</strong>Table 2.30 Attitudes toword the statement that juvenile status <strong>of</strong>fenses should be handled byagencies other than the juvenile court system, by demographic characteristics, United States, 1982Table 2.29 Attitudes toward the statement that committing juveniles to correctional Institutionsdeters other youth frorn committing CI !rne, by demographic characteristics, United States, .982 N:>TE: See N:>TES, Tables 2.25 and 2.26.N:>TE: See [\OTES, Tables 2.25 and 2.26. Question: "I'd like you to tell me whether you agree strongly, agree somewhat, disagree somewhat, ordisagree strongly with each <strong>of</strong> the statements."Question: "I'd like you to tell me whether you agree strongly, agree somewhat, disagree somewhat, ordisagree strongly with each ?f the statements.""Youths who are runaways, habitual truants and youths in conflict with their parents should not behandled by the juvenile court system, but by other community agencIes.""Corrmitting juveniles to correctional institutIons serves as a deterrent to other youths from committingcrimes."(Percent)(Percent) NUmber <strong>of</strong> Agree Agree Disagree Disagree No opinion!respondents strongll somewhat somewhat strongl:t no responseNUITiber <strong>of</strong> Agree Agree Disagree Disagree No oplnlon/respondents strongll somewhat somewhat strongl:t no response Total 1,002 30 31 18 12 9Total 1,002 23 34 20 16 7 Sex:Sex:Mole 499 29 29 20 13 9Mole Female 503 3049933 17928 32 19 16Female5503 III 37 21 16 8 Race:"Race:White 871 28 32 19 II IJWhite Black/other 12387141 23 13 20 322 34 21 16Black/other7123 28 38 15 16 3 Education:Education:High school, incomplete 167 32 26 1813High school, incompleteHigh school, gradUate 357 2ll16729 18 " 16 936 26 14 /I 13High school, graduateCollege, incomplete 19O 31 34 17 /I357724 39 16 14College, incomplete7 College, graduate 285 2919035 19 7 1O20 37 24 16College, graduate3285 16 33 25 21 5 Occupation:Occupation:Pr<strong>of</strong>essional, manager, owner 292 28 31 22 9 10Pr<strong>of</strong>essional, manager, ownerSales and clerical292120 27 40 17514 39 24 18Sales and clerical5 Blue collar120221 34 29 16"13 829 29 22 16Blue collar4221 28 31 21 15 5 Household income:Household income:Under $15,000 237 35 27 16 13 9U1der $15,000 ~23715,000 to $24,999 215 30 352518 9 e32 19 16 8 25,000 and over 397 29'>,~15,000 to $24,999 215 -',20 i2 819 32 ~e?24 17 8 ~25,000 to $34,9994J«25,000 and over 39730 32 18 1223836 21 IS 5 35,000 and over~25,000 to $34,999 252145 28 292323 12 838 2035,00014and over5145 23 35 22 15 5 Age:Age:U1der 35 years 429 25 36 21 13 5U1der 35 years 18 to 24 years 147 29 29 21 III429318 40 221817to 24 years:3 25 to 34 yean:147282 23 402421 10 644 202510to 34 years2 35 to 44 yearl,282181 35 30 14 10 /I15 37 233521to 44 years4 45 to 64 years 24618132 26 19 10 1321 33 204517to 64 years9 65 years and older 133 31 29 13 IS2461229 31 186514years and older8133 32 27 IS 13 13 Corrmunity size,:Corrmunity size:Nonmetro 551 30 31 17 12 /0NonmetroMetro;551 24 36 18 15Metro:7 50,000 10 999,999 341 26 34 20 1O /050,000 to 999,999 I ,000,000 and over /1034136 25 20 13 621 34 231,000,00016and over /1O622 31 19 20 8 Region:Region:Northeast 219 36 29 18 10 7Northeast North Central 260 27 29 22 14 821~ 22 30 25North Central18 5 South260331 27 31 17 IS 1O19 35 22South16 8 West331192 30 36 16 7 /I26 36 16WestIS 7192 23 38 17 16 6 Home ownership:Home own!","ship:Own 702 28 32 19 /I /0Own 702Rent 296 32 312416 14 735 18Rent16 7296 20 34 23 17 6 Household sIze:I-busehold size:I or 2 people 441 30 32 16 11 /I1 or 2 people 3 or 4 people441408 282331 19 13 932 193 or 4 people17 9 5 people and mare408148 32 302321 10 736 21515people and more 5148 22 36 21 15 6 MarItal status:Marital status:Married 658 29 31 18 12 10Morried Not married658341 31 31 19 11 825 34 19 16Not married 6341 20 35 22 16 7 Employment status:Employment status;Employed 640 30 32 19 10 9Employed Employed female 265 30 34 18 9 9 ~640 21 35 22 17Employed female5 f\Dt employed265362 29 29 17 14 /I19 34 24 17Not employed 6 Not employed female362238 29 32 16 13 1026 34 15 15Not employed female 2381016 40 17 15 12 Head <strong>of</strong> household:Head <strong>of</strong> household:Male 432 29 30 19 12 10Femol~Male 432440 29 33 17 11 1029 31 18 17Female 5440 17 38 20 16 9 Source: Hubert H. Humphrey Institute <strong>of</strong> Public Affairs, Public Attitudes Toward Youth Crime, WorkingSource: Hubert H. Humphrey Institute <strong>of</strong> Public Affairs, Public Attitudes Toward Youth Crime, Workingpaper (Minneapolis, Minn.: Hubert H. Humphrey Institute <strong>of</strong> Public Affairs, 1982). Table Gdapted bySCllRCEBCXX staff. Reprinted by permission.paper (Minneapolis, Minn.: Hubert H. Humphrey Institute <strong>of</strong> Public Affairs, 1§1l2). Table adapted bySCllRCEBCXX staff. ReprInted by permIssion.224225
----------- --~-_.------~---t]<strong>Sourcebook</strong> <strong>of</strong> <strong>Criminal</strong> <strong>Justice</strong> <strong>Statistics</strong> <strong>1983</strong>Table 2.31 Attitudes toward the statement that increasing youth employment opportunities couldreduce serious crime, by demographic characteristics, lkIlted States, 1982~TE: See ~TES, Tables 2.25 and 2.26.Question: "I'd like you to tell me whether you agree strongly, agree somewhat, disagree somewhot, ordisagree strongly with each <strong>of</strong> the statements.""Increasing employment opportunities for youths could prevent a lot <strong>of</strong> serious crimes."(Percent)i'iillber <strong>of</strong> Agree Agree Disagree Disagreerespondentsf\b opinion!strongll:: somewhat somewhat strongly no responsePublic Attitudes Toward Crime and <strong>Criminal</strong> <strong>Justice</strong>-Related TopicsTable 2.32 Attitudes toward the statement that the juvenile crime problem Is not as serious as mostp~ople soy, by demographic characteristics, United Stotes, 1982~TE: Se" I\OTES, Tables 2.25 and 2.26.Question: "I'd like you to tl}1I me whether you agree strongly, agree somewhot, disagree somewhot ordisagree strongly with each <strong>of</strong> the statemenh\." ,"The juvenile crime problem Is not reall)' as serious as most peC'ple are saying It is."(Percent)Number <strong>of</strong> Agree Agree Disagree Disagreeres~ndents No opinion/stron21l:: somewhat somewhat .5tron21l:: no reseonseTotal 1,002 67 22 5 4 2 TotalSex:1,002 6 9 20 61 4Mole 499 68 20Sex:Female 65035 I66 24 Male4 4 2499 6Female10 215036162Race:7 20 6,1 6White 871 65 Race:Black! other 24 5123480210 WhiteI 8 I871 5 9 Black/ other 221236013 4Education:I7 10 68 2High school, incomplete 167 72 Education:High school, graduate18 33575 272 tHigh school, Incomplete 167College, incomplete 18 5 4 I10 10 20190 65 High school, graduate 3575674College, graduate21 7 82855 2 Callege, Incamplete 1860 190642936 4 I 5College, graduate10 202856124Occupatian:7 24 61 6Pr<strong>of</strong>essional, monager, owner 292 64 25 IOccupatlan:Soles and clerical 5120557 Pr<strong>of</strong>esslonol, monager, ownerI292Blue collar 31 5 6 2Sales and clerical8 24221 69 1206220 34G 4 Blue collar 10 172216783I-busehold income:8 16 66 2lklder $15,000 237 72 18I-busehold Income:~15,000 to $24,999 4 4 2 ,1215 Under $15,000 23725,00070and over 22 5 3 07 7~ 15,000 to $24,999 19397 2156463 73~25,000 to $34,99925 5 6 I I 25,000 and over10 17252 397634335,00067and over 22 5 5 I9~25,000 to $34,999 23145 2526157 21l 436 7 2 ! 35,000 and over 9 241456023Age:8 23 63 4lklder 35 years 429 Age:1862to 24 years 27 6 5 (0)147 iUnder 35 years 4292564 5to 34 years 22 8 5 I18 to 24 years7 242826161330 5 4 0I147 525 to 34 years10 22282595 It45 35 to 44 to 64 years years 181 68 22 4 4 35 to 44 years 181 5 ,., 6 25246 262 2i.c;6S73years and o!der16 3 5 3 45 to 64 years 17133 246 :;6372316 6 5 I65 years and older9 1613366 5Community size:II 7 21 53 8Nonmetro 551 69 CQrrIllunlty size:Metro:21 5 4 IN.lnmetro 551 650,000 to 999,999 Mel-ro:10 2134159654I,OOO,OOU und over 25 4110567I1750,000 to 999,9'99 53412 ~51,000,000 and over8 20110637 4Region:6 18 66 3Northeast 219 69 f:Region:North Central 20 7260365I Nottheast23 5 521926North Central6 182606753II 25 53 6South 331 68 21 4 5 2 South 331 8 9 III 62 3West 192 69 22 4 5 0 West 192 3 6 22 65 4I-bme awnership:Own 702 67 21Home ownership:5 5 2 Own 702 6 10 20 60 4Rent 296 67 23 5 4 I Rent 296 6I-busehold size:5 22 63 4I or 2 people 441 68 I-busehold size:21 5 5 I I' I or 2 people 441 7 7 20 61 53 or 4 people 408567people and more 22 4 5 2 Ii148 65 3 or 4 people23 7 440811I55 people and more9 201486353Marital status:" IIII 23 58 3to'\orrled 651l 68 ~ Marital status:Not morried 21 53414672 IJ Married23 5 4658 5INot married10 203416174Employment status:6 21 61r:5Employed 640 FEmployment sta~us:64Employed female 24 6265560I ~ Employed 640 5Not employed 27 5 7 IEmployed femole8 20 64362 733~ 265 4Not employed female17 4 4 2 Not employed 6 2136265238 73 8419 3 2 3 h 9Not employed female 212385676Head <strong>of</strong> household:Ii9 19 58 7Male 432 69Head <strong>of</strong> household:Female 20 5!!!IO5 I ~Male21 23 g g 43226Femole 10 20 61 3~440 5 8aLess than 0.5 percent.I20 62 5Source: Hubert H. Humphrey Institute <strong>of</strong> Public Affair~, Public Attitudfls Toward Youth Crime, WorkingSource: Hubert H. I-Mnphrey Institute <strong>of</strong> Public Affairs, Pu);)lic Attitudes Toward Youth Crime, Workingpaper (Minneapolis, Minn.: Hubert H. Humphrey Institute <strong>of</strong> Public AU'airs, 1982). Table adapted bypaper (Minneapolis, Minn.: Hubert H. Humphrey Institute (if Public Affairs, ! 982). Table adopted bySQ.RCEBOO< st<strong>of</strong>f. Reprinted by permission.SOLRCEBO'.l< st<strong>of</strong>f. Reprinted by permission.nI226r227
","::"~ __ ~,,,-,l,J..=,----- -------<strong>Sourcebook</strong> <strong>of</strong> <strong>Criminal</strong> <strong>Justice</strong> <strong>Statistics</strong> <strong>1983</strong> !PublicAttitudes Toward Crime and <strong>Criminal</strong> <strong>Justice</strong>-Related TopicsTable 2.33 Attitudes toward the statement that not enough money and resources are being spent toprevent juvenile crime, by demographic characteristics, United States, 1982Table 2.34 Attitudes toward causes <strong>of</strong> Increasing crime,United Sil,tes, 1981f'VTE: See f'VTES, Tables 2.25 and 2.26.)\OTE: The Gallup Organization conducted 1,030 telellhoneQuestion: "I'd like you to tell me whether you agree strongly, agree somewhat, disagree somewhat, orInterviews across the Notion between Jon. 16-23, 1981 for thedisagree strongly with each <strong>of</strong> the statements."Newsweek Poll. The margin <strong>of</strong> error is plus or minus 3 percent"Not enough money and resources are being spent on trying to prevent crime by juveniles." (Source, p. 47).(Percent)QUestion: "What is most responsible for the Increasingrate <strong>of</strong> crime?")\Unber <strong>of</strong> Agree Agree Disagree Disagree No opinion/respondents strongly somewhat somewhat strongly no response 1(Percent a )Total 1,002 35 26 15 10 14CausesSex:I,Male 499 37 26 13 II 13 Unemployment 37Female 503 32 27 17 9 15ICourts too lenient 20L Breakdown <strong>of</strong> fomlly, society, values 19Race:[,Punishment not severe llnough 13White 871 32 28 15 10 15 Drugs 13Block/other 123 51 16 10 12 II TV vlulence, movies 3Education:Opercents do not odd up to 100 because <strong>of</strong> multipleHigh school, incomplete 167 41 23 10 12 14 responses.High school, graduate 357 40 25 15 8 12College, incomplete 190 31 29 15 9 16 Source: "The Plague <strong>of</strong> Violent Crime," Newsweek, Mar.College, graduate 285 28 29 18 10 15 23, 1981, p. 47. Copyright 1981 by Newsweek Inc. All rightsreserved. Reprinted by permission.Occupation:Pr<strong>of</strong>essional, manager, owner 292 33 28 18 8 13Sales and clerical 120 30 28 21 8 13Blue collar 221 38 25 15 12 10Household income:Under $15,000 237 40 24 II 12 13$15,000 to $24,999 215 39 27 14 8 12$25,000 and over 397 30 29 17 10 14~25,OOO to $34,999 252 34 27 16 8 1535,000 and over 145 25 32 18 12 13Age:Under 35 years 429 33 34 16 6 II 18 to 24 years 147 37 39 10 5 925 to 34 years 282 31 31 19 7 12I35 to 44 years 181 35 27 21 7 1045 to 64 years 246 39 It! II 16 1665 years and older 133 33 20 8 13 26IICorrmunity size:INilnrnetro 551 33 27 17 9 '14Metro:50,000 to 999,999 341 36 28 12 II 131,000,000 and over 110 43 20 13 10 14Region:Northeast 219 34 32 15 9 10North Central 260 35 28 15 7 15IISouth 331 35 23 16 II 15iWest 192 35 24 II 13 17I-Home ownership:Own 702 32 26 16 II i5Rent 296 41 28 II 7 13Household size:I I~r 2 people 441 36 22 12 II 19I3 or 4 people 408 33 31 17 10 9 !5 people and more 148 38 26 16 6 14jMarital status:\'IiIil)IiIIIMarried 658 32 27 16 II 14Not married 341 40 25 12 9 14IfEmployment status:IIEmployed 640 34 28 17 9 12 IEmployed female 265 34 27 20 8 IINot employed 362 37 25 10 10 18 II-.Not employed female 238 31 27 13 9 20Head <strong>of</strong> household:Mole 432 36 24 13 13 14Female 440 31 27 17 9 16Source: Hubert H. Humphrey Institute <strong>of</strong> Public Affairs, Public Attitudes Toward Youth Crime, Workingpaper (Minneapolis, Minn.: Hubert H. Humphrey Institute <strong>of</strong> Public Affairs, 1982). Table adopted bysaRCEBOa< st<strong>of</strong>f. Reprinted by permission.228229
<strong>Sourcebook</strong> <strong>of</strong> <strong>Criminal</strong> <strong>Justice</strong> <strong>Statistics</strong> <strong>1983</strong>Table 2.35 Reasons given for Increased level <strong>of</strong> crime by respondents who believe crime has Increased In their community, bydemographic characteristics, United States, 1981N)TE: The data presented below are from a subsample <strong>of</strong> people, 54 percent <strong>of</strong> 1,540 respondents,who believe there Is more crime In their corrmunlty now than a year ago. The specific screenquestion WaS, "Is there more crime In this area than there was a year ogo, or less?" Thoseresponding that there was more crime were then asked the question below. See Table 2.2 forresponses to the first question. For a discussion <strong>of</strong> public opinion survey sampling procedures, seeAppendix 7.Question: "In your opinion, why Is there more crime in this area than there was a year ago?"NotionalSex:MaleFemaleRace:WhiteNonwhiteEducation:CollegeHigh schoolGrade schoolOccupation:Pr<strong>of</strong>essional and businessClerical and salesManual workersNonlabor forceIncome:25,000 and over20,000 to ~24'99915,000 to 19,99910,000 to 14,99915,000 to $9,999Under $5,000Age:Total under 30 yearsI B to 24 years25 to 29 years30 to 49 years50 years and olderCity size:1,000,000 and over500,000 to 999,99950,000 to 499,9992,500 to 49,999Under 2,500, ruralRegion:EastMidwestSouthWestReligion:ProtestantCatholicPolitics:RepublicanDemocratIndependent(Percent a )Economic problemsLegal systemLock In-InadequateUnem- <strong>of</strong> creased LenientDrugs,ployment Inflation money population courts police alcohol21212120282221211817232320171824221920192222212523221520222714232222162323bTotal anol' to more than 100 percent due to multiple responses.Other rderences to a breakdown In morality include: "T.V.,mOVies, pornography" (J percent), "lock <strong>of</strong> spiritual training" (Jpercent), and "attitudes in our society" (2 percent).161716177221682220167222118131110231634191017181816141716II211618171321666646734773i'54II43IIIIII5434668497555666II12II128II12101679121218!III10714151212971514121076151812II12IIII152010151420149152114121814181;913998158192391315131414181513171314II139II610121071812II106II121641519107111517139615II1088161013818171918231617291791922151419202227IIIIII16252314152318201222191919172115Breakdown In moralityDecline <strong>of</strong>respect,Lock <strong>of</strong> morals;parental permls- bguidance slveness Other12111312II15IIiO1241412151797147131610121213II92010II151013121413II1210910914137159412878IIII121373P10II125912988148II5121074544764396245563484445447435266533547597996971659931047157II296105867888577878Noopinion75B71047105661045B8.89cOther mentions include: "mothers working, children unsupervised"(J percent), "government (genera!)" (J percent), "dissatisfaction wll'hlife" (2 percent), "divorce rate" (Jess than I percent), and''mIscellaneous'' (3 percent).Source: George H. Gallup, The Gallup Report, Report No. 187 (Princeton, N.J.: The Gallup Poll, April 1981), pp. 8, 9. Reprinted by permission.4636975847146II374776\II,rI,IIIIITable 2.36 Attitudes toward statements about crime, UnitedStates, 1982N)TE: See f\OTE, Tobie 2.1. For a discussion <strong>of</strong> public opinion surveysampling procedures, see Appendix 7. For detailed Informctlon onthis survey, see Appendix 8.Question: "I'm going to mention several things peoplesometimes soy about crime. After each, please tell me whether youagree or disagree with it."If a person spends time in Jailchances are goad he won't commitany more crimes after he gets out<strong>of</strong> jailMost Judges have more sympathy forthe criminals than for their victims 55A block person is more likely tocommit a crime than a white person 29Most crimes go unpunished these days 80Police should be able to stop andsearch anybody at any time If theysuspect that person has committeda crimeMore (;.rlzens should corry defensiveweapons ~uch as teargas to protectthemselves on the street 47This country Is finally beginning tomoke some progress In solving thecrime problem 34We'd have less crime In this countryIf more parents disciplined theirchildren strictly 79The only way the crime problem willbe solved Is by pr:1Iate citizensforming their iJwn armed streetpatrols 27The police can't really do much aboutcrime because the courts have puttoo mony restrictions on the police 68<strong>Criminal</strong>s today are more violentthan they were 5 yef.lrs ago 67Prl;~ authorities should be allowedte free a prisoner from Jail oncethe authorities feel that prisonerwill not return to a life <strong>of</strong> crimeMost convicted criminals could betrusted to work at regUlar jobsoutside prison during the day andreturn to prison at nightOpercents moy not odd to 100 due to rounding.Public Attitudes Toward Crime and <strong>Criminal</strong> <strong>Justice</strong>-Related TopicsNo opinion,refusedAgree Dlsggree to answerSource; Table construct,':!d by SOLRCEBOO< st<strong>of</strong>f from dataprovided by the ABC News Poll; data were made available throughthe <strong>Criminal</strong> <strong>Justice</strong> Archive and Information Network, InteruniversityConsortium for Po!itical and Social Research.II5B3634864066113405061.207129285960445222423545Table 2.37 Attitudes toward the statement that chances aregood persons who spend time in Jail will not commit morecrimes, by demographic characteristics, United States, 19B2N)TE: See N)TE, Table 2.1. For a discussion <strong>of</strong> public opinion surveysampling procedures, see Aopendix 7. F"r detailed informatlor'l onthis survey, see Appendix 8.Question: "I'm going to mention several things peoplesometimes soy about crime. After each, please tell me whether youagree or disagree with it.""If a person spends time In jail chances are (lood he won'tcommit any more crimes after he gets out <strong>of</strong> jail."-t :JtionalSex:MoleFemaleRace, ethnlclty:WhiteBlockHispanicEducation:CollegeHigh schoolGrode schoolEmployment status:Full-time employedPart-time employedUnemployedLaid <strong>of</strong>fRetiredFull-time homemokerStudentIncome:30,000 and over12lt,000 to $29,99912,000 to $19,9998,000 to $11,999Under $8,000Age:18 to 24 years25 to 29 years30 to 49 years50 to 64 years65 years and olderCommunity size:Lorge citySuburbSmoll townRuralRegion:NortheastMidwestSouthWrist(Percent a ): .... ";';lborhood racial characteris~lcs:,
--~- ~r------.~-.. --" .•. -Table 2.38 Attitudes toward the statement that judges havemore sympathy for criminals than {(ir vi'ctims, bydemographic characteristics, United States, 1982N::>TE: See N:JTE, Table 2.1. For a discussion <strong>of</strong> public opinion surveysampling procedures, see Appendix 7. For detailed information onthis survey, see Appendix tl.Question: "I'm going to mention several things peoplesometimes soy about crime. After each, please tell me whether youagree or disagree with it.""Most judges have more sympathy for the criminals than fortheir victims."NotionalSex:MaleFe.noleRace, ethnicity:WhiteBlackHispanicEducation:CollegeHigh schoolGrade schoolEmployrmnl status:Full-time employedPart-time employedUnemployedLaid <strong>of</strong>fRetiredFull-time homemakerStudentIncome:~30,OUO and over~20,000 to $29,9991"2,OUO to $19,999~8,000 to $11,999Under $8,000Age:18 to 74 years25 to 29 years30 to 49 yeol s50 to 64 years65 years and olderCommunity size:Lorge citySuburbSmoll townRuralRegion:NortheastMidwestSouthWestNeighborhood racial characteristics:Mostly or all whileRacially mixedMostly or all blockNeighborhood age structure:Mostly younger than 35 yearsMostly between 35 and 55 ye:JrsMostly older than 55 yearsMixed, all ages<strong>Sourcebook</strong> <strong>of</strong> <strong>Criminal</strong> <strong>Justice</strong> <strong>Statistics</strong> <strong>1983</strong>/~~. ·)pinion,",)fusec;lAgree Disagree fa answer5!l555656446152595655494853646350525759555241515663655S555459555259545751444057625640414U40503844383tl424tl48472734484439394042564842312641414237110443841394750apercents may not add to 100 due to rounding.Source: Table constructe(i by 5O...RCEBCDK st<strong>of</strong>f from dataprovided by the ABC News Poll; data were mode available throughthe <strong>Criminal</strong> Just;ce Archive and Information Network, Interuniversit)"Consortium for Political and Social Hesearch.5640284044446I446333o942432563I3694I:44544543644104Table 2.39 Attitudes toward the statement that a black personis more likely to commit a crime thein a white person, bydemographic characteristics, United States, 1982N:JTE: See N:JTE, Table 2.1. For a discussion <strong>of</strong> public opinion surveysampling procedures, see Appendix 7. For detailed information onthis survey, see Appendix 8.Question: "I'm going to mention sevel'al things peoplesometimes soy about crime. After each, please tell me whether youagree or disagree with it.""A blcek person is more likely to cmmit a crime than awhite person."NotionalSex:MaleFemaleRace, ethnicity:WhiteBlockHispanicEducation:CollegeHigh schoolGrade schoolEmpioYMent status:Full-time employedPart-time employedUlp.mployedLaid <strong>of</strong>fRetiredFull-time homemokerStudentIncome:t30,000 and over20,000 to 29,999):'2,00!) to ~'9,999,,8,000 to $11,999Under $8,000Agel18 to 24 years25 to 29 years30 to 49 years50 to 64 years65 years and olderConmunity size:Large citySuburbSmall townRuralRegion:NarfheostMidwestSouthWestNeighborhood racial characteristics:Mostly or all whifeRacially mixedMostly or all blackNeighborhood age structure:Most Iy younger than 35 yearsMostly between 35 and 55 yearsMost I y older thaI! 55 yearsMixed, all agesNa opinion,refusedAoree Disagree to answer2933233116273227213224291930222537272823252427293529303227273228302631242333304027'666272658t686469676472681:116076756068697168747168596065646!l68626866706473756565536tlapercents ma,. not add to 100 due to rounding.Source: Table constructed by so....RCEBOO< st<strong>of</strong>f from dutaprovided by the ABC News Poll; data Vlere made available throughthe <strong>Criminal</strong> <strong>Justice</strong> Archive and Information Network, InteruniversityConsortium for Political and Social Research.5545354412443o93o354662236II545554445332475Table 2.40 Attitudes toward the statement that most crimesgo unpunished, by demographic characteristic.", UnitedStates, 1982NJTE: See N:JTE, Table 2.1. For a discussion <strong>of</strong> public opinion sur~eysampling procedures, see Appendix 7. For detailed information onthis survey, see Appendix 8.QUestion: "I'm going to mention several things peoplesometimes say about crime. After each, please tell me Whether youClgree or disagree with it.", "Most crimes go unpunished these days."NationalSex:MoleFemal"aRace, ethnicity:WhiteBlackHispanicEducation:CollegeHigh schoolGrade schoolEmployment status:Full-time employeclPort-time employedU1employedLaid <strong>of</strong>fRetiredFull-time homemakerStudentIncome:$30,000 and ave,~LU'OOO to $29,99912,000 to $19,9998,000 to $11,S-}9Under $8,000Age:I Il to 24 years25 to 29 years30 to 49 years50 to 64 years65 years and olderCommunity size:Large citySuburbSmall townRuralRegion:NortheastMidwestSouthWestNeighborhood racial characteristics:Mostly or all whiteRaciany mixedMostly or all blockNeighborhood age structure:Mostly younger than 35 yearsMostly between 35 and 55 yearsMostly older than 55 yearsMixed, all agesPublic Attitudes Toward Crime and <strong>Criminal</strong> <strong>Justice</strong>-Related TopicsNa opinion,refusedAgree Disagree to Uilswer8080798074817'781eo81787981761128479808082797984817')757982778281798079808080818078IlU1818III17241618181517202019181516III17181718201518II:!1718172016~ercents may not add to 100 due to rounding.Less than or ~qual to 0.5 percent.16181819181816III17191822322332522Io63o32223I(t-)238lource: Table constructed by SCLRCEB;JCK staff from datoprovided by the ABC News Poll; data were mode available throughthe ('Timinal <strong>Justice</strong> Archive and Information Network, Interuniver~ityConsortium for Po Ii tk..:tl and Social Rese
234<strong>Sourcebook</strong> <strong>of</strong> <strong>Criminal</strong> <strong>Justice</strong> <strong>Statistics</strong> <strong>1983</strong>Public Attitudes Tow
---'""- ~ ,..--Table 2.46 Attitudes toward the statement that police cannotdo much about crime because <strong>of</strong> restrictions imposed l1y thecourts, by demographic characteristics, United States, 1982NJTE: See NJTE, Table 2.1. For a discussion <strong>of</strong> public opinion surveysampling procedures, see Appendix 7. For detailed information onthis survey, see Appendix 8.Question: "I'm going to mention severo'll things peoplesometimes soy about crime. After each, please tell me whether youagree or disagree with it.""The police can't really do much about crim., because thecourts have put too many restrictions on the police."NotionalSex:MoleFcm"l.lleRace, ethnicity:WhiteBlockHispanicEducation:CollegeHigh schoolGrode schoolEmPloyment status:Full-time employedPert-time employedUnemployedLaid <strong>of</strong>fRetiredFull-time homemakerStudentIncome:30,000 and over20,000 to $29,999I L,OOU to $19,99918,000 to $11,99:fUnder $8,000Age:18 to 24 years25 to 29 years30 to 49 years50 to 64 years65 years and olderCOfTl'l1IJ!1ity size:Lorge citySuburbSmall townRuralRegion:NortheastMidwestSouthWest(Percent a )Neighborhood racial choracteristics:Mostly or all whiteRacially mixedMostly or all blQ{!KNeighborhood age structure:Mostly younger than 35 yearsMostly between 35 and 55 yearsMostly older than 55 yearsMixed, all ages<strong>Sourcebook</strong> <strong>of</strong> <strong>Criminal</strong> <strong>Justice</strong> <strong>Statistics</strong> <strong>1983</strong>N5 opinion,refusedAgree Disagree to answer68617070527964727968626158787657656971707255586979786466717368707064696663556970702931262846193426153034344216234334292627224341291717343226253027273328323644282627Opercents may not odd to 100 due to rounding.Source: Table constructed by 5CX..RCEBOO< st<strong>of</strong>f from dataprovided by the ,ABC News Poll; data were made available throughthe <strong>Criminal</strong> <strong>Justice</strong> Archive and Information NetwDrk, InteruniversityConsortium for Political and Social Research.323332326235o62o223462224623333323332J43Table 2.47 Ah itudes toward the statement that criminals aremore violent today than they were 5 years ago, bydemographic characteristics, United States, 1982NJTE: See NJTE, Table 2.1. For Q discussion <strong>of</strong> public opinion surveysampling procedures, see Appendix 7. For detailed Information onthis su~vey, see Appendix 8.Question: "I'm going to mention several things peoplesometimes soy about crime. After each, please tell me whether youagree or disagree with it.""<strong>Criminal</strong>s todoy are more violent than they were five yearsago."NotionalSex:MoleFemaleRace, ethnicity:WhiteBlockHispanicEducation:CollegeHigh schoolGrode schoolEmployment status:Full-time employedPort-time employedUnemployedLaid <strong>of</strong>fRetiredFUll-time homemakerStudentIncome:30,000 and over20,000 to $29,99912,000 to $19,99918,000 to $11,999Under $8,000Age:18 to 24 years25 to 29 years30 to 49 years50 to 64 years65 years and olderConmunity size:Larg':' citySuburbSmall townRuralRegion:NortheastMidwestSouthWestNeighborhood racial characteristics:Mostly or all whiteRacially mixedMostly or all blockNeighborhood age structure:Mostly younger than 35 yearsMostly between 35 and 55 yearsMostly older than 55 yearsMixed, all agesAgree6762746675696073796366696180727060636975626762637277726467666965676765747658666769N5 opinion,refusedDisagree to answer2B3321292227342317322B263915222935312622133133322514233030282530292930232136292427Opercents may not odd to 100 due to rounding.Source: Table co,1structed by 5CX..RCEBOO< st<strong>of</strong>f from dataprovided by the ABC News Poll; data were made available throunhthe <strong>Criminal</strong> <strong>Justice</strong> Archive and Information Network, InteruniversityConsortium for Political and Social Research.555534644554o652565253554a573665445435594Public Attitudes Toward Crime and <strong>Criminal</strong> <strong>Justice</strong>-Related TopicsTable 2.~8. Attitudes toward the statement that prisonauthontlE:'s should be allowed to free prisoners when theyfeel the prisoner will not return to a life <strong>of</strong> crime bydemographic characteristics, United States, 1982 'NJTE: S~e NJTE, Table 2.1. For a discussion <strong>of</strong> public opinion surveysampling procedures, see Appendix 7. For detailed information onthis survey, see Appendix 8.Question: "I'm going to mention several things people!sometimes say about crime. After each, please tell me whether youagree or disf!l;lr'ile with it."I, ~" ''Prison author!t!es should be allowed to free a prisoner fromJail once the authOrities feel that prisoner will not return to a lifeIi<strong>of</strong> crime.",It\6 OpiniOn,Irefused1Agree Disagree to answerflNotional36 59If4NotionalSex:Sex:Mole39 58 4FemaleMole33 6L 5FemaleRace, ethnicity:WhiteRace, ethnicity:d36 60 4BlockWhite37 58 5HispanicBlock34 56 IIHispanic!:Education:CollegeEducation:37 59 4I!High schoolCollegt':36 61 4Grode schoolHigh school38 50 12Grade schoolIiErr,ployment status:Full-time employedEmployment status:37 60 3Port-time employedFull-time employed37 60 4IiUnemployedPort-time employed40 57 3Laid <strong>of</strong>fUnemployed50 50 o/iRetiredLaid <strong>of</strong>f32 59 9RetiredFull-time homemaker31 62 7StudentFull-time homemaker1134 64 2StUdentIiI iIncome:30,000 and overIncome:134 63 320,000 to $29,99930,000 and over34 63 3I L,OOO to $19,99920,000 to $29,99938 57 4II8,000 to $11,99912,000 to $19,99941 53 6I Under $8,OUO18,000 to $1 1,99941 51 8Under $8,000Age:Age:18 '10 24 years36 62 II2S to 29 years18 to 24 years34 64'l.30 to!119 years25 to 29 years37 59 35U to 64 years30 to 49 years38 56 665 years and older50 to 64 years32 58 1065 years and olderComnunl'ty size:Large cityCorrmunity size:36 59 6~ Lorge citySuburbSmall townRuralRegion:NortheastMidwestSouthWestNeighborhood racial characteristics:Mostly or all whiteRacially mixedMostly or all blackNeighborhood age structure:Mostly younger th{in 35 yearsMostly between 35 and 55 yearsMost Iy older than 55 yearsMixed, all ages373831363537373637:l83833323B5958645B62595860585760636358Opercenhl may not add to 100 due to rounding.Source: Table constructed by SOLRCEBOO< staff from dataprovided by the ABC News Poll; data were made available throughthe Cr,imlnal Jus!lce Archlv: and Information Network, InteruniverSityConsortium for Political and Social Research.44563464542465Table 2.49 Attitudes toward the statement that prisoners couldbe trusted '10 work regular jobs outside the 'prison duringthe day and .return to prison at night, by demographiccharacteri:!~'ics. United States, 1982NJTE: S~e NJTE, Tab!e 2.1. For a discussion <strong>of</strong> public opinion surveysampling procedures, see Appendix 7. For detailed information emthis survey, see Appendix 8. "Question: "I'm going to mention several things peoplesometimes say about crime. After each, please tell me whether youagree or disagree with it.""Most convicted criminals could be trusted to work atregular jobs outside prison during the day and return to prison atnight."SuburbSmall townRuralRegion:NortheastMidwestSouthWestNeighborhood rat 101 characteristics:Mostly or all ~ hiteRacially mixedMostly or all 1,IackNeighborhood age structure:Mostly younger than 35 yearsMostly between 35 and 5S yearsMostly older than 55 yearsMIxed, all agesAgree34383034473333355034324039393129313435404332383138393S3236343233383434345038323435NO OpiniOn,refusedDisagree to answer6U586461496461614762635861516370656060565U6660645551606359616162595961604B58635860Opercents may not odd to 100 due to rounding.54654364345Io1062Source: Table constructed by SOLRCEI3()()( st<strong>of</strong>f from dataprovide~ ~y the AB~ News P?II; data were made available throughthe <strong>Criminal</strong> <strong>Justice</strong> Archive and Informotion Network InteruniVersityConsortium for Political and Social Research. '455462356IU565574375524585237
<strong>Sourcebook</strong> <strong>of</strong> <strong>Criminal</strong> <strong>Justice</strong> <strong>Statistics</strong>, 19113Table 2:.50 Attitudes toword the relationship between television violence and rising crime in thecountry, by demographic characteristics, United States, 1977 and 1982NJTE: For a discussion <strong>of</strong> public opinion survey sompling procedures, see Appendix 7.Question: "There has been a good deal <strong>of</strong> discus~ion lately about television programs that showviolence--that is, gunplay, fistfights and the like. Do you think there is a relationship between violenceon television and the rising crime rate in the United States, or not?"(Percent)1211 1982There is a There Is not a I'b There is a There Is not a I'b[elali!;~nshi!;! relationshi!;! o!;!inion relationshiQ relatlonshiQ oQinionI'btional 7U ~s 4 66 30 4Sex:Male 66 30 4 59 37 4Female 73 22 5 72 24 4Race:White 71 25 4 67 29 4I'bnwhite 62 31 7 56 38 6Education:College 73 23 4 66 30 ,I,High school 69 28 3 64 33 :'1Grade school 69 21 10 71 22 7Occupation:?r<strong>of</strong>essional and business 73 22 5 66 32 2Clerical and sales 65 34 I 70 28 2Manual workers 67 30 3 62 34 4I'bnlabor force 73 21 6 74 20 6Income:1",000 o,dN\ N\ N\ 62 36 20",'20,000 to '£4,999 N\ N\ N\ 65 33 215,000 to ~19,999 71 26 3 60 35 510,000 to '$14,999 64 32 4 68 28 4$5,000 to ~9,999 N\ N\ N\ 74 20 6Under $5,('.00 N\ N\ N\ 72 23 5Age:Total under 30 years 66 31 3 63 35 218 to 24 years 63 34 3 62 J6 l25 tl,) 29 years 70 27 3 64 ~3 330 tc 49 years 67 28 5 61 36 350 years and older 75 19 6 72 22 650 to 64 years N\ N\ N\ 68 28 465 years and older N\ N\ N\ 76 16 8City size:1,000,000 and over 72 23 5 62 33 5500,OUO to 999,999 51l 37 5 67 29 450,000 to 499,999 70 25 5 63 33 42,500 to 49,999 71 25 4 72 25 3Under 2,500, rural 72 24 4 67 30 3Region:East 73 22 5 65 31 4Midwest 68 27 5 69 28 3South 68 28 4 65 30 5West 69 26 5 62 35 3Religion:Protestant 71 25 4 68 28 4Catholic 71 25 4 6l 35 3Politics:Republican 75 22 3 69 26 5Democrat 68 27 5 65 31 4Inde~ndent 6B 28 4 64 33 3Source: George H. Gallup, The Gallup Opinion Index, Report I'b. 141 (Princeton, N.J.: The GallupPoll, April 1977), p. 16; George H. Gallup, The Gallup ~rt, Report I'b. 200 (Princeton, N.J.: TheGallup Poll, Moy 1982), p. 36. Table adapted by SOlRCEB staff. R.'printed by ~ermission.Public Attitudes Toward Crime and <strong>Criminal</strong> <strong>Justice</strong>-Related TopicsTable 2.51 Attitudes toward selected methods <strong>of</strong> dealing withcrime, United States, 1981NJTE: See NJTE, Table 2.34.Question: "Do y()U approve or disapprove <strong>of</strong> these alternativesfor dealing with crime?"Method(Percent)A!>QroveDisaQproveDon'tknowAllowing the police to stop andsearch anybody on suspicion 48 50 2Allowing the police to wiretap thetelephone <strong>of</strong> anyone they suspect 30 67 3Allowing the police to searcha home without a warrant 13 86Encouraging citizens to carrydefensive weapons such as Mace 65 32 3Source: "The Plague <strong>of</strong> Violent Crime," Newsweek, Mar. 23, 1981,b' 52. Cop~rtght 19111 by Newsweek Inc. All rights reserved. Reprintedy permiSSion.
Public Attitudes Toward Crime and <strong>Criminal</strong> <strong>Justice</strong>-Related Topics<strong>Sourcebook</strong> <strong>of</strong> Criminol <strong>Justice</strong> <strong>Statistics</strong> <strong>1983</strong>nant as a result <strong>of</strong>Id b,' legal if a woman became pregTable 2.52 Respondent:, agreeing thi~: ab°St~~~ds~~~tes, -1972-78, 1980, and 1982by demographic character SICS, d' 7rape, r edures see Appen IX ,!'OTE: For a discussion <strong>of</strong> public opinion survey samp Ing proc, a n to obtain at th'nk i" should be possible for a pregno nt w maQuest!on: .''PI~os~ tell mepr:~~~~r a~r a n~es~l~u <strong>of</strong> ~ape?1Ilegal abortion If slle ecame , )d ' bortion sho'Jld be possible(Percent respon Ing aTotalSex:MoleFemaleRace:WhiteBlock/otherEducation:CollegeHigh schoolGrode schoolOccupation: .Pr<strong>of</strong>essional and bUSinessClericalManualFarmerIncome:15,000 and over10,000 to $14,9997,000 to 19,9995,000 to 6,9951\ 3,000 to 4,999Lhder $3,000Age:18 to 20 years21 to 29 years30 to 49 years5C years and olderRegion:I~rtheostMidwestSo'JthWestReligion:ProtestantCatholicJewishi'bne197Z 1973 1974 1975 1976 197775 81 83 80 81 817475785688755581806864737'17770807368807470968681808366918261848676619182817378668\8483718878766581759893838382Politics: 82 84 85 80 84 ~~ 79Republican 70 79 81 78 79 79 82Democrat 79 84 86 82 80lndopendent h N tional- _ st<strong>of</strong>f from data provided by teaSource: Table constructed by ~~E~h~per public Opinion Research Center.Center; data were mode available t aug84n898469878778699184827878738489828t898476868379100898080826887816581847877868280827\70798580778581748580769692808182688882658684775487827974747186867979868175848274100908\BI836688816885867674888282767165768380819078758782759794197881818183658582678386777684847976786878867979868077838174100921980808378826986826384797785848279697669828179818577778780'/691938281781982838483857390836987887980898381677666858386818983788783819292868284Opinion ResearchI !II I iI iI jII ,ITable 2.53 Attitudes toward wiretapping, by demographic characteristics, United States, selected years 1974-82!'OTE: For a discussion <strong>of</strong> public ~pinlon survey sampling procedures, see Appendix 7.Question: "Everything considered, would ~ou soy that you approve or disapprove <strong>of</strong> wiretapping?"i'btionalSex:MoleFemaleRace:WhiteBlael:/ otherEducation:CollegeHigh schoolGrode schoolOccupation:Pr<strong>of</strong>essional and business t9Clerical 17Manual 15Former 20Income:15,000 and over10,000 to $14,9997,000 to ~9'9995,000 to 6,99913,000 to 4,999U1der $3,000Age:18 to 20 years21 to 29 years30 to 49 years50 years and olderRegion:NortheastMidwestSouthWestReligion:ProtestantCatholicJewishNonePolitics:RepublicanDemocratIndependent(Percent a )1974 1975 1977 1978 1982Dis- i'b Dis- i'b Dis- f\b Dls- No Dis- i'bApprove approve opinion Approve approve opinion Approve approve opinion Approve approve opinion Approve approve opinion16211318720161022171410178II151817181416201815II1322131880768378907880827B7982757778848680848682797879828077788~8481748479435433382434242438°Percents may not add to 100 due to rounding.43263443444643416221217II23141223131418172017101314916181618171514171513132212t8807484798475828075B582748178788680818883787878808081788378857485784444524822582254654I4643455292435Source: Table constructed by S~CEBOO< staff from data prOVided by the Notional Opinion Research Center; data were mode available throughthe Raper Public Opinion Research Center,182314201021191324171719231616201510613182321221419182020152617167875827885777883747979787582827882869186797277768278797774807181803243523424422332343I3522433365324192614208211917221518242120161918II101520212516191719181419261618787183778876797874837974777779778084908378737383777878797978718179333333263232233424a22522443213333192714217231813211719312315141715108172121221817232017271727161877708275897578787580785474838377788489827674758078737680688168807943444231042415323665423532544352543
~---.-.-.~~~ .. ~.<strong>Sourcebook</strong> <strong>of</strong> <strong>Criminal</strong> <strong>Justice</strong> <strong>Statistics</strong> 19[:13'Table 2.54 Attitudes to'Nard the job performance <strong>of</strong> local, State, and Federal low enforcement.<strong>of</strong>ficials, by demograJ.hlc characteristics, IJnlttiJ States, 19S1/.!'OTE: For.o discussion <strong>of</strong> public opinion survey sanpling procedures, see Appendix 7.Question: "How would you rate the job done by law enforcement <strong>of</strong>ficials on the (local level, Statelevel, Federal level)--{~xcellent, pretty goad, only fair, or poor?"Race:WhiteBlackAge:IS to 29 years30 to 49 yeal's50 to 64 years65 years and olderComnunlty size:CitySuburbTownRuralRegion:EastMidwestSouthWestPolitics:ConservativeMiddle <strong>of</strong> the roadLiberal(Percent)Local level State level Federal levelPositive Negative N:>t sure Positi',1e Negative N:>t sure Positive Negative N:>t s~~65525763626961686158646362596561603448423737283831384135363741343840IoI(c)I3IIIo!Io59475958535448595663555761505657583549393740354435413439373446:!P?sltlve Is defined as responses <strong>of</strong> "excellent" and "pretty good."-Negative is defined as responses <strong>of</strong> "only fair" and "poor."cLess than 0.5 percent.Source: Louis Harris, The Harris Survey (New York: The Chicago Tribune-New York News Syndicate,Feb. 26, 1981), pp. 3, 4. Table adapted by 5O...RCEBOO< staff. Reprinted by permission.39393764257II86I366545454944544842434348495150495038494552435342464B44464545444143435544474283461013II76598777Il6"•• 4\"
-rI--Ii! I.~dt lI,IIIIIri'--I;r1r-,.~----:-,-:----:itJ,.- c: - -\, to
,~--------~---------------~-------------------------Public Attitudes Toward Crime and <strong>Criminal</strong> <strong>Justice</strong>-Related TopicsFigure 2.8 Positive attitudes toward the job performance <strong>of</strong> local, State, and Federal law enforcement <strong>of</strong>ficials,lkIited States, selected years 1%7-82NJTE: In this figure, a "positive" attitude is defined as a response <strong>of</strong> "excellent" or "pretty good" tothe question presented below. For oJ discussion <strong>of</strong> public opinion survey sampling procedures, seeAppendix 7.Question: "How would you rate the job done by law enforcement <strong>of</strong>ficials on the (local level, State level, Fedl!ral leveJ)-excellent, pretty good, only fair, or poor?"Percent positive'00180-.-.-.~............ .. -- .".,.. .-....... .,.",.-60••• • a ••····... -............ .. ~ ~.-.40~ .........,.",.-•• «It ___ ,,•• •..., .,...... ,.~...................-. .-....•••••-" .. -• •••Local levelState levelFederal level20O~--r--------, ________ ~ ____ -, ______ ~~ ________ ~ __1967 1970 1973 1975 1977 1978 1981 1982Source: Louis Horris, The Ho~urow. (New York: The Chicago Tribune-New York News Syndicate, May 24, 1982), p.2. Figure constructed by SOlRCE - st. Reprinted by penmission."4\o"243
--~--~--,--~ -- - --- - -----i"--...= ..... ~ ... ~-r 1i.Public Attitudes Toward Crime and <strong>Criminal</strong> <strong>Justice</strong>-Related TopicsTable 2.55 Reported confidence in the ability <strong>of</strong> the police to prevent or solve crimes, by demographic characteristics, UnitedStates, 1982i'OTE: See i'OTE, Table 2.1. For a discussion <strong>of</strong> public opinion survey sampling procedures, seeAppendix 7. For detailed information on this survey, see Appendix 8.Questions: ''l-bw much confidence do you have In the police to prevent crimes such as robberies from happening--would you sayyou have a great deal <strong>of</strong> confidence, a good amount <strong>of</strong> confidence, very little confidence, or no confidence at all?"''l-bw much confidence do you have in the police to solve crimes such as robberies after they have happened-~would you say youhave a great deal <strong>of</strong> confidence, a good amount <strong>of</strong> confidence, very little confidence, or no confidence at all?"(Percent a )Confidence in the ability <strong>of</strong> the policeConfidence in the ability <strong>of</strong> the policeto I!revent crimesto solve crimes, _.No opinion,No opinion,Great Good Very None refused Great Good Very None refuseddeal amount little at all to answer deal amount little at all to answerNotional 18 43 33 5 14 46 34 5Sex:Male 18 41 34 6 (b) 14Female47 34 519 45 31 4 I 13 46 33 6Race, ethnicity:White 18 44 33 5 (b) 13Black49 32 425 29 38 8 I 15Hispanic34 42 814 38 38 8 I 12 34 42 IIEducation:College 14 43 37 6 (b) 10High school49 35 420I43 31 6 I 15Grade school45 33 637I37 22 3 I 28 39 23 5 6Employment status:Full-time employed 15 42 36 7 (b) 12 46Part-time employed36 515I48 34 3 0 10Unemployed52 33 5 (b)22 37 3. 1 8 I 13Laid <strong>of</strong>f42 37 5 214 42 :;6 8 0RetiredII 53 19 14-34340 21 3 2 25Full-time homemaker46 24 317345 34 4 (b)StudentII 47 30 89339 48 4 0 9 36 50 5 0Income:ro,ooo and over 16 41 36 7 (b) 10 47 3720,000 to5~29,999 16I44 35 5 I 1412,000 to 19,99951 31 318I45 32 4 I 158,000 to $11,99946 32 620I44 32 4 I 12Under $8,00042 41 5 (b)26 36 33 5 (b) 17 43 33 6 2Age:W to 24 years 12 45 37 6 025 to 29 years9 46 38 712044 36 8 (b) 1030 to 49 years41 43 6 (b)15 43 36 6 (b) II50 to 64 years49 34 524I40 31 4 I 1865 years and older47 30 433I42 21 2 I 22 46 25 3 4Corrmunity size:L.arge city 18 39 35 8 ISuburb14 40 38 717 42 36 4 I 12Small town49 34 418 45 30 6 I 14Rural47 33 520 43 33 4 0 15 49 30 4Region:Northeast II:! 43 32 6 I 12Midwest42 37 718246 30 5 (b)South/4 50 31 419I41 34 6 0West15 47 32 416I40 36 6 2 12 45 35 6 2Neighborhood racial characteristics:Mostly or all white 18 45 32 5 (b) 13Racially mixed49 3220434 38 7 (b) 15Mostly or all black34 40 1021 31 36 9 3 12 36 44 7Neighborhood age structure:Mostly younger than 35 years II 45 36 8 (b) 14Mostly between 35 and 55 years43 40 3 (b)18 44 34 4 (b) 12 48Mootly older than 55 years3424543I23 8 2 22Mixed, all ages45 2218842334 5 (b) 13 47 34 5 I!II)II\II'IjjjI!II!JIIi,! I!IrI:\iI'1/:I,t·I )11I!JPublic Attitudes Toward Crime and <strong>Criminal</strong> <strong>Justice</strong>-Related TopicsF:;;
-~---------i': 1r\ jI~1 Public Attitudes Toward Crime and <strong>Criminal</strong> <strong>Justice</strong>-Related TopicsI<strong>Sourcebook</strong> <strong>of</strong> <strong>Criminal</strong> <strong>Justice</strong> <strong>Statistics</strong> <strong>1983</strong> IITobie 2.58 Respondents reporting whether someone in the household called the police during the last year and satisfaction with response'1 time, by demographic characteristics, United States, 1982Table 2.57 Reported con,fidence in police, by s,;lected!'OTE: See NOTE, Table 2.1. The data below are responses to a response had taken a long time they were asked if pol/ce should havevictimization experienc~ <strong>of</strong> respondent or acquaintance, ! sequence <strong>of</strong> questions. First, respondents were asked if anyone in the arrived sooner. For a discussion <strong>of</strong> public opinion survey samplingIUnited States, 19801household hod calJed the police in the last year. If someone in the procedures, see Appendix 7. For detailed Information on this survey,!'OTE: See !'OTE Table 2.9. The "confidence in the local police I household had called the ~ olice, they were asked if the police response see Appendix 8.hod token a long or short time. If respondents indicated that theindex" Is the ;imple sum <strong>of</strong> responses to six dic~otomi~edquestions dealing with police performance and perceived police\Questions: "Have you or anyone in your houJehold had on occasion to call the police in the past year?""- attitudes. ''High'' confidence scores were assigned respondents~I~( If yes, ''Would YOI) soy the police arrived a short time after you colied, a long time after you called or what?"who answered that they agreed with 3 to 6 <strong>of</strong> tt.!! p(1sitiveIf a long time, "1.)0 you think they should have arrived more quickly or not?"dimensions <strong>of</strong> the confidence questions. If the fatal <strong>of</strong> ~sitiveresponses was less than 3 :hen a ."Iow" confidenc~ s.core was I(Percent a )assigned. For further diSCUSSion <strong>of</strong> the survey and indices, seeIAppendix 9. Call 22lice ___ tbw fast did 22lice res[!ond Should the I?:2lice have arrived soonerNJO'iberwtlO(Percent)Don't kilow, Nurrbersaid policerefused who calbed Short Somewhere cLong Don't took a Don'tPersonalYes i'b to answer 22lice time in between time know long timed Yes i'b knowConfidence burglary Acguaintance victimization!in victimization Burglarl:: Robberl::National 35 65 (e) 825 72 4 22 2 185 94 5 (e)police ?es I\k) Yes i'b Yes i'bI80 87 77 85Sex:High 69 85 Mole 34 66 (e) 469 72 5 22 2 101 93 6 IFemale 36 64 (e) 356 72 3 24 2 84 95 5 0Lcm 31 15 20 13 Jj 15Race, ethnicity:White 35 65 (e) 712 74 4 20 2 143 92 7 ISollrce: Research and Forecasts, Inc., The Figaie Re[!ort ~nI Block 31 69 0 58 59 9 33 0 19 100 0 0Fear 0'1 Crime: America Afraid (Willoughby, OI1io: FiggleHispanic 43 57 0 45 56 4 40 0 18 100 0 0Internctional, Inc, 1980), pp. 117, 118. Table adapted bySo..RCEBCXl< st<strong>of</strong>f. Reprinted by permission.\ .Education:I College 39 61 (e) 432 71 6 21 2 90 92 7 IHigh school 33 67 (e) 370 73 2 24 I 88 96 4 0Grade school 16 84 0 20 60 5 35 0 7 100 0 0\:,Employment status:,", Full-time employed 37 63i(e) 480 72 5 21 2 101 93 6 IPart-time employed 41 59 0 131 69 3 26 2 34 94 6 0Unemployed 36 63 I 50 54 6 40 0 20 100 0 0Laid <strong>of</strong>f 42 58 0 15 80 0 20 0 3 67 33 0Retired 20 80 0 64 89 2 9 0 6 100 0 0Full-time homemaker 35 65 0 60 75 2 20 2 13 92 8 0Student 43 57 0 24 62 4 33 0 8 100 0 0Income:11 rOOD 0" ow, 41 59 (e) 272 74 6 20 2 53 96 2 220,000 to ~29,999 36 64 0 211 72 4 22 3 46 94 6 012,000 to 19,999 32 68 0 164 70 4 24 I 40 90 10 0Ii 8,000 to $11,999 29 71 (e) 71 63 I 35 0 25 100 0 0Under $8,000 29 71 0 61 70 2 28 0 17 88 12 0IIAge:Ii 18 to 24 years 41 59 (e) 147 60 6 33 I 49 96 4 025 to 29 years 40 60 0 132 62 6 30 2 40 88 10 230 to 49 years 41 59 0 375 73 4 20 2 77 96 4 050 to 64 years 26 74 (e) 120 85 2 12 I 15 93 7 065 years and older 18 82 0 48 90 2 8 0 4 100 0 0Community size:Lorge city 45 55 (e) 207 61 5 32 I 66 94 6 0! Suburb 35 65 (e) 237 75 5 18 2 43 95 5 0Small town 35 65 0 270 76 3 19 2 51 94 4 2Rural 25 74 (e) 108 74 4 22 0 24 92 8 0\!II\1R;::glon:~-hrtheast 38 62 (e) 202 69 3 27 I 55 96 4 0Midwest 32 68 0 201 77 4 16 3 33 100 0 0South 32 68 0 257 69 5 24 2 63 90 8 2Ii West 40 60 (e) 165 73 6 21 I 34 91 9 0·1Neighborhood racial characteristics:I Mostly or 01/ white 34 66 (e) 641 75 4 19 2 122 93 6 II Racially mixed 40 60 0 145 57 4 39 I 56 95 5 0·1 Mostly or all black 32 68 0 35 69 9 20 3 7 100 0 0)Ii~ ,INeighborhood age structure:Mostly younger than 35 years 36 64 0 64 67 6 19 8 12 83 8 8Mostly between 35 and 55 yecr(; 34 66 0 193 76 5 19 0 37 95 5 0Mostly older than 55 years 31 69 0 48 88 0 10 2 5 100 0 0Mixed, all ages 36 64 (e) 520 69 4 25 I 131 95 5 0?Percents rnay not odd to 100 due to rounding.dThe number who said the police took a long time to arrive doesbThe number who coiled police does not include respondents who not Include respondents who refused to answer when asked If the policecalled the roJice but refused to answer when asked If the police should have arrived sooner.arrived a s art or long time after they were coiled. • eLess than or equal to 0.5 percent.cRespandents volunteered this response.Source: Table constructed by So..RCEBCXl< staff from data provided by the ABC News Poll; data were ffilJde available through the <strong>Criminal</strong><strong>Justice</strong> Archive and Information Network, Inter-university Consortium for Political and Social Research.') -.--"-~"" ... -
~.---~--------------------------Public Attitudes Toward Crime and <strong>Criminal</strong> <strong>Justice</strong>-Related TopicsTable 2.59 Reasons given for calling the police, UnitedStates, 1982!\oTE: See !\oTE, Table 2.1. The following question was asked <strong>of</strong>860 respondents who said they or someone In their householdhad called the police in the last year. The percents below arepercents <strong>of</strong> the total sample <strong>of</strong> 2,464 respondents. For adiscussion <strong>of</strong> public opinion survey sampling procedures, seeAppendix 7. For cietail"ld information on this survey, seeAppendix 8.Question: "Thinking <strong>of</strong> the last time you called thepolice, why did you call them?"(Percent a )<strong>Sourcebook</strong> <strong>of</strong> Criminol <strong>Justice</strong> Stotistics <strong>1983</strong>Table 2.60 Attituaell tpword limiting police response to CIrelated calls for service, by demographic characteristiUnited States, 1982!\oTE: See N.JTE, Table 2.1. For a discussion <strong>of</strong> public oo':;:on surve,sampling procedures,· see Appendix 7. For detaile::! iniormatlon onthis survey, see Appendix 8.Question: "Which <strong>of</strong> these two statements comes closest toyour views? Police should respond to all calls for help even If thecolier says the problem does not involve a crime, or police shouldrespond only to those calls for help which the coller says involvesa crime or suspected crime."Figure 2.10 Attitudes toward permitting police to strike, United States, 1975, 1978, 1979,and 1981!\oTE: For a discussion <strong>of</strong> public opinion survey sampling procedures, see Appendix 7.Question: "Should policemen be permitted to strike, or not?"8060Should not be permitted to strike61 6169~Crimes or suspected crimesA robbery in progress or after the factA burglary in progress or after the factAn assault in progress or after the factA car theft in progress or after the factVandalism in progress or •• fter the factOther crime related reasonDangerous si tuationsFire/explosion/or threat there<strong>of</strong>An illness or injuryCar or traffic related accidentOther dangerous situationNoncriminal, not dangerousLoud porty or other neighborhooddisturbance <strong>of</strong> nonviolent natureDomestic argument between two neighbors,within householdSituation involving a pet (treed cat,biting dog, barking dog, etc.)Other19.63.46.61.71.74.31.93.70.30.51.71.310.84.22.10.64.0aDetail percent may not add to categorical total due torounding.Source: Table constructed by SOURCEBOO< staff fromdata provided by the ABC News Poll; data were made availablethrough the <strong>Criminal</strong> <strong>Justice</strong> Archive and Information Network,Inter-university Consortium for Political and Social Research.NationalSex:MaleFemaleRace, ethnicity:WhiteBlackHisponicEducation:CollegeHigh schoolGrade schoolEmployment status:Full-time employedPart-time employedlklemployedLaid <strong>of</strong>fRetiredFull-time homemakerStudent1""00 ,"" ow,20,000 to ~29,99912,000 to 19,9998,000 to $11,999Under $8,000Income:Age:18 to 24 years25 to 29 years30 to 49 years50 to 64 years65 years and olderComnunity size:Large citySuburbSmall townRuralRegion:NortheastMidwestSouthWestNeighborhood racial characteristics:Mostly or all whiteRacially mixedMostly or all blackNeighborhood age structure:Mostly younger than 35 yearsMostly between 35 and 55 yeafsMostly older thon 55 yearsMixed, all agesPolice PoliceshOUld should only No opinion,respond to respond to refUsedall calls crime calls to answer41 5741424145394;)414939454344444352394038444639463944413740/)54248/153932423448484050405857585458595848605556565455486158615650615460555561595456~I!i.;.606656645051594859{bI23II3(b)III42II2I2III12(b)II2:1'ercents may not odd to 100 due to rounding.Less than Of equal to 0.5 percent.Source: Table constructed by SOlRCEBOO< st<strong>of</strong>f from dataprovided by the ABC News Poll; data were made available throughthe <strong>Criminal</strong> <strong>Justice</strong> Archive and Information Network, InteruniVersityConsortium for Political and Social Research.2041 Should be permitted to strike-..............- -.............. 33 34- ------- .. - ~..... 27...........No opinion7• •••••••••••••••••••••••••••••••••••65 4•.....................O~--~-------------------r----~~----------~1975 1978 1979 1981Source: George H. Gallup, The Gallup Poll (Princeton, N.J.: The Gallup Poll, Sept. 17,198/), p. 7. Figure constructed by Sa...RCEBOO< staff. Reprinred by permission.249
--~---------------~----------<strong>Sourcebook</strong> <strong>of</strong> <strong>Criminal</strong> <strong>Justice</strong> <strong>Statistics</strong> <strong>1983</strong>Public Attitudes Toward Crime and <strong>Criminal</strong> <strong>Justice</strong>-Related Topics.Table 2.61 Attitudes toward permitting police to strike, bydemographic characteristics, United States, 1981NJTE: For a discussian <strong>of</strong> public opinion survey samplingprocedures, see Appendix 7.Question: "Here are some questions about strikes bypersons in various occupations ••• Should policemen bepermitted to strike or not?"(Percent)ShouldShould be not be I\be!::rmitted e!:rmitted opinionI\btionol 27 69 4Sex:Male 29 68 3Female 27 68 5Race:White 25 71 4I\bnwhite 42 53 5Education:College 23 74 3High school 29 67 4Grade school 33 62 5Occupation:Pr<strong>of</strong>essional and business 21 77 2Clerical and sales 19 76 5Manual workers 31 64 5Nonlabor force 28 68 4Income:22 76- 21"'000 20,000 ood to r4,999 ....32 64 415,000 to 19,999 28 68 410,000 to 14,999 27 68 55,000 to $9,999 27 69 4Under $5,000 36 59 5Age:Total under 30 years33 65 218 to 24 years 31 67 225 to 29 years 35 62 330 to 49 years 30 66 450 years and olc!'lf 21 73 6City size:1,000,000 and over27 72 I500,000 to 999,999 26 69 550,000 to 499,999 32 65 32,500 to 49,999 23 73 4Under 2,500, rural 27 67 6Region:East25 72 3Midwest 28 67 5South 30 65 5West 26 71 3Religion:Protestant26 69 5Catholic 28 69 3Politics:Republican 18 79 3Democrat 33 63 4Independent 33 62 5Source: George H. Gallup, The Gallup ReWt, Report I\b.191 (Princeton, N.J.: The Gallup Poll, August if)), p. 8.Reprinted by permisisOil.,ff\ !I'~.IiilII:iIfij1,j:1I!lI iIAgure 2.11 Respondents in favor <strong>of</strong> permitting prison guards to strike, United States,1975, 1976, and 1961!>OTE: For 0 discussion <strong>of</strong> public opinion survey sampling proced\Jres, see Appendix i.Question: "How do you feel about workers' right to strike--do you fovor or Oppose theright <strong>of</strong> (prison guards) to strlk~?"60 -50////////,////,////,,~40 ////////,OlC ////,'C /,///,0 ////> ////~...////,c ////,Q) ////,~ ////,////,If 20 ////,- ////,////,////,o////,////////~//////////////////197549~/////////////////////////////////////////////,1//////////////////////////////////////////////////I~~~~197639~////////////////////////////////////////////////////////~~~~I ////////////~~I-/~1981Source: Louis H:lrrls, The H:ll'rls Surl'eJt (Chicago: The Chicago Tribune, Aug. 24, 1981),p. 4. Figure constructed by SOCRCEBOO< ~tafr. Reprinted by permission.250251
<strong>Sourcebook</strong> <strong>of</strong> <strong>Criminal</strong> <strong>Justice</strong> <strong>Statistics</strong> <strong>1983</strong>Public Attitudes Toward Crime and <strong>Criminal</strong> <strong>Justice</strong>-Related TopicsTable 2.62 Attitudes toward a policeman strilking on adult male citizen, by demographic characteristics, United States, selected years Fig~re 2.; 2 ResPoud~nts approving <strong>of</strong> a policeman striking a citizen under certain1973-80 clrcums ances, nlted States, selected years 1973-80NJTE:NJTE: For a discussi<strong>of</strong>! <strong>of</strong> public opinion sUI'vey sampling procedures, see Appendix 7."These h data are based 9n the subsample <strong>of</strong> respond·.lOts who answered "yes" or "notsure to t 17 question presented In Table 2.62. For a discussion <strong>of</strong> public opinionQuestion: "Are there any situations you can imagine in which you would approve <strong>of</strong> a policeman striking an adult male citizen?" survey samp 109 procedures, see Appendix 7.(Percental__ ill.L ___ 1975 1976 1978 1980Not N:>t N:>t N:>t Npt Percent responding yesYes N:> sure Yes N:> sure Yes N:> sure Yes N:> sure Yes No sureN:>tional 73 25 2 73 23 4 76 20 4 76 20 3 73 24 3 100Question: "Would you approve <strong>of</strong> a policeman striking a citizen who ... ?"-.--........-.~--.........--..,.. .--....Sex: \ ,..,....--.".......... ~ ....--.,---.-.Race:--. - White 77 21 2 77 20 3 79 18 3 80 17 3 76 21 3.....Male 75 22 3 77 20 3 81 17 2 82 16 2 80 18 2 Was attacking the policeman with his fistsFemale 71 28 2 70 26 4 72 22 5 72 23 4 68 29 4Black/other 42 54 4 46 47 7 48 44 8 48 45 8 45 49 6Education:.College 84 14 2 86 13 I 85 13 3 85 12 3 82 17 IHigh school 72 27 I 71 26 4 76 20 4 76 21 2 73 24 3Grade school 56 38 6 58 35 7 62 33 5 59 33 8 52 41 7Occupation:Pr<strong>of</strong>essional and business 83 16 2 84 14 3 84 14 2 86 II 2 77 20 3Clerical 80 18 2 77 20 3 78 18 5 79 19 2 78 21 2Manual 65 33 2 65 31 4 71 26 4 69 28 3 67 29 4 60Farmer 70 27 3 71 27 2 78 20 2 83 12 5 70 24 6Income:~ I 5,000 and over 80 19 (b) 83 15 2 83 14 3 85 14 2 82 17 I10,000 to $14,999 82 17 2 77 21 2 77 19 4 78 19 2 72 25 3f'OOOr999 70 28 2 71 24 4 76 21 J 72 24 5 66 29 55,000 to 6,999 62 36 2 59 36 6 72 25 3 69 28 3 61 31 93,000 to 4,999 66 30 5 63 34 3 71 26 3 61 31 8 56 37 7Under $3,000 49 46 4 66 27 7 61 32 7 60 34 7 46 52 3 40"'"80 \ ---- --Was attempting to escape from CUstodyAge:18 to 20 years 55 45 0 70 27 2 78 20 I 67 30 3 71 29 021 to 29 years 76 22 2 75 22 2 78 20 2 79 19 I 76 23 I30 to 49 years 76 23 I 79 18 3 79 17 4 79 18 2 79 20 250 years and older 70 26 4 68 27 5 73 23 5 73 21 6 66 28 6 Had said vulgar and obscene/ things to the policemanRegion:IN:>rtheast 68 31 I 74 24 2 75 22 3 74 25 2 74 24 220'-..". ".•... ..~Midwest... Q........ .............72 25 3 77 21 3 78 18 4 80 18 3 70 26 4South 73 25 2 71 24 5 74 ~W 5 74 21 5 71 26 3 I:•••••••West 79 19 2 70 26 4 78 '-'.0 2 80 16 3 79 18 3 I' •••••••••••I;,Religion:Protestant 74 24 2 73 22 4 77 15 1 4 7S 21 4 74 22 3Catholic 70 27 2 71 27 2 74 23 3 76 21 3 70 28 2Jewish 71 26 2 91 4 4 70 30 0 72 24 3 81 16 3 \Was being quostloned In a murder caseN:>ne 69 30 I 76 23 I 82 16 3 85 13 2 70 26 4Politics:i. 0II I i[)1973I1975 1Republican 76 22 2 76 19 4 79 17 4 76 20 3 78 20 3 H 19761978 1980Democrat 67 31 2 67 29 4 72 24 4 73 23 4 67 29 4 )1IiIndependent 79 19 2 78 19 3 79 17 3 80 18 3 75 22 2'i . Sourc~:. Figure constructed by SOLRCEBOO< staff from data provided by the~ercents may not add to 100 because <strong>of</strong> rounding. :1 ~rlonal Opinion Research Center; data were made available through the Roper Publicnlon Research Center.One-half <strong>of</strong> I percent or less.ISource: Table constructed by SOLRCEBOO< staff from data provided by the National Opinion Research Center; data were made available throughthe Roper Public Opinion Research Center.I.252 Iil!;1!I iii' I!II:jIIIIIi !~i!!IIIiHIIliIIIiIIIIiII !IIilII~" ii253
~-~ - -'--~-------~----~~------------------"-- ~ ~- ---~-,"<strong>Sourcebook</strong> <strong>of</strong> Crimi no I <strong>Justice</strong> <strong>Statistics</strong> <strong>1983</strong>Table 2.63 Reported confidence in the U.S. Supreme Court, by demographic characteristics, Uniteu States, 1973-78, 1980, and 1982!'OTE: For 0 discussion <strong>of</strong> public opinion survey sompling procedurt!s, sele Appendix 7.Question: "I'm going to nome some institutions In this country. As for as the people running th~lse Institutions (U.S. Supreme Court) areconcerned, would you soy you hove a great deal <strong>of</strong> confidence, only some confidence, or hardly on)' confidence at ali In them?"NotionalSex:MaleFemaleRace:WhiteBlock/otherEducation:CollegeHigh schoolGrade schoolOccupation:Pr<strong>of</strong>essional and buslr,lessClericalManualFarmerIncome:15,000 and over10,000 to $14,9997,000 to ~9' 9995,000 to 6,99913,000 to 4,999Under $3,000Age:18 to 20 years21 to 29 years30 to 49 years50 years and olderRegion:NortheastMidwestSouthWestReligion:ProtestantCatholicJewishNonePolitics:RepublicanDemacratIndependent(Percent a )1973 1974-:A"'-gr-e-at:--"COn:::-:"ly'-w:-;H:I"""r-:d"-IY--:D==-o-n"'""t A great Only H:lrdly1975Don't A great Only H:lrdly1976Don't A great Only H:lrdly Don'tdeol some any know deal some any know deal some any know deal some ony know32 50 15 3 35 48 14 4 31 46 19 4 35 44 15 6323132273530293730312832283631293927323132.14~\I303031334028343132485149545153391~7574947525449464841665452434950485350505253485050181315161315201612172115171417161551315181315171516147171415162443I212I234(b)2I666~ercents may not odd to 100 because <strong>of</strong> rounding.One-half <strong>of</strong> I perCl1nt or less.3I26344244o243238293427363231382833333436342934284535343133363134343530243733324352475252484250594443524752504544435349445249464547475757435049Source: Table constrlJ,~tQd by Sa..RCEBCJa< st<strong>of</strong>f from data provided by the Notional Opinion Research Center; data were made available thro\l\lhthe Roper Public Opinion HF. .. earch Center.1712141510!617IIII17201314II181815II10141712II181614III71717121627472410I263I4333122238346454724533329312736292735302928313233313028413129313332283231303!136343030425046514648434850463649454642425345504843464648434648483942494623151918171918161420311920172221II121719201818182018209211918192645I4II2556I34578I2372554534454539323631443427453032353837413233303838333539373333353467393935334146434744444140504537444838424242474846354544424545423340464343161416131018181216162416II152017141291718131317191519o15II1716385824152573I5668143448468464o7448Public Attitudes Toward Crime and <strong>Criminal</strong> <strong>Justice</strong>-Related Topics1977 1978 1980A great Only H:lrdly Don't A great Only H:lrdly Don't A great Only HClrdly Don't A great 1982deal some on know deal some on know deal some on know deal s~ ~~dIY ~~~:36 49 II 4 28 53 15 4 25 50 20 6 31 53 12 439 47 1233 52 1036 50 II37 47 1040 50 834 52 II34 42 1640 50 831 58 835 47 1238 43 1638 51 1039 48 1034 52 929 48 1533 48 1430 46 1239 51 936 53 833 52 1237 46 1235 53 940 49 834 48 1232 48 1635 49 1238 50 1040 51 635 50 II35 49 1238 47 II34 53 102 32 50 165 25 55 144 28 52 157 25 58 123 37 52 103 25 55 169 21 47 182 34 52 123 27 55 145 23 53 163 28 54 17I 32 53 143 27 54 165 22 58 167 36 42 124 19 58 1612 22 51 122 35 53 122 26 58 144 31 54 146 26 49 163 26 56 154 32 51 135 26 52 155 27 54 164 28 52 144 27 56 163 31 59 34 33 46 205 33 51 123 28 55 124 26 52 182 27 49 216 23 51 184 24 50 205 29 47 16I 28 55 164 24 50 2214 21 39 202 25 54 173 25 51 197 24 ~6 21I 21 47 29I 23 55 213 33 48 164 22 46 22II 26 36 178 22 41 1915 24 46 16o 34 57 73 30 52 152 24 53 209 22 46 224 24 50 194 27 57 147 24 51 223 211 46 246 23 52 19I 29 42 217 25 59 122 21 57 195 23 53 214 28 48 174 22 50 213 32 53 138 30 53 126 30 54 128 31 49 132 36 53 104 27 55 1420 30 45 II5 34 52 104 29 58 II8 28 52 153 38 50 12I 31 56 123 34 57. II10 29 57 1020 34 40 1618 24 54 1415 29 52 142 43 47 93 33 53 124 28 56 1410 31 52 127 34 49 137 30 57 II4 27 53 157 32 53 II6 29 54 138 33 54 103 35 43 193 30 53 163 34 50 136 30 54 II7 29 54 142537I3143I5oI34965o22642544332354254255
-- ..... --~--,~ ---~----------- -- -~<strong>Sourcebook</strong> <strong>of</strong> <strong>Criminal</strong> <strong>Justice</strong> <strong>Statistics</strong> <strong>1983</strong>Table 2.64 Attitudes toward severity <strong>of</strong> courts in own area, by demographic characteristic.>, United States, 1972-78, 1980, and 1982I\OTE: For a discussion <strong>of</strong> public opinion survey sampling procedures, sec Appendix 7.Question: "In general, do you think the courts in this area deal too harshly or not harshlY enough with criminals?"NotionalSex:MaleFemaleRace:WhiteBlack/otherEducation:CollegeHigh schoolGrade schoolOccupation:Pr<strong>of</strong>essional and businessClericalManualFarmerIncome:$15,000 and over$IO,OUO to $14,9997,000 to $9,999$5,OUU to $6,999$3,000 to $4,999Under $3,OUOAge:18 to 20 years21 to 29 years30 to 49 years50 year~ and olderRegion:NortheastMidwestSouthWestReligion:ProtestantCatholicJewishNone1972NotToo harshly About Don'tharshly enough right know676417965667522134454986562366676569515969716571657435527272736!:l606668686846161815161919161517"18162721141613162015i618714"913101214109121210416141091012"" 81817Politics:Republican3 78 14 5Democrat7 65 18Independent9 63 15"14Cpercents may not add to 100 because <strong>of</strong> rounding.(Percent a )1973NotToo harshly Aboutharshly enough right564317544426433710551385244654557364737472746566767775687/~8074797072736960617877717575707673695377737313121414;I151310" 1613"1412" 814171418" 13131513"1314101613121571974 1975NotNotDon't Too harshly About Don't Too harshly Aboutknow harshly enough right know harshly enough right9 6 78 104 79 107 2 83 9 5 2 84 69 6 767 5 80 108 7 77 " 7 4 76 Il8 6 78 9 6 4 80 810 5 77 10 8 4 78"9 5 79 10 6 3 8U 109 10 72 714 69 9"14 6 7410 4 74 127 6 796 5 80 99 5 814 3 84 8"10 7 77 8 a 2 80 1014 5 79 9 7 4 787 4 80 10 6 6 79"6 6 82 8 4 2 83 898 4 84 7 5 4 82 97 4 81 9 6 3 81 84 76 10 9 7 76 10" 10 3 84 10 3 4 73 148 13 70 10 6 3 80 99 14 62 15 9 5 74 1213 17 54 :li 8 9 65 1613 7 71 12 10 8 717 6 78 8 8 4 809 3 84 9 4 2 85"10813 5 79 8 8 5 81 86 2 82 10 6 4 81 107 7 78 9 6 4 81 91468 13 8 5 70 12"8 5 81 8 6 4 81 98 4 787 3 B2 1017 10 58 " 16 16 o 78 1324 22 55 14 10 8 61 14Don'tknow77778IU65876658698810IU667561266916759IIIIitI'11IIi~'I ,'INOt1976Too harshly Aboutharshly enough right333394322233324524II622333424o6I3581828082767684B282818186848280788')76767084868380827983798970858376101010107"991010991081012129"14989129"9104149812Don'tknow6576884756734656II310555577577104571977NotToo harshly Aboutharshly enough right343374353I52I443968722524235o22258383838480788782818!:l8383878679827580827584868285818484858872848S76Public Attitudes Toward Crime and <strong>Criminal</strong> <strong>Justice</strong>-Related Top.ics89887II77106610879108691096510898661496101978 1980N6tNotDon't Too harshly About Don't Too harshly Aboutknow harshly enough right know harshly enough right6465684664644485892H55837454612439332263322I242332381343I32323235I248587838581838879858984898887838B74717382858!l86888282868672749085827777"86II76846498151010967858977211067853764647545346527II36744467453II357334393~2424o255766II73I233533o10234838383847779868482868391868285717774777984868682867685837571898578897881068868978614126578878710779105891982l'kitDon't Too harshly About Don'tknow harshly enough right know6 3 86 8 46665846765o55495157765465957161044923210324I335I42o98o32II5332o2I4284888779838984869284798883848879849081858985908387878891728987849679II56102716897958512856797769147795342346235o34727o54It4822434U12425Source: Table constructed by Scx..RCEBOO< staff from data prOVided by the Notional Opinion Research Center; data were mode availablethrough the Roper Public Opinion Research Center.256257
~-~- ~--------------------------------------------<strong>Sourcebook</strong> <strong>of</strong> <strong>Criminal</strong> <strong>Justice</strong> <strong>Statistics</strong> <strong>1983</strong>Figure 2.13 Respondents agreeing that courts in own area do not deal harshly enough with criminals by race UnitedStates, 1977 .78, 1980, and 1982 ' ,NJTE: For a discussion <strong>of</strong> public opinion survey sampling procedures, see Appendix 7.Question: "In general, do you think the courts in this area deal too harshly or not harshly enough with criminals?"10080604020oI1972(Percent agreeing that courts do not deal harshly enough with criminals)i1973 1974 1975• ••1976••......•......•....•.•1977---------. ....... _ .•......•.......National--- White•• ••••••• B!~ck/other1978 1980 1982Sou\ce: Figure constructed by sa.RCEBOO< st<strong>of</strong>f from data provided by the Notional Opinion Research Center' data weremade available through the Roper PUblic Opinion Research Centel. • .259hji1\r\I\I.t1II1I!j, ~ttI, !Public Attitudes Toward Crime and <strong>Criminal</strong> <strong>Justice</strong>-Related TopicsTable 2.65 .4.Hltudes toward judicial discretion in determining' Table 2.66 Attitudes toward appointing more judges tothe len~th <strong>of</strong> prison sentences, by demographic shorten court delay, by demographic characteristics,characteristics, United States, 1982 United States, 1982NJTE: See NJTE, Table 2.1. For a discussion <strong>of</strong> plJbllc opinion survey NJTE: Respondents were asked whether they thought the followingsampling procedures, see Appendix 7. For detailed information nn proposa I was a good idea or a poor idea. For a discussion <strong>of</strong>this survey, see Appendix 8. public opinion survey sampling procedures, see Appendix 7.Question: "Some people say that each crime should carry a Question: "Appoint more judges in order to reduce theprison sentence <strong>of</strong> a definite length no matter what the Time between arrest and trial to a maximum <strong>of</strong> 2 months."clrcurmtances. Other say that judges shOUld decide how long prisonsentences should be on a case by case basis. What about you, do(Percent)you think judges should be able to set prison sentences <strong>of</strong> differentlengths for similar crimes or do you think judges shOUld have little Good Poor NOor no choice about the length <strong>of</strong> prison sentences for similar Idea Ideo opinioncrimes?"(Percent a National 74 18 8)Sex:NO opinion, Mole 7i 21 8Should ShOUld refused Female 77 15 8be able not be able to answerRace:Notional 60 36 4 White 75 17 8Nonwhite 73 20 7Sex:Mole 59 39 2 Education:Female 62 32 5 College 78 16 6High school 74 18 8Race, ethnlcity: Grode school 67 18 15White 61 36 4Block 56 39 5 Occupation:Hispanic 56 38 6 Pr<strong>of</strong>essional and business 77 17 6Clerical and sales 86 12 2Education: Manual workers 75 18 7College 61 37 2 Nonlabor force 68 20 12High school 59 36 4Grade school 64 26 10 Income:1"'000 ood o~, 77 18 5Employment status: 20,000 to r4,999 80 18 2Full-time employed 60 38 2 15,000 to 19,999 70 21 9Port-time employed 63 34 3 10,000 to 14,999 74 16 10Unemployed 60 35 5 5,000 to $9,999 74 16 10Laid <strong>of</strong>f 61 39 0 Under $5,000 73 16 IIRetired 60 33 7Full-time homemaker 63 29 7 Age:Student 54 45 2 Totai under 30 years 79 i4 718 to 24 years 82 10 8Income: 25 to 29 years 75 19 6130,000 0", 0",' 62 35 2 30 to 49 years 78 16 620,000 to 29,999 60 37 3 50 yeats and older 67 22 II12,000 to ~19,999 61 37 3 50 to 64 years 69 22 98,001) to $11,999 54 39 6 65 ~'ears and older 66 21 13Under $8,000 61 31 8City size:Age:1,000,000 and over 79 15 618 to 2li years 61 :;8 2 500,000 to 999,999 79 16 525 to 29 years 62 36 2 50,OOU to 11:1::1,999 79 16 530 f 49 years 59 37 4 2,500 to 49,999 67 22 II50 to 64 years 60 37 2 Under 2,500, rural 69 19 1265 years and older 60 30 10Region:Community size: East 80 16 4Lorge city 6i 34 6 Midwest 71 22 7Suburb 59 38 3 South 71 16 13Small town 62 35 3 West 75 17 8Rural 58 37 5Religion:Region: Protestant 73 18 9Northeast 64 33 3 Catholic 76 19 5Midwest 62 34 4South 58 38 4 Politics:West 59 38 3 Republican 70 20 10Democrat 77 16 7Neighborhood racial characteristics: Inde~ndent 75 18 7Mastly or all white 60 37 3Racially mixed 66 30 5 Source: George H. Gallup, The Gallup Reports Repart No.Mastly or all block 50 4S 4 200 (Prlncetan, N.J.: The Gallup Poll, May 19 2), p. 12.Reprinted by permission.Neighborhood age structlJre:Mostly younger thaI" 35 years 62 35 3Mostly between 35 and 55 years 58 38 3Mostly older than 55 "ears 65 31 4Mixed, all ages 60 36 4Opercents rnay not add to 100 due to rounding.Source: Table constructed by SC'~~CEBOO< staff fram dataprovided by the ABC News Poll; data were made available throughthe <strong>Criminal</strong> <strong>Justice</strong> Archive and Information Network, InteruniversityConsortium for Political and Social Research.259
<strong>Sourcebook</strong> <strong>of</strong> <strong>Criminal</strong> <strong>Justice</strong> <strong>Statistics</strong> <strong>1983</strong>Table 2.67 Attitudes toward prison sentences as a deterrentto crime, by demographic characteristics, United States,1980I-.oTE: See !'-OTE, Table 2.9. For further discussion <strong>of</strong> the survey,see Appendix 9.Question: "Do prison sentences discourage crime?"(Percent)YesNational 52 48Sex:Male 54 46Female 44 56Race:WhiteBlack4942515!JEducation:College graduate 41 59High school graduate or some college 44 56Less than high school graduate 60 40Age:18 to 29 years 39 6130 to 39 years 48 524U to 49 years 53 4750 to 59 yer 51 4960 years on ... ,nder 55 45Marital s!atus:Married 53 47Divorced, widowed, separated 40 60Single 41 59Comnunity size:Large city 43 57Small city 46 54Suburb 48 52Rural - 57 43Region:East 4!J 52Midwest 40 60South 55 45West 45 55Source: Research and Forecasts, Inc., The Figgie Reporton Fear <strong>of</strong> Crime: America Afraid (Willoughby, Ohio: FiggieInternational, Inc., J9IJO), pp. 130, 131, 133, 134. Tableadapted by SOLRCEBOC'K st<strong>of</strong>f. Reprinted by permission.No"4\260o\
· -.Figure 2.14 Attitudes toward the main emphasis <strong>of</strong> prisons, lklited States, 1970, 1978, 1981, and 1982f\OTE: For a discussion <strong>of</strong> public opinion survey sampling procedures, see Appendix 7.Question: A. "Do you think the main emphasis in most prisons is on punishing the individuol convicted <strong>of</strong> a crime, trying to rehabilitate the individual so thathe might return to society as a productive citizen, or protecting society from future crimes he might comnit?"Question: B. ''N:Jw what do you think should be the main emphasis in most prisons--punishing the individual convicted <strong>of</strong> 0 crime, trying to rehabilitate theindividual so that he might return to societyCiSO productive citizen, or protecting society from future crimes he might conmit?"Prison emphasis todayPrison emphasi:> should be8070 6050Percent4030 20 1000 10 20 30Percent40 5060 7080-1970-Punish3312RehabilitateProtect societyNot sure--1978--PunishRehabilitateProtect societyNot sure--1981--PunishRehabilitateProtect society49~73 E:0'§C0..~c;f:IEca.Q~'C:l0..., n~::l~'- c~0'~,~[~0..c;f" 0'II>Not sure!5PunishRehabilitate38Protect societyNot sureSource: Loui', Harris, The Harris Survey (New York: The Chicago Tribune-New York News Syndicate, May 24, 1982), p. 4, Figure constructed bySOlRCEBCO< staff. Reprinted by permission., t ..o
----------------------<strong>Sourcebook</strong> <strong>of</strong> <strong>Criminal</strong> <strong>Justice</strong> Stat istlcs 19!13.-
<strong>Sourcebook</strong> <strong>of</strong> <strong>Criminal</strong> <strong>Justice</strong> <strong>Statistics</strong> <strong>1983</strong>Public Attitudes Toward Crime and <strong>Criminal</strong> <strong>Justice</strong>-Related TopicsTable 2.71 Suggested methods <strong>of</strong> lowering the recidivism rate <strong>of</strong> persons released from prison, by demographic characteristics, UnitedStates, 1982I\QTE: The question below was asked <strong>of</strong> the 69 percent <strong>of</strong> respondents who Indicated that somethingcould be done to reduce the repeat rate (see Table 2.70). For a discussion <strong>of</strong> public opinionsurvey sampling procedures, see ~-9f.'!!ndix 7.Question: "What do you think can be done?"i'htionalSex:MaleFemaleRace:Whitei'hnwhiteEducation:CollegeHigh schoolGrade schoolOccupation:Pr<strong>of</strong>essional and businessClerical and salesManual workersi'hnlabor forceIncome:25,000 and over20,000 to $24,99915,000 to $19,99910,000 to $14,99915,000 to $9,999Under $5,000Age:Total under 30 years18 to 24 years25 to 29 years30 to 49 yearsTotal SO years and olderSO to 64 years65 years and olderCity size:1,000,000 and over500,000 to 999,99950,000 to 499,9992,500 to 49,999Under 2,500, ruralRegion:EastMidwestSouthWestReligion:ProtestantCatholicPolitics:RepublicanDemocratIndependentStrongerStiffer rehabi- i'hsentences Iitation parole363735382333393134323640364439383030343433353838393740312942373440323735403238363735363747322444343630403737313733454940362933253542433428344130393534283939ISISISIS1413IS20II1417181417918IS1312148IS18181718II1320141213142214IS18IS13SegregateLess Jobs Enforce Watched Mtlre prisoners Punishleniency when capital when selective by degree withoutin prison released punishment released paroles <strong>of</strong> crime prison8 8 8 5 4 397955109688II8989II44371010II9857612751013;?ercents add to more than 100 due to multiple responses.Less than I percent.88889887IS68147101076410145138799887510106810878886810879241010513897512'88II9710884II5497IIII51058101464465784554575447II')66765545766565476556554466364436456345434366646426545455653433452(b)44224342J245I3333334323252334332I2(b)I2(b)III3222II(b)(b)(b)(b)222322I3(b)I(b)23I22I3Other22225I3,223232322242I223233II5I3II222I23i'hopinionSource: George H. Gallup, The Gallup Report, Report i'h. 200 (Princeton, N.J.: The Gallup Poll, May 1982), p. 25. Reprinted by permission.4454654375246I5433445442554294S62454246Table 2.72 Attitudes toward selected proposals for theImprovement <strong>of</strong> prisons and the reduction <strong>of</strong> crime, UnitedStates, 1932I\QTE: For a discussion <strong>of</strong> public opinion survey samplingprocedures, see Appendix 7.Question: 'Please tell me Whether you think the proposalis a good Idea or a poor Idea."Proposal(Percent)GaodideaRequire prisoners to have a skillor to learn a trade, to fit them fora Job before they are releasedfrom prison 94Require every prisoner to be ableto read and write before he orshe Is released from prison 89Keep prisoners constructingbuildings, making prodUcts or perfor,'"ingservices that the Statewould have to hire other peopleto do 83Pay prisoners for their work, butrequire them to return two-thirds<strong>of</strong> this amount to their victims orto the State for the cost <strong>of</strong> maintainingthe prison 81In some nations and In some Statesin the United States, in order tokeep families together, wives arepermitted to spend some weekendseach year with their husbands inspecial weekend guest houseswithin the prison grounds 61Refuse parole to any prisoner Whohas been paroled before for aserious crime 80Appoint more judges in order toreduce the time between arrest andtrial to a maximum <strong>of</strong> 2 manths 74PoorIdeai'hopinion4 28 313 415 431 814 618 8Source: George H. Gallup, The Gallup Poll (Princeton, N.J.:The Gallup Poll, Mar. 31, 19!:!2), p. 2. fable adapted by5OLRCEBOO< staff. Reprinted by permission.Table 2.73 Attitudes toward paying prisoners for their workbut requiring that these prisoners compensate theirvictims or pay the State for the costs <strong>of</strong> Imprisonment,by demographic characteristics, United States, 1982I\QTE: Respondents were asked whether they thought the followingproposal was CI good Idea or a poor idea. For a discussion <strong>of</strong>public opinion survey sampling procedures, see Appendix 7.Question: 'Pay prisoners for their work, but require themto return two-thirds <strong>of</strong> this amount to their victims or to theState for the cost <strong>of</strong> maintaining the prison."NationalSex:MaleFemaleRace:Whitei'hnwhiteEducation:CollegeHigh schoolGrade schoolOccupation:Pr<strong>of</strong>essional and businessClerical and salesManual workersi'hnlabor forceIncome:l25,000 and over20,000 to ~24'99915,000 to 19,99910,000 to 14,9995,000 to $9,999Under $5,000Age:Total under 30 years18 to 24 years25 to 29 years30 to 49 years50 years and older50 to 64 years65 years and olderCity size:1,000,000 and over500,000 to 999,99950,000 to 499,9992,500 to 49,:199Under 2,500, ruralRegion:EastMidwestSouthWestReligion:ProtestantCatholicPolitics:RepublicanDemocratIndependent(Percent)Gaod Poor i'hIdea Idea opinion818182818081818280868083828180818480787582838279Bt;8188798677818477837984818477151613151415161215II161315171514131318201514131510Source: George H. Gallup, The Gallup Report, Report No.200 (Princeton, N.J.: The Gallup Poll, May 1982), p. 10.Reprinted by permission.1491613181413181317121412194354643653443255374533564535I5535444544264
266----------------------------------------------<strong>Sourcebook</strong> <strong>of</strong> <strong>Criminal</strong> <strong>Justice</strong> <strong>Statistics</strong> <strong>1983</strong>Public Attitudes Toward Crime and <strong>Criminal</strong> <strong>Justice</strong>-Related TopicsTable 2.74 Attitudes toward having prisoners makeproducts or perform services for the State, bydemographic characteristics, United States, 1982(\OTE: Respondents were asked whether they thought the followingproposal was a good idea or a poor Idea. For a discussion afpublic opinion survey sampling procedures, see Appendix 7.Question: ''Keep prisoners constructing buildings, makingproducts or performing services that the state would have tohire other people to do."NotionalSex:MaleFemaleRace:WhiteNonwhiteEducation:CollegeHigh schoolGrade schoolOccupation:Pr<strong>of</strong>essional and businessClerical and salesManual workersNonlabor forceIncome:25,000 and over20,000 to 124,99915,000 to 19,99910,00U to 14,99915,000 to $9,999Under $5,00UAge:Total under 30 years18 to 24 years25 to 29 years30 to 49 yearsTotal 50 years and older50 to 64 years65 years and olderCity size:1,000,000 and over500,000 to 999,99950,000 to 499,9992,500 to 49,999Under 2,500, ruralRegion:EastMidwestSouthWestReligion:ProtestantCatholicPolitics:RepublicanDemocratIndependent(Percent)Goodidea838383847781848~817883838285u4828281787978848586848578858083818383848481888280PoorideaNoopinion13 4Source: George H. Gallup, The Gallup Report~ Report No.200 (Princeton, N.J.: The Gallup Poll, May I 82), p. 9.Reprinted by permission.141212171513II1417131214131314II1318161912IIIIIIII181214131513121312151014143546437554542347645344354'* 364445344246Table 2.75 Attitudes toward requiring that prisoners beable to read and write before they are released fromprlson~ by demographic characteristics, United States,1982(\OTE: Respondents were asked whether they thought the followingproposal was a good Idea or a poor Idea. For a discussion <strong>of</strong>public opinion survey sampling procedures, see Appendix 7.Question: ''Require every prisoner to be able to read andwrite before he or she is released from prison."NotionalSex:MaleFemaleRace:WhiteNonwhiteEducation:CollegeHigh schoolGrade schoolOccupation:Pr<strong>of</strong>essional and businessClerical and salesManual workersNonlabor forceIncome:~25,000 and over20,000 t" ~r.24'99915,000 to 19,999$10,000 to 14,999$5,00U to $9,999Under $5,000Age:Total under 30 years18 to 24 years25 to 79 years30 to 49 yearsTotal 50 years and older50 to 64 years65 years and olderCity size:1,000,000 and over500,000 to 999,99950,000 to 499,9992,500 to 49,999Under 2,500, ruralRegion:EastMidwestSouthWestReligion:ProtestantCatholicPolitics:RepublicanDemocratIndependent(Percent)Goodidea8986928995849193869091908892888992938989889089898993918888879386H8908991899287PoorideaNoopinion8 3Source: George H. Gallup, The Gallup Report, Report No.200 (Princeton, N.J.: The Gallup Poll, May 1982), p. 8.Reprinted by permission.106831263II96610687538878887488Il1059898776942324343I3422443433523343I443254I3241.:.Table 2.76 Attitudes toward requiring that prisoners have askill or learn a trade before thay are released fromprison, by demographic characteristics, United States,1982(\OTE: Respondents were asked whether they thought the followingproposa I was a gaod ide!: or a poor idea. For a discussion <strong>of</strong>public opinion surve~ sampling procedllres, see Appendix 7.Question: ''Require prisoners tp have a skill ar to learn atrade, to fit them for a job before they are released fromprisen."NotionalSex:MaleFemaleRace:WhiteNonwhiteEducation:CollegeHigh schoolGrade schoolOccupation:Pr<strong>of</strong>essional and businessClerical and salesManual workersNon labor forceIncome:25,000 and over20,000 to $24,99915,000 to $19,999I 0,000 to $14,99915,000 to $9,999Under $5,000Age:Total under 30 years18 to 24 years25 to 29 years30 to 49 yearsTotal SO years and older50 to 64 years65 years and olderCity size:I ,000,000 and over500,000 ,to 999,99950,000 to 499,9992,50U to 49,999Under 2,500, ruralRegion:EastMidwestSouthWestReligion:ProtestantCatholicPolitics:RepublicanDemocratIndependentaLess than I percent.(Percent)Goodidea949495949695949694989495959891959794949494959'~95949598959294959494969594959594Poorlo"a4434244I4(a)43425322443344332274443334334Noopinion22222I232222I(a)42I422322I32(a)3I2Saurce: George H. Gallup, The Gallup Report Report No.200 (Princeton, N.J.: The Gallup Pail, May 1 ~82), p. 7.RCiJrinted by permission.I23I22222Table 2.77 Attitudes toward permitting wivCls ·to visitimprisoned husbands for weekends in prison guest houses,• by demographic characteristics, United States, 1982!'OTE: Respondents were asked whether they thought the followingproposal was a good idea or a poor idea. For a discussion <strong>of</strong>public opinion survey sampling procedures, see Appendix 7.Question: "In some nations and in some states in the U.S.,in order to keep families together, wives are permitted tospend some weekends each year with their husbands in specialweekend guest houzes within the prison grounds."NotionalSex:MaleFemaleRace:Whitc;NonwhiteEducation:CollegeHigh schoolGrade schoolOccupation:Pr<strong>of</strong>essional and businessClerical and salesManual workersNonlabor forceIncome:25,000 and over20,000 to ~24'99915,000 to 19,99910,000 to 14,99915,000 to $9,999Under $5,000Age:Total under 30 years18 to 24 years25 to 29 years30 to 49 yearsTotal 50 years and older50 to 64 years65 years and olderCity size:1,000,000 and over500,000 to 999,99950,000 to 499,9992,500 to '19,999Under 2,500, ruralRegion:EastMidwest. SouthWestReligion:ProtestantCatholicPolitics:RepublicanDemocratIndependent(Percent)GoodIdea616358597171594569626346655964575053716973684649426171635557586159665761546266PoorIdea31303333192533402627314130:;629343231232322264344433123293935363131273433382928Noopinion79181048155II613557910166856II71586868G810Source: George H. Gallup, The Gallup Report, Report No.200 (Princeton, N.J.: The Gallup Poll, May 1982), p. 14.Reprinted by permission.~,96896
<strong>Sourcebook</strong> <strong>of</strong> <strong>Criminal</strong> <strong>Justice</strong> <strong>Statistics</strong> <strong>1983</strong>Table 2.78 Attitudes toward refusing parole to prisoners Table 2.79 Attitudes toward the need for more prisons Inwho have been paroled before for a serious crime, by respondent's State, by demographic characteristics,demographic characteristics, United States, 1982 United States, 1982N:)TE: Respondents were asked whether they thought the following N:)TE: For a discussion <strong>of</strong> public opinion survey samplingproposal was a good Idea or a poor idea. For a discussion <strong>of</strong> procedures, see Appendix 7.public opinion survey sampling procedures, see Appendix 7.Question: "In your opinion, does your State need moreQuestion: "Refuse parole to any prisoner who has beenprisons, or not?"paroled before for a serious crime."(Percent)(Percent)Don'tGood Poor N:> Yes !'b knowideo idea ol:!inionNational 57 30 13!'btional 80 14 6Sex:Sex: Male 60 30 10Male 78 17 5 Femole 53 31 16Femole 82 12 6Race:Race: White 57 30 13~ite 81 13 6 !'bnwhite 51 33 16( !'bnwhite 71 23 6Education:Education: College 56 31 13College 76 18 6 High school 59 30 IIHigh school 83 12 5 Grade school 51 31 18Grade school 76 16 8Occupation:Occl'oation: Pr<strong>of</strong>essional and business 56 32 12Pr<strong>of</strong>essional and business 76 19 5 Clerical and sales 60 22 18Clerical and sales 85 10 5 Manual workers 55 34 IIManual workers 82 14 4 !'bnlabar force 62 23 15!'bnlobor force 80 13 7Income:Income:1".000 ood~, 58 31 II79 17 4 20,000 to $24,999 55 34 II1"'000 20,000 to "d ~24'999 ""85 II 4 15,000 to ~19,999 54 33 1315,000 to 19,999 88 9 3 10,000 to 14,999 62 27 II10,000 to 14,999 76 16 8 5,000 to $9,999 56 30 145,000 to $9,999 77 14 9 Under $5,000 50 30 20Under $5,000 73 22 5Age:Age: Total under 30 years 53 33 14Total under 30 years 79 15 6 18 to 24 years 50 37 1318 to 24 years 77 17 6 25 to 29 years 57 28 1525 TO 29 years 81 13 6 30 to 49 years 56 31 1330 to 49 years 80 15 5 Total 50 years and older 59 28 13Total 50 years and older 81 14 S 50 to 64 years 55 34 II50 to 64 years 82 15 l 65 years and older 64 2! 1565 years and older 80 13 7City size:City size: 1,000,000 and over 62 24 141,000,000 a;ld over 81 14 5 500,000 to 999,999 68 20 12500,000 t,) 999,999 80 13 7 50,000 to 499,999 52 35 1350,000 to 499,999 80 16 4 2,500 to 49,999 58 30 122,500 to 49,999 80 15 5 Under 2,500, rural 51 36 13Under 2,::i00, rural 79 14 7Region:Region: East 60 27 13cast 82 13 5 Midwest 50 37 13Midwest 79 14 7 South 58 29 13South 82 12 6 West 58 29 13West 75 20 5Religion:Religion: Protestant 58 29 13Protestant 83 12 5 Catholic 55 34 IICatholic 78 16 6Politics:Politics: Republican 57 ,~ "J2 IIRepublican 83 12 5 Democrat 59 i28 13Democrat 79 17 4 Independent 56 30 14Independent 79 14 7Source: George H. Gollup, The Gollu~ Report, Report No.Source: George H. Gollup, The Gollup Report, Report No. 200 (Princeton, N.J.: The Gallup Pol, May 1982), p. 4.200 (Princeton, N.J.: The Gallup Poll, May 1982), p. 13. Reprinted by permlsslr;n.Reprinted by permission.26Br/1IiI,JiIif!IIIiuI' ,IIi!/'11I{If,IIIII,(IfJ!1/~IIPublic Attitudes T award Crime and C' ,rlmlnal <strong>Justice</strong>-Related T 'OPICSTable 2.80 Public wi 'constructio b Ilingness to pay moStates, 1982 n, y demographic chara~~e~'Xte.s for prisonSICS,UnitedNJTE' F '• or a diSCUSsion f 'prot;edures, see Append' 7 0 publiC opinion survIX • ey samplingQuestion: "If more 'w,?u/d you be wll/in PriSons Were needed 'PriSons, or not?" g to pay more taxes to h I Inbyour State,, e p ul/d these!'btlonalSex:MaleFemaleRace:WhiteNonWhiteEducation:CollegeHigh schoolGra'Je schoolOcC('~'ation:Pr<strong>of</strong>eSSional and bus'Clerical and sales inefoSManual WorkersNonlabor forceIncome:25'000 and over~20,000 to $24,99915,000 to $/9 99910,000 to $/4'9995,000 to $9,999U,der $5,000Age:Total under 30 y18 to 24 years ears25 to 29 years30 to 49 yearsTotal5050years and olderto 64 years65 years and olderCity size:1,000,000 and ov500,000 to 999 9~~50,000 to 499 9992,5UO to 49,!l99U,der 2,5();), ruralRegion:EastMidwestSouthWestReligion:ProtestantCathOlic(Percent)Yes4951465136No444346435659 3647 4633 5757 3748 4244 5050 4256 3952 4644 5148 4440 4949 4448 454/:J 4548 4551 4347 4647 4848 4441 5062 3352 4251 4445 4843 4941 5256 3757 4053 4140 536Politics:7RepublicanDemocrat53 41_ Independent46 47 652 42 7Source: Gear e H. 6768685710610685258If77776758955 "7200 (Princeton ri Gallup, The Gaflu RReprinted by pe;mis·s1~~. The Go TiUp Pail; M~~8~)porpt Nos'8773, ..
---~~[:__ ,,,,_n,_<strong>Sourcebook</strong> <strong>of</strong> <strong>Criminal</strong> <strong>Justice</strong> <strong>Statistics</strong> <strong>1983</strong>Public Attitudes Toward Crime and <strong>Criminal</strong> <strong>Justice</strong>-Related TopicsTable 2.81 Attitudes toward prisan construction to accorrmodate longer sentence~" and willingness toincrease taxes to pay for prisan construction, by demographic characteristics, United States, 1982Table 7.82 Attitudes taward building prisons in high crime!\oTE: See !\oTE, Table 2.1. The data below are answers to a sequence <strong>of</strong> questions. First, respondents were19~2s, by demographic characteristics, United States,asker! if they approved or disapproved <strong>of</strong> prison construction. If they indicated they approved, they wereI'a~ked if they would still approve if it required a tax increase. The percents under the heading "tax increaseN:JTE: Respondents were asked whether they thought the followingto pay for construction" are based on the total sample <strong>of</strong> 2,464 respondents. For a discussion <strong>of</strong> publicIproposal was a good Idea or a poor idea. For a discussion <strong>of</strong>opil"'''n survey sampling procedures, see Appendix 7. For detailed information about this survey, see Appendix public opinion survey sampling procedures, see Appendix 7.8.,Question: "B~lId prisons In high crime areas to serve as aQuestions: "Would you approve or disapprove <strong>of</strong> building more prisons so that longer sentences could bewarning to potential criminals In those areas."given to criminals?"If approve, "What if building more prisons meant your taxes went up to pay for them, would you(Percent)still approve?"(Percent Iia Good)Poor Noidea idea opinionI,Notional 36Prison construction Tax increase to ga)1 for coQ!!tl"uction53 IINo opinion, Did not approve ) Sex:Dis- refused Still Dis- constructionMale 36Approve approve to answer 55 9a~prove approve or don't know FemaleI36 52 12IiNotional 69 2B 3 62 6 31Race:J' White 36Sex:53Nonwhite II36Male 71 27 2 65555 309Female 68 28 5 59 8 34 IEducation:College 28 64 8Race, ethnicity: High school 3tl 51 I!White 69 28 3 63 6 3L Grade school 43 40 17Black 67 31 2 56 9 35Hispanic 713 21 I 69 9 22 Occupation:Pr<strong>of</strong>essional and business 31 61 8Education: Clerical and sales 33 51 16College 67 30 2 63 4 33 Manual workers 41 50 9High school 71 25 3 62 8 29 Nonlabor force 33 52 15Grade school 72 23 5 56 II 32Income:Employment status: 1".000 ood o~, 31 61 8Full-time employed 70 28 2 64 5 31 20,000 to r4,999 34 56 10Part-time employed 69 28 4 61 8 31 15,000 to 19,999 40 47 13Unem~loyed 63 36 I 52 10 38 10,000 to 14,999 39 53 8Laid <strong>of</strong>f 81 19 0 69 II 19 5,000 to $9,999 37 49 14Retired 70 23 7 63 6 31 Under $5,000 33 53 14Full-time homemaker 72 24 4 61 8 31Student 61 39 0 55 5 39 Age:Total under 30 years 41 50 9Income: 18 to 24 years 42 49 9ro,ooo and over 68 30 2 63 5 32 25 to 29 years 39 52 920,000 to ~29,999 71 26 3 66 4 30 30 to 49 years 33 58 912,000 to 19,999 73 25 I 66 6 28 Tot
--"'" - -~--..--- -<strong>Sourcebook</strong> <strong>of</strong> <strong>Criminal</strong> <strong>Justice</strong> <strong>Statistics</strong> <strong>1983</strong>Table 2 83 Attitudes toword the conversion <strong>of</strong> unused ~myboses'into prisons, by demographic characteristics, UnitedStates, 1982!'OTE: For a discussion <strong>of</strong> public opinion survey samplingprocedures, see Appendix 7.Question: "It has been proposed that army bases no! nowbeing used be converted into prisons. Does this sound like agood idea to you or a poor idea?"(Percent)Good Pooridea • icleai'bopinionPublic Attitudes Toward Crime and <strong>Criminal</strong> <strong>Justice</strong>-Related TopicsFigure 2.15 Attitudes toward capital punishment for persons convicted <strong>of</strong> murder, United States, selected years 1953-81t'DTE: For a discussion <strong>of</strong> public opinion survey sampling procedures, see Appendix 7.Question: "Are you in favor <strong>of</strong> the death penalty for persons convicted <strong>of</strong> murder?"Percent100i'btional 76 18680Sex:MaleFemaleRace:Whitei'bnwhiteEducation:CollegeHigh schoolGrade sch(Y.)i77 1976 1778 1765 2576 1978 1770 19Occupation:Pr<strong>of</strong>essional and business 76 19Clerical and sales 80 17Manual workers 77 17i'bnlabor force 74 184751055II53686040-. .. ... .•• •••••••• ••••••...., ..-.... .:~••...... ......... ..•••••~····X .... ~ ......'--,~ ..,.. •• •••• Favor ..... • •••...Income:79 181',.000 00' 0",'20,000 to r4,999 81 1715,000 to 19,99~ 80 1610,000 to 14,999 79 145,OUO to $9,999 7U 21lklder $5,000 70 1932479IIoppos~' \..... ...........~' ~~Age:Total under 30 years77 1918 to 24 years 76 2025 to 29 years 79 1730 to 49 years 79 16Total 50 years and older 73 1950 to 64 years 71 2365 years and older 74 1644458610City size:1,000,000 and over78 155UO,00U to 999,99981 1550,000 to 499,999 74 202,5UU to 49,999 7U 22lklder 2,500, rural 79 16Region:East71:1 18Midwest77 17South 71; 19West 77 18Religion:ProtestantCatholicPolitics:RepublicanDemocratInde~ndent75 1979 1783 1275 1975 20Source: George H. Gollup, The Gollup Report, Report No.200 (Princeton, N.J.: The Gallup Poll, May 1982), p. 6.Reprinted by permission.74685467564565Source: George H. Gallup, The Gallup Poll (Princeton, N.J.: The Gallup Poli, Mar. I, 1981), p. 3. Figure constructed bySOlRCEBOO< staff. Reprinted by permission.272273
---------- - - ~----------------------------------------<strong>Sourcebook</strong> <strong>of</strong> <strong>Criminal</strong> <strong>Justice</strong> <strong>Statistics</strong> 19H3Table 2.84 Attitudes toward capital punislvnent for persons convicted <strong>of</strong> murder, by demographic characteristics, lktlted States, 1972-78,1980, and 1982I·1Public AttitUdes Toward Crime and <strong>Criminal</strong> <strong>Justice</strong>-Related Topics,"!\oTE: For a discussion <strong>of</strong> public opinion survey sampling procedures, see I',;lpendlx 7.Question: "Do you favor or oppose the death penalty for persons convicted <strong>of</strong> murder?"Notional 53Sex:Male 61Female 45Ra','l:White 5t!Black/other 29Education:Collllge 54High school 53Grade school 51Occupation:Pr<strong>of</strong>essional and bus;,1ess 57Clerical 51Manual 49Farmer 66Income:15,000 and over N!>.10,000 to $14,999 N!>.7,000 to 19,999 N!>.5,000 to 6,999 N!I,13,000 to 4,999 N!>.lklder $3,000N!I,Age:18 to 20 years 4021 to 29 years 4630 to 49 years 5650 years and older 56Region:Northeast 64Midwest 51South 41West 62Religion:Protestant 50Catholic 60Jewish 65None 47Politics:Republican 63Democrat 50Independent 50(Percent a )19741975FavorDon'tOppose know Favor OpposeDon'tknow Favor OpposeDon'tknow Favor Oppose39344435624038403739423056483734304149324234264931404485II71068961084567106810696946106606854643657616365565875656758545846474863666160596262646237715559:/,ercents may not add to 100 because <strong>of</strong> rounding.The question in 1972 and 1973 was "Are you in favor <strong>of</strong> the death penalty for persons convicted <strong>of</strong> murder?"3529403257393430303937213129394136475048322835333734333233582540365465845755544425673456475454554556368596638586664626960776966606058545558656666596366637139437359623229352954382830342735202730343339404339312729353229322552502236335375846644524466362348466554975556067S4633358606264605769626761585442535362646659556459676150675759332738305737332831343523332632353547424033283034363033303942263634DOnltknow76861047II66785576IIII5758478683o7767Favor66736068446368616766657774686154595155586968706563656561:174557365621976DOn'tOppose know30 524 334 628 551 433 327 43J 830 327 732 418 423 326 535 440 636 543 642 33H 427 426 626 431 431 632 330 527 426 041 423 1130 534 41I!IIJIJIII1, IIFavor6775617046666965646469777167706556586962677064686477677066647467641977Don'tOppose know26 622 330 924 647 !l29 624 729 628 826 926 518 424 527 522 728 737 735 730 231 627 723 731 625 72H 820 326 725 526 934 221 627 629 7Favor667461694466686068726376726771605H436364676867696464676879587363661978ose2824312548292631282330212428:22343250333128252824303127272138233127Don'tknow63868568467355771073557566666o44671980Don'tFavor Oppose know67 27 675 21 461 32 770 24 640 51 967 30 471 23 656 33 II66 29 569 26 568 26 771 15 1573 23 466 32 364 27 958 30 1253 36 1046 36 1870 27 466 31 469 26 566 25 968 26 666 26 866 28 670 25 567 26 671 23 675 22 354 39 777 18 563 31 666 28 7Favor7480697751717864717973777876736461606874747474727476737673737971731982Don'tOppose know20 616 424 718 642 721 517 526 923 617 421 615 818 420 418 924 1231 831 926 620 621 520 622 421 721 518 621 620 419 816 1016 524 520 7Source: Table constructed by SO-RCEBOO< staff from data provided by the Notional Opinion Research Center; data were made available throughthe Roper Public Opinion Research Center.IIIIII274
.,.----------- - --" ,,j<strong>Sourcebook</strong> <strong>of</strong> <strong>Criminal</strong> <strong>Justice</strong> <strong>Statistics</strong> 19l13Public Attitudes Toward Crime and <strong>Criminal</strong> <strong>Justice</strong>-Related Topics,"Table 2.87 Reasons for fovoring the death penalty forperS9ns !:onvicted <strong>of</strong> murder, United States, 1981NJTE: The data below represent the reasons given by the 73percent subsample <strong>of</strong> the 1,533 persons surveyed who onsweredyes to the question, "Are you In favor <strong>of</strong> the death penalty forpersons convicted <strong>of</strong> murder?" For a discussion <strong>of</strong> public opinionsurvey sampling procedures, see Appendix 7.ReasonQuestion: ''Why do you favor the d~ath penalty?"Revenge--eye for an eyeIt's a crime deterrentJail does not rehabilitate; murderermay get paroled and do it again<strong>Criminal</strong>s get <strong>of</strong>f too easily todayJail sentences cost society too much maneyOtherDon't know/no opinionPercent c'tdngreason423522149II4aTotal adds to more than 100 percent due to multipleresponses.Source: Jeffrey D. Alderman, Linda A. Cranney, and PeterBegans, ABC News-Washington Post Poll, Survey No. 0034 (NewYor\e: ABC News, June 8, 191:li ), Question 37A. Table adaptedby SOLRCEBOO
--~-------------------~--~<strong>Sourcebook</strong> <strong>of</strong> <strong>Criminal</strong> <strong>Justice</strong> <strong>Statistics</strong> 19tJ3Public Attitudes Toward Crime and <strong>Criminal</strong> <strong>Justice</strong>-Related TopicsTable 2.?0 Re~POi1denjs reporting a firearm In their home, byTable 2.89 Respondents reporting a firearm in their home, by type <strong>of</strong> firearm and demographic characferlllt!~!l, United Table 2.91 Responop.'lts rcporHn!J ownership <strong>of</strong> a firearm, bydemographicStotes. !982characteristics, United States, selected years 1973-82demographic chgracreristics, United States, 1980 and1982I\K)TE: For a discussion <strong>of</strong> public opinion survey sampling procedures, see Appendix I\K)TE: For a discussion <strong>of</strong> public opinion survey sampling procedures,7.see Appendix 7.I\K)TE: For the results <strong>of</strong> the screen question, see Table 2.89. Fora discussion <strong>of</strong> public opinion survey sampling procedures, seeQuestion:Question: "Do you happen to have In your home AppendIx 7."Do you happen to have In your home (or garage) any guns orany guns or revolvers?"(or garage)revolvers?"!f ),e3, "15 I. (j pistol, shotgun, rifle, or what?"Question: "Do you happen to have in Yourgarage) any guns or revolvers?"home (or(Percent reporting havIng guns)(Percent reporting having guns)If yes, "Do any <strong>of</strong> these guns belong to YIJli?"-tional Opinion Research Center; data were mode data provided by the N:>tional Opinion Research Center; dataavailable through the Roper Public Opinion Research Center.were made available through the Roper Public Opinion ResearchCenter.281
~---~----~---" '--<strong>Sourcebook</strong> <strong>of</strong> <strong>Criminal</strong> <strong>Justice</strong> StatisticR <strong>1983</strong>Table 2.92 Attitudes toward a low forbidding ownership <strong>of</strong> pistols and revolvers except by pollce and other authorized p,ersons, bydemographic characteristics lind gun ownership, Unit~d States, 1975 and 1979-81N:>TE: "Gun owners" are defined as members <strong>of</strong> households in which there ere guns. For a discussion<strong>of</strong> public opinion survey sampling procedures, see Appendix 7.Question: "Do you think there should or should not be a law which would forbid the possession <strong>of</strong> pistols and revolvers except by thepolice and other authorized persons?"Sex:MaleFemaleNotionalRace:WhiteNonwhiteEducation:CollegeHigh schoolGrade schoolOccupation:Pr<strong>of</strong>essional and business 49Clerical and sales 46Manual workers 36Nonlabor force 37Income:25,000 and over20,00U to ~24'99915,000 to 19,99910,000 to 14,99915,000 to $9,999Under $5,000Age:Total under 30 years18 to 24 years25 to 29 years30 to 49 years50 years and olderCity size:1,000,000 and aver500,000 to 999,99950,000 to 499,9992,500 to 49,999Under 2,500, ruralRegion:EastMidwestSouthWestReligion:ProtestantCatholicPolitics:RepublicanDemocratIndependentGun ownership:Gun ownerNot a gun owner(Percent)1975 1979:980Shou·-:I...,.d-:S.,.h....:ou~l:..;d"-- should should Should Shoulc.lbe no! 'be No be not be No be not bl)a law a law opinion a law a law opinion a law a law41 55 4 31 65 4 38 513546404149393643414739416644403628584427293549434437245462495557Gun possession:Guns in the home(all types)HandgunsNo guns in the home,bFor this survey, this age category was 18 to 3 1 "i'ears.For this survey, this age category was 35 to 49 rears.cFor this survey, the city category was 500,000 and over.47575948506056545551295355586937536965614551152587440355244534473424S535635346463452625363222332932333825323633322730293028332933463537221846322023244433322618427159656764666364597064656660676568656665676347586176785062777372536564698052453II35533545I,86535624477224463443:L45263144444127f\f>.47 c383232533330341913506240554951N\47 c48466139515956706139April 1981Should Should ShouldNo beopinion a lawNo be not beopinion a law a lawII716I1022f\f>.6 c14227816II10II6II39334538494238383748403737354339394242421,2383967373730285240283631523642375865525948565957604958606163525956565655576058316161656946566962664761566032333235332322525223I232225324323I323413448404647374549463442354142414646464843384061'14433131603730373453324642June 1981Shouldnot be Noa law opinionSource: George H. Gallup, The Gallu~ Opinion Index, Report No. 123, p. 10j Report No. 174, p. 29 (Princeton, N.J.: The Gallup Poll); TheGallup Poll, Feb. 3, 1980, pp. 7, 8; Jan. 22,1981, pp. 5-7 (Princeton, N.J.: The Gallup Pol!); and George H. Gallup, The Gallup Report, ReportNo. 187, p. 15; Report No. 190, p. 27 (Princeton, N.J.: The Gallup Poll). Table adapted by Sa...RCEBOO< staff. Reprinted by permission.28254624655464957494738635163564953484449475357543349536166365764596142624855546584664163723966105545Ii674e3466455663Public Attitudes Toward Crime and <strong>Criminal</strong> <strong>Justice</strong>-Related TopicsAgure 2.17 Attitu~es to",!,ard ? Federal law requiring that all handguns be registered byFederal authorities, United Mates, 1975 and 1978-80N:>TE: For a discussion <strong>of</strong> public opinion survey sampling procedures, see Appendix 7.Question: "Do you favor or oppose a Federal law requiring that all handguns people awn beregistered by Federal authorities?"fZ] FavorIZ:::a OpposeC!I!ll Not sureSource: L?uis Harris, The ABC News-Harris Survey (New York:The Chicago Tribune-NewYork News. Syndicate, Dec. 4, 1980), p. 2. Figure constructed by Sa...RCEBOO< staff. Reprintedby permiSSion.283
<strong>Sourcebook</strong> <strong>of</strong> <strong>Criminal</strong> <strong>Justice</strong> <strong>Statistics</strong> 15183Table 2.513 AttituGes toward a law requiring a police permit prior to gun purchase, by demographic characteristics, United States, 1972-77, 1980, and 1982;I /\oTE: For a discussion <strong>of</strong> public opinion survey sampling proced\Jres, see Appendix 7.Question.: "Would you favor or oppose a law which would require a person to obtain a police permit before he or she could buy a gun?"{Percental1"1 ,\Public Attitudes Toward Crime and <strong>Criminal</strong> <strong>Justice</strong>-Related TopicsNationaiSex:MaleFemaleRace:WhiteBlack/otherEducation:CollegeHigh schoolGrade schoolOccupation:Pr<strong>of</strong>essional and businessClericalManualFarmerIncome:~15,000 and over~IO,OOO to $14,99957,000 to ~9'999$5,000 to 6,999$3,000 to 4,999Under $3,000Age:18 to 20 years21 to 29 years30 to 49 years50 years and olderRegion:NortheastMidwestSouthWestReligion:ProtestantCatholicJewishNonePolitics:RepublicanDemocrotIndependent15172 15173 1974 1975 1976Don't Don't Don't Don't Don'tFavor Oppose know Favor Oppose know Favor Oppose know Favor Oppose know Favor Oppose know706179706971726669807254707468708369636766789669707268273717'1.7262726292818264427242926162733323119429272530324352353232323424433° 2;rercents may not add to 100 because <strong>of</strong> rounding.One-half <strong>of</strong> I percent or less.34I746779737476737071787469747272747178737($72748872676!:1688398817076732532192524232527272125282526262627182723262410283129311521828222622222I232(b)23II2I24oI222(b)2222oII2275668375777775717484766277747668797675777674887770667185987074787324331524222223272516223822252332192223232424122228322814229252225(b)2I22II2°IIIo222(b)I2oI222(b)° III274668073817674687381726376707476717674797073857666707083967174777024321725152224262418263423272322262126192724122230292715428232028323242263222I23233oI33323I32° I32272647871747172717478705972716873727478717370867263686782896871746927352027242727282520293927272926282422272529132735303118II28272529I2I32IIo2I3(b)23II2o2IIII2I2o42I2\ :I'II,1\\\:Ii I;11\i\Ii il'l'! ,I,!iFavor7264787081747U72767571587171717176716972707485676968678089737173711977Don'tose know Favor26 2 6935 I 6319 2 7428172528252322274228282725212831262924143128313020926262628222231321112421o2121232213132268817069707U7167536873766274797173706786716460648388716474681980Don'tose know Favor29 2 7236 I 6823 3 75301529292728213247312621302419292729291327343834161228352S2924222222o1I2822oI13I22221o1I227178767164757169367371757168767776726985736269688189726675721982oseDon'tknow26 231 123 227192323 127 130 623 223 (b)29 260 426 229 (b)2424I630 321 323 024 (b)26 229 213 224 236 230 230 217 25 528 0332426I22Source: Table constructed by S
<strong>Sourcebook</strong> <strong>of</strong> <strong>Criminal</strong> <strong>Justice</strong> <strong>Statistics</strong> 1783Public Attitudes Toward Crime and CrimInal <strong>Justice</strong>-Related Topics"Table 2.97 Attitudes toward a law requiring a person to obtain a license to carry a gun outside <strong>of</strong> home,by demographic characteristics and gun ownership, United States, 1975, 1980, and 1981NJTE: "Gun owners" are defined as members <strong>of</strong> households in which there are guns.For a discussion <strong>of</strong> public opinion survey sampling procedures, see Appendix 7.Question: "In Massachusetts a law requires that a person who carries a gun outside his home must have alicense to do so. Would you approve or disapprove <strong>of</strong> having such a law in yaur own State?"I'btionalSex:MaleFemaleRace:WhiteI'bnwhiteEdUcation:CollegeHigh schoolGrade schoolOccupation:Pr<strong>of</strong>essional and businessClerical and salesManual workersI'bnlabor forceIncome:25,000 and over120,000 to ~24,99915,000 to 19,99910,000 to 14,999$5,000 to $9,999Under $5,000Age:Total under 30 years18 to 24 years25 to 29 years30 to 49 years50 years and olderCity size:1,000,000 and over500,000 to 999,99950,000 to 499,9992,500 to 49,999Under 2,500, ruralRegion:EastMidwestSouthWestReligion:ProtestantCatholicPolitics:RepublicanDemocratIndependentGun ownership:Gun ownerI'bt a gun owneraLess than I percent.(Percent a )1975 1980 1981Dis- I'b Dis- I'b Dis- I'bApprove approve opinion Approve approve opinion Approve approve opinion777480777783766983797576818181757684788772648379TL72748374787868851924151920152123152021191718122329141812232913182325221522191829/I425432382I452I44524I5743534243434Source: George ri. Gallup, The Gallup Opinion Index, Report I'b. 129, p. 26; Report I'b, 174, p. 31 (Princeton,N.J.: The Gallup Pol!); and George H. Gallup, The Gallup Report, Report l\b. 187 (Prince1on, N.J.: The Gallup Poll,April 1981>, p. 16. Table adopted by 5O...RCEBOCX< staff. Reprinted by permission.75698175778072767882727575787677747380788272758674767068857269737280717776658320271321121723131818241523171919201618191824171018202526/I232521221723191930125464/I35II465725546II23(a)484845645666364555817784808681818080828280807781808385858682778187858277758881767778867683821717121816171813161718221318151213/I1721161012162023817212220/I21141622332I3325232I622323I2333232423123332II I!1Table 2.98 Attitudes toward change In laws ccverlnc sale <strong>of</strong> handguns, by demographic characteristics and gun ownership, United States,1975, 1980, and 1981I'-OTE: ''Gun owners" are defined as members <strong>of</strong> households in which there are guns. For a discus$ion<strong>of</strong> public opinion survey sampling procedures, see Appendix 7.Question: "In general, do you feel that the luws covering the SGI~ <strong>of</strong> handguns should be rnade more strict, less strict, or kept as they arenow?"NotionalSex:MoleFemaleRace:WhiteNonwhiteEducation:CollegeHigh schoolGrade schoolOccupation:Pr<strong>of</strong>essional and business 77Clerical and sales 76Manual workers 65I'bnlabor force 68Income:25,000 and over20,000 to $24,99915,000 to ~19,9515110,000 to $14,99915,00U to $9,999Lhder $5,000Age:Total under 30 years18 to 24 years25 to 29 years30 to 49 years50 years and olderCity size:1,000,000 and over500,000 to 999,99950,000 tb 499,9992,500 to 49,999Lhder 2,500, ruralRegion:EastMidwestSouthWestReligian:ProtestantCatholicPolitics:RepublicanDemocratIndependentGun ownership:Gun ownerNot a gun ownerMore Lessstrict strict69647569697766686971656871826517i67597570666566756573686179342:33" 3I24335I3324I354224324234I1975Keptas theyurenow242918241920262220192723252229262013242525301825262826212722253215I'b More LessopinIon strid strict354924723463253633356336352434355952(;4586165565662715557596661575456585858595870615755527154505954665164574868(Percent)January 1980685684l:!66385359176776756767657856645975I
<strong>Sourcebook</strong> <strong>of</strong> <strong>Criminal</strong> <strong>Justice</strong> <strong>Statistics</strong> 19113Public Attitudes Toward Crime and <strong>Criminal</strong> <strong>Justice</strong>-Related Topics.Table 2.99 Attitudes toward a law making it illegal toimport gun parts from other nations, by demographiccharacteristics, United States, 1981f\OTE: For a discussion <strong>of</strong> public opinion survey samplingprocedures, see Appendix 7.Question: "Would you favor or oppose a law which wouldmake it illegal to Import gun parts from other nations?"(Percent)Favor Oppose f\ba law a law oQinlonf\btlonal 49 37 14Sex:Male 47 41 12Female 50 33 17Race:White 48 37 15f\bnwhite 50 34 16Education:College 51 36 13High school 48 38 14Grade school 49 33 18Occupation:Pr<strong>of</strong>essional and business 52 34 14Clerical and sales 50 36 14Manual workers 47 41 12f\bnlabor force 47 34 191"'000 ood o~, 46 42 1220,000 to r4,9'9 51 36 1315,000 to 19,999 4!.l 36 1610,000 to 14,99' 54 32 145,000 to $9,999 50 32 111lklder $5,000 44 37 19Income:Age:Total under 30 years 49 36 15111 to 24 years 48 36 1625 to 29 years 49 37 1430 to 49 years 47 40 1350 years and older 50 35 15City size:i,OOO,OOO and over 61 23 165LO,OOO to 999,999 53 36 II50,000 to 499,9" 48 41 II2,500 to 49,999 42 39 19lklder 2,500, rural 43 41 16Region:East 61 27 12Midwest 48 40 12South 39 43 18West 46 38 16Religion:Protestant 46 311 16Catholic 54 35 IIPolitics:Republican 45 38 17Democrat 51 35 14Independent 49 39 12Source: George H. Gall\!p, The Gallup Report, Report No.190 (Princeton, N.J.: The Gallup Polr, July 1911 I), p. 30.Reprinted by permission.290Table 2.100 Attitudes toward the effect <strong>of</strong> stricter guncontrol laws on the number <strong>of</strong> murders, by gun ownership,United States, 1981f\OTE: See NOTE, Table 2.94. For a discussion <strong>of</strong> public opinionsurvey sampling procedures, see Appendix 7.Question: "Do you agree or disagree with the followingstatement: "Stricter gun control laws would help reduce thenumber <strong>of</strong> murders in this country."f\btionalGun ownersf\bt gun owners(Percent)f\btAgree Disagree sureSource: !\BC News and The Associated Press, Poll Results!\BC News, Report No. 66 (New York: NBC News, Apr. 28,1981 ), p. 12. Reprinted by permission.Table 2.101 Attitudes toward the sentencing <strong>of</strong> criminalswho carry a gun during the commission <strong>of</strong> a crime, UnitedStates, 1981503164476832f\OTE: See f\OTE, Table 2.34.Question: "Leaving aside those cases in which there is amurder, how do you feel a criminal who carries a gun whencomnittlng a crime should be sentenced?"Sentence(Percent)Life in prison5 to 10 years added to sentenceSentence should be the same as with no gunDepends on circumstancesDon't know34Total public15512086Source: "The Plague <strong>of</strong> Violent Crime," Newswee;!, Mar.23, 1981, p. 52. Copyright 1911 I by "Iewsweek Inc. All rightsreserved. Reprinted by permission.Iit, \J1) IiI'il'j'IijII1":1d\1\I! ~ ,I\'IIIi,IilIi'II, Ii l I1I!iIt!Table 2.102 Respondents who report knowing victims <strong>of</strong>child abuse, wife abuse, or abuse <strong>of</strong> th~ «:Iderly! bydemographic characteristics and type <strong>of</strong> Victim, UnitedStates, 1981f\OTE: For a discussion <strong>of</strong> public opinion survey samplingprocedures, see ,\ppendlx 7.Question: "Do you know anyone who Is or has been avictim <strong>of</strong> the following (child abuse, wife abuse, or abuse <strong>of</strong> theelderly)?"f\btionalSex:MoleFemaleRace:WhiteBlackEducation:8th grade or lessHigh schoolCollegeOccupation:Pr<strong>of</strong>essionalExecutiveProprietorWhite collarSkilled laborIncome:25,00 I and over115,00 I to $25,0007,501 to $15,0007,500 and underAge:18 to 29 years30 to 49 years50 to 64 years65 years and olderCommunity size:CitySuburbTownRuralRegion:EastMidwestSouthWestPolitics:RepublicanDemacratIndependent(Percent responding "know someone")Wife Child Abuse <strong>of</strong>abuse abuse the elderly272132272516262930281934292831252131341816302526252530242828223323 ,18272325122226302920262124232124282818122418272523212230262025Source: Table adopted by saRCEBOO< staff fr~ tablesprovided by Louis Harris and Associates, Inc. Reprinted bypermission.161417151914141717II1217121416141914199181912151616141715151318291Table 2.103 Respondents rating the problems <strong>of</strong> chil~ abuse,wife abuse, and abuse <strong>of</strong> the elderly as very seriOUS, bydemographic characteristics, United States, 1981f\OTE: For a discussion <strong>of</strong> public opinion survey samplingprocedures, see Appendix 7.Question: ''How serious a problem do you think (childabuse wife abuse, abuse <strong>of</strong> the elderly) Is In this country--veryr. :lrio~s, somewhat serIoUS, hardly serious, or not a problem?"f\btlanalSex:MoleFemaleRace:WhiteBlockEducation:8th grade or lessHigh schoolCollegeOccupation:Pr<strong>of</strong>essionalExecutiveProprietorWhite collarSkilled laborIncome:25,00 I and over115,00 I to $25,0007,50 I to $15,0007,500 and underAge:18 to 29 years30 to 49 years50 to 64 years65 years and olderCommunity size:CitySuburbTownRuralRegion:EastMidwestSouthWestPolitics:RepublicanD,~mocratIndependent(Percent responding "very serious")Childabuse6256686172S6665961636366n58676863756552456459656162616065606560WifeabuseAbuse <strong>of</strong>the elderly42 3934504059404540403933505234474948524535294938414042443847411144133443658334436353639424532434347484030344537413447373441344436Source: Table adapted by Sa.RC~BOO< staff fr~ tablesprovided by Louis Harri" and ASSOCiates, Inc. Reprinted bypermission.o
....... ,-"'-~--... ~.<strong>Sourcebook</strong> <strong>of</strong> <strong>Criminal</strong> <strong>Justice</strong> <strong>Statistics</strong> <strong>1983</strong>Table 2.104 Respondents reporting whether they know someone whouses drugs, by type <strong>of</strong> drug, United States, 1978 and 1982!'OTE: The 1982 survey was conducted between Oct. 29 and Nov. I, 1982,shortly after seven people in Chicago died from taking Tylenol capsulesconTolning cyanide. For a discussion <strong>of</strong> public npinion survey samplingprocedures, see Appendix 7.Question: "Do you know anyone who uses (type <strong>of</strong> drug), or not?"(Percent)1978 1982Do notDa notKnow know l
Sourcebaok <strong>of</strong> <strong>Criminal</strong> <strong>Justice</strong> <strong>Statistics</strong> <strong>1983</strong>Table 2.107 High school seniors' perceptions <strong>of</strong> availability <strong>of</strong> drugs, by type <strong>of</strong> drug, UnUed States, 1975-82NJTE: See NJTE, Table 2.106. For survey methodology and definitions <strong>of</strong> terms, see Appendix 10.Question: ''How difficult do you think it wouid be for you to get eoch <strong>of</strong> the following types <strong>of</strong> drugs, if you wanted some?"Type <strong>of</strong> drugMarihuana/hashishLSDSome other psychedelicCocaIneHeroinSome other narcotic (Including methadone)knphetaminesBarbituratesTranqui Ii zers(Percent saying drug would be "fairly easy" or "very easy" for them to get O )Closs Closs Closs<strong>of</strong> 1975 <strong>of</strong> 1976 <strong>of</strong> 1977(N=2,627) (N=3,163) (N=3,562)87.846.247.837.024.234.567.860.071.887.437.435.734.018.426.961.854.465.5°klswer alternatives were: (I) probably impossibie, (2)very difficult, (3) fairly difficult, (4) fairly easy, and (5) veryeasy.Source:87.934.533.833.017.927.858.152.464.9Closs Closs Closs Closs Closs<strong>of</strong> 1978 <strong>of</strong> 1979 <strong>of</strong> 1980 <strong>of</strong> 1981 <strong>of</strong> 1982(N=3,598) (N=3,172) (N=3,240) (N:3,578) (N=3,602)87.8 90.1 89.0 89.2 88.532.2 34.2 35.3 35.0 34.233.8 34.6 35.0 32.7 30.637.B 45.5 47.9 47.5 47.416.1* IB.9 21.2 19.2 20.826.1 28.7 29.4 29.6 30.458.5 59.9 61.3 69.5 70.850.6 49.8 49.1 54.9 55.264.3 61.4 59.1 60.8 58.9Lloyd D. Jr,hnston, Jerold G. Bachman, and Patrick M. O'Malley, Student Drug UseS Attitudes and BellefstNotionalTrends i975-1982, U.S. DfJpcrtment <strong>of</strong> Health and Human Services, Notional Institute on Drug A use (Washington, D ••: 0.5.Government Printing Oh!ce, <strong>1983</strong>), p. i22. Table adopted by SOLRCEBOO< st<strong>of</strong>f.Table 2.108 High school seniors favoring prohibition <strong>of</strong> drug use, by type <strong>of</strong> drug and place <strong>of</strong> use, United States, 1975-82NJTE: Sec: NJTE, Tobie 2.106. For survey methodoiogy and definitions <strong>of</strong> terms, see Appendix 10.Question: "Do you think that people (who are i8 or older) shouid be prohibited by low from doIng each <strong>of</strong> the following?"Type <strong>of</strong> drug andplace <strong>of</strong> useSmoke marihuana/hashish in privateSmoke marihuana/hashish in public placesToke LSD in privateToke LSD In public places,Toke heroin in privateToke heroin in public placesToke amphetamines or barbiturates inprivateToke amphetamines or barbiturates inpublic placesGet drunk in privateGet drunk in public placesSmake cigarettes in certain specifiedpublic places(Percent saying "yes"a)Closs b Closs Closs Closs Closs Closs Closs Closs<strong>of</strong> 1975 <strong>of</strong> 1976 <strong>of</strong> 1977 <strong>of</strong> 19711, <strong>of</strong> 1979 <strong>of</strong> 1980 <strong>of</strong> 1981 <strong>of</strong> 1982(N:2,620) 0"=3,265) (N:3,629) (N:3,7U3) (N:3,288) (N:3,224) (1"=3,61 J) (N:3,627)32.863.167.285.876.390.i57.279.614.155.727.559.165.181.972.484.853.576.115.650.7a Answer alternatives were: (I) no, (2) not sure, and (3)yes. bThe 1975 survey que~tion asked about peopie who are "20or older."Source: Lloyd D. Johnston, Jerold G. Bachman, and Patrick M. O'Malley, Student Dru Use Attitudes and BeliefsTrends 1975-1982, U.S. Department <strong>of</strong> Health and Human Services, Notional Institute on DrugGovernment Printing Office, <strong>1983</strong>), p. 100. Table adopted by SOLRCEBOO< st<strong>of</strong>f.26.858.763.379.369.281.052.873.718.649.042.025.459,562.780.768.882.552.275.817.450.342.228.06i .862.481.568.584.053.477.316.850.443.128.966.165.882.870.383.854.176.116.748.342.835.467.462.680.768.882.452.074.219.649.143.036.672.867.182.169.382.553.575.519.450.742.0IIL'JII'1!I'I!If rf:LL -,~!!,Public Attitudes Toward Crime and <strong>Criminal</strong> <strong>Justice</strong>-Related TopicsTable 2.109 Attitudes toward I II tl fego za on a marihuana use, by demographic char(!cterl~tlc5, United States, selected years 1~73-80NJTE: For a discussion <strong>of</strong> public opinion survey sampling procedures, see Appendix 7.Question: "Do you think the use <strong>of</strong> marihuana should be made legal or not?"Notional 18Sex:Male 22Female 15Race:White 18Block/other 18Educatioll!College 32HJgh school 15Q-ade school 6Occupation:Pr<strong>of</strong>essional and business 23Clerical 15Manual 17Former 13Income:15,000 and over 2510,000 to $14,999 147,000 to 19,999 215,000 to 6,999 1013,000 to 4,999 16lktder $3,000 17Age:18 to 20 yeors 4221 to 29 years 3830 to 49 years 1450 years and older 9Region:Northeost 22Midwest 20SouthIIWest 24Religion:Protestant 14Catholic 18Jewish 33None 52Politics:RepublicanIIDemocrat 17Inde ndent 251973 1975ShouldShould notDon't Shouldknow Should notDon'tknow80 275 383 280 279 466 383 294 I74833281 I86 I72 284 I78 I89 282 280 356 260 284 289 274 478 289 (b)73 384 281 I67 01:3 587 282 I72 3202516.2022351652920161625192520131534401892620123215214853121926bPercents may not odd to 100 because <strong>of</strong> founding.Ole-half <strong>of</strong> I percent or less.156980757159798965767"81717,(;11788280565479867075846381734843867767(Percent a )5644764665525542551063S45564644247ShoUld1976Shouldnot28 6932 6424 7327 7033 6040 5626 70II 8636 6026 7225 7119 7633 6426 7130 6524 7328 7022 7757 3949 4825 7216 8132 6425 7222 7437 6122 7432 6437 6354 31120 7826 7134 62Don'tknow Should3423643342:35335332'+434434233i)72341978Shouldnot30 6734 6326 7129 6838 5942 5527 7013 8437 6027 7128 6824 7430 (,7332!.l63Ii')30 6726 7132 6751 4849 4929 6916 8033 6226 7227 7238 5924 7431 !!46Z 3864 3319 8029 6737 601980Don't Should Don'tknow Should Mt. knowSource: Table constructed by SOLRCEBOO< st<strong>of</strong>f from data rovld d bthe Roper Public Opinion Research Center. p e y the N:!tlonal Opinion Research Center; dota were made ovallable through33332333324224333I2224522426o22432S3021252735238292323122;25 .,.,'f1915254542271327202038.. ".,20..28601824307267767271617588687S7479707372768069525671847077785777i!62368073663333242442393Il556432433263394234'.II294295
-- ..... --~.....-- -- -~ --'\,j--<strong>Sourcebook</strong> <strong>of</strong> <strong>Criminal</strong> JlJstice <strong>Statistics</strong> <strong>1983</strong>Figure 2.18 Respondlents favoring the legalization <strong>of</strong> marihuana use, United States, selected years 1~6~-80NJTE: "N:> opinion" responses varied slightly from survey to survey: 4 percent in 1969 and 1972; 6 percent in1973 and 1977; and 5 percent in 1979 and 1980. For a discussion <strong>of</strong> public opinion survey sCllll>ling procedures,see Appendix 7.Question: "Do you think the use <strong>of</strong> marijuana ~hould be made legal, or not?"Percent saying "yes"25201510sJO~----~I--~l----------------~i--------PI--~i----1969 1972 1973 1977 1979 1980Source: George H. Ga"'up, The Gallup Opinion Index, Report N:>. 179 (Princeton, N.J.:July 1980), p. 14. Figure constructed by SCLRCEBro< staff. Reprinted by permission.The Gallup Poll,I~II!lJ!I;\i\!,III\!I~n~Public Attitudes Toward Crime and <strong>Criminal</strong> <strong>Justice</strong>-Related TopicsTable 2.110 Attitudes toward the legalization <strong>of</strong> possession<strong>of</strong> small amounts <strong>of</strong> marihuana, by demographiccharacteristics, United States, 1982NJTE: The data below are from Q survey by the Galluporganization that simulated a national referendum on selectedissues. For a discussion <strong>of</strong> public opinion survey samplingprocedures, see Appendix 7.Question: "Suppose that on Election Day, N:>vember 2, youcould vote on key Issues as well as candidates. Please tell mehow you would vote on (this proposition)." (Statements:) "Ifavor legalizing the possession <strong>of</strong> small amounts <strong>of</strong> morijuana forpersonal use." or "I oppose legalizing the possession <strong>of</strong> smallamounts <strong>of</strong> marijuana for personal use."(Percent)Legalize morihuanaFavor OpposeN:>tional 30 70Sex:Male 35 65Female 25 75Race:Whit~N:>nwhite29377163Education:College 36 64High school 30 70Grade school J7 83Region:East 31 69Midwest 24 76South 27 73West 40 60Age:Total under 30 years 48 5218 to 24 years 49 512S to 29 years 46 5430 to 49 years 31 69Total 50 years and older 15 8550 to 64 years 16 8465 years and older 14 861"'000 "'" o~,Income:33 6720,000 to $24,999 29 7115,000 to ~19,999 26 7410,000 to 14,999 28 725,000 to $9,999 32 68U1der $5,000 28 72Politics:Republican 20 80Democrat 33 67Independent 35 65Religion:ProtestantCatholic25347566Occupation:Pr<strong>of</strong>essional and business 32 68Clerical and sales 32 68Manual workers 34 66N::nlabor force 19 81City size:I,OUO,OOO and over 38 62500,000 to 999,999 37 6350,000 to 499,999 28 72 ...2,500 to 49,999 28 72U1der 2,500, rural 23 77Source: George H. Gallup, The Gal~ Report, Report No.206 (Princeton, N.J.: The Gallup PolI,veiTibir 1982), p. 12.Reprinted by permission.296297
---~----<strong>Sourcebook</strong> <strong>of</strong> <strong>Criminal</strong> <strong>Justice</strong> <strong>Statistics</strong> <strong>1983</strong>Agure 2.19 Respondents favoring a low forbidding the sale <strong>of</strong> alcoholic beverages, United States, selected years 1936-81f\[)TE: For a di;cussion <strong>of</strong> public opinion survey sompling procedures, see Appendix 7.Question: 'Would you favor or oppose a low forbidding the sale <strong>of</strong> all wine, beer and liquor throughout the nation?"Percent favoring5040302010O~-'r------r------'-r----'r---·-----~ir----'Ir----ri----------Yi-----------------'ir-------~ir-1936 1940 1944 1945 1948 1954 1957 1960 1966 1976 1981Source: George H. Gallup, The Gallup Poll (Princeton, N.J.: The Gallup Poll, Feb. 8, 1981), pp. 4, 5. Figure constructed by5CX.RCEBOO< st<strong>of</strong>f. Reprinted bi' permission.I,!!I !~IiIPublic Attitudes Toward Crime and <strong>Criminal</strong> <strong>Justice</strong>-Related TopicsTable 2.111 Attitudes toward a law forbidding the sale <strong>of</strong>beer, wine, c."d liquor, by demographic characteristics,United States, 1981!\oTE: For a discussion <strong>of</strong> public opinion survey somplingprocedures, see Appendix 7.Question: "Would you favor or oppose a law forbidding thesale <strong>of</strong> all beer, wine and liquor throughout the notion?"(Percent)Favor Opposea low a lowforbidding forbidding /\btsole sale sure/\btional 17 80 3Sex:Mole 15 in 2Female 19 77 4Race:White 17 81 2/\bnwhite 2U 74 6Educatio.1lCo II elJe 9 90 IHigh school 18 79 3Grade school 28 66 6Occupation:Pr<strong>of</strong>essional and business 12 86 2Clerical and sales 17 80 3Manual workers 21 76 3/\bnlabor force 18 80 2Income:9 90 I1'5'000 20,000 "d to $24,999 '""13 85 215,000 to ~19,999 18 80 210,000 to 14,999 19 79 25,000 to $9,999 21 74 5Under $5,000 33 57 JOAge:Total under 30 years 17 82 I18 to 24 years 17 81 225 to 29 years 17 83 030 to 49 years 17 79 450 years and older 17 80 3City size:1,000,000 and over 14 82 4500,000 to 999,999 14 84 250,000 to 499,999 13 85 22,500 to 49,999 22 76 2Under 2,500, rural 21 75 4Region:East 10 86 4Midwest 17 82 ISouth 25 71 4West 17 81 2Religion:Protestant 21 76 3Catholic IJ 85 4Politics:Republican 18 79 3Democrat 18 79 3Indeeendent 17 81 2Source: George H. Gallup, The Gallup Report, Report No.IH6 (Princeton, N.J.: The Gallup Poll, March 1981), p. 36.Reprinted by permission.
"~<strong>Sourcebook</strong> <strong>of</strong> <strong>Criminal</strong> <strong>Justice</strong> <strong>Statistics</strong> <strong>1983</strong>Table 2.112 Respondents favoring stricter drunk drivinglows and mandatory jail sentences for first <strong>of</strong>fenders,by region, United States, 1982!'OTE: For a ;i(scussion <strong>of</strong> public opinion survey samplingprncedul es, see Appendix 7.Questions: "Do you think that there should or shouldnot be stricter laws regarding drinking and driving?""I n some states, drunl< drivers convicted <strong>of</strong> a first<strong>of</strong>fense are required to serve a mandatory two-day jailsentence. Would you like to see such 0 low in this state, ornot?"RegionNotionalEastMidwestSouthWestPercent favoringstricter drunkdriving laws8992918786Percent favoring 2-day jail sentencesfor first <strong>of</strong>fensedrunk drivers7776787782Source: George H. Gallup, The Gallup Poll (Princeton,N.J.: The C.allup Poll, Apr. 22, 1982), pp. I, 2. Reprinted bypermission.300\\\I:Ij1IjI1IIl1\di1\1III11II1111i\1Public Attitudes Toward Crime and <strong>Criminal</strong> <strong>Justice</strong>-Related TopicsTable 2.113 Attitudes toward pornographic material leading to rope, by demographic characteristics, lkIited States, seJected years 1~73-80!'OTE: For a discussion <strong>of</strong> public opinion survey sampling procedures, see Appendix 7.Question: "The next questions are about pornography--books, movies, magazines, and photographs that show or describe sex activities. I'm goingto read some opinions about the effects <strong>of</strong> looking at or reading such sexual materials. As I read 2ach one, please tell me if you think sexualmaterials do or do not have that effect: Sexual materials lead people to comnit rape."(Percent a )1973 1975 1216 1216 121lQDon't Don't Don't Don't Don'tYes No know Yes No know Yes No know Yes No know Yes No knowNotional 50 43 7 52 38 10 53 - 38 9 57 36 7 54 37 9Sex:MaleFemale43565136684657463171246584632810506145305947594530810Race:White 50 43 7 53 38 10 54 38 9 57 36 7 54 38 ~Black/other 52 43 5 47 41 12 44 44 12 55 38 8 59 31 IIEducation:Grade school 69 23 8 70 18 12 67 19 14 76 15 9 68 17 15CollegeHigh school345360406737555435910405653367840615133963562563088Occupation:Pr<strong>of</strong>essional and business 41 50 8 46 45 8 43 51 6 46 46 8 46 44 10Clerical 47 44 9 50 37 13 55 35 10 62 30 8 62 30 8Manual 55 39 6 56 36 8 57 35 8 58 35 6 58 33 8Farmer 61 35 4 55 36 8 56 28 16 60 34 6 50 32 18Income:1'5,000 00' 0_"38 56 6 45 44 II 42 51 7 50 42 7 48 46 610,000 to $14,999 50 42 8 51 41 8 56 35 8 57 37 6 63 33 57,000 to f,999 51 44 5 52 41 7 53 36 10 58 31 II 60 32 85,000 to 6,999 57 36 7 55 40 5 58 32 10 58 35 7 68 18 153,000 to 4,999 63 33 4 61 25 14 67 26 8 72 23 6 56 23 21lkIder $3,000 59 34 7 63 26 12 60 28 12 68 27 6 62 26 12Age:18 to 20 years 41 56 3 44 51 5 39 54 7 53 45 2 50 43 721 to 29 years 36 60 5 3~' 55 8 38 54 8 47 46 "/ 45 50 530 to 49 years 47 47 6 47 42 II 49 44 7 50 42 8 48 44 750 years and older 62 28 10 66 23 II 65 23 12 69 23 8 65 22 13Region:Northeast 42 49 9 54 3S 8 49 47 4 48 42 10 51 38 12Midwest 53 39 7 51 41 8 56 34 10 57 35 8 53 38 8South 53 41 6 57 30 13 53 34 13 65 29 7 61 32 7West 50 45 6 40 50 10 51 41 8 52 43 5 46 42 12Religion:Protestant 54 39 7 56 33 II 56 34 10 62 32 6 59 33 8Catholic 50 41 8 54 38 8 54 39 6 56 35 9 48 42 10Jewish 24 67 10 26 56 17 38 58 4 41 48 10 39 45 16None 21 75 4 20 73 7 26 65 9 26 66 8 36 55 9Politics:Republican 54 39 7 58 30 12 56 31 13 63 29 8 57 34 9Democrat 52 40 7 54 36 10 56 35 8 57 38 6 57 34 9Independent 44 50 7 46 44 9 47 45 8 53 39 8 50 40 10Clpercents may not add to 100 because <strong>of</strong> rounding.Source: Table constructed by 5O..RCEBOO< st<strong>of</strong>f from data provided by the NotiOnal Opinion Research Center; data were made available throughthe R~per Public Opinion Research Center.
Source: Table constructed by SOlRCEBOO< st<strong>of</strong>f from data provided by the Notional Opinion Research Center; data were made availablethrough the Roper Public Opinion Research Center.iiIIIIIfdII
--~----- --~-----r\ I,I.-------. " ...•Nature and Distribution <strong>of</strong> Known OffensesiTable 3.1 Estimated number <strong>of</strong> personal and household victimizations, by type <strong>of</strong> victimization and reporting to police, United States,1981 0NJTE: These estimotes are based on data derived from surveys thatwere undertaken in connection with the <strong>Bureau</strong> <strong>of</strong> <strong>Justice</strong> <strong>Statistics</strong>'victimization data were collected for all household members whowere at least 12 years <strong>of</strong> age; therefore, victimizations <strong>of</strong> thoseNational Crime Survey (NCS) program. In these surveys, conducted under 12 years <strong>of</strong> oge were not counted in the survey. Some crimes,by the U.S. Bureou <strong>of</strong> the Census for the' <strong>Bureau</strong> <strong>of</strong> <strong>Justice</strong> <strong>Statistics</strong>, such as homicide, were not counted.representative notional samples <strong>of</strong> households and businesses weredrown. The business portion <strong>of</strong> the survey was not conducted after II.For survey methodology and definitions <strong>of</strong> terms, see Appendix1976. In the personal and household portion <strong>of</strong> the survey,Nat reported Don't know whetherTotal ReQortea to Qolice to QoliceT~e!! <strong>of</strong> victimization Number Percent Number Percent Number PercentreQ2rted to J:loliceNumber PercentSection 3:Nt\TLRE AND DISTRIBUTION OF Kr\DWN OfFENSESThis section contains data on the extent information on self-reported alcohol and drugand nature <strong>of</strong> criminal incidents. Severa I use among adults and youth. These data arecollection methods and strategies are from national surveys conducted by researchersrepresented by these data. Because it is wellknownthat crimes reported to the police are segment includes information on the use <strong>of</strong>for the National Institute on Drug Abuse. Thisnot the universe <strong>of</strong> crimes that occur, efforts over-the-counter drugs, marihuana, hashish,have been made to complement police reports glue, PCP, LSD, ct)caine, heroin, methadone,<strong>of</strong> <strong>of</strong>fenses known with additional indicators <strong>of</strong> and a I coho I. Some tables display thethe occurrence <strong>of</strong> il/egal behavior. Perhaps the distribution <strong>of</strong> drug use by demographicmost commonly used alternative method <strong>of</strong> characteristics <strong>of</strong> the respondents. Informationassessing the occurrence <strong>of</strong> illegal behavior has is also provided on the extent <strong>of</strong> misbehavior inbeen with surveys. These have been <strong>of</strong> two schools as perceived by students, teachers, andgeneral types: (I) surveys <strong>of</strong> households and administrators.businesses to determine the rates and The final segment <strong>of</strong> this section containscharacteristics <strong>of</strong> those who have been victims data compiled through the use <strong>of</strong> the <strong>of</strong>ficial<strong>of</strong> illegal acts; and (2) surveys <strong>of</strong> the general records <strong>of</strong> agencies. The Federal <strong>Bureau</strong> <strong>of</strong>population to determine the proportions and Investigation's Uniform Crime Reports providescharacteristics <strong>of</strong> those who may have engaged data on <strong>of</strong>fenses known to police that arein illegal acts.tabulated by city, county, StandardThe initial segment <strong>of</strong> this section MetropolitOlI Statistical Area, population sizepresents data from the National Crime Survey group, and geographic division. Trends in the(NCS), which is sponsored by the <strong>Bureau</strong> <strong>of</strong> characteristics <strong>of</strong> known <strong>of</strong>fenses are also<strong>Justice</strong> <strong>Statistics</strong> <strong>of</strong> the U.S. Department <strong>of</strong> reported, as is information on law enforcement<strong>Justice</strong> and conducted by the U.S. BurealJ <strong>of</strong> <strong>of</strong>ficers killed and assaulted. This part <strong>of</strong> thethe Census. The NCS is a multi-faceted section also presents data on <strong>of</strong>fensesnational probability survey <strong>of</strong> households that committed in U.S. park areas; bombings; fireregularly provides information regarding the losses; motor vehicle thefts; drug thefts;nature and extent <strong>of</strong> corrmon crime, its costs, Federal alcohol, tobacco, and firearms cases,characteristics <strong>of</strong> victims, and characteristics hijackings; child abuse; terrorism; <strong>of</strong>fenses<strong>of</strong> criminal events.ago i nst ra i I roads; and the Federal CrimeThe next segment <strong>of</strong> the section provides I nsurance Program., ',Personal victimizations:Robbery and attempted robberyRape and attempted rapeRobbery177,5411,380,96210010098,871770,369565674,031596,29942434,64014,2943Iwith injury 440,075 100 293,246 67 138,101 31 8,727 2Serious assault 215,204 100 159,262 74 50,167 23 5,775 3Minor assault 224,871 100 133,984 60 87,934 39 2,952 IRobbery without injury 595,194 100 362,456 61 231,357 39 1,381 0Attempted robbery without Injury 345,693 100 114,666 33 226,841 66 4,186 IAssault 5,023,806 100 2,196,346 44 2,678,875 53 148,585 3Aggravated assaul t 1,795,702 100 937,493 52 798,703 44 59,506 3With injury 590,542 100 366,591 62 197,039 33 26,912 5Attempted assault with weapon 1,205,160 100 570,903 47 601,664 50 32,593 3Simple assault 3,228,104 100 1,258,853 39 1,880,172 58 89,079 3With injury 842,949 100 425,609 50 391,584 46 25,756 3Attempted assault without weapon 2,385,154 100 833,244 35 1,488,587 62 63,322 3Personal larceny with contact 604,875 100 244,430 40 350,348 58 10,097 2Purse snatching 146,330 100 90,241 62 56,089 38 0 XAttempted purse snatching 48,975 100 B B B B B BPocket picking 409,571 100 145,320 35 255,841 62 8,409 2Personal larceny without contact 15,273,714 100 4,001,328 26 10,970,185 72 302,201 2I-busehold victimizations:Burglary 7,392,603 100 3,774,784 51 3,505,622 47 112,197 2Forcible entry 2,587,098 100 1,972,734 76 583,362 23 31,002 ILnlawful entry without force 3,078,168 100 1,205,539 39 1,821,559 59 51,070 2Attempted forcibl e entry 1,727,337 100 596,510 35 1,100,702 64 30,125 2Larceny 10,174,660 100 2,667,509 26 7,426,308 73 80,843 ILnder $50 4,903,484 100 630,548 13 4,241,315 86 31,621 I$50 or more 4,032,487 100 1,734,054 43 2,273,140 56 25,294 IAmount not ascertained 507,655 100 117,876 23 378,695 75 11,084 2Attempted 731,033 100 185,031 25 533,159 73 12,844 2Vehicle theftCompleted1,438,980890,898100100958,997774,8796787468,283110,497331211,7005,522IIAttempted 548,082 100 184,118 34 357,786 65 6,178 IaSubcategories may not sum to total because <strong>of</strong> rounding.Source: Table constructed by SOlRCEBOO< staff from data provided by the U.S. Department <strong>of</strong> <strong>Justice</strong>, <strong>Bureau</strong> <strong>of</strong> <strong>Justice</strong> <strong>Statistics</strong>.Precedin - ~
<strong>Sourcebook</strong> <strong>of</strong> <strong>Criminal</strong> <strong>Justice</strong> Stotistics <strong>1983</strong>Table 3.2 Estimated number <strong>of</strong> personal and household victimizations and percent not reported to police, 1973-81, snd estimated number<strong>of</strong> business victimizations and percent not reported to police, 1973-76, by type <strong>of</strong> victimization, United Statesi'OTE: See NJTE, Table 3.1. The data presented for the years 1973-79are weighted estimates based on 1970 population figures from the U.S.<strong>Bureau</strong> <strong>of</strong> the Census. Data for 1980 and 1981 are weighted estimatesbased on 1980 population figures from the U.S. <strong>Bureau</strong> <strong>of</strong> the Census.The 1980 data presented here are not comparable to the 1980 datapresented in the 191fl SO-RCEBOO< because the 19110 data in the 1982Sa..RCEBOO< were based on 1970 population figures.Type <strong>of</strong> victimizationPersonal victimizations:Rape and attempted rapeRobberyRobbery and attempted robberywith injurySerious ossaultMinor assaultRobbery without injuryAttempted robbery without injuryAssaultAggravated assaultWith injuryAttempted assault with weaponSimple assaultWith injuryAttempted assault without weaponPersonal larceny with contoctPurse snatchingAttempted purse snatchingPocket pickingPersonal larceny without contactI-busehold victimizations:BurglaryForcible entryUnlawful entry without forceAttempted forcible entryLarcenyUnder $50$50 or mareAmount not oscertainedAttemptedVehicle theftCompletedAttemptedBusiness victimizations:RobberyBurglaryEstimatednumber152,7401,086,700376,000208,800167,200396,740313,9604,001,8201,616,700496,9601,197,7402,385,120603,5001,781,610495,590103,28071,260321,05014,635,6556,432,3502,070,9502,956,8301,404,5607,506,4904,824,9001,884,280263,750533,5601,335,41081l4,710450,710264,1131,384,998aSubcategories may not sum to total because <strong>of</strong> rounding.Source:The business portion <strong>of</strong> the survey only counted burglaries androbberies; crimes such as shoplifting and employee theft were notcounted. The business portion <strong>of</strong> the survey was not conducted <strong>of</strong>ter1976.For survey methodology and definitions <strong>of</strong> terms, see Appendix I I.1973 1974 127~ 1976PercentPercentPercentPercent1977not Estimated not Estimated not Estimated not Estimatedreported number reported number reported number reported number51 161,16046 1,173,98035 383,47028 215,00042 168,46043 466,40064 324,12055 4,063,68047 1,695,44039 545,99051 1,149,45061 2,368,24051 582,19064 1,786,05066 511 ,48051 90,230B 62,83068 358,41077 15,098,11852 6,655,07029 2,190,33062 3,031,08068 1,433,66074 8,866,06084 5,641,16047 2,351,49077 296,00080 577,41031 1,341,89013 855,68067 486,21014 266,62421 1,555,30447463732444163544639496154636536B717551286264748451777532II681019151,055 44 145,193 47 154,2371,121,374 46 1,110,639 46 1,082,936353,493 34 360,700 36 386,405207,114 33 175,660 32 214,670146,380 37 185,041 39 171,735467,595 41 453,867 40 412,505300,285 69 296,071 67 284,0264,176,056 54 4,343,261 52 4,663,8271,590,080 44 1,694,941 41 1,737,774543,175 34 581l,672 37 541,4111,046,905 49 1,106,269 43 1,196,3632,585,976 60 2,648,320 59 2,926,053687,352 51 691,534 53 755,7801,898,624 63 1,956,786 60 2,170,273513,952 65 497,056 63 461,014119,096 36 91,595 32 87,93760,912 B 55,535 B 46,687333,943 72 349,926 70 326,39015,455,660 73 16,021,110 73 16,469,1546,61l8,964 51 6,663,422 51 6,766,0102,251,869 27 2,277,063 29 2,300,2922,959,734 62 2,826,599 60 2,962,7051,477 ,361 67 1,559,760 66 1,503,0139,156,711 72 9,300,854 72 9,415,5335,615,914 84 5,601,954 84 5,443,6972,707,605 46 2,745,097 47 2,851,831277,922 81 299,350 i8 410,196555,270 76 654,454 73 709,8081,418,725 28 1,234,644 30 1,296,759910,253 B 759,816 II 797,671508,472 63 474,828 61 499,089261,725 9 297,516 12 X1,518,339 18 1,576,242 25 XTable constructed by SOtRCEBOO< staff from data provided by the U.S. Deportment <strong>of</strong> <strong>Justice</strong>, <strong>Bureau</strong> <strong>of</strong> <strong>Justice</strong> <strong>Statistics</strong>.Percentnotreported42443324453570554737516051636236B6674SO276067748552827331II63XX:i1978PercentEstimated notnumber re /'ted1979Estimatednumber171,145 49 191,7391,031l,074 49 1,115,870330,843 3~179,90531l1,24529150,939203,30037408,833177,94644298,391l 470,846724,730,097263.771l561,707,8834,845;82246576,7311,768,61l3361,131,152 599,136513,022,2141,169,54762755,1253,077,139512,267,089 795,41l366549,9672,281,65664111,475510,7904465,56!l119,548B372,92446,7076616,492,446 344,53574 15,861,37!J6,69!J,51l1 522,199,9256,6!J4,01!l292,911,696 2,154,639611,586,9593, 1U9,2!l0679,344,239 1,420,099755,177,91610,631,289873,125,6045,726,44154395,9433,666,79677644,776562,414771,364,549 675,639,33860,0161,392,837II504,533 920,15tl71/1472,679II!Ii III~IId11IIIII ,I i;111/II{U'"(1IilinIip11ilIi:!,.i ~1 fitX X XX X XNature and Distribution <strong>of</strong> Known Off enses1980Percent 1981notPercentEstimated notPercentre rted numberEstimatedre or tednotnumber re rted4842173,770 57 177,541 421,209,039 41 1,380,962 4335 415,6153228210,410440,075 313822205,205 215,204 233434478,035224,871383967 315,388595,194 3954644,747,256 345,693 6644521,706,7455,023,806 533643587,5301,795,702 4449361,1/9,215 590,542 3359463,040,5111,205,160 504657849,9843,228,104 5864492,190,527 842,949 466460557,7602,385,154 624063143,626604,875 58B4055,168146,330 3870B358,966 48,97569 B74 14,751l,069 409,571716215,273,714 7251 6,973,93227482,462,0807,392,603 4760263,033,1632,587,098 2367571,478,6903,078,168 59746410,466,874 1,727,337 6486725,060,05010,174,660 7355864,150,0334,903,484 867755500,3214,032,487 567570756,469507,655 7530721,380,796731,033297313 936,5931,438,980123336 444,203890,89!l6412548,082 65XXX X X XX X X X,0
---------------------,-------------------<strong>Sourcebook</strong> <strong>of</strong> Criminol <strong>Justice</strong> <strong>Statistics</strong> <strong>1983</strong>Agure 3.1 Estimated percent <strong>of</strong> personal victimizations not reported to police, by type <strong>of</strong> victimization, UlltedStates, 1973-81l'O'rE: See I'OTES, Tables 3.1 and 3.2. For survey methodology and definitions <strong>of</strong> terms, see Appendix II.j"'O' ,1 .1I lI tINature and Distribution <strong>of</strong> Known OffensesAgure 3.2 Estimated percent <strong>of</strong> household victimizations not reported to police, by type <strong>of</strong> victimization, UnitedStates, 11l73-81I'OTE:10090See )\[)TES, Tables 3.1 and 3.2. For survey methodology and definitions <strong>of</strong> terms, see Appendix II.~----------------------~~ -----, ~.....8070--------...-- --~ ----------- ~'0CIIt::0C<strong>of</strong>!(5c:1:CI)eCI)Q.60---------------50402010---.. ~-- ................... ..----------..-........ .------- .,.,..--- ......... "",."'-; ........ ~.-'.......... ~~--;..... d ~ ,••••••• II ............ "' ............. ...: :-a..•• ~., ••• "-......... '-L ..... '.. 8"""' WI'" •• • ••• e •••••••••• 1' •••O~~----T----,~--~-----.----.-----r---~--__ ,1973 1974 1975 19761977 1978 1979 1980 1981I !IrI''0CI)t::0..a.CI)...0c:1:CI)..uCI)Q.6050 - -40.. ............. .....30 ••.•..........•....2010........ ....... .........•....• ............o ~·,.-yi--------~I~-------rj--------'I---------rl--------TI--------'I---------ri------~-,1973 1974 1975 1976 1977 1978 1979 1980 1981Personal larceny without contact- - Personal larceny with contact- • - ., Assault- - _. Rape a~d attempted rape•••••••••• RobberySource: Figure constructed by SCLRCEBOO< staff from data provided by the U.S. Department <strong>of</strong> <strong>Justice</strong>, <strong>Bureau</strong> <strong>of</strong><strong>Justice</strong> <strong>Statistics</strong>.Iii• - - Larceny-Burglary••••••• Vehicle theft<strong>Justice</strong>Source:<strong>Statistics</strong>.Figure constructed by SOURCEB(X)( staff from data provided by the U.S. Department <strong>of</strong> <strong>Justice</strong>, <strong>Bureau</strong> <strong>of</strong>UnIIIiIi311
--""'l--...--,..------------<strong>Sourcebook</strong> <strong>of</strong> <strong>Criminal</strong> <strong>Justice</strong> <strong>Statistics</strong> <strong>1983</strong>Noture and Distribution <strong>of</strong> Known OffensesTable 3.3 Estimated number <strong>of</strong> personal ~ctinib:ctionsand age <strong>of</strong> victim, lklited States, 1981and S'stimated number not reported to police, by type <strong>of</strong> victimization, and sexi'DTE:See i'DTE, Table 3.1. For survey methodology and definitions <strong>of</strong> terms, see Appendix II."Type <strong>of</strong> victimizationand sex <strong>of</strong> victimRope and attempted rope:Molef3Female 56,919Robbery:Mole 277,115Female 512,069Robbery end attemptedrobbery with injury:Mole 84,586Female 26,5123Serious assault:Mole 43,706FemaleBMinor assault:Mole 40,880Female 18,426Robbery without injury:Mole 112,486Female 42,196Attempted robberywithout injury:Mole 80,043Female 22,949Assoult:Mole 1,038,525Female 480,269Aggravated assault:Mole 404,954Female 125,889With injury:Mole 170,257Female 47,847Attempted assaultwith weapon:Mole 234,697Female78,04:lSimple assault:Mole 633,571Female 354,380With injury:Mole 176,493Female 512,847Attempted assaultwithout weapon:Mole 457,078Female 261,533Personal larcenywith contact:Mole 60,398Female 35,456Purse snatching:MoleBFemale 17,077Attempted purse snatching:MoleBFemale 3, 1~7Pocket picking:Mole 60,398Female 15,183Peuonal larcenywithout contact:MoleFemale12 to 19 20 to 34Not reportedNot reportedTotalto policeTotalto policeNJf11ber Percen! N:JrTlber Percent Number Percent Number Percent2,041, 1131,854, 115B100100100100100100B100100100100100100100100100100100100100100100100100100100100100100B100B100100100100100BB170,01946,29742,903BBBBB57,468B69,648B684,902295,620222,512254,86971,809B151, I 1339,363461,979240,751113,26160,470346,716180,261BBBBBBBB1,687,8721,559,973BB615051BBBBB51B67B6662554442B6450736864657669BBBBBBBB8384B90,604351,465201,138106,00171,91958,027B47,97440,946156,59980,80386,66546,4161,576,502875,514634,91 I256,057185,20177,494449,710178,563941,5512639,456227,545213,776714,047425,681107,810132,163853,624B24,890107,81053,6493,427,5373,019,416B100100100100100100B100100100100100100100100100100100100100100100100100100100100100100B100B100100100100100B37,1512172,70067,25036,190BBBBB73,89729,56862,613B652,023399,019310,79665,40757,13729,763253,65955,624541,227313,61285,00460,956456,223232,65667,43969,774BBBB67,439B2,463,7542,075,111B41493334BBBBB473770B54454933313656315749373864556353BBBB63B7269Age <strong>of</strong> victim On years)35 to 49Not reportedTotalto policeNumber Percent Number PercentB12,839125,42481,21932,512426,06123,857B9,06714,34152,86934,36739,61120,791403,746257,631177,166512,66443,96732,634133,21860,050226,560164,94736,86349,725187,677115,22228,67172,293B23,260B9,58227,08839,4511,386,3751,461,381B100100100100100100B100100100100100100100100100100100100100100100100100100100100100100B100B100100100100100BB46,76626,349BBBBBBBBBB176,260102,:l0160,60530,951BB53,454B115,65571,250BB102,16948,459B35,296BBBBBB900,206959,662BB3732BBBBBBBBBB44403433BB40B5143BB5442B49BBBBBB6566'iIIi)II'iIiIII'I50 to 64 65 or olderNOt reportedTotalNOt reportedTotal to police TojalNOt reportedto policel\kJITlber Percent Number Percent Number PercentTotalto policeNumber Percent Number Percent Number PercentB6,66973,11480,12531,29126,56519,0935,27012,19821,7.9526,97340,91614,85112,644158,519119,99453,56230,839,13,3437,10230,21923,737104,95689,15624,60713,43980,34975,71721,74573,604B32,693B8,27321,74532,638747,770851,290B B100 B100 24,260100 15,803100 B100 B100 B100 B100 B100 B100 B100 B100 B100 BIOU "/5,477100 47,634100 B100 B100 B100 B100 B100 B100 57,176IUU 39,224IOU100 B100 51,142100 B100 B100 40,772B B100 BB B100 B100 B100 B100 458,973100 549,888B BB 2,72633 48,78820 50,504B 6,945B 26,8602,733B BB 4,212B 15,532B 31,393B 16,572B 10,449B 7,07348 52,34940 40,756B 8,190B 11,429B BB 2,697B 8,190B 8,73J54 44,15944 29,326B 4,190B 1,44564 39,969B 27,882B 23,69055 49,045B BB 18,093B BB 3,032B 23,690B 27,512061 250,64665 234,072B B100 B100 B100 B100 B100 B100 BB B100 B100 B100 B100 B100 B100 £:j100 B100 B100 B100 BB B100 B100 B100 B100 B100 B100 B100 B100 B100 B100 B100 BB B100 BB B100 B100 B100 B/00 169,749100 144,778B 7,783B 169,757B 875,906B 505,055B 261,746B 178,328B 147,415B 67,789B 114,331B 110,540B 380,340B 214,854B 233,819B 111,873B 3,229,641B 1,794,165B 1,278,803B 516,899B 422,769B 167,774B 856,034B 349,126B 1,950,838B / ,277 ,265B 471,718B 371,231B 1,479,120B 906,034B 242,314B 362,562B 1,583B 144,747B 0B 48,975B 240,730B 168,84068 7,853,44162 7,420,273100 B100 66,247100 432,244100 164,055100 100,009100 38,093100 39,896100 B100 60,112100 27,822100 166, In100 65,165100 166,044100 60,797100 1,817,830100 861,045100 617,689100 181,014100 141,689100 55,350100 475,999100 125,665100 1,200,141100 680,030100 217,786100 173,798100 982,355100 506,232100 :':;2,704100 197,644100 B100 56,089X B100 38,418100 152,704100 103,137100 5,680,553100 5,289.632B394932382127B53254430715456484835343356366253464766566355B39B7863617271aSubcategories may not sum to total because <strong>of</strong> rounding.Source: Table constructed by SO-.RCEBOO< st<strong>of</strong>f from data provided by the u.S. Deportment <strong>of</strong> <strong>Justice</strong>, <strong>Bureau</strong> <strong>of</strong> <strong>Justice</strong> <strong>Statistics</strong>.313312
<strong>Sourcebook</strong> <strong>of</strong> <strong>Criminal</strong> <strong>Justice</strong> <strong>Statistics</strong> <strong>1983</strong>Ta~le 3.4 Estimated number <strong>of</strong> personal ~ctimizations and estimated number not reported to police, by type <strong>of</strong> victimization, and raceand age <strong>of</strong> victim, United States, 1981Type <strong>of</strong> victimizationand race <strong>of</strong> victimf\OTE:Rape and attempted rape:WhiteBlack and other racesRobbery:WhiteBlack and other racesRobbery and attemptedrobbery with injury:WhiteBlack and other racesSerious assault:WhiteBlack and other racesMinor assault:WhiteBlack and other racesRobbery without injury:WhiteBlack and other racesAttempted robberywithout injury:WhiteBlack and other racesAssault:WhiteBlack and other racesAggravated assault:WhiteBlack and other racesWith injury:WhiteBlack and other racesAttempted assaultwith weapon:WhiteBlack and other racesSimple assault:WhiteBlack and other racesWith injury:WhiteBlack and other racesAttempted assaultwithout weapon:WhiteBlack and other racesPersonal larcenywith contact:WhiteBlack and other racesPurse snatching:WhiteBlack and other racesAttempted purse snatching:WhiteBlack and other racesPocket picking:WhiteBlack and other racesPersonal larcenywithout contact:WhiteBlack and other racesSee f\OTE, Table 3.1. For survey methodology and definitions <strong>of</strong> terms, see Appendix II.Age <strong>of</strong> victim (In ~ears)12 to 19 20 to 3435 to 49Not reportedNot reportedf\k:t reportedTotalto policeTotalto police Totalto police~er Percent ~er Percent ~ber Percent ~er Percent ~er Percent ~er Percent42,687B263,385105,80092,07219,43742,770B49,302B85,11669,S6686,1%B1,249,016269,778419,475111,368166,77351,331252,70360,037829,541158,411235,08134,25!1594,460124,15177 ,90717 ,94712,175BBB64,348B3,432,349462,879100B100100:00100100B100B100100100B100100100100100100100100100100100100100100100100100BBB100B100100BB163,06353,25340,061BBBBB54,475B68,528B815,582164,94U219,93257,85967,632B152,300B595,650107,080155,023B440,62788,372BBBBBBBB2,835,571412,274aSubcategories may not sum to total because <strong>of</strong> rounding.BB625044BBBBB64B80B6561525241B60Bn6866B7471oBBBBBBB838977 ,855B395,716156,887132,36645,55456,942B75,423B156,73280,669106,018B2,174,779297,237759,662131,306209,74652,950549,91678,3571,1115,117165,9313%,30545,0151,018,812120,9151';.$,31263,C6127,133BBB130,302B5,520,373926,580100B100100100100100B100B100100100B100100100100100100100100100100100100100100100100100BBB100B10010035,481B168,07671,87438,331BBB29,483B65,49537,97164,250B1,102,909148,134338,92857,27570,946B267,983B76::1,98090,859151,190B612,79076,089108,383BBBBB86,855B3,905,386633,47946B424629BBB39B424760B5150454434B49B545538B606361BBBBB67B716812,389B!56,81749,82746,04112,94428,790B17,251B65,19822,05845,578B540,177121,201206,50363,36756,23320,368150,27042,999333,67457,83477,81110,797255,86347,0377:1,91921,04514,854BBB55,484B2,488,056359,699100B100100IUO100100B100B100100100B100100100100100100100100100100100100100100100100100BBB100B100100BB48,377BBBBBBBBB13B225,229B64,023BBB55,705B161,206B33,508B127,698B38,296BBBBBBB1,604,9512S5,I38Source: Table constructed by SOLRCEBOO< staff from data provided by the U.S. Deportment <strong>of</strong> <strong>Justice</strong>, <strong>Bureau</strong> <strong>of</strong> <strong>Justice</strong> <strong>Statistics</strong>.BB31BBBBBBBBBBB42B31BBB37B48B43B50B48BBBBBBB6571[i!IiII!I!iINoture and Distribution <strong>of</strong> Known Offenses- - ___--'so:!!W! 64 65 Id- Not t d or a er Total_ Total t re~r e Not reportedI'bliber Percent n:sP po ce Total to pol!ce''MTlOer Percent N..mber Percent Number Percent5,433 100B B106,458 10046,7111 10038,561 10019,294 10017,399 100B B21,162B100B45,19722,692100100:t2,7OU 100B B:C!.'!242,n::35,575 10072,354 10012,048 IOU22,716 1007,729 1004!1,638 1004,319 100170,585 10023,527 10033,507 1004,539 100137,078 10018,988 10082,71212,63728,492BBB47,314B1,476,392122,667BB30,277BBBBBaBBBBB110,070B23,985BBBBB86,084BBB71,%0B100 44,199100 B100 BB BBBBB100 BB B100 912,642100 96,219BB28BBBBBBBBBBB45B33BBBBB50BBB52B1,484 100B B73,091 10026,201 10029,553 1004,252 10012,441• 100B B17,109100B B29,686 10018,279 10013,852 100B B69,890 10023,214 10012,951 1006,669 1002,697 100o X10,254 1006,669 10056,940 10016,545 1005,634 100o X51,305 10016,545 100BB12,469BBBBBBBBpBBBBBBBBB8BBBBBB53 57,483 100 BB 15,253 100 B12,178B BB BB BB43,938B62 426,55178 S8,I67100 BB BB B100 BB B100 267,617100 BTotalNumber PercentB 139,847 100B 37,694 10017 995,466 100B 385,495 100B 338,594 100BIOI,481 100B 158,346 100B 56,858 100B 180,248 100B 44,623 100B 381,930 100B 213,265 100B 274,943 100B 70,750 100B 4,276,800 100B 747,rj,(;.'i 100B 1,470,944 100B 324,758 100B 458,164 100B 132,378 100B 1,012,780 100B 192,380 100B 2,805,856 100B 422,248 100B 748,339 100B 94,611 100B 2,057,517 100B 327,637 100B 474,333B 130,542B 94,833B 51,497B 38, 114B 10,860B 341,386B 68,18563 13,343,721B 1,929,993315Not reportedto pol!ceNumber Percent60,267B422,263174,036104,87533,22634,953B69,922B145,52385,834171,1l65B2,285,646393,228651,650147,053153,77443,265497,876103,7881,633,996246,176353,84637,7381,280,150208,437100 285,266100 65,081100 39,020100 B100 B100 B100 215,833100 B100 9,526,167100 I ,444,01843B4245313322B39B384063B5353444534334954585847406264605041BBB63B7175
<strong>Sourcebook</strong> <strong>of</strong> <strong>Criminal</strong> <strong>Justice</strong> <strong>Statistics</strong> <strong>1983</strong>Table 3.5 Estimated number <strong>of</strong> household victimizations and estimated number not reported to police, by type <strong>of</strong> victimization, race <strong>of</strong>head <strong>of</strong> household, and family income, lkIlted States, 198 I aNJTE: See NJTE, T(lble 3.1. For survey methodology and definitions <strong>of</strong> terms, see Appendix II.lkIder $3,000N:Jt reportedType <strong>of</strong> victimization and Total to policerace <strong>of</strong> head <strong>of</strong> household NJrnber Percent NJrnber PercentBurglary:White 396,270 100 231,834Block and other races 203,485 100 109,472Forcible entry:White 95,974 100 27,618Black and other races 87,954 100 26,0661kI1awfui entry withoutforce:White 218,595 100 146,868Black and other races 49, 120 100 BAttempted forcible entry:White 81,701 100 57,341lBlock and other races 66,411 100 BLarceny:WhiteBlock and other raceslkIder $50:WhiteBlock and other races$50 or more:WhiteBlock and other racesAmount not ascertained:WhiteBlack and other racesAttempted:WhiteBlack and other racesVehicle theft:WhiteBlock and other racesCompleted:WhiteBlack and other racesAttempted:WhiteBlock and other races390,270145,403204,66757,826141,25058,83925,79321,19118,5597,54610010010010010010010010010010043,07610,85910010030,2353,27910010012,8417,580100100287,762106,609174,709B78,391BBBBBBBBBBB59542930°Subcategories may not sum to total because <strong>of</strong> rounding.67B70B972,567 100 544,660367,646 100 194,146306,254 100 101,374155,070 100 46,080432,138 100 ?{i;l,880114,633 100 '71 ,694234,174 100 153,40697,943 100 76,37274 1,277 ,25473 348,67485 656,106B 160,53355 447,343B 143,189B 81,852B 26,515B 91,953B 18,437BBBBBB100100100100100100100100100100127,29840,58310C10074,76426,80810010052,53413,775100100969,101277,761575,157140,235264,24399,67962,937B66,764B53,689B14,892BBB56 385,512 100 163,65753 116,872 100 50,55933 152,570 100 38,07630 56,928 100 B6763139,47626,41310010077,863B667893,46633,53110010047,718B76808887597077B73B42B20BBB558,426120,180299,96938,734190,26652,46625,40815,08342,78413,89710010010010010010010010010010062,529 10014,006 10037,398 10012,325 10025,131 100I ,681 100422,66889,323260,647B113,319BBBBBBBBBBB424325B56B51B962,959 100187,397 100315,659 10072,809 100418,028 10077,415 100229,273 10037,173 10076 1,412,48574 218,32587 697,972B 77,61460 557,722B 112,040B 63,629B 16,339B 93,163B 12,332Source: Table constructed by SOlRCEBOO< st<strong>of</strong>f from data provided by the U.S. Deportment <strong>of</strong> <strong>Justice</strong>, <strong>Bureau</strong> <strong>of</strong> <strong>Justice</strong> <strong>Statistics</strong>.BBBeBB100100100100100100100100100100215,345 1005U,298 100135,124 10029,217 10080,221 IOU21,082 100IN:Jture and Distribution <strong>of</strong> Known OffensesI}L.$14,999r$15,000 to $24,999$25,000 or more N:?t ascertainedN:lt reportedN:Jt reportedN:Jt reprtedN:lt reportedto police Total to police(Total to police Total to policel\Unber Percent twmber Percent ~er Percent twmber Percent twmber percent Number Percent IWmber pe;:centI475,266 49 1,386,832 100 604,388 44 1,357,233 100 586,632 43 613,489 100 269,99081,6404444 189,548 100 86,375 46 111,497 100 40,361 36 141,298 100 66,642 4777 ,089 24 489,015 100 92,452 19 455,971l 100 62,783 14 229,674 100 54,886 24B B 74,558 100 9,244 14 47,710 100 B B 46,945 100 B B261,590 63 595,744 100 306,230 51 625,609 100 354,445 57 239,322 100 132,785 55B B 54,012 100B B 33,423 100 B B 54,240 100 B BI136,51l7 60 302,073 100 205,106 68 275,646 100 16~,404 61 144,492 100 82,318 57IB B 60,977 100B B 30,364 100 B B 40,113 100 B Bl1,0
--------------------_.;e __ ... , .... ,.~_I~~('<strong>Sourcebook</strong> <strong>of</strong> <strong>Criminal</strong> <strong>Justice</strong> <strong>Statistics</strong> <strong>1983</strong>Table 3.6 Estimated number <strong>of</strong> personal and household victimizations not reported to police, by type <strong>of</strong> victimization and reason givenfor not reporting to police, United States, 1981 aNJTE: See NJTE, Table 3.1. Because respondents may have given morethan one reason for not reporting the victimization to the police, therow sum <strong>of</strong> the "reason for not reporting to the police" may exceed"total victimizations not reported." Beginning in 1979, new responsecategories for "reason for not reporting the victimization to the police"were used. Because <strong>of</strong> this change, caution should be observed incomparing the results <strong>of</strong> surveys after 1978 with earliet years--particularly for the category "nothing could be done." For surveymethodology, definitions <strong>of</strong> terms, and a discussion <strong>of</strong> changes In the1979 interview schedule, see Appendix II.Reason for not rel20rting victimization to 120l!ceTotal Nothing Victimization not Police wouldn't wont Did notvictimizations could be done Iml20rtant enough to be bothered wont to toke ti!I!!lType <strong>of</strong> victimization not rel20rted Number Percent ~\!!I!be[ Esm;;eo! bl!.!robe[ ~[!
<strong>Sourcebook</strong> <strong>of</strong> Criminol <strong>Justice</strong> Stotistics <strong>1983</strong>.Table 3.7 Estimated rate (per 100,000 units <strong>of</strong> each respective category) <strong>of</strong>personal and household victimization, by type <strong>of</strong> victimization and extent <strong>of</strong>urbanization, United States, 1981 aNJTE: See NOTE, Table 3.1. 'fhe figures in this table estimate rates <strong>of</strong> personal andhousehold victimization. Estimat
-----_.------------------------------------<strong>Sourcebook</strong> <strong>of</strong> <strong>Criminal</strong> <strong>Justice</strong> <strong>Statistics</strong> I Sl83Figure 3.4 Estimated rate (per 100,000 persons 12 years <strong>of</strong> age or older) <strong>of</strong> robbery victimization, United States, ISl73-81!'DTE: See !'DTES, Tables 3.1, 3.2, and 3.7. For survey methodology and definitions <strong>of</strong> terms, see Appendix J I.(Rate per 100,000 persons 12 years <strong>of</strong> age or older)750 741Nature and Distribution <strong>of</strong> Known OffensesFigure 3.6 Estimated rate (per 100,000 persons 12 years <strong>of</strong> age or older) <strong>of</strong> personal larceny with contact victimization, United States,1973-81!'DTE:See N::lTES, Tables 3.1, 3.2, and 3.7. For survey methodology and definitions <strong>of</strong> terms, see Appendix II.(Rate per 100,000 persons 12 years <strong>of</strong> age or older)600626375l324~II:4503001500300225150751975 1976 1977 1978 1979 1980 1981Source:Figure constructed by SaRCEBOa< staff from data provided by the U.S. Deportment <strong>of</strong> <strong>Justice</strong>, <strong>Bureau</strong> <strong>of</strong> <strong>Justice</strong> <strong>Statistics</strong>.1973 1974 1975 1976 1977 1978 1979 19801981Figure 3.5 Estimated rate (per 100,000 persons 12 years <strong>of</strong> age or older) <strong>of</strong> assault victimization, United States, ISl73-81!'DTE: See !'DTE.S, Tables 3.1, 3.2, and 3.7. For survey methodology and definitions <strong>of</strong> terms, see Appendix II.(Rate per 100,000 persons 12 years <strong>of</strong> age or older)3,000Source:Figure constructed by SaRCEBOO< st<strong>of</strong>f from data provided by the U.S. Department <strong>of</strong> <strong>Justice</strong>, <strong>Bureau</strong> <strong>of</strong> <strong>Justice</strong> <strong>Statistics</strong>.Figure 3.7 Estimated rate (per 100,000 persons 12 years <strong>of</strong> age or older) <strong>of</strong> personal larceny wiihout contact victimization, lklitedStates, 1973-81!'DTE: See N::lTES, Tables 3.1, 3.2, and 3.7, For survey methodology and definitions <strong>of</strong> terms, see Appendix II.(Rate per 100,000 persons 12 years <strong>of</strong> age or older)2,5002,00010,5009,0009,4628,8998,194.!!lI'IJII:1,5007,5001,000500.!!lI'IJII:6,0004,50003,0001979 1980 198'1Source:Figure constructed by SaRCEBOO< st<strong>of</strong>f from data provided by the U.S. Department <strong>of</strong> <strong>Justice</strong>, <strong>Bureau</strong> <strong>of</strong> <strong>Justice</strong> <strong>Statistics</strong>.1,500322:" ;/iI11!\II "?lIIj1;1I), ,1973 1974 '1975 1976 1977 1978 1979 1980 1981Source: Figure constructed by SaRCEBCJCK staff from data provided by the U.S. Deportment <strong>of</strong> <strong>Justice</strong>, <strong>Bureau</strong> <strong>of</strong> <strong>Justice</strong> <strong>Statistics</strong>.323
<strong>Sourcebook</strong> <strong>of</strong> <strong>Criminal</strong> <strong>Justice</strong> <strong>Statistics</strong> <strong>1983</strong>Figure 3.8 Estimated rate (per 100,000 households) <strong>of</strong> household burglary victimization, United States, 1973-81/\oTE: See /\oTES, Tables 3.1, 3.2, and 3.7. For survey methodology and definitions <strong>of</strong> terms, see Appendix II.(Rate per 100,000 households)Nature and Distribution <strong>of</strong> Known OffensesFigure 3.10 Estimated rate (per 100,000 households) <strong>of</strong> motor vehicle theft, United States, 1973-81/\oTE: See /\oTES, Tables 3.1, 3.2, and 3.7. For survey methodology and definitions <strong>of</strong> terms, see Appendix II.(Rate per 100,000 households)HI,5009,0009,2679,1468,890 8,856 8,591 8,4098,7882,0001,6001,9401,750 1,7521,711$asa:7,5006,0004,500$asa:1,2008004003,00001973 1974 1975 1976 1977 1978 1979 198019811,500.SvUii::c,Figure constructed by SCLRCEBOO< staff from data provided by the U.S. Deportment <strong>of</strong> <strong>Justice</strong>, <strong>Bureau</strong> <strong>of</strong> <strong>Justice</strong> <strong>Statistics</strong>.0Source:1973 1974 1975 1976 1977 1978 1979 1980Figure constructed by S
--~--~-...---<strong>Sourcebook</strong> <strong>of</strong> <strong>Criminal</strong> <strong>Justice</strong> <strong>Statistics</strong> <strong>1983</strong>Agure 3.11 Estimated rate (per 100,000 persons 12 years <strong>of</strong> age or older) <strong>of</strong> personal victimization, by type <strong>of</strong>victimization and sex <strong>of</strong> victim, lkIlted States, ISl81NJTE:G)n;a:See NJTES, Tables 3.1 and 3.7. For survey methodology and definitions <strong>of</strong> terms, see Appendix II.r(Rate per 100,000 persons 12 years af age or older)9,0008,0007,0006,0005,0004,0003,0002,0001,00009175Rape andattemptedrape983Robbery3,623////////////////////////~~~ 1,845/// ../// .... /// .... ///:.:.:./// .. /// /// ....../// :.:.:./// ......AssaultPersonallarceny withcontllctPersonallarcenywithoutcontactNature and Distribution <strong>of</strong> Known OffensesTable 3.9 Estimated rate (per 10v,000 persons 12 years <strong>of</strong>age or older) <strong>of</strong> personal victimization, by type a<strong>of</strong>victimization and race <strong>of</strong> victim, United States. 1981NJTE: See NJTES, Tables 3.1 and 3.7. For survey methodologyand definitions <strong>of</strong> terms, see Appendix II.(Rate per 100,000 persons 12 years <strong>of</strong> age or older)Type <strong>of</strong> victimizationBaseRape and attempted rapeRabberyRobbery with injuryS-:daus assaultMinar assaultRobbery withaut injuryAttempted rabbery without injuryAssaultAggravated assaultWith injur~Attempted assault with weaponSimple assaultWith injuryAttempted assault without weaponPersonal larceny with contactPurse snatchingAttempted purse snatchingPocket pickingPersonal larceny without cantactRace <strong>of</strong> victimBlack andWhite other races161 ,957,7908661520998III2361702,6419082836251,73:14621,27U29359242118,23924,453,7031541,576415233182~722893,0551,3285417871,7273871,340534211442797,892aSubcc;tegories may nat sum to total because <strong>of</strong> rounding.Source: Table constructed by S(LRCEBOO< staff fromdata provided by the U.S. Department <strong>of</strong> <strong>Justice</strong>, <strong>Bureau</strong> <strong>of</strong><strong>Justice</strong> <strong>Statistics</strong>.mMale1;:;:1 FemaleSource: Figure constructed by 5O..RCEBOO< staff from data provided by the U,S. Department <strong>of</strong> <strong>Justice</strong>, <strong>Bureau</strong> <strong>of</strong><strong>Justice</strong> <strong>Statistics</strong>.I I jI326"1'-
- -~ - ~------~Nature and Distribution <strong>of</strong> Known Offenses<strong>Sourcebook</strong> <strong>of</strong> <strong>Criminal</strong> JU5~ice <strong>Statistics</strong> <strong>1983</strong>. d t ( 100 000 persons 12 years~ Qf age or older) <strong>of</strong> personal victimization, by typeRgure 3.12 EstmlOte ra e per , • d S t 1981<strong>of</strong> victimization and race <strong>of</strong> victim. Unite ta ~:;,• I 3 I nd 3 7 For survey methodology and definitions <strong>of</strong> terms, see Appendix II.NJTE: See N::> TES ,QU T es • a • •Q)iiia:9,0008,0007,0006,0005,0004,0003,0002,0001,000(Rate per 100,000 persons 12 yeaf" <strong>of</strong> age or older)1,576-L __ ~8~6~1~5~40-__ ~~~~--~/~/~~8,239///7,892////// /// /// /// /// /// /// /// /// /// /// /// /// /// /// /// /,~/ .... /// '.'.'/// /// /// .... /// ./// .:.:./// .... /// .... /// ./// .....3,055 /// •••••2641 ;'// .••••.I :-:-: /// •••••. /// "' /// ..... /// .... /// . . . ,,"'// /// /// .... /// // /// ..... /' /// ..... /// ...../// ••••• /// .111 /// /// ...../// ..... /// .... "/ / / ••••• 534 / / ~ •••••///..... /,,, /// ..... // /' /// .....•• ~ •• ~.L-~~~:~~--~/~/~/~.~ •• ~o d Robbery Assault Personal PersonalRape an larceny with larceny~m~~ contact w 1 thoutrapecontact•• ~---Table 3~10 Estimated rate (per 100,Oll0 persons 12 y'ears <strong>of</strong> age or older)victimization and age <strong>of</strong> Victim, Un/tecl State;;, 1981 a<strong>of</strong> personal victimization, by type <strong>of</strong>N::>TE:See N::>TES, Tables 3.1 and 3.7. For survey methodology and definitions <strong>of</strong> terms, see Appendix II.(Rate per 100,000 persons 12 years <strong>of</strong> age or alder)Age c.f victim (in years)Tle!: <strong>of</strong> victimization 12 to 15 16 to 19 20 to 24 25 to 34 35 to 49 50 to 64 65 o[ gl9'.£LBase 14.511 1 861 16 1143.846 21.124,159 38.458.920 37.876.884 33,249,820 25,046,004Rape and attempted rape 142 243 199 135 38 20 IIRobbery 1,176 1,230 1,227 763 546 461 396Robbery with Injury 327 397 302 29/ 156 174 135Serious assault ;56 184 122 164 94 73 56Minor assault 171 213 179 133 62 101 79Robbery without injury !oIl8 483 56!J 305 230 204 InAttempted robbery without injury 321 350 357 161 159 83 70Assault 4,566 5,303 5,395 3,464 1,746 838 372Aggravated assault 1,38!! 2,040 2,037 1,198 712 254 78With injury 624 790 618 343 20l 92 IIAttempted assault with weopon 765 1,250 1,418 854 510 162 68Simple assault 3,1T! 3,264 3,358 2,266 1,034 584 293With injury 912 849 998 599 234 114 22Attempted c.:~ault without weapon 2,266 2,t~15 2,360 1,667 800 469 271Personal larcen~ with contact 251 368 442 381 267 287 290Purse snatch in 9 28 81 106 81 66 98 72Attempted purs'! snatchIng 0 20 22 52 25 25 12Pocket picking 223 26!J 314 248 176 164 206Personal larcenl without contact 12.567 12,832 12,864 9,697 7,518 4,809 1,935aSubcategories may not sv n to total because <strong>of</strong> rounding.Source:Statlstfcs.Table construct\;C/ by so....RCEBOO< staff from data provided by the U.S. Department <strong>of</strong> <strong>Justice</strong>, <strong>Bureau</strong> <strong>of</strong> <strong>Justice</strong>~~I Whiteo Black/other. t ted by rr. cCEBOO< staff from data provided by the U.S. Department <strong>of</strong> <strong>Justice</strong>, <strong>Bureau</strong>Source: Figure cons ruc "'-"-"<strong>of</strong> <strong>Justice</strong> <strong>Statistics</strong>.
----....--,-"..__._-..- ~ -- ~~ ...<strong>Sourcebook</strong> <strong>of</strong> <strong>Criminal</strong> <strong>Justice</strong> <strong>Statistics</strong> <strong>1983</strong>Agure 3.13 Estimated rate (per 100,000 persons 12 y~ar.s <strong>of</strong> ,!ge or 0lderl9:r personalvictimization, by type <strong>of</strong> victimization and oge <strong>of</strong> victim, United States,N)TE: See N)TES, Tables 3.1 and 3.7. For survel' methodology and definit!ons <strong>of</strong> terms, seeAppendix II.13,50012,000(Rate per 100,000 persons 12 years <strong>of</strong> age or older)Nature and Distribution <strong>of</strong> Known OffensesTable 3.11 Estimated rate (per 100,0(10 persons 12 years <strong>of</strong> age or older) <strong>of</strong> personal Victimization, by type <strong>of</strong>Victimization, and sex, race, and age Ilf victim, United States, 1981af\OTE:Type <strong>of</strong> victimizationand race <strong>of</strong> victimBase:See N)TES, Tables 3.1 and 3.7. For survey methodology and definitions <strong>of</strong> terms, see Appendix II.(Rate per 100,000 persons 12 years <strong>of</strong> age or older)SEX IF VICTIM: MALEAge <strong>of</strong> victim (in years)12 to 15 16 to 19 20 to 24 25 to 34 35 to 49 50 to 6465 and olderWhite6,157,874Black and other races6,787,266 8,872,6751,238,11716,471,1181,285,62816,233,5271,481,20814, 101,6842,456,23'19,287,2412,253,965 1,564,182 956,314!II:10,5009,0003,0001,500/-"'\, ", " ".-........ " ........ .... ......'''- ~~,.-.-.-.-~ ........o l---..:~~1!~·~,·~·~·~i~·!·;:··;·~i~·~·~·~·;·:;:·;;··~!!~e~j~·!:;·;·:;:&·,~·ij·jj·~·~·~1~·~'.;:.;::.;::.::,:.~,~,---1:1 coa.r._12 16 20 25 35 50 65 orto to to15 19 24to34to49to64olderPersonal larceny without contactAssaultRobberyPersonal larceny with contactall". ..... Rape and attempted rapeSource: Figure constructed by SOUf!C~BOOK staff from data provided by the U.S.Department <strong>of</strong> <strong>Justice</strong>, <strong>Bureau</strong> <strong>of</strong> <strong>Justice</strong> <strong>Statistics</strong>.330, III Ii]!I' "LfI1,'j,it~IIIIrIIIIIRape and attempted rape:White0Black and other races21 009III81410000 0Robbery:0White1,418Black and other races1,549 1,5163,1627343,5386112,9443612,135334Robbery and attempted robbery1,167 1,421with injury:1,856White475Black and other races548 413 277264 1,15817148114667875Serious assault:229 687White0247Black and other races 281 148264157 115 94Minor assault:47:9 363 55629229 373White0228Black and other races267 265 120 56 52 450Robbery withaut injury:679 118 122 0 314WhiteU489Black and other races 457 6472,4122941,6722491,6761211,057169Attempted robbery without injury:553 638White1,641454Black and other races545 45648S1647071907889539990386 97Assault:215White5,494Black and other races7,893 7,5405,7S44,491l 2,142 1,019Aggravated assault:7,253 6,082 3,1134222,484 947White1,3741,976 2,944 3,180 1,594 915 345 52Black and other racesWith injury:2,177 4,394 3,216 1,737 1,269 316White347916Black and other races1,165 9011,2324331,5182119211318260Attempted assault with weapon:434 316White01,060Black and other races1,779 2,279 1,161 705 2111Simple assault:944 2,876 2,294 91152836 0White3473,518Black and other races4,948 4,361 2,905 1,227 674With injury:3,578 2,859 2,866 1,3763701,215 631White1,0271,104Black and other races1,276 1,2151,176631571228 163838 14245Attempted assault without weapon:81 106White02,415Black and other races3,672 3,1462,4022,2742,2889992,0275121,2343251,134 525 1,027Pt'rsonal larceny with contact:White392Black and other races 441 407 303 135 131PUrse snatching:291 209 1,0% 223218300 208White3620Black and other races 0 000000000Attempted purse snatching:70 0White00Black and other races0 0 0 0 0Pocket picking:0 0 C 000 0White0392Black and other races441 4072913032091351,0%131223218229 208 362Personal larceny without contact:White13,572Black and other races13,907 14,1219,10210,06011,5707,46415,5£74,1:!3811,7092,3607,752 4,193 3,287See footnote "t end <strong>of</strong> table.
~~--...-----.-.--- --Nature end Distribution <strong>of</strong> Known Offenses<strong>Sourcebook</strong> <strong>of</strong> <strong>Criminal</strong> <strong>Justice</strong> <strong>Statistics</strong> <strong>1983</strong>Table 3.11 Estimated rate (per 100,000 persons 12 years <strong>of</strong> age or older) <strong>of</strong> personal victimization, by type <strong>of</strong>victimization, and sex, race, and age <strong>of</strong> victim, United States, 198I a --ContinuedAge <strong>of</strong> victim (in years)Type <strong>of</strong> victimizationand race <strong>of</strong> victim 12 to 15 16 to 19 20 to 24 25 to 34 35 to 49 50 to 64 65 and olderSEX a=- VICTIM: FEMALEBase:WhiteBlock and other racesRape and attempted rape:WhiteBlack and other racesRobbery:WhiteBlack and other racesRobbery and attempted robberywith injury:WhiteBlack and ether racesSerious assault:Vv'hiteBlack and other racesMinor assault:WhiteBlack and other racesRobbery without injury:WhiteBlack ond other racesAttempted robbery without injury:WhiteBlack and other racesAssault:WhiteBlack and other racesAggravated assault:WhiteBlack and other racesWith injury:WhiteBlack and other racesAttempted assault with weapon:WhiteBlack ,f/ld other racesSimple asS6 ... t1':WhiteBlack and other racesWith injury:WhiteBlack and other racesAttempted assault without WE'apon:WhiteBlack and other racesPersonel larceny with contact:WhiteBlack and other racesPurse snatching:WhiteBlack and other racesAttempted purse snatching:WhiteBlack and other racesPocket picking:WhiteBlack and other racesPersonal larceny without contact:White__....:B:.:.la.d~and other races5,869,8671,246,003170800610620250o60o180o1704901801303,2005,2206601,1002005604605302,5304,1207504201,7703,6909025060oo2025013,1908,0806,730,3131,340,6384504205109901509060(l909020U890150o2,7703,0008701,0602307005803501,9001,9405305201.3601,4102706301203602013013012013,0407,510aSubcategories may not sum to total because <strong>of</strong> rounding.Source~<strong>Statistics</strong>.9,070,825 16,542,599 16,756,2351,699,450 2,988,966 2,633,1573504406501,27015035050160100180260820240903,4304,07U8801,1802806505905302,5402,89U7801,1401,7601,74035048019029050o11018012,0308,4002602204801,300210520803401301801605201002502,71,02,0508106901902606104301,9201,3506803201,2401,0303401,12050710802002002009,1808,9006060340890100290606040230140360802301,1402,4703401,3201304002109108001,1502403
-- ..... -~-..---=4'CI)("")CI)9:::s~Table 3.13 Estimated number <strong>of</strong> personal and household incidents, by type <strong>of</strong> victimization and time <strong>of</strong> occurrence, lktited States, 1981 0~0) I'OTE: See !\oTE, Table 3.1. Because a personal incident may involve more than one victim, the number <strong>of</strong>O'qpersonal victimizations can be expected ta e>.'ceed the number <strong>of</strong> persanal incidents. For hauseholdCI)!2:0)::svictimizations, the number <strong>of</strong> incidents is equivalent ta the number <strong>of</strong> victimizations, because the householdis cansidered to be the victim. Far survey methodology and definitions <strong>of</strong> terms, see Appendix II.Time <strong>of</strong> occurrence.;:II:- 6 p.m. Midnight to Nighttime, but Don't know orTotal 6 a.m. to 6 E.m. to midnight 6 a.m. time unknown not ascertainedT~2e <strong>of</strong> victimization Number Percent Number Percent Number Percent Number Percent Number Percent Nu-nber Percent""\Personal incidents:Rape and attempted rape 16,,745 100 68,291 41 58,312 35 38,800 23 0 X 1,343 IRobbery 1,20',127 100 524,919 44 476,620 40 189,499 16 4,768 0 5,322 0Robbery and attempted robberywith injury 397,291 100 147,176 37 178,257 45 68,349 17 1,500 0 2,009 ISerious assault 184,564 100 59,278 32 82,152 45 39,62/+ 21 1,500 I 2,009 IMinor assault 212.,727 100 87,898 41 96,105 45 28,725 14 0 X 0 X~Robbery without injury 506,~09 100 224,486 44 191,733 38 85,701 .7 1,476 0 3,313 I ...c:II>Attempted robbery without0' injury 297,12\. 100 153,257 52 106,629 36 35,449 12 1,792 I 0 X::JCoAssaUlt 4,255,12:1 100 2,088,236 49 1,533,656 36 609,423 14 8,260 0 15,546 0Aggravated assault 1,444,984 100 666,933 46 :;38,344 37 231,051 16 3,1815,4750With injury 482,947 100 207,598 43 184,497 38 87,606 18 1,481 ° 0 1,765 ° 0 ~ .,Attempted assault with 5'wweapon 962,036 100 459,336 413 353,847 37 143,445 15 1,700 0 3,710S.UISimple assault 2,810,138 IUD 1,421,302 51 995,312 35 378,372 13 5,07910,0720"°::JWith injury 736,592 100 332,544 45 268,059 36 129,970 18 3,026 0 2,992 ° 0 0Attempted ossoult without ..,weapon 2,073,546 100 1,088,758 53 727,253 35 248,402 12 2,0537,0805'Personal larceny with contact 589,351 100 365,488 62 146,462 25 61,9080II 6,053 ° I 9,439 ° 2 lEPurse snatching 139,189 100 86,790 62 45,076 32 5,842 4 1,482 IX::JAttempted purse snatching 46,788 100 B B B B B B B B B ° BPocket picking 403,374 100 245,047 61 88,249 22 56,0&7 14 4,57"1. I 9,439 2~Personal larceny without contact 14,563,963 100 6,782,813 47 2,770,090 19 1,407,437 10 1,157,534 8 2,446,090 17I-busehold incidents:Burglary 7,392,603 100 2,580,275 35 1,228,961 17 835,873 II 496,896 7 2,250,599 30Forcible entry 2,587,098 100 1,044,933 40 515,789 20 281,259 I! 169,595 7 575,523 22Lkllawful entry without force 3,078,168 100 1,043,619 34 415,45.i! 13 287,031 9 208,396 7 1,123,629 37Attempted forcible entry 1,727,337 100 491,722 28 297,680 17 267,583 15 118,905 i' 551,446 32Larceny 10,174,660 100 2,123,599 21 1,222,446 12 2,006,034 20 1,863,914 18 2,958,667 29Lklder $50 4,903,484 100 1,007,953 21 514,359 10 816,547 17 947,739 19 1,616,885 33$50 or more 4,032,1187 100 891,795 22 526,020 13 869,017 22 699,818 17 1,045,837 26Amount not ascertained 507,655 100 135,976 27 42,869 8 53,435 II 74,838 15 200,537 40Attempted 731,033 100 87,875 12 139,198 19 267,034 37 141,518 19 95,40U 13Vehicle theft 1,438,980 100 376,102 26 319,467 22 403,541 28 171,654 12 168,216 12Completed 890,898 100 276,909 31 214,812 24 224,733 25 86,067 10 88,376 10Attempted 548,082 100 99,193 18 104,654 19 178,808 33 85,587 16 79,840 15 , .aSuDcategories may not sum to total because <strong>of</strong> rounding.::JInII>In~Source:Table constructed by saRCEBOO< st<strong>of</strong>f from data provided by the U.S. Deportment <strong>of</strong> <strong>Justice</strong>, <strong>Bureau</strong> <strong>of</strong> <strong>Justice</strong> <strong>Statistics</strong>.4\\, I ..
"""""'----.--~ ,",..,<strong>Sourcebook</strong> <strong>of</strong> <strong>Criminal</strong> <strong>Justice</strong> <strong>Statistics</strong> <strong>1983</strong>Table 3.14 Estimated number <strong>of</strong> personal incidents, by type <strong>of</strong> victimization and place <strong>of</strong> occurrence, United States, 1981 a'1..,Nature and Distribution <strong>of</strong> Known OffensesNJTE: See NJTE, Table 3.1. Because a personal incident may involve more than one victim, thenumber <strong>of</strong> victimizations can be expected to exceed the number <strong>of</strong> incidents. Beginning in 1979,new response categories for the "place <strong>of</strong> occurrence" were used. Because <strong>of</strong> this change, cautionshould be observed in comporing the results <strong>of</strong> surveys after 1978 with earlier years. For surveymethodology, definitions <strong>of</strong> terms, and a discussion <strong>of</strong> changes in the 1979 interview schedule, seeAppendix II.Place <strong>of</strong> occurrenceInside non-Inside home or Vacation home, residential building,Totol other building hotel. mgtel ~ar horne [!ublic conve)!anceType <strong>of</strong> victimization Number Percent Number Percent N.Jmber Percent N.Jmber Percent N.Jmber PercentRape and attempted rape 166,745 100 43,9% 26 3,344 2 6,993 4 15,877 10Robbery 1,201,127 100 142,%6 12 5,933 0 99,492 8 142,860 12Robbery and attempted robberywith Injury 397,291 100 49,264 12 2,787 I 25,850 7 43,%8 IISerious assault 184,564 100 26,667 14 2,787 2 15,147 8 21,163 IIMinor assault 212,727 100 22,598 II 0 X 10,704 5 22,805 IIRobbery without injury 506,709 100 73,646 15 0 X 46,085 9 67,931 13Attempted robbery without injury 297,126 100 20,056 7 3,146 I 27,557 9 30,%0 10Assault 4,255,122 100 492,5% 12 12,935 0 709,%3 17 1180,233Aggravated assault 1,444,984 100 143,029 10 3,105 0 216,700 15 182,878"13With injury 482,947 100 44,550 9 0 X 77,840 16 59,3% 12Attempted assault with weapon 962,036 100 98,479 10 3,105 0 138,860 14 123,482 13Simple assault 2,810,138 100 349,568 12 9,829 0 493,263 18 297,355 IIWlth injury 736,592 100 134,719 18 0 X 103,014 14 56,759 8Attempted assault without weapon 2,073,546 100 214,849 10 9,829 0 390,249 19 240,5% 12Personal larceny with contact 589,351 100 10,690 2 4,470 I 241,170 41 21,739 4Purse snatching 139,189 100 0 X 0 X 15,952 II 15,945 IIAttempted purse snatching 46,788 100 B B B B B B B BPocket picking 403,374 100 10,690 3 4,470 I 215,029 53 5,794 IPersonal larceny without contact 14,563,%3 100 0 X 142,071 I 2,838,714 19 0 XaSubcategories may not sum to total because <strong>of</strong> rounding.Source:Table constructed by 5a.RCEBro< staff from data provided by the U.S. Deportment <strong>of</strong> <strong>Justice</strong>, <strong>Bureau</strong> <strong>of</strong> <strong>Justice</strong> <strong>Statistics</strong>.i !~~"Ii~'IifiStreet, park,field, etc.Number Percent63,977 38691,923 58227,527 57107,790 58119,737 56281,522 56182,874 621,717,442 40656,242 4S218,749 45437,493 451,061,200 3!:l266,564 36794,637 38235,854 4097,134 70B B103,934 266,652,958 46In~ideNumberschoolPercent1,503 I31,4
-~-~ -----------------<strong>Sourcebook</strong> <strong>of</strong> <strong>Criminal</strong> <strong>Justice</strong> <strong>Statistics</strong> <strong>1983</strong>Table 3.16 Estimated number <strong>of</strong> personal incidents, by type <strong>of</strong> victimization and type <strong>of</strong> weapon used, United States, 1981 0NJTE: See NJTE, Table 3.1. Becouse a personal incident mey involve more than one victim, thenumber <strong>of</strong> victimizations can be expected to exceed the number <strong>of</strong> incidents. Becouse more thanone weopon mey have been used in a given incident, the sum <strong>of</strong> the "type <strong>of</strong> weapon" entries inany given row mey exceed the number <strong>of</strong> "incidents with weapon." For survey methodology anddefinitions <strong>of</strong> terms, see Appendix II.IncidentsI:il:!e <strong>of</strong> weal:!QnTotal incidents with weapon b Gun b Knife b Other Not cscertalned bType <strong>of</strong> victimization Number Percent Number Percent Number Percent Number Percent Nurrber Percent b N.mber PercentPersonal incidents:Rape and attempted rape 166,745 100 38,511 23 B B B B B B B BRobbery 1,,201,127 100 555,582 46 216,758 18 246,452 21 112,377 9 24,051 2Robbery and attempted robberywith injury 397,291 100 152,151 38 38,364 10 69,166 17 57,694 15 6,041 2Serious assoult 184,564 IUD 152,151 82 38,364 21 69,166 37 57,694 31 6,041 3Minor assault 212,727 100 X X X X X X X X X XRobbery without injury 506,709 100 271,493 54 144,400 28 108,150 21 20,844 4 12,477 2Attempted robbery withoutinjury 297,126 100 131,938 44 33,993 II 69,136 23 33,839 II 5,532 2Assault 4,255,122 100 1,358,428 32 376,291 9 378,919 9 595,649 14 49,242 IAggravated assault 1,444,984 100 1,358,428 94 376,291 26 378,919 26 595,649 41 49,242 JWith injury 482,947 100 396,392 82 50,580 10 94,931 20 252,074 52 15,922 3Attempted assault withweapon 962,036 100 962,036 100 325,710 34 283,988 30 343,575 36 33,320 3bSubcott.lgories may n'.lt sum to total because <strong>of</strong> rounding and multiple responses.Percent af total incidents.5curce:Table constructed by SOLRCEBOO< steff from data provided by the U.S. Deportment <strong>of</strong> <strong>Justice</strong>, <strong>Bureau</strong> <strong>of</strong> <strong>Justice</strong> <strong>Statistics</strong>.41..o ,338
------~----.-----------------------------------------------------r1\1II, Ilf \oI)
Nature and Distribution <strong>of</strong> Known OffensesTable 3.17 Estimated number <strong>of</strong> personal incidents and percent with weapon, by type <strong>of</strong> victimization and perceivedage <strong>of</strong> lone <strong>of</strong>fender, United States, 1981 0!\oTE: See !\oTE, Table 3.1. Because a personal incident may involve more than one victim, thenumber <strong>of</strong> victimizations can be expected to exceed the number <strong>of</strong> incidents. I t must be stressedthat this table reflects the victim's perception <strong>of</strong> the <strong>of</strong>fender; the occuracy <strong>of</strong> these perceptionshas not been extensively studied in the NCS developmental work. For survey methodology anddefinitions <strong>of</strong> terms, see Appendix II.t.Perceived age <strong>of</strong> lone <strong>of</strong>fender (in ~earslDon't know orTotal Under 12 12 to 20 21 or older not a~Ce[tgiDlldPercent rercent Percent Percent Percentwith with with with withTl::ee <strong>of</strong> victimization Number weal?Qn Number weal?Qn Number weaflQn ~be[ weaflQO ~be[ WlllJl2QDRape and attempted rape 139,511 20 0 X 26,08!! B 110,713 24 2,710 BRobbery total 556,094 44 1,323 B 194,130 36 331,669 47 28,973 BRobbery witn injury 176,290 33 0 X 50,149 B 115,557 40 10,5!!3 BRobbery without injury 220,949 52 0 X 72,021 33 137,695 58 11,233 BAttempted robberywithout injury 158,856 44 1,323 B 71,959 51 78,417 37 7,157 BAggravated assault 1,019,007 93 4,332 B 262,548 89 726,231 94 25,896 BaSubcategories may not sum to total because <strong>of</strong> rounding.Source: Table constructed by So...RCEBCX)(; s'laff from data provided by the U.S. Department <strong>of</strong> JustiL-', <strong>Bureau</strong> <strong>of</strong><strong>Justice</strong> <strong>Statistics</strong>.Table 3.18 Estimated number <strong>of</strong>
<strong>Sourcebook</strong> <strong>of</strong> <strong>Criminal</strong> <strong>Justice</strong> <strong>Statistics</strong> <strong>1983</strong>Naf'ure and Distribution <strong>of</strong> Known OffensesTable 3.19 Estimated number <strong>of</strong> personal incidents and sercent with weapon, by type <strong>of</strong> victimization andperceived race <strong>of</strong> lone <strong>of</strong>fender, United States, 1981NJTE: See I'OTE, Table 3.1. Because a personal incident may involve more than one victim, thenumber <strong>of</strong> victimizations can be expected to exceed the number <strong>of</strong> incidents. It must be stressedthat this table reflects the victim's perception <strong>of</strong> the <strong>of</strong>fender; the accuracy <strong>of</strong> these perceptiorc5has not been extensively studied in the NCS developmental work. For survey methodology anddefinitions <strong>of</strong> terms, see Appendix II.Perceived race <strong>of</strong> lone <strong>of</strong>fen
--------.-~ '-'=~~-------- -- -I1Nature and Distribution <strong>of</strong> Known Offenses<strong>Sourcebook</strong> <strong>of</strong> <strong>Criminal</strong> <strong>Justice</strong> <strong>Statistics</strong> <strong>1983</strong>Table 3.21 Estimated number <strong>of</strong> personc.'1 victimizati~ns, 8 Y typ,: <strong>of</strong> victimization, sex and race <strong>of</strong> victim, andrelationship <strong>of</strong> <strong>of</strong>fender to victim, United States, 1981 --ContinuedType <strong>of</strong> victimization Total Slran~r Non-stran9!!rand race af victim Number Percent Numbel' Percent Number PercentSEX cr VICTIM: FEMALERape and attempted rape:135,580 100 92,157 68 43,423 32White100 B B B BBlack and other races 34,177Robbery:366,531 100 296,478 81 70,052 19White138,525 100 115,818 84 22,706 16Black and other racesRobbery and attempted robbery with injury:134,690 100 99,170 74 35,520 26White43,638 100 B B B BBlack cnd other racesSerious (lssault:50,385 100 B B B BWhite17 ,404 100 B B i3 BBlock and other racesMinor assault:84,305 100 62,829 75 21,476 25WhiteBlack and other racles 26,235 100 B B B BRobbery without injury:. 141,882 100 119,197 84 22,685 16White72,972 100 5H,567 80 14,405 20Black and other r~cesAttempted robbery without injury:89,959 100 78, III 87 11,847 13WhiteBlack and other races 21,914 100 B B B aAssault:1,462,132 100 748,460 51 713,672 49WhiteBlack and other races 332,033 100 143,314 43 188,719 57Aggravated assaul1:402,739 100 237,925 59 164,814 41White114,160 100 52,022 46 62,138 54Black and other racesWith injury:118,823 100 :;0,066 42 68,757 58WhiteBlack and other races 48,951 100 B B B BAttempted assault with weapon:283,916 100 187,859 66 96,057 34WhiteBlack and other races 65,210 100 B B 25,385 BSimple assault:1,059,393 100 510,535 48 548,85H 52White42 126,580 58Black and other races 217,873 100 91,292With injury:317,916 100 104,803 33 213,113 67WhiteBlack and other races 53,315 100 B B B BAttempted assault without weapon:741,477 100 405,732 55 335,745 45White164,558 100 78,860 48 85,698 52Black and other racesPersonal larceny with contact:273,499 100 270,833 99 2,666 IWhite89,063 100 87,495 98 1,567 2Black and other racesPurse snatching:94,833 100 94,833 100 0 XWhiteBlack and other races 49,914 100 B B B BAttempted purse snatching:38,114 100 B B B BWhitelor B B B BBlack and other races 10,860Pocket picking:140,552 100 137,886 98 2,666 2WhiteBlack and otnf victimization NUmber Percent Number Percent Number Percent Number PercentPersonal victimizations:Rape lind attempted rape 177,541 100 144,441 81 33,100 19 0 XRobbery 1,380,962 100 623,958 45 737,717 53 19,286 IRobt ery and attempted robberywit/) injury 440,075 fl.lO 188,935 43 239,137 54 12,002 3SI~rious assault 215,204 100 83,836 39 123,664 57 7,705 4Minor assault 224,871 100 105,100 47 115,473 51 4,298 2Robbery without injury 595,194 \00 258,026 43 329,885 55 7,284 IAttempted robbery without injury 345,693 100 176,997 51 168,696 49 0 XAssaUlt 5,023,806 IllG 3,688,657 73 1,227,358 24 107,790 2Aggravated assault 1,795,702 IUD 1,219,932 68 516,205 29 59,565 3With injury 590,542 100 3!1l,J80 66 189,002 32 9,160 2Attempted assault with weapon 1,205,160 100 827,552 69 327,203 27 50,405 4Simple assault 3,22H,104 100 2,46d,726 76 711,153 22 48,225 IWith injury 842,949 100 656,910 78 180,067 21 5,973 IAttempted assault without weapon 2,385,154 100 1,811,816 76 531,U86 22 42,252 2Personal larceny with contact 604,875 100 244,325 40 113,190 19 247,361 41Purse snatching 146,330 IOU 85,818 59 43,858 30 16,654 IIAttempted purse snatching 48,975 100 B B B B B BPocket ~icking 409,571 100 127,517 31 51,347 13 23U,707 56aSubcategories may not sum to total because <strong>of</strong> rounding.Source: Table constructed by SaRCEBOO< st<strong>of</strong>f from data prOVided by the U.S. Deportment <strong>of</strong> <strong>Justice</strong>, <strong>Bureau</strong> <strong>of</strong><strong>Justice</strong> <strong>Statistics</strong>.Table 3.23 Estimated number <strong>of</strong> personal victimizations, by type <strong>of</strong> victimization and perceived age <strong>of</strong> lone <strong>of</strong>fender, United States,1981 a (\OTE: See (\OTE, Table 3.1. It must be stressed that this table reflects the victim's perception <strong>of</strong>the <strong>of</strong>fonder; the accuracy <strong>of</strong> these perceptions ha~ not been extensively studied in the NCSdevelopmental work. For survey methodology and definitions <strong>of</strong> terms, see Appendix II.Perceived age <strong>of</strong> lone <strong>of</strong>fender (In years)Total Under 12 12 to 20 21 or olderT~e <strong>of</strong> victimization Number Percent Number Percent Number Percent Number PercentPersonal victimizations:Rape and attempted rape 144,441 100 0 X 26,088 18 il5,642 80Robbery 623,958 100 1,323 0 215,326 35 377,621 61Robbery and attempted robberywith injury 188,935 100 0 X 52,110 28 126,242 67Serious assault 83,836 100 0 X 13,630 16 65,964 79Minor assault iDS, 100 100 0 X 38,480 37 60,278 57Robbery without injury 258,026 100 0 X 82,911 32 163,166 63Attempted robbery without injury 176,997 100 1,323 I 80,305 45 88,213 50Assault 3,688,657 100 20,884 I 1,067,190 29 2,531,224 69Aggravated assault 1,219,932 100 4,332 0 308,262 25 876,256 72With injury 392,38U 100 0 X 119,215 30 263,117 67Attempted assault with weapon 827,552 100 4,332 I 189,047 23 613,140 74Simple assault 2,468,726 100 16,552 I 758,929 31 1,654,968 67With Injury 656,910 100 6,903 I 193,018 29 452,631 69Attempted assault without weapon 1,811,816 100 9,649 I 565,911 31 1,202,337 66Personal larceny with contact 244,325 100 0 X 99,151 41 103,343 /12Purse snatching 85,818 100 0 X 35,308 41 37,836 44Attempted purse snatching 30,990 100 B B B B B 9Pocket Eicking 127,517 100 0 X 42,299 33 60,050 47a'lubcategories may not sum to total because <strong>of</strong> rounding.Source:Don't know ornot ascertainedNumber Percent2,710 229,689 510,583 64,242 56,342 611,9487,1575469,35931,0812310,048 321,033 33H,278 24,358 I33,920 241,831 1712,674 15B25,I6HB20Table constructed by SOlRCEBOO< st<strong>of</strong>f from data prOVided by the U.S. Deportment <strong>of</strong> <strong>Justice</strong>, <strong>Bureau</strong> <strong>of</strong> <strong>Justice</strong> <strong>Statistics</strong>.343
----------- - -- -----~--------------------.~---_____;1__-' _'J~,<strong>Sourcebook</strong> <strong>of</strong> <strong>Criminal</strong> <strong>Justice</strong> <strong>Statistics</strong> <strong>1983</strong>Table ~24 Estimated number <strong>of</strong> personal victimizations, by type <strong>of</strong> victimization and perceived ages <strong>of</strong> multiple <strong>of</strong>fenders, United States1981 •N)TE: See I\(lTE, Table 3.1. It must be stressed that this table reflects the victim's perception <strong>of</strong>the <strong>of</strong>fenders; the accuracy <strong>of</strong> these perceptions has not been extensively studied In the NCSdevelopmental work. For survey methodology and definitions <strong>of</strong> terms, see Appendix II.~[ceived ages <strong>of</strong> multi!;!le <strong>of</strong>fenders ~in tears)Mixed b Don't know MTotal All under 12 All 12 to 20 All 21 and older not ascertainedT~pe <strong>of</strong> victimization Number Percent Number Percent Number Percent Numoer Percent Number Percent Noo1ber PercentPersonal victimizations:Rape and attempted rape 33,100 100 B B B B B B B B B BRobbery 737,717 100X 303,342 41 226,0!l3 31 157,567 21 50,725 7Robbery and attempted°robbery with injury 239,137 100 0 X 88,086 37 65,428 27 51,954 22 33,668 14Serious assault 123,664 100X 32,922 27 41,619 34 30,274 24 18,849 15Minor assault 115,473 100X 55,164 48 23,809 21 21,681 19 14,819 13Robbery without injury 329,885 100X 128,672 39 118,381 36 70,492 21 12,339 4Attempted robbery withoutinjury 166,696 1U0X 86,584 51 42,274 25 35,120 21 4,717 ~Assault 1,227,358 100 6,227 I 530,167 43 372,546 30 258,068 21 60,351 5Aggravated assault 516,205 100X 202,243 39 167,178 32 121,381 24 25,404 5With injury 189,002 100X 68,706 36 64,064 34 47,118 25 9,115 5Attempted assault withweapon 327,203 100X 133,537 41 103,114 32 74,263 23 16,289 5Simple assault 711,153 100 6,227 ° I 327,924 46 205,368 29 136,686 19 34,947 5With injury 180,067 100 1,431 I 70,462 39 52,697 29 45,618 25 9,859 5Attempted assault withoutweapon 531,086 100 4,796 I 257,462 48 152,671 29 91,069 17 25,088 5Personal larceny with contact 113,190 100 3,293 3 47,146 42 34,591 31 20,044 18 8,115 7Purse snatching 43,858 100 B B B B B B B B B BAttempted purse snatching 17,985 100 B B B B B B B B B BPocket picking 51,347 100 B B B B B B B B B BbSubcategories may not sum to total because <strong>of</strong> rounding."Mixed" cases are those in which the victim reported that therewere <strong>of</strong>fenders from more than one age group. "Don't know/notSource:ascertained" includes cases in which the victim did not know any <strong>of</strong> theages, or in which the victim did not know whether mare than one agegroup was involved.Table constructed by 50lRCEBOO< staff from data provided by the U.S. Deportment <strong>of</strong> <strong>Justice</strong>, <strong>Bureau</strong> <strong>of</strong> <strong>Justice</strong> <strong>Statistics</strong>.Table 3.25 Estimated number <strong>of</strong> personal victimizations, by type <strong>of</strong> victimization and Dt!rceived race <strong>of</strong> lone<strong>of</strong>fender, United States, 1981 a -N)TE: See N)TE, Table 3.1. It must be stressed that this table reflects the victim's perception .:.Tthe <strong>of</strong>fender; the accuracy <strong>of</strong> these perceptions has not been extensively studied in the NCSdevelopmental work. For survey methodology and definitions <strong>of</strong> terms, see Appendix II.Perceived race <strong>of</strong> lone <strong>of</strong>fenderBlock and Don't know orTotal White other races not ascertainedType <strong>of</strong> victimization Number Percent Number Perc~\nt Number Percent Number PercentPersonal victimizations:Rape and attempted rope 144,441 100 78,533 511 54,201 38 11,707 8Robbery 623,958 100 246,685 40 321,448 52 55,825 9Robbery and aaempted robberywith injury 188,935 100 90,861 48 81,635 43 16,439 9Serious assault 83,836 100 45,861 55 36,545 44 1,430 2Minor assault 105,100 100 45,000 43 45,091 43 15,009 14Robbery without injury 258,026 100 83,474 32 148,990 58 25,561 10Attempted robbery without injury 176,997 100 72,349 41 90,823 51 13,825 8Assault 3,688,657 100 2,691,353 73 804,956 22 192,348 5Aggravated assault 1,219,932 100 819,836 67 320,840 26 79,256 6With injury 392,380 100 253,013 64 121,487 31 17,880 5Attempted assault with weapon 827,552 100 566,822 68 199,354 24 61,375 7Simple assault 2,468,726 100 1,871,517 76 484,116 20 113,093 5With injury 656,910 100 505,030 77 113,693 17 38,187 6Attempted assault without weapon 1,811,816 100 1,366,487 75 370,423 20 74,906 4Personal larceny with contact 244,325 100 80,017 33 134,081 55 30,227 12Purse snatching 85,818 100 15,636 18 53,820 63 16,362 19Attempted purse snatching 30,990 100 B B B B B BPocket picking_ 127,517 100 49,216 39 64,437 51 13,865 IIaSubcolegories may not sum to total because <strong>of</strong> rounding.Source: Table constructed by SCu\CEBOO< staff from data provided by the U.S. Department <strong>of</strong> <strong>Justice</strong>, <strong>Bureau</strong> <strong>of</strong><strong>Justice</strong> <strong>Statistics</strong>.344'.)1IiIiI:I'I:Iini;11IivI I!!\1,IJiIII'IIII IIN:Jture and Distribution <strong>of</strong> Known OffensesTable 3.26 EstHm'ted number <strong>of</strong> personal victimizations, by type <strong>of</strong> victimization and perceived races <strong>of</strong> multiple <strong>of</strong>fenders, UnitedStates, 1981N)TE: See N)TE, Table 3.1. It must be stressed that this table reflects the victim's perception dthe <strong>of</strong>fender; the accuracy <strong>of</strong> these perceptions has not been extensively studied in the N( 5developmental work. For survey methodology and definitions <strong>of</strong> terms, see Appendix II.Perceived races <strong>of</strong> multi[!le <strong>of</strong>fendersBlack andDon't know orTotal All white other races Mixed b not ascertained bT~E!!! <strong>of</strong> victimization Number Percent N.lmber Percent Number Percent Number Percent Number PercentPersonal vldtimlzations:RaP'" and attempted rape/Vi;;"''l!ry33,100737,717100100B201,408B27B464,409B63B49,720B7B22,181B3Robbery and attempted robberywith injury 239,137 100 74,410 31 137,602 58 17,067 7 10,057 4Serious assault 123,664 100 31,854 26 67,570 55 15,669 13 8,571 7Minor assault 115,473 100 42,556 37 70,032 61 1,398 I 1,486 IRobbery without Injury 329,885 100 72,735 22 223,412 68 21,614 7 12,123 4Attempted robbery without Injury 168,696 100 54,263 32 103,395 61 11,038 7XAssault 1,2D,35!l 100 768,764 63 342,953 28 79,359 6 36,2!l2 ° 3Aggravated assault 516,205 100 330,742 64 143,447 28 33,606 7 8,411 2With injury 189,002 100 131,956 70 47,025 25 8,650 5 1,371 IAttempted a~5ault with weapon 327,203 100 198,786 61 96,422 29 24,956 8 7,040 2Simple assault 711,153 100 438,022 62 199,507 28 45,753 6 27,871 4With injury !8(),067 100 129,164 72 38,513 21 7,881 4 4,508 3Attempted assault without weapon 531,086 100 308,858 58 160,993 30 37,872 7 23,363 4Personal larceny with contact 113,190 100 18,S84 17 86,556 76 4,543 4 3,207 3Purse snatching 43,85!l 100 B B B B B B B BAttempted purse snatching 17,985 100 B B B B B B B BPocket eicking 51,347 100 B B B B B B B BbSubcategories may not sum to total because <strong>of</strong> rounding."Mixed" cases are those in which the victim reported that therewere <strong>of</strong>fenders from more than one race group. "Don't know/notascertained" includes cases in which the victim did not know any <strong>of</strong> theraces, or in which the victim did not know whether mare than one racegroup was involved.Source: Table constructed by SOlRCEBOO< staff from data provided by the U.S. Deportment <strong>of</strong> <strong>Justice</strong>, <strong>Bureau</strong> <strong>of</strong> <strong>Justice</strong> <strong>Statistics</strong>.Table 3.27 Estimated number <strong>of</strong> personal victimizations and perce:n! involving victim'S use<strong>of</strong> self-protective J"easures, by type <strong>of</strong> victimization and use <strong>of</strong> weapon by <strong>of</strong>fenderUnited States, 1981'N.)TE: See N.)TE, Table 3.1. Self-protective measures include using or showing a weapon using ortrying physical force, trying to attract attention, threatening, and using evasive actIon. Forsurvey methodology and definitions <strong>of</strong> terms, see Appendix II.'ype <strong>of</strong> victimizationRope and attempted ropeRobbery totalRobbery with injuryRobbery without injuryAttempted robbery withoutinjuryAggravated assaul tCompleted aggravated assaultAttempted aggravated assaultTotalPercent<strong>of</strong> victimsusing selfprotectiVeNumber measure177,541 901,380,962 63440,075 78595,194 41345,6931,795,7028278590,542 761,205,160 79aSubcategories muy not sum to total because <strong>of</strong> rounding.Offenderwith weaponPercent<strong>of</strong> victimsusing selfprotectiveNumber measure44,435688,433B52180,661 79344,557 26163,2151,692,2517678487,0911,205,1607779Offenderwithout wea[!onPercent<strong>of</strong> Victimsusing selfprotectivei'AAnber measure133,106692,5299174259,414250,6377761182,477 87103,451 73103,451 73XSource I Table constructed by SOURCEBOOK st<strong>of</strong>f from data provided by the U.S.Deportment <strong>of</strong> <strong>Justice</strong>, <strong>Bureau</strong> <strong>of</strong> <strong>Justice</strong> <strong>Statistics</strong>.345°
Nature and Distribution <strong>of</strong> Known OffensesS"urcebook <strong>of</strong> <strong>Criminal</strong> <strong>Justice</strong> <strong>Statistics</strong> <strong>1983</strong>Table 3.28 Estimated number <strong>of</strong> 8ersonal and household victimizations, by type <strong>of</strong> victimization and value <strong>of</strong> stolen property (Includingdamages), United States, 1981.!'OTE: See !'OTE, Table 3.1. For survey methodology and definitions <strong>of</strong> terms, see Appendix II.V'Jlue <strong>of</strong> stolen property, including damagesTotalVictimizationsvictimizations with loss b ~I to ~9 b ~IO to ~49 .....,}o ~50 to ~249 bT~~e <strong>of</strong> victimization Number Percent Number Percent Number Percent I\lumber Pcrcent-~ Number PercentPersonal victimizations:Rape and attempted rapeRobbery177,5411,380,%210010043,815947,7702569B93,271B7B255,245B18B341,17l:!B25Robbery and attempted robberywith injury 440,075 100 352,200 80 32,144 7 91,289 21 118,387 27Serious assault 215,204 100 174,621 81 19,058 9 38,515 18 59,579 28Mi nor assau I t 224,871 100 177,579 79 13,087 6 52,774 23 58,808 26Robbery without injury 595,194 100 558,844 94 50,431 8 148,045 25 215,372 36Attempted robbery without injury 345,693 100 36,726 II B B B B B BPersonal larceny with contact 604,875 100 552,150 91 47,653 8 213,285 35 217,063 36Purse snatching 146,330 100 143,553 98 5,874 4 51,743 35 62,860 43Attempted purse snatching 48,975 100 B B B B B B B BPocket picking 409,571 100 401,432 91l 41,779 10 161,542 39 154,203 38Personal larceny without contact 15,273,714 100 14,299,423 94 2,374,894 16 5,022,378 33 4,622,195 30I-busehold victimizations:Burglary 7,392,603 100 6,105,293 83 394,951 5 1,078,018 15 1,497,648 20Forcible entry 2,587,098 100 2,393,593 93 77,791 3 223,084 9 455,855 18Unlawful entry without force 3,071l,168 IuD 2,608,983 85 199,317 6 607,731 20 925,191 30Attempted forcible entry 1,727,337 100 1,102,718 64 117,844 7 247,203 14 116,602 7Larceny 10,174,660 100 9,194,304 90 1,497,341 15 3,353,910 33 3,051,755 30Under $50 c 4,903,484 100 4,903,484 100 1,463,313 30 3,301,359 67 42,394 I$50 or more 4,032,487 100 4,032,487 100XX 2,949,261 73Amount not ascertained 507,655 100 51,333 '10 B ° B B ° B B BAttempted 731,033 100 207,000 28 25,090 3 47,149 6 51,713 7Vehicle theft 1,438,980 100 1,179,350 82 17,778 I 69,181 5 146,291 10Completed 890,898 100 855,448 %X 2,73023,746 • 3Attem~ted 548,082 100 323,902 59 17,778 3 66,4,5_1 __ 12 122,54S 22aSubcategories may not sum to total because <strong>of</strong> rounding.b?ercent <strong>of</strong> total victimizations.cThe category "under $50" refers only to the value <strong>of</strong> theSource:°property stolen. When damoges are included, some cases fall into thehigher loss columns.Table constructed by Sa.RCEBOO< staff from data provided by the U.S. Department <strong>of</strong> <strong>Justice</strong>, <strong>Bureau</strong> <strong>of</strong> <strong>Justice</strong> <strong>Statistics</strong>.Table 3.29 Estimated rate (per 100,000 households) <strong>of</strong>household victimization, by type <strong>of</strong> victimization andrace <strong>of</strong> headl <strong>of</strong> household, United States, 1981 0°Iif!II'\1 iI.I;Ij~ or tnOre b--r PercentB B2:.!O,464 1682,442 1947,376 2235,065 16138,022 23B a60,733 1018,152 12B B42,5112 10l,lI20,335 132,170,807 291,322,091 51810,460 2638,256 21,047,11I4 108,449 01,024,706 25B B9,8;17 I826,702 57803,653 9023,049 4Na value,don't know, ornot ascertained bNxnber PercentB B37,613 3:.!7,939 610,094 517,845 Il6,974 IB B13,416 24,9:l4 3B B1,327 0359,621 2%3,869 13314,772 1266,284 251l2,Sl3 34244,115 287,970 2511,520 IB B73, 2..! I IU119,398 825,319 394,079 17Table 3.30 Estimated rate (per 100,000 households) <strong>of</strong> household v~ctimization, by type <strong>of</strong>victimization and age <strong>of</strong> head <strong>of</strong> household, United States, 198 I!'OTE: See NOTES, Tables 3.1 and 3.7. For survey methodology and definitions <strong>of</strong> terms, seeAppendix II.!'OTE: See !'OTES, Tables 3.1 and 3.7. For survey methodologyand definitions <strong>of</strong> terms, see Appendix II.Type <strong>of</strong> victimizationBaseBurglaryForcible entryUnlawful entry without forceAttempted forcible entryLarcenyUnder $50$50 or moreAmount not ascertainedAttemptedVehicle theftCompletedAttempted(Rate per 100,000 households)Race <strong>of</strong> head <strong>of</strong> householdBlack andWhite other races73, 523,51l48,2622,7823,6301,851II ,8485,8844,5595398651,6331,00163210,597,38012,4355,1143,8623,45913,8125,4476,4191,0498972,2491,461788aSubcategories may not sum to total because <strong>of</strong> rounding.IiI(Rate per 100,000 households)Age <strong>of</strong> head <strong>of</strong> household !In vears)Type <strong>of</strong> victimization J:l to 19 20 t(l 34 35 to 49 50 to 64 65 or olderBase 972,393 25,838,579 21,066,691 19,238,526 17,004,775Burglary 21,7l12 11,470 9,451l 6,783 5,40!lForcible entry 5,679 4,179 3,319 2,343 I,TnUnlawful entry without force 12,236 4,441 4,136 2,!l!l9 2,261Attempted forcible entry 3,877 2,850 2,003 1,552 1,370Larceny 18,403 15,563 13,749 10,408 6,326Under $50 7,454 7,633 6,086 4,92:1 3,702$50 or more 8,632 6;,181 6,027 4,214 1,595Amount not ascertained 736 580 652 573 605Attempted 1,579 1,169 984 697 424Vehicle theft 2,B72 2,502 2,032 1,170 655Completed 1,36!l 1,$00 1,301 7114 382Atte!!!pted 1 1 504 1,002 730 386 273aSubcategorles may not sum to total because <strong>of</strong> rounding.Source: Table constructed by SOURCEBOOK staff from dllta provided by the U.S.Department <strong>of</strong> <strong>Justice</strong>, <strong>Bureau</strong> <strong>of</strong> <strong>Justice</strong> <strong>Statistics</strong>.Source: Table constructed by SOURCEBOOK staff fromdata provided by the U.S. Department <strong>of</strong> <strong>Justice</strong>, <strong>Bureau</strong> <strong>of</strong><strong>Justice</strong> <strong>Statistics</strong>.347346
-------------~------------_____ ' ___ 0 "<strong>Sourcebook</strong> <strong>of</strong> <strong>Criminal</strong> <strong>Justice</strong> Stat/stlcs <strong>1983</strong>!'-bture \1nd Distribution <strong>of</strong> Known Offen~esTable 3.31 Estimated rate (per 100,000 households) <strong>of</strong> housebold victimization, byTable 3.32 Estimated rate !per 100,000 motor vehicles owned) <strong>of</strong> attemptedhead <strong>of</strong> htlusehold, 13nd family income, United States, 1981 type <strong>of</strong> victimization, race ai' and completed motor vehIcle thefts, by type <strong>of</strong> victimization and selectedcharacteristics <strong>of</strong> household, United States, 1981NJTE: See NJTES, Tables 3.1 and 3.7.For survey methodology and definitions <strong>of</strong> terms, see Appendix II.(Rate per 100,000 households)Family incomeType <strong>of</strong> victimization and Underrace <strong>of</strong> head <strong>of</strong> hl,usehold $3~000 to $7,!iOO to$3.000 $10,000 to7,499$15,000 to$11 $25,0001 999 $14,999 !'-bt$24,999Bose:or more os(.'ert~White 3,251,340Block and othel' r(lces 10,955,8871,21l0,0104,771,781 11,546,8302,641,036 18,052,095845,492 16,481,985!,683,737 8,463,6661,783,269 1,187,491 1,176,345NJTE:. See NJTE, Table 3.1. Estimated rates are based un the number <strong>of</strong> motorvehicles owned, rather than an the number <strong>of</strong> households or persons. "Base"represents the estimate.d number <strong>of</strong> vehll!les owned by those in Various categories<strong>of</strong> the Independent varJabie$.To abtain the estimated number <strong>of</strong> VictimiZationsfigurethat correspondand dividetobyany 100,000. giVen rate, multiply the partiCUlar rote shown by the baseIncluded in this table, but not Included in other tables in which vehiclet~efts are sha~n, ar~ vehicle thefts or attempts that occurred in conjunctionWIth more serious CrJmes such as rape or robbery.For survey methodology and definitions <strong>of</strong> terms, see Appendix II.Burglary:White12,188Block and other races 8,877 8,07915,897 8,340 7,682 8,235Forcible entry:13,921 13,8.U 11,130 7,24910,629 9,389White12,0122,952Block and other races 2,795 3,1976,8712,73Q,5,872 2,7096, 2,76773.~ 4,324 2,714lkIlowful entry without force:4,181 4,018White3,9916,723Block and other races 3,944 2,9233,837 3,620 3,3004,3/~0 3,796Attempted forcible entry:3,124 4,596 2,8283,029 2,815White4,6112,513Block and other races 2,137 1,959 1,986 1,673Larceny:5,188 3,709 3,966 1,6722,208 1,7073,419 2,557White3,41012,tI!J3" ,658 ",703 12,233 12,609lkIder Block $50:and other races 11,3'50 13,202 1!1,214 12,967 16,160 16,446 " ,994 12,5569,682White6,25'5 5,~89Block and other races 6,286 6,045 6,570$504,518 6,078 4,581 5,559or more:4,610 4,3166,401 6,364White4,4904,344Block and other races 4,083 3,9874,597 4,830 ,~,669 5,067Amount not ascertained:5,422 6,205 6,654 3,9897,534 8,469White6,701793Block and other races 747 532 55f 491Attempted:1,656 1,004 1,784 356970 618936White336 969571Black and other races 839 897 807 878 1,012Vehicle theft:590 698 1,644 732 7591,289 1,278White3961,325Block and other races 1,162 1,310 1,865 1,763 1,679Completed:848 1,537 1,657 2,987 1,8593,197White2,892 2,659930Block and other races 682 784 1,170 1,074Attempted:256 1,015 1,458 9901,735 1,1992,174White2,364 1,395395Block and other races 480 527592 695522 690199 6891,252 1,023660528 1,264aSubcategories moy nat sum to total because <strong>of</strong> rounding.Source:<strong>Justice</strong> <strong>Statistics</strong>. Table constructed by SOLRCEBOO< st<strong>of</strong>f from data provided by the U.S. Deportment <strong>of</strong> <strong>Justice</strong>, <strong>Bureau</strong> <strong>of</strong>j![1IIiII ,'"j/1Ii)rIiHIiii IIICharacteristics<strong>of</strong> householdAll householdsRace <strong>of</strong> head <strong>of</strong> household:WhiteBlack and other racesAge <strong>of</strong> head <strong>of</strong> household,12 to 19 years20 to 34 years35 to 49 years50 to 64 years65 years and olderTenure:Home ownersRenters and no cosh rentPersons In household:OneTwo to threeFour to fiveSix or more ond notascertained(Rate per 100,000 motor vehicles owned)Base MQtor vehicle theftTotal Completed Attempted141,372,000 1,102 682 420129,047,000 1,01012,325,000 6173,2373932,143 1,0941,051,000 2,94443,229,000 1,4031,6141,54142,954,000 9671,08464736,311,000 69765638717,828.000 440702216405 297104,892,000 70436,480,000 4592,2442451,322 92216,727,000 1,85175,810,000 1,0131,02283840,886,000 636945386632 3137,950,000 1,098 689 409Source: Table constructed by SOLRCEBOO< staff from data provided by theU.S. Department <strong>of</strong> <strong>Justice</strong>, <strong>Bureau</strong> <strong>of</strong> <strong>Justice</strong> <strong>Statistics</strong>.348IIIiIIl'349
---------~----------------~---------------------<strong>Sourcebook</strong> <strong>of</strong> Crlminol <strong>Justice</strong> StCitlstlcs <strong>1983</strong>.Table 3.33 Number and rate (per 1,000 units <strong>of</strong> each respective category) <strong>of</strong> personal and household victimization, by type <strong>of</strong>victimization, United States, 1973-81N:lTE: See N:lTES, Tobles 3.1, 3.2, ond 3.7.For survey methodology and definitions <strong>of</strong> terms, see Appendix TYpe <strong>of</strong> victimizationm~ II.1971i 19Z5 1976 1mPersonal Victimization:197s 1979 1980 1981Crimes <strong>of</strong> violence:(I~te per I,UOO persons 12 years <strong>of</strong> age or older):f'iJmber 5,351,000Rate5,510,000 ':;,573,000 5,599,000 5,902,000Rope:32.6 33.0 32.8 5,941,00032.6 6,159,00033.9 6,130,00033.7 6,582,OUOI'Mnber34.5 33.3 35.3Rate156,000 163,000 154,OUO 145,000 154,000Robbery:1.0 1.0 0.9 171,0000.8 192,0000.9 174,0001.0 I 7t:l, 000f'iJmber1.1 0.9 1.0Rate1,108,000 1,199,000 1,147,000 1,111,000 1,083,000Assault:6.7 7.2 6.8 1,038,0006.5 1,116,0006.2 1,209,0005.9 1,381,OUOl'Mnber6.34,087,00U 6.64,148,000 4,272,UUU7.4Rate24.9 4,344,000 4,664,00UAggravated ossoult:24.8 25.2 4,732,OOU25.3 4,851,00026.8 4,747,OOU26.9 5,U24,OOOI'Mnber27.2 25.8 27.URate1,655,000 1,735,000 1,631,00010.1 1,695,000 1,738,000Simple assault:10.4 9.6 1,708,0009.9 69,0001,710.0 1,707,0009.7 . 9.91,7%,000l'Mnber2,432,OUO 9.3 9.6Rate2,413,OUO 2,641,000 2,648,000 2,926,OUUCrimes <strong>of</strong> theft:14.8 14.4 15.6 3,024,00015.4 3,Ot:l2,UUU16.8 3,041,OUU17.2 3,22t:l,OUUf'iJmber 17.314,971,000 16.515,889,000 17.3Rate16,294,00091.1 16,519,000 16,933,000Personal larceny with95.1 %.0 17,050,000%.1 16,382,00097.3 15,300,000%.8 15,863,000contact:91.9 83.0 85.1l'Mnber504,000Rate520,000 524,0003.1 497,000 461,000Personal larceny without3.1 3.1 549,0002.9 511 ,0002.7 558,0003.1 6115,000contact:2.9 3.0 3.3f'iJmberRate14,466,000 15,369,000 15,770,000 16,022,000 16,472,000Total population age88.0 92.0 92.9 16,501,000 12 and93.2 15,871,00094.6 14,742,00093.6 15,258,000older89.0164,353,OUO 80.0167,058,000 81.9169,671,000 171,901,00U 174,093,OUUI-busehold victimization:176,215,000 178,284,000 184,324,OUO 186,336,000I-busehold burglary:(Rote per 1,000 households)l'Mnber 6,458,700Rate6,72U,6UO 6,743,7UO 6,6'.S3,4UU 6,764,900I-busehold larceny:91.7 93.1 91.7 6,704,00088.9 6,685,4UU88.5 6,973,00086.0 7,394,OUONumber 84.1 84.3 87.9Rote7,537,3UO 8,933,100 9,223,000 9,30L\,900 9,418,300Motor vehicle theft:lU7.0 123.8 125.4 9,351,9001:14.1 10,630,100123.3 10,468,000119.9 IO,I76,OUOI'Mnber133.71,343,9UU 126.51,351$,400 121.0Rate1,433,000 1,234,60U 1,296,80UTotal number <strong>of</strong> households19.1 18.8 19.5 1,365,10016.5 1,329,8UU7U 442 400 17 .0 1,381,00072 162 900 17.5 1,439,00073 559 600 74 956 100 76 412 30017.577 980 40016.779 498 60017.1°Detoil may not odd to total shown because <strong>of</strong> rounding.82 753 OOU 84 095 000Nature and DistributIon <strong>of</strong> Known OffensesI 000 units <strong>of</strong> each respt~ctlveTable 3.34 Percent change In rates (percategory) <strong>of</strong> personaland household victimization between I97J an d 1981 , by type <strong>of</strong> victimization, United StatesN:lTE'5ee N:lTES, Tables 3.1, 3.2, and 3.7. The rO~~~eobeenwhichcl)mputedtheseusingpercentrateschangethat weredataroundedwerecol~uloted are presented In Table 3.33. All cho~geh ges have been rounded to one decimal point. Forto the nearest hundredth. The resulting percen cApon dlx IIsurvey methodology and definitions <strong>of</strong> terms, see pen •Percent change In victimization rateType <strong>of</strong> victimization 1973-81 1974-81 1975-81 1976-81 1977-81 1978-81 1979-81 1980,&LPersonal victimization:Crimes <strong>of</strong> violenceRapeRobberyAssaultAggravated assaultSimple assaultCrimes <strong>of</strong> theftPersonal larcenywith contactPersonal larcenywithout contactI-busehold victimization:I-busehold burglaryI-busehold larcenyMotor vehicle theft8.5 0 7.1 0 7.6 00.0 -3.1 4.49.9 3.28.4 09.68.6 0 7.1!!-4.3 -7.2 0.3_7.0 0 -11.0 0 -11.9 017 0 0-6:5 0 19.9~-10.51I.3~-11.45.9 4.5 5.2b-4.l b-3.5_12.2°8.4 013.1 0 14.706.7-2.212.4~-11.4Il.5-12.2 0-1.1-2.53.9. . II ' Tcont at the 0.05 level.~i~: ~m:~:~~: l~ :t~ti!ti~~ll~ ~i~~lficant at the 0.10 level.4.26.719.1 00.6-3.43.0_12.5 022.60-13.5 0-0.7-1.80.64.7-2.125.6 00.4-0.50.9-12.0 04.2_12.6 02.30.9-2.32.3 6.2 0-12.0 1.118.4 0 13.0 0-0.9 4.7-2.8 4.10.2-7.4 05.02.6_8.0 0 2.413.2 7.3b4.3 0-4.32.5Source' Adolfo L. Poez, <strong>Criminal</strong> VlctimlzotWn,h-'ht t eU'D'C,"U5 U 5 Deportment5 Deportment<strong>of</strong> <strong>Justice</strong>,<strong>of</strong> <strong>Justice</strong>,<strong>Bureau</strong>March<strong>of</strong><strong>Justice</strong> <strong>Statistics</strong>, Technical Report NCJ-B7S77 ( as 109 on, ... ••<strong>1983</strong>), p. 3, Table 3.Table 3.35 Number and percent <strong>of</strong> "households touchedby crime" during the last 12 months, by type <strong>of</strong>victimization, United States, 1975-62 75 80 are weighted estimates based on 1970TE Table 3 I The data presented for the yeors 19 - I hted estimates based on a composite""$~:~'~;~.~~~~~:~oi:~~::W!rt~E:~~~~ii;Y:~rt~:;I~~;;!:;'~~~~:which a household member was a vIctIm 0 pdefinitions <strong>of</strong> terms, see Appendix II.1975 1976 1m 1218 1212 1260 1261 1262Households, total (in thousands) 73, l23 74,528 75,904 77 ,57B 7B,%4 80,622 62,797 85,OO:lHouseholds touched by crime(In thousands) 23,377 23,504 23,741 24,277 24,730 24,222 24,B03 24,B28Percent <strong>of</strong> households touched by:All crimes 32.0 31.5 31.3 31.3 31.3 30.0 30.0 29.2Rope 0.2 0.2 0.2 0.2 0.2 0.2 0.2 0.2Robbery 1.4 1.2 1.2 1.1 1.2 1.2 1.3 1.4Assault 4.5 4.4 4.7 4.6 4.8 4.4 4.7 4.5Personal larceny 16.4 16.2 16.3 16.2 15.4 14.2 13.9 13.8Burglort 7.7 7.4 7.2 7.2 7.1 7.0 7.4 6.9I-busehold larceny 10.2 10.3 10.2 9.9 10.8 IU.4 10.2 9.6Motor vehicle theft 1.8 1.6 1.5 1.7 1.6 1.6 1.6 1.6350i:!i'/:1)/I''IIi "III.IiIIIIIIIli "II,IIIII1lII!°Detoil does not odd to t~tal beco,use <strong>of</strong>overlap In households touch~c by dIfferent Crtmes. i I D6 I B lietinI St t' t' s The Prevalence <strong>of</strong> Cr me J , U ,Source: U.S. Deportment <strong>of</strong> <strong>Justice</strong>, <strong>Bureau</strong> <strong>of</strong> Just,ce A~ ~s;c 1'~82), p. I; and U.S. Departm~nt <strong>of</strong> JUStIC~,NCJ-7590S (\yoshlng~on, D.S,:: U~~lcPset~~~:dt b;f ~~i~cel'98I,gBlIllet!n NCJ-64406, p. ~ Job~(J{~~~~u~:~f~<strong>Bureau</strong> <strong>of</strong> JustIce StatIstics, I ... ~se DC' US Deportment <strong>of</strong> Justtce). loble odopte y\'¥.:J-8867I , p. I, Table I (Woshtngton, ... "/1;:I
<strong>Sourcebook</strong> <strong>of</strong> Crimi no I <strong>Justice</strong> <strong>Statistics</strong> <strong>1983</strong>Table 3.36 Percent <strong>of</strong> "l'lou:;eholds touched by crime" during the last 12 months, by race <strong>of</strong> head <strong>of</strong>household, family income, and place <strong>of</strong> residence, United StQ~es, 1982Any crimef\OTE: See f\OTES, Tables 3.1 and 3.35. The entries for white "households louched bycrime" are computed as a percent <strong>of</strong> the total number <strong>of</strong> white households and theentries for block "households touched by crime" are computed as a percent <strong>of</strong> the totalnumber <strong>of</strong> block hQuseholds. For survey methodology and definitions <strong>of</strong> terms, seeAppendix II.Violent crimeRopeRobberyAssaultAggravatedSimpleProperty crime:Personal larceny 13.7Burglory 6.4f-busehold larceny 9.5Motor vehicle theft I .5Serious. aviolentcnme bTotal la.-cenyRace <strong>of</strong> head<strong>of</strong> householdWhite Block21l.75.50.21.24.51.63.22.820.833.27.10.22.84.72.32.813.710.210.52.55.021.3~Rape, robbery, aggravated assault.Personal larceny, household larceny.(Percent)Annual fomil~ income$7,5UU 15,OUOUnder to to $25,000_$7,50U $14,9~9 $24,999 and over25.76.10.31.1l4.5/.93.09.68.69.11.83.716.428.66.00.21.54.71.83.211.76.710.01.63.320.13U.75.50.11.34.31.53.215.06.310.11.92.822.633.95.80.11.14.81.53.718.66.410.11.72.625.8Place <strong>of</strong> residenceCenfralcities Suburban RuralSource: U.S. Department <strong>of</strong> <strong>Justice</strong>, <strong>Bureau</strong> <strong>of</strong> <strong>Justice</strong> <strong>Statistics</strong>, f-buseholds Touched by Crime, 1982JBulletin NCJ-8!l67I (Washington, D.C.: U.S. Department <strong>of</strong> <strong>Justice</strong>, June 19113), p. 2, Table 2. Tableadapted by SOlRCEBOO< staff.34.67.30.22.55.22.03.615.48.9II .52.64.523.43U.15.70.11.24.61.63.415.46.39.41.52.822.3Table 3.37 Respondents reporting being victimized during the " last 12 months, by<strong>of</strong>fense, United States, selected years 1972-83f\OTE: "Crimes against person" includes respondents who were assaul1cid or mugged, or whohad money or property taken by force or threat <strong>of</strong> force. For a discussion <strong>of</strong> plJblic opinionsurvey sompling procedures, see Appendix 7._Question: "During the lost 12 months, have any <strong>of</strong> these happenened to you?"(Percent responding yes)1972 1975 1977 1979 1981 1982 <strong>1983</strong>Crimes against property:Money or property stolen 8 IIProperty vandalized8 II IIb14IU12IIf-bme broken into or break-in10 II II IIattempted 7 8 5 7 ,'7Cor stolen 2 728I 2 2 2 2Cr}mes against persor 2. 2 2 3 2 3 3Source: George H. Gallup, The Gallup Report , Report Na. 210 (Princeton, N.J.: TheGallup Poll, March 19!13), p. 5. Table adopted by SOURCEBOOK st<strong>of</strong>f. Reprinted bypermission.352.,23.24.10.10.63.71.42.510.35.78.00.72.016.8Nature and Distribution <strong>of</strong> Known OffensesFi ure 3.14 Percent <strong>of</strong> "households touched by crimes <strong>of</strong> high~oncern"o during the last 12 months, by ~ace <strong>of</strong> hea~ <strong>of</strong>household, family income, and place <strong>of</strong> reSidence, UnitedStates, 1982f\OTE: See NOTE, Tables 3.1, 3.35, and 3.36.,. For surveymethodology and definitions <strong>of</strong> terms. see Appenmx I I.Any hlgh·concern crime JRaceWhiteBlackFamily IncomeLess than $7,50C$7,500-$14,999I$15,OOO-~24,999$25,000+Place <strong>of</strong> residenceUrbanSuburbanRural1o 5 10 15IIIaRape, robbery or assault by strangers, or burglary.Source: U.S. Deportment <strong>of</strong> <strong>Justice</strong>, <strong>Bureau</strong> o~ <strong>Justice</strong><strong>Statistics</strong>, f-buseholds Touched by Crime, 1982, Bullet!n IjCJ-1l1l67 I (Washington, D.C.: U.S. Department <strong>of</strong> <strong>Justice</strong>, une<strong>1983</strong>), p. 3, Figure 2.Fi r 3 15 Percent <strong>of</strong> "households touched by crime" d~ringI~~ee la'sf 12 months, by type <strong>of</strong> victimization, UnitedStates, 1975-82f\OTE: See f\OTES, Tables 3.1 and 3.3,5. For survey methodologyond definitions <strong>of</strong> terms, see AppendiX II.Percent30 Any crime-25IJI-2015Personal larceny without contact0Household burglary.-5 ~Rape. robbery. and assaultf/Motor vehicle theftr L1975 76 77 78 79 80 81 82Source: U.S. Deportment <strong>of</strong> <strong>Justice</strong>, <strong>Bureau</strong> <strong>of</strong> .<strong>Justice</strong><strong>Statistics</strong>, Households Touched by Crime, 1982, BulJ?tm ~CJ-88671 (Washington, D.C.: U.S. Deportment <strong>of</strong> <strong>Justice</strong>, une<strong>1983</strong>), p. I, Figure I..,--~
-------'''*'''_''' __ ,~=IW".(I<strong>Sourcebook</strong> <strong>of</strong> <strong>Criminal</strong> <strong>Justice</strong> <strong>Statistics</strong> 19113Nature and Distribution <strong>of</strong> Known OffensesTable 3.38 Respondents reporting crime vic'llmizatlon and crime reporting during the lastde/ll()graphlc characteristics, Ullted States, 1!l8212 months, by type <strong>of</strong> victimization andTable 3.39 Reports <strong>of</strong> child abuse or neglect, by type <strong>of</strong>report, 25 jurisdictions, 1981(\N)TE: The "victimized" are the percent <strong>of</strong> total respondents who reported they had been the victim<strong>of</strong> a particular <strong>of</strong>fense. Those who "reported" are a subset <strong>of</strong> the victims but a percent <strong>of</strong> thetotal respondents. For a discussion <strong>of</strong> public opinion survey sampling procedures, see Appendix 7.Question: "During the last 12 months have any <strong>of</strong> these happened to you?""Did you happen to report this to the police or nat?"(Percent)i-bne, car,Personally,Vioney orMoney oror propertymugged orI-ilrne broken intopropertv stolenproperty taken byvandalizedphysicallyor atteapt rngdeTotalCor stolenVicthreator forceRe- VicgssgultedRe- VicvictimizedRe- VictimizedRe- Vlce£rtedtlmlzedRe- Vice£rtedtimizedRe- at ae£rted t1mized e£rted timized ~rted timized ~rted least onceNotional 12 7 II 7 8 6 2 2 2 (b) 25Sex:Male 12 7 II 6 5 4Female2 I122 (b)8 II(b)72510 ~i 3 2 2 I (b) 25Race:White 12 7 12 7 8 6 3 2 I I 25Nonwhite II 6 !I 6 7 6 2 I 2 (b) 24"'ducation:College 13 8 15 9 9 8 3 2 I (b) (b) (b) 29High school 14 8 II 7 8 6 3 2 2 I I I 26Grade school 4 I 3 I 5 2 2 (b) 2 I (b) I 13Region:East 8 4 10 7 6 4 3 2 3 I I (b) 22Midwest II 7 9 5 7 5 3 2 I I (b) (b) 23South 13 7 9 5 8 6 I I (b) (b) I I 24West 18 12 19 12 II 9 3 2 2 2 I I 35Age:Total under 30 years 16 9 16 II 9 6 3 I 3 I I I 31III to 24 years 19 II 19 13 9 5 4 2 4 I I I 3825 to 29 years 10 6 12 8 9 8 I I (b) (b) (b) 2230 to 49 years 14 8 II 6 10 8 4 2 2 I I I 29Total 50 years and older 8 5 8 4 5 4 ! I I (b) (b) (b) 175U to 64 years 8 5 8 5 5 4 I I I (b) (b) (b) III65 years and older 8 5 6 3 5 4 I I I I (b) (b) 15rooo ood~,13 9 13 9 8 7 I I I I (b) (b) 2720,000 to r4,999 10 4 7 4 5 4 4 3 I I (b) (b) 2015,OUO to 19,999 II 4 15 8 9 5 2 I 2 (b) 3 2 2610,000 to 14,999 13 4 7 5 7 6 2 I I I (b) (b) 225,000 to $9,999 :6 10 13 8 10 8 2 I 3 2 I I 21lLklder $5,000 7 4 4 I 6 3 2 I 2 (b) (b) (b) !7Income:Politics:Republican 12 7 8 5 7 5 2 I 2 I 24Democrat II 7 9 5 8 6 3 2 I (b) 24Independent 13 7 17 10 8 7 3 I 2 I 27Religion:Protestant 10 6 10 6 7 5Catholic2 I I (b)12 6(b)12(b)8 8226 2 2 2 I (b) (b) 25Occupation:Pr<strong>of</strong>essional and blliliness 13 9 12 10 7 7Clerical and sales2 215I9 21I I12 16I 26IIManual workersI124 (b)7 II2 (b)6 Il346Nonlabor force21026I (b)9 4I4274 I I I I I 19City size:1,000,000 and over 13 9 II 8 9 7 2 2 2 I (b) (b) 2135UO,OOO to 999,999 17 10 18 14 9 8 5 5 I (b) (b) (b) 3250,000 to 499,999 13 7 10 5 13 10 4 2 3 I I I 272,500 to 49,999 7 3 12 8 4 3 (b) (b) (b) (b) I I 21Under 2,500, rural 12 7 9 5 4 3 I I (b) (b) !b) ~b) 20aThis figure represents the net proportion <strong>of</strong> households for whichone or more crimes was raported by thl1 :espondent. In addition to thecrimes presented individually In the table, other crimes were reportedby I percent or less <strong>of</strong> respondents.bless than I percent.Socrce: George H. Gallup, The Gallup Ree£rt, Report No. 210 (Princeton, N.J.: The Gallup Poll, Morch <strong>1983</strong>), pp. 4, 5. Reprlnterl by P"1rmisslon.354i~It!III~~II!I!r~1\~If!ij~II,I;II)),IikilI,d;,j:1H;,I!IIi\I.q[1'II)~IiII)II1N)TE: These data were collected by the Notional Study on ChildNeglect and Abuse Reporting <strong>of</strong> the American HumaneAssociation. The data were complied from the reports <strong>of</strong> the37 Jurisdictions that submitted Individual case Information.They do not represent the total number <strong>of</strong> reports receivedbecause reports were edited by the Notional Study's staff forcorrectness and completeness. Only edited reports have beentabulated.The reader Is urged to use caution In making comparisonswith data presented In previous SClRCEBOO
357<strong>Sourcebook</strong> <strong>of</strong> <strong>Criminal</strong> <strong>Justice</strong> <strong>Statistics</strong> <strong>1983</strong>20,000Figure 3.17 Perpetrators <strong>of</strong> child abuse or15,0009,748Ineg eet, by age and sex, 22 jurisdictions, 1981!\OTE: See !\OTE, Table 3.39. Definitions <strong>of</strong> abuse and I .State to State. For information on the meth d I . neg h ect , and reporting procedures vary from. 0 0 ogy 0 f t e study, see Appendix t 2.Male perpetrators(N = 51,453)~~~.......J10,000 5,000 oAge(in years)60 and older55 to 5950 to 5445 to 4940 to 4435 to 3930 to 3425 to 2920 to 2415 to 19o to 15 346oFemale perpetrators(N = 82,939)5,000 10,000Sovrce: Figure constructed by S(LRCEBOO< staff from dataprovided by the American H.nnane Association.15,000 20,000iIIjIII)ItiI'III ! I:IiI:"I:I,Ii~ !I:iI'I\:Table 3.40 Fublic school teachers reporting whether they havebeen physically attacked by students, by region, school systemenrollment, teaching level, and number <strong>of</strong> attacks, UnitedStates, 1981Noture and Distribution <strong>of</strong> Known Offenses!'OTE: These data were collected from a mail survey sent to a sample<strong>of</strong> public school teachers drawn at random from a sample <strong>of</strong> schoolsystems in the United States, also selected at random. Of the 1,709public school teachers to whom the mail survey was sent, 1,265, or74.0 percent, completed and returned the qUestionnaire. The Statescomprising each region are as follows: Northeast--Connecticut,Delaware, District <strong>of</strong> Columbia, Maine, Maryland, Massachusetts, NewHampshire, New Jersey, New York, Pennsylvania, Rhode Island,Vermont; Southeast--Alabamo, Arkansos, Florida, Georgia, Kentucky,Louisiana, Mississippi, North Carolino, South Carolina, Tennessee,Virginia, West Virginia; Middle--Illinois, Indiana, Iowa, Kansas,Michigan, Minnesota, Missouri, Nebraska, North Dakota, Ohio, SouthDakota, Wisconsin; West--Alaska, Arizona, California, Colorado,Hawaii, Idaho, Montano, Nevada, New Mexico, Oklahoma, Oregon,Texas, Utah, Washington, Wyoming,Question: "Have you been physically attacked by a studentwithin the past 12 months?"(Percent a )Yeslhreetimes orNo Once Twice or moreTotal 95.3 3.6 0.8 0.4Region:Northeast 95.8 3.6 0.7 0.0Southeast 95.3 3.2 1.4 0.0Middle 94.4 3.5 1.2 0.9West 95.6 3.8 0.0 0.6School system enrollment:25,OUO students and over 90.1 6.8 2.0 1.03,000 to 24,999 students 96.9 2.6 0.2 0.32,999 and fewer students 96.7 2.5 0.8 0.0Teaching level:Elementary 95.1 3.8 0.8 0.3Junior high 95.5 2.9 1.3 0.3Senior high 95.8 3.3 0.5 0.5Opercents moy not odd to 100 due to rounding.Source: National Education Association, Nationwide Teacher~inlon Poil 1981 (Washington, D.C.: Notional Education Association,81), p. 26. Table adopted by SOlRCEBOJK st<strong>of</strong>f. Reprinted bypermission.Table 3.41 Public school teachers reponing whether personal propertyhas been stolen Q,nd/or damaged by students, by region, schoolsystem enrollment, and teaching level, United States, 1982I-DTE: See !\OTE, Table 3.40.Question: "Has your personal property been stolen or intentionallydamaged by a student within the past 12 months?"TotalRegion:NortheastSoutheastMiddleWest(Percent a )No personalpropertystolenor intentionallydamaged68.969.069.072.765.0Personalpropertystolen16.716.916.913.919.1School system enrollment:25,000 students and over 64.6 20.73,000 to 24,999 stUDents 71.8 15.52,999 and fewer students 61:1.1 14.6Teaching level:ElementarySecondary74.164.115.417.6Opercents may not odd to 100 due to rounding.PersonalPersona I property bothproperty stolen andinten- and intentionallytionallydamaged damoged7.8 6.77.7 6.57.3 6.97.7 5.78.2 7.77.2 7.57.0 5.69.5 7.J5.1 5.310.0 8.3Source: Table provided to SOURCEBOOK st<strong>of</strong>f by the NotionalEducation Association.Table 3.42 High school administrators' reports <strong>of</strong> the seriousness<strong>of</strong> selected school problems, United States, 1980NOTE: The sample size on which each <strong>of</strong> the percent distributions isbased may differ slightly from the total numb:'!r <strong>of</strong> high schooladministrators (988) due to nonresponse. For survey methodology anddefinitions <strong>of</strong> terms, see Appendix 13.(Percent)Seriousness <strong>of</strong> school problemNOtSchool problem Serious Moderate Minor at 011Absenteeism 8.1 39.7 43.5 8.7Student use <strong>of</strong> drugs or alcohol 5.6 36.5 50.5 7.4Closs cutting 4.7 25.6 51.6 18.1Vandalism <strong>of</strong> school property 2.4 19.6 68.5 9.5Robbery or theft 1.7 16.1 69. I 13.1Verbol abuse <strong>of</strong> teachers 0.1 8.3 62.8 21:1.1:1Physical conflicts among students 0.1 5.8 62.6 31.5Conflicts between students andteachers 0.0 5.2 69.5 25.3Student possession <strong>of</strong> weapons (0) 0.5 21.1 78.4Rape or attempted rope 0.0 0.2 3.9 95.9aCeil entry is less than I percent, but not zero.Source: U.S. Department <strong>of</strong> Education, Notional Center forEducation <strong>Statistics</strong>, Discipline. Order and Student Behavior inAmerican Hit Schools (Washington, D.C.: U.S. Government PrintingOffice, 1982, p. 17. Table adapted by SQRCEBOO< staff.356
;1INoture ond Distribution <strong>of</strong> /
.,~Iu,, ______ ~~ __<strong>Sourcebook</strong> <strong>of</strong> <strong>Criminal</strong> <strong>Justice</strong> <strong>Statistics</strong> <strong>1983</strong>Table 3.46 Reported drug use within last 12 months among high school seniors, by type <strong>of</strong> drug, United States, 1975-82f\OTE: See NOTE, Table 3.45. Data for the categories "inhalants" and "hallucinogens" areunderestimated because some users <strong>of</strong> amyl and butyl nitrites, and PCP fail to report in these drugcategories. The 1979, 1980, 1981, and 1982 surveys address this issue by asking specifi!: questionsabout amyl and butyl nitrites (inhalants) and PCP (a hallucinogen) an one survey alternate form.These data were then used to adjust the 1979, 1980, 1981, and 1982 data for underreporting inthese drug categories. For survey methodology and definitions <strong>of</strong> terms, see Appendix 10.bQuestion: ''On how many occasions, if 'Jny, have you used ••• during the last 12 months?"(Percent who used in last 12 months)~Type <strong>of</strong> drugClass Class Clt,Jss Class Class Class Class Class<strong>of</strong> 1975 <strong>of</strong> 1976 <strong>of</strong> 1977 <strong>of</strong> 1978 <strong>of</strong> 1979 <strong>of</strong> 1980 <strong>of</strong> 1981 <strong>of</strong> 1982(N=9,400) (N=15,400) (N=17,100) (N=17,800) (N=15!SOO) (N=15!900) (N=17 ISOO) (N=17,700)Marihuana/hashish 40.0 44.5 47.6 50.2 50.8 48.8 46.1 44.3Inhalants a N\ 3.0 3.7 4.1 5.4 4.6 4.1 4.5Adjusted b N\ N\ N\ N\ 9.2 7.8 6.0 6.6Amyl and butyl nitrites N\ N\ N\ N\ 6.5 5.7 3.7 3.6Hallucinogens 11.2 9.4 8.8 9.6 9.9 9.3 9.0 8.1Adjusted N\ N\ N\ N\ 12.8 10.6 10.1 9.37.2 6.4 5.5 6.3 6.6 6.5 6.5 6.1N\ N\ N\ N\ 7.0 4.4 3.2 2.2~~Cocaine 5.6 6.0 7.2 9.0 12.0 12.3 12.4 11.5Heroin 1.0 0.8 0.8 0.8 0.5 0.5 0.5 0.6Other apiates C 5.7 5.7 6.4 6.0 6.2 6.3 5.9 5.3Stimulant{ 16.2 15.8 i6.3 17.1 18.3 20.8 26.0 26.1Sedatives 11.7 10.7 10.8 9.9 9.9 10.3 10.5 9.1Barbiturates C 10.7 9.6 9.3 8.1 7.5 6.8 6.6 5.5Methaqualone c 5.1 4.7 5.2 4.9 5.9 7.2 7.6 6.8Tranquilizers c 10.6 10.3 10.8 9.9 9.6 8.7 8.0 7.0Alcohol 84.8 85.7 87.0 87.7 88.1 87.9 87.0 86.8Cigarettes N\ N\ N\ N\ N\ N\ N\ t::lIaData based on four questionnaire forms. N is four-fifthscOnly drug use which was not under a doctor's orders is<strong>of</strong> N w.dicated.included here.Data based on a single questionnaire form. N Is onefifth<strong>of</strong> N indicated.Source: Lloyd D. Johnston, Jerald G. Bachman, and Patrick M. O'Malley, Student Drug Use, Attitudes and Beliefs, NationalTrends 1975-1982, U.S. Department <strong>of</strong> Health and \-iJman Services, National Institute on Drug Abuse (Washington, D.C.: U.S.Governll1Ct1t Printing Office, <strong>1983</strong>), p. 33. Table adapted by S
~~~-~----- ---- -~---~---~--~~------------------~<strong>Sourcebook</strong> <strong>of</strong> <strong>Criminal</strong> <strong>Justice</strong> <strong>Statistics</strong> <strong>1983</strong>i'bture and Distribution <strong>of</strong> Known OffensesTable 3.48 Reparted marihuana/hashish, cocaine, and heroin use and most recent use among high school seniors, by sex, region,population density, and college plans, United States, 1982f\OTE: See f\OTE, Table 3.45. These data were derived from the questions Indicated below. Forsurvey methodology and defin!tlons <strong>of</strong> terms, see Appendix 10.Questions: "On how many occasions, if any, have you had (marihuana/hashish, cocaine, heroin) In your lifetime? On how many occasions, Ifan)" have )'OU hod (marihuana/hashish, cocaine, heroin) during the last 12 months? ,On how many occasions, if any, have you had(marihuana/hashish, cocaine, heroin) during the lost 30 days?"(Percent)MarihuanaLhashish Cocaine HeroinMas t recen t use Most recent use Mast recent useWithin Within Withinlast 12 last 12 last 12manths, i'bt manths, i'bt months, i'btWithin but not within Wi th.i n but not within Within but not withinNever Ever lost lost lost 12 Never Ever Ic
.<strong>Sourcebook</strong> <strong>of</strong> Criminol <strong>Justice</strong> Stotistics 19B3Table 3.S0 Reported drug use and most recent use among adults, young adults, and youth, by type <strong>of</strong> drug, United States, 1982!\oTE: See NOTE, Tobie 3.49. These dot a are based on the responses <strong>of</strong> 2,760 adults (26 Yllars ,<strong>of</strong>age and oider), 1,283 young adults (18 to 25 years <strong>of</strong> age), and 1,581 youth (12 to 17 years <strong>of</strong>age). The "ever used" column reports data on those who reported any post experience with drugs.For survey methodology and definitions <strong>of</strong> terms, see Appendix 14.Questions: "When was the most recent time you took (sedatives, tranquilizers, stimulants, ond analgesics) to get high?recent time you used (marihuana or hashish, cocaine, LSD or other hallucinogen, heroin, alcohol, cigarettes)?"(Percent a )When was the mostMost recent useNever used Ever used Pas! month Post ~eor I not Qast Illonth Not 129~! ~eg[Young Young Young Young YoungType <strong>of</strong> drug Adults adults Youth Adults adults Youth Adults adults Youth Adults adults Youth Adults adults YouthMarihuana and/orhashish 77.0 35.9 73.3 23.0 64.1 26.7 6.6 27.4 11.5 4.0 12.9 9.1 12.4 23.7 6.0Hallucinogens 93.6 78.9 94.8 6.4 7.1.1 5.2 (b) 1.7 1.4 0.7 5.2 2.2 5.7 14.2 1.6Cocaine 91.5 71.7 93.5 B.5 2B.3 6.5 1.2 6.8 1.6 2.6 11.9 2.4 4.7 9.5 2.4Heroin 98.9 98.8 99.6 1.1 1.2 (b) (b) (b) (b) (b) (b) (b) 1.0 0.8 (b)Stimulants 93.8 82.0 93.3 6.2 IB.O 6.7 0.6 4.7 2.6 1.2 6.1 3.0 4.4 7.2 1.1Sedatives 95.2 81.3 94.2 4.8 IB.7 5.8 (b) 2.6 1.3 1.1 6.1 2.4 3.4 10.1 2.1Tranquilizers 96.4 84.9 95.1 3.6 15.1 4.9 (b) 1.6 0.9 0.9 4.3 2.4 2.4 9.1 1.6Analgesics 96.8 87.9 95.8 3.2 12.1 4.2 (b) 1.0 0.7 0.7 3.4 3.0 2.2 7.7 0.5Alcohol 11.8 5.4 34.8 8B.2 94.6 65.2 56.7 67.9 26.9 11.7 15.5 20.4 19.9 11.2 17.9Cigarettes 21.3 23.1 50.5 78.7 76.9 49.5 34 .. 6 39.5 14.7 3.6 7.8 10.2 40.4 29.7 24.6bSome categories do not sum to 100 percent because <strong>of</strong> rounding.Less than 0.5 percent.Source: Judith Droitcour Miller, Notional Survey on Drug Abuse: Main s 1982, U.S. Deportment <strong>of</strong> Health and I-Mnan Services, NotionalInstitute on Drug Abuse (Wahington, D.C.: U.S. Government Printing Office,Findin1 I !lBZ , pp. 10, 12,. 14. Table adopted by Sa..RCEBOO< st<strong>of</strong>f.Table 3.51 Reported psychotherapeutic drug use among adults, young adults, and youth, by demographiccharacteristics and type <strong>of</strong> drug, United States, 1982Nciture and Dlstrlbut!on <strong>of</strong> Known OffensesTable 3.52 Reported drug use among adults, young adults, and youth by type <strong>of</strong> drug anduse <strong>of</strong> alcohol, United States, 1902'!\oTE: See !\OTES, Tables 3.49 and 3.50. These data were constructed by combining the questionsbelow Into the four categories shown In the table. The "current drinkers" category was derivedby on~ positive response to the question abol"1 alcohol use. For survey methodology onddefir,ltlons <strong>of</strong> terms, see Appendix 14.• Questions: "When was the most ~ time you hod a drink? When was the most recenttime yo~ took a (sedative, tranquilizer, stimulant, analgesic) to get high? When was the most~ time you used (mol'lhuana or hashish, LSD or other hallucinogen, cocaine, heroin)?"(Percent reporting ever used drug)Adults Young adUlts Youth(26 and older) (18 to 25) (12 to 17)J\bf J\bf J\bfCurrent current Current current Current currentdrinkers drinkers drinkers drinkers drinkers drinkers(N=I,648) (N=1,112) (N=857) (N=4l6) (N=410) (1'>61,171)Ever used psychotherapeuticpills for nonmedical reasons:Yes 13 3 37 10 25 5No B7 97 63 90 75 95Ever used morlhuana and/or hoshish:Yes 35 7 76 39 60 15No 65 93 24 61 40 85EVer used hallucinogens, cocaine,heroin:Yes 16 2 43 II 22 3No 84 98 57 89 78 97
<strong>Sourcebook</strong> <strong>of</strong> Criminol <strong>Justice</strong> <strong>Statistics</strong> <strong>1983</strong>Agure 3.19 Reported marihuana use and use in past manth among adults, yaung adults, and youth,lkIlted States, selected years 1971-82/'DTE: See ~TE, Table 3.49. The "ever used" column reports data on those who reported any postexperience with marihuana. Data for some years have been revised from previous reports. For surveymethodology and definitions <strong>of</strong> terms, see Appendix 14.Question:Adult. (26 and older)"When was the most ~ time you used morlhuana, hashish?"(Percent)~~------------'--------------------~~4---------------------------------~1111 181:1 HI'4 lora tim 11170 lIMO'IN. U64) IN .,.81:1) IN· 2221J IN. 1,7l)B) eN ·',122) IN .3.015) IN" 2.160)Young .dulfl (18 10 251EVdrused~~---------------------------------,...1112 1174 1;70 tl17 Ion 1882IN·172) (N ..... ' IN-U21 1"'.',500) IN.2.~) (N-Uell13 2.5 2.0HI7IIN·Ue.4,UIO In palt month\INature and Distribution <strong>of</strong> Known OffensesTable 3.53 Reported marihuana use and use In past month among adults, by demographiccharacteristics, United States, 1976, 1977, 1979, and 1982/'DTE: See /'DTE, Table 3.49. The "ever used" coll.l'm reports data on those who reported any post experiencewith morihuana. For survey methodology and definitions <strong>of</strong> terms, see Appendix 14.Question: "When was the most recent time you used mor thuana, hashish?"(Percent)__ ~.'__ Ever used Used in post rrpnth_______________ ~19~7~6_~1~97~7_~1~9~79~ __ ~i9~8~2_~1~97~6 __ ~I~97~7 ___ ~19~7~9 __ ~1982All ad'Jits(26 and older)Sex:MoleFemoleRace:Whitel'-hnwhlteEducation:Nat high school graduaterfigh school graduateCollegeNat a graduateGraduateRegion:NartheastNarth CentralSouthWestPopulation density:Lorge metropolitanSmoll metropolitanNanmetropolitanRvral:':,,500 to 24,9992,499 or less12.9~t tabulated in this year.19712176122016241610101819127(0)(a)(a)15.321101520616252624191492320169(a)(a)(a)19.62614192691830273320161827232114131313Source: Patricio M. Fishburne, Herbert I. Abelson, and Ira Clsin, National Surve on Dru Abuse: Main~n~ingsu'l7& U.S. Deportment <strong>of</strong> Health and H.rnon Services, National ,nsf tute on rug se as ington,•• : •• vernment Printing Office, 1980), pp. 52, 5G; and Judith Droltcour Miller, National Svrvey onDrug Abuse: Main Findings 11I82, U.S. Deportment <strong>of</strong> Health and \-\.man Services, National InstHute on DrugAbuse (Washington, D.t:r' U.s. Government Printing Office, 1982), p. 32. Table adopted by SOL.RCEBOOKst<strong>of</strong>f.23.030172327102036343826211732272415(a)(a)(a)3.56236I3657523454I(a)(a)(a)3.34'l34I379453I553I(a)(a)(a)6.0936835109II74598643436.61036925IIIIII9559963(a)(a)(a)EveruledU'.ln past monthYouth (12 to 17)~~,4---------------------------------~~4---------------------------------~.. -1----------430'EveruledU,a In paat month366,I
-~----- --- -- --<strong>Sourcebook</strong> <strong>of</strong> <strong>Criminal</strong> <strong>Justice</strong> <strong>Statistics</strong> <strong>1983</strong>Table 3.54 Reported marihuana use and use In past month among young adults, by demographiccharacteristics, United States, 1976, 1977, 1979, and 1982NOTE: See N::>TE, Table 3.49. The "ever used" column reports data on those who reported any PllSt experiencewith marihuana. For survey methodology and definitions <strong>of</strong> terms, see Appendix 14.Question:"When was the mast ~ time you used marihuana, hashish?"1m(Percent)Ever used1977 1919 198~ l~i6Used in East manth1917 I~'~ i9!i2:All young adults(18 to 25) 52.~ 5~.~ 68.2 64.1 25.0 27.4 35.4 27.4Sex:Male 62 66 75 68 31 35 45 36Female 44 55 61 60 I~ 20 26 I~Race:White 55 61 6~ 65 26 28 36 26Nonwhite 48 55 62 61 22 24 34 35Education:Not high school graduate 41:1 52 67 66 23 21 41 35HIgh school graduate 50 60 65 64 21 2~ 30 26College 60 65 73 62 32 30 38 24Not a graduate 57 66 74 64 33 32 40 26Graduate 6!l 58 68 58 28 22 33 19Now a full-timecollege student 62 63 64 60 32 31 37 26Region:66 71 66 26 34 40 31Northeast 60N:lrth Central 54 61 72 64 27 2~ 38 27South 42 50 61 5~ 18 17 30 26West 64 67 71 70 35 33 36 27Population density:73 2~ 31 3~ 32Large metropolitan 59 63 69Small metropolitan 59 64 68 63 2!l 2~ 36 26Nonmetropolitan 38 48 61 59 16 18 30 23Rural (a) (a) 6U (a) (a) (a) 28 (a)2,500 tG 24,99~ (a) (a) 68 (a) (a) (a) 37 (a)2,4~9 or less (a) (a) 54 (a) (a) (a) 23 (a)~t tabulated in this year.Source: Patricia M. Fishburne, Herbert I. Abelson, and Ira Cisin, N:ltional Survey on Drug Abuse: MainFindings 1979, U.S. Department <strong>of</strong> Health and Human Services, National Institute an Drug Abuse (Washington,D.C.: U.S. Government Printing Office, I ~8U), pp. 51, 55; and Judith Droitcour Miller, National Survey onDrug Abuse: Main Findings 1982, U.S. Deportment <strong>of</strong> Health and Human Services, Nationol Institute on DrugAbuse (Washington, D.C.: U.S. Government Printing Office, I ~82), p. 31. Table adapted by SCLRCEBOOTE: See N::>TE, Table 3.4~. The "ever IJsed" column reports data on those who rejAlrtecl ony pastexperience with marihuana. For survey methodology and definitions <strong>of</strong> terms, see Appendix 14."When was the most ~ time you used marihuana, hashish?"(Percent)E~[ Il~!ldUsed In l2ast manth1971 1~72 1~74 1~76 1~77 1~79 1982 1971 1~72 1974 1~76 1~77 1~7~All youths(12 to 17) 14.0 14.0 23.0 22.4 28.0 30.~ 26.7 6.0 7.0 12.0 12.3 16.6 16.7Sex:Male 14 15 24 26 33 34 28 7 ~ 12 14 20 I~Female 14 13 21 I~ 23 28 25 5 6 II II 13 14Race:White 15 16 24 22 2~ 31 27 (a) 8 12 12 17 17Nonwhite 12 5 17 22 25 31 23 (a) 2 ~ II 14 15Region:Northeast 16 16 26 21 35 34 31 ~ 7 14 13 22 20N:lrth Central 13 14 21 26 29 34 26 5 7 II 16 20 19South 7 8 17 16 I~ 24 23 2 4 6 7 8 12West 26 24 30 30 35 36 2~ II 14 19 17 22 16Population density:Large metropolitan 15 I~ 27 25 36 36 32 ~ (a) 14 18 22 20Small metropolitan 15 l!l 22 24 28 28 23 7 (a) II II 17 14N:lnmetropolitan 13 7 18 18 18 27 24 3 (a) 10 8 10 15Rural (a) (a) (a) (a) (a) 27 (a) (a) (a) (a) (a) (a) 142,500 to 24,999 (a) (a) (a) (a) (a) 28 (a) (a) (a) (a) (a) (a) 172,49~ (,t less (a) (a) (a) (a) (a) 26 (a) (a) (a) (a) (a) (a) 13aN:lt tabulated In this year.Source: Patricia M. Fishburne, rJ:rbert I •. Abelson, .and Ira Cisin, National Survey on Drug Abuse: Main Findings I ~79, U.S.Department <strong>of</strong> Health and. Human. Servlce~, National Institute on Drug Abuse (Washington, D.C.: U.S. Government Printing Office,19!1U), pp. 5.U, 54; an? Judith ,?roltcour Miller, National Survey on Drug Abuse: Main Findings 19G2, U.S. Deportment <strong>of</strong> Health andl-luman Services, Natlona! Institute on Drug Abuse (Washington, D.C.: U.S. GOvernment Printing Office 1982) p 30 Table adaptedby 5CLRCEBOOK staff. ' ,..1~1:I2II .5131012IU1515!:l1017!l9(a)(a)(a)369
~ ---~ ---------- - ---Sout!:eboci< <strong>of</strong> <strong>Criminal</strong> <strong>Justice</strong> <strong>Statistics</strong> <strong>1983</strong>Table 3.56 Estimated number and rate (per 100,000 Inhabitants) <strong>of</strong> affem;es known to police, by <strong>of</strong>fense, United States, 1960-81N)TE: These data were complied by the Federal <strong>Bureau</strong> <strong>of</strong> Investigationthrough the Unifbrm Crime Reporting Pragram. On a monthly basis, lawenforcement agencies (police, sheriffs, and State police) report thenumber <strong>of</strong> affenses that become Imown to them in the fallowing crimecategories: murder and nannegligent manslaughter, manslaughter bynegligence, forcible rape, robbery, assault, burglary, larceny-theft, andmotor vehicle theft. A count <strong>of</strong> these crimes, which are known as PartI affenses, is taken from records <strong>of</strong> all complaints af crime received bylow enforcement agencies from victims or other sources and/or from<strong>of</strong>ficers who discovered the affenses. Whenever complaints <strong>of</strong> crime aredetermined through investigation to be unfounded or false, they areeliminated from the actual count (SrJurce, p. 2).The Unifarm Crime Reporting Program uses seven crimecategaries tQ establish a "crime index" in order to measure the trendand distribution <strong>of</strong> crime in the United States. Crime index <strong>of</strong>fensesinclude murder and nonnegligent manslaughter, farcible rape, rabbery,aggravated assault, burglary, larceny-theft, and matar vehicle theft;the "Total Crime Il'idex" is a simple sum <strong>of</strong> the index affenses. Arsonwas designated as a Part I Index <strong>of</strong>fense in October 1978; datacollection was begun in 1979. However, due to the incompleteness <strong>of</strong>arson reporting by police in 1979 and 1980, arson data are notdisplayed nor are they included in the Total Crime Index <strong>of</strong> the<strong>of</strong>fenses knawn to the palice., The figuNls in this table are subject to updating by the UniformCrime Reporting Program. The number <strong>of</strong> agencies reporting andpapulations represented may vary from year to year. This table, Table3.58, and Table 3.59 present estimates for the United States arparticular areas based on agencies reporting. For definitions <strong>of</strong><strong>of</strong>fenses, see Appendix 2."Murderand nonnegligentPopulotian a TotalCrimEbIndexPropertycrime cmanslaughterForciblerape RabberyAggravatedassaultBurglaryLarcenytheftMotarvehicletheftNJrnber <strong>of</strong> affenses:1960 - 179,323,1751961 - 182,992,OUO1962 - 185,771,0001963 - I !!1:!,41:!3,UUU1964 - 191,141,000196!> - 193,526,0001966 - 195,576,0001%7 - 197,457,OUO1968 - 199,399,UOO1969 - 20 I ,385,0001970 - 203,235,2981971 - 2U6,212,0001972 - 208,230,tJOO1973 - 209,!!51,OOO1974 - 211,392,('.00197!> - 213,124,JUO1976 - 214,659,0001977 - 216,332,0001978 - 218,059,0001979 - 22U,rJ99,OUO1980 - 225,349,26419!!1 - 229,146,0003,31:!4,2UU3,488,00U3,7!>2,20U4,109,5004,564,60U4,739,4005,223,5UO5,903,4006,720,20U7,410,900!!,09B,0008,588,2008,24l'l,80U8,71!!,IOOIO,2~3,40011,256,60011,304,BUO10,935,80011,141,30U12,152,70013,29!l,400!3,290,30021l8,460 3,095,70U289,390 3,198,6003UI,510 3,45U,70U316,970 3,792,500364,220 4,20U,4UU387,390 4,352,00043U,I!!0 4,793,3UU499,930 5,403,500595,UIU 6,125,20U661,870 6,749,000738,82U 7,359,2UU816,500 7,771,700834,9UO 7,413,9UO1l75,910 7,842,200974,720 ~,278,7UU1,026,28U 10,230,30091l6,58U 10,318,2UU1,009,500 9,926,3001,061,830 IU,U79,5UO1,178,540 10,974,2001,30~,9UU 11,91:!6,5001,321,900 11,968,4009,1108,7408,53U8,6409,3609,96011,04U12,24013,80014,76016,00U17,78018,67019,6402u,71020,51018,71lU19,12019,56021,46023,04022,52017,19017,22017,55U17,65021,42023,41025,82027,62031,67037,17037,99042,26046,IlS051,40055,40056,09056,73U63,02067,13075,990!l2,09081,540107,840106,670110,860116,47013U,390138,690157,990202,910262,84U298,!!50349,86U387,700376,2903!!4,220442,40U464,970420,210404,850417,U40466,880548,810574,130154,320156,760164,57U174,210203,050215,330235,330257,160286,700311,090334,97U368,760393,090420,650456,210484,710490,850522,510558, IOU614,210654,96U643,720912,100949,600994,3UO1,086,4001,213,2001,282,5001,410,1001,632,1001,858,9001,981,9002,205,0002,399,30U2,375,5UO2,565,5003,039,20U3,252,1003,u89,8UO3,052,2003,104,5003,299,5003,759,2003,739,8001,855,40U1,913,0002,OB9,6002,297,BOO2,514,4UU2,572,6002,822,0003, 111,6003,482,7003,888,600il,225,8004,424,2004,151,2004,347,9005,262,5005,977,7006,270,8005,905,7005,9!l3,4006,577,5007,112,7007,154,500328,200336,000J66,1l00408,30U472,800496,90U561,ZOO659,8007!l3,6UO1l78,50092B,400948,200887,2UO928,800977,1001,00U,5OO957,600968,40U991,6001,097,2001,114,7UU1,074,000Rate per I 'J'a000inhabitants:1%01961196219631%41%51%61967I % I:!196919701971197219731974197519761977197!l1979191:!OI 91:! I1,!!!!7.21,906.12,019.!!2,11l0.32,3!!ll.12,449.02,670.8;;:,989.73,37U.23,680.03,9!!4.54,164.73,%1.44,154.44,85U.45,281.75,266.45,055.15, 10~.35,521.55,899.95,799.9160.9158.1162.3168.2190.6200.22LU.0253.229!l.4328.7363.5396.0401.0417.4461.1481.5459.8466.64!l6.9535.5580.8576.91,726.31,747.9I ,1:!!l7.52,012.12,197.52,248.82,450.92,736.53,071.83,351.33,621.03,768.83,560.43,737.04,389.34,800.24,806.!!4,588.44,622.44,986.05,319.15,223.05.14.84.64.64.95.15.66.26.97.37.98.69.09.49.89.68.88.89.09.710.29.!!9.69.49.49.411.212.113.214.015.918.518.720.522.!l24.526.226.326.429.130.1l34.536.435.66U.158.359.761.868.271.78U.8102.l.J131.8148.4172.1188.0IBO.7183.1209.3218.2195.8187.1191.3212.1243.5250.686.185.71l!!.692.4106.2111.3120.3130.2143.B154.5164.8178.8181l.8200.5215.B227.422B.7241.5255.9279.129U.6280.9508.6518.9535.2576.4634.7662.7721.0826.6932.3984.11,084.91,163.51,140.81,222.51,437.71,525.91,439.41,410.91,423.71,499.11,668.21,632.11,034.71,045.41,124.B1,219.11,315.51,329.31,442.91,575.81,746.61,930.92,079.32,145.51,993.62,071.92,489.52,804.82,921.32,729.92,743.92,988.43,156.33.122.31!l3.0183.6197.4216.6247.4256.B2!!6.9334. I393.0436.2456.84S9.B426.1442.646L.2469.4446.1447.6454.7498.5494.6468.7,;'\i..'"'"°Populations are U.S. <strong>Bureau</strong> <strong>of</strong> the Census pravlsional estimatesas <strong>of</strong> July I, except for the Apr. I, 1960, 1970, and 1980 preliminarycensu~ caunts, and are subject to change.Due to rounding, the <strong>of</strong>fenses may not odd ta totals.cViolent crimes are <strong>of</strong>fenses <strong>of</strong> murder, forcible rape, robbery,and aggravated assault. Property crimes are <strong>of</strong>fenses <strong>of</strong> burglary,larceny-theft, and motor vehicle theft. Data are not included for theproperJy crime <strong>of</strong> arson.Crime rates calculated priar to raunding number <strong>of</strong> <strong>of</strong>fenses.4\Source: U.S. Department <strong>of</strong> <strong>Justice</strong>, Federal <strong>Bureau</strong> <strong>of</strong> Investigation, Crime in the United States, 1975, p. 49, Table 2; 1976, p. 37; 1977, p.37, Table 2; 197B, p. 39; 1~79, p. 41; 19110, p. 41, Table 2; 1981, p. 39, Table 2 (Washington, D.C.: U.S. Government Printing Office). Table adaptedby SOLRCEBOO< staff.,370
Figure 3.20 Estimated rate (per 100,000 inhabitants) <strong>of</strong> <strong>of</strong>fenses known to police, by type <strong>of</strong> <strong>of</strong>fense, lkIited States, 1960-81I\DTE: See I\DTE, Table 3.56. Violent crimes are <strong>of</strong>fenses <strong>of</strong> rrorder, forcible rape, robbery, and aggravatedassault. Property crimes are <strong>of</strong>fenses <strong>of</strong> burglary, larceny-theft, and motor vehicle theft. For definitions <strong>of</strong><strong>of</strong>fenses, see Appendix 2.(Rote per 100,000 inhabitants)6,0005,500Total Crime IndexProperty crime5,0004,5004,000.......w!a:3,5003,0002,5002,0001,5001,000500..•.•....•..............•..................................•..•.••.•.......•.............•.•..•...................... ,...............0 1974 1976 1978 1980 19811960 1962 1964 1966 1968 1970 1972Violent crimeSource: U.S. Deportment <strong>of</strong> <strong>Justice</strong>, Federal <strong>Bureau</strong> <strong>of</strong> Investigation, Crime in the United States, 1975, p. 49, Table 2; 1981, p. 39, Table 2 (Washington, D.C.:U.S. Government Printing Office). Figure constructed by Sa..RCEBCXl< st<strong>of</strong>f.\4\, I..,
- ~--J."'~~~"_~ ..~F'"-_ ....<strong>Sourcebook</strong> <strong>of</strong> <strong>Criminal</strong> <strong>Justice</strong> <strong>Statistics</strong> <strong>1983</strong> !C'I1INature and Distribution <strong>of</strong> Known OffensesTable 3.57 Offenses known to the police in cities overTable 3.57 Offenses known to the police in cities over 100,000 population, 1981 and 1982100,000 population, 1981 and 1982--Continulldf\OTE: See f\OTE, Table 3.56. For definitions <strong>of</strong> <strong>of</strong>fenses, see Appendix 2.\Murderand nan-Total(All 1982 crime figures from reporting units are preliminary. Final figures and crime rates per unit <strong>of</strong>negligent Aggra- MotorCrimepopulation are not available until the publication <strong>of</strong> Crime in the Lhited States! 1982.)mon- Forcible votedCity YearLarceny-Indexvehicleslaughter rape Robbery assault Burglary theft theftMurder \ Des Moines, Iowaand non-1981 19,974 7 104 476 452 3,974 14,125 836I 1~82Total negligent Aggro- Motor19, lL3 13 85Detroit, Mid'347 344 3,891 13,700 743Crime mon- Forcible voted Larceny- vehicle1981 143,107 502 1,229 14,797 6,648 46,224 46,186 27,5211~1l2City Year Index slaughter rape Robber>:: assault Burglart theft theft 153,492 515 1,167 16,037 6,029 49,635 48,0011Durham, N.C. 198132, lOll10,746 13 65 245 289 2,764 6,9881982 10,38273~Abilene, Tex 1981 5,687 14 50 119 198 1,269 3,722 315 20 60 264 Elizabeth, N,J.252 2,751 6,~71l1981 9,337 154101982 6,249 12 61 130 246 1,363 4,102 33550 692 694 2,387 4,065 1,434Akron, Ohio I 19112 9,06619111 18,525 24 189 603 421 3,852 12,205 1,2318 60 75lEI Paso, Tex1103 1,912 4,01l619811,44529,2751982 16,737 15 146 606 342 3,471 11,086 1,071 35 205 871 2,399 7,140 16,568 2,057Albany, N.Y.1982 29,4271981 5,921 13 38 222 379 2,022 2,990 257 41 219 932 2,730 7,199 16,079rErie, Po 19812,2275,683 5 52 268 263 1,318 Albuquerque, N. Mex 1982 5,633 8 49 268 411 1,763 2,915 2193,43319112 5,7')/.3446 50 291 2113 1,485 3,345 3321982 1981 30,614 29,214 45 26 213 199 1,107 926 1,620 1,508 7,980 9,074 17,214 16,91l4 1,571 1,361 1EUgene, Ore 1981 10,645 I 50 167 210 2,470 7,373 374'iAlexandria, Va19112 9,5131981 9,122 17 64 553 316 2,192 5,519 461 6 2lEvansville, Ind.149 163 1,910 6,933198133U1982 8,550 6 62 591 320 1,754 5,311 5069,061 II 40 329 462 2,253 5,49819112 8,81l9462Allentown, Po 1981 6,7HO 5 31 246 95 1,816 4,274 313 4 43 207 49~Flint, Mich 2,125 5,6731981331l23,64~1982 6,684 7 3:: 242 115 1,651 4,383 250 34 178 891 2,274 7,433 II,B911982 22,509948Amarilla, Tex 1981 9,751 15 6,,: 167 549 2,903 5,587 468 33 166Fort Lauderdale, Flo787 2,139 7,045 11,4391981 22,0229UO1982 11,160 22 50 223 570 3,372 6,394 52949 94 1,347 561 7,823 10,39819H2 21,H231,750Anaheim, Calif 19111 17,202 19 135 576 525 5,843 8,618 1,48650 IIIFort Wayne, Ind[,28G 523 7,070 10,9531981I,H301982 17,13613,112II 108 582 484 5,343 9,047 1,561 18 85 38'1 334 2,384 9,38719112520Anchorage, Alas 1981 13,731 1813,351173 380 353 2,797 8,826 1,18421 79Fort Worth, Tex387 21l1l 2,031l 9,906198163247,1531982 13,471 22 158 481 431 2,459 8,800 1,120 113 435 2,312 2,086 14,276 24,1231911l3,808Arlington, Tex47,1281981 11,541 12 102 212 373 2,508 7,415 919IU3Fremont, Calif470 2,233 2,;'Y5 13,426 25,06319813,731l7,9831982 11,425 7 67 191 342 2,732 7,153 933 6 34 156 307 2,203 4,8291982 7,785448Arlington, Va 1981 9,538 7 55 380 251 2,157 6,094 5947Fresno, Calif29 136 251 2,233 4,7721981 24,5813571982 7,905 6 61 320 267 1,445 5,318 48833 15,) 1,102 868 6,886 13,76919112 25,1241,768Atlanta, Ga 1981 60,569 182 644 4,507 5,246 17,458 28,966 3,56633Fullerton, Calif155 1,21l 782 6,862 14,4371981 6,6761,6431982 56,964 152 613 3,999 5,722 15,134 27,818 3,5263 55 185 237 1,809 3,9001982 6,823487Aurora, Colo 19111 11,903 10 76 359 992 3,484 6,458 5245Garden Grove, Calif43 186 205 1,892 3,961l1981 9,5845241982 11,606 10 76 353 967 2,675 6,974 55112 76 326 495 2,963 5,08319112629Austin, Tex9,1971981 30,867 39 263 669 574 7,875 19,838 1,6092Garland, Tex41 372 389 2,677 5,11019816067,0481982 31,811 57 235 635 605 8,774 20,114 1,3915 37 70 121 2,125 4,35219112 7,056338Bakersfield, Calif 1981 13,655 23 93 488 523 4, 413/~ 7,435 959 Gary, Ind31l 96 161 1,776 4,6321981 12,2683491982 13,489 19 70 571 386 3,939 7,552 952 85 256 1,072 645 4,362 3,71819ti22,130Baltimore, Md11,1541981 77,563 228 565 10,715 6,2l$l 18,446 36,066 5,31491Glendale, Calif203 835 602 3,636 3,36719812,4207,6931982 72,906 227 550 9,347 6,559 16,315 35,456 4,452 6 34 307 258 2,478 3,90019112 7,504710Baton Rouge, La 19111 25,917 50 129 609 2,073 7,807 13,735 1,5146Grand Rapids, Mich22 337 1')9 2,268 3,8351981 17,0498371982 27,343 40 133 743 2,216 7,913 14,956 1,342 24 190 562 1,100 4,660 9,9051982 18,05i608Beaumont, Tex 1981 13,242 19 138 407 1,369 4,399 6,169 74122Greensboro, N.C.173 631 1,190 4,717 10,7331981 12,0145851982 12,473 20 112 468 1,465 3,607 6,164 637 II 53 302 664 2,95219827,55711,161475Berkeley, Calif 1981 14,563 16 72 598 340 3,518 9,147 87214 77 236 7S'5 2,50~Hampton, Va. 7,1301981 7,4614001982 12,920 16 70 497 301 2,661 8,718 657 16 53 172 169 1,831 4,9291982 7,365291Birmingham, Ala 61981 34,249 97 267 1,502 1,426 10,128 17,771 3,058J-brtfora, Conn39 180 131 1,5n 5,16719812501982 30,675 91 230 1,291 1,272 • 8,275 16,076 3,44024,732 32 94 2,482 1,387 6,545 10,250 3,942Boise, Idaho19!:ll1981 7,59423,5124 41 99 348 2,208 4,600 29435 128IHialeah, Flo2,041 1,182 5,401l II ,44219813,276IO,4UI1982 6,375 3 28 69 360 1,575 4,063 27737 28 476 738 2,004 6,118 1,080Boston, Massa1982 10,951 26 29 4371~1l1 (a) 100 531 (a) 4,192 16,694 (a) 21,741 Hollywood, Flo681l 1,914 6,59419811,26313,4511982 74,039 93 366 6,531 3,980 14,286 27,079 21,70419 49 657 508 3,461l 7,776 ,974Bridgeport, Conn It1982198113,12217,.160 38 44 986 621 5,130 8,291 2,25012J-bnolulu, J-b36 546 584 3,194 7,834 916II 1981 49,5481982 17,5('4 31 41 1,027 602 4,466 8,626 Z,71140 265 1,320 340 12,576 31,362 3,645Cedar Rapids, Iowa J-buston, Tex b 19112 50,6UU1981 9,264 3 19 146 199 1,917 6,600 38025 269 1,457 400 12,381 32,416 3,6~l1981 (b)1982 7,786 4 22 84 99 1,648 5,603 326(b) (b) (b) (b) (b) (b) (b)Charlotte, N.C.1982 166,0631981 29,646 51 198 774 2,143 8,51l7 16,444 1,449671l 1,270 12,392 3,461 53,305 61,747 33,2101I Huntington Beach, Calif 198119829,36932,987 48 198 990 2,864 8,805 18,762 1,3204 68 211 260 3,269 4,861 6%Chattanooga, TennII 19H2 8,Il571981 13,555 29 54 370 978 2,738 8,440 9468 36 227 236 2,737 4,71l5 1l21lII Huntsville, Tex 1981 11,0781982 16,280 34 70 369 991 3,297 10,565 95419 63 244 273 3,441 7,386 652Chesapeake, Va 11 1982 11,6921981 4,514 10 44 188 172 1,323 2,579 19816Independenc
- --- ~------ ---, ...r~'~-<strong>Sourcebook</strong> <strong>of</strong> <strong>Criminal</strong> <strong>Justice</strong> <strong>Statistics</strong> 19113Nature and Distribution <strong>of</strong> Known OffensesTable 3.57 Offenses known to the police in cities over 100,000 population, 1981 and 1982--ContlnuedTable 3.57 Offenses known to the police in eities over 100,000 population, 1981 and 1982--ContinuedMurderand non-Murder Total negligent Aggra- Motorand non-Crime man- Forcible voted Larceny- vehicleTotal negligent Aggra- MotorCity Year Index slaughter raEe Robber~ assault Burglary theft theftCrime man- Forcible voted Larceny- vehicleCity Year Index slaughter rOEe Robber~ assault Burglar~ theft theft Richmond, Va 1981 24,766 48 195 1,364 1,061 7,412 13,649 1,0371982 22,464 69 171 1,395 1,139 6,824 11,87U 996Lincoln, Nebr 19tH 10,601 5 41 90 290 2,274 7,538 363 Riverside, Calif 1981 15,361 13 121 528 905 4,427 8,360 1,00719B2 9,91B I 43 95 269 1,%3 7,190 357 1982 15,698 13 121 4B3 923 4,479 1l,442 1,237Little Rock, Ark 1981 18,781 36 151 759 1,361 5,IB5 10,246 1,043 Roanoke, Va 19BI 9,B42 16 3B 214 213 2,73B 6,260 3631982 20,362 27 176 767 1,390 5,270 II ,614 1,118 19112 9,01l1 14 29 214 245 2,270 5,993 316Livonia, Mlch 1981 5,646 2 9 7U 217 1,342 3,395 611 Rochester, N.Y. 1981 27,291 3B 141 1,246 1,546 7,B27 15,168 1,325i982 5,IB9 2 15 85 174 1,313 2,949 651 1982 26,822 2B 120 1,147 1,511' 7,017 15,615 1,378Long Beach, Calif 1981 32,280 74 307 2,92B 1,270 10,004 13,011 4,61l6 Rockford, III 1981 12,B50 13 46 404 6/1S 4,415 6,972 3841982 31,352 6B 277 2,87B 1,275 B,571 14,000 4,283 1982 12,45:1 12 45 441 722 3,549 7,333 350Los Angeles, Calif 19111 304,100 879 2,666 28,152 21,121 tJ6,783 121,997 42,502 Sacramento, Calif 1981 36,661 53 22B 1,833 1,421 10,835 19,981 2,3101982 320,376 853 2,706 30,029 20,373 85,000 132,544 48,B71 1982 31,202 43 191 1,543 1,211 9,230 16,93:1 2,052Louis,ville, Ky 1981 21,124 55 151l 1,730 71l1l 6,907 9,954 1,532 Saint Louis, Mo 1981 62,654 265 413 5,365 4,32:1 19,214 27,195 5,8811982 22,734 36 108 1,697 720 7,242 11,2% 1,635 1982 60,136 226 316 4,899 4,6,18 17,149 27,63B 5,280Lubbock, Tex 1981 15,418 3lf 143 314 1,107 4,649 8,371l 793 Soint Paul, Minn 1981 22,799 13 197 1,061 I,O:J8 7,%4 11,364 1,1621982 17,637 24 150 315 1,309 5,196 9,811 832 1982 24,413 9 216 B46 9'75 8,341 12,729 1,297Macon, Go C 1981 (c) 29 (c) 299 402 2,690 5,025 544 Saint PetersbUrg, Flo 19BI 20,B94 26 150 857 1,476 6,105 11,750 5301982 8,51l2 17 47 202 405 1,716 5,575 620 1982 19,563 22 176 1,069 1,581l 5,463 10,765 480Madison, Wisc 19111 14,891l 6 66 221 170 3,381 10,/171 583 Salt Lake City, Utah 1981 20,849 14 137 587 530 5,574 12,B18 1,189. 19B2 12,623 3 63 164 189 2,721 9,073 410 1982 18,915 II 124 656 488 4,516 12,119 1,001Memphis, Tenn 1981 53,325 133 760 4,092 2,071 18,157 22,944 5,168 San Antonio, Tex 19::1 62,035 185 376 1,835 2,255 20,OBO 32,411 4,8931982 55,931 122 713 4,404 2,370 16,B97 26,293 5,132 1982 66,405 190 400 2,195 3,120 20,034 35,070 5,396Mesa, Ariz 1981 11,170 I 51 143 546 2,510 7,446 473 Son Bernardino, Calif 1981 17,327 56 91 93B 882 5,163 8,748 1,4491982 10,739 3 40 129 533 2,335 7,250 449 1982 16,806 25 III 1,061 U35 4,961l 8,465 1,371Miami, Flo 1981 52,911 210 3112 6,1% 4,423 12,570 24,3ll8 4,742 San Diego, Calif 1981 66,123 94 559 3,323 2,/iI8 18,708 33,851 6,9701982 52,901 190 349 5,123 4,301 11,130 26,329 5,479 1982 65,547 74 " 428 3,142 2,i93 16,214 35,693 7,803"Milwaukee, Wisc 19BI 44,775 71 290 1.806 1,257 10,293 27,512 3,546 San Francisco, Calif 1981 71,812 126 672 7,386 3,1327 17,715 35,337 6,7491982 45,851 62 194 2,087 1,250 10,11l3 28,794 3,281 1982 68,598 III 594 7,153 3,75'; 13,704 36,901 6,378Minneapolis, Minn 1981 38,215 28 367 2,296 1,192 12,543 18,943 2,846 San Jose, Calif 1981 54,514 68 465 2,070 1,519 14,932 31,708 3,7521982 37,259 36 314 2,583 1,314 II ,467 19,058 2,487 1982 51,781 37 430 1,701 1,448 12,593 32,199 3,373Mobile, Ala 1981 21,998 39 123 938 1,529 7,439 10,%1 969 Santo Ana, Calif 1981 20,712 22 92 867 777 6,736 10,935 1,2831982 22,344 46 153 823 1,414 6,416 12,657 835 1982 19,945 21 77 815 718 5,646 II ,2B7 1,381Modesto, Calif 1981 10,602 7 56 209 405 2,9tJ4 6,525 416 Savannah, Go 19111 15,369 45 171 618 809 4,067 9,062 59719B2 10,258 4 41 170 353 2,578 6,6B6 426 1982 15,589 31 134 629 745 3,432 10,061 557Montgomery, Ala 1981 II ,51:1 30 37 263 523 3,203 6,931 5:15 Seattle, Wash 1981 55,764 59 4B5 2,344 2,526 14,567 32,1l35 2,9481982 10,545 22 30 267 353 2,770 6,6B2 421 1982 53,401 31 435 2,271 2,383 13,273 32,321 2,687Nashville, Tenn 19BI 33,604 79 363 1,594 1,051 IO,35B 17,968 2,191 Shreveport, La 19BI 16,030 54 138 394 803 4,267 9,705 6691982 35,206 67 321 1,662 1,198 9,530 20,379 2,049 1982 15,816 37 93 415 883 4,078 9,534 776New l-iaven, Conn 19l11 16,175 19 112 1,552 291 4,639 7,451 2, III South Bend, Ind 19BI 11,736 8 84 497 209 3,856 6,758 3241982 13,839 II 84 1,015 292 3,842 6,759 1,836 1982 11,750 8 76 3112 20ll 3,464 7,257 355New Orleans, La 1981 52,I5ll 217 453 4,950 2,501 13,117 25,305 5,615 j Spokane, Wash 19BI 15,698 II 88 410 576 4,256 9,627 7301982 49,483 233 488 5,106 2,777 1.2,j20 23,613 4,946 ! 19112 13,005 12 37 2.79 525 3,216 8,364 572Newport News, Va 1981 9,269 18 BO 415 406 3,042 4,B68 4'10Springfield, Mass 1981 14,442 10 183 391 2,124 4,336 5,496 1,902j1982 8,150 24 51 313 516 2,183 4,654 409 1982 14,392 12 152 372 2,173 4,879 5,309 1,495New York, N.Y. 1981 725,846 1,826 3,862 107,475 43,783 205,825 25ll,369 104,706Springfield, Mo 1981 13,414 8 41 126 191 4,037 8,592 419i1982 688,567 1,668 3,547 95,944 42,784 172,794 264,400 107,430 1982 11,996 6 56 160 195 3,288 7,B71 420Narfolk, Va 19BI 20,769 43 189 1,085 1,124 4,793 12,656 879!Stamford, Conn 1981 7,817 3 16 385 242 2,576 3,858 73719B2 20,934 36 170 1,104 1,065 4,088 13,440 1,031 1982 7,664 6 19 362 233 2,033 4,365 646Oakland, Calif 1981 44,678 118 430 3,836 2,652 14,171 20,070 3,401 Sterling Heights, Mich 1981 5,452 0 20 51 275 1,011 3,556 53919B2 43,342 93 441 3,194 2,8BO 12,780 20,947 3,007 1982 4,95424 25 136 1122 3,434 513Oklahoma City, Oklo°19BI 35,128 65 336 1,491 2,236 12,364 14,827 3,809Stockton, Calif 1981 17,271 42 96 929 679 5,171 9,269 1,0851Omaha, Nebr d 19112 38,195 89 386 1,801 2,010 12,682 16,274 4,953 i 19B2 16,945 42 92 712 651 4,818 9,685 9451981 (d) 28 186 899 (d) 5,933 15,239 1,596Sunnyvale, Calif 1981 6,337 7 36 156 114 :,124 4,467 4331982 24,377 20 175 743 1,.)12 5,352 15,345 1,230 f1982 5,572 4 36 130 95 990 3,980 337Orlando, Flo 1981 17,469 25 154 885 1,309 5,180 9,061 855 ( Syracuse, N.Y. 1981 14,445 18 68 929 341 4,957 7,571 5611982 17,154 34 160 809 1,659 4,473 9,184 835 \ 1982 13,194 8 68 732 310 4,380 7,195 501Oxnard, Calif 19111 7,548 17 92 351 316 2,058 4,038 676,Tacoma, Wash 1981 16,193 10 174 494 678 4,855 9,103 8791982 8,210 12 73 413 286 2,442 4,268 716 11982 17,183 16 151 502 688 5,116 9,835 875Pasadena, Calif 1981 II ,30,) 19 83 767 756 3,175 5,381 1,124Tampo, Fla 1981 40,856 69 409 2,314 2,882 12,575 20,554 2,0531982 12,86B 19 72 799 567 3,322 7,007 I,OB2 1982 38,532 59 411 1,842 3,424 II ,201:1 19,661l 1,920IPasadena, Tex 1981 8,059 15 73 179 503 2,546 3,724 1,019Tempe, Ariz 1981 10,990 4 55 189 4S6 2,740 7,079 4671982 8,029 12 68 172 405 2,271 4,019 1,082 1982 10,965 5 4B 167 470 2,723 7,106 446\Paterson, N.J. 1981 14,713 41 39 1,405 803 4,676 5,773 1,976 Topeka, Kans 1981 10,742 13 60 249 431 3,759 5,880 3501982 13,571 26 22 1,773 828 3,392 5,415 2,115 \ 1982 8,927 6 III 214 333 2,593 5,472 268Peoria, III 1981 II,B22 8 62 405 970 3,Oll0 6,933 364 Torrance, Calif 1981 7,294 7 51 383 21B 2,073 3,647 915\1982 11,693 10 69 367 B34 2,95B 7,149 306 ! 198:1 6,41l0 5 36 359 175 1,655 3,261 989Philadelphia, Po 1981 100,5n 362 936 10,816 5,5U2 26,676 39,731 16,569Tucson, Ariz 1981 37,241 28 163 872 1,747 10,521 22,126 1,7841982 94,641 332 839 10,604 5,734 23,127 40,099 13,906 \1982 35,925 31 236 910 1,748 9,481 21,803 1,716Phoenix, Ariz 1981 81,370 96 408 2,696 3,119 23,U52 46,977 5,022 Tulsa, Oklo 19BI 30,257 47 247 949 1,435 10,271 14,115 3,193Ii1982 75,654 95 431 2,402 2,503 21,4B2 44,347 4,39419112 32,846 31 22B 1,050 1,395 9,564 17,134 3,444IIPittsburgh, Po 1981 31,31l4 49 213 4,2BIl 1,433 B,843 II ,661 4,B97Virginia Beach, Va 19BI 15,337 12 93 235 266 3,694 10,525 5121982 29,913 51 236 3,841 1,263 8,096 11,769 4,657 19B2 14,537 15 97 258 276 3,166 10,236 4B9Portland, Ore I5I1l1 50,432 3B 403 3,072 2,939 14,395 27,141 2,444 Waco, Tex 1981 8,701 13 55 212 464 2,252 5,410 29519B2 4B,092 36 392 2,811 3,245 13,728 25,632 2,248 111982 9,61:16 26 61 241 500 2,581 5,81:18 389Portsmouth, Me 19111 6,21l5 16 43 479 183 1,42U 3,855 289Warren, Mlch 1981 12,095 6 3B 253 561 2,383 7,027 1,827I1982 5,944 16 39 313 152 1,308 3,868 248 , 1982 10,5U7 7 23 238 459 1,731 6,396 1,653Providence, R.I. 1981 15,548 23 55 852 751 4,401 5,470 3,996 Washington, D.C. 1981 67,910 223 414 10,399 3,432 16,832 32,845 3,7651982 15,233 15 67 728 730 4,049 5,955 3,6891982 65,692 194 421 9,137 3,645 14,774 33,435 4,086Pueblo, Colo 191:11 7,840 7 59 126 631 2,107 4,639 271 Waterbury, Conn 1981 7,240 5 27 313 154 1,96B 4,175 59819B2 7,709 9 47 155 471 2,191 4,524 312 I 1982 7,B09 IB 2B 277 132 2,134 4,568 65lRaleigh, N.C. 191:11 11,085 II 56 281l 364 2,599 7,345 42219B2 11,224 20 62 322 482 2,730 7,195 413\1Rena, Nev 1981 9,775 II 69 395 265 2,835 5,511 6691982 9, H8 7 106 366 IB9 2,478 5,416 556See footnotes at end <strong>of</strong> table.IIIi
Nature and Distribution <strong>of</strong> Known Offenses<strong>Sourcebook</strong> <strong>of</strong> <strong>Criminal</strong> <strong>Justice</strong> <strong>Statistics</strong> 19113Table 3.57 Offenses known to the police In cities over 100,000 population, 1981 and 1982--ContlnuedMurderand nonnegligentAggra-TotalCrime mon- Forcible vated Larceny-City Year Index slaughter rope Robbery assault Burglary theftWichita, Kans 191111982Winstoll-SC;h''rn, N.C. 191111982Yonkers, N.Y. 19!111982Youngstown, Ohio 1911119822.5,38325,35612,61113,03411,21910,4929,7248,5374331161761921l19a 19!11 robbery and larceny-theft figlJres notcompcgable with 1982.198 I figures not comparable with 1982.2021979178323/~4754Motorvehicletheft816 66!l 6,594 15,79!l 1,262677 790 6,160 16,274 1,227290 1,214 3,611 6,813 576419 1,487 3,689 6,766 578853 17B 3,391 5,257 1,50:.1657 IB6 2,652 5,259 1,685748 729 3,572 3,972 628549 997 2,899 3,326 693cl 98 1 forcible rape figures not comparablewith ~982.1981 aggravated assault figures notcomparable with 1982.Source: Table adopted from table provided to SOLRCEBOO< st<strong>of</strong>f by the U.S. Deportment <strong>of</strong> Just/ce,Federal <strong>Bureau</strong> <strong>of</strong> Investigation.Agure 3.21 Estimated rate (per 100,000 inhabitants) <strong>of</strong> violent crime known to police, by <strong>of</strong>fense and extent <strong>of</strong> urbanization, 1981NJrE: See /'.OTES, Tables 3.56 and 3.58. For definitions <strong>of</strong> <strong>of</strong>fenses and areas, see Appendix 2.(Rate per 100,000 Inhabitants)700691.4600500400322.5316.2300Table 3.58 Estimated nl.mber and r'Jte (per 100,000 Inhabitants) <strong>of</strong> <strong>of</strong>fenses known to pol/ce, by <strong>of</strong>fense and extent <strong>of</strong> urbanization, 1981AreaUnited States totalRate per 100,000inhabitantsStandard MetropolitanStatistical AreaArea actuallyreporting CEstimated totalRate Pl'r IOU,OUOinhabitantsOther citiesArea actually. reporting CEstimated totalRate per 100,000inhabitantsRuralArea actuallyreporting CEstimated totalsRate per IUO,OUOinhabitants/'.OTE: See NOTE, Table 3.56. These figures are aggreg'lted from Individual State statisticspresented in Table 3.59. These data include estimated <strong>of</strong>fense totals for agencies submitting iessthan 12 months <strong>of</strong> <strong>of</strong>fense reports (Source, p. 313). For definitions <strong>of</strong> <strong>of</strong>fenses and areas, seeAppendix 2.Population oTotalCrimeIndexV~oleBtcrimePrc;>pet,tycrime229,146,000 13,290,256 1,321,906 11,968,350171,299,879X 5,799.9 576.9 5,223.(J9!l.~ 11,209,356 1,176,719 10,032,637100.~ 11,313,693 1,184,296 10,129,397X24,022,39095.~IUO.~X33,823,73193.lh>IOO.~X6,604.61,174,7391,240,41l25,163.9694,843736,0812,176.2691.4 5,913.375,336 1,099,40379,173 1,161,309329.6 4,!l34.354,804 640,03958,437 677,644172.1l 2,003.5apopulations are U.S. <strong>Bureau</strong> <strong>of</strong> the Census prOVisional estimotesas <strong>of</strong> oluly I, 1981, and are subject to change.Violent crimes are <strong>of</strong>fenses <strong>of</strong> murder, forcible rope, robbery,and aggravated assault. Property crimes are <strong>of</strong>fenses <strong>of</strong> burglarY,larceny-theft, and lTlCitor vehicle theft. Data are not included for theproperty crime <strong>of</strong> oman.Murderand nonnegligentAggramon-Forcible voted Lorcenyslaughterrope Robbery assault Burglary theft22,516 81,536 574,134 643,720 3,739,821 7,154,5419.8 35.6 250.6 280.9 1,632.1 3,122.318,717 70,895 550,~52 536,655 3,153,856 5,910,75718,815 71,401 552,510 541,570 3,183,353 5,969,0581l.0 41.7 322.5 316.2 1,1l58.4 3,484.61,202 4,707 13,758 55,669 275,252 770,6041,279 4,91l3 14,541 58,370 290,404 1l14,2765.3 20.7 60.5 243.0 1,201l.9 3,3!l9.72,221 4,799 6,614 41,170 250,249 351,7492,422 5,152 7,083 43,780 266,064 37 1,2077.2 15.2 20.9 129.4 786.6 1,097.5Motorvehicletheft1,073,91l8468.7968,024976,9!l6570,353,54756,629:.135.731l,04140,373c The percentage representing area actually reporting will notcoincide with the ratio between reported and estimated crime totals,since these data represent the sum <strong>of</strong> the calculations for IndividualStates that have varying populations, portions reporting, and crimerates.Source: U.S. Deportment <strong>of</strong> <strong>Justice</strong>, Federal <strong>Bureau</strong> <strong>of</strong> Investigation, Crime in the United States, 1981 (Washington, D.C.: U.S. GovernmentPrinting Office, 191:11;), p. 39, Table I. Table adopted by SOLRCEBOOK st<strong>of</strong>f.119.4,200100o -'-_-l.ILL .....~::~ RuralTotalviolentcrimeII Other citiesm SM$A7.2 5.3 11.0Murderandnonnegligentmanslaughter15.2 20.7ForciblerapeSource: U.S. Deportment <strong>of</strong> JUstice, Federal Burenu <strong>of</strong> Investigation, Crime in the United States,Printing Office, 1982), p. 39, Table I. Figure constructed by SOLRCEBOO< stOff.41.7RobberyAggravatedAssault1981 (Washington, D.C.: U.S. Government377
-- ""'- ~-..--- - - - -<strong>Sourcebook</strong> <strong>of</strong> Criminol <strong>Justice</strong> Stotistics I ~83Figure 3.22 Estimated rate (per 100,000 inhabitants) <strong>of</strong> property crime known to police, by <strong>of</strong>fense .:Jnd extent <strong>of</strong> urbanization, 1981600050004000300020001000o -'-_-LlL-& .....I\QTE: See I\QTES, Tables 3.56 and 3.58. For definitions <strong>of</strong> <strong>of</strong>fenses and areas, see Appendix 2.Totalpropertycrimef·:·~•• RuralII Other citiesmSMSA5,913.3(Rate per 100,000 inhabitants)BurglaryLarcenytheft119.4 235.7MotorvehicletheftSource: U.S. Deportment <strong>of</strong> <strong>Justice</strong>, Federal <strong>Bureau</strong> <strong>of</strong> Investigation, Crime in the U1ited St1tes, 1981 (Washington, D.C.: U,S.Government Printing Office, 1982), p. 39, Table I. Figure constructed by SO-RCEBClCl< st<strong>of</strong>f.570.3i .Jotetre and Distribution <strong>of</strong> Known OffensesTable 3.59 EstlrTllJted number and rate (per 100,000 Inhabitants) <strong>of</strong> <strong>of</strong>fenses known to police, by <strong>of</strong>fense, jurisdiction, and extent <strong>of</strong>urbanization, I'll IJurisdictionALABAMAStandard MetropolitanStatistical AreaArea actually reportingEstimated totalsOther citiesArea actually reportingEstimated totalsRuralArea actually reportingEstimated totalsState totalRate per I UO,OOO Inhabi tantsALASKAStandard MetropolitanStatistical AreaOther citiesArea actually reportingEstimated totalsRuralArea· actually reportingState totalRate per I UO,UOO InhabitantsARIZO\lAStandard MetropolitanStatistical AreaArea actually reportingOther citiesArea actually reportingRuralArea actually reportingState totalRate per 100,000 inhabitantsARKJ>NSASStandard MetropolitanStatistical AreaArea actually reortingEstimated totalsOther citiesArea actually reportingEstimated totalsRuralArea actually reportingState totalRate per I UU,OOO inhabitantsCAL IFrnNIAStandard MetropolitanSta . 01 AreaA; .::tually reortingEsl,,,,.Jted totalsOther citiesArea actually reportingRuralArea actually reportingState totalRote per 10U,000 i!"lhabltantsCOLORADOStandard MetropolitanStatistical AreaArea actuallY reportingEstimated totalsOther citiesArea actually reportingEstimated totalsRuralkeo actually reportingEstimated totalsState totalRate per 100,UOO inhabitantsSee footnotes at end <strong>of</strong> table.NOTE: See NOTE, Table 3.56. These data include estimated <strong>of</strong>fense totals foragencies submitting less than 12 months <strong>of</strong> <strong>of</strong>fense reports (Source, p. 313). Fordefinitions <strong>of</strong> <strong>of</strong>fenses and areas, see Appendix 2.Murderand non-Total negligent Aggra-Estimated Crime Vlolery Propertl man- Forcible votedpopulation Index crime crime slaughter raee I"{obberl:: ~ssault2,423,20499.~ 148,367 14,04J 134,3:l4 J28 c:ll 4,335 Il,S49100.016 14~,611 14,155 135,456 330 1135 4,363 l:l,6l7663,31696.3%100.a.b30,10231,2503,llll3,12b27,09128,1244850IU7III4504672,4062,49l:l829,4809,U71 7l:l 69 113 7949,831 85 75 122 l:l603,916,OUIJ I~I ,834 1l:l,423 173,411 465 I,U21 4,952 II ,~Il!iX 4,898.7 470.5 4,428.3 11.5' 26.1 126.5 306.192.3!b100.(K,IU,I2510,9731,0541,142f\bne2!J4,4UI91l.~ 22,954 1,890 21,064 27 334 431l 1,091IUll.lJib 23,27U 1,912 21,308 27 3311 443 1,104127,599IUU.WO 3,951 615 3,326 33 83 2~ 4110412,00U 27,171 2,537 24,634 60 421 472 1,584X 6,594.9 615.8 5,979.1 14.6 102.L 114.6 31l4.52, lUI ,l:l7b100.ox,341,6U6179,406 13,334 166,072 IIlI 892 4,511 7,750100.010 24,214 1,831 22,383 23 102 3UO 1,406349,511l100.ox, 9,037 917 8,120 23 70 150 6742,793,000 212,65', 16,082 1%,575 227 1,064 4,961 9,l:l3UX 7,613.9 575.8 7,U38.1 8.1 38.1 177 .6 352.08~7,9359~.b% 52,91l3 4,51l~ 4l:l,394 IIU 394 1,377 L,7U8100.010 53,098 4,595 48,503 110 394 1,379 2,712564,37799.~ 22,479 1,1l03 20,676 38 85 300 1,380luU.O!o 22,672 1,819 20,853 38 86 303 1,392l:l31,68810U.0% i I ,321 705 10,616 61 97 94 4532,294,000 1l7,U91 7,119 79,972 209 577 1,776 4,557X 3,796.5 310.3 3,486.1 9.1 25.2 77.4 198.622,929,56499.896 1,761,629 202,154 1,559,475 3,049 13,139 92,677 93,2l:l9I uu.l1iE> 1,7!i5,243 202,491 1,562,752 3,053 13,161 92,820 93,457525,862100.VJO 37,8U'/ 2,951 34,856 21 1115 628 2,117703,574IOu.Oto 30,737 3,043 27,694 69 220 333 2,42124,159,000 1,833,787 208,485 1,625,302 3,143 13,566 93,781 517,995X 7,5~0.5 863.0 6,727.5 13.0 56.2 38l:l.2 40!>.62,3%,62699.5I'J&IUU.iJfo187,3741!!7,50414,08014,0l:ll:l173,294173,4162152151,1931,1!l34,5254,5278,14711,153272,75492.410 Itl,755 9U9 17,846 12 114 131 6b2100.0% 20,302 ~84 19,318 13 91 142 738293,62U')7. Sif, 9,616 666 9,150 II 66 56 533luU.Olb 1U,061l 6113 9,385 II 6l:l 57 5472,963,000 217,874 15,755 202,119 239 1,352 4,726 9,43BX 7,353.2 !)JI.7 6,tl21.4 8.1 45.6 159.5 311l.SMotorLarceny- vehicleBurlllarl:: theft theft44,IZl IlU,915 ~,211744,463 1l1,635 9,3587,709 III,LI4 1,161l8,003 1l:l,901l 1,2134,OU9 4,547 5154,345 4,928 55l:l56,1111 IU5,471 11,1291,450.7 2,693.3 Ll:l4.24,LJI 14,417 2,4164,280 14,5114 2,4441,199 1,726 4UI5,479 16,310 2,1l451,329.9 3,~58.7 690.549,22U IU7,044 9,8085,568 15,739 1,0762,1l67 4,6e:; 56757,655 ID,469 II ,4512,064.3 4,563.9 410.014,36U 31,18~ 2,1l5214,387 31,258 2,1l5l:l5,755 14,030 8915,llll4 14,150 8994,541 5,551 52424,732 50,959 4,2811,07u.1 2,221.4 I1l6.6519,225 881,559 158,6915LU,L5!! 883,513 158,901!I,7'1S 23,050 2,011IU,75J 15,37b 1,565!)40,llll6 921,939 162,5572,~JCl.5 3,8Ib.1 672.953,602 109,013 10,679!l3,6J3 109,0911 10,61l5J,6IL 13,320 9143,910 14,419 989l,Slld 5,987 5752,054 6,141 5')0bU, 1~7 129,65B 12,2644:,U~I.6 4,375.9 413.9378379
--------"Source bo 0 k <strong>of</strong> Crimi no I <strong>Justice</strong> <strong>Statistics</strong> <strong>1983</strong>. ted number and rateTable 3:59 ~stli981 __ Continued(per 100,000 inhabitants) <strong>of</strong> <strong>of</strong>fenses known ta police, • b yo, ffense jurisdiction, and extent <strong>of</strong>urbanization,JurisdictionCQ\NECTICUTStandard MetropolitanStatistical Area .Area actually reportingOther cities .Area actually reportingRuralt'Area actually repor IngState total 100 000 inhobitantsRate per ,DELAWAREStandard MetropolitanStatistical Area .Area actuolly reportingOther cities .Areo actually reportingRuralt'Area actually repor IngState total IOU 000 inhabitantsRate per ,cDISTRICT
------.~'''.''-<strong>Sourcebook</strong> <strong>of</strong> <strong>Criminal</strong> <strong>Justice</strong> <strong>Statistics</strong> 19!13Table 3.59 Estimated number and rote (per 100,000 Inhabitants) <strong>of</strong> <strong>of</strong>fenses known to pollee, by <strong>of</strong>fense, jurl,dlctlon, and extent <strong>of</strong>urbanization, I!lB I--ContlnuedJurisdictionMAJI\lEStandard MetropolitanStatistical AreaArea actually reportingOther citiesArea actually reportingRuralArea actually reportingState totalRate per 100,000 InhabitantsMARYL.ANDStandard MetropolitanStatistical AreaArea actually reportingOther citiesArea actually reportingRuralArea actually reportingState totalRate per 100,OUU inhabitantsMASSACI-USETTSStandard MetropolitanStatistical AreaArea actually reportingEstimated totalsOther citiesArea actually reportingEstimated totalsRuralArea actually reportingState totalRate per 100,000 inhabitantsMICHIGANStandard MetropolitanStatistical AreaArea actually reportingEstimated totalsOther citiesArea actually reportingEstimated totalsRuralArea actually reportingState totalRate per /OO,UUU inhabitantsM I/\f\JESOTAStandard MetropolitanStatistical AreaArea actually reportingOther citiesArea actually reportingRuralArea actually reportingState totalRate per 100,000 inhabitantsMISSISSIPPIStandard MetropolitanStatistical AreaArea actually reportingEstimated totalsOther citiesArea actually reportingEstimated totalsRuralArea actually reportingEstimated totalsState totalRate per 100,000 inhcbitantsSee footnotes at end <strong>of</strong> table.Estimatedpopulation317,611100.~47!l,33710U.~336,05210U.Oib1,132,000X3,7tJ3,414100.(1;(,119,;'i83100.(1;(,3511,003100.0%4,261,OUUX5,542,4!l190.~100.Oib216,02488.4%100.~11,495IUU.lfj(,5,770,00UX7,617,84999.9-,1',IOU. 0%611,21399.1#0100.Oib971,938/00.0%9,201,OUOX2,638,925100. ON507,238IOU.O%943,837100.0i04,090,000X675,72282. a\,iOO.O%695,02388.~100.0%1,159,25558.ax,100.0%2,530,000XTotalCrimeIndex19,46U21,2t127,29248,0344,24J.325t1,44210,87210, III279,4L56,557.729tJ,612321,42613,29615,042233336,7015,/j35.4560,088560,64930,14130,32739,664630,64U6,tl54.0151,04!l22,5UI20,ltJ2193,7314,736.735,75539,44833,37837,5677,23712,4/j089,4953,537.4Murderand nannegligentVlolenJcrimeProper&,cmneman- Farclbleslaughter i'ape Robbery1,12U7733212,214195.636,0137/j61,00137,/jUU8tl7.133,611235,289!l529642036,273628.655,61955,6541,2031,2112,19359,058641.98,4034035389,344228.52,8143,1982,6162,9449071,5647,706304.618,34020,5096,97145,8204,047.7222,42910,0869,110241,6255,670.6264,930286,13712,44414,0711213300,4285,206.7504,469504,9952tl,93/j29,11637,471571,5tl26,212.2142,64522,09819,644184,3874,SO/j.232,94136,25030,76234,6236,33010,91681,7893,232.810II15363.23921217411!I.920020733o2103.6818/;J18IIII328619.464219852.1869877877813431912.6566U2914512./j1,55631671,6543U.tl1,45/j1,529434921,58027.43,9203,9221021033414,36647.592660701,05625.823127216818911419765626.02051412236832.517,8331471051/j,Utl541./1.1115,10115,52296109215,633270.923,24623,25611J51!J624623,6tl/j257.54,11596554,266104.31,1491,23454361/1242142,05981.4Aggra-i't\otorvated Larr.eny- vehicleassault Burglary theft theft8495612551,665147.116,23259681217,64()1,11'.05,663 11,7525,07!; 14,5433,343 3,25014,Otll 29,5451,243.9 2,610.064,778 139,9762,603 7,0933,359 5,33670,74(J 15[,405I ,66,).1 :j,~'lt;."'16,923 b2,490 128,83718,031 /j9,346 139,9787108034,91185,6436,7537,64016 91 7318,1J50 95,080 147,691326.7 1,647.8 2,559.627,635 150,629 297,91427,65!J 150,758 29/j,264905 5,695 22,270911 5,730 22,4071,574 14,843 21,13430,143 171,331 341,805327.6 1,862.1 3,714.93,298 41,354 93,050245 4,040 17,0703!14 6,659 11,7143,937 52,253 121,83496.3 1,277.6 2,97b.81,34/j1,5941,8282,0575911,0194,670184.6II ,8/j013,2199,30510,4733,4345,92229,6141,170.51!J,66320,36520,35222,9062,5034,31647,Stl7l,tll:lU.?925!J9137/j2,194193.817,6753904151fJ,4tJO/(Jj.153,60356,81370~7!1:,4957,657999.355,92655,973'j739791,49458,446635.28,241981l1,07110,300251.1l2,3982,666I, IUS1,2443936784,581lItll.3j'Nature and Distribution <strong>of</strong> Known Offenses) f ffk to police, by <strong>of</strong>fense, jurisdiction, and extent <strong>of</strong>Table 3.59 Estimated number and rate (per 100,000 inhabitants 0 0 enses nownurbanization, 1981--ContinuedMurderand nonnegligentAggra- MotorTotalEstimated Crime Violent Property man- F orcl'blevoted Larceny- vehicleJurisdictionpopulation Indexcrimea crimeI)' slaughter rape Rob~b:=.er!.1y:...-..:os~sa:!:u::!lt'--.:B~u:::.r.l!.gl::a::..ry,--...;t~h:::ef:..:.t_--,t,,-hc:.ef:.;.t_MISS(J..RIStandard MetropolitanStatistical AreaArea actually reportingEstimated totalsOther citiesArea actually reportingEstimated tatalsRuralArea actually reportingEstimated totalsState totalRate per 100,OOU inhabitantsM
<strong>Sourcebook</strong> <strong>of</strong> Criminol <strong>Justice</strong> <strong>Statistics</strong> <strong>1983</strong>Table 3.59 Estimated number and rate (per 100,000 inhabitants) <strong>of</strong> <strong>of</strong>fenses known to poll'ce,urbanization, 19111--CantinuedJurisdictionNEW MEXICOStandard MetropolitanStotistical AreoArea actually reportingOther citiesArea actually reportingEstimated totalsRuralArea actually reportingEstimated totalsState totalRate per 100,000 inhabitantsNEW YrnKStandard MetropolitanStatistical AreaArea actually reportingEstimated totalsOther citiesArea actually reportingEstimated totalsRuralArea actually reportingState totalRate per 100,000 inhabitantsN:RTH CAROLlNt>.Standard MetropolitanStatistical AreaArea actually reportingEstimated totalsOther citiesArea actually reportingEstimated totalsRuralArea actually reportingEstimated totalsState totalRate per 100,000 inhabitantsN:RTH DAKOTAStandard MetropolitanStatistical AreaArea actually reportingOther citiesArea actually reportingRuralArea actually reportingState totalRate per 100,000 inhabitants0-110Standard MetropolitanStatistical AreaArea actually reportingEstimated totalsOther citiesArea actually reportingEstimated totalsRuralArea actually reportingEstimated totalsState totalRate per 100,000 inhabitantsO
._------- - - ~-------------------------------------------------------------------------------~---------------------~<strong>Sourcebook</strong> <strong>of</strong> <strong>Criminal</strong> <strong>Justice</strong> <strong>Statistics</strong> 19B3Table 3.59 Estimated number and rate (per 100,000 inhabitants) <strong>of</strong> <strong>of</strong>fenses known to police, liy <strong>of</strong>fense, jurisdiction, and extent <strong>of</strong>urbanization, 1981--ContinuedJurisdictionTEN'ESSEEStandard MetropolitanStatistical AreaArea actually reportingEstimated totalsOther citiesArea actually reportingEstimated totalsRuralArea actually reportingEstimated totalsState totalRate per 100,000 inhabitantsTEXASStandard MetropolitanStatistical AreaArea actually reportingEstimated totalsOther citiesArea actually reportingEstimated totalsRuralArea actually reportingState totalRate per 100,000 inhabitantsEstimatedpopulation2,892,97896.110100.016595,39891.1t%100.reo1,121,62489./&I 00. reo4,610,00UX11,798,72799.9iI>100.reo1,35B,96097.9iI>100.reo1,597,313I 00. reo14,755,000XTotalCrimeIndex153,838156,13424,22526,49614,41716,12619B,7564,311.4810,153810,19954,61155,78526,739892,7236,050.315,83016,0181,6691,8261,0511,17519,019412.670,90970,9125,2855,3992,24978,560532.4Propert!crime138,00B140,11622,55624,67013,36614,951179,7373,898.9739,244739,28749,32650,38624,490814,1635,517.9Murderand nonnegligentman- Forcibleslaughter rape335339404458654489.72,1452,14511.81211802,44616.61,5041,52198107961071,73537.66,3496,3492552602126,82146.2Robbery7,2347,2734124511721927,916171.727,68727,68856257426628,528193.3Aggra-MotCilrvoted Larceny- vehit;leossault Burglary theft th
"---- ~ -------~~ ------------------ ------------,-j!<strong>Sourcebook</strong> <strong>of</strong> <strong>Criminal</strong> <strong>Justice</strong> <strong>Statistics</strong> 19113Table 3.60 Offenses known to police, by <strong>of</strong>fense and size <strong>of</strong> place, 1980 and 1981Population groupTOTAL ALL AGENCIES1l.,877 agencies; totalpopulation 218,149,000:19BU1981Percent changeTOTAL CITIES8,825 cities; totalpopulation 146,69~,UUU:198019b1Percent changeGroup I:57 cities, 25U,000 and over;populat ion 41 ,638,000:19BO1981Percent change6 cities, I,OOU,OUU and over;population 17,617,000:1911U1981Percent cn'Jnge18 cities, 500,000 to 999,999;population 12,147,000:198019BIPercent change33 cities, 25U,OUO to 499,999;population 11,874,000:191101981Percent changeGroup II:115 cities, 100,000 to 249,999;population 16,959,000:198019!11Percent changeGroup III:291 cities, 50,000 to 99,999;population 19,815,000:I9tiU1981Percent changeGroup IV:613 cities, 25,000 to 49,999;population 21,072,OUU:19801981Percent changeGroup V:1,577 cities, IO,OUO to 24,999;population 24,770,000:19BO1981Percent changeGroup VI:6,172 cities under 10,000;population 2l,446,OUO:19801981Percent change!'OTE: See !'OTE, Table 3.56. Figures represent all law enforcement agencies submitting completereports for at least 6 cornnon months in 1980 and 1981 (Source, p. 314). For definitions <strong>of</strong><strong>of</strong>fenses, suburban and rural areas, see Appendix 2.TotalCrimeIndex12,739,20412,711,151-0.210,298,75U10,306,384+0.13,831,4553,882,333+1.31,543,3641,549,4BO+0.41,13l.,8B31,149,623+1.51,155,2081,11l3,2:J0+2.41,44B,7B21,466,385+I.l.1,367,7341,346,752-1.5See footnotes at end <strong>of</strong> table.1,333,7241,316,427-1.31,292,3691,276,934-1.21,024,6B61,017 ,553-0.71,264,122 11,475,0821,276,618 11,434,533+1.0 -0.41,059,7341,071,901+1.1571,576585,012+2.4282,45921l6,439+1.4141,475147,113+4.0147,642151,460+2.6134,699138,235+2.6113,922109,791l-3.693,31694,121+0.983,6581l2,694-1.262,56362,041-0.8(1981 estimated population)9,:l39,0169,234,4830.03,259,8793,297,321+1.11,260,9U51,263,041+0.2991,40!l1,002,510+1.11,007,5661,031,770+2.41,314,0831,328,150+1.11,253,8121,2:],6,954-1.31,240,40B1,222,306-1.51,208,7111,194,240-1.2962,123955,512-0.722,07521,461-2.817,04016,532-3.010,1569,821l-3.25,1464,943-3.92,4622,451-0.42,5482,434-4.52,0542,182+6.21,4271,410-1.21,2731,183-7.11,2031,071l-10.4927851-1l.2Murderand nonnegiigentPropertfcrimernanslauhterForcibleAggravatedassault79,158 536,578 626,3117b,235 561,212 615,710-1.2 +4.6 -1.761,79~ 487,41l6 493,40961,064 510,573 483,732-1.2 +4.7 -2.030,674 324,675 205,87130,131l 343,253 201,793-1.7 +5.7 -2.011,258 174,98510,915 184,251-3.0 +5.39,6'l17 76,7269,262 83,506.,4.5 +8.89,719 73,1649,961 75,496+2.5 +3.29,4369,413-0.27,3377,160-2.46,1106,047-1.04,7524,826+1.63,4903,480-0.355,05158,447+6.243,00443,157+0.431,05932,060+3.222,04122,096+0.211,45611,560+0.991,07086,33U-5.252,59U51,894-1.362,21163,569+2.268,15868,193+0.162,15458,071-6.654,37454,831-0.155,66254,694-1.746,69046,150-1.2Bur lor3,597,0233,57L,6:JU-0.72,780,7672,770,536-0.41,087,3541,093,939+0.6435,99643U,772-1.2312,222318,491+2.0339,136344,676+1.6410,818415,084+1.0377 ,891372,43U-1.4345,1382338,727-2.1370,712316,44!l-1.3231l,11O233,908-1.8Larcenythefl6,808,7146,833,0~1+0.45,556,2575,592,727+0.71,722,5771,753,990+1.8589,443586,413-0.5562,6!l8572,797+1.8570,446594,71l0+4.3795,020813,030+2.3762,841757,353-0.7UOO,1l41l795,970-0.6805,609800,845-0.6669,362671,539+0.3Motorvehicletheft1,069,3451,02B,852-3.B901,992871,220-3.4449,948449,392-0.1235,466l45,!!S6+4.4116,491l111,222-4.597,91:l49L,314-5.1l108,245100,036-7.6113,080107,171-5.293,67687,609-6.582,39076,947-6.654,65150,065-8.4\\l1I\,IIlf1:I:IiI:~nIIj l IIij ~1\!i IIII!Nature cnd Distribution <strong>of</strong> Known OffensesTable 3.60 Offenses !(nown to police, by <strong>of</strong>fense and size <strong>of</strong> place, 1980 and 1981--ContinuedPopulation groupSLeLRBI>N CN MEAdTotalCrirrre:Index1,780,3651,754,655-1.4660,089650,112-1.5Vlolen·crlme~153,336IS3,81l9+0.451,05250,82B-0.4Propertrcrur.:;1,627 ,02!lI ,60U, 766-1.6609,0375:=J9,2!l4-1.62,9032,1l48-1.92,1322,Otll-2.'1Forciblerope12,B5412,61l1-1.34,5U54,490-0.35,8U3 ogencies; popUlation1l5,419,000:1911U 4,098,194 304,235 3,793,959 4,869 21,9911981 4,037,71l6 305,174 3,732,61l. 4,602 21558~P~er~c~e~n~t~c~h~an~g~e~ __________ ~-~I~.=5 ______ ~+~0~.3~ ____ ~-~1.~6~ __ ~-~5~.5~~~2.0aViohmt crimes <strong>of</strong> <strong>of</strong>fenses <strong>of</strong> murder, forcible rope robbery andaggra~ated assault. ' ,Property crimes are <strong>of</strong>fenses <strong>of</strong> burglary, larceny-theft, andmotor vehicle theft. Data are not Included for the property crill'-! ,;forson.Murderand nonnegligentmanslaughterAggravatedRobbery assault42,79944,432+3.86,2936,207-1.489,10391,385+2.6~4, 78093,921l-0.931l,12231l,U~U-0.2188,27211l7,629-0.3Burglary575,699S66,71l~-1.5240,557235,3u5-2.21,161,7191,13;,604-!.9922,8851912,261-1.2329,56B321l,063-0.52,338,71lU2,317,763~O.9Motorvehicletheft1213,441121,716-5.238,91235,916-7.7293,460275,2115-6.2cdlncludes State police agencies with no county breakdown.. . Includes suburban city and county low enforcement agencieswlthln metropolitan areas. Excludes core cities. Suburban cities andCil~i'ltles ore also Includ;;d in other groups.Table 3.61 Offenses in Federal parks known to police, by <strong>of</strong>fense, 1975-81!'OTE: The National Pork Service :~ responsible for the administration <strong>of</strong> 333 pork areas that areowned by the Federal Government. Three urban pork areas are policed by the US Pork~ollce, whereas other pork areas ore policed by the U.S. Pork Rangers. The <strong>of</strong>fense cl;t~gorieslisted below are the Umform Crime Reports Part I <strong>of</strong>fenses; see Appendix 2 for definitions.~ote, however, that these <strong>of</strong>fenses are not counted in the Federal <strong>Bureau</strong> <strong>of</strong> Inve:ltigationIgures: In 1975, the ''HurTJ?n !
[I\j<strong>Sourcebook</strong> <strong>of</strong> <strong>Criminal</strong> <strong>Justice</strong> <strong>Statistics</strong> <strong>1983</strong>i'bture and Distribution <strong>of</strong> Known OffensesTable 3.62 Percent distribution <strong>of</strong> murders and nonnegllgent manslaughters known to police,by type <strong>of</strong> weapon used, United States, 196/1-81N::>TE: See N::>TE, Table 3.56. In trend tables "constructed" or "adopted" by SOl.RCEBOO< staff fromCrime In the United States, the data were taken from the first year In which the data werereported. It should be noted that the number <strong>of</strong> agencies reporting and the popUlations representedvary from year to year.The Uniform Crime Reporting Progrom requests that additional Information !,)e transmitted tothe FB I when a homicide has been committed. The actual number <strong>of</strong> <strong>of</strong>fenses presented In the tablesdisplaying characteristics <strong>of</strong> murders known to the police may differ from figures In other tables thatreflect data from only the Initial report on the I:lffense.Tab!e 3.64 Percent distribution <strong>of</strong> murders andvictim-<strong>of</strong>fender relationship and clrcurnstan'ce nonfn~~"geffnt manslaughters known to police, by• s n e a ,ense, United States, 1981N::>TE: See N::>TES, Tables 3.56 and 3 62 Law e ~circumstances <strong>of</strong> murders and non~~gli~ent men~I~~chfent afhncles are requested to describe theUnIfor!"" Crime Reporting Program. ''Felon t ell g ers. ese descriptions are categorized by the~ommlsslon <strong>of</strong> another felony, such as ~o:tery ~:eb~/J killings that occur In conjunction with theC Cllrcumstanes <strong>of</strong> the <strong>of</strong>fense" category was provided by t~ ar~. d The total number <strong>of</strong> <strong>of</strong>fenses for eachr me Reporting Section. e e era l <strong>Bureau</strong> <strong>of</strong> Investigation, Uniform(Percent).(Percent)T~~e <strong>of</strong> wea~an usedBlunt Personalobject weapons TotalCutting or (club, (hands, Unknown number <strong>of</strong>stabbing hammer, feet ,flsds,Other b or not nannegligentYear Firearm Instrument etc.) etc.) stated Total C manslaughters1%4 55 24 5 10 3 2 100 7,9901%5 57 23 6 10 3 I 100 8,7731%6 59 22 5 9 2 I 100 9,5521%7 63 20 5 9 2 I 100 11,1141%8 65 18 6 8 2 I 100 12,5031%9 65 19 4 8 3 I 100 13,5751970 66 18 4 8 3 I 100 13,6491971 66 19 4 8 2 I 100 16,1831972 66 19 4 8 2 I 100 15,8321973 66 17 5 8 2 2 IOU 17,ll31974 67 17 5 8 I I 100 18,6321975 65 17 5 9 2 2 100 18,6421976 64 18 5 8 2 3 100 16,6051977 6.: 19 5 8 2 3 100 18,0331978 64 19 5 8 2 3 100 18,714m9 63 19 5 8 2 3 IUD 20,5911980 62 19 5 8 2 4 100 21,8601981 62 19 5 7 2 3 100 20 l U53bThis category includes beatings and strangulations.This category includes drownings, orson, polson, explosives,narcotics, asphyxiation, etc.cBecause <strong>of</strong> rounding, percents mey not add to total.Source: U.S. Deportment af <strong>Justice</strong>, Federal <strong>Bureau</strong> <strong>of</strong> Investigation, Crime lil the United~bati~ 1%4, p. 104, Table 16; 1%5, p. 106, Table 16; 1%6, p. 107, Tobie 2o;rm;-p. 112, Table; 68,'"il." lOB, Table 20; 1969,'p. 106, Table 21; 191Q,""j). 188, Table 21; 197f,p. 114, Table 21;19?, p. IBtl, Table 24; 1973;-p.-8j 1974, p. 18; 1975, p. 18; 1976, p. 10; 190~. II; .1978~9 9, p. II; 1980, p. 12;T981, p. ITTWashington, D.C.:. U.S. Government Printing Office).·· Tableadopted by 5CX..RCEBOO< staff.Table 3.63 Percent distribution <strong>of</strong> murders ond nonnegllgentmanslaughters known to police, by type <strong>of</strong> weapon used andregion, 1981N::>TE: See NOTES, Tables 3.56 and 3.62. In this table,strangulations are classified in the "unknown or other o:i!lngerousweapon" category rather than In the category "personal weapons,"as was done in Table 3.62. For a list <strong>of</strong> States in regions, seeAppendix 2.(Percent)Type <strong>of</strong> weaponPcr~;;::;JKnife Unknown weaponsor other or other (hands,Region Total a Firearmcutting dangerous fists, feet,instrument weapon etc.)i'brtheast 100.0 53.4 24.0 14.6 7.9i'brth Central 100.0 62.fj 18.2 13.0 6.0South 100.U 68.0 17.2 10.7 4.1West 100.0 57.6 21.3 14.2 6.8Total 100.0 62.4 19.4 12.5 5.6aBecause <strong>of</strong> rOlll'lding, percents may not add to total.Source: U.S. Deportment <strong>of</strong> JUstice, Federal <strong>Bureau</strong> <strong>of</strong>Investigation, Crime In the United States, 1981 (Washington, D.C.:U.S. Government Printing Office, 1982), p. 10.IIIII~IIII'I11Circumstoncei <strong>of</strong> the <strong>of</strong>fenseArgument Miscel- Unable toSUspected over laneous d t I~eylpo~y Rt~ntllc money or Other non-felony ~ire;::n~eRelationship<strong>of</strong> victimFelonyTotal typeto <strong>of</strong>fender(N=20,053) (N=3,457)nang e property arguments typ t(N= I ,103) (N=510) (N=606) (N=6,523) (N=4.:88) (~~3,~~s6)Total (N=20,053)a IUU.O IOU.O100.0 100.0 100.0 100.0 100.0 100.0HJsbandWife3.B 0.2 0.3 3.9Mother 4.8 0.2 0.7 7.3Father 0.6 O. I 0.3 0.02.32.0U.OD aug h ter0.9I 00.1 0.4 0.0 1.2Son • 0.5 0.1 0.2 0.0Brother 1.3 0.6 0.3 0.0 0.3Sister 1.3 0.5 0.4 0.2 2.8Oth er•,omlly.30.200.0 0.4 0.00.0A cqua I ntances 2°•51.4 0.6 1.6 2.8Friend ;. 20.2 8.7 53.9 56.4Boyfriend f·8 1.9 1.2 8.4Girlfriend • 312.50.1 0.3 4.7 0.8Neighbor 1.8 O. I 0.7 6.7 1.0St 1.5 1.6 1.8 1.0ranger 15 53. IUnknown relationship 29:6 ~~:~ 7~:~ ~:j~.25.4aBecause <strong>of</strong> rOUnding, percents may not add to total.8.28.30.81.40.31.12.30.35.340.55.62.73.22.19.C7.93.96.61.01.53.33.51.20.33.936.13.41.01.91.213.417.80.52.20.30.40.40.50.3O. I0.49.01.70.20.50.59.873.2Source: U.S. Deportment <strong>of</strong> Justlc t=: d I BIt9~}, (Washington, D.C.: U.S. Governmen~'Print~~~ o,~rc:aul~~i)nvestliglation, Crime in the U,ited States.s • " ,p.. Table adapted by SQRCEBOO
.------~~- --~<strong>Sourcebook</strong> <strong>of</strong> <strong>Criminal</strong> <strong>Justice</strong> <strong>Statistics</strong> <strong>1983</strong>Nature and Distribution <strong>of</strong> Known OffensesTable 3.66 Percent distribution <strong>of</strong> murders ond nannegligent manslaughters known to police, by age <strong>of</strong> victim, United Stahs, 1964-81NJTE: See NJTES, Tables 3.56 and 3.62.(Percent)Age 01' victim 1964 1965 1966 1967 1968 1969 1970 1971 1972 1973 1974 1975 1976 1977 1978 1979 1980 1981Infant (under I) 2 I I I I I I I I I I I I I I I I II to 4 3 2 2 2 2 2 2 2 2 2 2 2 2 2 2 2 2 25 to 9 I I I I I I I I I I I I I I I I I I10 to 14 2 I I I I I I I I I I I I I I I I I15 to 19 7 7 8 8 8 9 9 9 8 9 9 9 8 9 9 9 9 820 to 24 12 12 13 14 14 15 16 16 16 16 16 16 16 16 16 17 17 1625 to 29 12 13 12 13 13 14 14 15 15 14 1.5 15 15 15 16 16 17 163U to 34 12 12 II II II II II II II II 1.'2 II II 12 12 12 13 1435 to 39 12 12 12 12 II 10 9 10 10 9 ~' ~ 9 9 9 9 9 940 to 44 10 10 10 10 10 9 9 9 9 8 8 8 8 7 7 7 7 745 to 49 8 8 8 8 8 7 7 7 7 7 7 7 7 6 6 6 5 650 to 54 6 6 6 6 6 5 6 6 6 6 6 6 6 6 5 5 5 555 to 59 4 4 4 4 4 4 /f 4 4 4 4 4 4 4 4 4 4 460 to 64 3 3 3 3 3 3 3 3 3 3 4 3 3 3 3 3 3 365 to 69 2 2 2 2 2 2 2 2 2 2 2 2 2 2 2 2 2 270 to 74 I 2 I 2 I I I I I 2 I 2 2 2 2 2 2 I75 and older 2 2 2 2 2 2 2 2 2 2 2 2 2 2 2 2 2 2Unknown 2 2 2 2 2 2 2 2 I I 2 2 I I I 2 2 2Total a 100 IOU 100 IOU 100 100 100 100 100 100 100 100 100 100 100 100 100 100Total number <strong>of</strong> murdersand nonnegligentmanslaughters 7,990 8,773 9,552 11,114 12,503 13,575 13,649 16,183 15,832 17,123 18,632 18,642 16,605 18,033 1Il,714 20,591 21,850 20,053aBecause <strong>of</strong> rounding, percents may not odd to total.Source: U.S. Deportment <strong>of</strong> <strong>Justice</strong>, Federal <strong>Bureau</strong> <strong>of</strong> Investigation, Crime in the United States, 1964, p. 104, Table 17; 1965, p. 106, Table17; 1966, p. 107, Table 21; 1967, p. 112, Table 21; 1968, p. 108, Table 21; 1969, p. 106, Table 22; 1970, p. 118, Table 22; 1971-;-p.-114, Table 22;1972,p. 118, Table 25; 197'3,p. 8; 1974, p. 17, Tabi'el1; 1975, p. 17; 1916,P. II; 1977, p. 12; 19i8,"'p. 19; 1979, p. 10; mu; p. II; 1981, p. 10(Washington, D.C.: U.S. Government Printing Office). Table adapted by SOLRCEBOO< st<strong>of</strong>f. -- -- -- --Table 3.67 Percent distribution <strong>of</strong> murders andTable 3.68 Percent distribution <strong>of</strong> murders and nonnegligentnonnegligent manslaughters known to po!1ce, by sexmanslaughters known to police, by race <strong>of</strong> victim, United<strong>of</strong> victim, United States, 1964-81 States, 1964-81NJTE: See NJTES, Tables 3.56 and 3.62. NJTE: See NJTES, Tables 3.56 and 3.62.(Percent)Total numberRace <strong>of</strong> victim<strong>of</strong> murders and All others Total numberSelS Qf vi!;;tiro.... nonnegligent {including <strong>of</strong> murders andYear Mole Female Total a manslaughters race nonnegligentYear White Block unknown} Total a manslaughters1964 74 26 100 7,9901965 74 26 100 8,773 1964 45 54 I IOU 7,9901966 74 26 100 9,552 1965 45 54 I 100 8,7731967 75 25 100 11,114 1966 45 54 I 100 9,5521968 78 22 100 12,503 1967 45 54 I 100 11,1141969 78 22 100 13,575 1968 45 54 I 100 12,5031970 78 22 100 13,649 1969 44 55 2 100 13,5751971 79 ·21 100 16,183 197U 44 55 I iOO 13,6491972 78 22 100 15,832 1971 44 55 2 100 16,1831973 77 23 100 17,123 1972 45 53 2 100 15,8321974 77 23 100 18,632 1973 47 52 I lOG 11,1231975 76 24 100 18,642 1974 48 50 2 100 18,6321976 76 24 100 16,605 1975 51 47 2 100 18,6421977 75 25 100 18,033 1976 51 47 2 100 16,6051978 16 24 100 18,714 1977 52 45 2 100 18,0331979 77 23 100 20,591 1978 54 44 2 100 18,7141980 77 23 100 21,860 1979 54 43 2 100 20,5911981 77 23 100 20,053 1980 53 42 4 100 21,8601981 54 44 2 100 20,053aBccause <strong>of</strong> rounding, percents may not odd tototal.aBecause <strong>of</strong> rounding, percents may not odd to total.Source: U.S. Deportment <strong>of</strong> <strong>Justice</strong>, Federal Source: U.S. Deportment <strong>of</strong> <strong>Justice</strong>, Federal <strong>Bureau</strong> ::.i<strong>Bureau</strong> <strong>of</strong> Investigation, Crime in the United States,Investigotion, Crime in the United States, 1964, p. lett, Table1964,,P. 104, Table 17; 19~5t' p. 106, Table 17; 1966, p. 17; 1965, p. 106, Table 17; 1966, p. 107, Tab1ell; 1967, p. 112,TOT, ,able 21; 1967, p. 2, Table 21; I 968,p.l08, Table2'T; 1968, p. lOll, Tabte2l; 1969, p. 106, Ta~2; 1970,Table 21; 1969, p:-106, Table 22; 1970, p. Iw,-Table 22;p. 118, Ta~2; 1971, p. 114, Tabi'e7l; 1972, p. 118, TableB";1971, p. lT4,Table 22; 1972, p. I'TB;-Table 25; 1973, p. 1973, p. 8; 1974, p. 17; 1975, p. 17; 197'6,'P. II; 1977, p. 12;8;1"974, p. 17; 1975, p.1T;"1976, p. II; 1977;P:-12; IDif, p. 9; 1979, p. 10; 1980, p. II; 19!1r,p. 10 (\VciSlilngton,19ra;-p. 9; 1m p. 10;T9i:f0, p. 1I;T9i:fI, p. 10 D.C:: U.S. Government Printing Office). Table adopted by(Washington, D.C.: U.S. Government Printing Office). SC'X.RCEBOO< st<strong>of</strong>f.Table adopted by SC'X.RCEBOO< st<strong>of</strong>f.{Percent}~392 'q
------------------ ------~---<strong>Sourcebook</strong> <strong>of</strong> <strong>Criminal</strong> <strong>Justice</strong> <strong>Statistics</strong> <strong>1983</strong>Table 3.69 Murders and nonnegligent manslaughters known to police, by age, sex, race, and ethnicity <strong>of</strong> victim, United States, 1981Age <strong>of</strong> victimTotalPercentInfant (under I)I to 45 to 910 to 1415 to 1920 to 2425 to 293U to 3435 to 3940 to 4445 to 4950 to 5455 to 5960 to 646S to 6970 to 7475 and olderUnknownNJTE: See NJTES, Tables 3.56 and 3.62.Total number ___ Se-: <strong>of</strong> victim Race <strong>of</strong> victim Ethnicity <strong>of</strong> victim<strong>of</strong> murders andnonnegligentAmericanIndian or Asian ormanslaughtersUnknownWhite Black Native IslanderAlaskan Pael ficNJmber Percent Male FemaleUn··knownNan-Hispanic Hispanic Unknown20,053X1823121562141,5883,2953,31U2,7481,8051,4011,1021,049808571:J374285477369X 15,4911IUO.O a 77.30.91.6O.S1.17.916.416.513.79.U7.05.55.l4.02.91.91.42.41.897168921061,1902,5872,6712,2281,4451,1328728556354372601932492814,53822.685141,6410839870863952036U2692301941731411149222871aBecause <strong>of</strong> rounding, percents may not add to total.17 10,8310.1 54.0Source: U.S. Department <strong>of</strong> <strong>Justice</strong>, Federal <strong>Bureau</strong> <strong>of</strong> Investigation, Crime in the United States, 1981 (Washington, D.C.:Printing Office, 1982), p. 10.oooo17116175951278931,6951,5891,3509367926365934873472401883532198,78243.86013U56836581,5291,6581,34182658445043330922412890119104Il50.622II1025281410124fj22oII21850.9353o1326243221109I~83554213U0.6IoI31420IIII1233322IIo422,737 11,98213.6 59.821271623330542506385252205118846B251617IS87III191791158461,9531,9661,6311,0718476996785323832421793271325,33426.650946176412BOO83873248234928528720817011689135150U.S. GovernmentTable 3.70 Murders and nonnegligent mam;(augilters known to police, by race, sex, and ethnicity <strong>of</strong> victim and <strong>of</strong>fender, United States,1981Characteristics<strong>of</strong> victimRace:WhiteBlockAmerican Indianor Alaskan NativeAsian or PacificIslanderUnknownSex:MaleFemaleUnknownEthnicity:HispanicNan-HispanicUnknownTotalNJTE: See NOTES, Tables 3.56 and 3.62. During 1981, 16,456 <strong>of</strong>fenders were identified inconnection with the murder <strong>of</strong> 14,728 victims. These data pertain only to the 12,247 murders andnonnegligent manslaughters in which there was a single <strong>of</strong>fender and a single victim.Totalvictims6,2125,8118694449,3742,829441,4337,8182,99612,247Total<strong>of</strong>fenders6,2125,8118694449,3742,829441,4337,B182,99612,247White5,4442742426124,2511,517121,2353,3121,'2335,780Black6835,5187II44,96111,2514IB44,35~1,6&16,22327653Io6B19o361238723356o6023o5717833510o282719285,4344,6547283167,6952,548166 1,31522 6,45646 2,48874 10,259SexFemale7431,14713IIo1,652262o1121,3404621,914EthnicitySource: U.S. Department <strong>of</strong> <strong>Justice</strong>, Federal <strong>Bureau</strong> <strong>of</strong> InVestigation, Crime in the United States, 1981 (Washington, D.C.: U.S. GovernmentPrinting Office, 19112), p. B.3510o28'l7192862246741,2901416II21,21023821,180206641,4503,5664,069617545,nl1,85041987,555227,775Character isties <strong>of</strong> <strong>of</strong>fenderRaceAmericanIndian or Asian orAlaskan Pacific UnNative Islander known MaleUn-NanknownHispanic HispanicUnknown1,3561,601<strong>1983</strong>112,2437413855572,9103,022iIilIIMl1!II i!jIIfa-ITable 3.71 Percent distribution <strong>of</strong> robberies known to police, bytype <strong>of</strong> weapon used, United States, 1974-81Year1974197519761977197819791980191:l1NJTE: See NJTE:.S, Tables 3.56 and 3.62.(Percent)Type <strong>of</strong> weaponKnifeor othercutting Other Strong-Firearm Instrument weapon armed454543424140404U1312131313131313888B99993435363737383838Nature and Distribution <strong>of</strong> Known Offenses100100100100100100100100aBe cause <strong>of</strong> rounding, percents may not add to total.Totalnumber <strong>of</strong>robberies422,989444,937410,651391,128408,358458,749530,070548,038~ou~ce: !-l'S,. Department <strong>of</strong> JUstice, Federal <strong>Bureau</strong> <strong>of</strong>Investigation, Crime In the United States 1974 pp 26 160 197526, 160; ~d6, pp. 21, 153; 1971, pp. 19, '15J;f~m: pp: 19, ;li1iiI'9~~'pp. 18, I ; 1980, pp. 19, T'7'3;" 1981, pp. 18, 144 (Washington ' DC:U.S. Government Printing Office). Table adapted by SCLRCEBCxi
396----------- -- ~<strong>Sourcebook</strong> <strong>of</strong> <strong>Criminal</strong> <strong>Justice</strong> <strong>Statistics</strong> <strong>1983</strong>Table 3.74 Percent distribution. <strong>of</strong> aggravated assaults known to police,by type <strong>of</strong> weapon used, United States, 1964-8!!'OTE: See I'OTES, Tables 3.56 and 3.62.(Percent)T~~e <strong>of</strong> wea&'f" useatherTotalKnife weapon;or other club,number <strong>of</strong>cutting poison, PersonalTotal a aggravatedYear Fireanm instrument etc. weapons assaults1964 15 40 23 22 100 159,5241965 17 36 22 25 100 185,115!966 19 34 22 25 100 208,0431967 21 33 22 24 100 229,4701968 23 31 24 22 100 255,9061969 24 30 25 22 100 280,9021970 24 28 24 23 100 300,2631971 25 27 24 24 100 333,0841972 25 26 23 25 100 349,2451973 26 25 2;' 27 100 382,5861974 25 24 23 27 100 409,81l61975 25 24 25 27 100 436,1721976 24 24 26 27 100 459,7611977 23 23 27 26 100 485,0781971l 22 23 28 27 100 531,0061979 23 22 28 27 100 586,9141980 24 22 28 27 100 622,8791981 24 22 28 26 100 603,161aBecause <strong>of</strong> rounding, percents may not odd to total., pp. 8, 94; 1966, PPi 9'16Z;Source: U.S. Deportment <strong>of</strong> <strong>Justice</strong>, Federal <strong>Bureau</strong> <strong>of</strong> Investigation,Crime in the U,ited States, 1964, pp. 9, 92; 1961967 pp II 100' 1968, pp~ 96; 1969, pp. 10, 94; 1970, pp. I, ;1m: pp: 12: 100; 1972, pp. 10, 102; It~t pp. II, 104;l9i4, pp. 20, 160:T915 20 160' T9i6 pp 13, 153; 9 pp. 21, 153; niS, pp. 21, 168,'Wi? Pg; 20 J70l19B0 p~. 21, 73; 1981', pp. 20, 144· (Washington, D.C.:U.S. Gove'r~nt ~inting' Office). Table adopted by S
<strong>Sourcebook</strong> <strong>of</strong> Criminol <strong>Justice</strong> Stotistics I ~(j3Table 3.78 Violations <strong>of</strong> the Federal Bank Robbery and IncidentalCrimes Statute and <strong>of</strong> the Hobbs Act, by type <strong>of</strong> violation andjurisdiction, 191:11N.)TE: The following bonk crime statistics were compiled by theFederal <strong>Bureau</strong> <strong>of</strong> Investigation. Violations <strong>of</strong> the Federal BankRobbery and Incidental Crimes statute include robber)" burglary(entry <strong>of</strong> bank and/or theft from bank during non-business hours),and larceny (theft not involving direct confrontation between<strong>of</strong>fender and bank personnel or customers) <strong>of</strong> commercial banks,savings and loan institutions, and credit unions. Violations <strong>of</strong> theI-bbbs Act involve extortion and kidnaping <strong>of</strong> bank <strong>of</strong>ficiols or theirfamilies.JurisdictionRobberyI~(l!l <strong>of</strong> villlgiiQOBurglary Larceny I-bbbs ActTotal 7,037 524 230 212Alabama 29 19 5 2Alaska 7 0 0 0Arizona 102 22 5 7Arkansas 28 8 3 ICalifornia 2,551 78 19 33. Colorado 98 6 6 3Connecticut 97 5 2 5Delaware 7 I 0 0District <strong>of</strong> Columbia 93 I 4 0Florido 340 32 8 9Georgia 134 14 5 5Guam 0 0 3 0I-bwaii 45 I 0 2Idaho 22 3 0 3Illinois 80 It;': 13 4Indiano 109 13 I 10Iowa 25 I 3 IKansas 36 3 l. 0Kentucky 40 8 3 7Louisiana 70 6 I 4Maine 8 0 0 0Maryland 209 8 II 2Massachusetts 93 3 4 2Michigan III 34 14 6Minnesota 69 7 3 IMississippi 39 10 I 5Missouri 72 9 7 0Montana 5 2 2 INebraska 27 4 0 0Nevada 97 4 0 INew Hampshire 7 7 0 2New Jersey 96 12 7 7New Mexico 24 3 3 3New York 81 J 34 12 21North Carolina 9~ 19 10 5North Dakota I 0 0 0Ohio 229 25 14 4Oklahoma 29 10 I IOregon 123 7 3 3Pennsylvania 279 22 9 6Puerto Rico 13 0 0 0Rhode Island I 0 0 ISouth Carolina 39 7 5 0South Dakota 2 2 0 ITennessee 49 12 5 8Texas 229 14 21 21Utah 45 3 0 IVermont 4 0 0 0Virgin Islands 0 0 0 0Virginia 150 14 2 6Washington 115 13 3 6West Virginia I 2 0 0Wisconsin 44 4 10 2Wyoming 2 2 0 0Source: U.S. Department <strong>of</strong> <strong>Justice</strong>, Federal <strong>Bureau</strong> <strong>of</strong>Investigation, "Bank Crime <strong>Statistics</strong>, Federally Insured FinancialInstitutions, January I, 1981-June 30, 1981," pp. IS, 16; "July I,191:11-Dece:mber 3 I, 1981," pp. 15, 16. U.S. Deportment <strong>of</strong> <strong>Justice</strong>,Federal <strong>Bureau</strong> <strong>of</strong> InVestigation, 1982. (Mimeographed.) Tableconstructed by SOURCEBOOK staff.f'IIII;iI,I'IINoture and Distribution <strong>of</strong> Known OffensesFigure 3.23 Estimated rate (per 100,000 motor vehicle registrations) <strong>of</strong> motor vehiclethefts known to police, United States, 1968-81N.)TE: This figure was constructed from data compiled by the Insurance Information Institute.Data on motor vehicle registrations were obtained from the Federal Highway Administration.Registration figures include motorcycles. Theft data are Federal <strong>Bureau</strong> <strong>of</strong> Investigl'ltlonestimates.1,0008006004002000(Rate per 100,000 motor vehicle registrations)1968 1969 1970 1971 1972 1973 1974 1975 1976 1977 1978 1979 1980 1981Source: Insurance Information Institute, Insurance Facts, 1978, p. 63; 1982-83, p. 71(New York: Insurance Information Institute). Figure constructed by SOURC"'NCXiR staff.Reprinted by permission.398
<strong>Sourcebook</strong> <strong>of</strong> <strong>Criminal</strong> <strong>Justice</strong> <strong>Statistics</strong> <strong>1983</strong>~ bl 3 79 Number <strong>of</strong> <strong>of</strong>fenses known to police and averageaseiected <strong>of</strong>fenses and type <strong>of</strong> target, United States, 1981loss incurred, by!'OTE' See !'OTES, Tables 3.56 and 3.73. "Loss" refer~ to property j~aken duriig th~~~~~::;,iO;e~: ~~:d o~e~:,;nl~~ "~~e~~::si~~;~~lu~~g J~~~it~~~ts I~¥o~~fe~~es~s~eaeAppendix 2.{13,090 agencies; 1981 estimated population 216,579,000}PercentNumber <strong>of</strong> change AverageOffense and type <strong>of</strong> target<strong>of</strong>fenses1981aver1980 Percent a loss {indollars}Murder 21,412 -1.7 100.0 $59Forcible rape 76,423 -1.1 10U.0 46Robbery 553,7H4 +4.5 100.0 66';Street /highway 288,614 +4.9 52.1 441Comnercial house 72,430 -0.8 13.1 1,091Gos or service station 22,934 +5.4 4.1 372Convenience store 34,809 -2.9 6.3 429Residence 60,670 +7.4 11.0 1,020Bank 7,559 -5.3 1.4 3,654Miscellaneous 66,768 +11.3 12.1 729Burglary3,520,825 -0.7 100.0 924Residence (dwelling)2,372,724 +0.7 67.4 987Night 764,933 +1.3 21.7 841Day 1,008,561 +1.3 28.6 1,073Lhknown 599,230 -1.1 17.0 1,028Nanresidence {store, <strong>of</strong>fice, etc.} 1,148,101 -3.6 32.6 794Night 625,842 -4.5 17.8 747Doy 191,055 +2.5 5.4 745lklknown 331,204 -5.1 9.4 911Lorceny-theft (except motor vehicle theft) 6,743,638 +0.3 100.0 340By type:Pocket-picking 75,953 -6.0 1.1 235Purse-snatching 103,915 +3.0 1.5 196Shoplifting . 768,310 +5.6 11.4 Tl.From motor vehicles (except accessories) 1,199,220 +3.3 17 .8 366M('ltor vehicle occessories 1,284,526 0.0 19.0 192Bicycles 627,H12 -6.8 9.3 138From buildings 1,117,282 -0.2 16.6 518From coin-operated mochines 55,862 +1.5 0.8 146All others 1,510,758 -0.8 22.4 554By value:Over $20U2,027,628 +8.7 30.1 989$50 to $2002,157,998 -2.5 32.0 109lklder $502,558,012 -3.3 37.9 19Motor vehicle theft 1,021,434 -3.2 100.0 3,173°Because <strong>of</strong> rounding, percents may not odd to total.SUS Deportment <strong>of</strong> <strong>Justice</strong>, Federal <strong>Bureau</strong> <strong>of</strong> Investigation, Crime Inthe Lh~~J~tate~: 1981 (Washington, D.C.: U.S. Government Printing Office, 191:12), p.150, Table 17.Nature and Distribution <strong>of</strong> Known OffensesTable 3.80 Assaults on Federal <strong>of</strong>ficers, by department and agency, 1978-81TotalNJTE: These data were complied from repor\~ <strong>of</strong> investigations conducted by the Federal <strong>Bureau</strong> <strong>of</strong>InVestigation, the U.S. Deportment <strong>of</strong> the Treasury, and the U.S. Postal Service. The Federal<strong>Bureau</strong> <strong>of</strong> Investigation Is responsible forrfJe InVestigation <strong>of</strong> assaults on personnel <strong>of</strong> the U.S.Department <strong>of</strong> the Interior, the U.S. Department <strong>of</strong> JYstlce, and the Federal judiciary.Customarily, the U.S. Department <strong>of</strong> the Trea£ury and the U.S. Postal Service investigate assaultsagainst <strong>of</strong>ficers ossigned to their agencies. AU assaults and threats <strong>of</strong> assault are Included in theanalysis even though no injury to an <strong>of</strong>ficer may have resulted, as are assaults that resulted In thedeath <strong>of</strong> an <strong>of</strong>ficer.~[!Jbe[ <strong>of</strong> <strong>of</strong>fl~~[~ a§~aulted197H ~ber1979<strong>of</strong> known <strong>of</strong>fenders1980 1981 1971:1 1979 1980 1981771 622 724 728 581:1 539 592 593U.S. Department (,f the Interior 24<strong>Bureau</strong> <strong>of</strong> Indian Affairs25 19 29 27202215201325National Park Service22 2441810 126177 3 4 8 8U.S. Department <strong>of</strong> <strong>Justice</strong> 261<strong>Bureau</strong> <strong>of</strong> Prisons208 243 316 179107 16999184120249Drug Enforcement Administration III 76379210252 99Federal <strong>Bureau</strong> <strong>of</strong> Investigation 95 275243353764Immigration and Naturalization Service 425644 364123194UU.S. and Assistant U.S. Attorney 46 45636417934U.S. Marshals Service8 314219 46214 9 14 3 10U.S. Deportment <strong>of</strong> the Treasury 450 358 1106<strong>Bureau</strong> <strong>of</strong> Alcohol, Tobacco and Firearms 333 356363303235228273Internal Revenue Service 3131229 25254 30 19U.S. Customs Service31~ 251 252592413627725217U.S. Secret Service25 4643393622371626 29 25 23 21Judicial branch8 10 28 24 5 4 17 23U.S. Postal Service28Pastal Inspectors21 28 26 2113 144191323Postal Securitl Polrce4 915 317 159 422 12 II 10 19Source: U.S. Deportment <strong>of</strong> <strong>Justice</strong>, Federal <strong>Bureau</strong> <strong>of</strong> InVestigation, Assaults on Federal Officers, 1979, p. 7;SOlRCEBOO
\<strong>Sourcebook</strong> <strong>of</strong> <strong>Criminal</strong> <strong>Justice</strong> <strong>Statistics</strong> <strong>1983</strong>Nature and Distribution <strong>of</strong> Known OffensesTable 3.82 Law enforcement <strong>of</strong>ficers killed, by circumstances at scene <strong>of</strong> Incident and type <strong>of</strong> asslgrvnent,United States, 1972-81 (aggregate)N:JTE: These data include Federal, State, and local law enforcement <strong>of</strong>ficers feloniously killed In thelk1lted States, its territories, Puerto Rico, and abroad. These tabulatlC>l1s have only Included Guamand the Virgin Islands since 1975.Circumstances atscene <strong>of</strong> IncidentTotalTotal 1,110Disturbance calls (familyquarrels, man with gun) 196Burglaries in progress orpursuing burglary suspects 75Robberies in progress orpursuing robbery suspects 204Attempting other arrests 227Civil disorders (massdisobedience, riot, etc.) 3Handling, transporting,custody <strong>of</strong> prisoners 44Investigating suspiciouspersons and circumstances 103Ambush (entrapment andpremeditation) 41:1Ambush (unprovoked attack) 41Mentally deranged 25Traffic pursuits and stops 1442-<strong>of</strong>ficervehicle2~367162834o1017IL4728I-<strong>of</strong>ficer vehicleAlone Assisted35046284844o8441013710214t144132335o66325IIType <strong>of</strong> assignmentFoot potrolAlone Assisted16323oo4I2oIIo23oQo2.3oDetective,~clal assignmentAlone AssistedSource: U.S. Department <strong>of</strong> <strong>Justice</strong>, Federal <strong>Bureau</strong> <strong>of</strong> Investigation, Law Enforcement Officers Killed, 1981,FBI Uniform Crime Reports (Washington, D.C.: U.S. Government Printing Office, 1982), p. 15.Table 3.83 Law enforcement <strong>of</strong>ficers killed, by circumstances at scene <strong>of</strong> incident .and type <strong>of</strong> assignment,United States, 1981Circumstances atscene <strong>of</strong> incidentTotalDisturbance calls (familyquarrels, man with gun)Burglaries in progress orpursuing burglary suspectsRobberies in progress orpursuing robbery suspectsAttempting other arrestsCivil disorders (massdisobedience, riot, etc.)Handling, transporting,custody <strong>of</strong> prisonersInvestigating suspiciouspersons and circumstancesAmbush (entrapment andpremeditation)Ambush (unprovoked attack)Mentally derangedTraffic pursuits and stopsTotal9119G1715o1054212NJTE: See I'OTE, Table 3.82.2-<strong>of</strong>ficervehicle167o3IXo2I()o2I-<strong>of</strong>ficer vehicleAlone Assisted3526j4Xo63Io10176o43XooII2oType <strong>of</strong> assignmentFoot patrolAlone AssistedoxXXXXXXXXXXoXXXXXXXXXXX70371812o9739II164182218431012uI4IDetective,special assignmentAlone AssistedSource: U.S. Department <strong>of</strong> <strong>Justice</strong>, Federal <strong>Bureau</strong> <strong>of</strong> Investigation, Law Enforcement Officers Killed, 1981,FBI lk1iform Crime Reports (Washington, D.C.: U.S. Government Printing Office, 1982), p. 14.3oooIXo7oI5Xooo121!1486212o13'JIIIOffdutyOffduty133o6IXoo2oTable 3.84 Percent distribution <strong>of</strong> low enforcement <strong>of</strong>ficerskilled, by selected characteristics <strong>of</strong> <strong>of</strong>ficers, United States,InS-81N:JTEI See NOTE, Table 3.8:.!. Because <strong>of</strong> rounding, percents may notadd to 100.(Percent)Characteristics <strong>of</strong><strong>of</strong>ficers killedRace:White 91Block 9(nher 0SeXIMaleIOUFemale 0Age:lk1der age 25 1425 through 30 3031 through 40 3041 and older 26Length <strong>of</strong> service:Less thon 5 years <strong>of</strong> service 39I year or less <strong>of</strong> service 105 through 10 years <strong>of</strong> service 30Over 10 years <strong>of</strong> service 31In uniform 80197IJ 1979 19UU 1981(N::93) (N:: I 06) (N= I 04) (N=91)889399I920413034104026718613o99I122643193124227698514I!:It!21323422231:14332980Source: U.S. Department <strong>of</strong> <strong>Justice</strong>, Federal <strong>Bureau</strong> <strong>of</strong>InVestigation, Law Enforcement Officers Killed, 1978, p. 22; 1979, p.221 1979, p. 22; 1980, p. 23; 1981, p. lu; FBI lk1lform Crime Reports(Wailililgton, D:C::U.S. Government Printing Office). Tableconstructed by SCLRCEBOO< staff.Table 3.85 Persons Identified In the killing <strong>of</strong> law enforcement<strong>of</strong>ficers, by demographic characteristics and prior record,United States, 1972-81 (aggregate) and 1981N:JTE: See NOTE, Table 3.82. Percents do not add to 100 in the agecategory because all ages are not represented in the table. Multipleresponses are possible for prior record.Characteristics <strong>of</strong>1972 to 1981 1981persons Identified Number Percent NJrnber PercentTotal 1,566 IUO IL5 IOUAge:Under age 18 11918 to 30 954Sex:MaleFemale1,50660Race:White 801Black 731Other 34Ethnlcity:Hispanic(a)Nan-Hisponlc(a)Prior record:Prior criminal arrestConvicted on prior criminalI , 101~arge 8~Prior arrest for crime <strong>of</strong>violence 576Convicted on prior criminalcharges--granted leniency 605On parole or probation at time<strong>of</strong> killing 290Prior arrest on murder chargePrior arrest on narcotic drug81law violation 288Prior arrest for assaultingpoliceman or resisting arrest 122Prior arrest for weaponsviolation 392aData not available prior to 1980.86196451472XX7U513739195III825957120551n221104Source: U.S. Department <strong>of</strong> <strong>Justice</strong>, Federal <strong>Bureau</strong> <strong>of</strong>Investigation, Law Enforcement Officers Killed, 1981, FBI UniformCrime Reports (Washington, D.C.: U.S. GOvernment Printing Office,1982), p. 19. Table constructed by SCXRCEBOO< staff.Table 3.86 Persons Identified In the killing <strong>of</strong> lowenforcement <strong>of</strong>ficers, by type <strong>of</strong> disposition, United States,1970-79 (oggregte)N:JTE: See NOTE, Table 3.82. Because <strong>of</strong> rounding, percents maynt 1 add to 100.Type <strong>of</strong> dispositionPersons identifiedFugitiVesJustifiably killedConmitted suicideArrested and chargedPersons arrested and charged('rUilty <strong>of</strong> murderGuilty <strong>of</strong> a lesser <strong>of</strong>fenserelated to murderGuilty <strong>of</strong> crime other than murderAcquitted or otherwise dismissedConmltted to mental InstitutionCase pendingDied In custodyTotal1,6011719946I ,33~1,33986910611216343311591675961329331857PercentIOuI12384Source I U.S. Department <strong>of</strong> JUstice, Federal <strong>Bureau</strong> <strong>of</strong>Investigation, Law Enforcement Officers Killed, I!lUI, FBI lkllformCrime Reports (Washington, D.C.: U.S. Government Prlntng Office,1982), p. 20. Table constructed by 5O.RCEBOO< staff.10065IlIl1232746964415tl2178373544749267261446
--Agure 3.24 Rate (per 100 <strong>of</strong>ficers) <strong>of</strong> assault and assaults with injury on low enforcement <strong>of</strong>ficers, United States, 1970-81!'OTE: These data are based on monthly reports from local, county, and State law enforcement agencies to theFBI. The number <strong>of</strong> agencies reporting and the populations represented vary from year to year.Rate per 100 lawenforcement <strong>of</strong>ficers2018...a....16141210 -864Assaultswith Injury-IX>g>., e0"cr0X-0 ....,Q3'5'Eol- e~0'"~as:ao'"wt!2"01970 1972 1973 1974Source: u.s. Department <strong>of</strong> <strong>Justice</strong>, Fedeml <strong>Bureau</strong> <strong>of</strong> Investigation, Crime in the U1ited States, 1970, p. 164, Table 54; 1971, p. 163, Table 59; 1972, p. 167,Table 62; 1973, p. 170, Table 62; 1974, p. 241, 'fable 65; 1975, p. 239, Table 66; 1976, p. 281, Table 68; 1977, p. 283, Table ge;r978, p. 300, Table65l1979, p.302; 1980,,,::331; 1981, p. 303 (WOsfiington, D.C.: U.S. Government Printing Office). Figure constructecT"bY SO-RCEBOO< st<strong>of</strong>f.-- --", eoa
Nature and Distribution <strong>of</strong> Known OffensesTable 3.87 Drug thefts, by type <strong>of</strong> drug and region, 1976-82!'OTE: Registered hondlers <strong>of</strong> controlled substances (pharmacies, practitioners, manufactur'lrs,and hospitals) are required, under the Controlled Substances Act, to report the theft <strong>of</strong> allcontrolled drugs to the Drug Enforcement Administration. This table includes drug theftsreported by these registered handlers.The States included in the regions are as follows: Northeast--Con;'ecticut, Delaware,Maine, Massachusetts, New H:lmpshire, New Jersey, New York, Pennsylvania, Rhode Island,Vermont; Southeast--Alabama, Arkansas, District <strong>of</strong> Columbia, Florida, Georgia, Louisiana,Maryland, Mississippi, North Carolina, South Carolina, Tennessee, Virginia; North Central-Illinois, IndiaM, Iowa, Kansas, Kentucky, Michigan, Minnesota, Missouri, Nebraska, NorthDakota, Ohio, South Dakota, West Virginia, Wisconsin; South Central--Arlzona, Colorado,New Mexico, Oklahoma, Texas, Utah, Wyoming; West--Alaska, California, Hawaii, Idaho,Montona, Nevada, Oregon, Washington.Drug theft data for 19111 and 19112 are not available by geographic area.Type <strong>of</strong> drugand regionNorcotics aNortheastSoutheastNarth CentralSouth CentralWestStimulantsNortheastSoutheastNorth CentralSouth CentralWestDepressantsNorthea!:SoutheastNorth CentralSouth CentralWestTotal197610,6143,8912,1472,4467911,33912,3155,7311,6972,9428381,10743,51227,8094,4546,5151,9652,76966,441(In thousands <strong>of</strong> dosage units)197710,0722,5722,4002,6759791,1+469,5962,1l631,8261,9809601,96724,6017,9205,2935,651l2,5003,23044,269197811,7323,2222,7083,1571,0251,62611,6365,0111,5672,5921,1911,27523,3495,4904,7477,5372,3983,17746,717alncludes methadone, cocaine, and other narcotics.197912,2102,51l72,98tl2,8671,4972,271II ,2685,7841,3431,8141,021s1,29921,4365,4364,9675,6352,3593,03944,9141911010,8811,4632,7112,7621,4982,4475,5551,0131,191l1,4897061,14918,7553,7204,7465,3682,2752,64535,1911911110,770N\N\N\N\N\6,639N\N\N\N\N\22,363N\N\N\N\N\39,77319828,530N\N\N\N\N\2,883N\N\N\N\N\8,931N\N\N\N\N\20,3446Source: U.S. Department <strong>of</strong> <strong>Justice</strong>, Drug Enforcement Administration, ~80r.Enforcement Statistical Report, 1979 (Washington, D.C.: U.S. Deportment <strong>of</strong> <strong>Justice</strong>, I ,p. 39; and data provided by the U.S. Department <strong>of</strong> JuMice, Drug EnforcementAdministration. Table adapted by SOlRCEBOO< staff.Table 3.88 EstiIMted average illegal market retail drug prices, by type <strong>of</strong> drug, United States, 1973-82!'OTE: The estimated average illegal market retail heroin price is calculated from a sample <strong>of</strong> evidence exhibits removed from the illicit marketby the Drug Enforcement Administration. The sample is selected 1'0 include "only those exhibits which fall within a certain range <strong>of</strong> valuesrepresentative <strong>of</strong> a retail level <strong>of</strong> the illicit market." Beginning in 197tl, the estimated nationol average Is derived from regional averagesweighted for the "intensity <strong>of</strong> the narcotic problem." That is, through statistical procedures, a lorge number <strong>of</strong> transactions In one locationare clustered to limit their influence on heroin price and purity statistics in the sample group (Source, 1979, p. 34).Cocain~ prices are derived from :,., Cocaine Retail Price Index, which is based upon evidence exhibits purchased by the DrugEnforcement .A.cministration (Source, 197'), p. 37).In 1979 and 19110, prices <strong>of</strong> dangerous drugs (marihuana, h~'shish, LSD, PCP, barbiturates, and amphetamines) were based an reports forthe last quarter <strong>of</strong> each year submitted by Drug Enforcerr~"t Administra1:ion's field <strong>of</strong>fices in 24 large metropolitan areas. These prices arecompiled through a newly-initiated collection method, which reflects trrJnsaction data at the retail level. Comparison with prices <strong>of</strong> earlieryears is not reconmended by the Source (1979, p. 36). Prices for 19/J i and 19t12 reflect the price reported at the end <strong>of</strong> the year.The notation "d.u." means dosage unit.Tl~ <strong>of</strong> dru!! 1973 1974 1975 1976 1977 1978 1979 1200 12~1 19112Heroin (gm.)a $1, iSO.O!) $1,230.00 $1,150.00 $1,4f}0.00 $1,590.00 $2,190.00 $2,290.00 $2,200.00 $2,340.00 $2,110.00Cocaine (gm.)a 41lJ.OlJ 490.00 560.00 530.00 640.00 63U.OU 780.00 670.00 690.00 600.00Marihuana (gm.) .63 .56 .65 .64 .69 .80 1.42 1.66 1.64 1.74H:lshlsh (gm.) 9.66 9.85 8.31l 10.20 B.67 9.64 5.37 2.61 3.82 7.76LSD (d.u.) 1.56 1.66 1.73 1.91 2.06 2.18 3.18 3.23 3.58 4.30PCP (d.u.) N\ N\ ~I\ N\ N\ 1.59 7.95 8.36 1.\ .60 14.00Methamphetamine (d.u.) ~ .62 1.07 1.26 1.14 .93 N\ N\ N\ N\Barbiturates (d.u.) .55 .75 .80 .1l3 .92 1.07 2.99 3.50 3.62 4.50hr4>/1etomlne (d.u.) .45 .59 .63 .72 .74 .93 3.49 3.23 3.23 3.60Methadone (d.u.) 4.48 3.45 5.17 4.62 3.49 3.79 N\ N\ N\ N\C!p,ices ore per pure gram.Source: U.S. Deportment <strong>of</strong> <strong>Justice</strong>, Drug Enforcement Administration, Drug Enforcement Statistical Rel3rt, 1976, pp. 33, 351 11978, pp.33, 351 1979, pp. 35, 37 (Washington, D.C.: U.S. Department <strong>of</strong> <strong>Justice</strong>); and data provided by the U~. Deportment <strong>of</strong> Just ce, DrugEnforcement AchUnistration. Table adapted by SOLRCEBOO< staff.'" 4\~o\405
407-~------- ----<strong>Sourcebook</strong> <strong>of</strong> <strong>Criminal</strong> <strong>Justice</strong> <strong>Statistics</strong> 191:13...~,!Table 3.89 Bombing incidents known to police, by type <strong>of</strong> incident and device, value <strong>of</strong>property damage, and outcome <strong>of</strong> incident, United States, 1973-82!\oTE: Detailed information concerning each bombing incident reported as occurring in the LhltedStates, Puerto Rico, and the Virgin Islands is submitted by FBI field <strong>of</strong>fices to the Lhlform CrimeReporting Program. Local and State public safety agllncies bring incidents within theirjurisdictions to the attention <strong>of</strong> the field <strong>of</strong>fices. Because not all bombing incidents constituteFederal violations within the FBI's investigative purview, these other low enforcement agenciesgreatly facilitate the reporting <strong>of</strong> occurrences and details <strong>of</strong> the incidents.Bombing incidents refer to actual and attempted detonations <strong>of</strong> explosive or incendiarydevices in violation <strong>of</strong> a State, local, or Federal law. Excluded from the tabulations are threatsto bomb, hoax bomb devices, tlccidental explosions, recoveries <strong>of</strong> explosive or incendiary devices,and such misdemeanor <strong>of</strong>fenses as the illegal use <strong>of</strong> fireworks.TotalPropertyactual and Actual Attemeted damageattempted Explo- Incen- Explo- Incen- (dollar PersonalYear bombings sive diorl sive diorl value) injurl DeathTotal 14,668 7,802 4,310 1,510 1,046 $169,643,172 1,794 3071973 1,955 742 787 253 173 7,261,832 187 221974 2,044 893 758 236 157 9,886,563 207 241975 2,074 1,088 613 238 135 27,003,981 0 326 a 69 a1976 1,570 852 405 188 125 11,265,426 212 501977 1,318 867 248 118 85 8,943,300 162 221978 1,301 768 349 105 79 9,161,485 135 181979 1,220 728 305 104 83 9,273,024 173 221980 1,249 742 336 99 72 12,562,257 160 341981 1,142 637 315 92 98 67,082,4560 133 301982 795 485 194 77 39 7,202,848 99 16°lncludes major bombing incidents resulting inon unusually high number <strong>of</strong> personal injuries anddeaths, and substantial damage to property.Source: U.S. Deportment <strong>of</strong> <strong>Justice</strong>, Federal <strong>Bureau</strong> <strong>of</strong> Investigation, Bomb Sumnory 1982,FBI Lhiform Crime Reports (Washington, D.C.: U.S. Government Printing Office, (983), Table I.II[IliIi1 '1jNature and Distribution <strong>of</strong> Known OffensesTable 3.90 Bombing incidents known to r boutcome <strong>of</strong> incident, United States, If:z,ce, y type <strong>of</strong> target and device, value <strong>of</strong> property damage, andTotalResidencePrivate residenceApartment houseOther priVate propertyCommercial operationsCommercial buildingOffice buildingIndustrial bUildingBonkTheater!-htel or motelVehiclesAutomobileOther vehicleAircraftSchool facilitiesPublic safetyLaw enforcemP.ntBuildingVehicleOtherFire dep'lrtment and equipmentGovernment propertyFederalStateLocaiPersonsPublic utilitiesRecreation facilitiesTelephone facilitiesOther communication facilitiesTransportation facilitiesConstruction sites and eqUipmentPastal facilities ond equipmentChurchesMilitary facilitiesInternational estoblishmP.ntsMedical facilitiesNewspaper facilitiesOpen areaLhknown (premature detonation)OtherTotalactual andattemptedbombings7952131423338194156148·93414512123I511687oI19541043394279775643181614!\oTE: See !\OTE, Table 3.89.485 19496 1:1745 7418 II33 213010737289 44 28 II II I846815I371274XI1654737316o103I2X°2o2ActualExplo- IncensivediaryAttemptedExpla- Incensivediary77 3918 12II 124 03 °13 1410 III°I° o ° II1615I°3oIX°IoII87IoooXooPropertydamage(doilarvalue)$7,202,848774,209708,92019,11046,1793,802,5653,594,720111,5006,12589,1001,000120219,623171,32348,300o207,14088,37578,1259,750X50094,3005001,00092,80031 5 7 0 351:1,5003 0 0 0 500,2006 2 I 0 8750 3 0 I 0 1,300I I 0 04 I 2 0 9,7003 I 5 0 37,8006 I 0 0 404 0 3 0 351,000o 4 I 0 600,2004 ° 0 2 27,000~ 2 0 0 60,02514 0 I 0 1,350I I 2 100l~ 0 0 0 36,200o 2 0 32,346Source: U.S. Deportment <strong>of</strong> Just' F d I BReports (Washington, D.C.: U.S. Governr:~; P~ln~~~g ~~~~~ l~i~~e~~61:i2~' Bomb Sumnory 1982, FBIPersonalInjuryDeath9~ 168 26 22 °o °7 U5 o ° 0I 0I 0o 0o 019 I3 0I150I14 033 Io 0X Xo 024 ° 0I 0I 028 6o 03 00000000o 00o 02 010 6I 0Lhiform Crime406
Nature and Distribution <strong>of</strong> Known Offenses<strong>Sourcebook</strong> <strong>of</strong> <strong>Criminal</strong> <strong>Justice</strong> <strong>Statistics</strong> <strong>1983</strong>Table 3.91 Explosives incidents reported to or investigated by the <strong>Bureau</strong> <strong>of</strong> Alcohol,Tobacco and Firearms, by type <strong>of</strong> incident, United States, 1976-81N:JTE: These figures are from reports to the <strong>Bureau</strong> <strong>of</strong> Alcohol, Tobacco and Firearms (A TF)by ATF field <strong>of</strong>fices and other law enforcement agencies; these reports may not include allexplosives Incidents. "Explosives Incidents" are any explosives-related situation investigatedby or reported to the <strong>Bureau</strong> <strong>of</strong> Alcohol, Tobacco and Firearms. "Bombings" are criminalincidents using explosives or blasting agents Including premature detonations duringpreparation, transportation, or placement <strong>of</strong> Illegal explosives. "Incendiary bombings" arecriminal Incidents using an Incendiary or chemical device that burns. Arson motivatedincidents are not included under this category. ''!-box devices" are devices designed toappear as a bomb to deceive, threaten, or intimidate a victim (Source, pp. v, vi).Bombing figures for the years 1976 and 1977 include 30 and 21 criminal accidents,respectively, that were seporately enumerated by the Source.Type <strong>of</strong> incident 1976 1977 1978 1979 1980 1981Total 2,706 3,177 3,256 3,092 2,875 2,338Bombings 870 1,051l 963 901 922 805Attempted bombings 319 319 287 178 163 152Incendiary bombings 352 339 446 346 368 329Attempted incendiary bo;nbings 101 81 71 44 68 99Thefts <strong>of</strong> explosives 327 227 362 335 349 243Recoveries and seizures <strong>of</strong> explosives 579 853 987 1,167 908 637Threats to U.S. Department <strong>of</strong> theTreasury facilities 44 33 22 35 22 24Hoax devices 67 105 47 26 II 12N?ncriminal accidents 47 62 71 60 64 37Treasury, <strong>Bureau</strong> <strong>of</strong> Alcohol, Tobacco and Firearms,Table 3.93 Deaths, injuries, and property damageresulting from criminal bombings and accidentalexplosions reported to the <strong>Bureau</strong> <strong>of</strong> Alcohol,Tobacco and Firearms, United States, 1976-81!'-OTE: See NOTE, Table 3.91. These data includedetonated and incendiary bombings, and criminal andnoncriminal explosives incidents. The 1977 propertydamage figure includes approximately $50 millionresulting from grain elevator explosions. The dramaticincrease in the 1971:1 injury figure is due to two majorincidents: 150 people in New York City were injured inthe accidental, noncriminal explosion <strong>of</strong> an ice creamtruck; 250 people in Kentucky and West Virginia wereinjured by Illegal fireworks.DeathInjuriesProperty damage(in millions)1976 73 272 $12.11977 127 374 61.31971:1 69 707 27.51979 54 328 16.U19110 91 4113 31.21981 75 262 105.6Source. U.S. Department <strong>of</strong> the Treasury, <strong>Bureau</strong><strong>of</strong> Alcohol, ~;obacco and Firearms, Explosives Incidents,Annual Report, 1977, p. 4; 1979, p. 4; 1980, p. 4; 1981,p. 4 (Washington, D.C.. U.S. Goverii'iTient PrintingOffice). Table adapted by SQRCEBOO< staff.Table 3.94 Estimated number <strong>of</strong> fires, civilian fire deaths, andvalue <strong>of</strong> property loss due to incendiary or suspicious structurefires, United States, 1981!'-OTE: The data below are weighted estimates from a survey <strong>of</strong> astratified sample <strong>of</strong> fire departments drawn from the Fire ServiceI nventory File <strong>of</strong> the Notional F:re Protection Association. The FireService Inventory File lists 27,929 departments from whicl, 7,832 wereselected for the survey. Completed questionnaires were n:ceived from2,840 fire deportments. Readers are advised to see the Source formore detailed information on methodology and weighting procedures."Incendiary fires" are fires in which "legal decision or physicalevidence indicates that the fire was deliberately set." "Suspiciousfires" are fires in which "circumstances indicate the possibility that afire may have been deliberately set, multiple ignitions were found, orthere were suspicious circumstances and no accidental or naturalignition factor could be found." "Civilians" include "anyone other thana fire fighter, and covers public service personnel such as police<strong>of</strong>ficers, civil defense staff, non-fire service medical personnel, ondutility company employees."Estimatednumber <strong>of</strong> EstimatedEstimated civilian value <strong>of</strong>number fire property loss<strong>of</strong> fires deaths (in thousands)Total, all fires in structures 1,027,500 5; 760 $5,976,000Total, incendiary andsuspicious fires 154,500 820 1,658,000Incendiary fires 88,000 555 1,142,000Suspicious fires 66,500 265 516 1 00USource: Michael J. Karter, Jr., "Fire Loss in the United StatesDuring 1981," Fire Journal, 76 (September 1982), p, 68. Tableadapted by sa..RCEBOO< staff. R.::printed by permission.Table 3.n Explosives stolen and recovered as reported to the <strong>Bureau</strong> <strong>of</strong> Alcohol, Tobacco and Firearms, by typeStates, 1976-81!'-OTE: See N:JTE, Table 3.91. "Blasting agents" refers to a specific type <strong>of</strong> explosive that can beclassified as either a low or high explosive depending on how it is used. For this reason, it isseparately enumerated. ''RDX'' refers to an extremely powerful explosive manufactured by the U.S.Army and found, in small quantities, in blasting caps, shells, and bombs.<strong>of</strong> explosive, UnitedAmount stolenAmount recoveredType <strong>of</strong> explosive 1976 1977 1971J 1979 1980 19111 1976 1977 1971l 1979 191:10 19111Blasting agents (Ibs.) 128,651 20,834 42,172 65,457 51,168 24,036 9,317 21,260 23,623 33,335 27,744 12,822Low explosives (Ibs.):Black powder 2,297 145 379 2,446 772 325 113 277 723 2,856 433 19Smokeless powder 84 0 163 6 307 973 59 16 1,361 7,546 45 114Phot<strong>of</strong>lash cartridge powder Nt>. Nt>. Nt>. Nt>. Nt>. Nt>. 600 2 150 0 Nt>. Nt>.High explosives (lbs.):Potassium chlorate Nt>. Nt>. Nt>. Nt>. Nt>. Nt>. 2,401 6,30U 600 0 500Boasters 6,617 2,177 9,528 447 1,851 494 1,460 2,804 362 2,897 2,425 377Military Explosives 103 44 123 !,418 93 20 349 156 697 3,436 182 407RDX Nt>. Nt>. Nt>. Nt>. Nt>. Nt>. 484 4 20 0 ITNT 14U 5 17 37 79 fJ 313 699 86 1,1J97 106 95Dynamite 47,226 36,498 44,316 33,886 107,453 21,317 32,933 43,039 41,008 30,975 87,653 24,546Primer 27,039 1,300 4,333 545 2,681 1,461 14,768 2,733 344 138 268 47Blasting caps (each) 37,270 6!,531 66,614 47,918 87,664 33,990 20,857 40,719 44,456 29,222 37,690 II ,386Detonating cord, safety fuse,ignitor cord (ft.) 168,369 183,224 113,510 141,628 148,117 80,356 99,504 84,554 101,117 148,850 120,561 48,375Grenades (each) Nt>. Nt>. Nt>. 1,822 90 40 Nt>. Nt>. Nt>. 566 136 96Other (Ibs.)a Nt>. Nt>. 186 5 100 291 Nt>. Nt>. 308 497 513 79(lOther specific types <strong>of</strong> explosives were identified and combinedin this category due to the small quantities involved.Source: U.S. Department <strong>of</strong> the Treasury, <strong>Bureau</strong> <strong>of</strong> Alcohol, Tobacco and Firearms, Explosives InCidents, Annual RebYr~7, pp. 32, 41;1979, pp. 24, 33; 1980, pp. 26, 32; 1981, pp. 26, 32 (Washington, D.C.: U.S. Government Printing Office). Tab e adapted y CEBOO< staff. tII;1"illiq~II!IIIIiJ,\III~~ITable 3.95 International terrorist incidents involving U.S. citizens or property, by type <strong>of</strong> incident, 1%8-81N:JTE: Terrorism is defined as the threat or use <strong>of</strong> violence for politicalpurposes by Individuals or groups, whether acting for, or in oppositionto, established governmental authority, when such actions are intendedto shock or intimidate a target group Wider than the immediatevictims. I.nternational terrorism is defined as terrorism conducted withthe support af a foreign government or organization and/or directedagainst foreign nationals, institutions, or governments (CentralIntelligen~e Agency, Notional Foreign Assessment Center, Patterns <strong>of</strong>Intemation,,' Terrorism: 1980 (Washington, D.C.: Central IntelligenceAgency, 198 I), p. Ii). Terrorist attacks on the United States and alliedpersonnel and installations during the Indochina cO'lflict, as well asassassinations and cross-barder operations associated with the ArabIsraeli conflict, unless those incidents either victimized non-combatantnationals <strong>of</strong> states outside the principal area <strong>of</strong> conflict or became theobject <strong>of</strong> international controversy, are not included. The figures alsoexclude bombings, shellings, and incursions by conventional forces.Related but separately targeted actions undertaken by a singleterrorist group are counted as individual incidents, even when theywere staged on the same day and In close proximity to one another.Terrorist operations that miscarried, as opposed to those that wereabandoned or countered during the planning or staging phases arecounted (Central Intelligence Agency, Notional Foreign AssessmentType <strong>of</strong> Incident 1%8 1%9 1970 1971 1972 1973 1974Total 71 124 266 243 255 236 216(2.2) (3.9) (8.3) (7.6) (8.0) (7.4) (6.7)Kidnaping I 3 25 19 5 22 14BGf!'icade-hostage I 0 4 0 I 3 2Letfer bombing 2 I 2 0 29 3 1Incendiary bombing 12 21 46 42 18 30 31Explosive bombing 35 71 87 100 97 74 127Anmed attack I 4 3 5 10 8 6Hijacking I 5 12 4 4 0 IAssassination 3 3 10 2 4 4 2Sabatage 0 0 0 3 3 I 0Threat II 12 51 51 71 77 19Theft, break-in 0 3 15 8 I 3 4Conspiracy I 0 2 2 I 2 4Hoax 0 0 I 0 00Other actions 0 0 3 5 7 ° 2 2Sniping 2 I 5 2 3 0 3Shootout with police0 0 0 (} 0 0Arms smUggling I 0 0 0 I 7 0°aFlgures In parentheses are percentages <strong>of</strong> the tatal accountedfor blb each category.Includes hijacking by means <strong>of</strong> air, sea, or land transport.Source:Center, International Terrorism in 1979 (Washington, D.C.: CentralIntelligence Agency, 1980), p. 12).The data were obtained from chronologies provided by the U.S.Department <strong>of</strong> State, U.S. Department <strong>of</strong> Transportation, U.S.Department <strong>of</strong> Defense, the Federal Aviation Administration, the U.S.Information Agency, the RI\ND Corporation, foreign embassies, and theU.S. Senate and Hause <strong>of</strong> Representatives; staff reports prepared forcongressional corrrnitteesl Facts on File; reports found in the AssociatedPress wire service; The New York Times, The Washington Post, TheChicago Tribune, The Detroit Free Press, The Economist; various bookSan terrorism; and foreign sources, bath classified and unclassified. Forthis year's report, new events have been added for all years based onnew sources that were used to correct for a previous overemphasis onU.S. sources. The statistics in this year's report replace all statisticsin previous annual surveys (Central IntelligEnce Agency, NationalForeign Assessment Center, Patterns <strong>of</strong> International Terrorism: 19110(Washington, D.C.: Central Intelligence Agency, 1981 ), p. iiD."Barricade-hostage" refers to situations in w11ich hostages aretaken but there is no attempt to leave the scene. This information wasprovided to SQRCEBOO< staff by the. U.S" Department <strong>of</strong> State, Officefor Combatting Terrorism. Data have been revised from previouspresentations by the Source.1975 1976 1977 1978 1979 1980 1981 I01g1181 231 195 3% 2S6 278 258 3,206(5.6) (7.2) (6.1) (12.4) (8.0) (8.7) (8.0)23 8 7 8 8 10 9 162 (5. I)I 2 3 0 6 7 2 32 (1.0)0 4 74 2 I 56 ( 1.7)17 56 58 80 ° 29 23 22 485 (15.1 )95 65 70 95 93 72 60 1,149 (35.8)7 8 5 12 10 II 7 97 (3.0)2 5 4 3 15 2U 21 97 (3.1)8 15 6 7 10 18 14 106 (3.3)I I 0 0 II II (0.3)19 53 22 161 47 50 ° 29 673 (21.0)3 I 0 7 4 13 6 68 (2.1 )3 I 2 4 3 7 7 39 ( 1.2)0 0 0 0 I 25 51 78 (2.4)I 4 2 II 3 10 II 61 ( 1.9)I 6 8 7 20 9 9 76 (2.4)0 2 I 0I 0 4 (0.1 )00 I 2 0 0 12 (0.4~Table provided to S
------------- -- ~<strong>Sourcebook</strong> <strong>of</strong> <strong>Criminal</strong> <strong>Justice</strong> <strong>Statistics</strong> <strong>1983</strong>Table 3.96 Reported hljackings in and outside the United States, by outcome, 1930-67 (aggregate), 1968-82NJTE: Registry <strong>of</strong> an aircraft, regardless <strong>of</strong> the location <strong>of</strong> a hijacking attempt, is used to classifythe hijacking as "inside" or "outside" the United States. Data for "inside the United States"during 1930-67 actually refer to the period 1961-67. Prior to 1961, all reported hljackingsoccurred outside the United States."Successful" means that the hijacker controls the flight and reaches the destination orobjective. ''U1successful'' means that the hijacker attempts to take control <strong>of</strong> the flight but fails(the hijacking may be averted ei'lher in flight or on ground). An "incomplete" hijacking is one Inwhich the hijacker is apprehended/killed during the hijacking or as a result <strong>of</strong> "hot pursuit."Information concerning "incomplete" hijacklngs outside the United States was not presented in theSource. The data for the United States include hijackings <strong>of</strong> scheduled air carriers and generalaviation aircraft. "U.S. general aviation aircraft" refers to helicopters, charter planes, andprivate aircraft.loside tbe ~Joited Stgtes Outside the U, ited StQte~S!.!cce~~fuI Im:!llDlllete Uns us:s:essfl.! I Sus:s:essflJl Uns!.!!
<strong>Sourcebook</strong> <strong>of</strong> <strong>Criminal</strong> <strong>Justice</strong> <strong>Statistics</strong> 19!13~ Table 3.100 Reports <strong>of</strong> <strong>of</strong>fenses against railroads, by <strong>of</strong>fense, United States andCanada, 1978-82~f'.OTE:Data In this table are compiled from monthly statistical reports <strong>of</strong> railroad police.Offense 1978 1979 1980 1981 1982Number <strong>of</strong> rail carriers reporting 36 34 33 30 28Percent <strong>of</strong> Lklited States and Canadianrail mi leage represented 74.3 73.4 78.7 78.3 71l.0Theft:Theft from freight cars 10,302 11,217 8,915 7,503 5,064Theft from trailers 6,856 6,973 4,386 3,874 4,094Theft <strong>of</strong> entire trailer 46 64 91 73 91Theft from multi-level carrier 9,476 7,7'd7 4,538 3,681 2,439Theft <strong>of</strong> copper wire 909 1,659 3,379 2,647 1,186Theft <strong>of</strong> brass 232 256 443 431 261Theft <strong>of</strong> other company property 8,123 9,666 II ,471 11,131 9,051Burglary <strong>of</strong> buildings 1,931 2,079 2,342 2,241 2,019Other theft 2,393 3,122 3,333 3,6% 3,357Vandalism:Multi-level carriers 29,87'd 2:.1,488 13,442 II ,053 6,526Company property and equipment 5,096 5,549 5,745 5,463 4,963Track and signals 5,823 5,71l'd 5,947 5,243 4,872Switch tampering 1,718 1,446 1,228 1,056 986Track obstructions 7,695 7,329 7,1'i.7 7,834 6,434Stoning <strong>of</strong> trains 9,009 8,262 7,86B 8,826 7,056Shooting <strong>of</strong> trains 757 777 802 624 425Other vandalism 2,947 2,574 2,043 1,771 1,427Trespassin~ 371,971 439,678 450,825 489,193 541,310<strong>Criminal</strong> <strong>of</strong>fenses not listed above 8,195 9,632 11,493 12,718 12,663Total 483,357 546,346 545,418 579,058 614,224?o~rce: Tabl~ adapt~d by SOURCEBOOK st<strong>of</strong>f from tables provided by theAssoclafion <strong>of</strong> American Railroads, Safety and Special Services Division.U,I!I\\\~.'\1III ,IIJ,IIIk!, lI1II I1!\1I,LI', I\'! 'LI '[ iI ,I II ,\\"iIj( 1 ;liIiI I:iiII,I11h I,I)-II'[Ii\III'Ii IIiSection 4:OiARACTERISTICS AND DISTRIBUTION OF PERSONS ARRESTEDMost <strong>of</strong> the data presented in this sectionhave been compiled through the Federal <strong>Bureau</strong><strong>of</strong> Investigation's Uniform Crime ReportingProgram. The sunmary statistics collected bythe FB I on arrests involve--for each <strong>of</strong>fenseclassification--breakdowli by the age, sex, andrace <strong>of</strong> arrestees, as well as arrest rates forpopulation size groups. In 1981, policeagencies representing approximately 97 percent<strong>of</strong> the Nation's population reported arrest datato the FB I. On each arrest table, the number<strong>of</strong> police agencies reporting and the populationliving within the jurisdictions <strong>of</strong> these agenciesare reported.According to the Uniform CrimeReporting guidelines, an arrest is counted"each time an individual is taken into custodyfor committing a specific crime .."(If the<strong>of</strong>fender taken into custody is a juvenile andthe circumstances are such that if Ihe/she werean adult an arrest would be made, an arrest iscounted.) The same person may be arrestedseveral 'times in the course <strong>of</strong> a year. Thus,the number <strong>of</strong> arrests is not simply a measure<strong>of</strong> people arrested.The number <strong>of</strong> arrests made by the policeis an indicator <strong>of</strong> police activity. However,because the police are called upon to performa number <strong>of</strong> functions, the number <strong>of</strong> arrests______, "0.measures only one aspect <strong>of</strong> police activity.Another indicator presented by the UniformCrime Reporting Program for each <strong>of</strong>fense isthe "clearance rate"--that is, the ratio <strong>of</strong> thenumber <strong>of</strong> <strong>of</strong>fenses <strong>of</strong> that type for which atleast one person has been arrested, charged,and turned over to the court for prosecution,to the number <strong>of</strong> <strong>of</strong>fenses <strong>of</strong> that type knownto the police. Measures <strong>of</strong> other policeactivity, such as investigations and servicecalls made by the police, are unavai lable atthe national level.Statistical data for some law enforcementactivities under the jurisdiction <strong>of</strong> Federalagencies (Immigration and NaturalizationService, Secret Service, Coast Guard, CustomsService, <strong>Bureau</strong> <strong>of</strong> Alcohol, Tobacco andFirearms, and Drug EnforcementAdministration) are maintained by theseagene i es and have been included in thissecti
Characteristics and Distribution <strong>of</strong> Persons ArrestedTable 4.1 Estimated number <strong>of</strong> arrests,a by <strong>of</strong>fense charged, United States,1981f\OTE: These data were compiled by the Federal <strong>Bureau</strong> <strong>of</strong> Investigation through theUniform Crime Reporting Program. On a monthly basis, low enforcement agenciesreport the number <strong>of</strong> <strong>of</strong>fenses that become known to them in the following crimecategories: murder and nonnegligent manslaughter, manslaughter by negligence,forcible rope, robbery, assault, burglary, larceny-theft, motor vehicle theft, andorson. All <strong>of</strong> these crime categories, except manslaughter by negligence, are usedto establish a crime Index in order to measure the trend and distribution <strong>of</strong> crimein the United States. The "Totai Crime Index" is a simpie sum <strong>of</strong> the index<strong>of</strong>fenses. Arson was designated as a Part I Index <strong>of</strong>fense in October 1978. Unl;kethe table~ from Crime in the U,ited States presented in Sectian 3, arrest statisticsfar the crime <strong>of</strong> orson are complete for 1979 and appear in the "Total Crime Index"and ''Property crime" total.Arrest statistics are compiled as port <strong>of</strong> this manthly data collection effort.Participating low enforcement agencies are instructed to count one arrest eachtime a person is token into custody, notified, or cited for criminal infractions otherthan traffic violations. Annual arrest figures do not measure the number <strong>of</strong>individuals token Into custody because one person may be arrested several timesduring the year for the some type <strong>of</strong> <strong>of</strong>fense or for different <strong>of</strong>fenses. A juvenile iscounted as a person arrested when he/ she comnits on oct that would be a criminal<strong>of</strong>fense if comnitted by on adult. Two <strong>of</strong>fense categories, "curfew and loitering"and "runaway," are tabulated only for juveniles. Violations <strong>of</strong> local juvenile actsother than runaway and curfew and loitering low violations are included in the "allother" classification (U.S. Deportment <strong>of</strong> <strong>Justice</strong>, Federal <strong>Bureau</strong> <strong>of</strong> Investigation,Uniform Crime Reyorting Handbook (Washington, D.C.: U.S. Government PrintingOffice, 1978), p. 72 •Data in this table are estimates based on arrest statistics for all lowenforcemeht agencies in the Uniform Crime Reporting Program, including thosesubmitting reports for less than i2 manths in 19111 (Source, p. 314).For definitions <strong>of</strong> <strong>of</strong>fenses, see Appendix 2.Pffense charged10,840,000Murder and nonnegligent manslaughterForcible rapeRobberyAggravated assaultBurglaryLarceny-theftMotor vehicle theftArson21,59031,710153,a~0283,270518,9001,261,600129,20020,600Violent crime c dProperty crimeTotal Crime Index e490,4601,930,3002,42U,800Other assaultsForgery and counterfeitingFraudEmbezzlementStolen property; buying, receiVing, possessingVandalismWeapons; carrying, possessing, etc.Prostitution and commercialized viceSex <strong>of</strong>fenses (except forcible rope and prostitution)Drug abuse violationsOpium or cocaine and their derivativesMarihuanaSynthetic or manufactured drugsOther--dangerous nonnarcotic drugsGomblingBookmakingi'trmbers and lotteryAll other gamblingOffenses agClinst family and childrenDriving under the InfluenceLiquor lawsDrunkennessDisorderly conductVagrancyAll other <strong>of</strong>fenses (except traffic)Suspicion (not included In total)Curfew and loitering low violationsRunaways494,20086,600295,1008,700129,5UO242,600179,700106,60072,000559,90072,100400,30020,00067,50040,7003,3005,60031,7UO56,5001,531,400483,5001,155,400787,10033,0001,908,70016,20094,800153,300"4Ia Arrest totals based on all reporting agencies and estimates for unreportedareas b Because <strong>of</strong> rounding, items may not odd to totals.cViole'1t crimes are <strong>of</strong>fenses <strong>of</strong> murder, forcible rope, robbery, and aggravatedassaul,l."Property crimes are <strong>of</strong>fenses <strong>of</strong> burglary, larceny-theft, motor vehicle theft,and a&~~~iudes orson.\Preceding page blankSource: U.S. Deportment <strong>of</strong> <strong>Justice</strong>, Federal <strong>Bureau</strong> <strong>of</strong> Investigation, Crimein the U,ited States, 1981 (Washington, D.C.: U,S. Government Printing oTfi'Ce;1982), p. 162.415
--------.---._------<strong>Sourcebook</strong> <strong>of</strong> <strong>Criminal</strong> <strong>Justice</strong> <strong>Statistics</strong> <strong>1983</strong>Characteristics and Distribution <strong>of</strong> Persons ArrestedTable 4.2 Number and rate (per 100,000 inhabitants) <strong>of</strong> arrests, by <strong>of</strong>fense charged and size <strong>of</strong> place, 1981f\OTE: See f\OTE, Table 4.1. These figures present information from all low enforcement agenciessubmitting reports for at least 6 months in 1981. Population figures are July I, 1981 popUlationestimates for individual agencies (Source, p. 314). For definitions <strong>of</strong> <strong>of</strong>fenses, suburban areas, andrural counties, see Appendix 2.(Population figures rounded to the nearest thousand. All rates were colculated on the popUlation before rounding.)CountiesCities SUburbOn Rural SUburbOnTotal city Group I Group II Group III Group IV Group V Group VI counties counties areaTotal arrests (54 cities (112 cities (292 cities (604 cities (1,556 cities (6,281 cities (1,131 (2,781 (5,837(12,811 (8,899 250,000 100,000 to 50,000 to 25,000 to 10,000 to under agenciesl agencies; agencies;agencies; cities; and over; 249,999; 99,999; 49,999; 24,999; 10,000; population population populationpopulation population popUlation population population population population population 40,580,000) 29,184,000) 87,008,000)Offense char sed 214 1369 1000) 144 1605 1000) 40 1405 1 000) 16 1 422 1 000) 19 1929 1000) 20 1 781 1 000) 24 1442 1000) 22 1626 1000)1,459,374 942,242 3,475,442Total 10,278,107 7,876,491 2,754,171 955,407 926,099 998,723 1,120,655 1,121,4363,596.3 3,228.7 3,994.4Rate per 100,000 inhabitants 4,794.6 5,446.9 6.816.3 5,818.0 4.647.0 4,806.0 4,584.9 4,956.4Murder and nonnegligent3,394 2,154 5,211mons laughter 20,432 14,884 8,895 1,839 1,381 1,105 932 7328.4 7.4 6.0Rate per 100,000 Inhabitants 9.5 10.3 22.0 11.2 6.9 5.3 3.8 3.2 4,838 2,639 8,610. Forcible rape 30,050 22,573 11,236 3,157 2,546 2,120 1,985 1,529 11.9 9.0 9.9Rate per 100,000 inhabitants 14.0 15.6 27.8 19.2 12.8 10.l 8.1 6.8 16,762 4,370 34,186Robbery 147,396 126,264 76,260 14,174 12,873 10,564 7,819 4,574 41.3 15.0 39.3Rate per 100,000 inhabitants 68.8 87.3 188.7 86.3 64.6 50.8 32.0 20.2 43,761 27,185 88,406Aggravated assault 266,948 196,002 75,846 25,329 25,087 22,132 23,941 23,667 107.8 93.2 101.6Rate per 100,000 inhabitants 124.5 135.5 187.7 154.2 125.9 106.5 97.9 104.6 82,957 44,591 176,319Burglary 489,533 361,985 121,937 48,874 51,924 50,029 48,687 40,534 204.4 152.8 202.6Rate per 100,000 inhabitants 22B.4 250.3 301.8 297.6 260.5 240.7 199.2 179.1 138,342 56,892 416,548Larceny-theft 1,197,845 1,002,611 293,434 140,175 146,356 153,729 156,180 112,737 340.9 194.9 478.7Rate per 100,000 inhabitants 558.8 693.3 726.2 853.6 734.4 739.8 639.0 1198.3 18,694 9,480 38,722Motor vehicle theft 122,188 94,014 42,207 9,733 11,674 10,173 10,364 9,863 46.1 32.5 44.5Rate per 100,000 inhQbitants 57.0 65.0 104.5 59.3 58.6 49.0 42.4 43.6 3,718 2,057 7,665Arson 19,362 13,587 4,071 1,801 1,874 1,844 2,025 1,972 9.2 7.0 8.8Rate per 100,000 inhabitants 9.0 9.4 10.1 11.0 9.4 8.9 8.3 8.7Violent crime c 68,755 36,348 136,413464,826 359,723 172,237 44,499 41,887 35,921 34,677 30,502169.4 124.5 156.8Rate per 10l/t000 inhabitants 216.8 248.8 426.3 271.0 210.2 172.9 141.9 134.8 243,711 113,020 639,254Property crime I,R28,928 1,472,197 461,649 200,583 211,828 215,775 217,256 165,106 600,,6 387.3 734.7Rate per 100,000 inhabitants 853.2 1,018.1 1,142.5 1,221.5 1,062.9 1,038.3 888.9 729.7Total Crime Index e 312,466 149,368 775,667
---.0lIl, - ~-.,---------- . ---<strong>Sourcebook</strong> <strong>of</strong> <strong>Criminal</strong> <strong>Justice</strong> <strong>Statistics</strong> <strong>1983</strong>Characteri3tics and Distribution <strong>of</strong> Persons ArrestedTable 4.2 Number and rate {per 100,000 inhabitants} <strong>of</strong> arrests, by <strong>of</strong>fense charged and size <strong>of</strong> place, I 981--ContinuedCitiesTotal city Group I Group II Group III Group IV Group V Group VITotal arrests (54 cities (J 12 cities (292 cities (604 cities (1,556 cities (6,281 cities(12,811 (8,899 250,000 100,000 to 50,000 to 25,000 to 10,000 to underagencies; cities; and over; 249,999; 99,999; 49,999; 24,999; 10,000;population population population population population population population populationOffense charged 214,369,000) I 44,6U5,00U} 40,405,000) 16,422,000) 19,929,000) 20,78i,000) 24,442,000) 22,626,000)Disorderly conduct 748,603 674,894 289,911 5~ ,\;(13 66,228 73,799 87,637 97,516Rate per 100,000 inhabitants 349.2 466.7 717.5 ::164.2 332.3 355.1 358.5 431.0Vagrancy 31,706 29,235 16,182 /'. )68 2,802 2,650 1,861 1,672Rate per 100,000 inhabitants It: 8 20.2 40.0 24.8 14.1 12.8 7.6 7.4All other <strong>of</strong>fenses (except traffic) 1,801. i",' 1,365,504 630,078 138,536 123,769 144,813 163,854 164,454Rate per 100,000 inhabitants e .. Ci.:' 944.3 1,559.4 841.!i 621.1 696.9 67U.4 726.8Suspicion (not included in totals) 15, .. 68 13,930 5,420 964 2,594 896 2,638 1,418Rate per 100,OUU inhabitants 7.2 9.6 13.4 5.9 13.0 4.3 10.8 6.3Curfew and loitering law violations 90,599 84,783 42,461 4,663 7,314 10,943 10,468 8,934Rate per IOO,OOU inhabitants 42.3 58.6 105.1 28.4 36.7 52.7 42.8 39.5Runaways 145,301 114,404 40,230 12,799 17,479 16,593 16,427 10,876Rate ~r 100zOUO inhabitants 67.8 79.1 99.6 77.9 87.7 79.8 67.2 4ft. Iblncludes only suburban county law enforcement agencies.Includes suburban city and county law enforcement agencieswithin metropolitan areas. Excludes core cities. Suburban cities andcounties are also included In other groups.cVlolent crimes are <strong>of</strong>ftlnses <strong>of</strong> murder, forcible rape, robbery, andaggravated assault."Property crimes are <strong>of</strong>fenses <strong>of</strong> burglary, larceny-theft, motorvehicle theft, and arson.elncludes arson.Suburbancounties(J ,131agencies;population40,580,000)CountiesRural Suburbancounties area(2,781 (5,837agencies; agencies;population popUlation29,184,000) 1l7,008,000}42,544 31,165 2UI,855104.81,763106.87U8232.06,5U24.3 2.4 7.5277,574 158,662 5H4,038684.0 543.7 671.26U9 929 4,2l41.5 3.2 4.94,774 I,04L 25,57211.8 3.6 29.422,2U3 8,694 52,793___ 5~ .•_7__ 39.1l. ___ 60_._7_Source: U.S. Department <strong>of</strong> <strong>Justice</strong>, Federal <strong>Bureau</strong> <strong>of</strong> Investigation, Crime In the U,lted States z 1981 (Washington, D.C.: U.S. GovernmentPrinting Office, 1982), pp. 163, 164.,"iIIII418Ii'IHi,1 ilIiHIi'II:1; "419
421------_.» ...Characteristics and Distribution <strong>of</strong> Persons ArrestedTable 4.3 Arrests, by <strong>of</strong>fense charged and age group, 1972 and 1981f\OTE: See NOTE, Table 4.1. These figures present information from all law enforcementagencies submitting annual reports in 1972 and reports for all 12 months in 1981. Populationfigures are July I, 19HI population estimates (Source, p. 314). For definitions <strong>of</strong> <strong>of</strong>fenses, seeAppendix 2.(7,933 agencies; 19UI estimated population 172,7!i4,000)Total all ages lhder 18 ~ears <strong>of</strong> age 18 ~ears <strong>of</strong> age and olderPercent Percent PercentOffense charged 1972 1981 change 1972 1981 change 1972 1981 changeTotal 5,581,334 8,512,697 +52.5 1,470,298 1,718,348 +16.9 4, 111,036 6,794,349 +65.3Murder and non'legligentmanslaughter 12,31L 16,082 +30.6 1,738 1,438 -17.3, 10,574 14,644 +38.5Forcible rape 15,455 24,713 +59.9 3,125 3,715 +18.~1 12,330 20,998 +70.3Robbery 90,245 124,737 +3!!.2 29,025 36,669 +26.3 61,220 88,068 +43.9Aggravated assault 125,798 220,194 +75.0 22,162 31,684 +43.0 103,636 188,510 +81.9Burglary 250,693 403,572 +61.0 128,946 172,519 +33,.8 121,747 231,053 +89.8Larceny-theft 557,987 992,592 +77.9 2!i1,769 348,238 +23.6 276,218 644,354 +133.3Motor vehicle theft 93,77!! 99,644 +6.3 49,791 40,360 -IEi.9 43,9H7 59,284 +34.8Arson 8,569 15,828 +84.7 5,007 6,806 +35.9 3,562 9,022 +153.3Violent crimea b 2113,tl10 385,726 +58.2 56,050 73,506 +:'11.1 187,760 312,220 +66.3Property crime ;, f I ,027 1,511,636 +65.9 465,513 567,923 +22.0 445,514 943,713 + 111.8Total Crime Indexc 1,154,837. 1,897,362 +64.3 521,563 641,429 +23.0 633,274 1,255,933 +98.3Other assaults 253,99H 394,521 +55.3 51,161 68,162 +33.2 202,837 326,359 +60.9Forgery and counterfeiting 35,037 67,122 +91.6 3,570 7,107- +98.9 31,467 60,020 +90.7Fraud 80,478 241,187 +199.7 3,091 12,860 +316.0 77 ,387 228,327 +195.0Embezzlement 5,976 7,097 +1!i.8 328 720 + 119.5 5,648 b,377 +12.9Stolen property; buying,receiving, possessingVandalism62,142108,09!!102,6151!i9,947+65.1+75.718,52277,05528,06991,387+51.5+18.643,62031,04374,546911,560+70.9+217.5Weapons; carrying,possessing, etc. 99,053 138,330 +39.7 15,561 20,942 +34.6 83,492 117,3!itl +40.6comnercialized vicePros t i tut i on and31,25!! 70,811 +126.5 900 2,347 +160.8 30,35H 68,464 +125.5Sex <strong>of</strong>fenses (except forciblerape and prostitution) 39,392 54,639 +38.7 8,965 9,497 +5.9 30,427 45,142 +48.4urug abuse vlolaticmsGambling339,15052,82!!4!i3,77332,225+42.6-39.079,2841,41079,6011,144+0.4-18.9259,86651,418404,17231,081+55.5-39.6Offenses against familyLiquor laws I 72,47U 363,9U2 +111.0 63,7!i5 114,294 +79.2 108,6tJ5 249,60!! +129.7Drunkenness 1,080,899 911,!!35 -15.6 32,118 31,643 -1.5 1,048,781 880,192 -16.1Disorderly conductVagrancy4911,74750,260644,')U920,970+29.3-58.3107,6095,032101,8472,894-5.4-42.5391,13845,228543,06218,076+3tJ.8-60.0and childrenDriving under the influence41,010468,75344,0761,146,089+7.5+144.57485,8612,12823,522+184.5+301.340,262462,89241,94H1,122,567+4.2+142.5All other <strong>of</strong>fenses(except traffic) 741,273 1,497,529 +102.0 208,060 275,002 +32.2 533,213 1,222,527 +129.3in totals)Suspicion (not included36,041 11,575 -67.9 9,509 2,494 -73.8 26,532 9,081 -65.8Curfew and loitering lawviolations 101,667 81,937 -19.4 101,667 81,n7 -19.4 XRunaways 164,008 121,821 -25.7 164,008 ILI,821 -25.7 XXXXXbViolent crimes are <strong>of</strong>fenses <strong>of</strong> murder, forcible rape, robbery, and aggravated assault.Property crimes are <strong>of</strong>fenses <strong>of</strong> burglary, larceny-theft, motor vehicle theft, and arson.clncludes arson.b" »
--~----~c,<strong>Sourcebook</strong> <strong>of</strong> <strong>Criminal</strong> <strong>Justice</strong> Stotistics <strong>1983</strong>Table 4.4 Arrests, by <strong>of</strong>fense charged and age, United States, 1981Offense chargedNJTE: See NJTE, Table 4. I. These figures present information from ail law enforcement agenciessubmitting complete reports for at least 6 manths in 1981 (Source, p. 314). Population figures areJuly I, 198 I population estimates. For definitions <strong>of</strong> <strong>of</strong>fenses, see Appendix 2.(12,811 agencies; 1981 estimated population 214,369,000)Total Ages Ages Ages I/J Under 10all ages under IS under 18 and older 10 to 1213to 14 IS 16 17 18TotalPercent a 10,293,575 623,0182,035,7488,257,827 53,931 153,993 415,094 375,216 483,674 553,8-10 5%,937100.0 6.1 19.8 UO.2 0.5 1.5 4.0 3.6 4.7 .).4 --.5.Jl....Murder and nonnegligentmanslaughterForcible rapeRobberyAggravated assaultBurglaryLarceny-theftMotor vehicle theftArsonViolent crdmebPercent
<strong>Sourcebook</strong> <strong>of</strong> <strong>Criminal</strong> <strong>Justice</strong> <strong>Statistics</strong> 19!13Figure 4.1 Arrests for violent crimes, by <strong>of</strong>fense charged and age group, United States, 1981!\oTE: See !\OTES, Tables 4.1 and 4.4. For definitions <strong>of</strong> <strong>of</strong>fenses, see Appendix 2.100 -90.9Characteristics and Distribution <strong>of</strong> Persons ArrestedFigure 4.2 Arrests for property crimes, by <strong>of</strong>fense charged ond oge group, United States, 1981!\oTE: See !\OTES, Tables 4.1 and 4.4. For definitions <strong>of</strong> <strong>of</strong>fenses, see Appendix 2.100-cQ)0...Q)a..80 -60-40 -20 -80.2'77?///72.5 ///V77///////// ////// ////// ////// ////// ////// ////// ////// ////// ////// ////// ////// ////// ////// ////// ////// ////// ////// ////// ////// ////// ////// ////// ///27.5 /// ///r-;-:-:-:" /// ////// ///.... /// ////// 19.8 ///·.... ///r:-:-:-: ///• I.e.... /// //////It" •., .. ///· ·.e /// ... . ///·.. ., /// , .I' ••.///, .. ///.... ///, ///· .... ////// ////// ////// ... /// /// ......//////... . ///U.S. residentpopulationTotal all<strong>of</strong>fensesI: : :1 Under 18 years <strong>of</strong> age1~~118 years <strong>of</strong> age and older81.5777///////////////////////////////////////////////////////////////////////////////////////////////////18.5r:::: /////////.... ///· ///.... ///'" ///· ///....///. ///·... //////Violentcrimetotal'»//// 85.2////// '?7?/// ////// ////// ////// ////// ////// ////// ////// ////// ////// ////// ////// ////// ////// ////// ////// ////// ////// ////// ////// ////// ////// ////// ////// ////// ////// ////// ////// ////// ////// ////// ////// ////// ////// ////// ////// ///////// 14.8 ///////// r:-;-:-:- ///..../// ///9.1 /// ///..r.;-;-; /// ,.., .. ////// ////// ///.... /// .... //////. , ///.... -.-./// .. .. ///Murder andnon negligentmanslaughterForciblerape28.671.477/////////////////////////////////////////////////////////////////////////~·... ///.... ///.///, ///.... . //////.... //////I" • ///... . ///·... ///.... ///·... /////////Robbery86.0~////////////////////////////////////////////////////////////////////////////////////////////////////////////14.0 /////////~I' ..//////.... . ///... ///, ///.... //////.,. .. //Aggravatedassault-c:Q)erf80604020o---..A880.2777//////72.5 ///777///////////////////////////////////////////// ////// ////// ////// //////////////////////////////////////////////// ;///////////////// ////// ////// ///~ /// ////// //////..... ///////// 19.8/////////.... r-;-:-:-:'. /// ///. ///.. ////// .... ////// .... ////// ///'".... /// .... ///u ••• /// ///,.... /// ., //,/. //,/... /// ///.... ///.. ///U.S. residentpopulationTotal all<strong>of</strong>fensesUnder 18 years <strong>of</strong> age~ 18 years <strong>of</strong> age and older62.6777//////////////////////////////////// 37.4 ///r:-:7:' ///· .,. ///.... ///" ///.... . , ///.... //////.... ///" ///.... .... //////. ///.... .... ///. //////....·... //////,• '0'.... //////·... //////Propertycrimetotal57.4~///////~~ /////42.6 ///r:-:-:-: //////... . ///.... ///.... ///.... ///· , ///. /////////.... ///· //////~ ///...! ••• //////.... ...//////..... ~:/· /////..... //////·... ///Burglary65.2777/////////////////////////////////////////////34.8 ///r:-:-:-: ///. ///.... ///. ///.... /////////.... ///.., . ///....///.., . /////////. ... ///..... //////.... //////...., ., . /..;/Larcenytheft59.5~////////////////////////40.5 ///r:-:-:-: ///....., //////.... ///".... /////////.... ///· ///....///,..... /////////.... ///·... //////· //////.... ///· ///.... ///~~~Motorvehicletheft57.6777///////////////42.4 //////~ /////////....,I .. ///....///. /////////.... ///..... //////, /////////..... ///.... ///..... ///..../////////. ///.... ... //////.... //,/'ArsonSource: U.S. Department <strong>of</strong> <strong>Justice</strong>, Federal <strong>Bureau</strong> <strong>of</strong> Investigation, Crime in the United States, 198 I (Washington, D.C.: . U.S.Government Printing Office, 1982), p. 171; and U.S. Deportment <strong>of</strong> Commerce, <strong>Bureau</strong> <strong>of</strong> the Census, ?relimina~EStlmates <strong>of</strong> the Po,pulatlon <strong>of</strong>the United States by Age, and Race: 1970 to 1981, Population Estimates and Projections, Seies P-2S,. 9(7 (Washington, b.c.: O.S.GOvernment Printing Office,Sexh (9 2), pp. 26, 27. Figure constructed by So:RCEBOO< staff.424
------------ - -- ----- --------~IIfFigure 4.3 Percent distribution <strong>of</strong> toto I U.S. population and persons arrested for all <strong>of</strong>fenses, by Qge, Utited States, IlIBIf\OTE: See f\OTES, Tables 4.1 and 4.4. Becouse <strong>of</strong> rounding, percents do not odd to 100.'"jU.S. resident population:'....................... 11.4 ••••••••••••••••••••••••I......................... . . . . . ..f :' .4.5 ..........5.0:-: -:.:.:.:.:.:.:.:-............5.0.. ........... .. ·........ ..4.8::::::::::::::::::5.2 ·.................~:' 63 . . .......................... .................................. "I :' .... .8.2 •••••••••••••••••. r· .... ................ . . .. ...8.8.............................. . ..... .. . . .. .. .. .. .. .. .. .... .. .. .. .. .. .. .. .. .. .. .. .. .. .. .. .. .. .. .. .. .. .. .5.65.7.. .. .. .. .. .. ... .. .. .......................... .. .. .. .. .. . .. .. .. ...................... .. ..................... . . . . ...................I:' ........... ~.' .. ....................... .. .. .. .. .... .. . .. ... .. .............. ..54 •••••••••••4.8:' .. ........................................ . . . .. .19.2 ........................................................................................................................................... ..I.. .. " ......... " ...................................... " , ~.. .. .... . .. . . . .. .. .....Age65 and older60 to 6455 to 5950 to 5445 to 4940 to 4435 to 3930 to 3425 to 2922 to 2419 to 2116 to 181:1 to 1512 and youngerPersons arrested... ........................................................................... ..10.0·........................................................................................................... ...Ii .·.·o·.·.~..................................... ..·....·....·.·.·.·." '.' ...: •: •: •: •: •: •: •: •: •: •: •: •:-: •: •: •: •: •: •: •: •: •: -:•: •: .:- 12.9.. ... .................................................. ..:::::::::::::::::::::::::::::::::::::::::::::::::::::::::::::::::::::::::::::::::::::::::::::::::::::::::::::::::::::::::::::::::::::::.................... .•: •:-: •: : •: :-:-: : •: •: •: •:-: • 7.6·...................... .. .......... .... . 1.9 5 10 1516.2g'5inS-'"o "...CDW '"I20I15T10I5 oo20PercentSource: U.S. Deportment <strong>of</strong> <strong>Justice</strong>, Federal <strong>Bureau</strong> <strong>of</strong> Investigation, Crime in the Ulited States, 1981 (Washington, D.C.: U.S. Goverrvnent Printing Office,1982), pp. 171, 172; and U.S. Deportment <strong>of</strong> Comnerce, <strong>Bureau</strong> <strong>of</strong> the Census, Preliminor EStimates <strong>of</strong> the Po ulotion <strong>of</strong> the Ulited States b A e Sex and Race:1970 to 1981Ulrulotion Estil1l'ltes and Projections, Series P-2S, f\b. 917 (Washington, D.C.: .S. Government rinting Office, , pp. l. , Igure constructedby SdRCEB stOff.\'.41tJ
--------~--- - -- ------------ -----~----------- -----~,-~---- -Characteristics and Distribution <strong>of</strong> Persons ArrestedTable 4.5 Arrests, by <strong>of</strong>fense charged and sex, United States, 1981Offense chargedTotalMurder and nonnegligentmanslaughterForcible rapeRobberyAggravated assaultBurglaryLarceny-theftMotor vehicle theftArsonViolent crlme c dProperty crimeTotal Crime Index eOther assa(;ltsForgery and cCl!llterfeitingfraudEmbezzlementStolen property; buying,receiving, possessingVandalismWeapons; carrying,possessing, etc.Prostitution andcommerciolized viceSex <strong>of</strong>fenses (except forciblerape and prostitution)Drug abuse violations(".amblingOffenses against familyand childrenDriving under the infl~nceLiquor lowsDrunkennessDisorderly conductVagrancyAll other <strong>of</strong>fenses(except traffic)SuspiciorCurfew loiteringlow vi" ionsRunaw~/sN)TE: See N)TES, Tables 4.1 and 4.4. For definitions <strong>of</strong> <strong>of</strong>fenses, see Appendix 2.(12,811 agencies; 1981 estimated population 214,369,000)Persons arrestedTotalMaleFemalenumber Number Percent Number Percent10,293.575 8,633,401l 83.9 I ,660. 167 16.120,43230,050147,396266,948489,5331,197,845122,18819,362464,8261,828,9282,293,754466,35981,429272,9008,170122,452228,849170,660103,13468,36551l6,64640,95951,9081,422,342453,3561,081l,875748,60331,7061,801,74015,46890,599145,30117,84629,772136,816233,323458,899849,783111,25917,143417,7571,437,084I .854,841400,50855,325160,4135,842109,238208,446157,89127,42763,060509,21537,06146,4751,279,294384,4721,002,571632,17926,6721,521,16113,34370,67067,304aBecause <strong>of</strong> rounding, percents may not odd toto'al' bLess than one-tenth <strong>of</strong> I percent.cVio,ent crimes are <strong>of</strong>fenses <strong>of</strong> murder, forciblerope, robbery, and aggravated assault.87.399.192.887.493.770.991.188.589.978.680.985.967.958.871.589.291.192.S26.692.286.890.589.589.984.892.184.484.184.486.378.0116.32,58627810,58033,62530,634348,06210,9292,21947,069391,844438,91365,85126,104112,4872,32b13,21420,40312,76975,7075,30577,4313,8985,433143,04868,88486,304116,4245,034280,5792,12519,92977,99712.70.97.212.66.329.18.911.510.121.419.114.132.141.228.510.88.97.573.47.813.29.510.510.115.27.915.615.915.613.722.0:n.7Percent dlstributlo~<strong>of</strong> <strong>of</strong>fenses chargedTotal Male Female100.00.20.31.42.64.811.61.20.24.517.822.34.50.82.70.11.22.21.71.00.75.70.40.513.84.410.67.30.317.50.20.91.4100.00.20.31.62.75.39.81.30.24.816.621.54.60.61.90.11.32.41.80.30.75.90.40.514.84.511.67.30.317.60.20.60.8100~0.2(b)0.62.01.821.00.70.12.823.626.44.01.66.80.10.81.20.84.60.34.70.20.38.64.1S.27.00.316.90.11.24.7dproperty crimes are <strong>of</strong>fenses <strong>of</strong> burglary, larcenytheft,motor vehicle theft, and orson.elncludes orson.Source: U.S. Deportment <strong>of</strong> <strong>Justice</strong>, Federal <strong>Bureau</strong> <strong>of</strong> Investigation, Crime in the United States, 1981(Washington, D.C.: U.S. Government Printing Office, 19112), p. 178. Table adopted by 5O...RCE6OO< staff.427I " ~1IIin'
- ----~--~\"r--. 'I[I)1Ir ri II.~\, I.o\
- -.-------- ---------------------------------------------<strong>Sourcebook</strong> <strong>of</strong> Criminol <strong>Justice</strong> <strong>Statistics</strong> <strong>1983</strong>Characteristics and Distribution <strong>of</strong> Persons Arrested,.(Figure 4.4 Arrests for violent crimes, by <strong>of</strong>fense charged and sex, United States, 1981'EQ)...oQ)Cl.100 -80 .,.60 -40 -20 -oRQ51.448.6777.....-- ///.... ///i'OTE: See i'OTES, Tables 4.1 and 4.4. For definitions <strong>of</strong> <strong>of</strong>fenses, see Appendix 2..... ///////////////////////,','///////////////////////////////////////////////-:;-:;/U.S. residentpopulationMaie~ Female83.9~.... 16.1.... ////////////, /:::: I//~, .. "1/77'.::: ///Total all<strong>of</strong>fenses89.9r-;-:-:-;•••• 10.1::::Ijj~///.... ///:::: ///.... ///Violentcrimetotal87.3r-:"':7':12.7::::1///:::: //////.... ///.... ///:::: ///::: :1///Murder andnon negligentmanslaughter---99.10.9::::~Forciblerape92.8"7:":"':".. ..I •••7.2::::mJr//····v//::::V//Robbery87.4.... . " ......Aggravatedassault'EQ)... oQ)Cl.Figure 4.5 Arrests for property crimes, b f&Y 0 .ense charged and sex,United States, f 98 ff\OTE: See f\OTES, Tables 4. fond 4.4.For definitions <strong>of</strong> <strong>of</strong>fenses, see Appendix 2.100 -80 -60 -40 -20 -51.448.6f'7?r--- ///:::: ////, ////.... ///:::: //////.... ///:::: ///.... ///:::: //////.... ///:::: //////.... ///:::: //////.... ///:::: ///.... ///:::: //////.... ///:::: ///.... ///:::: ///o ....___ l .... ///U.S. resid3ntmPopulationMale~ Female~ ....'" '" '" '" .... '" .'" ,'" I....D •••........ ·'D.. '"'" .....'". '"......"It....... ..... · '"... · '"... .'".... · '".........•••• 16.1....::::'77////:::: ///•.•• r"//.... ///:::: ///.... ///:::: ~~~,Total all<strong>of</strong>fen.ses~. ...... ........... .....'t •• ,..... '"........ . ........21.4.... ///::::1';//:::: //////.... ///:::: //////.... ///:::: ///.... ///:::: ///.... ///Propertycrimetotal....·'"....... '".'"· '"..... ............... .....- ..................... . .............. ....•••• 63.... nft~ ~~~,Burglary....""'fo ••.............. . .. .......... ....: : :: 29.1::::'77;:::: ///.... ///:::: /////////.... ///:::: //////.... ///:::: ///:::: /////////.... ///.... ///Larcenytheft. '"......... ... ... .'"....... ........'" ........ ... "........ . ........" ..... '" .... '" .. ........ '" '" '" .....:::: 8.9~.... ///:::: ///.... ///:::: ///Motorvehicletheft88.5~.. .. ....... .".........'"....'" ... ..............." ...... .. '"..... ....: : :: 11.5.... ~:::: //////.... ///.... ///.... //;Arson:::: ///Source: U.S. Deportment <strong>of</strong> <strong>Justice</strong>, Federal <strong>Bureau</strong> <strong>of</strong> Investigation, Crime in the United States, 198 I (Washington, D.C.: U.S.Government Printing Office~ 1982), p. 178; and U.S. Deportment <strong>of</strong> Conmerce, <strong>Bureau</strong> <strong>of</strong> the Census, Prelimina~EStimates <strong>of</strong> the POi5ulatlon <strong>of</strong>the United States by Age, Sex and Race: 1970 to 1981, Population Estimates and Projections, Serief. P-25,. 917 (Washington,.C.: U.S.GOvernment Printing Office, 19 B 2), p. 26. Figure constructed by SCLRCEBOO< st<strong>of</strong>f.428429
.~--,..., - -~ --..--- --~ ----~------______ c_.~<strong>Sourcebook</strong> <strong>of</strong> <strong>Criminal</strong> <strong>Justice</strong> Stgtistics <strong>1983</strong>Table 4.6 Arrests, by <strong>of</strong>fense charged, sex, and age group, United States, 1980 and 1981Offense chargedf\OTE: See f\OTE, Table 4.1. These figures present information from all law enforcement agenciessubmitting complete reports for at least 6 comnon months in 1980 and 1981. Population figu"esare July I, 1981 population estimates. (Source, p. 314.) For definitions <strong>of</strong> <strong>of</strong>fenses, see Apper dix2.1980(11,571l agencies; 1981 estimated population 206,702,000)Total1981PercentchangeMales1980Under 181981Percentchange 1980Total1981FemalesPercentchange 1980Under 18Percent1981 changeTotal 8,046,895 8,419,034 +4.6.-Li~3,089 1,586,973 +0.2 1,51U,262 1,622,634 +7.4 ~ 407,074 -0.3Murder and nonnegligentmanslaughterForcible rapeRobberyAggravated assaul tBurglaryLarceny-theftMotor vehicle theftArsonViolent crimea bProperty crimeTotal Crime Index cOther assaultsForgery and counterfeitingFraudEmbezzlementStolen property; buying,receiving, possessingVandalismWeapons; carrying,possessing, etc.Prostitution andcommercialized viceSex <strong>of</strong>fenses (except forciblerape and prostitution)Drug abuse violationsGamblingOffenses against familyand childrer.Driving under the influenceLiquor lawsDrunkennessDisorderly conductVagrancyAll other <strong>of</strong>fenses(except traffic)Suspicion (not includedin totals)Curfew and loiteringlaw violationsRunaways16,22928,805128,724222,865444,45371l8,172117,01116,05917,54429,268134,998228,215449,461832,060109,02616,748+8. I+1.6+4.9+2.4+1.1+5.6-6.8+4.3396,623 410,025 +3.41,365,695 1,407,295 +3.01,762,318 1,1l17,320 +3.1389,2·.049,441151,0295,542102,221210,596144,1l3126,13058,084455,74442,19643,4871,162,270355,026963,362600,93825,0621,390,12914,21250,20159,048390,899 +0.454,109 +9.4157,133 +4.05,718 +3.2107,391 +5.1203,557 -3.3154,809 +6.927,056 +3.561,688 +6.2497,558 +9.236,602 -13.344,322 +1.91,244,379 +7.1375,203 +5.7979,541 +1.7618,510 +2.926,41l8 +5.71,481,061 +6.512,920 -9.169,663 +38.866,027 +11.81,5914,21638,90631,835198,9373U7,091l52,1277,22076,548565,382641,93063,7026,5025,27364131,126104,86922,37694110,16082,8461,6561,23626,092106,85536,49396,8453,390230,9072,84050,20159,048aViolenj· crimes are <strong>of</strong>fenses <strong>of</strong> murder, forcible rape, robbery,and aggravatetl assault.1,6914,31838,74630,945191,577302,11543,3647,31375,700544,369620,069+6.3+2.4-0.4-2.8-3.7-1.6-16.8+1.3-1.1-3.7-3.461,507 -3.45,864 -9.810,638 +101.75116 -8.629,583 -5.097,356 -7.223,549 +5.2880 -6.510,259 +1.079,168 -4.41,272 -23.21,38724,867104,35731,89194,9972,943250,110+12.2-4.7-2.3-12.6-1.9-13.2+8.32,548 -10.369,663 +38.866,027 +11.82,36226610,00631,58429.25032 1 ),:)3111,0642,18344,211l363,428407,64662,80022,324106,8072,22411,93419,86311,18859,5744,64370,6604,7555,143121,L":162,91'279,86i110,5084,091244,2392,31715,42982,3912,53327010,46232,86530,026341,5631O,6BI2,16846,130384,438+7.2+1.5+4.6+4.1+2.7+6.4-3.5-0.71~5182,8945,72513,562107,5435,822826+4.3 1l,832+5.8 127,753ISS712,9515,70713,007106,5B45,0967408,884125,42714.8-9.0+2.0-0.3-4.1-0.9-12.5-10.4+0.6-1.8430,568 +5.6 136,585 134,311 -1.764,28525,562109,9272,27513,02919,981+2.4+14.5+2.9+2.3+9.2+0.612,512 +11.875,317 +26.45,252 +13.175,658 +7.13,861 -18.85,281 +2.7139,736 +15.267,357 +7. I1l4,588 +5.9114,093 +3.25,008 +22.4272,512 +11.62,057 -11.219,538 +26.676,294 -7.416,9652,7452,0862383,0239,0361,35S2,13176716,438817173,00231,1475,88220,807511556,82763215,42982,39116,4942,5473,3832122,8828,564-2.8-7.2+62.2-10.9-4.7-5.2I , 4l'J I +9.32,U51 -3.8799 +4.215,223 -7.469 -14.99773,05031,6815,23919,097591+36.3+1.6+1.7-10.9-8.2+1.062,591 +10.1542 -14.219,531l76,294+26.6-7.4bproperty crimes are <strong>of</strong>fenses <strong>of</strong> burglary, larceny-theft, motorvehiclg theft, and arson.Includes arson.Source: U.S. Department <strong>of</strong> <strong>Justice</strong>, Federal <strong>Bureau</strong> <strong>of</strong> Investigation, Crime in the U1ited States, 1981 (Washington, D.C.: U.S. GovernmentPrintin9 Office, 1982), p. 170.! j ,,iiCharacteristics and Distribution <strong>of</strong> Persons ArrestedTable 4.7 Arrests, by <strong>of</strong>fense charged, age group, and race, United States, 1981f\OTE: See f\OTES, Tables 4.1 and 4.4. For definitions <strong>of</strong> <strong>of</strong>ferlses, see Appendix 2.(12,747 agencies; 1981 estimated population 213,771,000)______--!T~ot:QIarrestsPercent a kI1ericanAmericanIndian AsianIndian Asianor oror orAlaskan PacificOffense charged TotalAlaskan PacificWhite Black Native Islander Total White Black Native IslanderTotal 10,264,187 7,482,012 2,619,463 104,261 58,451 100.0 72.9 25.5 1.0 0.6Murder and nonnegligentmanslaughter20,404 10,129 9,998 133 144Forcible rape100.0 49.630,02149.0 0.7 0.7':5,077 14,457 280 207Robbery100.0 50.2147,51948.2 0.9 0.7~7 ,448 88,524 693 854Aggravated assault1U0.0 38.9266,76460.0 0.5!153,5000.699,394 2,422 1,448Burglary100.0 61.3 37.3488,8680.933 1,7770.5148,033 3,395 2,663Larceny-theft100.0 68.51,196,24730.3 0.7 0.57'r: ,278 380,766 10,625 11,578Motor vehicle theft100.0 66.3122,02731.8,:1:,,0710.9 1.036,859 1,132 965Arson100.0 68.119,31930.2 0.915,1410.83,952 140 86 100.0 78.4 20.5 0.7 0.4Violent crime bProperty crime cTotal Crime Index dOther assaultsForgery and counterfeitingFraudEmbezzlementStolen property; buying,receiving, possessingVandalismWeapons; carrying,possessing, etc.Prostitution andCOIlTTlIlrcialized viceSex <strong>of</strong>fenses (except forciblerape and prostitution)Drug abuse violationsGamblingOffenses against familyand childrenDriving under the influenceLiquor lawsDrunkennessDisorderly conductVagrancyAll other <strong>of</strong>fenses(except traffic)SuspicionCurfew and loiteringlaw violationsRunawaysSee footnotes at end <strong>of</strong> table.464,701l1,826,461246, I 541,226,2672,291,169 1,472,421465,61881,283276,7218,163122,266228,509170,451103,10368,-!40584. "Ii~'4C'J ~?';·151,/661,405,471453,1841,085,296747,10931,673308,00151,408189,3806,07279,900185,819106,16250,90653,337432,55613,13332,5381,231,342409,919892,250481,87922,1431,797,904 1,271,87415,361 9,25790,305144,84666,061115,654212,373569,6107111 ,983150,62729,18885,1311,99841,30439,77762,40250,86513,823146,85H26,67118,614151,90734,076166,200254,6561l,853491l,6735,92923,16726,7613,52815,29218,8204,1904171,358336231,9199083646172,4368754515,4987,45125,0028,31950113,388386011,1462,65315,29217 ,9452,800270852604399949799684632,9261,082696,7241,7381,8442,25517613,9691374761,285100.0100.0100.0100.0100.0100.0100.0100.0100.0100.0100.0100.0100.0100.0100.0100.0100.0100.0100.0100.0100.0100.0100.0100.053.067.164.366.163.268.474.465.381.362.349.478.274.032.162.987.690.582.264.569.970.760.373.279.845.731.234.132.335.930.824:533.817.436.649.320.325.165.136.010.87.515.334.128.027.738.625.718.50.80.80.80.90.50.50.40.50.80.50.40.90.40.21.11.11.62.31.11.60.70.20.70.80.60.80.80.60.30.30.70.40.40.60.90.70.52.60.10.50.40.20.30.60.80.90.50.9430
---------~~-----------------------<strong>Sourcebook</strong> <strong>of</strong> Crimi no I <strong>Justice</strong> Stotlstics <strong>1983</strong>Characteristics and Distribution <strong>of</strong> Persons Arrested,-Table 4.7 Arrests, by <strong>of</strong>fense charged, age group, and race, United States, !981--ContlnuedOffense chargedTotalTotal 2,028,860 I 'rES, 141Murder and nonnegligentmanslaughterForcible rapeRobberyAggravated assaultBurglaryLarceny-theftMotor vehicle theftArsonViolent crime bProperty crime cTotal Crime Index dOther assaultsForgery and counterfeitingFraudEmbezzlementStolen property; buying,receiving, possessingVandalismWeapons; carrying,possessing, etc.Prostitution andcommercialized viceSex <strong>of</strong>fenses (except forciblerape and prostitution)Drug abuse violationsGamblingOffenses against familyand childrenDriving under the influenceLiquor lawsDrunkennessDisorderly conductVagrancyAll other <strong>of</strong>fenses(except traffic)SuspicionCurfew and loiteringlaw violationsRunawaysSee footnotes at end <strong>of</strong> table.1,8554,44:;42,20637,292208,203416,26749,3378,18985,796681 ,996767,79279,0578,59514,13282332,937108,22325,3743,021/I ,26195,3131,3702,39128,307137,86037,587115,5743,571317,3743,14790,305144,846Arrests under 18Amt.lricanIndianorAlaskanWhite Black NativeAsianorPacificIslander70talPercent a AmericanIndian Asianor orAlaskan PacificWhite Black Native Islander493,616 15,411 14,692 100.0 74.2 24.3 0.8 0.7895 936 6 18 100.0 48.2 50.5 0.3 1.01,843 2,569 20 II 100.0 41.5 57.S 0.5 0.213,325 28,479 126 ~76 100.0 31.6 67.5 0.3 0.723,045 13,803 255 189 100.0 61,~ 37.0 0.7 0.5151,158 54,079 1,493 1,473 100.0 72.6 26.0 0.7 0.7290,258 117,818 3,532 4,659 100.0 69.7 28.3 ~ 8 1.136,381 /1,976 499 481 100.0 73.7 24.3 1.06,902 1,190 62 35 100.0 84.3 14.5 0.8 0.439,108 45,787 407 494 100.0 45.6 53.4 0.5 0.6484,699 185.063 5.586 6,648 100.0 71.1 27.1 0.8 1.0523.801,==2~3~0.b!.8~5:g,0~.,;;5~.~99~3~_7td'b\,1~42"=.:!1,)!;00~.~0=.lll68,g'k,2=3l1,l01.:,',b1 =.!
-------_ .. -<strong>Sourcebook</strong> <strong>of</strong> <strong>Criminal</strong> <strong>Justice</strong> <strong>Statistics</strong> <strong>1983</strong>Agure 4.6 Arrests for violent crimes, by <strong>of</strong>fense charged and race, United States, 1981100-!\oTE: See !\OTES, Tables 4.1 and 404. For definitions <strong>of</strong> <strong>of</strong>fenses, see Appendix 2..'!.cQ)eQ)D..80-60-40-20 .o85.77//////////////////////////////////////////////////////////////////////////////////////////////////////////////////////////11.8/// ~/// ....///////// .... 2.4////// hU.S. residentpopulation~ White72.9'777/////////////////////////////////////////////////////////////////////////// 25.5////// b./// ....///////// ....//////////// /// .... ////// ..../// .... 1.6/// \----,Total all<strong>of</strong>fenses53.077?////// 45.7////// I-:':-:-: .... ///////// ..../// ....////// .... ////// ....////// /// /// ....////// ........ ///////// ....///////// ....////// ///..../~/Violentcrimetotal1.3-49.6 49.0////// ....///////// ....////// ....///////// ....////// ..../// ....//////////// ....////// /// ....///////// ..../// . ...////// 1.4/// .... ~Murder andnonnegligentmanslaughterEO.2r"777 48.2///f-;-;-:-;o///....////// /// ....////// ....///////// /// /// /// ..../// ....////// ....///////// .... ///////// ........ ///////// ....///..2!.. ///Forciblerape60.0":"':":"":............. 38.9m////// /// ....////// . /// ....////// /// .... ////// ///....////// ///....////// .... ....////// 1.0/// ....RobberySl.377///////////////////////////////////// 37.3/// ~///////// ..../// ......... //////....//////////// /// ....////// ....///....////// ..../// ....////// 1.4/// .... I---.AggravatedassaultAQ[]BlackOtherOpercents may not add ta 100 because <strong>of</strong> ,'ounding.Igure constructeI..,434
~ ..Figure 4.7 Arrests for property crimes, by <strong>of</strong>fense charged and race, United States, 1'81100-f\OTE: See f\OTES, Tabies 4.1 and 4.4. For definitions <strong>of</strong> <strong>of</strong>fenses, see Appendix 2.....wU1C0....0..80604020o----~r::IQf'7'l ......'.'..•. ',.. '.W/// ..../// . '"/// /// /// .... 2.4/// ~U.S. residentpopulationWhiteBlackOther72.977?////////////////////////////////////////////////////////////////////////25.5///--///....////// ....///....////// ....... . ///////// .... . ////// ....///. , /// 1.6/// .... ~Total all<strong>of</strong>fenses67.1V77//////////////////////////////////////////////////////31.2///-.... ///////// ....////// .... . ///////// ///..../// ... .• I ••/// .... . /// /// ..../// . '"///....1.7~~~ r--,Propertycrimetotal68.5..,.,....,//////////////////////////////////////////////////////////// 30.3////// ~/// .....////// ,/// ....////// .... ////// ./// ....////// .. ,-///., ..//////-Burglary/// .... /// 1.266.377?////////////////////////////////////////////////////// 31.8/// ~////// .... · , ///////// .... · ////// ///....· /// . /// .... /// . ////// · ...//////· ~ .. ~/// ///.... 1.985.777?///////////////////////////////////////////////////////////////////////////////////////////////////'///////////////////// 11.8/// f;-:-:-:-Larcenytheft68.17/////////////////////////////////////////////////////////// 30.2 ////// -:-;"";"";"/// ·...////// ....///....////// . ///....////// ..../// ....//////... .////// .,./// ,-,· , ../// ~Motorvehicletheft78.4'777/////////////////////////////////1/////////////////////////////////////////////////////////////// ~ .... ////// /// . ....////// ... -.//,//// ....//,//// 1.1// h---apercents may not odd to 100 because <strong>of</strong> rounding.Source: U.S. Deportment <strong>of</strong> <strong>Justice</strong>, Federal <strong>Bureau</strong> <strong>of</strong> Investigation, Crime in the United States, 1981 (Washington, D.C.: U.S. Government Printing Office,1982), pp. 179-181; and U.S. Deportment <strong>of</strong> Conmerce, <strong>Bureau</strong> <strong>of</strong> the Census, P1'eliminar EStimates <strong>of</strong> the Po ulation <strong>of</strong> the United States b1970 to 1981, Population Estimates and Projections, Series P-25, NJ. 917 (Was ington, D.C.: U.S. Government Printing Office,S
<strong>Sourcebook</strong> <strong>of</strong> <strong>Criminal</strong> <strong>Justice</strong> <strong>Statistics</strong> <strong>1983</strong>Table 4.8 Arrests In cities, by <strong>of</strong>fense charged and sex, 1981Offense chargedTotalMurder and nonnegligentmons laughterForcible rapeRobberyAggravated assaul tBurglaryLarceny-theftMotor vehicle theftArsonViolent crime c dProperty crimeTotal Crime IndexeOther assaultsForgery and counterfeitingFraudEmbezziementStolen property; buying,receiving, possessingVandalismWeapons; carrying,possessing, etc.Prastltution andcommercialized viceSex <strong>of</strong>fenses (except forciblerape and prostitution)Drug abuse violationsGamblingOffenses against familyand childrenDriving under the influenceLiquor lawsDrunkennessDisorderly conductVagrancyAll other <strong>of</strong>fenses(except traffic)SuspicionCurfew and loiteringlaw violationsRunawaysN)TE: See NOTE, Table 4.1. These figures present information from all city law enforcementagencies submitting complete reports for at least 6 months in 1981 (Source, p. 31 S). Populationfigures are July I, 1981 population estimates. For definitions <strong>of</strong> <strong>of</strong>fenses and city areas, seeAppendix 2.(8,899 agencies; 1981 estimated population 144,605,000)TotalnumberPersons arrestedMaleNumber PercentFemaleNumber Percent.7 ,890,421 6,577 .587 83.4 1,312,834 16.614,86422,573126,264196,002361,9651,002,61194,01413,58713,00622,359117,173170,183339,240700,26685,50812,028359,723 322,7211,472,197 1,137,042I ,831 ,920 1,459,763359,22058,602140,8925,43294,000183,851:1138,81699,00054,177447~%135,95521,148871,639370,497894,554674,89429,2351,365,50413,93084,71:13114,404307,20539,25685,3763,76283,643167,291128,50126,15649,694389,93032,70617 ,332778,637314,557823,075568,39424,5361,145,92112,00666,46753,379aBecause <strong>of</strong> rounding, percents may not add tototal.bLess than one-tenth <strong>of</strong> I percent.cViolent crimes are <strong>of</strong>fenses <strong>of</strong> murder, forciblerape, robbery, and aggravated assault.87.499.192.886.893.769.891.088.589.777.279.785.567.060.669.389.091.092.626.491.787.091.082.089.384.992.084.283.983.986.278.446.71,8782149,09125,81922,745302,3458,5061,55937,002335,155372,15752,01519,34655,5161,67010,35716,56710,31572,8444,482158,0313,2493,81693,00255,94071,479106,5004,699219,5831,92418,31661,02512.60.97.213.26.330.29.011.510.322.820.314.533.039.430.711.09.07.473.68.313.09.018.010.715.18.015.816.116.113.821.653.3Percent distribution<strong>of</strong> <strong>of</strong>fenses charged aTotal Male Femole100.0 100.0 100.00.20.31.62.54.612.71.20.24.618.723.24.60.71.80.11.22.31.81.30.75.70.50.311.04.711.38.60.417.30.21.11.40.20.31.82.65.210.61.30.24.917.322.24.70.61.30.11.32.52.00.40.85.90.50.311.84.812.58.60.417 .40.21.00.80.1(b)0.72.01.723.00.60.12.825.528.34.01.54.20.10.81.30.85.50.34.40.20.37.14.35.48.10.416.70.11.44.6drroperty crimes are <strong>of</strong>fenses <strong>of</strong> burglary, iarcenytheft,motor vehicle theft, and arson.elncludes arson.Characteristics and Distribution <strong>of</strong> Persons ArrestedTable 4.9 Arrests In cities, by <strong>of</strong>fense charged, age group, and race, 1981N)TE: See N)TES, Tables 4. I and 4.8. For definitions <strong>of</strong> <strong>of</strong>fenses and city areas, see Appendix 2.(8,871 agencies; 1981 estimated population 144,392,000)Total arrestsPercent aAmericanAmericanIndian AsianIndian Asianor oror orAlaskan PacificAlaskan PacificOffense chargedTotal White Black Native Islander Total White Black Native IslanderTotal7,875,684 5,515,944 2,231,901 78,160 49,679 100.0 70.0 28.3 1.0 0.6Murder and nonnegligentmanslaughterForcible rapeRobberyAggravated assaultBurglaryLarceny-theftMotor vehicle theftArsonViolent crlme bProperty crime cTotal Crime Index dOther assaultsForgery and counterfeitingFraudEmbezzlementStolen property; buying,receiving, possessingVandalismWeapons; carrying,possessing, etc.Prastltutbn andcommeTl.::ialized viceSex <strong>of</strong>fenses (except forciblerape and prostitution)Drug abuse violationsCianblingOffenses against !"CITlilyand childrenDriving under the InfluenceLjquor lawsDrunkennessDisorderly conductVagrancyAll other <strong>of</strong>fenses(except traffic)SuspicionCurfew and loiteringlow violationsRunowaysSee footnotes at end <strong>of</strong> table.14,87422,561126,423195,937361,5971,001,47493,89913,549359,7951,470,5196,3109,97845,361111,729232,459645.,10760,15110,194173,378947,9111,830,314 1,121,289358,63458,521140,9245,42793,884183,580138,60798,99254,090446,50635,95521,093869,442369,723892,293673,71:1629,2311,362,15813,86284,534114,128225,47035,10689,5223,90858,013145,38580,96748,22941,135313,06310,00613,017756,376331,865718,957420,91720,102926,2248,06560,94487,3448,38112,20479,68981,428124,730336,61132,1403,199542085831,5352,2379,3267738712~1717901,2452,17110,43083569100.0100.0100.0100.0100.0100.0100.0100.042.444.235.957.064.364.464.175.256.354.163.041.634.533.634.223.6181,702 2,380 2,335 100.0 48.2 50.5496,680 12,423 13,505 100.0 64.5 33.8678,382 14,803 15,840 100.0 61.3 37.1127,89822,93750,0521,45435,07335,84756,10349,1.7012,028129,37624,8067,792100,08629,731150,841244,1298,509414,0975,71322,71724,8602,968275653194391,4906773575301,701782408,6586,55320,8556,6664559,313225598492,298203697463598588609363972,3661,065444,3221,5541,6402,07416512,524423141,075100.0100.0100.0100.0100.0100.0100.0100.0100.0100.0100.0100.0100.0100.0100.0100.0100.0100.0100.0100.0100.062.960.063.572.061.879.258.448.776.070.127.861.787.089.880.662.568.868.058.372.176.535.739.235.526.837.419.540.550.022.229.069.036.911.58.016.936.229.130.441.226.921.80.40.90.50.80.60.90.80.60.70.80.80.80.50.50.40.50.80.50.41.00.40.21.11.01.82.31.01.60.70.20.70.70.90.80.60.60.61.00.90.50.60.90.90.60.30.50.80.40.50.60.90.70.53.00.20.50.40.20.30.60.90.30.40.9Source: U.S. Department <strong>of</strong> <strong>Justice</strong>, Federal <strong>Bureau</strong> <strong>of</strong> Investigation, Crime in the United States, 1981(Washington, D.C.: U.S. Government Printing Office, 1982), p. 189. Table adapted by SCiRCE600< stOff.436
~--------~------------~-------------------------------------j."-----------------Characteristics and Distribution <strong>of</strong> Persons Arrestcd<strong>Sourcebook</strong> <strong>of</strong> Criminol <strong>Justice</strong> Stotistics <strong>1983</strong>Table 4.9 Arrests in cities, by <strong>of</strong>fense charged, age group, and race, 1981--Continuedqffense chargedTotalMurder and nonnegllgentmanslaughterForcible rapeRobberyAggravated assaultBurglaryLarceny-theftMotor vehicle theftArsonViolent crime bProperty crime cTotal Crime Index dOther assaultsForgery and counterfeitingFraudEmbezzlementStolen property; buying,receiving, possessingVandalismWeapons; carrying,possessing, etc.Prostitution andcommercialized viceSex <strong>of</strong>fenses (except forciblerape and prostitution)Drug abuse violotionsGamblingOffenses against familyand childrenDriving under the influenceLiquor lawsDrunkennessDisorderlY conductVagrancyAll other <strong>of</strong>fenses(except traffic)SuspicionCurfew ond loiteringlaw violationsRunawaysSee footnotes at end <strong>of</strong> tab !e.Arrests under 18Total White BlackAmericanIndianorAlaskanNative1,700.208 1,221,144 453.849 12.4351,4893,68138,26230,069158,826359,53139, III6,25873,501563,726637,22767,0866,71412,57871227,62089,1242! ,9972,9299,13277,1!:O61,2342,01319,014113,50330,397107,0813,014270,2162,94984,534114,1286331,39311,46617,717109,547244,69927,5715,21831,209387,035418,241142,3255,2956,46256219,12274,32214,7471,4006,46162,5421961,34!l18,290108,26428,29073,9122,572186,0642,43860,94487,3448362,26726,42411,99547,090107,39610,74297441,522166,202207,72423,6091,3405,9531388,23113,9096,9291,4732,56213,5669995B84993,1901,48132,38741680,77750122,71724,8602121041849933,206371413024,6114,9135064450513950713221333!l55671731,749546520141,2162559849AsianorPacificIslander12.7801892681731,1964,230427254685,8786,346646351137128386189357651334105230080262122,15983141,075Total100.0100.0100.0100.0100.0100.0100.0100.0100.0100.0100.0100.0100.0100.0100.0100.0100.0100.0100.0100.0100.0100.0!OO.O100.0100.0100.0100.0100.0100.0100.0100.0100.0100.0Percent a AmericanIndian Asianor orAlaskan PacificWhite Black Native Islander71.8 26.7 0.7 0.842.S 56.1 0.1 1.237.8 61.6 0.3 0.230.0 69.1 0.3 0.758.9 39.9 0.6 0.669.0 29.6 0.6 0.868.1 29.9 0.9 1.270.5 27.5 0.9 1.183.4 15.6 0.7 0.442.5 56.5 0.4 0.668.7 29.5 0.8 1.065.:§ 32.6 0.8 1.063.1 35.2 0.8 1.078.9 20.0 0.7 0.551.4 47.3 0.4 0.978.9 19.4 0.7 1.069.2 29.8 0.5 0.583.4 15.6 0.6 0.467.0 31.5 0.6 0.947.8 50.3 0.7 1.270.8 28.1 0.4 0.8~!.2 17.6 0.5 0.715.9 81.0 0.4 2.867.0 29.2 3.3 0.596.2 2.6 0.9 0.395.4 2.8 1.5 0.393.1 4.9 1.8 0.369.0 30.2 0.5 0.285.3 13.8 0.5 0.468.9 29.9 0.5 0.882.7 17.0 0.1 0.372.1 26.9 0.7 0.476.5 21.8 0.7 0.9Table 4.9 Arrests In cities, by <strong>of</strong>fense charged, age group, and race, 1981--ContinuedOffense chargedTotalMurder and nonnegligentmanslaughterForcible rapeRobberyAggravated assaultBurglaryLarceny-theftMotor vehicle theftArsonViolent crlme bProperty crime cTotal Crime Index dOther assaultsForgery and counterfeitingFraudEmbezzlementStolen property; buying,receiving, possessingVandalismWeapons; carrying,possessing, etc.Prostitution andcommercialized viceSex <strong>of</strong>fenses (except forciblerape and prostitution)Drug abuse violationsGamblingOffenses against familyand childrenDriving under the Inf! uenceLiquor lawsDrunkennessDisorderly conductVagrancyAll other <strong>of</strong>fenses(except traffic)SuspicionCurfew and loiteringlaw violationsRunawaysArrests 18 and oldert>mericanIndianorAlaskanTotal White Black Native6,175,476 4,294,800 1,77!l,05213,38518,88U88,161165,868202,771641,94354,7887,291286,294906,7931,193,087291,54851,807128,3464,71566,26494,456116,61096,06344,95!l369,50034,72119,080850,428256,220861,896566,70526,2171,091,94210,913XX5,6778,5!l533,89594,012122,912400,40832,5804,976142,169560,876703,045183,14529,81183,0603,34638,89171,06366,22046,82934,674250,5219,810II ,669738,086223,621690,667347,00517,530740,1605,647XX7,5459,93753,26569,43377 ,640229,21521,3982,225140,180330,47!l470,658104,28921,59744,0991,31626,84221,93849,17447,9979,466115,81023,8077,20499,58726,541149,360211,7428,093333,3205,212XX65,725521964791,3511,2446,120402462,0787,8122,8902,462231603143009835453364971,316731738,4854,80420,3096,1464418,09720XXAsianorPacificIslander36,899III1625221,0729756,200408441,8677,6279,4941,6521685!l4392314726719013211,8531,031344,2701,2541,5601,81215310,36534XXTotal10;).0100.0100.0100.0100.0100.0100.0100.0100.0100.0100.0100.0100.0100.0100.0100.0100.0100.0100.0100.0100.0IQO.O100.0100.0100.0100.0100.0100.0100.0100.0100.0XXPercent a AmericanIndian Asianor orAlaskan PacificWhite Black Native IslanderbB:cause <strong>of</strong> .roundlng, percents moy not add to total.cProperty crimes are <strong>of</strong>fenses <strong>of</strong> burglary, larceny-theftVIolent crtmes ore <strong>of</strong>fenses <strong>of</strong> murder, forcible rape rnotordvehlcle theft, and arson.'ro bbe ry, and oggravated assault. ' Includes arson.U.S. Government Source: U.S. Printing Department Office, <strong>of</strong> 1982), <strong>Justice</strong> p~. Federal 191-193. B ureau fl'0 nvestlgatlon, Crime in the United States, 1981 (Washington, D.C.:69.542.445.538.456.760.662.459.568.249.761.958.962.857.564.771.058.775.256.848.777.167.828.361.286.887.380.161.266.967.851.7XX28.856.452.660.441.938.335.739.130.549.036.439.435.841.734.427.940.523.242.2~c.o21.131.368.637.811.710.417.337.430.930.547.8XX1.10.41.00.50.80.61.00.70.60.70.90.80.80.40.50.30.51.00.50.31.10.40.20.9I.D1.92.41.11.70.70.2XX0.60.1l0.90.60.60.51.00.70.60.70.80.80.60.30.50.80.30.50.60.90.70.53.00.20.50.50.20.30.60.90.3XXj)III ~II'I!!I!IIII i439
----.---------------------------------~------------------------------<strong>Sourcebook</strong> <strong>of</strong> <strong>Criminal</strong> <strong>Justice</strong> <strong>Statistics</strong> <strong>1983</strong>Table 4.10 Arrests in suburban areas, a by oi'fense charged and sex, 1981Offense chargedTotalMurder and nannegligentmanslaughterForcible rapeRobberyAggrovated assaultBurglaryLarceny-theftMotor vehicle theftArsonViolent crime dProperty crime eTotal Crime IndeiN)TE: See N)TE, Table 4.1. These figures present information from all suburban law enforcementagencies submitting complete reports for at least 6 months In 1981 (Source, p. 318). Papulationfigures are July I, 19111 preliminary counts by the U.S. <strong>Bureau</strong> <strong>of</strong> the Census. For ddlnitions <strong>of</strong><strong>of</strong>fenses and suburbon areas, see Appendix 2.Other assaultsForgery and counterfeitingFraudEmbezzlementStolen property; buying,receiving, possessingVandrJlismWeapons; carrying,po!isessing, etc.Prostitution andcomnercialized viceSex <strong>of</strong>fenses (except forciblerape and prostitution)Drug obuse violotionsGamblingOffenses against familyand childrenDriving under the InfluenceLiquor lawsDrunkennessDisorderly conductVagrancyAll ather <strong>of</strong>fenses(except traffic)SuspicionCurfew and loiteringlaw violationsRunaways(5,837 agencies; 198 I estimated population 87,008,000)Totalnumber3,479,6665,2118,61034,18688,406176,319416,54838,7227,665136,413639,254775,667160,78628,795108,6282,78347,95892,83051,9926,39722,593191,9295,72323,367596,957177,282310,995201,8556,502584,0384,22425,57252,793Persons arrestedPercent distributlo~MaleFemale<strong>of</strong> <strong>of</strong>fenses charged~ber Percent ~r Percent Total Mole Female2,925,480 84.1 554,186 15.9 100.0 100.0 100.04,5418,52831,79378,186164,836294,71135,1076,844123,048501,498624,546138,10119,77961,4082,03942,87285,05148,2271,84821,467165,5595,04821,546533,434149,230284,516173,0775,708496,0713,67619,19723,080alncludes suburban city and county lawenforcement agencies within metropolitan areas.Excludes core cities. Suburbon cities and counties arealso iBcluded in other groups.Because <strong>of</strong> rounding, percents may not add tototal.87. !99.093.088.493.570.890.789.390.278.580.585.968.756.573.389.491.692.828.995.086.388.292.289.484.291.585.787.884.987.075.143.7670822,39310,22011,483121,8373,61582113,365137,756151,12122,6859,01647,2207445,0867,7793,7654,5491,12626,3706751,82163,52328,05226,47928,77879487,9675486,37529,71312.91.07.011.66.529.29.310.79.821.519.514.131.343.526.710.68.47.271.15.013.711.87,810.615.88.514.312.215.113.024.956.30.10.21.02.55.112.01.10.23.918.422.34.60.83.10.11.42.71.50.20.65.50.20.717.25.18.95.80.216.80.10.71.50.20.31.12.75.610.11.20.24.217.121.34.70.72.10.11.52.91.60.10.75.70.20,718.25.19.75.90.217.00.10.70.80.1(c)0.41.112.122.00.70.12.424.927.34.11.68.50.10.91.40.70.80.24.80.10.311.55.14.85.20.115.90.11.25.4~Lep~ than one-tenth <strong>of</strong> I percent.Violent crimes are <strong>of</strong>fenses <strong>of</strong> murder, forciblerape, l,obbery, and aggravated assault.Property crimes are <strong>of</strong>fen.~es <strong>of</strong> burglary, larcenytheft'fmotor vehicle theft, and orson.Includes arson.Source: U.S. Department <strong>of</strong> <strong>Justice</strong>, Federal <strong>Bureau</strong> <strong>of</strong> Investigation, Crime In the United States, 1981(Washington, D.C.: U.S. Government Printing Office, 1982), p. 225. Table adapted by sdRCES
~ -~--~......--------- ~--.-----~-----.----<strong>Sourcebook</strong> <strong>of</strong> <strong>Criminal</strong> <strong>Justice</strong> <strong>Statistics</strong> 19113rI[Characteristics and Distribution <strong>of</strong> Persons ArrestedTable 4.11 Arrests in suburban areas,a by <strong>of</strong>fense charged, age group, and race, 1981--ContinuedArrests under 18I>mericanIndian Asianor orAlaskf.!~' PacificOffense chargedTotalNative Islander Total WhiteTotalMurder and nonnegligentmanslaughterForcible rapeRobberyAggravated assaultBurglaryLarceny-theftMotor vehicle theftArsonViolent crime c dProperty crimeTotal Crime Index eOther assaultsForgery and counterfeitingFraudEmbezzlementStolen propto,'ty; buying,receiving, possessingVandalismWeapons; carrying,possessing, etc.Prostitution andcommercialized viceSex <strong>of</strong>fenses (except forciblerape and prostitution)Drug abuse violationsGombiingOffenses against familyand childrenDriving under the influenceLiquor lowsDrunkennessDisorder Iy conductVagrancyAll other <strong>of</strong>fenses(except traffic)SuspicionCurfew and loiteringlow violationsRunawaysSee footnotes at end <strong>of</strong> table.742,2854281,2178,16813,28279,905152,33816,7563,71723,095252,716275,81128,5523,1492,59225113,93148,7808,9862674,45238,17322455512,18863,39113,72841,0971,736/05,3871,17225,35652,507White640,4722957153,8579,80966,584120,62914,2453,31914,676204,777219,45322,7402,7212,06421211,15044,8847,5601893,71935,115:lO47911,90262,16613,11036,2011,52093,3181,07022,97447,825Black97,8721315014,2753,39112,86230,6812,4153818,29846,33954,6375,647415501362,6983,7401,352757092,891l124742061,0144454,759207II ,6441022,2844,3052,117Io1948265418556687448127876I4577291385o257128154714225o54268I ,824II173419461041II100.0100.0100.0100.0100.0100.0100.0100.0100.086.368.958.847.273.983.379.21l5.089.3Percent bI>mericanIndian Asianor orAlaskan PacificBlack Native Islander13.230.641.252.325.516.120.114.410.30.30.2X0.20.40.30.30.30.20.20.20.10.20.30.20.40.20.353 100.0 63.5 35.9 0.3 0.2856 100.0 81.0 18.3 "0.3 0.3909 100.0 79.6 19.8 0.38762123879452II75oo238319665200o44109100.0100.0100.0100.0100.0100.0100.0100.0100.0/00.0100.0100.0100.0100.0100.0100.0100.0100.0100.0100.0100.079.686.479.684.580.092.084.170.883.592.044.686.397.798.195.588.187.688.591.390.691.119.813.219.314.319.47.715.028.115.97.655.413.31.71.63.211.611.911.08.79.08.20.30.20.20.40.30.20.30.40.30.2X0.40.50.21.10.20.20.2X0.20.50.30.30.20.80.80.30.20.50.70.20.2XX0.20.10.10.20.30.2X0.20.2I,fI'Table 4.11 Arrests In suburban areas,a by <strong>of</strong>fense chorged, age group, and race, 1981--ContinuedArrests 18 and olderPercent bAmericanI>mericanIndian AsianIndian Asianor oror orAlaskan PacificAlaskan PacificOffense charged Totol White Block Native Islander Total White Block Native IslanderTotol 2,722,006 2,236,046 465,877 12,212 7,871 100.0 82.1 17.1 0.4 0.3Murder and nonnegllgentmanslaughterForcible ropeRobberyAggravclted assaultBurglaryLarcen),-theftMotor vehicle theftArsonViolent crlme c dProperty crime. eTotal Crime IndexOther assaultsForgery and counterfeitingFroudEmbezzlementStolen property; buying,receiving, possessingVandalismWeapons; carrying,possessing, etc.Prostitution andcommercialized viceSex <strong>of</strong>fenses (except forciblerope and prostitution)Drug abuse violationsGamblingOffenses against familyand childrenDriving under the InfluenceLiquor lawsDrunkennessDisorderly conductVagrancyAll other <strong>of</strong>fenses(except traffic)Suspicion4,7747,37825,99675,04096,113263,55821,1l963,935113,188385,502498.690131,85425,577109,0072,52933,95443,81042,8966,09918,059152,7035,51222,751575,455113,847295,530159,9574,755476,0163,0053,1755,03414,81855,63973,074190,67516,7493,34678,666283,844362.510102,53117,50678,6842,00524,23938,30032,4523,69515,695129,081l3,03515,377526,493107,382259,816134,3573,450377 ,0622,369Curfew and loiteringlow violationsRunawaysXXXXalncludes suburban city and county low enforcementagencies within metropolitan areas. Excludes core cities.Suburgan cities and counties are also included In other grvups.Because <strong>of</strong> rounding, percents may not odd to total.cVlolent crimes are <strong>of</strong>fenses <strong>of</strong> murder, forcible rope,robbery, and aggravated assault.1,5682,2A7II ,06518,81022,56370,4554,99355933,73098,570132.30028,31l87,94629,8795049,5135,25310,1882,3462,22823,0122,4567,28144,2095,74531,91924,6711,23596,177627xX18275632330899910120424I ,4281.852507742331011915712414553299712,4084893,313684491,7087XX13305726!l1681,4295310100.0100.0100.0100.0100.0100.0100.0100.066.568.257.074.176.072.376.585.032.831.042.625.123.526.7Z2.814.2368 100.0 69.5 29.81,660 100.0 73.6 25.62,028 100.0 72.7 26.5428512111083100132448127412222,345231482245211,0692XX100.0100.0100.0100.0100.0100.0100.0100.0100.0100.0100.0100.0100.0100.0100.0100.0100.0100.0100.0XX77.868.472.279.371.487.475.760,686.984.555.167.691.594.387.984.072.679.278.8XX21.531.127.419.928.012.023.838.512.315.144.632.07.75.010.815.426.020.220.9XX0.40.40.20.40.30.40.50.50.40.40.40.40.30.20.40.40.40.30.20.30.20.20.30.40.41.10.41.00.40.2XX0.30.40.20.40.20.50.20.30.30.40.40.30.20.20.40.20.20.30.70.40.20.20.10.40.20.20.20.40.20.1dproperty crimes are <strong>of</strong>fenses <strong>of</strong> burglary, larceny-theft,motor vehicle theft, and arson.elncludes arson.fLess than one-tenth <strong>of</strong> I percent.Source: U.S. Department <strong>of</strong> <strong>Justice</strong>, Federal <strong>Bureau</strong> <strong>of</strong> Investigation, Crime in the United States, 1981 (Washington, D.C.:U,S. Government Printing Office, 1982), pp, 227-229.XXIil442443
------------ - ~"<strong>Sourcebook</strong> <strong>of</strong> Criminol <strong>Justice</strong> Stotistics I ~83Table 4.12 Arrests in rural counties, by <strong>of</strong>fense charged and sex, 1~81I)ffense chorgedTotalMurder and nonnegligentmanslaughterForcible ropeRobberyAggravoted assaultBurglaryLarceny-theftMotor vehicle theftArsonViolent crime c dProperty crimeTotal Crime Index eNJTE: See NJTE, Table 4.1. These figures present Information from all rurol county lowenforcement agencies submitting cOl'Jl)lete reports for at least 6 months in 1~81 (Source, p. 315).Populotion figures are July I, 1~81 population estimotes. For definitions <strong>of</strong> <strong>of</strong>fenses and ruralcounties, see Appendix 2.Other assaultsForgery and counterfeitingFroudEmbezzlementStolen property; buying,receiving, possessingVandalismWeapons; carrying,possessing, etc.Prastitution andcomnercialized viceSex <strong>of</strong>fenses (except forciblerope ond prostitution)Drug abuse violationsGanblingOffenses agoinst familyand chiidrenDriving under the influenceLiquor lowsDrunkennessDisorderly conductVagroncyAll other <strong>of</strong>fenses(except traffic)SuspicionCurfew and loiteringlow violotionsRunoways(2,71l1 agencies; I ~81 estimated population 2~, 184,000)Totalnumber~43, !712,1542,63~4,37027,18544,5~156,892~,4802,05736,348113,02014~,36840,7608,58561,7741,0488,70715,841~,81627/13,83553,3081,40012,~48235,7~340,046~8,46831,165708158,662~2~1,042,8,6~4Persons orrestedMoleFemaleN\XTlber Percent NJITlber Percent822,883 87.2 120,288 12.81,8642,6174,06524,28~42,07448,1658,6~71,84432,835100,71l0133,61535,8056.20~35,~1l27~87,86014,557~,3121343,67~46,5~11,25112,302217,~5233,~5892,3~027,30~600137,0718077583,~43aBecause <strong>of</strong> rounding, percents may not odd tototol' bcLess thon one-tenth <strong>of</strong> I percent.Violent crimes are <strong>of</strong>fenses <strong>of</strong> murder, forciblerope, robbery, ond aggravated assault.86.5~~.2~3.08~.3~4.484.7~1.78~.6~0.38~.28~.587.872.358.276.1~0.3~I.~~4.~48.~~5.~87.48~.4~5.092.484.8~3.887.684.786.486.~72.745./12~0223052,8%2,5178,7277832133,51312,24015,7534,~552,37625,7922508471,2845041401566,71714~64617,8416,0886,0783,85610821 ,5~11222844,75113.50.87.010.75.615.38.310.4~.710.810.512.227.741.823.~~.78.15.151.14.112.610.65.07.615.26.212.415.313.613.127.354.6Percent dlstributlo~<strong>of</strong> <strong>of</strong>fenses chorredTotal Mole emole100.0 100.0 100.00.20.30.52.~4.76.01.00.23.~12.015.84.3O.~6.50.10.91.71.0(b)0.45.70.11.425.04.210.43.30.116.80.10.10.90.20.30.53.05.15.~1.10.24.012.216.24.40.84.40.11.01.81.1(b)0.45.70.21.526.54.111.23.30.116.70.10.10.50.2(b)0.32.42.17.30.70.22.~10.213.14.12.021.40.20.71.10.40.10.15.60.10.514.85.15.13.20.117.90.10.23.9drroperty crimes are <strong>of</strong>fenses <strong>of</strong> burglary, larceny"theft'emotor vehicle theft, and orson.Includes orson.Source: U.S. Deportment <strong>of</strong> <strong>Justice</strong>, Federal <strong>Bureau</strong> <strong>of</strong> Investigation, Crime in the United States 1981(Washington, D.C.: U.S. Government Printing Office, 1982), p. 213. Table adapted by Sct:RCEBOO< stOff. 'Characteristics and Distribution <strong>of</strong> Persons ArrestedTable 4.13 Arrests in rural counties, by <strong>of</strong>fense charged, age group, and race, 1981i'OTE: See NJTES, Tables 4.1 and 4.12. For definitions <strong>of</strong> <strong>of</strong>fenses and rural counties, see Appendix 2.(2,762 agencies; 1981 estimated popUlation 28,995,000)Offense char gedTotalMurder and nonnegligentmanslaughterForcible ropeRobberyAggravated assaultBurglaryLarceny-thefttAotor vehicle theftArsonViolent crlme bProperty crime cTotal Crime Index dOther assaultsForgery and counterfeitingFroudEmbezzlementStolen property; buying,receiving, possessingVandalismWeapons; carrying,possessing, etc.Prostitution andcommercialized viceSex <strong>of</strong>fenses (except forciblerope and prostitution)Drug abuse violationsGamblingOffenses against familyand childrenDriving under the influenceLiquor lowsDrunkennessDisorderly conductVagrancyAll other <strong>of</strong>fenses(except traffic)SuspicionCurfew and loiteringlow violationsRunawaysSee footnotes at end <strong>of</strong> table.Total935,2142,1432,6294,35127,14044,42456,631l9,4412,05U36,263112,553148,81640,6448,54062,4931,0461l,64515,71l99,71l62743,81953,1611,4U212,875229,77140,14197,97930,8114689157,9499021,0198,590Total arrestsAmericanIndianorAlaskanWhite Block Native778,5201,4741,8172,90719,35U36,43146,1438,2381,78725,54892,599118,14730,4166,50247,0938587,23314,1628,2251993,39247,7258798,149197,45737,10287,63525,002555128,27469971121l,034132,6405937391,3377,0366,7689,19611532139,70517,03026,7359,0121,91414,8021761,2761,2191,34/ 1753484,4785144,461l26,1282,1887,2624,39210025,828994623619,572685578659871770270408601,9512,811906925304101324160o55543I2495,4827412,9951,355343,002934144AsianorPacificIslander4,48281829953545298010Total100.0100.0100.0100.010U.0100.0100.0100.0100.0Percent a AmericanIndian Asianor orAlaskan PacificWhite Block Native Islander83.268.869.166.871.382.081.587.387.214.227.728.130.725.915.216.29.010.4150 100.0 70.5 26.8973 100.0 82.3 15.11,123 100.0 79.4 18.031032688358457o244158970411087135o84595157176100.0100.0100.0100.0100.0100.0100.0100.0100.0100.0100.0100.0100.010U.0100.0100.0100.0100.0100.0100.0100.074.876.175.482.083.789.784.072.688.889.862.763.385.992.489.481.U80.681.277.576.793.522.222.423.716.814.87.713.727.49.18.436.734.711.45.57.414.214.516.411.04.52.72.13.22.11.82.42.01.42.92.02.41.71.92.21.10.80.41.22.11.6X1.41.00.11.92.41.83.14.44.91.91 •.'.'3.31.70.50.40.70.70.40.80.90.110.50.40,90.80.80.40.10.1l0.40.50.6X0.60.80.60.10.30.30.10.4X0.510.515.42.0444445
-._-- -----~-~---~------r1,-<strong>Sourcebook</strong> <strong>of</strong> Criminol <strong>Justice</strong> Stotistics <strong>1983</strong>Table 4.13 Arrests in rural counties, by <strong>of</strong>fense charged, age group, and race, 1981--ContinuedOffense chorgedTotalMurder and nannegligentmons laughterForcible ropeRobberyAggravated assaultBurglaryLarceny-theftMotor vehicle theftArsonViolent crime bProperty crime cTotal Crime Index dOther assaultsForgery and counterfeitingFroudEmbezz!ementStolen property; buying,receiving, pos~esslngVandalismWeapons; corry lng,possessing, etc.Prostitution andcommercialized viceSeX <strong>of</strong>fenses (except forciblerope and prostitution)Drug abuse violationsGomb Ii ngOffenses against femllyand childrenDriving under the InfluenceLiquor lowsDrunkennessDisorderly conductVagrancyAli other <strong>of</strong>fenses(except traffic)SuspicionCurfew and loiteringlow violationsRunawaysSee footnotes aT end <strong>of</strong> tabie.TotalArrests under 18AmericonIndionorAlaskanWhite Block Native85,215 6,4282,035AsianorPacificIslander TotalPercent OAmericanIndianorAsianorAlaskan PacificWhite Block Native Islander1,421 100.0 89.6 6,8 2.1 1.5107 80 23 4 0 100.0 74.8 21.5 3.7 X206 137 60 8 I 100.0 66.5 29.1 3.9 0.5498 365 113 13 7 100.0 73.3 22.7 2.6 1.41,600 I ,262 284 44 10 100.0 78.9 17.8 2.8 0.614,709 12,763 1,377 357 ~12 100.0 86.8 9.4 2.4 1.412,954 11,275 1,244 178 257 100.0 87.0 9.6 1.4 2.03,329 3,031 163 99 36 100.0 91.0 4.9 3.0 1.1464 409 31 17 7 100.0 88.1 6.7 3.7 1.52,411 1,844 480 69 18 100.0 76.5 19.9 2.9 0.731,456 27,478 2,815 651 512 100.0 87.4 8.9 2.1 1.6~3~3.~8=67====2~9~13~2~2====3~,~29~5,====7g2~0====5~3~0==~IO~v~.0~~86~1~6==d9~.~7==~2~.1~~1,~6=2,654 2,079 410 83 82 100.0 78.3 15.4 3.1 3.1825 693 113 14 5 100.0 84.0 13.7 1.7 0.6604 524 57 20 3 100.0 86.8 9.4 3.3 0.514 13 I 0 0 100.0 92.9 7.1 X X1,188 1,07U 94 12 12100.090.1 7.9 1.0 I5,831 5,510 190 94 37 100.0 94.5 3.3 1.6 0.6658 598 39 15 6 100.0 90.9 5.~ 2.3 0.9II 8 3 0 0 100.0 72.7 27.3 X X487 426 43 9 9 100.0 87.5 6.8 1.8 1.85,369 4,921 260 64 124 100.0 91,7 4.8 1.2 2.332 19 10 0 3 100.0 59.4 31.3 X 9.4140 124 IS 0 I 100.0 88.6 10.7 X4,383 4,175 103 89 16 100.0 95.3 2.3 2.010,292 9,913 148 197 34 100.0 96.3 1.4 1.9.2,945 2,663 75 201 6 100.0 90.4 2.5 6.82,578 2,218 260 88 12 100.0 86.0 10.1 3.495 83 9 3 a 100.0 87.4 9.5 3.213,3901271,0198,59011,935 I,G08 244 203 100.0 89.1 7.5 1.8105 13 4 5 100.0 82.7 10.2 3.1782 46 34 157 100.0 76.7 4.5 3.38,034 236 144 176 100.0 93.5 2.7 1.70.70.40.30.20.5X1.53.915.42.0I\l!i!I1jIeIII1!E-irJICharacteristics and Distribution <strong>of</strong> Persons ArrestedTable 4.13 A.rrests in rural counties, by <strong>of</strong>fense charged, age group, and race. 1981--ContinuedOffense chargedTotalMurder and nonnegligentmanslaughterForcible rapeRobberyAggravated assaultBurglaryLorceny-theftMotor vehicle theftArsonViolent crime b cProperty crimeTotal Crime Index dOther assaultsForgery and counterfeitingFroudEmbezzlementStolen property; buying,receiving, possessingVandalismWeapons; carrying,possessing, etc.Prostitution andcommercialized viceSex <strong>of</strong>fenses (except forciblerope and prostitution)Drug abuse violationsGamblingOffenses against femil yClnd childrenDriving under the InfluenceLiquor lowsDrunkennessDisorderly conductVograncyAll other <strong>of</strong>fenses(except traffic)SuspicionCurfew and loiteringlow violationsRunawaysTotal840,1152,0362,4233,85325,54029,71543,61146,1121,511633,85281,097114,94937,9907,71561,8891,0327,4579,9589,1282633,33247,7921,37012,735225,38829,84995,03428,306594144,559775XXArrests 18 and olderAlTlElricanIndianorAlaskanWhite Block Native693.305 126,212 17,5371,3941,6802,54218,08823,66834,8685,2071,37823,70465,12188,82528,3375,80946,5698456,1638,6527,6271912,96642,8048608,025193,28227,18984,97222,784472116,339594'~Because <strong>of</strong> rounding, percents may not odd to total.Violent crimes are <strong>of</strong>fenses <strong>of</strong> murder, forcible rope,robbery, and aggravated assault.XX5706791,2246,7525,3917,9526901829,22514,21523,4408,6021,80114,745I7S1,1821,0291,305723054,2185044,45326,0252,0407,1874,1329124,82086XX644765615514592171237911,3002,09182378510489230145o46479I2495,3935442,7941,267312,7585XXAsianorPacificIslander3,061817228514227244313246159322827658234751o15291586887681123o64290XXTotal100.0100.0100.0100.0100.0100.0100.0100.0100.0100.0100.0100.0100.0100.0100.0100.0100.0100.0100.0100.0100.0100.0100.0100.0100.0100.0100.0100.0100.0100.0100.0XXPercent aAmericanIndian Asianor or'Alaskan PacificWhite Block Native Islander82.5 15.0 2.1 0.468.5 28.069.3 28.066.0 31.870.8 26.479.7 18.179.8 18.285.2 11.386.9 11.570.0 27.380.3 17.577.3 20.474.6 22.675.3 23.375.2 23.881.9 17.082.6 15.986.9 10.383.6 14.372.6 27.489.0 9.289.6 8.862.8 36.863.0 35.085.8 11.591.1 6.889.4 7.680.5 14.679.5 15.380.5 17.276.611.1XX3.11.91.72.41.71.42.81.52.31.61.82.21.00.80.41.22.31.6X1.41.00.12.02.41.82.94.55.21.90.6XX0.40.70.60.30.50.60.70.20.40.60.50.60.30.10.80.30.50.6X0.50.60.40.10.30.30.10.4X0.411.6cProperty cri'nes are <strong>of</strong>fenses <strong>of</strong> burglary, larceny-theft,motor dvehicle theft, and arson.Includes orson.Source: U.S. Deportment <strong>of</strong> <strong>Justice</strong>, Federal <strong>Bureau</strong> <strong>of</strong> Investigation, Crime in the United States, 1981 (Washington, D.C.:U.S. Government Printing Office, 1982), pp. 215-217.XX446lIt1jl JI'I1447
<strong>Sourcebook</strong> <strong>of</strong> <strong>Criminal</strong> <strong>Justice</strong> <strong>Statistics</strong> <strong>1983</strong>Figure 4.8 Arrest rates (per 100,000 inhabitants) for all <strong>of</strong>fenses, by extent <strong>of</strong> urbanization, 1972-81f\OTE: See f\OTES, Tables 4.1 and 4.2. Suburban arrest rates for 1978 and 1979 represent countylaw enforcement agencies only. For definitions <strong>of</strong> city and suburban areas, and rural counties, seeAppendix 2.(Rate per 100,000 inhabitants)IiIi~II ,ICharacteristics and Distribution <strong>of</strong> Persons ArrestedFigure 4.9 Arrest rates (per 100,000 Inhabitants) for violent crimes, by <strong>of</strong>fense charged and region, 1981f\OTE: See f\OTE, Table 4.1. For a list <strong>of</strong> States In regions and definitions <strong>of</strong> <strong>of</strong>fenses, see Appendix 2.180160163.5SuburbanRuralCitiesl3'164.5~7 __ o<strong>of</strong>\'1IL A1 2,757.9 r::2,369.51973IIII,IIII~1974 1975 1976 1977 1978 1979 1980 1981Source: u.'. Department <strong>of</strong> <strong>Justice</strong>, Federal <strong>Bureau</strong> <strong>of</strong> Investigation, Crime in the Lhited States, 1976, p. 171; 1977, p. 170; 1978, p. 186,Table 25; 1979, lJ. 188, Table 25; 1980, p. 192; 1981, p. 163 (Washington, D.C.: U.S. Government Printing Office):-F'igure constructed by5O...RCEBOO< staff. ----Table 4.14 Arrest rates (per 100,000 inhabitants) for violent crimes, by <strong>of</strong>fense charged and region, 1970-81f\OTE: See NOTE, Table 4.1. The number <strong>of</strong> agencies reporting and the populations representedvary from year to year. For a list <strong>of</strong> States in regions and definitions <strong>of</strong> <strong>of</strong>fenses, see Appendix 2.(Rate per 100,000 inhabitants)Offense charged and region 1970 1971 1972 1973 1974 1975 1976 1977 1978 1979 1980 1981Murder and nonnegligentmanslaughter:Northeast 5.9 7.1 6.8 7.9 6.5 6.9 6.3 5.9 7.4 5.6 6.3 6.3North Central 8.7 8.8 7.8 7.0 10.2 6.9 6.4 7.8 7.3 9.1 7.5 7.5South 12.1 12.7 13.3 12.8 14.3 13.1 11.7 11.7 11.5 11.9 II .1 11.3West 7.0 8.6 10.1 9.1 11.1 9.2 4.5 9.5 9.2 10.3 10.4 12.6Forcible rape:Northeast 7.8 8.5 10.0 12.1 12.3 11.9 12.0 13.2 15.1 12.8 12.9 13.1North Central 10.3 9.6 10.1 9.4 II. I 9.2 9.8 11.6 10.9 11.9 12.1 12.4South 11.3 12.2 13.7 13.5 15.2 14.0 13.7 14.5 14.2 15.2 14.8 14.6West 12.0 13.1 16.4 15.5 15.8 14.4 13.8 14.8 14.8 17.8 17.1 16.1Robbery:Northeast 60.3 83.4 82.2 84.8 87.2 91.2 84.6 83.7 110.7 79.4 91.9 98.6North Central 55.3 55.3 54.0 41.3 69.0 53.2 44.6 52.3 46.7 46.6 48.1 48.7South 51.0 54.4 58.6 59.3 75.5 69.3 56.9 53.2 52.5 56.6 54.4 55.7West 67.2 73.0 84.7 85.9 %.9 81.8 67.7 76.8 75.3 82.8 85.1 84.2Aggravated assault:Northeast 72.2 81.Z 83.7 %.5 108.6 109.1 106.3 117.3 149.2 114.3 118.1 115.2North Central 58.0 59.0 63.1 58.8 74.7 64.1 62.5 59.5 57.9 67.7 64.5 69.7South 112.6 119.5 125.0 120.2 134.1 139.2 135.6 137.1 144.7 151.9 147.0 148.5West 97.3 111.3 134.4 134.7 164.7 145.2 136.9 154.7 152.1 174.4 170.5 163.5Source: U.S. Department <strong>of</strong> <strong>Justice</strong>, Federal <strong>Bureau</strong> <strong>of</strong> Investigation, Crime in the Lhited States, 1970, p. 36; 1971, p. 35;1972, p. 35; 1973, p. 34; 1974, p. 45; 1975, p. 41; 1976, p. 172; 1977, p. 171; 1978, p. 185; 1979, p. 187; 1980, p. 190; 1981, p. 161(Woshington, D.C.: U.S. Government Printing Office). Table adapted by Sa...RCEBClO< st~140124.5.l!lc 120 ,'II.l!!I',':0 III'ctI.c,'I'I'll.S100,I,'0 III'0ciI','0 1'1','I'"-,I,'Q)c. 801'1'2III'~ I','.... ' IVl"'I' ',I. ~~ 60"- 55.7 ,','/~II:"46.7III, "," Illi40 III, 1,'1III, 'I',I,ll ','I'I', ',II·. ','II,llI,ll III,146.5II1III,',III,',II',','I''1'1.. ,20· . '1'1 II',','IIII,'III III,· .IiI, I,',,',I,, , III, ,0o UnitedMurder Forcible rape Robbery Aggravated assaultStates total ~ Northeast ~:::) North Central [Ill] South ITJJ WestGo Source: p.U.~. Deportment <strong>of</strong> <strong>Justice</strong>, Federal <strong>Bureau</strong> <strong>of</strong> Investigation, Crime in the Lhited States 1981 (Washington, D.C.'. U.S.vernment nntlng Office, 1982), p. 161. Figure constructed by Sa...RCEBClO< staff. . ,448449
<strong>Sourcebook</strong> <strong>of</strong> <strong>Criminal</strong> <strong>Justice</strong> <strong>Statistics</strong> <strong>1983</strong>Table 4.15 Arrest rates (per 100,000 inhabitants) for property crimes, by <strong>of</strong>fense charged and region, 1970-81Offense charged and regionBurglary:NortheastNorth CentralSouthWestLarceny-theft:NortheastNorth CentralSouthWesthIotor vehicle theft:NortheastNorth CentralSouthWestArson:NortheastNorth CentralSouthWestNJTE: See NJTE, Table 4.1. Arson was designated on Index property crime in October 1978. Datacollection began in 1979. The number <strong>of</strong> agencies reporting and the populations represented varyfrom year to year. For a list <strong>of</strong> States in regions and definitions <strong>of</strong> <strong>of</strong>fenses, see Appendix 2.1970143.0167.8202.2267.7246.1465.6451.5493.764.778.173.0136.6xXXX1971173.7170.7204.8295.2302.1455.8445.2572.172.169.567.5151.2XXXX1972164.0157.9200.3306.7281.8447.2431.0593.566.661.262.3137.4(Rate per 100,000 inhabitants)XXXX1973189.6154.3193.9314.2280.8424.6425.7572.677.158.960.6126.0XXXX1974207.9213.5269.5361.5398.0586.0542.5680.967.362.366.7139.9XXXX1975222.0186.5271.0344.3393.7528.8571.7658.163.149.956.8112.2XXXX1976232.9170.2241.5307.2423.8491.9550.4692.365.946.451.1115.0XXXX1977243.6178.8233.8320.84:.LO507.9521.3658.166.457.753.6125.4XXXX1978259.6166.7231.5304.5475.7485.9515.9646.277 .955.457.5124.0xXXX1979221.0163.2237.9315.8447.4499.5537.9697.560.652.258.1129.29.98.17.911.2198U226.1167.2239.0303.5463.5535.1516.3674.8Source: U.S. Deportment <strong>of</strong> <strong>Justice</strong>, Federal <strong>Bureau</strong> <strong>of</strong> 1 nvestigation, Crime in the United States, 1970, p. 36; 1971, p. 35;~72,'p. 35, 1973, p. 34; 1974, p. 45,1975, p. 41; 1976, p. 172; 1977, p. 171; 1978, p. 185, 1979, p. 187; 1980, p. 190, T98T, p. 161ashlngton,~.: U.S. GovernmentPiTn"ting Office). Table adopted by 5a.RCEBOO< st~ -- --Agure 4.10 Arrest rates (per 100,000 inhabitants) for property crimes, by <strong>of</strong>fense charged and region, 1981NJTE: See NJTE, Table 4.1. For a list <strong>of</strong> States in regions and definitions <strong>of</strong> <strong>of</strong>fenses, see Appendix 2.700 685.9600500400558.860.146.050.2101.49.88.38.19.81981213.4172.5235.0305.94711.2558.2541.7685.955.242.847.893.99.28.68.510.5;[\!IIi~IICharacteristics and Distribution <strong>of</strong> Persons ArrestedTable 4.16 Offenses known to police and percent cleared by arrest, by <strong>of</strong>fense and size <strong>of</strong> place, 1981I\OTE: See NJTES, Tables 4.1 and 4.4. "An <strong>of</strong>fense Is 'cleared by arrest'or solved for crime reporting purposes when at least one person lSI (I)arrested; (2) charged with the commission <strong>of</strong> the <strong>of</strong>fense; and (3)turned over to the court for prosecution. The prosecution can followarrest, court summons, or police notice." An <strong>of</strong>fense Is also counted ascleared by arrest If any <strong>of</strong> the following "exceptional" conditionspertain: (I) suicide <strong>of</strong> the <strong>of</strong>fender; (2) dOUble murder; (3) deathbedconfession; (4) <strong>of</strong>fender killed by police or citizen; (5) confession by<strong>of</strong>fender already In custody or serving a sentence; (6) on <strong>of</strong>fenderprosecuted in another Jurisdiction for a different <strong>of</strong>fense and thatJurisdiction does not release <strong>of</strong>fender to first Jurisdiction; (7)extradition denied; (8) victim refuses to cooperate In prosecution, (9)for reasons outside police control, <strong>of</strong>fender Is prosecuted for a lessPopulation groupTotalCrimeIndexVlolenJcrime(1981 estimated population)Properf{crimeTOTAL ALL AGENCIES13,334 agencies;popUlation 2! 'J,287,0001Offenses known 12,715,894 1,275,135 11,440,759Percent cleared by arrest 19.5 42.9 16.9TOTAL CITIES9,179 cities/ popUlation146,165,0001Offenses known 10,275,410 1,066,647 9,208,763Percent cleared by arrest 19.5 40.9 17.0Group I:55 cities, 250,000 and over;popUlation 40,525,000:Offenses known 3,795,404Percent cleared by arrest 17.56 cities, 1,000,000 and over;popUlation 17,617,000:Offenses known 1,549,480Percent cleared by arrest 16.517 cities, 500,000 to 999,999/popUlation 11',493,000:Offenses known 1,096,298Percent cleared by arrest 18.0.32 cities, 250,000 to 499,999;popUlation 11,415,000:Offenses known I, 149,626Percent cleared by arrest 18.6Group II:114 cities, 100,000 to 249,999;popUlation 16,785,000:Offenses known I ,461 ,388Percent cleared by arrest 20.5574,P,6~ 3,220,535:4.9 14.5286,439 1,263,04131.0 13.2140,057 ~56,24137.8 15.1148,373 1,001,25339.7 15.4137,47U 1,323,91044.2 18.0serious charge than that for which arrested; or, (10) handling <strong>of</strong> ajuvenile <strong>of</strong>fender either oraliy or by written notice to porents InInstances Involving minor <strong>of</strong>fenses where no referral to JUVenile Olurt Ismade as a matter <strong>of</strong> publicly accepted police policy. (U.S. Depr..rtment<strong>of</strong> <strong>Justice</strong>, Federal <strong>Bureau</strong> <strong>of</strong> Investigation, Uniform Crime ReportingHandbook (Washington, D.C.: U.S. Government printing Office, I 97tI),pp. 44, 45.) It should be noted that the arrest <strong>of</strong> one person can clearseveral crimes or several persons may be arrested to clear one crime.Arson was designated on Index property crime In October 1978. Due tothe Incompletenes~ <strong>of</strong> arson reporting by police for <strong>of</strong>fenses known in1979, 1980, and 1981, orson data are not Included In this table. Fordefinitions <strong>of</strong> <strong>of</strong>fenses, suburban areas, and rural counties, see Appendix2.ForcibleropeMurderand nonnegligentmClnslaughterAggravatedRobbery ossaul t21,413 77,623 557,162 618,93771.6 48.1 23.9 58.316,364 60,173 506,023 484,08771.1 46.4 23.4 57.59,616 29,015 337,567 198,67167.5 44.3 21.8 54.24,943 10,915 184,251 86,33063.5 40.6 20.5 50.22,318 8,502 79,414 49,82370.4 46.4 22.9 58.72,355 9,598 73,902 62,51872.9 46.6 23.8 56.22,160 9,335 58,080 67,90375.5 46.5 25.9 58.6Burglary3,569,75314.32,755,525/3.91,065,42411.9430,77210.4300,33413.1334,31812.8412,29914.~Larcenytheft6,842,88618.95,584,40119.21,713,07817.5586,41318.0549,85317.1576,81217.5811,88520.0hIotorvehicletheft1,028,12014.2868,83712.9442,0338.6245,8566.7106,05410.490,12311.8~9,72614.6300305.9Group III:292 cities, 50,000 to 99,999;popUlation 19,925,000:Offenses known 1,369, 035Percent clt:ared by arrest 19.9112,488 1,256,54744.4 17.71,418 7,343 44,098 59,62975.0 47.4 25.2 57.4378,28414.3768,33420.0109,92913.2200100 93.9Larceny-theft Motor vehicle theft Arsono Un~ted States total 0 Northeast ~:;:~ North Central Iillil South [TI] WestSource: . U.S. Deportment <strong>of</strong> <strong>Justice</strong>, Federal <strong>Bureau</strong> <strong>of</strong> Investigation, Crime in the United States, 1981 (Washington, D.C.:Government Printing Office, 1982), p. 161. Agure constructed by SaRCEBOd< stOff.450U.S.I'I:r :11, 'iI!IIIl!IililIIIiI'ii',IIiII , ,Group IV:611 cities, 25,000 to 49,999;popUlation 21,024,000:Offenses known I ,317,394Percent cleared by arrest 20.7Group V:1,575 cities, 10,000 to 24,999;popUlation 24,760,000:Offenses known 1,283,418Percent cleared by arrest 21 .3Group VI:6,532 cities under 10,000;populotlon 23,146,OOU:Offenses known 1,048,771Percent cleared by arrest 21.0See footnotes at end <strong>of</strong> table.94,310 1,223,08446.7 18.783,134 1,200,28451.4 1~.264,36859.4984,40318.41,192 6,034 32,062 55,02278.3 46.6 27.5 57.21,090 4,833 22,265 54,94676.2 50.4 27.7 60.688B 3,613 11,951 47,91677.6 54.3 30.5 66.7451339,3~015.3318,53115.7241,59116.57%,02220.4804,38620.5690,69618.487,67216.377,36720.252,11028.4
-------- --------~------------r<strong>Sourcebook</strong> <strong>of</strong> <strong>Criminal</strong> <strong>Justice</strong> St9tistic-.s <strong>1983</strong>\Characteristics and Distribution <strong>of</strong> Persons ArrestedAgure 4.11 Percent <strong>of</strong> <strong>of</strong>fenses known to police that were cleared by arrest, by <strong>of</strong>fense, United States, 1981Table 4.16 Number <strong>of</strong> <strong>of</strong>fenses known to police and percent cleared by arrest, by <strong>of</strong>fense and size <strong>of</strong> place, 1981--ContlnuedN)TE: See !>OTES, Tables 4.1, 4.4, and 4.16. Data fdr arson are not available for this figure. For definitions <strong>of</strong> <strong>of</strong>fenses, see Appendix 2.Murderand non-Total negligent Aggra- MotorCrime VI~lenJ Propert,v mon- Forcible voted Larceny- vehiclePopulation group Index crame crime slaughter rape Robbery assault Burglary theft theftSlBLRBI>N Ca.NfIES8071.61,200 agencies; population42,035,000:Offenses known 1,775,893 156,087 1,619,806 2,909 12,826 44,741 95,611 573,733 923,410 122,663Percent cleared by arrest 19.0 49.1 16.1 69.9 50.9 27.2 58.5 15.3 16.3 18.160..RU'W.. Ca...NTIES2,955 agencies; population30,087,000:Offenses known 664,591 52,401 612,190 2,140 4,624 6,398 39,239 240,495 335,075 36,620Percent cleared by arrest 20.7 63.8 17.0 77.4 62.7 40.4 67.0 16.8 15.5 31.8SlBLRBI>N />PEASc5,969 agencies; popUlation85,996,000:Offenses known 4,079,776 308,793 3,770,983 4,684 21,753 91,995 190,361 1,152,394 2,340,758 277,831Percent cleared by arrest 19.4 48.7 17.0 71.7 49.3 26.8 58.6 15.0 17.9 17.2aViolent crimes are <strong>of</strong>fenses <strong>of</strong> murder, forcible rape, robbery, and clncludes suburban city and county law enforcement agenciesaggra~ed assault. within metropolitan oreas. Excludes core cities. Suburban cities andoperty crimes are <strong>of</strong>fenses <strong>of</strong> burglary, larceny-theft, and counties are also included In other groups.motor vehicle theft. Data are not included for the property crime <strong>of</strong>arson.~til!1;itil!.!!uC~If4020Source: U.S. Department <strong>of</strong> <strong>Justice</strong>, Federal <strong>Bureau</strong> <strong>of</strong> Investigation, Crime In the Ulited States. 1981 (Washington, D.C.: U.S. GovernmentPrinting Office, 1982), pp. 153, 154. Table adapted by SURCEBro< staff.oTotalCrimeIndexTotalviolentcrimeTotalpropertycrimeMurder and Forcible Robberynon negligent rapemanslaughterAggravatedassBultBUlglaryLarcenytheftMotorvehicletheftSource: U.S. Deportment <strong>of</strong> <strong>Justice</strong>, Federal <strong>Bureau</strong> <strong>of</strong> Investigation, Crime In the Ullted States, 1981 (Washington, D.C.: U.S. GovernmentPrinting Office, 1982), p. 153. Figure constructed by SURCEBro< staff.
<strong>Sourcebook</strong> <strong>of</strong> <strong>Criminal</strong> <strong>Justice</strong> <strong>Statistics</strong> i9t13Figure 4.12 Percent <strong>of</strong> <strong>of</strong>fenses known to police that were cll!ared byarrelt, by type <strong>of</strong> <strong>of</strong>fense, lktlted States, 1980 and 1981,I'oOTE: See NJTES, Tables 4.1, 4.4, and 4.16. For definitions <strong>of</strong> <strong>of</strong>fenses,see Appendix 2.60\\1ifCharacteristic'; r.'ld Distribution <strong>of</strong> Persons ArrestedFigure 4.13 Percent <strong>of</strong> <strong>of</strong>fenses known to police that were cleared by arrest, by extent <strong>of</strong> urbanization,lktited States. 1972-81I'DTE: See I'DTES, Tables 4.1, 4.4, and 4.16. For definitions <strong>of</strong> <strong>of</strong>fenses, rural counties, and city and suburban areas,see Appendix 2.3043.6"0Q)....', andaggray'ated Qlsault."Property crimes are <strong>of</strong>fenses <strong>of</strong> burglary, larceny-theft, and rr.,torvehicle theft. Data are not Included for the property crime <strong>of</strong> orson.Sourc>!1 U.S. Department <strong>of</strong> <strong>Justice</strong>, Federal <strong>Bureau</strong> <strong>of</strong>Investigation, Crime In the Lhlted States, 198~ pp. 182, 183; 19~1i' pp.153, 154 (WashIngton, D.C.I U.S. GOvernment Intlng Office). gureconstructed by SCLRCEBOa< st<strong>of</strong>f.alncludes suburban city and county low enforcement agencies within metropolitan areas. Excludes core cities.Suburban cities and counties are also Included in other groups.Source: U.S. Dt>portment <strong>of</strong> <strong>Justice</strong>, Federal <strong>Bureau</strong> <strong>of</strong> Investigation, Crime In the Lhlted States, 1972., pp.107, 101.l; 197.3, pp. 109, 110; 1974, pp. 166, 167;319I~' pp. 166, 167; 1976, pp. 162, 163; 1971, pp. 162, i63;"T97ii, pp.177, 178;FI979, pp. 179, 180;19ll0, pp. 182, 18; 81, pp. 153, l54lWo.,hlngton, D.C::U.S. Governmentl5rJntlngOffice). gure c:onstrlA!ted by"SU..RCEBOO< staff.--Ii~II1 :tl( I~I!II1 i1 '!455
-~--~......--- ---------------------_..1<strong>Sourcebook</strong> <strong>of</strong> <strong>Criminal</strong> <strong>Justice</strong> <strong>Statistics</strong> <strong>1983</strong>Figure 4.14 Percent <strong>of</strong> violent crimes a known to police that were cleared by arrest, by e)dent <strong>of</strong> urbaniza·~;an, United States, I ~72-SIf\OTE: See f\OTES, Tables 4.1, 4.4, and 4.16. For definitions <strong>of</strong> <strong>of</strong>fenses, rural counties, and suburban and rural areas, see Appendix 2.Characteristics and Distribution <strong>of</strong> Persons ArrestedAgure 4.15 Percent <strong>of</strong> property crim·a k t Iurbanization, Unijed States, 1972-St" nown a po ice that were cleared by arrest, by extent <strong>of</strong>I'DTE: See f\OTES, Tables 4.1, 4.4, and 4.16. ~ d fl Isee Appendix 2.or e n tlons <strong>of</strong> <strong>of</strong>fenses, rural counties, and city and suburban areas, '301jeOJ"0 '"c:'" ~Q.'"7060504030...._-------------- .....----"" "" """. ··&a ..................... ··················• .... ."...........'- -......""CI ••••••••••'t:I~Q)(j '"EQ)CJ...Q)Q.2010... _-------. ..... --- ... -----~1972 1973 1974 1975 1976 1977 1978 1979 1980 1981Rural counties---Cities.....•.... Suburban areasb2010'Property crimes are <strong>of</strong>fenses <strong>of</strong> burglary larce th ft d .the Pboperty crime <strong>of</strong> arson. ,ny- e , an motor vehicle theft. Data are not included forIncludes suburban city and county law ~ t . "Suburban cities and counties are also includedei~r~:h::::ngr~~~~~les within metropolitan areas. Excludes core cities.Source: U.S. Deportment <strong>of</strong> <strong>Justice</strong> Federal B fl'107, 108; 1973, pp. 109, 110; 1974, pp. 166 167. 197/r:;ul~6 1~7tl~~~on, Crime in the U,ited States, 1972, pp.17?, 178;~, pp. 179, 180;19ll0, pp. Ilil, 113:f:i981' '5 ;r:r.-ml PP: 62, 163; 1977, pp. 162, 163;19711, pp.Office). Figure constructed by SCLRCEBCJa< staff.--' pp. I 3, I .... \rYashlngton, D.C.: U.S. GovernmentlSiiritingO~~----r_--_r----~----~I----,----,----~--~~--~1972 1973 1974 1975 1976 1977 1978 1979 1980 1981____ Rural counties----. Suburban areas b•••••••••• CitiesaViolent crimes are <strong>of</strong>fenses <strong>of</strong> murder, forible rape, robbery, andaggravated assault.blncludes suburban city and county Ic;w enforcement agencieswithin metropolitan areas. Excludes care cities. Suburban cities andcounties are also included in other groups.Source: U.S. Deportment <strong>of</strong> <strong>Justice</strong>, Federal <strong>Bureau</strong> <strong>of</strong> Investigation, Crime in the U,ited States, 1972, pp. 107, lOB; 1973, pp. 109, 110; Ir~~'pp. 166, 167; 1975, pp. 166, 167; 1976, pp. 162, 163; 19f1' pp. 162, 163, 1978, pp. 117, 178; 1979, pp.~, i80; 1980, pp.l82", 1113; 1981, pp. ,154 (Washington, D.C.: U.S. Government Printing Office. Figure constructed by 5O..RCEBOCRS'faff. --456
<strong>Sourcebook</strong> <strong>of</strong> <strong>Criminal</strong> <strong>Justice</strong> <strong>Statistics</strong> <strong>1983</strong>I' Characteristics and Distribution <strong>of</strong> Persons ArrestedTable It.17 Number <strong>of</strong> <strong>of</strong>fenses known to pollee that were cleared by arrest and percent <strong>of</strong> <strong>of</strong>fenses cleared by arrest <strong>of</strong> persons under 18years <strong>of</strong> age, by <strong>of</strong>fense and size <strong>of</strong> place, 1981NJTEI See /\DTES, Tables 4.1, 4.4, and 4.16. For definitions <strong>of</strong> <strong>of</strong>fenses, suburban areas, and ruralcounties, see Appendix 2.(Percent <strong>of</strong> total cleared; 1981 estimated population)Murderand non-SLBlRBI>N COl-NT I ESTotal negligent Aggra- MotorCrime Vlolenc! Properti' man- Forcible voted Larceny- vehiclePopulation group1,196 agencies; popUlationIndex crime crime slaughter rape Robbery assault Bur2lar~ theft theft 41,334,000:l'Table 4.17 Number <strong>of</strong> <strong>of</strong>fenses known to police that were cleared by arrest and percent <strong>of</strong> <strong>of</strong>fenses cleared by arrest <strong>of</strong> persons under 18years <strong>of</strong> age, by <strong>of</strong>fense and size <strong>of</strong> place, 1981 MMContinuedMurderand nonMTotal negligent AggraM MotorCrime Vi~lenc! Properti' manM Forcible voted Larceny-Population groupvehicleIndex crtme crtme slaughter rape Robbery assault Burglary theft theftTotal clearancesTOTAL ALL AGENCIES330,603 75,744 254,859 2,015 6,332 12,015 55,382 86,331 146,796Percent under 1821,73213,319 agencies; population20.9 9.8 24.2 5.5 8.1 14.0 9.2 26.6 23.2 21.2217,401,000:Total clearances 2,468,495RLRAL COl-NT I ES545,239 1,923,256 15,298 37,088 132,838 360,015 510,054 1,268,156 145,046Percent under 18 21.4 9.8 24.7 4.6 9.4 12.6 9.0 25.6 24.7 20.7 2,950 agencies; population29,992,000:TOTAL CITIES9,173 cities; populationTotal clearances 137,113 33,256 103,857 1,649 2,873 2,571 26,163 40,361 51,880Percent under 1811,616146,074,000:17.4 6.3 20.9 5.3 7.9 9.5 5.8 24.6 11:l.2 20.8Total clearances 2,000,779 436,239 1,564,540 11,634 27,883 118,252 278,470 383,362 1,069,480 III ,698Percent under 18 21.7 10.1 25.0SLBlRBI>N AREAS4.4 9.8 12.5 c9.3 25.5 25.3 20.6Q-oup I:5,963 agencies; population55 cities, 250,000 and over;85,284,000:population 40,525,000:Total clearances 783,848 149,395 634,453 3,339 10,536 24,503 111,017 171,140 415,842Percent under 1847,471Total clearances 666,047 200,565 465,482 6,489 12,856 73,477 107,743 126,86324.4 11.7300,491 38,12827.4 5.8 9.6 16.7 11.0 29.2 27.2 22.9Percent under 18 15.1 7.9 18.2 3.6 8.5 9.6 7.0 18.4 18.5 15.2 aVlolent crimes are <strong>of</strong>fenses <strong>of</strong> murder, forcible rape, robbery, am' clncludes suburban city and county law enforcementaggra'6ated assault.agencies6 cities, 1,000,000 and over;within metropolitan areas. Excludes core cities. Suburban citlC!s nrepopulation 17,617,000:~Property crimes are <strong>of</strong>fenses <strong>of</strong> bUrglary, larceny-theft, and also included In other city groups.Total clearances 255,678 88,685 166,993 3,141 4,430 37,737 43,377motor vehicle theft. Data are not included for the property crime <strong>of</strong>44,831 105,729 16,433Percent under 18arson.8.7 5.5 10.~ 2.9 10.1 5.8 5.0 9.4 11.2 7.117 cities, 500,000 to 999,999;population 11,493,000: J~Source: U.S. Department <strong>of</strong> <strong>Justice</strong>, Federal <strong>Bureau</strong> <strong>of</strong> Investigation, Crime in the United States, 1981 (Washington, D.C.: U.S. GoverrmentTotal clearances 197,091 52,978 144,113 1,632Printing Office, 1982), pp. 158, 159. Table adapted by SOLRCEBOO< staff.3,949 18,163 29,234 39,297 93,756 11,060Percent under 18 20.1 10.9 23.5 4.8 7.1 15.1 9.1 24.7 23.0 23.232 cities, 250,000 to 499,999;I ~population 11,415,000:Total clearances 213,278 58,902 154,376 1,716 4,477 17,577 35,132 42,735 101,006 10,635Percent under 18 18.2 9.0I21.7 3.6 8.1 12.0 7.8 21.9 21.8 19.3 iQ-oup II:114 cities, 100,000 to 249,999;population 16,785,000:11Total clearances299,085 60,815 238,270 1,630 4,343 15,056 39,786 61,293 162,460 14,517Percent under 18 21.3 10.6 24.0 5.3 8.5 15.2 9.2 23.5 24.5 21.3IIdnQ-oup III:291 cities, 50,000 to 99,999;~population 19,865,0001Total clearances 270,037 49,843 220,194 1,062 3,475 11,079 34,227 53,526 152,317 14,351Percent under 18 25.5 13.3 28.2 5.9 12.3 18.7 11.9 28.9 28.3 24.5Q-oup IV:i611 cities, 25,000 tv 49,999;population 21,024,000:Total clearances 272,813 44,048 228,765 933 2,812 8,820 31,483 51,910 162,590 14,265Percent under 18 26.5 13.0 29.1 6.2" .518.9 11.7 30.3 29.1 25.0Q-oup V:1,574 cities, 10,000 to 24,999;population 24,749,0001Total clearances 273,063 42,716 230,347 831 2,436 6,176 33,273 49,850 164,851 15,646Percent under 18 26.9 12.0 29.6 4.7 11.2 18.5 11.1 32.2 29.5 23.3Q-oup VI:6,528 cities under 10,000;:1popUlation 23,126,000:Total clearances '219,734 38,252 181,482 689 1,961 3,644 31,958 39,920 126,771 14,791 \i'1Percent under 18 25.6 10.6 28.7 4.2 13.2 15.6 10.0 31.9 28.4 23.1 :/See footnotes at end <strong>of</strong> table.458II' I~i:1 I'Ii11IIIiII'I/JII I,:IIiIii 1rJIIIIIIIII459
<strong>Sourcebook</strong> <strong>of</strong> <strong>Criminal</strong> <strong>Justice</strong> <strong>Statistics</strong> <strong>1983</strong>Figure 4.16 Percent <strong>of</strong> <strong>of</strong>fenses known to police that were cleared byarrest <strong>of</strong> persons under 18 years <strong>of</strong> aya, by type <strong>of</strong> <strong>of</strong>fense, lklitedStates, 1980 and 1981/\oTE: See !\oTES, Tables 4.1, 4.4, and 4.16. For definitions <strong>of</strong> <strong>of</strong>fenses,see Appendix 2.CI)c:0E(I)e.(I)-01010mo6040t: e1010>.(1).0>- 28.2'Ow(I)"'" 24.4 24.7......10(1)(1)'021.4~§ 20c:(I)e(I)Q..11.2aViolent crimes are <strong>of</strong>fenses <strong>of</strong> murder, forcible rape, robbery, andaggra)!.ated assault."Property crimes are <strong>of</strong>fenses <strong>of</strong> burglary, larceny-theft, and matorvehicle theft. Data are not included for the property crime <strong>of</strong> arson.Source: U.S. Department <strong>of</strong> <strong>Justice</strong>, Federal <strong>Bureau</strong> <strong>of</strong>Investigation, Crime In the United States, 1980, pp. 187, 188; /98}, pp.151l, 159 (Washington, D.C.: U.S. GOvernment Printing Office. igureconstructed by SCLRCEBOOK staff.:1ir1,! i1ij1i'" fli'i '\11i'\I !IfIII!I\II,1I( :1 ;f ij', 'Ij,1jIIIl ,11 iJ IU \11[I1~ !i[I'I'1rI~ rICharacteristics and Distribution <strong>of</strong> Persons ArrestedTable 4.18 Arrests for alcohol-related <strong>of</strong>fenses, by <strong>of</strong>fense and State, 1981!\oTE: These data were compiled from the Federal <strong>Bureau</strong> <strong>of</strong> Investigation's UniformCrime Reporting Program. The data presented in this table differ from those presentedin the U.S. Department <strong>of</strong> <strong>Justice</strong>, Federal <strong>Bureau</strong> <strong>of</strong> Investigation, Crime In the UnitedStates, 1981 (Washington, D.C.: U.S. Government Printing Office, 1982). This isbecause this table includes data processed by the Federal <strong>Bureau</strong> <strong>of</strong> Investigation afterthe cut <strong>of</strong>f date for that pUblication. "In one respect, these data may be consideredconservative estimates <strong>of</strong> alcohol-related arrests. Arrests are classified by a single<strong>of</strong>fense, using a hierarchical rule. Consequently, If a person corrrnits a crime whileIntoxicated, the arrest Is categorized according to the primary <strong>of</strong>fense and notrecorded as an alcohol-related arrest. On the other hand, "driving under theInfluence" Includes arrests for Impairment due to any type <strong>of</strong> drug; It is not limited toimpairment due to alcohol." (U.S. Department <strong>of</strong> Health and Human Services, NationalInstitute on Alcohol Abuse and Alcoholism, State Alcoholism Pr<strong>of</strong>ile Information System(SAPIS)--National Status Re 0rt (Rockville, Md.: U.S. Department <strong>of</strong> Health andHuman SerVices, 1982), p. I 45.)Totalalcohol- Driving Liquor DisrelatedState under Drunk- law orderlyarrests influence enness violation conduct VagrancyNational 3,763,861 1,429,497 1,093,81l4 456,506 752,213 31,761Alabama 81,918 29,954 32,639 8,959 10,112 254Alaska 7,176 3,352 139 2,448 1,237 0Arizona 59,593 38,385 0 10,580 10,318 310Arkansas 58,541 23,684 13,273 5,212 5,713 659California 663,I1l7 338,375 244,800 48,242 18,372 13,398Colorado 50,739 25,803 463 10,042 14,259 172Connecticut 22,848 2,918 46 751 18,978 155Delaware 3,248 239 38 1,090 1,548 333District <strong>of</strong> Columbia 7,313 0 5 229 7,059 20Florida 101,676 4$,136 21,930 13,680 16,514 1,416Georgia 130,974 71,548 39,351 3,628 15,568 879Hawaii 5,053 2,900 0 1,045 1,108 0Idaho 13,023 8,067 187 2,981 1,765 23Illinois 252,348 25,449 1,973 41,798 183,041 87Indiana 63,526 18,241 27,028 10,898 7,296 63Iowa 37,392 12,594 13,416 7,198 4,146 38Kansas 19,874 10,233 445 4,146 4,914 136Kentucky 105,879 32,646 60,137 4,891 8,167 38L:.visiana 50,887 17,199 19,863 919 12,722 184/,.olne 14,696 9,927 49 2,454 2,248 18Maryland 38,833 21,515 I 5,561 10,992 764Massachusetts 42,919 22,091 224 7,798 12,6~o 110Michigan 91,761 45,412 662 25,948 19,440 299Minnesota 36,978 20,783 0 9,286 6,818 91Mississippi 42,354 15,733 17,768 2,611 6,154 88Missouri 50,467 26,601 1,136 9,701 12,624 405Montana 6,485 2,059 263 1,857 2,287 19Nebraska 17,201 8,335 69 4,370 3,999 428Nevada 30,048 6,546 10,978 3,628 5,969 2,927t\lew Hampshire 13,371 7,311 1,943 1,846 2,232 39New Jersey 71,354 21,019 0 9,583 40,093 659New Mexico 5,860 3,203 0 1,199 1,450 8New York 128,382 52,246 0 16,504 55,752 3,880North Carolina 105,648 82,801 0 9,513 12,978 356North Dakota 13,243 5,454 2 5,882 1,801 104Ohio 105,546 36,154 31,140 10,773 27,331 1i18Oklahoma 93,752 31,555 51,404 5,981 4,812 0Oregon 46,255 29,817 0 13,129 3,309 0Pennsylvania 174,034 20,659 45,781 51,608 55,401, 582Rhode Island 6,734 1,660 79 1,441 3,500 54South Carolina 67,165 18,813 28,692 4,488 15,145 27South Dakota 9,055 4,000 548 2,720 1,777 10Tennessee 88,664 21,199 56,271 3,131 7,686 377Texas 392,932 85,965 250,573 14,190 40,603 1,601Utah 26,881 10,531 6,106 8,356 1,678 210Vermant 1,069 549 13 161 340 6Virginia 126,912 44,953 63,149 7,185 II ,624 1Washington 41,777 22,587 556 14,440 3,984 210West Virginia 46,482 7,096 36,735 810 1,791 50Wisconsin 77,396 28,313 II 18,572 30,392 108Wyoming 14,412 4,887 3,998 3,043 2,467 17Source: Table adapted by SOLRCEBOOK staff from table provided by the U.S.Department <strong>of</strong> Heolth and Human Services, National Institute on Alcohol Abuse andAlcoholism.;1
.~--~-----r<strong>Sourcebook</strong> <strong>of</strong> <strong>Criminal</strong> <strong>Justice</strong> <strong>Statistics</strong> <strong>1983</strong>Table 4.20 Juveniles taken Into police custody, by method <strong>of</strong> disposition and size <strong>of</strong> place, 1981NJTEI See NJTES, Tables 4.1 and 4.4.see Appendix 2.Population groupTOTAL ALL AGENCIES11,499 agencies; totalpopulation I 92,945,00U:NumberbPercentTOTAL CITIES8,098 cities; totalpopulation 128,658,000:NumberPercentGroup I:48 cities, 250,000 and over;population 28,406,000:NumberPercentGroup II:107 cities; 100,000 to 249,999;population 15,521,000:NumberPercentGrOUp III:287 cities, 50,000 to 99,999;population 19,579,000:NumberPercentGroup IV:597 cities, 25,000 to 49,999;popUlation 20,542,000:NumberPercentGroup V:1,519 cities, 10,000 to 24,999;population 23,818,000:NumberPercentGrOUp VI:5,540 cities under 10,000;population 20,792,000:NumberPercentSU3LRBPN COLNTIE51,027 agencies; population38,140,000:NumberPercentRLRAL COLNTIES2,374 agencies; popUlation26,147,000:Nl.mberPercentSU3LRBPN AREA c5,529 agencies; popUlation92,0 II ,000:IWrnberPercentTotal1,383,380100.01,158,280100.0238,908100.0128,046100.0172,251100.0206,437100.0225,547100.0For definitions <strong>of</strong> suburban areas and rural counties,(1981 estimated population)187,091100.0155,753100.069,347100.0634,252100.0alncludes all <strong>of</strong>fenses except traffic and neglectcases b Becau5e <strong>of</strong> rounding, percents may not odd tototal.Handled Referred towithinc;:p;:;ftmentjUVel'!!!e-courtand released jurisdiction468,21233.8401,01234.677,49632.442,16632.960,00134.875,69636.783,10136.862,55233.449,01131.518,18926.22!41,18838.0802,73458.0661,34757.1149,78062.77tl,33461.298,34957.1113,81355.1122,26054.298,81152.898,06663.043,32162.5337,27053.2Referredtowelfareagency20,7%1.517,4221.52,4891.02,9222.34,1532.43,2661.62,5001.12,0921.12,0121.31,3622.07,8841.2Referredto otherpoliceagency21,6251.6Itl,4951.65,8902.51,7421.42,3911.43,4361.72,5281.12,5081.31,5091.01,6212.38,1801.3R~f~riedto criminalor adultcourt70,0135.160,0045.23,2531.42,8822.37,3574.310,2265.1115,1586.721,128II .35,1553.34,8547.039,7;;06.3clncludes suburban city and county lawenforcement agencies within metropolitan areas.Excludes core cities. Suburban cities also included inother city groups.Saurce: U.S. Deportment <strong>of</strong> <strong>Justice</strong>, Federal <strong>Bureau</strong> <strong>of</strong> Investigation, Crime In the United States, 1981(Washington, D.C.: U.S. Government Printing Office, 1982), p. 233.Il'nIiI'ri:I1:I I:ICharacteristics and Distribution <strong>of</strong> Persons ArrestedI="igure 4.18 Percent distribution <strong>of</strong> juveniles token Into custody, by method <strong>of</strong> disposition, United States,1972-811:Q)50 -40~ 30Q)a.2010NJTE: See N:JTES, Tables 4.1 and 4.4.------- ........................................' ..... .......... .......... ................. - ----O~-r----~----~----~----r----'----~-----r----~----'1972 197J 1974 1975 1976 1977 1978 1979 1980 1981- - - Referred l!l IV'Jenile court jurisdiction---- Handled within department and releasedReferred to criminal or adult court•••••••••• , Referred to other police agency- • - •• Referred to welfare agencySaurce: U.S. Deportment <strong>of</strong> <strong>Justice</strong>, Federal <strong>Bureau</strong> <strong>of</strong> Investigation, Crime In the United States, 1972, p.116; 1973, p. 119; 1974, p. 177; 1975, p. 177; 1976, p. 220; 1977, p. 219; 1978, p. 228; 1979, p. 230; 1980;p:258;1981,p;--23J (Washington, D.C.: U.S. Government Printing omce). FigureconstructedDy S
---~--- ----------- -----------------------------------------------_.<strong>Sourcebook</strong> <strong>of</strong> Crlmlnol <strong>Justice</strong> <strong>Statistics</strong> 19113r\L
-----------------Figure 4.19 Seiz·~.res <strong>of</strong> illegal drug laboratories, by type <strong>of</strong> drug manufactured, Ulited States, 1975-82I'DTE: This figure represents activities <strong>of</strong> th~ U.S. Department <strong>of</strong> Jwtlce, Drug Enforcement Aaninistration asreported to the U.S. General Accounting vffi!'e.....0'10)~~.m2l!~'0~§z10020n::r., ccn...it[0''" c" c.0., [[0'" 0-~ ...:siil., :l;"... "'"" c.1875-11182PCP1975-11182Amphetamine1915-11182Methaqualone1975-11182Huhllhoil1975-1982LSD ' CocaineOther haUuc!novo".Other coniroilledlubstance,·aThis category includes other controlled substar,:;es such as phenal 2propanone, a precun.or used in making met~tanlne and CJITllhetanlne, andmethadone, an opiate-type heroin substltvte.4\..oc
~--~----------~---------------------~---,'d;,1\Characteristics and Distribution <strong>of</strong> Persons ArrestedTable 4.24 Seizures for violations <strong>of</strong> laws enforced by the U.S. Customs Service, by type and value <strong>of</strong> propertyseized, fiscal years 1975-!l2\N:lTE: See N:lTE, Table 4.22. The domestic value <strong>of</strong> an article seized is estimated fromretail value lists kept by U.S. Customs i;'1spectors.(Domestic value in thousands)TransitionType <strong>of</strong> property siezed 1975 1976 guarter 1977 1978 1979 1980 1981 1982Prohibited non-narcoticarticles:Nl.mber <strong>of</strong> seizuresDomestic value15,752 27,875 8,000 27,156 28,085 20,959 18,464 19,198 23,463Vehicles:Nl.mber <strong>of</strong> seizuresDomestic value11,680$29,56410,897$33,5734,010$9,31111,196$29,9406,198$19,3512,829$9,0603,039$12,2694,011$14,8825,951$35,936Aircraft:Nl.mber <strong>of</strong> seizures 68 130 42 124 94 135 195 272 206Domestic value $3,277 $18,799 $1,834 $5,640 $16,554 $19,979 $11,584 $32,487 $34,742Vessels:Nl.mber <strong>of</strong> seizuresDomestic value129$18,197191$46,40063$1,945291$90,656334$32,421272$74,5291,319$91,269556$46,535500$44,462Monetary instruments:Nl.mber <strong>of</strong> seizuresDomestic value300$7,345374$7,782168$2,695538$7,430721$13,0761,328$22,4721,257$31,3821,554$:39,8461,802$32,757General merchandise:Nl.mber <strong>of</strong> seizuresDomestic value27,188$88,26627,667 7,063$49,675 $16,00228,750$80,73226,151$46,78224,318$41,63919,789$39,6067..3,250$63,49127,132$92,015TotalNuTJber <strong>of</strong> seizuresDomestic value55,117 67,134 19,346 68,055 61,583 49,841 44,063$146,648 $156,228 $31,788 $214,399 $128,183 $167,680 $11:!6,10948,841 59,054$197,242 $239,912Source: U.S. Department <strong>of</strong> the Treasury, U.S. Customs Service, Prologue '76 (Washington, D.C.: U.S. Department <strong>of</strong>the Treasury, 1976), p. 37; and U.S. Department <strong>of</strong> the Treasury, U.S. Customs Service, Customs U.S.A., 1980, p. 32; 1982,p. 36 (Washington, D.C.: U.S. Department <strong>of</strong> the Treasury). Table adapted by SOLRCEBOO< staff.t,-'·1Table 4.25 Seizures and arrests by the U.S. Coast Guard, by type and amount <strong>of</strong> property seized, 1976-82N:lTE: A "thai stick" is a Southeast Asian marihuana bud that is bound onto a short section <strong>of</strong>bamboo. It may be laced with opium, hashish, or another narcotic in order to increase itspatency. This definition was provided to SOLRCEBOO< staff by the Source. Data have beenrevised by the Source and may differ from previous presentations in SOLRCEBOO
._----- - ---<strong>Sourcebook</strong> <strong>of</strong> <strong>Criminal</strong> <strong>Justice</strong> <strong>Statistics</strong> <strong>1983</strong>Characteristics and Distribution <strong>of</strong> Persons ArrestedI,ITable 4.26 Value and number <strong>of</strong> counterfeit notes and coln~ passed and seized before circulation, and number <strong>of</strong> counterfeiting plantoperations suppressed by the U.S. Secret Service, fiscal years 1972-82Fiscal year19721973197419751976Transition quarterU771.'i'7B111791911ll198119!:12NJTE: The data presented prior to and Including 1976 coincide with the former Federal fiscal year,the period July I to June 30. The transition quarter refers to the period July I, 1976 to Sept.30, 1976. The fiscal y~ar for the Federal Government is now from Oct. I to Sept. 30.Counterfeit notesValue <strong>of</strong> counterfeit coinsTotal value Seized Passed Seized<strong>of</strong> notes Passed on the eubllc before circulation on the before Totaland coins N..m5er Value I'bnber Value Total value ~ublic circulation value$27,752,324 287,014 $4,815,536 1,097,424 $22,910,797 $27,726,333 $15,333 $10,658 $25,99125,305,511 178,935 3,339,895 1,143,067 21,942,350 25,282,245 12,386 10,880 23,26621,401,788 120,956 2,431,353 659,746 18,950,777 21,382,130 7,934 11,724 19,65848,624,982 155,952 3,616,265 1,286,054 44,986,182 48,602,447 7,743 14,792 22,53535,088,968 135,422 3,374,520 672,606 31,705,689 35,080,209 5,470 3,289 8,7595,474,842 49,044 1,108,381 145,045 4,364,956 5,473,337 848 657 1,50544,038,593 255,497 4,871,847 1,178,456 39,158,293 44,030,140 7, III 1,342 8,45322,341,165 196,764 4,000,482 560,912 18,337,568 22,338,050 2,241 874 3,11550,769,774 187,727 4,515,388 1,239,969 46,248,953 50,764,341 1,842 3,591 5,43360,846,442 1!:I9,015 5,540,767 1,324,336 55,292,433 60,833,200 1,771 II ,471 13,24258,553,993 227,822 6,905,876 1,390,368 51,641,606 58,547,482 4,814 1,697 6,51182!272!619 273!306 8 1 585 1 991 1,484,224 73!681,444 82 1 267 1436 7 1 °37 4 1 146 5 1 183CounterfeitingplantoperationssueeressedNotes Coins84 I72 056 I75 I58 I12 087 057 06378°083 I86 2Source: U.S. Deportment <strong>of</strong> the Treasury, U.S Secret Service, "Annual Statistical Summary, Fiscal Yc:ar 1981," U.S. Deportment <strong>of</strong> theTreasury, 19112. (Mimeographed.); and data provided by the U.S. Deportment <strong>of</strong> the Treosury, U.S. Secret ServIce. Table adopted by Sa.RCEBOO
----------- _. ---~--------~------. - -_ ..<strong>Sourcebook</strong> <strong>of</strong> <strong>Criminal</strong> <strong>Justice</strong> <strong>Statistics</strong> <strong>1983</strong>Table 4.28 Arrests for <strong>of</strong>fenses Clgaln3t rcdlroads, by <strong>of</strong>fense and age group, United States and Canada, 1978-82t-OTE:Data In this table are complied from monthly statistical reports <strong>of</strong> railroad police.1978 1979 1980 1981Ju- Em- Ju- Em- Ju- Em- Ju- Em- Ju-Offense venlle Adult ployee venlle Adult ployee venlle Adult ployee venlle Adult ployee venlleTheft:Theft from freIght carsTheft from trailersTheft <strong>of</strong> entire trailerTheft from multi-levelcarrierTheft <strong>of</strong> copper wireTheft <strong>of</strong> brassTheft <strong>of</strong> other companypropertyBurglary <strong>of</strong> buildingsOther theftVandalism:Multi-level carriersCompony property andequipmentTrack and signalsSwitch tamperingTrack obstructionsStoning <strong>of</strong> trainsShooting <strong>of</strong> trainsOther vondalismTrespassing<strong>Criminal</strong> <strong>of</strong>fensesnot listed1,75B565527737I5651832042085374363286801,663243318I,OIU45231295171181,306141250402351251916114661943426I15o21044481,777616~1288725261252091385 6782 465° 294I 740o 1,6232 2117 2841,25855421199376191,8851133473624212018153123461174331I125!11896451,243394410518736411252086014 58167 491o 2214 62512 1,408o 225II 23991938035169677452,4361814043127514531131III60III441521613522613431,1133283741513563143123° 7216 4972 461° 244o 7967 1,500o 2345 27098148222122636262,2981676213721614427264131481233024I9651521646694591o574724611381142 8713 506453167564o 1,324° 1396 1951982Adult74054632118207271,5121564184,055 28,531 73 3,440 42,254 63 2,408 36,304 12 3,042 42,938 12 2,818 51,757 22705 3,582 194 727 3,094 281 706 3,413 218 637 4,766 238 542 4,907 195Totol 12.76B 36.668 539 12.079 50,975 794 9,874 45,858 637 10,254 54,049 560 8,899 61,218 474Source: Table adopted by SaRCEBOO< from tables provided by the Association <strong>of</strong> American Railroads, Safety and Special Services DivIsion:26245144241401213860Employee1270o4o3138314°6o° 7This section presents information relatingto the judicial disposition <strong>of</strong> juveniles andadults in the United States. Although theUniform Crime Reports and the NationalPrisoner <strong>Statistics</strong> programs provide nationwidedata on specific law enforcement andcorrectional activities, no comparable uniformState and local judicial processing data exist.Recent exceptions are data relating to casesfiled in State courts and data on individualspi"ocessed in juvenile courts, including theestimated number <strong>of</strong> delinquency cases handledby courts with juvenile jurisdiction in theU,ited States.Because <strong>of</strong> the limited amount <strong>of</strong> Stateand local judicial processing data, this sectionrelies heavily on data from the Federal courts.Included here are dato on the number and type<strong>of</strong> civil and criminal cases filed, terminated,and pending in Federal courts; requests forimmunity; and the nature <strong>of</strong> proceedings,dispositions, and sentences imposed on Federa Idefendants. Additional tables present data onSection 5:JJDICIAL PROCESSING OF DEFENDANTSthe number and nature <strong>of</strong> cases that reach theFederal courts via appeal. For example,information on the number and type <strong>of</strong> prisonerpetitions filed in U.S. District Courts, as wellas the number <strong>of</strong> petitions for review on writ<strong>of</strong> certiorari to the Supreme Court, is included.Also presented are data on the numberand type <strong>of</strong> court-authorized interceptions byState or Federal authorities <strong>of</strong> private wire ororal communications, including information onthe number, location, duration, and cost <strong>of</strong> theintercept devices; the types <strong>of</strong> criminal<strong>of</strong>fenses being investigated; the number <strong>of</strong>interceptions made, and the results (i.e.,arrests, convictions) <strong>of</strong> those intercepts.Judicial processing <strong>of</strong> postal violations,violations <strong>of</strong> U.S. immigration and nationalitylaws, and cases investigated by the U.S. SecretService also appear in this section. Finally,there is information relating to General andSpecial Courts-Martial <strong>of</strong> Army, Air Force,Navy, and Coast Guard personnel.472473
, .. --'" ,,,.~-"<strong>Sourcebook</strong> <strong>of</strong> <strong>Criminal</strong> <strong>Justice</strong> <strong>Statistics</strong> <strong>1983</strong>Table 5.1 Filings In State courts <strong>of</strong> general and limited jurisdiction, by State, 1981I'VTE: The data below are from a survey <strong>of</strong> State CourtMninistratlve Offices conducted in August 19B:! by the NationalCenter for State Courts for the <strong>Bureau</strong> <strong>of</strong> <strong>Justice</strong> <strong>Statistics</strong>. "Anyattempt to make comparisons between States or within a Stateover a period <strong>of</strong> time must ••• take into account the variations inreporting periods reflected in these data. About half <strong>of</strong> the Statesreport on a calendar year basis and the others report on a fiscalyear basis ••• the most common (fiscal year) runs from July Ithrough June 30 for any given year. However, in a few (six) casesthe fiscal year may be started on August I, September I, OctoberI, or February 4 and in these cases variations may also be foundin reporting periods within the State" (Source, pp. 7, 8).These figures represent virtually all cases filed in generaljurisdiction courts and between 70 percent and 80 percent <strong>of</strong>cases filed In limited jurisdiction courts. The following courtsreported no data: Alabama--Probation and municipal courts.Colarado--Municipal court. Georgia--<strong>Justice</strong> <strong>of</strong> the peace, smallclaims, mUnicipal, magistrate, civil, crlminol, municipal recorder's,mayor's city council, and police courts. Kansas--Munlcipal court.Louisiana- -<strong>Justice</strong> <strong>of</strong> the peace and mayor's courts. Moine-Probate court. Maryland--Orphan's court. Massachusetts-Probation and family court deportment. Michigan--Court <strong>of</strong>claims, Common Pleas Court <strong>of</strong> Detroit, and municipal andprobate courts. Mantana--<strong>Justice</strong> <strong>of</strong> the peace, city, andmunicipal courts. Nebraska--Separate juvenile court, workmen'scompensation court. New Jersey--Surrogate's and municipalcourts. New Mexico--Municipal and probote courts. New York-Town and village justice courts. Ohio--Mayor's court. Oklahoma-Municipal court. Rhode Island--Municipal and probate courts.Tennessee--County, general sessions, probate, juvenile, trialjustice, and municipal courts. Utah--Juvenile and justice <strong>of</strong> thepeace courts. West Virginia--Municipal court. Wyoming--County,justice <strong>of</strong> the peace, and municipol courts.TotalTotalexcludingincludingState Civil <strong>Criminal</strong> Juvenile traffic Traffic trafficAlalxrna L16,4UI:I 140,170 46,ll66 403,444 227,72:! 631,166Alaska 30,72ll 22,355 1,270 54,353 B6,729 141,0!:l2Arizona 138,621 148,395 1,076 2B8,On 1,153,217 1,441,309Arkansas 99,452 147,428 13,907 260,787 479,106 739,893California 1,639,518 923,834 102,333 2,665,6ll5 15,599,B45 a 11:1,265,530 0Colorado 202,775 59,578 26,153 288,506 181,873 470,379Connecticut 212,240 109,53~ 14,255 336,034 303,2lll 639,315Delaware 49,728 56,822 9,870 116,420 128,425 244,ll45District <strong>of</strong> Columbia 145,911 36,597 4,765 Ill7,273 10,403 197,676Florida 553.574 447,754 113,1l41 1,115,169 2,287,888 3,403,057Georgia 257;173 45,286 34,41:12 436,941 361,167 791l, lOBHowaii 47,382 52,537 8,913 108;632 871-'116 0 91l0,74!PIdaho 52,347 32,632 7,661 92,64U 209;904 0 3U:! , 544a0Illinois 647,096 712,379 32,642 1,392,117 6,582,043 0 7,974,160r"'l..,-j r::...,,I'".)I:J. ")-.1"')Indiana 381l,3UI 144,96U 26,315:J;;;)7,.:J/O"}.:J... ,r.~r.913,BOIlIowa 133,484 113,667 5,570 252,721 661,254 913,975Kansas 118,11l7 3U,093 10,607 151l,!l1l7 275,828 0 434,715 0Kentucky 187,210 217,193 b36,445 440,848 274,788 715,636Louisiana 23B,609 536,856 30,117 805,562 467,506 1,L73,08!lMaine 57,938 96,449 13,404 167,791 88,372 256,163Maryland 590,ljll7 171,781 29,750 792,411l 646,313 0 I , 43B , 731 a0Massachusetts 465,987 657,551 118,876 1,242,414 3,243,585 0 4,485,9911 aMichigan 263,863 538,014 22,131 824,UOll I , 313 , 532a0 2,137,54UMinnesota 251,062 114,986 44,672 410,720 1,448,626 1,859,346 0Mississippi N\ N\ N\ N6. N\ N\Missouri 220,643 148,155 14,935 383,733 656,011 1,039,744Mantana 6,533 1,340 576 ll,449 N\ N\Nebraska 81,199 173,844 3,118 258,161 189,089 447,250Nevada 81,874 52,1:122 2,777 137,473 225,953 363,426New Hompshire 65,476 39,175 7,287 111,938 202,218 314,156New Jersey 573,166 31,719 109,881 714,766 N\ N\New Mexico 66,325 69,355 4,342 140,022 382,177 0 522,199 0New York 793,896 1,209,061 37,005 2,039,962 460,260 2,500,222'North Carolina 378,688 487,783 19,900 886,371 677 ,247 1,563;61!lNarth Dakota 25,765 21,719 c 1,249 48, 733 c 119 , 662 a ,c 168 395 a ,cOhio 619,043 406,403 202,835 1,228,281 1,598,165 2,826,446 ' aOklahoma 2Ub,OI:lIl (d) 8,063 N\ (d) 483,691Oregor. 155,362 149,695 N\ N\ 671,893 N\aPennsylvania 515,014 745,308 47,979 1,3UB,301 4,54U,269 a 5,848,57URhode Island 40,175 3ll,940 7,275 86,390 N\ N\South Carolino 182,336 469,B94 9,633 661,863 416,11l4 1,071l,U47South Dakota 35,911 136,471 N\ N\ I'A I~Tennessee 94,631 37,213 N\ 131,844 I~ N\Texas 679,107 1,316,709 II ,761 2,U07,577 4,226,529 6,234,106Utah 92,894 37,366 34,848 165,IU!l 444,421 6U9,529Vermont 24,856 16,599 1,616 43,071 1l5,750 128,821Virginia 770,6~3 399,209 133,471 1,303,373 1,014,3U4 a 2,317,677 0Washington 218,446 170,557 24,424 413,427 1,650,194 0 2,063,621 0West Virginia 89,608 117,493 7,514 21'1,615 114,7B7 a 329,402 0Wisconsin 326,920 161,645 28,336 516,901 230,680 747,581Wyoming 11,513 1,772 975 14,260 N\ N!>.aparking tickets are included in the traffic case load <strong>of</strong> the number <strong>of</strong> cases filed during the yeor for case types forreparwd for these States.which filing data were not ovailable. In the Annual Report series,Traffic filings could not be completely separated from dispos~tions were found to be similar in nurriber to case filings.criminal and juvenile filings in Louisiana. Oklahoma reported 26,076 felonies and 241,464cThe number <strong>of</strong> cases dispased was used here as an estimate misdemeanors. The misdemeanor figure included traffic violations.Source: U.S. Deportment <strong>of</strong> <strong>Justice</strong>, <strong>Bureau</strong> <strong>of</strong> <strong>Justice</strong> <strong>Statistics</strong>, State Court Caselood <strong>Statistics</strong> 1977 to 19!11, Speciol ReportNCJ-87587 (Washington, D.C.: U.S. Department <strong>of</strong> <strong>Justice</strong>, February 19113), p. Z.,i ~II{l~IiIiIIIiIIIi1\!I1\:1II'l[!~"IJudicial Processing <strong>of</strong> DefendantsTable 5.2 State appellate court filings and dispositions, by State, 1981StateNJTE: See NJTE, Table 5.1.All oRpellate courtsFlJin s Dis ositlonsAlabama a 1,018AlaskaI,U87 496 0 417 495 0422 N\ N!>.Arizona 4631,1433351,1338!l0 757Arkansas 2,4364462,1384273,579 3,271Callfornlc 1,1944,325 1,23U3,9141,640 1,657Colorado 14,9331,052 14,6871,00119,258 18,601Connecticut 1,5125951,3205592,564 2,321Delaware 191337 165341l 786X724District <strong>of</strong> Columbia 1,663 X1,235337 348Florida X1,456X1,5371,663 1,235Georgia13,7951,61713,6571,73215,251 15,194Howall 2,152387 N\4833,769 N!>.Idaho 127455 176363 514 65~illinois X1,8U3 X1,777455 363Indiana 6,5164096,3333978,319I,Og58,IIUIowa 1,733 b 1,1091,2051,504 1,506I.6,318N\Minnesota 1,6095,9771,3528,267 7,690Mississippi XN!>. 1,541X 1,609 1,352Missouri XI ,05~X1,019 N!>. 1,541Montana2,9645742,7')25154,023 3,811Nebraska X956 X910574 515Nevada X732 XN\956X910New Hompshlre 55tl X251732 N\New Jersey X289 X232558 251New Mexico 5,9936105,2125946,282 5,444New York 505708 4447061,11511,6381,03t1North Carolina 98911,01194712,346 11,717Narth Dakota 1,994309 1,71:112802,983 2,728Ohio 2,134X X2,031309 280Oklahoma c 8,9152,543 2,427b 9,424 b 11,04!i'b 11,455Oregan 1,0808124768382,543 2,427Pennsylvania 3,403 3,2392,251• N!>.4,215 4,077Rhode Island 12,830592 N\62915,084 N\South Carolina X1,173 X613592 629South Dakota X363 X3721,173 613Tenne~seeX885 X945363 372Texas 1,7233,3951,7453,3292,608 2,690Utah 6,151700 3,4075779,546 6,736Vermont X601 X508700 577Virginia X2,257 X1,823601 508Washington X863 X8302,257 1,823West Virginia 2,7991,5492,4761,0603,662 3,306Wiseonsln X737X8171,549 1,060Wyoming2,4791982,3512113,216 3,168XXa198 211Data are Incomplete: Alabama has two Intermediateappellate courts, but only one, the court <strong>of</strong> Civil Appeals t~ansferred to the Intermediate appellate court forreporwd data In 1981. ' dlsposbtlon•All appellate cases In Iowa and Oklahoma are fliedrp-.. ' Both Okl'lhcmo and Texas have two courts._"""fT.<strong>of</strong> lastIn the courts <strong>of</strong> last resort, A portion f th!: ~(l'eioad IsSource: U.S. Deportment <strong>of</strong> <strong>Justice</strong> <strong>Bureau</strong> f J tl S I 'Special Report NCJ-875t17 (Washington 6 C • us 0 D us ce tat stlcs,. State Court Case load <strong>Statistics</strong> 1977 to 1~81,, ... •• epartment <strong>of</strong> JustIce, February <strong>1983</strong>), p. 5.474,j"'i1\475
<strong>Sourcebook</strong> <strong>of</strong> <strong>Criminal</strong> <strong>Justice</strong> <strong>Statistics</strong> <strong>1983</strong>Table 5.3 Percent change in filings in State appellate courts, by State, 1971 and 1981N:)TE: See N:)TE, Table 5.1. The 1977 data are token from State Court Case load<strong>Statistics</strong>: Annual Report, 1977, produced by the National, TE: See !'UTE, Table 5.4. For I 971l, 1979, and 198U, cases with missing informationwere allocoted to the nonmlsslng categories In a manner proportional to thedistribution <strong>of</strong> the weighted COSi~S with known information. For survey methodology anddefinitions <strong>of</strong> terms, see Appendl~ 15.1975 1216 1217 1216 121:1Estlm:JAedEs t ilTlJtgdEst in1.ltgdEs t ilTlJ t gdEst IITIJ~ednumber Percent nUTber Percent mrrber Percent milner Percent nUTber Percent1,4U6,100 lOO.U 1,396,800 100.0 1,355,500 100.0 1,340,700 100.0 I,JU6,1l00 100.0I ,U7I ,400 76.2 1,064,oou 76.2 I,U36,9UU 76.5 1,013,7UU 75.6 1,011l,9UO 78.0334,600 2:3.11 330,700 23.7 315,600 23.3 327,UOO 24.4 287,800 22.0IOU (b~ 2,100 0.2 3,UUU U.:.! X X X X~unded to the nearest hundred.unds to ° percent.477121l1JEs t ilTlJ~ednUTber Percent1,345,:.!OO 100.01,045,7UO 77.72519, SOU 22.3~ ~
Table 5.6 Estimated percent <strong>of</strong> delinquency cases disposed <strong>of</strong> bycourts with juvenile jurisdiction, by sex and race <strong>of</strong> juvenile,United States, 1980N)TE: See N)TE, Table 5.4. Cases with missing Informotion wereallocoted to the nonmlsslng categories In a manner proportional tothe distribution <strong>of</strong> the unweighted cases with known Information.Although the percent <strong>of</strong> wel9Stlid cases with missing Information onthese attributes Is unknown, • percent <strong>of</strong> the unwel9hted caseswere missing. For survey methodology and definitions <strong>of</strong> terms, seeAppendix 15.SexMaleFemoleWhite77.522.5(Percent)RaceBlack79.220.8<strong>Sourcebook</strong> <strong>of</strong> Crlmlnol JUstice Stotlstlcs <strong>1983</strong>Other73.226.8Source: Tobie provided to SCLRCEBOO< st<strong>of</strong>f by the N:JtJonolCenter for Juvenile <strong>Justice</strong>.Table 5.7 Estimated number and rate (per 1,000 childpopulation 10 through 17 years <strong>of</strong> age) <strong>of</strong> delinquency casesdisposed <strong>of</strong> by courts with juvenile jurisdiction, by age attime <strong>of</strong> referral to court, United States, 1980N)TE: See N)TE, Tobie 5.4. Although most States provide for juvenilejurisdiction over children 15 years <strong>of</strong> age ond younger, severalStates do n<strong>of</strong> provide for juvenile jurisdiction over 16- and 17-year-olds. Accordingly, the child population at risk nationwide forthe 16- and 17-year-old age categories Is less than the totalpopulation <strong>of</strong> 16- and 17 -year-olds. The data for 18-yearftolds andolder more <strong>of</strong>ten refer to cases In which the juvenile courtexercises continuing jurisdiction over the case, although In someInstances cases <strong>of</strong> original jurisdiction may be Included In thesecategories. Cases with missing Information were allocated to thenonmlsslng categories In a monner to the distribution <strong>of</strong> theweighted cases with known Information. For survey methodology anddefinitions <strong>of</strong> terms, see Appendix 15.EstimatedEstimatedAge at time number <strong>of</strong> child Estimated<strong>of</strong> referral dellnqueccy populatl'f,n rateto court cases Percent at risk eer IIOOOco through 9 years 20,900 1.6 N:\ X10 years 18,000 1.3 3,716,400 4.8II years 29,60U 2.2 3,58U,400 8.312 years 56,900 4.2 3,518,900 16.213 years 118,9UO 8.8 3,642,900 32.614 years 208,500 15.5 3,782,400 55.115 years16 years307,600326,30022.924.34,05!1,4003,680,30075.888.717 years 238,400 17.7 2,608,600 91.4l!l years and older 20,000 1.5 N:\ XTotal 1,345,200 100.0 N:\ X~Rounded to the nearest hundred.For a discussion <strong>of</strong> procedures used to generate childpopulation at risk estimates, see Appendix 15.cBased on number <strong>of</strong> delinquency cases per U.S. popUlation 10through 17 years <strong>of</strong> age.Source: Ttlble provided to SCLRCEBO:l< st<strong>of</strong>f by the NationalCenter for Juvenile <strong>Justice</strong>.Table 5.8 Estimated number and percent <strong>of</strong> delinquency casesdisposed <strong>of</strong> by courts with juvenile jurisdiction, by age attime <strong>of</strong> referral to court and sex <strong>of</strong> juvenile, United States,1980N)TE: Sec N)TES, Tobles 5.4 and 5.7. Cases with missing Informationwere ollocated to the nonmlsslng categories in a mannerproportJ anal to the distribution <strong>of</strong> the weighted cases with knowninformation. For survey methodology and definitions <strong>of</strong> terms, seeAppendix 15.MaleFemaleAge at timeEstimatednumber <strong>of</strong>Estimatednumber <strong>of</strong><strong>of</strong> referralto courtdellnqueccycases Percentdellnqueccycases Percento through 9 years 17,300 82.8 3,600 17.210 years 15,1100 85.3 2,70U 14.7II years 24,200 82.0 5,300 18.012 years 44,200 77.6 12,70U 22.413 years 87,800 73.8 31,200 26.214 years 151,300 72.6 57,120 27.415 years 230,3UO 74.9 77,400 25.116 yeors 26U,OUO 79.7 66,400 20.317 years 198,300 83.2 40,100 16.818 years and older 17,000 84.7 3,100 15.3Total 1,045,700 77.7 299,500 22.3°Rounded to the neorest hundred.Source: Table provided to SCLRCEBOO< staff by the NationalCenter for Juvenile <strong>Justice</strong>.IIIIJudicial Processing <strong>of</strong> DefendantsTab!e 5.9 Estimated number and percent <strong>of</strong> delinquency, casesdisposed <strong>of</strong> by courts with juvenile jurisdiction, by reason forreferral to court, United States, 1980N)TE: See NOTE, Table 5.4. Due to reporting differences somer.roblems exist with the recording <strong>of</strong> reasons for referral to ~aurt.Forcible rape" may Include cases <strong>of</strong> prostitution lewd behaviorpossession <strong>of</strong> pornographic materials, and sexual m'lsconduct. Th~reason for this problem Is the Inconsistency <strong>of</strong> States' methods <strong>of</strong>reporting <strong>of</strong>fenses and the variance In the application <strong>of</strong> labels. Forexample, most assaults reported In the table constituted minor<strong>of</strong>fe.nses such as fighting. This Information has been provided by the!\btlonal Center for Juvenile <strong>Justice</strong>.Cases with missing Information were allocated to thenonmlsslng categories In a manner proportional to thi:! distribution <strong>of</strong>the wel?ht~d cases with known Information. For survey methodologyand definitIons <strong>of</strong> terms, see Appendix 15.Reason for referral to courtTotol<strong>Criminal</strong> homicideForcible rapeRobberyAggravated assaultSimple assaultBurglaryLarcenyMotor vehicle theftArson and vandalismStolen property <strong>of</strong>fensesTresposslng!\brcotlcs <strong>of</strong>fensesOther drug <strong>of</strong>fensesWeapons <strong>of</strong>fensesSex <strong>of</strong>fensesDrunkennessDisturbing the peaceEscape, contempt, probation, paroleOther delinquent actsRUnning awayTruancyCurfew violationsUngovernabilitilLiquor violationsOther status <strong>of</strong>fensesa Rounded to the nearest hundred.EStimated number <strong>of</strong>delinquency cases aPercent1,345,200 100.01,8003,20026,50034,30082,100176,400278,10051,00084,30030,70031,2007,50067,30017 ,00012,5UO25,50043,30027,30092,9UO68,70032,8UO15,60050,70056,30028,1000.10.22.02.66.113.120.73.tl6.32.32.30.65.01.30.91.93.22.06.95.12.42.13.84.22.1Source: Table provided to SCLRCEBOO< staff by the !\btionaiCenter for Juvenile <strong>Justice</strong>.478479
------------------- ------------------------------------------------------<strong>Sourcebook</strong> <strong>of</strong> <strong>Criminal</strong> <strong>Justice</strong> <strong>Statistics</strong> <strong>1983</strong>Table 5.10 Estimated number and percent <strong>of</strong> delinquency casesdisposed <strong>of</strong> by courts with juvenile jurisdiction, by source <strong>of</strong>referral to court and manner <strong>of</strong> handling, United States, 1980NJTE: See NOTE, Table 5.4. Cases with missing information wereallocated to the nonmissing categories in a manner proportional tothe distribution <strong>of</strong> the weighted cases with known information. Forsurvey methodology and definitians <strong>of</strong> terms, see Appendix 15.Source <strong>of</strong> referral to courtLaw enforcementParents, relativesSchoolProbation <strong>of</strong>ficerSocial agencyOther courtOtherEstimated number <strong>of</strong>delinquency cases aPercent1,345,200 100.01,112,10047,20082.73.541,200 3.114,10043,7001.03.227,300 2.059,600 4.4Manner <strong>of</strong> handling 1,345,200 100.0Without petition 764,700 56.9__ ~W~it~h~pe~t~it~i=on~ ________________ ~5~B~0~,~40~0~ ______ 43.1aRounded to the nearest hundred.Source: Table provided to Sa...RCEBOO
-~--~------------Figure fiscal 5.1 years Requests 1973-82 for inmunity by Federal prosecutors to the U.S. Attorney General and witnesses involved in these requests, by origin <strong>of</strong> request,I--oTE: These data reflect requests received from Federal prosecutors under 18U.S.C. 6001-6005, the statute that now governs the granting <strong>of</strong> ill11lunity fromprosecution. l!:l U.S.C. 6003 requires prosecuting attorneys in all Federalcapacities to receive authorization from the U.S. Attorney General (orrepresentative) before seeking a court 0,' ~er for witness ill11lunity. It shouldbe noted that in some cases in which the authorization is obtained, theprosecutor may decide not to seek the immunity order from the courts.Therefore, the number <strong>of</strong> witnesses actually granted ill11lunity is probably lowerthan the data in the figure indicate. It should also be noted that data for1973 and 1974 include a total <strong>of</strong> II requests and 27 witnesses, and 7 requestsand II witnesses, respectively, falling under an older statute, l!:l U.S.C. 2514,which has since been repealed. "<strong>Criminal</strong> Division" refers specifically to the<strong>Criminal</strong> Division <strong>of</strong> the U.S. Deportment <strong>of</strong> <strong>Justice</strong> and includes the U.S.Attorneys. "Other" refers to the remaining divisions <strong>of</strong> the U.S. Deportment <strong>of</strong><strong>Justice</strong> (e.g., Antitrust, Tax, Internal Security, Civil Division, Civil Rights, andLands and Natural Resources), as well as to the other Federal agencies (e.g.,Interstate Commerce COll11lission, Federal Trade COll11lission, Securities andExchange COIl11lission, and Deportment <strong>of</strong> the Army) and to the Congress, all <strong>of</strong>which may request ill11lunity <strong>of</strong> witnesses.RequestsFiscal yearWitnesses1973197419751976197719784,41319791980198119825.0004,000 3,000 2,000 1,0000o <strong>Criminal</strong> Divisiono Other0 1,000 2,000 3,000 4,0005,000Source: Figure constructed by 5O...RCEBOQ< st<strong>of</strong>f from data provided by the U.S. Deportment <strong>of</strong> <strong>Justice</strong>, <strong>Criminal</strong> Division.r.\'.'b, !..o
--"~ ~- .... -~--,-----<strong>Sourcebook</strong> <strong>of</strong> <strong>Criminal</strong> <strong>Justice</strong> <strong>Statistics</strong> <strong>1983</strong>Table S.II Court-authorized orders for interception <strong>of</strong> wire or oral communication, by nature <strong>of</strong> order, duration and location <strong>of</strong>interception, and jurisdiction, 1982NJTE: The Director <strong>of</strong> the Administrative Office <strong>of</strong> the United StatesCourts, is required, in accordance with provisions <strong>of</strong> 18 U.S.C. 2519(1},to transmit to Congress a report regarding applications for ordersauthorizing or approving the interception <strong>of</strong> wire or oralconmunications. This report is required to contain informotion aboutthe number <strong>of</strong> such orders and any extensions granted. Every State andFederal judge is required to file a written report on each opplicationmode. This report is required to contain information on the grants anddenials, name <strong>of</strong> applicant, <strong>of</strong>fense involved, and duration <strong>of</strong> authorizedintercept. Prosecuting <strong>of</strong>ficials who have applied for intercept ordersJurisdictionFederalNumber <strong>of</strong> intercept orders'" o:;:;1'0N'':...,o.
-----~ -------------------~------~---------r<strong>Sourcebook</strong> <strong>of</strong> <strong>Criminal</strong> <strong>Justice</strong> <strong>Statistics</strong> <strong>1983</strong>Table 5.11 Court-authorized orders for interception <strong>of</strong> wire or oral conmunication, by nature <strong>of</strong> order, duration and location <strong>of</strong>interception, and jurisdiction, 1982--ContinuedJudicial Processing <strong>of</strong> DefendantsTable 5.12 Court-authorized orders for interception <strong>of</strong> wire or oral conmunicotion, by major <strong>of</strong>fense underInvestigation and jurisdiction, 1982AveragelengthPlace or facility authorizedNumber <strong>of</strong> interce~t orders in da~s in original a~~lication_Vl "COJ.....e: '- 0e:0>0 ~.:= 0..., ...,ro '- ~ .~.~OJ.0::> ...,ro Vl ...,'Ee:ro u Vl "0 ..... c: ro"@ a; 0Ne: ro ...,OJOJ.~'" o.g ~N"C Vl .:= '" ::>.~0 ..... 0>3: Vl :;:;ro'~'- OJ c c·,... 0"" e: OJ~ '-Vl e:'- Vl '""C Vl.~...,0ro"C '- .... .... OJ'~ E ,ro OJe: .~ OJ.c: 0 e: ~ ro ..... ...,~e: .~..., c:. 0..0 OJ ...,OJ.0 OJ Cl.e OJ roVl'- :;:; '"0.. Cl~'- '-.~> Vl .~...,E""..., ..., >, OJ .0e:OJOJro::;Vl E .c:Jurisdiction ::> E OOJ OJ e: ::>xex: ex: z .... '-::>z >-< zOJ Oro ~ f-"Co V'l "C ex: :0;: a> u QTexas:Duval I IGalveston30 93 3Harris30 7 74 I 22 2Hidalgo30 42 2I ILubbock30 24IRandall30 N\I ITarrant30 192 2 30 30 62Utah:Utah30 19Virginia:State Attorney General30 30 51Wisconsin:State Attorney Genera I 2 2 2 13 5 35~Basedon the actual number <strong>of</strong> intercept devices installed as reported by the prosecuting <strong>of</strong>ficial.Combination refers to the number <strong>of</strong> authorized interceptions where more than one location was repC'rted.0", c.. .~ 3: c.. ::> 0...,Source: Administrative Office <strong>of</strong> the United States Courts, -=R1:e,=,or"'iti-r0n'i-i;1f-fT.'iE:irr:::::':-:=-~~"-7-:;::~'::'I;'~:--='-*i1iE':"-':T'h:=:T.~':":i-=;;t~~~:':::'i7or Oral Comnunications for the Period January I , 1982 to December<strong>1983</strong>), pp. 8, 9.484IIl !)!",i'I'IiIi;!j:IIiIiI'iI'tiI)\OTE: See )\OTE, Table 5.11. In the table body, - represents zero.(This table shows generally the most serious <strong>of</strong>fense for each court-authorized Interception)..., ..;,-e:t'..... OOJOJ ::> ~0.. ......0 ro...,::> VlO.0 Vl Vl0 Vl 't ::>"'...,fVl'- ro .e..., -e: ..., ....."C "C Cl 0 0 Cle: e: "0 e:'~e:.~...,ro ro e: e:..., .;:ro ~ .... Vl 00..Cl OJ '-0 UOJ~"C >, ro ... '~'Qjt'b'" :;:;OJro.~ .~e: .ex VlU'-...,~ OJc,U OJ VlOJ 0 OJ OJ OJ OJro .0'-U e: U Vl'-o..'- 'E -'"'- ro"C .... Vl 0 U 1!Jurisdiction0 =:I ro 0 r<strong>of</strong>- a> a> :x: ..J ..Jro z CLOo.. 0: 0i..., .;:0
~-~--~......--- --------~--~- - ~--------~-~~.'".~ ..;;;0; ___ "" ... -"_I;;1' ij,<strong>Sourcebook</strong> <strong>of</strong> <strong>Criminal</strong> <strong>Justice</strong> <strong>Statistics</strong> 19!13 1iJudicial Processing <strong>of</strong> DefendantsTable 5.,\2 Court-authorized ordera for Interception <strong>of</strong> wire or oral communication, by major <strong>of</strong>fense underInvestlgqtlon and Jurisdiction, 1982--ContlnuedTable 5.13 Number and overage cost <strong>of</strong> court-authorized Intercepts <strong>of</strong> wireor oral cOlTmunication, by jurisdiction, 1982...., ....., .NJTE: See NJTE, Table 5.11 • In the table body, - represents zero... c~ :; ocucu ~ c. ....,Q::JClIO,Q VI'" ~ VI c"'" Orders where Orders with cost reported a0 VI cu ::J ~VI.c ...., ·c ...., .... Intercepts NJrnber Average';;; ....,Jurisdiction ~..,...., '"010 0 01c .,......,·C'" '".. VI oc.01 cu 0 ...~'"cuc ..,~~ "'...., .,.. VlCU....,.,.. .,......, ...., cuVlU"cu ....rwalk-Stamford 7 7 9171lkIlon 13 6 7 Judicial District <strong>of</strong> Tolland 2 2 1,441jJudicial District <strong>of</strong> Waterbury 3 3 5,142New Mexico:Bernalillo 1 Deloware:I State Attorney General 2 2 2,500jNew York:State Attorney General 16 4 8 2 Florida:1Chautauqua 3 3 State Attorney General ~ 1\'/\ ~Columbia 5 2 3 IFourth Judicial Circuit (Duval) 8FultonI I Fifth Judicial Circuit (Sumter) I I 30,031ljGenesee 1 I Sixth Judicial Circuit (Pasco and Pinellas) II II 11l,15UKings I IEighth Judicial Circuit (Alachua) 2 2 5,188Monroe 7 4 3 Ninth Judicial Circuit (Osceola) 2 2 10,600N:>ssau 5 2 3 Tenth Judicial Circuit (Polk) 3 3 17,317New Yark 7 I 3 2 I Eleventh Judicial Circuit (Dade) 8 8 3:.1,835!Niagara II 7 4Fifteenth Judicial Circuit (Palm Beach) 5 5 II ,52UOnondaga 5 4 Seventeenth Judicial Circuit (Broward) 9 9 13,136IOrange I IQueell$ 4 2 2 Georgia:Rensselaer I I ChathamSuffolk 30 3 5 2 20I 'Fulton ~ t-f>. t>f>.rTompkins 2 :' 2 Laurens 2 2 3,972Westchester 5 2 2 Monroe I I 12,547Wayne I ( 12,227Oregon:MultnomohIll:4 4 Maryland:Baltimore City 10 10 13,15UPennsylvania:1Baltimore County 4 4 7,777State Attorney Genoral 8 2 2 4 I-bward 4 4 11,047Allegheny 4 3 I Mantgomery 2 2 88,743Lackawanna 3 3IPrince George's 2MoI1tgomery1 ,IPhiladelphia 5 4 ! Massachusetts:j Essex I I 40,000Rhode Island: j Middlesex 7 7 6,237State Attarney General 5 5 ! N:>rfolk 4 4 4,879Worcester 2 2 8,351Texas:J ,Duval I IMinnesota:Galveston 3 3 F:Washington 20,000Harris 2 2 1 'Hidalgo 1I INebraska:Lubbock I IDawes I I 11,599Randall I I Douglos II II 16,044Tarrant 2 2I1 See footnotes at end <strong>of</strong> table.Utah: 1Utah1Virginia,State Attorney GeneralWisconsin:State Attorney General 2 2eror,III486
<strong>Sourcebook</strong> <strong>of</strong> <strong>Criminal</strong> <strong>Justice</strong> <strong>Statistics</strong> <strong>1983</strong>Table 5.13 Number and average cost <strong>of</strong> court-authorized intercepts <strong>of</strong> wireor oral communication, by jurisdiction, 1982--ContinuedTable 5.14 Arrests and convictions resultinglkIlted States, 1971-82Judicial Processing <strong>of</strong> Defendantsfrom court-authorized orders for Interception <strong>of</strong> wire or oral communication,Orders where Orders with cost reported a NJTE: See NJTE, Table 5.11. Arrests, trials, and convictions resulting from theintercepts Number AverageJurisdictionInterceptions <strong>of</strong> wire or oral corrmunlcatlon do not always occur within the someinstalled <strong>of</strong> orders costyear as the Implementation <strong>of</strong> the court order. This table presents arrests andNew Hampshire:conviction data for the year court-authorized Interception began and subsequentyears.State Attorney General3 3 $5,759Year arrestsNew Jersey:and convictions ~ct: Ics:l:olled1971 i!172 1973 1974 1975State Attorney General19762:1197722 10,793reeQrted (~792) (N=841)1978(N=812)1979(N=694) (N=676)1980 1981{N=63511982Atlantic :I 2 14,3:17{b/=601l {~5601 {N=5331 (N=524) {N=56:11 jN=5181Bergen 7 7 32,3761971:Burlington I I II, InArrests 2,811 X X X XCamden X4X4 5,906Convictions 322 XX XX XX XX XEssex X XN\ N\XN\X X X XGloucester I I 15,8511972:Hudson 28 28 6,224Arrests 641 2,861 X X XHunterdonXIConvlct(ons 708X402X XXXXXX XXMercer 6 6X11,953X X >, X XMiddlesex II II 6,0881973:Monmouth 3 3 5,794Arrests 150 532 2,306 X XOcean X6 6X2,470Convictions 441 1,091X409XXXXX XPassaic 8X X8 1,824X X X X XSomerset 3 3 3,161:11974:lAlion 13 13 5,034Arrests 17/j 129 293 2,162ConvictionsX X252X433 607X X179 X XX XNew Mexico:X X X X X X XBernalillo 26,7961975: 0Arrests 493 270 403 707New York:2,234ConvictionsX461X291X597X676 X336 X XState Attorney General X1616X10,715X X X X XChautauqua N\ N\ N\1976: 0Columbia N\ N\ N\Arrests 0 9 21 91Fulton538 2,189IXI XIIConvictions 52 68 146X413X615 358X XGenesee N\XN\XN\X X X XKings I I 180,0901977: 0Monroe 7 7 12,990Arrests 0 0 7 19Nassau203 64752,1915 29,935Convictions 35 X62 X46 161X412X772XNew York 53725 26,921X X X X XNiagara II II 5,0471978: 0Onondaga 5 5 9,249Arrests 0 0 0 13Orange53 145I492I 9,200Convictions I1,825I 21X30X155X246XQueens 4 450213,488337 X X X XRensselaer I I 8401979: 0Suffolk 28 28 11,606Tompkins N\ N\ N\Westchester 5 5 1,530Oregon:Multnomoh 4 4 4,746Pennsylvania:State Attorney General 4 4 14,045AlleghenyILackawanna 3 3 26,570Montgomery I I 10,900Philadelphia 5 5 3,/j12Rhode Island:State Attorney General 5Texas:Duval I I 11,015Galveston 3 3 31,378Harris 2 2 38,382Hidalgo I I 30,063LUbbock N\ N\ N\Randall I I 26,170Tarrant 2 2 5,840i.ltah:Utah 20,000Virginia:State Attorney General 71,531Wisconsin:State Attorne~ General 2 2 12,745a Incl'Jdes costs for orders where intercepts were installed but not used.Arrests 0 0 0 0 16Convictions26I500274I1,7179X22X75X198 303 368 X X X1980: 0Arrests 0 0 0 0 0Convictions30100106 5854 21,8712X19X48 146 424 259 X X1981: 0Arrests 0 0 0 5 9Convictions4501190 IB2III663791,73536X97 49 250 474 248 X1982: 0Arrests 0 0 0 0 0Convictions 03016044093I558 1,72526 22 108 310 745 4535 4,099 alncludes arrests and convictions that occurred prior to the year In which they were reported.4BB4B9
."<strong>Sourcebook</strong> <strong>of</strong> <strong>Criminal</strong> <strong>Justice</strong> <strong>Statistics</strong> <strong>1983</strong>Agure 5.2 Civil and criminal trials argued by U.S. Attarneys' <strong>of</strong>fices, fiscal years 1970-81f'.OTEI The U.S. Attorney Is the highest ranking law enforcement representative In eoch <strong>of</strong> theFederal judlclol districts. The Attorney and his staff assist the U.S. Attorney General In theenforcement <strong>of</strong> Federal criminal laws, the Investigation and prosecution <strong>of</strong> corrupt public <strong>of</strong>ficialsand organized crime figures, and the Initiation <strong>of</strong> environmental litigation. In addition, the U.S.Attarney Is respanslble for the enfarcement <strong>of</strong> laws pertaining to Federal programs. These Includeviolations Involving Medicaid and Medicare, U.S. Government contracts, the use <strong>of</strong> labor unionfunds, educational benefits for war veterans, and the food stamp program. In the civil law area,U.S. Attorneys are Involved In tort claim and civil fraud cases, actions flied against the U.S.Government, Freedom <strong>of</strong> Information cases, and other civil matters. U.S. Attorneys are responsiblefor collecting criminol fines, civil judgments, prejudgment claims, forfeitures, penalties, and othermanles owed to the Federal Government.I n thousands87I22l Civil[::J <strong>Criminal</strong>7,304Judicial Processing <strong>of</strong> DefendantsAgure 5.3 <strong>Criminal</strong> cases pending in U.S. Attorneys' <strong>of</strong>fices, by <strong>of</strong>fense, on Sept. 30, 1981Income tax(N=1,005, 4.00%) ,Immigration(N=1,060, 4.21~."'"Consumer protection(N= 1 ,092, 4.33%) ......Conspiracy _ ""~\~,,~,~~(N=1,123,4.46%)f'.OTE: See f'.OTE, Figure 5.2.(Total criminal cases pending=25,193)Postat crimes(N=961, 3.81%)\Banks and banking(N=819,3.25%)All others" (N=6,b42, 26.36%)Other stolen property _ F~~;?rt~~~~~~~~l~~::-,,",,~~~~ ____ J(N=1,133, 4.71%) r6Bank robbery(N=1,188,4.71%)5Ball ,..(N'1,192,5.00%)Weapons control /(N=1,294,5.14%)Controlled substances(N=6,271,24.90%)Fraud/governmen!(N=1,343,5.33%)4Source: U.S. i?epartment <strong>of</strong> ~llstice, Executive Office for United States Attorneys, United States Attorneys' OffIces:Statistical Report Fiscal Year 198. (Washington, D.C.: U.S. Government Printing Office, 1982), Chart 6.323.36111I!\1I!!1970 19711972 19731974 1971'; 1976 1977 1978 1979 1980 1981Fiscal yearSource: U.S. Department <strong>of</strong> <strong>Justice</strong>, ExecutlVf~ Office for United States Attorneys, United States Attorneys' OffIces:Statlsticol Report Fiscal Year 1980, Chart 5; 1981, Table II (Washington, D.C.: U.S. Government Printing Office) •.Figure adapted by SdRCEBOO< stOff.
-----------------------------------I:-----.. ~ ,"'-~<strong>Sourcebook</strong> <strong>of</strong> Criminol <strong>Justice</strong> Stotlstics <strong>1983</strong>Table 5.15 <strong>Criminal</strong> cases filed, terminated, and pending in U.S. District Courts,years ending June 30, 1955-82N::lTE: There are two reporting changes during fiscal year 1976 that have affected the database. Beginning Oct. I, 1975, all minor <strong>of</strong>fenses (<strong>of</strong>fenses involving penalties that do notexceed I year imprisonment or a fine <strong>of</strong> more than $1,000), with the exception <strong>of</strong> mostpetty <strong>of</strong>fenses (<strong>of</strong>fenses Involvin\! penalties that do not exceed 6 months incarceratlanand/or a fine <strong>of</strong> not more than ~500), are included. Minor <strong>of</strong>fe"ses are generally disposedor by the magistrates and, in post years, most <strong>of</strong> these minor <strong>of</strong>fenses would not have beencounted in the workload <strong>of</strong> the district courts. Second, when the Federal Government'smotion to dismiss an original indictment or information is granted, the supersedingIndictment or information does not become a new case as in the years prior to 1976, butremains the some case. (An indictment is the charging document <strong>of</strong> the grand jury and andinformation is the charging document <strong>of</strong> the U.S. Attorney.)''Received by transfer" includes defendants transferred by Rule 20, Federal Rules <strong>of</strong><strong>Criminal</strong> Procedure, which provides that defendants who (I) are arrested or held in adistrict other than that in which on indictment or information is pending against them orin which the warrant for their arrest was issued and (2) state in writing that they wish toplead guilty or nolo contendere, may consent to disposition <strong>of</strong> the case in the district Inwhich they are arreste(\ or are held, subject to the approval <strong>of</strong> the U.S. Attorney for bothdistricts.Judicial Processing <strong>of</strong> DefendantsFigure 5.4 <strong>Criminal</strong> cases f'l Ie, d termlnQ . t C d , on d pend'lng in U.S. District Courts, years ending June 30, 1973-82Number <strong>of</strong> Cases a60,00050,000CASES COMMENCEDCASES TERMINATEDCASES PENDINGi'OTE: See i'OTE, Table 5.15.Total filedPending Original Received by Total PendingYear Jull:: I eroceedin~ transfer terminated June 301955 10,100 35,310 1,813 38,580 8,6431956 8,643 28,739 1,914 32,053 7,2431957 7,243 28,120 1,958 29,826 7,4951958 7,495 28,897 1,840 30,781 7,4511959 7,451 2B,72~ 1,924 30,377 7,7271960 7,727 28,137 1,691 29,864 7,6911961 7,691 28,460 1,808 29,881 8,0781962 8,078 29,274 1,743 30,013 9,0821963 9,082 29,858 1,8!!!! 31,546 9,2821964 9,282 29,944 1,789 31,437 9,5781965 9,578 'JI,5691966 1,765 32,07810,83~' 29,72910,83419671,76511,68430,64430,534 1,673 30,350" ,6841968 13,541 30,71413,54119691,85714,76331,34933,58514,7631,828 32,406 17,7701970 17,770 38,102 1,857 36,819 20,9101971 20,910 41,290 1,867 39,582 24,4851972 24,485 47,043 2,011 48,101 25,4381973 25,438 40,367 2,067 43,456 24,4161974 24,416 37,667 2,087 41,526 22,644IIIII'i:Ii,!jiH40,00030,0001975 22,644 41,108 2,174 43,515 22,4111976 22,411 39,147 1,873 43,675 19,7561977 19,756 40,000 1,589 44,233 17,1501978 17,!::;!) 34,624 1,359 37,286 15,8471979 r:.,847 31,536 1,152 33,411 15,12420,0001980 15,124 27,9681981 95314,75929,29730,35514,7591982 93215,86630,22131,62315,866I ,05~ 31,889 16,659Percent change1982 over I 51!:! I 7.5 4.2 13.6 5.5 5.0Source: Administrative Office <strong>of</strong> the United States Courts, Annual ReFort <strong>of</strong> theDirector, 1981, p. 94; 1982, p. 132 (Washington, D.C.: Administrative Office a the UnitedStates Courts). Table adapted by saRCEBOO< st<strong>of</strong>f.,IiIII'I'I,~;II1I!10,00019731974 19'/5 1976 1977 1978 1979a Includes transfers.ISource: Adminlst~ative Office <strong>of</strong> the United States Courts, The United States Courts: A Pictorial Summary for the Twelve Month Period EndedJune 30, 1982 (Washington, D.C.: Administrative Office <strong>of</strong> the Glited States Courts, 1982), p. 12.
<strong>Sourcebook</strong> <strong>of</strong> <strong>Criminal</strong> <strong>Justice</strong> <strong>Statistics</strong> <strong>1983</strong>Table 5.16 <strong>Criminal</strong> cases filed in U.S. District Courts, by case conmencement method, fiscal years 1978-82I'OTE: The data exclude cases involving defendants received by transfer, i.e., wherejurisdiction in a case is extended to a district other than that in which anindictment or information is pending or in which an arrest warrant is Issued. AAindictment Is the charging document <strong>of</strong> the grand jury and an information is thecharging document filed by the U.S. Attorney.judicial ProceSSing <strong>of</strong> DefendantsFigure 5.5 <strong>Criminal</strong> cases filed In U.S. District Courts, bytype <strong>of</strong> <strong>of</strong>fense, year ending June 30, 1982I'OTE: See I'OTE, Table 5.15.(Excludes transfers. Total criminal cases filed=31,623.)Method <strong>of</strong> commencement 1978 1979 1980 1981 1982Total 33,666 30,540 28,787 30,566 31,995Percent change1981 to 19H24.7All Other - 10.7 %Homicide, Robbery, Assault and Burglary - 7.3 %Indictment 21,717 17,907 16,617 17,711 18,788Information, indictment waived 1,156 465 540 484 913Information, other 8,909 10,426 9,401 9,564 8,568Remanded from oppellate court 107 127 76 70 611Removed from State court 61 51 26 19 21Reopened/reinstated 211 148 96 75 107Appeal from U.S. Magistrate 110 168 169 174 166Juvenile delinquency proceedings 85 81 96 93 85Consent before magistrate 1,310 1,157 1,730 2,333 3,188Retrial on mistrial N6. 2 19 15 57Retrial, remand from aeeeals court N6. 8 17 28 38Source: Administrative Office <strong>of</strong> the United States Courts, Federal JudicialEnded Seetember 30, 1982 (Washington, D.C.: U.S. Government Printing Office,6.188.6-10.4-8.610.542.7-4.6-8.636.6280.035.7Month Periodsta •Drunk Driving andTraffic - 16.4 % ..........Table 5.17 <strong>Criminal</strong> cases filed in U.S. District Courts, by <strong>of</strong>fense, yearsending June 30, 1981 and 1982I'OTE: See I'OTE, Table 5.15.1981 1982 PercentNature <strong>of</strong> <strong>of</strong>fense <strong>of</strong>fenses <strong>of</strong>fenses changeTotal 30,555 31 1 623 4.2Homicide 186 151 -18.8Robbery 1,415 1,427 0.8Bank 1,314 1,323 0.7Postal 41 47 14.6Other 60 57 -5.0Assault 559 579 3.6Burglary 125 143 14.4Larceny and theft 3,030 2,887 -4.7Embezzlement 1,836 2,072 12.9Fraud 4,744 4,709 -0.7Auto theft 305 369 21.0Forgery and counterfeiting 1,810 2,128 17.6Sex <strong>of</strong>fenses 152 135 -11.2Narcotics laws 3,697 4,193 13.4Marihuana 1,189 1,664 39.9Drugs 1,772 1,698 -4.2Controlled substance 736 831 12.9Miscellaneous general<strong>of</strong>fenses 8,416 8,757' 4.1Weapons and firearms 1,306 1,779 36.2Escape a 919 819 -10.9Drunk driving and traffic 5,231 5,188 -0.8Kidnaping 59 60 1.7Other miscellaneousgeneral <strong>of</strong>fenses 901 911 1.1Immigration laws 1,929 1,803 -6.5Liquor, Internal Revenue 30 20 -33.3Federal statutes 2,121 2,250 6.1Agricultural acts 490 662 35.1AAtitrust viglations 82 82 0.0Civil rights 70 62 -11.4Contempt 76 43 -43.4Food and drug acts 95 77 -18.9Migratory bird laws 69 80 15.9Motor Carrier Act 82 87 6.1Other Federal statutes 1,157 1 1 157 0.0alncludes escape from custody, aiding and abetting an escape, failure toappeal; in court, and bail jumping.These are principally cases remaved from State courts under provisions<strong>of</strong> the Civil Rights Act, Title 28 U.S.C. Section 1443.Source: Administrative Office <strong>of</strong> the United States Courts, 1982 AAnualReport <strong>of</strong> the Director (Washington, D.C.: Administrative Office <strong>of</strong> the UnitedStates Courts, <strong>1983</strong>), p. 136.I'I,IIIEscape a - 2.6 %Weapons andFirearms - 5.6 %IDrugs -5.4%Drug Abuse Prevention and Control Act - 13.3 %aEscape from custody, aiding or abetting an escape, failure to appear in court, and bail jumping.Auto Theft - 1.2 %Embezzlementand Fraud-21.4%Forgery and Counterfeiting - 6.7 %Source: Administrative Office <strong>of</strong> the United States Cou .June 30, 1982 (Washington, D.C.: Administrative Office <strong>of</strong> th~\h~:dU;;:::esSt~~~s t COlr9t~2:)A,:::P;:,ilctfjatr!.:ia::.I..::S:.:::u!.!.mma~:!.Jryt...!!fa~r_t!lh!::e;..T.!.:w~e!:!l~v!!.elMo~n!!t!2hlP~e!ri~o~dJE~nlSd!!!egdr s, 0, p. 13.494495
---------------<strong>Sourcebook</strong> <strong>of</strong> <strong>Criminal</strong> <strong>Justice</strong> <strong>Statistics</strong> 19133Judicial Processing <strong>of</strong> DefendantsTable 5.1 B Defendants charged with violation <strong>of</strong> drug laws In U.S. District Courts, by type <strong>of</strong> disposition, and type and length <strong>of</strong>sentence, years ending June 30, 1945-82N::>TE: See NOTE, Table 5.15. These data represent defendants charged Drug Import and Export Act (Tit Ie 18 U.S.C 171-2UU); and otherwith Federal <strong>of</strong>fenses under the following statutes: TItle 21 U.S.C. narcotic drug laws (26 U.S.C. 4701-4736, 7237).176(0) (the Marihuana Tax Act); Title 26 U.S.C. 11107 (Customs laws The District <strong>of</strong> Columbia is excluded from these data throughgoverning border crossings by narcotic addicts or violators); Tit I e III 1973. The territorial courts <strong>of</strong> the Virgin Islands, Canal Zone, andU.S.C. 4741-62 (imposition <strong>of</strong> tax and affixing <strong>of</strong> tax stamps); 18 U.S.C. Guam are excluded through 1976. Data provided for the year ending494 (making false statements with Intent to defraud the United States); June 30, 1977 have been revised by the Source.113 U.S.C. 14U3 (conspiracy to commit an <strong>of</strong>fense under the Narcotic Beginning in 1977, the periods reported for lengths <strong>of</strong> sentences Drug Import and Export Act); 18 U.S.C. 1406 (Immunity from <strong>of</strong> Imprisonment are I through 12 months, 13 through 35 months, 36 prosecution for grand Jury testimony conc'!rning violations <strong>of</strong> the through 59 months, and 60 months and over. INarcotic Drug Import and Export Act>t, other prOVisions <strong>of</strong> the NarcoticjType <strong>of</strong> sentenceNat convictedConvicted and sentenced~cr; ... rtted by Convicted by ImprlSonmenf11Youth Average AverageIiCorrectionsI yearsentenceOver I yearsentencePlea <strong>of</strong> guilty IIAct orTotal<strong>of</strong> Im- toYear ending Total or noloIand I day and I day 3 to 5 5 years Split Indetera youthfulre2ularbFine a~d prisonment probationJune 30 defendants Total D/smissed a Court Jury Total contendere Court Juryand underTotalto 3 lears years and OVer sentence c minate <strong>of</strong>fender e Probation other (in months)g (in months)X1945 1,413 Z211 197 5 26 1,185 1,062 35 88 8613013 360 14U 53 X X X 287 37 22.2 Nt>.1946 1,687 349 305 13 31 1,338 1,218X 43037 83 949377 108 34 X X X 369X20 18.7 Nt>.1~47 1,131::1U 210 153 17 4U 1,670 1,517 57 96 1,128471Ii452 161 44 X X X 504 38 19.7 Nt>.1948 1,790 308 237 14 57 1,482 1,324 48 110 1,048 ,I. X 488 408 122 30 X X X 411 23 18.6 Nt>.1949 1,1::106 2UU 141::1 14 46 1,598 1,404 59X 541135 1,187451 152 43 X X X 391::1 13 18.9 Nt>.1950 2,400 264 184 28 52 2,136 1,907 61 161::1 1,654 i X 595 736 211l 105 X X X 471X 473II 21.9671Nt>.1951 2,332 304 234 25 45 2,028 1,745 105 178 1,659 328 187 X X X 345X 2212465227.1402 276Nt>.1952 2,121 252 184 29 39 1,869 1,523 109 237 1,551 X X X 312X6 35.2 1\)6.1953 2,336 333 237 30 66 2,003 1,589 121 293 1,51::16108 789))358 331 X XXX 40371.14 38.4681 Nt>.1954 2,220 310 239 213 43 1,910 1,491 107 312 1,4113 r, 360 370 X X X 411 16 41.3 Nt>.1955 2,166 363 279 32 52 1,803 1,386 95 322 1,457 ~ X 47 6411 360 402 X X X 329 17 43.5IiX 511 511 Nt>.1956 1,835 314 221 36 57 1,521 1,168 93 260 1,258 341 376 X X X 250 13 45.8 Nt>.1957 1,910 256 184 28 44 1,654 1,264 91 299 1,432!j X 16 326 2413 1342 X X X 2LU 2 66.0i' X 25 167 141Nt>.1958 1,942 301 217 25 5S' 1,641 1,138 129 374 1,3511,018 X XXX 282438 69.4 Nt>.1959 1,742 364 267 40 57 1,371:1 I,CU5 112 261 1,151126 95 887 X X X 224~3 74.2 Nt>.X1960 1,846 340 2633338 39 1,506 1,155 93 2511 1,232145 148 906 X X X 271X3 72.1l Nt>.1961 1,828 31342248 20 45 I,SI5 1,171 74 270 1,2513126 105 985 X X X 252 5 74.0~X 3111\)6.1%2 1,6113 240 175 29 36 1,4U3 1,022 113 2613 1,173129 106 900 X X X 217X13 70.5 Nt>.1963 1,689 283 2223934 27 1,406 1,040 112 254 1,085144 113 789 X XXX 304 17 70.1 1\)6.1964 1,67928271 205 32 34 1,4U13 1,039 112 257 1,076142157 749 X XJX 309 23 63.7 Nt>.X1965 2,071::153323 257 41 25 1,755 1,384 132 239 1,257186 197 821 XIiX X 480 J!jX 8560.3154 276Nt>.1966 2,223 349 280 36 33 1,874 1,469 119 286 1,272I757 X XXX 589 13 61.3 Nt>.1%7 2,25U 421l 363 34 31 1,822 1,42483115' 279 1,180139 245 713 X XXX 620 22 62.0 Nt>.1968 2,692 563 466 49 48 2,129 1,664 138 327931,3613141 203 841 X X X 728X IIU33 64.4Nt>.1%9 3,545 836 716 50 7U 2,7U9 2,239 123 347 1,581179 5UU 892 X X X 1,110 113 63.7 Nt>.197U 3,42U 959 886IX 101413 45 2,461 2,030 97 334 1,2133166 276 740 X X X 1,156X 24922 64.8Nt>.1971 5,366 2,204 2,OllU 43 81 3,162 2,682 94 386 1,834300 428 857 X XXX 1,25111113270 58.5 Nt>.1972 6,848 1,600 1,396 52 152 5,248 4,391 228 629 3,U5U396 7139 983 X XXX 2,0613 130 46.4 Nt>.1973 9,983 2,169 1,9051,44583 181 7,814 6,297 393 1,124 5,097744 1,343'I1,565 X X X 2,591X 1,547126 45.5Nt>.1974 10,9139 2,744 2,430 80 234 8,245 6,666 437 1,142 5,125792 1,390 1,396IIX X X 3,039 81 43.7 Nt>.1975 IU,901 2,7~0 2,454 62IX 1,366234 8,151 6,531 393 1,227 4,8877U6 1,441 1,374 X X X 3,20~X 1,22155 45.31\)6.1976 10,762 2,721 2,404 73 244 8,041 6,324 446 1,271 5,039790 1,544 1,484 X X X4,661l2,927 75 47.6 Nt>.1977 9,741 2,106 1,7541,50553 299 7,635 5,97U 387 1,2713 5,21213136 1,366 1,466 8'7 367 903,6052,324 90 42.1 39.51978 7,860 2,0438851,729 37 277 5,817 4,440 290 !,087 4,11623~956\1,141 169 275:1,82070 1,63036968 51.3 38.6197~ 6,6U9 1,542 1,297 34 211 5,067 3,662 24U 1,165 3,641614 13613 969 454 190 177 1,379 47 50.13 37.13!2,547198U 6,34321::111,5~4 1,337 32 225 4,749 3,450 236 1,063 3,479565 792 909 499 248 11::15 1,232 38 54.5i 2,865 38.719814037,008 1,662 1,385 29 248 5,346 3,757 308 1,21:l1 h3,1356578 748 1,136 527 321 143 1,371! 3,516 383119 55.5 36.619112 7,9111 1,64.'1 1,360 51 234 6,336 4,7913 342 1,196 4,5136729 966 1,431:l 643 312 liS 1,617 133 61.4 34.1aBeginning in 1968, defendants who were committed pursuant todTitle 18 U.S.C. 4205b(l) and (2). Included in total imprisonment213 U.S.C. 2902(b) <strong>of</strong> the Narcotic Addict Rehabilitation Act are prior JO 19713.Includ&d in the dismissed column. Title 18 U.S.C. 5010(b)(c). Included in total imprisonment prior ~I ncludes sentences <strong>of</strong> more than 6 months that are to be to 19113. f,followgd by a term <strong>of</strong> probation (mixed sentences).Includes deportation, suspended sentences, imprisonment for 4dThe split sentence is a sentence on a one-count indictment <strong>of</strong> 6 days or less or for time already served, remitted and suspended fines.months or less iii a jail type institution followed by a term <strong>of</strong> gExcludes split sentences, indeterminate sentences, Youthprobation. Included in these figures are mixed sentences involving Corrections Act and youthful <strong>of</strong>fender sentences, and life sentences~confinement for 6 months or less on one count, to be followed by a beginrNng in 1978.te'rm <strong>of</strong> probation on one 01' more counts.Includes 4U pleas <strong>of</strong> nolo contendere.Source: Administrative Office <strong>of</strong> the United States Courts, Federal Offenders in United States District Courts, 1982 (Washington, D.C.:Administrative Office <strong>of</strong> the United States Courts, 19B2), pp. H-22., H-23. Table adapted by SdRCEBOO< staff.~IIIi496 497
Judicial Processing <strong>of</strong> DefendantsFigure 5.6 Defendants in U.S. District Courts charged, con'licted, and imprisoned 'for violations <strong>of</strong> drug lows,years ending June 30, I ~45-82N:>TE: See N:>TES, Tables 5.15 and s.IB.Number <strong>of</strong> defendants12,00010,0008,0006,0004,0002.000.~~',,",\:I \\\ •I \'I \'I ... ...\,,''I • ... ·•·• .. .••:I : ~:• • II :· ·...·I :•/:tl :I :/J!,~............ ~:::~ -..../. ....•.~ .. ..... ............. . ., ...Total defendantsConvictedImprisoned1945 1950 1955 1960 1965 1970Iii1980"Source: Administrative Office <strong>of</strong> the United States Courts, Federal Offenders in United States District Courts, 1982(Washington, D.C.: Administrative Office <strong>of</strong> the United States Courts, <strong>1983</strong>), pp. R-zz, 1-1-23. Figure constructed by5Q..RCEBOO< staff.4\,Preceding page blank499
<strong>Sourcebook</strong> <strong>of</strong> Crimlnol <strong>Justice</strong> <strong>Statistics</strong> <strong>1983</strong>Table 5.19 Defendants disposed <strong>of</strong> in U.S. District Courts and defendants held in custody, by time in custody, circuit, anll district, yearending June 30, 1982NJTE: The Federal statute, 18 U.S.C. 3164(b), requires that the "trial <strong>of</strong>any person (held in custody) shall conmence no later than ninety daysfollowing the beginning <strong>of</strong> such continuous detention ..."."Time incustody" refers to time In detention prior to dismissal, guilty plea, orconmencement <strong>of</strong> trial minus excludable time. "Excludable time" refersto periods <strong>of</strong> delay for specified reas:1S as set forth In 18 U.S.C. 3161.Circuitand districtTotalDistrict <strong>of</strong> ColumbiaFirst CircuitMaineMassachusettsNew H::unpshireRhode IslandPuerto RicoSecond CircuitConnecticutNew York:I'brthernEasternSouthernWesternVermontThird CircuitDelawareNew JerseyPennsylvania:EasternMiddleWesternVirgin IslandsFourth CircuitMarylandI'brth Carolina:EasternMiddleWesternSouth CarolinaVirginia:EasternWesternWest Virginia:I'brthernSouthernFifth CircuitLouisiana:EasternMiddleWesternMississippi:I'brthernSouthernTexas:I'brthernEasternSouthernWesternCanal ZoneSixth CircuitKentucky:EasternWesternMichigan:EasternWesternOhio:'I'brthernSouthernTennessee:EasternMiddleWestern"Custody" refers to detention in a local jail or detention facility forwhich payment Is made to a local or State government by the U.S.Government, or to detention in a metropolitan correctional center orother correctional institution operated by the Federal <strong>Bureau</strong> <strong>of</strong>Prisons. I'bt included is detention by local or State authorities onlocal or State charges when 0 Federal chorge is also pending.Time In custodyTotal Total 151 doysdefend- detainees I to 10 days II to 30 ~ 31 to 90 days 91 to 120 duys 121 to 150 days and overdants N..mber Percent NJmber Percent NJrnber Percent I\Mnber Percent I\Mnber Percent NJrnber Percent (\lnnber Percent35,971 6,621 18.4 2,561 38.7 1,130 17.1 2,614 39.56051,01767510591492322,7452481261,0141,084187862,135427125702732452934,2611,1993701992464691,4U5187501363,8893924B161B3III621'1721,630670I3,2BO2B246362917332B278262370495230 3B.039 3.82 3.0o X9315.32.025 10.BIII 4.0B 3.2o XI 0.141 3.813 7.04tl 55.82BI 13.23547.17.626 4.621 7.725 10.2152 51.9615 14.4185 15.424 6.571 35.793 37.878 16.6106 7.5o X13 26.045 33.1768 19.7100 25.59 IB.B9 5.66 7.225 22.513B 22.216 9.34 0.2461 68.Bo X165 5.0II 3.915 3.231 4.96 3.545 13.7Itl 6.512 4.612153.23.0120 52.22oXo25.1XXXXB.O58 52.33 37.5X XI IOO.U27 65.9i 7.726 54.291 32.4I 33.329 53.7oX4 19.010 40.047 30.9219 35.650 27.06 25.014 19.750 53.B36 46.237 34.9X XI 7.725 55.6274 35.75 5.0o X3 33.3I 16.76 24.056 40.68 50.02 50.0193 41.9X X48 29.12 IB.23 20.0B 25.83 50.017 37.86 33.3S 66.7oXI 6.749 21.312 30.BoXXXI II. II 33.310 40.021 18.9o XXo X5 12.2I) 46.210 20.860 21.4o X4 7.42 7.74 19.05 20.045 29.6132 21.S38 20.56 25.02B 39.4131614.020.520 IB.9X X3 23.1B 17.8170 22.119 19.03 33.32 22.2o2XB.O22 15.94 25.0o XliB 25.6X X2B 17.03 27.3I 6.77 22.6I 16.713 2B.9I 5.6I B.3I B.3o X56 24.320 51.32X100.0X8 B8.9oX10 40.028 25.25 62.5Xo X8 19.56 46.29 18.8108 3B.42 66.7ii 20.424 92.313 61.97 28.051 33.6255 41.594 50.810 41.727 3B.030 32.326 33.347 44.3X X9 69.212 26.7272 35.462 62.06 66.73 33.3I 16.77 2B.04B 34.84 25.02 50.0139 30.2X X87 52.76 54.5II 73.316 51.62 33.315 33.310 55.63 25.010 83.314 93.3173 2.60.42 5.1o XX Xo XI 33.3I 4.03 2.7o XXXo X3 6.313 4.6o X5 9.3oXX3 12.05 3.32 0.3I 0.5I 4.2oXooXoXXXX21 2.710 10.0o XI 11.1oXI 4.03 2.2o X6 1.3X X2 1.2Xo XXo Xo XI 5.6o XI B.3o X5923oXoI20.90.97.7XXX33.38.0I 0.9o XX Xo XI 2.4o XXo4 1.4o X! !~9oXXX3 2.0I 0.2o XI 4.2Xo XoXoXXXX15 2.02 2.0o XXo3 50.03 12.03 2.2Xo X4 0.9X XoooooXXXXXXXX842oXooXo1.30.9XXXXXXXXXX5 1.8o X4 7.4Xo XI 0.7621.01.1o X2 2.Bo XXo2X1.9XoX16 2.12 2.0Xo XI 16.76 24.06 4.3XoXI 0.2X XoooooXXXXXXXXXX, .Judicial Processing <strong>of</strong> DefendantsTable .5.19 Defendants disposed <strong>of</strong> in U.S. District Caurts and defendants held in cu:stody, by time in custody, circuit, and 'distrlct yearending June 30, 1982--Contlnued ,Circuitand districtSeventh CircuitIllinois:(.JorthernCentralSouthernIndiana:I'brthernSouthernWi~consln:EasternWesternEighth CircuitArkonsas:EasternWesternIowa:I'brthernSouthernMinnesotaMissouri:E'lsternWesternNebraskaI'brth DakotaSouth DakotaNinth CircuitAlaskaArizonaCalifornia:NorthernEasternCentralSouthernHawaiiIdahoMontanaNevadaOregonWashington:EasternWesternGuamI'brthern MarianasTenth CircuitColoradoKansasNew MexicoOklahoma:M:lrthernEasternWesternUtohWyomingEleventh CircuitAlabama:I'brthernMiddleSouthernFlorldo:I'brthernMiddleSouthernGeorgia:I'brthernMiddleSouthernTime In custodyTotal Total 151 doysdefend- detainees I to 10 days II to 30 days 31 to 9q~ 91 to 120 days 121 to 150 doys and overdonts Number Percent I\&T\ber Percent NlXiier Percent N:XTlber Percent I'LiTlber Percent f\Li11ber Percent l'liiTiEier Percent1,707 175 10.3 87 49.7 22 12.6 65 37.10.6 o X o X7422041371452072046B2,0402199110511231321344891301281697,3041496025515361,3441,1131,36211614q20616016675967241,669297263227134121365183795,3195023301491695291,4B86111,11242953429105B3o271o18581341721341332,633313461991246448709II468959BO10619o1151814396I37o1,218oIII5410849258II247.120.66.66.92B.01.5X13.3X19.84.87.142.86.00.410.032.019.536.020.B57.536.123.147.978.20.79.530.943.236.948.214.0~ti.4X6.96.15.317.24.50.810.1XX22.9X0.37.432.01.957.142.21.05.63B175520oX120X222687o322149861313672292633133615291327625X424615o17XX514Xo227330416B5571.745.255.650.034.5XX44.3XII. I40.025.050.741.2X23.153.742.437.441.939.336.223.440.836.033.354.5J2.63~\'. 62LO33.B58.526.3X36.522.242.938.5XX45.9XX42.2XX18.250.030.035.865.145.520.83 5.79 21.4Xo3 lO.O7 12.1oXXX29 10.7XoXI 20.0I912.56.77 41.2I 50.0oX5 12.25 15.2469 17.88 25.876 22.053 26.628 22.672 11.2126 14.52 2.l.2o X12 26.118 20.219 32.227 33.825 23.63 15.8X X21 18.33 16.73 21.47 17.92 33.3oX6 16.2XX117 9.6XXI 100.03 27.33 5.626520.07.737 14.3o X6 25.0Source: Admlnlstrotlve Office <strong>of</strong> the Ullted States Courts, 19B2 Annual Report <strong>of</strong> the Director (Washington, D.C.: Administrative Office <strong>of</strong> theUllted States Courts, 19B3), pp. 352-355.121442312X98X16I3443I612121,12'1101317152290427I5IB42272619BX50105174I13XX448Xo42253544731322.63;1.3411.420.053.466.7X36.2X8B.920.037.532.817.650.0116.229.3;16.442.832.337.935.74·1.94·5.049.1Il.l45.539.147.245.832.517.942.1X43.555.635.71,3.666.7100.035.1XX36,BXX36.440.750.041,'7IB.227.354.2ooIX12XoIo10oIo33o3361232oIoo3XoUoXX83Xo'Io7453oXXXXX33.3X4.4XX20.0X7.5XXX2.4X1.3X0.91.54.81.90.322.2X2.2XXXX15.8XXXXXXXXXX6.8XX9.1XX8.71.927.3XoooX3XooI2o5oo3IIooX2IooIXX23Xoo23oXXXXXXX1.1XXX12.51.5XXXXX0.2XXX2.40.20.1XXXXXXXXX1.75.6XXXX2.7XX1.9XXXXX2.7XXXoooX9XooIIo4I213oo66oIoooXooXX33XoI2o29IooXXXXXXX3.3XXX12.50.7XX30.B2.46.10.5XXX4.80.9XII .1XXXXXXXXXXXXXXXXX2.7XX9.13.7X3.40.4XX500
<strong>Sourcebook</strong> <strong>of</strong> <strong>Criminal</strong> <strong>Justice</strong> <strong>Statistics</strong> 19113Judicial Processing <strong>of</strong> DefendantsTable 5.20 Defendants disposed <strong>of</strong> in U.S. District Courts, by statutory and recommended time limits, circuit, and district,year ending June 30, 1981f\OTE: These data are computed only for the respective timeintervals actually begun and terminated during the year endingJune 30, 1981. The Speedy Trial Act <strong>of</strong> 1974 (U.S.C. 3152-3156and 3161-3174) required each U.S. District Court to adopt a planfor the prompt disposition <strong>of</strong> criminal cases in accordance withstatutory time limits. The time interval from arrest to indictmentor information is 30 days (18 U.S.C. 3161 (b». Defendantsentering a plea <strong>of</strong> not guilty must be brought to trial not morethan 70 days after a filing <strong>of</strong> an information or indictment, orafter an appearance before a judicial <strong>of</strong>ficer <strong>of</strong> the court in whichthe charge is pending, whichever comes lost (18 U.S.C.Circuit and districtTotal all districtsDistrict <strong>of</strong> ColumbiaFirst CircuitMaineMassachusettsNew HampshireRhode IslandPuerto RicoSecond CircuitConnecticutNew York:i'brthergEasternSouthernWesternVermantThird CircuitDelawareNew JerseyPennsylvania:EasternMiddleWesternVirgin IslandsFourth CircuitMarylandi'brth Carolina:Eastern aMiddleWesternSouth CarolinaVirginia:EasternWesternWest Virginia:i'brthernSouthernFifth CircuitAlabama:i'brthernMiddleSouthernFlorida:i'brthernMiddleSouthernGeorgia:i'brthernMiddleSouthernLouisiana:EasternMiddleWesternMississippi:i'brthernSouthernTexas:i'brthernEasternSouthernWestern3161 (c)( I». The trial may not commence sooner than 30 daysfrom the date the defendant first appears unless written waiver isgiven (18 U.S.C. 3161(c)(2». See NOTE, Table 5.15 fordefinitions <strong>of</strong> indictment and information.The Speedy Trial Act does not establish time limitsgoverning the- period between conviction and sentencing, but doesrequire that statIstics be furnished regarding the tIme span <strong>of</strong> thisinterval. The Committee on Administration <strong>of</strong> the CrimInal Law<strong>of</strong> the Judicial Conference has recommended a 45-day time limitfor the interval from conviction to sentencIng.Indicted or firstConvicted andArrested during appearance dUring year sentenced during yearyear ended July I, 1981 ended July I, 1981 ended June 30, 1981Arrest to indictment or appear- Defendants sentencedindictment 30 once to trial 45 days or lessTotal days or less Total 70 days or less Total after convictiondefendants Number Percent defendants Number Percent defendants N.rnber Percent10,57020940381443II23786426133234157116633142975932631681,075166405852104603252253,604132107I6496654134946SO1261049II311073974828810,22717838081293923179625132724056516613142865730621641,047161375852101586252253,496130107I599660S134946SO1271049/I291033471328496.885.294.3100.089.6100.081.897.592.196.2100.084.297.691.5100.096.8100.096.396.693.898.497.697.497.092.5100.0100.097.197.2100.0100.0100.097.098.5100.0100.092.2100.092.5100.0100.0100.099.2100.0100.0100.093.596.387.295.398.625,0384607713835440472921,64413192600636129561,247394602701221512053,1916433211462053701,19416746996,958444235891513328813031,0328412782310349913941221,11746324,2844477323832440452851,55812588542628119561,243394602661221512053,1596253151462053706,757443234831513267693021,0328412782310048903901191,08243897.097.294.9100.091.5100.095.797.694.8nr: I..;J~.'t95.790.398.792.2100.099.7100.0100.098.5100.0100.0100.099.097.298.1100.0100.0100.099.799.4100.096.097.199.899.693.3100.098.287.399.7100.0100.0100.0100.097.198.098.999.097.596.994.629,27257198173470SO75313121874945195671,623496343961481971993,254691418183222404999163401347,7614562281071444001,01535498!!92137036116611104671411,30752721,977379809344244923279950i3i7427835591211,01139353252841221612,52032637516321725692015027866,55044921984123316583309974916277159156904061201,05945175.166.482.546.690.298.030.789.139.766.261.231.837.646.731.362.379.655.763.656.861.980.977.447.2!l9.789.197.763.492.192.067.564.284.498.596.178.585.479.057.487.398.699.574.941.778.491.881.886.985.181.085.6Circuit and districtCanal ZoneISixth CircuitKentucky:EasternWesternIMichigan:Eastern1WesternOhio:ii'brthernSouthernTennessee:IEasternMiddleWestern aSeventh CircuitIillinois:i'brthernCentralISouthernlIndiana:NorthernSouthernWisconsin:EasternWesternEighth CircuitArkafisu"EasternIWesternIiIowa:i'brthemI;SouthernMinnesotaI,Missouri:I,EasternWestern!:NebraskaLi'brth DakotafiSouth DakotaI,Ninth CircuitIAlaska1,ArizonaCalifornia:i'brthernEasternCentralSouthernHawaiiIdahoMontanaNevadaOregonWashington:EasternWesternGuami'brthern MarianasTenth C!rcultColoradoKansasNew MexIcoOklahoma:NorthernEasternWesternUtahWyomIngArrested duringyear ended July I, 1981Arrest toIndictment 31llTotaldefendants9528552814177993611225291924937276110IS1256437616943124312,1172121899129498436289IS1465674619030o517425212330202082022Indicted or firstConvicted andappearance dUring yeor sentenced during yearended July I, 1981 ended June 30, 1981Indictment or appeor- Defendants sentencedonce to trial45 days 0- lessdays or less Total 70 days or less Total after convictIonN..mber Percent defendants l'imber Percent defendants N:Xl'lber Pe;ccl1t85175SO794174963511225282854737276110IS3191256437536942II4312,0862121591127486430289IS1465674619030o513415212329202072021aSpeedy trial time Intervals were suspended alf yearfor New York, Eastern and Tennessee, Western. For North811.997.9100.096.297.5100.096.197.097.2100.0100.096.992.495.9100.0100.0100.0100.0100.097.0100.0100.0100.0100.086.9100.097.791.7100.0100.098.5100.0:;18.691.998.497.69B.6100.0100.0100.0100.0100.0100.0100.0100.00.099.297.6100.0100.096.7100.099.5100.095.5101,898128421336106207207952221761,14941116115993156114551,4501401094311420216138869701544,89210645123827SI, IDS7101,010651231441439836337241,3782252172358659338122961,791812441731092204199952211291,10537316115792156113531,4011391094311419316138764701214,7271064472172651,0386761,003621191431379835636241,36422520723386593381229480.094.496.999.092.386.898.696.1100.099.573.396.290.8100.098.798.9100.099.1%.496.699.3100.0100.0100.095.5100.099.792.8100.078.696.6100.09~. !91.296.493.995.299.395.496.799.395.8100.098.197.3100.099.0100.095.499.1100.0100.0100.0100.097.9132,4871734324821353012641143092771,375559159159117206!!?581,75116211953109283192465114781765,526III4573403521,3559028597712118519010541038241,5492372472531226637415397121,7911374282546621318210527513196635310014093141lOB311,26913398SO987717440461691054,506964012563041,1206718386183102939033136241,226204189225884327314163Carolina, Eastern, the suspension was for the period Dec.I, 1980 through May 31, 1981.Source: Administrative Office <strong>of</strong> the United States Courts 1981 AnAdministrative Office af the United States Courts, 1981), pp. I f 5~ f 19. nual Report <strong>of</strong> the Director (WashIngton, D.C.:92.372.079.299.152.7L18.970.868.992.189.047.370.363.162.968.179.568.492.353.472.582.182.494.389.927.290.686.953.588.559.781.586.587.775.386.482.774.497.679.268.655.148.985.780.794.7100.079.186.176.588.972.165.273.092.264.9502
<strong>Sourcebook</strong> <strong>of</strong> Crlmlnol <strong>Justice</strong> <strong>Statistics</strong> <strong>1983</strong>Judicial Processing <strong>of</strong> DefendantsTable 5.21 Defendants disposed <strong>of</strong> In U.S. District Courts, by type <strong>of</strong> disposition, and type and length <strong>of</strong> sentence, years ending June30, 1945-82I\OTEI See I\OTE, Table 5.15. The District <strong>of</strong> Columbia Is excluded from these data through 1973.The territorial courts <strong>of</strong> the Virgin Islands, Conal Zone, and Guom are excluded through 1976.Data provided for the year ending June 30, 1977 have been revised by the Source.Beginning In 1977, the periods reported for lengths <strong>of</strong> sentences <strong>of</strong> Imprisonment are Ithrough 12 months, 13 through 35 months, 36 through 59 months, and 6U months and over.N:lt convictedConvicted and sentenced!mprlsonment a Type <strong>of</strong> sentenceAcquitted byConvicted byI yearYouthAVerageN:lr.::otic Plea <strong>of</strong> and Corrections sentence AverageYear Addict guilty or Total I day Act or3 to 5 S years Split Indetertoimpris- sentence toending Total Rehabllit~t Dls- nolo Total re ular and under youthful Pro-ears and over sentence c mlnate d affender e onment probationJune 30 defendants iotal tlan Act missed Court Jury Total con tende!re Court Jury bation Fine Other (In months) (In months)17,U95 X 1O,5a 3,634 2,0171945 43,755 7,6419UX 6,462 331 848 36, 114 30,81'7 3,UB2 2,215 15,393 XX9,316X3,610X 14,3591,8094,660 (f)658 16.5X XN\1946 38,872 6,693 X 5,599 259 835 32,179 27,3B5 3,250 1,544 15,146 X 9,U33 3,679X 12,6911,7464,095 (f)68B X18.6X1'lO.1947 38,IIlO 5,592 X 4,512 279 BOI 32,5tlB 29,131l 2,336 1,114 13,505 X 8,033 3,329X 13,31B1,5174,12462'-(0X17.3)( N\1948 35,431 4,911 X 3,990 225 696 30,520 27,833 1,672 1,015 14,73U X 9,31l9 3,37BX1,39214,014 3,0015/1(0X17.6XN\1949 37,318 4,245 X 3,332 297 616 33,1)73 30,447 1,628 991l X 15,161 3,182 (0 15.1l N\14,991l X 8,910 3,7')'; 1,5BB1950 3B,835 4,210 X 3,268 276 666 34,625 31,739 1,7317011,15!> 15,568 XX9,215X3,758X 16,6031,8053,U24790 (0X17.5XN\1951 42,286 4,096 X 3,204 309 5113 38,190 35,271 1,795 1,124 15,963 X 9,U94 3,817X2,07219,855 2,7679110 (0X18.1XN\1952 39,947 3,904 X 2,947 296 661 36,043 32,734 2,002 1,307 16,355 X 8,969 4,213X 17,61l72,1642,393 (f) 19.1 N\1953 39,234 4,349 X 3,220 409 720 34,885 31,336 2,207 1,342 19,2211,009XX10,97'1X )(4,54615,8112,41l72,7191,211 (0X19.4XN\1954 44,447 4,903 X 3,617 501 7115 39,544 35,560 2,3UIl 1,678 X 17,517 2,806 (0 18.9 N\17,542 X 1l,942 4,51l4 2,7241955 40,235 5,184 X 3,832 450 9U2 35,501 31,148 2,077 1,1l26 13,5761,292XX5,681X4,217X2,47814,5841,2002,945 (0X21.9XN\1956 33,216 4,320 X 3,125 425 770 28,896 25,029 2,227 1,640 13,791l X 5,473 4,01BX2,63512,365 2,955 (f) 24.9 N\1957 31,2B4 3,544 X 2,426 348 770 27,740 23,867 l,343 1,53U 14,1011,67lXX5,382X4,029X2,86111,434 2,50B (0 28.0 N\1958 32,055 3,717 X 2,606 378 733 28,338 24,256 2,475 1,607 14,3501,829XX5,024X3,6IJUX 11,617 2,620 (0 28.2 N\195')3,23732,125 3,736 X 2,667 3211,849748 28,389 24,793 2,Oll9(c)1,507X X II ,379 2,660 (f) 29.2 N\14,170 X 5,U24 3,877 3,288I96U 31,984 3,82B1,9f.11 (c)X 2,629 340 859 28,156 24,245 2,17,) 1,732 14,462 X 4,057X4,753X 11,01$13,4812,9052,171 (e)(0 29.6XN\1961 32,671 4,046 X 2,887 291 868 28,625 24,830 2,124 1,671 14,042 X 4,OBIJ 4,441X3,41810,7142,U,)!>2,772(c)677 31.0X1'lO.1962 33,110 4,599 X 3,374 3')0 835 2B,511 24,639 1,997 1,875 13,639 X 2,949 4,218X3,228II ,071 2,618 780 32.0 N\1963 34,845 5,042 X 3,735 544 763 29,8U3 25,924 2,005 I,B74 13,2732,076 1,168X 2,992X4,085X 12,0473,0942,847 1,270 32.3 N\1964 33,3BI 4,2111,987X 2,936 559 716 2'),170 26,273 942 1,9551,115 X X II ,634 2,6B9 1,574 31.9 N\13,66B X 3,748 3,139 3,2621965 33,711$ 4,9612,252X 3,71l9 463 709 2B,757 25,n3 961 1,873 13,282 1,267X 3,549X2,926X3,33210,779 2,4772,0921,8331,38333.5XN\1966 31,975 4,661 X 3,570 397 694 27,314 24,127 1,066 2,121 13,085 X 3,236 2,837X 10,2563,4112,356 1,420 32.9 1'lO.1967 31,535 5, 191 1 X 4,196 409 5tJ6 26,344 23,121 1,04U 2,173 12,610l,3BI 1,220X 2,473X2,413X 9,4353,5682,293 1,531 36.5 N\1968 31,843 6,169 14 4,967 484 704 25,674 22,055 1,184 2,435 12,1l472,915 1,241X 2,771X2,252X 9,8203,5001,816 1,428 42.2 N\1969 32,796 5,993 15 ~,8S2 4833,012643 26,803 23,138 1,152 2,5131,312 X X 9,991 1,682 2,283 42.0 t'lO.12,415 X 2,753 2,253 3,2901970 36,356 8,1782,77519 6,589 703 867 2B,178 24,111 1,290 2,777 14,378 1,344X 2,tJ20X2,599X3,32611,387 1,9353,4822,4412,15141.1XN\1971 44,615 12,512 30 10,625 687 1,170 32,103 27,544 1,416 3,143 16,1l32 X 4,45U 2,645X 13,2433,6951,789 2,693 42.1 N\1972 49,516 12,296 18 10,201 690 1,387 37,220 31,714 1,847 3,659 17,5403,569 2,473X 3,384X2,912 X 15,3954,141 4,2202,l32 2,7612,8833B.1XN\1973 46,724 11,741 45 9,712 661 1,323 34,983 29,009 1,873 4,101 17,180 X 3,333 l,81lUX 1:1,0264,1071,8663,9605512,90015.4X1'lO.1974 48,014 11,7B4 21 9,998 SOB 1,257 36,230 30,660 1,7B5 3,785 X 16,623 2,071$ 349 42.2 N\17,301 X 3,337 2,825 4,4371975 49,212 11,779 5 10,269 3974,387I, lOB 37,433 31,816 1,51lU 4,037 18,477 2,315X 3,530X3,096X 17,91J4,7311,8764,862 2,258343 45.5XN\1976 51,612 11,500 (; 9,746 508 1,240 40,112 34,041 1,587 4,484 19,552 13,772 4,016 2,938X 18,2082,953 3,8653,199 2283,21747.21,6U4N\1977 53,IB8 11,732 N\ 9,952 598 1,382 41,456 35,323 1,629 4,504 17 ,426 12,234 h3,284 9592,80416,1352,7925,4093,3543603,26334.71,132 g 32.81978 45,922 9,417 N\ 7,792 311 1,314 36,505 31,112 1,431 3,962 14,5BO 9,81B 2,32U 7972,344 2,30914,525 4,279 285 48.6 g 32.419792,76541,175 8,262 N\ 6,791 303 1,168 32,913 27,295 2,0063,2343,6128B7 641 13,459 4,368 506 49.0hg 32.313,191 8,484 h2,016 1,936 1,94519802,5B736,560 7,962 N\ 6,633 283 1,046 28,59B 23, III 1,851 3,636 13,700 8,9063,012 1,123 572 II ,053 3,916 51.9 gh2,192 1,904 1,906 2,906 4383,U69 1,23233.11981 38,127 8,259 N\ 6,981 266 1,012 29,868 24,322 1,867 3,679 15,857 10,673 2,202 4912,31312,173 3,507 2,42·J 3,736 3,538488 55.391,16331.71982 40,lf66 8,214 N\ 7,051 255 938 32,252 27,392 I ,205 3,655 483 12,723 3,395 277 58.6 g 32.2olncludes S'entences <strong>of</strong> more than 6 ~nths that are to be more counts. For years 1959 through 1962, split sentences arefollow6d by 0 term <strong>of</strong> probation (mixed sentences). includad in prison terms less than I year and I day.Includes defendanTs wno Were committed pursuant to 28 e 18 U.S.C. 4205B( I) ond (2).U.S.C. 2902(b) <strong>of</strong> the N:lrcotic Addict Rehobilitotian Act.fiB U.S.C. 5010(b) ond (c).c A split sentence is a sentence on 0 one-count Indictment <strong>of</strong> 6~ncluded with sentences <strong>of</strong> probation.months or less in a jail-type institution followed by a term <strong>of</strong>Split sentences, indetermlnote sentences, Youth Correctionsprobation, 18 U.S.C. 3651 opproved Aug. 23, 1958 (72 Stat. 834). Act and youthful <strong>of</strong>fender sentences are not included in computingIncluded are mixed sentences Involving confinement for 6 months or the ay,erage sentence to Imprisonment.less on one count to be followed by a term <strong>of</strong> probation on one or llncludes Federal Juvenile Delinquency Act sentences. ISource: Administrative Office <strong>of</strong> the United States Courts, Federal Offenders In the United States District Courts Jull:: 1973-June 1974(Washington, D.C.: Administrative Office <strong>of</strong> the United States Courts, 1977), p. H-I; ond Aaministrotive Office <strong>of</strong> the United States Courts,Annual Re'T(rt <strong>of</strong> the Dlrecta~79, p. 108; 1981, p. 101, Tobie 46; 1982, p. 141 (Washington, D.C.: Administrative Office <strong>of</strong> the United StatesCourts). able adopted by CEBOO< sta-n:-504 III!Ii~~!\ ""505
<strong>Sourcebook</strong> <strong>of</strong> <strong>Criminal</strong> <strong>Justice</strong> ;itatistics <strong>1983</strong>Table 5.22 Defendants disposed <strong>of</strong> in lJ.S. District Courts, by <strong>of</strong>fense and type <strong>of</strong> disposition, year ending June 30, 1982f\bture <strong>of</strong> <strong>of</strong>fenseTotalGEf\ERAL CffENSESI-bmicldeMurder-first degreeMurder-second degreeManslaughterRobberyBonkPastalOtherAssaultBurglaryBonkPo~talInterstate shipmentsOtherLarceny and theftBonkPostalInterstate shipmentsOther U.S. propertyTransport etc. stolen propertyOtherEmbezzlementBonkPostalOtherFroudIncome taxLending institutionPostalVeterans and allotmentsSecurities and ExchangeSocial SecurityFolse pers.~:>nationN:ltionality lawsPassport fraudFolse claims and statementsOtherAuto theftForgery and counterfeitingTransport forged securitiesPastal ~orgeryOther forgeryCounterfeitingSex <strong>of</strong>fensesRopeOtherDrug Prevention and Control ActMarihuanaDrugsControlled substancesMiscellaneous general <strong>of</strong>fenseBriberyDrunk .:friving and trafficEscapeExtort racketeerinJ threatsGanbling and lotteryKidnapingPerjuryWeapons and firearmsOtherSPECIAL CffENSESIrrmigration lowsLiquor, Internal RevenueFederal statutesAgricultural actsAntitrust violationsFood and Drug ActMigratory bird lowsMotor Carrier Actf\bt ional defense lowsCivil rightsContemptCustoms lowsPostal lowsOlher40,4661725533841,7451,603697360617416587933,5572527594561,1153855902,1681,':,972608115,8081,1476031,440142628057190701,0209615192,2802481591,00786614371727,9813,2463,2621,4739,1872065,162746665164701261,8731752,655403,431886159121I J61085lOB136116459;,217Total8,2144218101421917917231953327I23688259872216762012157436105960148722912I56II18II2031479037140341651323622141,6458105892462,596461,6681432074913403537737477431631239515363464042279f\bt convictedTotaldefendantsDismisseda7,05129139716913910201503127I2159117884819366179164592778787116552252I52II1810169128813:2832251541173018121,3606684802122,348351,599134148341225290713476630147336504332443838235Acquitted byCourt Juryalncluded In this column ",'e defendants who were corrmitted Act <strong>of</strong> 1966.pursuan, /0 Tltf,: ~8 U.;j.C. 2902 <strong>of</strong> the f\brcotic Addict RehabilitationSource: Administrative Office <strong>of</strong> the Ulited States Courts, 1982 Annual Report <strong>of</strong> thll Director (Washington, D.C.: AdministrativeOffice <strong>of</strong> the U,lted States Courts, <strong>1983</strong>), pp. 310, 311.2252IoI2IoI9IooI18II343672I418522oo54o4oI3oo512917594o59284o41436o136oIoIoI4938II4I648397236IoI79792119716441382315527IS64o4oI2915939888156422341139229154II10751IIIII49321I1001093oIo3112340Toto I32,2S21303723701,5261,424525041114114516702,8692276613848993093891,9531,0232247064,8489995311,149122522446172598178144291,90920812S842734107495B6,3362,4362,6731,2276,5911603,49460345811557861,520982,281332,68e72314782651032459076417938Convicted and sentencedPlea <strong>of</strong>Plea <strong>of</strong> nolo Convicted bygui! ty contendere Court Jury26,355751413481,1911,1283033323110II413552,5781986213098322493691,8339692096553,975753465873II1921142158477016953591,721184958016417130414,7581,8072,0129394,9541132,4775512897943531,262872,147282,232639106765092I2537693957421,0374oI;44o3IoI19II593o127I410243918oI4o214II33o2Io402893753o73336oI28o6o878283o6I7o4301,20572233631I4148I3o4676882571325143810031522o2o222313325I58II1376342188946034332591872o345638I18336oI145o251312593,6554421815295261211371222731020S22316233SO78333II3967117252236I574128799564160232531812312II1,19641355822S541442S31IS63413l'U205590418640132IoII246107Judicial Processing <strong>of</strong> DefendantsAgure 5.7 <strong>Criminal</strong> defendants disposed <strong>of</strong> In U.S. District Courts, by type <strong>of</strong> disposition, year ending June 30, 1982Plea <strong>of</strong> Guilty:26,355 (65.1%)TotalConvicted and sentenced:32,252 (79.'1%)(Total=40,466)Acquitted byCourt or jury:1,163 (2.9%)Totalnot convicted:8,214 (20.3%)Dismissed:7,051 (17.4%)Convictedby courtor jury:4,860 (12.0%)Plea <strong>of</strong>nolocontendere:1,037 (2.6%)Source: Administrative Office <strong>of</strong> the United States Courts, Federal Offenders in United States District Courts, 1982 (Washington, D.C.:Administrative Office <strong>of</strong> the United States Courts, <strong>1983</strong>), p. 3.507
-------- ---~ -.,---,--..,~.--...",,-,,~ .• =".=<strong>Sourcebook</strong> <strong>of</strong> <strong>Criminal</strong> <strong>Justice</strong> <strong>Statistics</strong> 19113r~ ,Ij,Judicial Processing <strong>of</strong> Defendants-',.,.~-..Table 5.23 Defendants sentenced in U.S. District Courts, by <strong>of</strong>fense, and type and length <strong>of</strong> sentence, year ending June 30, 1982I:tp!: !If ~!:Di!:D~!:Sentsnces to i!!!Erlsonrr.ent , I 13 25 37RegularOtherthru thru thru months AverageI 13 36 60 Youth Correc-\12 24 36 and sentence FineOther fTotal Total thru thru thru months Average Split tlons Act or Total months months months over in months onl~defendants imprison- Total 12 35 59 and sentence b sen- Indete'(f youthfu~Offense sentence.J ment regular months month~ rmolh~ 211!1[ io ilJQoth~ t~[)C~c wi~g!!: affeode( 12,723 3,311 2,65U :;,641 3,121 32.3 3,395 277Total 32,252 15,857 10,673 2,202 2,313 2,422 3,736 5tl.6 3,53tl 1,163 411314 I I 6 6 41.1 ! 26GENERAL CfFENSES 0 X X X X X 0 21Homicide 130 89 58 2 8 14 34 148.6 7 13 1/ 0 X X X X X 0 5Murder-first degree 37 16 14 0 0 I 13 3tl6.6 0 2 0 14 I I 6 6 111.1 I 0Murder-second degree 23 18 10 0 0 I 9 132.0 0 6 2 91 0 2 24 65 53.0 I 3Manslaughter 70 55 34 2 8 12 12 55.4 7 5 9 85 0 I 24 6U 53.2 I 3Robbery 1,526 1,431 968 17 17 56 878 167.9 57 296 I/O 4 0 I 0 3 51.0 0 0Bonk 1,424 1,335 901 13 14 47 827 169.4 49 2tl5 100 2 U 0 0 2 49.0 0 0Postal 52 48 36 0 0 2 34 216.9 0 8 4 121 41 29 33 18 27.1 19 0Other 50 4tl 31 4 3 7 17 66.2 8 3 6 4U 0 13 12 15 40.2 I 0Assault 41/ 271 192 62 30 28 72 55.0 51 15 13 3 0 0 2 I 44.0 0 0Burglary 141 100 62 2 1/ 23 26 59.2 16 10 12 7 0 0 I 6 55.7 0 0Bonk 14 1/ 8 0 0 0 8 148.0 I I I 3 0 2 I 0 28.0 0 0Postal 51 44 29 I 5 14 9 43.l I 7 7 27 0 II 8 8 37.1 I 0Interstate shipments 6 3 3 0 0 I 2 56.0 0 0 U 1,434 469 279 416 270 30.1 153 17Other 70 42 22 I 6 8 7 48.3 14 2 4 88 9 8 37 34 39.8 0 ULarceny and theft 2,869 1,265 822 170 182 249 221 41.8 290 92 61 267 13 54 123 77 39.4 0 3Bonk 227 13!' 82 6 13 2U 43 66.1 18 Itl 21 175 14 47 65 49 39.2 3 IPostal 661 391 264 42 57 115 50 38.6 80 26 21 606 322 104 118 62 23.4 103 8Interstate shipments 384 2U5 137 Itl 39 36 44 44.9 58 7 3 89 6 12 40 31 40.4 8 0Other U.S. property 899 1112 1/5 51 21 20 23 30.8 49 14 4 209 105 54 33 17 21.3 39 5Transport et. stolen property 309 212 150 13 4U 41 56 50.2 37 23 2 1,348 215 307 429 397 36.0 1/ 8Other 389 136 74 40 12 17 5 20.5 48 4 10 709 82 137 2113 247 38.4 2 IEmbezzlement 1,953 586 243 86 6U 51 46 31.7 303 24 16 170 19 50 76 25 33.6 2 I&!nk I,U23 31/ 123 32 37 29 25 33.0 161 13 14 469 1/4 120 110 125 33.4 7 6Postal 224 51 16 7 4 4 I 21.8 34 I 0 2,563 353 656 856 698 35.5 152 19\Other 706 224 104 47 19 18 20 31.6 108 10 2 523 65 144 185 129 34.9 39 II"Froud 4,848 2,114 1,244 3115 331l 267 254 35.8 76U 99 II303 :!4 82 911 98 37.7 & 2Income tax 999 436 198 93 51 35 19 24.6 227 II 0 443 21 100 170 152: 39.4 20 2leiLepding institution 531 2111 114 31 56 2U 7 26.0 96 6 2 12 2 3 3 4 35.0 0 0Postal 1,149 684 458 88 125 105 140 46.3 175 45 6 I, 15 I 4 4 6 40.4 I UVeterans and allotments 12 0 X X X X X X X X X 196 42 42 54 51l 35.8 4 ISecurities and Exchange 25 9 5 3 0 2 0 23.4 4 0 U Ii18 I 4 9 4 37.3 I 0Social Security 224 23 14 12 I I 0 12.2 8 I 0 106 7 15 33 51 43.1 0 IFolse personotion 46 27 19 3 8 4 4 41.3 6 223 I 4 II 7 40.2 I 2UNationality law~ 172 65 35 15 9 8 3 23.2 27 3 U 503 74 133 171 125 3il.3 28 4Passport fraud 59 33 24 6 10 7 I 24.0 9 0 U421 1/5 125 117 64 29.6 50 6Folse claims and statements I1117 282 149 50 45 32 22 28.3 118 14 I 120 4 20 56 40 40.2 3 0Other 84 337 228 84 33 53 58 38.8 90 17 2 I 825 55 169 352 249 38.9 6 3Auto theft 429 306 218 24 56 77 61 52.3 44 29 15 fl56 2 13 20 21 40.6 0 0Forgery and counterfeiting 1,909 1,075 721 132 198 190 201 41.9 280 46 21lI;46 4 6 23 13 45.1 i 0Transport forged securities 2011 IS..! 114 18 31 20 45 48.4 22 15 I 410 42 92 164 112 36.2 4 3Postal forgery 125 78 47 5 7 16 19 48.9 30 0 I l' 313 7 58 145 103 41.2 I 0Other forgery 842 425 290 69 88 70 63 34.7 104 HI 13 It 19 4 5 5 5 33.2 5 2Counterfeiting 734 420 270 40 72 84 74 45.8 124 13 13 6 I 0 I I; 46.0 0 ISex <strong>of</strong>fenses 107 81 54 II 4 13 29 99.0 5 12 10II13 3 5 4 I 27.2 5 IRope 49 42 29 I 2 8 18 120.5 I 7 5 II 1,617 486 219 411 501 34.1 109 24Other 58 39 25 7 2 5 II 74.0 4 5 5 776 369 107 148 1!i2 26.9 96 19Drug Prevention and Control Act 6,336 4,586 3,516 383 729 %6 1,438 61.4 643 312 115il543 75 69 158 241 41.3 7 5IMarihuana 2,436 1,545 1,229 129 297 371 432 56.5 205 80 31,298 42 43 105 lOll 39.5 6 0Drugs 2,673 2,118 1,605 173 300 378 754 66.1 279 169 65 Ii 1,942 1,010 301 343 288 22.8 2,397 75Controlled substances 1,2:17 923 682 81 132 217 252 5!1.0 159 63 19Ii 61l 12 23 25 8 29.5 14 0Miscellaneous general <strong>of</strong>fense 6,591 2,177 1,587 461 423 344 359 40.6 430 109 51 1,042 916 102 22 2 9.9 2,314 491,Bribery 160 71l 46 7 9 III 12 40.9 26 5 I 61 10 14 14 23 37.0 4 8Drunk driving and traffic 3.494 tl9 37 35 I 0 I 6.0 52 0 0110 10 17 37 46 41.5 6 IEscape 603 530 446 251 92 60 43 20.5 56 22 6 52 3 19 14 16 36.5 12 0Extort racketeering threats 458 341 268 22 47 78 121 71.0 44 24 ,) t!0 X X X X X 0 8Gambling and lottery 115 51 31 8 15 I 1 34.7 20 0 0! 27 3 14 8 2 28.5 0 2iKidnaping 57 49 34 I I 5 27 150.8 5552 37 107 220 188 39.7 14 23 7Per]urr 86 57 31 !4 6 Il 3 25.5 24 2 0 l'30 19 5 3 3 20.3 33 5Weapons and firearms 1,520 952 673 108 251 170 144 40.0 198 53 21l IOther 91l 30 21 15 I 4 I 14.2 5 0 4 I,iSee footnotes at end <strong>of</strong> table.I\; r:'iJjhflI',11:,rpj'i:I:)1,I11\1IIi1II;II!,I~ IProbation!! 509iJ
--- ..... - ~-..--~--------. - ---I'<strong>Sourcebook</strong> <strong>of</strong> Crlmlnol <strong>Justice</strong> <strong>Statistics</strong> 19113\Judicial Processing <strong>of</strong> DefendantsTable 5.Z3 Defendants sentenced in U.S. District Courts, by <strong>of</strong>fense, and type and length <strong>of</strong> sentence, year ending June 30, 198Z--ContinuedITotal Total thrudefendants imprlson- Total IZOffense sentenced ment regular monthsSPECIAL a=FENSESImnigratlon laws Z,281 I,O~3 611 326Liquor, Internal Revenue 33 12 4 0Federal statutes 2,681l 671 373 144Agricultural acts 723 173 67 24Antitrust violations 147 413 2!l 18Food and Drug Act 82 2 2 0Migratory bird lows 65 2 I IMotor Carrier Act 103 8 5 3Notional defense laws 2 0 X XCivil rights 45 20 10 1Contempt 90 II II 8Customs lows 76 23 12 2Postal laws 4!7 'l'J. 44 38Other 938. 312 196 49-,."'"o I no I uclas sentences <strong>of</strong> more than 6 months that are to befollowed by a term <strong>of</strong> probation (mixed sentences).Excludes split sentence~, indeterminate sentences, YouthCorrections Act/youthful <strong>of</strong>fender sentences, and life sentences IncludedIn IIotBerll category.A split sentence Is a sentence on a one-count indictment <strong>of</strong> 6months or less in a jail-type Institution followed by a term <strong>of</strong>probation, 18 U.S.C. 365 I. Included In these figures are mixed~O~O!;;~~ ill itDll[i~o[ltDentRegularIl'1le af see ieeeeOther13 36 60 '?outh Correcthruthru months Average Spilt tlons Act or35 59 and sentence b sen- Indeter(j youthfu~months months over In months tence c mlnate <strong>of</strong>fender187 66 3:1 18.8 382 85 153 I 0 24.8 7 0 I67 77 85 39.7 :.163 21 1413 1932.1 98 5 341 5"U" .323 0 UI I 0 30.0 0 0 U0 0 U 4.U I U 02 0 0 14.4 3 0 UX X X X X X X4 I 4 174.3 8 2 U2 I 0 1:1.7 0 0 07 2 I 26.30 0I 3 2 12.2 25 0 3"35 45 67 48.5 94 14 8sentences Involving confinement for 6 months or less on one count, tobe fol~wed by a term <strong>of</strong> probation on one or more counts.Title 18 U.S.C. 4;'05b(l) and (2).entle 18 U.S.C. SOIO(b) and (c).f'nc'udes deportation, suspended sentences, Imprisonment for 4days or less or for time already served, remitted and su~pended fines,and life sentences.Source: Administrative Office <strong>of</strong> the United States Courts, 1982 Annual Report <strong>of</strong> the Director (Washington, D.C.: Administrative Office <strong>of</strong> theUnited States Courts, 19!13), pp. 3Il-315.\\\I\\I\ 'II,II jI I\1\\\j,I" I'\ ;ProbationI 13 25 37thru thru thru months AverageFine12 24 36 and sentencein months only Othe/Total months months months over324 387 37.5 26 651,097 160 226 I I719 0 I" 49.3510 34367 171 26.01,473 513 422 123 5102 50 26.34a 126 144 72 02 10 I 14 4·1.42741 07 3 21.239 21 823.1 23 015 7 340 15 23.5 57 015 6 3313 14 IZ.O I 0I 0 0 0II 39 3 31.121 5 416.0 20 I2 5 358 41318 5 32.4 13 040 5 1221.6 24 1057 14311 145 9529.2 135 15476 131 117 155 73~I511
-~-~-----SourcebOflk <strong>of</strong> <strong>Criminal</strong> <strong>Justice</strong> <strong>Statistics</strong> <strong>1983</strong>Figure 5.8 Average Stmtence <strong>of</strong> imprisonment far defendants imprisoned for marihuana violcltions from U.S.District Courts, years ending June 30, 1960-8280f\OTE: See f\OTE, Table 5.15.706050.cc:'"E.::o 40302010a\61 62 63 64 66 67 68 69 71 72 73 741960 1965 1970 1975aExcludes split sentences, indeterminate sentences, Youth Corrections Act and youthful <strong>of</strong>fender sentences, andlife sentences.Administrative Office <strong>of</strong> the United States Courts, Federal Offenders in U1ited States District Courts, 1982(Washington, D.C.: Administrative Office <strong>of</strong> the United States CourTs, <strong>1983</strong>), p. H-17. Figure constructed byS
- ~-----~----~ -~--Figure 5.9 Civil and prisoner lawsuits against the Federal Government filed in U.S. District Courts, years ending June 30, 1960-81I\()TE: "U.S. civil" filings involve suits against the Federal Government brought in U.S. District Courts. Prisonerpetitions, 0 subset <strong>of</strong> this category, include actions brought by Federal prisoners in the form <strong>of</strong> mations tovacate sentences, U.S. Parole Comnission reviews, habeas corpus, mandamus, civil rights actions, and mattersinvolving prisoner's grievances regarding administrative or judicial decisions. "Habeas corpus" is a writ whoseobject is to bring a porty before a court or a judge. "Mandamus" is a writ from a superior court to an inferiorcourt or to a public <strong>of</strong>ficial, a corporation, etc., comnandlng thot a speCified action be taken.;',65,00060,00055,00050,00045,000Prisoner petitions against the Federal GovernmentIfIIJhi scale,16'500/-.....// 6,000/II 5,500II 5,0004,500' C0..ii'2:40,0004,000....U1wl'I135,00030,000l3,5oo "I~ 3,000 ~25,0002,500Total U.S. civillilingsIlell scale)20,0002,00015,0001,50010,0001,0005,000500OL_ __-L____ JL __ ~ ____-L____ L_ ___J____ JL ____ L_ ___L____ L_ __ ~L_ ___L____ L_ ___J____ J_ __ ~L_ __ ~ __ ~L_ __ ~ _____L__--JO1960 1961 1962 1963 1964 1965 1966 1967 1968 1969 1970 1911 1972 1973 1974 1975 1976 1977 1!';~8 1979 1900 1981Source: Administrative Office <strong>of</strong> the United States Courts, 1981 Annual Report <strong>of</strong> the Director (Washington, D.C.: Administrative Office <strong>of</strong> the United StatesCourts, 19BI), p. 63, Tobie 20. Figure constructed by saRCEBOO< staff.\, ,"
-----------------------<strong>Sourcebook</strong> <strong>of</strong> <strong>Criminal</strong> <strong>Justice</strong> <strong>Statistics</strong> 19tJ3Table 5.24 Petitions filed In U.S. District Courts by State and Federal prisoners, by type <strong>of</strong> petition, years ending June 30, 1970-82!\oTE: See !\oTE, Figure 5.9. Petitions by State prisoners are those petitions In which the State orits representative(s) Is named as the defendanHs}.Judicial Processing <strong>of</strong> DefendantsTlee <strong>of</strong> eetition 1970 1971 1972 1973 1974 1975 1976 1'J77 1971lTotal all petitions 15,997 16,266 16,267 17,211l 11l,410 19,307 19,8U9 19,537 21,924Petitions by Federal prisoners 4, IS!> 4,121 4,179 4,535 4,91l7 5,047 4,78U 4,691 4,955Parole Commission reviews 232 20.2 268 466 371 662 538 2'31 121Motions to vocate sentence 1,729 1,335 1,591 1,722 1,822 1,69U 1,693 1,921 1,924Habeas corpus 1,600 1,671 1,368 1,294 1,718 1,682 1,421 1,508 1,730Other prisoner petitions 856 913 952 1,053 1,076 1,675 1,666 1,262 1,301Mandamus, etc. 720 699 700 639 631 1,197 1,164 779 665Civil rights 136 214 252 414 445 471l 502 1183 6:i6Petitions by State prisoners 11,812 12,145 12,01l8 12,6tJ3 13,423 14,26U 15,029 14,846 16,969Habeas corpus 9,063 8,372 7,949 7,784 7,626 7,843 7,833 6,866 7,033Other prisoner petitions 2,749 3,773 4,139 4,899 5,797 6,417 7,1% 7,91l0 9,936Mandamus, etc. 719 1:158 791 725 561 289 238 228 206Civil rights 2,03U 2,915 3,341l 4,174 5,236 6,121l 6,951l 7,752 9,73U1979 1911023,UOI2:1,21l74,1199 3,713117 521,907 .1,3221,577 1,4131,015 971l4l.7 375SIlIl 6U318,502 19,5747,123 7,03111,3n 12,543184 14611,195 IL,397Source: Administrative Office <strong>of</strong> the United States Courts, Annual Report <strong>of</strong> the Director, 1979, p. 61; 1981, p. 63, Table 21; 19H2, p.103 (Washington, D.C.: Administrative Office <strong>of</strong> the United States Courts):Table adopted by 5O...RCEBOO< st<strong>of</strong>f.Percent change1911l 19H2over over19!J1 19112 1977 I 'J1l I27,711 29,3U3 5U.0 !>.74,IU4 4,321l -7.7 5.551 X X X1,24tJ 1,186 -31l.3 -5.01,629 1,927 27.8 18.31,227 1,215 -3.H -J.O393 3HI -51.1 -3.1834 1134 72.7 0.023,6U7 24,975 61:1.£ 5.87,790 8,U59 17.4 3.515,817 16,916 52.9 6.5178 175 -23.2 -1.715,639 16,741 115.6 7.U514515
'rIlfI. '"• ""' .. t.':>\._ ;~~, "::~., ~".J:.)"'~.~'_~'~'~ __ ;: _._,~ .. __ •. .:_ .. _JIo
~---~ --- ----~--------~----------------------<strong>Sourcebook</strong> <strong>of</strong> <strong>Criminal</strong> <strong>Justice</strong> <strong>Statistics</strong> <strong>1983</strong>Judicial Processing <strong>of</strong> DefendantsTable 5.25 Appeals from U.S. District Courh filed in U.S. Courts <strong>of</strong> Appeals, by nature <strong>of</strong> suit or <strong>of</strong>fense, years ending June 30, 1971-82)\OTE: See )\OTE, Figure 5.9. 'Private cases" brought in U.S. District Courts include suits whereinlitigation is between States and/or private citizens. Prisoner petitions included in this categoryare those filed by State prisoners naming a State or its representative(s) as the defendant(s)."DiVersity <strong>of</strong> citizenship" refers to lawsuits between residents <strong>of</strong> different States.Percentchan9«=Nature <strong>of</strong> suit1982 overor <strong>of</strong>fense 1971 1972 1973 1974 1975 1976 1977 1978 1979 19!10 19!11 19!12 1981Total cases 10,79f.l 12,379 13,329 13,491 13,679 15,054 15,718 15,649 16,322 19,259 21,391 23,551 10.1Total civil cases 7,601 8,399 8,876 9,424 9,492 10,404 10,980 11,162 12,220 14,854 17,014 18,784 10.4U.S. coses 2,367 2,604 2,704 3,267 2,981 3,327 3,622 3,928 3,983 4,654 4,94U 5,517 11.7U.S. plointiff 363 399 388 510 513 407 449 537 720 869 777 899 15.7Contract o-:tions 28 45 34 45 57 41 24 52 64 99 5'i 91 65.5Real property actions 81 70 66 95 73 67 73 67 71 101 141 148 5.0Civil rights 34 38 22 62 42 44 55 49 49 62 47 96 IU4.3Labor lows 67 83 75 82 65 59 52 46 46 68 82 87 6.1All ot!1er 153 1';3 191 226 276 196 245 323 490 539 452 477 5.5U.S. defendant 2,004 2,205 2,316 2,757 2,468 2,920 3,173 3,391 3,263 3,785 4,163 4,618 10.9Contract actions 155 138 129 156 115 134 107 209 0 15!l 179 212 148 -3U.2Real property actions 19 45 51 40 40 33 32 58 0 62 63 82 83 1.2Tort actions 119 162 165 163 146 162 181 286 30!l 324 395 44] 12.2Civil rights Nt>. Nt>. Nt>. Nt>. Nt>. Nt>. Nt>. 405 432 454 469 619 32.0Prisoner petitions:Motions to vocatesentence 474 504 579 684 509 526 502 343 389 450 459 359 -21.8Habeas corpus 261 234 261 261 207 206 242 268 214 302 344 455 32.3Prisoner civil rights 36 39 53 53 61 64 71 89 102 159 234 234 0.0D+her prisoner petitions 99 113 108 225 103 99 60 59 70 96 118 ISS 31.4Selective Service Act 145 8B 14 6 2 0 3 0 0 0 0 0 XSocial Security laws 130 210 193 246 247 293 478 585 0 574 627 642 779 21.3Tax suits 220 260 213 233 220 212 193 240 206 197 239 248 3.8All other 346 412 550 690 818 1,191 1,304 849 0 748 934 784 875 11.6Pr ivate ':ases 5,234 5,795 6,172 6,157 6,511 7,077 7,358 7,234 8,237 10,200 12,074 13,267 9.9Feder'Ji question 3,697 4,053 4,483 4,521 4,676 5,267 5,589 5,383 6,208 7,728 9,005 9,994 11.0':':ontract actions 91 132 113 163 126 143 137 165 201 252 3U7 373 21.5Tort action~ 191 262 381 319 310 341 349 378 412 497 581 600 3.3Civil rights 804 991 953 1,118 1,126 1,297 1,334 1,535 1,795 l,145 2,5!l7 2,787 7.7.A.ntitrust 227 131 190 256 233 251 261 279 274 343 391 378 -3.3Prisoner petitions:Habeas corpus 1,261 1,319 1,301 1,084 871 866 837 676 859 1,020 1,258 1,529 21.5Prisoner Givil rights 311 349 47H 472 633 619 774 753 1,069 1,57!l 1,!l51 2,03!l 10.1Other pi "ncr petitions 71 56 49 46 48 54 39 37 50 70 47 63 34.0Labor lows 236 226 26U 235 284 279 287 349 363 417 580 70'1 21.4Copyrights, potent andtrademark 134 117 144 114 149 150 95 234 0 232 270 394 434 10.2All other 371 470 614 714 896 1,267 1,476 977 0 953 1,136 594 666 12.1Diversity ot citizen! r 1,286 1,499 1,46H 1,527 1,745 1,714 1,713 1,7')6 i,!i91 2,427 3,03U 3,217 6.2Contract actions 665 789 779 864 1,004 942 996 980 1,129 1,362 1,815 1,!lC8 -0.4Tort actions 562 610 62U 605 619 709 622 700 775 996 1,02~ 1,24U 20.5All other 59 100 69 58 122 63 95 116 87 69 186 1169 -9.1General local jurisdiction 251 243 221 109 90 96 56 55 38 4!i 39 56 43.6Contract actions 77 25 119 73 47 46 33 II 10 10 1,815 1,808 -0.4Tort actions 54 65 74 22 22 25 14 8 II 14 I ,Ol~ 1,240 20.5Prisoner petitions 22 7 5 II 6 II 9 I 0 7 0 0 XAll other 9B 146 23 13 15 14 0 35 17 14 39 56 43.6Totol crimi no I cases 3,197 3,9BO 4,453 4,067 4,187 4,650 4,738 4,487 4,102 4,~05 4,377 4,767 8.9t-bmicide 66 76 97 46 63 48 39 51 41 52 51 62 21.6Robbery and burglory 500 515 518 435 420 484 396 35!l 291 3'10 304 362 19.1Larce .. y and theft 248 261 268 223 276 303 251 306 247 244 324 285 -12.0Embezzlement and fraud 285 28!l 369 392 424 482 650 704 689 826 887 912 2.!lAuto theft 180 178 178 164 143 139 116 84 95 64 64 60 -6.3Narcotics 565 820 I,DI 1,328 : ,332 1,388 1,381 1,303 1,371 1,369 1,5!l3 1,605 1.4Extortion, racketeering,and threats 7!l 162 165 145 III 184 176 154 153 251 143 158 10.5Firearms 173 246 215 258 265 301 276 298 221 175 169 281 48.7Forgery and counterfeiting Nt>. Nt>. Nt>. Nt>. Nt>. Nt>. N\ 178 188 214 167 194 16.2Selective Service Act 261 324 214 95 56 14 5 0 0 0 0 0 XAll other 841 1 1 110 1 1 158 981 1 1 097 1 1 307 1144!l 1,0Sl a 806 900 4!l0 675 40.6aData revised from previous report.Source: Administrative Office <strong>of</strong> the United States Courts, Annual Report <strong>of</strong> the Director, 1977 (Preliminary Report), p. 68; ill!! (PreliminaryReport), p. 46; 1980, p. 45; 1982, p. 82 (Washington, D.C.: Administrative Office <strong>of</strong> the United States Courts). Table adopted by S(LRCEBOO< staff.516l'IiI!):IiIi1111II11IIf·Agure 5.10 Appeals commenced and judgeships authorized in U.S. Courts <strong>of</strong> Appeals, selected years endingJune 30, 1940-82)\OTE: Data on the number <strong>of</strong> appeals commenced are prOVided by clerks <strong>of</strong> court <strong>of</strong> the I I :..1.5.Courts <strong>of</strong> Appeals. The case load <strong>of</strong> the U.S. Courts <strong>of</strong> Appeals consists <strong>of</strong> civil and criminalappeals from U.S. District Courts, bankruptcy appeals, appeals from administrative agencies(Notional Lobor Relations Boord, Environmental Protection Agency, etc.), and original proceedings.Appealscommenced(!n thousands)Judgeships30 r-----------------------------------------------------~ 180252015.-.I .....105(57) ____ ..",..",.--(3,446)----=-/(68)~(65) "'"(2,830)////'(97)/ //o~I--~------~~------~~------~------.--~~j...... --_ Appeals commenced(In thousands)____ JudgeshipsSource: AdministratIve Office <strong>of</strong> the United States Courts, Annual Report <strong>of</strong> the Director, 1980, p. I; 1982, p.77, Table I (Washington, D.C.: AdmInIstratIve Office <strong>of</strong> the United States Courts). FIgure constructed bySURCEBOO< st<strong>of</strong>f.7//12090........III60o
."<strong>Sourcebook</strong> <strong>of</strong> Criminol <strong>Justice</strong> Stotistics <strong>1983</strong>Table 5.26 Cases filed, disposed <strong>of</strong>, and pending in the U.S.Supreme Court, by method <strong>of</strong> filing, at conclusion <strong>of</strong> theOctober terms 1976-81!\oTE: "Original" refers to those cases that were on the SupremeCourt docket previously and disposed <strong>of</strong>, b':1 that have beenreinstated for some reason. For cll cases other than "original"ones, a docket filing fee must be "paid." If the petitioner isindigent, the docket filing fee is waived and the case is filed "informa pauperis."In formaTotal Original Poid pauperis1976:Cases on docket 4,73U 8 2,324 2,398Disposed <strong>of</strong> 3,918 2 1,852 2,U64Remaining on dockets 812 6 47'2. 3341977:Cases on docket 4,704 14 2,341 2,349Disposed <strong>of</strong> 3,867 3 1,911 1,953Remaining on dockets 837 II 430 3961978:Cases on docket 4,731 17 2,383 2,331Db,',. ... " <strong>of</strong> 4,017 2,021 1,996Rerr ... r';·-J on dockets 714 17 362 3351979:Cases on docket 4,781 23 2,509 2,249Disposed <strong>of</strong> 3,8&9 I 2,05U 1,838Remaining on dockets 892 22 459 4111980:Cases on docket 5,144 24 2,749 2,371Disposed <strong>of</strong> 4,196 7 2,222 1,950Remaining on dockets 948 17 527 4211981:Cases on docket 5,:::: I 22 2,935 2,354Disposed <strong>of</strong> 4,4:l3 6 2,390 2,037Remaining on dockets 878 16 545 317Soun;e: Administrative Office <strong>of</strong> the United States Courts,Annual Reeort <strong>of</strong> the Director! 1981, p. A-I; 1982, p. 189(Washington, D.C.: Administrative Office <strong>of</strong> the United StatesCourts). Table adapted by SOLRCEBOO< staff.Table 5.27 Activities <strong>of</strong> the U.S. Supreme Cou!'t, at conclusion <strong>of</strong> the Octoberterms 1976-81I-DTI.:: See NJTI.:, Table 5.26.Qctober te~1976 1977 1978 1979 1980 1981Argued during term 176 172 168 156 154 184Disposed <strong>of</strong> by full opinions 154 153 153 143 144 169Disposed <strong>of</strong> by per curiamopinions :a 8 8 12 8 IUSet for reargument 0 9 8 I 2 4Granted review this term 169 162 163 154 183 210Reviewed and decided withoutoral argument 207 129 IIG 128 130 134Total to be available foror gument at out set <strong>of</strong>following term 88 75 79 78 102 126. Source: Administrative Office <strong>of</strong> the United States Courts, Annual Reeort <strong>of</strong> theDirector. 1981, p. A-I; 1982, p. 189 (Washington, D.C.: Administrative Office <strong>of</strong> theUnited States Courts). Table adapted by SOLRCEBCG< st<strong>of</strong>f.518I.1 I! 1!, fl. [1I !r' J, tJudicial Processing or DefendantsTar)le 5.28 Petitions for review on writ <strong>of</strong> certiorari to' the U.S. Supreme Courtfile?, disposed <strong>of</strong>, and pending, by circuit and nature <strong>of</strong> proceedings yeorending June 30, 1982'N)TE:. See NOTES, Figure 5.9 and Table 5.25. Administrative appeals includeapplications for enforcement or petitions for review <strong>of</strong> orders <strong>of</strong> an administrativeboard or agency. For a list <strong>of</strong> U.S. District Courts in each circuit, see Table 5.19.Circuit andnature <strong>of</strong>proceedingPending Terminated PendingJuly eI, Dis- June 30,1981 Filed' Granted Denied missed 1982Total 737 2,841 199 2,533 18 828<strong>Criminal</strong> 219 907 16 877 2 231U.S. civil 91 392 42 327 2 112Private civil 369 I,:m, 125 1,182 13 425Administrative appeals 58 166 16 147 I 60District c~ CollXnbla Circuit 25 135 20 116 0 24<strong>Criminal</strong>U.:l, ci ,i14II1361I131348003IIPr!vat .. civil 3 24 2 25 0 0Admini',!\ratlve appeals 7 37 4 30 0 10First C; cc Jit 15 104 6 86 I 26Crimi nul 3 29 0 23 0 9U.S. civil 3 ') I 9 0 2Private civil 9 61 5 50 I 14Administrative appeals 0 5 0 4 0 ISecond Circuit 67 266 20 zn 1 80<strong>Criminal</strong> 23 94 0 % 0 21U.S. civil 4 37 I 29 0 IIPrivate civil 33 122 16 93 I 45Administrative appealsThird Circuit751132333161420302363<strong>Criminal</strong> 6 68 I 60 0 13U.S. civil 15 33 6 33 0 9Private civil 26 114 7 96 2 35Administrative appeals 4 18 2 14 0 6Fourth Circuit I n 241 16 203 2 2\2<strong>Criminal</strong> 56 68 2 54 0 68U.S. civil 9 30 4 22 I 12Private civil 121 133 10 119 I 124Administrative aepeals 6 10 0 8 0Fifth Circuit 56 291 26 282 4835:::riminal 7 76 2 72 0 9U.S. civil 7 28 5 26 0 4f~ivate civil 37 174 19 1;0 3 19Administrative appeals 5 13 0 14 I 3Sixth Circuit 68 288 16 299 I 40<strong>Criminal</strong> 34 74 0 103 0 5U.S. civil 6 45 I 42 I 7Private civil 26 159 15 144 ::i 26Administrative aopeqls 2 10 0 10 0 2Seventh Circuit 62 246 15 193 2 98<strong>Criminal</strong> 15 72 4 60 0 23U.S. civil 12 24 3 19 0 14Private civil 31 142 8 108 2 55Administrative appeals 4 8 0 6 0 6Eighth Circuit 32 180 /I 168 0 33<strong>Criminal</strong> 10 50 2 53 0 5U.S. civil 2 15 0 II 0 6Private civil 18 109 9 96 0 22Admlnlstrgtive gopeals 2 6 0 8 0 0Ninth Circuit 108 483 35 410 3 143<strong>Criminal</strong> 31 167 4 152 2 40U.S. civil 15 73 5 59 0 24Private civil 42 204 19 165 I 61~~A~dm~l~nl~stllr~a~ti~vEe~a~p~PEea~l~s. ______ ~2~0~ __ ~~39~----~7--- 34 0 18Tenth Circuit 40 168 6 '-;'17~4f:-----~0---~2~8'--<strong>Criminal</strong> 24 103 0 113 0 14U.S. civil 6 23 2 19 0 8Private civil 9 38 4 40 0 3Administrative appeals I 4 0 2 0 3Eleventh Circuit 21 206 12 167 2 46<strong>Criminal</strong> 6 93 0 78 0 21U.S. civilPrivate civilI141496I/I107602421Administrative aeeeals 0 3 0 3 0 0aAdjusted.Source: Administrative Office <strong>of</strong> the \.kIlted States Courts, 1182 Annual Report <strong>of</strong>the Director (Washington, D.C.: Ackninlstratlve Office <strong>of</strong> the \.kIlted States Courts<strong>1983</strong>), p. 198. '519
------------- - - - ---.--- ----.--~------------------------------------------------<strong>Sourcebook</strong> <strong>of</strong> <strong>Criminal</strong> <strong>Justice</strong> <strong>Statistics</strong> <strong>1983</strong>.Table 5.29 U.S. Supreme Court cases argued and decided on merits, at conclusion <strong>of</strong> the October terms 1975-81ArguedNJ,TE: . Th7, data below represent actions taken during the annual terms <strong>of</strong> the U.S. Supreme Court.. AmIcus. refers to a ~~rty whl) is not involved directly in the suit, but who demonstrates anInterest. In the case by f"lng a sUpportive brief. "Decided on merits" ref~'rs to a reassessment andreso.l~tlo~ <strong>of</strong> the s~b.stantive issues presented in the case, but that does not involve activepartIcIpatIon <strong>of</strong> the lItIgants through the filing <strong>of</strong> written and oral arguments.1975 1976 1977 1978 1979Number Percent 1980Number Percent Number Percent Number Percent Number Percent Number Percent179 100Government involvement176 100121164 068100 168 0 100 156 0 100 154Government99 56 970 100~ petitioner 59 99 59 108 69or appellant101 6644 36 29Government I5s respondent29 35 36 ")9 29 43 40or appellee31 31:12 27Government as amicus b 36 36 4045 c 41373434 34 35 32 37/\h Government involvement c 35 22 c 23 36 c 3658 32 77 37443067 c 28413369 c 3341 48 31 53 34Decided on merit~d 351 100Government ir,.,olvement372 100 276175 10050 267 100 281 100 277Decided in favor <strong>of</strong>186 50 139 50 12210046 158 56 128Government's Position b 46134 77Decided againstIII 60 87 63 82 67 104 66 92Government's Position b 7233 19/\ht64cl~ifioble as for or34 41 29 32 26 51 32against33 258 4/\h Government involvementII 6176II5081868 750 3137 l.50 145 3a54 123 44 149 54~ncludes . cases set for reargument in succeeding terms... ercent IS based on the total cases in which the Government clncludes cases in which the Government filed briefs aspartIcIpated.in forma pauperis docket.g;~~~:~~::~v~~~~;J~~~~~~&:7~~~c;. ~ ~~d AJ:~~n;io~~~r~~ ~~~~~5201981Number Percent184 0 100104 0 5730 2927 2647 c 4580 43315 100136 43III 8220 155 3179 57curiae d but did not participate in the argument.amicusIncludes cases sUrrrTlOrily affirmed, reversed, or vacatedon theR~t~~t ~: ~~: t~~~r~:pa~:~~1 ~: ~~=ti~:ted f:::t~; t~as~~~~~~;Judicial Processing <strong>of</strong> DefendantsTable 5.30 Executive clemency applications for Federal <strong>of</strong>fensesreceiVed, disposed <strong>of</strong>, and pending, in the <strong>of</strong>fice <strong>of</strong> the U.S •Pardon Attorney, fiscal years 1953-82NJTE: Article II, Section 2 <strong>of</strong> the U.S. Constitufion authorizes thePresident to grant executive clemency for Federal <strong>of</strong>fenses. The U.S.Pardon Attorney, in consultation with the Deputy Attorney General,receives and reviews all petitions for executive clemency, initiatesthe necessary investigations, and prepares the recomnendation <strong>of</strong> theDeputy Attorney General to the President (Source, p. 35). Clemencymay be a rep.rieve, remission <strong>of</strong> fine, commutation, or pardon. A"pardon," which is generally considered only after sentencecompletion, restores basic civil rights and may aid in thereinstatement <strong>of</strong> pr<strong>of</strong>essional or trade licenses that may have beenlost as a result <strong>of</strong> the conviction. A "comnulalion" is a reduction <strong>of</strong>sentence. The figures presented in this table do not inclUde clemencyactions on draft resisters, or military deserters and absentees duringthe Vietnarr: era.GrantedFiscalComnu-~ear Received Pardons tatians Denied Pending1953 599 97 8 355 6811954 461 55 7 348 7321955 662 59 4 684 6471956 585 192 9 568 4631957 585 232 4 443 3691951l 406 91l 6 302 3691959 434 117 2 286 3981960 437 149 5 244 4371961 481 226 18 266 4081962 595 166 16 315 5061963 592 133 45 233 6871964 921 314 74 437 7831965 1,008 195 80 569 9471966 865 364 81 726 6411967 863 222 23 520 7391961l 749 13 3 415 1,0571969 724 0 0 505 1,2761970 459 82 14 698 9411971 454 157 16 648 5741972 514 235 20 410 4251973 485 202 5 341 3621974 426 187 8 337 2561975 613 147 9 328 3851976 604 78 II 244 6581977 722 129 8 300 8631971l 641 162 3 1336 5081979 710 143 10 448 6171980 523 155 II 500 4741981 548 76 7 260 6791982 462 83 3 547 508Source: U.S. Department <strong>of</strong> <strong>Justice</strong>, Office <strong>of</strong> the AttorneyGeneral, The Annual Reeort <strong>of</strong> the Attorne~ General <strong>of</strong> the U,itedStates 1979, p. 31; 1980, p. 35 (Wa-~hington, D.C.: U.S. GovernmentPrinting Office); anddiita provided to SCXRCEBOCK staff by the U.S.Department <strong>of</strong> <strong>Justice</strong>, Office <strong>of</strong> the Pardon Attorney. Table adaptedby SCXRCEBOCK staff.Table 5.31 <strong>Criminal</strong> tax fraud cases initinted by the Internal Revenue Service <strong>Criminal</strong>Investigatioll Division, by type <strong>of</strong> disposition, fiscal years 1976-82NJTE: The <strong>Criminal</strong> Investigation Division <strong>of</strong> the Internal Revenue Service is responsible for enforcingthe criminal provisions <strong>of</strong> the tax laws, investigating evidence <strong>of</strong> tax evasion or tax fraud, identifyingand investigating persons who derive substantial income from illegal activities and who violote taxlaws, and recomnending prosecution (Source, 1971l, p. 30).The Criminol Tax Division <strong>of</strong> the Office <strong>of</strong> Chief Counsel handles all criminal tax legal mattersfor the I nternal Revenue Service, reviews criminal cases and decides if cases warrant prosecution,coordinotes criminal tax prosecutions with the U.S. Department <strong>of</strong> <strong>Justice</strong>, and provides assistance toU.S. Attorneys In criminal tax trials upon request (Source, 1978, p. 53).1976 1977 1978 1979 1980 1981 1982Cases initiated by <strong>Criminal</strong>Investigation DivisionDisposed <strong>of</strong> by <strong>Criminal</strong>9,035 8,901 9,481 9,71l0 7,114 5,838 6,498Investigation Division:Prosecution recomroended 3,147 3,408 3,439 3,338Prosecution not recommended2,267 1,971l 2,2975,650 5,459 5,969 6,252Disposed <strong>of</strong> by Office <strong>of</strong>6,329 3,701 3,852Chief Counsel:Prosecution not warranted,including cases declinedby the U.S. Department <strong>of</strong><strong>Justice</strong> 589 486 597Prosecutions800 1,285 571 2932.031 2,161 2.m 2.,515 2.321 1,621 1.680Source: U.S. Department <strong>of</strong> the Treasury, Internal Revenue Service, Annual Reeort <strong>of</strong> theComnissioner <strong>of</strong> Internal Revenue, 1976, p. 151; 1977, p. 139; 1978. p. 98 (Washington, D.C.: 0.5.GOvernment Printing Office); and data provided to sa::RCEBOCKSfcitf by the U.S. Department <strong>of</strong> theTreasury, Internal Revenue Service. Tobie adapted by SCXRCEBOCK staff.
---------- - -- -<strong>Sourcebook</strong> <strong>of</strong> Criminol <strong>Justice</strong> <strong>Statistics</strong> <strong>1983</strong>judicial Processing <strong>of</strong> DefendontsTable 5.32 <strong>Criminal</strong> tax fraud cases handled by the Internal Revenue Service Office <strong>of</strong> ChiefCounsel, by type <strong>of</strong> disposition, fiscal years 1976-82."!\oTE: See NOTE, Table S.31. For on explanation <strong>of</strong> indictments and informations, see !\OTE, Table5.15. A "nolle prosse" disposition occurs when a prosecutor decides not to prosecute a case. "Notrue bill" refers to cases in which the grand jury decides not to indict the defendant.1976 1977 1971:1 197!1 1980 1981 ·,982Referrals by Office <strong>of</strong> ChiefCounsel for prosecution 2,037 2,695 2,634 2,883 1,726 1,955 2,176Grand jury action:Indictments and informations 1,331 1,636 1,724 1,820 1,832 1,785 1,844No true bill I 31 II 26 15 9 10Disposition:Plea <strong>of</strong> guilty or nolocontendere ')77 1,229 1,189 1,270 1,337 1,212 1,291Convicted after trial 216 247 225 342 264 282 333Acquitted 77 55 70 86 80 81 65Nolle erosse or dismissed 71 110 119 183 193 142 145Source: U.S. Deportment <strong>of</strong> the Treasury, Internal Revenue Service, Annual Report <strong>of</strong> the£~mmissioner <strong>of</strong> Internal Revenue, 1976, p. 61; 1977, p. 48; 1978, p. 53 (Washington, D.C.: U.S.Government Printing Office); and data provided to"SO..RCEBOO< st<strong>of</strong>f by the U.S. Deportment <strong>of</strong> theTreasury, Internal Revenue Service. Table adapted by SOlRCEBOO< st<strong>of</strong>f.Table 5.33 <strong>Criminal</strong> investigations by the U.S. Postal Inspection Service, by type <strong>of</strong> <strong>of</strong>fense, number <strong>of</strong> completed investigations, number<strong>of</strong> convictions, fines imposed, and recoveries and restitutions, .fiscal years 1978-82!\oTE: The U.S. Postal Inspection Service, the investigative arm <strong>of</strong> the U.S. Postal Service, isresponsible for the investigation <strong>of</strong> all violations <strong>of</strong> Federal statutes relating to the Postal Serviceand the internal audit <strong>of</strong> all Postal Service financial and nonfinancial operations. The Sourcereports that significant decreases in the number <strong>of</strong> convictions for miscellaneous <strong>of</strong>fenses are dueto a change In Investigation priorities.Investigations comeleted Convictio:' )Type <strong>of</strong> <strong>of</strong>fense 1971:1 1979 1980 1981 1982 1971:1 1')79 1980 1981 1982Theft <strong>of</strong> mail by employees, contractors,and others (internal) 8,026 7,146 6,801 6,331 5,059 796 745 665 782 853Embezzlement <strong>of</strong> postal funds 3,067 3,287 3,850 4,182 3,031 185 288 236 259 258Burglary <strong>of</strong> post <strong>of</strong>fices 1,125 1,095 1,324 1,197 1,016 344 354 242 213 238Hold up <strong>of</strong> postal facilities, carriersand Motor Vehicle Service driversAssaults/threats against U.S. Postal241 241 242 248 216 112 125 143 127 107Service personnel 1,873 1,815 1,651 1,930 1,922 173 182 110 III 126Mail theft from delivery receptacles 150,515 142,563 160,819 207,473 0 252,791 0 12,936 10,246 5,761 2,442 1,873Forgery/counterfeiting <strong>of</strong> U.S. PostalService money orders 2,550 2,287 2,183 1,040 (b) 228 221 184 80 (b)Willful damage or destruction<strong>of</strong> moil rec~ptacles 28,530 30,946 25,621 18,959 0 (b) 1,517 1,159 381 176 (b)Unlawful mailings:Obscene matter i04 114 301 237 161 16 II 16 34 39Firearms Nt>. Nt>. Nt>. Nt>. 73 Nt>. Nt>. Nt>. Nt>. 4Bombs/explosives 188 250 132 III 159 27 49 31 16 26Norcotics, dangerous dr"gs,ond controlled substances 871 688 409 300 201 209 154 81 71 61lScurrilous ond defamatory matter Nt>. Nt>. Nt>. N'\ 23 Nt>. Nt>. Nt>. Nt>. Nt>.Extortion letters 105 74 52 53 48 13 12 9 IS 10Other Nt>. 1,007 911 616 162 Nt>. 61 64 II IIMiscellaneous (thefts from self-serviceunits; theft <strong>of</strong> keys, locks, and otherU.S. Postal Service equipment; vandalism;interception <strong>of</strong> moil; possession andfencing <strong>of</strong> stolen property; false claimsor stotements; ather postal crimes) 1,956 1,894 1,616 1,583 4,273 608 436 283 27 204Mail fraud 5,724 5,497 4,430 3,550 2,867 2,012 2,063 1,370 1,046 966Total 204,475 198,904 210,342 247,810 272,002 19,176 16,106 9,576 5,410 4,783aNumber <strong>of</strong> complaints <strong>of</strong> theft and damage; most <strong>of</strong>ten, clncludes $927,747 restitution from non-fraud criminal <strong>of</strong>fenseinvest~gations cover numerous related complaints. areas.Included in the miscella:leous Qffenses.Source: Tobie provided to SOLRCEBOO< st<strong>of</strong>f by the U.S. Postal Inspection Service, Chief Postal Inspector.11nII1111/!ijr!\:IRecoveries and restitutions1978 1979 1980 1981 1982\ : o 0N\ 15,265,869I0 Nt>. Nt>. Nt>. Nt>.Nt>. $515,448 $812,918 $1,173,873 Nt>.Nt>. Nt>. 19,419 7,788 Nt>.0 0 Nt>. Nt>. Nt>.0 0 Nt>. Nt>. Nt>.Nt>. Nt>. Nt>. Nt>. Nt>.N\ Nt>. Nt>. Nt>. Nt>.0 0 N\ Nt>. Nt>.0 0 Nt>. Nt>. Nt>.Nt>. 0 Nt>. Nt>. Nt>.0 0 Nt>. Nt>. Nt>.0 0 Nt>. N\ Nt>.Nt>. 0 Nt>. Nt>. Nt>.0 Nt>. Nt>. Nt>. Nt>.Nt>. 0 N\ Nt>. Nt>.Nt>. $15,71:11 ,3172,638,820 1,335,136 Nt>.3,372,270 9,590,239 15,647,917$6,843,427 $12,107,036 $16,575,664 c:'522
--------_. -,<strong>Sourcebook</strong> <strong>of</strong> <strong>Criminal</strong> <strong>Justice</strong> <strong>Statistics</strong> 191:13Table 5.34 Complaints, ('rlmlnal investigations completed,arrests, and convictions In mall fraud cases handl6d bythe U.S. Pestal Inspection Service, fiscal years 1960-82NJTE: See NJTE, Table 5.33.FiscalInvestigationsyear Cgmplaints completed Arrests Convictions,.1960 9,263 5')4 3661961 10,395 651 4311962 72,550 9,842 676 5241963 88,223 '),012 619 5811964 11'),0')2 8,769 70') 5441%5 115,13') '),')85 929 6071%6 130,457 '),836 877 6331967 135,203 0 8,16') 714 5571961:1 146,847 0 8,851 1,018 61:111969 1')4,052 '),638 1,061 7671')70 125,8')8 10,047 1,163 ')101')71 135,648 10,31') 1,513 1,1131')72 125,048 12,nl 1,965 1,35U:,)73 118,')')5 11,277 1,')1') 1,5361974 111,~7 9,840 1,570 1,3')41')75 127,044 6,332 1,618 1,2601')76 135,717 5,7')3 1,674 1,4581')77 166,')17 5,037 1,9')3 1,6171')78 161,741 5,724 2,232 2,0121')79 204,332g 5,4')7 2,377 2,0631')80 200,000 ,c 4,430 1,367 1,3701981 200,000b,c 3,550 1,100 1,0461982 200,000b,c 2,867 1 1 026 %6~Includes certain nonfraud complaints.D6CS not include consumer protection complaints.CEstimated.Source: Tobie provided to SCXRCEec:a< st<strong>of</strong>f by the U.S.Postal Inspection Service, Chief Postal Inspector.Table 5.35 Mail fraud complaints received by the U.S. PostalInspection Service, by type <strong>of</strong> complaint, United States,fiscal year 1')8 INJTE: See NJTE, Table 5.33. These data represent only the 10most frequent moil fraud complaints received by the U.S. PostalInspection Service. Consumer protection complaints areexcluded from thesfl data.Type <strong>of</strong> complaint ~rMerchandise IQ, 660Credit card 11,410Solicitations 8,626Directories 8,442Investment 6, 160Travel 5,769Work-at-home 5,743Medical 3,603Insurance 2,162Gam==~b_l~in~g~!~lo~t~te~r~y ______________________________ ~I~.822Source: Table provided to SD..RCEBc:a< staff by the U.S.Postal Inspection Service, Chief Postal Inspector.t.4\..o\524
Figure 5.11 Obscenity complaints received by the U.S. Postal Inspection Service and conmercial pornography dealers convicted in Federal courts, fiscalyears 1969-82N:lTE: See N:lTE, Table 5.33. Section 3010 <strong>of</strong> Title 39 U.S.C. requires the U.S. Postal Service to maintain a list<strong>of</strong> persons who do not desire to receive sexually-oriented advertisements and prohibits the moiling <strong>of</strong> suchmaterial to any if'dividual whose nome and Ilddress has been on the list for more thon 30 doys."'1,"Number <strong>of</strong> complaints(in thousands)300250/200150100---r\4.266\ ~ November 1969 "",'" advertisement ""Sexually-orientedProgram to Intensify statutesFederal Prosecutive 139 U.S.C. 3010)Effortmplemented1\\Dealers convictedFiscal years1982 - 5"1981 - 8"1980 - 16"1979 -11"1978 - 16"1977 -11"1976 - 361975 -361974 -321973 - 271972 -301971 - 231970 -141969 -1650o-i'"~r---.....1969 1970 1971 1972 1973 1974T~~1975 1976 1977I11978 1979 198019811982oDe crease due to U.S. Deportment <strong>of</strong> <strong>Justice</strong> policy <strong>of</strong> emphasizingprosecution <strong>of</strong> dealers with lorge-scale operations and those having knownorganized crime connections.Source: U.S. Postal Service, Postal Inspection Service, United States Postal Inspection Service 1977 (Washington, D.C.: U.S. Government Printing Office,1978), p. 6; and data provided to SD.RCEBOO< staff by the U.S. Postal Inspection Service, Chief Postal Inspector. Figure adopted by SD.RCEBOO< st<strong>of</strong>f.\41..o ,o
--------~--~--------<strong>Sourcebook</strong> <strong>of</strong> <strong>Criminal</strong> <strong>Justice</strong> <strong>Statistics</strong> 19113Table 5.36 Antitrust cases filed in U.S. District Courts, by type<strong>of</strong> case, years ending June 30, 1960-82Judicial Processing <strong>of</strong> Defendants(\OTE: '\).S. cases" refers to suits in which the U.S. Government is theplaintiff.Figure 5.12 <strong>Criminal</strong> proceedings In cases Tleferred by the Securities and Exchange Comnlsslon to the U.S. Department <strong>of</strong> <strong>Justice</strong> forprosecution, fiscal years 1968-81U.S. cases Private casesElectricalYear endingequipmentJune 30 Total Civil <strong>Criminal</strong> industrl:: Other a1960315 60 27 0 228b1961 441 42b 21 37 3411962 2,079 41b 33 1,739 2661963 457 52 25 97 2831964 446 59 24 46 3171965521 36 II 29 c 4431966 770 36 12 278 d 4441967591l 39 16 7 d 5361968 718 46 II 0 6591969 7'J7 43 14 0 740250(\OTE: The activities <strong>of</strong> the Securities and Exchange Commission (SEC) include regulation <strong>of</strong>securities markets, registration <strong>of</strong> Investment companies and adVisors, corporate reorganization,and enforcement <strong>of</strong> Federal securities laws. The Comnlsslon has a wide range <strong>of</strong> enforcementremedies available Irn:ludlng Injunctions and other court orders. In appraprlate cases the SECmay refer Its files to the U.S. Department <strong>of</strong> <strong>Justice</strong> with a recommendation for criminalprosecution. The data below Include criminal contempt violations <strong>of</strong> inju~ctlve orders. Theconviction data In the figure refer to cases terminated In a given year.~1970 933 52 4 0 67719711,515 60 10 0 1,4451972 1,393 60 14 0 1,2'J91973 1,224 54 16 0 1,1521974 1,294 40 24 0 1,230200Ins 1,467 56 36 0 1,3751976 1,574 51 19 0 1,5041977 1,61:19 47 31 0 1,6111976 1,507 42 30 0 1,4351919 1,312 5U 26 0 1,2341980 1,535 39 39 0 1,4571961 1,434 60 62 0 1,292191:12 I! 141:1 29 62 0 1,037alncludes antitrust cases transferred under 28. U.S:C. 1407 •.blncludes nine U.S. electrical Industry cases flied In 1961, twoin 1962, and three in 1963. 0 4 4( )clncludes 26 cases trt!l"lsferred IJnder 20 U.S.C. lOa.d All cases were transferred under 26 U.S.C. 1404(a).Source: Administrative Office <strong>of</strong> the United States
- ----..--~<strong>Sourcebook</strong> <strong>of</strong> <strong>Criminal</strong> <strong>Justice</strong> <strong>Statistics</strong> <strong>1983</strong>Judicial P(ocessing <strong>of</strong> DefendantsTable 5.37 Prosecutions for violations <strong>of</strong> U.S. irrmigration and nationality laws, by type <strong>of</strong> case, type <strong>of</strong> disposition, andaggregate fines and imprisonment imposed, fiscal years 1968-81Type <strong>of</strong> caseand dispositiont-OTE: The data presented for years prior to and including 1976 coincide with the former Federalfiscal years. The transition quarter refers to the period July I, 15176 to Sept. 30, 1976. Thefiscal year for the Federal Government is now from Oct. I to Sept. 30.Violations <strong>of</strong> nationality laws include false representations as citizens <strong>of</strong> the United States,false statements and procurement <strong>of</strong> citizenship or naturalization unlawfully, and reprodl.'ction <strong>of</strong>citizenship and naturalization papers.Total, all c~esDismissalsAcquittalsConvictionsAggreg.Jte fines imposedAggregate imprisonment(in years)Total cases pending end<strong>of</strong> yearImmigration cases, totalDismlssals aAcquittalsConvictionsAggre£ate fines imposedAggregate imprisonment(in yeafs)Immigration cases pendingend <strong>of</strong> yearNationality cases, totalDismissals aAcquittalsConvictionsAggregate fines imposedAggregate imprisonment(in years)Nationality cases pendingend <strong>of</strong> yearaDismissed or otherwise dosed.1968 1969 1970 1971 1972 1973 19711 15175Transition1976 quarter2,885 5,079 6,034 10,215 13,200 16,415 17,734 14,172 17,126 3,563207 404 487 831 984 905 1,073 1,340 1,319 36417 52 50 74 27 52 27 21 35 252,661 4,623 5,497 9,310 12,189 15,458 16,634 12,811 15,772 3,174$109,985 $172,105 $249,785 $461,231 $687,444 $1,008,299 $927,003 $754,746 $1,050,148 $256,2282,2109473,9709384,0421,1515,3641,0864,8948435,7559225,9981,0395,3139856,3671,0661,3701,0372,629 4,565 5,510 9,550 12,865 16,309 17,608 13,947 16,927 3,467192 390 469 744 77~ 874 1,017 1,251 1,240 30417 50 50 71 27 49 25 20 34 242,420 4,125 4,991 8,735 12,063 15,386 16,566 12,676 15,653 3,139$102,635 $150,605 $228,085 $417,396 $671,144 $1,006,689 $922,503 $747,796 $1,043,448 $249,2282,00667525615o241$7,350204723,462694514142498$21,500508443,6251,08952418o.506$21,700417624,8821,020665873575$43,835482664,718803335209o!26$16,300176405,68687610631372$1,6106744S,92997912656268$4,50069605, III937225891135$6,950202486,1851,00619979I119$6,700162601,3169709660I35$7,00054671977 1978 1979 1980 198117,176 16,796 17,398 14,863 16,0051,754 1,402 1,893 1,882 3,19534 46 42 46 3915,388 15,348 15,463 12,5135 12,771$8751,208 $786,370 $606,818 $821,579 $672,7466,4781,0157,5971,1997,8671,4226,3612,8175,6053,25916,776 16,445 16,970 14,498 15,6021,521 1,265 1,767 1,7783,05732 40 40 42 3615,223 15,140 15,163 12,678 12509$877,108 $779,720 $602,818 $806,029 $667;7566,2599307,3071,1087,5051,3456,1672,6985,4413,1294002332165$2,100219853511376208$6,650290914281262300$4,00U362773651044257$15,5501941194031383262$4,9~!)164130Source: Table provided to SClRCEBClCl< staff by the U.S. Department <strong>of</strong> <strong>Justice</strong>, hmlgration and Naturalization Service.TGbie 5.38 Convictions for violations <strong>of</strong> U.S. irrmigratlon and nationality laws, by <strong>of</strong>fense, fiscal years 1970-81Offense·Violations <strong>of</strong> immigration lawsEntry <strong>of</strong> aliens i1legall)'Reentries <strong>of</strong> deported aliensBringing in, transporting, harboring,and inducing illegal entry <strong>of</strong> aliensFraud, misuse <strong>of</strong> visas, entry permits,and other entry documentsFraud and fa Ise statements or entriesAliens registration or alien addressviolationsAlien crewmen who remained longerStowaways on vessels or aircraftPerjuryImportation <strong>of</strong> aliens for immoralpurposesAll other violations19705,4974,9911,6521,2138508722023o379 °506t-OTE: See t-OTE, Table 5.37.19719,3106,7355,0841,0947161,01226o162oo763197212,26912,06310,29275757724745Violations <strong>of</strong> notionality lawsFalse repres~!ntation as citizens <strong>of</strong>the United StatesFalse statements and procurement <strong>of</strong>49357557412611972646860135Ii2119873530citizenship or naturalizationunlawfully137 3 3 3 o oReproduction <strong>of</strong> citizenship andnaturalization paperso o o 5 5 20 32 5,Source: Table provided to SClRCEBClCl< staff by the U.S. Department <strong>of</strong> <strong>Justice</strong>, Immigration and Naturalization Service.712oo126197315,45815,38613,53460373820685II22o22183197416,63416,56615,003516607206539IIoo161197512,81112,67611,094494370125612025oIo486197615,77215,65313,70749946538114730o7o786Transitionquarter3,1743,1392,85310388146I6oo68197715,38815,22:113,2764814978215II14oo84716511549197815,3 1815,14012,2576191,1438530212IIo990208161o47197915,46315,16312,3715421,2911581035IIo77630020792198012,93512,67810,0675771,1358936382oIo733257177198112,77112,50910,0223511,200973457l.°o7462621946 474 64528!>29
530- -- - ---------<strong>Sourcebook</strong> <strong>of</strong> <strong>Criminal</strong> <strong>Justice</strong> <strong>Statistics</strong> <strong>1983</strong>Judicial Processing <strong>of</strong> DefendontsTable 5.39 Investigative activity <strong>of</strong> the U.S. Sl:cret Sflrvice, fiscal years 1972-82NJTE: The data presented prior to -and including 1976 coincide with the former fiscal year <strong>of</strong> July Ito June 30. The transition quart',r refers to the period July I, 1976 to Sept. 30, 1976. The fiscalyear for the Federal Government Is now from Oct. I to Sept. 30.TransitionInvestigative activit~ 1972 1973 1974 1975 1976 guarter 1977 1978 1979 1980Total cases for investigation 210,626 174,419 Itl2,678 202,042 244,462 155,250 310,092 259,2U5 198,338 192,358Cases pendir" beginning<strong>of</strong> The fisca I year 67,584 50,145 50,030 52,368 61,852 104,180 113,363 99,123 70,376 54,247Counterfeiting 3,308 2,431 2,323 1,998 2,580 2,604 2,701 2,548 3,377 2,710Check forgery 41,291 30,113 30,846 35,385 43,115 83,162 93,517 31,488 53,733 37,974Bond forgery 20,249 15,615 15,032 13,068 13,981 14,773 13,854 12,119 9,501 9,24!lProtective intelligence 1,119 660 666 551 452 742 639 627 803 823Other criminal andnoncriminal 1,617 1,326 1,163 1,366 1,724 2,899 2,652 2,341 2,962 3,492Cases received 143,042 124,274 132,648 149,694 182,610 51,070 196,729 160,082 127,962 138, IIICounterfeiting 23,333 16,951 18,739 22,750 14,944 4,602 20,777 21,417 21,041 18,289Check forgery 75,759 63,927 70,880 84,863 113,035 35,022 128,500 92,832 65,322 69,414Bond forgery 16,599 14,359 13,805 13,183 14,735 2,825 12,58!l 10,670 9,966 8,446Protective intelligence 14,116 17,348 15,319 11,207 15,802 3,664 14,623 14,703 12,070 13,428Other criminal andnoncriminal 13,235 11,689 13,905 17,671 24,094 4,957 20,241 20,460 19,563 28,534(:ases closed 158,871 124,389 128,947 139,159 139,346 41,101 208,679 186,224 140,845 112,178Counterfeiting 23,377 17,059 18,778 22,055 14,833 4,419 20,7UI 20,466 20,556 17,575Check forgery 87,566 63,194 66,282 76,743 72,667 24,273 139,365 119,735 80,024 116,467Bond forgery 21,075 14,942 14,836 11,824 13,471 3,510 13,526 11,740 9,366 7,363Protective intelligence 13,783 17,342 15,403 11,268 15,494 3,748 14,605 14,500 12,022 13,291Other criminal andnoncriminal 13,070 11,852 13,648 17,269 22,881 5,151 20,482 19,783 18,877 27,4821981 1982232,5113 260,16678,280 83,1573,253 3,04059,899 63,8159,803 9,799915 1,6214,410 4,882154,283 177,00918,038 20,19078,746 101,29110,075 9,67616,562 17,33330,862 28,519147,424 156,10217,952 19,39673,798 82,7629,617 10,71515,820 17,35430,237 25,87550urce: u.s. Department <strong>of</strong> the Treasury, U.S. Secret Service, "Annual Statistical Summary, Fiscal Year 1981," U.S. Department <strong>of</strong> theTreasury, 1982. (Mimeographed.); and data pt .. vided by the U.S. Department <strong>of</strong> the Treasury, U.S. Secret Service. Table adapted by SaRCEBOO
<strong>Sourcebook</strong> <strong>of</strong> <strong>Criminal</strong> <strong>Justice</strong> <strong>Statistics</strong> I ~!l3JUdicial Processing <strong>of</strong> Defendants.Table 5.41 Dispositions <strong>of</strong> arrests by the U.S. Secret Service, fiscal years 1974-82!'OTE: See !'OTE, Tobie 5.3~.5.3:.!.Far definitions <strong>of</strong> "nalle prosse" and "no true bill," see !'OTE, TableTransitionDisposltian 1~74 1~75 1~76 guarter 1~77 1~78 1~7~ 1~1l0 1~81 1~82Canvicted 6,~34 7,788 7,283 1,815 10,n9 12,017 ~,543 6,310 6,142 7,646Acquitted 131 106 101 23 130 104 ~8 60 43 4:.!NJlle prosse 183 183 ~I 23 154 86 101 7~ 52 60No true bill 5 7 4 2 3 I I I 3 4Other dismissals 605 584 511 115 531 48~ 403 302 247 348Total 7,858 8,668 7!~~0 I !~78 11,7~7 12,6~7 10,146 6,752 6,487 8,iOOSource: U.S. Deportment <strong>of</strong> the Treasury, U.S. Secret Service, "Annual Statistical Summary, Fiscal YearI ~81," U.S. Deportment <strong>of</strong> the Treasury, I ~82. (Mimeographed.); and data provided by the U.S. Deportment <strong>of</strong> theTreasury, U.S. Secret Service. Table adapted by 5CA...RCEBOO< staff.Table 5.42 Persons indicted, awaiting trial on Dec. 31, and convicted <strong>of</strong> <strong>of</strong>fenses involving abuse <strong>of</strong> public <strong>of</strong>fice,government, 1970-82NJTE: Questionnaires are sent annually to the U.S. Attorneys' <strong>of</strong>fices in each <strong>of</strong> the Federal judicialdistricts eliciting dat
,"<strong>Sourcebook</strong> <strong>of</strong> <strong>Criminal</strong> <strong>Justice</strong> <strong>Statistics</strong> <strong>1983</strong>Table 5.45 Air Force personnel tried and percentpleading guilty to all charges entered in Generaland Special Courts-Martial, by type <strong>of</strong> court, 1971-82N::lTE: See N::lTES, Tables 5.43 and 5.44.General SpecialCourts-Martial Courts-Martial1971:Total number tried 184 2,018Percent pleading guilty 24.5 53.31972:Total number tried 228 2,306Percent pleading guilty 29.3 54.11973:Total number tried 2% 2,395Percent pleading guilty 30.4 50.81974:Total number tried 225 2,168Percent pleading guilty 32.9 49.31975:Total number tried 235 1,509Percent pleading guilty 34.9 44. i1976:Total number tried 165 909Percent pleading guilty 30.3 43.81977:Total number tried 173 866Percent pleading guilty 36.4 44.01978:Total number tried 122 843Percent pleading guilty 29.5 47.61979:Total number tried 202 1,033Percent pleading guilty 34,2 49.61980:Total number tried 289 1,368Percent pleading guilty 32.5 55.01981:Total number tried 360 1,345Percent pleading guilty 43.1 52.61982:Total number tried 428 1,563Percent pleading guilty 41.4 48.4Source: Table provided to Sa.RCEBOO< st<strong>of</strong>f by theU.S. Deportment <strong>of</strong> Defense, Deportment <strong>of</strong> the Air Force.rI I1\I\I, 1IJudicial Processing <strong>of</strong> DefendantsTable 5.46 Air Force peruonnel convicted in General and Special Courts-Martial, bytype <strong>of</strong> disposition and court, 1971-82N::lTE: See N::lTES, Tables 5.43 and 5.44. Punitive discharges imposed by General and SpecialCourts-Martial must be approved by the General Convening Authority. Discharges apply toenlisted personnel. The comparable disposition for <strong>of</strong>ficers is referred to as a dismissal. Thedata below Include only dispositions that were approved by the General Convening Authority.Qi~llo~i!ion alll2rovedGeneral Courts-MartialSeecial Courts-MartialD15- Bod f\h Bod f'k)hononlble conduct discharge or conduct discharge orIotal discharge a discharge dismissal Total discharge dismissal1971:NJrnber 157 23 67 67 1,811 161 1,650Percent 100.0 14.6 42.7 42.7 100.0 8.9 91.11972:N.Jmber 205 21 112 72 2,154 172 1,982Percent 100.0 10.2 54.6 35.2 100.0 8.0 92.01973:NJmber 271 23 178 70 2,212 345 1,867Percent 100.0 8.5 65.7 25.8 100.0 15.6 84.41974:NJmber 202 26 128 48 1,974 342 1,632Percent 100.0 12.9 63.4 23.7 100.0 17.3 82.71975:NJrnber 218 28 146 44 1,340 220 1,120Percent 100.0 12.8 67.0 20.2 100.0 16.4 83.61976:NJrnber 149 24 S14 31 814 137 677Percent 100.0 16.1 63.1 20.8 100.0 16.8 83.21977:NJmber 152 23 86 43 757 93 664Percent 100.0 15.1 56.6 28.3 100.0 12.3 87.71978:NJrnber 113 10 64 39 753 112 641Percent 100.0 8.8 56.6 34.5 100.0 14.9 85.11979:NJrnber 187 44 94 49 937 163 774Percent 100.0 23.5 50.3 26.2 100.0 17.4 82.61980:NJrnber 251 64 138 49 1,268 254 1,014Percent 100.0 25.5 55.0 19.5 100.0 20.0 80.01981:NJmber 360 73 189 98 1,345 289 1,056Percent 100.0 20.3 52.5 27.2 100.0 21.5 78.51982:l\Vmber 428 99 248 81 1,563 41 ~ 1,152Percent 100.0 23.1 57.9 18.9 100.0 26.3 73.7a Includes dismissals cf <strong>of</strong>ficers.Source: Table provided to ·Sa.RCEBOO< st<strong>of</strong>f by the U.S. Depurtment <strong>of</strong> Defense,Deportment <strong>of</strong> the Air Force.I1 :I I,1III iIiI
--~- ~,,------------ -- ~JUdicial Processing <strong>of</strong> Defendants,"<strong>Sourcebook</strong> <strong>of</strong> <strong>Criminal</strong> <strong>Justice</strong> <strong>Statistics</strong> <strong>1983</strong>Tuble 5.47 Navy and Marine Corps personnel tried and percentconvicted in General and Special (BCD) Courts-Martial, bytype <strong>of</strong> personnel, fiscal years 1971-82t-OTE: See t-OTE, Table 5.43. Data for <strong>of</strong>ficers are based on GeneralCourts-Martial only. Data for enlisted personnel reflect the combinedactivity <strong>of</strong> bath General and Special (BCD) Courts-Martial. Fiscalyears 1971-76 encompass the period July I to June 30. Fiscal years1977-82 encompass the period Oct. I to Sept. 30. The data for thetransition quarter, July I to Sept. 30, 1976, are not presented.Fiscal year andtype <strong>of</strong> personnel1971OfficersEnlisted personnel1972OfficersEnlisted personnel1973OfficersEnl is ted personnel1974OfficersEnlisted personnel1975OfficersEnlisted personnel1976OfficersEnlisted personnel1977OfficersEnlisted personnel1978OfficersEnlisted personneli979OfficersEnlisted pers:lnnel1980OfficersEnlisted personnel1981OfficersEnlisted personnel1982OfficersEnlisted personnelNavy Marine Corps~ber Percent ~ber Percenttried convicted tried convicted1,72241,7186814677527I5265602558788I7871,06151,056954594980137981,31261,3061,77171,7642,26972,2623,79293,71l398.975.098.998.1100.098.198.80.099.197.150.097.399.0100.099.095.180.095.297.580.097.698.433.398.695.7100.095.799.4100.099.499.471.099.599.7100.099.71,91381,9052,185S2,1772,26532,2622,16482,1562,822I2,8212,00722,0051,29731,2941,040o1,04074137381,21031,2071,29151,2861,46731,46497.575.094.598.787.598.798.366.798.398.687.598.699.3100.099.398.1100.098.198.5100.098.596.7X96.798.066.798.198.733.398.898.660.098.899.066.799.0Source: Table provided to SOlRCEBOOK staff by the U.S.Department <strong>of</strong> Defense, Department <strong>of</strong> the Navy.Table 5.48 Navy and Marine Carps personnel tried andguilty pleas entered in General and Special (BCD)Courts-Martial, by type <strong>of</strong> court and guilty plea, fiscalyears 1971-8lt-OTE: See t-OTES, Tables 5.43 and 5.47.(Guilty plea figures include the negotiated plea figures)Fiscal yearand type <strong>of</strong>guilty plea1971:Total number triedGuilty pleasNegotiated pleas1972:Total number triedGuilty pleasNegotiated pleas1973:Total number triedGuilty pleasNegotiated pleas1974:Total number triedGuilty pleasNegotiated pleas1975:Total number triedGuIlty pleasNegotiated pleas1976:Total number triedGuilty pleasNegotiated pleas1977:Total number triedGuilty pleasNegotiated pleas1978:Total nlXTlber triedGuilty pleasNegotiated pleas1979:Total number triedGuilty pleasNegotiated pleas1980:Total number triedGuilty pleasNegotiated pleas1981:Total number triedGuilty pleasNegotiated pleas1982:Total number triedGuilty pleasNegotiated pleasN'lvySpecialGeneral (BCD)Courts- CourtsMartial Martial34121765203145781911297118710855171975224016599200124891449372134886416512579210150713642631651,3811,179241478418116336275773732779361745814582162319875461626065758323i1,1781,0364681,6061,5068662,0581,9169803,4282,998I ,256Manne CorpsGeneralCourtsMartialSpecial(BCD)CourtsMartial587 1,326372 1,065155 96670 1,515527 1,335188 106597 1,668449 1,448282 26lf422 1,742291 1,505147 234520 2,302342 1,741200 366401 1,606235 1,133172 326211 1,086130 87988 436205 835129 747101 383i58 58;,103 48:87 245162 1,048113 91585 45221 I 1,081130 91489 378275 1,192202 1,003135 477Source: Table provided to SOvRCEBOO< staff by the U.S.Department <strong>of</strong> Defense, Department <strong>of</strong> the Navy.II,I!)II1I)IJ!II,Il![:! I,\1IIITable 5.49 Navy and Marine Corps personnel disposed <strong>of</strong> in General and Special (BCD) Courts-Martial, by type<strong>of</strong> personnel and disposition, fiscal years 1971-82•t-OTE: See t-OTES, Tables 5.43 and 5.47. Discharges apply to enlisted personnel. Thecomparable disposition for <strong>of</strong>ficers is referred to as a dismissal. Data for <strong>of</strong>ficers arebased on General Courts-Martial only. Data for enlisted personnel reflect the combinedactivity <strong>of</strong> both General and Special (BCD) Courts-Mortial.Fiscal yearand type <strong>of</strong>personnel1971:OfficersEnlisted personnel1972:Offic;:ersEnlisted personnel1973:OfficersEnlisted personnel1974:OfficersEnlisted personnel1975:OfficersEnlisted personnel1976:OfficersEnlisted personnel1977:OfficersEnlisted personnel1978:OfficersEnlisted personnel1979:OfficersEnlisted personnel1980:OfficersEnlisted personnEl I1981:OfficersEnlisted personnel1982:OfficersEnlisted personnelNaVYDispositionDis- BadNumber <strong>of</strong> honorable conduct Disconvictionsdischarge discharge missal31,7UO4664o521I543I77941,0354926I78761,29271,75352,25193,771X1.1X3.8X6. IX3.3X2.4X2.0X1.5X1.5X1.5X1.2X1.2X1.1X95.6X88.1X88.7X90.2X93.7X94.3X94.3X94.9X96.4X96.5X96.9X97.8(Percent)66.7X25.0XXX0.0X0.0X25.0X25.0X0.0X50.0X42.9X80.0X22.2XNJ dis- Dis-Morine CorpsDispositionBadmissal or ~ber <strong>of</strong> honorable conduct Disdischargeconvictions discharge discharge missal33.33.375.08.4X5.2100.06.6100.03.975.03.975.04.2100.03.650.02.257. I2.310.0! .977.81.161,86072,14922,22472,126I2,80021,96631,275o1,0062724I1,19331,27021,450X5.3X5.9X7.8X4.9X4.8X3.8X2.7X3.9}(3.9X3.2X4.3X6.2X91.5X91.3X90.1X92.9X93.5X93.9X94.0X93.3X92.5X94.0X93.5X92.250.0X71.4X100.0X100.0X100.0X100.0X100.0XXX50.0X0.0X66.7X100.0XSource: Table provided to SOvRCEBoa< st<strong>of</strong>f by the U.S. Department <strong>of</strong> Defense, Department <strong>of</strong> the Navy.I'k> dismissalordischarge50.03.228.62.90.02.00.02.20.01.70.02.30.03.3X2.850.03.6100.02.833.32.20.01.6536II/1IIIII'I'537
<strong>Sourcebook</strong> <strong>of</strong> <strong>Criminal</strong> <strong>Justice</strong> <strong>Statistics</strong> 19!13Table 5.50 Coast Guard personnel tried in General,Special (BCD), and Summary Courts-Martial, by type<strong>of</strong> court, fiscal years 1966 .. 82N::>TE: See N::>TE, Table 5.43. A Summary Court-Martial is amilitary trial by one commissioned <strong>of</strong>ficer who need not bea lawyer. Punishment may not exceed 30 days Inconfinement, and may include reduction and forfeitures <strong>of</strong>not mare than two-thirds <strong>of</strong> I month's pay. I'D counsel isfurnished for prosecution or defense. Accused personnelhave the option to refuse trial by Summary Court-Martiol,but refusal may result in the charges being referred to ahigher level court-martial. The data presented for yearsprior to and including 1976 coincide with former Federalfiscal years July I to June 30. The transition quarterrefers to the period July I, 1976 to Sept. 30, 1976. Thefiscal year for the Federal Government is now from Oct. Ito Sept. 30.Type <strong>of</strong> Courts-MartialSpecialFiscal year General (BCD) Summary1966 3 95 2121967 2 68 211196!l 0 91 2161969 2 92 207197U 2 76 1741971 2 127 2871972 6 167 3481973 5 206 3071974 7 190 2121975 4 189 2671976 4 181 221Transition quarter 0 25 471977 5 84 1881978 3 58 1801979 2 47 1221980 3 67 1691981 2 58 1921982 9 79 151Source: Table constructed by 5a..RCEBClCl< staff fromdata provided by the U.S. Department <strong>of</strong> Transportation,U.S. Coast Guard.Table 5.51 Coast Guard personnel convicted in Special (BCD) Courts-Martial, by type <strong>of</strong> disposition, fiscal years 1978-92I-oTE: See N::>TE, Table 5.43.1978 1979 1980 1981 1982NJrnber Percent NJrnber Percent NJrnber Percent NJrnber Percent N.xrber PercentNJmber <strong>of</strong> convictions 52 lOO 42 100 64 100 55 100 74 100Disposition: aBad conduct discharge 2 4 5 12 9 14 5 9 9 12Confinement at hord labor 25 48 24 57 37 58 34 62 41 55Hord labor without confinement 12 23 4 10 8 12 13 24 4 5Reduction in rate 28 54 26 62 34 53 38 69 46 62Restriction 18 35 6 14 12 19 II 20 II ISForfeiture <strong>of</strong> pay 28 54 30 71 45 70 41 74 48 65Fine NIl, NIl, NIl, NIl, NIl, NIl, NIl, NIl, 4 5Other 9 17 9 21 22 34 5 9 13 18aDisposition totals are greater ~han the conviction totolsshown because more than one disposition may be imposed in eachcase.Source: Table constructed by SOLHCEBClCl< st<strong>of</strong>f from data provided by the U.S. Department <strong>of</strong> Transportation, U.S. CoastGuord.11Ii ~n I1,I :1 I!!I"Ifp',Iij" qIi11ifIIi11~ur:cJudicial Processing <strong>of</strong> DefendantsTable 5.52 Offenses involved in Ceast Guard Special (BCD) Courts-Martial, fiscal years 1970-82N::>TE: See N::>TES, Tables 5.43 and 5.50. The data in this table are based on the total number <strong>of</strong><strong>of</strong>fenses involved. A person may have been charged with more than one <strong>of</strong>fense; see Table 5.50for the number <strong>of</strong> personnel tried.Type <strong>of</strong> <strong>of</strong>fense 1970 0 1971 1972 1973 1974 1975 I 976 b 1977 1978 1979 1980 1981 1982AWOL or desertion 58 103 197 214 239 215 252 82 72 50 73 44 56Marlhuona <strong>of</strong>fenses (c) 39 56 73 41 89 49 15 8 49 30 22 88Offenses involving controlled drugs 17 6 31 27 16 34 3 3 I 26 4 19 IIIMissing ship movements 16 25 58 51 47 28 55 14 14 2 7 7 9Willful disobedience or disrespect 5 21 25 70 63 77 110 6 7 5 6 16 IUAssault 12 16 10 34 16 40 34 16 I 4 4 14 6Violation <strong>of</strong> order or regulation 7 14 27 8 53 33 45 33 7 16 20 26 63False representation <strong>of</strong> <strong>of</strong>ficialstatements 7 13 8 18 NIl, NIl, 33 I 3 NIl, 2 I 22Forgery NIl, NIl, NIl, NIl, NIl, NIl, NIl, NIl, NIl, 46 72 NIl, NIl,Larceny or wrongful appropriation 28 12 18 12 21 36 83 20 33 66 62 20 35Breaking restriction NIl, II 35 28 21 36 41 10 8 I 13 6 35Offenses against Coast Guardproperty f\,16. 8 17 12 9 20 16 8 8 5 13 7 16Drunk or disorderly 4 5 NIl, NIl, NIl, NIl, NIl, NIl, NIl, NIl, NIl, NIl, NIl,Provoking words or threats 7 4 3 13 12 8 12 8 NIl, NIl, NIl, NIl, NIl,Neglect <strong>of</strong> duty NIl, 2 4 4 10 15 36 NIl, NIl, NIl, NIl, NIl, NIl,Sleeping on post NIl, 2 I 2 NIl, NIl, NIl, NIl, NIl, N,\ NIl, NIl, NIl,Escape from custody or resistingappreb~nsion 4 NIl, NIl, NIl, NIl, NIl, II NIl, 3 NIl, NIl, NIl, NIl,Cheating on advancementexaminotion NIl, NIl, NIl, 8 NIl, NIl, NIl, NIl, NIl, NIl, NIl, NIl, NIl,Mutiny NIl, NIl, 1'1\ 2 NIl, NIl, NIl, N\ N\ I\l
<strong>Sourcebook</strong> <strong>of</strong> <strong>Criminal</strong> <strong>Justice</strong> <strong>Statistics</strong> <strong>1983</strong>Table 5.53 Dispositions <strong>of</strong> persons arrested for <strong>of</strong>fenses against railroads, by <strong>of</strong>fense, United States and Canada, 1978-82Judicial Processing <strong>of</strong> Defendantsf\OTE:Data in this table are compiled from monthly statistical reports <strong>of</strong> railroad police.''Referrals'' indicate referrals <strong>of</strong> arrested persons to other-than-railroad authorities.1978 1979 19t1O 1981Convic- Re- Dis- Convic- Re- Dis- Convic- Re- Dis- Convic- Re-Offense tions ferrals missals tlons ferro Is missals tions ferrals missals tlons ferralsTheft:Theft from freight cars 1,431 405 208 1,485 550 201 1,164 391 102 1,067 375Theft from trailers 529 267 89 66!1 350 85 430 182 54 359 16!1Theft <strong>of</strong> entire trailer 16 2 4 6 10 0 14 7 4 14 0Theft from multi-levelcarrier 203 149 57 181 127 48 135 42 16 100 39Theft <strong>of</strong> copper wire 114 24 7 196 38 16 381 99 34 462 102Theft <strong>of</strong> brass 19 3 2 8 2 I 20 14 0 16 10Theft <strong>of</strong> other companyproperty 1,041 254 179 1,337 380 184 1,768 383 268 1,773 394Burglary <strong>of</strong> buildings 132 61:1 10 134 38 6 174 54 9 204 48Other theft 214 110 24 288 77 39 323 126 29 382 96Vandalism:Multi-level carriersCompany property and14tl 32712617 68 69 10 47 17 3 71 20~ equipment 417 54 575 215 80 422 234 62 352 1t!7Track and signals 305 ISO 26 342 186 29 351 198 19 324 192Switch tomperlng 175 110 22 167 89 27 107 93 6 134 70Track obstructions 456 231 69 473 336 39 447 251 33 480 405Stoning <strong>of</strong> trains 807 532 179 1307 633 75 744 493 82 836 586Shooting <strong>of</strong> trains 171 54 41 131 70 14 133 82 13 165 70Other vandalism 173 69 85 152 104 30 172 114 20 149 114Trespassing 4,368 18,497 437 4,509 39,396 356 4,150 31,122 384 8,216 25,400<strong>Criminal</strong> <strong>of</strong>fenses notlisted above 2,196 851 229 2,192 662 164 2,290 1,536 171 3,184 71410853216IS224115515113351560871330276206I'J69058t791252141,15714028057359263812965497615320,157Dis-missals1982ReferralsDismissalsConvictlons254 71:1269 470 I28 613 225 2266 17036 2390 3121 4211 35235 24tl6 17290 46543 7558 974 2232,100 903Total 12,915 22,229 I ,739 13,706 43,332 I ,404 13,272 35,438 1,309 18,288 28.987Source:Division.Table adopted by SURCEBOO< st<strong>of</strong>f from tables provided by the Association <strong>of</strong> American Railroads, S<strong>of</strong>ety and SpecialI .273Services3,30528,5087,571 17242. ISO 1,687IIIIIi rilIiI' ,!~540
~--------------------- --.--------Section 6:PERSONS lJ'-lDER CORRECTIONAL SLPERVISIONT~is section presents information onpersons under supervision or otherwise detainedunder some form <strong>of</strong> court or correctionalauthority. Data are reported on probation, onpost-adjudicatory confinement, on parole, andon persons sentenced to death.The probation data are from the I'JationalProbation Reports program and from theFederal Probation System. These data describethe flow <strong>of</strong> persons entering and leaving localand Federal probationary supervision.Post-adj ud i cator}f confi nement datainclude characteristics <strong>of</strong> residents <strong>of</strong> juvenilecorrectional facilities, drug treatmentprograms, local jails, and adult correctionalfacilities. The juvenile data are broken downaccording to confinement in public or privatefaci lities, ard detent ion or correct iona Ifaci I ities. For the drug treatment programs,information is given on the characteristics <strong>of</strong>persons entering federally-funded programs.Data on inmates <strong>of</strong> local jails areavailable from the 1978 National Jail Censusand the companion Survey <strong>of</strong> Inmates <strong>of</strong> LocalJai Is, both <strong>of</strong> which were conducted by theU.S. <strong>Bureau</strong> <strong>of</strong> the Census for the <strong>Bureau</strong> <strong>of</strong><strong>Justice</strong> <strong>Statistics</strong> under the National Prisoner<strong>Statistics</strong> program. Data are presented, byState, for adults and juveniles. The data onlocal jail inmate characteristics include age,race, sex, education, pre-arrest employmentand income, military service, heroin use,detention status, <strong>of</strong>fense, bai I status, legalrepresentation and method <strong>of</strong> conviction. Incomparison, similar information is available onadult inmates in State and Federal institutions.Additionally, data are presented on thepopulation <strong>of</strong> U.S. Army, Air Force, Navy andMarine Corps correctional institutions.--Detailed information is provided onpersons under post-release supervision fromcorrectional institutions, with a particularfocus on parole. Data regarding personsconditionally and unconditionally released fromFederal custody, and persons released to andremoved from Federal supervision are reported.Data are presented from the Uniform ParoleReports program on the number <strong>of</strong> admissionsto and departures from parole supervision.This section concludes with statisticscompiled on State and Federal inmates whohave been executed or who are presently undersentence <strong>of</strong> death. These data are presentedby the inmates' age, sex, race, commitment<strong>of</strong>fense, and time spent in detention awaitingexecution.'.4\,Preceding page blank543
"<strong>Sourcebook</strong> <strong>of</strong> <strong>Criminal</strong> <strong>Justice</strong> <strong>Statistics</strong> <strong>1983</strong>Figure 6.1 Persons under correctional supervision, by type <strong>of</strong> supervision, on Dec. 31,1981i'OTE: The parole data are frOtn the National Council on Crime and Delinquency's 1981Uniform Parole Reports survey. For a discussion <strong>of</strong> survey methodology, definitions <strong>of</strong> terms,and jurisdictional explanatory notes, see Appendix 17. The prison data are from the U.S.Department <strong>of</strong> <strong>Justice</strong>, <strong>Bureau</strong> <strong>of</strong> <strong>Justice</strong> <strong>Statistics</strong>, Prisoners in State and FederalInstitutions on December 31, 1981, NCJ-86485 (Washington, D.C.: U.S. GOvernment PrintingOffice, <strong>1983</strong>). The ja:1 data are from the U.S. Department <strong>of</strong> <strong>Justice</strong>, <strong>Bureau</strong> <strong>of</strong> <strong>Justice</strong><strong>Statistics</strong>, Jail Inmates 198~, Bulletin NCJ-87161 (Washington, D.C.: U.S. Department <strong>of</strong><strong>Justice</strong>, February <strong>1983</strong>). The prooation data are from the National Council on Crime andDelinquency's 1981 Notional Probation Reports survey. For a discussion <strong>of</strong> surveymethodology, definitions <strong>of</strong> terms, and jurisdictional explanatory notes, see Appendix 16.Jail 10%(210,000)Parole 11%(226,200)Prison 18%(368,800)Probation 61 %(1,242,300)Source: Figure provided to Sa...RCEBOO< st<strong>of</strong>f by the National Council on Crime andDelinquency, Research Center West.Persons Under Correctional SupervisionTable 6.1 Rate (per 10,000 adult population) <strong>of</strong> persons under cornnunity supervision, bytype <strong>of</strong> supervision, region, and State, 1981i'OTE: The parole data were collected by the annual Uniform Parole Reparts survey conducted in1982 and represent informatlan voluntarily provided by the U.S. Parole Commissian, the 50 Statesand the District af Columbia. Jurisdictions were instructed to Include in the parole populatlo~adult parolees and mandatary releasees sentenced to a year or more on a felony-type <strong>of</strong>fense whohave entered parole supervision either through the decislan <strong>of</strong> a parallng board far parolees ar asa result <strong>of</strong> serving a prison term shortened by reduction measures such as "good ti~" for~a~da!orr releasees. Jurlsdictians w,ere further instructed to include persons under their afficialJUrisdiction regardless <strong>of</strong> supervision locatian (In-State, out-<strong>of</strong>-State) or supervision status(active, inactive). Jurisdiction figures presented are the total cases reported to the UnifarmParole Repart program by each reparting agency.The probation data were collected by the National Probation Reports survey conducted in1982 ~nd ,represent information voluntarily provided by central reparting agencies in all 50 States,!he District <strong>of</strong> Columbia, and the Federal Probation System. The reporting agencies wereInstructed to caunt adults under their jurisdiction or under jurisdiction <strong>of</strong> agencies in the Stateregardless <strong>of</strong> where they were actually supervised. For a discussion <strong>of</strong> survey methodologydefinitions <strong>of</strong> terms, and jurisdictianal explanatory notes, see Appendices 16 and 17.'(Rate per I 0,000 adlllt~)ParoleProbationRe!lion and State sU2ervision sueervislonUnited States, total 14 74Nartheast 13 61Maine 2 36New Hampshire 7 27Vermant 7 91Massachusetts 8 63Rhode Island 3 80Connecticut 9 106New York 15 53New Jersey 18 65Pennsylvania II 61Narth CentralOhio9II5536Indiana 6 55Illinals 10 80Michigan 10 41Wisconsin 8 59Minnesota 6 58Iowa 4 47Missouri 8 53Narth Dakota 3 23South Dakata 5 103Nebraska 2 69Kansas 14 68South 15 88Delaware 14 89Maryland 20 154District <strong>of</strong> Columbia 67 146Virginia 14 32Wp,st Virginia 3 20I'brth Carolina 16 89South Caralina 15 86Georgia 7 162FloridaKentucky9358350Tennessee 10 31Alabama 9 47Mississl ppi 16 33Arkansas 18 23Louisiana 6 54Oklahoma 10 59Texas 21 147West 13 79Montana II 42IdahaWyoming663233CaloradoNew Mexico5126239Arlzana 7 72Utah 8 77Nevada 19 91Washington 49 100Oregon 9 73California 9 86Alaska 4 47Hawaii 7 71Source: Table adapted by SCLRCEBOO< staff from tables provided by the National Cauncilan Crime and Delinquency, Research Center West.544545
----- -------~--------------------r:i<strong>Sourcebook</strong> <strong>of</strong> <strong>Criminal</strong> <strong>Justice</strong> <strong>Statistics</strong> <strong>1983</strong>Persons Under Correctional SupervisionTable 6.2 Number and rate (per 10,000 adult population) <strong>of</strong> persons enteringcommunity supervision, by type <strong>of</strong> supervision, region, and jurisdiction, 1981f'.OTE: See f'.OTE, Table 6.1. For a discussion <strong>of</strong> survey methodology, definitions <strong>of</strong>terms, and jurisdictional explanatory notes, see Appendices i 6 and 17.Region and jurisdictionUnited States, totalFederalState, totalNortheastMoineNew H:JmpshireVermontMassachusettsRhode IslandConnecticutNew YorkNew JerseyPennsylvaniaNorth CentralOhioIndianaillinoisMichiganWisconsinMinnesotaIowaMissouriNorth DakotaSouth DakotaNebraskaKansasSouthDelawareMarylandDistrict <strong>of</strong> ColumbiaVirginiaWest VirginiaNorth CarolinaSouth CarolinaGeorgiaFloridaKentuckyTennesseeAlabamaMississippiArkansasLouisianaOklahomaTexasWestMontanaIdahoWyomingColoradoNew MexicoArizonaUtahNevadaWashingtonOregonCaliforniaAlaskaHawaiie.ntry ratei'Unber <strong>of</strong> entries (per 10.000 qdult residents>Total Parole Probation Total Parole Probation882,40226,747855,655164,5373,6711,6392,54331,0773,64121,81540,67525,80333,673184,86823,53125,73848,81117,76812,2529, 11~910,90514,5648872,8028,08110,380343,8362,70131,8247,1129,9822,68429,35910,64337,41050,92511,305II ,5446,5084,0673,3268,5098,209107,72816l,4141,1621,4771,07111,1122,2928,4677,3632,8257,5698,36l106,5495743,591126,3129,545116,76718,038262081431,2951921,4867,7143,5853,38928,8497,3312,5487,2344,7101,8151,0495211,6841643022911,20048,3884692,7571,2043,5393909,/~271,4232,5104,5252,0052,7841,7481,6551,4067051,01310,82821,4922081021711,1844761,0074415441,3591,43514,3425863756,O~017,202738,888146,4:15'3,6451,4312,40029,78l3,44920,32932,%122,21830,284156,01916,20023,19041,57713,05810,4378,1001O,3llA12,8807232,5007,7909,180295,4482,23229,0675,9086,4432,29419,9329,22034,90046,4009,3008,7604,7602,4121,9207,8047,1%%,900140,9229541,2759009,9281,8147,4606,9222,2816,2106,9:.1792,2075163.528Source: Table adopted by SOURCEBOOK staff from table provided by theNational Council on Crime and Delinquency, Research Center West.53XX454524687251943147384430665927363152401958716062621021452519684895664335232420293710451212332522542774525436021518XX53433667479797542546379II924932266688610925107435555594782I46XX404521646946B72541343721605020312750361552695353519312016164641896036261714122632944417202646203773372036521850i!IIIi. lIiIIIi\1II1111 ,11IIrrIiTable 6.3 Movement <strong>of</strong> the probation populotion, by region and jurisdiction,1981NJTE: The elata were collected by the National Probation Reports survey conductedin 1982 and represent information voluntarily provided by central reportingagencies in all 50 States, the District <strong>of</strong> Columbia, and the Federal ProbationSystem. The reporting agencies were instructed to count adults under theirjurisdiction or under jurisdiction <strong>of</strong> agencies in the State regardless <strong>of</strong> wherethey were actually supervised. For a discussion <strong>of</strong> survey methodology,definitions <strong>of</strong> terms, and jurIsdictional explanatory notes, see Appendix 16.ProbationpopUlation onRegion and jurisdiction Dec. 31, 1980United States, totalFederalState, totalNortheastMoineNew H:JmpshireVermontMassachusettsRhode IslandConnecticutNew YorkNew JerseyPennsylvaniaNorth CentralOhioIndianaIllinoisMichiganWisconsinMinnesotaIowaMissouriNorth DakotaSouth DakotaNebraskaKansasSouthDelawareMarylandDistrict <strong>of</strong> ColumbiaVirginiaWest VirginiaNorth CarolinaSouth CarolinaGeorgiaFloridaKentuckyTennesseeAlabamaMississippiArkansasLouisianaOklahomaTexasWestMontanoIdahoWyomingColoradoNew MexIcoArizonaUtahNevadaWashingtonO.-egonColifornlaAlaskaHawaii1,137,52945,3691,092,160198,3942,4191,6633,10019,5625.~(I!22,98163,69129,23950,238211 ,35825,00019,02163,24822,29219,08814,3008,81517,4009304,3007,9808,984440,2923,76241,6616,56211,5162,65836,46720,58958,45058,70012,4009, i3010,9904,8642,40015,12013,027131,996242,1161,9452,03894012,5912,79412,5806,8894,98928,49212,261151,0851,1814,331Movementduring 1981Entries Exits756,09017,202738,888146,4993,6451,4312,40029,7823,44920,32932,96122,21830,284156,01916,20023,19041,57713,05810,4378,10010,38412,8807232,5007,7909,180295,4482,23229,0675,9086,4432,29419,9329,22034,90046,4009,3008,7604,7602,4121,9207,8047,1%96,900140,9229541,2759009,9281,8147,4606,9222,2816~2;O6,92792,2075163,528651,32018,620632,700121,3163,0861,2362,10022,1313,23518,53227,96616,13126,899133,58313,20020,80738,9038,5999,4585,4009,34911,1105551,8008,0006,402248,3862,10122,6605,2925,2802,10718,02710,63929,80040,3008,6007,6602,7301,6085207,0446,93377,085129,4155301,2477109,1001,0785,7506,4651,5993,943ll(~%90,7293832,885Probationpopulation onDer.. 31, 19811,242,29943,9511,198,348223,5772,9781,8583,40027,2135,71524,77868,68635,32653,623233,79428,00021,40465,92226,75120,06717,0009,85019,1701,0985,0007,77011,762487,3543,89348,0687,17812,6792,84538,37219,17063,55064,80013,10010,23013,0205,6683,80015,88013,290151,811253,6232,3692,0661,13013,4193,53014,2907,3465,67130,7~914,192152,5631,3144,974Source: Table adopted by SO-.-RCEBOOK st<strong>of</strong>f from tables provided by theNotional Council on Crime and Delinquency, Research Center West.546547
Table 6.4 Level31, 1981<strong>Sourcebook</strong> <strong>of</strong> <strong>Criminal</strong> <strong>Justice</strong> <strong>Statistics</strong> <strong>1983</strong><strong>of</strong> <strong>of</strong>fense and conviction status <strong>of</strong> probationers, by region and jurisdiction, on Dec.!'OTE: See !'OTE, Table 6.3.Level <strong>of</strong> <strong>of</strong>fense and conviction status information is missing for488,512 and 406,653, respectively, <strong>of</strong> the 1,242,299 probotioners.methodology, definitions <strong>of</strong> terms, and jurisdictional explanatory notes,ForseeaAppendixdiscllssion16.<strong>of</strong> surve/Persons Under Correctional SupervisionTable 6.5 Probationers exiting the probation population, bymethod <strong>of</strong> exit, region, and jurisdiction, 1981!'OTE: See !'OTE, Table 6.3. For a discussion <strong>of</strong> survey methodology,definitions <strong>of</strong> terms, and jurisdictional explanatory notes, see Appendix16.Offense levelConvicti.,n statusMethod <strong>of</strong> exitRegion and jUrisdictionMis- PercentTotal FelonyCondemeanorUncon- PercentfelonyDis-TotalRevovictedvicted convictedRegion and jurisciiction Total charges cationsFederalDeaths OtherN\ N\ N\ N\ 43,951 43,951 0 100Federal 1!I,62U 14,629 2,876Northeast:2U3 9120Maine 2,97!1 Northeast:2,234New Hampshire 744 75 2,978N\ 2,97!1 0 100Maine Nt>. Nt>.Vermont Nt>. N\ Nt>. N\New Hampshire Nt>. N\N\1,858 1,858 0 1001,236 1,140Vermont96 (a)MassachusettsN\ N\ N\ 027,213 4,0553,400 3,400 0 100N\ Nt>.MassachusettsN\Rhode Island 23,158 N\ N\5,715154,299Nt>. N\ N\ N\~ Nt>.Rhode IslandN\Connecticut 1,416 N\3,069Nt>.21,520 0 756,7905,715 5,715 0 100b 2,820 227New York 14,730 Connecticut 2216,792N\68,68632 24,77829,690 21,520 3,258 8715,182 1,556New Jersey 38,996 New York 54 N\35,32643 68,68621,393 68,686 0 10027,966 22,940 4,776Pennsylvania 13,933 61 New Jersey 25016,1310Nt>.35,326 35,326Nt>. 0N\ Nt>.10013,854Nt>.2,121Nt>. Pennsylvania 15626,8990Nt>. N\24,693.2,071Mrth Central:135 0Ohio Nt>. North Central:Indiana Nt>. N\21,404 N\ Ohio8,447 N\ N\ N\ N\Nt>. N\Illinois 12,957 Indiana Nt>. N\20,807Nt>.65,92239 N\32,561 N\ Nt>. Nt>.17,450 1,571 (c)Michigan 33,361 Illinois 1,78626,7514926,751Nt>. Nt>. Nt>. f\Jl',N\ Nt>.Wisconsin 0 Michigan Nt>. N\8,599Nt>.20,058 0 100 26,7519,389 24,885 1,866 93b 6,678 1,418Minnesota 10,669 Wisconsin 718,83943217,00047 20,06714,200 19,537 530 977,236 1,603Iowa 2,800 MinnesotaN\ N\9,255 0 845,748N\ Nt>. N\ N\~ Nt>.Missouri 3,507 Iowa Nt>. N\6,823Nt>.19,1706211,0019,850 9,850 0 100b 6,019 804Missouri(a)North Dakota 8,169 57 N\N\18,378 0 18,211 167 9910,754 7,344 1,482South DakotaN\ N\ jNorth Dakota 875551,8415,000N\1,000Nt>. N\ N\ N\378 76Nebraska 4,000 South Dakota4 977,77020 5,000 5,000 0 100N\Kansas2,132 5,638 27 6,759 Nebraska Nt>. N\ N\" ,762 5,706 6,7596,056 490 100I 6,9~ 6,610Kansas348 (a)" ,762 11,762 0N\100I,6,402 5,794South:600 2 6J ,',Delaware N\South:Pt.laryland N\ N\ N\ N\3,893 DelawareN\3,663 230 94 ,2,101 1,860 216District <strong>of</strong> Columbia N\ Maryland 25 07,178Nt>. N\ N\ N\ N\Nt>. N\Virginia5,520 1,658 Nt>.District <strong>of</strong> ColumbiaN\12,679771/ ,3457,178 7,178 0 100 5,292 b 4,712 580 (a) "'~West Virginia 1,334 89 iVirginia 5,0580Nt>. N\ N\ Nt>. N\3,720 1,278North CarolinaN\ N\ 1West Virginia 60 N\38,372N\1/,764Nt>. N\ N\ Nt>. Nt>. N\South Carolina 26,608 31 JNorth CarolinaN\ N\18,027N\Nt>.38,372 38,372 0 100I14,756Georgia N\ N\ 2,949South Carolina 21510,63910747,667 0 N\ 19,170 19,170 0 100!9,528Florida24,930 22,737 1986Georgia 125 064,8005243,800N\ N\ N\ N\Nt>. N\Kentucky 21,000 68 Florida Nt>. N\ N\Nt>. N\ Nt>. N\ N\Nt>. N\TennesseeN\ N\ N\ KentuckyN\ N\8,600Nt>.N\ N\ N\ N\ Nt>.b 8,031Alabama N\ N\ 1\1\ 537 32 0Nt>. N\ Nt>. N\ 1\1\ITennessee 7,283 b 6,538Alabama745MiSSissippiN\ N\ (a) N\5,668N\ 13,0205,668 13,020 0 1002,671 2,073 598Arkansas 0 100 Mississippi(a) N\Nt>.5,668 5,668 0 1001,608 1,002Louisiana N\ N\ Arkansas412 2 19215,880N\ N\ Nt>. Nt>. Nt>.1Nt>. Nt>.Oklahoma10,957 4,923 69 Louisiana Nt>. N\ N\N\15,880 15,880 0 100 17,044 5,94UTexas N\ N\ !Oklahoma999 105151,81/ N\ 6,933083,03413,29068,77713,207 8355 151,81199I6,643 290Texas(a)93,763 58,048 77 ,085062 170,132West:,6,091 862 0Montana 2,369 West:Idaho2,306 632,06697 2,369 2,369 0 100Montana 530 480Wyoming1,949 117 94 1Idaho 50 0 0N\2,066 2,066 0 1001,247 782ColoradoN\ N\ N\ 431Wyoming 6 28N\ Nt>. Nt>. N\ N\710 560 42 (c)New MtixicoN\ N\ N\ ! Colorado 108N\13,419 13,419 0 100Nt>. Nt>.Arizona N\ N\ Nt>.New Mexico Nt>. N\14,290N\ N\ N\ N\ Nt>.1,078 b 901Utah12,013 2,277 157 20 07,322 I 0 84 14,290 14,290 0 100Arizona 5,406 4,575Nevada2,974 4,348 41 Utah831 (a)6,465N\N\7,346 7,322 24 100! 6,014Nevada302WashingtonN\ N\ N\ 191,599130Nt>. N\ Nt>. Nt>. N\I, 1,417Oregon N\ N\ 174Washington 83,943014,192Nt>. 30,75910,009 30,759 0 1003,184 723California4,183 71 14,,192 Oregon 36!0N\ 14,192 0 1004,996 4,322Alaska N\ Nt>. N\ 502California 6090,729112Nt>.152,563 152,563 0 10059,001Hawaii N\ N\ 27,657Alaska(c) 4,0714Nt>. N\1 974 3 N\1 323 1 Nt>.1 651 67 N\N\N\1\1\N\ IHawaii N\2,8~N\~ Nt>.!2,816 39 N\ N\a This item total is less then the corresponding total as reported in Table 6.3.detail regarding missing data.See Appendix 16 for alncluded with discharges.I b Thls item total Is less than the corresponding total as reported1In Table 6.3. See Appendix 16 for detail regarding missing data.Research Center West.,\clncluded with other exits.,Source: T!Jble provided to SClLRCEBOO< staff by the Notional Council on Crime and Delinquency,IISource: Table adapted by SOURCEBOOK staff from tables548iJIl I1 III tIi!provided by the Notional Council on Crime and Delinquency, ResearchCenter West.
----------- -~- - -- -<strong>Sourcebook</strong> I'f Criminol <strong>Justice</strong> Stotistics <strong>1983</strong>Persons Under Correctiollol SupervisionTable 6.6 Persons received for supervision by the Federal Probation System, by type <strong>of</strong> supervision, years ending June 30, 1974-82NJTE: Persons under supervision <strong>of</strong> the Federal Pr"botion System includepersons placed on probation--either by U.S. District Courts, U.S.mogistrates, or at the request <strong>of</strong> U.S. attorneys (deferred prosecution)-and Federal <strong>of</strong>fenders released from confinement on parole ormondatory release. A Federal prisoner is eligible for mondatory releasewhen the prisoner has served the full 'term <strong>of</strong> imprisonment less "goodtime"allowances. If the <strong>of</strong>fender has earned more than 180 days <strong>of</strong>"good-time" credit, supervision (as if on parole) is for that period inexcess <strong>of</strong> 180 days. If "good-time" is less than 180 days, releaseoccurs without supervision.These data represent persons who began supervision in the 12-month period prior to June 30 <strong>of</strong> the year noted. The Canal Zane,Guam, and the Virgin Islands began reporting data in 1977.''Pretrial diversion" was called "deferred prosecution" in yearsprior to 1977."Special parole" refers to a speci:ied period <strong>of</strong> parole attached toa term <strong>of</strong> imprisonment at sentencing. This provision is applicable toviolations <strong>of</strong> certain drug laws (see Drug Abuse Prevention and ControlAct <strong>of</strong> 1970, Public Law 91-513, Oct. 27, 1970, 84 Stat. 1260)..Type <strong>of</strong> 1974 1975 1976superVision Number Percent Number Percent Number PercentAll cases 3:1,660 100.0 36,061 100.0 35,102 100.0Court probation 19,452 59.6 18,665 51.8 18,375 52.3U.S. Magistrateprobation 3,351 10.2 4,8!j4 13.5 5,358 15.3Pretrial diversion 977 3.0 1,143 3.2 1,711 4.9Parole 6,299 19.3 7,888 21.9 6,286 17.9Mandatory release 2,398 7.3 2,408 6.7 1,935 5.5Military parole 183 0.6 200 0.6 232 0.7Special parole 873 2.4 1,205 3.41977 1978 1979 1980Number Percent Number Percent Number Percent Num6er Percent35,098 100.0 34,808 100.0 33,839 100.0 31,410 100.017,561 50.0 15,668 45.0 14,094 41.7 12,189 38.8S,678 16.2 5,812 16.7 5,202 15.4 4,589 14.62,081 5.9 2,135 6.1 2,255 6.7 2,015 6.45,222 14.9 5,816 16.7 6,829 20.2 7,652 24.42,521 7.2 3,298 9.5 3,222 9.5 2,671 8.5289 0.8 171 0.5 95 0.3 226 0.71,746 5.0 1,908 5.5 2,142 6.3 2,068 6.6Source: Administrative Office <strong>of</strong> the United States Courts, Annual Re~ort <strong>of</strong> the Director'aM)7y' p. X-tl; 1977 (Preliminary Report), p. 17,Table II; 1979, p. 13, Table 12; 1981, p. 13, Table IS; 1982, p. 172, Ta61e 62 Washington, D.C::-A n stratlve bffiCe""<strong>of</strong> the United States Courts).Table adapted by SQURCEBCO< staff. --1981Number Percent-29,575 100.011,886 40.25,423 18.32,014 6.86,452 21.81,939 6.6340 1.1I ,521 5.11982Number Percent31,531 100.013,286 42.16,455 20.52,013 6,1~5,906 18.71,962 6.2297 0.91,612 5.1i1l ! ,\"I '! :l550551
<strong>Sourcebook</strong> <strong>of</strong> <strong>Criminal</strong> <strong>Justice</strong> Stotistics <strong>1983</strong>Rgure 6.2 Persons under supervision <strong>of</strong> the Federal Probation System, by type <strong>of</strong> supervision, on June 30, 1982NJTE: See NJTE, Table 6.6.(Total number <strong>of</strong> persons under supervision=58,373)Persons Under Correctional SUpervisionTable 6. 7 Move~ent <strong>of</strong> persons under supervision <strong>of</strong>Federal Probat Ion System, year ending June 30, 1982NJTE: See NJTE, Table 6.6.theFROM INSTITUTION ----------.., ,...----------- FROM COURTOther Parole(20.6%)Mandatory Helease (2.1 %)\Court Probation (54.5%)/Persons under supervisionJuly I, 1981'Total receivedCourt probat i onPretrial diversionU.S. magistrate probationParoleMandatory releaseMi Iitary paroleSpecial paroleReceived by transferTotal removedCourt probationPretrial diversionU.S. magistrate probationParoleMandatory releaseMilitary paroleSpecial paroleRemoVfU by transferPersons under supervisionJune 30, 19H2 'NumberPercent a59,278 X38,773 10013,286 342,013 56,455 175,906 151,962 5297 I1,612 47,242 1939,678 10013,239 331,983 55,609 147,550 191,995 5299 I1,764 47,239 1858,373 Xapercents do not add to 100 because <strong>of</strong> rounding.1982 S;~~~~:I ~~;~~~st~~ti:h Of~:e Oft the United. States C'::'Jrrs,Administrative Oifice <strong>of</strong> the Jnite~r~~at~~ ~!~:shIJ~;3(t' D.C.:357. Table constructed by SOLRCEBCX)< staff. ' , pp. 356,SpecialParole(5.0%)Magistrate Probation (13.5%)Source: Admi nistrative Office <strong>of</strong> the United States Courts, .iT::::heTrUn:-&it::erdC'S7.t::ia:::te:-=s~C::::0::iur~t.o:::s:Tciirn~~rr-..:
~<strong>Sourcebook</strong> <strong>of</strong> Crimina! <strong>Justice</strong> <strong>Statistics</strong> I ~83Figure 6.3 Persons under supervision <strong>of</strong> the Federal Prabatlon System, by type <strong>of</strong> supervision, on June 30, 1~72-81f\()TE: See f\()TE, Table 6.6.Persons Under Correctional SupervisionFigure 6.4 Persons under supervislCl,n <strong>of</strong> the Federal Probation System and authorized probation afflcers onJune 2'J, selected years 1~40-82f\()TE: See f\()TE, Table 6.6.Thousands70Probationers(in thousands)75Probation<strong>of</strong>ficers(In thousands)3606050403020COURTPROBATIONPAROLE aJ45~30.. ,... e-0----Probationers//~--..,.,--'IIIIIII",,-'~-Probation <strong>of</strong>ficers.-D - -=--. / 02~~~~~ (j] ~ I R ~....!:) .... !),~ ::?! ~ ~ ~ 8;~6?~ '" "10o1972 1973 1974 1975 1976 1977 1978 1979On June 30blncludes military parole and special parole.Beginning July I, 1~76, pretrial diversion replaced def~lrred prosecution.1980 1981MANDATORY RELEASEMAGISTRATEPROBATIONDEFERRED PROSECUTIONOR PRETRIAL DIVERSIONbSource: Administrative Office <strong>of</strong> the United State~ Courts, The United States Courts: A Pictorial Su.1TTl(Jry for the Twelve Month PeriodEnded June 30, 1~81 (Washington, D.C.: Administrative Office <strong>of</strong> the U1lted States Courts, 198\), p. 17.ii,11IIII}i,I\!qIIII\jl.IpilIiIIIiIIIIH11IiISource: Administrative Office <strong>of</strong> the United States Courts, Annual Remrt <strong>of</strong> the Director, I ~80, p. 13; I ~81, p.·13, Table 14; 1~82, p. I~, Table I~ (Washington, D.C.: Administrative OflCe <strong>of</strong> the U1lted States Courts). Figureconstructed by SO-.RCEBCO< st<strong>of</strong>f.
------ --------------------~----------------Persons Under Correctional SupervisionSourcebool< <strong>of</strong> <strong>Criminal</strong> <strong>Justice</strong> <strong>Statistics</strong> <strong>1983</strong>Table 6.8 Persons removed fram supervision <strong>of</strong> the Federal Probation System, by type <strong>of</strong> supervision and violation, ~'ear endingJune 30, 1982f\OTE: See N:)TE, Table 6.6.(Excludes reinstatements, re-releases, and transfers)T~~ <strong>of</strong> violationf\bWithTotal violation violation Technical a Minor b Majo{Type <strong>of</strong> supervision removed Number Percent Number Percent Number Percent NJrnber Percent Noo1ber PercentTotal 28,869 23,754 82.3Probation U.S. District Courts 12,077 1U,217 84.6Pretrial divc',ion 1,961 1,880 95.9Federal parole 6,093 4,281 70.3Mandatory release 1,750 1,484 84.8Military parole from militaryinstitution275 266 96.7Probation U.S. mogistrates 5,195 4,403 84.8Military parole from Federalinstitution 4 4 100.0Special parole term 1,514 1,219 80.5aVialatlon <strong>of</strong> the conditions <strong>of</strong> supervision other thanconvici,tion for a new <strong>of</strong>fense.Conviction for minor <strong>of</strong>fenses such as drunk, disorderly,petty theft, traffic violation, etc. when a sentence is 90 days orless imprisonment, I year or less probation, or a fine.5,115 17.7 3,161 10.9 391 1.4 1,563 5.41,860 15.4 1,21S 10.1 150 1.2 495 4.181 4.1 67 3.4 3 0.2 II 0.61,812 '19.7 983 16.1 115 1.9 714 11.7266 15.2 165 9.4 17 1.0 84 4.89 3.3 6 2.2 0 X 3 1.1792 15.2 557 10.7 84 1.6 lSI 2.90 X X X X X X X295 19.5 168 II. I 22 1.5 105 6.9clnvolvement in or conviction <strong>of</strong> a new major <strong>of</strong>fense,Including obscondlng from custody, arrested on another charge, orconvicted and sentenced to more than 90 days Imprisonment ormore than I year probation.Source: Administrative Office <strong>of</strong> the United States Courts, 1982 Annual Report <strong>of</strong> the Director (Washington, D.C.: AdministrativeOffice <strong>of</strong> the United States Courts, <strong>1983</strong>), p. 387.II:Table 6.9 Drug users admitted to federally-funded drug abuse treatment programs, by ethnlcity, sex, age at adm!$lllon,and primary drug <strong>of</strong> abuse at admission, United States, 1981f\OTE: This table is based on data that were reported to the missing values in different categories. Clients for whom noClient Oriented Data Acquisition Process (CODAP), an primary drug was reported and transfer admissions betweeninformation system operated by the National Institute on Drug CODAP clinics are not included in these data. The "primaryAbuse (NIDA), that collects admission and discharge reports drug <strong>of</strong> abuse at admission" is the drug type causing the mostIan each client admitted to federally-funded drug abuse dysfunction at the time <strong>of</strong> admission to treatment. Thetreatment programs in the United States and each <strong>of</strong> its subtotals <strong>of</strong> each category do 110t sum to the total due to theterritories. The data are edited manually at the State and exclusion <strong>of</strong> cases with missing data on one or more <strong>of</strong> thesenational levels and the internal consistency <strong>of</strong> Information attributes. For ather definitions <strong>of</strong> terms and a discussion <strong>of</strong>prc;vided on Individual forms is checked in computer edits. limitations <strong>of</strong> the data, see Appendix 18.The number <strong>of</strong> cases for each table may vary because <strong>of</strong>{(Percent a )Primary drug <strong>of</strong> abuse at admission\otherTotal halJu- Tran- Otheradmissions Other Mari- Barbi- Amphet- cino- qulJ- seda-Nunber Percent Heroin opiates huon a turates omines Alcohol Cocaine PCP gens izers tives OtherI Total 249,762 100.0 35.9 8.2 19.1 2.9 7.7 8.5 5.8 2.2 1.8 2.5 3.1 2.3! '1 White mole 104,867 100.0 20.6 9.7 24.8 3.6 9.4 12.8 6.5 1.8 2.8 2.4 3.9 1.6\ Under 18 years 14,421 100.0 0.4 0.4 65.7 2.3 8.8 6.0 2.3 1.2 4.9 1.3 3.9 2.8'18 to 19 years 9,21:13 100.0 2.2 1.9 47.0 4.3 11.8 8.8 5.8 2.3 6.3 1.9 5.9 1.9I20 to 24 years 24,556 100.0 11.9 6.5 26.9 5.1 13.2 9.4 9.6 3.8 4.2 2.3 5.6 1.725 to 29 years 25,119 100.0 32.0 14.6 13.0 3.7 9.4 9.1 7.5 1.7 1.6 2.2 3.8 1.430 years and older 31,488 100.0 33.0 14.8 7.3 2.6 6.0 22.9 5.6 0.5 0.6 3.3 2.2 1.2J!White female 46,053 100.0 22.5 11.7 19.8 4.3 12.3 6.4 5.4 1.4 2.0 6.2 5.9 2.2Under 18 years 8,505 100.0 0.8 0.7 53.4 3.0 16.7 6.6 3.1 1.3 4.8 1.7 5.7 2.218 to 19 years 3,802 100.0 5.8 3.7 32.4 5.8 19.6 5.7 6.3 2.8 5.0 2.9 8.0 2.220 to 24 yeors 10,847 100.0 24.7 II. I 14.6 4.9 14.8 4.6 8.5 2.7 1.8 3.6 6.7 1.825 to 29 years 11,265 100.0 38.7 17.9 8.4 3.8 9.3 4.1 5.8 1.0 0.7 4.2 4.6 1.530 years und alder 11,634 100.0 26.2 16.7 6.8 4.6 7.2 10.3 3.6 0.3 0.3 14.9 5.7 3.3Black male 48,926 100.0 58.1 5.7 11.2 1.4 4.2 6.8 6.4 2.5 0.5 0.6 0.6 1.9Under 18 years 2,212 100.0 0.9 0.7 78.9 1.5 2.5 3.3 4.1 1.8 1.2 0.8 1.4 2.918 to 19 years 1,595 100.0 3.6 2.4 56.0 2.9 5.0 5.7 10.3 7.5 1.9 1.3 1.7 1.620 to 24 years 6,269 100.0 31.5 5.4 20.8 2.9 7.8 5.0 11.8 8.1 1.6 1.3 1.1 2.725 to 29 years 13,662 100.0 63.6 6.4 6.1 1.6 5.2 4.3 6.9 2.7 0.4 0.5 0.4 2.030 years and older 25,188 100.0 70.3 6.1 2.9 0.9 2.9 8.9 4.7 0.8 0.2 0.5 0.4 1.6I'Black female 17,074 100.0 62.4 7.1 9.4 2.0 3.8 3.0 4.8 2.6 0.4 1.3 1.2 2.0Ii Under 18 years 986 100.0 1.9 0.6 65.4 2.0 5.4 2.9 0.7 1.9 1.9 1.3 5.1 2.718 to 19 years 673 100.0 13.5 5.5 50.5 2.4 6.7 2.5 7.3 5.3 1.6 1.5 1.5 1.6li20 to 24 years 2,966 100.0 48.6 8.3 11.4 3.5 6.5 2.3 7.8 6.4 0.6 1.2 1.0 2.5j'25 to 29 years 5,842 100.0 73.2 7.2 2.8 1.6 3.6 1.5 4.5 2.2 0.2 0.9 0.8 1.630 years and 0 I del' 6,607 100.0 73.1 7.7 1.9 1.6 2.2 4.7 3.0 1.0 0.2 1.6 1.0 2.01 i1 ' Hispanic mole 23,058 100.0 61.5 2.6 15.4 1.5 2.4 2.2 3.3 3.7 1.1 0.6 0.9 4.9Under 18 years 2,093 100.0 4.5 0.3 53.8 1.6 3.5 2.1 2.0 4.6 2.2 0.7 1.6 23.2I 18 to 19 years 1,462 100.0 16.6 1.4 39.1 2.3 5.2 1.3 4.4 9.2 4.2 0.5 2.0 13.920 to 24 years 4,738 100.0 47.8 2.0 20.6 2.2 3.5 1.4 5.2 7.6 1.8 0.7 1.6 5.720S to 29 years 5,784 100.0 72.8 3.4 8.5 1.4 1.8 1.6 3.7 3.3 0.7 0.5 0.7 1.630 years and older 8,981 100.0 82.0 3.2 4.4 1.0 1.4 3.3 2.1 0.8 0.2 0.6 0.3 0.8IiHispanic female 5,799 100.0 61.0 4.1 11.9 1.7 3.6 0.9 2.9 4.8 0.7 1.8 1.2 5.4Under 18 years 654 100.0 4.1 1.1 49.2 2.0 6.1 2.0 5.7 6.4 2.4 0.6 2.4 17.918 to 19 years 433 100.0 25.4 0.7 33.5 3.7 8.5 1.4 5.3 8.3 1.4 0.9 1.6 9.2'11 to 24 years 1,453 100.0 62.7 2.9 9.4 1.6 4.3 0.6 3.2 8.5 0.7 0.8 1.6 3.91 : .' 29 years 1,617 100.0 77.8 5.1 2.7 1.3 2.4 0.6 2.4 3.7 0.2 1.2 0.6 2.0rears and older 1,642 100.0 75. I 6.2 2.5 1.5 1.9 1.1 1.5 1.0 0.3 4.1 0.7 4.2IJIIOther male 2,423 100.0 24.3 3.5 32.2 2.4 5.5 11.7 5.2 1.9 1.7 1.1 3.0 7.6Other female 1,166 IGO.O 22,.2 5.7 29.8 2.4 9.5 8.7 3.5 1.5 2.0 4.0 2.5 8.1'?ercents may not add to 100 because <strong>of</strong> rounding.Source: U.S. Department <strong>of</strong> Health and HlKnan Services, National Institute on Drug Abuse, Annual Data 1981, Data from theClient Oriented Data Acgulsitlon Process (CODAP), Statistical Series E, No. 25 (Washington, D.C.: u.S. G
---_.-. __ ." - --.•<strong>Sourcebook</strong> <strong>of</strong> <strong>Criminal</strong> <strong>Justice</strong> <strong>Statistics</strong> <strong>1983</strong>Persons Under Correctional Supervision.;'Table 6.10 Drug users admitted to federally-~unded drug abu~~ treatment programs, by ethnlclty,sex, age at admission, and number <strong>of</strong> arrests ~ithin 24 months prior to admission, lkIitedStates, 1981NJTE: See !\DTE, Table 6.9. The subtotals <strong>of</strong> each category do not sum to the total due to the exclusionaf cases with missing data on one or more <strong>of</strong> these attributes. For definitions <strong>of</strong> terms and a discussion<strong>of</strong> limitations <strong>of</strong> the data, see Appendix 18.(Percent a )Total Number <strong>of</strong> arrests within 24 months 2rior to admissionadmissions6 Ii orNumber Percent None 2 3 4 5 to 10 moreTotal 246,067 100.0 50.2 25.6 11.7 5.3 2.6 1.5 2.3 0.8White male 102,803 100.0 42.7 27.9 14.1 6.3 3.3 1.8 2.9 1.0lklder 18 years 14,137 100.0 40.3 27.3 14.7 7.3 3.8 2.0 3.3 1.318 to 19 years 9,092 100.0 26.3 32.1 19.1 9.2 4.7 2.6 4.6 1.420 to 24 years 24,082 100.0 29.6 31.8 18.2 8.5 4.3 2.4 4.0 1.325 to 29 years 24,609 100.0 46.2 27.8 13.1 5.3 2.7 1.6 2.5 0.830 years and older 30,883 100.0 56.1 24.0 10.0 4.1 2.2 1.1 1.9 0.7White female 45,034 100.0 65.2 19.8 7.5 3.2 1.6 1.0 1.4 0.4lklder 18 yeers 8,373 100.0 69.5 16.9 6.7 2.4 1.5 0.9 1.6 0.518 to 19 years 3,749 100.0 61.6 21.6 8.1 3.5 1.8 1.2 1.9 0.320 to 24 years 10,640 100.0 56.0 24.6 9.6 4.3 2.1 1.3 1.8 0.325 to 29 years 10,999 100.0 63.2 20.7 8.1 3.4 1.9 0.9 1.3 0.430 years and older 11,273 100.0 73.9 16.1 5.2 2.3 0.8 0.6 1.0 0.2Black male 48,681 100.0 49.6 26.7 1/ .8 5.3 2.5 1.5 2.0 0.6lklder 18 years 2,207 100.0 45.4 25.8 1/ .8 6.4 3.6 2.9 3.2 0.918 to 19 years 1,586 100.0 37.1 31.0 16.1 6.4 3.3 2.3 3.2 0.620 to 24 years 6,240 100.0 33.5 31.9 17.2 8.3 3.5 2.1 2.9 0.625 to 29 years 13,586 100.0 46.0 28.9 12.5 5.7 2.7 1.7 2.0 0.630 years and older 25,062 100.0 56.7 24.0 9.8 4.3 1.9 1.1 1.6 0.6Block female 16,964 100.0 61.7 21.5 8.5 3.5 1.8 0.9 1.6 0.6lklder 18 years 985 100.0 72.2 19.0 3.2 1.8 1.2 0.4 1.4 0.7IB to 19 years 672 100.0 n.o 15.5 6.0 2.7 1.0 0.9 1.5 0.420 to 24 years 2,945 100.0 54.2 23.5 10.9 4.8 2.5 1.3 2.3 0.625 to 29 years 5,799 100.0 S8.3 22.9 9.9 3.6 1.9 1.1 1.7 0.630 years and older 6,563 100.0 65.4 20.3 7.2 3.3 1.6 0.5 1.2 0.5Hispanic male 22,985 100.0 45.6 28.6 12.2 5.6 2.9 1.7 2.6 0.8lklder 18 years 2,084 100.0 32.7 25.2 17.9 9.0 4.4 3.6 5.6 1.718 to 19 years 1,455 100.0 25.2 34.5 18.3 8.9 4.4 2.8 4.7 1.220 to 24 years 4,n8 100.0 32.3 36.2 14.2 6.9 3.7 2.2 3.6 0.825 to 29 years 5,766 100.0 47.4 28.3 12.3 5.1 2.8 1.3 2.0 O.B30 years and older 8,952 10U.0 57.9 24.6 8.7 4.0 1.9 1.0 1.5 0.5Hispanic female 5,766 100.0 59.7 20.9 9.0 4.6 2.0 1.2 2.0 0.6lklder 18 years 653 100.0 61.7 18.7 7.4 4.4 1.8 1.7 3.4 0.9IB to 19 years 429 100.0 59.2 21.0 9.6 2.6 3.3 0.5 2.8 1.220 to 24 years 1,448 100.0 53.5 23.5 9.9 6.1 2.0 1.7 2.3 0.925 to 29 years 1,606 100.0 58.4 20.3 10.1 5.2 2.4 1.6 1.7 0.430 years and older 1,630 100.0 65.8 20.0 7.7 3.3 1.5 0.4 1.2 0.1Other male 2,337 100.0 39.0 26.1 14.2 7.7 4.2 3.1 3.9 1.7Other female 1,1/6 10U.0 59.1 19.4 7.5 4.7 2.2 3.0 2.5 1.5C1percents may not add to 100 because <strong>of</strong> rounding.Source: U.S. Department <strong>of</strong> Health and Human Services, Notional Institute on Drug Abuse, AnnualData 1981, Data from the Client Oriented Data Acquisition Process (COOR), Statistical Series t;'""i\b.'25 (Washington, D.C.: U.S. Gov'~rnment Printing Office, i9H2), p. 21. Table adapted by saRCEBOO
<strong>Sourcebook</strong> <strong>of</strong> <strong>Criminal</strong> <strong>Justice</strong> <strong>Statistics</strong> <strong>1983</strong>Persons Under Correctional SupervisionTable 6.12 Drug users admitted to federally.funded drug abuse treatmeni !Jrograms, by selected characteristics and primary drug <strong>of</strong>Table 6.13 Selected characteristics <strong>of</strong> residents <strong>of</strong> public juvenile custody facilities,abuse at admission, United States, 1981 United States, selected years 1971-79f\OTE: See f\OTE, Table 6.9. For definitions <strong>of</strong> terms and a discussion <strong>of</strong> limitations <strong>of</strong> the data, see Appendix 18. f\OTE: These data are from the censuses <strong>of</strong> State and local detention and correctionalfacilities. The censuses were conducted by the U.S. <strong>Bureau</strong> <strong>of</strong> the Census for the U.S.(Percent a ) Department <strong>of</strong> <strong>Justice</strong>. .Data for 1972, 1976, and 1978 are not available. The first twacensuses, 1971 and 1973, were restricted to public facilities, but all later censuses wereErlmar~ drug <strong>of</strong> abuse at a.dmisslon expanded ta include private facilities. The data for 1971-75 are as <strong>of</strong> June 30, and farOther 1977 and 1979 as <strong>of</strong> Dec. 31. For a description <strong>of</strong> data collection procedures andhallu- Tran- Other definitions <strong>of</strong> terms, see Appendix 3.Tatal Other Marl- Barbi- Amphet- cino- quil- sedaadmissionsHerain o~lates huana turates amines Alcahol Cocaine PCP gens Izers tlves Other Selected characteristics 1971 1973 1974 1975 1977 1979Highest grade level Number <strong>of</strong> residents, total 57,lJ9 47,983 47,268 49,ll6 45,920 45,251completed: Juvenile 54,729 45,694 -.1i,922 116,980 44,096 43,089Grade 0 to 9 21.8 15.6 12.5 35.3 21.8 24.0 23.6 12.6 17.6 32.5 19.9 23.8 42.3 Male 41,7tll 35,057 34,7!J3 37,926 36,9l1 37,063Grade 10 to II 28.1 27.8 21.7 32.3 28.4 30.8 24.3 24.7 40.1 33.3 20.5 27.1 25.7 Female 12,948 10,637 10,139 9,054 7,175 6,026Grade 12 33.3 37.6 38.1 22.6 34.4 33.2 35.4 36.~ 34.7 25.4 36.8 32.5 21.1 Adult 2,5IU 2,289 £,346 2,146 1,824 2,162Grade 13 and over 16.9 19.0 27.8 9.7 15.3 12.0 16.7 26.3 7.6 8.8 22.8 16.6 10.9Tatal 100.0 100.0 100.0 100.0 100.0 100.0 100.0 100.0 100.0 100.0 100.0 100.0 100.0 Average age (in years)aNt>. Nt>. 1'-1\ Nt>. 15.3 15.4Number <strong>of</strong> clients 249,059 89,466 20,514 47,556 7,251 19,180 21,167 14,389 5,416 4,510 6,186 7,678 5,746 Male Nt>. 15.l 15.3 15.3 15.4 15.5Female Nt>. 14.9 14.9 15.0 15.1 15.1Employment status:Unemplayed 69.8 72.6 68.2 67.0 75.2 71.1 67.2 60.3 71.6 74.4 67.9 66.4 80.2aBased on juvenile residents only.i'bt seeking work 53.2 55.2 50.4 52.5 58.3 52.6 50.1 44.9 54.5 58.4 53.2 49.0 64.4Seeking work 16.7 17.4 17.8 14.5 16.9 18.5 17.1 15.3 17.1 16.0 14.7 17.11 15.8Employed 30.2 27.4 31.8 33.0 24.8 28.9 32.8 39.7 28.4 25.6 32.1 33.6 19.8Part-time 6.8 4.4 5.8 I 1.5 6.0 7.6 5.9 7.5 6.4 9.1 7.8 7.5 5.7Full-time 23.2 23.0 26.0 21.4 18.8 21.3 26.9 32.2 22.0 16.5 24.3 26.2 14.1Total 100.0 100.0 100.0 100.0 100.0 100.0 100.0 100.0 100.0 100.0 100.0 100.0 100.0Number <strong>of</strong> clients 249,182 89,451 20,516 47,604 7,255 19,213 21,177 14,377 5,416 4,519 6,197 7,689 5,76BMarital status:Never married 5tl.0 48.6 41.6 81.6 63.0 63.4 42.8 61.5 73.5 83.1 40.4 63.5 65.9Married 18.7 23.9 26.9 9.4 14.3 13.8 22.3 16.8 12.4 6.3 25.8 14.2 14.9Widowed 1.3 1.5 1.7 0.3 1.1 0.6 2.3 0.8 0.6 0.3 3.4 1.1 :!.8Divorced 12.8 12.9 19.2 5.6 14.2 13.5 21.7 13.1 7.1 6.5 21.1 14.0 9.2Separated 9.3 13.1 10.5 3.1 7.4 8.8 11.0 7.8 6.4 3.9 9.3 7.2 7.2Total 100.0 100.0 100.0 100.0 100.0 100.0 100.0 100.0 100.0 100.0 100.0 100.0 100.0Number <strong>of</strong> clients 249,383 89,485 20,537 47,652 7,265 19,238 21,191 14,400 5,420 4,527 6,203 7,695 5,770Source <strong>of</strong> referral:Voluntory 75.9 86.2 86.4 62.1 72.9 69.7 73.2 66.6 59.4 67.0 83.3 72.0 71.5Self-referral 41.0 61.0 53.0 18.7 31.2 28.7 32.7 31.0 24.8 23.7 35.6 29.8 31.3Hospital 4.1 2.5 5.2 2.3 6.6 5.3 10.4 3.9 4.0 4.8 8.2 5.4 4.9Community services 12.2 8.9 11.9 12.8 15.7 15.6 14.2 12.8 13.4 15.8 20.1 16.1 16.4Community mentalhealth center 2.4 1.2 2.9 2.1 4.2 4.0 3.0 2.7 2.5 4.0 5.9 4.4 3.0Community servicesagencies/individual 9.8 7.7 8.9 10.7 11.6 11.6 11.2 10.1 10.9 11.7 111.3 11.7 13.4Family/friend 12.3 11.4 12.5 14.2 12.4 12.8 10.2 12.9 11.9 13.0 13.5 13.1 11.1Employer/school 3.2 0.4 0.6 10.1 2.5 3.8 2.5 1.7 2.2 5.3 2.5 3.6 3.4Employer 0.5 0.3 0.4 0.5 0.4 0.7 1.1 0.8 0.7 0.2 0.7 0.5 0.3School 2.7 0.1 0.2 9.6 2.1 3.1 1.4 1.0 1.5 5.0 1.8 3.1 3.2Other voluntary 3.1 1.9 3.3 4.0 4.5 3,,4 3.0 4.2 3.1 4.5 3.4 4.1 4.4i'bn-vo!untary 23.2 12.5 13.0 37.6 26.4 29.4 25.9 32.1 40.0 32.5 16.5 27.8 27.5Treatment Alternativesto Street Crime (rASC) 2.7 1.4 2.3 3.7 2.8 3.2 3.5 4.5 2.2 3.4 2.2 7.0 3.4Federal/Stote/countyprobation 13.4 5.5 6.9 24.5 15.0 17.3 14.1 20.0 29.0 18.3 9.0 14.7 16.4Federal/State/countyparole 3.8 4.0 2.0 1.8 4.8 5.3 2.7 4.4 5.1 5.1 2.4 2.2 3.2Other non-voluntary 3.3 1.5 1.8 .' 5 3.8 3.6 5.6 3.3 3.7 5.7 3.0 3.9 4.5Other b 0.9 1.3 0.6 0.3 0.7 0.9 0.9 1.3 0.6 0.5 0.1 0.2 1.0i<strong>Bureau</strong> <strong>of</strong> Prisons 0.9 1.3 0.6 0.3 0.7 0.9 0.9 1.3 0.6 0.5 0.1 0.2 1.0Veterans AdministrationArmed Services MedicalReferral Office (ASfllRO) (c) (c) (c) (c) 0.0 (c) (c) (c) 0.0 0.0 (c) (c) 0.0Total 100.0 100.0 100.0 100.0 100.0 100.0 100.0 100.0 100.0 100.0 100.0 100.0 100.0Number <strong>of</strong> clients 249,533 89,674 20,538 47,642 7,264 19,242 21,168 14,395 5,422 4,526 6,204 7,6tl9 5,769N.mber <strong>of</strong> arrests within 24 l:months prior to admission: I]i'bne 50.2 55.7 55.9 45.2 45.8 46.0 49.2 43.3 26.9 39.2 65.5 45.3 47.7I!i 25.6 23.1 23.3 30.6 24.9 25.8 24.1 32.0 31.0 26.9 16.9 26.3 21.52 11.7 10.2 10.1 12.6 13.0 12.9 13.4 12.2 18.5 14.3 8.6 14.1 12.1Ii3 5.3 4.7 4.6 5.3 6.5 6.1 5.2 5.4 9.3 7.5 3.6 6.5 6.44 2.6 2.4 2.4 2.4 3.2 3.1 2.9 2.5 5.3 3.4 1.9 3.0 3.8 ~5 1.5 1.3 1.1 1.4 2.0 2.0 1.7 1.5 3.1 2.4 1.0 1.5 2.76 to 10 2.3 2.0 2.0 2.0 3.6 3.0 2.5 2.2 4.5 4.6 1.8 2.4 4.0II or more 0.8 0.6 0.6 0.6 1.1 1.1 1.0 0.8 1.4 1.6 0.7 0.8 1.9Total 100.0 100.0 100.0 100.0 100.0 100.0 100.0 100.0 100.0 100.0 100.0 100.0 100.0N.mber <strong>of</strong> clients 246,067 89,035 19,990 46,470 7,172 18,966 21,046 14,150 5,400 4,473 6,007 7,635 5,723~ercents moy not add to 100 because <strong>of</strong> rounding.studY'cBa:> probationer, and other Ba:> (formerly DAP).<strong>Bureau</strong> <strong>of</strong> Prisons (BCP) includes BCP NARA Ii, BCP-IPDDR, BCP Less than 0.5 percent.ISource: U.S. Department <strong>of</strong> Health and fiJman Services, i'btional Institute on Drug Abuse, Annual Data 1981, Data from the Client Oriented1Data Acquisition Process (CODAP), Statistical Series E, i'b. 25 (Washington, D.C.: U.S. Government Printing Office, 1982), pp. 8, 9. Table adapted !by Sd:RCEBOO< staff. 1II/1I1
<strong>Sourcebook</strong> <strong>of</strong> <strong>Criminal</strong> <strong>Justice</strong> <strong>Statistics</strong> <strong>1983</strong>Table 6.14 Selected characteristics <strong>of</strong> residents <strong>of</strong> public juvenile custody facilities,United States, on Dec. 31, 1977 and 1979!\oTE: See I'OTE, Table 6.13. The data pertain to juvenile residents only. ''HIspanic'' refersto persons <strong>of</strong> Mexican, Puerto Rican, Cuban, Central or South American, or other Spanishorigin. A "status <strong>of</strong>fense" is an act that is Illegal if committed by a juvenile but is natIllegal If committed by an adult. Examples include truancy, possession <strong>of</strong> alcoholicbeverages, incorrigibility, and running away from home. The classification <strong>of</strong> "physicalenvironment" was first used In the 1977 and 1979 censuses. It was determined by responsesto questions on the degree <strong>of</strong> residents' access to the community and the extent <strong>of</strong> In-housephysical and staff controls. A majority <strong>of</strong> facilities Identified in earlier censuses 05detention centers, dlagnost;c centers, or training schools, and a significant proportion <strong>of</strong>ranches, fall into the "institutional" category. Most <strong>of</strong> those previously identified as sheltersor group homes, as well as some ranches, are classified as "open."Data on average length <strong>of</strong> stay are for the calendar year. For a description <strong>of</strong> datacollection procedures and definitions <strong>of</strong> terms, see Appendix 3.Type <strong>of</strong> facilityAll facilities Short-term Long-termSelected characteristics 1977 1979 1977 1979 1977 1979f\lJmber <strong>of</strong> juveniles, total 44,096 43,089 11,929 12,141 32,167 30,948Sex:MaleFemaleAverage age (in years)Race:WhiteBlackOtherf\bt reported aEthnic composition:Hispanicf\bn-HispanicAdjudication status:DetainedCommittedVoluntary admissionType <strong>of</strong> <strong>of</strong>fense:DelinquencyStatui> <strong>of</strong>fenseOtherPhysical environment:Institutional facilitiesOpe~ facilitiesAverage length <strong>of</strong> stay (in days)DetainedCommitted36,9217,17515.327,96314,~651,0452234,00940,08711,19032,47742937,8464,9161,33432,19711,89910712179a ln 1979 this category included 1,976juveniles (772 short-term and 1,204 longterm)in 51 Florida facilities for whom datawere ~ot reported in this category.In 1977 this category included 706non<strong>of</strong>fenders held for dependency, neglect,or abuse, and 115 for emotional disturbance37,0636,02615.425,93513,7279482,4794,39338,69611,5U831,28429739,4552,73490031,81711,272106141789,5212,40815.27,8933,6092U42231,33610,59310,6191,305510,0741,540315II ,3635661412769,9762,16515.17,2843,431~031,2231,43910,70210,8161,2784710,7871,03032411,25588615136927,4004,76715.620,07011,256841o2,67329,49457131,17242427,7723,3761,01920,83411,3331841818827,0873,86115.618,65110,2967451,2562,95427,99469230,00625028,6681,70457620,56210,38618322189or mental retardation; 429 juveniles whoadmitted themselves to a facility or werereferred by a parent, court, or school,wit hout being adjudged for an <strong>of</strong>fense; and84 who were not classifiable. In 1979 thf>corresponding numbers were 498, 56, 297,and 49, respectively.ffI(IIilII11iIqIII,.fiIII~i~Hi [iilI ilIi!III iPersons Under Correctional SupervisionTable 6.15 Selected characteristics <strong>of</strong> residents <strong>of</strong> pr ivatejuvenile custody facilities, United States, 1974, 1975 1977 and1979 ' ,!\oTE: See NOTE, Table 6.13. For a description <strong>of</strong> data collectionprocedures and definitions <strong>of</strong> terms, see Appendix 3.Selected characteristicsNumber <strong>of</strong> residents, totalJuvenileMaleFemaleAdultAverage age (In years)aMaleFemale19:i4"~ ----.,1""9'::"75=----,'""9 i'"'7---1-9-79-31,74931,74922,1049,645°N\14.614.8aBased on juvenile residents only.27,4·5027,29029,37729,07U28,70728,67819,1528,13820,3878,68320,5058,173160 307 29N\15.314.914.914.914.915.4 15.0 15.0Source: U.S. Department <strong>of</strong> <strong>Justice</strong>, Office <strong>of</strong> Juvenile <strong>Justice</strong>and Delinquency Prevention, Children in Custody: Advance Report onthe 1979 Census <strong>of</strong> Private Juvenile Facilities (Washington, D.C.: U.S.Department <strong>of</strong> JUstice, 19111 ), Table I. Table adapted byS(XRCEBOO< st<strong>of</strong>f.Table. 6,.16 Sel.ected characteristics <strong>of</strong> residents <strong>of</strong> private juvenile custodyfacilities, United States, on Dec. 31, 1977 and 1979!\oTE: Se~ ~TES, Tables 6.13 and 6.14. For a description <strong>of</strong> data collection proceduresand definitions <strong>of</strong> terms, see Appendix 3.Selected characteristicsNumber <strong>of</strong> juveniles, total 29,070Sex:MaleFemaleAverage age (in years)Race:WhiteBlackOtherEthnic composition:Hispanicf\bn-HispanicAdjudication status:Detained'CommittedVoluntary admissionType <strong>of</strong> <strong>of</strong>fense:DelinquencyStatus <strong>of</strong>fenseOther aPhysical environment:Institutional facilitiesOpen facilitiesAll facilities1977 197920,3878,68314.921,9176,0051,1482,09626,97489423,01195,0879,4847,43812,14~6,44522,62528,67820,5058,17314.921,65U5,8431,1851,90626,77273621,7386,2049,6036,29112,71145,45623,222Type <strong>of</strong> facilityShort-term1977 197984343940414.7616184435971147257444168402273184.55973244428814.65461068U416914621997123624625U264468Long-term1977 197928,22719,9488,27914.921,3UI5,8211,1052,03726,19016923,0155,0439,3167,03611,8756,26121,96627,94620,0617,88515.021,1045,7371,1051,86526,08127421,5396,1339,3676,04512,5345,19222,754Average length <strong>of</strong> stay(in day .::.:s)'--_______ ~27:..:::0 __...!::26~1___=20~_ _.:5::5~_ _=29:!1___=_27!..=..2a In 1977 this category included 5,296 non<strong>of</strong>fenders held for dependency neglector abuse! and 1,739 for emotional disturbance or mental retardation' 5 087 /uven i1esw~o admltt,ed th~mselves to a facility or were referred by a parent,' c~urt, or school,Without be!ng adjudged for an <strong>of</strong>fense; and 26 who were not classifiable. In 1979 thecorresponding numbers were 5,03U, 1,383, 6,204 and 167, respectively.
'""' - .----~-- ---~-------------------------Table 6.18 Estimated number <strong>of</strong> adult and juvenile jailinmates, by detention status and sex, United States,on June 30, 1982N:>TE: See NJTE, Tobie 6.17.Detention status Total Male FemaleTotal 209,582 195,730 13,852Adult 207,853 194,153 13,700Awaiting arraignmentor trialConvicted118,1891:l9,66411,0781l4,0758,1115,51l9Juvenile 1,729 1,577 152Awaiting preliminaryhearing or adjudication 1,274 1,145 129Adjudicated 455 432 23Source: U.S. Deportment <strong>of</strong> <strong>Justice</strong>, <strong>Bureau</strong> <strong>of</strong><strong>Justice</strong> <strong>Statistics</strong>, Jail Inmates 1982, Bulletin NCJ-87161(Washington, D.C.: U.S. Deportment <strong>of</strong> <strong>Justice</strong>, February<strong>1983</strong>), p. I, Table I.<strong>Sourcebook</strong> <strong>of</strong> <strong>Criminal</strong> <strong>Justice</strong> <strong>Statistics</strong> 19113Table 6.17 Estimated number <strong>of</strong> adult and juvenile jailinmates, by sex and race, United States, on June 30,1982N:>TE: These data were collected thtough a mall surveyconducted by the U.S. <strong>Bureau</strong> <strong>of</strong> the Census for the <strong>Bureau</strong><strong>of</strong> <strong>Justice</strong> <strong>Statistics</strong>. A total <strong>of</strong> 6!l3 jurisdictions weresurveyed, including 285 jurisdictions with on overage dailyinmate population <strong>of</strong> 100 or more based on the 1971lNational Jail Census. These 2!l5 jurisdictions accountedfor 70 percent <strong>of</strong> the 1982 estimated popUlation. Theremaining 398 jurisdictions In the survey were chosenrandomly from within 4 size categories. The likelihood <strong>of</strong>selection for any jurisdiction was proportional to the sizegroup to which it belonged. Eliminated from eligibilitywere jurisdictions in six States--Alaska, Connecticut,Delaware, Hawaii, Rhode Island, and Vermant--and theDistrict <strong>of</strong> Columbia, which have combined prison/jailsystems (Source, p. 4).Sex Total White a Block a Hispanic Other DTotal 209,51l2 9!l,61:l1:l 84,346 23,617 2,931Adult 207,853 97,732 83,684 23,555 2,882Mole 194,153 91,721 77,750 22,075 2607Female 13,700 6,011 5,934 1,480 275JuvenileMale1,7291,57795685966263562474936Female 152 97 27 15 13bExcludes persons <strong>of</strong> Hispanic origin.American Indians, Native Alaskans, Asians, andPacific Islanders.Source: U.S. Department <strong>of</strong> <strong>Justice</strong>, <strong>Bureau</strong> <strong>of</strong><strong>Justice</strong> Stotistics, Jail Inmates 1982, Bulletin NCJ-87161(Washington, D.C.: U.S. Deportment <strong>of</strong> <strong>Justice</strong>, February<strong>1983</strong>), p. I, Table 2.Table 6.19 Prisoners held in local jails because <strong>of</strong>overcrowding in State facilitic:: on Dec. 31, by State,1981 and 1982N:>TE: State inmates housed in local jails because <strong>of</strong>overcrowding are considered to be under Stc.te jurisdiction.A State prison system has jurisdiction over a person If itretains the legal power to incarcerate the person In one <strong>of</strong>its own prisons. States not listed and the FederalGovernment did not have prisoners held in local jailsbecause <strong>of</strong> overcrowding. For information on methodology,definitions <strong>of</strong> terms, and a detailed explanation <strong>of</strong> revised,estimated, and noncamparable data, see Appendix 19.State 1981 1982Total 6,900 8,217Aloboma 1,472 1,286CaliforniaColorado600 914244Florida 287 1lKentuckyLouisiana104793162 01,499Moine 24 61.Maryland 71 6lMassachusetts 7 1l20Michigan 43Mississippi 1,147 1,020MontanaNew JerseyaI995New Mexico 21,584Oklahoma 48TennesseeSouth Carolina219549 501166Utah 29 6Virginia 485 643Washington 24 21JaNat included in this State's <strong>of</strong>ficial prison count.Source: U.S. Department <strong>of</strong> <strong>Justice</strong>, <strong>Bureau</strong> <strong>of</strong><strong>Justice</strong> <strong>Statistics</strong>, Prisoners in 1982, Bulletin NCJ-87933(Washington, D.C.: U.S. Deportment <strong>of</strong> <strong>Justice</strong>, April<strong>1983</strong>), p. 3.iijII:,I I"Persons Under Correctional SupervisionFigure 6.5 Sentenced prisoners i" State and Fed'eral Institutions on Dec. 31, United States, 1925-82N:>TE: Prison population data were compiled by a yearend census <strong>of</strong> prisoners held In custody in State andFederal Instltu!ions. Data for 1925 through 1939 include sentenced prisoners in State and Federal prisonsand reformatorJe~ whether committed for felon if,s or misdemeanors. Data for 1940 through 1970 include alladult felons serving sentences In State and F'Jderal institutions. Since 1971, the census has included alladults or youthful <strong>of</strong>fenders sentenced t(1 a State or Federal correctional institution with maximumsentences <strong>of</strong> over I year." Beginn!n!! o~, Dec. 3,1, I ~78, a distInction was made between prisoners "in custody" and prisonersu~der jur,isdlctlon. As defined In a 1978 report (U.S. Deportment <strong>of</strong> <strong>Justice</strong>, <strong>Bureau</strong> <strong>of</strong> <strong>Justice</strong> <strong>Statistics</strong>,~ In Stat~ and Federal Institutions on December 3 lin 1978, National Prisoner <strong>Statistics</strong> Bulletin SD,.......,-P;)r-O (Washington, D.C.: U.S. Government Printing ice, 1980», "in custody" refers to the directphysical control and responsibility for the body <strong>of</strong> a confined person. ''Under jurisdiction" is defined asfallows: A State or Federal prison sr.stem has jurisdiction over a person if it retains the legal power tolncar~er
---_.-------- - -- ....<strong>Sourcebook</strong> <strong>of</strong> <strong>Criminal</strong> <strong>Justice</strong> <strong>Statistics</strong> <strong>1983</strong>Agure 6.7 Sentenced male prisoners in State and Federal institutiom; on Dec. 31, United States, 1925-82NJTE: See NJTE, Figure 6.5. For information on methodology, definitions <strong>of</strong> terms, and a detailedexplanatian <strong>of</strong> revised, estimated, and noncomparable data, see Appendix 19.Persons Under Correctional SupervisionTable 6.20 Number and rate (per 100,000 residentpopUlation) <strong>of</strong> sentenced prisoners in State and Federalinstitutions on Dec. 31, by sex, United States, 1925-82NJTE: See NOTES, Figures 6.5 and 6.8. For Information onmethodology, definitions "f terms, and a detailed explanation <strong>of</strong>revised, estimated, and noncomparable data, see Appendix 19.400,000Year(Rate per 100,000 resident population)TotalMalesFemalesRate Number Rate NUmber Rate-III'0c:
---.0lIl,- ~--,.--- - - - ------------------------- ---~--.------~-------\.'Persons Under Correctional Supervi.Ion<strong>Sourcebook</strong> <strong>of</strong> <strong>Criminal</strong> <strong>Justice</strong> <strong>Statistics</strong> <strong>1983</strong>Table 6.21 Rate (per 100,000 resident population) <strong>of</strong> sentenced prisoners in State and Federal Institutionson Dec. 31, by region and jurisdiction, 1971-82N:JTE: See N:JTES, Figures 6.5 and 6.8. The data for the years 1971-77 represent sentencedprisoners In the custody <strong>of</strong> State and Federal Institutions. The data for 1978-82 representsentenced prisoners under the jurisdiction <strong>of</strong> State and Federal correctional authorities. The1982 rates are preliminary and subject to revision. For Information on methodology,definitions <strong>of</strong> terms, and a detailed explanation <strong>of</strong> revfsed, estimated, and nOl)comparabledata, see Appendix 19.Figure 6.9 Rate (per 100,000 resident popUlation) <strong>of</strong> sentenced prisoners In State ond Feder., I Institutions, by jurisdiction, on Dec. 31,1982f'.OTE: See N:JTE, Figure 6.5. For InformatIon on methodolcgy, definitions <strong>of</strong> terms, and 0 detailedexplanation <strong>of</strong> revIsed, estimated, and noncompar,Jble data, see Appendix 19.(Rate per 100,000 resident populationa)Rate per 100,000 resident populgtlon on pec. 31Region and jurisdiction 1971 1972 1973 1974 1975 1976 1977 1978 1979 1980 1981 1982United States, total 96.4Federal institutions, total 10.2State institutions, total 136.2NortheastMaineNew HampshireVermontMassachusettsRhode IslandConnecticutNew YorkNew JerseyPennsylvaniaNorth CentralOhioIndianaIllinoisMichiganWisconsinMinnesotaIowaMissouriNorth DakotaSouth DakotaNebraskaKansasSouthDelawareMarylandDistrict <strong>of</strong> ColumbiaVirginiaWest VirginiaNorth CarolinaSouth CarolinaGeorgiaFloridaKenTuckyTennesseeAlabamaMississippiArkansasLouisianaOklahamaTexasWestMontanaIdahoWyomingColoradoNew MexicoArizona!.It'}!'Ne'/adaWashingtonOregonCaliforniaAlaskaHawaii56.445.128.046.538.340.563.365.072.544.772.984.782.952.4106.455.440.253.676.821.357.869.190.5123.933.2124.9349.2108.959.6153.0118.4146.1135.894. i86.11/0.082.783.9113.0144.2140.981.935.448.977.58S.961.374.35'L?124.082.493.5!:I7.465.633.794.610.:;84.156.846.330.830.032.136.159.364.072.452.665.677.272.850.493.944.934.545.574.728.851.062.873.5124.549.3139.3340.8106.359.1159.9121.2174.3139.38~.581.9103.583.180.492.2139.7136.078.639.549.675.781.355.776.951-2121.277.184.483.961.038.897.8 103.6 113 123 129 135 136 139 153 17010.9 10.6 II 13 13 12 10 9 10 1086.8 93.0 102 III 116 123 126 130 144 16060.443.834.840.334.343.254.271.473.555.062.871.963.450.386.847.236.049.079.424.934.966.060.6128.357.1144.0324.2107.960.8183.9130.1173.3132.589.454.2104.575.582.2108.3120.4146.68.643.554.676.677.566.48/.0!!4i7134.977.174.796.756.337.363.450.427.151.538.448.747.678.571.656.969.086.957.555.994.656.435.151.688.020.737.067.963.5135.076.1155.0289.2105.157.3207.2158.4191.4137.991.790.9110.391.899.6127.7108.5140.693.945.665.573.979.480.797.04C.1130.386.288.3105.657.138.6Source: U.S. Department <strong>of</strong> <strong>Justice</strong>, Law Enforcement Assistance AdministratIon, Prisoners In State andFederal Institutions, Notional Prisoner <strong>Statistics</strong> Bulletin SD-f\PS-PSF-2, pp. 20, 21; Notional Prisoner <strong>Statistics</strong>Bulletin SD-WS-PSF-3, pp. 16, 17; Notional Prisoner <strong>Statistics</strong> BUlletin SD-f\PS-PSF-4, p. 18; Notional Prisoner<strong>Statistics</strong> Bulletin SD-f\PS-PSF-5, p. 13 (WashIngton, D.C.: U.S. Government Printing OffIce); U.S. Department <strong>of</strong><strong>Justice</strong>, <strong>Bureau</strong> <strong>of</strong> <strong>Justice</strong> StatIstics, Prison::lrs in State and Federal InstItutions, Notional Prisoner <strong>Statistics</strong>.Bulletin SD-f\PS-PSF-6, p. 16; I'-k;tional Prisoner <strong>Statistics</strong> Bulletin SD-WS-PSF-7, p. 14; NatIonal Prisoner;;~tatistics Bulletin SD-NPS-PSF-8, NCJ-80520, p. 16; NCJ-86485, p. 16 (WashIngton, D.C.: U.S. GovernmentPrinting Office); and U.S. Department <strong>of</strong> <strong>Justice</strong>, <strong>Bureau</strong> <strong>of</strong> <strong>Justice</strong> <strong>Statistics</strong>, Prisoners In 1982, Bulletin NCJ-87:133 (Washington, D.C.: U.S. Department <strong>of</strong> <strong>Justice</strong>, April <strong>1983</strong>), p. 2. Table adapted by SOCRCEBOOFederal System 100 0 - 490 50 - 99~ 100-174Mass.77 bt:JW;WWJ 175 or more°Unpublished U.S. <strong>Bureau</strong> <strong>of</strong> the Census estimates for the resIdent population on July I, 1982, were used to calculate sentenced prisoners per100,09,0 persons for bath the States and the Notion as a whole. Sentenced prIsoners are defined as persons serving sentences longer than a year.Massachusetts cannot distinguIsh Inmates by sentence length; therefore, the incarceration rate Is based on the total prIsoner population.Source: U.S. Department <strong>of</strong> <strong>Justice</strong>, <strong>Bureau</strong> <strong>of</strong> <strong>Justice</strong> <strong>Statistics</strong>, Prisoners in 1982, Bulletin NCJ.·87933 (Washington, D.C.: U.S. Department<strong>of</strong> <strong>Justice</strong>, April <strong>1983</strong>), p. 2. Figure constructed by Sa..RCEBOO
-----~------------------- --~-,-- ~-~--~-..----------.-~--"> ""--<strong>Sourcebook</strong> <strong>of</strong> <strong>Criminal</strong> <strong>Justice</strong> <strong>Statistics</strong> <strong>1983</strong>Persons Under Correctional SupervisionTable 6.2~ Movement <strong>of</strong> sentenced prisoners in State and federal institutions, by region and jurisdiction, 1981!\oTE, See NOTE, Figure 6.5. All figures on qdmlssions and departures represent the number <strong>of</strong>transac'lons and not the number <strong>of</strong> individual prisoners who were involved in such movements.''Unconditional releases" include expiration <strong>of</strong> sentence, commutation <strong>of</strong> sentence, and other suchunqualified discharges. "Conditional releases" are those involving some form <strong>of</strong> supervision overthe <strong>of</strong>fender upon return to the community and include parole, probation, supervised mandatoryrelease (early release because <strong>of</strong> good behavior), and other forms <strong>of</strong> conditional discharge. ForinformatioT' on methodology, definitions <strong>of</strong> terms, and a detailed explanation <strong>of</strong> revised, estimated,and noncomporable data, see Appendix 19.AdmissionsParo:e or Return <strong>of</strong>other con- escapees Transfersditional and persons Return fromNumber <strong>of</strong> release absent from other Otherprisoners on New court violators without appeal juris- aanlss-B!::gion aDd iu[i~diction Dec. 31, 1980 Total commitments returned leave or bond dictions IonsReleasesEscapesTransfersUlcondi- and absent Out on to other Number <strong>of</strong>Conditional tiona I without appeal jurls- Other prisoners onTotal releases releases leave or bond dictions Death releases Dec. 31, 1981United States, total 315,974 212,264 160,272 35,674 9,174 910 3,147 3,087 174,955 124,415 27,901 9,462 2,507 2,408 791 7,471 353,167Federal institutions, total 20,611 13,976 11,086 1,709 694 35 452 0 12,418 b,431 3,396 400 89 245 58 1,799 22,169State institutions, total 295,363 198,288 149,186 33,965 8,480 875 2,695 3,087 162,537 117,984 24,505 9,062 2,418 2,163 733 5,672 330,998Northeast 43,165 28,466 20,048 6,537 610 123 732 41620,806 16,315 2,444 609 319 655 103 361 50,8253~0Maine 671 525 404 34 4 6 77 010;! 247 Itl 15 6 2 0 806New Hampshire 326 290 245 26 19 0 0 0 218 167 31 19 0 0 I 0 398Vermont 342 428 283 78 58 0 2 7375 305 24 42 I 0 2 0 395Massachusetts 3,150 2,179 1,496 349 208 0 126 01,538 796 263 229 0 244 6 0 3,791Rhode Island 611 364 260 56 31 7 9 I286 200 34 27 13 10 0 2 689Connecticut 2,750 2,671 1,464 1,052 65 6 74 102,426 1,522 793 57 21 13 20 0 2,995New York 21,639 12,481 9,035 3,058 100 67 221 08,521 7,536 590 75 132 147 39 2 25,599New Jersey 5,564 4,399 3,467 847 69 16 0 03,102 2,819 130 63 83 0 7 0 6,861Pennsylvania 8,112 5,129 3,394 1,037 56 21 223 3983,950 2,868 332 78 511 235 26 357 9,291North Central 64,494 46,265 33, 115 9,418 2,224 48 218 1,242Ohio 13,489 10,567 8,426 2,013 40 0 88 0Indiana 6,281 4,384 4,095 216 73 0 0 0Illinois 10,724 1/ ,987 6,897 4,067 101 4 2 916Michigan 15,124 7,030 4,189 1,152 1,563 0 126 0Wisc:onsin 3,980 2,341 1,884 377 0 0 0 80Minnesota 2,001 1,294 830 435 2~ 0 0 0Iowa 2,479 1,753 1,225 160 186 41 0 141Missouri 5,726 3,473 2,880 411 169 2 2 9North Dakota 185 208 160 27 0 I 0 0South Dakota 609 405 348 47 10 0 0 0Nebraska 1,402 947 766 65 0 0 0 96Kansas 2,494 1,876 1,375 448 53 0 0 039,190 2~, 722 3,841 2,270 70 316 146 2,825 71,4539,088 8,518 53 34 0 169 29 280 14,9683,106 2,789 210 85 0 0 22 0 7,55~9,715 6,199 1,171 6 5 0 7 2,327 12,9966,997 4,754 377 1,66tl 0 147 51 0 15,1571,905 1,741 125 0 0 0 7 32 4,4161,271 I,Otl8 148 34 0 0 I 0 2,024>1,562 835 308 202 52 0 5 160 2,5542,710 1,554 956 160 0 0 16 24 6,489175 . 165 9 0 0 0 I 0 218352 243 91l 9 2 0 0 0 662709 303 386 7 10 0 I 2 1,6401,600 1,533 0 60 I 0 6 0 2,770South 142,650 89,570 71,386 11,081 3,843 671 1,547 1,04276,434 50,174 16,527 4,135 1,984 1,025 353 2,236 155,786Delaware 1,087 735 563 25 49 0 0 98574 367 77 66 0 I I 62 1,248Maryland 7,731 5,963 4,750 423 495 0 279 1611,359 2,8tJU 25 371 724 325 27 7 9,335iDistrict <strong>of</strong> Columbia 2,719 2,421 1,141 2!ltl 217 0 775 0 2,208 797 670 228 0 497 16 0 2,932Virginia 8,581 4,480 3,219 685 135 0 435 6I4,04tl 3,539 275 114 2 63 'IS 10 9,013West Virginia 1,257 827 756 55 12 2 I I519 406 73 4 4 0 4 28 1,565North Carolina 14,456 9,402 7,628 965 725 0 0 849,004 6,890 1,323 669 94 0 28 0 14,854South Carolina 7,427 4,338 3,357 728 233 20 0 03,755 2,752 673 291 20 0 189 0 8,010Georgia 11,922 7,826 6,770 658 377 0 0 217,371 2,601 4,259 363 66 67 15 0 12,377Florida 20,211 13,579 9,877 2,159 698 613 17 215~10,590 5,735 3,019 782 1,015 0 39 0 23,200Kentucky 3,588 3,366 2,453 761 130 22 0 02,787 2,51l6 33 131 29 0 8 0 4,167rTennessee 7,022 4,684 3,814 423 439 5 3 03,809 2,881 413 490 5 0 16 4 7,897iAlabama 6,368 4,025 4,006 2 0 4 0 133,194 1,832 540 24tl 18 38 13 505 7,199Mississippi 3,793 2,880 2,170 385 72 0 4 2492,179 1,707 349 83 0 6 5 29 4,494Arkansas 2,911 2,452 1,746 457 18 0 15 216I,2,066 1,71l0 254 13 0 8 9 2 3,297Louisiana 8,889 2,957 2,732 154 70 0 I 02,431 707 1,683 24 0 3 14 0 9,415\Oklahoma 4,796 2,885 2,546 133 152 5 0 492,400 1,013 1,126 246 7 0 8 0 5,281Texas 29,892 16,750 13,858 2,780 21 0 17 7415,140 1/,701 1,735 12 0 17 86 1,589 31,502West 45,054 33,987 24,637 6,929 1,803 33 198 38726,107 21,773 1,693 2,048 45 167 131 250 52,934Montana 738 550 409 104 32 5 0 046U 361 57 35 2 0 2 3 828Idaho 817 755 596 136 13 2 0 8615 498 87 15 4 0 3 8 957Wyoming 534 326 296 14 15 I 0 0273 189 56 24 I 0 3 0 587Colorado 2,609 1,860 1,458 204 186 6 6 01,699 1,298 227 152 7 5 10 0 2,770New Mexico 1,199 1,255 388 401 28 0 106 332 1,109 705 350 43 0 I 10 0 1,345Arizona 4,360 2,919 2,261 498 141 0 19 02,080 1,832 34 180 2 26 6 0 5,1991Utah 928 792 518 160 108 6 0 0594 433 23 128 5 0 5 0 1,126Nevada 1,839 1,195 956 196 19 0 24 0918 613 239 62 0 0 4 0 2,116Washington 4,399 2,961 1,652 734 546 10 0 192,024 1,400 7 572 17 0 18 10 5,336Oregon 3,172 2,605 1,582 516 492 3 12 02,485 1,722 181 544 7 13 18 0 3,292California 23,264 18,024 13,932 3,885 207 0 0 013,375 12,366 415 279 0 36 51 228 27,913Alaska 571 502 390 43 10 0 31 28365 270 0 8 0 86 I 0 708Hawaii 624 243 199 38 6 0 0 0110 86 17 6 0 Q 0 I 1;;'1Source: U.S. Department <strong>of</strong> <strong>Justice</strong>, <strong>Bureau</strong> <strong>of</strong> JC3tice <strong>Statistics</strong>, Prisoners in State and Federal Institutions on December 3186485 (Washington, D.C.: U.S. Government Printing Office, <strong>1983</strong>), pp. 24, 25. I1981, NCJ-57071
<strong>Sourcebook</strong> <strong>of</strong> <strong>Criminal</strong> <strong>Justice</strong> <strong>Statistics</strong> <strong>1983</strong>r-- \\1Persons Ulder Correctional SupervisionTable 6.23 Prisoners under jurisdiction <strong>of</strong> State and Federal correctional authorities on Dec. 31,. by region and jurisdiction, 1981 and1982Table 6.24 Prisoners under jurisdiction <strong>of</strong> State and Federal correctional authorities,by race, region, and jurisdiction, on Dec. 31, 1981!'OTE: See !'OTE, Figure 6.5. Yearend prisoner counts may differ fromthose in U.S. Department oi <strong>Justice</strong>, <strong>Bureau</strong> <strong>of</strong> <strong>Justice</strong> <strong>Statistics</strong>,Prisoners in State and Federal Institutions on December 31, 1981, NCJ-86485 (Washington, D.C.: U.S. Government Printing Office, <strong>1983</strong>),because reporting <strong>of</strong>ficials are given the opportunity to update NationalRegion and jurisdictionUnited StatesFederal institutions aState institutionsN:>rtheastMaineNew H:!;HpshireVermantMassachusett~Rhode Islan%Connecticut~: :;~;!rth CentralOhioIndianaIIlinois eMichig
--~- ~--,,------~--~_ ...... oc=-=- "-,.~=.Persons Under Correctional Supervision<strong>Sourcebook</strong> <strong>of</strong> <strong>Criminal</strong> <strong>Justice</strong> <strong>Statistics</strong> 19!13Tabll! .6.7.6 Rate (pe~ 100,000 resident population) <strong>of</strong>prrsoners under Jurisdiction <strong>of</strong> State and Federal.1Table 6.25 Rate (per 100,000 resident population) <strong>of</strong> prisoners under the jurisdiction <strong>of</strong> State and Federalcorrectional authorities, by maximum sentencecorrectional authorities, by race, sex, region, and jurisdiction, on Dec. 31, 1981 length, region, and jurisdiction, on Dec. 31, 19111!\oTE: See !\oTE, Figure 6.5. For information on methodology, definitions <strong>of</strong> terms, and a detailed !\oTE: See NOTE, Figure 6.5. For information onexplanation <strong>of</strong> revised, estimated, and noncomparable data, see Appendix 19.methodology, definitions <strong>of</strong> terms, and a detailedexplanation <strong>of</strong> revised, estimated, and noncomparable data(Rate per 100,000 resident population) see Appendix 19. 'American Indian(Rate per 100,000 resident popUlation)All races White Black or Alaskan NotiveRegio:1 !Jnd jurisdiction Total Male Female Total Male Female Total Male Female Total Male Female Maximum sentence lengthI year orlklited States, total 163 321 13 101 200 8 635 1,282 55 233 445 27 More than less andRegion and jurisdiction Total I year unsentencedFederal institutions, total 12 24 8 16 33 65 5 31 60 2lklited States, total 160 153 7State institutions, total 150 297 12 93 184 7 602 1,217 50 202 384 24Federal institutions, total 12 IU 3Northeast 109 219 7 62 126 4 550 1,149 38 37 71 (a)Maine 88 177 4 87 57 4 (a) (a) (a) (a) (a) (a) State institutions, total 148 144 4New Hompshite 43 87 (a) 43 86 (a) (a) (a) (a) (a) (a) (a)Vermant 104 208 6 103 204 6 (a) (a) (a) (a) (a) (a) Northeast 108 103 5Massachusetts 68 135 6 48 95 4 601 1,204 56 (a) (a) (e) Maine 87 71 16Rhode Island 101 208 5 80 163 4 879 (a) (a) (a) (a) (a) New Hompshire 42 42 0Connecticut 150 295 14 91 180 7 970 1,934 115 (a) (a) (a) Vermant 103 76 27New York 146 298 8 86 174 4 558 1,185 34 (a) (a) (a) Massachusetts 67 65 2New Jersey 95 190 7 42 83 3 482 990 38 (a) (a) (a) Rhode Island 101 72 29Pennsylvania 79 159 5 40 80 3 485 1,018 29 (a) (a) (a) Connecticut 148 95 53New York 145 145 0North Central 123 243 10 71 140 5 634 1,278 57 322 611 37 New Jersey 94 92 2Ohio 139 272 14 81 160 6 671 1,341 78 (a) (a) (a) Pennsylvania 79 78 IIndiana 146 290 10 104 208 6 673 1,350 62 (a) (a) (a)illinois 116 231 7 54 107 3 491 1,018 29 (a) (a) (a) North Central 123 121 2Michigan 164 322 13 74 146 4 710 1,418 71 188 (a) (a) Ohio 139 139 0Wisconsin 94 184 7 58 114 4 923 1,852 82 458 (a) (a) Indiana 147 138 8Minnesota 50 98 3 36 71 2 794 1,507 54 471 (a) (a) Illinois 115 113 2Iowa 92 181 8 75 150 5 1,167 (a) (a) (a) (a) (a) Michigan 165 165 0Missouri 132 263 10 81 160 7 579 1,189 40 (a) (a) (a) Wisconsin 93 93 0North Dakota 43 84 (a) 37 72 (a) (a) (a) (a) (a) (a) (a) Minnesota 49 49 0South Dakota 100 195 8 80 157 5 (a) 1,400 (a) 371 (a) (a) Iowa 92 88 4Nebraska 105 208 8 69 137 5 I, I 10 2,213 96 (a) (01 (a) Missouri 131 131 0Kansas 117 227 12 82 160 8 741 1,400 83 (a) (a) (a) North Dakota 42 33 9South Dakota 101 97 5South 212 418 17 125 247 10 601 1,217 50 184 346 23 Nebraska 105 104 IDelaware 287 572 24 141 281 10 1,064 2,160 96 (a) (a) (a) Kansas 116 116 0Maryland 221 442 14 81 162 4 706 1,438 406 (a) (a) (a)District <strong>of</strong> Columbia 545 1,140 34 60 124 (a) 754 1,584 46 (a) (a) (a) South 206 201 5Virginia 176 345 13 93 181 7 533 1,069 39 (a) (a) (a) Delaware 285 208 77West Virginia 80 162 4 72 145 3 335 690 31 (a) (a) (a) Maryland 218 2 II:! 0North Carolina 269 531 21 158 310 13 637 1,288 47 539 1,006 58 District <strong>of</strong> Columbia 554 467 87South Carolina 274 539 23 166 322 15 524 1,065 40 (a) (a) (a) Virginia 172 165 7Georgia 228 1148 21 130 253 12 499 1,015 45 (a) (a) (a) West Virginia 80 80 0Florida 242 484 20 149 299 10 846 1,692 81 (a) (a) (a) North Carolina 264 248 16Kentucky 114 227 5 89 177 4 402 904 24 (a) (a) (a) South Carolina 268 251 17Tennessee In 339 17 119 231 13 461 947 35 (a) (a) (a) Georgia W 220 IAlabama 197 393 16 102 202: 8 474 977 38 (a) (a) (a) Florida 228 224 4Mississippi 183 369 II 7H 154 5 319 658 20 (a) (a) (a) Kentucky 114 114 0Arkansas 146 290 II 90 177 7 438 901 33 (a) (a) (a) TennEssee 171 171 0Louisiana 224 445 16 91 178 7 547 1,126 36 (a) (a) (a) Alabama 195 183 12Oklahoma 175 339 18 131 257 12 723 1,394 97 180 349 18 Mississippi 182 177 5Texas 221 429 20 159 310 12 803 1,574 87 (a) (a) (a) Arkansas 145 143 ILouisiana 216 216 0West I 2 I:! 247 II 108 211 9 637 1,211:l 63 188 359 23 Oklahoma 169 169 0Montana 106 206 6 87 168 6 (a) (a) (a) 450 (a) (0) Texas 210 210 0Idaho 101 198 5 99 196 4 (a) (a) (a) (a) (a) (a)Wyoming 125 234 10 120 224 II (a) (a) (a) (a) (a) (a) West 124 119 5Colorado 96 188 6 84 165 5 568 1,077 38 (a) (0) (0) Montano 105 104 0New MeXico 115 220 14 78 249 II (a) (a) (a) 52 106 (a) Idaho 99 99 0Arizona 192 373 17 178 347 6 1,345 2,487 108 110 215 (a) Wyoming 117 117 0Utah 78 152 6 73 143 4 (a) (a) (a) (a) (a) (a) Colorado 92 92 0Nevada 265 502 22 212 408 10 1,159 2,189 176 (a) (a) (a) New Mexico 112 100 IIWashington 129 250 10 99 193 6 1,043 1,828 133 347 657 46 Arizona 185 184 IOregon 125 246 8 114 226 6 919 (a) (a) 344 (0) (0) Utah 74 73 ICalifornia 123 238 12 102 199 10 565 1,097 54 109 188 32 Nevada 245 245 0Alaska 255 458 25 17,1 306 19 (a) (a) (c) 489 945 (a) Washington 125 125 0Hawaii 125 234 10 88 154 II (a) (a) (a) (a) (0) (a) Oregon 124 124 0California 120 114 5ORates are not computed because <strong>of</strong> a residentAlaska 245 170 75popUlation base <strong>of</strong> less than 25,000 or fewer than 10 Hawaii 122 77 46inmates.Source: U.S. Deportment <strong>of</strong> <strong>Justice</strong>, <strong>Bureau</strong> <strong>of</strong>Source: U.S. Department <strong>of</strong> <strong>Justice</strong>, <strong>Bureau</strong> <strong>of</strong> <strong>Justice</strong> <strong>Statistics</strong>, Prisoners In State and Feder::! Institutions on<strong>Justice</strong> <strong>Statistics</strong>, Prisoners In State and FederalDecember 31, 1981, NCJ-H6485 (Washington, D.C.: U.S. Government Printing Office, (983), p. 21. Insti~utlons an December 31, 1981, NCJ-86485(Washington, D.C.: U.S. Government Printing Office <strong>1983</strong>)~ 1& ' ,574575
---~~--- --- - --<strong>Sourcebook</strong> <strong>of</strong> Crimi no I <strong>Justice</strong> <strong>Statistics</strong> <strong>1983</strong>Table and 6.27 jurisdiction, Prisoners 1980 in custody and 1981 <strong>of</strong> State and Federal correctional authorities on Dec. 31 " by maximum sentence length region ,/\oTE: See !'OTE, Figure 6.5. For information on methodology, definitions <strong>of</strong> terms, and adetailed explanotion <strong>of</strong> revised, estimated, and noncomparable data, see Appendix 19.Maximum sentence len thI >::ear or less and unsentenceTotal More than I :!ear I yearPercentTotal or less19BO PercentUnsentenced19BI chon e 1980 19BI Percentchon e 1980 1981 chon e 198U 1981 1980 1981United States, total 319,598 359,781 12.6 304,692 344,456 13.1 14,906 15,325 2.8 7,991 7,280 6,915 8,Of~5Federal institutions, total 23,779 26,778 12.6 19,025 21,311 12.0 4,754 5,467 15.0 2,019 2,258 2,735 3,209State institutions, total 295,819 333,003 12.6 285,667 323,145 13.1 10,152 9,358 -2.9 5,972 5,022 4,18U 4,836Northeast 45,642 53,523 17.3 42,598 50,365 18.2 3,044 3,158 3.7 1,251 1,161 1,793 1,997Moine 653 802 22.8 541 667 23.3 112 135 20.5 112 135 0 0New J-k:unpshire 313 364 16.3 299 351 17.4 14 13 -7.1 I 0 13 13Vermant 468 503 7.5 326 361 10.7 142 142 0.0 78 52 64 90Massachusetts 3,080 3,91 I 27.0 3,032 3,791 25.0 48 120 150.0 35 98 13 22Rhode Island 803 969 20.7 601 688 14.5 202 281 39.1 74 93 128 188Connecticut 4,259 4,531 6.4 2,469 2,770 12.2 1,790 1,761 -1.6 572 559 1,218 1,202New York 21,942 26,021 18.6 21,639 25,599 18.3 303 422 39.3 0 0 303 422New Jersey 5,881 6,996 19.0 5,561 6,846 23. I 320 150 -53.1 320 150 0 0PennsylVania 8,243 9,426 14.4 8,13U 9,292 14.3 113 134 18.6 59 74 54 60North Central 65,212Ohio72,147 10.6 63,53613,138 71,152 12.0 1,676 995Indiana14,796 12.6 13,138 -40.6 1,576 8646,709 14,796 12.6 0 1000131Illinois8,054 20.0 6,281 X 0 011,497 7,559 20.3 428 495015.70Michigan13,304 15.7 10,451 402 46315,124 13,094 25.3 1,046 26210 -79.932Wisconsin15,157 0.2 15,124 1,046 2103,788 15,157 0.2 0 000Minnesota4,249 12.2 3,788 X 0 01,8114 4,249 12.2 0 00 0Iowa1,909 1.3 1,884 X 0 02,419 1,909 1.3 0 00 0Missouri2,670 7.7 2,435 X 0 05,726 2,554 4.9 44 1160163.60North Dakota6,489 13.3 5,726 6,489 13.3 2 77332 0 420 39South Dakota30G -9.6 264 238 X-9.80680651 620-8.80Nebraska696 6.9 625 68 621,430 665 6.4 26 031 19.20Kansas 1,708 19.4 1,389 26 312,454 1,642 18.2 41 6602,1115 61.0014.7 2,431 2,800 15.2322321(S 9-34.845South0 0139,48923153,17315Delaware 9.8 136,1081,339 149,746 10.0 3,381 3,427Maryland 1,388 3.7 967 1.4 2,917 2,6867,454 984 1.8 372 4649,264 404 741District <strong>of</strong> Columbia 24.3 7,454 9,2648.624.3162 1253,145 0 2100 2793,f~79Virginia 10.6 2,719 X 0 08,357 2,932 7.8 426 5470West Virginia8,514 1.9 8,231 28.4 325 4431,257 8,460 2.8 126 10154 -57.1104126 54°North Carolina1,565 24.5 1,25715,615 1,565 24.5 0 00 0South Carolina15,786 1.1 14,456 14,754 X2.101,15907,089 1,0320-I 1.00Georgia7,672 8.2 6,683 1,057 93712,178 7,185 7.5 406 48710220.095Florida 12,444 2.2 I 1,922 362 45920,457 12,377 3.8 256 674473.828I
--_._------~-----~------~------------<strong>Sourcebook</strong> <strong>of</strong> <strong>Criminal</strong> <strong>Justice</strong> <strong>Statistics</strong> j 983Persons Under Correctional SupervisionTable 6.31 Drug use habits <strong>of</strong> State prison inmates for selected drugs, by selectedcharacteristics, United States, 1979Table 6.32 Use <strong>of</strong> drugs by State prison inmates at the time <strong>of</strong>c:urrent <strong>of</strong>fense, by type <strong>of</strong> <strong>of</strong>fense and drug, United States,1979/'OTE: See /'OTE, Table 6.30. Numerical detail for a particular characteristicmay not add to the total due to non-responses, which in no case exceeds0.4 percent. "Recent use" refers to the month prior to the crimecommitted.percentAny drug Heroin Cocaine MarihuanaEver Recent Ever Recent Ever Recent Ever RecentCharacteristic Number used use used use used use used useTotalSeX:MaleFemaleAge at admission:Under 18 years18 to 25 years26 to 34 years35 and olderRace:WhiteBlack.Amerigan IndianaOther274,564263,48411,0806,412139,25181,53346,501136,296131,3295,4401,499787867828779467877797556564766675325575449SO303038IS28402130302137121218712IS9II13517373736284142204035353812131212IS13513128107576628186764176747771484832626043164!J464438/'OTE: See NOTE, Tobie 6.J(). t~erlcal detail moy not add to totaldue to non-responses (less than 0.5 percent).OffenseTotalViolentHlmlcldeAssaultRapeRobberyOther violentPropertyBurglaryForgery or fraudLarcenyOther propertyDrugsPublic orderAllinmates274,564157,74248/J4117,21616,46068,3247,7UI85,56249,22311,50513,018II ,81519,42010,982Percent usingAnyMarldrugHeroin Cacoine huanaSource: U.S. Department <strong>of</strong> <strong>Justice</strong>, <strong>Bureau</strong> <strong>of</strong> <strong>Justice</strong><strong>Statistics</strong>, Prlsaners and Drugs, Bulletin NCJ-87575 (Washington, D.C.:U.S. Department <strong>of</strong> <strong>Justice</strong>, March <strong>1983</strong>), p. 4, Table 4.323021272238343540253030471998452126888105224542226655463941716/I13IS20192024IIIS181814Ethnicity:HispanicNon-Hisponic25,816248,74883775955482827/I3638/I1378754448Table 6.33 Drug use habits <strong>of</strong> State prison Inmates, by participation In drugtreatment program and type <strong>of</strong> drug, United States, 1979Marital status:MarriedWidowedDivorcedSeparatedNever marriedEducation at admission:Not high school graduateHigh school graduateAny collegeEmployment in month priorto current <strong>of</strong>fense:Employed full-timeEmployed part-tilTh!Not employed, seeking jobNot employed, not seekingjob1~~~;:/noJ:~;e;criortoTotalNoneLess than $3,000$3,000 to $9,999$10,000 and overCurrent <strong>of</strong>fense: dViolentI-bmicideAssaUltRapeRobberyOther violentPropertyBurglaryForgery or fraudLarcenyOther prapertyDrugsPublic order61,4206,.~41l46,.iI418,ll19142,4.14I 96,04j·50,35928,158165,57727,22338,23U42,433128,0112,21835,50348,51141,779157,74248,04117,~1616,46068,3247,70185,56249,22311,50513,01811,1l1519,42010,9tl27347707384778078748086~Includes EsklmLj and Aleuts.Asians and Pacific Islanders.c To reduce thll effect <strong>of</strong> Inflation uponincome figures, only Inmates admitted to prison837875797878,15f','fn6,'.8t:79808569787592694926475263555556515865665554555258534r4739665958644553517442322029.392928343426263544272420263427192214382630312933235422137IIIS121213139/I16229137912/I684189/I12/I136315352135393934434834354248372830354734242821454039423539336328/I8101214121318/I13141813910/I181/77616171314121292496945686982747876727783807674767675736270628477788364757387674119384056474847445056534748494549453541365651SO573444475739after ~vember 1977 are included.Offense for which an Inmate wasIncarcerated.Source: U.S. Department <strong>of</strong> <strong>Justice</strong>, Bureou <strong>of</strong> <strong>Justice</strong> <strong>Statistics</strong>, Prisoners and Drugs, BulletinNCJ-87575 (Washington, D.C.: U.S. Deportment (rf <strong>Justice</strong>, March <strong>1983</strong>), p. 3. ,li78iiIII:'I!jIIIi,I1\I'Un ,II'~I i\l!t,j daR/'OTE: See /'OTE, Table 6.30. "Any drug" Includes heroin, cocaine, marihuana, and anyother drug used. The sum <strong>of</strong> all drugs used exceeds the total ("any drug II) becausemony persons t,;~ed more than one drug. Percent detail may not add to totals due tarounding.CharacteristicEver usedlAny drugDallyWeeklyLess than weeklyHeralnDallyWeeklyLess than weeklyCocaineDailYWeeklYLess than weeklyMarihuanaDallyWeeklyLess than weeklyRecently used: bAny drugDailyLess than dailyHeroinDallyLess than dallyCacalneDailyLess than dallyMarihuanaDailyLess than dallyUnder Influence <strong>of</strong> tugsat time <strong>of</strong> <strong>of</strong>fense:NoYesNumber <strong>of</strong>drug users213,131142,47330,22840,43U81,79251,8657,26522,662102,42726,95814,98660,483205,941116,54036,17653,225152,391108,4~843,89333,42524,0829,34334,21313,54620,667130,37485,86144,513119,20888,580Percent ever In programsPercent InThree pragrams atOne Two or more time <strong>of</strong>Total program programs programs <strong>of</strong>fense263610551633927404639382632201731361959624940483629322418391723943135302125282325172113II212413343532253022202215132558II1216749II10756546741416II91086664835o(a)B122267663422aLess than 0.5 percent.b"Recentlyll refers to the month prior to the crime committed.cApproxlmately 3 percent <strong>of</strong> the drug users did not provide this Information.Source: U.S. Department <strong>of</strong> <strong>Justice</strong>, <strong>Bureau</strong> <strong>of</strong> <strong>Justice</strong> <strong>Statistics</strong>, Prisoners andWaTt' Bulletin NCJ-87575 (Washington, D.C.: U.S. Deportment <strong>of</strong> <strong>Justice</strong>, March, p. 5.452101267764432679221418106IIIIIIII78558105181914II12107864II
<strong>Sourcebook</strong> <strong>of</strong> <strong>Criminal</strong> <strong>Justice</strong> <strong>Statistics</strong> <strong>1983</strong>rlFc.:!rsons Linder Correctional Supervision----~ .. ,'"Table 6.34 Drinking habits <strong>of</strong> State prison inmates and <strong>of</strong> persons 18 years <strong>of</strong> ageand older in the general population, by age and sex, United States, 1979 0I\OTE: See I\OTE, Table 6.30. "Three measures were used to assess inmates' drinkinghabits: (I) How <strong>of</strong>ten they drank during the year preceding their Incarceration. (2)How much they usually drank. (3) Their own assessment <strong>of</strong> their degree <strong>of</strong> Intoxicationwhen they finished drinking ("relatively sober," "feeling good," "pretty loaded," or"very drunk,")" (Source, p. I).To measure the amount <strong>of</strong> alcohol consumed, all alcoholic beverages wereconverted to their equivalent in pure alcohol (ethanol). One ounce <strong>of</strong> ethanol is equalto 2 cans <strong>of</strong> beer, I 1/2 glasses <strong>of</strong> wine, or 2 ounces <strong>of</strong> 80-pro<strong>of</strong> liquor (Source, p. I).Percents may not add to totals due to rounding.(Percent)Average ouncesMaleFemale<strong>of</strong> ethanol All ages Ages 18 to 34 All aaes Ages 18 to 34consumed eer da~ Inmates General Inmates General Inmates General I nmates General0.0 oz.b 17 250.0 I to 0.99 oz. 36 601.0 or more oz. 47 14aAges for the general populationare shown far 1979 (U.S. Department <strong>of</strong>Health and Human Services, NationalInstitute on Alcohol Abuse andAlcoholism, Alcohol and Health, 1981(Washington, D.C.: U.S. GovernmentPrinting Office, 1981». Ages for18354714 34 40 35 2569 44 56 42 7017 22 4 23 5inmates are shown for the time <strong>of</strong>admission to prison; 83 percent <strong>of</strong> theInmatts were admitted in 1976 or later.Did not drink during the yearprior to the current <strong>of</strong>fense or, in thecase <strong>of</strong> the general population, the yearprior to interview.Source: U.S. Department <strong>of</strong> <strong>Justice</strong>, <strong>Bureau</strong> <strong>of</strong> <strong>Justice</strong> <strong>Statistics</strong>, Prisoners andN83~01, Bulletin NCJ-86223 (Washington, D.C.: U.S. Deportment <strong>of</strong> <strong>Justice</strong>, January, p. I.IrI,I'I'Table 6.35 Drinking habits <strong>of</strong> State pljsoncharacteristics, United States, 1')7')inmates, by selected Table 6.35 Drinking habits <strong>of</strong> State prJson Inmates, by selectedcharacteristics, United States, I ')79 --ContinuedN)TE: See NOTE, Table 6.34. Detail may not add to totals due torounding. Numerical totals for a variable may not odd to the grandPercenttotal (274,564) due to non-response or to omission <strong>of</strong> one or more Light Very bcategories. Characteristic t-Mnber Abstalned b to heavyb heavyPercentCurrent <strong>of</strong>fense;gblight Very b Violent 157,742 18 47 35CharacteristicNumber Abstained to heav~b heav~ Homicide 48,041 16 51 33Assault 17,216 14 41 45Total 274,564 18 45 36 Rope 16,460 10 48 41Robbery 68,324 22 44 34Degree <strong>of</strong> drunkenness:Other violent 7,701 15 49 36Very drunk 43,986 X 16 8A Property 85,562 18 43 40Pretty loaded 41,135 X 32 68 Burglary 49,223 16 41 43Feeling good 87,886 X 65 35 Forgery or fraud 11,505 22 46 32Relatively sober 50,708 X 92 8 Larceny 13,01!J 22 47 31Other property j I ,815 16 39 44Frequency <strong>of</strong> drinking:Drugs 19,420 24 41l 28Every day 89,801 X 35 65 Public order 10,982 17 46 37Nearly every day 14,357 X 50 503 or 4 days a week 26,886 X 60 40 bDrlnklng experience Is for the year prior to current <strong>of</strong>fense.I or 2 days a week 59,884 X 70 30 Abstainers did not drink during the year prior to current3 or 4 days a month 12,234 X 77 24 <strong>of</strong>fense. Light to heavy drinkers typically consumed less than 4About once a month 8,560 X 84 16 ounces <strong>of</strong> ethanol and very heavy drinkers consumed 4 or more ouncesLess than once a month 12,186 X 88 12 <strong>of</strong> ethanol at a typical drinking session during the year prior tocurrent <strong>of</strong>fense.~ Includes Eskimos and Aleuts.Age at admission:Under 18 years 6,412 29 45 26 Asians and Pacific Islanders.18 to 25 )'ears 139,251 18 43 39 eTo minimize the effect <strong>of</strong> inflation upan income figures, only26 to 34 years 81,533 19 47 34 inmatTs admitted to prison after November 1977 are included.35 years and older 46,501 15 50 34 To minimize the effect <strong>of</strong> age upon comparisons <strong>of</strong> number <strong>of</strong>prior convictions, only Inmates age 26 to 34 at time <strong>of</strong> admission areSex:included.Mole 263,484 17 45 37 gOffense for which an Inmate was Incarcerated.Female 1/ ,080 34 47 18Source: U.S. Deportment <strong>of</strong> <strong>Justice</strong>, <strong>Bureau</strong> <strong>of</strong> <strong>Justice</strong>Race:<strong>Statistics</strong>, Prisoners and Alcohol, Bulletin NCJ-86223 (WashingtonWhite 136,296 13 37 SO D.C.: U.S. Deportment <strong>of</strong> <strong>Justice</strong>, January <strong>1983</strong>), pp. 2, 3. 'Block 131,329 24 55 21Amerigan Indian c 5,440 II 25 64Other 1,49') 40 37 23Marital status:Married 61,420 20 47 33Widowed 6,248 18 52 30Divorced 46,314 14 43 43Separated 18,168 18 47 35Never married 142,414 19 45 36Ethnicity:HispanicNon-Hispanic25,816248,748181838464336Education at admission:Not high school graduate 196,047 18 44 38High school graduate 50,359 19 46 35Some college 28,158 19 56 25Income In year p.rlor tocurrent <strong>of</strong>fense: eNone 2,211l 30 45 25~I to $9,999 84,014 16 45 4010,000 and over 41,779 17 47 36Employment in year priorto current <strong>of</strong>fense:EmployedNot employed192,80081,005162347433734i!jr IIIItI ,Number <strong>of</strong> prior convictlons/None 13,925 III 56 25I 13,069 21 47 322 to 4 29,046 21 47 325 or more 25,493 18 40 42...580581
--~ ~-....---r<strong>Sourcebook</strong> <strong>of</strong> <strong>Criminal</strong> <strong>Justice</strong> <strong>Statistics</strong> <strong>1983</strong>Table 6.36 Drinking habits <strong>of</strong> State prison inmatesjust prior to current <strong>of</strong>fense, by selectedcharacteristics, United States, 1979N::>TE: See N::>TE, Table 6.34. The totals for alcoholicbeverage and drinking setting exceed the number <strong>of</strong>inmates drinking just prior to the <strong>of</strong>fense because onindividual could have drunk more than one type <strong>of</strong>beverage and been in more than one setting; rate <strong>of</strong>non-response for the variables shown did not exceed0.3 percent.CharacteristicTotal!-burs spent drinkins:• Less than II to 23 to 45 to 89 or moreNot availableAlcoholic beverage:BeerWineLiquorOther alcoholDrinking setting:I-bmeFriend's homeBarCarRestaurantStreetWorkplaceElsewhereCurrent <strong>of</strong>fensel aViolent!-bmlcldeAssaultRopeRobberyOther violentPropertyBurglaryForgery or fraudLarcenyOther pr~partyDrugsPublic orderNumber129,44412,15032,19225,54729,55027,3302,67585,73526,18173,6791,41537,31035,87551,20736,8892,56621,113o2978,90524,39910,0999,41930,8174,17139,77424,8593,6785,1236,1145,2445, ISOParcen}light Veryto heavy ~3892623419II5236352318313132283230o\040443835403732294139325445628386681894864657782696968726870o10060566265606368715961684655aOffense for which an Inmate was Incarcerated.Source: U.S. Department <strong>of</strong> <strong>Justice</strong>, <strong>Bureau</strong> <strong>of</strong><strong>Justice</strong> <strong>Statistics</strong>, Prisoners and Alcohol, BulletinNCJ-!!6223 (Washington, D.C.: U.S. Deportment <strong>of</strong><strong>Justice</strong>, January <strong>1983</strong>), p. 3, Table 4.\!Persons U,der Correctional SupervisionTable 6.37 State prison inmates who drank during the year prior to I!'Jrrent <strong>of</strong>fense,by participation In alcohol treatment program and drinking habits, U,lted States,1979N::>TE: See N::>TE, Table 6.34. N.Jmerlcal totals include an Insignificant proportion (not morethan I percent) for which data were not available. Percents moy not add to totals due torounding.CharacteristicTotal drinkersFrequency <strong>of</strong> drinking:TotalEvery dayNearly every day3 or 4 days a weekI or 2 days a week3 or 4 days a monthAbout once a monthLess than once a monthTypical amount <strong>of</strong> alcoholconsumed year priorto current <strong>of</strong>fense:TotalVery heavy (4 or moreoz. <strong>of</strong> ethanol)Light to heavy (lessthan 4 oz. <strong>of</strong> ethanol)Amount <strong>of</strong> alcohol consumedjust prior to <strong>of</strong>fense:TotalVery heavy (4 or moreoz. <strong>of</strong> ethano/)Light to heavy (lessthan 4 oz. <strong>of</strong> ethanol)Not drinking thenTypical degree <strong>of</strong>drunkenness year priorto current <strong>of</strong>fense:TotalVery drunkPretty loadedFeeling goodRelatively soberDegree <strong>of</strong> drunkennessjust prio' to <strong>of</strong>fense:TotalVery drunkPretty loadedFeeling goodRelativeiy soberNot drinking thenTotal224,789224,71l989,80114,35726,88659,88412,2348,56012,186224,7!!999,570124,404224,78979,80449,63994,314224,78943,98641,13587,88650,708224,78945,51831,23531,70220,43394,314(Percent)In program attime <strong>of</strong> <strong>of</strong>fenseYes6,1181006388162I210075251006417191004125278100441413919216,910iOO3961227646100445610035224310019184023100201414943Programs everenrolled InTwo orOne moreNone program programs180,690100366122964610039611003023471001617412510016131494733,OGI100567II193221006733100572122100322532II1003520159229,983Source: U.S. Deportment <strong>of</strong> Just/ce, BUl'eau <strong>of</strong> <strong>Justice</strong> <strong>Statistics</strong>, Prisoners andtlS31ol, Bulletin NCJ-86223 (Washington, D.C.: U.S. Deportment <strong>of</strong> <strong>Justice</strong>, January9 ,p. 4.100688810223100802010068181410040252881004316161014582~:IiItrlI'~11~1\\,IIIIIIdr!II111111Ii r583
-------- ---~-<strong>Sourcebook</strong> <strong>of</strong> <strong>Criminal</strong> <strong>Justice</strong> <strong>Statistics</strong> <strong>1983</strong>Persons Under Correctional SupervisionTable 6.39 Population and movement <strong>of</strong> prisoners in Federal Institutions, fiscal years 1946_82 0Table 6.38 Inmates participating in education programs b) type <strong>of</strong> program N:)TE: The Federal Prison System is responsible for two distinct Federal total Federal prison population was housed in contract facilities at the<strong>of</strong>fered and jurisdiction, 1981 , '<strong>of</strong>fender populations: (I) Individuals who are housed in, have escaped end <strong>of</strong> fiscal year 191:l2. Data in this report are <strong>of</strong>ten broken down inf<strong>of</strong>rom, or are in transit between Federal Institutions and comnunity two sets <strong>of</strong> mutually exdusive categories: (I) court commitments andN:)TE: Thi~ info~mation was collected thr~ug~ a survey moiled to the departments <strong>of</strong>treatment cer ,arSj and (2) individuals who are housed In, awaiting trial other-than-court comnitmentsj and (2) prisoners under sentence andcorrectIons In the 50 States, the Dlstnct <strong>of</strong> C .. Il.mbia, Guam Puerto Rico and the in, or enroute to contract facilities, I.e., State, local, or private prisoners not ur,der sentence. For on explanation "f the sentencing~e~er?1 ~urea~ <strong>of</strong> Prisons. The survey was conducted in ~arly 1982. ' Twelve Ifacilities that are under contract with the Federal Prison System for procedures within these categories, see Appendix 20. For a definition <strong>of</strong>JUrJsdlctlons dId not respond to the survey: Connecticut, Indiana, Iowa, Louisiana,the housing <strong>of</strong> Federal <strong>of</strong>fenders. Approximately 7.1 percent <strong>of</strong> the "mandatory release," see N:)TE, Table 6.6.Montano, Nebraska, Tennessee, Texas, Utah, Virginia, West Virginia, and Puerto Rico.All figu\es are approximations received from the responding agencies. Received (transfers excluded) Trans-. "LIteracy programs" teach basic reading and writing skills to the illiterate andViolators returned Study Escaped ferred Discharged (transfers excluded)!unctionally illiterate. "Adult Basic Education (ABE)" provides basic educational skills IPopulation and prison- from Study Trans-I~ ,the, areas 0; read,ing, writing, and arithmetic, as well as coping ski lis needed forbegin- Mando- obser- ers other Manda- and ferred to Popula-IJvJn9 In today s socIety. "General Educational Development (GED)" allows students to Fisc
----------------.----------------------------~----<strong>Sourcebook</strong> <strong>of</strong> <strong>Criminal</strong> <strong>Justice</strong> <strong>Statistics</strong> <strong>1983</strong>Persons Under Correctional SupervisionTable 6.40 Number <strong>of</strong> and overage sentence for Federal prisoners received from court into Federal institutions, by Toole 6.41 Number <strong>of</strong> and overage sentence for Federal risoners .<strong>of</strong>fense, race, and sex, fiscal year 1982 <strong>of</strong>fense, sex, and sentencing procedure, fisl"al year 19C2 received from court into Federal institutions, byf\OTE: See f\()TE, Table 6.39. These data are 81.8 percent complete. "Completeness" refers to the f\()TE: See f\()TE, Table 6.39. These data are 81 4 t Ipercentage <strong>of</strong> the known prisoner population on which demographic data are available. For an percent?ge <strong>of</strong> the known prisoner population ~n ~e~~hn d comp et~: ':fompletenes~" refers to theexplanation <strong>of</strong> sentencing procedures, see Appendix 20. explanation <strong>of</strong> sentencing procedures, see Appendix 20. emograp IC ata are available. For on, ISentenced prjsoners All court coomitmentsAll prisoners White All otherSentencing procedureAverageFederalAverage Youth Average NarcoticsentenceJuvenile Youthsentence Corrections IsentenceAddict(in (in Act Delin- Correc- Title 18, U.S.! (inSplit Rehabili-Offense Total Male Female Nunber months) Male Female Number months} Male Female Male FemaleOFfense Totalquency tions Code 4205 (B)Mole Female months)sen-Regulartot ionAct Act (b I) (b2) tence ActTotal 14,087 12,901 1,lll6 10,552 38.8 9,843 709 3,535 65.8 3,058 477 507 66 Total 14,030 12,844 1,186 45.7 10,042Total excluding573 75I1,590 1,739 10lomigration and ~ Assault 60 56 4 55.9 40violent crimes a 9,659 8,674 985 6,976 43.2 6,422 554 2,683 41.7 2,252 431 322 55 Bankruptcy 07462I6 a 0iBurglary 42.4 5370 0 0 I I 0I; 29 8 59.8 25 0Assault 61 57 4 28 47.9 25 3 33 61.0 32 I74 0Counterfeiting 286 263023I40.54 0IllS 0Bankruptcy137 6 I 6 39.5 6 0 I 60.0 0 I 0 0 Drug lows, total 3,410 3,13932712853.857 0Burglary 43 35 8 18 51.2 16 2 25 51.7 19 6 7 0 Non-narcotics 2,3978900 1198551635517 36046.7 622ICounterfeiting 286 263 23 236 41.8 215 21 50 34.6 48 2 II 2 INarcotics 1,6640 201,518314614360.4102 0II1,184 0 87Drug lows, total 3,412 3,141 271 2,761 53.4 2,570 191 651 55.6 571 80 108 " IIControlled substances 856 7669 252 132I90 48.40591 0 12Non-narcotics 890 855 35 768 47.0 741 27 122 45.3 114 8 18 2 Embezzlement 378 262411612229.2126 I189Narcotics 1,666 1,520 146 1,311 59.2 1,209 102 355 64.4 311 44 79 8 Escape, fIi ght or 0 21 3 42 123 0Controlled substances 856 766 90 682 49.3 620 62 174 44.9 146 28 II I harboring a fugitiVe 115 103 12 31.5 81 0Embezzlement 379 263 116 277 30.0 1% 81 102 26.8 67 35 10 II Extortion 664650 14 16 0~IFirearms79.2 42 0Escape, flight, orI66436535II933.37 0harboring a fugitive 115 103 12 94 27.1 83 II 21 51.5 20 I 4 0 Forgery 4253910 202%395III 10536.80266Extortion 67 66 I 62 72.8 61 I 5 141.6 5 0 2 I Froud 1,0540 2293931153129.269 0660 0Firearms 666 655 II 485 34.2 479 6 181 30.3 176 5 20 0 Irrmigration 3,016172,90tl61081307.4241 02,710Forgery 392 297 95 166 42.1 132 34 226 32.7 165 61 16 6 Income tax I2991828201788 199 0Froud 1,057 942 115 813 31.4 743 70 244 21.6 45IKidnaping 19.5 174 0 0199 13 4 39 36I322253.6102 024Immigration 3,015 2,907 108 2,%0 7.4 2,853 107 55 9.4 54 I 17 I Larceny/theft, total 1,59401,3937 I201638.8I 0Income tax 299 282 17 271 18.5 256 15 28 29.0 26 2 0 0 Motor vehicle, interstate1,122 0'25781254103176 204 IPostal44.9 188 0Juvenile delinquency10I I 0 I 6.0 I 0 0 X X X 0 0 643 49041533330.122.. 0Kidnaping 39 36 3 24 204.2 22 2 15 332.8 14 I 6 ITheft, interstate 469 0 391'~6 142345138.480110ILarceny /theft, total 1,595 1,394 201 914 41.5 854 60 681 35.1 540 141 "67 14 Other 0548 5074 041846.324 0Motor vehicle, Interstate 257 254 3 214 43.9 211 3 43 50.1 43 0 9 I ILiquor laws 355 0102893I8429.478 0Postal 643 490 153 216 30.7 176 40 427 29.7 314 113 31 8 National security laws 6 022I2002I97.02 020i0Theft, interstate 146 142 4 116 41.1 115 I 30 27.8 27 3 4 0 Robbery 99309360572145.00 0Other 549 508 41 368 46.5 352 16 181 45.4 156 25 23 5SeCUrities, transporting 571 0 127 II 260 24 0Liquor laws 10 9 I 10 29.4 9 I 0 X X X I 0 false or forged 23 19 4 46.3j10 0National security laws 22 20 2 18 102.9 16 2 4I70.7 4 0 0 0 White slave traffic II 100I6115.66 010 0Robbery 994 937 57 500 137.2 464 36 494 152.6 473 21 120 7 Other and unclassifiable 8410781060043.6I5530ij0Selective Service Acts150 X X X X X X X X X X 0 0 Government reservation, 5 104 164 0Securities, transporting Ii high seas, territorial,11false or forged 23 19 4 18 44.8 16 2 5 51.6 3 2 0 Iand District <strong>of</strong> Columbia 711 641 70 94.7 525II0White slave traffic92II 10 I 4 24.0 4 0 7 168.0 6 I 0 0 Assault 101 97643567.045758Other and unclassifiable 843 783 60 681 42.6 6!~.c; 41 162 47.5 143 19 13 2Auto theft 07II7I0749.57 0Government reservation, IIBurglary' 7 0600590 0 0 0high seas, territorial, ItIForgery77.5 33 0 20 I 0j, 7 4 3 87.84 2I-brnicide 6 0and District <strong>of</strong> Columbia0739 669 70 199 71.4 181 18 540 98.3 488 52 87 582 670150253.91 0Assault 105 101 4 19 46.8 18 1 86 68.4 83 3 II 0 Larceny/theft 54 072II64081361.84 041Auto theft 7 7 0 0 X X X 7 49.5 7 0 0 0Robbery 0t9516850 310 179.19 376 0Burglary 62 61 I II 41.1 II 0 51 82.2 50 I 20 0 Rape 20152020I199.0I 012 0 3Forgery 7 4 3 2 66.0 I I 5 %.6 3 2 0 0 Sex <strong>of</strong>fenses, except rape 18I16025106.10 012 0I-brnicide 87 72 15 22 314.7 16 4 65 213.7 54 II II 0 Other and unclassifiable 2492222I27227.2I 0209Lorceny /theft 73 65 8 19 45.2 19 0 54 66.4 46 8 15 I Militar~ court-martial cases 0/:3142I54217.018230Robbery 105 95I10 19 119.5 17 2 86 171.4078 B 13 20 0 0Rape 22 22 0 4 184.5 4 0 18 180.1 18 0 3 0I:Prison~~~~:~~·f9B~)~pratbl:ntl~.JUstice, Federal Prison System, Statistical Report, Fiscal YearSex <strong>of</strong>fens~-s, except rope 19 17 2 7 95.1 7 0 12 103.7 10 2 2 0Other and unclasslfiable 252 225 27 % 13.2 86 10 156 35.2 139 17 12 2Militar~ court-martial cases II 6 5 6 51.5 1 5 5 68.4 5 0 1 0I!aThis total line excludes the Immigration low and violentcrime <strong>of</strong>fenses whose unusual sentence lengths distort thej Ioverage sentence length statistic.Source: U.S. Department <strong>of</strong> <strong>Justice</strong>, Federal Prison System, Statistical Report, Fiscal Year 1982 (Washington, D.C.: Federal !Prison System, <strong>1983</strong>), Table B-1.I; I1982 (Washington, D.C.; Federal586 587
:<strong>Sourcebook</strong> <strong>of</strong> <strong>Criminal</strong> <strong>Justice</strong> <strong>Statistics</strong> <strong>1983</strong>Persons Under Correctional SupervisionTable 6.42 Number <strong>of</strong> and average sentence for Federal prisoners confined in Federal institutions, by <strong>of</strong>fense, type <strong>of</strong> corrmitment, race,and sex, an SE!pt. 30, 1982Table 6.43 Number <strong>of</strong>, average sentence for, and avera e .by <strong>of</strong>fense and type <strong>of</strong> release, fiscal year 1982 g tune served by releasees from Federal institutions and contract facilities,/\oTE: See /\OTE, Table 6.39. These data are 87.2 percent complete. "Completeness" refers to the/\oTE: See NOTE, Table 6.39. These data a ."Completeness" refers to the ercenta e <strong>of</strong> h re appr?xlmately 73.6 percent complete.percentage <strong>of</strong> the known prisoner population on which demographic data are available. For an data are available. For an e~planatio~ <strong>of</strong> s t ~ kn?wn prisoner population on which demographicexplanation <strong>of</strong> sentencing procedures, see Appendix 20. en enclng procedures, see Appendix 20.Number <strong>of</strong> Releases exceQt <strong>of</strong> Qrisoners sentenced under the Y utb C !I Il!,Q orrec ODS cf~I~oners under sentence N:lrcotic AddictAll prisoners releasedRelease at expiration <strong>of</strong> sentence~II Qrisoners White All other Rehabilitation Released on ga[glegnd at mandatory relegseAverage Average Prisoners Act commitments AverageAverageYouthsentence sentence not under included in total time servedAveragetime servedCorrectionsOn (in sentence LOder N:lt under Percenttime servedPercentActAverageOffense Total Male Femole Number months) Male Female Number months) Male Female Male Female sentence sentence <strong>of</strong> Average Percent<strong>of</strong>celeasessentence average<strong>of</strong>(insentenceAverageTotal 22,028 20,646 1,382 14,036 103.1 13,280 756 7,852 146.8 7,239 613 127 13 75 18 Offensesen- (in time servedNumber monthsTotal excludingMonths tence Number montOnimmigration andTotal 11,348 36.6violent crirrtes a 14,147 13,067 1,080 9,878 74.0 9,287 591 4,168 85.3 3,690 478 9016.3II 66 18 /i44.6 3,554 itl.7 29.1 35.6 7,794 16.0AssaUlt 10.5 65.6 5934921.864 Bankruptcy43.6Assault 123 116 7 50 135.7 45 5 66 100.1 2 7 0 0 021.9 50.2 136110.034.542.5 38.6 36 19.6Bankruptcy 6 4 2 5 57.6 4 /:14.5I I 60.0 0 I 0 0 0 0 Burglary 12.3 35.7 3 56.0 15.6 73.727.9 333 3 13.029.658.8Burglary 62 55 7 34 81.7 32 2 26 124.6 21 5 224.9 42.3 9.00 0 0 Counterfeiting 15 92.0 33.6 69.236.5 0,242 30.9 18 X/'15.8 51.0 31.2 17.6Counterfeiting 393 370 23 304 62.8 7.85 19 84 52.4 80 4 5 0 0 0Drug laws, total 56.5 32,49699 51.8 18.7 36.0 143 16.515.346.3Drug laws, total 5,883 5,541 342 4,493 77.1 11,258 235I20.3 43.9 1,114 13.81,377 101.1 1,272 105 II 2 32 6 Non-narcotIcs 83.5 II47973.4 26.6 36.3 1,382 24.512.832.0 15.0 46.7 183 15.2N:ln-narcotics 1,228 1,187 41 1,050 56.6 1,021 29 177 65.0 165 12 I 0 0 0 Norcotics 62.3 1371,368 51.6 19.7 38.3 296 19.918.658.2Norcatics 3,429 3,218 211 2,48024.2 41.6 12.089.3 2,333 147 939 113.0 876 63 9 I 28 4 Controlled substances 705 84.9 29.9 60.335.3 66320649 29.914.231.8Controlled substl]nces 1,226 1,136 90 963 67.9 904
---------- ~ - ~<strong>Sourcebook</strong> <strong>of</strong> <strong>Criminal</strong> <strong>Justice</strong> <strong>Statistics</strong> <strong>1983</strong>Table 6.44 Average doily population <strong>of</strong> U.S. Army confinement and correctional facilities, byfacility, 1973-821974 1975 1976 1977 1978 1979 1980 1981 1982Facility 1973177 154 8$ 30 10 7 6 9 12 IIFort Bragg165 131 86 77 35 24 22 28 3U 41Fort Campbell II 31 39 5077 117 47 42 21 10Fort Corson135 96 55 33 31 37 49 67 56Fort !-bod II!! 29 40 54140 144 77 49 22 18 20Fort Lewis122 71 20 18 12 16 20 36 35Fort Meade 13112 16 33 7!!162 171 73 42 26 13Fort Ord42 27 13 10 8 8 13 25 21 16Fort Polk93 52 36 24 27 48 57 82 78 84Fort Riley 13 12 32 43 52Fort Benning 127 67 37 27 18Fort BlissFort DixFort GordonFort JocksonFort Knox49 42 33 21 14 10 10 7 12280 171 71 33 19 12 16 a 26 20 14125 97 53 38 20 17 19 23 30 3839 20 15 2 2 2 2 I I244 196 63 47 21 19 23 27 25 38109 19 19 21 16 18 21 30 56Fort Sill 155 4 246 21 13 7 4 7 IUFo\"t Leonord Wood 179 0I 2 3 2 I 3 2 2Fort FitzsirrmonsIU.S. Army Disciplinor',!931 1,153 1,152 1,189 1,038 818 1,022 1,315 1,4U2 1,452BarracksU.S. Army Retraining953 580 412 450 518 502 714 805 578Brigade 1,031~isoners ct Novy facility.Source: Tobie provided to sa...RCEBOO< st<strong>of</strong>f by the U.S. Deportment <strong>of</strong> Defense, Deportment <strong>of</strong>the Army.r'I,'I 1I IjI1\!l'j1iIjIIIIIIt!Table 6.45 Normal capacity and average population <strong>of</strong> U.S.Army correctional centers, by location, 1982NJTE: Data have been collected from the organizations oragencies through a moil survey. Facilities listed are formilitary personnel 17 years <strong>of</strong> age and older. "Normalcapacity" is the number <strong>of</strong> inmates the facility was designedto hold.Correctional centerand locationNormalcapacityU.S. Disciplinary Barracks,Fort Lea,'enworth, Kansas 1,500Fort BtmningConfinement Facility,Fort Benning, Georgia 62Fort GordonConfinement Facility,Fort Gordon, Georgia 60Fort Knox AreaConfinement Facility,Fort Knox, Kentucky 50Fod SillConfinement Facility,Fort Sill, Oklahoma 70U.S. Army Retraining Brigade,Fort Riley, Kansas 1,000Fort CampbellConfinement Facility,Fort Campbell, Kentucky 60Fort CarsonCcnfinement Facility,Fort Corson, Colorado 62Fort f-bodConfinement Facility,Fort f-bod, Texas 75Fort LewisConfinement Facility,Fort LeWis, Washington 50Fort MeadeConfinement Facility,Fort George G. Meade,Maryland 55Fort OrdConfinement Facility,Fort Ord, California 100Fort PolkConfinement Facility,Fort Polk, Louisiana 34Fort RichardsonConfinement Facility,Fort Richardson, Alaska 25Fort RileyConfinement Facility,Fort Riley, Kansas 96U.S. Eighth ArmyConfinement Facility,Camp Humphries, Korea 50BerlinConfinement Facility,Berlin, GermanyIISETAFConfinement Facility,Camp Darley, Italy 4MannheimConfinement Facility,Mannhelm, Germany 156Fort ClaytonConfinement Facility,Fort Clayton, Panama 19permission.Persons Under Correctional SupervisionAverage populationMole Female1,464 146148 045 066 2531 II3554 378 046 040 589 3II 028 079 4408 0o182 46 0Table 6.46 Normal capacity and average population <strong>of</strong> U.S.Air Force correctional center, 1981NJTE: See NOTE, Table 6.45. The correctional center listedincludes facilities for confinement <strong>of</strong> minimum, medium, andmaximum custody grades. "Normal capacity" is the number <strong>of</strong>inmates the facility was designed to hold.Correctional centerNormalcapacity3320th Correction and RehabilitationSquadron, Lowry Air Force Base,Colorado 200AveragepapulationSource: American Correctional Association, <strong>1983</strong>Director <strong>of</strong> Juveni Ie and Adult Correctional De artme;;tSInstitutions A encies and PafcJin Authorities College Par ,Md.: American Correctional Association, 8, p. 344. Tableconstructed by SaRCEBOO< staff. Reprinted by permission.Table 6.47 Normal capacity and average population <strong>of</strong> U.S.Navy correctional centers, by location, 1982NJTE: See NJTE, Table 6.45. The Novy also operates other smallcorrectional '1:.~nters and detention spaces in the United Statesand d'verseas. All facilities are for Naval personnel 17 years <strong>of</strong>age and older awaiting court-martial or serving court-martialsentences. "Normal capacity" Is the number <strong>of</strong> inmates thefacility was designed to hold.Correctional centerand locationNoval Station,Long Beach, CaliforniaNovo I Station,Son Diego, CaliforniaNoval Station, Treasure Island,Son Francisco, CaliforniaNovo I Submarine Bose,New London, ConnecticutNovo I Air Station,Jacksonville, FloridaNovo I Air Station,Pensacola, FloridaNoval Station,Pearl f-brbor, Howai iNoval Administrative Command,Great Lakes, IllinoisNova I Station,Philadelphia, PennsylVaniaNova I Education andTraining Center,Newpart, Rhode IslandNovo I Station,Charleston, South CarolinaNova I Air Station,Millington, TennesseeNoval Air Station,Corpus Christi, TexasNoval Station,Norfolk, VirginiaNova I Station,Seattle, WashingtonNaval Station,Guantanamo Bay, CubaNoval Station,GuamFleet Activities,Yokosuka, JapanNova I Base,Sub)c Bay, PhilippinesNova I Station,Roosevelt Roads, Puerto RicoNoval Station,Rota, SpainNormalcapacity341871482050728217021075956!!6528759242349561015103------...--....~ ''''''-Averagepapulation23170III1464465413014332825735264626144048720
<strong>Sourcebook</strong> <strong>of</strong> <strong>Criminal</strong> <strong>Justice</strong> <strong>Statistics</strong> <strong>1983</strong>Table 6.48 Normal capo!c:ity and average population <strong>of</strong> U.S.Marine Corps correctil.onal centers, by location, 1982!\oTE: See !\oTE, Table ,1.45. Facilities listed are for MarineCorps personnel I 7 yl~ars <strong>of</strong> age alld older awaiting courtmartialor serving sentence <strong>of</strong> Summary, Special, or GeneralCourts-Martial.Persons Und-:.r Correctional SupervisionTable 6.49 Conditional and unconditional releases <strong>of</strong> sentenced prisoners from Stote and Federaljurisdiction, by type <strong>of</strong> release, region, and jurisdiction, 1981!\oTE: See !\oTES, Figure 6.5 and Table 6.22. For Information on methodology, definitions <strong>of</strong>terms, and a detailed explanation <strong>of</strong> revised, estimated, and noncomparable data, seeAppendix 19.Conditional releaseUnconditional releaseSupervisedExpira- Commuta-Correctional center I'brrnal AVerage mandatory tion <strong>of</strong> tlon <strong>of</strong>and location ca2S!clt:! population Region ond lurlsdlctlon Total Porole Probation releases Other Totol sentence sentence OtherMarine Corps Base,United States, total 124,415 81,894 5,287 32,861 4,373 27,901 22,983 3,394 1,524Camp Pendleton, Califorl1ia 382 215Marine Corps Logistics Bor.e,Federal Institutions, total 6,431 4,055 0 2,376 0 3,396 3,228 3 165Albony, Georgia 30 2Marine Corps Base,State Institutions, total 117,984 77,839 5,287 30,485 4,373 24,505 19,755 3,391 1,359Camp Lejeune, North COl'olina 358 244Marine Corps DevelopmentI'brtheast 16,315 13,329 315 2,535 136 2,444 2,227 54 163and Education Command,Maine 102 19 83 0 0 247 247 0 0Quantico, Virginia 150 30 New Hcrnpshire 167 167 0 0 0 31 4 0 27Marine Corps Recruit Depc,'t,Vermont 305 120 180 0 5 24 21 0 3Parris Island, South Carolina 55 55Massachusetts 796 796 0 0 0 263 215 4Q 0Marine Corps Base,Rhode Island 200 148 52 0 0 34 30 4 0Okinawa, Japan 237 45 Connecticut 1,522 1,391 0 0 131 79~ 791 2 0New York 7,536 5,001 0 2,535 0 59U 590 0 (lSource: American Correctional Association, <strong>1983</strong>New Jersey 2,819 2,819 0 0 0 130 130 0 0~Y <strong>of</strong> Juvenile and Adult Correctional De artmentsPennsylvania 2,868 2,86B 0 0 0 332 199 0 133Institutiuns, Agencies and taro 109 \!! ontles 0 ege or,Md.: ArTlerican. Correcticlnal ASsociation, <strong>1983</strong>), pp. 344, 345.I'brth Central 29,722 18,565 2,494 7,838 825 3,841 3,236 61 544Table constructed by SOL..RCEBOOK staff. Reprinted byOhio 8,518 6,503 1,463 0 552 53 22 0 31Indiana 2,7B9 519 344 1,683 243 210 66 0 144permis~,on.illinois 6,199 866 0 5,333 0 1,171 I, I 15 43 13Michigan 4,754 4,754 0 0 0 377 377 0 0Wisconsin 1,741 929 13 778 21 125 85 0 40Minnesota 1,0BI3 1,088 0 0 0 148 101 0 47Iowa 835 607 228 0 0 308 297 0 IIMissouri 1,554 1,552 0 0 2 956 680 18 258I'brth Dakota 165 147 II 0 7 9 9 0 0South Dakota 243 221 22 0 0 98 98 0 0Nebraska 303 303 0 0 0 386 386 0 0I Kansas 1,533 1,076 413 44 0 0 X X XSouth 5tII l , 174 3B,515 1,862 7,200 2,5')7 16,527 12,725 3,255 547,j Delaware 367 231 0 136 0 77 54 0 23u Marylar.-i 2,880 2,OB7 0 793 0 25 II 14 0District ,.f Columbia 797 691 0 106 0 670 670 0 0Virginia 3,539 2,489 0 1,047 3 275 258 0 17West Virginia 406 300 79 0 27 73 68 0 51( I'brth Carolina 6,890 6,890 0 0 0 1,323 1,323 0 0ISouth .Carolina 2,752 2,195 557 0 0 673 660 I 1211~fI!1 !,\ '\IIGeorgia 2,601 1,750 48 0 803 4,259 1,394 2,851 14Florida 5,735 3,855 614 984 282 3,019 2,633 5 381Kentucky 2,586 2,026 310 250 0 33 30 0 3Tennessee 2,881 2,305 0 357 219 4!3 394 8 'IIAlabama 1,832 1,512 78 0 242 540 536 I 3Mississippi 1,707 940 138 0 629 349 320 0 29Arkansas 1,7BO 1,454 0 0 326 254 253 I 0Louisiana 707 705 2 0 0 1,683 1,634 I 48Oklahoma 1,013 1,013 0 0 0 1,126 753 373 0Texas 11,101 8,072 36 3,527 66 1,735 1,734 0 IWest 21,773 7,430 616 12,912 815 1,693 1,567 21 105Montana 361 288 58 2 13 57 57 0 0Idaho 498 203 295 0 0 87 85 0 2Wyoming 189 169 19 0 I 56 33 19 4Colorado 1,298 1,184 114 0 0 227 198 0 29New Mexico 705 502 0 0 203 350 350 0 0Arizona 1,832 805 97 332 598 34 34 0 0Utah 433 433 0 0 0 23 6 0 17Nevada 613 613 0 0 0 239 238 0 IWashington 1,400 1,400 0 0 0 7 3 I 3Oregon 1,722 1,722 0 0 0 181 180 I 0California 12,366 0 0 12,366 0 415 366 0 49Alaska 270 58 0 212 0 0 X X XHawaii 86 53 33 0 0 17 17 0 0Source: U.S. Department <strong>of</strong> <strong>Justice</strong>, <strong>Bureau</strong> <strong>of</strong> <strong>Justice</strong> <strong>Statistics</strong>, Prisoners in State and FederalInstitutions on December 31, 1981, NCJ-86485 (Washington, D.C.: U.S. Government Printing Office, 19B3), p. 30.5 3
- ---*"=-~.-.---.-: ..""--~,,- ,,,.-. '""I'J<strong>Sourcebook</strong> <strong>of</strong> <strong>Criminal</strong> <strong>Justice</strong> <strong>Statistics</strong> <strong>1983</strong>Table 6.50 Movement <strong>of</strong> the p~r~le .population under State and FederaljUrisdiction, by region and JUrisdiction, 1981/\oTE' The data were collected by the annual Uniform Parole Re~orts survey• ducted in 1982 and represent information voluntarily prOVided by the~oS Parole Conmission the 50 States, and the District <strong>of</strong> Columbia.J~r'isdictlons were ins'tructed to include in the parole population adultporolees and mandatory releasees ser,tenced to a ~ear or 'hre 0h a fe~O~tEntries to tlie ~arole 22~ulationExits from the ~arole populatIonMandatoryParolees releaseesfrom fromRegion and jUrisdiction Total prisonDis- Revo-prison Other Total charges cations Deaths Othert e <strong>of</strong>fense who have entered parole superVision elt er ! roug ed~~iSion <strong>of</strong> a paroling board for porolf:!es, or as a result <strong>of</strong> serving a prisonterm shortened by reduction measures such as "good time" for mandatoryreleasees. Jurisdictions were further instruct:~ to inclu.de p.ersons undertheir <strong>of</strong>ficial jurisdiction regardless <strong>of</strong> superVISion locatl~n ~In-:State.' out<strong>of</strong>-State)or supervision status (active, inactive). ~UrlSdlctlon figurespresented are the total cases reported to the Uniform Parole Reportprogram by each reporting agency. . • • dFor a discussion <strong>of</strong> survey methodology, definitions <strong>of</strong> terms, onjurisdictional explanatory notes, see Appendix 17.Parole Movement Parolepopulation on during 1981 popUlation onRegion and jurisdiction Dec. 31, 1980 Entries Exits Dec. 31, 1981United States, total 222,036 126,312 122,174 226,174Federal 23,652 9,545 11,855d/1•Persons Under Correctional SupervisionTable 6.51 Movement <strong>of</strong> the parole population under State and Federal jurisdiction, by method <strong>of</strong>entry, method <strong>of</strong> exit, region, and jurisdiction, 1981/\oTE: See /\OTE, Table 6.50. In California, the court may, at Its discretion, place personsbetween 18 ond 2U years <strong>of</strong> age in the custody <strong>of</strong> either the Deportment <strong>of</strong> Corrections orthe Deportment <strong>of</strong> the Youth Authority and each deportment maintains a paroie system.Information about the type <strong>of</strong> entry into the parole popUlation and exit from the parolepopUlation was missing for 13,052 entries (out <strong>of</strong> 126,312 total entries) and 8,223 exits (out<strong>of</strong> 122,174 total exits). For a dIscussion <strong>of</strong> survey methodology, definitions <strong>of</strong> terms, andjurisdictional explanatory notes, see Appendix 17.Federal 9,545 6,212 1,804 1,529 11,855 8,086 3,153 151 465i'brtheast:Moine 26 26 0New Hampshire0 35208 16510 2500430Vermant 170143 143138 270500Massachusetts 1651,295 1281,295 370(0)00Rhode Island 192 189N\ N\ N\ N\Connecticut0 3 I~1,486 144 49 I N\b1,486New York0 0 1,234 839 388 721,342 7,638 5,024 2,614 0New Jersey N\ 7,501N\4,539N\2,77UN\ InN\0N\I PennsylVania 3,3B9 3,389N\0N\0N\3,240N\1,938 1,206 96 0State, total 198,384 116,767 110,319 204,832!'brth Central:!'brtheast 45,359 18,038 17,301 46,096 OhioMoine 213 26 35 204I:7,331 7,060Indiana0 271 6,2012,548 b 4,4873571,636New Hampshire 441 208 1,912 78170 479I' 279 2,421N\Illinois 7,234 b1,397304273Vermant 293 143 165 2716,930 9I 0742Michigan 8,4674,710 6,2704,710 2,118Massach usett s 4,071 1,295 0791,961 3,4050 4,352N\Wisconsin b2,965 1,029Rhode Island 25754192 205 244304/:N\ N\MinnesotaN\ N\ 1,5571,049 1,212924345Connecticut 1,932 1,486 1,234 2,184125 0N\Ii 950N\Iowa 521 521474 463New York19,652 7,714 7,501 19,865013LJ 0 0Missouri 3751,649 b 1,43729821272New Jersey 8,911 3,585 2,79059,706,N\0!'brth Dakota 1,105 b 696 386Pennsylvania 9,589 3,389 3,240239,738~164 164 0 0 N\South Dakota 302162 141 20 I 0I263Nebraska0 39 241 198 42!'brth Central 36,635 28,849 28,745 36,739I Kansas 291 275 16 I00N\ N\ N\ N\ 328 N\ 265 N\ 63Ohio 8,849 7,331 N\ 0 ,07,709 8,471 J11Indiana 2,028 2,54ti 2,421 2,155South:N\ N\Illinois 9,507 7,234 8,497 8,24411DelawareMichigan 6,227 4,710 4,352 6,585469 282Maryland187 02,757464 397 64Wisconsin 2,63931,815 I,GOI 2,8530b 2,OB5If672District <strong>of</strong> Columbia0 3,0611,0292,3391,011 7'l.218 (0)Minnesota 1,534 1,049 950 1,633I: N\0Virginia 3,5397222,4923341,047367Iowa 63921521 375 7850 N\West Virginia 2,6tl5 1,966N\ N\685Missouri 2,395341,684 1,109 2,9700Ii N:>rth Caroli noN\ N\9,427 9,427N\!'brth Dakota 0N\127 164 162 1290N\8,9~N\I, South Carolina 1,4237,8361,4231,013South Dakota 052198 302 241 2590 1,241N\/: Georgia 2,5108422,510 364Nebraska 292 035291 328 25500Florida 3,027N\2,378N\649Kansas 2,200 1,200 N\01,000 2,400N\0Kentucky 6,728 6,446 282 (0)I:2,005 2,005 0 00Tennessee 1,129 470 642South 77,167 48,388 2,784 2,101 683 1743,780 81,77500Alabama 2,6011,748 2,3091,7482920(0)Delaware 619 469 464 62400MiSSissippi 1,9341,655 b1,4831,655 451 (0)Maryland 6,436 2,757 3,G61 6,1320 00Arkansas 1,1151,4066721,406289District <strong>of</strong> Columbia 3,045 0161,204 968 3,2810138Louisiana 1,3437G5930705413Virginia(0)4,783 3,539 2,685 5,6370rOklahoma0 0 6111,013 4441,013 154West Virginia 013475 390 380 48500Texas 10,828946 79B7,501133!'brth Carolina 6,496 3,327 159,427 9,048 6,875006,401f4,252 2,001South Carolina 3,124 1,4231481,24i 3,3060West:Georgia 3,169 2,510 3,027 2,652NoontanaFlorida 8,823 4,525 6,728 6,620I,i208 208Idaho0 0 32420222920295 (0)Kentucky 8,120 2,005 1,129 8,9960 00Wyoming 226171 14917176Tennessee 3,097 2,7B4 0I2,601 3,28000Colorado 12U 103 12Alabama 2,547 1,74851,934 2,361\ : N\ N\ N\ N\0New Mexico 1,01547B 8844781310(0)Mississippi 2,292 1,655 1,213 2,73400JArizona 26B1,007 557114 144Arkansas 450102,855 1,406 1,343 2,911l00Utah 781441603441174Louisiana 041,819 705 611 1,91300i-435I~257~ I" Nevada 544 544167Oklahoma 2,232 0II1,013 00~/l16 2,299 .IWashington 1,359424 2651,359153Texas 17 ,235 0610,828 6,401 21,662 II001,926 169!jdOregon 1,'135 1,435 7130440 0IICalifornia:2,323 2,023 258 28West 39,223 21,492 20,493 40,222 J14IiDeportment <strong>of</strong>Montano 758 20B 324 642CorrectionsIdaho 420 202 226 39612,379 92 12,274 13 11,673 7,71411Deportment <strong>of</strong>3,885 74 0Wyoming154 171 120 205 [IYouth AuthorityColorado 927 1,184 1,015 1,0961,896Iib 1,896Alaska0 N\ 1,84258i,51658305021New Mexico884 478 268 1,094 Ii00ii If Hawaii 63 SOb 3263 1800Arizona 1,093 1,007 781 1,319II0082 55 23 4Utah 767 441 435 773II IiN\Nevada 1,052 544 424 i,l72Ii 11blncluded with discharges.Washington 14,669 1,359 926 15,102i!This Item total is less than the corresponding totalOregon 2,639 1,435 2,323 1,751reported in Table 6.50. See Appendix 17 for detail(I !regarding missing data.California 15,253 14,342 13,515 16,080Alaska 93 58 50 101I rHawoii514 63 86 491Source: Table prOVided to SQLRCEBoo< st<strong>of</strong>f by the Notional Council on Crime and Delinquency,IResearch Center West.Source: Table adopted byJSO..RC~BOO< st<strong>of</strong>f from tables provided bythe Notional Council on Crime and Delinquency, Research Center West.! J~j!1595
-'•<strong>Sourcebook</strong> <strong>of</strong> <strong>Criminal</strong> <strong>Justice</strong> <strong>Statistics</strong> <strong>1983</strong>FiglJr,~ 6.10 Prison and parole populations on Dec. 31, United States, 1975-81f\OTE: See f\OTE, Table 6.50. For survey methodology and definitions <strong>of</strong> terms, see Appendix 17.Prisoners orparolees andmandatoryreleasees400,000350.000Prison population"1.Persons Lklder Correctional SupervisionFigure 6.11 Rate (per 100,000 Inhabitants) <strong>of</strong> persons In the parolepopulation, United States, 1975~80f\OThEI See f\OTE, Table 6.50. Rates were calculated using U.S. <strong>Bureau</strong> <strong>of</strong>t e hCensus popUlation figures for the number <strong>of</strong> Inhabitants. For surveymet odology and definitions <strong>of</strong> terms, see Appendix 17.Rale (per100,000Inhabitants10092 9299 100300,000757777250,000200,000150,000".'---~---., ,- -".---'Parole population! III50100,0002550,000O-L-.----~· ____ ~----~----~I----~----~I--1975 1976 1977 1978 1979 1980 1981O--,----r---,--__ ~I __ ~------1975 1976 1977 1978 1979 1980'11-ison population (adults sentenced to I year or more <strong>of</strong> imprisonment) data are from the U.S. Deportment<strong>of</strong> <strong>Justice</strong>, Law Enforcement Assistance Administration, Prisoners in State and Federal Institutions on December31, 1976; /977; 1978 (Washingtorl, D.C.: u..S. Government Piinting OffICe); and U.S. Department <strong>of</strong> <strong>Justice</strong>,<strong>Bureau</strong> 0 <strong>Justice</strong> <strong>Statistics</strong>, Prisoners In State and Federal Institutions on Decernber 31, 1979; 1980; 1981(Washington, D.C.: U.S. Governn1ent Piinting Office). ,--• Source: Figure constructed by SOURCEBOOK staff from dataprovided by the Notional Council on Crime and Delinquency ResearchCenter West. ,~r~' Figure adapted by Sa..RCEBOO< staff from figure provided by the N:ltlonal Council on Crime andDelinquency, Research Center WeSot.I, .
599~----~ ~~- - --~ -----------Persons Under Correctlonol SupervisionTable 6.52 Sentenced prfsaners admitted 10 State and Federal institutions for violations <strong>of</strong> parole or otherconditional relea!c, by whether a new sentence was imposed, sex, region, and jurisdiction, 1981NJTE: See NJTES, fl;Jure 6.5 and Table 6.22. For informotion on methodology, definitions <strong>of</strong> terms,and a detailed explanation <strong>of</strong> revised, estimated, and noncomparoble dota, see Appendix 19.Parole violatorsOther conditional release violatorsNew sentence No new sen- New !lentence No new senimecseclRegion and jurisdiction Total Total tence i!1l12o~ed iOlRQSed tence imeosedMale Female Male Female Total foA'·.le Female Male Femalelhited States, total 35,674 26,565 11,%9 430 13,597 569 9,109 3.1$0 151 5,640 168Federal institution, total 1,709 1,49? 27 2 1,361 102 217 0 0 211 6State institutions, total 33,%5 25,0·..., / I ,942 4ZB 12,236 467 8,892 3,150 151 5,429 162Northeast 6,537 4,723 1,830 41 2,728 124 1,814 1,129 20 649 16Maine 34 33 20 0 13 0New /-bnpshire 26 26 0 0 26 0I0I0000000Vermont 78 68 58 0 10 () 10 10 0 0 0Massochusetts 349 349 0 0 335 14 0 0 0 0 0Rhode Island 56 33 lli- 0 19 0 23 7 0 16 0Connecticut 1,052 162 0 0 157 5 890 719 15 151 5New York 3,058 2,168 847 14 1,255 52 890 392 5 482 IINew Jersey 847 847 263 4 540 40 0 0 0 0 0Pennsylvania 1,037 1,037 628 23 373 13 0 0 0 0 0North Central 9,418 4,753 2,434 94 2,150 75 4,665 427 35 4,091 112Ohio 2,013 1,786 1,357 55 362 12 227 0 0 205 22Indiana 216 0 0 0 0 0 216 216 0 0 0Illinois 4,067 406 II 2 393 0 3,661 31 24 3,542 64Michigan 1,152 1,152 634 23 4n 24 0 0 0 0 0Wisconsin 377 147 45 I % 5 230 88 0 139 3Minnesota 435 435 175 I 253 6 0 0 0 0 0Iowa 160 102 38 3 50 II 58 23 0 34 IMissouri 411 361 0 0 353 8 50 0 0 50 0North Dakota 27 22 0 0 n 0 5 0 0 5 0South Dakota 47 39 I 0 36 2 8 0 0 7 INebraska 65 65 12 I 49 3 0 0 0 0 0Kansas 448 238 161 8 65 4 210 69 II 109 21{,'"\South 11,081 9,281 5,219 198 3,751 113 1,800 1,408 77 307 8Delaware 25 25 3 0 21 I 0 0 0 0 0Mooyland 423 423 0 0 412 II 0 0 0 0 0District <strong>of</strong> Colunbia 288 2Zj 187 6 30 0 65 58 0 7 0Virginia 685 53~ 244 9 274 II 147 143 4 0 0Wesl Virginia 55 53 5 0 47 I Z 0 0 2 0North Carolina %5 %5 935 30 0 0 0 0 0 0 0 ~jSouth Carolina 728 466 132 I 328 5 262 174 7 78 3Georgia 658 658 639 19 0 0 0 0 0 0 0Florida 2,159 1,935 746 18 1,140 31 224 89 4 128 3Kentucky 761 701 240 I 449 II 60 29 0 30 1Tennessee 423 397 0 0 384 13 26 0 0 26 0Alahoma 2 2 0 0 2 0 0 0 0 0 0Mississippi 385 297 198 2 92 5 88 49 2 36 IArkansas 457 457 0 0 446 II 0 Ii 0 0 0Louistana 154 154 35 5 104 IU 0 0 0 0 0Oi
,-.-~------......-~-----n.~-".~" ... ""<strong>Sourcebook</strong> <strong>of</strong> Criminol <strong>Justice</strong> <strong>Statistics</strong> <strong>1983</strong>Persons 'Under Correctional SupervisionTuble 6.53 Prisoners granted parole by U.S. Parole Commission, by region, fiscal yearsTable 6.54 Deaths among sentenced prisoners under the jurisdiction <strong>of</strong> State and Federal correctional authorities, by cause <strong>of</strong>1977-81 death, sex, region, and jurisdiction" 1981NJTE: These date refer only to defendonts sentenced as adults. The "percent" column refers to NJTE: See NJTE, Figure 6.5. For information on methadolagy, definitions <strong>of</strong> terms, and a detailedinmates who were granted parole as a proportion <strong>of</strong> the total number <strong>of</strong> Inmates considered for explanation <strong>of</strong> revised, estimated, and nancomparable data, see Appendix 19.porole. The Source notes, "while the percentage granted parole has traditionally served as anindicator <strong>of</strong> paroling policy, it hos several limitations. First, It is affected by changes In types <strong>of</strong> Illness or Accidental Caused<strong>of</strong>fenders entering the system. For exomple, the rate <strong>of</strong> parole grants for auto thieves may not be Total Execution natural causes Suicide self-injuret bet another Not knownthe same as for narcotics dealers. Second, the measure may be <strong>of</strong>fected by changes in sentencing Region and jurisdiction iotal Male Female Male Female Male Female Mole Female Male Femole Male Female Male Femalepractices" (Source, 198 I, p. 4). The data do not reflect decisions modified under theCommission's oppellate or reopening provisions. Data for 1971:1 have been revised from earlier U,ited States, total m 776 IS 0 366 8 75 23reports by the Source.104 0 207 5For a list <strong>of</strong> States in regions, see Appendix 5. Federal Institutions, total 58 58 0 0 0 36 0 9 0 0 0 13 0 0 01977 1978 1979 1980 191:11 State Institutions, total 733 718 ISRegion0 330 8 66 23 91 0 207 5Number Percent l\lJmber Percent Number Percent Number Percent Number PercentNortheast 103 101 2 0 0 31 I 12 0TotalI 0 10 0 47 I3,746 44.1 5,260 54.3 6,427 65.8 6,722 69.7 5,436 64.8 Maine 2 2 0 0 0 0 0 I 0 0 0 0 0 I 0New H:Jmpshire I I 0 0 0 0Northeast0 I 0 0 0 0 0 0 0664 43.9 861 50.7 1,113 60.3 1,149 63.8 1,072 64.0 Vermant 2 2 0 0 0 0 0 2 0Southeast0 0 0 0 0 01,IU6 55.1 1,322 55.7 1,727 71.4 1,91:11:1 74.1 1,608 68.3 Massachusetts 6 6 0 0North Central0 3 0 2 0 0 0 I 0 0 01:164 41.7 1,330 59.9 1,564 71.3 1,354 72.0 1,066 65.9 Rhode Island 0 X X X X X X X X X XSouth CentralX X X X593 41.5 61:13 45.9 939 59.8 977 67.2 939 65.9 Connecticut 20West19 I 0 0 I 0 2 0 I 0 8 05197 I35.2 1,064 55.7 1,084 62.3 1,254 68.7 751 57.0 New York 39 39 0 0 0 0 0 0 0 0 0 0 0 39 0New Jersey 7 7 0 0 0 5 0 I 0 0 0 I 0 0 0Source: U.S. Department <strong>of</strong> <strong>Justice</strong>, U.S. Parole Corrmlsslon, Re!j0rt <strong>of</strong> the U.S. Parole Pennsylvania 26 25 I 0 0 22 I 3 0 0 0 0 0 0 0£'I)!"(rnlsslon, October I, 1976 to September 30, 1978, p. 18; Tables II-A an 11-8; October ), 1978to SepteiTiber 30, 1960, p. 21, Table 11-8; and Sheldon Adelberg, "Workload and Decision trendS: North Central 146 146 0 I 0 67 0 16 0 3 0 II 0 4!l 0Statistical Highlights (Fiscal Years 1979-1981 )," Report 32. U.S. Parole Commission 1982. Ohio 29 29 0 0 0 19 0 8 0 2 0 0 0 0 0(Mimeographed.) P. 3. Table adapted by SCJlRCEBCO< staff. • Indiana 22 22 0 I 0 18 0 0 0 0 0 3 0 0 0illinois 7 7 0 0 0 7 0 0 0 0 0 0 0 0 0iMichigan 51 51 0 0 0 0 0 7 0 0 0 3 0 41 0Wisconsin 7 7 0 0 0 0 0 0 0 0 0 0 0 7 0IMinnesota I I 0 0 0 0 0 0 0 I 0 0 0 0 0Iowa 5 5 0 0 0 2!0 I 0 0 0 2 0 0 0Missouri 16 16 0 0 0 16 0 0 0 0 0 0 0 0 0", j North Dakota I I 0 0 0 I 0 0 0 0 0 0 0 0 0South Dakota 0 X X X X X X X X X X X X X XI Nebraska I I 0 0 0 I 0 0 0 0 0 0 0 0 0I Kansas 6 6 0 0 0 3 0 0 0 0 0 3 0 0 0! South 353 342 II 0 0 170 5 18 I 15 I 33 0 106 4I Delaware I I 0 0 0 I 0 0 0 0 0 0 0 0 0,Maryland 27 27 0 0 0 18 0 5 0 0 0 4 0 0 0j District <strong>of</strong> Columbia 16 15 I 0 0 12 0 0 0 I I 2 0 0 IVirginia 45 44 I 0 0 24 0 0 0 0 0 0 0 20 0iWest Virginia 4 4 0 0 0 4 0 0 0 0 0 0 0 0 0INorth Carolina 28 26 2 0 0 19 2 2 0 2 0 3 0 0 0i ,South Carolina 19 19 0 0 0 9 0 3 0 3 0 4 0 0 0~ Georgia 15 15 0 0 0 10 0 I 0 I 0 3 0 0 0I Florida 39 38 I 0 0 29 0 3 I 2 0 4 0 0 0~ Kentucky 8 8 0 0 0 4 0 I 0 0 0 3 0 0 0Tennessee 16 16 0 0 0 7 0 2 0 2 0 4 0 I 0~ Alabama 13 12 I 0 0 12 I 0 0 0 0 0 0 0 0Mississippi 5 4 I 0 0 3 I I 0 0 0 0 0 0 0Arkansas 9 9 0 0 0 2 0 0 0 3 0 2 0 2 0Louisiana 14 14 0 0 0 13 0 0 0 0 0 I 0 0 0Oklahoma 8 7 I 0 0 3 I 0 0 I 0 3 0 0 0~Texas 86 83 3 0 0 0 0 0 0 0 0 0 0 83 311 West 131 129 2 0 0 62 l 20 0 4 0 37 0 6 0II Mantana 2 2 0 0 0 2 0 0 0 0 0 0 0 0 0IiIdaho 3 3 0 0 0 0 0 0 0 0 0 0 0 3 0Ij Wyoming 3 3 0 0 0 2 0 I) 0 0 0 I 0L0 0Colorado 10 10 0 0 0 3 0 J 0 I 0 2 0 3 0/I New Mexico 10 10 0 0 0 0 0 0 0 0 0 10 0 0 0Arizona 6 6 0 0 0 3 0 I 0 0 0 2 0 0 0Utah 5 5 0 0 0 2 0 2 0 0 0 I 0 0 0Nevada 4 4 0 0 0 2 0 I 0 0 0 I 0 0 0Washington 18 18 0 0 0 8 0 3 0 3 0 4 0 0 0IIOregon 18 18 0 0 0 18 0 () 0 0 0 0 0 0 0California 51 49 2 0 0 21 2 12 0 0 0 16 0 0 0Alaska I I 0 0 0 I 0 Ci 0 0 0 0 0 0 0iI,)iI({IiJwall 0 X X X X X X )I: X X X X X X XSource: U.S. Deportment <strong>of</strong> <strong>Justice</strong>, <strong>Bureau</strong> <strong>of</strong> <strong>Justice</strong> <strong>Statistics</strong>, Prlscner~ In State and Federal Institutions on December 31, i 981, NCJ-86485 (Washington, D.C.~ U.S. Government Printing Office, <strong>1983</strong>), p. ~600 601
~--------- - ~~ --------- ------------ -----------------------<strong>Sourcebook</strong> <strong>of</strong> <strong>Criminal</strong> <strong>Justice</strong> <strong>Statistics</strong> <strong>1983</strong>Table 6.55 Prisoners under sentence <strong>of</strong> death, by race orethnicity and jurisdiction, on Apr. 20, <strong>1983</strong>NOTE: The NAACP Legal Defense and Educational Fund, Inc.periodically collects data on persons on death row. As <strong>of</strong> Apr. 20,<strong>1983</strong>, 39 jurisdictions had capitol punishment lows and 32jurisdictions hod at least I prisoner under sentence <strong>of</strong> death.Between Jan. I, 1973 and Apr. 20, <strong>1983</strong>, on estimated 551 deathsentences have been vacated as unconstitutional and on estimated500 convictions or sentences have been reversed or vacated onother grounds.Race or ethnicit~N:ltiveJurisdiction Total Block White His2anic Americon AsianUnited States 1,168 491 610 55 8 4Federal 0 0 0 0 0 0Alabama 59 38 0 21 0 0 0AlaskaXX X X XArizona 54 7> 42 4 0 0Arkansas 23 7 c 15 c I 0 0California 124 47 52 20 2 3Colorado I 0 I 0 0 0Connecticut 0 0 0 0 0 0Delaware 6 3 3 0 0 0District <strong>of</strong> Columbia X X X X X XFlorida 195 BO Ill c 4 0 0Georgia 115 56 0 59c ,d 0 0 0Hawaii X X X X X XIdaho 7 0 6 I 0 0Illinois 53 34 15 4 0 0Indiana 16 8 8 0 0 0Iowa X X X X X XKansas X X X X X XKentucky 13 I 12 0 0 0Louisiana 37 19 18 c 0 0 0Moine X X X X X XMoryland 13 9 3 0 0 1 0 0Massachusetts 0 0 0 0 0 0Michigan X X X X X XMinnesota X X X X X XMississippi 35 20 150 0 0 0Missouri 21 12 9 0 0 0Montano 4 I 3 0 0 0Nebraska 12 3 8 0 I 0Nevada 18 50 II 2 0 0New Hampshire 0 0 0 0 0 0New Jersey 0 0 0 0 0 0New Mexico 5 I 2 2 0 0New York 0 0 0 0 0 0North Carolina 31 14 16 0 0 I 0North Dakota X X X X X XOhio 5 2 3 0 0 0Oklahoma 36 5 30c ,d 0 I 0Oregon X X X X X XPennsylvania 48 25 23 0 0 0Rhode Island X X X X X XSouth Corolina 23 9 14 0 0 0South Dakota 0 0 0 0 0 0Tennessee 33 10 22 0 I 0Texas 151 56 BOO 15 0 0Utah 4 3 I 0 0 0Vermont 0 0 0 0 0 0Virginia 19 II 6 I 0 IWashington 3 0 3 0 0 0West Virginia X X X X X XWisconsin X X X X X XWyoming 2 0 2 0 0 0U.S. military 7 5 0 0~Includes one female.Includes two persons sentenced to death in the State butservintl another sentence in another State.Includes one person sentenced to death in the State butservina another sentence in another State.Includes two females.Source: Table constructed by Sa..RCEBOO
SourcebG,.lk <strong>of</strong> <strong>Criminal</strong> <strong>Justice</strong> <strong>Statistics</strong> <strong>1983</strong>Table 6.56 Prisoners under sentence <strong>of</strong> death, by race, <strong>of</strong>fense, region, and jurisdiction, on Dec. 31, 1981Hegiull undjurisdictionFederalTotal.0 QJQ.It!c::Lklited States 83B 836 2State 838 836 2Northeast I I IIMaine X X XNew HampshireVermontMassachusetts X X XRhode Island X X XConnecticutNew YorkNew Jersey X X XPennsylvania II IINorth CentralOhio77Indiana 10 10Illinois 41 41Michigan X X XWisconsin X X XMinnesota X X XIowaMissouriX14X14XNorth DakotaSouth DakotaX X XNebraskaKansas12X12X XSouth 605 603 2Delaware 4 4Maryland 8 1:1District <strong>of</strong>Columbia X X XVirginia 17 17West Virginia X X XNorth Carolina 17 17South Carolina 21 21Georgia 91 91FloridaKentucky161915992Tennessee 21 21AlabamaMississippi16271627ArkansasLouisiana23102310Oklahoma 36 36Texas 144 144West 145 145Montano 3 3Idaho 2 2WyomingColorado I INew Mexico 3 3Arizona 38 38~~ 3 3Nevada Ii 12Washington(ffegon X X XCaliforniaAlaska83X83X XHawaii X X XXXXXXXXXXXXXXXXs..!!!o488 487488 487!'DTE: See !'DTE, Figure 6.12.(- represents zero)White7 7X X X XX X X XX X X XX X X X7 733 334 415 15X X X XX X X XX X X XX X X X6 6X X X X8 8X X X X345 3443 34 4X X X X7 7X X X X10 1012 1240 40% 959 913 133 38 815 157 730 3088 88103 1032 22 2I I3 333 33I I;0 10X X X X51 51X X X XX X X Xapersons enumerated under "other" were five American Indiansand twee Asians.The two persons enumerated under the category "rapell wereunder sentence <strong>of</strong> death for sexual battery.XXXXXXXXXXXXXXXs..QJ.s:::....o342 341342 341Black.0QJQ.It!c::4 4X X X XX X X XX X X XX X X X4 443 43626626X X X XX X X XX X X XX X X X8 8X X X X3 3X X X X258 257I4I4X X10X10XX X X X6 69 951 5165 647 713 1319 198 83 36 656 5637 37I I4 42 22 2X X28X28XX X X XX X X XXXXC'IC.....Q.It!C't:I;::;XXXXXXXXXXXXXXXxXXXXXXXxXXs..QJ.s:::....o8 8Printing Source: Office, U.S. <strong>1983</strong>), Department pp. 74, 75. <strong>of</strong> JUstice, <strong>Bureau</strong> <strong>of</strong> <strong>Justice</strong> <strong>Statistics</strong>, Capllol Punishment 1981, NCJ-86484 (Washington, D.C.: U.S. Government6045X4XX8XXXXXXXXXIX2XXI5X4XX8XXXXXXXXXIX2xXIXXXXXXXXXXXXXXXXXXXXXXXXXXXXXXXXXXXXXXXXXXXXXs..QJ.s:::....o~!I!I :!II i1, iItIIi !j ji1\I!II 1f i,IPersons Under Correctional SupervisionFigure 6.13 Characteristics <strong>of</strong> prisoners . un d er sen t en ce <strong>of</strong> death , United States, on Dec. 31, 196180604020!'DTE: See !'DTE, Figure 6" 12.(Percent a )o L----1~~~-------1~A~g~e~~r:~-l~~~~-----J~~~~--------~Race(In years)(N=838)~ercents may not add to 100 d~e ~o .~01~~1~~~· five American Indians and three Asi'lns.b The persons en')rnerated under ot er . hme t 1081 NCJ-86484• St f t'cs Ca'7ltal Pun' 5 n 7 ,Source: U.S. Depnrtment <strong>of</strong> <strong>Justice</strong>, BU'&fl <strong>of</strong> Jt;~~t p;. 16~, 76,8, 80. Figure constructed by(Washington, D.C.: U.S. Government Printing ce, ,SCl.RCEBOO< st<strong>of</strong>f.
- ,-. --~~- ~......--- -~--<strong>Sourcebook</strong> <strong>of</strong> <strong>Criminal</strong> <strong>Justice</strong> Statistic,s <strong>1983</strong>Agure 6.14 Prisoners under sentence <strong>of</strong> death, by prior felony history, United States, onDec. 31, 1981No priorfelonyconvictions-28%f\OTE: See /\OTE, Figure 6.12.(Percent; N=838)Not reported-19%Prior felonyconvlctlons-52%Source: U.S. Department <strong>of</strong> <strong>Justice</strong>, <strong>Bureau</strong> <strong>of</strong> <strong>Justice</strong> <strong>Statistics</strong>, Ca~ltal Punishment 1981,NCJ-86484 (Washingt"n, D.C.: U.S. Government Printing Office, <strong>1983</strong>), p. B. Figure constructeoby SOLRCEBOO< staff.iIj'tiPersons Under Correctional SupervisionTable 6.57 Prisoners received from court under sentence<strong>of</strong> death, by race, region, and jurisdiction, 1981Region and jurisdictionUnited StatesFederalStateNortheastMaineNew I-lampshireVermontMassachusettsRhode IslandConnecticutNew YorkNew JerseyPennsylvaniaNorth CentralOhioIndionaIllinoisMichiganWisconsinMinner·otaIowaMlssO'.JriNorth DakotaSouth DakotaNebraskaKansasSOllthDelowareMorylandDistrict <strong>of</strong>ColumbiaVirginiaWest VirginiaNorth CarolinaSouth CorolinaGeorgiaFloridaKentuckyTennesseeAlabamaMisslssl pplArkansasLouisianaOklahomaTexasWestMontanoIdahoWyomingColoradoNew Mexlf'oArizonaUtahNevadaWashingtonOregonCal:iarnlaAlaskaI-lawaiif\OTE: See !\oTE, Figure 6.12.(- represents zero)TotalWhite221:l 12422!l5XXXX5255IIXXXX7X2X141I7X5X5852448141312926572I284X40XX1243XXXX3722XXXX3XX77i3X3X3721246348714372I263X23XXBlackOther a100 41002XXXX21739XXXX4XIX634X2XII3122II9421218X16XXa The persons enumerated under "other" were threeAmerican Indians and :1lIne Asian.4XXXXXXXXXIXSource: U.S. Department <strong>of</strong> <strong>Justice</strong>, Burepu <strong>of</strong><strong>Justice</strong> <strong>Statistics</strong>, Capital Punishment 1981, NCJ-86484(Washington, D.C.: U.S. Government Printing Office,<strong>1983</strong>), pp. 24, 25. Table adapted by SOLRCEBOO< staff.XXI2XIXXI606ii607
<strong>Sourcebook</strong> <strong>of</strong> <strong>Criminal</strong> <strong>Justice</strong> <strong>Statistics</strong> <strong>1983</strong>Table 6.58 Prisoners received from court under sentence <strong>of</strong> death, by age, legal status at time <strong>of</strong> arrest, and region, UnitedStates, 1981lXlder 2020 to 24Iotal :tears l!ear~United States 228 13 59FederalState 228 13 59Northeast 5North Central 25 2 6SouthWest14157II 3716aThe person enumerated under theother" was on work release in Arizona.NJTE: See NJTE, Figul'e 6.12.(- represents zero)Legal status at arrest~geNotuoder seoteoce55lXldl:r ~e[] il:[]c!il --25 30 35 40 years NoOn Escapedto 29 to 34 to 39 to 54 and charges Charges probo- On from Impri- Not)!!ilar~ :tear~ )!egr~ )!egr~ older ~odi[]g ~[]di[]g t[g[] 119[011: Ilri~[] ~o[]ed Qtb!:[a r!:Il9[t!:g70 42 25 17 2 95 1/1 7 35 5 6 6570 42 25 17 2 95 14 7 35 5 6 65I 2 I I I I 26 6 2 3 19 3 344 21 16 10 2 64 9 4 31 5 5 2319 13 6 3 II I 3 I 40category "under sentence-Source: U.S. Department <strong>of</strong> <strong>Justice</strong>, <strong>Bureau</strong> <strong>of</strong> <strong>Justice</strong> <strong>Statistics</strong>, Capital Punishment 1981, NCJ-86484 (Washington, D.C.:Government Printing Office, <strong>1983</strong>), pp. 26-32. Table adapted by SCLRCEBOO< staff.U.S.'.4I\608
--I1
-------------------------------------------------------------.-----------------------_._,_. -'_"-Persons Under Correctional SupervisionTable 6.59 Movement <strong>of</strong> prisoners under sentence <strong>of</strong> death and status <strong>of</strong> death penalty statutes,by region and jurisdiction, 1981 l'
<strong>Sourcebook</strong> <strong>of</strong> <strong>Criminal</strong> <strong>Justice</strong> <strong>Statistics</strong> <strong>1983</strong>Table 6.60 Movement <strong>of</strong> prisoners under sentence<strong>of</strong> death, United States, 1968-81!\oTE: See !\oTE, Figure 6.12. Figures for 1977-80have been revised from those reported in Ca~italPunishment 1980, NPS Bulletin SD-NPS-C -9,December 198 I. In addition, as a result <strong>of</strong> a majorprocedural change regarding dispositions, the number<strong>of</strong> dispositions other thon e);ecution and the number<strong>of</strong> persons \i:1der sentence <strong>of</strong> deoth in 1976 andsubsequent yel1rs are not strictly comparable tocorresponding dtta for earlier yeors. See Source forfurther informotkln.Year1968196919701971197219731974ms19761977mo197919801981(- f'llpresents zero)DisposiReceived tions otherdeath thansentence execution1381431331138342166322249IS82071711972287885771023912425778317155150599777UndersentenceExecu- <strong>of</strong> deothtions on Dec. 312517575631642334134243487419lIZ I4785886S8838Source: U.S. Depr:rfment <strong>of</strong> <strong>Justice</strong>, <strong>Bureau</strong> 'lf<strong>Justice</strong> Stotistics, CapHal Punishment 198 I, NCJ-86484 (Washin(jton, D.C.: U.S. Government PrintingOffice, <strong>1983</strong>), p. 18. Table adapted by SOLRCEBOO
~~------r 'I,-<strong>Sourcebook</strong> <strong>of</strong> <strong>Criminal</strong> <strong>Justice</strong> <strong>Statistics</strong> <strong>1983</strong>Table 6.63 Prisoners removed from death row, b th d fY me a a removal, region, and jurisdiction, 1981NJTE: . Sec:: NJThE, Figure 6.12. This table identifies the legal or other event effectivelyterminating t e death sentence.Region and 'urisdictionUnited StatesFederalStateNortheastMaineNew HampshireVermantMassachusettsRhode IslandConnecticutNew YorkTotal7H7!lIXXX~.Jew Jersey XPennsylVaniaINorth Central 2OhioIndianaIIllinoisIMichiganXWisconsinXMinnesotaXIowaXMissouriNorth Dakota XSouth DakotaNebraskaKansasXSouth 58DelawareMarylandIDistrict <strong>of</strong> Columbia XVirginiaIWest Virginia XNorth Carolina 3South Carolina IGeorgiaIFlorida 18KentuckyTennessee 2AlabamaMississippiArkansas 4louisiana 2Oklahoma 3Texas 22WestMontanaIdahoWyomingColoradoNew MexicoArizonaUtahNevadaWashingtonOregonCaliforniaAlaskaI-bwaii173I253IXXSentencingprOVisions<strong>of</strong> Statestatutestruckdown a88XXXXXXXXXXXX853XXap . h'ersans In t IS category are subject to(- represents zero)ExecutionXXXXXXXXXXXXXXDeathotherthanexe'11-tion33XXXxXXXXXXJXX2XX<strong>of</strong> ye rsCapitolsentencevacatedConrnu- (conVictiontation c affirmed afurther administrative and legal steps before final iPp • •1515XXXXXXXXXX15X14XXX36IXXXXIIXXXXXX25XIXII13242I3I2IXXCapitalsentenceand convictiondvacateddisposition. This process could result for exompleh ersons. whose capitol sentence is vacatedin a conrnutatlan <strong>of</strong> sentence or in the vacation <strong>of</strong> ~r w ase capito! sentence and conviction aresentence with either affirmation or voidin <strong>of</strong> (acated are subJ7 c t .to further leg~1 proceedingsconvilfion (see footnote d for further di~cuSSio;).a~~~~~~ resant~~clln9f Ifh the conviction has. beenThe category "death other than execution" h or re r a I t e sentence and convictionincludes one death by suicide In Florida and tv'to d?ve b.~~n va~~~ to determine their ultimatedeaths due to natural causes in Texas ISP~hl Ion. I It er the vacating <strong>of</strong> the sentencecCormlUtation effects on irrmediC!te cha' nor e vacat ng <strong>of</strong> both sentence and convictionsentence from death to life imprisonment or ~~~r~~~~~~U!~~e~~~. possibility <strong>of</strong> reimposition <strong>of</strong> the(Wash:~;ce: DUeS: DU~arg:nt <strong>of</strong> Justic;:e,. Burea~ <strong>of</strong> <strong>Justice</strong> <strong>Statistics</strong>, Cattal Punishment 19111NCJ-86484on, ••• •• vernment Printing Office, <strong>1983</strong>), pp. 40, 43. To Ie adapted by SMCEBOO< st<strong>of</strong>f.1515.XXXXXXXXXX15IXX2I326XXheXXXXXXXXXXXXXXIiIII f! ;!I1Ik1! !! ;~iIIiIrIPersons Under Correctional SupervisionTable 6.64 Prisoners executed under civil authority, by region and jurisdiction, I 930-fllNJTE: In three States, Moine, Minnesota, and Wisconsin, the deathpenalty was abolished for the entire period covered by the table.Alaska and Hawaii have not had the death penalty since 1960, whenthey were first included as States. The death penalty was abolished inMichigan in 1963 and in Iowa and West Virginia In 1965. Death penaltylegislation expired in 1975 in North Dakota and was not renewed.Death penalty laws were found unconstitutional In New Jersey (1972),Kansas (1973), the District <strong>of</strong> Columbia (1973), Ohio (/'918), RhodeIsland (1979), and Massachusetts (1980) and have not been rewritten.Region and jurisdictionTotalUnited States 3,863Federal33State3,830Northeast60BMaineXNew H:nnpshire IVermont4Massachusetts27Rhode IslandConnecticut21New York329New Jersey74Pennsylvania152North Central404Ohio172Indiana42Illinois90MichiganWisconsinXMinnesotaXIowa18Missouri62North DakotaSouth DakotaINebraska4Kansas15South2,307Delaware12Maryland68District <strong>of</strong> Columbia 40Virginia92West Virginia40North Carolina 263South Carolina 162Georgia366Florida171Kentucky103Tennessee93Alabama135Mississippi154Arkansas118louisiana133Oklahoma60Texas297West511Montana6Idaho3Wyoming7Colorado47New Mexico8Arizona38Utah14Nevada30Washington47Oregon19Califor61ia292AlaskaI-bwali a XX1930 1935to to1934 1939776775155XI7280244110543II34XXI16XX419261581051376415IB1619262039254896I31627510I51XX8919882145XIII3731641113392027XX720524610520108030732931131412233199721004I9102313I57XX1940 1945 1950to to to1944 1949 19546457638110X65786154215213XX36341322631325032583819192934202463873I266359635XX639663374XI3536821643655XX49I22419219132296229722715:82126182373676723I57645XX(- represents zero)413640756X227819422028XXI5I52442315514165122!lI1415II14449652I22294439XXIn South Dakot'l, the death penal'iy was abolished In 1915, restored In1939, abolished again in 1977, and restored In 1979. Oregon abolishedthe death penally In 1914, restored it in 1920, abolished it again in1964, restored It In 1978, and it was found to be unconstitutional in1981. In the following States death penalty lows were foundunconstitutional but have been revised to meet constitutionalstandards: California, Colorado, Delaware, Illinois, Indiana, Kentucky,Maryland, Missouri, New Hampshire, New Mexico, North Carolina,Oklahoma, Pennsylvania, Tennessee, and Washington.1955to1959aAs States, Alaska and Howali are Included In the seriesbeginning Jan. I, 1960.Source: U.S. Deportment <strong>of</strong> <strong>Justice</strong>, <strong>Bureau</strong> <strong>of</strong> <strong>Justice</strong> <strong>Statistics</strong>, Capital Punishment 1981, NCJ-86484 (Washington, D.C.: U.S. GovernmentPrinting Office, 19!13), p. 15. Table adapted by SCLRCEBOO< st<strong>of</strong>f.304330151X5259121612XX21834I84510342787621713325512I64235XX1960 1965 1970to to to1964 1969 1974 1975 1976 1977 1978 1979 1980 19BI18118017XI103316712XX231026I81412II4109I529455I4I22I29XX1010X5XXXXI42X3XIXXXXXXXXXXXXXXXXXXXXXXX~XXXXXXXXXXXXXXXXXXXXXXXXXXXXXXXXXXXXXXXXXXXX22XXXXXXXXXXXXXxXXXXXXXXXXXXXXXXXXXXXXXXXXXX612
~~~-------------------------"" ....r-' I1! i)."<strong>Sourcebook</strong> <strong>of</strong> <strong>Criminal</strong> <strong>Justice</strong> <strong>Statistics</strong> <strong>1983</strong>Figure 6.15 Prisoners executed under civil authority, United States, 1930-81Number (Iolal 3.863)200100NJTE: See NJTE, Table 6.64.After 1967, a 10·year moratorium onexecutions ensued due to numerous1".1 ,h.Ion,,, 1""1h """.~ """~9~M~------------~1~9:~~·--------------1~9~~~'----------~~1~~~----~~~----1~9~70------------'~---~~1~~~cSource: U.S. Deportment <strong>of</strong> <strong>Justice</strong>, <strong>Bureau</strong> <strong>of</strong> <strong>Justice</strong> <strong>Statistics</strong>, Capitol Punishment 1981, NCJ-86484 (WashlngtlJn, D.C.:Government Printing Office, <strong>1983</strong>), p. 8, Figure a.U.S.\IIr!I.I,I !I I:1IPersons Under Correctlon
<strong>Sourcebook</strong> <strong>of</strong> Cril"":inal <strong>Justice</strong> <strong>Statistics</strong> <strong>1983</strong>Table 6.66 Prisoners executed under civil authClrity. by race, <strong>of</strong>fense, regIon, and jurisdiction, 1930-81 (aggregate)Region andjurisdictionU,ited StatesFederalStateNortheastMaineNew HampshireVermontMassachusettsRhode IslandConnecticutNew YorkNew JerseyPennsylvaniaNorth CentrGIOhioIndianaIllinoisMichiganWisconsinMinnesotaIowaMissouriNorth DakotaSouth DakotaNebraskaKansasSouthDelawareMa,ylan4Distrid <strong>of</strong>Col"mbiaVirginiaWest VirginiaNorth CarolinaSouth CarolinaGeorgiaFloridaKentuckyTennesseeAlabamaMississippiArkansasLouisianaOklahomaTexasWestMontanaIdahoWYomingColoradoNew MexicoArizonaUtahNevadaWashingtonOreganCaliforniaAlaska~HawaiiIIIeuIII~oTotal)\()TE: See )\()TE, Table 6.64.(- represents zero)White3,863 3,338 4SS 25 20 2S 1,755 1,668 4833 IS 2 2 6 81;;.c:.....oIIIeuIIIc:to28 10 2 2 6 8 3Black6 20 13 2,0(,6 1,630 405 193,8303,323 453 23 14 17 1,727 1,658 46 4 14 5 2,063 1,627 405 19608 606 2X X X X X XI I4 427 2721
- -.--Annotated list <strong>of</strong> sources and references<strong>Sourcebook</strong> <strong>of</strong> <strong>Criminal</strong> <strong>Justice</strong> <strong>Statistics</strong> 11I83Table 6.67 Female prisoners executed under civil authority, by <strong>of</strong>fense, race, andjurisdiction, \kIlted Stcites, I ~3ij-81!'-OTE:See !'-OTE, Table 6.64. /'-b females were executed in the years that are not listed.(- repres'ents zero)The following list <strong>of</strong> sources and references represents those publications containing data or Information used In Sa.RCEBOO
----------- - -- ~------~-------~------------------SourceboOk <strong>of</strong> CrImInal JustIce Stat/stlcs <strong>1983</strong>$c;urges and References,"Periodicity:Annual5O..RCEBOO< table:1.23ThIs report presents workload and performance statistIcs on bothcivil and criminal matters for each <strong>of</strong> the U.S. courts <strong>of</strong> appeals andeach <strong>of</strong> the 95 U.S. district courts. Data for the former lncludeappeals flied, terminated, pending; number <strong>of</strong> judgeships; types <strong>of</strong>appeals; nl..mber <strong>of</strong> opinions and percent reversed or denied; mediantime from filing to disposition; and other matters pertaining to theappellate courts. Data for the U.S. district courts Includes casesfiled, terminated, and pending; actions per Judgeship; medlC'1I time fromfiling to disposition; juror usage Index; and other matters related toactivities in U.S. district courts. As part <strong>of</strong> the pr<strong>of</strong>ile, each court Isranked on various dimensions. Two tables presenting the notionalpr<strong>of</strong>ile, for all U.S. Courts <strong>of</strong> Appeals and all U.S. District Courts onthe workload and performance measures are also Included.* * *Administrative Office <strong>of</strong> the United States Courts. Report onApplicatIons for Orders Authorizing or ApprovIng theInterception <strong>of</strong> Wire or Oral Conmunicatlons for the PeriodJanuary I, 1982 to December 31, 1982. Washington, D.C.:Administrative Office <strong>of</strong> the Lkllted States Courts, <strong>1983</strong>.Contents:I 09 pages, 13 tables, 2 appendicesDotes <strong>of</strong> data presented:Primary period: 1982Trend tables: 1972-82Periodicity:• AnnualSa..RCEBOO< tables:5.11-5.14Thi:s Is a report on the applications for orders authorizing a!'approving the interception <strong>of</strong> wire or oral comnunlcatlons, as requiredby Title 18, United States Code, Section 2519(1). There is adescription <strong>of</strong> the reporting requirements <strong>of</strong> the statute, regulationsfor filing reports, and sl.\1TT1Orles <strong>of</strong> the reports submitted by judgesand prosecuting <strong>of</strong>ficials. The tables In the body <strong>of</strong> the report Includedata on grants, denials, and authorized length <strong>of</strong> Intercept orders;<strong>of</strong>fenses for which court intercept orders were granted; types <strong>of</strong>locations <strong>of</strong> authorized interceptionsl nature <strong>of</strong> the intercept order;overage costs <strong>of</strong> the electronic surveillance; arrests and convictionsresulting from electronic surveillance; and a SlXTlTlar}' <strong>of</strong> authorizedintercepts from 1972 to the year <strong>of</strong> the report. The appendicescontain detailed data from reparts flied by Federal and State judgesand prosecuting <strong>of</strong>ficials on court-authorized electronic surveillanceactivities during the focal year and on arrests, trials, and convictionsas a result <strong>of</strong> intercepts installed during previous years.* * *Adninlstrative Office <strong>of</strong> the United States Courts. The United StatesCourts: A Pictorial Sunmary for the Twelve-Month PeriodEnded June 30, 1982. Washington, D.C.: Adnlnlstratlve Office <strong>of</strong>the United States Courts, 1982.Contents:22 pages, 8 tables, 16 figuresDotes <strong>of</strong> data presented:Primary period: year ending June 30, 1982Trend tables: years ending June 30, 1963-82Periodicity:Annual5O..RCEBCO< figures:1.5, 1.7, 5.4, 5.5, 6.2, 6.3The data presented In this report are from annual U.S. Courts <strong>of</strong>Appeals' and U.S. District Courts' work;oad statistics, compiled Inaccordance with 28 U.S.C. 604(0)(3).This pictorial s~ry provides a descrIption <strong>of</strong> the number <strong>of</strong>civil and criminal cases in the U.S. courb, grand and petit jurorutilization, court-appointed counsel, duties <strong>of</strong> the U.S. magIstrates,persons served by the Federal Probotion System, and the budget <strong>of</strong> theFederal judicIary.* * *Alderman, Jeffrey D.; Begans, Peter; and Cranney, LIndo A.News-Washington Post Poll. New York: ABC News.ABCDotes <strong>of</strong> data presented:See narratIvePeriodIcity: ,See narrativeSa..RCEBOO< tables:2.87, 2.88The ABC News-Washington Post Poll contains the results <strong>of</strong>opinIon surveys conducted by Chilton Research Services <strong>of</strong> Radnor,Pennsylvania, a ,5ubsldtory <strong>of</strong> American Broadcasting Company, Inc., forABC News and 'rhe Washington Post. There Is to be at least onemajor topical poll per mauth and frequent spot polls on current Issuesand trends. A brief note on sample size, sampling error, and surveydotes is included in each survey releas.e.* * *American Correctional Association. <strong>1983</strong> Directory <strong>of</strong> Juvenile andAdult Correctional Departments, Institutions, Agencies andParoling Authorities. College Pork, Md.: American CorrectionalAssociation, <strong>1983</strong>.Contents:431 pages, 13 tables, 2 figuresDotes <strong>of</strong> data presented:1982Periodicity:Annual5O..RCEBOO< tables:1.62, 6.45-6.48This directory describes the organization and administrativestructure <strong>of</strong> correctional services In all 50 States, the District <strong>of</strong>Colunbla, the Federal <strong>Bureau</strong> <strong>of</strong> Prisons, and the U.S. territories. Foreach jurisdiction, information Is provided on Institutions, paroleboards, and parole and probation services for both adults andjuveniles. Descriptive listings and addresses <strong>of</strong> the individualfacilities within each jurisdiction ore also provided.Summary statistics are provided on personnel, fiscalexpenditures, correctional populations, paroling authorities, types <strong>of</strong>facilities, and the death penalty. In addition, information Is providedon the U.S. Department <strong>of</strong> <strong>Justice</strong>, military correctional facilities, andthe Canadian correctional system. Jails and county departments <strong>of</strong>c'Jrrectlons are not included in this report.* * *Berkson, Lorry C.; Beller, Scott; and Grimaldi, Michele. JudicialSelection in th..: United States: A Compendium <strong>of</strong> Provisions.Chicago: American Judicature Society, 1980.Contents:181 pages, 12 tablesDotes <strong>of</strong> data presented:1980Perlodiclty:SpecialSa..RCEBOO< tables:1.33-1.35This document describes the methods by which Judges areselected In the 50 States and the District <strong>of</strong> Columbia. The bookbegins with a historical review <strong>of</strong> judicial selection in the UnitedStates. It then provides a discussion <strong>of</strong> trends in selection proceduresat the State level, and contemporary changes in the processes <strong>of</strong>selecting Federal judges. A survey <strong>of</strong> State statutes collected data for1980. Data are presented on the selection and retention process forState supreme court justices; Intermediate appellate judges; andgeneral, limited, and special jurisdiction trial court judges. Currentprovisions for selecting judges through commission plans, partisanelections, and nonpartisan elections are also presented in tabularfashlpn. The book concludes with a Stote-by-State presentation <strong>of</strong>relevant statutory citations and their texts.* * *Bronstein, Julie N. Survey <strong>of</strong> State Mandatory Judicial EducationRequirements. Washington, D.C.: The America!) University, :981.Cantents:79 pages, 5 tables, 2 appendicesPeriodicity:SpecialSa..RCEBOO< table:1.30This report presents the results <strong>of</strong> a 1980-81 telephone survey <strong>of</strong>State judicial education <strong>of</strong>ficers or State court administratorsconcerning the extent and nature <strong>of</strong> mandatory State Judicialeducation requirements. Information Is presented on types <strong>of</strong> requirededucational programs, Judicial participation requirements, and thesource <strong>of</strong> the educational mandate. The appendices provide a list <strong>of</strong>survey respondents, and a sampling <strong>of</strong> rules, orders, and Stateconstitutional prOVisions that require judicial education.* * *Comptroller General <strong>of</strong> the United States. Report to the Congress:Stronger Crackdown Needed on Clandestine LaboratoriesManufacturing Dangerous Drugs. Washington, D.C.: U.S.General Accounting Office, 1981.Contents:44 pages, II tables, i figure, 3 appendicesDotes <strong>of</strong> data presented:1975-80Periodicity:SpecialSa..RCEBOO< figure:4.19This report assesses whether the Federal Government Ismounting on effective attock on illicitly manufactured dangerousdrugs. The report examines the penaltl~s available to those who areconvicted <strong>of</strong> manufacturing and trafficking In dangerous drugs. Waysin which the Drug Enforcement Administration could be more effectiveIn dealing with the problem <strong>of</strong> the illicit manufacture <strong>of</strong> dangerousdrugs are discussed. Appendix I outlines the criteria by which drugsare classified. Appendix 2 presents data on illicit laboratory seizuresfor 1975-80. Appendix 3 consists <strong>of</strong> a response to this report fromthe U.S. Deportment <strong>of</strong> <strong>Justice</strong>.* * *Conference <strong>of</strong> State Court Administrators and Nltional Center forState Courts. State Court Organization 1980. U.S. Department<strong>of</strong> <strong>Justice</strong>, <strong>Bureau</strong> <strong>of</strong> <strong>Justice</strong> <strong>Statistics</strong>. Washington, D.C.: U.S.Government Printing Office, ! !182.Contents:537 pages, 36 tables, 106 figures, 3 appendicesDotes <strong>of</strong> data presented:1980Periodicity:SpecialSa..RCEBOO< tables:1.27, 1.36• This document, containing Information on State courtorganization as <strong>of</strong> Jon. I, 1980, Is the product <strong>of</strong> a cooperative effort<strong>of</strong> the Conference <strong>of</strong> State Court Administrators and the NltionalCenter for State Courts and funded by the <strong>Bureau</strong> <strong>of</strong> <strong>Justice</strong><strong>Statistics</strong>. Data are presented on the organizational, financial, andpersonnel characteristics <strong>of</strong> court systems <strong>of</strong> the fifty States, theDistrict <strong>of</strong> Colunbla, Puerto Rico, American Samoa, the Virgin Islands,and Guom. Data contained In this volt.me were collected directly fromeach State court administrative <strong>of</strong>fice as well as from other,Independent sources. The three appendices present a listing <strong>of</strong> theState court administrators conSUlted by the Source concerning theaccuracy and completeness <strong>of</strong> the data, the data collectioninstruments, and a glossary <strong>of</strong> terms. This document is Intended toserve as a companion volume h) the State Court Case load<strong>Statistics</strong>: Annual Report series that contains court case load datafrom most <strong>of</strong> these some jurisdictions.* * *Contact, Inc. Corrections Compendium. Lincoln, Neb.: Contact, Inc.CootentslSee narrativeDotes <strong>of</strong> data presented:See narrativeSa..RCEBOO< tables:1.60, 1.61, 6.38The Corrections Compendium Is a manthly publication focusing onIssues In the area <strong>of</strong> corrections. Regular features <strong>of</strong> the CorrectionsCompendium Include sections on court decisions, legislation, specialI nterest Items, criminal justice publications, women In corrections, andupcoming events. Each Issue also carries a specIal chart on a selectedIssue (e.g., April <strong>1983</strong>, volunteer programs In correctional Institutions).* * *Cooper, Coraline S.; Kelley, Debra; and Lorson, Sharon. Judicial andExecutive Discretion In the Sentencing Process: Analysis <strong>of</strong>State Felony Code Provisions. Washington, D.C.: The AmericanUniversity, 1982.Contents:215 pages, 5 tables, 2 appendicesDotes <strong>of</strong> data presented:1981Periodicity:SpecialSa..RCEBOO< tables:1.70-1.72This report describes State statutory prOVisions regardingsentencing process decisions. Included are discussions <strong>of</strong> felonysentencing and habitual crimInal sentence enhancements, sentencingprOVisions regarding the use and possessIon <strong>of</strong> firearms or other deadlyweapons, and statutory provisions affecting parole eligibility andsentence reductions. The report also examines the differencesbetween Indeterminate and determinate sentencing structures. Finally,there Is a review <strong>of</strong> statutory provisions pertaining to judicial andexecutive discretion In sentencing decisions. The appendices containa literature review and a list <strong>of</strong> acknowledgments.* * *The Council <strong>of</strong> State Governments. The Book <strong>of</strong> the States 1982-83. Lexington, I
<strong>Sourcebook</strong> <strong>of</strong> <strong>Criminal</strong> <strong>Justice</strong> <strong>Statistics</strong> <strong>1983</strong>Sources and ReferencesFolan, Rita. Status <strong>of</strong> Offender Based Transaction <strong>Statistics</strong>(OBTS) System Development in the States. Washington, D.C.:<strong>Criminal</strong> <strong>Justice</strong> <strong>Statistics</strong> °Association, Inc., 1981.Contents:129 pages, 23 tables,' 20 figures, 3 appendicesDates <strong>of</strong> data presented:1980 and 1981Periodicity:SpecialSOlRCEBOO< table:1.83The report pre!!:lnts results <strong>of</strong> a survey <strong>of</strong> directors <strong>of</strong> StateStatistical Analysis Centers (SAC). The survey was designed to assessthe status <strong>of</strong> the development <strong>of</strong> <strong>of</strong>fender based transaction statistl cs(OBTS) systems and to determine the level <strong>of</strong> analysis reasonablyexpected <strong>of</strong> the current or planned data. Topics addressed In thereport are: an overview <strong>of</strong> <strong>of</strong>fender based statistics systems, by State;the development and use <strong>of</strong> <strong>of</strong>fender based statistics, by State; quality<strong>of</strong> OB TS system data; and examples <strong>of</strong> OBTS systems in Oregon, NewYork, and Pennsylvania. The appendic:es include a copy <strong>of</strong> the surveyinstrument, Puerto Rico's response to the survey, and a listing <strong>of</strong> thecategories <strong>of</strong> OBTS system development used throughout the report.* * *Gallup, George H. The Gallup Poll. Princeton, N.J.: The C.gl/up Poll.Contents:See narrativeDotes <strong>of</strong> data presented:See narrativePeriodicity:See narrat iveSOlRCEBOO< tables:2.20, 2.72, 2.85, 2.92, 2.96, 2.98, 2.112, Fig. 2.10, Fig. 2.15, Fig.2.19The results <strong>of</strong> public opinion research condJcted by the Gal/uporganization are released every Sunday and Thursdu!, in The GallupPall. A wide variety <strong>of</strong> topics are included in these surveys includingeconomic policy, fear <strong>of</strong> crime, and the legalization <strong>of</strong> marihuana. Abrief note on sample size, sample tolerance, and survey dates isincluded in each release.* * *Gal/up, George H. The Gallup Report. Princeton, N.J.: The GallupPoll.Contents:See narrativeDates <strong>of</strong> daola presented:See naf nit i vePeriodicity:Monthly5O.RCEBOO< tables:2.2, 2.4-2.6, 2.14-2.16, 2.20, 2.21, 2.35, 2.50, 2.61, 2.66, 2.69-2.", 2.73-2.80, 2.82, 2.83, 2.86, 2.92, 2.95, 2.97-2.99, 2.110,2.1 II, 3.37, 3.38, Fig. 2.I-Fig. 2.3, Fig. 2.18The Gallup Report contains the results <strong>of</strong> opinion surveysconducted by the Gal/up Poll. Political, social, and economic trendsare presented in issues that include many topics (e.g., April 1981-presidential safety, crime, political parties, and EI Salvador). A briefnote on sample size, sampling toleronce, and survey dates is Includedin eoch issue.* * *Gaynes, Elizabeth. "Typology <strong>of</strong> State Laws Which Permit theConsideration <strong>of</strong> Danger in the Pretrial Release Decision." PretrialServices Resource Center, 1982. (Mimeographed.)Contents:32 pages, I table, 6 appendicesDates <strong>of</strong> data presented:1982Periodicity:Special5O.RCEBOO< table:1.69622This report describes State constitutional requirements, statutes,and court rules regarding the consideration <strong>of</strong> potentially dangerous orcriminal behavior in pretrial release decisions, The appendices containconstitutional and statutory provisions relating to pretrial release, acopy <strong>of</strong> the Bail Reform Act <strong>of</strong> 1966, and performance standards andgoals for release and diversion.* * *Harris, Louis. The Harris Survey. Ne", York: The Chicago TrlbuneNew York News Syndicate.Contents:See narrative:Dates <strong>of</strong> data presented:See narrativePeriodicity:See narrativeSOlRCEBOO< tables:2.54, 2.68, 2.102-2.105, Fig. 2.8, Fig. 2.9, Fig. 2.11, Fig. 2.14,Fig. 2.17The Harris Survey is a twice weekly release <strong>of</strong> results <strong>of</strong> publicopinion research conducted by Louis Harris and Associates. Thereleases deal with a variety <strong>of</strong> topics including politics, economics,gun control, and law enforcement. A brief note on sample size andsurvey dates is Included in each release.* * *Insurance Information Institute. Insurance Facts 1982-83. NewYork: Insurance Information Institute., 1982.Contents:92 pages, 83 tables, 8 figuresDates <strong>of</strong> data presented:Primary period: 1981Trend tables: 1950-81Periodicity:AnnualSOlRCEBOO< figure:3.23This yearbook provides basic data on the property and liabilitysegment <strong>of</strong> the insurance industry in the United States. Statisticaldata are presented on property and liability insurance companies;policies written and in force, by type <strong>of</strong> coverage; and Insurancewritten through special programs such as flood insurance, the FederalCrime Insurance Program, and others. Data are presented oninsurance losses due to fire, natural disasters, traffic accidents, crime,and other causes.* * *Johnston, Lloyd D.; Bachman, Jerald G.; and O'Mal/ey, Patrick M.Student Drug Use, Attitudes and Beliefs, National Trends1975-1982. U.S. Department <strong>of</strong> Health and Human Services.National Institute on Drug Abuse. Washington, D.C.: U.S.Gavernment f'rinting Office, <strong>1983</strong>.Contents:134 pages, 19 tables, 37 figuresDates <strong>of</strong> data prel'llnted:Primary period: 1982Trend tables: 1975-82o Periodicity:AnnualSOlRCf:Soa< tables:2. I 06-2.1 08, 3:45-3.48, Fig. 3.18This document is the sixth in an annual series reporting drug useand related attitudes <strong>of</strong> high schaol seniors in the United States. Thereport presents only highlights <strong>of</strong> the larger volOOle that has beenpubJished by the National Institute on Drug Abuse, entitled StudentDrug Use in America: J 975- J 982. Two <strong>of</strong> the major topics treato:>dIn the report are the trends in drug use among Pmerican high schoolstudents since 1975 and the prevalence <strong>of</strong> drug use among />merlcanhigh school seniors. Also reported are data an school grade at firstuse; intensity <strong>of</strong> "high" produced by drug use; attitUdes and beliefsamong seniors about various types <strong>of</strong> drug use; and their perceptions <strong>of</strong>cel·tain ralevant aspects <strong>of</strong> the social enVironment, such as parentaldisapproval <strong>of</strong> drug use or availability <strong>of</strong> drugs.* * *Karter, Michael J. Jr. "Fire Loss In the United States During 1981."Are Journal 76(September 1982), p. 68.\\ 'I1II1 ;! I! IContents:16 pages, II tables, 4 figuresDates <strong>of</strong> data presented:Primar)' period: 1981Trend tables: 1977-81Periodicity:Annual5O.RCEBOO< table:3.94This article reports the results <strong>of</strong> the 1981 National FireExperience Survey conducted by the National Fire ProtectionAssociation. Data are presented that describe fire incidence, deaths,and property lass, by fire type (s~ructural, vehlcul,ar, and arson),conmunity size, and geographiC region. ,A methodological addend.urn tothe article details the sampling and estimation procedures used In thesurvey.* * *Kerle Kenneth E., and Ford, Francis R. The State <strong>of</strong> Our Nation'sJdils 1982. Washington, D.C.: National Sheriff's Association, 1982.Contents:233, pages, SO tables (estimated)Dates <strong>of</strong> data presented:Primary period: 1981-82Trend tables: 1800-1980 (decades)Periodicity:SpecialSOlRCEBOO< tables:1.50-1.56, Fig. 1.9This report presents sunmary analyses <strong>of</strong> the legal problems <strong>of</strong>jails, jail administration, physical d~scriptio.ns <strong>of</strong> jails! jail staffing,inmate populations, programs and servIces available to Inmate,s" andmost important problems facing jails. Data are presented for JaIls <strong>of</strong>different sizes. .The report also discusses survey methodology a~d al!e!natlvedefinitions <strong>of</strong> jails, presents sl.mmOry data on selected cIty Jails, andincludes a copy <strong>of</strong> the survey instrument.* * *Miller Judith Droitcour. National Survey on Drug Abuse: MainFI~dings 1982. U.S. Department <strong>of</strong> Health an(j HOOlan Services.National Institute on Drug Abuse. Washington, D.C.: U.S.Government Printing Office, 1982.Contents:141 pages, 80 tables, 6 appendicesDates <strong>of</strong> data presented:Primary period: 1982Trend tables: 1971, 1972, 1974, 1976, 1977, 1979 and 1982Periodicity:SpecialSQRCEBOO< tables:3.49-3.55, Fig. 3.19This report Is the seventh In a series <strong>of</strong> reports on the extent <strong>of</strong>drug abuse In the United States. The document presents informationon the prevalence, InCidence, and correlates <strong>of</strong> drug use and abuseamong adults (26 and older), young adults (/8 to 25), and youth (12 to17). Data are presented in such areas as the use <strong>of</strong> marihuana,hallucinogens, cocaine, and heroin; the medical and nonmedical use <strong>of</strong>prescription psychotherapeutic drugs; and the IJse <strong>of</strong> cigarettes andalcohol. Trend tables present comparison d
--------~~--- --- --~--- --------National Opinion Research Center. General Social Surveys 1972-82. Storrs, Conn.: Roper Public Opinion Research 'CenterU,lverslty <strong>of</strong> Connecticut, distributors.'Contents:See narrativeDates <strong>of</strong> data presented:1972-78, 1980, and 1982Periodicity:Biennial5aRCEBCXlK tables:2.23, 2.52, 2;53, 2.62-2.64, 2.89~2.91, 2.93, 2. 109, 2.113, 2.1 14,3.44, 4.19, Fig. 2.7, Fig. 2.12, Fig. 2.16, Thi~ clXllulativ: dota file merges all eight General Social SurveysInto, a single :nochlne-readable data file with each survey year as asubfile. In,tervlews "'ere conducted by the National Opinion ResearchCenter dunng Februu.y, March, and April <strong>of</strong> 1972-78 1980 and 1982The d~ta are derived from a nafional probability sa~ple df English~speaking ad~lts, 18 y:arr or older, living in non-institutionalarrongements In t~e contlnen!al !Jnited States. Survey questionsrel,a!ed to a vane,ty <strong>of</strong> ,social Issues, including politics, abortion,reli?lon, homosexuality, cnme, law enforcement guns and capitalpunishment. ' ,The items appearing on the surveys are one <strong>of</strong> three types'permanent questions that occur in each survey, rotating questions thatapp:ar two out <strong>of</strong> every three years, and a few questions that occur Ina Single survey. A comprehensive codebook entitled General SocialSurveys, 1~72-1?~2: Cumulative Codebook is published by theRoper Public Opinion Research Center. Survey methodology and thedata program are explained In detail in the document.* * *''Opinion Roundup." Public Opinion. Washington, D.C.: AmericanEnterprise Institute.Contents:See narrativeDates <strong>of</strong> data presented:See narrativePeriodicity:See narrativeSCXRCEBCXlK table:2.19, ,.''Opinion Ro~ndup" is a monthly feature <strong>of</strong> Public Opinion. The~lnlOn Roundup, pre~e,nts data on a a variety <strong>of</strong> topics reprintedom, sever? I ,public Opinion survey sources. For example, one issue <strong>of</strong>~,b!IC, Opinion ,presents data on volunteerism, public values, privateInitiative, environmental issues, and politics. These data wereexcerpted from reports by the Gallup OrganiZation Research andForecasts, the Roper organization, Louis Horris onl Associates andothers. ,* * *Paez, Adolpho L. ~riminal Victimization in the U.S. U.S.Department <strong>of</strong> <strong>Justice</strong>. <strong>Bureau</strong> <strong>of</strong> <strong>Justice</strong> <strong>Statistics</strong>. TechnicalReport NCJ-87577. Washington, D.C.: U.S. Department <strong>of</strong> <strong>Justice</strong>March <strong>1983</strong>. ,Contents:7 pages, 9 tables, 3 figuresDates <strong>of</strong> data presented:Primary period: 1980 and 1981Trend tables: 1973-81Pl!riodicity:Special5aRCEBOO< tables:3.33, 3.34U. This report presents information on criminal victimization in theI nlted States using National Crime Survey (NCS) data from 1980 and981 based on popUlation figures derived from the 1980 census Datapresented in this report inc;ude levels and rates <strong>of</strong> victimiZation forpersonal and household crimes and police reporting rates for personaland househo!d crimes. for 1980 and 1981. Changes In victimiZationrhtes a~d police reporting rates for personal and household crimes fort / ~enod 1973 through 198 I are also presented. The second sectiono t e report discusses and compares the changes in victimizationI~ve Is and rates When the 1970 census figures and the 1980figures are used in the estimation procedure.census<strong>Sourcebook</strong> <strong>of</strong> <strong>Criminal</strong> <strong>Justice</strong> <strong>Statistics</strong> <strong>1983</strong>624"The Plague <strong>of</strong> Violent Crime." Newsweek. Mar. 23, 1981, pp. 46-50,52, 53-54.Contents:8 pages, 12 tables, I figureDates <strong>of</strong> data presented:Primary period: 1981Trend tables: 1972, 1975, and 1980Periodicity:SpecialSCXRCEBCXlK tables:2.34, 2.51, 2.56, 2.101This article reports the results <strong>of</strong> a Newsweek Poll conductedb>: the Gallup Organization, dealing with attitudes to~ard fear <strong>of</strong>~nme, rates <strong>of</strong> criminal Victimization, and the crime rate. AlsoInclude~ In t,he survey were questions concerning approval <strong>of</strong> methods<strong>of</strong> ~eallng With crime, sentencing, and levels <strong>of</strong> confidence in thepolice and the courts. The article also presents crime rates based onfid:deral Bu~e?u <strong>of</strong> Investigation data for seven large, geographically_Ispersed cities for the years 1972, 1975, and 1980.* * *Police ~xecutive Res.earch Forum and Police Foundation. Survey <strong>of</strong>Poll~e Operational and Administrative Practices-1981.Washln~ton, D.C.: Police Executive Research Forum PoliceFoundation, 1981.'Contents:633 pages, 100 tables (estimoted), I appendixDates <strong>of</strong> data presented:1981Periodicity:See narrativeSCXRCEBCXlK table:1.15• TI:e 19~1 edition <strong>of</strong> the Survey <strong>of</strong> Police Operational andAdministrative Practices is the most recent in a series <strong>of</strong> periodicrep?rts that present data describing police agency personnel policiespolice budgets, resource allocation, firearms incidents service colis'and other ~dministrative activities. The data are pre~ented in tw~form~ts. First, summar,>' data are presented for agencies according tothe size <strong>of</strong> the population served, and, where pas sible, by region <strong>of</strong> thecount? Sec~nd, detailed data are presented for each <strong>of</strong> the~espondlng agencies. The appendix lists the agencies that participatedIn the survey.* * *Research. and For:casts, Inc. The Flggie Report an Fear <strong>of</strong> Crime'Amerrca Afraid. Willoughby, Ohio: Figgie International Inc., 1980:Contents:163 pages, 117 tables, 6 figures, 3 appendicesDates <strong>of</strong> data presented:1980Perie,dicity:SpecialSO .... RCEBCXlK tables:2.9,2.11,2.17,2.18,2.57,2.67, Fig. 2.4-Fig. 2.6This re~ort presents the results <strong>of</strong> a 1980 telephone survey <strong>of</strong>adults on their attitudes, and experiences regarding fear <strong>of</strong> crime andlhe consequences <strong>of</strong> that fear on their daily living. Data are pres~ntedrelevant to the fo!lowing areas <strong>of</strong> interest: (I) precautions taken Inresponsle) to fea(r)<strong>of</strong> crime; (2) types <strong>of</strong> fear <strong>of</strong> crime (specific andgenera ; and 3 ~ttltudes about criminal justice.d !h: appendices Includes a copy <strong>of</strong> the survey instrument, escnptlon ~f the sampling method, data analysis, and co sit~Indbl~bes used In the data presentation. Also included as an appe~x isa I 1I0graphy <strong>of</strong> literature on crime.* * *Roper, ~eah Eve Lie!>er. "Law Enforcement Selection Requirements: ANI atlonal AnalYSIS." Ph.D. dissertation, Sam Houston U,lverslty981. ,Contents:181 pages, 52 tables, 2 appendicesDates <strong>of</strong> data presented:Prlmory period: 1981Trend tables: 1970, 1972, and 198111it~~IIf:Iij 'I, !/1ilIIi11i,j\ /l.I IiIII!tiIJ'rPeriodicity:Special5aRCEBCXlK tables:1.17, 1.18This report provides a summary <strong>of</strong> law enforcement selectionrequirements and procedures, and Identifies trends In selectioncriteria. Data are presented on requirements for age, vision, hearing,physical agility, work performonce, residency, and criminal recordrestrictions for State, county, and municipal law enforcement agenciesemploying 100 or mare sworn police <strong>of</strong>ficers. Use <strong>of</strong> Intelligence andother qualifying tests, polygraph tests, psychological tests, and types<strong>of</strong> oral Interviews are also discussed. The two appendices contain acopy <strong>of</strong> the survey instrument and data describing the responsepattern, by State.* * *Securities and Exchange Commission. Annual Report <strong>of</strong> the SEC forthe Fiscal Year Ended September 3D, 1981. Washington, D.C.:U.S. Government Printing Office, 1982.Contents:165 pages, 45 tables, 6 figures, I appendixDates <strong>of</strong> data presented:Primory period: fiscal year 198 ITrend tables: fiscal years 1935-80Periodicity:Annual5aRCEBCXlK figure:5.12This forty-seventh annual report <strong>of</strong> the Securities and ExchangeCommission (SEC) is divided into nine sections. These sections are(I) regulation <strong>of</strong> the securities markets, (2) the disclosure system, (3)investment companies and advisors, (4) enforcement program, (5)programmatic litigalion and legal work, (6) public utility holdingcompanies, (7), corp/.)rate reorganizations, (8) administration andmonagement, and (9) statistical appendix.Of special relevance to criminal justice is the narrative sectionon enforcement detailing the responribilities <strong>of</strong> the SEC and providingillustrative case histories, and the statistical section on enforcementthat presents data about types <strong>of</strong> authorized proceedings,investigations, administrative proceedings, Injunctive actions, andcriminal proceedings.* * *Smith, Robert Ellis. Compilation <strong>of</strong> State and Federal PrivacyLaws 1981. Washington, D.C.: Privacy Journal, 1981.Contents:80 pages, I table, I appendixDate's <strong>of</strong> data presented:1980Periodicity:See narrat i veSCXRCEBCXlK table:1.73This report updates an earlier report on State and Federal lawsrelating to privacy. These laws are grouped and summarized byseveral major categories. They include: arrest records, bank records,Information systems, government data banks, employment records,medical records, school records, tax records, Social Security numbers,wiretaps, privileged communications, the use <strong>of</strong> polygraph inemployment, privacy statutes and State constitutions, andmiscellaneous problems such as special laws applying to pown shopsand preclnC't registers. The appendix includes a compilation <strong>of</strong>applicable State laws giving the title, article, chapter or sectioncitation, and a brief summary <strong>of</strong> the legislation; and the full texts <strong>of</strong>selected representative statutes.* * *Sn)'der, Howard N.; Finnegan, Terrence A.; 'md Hutzler, John L.Delinquency 1980: A Description <strong>of</strong> Delinquency CasesProcessed by Courts with Juvenile Jurisdiction. Pittsburgh:National Center for Juvenile <strong>Justice</strong>, 1982.Contents:118 poges, 92 tables, 14 figures, 3 appendicesDates <strong>of</strong> data presented:Primary period: 1980'Trend tables: 1975-80Sources and ReferencesPeriodicity:Annual5aRCEBCXlK tables:5.4-5.10This report presents 1980 national estimates <strong>of</strong> delinquency casesdisposed <strong>of</strong> by courts with juvenile jurisdiction. Analysis <strong>of</strong> the data Isgenerally by demographic characteristics <strong>of</strong> the juvenile <strong>of</strong>fender andlegal characteristics <strong>of</strong> the case (e.g., age, race, sex, source <strong>of</strong>referral, detention status). All data are presented in aggregate formonly. Appendix A describes the statistical procedures used to generatethe national estimates and discusses some limitations <strong>of</strong> the results.Appendix B is a glossary <strong>of</strong> terms used in the data research effort.Appendix C displays the bivariate relations~ips among selectedvariables in the report.* * *Sultan, Cynthia G., and Townsey, Roi D. A Progress Report onWomen in Policing. Washington, D.C.: Police Foundation, 1981.Contents:100 pages, 99 tables, 4 appendicesDates <strong>of</strong> data presented:Primary period: 1979Tr".,d tables: selected years 1944-1979Periodicity:Special5aRCEBCXlK table:1.16This report reviews the history <strong>of</strong> women in policing andpresents sumnery data developed from a national survey <strong>of</strong> State andmUnicipal police departments serving populations larger than 50,000.Five case studies are highlighted, focusing on women in Washington,D.C., Miami, Houston, Detroit, and Denver. Data from the survey arepresented by race, region, and size <strong>of</strong> population served. The numberand percentage <strong>of</strong> women police <strong>of</strong>ficers, assignment <strong>of</strong> women police<strong>of</strong>ficers to police department tasks, and police employee eligibility andselection criteria are also examined. The narrative concludes with 12recommendations concerning police department hiring and promotionalpractices thought to unfairly restrict women in police occupotions.The four appendices contain the interviuw pool used in the casestudies, an index <strong>of</strong> principal litigation and legislation affectingemploYlnent <strong>of</strong> WClmen in police departments, detailed case studypresentations, and a copy <strong>of</strong> the moil questionnaire.* * *U.S. Department <strong>of</strong> Education. National Center for Education<strong>Statistics</strong>. Discipline, Order and Student Behavior inAmerican High Schools. Washington, D.C.: U.S. GovernmentPrinting Office, 1982.Cilntents:202 pages, 80 tables, 10 figures, 2 appendicesDates <strong>of</strong> data presented:1980Periodicity:SpecialSCXRCEBCXlK tables:3.42, 3.43This report presents the results <strong>of</strong> a survey <strong>of</strong> U.S. high schoolseniors and sophomores conducted for the National Center forEducation <strong>Statistics</strong> by the National Opinion Research Center at theUniversity <strong>of</strong> Chicago. This survey represents the first wave <strong>of</strong> anongoing longitudinal study '<strong>of</strong> high school seniors and sophomores.Information was also obtained from school administrators, a sample <strong>of</strong>parents <strong>of</strong> seniors and sophomores, and teachers. Topics covered inthe report Include information on sampling procedures; theoreticalperspectives on mlsbehav~or in high schools; reported misbehavior byhigh school students; and student misbehavior and the disciplinaryclimate <strong>of</strong> the high school. Appendices provide definitions <strong>of</strong> variablesand an examination <strong>of</strong> non response bias. References are included.* * *U.S. Department <strong>of</strong> Health and Hunan Services. National Institute onDrug Abuse. Annual Data 1981, Data from the ClientOriented Data Acquisition Process (CODAP). Statistical SeriesE, No. 25. Washington, D.C.: U.S. Government Printing Office,1982.Contents:388 pages, 389 tables, 3 appendices
~"--------'~.---Sources and Refere,lcesDates <strong>of</strong> data presented:1981Periodicity:AnnualSOLRCEBOO< tables:6.9-6.12This report presents data callected by the National Institute onDrug Abuse (NIDA) on clients admitted to or discharged fromfederally-funded drug abuse treatment centers during 1981, usi ng theClient Oriented Data Acquisitian Process (CODAP) system. Thecontent <strong>of</strong> this report facuses on displaying pertinent relationshipsamong variables, including the race, sex, age, marital status,employment status, education, and frequency <strong>of</strong> drug abuse. Detailedanalysis is presented for the demographic variables according to theparticular type af drug abused. For example, one section presentstables on the clients who were admitted because <strong>of</strong> heroin problems;similar sections report on clients who abused other opiates, alcohol,marihuana, barbiturates, tranquilizers, other sedatives, amphetamines,cocaine, hallucinogens, and PCP. The first appendix presents excrnples<strong>of</strong> CODAP forms; the second is a glossary <strong>of</strong> terms; and the thirdpresents an overview <strong>of</strong> CODAP data for 1981 from drug abusetreatment programs funded by NIDA.* * *U.S. Department <strong>of</strong> <strong>Justice</strong>. <strong>Bureau</strong> <strong>of</strong> <strong>Justice</strong> <strong>Statistics</strong>. CapitalPunishment 1981. National Prisoner <strong>Statistics</strong> BUlletin NCJ-86484. Washington, D.C.: U.S. Government Printing Office, <strong>1983</strong>.Contents:97 poges, 33 tables, 7 figures, 4 appendicesDates <strong>of</strong> data presented:Primory period: 1981Trend tables: 1930-81Periodicity:AnnualSOLRCEBOO< tables:6.56-6.67, Fig. 6.12-Fig. 6.16<strong>Sourcebook</strong> <strong>of</strong> <strong>Criminal</strong> <strong>Justice</strong> <strong>Statistics</strong> <strong>1983</strong>This report, one <strong>of</strong> the National Prisoner <strong>Statistics</strong> series,pro vi des inforrn;:!tion on persons under sentence <strong>of</strong> death in calendaryear 1981, persons removed from death row, executions carried outduring the period 1930-81, and recent trends in the evolution <strong>of</strong>capital punishment legislation. Information on <strong>of</strong>fenders includes age,race, sex, <strong>of</strong>fense for which sentenced, marital status, level <strong>of</strong>educational attainment, and legal status at time <strong>of</strong> arrest. Data onpersons removed from death row refer to the various alternativedispositions that are available. The appendices present tabular data, acopy <strong>of</strong> the survey instrument, a discussion <strong>of</strong> the survey methodology,and a jurisdictional listing <strong>of</strong> the status <strong>of</strong> death penalty statutes, as<strong>of</strong> Dec. 31, 1981.* * *U.S. Department <strong>of</strong> <strong>Justice</strong>. <strong>Bureau</strong> <strong>of</strong> <strong>Justice</strong> <strong>Statistics</strong>.Expenditure and Employment Data for the <strong>Criminal</strong> <strong>Justice</strong>System 1971-79.Contents:See narrativeDates <strong>of</strong> data presented:See narrativePeriodicity:See narrativeSo...RCEBOO< tables:1.1-1.8, 1.11, 1.19, 1.20, 1.25, 1.26, 1.39, 1.40, Fig. I. I-FIg. 1.3This survey <strong>of</strong> criminal justice expenditure and employment inthe United States is conducted annually by the U.S. <strong>Bureau</strong> <strong>of</strong> theCensus for the U.S. Department <strong>of</strong> JUstice, <strong>Bureau</strong> <strong>of</strong> <strong>Justice</strong><strong>Statistics</strong>. In general, six categories <strong>of</strong> criminal justice activities arecovered: police protection, judicial, legal services and prasecution,public defense, corrections, and other. Data are also collected foreach <strong>of</strong> three levels <strong>of</strong> government: Federal, State, and local. Publicexpenditure data are for fiscal years 1971-79 and employment data arefor October 1971-October 1979.* * *U.S. Department <strong>of</strong> <strong>Justice</strong>. <strong>Bureau</strong> <strong>of</strong> <strong>Justice</strong> <strong>Statistics</strong>. HouseholdsTouched by Crime, 1982. Bulletin NCJ-88671. Washington,D.C.: U.S. Deportment <strong>of</strong> <strong>Justice</strong>, June <strong>1983</strong>.Contents:4 pages, 3 tables, 7 figuresDates <strong>of</strong> data presented:Primary period: 1982Trend tables: 1975-82Periodicity:AnnualSo...RCEBOO< tables:3.35, 3.36, Fig. 3.14, Fig. 3.15This annual bulletin presents data from the National CrimeSurvey (NCS) regarding the frequency with which American homesexperience crime directly. While concentrating on 1982, the bulletinalso presents trend data from 1975. Also presented are data forhouseholds eXperiencing mUltiple victimizations and an explanation <strong>of</strong>the methodology involved in developing the households touched bycrime indicator.* * *U.S. Department <strong>of</strong> <strong>Justice</strong>. <strong>Bureau</strong> <strong>of</strong> <strong>Justice</strong> <strong>Statistics</strong>. JailInmates 1982. Bulletin NCJ-87161. Washington, D.C.: U.S.Deportment <strong>of</strong> <strong>Justice</strong>, February <strong>1983</strong>.Contents:4 pages, 3 tablesDates <strong>of</strong> data presented:1982PeriodiCity:SpecialSOLRCEBOO< tables:6.17, 6.18This bulletin presents information from a sample survey <strong>of</strong> jailinmates conducted by the U.S. <strong>Bureau</strong> <strong>of</strong> the Census for the <strong>Bureau</strong> <strong>of</strong><strong>Justice</strong> <strong>Statistics</strong>. This survey, which is to be conducted yearly, isdesigned to augment the census <strong>of</strong> jails that is to be conducted next in<strong>1983</strong>. This bulletin in text and tables details the state <strong>of</strong> our nation'sjails by giving data on such subjects as overcrowding, overage jailstay, average daily population in jails, female inmates, racialcomposition <strong>of</strong> inmotes, and number and function <strong>of</strong> jalls.* * *U.S. Deportment <strong>of</strong> <strong>Justice</strong>. <strong>Bureau</strong> <strong>of</strong> <strong>Justice</strong> <strong>Statistics</strong>. NationalCrime Surveys (NCS).Contents:See narrativeDates <strong>of</strong> data presented:See narrativePerloJicity:See narrat i veSOLRCEBOO< tables:3.1-3.32, Fig. 3.I-Fig. 3.13In 1972, the Law Enforcement Assistance Administration (LEAA)and the U.S. <strong>Bureau</strong> <strong>of</strong> the Census, after extensive development andpretesting, began a series <strong>of</strong> surveys <strong>of</strong> criminal victimization entitledthe National Crime Survey program. Using probability samples <strong>of</strong>households, the U.S. <strong>Bureau</strong> <strong>of</strong> the Census Interviewed householdmembers aged 12 and older about their experiences as victims <strong>of</strong>comman crimes such as assault, robbery, rape, personal and householdlarceny, burglary, and vehicle theft. Probability samples <strong>of</strong> businesseswere also drawn, and persons knowledgeable abaut the affairs <strong>of</strong> thebusiness were interviewed about robberies or burglaries suffered by thebusiness. The business survey was suspended as <strong>of</strong> 1977. Dataabtained from the interviews <strong>of</strong> both household members and businesspersonnel are used to estimate the extent and nature <strong>of</strong> criminalvictimization <strong>of</strong> persons, households, and businesses.Further Infonmation about the survey design, methodology, andestimation procedures is available in Appendix II <strong>of</strong> the So...RCEBOOKand in the sources cited in Appendix II. Mast <strong>of</strong> the tables in theSo...RCEBOOK that present data fonm the National Crime Survey werecompiled from machine-readable data provided to the SOLRCEBOOKstaff by the <strong>Bureau</strong> <strong>of</strong> <strong>Justice</strong> <strong>Statistics</strong> (BJS) <strong>of</strong> the U.S. Department<strong>of</strong> <strong>Justice</strong> (formerly the National <strong>Criminal</strong> <strong>Justice</strong> Information and<strong>Statistics</strong> Service af LEAA). Other tables are from published BJSreports. Tables are Included that show (I) estimated nationwidenumber <strong>of</strong> personal, household, and bl,lslness victimizations, by variouscharacteristics af victims and events; (2) estimated nationwide rates<strong>of</strong> personal victimization, by age, sex, race, and family income; (3)estimated nationwide rates <strong>of</strong> household victimization, by householdcharacteristics; and (4) changes in estimated nationwide rates <strong>of</strong>personal and household victimization du,ring the years 1973 through1979. Additional NCS victimizatioJl survey data are published in anumber <strong>of</strong> BJS reports.U.S. Deportment <strong>of</strong> <strong>Justice</strong>. <strong>Bureau</strong> <strong>of</strong> <strong>Justice</strong> <strong>Statistics</strong>. Prisoners1925-81. Bulietin NCJ-85861. Washington, D.C.: U.S. Department<strong>of</strong> <strong>Justice</strong>, December 1982.Contents:4 pages, 3 tables, 2 figuresDates <strong>of</strong> data presented:1925-81Periodicity:SpecialSOLRCEBOO< table:6.20This bulletin presents trend data from the National Prisaner<strong>Statistics</strong> Program (I~S) from 1925-81. The bulletin details changes Inthe j\PS reporting format over the years. These changes includerefinements in the definition <strong>of</strong> who is to be included in the headcounts. The refinements have been made in order to exclude minor<strong>of</strong>fenders. In 1977 the f\PS program asked that jurisdictions report onprisaners under their jurisdiction rather than those they had incustody. Aiso, in 1978 the j\PS pragram began collecting statistics byrace and ethnic/ty. These data are presented in the bulletin.* * *U.S. Department <strong>of</strong> <strong>Justice</strong>. <strong>Bureau</strong> <strong>of</strong> <strong>Justice</strong> <strong>Statistics</strong>. Prisanersand Alcohol. Bulletin NCJ-86223. Washington, D.C.: U.S.Department <strong>of</strong> <strong>Justice</strong>, January <strong>1983</strong>.Contents:4 pages, 5 tablesDates <strong>of</strong> data presented:1979Periodicity:SpecialSo...RCEBOO< tables:6.34-6.37This bulletin describes the use <strong>of</strong> alcohol by Inmates In Stateprisons in 1979. The data presented were collected for the <strong>Bureau</strong> <strong>of</strong><strong>Justice</strong> <strong>Statistics</strong> by the U.S. <strong>Bureau</strong> <strong>of</strong> the Census through the 1979Survey <strong>of</strong> Inmates <strong>of</strong> State Correctional Facilities. Information isgiven in the text and in tabular form on such topics as inmate drinkinghabits compared to the general population, the patterns <strong>of</strong> inmates'drinking, drinking patterns by <strong>of</strong>fense, drinking just prior to <strong>of</strong>fense,drinking environment, and the use <strong>of</strong> alcohol treatment programs byinmates.* * *U.S. Department <strong>of</strong> <strong>Justice</strong>. <strong>Bureau</strong> <strong>of</strong> <strong>Justice</strong> <strong>Statistics</strong>. Prisonersand Drugs. Bulletin NCJ-87575. Washington, D.C.: U.S.Department <strong>of</strong> <strong>Justice</strong>, March <strong>1983</strong>.Contents:6 pages, 5 tables, 4 figuresDates <strong>of</strong> data presented:1979Periodicity:Special5O..RCEBOO< tables:6.30-6.33This bulletin is one in a series <strong>of</strong> bulletins based on the 1979Survey <strong>of</strong> Inmates <strong>of</strong> State Correctional Facilities. The bulletinfocuses on three measures <strong>of</strong> drug use: lifetime use, use in the monthprior to the commission <strong>of</strong> the crime which led to the individual'sincarceration, and use at the time <strong>of</strong> that crime. Information is alsopresented on various drugs used by inmates and how the use <strong>of</strong> thesedrugs affected the criminal activity and income <strong>of</strong> the inmatessurveyed.* * *U.S. Department <strong>of</strong> <strong>Justice</strong>. <strong>Bureau</strong> <strong>of</strong> <strong>Justice</strong> <strong>Statistics</strong>. Prisunersin 1982. Bulletin NCJ-87933. Washington, D.C.: U.S. Deportment<strong>of</strong> <strong>Justice</strong>, April <strong>1983</strong>.Contents:5 pages, 5 tables, 2 figuresDates <strong>of</strong> data presented:Primary period: 1982Trend tables: 1925-82Periodicity:SpecialSo...RCEBOO< tables:6.19, 6.21, 6.23, Fig. 6.S-Fig. 6.9This bulletin presents preliminary data on the number <strong>of</strong> inmatesin State and Federal prisons at the end <strong>of</strong> 1982. The bulletin discussesthe upward trend in the number <strong>of</strong> people incarcerated and themeasures taken by State and Federal authorities to deal with theincreasing number <strong>of</strong> inmates.Information is also given on femaleprisoners, incarceration rates, short-term and unsentenced prisoners,and inmates held in local jails due to overcrowding.* * *U.S. Deportment <strong>of</strong> <strong>Justice</strong>. <strong>Bureau</strong> <strong>of</strong> <strong>Justice</strong> <strong>Statistics</strong>. Prisoners inState and Federal Institutions on December 31, 1981. NCJ-86485. Washington, D.C.: U.S. Government Printing Office, <strong>1983</strong>.Contents:47 pages, 25 tables, 17 figures, 4 appendicesDates <strong>of</strong> data pl·~~ented:Primary period: 1981Trend tables: 1925-81Periodicity:AnnualSOLRCEBOO< tables:6.22, 6.24-6.27, 6.49, 6.52, 6.54This report, one <strong>of</strong> the National Prisoner <strong>Statistics</strong> series,provides information on the number and movement <strong>of</strong> prisoners held incustody In State and Federal correctional institutions. The reportexamines the size and distribution <strong>of</strong> the yearend prisoner populationat the national, regional, and State levels. Special attention is paidto growth and overcrowding, increases in the number <strong>of</strong> female inmatesand inmates and Hispanic origin, geographic distributions, and thetypes and volume <strong>of</strong> admissions and releases. The appendices containt!1e data tables, a discussion <strong>of</strong> the data collection method, a copy <strong>of</strong>the survey qUestionnaire, explanatory nates for each State on the datathat were provided, and some special historical series tables.* * *U.S. Department <strong>of</strong> <strong>Justice</strong>. <strong>Bureau</strong> <strong>of</strong> <strong>Justice</strong> <strong>Statistics</strong>. Prisons andPrisoners. Bulletin NCJ-80697. Washington, D.C.: U.S.Department <strong>of</strong> <strong>Justice</strong>, January 1982.Contents:4 pages, 2 tablesDates <strong>of</strong> data presented:1979Periodicity:SpecialSOLRCEBOO< tables:1.58, 6.28This bulletin presents information from the 1979 Survey <strong>of</strong>Inmates <strong>of</strong> State Correctional Facllities and its companion volume, theCensus <strong>of</strong> State Correctional Facilities. The bulletin concentrates oncharacteristics <strong>of</strong> State prison inmates including race, age, education,income status, nature <strong>of</strong> <strong>of</strong>fense, and drug and alcohol use.Information is also presented on the nature <strong>of</strong> the institution (secure,open) and the conditions <strong>of</strong> confinement (maximum security, minimumsecurity).* * *U.S. Deportment <strong>of</strong> <strong>Justice</strong>. <strong>Bureau</strong> <strong>of</strong> <strong>Justice</strong> <strong>Statistics</strong>. Privacyand Security <strong>of</strong> <strong>Criminal</strong> History Information: Comptotldium<strong>of</strong> State Legislation, 1981 Supplement. Washington, D.C.: U.S.Government Printing Office, 1982.Contents:730 pages, 83 tablesDates <strong>of</strong> data presented:See narrativePeriodicity:See narrative
<strong>Sourcebook</strong> <strong>of</strong> Crlmlnol <strong>Justice</strong> <strong>Statistics</strong> <strong>1983</strong>Sources and ReferencesSo..R.CEBQOK toble:1.74This document contains the results <strong>of</strong> a continuing survey <strong>of</strong>legislation regulating the privacy and security <strong>of</strong> criminal historyinformation in the United States. The information presented Is currentas <strong>of</strong> July 1981. It updates the results <strong>of</strong> pre\>'ious surveys conductedby the U.S. Department <strong>of</strong> <strong>Justice</strong>, Law Enforcement AssistanceAdministration in 1974 and 1977, and by the U.S. Deportment <strong>of</strong><strong>Justice</strong>, <strong>Bureau</strong> <strong>of</strong> Juctice <strong>Statistics</strong> in 1979.This edition contains five sections. Section one provlqes adiscussion <strong>of</strong> major findings and trends in State regulation <strong>of</strong> criminalhistory information. Section two provides definitions <strong>of</strong> the 28categories into which State laws and regulations have been classifiedand provides summory tables <strong>of</strong> the States' statutory provisions andregulations according to the classification categories. Section threediscusses four specific policy arerJS: regulatory outhority, review andchallenge, access and disseminotion, record quality and audit. Sectionfour disc')sses the impact <strong>of</strong> privacy and security regulations on accessto records for research ond statistical purposes. Section five provides.$ummary tobles as well as the full text <strong>of</strong> relevant statutes andre.gulations for each <strong>of</strong> the 50 States, the District <strong>of</strong> Columbia, PuertoRico, and the Virgin Islands.When taken together this collection provides full citations andtexts <strong>of</strong> the statutes and regulations controlling privacy policies. Alsoincluded are tabular comparisons between States and across surveys.* * *U.S. Department <strong>of</strong> <strong>Justice</strong>. <strong>Bureau</strong> <strong>of</strong> <strong>Justice</strong> <strong>Statistics</strong>. State CourtCaseload <strong>Statistics</strong> 1977 to 19BI. Special Report NCJ-87587.Washington, D.C.: U.S. Deportment <strong>of</strong> <strong>Justice</strong>, February <strong>1983</strong>.Contents:8 pages, 4 tables, 2 figuresDotes <strong>of</strong> data presented:1977 and 1981Periodicity:Special5O..RCEBQOK tables:5.1-5.3This special report provides selected data on State courtcase loads for 1981 and also shows similar data for 1977 to allow forcomparisons <strong>of</strong> national case load trends. Information is presented oncivil and criminal filings in courts <strong>of</strong> general ond limited jurisdictionand appellate court filings and dispositions for 1981. Data are alsopresented on the percent change in these court activities between1977 and 1981.* * *U.S. Deportment <strong>of</strong> <strong>Justice</strong>. <strong>Criminal</strong> Division. 'Report to Congresson the Activities and Operations <strong>of</strong> the Public Integrity Section for1982." U.S. Deportment <strong>of</strong> <strong>Justice</strong>, Washington,D.C.(Mimeographed.}Contents:29 pages, 4 tablesDates <strong>of</strong> data presented:1973-82Periodicity:AnnualSo..R.CEBOOK table:5.42This report was compiled by the Public Integrity Section <strong>of</strong> theU.S. Department <strong>of</strong> <strong>Justice</strong>. It presents tabular information describingFederal prosecutions <strong>of</strong> Federal, State, and local public <strong>of</strong>ficials for<strong>of</strong>fenses involving abuse <strong>of</strong> public <strong>of</strong>fice. The number <strong>of</strong> public <strong>of</strong>ficialsand others i"volved who were indicted, convicted, and awaiting trial Ispresented for each year from 1973 to I 982. Additionally, the ntxnber<strong>of</strong> convictions £;f in'dividuals involved in abuse <strong>of</strong> public <strong>of</strong>fice isreported by judicial district.* * *U.S. Deportment <strong>of</strong> <strong>Justice</strong>. Executive Office for United StatesAttorneys. United States Attorneys' Offices: StatisticalReport Fiscal Year 1981. Washington, D.C.: U.S. GovernmentPrinting Office, 1982.Contents:77 pages, 37 tables, 14 figuresDates <strong>of</strong> data presented:Primary period: fiscal yeor 1981Trend tables: fiscal years 1972-81Periodicity:AnnualSo..R.CEBOOK figures:5.2, 5.3This annual publlcatlan Is comprised <strong>of</strong> charts, tables, andCOITIlltlntary summarizing the criminal and civil workloads in U.S.Attorneys' <strong>of</strong>fices. Data are presented on civil and criminal casesflied, terminated, and pending; criminal complaints received, closed,and pending; monetary and nonmonetary civil matters received,terminated, and pending; criminal and civil trials in U.S. DistrictCourts; and number and method <strong>of</strong> disposition <strong>of</strong> criminal cases anddefendants In U.S. District Courts and U.S. Appellate Courts.Additional Information is provided on fines imposed, collected,suspended, and uncollectable; grand jury proceedings; appeals flied andterminated In U.S. Attorneys' <strong>of</strong>fices; and staffing in U.S. Attorneys'<strong>of</strong>fices.* * *U.S. Department <strong>of</strong> <strong>Justice</strong>. Federal <strong>Bureau</strong> af Investigation. Assaultson Federal Officers, 1981. FB I Uniform Crime Reports.Washington, D.C.: U.S. Department <strong>of</strong> <strong>Justice</strong>, 1982.Contents:13 pages, 12 tables, 4 figuresDates <strong>of</strong> data presented:1977-81Periodicity:AnnualSo..R.CEBOOK tables:3.80, 3.81This report presents data on assaults on <strong>of</strong>ficials from fivesectors <strong>of</strong> the U.S. Government: the Department <strong>of</strong> the Interior, theDepartment <strong>of</strong> <strong>Justice</strong>, the Department <strong>of</strong> the Treasury, the judicialbranch, and the U.S. Postal Service. The report begins withdepartmental summaries and descriptive summaries <strong>of</strong> selectedincidents <strong>of</strong> assaults on Federal <strong>of</strong>ficers that occurred during 1981.Information about weapons used, geographic location, activity <strong>of</strong> theFederal agent, and disposition <strong>of</strong> cases is also included.* * *U.S. Department <strong>of</strong> <strong>Justice</strong>. Federal <strong>Bureau</strong> <strong>of</strong> Investigation. "BankCrime <strong>Statistics</strong>, Federally Insured Financial Institutions." U.S.Department <strong>of</strong> <strong>Justice</strong>, Federal <strong>Bureau</strong> <strong>of</strong> Investigation, 1982.(Mimeographed.)Contents:19 pages, 41 tablesDates <strong>of</strong> data presented:July I, 1981 to Dec. 31, 1981Periodicity:Semi-annualSo..R.CEBOOK table:3.78Annual data are compiled by combining the data presented intwo reports, The first report covers the period between January 1and June 30. The second report covers the period between July I andDecember 31.The first three sections <strong>of</strong> these reports present data onviolations <strong>of</strong> Federal bonk robbery statutes and the H;lbbs Act. Thedata are broken down by choracterlstlcs <strong>of</strong> the banking institutions,<strong>of</strong>fenders, property loss and recovery, community characteristics,injuries sustained, and State and region <strong>of</strong> occurrence. The final twosections <strong>of</strong> the report present data on the number <strong>of</strong> bank fraud andembezzlement violations by the amount lost and by State andterritory.* * *U.S. Department <strong>of</strong> <strong>Justice</strong>. Federal <strong>Bureau</strong> <strong>of</strong> InVestigation. BombSUllmary 1982. FBI Uniform Crime Reports. Washington, D.C.:U.S. Government Printing Office, <strong>1983</strong>.Cantents:21 pages, II tables, 7 figuresDates <strong>of</strong> data presented:Primary period: 1982Trend tables: 1973-82Periodicity:AnnualSo..R.CEBCX)K tables:3.89, 3.90This summary provides tables, charts, narrative descriptions, andcomments on bombing Incidents reported to the FBI. Data arepresented along such lines as type <strong>of</strong> target; region; population group;time <strong>of</strong> day; day <strong>of</strong> week; month <strong>of</strong> year; apparent motive, Includingthose incidents claimed by terrorist groups; and personal and propertydamage.* * *U.S. Department <strong>of</strong> <strong>Justice</strong>. Federol <strong>Bureau</strong> <strong>of</strong> Investigation. Crimein the United States, 1981. Woshlngton, D.C.: U.S. GovernmentPrinting Office, 1982.Contents:368 pages, 128 tables, 34 figures, 6 appendicesDotes <strong>of</strong> data presented:Primary period: 1981Trend tables: 1972-81Periodicity:AnnualSo..R.CEBCX)K tables:1.12-1.14, Fig. 1.4, 3.56-3.60, 3.62-3.77, 3.79, Fig. 3.20-Flg.3.22, Fig. 3.24, 4.1-4.17, 4.20,4.21, Fig. 4.I-Flg. 4.18This report begins with a summary <strong>of</strong> the Uniform CrimeReporting Program. Each Index <strong>of</strong>fense (murder and nonnegligentmanslaughter, aggravated assault, forcible rope, robbery, burglary,larceny-theft, motor vehicle theft, and orson) is described Individuallyin terms <strong>of</strong> the volume and trend <strong>of</strong> <strong>of</strong>fenses known to police, thenature <strong>of</strong> the <strong>of</strong>fense (e.g., type <strong>of</strong> weapon used, regional distribution,or target <strong>of</strong> the <strong>of</strong>fense), clearances <strong>of</strong> the <strong>of</strong>fense, and personsarrested and charged. Data on Index <strong>of</strong>fenses cleared by arrest arethen presented, followed by Information on persons arrested andpersons charged. The lost section <strong>of</strong> the report focuses on lowenforcement personnel.Data ore presented on <strong>of</strong>fenses known to police, by State,region, size <strong>of</strong> place, and extent <strong>of</strong> urbanization. Clearance andarrest information are presented for the United States a's a whole(estimated), cities, suburban areas, and rural areas. Disposition dataare based on a limited number <strong>of</strong> reporting agencies and are presentedby <strong>of</strong>fense, except for juveniles taken Into custody. The lawenforcement personnel information includes data on (I) number <strong>of</strong>employees, (2) law enforcement <strong>of</strong>ficers assaulted, and (3) lawenforcement <strong>of</strong>ficers killed. A pr<strong>of</strong>ile <strong>of</strong> the <strong>of</strong>ficers killed and personsidentified as killing low enforcement <strong>of</strong>ficers is presented.The .198 I report Includes six appendices. The first appendixdescribes the data base ond construction <strong>of</strong> each <strong>of</strong> the mojor tables inthe report. Definitions <strong>of</strong> the <strong>of</strong>fenses are presented in the secondappendix. In the third appendix there are definitions <strong>of</strong> populationcategories used throughout the repor'!. The fourth appendix includesgraphic presentations <strong>of</strong> quarterlY crime data for the 10-year period,1972-81, and examines basic crime trends. The fifth appendix presentsdata on the lifetime probability <strong>of</strong> murder victimIzation by age, sex,and race. The final appendix presents the index <strong>of</strong> -::rime and thenumber <strong>of</strong> index <strong>of</strong>fenses known to police by Standard MetropolitanStatistical Area.* * *U.S. Department <strong>of</strong> <strong>Justice</strong>. Federal <strong>Bureau</strong> <strong>of</strong> Investigation. LawEnforcement Officers Killed, 1981. FBI Uniform Crime Reports.WashIngton, D.C.: U.S. Government Printing Office, 1982.Contents:34 pages, 14 tables, 5 figuresDotes <strong>of</strong> data presented;Primary period: 1981Trend tables: 1972-81Periodicity:AnnualSOLRCEBOOK tables:3.82-3.86This report contains comments, tables, charts, and descriptiVesummaries on low enforcement <strong>of</strong>ficers feloniously killed In the line <strong>of</strong>duty. Data are presented on geographic region; populatIon group;circumstance at the scene <strong>of</strong> the Incident; type <strong>of</strong> <strong>of</strong>ficer assIgnment;type <strong>of</strong> weapon used in killing the <strong>of</strong>ficer; location <strong>of</strong> the fatal wound;distance between the <strong>of</strong>ficer and <strong>of</strong>fender; and the month, day, andtime <strong>of</strong> the attock. Pr<strong>of</strong>iles <strong>of</strong> the victim <strong>of</strong>ficers and the known<strong>of</strong>fenders are included as well as a brief summary <strong>of</strong> the IncIdents bymanth and jurisdIction.U.S. Department <strong>of</strong> JUstice. Office <strong>of</strong> the Attorney General. TheAnnual Report <strong>of</strong> the Attorney General <strong>of</strong> the United States1980. WashIngton, D.C.: U.S. Government PrintIng OffIce, 1981.Contents:175 pages, 13 tables, 22 figuresDates <strong>of</strong> dota presented:Primary period: fiscal year 1980Trend tables: fiscal years 1975-80PerIodicIty:AnnuolSo..R.CEBOOK tables:5.29, 5.30This report sLmnarizes the activities <strong>of</strong> the U.S. Department <strong>of</strong><strong>Justice</strong> for fiscal year 1980. A review presents narrative Information,tables, and figures for the following divisions <strong>of</strong> the Department: Office<strong>of</strong> the Deputy Attorney General; Office <strong>of</strong> the Associate AttorneyGeneral; Office <strong>of</strong> the Solicitor General; Office <strong>of</strong> Legal Counsel; Office<strong>of</strong> Legislative Affairs; Office for Improvements in the Administration <strong>of</strong><strong>Justice</strong>; Office <strong>of</strong> Pr<strong>of</strong>essional Responsibility; <strong>Justice</strong> ManagementDivision; Office <strong>of</strong> Information Law and Policy; Office <strong>of</strong> IntelligencePolicy and Review; U.S. Parole Commission; Office <strong>of</strong> the PardonAttorney; Federal <strong>Bureau</strong> <strong>of</strong> Investigation; Drug EnforcementAdministration; <strong>Criminal</strong> Division; Executive Office for U.S. Attorneys;Executive Office for U.S. Trustees; <strong>Bureau</strong> <strong>of</strong> Prisons, including FederalPrison I ndust r I es, I nc.; U.S. Marshals Service; <strong>Justice</strong> System~mprovement Act agencies (includes Office <strong>of</strong> <strong>Justice</strong> Assistance,Research, and <strong>Statistics</strong>, /\btional Institute <strong>of</strong> <strong>Justice</strong>, and <strong>Bureau</strong> <strong>of</strong><strong>Justice</strong> <strong>Statistics</strong>); Board <strong>of</strong> Immigration Appeals; Antitrust Division;Civil Division; Civil Rights DiVision; Tax Division; Land and /\bturalResources Division; Immigration and /\bturalization Service; CommunityRelations Service; and Foreign Claims Settlement Commission.* * *U.S. Department <strong>of</strong> <strong>Justice</strong>. Office <strong>of</strong> Juvenile <strong>Justice</strong> andDelinquency Prevention. Children in Custody 1977-79, A Reporton the 1977 and 1979 Censuses <strong>of</strong> Public and PrivateJuvenile Detention, Correctional, and Shelter Facilities(Draft). Washington, D.C.: U.S. Department <strong>of</strong> <strong>Justice</strong>, 1982.Contents:See narrativeDates <strong>of</strong> dato presented:Primary period: 1977 and 1979Trend tables: 1971, 1973-75, 1977, and 1979Periodicity:AnnualSo..R.CEBOOK tables:1.43-1.48, 6.13-6.16This draft report presents data from the 1977 and 1979 censuses<strong>of</strong> public and private juvenile detention and correctional facilities.The censuses were conducted by the U.S. <strong>Bureau</strong> <strong>of</strong> the Census for theNational <strong>Criminal</strong> <strong>Justice</strong> Information and <strong>Statistics</strong> Service. Thissurvey is now under the auspices <strong>of</strong> the Office <strong>of</strong> JUVenile <strong>Justice</strong> andDelinquency Prevention. Data are presented on the characteristics <strong>of</strong>residents and personnel <strong>of</strong> public and private juvenile detention andcorrectional facilities on Dec. 31, 1977 and 1979; trend data arepresented for selected years 1971-79.* * *U.S. Department <strong>of</strong> Transportation. Federal Aviation Administration.Semi-Annual Report to Congress on the Effectiveness <strong>of</strong> theCivil Aviation Security Program, July I-December 31, 1982.Washington, D.C.: U.S. Department <strong>of</strong> Transportation, <strong>1983</strong>.Contents:18 pages, II tables, 7 figuresDates <strong>of</strong> data presented:Primary period: 1982Trend tables: 1930-82Periodicity:Semi-annualSOLRCEBOOK tables:3.96-3.98These reports contain data on the threats against civil aViation,both foreign and domestic, in the forms <strong>of</strong> hijackings, airport bombings,bomb threats, and security Incidents. Also included in these reports
are data on passenger screening activities and summaries <strong>of</strong> otherongoing preventive measures. This particular report covers the periodJuly I to Dec. 31, 1982, and provides mare detailed descriptions <strong>of</strong>criminal acts against civil oviation committed during that period. Thetrend tables span various combinations <strong>of</strong> the years from 1930 to 1982depending on the availability af data.* * *U.S. Department <strong>of</strong> Transpartatian. National Highway Traffic SafetyAdministration. Digest <strong>of</strong> State Alcohol-Highway SafetyRelated Legislation, January <strong>1983</strong>. Washington, D.C.: U.S.Department <strong>of</strong> Transpartation, <strong>1983</strong>.Contents:320 pages, 8 tablesDates <strong>of</strong> data presented:1982Periodicity:Special5O..RCEBOO< tables:1.77-1.80This digest provides a detailed description <strong>of</strong> the variousstatutory provisions related to alcohol use and highway safety. I.t isan upda~e af an earlier National Highway Traffic Safety Administrationpublication titled Alcahol and Highway Safety Laws: A NatianalOverview, 1981. The data were collected through an examination <strong>of</strong>the statutory codes <strong>of</strong> the 50 States, the District <strong>of</strong> Columbia, andPuerto Rico. Statutory provisions are examined in the following areas:billod alcohol concentration levels as evidence in court; preliminarybreath test and implied consent laws; chemical tests authorized underimplied consent laws; provisions related to adjudication af drivingwhile intoxicated charges; sanctions for refusal to submit to a blaodalcohol concentration test; sanctians following a conviction for drivingwhile Intoxicated related <strong>of</strong>fenses; laws requiring a blood alcoholconcentratian test on persons killed in traffic crashes; minimum legaldrinking age; liability <strong>of</strong> owners <strong>of</strong> drinking establishments far servingalcohol to intoxicated patrons and to minors; and open container laws.* * *U.S. Department <strong>of</strong> the Treasury. <strong>Bureau</strong> <strong>of</strong> Alcohol, Tobacco andFirearms. Explosives Incidents, 1981. Washington, D.C.: U.S.Government Printing Office, 1982.Contents:52 pages, 29 tables, 10 figuresDates <strong>of</strong> data presented:Primary period: 1981Trend tables: 1980 and 1981Periodicity:Annual5O..RCEBOO< tables:3.91-3.93This report provides tables and figures on and narrativedescriptions <strong>of</strong> criminal bombings and other explosives incidents thatwere reported to and investigated by the <strong>Bureau</strong> <strong>of</strong> Alcohol, Toboccoand Firearms. This, however, does not necessarily include all thebombings and explosives incidents that mar have accurred in theUlited States during these years.The repart is divided into four sections. The first sectionanalyzes the bombing incidents. Data are presented on thecharacteristics, targets, motives, victims, property damage, types <strong>of</strong>devices, geographic location, and peak occurrences <strong>of</strong> known bombings.The second section describes stolen and recavered explosives. Dataare presented on the amount, geographic location, and peakoccurrences <strong>of</strong> known incidents. The third section analyzes arsonincidents investigated by the <strong>Bureau</strong>.<strong>Sourcebook</strong> <strong>of</strong> <strong>Criminal</strong> <strong>Justice</strong> <strong>Statistics</strong> <strong>1983</strong>Data are presented on injury,property damage, targets, motives, and types <strong>of</strong> fire accelerants. Thefinal section provides descriptive narratives on selected explosivesincidents for the reporting year.* * '*U.S. Department <strong>of</strong> the Treasury. Internal Revenue Service. AnnualReport <strong>of</strong> the Commissioner <strong>of</strong> Internal Revenue, 1978.Washington, D.C.: U.S. Government Printing Office, 1978.Contents:119 pages, 69 tables, 9 figures, I appendixDates <strong>of</strong> dota presented:Primary period: fiscal year 1978Trend tables: fiS~al years 1940-78Periodicity:AnnualSOlRCEBOO< tables:5.31-5.32This report details the activities <strong>of</strong> the Internal Revenue Serviceand presents data on a wide variety <strong>of</strong> subjects related to the incometax system. Data are reported on tax returns filed, revenuecollections, aUditing <strong>of</strong> tax returns, tax penalties, tax fraudinvestigations, tax litigation, and criminal prosecutions for tax-relatedcases.* * *U.S, Department <strong>of</strong> the Treasury. U.S. Customs Service. CustomsU.S.A. Washington, D.C.: U.S. Department <strong>of</strong> the Treasury, 1982.Contents:37 pages, 7 tablesDates <strong>of</strong> data presented:Primary period: fiscal year 1982Trend tables: fiscal years 1978-82Periodicity:AnnualSOlRCEBOO< tables:4.22, 4.24This document describes the activities <strong>of</strong> the U.S. CustomsService for fiscal year 1982. The report discusses the agency's rale incollecting revenue from imparts and enfarcing customs and relatedlaws. Data are presented in such areas as Customs' collections byregion, district, and category; carriers and persons entering the UlitedStates; merchandise entries, and seizures <strong>of</strong> property, norc.)tics, onddongerous drugs for violation <strong>of</strong> laws enforced by the Customs Service.* * *Vereb, Thomas S., and Hutzler, John L. Juveniles as <strong>Criminal</strong>s:1981 Statutes Analysis, Preliminary Draft. Pittsburgh: NationalCenter for Juvenil e Justi ce, 198 I • IContents:3 tablesDates <strong>of</strong> data presented:1979, 1980, 1981, and 1982Periodicity:Special5O..RCEBOO< tables:1.67, 1.68This docul11ent is an update <strong>of</strong> an earlier document providing a •summary <strong>of</strong> States' provisions governing waiver procedures. Infonmotionon both transfel from juvenile court and to juvenile court Is reviewed.The data were I;ompiled through a survey <strong>of</strong> statutes and courts' rules<strong>of</strong> the 50 State:s and the District <strong>of</strong> Columbia. The survey wasconducted by "he Notional Center for Juvenile <strong>Justice</strong>, the ResearchDivision <strong>of</strong> the Notional Council <strong>of</strong> Juvenile and Family Court Judges,under a grant from the Office <strong>of</strong> Juvenile <strong>Justice</strong> and DelinquencyPrevention. ThE i .. formatlon is current as <strong>of</strong> 1979 (5 States), 1980 (J 9States), 198123 States), anr! 1982 (4 States); it covers prOVisionssuch as the ages at which transfer is allowed, restrictions on who maybe waifed--due to crime type, mental illness, or retardation, theright's provided at hearings on transfer, and criteria for waiverdecisions.* * *Wolford, Bruce I. and Littlefield, John F. "An Examination <strong>of</strong> PostSecondary Institutions that Provide Educational Programs for theIncarcerated." Paper presented at the <strong>1983</strong> meeting <strong>of</strong> the Academy<strong>of</strong> <strong>Criminal</strong> <strong>Justice</strong> Sciences, Son Antonio, Texas, 25 March <strong>1983</strong>.Contents:18 pages, 8 tablesDates <strong>of</strong> data presented:1976 and 1982Periodicity:Special5O..RCEBOCl
---- - --------~Sources and References. ,Police Foundation1909 K Street, N.W.Washington, DC 20006Pretrial Services Resource Center918 F Street, N.W., Suite 500Washington, DC 20004Prlvocy JournolP.O. Box 8844Woshlngton, DC 20003Reseorch ond Forecosts, Inc.I 10 East 59th StreetNew York, NY 10022The Roper Public Opinion Research Cente!Williamstown, MA 01267The Roper Public Opinion Research CenterYole UniversityP.O. Box 1732Yale StationNew !-bven, CT 06520Securities and Exchange Conmission500 Ncrrth Capitol StreetWoshington, DC 20549State Court JournalNcrtional Center for State Courts300 Newport AvenueWilliamsburg, VA 23185U.S. Deportment <strong>of</strong> ConmerceBllreau <strong>of</strong> the CensusWashington, DC 20233U.S. Deportment <strong>of</strong> DefenseDeportment <strong>of</strong> the Air ForceMilitary <strong>Justice</strong> DivisionOffice <strong>of</strong> the Judge Advocate GeneralHeadquartersWashington, DC 20324U.S. Deportment <strong>of</strong> DefenseDeportment <strong>of</strong> the ArmyClerk <strong>of</strong> the CourtU.S. Army JudiciaryNassif BuildingsFalls Church, VA 22041U.S. Deportment <strong>of</strong> DefenseDeportment <strong>of</strong> the ArmyOffice <strong>of</strong> the Deputy Chief <strong>of</strong> St<strong>of</strong>f for PersonnelLow Enforcement DivisionWashington, DC 20310U.S. Deportment <strong>of</strong> DefenseDeportment <strong>of</strong> the NavyMilitary <strong>Justice</strong> DivisionOffice <strong>of</strong> the Judge Advocate General200 Stovall StreetAlexandria, VA 22332U.S. Deportment <strong>of</strong> EducationNational Center for Education <strong>Statistics</strong>1001 Presidential Building400 Maryland Avenue, S.W.Washington, DC 20202U.S. Deportment <strong>of</strong> Health and H..mon ServicesPublic Health ServiceAJcohol, Drug Abuse and Mental Health AdministrationNational Institute on Alcohol Abuse and Alcoholism5600 Fishers LoneRockville, MD 20857U.S. Deportment <strong>of</strong> Health and I-lmon ServicesPublic Health ServiceAlcohol, Drug Abuse and Mental Health AcinlnlstratlonNational Institute on Drug Abuse5600 FIshers LoneRockville, MD 20857<strong>Sourcebook</strong> <strong>of</strong> Crimi no I <strong>Justice</strong> <strong>Statistics</strong> <strong>1983</strong>U.S. Deportment <strong>of</strong> !-busing and Urban DevelopmentFederal Emergency Management AgencyFederal Insurance Admlnlstrotlon451 Seventh Street, N.W.Washington, DC 20410U.S. Deportment <strong>of</strong> the InteriorNational Pork ServiceWoo';lngton, DC 20240U.S. Deportment <strong>of</strong> <strong>Justice</strong>Bllreau <strong>of</strong> <strong>Justice</strong> <strong>Statistics</strong>633 Indiana Avenue, N.W.Washington, DC 2053 IU.S. Deportment <strong>of</strong> <strong>Justice</strong><strong>Bureau</strong> <strong>of</strong> <strong>Justice</strong> StotlstlcsNational <strong>Criminal</strong> <strong>Justice</strong> Information and <strong>Statistics</strong> Service633 Indiana Avenue, N.W.Washington, DC 2053 IU.S. Deportment <strong>of</strong> <strong>Justice</strong><strong>Criminal</strong> DivisionLegislation and Special Project SectionConstitution Avenue Between 9th and 10th Streets, N.W.Washington, DC 20530U.S. Deportment <strong>of</strong> <strong>Justice</strong>Drug Enforcement Administration1405 I Street, N.W.Washington, DC 20537U.S. Deportment <strong>of</strong> <strong>Justice</strong>Executive Office for United States AttorneysConstitution Avenue and Tenth Street, N.W.Washington, DC 20530U.S. Deportment <strong>of</strong> <strong>Justice</strong>Federal <strong>Bureau</strong> <strong>of</strong> InvestigationNinth Street and Pennsylvania Avenue, N.W.Washington, DC 20535U.S. Deportment <strong>of</strong> <strong>Justice</strong>Federal Prison System320 FIrst Street, N.W.Washington, DC 20534U.S. Deportment <strong>of</strong> <strong>Justice</strong>Immigration and NcrturaJizatlon Service425 I Street, N.W.Washington, DC 20536U.S. Deportment <strong>of</strong> <strong>Justice</strong>National Institute <strong>of</strong> <strong>Justice</strong>633 Indiana Avenue, N.W.Washington, DC 2053 IU.S. Deportment <strong>of</strong> <strong>Justice</strong>Office <strong>of</strong> the Attorney GeneralWoshlngton, DC 20535U.S. Deportment <strong>of</strong> <strong>Justice</strong>Office <strong>of</strong> <strong>Justice</strong> Assistance, Research, and <strong>Statistics</strong>633 Indiana Avenue, N.W.Washington, DC 2053 IU.S. Deportment <strong>of</strong> <strong>Justice</strong>Office.<strong>of</strong> Juvenile <strong>Justice</strong> ond Delinquency Prevention633 Indiana Avenue, N.W.Washington, DC 2053 IU.S. Deportment <strong>of</strong> <strong>Justice</strong>Office <strong>of</strong> the Pardon AttorneyWashington, DC 20530U.S. Deportment <strong>of</strong> <strong>Justice</strong>Office <strong>of</strong> the Solicitor Genera!Washington, DC 20530U.S. Deportment <strong>of</strong> StateOffice for Combatting TerrorismWashington, DC 20520,1.\'111qItIiiI11IIiiIII:(I~ ,r ,IIi!I\~~/1I,>'1liIir!:~'J~III~II!IIIIIU.S. Deportment <strong>of</strong> TransportationFederal Aviation Administration800 Independence Avenue, S.W.Washington, DC 20591U.S. Deportment <strong>of</strong> TransportationNational Highway Traffic S<strong>of</strong>ety AdministrationWashington, DC 20590U.S. Deportment <strong>of</strong> TransportationU.S. Coast GuardMilitary <strong>Justice</strong> Division400 Seventh Street, N.W.Washington, DC 20590U.S. Deportment <strong>of</strong> the TrEl"'..!:ury<strong>Bureau</strong> <strong>of</strong> Alcohol, Tobacco and Firearms1200 Pennsylvania Avenue, N.W.Washington, DC 20226U.S. Deportment <strong>of</strong> the TreasuryConmlssloner <strong>of</strong> Internal Revenue1111 Constitution Avenue, N.W.Washington, DC 20224U.S. Deportment <strong>of</strong> the TreasuryU.S. Customs Service1301 Constitution Avenue, N.W.Woshington, DC 20229U.S. Deportment <strong>of</strong> the TreasuryU.S. Secret Service1800 G Street, N.W., Room 921Washington, DC 20223U.S. General Accounting Office441 G Street, N.W.Washington, DC 20548U.S. Government Printing OfficeSuperintendent <strong>of</strong> DoclKT1entsWoshington, DC 20402U.S. Porole Conmission5550 Friendship BoulevardChevy Chose, MD 20815U.S. Postal ServicePastal Inspection Service475 L'Enfant Pluza, S.W.Washington, DC 20260632633
foPPEND ICESAppendix I Expenditurl~ and Employment Data for the <strong>Criminal</strong> <strong>Justice</strong> System--Surveymethodology and definitions <strong>of</strong> termsAppendix 2 Crime In the United States--Definltlons <strong>of</strong> termsAppendix 3 Children In Custody--Data collection procedure., ond definitions <strong>of</strong> termsAppendiX 4 Survey <strong>of</strong> Delinquency Prevention Programs--Survey methodologyAppendix 5 Report <strong>of</strong> the U.S. Parole Corrrnission--Parole guidelines and definitions <strong>of</strong> termsAppenc'.Ix 6 Privacy and Security <strong>of</strong> <strong>Criminal</strong> History Information--Definltions <strong>of</strong> termsAppendix 7 Public opinion survey sampling proceduresAppendix 8 ABC News Crime PollAppendix 9 The Figgle Report on Fear <strong>of</strong> Crime:America Afraid--Survey methodology anddefinitions <strong>of</strong> termsAppendiX 10 Student Drug Use In America, 1975-1982--Survey methodology and definitions <strong>of</strong>termsAppendix II National Crime Survey--Data collection procedures and definitions <strong>of</strong> tGrmsAppendiX 12 National Analysis <strong>of</strong> Official Child Neglect and Abuse Repartlng--StudymethodologyAppendix 13 Discipline, Order and Student Behr)vlar In American High Schools--Surveymethodology and definitions <strong>of</strong> termsAppendix 14 Notional Survey on Drug Abuse:I 982--Survey methodology and definitions <strong>of</strong> termsAppendix 15 Delinquency 1975, 1976, 1977, 1978, 1979, 1980--Survey methodology anddefinitions <strong>of</strong> termsAppendix 16 Probation In the United States--Deflnltlons <strong>of</strong> terms and' survey methodologyAppendix 17 Parole In the United States--Deflnltlons <strong>of</strong> terms and survey methodologyAppendix 18 Client Oriented Data Acquisition Process (CODAP), 1981 Annual Data--Surveymethodology and definitions <strong>of</strong> termsAppendix 19 Prisoners In State and Federal Institutions on December 31, 1981--Surveymethodology and definitions <strong>of</strong> termsAppendix 20 Federal Prison System--Statlstlcal Report, Fiscal Year 1980oPreceding page blank635
- ---------~Expenditure and Employment Data for the <strong>Criminal</strong> <strong>Justice</strong> System-Survey methodology and definitions <strong>of</strong> termsNJTE: The following information was provided by the <strong>Bureau</strong> <strong>of</strong> <strong>Justice</strong> <strong>Statistics</strong> and the U.S.<strong>Bureau</strong> <strong>of</strong> the Census.Survey methodologyAs in previous editions <strong>of</strong> this annual publication, several tablesshow comparisons <strong>of</strong> criminal justice expenditure and full-timeequivalent employment with the total general expenditure and full-timeequivalent employment for all functions <strong>of</strong> the particular government orlevel c.f government. Prior to the fiscal year 1971 report, localgovernment total expenditure and full-time equivalent employmentincluded data for independent school districts and special districts aswell as for general local governments, i.e., counties, municipalities, andtownships. Beginning with the 1970-71 report, however,' the totalgeneral expenditure and total full-time equivalent employment figuresshown for the "local" level <strong>of</strong> government in these comparisons includedata for units <strong>of</strong> general local government only.The "variable pass-through" provisions <strong>of</strong> the Omibus CrimeControl Act <strong>of</strong> 1970 reqUired that the concept <strong>of</strong> "local" government beconfined to units <strong>of</strong> general local government in determining the ratio<strong>of</strong> State-to-Iocal government criminal justice expenditure. Beginningwith the fiscal year 1971 report, the same concept was appliedconsistently throughout the publication to reflect the intent <strong>of</strong> the low.Therefore, the total general expenditure and total full-time equivalentemployment figures used for comporison with criminal justice figures donot include indepmdent school districts or special districts. Thischange may result in significant differences from the percentages shownfor years prior to fiscal year 1971 in those States where education islargely the responsibility <strong>of</strong> independent school districts, or wherethere are large special districts. <strong>Criminal</strong> justice e)tpenditure andemployment data in this series have always been for units <strong>of</strong> generallocal government only. As in previous reports, however, Appendix I <strong>of</strong>the Source shows those independent school districts and specialdistricts having significant special police expenditures and employment.In addition, Appendix I <strong>of</strong> the Source includes seporate data for campuspolice <strong>of</strong> colleges and universities that are dependent agencies <strong>of</strong> Stateand local governments--data that are also included in the summaryfigures for State and local governments.Readers should be generally cautious in compllring governments,because other differences in functional responsibilities from State-toState and government-to-government can also affect the comparability<strong>of</strong> expenditure and employment data. For example, some Stategovernments directly administer certain activities that elsewhere areundertaken by local governments, with or without fiscal aid, and thesame variation in the division <strong>of</strong> responsibilities exists for counties andcities. Sampling error and response error are discussed in the followingsection.The documents used to collect data did not ,-:onsistently providefull itemization <strong>of</strong> expenditure or employmp.·nt for the sectorsubcotegories presented in this report. As a resull, sector breakdownsmay be incomplete for porticular governmental units.Because <strong>of</strong> rounding, the detail data in some tables may not oddprecisely to the totals shown.Survey coverageThe survey covered the Federal Government, (III Stategovernments, and a representutive sample <strong>of</strong> local governments withineach State. Data were collected for all county governments(regardless <strong>of</strong> size), for all municipolities (and townships in ~he NewEngland and Middle Atlantic States) having a 1977 populaTion <strong>of</strong> 10,000or more, and for a sample <strong>of</strong> the remaining municipalities and townshipswith less than 10,000 population, selected according to the relativesize <strong>of</strong> their annual expenditures as reported in the 1977 Cel'lSus <strong>of</strong>Governments. The survey panel included the Federal Government, the5U State governments, and 11,855 local governments (3,040 countygovernments, 6,728 municipalities, and 2,067 townships).The sa.'nple selected to develop local government figures Is one <strong>of</strong>all possible samples <strong>of</strong> the same size that could have been chosen usingthe same sampling design. Estimates derived from these differentsamples would differ from each other, and also from a complete censususing the same data collection procedures. This variation O!nong allpossible estimates is ~ompling error. Because all St"fe end countygovernments were included in the surVf~y, State and r- ;\''f1ty figures arenot subject to sampling error.The local government sample was delligned to produce anestimate for each State <strong>of</strong> the portion <strong>of</strong> total criminal justiceexpenditures made by local governments with a relative sampling error{)f less than one-half <strong>of</strong> I percent.The data are also subject to the inaccuracies In classification,response, and processing that would occur if a complete census hadbeen conducted under the same conditions as the sample survey. Everyeffort was made to keep such errors to a minim'Jm through core Inexamining, editing, and tabulating the data submitted by government<strong>of</strong>ficials. Follow-up procedures were used ~xter.sively to clarifyInadequate and inconsistent survey returns.Survey periodFederal Government data are shown for fiscal yeor 1979, whichbegan on Oct. I, 1978 and ended Sept. 30, 1979.The State expenditure data presented in this report cover thefiscal year ending June 30, 1979 for all Sfates except four who~e fiscalyears ended as follows: New York, Mar. 31, 1979; Texas, Aug. 31, 1979;and Alabama and Michigan, Sept. 30, 1979. However, there are someState agencies that operate on a different fiscal year basis from therest <strong>of</strong> the State government. In such instances, figures shown are forthe agency's fiscal year that ended within the State's regular fiscalyear.For local governments, the 1979 fiscal years reported are thoseclosed between July I, 1978 and June 30, 1979. Most municipalitiesand counties ended their fiscal years on Dec. 3 I, 1978 or June 30,1979. The fiscal year reported for Washington, D.C. ended on Sept. 30,1979.Employment data shown for ,Federal, State, and local governmentsare for October 1979.Data collectionThe survey was accomplished using two methods <strong>of</strong> datacollection: field compilation and mai I canvass. Trained fieldrepresentatives compiled expenditure and employment data from thegovernments' own records for the 50 States, 350 largest counties, 415largest cities, and selected smaller units. The compilation work wasdone between October 1979 and June 1980. All other units in thesample were canvassed by moil for expenditure and employment dataover a 5-month period beginning in January 1980 and ending in May1980. Response for field-compiled units was 100 percent. Theresponse from moil canvass units was 91 percent.The field survey efforts and mail canvass were supplemented byreference to a variety <strong>of</strong> published gO\'"Hnment docum2nts such asi:x.,dgets, financial statements, and audit reports. In some cases, suchsources are the basis for breakdowns <strong>of</strong> totals into more detailedemployment and expenditure figures.The expenditure and employment data for the Fede' II Governmentwere collected through a special mail survey, with teleph,)ne followup,<strong>of</strong> Federal criminal justice agencies. For report:; previa IS to fiscal year1971, expenditure data were derived from the Budge! <strong>of</strong> the UnitedStates Government and employment figures were obtained from theU.S. Civil Service Comnission.Definitions <strong>of</strong> termsThe definitions are those applied in the field compilation <strong>of</strong> datafor the 50 States, 350 largest counties, and 415 largest cities. Thesedefinitions were necessarily summarized for inclusion in the surveyquestionnaires (see Appendix 3 <strong>of</strong> Source) sent to governments on themall portion <strong>of</strong> the survey.Government expenditure--"Expenditure" comprises all amounts<strong>of</strong> money poid out (net <strong>of</strong> any correcting transactions) other than forretirement <strong>of</strong> debt (including interest), investment In securities,extensions <strong>of</strong> loons, or agency transactions. It includes only externalcash poyments and excludes any Intragovernmentol transfers and noncosh transactions, such as the provision <strong>of</strong> meals or housing <strong>of</strong>employees. It also includes any poyments financed from borrowing,fund balances, intergovernmental revenue, and other current revenue.In several Instances, two or more governments shore the expense <strong>of</strong>maintaining a court or other criminal justice agency. In these cases,the allocable direct expenditure amount is repor1 ed for eachgovernment in the appropriate category. When a goverrvnent payspensions directly to retired employees from appropriated funds, suchpayments are included as expenditure <strong>of</strong> the government concerned.However, State and local government contributions to retirementsystems and various other employee benefits are not Included Inexpenditure data, since the majority <strong>of</strong> governments make lump-fumcontributions to plans covering all government employees and cannotreport for criminal justice employees separately. Neither Ingovernments' basic accounting records (from which criminal justiceexpenditure figures are drown) nor in the records <strong>of</strong> their general.·coverage employee benefit systems is there usually any breakdown <strong>of</strong>QT)Ounts contributed In terms <strong>of</strong> the various agencies or functionsInvolved. Nor hos on adequate procedure for calculating the proportion<strong>of</strong> such contributions allocable to criminal justice employees,4\Preceding page blank637
~~~-------- -, -- -~-~-~-~-~----"'-~------------------------~<strong>Sourcebook</strong> <strong>of</strong> <strong>Criminal</strong> <strong>Justice</strong> <strong>Statistics</strong> <strong>1983</strong>Appendicesbeen developed due to th" wide variotion )~ 1 the coverage <strong>of</strong> variouspions, employee stotus requirements, bene~,t rotes, etc.. ,For !hos: governments whose records reflect contributions for<strong>Criminal</strong> ju~tlce employees separately, separate data were obtained.How~'.er, thes,e data are subject to variation and neither the amountnor, the quality <strong>of</strong>, th~ dota reported would permit any attempt toestimate t?tal contributions for all similar governments in a giVenSta~e. Given the problems involved, no estimation procedure seemedfeaSible. Such data as were reported separately were thereforeexc~lJded from total criminal justice expenditures to provide acons~stent data bose for administering the "variable pass-through"requirement.Expenditure is divided into two major categories by character'I. "D.irect expenditure" is all expenditure except thatclassed as Intergovernmental and is further divided into twoprincipal object categories:(0) "Direct current," which includes salaries, wagesfees, and commissions, purchase or supplies, materials andcontractuol services.'(b) "Capitol outlay," which includes expenditure forthe three subcategories below:(I) "Construction:" Production <strong>of</strong> fixed works andstructures, and additions, replacements and majoralterations thereto undertaken either on a contractbasis by private contractors or through force accountconstruction by the employees <strong>of</strong> the government.Included are the planning and designing <strong>of</strong> specificprojects, the grading, landscaping, and other siteImprOVement, and the provision <strong>of</strong> equipment andfacilities that are integral parts <strong>of</strong> the structure.(2) "Equipment:" Purchase and Installation <strong>of</strong>apparatus, furnishings, <strong>of</strong>fice equipment, motorvehicles, and the like having on expected life <strong>of</strong> morethan 5 years. This Includes both additional equlprnentand repl-lcements. Rentals for eqUipment, inc!udlngrental payments that may be credited on the purchaseprice if purchase options are exercised, are closslfledas current operation expenditure. Equipment andfacIlities that are integral parts <strong>of</strong> constructed orpurcha,~ed structures are classified respectively underconstruction or purchase <strong>of</strong> land and existingstructures.(3) ''Purchase <strong>of</strong> land and existing structureSI"Purchase <strong>of</strong> these assets os such, purchase <strong>of</strong> rights<strong>of</strong>-way,and title search and similar activitiesassociated with purchase transactions.The o!her object categorles--Interest on general debt, osslstanceand subsidies, and insurance beneflts--are not applied to specificfunctions because they are not ordinarIly available on a functional basisfrom government financial reports. In the few Instances where bondedor mortgaged general Indebtedness Is Identified for specific purposesthe Interest payments are aggregated with other Interest expendlture~that make it virtually impossible to arrive at reliable and consistentbreakouts <strong>of</strong> such data over a long period <strong>of</strong> time.2. "Intergovernmental expenditure" Is payments from onegovernme~t t? another, incioJding gronts-In-ald, shared revenues,payments In lieu <strong>of</strong> taxes, and amounts for services performed byone, government for another on a reimbursable or cost-shoringbasIs, (for e,xample, payments by one government to another forboarding prISoners)."Total expenditure" is direct and intergovernmental expenditure<strong>of</strong> a government or level <strong>of</strong> government for criminal justice activities"Total general expenditure" is all expenditure <strong>of</strong> a government 0;!ev~1 <strong>of</strong> go,v~rnment for all ,government functions, including criminal<strong>Justice</strong> ~ctlvlties, but, excluding utility system expenditure, liquor storeexpen~lture, and Insurance trust expenditure. Total generalexpendl!ure shown for the local level <strong>of</strong> government includesexpen?lture only, <strong>of</strong> ~eneral purpose governments, and excludesexpenditure <strong>of</strong> speCial districts and school districts.Government employment--"Employees" includes all persons paidfor pe,rsonal services performed, i.ncluding all paid <strong>of</strong>ficials and personsin paid le'!ve status, and excluaes unpaid <strong>of</strong>ficials, persons on unpaidleave, pensioners and contractors. Under this definition are twoclasses:I. 'f'ull-time employees," who are all persons employedduring the poy period including Oct. 15, 1979, on a full-timebasis, including all full-time temporary or seasonal workersemployed dUring this pay period as well as persons havingpermanent status.• 2. ''Pa.rt-time et;nployees," who are persons employed during.~e pay period Including Oct. 15, 1979, on a basis other than f'JIItime,and persons paid by more than one governmentDerived fram these two closses iSl•"Full-time equivalent employees," which means thetotal ~umber o,f employees, discounted by applying overagefull-time earning rates. This Is colculated by dividing thetotal payroll (full-time plus port-time) by the full-timepayroll and multiplying this by the number <strong>of</strong> full-timeemployees, where both full-time and part-time employeesand payroll are reported. Where only part-time employeesand payroll are r:p?r!ed, full-time equivalent employees arecalCUlated by diViding the total port-time payroll by theaverage full-time salary for the particular crIminal justice~ector and type <strong>of</strong> government, "Average full-time salory"IS calcul~ted by dividing the full-time payroll by the number<strong>of</strong> full -time employees for the porticular criminal justicesector and type <strong>of</strong> government.,"Payroll" is the gross payroll before deductions and Includessalaries, wages, fees, and commissions paid to employees as definedabove for the month <strong>of</strong> October 1979.Governmental functions--''Police protection" is the function <strong>of</strong>e~forclng the law, preserving order, and apprehending those whoViolate the low, w~ether the~e activities are performed by a policedeportment, a sheriff's deportment, or a special police force maintainedby an agency whose prime responsibility is outside the criminal justicesystem .. but that has a ~lice force to perform these activities in itsspecialized area (geographiC or functional)., Included I~ this activity are regular pq,lice services, themaintenance <strong>of</strong> buildings used for police purposes, and such specializedpol,lce forces (including public and private contract forces) as airportpolice, free and toll highway police, free and toli bridge and tunnelpolice, housing police, maritime police, pork police, transit and otherutility system police, college and University campus police andalcoholic beverage control agents. Coroners and medIcal examlne;s arealso included. Excluded ?re vehicular inspection and licensing, traffics,afety and engineering, fish and game wardens, fire marshals and thelike.'The special police forces included in the dot a are only those thatare port <strong>of</strong> general purpose governments. Security forces buIldingguords, school crossing guards, and metermaids without the' power tomake a police arrest were excluded. Those special police forces thatare part <strong>of</strong> Independent school districts or special districts are natincluded In the data, Inasmuch as these districts are not generalpurpose governments.In mast States, sheriffs' deportments are multifUnctional ogenclesproviding police protection, judicial, and/or correctional services. Inorder to allocate expenditure and employment data to the properactivity, the data for sheriffs' departments are prorated using factorsdevelop'~d from a special survey <strong>of</strong> sheriffs' departments conducted In1973, or more current estimates <strong>of</strong> manpower distribution If available.Short-term custody and detention have traditionally beenconsidered part <strong>of</strong> the "police protection" function, and In editionsprior to the 1969-70 report, were treated as such. However beginningwith the 1969-70 report, the concept was modified on the basis <strong>of</strong>Information obtained from the 1970 NationcJ/ Jail Census. Data forInstitutions with authority to hold prisoners 48 hours or more areincluded in the "corrections" sector. Data for lockups or "tanks"holding prisoners less than 48 hours are Included In the "policeprotection" sector."Judicial activities" encompass all courts and activitiesossoclated with courts such as law libraries, grand juries, petit juries,and the like. Because the names <strong>of</strong> courts with similar functions ondlegal jurisdictions vary from State to State and even within Statesdata have been categorized by types <strong>of</strong> court rather than by courtname.I. "Appellate courts" Include courts <strong>of</strong> last resort and!nter":1ediate appellate courts. These are courts haVingJurisdiction <strong>of</strong> appeal and review, with original jurisdictionconferred only In special cases.2. "Courts <strong>of</strong> general jurisdiction" are trial courts <strong>of</strong>general j~ri~dlction having unlimited original jurisdiction In civIland/or criminal cases.In many States, statutes either reqIJire or permit localgovernmen,ts to supplement the salary <strong>of</strong> State-paid judges <strong>of</strong>~neral jUrISdiction courts. These judges were counted as porttimeemployees at both the State and local levels when actuallyreceiving a check from both governments., 3., "Courts <strong>of</strong> limited jurisdiction" are courts whose legaljUrisdiction covers only a particular closs <strong>of</strong> cases or cases Inwhich the amount in controversy Is below a prescribed sum orthat is subject to specific exceptions. Included In this categoryar~ probate courts, juvenile courts, and other courts <strong>of</strong> limitedjUrisdiction.4. "Miscellaneous judicial" Includes data on judicialactivities that could not be reported under any <strong>of</strong> the abovecourt categories, such as Judicial councils and conferellces courtadministration <strong>of</strong>fices (where Identifiable), law IIbrarle~ jurycommissions, and grand juries.'• "Legal, services and prosecution" Includes the civil and criminal<strong>Justice</strong> activities <strong>of</strong> the attorneys general, district attorneys State'satt?rneys and their variously named equivalents; corporation dounsels,so II c,ltors, and lega! departments with various names. It IncludesprOViding legal adVice to the chief executives and subordinatedepartmental <strong>of</strong>ficers, representation <strong>of</strong> the government In lawsuits andthe prosecution <strong>of</strong> accused violators <strong>of</strong> criminal law. These act!~ltlesare Included whether performed by one <strong>of</strong>fice or several, because insome jurisdictions a single <strong>of</strong>fender provides all legal services whlle Inothers a prosecutor's <strong>of</strong>fice handles only orimlnal matt~rs and aseparate attorney's <strong>of</strong>fice performs all civil legal services. Theoperations <strong>of</strong> various Investigative agencies having fullarrest powers and attached to <strong>of</strong>fices <strong>of</strong> attorneys general, distrlctattorneys or their variously named equivalents are also included.''Public defense" includes legal counsel and representation asprovided by public defenders, and other government programs that paythe fees <strong>of</strong> court-appointed counsel. These include court-paid fees t?individually retained counsel, fees paid by the court to court-appointedcounsel, government contributions to private legal aid societies and barassociation-sponsored programs, and the activities <strong>of</strong> on establishedpublic defender <strong>of</strong>fice or program. Employment data are included onlyfor public defenders' <strong>of</strong>fices because fee-paid counselors are notconsidered government employees, nor are counselors working for barassociations or legal aid societies."Corrections" Is that function <strong>of</strong> government involving theconfinement and rehabilitation <strong>of</strong> adUlts and juveniles convicted <strong>of</strong><strong>of</strong>fenses against the law, and the confinement <strong>of</strong> persons suspected <strong>of</strong> acrime and awaiting adjudication. Data for institutions with authorityto hold prisoners 48 hours or more are included in this sector. Datafor lockups or "tanks" holding prisoners less than 48 hours are includedin "police protection." Corrections includes the operation <strong>of</strong> prisons,reformatories, jails, houses <strong>of</strong> correction, and other institutions. Italso includes institutions, facilities, and programs exclusively for theconfinement <strong>of</strong> the criminally insane 01 for the examination, eValuation,clossification, and ossig'1ment <strong>of</strong> inmates; and institutions and programsfor the confinement, treatment, and rehabilitation <strong>of</strong> drug addicts andalcoholics if the institution or program is administered by a correctionagency <strong>of</strong> the criminal justice system. Pardon boards, parole andprobation agencies, including resettlement or halfway houses for thosenot in need <strong>of</strong> institutionalization, ore included in the correction sectoras a separate subcategory.I. "Correctional Institutions" are prisons, reformatories,jalls, houses <strong>of</strong> correction, penitentiaries, correctional farms,work-houses, reception centers, diagnostic centers, industrialschools, training schools, detention centers, and a variety <strong>of</strong>other types <strong>of</strong> institutions for the confinement and correction <strong>of</strong>convicted adults or juveniles adjudicated delinquent and or inneed <strong>of</strong> supervision, and for the detention <strong>of</strong> those accused <strong>of</strong> acrime and awaiting trial or hearing. When an institutionmaintains a prison industry or agricultural program, data on thecost <strong>of</strong> production or the value <strong>of</strong> prison labor used by agencies<strong>of</strong> the same government, if identifiable, are excluded (and classedas expenditure for the function using the products or services).ExpenditIJre for the manufacture, production, sale,' anddistribution <strong>of</strong> goods produced for sale or use outside thegovernment are included under this heading.(a) "Institutions for men" include identifiableexpenditure and employment data for institutions exclusivelyfor adult male <strong>of</strong>fenders.(b) "Institutions for women" include identifiableexpenditure and employment data for institutions exclusivelyfor adult female <strong>of</strong>fenders. Where there is no seporatewomen's prison, women <strong>of</strong>fenders are either maintained In aprison complex that also houses other <strong>of</strong>fenders, or areboarded In private facilities or Institutions in another State.N:> attempt was made to prorate data on Institutions housingmore than one type <strong>of</strong> inmate, but where females areboarded in private institutions or in another State, availableexpenditure data were tabulated. Employment data werenot tabulated because the personnel were employees <strong>of</strong>another government.(c) "Institutions for juveniles" are those institutionsidentified by the 1977 Juvenile Detention and CorrectionalFacility Census as housing primarily juveniles, and in someStates, "youthful <strong>of</strong>fenders." These institutions includethose under the control <strong>of</strong> a juvenile court, a probationdeportment, or a youth authority or other similarlydesignated administrative body, as well as independentlYadministered institutions. Also included are governmentpayments to private agencies for the detention or treatment<strong>of</strong> delinquent juveniles. There is considerable variation fromState to State in the legal definition <strong>of</strong> a juvenile,particularly i" regard to the age at which a person is nolonger considered a juvenile. Institutions for juveniles havebeen classified individually in accordance with the lows andage designations <strong>of</strong> their respective States.(d) "Other and combined institutions" are thoseinstitutions holding a combination <strong>of</strong> inmates, Whereexpenditure or employment data for physically separateinstitutions for juveniles, adult females, and adult maleswere not seporable by institution or type <strong>of</strong> institution, theentire amounts were included under this category.2. "Correctional administration" consists <strong>of</strong> data for theadministration <strong>of</strong> the correctional system, including data on thecentral administrative <strong>of</strong>fice (e.g., the department <strong>of</strong> correctionsor a youth authority). Data an the administration <strong>of</strong> individualcorrectional Institutions or probation/porole/pordon agencies areincluded in the appropriate subcategory if it was possible todeduct them.3. "Probation, parole, and pardon" includes data onprobation agencies, boards <strong>of</strong> porole, boards <strong>of</strong> pardon, and theirvariously named eqUivalents. Although probation agenciesfrequently function under the administration <strong>of</strong> the generaljurisdiction court, the data are presented here after having beendeducted from the judicial data, because <strong>of</strong> the correctionalnature <strong>of</strong> the probotion function. If the probation, parole, andpordon activities, or any <strong>of</strong> them individually, were part <strong>of</strong> thecorrectional administrative <strong>of</strong>fice, data were deducted and shownseparately here, and the balance was shown under thecarrectional administration category. The overlapping character<strong>of</strong> the probation, parole, and pardon activities prevented theseparate presentation <strong>of</strong> these data.4. "Miscellaneous correction" includes expenditure andemployment data which could not be classified under one <strong>of</strong> theother subcategories.''Other criminal justice activities," shawn in some tables, includesexpenditure or employment data that are not clossified elsewhere, orthat cut across more than one category, or that are not allocable toseporate categories (e,g., expenditure on a general curriculum ineducational institutions, the operation <strong>of</strong> State criminal justiceagencies, crime commissions, etc.), Such data are included in thetotals, where they are not shown separately.63B639
AppendicesPopulation definitionsJ!f'PENDIX 2Crime in the United States-Definitions <strong>of</strong> terms"NJTE: The following information has been excerpted from the U.S. ,?epartment <strong>of</strong> <strong>Justice</strong>, Federal<strong>Bureau</strong> <strong>of</strong> Investigation, Crime in the tktited States, 1961 (Washlngton~ D.C.: U.S. GovernmentPrinting Office, 1982), pp. 1-4, 318, 319; and U.S. Department <strong>of</strong> <strong>Justice</strong>, Federal Bure?u. <strong>of</strong>Investigation Uniform Crime Reporting Handbook (Washington, D.C.: U.S. Government PrintingOffice 1978)' pp. 5-33, 89-92. I\bn-substantive editorial adaptations have been made. See theH::mdbook fo~ further information on classification and counting rules.For purposes <strong>of</strong> statistical presentntion, the cities and c~untie~ inthe United States are divided into groups based on population size.The :>opulation group classifications used by the Uniform CrimeReporting Program are shown in Table I.Table I Population group, political label, and population coveragePopulation group Political label Population coverageICity250,000 and overIICity100,000 to 249,999IIICity50,000 to 99,999IVCity25,000 to 49,999VCity10,000 to 24,999VICityLess than 10,000VIII (Rural county) County_X_I_(~S_u_bu_r_b_an __ c_o_u_nt~y_) _______ C_o_u_nt __ y ._______________________The major source <strong>of</strong> Uniform Crime Reporti,ng (UCR) data is. theindividual police agenc),; therefore. "Ome population and geographicalaggregations may differ from st·Jndard U.S. <strong>Bureau</strong> <strong>of</strong> the Censusdefinitions to render them consistent to police reporting areas andjurisdictions. The. UCR program employs s!a~dar? city and StandardMetropolitan Statistlca~ Area (SMSA) classifications from the U.S.<strong>Bureau</strong> <strong>of</strong> the Census but rural and suburban areas are slightlychanged to match the r~porting area <strong>of</strong> the local police.Rural counties--Hural counties are those outside SMSAs. Theseareas represent 15 percent <strong>of</strong> the national population in 1981. Prior to1981, rural counties were referred to as rural areas.Suburban areas--These areas consist <strong>of</strong> cities with populationsaf less than 50,000 together with counties (unincorporated areas) thatare within a SMSA. Suburban areas can therefare be subdivided intosuburban cities and suburban counties.Standard Metropolitan Statistical Area--This includes a corecity or cities with a population <strong>of</strong> 50,000 or more in~abitants and. thesurrounding county or counties that share certam metropolitancharacteristics. SMSAs made up approximately 75 percent <strong>of</strong> the totalU.S. population in 1981. .Other cities--Othel' cities are urban places outSide SMSAs; most<strong>of</strong> these areas are incorporated. These cities comprise 10 percent <strong>of</strong>the 1981 national population. . . .The following diagram illustrates the aforementioned diSCUSSIon <strong>of</strong>the comnunity types.CitiesCounties(unincorporated area)SMSACities over 50,000,Suburban citiesSuburban countiesI\bn-SNISAOther ruralRural countiesAs a general rule, sheriffs, county police, and many State policereport on crimes committed within ~he limits .<strong>of</strong> the .co~nties, ~toutside cities' local police report on Crimes comnltted within the citylimits (urba~ places). The number <strong>of</strong> ~ull-service law enforceme~tagencies serving the population groups varl~s from year to year •. ThiSphenomenon is caused through population growth,. geo-politlcalconsolidation, municipal incorporalion, etc. The follOWing toble showsthe number <strong>of</strong> agencies within each population group in 1981.Table 2 Population group and number <strong>of</strong> agenciesPopulation groupIIIIIIIVVVIV III (Rural area)IX (Suburban county)TotalNurnber <strong>of</strong> agencies571152976331,6357,7473,6741,53415,692Regions and divisionsThe United States is divided into four regions; these regions arefurther divided into nine divisions. The following is a list <strong>of</strong> Stateswithin divisions and regions.I\brtheust:New England--Connecticut, Maine, Massachusetts, NewHc:rnpshire, Rhode Island, VermontMiddle Atlantic--New Jersey, New York, PennsylvaniaNorth Cent ral: .East North Central--lIlinois, Indiana, Michigan, OhiO,WisconsinWest North Central--Iowa, Kansas, Minnesota, Missouri,Nebraska, North Dakota, South DakotaSo.uth:South Atlantic--Delaware, District <strong>of</strong> Columbia, Florida,G20rgia, Maryland, I\brth Carolina, South Carolina, Virginia, WestVirginiaEast South Central--Alabama, Kentucky, Mississippi,TennesseeWest South Central--Arkansos, Louisiana, Oklahoma,TexasWest:Mountain--Arizona, Colorado, Idaho, Iv\ontana, Nevada, NewMeXico, Utah, WyomingPaclfic--Aloska, California, Howaii, Oregan, WashingtonPart I Offense Class and the Crime IndexA. The Crime IndexThe following <strong>of</strong>fenser. and attempts to commit these<strong>of</strong>fenses are used in compiling the Crime Index: (J) murder andnonnegligent manslaughter, (2) forcible rape, (3) robbery, (4)aggravated assault, (5) burglary, (6) larceny-theft, (7) matorvehicle theft, and (8) arson. Arson was added as the eighthIndex <strong>of</strong>fense in October 1978. In situations where there aremultiple <strong>of</strong>fenses, only the most serious ot:ense, based on a UC~hierarchy, is reported. However, arsan IS excluded from thiShierarchical prQCedure. All arsons, regardless <strong>of</strong> their occurre~cein canjunctian with another crime against property or crimeagainst a person, are counted.(NJTE--Manslaughter by negligence and simple or minorassaults are not inclu~
<strong>Sourcebook</strong> <strong>of</strong> <strong>Criminal</strong> <strong>Justice</strong> <strong>Statistics</strong> <strong>1983</strong>be uniformly compiled in terms <strong>of</strong> a single classification <strong>of</strong> <strong>of</strong>fenses.The definitions <strong>of</strong> the Part II <strong>of</strong>fenses that follow include some <strong>of</strong> the<strong>of</strong>fense titles described in local or State law. The inclusion <strong>of</strong> thesetitles is intended to serve as descriptive data to aid in determiningwhat <strong>of</strong>fenses should be included or excluded in each classification.9. Other assaults--Assaults and attempted assaults where noweapon was used or that did not result in serious or aggravated injuryto the victim are included as other assaults.Examples <strong>of</strong> local jurisdiction <strong>of</strong>fense titles that would beincluded in "other assaults" are: (a) simple assault; (b) minor assault.(c) assault and battery; (d) injury by culpable negligence; (e) resistingor obstructing an <strong>of</strong>ficer; (f) intimidation; (g) coercion; (h) hazing. (j)attempts to commit above.'10. Forgery and counterfeiting--In the majority <strong>of</strong> States,forgery and c:ounterfeiting are treated as allied <strong>of</strong>fenses. In this classare placed all <strong>of</strong>fenses dealing with the making, altering, uttering, orpossessing, with intent to defraud, anything false in the semblance <strong>of</strong>that which is true.Included are: (a) altering or forging public and other records'(b) making, altering, forging, or counterfeiting bills, notes, drafts:tickets, checks, credit cards, etc.; (c) forging wi lis, deeds, notes,bonds, seals, trademarks, etc.; (d) counterfeiting coins, plates,banknotes, checks, etc.; (e) possessing or uttering forged orcounterfeited instruments; (f) erasures; (g) signing the name <strong>of</strong> anotheror fictit.ious person with intent to defraud; (h) using forged labels; (I)possession, manufacture, etc., <strong>of</strong> counterfeiting apparatus; (j) sellinggoads with altered, forged, or counterfeited trademarks; (k) allattempts to commit the above.II. Fraud--Fraud is defined as fraudulent conversion andobtaining money or property by false pretenses. Included are bodchecks, confidence gomes, etc., excellt forgeries and counterfeiting.12. Embezzlement--Embezzlement is defined asmisappropriation or misapplication <strong>of</strong> money or property entrusted toone's core, custody, or control.13. Stolen propertYl buying, receiving, possessing--Includedin this closs ore all <strong>of</strong>fenses <strong>of</strong> buying, receiving, and possessing stolenproperty, as well as all attempts to commit any <strong>of</strong> these <strong>of</strong>fenses.14. Vandalism--Vandalism consists <strong>of</strong> the willful or maliciousdestruction, injury, disfigurement, or defacement <strong>of</strong> any public orprivate property, real or personal, without consent <strong>of</strong> the owner orperson having custody or control, by cutting, tearing, breaking,marking, pointing, drawing, covering with filth, or any such means asmoy be specified by local low. This <strong>of</strong>fense covers a wide range <strong>of</strong>malicious behavior directed at property such as: cutting :luto tiresdrawing obscene pictures on public restroom walls, smashing windows:destroying school records, tipping over gravestones, defacing librarybooks, etc. All arrests for the above, including attempts, are counted.15. Weapons; carrying, possessing, etc.--This closs deals withweapon <strong>of</strong>fenses, regulatory in nature, such as: (0) monufacture, sale,or possession <strong>of</strong> deadly weapons; (b) carrying deadly weapons,conc~al~d or openly; (c) using, manufacturing, etc., silencers; (d)furnishing deadly weapons to minors; (e) aliens possessing deadlyweapons; (f) all attempts to commit any <strong>of</strong> the above.16. Prostitution and commercialized vice--Included in thisclass are the sex <strong>of</strong>fenses <strong>of</strong> a commercialized nature, such as: (0)prostitution; (b) keeping a bawdy house, disorderly house, or house <strong>of</strong>ill fane; (c) pandering, procuring, transporting, or detaining women forimmorol purposes, etc.; (d) all attempts to commit any <strong>of</strong> the above.17. Sex <strong>of</strong>fenses (except forcible rape and prostitution andcomnercialized vice)--Included are <strong>of</strong>fenses against chastity, commondecency, morals, ond the like, such as: (0) adultery and fornication'(b) buggery; (c) incest; (d) indecent exposure; (e) indecent liberties!(f) intercourse with an insane, epileptic, or venereally diseased person!(g) seduction; (h) sodomy or crime against nature; (j) statutory rap~(no force); (j) all attempts to commit any <strong>of</strong> the above.18. Drug abuse violations--Drug abuse violation arrests arerequ~s:~d on the basis <strong>of</strong> the. narcotics used. The followingsubdiVISions are used: (0) opIUm or cocaine and their derivatives(morphine, heroin, codeine); (b) marihuana; (0) synthetic narcotics-manufactured narcotics that can cause true drug addiction (demerol,methadones); (d) dangerous nonnarcotic drugs (barbituratesbenzedrine).'Included are all arrests for violations <strong>of</strong> State and local lawsspecifically those relating to the unlawful possession, sale, use:growing, manufacturing, and making <strong>of</strong> n'Jrcotic drugs.19. Gombling--AII charges that relate to promoting, permitting,or engaging in gambling are included in this category. To provide amore refined collection <strong>of</strong> gambling arrests, the following breakdown <strong>of</strong>gambling arrests is made: (0) bookmaking (horse and sport book); (b)numbers and lottery; (c) all other.20. Offenses against the family and children--I ncluded areall charges <strong>of</strong> nonsupport and neglect or abuse <strong>of</strong> family and children,such as: (0) desertion, abandonment, or nonsupport <strong>of</strong> wife or child; (b)neglect or abuse <strong>of</strong> child (if the injury is serious, it is counted asaggravated assault); (c) nonpayment <strong>of</strong> alimony; (d) all attempts tocommit any <strong>of</strong> the above.21. Driving under the influence--This closs is limited to thedriving or operating af any vehicle or common carrier while drunk orunder the influence <strong>of</strong> liquor or narcotics. Included are: (0) operatinga motor vehicle while intOXicated, (b) operoting on engine, train,streetcar, boat, etc., while intoxicated.22. Liquor laws--With the exception <strong>of</strong> "drunkenness" (closs 23)and "driving under the influence" (class 21), liquor low violations, Stateor local, are placed in this class. Federal violations are not included.Included are: (a) manufacturp., sale, transporting, furnishing,possessing, etc.; intoxicating liquor; (b) maintaining unlawful drinkingplaces; (:) advertising and soliciting orders for intoxicating liquor; (d)bootlegging; (e) operating still; (0 furnishing liquor to a minor orintemperate person; (g) using a vehicle for illegal transportation <strong>of</strong>liquor; (h) drinking on train or public conveyance; (j) all attempts tacommit any <strong>of</strong> the above.23. Drunkenness--Included in this class are all <strong>of</strong>fenses <strong>of</strong>drunkenness or intoxication, with the exception <strong>of</strong> "driving under theinfluenc.e" (class 21). Such things as drunkenness, drunk and disorderly,c:omnon or habitual drunkard, and intoxication are counted.24. Disorderly conduct--In this closs are placed all charges <strong>of</strong>c;ommitting a breach <strong>of</strong> the peace. Included are: (0) affray; (b)unlawful assembly; (c) disturbing the peace; (d) disturbing meetings;i(e) disorderly conduct in State institutions, at court, at fairs, on'trains! or public conveyances, etc.; (f) prize fights; (g) blasphemy,pr<strong>of</strong>anity, and ob.ccme language; (h) desecrating flog; (j) refusing toIJssist on <strong>of</strong>ficer; (j) all attempts to commit any <strong>of</strong> the above.25. Vagrancy--Persons prosecuted on the charge <strong>of</strong> being a'''suspicious character or person, etc." are included in this closs. Itincludes: (a) vagrancy; (b) begging; (c) loitering (persons 18 and,alded; (d) vagabondage.26. All other <strong>of</strong>fenses--Included in this closs are all otherState or local <strong>of</strong>fenses not included in classes I to 25, such as: (a)'Jdmitting minors to improper places; (b) obduction and compelling tomarry; (e) abortion (death <strong>of</strong> on expectant mother, resulting from'Jbortion. is a homicide, closs 10); (d) bigamy and polygamy; (e)blclckmail and extortion; (f) bribery; (g) combination in restraint <strong>of</strong>trade, trusts, or monopolies; (h) contempt <strong>of</strong> court; (j) crimina'Jnarchlsm; (j) criminal syndicalism; (k) discrimination, unfair.~ompetition; (J) kidnaping; (m) marriage within prohibited degrees; (n)IJffenses contributing to juvenile d.elinquency (except as provided for in,:iclSses I to 28 inclusive) such as. employment <strong>of</strong> children in immoralvocations or practices, admitting minors to improper places, etc.· (a)perjury and subornation <strong>of</strong> perj". y; (p) possession, repair. manufacture,C!t·c., Clf burglar's tools; (q) possession or sale <strong>of</strong> obscene literature,pictures, etc.; (r) public nuisances; (s) riot and rout; (t) trespass' (u)unlawfully bringing weapons into prisons or hospifals' (v) unlaw'fullybringing drugs or liquor into State prisons, hospitals, etc. or furnishing10 convicts(. (w) unlawful disinterment <strong>of</strong> the dead and violation <strong>of</strong>!~pul!ure; x) unlawful use, possession, etc., <strong>of</strong> explosives; (y)I'l()lat~ons <strong>of</strong> State regulatory lows and muniCipal ordinances (this doesrot include those <strong>of</strong>fenses or regulations that belong in the abovecJ,~ssles); (z) violation <strong>of</strong> quarantine; (00) all <strong>of</strong>fenses not otherwiseclclSsified; (ab) all attempts to commit any <strong>of</strong> the above.27. Suspicion--Although "suspicion" is not an <strong>of</strong>fense, it is thegr,oun,d for many arrests in those Jurisdictions where the law permits.After examination by the police, the prisoner is either formally charged,or released. Those formally charged are entered in one· <strong>of</strong> the Part I orII oHense classes. This closs is limited to "suspicion" arrests whereI:~~rsons arrested are released by the police.28. Curfew and loitering laws--(juveniles)--i~1I arrests madefor 'Iiolation <strong>of</strong> local curfew or loitering ordinances where such laws(~lIist are counted.29. Runaway--{juveniles)--lncluded in this category arenpprehensions <strong>of</strong> runaways for protective custody as defined by localS.t'ltute. The jurisdiction from which the juvenile runs away countscu·rests <strong>of</strong> juveniles made by other jurisdictions.1
,-<strong>Sourcebook</strong> <strong>of</strong> <strong>Criminal</strong> <strong>Justice</strong> Stotistics <strong>1983</strong>an <strong>of</strong>fense) Is alleged or demonstrated to have occurred while his/herage was belllW the statutory limit <strong>of</strong> original jurisdiction <strong>of</strong> a juvenilecourt.Long-term focility--A correctional, as opposed to a detentionfacility. Includes training schools; ranches, forestry camps, and farms;and halfway houses and group homes.Nonpayroll staff--Full-time or part-time personnel not on thepayroll <strong>of</strong> the ~eporting facilit~. Includes individuals paid by a parentag~ncy or service who are assigned to the juvenile facility, personnelpaid under Conlr'lctual agreements or Federo! grcnts, and ;:;oiiegeI nterns. Excludes conmunity volunteers in 1971 when they were notcounted, and. in 1975, whe.n they were counted ds a separate group.C?i>eratlonal expendltures--Grass salaries and wages, plus otheroperating expenses.Payroll staff--Full-time and part-time personnel on the payroll<strong>of</strong> the reporting facility.Person in need <strong>of</strong> supervision (PINS)--Detention status <strong>of</strong> ajuvenile declared by a juvenile COl'rt to be in need <strong>of</strong> supervision.Encompasses those known variously as child in need <strong>of</strong> supervision(CHINS), juvenile in need <strong>of</strong> supervision (JINS), and minor in need <strong>of</strong>supervision (MINS), as well those designated as unruly unmanageableor incorrigible under special statutes for status <strong>of</strong>fende:s. All PINS ar~not stat~s <strong>of</strong>fenders, and all status <strong>of</strong>fenders are not PINS. Even inStates With status <strong>of</strong>fender statutes, juveniles with previous <strong>of</strong>fensescan be adjudicated delinquent for status <strong>of</strong>fenses. Conversely a judgecan declare. a jUvenile to be a person in need <strong>of</strong> supervisi~n for afelony or misdemeanor., Private focility--A juvenile detention or correctional facilitysubject to governmental licensing, but under the direct administrativeand oper.ational control <strong>of</strong> pri.vate enterprise; typically receivessubstantial governmental funding, in addition to support by privatesources.Public faciJity--A juvenile detention or correctional facilityunder the direct administrative r)'1d operational control <strong>of</strong> a State orlocal government.,Ranch, forestry camp, and farm--A long-term facility forpersons whose behavior does not necessitate the strict confinement <strong>of</strong> atraining school, <strong>of</strong>ten allowing them greater contact with theconmunity.Reception or diagnostic center--A short-term facility thotscreen~ person~ .conmltted by courts and assigns them to appropriatecorrectional facilities.Resident--A person, jUvenile or nanjuvenile, held In ajuvenile detention or correctional facility... Shelter--A shc;>r.t-t~rm facility that provides telTlf'Qrory careslm~lar to thet <strong>of</strong> d deTention center, but In a physically unrestrictingenvironment.Short-term faciJity--A detention, as opposed to a correctionalfc;>cility: Includes detention centers, shelters, and reception 0;diagnostic centers.Status <strong>of</strong>fense--An act or conduct that is declared by statute tobe on <strong>of</strong>fense, but cnly when conmltted or engaged In by a juvenile'.lnd that can .be odjudlcated only by a juvenile court. Typical statu~<strong>of</strong>fenses are Violation <strong>of</strong> curfew, running away from home truancypossession <strong>of</strong> alcoholic beverages, ond leading an Immoral 'life Bothadjudi~a!ed delinquents and juveniles declared to be persons in ~eed <strong>of</strong>supervIsion can be status <strong>of</strong>fenders.Training school--A long-term specialized type <strong>of</strong> facility thatprovide:; strict confinement for its residents.V",luntary .adm!ssion--A type <strong>of</strong> admission in which a juvenilevoluntarily canmlts hImself/herself to a fccillty without being adjudgedby a court to be delinquent or In need <strong>of</strong> supervision. The JUVenilemoy bt; referred to the facility for treatment by parents, court, schoolor SOCial agency.'Youthful <strong>of</strong>fender--A person, adjudicated In criminal court whomaY.b.e above the s~atytory age limit for jUveniles but bel~w aspeCified upper age limit, for whom special correctionol conmitmentsond spec!al record-:sealing procedures ore made avoiloble by statute.The speCial correctional conmltment may be to a juvenile facility to aspeci?1 section <strong>of</strong> on adult facility, or to 0 separate facility fa~ theconfinement <strong>of</strong> persons between the age limits specified In theparticular statute. Such provisions exist In Federal low and In the lows<strong>of</strong> several States.APPENDIX I,Survey <strong>of</strong> Delinquency Prevention Programs-Survey methodologyNJTE: The follOWing Information has been provided by the Notional Center for the Assessment <strong>of</strong>Delinquent Behavior and Its Prevention, Center for Low and <strong>Justice</strong>, University <strong>of</strong> Washington,Seattle, Washington.Identification <strong>of</strong> delinquency prevention programsIn 1979, the Notional Center for the Assessment <strong>of</strong> DelinquentBehavior and Its Prevention, Center for Low and <strong>Justice</strong>, UniVersity <strong>of</strong>Washington, initiated a notional survey in search <strong>of</strong> programs whoseactivities qualified as primary or secondary delinquency prevention.Primary prevention was def1'wd as modifying conditions in the physicaland social environment that lead to crime. Secondary prevention wasdefined as the early identification and intervention in the lives <strong>of</strong>youths in criminogenic circumstances. The focus was on youths beforedelinquent acts hod been conmitted or detected, generally before theycome in contact with law enforcement agencies. To identify a broadrepresentation <strong>of</strong> such p·ograms, a questionnaire was mai led to 898public funding, policy, and planning ager,cies <strong>of</strong> the Federal Governmentand all 50 States and Puerto Rico; to private foundations and agencies(such as the United Way); and to local social service agencies in 261U.S. cities. The following sources were used to generate the list <strong>of</strong>sampled agencies and organizations: The Foundation Directory, TheFoundation Grants Index, the Encyclopedia <strong>of</strong> Associations, TheAnnual Register <strong>of</strong> Grant Support, The Catalogue <strong>of</strong> FederalDomestic Assistance, The Government Organization Manual, andThe State Information Book. Any foundation or agency which mightprovide funding for delinquency prevention was included. Agenciesresponsible for social services, youth programs, 1('" enforcement,recreation, education, and labor were surveyed. The director <strong>of</strong> eachsurveyed organization was asked to nominate three programs he or sheviewed as the most promising or effective for preventing delinquencybefore youths become Involved with the low. A total <strong>of</strong> 875 programswere identified In this way. The principal administrator <strong>of</strong> each <strong>of</strong> theidentified programs was then surveyed using a second questionnaire.Sixty-two percent (540) <strong>of</strong> the 875 surveyed programs ultimatelyreturned completed questionnaires. Respondents inclUded a brood crasssection <strong>of</strong> youth-focused programs. Schools, various components <strong>of</strong> thecriminal justice system, mental health centers, youth service bureausand other organizations <strong>of</strong>fering a brood range <strong>of</strong> services wererepresented.In 1981, essentially the same procedures were followed in oneffort to identify addltlanal delinquency prevention programs. Thesources <strong>of</strong> progrom nominations were expanded to Include pr<strong>of</strong>essionalsworking In the area <strong>of</strong> delinquency prevention, program evaluators,academicians, and a search <strong>of</strong> research journals and newsletters.Nominators were asked for the names <strong>of</strong> promising delinquencyprevention programs without specifying that the programs shouldconcentrate on primary and secondary prevention. In addition, thenominators were not restricted to listing a maximum <strong>of</strong> three programs.After removing the names <strong>of</strong> programs which hod responded to the 197';1survey, 686 additional programs were identified. Surveys were sent tothe principal administrators <strong>of</strong> these programs. Ferty percent (275)returned completed questionnaires which were added to the data bose.SampleWhile the emphasis in the 1979 survey hod been on programsinvolved in primary and secondary delinquency prevention, a number <strong>of</strong>the nominators included programs which dealt with youths after theybecome involved with low enforcernent agencies (programs working topercent recidivism, i.e., terti(lry delinquency prevention). A number <strong>of</strong>the nominated programs were also found to be involved in all threelevels <strong>of</strong> prevention from primary to tertiary. These programs wereincluded in the survey and the data bose. The 1981 survey did notrestrict the nominators to primary or secondary prevention programs.The programs which responded to both surve';3 also varied in the targetages <strong>of</strong> their client populations, ranging from chilnren through adUltswho were <strong>of</strong>ten the parents <strong>of</strong> younger clients, protessionals in the lield<strong>of</strong> delinquency prevention, low enforcement personnel, or teachers. Inthe data presented here, programs exclusively targeting adults and onlyproviding services such as pareflfing training, delinquency preventioninformation, or other CJdult focused services were excluded. Inaddition, a Variety <strong>of</strong> organizational levels were represented by theprograms responding to the surveys. Programs which do not providedirect services to youths, acting, for instance, solely as servicebrokers, information and referral services, or program networkcoordinators were excluded from these data. These excluilionsestablished a data set for the information prllvlded here that includes494 programs from the 1979 survey and 254 programs from the 1981survey (91.8 percent <strong>of</strong> the 815 programs In the data bose).The surveyThe surveys were divided into two parts. The first port solicitedInformation an the program itself, Including geographical area served,target popUlation, organizational structure, st<strong>of</strong>f composition, services<strong>of</strong>fered, progrom budget, funding sources, and evaluation Information. Asecond section asked the administrator <strong>of</strong> the program to respond to aset <strong>of</strong> Likert-scaled propositions on causes <strong>of</strong> delinquency and methodsfor preventing It, based on seven mojor perspectiVes on the causes <strong>of</strong>juvenile delinquency. The data presented here are drown from the firstpart <strong>of</strong> the survey.Service codingThe programs responding to the surveys provided a wide variety<strong>of</strong> services, each program, typically, providing mare than one type <strong>of</strong>service. Services were identified and coded through content analysis <strong>of</strong>the returned questionnaires, descriptive literature provided by theprogram, interviews with some program personnel, and programevaluations, when these could be obtained. A maximum <strong>of</strong> eight <strong>of</strong>each program's mojo" services could be included in the data bose. Asubset consisting <strong>of</strong> 54 <strong>of</strong> these services provides the basis for some <strong>of</strong>the data presented here.644645
.~---------- - ~APPENDIX 5APPENDIX 6Privacy and Securit)' <strong>of</strong> <strong>Criminal</strong> History Information-Ddlnitions <strong>of</strong> termsParole guidelinesReport <strong>of</strong> the U.S. Parole Conmission-Parole guidelines and definitions <strong>of</strong> termsI'OTE: The following information was eXcerpted from U.S. Department <strong>of</strong> JUstice, U.S. ParoleCommission, United States Parole Commission Rules (28 C.F.R. 2.1-2.60i and GuidelineApplication Manual (Washington, D.C.: U.S. Deportment <strong>of</strong> <strong>Justice</strong>, 1982), pp. RIO, R17, R18;Title 28 <strong>of</strong> the U.S. Code <strong>of</strong> Federal Regulations, sections 2.12, 2.14, and 2.34; and informationprovided by the Source. N:!n-substantive editorial adaptations have been made.Initial parole consideration--The U.S. Parole Commission hasadopted guidelines for parole release considerations. These gUidelinesindicate the customary range <strong>of</strong> time to be served before release forvarious combinations <strong>of</strong> <strong>of</strong>fense (severity) and <strong>of</strong>fender (paroleprognosis) characteristics. The time ranges specified by the guidelinesare established specifically for cases with good institutional odjustmentond program progress. These time ranges are merely gUidelines, wherethe circumstances warrant, decisions outside <strong>of</strong> the guidelines (eitherobove or below) may be rendered.The gUidelines designate <strong>of</strong>fense behaviors as falling Into one <strong>of</strong>several severity levels. Severity levels include low, low moderote,moderate, high, very high, greatest I, and greatest II. Mitigating oraggravoting circumstonces in a particular cose may justify a decision oro severity roting different from that listed.An evoluotion <strong>of</strong> <strong>of</strong>fender characteristics, resulting in thecalculation <strong>of</strong> a salient factor score, serves as an oid in determiningthe <strong>of</strong>fender's parole prognosis. Parole prognosis refers to the patentlalrisk ?f a parole violation. A salient factor score is calculated bysummtng the <strong>of</strong>fender'S scores on each <strong>of</strong> the follOWing items: number <strong>of</strong>prior convictions and adjudications, number <strong>of</strong> prior corrmitments <strong>of</strong>more than 30 days duration, age at current <strong>of</strong>fense, commitment <strong>of</strong> 30days durotion within the past 3 years,probation/parole/confinement /escape status at time <strong>of</strong> current <strong>of</strong>fense,and heroin/opiate dependence.R,eparoie consideration--In most States, an <strong>of</strong>fender whoseparole is revoked is eligible to be considered for reparole.If revocation Is based upon an administrative violation only, i.e.,a violation not involving new criminal conduct, the following guidelinesapply.Positive supervision history:a. No serious alcohol/durg abuse and noposse.5sion <strong>of</strong> weopon(s} (and)b. At least 8 months from date <strong>of</strong> release todate <strong>of</strong> violation behavior (and)c. Present violation represents first instance <strong>of</strong>failure to comply with parole regulations <strong>of</strong> thisterm.Negative supervision history:a. Serious alcohol/drug abuse (e.g., readdictianto opiates) or possession <strong>of</strong> weapon(s} (or)b. Less than 8 months from date <strong>of</strong> relese todate <strong>of</strong> violation behavior (or)c. Repetitious or persistent violationsCustomary timeto be servedbefore releaseLess than6 months6 to 9 monthsIf a finding is made that the prisoner has engaged in behaviorconstituting new criminal conduct, the appropriate severity rating forthe new criminal behavior is calculated. New criminal conduct may bedetermined either by a new Federal, State, or local conviction or by anindependent finding by the U.S. Parole Commission at a revocationhearing. If the criminal conduct is in violation <strong>of</strong> State or local lawthe appropriate severity level is determined by analogy with the listedFederal <strong>of</strong>fense severity ratings. The guidelines for pilroleconsideration specified at the initial parole hearing are applied.Time served on a new State or Federal sentence is counted astime in custody for reparole guideline purposes. This does not affectthe computation <strong>of</strong> the expiration date <strong>of</strong> the violation term.Definitions <strong>of</strong> termsInitial hearing--The initial parolt· determination hearing for aneligible prisoner.One-third hearing--Covered undel' 28 C.F.R. 2.14(e} (1976)unti I it was phased out. The section provided that a prisonersentenced to a maximum term <strong>of</strong> more than 18 months under 18 U.S.C.4205(b)(2), 18 U.S.C. 294, or 26 U.S.C. 5811, could not be continuedpast one-third <strong>of</strong> the maximum sentence. Tile one-third hearing wasphased out after implementation <strong>of</strong> presurr.,\>tive date procedures inSeptember 1977.Pre-heairing record reviews--A review <strong>of</strong> the prisoner's casefile by on exominer during the month preceding a regularly scheduledinstitutional review hearing. If the recomml\ndation was to grantparole, and the regional commissioner concurred, ,10 in-person hearingwas conducted. Pre-hearing record reviews (28 ::.F.R. 2.14(b)(1976)were replaced by presumptive date record reviews. A presumptive daterefers to the set time at which a prisoner can expl~ct to be released(either by parole or mandatory release) if he malntl1ins a record <strong>of</strong>good institutional conduct and 0 suitable release plan.Statutory review hearings--Replaced by stc·tutory interimhearings. The purpose <strong>of</strong> the "interim hearing" Is "0 consider anysignificant developments or changes that may have occun'ed subsequentto the initial hearing. At the interim hearing the presumptive releasedate that had been set moy be advanced, retarded, or rllscinded fordiSCiplinary infractions, or remain unchanged.Review hearing--Subsequent parole hearlngs Intended to focuson developments or changes in the prisoner's status.Recission heoring--28 C.F.R. 2.34 provides thot if a prisonerhas been granted parole and has subsequently been charged withinstitutional misconduct sufficient to become a matter <strong>of</strong> recllrd, theparole grant may be retarded and the case scheduled for a recission~earing. At a recission hearing, cancellation <strong>of</strong> the parole grar!t is G1Issue.Retroactive record review--A special type <strong>of</strong> considerationresulting from a revision <strong>of</strong> the parole decision guidelines in June 19n;for more information, see 28 C.F.R. 2.20, 2.21. For information on thelocal revocation hearing and institutianai revcx.:uTion lleufi,jg, 5ec 2gC.F.R. 2.48-2.52 (1976).Local or institutional revocation hearing--28 C.F.R.2.49(a)(c)( 1981) provides that the parolee may request that he begiven a revocation hearing reasonably near the place <strong>of</strong> the allege'Clviolation or arrest if the following conditions are met: (I) the parole'!has not been convicted <strong>of</strong> a crime committed while under supervision;and (2) the parolee denies that he has violated any condition <strong>of</strong> hisrelease. A parolee will be given a revocation hearing upon his returnto a Federal institution if he voluntarily waives his right to a localrevocation hearing, if he admits any violation <strong>of</strong> the conditions <strong>of</strong>parole, or if he Is retaken following conviction for a new crime.Region--The five regions <strong>of</strong> the United States are defined in thefollowing manner: Northeast--Connectlcut, Delaware, District <strong>of</strong>Columbia, Maine, MarYland, Massachusetts, New /-bmpshire, New Jersey,New York, Pennsylvania, Rhode Island, Vermont, Virginia, West Virginia;Southeast--Alabama, Florida, Georgia, Kentucky, Mississippi, N:!rthCarolina, South Carolina, Tennessee; N:!rth Central--lliinols, Indiona,Iowa, Kansas, Michigan, Minnesota, Missouri, Nebraska, Ohio, Wisconsin;South Central--Arkansas, Louisiana, New MeXico, Oklahoma, Texas;West--Alaska, Arizona, California, Colorado, Hawaii, Idaho, Montana,Nevada, North Dakota, Oregon, South Dakota, Utah, Washington,Wyoming.iII,J:1qIIiI1Ii:I!l!I'tl'1I';/IiI;l\!l,i!I!IrII,IUrjj'I:~;l ,Definitions <strong>of</strong> termsI'OTE: The following Information has been e,'xcerpted from the U.S. Deportment <strong>of</strong> <strong>Justice</strong>, <strong>Bureau</strong> <strong>of</strong><strong>Justice</strong> <strong>Statistics</strong>, Privacy and Security <strong>of</strong> <strong>Criminal</strong> History Information: Compendium <strong>of</strong>State Legislation, 1981 Supplement (Wotion}--Provisions for public access to government records formwhich criminal justice records are specifically excluded.Freedom <strong>of</strong> Information (including criminal justiceInformation}--Provislons for public access to government records thatapply to criminal justice records.JUdicial review <strong>of</strong> challenged information--The right <strong>of</strong> onindividual to appeal an adverse agency decision concerning challengedinformation to a State court.Listing <strong>of</strong> information systems--A mondatory disclosure <strong>of</strong> theexistence <strong>of</strong> all criminal justice information systems describing theinformation contained in .such systems.Privacy ond security counci I--A State bOIJrd, committee,commission, or council whose primary statutory function is monitoring,evaluating, or supervising the confidentiality and ser;urlty <strong>of</strong> criminaljustice information"Public records--Requirements that <strong>of</strong>ficial records maintained bypublic <strong>of</strong>ficials be open to the pub II c.Purging: conviction information--The destruction or return toan Individual <strong>of</strong> criminal history information indicating a conviction.Purging: non-.convictlon Informotion--The destruction orreturn to the individual <strong>of</strong> criminal justice information where noconviction has resulted from the event triggering the collection <strong>of</strong> theinformation.Regulation <strong>of</strong> dissemination--Restrictions on dissemination <strong>of</strong>criminal history information.Regulatiim <strong>of</strong> intelligence collection--Restrictions on the kind·~f intelligence Information which may be collected and retained and/orprohibition on .ts storage in computerized systems.Removol <strong>of</strong> disqualifications--The restoration <strong>of</strong> rights andprivileges such as public employment to persons who have had criminalhistory records purged or seoled.Research access--The provision for and regulation <strong>of</strong> access tocriminal justice Information by outside researchers.Right to challenge--The right to on administrative proceedingin which individuals moy contest the accuracy or completeness <strong>of</strong> theircriminai hi~tary record.Right fo inspect--The right <strong>of</strong> on individual to exomine hiscriminal history records.Right to state non-existence <strong>of</strong> a record--The right toindicate In respOi'se to public or private inquiries the absence <strong>of</strong>cr iminal history In cases <strong>of</strong> arrest not leading to conviction or wherean arrest or conviction record has been purged.Sealiny' conviction informotion--The removal from active flies<strong>of</strong> individual criminal history Information indicating a conviction.Sealing: non-conviction informotion--The removal <strong>of</strong> criminalhistory Information from active files where no conviction has resultedfrom the event triggering the collection <strong>of</strong> information.Security--Requirements ti~at criminal justice agencies Instituteprocedures to protect their information systems from unauthorizeddisclosure, sabotage, and accidents.Separation <strong>of</strong> fi les--Requirements that criminal historyinformation be stored separate from investigative and intelligenceInformation.State regulatory autharjly--A grant <strong>of</strong> power to a Stateagency to promulgate statewide security and privacy regUlations forcriminal justice information systems.Tra i n i ng <strong>of</strong> e~, ployees--Security and privacy instruction whichmust be provided to employees handling criminal justice information.Transaction logs--Records which must be maintained bycriminal justice agencies indicating when and to whom criminal justiceinformation Is disseminated.647Ii.
Appendices"NJPENDIX 7Public opinion survey sampling proceduresI'OTE: Informotion on Gallup survey sampling procedures was excerpted from George H. Gallup, TheGallUp Pall, Public Opinion 1934-1971, Vol: .1, 1935-194B (New York: Ran?om I-huse, 1.972),pp. vi-viii; George H. Gallup, The Gallup Opinion Index, Report f\1o. 162 (Princeton, N.J •• TheGallup Poll, January 1979), pp. 29, 30; George Gallup, The Sophisticated. Poll W?tcher's. Guide(Princeton, N.J.: Princeton Opinion Press, 1976), p. 102; and from information provided. toS()I.R.CEBc:a< st<strong>of</strong>f from the Gallup Organizotlon. Informat,ion on. the Harris. survey sompl!ngprocedures was provided to SOURCEBOOK staff by LouIs I-hms ond Associates, Inc.; similarprccedures used In earlier surveys are described In Louis I-hrris and Associa!es, Inc.,. The HarrisYearbook <strong>of</strong> Public Opinion 1970: A Compendium <strong>of</strong> Current American Attitudes (NewYork: Louis I-hrris and Associates, Inc., 1971), pp. 511-514. Information on the surv~y proce~u~esemployed by the National Opinion Research Center was excerpted from the Notional OpinionResearch Center, General Social Surveys, 1972-19B2: Cumulative Codebook (Ch!cago:Notional Opinion Research Center, University <strong>of</strong> Chicago, 19I1l), pp. I, 207-211. Information onthe survey procedures used by the ABC News-Washington Post Poll was excerpted from Jeffrey D.Alderman, Lindo A. Cranney, and Peter Begons, ABC News-Washington Post Poll, Survey No.U03U (New York: ABC News, Mar. 23, 19B I), p. II. Information an the survey pr~cedures used byN3C News and The Associated Press was excerpted from N3C News and The AsSOCiated Press, P~IIResults NBC News, Report No. 66 (New York: N3C News, Apr. 2B, 19B I), p. 18. Non-substantiveeditorial adaptations have been made.The sampling procedures <strong>of</strong> five public opinion surveyorganizations are presented in this appendix; The Gallup Poll, theI-hrrls Survey, the l.Jational Opinion Research Center, the ABC NewsWashington Post poll, and the NBC News-The Associated Press poll.GALLLP POLLSAll Gallup polls since 1950, excluding certain special surveys,have been based on a national probability somple <strong>of</strong> interviewing areas.Refinements in the sample design have been introduced at variouspoints in time since then. I-hwever, over this period the design In Itsessentials has conformed to the current procedure, as described in thefollowing paragraphs.The United Stales is divided into seven size-<strong>of</strong>-communlty strata:cities <strong>of</strong> population 1,000,000 and over, 250,000 to 999,999, arId 50,000to 249,999, with the urbanized areas <strong>of</strong> all these cities forming a singlestratum' cities <strong>of</strong> 2,500 to 49,999; rural vi lIages; and farm or opencountry rural areas. Within each <strong>of</strong> these strata, the papulation Isfurther divided into seven regions: New England, Middle Atlantic, EastCentral, West Central, South, Mountain, and Pacific Coast. Within eachslze-<strong>of</strong>-communlty and regional stratum the population is arrayed Ingeographic order and zoned into equal slz~d groups <strong>of</strong> sampling units:Pairs <strong>of</strong> localities in each zone are s~lected with probability orselection proportional to the size <strong>of</strong> each locality's population-producing two replicated samples <strong>of</strong> localities.Wi thin selected cities for which population data are reported bycensus tracts or enumeration districts, these sample subdivisions aredrawn with probability <strong>of</strong> selection proportional to the size <strong>of</strong> thepopulation. For other cities, minor civil divisions, and rural areas Inthe somple for which population data are not reported by census tractsor enumeration districts, small, definable geographic areas are drawn,with the probability <strong>of</strong> selection proportional to size where availabledata permit; otherwise with equal probability.A black or block cluster is drawn with probability <strong>of</strong> selection. proportional to the num~er <strong>of</strong> dwelli~g. units fro,!! within e.a;hsubdivision selected for whIch block statistICS are available. In citiesand towns for which block statistics are not available, blocks aredrown at random, that is, with equal probobility. In subdivisions thatare rural or open country in character, segments approximately equalin size <strong>of</strong> popUlation are delineated and drawn with equal probability.In each cluster <strong>of</strong> blocks ond each segment so selected, arandomly selected starting point is designated on the interviewer's map<strong>of</strong> the area. Starting at this point, interviewers are required to followa given direction in the selection <strong>of</strong> households, taking households insequence, until their assigned number <strong>of</strong> interviews has been completed.Within each occupied dwelling unit or household reached, theinterviewer asks to speak to the youngest man I B or older at home, orif no man is at home, the oldest woman IB or older. This method <strong>of</strong>selection within the household has been developed empirically toproduce an age distribution by men and women separately whichcompares closely with the age distribution <strong>of</strong> the population. Itincreases the probability <strong>of</strong> selecting younger men, who are at homerelatively infrequently, and the probability <strong>of</strong> reaching older women Inthe household who tend to be under-represented unless given adisproportionclte chance <strong>of</strong> being drawn from a""!on.g those at hom:.The method Ijf st::.:c-tion among those at home Within the household ISnot strictly random, but it is systematic and objective, and eliminatesinterviewer judgment in the selection process. Interviewing. iscona,lcted at times when adults are most likely to be at home, whichmeans on weekends or if on weekdays, after 4 p.m. for women and after6 p.m. for men. Allowance for persons not at home Is made by a"times-at-home" weighting procedure rather than by "cali-backs." Thisprocedure Is a standard method for reducing the sample bias that wouldotherwise result from under-representation <strong>of</strong> persons who are difficultto find at home.The pre-stratification by regions Is routinely supplemented byfitting each obtained sample to the latest available U.S. <strong>Bureau</strong> <strong>of</strong> theCensus estimates <strong>of</strong> the regional distribution <strong>of</strong> the popUlation. Alsominor adjustments <strong>of</strong> the sample are mode by educational attainment(for men and women separately), based on the annual estimates <strong>of</strong> theU.S. <strong>Bureau</strong> <strong>of</strong> the Census derived from their Current PopulationSurvey. The sample procedure described is designed to produce onapproximation <strong>of</strong> the adult civilian population living in the UnitedStates, except for those persons In Institutions such as prisons orhospitals. The four regions <strong>of</strong> the country, as reported In Gallup publicopinion surveys, have been defined In the following manner:East--Malne, New Hampshire, Vermont, Massachusetts,Rhode Island, Connecticut, New York, New Jersey, Pennsylvania,Maryland, Delaware, West Virginia, District <strong>of</strong> Columbia;Mldwest--Ohlo, Michigan, Indiana, IIlInals, Wisconsin,Minnesota, Iowa, Missouri, Nor'lh Dakota, South Dakota, Nebraska,Kansas;South--Virglnla, North Carolina, South Carolina, Georgia,Florida, Kentucky, Tennessee, Alabama, Mississippi, Arkansas,Louisiana, Oklahoma, Texas, andWest--Montana, Arizona, Colorado, Idaho, Wyoming, Utah,Nevada, New Mexico, California, Oregon, Washington, Hawaii,Alaska.Prior to 1950, the samples for all Gal!up surveys, eXcludingspecial surveys, were a combination <strong>of</strong> what is known as a purposivedesign for the selection <strong>of</strong> cities, towns, and rural areas, and the quotamethod for the selection <strong>of</strong> individuals within such selected areas.The first step In obtaining the sample was to draw a nationalsample <strong>of</strong> places (cities, towns, and rural areas). These weredistributed by six regions and five or six city-size, urban-rural groupsor strata in proportion to the distribution <strong>of</strong> the population <strong>of</strong> votingage by these regional city-size strata. The distribution <strong>of</strong> casesbetween the non -South and South, however, was on the basis <strong>of</strong> thevote in presidential elections.Within each region the sample <strong>of</strong> such places was drawnseporately for each <strong>of</strong> the larger States and for groups <strong>of</strong> smallerStates. The places were selected to provide broad geographicdistribution within States and at the same time in combination to bepolitically representativp. <strong>of</strong> the State or groups <strong>of</strong> States in terms ?fthree previous elections. Specifically, they were selected so that Incombination, they matched the State vote for three previous electionswithin small tolerances. Great emphasis was placed on election data asa control in the era from 1935 to I 95U.Within the civil divisions In the sample, respondents wereselected on the basis <strong>of</strong> age, sex, and socioeconomic quotas.Otherwise, interviewers were given considerable latitude within thesample areas, being permitted to draw their cases from households andfrom person the street anywhere in the community.According to Gallup policy, if the interviewee does not hear ordoes not understand a question, the interviewer repeats the questionand if on the second reading the person does not undt!rstand or doesnot get the point <strong>of</strong> the question, the Interviewer checks the "noopinion" box. It should also be noted that seldom mare than 10percent <strong>of</strong> all those contacted refuse to be interviewed.Surveys <strong>of</strong> college students usually are based on In-personinterviews with 1,000 full-time students representing 60 campuses.Occasionally, special surveys conducted by Gallup for otherorganizations Use smaller samples because <strong>of</strong> time and/or financialconstraints.The data presented In SC1-.RCEBOO< from this Source were takenfrom the foliowlng reports. The dates on which Interviews wereconducted are presented in pareiltheses after each citation. At least1,500 Interviews were conducted unless indicated otherwise.The Gallup Opinion IndicesGeorge H. Gallup. The Gallup Opinion Index, Report No. 123.Pr!ncet~nj N.J.: The ~I!up Pc!!, Septc:r.!xlr !975, p. 10, (Mar. 7-10,1975.)• The Gallup Opinion Index, Report No. 124.Prince:-'to"'n:-,-;N".'j"".:~Tr1:he Gallup Poll, October 1975, p. 17. (June 17-30,1975.)• The Gallup Opinion Index, Report No. 129.Prince"'t"'o"'nC",'N".-jr.:-: The Gallup Poll, April 1976, pp. 24, 26. (Oct. 3-10,1975.)• The Gallup Opinion Index, Report No. 141.Prlnce:-'to"'n:-,-;N".'J"".:~Tr1:he Gallup Poll, April 1977, p. 16. (Jan. 14-17, 1977.)• The Gallup Opinion Index, Report No. 154.Princeton, N.J.: The Gallup Poll, May 197B, p. 30. (Nov. 17-20, 1977.)• The Gallup Opinion Index, Report No. 172.Prince:-'t"'on:-,-;N:-;.'J"".:~Tr1:he Gallup Poll, November 1979, p. 22. (Nov. 2-5,1979.)• The Gallup Opinion Index, Report No. 174.Prince"'t~on:::-,'Nrr'1.Jr.:C"T"":he Gallup Poll, January 19l1U, p. 29 (Nov. 2-5, 19!1O);pp. 30, 31 (Jan. 4-7, 1980).• The Gallup Opinion Index, Report No. 179.Prince"'t~on:-,'N".'J"".:~Tr1:he Gallup Poll, July 19BO, p. 14. (June 27-30, 1980.)The Gallup ReportsGeorge H. Gallup. The Gallup Report, Report No. 186.Princeton, N.J.: The Gallup Poll, March 19BI, p. 36. (Jan. 9-12, 19BI.)• The Gallup Report, Report No. 1!!7. Princeton, N.J.:The Ga
-------~---------------<strong>Sourcebook</strong> <strong>of</strong> <strong>Criminal</strong> <strong>Justice</strong> <strong>Statistics</strong> <strong>1983</strong>Appendices• The Harris 5i:rvey. New York: The ChicagoTribun-e--""Nei':"w""""'Y"'o-rT"k News Syndicate, Feb. 23, 1981, p. 3. (N= 1,250, Jan.22-25, 1981.)• The Harris Survey. New York; The ChicagoTribun:-e:--·NeL'Cw"'Y""o":'1 rk-:-'News Syndicate, Feb. 26, 1981, pp. 3, 4. (N= 1,250,Jan. 22-25, 1981.)-=::-"''17.'""' The Harris Survey. Chicogo: The Ch i co goTribune, Aug. 24, 19!11, p. 4. 0'1=1,248, Aug. 11-16, 19!11.)• The Harris Survey. New York: The ChicagoTribun:-e:--·NeL'Cw:-VY""or":'1k News Syndicate, May 24, 1982, p. 2. (N=I,249, Mar.12-16, 1982.)Th.e Harris Survey. New York: The ChicagoTribune-Tribune Company Syndicate, I nc., Nov. 8, 1982, pp. 2, 3.(N= I ,250, Oct. 29-Nov. I, 1911l.)Data presented in S
--------------~-------APPENDIX 8ABC News Crime PollNOTE: Information on the survey procedures used by the ABC News Poll was excerpted from JeffreyAlderman and Peter Begans, ABC News Poll, Survey No. 0066 (New York: ABC News, Feb. 13,<strong>1983</strong>). Non-substantive editorial adaptations have been made.APPENDIX 9The Figgle Report on Fear <strong>of</strong> Crime: America Afrald--Survey methodology and definitions <strong>of</strong> termsNOTE: The following Information has been excerpted from Research and Forecasts, Inc., The FiggieReport on Fear <strong>of</strong> Crime: America Afraid (Willoughby, Ohio: Flggie International, Inc., 1980),pp. 3, 149-160; and from John Crothers Pollock, "Perhaps Evanston Is not America: A Reply toLavrakas et 01.," <strong>Criminal</strong> <strong>Justice</strong> Newsletter, II (22, Nov. 10, 1980), pp. 5-7.MethodologyThe ABC News Poll on crime was based on telephone interviewswith 2,464 men and women, 18 years old and older, and living in thecontinental United States. The survey was conducted during the periodbetween Dec. 7-18, 1982. The sample <strong>of</strong> telephone numbers wereselected by sampling telephone exchanges. Telephone numbers werethen created by adding random digits to the sample <strong>of</strong> telephoneexchanges. Respondents, persons interviewed oj the telephone number,were selected in the following manner: the interviewer first asked tospeak to a male 18 years old or older; if there W/JS mare than one male18 years or older at that telephone number the, interviewer asked tospeak to the youngest male; if no male~ '; 8 years or older wereavailable the interviewer asked to speak to a female 18 years or older;and if more than one female was at that telephone number theinterviewer asked to speak with the youngest.Definitions <strong>of</strong> termsEducatian--Respondents were asked what the last grade <strong>of</strong>school was that they completed. Those who indicated eighth grade orless were included in the grade school group. Those who said they hadsome high school or graduated high school were included in the highschool group. Those who said they had some college, had graduatedcollege, or had post-graduate college were included in the collegegroup.Age--Respondents were asked in what year they were barn.Those barn between 1958 and 1%4 were int:;/uded in the 18 to 24 yeargroup. Those barn between 1953 and 1957 were included in the 25 to29 year group. Those barn between 1933 and 1952 were Included inthe 30 to 49 year group. Those born between 1918 and 1932 wereIncluded in the 50 to 64 year group. Those born before I 91 B wereincluded in the 65 years and older group.Community size--Respondents were asked to characterize thearea they lived in as either a large city, a suburb <strong>of</strong> a large city, asmall town or a rural area.Neighborhood racial characteristics--Respondents were askedto characterize the neighborhood they lived in as either all white,mostly white, about one-half black and one-half white, mostly black, orall black.Neighborhood age structure--Respondents were asked tocharacterize the people living in the neighborhood as either mostly onthe young side (35 years old or younger), mostly middle aged (between35 and 55 years old), mastly older (over 55 years old), or basically amixture <strong>of</strong> all ages.Regions--Survey results are reported for four regional categorieswith States classified in the following way: Northeast--Connecticut,Maine, Massachusetts, New Hampshire, New Jersey, New York,. Pennsylvania, Rhode Island, Vermont; Midwest--IIlinois, Indiana, Iowa,Kansas, Michigan, Minnesota, Missouri, Nebraska, North Dakota, Ohio,South Dakota, Wisconsin; South--Alabama, Arkansas, Delaware, Florida,Georgia, Kentucky, Louisiana, Maryland, Mississippi, North Carolina,Oklahoma, South Carolina, Tennessee, Texas, Virginia, West Virginia;and West--Alaska, Arizona, California, Colorado, Hawaii, Idaho,Montana, Nevada, New Mexico, Oregon, Utah, Washington, Wyoming.Distribution <strong>of</strong> respondentsThe following table shows the number <strong>of</strong> respondents in eachdemographic category. With these data it is possible to determine thefrequency <strong>of</strong> a response in each cell <strong>of</strong> each table extracted from theABC News Crime Poll and the sampling error for each group.NationalSex:MaleFemaleRace, ethnicity:WhiteBlackHispanicOther aMissing casesEducation:CollegeHigh schoolGrade schoolMissing casesEmployment status:Full-time employedPart-time employedUnemployedLaid <strong>of</strong>fRetiredFull-time homemakerStudentMissing casesIncome:1""0020,000",'to ~29,999"~,12,000 to 19,9998,000 to $11 ,999Under $8,000Missing casesAge:18 to 24 years25 to 29 years30 to 49 years50 to 64 years65 years and olderMissing casesCommunity size:Large citySuburbSmall townRuralMissing casesRegion:NortheastMidwestSouthWestNeighborhood racial characteristics:Mostly or all whiteRacially mixedMostly or all blackMissing casesNeighborhood age structure:Mostly younger than 35 yearsMostly between 35 and 55 yearsMostly older than 55 yearsMixed, all agesMissing casesNumber <strong>of</strong>respondentsin survey2,4641,4131,0512,1391861042781,1591,169124121,3373311473635218856176866205302552171563713449524832902447770481045914S506508254391,970363115161855951611,512IIaThis category Is not presented In tab:,es because thenumber <strong>of</strong> respondents In this category is small andheterogeneous.~ i1\I ~\':1 i Iif!Uf,IjIIIPurpose <strong>of</strong> the ReportThe Figgle Report presents the findings <strong>of</strong> a survey conductedby Research and Forecasts, Inc., a subsidiary <strong>of</strong> A-T-O Inc. Thepurpose <strong>of</strong> the report Is to measure the fear <strong>of</strong> crime and examine howIt has affected the lifestyles <strong>of</strong> the American public.Sample selectionThe sample used in this study was a national random-digit sample<strong>of</strong> the telephones <strong>of</strong> the United State constructed for Research andForecasts by Survey Sampling, Westport, Conn.. The method used to construct such samples Involves the use <strong>of</strong> amassive data base that is updated frequently. Using the data base, aspecialized computer program generates a list <strong>of</strong> telephone numbersthat Is organized In such a manner that each telephone has an equalprobablHty <strong>of</strong> being called.The use <strong>of</strong> the random digit dialing technique overcomes one <strong>of</strong>the main objections to telephone surveys, the problem <strong>of</strong> unlistednumbers. Because the data base from which the romple is drawn Isconstructed from working eXchanges supplied by the Nation's telephonecompanies rather than telephone books, both listed and unlistednumbers have an equal probability <strong>of</strong> being called.Another criticism <strong>of</strong> telephone surveys In the post has been thattelephone surveys tend to oversample the affluent, because only theycan afford telephones. However, U.S. Notional Health Service surveysIn 1976 found that 91.6 percent <strong>of</strong> American households now containtelephones. Consequently, although national random telephone surveysmay stili somewhat undersample the poor, It is clear that any bias isrelatively small.Data collectionTwenty trained interviewers conducted phone inte(vlews for aperiod <strong>of</strong> 6 weeks during April and May 1980. The interviews wereconducted during the week between the hours <strong>of</strong> 6 p.m. and II p.m.,and on weekends between the hours <strong>of</strong> 10:30 a.m. and 10:30 p.m. Theinterview took approximately 35 n'lnutes.In order to assure random sek,ction, three call-backs were madefor those telephone numbers that r'~sulted In nan-response before thenumber was discarded. Final non-response was 12 percent <strong>of</strong> the phonecalls and consisted ()f 3 groups: (J J those households where the phonewas not answered; (:!~ !:'o~"" households where Individuals simplyrefused to be Interviewed, and (3) those households for whom the giventime was not convenient. Although three call-backs were made for allthree categories <strong>of</strong> non-response, the first two categories representnon-response problems that will persist regardless <strong>of</strong> Interviewerpersistence. Interviewers attempted to set convenien\' times to callback respondents In the third category to minimize the number <strong>of</strong>individuals In the third category. In addition, 3 percent <strong>of</strong> the phonecalls resulted In Interviews that were terminated while the Interviewwas In progress.One thousand and forty-seven Interviews were fully completedand usable. This represents an 8S percent overall completion rate.Sampling distributionData collection techniques ensured that the randomness <strong>of</strong> thetelephone number selection process was maintained. The randomselection process ensures access to probability theory to measure thescmpllng error for the sample.A table <strong>of</strong> the estimated sampling error for binomIal percents atthe 95 percent confidence level Is presented below.Recomended allowonce for sampling error (plus or minus) at 95percent confidence level(Percent)PercentagesSam21e sizenear 1,000 900 800 700 600 500 400 300 200 10010 or 90 2 2 2 2 2 3 3 4 4 620 or 80 2 3 3 3 3 4 4 5 6 830 or 70 3 3 3 4 4 4 5 5 6 940 or 60 3 3 4 4 4 4 5 6 7 1050 3 3 4 4 4 4 5 6 7 10The geographic distribution <strong>of</strong> the respondents is as follows:East, 23 percent; Midwest, 25 percent; West, 21 percent; and South, 31percent.WeIghtingThe inItial sample did not exactly correspond to recent U.S.<strong>Bureau</strong> <strong>of</strong> the Census estimates <strong>of</strong> the demagraphic char'acteristlcs <strong>of</strong>the population over age 18. In order to make the two popUlationscorrespond mare closely, the sampled popUlation was weighted on twovariables: gender and Income.The Census <strong>Bureau</strong> estimates the 1979 popUlation over III asbeing 41.9 percent male cnd 58.1 percent female. In order to correctthe sample fIndings to approximate the census figures, males in thesample were Increased by a factor <strong>of</strong> 1.136 and females were decreasedby a factor <strong>of</strong> .902.SimIlarly, the Income groups were weighted. The group earningunder $2,999 for 1978 (5.9 percent <strong>of</strong> the sample) was multiplied by afactor <strong>of</strong> 3.4. Those earning $3,000 to $7,999 per year (15.7 percent <strong>of</strong>the sample) were multiplied by a factor <strong>of</strong> 1.2. Those earning $8,000to $11,000 (11.5 percent <strong>of</strong> the sample) were mUltiplied by a factor <strong>of</strong>I. Those earning $11,000 to $15,999 per year (14.5 percent <strong>of</strong> thesample) were multiplied by a factor <strong>of</strong> .61. Those earning $16,000 to$21,000 (16.9 percei,t <strong>of</strong> the sample) were multiplied by 0 factor <strong>of</strong> .65.Those earning $21,000 or over (35.5 percent <strong>of</strong> the sample) weremultllllled by a factor <strong>of</strong> I.Construction <strong>of</strong> composite measuresThe "formless fear index" is a Guttman scale constructed fromresponses to six questions concerning s<strong>of</strong>ety felt at home, in theneighborhood, or In the central business distrIct, during the day, andduring the night. For each item, response categorie~ were "frequently,""sometimes," "rarely," or "never." The "concrete fear index" is aGuttman scale built from six questions asking respondents how <strong>of</strong>tenthey worried about being a victim <strong>of</strong> murder, sexual assault, mugr1ng,knifing, beating, or armed robbery. For '1hese items, responsecategories were "very safe," "somewhat safe," "somewhat unsafe," or"very unsafe." In each scale, the individual items were dichotomizedinto values <strong>of</strong> 0 and I and sunmed to arrive at a score ranging from 0to 6. For the concrete fear scale, responses <strong>of</strong> "frequently" and"sometimes" were giVen scores <strong>of</strong> I. "Rarely" and "never" responseswere given scores <strong>of</strong> O. For the formless fear scale, responses <strong>of</strong> "verysafp," and "somewhat safe" were given scores <strong>of</strong> O. "Somewhat unsafe"and "very unsafe" responses were given scores <strong>of</strong> O. In both scales,total scores <strong>of</strong> 0 to 2 were classified as moderate to low levels <strong>of</strong> fearand scores <strong>of</strong> 3 to 6 as high fear level.The "confidence in the local police index" combines severalqUestionnaire items In order to create an overall measure <strong>of</strong> attitudestoward local police. The Items included In the Index were as follows:--"In general, would you rate your local police deportmentas: excellent or good (I), fair or poor (D)?"--"The local police treat people <strong>of</strong> all races the same."(agree= I, dlsagree=O)--"The local police Just enjoy push:ng people around andgiven them a hard time." (agree= I, disagree=O)--"The local police spend most <strong>of</strong> their time going afterpeople who do little things wrong and ignore mast <strong>of</strong> the badthings goIng on." (agree=O, dlsagree= I)--"Which <strong>of</strong> the following best describes your local police<strong>of</strong>ficers?" (respectful= I, arrogant=O)--"Do police use too much force?" (yes=O, no= I)As with the other composite scores, the police confidence index wasthe sum <strong>of</strong> the responses to each Index item. However, unlike theother Indices, the "confidence in the local police index" did not form aGuttman scale. ''High'' confidence in the local police was assigned tosums <strong>of</strong> 3 to 6 and "low" confidence to totals <strong>of</strong> less than 3.Community size Is the respondents' subjective classIficatIon <strong>of</strong>their residential environment. This is distinct from many otherdefinitions <strong>of</strong> comnunlty size that rely on population counts and U.S.<strong>Bureau</strong> <strong>of</strong> the Census definitions.652653
Research design and proceduresN'PENDIX 10Student Drug Use in America, 1975-1982-Survey methodology and definitions af termsNJTE: The following is excerpted from Lloyd D. Johnston, Jerald G. Bachman, and Patrick M.O'Malley, Student Drug Use, Attitudes and Beliefs National Trends 19!5-1982, U.S.Department <strong>of</strong> Health and Htxl1an Services, Notional Institute on Drug Abuse (Washington, D.C.:U.S. Government Printing Office, 1982), pp. 3-7; and information provided by the Source.The basic research design involves annual data collections fromhigh school seniors during the Spring <strong>of</strong> each year, beginning with theclass <strong>of</strong> 1975. Data collection takes place in approximately 125 to 140public and private high schools selected to provide an accurate crosssection <strong>of</strong> high school seniors throughout the United States.One limitation in this design is that it does not include in thetarget population those young men and women who drop out <strong>of</strong> highschool before the last few months <strong>of</strong> their senior year (j.e., prior to thesurvey)--between 15 to 20 percent <strong>of</strong> each age cohort. The omission<strong>of</strong> high schaol dropouts does introduce biases in the estimation <strong>of</strong>certain characteristics <strong>of</strong> the entire age group; however, for mostpurpo£es, the small proportion <strong>of</strong> dropouts sets outer limits on the bias.Further, .since the bias from missing dropouts should remain just aboutconstant from year to year, their omission should introduce little biasinto the various types <strong>of</strong> change being estimated for the majority <strong>of</strong>the population. . ..Sampling procedures--The procedure for securing a nationwidesample <strong>of</strong> high school seniors is a multistage one. Stage I is theselection <strong>of</strong> particular geographic areas; Stage 2 is the selection <strong>of</strong> oneor more high schools in each area; and Stage 3 is the selection <strong>of</strong>seniors within each high school.Stage 1--The geographic areas used in this study are theprimary sampling units (PSUS) developed by the Sampling Section<strong>of</strong> the Survey Research Center for use in the Center's nationwideinterview studies. These consist <strong>of</strong> 74 primary areas throughoutthe coterminous United States. In addition to the 12 largestmetropolitan areas, containing about 30 percent <strong>of</strong> the Notion'spopulation, 62 other primary areas are included: lOin theNortheast, 18 in the North Central area, 24 in the South, and 10in the West. Because these same PSUs are used for personalinterview studies by the Survey Research Center, local fieldrepresentatives can be assigned to administer the data collectionsin practically 011 schools.Stage 2--ln the major metropolitan areas more than onehigh school is <strong>of</strong>ten included in the sampling design; in mast othersampling areas 0 single high school is sampled. In all cases, theselections <strong>of</strong> high schools are made such that the probability <strong>of</strong>drawing a school is proportionate to the size <strong>of</strong> its senior class.The larger the senior class (according to recent records), thehigher the selection probability assigned to the high school.When a sampled school is unwilling to participate, a replacementschool os similar to it as possible is selected from the sameg~ographical orea.Stage 3--Within each selected schoo!, up to about 400seniors may be included in the data collection. In schools withfewer than 400 seniors, the usual procedure is to include all <strong>of</strong>them in the data collection. In larger schools, a subset <strong>of</strong> seniorsis selected either by randomly sampling classrooms or by someother random method that IS convenient for the school ond judgedto be unbiased. Sample weights are assigned to each respondentso as t.: ,' voriations inselection probabilities occurring at the earlier stages <strong>of</strong> sampling.The three-stage sampling procedure described above yielded thenumber <strong>of</strong> participating schools and students presented in Table I.Table IClass <strong>of</strong>1975 1976 1977 1978 1979 1980 1981 1982Total number<strong>of</strong> schools 125 123 124 131 131 127 12!l 137Public III 108 108 III III 107 109 116Privote 14 15 16 20 20 20 19 21Students porticipating: a~ber 15,791 16,678 18,436 18,924 16,662 16,524 18,267 18,661Percent 78 77 79 83 82 82 81 83Each school (except for half <strong>of</strong> those in the 1975 data collection)was asked to participate in two data collections, thereby permittingreplacement <strong>of</strong> half <strong>of</strong> the total sample <strong>of</strong> schools each year. Onemotivation for requesting that schools participate for 2 years isadministrative efficiency; it is a costly and time-consuming procedureto secure the cooperation <strong>of</strong> schoolS, and a 2-year period <strong>of</strong>participation cuts down that effort substantially. Another importantadvantage is that whenever an appreciable shift in scores from one654graduating class to the next is observed, it is possible to checkwhether the shift might be attributable to some differences in thenewly sampled schools. This is done simply by repeating the analysisusing only the 60 or so schools that participated both years. Thus far,the half-sample appraach has worked quite well; an examination <strong>of</strong> drugprevalence data from the "matched half-samples" showed that the halfsamples<strong>of</strong> repeat schools yielded drug prevalence trends that werevirtually identical to trends based on all schools.Definitions <strong>of</strong> termsCollege plans--Respondents were asked the question "How likelyis it that you will do each <strong>of</strong> the following things after high school?"One <strong>of</strong> the alternatives listed is "gradUate from college (four yearprogram)." Seniors responding "definitely won't" or "probably won't"were assigned to the college plans category "none or under 4 years."Students responding "probably will" or "definitely will" were assigned tothe college plans category "complete 4 years."Region--States grouped as "I'hrtheast" (Census classifications <strong>of</strong>New England and Middle Atlanticl: Maine, New Hampshire, Vermant,Massachusetts, Rhode Island, Connecticut, New York, New Jersey, andPennsylVania. States grouped as "North Central" (Census classifications<strong>of</strong> East North Central and West North CentraD: Ohio, Indiana, Illinois,Michigan, Wisconsin, Minnesota, Iowa, Missouri, North Dakota, SouthDakota, Nebraska, and Kansas. States grouped as "South" (Censusclassifications <strong>of</strong> South Atlantic, East South Central and West SouthCentraJ): Delaware, Maryland, District <strong>of</strong> Columbia, Virginia, WestVirginia, North Carolina, South Carolina, Georgia, Florida, Kentucky,Tennessee, Alabama, Mississippi, Arkansas, Louisiana, Oklahoma, andTexas. States grouped as "West" (Census classifications <strong>of</strong> Mountainand Pacific): Montana, Idaho, Wyoming, Colorado, New Mexico, Arizona,Utah, Nevada, Woshington, Oregon, and California.Population density:"Large SMSAs" inclL'des the 12 largest StandardMetropolitan Statistical Areas (SMSA) as <strong>of</strong> the 1970 census: NewYork, Los Angeles, Chicago, Philadelphia, Detroit, Son Francisco,Washington, Boston, Pittsburgh, Sf. Louis, Baltimore, andCleveland.''Other SMSAs" include all other Standard MetropolitanStatistical Areas excluding the 12 above. Except in the NewEngland States, an SMSA is a county or group <strong>of</strong> contiguouscounties that contains at 1"I1.y: household respondents, self-respondents,and proxy respondents.I. Household respondent--A household respondent waschosen to answer questions that pertained to the entirehousehold. Items asked <strong>of</strong> the household respondent included suchquestions as whether the residence was owned or rented and totalfamily income. In addition, the household respondent was asked aseries <strong>of</strong> household "screen" questions, designed to elicitinformation concerning crimes against the household such asburglary and auto theft.The interviewer was instructed to interview aknowledgeable adult household member as the householdrespondent; that is, one who appeared to know--or who couldreasonably be expected to know--the answers to the householdquestions. For the data presented in this SOURCEBOOK, thisusually was the head <strong>of</strong> the household or the spouse <strong>of</strong> the head<strong>of</strong> the household. If it became apparent that the particularhousehold member being interviewed was unable to answer thesequestions, a more knowledgeable respondent was found, orarrangements were made to call back when a knowledgeablerespondent was available.2. Self-respondent--Questions that pertained to individualvictimization were asked <strong>of</strong> each household member 14 years <strong>of</strong>age or older. The questions asked <strong>of</strong> each Individual memberinclude personal characteristics and whether they were victimizedin some way during the preceeding 6 months.3. Proxy respondent--Information about each householdmember aged 12 and 13 was obtained by a proxy; that is, thequestions for these persons were asked <strong>of</strong> the householdrespondent or some other knowledgeable adult household member.Proxy respondents were also utilized for those household memberswho were physically or mentally unable to answer the individualquestions, as well as for those household members who weretemporarily absent and not expected to return within theenumeration period.Commercial interviews--For the commercial portion <strong>of</strong> thesurvey, either the owners or the managers <strong>of</strong> the commercl alestablishment were to be interviewed. If the owner or manager wa.not available at an establishment, the interviewer asked for the nam,~and telephone number so that he/she could make an appointment for aninterview. If the owner or manager was temporarily absent for theentire Interview period, or was ill for the entire period, or was toobusy, or if the interviewer could not obtain an interview for some otherreason, the interview was conducted with the assistant manager, an655accountant, the senior sales-clerk, the nurse, secretary, receptionist,or some other employee who was knowledgeable about the business.The conmercial survey was suspended as <strong>of</strong> 1977.QuestionnairesI-husehold portion--The questionnaire used in the householdsurvey had four parts. The first portion <strong>of</strong> the questionnaire completedby the interviewer consisted <strong>of</strong> such items as basic householddemographic data and pertinent information concerning noninterviews.The second portion, asked <strong>of</strong> the household respondent, was designed toobtain--for the purpose <strong>of</strong> describing the household--characteristics <strong>of</strong>the household members i2 years <strong>of</strong> age or older as well as to elicitgeneral information concerning crimes committed against the householdas a whole during the reference period. Items :ncluded in this sectionIncluded such "screen" questions as: "During the last 6 months, didanyone break into or somehow illegally get into your home, garage, oranother building on your property?" and "Did anyone steal or try tosteal, or use your motor vehicle without permission?"The third portion <strong>of</strong> the household questionnaire was asked <strong>of</strong>each household member 12 years <strong>of</strong> age or older, or a proxy. Itconsisted <strong>of</strong> items <strong>of</strong> person characteristics, such as educationalattainment and marital status, as well as individual "screen" questions,desi gned to elicit whether or not the respondent had been the victim <strong>of</strong>a specific crime during the reference period. For example, thefollowing questions were asked: "Did anyone take something directlyfrom you by using force, such as by a stickup, mugging or threat?" and"Did anyone beat you up, attack you or hit you with something, such asa rock or bottle?"The final portion <strong>of</strong> the household questionnaire, the CrimeIncident Report, was used to gather detailed information about crimesreported in either the household screen section (portion II) or theindividual screen section (portion III). One incident report was filledout for each incident reported in answer to a screen question. Forexample, if a respondent said that her purse was snatched once andthat she had been beaten up twice, three Crime Incident Reports--onefor each seporate incident--were completed.Commercial--The commercial victimization questionnaire hadthree primary components. The first contained questions that enabledthe interviewer to classify the type <strong>of</strong> establishment, non interviewreasons, gross income, ownership, and number <strong>of</strong> employees. Thesecond portion contained "screen" questions regarding whether anyburglaries and/or robberies had occurred during the reference periodand, if so, how many. This part ion also included questions regardinginsurance coverage and security measures used by the establishment.The final portion <strong>of</strong> the commercial questionnaire consisted <strong>of</strong>robbery and burglary incident reports. These detailed reports werefiled on every robbery and burglary incident reported in the screenquestionnaire. Seporate reporting forms were used for robbery andburglary incidents for the survey period from July 1972 throughDecember 1972. Beginning in January 1973, the same i nci dentreporting form was used to record details <strong>of</strong> both robbery and burglaryincidents.Changes in the 1979 Household QuestionnaireIn 1979, a revised questionnaire was used in the householdsurvey. To be able to make data comparable across years,specifications were given for reformatting the recponses from the newquestionnaire to coincide with the old survey questionnaire. Tablesconstructed for SOLRCEBOCK are based on the format <strong>of</strong> the old surveyquestionnaire. However, for Tables 3.6 and 3.14, it was not alwayspossible to reformat the new respanse categories (and hence columndistributions) to those from the old questionnaire. The result is thatthe tables presented in this edition <strong>of</strong> SOURCEBOOK are notcomparable to those presented in earlier editions. To aid the reader,the table below compores the response codes for these variables fromthe 1978 and revised 1979 questionnaires.
- -~~ - -~-----~~ ----------~-------------__•___ 0.' '-"<strong>Sourcebook</strong> <strong>of</strong> <strong>Criminal</strong> <strong>Justice</strong> <strong>Statistics</strong> <strong>1983</strong>AppendicesTable 3.6 Reasons for not reporting the victimization to the police1978 CodesI'bthing could be done--Iack <strong>of</strong>pro<strong>of</strong>Did not think it importantenoughPolice wouldn't wont to bebotheredDid not wont to toke time-too inconvenientPrivate or personal motter, didnot wont to report itDid not wont to get involvedAfraid <strong>of</strong> reprisalReported to someone elseOther--specifyI'bt ascertainedConfidentiality1979 CodesLock <strong>of</strong> pro<strong>of</strong>, no way t<strong>of</strong>ind/identify <strong>of</strong>fenderRespondent did not think itimportant enoughPolice wouldn't think it wasimportant enough, theywouldn't wont to be botheredDid not wont to toke time-too inconvenientPrivate or personal matter ortook core <strong>of</strong> it myselfI'b compal able codeAfraid <strong>of</strong> reprisal by <strong>of</strong>fenderor his family/friendsReported to someone elseObject recovered or <strong>of</strong>fenderunsuccessfulDidn't realized crime happenedtilllaterProperty difficult to recoverdue to lock <strong>of</strong> serial or I.D.numberpolice would be inefficient,ineffective, insensitive (theywould arrive late, wouldn'tpursue case properly, wouldharass/insult respondent, etc.)Other--specifyI'bt ascertainedA notice <strong>of</strong> confidentiality appeared on both the household andthe commercial questionnaires, indicating to the respondent that theanswers given were confidential by iaw and could be seen only bysworn U.S. <strong>Bureau</strong> <strong>of</strong> the Census personnel.I'btional sampling procedures and standard errors <strong>of</strong> the estimatesAll <strong>of</strong> the National Crime Survey data presented are populationestimates derived from nationwide probability samples. The samplesused for the notional survey are large; during a 6-manth period, about60,000 household interviews and 135,000 personal interviews areconducted. Nevertheless, whenever samples <strong>of</strong> a population--ratherthan the entire population--are studied, a certain amount <strong>of</strong> samplingerror is introduced into the results. The size <strong>of</strong> this error depends onsuch factors as the size <strong>of</strong> the sample and the variability <strong>of</strong> thepopulation. However, the sampling design and techniques were carriedout in a way'that permits on estimation <strong>of</strong> the amount <strong>of</strong> samplingerror present in the results.656Table :1.14 Place <strong>of</strong> occurrence <strong>of</strong> victimization1978 C~des. ________________ ~19~7~9_C=0~d~e~:; ______________ _At or !n own dwelling, ingarr.:ge or other building onp~operty (includes break-in orattempted break-in)At or In vocation home,hCltel/motelIn;lide non-residential bui/ding,pu:~lIc conveyance (Includesstore, restaurant, bonk, gasst(.ltlon, public conveyance orstc·tlon, <strong>of</strong>fice, factory,wa.-ehouse)Neer own home; yard, sidewalk,driveway, carport, apartmenthall (does not include break-inor 'Jttempted break-in)On the street, in pork, field,playground, school grounds orparking lotInside schoolElsewhereI'bt ascertainedAt or in own dwelling, or owngarage (always mark for breakinor attempted break-in <strong>of</strong>some)At or in detached buildings onown property such as detachedgarage, storage shed, etc.{Always mark for break-in orattempted break-in <strong>of</strong> someAt or in vocation home,hotel/motelInside restaurant, bar,nightclubInside other commerclaibuildingsuch as store, bonk, gas stationOn public transportation or instation (bus, train, plane,airport, depot, etc.)Commercial parking lotInside <strong>of</strong>fice, factory, orwarehouseNear own home; yard,sidewalk, driveway, carport, onstreet immediately adjacent toown home, apartmenthall/storage area/laundry room(does not include apartmentparking lots)On the street (other thanimmediately adjacent tooWn/friend/relative/neighbar'shome)I'bncomnercial parking lotAportment parking lotOn school property (schoolparking area, ploy area, schoolbus, etc.)In a pork, field, playgroundother than schoolInside school buildingAt, in, or near afriend/relative /neighbor'shome, other building on theirproperty, yard, immediatelyadjacent to their home,apartment hall/storagearea/laundry roomI'bt ascertainedThe sample <strong>of</strong> particular households or businesses actually drownIs only one <strong>of</strong> on extremely large number <strong>of</strong> different samples thatcould have been drown. If all possible samples <strong>of</strong> a given size were tobe drown from a popUlation and the sample results were used toestimate the popUlation value for a particular characteristic, theestimates from the samples would differ somewhat from each other.These differences are distributed in a known way, however, andstatistical sampling theory can give on ideo <strong>of</strong> how much confidencecan be placed in the estimate <strong>of</strong> a popUlation characteristic that isd::rived from a sample <strong>of</strong> a given size. Using a statistic called thestandard error <strong>of</strong> the estimate, we can create on interval around thesample characteristic in such a way as to know the probability thatir.tervals mode in thi~ manner contain the population characteristic.Because the method utilized in the production <strong>of</strong> these standarderrors and confidence intervals is based on approximations, thestandard errors are on Indication <strong>of</strong> the order <strong>of</strong> magnitUde <strong>of</strong> thestandard error rather than the precise standard error, for any specificitem. I t should be noted that as finer and finer breakdowns <strong>of</strong> thepopulation are mode--for example, along dimensions <strong>of</strong> race, income,age, etc.--the size <strong>of</strong> the standard error, relative to the size <strong>of</strong> theestimate, can be expected to increase. ---\j{·i;i:1IJ!rI:I : ijIIIIiIDefinitions <strong>of</strong> personal crime categoriesI. Rope ond ottempted rape--Rape was the method <strong>of</strong>attock; or the type <strong>of</strong> injury suffered; or there was a verbalthreat <strong>of</strong> rope; or the method <strong>of</strong> attock was attempted rope; orthere was attempted rope injuries suffered. This categoryincludes victimizations both with and without theft.2. Robbery--Aggregates categories 3, 6, and 7 below.3. Robbery.; nd attempted robbery with injury-Aggregates categories 4 and 5 below.4. Robbery and attempted robbery with injury, seriousassault--In a personal confrontation, something was stolen ortoken without permission from the victim; or there was onattempt to steal or toke something without permissioh; and thevictim suffered a serious injury. The robbery mayor may nothave involved a weapon.5. Robbery and attempted robbery with Injury, minorassault--In a personal confrontation, something was stolen ortoken without permission from the victim; or there was onattempt to steal or toke something without permission; and the<strong>of</strong>fender hod no weapon or the victim did not know whether the<strong>of</strong>fender hod a weapon; and the victim was attacked in somefashion; and received minor injuries. a6. Robbery, without injury--In a personal confrontation,something that belonged to the victim was stolen or tokenwithout permission; and the victim was threatened or attacked,but not injured in any way. Victimizations in which the <strong>of</strong>fenderhod a weapon as well as those in which the <strong>of</strong>fender did not havea weapon are included.7. Attempted robbery without injury--In a personalconfrontation, the <strong>of</strong>fender attempted to steal something; and thevictim was threatened or attacked, but not injured in any way.Victimizations in which the cffender hod a weapon as well asthose in which the <strong>of</strong>fender did not have a weapon are included.8. Assault--Aggregates categories 9 and 12 below.9. Aggravated assault--Aggregates categories 10 and I Ibelow.10. Aggravated assault with injury--I'bthing was stolenor token without permission, nor was there on attempt to steal ortoke something without permission; and the victim suffered aserious injury. The a5SQu/t mayor may not have involved aweapon.II. Aggravated assault, attempted assault withweapon--I'bthing was stolen or token without permission, norwas there on attempt to steal or take something withoutpermission; and the <strong>of</strong>fender hod a weapon; and the victim wasthreatened with harm, or was actually attacked but received noinjury.12. Simple assault--Aggregates categories 13 and 14below.13 Simple assault with injury--I'bthing was stolen ortoken without permission, nor was there on attempt to steal ortoke something without permission; and the <strong>of</strong>fender hod noweapon, or the victim did not know whether the <strong>of</strong>fender hod aweapon; and the victim was attacked in some fashion; andreceived minor injuries.14. Simple assault, attempted assault withoutweapon--I'bthing was stolen or token without permission, norwas there on attempt to steal or toke something withoutpermission; and the <strong>of</strong>fender did not have a weapon; and thevictim was threatened with harm, or was actuallY attacked butreceived no injury.15. Personal larceny with coo.tact--Aggregatescategories 16, 17, and IB below.16. Personal larceny with contact, purse !;natching--Apurse was token from the person; and the <strong>of</strong>fender did not have aweapon; and the victim was not threatened with harm or actuallyattacked.17. Personal larceny with contact, attempted pursesnatching--An attempt was mode to toke a purse from theperson; and the <strong>of</strong>fender did t.
AppendicesJlPPENDIX 12Table 2 Distribution <strong>of</strong> reports across jurisdictions that submitted case data(N=420,216)National Analysis <strong>of</strong> Official Child Neglect and Abuse Reporting-Study methodologyAbuse/Abuse Neglect neglect Olher a TotalNJTE: The following information was provided to SOURCEBOOK staff by the American HumaneAssociation.The National Study on Child Neglect and Abuse Reporting is aproject conducted by the American Humane Association and funded bythe National Center on Child Abuse and Neglect <strong>of</strong> the U.S. Department<strong>of</strong> Health and Human Services. It began as a grant awarded to theAmerican Humane Association in 1973 to determine the feasibility <strong>of</strong>operating a national clearinghouse for child abuse and neglect reportsin order to be able to describe the national status <strong>of</strong> the childmaltreatment problem. In 1976, detailed analyses <strong>of</strong> the data werefirst available. In 1978, the American Humane Association, inconjunction with the Denver Research Institute, was awarded acontract to continue the work <strong>of</strong> the clearinghouse, to more carefullydefine the data set, and to provide training and technical assistance toStates.The rosie objectives <strong>of</strong> the clearinghouse function <strong>of</strong> the NationalStudy are as follows: (I) determine the number <strong>of</strong> families, allegedperpetrators, and involved children on <strong>of</strong>ficial reports <strong>of</strong> childmaltreatment; (2) determine the source <strong>of</strong> referral and the geographicdistribution <strong>of</strong> <strong>of</strong>ficial reports; (3) describe the characteristics <strong>of</strong>families, peroetrators, and children involved in <strong>of</strong>ficial reports and,where possible, compare then against the general population; (4)describe the response <strong>of</strong> the child protective services system to thereport; and (5) identify and describe trends in the reporting dataacross and within jurisdictions.Procedures for data collection and analysisThe data collected by the National Study are basically <strong>of</strong> twotypes: summary data, used to describe the extent <strong>of</strong> reportedmaltreatment on a national basis; and case information, used todescribe the dynamics <strong>of</strong> reporting and also the nature <strong>of</strong> what wasreported. Jurisdictions that submit case data do so voluntarily. Most<strong>of</strong>ten, participation in the National Study is integrated into thejurisdiction's child protective services management information system.During 1982, all 50 States, the District <strong>of</strong> Columbia, and threeU.S. Territories participated in the National Study to some degree.The 37 fully participating jurisdictions submitted case data by means <strong>of</strong>either nonidentifying copies <strong>of</strong> <strong>of</strong>ficial reparting forms or a data tapethat contained reporting data organized by case (Level I). Theremaining jurisdictions submitted sumnary statistics to the NationalStudy (Level 2). Table I shows the distribution <strong>of</strong> participation ateach level.Prior to inclusion, each record must meet certain minimumcriteria for completeness and must successfully pass a series <strong>of</strong> editspecifications to insure the integrity <strong>of</strong> the data base. Forms that failediting at any point are either corrected by the National Study staff orare returned to the originating participant jurisdiction for correctionand resubmittal.Potentially any jurisdictional reporting form is appropriate forcollection <strong>of</strong> National Study data. However, only those data items thatare compatible with the National Study's masterfile can be used.Jurisdictions can and do vary in terms <strong>of</strong> how milch <strong>of</strong> their data canbe actually included in the data base.Data compatability is determined through a mapping process,which essentially entails verifying with the jurisdiction that thepurpose and meaning <strong>of</strong> a particular data element on their form is thesame as that <strong>of</strong> a corresponding National Study data element. Hence,the total number <strong>of</strong> reports used in each data table varies. This is afunction <strong>of</strong> two types <strong>of</strong> data completeness: the actual number <strong>of</strong>campatible data elements and the combination <strong>of</strong> compatible dataelements that constitute a data category.Fully participatingAlaskaArizonaArkansasColoradoDelawareDistrict <strong>of</strong>ColumbiaFloridaGeorgiaHawaiiIllinoisIndianaIowaKentuckyLouisianaMaineMichiganMinnesotaMississippiTableLevelMissouriNebraskaNevadaNew HompshireNew MexicoNew YorkNarth CarolinaNcnh DakotaOhioPennsylvaniaRhode IslandSouth CarolinaTexasUtahVermontVirginiaWisconsinGuamVirgin IslandsLevel 2Summary statisticsAlabamaCaliforniaConnecti cutIdahoKansasMarylandMassachusettsMontanaNew Jer5eyOklahomaOregonPuerto RicoSouth DakotaTennesseeWashingtonWest VirginiaWyomingTable 2 shows the distribution <strong>of</strong> reports across jurisdictions thatsubmitted case data. These reports constituted the data bank used inthe analyses <strong>of</strong> case information. It is important to remind the reader,however, that although the majority <strong>of</strong> reports represent the same set<strong>of</strong> data elements, some do not. In addition, there was variation in thecompleteness <strong>of</strong> each report's data set. For these reasons, all <strong>of</strong> thereports in the !'lational Study data base were not always used to derivea given statistical summary. The "N" fer each data table varies as afunction <strong>of</strong> data element compatibility and data set completeness.Interpretation <strong>of</strong> the dataReporting on a national level has increased by 106 percent since1976. This can be attributed to a number <strong>of</strong> factors. First, it must bepointed out that it may be impossible to determine if an increase inreporting is directly related to an increase in the number <strong>of</strong> childrenwho are maltreated. The main reason for this is that there is nonationally standardized definition <strong>of</strong> maltreatment. Further, individualjurisdictions continue to modify reporting legislation to encompass newreportable conditions, e.g., emotional maltreatment. Reporting"measures" different phenomena in each jurisdiction and, in addition,what is measured in each jUrisdiction may change each year.Compounding this situation is that it is known that not all occurrences<strong>of</strong> maltreatment are reported. It is likely that the increase inreporting is due to improved accountability on the port <strong>of</strong> jurisdictionalsystems.In addition to reflecting broadened reportable conditions andimproved accountability, the increase in reporting also reflectsincreased public awareness <strong>of</strong> the child maltreatment problem, and acorresponding increase in willingness to report.It is interesting to note, however, that the magnitude <strong>of</strong> theincrease from one year to another has been steadily decreasing withtime. It is unlikely that this means that reported incidence isapproaching actual incidence for the reasons mentioned above. Rather,it probably reflects a steady approach to the limit in terms <strong>of</strong> whatchild protective services can handle.!i1\IiiIIILJII!I" I'hIiii"Alaska 0 0 0 2,649 2,649Arizona 1,452 1,530 148 4,58U 7,710Afkansas 3,073 4,607 1,074 0 8,754Colorado 0 0 0 5,446 5,446Delaware 450 698 190 928 2,266District <strong>of</strong> Columbia 0 0 0 1,878 1,878Florida 0 0 0 46,035 46,035Georgia 2,885 5,685 833 5,051 14,454Howaii 1,075 437 157 14 1,683Illinois 10,845 14,383 6,784 II 32,023Indiana 5,570 6,061 4 119 11,754Iowa 0 0 0 14,062 14,062Kentucky 3,110 4,589 0 80 7,779Louisiana 2,911 6,648 1,346 189 11,094Maine 778 1,141 851 II 2,781Michigan 4,341 8,527 298 19,153 32,319Minnesota 4,050 2,765 968 9 7,791Mississippi 0 0 0 2,813 2,813Missouri 4,181 9,858 819 13,574 28,432Nebraska 0 0 0 1,497 1,497Nevada 1,023 1,878 292 78 3,271New Hampshire 0 0 0 2,136 2,163New Mexico 1,225 1,937 384 32 3,57!lNew York 2,596 13,878 27,200 8,132 51,806Narth Carolina 0 0 0 15,830 15,830North Dakota 454 849 226 20 1,549Ohio 6,252 7,345 1,823 1,094 16,514Pennsylvania 0 0 0 13,653 13,6$:~Rhode Island 380 272 98 59 ;:'l!l"South Carolina 3,S02 7,162 728 298 II ,~~(jTexas 0 0 0 29,660 29,660Ulah 0 0 0 4,651 4,651Vermont 385 411 455 2 1,253Virginia 0 0 0 14,253 14,253Wisconsin 3,514 2,453 317 15 6,299Guam 2 3 I 0 6Virgin Islands 19 8 10 I 38Total 64,073 103,124 45,006 208,013 420,216a"Other" incudes all <strong>of</strong> those reports not clearly labelled as either "abuse""neglect," or "abuse/neglect," or those for which "type <strong>of</strong> repart" was missing ~rincompatible with National Study criteria.~659658
------------ - -APPENDIX 14APPENDIX 13Discipline, Order and Student Behavior in American High Schools-Survey methodology and definitions <strong>of</strong> terms!\oTE: The following information was excerpted from U.S. Deportment <strong>of</strong> Education, Notional Centerfor Education <strong>Statistics</strong>, Discipline, Order and Student Behavior in American High Schools(Washington, D.C.: U.S. Government Printing Office, 1982), pp. xiii-xiv, II, 12, Appendix A.The data and analyses presented in this report are from the first(1980) wove <strong>of</strong> the Notional Center for Education <strong>Statistics</strong> study, HighSchool and Beyond, a longitudinal study <strong>of</strong> U.S. high school seniors andsophomores. This study was conducted for the Notional Center forEducation <strong>Statistics</strong> by the Notional Opinion Research Center at theUniversity <strong>of</strong> Chicago.Survey methodologyThe sample was a two-stage stratified probability sample withschools within a stratum drown with a probability proportional to theirsize. Once a school was selected, up to 36 sophomores and 36 seniorswere drawn randomly from the students enrolled in each selectedschool.Several special strata were included in the sample design.Schools in these special strata were selected with probabilities higherthan those for schools in regular strata to allow for special study <strong>of</strong>certain types <strong>of</strong> schools or students. The following kinds <strong>of</strong> schoolswere oversampled: public schools with high proportions <strong>of</strong> Hispanic(Cuban, Puerto Rican, and Mexican) students; Catholic schools withhigh proportions <strong>of</strong> minority group students; public alfernative schools;private schools with high proportions <strong>of</strong> Notional Merit Scholarshipfinalists. Substitutions were mode for noncooperating schools in thosestrata where it was possible. Out <strong>of</strong> 1,122 possible schools, students at1,015 schools and school administrators from 988 schools filled outquestionnaires.In many schools the actual number <strong>of</strong> seniors and sophomores wasless than the target number for several reasons. First, in some schoolsfewer than 36 sophomores or 36 seniors were enrolled. This reducedthe number <strong>of</strong> eligible students from 73,O!J0 (72 students in each <strong>of</strong>1,015 schools) to 70,704. Second, 8,278 students were absent on thesurvey dote. Third, 1,982 students, or in some cases their parents,declined to po,ticipate, exercising their right in a voluntary survey.Substi tutions were not mode for noncooperating students. Finally,2,174 cases were deleted because they contained only very incampleteinformation. Thus, the main student sample consists <strong>of</strong> 30,030sophomores and 28,240 seniors. This represents a completion rate <strong>of</strong> 82percent: 58,270 out <strong>of</strong> the 70,704 eligible students. This report, likeothers in this series, is based on a slightly larger number (30,263sophomores and 2!J,465 seniors), since the twins <strong>of</strong> some sampledstudents were included in the original data files.Weights were calculated to reflect differential probabilities <strong>of</strong>sample selection and to adjust for non-response. Using appropriateweights yields estimotes for high school sophomores and seniors in theUnited Sta.~s and separate estimotes for schools or students classifiedin various ways, such as by geographical region or school type.The use <strong>of</strong> weighted frequencies in the computation <strong>of</strong> the tables<strong>of</strong> the report has implications for the interpretation <strong>of</strong> table entries.660Weighted and unweighted frequencies cannot be used interchangeably.Thus, for exarns on the nonmedical use <strong>of</strong> psychotherapeutics. These formsWeTe filled out by the respondent while the interviewer read thequestions aloud. On certain later answer sheets, interviewers usedtheir judgment on whether or not to <strong>of</strong>fer respondents the option <strong>of</strong>reading silently and filling the sheets out entirely on their own.Definitions <strong>of</strong> termsAlcohol-1982: beer, _wine, and liquor, like whiskey or gin. 1979:beer, wine, and whiskey, gin, other hard liquors. 1977, 1976, and 1974:beer, wine, whiskey, or anything else to drink with alcohol in it. 1972:beer, wine, hard liquor like cocktails or highballs, or on the rocks, orstraight shots. Note: the responses to the 1979 and 1982 alcoholquestions were marked on a private answer sheet rather than beingspoken to the interviewer as in 1977, 1976, 1974, and 1972.Analgesics-1982: painkilling pills thaI are usually avaiiable onlywith a Q9ct9r's prescription. 19791 pills ysed megjcqlly to relieve pain.Analgesics are divided into four subgroups: propoxyphene, otheranalgesics, methadone, and agonist/antagonist. Note. see definition for"Nonmedical experience with psychotherapeutic drugs."Current drinker-1982, 1979, 1977, 1'i76, and 1974: drank in postmonth. 1972: drank in post 7 days. Note: the response to the 1982and 1979 alcohol questions were marked on a private answer sheetrather than being spoken to the interviewer as in 1977, 1976, 1974 and1972.Current srnoker-1982, 1977, 1976, and 1974: smoked within postmonth. 1')79: smoked in past 30 days, and has smoked as many as fivepocks <strong>of</strong> cigarettes during lifetime. 1971 and 1971: smoke at the"present time."Current user <strong>of</strong> drugs-1979, 1977 and 1976: has used within thepast month. 1974: has used within the post month, and indicatesintention to use again. In practice, intention to use was dropped incomputation because virtually all past month users indicated intent touse again. 1972 and 1971: marihuana--self-designated current userswho report usage "once a month or less" as well as those users whoreport frequent usage; other drugs, has used within post manth.HolJucinagens-1982 and 1979. LSD and other hallucinogens suchas PCP or phencyclidine, mescaline, peyote, psilocybin, DMT. 1977and 1976: LSD and other hallucinogens like mescaline, peyote,psilocybin, and DMT. 1974: LSD or other hallucinogens. 1972: LSD orsomething like it, such as mescaline, psilocybin, MSA, STP.Inhalants-1979: I) gasoline or lighter flUid; 2) spray points; 3)other aerosol sprays (PAM or deodorants); 4) shoe shine, glUe, ortoluene; 5) lacquer thinner, or other point solvents; 6) amyl nitrate,'poppers'; 7) halothane, ether, a'· other anesthetics; 8) nitrous oxide,whippets; 9) locker room od"rizersj I 0) other substances used as
,-flC!urcebook <strong>of</strong> <strong>Criminal</strong> <strong>Justice</strong> <strong>Statistics</strong> <strong>1983</strong>inhalants. Data for locker room odorizers are included within generaldata on inhalants and are also pra,ided separately. 1977 and 1976:glue or some other substances that people inhale for kicks or to gethigh. Besides glue, there are things like gasoline, some aerosols,nitrous oxide, amyl nitrate that is also called "poppers" and othersolvents. 1974: glu!': or some other inhalant. 1972: glue or otherthings YOll breathe in.Marihuana-1982 and 1979: marihuana and/or hashish. 1977,1976, 1974, 1972, and 1971: marihuana only.Nonmedical experience with psychotherapeutic drugs-1982:Use <strong>of</strong> a pill or other drug(s) from any <strong>of</strong> the four psychotherapeuticdrug categories in order to get high or to enjoy the feeling or just forkicks or curiosity or for any other nonmedical purpose. 1979, 1977,1976, and 1974: a "yes" or "not sure" response to anyone (or more) <strong>of</strong>the following three items: Did you ever take any <strong>of</strong> these kinds <strong>of</strong> pillsjust to see what it was like and how it would work? Did you evertake any <strong>of</strong> these kinds <strong>of</strong> pills just to enjoy the feeling they give you?Did you ever take any <strong>of</strong> these pills for some other nonmedical reason,and not because you needed it? Note: the responses to the 1982nonmedical experience with psychotherapeutic drugs questions weremarked on a private answer sheet rather than being spoken to theinterviewer as in 1979, 1977, 1976, 1974, and 1972. Note: in 1977only, questions about nonmedical experience were assigned to a randomhalf <strong>of</strong> the households in which interviews were conducted. 1972: a"yes" resp'.:mse to anyone (or more) <strong>of</strong> the following five items: Hoveyou ever taken these pills to help you get along with your family orother people? Hove you ever taken any <strong>of</strong> these pills to help you getready for some big event, or help you accomplish something? Did youever take any <strong>of</strong> these kinds <strong>of</strong> pills just to see what it was like andhow it would work? Hove you ever taken any <strong>of</strong> these pills beforegoing out, so that you could enjoy yourself more with other people?Did you ever take these kinds <strong>of</strong> pills just to enjoy the feeling theygive you?Now a full-time college student-1982, 1979, 1977, and 1976:This term is defined by a "yes" response to the question: "Are you astudent or taking any course this year in a college or other kind <strong>of</strong>school?"; a "college" or "community college" response to the question:"Is that a college or a vocational school, or what?"; and a "full-time"response to the question: "Are you a full-time student or a part-timestudent?"Population densityLarge metropolitan areas-includes the StandardMetropolitan Statistical Areas (SMSA's) with populations <strong>of</strong>1,000,000 or more in 1970. Large metropolitan areas includecentral cities and surrounding areas as defined by the U.S. <strong>Bureau</strong><strong>of</strong> the Census.Small metropolitan areas-includes a sample <strong>of</strong> thoseStandard Metropolitan Statistical Areas under 1,000,000 inpopulation in 1970.Nonmetropolitan area-includes a sample <strong>of</strong> those areasthat were not part <strong>of</strong> a Standard Metropolitan Statistical Area as<strong>of</strong> 1970, according to standards set by' the U.S. <strong>Bureau</strong> <strong>of</strong> theCensus. In general, this includes smaller communities, rural nonfarmareas, and rural farm areas.Race-Race is grouped info two categories, "White" and"Nonwhite". Note: due to recent changes in Federal reporting optionsfor race and ethnicity as well as frequent changes in the administrationand content <strong>of</strong> such items over time, Hispanics have appeared in bathracial categories. In 1982 and 1979, Hispanics Were included in the"White" category; in 1977, they appeared in one or the other categorydepending on how they identified themselves; in 1976 and 1974 theywere included in one or the other category depending on how theinterviewer identified them; and in 1972 and 1971, all Hispanicsappeared in the ''Nonwhite'' category.White-1982: those individuals who chose the category Wnite orHispanic as the category that best described them. 1979: thoseindividuals who state that their fomily origin Is White or that they are<strong>of</strong> Spanish-American origin. 1977: those individuals who state thattheir family origin is White. 1976, 1974, 1972, and 1971: thoseindividuals whose racial background, according to interviewerobservation, is determined to be White.Nonwhite-1982: those individuals who stated that they wereBlack, American Indian or Alaskan Notive, Asian or Pacific Islander, orwho volunteered Black/Hispanic or some other combination. 1979 and1977: those individuals who state that their fomily origin is AmericanIndian, Alaskan Native, Asian, Black, Pacific Islander, or some otherrace (other than White). 1976 and 1974: those individuals whose racialbackground, according to interviewer observation, is determined to beAmerican Indian, Black, Oriental, or some other race (other thanWhite). 1972 and 1971: those individuals whose category, according tointerviewer observation, is determined to bp. Black, Puel to Rican orother Latin American group, or some other category (other thanWhite).RegionNortheast-Connecticut, Maine, Massachusetts, NewHompshire, New Jersey, New York, Pennsylvania, Rhode Island,VermontNorth Central-Illinois, Indiana, Iowa, Kansas, Michigan,Minnesota, Missouri, Nebraska, North Dakota, Ohio, South Dakota,WisconsinSouth-Alabama, Arkansas, Delaware, District <strong>of</strong> Columbia,Florida, Georgia, Kentucky, LOUisiana, Maryland, Mississippi, NorthCarolina, Oklahoma, South Carolina, Tennessee, Texas, Virginia,West VirginiaWest-Arizona, California, Colorado, Idaho, Montana,Nevada, New Mexico, Oregon, Utah, Washington, WyomingSedatives-1982 and 1979: barbiturates and other sedatives usedmedically to help people relax or sleep. Sedatives are divided Into foursubgroups: intermediate/long acting barbiturates, nonbarbiturate/nonbenzodiazepinesedatives, short acting barbiturates, and Dalmane.Note: See definition for "nonmedical experience with psychotherapeuticdrugs."Stimulants-1982 and 1979: amphetamines and other stimulantssometimes used medically for weight control. Stimulants are dividedinto four subgroups: amphetamines, nonamphetamine anorectics, Ritalin,and Cylert. Note: See definition for "nonmedical experience withpsychotherapeutic drugs."Tranquilizers-1979: pills used medically to relax nerves andmuscles. Tranquilizers are divided into four subgroups:benzodiazepines, Meprobamate, hydroxyzine, and Benadryl. Note: Seedefinition for "nonmedical experience with psychotherapeutic drugs."Sampling dataAPPENDIX 15Delinquency 1975, 1976, 1977, 1978, 1979, 1980-Survey methodology and definitions <strong>of</strong> termsf\OTE: The following information has been excerpted from Daniel D. Smith, Terrence Finnegan,Howard Snyder, and Jacqueline Corbett, Delinquency 1975: United States Estimates <strong>of</strong> CasesProcessed by Courts with Juvenile Jurisdiction (Pittsburgh: National Center for Juvenile<strong>Justice</strong>, 1979), pp. 11-4-11-21; Daniel D. Smith, Terrence Finnegan, and Howard N. Snyder,Delinquency 1976: United States Estimates <strong>of</strong> Cases Processed by Courts with JuvenileJurisdiction (Pittsburgh: Notional Center for Juvenile <strong>Justice</strong>, 1979), pp. 17-3!l; Daniel D. Smith,Terrence Finnegan, and Howard N. Snyder, Delinquency 1977: United States, Estimates <strong>of</strong>Cases Processed by Courts with Juvenile Jurisdiction (Pittsburgh: Notional Center forJuvenile <strong>Justice</strong>, 1980), pp. 18-37; Daniel D. Smith, Terrence Finnegan, Howard N. Snyder, NormaG. Feinberg, and Patricia McFall, Delinquency 1978: United States Estimates <strong>of</strong> Ca~esProcessed by Courts with Juvenile Jurisdiction (Pittsburgh: National Center for Juvenile<strong>Justice</strong>, 1981), pp. 5-19, 153-157; Howard Snyder, Terrence Finnegan, Daniel Smith, NormaFeinberg, John Hutzler, and Patricia McFall, Delinquency 1979 (Pittsburgh: National Center forJuvenile <strong>Justice</strong>, 1982), pp.II-28; Howard N. Snyder, Terrence A. Finnegan, and John L. Hutzl.er,Delinquency 1980: A Description <strong>of</strong> Cases Proceesed by United S'ates '-:ourts WithJuvenile Jurisdiction (Pittsburgh: Notional Center for Juvenile <strong>Justice</strong>, 19!:!3), pp. 30-43. Nonsubstantiveeditorial adaptations have been made.the data used to derive the national estimates for 1975-80re;->resen t subsamples drawn from a larger data base. The total database and the subsample for each year are as follows:1975--The total data base consists <strong>of</strong> over 580,000 casesreported from 13 States. The total population <strong>of</strong> these 13 Statesrepresented 42 percent <strong>of</strong> the en1'ire U.S. population and 41 percent <strong>of</strong>the total youth population at risk (from age 10 to the upper age <strong>of</strong>juvenile court jurisdiction).The subsample was generated from 10 States. They include:Connecticut, Marylond, Pennsylvania, and West Virginia in the East;Alabama and Mississippi in the South; Ohio, Kansas, and Nebraska in theMidwest· and California in the West. New York, Florida, and Idahodata we;e excluded because <strong>of</strong> inconsistencies In the methods <strong>of</strong>reporting. The sample <strong>of</strong> these 10 States comprises a total <strong>of</strong> 555counties out a <strong>of</strong> a possible 3, I 4 I nationwide. The sample represents27 percent <strong>of</strong> the total child population within the courts with juvenilejurisdiction. A total number <strong>of</strong> 372,592 cases comprises the sampleused to generate 1975 national estimates.1976--The total data base contains more than 707,000 caserecords collet!ted from 17 States and the District <strong>of</strong> Columbia. After areview, data from New York, Idaho, South Dakota, and the District <strong>of</strong>Columbia were excluded from the estimating sample because <strong>of</strong> internalvariances in reporting methods. The resulting sample includes datafrom Connecticut, Maryland, Pennsylvania, and West Virginia in theEast; Alabama, Florida, and Mississippi in the South; Iowa, Kansas,Nebraska, North Dakota, and Ohio in the Midwest; and California andUtah in the West. The sample used to generate 1976 national estimatesincludes data from 849 <strong>of</strong> the Notion's 3,141 counties and represents35.2 percent <strong>of</strong> the total child population wahin jurisdiction <strong>of</strong> juvenilecourts in the United States.1977--The total data base contains more than 700,000 caserecord$ collected from 17 States and the District <strong>of</strong> Columbia. After areview, data from New York, South Dakota, and the District <strong>of</strong>Columbia were excluded from the estimating sample because <strong>of</strong>significant differences in reporting methods. The resul ling sampleincludes data from Connecticut, Maryland, Pennsylvania, and WestVirginia in the East; Alabama, Florida, and Mississippi in the South;Iowa, Kansas, Nebraska, North Dakota, and Ohio in the Midwest; andCalifornia and Utah in the West. The sample used to generate 1977national estimates Includes data from 856 <strong>of</strong> the Notion's 3,14 I countiesand represents 35.5 percent <strong>of</strong> the total child population withinjurisdiction <strong>of</strong> juvenile courts in the United States.1978--The primary data base consists <strong>of</strong> more than 515,000 caserecords from courts with juvenile jUrisdiction in 13 States (California,Connecticut, Florida, Iowa, Kansas, Maryland, Missi~sippi, NorthDakota, Nebraska, Ohio, Pennsylvania, Utah, and West Virginia), theDistrict <strong>of</strong> Columbia and Clark County, Nevada. Data from 794 <strong>of</strong> the3, I 43 counties in the United States, containing mare than one-third <strong>of</strong>the total child population within the jurisdiction <strong>of</strong> juvenile courts <strong>of</strong>the United States, are represented.1979--The primary data base consists <strong>of</strong> more than 470,000 caserecords from courts with juvenile jurisdiction in 15 States (Alabama,California, Connecticut, Florida, Hawaii, Iowa, Kansas, Maryland,Minnesota, Nebraska, North Dakota, Pennsylvania, South Dakota, Utah,and West Virginia); Maricopa County, Arizona; Clark County, Nevada;and Shelby County, Tennessee. Data from 830 <strong>of</strong> the 3, I 43 counties inthe United States, containing mare than one-third <strong>of</strong> the total childpopulation within the jurisdiction <strong>of</strong> juvenile courts <strong>of</strong> the UnitedStates, are represented.1980--The primary data base consists <strong>of</strong> more than 435,000 caserecords from courts with juvenile jurisdiction in 13 States (Alabama,Californfo, Connecticut, Florida, Hawaii, Iowa, Kansas, Maryland,Nebraska, North Dakota, Pennsylvania, South Dakota, and WestVirginia); Maricopa County, Arizona; and Shelby County, Tennessee.Data from 741 <strong>of</strong> the 3,137 count!e:l in the United States, containingmore than one-quarter <strong>of</strong> the total cilHd population within theJurisdiction <strong>of</strong> juvenile courts <strong>of</strong> the United States, are represented.Child popuiation at riskDeveloping national estimates for 1980 required that the childpapulation at risk be determined for each <strong>of</strong> the 3, i 37 counties in theUo1ited States. "Child population at risk" is defined as the number <strong>of</strong>chi Idren from the age <strong>of</strong> 10 through the lJ,:;per age <strong>of</strong> juvenile courtjurisdiction. Although there may be exclusions based on instant<strong>of</strong>fense, or a combination <strong>of</strong> instant <strong>of</strong>fense and prior delinquencyhistory, the age at which an individual is no longer considered underjuvenile court jurisdiction is defined by State statute. In 191J0, in 37States and in the District <strong>of</strong> Columbia, individuals 18 years <strong>of</strong> oge orolder were within the jurisdiction <strong>of</strong> the criminal courts. In eightStates (Georgia, Illinois, Louisiana, Massachusetts, Michigan, Missouri,South Carolina, and Texas) individuals had to be at least 17 years <strong>of</strong>age to be within the jurisdiction <strong>of</strong> the criminal court, in four States(Connecticut, New York, North Carolina, and Vermont) the individualhad to be at least 16 years <strong>of</strong> age, and in Wyoming individuals had tobe at least 19 years <strong>of</strong> age to be routinely processed as an adult(Source, p. 3 I).Though both public and private sources were checked extensively,no ,ource <strong>of</strong> popUlation estimates by county and age was available forI ~75-79. However, the 197U census data contained information in thisform, and this Information was utilized. In addition, the U.S. <strong>Bureau</strong> <strong>of</strong>the Census, under special contract from the Notional Cancer Institute,had produced population estimates for each year, 1975 through 1979, bycounty in five-~ear age groupings (0 to 4, 5 to 9, etc.).Using the following method, estimates <strong>of</strong> child population at riskwere made for each year from 1975 through 1979. From the 197Ucensus, a summation <strong>of</strong> the number <strong>of</strong> children in a county from 0through 4 years <strong>of</strong> age was made to obtain a total estimate <strong>of</strong> thechildren in this age range. SimilarlY, the process was repeated for the5 through 9 a;ld the 10 through 14 age groups. A percentage <strong>of</strong> thetotal for a particular age was calCUlated by dividing the number <strong>of</strong>children <strong>of</strong> a single age by the total number <strong>of</strong> children in its five-yeargroup. Thus, the relative percentages were d'atermined for 5-, 6-, 7-,8-, and 9-year-olds in 1970; and from the 1975 census estimates, thetotal number <strong>of</strong> youth was determined in the 10 through 14 age groupin 1975 (from the National Cancer Institute data). It was assumedthat the relative percentage <strong>of</strong> 5-year-olds in the 5-to-9 group in 1970would be equivalent to the relative percentage <strong>of</strong> JO-year-olds in 1975.Continuing with this procedure, 1975 estimates <strong>of</strong> the number <strong>of</strong>children <strong>of</strong> each age group from 10 through 19 were developed for eachcounty.Another assumption was that the change in single age populationsfrom 1975 to 1979 would be minimal. For example, the estimate <strong>of</strong> 9-year-olds in 1975 was used as the estimate <strong>of</strong> 13-year-olds in 1979.Knowing the upper age <strong>of</strong> jurisdiction in each county, as estimate wascalculated for the number <strong>of</strong> children from 10 through the upper age <strong>of</strong>jurisdiction (the child population at risk) for each <strong>of</strong> the 3, I 43counties. AJth~..:!)h migration, undercounting, and death rates wouldaffect the extrapalaj Ion af population estimates from one year toanother, It was aS~Jmed that these factors would be <strong>of</strong> minimalimportance for the target group ,nd that they would be <strong>of</strong> minorImportance compared with the impact <strong>of</strong> birth rates and childpopulations. In 1980 the child population at risk was derived form the1980 decennial census counts provided by the U.S. <strong>Bureau</strong> <strong>of</strong> theCensus, unlike the previous ye(jr~ in which the child population at riskfigures were based on estimates developed by the U.S. <strong>Bureau</strong> <strong>of</strong> theCensus.
--~- ~-..---Estimating procedure<strong>Sourcebook</strong> <strong>of</strong> <strong>Criminal</strong> <strong>Justice</strong> <strong>Statistics</strong> <strong>1983</strong>The primary task was to describe the number and nature <strong>of</strong> thejuvenile court cases handled notionally in each <strong>of</strong> the survey years.Data were available from the reporting counties; for those counties notreporting, e$timates hod to be generated. The adopted estimatingprocedure assumed that the best method for predicting the number andtypes <strong>of</strong> cases for non-reporting jurisdictions was to use the data forsimilar reporting jurisdictions as a guide."Similar" was operationalized, or given a working definition, byusing population at risk as a criterion. Jurisdictions <strong>of</strong> similar size(based on population at risk) were conceptualized as belonging to thesome cluster. Clusters were formed based on the following concerns.First, the range <strong>of</strong> population at risk within a cluster hod to be smallenough to assure a reasonable similarity in rhe relative sizes <strong>of</strong> thecounties. Second, it was necessary to define on adequate number <strong>of</strong>reporting jurisdictions within a cluster to assure the stability <strong>of</strong> thatcluster's estimates. Accordingly, the 3,137 counties were divided into10 clusters.Estimates were mode for non-reporting jurisdictions by using theinformation from reporting jurisdictions within the some cluster. It wasassumed that the dynamics that produce the juvenile cases within acluster are shored by all the counties in the cluster and are unique tothat cluster. Thus, if a model could be developed to reproduce tbedata from reporting counties within a cluster, then this model could beapplied to non-reporting jurisdictions <strong>of</strong> that cluster to generatepredictions <strong>of</strong> their caseloods. .Descriptive variables found in the City/County Data Book (U.S.<strong>Bureau</strong> <strong>of</strong> the Census) were utilized to identify characteristics <strong>of</strong> thecounties, which could be incorporated into the madel to produce theseestimates., This volume contains approximately 200 descriptivevariables on individual counties detailing such information aspopulation, income level, educational characteristics, labor force,housiriJ, and type <strong>of</strong> government. These data were used as predictorsin the madel. To reduce the potential predictors to a workable numberend to minimize covariation and duplication <strong>of</strong> information, eachvariable was correlated with the total number <strong>of</strong> cases in each <strong>of</strong> thereporting jurisdictions. Only variables that were significant Iycorrelated with the number <strong>of</strong> cases were retained. This processreduced the number <strong>of</strong> variables <strong>of</strong> inten~st to approximately 99(depending on the particular survey year in question). Next, thereduction procedure created summary variables, grouping theseindividual variables under broader headings. A principal componentsfactor analysis <strong>of</strong> the variables yielded summary factors thatincorporated the distinctions found in the original variables, accountingfor approximately 68 percent <strong>of</strong> the variance <strong>of</strong> the original variables.After determining that these summary factors were reliabledescri;Jtors <strong>of</strong> the counties, they were utilized to develop regressionequations that produced estimates <strong>of</strong> the number <strong>of</strong> cases handled byeach jurisdiction reporting within each cluster. Applying the someequations to the non-n~porting jurisdictions, estimotes <strong>of</strong> individualcaseloads were produced. By summing over the case loads (eitherreported or predicted), it was possible to estimate the total number <strong>of</strong>cases from all the counties in a cluster and, subsequently, the totalnumber <strong>of</strong> cases handled notionally. (The 1975 estimating proceduresdiffer slightly from those described above; for a discussion <strong>of</strong> 1975estimating procedures, see Delinquency 1975, pp. II -4-11-10.It was also necessary to estimate the nature <strong>of</strong> all the caseshandled by the juvenile court system--for example, type <strong>of</strong> <strong>of</strong>fense, sex<strong>of</strong> <strong>of</strong>fender, reClSon for referral, time in system, and disposition. Byusing the assumption that the reporting courts in a clusterapprOXimately represent the non-reporting courts' data, a weightingprocedure was developed to estimate the nature <strong>of</strong> the cases in thecluster as a whole, including the non-reporting courts. If, for example,the reported cases within a cluster represented 25 percent <strong>of</strong> the totalestimated number <strong>of</strong> cases for that cluster, by weighting each case bya factor <strong>of</strong> 4 (total estimated number <strong>of</strong> cases in the cluster divided bythe total number <strong>of</strong> cases from the reporting jurisdictions in thecluster), it was possible !o represent not only the number <strong>of</strong> cases butalso the nature <strong>of</strong> the cases. By employing this process <strong>of</strong> developingweights to permit the sample data to represent the popUlation, detailedestimates <strong>of</strong> the Notion's juvenile court cases were produced.Data collectionIdentification <strong>of</strong> States that collect information on the processing<strong>of</strong> youths through the juvenile justice system is made through contactwith individuals and agencies with responsibi lity to collect or to reportjuvenile court statistics. States that compile information on a regularbasis and have data on a computer-readable medium are sent writtenrequests for the data; the information is then transmitted to theNotional Center for Juvenile <strong>Justice</strong>.Variations in information compilation and interpretation arechecked with the respective State personnel and edited by the NotionalCenter for Juvenile <strong>Justice</strong> st<strong>of</strong>f. Tne data are then transformed into astandard format for the natio/lal file. JUrisdictio>lal differences injuvenile court statutes and procedures used to collect the data cousesome problems with uniformity that cannot be corrected. The Sourcenotes, among other limitations <strong>of</strong> the data, the following:--The accl'racy (reliability and validity) <strong>of</strong> the originalcoding proces. is unknown.--There are wide ranges <strong>of</strong> definitions regarding courtdispositions.--The reasons for referral to court and their definitionsvary dramatically.--Some State statutes exclude major crimes (j.e., homicide,forcible rope, and aggravated assault) from the jurisdiction <strong>of</strong> thejuvenile court, while other State statutes exclude types <strong>of</strong> minorcrimes (i.e., fish and game violations).--Some States differentiated between specific types <strong>of</strong>crime, while others used brooder categories for their <strong>of</strong>fenses(i.e., larceny was alternately defined a! grand larceny, petitlarceny, shoplifting, and larceny except s,10plifting).--Some States changed their reporting system, whichaltered some <strong>of</strong> the variables and values reported during thereporting period.--The <strong>of</strong>fense labels are not always an accurate indicator <strong>of</strong>actual behavior (j.e., larceny may vary from stealing bubble gumto the theft <strong>of</strong> a handgun).--The data represent cases disposed <strong>of</strong> by courts; they donot represent individuals, nor do they represent incidents.Definitions <strong>of</strong> tennsOffense categories--The Notional Center for Juvenile <strong>Justice</strong>utilizes the <strong>of</strong>fense categories defined by the U.S. Department <strong>of</strong><strong>Justice</strong>, Federal <strong>Bureau</strong> <strong>of</strong> Investigation, Uniform Crime ReportingProgram. For detailed definitions <strong>of</strong> these <strong>of</strong>fense categories, seeAppendix 2.'Unit <strong>of</strong> count--The unit <strong>of</strong> count refel ~ to a case disposed <strong>of</strong> bya court with juvenile jurisdiction during the reporting year. The term"disposed <strong>of</strong>" means that some definite action was token or sometreatmenf plan was decided upon or begun. Each "case" represents ayouth referred to court, with or without a petition during the year, ora new referral for one <strong>of</strong> the reasons described it'l "reason for referral";it does not include traffic, dependency an.J neglect cases, or specialproceedings brought before the court.Race--The reporthlg <strong>of</strong> race varied greetly. Some Statesreported white, block, and other, whfle a few States reported tencategories <strong>of</strong> race. For the purpose <strong>of</strong> consistency omang States, threecategories <strong>of</strong> race were selected. The "other" category refers to allraces that were reported as anything other than white or block.Source <strong>of</strong> referralLaw enforcement agency--The term "law enforcement"should be interpreted as including metropolitan police, Statepolice, pork police, sheriffs, constables, police assigned to thejuvenile court for special duty, and all others performing a policefunction with the exception <strong>of</strong> probation <strong>of</strong>ficers and <strong>of</strong>ficers <strong>of</strong>the court.Parents or relatives--This category includes the youth'sown parents, foster parents, adoptive parents, step parents,grandparents, aunts, uncles, and other legal guardians.School department-- This term includes counselors,attendance <strong>of</strong>ficers, teachers, principals, superintendents <strong>of</strong>schools, and member <strong>of</strong> the board <strong>of</strong> education.Probation <strong>of</strong>ficer--A probation <strong>of</strong>ficer was considered tobe an <strong>of</strong>ficer <strong>of</strong> the court or any person designated to perform (Jprobation function.Social agency--This category includes both public ondpriVate agencies, such os a department <strong>of</strong> public welfare, theboard <strong>of</strong> health, a children's aid society, a child-welfare boord,and institutions coring for children (such as homes for dependentchildren, hospitals, group homes, runaway homes, and agenciesthat perform functions <strong>of</strong> after-care, parole, and correction).Other court--1975-77: this catl,lgory includes any courtthat is physically locoted in another district, has no lega Ijurisdiction over th .. ",.,se, or has concurrent jurisdiction with thejuvenile court that hod original jurisdiction over the case; 1978and 1979: includes any court other than The court disposing <strong>of</strong> thecase.Reason for referral--1975-77: this includes attempting tocommit or committing <strong>of</strong>fenses (behavior that is defined as constitutingjuvenile delinquency or in need <strong>of</strong> supervision by State or local low),but does not include traffic, dependency and neglect cases, or specialproceedings brought before the court; 1978 and 1979: attempts tocommit on <strong>of</strong>fense were included under the <strong>of</strong>fense behavior, except forattempted murder, which was included in the assault category.Definitions <strong>of</strong> termsAPPENDIX 16Probation in the United States-Definitions <strong>of</strong> terms and survey methodologyNJTE: This information was provided by the Notional Council on Crime and Delinquency, ResearchCenter West. , I P b t' R t gramThe 1981 probation data were provided to the Natlona ;0 ,a Ion epor ,s provoluntarily by central reporting agencies in 0/1 50 States, the District <strong>of</strong> Columbia, and theFederal Probation System.Entries--Persons entering probation directly fro,:! a sente,nclngcourt, or from a correctional facility as a result <strong>of</strong> spirt sentencing orsentence modification. , 'Exits--Persons removed from probation including discharges(termination, completion <strong>of</strong> terms, and early discharges)" revoc;:ationand commitment to incarcerotion, and people who die while onprobation.Probation population--AII adults who have been placed underthe supervisory auth!l~ity <strong>of</strong> a probation agency as port <strong>of</strong> a courtorder. Probationers--Persons who have heen placed under thesupervisory authority <strong>of</strong> a probation agency as port <strong>of</strong> a court orderregardless <strong>of</strong> whether they have been convicted.F.r cases. ,Mississippi--The 1980 yearend probation population ~asbeen revised to exclude double counted cases. Yearend probationpopulation includes unwarranted absconders but not those f?rwhom warrants have been issued. "Other exits" includes 105· rnjail awaiting disposition and 87 warranted ,absconders. ,Missouri--Yearend probation population does not rncludeabsconders. "Other exits" includes those <strong>of</strong>f-records, thoserelieved <strong>of</strong> supervision, and suspensions., :'Exit totals" in Tables6.3 and 6.5 are not the same due to missing data: ,Montana--Yearend probation popul at I on I nc I udesunwarranted absconders but not those for whom warrants havebeen issued. , , I dNebraska--Yearend probation population inC u esabsconders. "Exit totals" in Tables 6.3 and 6.5 are not the somedue to missing data.Nevada--Yearend probation population includ~s absconde!'s.New Hampshire--The 1980 yearend probatron populationhas been revised. Yearend probation population includes thosewho have been on absconder status for less than 6 months. Aft~r6 months absconders are removed from the caseload, but Ifapprehended and returned to court they are returned to thecaseload.New Jersey--Yearend probation population includesabsconders. ,New Mexico--Yearend probation population does notinclude absconders. ,New York--The 1980 yearend probation population hasbeen revised. Yearend probation population includes, absconders.North Carolina--The 1980 probation populc.llon has beenrevised. Yearend probation population includes ~bsconders.Persons under dual supervision, parole and probation, are notcounted as probation cases. "Other exits" includes thosecancelled by court. , 'North Dakota--Yearend probation population Includesabsconders. "Other exits" includes terminations a;)d mergers <strong>of</strong>sentenl'.e. ,Ohio--Yearend probation population rncludes absconders.Oklahoma--The 1980 yearend probation population has, b~enrevised to exclude out-<strong>of</strong>-State cases under Oklahoma supervIsion.Yearend probation population includes absconders.665664
<strong>Sourcebook</strong> <strong>of</strong> <strong>Criminal</strong> <strong>Justice</strong> <strong>Statistics</strong> 19H3Oregon--The 1980 yearend probation population has beenrevised. Yearend probation population includes unwarrantedabscanders but not those for whom warrants have been issued."Discharges" includes 1,5HO early terminations, 839 warrantedabsconders, and 187 odministrative closures. "Other exits"includes persons incarcerated while probation time remainsrunning.Pennsylvania--Yearend probation papulation does notinclude abscanders. "Discharges" includes 215 absconders.Rhode Island--Yearend probation population includesabsconders. "Exit totals" in Tables 6.3 and 6.5 are not the samedue to missing data.South Carolina--Yearend probation population includesabsconders.South Dakota--The data are for the year ending June 30,1981. Yearend probation population includes absconders.Tennessee--Yearend probation population does not incJuc',~abscanders. "Exit totals" in Tables 6.3 and 6.5 are not the somedue to missing data.Texas--Yearend probation population includes absconders."Discharges" includes 63,081 successful di scharges, 5,515unsuccessful discharges, and 1,536 administrative closures.Utah--Yearend probation population includes absconders."Other exits" includes terminated absconders. "Offense level"data are missing for 24 cases not included in Table 6.4.Verniont--Yearend probation population includesabscon(i.~rs.Virginia--The data are for the year ending June 30, 19HI.Yearend probation population does not include c:bsconders."Entries" includes 248 cases restored to supervision and 96 casesopened administratively. "Discharges" includes 1,855 expirations,1,735 court ordered discharges, and 130 cases closedadministratively. "Exit totals" in Tables 6.3 and 6.5 are not thesome due to missing data.Washington--The 19HO yearend probation population hasbeen revised to include unsupervised cases, warranted cases,"inactive letter" cases, cases supervised out-<strong>of</strong>-State andprobationers excused from reporting. Yearend probotionpopulation includes absconders.West Virginia--Yearend probation population does notinclude absconders.Wisconsin--The 19t1U probation population has been revised.The 198 I yearend probation population includes 2,506 absconders."Exit totals" in Tables 6.3 and 6.5 are not the same due tomissing dato. ''Offense level" data are missing for 9 cases notincluded in Table 6.4.Wyoming--Yearend probation population includes personswho have been on absconder status for less than 6 months. After6 months absconders for whom warranfs have been issued areremoved from the case load.Agencies providing dataMost <strong>of</strong> the central reporting agencies listed below reportdata representing all probationers within their State. Some,however, report data representing only a portion <strong>of</strong> the totalpopulation. In some instances (Alabama, Missouri, Nebraska,Tennessee, Texus, and Wyoming) the central reporting agency hada precise enoug:' handle on the total to make conversion fromtheir reported1umbers to the 100 percent estimate verystraightforward. ("'~exas, for example, reported on 97.69 percent<strong>of</strong> its total population; Nebraska's reported data cover allprobationers except those from 2 municipal courts, for whichyearer:d counts were readily available.) In the remaining partiallyreporting states (Arkansas, Georgia, Minnesota, Ohio, and SouthDakota) the National Probation Reports Program worked with thecentral reporting agencies, Gnd also used data from the U.S.Departmen t <strong>of</strong> Just ice, Law Enforcement AssistanceAdmini~tration, State and Local Probation and Parole Systems(W~shlngton, D.C.: U.S. Gc.vernment Printing Office, 197!l), toarrive at the most reasonable estimates possible.United States Courts {FederaJ}--Statistical Analysisand Reports Division, Administrative Office <strong>of</strong> the UnitedStates Courts.Alaboma--Board <strong>of</strong> Pardons and Paroles.Alaska--Division <strong>of</strong> Corrections, Department <strong>of</strong>Health and Social Services.Arizona--Administrative Director's Office, SupremeCourt <strong>of</strong> Arizona.Arkansas--Probation and Parole Services, Department<strong>of</strong> Corrections.California--<strong>Bureau</strong> <strong>of</strong> <strong>Criminal</strong> <strong>Statistics</strong> and SpecialServices, Department <strong>of</strong> <strong>Justice</strong>.Colorado--State Court Administrator's Office.Connecticut--Office <strong>of</strong> Adult Probation, ConnecticutJudicial Department.Delaware--Office <strong>of</strong> Probation-Parole, <strong>Bureau</strong> <strong>of</strong>Adult Correction.District <strong>of</strong> Columbia--Social Services Division, D.C.SUperior Court.Flodda--Planning, Research, alld <strong>Statistics</strong>;Deportment <strong>of</strong> Corrections.Georgia--Division <strong>of</strong> Probation, Department <strong>of</strong>Offender Rehabilitation.Hawaii--Planning and <strong>Statistics</strong> Division, Office <strong>of</strong> theAdministrative Director <strong>of</strong> the Courts.. Idaho--Department <strong>of</strong> Corrections, Division <strong>of</strong>Probation and Parole.IIlinois--Probation Division, Administrative Office <strong>of</strong>the Illinois Courts.Indiana--Division <strong>of</strong> State Court Administration,Indiana Supreme Court.lowa--Division <strong>of</strong> Adult Corrections, Department <strong>of</strong>Social Services.Kansas--Office <strong>of</strong> Judicial Administration.Kentucky--Research and Evaluation Unit, <strong>Bureau</strong> <strong>of</strong>Corrections.Louisiana--Office <strong>of</strong> Management and Finance,DepartmE.nt <strong>of</strong> Corrections.Maine--Division <strong>of</strong> Probation and Parole, Department<strong>of</strong> Mental Health and Corrections.Maryland--Division <strong>of</strong> Parole and Probation.Massachusetts--Office <strong>of</strong> the Commissioner <strong>of</strong>Probation.Michigan--Bureou <strong>of</strong> Field Services, Department <strong>of</strong>Corrections.Minnesota--Department <strong>of</strong> Corrections.Mississippi--Department <strong>of</strong> Corrections.Missouri--Board <strong>of</strong> Probation and Parole, Department<strong>of</strong> Social Services.Montana--Corrections Support <strong>Bureau</strong>, CorrectionsDivision, Deportment <strong>of</strong> Institutions.Nebraska--District Courts-State ProbationAdministration.Nevada--Department <strong>of</strong> Adult Parole and Probation.New Hampshire--Deportment <strong>of</strong> Probation.New Jersey--Administrative Office <strong>of</strong> the Courts.New Mexico--Field Services Bureou, CorrectionsDivision, <strong>Criminal</strong> <strong>Justice</strong> Deportment.New York--Divisior. <strong>of</strong> Probation.North Carolina--Division <strong>of</strong> Adult Probation andParole, Deportment <strong>of</strong> Corrections.North Dakota--Interstate Compact AdministrationOffice, Department <strong>of</strong> Parole and Probation.~hio--Probation Development Section, Adult ParQleAuthority.Oklahoma--Division <strong>of</strong> Probation and Porole,Department <strong>of</strong> Corrections.Oregon--Corrections Division, Department <strong>of</strong> HumanResources.Pennsylvania--Research and Statistical Division,Board <strong>of</strong> Probation and Parole.Rhode Island--Adult Probation and Parole,Department <strong>of</strong> Corrections.South Carolina--Probation, Parole, and Pardon Board.South Dakota--State Court Administrator's Office,lJI1ified Judicial System.Tennessee--Adult Probation, Deportment <strong>of</strong>Correction.Texas--Division <strong>of</strong> Information Services, Texas AdultProbation Commission (TI>PC).Utah--Adult Probation and Parole, Division <strong>of</strong>Corrections.Vermont--Research and Planning DIvision, Deportment<strong>of</strong> Corrections.Virginla--Research and Reportir,g Unit, Division <strong>of</strong>Program Development and Evaluation, Department <strong>of</strong>Corrections.Washington--Adult Corrections Division, Department<strong>of</strong> Social and Health Services.West Virginia--Administratlve Office, Supreme Court<strong>of</strong> Appeals, and Probation/Parole Services, Deportment <strong>of</strong>Corrections.Wi scons i n- -PI ann ing, Evaluation and StatisticalAnalysis Section; Division <strong>of</strong> Corrections; Department <strong>of</strong>Health and Social Services.Wyoming--Department <strong>of</strong> Probation and Parole.,tII.~Definitions <strong>of</strong> termsAPPENDIX 17Parole in the United States-Definitions <strong>of</strong> ter= and survey methodologyNJTE: This information was provided by the National Council on Crime and Delinquency, ResearchCenter West.The 1980 aggregate porole data were provided to the Uniform Parole Reports programvoluntarily by the parole authorities/corrections departments <strong>of</strong> the 50 States, the U.S. ParoleCommission, the District <strong>of</strong> Columbia, Puerto Rico, American Samoa, Guam, and the Virgin Islands.These data update the 1979 data published in National Council an Crime and Delinquency, UniformParole Reports, Parole in the United States: 1979 (San Francisco: National Council an Crimeand Delinquency, Research Center West, 1980). The 1981 parole data survey was used to collectdata from the 50 States, the U.S. Parole Commission, and the District <strong>of</strong> Columbia.Entries--Persons entering porole supervision from a correctionalfacility as a result <strong>of</strong> either parole, reparole, reinstatement, ormandatary supervised release.Mandatory supervised release--Persons entering parolesupervision from a correctional facility upon expiration <strong>of</strong> sentence notas a result <strong>of</strong> a paroling authority decision.Parole population--AII persons under the jurisdiction <strong>of</strong> aparoling authority. (Out-<strong>of</strong>-state parolees under courtesy supervisionare counted in the population <strong>of</strong> the paroling authority withjurisdiction.)Paroling authority--A board, commission, or authorityresponsible for parole supervision which mayor may not havediscretionary power to release <strong>of</strong>fenders from prison to the expiration<strong>of</strong> sentence, to revoke parole and return violators to prison, and toreinstate or grant other forms <strong>of</strong> reentry to porole supervision.Removals--Persons removed from parole: discharges, includingterminations, completion <strong>of</strong> term and early discharges; revocations andrecommitments to prison; and deaths.Agency explanatory notesU.S. Parole Commission (FederaJ)--The 1980 yearend parolepopulation has been revised. Yearend purole population includesabscanders. "Other entries" includes special parole, an additionalperiod <strong>of</strong> parole served following completion <strong>of</strong> regular parole ormandatory release by some drug <strong>of</strong>fenders as required under the DrugAbuse Prevention and Control Act <strong>of</strong> 1970. "Revocations" includesviolators who may not have been <strong>of</strong>ficially revoked but whose lastrecorded activity prior to the case being closed was a violation."Otner exits" includes terminations due to hospitaliZations,deportations, etc., and an adjustment residual.Alabama--The data are for fiscal year HHI. Yearend porolepopulation includes absconders. Abscanders are considered inactive,delinquent cases. "Discharges" is a Uniform Parole Report estimate tomake the yearend totals balance anel includes 29 persons who werepardoned.Alaska--Yearend parole population includes absconders. Thedata reported include only parolees released from prison through aparole board decision. Nat included are approximately 35 mandatoryreleasees under supervision <strong>of</strong> the Department <strong>of</strong> Corrections.Arizona--Yearend porale population does not include absconders."Entries" does nat ir,o::lude 276 work furloughees released during 1981under the coordinated supervision <strong>of</strong> the Community Treatment Centerand Adult Parole Services.Arkansas--Yearend parole population does not includeabsconders. "Discretionary entries" includes 56 persons paroled todetainers.California Deportment <strong>of</strong> Corrections--Yearend parolepopulation includes absconders. "Other entries" includes reactivatedcases.California Department <strong>of</strong> Youth Authority--Yearend parolepapulation i.ncludes absconders. On Dec. 31, 1981 there were 224absconders. "Other entries" inclUdes persons whose holding timeexpired, releasees from Department <strong>of</strong> Health institutions, etc. The"Entry" data in Tables 6.50 and 6.51 are not the same due to missingdata.Colorado--Yearend parole population does not includeQbscollders.Connecticut--Yearend porole population includes absconders.On Dec. 31, 19U I there were approximately 400 absconders."Discharges" includes 269 early discharges.De laware--Yearend parole population includes absconders."Discharges" includes dishonorable discnnrges.District <strong>of</strong> Columbia--Yearer." parole population includesunwarranted absconders but does not include absconders for whomwarrants have been Issued. The "Entry" and "Exit" data are not thesame in Tables 6.50 and 6.51 due to missing data.Florida--The 19BO yearend parole population has been revised.Yearend porole population does not include absconders. The datainclude mandatory parolees although the program is being eliminated.At the beginning <strong>of</strong> 1981 there were 921 mandatory conditiona Ireleasees but by the end <strong>of</strong> 198 I there were only 5.Georgia--The 19BO parole population has been revised. Yearendparole population does not include absconders. The data include out<strong>of</strong>-Statecases under supervision in Georgia, but do not include Georgiacases under supervision out-<strong>of</strong>-State. "Discretionary entries" includes689 youthful <strong>of</strong>fenders. "Exits" includes 542 youthful <strong>of</strong>fenders, 262 <strong>of</strong>whom were discharged and 280 <strong>of</strong> whom were revoked.Hawaii--Yearend porole papulation does not include absconders."Revocations" includes two persons revoked for technical violations.The "Exit" data are not the same in Tables 6.50 and 6.51 due tomissing data.Idaho--Yearend parole population includes absconders.IIlinois--Yearend parole population does nat include absconders.The "Exit" data are not the same in Tables 6.50 and 6.51 due tomissing data.Indiana--Yearend parole population does not include abscondersor inactive cases. Movement <strong>of</strong> the parole population includes transferswithin and between districts. "Other entries" includes reinstatementsand transfers. "Other exits" includes absconders, parolees placed onannual reporting status, parolees re
------------------------~included in the yearend parole population. "Other entries" includesparolees restored to active statu~. , The "Exit" data in Tables 6.50 and6.51 are neff the same due to missing data.Oklahoma--Yearend parole population includes abscondersOregon--The 1980 parole ~pulation has been revised Yearendparole papu!atio!' does not in.:lude absconders. "Discharges'; includes~arlY ter,ml,~~tlons, absconders, appeals, and administrative removals.~ther ex!ts Includes parolees who are incarcerated while their paroletime continues to run."D' Pe~nsYlvania~-Ye?rend parole population includes absconders.IscretlOnary ~ntrles" Includes 450 reparoles and 301 persons paroledfrom county prisons by county courts and supervised by the State.Rhode !sland--The, data are for fiscal year 1981. Yearendparole population does not Include absconders. "Other entries" includespers0!1 s whose supervision is resumed. The "Exit" aata in Tables 6.50and 6.5 I are not t~e same due to missing data."D' hSout~, ~arolana--Yearend parole popUlation includes absconders.ISC arges Includes 17 persons pardoned.South Dakota--The data are for the year ending June 30 1981The I d l980 yearend parole popUlation has been revised. "Other :ntries';inC U es suspended sentence cases (probotion).Tennessee-_ Yearend parole popUlation includes absconders.<strong>Sourcebook</strong> <strong>of</strong> <strong>Criminal</strong> <strong>Justice</strong> <strong>Statistics</strong> <strong>1983</strong>Texas--The ?ata are for the year ending Aug. 31 1981. Yearendparole population Includes 1,868 absconders. '" ' Utah--Yearend parole popUlation includes abscondersDI~ch?rges" includes 239 discretionary early discharges and 1!3expiratIOns <strong>of</strong> sentence.V7rm?n~--Yearend parole population includes obsconders." ' V'.rg,n,a--Yearend parole popUlation includes abscondersD,scretlon~ry entries" includes three conditional pardons. •, Wcishangton--The 1980 yearend parole population has been~e~lse " Yearend parole popUlation includes abscondersDlscre~,onary entries" includes 10 persons who were rantedGovernor s pardons and other conditional releaseesgb West Virginia--Yearend parole populatio~ does not includea sconders. "En~ries" and "Exits" are Uniform Parole Report estimates~nas:h~ 0~9~8e d~~~I.os <strong>of</strong> movement to yearend parole popUlation reportedWisconsin--The 1980 yearend parole popUlation has been revisediebrend parole papulation includes 215 absconders. The "Exit" data i~ales 6.50. and 6.5 I are not the same due to missing data." ' Wy?mmg--Yearend parole population includes abscondersDJ;'IZgtlonary entries" includes 69 persons by parole board decisio~an persons whose sentences were commuted by the Governor.Client Oriented Data Acquisition Process (CODAP), 1981 Annual Data-Survey' methodology and definitions <strong>of</strong> terms/tPPEf\D IX 18i'OTE:Survey methodology and limitations <strong>of</strong> the dataThis report contains information on clients admitted to anddischarged from federally funded drug abuse treatment programs In theUnited States and outlying areas. It is based on data collected fromthese units by the Notional Institute on Drug Abuse (NIDA) through theClient Oriented Data Acquisition Process (CODAP). CODN' is arequired reporting process for all drug abuse treatment andrehabilitation units receiving Federal funds for the provision <strong>of</strong> drugabuse treatment and rehabilitation services. CODAP admission anddischarge forms are completed for each client admitted to anddischarged from these clinics, regardless <strong>of</strong> source <strong>of</strong> funding supportfor any particular client. Thus, CODN' data reflect all clients treatedI at CODN' reparting units, not just those clients specifically supportedby Federal funds. CODN' Client Flow Summary forms are completedeach month by every clinic that reparts through COOftP, regardle,. <strong>of</strong>1: whether the clinic has any current admissions or discharges or anyactive clients in treatment.The data presented are based on a data file that has been editedI'I for internal consistency. The following information should beconsidered when using the reported data.Each admission reported on a CODN' form does not necessarilyj; represent a different client. To reduce multiple counting <strong>of</strong> someindividuals, records that represent transfer admissions between COON'I': clinics within a program are not included in the tables that containdata on clients admitted during the year.Tables that contain data on clients discharged during the yearI: are based on matched admission and discharge reparts. Thus, dischargeI reports for which there were no matching admission reports ore! excluded from these tables. - .To avoid the loss <strong>of</strong> useable information, reports with someincomplete or invalid information were retained and are excluded onlyIfrom those tabulations involving the specific items with Invalid1 responses. Thus, the number <strong>of</strong> clients on which related tables are~based varies somewhat from table to table.!In some instances, drug problem type and/or severity wasincorrectly reported on the CODN' forms. All tables in this report{ present data according to primary drug <strong>of</strong> abuse; thus, records onwhich the client's primary drug problem could not be identified areI excluded.Percentages shown in the tables have been rounded to thenearest tenth <strong>of</strong> a percent, i.e., fractional percentages <strong>of</strong> 0.05 orgreater have been rounded to the next higher tenth <strong>of</strong> a percent. Thist, rounding process results in some percent distributions adding to 99 orIU I percent; however, all "totals" reflect 100 percent.'I I; \ Definitions <strong>of</strong> termsIii \Age at admission--Derived by subtracting a client's year <strong>of</strong>: ~birth from year <strong>of</strong> admission to treatment.;1Age at first use--The chronological age at which a person firsti I! i used the drug now listed as his/her primary drug problem.jDrug users {clients)--Persons admitted to a clinic for theprevention <strong>of</strong> treatment <strong>of</strong> a drug problem; they are assigned to atreatment plan and receive the clinical and supportive servicesJ! identified in the regimen. Criteria for completing treatment arei Ii established at this time. When a clinic's Federal contract or grant,jstates that both prevention and treatment services are to be provided,the persons receiving prevention services are also considered clients.l IIIi ., The guidelines <strong>of</strong> the Federal funding agencies state that a client is'I ! considered active if he/she receives treatment services at least once!q i every 30 days. Only active clients are reported on CODAP. If the.J client has not received treatment or direct services for 30 days, he orilIshe must be discharged from the COON' reporting system. Partiali services are occasionally <strong>of</strong>fered to community groups, clients' families,iIand individuals; this activity is not repo,'led by CODN' clinic!; because1I r the people involved in receiving partial services ore not treated forIIdiagnosed drug problems.i'Drug types--Drugs are classified into 12 categorie~: heroin;other opiates--illegal methadone, opium, morphine, codeine, Demerol,il II Dilaudld, etc.; marihuana/hashish--includes THC, "hash oil," otherIJcannabis preparations; barblturates--phenobarbltal, Seconal, Nembutal,"etc.; omphetamines--Benzedrine, Dexedrine, methamphetamine, "speed,"Iijand related compounds such as Preludin, Ritalin, etc.; alcohol; cocaine;~ ! halluclnogens--LSD, mescaline, psilocybin, MCA, DMT, ffilJshrooms,I'peyote, etc.; PCP--"angel dust"; tranquilizers--Jibrlum, Valium,fi I!\'This information was excerpted from the U.S. Department <strong>of</strong> !-balth and Human Services,National Institute on Drug Abuse, Annual Data 1981, Data from the Client Oriented DataAcquisition Process (CODAP), Statistical Series E, No. 25 (Washington, D.C.: U.S. GovernmentPrinting Office, 1982), pp. I, 2, 369-374. Non-substantive editorial adaptations have been made.669Miltown, etc.; other sedatives or hypnotics--methaqualone, chloralhydrate, Placidyl, Doriden, etc.; other--Includes inhalants (glue, nitrousoxide, organic solvents, etc.), over-the-counter drugs (legally obtained,non-prescription medication), as well as any drug not falling into one<strong>of</strong> the above categories.Employment status--The following categories are used toindicate if the client is legally employed (including self-employment) atthe time <strong>of</strong> admission. To qualify as being employed, the client'searnings must be subject to income taxes. For example, stipends andwelfare payments are not taxable; therefore, the client receiving thesemonies would nat be considered employed. The categories ore:unemployed, not seeking work--has not sought employment in last 30days; unemployed, seeking work--has sought employment in last 30days (this includes registering with employment agencies, etc.);employed, part-time--working less than 35 hours a week; employed,full~time--working 35 or more hours a week (this category alsoincludes clients with concurrent full-time and part-time positions).Highest grade level completed--Number <strong>of</strong> years <strong>of</strong> educationthe client completed.Marital status--The following categories indicate the client'smarital status at time <strong>of</strong> admission: never married--this includesannulment; married--this includes commpn-Iaw marriage and thoseclients who consider themselves married; widowed; divorced; separated-this refers to married persons not living together by choice, whetheror not the separation is legal.Primary drug--The drug type that is the major problem in thatit has caused the mast dysfunction. Primary drug at admission is thedrug problem for which the client was admitted to treatment.Similarly, primary drug at dlsch::rge 15 the drug problem, if any,causing the most dysfunction at the time <strong>of</strong> dischorge Trur;; tregtment.Only or e primary problem may be reported at admission and one atdischarg\~.Race/ethnicity--Based 01'1 staff observation and client selfidentification,the following categories have been selected to conformwith the Federal Interagency Committee on Education Ad HocSubcommittee on Racial and Ethnic Definitions: White (not <strong>of</strong> Hispanicorigln)--a person having origins in any <strong>of</strong> the pe(1ple <strong>of</strong> Europe, NorthAfrica, or the Middle East; Black {not <strong>of</strong> Hispanic origin)--a personhaving origins in any <strong>of</strong> the people <strong>of</strong> sub-S(Jharan Africa; Hispanic-Mexican, Puerto Rican, Cuban, or other Hispanic; other--includesAmerican Indian (a person having origins in any <strong>of</strong> the original people<strong>of</strong> North America), Alaskan Notive (a person· such as Aleut or EskimoIndian who has origins In any <strong>of</strong> the original people <strong>of</strong> North America),and Asian or Pacific Islander (a person having origins In any <strong>of</strong> theoriginal people <strong>of</strong> the For East, Indian subcontinent, Southeast Asia, orthe Pacific Islands).Reason for discharge--The circumstances under which a clientleaves treatment. :,everal types <strong>of</strong> discharge are reported as follows:Completed treatment, no drug use--The client hassuccessfully completed the prescribed treatment regimen in theprogram and no further treatment services are prescribed withinthis program or ar:y other program; however, follow-up contactmay be recommended. The client is no longer using illegal drugsor abusing alcohol.Completed treatment, some drug use--The decision <strong>of</strong>the clinic staff is that the client has successfully completed theprescribed treatment regimen In the program, and no furthertreatment services are prescribed within this program or anyother program. The client meets all other criteria· for completion<strong>of</strong> treatment except concerning the use <strong>of</strong> drugs during the monthprior to discharge.Transferred/referred--The client is discharged from theclinic and, with no interruption in treatment, is transferred toanother clinic that is within the same program; or, the client isdischarged from the clinic and referred to another drug treatmentprogram or to a medical or psychiatric iostitution.Program decision to discharge client fornoncompliance with program rules--Treatmftnt is notcompleted; the client is discharged for violation <strong>of</strong> program rUles.Left before completing treatment--The client isdischarged because <strong>of</strong> his/her decision to leave the clinic beforecompletion <strong>of</strong> treatment, or his/her refusal to continue a furtherphase <strong>of</strong> treatment in this or any other program.Incarcerated--Treatment is not completed; the client isdischarged because <strong>of</strong> incarceration.Died--The client died before completing treatment;
however, this does not necessarily Irrply a drug-related death.Source <strong>of</strong> referral--The following categories indicate theagency, Individual, or legal sltuotlon through which the client iscornmtted to or referred to treatment: self-referral' hospital--Includesa general or mental hospital; community services--includes acommunity mental health center, Federal, State, or local agencies aprivate physician, psychiatrist or other mental health pr<strong>of</strong>essional 'oranother drug treatment program; family/friend; employer/school' othervoluntarYI Treatment Alternatives to Street Crime (TASC)' F~deralState, and county probation; Federal, State, and county po;ole; othe:n.on-voluntury~-Includes police, Narcotic Addict Rehabi litatlon Act<strong>Sourcebook</strong> <strong>of</strong> <strong>Criminal</strong> <strong>Justice</strong> <strong>Statistics</strong> <strong>1983</strong>(NlIRA) I, and NlIRA III; other--includes <strong>Bureau</strong> <strong>of</strong> Prisons (BO"-NlIRAII, BCP-IPDDR, BCP study, BCP probationer), and other BO" (formerlyDAf'), and Veterans Administration Armed Services Medical ReferralOffice (VA ASNRO).Arrests within 24 months prior to this admission number<strong>of</strong>--Indlcates the m.mber <strong>of</strong> times the client has been arre~ted andbooked during the 24 months prior to aanlssion. This item does notkr4lly conviction and relates to alleged <strong>of</strong>fenses. Arrests for trafficInfractions are not Included. However, arrests for driving while underthe Influence <strong>of</strong> alcohol or drugs and driving while intOXicated because<strong>of</strong> alcohol or drugs are included.I.J .,1I'I1.'1I;II(1i1II/1Ii!I rIII·,j n~~~I/:I:)I:Survey methodologyN'PENDIX 19Prisoners In State Ilnd Federal Institutions on December 31, 1981-Survey methodology and definitions <strong>of</strong> termsI'OTE: The following Information has been excerpted fram the U.S. Department <strong>of</strong> <strong>Justice</strong>, <strong>Bureau</strong> <strong>of</strong><strong>Justice</strong> <strong>Statistics</strong>, Prisoners in State and Federal Institutions on December 31, 1981,Notional Prisoner <strong>Statistics</strong> BUlletin (Washington, D.C.: U.S. Government Printing Office, <strong>1983</strong>).Non-substantive editorial adaptations have been made.Data presented In· this report are based on yearend 1980 and198 I lnmate counts and on enumerations <strong>of</strong> prisoner transactions during198 J. As In past years, the data were collected with a standardquestionnaire transmitted to the approprl ate State authorities and theFederal <strong>Bureau</strong> <strong>of</strong> Prisons. The final date for receipt <strong>of</strong> Informationwas Mar. 16, 1982.In each Jurisdiction, the questlonnolre was completed by acentral agency reporting for Institutions within the correctional system.This procedure was also used by the Federal <strong>Bureau</strong> <strong>of</strong> Prisons Insupplying data on Federal Institutions. Because the Information wasderlveo from a complete enumeration rather than a survey, thestatistical data are not affected by sampling error. Response errorswere held to a minimum by means <strong>of</strong> a systematic telephone follow-upand, where necessary, other control procedures. Thus, the yearendcounts are generally considered reliable. Because <strong>of</strong> the absence <strong>of</strong>standardized administrative and record keeping practices fram State toState, the data for admissions and departures are not always entirelycomparable across Jurisdictions.Notional Prisoner <strong>Statistics</strong> (i'f'S) category definitionsJurisdiction population, Dec. 31, 1981--lncJudes all Inmatesunder JUrisdiction <strong>of</strong> State correctional authorities on Dec. 31, 1981regardless <strong>of</strong> location. But does not Include other Jurisdictions'inmates (for example, inmates from other States, pretrial detainees)merely housed In prisons.Custody population, Dec. 31, 1981--lncludes all Inmates Inthe State's custody, that Is, housed In State correctional faCilities onDec. 31, 19111. Does not include State inmates housed outside Stateprison facilities; does Include ather JUrisdictions' Inmates (for example,Inmates from other States, the courts, local Jails) housed In State'sfacilities.OVercrowding, Dec. 31, 1981--lncludes all Stote prisonInmates housed in local Jails on Dec. 31, 1981, as a direct result <strong>of</strong>State prison ave' crowding. Does not Include State prison Inmates heldIn local JailS for other reasons (for example, work releosle, courtappearance, etc.).AdmissionsNew court commltments--Includes all Inmates who wereadmitted with all new sentences, that Is, these Inmates were notreadmitted for any sentences for which they had already s(,rved someprl$on time. This category Inciudes probation violators entering prisonfor the first time on the probated <strong>of</strong>fenses. Does not Include paroleviolators with new sentences.Parole violators with new sentences--Includes (III paroleesreturned with new sentences.Other conditional release violators with new ",ntences-Includes all individuals on conditional release (other than parole) whoare returned with new sentences, for example, returns from supervisedmandatory release, from shock probation, etc.Parole violators only, no new sentences--Includes allparolees returned only for formal revocations <strong>of</strong> parole tho 11 were notaccompanied by new sentences. If the parole was not formallyrevoked, that Is, the parolee was held only temporarily pending ahearing, no admission occurred for t-PS purposes.Other conditional release violators only, no new aentences-Same as above, substituting conditional release violator for paroleviolator.Transfers from other jurlsdlctlons--Includes all inmatestransferred to this State's Jurisdiction to continue sentences already Inforce. Does not Include admissions if State does not acquireJurisdiction. Does not Include mavements from prison to prison withinState.Absent without leave (AWOL) returns, with or withoutsentences--Includes all returns from AWOL, that Is, failures to returnfrom authorized temporary absences such a work furlough, studyrelease, mercy furlough, or other authorized temporary absence.Escapee returns, with or without new sentences--Includesall returns from escape, that Is, unlawful departures from a Statecorrectional facility or from the custody <strong>of</strong> State correctionalpersonnel.Returns from appeal/bond--Includes all inmates reinstated tocorrectional Jurisdiction from long-term Jurisdictional absences on671appeal or bond. Does not include returns from short-term movements(less than 30 days) to court (that Is, where the State retainsJurisdiction).Other admlsslons--Includes all other admissions not covered bythe above categories.ReleasesUncondltlonal--An unconditional release occurs only If thereleased Inmate cannot be relmprisoned for any sentence for which hewas In prison.Expirations <strong>of</strong> sentence--Includes all inmates whose maximumcourt sentences minus credits have been served.Commutations--Includes all inmates whose maximum sentenceshave been changed (lowered) to time served to allow Immediateunconditional release.Other unconditional releases--Includes all other unconditionalreleases not covered by the above categories.Condltlonal--A conditional release occurs if the released inmate,upon Violating the conditions <strong>of</strong> his release, can be imprisoned again forany <strong>of</strong> the sentences for which he was in prison.Probatlons--Includes all inmates who have been placed underprobation supervision and conditionally released; includes all shockprobation (split sentence) releases.Supervised rnondatory releases--Includes ali inmates who must,by law, be conditionally released. This type <strong>of</strong> release may also becalled mandatory conditional release.Paroles--Includes all inmates conditionally released to parole.Other conditional releases--Includes all other conditionalreleases not covered by the above categories.DeathExecutlons--Self-explanatory.Illnesses/natural causes--Self-explanatory.Sulcldes--Self-explanatory.Accidental Injury to self--Includes all Inmates whoaccidentally caused their own deaths (for example, a fall from aladder, mishandling electrical equipment).Death caused by another person--Inclurles all Inmateswhose deaths were caused accidentally or Intentlonall y byanother Inmate or prison personnel.Other deaths--Includes all other deaths not covered bythe above categories.Other releasesAbsent without leave {AWOU--Includes all failures toreturn from an authorized temporary absence such as workfurlOUgh, study release, mercy furlough, or other authorizedtemporary absence.Escapes from conflnement--I nel/udes all unlawfuldeportures fram a State correctlonol facility or from the custody<strong>of</strong> State correctional personnel.Transfers to other jurlsdlctlons--Includes all Inmateswho were transfe,'red from one State IS Jurisdiction to another tocontinue sentences already In force. Does not Include the releaseif State does not relinquish jurlsdictlon. Does not Includemovements fram prison to prison Within State.Releases to appeal/bond--Includes all inmates releasedfrom correctional Jurisdiction to long-term Jurisdictional absenceson appeal or bond. Does not Include short-term movements (lessthan 30 days) to court (that Is, where the State correctionalsystem retains Jurisdiction).Other releases--Includes all other releases not covered bythe above categories.RaceWhlte--A person having origins in any <strong>of</strong> the original peoples <strong>of</strong>Europe, North Africa, or the Middle East.Black--A person having origins in any <strong>of</strong> the black racial groups<strong>of</strong> Africa.American Indian or Alaskan Natlve--A person having origins inany <strong>of</strong> the original peoples <strong>of</strong> North Ainerica, who maintains culturalIdentification through tribal affiliation or community recognition.Asian or Pacific Islander-~A person having origins in any <strong>of</strong> theoriginal peoples <strong>of</strong> the For East, Southeast Asia, the IndianSubcontinent, or the Pacific Islands. This area includes, for example,China, India, Japan, Korea, the Philippine Islands, and Samoa.Other--Any other race not covered by the above categories.
---~--------~--~------<strong>Sourcebook</strong> <strong>of</strong> <strong>Criminal</strong> <strong>Justice</strong> <strong>Statistics</strong> <strong>1983</strong>Not known--Any inmate whose race is unknown.Ethnic originHispanic--A person <strong>of</strong> Mexican, Puerto Rican, Cuban, Central orSouth American or other Spanish culture or origin, regardless <strong>of</strong> race.Not Hispanic--A person not covered by' the above category.Not known--Any inmate whose race is unknown.Explanatory notes for StatesDiffering legal and administrative requirements as well as diverserecordkeeping practices omong jurisdictions hamper efforts to collectuniform nationwide data on the number and movement <strong>of</strong> inmates inState and Federal correctional institutions. NJt 01/ jurisdic£ions oreable to provide information that meets I\PS definitions. For some, thediscrepancies between reported data and the criteria are mInor, but inothers these discrepancies are more serious and, overall, serve to limitthe comparability <strong>of</strong> data omon!;) jurisdictions. Limitotions in Stotedata, <strong>of</strong> course, corry over into regional and nationol figures, which, asa consequence, should be viewed as providing on order <strong>of</strong> generalmagnitude rather than precise totals.The notes that follow identify deviations from the categorydefinitions used in the 19!11 questionnaire, provide details on thecontent <strong>of</strong> "other" admission and release categories, and specifyrevisions to data that should be token into account when comparing19!10 and 198 I figures. State inmates housed in local jails because fJfovercrowding are generally considered to be under State jurisdictir..n.Exception~ to this rule are noted below. Some States included onadjustment residual in their admission or release figure in order tobalance the yearend 1980 count with the yearend 1981 count.Alabama--Yearend jurisdiction counts for 19!10 are revised fromthose reported in the 1980 publication. Differences be. tweenjurisdiction and custody counts for 19!11 are due to persons hoJused inlocal jails. New court commitments: Includes some split sentenceviolators and SOme parole violators with new sentenc~;s. Otheradmissions: Type not specified and on adjustment residual. Otherunconditional releases: Unconditional court-ordered rel',ases. Otherreleases: Type not specified and adjustment residual.Alaska--AII data include both jail and prison inm'.Ites, as prisonsand jails form on integrated system. Admission and fE~lease figures areestimates based on 19!10 data. Differences betwe6n jurisdiction andcustody counts for 1981 are due to the large proportion <strong>of</strong> Stateinmates held in Federal prisons. Parole violat<strong>of</strong>f; with new sentence:Includes parole violators with no new sentences and other conditionalrelease violators with and without new sentences. Other admissions:Adjustment residual. Supervised mandatory releases: Includes some(fewer than 5 percent) expirations <strong>of</strong> sentence and releases toprobation <strong>of</strong> inmates serving a split sentence. The remainder aresupervised releases, many <strong>of</strong> which convert to probation shortly afterdischarge. Hispanic origin: Alaska cannot determine the ethnlcity <strong>of</strong> itspapUlation.Arizona--Differences between jurisdiction and custody counts for1981 are due to inmates housed in other States or in Federal prisons.Other conditional releases: Work furloughs. Other deaths: Vehicleaccidents. Other releases: Adjustment residual.Arkansas--Yearend jurisdiction counts for 1980 are revised fromthose reported in the 1980 publication. The breakdown <strong>of</strong> thejurisdiction and custody papUlation by sentence lengths are estimates.Admissi ons and release data include inmates sentenced to less than Iyear. Parole violations, no new sentence: Includes parole violatorswith new sentences. Figures for suicides, race, and hispanic origin areestimates.California--Yearend female jUrisdiction counts for 1980 arerevised from those reported in the 1980 publication. Otherunconditional releases: Court-ordered releases. Transfers to otherjurisdictions: Includes the net difference between transfers from and tojails, hospitals, and other States. Other releases: Includes the netdifference between returns from and releases to court. Hispanic origin:Figures for Hispanics includes Mexicans only; other Hispanics areincluded in the figure for non-Hispanics.Colorado--Yearend jurisdiction counts for 1980 are revised fromthose reparted in the 1980 publication. Other conditional releases:Unconditional court-ordered releases. Race: Figures are estimates.Hispanic origin: Figures are estimates.Connecticut-_AII data include both jail and prison Inmates, asprisons and jails form on integrated system. Yearend jurisdIctioncounts for 1980 are revised from those reported in the 1980publication. Custody counts are estimates. Persons in halfway housesand on re-entry furlough due to overcrowding account for thedifferences between jurisdiction and custody counts. ExpiratIon <strong>of</strong>sentence: Includes some releases to probation. Other conditionalreleases: Persons released to group homes.Delaware--AII data include both jail and prison inmates, asprisons and jails form on integrated system. Persons receiving a spll tsentence <strong>of</strong> more than I year, port to be served in prison ond theremainder on probation, are excluded from the mavement data unlessthe prison portion <strong>of</strong> the sentence exceeded I year, a practiceresulting in on understating <strong>of</strong> movement transactions. Differencesbetween jurisdiction and custody counts for 1981 are due to State672inmates held in other State and Federal institutions. New courtcommitments: Includes probation violators. Other unconditionalreleases.: Unconditional Court-ordered releases. Supervised mandatoryrelease:s: Includes persons released on probation. Escapes: Includesescape:s from supervised custody. Race: Breakdown based onpercentages. Hispanic origin: Delaware cannot determine the ethnicity<strong>of</strong> its populatIon.District <strong>of</strong> Columbia--The District <strong>of</strong> Columbia hod onIntegrated jail and prIson system. Data Include unsentenced inmatesand those with sentences <strong>of</strong> I year or less, with the exception <strong>of</strong> thosehoUiJed in the DIstrict <strong>of</strong> Columbia Jailor Detention Center. Personsreceiving a split sentence <strong>of</strong> more than I year, port to be served Inprison and the remainder on probation, were excluded from movementdrjta unless the prison portion <strong>of</strong> the sentence exceeded I year, onanisslon resulting in on understating <strong>of</strong> such transactions. Paroleviolators with and without new sentences and other conditional releaseviolators with and without new sentences: The total number <strong>of</strong>violators is accurate, but the breakdown by type is estimated from1980 figures. Transfers to and from other jurisdictions: Transfers toand from mental hospitals and Federal facilities. Escapees and AWOLsreturned: May include some sentenced to I year or less. EXpirations<strong>of</strong> sentence: Includes supervised mandatory releases with fewer than180 days remaining on their sentences. Such person are not consideredto be subject to the conditions normally attached to this type <strong>of</strong>release. SupervIsed mandatory releases: Includes only those supervIsedmandatory releases with 180 days or more remaining on theirsentences. Race: Estimates based on 1980 data. Hispanic origin: TheDistrict <strong>of</strong> Columbia cannot distinguish the ethnic composition <strong>of</strong> ItspopUlation.Florlda--Persons housed In local Jails account for the differencesbetween jUrisdiction and custody counts.Georgia--Yearend jUrisdIctIon counts for 1980 are revised fromthose reported in the 1980 publication. Parole vIolators returned withnew sentences: Includes parole and other conditional release violatorsreturned with and without new sentences. Other admissions: Type notspecified. Transfers to other jurisdictions: Transfers to other States toserve time on sentences in other States. Hispanic origin: Georgiacannot determine the ethnicity <strong>of</strong> its popUlation.Hawaii--Data Include both jail and prison inmates, as prisons andjails form an integrated system. Jurisdiction and custody figures areestimates believed to be within 5 percent <strong>of</strong> actual counts. Differencesbetween jurisdiction and custody counts are due to inmates in thecustody <strong>of</strong> the Federal prisons. Probation: Inmate whose sentences werere-evaluated withIn 60 days <strong>of</strong> commitment and modified to probation.Idaho--Custody figures are believed to be within 5 percent <strong>of</strong>the actual count. The male/femole breakdown <strong>of</strong> admission and releasefigures are estimates based on 1980 data. Differences betweenjurisdiction and custody counts are due to inmates held in other Stateand Federal institutions. Other acmisslons: Court orders and returnsfrom agreement on detainers. Other unconditional re leases: Releasesbecause <strong>of</strong> acquittal or dismissal <strong>of</strong> sentence. Other releases: Releasesto agreement on detainer. Unsentenced inmates (custod>, count): Civilcommitments held for psychologicql testing and evaluation. Race:Estimates based on 1980 data. Hisponic origin: Estimates based on1980 data.IlIinois--Admlssiol' and release counts include persons sentencedto I year or less. Differences between jurisdiction and custody countsare due to Inmates housed in other States or In Federal facilities andinmates out to court. Parole violators, no new sentence: Personspreviously reported in this category are now being reported as otherconditional release violators dve to a new supervised mandatory releaseprogram in effect in 198 I" Other conditional release violators, no newsentences: Includes mostly supervised mandatory release violators.Other admissions: Includes work release vIolators. Other releases:Transfers to community correctional centers.Indiana--Data on race, HIspanic origin, ond probations areestimates. Other conditional release vIolators with new sentences:Includes parole, probation as port <strong>of</strong> a split sentence, and probationviolators with or without new sentences. Other unconditional releases~Releases <strong>of</strong> persons with Indeterminate sentences wIthout post-releasesupervisIon. Other conditional releases: Releases to RegulatedCommunity Assignment in the community. Persons released in thismanner retain inmate status and report to a parole <strong>of</strong>ficer weekly.They are released to parole status in 90 dtlys unless there areInfractions, in which case they are returned to the institutions.10'Ca--Data for 1980 are revised from those reported In the 1980publication. All population and movement data for 198 I are custodyfigures. Male/female counts <strong>of</strong> admissions and releases are estimatesbased on 1980 data. Admission and release figures contain onestImated 137 admissions and 154 releases with sentences <strong>of</strong> less than Iyear. Maleifemale ratios <strong>of</strong> the racial and ethnic composition areestimated. Escopees and AWOLs returned: Includes escapes only, notAWOLs. Ese(lpes and AWOLs: Includes escapes only, not AWOLs.Kansa$--Probation: Includes fewer than 50 inmates released tocourt.Kentucky __ Yearend Counts for 1980 are revised from thosereported in the 1980 publication. Custody figures Include 104 inmatesheld in local jails to relieve overcrowding. Probation: All probationreleases are shock probation.Lou!siana--Dlfferences between jurIsdiction and custody countsAppendicesII des some commutations (fewer than 10 percent).~~ieta~~~et~ anp~~al or bond: Ur1co~ditlonal c~urt-ordered [*;Ijases. h~~contain some overturned convictions for which no new no was" h ". cam rised <strong>of</strong> Inmates whose race was not known.Race: NOt th r DI~kot:"-Differences between jurisdiction and custodyor d F deral risoners and prisoners from other StateshO¥dt\a~rthe ci~ko~a insti~Utions. Other conditional rele~s*;s: C:0~rto~der~dreleases. Race: Figures are estimates. HispanIc onglO: FlgLresare eg~~~:~ifferences between jurisdiction a~d cust?dy counts arddue to Inmates living in halfway houses, relOtegr~~lonSt~~~te:~ta~~sthose incarcerated ol't~ide th*;t S~~\~,. ~~~,~~~s ws~C;: "o~her conditionaljurisdiction. New cour comml III'" T nsfers from and to otherrelease violators with new se~tences. d /0 mental hospitals. OtherL~~~~:~~~~i;r~~d;d~~£}~~~~nf~r~~~~~t~~}~r~~~~~'le ?~;I~~g:~di~~~~:~~g~~:se~'re ~s~imates. Hispanic orIgIn: Based on custody popule-tlononly. f' . I h -~Yearend jurisdictIon counts for 1~80 are revised from'- a om to d 'n the 1980 publication.Differences betweenthose rep.or e I h Id in hospitals andjurisdiction and cus~od~ ~?~~'~n a~~u~~: !~crud!0~9 ~ale and IS femaleinmates halfway on houses. escape. uOrtlhSerl aldmissions' .' Sentenced <strong>of</strong>fenders held incountbj~~~n~~ ~:~~:~~ j~~rsill~~.~~ngiountsfor 1980 are revised fromthose reported in. the ~~~2n~u.~':~~~on~n counts for 1980 are revisedPennsYlva~I~-~Y the 19JO publication. Other admissions: Inmatesfrom. those reporth 10 uthorities. Other releases: Inmate~ rel:ase~ .toroetch:l;e~u:h:1tfes e~nd administrative final discharges. H,lstpa, OIC onglO:. I th thnicity <strong>of</strong> its popu a on.Penns~~~~~ ~~I~~~-~~r~a~~ inc~ude both jail and prison in~t*;s, asprisons and jails form on integrated system. Person~ b:c:~;~;Jl i~partially suspended se~tednce <strong>of</strong> moreb~~~~ I ~:~~ ~~;'~ded from the~~~~~ean~d d~~~, ru~Ie~~n th~ .;r1s~~op~~i~n:d~:~:a~7g~en~~ ~x::::~n~year, a~1 omlssb~he~e:~i~ls7;ns:nOne male paroled illegally, who was:~~~:nae~ tonsprlson to complete his sentence. Other releases: CourtovertU;~~~hs~~~~f~a--Differences between j ur !sd ilct i o,n . a~ld c us~~~~d' t to persons housed oca Jal s t a~~~r~:~wd~~9. U~ther P~~conditional release.s: In~~~:~id~~lon~\!~~f~co~~t-o~~~~hd ~~~~~~~s'ca~~~:rd~~!~:~~ ~~u::::City <strong>of</strong> its ~pulatio~,on91OSouth Dakota--Differences in jurisdict!on and hUi~o .Y ~ou~~are due to out-<strong>of</strong>-State inmates and Federal pnsoners e In 0Dakodt~u~n~esps~~;_p~ffpe~~~~~~ ~~~se:g i~ri,s~~~~ij~i~~d ~~:~f:yvi~fa~~~~are e In I . I t rs with new sentences.~;~~~u~gd~i~~~:~~I;~~e ~~t~~~s J£~yX:~~~ ::,~~~:~~su~:~~1~fo~~:cases returnedd ta, Prison' Other conditional releases: Includes jail casescourt-ordere re eases. . Oth d ths' Drugrele~sed toojt~~~ ~:~e~~se~:o~dj~~~:eOn~d~~~idual. e~i.s~~nic· origin:overuoses. h . It f't populationTenne~see c~~~~t J;t~r;;;~ecJ~t~d~ fi~~r:s,o as l jSUriSdi~tion ~oun!s wereexas d th dltional release Violators With newnot provided. Parole on 0 er con her conditional release violatorssentences: Incl~des parOihe~nu~c~~ditional releases: Unconditionalwithout new s~n eices·s Other conditional releases: ConditionalcouJt-or~;:r Je~th~~eC~use not known. Other r*;'eases: Adjus.tment~;'d~~~: H;~'PQnlc origin: Figure is estimated at 22 percent <strong>of</strong> InmatepoPul~~~h __ Dlfferences between jurisd~ct~~e~~~ f~~til~;;e~~ungt~~~due to inmates housed In other State on B d <strong>of</strong> Pardonsuncon~'!~=~[:~~ie~ai~'~~I~~oen b~thej~etl~~n~ prl~~n in.m~tes, ~sprisons OJld jail~ form on tin~~g~~~~~tli~t~~~i r:rf~:e~; U~~~~d~~io~~~releases adre ~tlmlt~~'es 0 hOther conditional releases: Includes courtcourt-orere re e. 'th release to a special probationsupervIsion. orderc:d. ameRndaceed. • FS~19n~::sc~~e :~tlmates. Hispanic origin: Figures areestim~fs •. '0 Differences between jUrisdiction and custody countsrglOl r;ns held in local jails and those held in other States.Tr~n~~:rst~r: ot~er jUrisdi~!i~~~~ ~n~~~~~~ct:~n¥~~~e~~~ d~~~r f;:~~~~who may be stor,hn g or ~~n ~nand new court commitments understated,category may e overs ate ified Other unconditional releases:Other admissions types no spec • vernor Other deaths. Couse notCondltioroal pardons gra~tTed by ~~es Gopecified •• Hispanic origi~: Virginiaknown. Othe" releases. ype n I .has not identified the eth~'cit~ dfc!I~ni~J~t~Of~r aV~80 are revised~shingto~-d~~a~h~ I~;~s p~blicatlon. Other admissions: Returnsfrom t se repor e Ignment t.; mental hospitals or other States. Otherfrom temporary ass d b th Governor Otherunconditional releases: Full pardon~ gra~t~ 6the~ races: I'ncludesreleases: Releases to temporary asslgnm n •
persons <strong>of</strong> Hispanic origin.West Vlrginla--Other odmlsslons: Type not speclfi~d. Otherunconditional releases: Unconditlonol court-ordered releases. Othercandltlonal releases: Conditional court-ordered releases. Otherreleases: Includes persons returned to court JUrisdiction after beihgdeclared unsuited to serve at a particular minimum security institution.Wisconsln--Yearend jurisdiction counts for 1980 are revised fromthose reported In the 1980 publication. Other admissions: Includesreturns pending revocation <strong>of</strong> parole and returns from mandatoryrelease pending revocation. Other unconditional releases: Includesreinstatement to porole and reinstatement to mandatory release. Otherdeaths: Cause not known. Other releases: Includes reinstatement toprobation supervision, reinstatement to mandatory release, and oneunknown release type.Wyoming--Differences between Jurisdiction and custody countsare due to Inmates held In other States. Other conditional releases:<strong>Sourcebook</strong> <strong>of</strong> <strong>Criminal</strong> <strong>Justice</strong> <strong>Statistics</strong> <strong>1983</strong>Court-ordered releases.Federal <strong>Bureau</strong> <strong>of</strong> Prisons--Persons receiVing a split sentence<strong>of</strong> more than I year, part to be served In prison and the remainder onprobation, are excluded for 1980 and 1981 cOllnts for those withmaximum sentences <strong>of</strong> mare than I year unless the priwn portion <strong>of</strong> thesentence exceeded I year, a practice resulting In on understating <strong>of</strong>these counts. Such persons are Included In the count <strong>of</strong> inmates withmaximum sentences <strong>of</strong> I year or less. Yearenu Jurisdiction count for1981 Includes 1,921 persons held In Federal prisons but under thejurisdiction <strong>of</strong> the Immigration and Naturalization Service. Suchpersons were excluded from Jurisdiction counts In 1980. I\'ew courtcommitments: Includes "other conditional release violators with newsentences." Parole violators with new sentences: Figures are estimatesbased on new court commitments. Race: Data available only forsentenced Inmates. Hispanic origin: Data avalloble only for s,entencedInmates.rl'1,It1II!!iI10I I'I! 'Lr) 1ILII 1 iI:Ii) iIIi:Uu~ri! !N'PEI'VIX 20Federal Prison System-Statistical Report, Fiscal Year 1980NJTE: Data in this report are broken down Into two sets <strong>of</strong> mutually exclusive categories: (I)court commitments and other-than-court commitments; and (2) prisoners under sentence andprisoners not under sentence. Beginning In fiscal year 1974, persons remanded for a mentalcompetency determination or for (1 mental Incomp-atencY'commitment were considered to be "studyond observotlon" coses. The figure below presents the breakdowns within these categories:lA'JDER SENTENCENJT lA'JDER SENTENCECOLRT COMllliTMENTS.( I) Reguiar adult(2) Federal Juvenile Delinquency Act(3) Youth Corrections Act(4) 18 U.S.C. 4205 (b){ I) ond (b){2)(5) Narcotic Addict Rehabilitation Act(6) Split sentence(7) District <strong>of</strong> Columbia, juvenileOTJ-ER-TJ-W'.J-COLRT COMMITMENTS(I) Parole violator(2) Mandatory release violator(3) Sentenced adult, study ond observation(4) State commitments(I) Mental competency determination(2) Mental incompetency commitment(3) Federal Juvenile Delinquency Act,study and observation(/1) Youth Corrections Act, study ondobservationThe following Information was token from the U.S. Deportment <strong>of</strong> <strong>Justice</strong>, Fe~ral Prison System,Statistical Report, Fiscal Year 1975 (Woshington, D.C.: Federal Prison S>-~~=, : 977), pp. 113-114. Revisions have been made on the basis <strong>of</strong> Crlminol Code, Title 18, United States Code, withomendments to July IS, 1978, and information received from the Federal <strong>Bureau</strong> <strong>of</strong> Prisons.Regular adult--A District <strong>of</strong> Columbia adult, military prisoner"or other individual who quailfles under the parole eligibility provisions<strong>of</strong> 18 U.S.C. 4202 and 4205(0), or 26 U.S.C. 5871 and 7237.18 U.S.C. 4205(a)--An individual sentenced to a term in excess<strong>of</strong> I year with the porole eligibility date determined to be one-third <strong>of</strong>the maximum sentence imPClsed, ond no mare than 10 years.18 U.S.C. 4205(b)( I )--An individual sentenced to a term Inexcess <strong>of</strong> I year. with the paroie eiigibiiity doh: cl€teiTrilnca by trn:court to be less than one-third <strong>of</strong> the maximum sentence imposed.18 U.S.C. 4205(b)(2)--An Individual eligible for parole at thedetermination <strong>of</strong> tho United States Parole Commission.18 U.S.C. 4205(c) (Sentenced adult, study andobservation)--A commitment for a study (deemed to be for themaximum .sentence). The results <strong>of</strong> the study sholl be provided br theDirector <strong>of</strong> the <strong>Bureau</strong> <strong>of</strong> Prisons to the courts within 3 months atwhich time the Inmate may be eligible for resentencing.18 U.S.C. 5010(b), 5017(c) (Youth Corrections Act,Indeterminate)--A youth <strong>of</strong>fender or young adult sentenced fortreatment ond supervision who sholl be released conditionally undersupervision on or before the expiration <strong>of</strong> 4 years from the dote <strong>of</strong>conviction and who sholl be discharged Unconditionally on or before 6years from the dote <strong>of</strong> conviction.18 U.S.C. 5010(c), 5017(d) (Youth Corrections Act, specificterm)--A youth <strong>of</strong>fender or young adult sentenced for treatment ondsupervision in excess <strong>of</strong> 6 years, but not to exceed the maximum <strong>of</strong> the<strong>of</strong>fended statute, ond who sholl be released conditionally undersupervision not later than 2 years before expiration <strong>of</strong> the maximumsentence imposed.18 U.S.C. 50 I O(e) (Youth Corrections Act, study andobservation)--A youth <strong>of</strong>fender or young adult committed forobservation and study. The findings <strong>of</strong> the study shall be provided bythe Youth Division <strong>of</strong> the United States Parole Commission to the cou,twithin 60 doys.18 U.S.C. 5034 (Federal Juvenile Delinquency Act,mlnorlty)--A juvenile committed for the period <strong>of</strong> his minority.18 U.S.C. 5034 (Federal Juvenile Delinquency Act, otherthan mlnorlty)--A juvenile committed for a period <strong>of</strong> time less thanhis minority.18 U.S.C. 5034 (Federal Juvenile Delinquency Act, studyand observatlon)--A Juvenile conmltted for observation and study.The results <strong>of</strong> the study sholl be provided by the Director <strong>of</strong> the<strong>Bureau</strong> <strong>of</strong> Pr!~Qns to the court within 30 days.16 D.C.C. 2318 (District <strong>of</strong> Columbia, juvenile)--A District<strong>of</strong> Columbia juvenile.18 U.S.C. 3651 (Split sentence)--A sentence on one countconsisting ot a suspended sentence with a definite term, and aconfinement portion <strong>of</strong> 6 months or less followed by a period <strong>of</strong>probation not to exceed 5 years.18 U.S.C. 4244, 4245 (Mental competency determinatlon)-An individual whose mental condition Is examined prior to sentencing todetermine If he Is presently Insane or otherwise so' mentallyIncompetent as to be unable to understand the proceedings against himor properly to assist in his own defense.18 U.S.C •. 4246 (mental Incompetency commitment)--Aperson found to be mentally incompetent and committed until such timeas the person shall be found mentally competent to stond trial or untilthe pending charges against him are disposed <strong>of</strong>.18 U.S.C. 4252 (Narcotic Addict Rehabilitation Act, studyand observatlon)--A person committed for on examination todetermine If he is on addict and likely to be rehabilitated throughtreatment. The examination report shail be furnished to the court bythe Attorney General within 30 doys.18 U.S.C. 4253 (Narcotic Addict Rehabilitation Act,sentenced prlsoner)--An addict committed for treatment for onindeterminate period <strong>of</strong> time not to exceed 10 years or the maximumperiod <strong>of</strong> time which could otherwise have been imposed.State commitment--A State prisoner serving his State sentencein a Federal institution under contract.674JI
INDEXAbortionAbuse and neglectAcquittalsAffirmative actionAgencies, criminal justiceAir piracyAlcoholAliensAmphetominesAppeals, FederolArrestsArsonAssaultAttitudesAttorney generolAuto theftBarbituratesBombingsBudgetBurgloryCapitol punishmentChild obuse and neglectChildren In Need <strong>of</strong> Supervision (CHINS)CigarettesClearance ratesClemencyCocaineCommutationsCompensationConfidentialityControlled substancesConvictionsCorporate crimeCorrectionsCounselCounterfeitingCourtsCourts-martialCrimeCrime and lawCrime insurance<strong>Criminal</strong> history informationCurfew and loitering lawsDongerousnessDeeth penaltyDeathsDefendantsDefense activities for indigent defendantsDelinquencyDependency and neglectDetention, pretrialDismissal <strong>of</strong> chargesDisorderly conductDisposition <strong>of</strong> defendant:;Domestic violenceDriving while intoxicatedDrug abuse violationsDrug Enforcement AdministrationDrugsDrunkennessEducationElderly abuseEmbezzlementEmploymentExecutionsExpendituresExplosivesFederal <strong>of</strong>fendersList <strong>of</strong> Index reference termsFeloniesFirearmsFiresForgery and counterfeitingFraudGamblingGood timeGrand juryGuilty pleasGunsI-bbeas corpusI-bbitual criminalsI-blfway housesI-bndgunsI-bshlshHeroinHijacklngsHomicideInmlgrotlonInmunltyInmatesInternal Revenue ServiceInvestigationJailsJudgesJudicial activitiesJuriesJurorsJuvenile correctionsJuvenile courtsJuvenile delinquencyJuvenile InstitutionsKidnapingLarceny-theftLaw enforcementLaw Enforcement Assistance AdministrationLawyersLegislationLicensing'Liquor lawsMagistratesMorihuanaMisdemeanorsMortalityMotor vehicle theftMugging!>Murder and nonnegligent manslaughterNorcotic drug lawsNon-reporting <strong>of</strong> victimizationObscenityOffender-Bosed Transaction <strong>Statistics</strong>OffendersOffenses against family and childrenOffenses known to policeOpinion pollsPardonsParolePayrollPenitentiaryPersonnelPersons In Need <strong>of</strong> Supervision (PINS)Petit juryPocket-pickingPolicePornographyPretrial releasePrisonersPrisonsPrivacy and securityProbationProperty <strong>of</strong>fensesProsecutionProstitution and conmerclallzed vicePsychedelicsPub Ii c defende rsPublic opinionPurse-snatchingRape, forcibleRecidivismRehabllitotion programsRelease without prosecutionRestitutionRevocationRobberyRunawaysSalariesSecurities and Exchange ConmlsslonSeizuresSelf-reported criminal activitySentencesSentencingSex <strong>of</strong>fenses (except forciblerape and prostitution)ShopliftingSpouse abuseStatus <strong>of</strong>fendersStatutory provisionsStolen property (buying, receiving, possessing)SuicideSupervisionSuspicionTerrorismTime servedTraffic violationsTronsfersTrialsU,lform Crime Reports, Index <strong>of</strong>fensesUniform Parole Reportsu,reported crimesU,solved crimesU.S. Air ForceU.S. ArmyU.S. <strong>Bureau</strong> <strong>of</strong> Alcohol, Tobacco and FirearmsU.S. Coast GuardU.S. Customs ServiceU.S. District CourtsU.S. Marine CorpsU.S. NovyU.S. Postal Inspection ServiceU.S. Secret ServiceU.S. Supreme CourtVagrancyVandalismVehicle theftVictim compensationVictimizationViolent <strong>of</strong>fensesWaiverWeaponsWhite-collar crimeWire or oral communications, Interceptions <strong>of</strong>WiretapsWitness InmunltyWrit <strong>of</strong> certiorari\'1,I11IIIi .ABrnTlCNLegalizationIf a result <strong>of</strong> rape, 240ABUSE ,AN() NEGLECTChild abuse and neglectPublic opinionRespondents knowing abused children, 291Respondents rating problem as very serious, 291Reports <strong>of</strong> child abuse or neglectPerpetrators reportedAge, 356Sex, 356Status ond type <strong>of</strong> report, 355Victims reportedAge, 355Sex, 355Elderly abusePublic opinionHespondents knowing abused elderly, 291Respondents rating problem as very serious, 291Spouse abusePublic opinionRespondents knowing abused spouses, 291Respondents rating problem as very serious, 291See also:Appendix 12, Notional analysis <strong>of</strong> <strong>of</strong>ficial child neglect andabuse repor~JngMurder and nonnegligent manslaughter, victim relationship to<strong>of</strong>fenderOffenses against family and childrenPublic opinion, abuse and neglectACQUITTALSSee CourtsAFFIRMATIVE ACTlCNLaw enforcement, 49, SOMunicipal, 53State, 53AGENCIES, CRIMIN
----------~-----.-----------------------------------------------------------ASSAULT (continued)VictimizationDefined by National Crime Survey, Appendix IIHouseholds touched by, 351-353Incidents, 335-340N,t reported to police, 307-31~'. 318i'i.Jmber <strong>of</strong>, ,307, 308, 312-314, j35-346, 350, 354Rate, 320, 322, 325-333, 350, 351Reported to police, 307, 3!>4See also:ArrestsOffenses known to policeVictimization, personalATTITUDESSee Public opinionA TTffi\EY GEi'ERALSee Prosecution, U.S. AttorneysAUTO THEFTSee Motor vehicle theftBARB I TLRA TESSee DrugsSee Narcotic drug lowsSee Prisoners, drug useSee Public opinion, drugsBOMBINGSSee HijackingsSee Offenses Icnown to the policeBUDGETSee ExpendituresBLRGLARYArrests, 415-422, 1125, 4~7, 429-431, 435-445, 450-453, 458Age, 421, 422, 425, 430, 431, 437, 441, 445, 458Extent <strong>of</strong> urbanization, 436-445Race, 431, 435, 437, 441, 445Rotes, 416, 450Sex, 427, 429, 430, 436, 440, 444Basis for wiretap, 485Clearonce by arrest, 451-453, 458Court cases, Federal, 494, 495Appeals, 516Convictions in U.S. Postal Inspection Service cases, 522Investigations, 522Crime insurance, 41 IDefendants, Federal, 506Sentences, 508Defined by lkIiform Crime Reports, Appendix 2In Federal parks, 389Offenses known to police, 370, 372-376, 378-389, 397, 398, 400Federal violations, 398Percent cleared by arrest, 451-453, 458Place and time <strong>of</strong> occurrence, 397Property loss, 400Rate, 370, 376, 378, 379PrisonersAdmitted to Federal institutions, 586, 587Confined in Federal institutions, 588Railroads, 412Arrests, 472Dispositions, 540VictimizationDefired by National Crime Survey, Appendix IIHoust!holds touched by, 351-353Incide.'lts, 335'~t repcrted to police, 307, 308, 311, 316, 318N..mber <strong>of</strong>, 307, 308, 316, 318, 346, 354Rote, 320, 324, 346-348, 350, 351Reported to police, 307, 354Value <strong>of</strong> property stolen, 346See also:ArrestsOffenses known to policePublic opinion, fear <strong>of</strong> victimizationVictimization, business and householdCAP I TAL PLNI SI-MENTExecutions under civil authority, 613, 615, 616, 618Females, 618Jurisdiction, 613, 616, 618Offense, 615-618Race, 615, 617, 618Region, 613, 616Movement <strong>of</strong> prisoners under sentence <strong>of</strong> death, 609, 610Prisoners received from court under sentence <strong>of</strong> death, 607, 608Age, 608Jurisdiction, 607Legal status at time <strong>of</strong> arrest, 601:1Race, 607Region, 607, 608<strong>Sourcebook</strong> <strong>of</strong> <strong>Criminal</strong> <strong>Justice</strong> Statistlcs <strong>1983</strong>680.CI>PITAL PLNISl-MENT (continued)Prisoners removed from death row, 6", 612Prisoners under sentence <strong>of</strong> death, 602-604Choracteristics <strong>of</strong>, 605, 606Jurisdiction, 602-604Offens.;, 604Race, 602, 604Region, 607, 608Public opinionReasons for faVoring, 278Reasons for opposing, 278Specific <strong>of</strong>fensesAirplane hijacking, 276, 277Murder, 273-278Rape, 276, 277Treason, 276, 277See also: Specific <strong>of</strong>fenses (e.g., Murder and nonnegligentmons laughter, Rope)CHILD ABUSE AND NEGLECTSee Abuse and neglectCHILDREN IN NEED a=- SLPERVISIQ\I (CHINS)See Persons In Need <strong>of</strong> Supervision (PINS)CIGARETTESPublic opinionHormfulness <strong>of</strong>, 293Prohibition on use <strong>of</strong>, 294See also: Drugs, use, self-reportedCLEAR.ANCE RATESS~e Ar~estsCLEMENCYApplications involving Federal <strong>of</strong>fenses, 521COCAINESee DrugsSee Narcotic drug lawsSee Prisoners, State, drug useSee Public opinion, drugsSee SeizuresCOMMUTATIQ\ISGranted, 521Prisoners removed from death row, 612See also: ClemencyCOMPENSATIONU.S. Postal Inspection Service investigationsRecoveries and restitutions, 522 .Victim compensation by prisoners, attitudes toward, 265See also: Crime insuranceC()\f"1 DENTI ALI TYSee <strong>Criminal</strong> history informationCONTROLLED SUBSTANCESSee Drug Enforcement !l.dministrationSee DrugsSee MarihuanaSee Narcotic drug lawsSee Public opinion, drugsSee SeizuresCONVICTlQ\ISSee CourtsCmPCRATE CRIMESee Courts, Federal, cases, antitrustCORRECTlQ\ISEmployeesNumber <strong>of</strong>, 15, 18, 22, 26, 28, 110, 131lkIions, 130Employment and payrollFederal, 18Local, 26, 28, 110State, 22, 28, 110, 131Expenditures, 4, 16, 20, 24, 36, 109InstitutionsFederalPopulation, 572, 573, 576, 585, 588MilitaryAir ForceAverage populotion, 591Capocity, 591ArmyAverage population, 590, 591Capacity, 591Morine CorpsAverage population, 592Capacity, 592NavyAverage population, 59!CapaCity, 591Offering educational programs, 1331\ .I~11\J1IfJIIII11IjI!I'iC~ECTIQ\IS (continued)Institutions (continued)StatePopulation, 132Prison industries, 134Security classification, 132Type <strong>of</strong>, 132Volunteer programs in, 138See also:Appendix I, Expenditure and employment dataAppendix 20, Federal Prison System statistical reportEmploymentExpendituresJailsJuvenile correctionsParolePrisonersProbationPublic opinion, incarcerationCCll..NSELSee Courts, Federal, casesSee Defense activities for indigent defendantsSee EmploymentSee ExpendituresCOLNTERFEITINGSee Fargery and counterfeitingSee SeizuresCOlRTSAdministrative <strong>of</strong>ficesFeuc.-c.:J1 personnel, 72Courts <strong>of</strong> general jurisdictionFilings, 474JudgesMethod <strong>of</strong> selection, 99Number <strong>of</strong>, 90Qualifications, 93Salary, 95Terms <strong>of</strong>, ;Ok), 99Courts <strong>of</strong> intermediate appealsDispositions, 475Filings, 475, 476JudgesMethod <strong>of</strong> selection, 96, 98Number <strong>of</strong>, 88-90Qualifications, 93Salary, 95Terms <strong>of</strong>, 90, 98Courts <strong>of</strong> last resort<strong>Justice</strong>sMethod <strong>of</strong> selection, 96Number <strong>of</strong>, 90Qualifications, 93Salary, 95Terms <strong>of</strong>, 90, 96Courts <strong>of</strong> limited jurisdictionFilings, 474Employment and payrollFederal, 18, 72Lcx:al, 26, 28State, 22, 28Expenditures, 4, 16, 20, 24, 36, 70, 71, 79FederalCases, 492-499AntitrustFilings, 526Type <strong>of</strong> case, 526Civil,513Appeals, 516Prisoner petitions, 513, 514Trials, nature <strong>of</strong> <strong>of</strong>fense, 490Clerks, 72<strong>Criminal</strong>Filings, 492-495Offense, 494, 495Per Judgeship, 74Status <strong>of</strong> case, 5U4Pending, 491-493Terminations, 492, 493Dispositions, 500, 502, 507Offense, 499, 506, SOBSentence, 504, 508Type, 504-508Trials, nature <strong>of</strong> <strong>of</strong>fense, 490, 506Immigration and nationality lawsOffense, 52BType <strong>of</strong> case, type <strong>of</strong> disposition, and sanction, 528IndexCOlRTS (continued)Federal (continued)Cases (continued)Internal Revenue Servicef-bndled by Office <strong>of</strong> Chief Counsel, 522In!tiated by <strong>Criminal</strong> Investigation Division, 521Prisoner petitionsAppeals from U.S. District Courts, 5 I 6Filings, 513Type <strong>of</strong> petition, 513, 5 I 4Securities and Exchange CommissionCases referred to the U.S. Department <strong>of</strong> <strong>Justice</strong> forprosecution, 527Convictiuns, 527Indictments, 527U.S. Postal Inspection Service, 522Moil fraud cases, 522-524U.S. Secret ServiceDisposition <strong>of</strong> arrests by, 532U.S. Supreme CourtActivities <strong>of</strong>, 518CasesArgued and decided on merits, 520Filed, disposed <strong>of</strong>, and pending, 519Writs af certiorariCircuit, 519Nature <strong>of</strong> proceedings, 519Petitions for review filed, disjlosed <strong>of</strong>, and ;>ending, 519Judges, 72, 88Courts <strong>of</strong> appeals, 527District courtsMagistrates, duties performed, 77JurorsExpenditure, 105Utilization, 107, 108Personnel, 72, 73Prosecution by U.S. AttorneysCases pending<strong>Criminal</strong>, 491Trials arguedCivil, 490<strong>Criminal</strong>, 490Time limits, U.S. District CourtsDefendants disposed <strong>of</strong>Arraignment to trial, 502Arrest to indictment, 502Conviction to sentencing, 502Indictment to arraignment, 502Trials, nature <strong>of</strong> <strong>of</strong>fense, 506WitnessesImmunity requests, 481JuvenihiCa~.:s disposed <strong>of</strong>, 477-480Delinquency, Appendix 15, Delinquency 1975, 1976, 1977,1978, 1979Age at time <strong>of</strong> referral to court, 478Manner <strong>of</strong> handling, 480Number ,nf, 477-480Race, 478Rate, 477, 478Reason for referral to court, 479Sex, 477, 47BSource <strong>of</strong> referral, 477Waiver to criminal court, 150, 153See also:Appeals, FederalCourts-MartialDefendantsDefense act ivities for indigent defendantsJudgesProsecutionPublic opinion, courtsTrialsU.S. Supreme CourtCOlRTS-MARTIALAir ForceConvictions, 533-535Court, 533-535Dispositions, 535Guilty pleas, 534Personnel tried, 533, 534ArmyConvictions, 533Personnel tried, 533
--~--~--,,--682rCOLRTS-MARTIAL (continued)Coast GuardConvictions, 538Court, 538Dispositions, 538Offenses involved, 539Personnel tried, 538Marine CorpsConvictions, 536Court, 536Dispositions, 537Guilty pleas, 536Personnel tried, 536, 537NavyConvictions, 536Court, 536Dispositions, 537Guilty pleas, 536Personnel tried, 536, 537CRIMESee Offenses known to policeSee Public opinion, crime problemsSee Specific <strong>of</strong>fenses (e.g., Assault, Motor vehicle theft)See VictimizationCRIME AN) LAWSee ArrestsSee Courts, juvenileSee Offenses known to policeSee Prisoners, StateSee Public opinion, crime problemsSee Specific <strong>of</strong>fenses (e.g., Assault, Motor vehicle theft)See Statutory provisionsSee lkIiform Crime Reports, Index <strong>of</strong>fensesSee VictimizationffiIME"INSlRANCELosses paid, 411Policies written, 411CRIMINAL HISTffiY II'FCRMATIO'JConfidentiolity <strong>of</strong>Federal, 171State, 171Record for decriminalized possession <strong>of</strong> marihuana, 187Statutes on privacy and security <strong>of</strong>, 172CLRFEW AN) LOITERII\(; LAWSArrests, 415-422, 427, 430, 431, 436-445Defined by Uniform Crime Reports, Appendix 2DAf\GEROUSf\ESSPretrial release decisions, effect on, 155DEAn; PENAL 1YSee Capital punishmentSee PrisonersSee Public opinion, capitol punishmentSee Specific <strong>of</strong>fenses (e.g., Murder and nonnegligentmanslaughter, Rape)DEATHSBombing or explosion, 406, 407, 409In prison, 60 ISee also:Capital punishmentMurder and nonnegligent manslaughterPrisonersDEFENDANTSFederalAlcohol casesDisposition, 506Sentences, 508AntitrustDisposition, 506Sentences, 508Armed forces personnelConvictions, 533, 535, 536, 538<strong>Criminal</strong> tax fraud casesDisposition, 506, 521, 522Sentences, 508DispositionOffense, 506, 508Sentences, 504, 507, 508Drug Abuse Prevention and Control Act violatorsAverage sentence, 512Disposition, 496, 499, 506Number <strong>of</strong>, 496, 499, 506Sentences, 496, 508Firearms casesDisposition, 506Sentences, 508<strong>Sourcebook</strong> <strong>of</strong> <strong>Criminal</strong> <strong>Justice</strong> <strong>Statistics</strong> <strong>1983</strong>DEFEI'OANTS (continued)Federal (continued)Inmigration law vidatorsDisposition, 506Sentences, 508Marihuana Tax Act ViolatorsAverage sentence, 512Disposition, 496, 499NJrnber <strong>of</strong>, 496, 499Sentences, 496Narcotic drug law violatorsDisposition, 496, 499, 506Sentences, 496, 508Offenses against railroadsDisposition, 540Officials <strong>of</strong> public <strong>of</strong>ficeAwaiting trial, 532ConVicted, 532Indicted, 532Securities and Exchange Commission cases referred forprosecutionConvictions, 527Disposition, 506Indictments, 527Sentences, 508Time in custody, 500, 5(12U.S. Postal Inspection Service casesDisposition, 506, 514NJrnber <strong>of</strong> investigations and convictions, 522, 525Sentences, 508Officials <strong>of</strong> public <strong>of</strong>ficeFederal, 532State and local, 532See also:Appendix 20, Federal Prison System statistical reportCourtsCourts-MartialDefense activities for indigent defendantsDEFENSE ACTIVITIES Fffi II'DIGENT DEFENDANTSEmployment and payrol/Federal, 18Local, 26, 28, 54State, 22, 28, 54Expenditures, 4, 16, 36See also:DefendantsEmploymentExpendituresDELlN3UENCYSee ArrestsSee Courts, juvenileSee Juvenile correctionsDEP&DENCY AND f\EGLECTSee Abuse and neglectDETENTIeN, PRETRIALSee Federal <strong>of</strong>fendersSee JailsDISMISSAL CF CHARGESSee CourtsSee DefendantsDISffiDERL Y C(N)UCTArrests, 415-422, 427, 430, 431, 436-445Defined by Uniform Crime Reports, Appendix 2DISPOSITIa-l CF DEFENDANTSSee CourtsSee DefendantsSee Federal <strong>of</strong>fendersDOMESTIC VIOLENCESee Abuse and neglectDRIVII\(; w-lILE INTOXICATEDSee Arrests, alcohol-relatedSee Defendants, Federal, alcohol casesSee Public opinion, alcoholDRUG ABUSE VIOLATIO'ISSee Defendants, FederalSee Dr
--------- .. -- -~--~.........-----~-------<strong>Sourcebook</strong> <strong>of</strong> <strong>Criminal</strong> <strong>Justice</strong> <strong>Statistics</strong> <strong>1983</strong>IndexEXPENDITLRES (continued)Corrections (continued)TotalFederal, 3, 16Local, 3, 24State, 3, 20CourtsDirect, 2Federal, 16, 70, 71Local, 4, 24State, 4, 20, 79IntergovernmentalFederal, 16Local, 24State, 20TotalFederal, 3, 16Local, 3, 24State, 3, 20<strong>Criminal</strong> justice systemDirect, 2Federal, 16Local, 4, 24State, 4, 20IntergovernmentalFederal, 16Local, 24State, 20TotalFederal, 3, 16Local, 3, 24State, 3, 20Defense activitiesDirect, 2Federal, 16Local, 4, 24State, 4, 20IntergovernmentalFederal, 16Local, 24State, 20TotalFederal, 3, 16Local, 3, 24State, 3, 20FederalBudget authorities and outlays, 36Direct, type <strong>of</strong> activity, 4, 16Grand and petit juries, 105Intergovernmental, type <strong>of</strong> activity, 16 . .Office <strong>of</strong> <strong>Justice</strong> Assistance, Research, and StatIstIcs, 37Intergovernmental, 16, 20, 24Juvenile facilities, public and private, 119, 121-123Law enforcementDirect, 2Federal, 16Local, 4, 24State, 4, 2UIntergovernmentalFederal, 16Local, 24State, 20TotalFederal, 3, 16Local, 3, 24State, 3, 20Legal services and prosecutionDirect, 2Federal, 16Local, 4, 24State, 4, 20IntergovernmentalFederal, 16Local, 24State, 20TotalFederal, 3, 16Local, 3, 24State, 3, 20LocalDirect, type <strong>of</strong> activity, 4, 24Intergovernmental, type <strong>of</strong> activity, 24StateCorrections, 109Courts, 79Direct, type <strong>of</strong> activity, 4, 20Intergovernmental, type <strong>of</strong> activity, 20EXPEI'OITLRES (continued)See also:Appendix I, Expenditure and employment dataDefense activities for indigent defendantsEmploymentSalariesEXPLOSIVESSee HjackingsSee Offenses known to policeSee SeizuresFEDERAL a=FENDERSAppeals, 514-517, 519Commutations, 521<strong>Criminal</strong> cases, 490-495Dispositions, 496-508, 540Federal B'Jreau <strong>of</strong> PrisonsAdmissions, 585-587, 599Population, 570, 585, 588Releases, 585, 593Guilty pleas, 518, 519, 526, 528, 530Pardons, 521Parole <strong>of</strong> Federal <strong>of</strong>fenders, 585, 593, 594, 600Pretrial cllstody, 500 .Sentence!" 496, 504, 508, 512See also:Appeds, Federal , .Appendix 19, Prisoners in State and Fed:r~1 instItutionsAppendix 20, Federal Prison System statIstIcal reportCorrectionsCourtsDefendantsPrisonersSpecific <strong>of</strong>fenses (e.g., Assault, Motor vehicle theft)FELCNIESSee ArrestsSee CourtsSee Habitual criminalsSee Offenses known to policeSee Specific <strong>of</strong>fenses (e.g., Assault, Motor v~hicle theft)See Uliform Crime Reports, Index <strong>of</strong>fensesFIREARMSSee GunsSee LicensingSee Offer.ses known to policeSee Public opinion, gUns/firearmsSee SeizuresSee VictimizationFIRESEstimated number, 409Incendiary or suspiciousEstimated number <strong>of</strong> deaths, 409Estimated value <strong>of</strong> property loss, 409See also: ArsonFORGERY />N) Ca..NTERFEITII'GArrests, 415-422, 427, 430, 431, 436-445Court cases, 494, 495, 522Appeals, 516Defendants, FederalDispositions, 506Sentences, 508Defined by Uniform Crime Reports, Appendix 2PrisonersAdmitted to Federal institutions, 586, 587Confined in Federal institutions, 588U.S. Secret ServiceCases received and closed, 530Counterfeit notes and coinsPassed, 470Seized before circulation, 470Investigations, 530Plant operation; suppressed, 470See also: SeizuresFRAUDArrests, 415-422, 427, 430, 431, 436-445Court cases, Federal, 494, 495, 522Appeals, 516Defendants, FederalDispositions, 506Sentences, 508Defined by Uliform Crime Reports, Appendix 2PrisonersAdmitted to Federal institutions, 586, 587Confined in Federal institutions, 588GAMBL/I'GArrests, 415-422, 427, 430, 431, 436-445Basis for wiretap, 485GAMBL/I'G (continued)Defendants, FederalDispositions, 506Sentences, 508Defined by Uliform Crime Reports, Appendix 2GOOD TIMESee Sentences, statutory provisions for reductionGRAND JLRYSee JuriesSee JurorsGUI L TY PLEASCourts-MartialAir Force, 534Marine Corps, 536NJvy, 536Federal <strong>of</strong>fenders, 496, 504, 5U6, 522See also:CourtsCourts-MartialDefendantsCLNSCourt cases, Federal, 494, 495Appeals, 516Defendants, FederalDispositions, 506Sentences, SOBDetected at airport screenings, 411Gun control lawsState, 175Manufactured in the Ulited States, 174Ownership, 279-281PrisonersAdmitted to Federal institutions, 586, 587Confined in Federal institutions, 588Public opinion, guns/firearms, 279-290Statutory provisions for sentence enhancements, 161Ullawful mailings, 522Weapons (carrying, possessing, etc.)Arrests, 415-422, 427, 430, 431, 436-445Defined by Uliform Crime Reports, Appendix 2Statutory provisions for sentence enhancements, 161See also:LicensingOffenses known to policeSeizuresHABEAS CORPUSSee Appeals, FederalSee Courtst-W3ITUAL CRIMINALSSentence enhancements for, 156HtlNDCLNSSee GunsHt>.SHISHSee Drugs, use, self-reportedSee Drug Enforcement AdministrationSee Public opinion, drugsSee Seizuresf-EROINSee Defendants, Federal, narcotic drug law violatorsSee Drugs, use, self-reportedSee NJrcotic drug lawsSee Prisoners, State, drug useSee SeizuresHIJACKII'GSCapital punishment for, attitudes toward, 274, "1.76Location, 410Number <strong>of</strong>, 410Outcome, 410Results <strong>of</strong> airline passenger screening, 411Terrorism, 409I-OMICiDEIn prison, 60 iSee also:Capital punishmentDeathsMurder and nonnegligent manslaughterIMMIGRATIQ\IAliensDeported, 471Reason, 471IMMIGRATlCN (continued)Violations <strong>of</strong> immigration and natianality lawsAggregate fines and imprisonment imposed, 528Court cases, 494, 495Dispositions, 506, 532Offense, 528PrisonersAdmitted to Federol institutions, 586, 587Confined in Federal institutions, 588Sentences, SOBType <strong>of</strong> case, 528IMMlNITYRequests for immunity and witnesses involved, 481IN'MTESSee Federal <strong>of</strong>fendersSee JailsSee Juvenile correctionsSee PrisonersINTERNAL REVENJE SERVICECourt cases Initiated and handled, 521, 522INVESTIGA TlCNSee EmploymentSee ImmigrationSee Law enforcementSee Offenses, known to policeSee SeizuresSee Wire or oral communications, interceptions <strong>of</strong>JAILSDate <strong>of</strong> jail construction, 127EmployeesAmount <strong>of</strong> supervision, 130Hiring practices, 128Supervision <strong>of</strong> inmates by opposite sex <strong>of</strong>ficers, 129Ulion representation <strong>of</strong> staff, 130Hausing arrangements with other jurisdictions, 128InmatesDetention status, 564Estimated number, 564Race, 564Region, 564Sex, 564Slate, 5611Services and facilities provided, 128, 129State prisoners housed in local facilities, 564See also:CorrectionsJuvenile correctionsPublic opinIon, incarcerationJLOGESCases per judgeship, 74Courts <strong>of</strong> general jurisdictionMethod <strong>of</strong> selection, 99Terms <strong>of</strong>, 90, 99Courts <strong>of</strong> intermediate appealsN.llthod <strong>of</strong> selection, 98Terms <strong>of</strong>, 90, 96Courts <strong>of</strong> last resortMethod <strong>of</strong> selection, 96Terms <strong>of</strong>, 90, 96Education <strong>of</strong>, 92Federal, 72, 73Appropriations for, 70Magistrates, 73Duties performed, TlNJiTober <strong>of</strong>, 68-90Qualifications, 513Salaries, appellate and general trial courts, 95Terms <strong>of</strong>, 90, 96See also:Courts .Public opinion, courtsJUDICIAL ACTIVITIESSee CourtsSee EmploymentSee ExpendituresSee JudgesSee Public opinion, courtsJLRIESQ-and juries, 101, )07Utilization <strong>of</strong>, 107684
---....--~,..-- -- -~ --IndexJ\.RIES (continued)Petit juriesUtilization <strong>of</strong>, 108See also:CourtsJurorsJ\.RffiSFederalExpenditures, grand and petit, 105Grand juror usage in U.S. District Courts, 107Petit juror usage in U.S. District Courts, 108See also:JuriesJUVENILE C(liRECTIONSFacilitiesEmployeesPrivate, 122, 123Public, 119-121ExpendituresPrivate, 122, 123Per capita, 121Public, 119Per capita, 122tiJrnber <strong>of</strong>Private, 122, 123Public, 119-121Physical environmentPrivate, 122Public, 120Security levelPrivate, 122Public, 120Juveniles confined in local jails, 564Juveniles confined in private juvenile facilitiesAdjudication status, 563Admissions, 122Average age, 563Departures, 122Ethnicity, 563Frequency <strong>of</strong> community access, 122Race, 563Reason held, 563Residents, 123Sex, 563Type <strong>of</strong> facility, 122, 563Juveniles confined in public juvenile facilitiesAdjudication status, 561, 562Admissions, 119Average age, 561, 562Depry-tures, 119Ethnicity, 561, 562Frequency <strong>of</strong> eClfrrl1unity access, 133Race, 561, 562Reason held, 561, 562Residents, 121Sex, 561, 562Type <strong>of</strong> facility, 120, 561, 562Juvenile prisoners in Federal institutions for juveniledelinquency <strong>of</strong>fensesAdmitted, 586Confined, 588See also:Courts, juvenileExpendituresJUVENI LE CaRTSSee Courts, juvenileJUVENILE DELlN?lJENCYSee ArrestsSee Courts, }JvenileSee Juvenile correctionsSee Public opinion, juvenile delinquencySee Statutory provisionsJUVENILE INSTITUTIONSPublic and private institutions housing juvenlles, 561-563See also:Courts, juvenileJuvenile correctionsKIDNAPII'-GBasis for wiretap, 485Court coses, Federal, 494Death penaltyMovement <strong>of</strong> prisoners under sentence <strong>of</strong> death, 610Prisoners executed under cr .. iI authority, 615-618Prisoners received from court under sentence <strong>of</strong> death, 607Prisoners under sentence <strong>of</strong> death, 604<strong>Sourcebook</strong> <strong>of</strong> <strong>Criminal</strong> <strong>Justice</strong> <strong>Statistics</strong> <strong>1983</strong>KIDNAPII'G (continued)Defendants, FederalDispositions, 506Sentences, 508Defined by Uniform Crime Reports, Appendix 2PrisonersAdmitted to Federal institutions, 586, 587Confined in Federal institutions, 588See also: HijackingsLARCENY - Tt-EFT .Arrests, 415-422, 425, 427, 429-431, 435-445, 450-453, 458Age, 421, 422, 425, 430, 431, 437, 441, 44.s, 458Extent <strong>of</strong> urbanization, 436-445Race, 431, 435, 437, 441, 445R"!es, 416, 450:iex, 427, 429, 430, 436, 440, 444Basis for wiretap, 485Clearance by arrest, 451, 453, 458Court cases, Federal, 494, 495Appeals, 516Convictions in U.S. Postal Inspection Service cases, 522, 524Defendants, FederalDispositions, 506Sentences, 508Defined by Uniform Crime Reports, Appendix 2Drugs, 405In Federal porks, 389Offenses known to police, 370-376, 389, 397, 398, 400Federal violations, 398Percent cleared by arrest, 451, 453, 458Property loss, 400Rate, 370, 376, 378, 379Type <strong>of</strong> target, 397PrisonersAdmitted to Fe
------------ - -r;NARCOTIC DRUG LAWS (continued)Defendants, FederalDispositions, 496, 499, 506Sentences, 496, SOBDefined by Uniform Crime Reports, Appendix 2PrisonersAdmitted to Federal institutions, 5B6, 5B7Confined in Federal institutions, 5BBSee also:ArrestsDefendantsDru(1sMarihuanaOffenses known to policePublic opinion, drugsI\O'.l-REPffiTlN:; a=- VICTIMIZATIONSee Specific <strong>of</strong>fenses (e.g., Assault, Motor vehicle theft)See VictimizationOBSCENITYComplaints received by U.S. Postal Inspection Service, 525Federol defendants, 506, 525Sentences, 50BSee also: Pornographya=FENDER-BASED TRANSACTION STATISTICSSee Prisoners, Statea=FENDERSSee Arr:!St sSee CorrectionsSee Courts, juvenileSee DefendantsSee Federal <strong>of</strong>fendersSee JailsSee Juvenile correctionsSee PrisonersSee Victimizationa=FENSES AGAINST FAMILY MD CHILDRENArrests, 415-422, 427, 430, 431, 436-445Defined by Uniform Crime Reports, Appendix 2See also: Abuse and neglectCffENSES Kl\O\'vN TO POll CEAir piracyBomb threats and explosions, 410Hijackings, 410Outcomes <strong>of</strong> airline passenger screening, 41 IAssault, aggravated, 370, 372, 376, 377, 379, 38B, 396Rate, 370, 376, 377, 379Region, 396Type <strong>of</strong> weapon used, 396Assnult on law enforcement <strong>of</strong>ficersFederal, 401Rate, 404With injury, 404Without injury, 404Auto theft, 370, 372, 376, 37B-3B9, 399, 400Property loss, 400Rate, 370, 376, 378, 379, 399Bombings and explosives incidents, 406-409Explosives stolen, recovered, and seized, 408Incendiary incidents, 406, 407Persons killed or injured, 406, 407, 409Threats, 408Type <strong>of</strong> device, 406, 407Type <strong>of</strong> target, 407Value <strong>of</strong> property damage, 406, 407Burglary, 370, 372, 376, 378-389, 397, 398, 400Federal violations, 398Place and time <strong>of</strong> occurrence, 397Property lass, 400Rate, 370, 376, 378, 379Clearance by arrest, 45 I, 453, 458Property critt.es, 453Size <strong>of</strong> place, 451, 458Violent crimes, 453Drug thefts, 405Extent <strong>of</strong> urbanization, 376, 379Hijacklngs, 410Homicide <strong>of</strong> law enforcement <strong>of</strong>ficersCircumstances at scene <strong>of</strong> incident, 402OffendersCharacteristics, 403Disposition, 403Prior record, 403Officers killedAssignment, 402Characteristics, 403Type <strong>of</strong> weapon used, 402<strong>Sourcebook</strong> <strong>of</strong> <strong>Criminal</strong> <strong>Justice</strong> <strong>Statistics</strong> 19B3a=FENSES Kl\O\'vN TO POLICE (continued)In cities over 100,000 popUlation, 372In Federal parks, 3B9Larceny-theft, 370, 372, 376, 378-3B9, 397, 398, 401Federal violations, 39BProperty loss, 400Rate, 370, 376, 378, 379Type <strong>of</strong> target, 397Murder and nonnegllgent manslaughter, 370, 372-377, 379-394, 400Circumstances <strong>of</strong> <strong>of</strong>fenses, 391Offender characteristics, 394Property loss involved, 400Rate, 370, 372, 377, 379Region, 390Type <strong>of</strong> weapon, 390, 391VictimAge, 39 I, 392, 394Race, 393, 394Relationship to <strong>of</strong>fender, 391Sex, 392, 394Property crime, 370, 371, 378, 379, 388Cleared by arrest, 453Railroads, <strong>of</strong>fenses against, 412Defendant dispositions, 540Rape, forcible, 370, 372, 376, 377, 379-389, 400Property loss involved, 400Rate, 370, 376, 377, 379Robbery, 370, 372, 376, 378-389, 395, 398, 400Federal violations, 398Place <strong>of</strong> occurrence, 395Property loss, 400Rate, 370, 376, 377, 379Region, 395Type <strong>of</strong> target, 400Type <strong>of</strong> weapon used, 395Size <strong>of</strong> place, 3B8State, 379Uniform Crime Reports, Index <strong>of</strong>fensesDefined, Appendix 2I\l.Jmber <strong>of</strong>, 370, 372, 376, 379, 388Rate, 370, 376, 379State, 379Violent crirne, 370, 371, 377,.379Cleared by arrest, 453See also:Appendix 2, Uniform Crime ReportsArrestsPublic opinionSpecific <strong>of</strong>fenses (e.g., Assault, Motor vehicle theft)Victimization(PINION POLLSSee Public opinionPARDCNSGranted, 521See also: ClemencyPAROLEAuthoritiesAgency administering parole field services, 146Agency granting parole, 146Eligibility, 164Expenditure, 109Investigative reports, liBParoleesMovement uf, 594, 595N..mber under supervision, 593, 596Rate, 597Prediction, attitudes toward, 237Refusal based on past parole performance, attitudes toward, 261lRelease heorlngsFederal, 148, 600Petitions for Federal court review, 514Removals, 595Revocation,FederalHearings conducted, 147, I,.~Statutory provisions for eligibility, 164U.S. Parole Commission decisions, 148Workload, Federal, 118See also:Appendix 17, Parole In the United StatesClemencyCorrectionsEmploymentJuvenile correctior"PAYROLLSee Employmenti!I"iIiIj)1t L;'i1l ,IPENITENTIARYSee Appendix 19, Prisoners in Stote and Federal InstitutionsSee Corrections, institutionsSee Public opinion, IncarcerationPERSONNEL•See EmploymentPERSONS IN I'-EED a=- SUPERVISION (PINS)Confined in public and priVate juvenile facilities, 561-563Reason for referral to court, 479See also: Courts, JuvenilePETIT JURYSee JuriesSee JurorsPOCKET -PICKIN:;See Larceny-theft, victimizationPOLICESee EmploymentSee ExpendituresSee Law enforcementSee Public opinion, law enforcementSee SalariesPOONXRAPHYAttitudes towardLaws regUlating distribution, 302Pornographic materials leading to rape, 301U.S. Postal Inspection ServiceConvictions, 522, 525Investigations, 522See also: Statutory provisionsPRETRIAL RELEASESee DongerousnessPRISO\lERSFederalAdmissionsFrom court, 570, 585-51l7Average sentence length, 5B6, 5B7Jurisdiction, 570Offense, 586-588Roce, 586, 58BSentencing procedure, 587Sex, 5B6, 587Violations <strong>of</strong> parole or other conditional release, 599Air ForceAveroge population, 591ArmyAverage population, 590, 591Conditional releasees, 593, 594, 596Deaths, 570, 5B5, GO IEscapes, 570, 585ExeCUtions, 613-618Housed in local facilities, 564Marine CorpsAvr.rage population, 592Movement, 570, 585NavyAverage populatio:l, 591Petitions, 513-516, 519Population, 544, 565, 566, 570-573, 576, 5B5, 5BBAverage sentence, 5B8Jurisciction, 570-573, 576Maximum sentence length, 572, 576Offense, 581lRace, 573, 588Region, 570-573, 576Sentenced, 565, 566, 569, 570, 588Sex, 5BBRate per 100,00U civilian population, 566, 568, 569, 574, 575Jurisdiction, 568, 569, 574, 575Maximum sentence length, 575Race, 574Region, 568, 574, 575Sex, 574ReleaseesOffense, 5B9Removed from death row, 611, 612Transfers, 570, 585Type <strong>of</strong> release, 5B9, 593StateAdmissionsFrom court, 570Violations <strong>of</strong> parole or other condltlonol release, 599Alcohol use, 5BO-583Conditional releasees, 593, 594Deaths, 570, 60 IDrug use, 577-579Education, 5B4Escapes, 570EXecutions, 613, 616, 618IndexPRIS
------- ~(ffiOSECUTIQ\J (continued)U.S. Deportment <strong>of</strong> <strong>Justice</strong>Coses referred by Securities ond Exchonge Conmisslon, 527Immigration and NaturaliZation Service, 494, 495See also:Appendix I, Employment and expenditure dataCourtsEmploymentExpendituresImmigrationffiOSTITUTlQ\J />J\[) COWvIERCIAllZED VICEArrests, 415-422, 427, 430, 431, 436-445Defined by Uniform Crime Reports, Appendix 2PrisonersAdmitted to Federal institUtions, 586, 587Confined in Federal institutions, 588PSYCI-EDELI CSSee DrugsSee Narcotic drug lawsSee Prisoners, Stote, drug useSee Public opinion, drugsPlBLiC DEFEl'DERSSee Defense activities for indigent defendantsPySllC CPINIQ\JAbortionlegalization <strong>of</strong>, 240Abuse and neglect, 291AlcoholHarmfulness <strong>of</strong>, 292, 293Need for stricter drunk driving laws, 300Prohibition on use <strong>of</strong>, 294, 298, 299Capital punishment, 273, 274Reasons for favoring, 278Reasons for opposing, 278Specific <strong>of</strong>fensesAirplane hijacking, 276, 277Murder, 273-278Rape, 276, 777Treason, 276, 277CigarettesHarmfulness <strong>of</strong>, 292, 293Prohibition on use <strong>of</strong>, 294CourtsAppointing rrore judges, 259Confidence in U.S. Supreme Court, 254Judicial discretion, 259Purpose <strong>of</strong> juvenile court, 221Restrictions on police, 236Severity in dealing with criminals, 256, 258Severity in dealing with juveniles, 222Sympathy toward criminals, 232Crime problemsChanges in level, 191, 192, 229, 230Confidence in nation's progres~ in solving crime problem, 234Crime going unpunished, 233Fear <strong>of</strong> Victimization, 200-204, 206Methods <strong>of</strong> dealing with crime problem, 235, 239, 265Armed citizen street patrols, 235Personal safetyAt home at night, 194, 195Avoid teenagers on street, 220Crime-watch programs, 208, 209Protection, 210-213, 234Security personnel in pUblic schools, 207Walking alone at night, 1%, 197Walking alone" during day, 199Race, 232Spending to halt crime rate, 218Statements about crime, 231Television and fear <strong>of</strong> crime, 206Trend <strong>of</strong> crime rate, 190Trend <strong>of</strong> violent crime in neighborhood, 193Violent crime in neighborhood, 216DrugsAvailability <strong>of</strong>, 294Harmfulness <strong>of</strong>, 292, 293HeroinAvailability <strong>of</strong>, 294Harmfulness <strong>of</strong>, 292, 293Know someone who uses, 292Prohibition on use <strong>of</strong>, 294MarihuanaAvailability <strong>of</strong>, 294Harmfulness <strong>of</strong>, 292, 293legalization, 295-297Prohibition on use <strong>of</strong>, 294<strong>Sourcebook</strong> <strong>of</strong> Crimlnol <strong>Justice</strong> Stotistlcs <strong>1983</strong>PlBLiC CPII~IQ\J (continued)Drugs (continued)Prohibition on use <strong>of</strong>, 294PsychedelicsAVililability <strong>of</strong>, 294Harmfulness <strong>of</strong>, 292, 293Prohibition on Use <strong>of</strong>, 294Guns/firearmsHandgunsBanning private ownership, 265, 282Firearm in home, 279-281licensing, 288Making it illegal to Import parts, 290Mandatory prison sentence, 290Ownership, 279-28 IRegistration law, Federal, 283Regulation <strong>of</strong> manufacture/saleChange in, 289Police permit prior to purchase, 284, 286Waiting period for ownership, 286, 287IncarcerationBuilding prisons in high crime areas, 271Compensation by prisoners to Stote or Victims, 265Conjugal visitotion, 267Conversion <strong>of</strong> unused Army base3 to prisons, 272De •.:rrent effect <strong>of</strong> prison sentences, 260Juveniles, 224Objectives <strong>of</strong> imprisonment, 261-263Improvement <strong>of</strong> prisons, 265Literacy as a requirement for release, 266Need for mare prisons, 26B, 270Occupational training as a requirement for release, 267Prison industries, 266Reduction in recidivism, 2~lt 263, 264Joil sentence, 231Willingness to pay more taxes for new prisons, 269, 270Work release programs, 237Juvenile delinquencyCourts too lenient, 222Discipline as prevention, 235Employment opportunities, 226Expenditures for prevention, 228Feor <strong>of</strong> juveniles, 220Handling status <strong>of</strong>fenders, 225Statements about juvenile crime, 220, 223, 227law enforcementConfidence in police, 245, 246Contacting the police, 247, 248Deterrent effects, 245Evaluation <strong>of</strong> performance, 242, 243, 247Limiting police response to calls, 248Restrictions imposed by courts, 236Right to stop and search, 233Right to strike, 249, 250Use <strong>of</strong> physical force, 252, 253Newsir.-.ediaAttention given to crime stories, 205Fear <strong>of</strong> crime, effect on, 206TeleVision violence and crime, 238PoralePrediction <strong>of</strong> success, 237Refusal based on past porole performance, 268Pornographylaws regulating distribution, 302Pornographic materials leading to rape, 30 IPrison guardsRight to strike, 251Problems facing schoolsSecurity personnel in schools, 207Teacher safety, 206Problems facing societyNational level, 213-215Spending on problem areos, 217RapeAbortion as a result <strong>of</strong>, 240Capitol punishment for, 276, 277Pornographic materials leading to, 3U IU.S. Supreme Court, confidence in, 254Violence<strong>Criminal</strong>s mare violent today, 236Neighborhood, 216Proposals to control handguns, 283-290Television and .crime, 238Wiretapping, 24 ISee also: Appendix 7, Public opinion survey sampling proceduresPLRSE-SNA. TCHINGSee larceny-theft, victimizationRt>fr~~~~~ I ~~~4, 427, 428, 430-434, 436-445, 448, 449, 451-456, 458Age' 421-424, 430, 431, 437, 441, 445, 458Ext~nt <strong>of</strong> urbanization, 436-445Race, 431, 434, 437, 441, 445Rates, 416, 448, 449Sex 427 428, 430, 436, 440, 444Cleara~ce b'y arrest, 451-456, 458Death penalty f d th 610Movement <strong>of</strong> prisoners under sentence 0 eo ,Prisoners executed under civil authority, 615-617 h 607Prisoners received from court under sentence <strong>of</strong> de at ,Prisoners under sentence <strong>of</strong> deoth, 604Defendants, FederalDispositions, 506Sentences, 508 d' 2Defined by Uniform Crime Reports, Appen IXOffensesIn Federalknownparks,to389police,370,372,376,377,379-389, 400Percent cleared by arrest, 451, 453, 458Property loss involved, 400Rate, 370, 376, 377, 379Prisoners , , 587Admitted to Federal Institutions, 586,Confined in Federal institutions, 588Public opinionCapital punishment, 276, 2~7Pornographic materials leading to, 30 IVictimization Ap d' IIDefined by National Crime Survey, pen IXHauseholds touched by, 351-353Incidents, 335-340 14 318Nat reported to police, 307-310, 312, 3 '46 350 351Number <strong>of</strong> 307, 308, 312, 314, 318, 341-3, ,Rate, 320,' 321, 325-333, 350, 3S IReported to police, 307, 354 , ,Value <strong>of</strong> property loss from <strong>Criminal</strong> event, 346See also:ArrestsDefendantsOffenses known to policeVictimization, personalRECIDIVISM ,See Public opinion, incarcerotlon ')See Specific <strong>of</strong>fenses (e,g" Assault, Motor vehicle theftREHABILITATIQ\J PR()(RAMSDrug users in federally-funded drug abuse treatment programsAge at admission, 557, 558 '55B 560Arrests within 24 manths <strong>of</strong> first admiSSIOn to, ,Characteristics <strong>of</strong>, 560Education, 560Ethniclty, 557, 558Primary drug <strong>of</strong> abuse, 557, 559, 560Sex, 557-559 t 't 149Federal expenditures for drug abuse treatmen unl s,See also:CorrectionsDrugsJailsRELEASE WITt-OUT PROSECUTIONSee ArrestsSee CourtsSee DefendantsRESTITUTION , 65Compensation by prisoners" att!tudes, to",;,ard, 2U.S. Postal Inspection ~er':lce investigationsRecoveries and restitutiOns, 522REVOCATIONSee ParoleSee ProbationR,!~~~, 415-424, 427, 428, 430-434, 436-445, 448, 449, 451,453 458Age 421-424, 430, 431, 437, 441, 445Ext~nt <strong>of</strong> urbanization, 436-445Race, 431, 434, 437, 441, 445Rates, 416, 448, 449Sex 427, 428, 430, 436, 440, 444Cleara~ce by arrest, 451-456, 458Court cases, Federal, 494, 495~~~~~~io~61n U.S. Postal Inspection Service cases, 522, 524, 525Crime insurance, 411Death penalty , 16Prisoners executed under civil authority, 6IndexROBBERY (continued)Defendants, FederalDispositions, 506Sentences, 508Defined by Uniform Crime Reports, Appendix 2~f:~s~~r~n~~~Sto 3:~lice, 370, 372-377, 379, 389, 395, 398, 401Federal violations, 398Percent cleared by arrest, 451-456, 458Place <strong>of</strong> occurrence, 395Property loss, 400Region, 395Type <strong>of</strong> target, 400Type <strong>of</strong> weapon used, 395Prisoners " 5 6 5u7Admitted to Federal institutions, 8, 0Confined in Federal institutions, 588Victimization Ap dl IIDefined by Notional Crime Survey, pen x• Hauseholds touched by, 351-353Incidents, 335-340 318Nat reported to police, 307-310, 312, 431143'46 350 354Number <strong>of</strong>, 307, 308, 312, 314, 318, 3 - , ,Rate 320, 322, 325-333, 350, 351Repo'rted to police, 307, 354Value <strong>of</strong> property stolen, 346See also:ArrestsOffenses known to policeVictimization, personal and businessRlj-JAWAY5Arrests, 415-422, 427, 430, 431, 436-445 , 2Defined by Uniform Crime Reports, AppendiXIn Need <strong>of</strong> Supervision (PINS)SALARIESJudgesAppellate and trial courts, 95Federal, 78See also: d d't d toAppendix I, Employment an expen I ure aEmployment, payrollSEClRITIES />J\[) EXCH.
--~--~ --- ..-----~------------------------~IndexSEX a=FENSES (continued)PrisonersAdmitted to Federol institutions, 586, 587Confined In Federal Institutions, 588See also:Prostitution and commercialized viceRope, forcibleSH:PLlFTIN:;See larceny-theftSPOJSE ABUSESee Abuse and neglectSee Murder and nonnegligent manslaughter, victim relationship to<strong>of</strong>fenderSee Public opinion, abuseSTATUS a=FENDERSSee Persons In Need <strong>of</strong> Supervision (PINS)See Courts, JuvenileSee Juvenile correctionsSTATUTffiY PROVISI()\5Abortion, attitudes toward legalization, 240<strong>Criminal</strong> history information, privacy and security <strong>of</strong>, 172Driving while Intoxicated, 178-182Gun control, 174, 175Attitudes toward, 283-290JuvenilesWaiver to criminal court, 150, 153MarihuanoDecriminaliZation, 187Penalties, 187Public opinion, 295, 296Parole eligibility, 164Pornography distribution, attitudes toward regulations, 284Privacy, area protected, 171Public intoxicationDecriminalization, 177SentencingEnhancements, 156Reduction, 164STOLEN PRCFERTY (buying, receiving, possessing)Arrests, 415-422, 427, 430, 431, 436-445Defined by Uniform Crime Reports, Appendix 2See also:Burglarylarceny-the.'tSeizuresSUICIDESee DeathsSLPERVISIQ\ISee ParoleSee ProbationSUSPICIQ\IArrests, 415-422, 427, 430, 431, 436-445Defined by Uniform Crime Reports, Appendix 2TERRffilSMInternational incidents involving U.S. citizens or propertyType <strong>of</strong> incident, 409See also:Offenses known to police, bombingsOffenses known to police, hijackingsTIME SERVEDSee Federal <strong>of</strong>fendersSee Prisoners, releaseesTRAFFIC VIOLATI()\5Court casesFederal, 494, 495Defendants, FederalDispositions, 506Sentences, 50BSee also:Public opinion, alcoholTRANSFERSSee PrisonersTRIALSU.S. Attorneys' <strong>of</strong>fices, civil and criminal, 490See also:CourtsJuriesJurorsSpecific <strong>of</strong>fenses (e.g., Assault, Motor vehicle theft)U'IIFCRM CRIME REPffiTS, II\OEX (ffENSESArrests, 415-425, 427-445Arrest rates, 416, 448-450Defined by Uniform Crime Reports, Appendix 2Offenses cleared by arrest, 451-460Offenses known to police, 370-397, 399, 400, 451, 453, 458<strong>Sourcebook</strong> <strong>of</strong> <strong>Criminal</strong> <strong>Justice</strong> <strong>Statistics</strong> <strong>1983</strong>WIFCRM CRIME REPffiTS, IN:'lEX CffENSES (continued)See "I~o:ArsonAssaultBurglarylarceny-theftMotor vehicle theftMurder and nonnegligent manslaughterRope, forcibleRobberyWIFCRM PAROLE REPffiTSSee Appendix 17, Parole In the Lhlted StatesSee ParoleSee Specific <strong>of</strong>fenses (e.g., Assault, Motor vehicle theft)UNREPORTED CRIMESSee VictimizationU\ISOlVED CRIMESSee Arrests, clearance <strong>of</strong> <strong>of</strong>fenses by arrestU.S. AIR FffiCESee Courts-MartialU.S. ARMYSee Courts-MartialSee PrisonersU.S. BLREAU a=- ALCQ-()L, TOBACCO AN) FIREARMSExplosives Incidents, 408OJtcome, 409U.S. COAST GUARDSeizures and arrests, 469See also: Courts-MartialU.S. CUSTOMS SERVICEDrug seizures, 466Property seizures, 469U.S. DISTRICT Ca..RTSSee Courts, FederalU.S. MARIf\E CCR'SSee Courts-MartialSee PrisonersU.S. NAVYSee Courts-MartialSee Prisonersu.s. POSTAL INSPECTIQ\I SERVICEComplaints and investigations, 522-525ConvictionsMoll fraud, 522, 524Pornography, 525Recoveries and restitutions, 522U.S. SECRET SERVICECounterfeit currency seized, 470Dispositions <strong>of</strong> arrests, 532Forgery cases, 530Investigations, 530U.S. SLPREME Ca..RTCasesArgued and decided on merits, 520Filed, disposed <strong>of</strong>, and pending, 518Method <strong>of</strong> filing, 518Nature <strong>of</strong> proceedings, 518Writs <strong>of</strong> certiorariCircuit, 519Nature <strong>of</strong> proceedings, 519Petitions for review flied, disposed <strong>of</strong>, and pending, 519Public opinionConfidence in, 254See also:Appeals, FederalCourts, FederalVAr:R/J.NCYArrests, 1115-422, 427, 430, 431, 436-445Defined by lXliform Crime Reports, Appendix 2VI>NJAlISMArrests, 415-422, 427, 430, 431, 436-445, 47'LDefined by lXllform Crime Reports, Appendix 2Offenses against railroads, 412Arrests, 472Dispositions, 540Victimization, 352, 357VEHI CLE TI-EFTSee Motor vehicle theftSee Offenses known to policeVICTIM CONPENSATIQ\ISee CompensationVICTIMiZATIQ\IChange In rates <strong>of</strong> victimizationI-busehold <strong>of</strong>fenses, 350, 351Personal <strong>of</strong>fenses, 350, 351Crime reporting, 354VICTIMIZA T1Q\1 (continued)Estimated number <strong>of</strong> IncidentsHousehold IncidentsTime <strong>of</strong> occurrence, 335Personal Incidentslone <strong>of</strong>fenderPerceived age, 339Perceived race, 340Percent with weapon, 339, 340Multiple <strong>of</strong>fendersPerceived ages, 339Perceived races, 340Percent with weapon, 339, 340NJrnber cf Victims, 336Place <strong>of</strong> occurrence, 336Type <strong>of</strong> weapon, 338Estimated nUmber <strong>of</strong> victimizationsBusiness victimizationsi'bt reported to police, 308Household Victimizations, 307, 308, 316, 346, 350, 352, 354Family income, 316f\bt reported to police, 307, 308, 311, 316, 318Reason given for not reporting, 318Race <strong>of</strong> head <strong>of</strong> household, 316Reported to police, 307Value <strong>of</strong> stolen property, 346Personal victimizations, 307-314, 341-346, 350, 352, 354lone <strong>of</strong>fender, 343Perceived age, 343Perceived race, 3/14Multiple <strong>of</strong>fenders, 343Perceived ages, 344Perceived races, 345f\bt reported to police, 307-310, 312, 314, 318Reason given for not reporting, 318Relationship <strong>of</strong> <strong>of</strong>fender to victim, 341Reported to police, 307Use <strong>of</strong> self-protective measures by Victim, 345Use <strong>of</strong> weapon by <strong>of</strong>fender, 345Value <strong>of</strong> stolen property, 346Victim characteristicsAge, 312, 314Race, 314, 341Sex, 312, 341Estimated rate <strong>of</strong> victimiZationI-busehold victimization, 320, 324-329, 346-351Age <strong>of</strong> head <strong>of</strong> househOld, 347Burglary, 32/1Extent ot' urbanization, 320Family In':Ome, 348Motor vehlcllil the .. , 325, 349Characl.::rlatlcs <strong>of</strong> household, 349Race <strong>of</strong> head <strong>of</strong> household, 346, 348Personal victimization, 320-323, 325-333, 350, 3S IAssault, 322Extent <strong>of</strong> urbanization, 320Family Income, 333Personal rorcenyWith contact, 323Without contact, 323VICTlMIZATIQ\I (continUed)Estimated rate <strong>of</strong> victimization (continued)Personal victimization (continued)Rope, 321Robbery, 322Victim characteristicsAge, 329-331Race, 327, 328, 331, 333Sex, 325, 326, 3311-b~lseholds touched by, 351-353Per,;;onal safety, attitudes toward, 191-195, 206, 211, 212, 216, 234, 235Protection from, methods, 207-213Teachers In pUblic schools, 206, 207, 357See also:Appendix II, National Crime SurveyCompensationOffenses known to policeVIOLENT CffENSESSee AssaultSee Murder and nonnegligent rTKInslaughterSee Offenses known to policeSee Rope, forcibleSee RabberySec VictimiZationWAIVERSee Statutory provisions, juvenilesWEAPONsSee GunsSee Offenses known to PoliceSec Public opinion, guns/firearmsSee SeizuresSee '"')ecific <strong>of</strong>fenses (e.g., Assault, Murder and nonnegligentmanslaughter)See VictimiZationIM-fITE-COLLAR CRIMESee Courts, Federal, C'lsesSee EmbezzlementWIRE ffi ffiAL COMMWICATI()\5, li'-lTERCEPTI()\5 a=Attitudes toward, 241Court-authorized orders, 482-489Arrests as a result <strong>of</strong>, 489Average cost, 487Conviction; as a result <strong>of</strong>, 489Duration and locotion, 482JUrisdiction, 485NJrnber <strong>of</strong>, 487Offense under Investigation, 485Privacy protection statutes, 171WIRETAPSSee Wire or oral communications, interceptions <strong>of</strong>WITf\ESS IMMLNITYRequests to U.S. Attorne~' General fori 481'hRIT a=- CERT IffiAR ISee U.S. Supreme Court693
Evaluation form for<strong>Sourcebook</strong> Of <strong>Criminal</strong> <strong>Justice</strong> <strong>Statistics</strong> <strong>1983</strong>b1. For exactly what purpose did you consult the Soulwer .. :lok?2. Was the <strong>Sourcebook</strong> adequate for that purpose? n quite adequate 0 adequate [J somewhat adequate [] not adequate[! quite InadequateSpecifically, what helped or hindered your achieving that purpose?3. Can you suggest data from primary sources (not found In the <strong>Sourcebook</strong>) the Inclusion <strong>of</strong> which would have helped you achieve your pur·pose? (Please give full citations.)4. Are there data from other primary sources which you would suggest Including In future <strong>Sourcebook</strong>s?5. Can you point out specific table notes which are not clear or additional terms which need to be defined?6. Are there sources <strong>of</strong> data Included In the <strong>Sourcebook</strong> which are <strong>of</strong> strong Interest to you, but <strong>of</strong> which you were not aware before con·suiting the <strong>Sourcebook</strong>? (Please specify sources.)7. To achieve your purpose, was It necessary for yo~ to consult the original source <strong>of</strong> the data? For what reason?8. In what capacity did you consult the <strong>Sourcebook</strong>? l. criminal JusticO agency employee (specify functional area) :':J researcherC student U other governmental agency employee ~.. educator [, other9. On about how many separate occasions have you consulted the <strong>Sourcebook</strong>?10. Add any additional comments you care to make.o
~- ~-..--------~---~---------\OPTIONALNameNumber and ItreetTelephone( )NCJ-91534<strong>Sourcebook</strong> <strong>1983</strong>Sept. 1984\j1INCJRS REGISTRATIONThe National <strong>Criminal</strong> <strong>Justice</strong> Reference Service (NCJRS) abstracts documents published in the criminal justice field. Persons whoare registered with the Reference Service receive announcements <strong>of</strong> documents in their stated fields <strong>of</strong> interest and order forms for freecopies <strong>of</strong> <strong>Bureau</strong> <strong>of</strong> Justic~ <strong>Statistics</strong> publications. If you are not registered with the Reference Service, and wish to be, please provideyour name and mailing address below and check the appropriate box.NameNumber and streetTelephone( )NCJ-91534Sept. 1984<strong>Sourcebook</strong> <strong>1983</strong>0 Please sond me aNCJRS registrationform.. CitySlateZIP CodgCityState(Fold here)ZIP Code0 Please send me thereports listedbelow.------U.S. DEPARTMENT OF JUSTICEBurasu <strong>of</strong> Ju!ltlcll <strong>Statistics</strong>Wanhington. D.C. 20531- - - (Fokl here) - - -PLACESTAMPHEREU.S. DEPARTMENT OF JUSTICE<strong>Bureau</strong> <strong>of</strong> <strong>Justice</strong> <strong>Statistics</strong>Welhington, D.C. 20531<strong>Bureau</strong> <strong>of</strong> <strong>Justice</strong> <strong>Statistics</strong>U.S. Department <strong>of</strong> <strong>Justice</strong>Washington, D.C. 20631User Services Department 2National <strong>Criminal</strong> <strong>Justice</strong> Reference Servics<strong>Bureau</strong> <strong>of</strong> <strong>Justice</strong> <strong>Statistics</strong>U.S. Department <strong>of</strong> <strong>Justice</strong>Box 6000Rockville, Maryland 20850(Fold here)___ (Fold hire) __ _If you wish to receive copies <strong>of</strong> any <strong>of</strong> the <strong>Bureau</strong> <strong>of</strong> <strong>Justice</strong> <strong>Statistics</strong> Reports listed on the reverseside, please list them below.)'~
~ .... --------r~-- - --<strong>Bureau</strong> <strong>of</strong> <strong>Justice</strong> <strong>Statistics</strong> repor(s(revised June <strong>1983</strong>)Single copies are available free from the National<strong>Criminal</strong> <strong>Justice</strong> Reference Service, Box 6000,Rockville, Md. 20850 (use NCJ number to order).Postage and handling is charged for multiplecopies (301/251-5595).Public-use tapes <strong>of</strong> BJS data sets and othercrimlnai justice data are available from the Criminai<strong>Justice</strong> Archive and Information Network, P.O.Box 1240, Ann Arbor, Mich. 481 06, (313n64-5199).National Crime Survey<strong>Criminal</strong> victimizat/on in the U.S.:1980-81 changes based on new estimates(BJS technical report), NCJ-87577, 3/831980 (finai report), NCJ-84015, 4/831979 (final report), NCJ-76710, 12/811973-79 trends, NCJ-77639, 4/82BJS bulletins:Hous~holds touched by crime 1982,NCJ-86671 , 6/83Violent crime by strangers, NCJ-80829, 4/82Crime and the elderly, NCJ-79614, 1/82Victims <strong>of</strong> crime, NCJ-796~5, 11/81Measuring crime, NCJ-75710, 2/81The National Crime Survey: Working papers,vol. I: Current and historical perspectives,NCJ-75374,8/82CrIme against the elderly In 26 cltlos,NCJ-76706,1/82The Hispanic victim, NCJ-89261, 11/81Issues In the measurement <strong>of</strong> crime,NCJ-74682 , 10/81<strong>Criminal</strong> vlctimlzat/on <strong>of</strong> California residents,1974-77, NCJ-70944, 6/81Restitution to vict/ms <strong>of</strong> personal and householdcrlmtls, NCJ-72770, 5/81<strong>Criminal</strong> vlctimizat/on <strong>of</strong> New York StatereSidents, 1974-77, NCJ-70944, 9/80The Ctist <strong>of</strong> negligence: Losses from preventablehousehold burglaries, NCJ-53527, 12179Rape victimization In 26 American cities,NCJ-55878, 8179<strong>Criminal</strong> victimization in urban schools,NCJ-56396, 8179CrIme against persons In urban, suburban, andrural areas, NCJ-53551, 7/79All Introduction to the National Crime Survey,NCJ-43732, 4178Local victim surveys: A review <strong>of</strong> the Issues,NCJ-39973, 8177National Prisoner <strong>Statistics</strong>BJS tJLIlletlns:Capital Punishment 1982, NCJ-89395, 7/83Pl'lsoners in 1982, NCJ-87933,4/83Prisoners in 1981, NCJ-82262, 5/82Prisoners 1925-81, NCJ-85861, 12/82Prisoners in State and Federal institutions onDecember 31 , 1981 (final report), NCJ-86485,7/83Capital punishment 1981 (final report),NCJ-86484, 5/831979 survey<strong>of</strong> Inmates <strong>of</strong> Statec<strong>of</strong>rectlonal facilitiesand 1979 census <strong>of</strong> State correctional facll/tlesCareer patterns In crime (BJS special report),NCJ-88672, 6/83BJS Bulletins:Prisoners and drugs, NCJ-87575, 3/83Prisoners and alcohol, NCJ-86223, 1/83Prisons and prisoners, NCJ-80697, 2/82Veterans In prison, NCJ-79632, 11/81Census <strong>of</strong> falls and survey <strong>of</strong> fall Inmates:Jail Inmates 1982 (BJS bulletin), NCJ-87161, 2/83Census <strong>of</strong> Jails, 1978: Data for indivlduai Jails,vols. HV, Northeast, North Central, South, West,NCJ-72279-72282,12/81Pr<strong>of</strong>ile <strong>of</strong> Jail Inmates, 1978, NCJ-65412, 2/81Census <strong>of</strong> Jails and survey <strong>of</strong> jail Inmates, 1978,preliminary report, NCJ-55172, 5179Parole and probationCharacteristics <strong>of</strong> persons entering paroleduring 1978 and 1979, NCJ-87243, 5/83Probation and parole, 1981 (BJS bulletin),NCJ-83647,8/82Characteristics <strong>of</strong> the parole population, 1978,NCJ-66479, 4/81Parole in the U.S., 1979, NCJ-69562, 3/81CourtsState court caseload statistics:1977 and 1981 (BJS special report),NCJ-87587, 2/83State court organization 1980, NCJ-76711, 7/82State court model statistical dictionary,NCJ-62320, 9/80A cross-city comparison <strong>of</strong> felony C8seprocessing, NCJ-55171, 7 n9Federal crlmlnai sentencing: Perspectives <strong>of</strong>analysis and a design for research, NCJ-33883,10178Variations In Federal criminal .entenc8s,NCJ-33884, 10178Federal sentenCing pattemf: A study <strong>of</strong>geographical Variations, NCJ-33685, 10n8Predicting sentences in Federal court.: Thefeasibility 01 a national sentencing polley,NCJ-33686, 10178State and local prosecution and civil attomllYsystems, NCJ-41334, 7/78Expenditure and employment<strong>Justice</strong> expenditure and employment in theU.S., 1979 (final report), NCJ-87242,9/83<strong>Justice</strong> expenditure and employment in theU.S., 1979: Preliminary report, NCJ-73288, 1/81Expenditure and employment data for thecriminal justice system, 1978, NCJ-66482, 7/81l'rends in expenditure and employment data forthe criminal justice system, 1971-77,NCJ-57463,1/80Privacy and securityComputer crime:Computor security techniques,NCJ-84049, 9/82Electronic funda transfer systems and crime,NCJ-83736, 9/82Legislative resource manual, NCJ-78890, 9/81Expert witness manual, NCJ-77927, 9/81<strong>Criminal</strong> justice, NCJ-61550, 12/79Privacy and security <strong>of</strong> criminal historyinformation:A guide to research and statistical use,NCJ-69790, 5/81A guide to dissemination, NCJ-4OQOO, 1/79Compendium <strong>of</strong> State legislation:NCJ-48981 , 7/781981 supplement, NCJ-79652, 3/82Crimlnaljustlco information policy:Research access to criminal <strong>Justice</strong> data,NCJ-84154, 2/83Privacy and Juvenile justice records,NCJ-84152,1/83Survey <strong>of</strong> State laws (8JS bulletin),NCJ-80836, 6/82Privacy and the private employer,NCJ-79651, 11/81General<strong>Sourcebook</strong> <strong>of</strong> criminal justice statistics, 1982,NCJ-86483, 8/83Victim and witness Dsslstance: New Statelaws and the system's response (BJSbulletin), NCJ-87934, 5/83BJS tive·year progrem plan, FY 1982-86, 7/82Violent crime In the u.S. (White House briefingbook), NCJ-79741, 6/82Federal justice stlltiStiCS (BJS bulletin),NCJ-80814,3/82Dictionary <strong>of</strong> criminal <strong>Justice</strong> data terminology:Terms and definitions proposed for interstateand nation a! data coliection and exchange, 2nded., NCJ-76939, 2/82Correctional data analysis sY!ltems,NCJ-76940,8/81Technical standards f01 machlne-re~dable datasupplied to BJS, NCJ-75318. 6/81<strong>Justice</strong> agencie, In tile U.S., 1980, NCJ-65560,1/81Indicators <strong>of</strong> crime and criminal <strong>Justice</strong>:Quantlt!ltlve studies, NCJ-62349, 1/81A style manual for machine-readable data,NCJ-82766, 9/80Myths and realities about crime,NCJ-48249,10178"'\4\..o
-~--~,..---------~ ----- -----~------------<strong>Bureau</strong> <strong>of</strong> <strong>Justice</strong> <strong>Statistics</strong> reports(revised June <strong>1983</strong>)Single copies are available free from the National<strong>Criminal</strong> <strong>Justice</strong> Reference Service, Box 6000,Rockville, Md. 20850 (use NCJ number to order).Postage and handling is charged for multiplecopies (301/251-5585).Public-use tapes <strong>of</strong> BJS data sets and othercriminal justice data are available from the <strong>Criminal</strong><strong>Justice</strong> Archive and Information Network, P.O.Box 1240, Ann Arbor, Mich. 481 06, (313/764-5199).National Crime Survey<strong>Criminal</strong> victimization in the U.S.:1980-81 changes based on new estimates(BJS technical report), NCJ-87577,3/831980 (final report), NCJ-84015, 4/831979 (final report), NCJ-76710, 12/811973-79 trends, NCJ-77639, 4/82BJS bulletins:Households touched by crime 1982,NCJ-86671, 6/83Violent crime by strangers, NCJ-80829, 4/82Crime and the elderly, NCJ-79614, 1/82Victims <strong>of</strong> crime, NCJ-79615, 11/81Measuring crime, NCJ-75710. 2/81The National Grime Survey: Working papers,vol. I: Current and historical perspectives,NCJ-75374,8/82Crime against the elderly in 26 cities,NCJ-76706, 1/82The Hispanic victim, NCJ-69261, 11/81Issues in the measurement <strong>of</strong> crime,NCJ-74682,10/81<strong>Criminal</strong> victimization <strong>of</strong> California residents,1974-77, NCJ-70944. 6/81Restitution to victims <strong>of</strong> personal and householdcrimes, NCJ-72770, 5/81<strong>Criminal</strong> victimization <strong>of</strong> New York Stateresidents, 1974-77, NCJ-70944, 9/80The cost <strong>of</strong> negligence: Losses from preventablehousehold burglaries, NCJ-53527, 12,79Rape victimization in 26 American cities,NCJ-55878. 8179<strong>Criminal</strong> victimization in urban schools,NCJ-56396, 8179Crime against persons in urban, suburban, andTural areas, NCJ-53551, 7179An introduction to the National Crime Survey,NCJ-43732, 4178Local victim surveys: A review <strong>of</strong> the issues,NCJ-39973, 8177National Prisoner <strong>Statistics</strong>8JS bulletins:Capital Punishment 1982, NCJ-89395, 7/83Prisoners in 1982, NCJ-87933, 4/83Prisoners in 1981, NCJ-82262, 5/82Priso:lers 1925-81, NCJ-85861, 12/82Prisoners in State and Federal institutions onDecember 31, 1981 (final report), NCJ-86485,7/83Capital punishment 1981 (final report),NCJ-86484, 5/831979 survey<strong>of</strong> inmates <strong>of</strong> State correctional facilitiesand 1979 census <strong>of</strong> State correctional facilitiesCareer patterns in crime (BJS special report),NCJ-88672,6/83BJS Bulletins:Prisoners and drugs, IICJ-87575, 3/83Prisoners and alcohol, NCJ-86223, 1/63Prisons and prisoners, NCJ-80697, 2/82Veterans in prison, NC,I-79632, 11/81Census <strong>of</strong> jails and surv!,y <strong>of</strong> jail inmates:Jail inmates 1982 (BJS c'llietin), NCJ-87161 ,2/83Census <strong>of</strong> jails, 1978: Da:a for individual jails,vols. HV, Northeast, Nortr, Central, South, West,NCJ-72279-72282,12/81Pr<strong>of</strong>ile <strong>of</strong> jail inmates, 19n1, NCJ-65412, 2/81Census <strong>of</strong> jails and survey c"f jail inmates, 1978,preliminary report, NCJ-55172, 5/79Parole and probationCharacteristics <strong>of</strong> persons entering paroleduring 1978 and 1979, NCJ-87243, 5/83Probation and parole, 1981 (BJS bulletin),NCJ-83647.8/82Characteristics <strong>of</strong> the parole population, 1978,NCJ-66479,4/81Parole in the U.S., 1979, NCJ·69562. 3/81CourtsState court caseload statistics:1977 and 1981 (BJS special report).NCJ-87587, 2/83State court organization 1980, NCJ-76711, 7/82State court model statistit;GI dictionary,NCJ-62320, 9/80A cross-city comparison <strong>of</strong> felony caseprocessing, I~CJ-55171, 7/79Federal criminal sentencing: Perspectives <strong>of</strong>analysis and a design for research, NCJ-33683,10178Variations in Federal criminal sentences,NCJ-33684,10178Federal sentencing patterns: A study <strong>of</strong>geographical variations. NCJ-33685, 10178Predicting sentences in Federal courts: Thefeasibility <strong>of</strong> a national sentencing policy,NCJ-33685, 10178State and local prosecution and civil attorneysystems, NCJ-41334. 7/78Expenditure and employment<strong>Justice</strong> expenditure and employment in theU.S., 1979 (final report), NCJ-87242, 9/83<strong>Justice</strong> expenditure and employment in theU.S., 1979: Preliminary report, NCJ-73288, 1/81Expenditure and employment data for thecriminal justice system, 1978, NCJ-66482, 7/81Trends in expenditure and employment data forthe criminal justice system, 1971-77,NCJ-57463,1/80Privacy and securityComputer crime:Computer security techniques,NCJ-84049, 9/82Electronic funds transfer systems and crime,NCJ-83736, 9/82Le9islative resource manual, NCJ-78890, 9/81Expert witness manual, NCJ-77927, 9/81<strong>Criminal</strong> justice, NCJ·61550, 12/79Privacy and security <strong>of</strong> criminal historyinformation:A guide to research and statistical use,NCJ-69790, 5/81A guide to dissemination, NCJ-4OQOO, 1/7'9Compendium <strong>of</strong> State legislation:NCJ-48981, 7/781981 supplement, NCJ-79652, 3/82<strong>Criminal</strong> justice information policy:Research access to criminal justice data,NCJ-84154, 2/83Privacy and juvenile justice records,NCJ-84152, 1/83Survey <strong>of</strong> State laws (BJS bulle'in).NCJ-80836, 6/82Privacy and the private employer,NCJ-79651. 11/81General<strong>Sourcebook</strong> <strong>of</strong> criminal justice statistics, 1982,NCJ-86483. 8/83Victim and witness assistance: New Stat.alaws and the system's response (BJSbulletin), NCJ-87934, 5/83BJS five-year program plan, FY 1982-86, 7/82Violent crime in the U.S. (White House briefingbook). NCJ-79741, 6/82Federal justice statistics (BJS bulletin),NCJ-80814,3/82Dictionary <strong>of</strong> criminal justice data terminology:Terms and definitions proposed for interstateand national data collection and exchange, 2nded., NCJ-76939, 2/82Correctional data analysis systems,NCJ-76940,8/81Technical standards for machine-readable datasupplied to BJS, NCJ-75318. 6/81<strong>Justice</strong> agencies in the U.S., 1900., NCJ-65560.1/81Indicators <strong>of</strong> crime and criminal justice:Quantitative studies. NCJ-62349. 1/81A style manual for machine-readable data,NCJ-62766, 9/80Myths and realities about crime,NCJ-46249. 10178I!'Ii!!!,;II !, \: iIiIII,II~I ,'.'"" w4\..o
-.'>(':;'~."'\-IIIi· "IfJ./II11IIII/1, u ,IIIIIfII!II,I/iI)I iIIf'"11J III,/ .I!II1f'I!Lri


