L - Alaska Energy Data Inventory
L - Alaska Energy Data Inventory
L - Alaska Energy Data Inventory
- No tags were found...

Create successful ePaper yourself
Turn your PDF publications into a flip-book with our unique Google optimized e-Paper software.
Southcentral Railbelt Area, <strong>Alaska</strong>Upper Susitna River Basin ~--;:: ~ut¢ "5 PPLEMENTAL FEASIBILITY REP RTYDROELECTRIC POWERand related purposesU.S. Department of the Army<strong>Alaska</strong> DistrictCorps of EngineersAppendixPart 1Anchorage, <strong>Alaska</strong>1979
T'\---SOUTHCENTRAL RAILBELT AREA. ALASKAUPPER SUSITNA RIVER BASINSUPPLEMENTAL FEASIBILITY REPORTAPPENDIX - PART ISection A - HydrologySection B - Project Description and Cost EstimatesSection C - Power Studies and EconomicsSection D - Foundations and MaterialsSection E - Environmental AssessmentSection F - Recreational AssessmentLr~.~r~e~~,ed With. . .R.L.l.S.ALASKA.u.s. D ''_.It£ -... tRYFebruary 1979
SECTION AHYDROLOGYThe 1976 Interim Feasibility Study was based on25 years of historical streamflow records. <strong>Data</strong>through 1977 has been added, extending the periodof historical streamflow to 28 years. The annualrunoff for the additional 3-year period was 96percent of the long-term average.Power capabilities of the hydroelectric projectswere reevaluated on the basis of the extendedperiod of record. The results of this analysisappear in Section C, Power Studies and Economics.
SECTION BPROJECT DESCRIPTION AND COST ESTIMATESTABLE OF CONTENTSItemSUMMARY OF CHANGESGeneral~JatanaDevil CanyonWATANADamSpillwayOutlet WorksDiversion Features and OperationPenstocks and WaterwaysDEVIL CANYONMa i n DamSpillwayDiversion StructurePowerplantPenstocks and WaterwaysCONSTRUCTION SCHEDULEGeneralDiversion PlansMa in DamsPower-on-LineTransmission LineCOST ESTIMATESDetailed Cost EstimatesCont -j ngenc i esWatanaDevil CanyonPageB-1B-1B-18-2B-3B-3B-3B-48-4B-4B-5B-5B-5B-5B-6B-6B-7B-7B-7B-7B-7B-8B-9B-9B-10B-10B-llLIST OF TABLESNumber Title PageB-1 Detailed Cost Estimate - Watana (First added) B-13B-2 Detailed Cost Estimate Devil Canyon Concrete Gravity(Second added) B-23i
NumberLIST OF PLATESTitle8-1 Selected Two-Dam Plan - General Plan8-2 Watana Dam - Detail Plan8-3 Watana Dam - Sections8-4 Watana Dam - Profiles8-5 Watana Dam - Profiles, Sections, and Details8-6 Watana Dam - DetailsB-7 Devil Canyon Dam - Concrete Gravity Dam - Detail Plan8-8 Devil Canyon Dam - Concrete Gravity Dam - Elevationand Sections8-1 Construction ScheduleLIST OF FIGURESi i
SUMMARY OF CHANGESGENERALField surveys during 1978 revealed that topography for Watana damshown in the 1976 Interim Feasibility Report was 15 feet higher thanactual conditions. <strong>Data</strong> in this report has base elevations correctedto the 1978 topography. Only plates or text revised for this submittalwill reflect the new elevations which are 15 feet lower. The top ofdam is now shown at elevation 2,195 feet and normal pool at elevation2,185 feet.Quantities and cost estimates have been revised and updated toOctober 1978 levels. The cost for Watana dam and reservoir (first-added)is $1,765,000,000 versus $1,088,000,000 in the 1976 report. The costfor Devil Canyon dam and reservoir (second-added) is $823,000,000(concrete gravity) and $665,000,000 (concrete arch) versus $432,000,000(concrete arch) in the 1976 report.A construction schedule reanalysis resulted in the extension of theconstruction period from 10 to 14 years. Initial power-on-line isanticipated in 1994.WATANAThe main dam cross section was revised to best utilize materials asdetermined in 1978 field investigationso A grouting gallery was addedunder a portion of the dam.The spillway was moved laterally and revised to take better advantageof rocklines and to discharge directly into Tsusena Creek at stream1 evel .The outlet works were revised to improve hydraulic layout andaccess into the intake structures.The diversion tunnel portals were relocated in better rock basedupon information obtained from the exploration program.The power intake selective withdrawal system was revised to be morecomparable with those currently in use at other projects.Rock excavationtinuous cut slope.should be terraced.are compatible withquantities in the 1976 report were based on a conFoundation explorations concluded that the rock cuts<strong>Data</strong> in this report is based upon rock cuts thatthis latest field information.B-1
As a result of new and more accurate topography, the length of thedam has changed; therefore, total embankment quantities have increased.DEVIL CANYONA gravity dam was evaluated and is presented with an overdam spillway,and the diversion structure modified to be more compatible with agravity structure.Elevator access was provided to the powerplant instead of a roadaccess tunnel.The power intake selective withdrawal system was revised to bemore comparable with those currently in use at other projects.The general plan showing the locations of the two dams is on PlateB-1.8-2
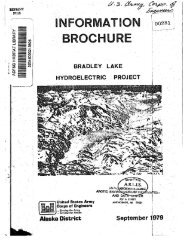
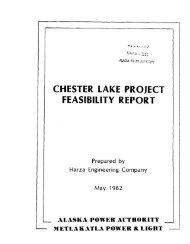
WATANADAMThe crest length of the dam has changed from 3,450 feet to 3,765feet, based upon new topography.As a result of explorations in the river bottom, the foundationexcavation has been revised. The river alluvium will be removed tobedrock under the cam. A grout gallery, excavated into rock, has beenadded to insure adequate treatment of the permanently frozen bedrock.The 1976 Interim Feasibility Report presented an earthfill damutilizing local gravel deposits for shell material. Explorations haverevealed that there are insufficient gravel deposits within economichaul distances. Since a large amount of sound rock will be generatedfrom spillway excavation and an excellent quarry source is availableimmediately adjacent to the damsite, the design has been revised tosubstitute rockfill for gravel in the upstream and downstream shells.Field explorations revealed an abundance of glacial till in the areasuitable for use as core material. For this reason, a semiperviouszone has been added to use the less expensive glacial material ratherthan quarried rock. The filters have also been revised to take advantageof adequate quantities of gravelly sand and the readily availablerock quarry (see Plate B-3). The gravelly sand from Borrow Pit E, nearthe mouth of Tsusena Creek, will be used for the fine filter, and rockfill,in the smaller sizes from the quarry, will be used for the coarsefilter. Details of the revisions are discussed in Appendix D, Foundationsand Materials.SPILLWAYThe saddle spillway centerline has been moved approximately 800feet southwest (see Plates B-2 and B-5). The foundation explorationsmore definitely located top of rock in this area; therefore, the spillwaywas relocated to insure construction in rock. Crest gate widthswere reduced from 59 feet to 55 feet after additional hydraulic calculations.The concrete lined downstream channel section was lengthenedfrom 150 feet to 800 feet to protect against rock plucking caused byhigh water velocities. The length of channel divergence was revisedfrom 930 feet downstream of the crest to 1,360 feet to improve hydraulics.The spillway channel slope was revised, requiring excavation its fulllength, so that it emerges at the Tsusena Creek level to reduce environmentaldamage expected from the 400-foot vertical water drop over naturalterrain with the original spillway design. This substantially increasesexcavation; however, almost all of the material will be used in the damembankment.B-3
OUTLET WORKSThe intake structures were moved, shifting the high level intakestructure away from the dam embankment, realining both intake tunnelsto improve connections to the diversion tunnels and changing the accessshafts from within the embankment to tunnels through the right abutmentrock upstream of the dam (see Plates 8-4 and 8-6). This improves access,eliminates problems associated with a structural shaft in the embankment,and reduces susceptibility to damage from seismic events. The high levelintake invert was raised to restrict operating heads on gates to under250 feet.DIVERSION FEATURES AND OPERATIONThe two diversion tunnels were lengthened, both upstream and downstream,to locate the portals in better rock as a result of explorationdata obtained in 1978. The roller gates for controlling the diversiontunnels have been deleted because stream regulation is not requiredduring diversion. Wheeled bulkhead gates will be used to close onetunnel at a time during periods that closures are required. The diversiontunnel inverts have been raised to reduce cofferdamming anddewatering requirements at tunnel portals. Cofferdam height willremain unchanged since there is outlet control of diversion tunnelflows up to cofferdam design flood. The scheme of tunnel pluggingand water control during pool filling has not changed. See Plate 8-6for plug and fill valve details.PENSTOCKS AND WATERWAYSThe selective withdrawal system, designed to select water at elevationswithin the reservoir which will allow meeting downstream water qualityrequirements, has been revised to be more comparable with those currentlyin use on other projects. This revision requires a larger concretestructure on the upstream face of the dam to accommodate the gates,trashracks, bulkheads, and operating equipment.8-4
POWERPLANTThe access tun~el to the powerplant has been replaced with a housedvertical entrance shaft and elevator. This shaft will be 20 feet by 30feet wide by 548 feet deep and will house an elevator capable of liftingthe largest items required in the powerhouse. The l85-foot long accesstunnel will connect the access shaft to the powerplant. The elevatorwill provide equipment, personnel, and vehicular access to the powerplantlevel at elevation 907 feet.PENSTOCKS AND WATERWAYSThe selective withdrawal system has been revised to be more comparablewith those currently in use at other projects. The system hasbeen designed to select water at elevations within the reservoir whichwill allow meeting downstream water quality requirements. This revisionrequired a larger concrete structure on the upstream face of the damto accommodate the gates, trashrack, bulkheads, and operating equipment.B-6
Congessional construction authorization from July 1980 to October 1984and the reanalyzed construction schedule. The construction schedulein the 1976 report was based on an authorization for construction, whilethe Chief of Engineer's Report recommended authorization for Phase IAE&D. This recommendation incorporated 4 years for study prior toseeking construction authorization.TRANSMISSION LINETransmission line construction is scheduled to be completed in 1991,making it available to tie the Anchorage and Fairbanks areas togetherin advance of Watana power-on-line.8-8
COST ESTIMATESDETAILED COST ESTIMATESTables B-1 and B-2 present the cost estimates for Watana and DevilCanyon.The estimates are presented in as much detail as possible based onthe concept drawings. Unit cost for a major items also includes minoritems that will appear as bid items as the design progresses.Extensive use has been made of bid abstracts from similar projectsconstructed in the western United States and Canada. All abstractedcosts have been escalated to the October 1978 level and an additionalfactor applied to reflect the higher cost of construction in <strong>Alaska</strong>.The <strong>Alaska</strong> Power Administration (APA) prepared the transmissionline cost estimate and have updated the estimate to the October 1978level. The transmission line cost estimate includes all structures,equipment and transformers for the switchyards and substations forWatana, Devil Canyon, Fairbanks, and Anchorage. The transmission linecost is shown in Table B-1, Watana.The transformers 1 isted under "Switchyard" in Tables B-1 and B-2are located in an underground transformer chamber adjacent to the powerhouse.The cables listed connect the transformers to potheads locatedin the switchyard.The APA estimate did not include earthwork for the switchyards.This cost is shown under "Switchyard" "in Tables B-1 and B-2.The following lists the estimated January 1975 cost and the October1978 cost.WatanaDevi 1 CanyonThin Arch DamConcrete Gravity DamJan 1975($1 ,000)$1,088,000432,000Oct 1978($1,000)$1,765,000665,000823,000The project cost used in the economic analysis includes Watana andthe concrete gravity dam plan at Devil Canyon. The total cost is$2,588,000,000.B-9
CONTI NGENC I ESWatana DamThe total estimated contingencies for Watana dam are $245,917,000,or 18 percent of the estimated Watana construction cost. The main dam,the largest single feature of Watana project, has a contingency of 15percent, or $58,178,000. This is a relatively uncomplicated earth androckfi11 structure. The 1978 exploration program established foundationconditions and sources of suitable embankment materials in sufficientquantities to construct the dam. The overburden is minimal andfoundation rock exposed over much of the site. Radical changes infoundation conditions and borrow sources are not anticipated.The design approach for the spillway is conservative for a relativelyuncomplicated structure. Fifteen percent contingencies, or$20,528,000, were estimated.The outlet works estimate includes 20 percent contingencies, or$7,016,000. The estimate includes 100 percent lining of the diversionand outlet tunnels. If rock quality is good, some of the lining maybe deleted.The power intake works estimate includes 20 percent contingencies,or $40,772,000.The powerhouse estimate includes 20 percent contingencies or$13,294,000. The underground powerhouse interior feature requirementsare known from comparison with other projects and a careful review ofthis item.Turbines, generators, accessory electrical equipment, and miscellaneouspowerplant equipment are estimated with 15 percent contingencies.These are known features with quantities and basic costs furnished byexperienced powerhouse design personnel.The tailrace tunnels are assumed to be 100 percent concrete lined.If the rock quality is 900d, some of these lining requirements may bedeleted. Contingencies for this feature are 15 percent.Twenty percent contingencies were used for transmission facilities.The transmission system estimate was prepared by the <strong>Alaska</strong> PowerAdministration with consultation with Bonneville Power Administration.Contingencies of 20 percent were used for roads and bridges.Assumptions on foundations assume extensive tundra removal and replacementwith nonfrost susceptable fill which requires large borrow quantitiesfor replacement.B-10
The construction facility requirements have been reviewed and comparedwith facilities required for similar structures on similar projectssuch as Dworshak, Mica and Oroville. The Trans <strong>Alaska</strong> Oil Pipelineconstruction camp experience was also reviewed. Diversion tunnels areassumed to be fully lined and rock support assumptions during tunnelinghave been conservative. Careful analyses of means of diversion andprocedures have been made. Contingencies for construction facilitiesare 20 percent.Devil Canyon DamThe total contingencies used for the Devil Ca~yon gravity damestimate are $120,551,000, or 20 percent of the Devil Canyon constructioncosts. Contingencies for all features are the same percentages as forWatana dam for the same reasons, except that contingencies for the maindam, spillway, and auxiliary dam features have been increased to 20percent.Twenty percent contingencies were used for the main dam. Assumptionson foundation excavation and preparation for a gravity dam areconservative. Both abutments are exposed rock. The concrete gravitystructure is relatively simple with known features. Aggregate locationsand quantities available have been established.The auxiliary earthfill and concrete dam was estimated at 20 percentcontingencies. The borrow source is known, partially explored,and quantities determined. This is a simple, uncomplicated structure.Foundation excavation and preparation assumptions are conservative.The total contingencies for the thin arch dam alternate are$103,756,000 or 21.2 percent of the updated total estimated constructioncost of $665,000,000.In general, the contingencies used for this project are based onintensive study and comparison with cost histories and experience withother projects.The Office of Management and Budget (OMB) has questioned the contingenciesused based on a 36 percent overrun on the Snettisham project.The project cost estimate for the Snettisham project was $41,500,000 forfiscal year 1967. the first year of construction. This estimate includedthe Long Lake phase of project development, camp facilities, the transmissionsystem, and related features. The Crater Lake phase of projectdevelopment was added in fiscal year 1973, but design and constructionwere subsequently deferred.B-11
The estimate submitted to Congress for fiscal year 1976 was$98,540,000, of which $22,132,000 was a price level adjustment, reflectinga 35 percent cost overrun; however, with deferment of the CraterLake phase, total expenditures through fiscal year 1978 are $81,386,975,an actual cost overrun of $17,754,975, or 22 percent. This cost overrunincludes the temporary repair and subsequent permanent relocation of afailed portion of the transmission line. Environmental considerationsdictated its original location in an area of unanticipated and unknownextreme winds and ice conditions not previously encountered on any transmissionline in North America. The increased cost for the transmissionline temporary repairs and permanent relocation was $9,976,000 of theoverrun, reducing the remainder of the overrun to $7,778,985 or 10 percent.This information is reflected in the General Accounting OfficeReport to Congress on Financial Status of Major Civil Acquisitions -December 31, 1975, dated 24 February 1975.B-12
TABLE B-1--DETAILED COST ESTIMATEWATANA DAM AND RESERVOIR ELEVATION 2185OCTOBER 1978 PRICE LEVEL(FIRST -ADDEO)CostAccount Unit TotalNumber Description or Item Unit Quant Cost Cost($) ($1,000)01 LANDS AND DAMAGESReservoirPublic domc.in AC 2,560 195.00 500Private land AC 99,170 186.00 18,446Site und other AC 1,080 185.00 200Access road AC 780 186.00 "145Transmission facilities AC 3,965 965.00 3,826Recreation AC 90 222.00 20Mining claims EA 4 8,000.00 32.Subtotal 23,169Contingencies 20% 4,634Government administrative costs. 880TOTAL LANDS AND DAr~AGES (28,683)Construction cost 28,000Economic cost ( 500)03 RESERVOIRMob and Prep LS 1 204. Clearing AG- 5,100 800.00 4,080Contingencie's 20% 857TOTAL, RESERVOIR 5,00004 DAMS04.1 MAIN DAMExcavation commonLeft abutment CY 1,466,000 5.00 7,330Right abutment CY 1.292.000 5.00 6,460River channel CY 1,547,000 5.00 7,735Rock ExcavationLeft abutment CY 616,000 18.00 11 ,088Right abutment CY 428,000 18.00 7,704River channel CY 198,000 18.00 3,564Drainage system LF 135, 000 35.00 4,725Foundation preparation . SY 114,000 35.00 3,990Drilling-grouting LF 145,000 50.00 7,250Care of water andpumping LS 1 2,000Mobilization and Prepatorywork LS 1 19,000Instrumentation LS 1 960Clearing grubbing AC 111 3,500.00 389B-13
TABLE B-l--U~TAIL~OCUST ESTIMATE--ContinuedWATANA DM1 Arm RESERVOI RCostAccountNumber Descript: .. o.~ Item Unit04 DAMS04.1 MAIN DAM (Cont'd)Embankmer::Semi Pen'i ousFrom stockpileCyFrom req. excavation cvImperviousFrom req. excavation cvFrom bOI'TOWCVRockFrom abutmentsriReq .1:excavCiti onCYSttickpi 1eCYFrom Spillway Req. exca.CYFrom roads (stocKpile) CVFrom grout ga 11 er'Y , CVFrom stockpile misc. CVFrom borrowCVFilters from borrow CVRiprapCVGrout galleryExcavationCVConcrete (roof-sides), CVCementCwtReinforcementLBConcrete floor steps,landings, etcCVVentilati8nAccess tun~el fromPowerhouseExcavation rockCYCor.creteCVCementCwtResteelLB04.2SubtotalContingencies 15%TOTAL, Mi\ I N DAJvlSPILLWAYCleari~g& strippingFoundation pl'ep.ExcavdiocComnOI)ACSVCyQuant1.335,0004,743,OGO3,342,0004,031,0001,123 JJOO420,000'13,693,0002,348,00036,000800,00017,876,0007,822,000223,00026,70019,00087,0006,793,0002,75010,7686,52826,1092,164,000UnitCost($)3.501.00l. 004.00.753.25.753.25.753.259.008.0022.0075.00375.008.00.55500.00190.00600.008.00.55158 2,500.0033~700 50.0010,568,000 2.00TotalCost($1,000)4,6734,7433,34216,1248421 ,36510,2707,631272,600160,884·65,5764,9062,0037,1256963,7361,3753752,0463,9172091 ,190387,85058,178446,0003951,68521 ,136
CostAccountNumber0404.2"II\I\L[ L;- 1--UI_lI\I LLU CU',I LJI1I'1/\ IT- -CUll L i 111WU\'JATANA D/\i-l flrW RESERVOIROescri ption or Itclli Unit QuantDAMSSPILLWJ\yRock CY 10,533,000ConcreteMassCY16,9CJUStructurc.lCY 9,750LiningCY 15,600CementCwt 82,500Rei nforcementLb 1, 23,000Drill & grout foranchorsLF 17,200Tainter gates 1200000#gate hoistsEAStorlogs (400000#) LSSpillway bridges( 55 I L by 26 I W) (3EA) LSDrainageLSMob-PrepLSSubtotalContingencies 15%TOTAL, SPILLWAYUnitCost($ )8.00100.00500.00450.008.00.5520.003 1,250,000.001111TotalCost($1 ,000)84,2641 ,6904,8757,0201 ,4606183443,7506005002,0006,517136,85420,52815/,OOD04.3 OUTLET WORKSExcavationCommonRockTunnel 25 045° slopeVerticalHorizontalConcreteLining45° slopeRebarVert"j ca 1RebarHorizontalRebarStructuralRebarRockboltsIn vertical faceDrill & grout bolts(92,200 LB)CYCYCYCYCYCYU3CYLBCYLI3CYLBLF35,700115,40029,4001 ,8804,2506,000322,00035014,100B2033,1009,600900,00021 ,40015.0050.00190.00140.00125.00600.00.55500.00.55. 300.00.55600.00.5520.005365,7705,5862635313,6001771758246185,7604954288-15
T/\I~I.r1\- 1 - -Ill T/\I LrIJ COS I Isr Ir~/\lf· --ConI. i n\J('dWATANA DAM ANU RESERVOIRCostt\ccoun tUnit TotalNumber Description or Item Unit Quant Cost Cost(S)(Sl,OOO)04 DAMS04.3 OUTLET WORKS45° Slope LF 4,800 20.00 96Horizontal LF 4,400 20.00 88Tainter gates (4) LB 496,000 3.00 1 ,488Slide gates (4) LB 2,200,000 3.00 6,600Trashracks (2) LB 64,800 2.00 130Cement Cwt 110,700 8.00 886Elevators (50-ton) LS 2 250,000.00 500Mob and Prep work LS 1 1 ,700Subtotal 35,081Contingencies 20% 7,016TOTAL, OUTLET WORKS 42,00004.4 POWER INTAKE WORKSMob and Prep Work LS 9,700Intake structureExcavation (rock) CY 222,000 30.00 6,660Foundation preparation SY 3,700 50.00 185Mass concrete CY 39,500 100.00 3,950Structural concrete CY 102,900 500.00 51 ,450Cer:lent CVJt 555,600 8.00 4,445Resteel LB 9,372,000 .55 5,155Emb. meta 1 U3 35,000 4.50 158Trash rack LB 938,000 2.00 1 ,876Stairs LS 1 100Elevator LS 1 300Bu"! khead gates LB 3,860,000 2.00 7,720Stoplogs : LB 1 ,594,000 2.00 3,188El ectri ca 1 andmechanical work LS 1 2,250Truck crane LS 1 300Bridge LS 1 3,500Trash boom LS 1 425Tunnel excavation CY 95,100 175.00 16,643Concrete CY 35,200 350.00 12,320Cement Cwt 140,800 8.00 1 , 126Resteel LB 483,000 .55 266Steel 1 i ner U3 24,350,000 2.70 65,745Bor.netted ga tes EA 3 1,800,000.00 5,400Log Goom LS 1 500B- 16
1/\1 ~ LI_ 1\- 1- -IJU /\ l LI_IJ ell:) 1 L~)ll M/\ I L - -COIl L i Jlu(~dhATANA DAt1 ArW RESERVOIRCostAccount Unit Tota 1Number Description or Item Ur. it Quant Cost Cost($) ($1,000)04 [JAMS04.4 POWER INTAKE WORKS (Cont'd)Electrical andmechanical work LS 500Subtotal 203,862Contingencies 20%40,T/2TOTAL, POWEF: INTAKE l-JORKSTOTAL DAt~S24~~,OOO8:)O,UUO07 POWERPLANT07.1 pm'JERHOUSEMob and prep work LS 3,000Rock excavation, tunnels,P.H. chamber, transformerchamber, etc CY 202,000 75.00 15,150Concrete CY 57,600 500.00 28,800Cement Cwt 261 ,000 8.00 2,038Reinforcerr.ent LB 6,912,000 .55 3,802Architectural features LS 1 ,500El eva tors LS 600r~echanc i a 1 andelectrical work LS 1 5,000Structural steel U3 1,250,000 2.00 2,500Misc. ~1etalwork LB 150,000 4.50 675Draft tube bulkheadgates - guides LS 750Rock bo lts LF 8,445 . 30.00 253Steel sets LB 102,000- 2.00 204600 ton bridge crane LS 1 1,000 "30 ton bridge crane LS 1 250Airshaft (transformerchaillber) 3' DIA 880' LS 900Subtotal 66,472Contingencies 20% 13,294TOTAL, POWERHOUSE 80,000B-17
-11\/:1[: H-l--On/\IL[I) eusl L S T H~I\ T [ - -c() 1\ Lin u e dWATANA [)M~AIW R[SERVOIRCostAccount Unit Toto 1Number Description or Item Unit Quant Cost Cost(S) ($1 ,000 )07 POWERPLANT (Cont'd)07.2 TURBINES AND GENERATORSTurbines LS 1 18,900Governors LS 1 814Generators LS 1 21,600S~Jbtota 1 41,314Contingencies 15% 6,197TOTAL, TURBINES AND GENERATORS 48,00007.3 ACCESSORY ELECTRICAL EQUIPMENTAccessory ElectricalEqu-ipment LS 3,532Contingencies 15% 530TOTAL, ACCESSORY ELECTRICAL EQUIPMENT 4,00007.4 MISCELLANEOUS POWERPLANT EQUIPMENTMiscellaneous Powerp1antEquipment LS 1 ,716Contingencies 15% 257TOTAL, II1ISCELLANEOUS POWERPLANT EQUIPMENT 2,00007.5 TAILRACEMob and Prep Work LS 1 2,400Tunnel excavation CY 233,000 85.00 19,805Concrete 1in-ing CY 28,200 250.00 7,050Cement Cwt 112,800 8.00 902Reinforcement LB 5,202,000 .55 2,861Rock bolts LF 51,000 20.00 1 ,020Steel sets LB 1,115,000 1. 50 1 ,673Outlet PortalExcavation rock CY 2,500 75.00 188Concrete CY 450 500.00 225Cement Cwt 1,800 8.00 14Reinforcement LB 207,000 .55 114Stop1ogs-stee1 LB 737,100 1. 50 1 ,106Tailrace channelExcavation rock CY 176,300 50.00 8,815Concrete CY 4,425 300.00 1 ,328Cement Cwt 17,700 8.00 142Reinforcement LB 177 ,000 .55 97Anchor bars #9 LF 5,700 15.00 86B-18
1/\ I \ II ! \ - I - -Il L"I/\I L I J) C () S I I S I I M/\ 11- - C () II Lin I j(' dWA1ANA UAM A~UklS[RVOIRCostIlccountNun:berU:.: scri p t i on or [len]Un~ tQUilntUnitCost($)Tota 1Cost($1,000)0707.5POWERPLANT (Cont'd)TAILRACE (Cont'd)CofferdamLS2,000Subtota 1CClntingencies 249,£1,269,9GSTOTAL, TtULRACE60,00007.6 SWITCHVARDTransformersInsulated cablesEarthworkLSLSlS5,4342,8321,300SubtotalContingencies 20%9,5661 ,913TOTAL, SWITCHVARD11 ,00007.7 TRANSMISSION FACILITIESTransmission facilities LSContingencies 20%255,00051 ,000TOTAL, TRANSMISSION FACILITIES306,000TOTAL, POWERPLANT5n ,00008ROADS AND BRIDGESPermanent Access Road -(Highway NO.3 to OevilClearing and grubbingExcavationRockCommonEmbankmentRiprap27 mi 1 esCanyon)ACIVCVCVCVRoad surfacing (crushed) CVBridgesLSCulverts and guardrail LSPermanent Access Road - 37 miles(Devil Canyon to Watana)ClearingfiCExcavationRockCVCommonCV135200,00060,000890,0002,700216,00011195300,00090,0001,500.0020.003.003.5030.0015.001,500.0020.003.002034,0001803,115813,24015,0001 ,2502936,000270B-19
1/\lllL !\-I- -\)[1/\1 LUJ CU~);LS 11 M/\ TL - - CUll L i lIuL:dWATANA D/\M /\NU RESERVOIRCostAccount Unit TotalNumber Description or Item Ur. it Quant Cost Cost($ ) ($1,000)08 ROADS AND BRIDGES (Cont'd)Embankment CY 1,244,000 3.50 4,354Riprap CY 3,800 30.00 114Road surfacing (crushed) CY 304,000 15.00 4,5608ridges LS 1 5,000Culverts and guardrail LS 1 2,250Permanent on-site roadsPow~r plant accesstunnel LS 1 15,459Power plant access road LS 1 1 ,97lDam crest road LS 1 125Mob and prep LS 1 3,500Spillway access road LS 1 560Switchyard access road LS 1 300Road to operatingfaci 1 ity LS 300Power intake structureaccess road LS 375Airstrip access road LS 650Subtotal 73,150Contingencies 20% 14,630TOTAL, ROAD AND BRIDGES 38,00014 RECREATION FACILITIESSite DCamp units (tent camp) EA 10 3,000.00 30Vault toilets EA 2 3,000.00 6Subtotal 36Contingencies 20% 7. Tota 1 Site D 43Site ETra i 1· sys tern MI 12 15,000.00 180Contingencies 20% 36Total Site E 216TOTAL, RECREATION FACILITIES 1,00019 BUILDINGS, GROUND, AND UTILITIESLiving quarters andO&M facilities LS 1 2,500B-20
I/\[ILL 11-1--l)LII\JUjJ COSIISIJr~I\I[--C()ntinueuWATANA DM-' AIW j{[SEI{VOII{CostAccountNumberDescription or Item Unit QuantUnitCost($ )TotJlCost(S 1 ,000.'19BUILDINGS, GROUNDS, AND UTILITIES (Cont'd)Visitor facilitiesVisitor building LS 1Parking area SF 12,000Boat ramp LS 1Vault toilets EA 2Runway fac i 1 i ty LS 13.003,000.00100362006250SubtotalContingencies 20%3,192638TOTAL, BUILDINGS, GROUNDS, AND UTILITIES~,OOO20PERMANENT OPERATING EQUIPMENTOperating Equipmentand FacilitiesLSContingencies 20%2,500500TOTAL, PE~MANENTOPERATING EQUIPMENT3,00050CONSTRUCTION FACILITIESDiversion tunnelsD.S. BulkheadExcavationCommonRockTunnel 33 H.S.ConcreteL-iningRei nforcerilentStructuralReinforcementRock boltsVertical faceTunnel roofBulkheadsCelnentPluq tunnelsCa re of \va terMob and prep workLSCYCYCYCYLGCYLBLFLFLSCwtLSLSLS37,700173,600336,20058,3503,155,0009,1501,045,00024,90040,OO()1386,1"0011115.0050.0090.00275.00.55500.00.5520.0020.008.00755668,68030,25816,0461 ,73G4,5755754938009003,0941 ,3521 ,2503,500SubtotalContingencies 20%73,92414,785TOTAL, CONSTRUCTION FACILITIES
-1/\lILl lJ-l--OLTl\l LEO COS I LSI IMATI:.--Con ti nuedWATANA DAM AND RESERVOIRCostAccountNumberDescription or ItemUnitQuantUnitCost($)Tota 1Cost($1,000)TOTAL CONSTRUCTION COST1,619,000ENGINEERING AND DESIGN 4%65,000SUPERVISION AND ADMINISTRATION 5%81,000TOTAL PROJECT COSTWATANA DAM AND RESERVOIRELEVATION 2185(First-Added)1,765,0008-22
TABLE B-2--DETAILED COST ESTIMATtDEVIL CANYON DAM AND RESERVOIR, ELEVATION 1450, GRAVITY DAMOCTOBER 1978 PRICE LEVEL(SECOND-ADDED)CostAccountNumberDescription or ItemUnitQuantityUnitCost(S)TotalCost($1,000)01 LAND AND DAMAGESReservoi rPublic DomainState & Private LandMining Claim(0)14,1608Subtota °1Contingencies 20%Government Administrative Cost14, 1682,834558TOTAL, LAND AND DAMAGESConstruction CostEconomic Cost18,00018,000l8,00C03RESERVOIRlV1ob-Prep WorkClearingAC1 ,920800.00771 ,536SubtotalContingencies 20%TOTAL, RESERVOIR1 ,6133232,00004 DAt~S04. 1 t~AIN DAMExcavation RockExcavation commonExterior mass concreteInterior mass concreteStructural concrete(dam structure)Concrete (spillway)Post coolingInstrumentationPier & spillway rebarTaintor gatesBridgesPrevention or waterpollutionCYCYCYCYCYCYLSLSLbEALSLS476,40089,400256,1002,138,0008,88318,600113,255,0002120.005.0080.0075.00475.00450.00.551,500,000.009,52844720,488160,3504,2198,3708,0009001 ,7903,0007001 ,000B-23
TABLE 1)- 2--DETAI L ED COST EST H~ATE--Conti nucdD[V 1 L CI\NYOI~ DAM Ai'll) HLSUWOII{, lLLVI\TlOl'~ 145[), GHI\V ITY l)/\I~Cos tAccount Unit TotalNumber Description or Item Unit Quantity lost Cost($) ($1,000)04 DAMS04. 1 MAIN DAM (Contld)Scaling canyon walls LS 1 ,000Stop log, COlilP 1 ete LS 1 ,000Gantry crane LS 750Elevator LS 600Stairways LS 686Rock bolts LS 1,500Electrical andmechancial work LS 1 1,500Miscellaneous metalwork Lb 2,500 4.50 11Foundation treatment LF 400,000 5.56 2,224Drilling and grouting LF 70,000 50.00 3,500Drilling drainage holes LF 52,500 35.00 1 ,838Concrete for parapetand over hong CY 3,352 500.00 1 ,676Resteel Lb 4,296,115 .55 2,363Slide gates, frames,guides and operators Sets 4 1,350,000.00 5,400Chain link fence LF 1 ,845 20.00 37Resteel for sluce conduits Lb 891,560 .55 490Exploratory tunnels(excavation) CY 3,500 400.00 1 ,400Rock bolts LF 50,000 20.00 1,000Contraction joint & coolingsystem grouting LS 1 2,750Cement Cwt 7,441,000 8.00 59,528Mob and Prep LS 1 15,400Subtotal 323,445Contingencies 20% 64,689TOTAL, MAIN DAM 388,00004.4 POWER INTAKE WORKSMob and Prep LS 4,496ExcavationOpen cut CY 7,200 75.00 540Tunnels CY 34,400 175.00 6,020ConcreteMass CY 7,300 100.00 730Structural und backfill CY 10,430 500.00 5,215Cement Cwt 74,000 8.00 592Reinforcing steel Lb 2,478,000 .55 1',363Penstocks Lb 9,582,270 2.25 21,5608-24
T/\I~LEIJI:VIL CMYOI~Il-2--DUAILED COST lSTIMATE-- Cont i nucdlJ/\M /\NIJ R[S[I{VOll{, LLlVATION 1450, GI(AVIIY i)1\t~CostAccountNumberIJcscri fJtioll or I telllUnitQuantityUnitCost($ )Tota 1Cost($1 ,000)0404.4DA~1SPOWER INTA~E WORKS (Cont'd)Bonnetted gates andcontrolsStoplogs, (936000#)Trashracks (421,000# each)Intake selector gate towerExcavation rockConcrete structuralCementReinforcementSelector gates(l,500,000#)EALSEACYCYCwtLbEA4-121 , 80C , 000.001. 507,400 50.0047,100 500.00188,400 8.007,OG5,00O .554- 3,375,000.007,2001,8751 ,26337023,5501,5073,88613,500SubtotalContingencies 20%TOTAL, POWER INTAKE WORKS94,41718,883113,00004.5AUXILIARY DAM (EARTH FILL AND CONCRETE)Mob and PrepLSExcavationDam foundationCYFoundation prepareation SYDam embankmentCYDrilling and grouting LF100,0002,100835,0008,8006.0050.006.0060.003126001055,010528Subtota 1Contingencies 20%TOTAL, AUXILIARY DAM6,5551 ,3118,000TOTAL, DAMS509,00007 POWERPLANT07.1 POWERHOUSEMob and Prep worKExcavation, rockConcreteCementReinforcing steelArchitectural featuresLSCYCYCwtLbsLS1208,40022,00088,0005,400,000175.00500.008.00.552,00015,63011 ,0007042,9701 ,500B-25
TAGLE G-2--DETAILCD COST lSTIMATE--ContinuedDEVIL CANYON DAM AND RESERVOlR, ELEVATION 1450, GRAV lTY DAMCostAccount Unit Tota 1Nunlber Descri pt; on or Itelll Unit Quantity Cost Cost($ ) ($1 ,000)07 Po\~ERPLANT07.1 POWERHOUSE (Cont'd)E1evJtor LS 200Mechancia1 andelectrical work LS 1 4,812Structural steel Lb 1 ,200,000 2.25Miscellaneous metalwork Lb 150,000 4.50 675Subtotal 42,191Contingencies 20% 8,438TOTAL, POWERHOUSE 51 ,00007.2 TUR8INES AND GENERATORSTurbines LS 1 20,250Governors LS 1 1 ,053Generators LS 1 22,950Subtotal 44,253Contingencies 15% 6,638TOTAL, TUR8INES AND GENERATORS 51 ,00007.3 ACCESSORY ELECTRICAL EQUIPMENTAccessory ElectricalEquipment LS 2,512Contingencies 15% 377TOTAL, ACCESSORY ELECTRICAL EQUIPMENT 3,00007.4 MISCELLANEOUS POWERPLANT EQUIPMENTMiscellaneous Powerp1antEqu"j pment LS 1 ,798Contingencies 15% 270TOTAL, MISCELLANEOUS POWERPLANT EQUIPMENT 2,00007.5 TAILRACEMob and Prep LS 1 766Excavation tunnel CY 74,500 85.00 6,333Concrete CY 17,500 300.00 5,250Cement Cwt 70,200 8.00 562Restee1 Lb 3,029,000 .55 1 ,666Draft tube bulkh0adqJte and guides LS 700Tailrace tunnelstoplogs (370,000#) LS 1 800Subtotal 16,077Contingencies 20% 3,215TOTAL, TAILRACE 19,000B-26
TA3LE 8-2--DETAILED COST LST1MATE--ContinuedIJEV[L CI\NYON D/\M /\NO I{[:)ERVOI R, [L[VATION 1450, GRAV ITY DI\MCostAccount Unit TotalNumber Ucscription or Item Unit Quant ity Cost Cost($) ($1 ,000 )07 POWERPLANT07.6 SvJITCHYARDTransformers LS 6,545Insulated cables LS 3,312ExcavationRock CY 36,000 20.00 720Common CY 75,000 5.00 375Embankment CY 470,000 4.00 1 ,880Subtota 1 12,832Contingencies 20% 2,566TOTAL, SWITCHYARD15,00ClTOTAL, POWERPLANT 141 ,00008 ROADS AND BRIDGESMob and Prep LS 400On-site roadClearing and earthwork Mile 2.3 300,000.00 690Paving Mile 2.3 11 0 ,000. 00 253Culverts LF 850 100.00 85Powerhouse and tailraceaccess LS 6,000Road to operating fac; 1 ity Mile 2 125,000.00 250Portals EA 2 500,000.00 1, 000Subtotal 8,678Contingencies 20% 1 ,736TOTAL, ROADS AND BRIDGES 10,00014 RECREATION FACILITIESSite A(Boat access only)Goat dock EA 1 40,000.00 40Camping units EA 10 3,000.00 30Two-vault toilets EA 2 3,000.00 6Subtotal 76Contingencies 20% 15Total Site A 91Site BAccess road Mile 0.5 150,000.00 75Overnight camps EA 50 4,000.00 200B-27
TABLE B-2--DETAILEO COST lSTIMATE--ContinuedULVIL CArlYON DAM ANO RESERVOIR, ELEVATION 1450, GRAVITY ON~CostAccount Unit TotalNumber Oeseri ption or I tell! Unit Quant i ty Cost Cost($) ($1,000)14 RECREATION FACILITIESSite B (Co n tid)Comfort stations EA 2 60,000.00 120Power LS 1 40SevJage LS 1 75Subtota 1 510Contingencies 20% 102Total Site B 612Site CTrailhead picnic areaaccess road Mile .2 lSO,OOO.OO 30Picnic units w/parking EA 12 3,000.00 36Tra -j 1 sys tern Mile 30 lS.OOO.OO 4S0Two-vault toilets EA 2 3.000.00 6Subtotal 522Contingencies 20% 104Total Site C 626TOTAL, RECREATION FACILITIES 1,00019 BUILDINGS, GROUND, AND UTILITIESLiving quarters and O&Mfacilities LS 2,SOOVisitor facilitiesVisitor buildings LS 300Parking Area LS 70Boat ramp LS 220Vault toil ets EA 2 3,000.00 6Subtotal 3,496Contingencies 20% 699TOTAL, BUILDINGS, GROUNDS, AND UTILITIES4,000'20 PERMANENT OPERATING EQUIPMENTOperating Equipment andfacil ities LS 2,200Contingencies 20% 440TOTAL, PERMANENT OPERATING EQUIPMENT 3,000B-28
TABLE B-2--UETAILED COST LSTIMATE--ContinuedDEVIL C/\NYOr~D/\M /\ND RESERVO!f\, ELEVATION 1450, GR/\ V ITY [J/\MCostAccount Unit To ta 1Number Descri ption or Item Unit QUilntity Cos t Cost($ ) ($1 ,000)50 CONSTRUCTION FACILITIESMob and Prep work LS 1,885Coffer damsSheet pile Ton 1,024 1,500.00 1 ,536F.arth fill CY 38,000 15.00 570Pumping LS 1 3,500Remove Coffer dams LS 1 600Diversion workdsTunnel excavation Cy 35,700 100.00 3,570Concrete CY 9,200 300.00 2,760Cement Cwt 36,800 8.00 294Re-j nforcement Lb 1,564,000 .55 860Steel sets Lb 157,000 3.00 471Rock bolts EA 1 ,150 300.00 345Tunnel PlugConcrete CY 1,100 600.00 660Cement Cwt 4,400 8.00 35Reinforcement Lb 187,000 .55 103Diversion Intake StructureExcavation rock CY 104,000 30.00 3,120Concrete structural CY 3,800 500.00 1,900Cement Cwt 15,200 8.00 122Reinforcement Lb 380,000 .55 209~ulkhead Lb 960,000 1. 50 1,440Approach Channel LiningConcrete CY 1 ,600 300.00 480Cement Cwt 6,400 8.00 51Rei nforcement Lb 80,000 .55 44Diversion Outlet StructureExcavation Rock CY 274,000 50.00 13,700Concrete CY 1 ,100 500.00 550Cement Cwt 4,400 8.00 35Reinforcement Lb 110,000 .55 61Stoplogs Lb 100,000 1. 50 150Outlet Channel LiningConcrete CY 900 500.00 450Cement Cwt 3,600 8.00 29Reinforcement Lb 45,000 .55 25Subtota 1 39,555Contingencies 20% 7,911TOTAL, CONSTRUCTION FACILITIES 47,000B-29
T/\I\L[ 13-2--DLTA1LlD COST E.STIM/\TE--ContinuedDEVlL CANYUN DAM AND RESERVOIR, ELEVATION 1450, GRAVITY DAMCostAccountNumberDescription or ItemUnitQuantityUnitCost($ )TotalCost($1 ,OOO)TOTAL, CONSTRUCTION COST735,00030ENGINEERING AND DESIGN 7%51 ,00031SUPERVISION ANO ADMINISTRATION 5%37,000TOTAL PROJECT COSTDEVIL CANYON DAM AND RESERVOIRELEVATION 1450, GRAVITY DAM(SECOND-ADDED)823,0006-30
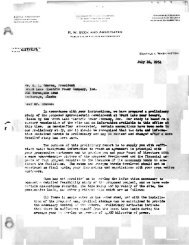
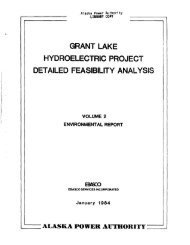
2:18!l14~ODEVIL CANYONDilioncit rtf. 10 mil .. gbo\le moulh.Ell'follonl reter 10 meon NO lev,1UPPER SUSITNA RIVER PROFILERIVER MILES 120-290\I')--""'Ft~('--1/'")LOCATION MAP~on_GOLDi. CREEK
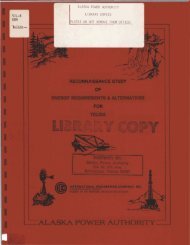
NOTES TOURS ARE BASED TUM ON ISI. DATEDTOPOGRAPHIC10 JUNEC~~78. VERTICAL DA AERIALMEAN SEATOGRAPHYPH~EVEL (M S U2,300,POWERPLANT3 UNITS2,200NORMAL POOL Elo 2195HIGH LEVEL 'OUTLETCREST 2,147:J~ 2,100t UJUJ"-i!:zo~>UJ...JUJa:is~UJ(f)UJa:2,0001,900.-,,POWER~e~~' 19~OEL. 19850~~~ETHI~~OLLEVEL- LOW lEVEL OUTLET-El. 19~O ~~ETHI~~OLLEVEL OU1,800PROJECTWATANA CAPABILITYDISCHARG~MERGENC YDURINGALL DRAWDOW~. GATEFULL OPEN100,000 120,000140,'000 160,00090'0TO~"- 210060·'0o«UJ::c 40a:o::cto..UJo10WATANADIVERSIONWORKS CtIRVES-~GALASKARAILBELT AREA, YSOUTHCENTRAL FEASIBILITY STUDSUPPLEMENTAL VER BASINUPPER SUSITNA RI MWATANA DADETAIL PLAN---45.000"'ODIN CFS"n"·0014UNEO TUNNE~ ___ 00-60.000!la,OOo &0,000 70,0ALASKADISTRICT,CORPSANCHOf'lAGE,OfALASKAFEBRUAR Y 1979ENGINEERS
,.------rr I.35' 5' 8' 12' 3' 7'II IWIDTH)TO If. DAMI i I I Ii I,_-_~COARSEFILTERELMAXIMUM POOL EL,2185ROCK FILL---~FINE FILTER- 22001.5~I- 210021[-20502,25~ICOFFERDAM -DETAIL ATYP EACH SI DEMINIMUM POWER POOL EL,1940- 2000-1900 ~::IE(COFFERDAM(SEE DETAIL A)'"12' COARSE FILTER"- ROCK FILLSEMI PERVIOUSFILL --FINEFILTER --FILTER--- ROCKEL.l55 0212' COARSE FILTER ~ COFFERDAMI (SEE DETAIL A)-1800 ~~w-1700 ~-1600-1500ROCK LINE SANDY GRAV EL -14001400 1200 1000 800 600I400200,oDISTANCE IN FEET,400I600I800I1000,1200 1400I1600I1800TYPICALSECTION2400-2300- 7 BRIDGE PIERS @ 105'c-= ,L~':~'~/'---- n-_~~~ftnnn~~ I I2000-1900-IGLACIAL TILL-~--I~~~~~~----EL, 1875DAM CREST EL 2195--STAIRWELLELEVATOR SHAFT- ---POWER INTAKE STRUCTURERETAINING WALLEXISTING GROUND--- ---'----------------------------"----\---===--::::;--..JVl::;;1800-~ 1700-w"-~z 1600-Q~:;W..J 1500-wSTRIPPED TO SURFACE OF ROCK---~--ROCK EXCAVATION BEN EATH CORE ----------~ DIVERSION TUNNEL # I,30' DIA, ( NOT TO SCALE)\)If. DIVERSION TUNNEL #2, --:L ~"'",, '''''''" """~-~ tj}-3200 3400 36001400-SOUTHCENTRAL RAILBELTAREA, ALASKASUPPLEMENTAL FEASIBILITY STUDY0200 400600800 1000,1200 1400 1600DISTANCE IN FEET1800WATANA DAM ANDINTAKE STRUCTURE LOOKING DOWNSTREAM,20002200,2400100'10,26000'.'2800100' 200', ===-1GAAPHIC SCALE I"' 10C' - O·UPPER SUSITNA RIVER BASINWATANA DAMSECTIONS.t.OSKA DISTRICT, CORPS OF ENGINEERSAHCI'1ORAGE,ALASKAFEBRUARY 1979PLATE B-3
NOTETHE HIGH AND LOW LEvEL INTAKE STRUCTURES ARE PLOTTEDAT TWICE HORMA L SCALE FOR CLARITY2200-2100- 2000!9001600EXISTINGOIVERSIO''Ij TUNNELINTAKE STRUCTURE113001500- 40015048I4644 42I40 ~8PROFILE LOW LEVEL OUTLETI30 28I26I248 DIVERSION TUNNEL"2I14Io-2200ACCESS SHAFT INWALLLEVEl.. iNTAKE STRJCTURE-2100-2000El 195019351900EXIST'NG180016001500SOUTHCENTRAL RAILBELT AREA. ALASKASUPPLEMENTAL FEASIBILITY STUDYUPPER SUSITNA RIVER BASIN52I50 4S464414240 32136 34 3228 26 2422 20 18PROFILE HIGH LEVEL OUTLET 8 DIVERSION TUNNEL "'I16 14oHOA!VERT0 258..... IGRAPHIC $C-'lE'°,00••••• 1GJIIAPHIC sc .. u:6eo1" FEET200 »0I I.- FEETWATANA DAMPROFILESALASKA DISTRICT. CORPS OF- ENGINEERSANCHORAGE, ALASKAFEBRUARY 1979PLATE B-4
STOPLOG SLOT_N0!i~~OLMAXIMUM SURCHARGEPCOL EL. 2190EL.218~~_._~_~··-CRESTEL 214t __800'CONCRETE LINED2500 ---2000/WS.EL.1633,/ TSUSENA CREEK_SLOPE.0.01SADDLE SPILLWAYDETAILNOT TO SCALE/000o ;000 2000 3000DISTANCE IN FEET4000----------~------------+5000 60007000SADDLE SPILLWAY It PROFILESCALE IN FEET~oo CJ ~ooL-,---,--.~ ___ ~1----SLOPE TO DRAIN-INVEL~5J---I__ SLOPE~C)I002 .,I\'~ CONCRETE------------...r~~'f SAODLJE S_P_IL_L_W_AY _______~p~ - ---- - SLOPE0,02 • 0.01-~ NATURAL~ ROCK-------;;:~--€ WATANA DAMLI1£5.L_~2(9~2.251'-::::::;INTAKE STRUCTUREDOWNSTREAM WALL--SADDLE SPILLWAYSECTION A-ANOT TO SCALEANDESITEAVERAGE EXISTING GROUNDTHRU PENSTOCKS ANDPOWERHOUSEIr-- f POWERHOUSEUNITSL-- { SURGE CHAMBER ANDDRAFT TUBE BULKHEAD WEL L~ - -- -?---SOUTHCENTRAL RAILBELT AREA, ALASKASUPPLEMENTAL FEASIBILITY STUDYUPPER SUSITNA RIVER BASIN/- 18' [)IA. PENSTOCKWATANA DAMSADDLE SPILLWAY AND PENSTOCKPROFILES, SECTIONS AND DETAILSALASKA DISTRICT, CORPS OF ENGINEERSPENSTOCK ~NOT TO SCALEPROFILEANCHORAGE. ALASKAFEBRUARY 1979PLATE B-5
I~. -"-\III,' ;;'\ IrAIR INJECTOR SLOT ITYP)-SI,DE SEAL PLATE ITY?)/ ,EMERGENCY GATE/, I I SLOT ITYP)/ I! Io • I.-~IDIVERSION TUNNELS #1 AND =IfPLAN 'Q) EL. 14852 INTAKE STRUCTUREHIGH AND LOW LEVEL INTAKEPLAN @ A-AI: If= ~";/l' '
\"ABA~DO!, ED,---j"AIRSTAIP(\ SWITCHYARDEL.1410=,)-,/IV ON2HIV ON 2.5H1335100' o·100'I••••• IGRAI'HIC SCALE I". 100 ·0"200'I/- 1465SOUTHCENTRAL RAILBELTAREA. ALASKASUPPLEMENTAL FEASjBILITY STUDYUPPER SUSITNA RIVER BASINDEVIL CANYON DAMCONCRETE GRAVITY DAMDETAIL PLANALASKA DISTRICT I CORPS OF ENGINEERSANCHORAGE, ALASI';AFEBRUARY 1979PLATE B-7
E;I,..I~CREST~ EI,. 14~"TOP OF DAM EL 1455---AXIS OF DAM~ AXIS OF DAMr---~--- ___ 4 .... 6,,-,7,--' __ -------1SPILLWAY SECTION100' 0'.. IGAAPI-IIC SCA.~E'00II'· 100'-0'ELEVATORTOWER\24" DIA PENSTOCK-+-~\'16" DIA.PENSTOCKSECTION THRU PENSTOCK AND POWER PLANTSCALE: I'~ 100'+ I' FINE FILTER,i I c;/ , 3' RIP RAP 2 COARSE FILTERJ.:.1\~TOP OF ROCKTYPICAL NON-OVERFLOW SECTION'0' 0' .0' 00'low wi I IGRAPHIC SCA,LE' ,', ~O'-O'MONOLITH JOINTS)FINEASSUMED EXCAVATIONI I fc'-+*-+hL-'t. INTAKE EL. 1150[Q]' [QJ~ 11m+-I /'/SLUICESFOR EMERGENCY DRAWDOWNII 5 ",----'f----:I1.5ORIGINAL GROU,ND SURFACE/26' DIA. DIVERSION __ ~~.TUNNEL~- 'LJ\\\ , /-~I"'"//DEVILCANYON AUXILIARY EARTH FILL DAM010' 0' .0' 00'W _ IIUPSTREAM ELEVATIONDEVELOPED ALONG ~ OF DAMSCALE: I" • 100'SOUTHCENTRAL RAILBELTAREA, ALASKA//26' DIA.1000,600sOOjPLUG----------.;~o:;;:::;400SECTION200~"-0E~SUPPLEMENTAL FEASIBILITY STUDYUPPER SUSITNA RIVER BASINDEVIL CANYON DAMCONCRETE GRAV ITY DAMELEVATION AND SECTIONSDIVERSON TUNNEL PROFILESCALE: 1".100'ALASKA DISTRICT, CORPS OF ENGINEERSANCHORAGE,ALASI
SECTION CPOWER STUDIES AND ECONOMICS
SECTION CPOWER STUDIES AND ECONOMICSTABLE OF CONTENTSItemSUMMARY OF CHANGESSTUDY AREA ECONOMYSummary of ChangesIntroductionHuman ResourcesEmploymentPersonal IncomeAggregate Economic PerformancePRESENT AND HISTORICAL POWER REQUIREMENTSFUTURE POWER NEEDSSummary of ChangesForecast MethodologyPopulation and Economic Activity ForecastDevelopment Assumptions, 1975-2000Development Assumptions, 2000-2025Forecast ResultsUtility SectorNational Defense SectorSelf-Supplied Industries SectorCredit for <strong>Energy</strong> and CapacityTHE SELECTED PLANPower CapabilitiesSeasonal Reservoir OperationECONOMIC ANALYSISCosts - The Base CaseHydropower BenefitsPower Values and Alternative CostsNatural Gas AlternativeOil-Fired AlternativeDerivation of Power Benefits - The Base CaseOther BenefitsRecreationFlood ControlEmploymentIntertieC-1C-2C-2C-2C-2C-3C-4C-5C-9C-11C-11C-12C-12C-13C-21C-31C-32C-33C-34C-39C-48C-48C-49C-54C-54C-54C-54C-57C-64C-65C-66C-66C-66C-66C-69i
TABLE OF CONTENTS (cont)ItemPlan Justification - Base CaseSensitivity of Project JustificationComparability TestAlternate Discount RatesVariations in the Load Forecast and Project TimingConstruction DelaysAlternate Investment Cost EstimatesOil-Fired Thermal AlternativeInflationFuel EscalationFuel Cost AssumptionsTest ResultsSummaryC-71C-73C-73C-73C-75C-76C-76C-77C-78C-80C-82C-83C-83NumberC-lC-2C-3C-4C-5C-6C-7C-8C-9C- 10C-11C-12C-13C-14C-15C-16C-17C-18C-19C-20C-21C-22C-23LIST OF TABLESTitleStudy Area Population as Percent of TotalIndustry Employment SharesTotal Personal Income in <strong>Alaska</strong><strong>Alaska</strong> Economic IndicatorsSummary of Existing Generating CapacityNear-term Planned Reso~rcesHistorical Net GenerationDevelopment AssumptionsPopulation EstimatesPer Capita Use ProjectionsSelf-Supplied Industry Sector AssumptionsTotal Power and <strong>Energy</strong> RequirementsAnchorage-Cook Inlet Area Power and <strong>Energy</strong>RequirementsFairbanks-Tanana Valley Area Power and <strong>Energy</strong>RequirementsUsable Capacity and <strong>Energy</strong>, Base CaseAt-Site Power CapabilitiesAt-Market Power CapabilityAnnual Cost ComputationsCook Inlet Natural Gas BalanceCook Inlet Natural Gas Reserves and Committments1976 <strong>Alaska</strong> Gas UseManpower ExpendituresIntertie Capacity Benefitsi iC-3C-4C-5C-7C-9C-10C-10C-22C-32C-33C-35C-36C-37C-38C-45C-48C-49C-55C-60C-62C-63C-67C-71
LIST OF TABLES (cont)NumberC-24C-25C-26C-27NumberC-lC-2C-3C-4C-5C-6C-7C-8C-9C-10C-11TitleAverage Annual CostsAverage Annual BenefitsPlan JustificationInflation Adjustment MultipliersLIST OF FIGURESTitleLoad Forecast ComparisonDevil Canyon and Watana Unit Maximum PerformancesAnnual Head-Duration Curve, Watana ReservoirLoads and ResourcesMarketable <strong>Energy</strong>Operating Levels, Watana ReservoirSpill Frequency DiagramTransmission Line Capacity CreditPlan Justification Under Alternate Discount RatesSensitivity to Inflation and Escalation - Coal-FiredAlternativeSensitivity to Inflation and Escalation - Oil-FiredAlternativeC-72C-72C-72C-79C-11C-42C-43C-46C-47C-51C-53C-70C-74C-84C-85NumberC-lC-2LIST OF PLATESTi tl eReservoir Operation and <strong>Energy</strong> Output, WatanaReservoir Operation and <strong>Energy</strong> Output, Devil CanyonNumberC-lC-2C-3C-4C-5C-6C-7EXHIBITSTitleLoad-Resource AnalysesLoad-Resource GraphsUsable Capacity SummaryPower Value CalculationsPower Benefit CalculationsInvestment Cost CalculationsCorrespondence; i i
SUMMARY OF CHANGESThis section updates benefit calculations and the determination ofthe project's economic justification presented in the 1976 InterimFeasibility Report. Economic trends and power usage continue to indicatethat significant amounts of new generation will be required inthe railbelt area of southcentral <strong>Alaska</strong>. A new load forecastingmethodology and the three additional years of historical data resultin slightly decreased peak load projections. The estimated costs ofboth the hydroelectric project and the coal-fired alternative have risensignificantly since 1975. Under the base case set of assumptions,hydroelectric development in the upper Susitna River basin continuesto appear economically justified. The 1978 updated benefit-cost ratioof the proposed development is 1.4 compared to the earlier estimateof 1.3.C-l
STUDY AREA ECONOMYSUMMARY OF CHANGESThe economic base analysis presented in the 1976 Interim FeasibilityReport was based on the market area's economic performance through 1974.Fears of a severe post-pipeline depression in <strong>Alaska</strong> have been largelydissipated by the slJstained performance of the State's economy in the2 years since the pipeline phased down in 1976. In 1977. higher productionlevels were reached in the forest products, fisheries, andagricultural industries when compared to 1976. The State's financialinstitutions reached record high levels in 1977 in deposits, loans.and total assets. In addition, more houses and commercial and industrialbuildings were constructed in 1977 than during any previous year.In fact, by excluding contract construction employment (under whichpipeline workers were classified), there appears to have been a netincrease in 1977 of 1,500 nonagricultural jobs in <strong>Alaska</strong>.INTRODUCTIONThe discussion that follows both augments and updates the economicbase analysis of the 1976 report. It is based on three primary sources.One is a detailed analysis of the southcentral <strong>Alaska</strong> economy between1965 and 1975. This work was done by the Institute of Social andEconomic Research of the University of <strong>Alaska</strong> for the SouthcentralLevel B Study. Two other reports, one by the State's Department ofCommerce and Economic Development and the other by the Department ofLabor, provide information on the performance of the economy since1975. Some of the population and income estimates through 1974 presentedhere differ from the estimates reported in the 1976 Interim FeasibilityReport. These differences result from recent efforts by the State andothers to develop a consistent data base.HUMAN RESOURCESThe rapid economic growth in the Railbelt area of <strong>Alaska</strong> and in<strong>Alaska</strong> as a whole has resulted in substantial immigration of peopleseeking jobs in the <strong>Alaska</strong>n economy. Table C-l summarizes populationgrowth in the study area and in the state as a whole.C-2
TABLE C-lSTUDY AREA POPULATION AS PERCENT OF TOTALYear Total <strong>Alaska</strong> Stud~ Area Percent of Total1960 226,167 149,186 661970 302,361 209,178 691973 330,365 234,768 711974 351,159 245,846 701975 404,634 290,522 721976 413,289 301,250 73Source:State of <strong>Alaska</strong> Department of Commerce and EconomicDevelopment, The <strong>Alaska</strong>n Econom~, Year-End PerformanceReport 1977.There are two major economic motivating factors which explain thelarge population increase. One is the fact that real incomes havebeen rising in <strong>Alaska</strong> faster than the rate in the U.S. as a whole.This is an indication that <strong>Alaska</strong> has been a region of improving economicopportunity in comparison to nationwide averages. In addition, individualssee explicit opportunities in the growth in employment. 1/The <strong>Alaska</strong> Department of Labor estimates that net migration accountedfor a 73,000 increase in resident population between 1970 and 1975,about 72 percent of the increase, while natural increase accounted foronly 29,000, or about 28 percent of the total.EMPLOYMENTEmployment shares of major industrial categories are presented inTable C-2. As can be seen, some significant changes in employmentpercentages have taken place over the past 5 years. In 1973, governmentclaimed by far the largest share (38 percent) of total employmentwith services and retail trade a distant second at 14 percent. By 1978,Government's share declined to 30 percent. Manufacturing is the onlyother sector to show a significant decline - its share drops from 8.5percent to 7 percent. Mining, construction, and services show thelargest gains.1/ Institute for Social and Economic Research, University of <strong>Alaska</strong>,Southcentral <strong>Alaska</strong>'s Economy 1965-75, draft report.C-3
IndustryMiningManufacturingGovernmentConstructionRetail TradeWholesale TradeFinance, Insurance andReal EstateTransportationCommunicationsPu b 1 i c Ut i 1 it i esSource:TABLE C-2INDUSTRY EMPLOYMENT SHARES(Percent)19731. 798.5037.757.0913.603. 103.862.402.400.921978 (Projection)3.067.1130.4910.0214.023.404.872.462.460.78<strong>Alaska</strong> Department of Labor, <strong>Alaska</strong> Economic Outlookto 1985, July 1978.<strong>Data</strong> for 1977 indicates that while the mid-year completion of thetrans-<strong>Alaska</strong> oil pipeline had an impact on the State's economy, it hasnot been as severe as expected. As a result of the large decrease incontract construction employment, total nonagricultural employmentdeclined accordingly. The decline in nonagricultural employment,however, was less than that of contract construction, indicating apreviously unexpected economic stability.PERSONAL INCOMETotal personal income is defined as the sum of wage and salaryincome, proprietor's income, dividends, interest and rental income,and transfer payments. Subtracted from this are personal contributionsfor social insurance. Once total personal income is compiled, it isthen adjusted by the residency of the worker.From statehood in 1959 through 1973, there has beerr stable growthin the State's personal income, paralleling the national trends.<strong>Alaska</strong>'s per capita income estimate increased 86 percent from $2,498C-4
in 1959 to $4,644 in 1970 while the U.S. average rose 83 percent from$2,167 to $3,966 respectively during this same time period. Thistrend continued through 1973 with <strong>Alaska</strong>'s per capita income risingan additional 28 percent while the national level rose 27 percent.Since 1973 per capita income in <strong>Alaska</strong> has demonstrated a phenomenalrate of growth. In 1974 it increased 17 percent to $7,117 whilein 1975 the reported increase was 33 percent to $9,440. During 1976the annual rate of increase slowed considerably to 10 percent, boostingper capita income to $10,415. Correspondingly, on the national levelit increased 9 percent in 1974, 8 percent in 1975, and 9 percent in1976.Clearly, <strong>Alaska</strong>'s resident personal income has increased substantiallythe past few years. The State's economy has received a tremendousboost from construction of the oil pipeline, Native land claims,outer continental oil development, and government expenditures. Withthe completion of the oil pipeline, personal income of <strong>Alaska</strong>ns isinitially declining in real terms. As additional projects come online in the future, the rate of growth in real personal income willagain turn positive.TABLE C-3TOTAL PERSONAL INCOME IN ALASKA, 1970-1977Source:Year19701971197219731974197519761977Personal Income(In billions of $)1.31.51.61.92.43.33.83.9<strong>Alaska</strong> Department of Commerce and Economic Development,The <strong>Alaska</strong> Economy, Year-End Performance Report 1977.AGGREGATE ECONOMIC PERFORMANCEIt has generally been assumed that there existed a direct causeand effect relationship between pipeline construction and the State'sC-5
economic expansion. Preliminary data for 1977 indicate that whilepipeline construct"ion employment declined during the year, it did nottrigger massive layoffs in other nonpipeline sectors of the State'seconomy. Indeed, even with an annual average loss of 11,300 constructionworkers, total employment in <strong>Alaska</strong> for 1977 declined by onlyabout 9,700 workers, or less than 6 percent, from the historic highlevel in 1976. Refer to Table C-4.Obviously, there have been other factors which have contributedsignificantly to the State's recent economic expansion. By the end ofSeptember 1977, over $348 million had passed through the <strong>Alaska</strong> NativeFund to the Native corporations. Of this amount, a considerable portionhad been invested in <strong>Alaska</strong> businesses and industry. In addition,public sector expenditures by Federal, State, and local governmentshave demonstrated dramatic increases in recent years, and mineralexpioration activity has continued at a strong pace. These and othersources of nonpipeline economic stimulation have occurred during thepipeline construction time period and they appear to have played asignificant role in expanding and strengthening <strong>Alaska</strong>'s economy.The forest products industry, after considerable expansion in 1976from the previous depressed levels, maintained a stable high level ofactivity in 1977. Pulp and lumber production remained constant in1977 although the production of wood chips declined significantly asa result of world market conditions. Japan, the major purchaser of<strong>Alaska</strong>'s forest products, continues to be hampered by the slow recoveryof its national economy, especially in its residential housing sector.The State's commercial fisheries industry greatly surpassed allexpectations during 1977. The salmon harvest was the highest since1970 with strong returns of pink salmon to the southern portion ofsoutheast <strong>Alaska</strong> and with good returns to most other areas of theState. Generally, the shellfish harvest and prices paid to fishermenwere higher than in 1976.As a result of the overall increases in 1977's fin and shellfishharvest, higher employment levels were stimulated in the State's fishprocessing sector.Investment in hard rock mineral exploration increased substantiallyduring 1977 to an estimated record high of $60 million. Oil explorationcontinued with 33 wildcat and step-out wells drilled in 1977, representingnearly a threefold "increase "in activity over the 1976 total. Majoroil discoveries were announced in 1977 at Point Thompson and FlaxmanIsland (located east of Prudhoe Bay), indicating the possibility ofadditional North Slope oil and gas fields of significant scale. InOctober 1977, the Lower Cook Inlet lease sale was held in Anchorage.C-6
nI'-JTABLE C-4ALASKA ECONOMIC INDICATORS.1970 1971 1972 1973 1974 1975 1976Resident Population (000) ..· 302.4 312.9 324.3 330.4 351.2 404.6 413.3Civilian Labor Force #(000) .•·87.2 92.9 98.6 103.8 119.5 148.5 158.0Employment #(000) . . . . · . . . 81.1 85.4 90.5 95.2 11 O. 3 138.5 145.0Nonagricultural Employment (000). 92.5 97.6 104.2 109.9 128.2 161. 3 171. 7Number Unemployed #(000). 6.0 7.5 8.0 8.6 9.2 10.0· · ·13.0Wage & Salary Payments ($000,000) .·$1 ,253 $1 ,359 $1 ,471 $1,621 $2,167 $3,449 $4,247Resident Personal Income *($000,000). $1,412 $1 ,563 $1 ,698 $2,006 $2,429 $3,443 $3,979Anchorage CPI (1967 = 100).· · · . ·109.6 112.6 115.9 120.8 133.9 152.3 164.1Percent Change in CPI . . · · . ·3.5 3.0 2.7 4.2 10.9 13.8 7.8N.A. Not Availablee = Estimate# = Current Population Survey Basis* = Place of Residence BasisSource:<strong>Alaska</strong> Department of Commerce and Economic Development, The <strong>Alaska</strong> Economy, Year-End PerformanceReport 1977.1977eN.A.158.9136.4162.020.5$3,737$4,000175.77. 1
Although drilling results in the Gulf of <strong>Alaska</strong> have been disappointingto date, other oil and gas exploration activities are continuingon the National Petroleum Reserve <strong>Alaska</strong> (old PET-4) and on Nativecorporation lands.C-8
PRESENT AND HISTORICAL POWER REQUIREMENTSThis section presents the existing and planned generating capacitiesof the railbelt area as of 1977 along with generating resources thatare planned for the near future. Also shown are the historical netgeneration estimates through 1977.TABLE C-5SUMMARY OF EXISTING GENERATING CAPACITYInstalled CaQacitt (MWlGas SteamHtdro Diesel Turbine Turbi ne TotalAnchorage-Cook Inlet Area:Util ity System 45.0 27.5 435.1 14.5 522. 1National Defense 9.2 40.5 49.7Self-Supplied Industries 11 .3 15.2 37.5 64.0SUBTOTAL 45.0 48.0 450.3 92.5 635.8Fairbanks-Tanana Valley Area:Utility Systems 35. 1 203.1 53.5 291 .7National Defense 14.0 63.0 77 .0SUBTOTAL --0 49.T 203.1 116.5 368.7Source:TOTAL 45.0 97.1 653.4 209.0 1004.5<strong>Alaska</strong> Power Administration, "Power Market Analysis," January1979. Anchorage-Cook Inlet figures include the ValdezGlennallen area which totals 56.8 MW.The total 1977 installed capacity of 1,004.5 MW represents a 45percent increase over the 692 MW of installed capacity that existedin 1974.C-9
TABLE C-6NEAR-TERM PLANNED RESOURCESInstalled Ca~acit~ (MW}~-----.-Gas SteamYear Turbine Turbine TotalAnchorage-Cook InletUtilities 1978 66.7 66.71979 113.7 113.71980 100.0 100.01981 18.0 18.01982 100.0 100.01984 18.0 400.0 418.0SUBTOTAL 416.4 400.0 816.4Fairbanks-Tanana ValleyUtilities 1982 104.0 104.0TOTAL 416.4 504.0 920.4Source:Ba ttell e Pacifi c Northwest Laboratori es, "A 1 askan El ectri cPower: An Analysis of Future Requirements and Supply Alternativesfor the Rai"'belt Region," March 1978.TABLE C-7HISTORICAL NET GENERATION (GWH)Anchorage-Cook Inlet Area Fairbanks-Tanana Valley AreaYear Util Nat. Oef Indu Util Nat. Def Indu Total1970 744. 1 156.2 1.7 239.3 203.51971 886.9 161. 2 25.0(e)1I 275.5 201. 41972 1,003.8 166.5 45.3 306.7 203.31973 1 , 1 08. 5 160.6 45.3(e) 323.7 200.01974 1 , 189. 7 155. 1 45.3 353.8 197.01975 1,413.0 132.8 45.3(e) 450.8 204.41976 1,615.3 140.3 45.3(e) 468.5 217.51977 1,790.1 130.6 69.5 482.9 206.8l! (e): estimated industrial load, revised by APA, January 1979.1 ,344.81,550.01,725.61,838.11,940.92,246.32,486.92,679.9Source:APA, Upper Susitna Project Marketability Analysis,November 1978.C-l0
SUMMARY OF CHANGESFUTURE POWER NEEDSThe forecasted demand for electrical power presented in this sectionconstitutes a downward revision from those estimates used in the 1976Interim Feasibility Report. The cumulative changes are due to the useof a different forecast methodology, 3 additional years of historicaldata, and generally more conservative economic development assumptions.The extent of change in the forecasts, however, is not great. Forinstance, the midrange forecast of peak load for the year 2000 has beenrevised to 2,852 MW, a 10 percent decrease from the earlier estimateof 3,170 MW (refer to Figure C-l). The most noticeable change occursin the high range forecast which was reduced 36 percent in the year 2000.Additionally, the revised forecast has been extended an additional25 years to 2025 in order to facilitate longer range planning.)000Figure C-ILOAD FORECAST CONPARISON(Medium Grow·th)'i 2000 1975 FORECAST /6/."/ .. 'Qc:{o...J~
FORECAST METHODOLOGYThe <strong>Alaska</strong> Power Administration (APA) has used a simplified end-usemodel to forecast future power requirements, augmented by trend analysisand an econometric model. Total power demand has been categorized intothree primary end uses: the residential/commercial/industrial loadssupplied by electric utilities, the national defense installation sector,and the self-supplied industrial component.Those factors in each category that best explain historical trendsin energy use were identified. In the utility sector, those explanatoryvariables are population and per capita use. Population was forecastedwith the help of a committee of experts using a regional econometricmodel, while per capita use estimates are an extrapolation of pasttrends adjusted to account for anticipated departures from those trends.National defense needs are assumed to depend on the level of militaryactivity and the number of military personnel in the study area. Futureself-supplied industrial power requirements are based on explicit assumptionsregarding future economic development and the energy needs associatedwith such development.POPULATION AND ECONOMIC ACTIVITY FORECASTThe most important sector in terms of magnitude of electricalenergy use is the utility sector, and population is the key factor inthis sector's future power requirements. Population forecasts in turn,are highly dependent upon assumptions of future economic activity.Economic activity assumptions are also important because they have adirect impact on energy requirements in the self-supplied industrialsector.The population and economic activity assumptions used in this forecastare based on a draft report of the Economics Task Force, Southcentral<strong>Alaska</strong> Water Resources Study, dated September 18, 1978. Thereport is entitled, Southcentra1 <strong>Alaska</strong>'s Economy and Popu1ation,_1965-2025: A Base Study and Projection.The report was a joint effort of economists, planners, and agencyexperts who were members of the Economics Task Force of the Southcentra1<strong>Alaska</strong> Water Resources Study (Leve1 B), being conducted by the <strong>Alaska</strong>Water Study Committee, a joint committee of Federal and State agencies,the <strong>Alaska</strong> Federation of Natives, the <strong>Alaska</strong> Municipal League, theMunicipality of Anchorage, the Southcentra1 region borough governments,and regional Native corporations.The projections repol~ted relied on two long-run econometric modelsdevised by economists from the University of <strong>Alaska</strong> Institute of SocialC-12
and Economic Research and from the MIT-Harvard Joint Center for UrbanStudies. Funding was provied by the National Science Foundation's Manin the Arctic Program (MAP). The two specific models used here weremodifications of the <strong>Alaska</strong> State and regional models developed underthat program. The models produced estimates of gross output, employment,income, and population for the years 1975-2000. Population andemployment were disaggregated and extrapolated to the year 2025 by ISERresearchers under Economics Task Force direction, and using Task Forceconcensus methodology. The data required to run the model were providedby various members of the Economics Task Force, the assumptions werereviewed by the Task Force, and the model outputs and tentative projectionswere reviewed for internal consistency and plaus'ibility byISER researchers and by the Task Force.The use of the econometric model requires a set of assumptionsrelated to the level and timing of development. The assumptions primarilyconsist of time series on employment and output in certain ofthe export-base industries and in government. Because of the importanceof these assumptions to the electrical energy load forecast, they arepresented here in full on pages C-13 through C-31 from the EconomicTask Force Report.Assumptions Used to Produce Economic and Population Projections, 1975-2000The critical assumptions are organized into two scenarios whichconsist of all low-range assumptions taken together and, alternatively,all high-range assumptions taken together. The scenarios were intendedto show a "reasonable" high and reasonable low development series ofspecific projects which together would offer about the broadest rangeof employment and population outcomes which could be foreseen. Thisdoes not mean that the Task Force predicts that all or any of theprojects assumed will actually occur; on the contrary, there is a highlyvariable degree of uncertainty with respect to the level and timing ofall developments in the scenarios. However, some projects were subjectivelyrated more likely than others, some unlikely, and some veryunlikely. Task Force consensus assigned most of the more likely projectsto the low development scenario, some of the less likely to the highdevelopment scenario, and the remainder were assumed not to occur withinthe time horizon of the study.The resulting low and high scenarios should not be considered synonymsfor the terms "minimum" and "maximum" development. The Task Force didnot feel competent to say what the theoretical minimum or maximumpossible level of economic development in Southcentral <strong>Alaska</strong> mightbe, since this could be influenced by Government policy at Federal,State, and local levels and by market developments beyond the powerof anyone to predict at this time; nor would that exercise have beenof much use to planners.C-13
The assumptio:cs are organized by industry and discussed in thefollowing sections.Agriculture: Agriculture is currently a marginal industry in <strong>Alaska</strong>,employing about 1,000 people statewide (depending upon the definitionof part-time, family help, and proprietors). In southcentral <strong>Alaska</strong>,about 115 man-years per year are expended in agriculture. Under aset of very favorable public policy decisions and favorable markets,considerable further development might occur. PY'imary requirementsinclude: public priority given to agricultural production in <strong>Alaska</strong>at the same level as petroleum, minerals, and marine products; activepursuit of statutes and programs to reserve and preserve agriculturallands; and public aid to innovative settlement and development techniques.In this case, the agricultural experts on the Task Force could foreseepossible commercial agricultural employment of around 800 man-years insouthcentral <strong>Alaska</strong> per year, and about 4,600 statewide by the year2000, rising to 6,900 by 2025. This reflects the current emphasis ondevelopment of the Tanana Valley, rather than the southcentral area.Total statewide sales of agricultural products in the high case rise toabout $400 million (1975 dollars) per year in the year 2000, and toabout $500 million in 2025. Value of output in constant 1958 dollarsrises to $51 million by 2000, about $8.5 million from southcentral. Bythe end of the study period in the high case, about 1.06 million acreswould be cultivated for crops, and 5.2 million acres of range landutilized. (Currently, about 20,000 acres are used for crops and grassin the State, about 12-13 thousand in southcentral.)In the low case, public priority is given to "national" and "public"interest in esthetic, recreational, subsistence, and wilderness values,tending to reduce the amount of land available for crops and reducingthe access and usability of land for agriculture. In addition, publicagricultural agencies and institutions which support agriculture areallowed to atrophy. In this case, and with market conditions continuingto be unfavorable to <strong>Alaska</strong>n agriculture, the southcentral industry outputand commercial employment drops to zero as the land is subdividedfor homesites and recreational use. Value of commercial output dropsto zero by 1991, with only "amenity" (part-time, partly subsistence)output remaining.Forestry: Aggregated in State statistics under Agriculture-ForestryFisheries, this is a tiny sector which employs about 22 people statewide.Virtually all employment in logging occurs in lumber' and wood productsmanufacturing. Value added is likewise negligible. In the high case,this sector grows in proportion to growth in lumber and wood products.In the low case. it stays at current levels.C-14
Fisheries: The fisheries sector primarily consists of personsactually engaged in fishing, but it is troublesome for several reasons.It is difficult to count fishermen since this is an industry in whichproprietors do much of the work, often with unpaid family help, thework is seasonal in nature, and many out-of-state persons take part.This causes the State's employment statistics, based on employmentcovered by unemployment insurance, to be misleading. Likewise, multiplelicenses and unfished licenses make fisherman licenses a misleadingindicator. Area-of-catch statistics collected on fish landed in <strong>Alaska</strong>,together with independent data on crew size, by gear type, give apretty good picture of total persons actually engaged in fishing. Forsouthcentral <strong>Alaska</strong> (but including the Aleutian chain), annual averageemployment on this basis is about 2,000 persons, while it was 4,359statewide in 1975. In the high case, it is assumed that in existingfisheries, expansion of fishing productivity would be offset by 1 imitedentry and 1 abor-savi ng improvements in the fl eet, 1 eaving employmentconstant at existing levels despite a fourfold increase in the salmoncatch. However, given very favorable conditions, major development ofthe American trawl fishery off <strong>Alaska</strong>'s coast could result in 100 percentreplacement of the foreign fishing effort inside the 200-mile limitby the year 2000, employing about 17.5 thousand persons in fishing statewideand 8.7 thousand (or 50 percent) in southcentral. This was consideredto be a very speculative development; consequently, no bottomfishingdevelopment was considered in the low case, while existing fisheriesjust maintained current employment.Output level of existing fisheries in the high case expands considerably,since the State is assumed to undertake an aggressive hatcheryand habitat improvement program, together with the 200-mile economiczone. The combined effect is assumed to be a quadrupling of salmoncatch, while shellfish remain at about existing levels. The expansionof the trawl fishery was assumed to result in a southcentral catch of1.85 billion pounds per year, worth $361 million exvessel in the highcase. In the low case, all fisheries maintain their approximate 19751 evels.Mining, Including Oil and Gas: The mining sector is dominated byemployment and output in oil and gas, with lesser amounts in coal,sand, and gravel, and a few persons engaged in precious metal explorationand extraction. For the State as a whole, oil and gas developments areexpected to dwarf all other considerations in this industry. Withinsouthcentral <strong>Alaska</strong>, an important local issue is the development ofthe Beluga coal field.The developments in mlnlng in the high case are assumed to be asfollows: There is a small find of hydrocarbons in the Northern Gulf of<strong>Alaska</strong>, but no important production. If the mean expected reserves areC-15
found, peak production would be about 932 thousand barrels of oil perday in 1985, and peak gas production of 0.5 billion cubic feet per dayin 1987. The Sadlerochit, Kuparuk River, and Lisburne formations atPrudhoe Bay all combine in the high case for a 1,785 million barrels/day flow of oil in 1985. In addition, the joint State/Federal offshorelease sale is assumed to contain oil and gas resources equivalent tototal reserves of 1.9 billion barrels. There are also two lease sales-in the Northern Gulf of <strong>Alaska</strong> (Sale 55) and Western Gulf/Kodiak area(Sale 46)--which result in moderate sized oil finds. Peak oil productionin the Northern Gulf is about 0.550 million barrels per day in 1986,and 0.515 million barrels per day in 1992 in the Western Gulf. Dailygas production peaks at 1.0 bcf/day in the Northern Gulf and 0.26 bcf/day in the Western Gulf. Coal production in the high case would beginin 1983, with full-scale mining of 730,000 tons of coal per year by1984 to feed a mine-mouth powerplant, twice that amount by 1986 to feeda second plant, and development of 6 million tons/year exports by1990. In the high case, employment peaks at slightly over 9,000 in1984, subsequently declining to 8,200 in 1995, while output rises to$3.2 billion (constant 1958 dollarsl/), tail"ing off to $2.6 billion.Low case oil and gas development basically consists of developmentat or around Prudhoe Bay. There is exploration in all the areas notedin the previous case, but exploration turns up far fewer prospectsworth developing. While the Kuparuk and Lisburne are developed in thiscase and there is a joint offshore sale, the Beaufort sale turns uponly 0.8 billion barrels of reserves instead of 1.9 billion. The lowerCook Inlet turns up only a small find, while the northern and westernregions of the Gulf of <strong>Alaska</strong> are dry and result in "exploration only",employment. Beluga coal is not developed in the low case. As a resultof all this, statewide peak employment in mining rises to about 7,000in 1984, dropping to less than 4,800 by the end of the century.Within the region, exploration plus development of oil and gasemploy almost 4,800 persons by 1984 in the high case, declining toalmost one-fourth that number by 1993. Beluga coal adds about 220workers by 1990 5 the first year of coal export. In the low case, thepeak employment is only 2,700 persons -in 1984, the peak year, declinessharply thereafter, and levels off at 1,200 after 1987.Food Manufacturing: The food manufacturing industry in <strong>Alaska</strong> isdominated by seafood processing, a situation which i~ not expected tochange in the near furure. In the high case, the projected fourfoldincrease in the output of the salmon fisheries implies about a doublingl/ The 1958 base year was used for convenience since U.S. Departmentof Commerce estimates of gross product were in terms of 1958 dollarswhen the study began.C-16
in employment required to process the salmon. Since it was the consensusof the Task Force that shellfish are at or near maximum sustainedyield, the overall processing plant employment for existing fisheriesis projected to increase about 25 percent. Also in the high case, bythe year 2000 the 100 percent replacement of foreign bottom fish effortoff <strong>Alaska</strong> results in a catch of 3.7 million metric tons per year,requiring estimated total processing employment of about 12,000 andshort-term (5-month) seasonal employment of 21 ,211--for an annualaverage of 21,000 by 2000. However, we assumed that only about one-thirdof total catch would be processed in <strong>Alaska</strong> shore-based facilities,resulting in total <strong>Alaska</strong> shore-based employment of 3,759, half ofwhom are employed in southcentral, and affect the local economy. Theremainder of the 21,000 work on processing vessels near shore and offshore.but their incomes probably would affect the Anchorage economyand the statewide economy to some degree. Output for this industrywas estimated by taking the expected exvessel value and using the historicratio of exvessel to wholesale value, and the ratio of value-added towholesale value. In the high cases, the value of catch in existingfisheries was assumed to rise at the same rate as total catch, yielding$145 million in value added in 2000, while catch in the emergent trawlfishery was assumed to rise to $722 million (3.7 million metric tons),yielding about $167 million of value added in processing (all valueadded in constant 1958 dollars). In the low case, a growth rate of1 percent per year was projected for total output, yielding $81.5million per year val~e-added by 2000.Lumber and Wood Products Manufacturing: The two critical assumptionsfor this industry are the annual cut of timber in the State, determinedmostly by Forest Service allowable cut and Japanese market conditions,and whether any dimension sawmills are built in <strong>Alaska</strong>. In the highcase, the annual cut by the year 2000 was assumed to be 1,260 millionboard feet (probably partly from Native lands), compared with 660million in 1970. In the low case, the increase is to only 960 million.No new mills are built in either case. While not exactly proportional,the increase in employment is similar: in the high case, statewideemployment rises to 3,834 from 2,176 in 1975; in the low case, the riseis from 2,176 to 3,280. The output of this industry was estimated bycalculating the 1975 ratio of output per employee. This was assumedto escalate at its 1965-1975 rate of growth in the high case (about1.66 percent), but stayed at 1975 levels in the low case.Since almost all the prime timber likely to be exploited by anexpanding industry is located outside the southcentral region, weassumed that outside of Anchorage, the employment of firms in thissector would escalate by about 1 percent per year in the low case, by2.3 percent per year in the high case, which is about the same or lessthan the statewide rates. Employment was assumed constant in Anchorage.C-17
Pulp and Paper M~nufacturing: The growth in this sector is determinedby most of the same factors as lumber and wood products. In neithercase is there a pulp mill built in southcentra1 <strong>Alaska</strong>, so there is noemployment or output in this sector within the region. In the State,the increase in total cut results in average employment increases ofabout 1.6 percent per year in the low case, 1.8 percent per year inthe high, resulting in totals of 1,777 and 1,886, respectively. Inthe low case, productivity per worker remains at its 1975 value; inthe high case, it increases at 2.76 percent annually, its 1965-1975rate, resulting in value added of $88.2 million and $93.6 million,respectively, in the year 2000.Other Manufacturing: This sector is an odd mixture of a wide varietyof cottage industries, printing and publishing, and consumer goodsmanufacture, together with a few major petrochemical plants and refineries.The major possible sources of new employment in this sector wereassumed to be the Alpetco royalty oil refinery-petrochemical complex,<strong>Alaska</strong> Pacific LNG plant, and whatever other LNG or gas treatmentfacilities might be associated with gas output from lower Cook Inletand the Gulf of <strong>Alaska</strong>. In the high case, the total operating employmentof these facilities was about 2,000 persons (mostly working for Alpetco).In the low case, the only source was Pacific LNG, employing about 60persons. Statewide output in this sector was more of a problem sinceit was unclear how much the output to be added by any of the LNG plantsmight be. It was decided to subsume LNG value-added under mining, andin the high case, value-added in other manufacturing was estimated asthe existing level of output, plus total revenues of Alpetco, minuscost of feedstocks, from the A1petco pro forma financial projectionsof March 10, 1978. All the growth was entered outside of Anchorage.In the low case, the existing level of output was used.Construction: For modeling purposes, it was only necessary toestimate total employment working on major projects exogenous to theeconomy, since the rest of construction is projected with the supportsector and output is determined by employment in this sector in themodels. In the high case, the significant projects within the regionwere assumed to be oil treatment and shipment facilities in the Gulfof <strong>Alaska</strong> and Kodiak subregions and the Kenai-Cook Inlet Census Division,small LNG facilities associated with the Northern Gulf and lower CookInlet development, a Beluga coal transshipment facility, Pacific LNGand Alpetco plants, and a new State capital in Willow. Outside theregion, there is augmentation of TAPS pipeline capacity, the northwest<strong>Alaska</strong> gas pipeline is constructed, and field development facilitiesare projected for the Beaufort Sea and the Kuparuk and Lisburne formations.Statewide, total exogenous construction employment peaks ata total of about 14,000 in 1981, declining rapidly thereafter to lessthan 1,000 by 1991. In the region, the peak employment is a bit lessthan 7,000 in 1981.C-18
The level of construction employment was considerably less in thelow case, both because of fewer developments in oil and gas, and becauseseveral projects needing State support do not occur, e.g, Alpetco andthe State capital move. In this case, the northwest <strong>Alaska</strong> pipelineis constructed, but the oil finds at Prudhoe Bay offshore areas arerelatively small, as are those in lower Cook Inlet. The Kuparuk andLisburne formations are developed, and the Pacific LNG plant is built.However, there is no new substantial augmentation to fish processingin the form of new plants to process bottom fish. In the low case, statewidepeak employment in exogenous construction is about 9,500, whilein the region it is about 1,800.Federal Government: Federal Government employment has been growingvery little over the last 10 years, with civilian increases about offsetby decreases in military employment. The rate of civilian increase hasbeen about 0.5 percent per year, and lacking the boost of any massivedevelopments requiring Federal support, and lacking a new State capital,the likely rate of increase in Federal civilian employment for the lowcase is assumed to remain at 0.5 percent, increasing employment from18,000 to 21,000 statewide, and from 10,900 to 12,250 in the region by2000. In the high case, general development results in a doubling ofthe average rate of increase to about 1 percent per year in FederalGovernment in most of the State, and 1.2 percent per year in southcentralto reflect the State capital move. This increases statewideFederal civilian employment from 18,000 to 22,000, and regional employmentfrom 10,900 to 14,500. Federal military employment is assumed toremain constant at 1975 levels in both the State and region.State Government: State Government employment went through severalrevisions because of concern about State budgets. Historically, the rateof growth in this sector averaged 8.5 percent per year, a rate whichmost Task Force members believed was unlikely to continue. On the otherhand, in the high case bottomfish development, major oil development,and the moving of the State capital to Willow were likely to result infairly substantial increases in State employment. In the high case,it is assumed that 2,750 positions were transferred from Juneau toWillow and that total State Government employment would increase from14,700 to about 39,000 in the year 2000, declining from around 7.6percent of civilian wage and salary employment to about 7.2 percent.In the region, State employment bulks fairly large because of the Statecapital move, with the total from Anchorage and other southcentralcombined moving from 5,400 to 14,900, or from 5.2 percent to 13.1 percentof total ernp 1 oyment.In the low case, it was assumed that government growth was restrictedby lower development needs, by funding constraints or public opinion,and by the fact that the State capital did not move. Before 1985, StateGovernment employment growth was held to about 2 percent per year, withC-19
zero growth thereafter. State employment as a result goes from 14,700in 1975 to 19,159 in 2000, about 6.4 percent of civilian employment inthe latter year. In the region, total State employment rises from 5,400to 7,140 in 1985-2000, about 6.1 percent of civilian employment in 1975and 3.1 percent in the year 2000.Local Government: Local government was assumed to be influenced inthe future by many of the same factors influencing the rate of growthin State employment. The historic rate from 1965 to 1975 was 10.5 percent(10.1 percent in southcentral), partly a result of development ofschool systems and the transfer of State-operated rural schools in theunorganized borough to local control. Due to increasing numbers offunctions being performed at the local level and rural development inthe high case, statewide growth was expected to be faster than insouthcentral, where local governments are already well organized. Dueto the moving of the State capital and due to local government responseto fishing and oil, local government employment was projected to sustainabout a 4 percent per year growth rate outside the region and about 3.4percent within the southcentral region. This meant a statewide increasein local employment from 14,200 in 1975 to 34,900 in 2000. In the lowcase, since the State capital does not move and State-local transfersare expected to be sharply curtailed after 1985, the assumed rates ofgrowth are about 2 percent until 1985 and about 1 percent thereafter.Total employment in local government goes from 14,200 in 1975 to 20,100in 2000. Within the region, local government in the high case growsfrom about 8,100 to about 18,600. In the low case, regional localgovernment employment grows from 8,100 to 11,300.Miscellaneous Assum tions: In the model, <strong>Alaska</strong>n wage rates aredetermine in most ln ustries as a function of <strong>Alaska</strong>n prices and U.S.average weekly wages in the private econon~, deflated by the U.s.Consumer Price Index for Urban Clerical Workers. (Both the latterseries are published by the Bureau of Labor Statistics.) <strong>Alaska</strong>n pricesare in turn determined as a function of U.S. prices and local demandconditions, reflected by changes in employment. Finally, migration to<strong>Alaska</strong> is calculated as a function of the change in employment opportunitiesand relative per capita income in <strong>Alaska</strong>, compared to therest of the country. In order to project a "high" and "low" scenario,the economics Task Force reexamined the assumptions usually used torun the model for impact-assessment purposes in <strong>Alaska</strong> and concludedthat "high" or "low" growth could occur because of movements of theeconomy outside the State as well as inside the State. In particular,the rates of growth of U.S. disposable personal income per capita (2.0percent) and wages (1.2 percent) appeared a bit optimistic for the lowcase. Therefore, in the low case, "pessimistic" forecasts by <strong>Data</strong>Resources, Inc. were used: 1.0 percent per annum average increase inreal wages and 1.77 percent average increase in real disposable personalincome per capita. These two changes had little influence.C-20
Government expenditures other than wages and salaries directlyinfluence output in the construction sector. To avoid having to makea series of complex assumptions of doubtful validity concerning governmentcapital spending programs, the Task Force assumed other Governmentspending increased proportionately to Government employment.Finally, the Task Force recognized that some of the service, publicutilities, and transporation employment in the southcentral areawould not be local-serving employment at all. Particularly, employmentin these sectors for Alyeska Pipeline Service Company and Beluga coalextraction would be essentially exogenous to the local economy. Consequently,an exogenous component was added for employment in thesethree sectors to adjust for the employment by Alyeska and by Beluga.These assumptions are summarized in Table C-8.Assumptions Used to Estimate Employment and Populations, 2000-2025The Task Force was charged with estimating total employment andpopulation after the year 2000, but the econometric models' resultswere doubtful that far in the future. The Task Force instead developedsome educated guesses concerning the <strong>Alaska</strong>n economy in the post-2000period, and these were used to extrapolate the year 2000 results to2025.Basically, the same methodology was used as above. The basic sectoremployment was projected by individual industry, a relationship betweennonbasic and basic employment was assumed, and then a relationshipbetween population and employment assumed and projected.Basic employmemt was projected as follows: Since there were nosignificant additional prospects for oil development in southcentral<strong>Alaska</strong> after 2000, this sector was assumed to stabilize at its year 2000level, replacing old fields with some additional development. Thiswas true in both cases. Exogenous construction tends to follow oildevelopment, so it, too, was left at its year 2000 level. Federalcivilian employment continued to grow to serve the expanding post-2000population; by 1.2 percent per year in the high case and 0.5-0.6 percentin the low case. State and local government continued to grow at therates projected for their respective cases from 1975 to 2000, withfairly rapid expansion in the high case, and virtually no expansion inthe low case. Agriculture continued to expand after 2000 in the highcase, with some significant opening up of lands. There was no post-2000development in the low case. Since manufacturing of fish products,lumber, wood, and pulp was assumed to fully utilize the availableresources (as in the high case}, or its growth was restricted byexternal institutional market factors (as in the low case), the levelC-21
nINNSECTORSExogenousConstructionEmploymentHIGH1. Oil treatment and shipment facilities:Gulf of <strong>Alaska</strong>KodiakKenai - Cook Inlet2. Small LNG facilites in:Lower Cook InletNorth Gulf of <strong>Alaska</strong>3. Beluga coal developed and transhipfacil ity4. State capital built at Willow5. ALPETCO built on Kenai Peninsula6. Pacific LNG built on Kenai Peninsula7. Northwest Gas Pipeline built8. TAPS expanded9. Facilties developed for Kaparuk andLisburne at Prudhoe Bay10. Major Beaufort Sea oil discovery11. Peak employment of 7,000 in 1981 inSouthcentral, 14,000 StatewideTABLE C- 8DEVELOPMENT ASSUMPTIONSLOWPacific LNG built on Kenai PeninsulaNorthwest Gas Pipeline builtFacilites developed for Kaparuk and Lisburneat Prudhoe BaySmall oil find offshorePeak employment of 1,800 in Southcentral,9,500 Statewide
SECTORSAgri cultureEmploymentHIGHTABLE C-8 (cont)1. Major development: 800 man-years by2000 in Southcentral, 4,600 Statewide,6,400 by 2025LOWZero employment by 1990AgricultureVa lue ofOutput1. 1958 dollars: 8.5 million in Southcentralby 2000, 51 million StatewideAmenity onlynINWForestryEmploymentForestryValue ofOutput1. Essentially none1. Negligible increaseEssentially noneNegligible increaseFisheryEmployment1. No increase in existing fisheries2. 17,500 increase in bottom fishingStatewide, 8,750 in Southcentralby 2000No increase in existing fisheriesNo bottom fish developmentFisheriesValue ofOutput1. Salmon quadruples by 20002. No increase in shellfishNo increase in salmonNo increase in shellfish3. Bottom fish: 722 million 1958 dollarsStatewide by 2000, 361 million SouthcentralNo bottom fish development
TABLE C-3 (cont)SECTORSHIGHPulp and 1. Employment increases by 1.8% per year,Paperto 1,886 by 2000 StatewideManufacturingEmployment 2. No employment in Southcentral3. Value added of $93.6 million by 2000LOWEmployment increases by 1.6% per year, to 1,777by 2000 StatewideNo employment in SouthcentralValue added of $88.2 million by 2000nINPulp andPaper Valueof Output1. Real output per employee grows at2.76% Statewide2. Employment does not grow in Southcentral~ Outer 1. Dominated by petroleum industryManufacturingEmployment2. Increases reflect employment byALPETCO, Pacific LNG, and two smallLNG plants3. Total employment of 2,000Real output per employee remains constantOnly increase is for Pacific LNG, employing60 peopleOther 1. Existing level, plus additons fromManufacturing ALPETCOValue ofOutputExisting level of output
SECTORSHIGHLumber 1. Annual cut by 2000 is 1,260 millionand Woodboard feetProductsManufacturing 2. No new millsEmployment3. Statewide rises to 3,8344. Other Southcentral employment increases2.3% per year5. Employment constant in AnchorageTABLE C-8 (cont)LOWAnnual cut by 2000 is 960 million board feetNo new mi 11 sStatewise rises to 3,280Other Southcentral employment increases 1%per yearEmployment constant in Anchoragenr.!v Lumber and 1. Real output per employee grows at~ Wood Products 1 .659% per yearValue ofOutputOutput per employee does not growFood 1. Fourfold increase in output of salmonManufacturing fisheriesEmployment2. Doubling of salmon processing employment3. Existing fisheries plant employmentincreases 25%4. By 2000, 100% replacement of foreignbottomfish effort5. 3.7 million metric tons/year catch by2000Existing fisheries stay at existing levelsNo bottomfish development
SECTORSFoodManufacturingEmployment(cont)HIGH6. Total processing employment of 12,000by 20007. Short-term (5-month) processing employmentof 21,211TABLE C- 8 (cont)8. Annual processing employment average of21,000 by 20009. Total <strong>Alaska</strong> shore-based employment of3,759, 1/2 in SouthcentralLOWnIN0'\FoodManufacturingValue ofOutput1. Existing fisheries value added (1958 $)$145 million by 20002. Trawl fishery catch rises to 3.7 millionmetric tons, $722 million, $167 millionvalue added in processingGrowth at 1% per year for total output,$81.5million per year value added by 2000No enhancement of fisheries outputMining Oiland GasEmployment1. Development of Kaparuk River sand andLisburne formation, 1.785 millionbarrels/day in 1985Development of Kaparuk River sands and Lisburneformation2. 1.0 billion barrels developed offshorePrudhoe Bay0.8 billion barrels developed offshore PrudhoeBay3. North Gulf of <strong>Alaska</strong>: .550 millionbarrels/day in 1986No find in North Gulf of <strong>Alaska</strong>
TABLE C- 8 (cont)nIN"-.JSECTORSMining Oiland GasEmployment(cont)HIGH4. West Gulf/Kodiak Area: .515 millionbarrels/day in 19925. 1.0 BCF/day gas production in NorthGulf of Al aska6. .26 BCF/day gas production in WestGulf/Kodiak Area7. Coal production begins in 1983:730,000 tons/year by 1984 to feedmine mouth plant; 1,460,000 tons/yearby 1986 to feed second plant; 6 milliontons/year exports by 19908. 9,000 employed in 1984 Statewide8,200 employed in 1995 Statewide9. North Gulf of <strong>Alaska</strong>: 932,000 barrelsof oil per day by 1985, 0.5 billioncubic feet per day in 198710. 4,800 employed regionwide by 1984,declining thereafter11. 220 employed by Beluga coal by 1990LOWNo find in West Gulf/Kodiak AreaNo gas production in North Gulf of <strong>Alaska</strong>No gas production in West Gulf/Kodiak AreaNo Beluga coal development7,000 employed in 1984 Statewide4,800 employed in 2000 Statewide2,700 employed in 1984 regionwidedeclines sharply thereafterValue ofHard MineralProduction1. Present levels plus output of BelugacoalPresent levels
SECTORSValue ofOil and GasProductionHIGHTABLE C-8 (cont)1. Production is multiplied times estimated Production is multiplied times estimatedwellhead values of $17.00/bbl ($1.80/MCF 1/ wellhead values of $7.50/bbl (l.40/MCF forfor gas), new fields only in Southcentral - gas), new fields only in Southcentral l!2.Prudhoe and other North Slope productionstarts at $5.32/bbl and 25¢/MCF in 1977,with oil rising to $29.28 by 2000 l!LOWPrudhoe and other North Slope productionstarts at $5.20/bbl and 25¢/MCF in 1977,with oil rising to $29.28 by 2000 1/nINex>FederalGovernmentEmploymentTotal LocalGovernmentEmploymentl.2.l.2.Rises at 1.2% per year in Southcentral,10,857 to 14,500 by 2000Rises at 1% per year outside Southcentral4% growth rate outside the region3.4% growth rate within SouthcentralregionRises at 0.5% per year in Southcentral,10,900 to 12,250 by 2000Rises at 0.5% per year outside Southcentral2% growth iate until 1985, 1% thereafter3.Statewide increase from 14,200 to 34,900in 2000Statewide increase from 14,200 to 20,100in 20004.Southcentral region increase from 8,100to 18,600Southcentral region increase from 8,100to 11 ,300Total Localand StateGovernmentExpendituresl.Proportional to increase in wages andsalaries of Government workersProportional to increase in wages andsalaries of Government workerslJ Estimates are in current dollars incorporating a 5 percent annual rate of inflation.
TABLE C-8 (cont)n ,N1.0SECTORSTotal StateGovernmentEmploymentHIGH1. 2,750 positions transferred from Juneauto Willow, 1982-19842. Total employment increases from 14,700to 38,000 in 20003. Declines from 7.6% of civilian wage andsalary employment to about 7.2% by 20004. Southcentra1 employment increases from5,400 to 14,900, or from 5.2% to 13.1%of total employment5.Statewide rate of employment growth isabout 5.4% per yearTotal emp1o~nent19,159 in 2000LOWincrease from 14.700 toDeclines to 6.4% of civilian employment by2000Southcentra1 employment rises from 5,400 to7,140, from 6.1% of civilian employment to3.1% by 2000Before 1985, government employment growthheld to 2% per year, with zero growththereafterValue ofFacilitiesOil and GasProduction,Transportation1.Based on Dept. of Revenue, <strong>Alaska</strong>'s Oiland Gas Tax Structure, February 1977,Page IV, 23, thru 1985, declined at 5%per year thereafterBased on Dept. of Revenue. <strong>Alaska</strong>'s Oil andGas Tax Structure. February 1977, Page IV,23, thru 1985. declined at 5% per yearthereafterValue ofFacilities,Manufacturing1.Includes estimated value of LNG andPetrochemical facilities for localproperty taxIncludes value of Pacific LNG facilities
SECTORSExogenous 1.Transporationand ServicesEmploymentHIGHTABLE C-8 (cont)Estimated Alyeska employees in thesesectors, plus 40 workers at the Belugacoal transshipment facilitiesLOWAlyeska workforce onlyRate of 1.Growth ofDisposable 2.PersonalIncome PerCapita and'( WageswaIncome - 2%Wages - 1. 2%Income - 1.77%Wages - 1.0%
of employment in these industries was held constant at the year 2000level. Fishing itself was assumed to replace 10 percent of the foreignbottomfishing effort after 2000 by the year 2025 in the low case, butthere was assumed to be no change in the traditional fisheries beyondtheir year 2000 level. In other manufacturing, the year 2000 employmentlevel was sustained, except that nonpetrochemical "other" manufacturingwas projected to double after the year 2000 to serve local markets inthe high case.In projecting the nonbasic/basic ratio, somewhat different procedureswere used for Anchroage and the rest of the region. In OtherSouthcentral, the year 2000 regional ratio of nonbasic to basic employmentwas multiplied times regional basic employment each year out to2025 and disaggregated, using year 2000 proportions, which permittedproportional growth in the nonbasic sector in each subregion after theyear 2000. In the high case, the nonbasic/basic ratio was assumed toconverge to the existing 1975 U.S. ratio by 2025, but it was found tobe already there by 2000. In Anchorage, it was recognized that muchof the "support sector" employment in fact serves statewide needs intransportation, financial services, etc. Therefore, an estimate wasmade of local-serving nonbasic employment by multiplying the statewidenonbasic/basic ratio by local basic sector employment. The remainderwas designated "statewide-serving" nonbasic employment, which wasassumed to grow at the same rate as basic employment because Anchoragestatewide services in both the basic sector and this part of the nonbasicsector can be assumed to grow in response to similar statewidedemands for central offices and general support services. With theAnchorage economy relatively mature by that time, it is more difficultto argue that statewide-serving nonbasic firms would continue to growfaster than their counterparts in the basic industries after 2000 thanbefore 2000.Finally, civilian non-Native population not employed in exogenousconstruction was estimated using year 2000 population/employment ratiosat the regional level and allocated to subregions using year 2000 proportions.Any assumption other than proportional population growthamong subregions after 2000 was judged too difficult to defend, sinceso little is known about the character of <strong>Alaska</strong>'s economy at thatpoint. To this was added exogenous construction employment (no growth).Native population (2 percent growth per year), and military (no growth).FORECAST RESULTSThe Level B population forecast for the Anchorage-Cook Inlet subregionwas adopted by APA for estimating power requirements withoutany modification. APA applied projected statewide growth rates to theFairbanks-Tanana Valley area to develop population forecasts for thatregion. The resulting population projections upon which the loadC-31
forecast is based are presented in Table C-9. The figures includenational defense personnel. Actual population growth will likely fallwithin the limits established by the high and low forecasts. The APApopulation and load forecasts are discussed at length in Section G,Marketability Analysis.TABLE C-9POPULATION ESTIMATESAnchorage-Cook Inlet Fairbanks-Tanana Valle1 StatewideYear Low High Low High Low High1980 239,200 247,200 60,390 62,020 500,225 513,7661985 260,900 320,000 68,010 77 ,350 563,303 640,7181990 299,200 407,100 74,660 95,370 618,397 790,0421995 353,000 499,200 82,130 114,360 680,286 947,3122000 424,400 651,300 89,700 139,760 743,034 1,157,7302025 491,100 904,000 99,040 179,240 820,369 1,484,784UTILITY SECTORThe midrange net generation forecast from 1977 to 1980 was basedon the average annual growth rate between 1973 and 1977. This rate wasadjusted upward and downward by 20 percent to establish the 1980 highand low forecasts respectively. Beyond 1980, the high and low case netgeneration is estimated by multiplying forecasted population by projectedper capita use. Between 1973 and 1977, per capita use of electricitygrew at an annual rate of 3.8 percent in Anchorage and 9.4percent in Fairbanks. The lower Anchorage growth rate was adopted asthe basis of the per capita use trend. Increasing electrification isassumed to be partly offset by increasing effectiveness of conservationprograms, resulting in a gradually slower rate of growth in per capitause. The future rate of growth in per capita use was projected todecline as shown in Table C-10.In order to test the validity of this methodology for estimatingper capita power consumption, comparable regions in the Pacific Northwestwere examined. The Eugene metropolitan area, Oregon, (population150,450) as well as the Richland-Kennewick SMSA, Washington, (population100,100) were selected on the basis of their similarity in populationand commercial/industrial characteristics to the railbelt area (i.e.,substantial population coupled with relatively little heavy industry).In the period from 1970-1977 per capita electricity use increasedby an average of 5.4 percent and 7.1 percent for Eugene and the RichlandKennewick SMSA, respectively. This compares to a 3.8 percent per capitaC-32
growth rate for Anchorage (1973-1977). Furthermore, the power salesanticipated by the utilities which serve Eugene and the RichlandKennewick SMSA, coupled with the population projections for these tworegions, reveal an ever increasing rate of per capita consumption.Clearly, these utilities make little or no provision for energy conservation.In 1977, per capita use in Eugene and the Richland-Kennewick SMSAwas 13,424 kWh and 17,297 kWh, respectively. These current rates meetor exceed the high forecast for <strong>Alaska</strong> in the 1980-1985 period. Withoutdoubt, <strong>Alaska</strong> holds a considerable potential for increased electrification.Pacific Northwest current per capita consumption (excluding aluminumand others that buy at bus bar) is 13,550 kWh/yr.TABLE C-10PER CAPITA USE PROJECTIONSLow Mid-Range HighRate Forecast Rate Rate ForecastPeriod (%) ( KWH/CaQ} ilL ilL (KWH/CaQ)1980-1985 2.5 11 ,000 3.5 4.5 13,8001985-1990 2.0 12,400 3.0 3.5 16,3001990-1995 1.5 13,100 2.5 3.0 18,9001995-2000 1.0 13,800 2.0 2.5 21,4002000-2025 0 13,800 1.0 2.0 35,000With the high and low population forecasts and with high, mid, andlow per capita use assumptions, six different net generation forecastswere calculated. From these, the high population-high energy use andthe low population-low energy use combinations were used for the highand low range net generation forecasts. The midrange utility sectorforecast came from averaging the high population-low energy use and thelow population-high energy use forecasts.The resulting forecasts are shown in Tables C-12 through C-14.Peak load forecasts were calculated from projected net generation usinga 50 percent load factor.NATIONAL DEFENSE SECTORThe forecast for this relatively minor sector is based on historicaldata from Army and Air Force installations in the rail belt area. Zerogrowth is assumed for the midrange forecast. For the high range, growthC-33
at percent per year is assumed, while the low range forecast is basedon a decline of 1 ~ercent annually (see Tables C-12 through C-14).SELF-SUPPLIED INDUSTRIES SECTORThis category of load is comprised of those existing industriesthat generate their own power, along with all similar type facilitiesexpected to be constructed in the future. It is likely that suchindustries would purchase power and energy if available at reasonablecost. The specific assumptions for this sector are based on Battelle1sMarch 1978 report entitled <strong>Alaska</strong>n Electric Power, An Analysis ofFuture Requirements and Supply Alternatives for the Railbelt Region.The high range of development includes an existing chemical plant,LNG plant and refinery, along with a new LNG plant, refinery, coalgasification plant, mining and mineral processing plants, timberindustry, capital city, and some large energy intensive industry. Thisset of assumptions coincides with the Level B Study Task Force high casedevelopment assumptions with two exceptions. Coal gasification and anenergy intensive industry were included by APA because informed judgementindicates their definite potential. Their impact on populationand economic activity is relatively minor but their effect on peak loadrequirements could be substantial.The University of <strong>Alaska</strong> and Battelle completed a study entitled<strong>Energy</strong> Intensive Industries for <strong>Alaska</strong> in September 1978. The studyevaluated a number of energy intensive industries that might be attractedto the State as a consequence of the availability of its large anddiversified sources of primary energy. For a number of economic reasons,it was concluded that the availability of energy resources per se wouldnot be sufficient to overcome the higher capital, operating and marketingcosts for a world scale primary industry located in the State.However, it was also concluded that of all industries examined, theprimary aluminium metal industry appeared to be the most likely tosucceed in <strong>Alaska</strong>. It was further concluded that a large electroprocessindustry would have important implications to <strong>Alaska</strong>1s electricpower supply· planning. The viability of such an industry is contingentupon the availability of low cost hydropower. For these reasons, thedevelopment assumptions for the high range case include some largeenergy intensive industry.The assumed peak load requirements in the year 2000 are presentedin Table C-ll. The midrange forecast is the same as the high rangeexcept that the large energy intensive industry (aluminium smelter) isexcluded. The low range further excludes the new capital city. Thereis also some reduction of peak load requirements of the mid and lowrange cases. The resulting forecast is shown on Tables C-12 throughC-14.C-34
TABLE C-11SELF-SUPPLIED INDUSTRY SECTOR ASSUMPTIONS, 2000(High Range)Type of LoadExisting Facilities:Chemical PlantLNG PlantRefineryTimberNew Fac il it i es :LNG PlantRefineryAluminium SmelterCoal Gasification PlantMining and Mineral ProcessingPlantTimberNew CityTotal Peak LoadLoad (MW)26.00.62.45.017.015.5280.0250.050.07.030.0683.5C-35
TABLE C-12TOTAL POWER AND ENERGY REQUIREMENTSAnchorage-Cook Inlet Area and Fairbanks-Tanana Valley Area CombinedPeak Power1977 1980 1985 1990 1995 2000 2025~1I MW MW MW MW MW MWTOTALHigh 890 1 ,671 2,360 3,278 4,645 10,422Median 650 829 1.162 1,592 2,134 2,852 4,796Low 769 961 1,177 1,449 1 ,783 2,146Annual <strong>Energy</strong>GWH 1I GWH GWH GWH GWH GWH GWHTOTALHigh 3,928 7,636 10,684 14,844 20,936 47,054Median 2,681 3,663 5,133 7,078 9,528 12,738 21 ,578Low 3,391 4,256 5,219 6,430 7,890 9,630lJ Thousand KWMWMillion KWH = GWHSource:<strong>Alaska</strong> Power Administration, Department of <strong>Energy</strong>C-36
Peak PowerTABLE C-13ANCHORAGE-COOK INLET AREA POWER AND ENERGY REQUIREMENTS1977 1980 1985 1990 1995 2000 2025~1I MW MW MW MW MW MWUTILITYHigh 620 1,000 1 ,515 2,150 3,180 7,240Median 424 570 810 1,115 1,500 2,045 3,370Low 525 650 820 1,040 1 ,320 1 ,520NATIONAL DEFENSEHigh 31 32 34 36 38 48Median 41 30 30 30 30 30 30Low 29 28 26 24 24 18INDUSTRIALHigh 32 344 399 541 683 1 ,615Median 25 32 64 119 199 278 660Low 27 59 70 87 104 250TOTALHigh 683 1,376 1,948 2,727 3,901 8,903Median 490 632 904 1,264 1,729 2,353 4,060Low 581 737 916 1 ,151 1 ,448 1 ,788Annual Energ~GWH l! GWH GWH GWH GWH GWH GWHUTILITYHigh 2,720 4,390 6,630 9,430 13 ,920 31,700Median 1,790 2,500 3,530 4,880 6,570 8,960 14,750Low 2,300 2,840 3,690 4,560 5,770 6,670NATIONAL DEFENSEHigh 135 142 149 157 165 211Median 131 131 131 131 131 131 131Low 127 121 115 105 104 81INDUSTRIALHigh 170 1,810 2,100 2,840 3,590 8,490Median 70 170 340 630 1,050 1,460 3,470Low 141 312 370 460 550 1 ,310TOTALHi gh 3,025 6,342 8,879 12,427 17,675 40,401Median 1,991 2,801 4,001 5,641 7,751 10,551 18,351Low 2,568 3,273 4,075 5,125 6,424 8,061II Thousand KW = MWMillion KWH = GWHSource: <strong>Alaska</strong> Power Administration, Department of <strong>Energy</strong>C-37
TABLE C-14FAIRBANKS-TANANA VALLEY AREA POWER AND ENERGY REQUIREMENTSPeak Power1977 1980 1985 1990 1995 2000 2025~l! MW MW MW MW MW MWUTILITYHigh 158 244 358 495 685 1 ,443Median 119 150 211 281 358 452 689Low 142 180 219 258 297 329NATIONAL DEFENSEHigh 49 51 54 56 59 76Median 41 47 47 47 47 47 47Low 46 44 42 40 38 29TOTALHigh 207 295 412 551 744 1 ,519Median 160 197 258 328 405 499 736Low 188 224 261 298 335 358Annua 1 <strong>Energy</strong>Gl~H l! GWH GWH GWH GWH GWH GWHUTILITYHigh 690 1,070 1,570 2,170 3,000 6,320Median 483 655 925 1,230 1,570 1 ,980 3,020Low 620 790 960 1 ,130 1 ,300 1 ,440NATIONAL DEFENSEHigh 213 224 235 247 260 333Median 207 207 207 207 207 207 207Low 203 193 184 175 166 129TOTALHigh 903 1,294 1,805 2,417 3,260 6,653r~ed;an 690 862 1,132 1,437 1,777 2,187 3,227Low 823 983 1 ,144 1,305 1,466 1 ,569l! Thousand KW = MW Million KWH = GWHSource:<strong>Alaska</strong> Power Administration, Department of <strong>Energy</strong>C-3S
CREDIT FOR ENERGY AND CAPACITYThe amount of project power for which benefit can be claimeddepends on both the project's capability and the market requirements.The latter, in turn, is a function of total loads and the mix of availablegenerating resources. The determination of this lIusable" energyand capacity from the Susitna project is based on a load/resourceanalysis conducted by Battelle Pacific Northwest Laboratories for APA.The load/resource analysis matches forecasted electric powerrequirements with appropriate generating capacity additions. Thecomputer aided analysis schedules new plant additions, keeps track ofolder plant retirements, and computes the loading of installed capacityon a year-by-year basis over the period 1978 to 2011.The analyses are based on the load forecasts and the existing andplanned generating resources described in the previous sections.Reserve margins of 25 percent for non interconnected load centers and20 percent for the interconnected systems are assumed. The results ofthe load/resource analysis are in terms of net deliverable capacityand energy after deductions for anticipated transmission losses. Theload/resource analysis methodology recognizes construction scheduleconstraints by not allowing call-up of new generation or transmissioncapacity that could not be made available. For purposes of thisanalysis, the following economic facility lifetimes have been assumed:Coal-fired Thermal GenerationOil-fired Steam GenerationGas-fired Combustion TurbineOil-fired Combustion TurbineHydroelectric GenerationYears3535202050 11At the end of its economic life, the facility is retired fromservi ceoGenerating plant availabil.ity can be expressed in terms of plantutilization factors (PUF's), which are primarily dependent upon planttype and plant age. For new capacity and most types of existingcapacity, the following maximum PUF's are assumed:1/ While the payback period for financial calculations is 50 years,the physical life of a hydroelectric project is typically in excessof 100 years. The effect of this discrepancy is insignificantbecause there are only 53 MW of hydro capacity.C-39
HydroStream ElectricCombustion TurbineDieselMaximum PUF0.500.750.500.10Plants are allowed to run at the maximum PUF from the start, exceptfor new coal-fired steam electric plants which generally experiencelower plant utilization in the first few years and also toward theend of their economic lives.Hydroelectric generation systems, as a result of their storageability and conservative ratings, can make additional power availablefor peaking and it is assumed they can be scheduled at 115 percent ofdesign capacity for this service, except during the critical hydraulicperiod when head limits plant output.The results of the base case are presented as Exhibit C-l. Inthose years when Susitna hydropower is available, the total system1ssurplus capacity in any given year is subtracted from Susitna hydrocapability in that year to give the actual amount of Susitna capacitythat is usable. The remainder of the Susitna capacity is consideredtemporarily surplus to the needs of the market area and no capacitybenefit is claimed. For instance, refer to Exhibit C-l, Watana POL in1994 and the midrange load forecast. In 1995-96 (Pages C-1-13 andC-1-14), adding Anchorage and Fairbanks, Watana is on line with 703 MWdependable capacity and 808 MW overload capacity. The combined Anchorageand Fairbanks surplus peak capacity in that year is 543 MW. 1/ Therefore,only 265 MW, or 808 less 543, is usable Susitna capacity. Althoughno benefits are claimed for the hydro capacity that appears surplus tothe needs of the market area, that capacity in actuality would beutilized to generate power. This would result in older thermal generationbeing placed in a cold reserve status. This, in turn, extends theuseful life of these temporarily retired plants and postpones the needfor future capacity additions. Though real, the monetary benefitsattributable to this postponement of new capaicty are minor and hasbeen ignored in this analysis.For both the medium and high range load growth cases, additionalcoal-fired generation would have to be installed after Watana completionlJ The load resource analysis shows 101 MW surplus in Fairbanks, butthis must be adjusted down by 25 MW to account for the 25 MW steamplant that comes on line subsequent to Watana.C-40
ut before Devil Canyon power would be available. Unfortunately, dueto construction timing requirements, Devil Canyon cannot be advancedin order to postpone the coal-fired addition.Once the Susitna project's dependable capacity is fully absorbedby increasing peak load requirements, there is the opportunity tocapitalize on the hydroelectric projects' capability to produce additionalpeaking capacity on an intermittent basis. This additionalcapacity is available when the net power head exceeds the critical head.(The critical head is where rated capacity is available at full gateopening.) The amount of additional capacity increases with head untilthe full 15 percent overload is reached. This occurs at full gate andaverage head (where generator output is maximum), which is at about630 feet for Watana and 545 feet at Devil Canyon, as can be seen onFigure C-2. Figure C-3 shows that the head at Watana exceeds 630 feetabout 75 percent of the time. Because the power pool at Devil Canyonis almost never drafted, Devil Canyon head is sufficient to produce15 percent overload essentially 100 percent of the time.Since this interruptible capacity cannot be guaranteed, its valueis typically less than that for dependable capacity. In keeping withaccepted practice, interruptible capacity, when needed to meet peak loadrequirements, is valued at 50 percent of dependable capacity. 1/ Forpurposes of benefit calculations, Watana is credited with 15 percent ofits at-market dependable capacity, or 103 MW of interruptible capacity.(Since the full amount is available only 75 percent of the time, thefigure is adjusted downward to 77 MW.) The comparable figure for DevilCanyon is 100 MW, which brings the combined project's interruptiblecapacity to 177 MW for benefit calculation.Again referring to the load resource analyses in Exhibit C-l (PagesC-1-13 through C-1-18), it can be seen that the Susitna project's energyis fully utilized as it becomes available. There is no surplus energybecause thermal plant utilization factors are reduced to take advantageof the less expensive hydro energy. Therefore, unlike Susitna capacitybenefits which are only claimed through assimilation into the system,all Susitna energy is useful and benefits can be claimed for all of it.The value of this hydro energy depends upon the type of generationthat would otherwise be producing the energy in the absence of thehydroelectric generation. Part of the hydro energy goes to meet thegrowth in demand for energy over time. In the absence of the hydroelectricproject, this load growth would be met by new coal-fired11 Department of the Army, Office of the Chief of Engineers, Digestof Water Resources Policies, p. A-129.C-41
Figure G-2DEVIL C ANYON AND WATANAUNIT MAXIMUM PERFORMANCE.S800.-------------------------------------------------------~700o«W 600I0::W3o0....I-WZ~ooDEVIL CANON~"-WATANA400300+-----------------~------------------~----------------~100 200 300MAXIMUM GENERATOR OUTPUT (MW)400INTERIM REPORTSOUTHCE NTRAL RAILBELTAREA,ALASKAALASKA DISTRICTCORPS OF ENGINEERSJUNE 1975C-42
Fi gure C-3ANNUAL HEAD DURATION CURVEWATANA RESERVOIR730710690\MAXIMUM HEAD670650,....~I.LJWLL-a
generation, and the value of this portion of the hydro energy is thereforethe cost of coal-fired energy. The remainder of the hydro energydisplaces more costly thermal generation. While the existing thermalplants continue to provide peak load capacity, the utilization of theplants decline. This displaced energy is comprised of several types ofgeneration: coal-fired steam, oil-fired and gas-fired plants, anddiesel plants, each having its unique energy cost. The value of thehydro energy produced in any year, then, is a composite value determinedby the relative shares of generation type that would be producingenergy in the absence of the hydro.The load-resource analysis shows that the great majority of thedisplaced generation is coal-fired, since the plant utilization factorsof the diesel, gas, and oil-fired plants were already reduced priorto Susitna hydropower availability. This results in a composite energyvalue that, in the most extreme year, is only 5 percent greater thanthe coal-fired energy value. Within 12 years after power-on-line, allSusitna energy goes toward meeting load growth and is therefore valuedentirely at the coal-fired value. Because the effect on project justificationis so minor over the lOO-year economic life, the benefit ofthe hydro energy has been calculated using the coal-fired energy value,not the slightly higher composite energy value.The usable capacity and energy for the midrange forecast withinterconnection in 1991, Watana power-on-line in 1994 followed by DevilCanyon in 1998 is presented in Table C-15 and is portrayed graphicallyon Figures C-4 and C-5. The usable capacity analysis results for thevarious cases analyzed appear as Exhibit C-3 and are presented graphicallyin Exhibit C-2. Shown are cases for the low and high-range loadforecasts, as well as for delayed power-on-line dates.C-44
TABLE C-15USABLE CAPACITY AND ENERGY, BASE CASEDependable Interruptible Prime SecondaryYear Ca~acit~ (MW} CaQacit~ (MW) Energ~Energ~1994 * 27 0 2,9971995 265 0 3,0581996 680 0 3,0581997 680 0 3,0581998 # 950 0 6,0571999 1,035 0 6,0572000 1,231 0 6,0572001 1,347 1 6,0572002 ## 1 ,347 177 6,057* Watana power-on-1ine with interconnection.** Less than full energy avai1abe due to reservoir filling.# Devil Canyon power-on-1ine.## Full utilization of Susitna power.o **397397397397 **785785785785C-45
Figure C-44000SOUTHCENT RAL RAILBEL TLOADS a RESOURCESMEDIUM LOAD FORECASTINTERTIE 1991, WATANA 1994INTERCONNECTED RAILBELT SYSTEM30002000WATANA(809 MW)ANCHORAGE1000FAIRBANKSO~---P--~--__ --~~--r---~--~--__ --~--~---P--~--__ --~~--r---r---~--'---~--~---r--~---' __ __1980 85 90 95 2000TIME IN YEARS
14Fi gure C- 512SOUTHCENTRAL RAILBELTMARKETABLE ENERGYGROWTH FORECASTMEDIUMWATANA 1994109>(!)crwzw64NOTE:Secondary energy is deferred one year for reservoir filling.2O~ __________ ~ __________ ~ ________ ~r-________ ~ __________ ~ __________ ~ __________ ~ ________ ~ __________ ~ ______1993 94 95 96 97 98 99 2000 2TIME IN YEARS
THE SELECTED PLANPOWER CAPABILITIESThe installed capacities at Devil Canyon and Watana reservoirswere selected based upon the project firm annual energy produced ina 28-year period of historical streamflow (1950-1977). This periodincluded three new years of streamflow, in addition to the 25 yearsused in the original scoping analysis prepared in 1975. An updatedseasonal load curve prepared by APA was used in the new simulatedoperation study.The addition of the 3-year period of recorded streamflows resultedin changes to the average annual and firm annual energy capabilityamounting to less than 2 percent. The annual runoff for the 3-yearperiod is 96 percent of the long-term average. Therefore, no adjustmentin the original energy capab-ilities is considered necessary. Thepower generating capabilities for the project are given in Table C-16.TABLE C-16Installed Capacity, MWPeaking Capacity, MWDependable Capacity, MWAT-SITE POWER CAPABILITIESAverage Annual <strong>Energy</strong>, 10 3 MWhFirm Annual <strong>Energy</strong>, 10 3 MWhSecondary <strong>Energy</strong>, 103 MWhAverage Annual Spilled <strong>Energy</strong>, 103 MWhPlant Factor - Percent l/II Based on firm annual energy.Devil Canyon6897926893,4103,0203903150Watana7038097033,4803,0804004450Total1 ,3921 ,6011 ,3926,8906,1007907550The driest year of record was 1969, which was estimated to have a1,000 year return period based upon a Log Pearson Type III probabilitydistribution, with an average annual runoff at Devil Canyon of 5,600cubic feet per second, or 59 percent of average. The second driestyear of record (1950) had a return period of 20 years with an averageannual runoff of 7,340 cubic feet per second. The 100-year averageannual low flow is estimated to be 6,500 cubic feet per second or 68C-48
percent of average. The 10 month period immediately following the 100-year low flow would likely be the most critical power period to be encounteredin the life of the project.The project dependable capacity is based upon the firm annualenergy and is equal to the installed capacity. The project firm annualenergy using the 28-year record of historical flows occurred in 1971.During May of that year total project storage was reduced to its lowestlevel of the entire period (230,000 acre-feet or 3 percent of usablestorage). The annual energy produced by the project in 1971 was approximately6,100,000 megawatt hours.The maximum peaking capacity for both powerplants is 115 percentof installed or rated capacity at 0.9 power factor. This 15 percentoverload capability was assumed to be available only at or near maximumhead on each unit for routing purposes.The large storage capacity of Watana reservoir provides nearly fullriver control. Spills occurred in 8 of the 28 years of record and wereonly about 1 percent of the average annual project energy.The transmission losses have been estimated by APA to be 3.2 percenton-peak and 0.7 percent for the long-term average. The at-marketpower capabilities are shown in Table C-17.TABLE C-17AT-MARKET POWER CAPABILITYInstalled Capacity, MWPeaking Capacity, MWDependable Capacity, MWAverage Annual <strong>Energy</strong>, 103 MWhFirm Annual <strong>Energy</strong>, 103 MWhSecondary <strong>Energy</strong>, 103 MWhAt-Site1 ,3921 ,6011,3926,8906,100790LossesAt-Market45 1 ,34751 1,55045 1,34748 6,84243 6,0576 784SEASONAL RESERVOIR OPERATIONThe 1978 update of the simulated operation study did not resultin any substantial revisions to the overall pattern of project operation.The general criterion as before was to maintain Devil Canyonreservoir at maximum pool to realize the greatest possible head onC-49
that reservoir. During the winter, withdrawals were made from Watanastorage to meet th~ system power demand. Devil Canyon storage wasused only after the supply in Watana reservoir was exhausted.The general characteristics of the Watana operation are shown inFigure C-6. The pool elevations shown have been adjusted in accordancewith the topographic information obtained in the 1978 field surveysat the Watana damsite. In years of average streamflow the maximumdrawdown on Watana reservoir waS about 100 feet. The reservoir reachedminimum active pool (elevation 1,940 feet) on only two occasions inthe 28-year period.In the simulated operation, one criteria was to fill Watana reservoiron September 30 each year. This was not possible, however, in13 of 28 years of record. In such years of reduced streamflow, itproved to be inefficient to draw the Watana pool to a low level onSeptember 30 in order to meet the system load requirement. If thereservoir was consistently drawn below elevation 2.100 feet (storage =6,700,000 acre-feet) on September 30 each year, the resulting headloss was of such magnitude that the project was unable to recoversufficiently to meet minimum system load requirements, even in yearswith above average runoff. The minimum September 30 carry-over forWatana reservoir was therefore set at 6,700,000 acre-feet for theupdated 1978 simulated operation studies. The generation and waterstorage levels for Devil Canyon and Watana reservoirs for the entire28-year period of record are shown on Plates C-l and C-2.The spring and summer filling operation for Watana reservoir in theoperation studies was guided only by a fixed flood control rule curve.In later scoping studies this operation could be improved somewhatthrough the use of a variable rule curve based upon both 7-day andseasonal volume forecasts.In the simulated operation, only the releases necessary for minimumgeneration requirements were made until the month when the reservoirwould fill or encroach the flood space. Only during that month couldthe excess runoff be used to generate secondary energy. The method ofoperation results in unnecessary spillage of water.In order to obtain a more realistic estimate of the spill frequencyat Watana reservoir, a separate study was conducted. In this studythe daily inflow to Watana reservoir was estimated using the recordsfrom the stream gage at Gold Creek. It was assumed that the fullhydraulic capability of the Watana turbines could be used for 15 daysin advance of the spills observed in the other simulation study. Inaddition, for 5 days in advance of the spills, the outlet tunnel withdischarge capacity of 30,000 cfs was used to maintain the pool belowC-50
2,185-_-_--~ MAXIMUM WATER SURFACE-----9,6242,145 -~.MAXIMUM LEVEL'----/ ~-8,200...J(f)2,105 -2,065-~ 2,025 -lLLMEAN LEVEL ______-7,000IWWLL___ ----5,900 WcrU 1985W' M!NIMUM LEVEL -4,000 J...JWLt'j)1945 --3,400• MIN POWER POOL ---1,905- IOCTINOVIDECIJANIFEBMARIAPRIMAYIJUNIJLYIAUGISEPNOTE: DATA FROM OPERATIONAL STUDY OFAVERAGE MONTHLY STREAMFLOW FORPERIOD OF RECORD 1950 - 1977 WITHJAN 1976 SELECTED PROJECT PLAN.Fi gure C- 6OPERATINGLEVELSWATANA RESERVOIRALASKA [ISTRICT, CORP~ OF E~JGINEERSANCHOR AGE, ALASKAOCTOBER 197RC-::i 1
the crest of the spillway as much as possible. When the inflowsexceeded the discharge capacity of both the powerplant and the outletworks and the reservoir reached full pool, the spillway, of course,had to be used.The results of the study are shown in Figure C-7. The curve on theright indicates the frequency of spills if the outlet tunnel is notused; the curve on the left assumes both the powerplant and the outlettunnel are used. The curve illustrates that the spillway at Watanareservoir would be used approximately once in 10 years.C-52
50 20I I10 8 5 4 3I I I I IRECURRENCE INTERVAL - YEARS2I50,000- NOTESI. CURVES NOT APPLICABLE ABOVE 50,000 CFS.Cflu..~40,000-wC2a:«IuCflCl~ 30,000-3:.J.JCLCfl:::E:J:::E~ 20,000-:::Ea2. NORMAL WINTER DRAWDOWN FOR PROJECTULTIMATE POWER DEMAND.3. OPERAT E TO FILL RESERVOIR ON SEPT 30EACH YEAR.4. MAINTAIN 124,000 AF FLOODSPACE UNTILSEPT 30.DISCHARGE USING SPILLWAY ONLYDISCHARGE OVERSPILLWAY USING 0UPPER OUTLET VALVEWITH QMAX = 30,000 CFS10,000-5,000-00- II I I10 20 30 40 50ANNUAL EXCEEDENCE FREQUENCYIN PERCENTFigure C - 7SPILL FREQUENCYDIAGRAMWAT ANA RESERVOIRALASKA DISTRICT, CORPS OF ENGINEERSANCHORAGE,ALASKAOCTOBER 1978(-53
ECONOMIC ANALYSISCOSTS - THE BASE CASEA detailed construction cost estimate for Watana, Devil Canyon,and the connecting transmission systems is presented in Section B,Project Description and Cost Estimates. It is expected that constructionwill begin in 1984, the transmission intertie would be completein 1991, Watana would be complete in 1994, and Devil Canyon would becomplete in 1998. Total estimated first cost of Devil Canyon andWatana plus the transmission system is $2.588 billion.Interest During Construction (IDC)The interest charged on money expended during the construction periodis considered an additional cost of the construction phase. Simpleinterest is calculated at 6-7/8 percent for each year1s expenditureand added to first cost to establish the investment cost.System Annual CostsExpenditures and IDC made after the October 1994 POL date of Watanaare discounted to 1994. The resultant total investment cost is thentransformed into an equivalent average annual fixed cost by applyingthe appropriate capital recovery factor associated with the 6-7/8 percentinterest rate and 100-year project life.Annual Operations, Maintenance, and ReplacementOperations, maintenance, and replacement costs estimated by APAare added to the average annual costs to obtain a total average annualcost of $228 million. See Table C-18.HYDROPOWER BENEFITSPower Values and Alternative CostsThe power values and alternative costs for use in power benefitcalculations were developed by the San Francisco Regional Office ofthe Federal <strong>Energy</strong> Regulatory Commission (FERC), an agency of theDepartment of <strong>Energy</strong>. A copy of the letter forwarding the power valuesis included in Exhibit C-7. The method of analysis used by the FERCstaff in developing the power values is explained in H droelectricPower Evaluation, by the Federal Power Commission (FPC , dated March 1968.The calculations were based on a 50 percent plant factor for theupper Susitna basin projects. Based on future load estimates, FERCC-54
TABLE C-18ANNUAL COST COMPUTATIONS(in thousands of dollars)Watana Devil Canton Gravit~ DamAccumulated Present Worth Accumulated Present Worti'Year Expenditure Expenditure IDC Expenditure of Expenditure Expenditure IDC of IDC1984 30,500 1,0481985 107,000 30,500 5,7751986 114,000 137,500 13,3721987 159,000 251,500 22,7561988 218,500 410,500 35,7331989 214,000 629,000 50,6001990 248,000 843,000 66,481n 1991 258,000 1,091,000 83,875Ic.n 1992 223,000 1,349,000 100,409 39,000 39,000 1 ,341 1 ,341c.n1993 161,000 1 ,572,000 113,609 98,500 98,500 39,000 6,067 6,0671994 32,000 1,733,000 120,244 117,000 117,000 137,500 13,475 13,4751995 1,765,000 1,765,000 613,902 137,000 128,187 254,500 23,581 22,0641996 144,000 126,070 391 ,500 38,191 33,4361997 158,000 129,428 535,500 43,622 35,7341998 129,500 99,258 693,500 53,505 41 ,010823,000 737,443 823,000 179,782 153,127Watana Devil Can~on Total Watana & Devil CanyonConstruction Cost $1,765,000 $737,443 $2,502,443I.D.C. 613,902 153,127 767,029Investment Cost $2,378,902 $890,570 $3,269,472Interest and Amortization $ 163,761 $ 61 ,307 $ 225,068Operation, Maintenance, andReplacement 2,620 700 3,320Average Annual Cost $ 166,381 $ 62,007 $ 228,388
assumed that the output of the proposed hydropower project would beutilized between the two major railbelt area load centers in the ratioof 80 percent to Anchorage-Kenai and 20 percent to Fairbanks-TananaValley.Power values are provided for two generation alternatives at eachof the load centers. An oil-fired combined cycle plant located nearAnchorage and a mine-mouth coal-fired steam-electric generating plantlocated near the Beluga coal fields are considered as alternatives tohydropower for the Anchorage-Kenai area. For the Fairbanks load center,an oil-fired regenerative combustion turbine plant near Fairbanks anda mine-mouth coal-fired steam-electric plant near Healy are suggestedas the proper alternative power sources. FERC notes that the agency isunable to state that either is the most probable source, despite theoil-fired alternatives appearing less expensive.Whereas in 1975 FPC presented gas-fired generation as a possiblealternative, it is no longer considered a viable option because ofnational policy and, specifically, the National <strong>Energy</strong> Act.The Anchorage area coal-fired power values are based on a twounit, 450 MW plant with a service life of 30 years. The heat rate is10,000 BTU/kwh and the annual plant factor is 55 percent. The investmentcost estimate is $1,240 per kilowatt, while the cost of fuel isestimated at $1.10 per million BTU. Included in the estimate arebaghouse filters and S02 scrubbers at $187 per kilowatt and coolingtowers at $35 per kW. These are July 1978 costs, and neither inflationnor fuel cost escalation are considered.The coal-fired alternative at Fairbanks is a two unit 230 MW plant,also with a 30 year service life. Its heat rate is 10,500 BTU/Kwh andhas a 55 percent plant factor. The estimated investment cost is $1,475per kilowatt and the fuel cost is assumed to be $.80 per million BTU.Included in this estimate are electrostatic precipitators and S02scrubbers at $357 per kW and cooling towers at $44 per kW. Again,these are the costs as of July 1978.Financing for the Anchorage alternative is a combination of 75percent REA and 25 percent municipal. In Fairbanks, the assumption isthat financing would be provided by the <strong>Alaska</strong> Power Authority.The composite capacity value of the coal-fired alternative is$186.58 per kilowatt-year. The corresponding energy value is 12.76mills per kWh. This and other sets of power values are shown in moredetail in Exhibit C-4.C-56
Natural Gas AlternativeIn not providing power values for a gas-fired thermal alternative,FERC indicates its agreement with APA and the Corps of Engineers thatnatural gas is not an appropriate long-term alternative to hydropowerin the Anchorage area. This is in keeping with the National <strong>Energy</strong>Act which prohibits such use in base-load plants with very limitedexception.The strongest argument against the use of natural gas for electricalgeneration is the national energy policy, but limited Cook Inlet suppliesoffer additional rationale. Since the Office of Management and Budgetspecifically commented on the Cook Inlet gas supply situation, updatedinformation has been gathered.The estimated Cook Inlet natural gas balance through the year 2000is presented in Table C-19. The reserve estimates are based on ananalysis entitled "Estimated Recoverable Gas Reserves from Gas Fieldsin the Cook Inlet Area" by the State Division of Oil and Gas Conservation,April 13, 1978. Division analysts believe that more detailedstudy would likely result in as much as a 20 percent increase in theestimate for three fieldso 1/ This correction would result in anincrease of 436 BCF over the 13 April 1978 estimate of 3,776 BCF. Notincluded in the Divisionis estimate are approximately 216 BCF of KenaiField gas that has been leased for reservoir pressure maintenance.This gas will be returned in future years and will be available forsale. The adjusted estimate of recoverable Cook Inlet gas reserves istherefore 4,428 BCF. The <strong>Alaska</strong> Division of Mineral and <strong>Energy</strong> Managementestimates potential additional resources of about 7 trillion cubicfeet; such estimates are speculative with little agreement among experts.Approximately 3,698 BCF, or 84 percent of those reserves arepresently committed to <strong>Alaska</strong>n and export uses. Table C-20 presentsthe estimated reserves and commitments by field. The Pacific <strong>Alaska</strong>LNG contracts, amounting to 952 BCF. have lapsed as a result of failureto gain FERC approval of the project. The approval has been delayedlargely due to the PALNGls inability to gain gas cornmittments sufficientto operate at required scale. PALNG continues to explore forgas in Cook Inlet and eventual FERC approval is anticipated. PALNGexpects the lapsed contracts to be readily reinstated with an extendeddeadline for project approval and some renegotiation of price. ThePALNG lapsed contracts are therefore considered committments for thisanalysis.l! Conversation with staff of the Division of Oil and Gas Conservation,27 September 1978.C-57
There has been an unwillingness on the part of natural gas ownersto enter into contracts for the provision of gas during a period ofrapidly escalating gas prices and great uncertainty regarding gasprice deregulation. Additional commitments are anticipated as thepricing structure stabilizes.In 1976, 34 percent of <strong>Alaska</strong>'s total energy consumption was providedby Cook Inlet natural gas. The uses are detailed in Table C-21.In the same year, 54 percent of <strong>Alaska</strong>'s electrical generation wasprovided by Cook Inlet gas. Natural gas is exported in large quantitiesin the form of both LNG (liquified natural gas) and ammonia-ureafertilizer. Comparing consumption in 1976 with the previous year,natural gas use was up 12 percent with the largest increase, 18 percent,in electricity generation.Projections of natural gas consumption levels between 1980 and 2000were developed in a study for the <strong>Alaska</strong> Royalty Oil and Gas DevelopmentAdvisory Board and the 1978 <strong>Alaska</strong> State Legislature. The report, publishedin January 1978, is entitled Oil and Gas Consumption in <strong>Alaska</strong>,1976-2000. A base case projection of gas demands is presented andpossible departures from the base case are analyzed. Over the entireperiod, natural gas use is forecasted to grow at 2 percent annually.This low rate is attributable to the base case assumptions of prohibitionon the use of gas in new electricity generating facilities "in themid-1980's and only moderate increases in industrial use. As a result,use of gas in 1980 is 238 billion cubic feet, up from 165 BCF in 1976.By 2000 its has risen to 267 BCF, reflecting the fact that most of thegrowth in natural gas consumption is assumed to occur in the nearterm and in the industrial sector.The forecast shows gas use in space heating to be the most rapidlygrowing demand throughout the period at 5 percent. Gas use in electricitygeneration remains essentially constant, while industrial useof gas rises sharply in the near future, but further increases areassumed to be zero because of supply constraints. The base caseassumes population growth of about 3 percent annually, per capitademand somewhat moderated by high energy prices, and no significantnew industrial consumers of large amounts of gas.The sensitivity of the projection to changes in several of theassumptions was tested. All resulted in increased demand relative tothe base case. Two of the possible scenarios are of special interestand appear in Table C-19.One possibility is the continued use of gas in new electricitygenerating units in Anchorage after the mid-1980's. By 1990 thiswould add about 23 BCF annually to gas demands for electric power,C-58
essentially doubling gas use by that sector. This would add 10 percentto total gas requirements in that year and increase the overallgrowth rate in gas consumption from 2 percent up to 3 percent for theprojection period.The active proposal to liquify Cook Inlet natural gas for transportto California is a second scenario of interest. As noted earlier,required FERC approvals have yet to be given, but PALNG continues toactively explore for additional Cook Inlet gas and to plan for constructionof facilities beginning in 1980. This proposal wouldrequire about 80 BCF annually in its initial phase. Were adequatereserves available, this would be essentially doubled to 161.6 BCFannually. Over a period of 15 years (assuming a start in 1985) sucha project would thus require from 1,200 to 2,424 BCF of Cook Inlet gas.Another source of Cook Inlet gas demand forecasts is Natural GasDemand and Supply to the Year 2000 in the Cook Inlet Basin of SouthCentral <strong>Alaska</strong>, a November 1977 report compiled by the StanfordResearch Institute (SRI) for Pacific <strong>Alaska</strong> LNG Company. The SRIforecast is somewhat higher than that previously discussed. Thisdifference is accounted for primarily in the industrial component,where SRI does not limit growth as was done in the 1978 base caseforecast to accommodate anticipated supply constraints. The SRIintermediate forecast is presented along with the other three scenariosin Table C-19.Summing the annual estimates of Cook Inlet demand requirementsfrom 1976 to 2000 results in total estimated requirements of 5,211 BCFin the base case. The addition of Pacific <strong>Alaska</strong> LNG increases theforecast to 6,411 BCF or 7,635 BCF depending on the scope of the operation.The addition to the base case of new gas-fired electrical generationincreases the forecast to 5,743 BCF. The SRI intermediateforecast of total demand over the period is 8,232 BCF, which includesfull scale PALNG, but no new gas-fired generation.Estimated proven Cook Inlet gas reserves are inadequate to meet therequirements in all forecasted cases. The deficit through the year 2000varies from a low of 783 BCF in the base case to 3,804 BCF in the SRIintermediate forecast (see Table C-19). The use of Cook Inlet gas fornew gas-fired electrical generation after 1985 would increase the year2000 deficit by about 532 BCF.There mayor may not be sufficient undiscovered gas reserves in theCook Inlet area to meet the anticipated deficit. Estimates of undiscoveredreserves range from 6-29 trillion cubic feet. Because the CookInlet gas supply has historically far exceeded local demand and becauseC-59
DemandTABLE C-19COOK INLET NATURAL GAS BALANCE1977 to 2000 11(Billion Cubic Feet)LNG to California New Gas Generation SRI(80 BCF/161 in Anchorage (79 BCF IntermediateBase Case BCF Annua lll:) Annuall~ in 2000) Case(A) Estimated Requirements 5,211 6,411/7,635 ?J 5,743 Y 8,232 Y(B) Committed Reserve ~ 3,698 3,698 3,698 3,698(C) Remaining Requirements §j 1,513 2,713/3,937 2,105 4,534nI0'1Suppll:0(D)Estimated RecoverableReserves 11 4,428 4,428 4,428 4,428(E) Uncommitted Reserves ~ 730 730 730 730(F) Undiscovered Reserves ~ ? ? ? ?Balance(G)Deficit (Not IncludingPossible UndiscoveredReserves) .!.Q! 783 1,983/3,207 1 ,375 3,804
NOTES TO TABLE C-19:11 Based on "Oil and Gas Consumption in <strong>Alaska</strong>, 1976-2000," January1978 by the Division of <strong>Energy</strong> and Power Development and theDivision of Minerals and <strong>Energy</strong> Management, Table IV.l. withmodifications explained below.?J Base case requirements plus additional LNG export from 1985 to2000 of either 80 BCF annually or 161 BCF annually.}/ Gas use in new gas-fired electrical generation increases from zeroin 1985 to 79 BCF annually in 2000.if Intermediate case without additional gas-fired electrical generationfrom "Natural Gas Demand and Supply to the Year 2000 in the CookInlet Basin of southcentral <strong>Alaska</strong>," November 1977 by the StanfordResearch Institute for Pacific <strong>Alaska</strong> LNG Company, Table II.~/ See Table 2.§j (C) = (A) - (B)]j See Table 2.f}j(E) = (D) - (B)9/ Estimates range from 6 to 29 trillion cubic feet but are toospeculative for purposes of power planning.(G) = (A) - (0) or (C) - (E)C-61
TABLE C-20COOK INLET NATURAL GAS RESERVES AND COMMITTMENTSFieldSource lJCommitted-(BenTotal Reserves £!(BCnBeaver CreekBeluga RiverBirch HillFalls CreekIvan RiverKenaiLewis RiverMcArthur RiverNicolai CreekNorth Cook InletNorth ForkSterlingSwanson RiverWest ForelandsWest ForkPALNGDOGC, PALNGPALNGDOGCPALNGDOGC, PALNGDOGC1121,0031011,70822876662391 ,05711131011,785 3/ 4/90 - -140 3/17 -912 3/12 -23o208TOTAL3,6984,428NOTES:lJ DOGC is short for "Summary of Gas Sales Contracts, Cook Inlet Area,March 15, 1976" by the Division of Oil and Gas Conservation.PALNG refers to data provided by Len McLean of Pacific <strong>Alaska</strong> LNGCompany in un interview on 4 October 1978.?J The total reserve estimates are taken from "Estimated RecoverableGas Reserves from Gas Fields in the Cook Inlet Area," April 13,1978 by the State Division of Oil and Gas Conservation. The reportwas augmented by information provided by Lonnie Smith, ChiefPetroleum Engineer, DOGC, in an interview on 28 September 1978.~ Includes a 20 percent increase over estimate contained in April 13,1978 DOGC report on the basis of new information avai~able to DOGC.if Includes 216 BCF leased for reservoir pressure maintenance thatwas not included in the DOGC report.C-62
TABLE C-211976 ALASKA GAS USE JjUseFinal Consumption (Heating)Electrical GenerationExtraction and Processing UsesExportsTOTALQuantity (MMCFl16,80429,284137,880 Y87,765 'ij271,733NOTES:.lI Source is "Oil and Gas Consumption in <strong>Alaska</strong>, 1976-2000,"January 1978.~ 26,798 MMCF production related; 111,082 MMCF reinjected, muchof which can be eventually recovered.11 63,509 MMCF for LNG; 24,256 MMCF for ammonia-urea.C-63
until recently there has been no substantial export market, the CookInlet area has not yet been extensively explored for natural gas.Despite the possibilities, the speculative reserves are inappropriatefor consideration in power planning. Regardless of availability, however,the worldwide competition for natural gas will escalate the priceof gas to levels which will likely make new gas-fired base load generationuneconomic in the face of large available supplies of coal andhydropower potential.Oil-Fired Generation AlternativeAs noted previously, FERC provided power values based on both oilfiredand coal-fired generation for both Anchorage and Fairbanks. TheNational <strong>Energy</strong> Act generally prohibits the use of oil as fuel in newlarge-scale base load generating plants. The act also includes, however,several provisions under which a utility may be exempted from the restrictionson use of oil. Under the law, companies may be exempted from thefuel-switching requirement for new plants if they can prove it wouldbe overly costly, environmentally unsound, or impossible because ofinsufficient or unavailable supplies of coal or other fuels at theplant's location.Proposed regulations to implement the coal-conversion portion of theenergy bill have been issued by the Department of <strong>Energy</strong>. 1/ To gainan exemption on cost grounds, for instance, a company would have toprove that a coal or alternate fuel plant was much more expensivethan the oil or gas plant. Under the proposed rules, coal plantscosting 30 to 80 percent more than oil or gas plants would not necessarilybe considered too costly to avoid mandatory conversion. Basedon the FERC-provided power values, annual costs for coal-fired generationare approximately 40 percent higher than for oil-fired. Thisis based on a 50 percent plant utilization factor and includes capitalexpenses as well as the costs for operation and fuels.To gain an environmental exemption under the proposed rules, companieswould be required to produce decisions from the EnvironmentalProtection Agency or State agencies proving that coal plants would beenvironmentally unacceptable. Although some proposed plant sites in<strong>Alaska</strong> are extremely sensitive, such as at Healy adjacent to Mt. McKinleyPark, there is no evidence that acceptable sites cannot be found.To gain an exemption based on fuel availability at a plant'slocation, a utility would have to show it fully considered a range ofalternative sites, including sites outside the utility's traditionalservice area. The substantial proven coal resources at both Healyand Beluga argue against using this rationale in seeking an exemption.l! As reported in the Wall Street Journal, November 14, 1978, P 14.C-64
To gain an exemption based on an inability to raise capital, acompany would have to show that the added capital needed to burn coalor alternate fuels, instead of oil or gas, equals 25 percent or moreof the annual average capital budget.In writing these regulations, it is clear that the administration'sintent is to severly limit the scope of exemptions and place a heavyburden of proof on utilities seeking an exemption. Based on the proposedregulations, it would appear that rail belt utilities would have adifficult time obtaining exemption for new base load plants. The <strong>Alaska</strong>Power Administration, Department of <strong>Energy</strong>, agrees with this assessment.The APA Administrator, Robert J. Cross, writes that "(APA's) finding isthat exemptions don't seem all that permanent or pertinent in terms ofa large new hydro project coming on line in 1992. I just don't see thelogic of the oil assumption in benefit determinations for lOO-years ofpower from a major new hydro project." 1/ Also agreeing that oil is aninappropriate alternative for benefit calculation is the State's <strong>Alaska</strong>Power Authority. The Power Authority's Executive Director, Eric P. Yould,states that, "oil-fired generation for the rail belt area may not be acceptableeither for legal and regulatory reasons or from the standpoint offuel availability." 2/ He notes further that Golden Valley ElectricCooperative at Fairbanks recently analyzed the coal versus oil-firedgeneration question. GVEA has determined that the coal-fired generationalternative is preferable to oil if capital costs are not prohibitive.The full text of both pieces of correspondence are containedin Exhibit C-7.Based on the foregoing, coal-fired generation has been selectedas the most likely and appropriate alternative against which to comparethe Susitna hydroelectric proposal. Coal is therefore the basis forthe base case benefit calculations. Oil-fired generation is addressedin the sensitivity analysis.Derivation of Power Benefits - The Base CaseAnnual power benefits were computed by applying the unit value ofcapacity and energy to the usable output of the hydropower project.Benefits were computed for each year of the lOO-year economic life ofthe project and were then discounted to the base date to determine thecombined present worth. The base date in all cases is the power-onlinedate of the Watana project. The prescribed Federal discountrate of 6-7/8 percent was used. The last step of the calculations1/~/Robert J. Cross, Administrator, <strong>Alaska</strong> Power Administration in amemo to FERC dated 9 November 19780Eric P. Yould, Executive Director, <strong>Alaska</strong> Power Authority in aletter to Colonel George Robertson dated 17 November 1978.C-65
entailed the conversion of the present worth value to an equivalentaverage annual benefit, again using the 6-7/8 percent discount rate.The results of the computer-aided calculations are shown in Exhibit C-5.For the base case, which included coal-fired power values, themedian load forecast, power-on-line dates of 1994 and 1998 for thetwo stages of development, transmission line completion in 1991, publicinon-Federal financing of the thermal alternative, and stable prices,the average annual power benefits are estimated at $289 million. ForWatana alone, the corresponding figure is $158 million.OTHER BENEFITSRecreationRecreation-day values for 1978 were researched in order to checkthe need for changing the values as originally reported in the 1976Interim Feasibility Report. A review of other projects such as theChena Lakes Project at Fairbanks indicated that the former values aretypical of 1978 visitor-day recreation values and remain unchanged.Therefore, the average annual benefit for recreation is $300,000.Flood ControlThe extent of damage prevention from downstream flooding remainsunchanged. The dollar value of those losses has been adjusted toreflect the time elapsed since the original estimate. The annualbenefits for flood control are $65,000.EmploymentWhen otherwise unemployed labor resources are used in the constructionof a project, the economic cost of those resources is less thanthe prevailing wage rate. Conceptually, this adjustment can be madeeither by an appropriate reduction to the project's cost or by anincrease in project benefits. The latter approach has been adopted byCorps of Engineers regulations.The labor area for this project is to be Anchorage and Fairbanks.The proposed project will be located in an unpopulated area and willdraw heavily from these two population centers. <strong>Alaska</strong> is designatedby the U.S. Department of Labor as an area of substantial and persistentunemployment.The present labor force in the Anchorage/Fairbanks area is 114,800,with approximately 12,534 in the construction industry. With anaverage 10,443 unemployed, approximately 25 percent or 2,610 areconstruction labor. The possibility of a gas pipeline project and theC-66
capita 1 rel ocati on wi 11 affect the avail abil ity of otherwi se unemployedworkers to the Susitna project. The adjustment depends on whetherthese projects occur prior to or concurrent with the Susitna project.During the oil pipeline construction a preferential hire law wasin force which directed pipeline contractors to hire qualified <strong>Alaska</strong>residents in preference to nonresidents. The <strong>Alaska</strong> Department ofLabor reports that during construction of the oil pipeline the averagepercent of manpower requirements drawn from within <strong>Alaska</strong> was 40 to50 percent. The proposed upper Susitna hydro project is much smallerthan was the oil pipeline project. It is thought that an 80 percentlocal hire goal could easily be met. The proposed gas pipeline projectis planned to begin in the early 1980's and completion is anticipatedbefore Susitna construction begins.Estimated yearly manpower expenditures for construction of the DevilCanyon and Watana dams and the transmission line are shown in TableC-22. These figures were derived by estimating the labor cost associatedwith each major feature of the project, net of contingencies. Overall,38 percent of project costs are estimated to be labor expenses.TABLE C-22MANPOWER EXPENDITURES($1,000)PercentYear Sk ill ed Unskilled Total of Total1984 8,307 2,077 10,384 1.21985 28,378 7,094 35,472 4. 11986 30,454 7,614 38,068 4.41987 42,221 10,555 52,776 6.11988 58,140 14,535 72,675 8.41989 57,448 14,362 71,810 8.31990 66,446 16,611 83,057 9.61991 69,214 17,304 86,518 10.01992 69,906 17,477 87,383 1 0. 11993 69,214 17,304 86,518 10.01994 40, 144 10,036 50,180 5.81995 36,683 9, 171 45,854 5.31996 38,760 9,690 48,450 5.61997 42,221 10,555 52,776 6.11998 34,607 8,651 43,259 5.0692,143 173,036 865,179 100.0C-67
Approximately 6 percent of these labor expenses are attributable tothe contractors' supervisory and managerial functions. Of the remaining$813 million labor costs, 80 percent are expected to be paid to locallyhired labor. Of this total an estimated 20 percent or $130,000,000will be for unskilled labor, while 80 percent or $521,000,000 will befor skilled labor. Following the recommendations of Draft ER 1105-2-354,the proportion of labor costs claimed as employment benefits for skilledand unskilled categories are 40 percent and 55 percent respectively.Using an interest rate of 6-7/8 percent, each year's benefits arepresent-worth to POL. Then, using the summation of all years, theappropriate capita1 recovery factor is applied to obtain the annualemployment benefit for each category of workers (skilled and unskilled).The annual skilled labor benefit is $17,562,000 and the annual unskilledlabor benefit ;s $6,037,000. Thus, the total employment benefit for theSusitna project is $23,599,000.Similar procedures have been applied to the coal-fired and oil-firedgeneration alternatives to estimate their respective employment benefits.This is in keeping with Draft ER 1105-2-354 which directs that employmentimpacts of each alternative plan are to be assessed. The estimatedlabor portion of the total project cost was calculated using FERC investmentcost data and labor percentages for the planned Healy II coal-firedplant. At a composite (Anchorage-Fairbanks) investment cost of $1,287per kilowatt, the total cost of coal-fired plant construction, equivalentin output to the Susitna project, is $2,060,487,000. This total amountwas scheduled over the planning period to reflect capacity additionsindicated by the load-resource analysis medium range case.According to Stanley Consultants, the engineering firm that hasdeveloped the plans for Healy II on behalf of Golden Valley Electric,approximately 40 percent of construction costs are payments to labor. 1/Using the same proportion of skilled and unskilled labor as was usedwith the hydro project calculations and the same discounting procedures,the average annual equivalent employment benefit for the coal-firedgeneration alternative is $19,635,000. 2/ The comparable figure forthe oil-fired alternative is $5,203,000~ These estimates are presentedfor rough comparison only since they do not reflect a detailed studyof labor requirements for thermal plant construction. Since, on average,a more skilled workes is required for construction of the thermal plantand since such a worker would probably not be available locally, thethermal alternative employment benefit estimate is probably somewhatoverstated.1/ Per conversation with Stanley Consultants, 20 December 1978.~ This amount incorporates a 20 percent reduction to account forcontingency factors in the cost estimates, thus insuring comparabilitywith the hydro project.C-68
The thermal alternatives are procedurally defined to have powerbenefits equal to plan costs. The crediting of employment benefits,therefore, results in the thermal alternatives each having positive netbenefits equal in magnitude to the employment benefit.Intertie BenefitsThe original feasib-ility report discussed the value of interconnectedload centers made possible by the construction of a transmissionline between Anchorage and Fairbanks. It was noted that intertiebenefits arise from two aspects of interconnection, shared reservesand energy transfer.The load-resource analysis has demonstrated that capacity additionscan be postponed as a result of reduced reserve requirements in an interconnectedsystem. Since the reserve margin effectively increases theamount of generating capacity in place at any given time, it contributescosts to the system. Therefore a reduction in that reserve marginwill reduce cost. Realizing that a more refined analysis of desiredreserve margins will be needed at a later date, APA now estimates thata 25 percent margin would be required without interconnection whileonly 20 percent reserves would be needed with interconnected load centers.These estimates are based largely on the experience in other market areas.The flexibility afforded by the transmission line decreases as the1 i ne becomes loaded with Sus itna power. The reserve reducti on capabi 1 ityis limited by the unused portion of the line segment with the leastcapacity - that portion from Devil Canyon to Fairbanks. When the lineis completed and before Watana power production beg"ins, a full 300 MWcapacity is available in the line. 1/ This is reduced as time goeson by the amount of Susitna capacity allocated to the Fairbanks loadcenter. The capacity savings due to interconnection for each year,then, is the lesser of unused line capacity and the 5 percent reservedifferential applied to the total peak load requirement. This isshown graphically in Figure C-8, and the results are presented inTable C-23. Each year's capacity saving is valued at the capacityvalue of a coal-fired steam plant as provided by FERC, $170 per kW.The values are discounted at 6-7/8 percent to give the present worthas of the Watana power-on-line date. The lOO-year capital recoveryfactor is then applied to the summation to give the equivalent annualcapacity benefit from interconnection.This figure is not an absolute maximum capacity, but rather areasonable limit for the Devil Canyon-Fairbanks segment based onacceptable line loss.C-69
Figure C-8TRANSMISSION LINE CAPACITY CREDIT:5 00 - - - - - - - - - - - --2001I1~~«~«l!>W1 __ - __II L ______________ I1 __ 1--1--'~100/'--,-O'~----~----~--~~~--~~~----~~--~~---r--~-r~--~----1991 92 93 94 95 96 97 98 99TIME IN YEARS2000------Unused Capacity5 % Reserve Di fferenli al A pplied To TotalPeak Load Requirements.C-70
TABLE C-23INTERTIE CAPACITY BENEFITSCapacity Capacity PresentYear Saving Value Worth(MW) ($1 ,000) ($1 ,000)1991 90 15,300 18,7001992 96 16,300 18,6001993 101 17 ,200 18,4001994 107 18,200 18,2001995 114 19,400 18,2001996 121 20,600 18,0001997 128 21 ,800 17,9001998 30 5,100 3,9001999 through 2041 12 2,000 27,300Total ($1,000) $159,200Annua 1 Benefit ($1,000) $ 10,959The other aspect of interconnection discussed in the originalfeasibility report was the capability for transfer of energy from thelow energy cost producing load center to the high cost area. Thetransfer allows a cost saving equal to the differential cost of energyproduction for the amount transferred. Estimates in 1975 indicatedthat energy could be transferred from Anchorage to Fairbanks for acost saving of 2.48 mi 11 s/kWh. The 1978 estimates by FERC indicatethat coal will be cheaper in Fairbanks than in Anchorage with theresult that Fairbanks energy would be 2.65 mills/kWh cheaper than thatproduced by coal plants in Anchorage. This reversal in 3 years highlightsthe volatility of this cost differential. For instance, if newcoal plants had to be located at some distance from the Healy coalfields due to their proximity to Mt. IVlcKinley National Park's clean air,the additional cost for transporting the coal would essentially eliminateany energy cost differential. Therefore, although the opportunityremains to take advantage of energy cost differentials through thetransfer of energy, no energy transfer benefits are claimed because ofthe possibility that energy production costs in the two load centersmight well be almost equal.PLAN JUSTIFICATION - THE BASE CASEA summary of project costs and benefits for the proposed two stagedevelopment as well as for Watana alone are presented in Tables C-24and C-25. The base case set of assumptions applies.C-7l
TABLE C-24DevelopmentWatanaWatana and Devil CanyonAVERAGE ANNUAL COSTSInterest &Amortization($1.000)163.761225.068o. r~ & R($1 • 000)2.6203.320Total (Rounded)($1 .000)166.381228,388TABLE C-25AVERAGE ANNUAL BENEFITSWatana Watana and Devi 1($1.000) ($1 .000)CanyonPower 163.958 288.700Recreation 100 300Flood Control 65 65Intertie 10.959 10,959Employment 18.654 23,599Total 193.736 323.623Benefits and costs are compared in Table C-26.TABLE C-26PLAN JUSTIFICATIONWatanaWatana andDevil CanyonDevil CanyonLast AddedAnnual Costs ($1.000)Annual Benefitis ($1.000)Net Benefits ($1.000)Benefit Cost Ratio166,381193.73627.3551. 16228,388323,62395.2351. 4263,007129.88767,8802.09C-72
These figures indicate that, given the base case assumptions, theWatana-Devil Canyon system is economically justified; the Watanaproject first added is economically feasible by itself; and DevilCanyon is incrementally justified on a last added basis.SENSITIVITY OF PROJECT JUSTIFICATIONThis section presents the results of various sensitivity testsconducted to determine the impact on the project's economic justificationof possible departures from the basic set of assumptionsthat underlie the calculation of benefits and costs. Each test wasconducted using the same procedures as described earlier in thissection, but with certain specific assumptions altered as outlined inthe following paragraphs.Comparability TestThe power values for the base case are computed using the mostlikely means of financing the various thermal alternatives. Theseincluded municipal, REA, and <strong>Alaska</strong> Power Authority financing. Thistest examines project justification when the power values are calculatedon the basis of thermal alternative financing at the same rate appliedto the hydropower alternative, the Federal discount rate of 6-7/8 percent.Using power values based on Federal financing, the average annualpower benefits are $264 million, a decrease of 9 percent. The hydroproject costs and nonpower benefits are already based on the Federaldiscount rate and therefore remain unchanged. The effect on projectjustification is noticeable; net benefits fall from $95 million to $71million, while the justification ratio becomes 1.31.With Federal financing, Watana alone offers net benefits of $14million and a justification ratio of 1.08.Alternate Discount RatesThe rate at which future project benefits are discounted and atwhich interest during construction is calculated can affect the comparisonof projects. The discount rate to be used in the evaluationof Federal water resource projects is established annually and ispegged to the interest rate on long-term government bonds. This servesas an approximation of the opportunity cost of Federal funds. Theestablished rate has risen to the current value of 6-7/8 percent,reflecting the influence of inflation.In order to determine the magnitude of impact a different discountrate would have on the project's economic justification, benefits andC-73
costs were recalculated using interest rates lower and higher than theestablished rate. With a discount rate of 5 percent, annual costsdecline while benefits increase. Net benefits rise from $95 millionin the base case to $180 million, and the benefit-cost ratio becomes2.14. With an 8 percent rate, the effects are reversed. Net benefitsfall to $42 million with a benefit-cost ratio of 1.15. Refer to FigureC-9. It can be concluded that the project's economic justification issensitive to changes in the discount rate. The effects would be dampered,however, if the costs of the alternative generation mode were similarlycalculated using the alternate rates.200Figure C- 9P LAN JUST I FI CATION,ALTERNATE DISCOUNT RATESenz0:J...Ji-(/)I-Li:wzWIX!I-Wz150100~o6YaDISCOUNT RATE (%)8C-74
Variations in the Load Forecast and Project TimingThe base case set of assumptions incorporates the mid-range loadforecast because it has been judged to reflect the most likely futurepower requirements. The actual demand for electrical power, however,will almost certainly depart from the mid-range forecast, and it isimportant to determine how such departures can effect the viability ofthe project. A significant departure on the low side could have severalresults. The first, and most likely, would entail a planned delay inthe start of project construction when it became apparent that the loadwas not growing as rapidly as expected. Another possibility would bethat the departure from anticipated growth only becomes apparent afterconstruction has already begun. In this case, the construction periodwould be stretched out so that the project is not completed until theproject's power is needed. A third possibility would be to postponeor cancel other generating resource additions with shorter lead times.The last and potentially most damaging possible circumstance wouldentail the sudden slackening of load growth immediately after the projectwas completed.If, on the other hand, the load requirements grow more rapidlythan expected, Susitna power would be needed earlier than presentlyplanned. The Watana project, however, probably cannot be completedany earlier than the planned 1994 power-on-line date, and the DevilCanyon project cannot be completed earlier than 4 years after Watana.To assess the impacts of these various circumstances, the loadresourceanalysis was conducted using the low and high range forecasts.With the low range forecast, the initial project continues to be requiredas soon as it is available, ie., 1994. A coal-fired steam plant additionin 1997 is no longer needed, but Devil Canyon is still required in 1998.The net effect is that Susitna capacity is absorbed at a slower rate,and power benefits fall 3 percent to $280 million. Net benefits become$87 million and the benefit-cost ratio is 1.38.As noted above, the most damaging possibility in terms of projecteconomics would occur if there was a sudden decrease in the rate_of loadgrowth immediately after power-on-line. This would mean that Susitnapower would be needed less rapidly, and less Susitna capacity wouldbe usable in the early years. In the base case, Susitna power is fullyabsorbed in the railbelt system by 2002. The annual growth rate inpeak load during the period between power-on-line and 2002 is 4.6 percent.In the low-load growth case, Susitna power is absorbed over alonger period, between 1994 and 2010. The annual growth rate in peakload for this case is 1.9 percent. Additional cases were analyzed todetermine how low the growth rate would have to be before the powerbenefits declined to the point that the project would no longer beC-75
economically justified. The annual rate of growth in peak load requirementswould have to suddenly fall to 0.8 percent and remain at thatrate indefinitely before project costs would exceed benefits. Withload growth dependent upon both population and per capita use changes,there is no evidence to suggest that such a low growth rate is reasonable.Despite the greater peak load requirements of the high range forecast,there is no opportunity to advance project construction since theprojects cannot be brought on line prior to 1994 and 1998.Using the high-range load forecast results in more rapid utilizationof Susitna power and an increase of $12 million in net benefits. Thebenefit-cost ratio becomes 1.47.Construction DelaysThe base case analysis is ,predicated on a l4-year combined constructionschedule. Watana construction is planned to take 10 yearsand Devil Canyon 8 years. There is overlapping construction to meetload requirements.Construction delays are possible for any of a number of reasons.Project economics have been analyzed to assess the impact such delayswould have on project justification. A 2-year construction delaywas adopted for analysis. The effect of the delay is to postponepower-on-line and increase interest during construction. If fossilfuel costs are escalating, the delay also increases the value of powerproduced. With stable prices, a 2-year construction delay causes annualcosts to rise to $245 million and net benefits to fall to $75 million,with a benefit-cost ratio of 1.31. It would require a delay of at least9 years before the Susitna project's net benefits would fall as low asthose of the coal-fired alternative.Alternate Investment Cost Estimates for Coal-Fired PlantsThe <strong>Alaska</strong> Power Administration has provided independent estimatesof coal-fired generation costs that serve as useful comparisons tothose estimates provided by the Federal <strong>Energy</strong> Regulatory Co~nission.APA data primarily reflects experience in the lower 48 states withadjustment to reflect <strong>Alaska</strong> price levels, smaller sized plants, andconstruction conditions. The basic reference is the Comparative Studyof Coal and Nuclear Generation 0 tions in the Pacific Northwest, June1977 by the Washington Public Power Supply System WPPSS .APA's estimate is premised on powerplant locations near miningoperations at Beluga and Healy. Plants of 200 MW and 500 MW areexamined. The investment costs, which include construction and interestC-76
during construction assume that flue gas desulpherization would berequired. Mid-1976 costs from the WPPSS study were increased toOctober 1978 using the Handy-Whitman Steamplant cost trends and a 1.8<strong>Alaska</strong> factor to account for cost differentials. The resulting compositeinvestment cost estimate of $1,644 per kilowatt for the 450 and230 MW plants in Anchorage and Fairbanks respectively was used in thecalculation of power values in lieu of the FERC composite estimate of$1,299 per kilowatt. This resulted in an increased capacity value.See Exhibit C-4. Using the adjusted value results in a $40 millionincrease in the power benefit. Net benefits rise to $135 million, andthe benefit-cost ratio becomes 1.59.Oil-Fired Thennal Alternative, As discussed in a previous section, oil-fired generation is not themost appropriate alternative for derivation of power values. Nationalenergy policy priorities strongly suggest that coal-fired generationis the likely and proper alternative to hydropower in the mid-1990'sand beyond. Since oil-fired power values were provided by FERC alongwith coal values, however, and since the Office of I~anagement andBudget raised questions specifically addressing the sensitivity ofproject justification to oil prices, power benefits were also calculatedusing oil-fired power values.In Anchorage, FERC reports that the likely oil-fired alternativeis a combined cycle plant consisting of four units of 105 MW each.The service life is 30 years, and the heat rate is 8,350 BTU/kWh. Theinvestment cost is estimated at $360 per kilowatt, while the oil fuelcost is $3.00 per million BTU.For Fairbanks, the oil-fired alternative is a regenerative combustionturbine with four 60 MW units. The service life is again 30years, while the heat rate in this case is 10,000 BTU/kWh. The investmentcost is $265 per kilowatt, and fuel is estimated at $2.00 permi 11 i on BTU.The composite railbelt oil-fired power values with public, nonFederal financing are $43.95 per kilowatt and 26.92 mills per kilowatthour. Power benefits amount to $212 million which is 27 percent lessthan the base case. The corresponding benefit-cost ratio is 1.08, withnet benefits of $18 million.C-77
InflationThe economic evaluation procedures normally followed in Federalwater resource studies ignore the effects of inflation and escalation. 1/The implicit assumption is that price level changes will impact equallyonall alternatives being compared. In time of relatively stableprices, this is a reasonable simplifying assumption.Ever since the 1930's, however, there has been an acceleratingrise in costs in the United States. Nationwide, the annual increasein construction costs from 1970 to 1976 approximated 10 percent. TheAnchorage composite consumer price index has increased at an annualrate of 4 percent since 1960 and at almost 7 percent since 1970. Inspite of possible temporary periods of price stability, it appears thatsubstantial inflation may become a regular aspect of the economic scene.The extent and persistence of inflationary trends indicates the needto examine their effect on the comparison between hydroelectric andthermal generation.Inflation does not affect hydro and thermal alternatives equallybecause there is a differential susceptibility to rising prices. Theextent of these differential impacts is determined by adjusting thecapacity and energy values as well as the hydro project costs to accountfor inflation. A distinction has to be made between interest andamortization costs on the one hand and all other charges on the other,because the affect of inflation on these two categories of expenditureis quite different. The latter category is addressed first.A multiplier is developed for adjustment of annual charges associatedwith operating costs, fuel costs, insurance, interim replacements, andtaxes. Expenditures for these items are continually susceptible torising prices. The initial annual expenditure associated with thesecost components in the base year is the value used in the standardmethod of computing power values. With inflation, a higher figuremust be used, since the annual expenditures increase from year toyear. The assumed rate of inflation, the duration of the assumedinflation, and the discount rate together determine how large the increasewill be. The appropriate adjustment multiplier is found by computingthe sum of the present values of the inflated payments, and dividingthat by the sum of the present values of the yearly payments withoutinflation. The resulting quotient is the multiplier by which thefixed initial payment of the standard method must be adjusted to takeinflation into account.Throughout this report, lIinflation" refers to increases in thegeneral price level, while lIescalation" refers to real price changesor changes over and above increases in the general price level.C-78
For this analysis, inflation is assumed to prevail for a periodof 15 years beyond the initial project's power-on-line date. Thisperiod of inflation is assumed to be followed by a period of stableprices to the end of the 100 year economic life of the project. 1/Inflation rates of 3 and 5 percent have been adopted as reasonablevalues with which to explore the magnitude of inflationary impact. Thecorresponding annual expenditure multipliers for a discount rate of6-7/8 percent are 1.34 and 1.64.The second type of cost to examine is the interest and amortizationcharge. During the life of a hydroelectric project, an alternativethermal plan with a life of only 30 to 35 years will have to be replacedat least twice. Each time it is replaced, its cost will have risenin keeping with the compound rate of inflation. The multiplierreflecting the increase in these capital expenditures resulting frominflation ;s found by dividing the present worth of the interest andamortization with inflation affecting future replacements by theirpresent worth without inflation. Again, inflation is confined to thefirst 15 years beyond power-on-1ine with stable prices assumed thereafter.The multipliers are 1.08 for 3 percent inflation and 1.15 fora 5 percent rate.TABLE C-27INFLATION ADJUSTMENT MULTIPLIERS(6-7/8 percent discount rate, 30 year thermal plantlife, 15 year period of inflation)Cos t CategoryVariable CostsCapital ExpensesInflation Rate3% 5%1.341.081.641. 15These multipliers are then applied to the various cost componentsof the power values and to the elements of the hydro project cost asshown in Exhibit C-4. Note that the multiplier for interest andamortization of the hydro project is unity. This occurs because thehydro project does not have to be replaced during the period of analysisand is therefore not susceptab1e to inflating prices.l! Inflation in the years prior to power-on-1ine is ignored becausethere is little differential inflation impact before costs areactually incurred. Battelle in <strong>Alaska</strong>n Electric Power, March 1978,page 6-3, reports that prices for thermal powerp1ants have risensince 1970 at almost exactly the same rate as that for hydroelectricfacil ities.C-79
Fuel EscalationIn deriving power values for use in benefit analysis, FERC usespresent day costs for the fuel requirements of the thermal plant. Evenafter inflation is taken into account, this procedure is not equitablein a period of sUbstantial fuel cost escalation, when fuel pricesrise faster than the general price level. Whereas a hydro developmentwill continue to produce its energy from falling water without cost,a thermal plant depends on fossil fuels that are susceptible to realprice increases as well as to inflationary trends. Depleting supplies,intensified environmental controls, cartelized production, and theneed to go further and deeper for supplies all tend to boost pricesat rates higher than inflation.Fuel Oil: As a practical matter the world oil market is controlledby the Organization of Petroleum Exporting Countries (OPEC). The OPECcartel pricing strategy appears to be based on their perception of themarginal costs of production of their nearest competitor. This policyis intended to maximize their long-term profits. 1/In the future OPEC's most probable strategy (assuming the cartelcan be sustained and no other super-giant oil fields are found oralternative lower cost technologies are developed) will be to escalateits prices paralleling the market rate of interest occurring in itswestern world market area. The market rate of interest sets the basisfrom which OPEC can measure its opportunity cost and escalates atapproximately 3 percentage points higher than the general inflationrate as measured by the GNP deflator. Thus for a general 5 percentper annum inflation rate, the OPEC oil price increase rate would beexpected to be about 8 percent per annum.If Mexico enters the continental market as a major source, it willprobably shave prices slightly to gain market entry by displacingMiddle East crude, but then generally trade at OPEC's world marketprice.Another possibility is the collapse of the OPEC cartel. Iran andSaudia Arabia, the largest oil producers in OPEC, are committed alongwith many other OPEC nations to rapid economic development programs.These programs are dependent upon oil export revenues for their funding.Under the umbrella of OPEC's pricing policy, there is opportunityand strong incentive to develop substantial new productive capacityboth within and outside the cartel. The increase in capacity imposesThis discussion of fuel price behavior is based largely on a March1978 report by Battelle Pacific Northwest Laboratories entitled,<strong>Alaska</strong> Electric Power, An Analysis of Future Requirements and Supplyfor the Railbelt Region and on discussions with Ward Swift of Battelle.C-80
downward pressure on prices. To offset this pressue and maintain thecartel price, production must be cut back somewhat; principally thiswill fallon the largest producers, Iran and Saudia Arabia in this case.Thus they are caught in a d"ilemma between a decl ining market shareand the need for export earnings for developmental programs. Thissituation could lead to price wars to regain market shares and thusthe collapse of OPEC as an effective cartel.Price cutting has a theoretical floor - the marginal cost ofproducing the level of output demanded at such a market price. Thiswould likely be determined by Mexico, the North Sea producers and thecosts of increased production in Iran. All of the conditions contributingto the initial cartelization would still be present, a highlyconcentrated market and very inelastic commodity demand. Thus acollapse might only be temporary and under this scenario, world pricescould become rather volatile.Given the many vested (U.S. and foreign) interests in maintainingoil prices, a major downward break in oil prices is not likely. As acase in point, if Saudi Arabia went back to pre-1973 prices, and couldsatisfy demand, (not likely at those prices) both North Sea and NorthSlope production could be shut in.Given that scenario and without governmental intervention, U.S.and other nations' dependence on foreign oil would increase markedly,domestic exploration and field devel~pment would be severely cut back,and consumption would increase. Although existence of contingencypolicies to respond to such a case are unknown, it is hard to visualizethat very rigorous governmental intervention would not occur eitherthrough import quotas or duties that would maintain the economicviability of the domestic industries.In 1977, the domestic refinery acquisition cost of domestic crudewas about 35 percent less than that of foreign crude ($9.20 per bblversus $14.10 per bbl). A price decline of greater than 35 percentis deemed highly unlikely for the reasons outlined above.Coal: Coal prices in <strong>Alaska</strong> appear much more predictable due tothe absence of regulation and the currently limited influence ofmarketability factors.Two sources of coal supply for the rail belt region are most pertinentto this analysis:1. The Healy coal field is currently being mined by the UsibelliCoal Company at about 700,000 tons/year with plans for expansion to1.5 million tons per year. This mine currently supplies the GoldenValley Electric Association (GVEA) plant located at Healy and theFairbanks Municipal Utility System in Fairbanks.C-81
2. A potential future coal source is the Beluga field in the CookInlet region. The latter field is known to contain very substantialreserves but the new mine development required will be costly due tolack of transporation facilities and mine supporting infrastructure.The Healy coal field is the obvious supplier for future interiorgeneration based on coal. Recent cost of coal delivered by truck tothe GVEA Healy plant is $0.80/MMBTU and by rail at Fairbanks, $1.15/MMBTU. 1/ Although the Healy site may be able to expand to perhaps 200MW capacity, its location 4.5 miles from Mt. McKinley l~ationa1 Parkmay restrict further development due to air quality considerations.Thus further coal fired expansion in the upper rail belt most probablywill necessitate plant location in the Nenana area along the railline. In this case, additional costs above mine mouth costs, willbe incurred including tipple costs (approximately $0.11 per MMBTUcurrently) and <strong>Alaska</strong> Railroad tariffs. The latter may be reduced ifunit trains were to be employed.The Usibelli Coal Mine, Inc. has indicated that they expect theirprices to rise at about 7 percent per annum. This pricing scheduleappears reasonable if it is assumed that a 5 percent per annum generalinflation rate continues and a 2 percentage point markup escalationis appropriate for the resource owner.The Beluga/Susitna coal field is an obvious source of supply forcoal fired generation. The reserves are very large and capable ofsupporting a world scale mine for export and mine mouth power generation.The coal is subbituminous (Rank C) and of relatively low heating value(7,100 BTU/lb) at run-of-mine but quite low in sulfur (0.15 percenttypical). Coal preparation including washing and drying could raisethe heating value to 9,000 BTU/lb. Some of the coal will be of toolow a quality for export but would nevertheless be suitable for moinemouth power generation.Fuel Cost AssumptionsTo calculate the impact of relative changes in the price of fuelson project feasibility, adjustments are made to the power valuesupon which the calculation of power benefits is based. The periodfrom 1978 to the initial project power-on-1ine date is looked atseparately from the period after POL. For the initial period, theestimated 1978 fuel price is compounded at the assumed annual escalationrate to give the anticipated constant dollar fuel cost at thetime of power-on-line. The energy and capacity values are then recalculatedusing standard FERC procedures. For the post-POL period, amultiplier is used to adjust the energy value using procedures identicalto those used to adjust for inflation. The period of escalation islimited to the years prior to the 30th year after power-on-1ine.Thirty years corresponds to the service 1 ife of the initial thermalplant.1/ September, 1978C-82
Three sample cases are analysed. First, for both coal and oil,there is an assumption that fuel costs escalate at 2 percent per yearbetween 1978 and the 30th year after power-on-line, after which thereis no additional escalation. The 2 percent rate is selected as representativeof long-term real price increases arising from depleting,more distant sources, increasing environmental safeguards in extraction,processing and handling, and anticipated producing nation pricingpolicy. (Refer to the previous discussion of fuel price trends.)The second case looks at no escalation prior to power-on-linefollowed by a 3D-year period of 2 percent annual escalation. This caseis designed to reflect the possibility of a near-term softening of themarket for oil due to slackening demand or increased supply in theshort-term.The final case explores the impact of real oil price declines priorto power-an-line. An immediate 35 percent drop in price is assumed,with no change in price thereafter. This scenario is included to showthe possible effect on project justification of a breakup of the OPECcartel. Exhibit C-4 shows how these various adjustments are made tothe energy value provided by FERC.Test ResultsThe results of the sensitivity tests for inflation and escalationare presented on Figures C-10 and C-ll. Two percent annual escalationin the price of coal results in a 55 percent increase in net benefitsand the benefit-cost ratio becomes 1.64. In the most extreme coal-firedcase, 2 percent fuel escalation with 5 percent inflation, the benefitcostratio rises to 2.17. The worst case analyzed in terms of projectjustification is with the oil-fired alternative and a sudden 35 percentdrop in oil prices. The resulting benefit-cost ratio is 0.85.SummaryIn summary, it has been shown that the benefit-cost ratio is sensitiveto the source of financing, to the discount rate, to the type ofalternative generation, to construction delays, and to inflation andfuel cost escalation. It is relatively insensitive, on the other hand,to variations in load requirement forecasts. Under the full range offorecasts, Susitna hydropower is needed as soon as it is available.Despite the sensitivity of project economics to many of theseparameters, the degree of sensitivity is not sufficient to make theproject uneconomic, except in one case. Only if oil-fired generationwere to be considered the appropriate long-term alternative to hydropowerand if the price of oil were to suddenly fall drastically as aresult of world market forces would net benefits of Susitna hydropowerdevelopment be less than those of the thermal generation alternative.C-83
300F igu re C - 10SENSITIVITY TO INFLATIONAND ESCALATION-COAL2~02002% ESCALATION(/)zo--.J--.J 150~~(/)tIi..WZWrDtWZ100~o(COAL-FIRED ALTERNATIVE)----------------------o3 5I NFL A T ION RAT E (%)C-84
Figure C-II350SENSITIVITY TO INFLATIONAND ESCALATION -OIL30()250200(/)zo-l-l 150~2% ESCALATIONAFTER POL~If)lLLWZw(l)IuJZ1005035% PRICE DECLINEo(OIL- FIRED ALTERNATIVE I----------------o-50INFLATION RATE (%)
CORPS OF ENGINEERSu S AR~Y- Ii::I:It-!;t 600~(!) 500w::::E04000o~300>-
CORPS OF ENGINEERSU S. ARMY2:::z:::tL600~~(!) 500ILl~4000q 300>200(!)a::UJ 100ZUJ0DEVIL CANYON GENERATIONn~ ~jl .. j ..1I'l ~ &-'" I\- "- ~ Vl ~ ~ ~ ~,h ~ W ~ .& A JI'\. fi .. .a....L .... ...II'--"- ~ r-~,•~ ... ""\"..0 ~ \. J 'r-'-" ~"-~, ~, ~, /)1950 1951 1952 195~ 1954 1955 1956 1957 1958 1959 1960 1961 1962 196~ 1964 1965 1966 1967 1968 1969 1970 1971 1972 197~ 1974 1975 1976 1977.,..:u..IILla:::ucl1,2501,0008 750 qDEVIL CANYON STORAGE- - -- - - - r-- - rr- - - ~V --UJ 500(!)
EXHIBIT C-lLOAD RESOURCE ANALYSES
.. :;UFF IllE. T PLA •• T S 1" I'HII-lqlqIfSU.F IC IE,PLA,',T;;, I" 1'175-1-IQbt.: ..... lluNAL o. AIICH 1. 0.10 DIES 1"11&.f>4EE['Eu AU,) IIIii', ! ,; I'Hi:'-19!:!6: CUALA2 PStA2
~t£Jtc' ,:. •. -,! flu'~ I,. 1"'1~-I°.,,,: CuAlLA" FSt Ato "(,Il. r, .1., SIE. l'U,4.IJH't- ",,:-.1 T-" &. uld:JI I~q"-I";;S: .. ~rr'"A-I "y( .... " I> II. o.!)1> "Yu~ 19'0'1.Pl.A ,-',f;f'I A(JoIIT I'):' I'. 1"0:'-19,,.,: ,~11" It!'''AL o. ~Alk 2'1. v.l!) STE. 199b.UPPeR SuS!' .~ AUULi, I"'I~-I""b: .,A l1A,'.A-2 ... 'vt "YilR 199".PLA ,t-4t.lI '" l~t"il'JI I' 1 .. '0::.-1'1"1>: HE .. A .. CH 7. u.~(· TU~1i 1'1910.PlA"',~L' ",t. r 1 ~t .~i.. f~ r IN H'b-l'lI[ T IIlE''.t:,r I"J ZlJuc::-c(,u3; "E II\L"F A lit 025. 0.15 STEA 20113."E:ElI~U ~Di)ITIl'., I', ;>v03-cOOIl: Cll6LF 2 PSEF2 100. 0.75 STEA 1"0'1.PLAMJlU liE. TIRHOt"'l 1 !. 20U4-c(lu5: CE_oL5 AtICH III. 11.50 TURI3 20115.I~EELlE" ,,0011 luI'< I;, ~OO"-020u5: CUML,F3 PSlF3 100. 0.75 STEA 1985.PLA"!-It- IJ RET 1>l~Mt,Nr I .. 2QO~-200b: CHI"'''.'1 FAIR 20. 0.75 STEA 2llub.NlElifU lU,) 11 I'",'~ I .. ?",u5-~O"b: COA ..... II PSEAIl 1.100. 0.75 STEA 1984.NEEiJEu ADill-IUN 1" 200
a,,[~: ".C"O"".. EA .C"",,,A;.~ C~St.: ~ -- "'[CI'I" I.tJAJ t:,lhi .. Th1.hJ.llt ,Eatf: 1~2.',UTfS:',.¥. 5(,. 1~18 .. , u.~.-I'I"Q.nI-'IWII PlA ...------"f;"lllkt:·'",;J5 ---------------1 I 585.---------------1HE:;()uIuF APuF.!:Iu .50.15 .15.50 .35• 15 .00.50 .50• vO .0031)41.204.312.211 J.II •438.O •3081.3041.o.PEA~ PtAI( LOAU'~EtACITY lCEf,j(lIHE~IE",TS("'EGA"ATTs)~pUF M.Xl~U~ PLA~T UTILIZAllu~ FACTURA~uF ACTUAL PL_"T uTIL1ZATIU~ Fo\CTuHE~E~G, -- GtNtHAT'd"A~~UAL ENE~GY "EQUIWEME",lSl"'lLLIONS OF KILO~ATT-HOURS)
'~EA:F~I""'.:.I,"S~~I~~.~~~ CAS~: i -- ~iOIUN LilAC 6~~~T~J • Tt- .. fit 'E~": I "'fl.;"JTl~:'.\.Y. ~o, 1~ld ., u.S.-1 .. 9~.ClilTltAL f> E 0( 1 0 ilnII...,.II PE""-------------- ------1l(~i'ul.
.. 01[.: .. I.C"O" .... E'~CHU~ .. b[ C~St: ~ -- ~£UIU~I.Tt. .. IIt. ,I-.R: l'i ... i!.Lu"~ ~AO~'";.llTE5:'.lJv • .10. 1
a .. [a: F'I~i'A""Sfa,,,;;,-•• q; CASt: 2 -- ~ElJl ... " LUliJ (;II(IIITH1"TtO(I It. .lAII: 1'I1J2.~ulES:~uV. 50, 1~18 _I U.~.-1994.nII0'1CWlrlCAL f E fI J 0 019"I-l .. lJ~196i!-1983I, PEAK ".PuF APllF E .• E.2. o. I 41.\'id 1-1 'l8Q"'PvF APuFPEAK 1'1:._ .. LOAU/!it>~£I'IAT I,.,G CaPACITY REyUIRE~ENTS(MEGANATTS)',f'IJF I
AwEA:,,·.C-;[O~A.,E~ .en". tl·E C~St.: 2 -- kEIIIU'" LuAlJ Gka •• TNJ ... T E ~ 1 It.' EAR: I 'Hi.!.;·.~Tt.5:"'{JV.30, 197.'06 ., U.S.-1'I911.CRITICALP E Ii 100('"')I--'I....1IPtA'"1--------------------1~E~llj"t~Ei~TS I 90Q."1:.50('"C[5---------------11ExIsT I'll> 1hYURQ 1 53.5TtA~/ELEC 1 251.l.LJf""'!. Tut.11.110 • OW1E",E .. liY 1 PEA."-------- 1------14uOI. 1 97&.111~O". 1II,,... 12,,15. Iv. 113982. 111117'1. 111111u. 111141lb I. 111111bO. 1153.251.OOb •15 •1205.IH.207.31.10.1452."'.'01. ' 1159.11 O.11O. 1 liB.• 50.75.50.15.50• 75.00.011• 50.20.00.001111U. 111 PtA"1------11 1041;.111Ijll •"58.05Oj.5.1 1452.11307 • 13&3 • 1111111O. 1O. 1111 1452.11 0.38511 2b2.1b5. 1 52.11 11311.11 o.11O. 1 90.198&-1987~""~ APUF• 511 .50• 15 .5&• 50 .2&.15 .00ENEk'Y4b57.5111 •2259 •1958 •O.4727.11727.70.4&57 •o.PEAK PtAI< LOAO/I;;EHt'RATlNG CAPACITY i
."'~A:F.I"'~AI'1\SFAI.~~~'S CAS,: l -- ~EOluM L~A~ ~RO~T"I ,l,,"'fl~ tt~l/: 19"'2.~UT~S:N~V. ju, 1~1& ~I u.S.-lqq4.CilITICAL("')I--'ICO11 Pt::API------_._------, 1-----"t::"ul>lt"t-.H;; / C!Sf:!.-----------·---1~t::~Ov~CES 1f'~' :.Tf'~G IhY~~O 1 u.~Tt::~~/~LEC , 11U.CO··'Il. TUl/rr;,E' lO~.~J'~EL'Qb.ITOTAL I 3&0.IAOu J T 1ur.s ,"YIJRJ 1:,Tt......'fUC 1CO·'Ii. TUK. ////115. //////////I1211. //////18. II11'13. //I/IO. /o.elli.204.22.0.52312.14.350.o.FI86-I Q 31",P"F APUF.50 .50• 'S ."• 50 .111.U .ot}1l54.o.1018 •254 •O.ll13.1213.o.P~AK PiAPI LOAD/GE~~RArl~~ CAPACITy kEQUlREME~TS(MEG~wATTS)~PUF M~~lMuM PL~~T UTILllArI0~ fACTOI'
"f".ll"l"·;t.---------------1.• TS 1wEl>(luRCE" ---------------1AME .. : .... ChO ...... E_~C~n.AbE e~s~: ~ -- -EDlu~ LOID G~O~'HT~ll~Jlt fEAa: .~~~.~OlLS:~UV.1 J 211.ExI"TlNut1."Jttl.SIHtl'IIELEC I(;O'Il>.TuRt!l!.E IuII:.SELI1TOTAL 1 t 452.IAODI HOlliS /fiTUilOSTEA~/ELEC 200.CO",,,. TUR"Ir.EUH'8ELI/RlTIIiE. _I\lTS 1IHLii/O 1STE4A/fLEC I 15.COHiI. TUwe II;E IIJlfSft..I/---------------/GROSol> WESOII~C£&1103'.ILAP "ES. ",,'(GIll/ 0.41>2I~E.t~vf AE~. / 280./t..OSSES / 51>./. f! RE SUURCE ~ .' 1301.11 u.IISuI/PLUS / 181.5u. 1978 ., u.S.-199_.1407-a''8b!~PUF """Jf'.~I) _!l0.75 _tl3.~O _.o!1O.15 _.00• 15_cOSIC.. I2413. 11780. IO. ///IIII/II/IO. IIII//I/Ie;eITICAL11 I-EAI\1------1/ 1192.III1513.a.J.:!oI aqll.I75. I 60.I1196':'. IIllb.I/ o./Io. I 24.19ae-l .;0 .11>.15 .00.75 .lO510.3145.Illu •o •5l75.J50 •57lf>.85.5&4t •o.
A",t .. :FA(I
• .. E,u ."'CI'I"" ... tA~C~~~A'E C.S~: 2 -- NE~IU4 LU.u GWOftTH1·;l~"llt H~tIi .11l.15 .00.75 .co.00 .00• 00 .00.00 .00P 10 Ii 1 (J l)IE",EwGY I "EAI582. I 190b./I 0.2351I 509./91. / 77.1b485. I 1520.I/ O.I/0 •. / .23.Pt.A" LIJA.II/",t:>lEtUT1Nb ClPlCIl'\' KEIoIUlWE"EI\ITS(""EGA .. ATTSl\'i9i!-19H"'''"F APUF• ,)0 .50.75 .70• SO • I b.15 .00.75 .20.00 .00Pt::A~f;l'uf I~H!H;J:~ ... l. ... "'T IJi1lIZATlOI\I FACfURA"(JF ACTtAL 1-1l..·I.'4f ,JlII.IlATIO' FACTOI(E.,EkGY -- Gt.f
A'[A: FIl)o(fI ...... Sf~I""~'~i~!' C~S~: ~ -- "Eu".. ,,. LOAO GROll HiI"l,,"ll{; IE ... : 1""~.~~TES:NuV. 30. 1.'~ ., u.5.-1994.CRITICAL P t .. I 0 {)("')I............NI Pt ..../---------------------1tiE"uiili:."i:."rs / 3~$.---------------1KE50~~CfS 1E lI!>TJ "G 1MY~RO I o.:.1t,A ~/£L£C 31b.CO"rl. T"II!:;1;;£ I 20'1.uIlSl:L 1 u.1TOTAL / 519.IAOOlTIONS 1!iYUIlOIS'EAM/fLtC I 32.CO.\~. TuR& Ir.E I,HESELIIRtliREMff S 1HYVI>U 1:,TtAM/tLtC 1 32.C. 1);.11
4~EU .:-'(';(I"A",£."C"IHAiof C'SI:: Z -- "'EIII.jM LI.IAO GRU"T"1"Ttltlh:. ,rak: 1" .. Z.',vT!:;S: .l,V • .)'*c. I58t>. /II. IICR1TIC"L .. £ Ii I U 0-._-----------------------------------------.------------------------...-------_._.------IICI"3-1>/9 ..19'111-1"95/1~'15-I"ibI "I:AI\ ",.."I' A ..... 1'"PlIf .I'ul' e .. EItG1 I PEAI\ ,,".. I' Ai"uF £IOEH6f1------------- 1------ -------- 1------II73l~. I 172Q.1751. I 111511.8311.IIIII5111. I 7011.1311 •1""5.&&'1.3 •6151$. I 2e!51'.I~~'0 t. I "---.III/IIO. IIII7439. I 2822.II 0.b3e!II 54b.IllCi. I 8b.Iu.IIIII. 1,1I6aJ".50 .5u.75 .3 11.50 .16• 15 .{lOII.U!. I 144':>.,:>8t>. / 6b'l.fi. I 3 •I5qi?'1. I 202C!.II21136. I 811.IIIIIIII 125 •III1061. I 2184.II 0.5ue?II :571.I116. I 93.I7151. I 2321.IIIIO. IPEAM LUlD/GENERATING CAPACITT HEQUIkE~E_TS(MEGA~ATTS}~ •• I~U~ ~LA~T UTILIZ'TluN fAC10Ro.IIb1.• 55 .55• 1"; .31• 5u • I 0.15 .110.IiO .110P':AKH'UFAPuf A~Tu~L PL~~I UTllilArl0~ fACTOREf.EKGr -- ~tNtR~IIUN/A~NUAL £~ERG' ~EUUJREMEN1S(MILLtONS Of KILO~AT1-HO~RS)2949 •IIblll •411 •c,.6Ubl.o.125.6311.o.
("')I--'.","A: FA1IC!tU",Sf.\f .. ~AI .51>.15 .42• ~tI , 10.10 .vO.5b .51>.15 .C!O.00 .00PEAK Pf,V. LOilllIY'SE!\iI:::R'\T!iII& CAPACITY REQUIWE~lEt.TS(~EGAIfAnS}"'PUF MAXl~UM PLA~l UTILIlATID~ fACTORAPtit ACTUAl.. .. L ..... T uTIL1ZAfiO ... FACTORE:~E~GY -- Gtf-.lc.RAl110UUI"UAL ["'EkGY "ElJull
A'E": ... ' .. v ..... E... C",· ... I>£ r"Se: i'! •• "IEJttJM lO.1: fiRthcHII.TEWllt. TeAll!'.I,lS.._-...__. __...,~E1I(Jl''''CE~EU~Tl;"itll'lHHi~lt4"/tLt.CCO"", T:;"tlIr.[u1i:.StLTU1.LAUO 1 T 10:.11"YlIRO:;TtA"'/I:.LECttl',,,. T IIKtll i.ElItEliELRt:Tlf1E'~f.TSIHllwa1ITtM!/ELt:CClIe"'. Til"''' I ,.EtHtSEL--_._--_......_/'1"1'1.II/ 7'12.I 14"5./ '>4'>./ 5.// inll I ~07~.SURPLUSI111III.1'1.,,,.t.,Q7 1·;"l.F ''''LiF E·,E"Gt 1 !'tAKovO.vl).---.• -- 1-···_·/~,,71. / 211)3./1IIIc!q,.. /O. IIIII1I1IIIIIO. III. 11I1I1IlH.11IIC " I TIC A L P E h 100c,.400.II -11 O.1IO. I 231.lq~7-1qqoI"Puf AFUF ""Eotti' I PiAl(.75.55.,,2.10.00.20--...... 1-···--I9 .. U. / 2i!iU.IIIHn. / 792.5';:"1. / 11$115.2• 110• 55• i!5.1e• 00.1103J17 •4115 •278.O •7710.ji!431.O •10141.150.qqql.o.
IHfA: f .. ,_.,A.'4"SFAI~~.~~5 CA5L: ~ -- ~EDJUM LUAU &AO~'"1 ·,ItRl It. .EAI
aRE.: .... CHOkAioEA .CHn~AmE C.St: ~ -- ~EOlu~ LOAD G~u.T"1.lt"TIt. lEu,': 1 .... 2.I,.)Tt.S:1H'V. ~t), 1 ~11l ", u.::;.-I~~q.CRITICAL("")I......---------------/';[I,ul""-',,-,T'> 1---------------1wE l:Illlli
A"'(~t.: J:41,,8."Jf\5"Al~~.A"S C~S~: ? -- ~Ei.J1u"! LOAu bil(ll>fHI .lfR11r::. 'f :.1;: I ~-'2.~u'fS:~lJ'. SO, lQi'~ ~I u ••• -l~~4.('")I..........(X)L ~ I T 1 CAL P E. >I 100------------_._--------------------------------------------------------------------------11 ;>fAII---------------11------",EJUJilUI:, TE. A:~IE:U:C IClI·.t!. rU~dh'E IuleSt:lII---------------,~NOSS RfSOuktEsl,CAP ~E •• ~A~il~1I~ESE~VE wEw. I1lOSS!'.S ,210.310.v.II.1011.25.I~t! ~£SOlJRCfS I 419.ITNANSFERED I 10.IISu~PluS 1 O.1 q .. .5t>.15 .37• '!oil .10.1\1 .00EfliElliGTli.!.?9 •1034i>tJf !lUIMuM PL.dHT lIf(LllAllLJN FACTORAPllF ALTull1. PL".
- .. fA: ...·.(H(\.." .. £A.C"U~A.t C.~t: ~ -- ~fulu~ L~A~ GkO~'Ht.lt...tlit. 'teAl
A"'ttA: FAl"~A""SFAr~b~~AI C~St: i -- ME~I~~ LuALI GMLN1"1.Tt"11< IE~": 1';~.?r,()rE5:,,~~. 30. 1""1& '" IJ.S.-l'lq".CwlTICAL '" E Ii 100n,......INo1, "'t:~ ...--------. ·-----11-----~E,'"iIlE"1: 'IT::. 1 "iC!7.---------------1l• 7, .39.,11 .10.11) .011.7S .20IEI
A .. E .. : .... (.,0 .... £l.r ... n ... ",. (AS::.: "... -- "Evltj'~ lulu .. Ru.n ...! T::..~!!::. ,E''1; ).,. .. 2.'.~Tr:S:'fV'i. ,}1.." 1;....,8 ." u.~.-lq'1.q.P E " 10,)nI......IN......---------------1I(Ej4u.l.;J€'·'·E.·~TS---------------1,.E::'Llu~CE:iExl;,Ti·I"N'ru"'i;,fLA"/EU:Cr.O:,.:l. TUibl'.ElIlE!:>£lI PEA~1-----III21&3.1TorAl I 3292.IAUU! r !o.,s Inh'RUItiTE'~/ELEC I aov.eo "". TlI"~ I'.E IIJIt.SH 1IRETIRE'4fr.I:> II1YJRJtiTt:Ai/E.lEe 1CO'·'tl. TU"ioltJE Ivlr.SEL /1---------------1b~uS5 I
A'1tl.: F"I~".u.,f!o..)F~I""~.1··"~ C ... ::.c.: ., - ... ~E":·I·..;~ LvlO G"!~)f,.TrtI dr." I I~ If" .. : 1-."('.; .. \JTt,,;;:t • ...,·v •. )ti, l-,/d If/ .J: • .i.-1Q''H ••c"ITIClLPE~Irl!lnI........INN---------------1t'tt.;;i..;l"'c.""'~~-l ~-l8 II,E ILltES€LI1RiT lKE .... tr~TS 1rlYuKUIb H.A.·;/ELtL It:(n,;'. T uwe I jtlf. /lJH:llfLII---------------1bIllS!) !>/E:)UU~CESIICAP "ES. "1A""'lr./I,;EbEi.31• I 0,00IEr.E .. ;;y I PEA~-------- 1------I2410. III1122'1. I126c. Iu. 1(J. II2515. IIIIIIIIIIIIIII2515. I268.1111 •U.U •II 0.31'1II 115.I31. I l'l.I2Hfl. I 1>15.II O.II0. I 40.,Ou1-i!(,uo~~JF APuF E~ERGY• ,&• 1S.,0.to• Sf>.32• 10• 002520.1229 •1329 •(I •O •2550.2558.38.2520.o.PI:A~ P~A~ LO.J~/;f~ERATl~& CAPACITY REYUIREhEI>;'S(MEGA~ATTS)',PUF M.lqMI.J.~ ... ,'_4·.Y UI {LIZ_nUN fACTUW'PU~ .tTu~L PL·A~T UrILllATIP~ FACTO~f~EhGY -- GtN~M.I.lU./ANNUAL ENt~G( k£WUIWE"lNTS(~llLIONS UF KIL0h.TT-"OuR~)
1."'(£4 .\ .. C"vII\A·~€.'.C" ""E C.:.",: ~ -- ,-Evl ...·' L.J"v I>I
Aio(fa: FAlI'(I1A .• ",Sf'H~.·.,S C.S~: ~ -- "E0f'~" LJ'':' GiiI(.nl ..1,lc"ll:' , ... ~: I ~2.·Ivlt~:;~~v. ,~, l-!~ ~I u.~.-lQi ••Ci1'U;OIl> Ti:. A '
EXHIBIT C-2LOAD RESOURCE ANALYSES (GRAPHS)
5000Figure C-2-1400SOUTHCENTRALRAILBELTLOADS 8 RESOURCESGROWTH FORECASTMEDIUMWITHOUT PROJECT30002000ANCHORAGEnI'"'VI1000FAIRBANKSO~--~---'----.---~--~---.---r--~---'----.---~--'----.--~---'--~.---~--'----.---r---'----.---~--~1980 85 90 95 2QOOTIME IN YEARS
Figure C-2-24000SOUTH CENT RAL RAILBEL TLOADS a RESOURCESMEDIUM LOAD FORECASTINTERTIE 1991, WATANA 1994INTERCONNECTED RAILBELT SYSTEM30002000WATANA(809 MW)ANCHORAGE1000FAIRBANKSO~--~---P--~---'--~~~~--~--~--~--~--~--~--~---P---T--~--~---'--~~~~--r---r---r---1980 85 90 95 2000TIMEIN YEARS
5000Figue C-2-34000SOUTHCENTRAL RAILBELTLOADS a. RESOURCESLOW LOAD FORCASTINTERTIE 1991,WATANA 1994'3000INTERCONNECTED RAILBELT SYSTEM,"".;;IW2000DEVIL CANYON(792 MW)WATANA(809 MW)1000ANCHORAGEFAI RBANKSO~--~---'----r---~--'----r--~--~---'r---r---~--'----r--~---'r---r---T---~---r--~--~--~~--~--1980 85 90 95 2000TIME IN YEARS
50004000SOUTI1CENTRAL RAILBELTLOADS 8 RESOURCESHIGH LOAD FORECASTINTE R TIE 1991, WATANA 19943000WATANA(809 MW)2000ANCHORAGE()!NI-PoINTERCONNECTED RAILBELTSYS TEM1000FAIRBANKSO~--~--~--~---r---r--~--~--~--~---'---'---'---'---'---'---'---.---'---'---'--~r-~r-~r---1980 8S 90 95TIMEIN YEARS
EXHIBIT C-3USABLE CAPACITY SUMMARY
Year199419951996199719981999200020012002200320042005TABLE C-3-1USABLE CAPACITY SUMMARY(Dependable Capacity Only)9411, Low?:! 94, Med 94, High0 27 99214 265 533533 680 680680 680 680*858 *950 *1,1511,023 1,035 1,3471,143 1 ,2311 , 178 1,3471,3211,3391,34796, Med160476674680*7318471 ,0691 ,1671 ,2811,347NOTES: 1/2/'*Watana power-on-line and interconnection date.Low, Medium or High load forecast.Year of Devil Canyon power-on-line.
EXHIBIT C-4POWER VALUE CALCULATIONS
TABLE C-4-lCOAL-FIRED, FERC VALUESBASE CASE AND FUEL ESCALATION TO POLItem of Cost Anchorage FairbanksInterest & Amortization 110.77 X .80 = $ 88.62 99.64 X .20 = $19.93Interim Replacements, Insurance,and Taxes 9.26 X .80 = 7.41 8.33 X .20 = 1.66Annual Carrying Cost of Fuel<strong>Inventory</strong> .91 X .80 = .73 .48 X .20 = .10Fixed Operating Costs 14.69 X .80 = 11.75 16.29 X .20 = 3.26Administrative & General 5.65 X .80 = 4.52 6.68 X .20 = 1.34Transmission Cost 30.25 X .80 ::: 24.20 30.50 X .20 = 6.10Total Capacity Cost ($/Kw) $137.23 $32.39with Hydro Adjustment<strong>Energy</strong> Fuel (mil s/kWh) 11.00 X .80 ::: $ 8.80 8.40 X .20 = $ 1.68Variable O&M 1.64 X .80 = 1. 31 1.82 X .20 ::: .37Transmission Cost .65 X .80 ::: .52 .42 X .20 = .08---Total <strong>Energy</strong> Cost (mi l/Kwh) $ 10.63 $ 2.13(B)(A) FuelBase EscalatedCase l! to 1994 @ 2%---.~ .. "~---~ --$108.55 $108.559.07 9.07.83 1.2015.01 15.015.86 5.8630.30 30.30$169.62 $169.99186.58 186.99$ 10.48 $ 14.391.68 1.68.60 .60$12.76 $ 16.67l! Base case is a composite value based on the weighted average of Anchorage and Fairbanks values.The 80-20 proportion is derived from the relative future estimated electrical needs of Anchorageand Fairbanks.
TABLE C-4-2COAL-FIRED~ FERC VALUES(C) (D) (E) With 3% With 5%With 3% With 5% With 2% Fuel Inflation & 2% Inflation & 2%Item of Cost Inflation Inflation Escalation l! Fuel Escalation Fuel EscalInterest & Amortization A X 1.08 = 117.23 A X 1.15 = 124.83 108.55 E X 1.08 = 117.23 E X 1.15 = 124.83Interim Replacements~Insurance & Taxes A X 1.34 = 12.15 A X 1.64 = 14.87 9.07 E X 1.34 = 12.15 E X 1.64 = 14.87Annual Carrying Costof Fuel <strong>Inventory</strong> A X 1.34 = 1.11 A X 1.64 = 1.36 B X 1.32 = 1.58 E X 1.34 = 2. 12 E X 1.64 = 2.59Fixed Operating Costs A X 1.34 = 20.23 A X 1.64 = 24.62 15.01 E X 1.34 = 20. 11 E X 1.64 = 24.62nIAdministrative & General A Xl. 34 = 7.85 A X 1.64 = 9.61 5.86 E X 1.34 = 7.85 E X 1.64 = 9.61.~I:"-lTransmission Cost 30.30 30.30 30.30 30.30 30.30Total Capacity Cost($/Kw) 188.87 205.59 170.37 189.76 206.82with Hydro Adjustment 207.76 226.15 187.41 208.74 227.50<strong>Energy</strong> Fuel A X 1.34 = 14.04 A X 1.64 = 17.19 B Xl. 32 18.99 E X 1.34 = 25.45 E X 1.64 = 31. 14Variable O&M A X 1.34 = 2.25 A X 1.64 = 2.76 1.68 E X 1.34 = 2.25 E X 1.64 = 2.76Transmission Cost .60 .60 .60 .60Total <strong>Energy</strong> Cost(mil/Kwh) 16,89 20.55 21.27 28.30 34.50l! Fuel escalates from 1978 to POL and from POL through 30-year life of initial thermal pl ant.(F)(G)
TABLE C-4-3COAL - FI RED, FEDERAL FINANCING, & APA INVESTMENT COST(I)(J)(H) APA APA With 3 0 /0/Federal Investment Inflation & 2%Item of Cost Fi nand ng Cost Fuel EscalationInterest & Amortization 101. 73 137.77 148.79Interim Replacements,Insurance & Taxes 11. 51 15.42Annual Carrying Costof Fuel <strong>Inventory</strong> .71 .83 1. 78Fixed Operating Costs 15.01 15.01 20. 11(""')IAdministrative & General 5.86 5.86 7.85-PoIw Transmission Cost 26.93 30.30 30.30Total Capacity Cost ( $/Kw) 150.24 201.28 224.25with Hydro Adjustment 165.26 221. 41 246.68<strong>Energy</strong> Fuel 10.48 10.48 21.40Variable O&M 1. 68 1. 68 2.25Transmission Cost .60 .60 .60Total <strong>Energy</strong> Cost (mil /Kwh) 12.76 12.76 24.25
TABLE C-4-4OIL-FIRED, FERC VALUES(K)(L)Fuel Escalation No Inflation,Item of Cost to 1994 No EscalationInterest & Amortization 29.22 29.22Interim Replacements,Insurance & Taxes 2.55 2.55Annual Carrying Costof Fuel <strong>Inventory</strong> 2.52 1. 75Fixed Operating Costs("')I,.f:::. Administrative & General 2.98 2.98I+=>-Transmission Cost 5.36 5.36Total Capacity Cost ($/Kw) 42.63 41.86with Hydro Adjustment 44.76 43.95<strong>Energy</strong> Fuel 33.28 24.24Variable 0&r1 1. 70 1. 70Transmission Cost .98 .98Total <strong>Energy</strong> Cost (mi l/Kwh) 35.96 26.92
TABLE C-4-5OIL-FIRED, FERC VALUES(M) (N) (P) With 3% \-Ji th 5%With 3% With 5% With 2% Fuel Inflation & 2% Inflation & 2%Item of Cost Inflation Inflation Escalation Fuel Escalation Fuel Escalation--.~Interest & Amortization L X 1.08 = 31.56 LX1.15= 33.60 29.22 P X 1.08 = 31.56 PX1.15= 33.60Interim Replacements,Insurance & Taxes L X 1.34 = 3.42 L X 1.64 = 4.18 2.55 P X 1. 3~ = 3.42 P X 1.64 = 4.18Annual Carrying Costof Fuel <strong>Inventory</strong> L X 1.34 = 2.35 L X 1.64 = 2.87 K X 1.32 :: 3.33 P X 1.34 = 4.46 P X 1.64 = 5.46Fixed Operating Costsn Administrative & General L X 1.34 = 3.99 L X 1.64 = 4.89 2.98 P X 1.34 = 3.99 P X 1.64 = 4.89I-P:.Ic.n Transmission Cost 5.36 5.36 5.36 5.36 5.36Total Capacity Cost($/Kw) 46.68 50.90 43.44 48.79 53.49with Hydro Adjustment 49.01 53.45 45.61 51.23 56.16<strong>Energy</strong> Fuel L X 1.34 = 35.48 L X 1.64 = 39.75 K X 1.32 =43.93 P X 1 .34 :: 58.87 P X 1.64 = 72.05Va riab 1 e O&M L X 1.34 = 2.28 L X 1.64 :: 2.79 1. 70 P X 1.34 :: 2.28 P X 1.64 = 2.79Transmission Cost .98 .98 .98 .98 .98Total <strong>Energy</strong> Cost(mil/Kwh) 38.74 43.52 46.61 62.13 75.82(Q)(R)
nI+=:0TABLE C-4-6OIL-FIRED, FERC VALUES, FUEL ESCALATION AFTER POL(T)(U)(S) With 3% With 5%Without Inflation & 2% Inflation & 2%Item of Cost Inflation Fuel Escalation Fuel EscalationInterest & Amortization 29.22 S X 1.08 = 31.56 SX1.15= 33.60Interim Replacements,Insurance & Taxes 2.55 S X 1.34 = 3.42 S X 1.64 = 4.18Annual Carrying Costof Fuel <strong>Inventory</strong>(2% Esc after POL) L X 1.32 = 2.31 S X 1.34 = 3.10 S X 1.64 = 3.79Fixed Operating CostsI Administrative & General 2.98 S X 1.34 = 3.99 S X 1.64 = 4.89enTransmission Cost 5.36 5.36 5.36Total Capacity Cost ($/Kw) 42.42 47.43 51.82with Hydro Adjustment 44.54 49.80 54.41<strong>Energy</strong> Fuel(2% Esc after POL) L X 1.32 = 32.00 S X 1.34 = 42.88 S X 1.64 = 52.48Variable O&M 1.70 S X 1.34 = 2.28 S X 1.64 = 2.79Transmission Cost .98 .98 .98Total <strong>Energy</strong> Cost (mi l/Kwh) 34.68 46. 14 56.25
('"')I.+:00TABLE C-4-7OIL-FIRED, FERC VALUES, FUEL COST DECLINE OF 35%(W)(X)(V) With 3~& With 5%Without Inflation & 2% Inflation & 2~hItem of Cost Inflation Fuel Escalation Fuel EscalationInterest & Amortization 29.22 V Xl. 08 :; 31. 56 VX1.15:; 33.60Interim Replacements,Insurance & Taxes 2.55 V X 1.34 :; 3.42 V X 1.64 :; 4. 18Annual Carrying Costof Fuel <strong>Inventory</strong> 1. 19 V X 1.34 = 1. 59 V X 1.64 :; 1. 95Fixed Operating Costs, Administrative & General 2.98 V X 1.34 :; 3.99 V X 1.64 = 4.89""-.JTransmission Cost 5.36 5.36 5.36Total Capacity Cost ($/Kw) 41.30 45.92 49.98with Hydro Adjustment 43.37 48.22 52.48<strong>Energy</strong> Fuel 15.77 V X 1.34 :; 21. 13 V X 1.64 :; 25.86Variable O&M 1. 70 V X 1.34 = 2.28 V X 1.64 :; 2.79Transmission Cost .98 .98 .98Total <strong>Energy</strong> Cost (mil/Kwh) 18.45 24.39 29.63
TABLE C-4-8HYDROPOHER COSTS WITH INFLATION($1,000)Cost ItemNo Inflation37~ Inflation5~~ InflationInterest and Amortization216,671X 1 = 216,671X 1 = 216,671Operation and Maintenance2,890X 1. 34 = 3,873X 1.64 = 4,740Replacement430X 1.34 = 576X 1.64 = 705Total219,991221,120222,116("")I~Ico
EXHI BIT C-5POWER BENEFIT CALCULATIONS
~ .--..c('------.~ ... ------------------..O~ESE ',T"~E'H',T"J" T'" Y.\~~UA:h.E 'f~': f~ .1f CAPACIT.aC IlY' Ft,.~Fns.------- -------- -- ..----- -------- ---- ..- ..-(",j) (~" ) 01000 lI '1~.j O,:HS7 27,n ;>5.3 .. 713.1.-1'1'?5 O •. G15') 2b5.0 i'12,O !J32Wl.1IGl~!> 1),~!Q2 !>qG,ij ":> 7.0 11)3 QH,!IQ'l'7 O.7co';) c"-O.O '-21.2 - - '(H2US~"I'I~S (\.7172 9")O,C I! ~! .! 127118.319 •• e.b710 1035,0 ~ 'l:.l. ~ 129'ji!3.220JO 0,1,27,0 0,0 81883.5JQC;~ ;0 250S.0 JI91>3,9 3'11.0 325,2 QI~9.7 0,0 lQOOQ4,7305B.O 23113.9 299(}7 :i------ 3'17.0 30a.l J6132:i :J.el 131030;01;0051.0 03Q3.9 551127, B H7,O 2~ij.7 30~3,Q 0, .J 1151>119,0,,057.0 '100"." 51ll02.3 7!>S.~ 521>.~ 1>72l.5 'J,a 186100.901)57.~ 3~ol.0 ~!\'j20.1 B5.~ 492,9 02>\'1.1 V.O IQH23.50057.0 1~S8.3 ~5"'J 1 • .2 5!.1134.5 54,S 198990,50057.0 ~J2q.4 ... 42~iB.8 7S5.0 .nl,:' 5S00.0 _. 1011>.0 195215375'> 19. j- II050t.~ 9131 • .1 131>1034,bost;o .. ·
00.. -'-Innl>~E5E~'TP::;;ESf"'TIOA;j,ETAE'LE PIIESE .. T FIll" "AIlKE fA~~E PilE S':', 1 SECO',:ul'!Y., ) .. T·, "A~(~ T.\~LE .. 0~;1t't SF CAP4Cnf"alll", "1'1'H5 O. US5 2'>5.0 2'3. ~ oIl251.!19'11> tl.~lq2 "~O.O ",57.0 hH'IH .1i 997 ---0-;161.5--680~'O----"'.21.2 972101".5Zl.l9177 .3FJ~"E ';f.;jf, f--------(G/..,)29q7.n31';1'.031)5B,O30sa,O-------- -------- --.-.---c; .. ~} (SHOO) (GhM)2'1010.2 3'57'11.7 '.02677.2 3'411>1.11 3Q7.~2505.0 H'lf..3.9 3'H.O ..23113.9 2'1907,7 397.(1131~1I1.6............... -(G.>·... )0.0367. b325.2lOtl.3.-_ .... _--(Ury00)0.0(lu3'5.0IIlq'l.73111'2.712 11 b7,3I'HE~'lJl>C4"~Cln. TOTAL. AE',EflTS "'['IEI' Ir-S-------.----. ------..($1000) (!'lolOO)~.o 11(14'15.30.0 8181"3.')11>,11 1110121.15505.8 I3b541-~e-----5se2.;! J9901ll,70C0Q~0?o.~ 11,12q~ b~O.OPRES[,H 'J"TIi flbfF ItS7~~".1 1"!2069,~IbI>12bb.~IIHbO.23058.0JQ035,O IIJIIZ~6.5 397.05bbl0l.35&360.&b~I'\~1.'l._----,,----7~9ij9.2 198Z705,7aSSll.Q 23817117.458"7.9 IbJ951.50 l•'")nIUlIN---_..__.._---. _.._-_ ..-_.-005Y5TE~ JF D[VlLOP~ENT~I::" SY51£"-~ATArJA.LO'IE~:'- CO_L~Ei'Ir5Y5TE14---------CAPACITY f,r,ERGY SECONOUY fuTAL5---POIIIER VALUES &.l1Q3bO. -j89i3-.-~4739.-163958-:--'INTERESf'0.0t• ~t0------_._----_.._----_._-------_. _.- -.-,,- .. _---------------------00r.-_.._-----_._------_.._-- .._----_ .._.__.__ ..00(;0
--~----- ...«-.---------«-----«.. -----..._---------.._--_.._.__.._--_.---- --------_._--_..._---_._-----.---..---...--r-co(.CJI01IW!>RESE'IT P":::SE~l "A>iK!: TABLE" );;T-I "'A"~ETA3LE I',J.,.. , M 'IF C~PACIH FIQv-1t-...... nCf:1~ CAP~CI1¥ "CA;;,0zon2 0.51,\97 13 ~
---_._-_ ... _------- _._---_._----------_.....00,..r'"'ESE''' T"-·~SC.T~"~~ETA~LE PQESE~T F 11'1" .. ~~o(f.1 Ach.E P~ESE~T SECJ~OARV I~TE~'1JD~J~TH ~AR~e:T~~L£ 1'1 ~I:'_ r"1 :JF eAP~eITY FJ~. ~n~Tw FtR~ E~EPG' SEeJ~JI~' ~lQT~ S~~ E~EQG' CAIIICIn fOTAL•"c T') ~-- .. tap A C I TV (F .\el TV ~E~t'IT5 t~ERG' E~EI" -3f'.H ITS E·,E.~G' E't'?:>y ~E.3 Q 175. n 2"91,0 2'04.2 357~1.7 0,0 '.0 0.0 0.0 3995&,7., '52.1'131\3L1').~ 3('SS AV A'
OQ!:S ... ,51 :7SCDv"r 'UTE~"~SE .. T~J:.? ... "'l-lo·.-n-- -~::,q • .: "",37".'1I'I~~ ').1~15 ~50,o :;"",3 131i\~~t'. RI"q'l 0.7 4 02 IH5.0 '7~.3 1.j.b311.15~5.8557."531.35~6.0---I~TE~'lJPCAPACITYrOTALe!,
---.----.... ----~.('")I(J1I0'1..O'iESE ~T"";0-'. T Y~R~E TA~lf P~~5E"T~. J~ r "1 '4~(EU~L': .. ... "! ... )F C~i>lCtTY f 1 '"57,0 IIIU.3I~~~ i).b302 1035.0 ., " l,2 1216'12.? 1>057,0 HII.>,'I2000
("')IU1I'-II--- ~·~yEl~,../.,r----... ------'..1" LOAD GIIO"T'"------------------- ~- -----~--~--------------l>'1ES£'.T ""£Se:"T "A.i'E.T49l.E P"ESE'. T FI"~ "4il~ETA~L~ PiACtlr TOTAL~ At:')'< C~".lCI P CL c 4CIH r.E'.(FIT3 E '.f '1G.~ !:~~~GY !;~r'EfIT5 f:Jt:f~.j, c' ":;Y :I!::: '.tcFI Hl oE',EFtlS "IEIIt£FITS.-...-.--- ._---- ..... --------( ~,
~ ,P~ESE 'IT:: -'ESt. 'IT""~ T- -4i!6b~b.Ot'H7 ~-~>. ibOS1b2111/H.9"~"IkE u'ILEF' 1 ,.;"E·.E>lr,y--_ .... -.. -(G '.M >2Q'H. ':)3('Si'.OHS~.O ..3:)511.0bO77.2O';OS.v23~3..'11I3Q.5 .'iIQObll.3.5781.7311lbl.Q11q03. QZq9rc7,755lA27.~'511!&~,3.23.'110
cc-------- -------- --------('I..)19~0 0.~)57 1.,0.0PH 0.~75'> ::J7".l'19 .. " v.'HQ,? !)lJ. nIQ~-~--- 11.7665-' -b~ 0. (.2~O' 0.7112 731.02001 o. '>7\ 0 5J7.02 n ,12 u • .,n9 l(1b~.tjnn 0.5~75 11!>7.020r,(J 0.5J'17 12"1.020·)e; 0-.5143 13lESE"T FIil" "'AQ~ET4~LE P'IESE'H SECJ',')A'lY... ,:;. T'i "~R?" .... O,..-T .. FI~" E'.E"(;l St((!··;~..;y ,\ ')~ T"1 SEC E"'=.~:';,(--t(A~ ~ ACT ='~ C.1 p ":lr't' C:'C'4CIT't' ~t>EFlrs E"~ "GY E \E%Y BE'IEF (I S E: "".t. ";GY ['IE ~';\".-----.- ----.---(V~) 010~()1119.7 279J2.a~1~.7 77753.5""2.1 1-J301~.1..."21.? Q72~5.552J.2 Q7lqu .25~""'.u671.230.4e~5.o 127Qlb.O1 (: ~. I 13137'1.9b1?A 12Q2b2.2"~~.2 120Q.56 12.7b 12.7b 0.Ob875SYSTE" JF DfVELOP~ENTIIJ(., S Y S 1 E ~T~O YF.A~ CO~ST~JCTION DELAY'IE .. SYSIE~--------- ----_._--------CAPACITY ENERGY SECO~DAQY TJTALS---PO~ER VALUES & INTEREST112111\. 284715.00 ...0, f0jt0'J,..
c--'oPC!!£~E"TP~!St~T ~4C!.ET1~LE p~EsE~r FIR" "'A~"ETA"Lt p~ s~.r SEC8~~A=Y I'HEQ'lIJ"~J~T~ vA~~~T~3~E ...... '. r ... 'iF C~f'lC 1 T1 F I=?'" ~C·~f~ ;'I~wf E~E~~' SEC~'~r!~r ~ ~T~ SE: ~·lEg~, C4"'_:1 TVF.:rj./ .. C~"'''CI T Y c: - .l CITY : E '. ~_ FITS '_.E i< [; Y t ',E ~ G Y . ",f',[FIlS ~,,~~;,;,·.~"GY eE~UITS 8E';!:FITS·...-.-.. --...-.- --.._--- .-.---.. ---..._. -_._---- --_._--- ----._-- .-._---- -------- -------- .------- ._._....(~\O00 ) (G" "I)(G""J (G..,~) (~IO~O) ($1000) (SIOOO)55H.5 2~7O:51~"'7 ••tn3P.o11530 ",.015()e~"."1~3773.317112". t;I 75~~i'.~Itd'n~ .';·111 0 58q·.5-23B9B.73051.0!>O'5 7 • Qb~51.o/>0.,'.:1b057,O0057.0._--------.. -------.-------..(:;, .. )2"OIJ..22077.225n.,.~in~>.\j~389.1 0.0 225943.75,,"4.5 b5.~ 22&502.95500.04(; 50 1,1.110771.0 2221>9a.8'108 H ~ 0 -IS37 4Qb~-2---'----15b2Q9.7 3231021.3lb7135.7 G1b90b7.S11505.5 3Z8298.1CAPACITY ENERGY S~CO~DARY TOTALS·--PO~ER VALUES .. ' .INTEREST .,----------------.-.-.-----~-.... ---------------~-----..---.. ------_._.... ~----~.-----------.--.. --cc~,,0 i,..0 I0c00 ....0t0l0 r0, ...1,1..., ""(). ,I
-~-- ....... -~--~-- --"~!::SE" T "·::SE.\T'" J;,;l Tw UA'h(Er1~L!: .- -T ... 11' C..1PACT'!'!'{':'';' F .\: T )..,j' C~"'lClTf C"lefTY "!-',UIlS..... ---._- ----.--- -----_ .... .- .... _--- --------C">} (. " ) (\ln~0)I ~~" 1)"n57 27 • t~ 2S.3 .,231 • QI'H:; (l.b7S5 ? b">, C· ?~2.(i ~72P .'l1"1 • ., 0.5192 ""'0.0 ::",:' 7 • () 131~,;" .@1'1'11 C.7bb5 c 1,2 12f"'bq~e1 'l~. 0.7172 " " I • ) 1"~ (,~ ... q19q~ O."'71~ .... c.,"'.S 171 323 • 7200~ ry.o27~ -72." 1"06'5" , e2 I) 01 u.'j~75 7 ~ 1 • 3 1'i':i?JS, 72002 a 5a97 ?·~o.u 1"262.7 7~" ~ 521>.8 12773.9"0',,7.0 3~0}.O 92222.4 7°",0 Iiq~.9 11952.2"n'57.ry !S5~.3 do290.0 78,.0 ~!> 1.2 11!83.~;'057.0 B29.1i 61) 739.1 ~ ~1. 8," ~_ .. ,.. II 3.1 .5 10~1>4.Q713b/,3.27b971.bI~TE""~PCAPlCITYB:c'.tF'lTS------.. _TOTAL"'E',UI T.... -----(HOOD) (UOOO)0.0 74234.00.0 130581.80.0 20b0410.0 lq27~7.0.0 281)308.10.0 (1)21>bO.40.0 294834.472.S 292751.512(100.3 21!5!'52.0-----12072.8 2040051.0c0 .,.-r0fnGC
":)~1U"1I......N"PI( SE~T"~T" "":';'\o(£TA~L~Y~4" .:. 1 T~ CI.:>AClTr.-.---.- --_ .. _--- -- ..-----"'. )1 ''1'>4 0.9357 27.0I'H, 0.,,755 205.0IH~ ,).'11'12 ~~O. Q_IQH '0.7'>05 ~50.C1'I'lS 0.7112 '1511.0I'ln ry.!>l1 I) IH5.02J~Q 0 ...;>1'1 1231 .02001 0.55 75 13u7.0zonz- 0,5491....1547.0-- .--~--~--- -------..200320'lQ 7.9700"RESE ,T -J'HH 'lr:':'IEF iTSCIlF=CAPACITy IIALIIE =£'JE'ij~9.321.> 17.2 72u71.02505.0 b7~J~.e23.:.11.'1 ,,}(>Q".9111"3.'1 110'137.0!.t06 i.l.1.i H''IaI4.73~O3.0 102370. 113558.3 '15790.8~329., ~ 8Q028.e71)223'1,74~3111.2 1300b19.i20925"!I.8 IGIBO.II11'12.9 1)2611.2ubl,2 12111 .. ,7'Ul,5 11011>,18'5a 4 0."b21.>1.6 108
,------ ¥EA-~°..rt:SE'.r~6T~ A ALO~E • OIL'~SE~TPo JQT'" vl~ .... ~T.!5L€ T '--4 ,,~CAPl\CITYFA;:r,)- C'''~::IT'' : ,~CITY ""'~F ITS-------- -------- -------- .""'- .. _---( " .) ( . ~)lQ~4 C.'H57 27 .(\ 25.31 ~"5 0,"75'>,O ; 52,01 ~,!> ,192 b~~.O '.::!:. 7 • C1'1'11 .7/>0" 6'.10-; 6- '-.21.2---- ... ---(H~r,{> l11!C'.3I~lq",~2Li"·t.~22900.15BbQ".2"Ai;LI:"IR"E"!:'8,03.:1035,0 Ql02l2,O11Q431.:1.1~Jl~,~ 11~'l47.1 1~832,5 13Ab621.51452Q9.6 20147.4 1751032.1CI'lF '"CAPACIT¥ VALUE '" ~J,'l5n"O~/~~-Ykf'IE'lGY ;/ALUF = 2b,'l20(\0"ILI.S/!("~SEC!l'l').\~Y IJILUE= ?0.920()Oy,ILI.S/~"'"I,.Tf>lESr 'UTE = _____ I),,06lU5 ____ _tCIP1crfY F~[QG' SEC1~DAP' l~lE'lEST1 4),95 2b,92 26,'12 a.ebB7S-----------_._-------, .. _- ----0 1of I0C~SYSTE" JF ~EVElJPME~TCAPACITY ENERGY SECO~DA~YTOTALS---PowER VALUES & INTEREST00"---'-~-'--"""----------'--------~ ~ -- -_._ .. __ ._-00 t10 tooo ..o
-~, -~.---P,! Sf'lT c·: ;f', ,,\ ~r~ vAwl(Erd"1~~ ~ ·1F CAPAC' T,Y t-A·~ F-", TJ~ C"P4:::ITY C.1 ... :lr.,. ~lq.FI TS._.----- -----._- .-._-_.- -- ..... ---- ----.-.-("~J ( , J OIQri)I 'P~ r, Be; 7 '17,0 ?5,3 52 .. ",1I'P; o,I'75e; 205. \1 r -·2.G q~20; 0,-142 o~v.() ... -·,1. (} 11,)7;>".1--- ~I qq 1 O,1/.>t,
~~---~--~~~-~~ ~~-------------~--~~ ~- ~~~~~~~--~(JI •"~~5[ P;:-;E'~TI. J;;;l T "A"'''fA~L~, - . ~'r CAP~C!itVE4~ ~ C T , tt".~ClTl C Co ~ C IlY .. ~\,.'115......----- .---- ....... -- ... -...- .......... ~-* .. --_ ..... _....( "" ) (' Oln~,~)l'H; D.H,)l 27, ,1 )Z).3 S715,~lH5 '),11 7')5 2bS.~ .2 _,,2. n 52iJ07.51'I'l~ O.~1~2 b~C.ti "': ., I, 0 , 2'J Q 72.'1I q~7 :J,761>" b"O.ry l... ~ 1 .2 It7ebq.~1'1 'I ~ 0.7172 '1'iD.O t • 1 • J 15u017.0Iq~q (), h 7 I .J 101:'.0 ,... ;';..f. 5 1'>7('05.32·n~ 0.1>27'1 1231.C 7 '2. '1 17"H2.120'1 ().5~79,72012 0,51.4 7;,>. '7312
.. ---~.-.P'lO: SEt. T PRE:iEIIT MARKETAFllE PRESEI\T FrR~ "'''KETABlE PRESll.T SHOt-DAR V I "TE'UIUI'"A~HTABLE CAPACITV ,.oRTh Er.EFlGV sEcm,CAIlV p,(JRTHFI"" St:.C t"',£Rt;y CAPAC lTv Tcr~LTY F TS ENERGY BE~;EF r TS t:'JE~GY tNlqGY BENEFITS BENE" IT~ 2c~~Fi T~-- -------.- - -~.. _-- ... --- ... ----_ ....----_ ...... _- --_ ... --.- -------- - ... ------ --_ ... _-_ ... ---.- ... _... ........ - .... _-- -_ ... _-_ ......(MVt)-~---jqq4 0.'l357 27.0 2'::>.3 4734,6 2'197,0 280".2 5'1/:,115.6 v.U v.U 0,0 O.v .. to 3P.,. 1~ lQ'1S 0.8755 2b5.0 232.r 43tH9.1 3\)58,0 2017.2 5~'U4.8 397.0 347 ,0 73'12.7 0 .. Ij 1011'17.1-~lq'll> 0.~lq2 b80.u 557.v 10113'13.5 !OSS,O ~2505.0 532el.5 3Q7.0 325.2 11'117.2 0.0 Ib"578,l 30511.0 23 t1 3.'l II QIlSII.l 397.0 30".3 e41~.2 0,0 154U('".~---'I ~'-"!!--An "-.' nr2---Q50. 0 b81.:;127b"A3:e 6057.0 4343.'i Q23Q4.1 '"3ll1~o-' ~28/j.:t--e()'5~Q---l).O 22!'1~1."-__" ~ 19'1'1 0.b710 1035.0 b'ltl.5 130159.1> &057.0 IIOfo4.11 81>11
___C' -•..-"."\,P"1fSENTP~E5H,TMiR>l:ETABLE'TY"'!')~TH OFTVCAPACITY FIPM wORTH FIR~p",,) (~!iI\ ) (SI000) (G"H)----i~~" I). 'HSl 27 .0 25.3 5273.4 2':"H • V19'15 O.~'55 26'5.0 232.0 tl8"5 beo.v 5
PRESE~r PRESENT MAR~ETAeLE PRESE~T FI~w ~ARKETA8LE p~ESE~r SECO~DA~Y I\TERR ~NONTH MARKETABLE ~Owrh OF CAPACI'Y FI~M WORTH Frw~ E~E~GY SECrN~ARY ~~At" StC E~E~GY CAP. IT. rn!'L___ -_-_-_~~.~-~--.;~~~~:~-~~~~~~g-T-_-:~~~~gT_~:~~~!-~-S-_~~:~~-~-_-.-~:II.. --:-~-.--.~~:~:~~~S _~~:~~:_ .:~:~~:. e:~:~~~:_ 6:~:F :.=. :~~~~~~:("•• ) Ct-'ft) (SI()I)O) (G'.H) (G ... H) (S100u) (G",") (G ... ,,) (SIUOO) (SlJC'C) (~ ! • Q\, 11
-~ ------~-----~~"ltS€ .T::JIl .. ,!'IE[l "IT" :n hFLATlJ"F, Sl,T.. J;; r""'4 ~A~.-;~fL\:-;t..E ,', :.'- - '"1 ~Jf- CAP~C!TYH-A~ ~.\:TJr? cap.:.Cl1Y C"''' ,-:rry- -- "t,U 1 TS.....-.-....- ..-- ... _- -- ...--- ..... ...._-_...- ._-----.("h) (V,.j «l nr }o)I'HJ 1).~5;;7 27. I) ;~5 .1 12 3~. 11~~5 0,"755 ;>05.0 ( -52. ~ IIH~.Slq~~ 0,-1"12 ~~r' r ~ 7J 1. 0 2730'J ,2rei ~7 --, 0 .1 ~b'",. (1'I'e 0,7172 950,0 t-::-l • .3 333'1","1'1." 0,071,) IO~S.O J: ~~ ..·JA".:ETAillEFPPE "E. ~(> Y-- ........ -..(r. ... ",)2'1'17.0305".03~5i\.n3~5;;.Ci1>051.(,00-;7,01>0
~~ .. --~----.-.-,---,.,JIl " : R!:.u "IT,.. 5::-DllElE'. rpo:: 'S~:. T.. '~Tr. ·,1j"o(ET~:;L€ ,", ~'1-. - ...':-VtF/ f Ae Lj~ C6"~Cl TV C!c::lTY"------ ..- .-_ ....PRESE~r_----------- . --- .... _-P'" )(. , )19~' 0.9357 27.0 :>'5.319'15 O. il7S." 2~,).o ~ 32. ()19'1~ O. ~1'1i' 680.0 , .,. 7 • ~I 'l ~ 7 C.7b05 "il~.O {) ? 1.21'1~~ 'J.7172 950.0 " " I .3IQ~~ a.o7lll 103
•_________________________ . ____ ~~_FIREOWITH 21 ESC.LA __ T~l~Q._~ _______________ _------ ... _--_ ... --. -lCPRESE'I,T- PRESE .. T ~lR~ETA8LE P~ESE~T FIR'" uARKETAI'lLE PRESE"T SEC()~OARY I,,+TERC/U""J~T'" ~.R'65- 61;0,0 521.2 23771.9 10511.0 2343.9 1092
---------------------------------- ---- _ ...._---_.....-2001~ 20QQ 7.Q76b 1347.0" PRESE~T .. O~TIt Ilt~EFIrS10744;5 '55043',38074/)1l.360'57.0 ·48314,2 3001763.31l830212.478'5.0 6261.6 389034,95862~O.93bl&Il,7 3977a02.238672.0 &2&2Sll.6CRF= O.D~~A AV A~~ RE~EFITS •112507.8nI(J'1INNICAPACITY VALUE = 51.ENE~(;yviClfE--.-~2.• SECDNDARY VALUE= b2.13000~ILLS/K_HltJIf Itl'" ~Afl f).Ot.",,·,1S£CG~OA~Y INllHl~T3YSTE~ J" OEVELOPME~T~E"SYSTE"OIL F I RED "ITH 2" ESC ALA TION_A_t.O_}LINfLA fION-,.E,.,-SYSTE'l· ---- -- -..---CAPACITY ENERGY SECONDARY INTERRUPTABLE TOTALS21>62. 43008.il--------------------------------------------------------------------------- --------,.
c_---------------------...--~~--..---..- ---- ....•_--------_.------- ---.. - -- ---..._---.,_________________________.._____ T __ Il .. ~!..._ES_C_A_L~!.!~~. A_ .. _O_~~ ..! IjfL~!.!O';PRESENT'"QRTIl J4AR!(EU6LEYEAII FACTO~ CAPACITY______ ._ _P"ESE'lT..()RIM OFCAPACITY~AR~tIABLE-PRESE~TCAP~C!TY FIQ~ ~ORTIl FIR~ E~ERGY SECO~nA~Y ~ORT~ SEC E~~R;'__ a____ ________ ________ ________ RE~EfITS _ EkE~G~ ___ a_a. ________ E~ERGY ________ !.IE'lHlTS _ ENERr.y ___ a_a. ________ E~t~~Y SE~EflT3 ______•. !lE'4EFIIS ____ a_a. .;It. ____ "t-J._.T SFIR"~ARK£IARlEPREsl~TSECJ~~ARYI'HE~~J;>CAP.1:: IT ~('4--..) ("'"j---CS100u) --rG."i)---n;·"H)~--(s1000)--~Tc;..,H) --ct.... ) - ---(j.1000)- -(S10~Q)19~q 0.9357 27,0 2'.l \ij\B,8 2997,0 2~Oq.2.,----212015.2 0.0 0.0 0,0 0,019q5 0.8755 2&5.0 23C.O 1302Q.3 3058,0 2&77.~ 202q~7.q 397.0 3~7.& 203~2.5 0,019q& O,~192 6~O.0 557.0 31282.9 305A.0 2505.0 16992Q.7 397,0 \25.2 2Q6~7,3 0.0IQq7 0.7&&5 b~O.O 521,2 2Q270.6 3056.0 23q3.9 177712.0 397,0 )oa,3 23071.2 0,019qe 0.7\72 950.0 bel,! 362&2,2 &Q57.a 43~j.9 329~5~,3 3'17,0 28a.7 215~7.1 0.0---T!...9q-,,-q--"'O..:..7b ... 7"TI .... O-~"TI..,.O,.,.3~-Plti;~qOOil; ~b05T~ o-lfO-I)lr~ 1Q81&5, q----,-l!~~i!b, g-"lq9H. Q---- o. ()1C" 2000 O,b27Q 1231.0 17?.9 '13 .. 0".2 b057,O 3803,0 268342.4 785,0 Q92.9 Hlb9,6 '.0
__ ~ ____ , ___ M_" ___ T ___._-_.----,~-"~JIL FIRf;D !lITH 2X ESCALATION AFTEII POL. ....--.----...tl-~-------- -PRESE'IT pqESE~JT I!AR!(ETA'RE PRESE'll I' I 1"'4 "'ARKETABLE PRE.SE ~ T SECO,.jJ AllYWO~TH "AH~ETAaLE .. OR p, :JF CAPAC I TV 1'1"" ltOilTI1 FIR" l:."Ei'lG~ SECa'tDAIl~ .. aRT '1 SEC E'tEIIGYYEA'! FAC rOR CAPAC lTV (AP6C ITV Ilf"'[F'ITS E"t::~C;v E\jE;!G~ !H':'if.FITS E'45,S-1999 0,6110 1035, 'l1---o9lf;'5~OqH~8--"OS7-.!r----4IOl)Il, II -11l0954,lr" 2000 0.b279 1231,0 772.9 3~42". 1 b057,O 3803.0 13161'17.52001 0.5~75 13117,0 7'11,3 352 ' .5.9 0'>57,0 3558,3 123403,520a2 0,5'197 1347,0 7110.'1 3;>97;\, " /0057.0 3329. II 115'1b5.3O~ 2231112.0 10201> 11,978'>;0---'52£.-';8'785,0 492.9785,0 41.1.2785,0 431,5.-------(HOOO)0,01(1)5"3.&11276,210552.79871,9·'11l268·, ()17092,9IS Q 'H.'I1Il'1b~.S110077 • .1I'lTER~J"CAPAC tTy T::JqLBE"EF IT" 'lE~."nT5. __ ._.- .. ----_ .. _-·UIOC)} (\lOC');O,n Q'H7' .• 20,0 11'>2H,~O.J 122Qb2.1G.C 1150,0 113,uO".b13.1 11~~5'>. ~21011. 1 11>'>575.221 n,s 1350251.1Z00320911 7.97bb 1347,0,. PRESE~T 1'f:JIIT., AENEl'lTS107U,5 H8sse.s701970,8, /0051,0 QRJIIl,2 1675537,02&9"'149,5785,0 ,-217t'53.2327aO.bltll~2,\ ?~~,,~q!, 71!&21.~3150Q72. oeliI':2252b.3nIUlIN+::>CAPACITY VALIlE .. llq.S4000$/1( ... ·~R'ENfIiGv-i'lliE--,.~-iti,-66000\4ILCS-'oI";K-,.7CH~~~~~~~-~~~---~-~~~-, SECO'
;7-____ .____ -~,. ____________________ -.::.~_F_l'c~E() flITH 2\ ESCALATlD~ AFTER POL ANO 3% PIFLATIO'IPRESE/. T... ORT'" OFPRESE,rSEC)I\jD'RVPRE5E~r~AR~ET~~LE PRESE~T F[A~ ~ARKET4BLEI~TER~J".. )'1T" ~ARI(ETABLECAPACITY FlAM ~o~r .. FIR~ E~ER~Y SECO~D4Rr .o~r~ SEC E~E~G1 cl.,&:nV T"HLF~CTOR ClOACITY CA.PACITY 8E~EFITS E~ERGY E~ERGY B("EF ITS E!\jERGY E~E~~Y BE~E'IT9 BE"iEF IT 5'l~ . C ;1 S-------- -------- --_.---. ____ a_a. ________ ._______ _. _____• _.______ ________ ___._._. ________ ._______ ____ * __ •----.-------.---rll.ijI~---{l'A ~--- U 1(> 0 l)) --(G•• 11)--- ---C;;"'")------ (U 1 11 1 • 71994 0.9351 27,0 25.1 12~~.1 2997.0 2~OQ,2 1293~o.3 0.0 0.0 0,0 0.01~q5 0.8755 2b5.0 232.0 11~';.7 30~~.O 2677.2 123521,3 3Q1.0 3Q1.6 160~o.1 0.0199b 0.8192 b80.0 5~7.0 277~O.2 3056.0 2~O'.o lt55BI.l 397.0 3c5.2 15005.1 v.a19~7 0.10b5 b80.0 521.2 25955.~ 3058.0 23q3.~ 1081Qo.0 397.0 30".3 14039.9 o.~lQ9S 0.7112 950.0 b'II.3 3392'1.1 bOS7.0 IBII3.Q 20QI.I,?b.2 3'!1.0 281i.7 13136.7 o,~----7-1"'9 ~ 9 O. !iT[ o------nl15. 0 6 H;;-S--34 SA 7 ;~O.,T;;Q-'il)bIl,Q18 75 n;r -~85;O ---.,
.,. PRESE'. T - ·PREstsT \4ARI3.743(15b. 4II021!b.7272919.83803.0 213917.93558.3 2001.,7.13129.11 167281.51655404.2785.0 /192.'1 277211.2 0.0 23\;,QS.8785.0 11&1.2 25'140.8 110.0 2"-)17 J. ~785.0 431.5 24272.1 26Qb.'1 25
-~-"~~---~ -------------------------5\"~'1~5P.T,. Sf ~~ TJ\J~rr1 w.\f.(-:ET.l~L::: -~ (If. c~"4cll'Vtl:1---' ~~:T'~~~ C~D~ClTY C~ "C I n- ",[,,,,F 11 ~---- .... _- -.--- ... -- -----.. -- -------- .... ------( ...... ) ( . , ) Ol~nn19~4 ~.'~'l7 27,~ 2'>.3 1(iq~.71"~5 ').0 i 55 2,,5,(; , ~2. (i 1.)tln2.f,,~~ il ,P2 b~i') ..., :)1.0 2uj;f-.5"; ~7 .7o~!) "E:1.0-·~ - 21 • .? .?;?!)n •••I'-I~· ".7172 Q5~- .11 01.3 2 Q s.a.319N O.~711l I035.~ !- 0"'.5 :PI2! .32J ,,~0.1>279 1231.0 i /2.9 33'52n.'2,-j,) I I'. ~,'"'75 1 ,u7.0 ; q I .3 3~32G.12i, .~2 J.sa~7 I3H.n 7',,1,0.&1 3211;?3--~-~2175H.320032j~~ 7.97bo 13~7.ng~ESE~1 NORTH ~E~EFITSlo;a~.54b5qB7.~b1\3531.1"AQ,~ Hell!:F I ;?·,tE',ERGY---... -.....( r;., I..f)?Q:n.o}.151\.O3~ET~bU:.,O'lT .. FI~"! r::t,t:~GYn"e:olGY 3E',EFItS-....... --... -------.(GI'·'" )(~lnI)Ol2'1(\11,2 ., 173 7.721, 71.2 lIQ3QII.8250S.0 110211,.",a3.q ~32lj".34343,9JOb"',lI;;Ol"".~749811,9B1)3.0 70Ib'5.1'5SI
-~- ... "------------_._-----"";;ESE-, T P;;' ~ Sf.', T "4'
.. ---~- - ---- ~-------.:lIL-' _':JOE "-------. -------- -_ .. _---- ---........ _---_ .. _------PR~SE';T ". SEc ~ r,'J" T M ·IAi,0 ? -:";.0 1('175.:-IQ'h n.91q;)- b'lO.O ~. ) 7 • C 2n.B.lI'H7 O.7obS- b"lll.O ~ c I • c 21"552.!>H~8 'J • 71 72- 'SQ.n r ' 1 .319q~ 0.;,7\0 103'>.0 , :,J .... 5 3~lJcJR.32000 ).,,27Q 1231. (I 7 t 2 .. q2()01 O,~I\7'i 1347,0 " :11 .. ~ 41S2'1.12002 0,5t-.Q~ J ~ FIR" U:tRGY SI::CU'.!)A'Y 'dJ~ T'" SEC t. "f: Jol(; Y CAP~: lTY TOTALE'IE"GY 5F:"£FITS E'-E~GY E"E'lG'I' BE',HIIS 'iE"EFr~S -SEt..H I T5-------- ------- ... _.. ------ -------- -.---...... - ---_ ......... - --_ ... ----(G~H) !lIOOO) (G~"') (Gf. -;) ( S%OOO) 010::;) ($JOOOI2~Ou,i? ~3G(\8,,,, Q,(\ o ~O 0.0 :'.0 £1"4111,&21:- 77,2 7'1326,2 3 0 7.0 347.!.- I no~ ,II :.0 101800.22505.0 7lJU"5.1.l 3'l7.0 32').2 9b35.q - .0 11"3092 II2343,1'\,3 I05Q33.Q 7~5.0 41>1.2 13bb'l.5 I ". u 1&0&42.8:332Q,4 '1AbSI.b HS.O IHI.,) 12IA':>.5 25S::;.n 152fl47.7-.-~-871993,4- 940118.2 25" ~ • 'I 123181>,Si'&Q,Q b057.0B2710~.Q'18514.2 1431550,7 785.0 &2bl,b 185532.031().:.~.1 221799Q,8.!'s035lJ4,l 279580.2 ~~b~ ".& 3I1lJ74.1 19211&.1 27;::- "'.1 23748Q,7~CAPACITY VALUE =E"JER::;Y IIALJE =SI'CO'lDA'lY VALUE='i2.UflOI)(H/K,~.V!I29.b3DOO~lLLS/K~M2q.b30nO·ILLS/K~~O.O&!l75Pdl"lST ~ATE =_L__CAPACl r-v·-~f..~~·E,~GY ~~ C-ONDARY INTE .~ST _·_._____ ~~ ___.____..__ ~~ _______ ~~ ___.~___ ~ __.... -------~---- .----~'"wGI ~2.q8 29.bl 29.b] 0~n6875SYSTf~ JF D[VEL1P~ENT\IE·' SVSTE'4JIL-SUf);W. Q391'_)F~_3'H 4.:JD_5~_1_'j~LA1TJ.o"~l ... ·SYSTE\;---~.-. ----.. -------... ----- .-._------ --.----~------ .. ------.-------.-----.----.-~.----..... -~-----.-------.--.~-----.. ---------.~--00 t,.... t'--'0---.-.--~-... --------,J0
.~~----CJIU1w •0PRESENT PRESENT ~AAKlTl8LE PAESENT FIRM MlRKETABLE PRESE~T SECONoaRT J .. TfRqU"WORTH MAR~ETABLE IORTH OF CAPACITY FIRM WORTH FIRM f~ERGY S[CONOART .ORT~ SEC E~ERGY CAPACITY__-..!.Y['~_ ~ACTO,!_C:~PACJ!_Y _tAPlCHL BENEFITS [NERGY £~£RG. BEM.FITS _£NERGl [NERGY .!£N[FIrS B~NEFITS..---••••("III) (Mil) (Jl000) (GIIH) (c'.H) UIOOO) CIfWH) CGII ..)(11000) (11000)..-99/1 0.9357 0.0 0.0 0.0 2997.0 2804.2 357111.7 0.0 0.' 0.0 0.0'''95 0.11155 107.0 'n.7 11418.2 30511.0 2677.2 341()1 •• 397.0 3117 • () 411)'5.0 0.04149.7 0.038'32.7 0.0- lbH.O 0;0() 721. '5 0.06289.1 0.05884.5 0,05506.0 0.0~151.S 0,00121).4 0.04'510.3 0,04220.2 0.03948.7 0,03694.7 0.03457.0 0.02010 0.3229 105Q.O 1110.11 1>3505.5 b057.0 1956.0 Z4958.2 785.0 253.5 3234.0 0.02011 0.3022 tOU.O 320.6 59615.0 6057.0 Ib30.2 233'52.1 765.0 237 .2 lO2o.() 0.020U 0.l1'l27 1070.0 10l.S 5UIIZ, a 6057.0 1712 •• l1850.5 785.0 221.9 2831.9 0.0un O.lb~' 'OH.O tell.' !lH~b,7 fIO~7.0 lb02,l 2011114,~ 185,0 201.1 2b49.1 0,0lO III 0.2475 1085,0 261.6 50106.7 6051.0 1499.2 19129.8 785.0 I'1Q.l ZIIH.3 0.02U L~.2.11.b lOiS. (I 251,,"_.47315.6 b(lSZ .. ~IJ)LL---'-.IM9.2 7.85.~_111....L.-...l319.11 ___ 0.0TOUL8£"HITS- •• ---._. ____ a_e. _.e._... _____ ._. .._._._. .._._._. ..______ •. ______ _._..... • ______ . _ •.. _._. ____ a_e •1996 0.8192 366.0 19'.11 559;9,4 3058.0 Z505.0 Jl9b3.9 397,0 325,21991 0,7665 530.0 406.2 75794.3 ;058.0 2343.9 2'907.7 1'7.0 3041.3I 99i1-----o-;t i 12--~lii • 0 391.6- 73059.6 6051.0--431H.~· 55427.8-- 397.0-- '28 II • .,1999 0.&710 b51.0 43().8 81505.9 6057.0 40&4.4 51862.3 785.0 Si!b,&2000 o .()219 764.0 179.7 8'1500.5 &057,0 3803.0 08526.1 78S.0 "9.2',9200S 0.5815 792.0 4(05.3 86812,3 .057.0 3558.3 11511011.5, 785.0 461,2~2002 0.51197 927.0 509.6 95071.5 ()O57,O l3i!'l.0 112463.8 785.0 IIll.5,. 2003 0,5143 918.0 IIIl.4 90011.3 60~1.0 3115.3 19750.9 185.0 403.7--- 20(10- -0. illl1 r--968.-0 --465.8-16916.'-- ()051,O' 2914.9 --31193.8 185.0 377.1ZOOS 0.11503 999.0 .0119.1 819lO.O b057.0 27?7.11 34801.2 785.0 15,1.5lOO6 0.4213 1009.0 125.1 79317.1 fI057.0 2551.9 3Z5b2.6 '185.0 330.72007 0,3942 1020.0 002,1 75023.9 6057.0 2387.8 10Clb7.9 785,0 30q,~\wi 2008 0.3689 1031,0 380.3 709S0.1 6057,0 22311.2 28508.0 785.0 2S9.fI,2009 0.1451 lou.a • _3bO.0 b7lbl.Z 6057.0 2090.4 2&Eo7ll.1 785.0 270.91""\'-' ,2016 0.2107 1100.0 U8 •• 411474.1 6057.0 1312.5 161117.8Ion O.lOll I tnt.o 224,7 41915.' b057.0 1228.1 15b70.11itOla 0.1197 tlltl.O IIZ.1 )90:.13.4 6051.0 11.'.1 t .. bb2.11aU9 0.177! UZI,O 1'19.5 31;"26,5 6051.0 1075.l 13119,27'>311.0bH92.459"11.Z51>116.11]9,3 1778.0 0,0 ~n2l. 79412b.l 0.0 2510b~3.1_____ "5 __ 20,9 0.0 172831.3O. __ 172831.----.. ---------~
EXHIBIT C-6INVESTMENT COST CALCULATIONS
TABLE C-6-1INVESTMENT COST WITH 2 YEARS CONSTRUCTION DELAY(in thousands of dollars)("")I0"'1IWatana Devil Can~on Grav;t~ DamAccumulated Present Worth Accumulated Present WorthYear Expenditure Expenditure IDC Expenditure of Expenditure Expenditure IDC of IDC1984 30,500 1,0481985 107,000 30,500 5,7751986 114,000 137,500 13,3721987 159,000 251,500 22,7561988 214,500 410,500 35,5951989 208,000 625,000 50,1191990 230,000 833,000 65, 1751991 245,000 1,063,000 91,5031992 223,000 1,308,000 97,5911993 161,000 1,531,000 11 0,7911994 32,000 1 ,692,000 117,425 39,000 39,000 1 ,341 1 ,3411995 25,000 1,724,000 119,384 98,500 98,500 39,000 6,067 6,0671996 16,000 1,749,000 120,794 117,000 117,000 137,500 13,475 13,4751997 1,765,000 1,765,000 851,328 137,000 128,187 254,500 23,581 22,0641998 144,000 126,070 391 ,500 38,191 33,4361999 158,000 129,428 535,500 43,622 35,7342000 129,500 99,258 693,500 53,505 41,010823,000 737,443 823,000 179,784 153,127Watana Devil Can~on Total Watana & Dev; 1 Can~onConstruction Cost $1,765,000 $737,443 $2,502,443I.D.C. 851,328 153,127 1,004,455Investment Cost $2,616,328 $890,570 $3,506,898Interest and Amortization $ 180,106 $ 61 ,307 $ 241,413Operation, Maintenance, andReplacement 2,620 700 3,320Average Annual Cost $ 182,726 $ 62,007 $ 244,733
WatanaTABLE C-6-2INVESTMENT COST WITH 8% DISCOUNT RATE(in thousands of dollars)Devil Canyon Gravity DamAccumulated Present Worth Accumulated Present WorthYear EXQenditure EXQenditure IDC EXQenditure of EXQenditure EXQenditure IDC of IDC1984 30,500 1,2201985 107,000 30,500 6,7201986 114,000 137,500 15,5601987 159,000 251,500 26,4801988 218,500 410,500 41 ,5801989 214,000 629,000 58,9201990 248,000 843,000 77 ,3601991 258,000 1 ,091 ,000 97,600n 1992 223,000 1,349,000 116,840 39,000 39,000 1 ,560 1,560I0'11993 161,000 1 ,572,000 132,200 98,500 98,500 39,000 7,060 7,060~1994 32,000 1,733,000 139,920 117,000 117,000 137,500 15,680 15,6801995 1,765,000 1,765,000 714,400 137,000 126,852 254,500 25,840 23,9261996 144,000 123,457 391,500 37,080 31,7901997 158,000 125,425 535,500 49,160 39,0251998 129,500 95,186 693,500 60,660 44,587823,000 725,420 823,000 197,040 163,628Watana Dev; 1 Can~on Total Watana & Dev; 1 Can~onConstruction Cost $1,765,000 $725,420 $2,490,420I.D.C. 714,400 163,628 878,028Investment Cost $2,497,400 $889,048 $3,368,448Interest and Amortization $ 198,442 $ 71.156 $ 269,598Operation, Maintenance, andReplacement 2,620 700 3,320Average Annual Cost $ 201 ,062 $ 71,856 $-272-,918
WatanaTABLE C-6-3INVESTMENT COST WITH 5% DISCOUNT RATE(in thousands of dollars)Devil Canton Gravitt DamAccumulated Present Worth Accumulated Present WorthYear Expenditure Expenditure IDC Expenditure of Expenditure Expenditure IDC of DC1984 30,500 7631985 107,000 30,500 4,2001986 114,000 137,500 9,7251987 159,000 251,500 16,5501988 218,500 410,500 25,9881989 214,000 629,000 36,8001990 248,000 843,000 48,3501991 258,000 1,091,000 61,000("")1992 223,000 1,349,000 73,025 39,000 39,000 975 975I0\1993 161,000 1,572,000 82,625 98,500 98,500 39,000 4,413 4,413Iw 1994 32,000 1,733,000 87,450 117,000 117,000 137,500 9,800 9,8001995 1,765,000 1,765,000 446,476 137,000 130,476 254,500 19,575 18,6431996 144,000 130,612 391 ,500 23,175 21,0201997 158,000 136,486 535,500 30,725 26,5411998 129,500 106,540 693,500 37,913 31,191823,000 758,614 823,000 126,576 112,583Watana Devil Canton Total Watana & Devi 1 Can,lonConstruction Cost $1,765,000 $758,614 $2,523,6141.D.C. 446,476 112,583 559,059Investment Cost $2,211,476 $871,197 $3,082,673Interest and Amortization $ 111 ,421 $ 43,894 $ 155,315Operation, Maintenance, andReplacement 2,620 700 3,320Average Annual Cost $ 114,041 $ 44,594 $ 158,635
WatanaTABLE C-6-4INVESTMENT COST WITH ARCH DAM AT DEVIL CANYON(in thousands of dollars)Devil Canlon Gravity DamAccumulated Present Worth Accumulated Present WorthYear Expenditure Expenditure IDC Expenditure of Expenditure Expenditure IDC of IDC1984 30,500 1,0481985 107,000 30,500 5,7751986 114,000 137,500 13,3721987 159,000 251,500 22,7561988 218,500 410,500 35,7331989 214,000 629,000 50,6001990 248,000 843,000 66,481n1991 258,000 1,091,000 83,875I 1992 223,000 1,349,000 100,409 32,500 32,500 1,117 1,1170'>I1993 161,000 1,572,000 113,609 61 ,000 61 ,000 32,500 4,331 4,331+::>1994 32,000 1,733,000 120,244 87,000 87,000 93,500 9,419 9,4191995 1,765,000 1,765,000 613,902 113,000 105,731 180,500 16,294 15,2461996 122,000 106,809 203,500 24,372 21,3371997 148,500 121,646 415,500 33,670 27,5811998 101,000 77 ,413 564,000 42,247 32,381665,000 592,009 665,000 131 ,449 111,412Watana Devil Can~on Total Watana & Devil CanyonConstruction Cost $1,765,000 $592,099 $2,357,099I.D.C. 613,902 111,412 725,314Investment Cost $2,378,902 $703,511 $3,082,413Interest and Amortization $ 163,761 $ 48;429 $ 212,190Operation, Maintenance, andReplacement 2,620 700 3,320Average Annual Cost $ 166,381 $ 49,129 $ 215,510
EXHIBIT C-7CORRESPONDENCE
FEDERAL ENERGY REGULATORY COMMISSIONREGIONAL OFFICE555 BATTERY STREET. ROOM 415SAN FRANCISCO. CA 9411 tOctober 31, 1978Colonel George R. RobertsonDistrict Engineer<strong>Alaska</strong> District, Corps of EngineersP. O. Box 7002Anchorage, <strong>Alaska</strong> 99510Dear Colonel Robertson:This is in response to your letter of April 14, 1978, in which yourequested updated power values for use in your studies of the UpperSusitna River Basin. We regret that we were not able to provide thevalues earlier.Attached Tables I through VI give details of our estimates. AtMr. Mohnls suggestion, an annual capacity factor of 50 percent wasassumed for the Upper Susitna Basin projects.At your request, we have provided a breakdown of our cost estimatesin order that your staff may make sensitivity analyses of the effectsof possible inflation of all components of the estimates includingfuel cost escalation. Power values are provided based on estimatedcosts of power from two possible alternative thermal sources for boththe Anchorage-Kenai and Fairbanks areas. An oil-fired combined cycleplant, located near Anchorage, and a mine-mouth coal-fired steamelectricgenerating plant located near the Beluga coal fields areconsidered as alternatives to hydro power for the Anchorage-Kenai area.For the Fairbanks area, an oil-fired regenerative combustion turbineplant near Fairbanks and a mine-mouth coal-fired steam-electric plantare believed to be the proper alternative power sources. A combinedcycle plant alternative was not studied for Fairbanks because of itsassociated "ice fogging" problems and proximity to populated centers.Our estimates indicate that the combined-cycle plant near Anchorageand the regenerative combustion turbine plant near Fairbanks,respectively, are the least costly sources of power alternative tohydroelectric. However, we are not able to state that either is themost probable source.As you know, there is significant speculation with respect to thepractical and economic feasibility of the development of a coal mine
-2-in the Beluga area to serve a relatively small coal-fired steam-electricplant. To be feasible, it is probable that the field must be developedto provide coal for export in large quantities, or for added local use.It is not readily apparent to us that coal will be available near termto fuel a plant in the Beluga area. We have, nevertheless, included apower value based on the existence of such an installation in ourestimates.Coal is readily available in the Healy field near Fairbanks. GoldenValley Electric Association, Inc. has contracted for a consultant'sstudy of the potential of installing additional coal-fired generationto its system. Coal-fired generation, according to our estimates,however, would be significantly more costly than that from a regenerativeoil-fired combustion turbine.The National <strong>Energy</strong> Act generally prohibits the use of oil or naturalgas as fuel in large-scale base load generating plants. However, theAct also includes many provisions under which a utility may be exemptedfrom the restrictions on use of oil, Exemptions may be obtained becauseof unavailability of coal, high cost of coal and associated facilities,site limitations, environmental requirements, and, most importantly,if the required use of coal would not allow the petitioner to obtainadequate capital for the financing of such a powerplant. Undoubtedly,rules regarding the above will be prescribed and interpretations ofthe Act will be made by proper authority. Care should be exercised inthe selection of probable alternative power sources because of theseexemption provisions. We suggest that inquiries be made of the intentionsof local utility officials regarding possible requests forexemptions to the use of coal in lieu of other fuels in light of thehigh investment cost of coal-fired plants.Pursuant to one of your requests, associated investment costs ofpollution control equipment included in the total investment costs forcoal-fired plants are given below. These costs include indirects andoverheads as well as interest during construction.(1)(2)Estimates of future loads are supplied the FERC on FPC Form 12E-2 bythe four principal utilities operating in Fairbanks and Anchorage.These estimates show that in 1988 approximately 80 percent of the total
-3-electric needs of the so-called "ra ilbelt area" will be in theAnchorage-Kenai area and 20 percent in the Fairbanks area. Thisdivision of requirements would probably be a useful guide in yourallocation of Upper Susitna projects output.These estimates of power values are subject to the approval of ourWashington Office.If we can be of further assistance, please advise.Very truly yours,(Attachmentslettngineer
TABLE IAnnual Fixed Charge RatesAnchorage-Kenai Market AreaService Life, yearsREA FinancingCost of MoneyDepreciation (Sinking Fund)InsuranceTaxesTotal, Fixed ChargesUseMunicipal FinancingCost of MoneyDepreciation (Sinking Fund)InsuranceTaxesTotal, Fixed ChargesUseComposite - REA and Municipal 11REA @ 75%Municipal @ 25%Total, CompositeFederal FinancingCost of MoneyDepreciatiQ? (Sinking Fund)Insurance ~Total. Fixed ChargesUseGeneratingStations andSubstations30%8.5000.8050.2500.3509.9059.916.2501.2100.2501.3009.0109.017.432.259.686.8751.0831.9587.96Steel TowerTransmissionLines50%8.5000.~460.1000.3509.0969.106.2500.3170.1001.3007.9677.976.821.998.816.8750.2577. 1327.13y Based on appro:r:imate proportion of total futureloads in Anchorage-Kenai Market Area.~ omitted at request of NPD~ Corps of Engineers.
Service Life, YearsTABLE IIAnnual Fixed Charge RatesFairbanks Market AreaGeneratingStations andSubstations30Steel TowerTransmissionLines50Pub1ic-nonfedera1 Financing 1ICost of MoneyDepreciation (Sinking Fund)InsuranceTaxesTotal, Fixed ChargesUseFederal FinancingCost of MoneyDepreciation (Sinking Fund)Insurance YTotal, Fixed ChargesUse%5.7501.3220.2507.3227.326.8751.0837.9587.96%5.7500.3740.2506.3746.376.8750.2577. 1327.13Y <strong>Alaska</strong> Power Authority financing a8swned.2/ Omitted at request of NPD, Corps of Engineers.
TABLE IIIHydroelectric Plant Power Values At MarketAnchorage-Kena; Area(Costs as of 7/1/78)A. Plant DescriptionCapacityUnit SizeService LifeHeat RateFuel CostAnnual Plant FactorB. Investment CostMWMWYearsBtu/kWh¢/l06 Btu%$/kWC. Annual Capacity Cost at PlantO. <strong>Energy</strong> CostFixed ChargesFuel <strong>Inventory</strong>Fixed O&MAdministrative and GeneralAnnual Capacity Cost atGenerator BusFuelVariable O&M<strong>Energy</strong> Costs at Generator BusCoal-firedGenerating Plant4502253010 00011055FinancingPub.-nonfed.l! Federal1 240120.030.9114.695.65141.2811.001.6412.64$/kW-yr.mills/kWh1 22097.110.7514.695.65118.2011.001.6412.64
TABLE III (cont'd.)Hydroelectric Plant Power Values At MarketAnchorage-Kenai Area(Costs as of 7/1/73)Coal-fired Generating PlantPub.-nonfed.Fin a n c ; n 9Federal- - - $/kW-yr.- - - mills/kWhE. Cost of Thermal Plant Out2utat ~enerator Bus 141. 28 118.20 12.64F. Plant to Market Thermal PlantTransmission Costs - 230 kVl. Step-up substation(a) Fixed charges 2.50 2.04(b) O&M and Adm. & Gen. 0.53 0.532. Transmission Lines(a) Fixed charges 10.97 8.79(b) O&M and Adm. & Gen. 2.56 2.533. Receiving Station(a) Fixed charges 1.83 1. 50(b) O&M and Adm. & Gen. 0.39 0.394. Losses~a) Capacity 11.45 9.58b) <strong>Energy</strong> 0.65G. Cost of Thermal Power Deliveredat Marketl. Capacity 171.51 143.562. <strong>Energy</strong> 13.29H. ,Hol:dro-therma 1 Ca2aci tol: and Ener~ol:Value ~Justments1. Capacity 17.15 14.362. <strong>Energy</strong> -y1. Value of H~dro Plant Out~ut Delivered. at Market 'l. Capacity 188.66 157.922. <strong>Energy</strong> 13.291/ REA~ 75%; MUnicipal, 25%.y Negligible.
TABLE IVHydroelectric Plant Power Values At MarketAnchorage-Kenai Area(Costs as of 7/1/78)A. Plant DescriptionCapacityUnit SizeService lifeHeat RateFuel Cost J OilAnnual Plant FactorB. Investment CostMWMWYearsBtu/kWh¢fl06 Btu%$/kWC. Annual Capacity Cost at PlantD. <strong>Energy</strong> CostFixed ChargesFuel <strong>Inventory</strong>Fixed O&M 2/Administrative and GeneralFuelO&MAnnual Capacity Cost atGenerator Bus<strong>Energy</strong> Costs at Generator BusCombined Cye1 eGenerating Plant420105308 35030050FinancinsPub.-nonfed.l! Federal36034.851. 913.2039.9625.051.8326.88$/kW ... yr.millsjkWh35528.261.583.2033.0425.051.8326.88
TABLEIV (cont'd.)Hydroelectric Plant Power Values At MarketAnchorage-Kenai Area(Costs as of 7/1/78)Combined CycleGenerating PlantF 1 nan c i n 9E. Cost of Thermal Plant Outputat Generator BusF. Plant to Market Thermal PlantTransmission Costs - 138 kV1. Step-up substation(a) Fixed charges(b) O&M and Adm. & Gen.2. Transmission Lines(a) Fixed charges(b) O&M and Adm. & Gen.3. Receiving Station(a) Fixed charges(b) O&M and Adm. & Gen.4. Losses(a) capacity(b) <strong>Energy</strong>G. Cost of Thermal Power Deliveredat Market1. Capacity2. <strong>Energy</strong>H. Hydro-thermal Capacity and <strong>Energy</strong>Value Adjustments1. Capacity2. <strong>Energy</strong>I. Value of Hydro Plant Output Deliveredat Market1. Capacity2. <strong>Energy</strong>1/ HEIt, 75%; MunicipaZ~ 25%.2/ Included in energy cost.Y Negligible.Pub.-nonfed. Federal- $/kW-yr~- - -39.96 33.041.33 1.080.28 0.280.81 0.650.19 0.190.19 0.160.04 0.042.30 1.8945.10 37.332.26 1.8747.36 39.20mi11 s/kWh26.881.0227.90-'}j27.90
TABLE VHydroelectric Plant Power Values At MarketFairbanks, <strong>Alaska</strong>(Costs as of 7/1/78)A. Plant DescriptionCapacityUnit SizeService LifeHeat RateFuel CostAnnual Plant FactorB. Investment CostMWMWYearsBtu/kWh¢fl06 Btu%$/kWC. Annual Capacity Cost at PlantD. Energx CostFixed ChargesFuel <strong>Inventory</strong>Fixed O&MAdministrative and GeneralAnnual Capacity Cost atGenerator BusFuelVariable O&M<strong>Energy</strong> Costs at Generator BusCoal-firedGenerating Plant2301153010 5008055Financing-----Pub.-nonfed.l/ Federal.,.. "'--"---'-1 475 1 510107.970.4816.296.68-131.428.401.8210.22$/kW-yr.mills/kWh120.200.5716.296.68143.748.401.8210.22
Hydroel~ctricE. Cost of Thermal Plant Outputat Generator BusF. Plant to Market Thermal PlantTransmission Costs - 230 kVTABLE V (cont'd.)1. Step-up substation(a) Fixed charges(b) O&M and Adm. & Gen.2. Transmission lines(a) Fixed charges(b) O&M and Adm. & Gen.3. Receiving Station(a) Fixed charges(b) O&M and Adm. & Gen.4. losses(a) Capacity(b) <strong>Energy</strong>G. Cost of Thermal Power Deliveredat Market1. Capacity2. <strong>Energy</strong>H. Hydro-thermal Capacity and <strong>Energy</strong>Value Adjustments1. Capacity2. <strong>Energy</strong>I. Value of Hydro Plant Output Deliveredat Market1. Capacity2. <strong>Energy</strong>Plant Power Values At MarketF~irba~ks. ~laskaCosts as ~F-_ 7 1 .. 78..---'.. _-----Coal-fired Generating PlantFin a n c i n 9Pub.-nonfed. Federal- - - $/kW-yr. - - - mills/kWh131.42 143.74 10.223.18 3.470.89 0.9011.19 12.663.61 3.652.09 2.280.59 0.598.81 9.64161.78 176.9316.18177 . 960.4210.64- 2/10.641/ <strong>Alaska</strong> P~er Authority financing assumed.2/ Negligible.
TABLE VIHydroe1ectric Plant Power Values At MarketFairbanks, <strong>Alaska</strong>(Costs as of 7/1/78)A. Plant DescriptionCapacityUnit SiteService lifeHeat RateFue 1 Cost, OilAnnual Plant FactorB. Investment CostMWMWYearsBtu/kWh¢/1 06 Btu%$/kWC. Annual Capacity Cost at PlantD. <strong>Energy</strong> CostFixed ChargesFuel <strong>Inventory</strong>Fixed O&M 2/Administrative and GeneralFuelO&MAnnual Capacity Cost atGenerator Bus<strong>Energy</strong> Costs at Gen€rator BusRegen. CombustionTurbine Plant240603010 00021050FinancingPub.-nonfed.lI Federal265 270$/ HI-yr.19.40 21,491.09 1.302.08 2.0822.57 24.87mills/kWh21.00 21.001. 19 1.1922.19 22.19
TABLE VI(cont'd.)Hydroelectric Plant Power Values At MarketFairbanks, <strong>Alaska</strong>(Costs as of 7/1/78)E.F.G.H.I.Pub.-nonfed.Regen. Combus!ionTurbine PlantFin a n c i n gFederal- - - $/kW-yr.- - - mills/kWhCost of Thermal Plant OutEutat Generator Bus 22.57 24.87 22.19Plant to Market Thermal PlantTransmission Costs -i138 kVl. Step-up substation(a) Fixed charges 1.60 1. 75(b) O&M and Adm. & Gen. 0.44 0.452. Transmission Lines(a) Fixed charges 1.88 2.14(b) O&M and Adm. & Gen. 0.62 0.623. Receiving Station(a) Fixed charges 0.25 0.27(b) O&M and Adm. & Gen. 0.07 0.074. Losses~a ) Capacity 1.39 1.52b) <strong>Energy</strong> 0.81Cost of Thermal Power Deliveredat RarKet1. Capacity 28.82 31.692. <strong>Energy</strong> 23.00Hxdro-thermal CaEacitx andQa1ue ~ajustments<strong>Energy</strong>1. Capacity 1.44 1.582. <strong>Energy</strong> - 3/Value of H~droat MarketPlant OutEut Delivered1. Capacity v 30.26 33.272. <strong>Energy</strong> 23.001/2/ij<strong>Alaska</strong> POwer Authority financing assumed.IncZuded in energy cost.NegUgihZe.
Department of Ener~y<strong>Alaska</strong> Power AdministralionP.O. Box 50Juneau, <strong>Alaska</strong> 99802MEMORANDUl-l POH EUGENE NEBLETT I "RE:GIOW':',L EliGINEERFEDr.R'\-L ENERGY rux;U~TOR'i COMMISSIONl"ROM:::';013ERT .:;. CROSS, j\DMINI~'l'FIATORSUBJECT: AL'1'Eru~!.TIV1: POf'lF.:R SOURCE!":; FOR THEColonel Robertson IS c)ffice s~nt us a CICP:! of your Octob.lr 31 memornnt1u:rcexplaining yOl1."t" ass~:?tion3 on likely a 1 ter nativ6 & to tipper Susi tnapower for the Anchoraqo and, }'l'airbanks areas.I am not in tun£! 1(1.i tll the suggestion that oil-fired pll'.nt.s may bo -3realistic alt.ern&tive for the 1,500 JIm Upper Susitna Project.I"lany utilities in Alaskl'. and other parts of the country will continu€their push for more and more exemptions to allow continued Ul;;!e of oiland q&S in both existing and new plants. now successful they will beand tor how long is conjecture. l'mp legislation this year does, as yourletter points out, pro .... ide a range of exemptions.We've looked at the samo issues as a part of our report on marketabilityof Upper Suaitna power. OUr finding is that the exemptl.ons don't seemall that permanent or pertinent in terms of 1.1 large nen.1 hydro project-.coming on line in 1992.I just don't see the logic of the oil assumption in benefit detfoarminatione.for lOO-years of pOlf1er from Cl major new hydro projt'!ct.cc: l ColoneJ;..J~9l.le!~Robert Volk, OT'NC
333 WEST 4th AVENUE SUITE 31 - ANCHORAGE, ALASKA 99501Phone: (907) 277-7641(907) 276-2715Movcmber 17. 197:Colonel George RobertsonU. S. /-\rillY Corps of [119 i neers<strong>Alaska</strong> C'istrictPost Office Box 7002Anchorage, <strong>Alaska</strong> 99510Dear Colonel Robertson:1 have reviewed the material provided by tne Federal LnergyRegulatory Commission (FERC), associated with the Upper Susitnastudy power values. 1 feel that oil-fired generation as analternative to Susitna hydroelectric must be questioned. Oil-firedgeneration for new plants in Anchorage and Fairbanks will requireexemptions from the Secretary of <strong>Energy</strong> from the provisions of thePowerp1ant and Industrial Fuel Use Act of 1978. The ability ofAnchorage and Fairbanks to qualify for the exemptions to meet peakload requirements is doubtful. Due to limited refining capabilityin <strong>Alaska</strong>, distillate fuel oil requirements by 1990 would requirea major expansion of refining capabilities in <strong>Alaska</strong>. Without expansionthe utilities will import distillate fuel and pay associatedhigh transportation costs. Therefore, oil-fired generation forthe rail belt area may not be acceptable either for legal and regulatoryreasons or from the standpoint of fuel availability.The cost of fuel for oil-fired generation is an area that isnot adequately addressed in the economic analysis of hydroelectricalternatives by the federal government. The provision of powervalues by FERC and the subsequent present worth analysis of alternativepower generation is insensitive to National <strong>Energy</strong> Policyand the inelastic commodity demand of non-renewable resources suchas distillate fuel. I feel that the economic analysis of thealternatives must be sensitive to these considerations byappraising the true costs of energy to the consumer over a fiftyyear time frame with the capital intensive nature of facilities,the economic life of facilities, and the projected cost of fueltaken into account. The Golden Valley Electric Cooperative inFairbanks has recently studied the coal vs. oil-fired generationquestion for the next addition to GVEA's base load capacity. GVEAhas determined that the coal fired generation alternative is preferableto oil.
Colonel George RobertsonPage TwoNovember 16, 1978I hope these comments will assist the Corps of Engineers inthe application of Upper Susitna power values in the supplementalfeasibility studies currently in progress. Thank you for theopportunity to comment.C~ JlEric P. YOU1~Executive Director
SECTION DFOUNDATIONS AND MATERIALS
SECTION DFOUNDATION AND MATERIALSTABLE OF CONTENTSItemSUMMARY OF CHANGESChanges to the 1976 Interim Feasibility ReportChanges in DesignREGIONAL GEOLOGYPhysiographyInferred Geologic HistoryRegional TectonicsSeismicityRock and Soil UnitsRock StructureDEVIL CANYONSeismic Refraction SurveyMa teri a 1 Requ'j rementsWATANA SITEScope of InvestigationsField ReconnaissanceTest PitsSeismic Refraction InvestigationsInstrumentationSite GeologyIntroductionFoundation ConditionsValley Wall ConditionsRelict ChannelSpillwayPermafrostGround WaterReservoir GeologyDam DesignDam Foundation TreatmentEmbankment DesignPowerhouse and Underground StructuresIntake StructureSpi 11 waySeepage Control, Relict ChannelPage0-1D-l0-10-40-40-40-6D-60-70-80-100-10D-100-120-120-120-120-13D-l30-170-170-18D-190-210-22D-231)-240-250-260-260-270-290-290-300-30i
ItemConstruction MaterialsMaterial RequirementsSources of MaterialsGeneralRock ShellCore Ma teri a 1Filter MaterialsConcrete AggregatesGradation EnvelopesNumberTABLE OF CONTENTS (cont)LIST OF CHARTSTitle0-1 Soils Gradation Envelope - Borrow Area ETest Pits 1 through 50-2 Soils Gradation Envelope - Borrow Area 0Test Pits 8 through 190-3 Gradation Envelopes - Borrow Area ESuperimposed on Fine Filter0-4 Gradation Envelopes - Fine Filter andImpervious Core0-5 Gradation Envelopes - Coarse Filter andBorrow Area E0-6 Gradation Curve - Composite Sample No. 10-7 Gradation Curve - Composite Sample No. 20-8 Specific Gravity and Permeability Report0-9 Compaction Test Report - Method A0-10 Compaction Test Report - Method 00-11 Triaxial Compression Test Report I - Q Test,Composite Sample No.1, 3.5% W.C.0-12 Triaxial Compression Test Report II - Q Test,Composite Sample No.1, 7.5% W.C.0-13 Triaxial Compression Test Report III - Q Test,Composite Sample No.1, 11.5% w.e.0-14 Triaxial Compression Test Report IV - R Test,Composite Sample No.1, 7.5% W.C.0-15 Triaxial Compression Test Report IV - Back Pressureand Pore Pressure Test Oata0-16 Triaxial Compression Test Report V - R Test,Composite Sample No.1, 3.5% W.C.0-17 Triaxial Compression Test Report V - Back Pressureand Pore Pressure Test OataiiPage0-310-310-310-310-310-330-340-35Page0-370-380-390-400-410-420-430-440-450-460-470-480-490-500-510-520-53
Number0-180-190-200-210-220-230-240-250-260-270-280-29Number0-10-20-30-40-50-60-70-80-90-100-110-120-130-140-150-160-170-180-190-200-210-22LIST OF CHARTS (cont)TitleConsolidation Test Report IConsolidation Test I - Time Curves - 1, 2, 4, 8 tonsConsolidation Test I - Time Curves - 16, 32 tonsConsolidation Test Report IIConsolidation Test II - Time Curves - 1, 2,4,8 tonsConsolidation Test II - Time Curves - 16, 32 tonsConsolidation Test Report IIIConsolidation Test III - Time Curves -1, 2, 4, 8 tonsConsolidation Test III - Time Curves - 16, 32 tonsConsolidation Test Report IVConsolidation Test IV - Time Curves - 1, 2, 4,8 tonsConsolidation Test IV - Time Curves - 16, 32 tonsLIST OF PLATESTitleDevil Canyon - Site Plan and ExplorationsWatana Oamsite - Exploration PlanWatana Oamsite - Surficial Geology - West SheetWatana Oamsite - Surficial Geology - East SheetWatana Reservoir - Surficial GeologyWatana Oamsite - Stereographic ProjectionsWatana Oam - Section Along Oam AxisWatana Embankment - Plan ViewWatana Embankment - Section AWatana Oamsite - Quarry Source AWatana Damsite - Quarry Source B and Borrow Area 0Watana Oamsite - Borrow Area EGround Temperature <strong>Data</strong> IGround Temperature Oata IIGround Temperature Oata IIIPiezometer Oata IPiezometer <strong>Data</strong> IIPiezometer <strong>Data</strong> IIIWatana Oamsite - Borrow Area E; Logs: TestPits 1 through 5Watana Oamsite - Borrow Area C & 0; Logs: TestPits 7 through 14Watana Oamsite - Borrow Area 0; Logs: TestPits 15 through 22Watana Damsite - Borrow Area F; Logs: TestPits 6 and 23 through 26iiiPage0-540-550-560-570-58D-590-600-61D-620-630-640-65
NumberLIST OF PLATES (cant)Titl e0-23 Watana Damsite - Borrow Area 0; Logs: AugerHoles 1 through 60-24 Watana Damsite - Borrow Area 0; Logs: AugerHoles 6 (cont) through 90-25 Watana Damsite - Borrow Area D; Logs: AugerHoles 9 (cont) through 140-26 Watana Damsite - Borrow Area 0; Logs: AugerHoles 15 through 220-27 Watana Damsite - Borrow Area 0; Logs: AugerHoles 23 through 240-28 Drill Hole Logs No.1; DH-l through DH-40-29 Drill Hole Logs No.2; DH-4 (cont) through DH-70-30 Drill Hole Logs No.3; DH-8 through DH-100-31 Drill Hole Logs I~o. 4; DH-10 (cont) through DH-120-32 Drill Hole Logs No.5; DH-12 (cont) through DR-150-33 Drill Hole Logs No.6; DR-16 through DR-200-34 Drill Hole Logs No.7; DR-20 (cont) through DH-2l0-35 Drill Hole Logs No.8; DH-2l (cont) and DR-220-36 Drill Hole Logs No.9; DR-22 (cont) through DR-260-37 Drill Hole Logs No. 10; DR-27 and DH-280-38 Watana Damsite - Core Photos No.1; DH-l through DH-40-39 Watana Damsite - Core Photos No.2: DH-5 through DH-60-40 Watana Damsite - Core Photos No.3; DH-7 through DH-9D-41 Watana Damsite - Core Photos No.4; DH-9 (cont)through DH-ll0-42 Watana Damsite - Core Photos No.5; DH-ll (cont)through DH-120-43 Watana Oamsite - Core Photos No.6; 0 -15 through DR-200-44 Watana Damsite - Core Photos No.7; DH-210-45 Watana Damsite - Core Photos No.8; DR-22 through DH-28iv
NumberEXHIBITSTitle0-1 location Maps and Seismic Refraction VelocityProfiles, Watana and Devil Canyon Damsites.By Shannon & Wilson, Inc. Geological Consultants;Contract No. DACW85-78-C-0027, November 19780-2 Report - Reconnaissance of the Recent Geology ofthe Proposed Oevil's Canyon and Watana Oamsites,Susitna River, <strong>Alaska</strong>. By Kachadoorian & Henry J.Moore, U.S. Geological Survey, November 19780-3 Report - Earthquake Assessment at the Susitna Projectby E.l. Krinitzsky, U.S. Army Engineer WaterwaysExperimental Station, Vicksburg, Mississippi,10 November 19780-4 Technical Note - Procedure for Estimating BoreholeSpacing and Thaw Water Pumping Requirements forArtificially Thawing the Bedrock Permafrost at theWatana Oamsite. By F.H. Sayles, U.S. Army EngineersCold Regions Research and Engineering laboratory,Hanover, New Hampshire, October 19780-5 Open File Report 78-558-A, U.S. Geological Survey -Reconnaissance geologic map and geochronology,Talkeetna Mountains Quadrangle, northern part ofAnchorage Quadrangle, and southwestern portion ofHealy Quadrangle, <strong>Alaska</strong> by Csejtey, et al 1978v
SUMMARY OF CHANGESCHANGES TO THE 1976 INTERIM FEASIBILITY REPORTIn 1978, The <strong>Alaska</strong> District, Corps of Engineers, performed additionalfield explorations and geologic studies to verify the feasibilityof the Watana damsite. As a result of these studies, considerably moreinformation is now available concerning the site and the regional geologyof the area. Therefore, the entire sections on Regional Geology, pages0-1 through 0-9; Watana Site, pages 0-10 through 0-12; and the paragraphon Seismology at Devil Canyon, page 0-7, of Appendix 0, Foundations andMaterials, of the 1976 Interim Feasibility Report are deleted and replacedby this supplemental report. No changes to the Vee Canyon and Denalisites have been made. Plate 0-3, Watana - Site Plan and CenterlineProfile is deleted and replaced with revised drawings. Several newplates showing geologic sections, borrow areas, and exploration logshave been added. These are listed in the index.CHANGES IN DESIGNAs a result of the additional field exploration and geologic studies,a more knowledgeable assessment of the proposed project can now be made.A summary of the items which reflect changes to the 1976 Interim FeasibilityReport, or reinforce the basic concepts of that report follows.1. Nothing was found during this phase of the study to cast doubton the feasibility of a dam at the Watana damsite. All exploration andgeologic studies reinforced the concept that a large earth and rockfillor a concrete gravity dam could be built in this general vicinity.2. Detailed surveys were performed at the Watana site. It wasfound that the topography used for the 1976 report was in error byapproximately 15 feet. Therefore, the elevations shown on the platesor sections in this supplement are 15 feet lower than those shown inthe 1976 report. The detailed survey showed the valley section to bea little wider than previously assumed and therefore, the crest lengthof the dam and the total quantities within the dam are somewhat larger.3. The explorations at the damsite indicate that the rock is asgood or better than previously assumed. Foundation rock is consideredadequate to support either an earth-rockfill structure or a concretegravity dam. To support this conclusion, the regional and site geologyas well as the rock structure are discussed in much greater detail inthis supplemental report.D-l
4. The 1976 report recognized that the Watana damsite is an areaof marginal permafrost and, therefore, permanently frozen ground couldbe expected in the vicinity. In the 1978 exploration program, specificlocations of permafrost were identified and a number of temperaturemeasuring devices were installed. The earlier assumption that permafrostdoes exist over much of this area was confirmed; however, it wasdetermined that this is a very "warm" permafrost, ranging from 0° C to_1° C. Premafrost was encountered in bedrock in the left abutment ofthe dam and its effects on the grouting in this area are discussed inthis supplemental report. Permafrost was also encountered in the imperviousborrow area; however, because of its marginal temperature, ittends to be soft and can be easily excavated. A more detailed discussionis contained in the body of this report.5. The 1976 report envisioned rather large amounts of gravel availablefor construction of the shells of the dam and limited amounts ofimpervious core material. The recent explorations indicate that thisis not the case since gravels in large quantities were not verified butlarge quantities of impervious core material were discovered near thedamsite. Because of the apparent shortage of gravel and an excess ofimpervious material, the dam section has been completely revised. Thegravel shells have been changed to rock shells. This change to rockfillhas allowed the use of a somewhat steeper slope on the upstream face ofthe dam. A large portion of the rock will come from required excavationof the spillway. The remainder will come from excavation of undergroundfacilities and access roads and from a large borrow source on the leftabutment.6. The foundation excavation has been increased to require theentire foundation of the dam to be stripped to bedrock. The 1976 reportenvisioned excavation to bedrock under the core and filters only. However,because the evidence of the limited drilling performed ;s inconclusive,it was considered adviseable to require removal of in situgravels beneath the entire embankment. If additional drilling supportsa less conservative approach, the change can be made under subsequentfeature design.7. The core has been widened somewhat from that shown in the 1976report and a zone of semipervious material, approximately of the samewidth as the core, has been added. This was done because large amountsof semi pervious material are available and estimates show that it canbe placed within the dam at a considerably lower cost than the rockshell material. The total thickness of these impervious and semiperviouszones was determined by considering their effect on total stability ofthe dam and the difficulties of placing materials which require carefulmoisture control in the arctic environment. Laboratory tests performedon these materials indicate that optimum moisture will be a rather criticalfactor in their compaction. Therefore, the use of such materials hasbeen held to within reasonable limitso0-2
8. The 1976 report showed a vertical access shaft to the low-leveldrain system which passed through the embankment of the dam. This hasnow been changed to a tunnel through the right abutment, thereby eliminatingany structures in the dam embankment.9. A grout gallery has been added to the lower portions of the damto facilitate grouting and to accommodate the process of thawing thepermafrost. Use of the gallery will allow embankment placement andcurtain grouting to proceed simultaneously, resulting in a shortenedconstruction schedule. The gallery will also provide for "read-out"stations for instrumentation in the foundation and lower levels of theembankment and for general access.10. The spillway location as shown in the 1976 report has beenshifted southwest to a location which insures rock cut for its entirelength. The rock and overburden material from this large excavationwill be utilized in the dam embankment.11. The 1976 report discusses a potential problem of seepage alonga relict channel in the right abutment. The 1978 explorations verifiedthe existence of this channel; however, studies indicate that it is nota problem and, therefore, no remedial action is required.12. The diverison tunnel portals have been shifted to ensure theirlocation in reasonably sound rock.13. Professional services of Ellis Krinitzsky of the WaterwaysExperiment Station and Reuben Kachadoorian and Henry J. Moore from theU.S. Geological Survey were obtained by contract to perform seismicstudies and evaluate the earthquake risk at these sites. Their work wasdivided into two phases. Kachadoorian and Moore of USGS performed thefield reconnaissance to look for active faults and other geologic hazards.Krinitzsky's work was aimed at assessing the potential earthquakes whichcould be associated with such faulting. The USGS report recognized thatthis is a highly seismic region; however, the geologic reconnaissance ofthe proposed Devil Canyon and Watana damsites and reservoirs did notuncover evidence of recent or active faulting along any of the known orinferred faults. In their work they did not uncover evidence of theSusitna Fault, which was previously thought to exist a short distancewest of the Watana damsite. Krinitzsky's work assessed the possibleoccurrance of earthquakes at the damsite and the motions that are likelyto be associated with earthqauke activity. His findings indicate thatthe design of the proposed dams to withstand such activity is within thestate of the art of seismic design.14. In the fall of 1978, the consulting firm of Shannon & Wilsonwas engaged to perform refraction seismograph work at both the Watanaand Devil Canyon damsites. This work supplemented the drilling information.The location maps and seismic velocity profiles from the Shannon& Wilson report are included as Exhibit D-l to this appendix.D-3
REGIONAL GEOLOGYPHYSIOGRAPHYThe area of study is located within the Coastal Trough Province ofsouthcentral <strong>Alaska</strong>. The Susitna River is a glacially fed stream whichheads on the southern slopes of the <strong>Alaska</strong> Range, and flows by way ofa continuously widening valley to the tidewaters of Cook Inlet. Withinthe upper 200 river miles, the Susitna passes through a variety of landforms related to the lithology and geology of the region. From itsproglacial channel in the <strong>Alaska</strong> Range, it passes through a broad,glaciated, intermontane valley characterized by knob and kettle topographyand by braided river channels. Turning westward along thenorthern edge of the Copper River lowlands, the river enters a deep,V-shaped valley and traverses the Talkeetna Mountains, emerging intoan outwash plain and broad valley which it follows to the sea.Three regional topographic lows, still identifiable today, are theSusitna River-Chulitna River area downstream of the Devil Canyon site,the middle reach of the Susitna River from Prairie Creek to WatanaCreek, and the Oshetna River area at the Susitna Big Bend. These mayrepresent drainage base levels that existed during the glacial periods.Whether they were interconnected at one time is not known since glaciationhas modified the original drainages. One possible interpretationis that the ancestral Susitna River may have followed the course of thepresent Watana Creek and continued southwest along an ancestral valleythrough the area now occupied by Stephan Lake, Prairie Creek, and theTalkeetna River.The Susitna River, presently incised 500 feet into that broad,ancestral, U-shaped valley, makes two sharp right-angle turns downstreamof Watana Creek in the Fog Creek area and leaves the ancestral valleyto flow westward into the steep, V-shaped Devil Canyon area. Glaciationprobably blocked its former southwest course forcing the river to finda new outlet in Devil Canyon. Once established in a westward course,the Susitna River downcut its channel rapidly and became entrenched inDevil Canyon.INFERRED GEOLOGIC HISTORYThe upper Susitna River basin is a complex geologic area with avariety of sedimentary, igneous, and metamorphic rock types. Theserange from Pennsylvanian to Pleistocene in age and have undergone atleast three major periods of tectonic deformation.0-4
The oldest outcrops in the area are Pennsylvanian and Permian agedmetavolcanic flows and tuffs, locally containing limestone interbedsthat have subsequently been altered to marble. This transitional shelfenvironment continued throughout the Triassic and into early Jurassictimes, with alternate deposition of basalt and thin sedimentary interbeds.Metavolcaniclastics include altered marine sandstones and shales.This deposition was contemporaneous with a massive outpouring of lavasin the eastern <strong>Alaska</strong> Range, resulting in regional subsidence.The first major tectonic upheaval in the Susitna area occurred inmid to late Jurassic time and consisted of large plutonic intrusionsaccompanied by uplift and intense metamorphism. Erosional remnantsof these intrusives include amphibolites, greenschists, diorites, andacidic granitic types in the upper Watana reservoir areas. This uplift,and subsequent erosional period, was followed by marine deposition ofargillite and graywacke in late Cretaceous. These rocks are exposedin the northwestern half of the upper Sus;tna basin and include thephyllites of the Devil Canyon site.The second major tectonic event occurred in middle to late Cretaceous.Most of the structural features in the Talkeetna Mountains, includingthrust faulting, complex folding, and uplift, occurred at that time.As a result of the thrust faulting, Pennsylvanian and Permian volcanicflows and tuffs were thrust over the much younger late Cretaceousargillite and graywacke.In early Tertiary, approximately 65 million years ago, the northwesternportion of the upper Susitna basin was intruded by plutons ofigneous rock. The diorite pluton that underlies the Watana site isone of these intrusives. Deposition of undifferentiated volcanic flows,pyroclastics, and associated near-surface intrusives occurred concurrentwith and following the intrusion of the plutons.The third major tectonic event was a period of extensive uplift anderosion in middle Tertiary to Quaternary. Uplift of 3,000 feet has beenmeasured in the southern Talkeetna Mountains. The widespread erosionthat occurred during this period removed thick rock sequences from theSusitna basin area.Glaciation has been the prime erosion agent during the past severalmillion years. At least two, and probably more, periods of glaciationoccurred within the upper Susitna basin area. The central and easternportions of the area may have been partially covered by glacial lakesduring the latter glaciations. Renewed uplift in late Pleistocenerejuvenated the erosion cycle until the streams, with their increased0-5
gradients, became incised within glaciated valleys. The area currentlyis undergoing continued stream erosion, and is covered in many areaswith a veneer of glacial and alluvial clay, silt, sand, and graveldeposits.REGIONAL TECTONICSThe arcuate structure of southcentral <strong>Alaska</strong> reflect both the magnitudeand direction of regional tectonic forces caused by the collisionof the North American and Pacific Plates. The Talkeetna Mountains andadjacent Susitna River basin are believed to have been thrust northwestwardonto the North American Plate from their parent continentalblocks. It was this thrusting action which caused most of the structuralfeatures now seen in the upper Susitna basin.Two major tectonic features bracket the basin area. The DenaliFault, about 43 miles north of the damsites and active during theHolocene, is one of the better known <strong>Alaska</strong>n faults. A second fracture,the Castle Mountain Fault, is 75 miles south of the river basin.The Susitna basin is roughly subdivided by the northeast-southwesttrending Talkeetna Thrust, which roughly parallels the location of theSusitna Fault, as referred to in the 1976 Interim Feasibility Report.The Talkeetna River is a surface expression of the southern portion ofboth structures; however, Kachadoorian and Moore were unable to locateevidence of faulting in the Tsusena Creek area and, therefore, expresseddoubt that the Susitna Fault exists. They found evidence of movementin the Talkeetna River and Watana Creek valleys and postulated thatthe Talkeetna Thrust could be a projection of this feature. Such aprojection passes about 4 miles to the south of Watana damsite. Themajor alpine orogeny which formed many of the basins' present northeastsouthwesttrending compressional structures occurred in conjunctionwith the Talkeetna Thrust in late Cretaceous. Another contemporaryzone of intense shearing, roughly parallel to the Talkeetna Thrust, islocated about 15 miles east of the Talkeetna Thrust.Two poorly exposed normal faults of probable Cenozoic age havebeen projected from gravimetric data as occurring in the Chulitna Rivervalley about 15 miles northwest of the proposed Devil Canyon damsite.These faults have the northeast-southwest trend typical of the majorstructures within the area. No faults with recent movement have beenobserved within the upper Susitna River basin.SEISMICITYA seismological assessment of the basin area was prepared byDr. E.L. Krinitzsky of the U.S. Army Engineer Waterways ExperimentStation in the summer of 1978, under contract with the <strong>Alaska</strong> District,0-6
Corps of Engineers. Field reconnaissance to look for active faults andother geological hazards was conducted by U.S. Geological Survey underthe direction of Reuben Kachadoorian and Henry J. Moore. These reportsare included as Exhibits D-3 and D-2 in this appendix. They recognizethat the Devil Canyon and Watana damsites are in a region of high seismicityand major faults. However, the geologic reconnaissance of theproposed Devil Canyon and Watana damsites and reservoir areas by theUSGS experts did not uncover evidence of recent or active faulting alongany of the known or inferred faults. The tectonic framework of theregion is not well understood because of the lack of local seismic monitoringstations. Present knowledge indicates that historical earthquakesin the area often have hypocenter depths in excess of 50 km. Such eventsare associated with movement along the Benioff zone and often are notdirectly associated with local surface faulting. The Denali Fault inthe <strong>Alaska</strong> Range, approximately 43 miles to the north, is the dominantsurface feature in this area. The Susitna Fault, previously thoughtto exist west of the Watana damsite, was not confirmed in recent geologicmapping by the USGS team, nor did they find any evidence of faultingin the river channel at either of the damsites. The results of thecore drilling and geologic reconnaissance at the damsite are strongevidence that no major faulting exists under the Watana damsite. Thelack of significant shearing in DH-21, the 600-foot cross river hole,reinforces this conclusion.Krinitzsky's work assessed the possible occurrence of earthquakeactivity based on the USGS field work. He assumes an earthquake ofmagnitude 8 along the Denali Fault, however, these motions are notcritical when attenuated to the damsites. To account for the possibilitythat a major active fault could exist near the damsites, Krinitzsky hasassigned a "floating" earthquake of magnitude 7 which could occur inthe near vicinity of the dam. This generates the most severe designmotions. The rational for the "floating" earthquake and a table ofassociated motions is included in his report (Exhibit D-3). Thiscriteria is within the state of the art for earthquake design for largedams, and therefore. should not preclude proceeding with detaileddesign of the projects •.ROCK AND SOIL UNITSThe proposed Watana damsite and reservoir area ;s underlain by acomplex series of metamorphic, igneous, and sedimentary rock. Specificformation names have not been applied to most of these units and theyare instead assigned lithologic descriptions for correlation and mappingpurposes. The distribution of various rock units that underlie theproposed reservoir are shown on Plate 5. Following is a brief descriptionof the various rock units, beginning at the upper end of the reservoirand proceeding downstream to the damsite. Additional informationand descriptive details concerning the rock units are includedin the U.S. Geological Survey's Open File Report 78-558-A, ReconnaissanceGeologic Map and Geochronology, Talkeetna Mountains Quadrangle,D-7
The upper reaches of the reservoir are underlain by an amphiboliteunit. These are metamorphic rocks including greenschists, diorites,and local marble interbeds. Directly downstream of this unit is azone of granitic types that are exposed north of the river at elevationsabove the proposed reservoir level.The oldest rocks exposed within the area are farther downstreamwithin the middle reservoir reaches and include both volcanics and limestoneunits. The volcanics consist mostly of metamorphosed basaltand andesite flows and tuffs that outcrop in the vicinity of Jay Creekand downstream from Kosina Creek. The limestone unit consists of marbleinterbeds that occur locally within the volcanics. The volcanics areoverlain farther downstream by a volcanic unit of younger age consistingof a series of metamorphosed basaltic flows with interbeds of chert,argillite, and marble. This unit is exposed both near the mouth ofWatana Creek and on the higher slopes west of Watana Creek. A muchyounger series of interbedded conglomerates, sandstones, and claystonesis exposed along the lower reaches of Watana Creek directly upstreamfrom its mouth.The downstream reaches of the reservoir area are underlain by asequence of argillites and graywackes. Exposed within the immediatedamsite area is a granitic body intruded into these metasediments. Itconsists primarily of diorite with upstream and downstream margins thatinclude associated schist, gneiss, and composite igneous and metamorphicrock types. Andesite flows and dikes are associated with this dioritepluton.Other granitic intrusives occur east of the reservoir area. locally,these intrusives are overlain by a series of younger igneous flows andtuffs and related shallow intrusives.Overburden units in the proposed reservoir area include deposits ofglacial till and drift with associated outwash and lake sediments,colluvium including slopewash and talUS, alluvium and local slide debris.ROCK STRUCTURERocks within the reservoir area have undergone a complex deformationsequence, including uplift, intrusion, thrust faulting, folding,shearing, and associated metamorphism. The most significant structuralfeature within the reservoir area is the Talkeetna Thrust which strikesnortheastward across the lower reservoir area and is roughly parallelD-8
to the lower reaches of Watana Creek. The Talkeetna Thrust, within theWatana reservoir area, has displaced the volcanic unit over the muchyounger metasediments.A northeast striking shear zone that dips steeply southeasterly,and is roughly parallel to the Talkeetna Thrust, crosses the reservoirarea about 15 miles east of the Talkeetna Thrust near Kosina Creek.Whether this shear zone represents a significant feature is not known.The most significant rock structure in the immediate dam area isthe intrusive diorite pluton of Tertiary age. It is observable for4 miles parallel to the river and 2 miles north and south and is probablyof great depth. Upstream and downstream border zones developedwith several different metamorphic and igneous rock varieties. Twodistinct northwest trending shear zones have been mapped in the vicinityof the damsite. One is 3,400 feet upstream and the other 2,500 feetdownstream from the proposed dam axis. Attitudes vary with strikesranging from N 40 0 W to 60 0 Wand dips from 70 0 to 90 0 either SW or NE.The two shears can be seen in the right valley wall, but not on the leftvalley wall. The left wall is obscured by a slide block at the upstreamshear, and the left wall at the downstream shear has a rock face thatparallels the shear direction making observations difficult. The upstreamshear zone has been named "The Fins," and has an observablewidth in excess of 400 feet. It includes seven near vertical rock finsaveraging 5 to 25 feet in width bounded on both sides by altered andcrushed' rock. The downstream shear zone, named lIF;nger Buster", is somewhatless distinct and is partially covered by slope debris. It has anestimated width of 300 feet. Another northwest trending shear zone,similar to the two shears mentioned above, occurs downstream from thedamsite in the vicinity of Tsusena Creek.Fracture patterns including both joints and local shears have beenmapped within accessible areas 'in the vicinity of the damsite. Detailsof this mapping are shown on Plates 0-3 and 0-4. Fractures include bothcooling type jointing and structural deformation jointing resulting fromthe regional tectonic forces of uplift and thrust faulting. Shear,tension, and relief joints resulting from unloading by erosion of overlyingsediments and/or melting of glacial ice are all present withinthe damsite area. A joint diagram plotted on an equal area stereographicprojection is shown in Figure 0-6. The dominant fracture orientation;s to the northwest, but fractures strike in several directions. Themajor joint sets are N 50° Wand the minor joint sets are N 30 0E asobserved within the area.D-9
SEISMIC REFRACTION SURVEYDEVIL CANYONDuring September 1978, seismic refraction surveys were undertakenat Watana and Devil Canyon damsites by Shannon and Wilson, geotechnicalconsultants. At Devil Canyon, the seismic survey consisted of threelines, each approximately 1,100 feet long. One of these lines waslocated near the proposed ali.nement of the saddle dam on the left abutmentand the remaining two lines were located near an abandoned airstripon the alluvial fan at the confluence of Cheechako Creek and the SusitnaRiver (see Plate 0-1). The seismic line near the centerline of the leftabutment saddle dam was alined to expand information derived from drillingaccomplished on this site by the U.S. Bureau of Reclamation (USBR) in1957. The refraction profile correlated well with the top of rock fromthe drilling data (see Sheet No. 10, Exhibit 0-1). A lower velocityzone of rock sandwiched between competent phyllite indicates the possibilityof a shear zone at the low point of the saddle. This correlateswith hole DH-6 which indicated shearing in the 20 feet of bedrock penetratedby the boring.The seismic lines on the Cheechako Creek aggregate deposit werealined to establish the depth to bedrock beneath these deposits andthereby confirm the quantity of material available for borrow. Thevelocities for the material in the alluvium indicate that the area iscomposed of a layer of sands and gravels or glacial materials severalhundred feet thick overlying bedrock. This confirms the existence ofmaterial well in excess of the requirements for the project.The location map and seismic velocity profiles from the Shannon &Wilson report and included in Exhibit 0-1 to this appendix.MATERIAL REQUIREMENTSCo,crete RequirementsMaterial requirements for Devil Canyon dam are based on a concretegravity dam. Under this proposal approximately 2.6 million cubic yardsof concrete will be required, most of which will be masi concrete. Theremainder will be structural concrete for the appurtenant structuresto the dam, including the powerplant. With stockpile losses, thisamount of concrete wi 11 requ; re approximately 3 mi 11 ion cub; c yardsof processed aggregate.The USBR located an extensive deposit of material which will yieldconcrete aggregate of adequate quality in an alluvial fan approximately1,000 feet upstream of the proposed dam axis. The fan was formed atthe confluence of Cheechako Creek and the Susitna River.0-10
Thirteen test pits and trenches were dug in the fan area by Bureauof Reclamation personnel in 1957. About 1,300 pounds of minus 3-inchmaterial was tested by the USBR for basic aggregate suitability studies.An additional 200 pounds of material was collected by Corps of Engineerspersonnel in 1975 from the existing Bureau test pits and the riverbank.This material was tested by the North Pacific Division Materials Laboratoryin 1978 .If the excavation of materials is confined to that part of thealluvium located above river level (elevation 910 to 920 feet) withconservative back slopes through the ridges and benches, approximately6,000,000 cubic yards of material is available in this location withall the resulting excavation in the reservoir area. Seismic refractionsurveys indicate that usable gravel exists to approximately elevation870 feet, so additional material could be retrieved if needed by bailingfrom below the water surface. Placement of the coffer dam, sizing ofthe diversion tunnel, and the ability to control the flow in the riverat Watana dam will ultimately affect the method of exploitation of thissource.The locations of the test pits are shown on Plate D-l and the~etailed logs can be found in the U.S. Bureau of Reclamation's <strong>Alaska</strong>Geologic Report #7, Devil Canyon Project, dated March 1960. Laboratoryinvestigations of the aggregate samples were reported in USBR Report#C-932 by their Concrete Laboratory Branch, dated 21 December 1959.Petrographic analyses of the fine (sand sized) particles and coarse(gravel size) particles indicate that the sands and gravels in the fanare composed of quartz diorites, diorites, granites, andesites, dacites,metavolcanic rocks, aplites, breccias, schists, phyllites, argillites,and amphibolites. The gravel particles are stream worn and generallyrounded in shape. The sand grains vary from nearly rounded to sharplyangular in shape, averaging subangular. The specific gravity (BSSD) ofthe material ranges from 2.68 to 2.80.Results from both labs indicate that the materiai in the CheechakoCreek fan is of adequate quality for use as concrete aggregate.Embankment Material ReguirementsThe saddle dam on the left abutment, associated with the concretegravity dam, will require approximately 835,000 cubic yards of material.These materials will be obtained from the same sources as discussed inthe Interim Feasibility Report.D-ll
SCOPE OF INVESTIGATIONSField ReconnaissanceWATANA SITEGeologic reconnaissance and mapping of the reservoir area and damsitewere conducted concurrently with subsurface investigations throughoutthe spring and early summer of 1978. The work of the geologic teamswas made easier in the early spring as rock outcrops were not obscuredby the leaves on the trees and the dense ground foliage. Through themonths of March and April, geologic mapping of the lower canyon was donefrom the frozen surface of the river, which allowed access to areasotherwise inaccessible after the ice had melted and high summer flows onthe river had begun. Within the damsite area the primary purpose was tofind, identify, 'and trace the surface expressions of discontinuities andshear zones as an aid in directing the drilling program and to providepreliminary geologic mapping of the site. Within the reservoir area~the primary thrust of the reconnaissance was toward identification ofslopes, which by reason of shape, structure or overburden mantle coulddevelop minor slumps and slides as a result of permafrost degradationor seismic action.Borings and Test PitsOuring 1978, explorations were conducted in the dam foundation andrelict channel area. Core borings in the valley walls and floor wereused to explore the quality and structure of the foundation rock and toobtain representative samples for testing. Borings in the relict channelarea were used to define the depth of overburden, the extent of permafrost,the location of the water table and to examine, by drilling andsampling, the nature and condition of the materials.Shallow auger holes were also used to determine the extent of depositsin the borrow areas and to verify the existence of quantities necessaryfor embankment construction. .Locations of explorations are shown on Plate 0-2. Logs are shownon Plates 0-19 through 0-37; and core photos are shown on Plates 0-38through 0-45.Test pits were dug in potential borrow areas utilizing tractormountedbackhoes. Bulk sack samples were retrieved from each testpit for testing later at the North Pacific Oivison Materials Laboratoryin Troutdale, Oregon.0-12
A total of 27 test pits were dug in four areas as follows:1. The mouth of Tsusena Creek (Borrow Area lEI) - 6 test pits.2. The glacial till borrow area (Borrow Area 10 1 ) - 14 test pits.3. Upper Tsusena Creek, north of Tsusena Butte, (Borrow Area IC I ) -test pit.4. Middle Tsusena Creek - 6 test pits.The locations of Test Pits 1 through 5 and 8 through 21 are shownon Plates 0-12 and 0-11. The remainder of the test pits are locatedin areas which are not presently considered as borrow areas; however,they may be located on Plate 0-2. The logs of all the test pits areshown on the appropriate borrow area Plates 0-19 through 0-22.Seismic Refraction SurveysA seismic refraction exploration program consisting of 22,500lineal feet of seismic refraction lines was completed by Dames and \Vloore,Consultants, in 1975. Results of those investigations were presentedas Exhibit 0-1, Section 0, Foundation and Materials, in the 1976 InterimFeasibility Report. In the fall of 1978, an additional seismic refractionsurvey was completed by Shannon and Wilson, Consultants, whichincludes 47,665 feet of seismic refraction lines. Locations of theseadditional seismic explorations are shown on Plate 0-2, and the locationmap and seismic velocity profiles are presented as Exhibit D-l. Thesurvey confirmed the findings of the Dames and Moore study. It confirmedthe existence of a buried channel in the relict channel area and ingeneral supported conclusions relating to shear zones in the abutmentsas interpreted from the recent core borings and geologic reconnaissance.The Shannon and Wilson survey also confirmed the existence of largequantities of borrow materials on Tsusena Creek in the proposed borrowarea.InstrumentationInstrumentation conducted under this phase of the project consistedof the installation and data reading of ground water measurementdevices, temperature logging devices, and the recording of the ambienttemperature.Ground Water: All piezometers installed were of the open well pointtype and were filled with diesel oil where they extend through permafrostzones to prevent freezing. A total of 10 piezometers were installed atthe following locations.0-13
TABLE D-lSurface TipLocation Elevation Elevation Date Set SizeDR-14 2,340 2,271. 0 26 Apr 4112,340 2,295.2 19 Aug 1-1/211DR-20 2,207 2,123.8 30 May 1-1/211DR-18 2,172 2,107.0 21 Jun 1-1/2"DR-17 2,167 2,136.3 8 Jun 1-1/2"DR-16 2,099 2,05308 5 Jun 1-1/2"AP-1 2,202 2,188.6 20 Jun 1-1/2"AP-2 2,200 2,189.0 20 Jun 1-1/2"DR-19 2,151 2,109.0 3 Ju1 1-1/2"DR-22 2,229 2,005.5 3 Aug 1-1/211DR-26 2,295 2,229.5 11 Aug 1-1/2"All locations are shown on Plate D-2 and Plate D-ll.is shown on Plates D-16 through D-18.Plotted dataSubsurface Temperature: The principal temperature logging deviceconsisted of a 3/4-inch galvanized pipe, with the lower end capped and.sealed. The pipe was filled with a mixture of ethylene glycol and water(50/50) or arctic grade diesel fuel. Readings were taken using a digitalvolt-ohm meter and a single thermister which was lowered into the pipe.At location DR-26 both a 3/4-inch galvanized and a 1-l/2-inch PVCpipe were installed to determine if readings could be duplicated in apipe of larger diameter. A total of 14 devices were installed at thelocations shown in Table D-20D-14
TABLE D-2DateBuriedLocation Ins ta 11 ed Length Stick UE DeEth Fl dAP-8 23 Jun 64 1 4.2' 58.9' DieselAP-9 23 Jun 211 3.21 17.8' DieselDH-12 3 Jul 129' 1.8' 127.2' DieselDH-23 17 Ju 1 76' 0.5' 75.5' AntifreezeDH-24 1 Aug 86 1 1.21 84.8' AntifreezeDR-18 21 Jun 25,. 3.4' 247.6' DieselDR-19 3 Jul 83' 3.9' 79. l' DieselDR-22 3 Aug 492' 2.0' 490.0' AntifreezeDH-28 30 Aug 124' 1.0' 123.0' AntifreezeDR-26(3/4" pipe) 11 Aug 68' 3.8' 64.2' AntifreezeDR-26(1-1/2" pipe) 11 Aug 99' 3.4' 95.6' AntifreezeDR-14 19 Aug 65' 2.8' 62.21 AntifreezeDH-21 23 Aug 160' 2.0' 158.0' AntifreezeDH-25 15 Aug 80' 4.0' 76.0' AntifreezeAll locations are shown on Plate D-2 and Plate D-ll. The plottedtemperature data can be found on Plates D-13 through D-15.A second type of temperature logging device, installed at DR-22,consisted of a multipoint thermistor string. The purpose of this installationwas to act as a check against the 3/4-inch fluid filled devicesdescribed above.Ambient Temperature: The ambient temperature was obtained usinga standard high-low Mercury thermometer placed in the shade on theright abutment riverbank approximately 4 feet above the ground. Priorto this phase of the project, there was no ambient temperature dataavailable for this section of <strong>Alaska</strong>. <strong>Data</strong> obtained is shown on TableD-3.D-15
TABLE 0-3Date High of Low of Date High of Low of---23 Mar 78 22 0 23 t~ay 78 60 3924 Mar 78 24 13 24 May 78 60 3225 Mar 78 28 19 25 May 78 61 4027 ~~ar 78 32 10 26 May 78 41 3628 Mar 78 26 13 27 May 78 6429 Mar 78 40 6 28 May 78 3630 Mar 78 35 6 29 May 78 58 3331 Mar 78 36 5 30 May 78 63 361 Apr 78 31 5 31 May 78 66 402 Apr 78 28 -4 1 Jun 78 54 363 Apr 78 28 3 2 Jun 78 58 384 Apr 78 36 4 3 Jun 78 68 415 Apr 78 36 20 4 Jun 78 68 386 Apr 78 33 11 5 Jun 78 57 397-8 Apr 78 40 28 6 Jun 78 66 449 Apr 78 41 10 11 Jun 78 72 4410 Apr 78 43 13 12 Jun 78 62 3911 Apr 78 38 20 14 Jun 78 57 4012 Apr 78 38 15 16 Jun 78 58 3413 Apr 78 40 30 19 Jun 78 52 3314 Apr 78 44 32 20 Jun 78 61 3315 Apr 78 40 38 21 Jun 78 6316 Apr 78 39 29 22 Jun 78 4617 Apr 78 38 21 27 Jun 78 55 3818 Apr 78 43 21 28 Jun 78 59 3719 Apr 78 44 20 30 Jun 78 62 4320 Apr 78 48 24 1 Ju1 78 57 4121 Apr 78 44 25 2 Ju1 78 62 4322 Apr 78 45 30 4 Ju1 78 70 4723-24 Apr 78 47 32 7 Jul 78 62 4025-26 Apr 78 50 26 8 Ju1 78 73 4330 Apr 78 59 32 9 Ju1 78 70 491 May 78 60 34 10 Ju1 78 66 429 May 78 64 30 11 Ju1 78 7110 May 78 72 33 12 Ju1 78 5011 ~1ay 78 70 33 14 Ju1 78 59 5012 May 78 65 40 16 Ju1 78 58 4713 May 78 72 30 26 Ju1 78 66 4514 ~1ay 78 72 31 27 Ju1 78 78 4015 May 78 66 36 28 Ju1 78 74 5516 May 78 55 32 29 Ju1 78 78 3917 May 78 60 30 30 Ju1 78 82 4618 May 78 64 37 31 Ju1 78 84 5219 May 78 60 37 1 Aug 78 80 5820 May 78 75 24 9 Aug 78 71 4621 ~~ay 78 70 43 10 Aug 78 68 5422 May 78 36 11 Aug 78 66 490-16
Accuracy of Subsurface Temperature <strong>Data</strong>: Resistance measurementswere obtained using a Keithley volt-ohm meter, which allowed readingsto the nearest ohm. With a span of 225 ohms per degree centigrade, 1ohm represents 0.005 0 C. The temperature data in this report has beenreported to 0.010 C and is reliable to that degree of accuracy. Toverify the accuracy of each thermister, its resistance was measured inan ice bath. It was found that the thermistors are very stable and donot tend to drift from their original resistance at 0.00 0 C.General CommentsThe drilling in the permafrost was performed with core drills androtary drills, which introduce a large amount of heat into the ground.Where the penllafrost temperature is only slightly below the freezingpoint, this tends to melt the permafrost and makes identification verydifficult. Therefore, the drilling operation mayor may not reflectthe existence of permafrost, and it is necessary to rely heavily on theinstrumentation for a true evaluation of the location and depth, at whichpermafrost exists. By December of 1978, the temperature logging devicesmay not have stabilized due primarily to the fact that the drillingmethod used was rotary with drilling "mud" as the circulation medium,which tends to thaw the permafrost. Upon inspection of the plotteddata for the locations in this area it can be seen that the temperaturesare gradually approaching the 0 0 C point. Through a cont"inual programof monitoring these points, a great deal can be learned about IIfreezeback."At location DR-26, 3/4 inch and 1-1/2 inch pipes were installed todetermine if convection currents in the pipe would affect the accuracyof the near surface readings. It can be seen from the temperatureplots, shown on Plates D-13 through D-15, that there is a degree ofconvection in the upper zones, while with depth the two readings arevery similar. At location DR-22, the string had 14 thermistors in a150 foot length. The data obtained from this string has not beenincluded in this report since its reliability is in question. This isdue to damage received during installation as well as the fact that thethermistors are of a lower quality and adequate calibration could notbe obtained prior to installation. At location DH-12 the 3/4-inch pipetemperature logging device was lost when it was decided that the boreholecamera should be run in this boring. At location DH-25 no datais available because the 3/4-inch pipe froze up during installation.5 ITE GEOLOGYIntroductionThe river valley at the site has a V-shaped lower or bottom canyondeeply incised into an upper, much broader, U-shaped river valley ofconsiderable extent and width.D-17
The lower ri ver valley fl oor ranges from 300 to 600 feet wi de andhas side slopes of 35 to 60 degrees with locally scattered rock outcropsthat rise in near vertical cliffs. The incised portion of the canyonextends from subriver level upward about 500 feet to approximate elevation2,000 feet, where it ranges in width from 1,500 to 3,000 feet.Above elevation 2,000 feet, there is a distinct flattening of the valleyslopes and the area broadens out into a very wide fonner river valley.Width of this former valley base level is from 8 to 10 miles in thelower reservoir area, narrows to about 1 mile in the midreservoir areaupstream of Jay Creek and widens to more than 20 miles in the upperreaches of the reservoir.Foundation ConditionsThe site was mapped and explored with 17 core holes, 12 of whichare on the dam axis shown in this report. Six of the holes are angleholes, five were drilled normal to the dominant structural trend, andone drilled across the river valley. The exploration plan with holelocations is presented on Plate D-2.The river valley is filled with alluvium consisting of gravels,cobbles, and boulders in a matrix of sand or silty sand. Overburdendepths in the valley bottom range from 40 to 80 feet and may exceed 100feet in places. Overburden depths on the valley slopes range up to 10feet deep on the left abutment and up to 20 feet on the right abutment.However, overburden upstream of the left abutment is more than 56 feetdeep.Overburden on the valley slopes is mostly glacial debris and talusconsisting of various gravel and sand mixtures and some silts, withcobbles and small boulders. The underlying rock is diorite, granodiorite,and quartz diorite with local andesite porphyry dikes and morewidely scattered minor felsite dikes. Most of the rock, although fractured,is relatively fresh and hard to very hard within 5 to 40 feetof top of rock. Overburden and rock stripping depths along the damaxis are shown in cross section on Plate D-7.Fractures are closely to moderately spaced at the bedrock surface,generally becoming more widely spaced with depth. Fracture zones foundat all depths tend to be tight or recemented with calcite or silica.The northwest trending joints and high angle shears mapped in the rockoutcrops are found at different depths within most drill holes andrange from single fractures to broken zones more than 20 feet thick.Broken rock within the shear zones is locally decomposed but consistsmainly of moderately hard to very hard fragments. Many fractures havethin clay gouge seams and slicken sides. Pyrite and chlorite mineralizationis found as coatings on many fracture surfaces. Shears areD-18
spaced from a few feet to more than 100 feet apart, and since the shearsare mostly vertical, greater lengths of sheared material were recoveredin vertical drill holes. In addition to the shears, primary and rehealedbreccia zones occur in some areas adjacent to the andesite porphyry dikes.Most of these rehealed breccias are relatively competent rock, but aprimary breccia zone downstream of the axis on the left abutment includeslocally decomposed materials.Valley ConditionsThe river valley bottom was explored with six core drill holes.Three holes are on the axis and three are about 1,000 feet downstreamof centerline in the toe area. River alluvium varied in depth from 44to 78 feet. This alluvium consists of gravels, cobbles, and bouldersimbedded in sands with local gravelly or silty sand lenses. The gravelsand larger sizes are mostly subrounded to rounded with occasional largeboulders. Most large sizes are of dioritic composition, but metamorphicand other rock types were also noted. Most of the gravels are fresh,but a few are coated with plastic fines. Alluvial materials in someareas were frozen to depths in excess of 50 feet and possibly all theway to bedrock at the time of drilling.The bedrock is a diorite that in most holes is very closely fracturedin the upper 10 to 20 feet. Fractures become more widely spaced withdepth; however, local zones of closely spaced fractures occur throughout.Joints are both open and rehealed or cemented with calcite and silica.The rock below river level is mostly fresh and hard to very hard. Shearzones occur in several of the holes and include some thin clay gougecoatings and slickensides. Soft chloritic materials were also encounteredin one shear zone, and iron staining with pyrite mineralization is common.It should be noted that DH-2l was drilled essentially across the riverfrom the left to the right abutment. No major fault or significantchange in materials was seen although six minor shear zones wereencountered in the hole. Most of these zones are less than 3 feet thick,whereas, some of the vertical holes penetrated sheared material fordistances of more than 10 feet. This confirms the near vertical natureof most shearing. Geologic mapping in rock exposures along the riverbankalso indicates the near vertical nature of shearing. An andesiteporphyry dike was penetrated at depth by OH-21. This dike has anapparent thickness of about 13 feet, and the contacts with the dioriteare tight and contain no notable planes of weakness.The left abutment was explored with five drill holes, three on thedam axis and one each upstream and downstream of the embankment. Overburdendepths in the downstream hole and the three axis holes are lessthan 10 feet. This overburden consists of small subangular to subroundedboulders in silt, sand, and gravel. Overburden in OH-28, locatedapproximately 1,000 feet downstream of the axis at elevation 1,971 feet,0-19
consists of 6 feet of silty clay overlaying 2 feet of sand. DH-25,located about 750 feet upstream of the axis at elevation 2.045 feet,penetrated a vertical depth of 56 feet of glacial and alluvial depositsand had not yet encountered rock when it was abandoned. Overburden inDH-25 consists primarily of gravelly, silty sand with boulders to adepth of 15 feet, underlain by gravelly, clayey silt. Gravels are subroundedto rounded and the clayey silts are stiff and plastic.Rock in the three axis holes is a hard quartz diorite, whereas inDH-28 downstream of the embankment, it is an andesite porphyry. Therelationship between the quartz diorite as a plutontic rock and theandesite porphyry as a surface flow rock is not clearly understood.This contact area between the two type rocks is in the location of theunderground powerhouse and wi 11 be closely explored during des i gn ; nvestigations.It is assumed the underground powerhouse will be located inthe dioritic rock. Weathering is primarily staining on fracture surfaces.Fracture spacings vary from very close to moderately spaced; spacingincreases with depth.Fractured zones, encountered in all holes, are from less than 1 tomore than 20 feet thick and are separated by from 10 to more than 50feet of relatively undisturbed rock. Many fractures include thin seamsof clay gouge, slickensides, secondary pyrite, and breccia. DH-28,downstream of the embankment. appears to have been drilled in an andesiteporphyry breccia contact zone adjacent to the diorite pluton. Much ofthe core is brecciated, moderately weathered to highly altered, andrecovered in small fragments. Several zones of clay gouge were noted.Right abutment conditions were explored with six core drill holesalong the proposed dam axis. Three of these holes were angle holesdrilled normal to the dominant structural trends. Overburden depthswithin the six holes range from 4 to 20 feet, with the greater depthsin the holes farthest upslope. Overburden consists of gravelly sandwith cobbles and small boulders.Bedrock is moderately hard, but weathered, closely fractured andlocally sheared in the upper 10 to 40 feet. The rock is diorite orquartz diorite with zones of quartz diorite breccia. The quartz dioritebreccia is healed, probably formed during emplacement, and is not considereda zone of weakness.Fractured zones encountered during drilling are similar to thosenoted on the left abutment. Shears range up to 22 feet thick and areseparated from each other by about 10 to 100 feet of competent rock.Very thin films of clay gouge and slickensides occur on some fracturesurfaces. Iron staining occurs on many fracture surfaces and fine disseminatedpyrite mineralization occurs more widely.D-20
Relict Channel AreaThe relict channel is a suspected ancestoral Susitna River channelnorth of the right abutment under the broad terrace area between Deadmanand Tsusena Creeks. Ground surfaces within the Relict Channel area arebetween elevation 2,100 and 2,300 feet along low elongated ridges andshallow depressions. This area was originally explored with two seismiclines and the results presented in the Feasibility Report, Appendix 1as Exhibit 0-1. Subsequent 1978 explorations include 1,814 linear feetof drilling, borrow explorations near Deadman Creek and 23,600 feet ofseismic refraction lines. The 11 drill holes range from 21 to 494 feetin depth and were mostly noncore rotary holes supplemented with drivesamples and some bedrock coring. The results of these 1978 explorationsconfirm the existence of the deeply buried bedrock surface depressiondiscovered during the 1975 seismic investigations. The lowest bedrockelevation encountered in drilling was in DR-22 at 1,775 feet, MSL or454 feet below ground surface.Overburden consists of both glacial and alluvial materials occurringin varying sequences that are difficult to correlate with the limiteddrilling to date.Outwash occurs over much of the area, consisting of gravelly,silty sands or silty, gravelly sands in varying proportions, with somelocal cobbles and boulders and more widely scattered clay lenses.These materials are mostly loose and the fines are predominantly nonplastic.Glacial till is the most abundant overburden material found withinthe relict channel area. These tills occur in three separate sequencesin the deepest drill holes, separated by lenses of alluvial materials.The near surface tills are normally consolidated while the tills fromgreater depths are highly over consolidated and dense. It is quiteprobable that this over consolidation was caused by glacial loading inthe geologic past. All of the tills contain fines that are nonplasticor only moderately plastic. Smaller gravel sizes are rounded, whilelarger si"zes are more subrounded to subangular. ~laterials are poorlysorted with little or no indi'cation of bedding. The tills vary considerablyin thickness from only a few feet to a maximum of 163 feetin DR-18. .Apparent river deposited alluvial lenses which represent interglacialperiods, separate many of the till units. These deposits consistof sandy gravels with some silts. Sandy alluvial units have a tendencyto cave during drilling and several appear to have relatively highpermeabilities. Most of these river deposits were less than 50 feetin thickness but in DR-22, directly above bedrock, the alluvial unitwas 159 feet thick.D-2l
At least two deposits of lake sediments were encountered duringdrilling. The larger of these was named "Lake Woller" and occurs inDR-l3, DR-15, DR-26, and DR-27 in varying thi.cknesses. Maximum thicknessis 60+ feet in DR-13. Lake Woller deposits appear to be confinedbetween elevations 2,240 and 2,305 feet. Another apparent lake depositwas penetrated in DR-18 and DR-20. Maximum thickness of this depositis 33 feet and appears to be confined between elevations 2,130 and 2,190feet. Both lake deposits may represent either quiet lake depositionduring an interglacial period, or possibly proglacial lakes formedduring glacial retreats. The lake deposits consist primarily of highlyto moderately plastic clays and silts with local gravel and sand lenses.Spi 11 wayThe original location of the Saddle Spillway in the Interim FeasibilityReport, Appendix I, Plate D-3, was found to lie directly upontwo adverse structures. The overburden depths increased from 9 feetat DR-17 on the left side of the proposed alinement to 231 feet at DR-18on the right or east side of the spillway. This depth of overburdenprevailed throughout the length of the spillway, including the proposedgate structure area.The glacial tills, clay, and intermittent sand lenses of the overburdenwould have required additional excavation and flatter sideslopes.Added expense would also have resulted from increased foundation requirementsfor the gate structure and from the full length lining which wouldhave been required in the spillway channel. To avoid these disadvantagesa change of the channel alinement was made.The new proposed a1inement lies approximately 800 feet laterally tothe left (southwest) of the original design and will be in rock cut frominlet to final outlet at Tsusena Creek. This alinement will also avoidpotential structural problems from the second adverse structure, theshear zone titled liThe Fins" (Plate D-4) which will now parallel thespillway for its entire length. Rock quality is such that excavated rockwill be used as dam shell rock.As a result of the move, it is anticipated that sound bedrock willbe encountered at a maximum depth of 25 feet at the gate structure andwill continue down spillway for at least 2,500 feet. As the spillwaydips down to Tsusena Creek, deeper glacial till is again encountered,so the final section of the outflow may not be totally founded on bedrock.The plunge pool at Tsusena Creek will be contained by existingrock cl iffs.D-22
PermafrostThe Watana damsite lies within the discontinuous permafrost zoneof <strong>Alaska</strong>. For this reason it is to be expected that permafrost wouldbe found during the exploratory effort, particularly on north facingslopes and areas where arctic vegetation has effectively insulated theground surface. Depths of permafrost within the discontinuous zone arevariable and often change drastically within short distances dependingon exposure, ground cover, soil characteristics and other factors.Permafrost conditions at Watana as indicated by the exploratorywork done to date appear to be typical for the zone. The left abutmentwhich faces north and is either continuously shaded or receives onlylow angle rays from the sun was explored with core drilling equipment.Five holes were drilled and pressure tested by pumping water into thedrill holes at selected intervals using a double packer. Observationof drill water returns and pressure tests showed that permafrost existsfor the entire depth of the holes. Holes drilled in the right abutment,where the sun's rays are most effective, did not indicate any permafrost.Within the relict channel areas, on the terrace north of theright abutment, indications of permafrost were observed as reflectedby ground water conditions and water table measurements, drill action,and sampling. Drill hole DR-27 was sampled and ice lenses were retrievedfrom a depth of 30 through 36 feet. Permafrost was also encounteredduring test pit activities. However, in general, permafrost in thespillway and relict channel area, while encountered as near as 1 footto the surface, is expected to be confined to a relatively shallow layer.This expectation has been reinforced by the fact that ground water hasbeen encountered at various depths. In order to study the thermal regimeof the permafrost and to more accurately define the lower limits of thefrozen zone, temperature probes were installed at 13 locations. Theselocations are shown on Table 1 under the heading "Instrumentation!! andthe graphs of readings taken to date are shown on Plates 0-13 through0-15. It is still too early to reach definite conclusions from thelimited data obtained since installation due to the fact that heat wasintroduced into the regime by drilling and equilibrium may not yet bereestablished. However, it appears that the readings do support theconclusion that permafrost is not as widespread or as deep as was previousbelieved.Of equal significance is the fact that the temperature probesindicate that the temperatures within the permafrost are generallywithin 1 degree of freezing. Construction in cold regious has shownthat, within this range, materials can be excavated with considerablyless dificu1ty than in areas where the permafrost temperatures arelower. Particularly in borrow areas, where a rather large area can beexposed, degradation is rapid and by alternating from side to side inthe area, the material can be ripped, left exposed to the sun for a0-23
few hours and then handled in the normal fashion. The fragile natureof the permafrost regime as indicated by temperature studies will beof prime importance in the scheduling related to foundation grouting.Permafrost barely within the frozen range will be much easier to thawand foundation grouting will be facilitated.As explorations at the damsite continue, the installation of frostprobes will be expanded to provide detailed knowledge of the extent ofexisting permaforst areas as well as their condition. A discussion ofdesign type of probes installed and the degree of accuracy to be expectedfrom data readings can be found under II Instrumentation. IIGround WaterGround water conditions in the terrace area north of the spillwayalinement were examined during exploratory drilling, but the use ofdrilling mud used for most of the rotary drilling made direct watertable measurements difficult. Pervious zones were occasionally encounteredwhere loss of drilling mud was noted. Examples are DR-22 wheremud losses were experienced of approximately 50 gallons per foot of holedrilled between elevations 2,025 and 2,000 feet and losses of approximately14 gallons per foot of hole drilled between elevation 1,940 and 1,855feet. In a very few "instances water tables could be measured at thetime of drilling. A notable example of artesian head was measured whiledrilling DR-13 and OR-14. In both of these holes the ground water wasunder sufficient head to rise from elevation 2,240 and 2,270 feet,respectively, to elevation 2,300 + feet when the overlying clay layerwas penetrated by the drill. -A discussion of the overburden units encountered in the terracearea can be found under the heading "Relict Channel Area." It willbe noted in that discussion that at least two deposits of lake sedimentswere encountered which appear to be rather extensive. As might beexpected, perched water was encountered above the higher deposit, LakeWoller, in some holes because of the impermeability of the material.In the alluvial zones between the lake deposits water was usually encounteredalthough, as previously noted, in only one instance was this waterunder artesian head. Below the lower lake deposit, approximate elevation2,190 feet, the glacial tills were very compact and can be expected to berelatively impervious. The over consolidation of these materials aspreviously stated is probably due to being overloaded by the weight ofice in glacial times.The significance of ground water conditions in this area lies inthe fact that the deep deposits in the relict channel area will beunder a head of approximately 400 feet from the proposed Watana reservoir.The decision as to whether or not an impervious cutoff acrossthis channel is necessary depends on the pervious nature of the materials0-24
encountered. While a more detailed program of exploring, sampling,and testing will be undertaken to ensure that pervious layers will notpresent a seepage danger in this area, it is presently believed thatno impervious barrier is required. A more detailed discussion of therationale in support of this belief can be found under the heading"Seepage Control, Relict Channel. 1IReservoir GeologyThe Watana reservoir includes seven general zones of geology, asindicated by Plate D-5 (Watana Reservoir Surficial Geology). Glacialfill, outwash, and proglacial lake deposits predominate in the meanderingreaches of the river upstream of the Oshetna River confluence.The next zone extends downstream along the incised channel to JayCreek and Kosina Creek, and includes localized sedimentary and alluvialunits with metamorphics such as the Vee Canyon schist. The predominatingdioritic gneiss and amphibolite is laced with bands of mica schist,pyroxenite, and augen gneiss that are inferred to correspond with contactand shear zones trending northeast. The area around Jay and KosinaCreeks and downstream to Watana Creek includes two zones with outcropsof high grade schist and basalt flows at the river level. The surroundinghills are composed of volcanics with limestone interbeds on thesouth, and mixed volcanics and near surface intrusives to the north fora minimum of 10 miles. The Watana Creek area consists of basalt flowsand semiconsolidated predominately clastic sediments overlain by thickglacial and outwash deposits. This area also contains the TalkeetnaThrust as identified by the U.S. Geological Survey. Downstream ofWatana Creek lie the remaining two units, starting with moderatelymetamorphosed sediments (phyllite. argillite, graywacke) with two bandsof schist. The final unit starts just upstream of Deadman Creek andincludes all materials downstream to Fog Creek below the damsite. Thepredominate types are the diorites, granites, and migmatites of thedamsite pluton.The Watana reservoir includes many permafrost areas, especially onnorth facing slopes. Frozen overburden will tend to slough as thereservoir is filled and the permafrost degrades. Since most of thelower canyon elevations are covered with only shallow overburden deposits,sloughing will be minor and have minimal effects upon the reservoir.Deep overburden deposits, mostly of glacial origin, occur above approximateelevation 2,000 feet where the slopes flatten out into a broad rivervalley base level. Most of these glacial deposits will be stable due tothe flat topography.Some rock and overburden landslide deposits have occurred withinthe reservoir area. One such slide deposit, known as the "Slide Block,lIis located upstream of the axis on the south bank opposite liThe Fins"shear. Several old and potential landslides are identified by Kachadoorianand Moore in their reconnaissance of the project area.0-25
In general terms, the geology in the immediate damsite is controlledby the diorite intrusive believed to be the top of a stock which upliftedthe surrounding sediments and volcanics and was later eroded by glaciers.Subsequent glacial and stream deposition has masked much of the flatupland areas and stream valleys.DAM DESIGNDam Foundation TreatmentMain Dam: Foundation conditions are more than adequate for constructionof an earth-rockfill dam. The underlying rock is a dioriteor granodiorite which, in nonfractured fresh samples, had unconfinedcompressive strengths that ranged from 18,470 to 29,530 psi. Only theuppermost 20 to 40 feet of this rock is closely fractured and sufficientlyweathered to require removal within the core area. Strippingdepths along the centerline section are shown on Plate 0-7. Strippingto sound foundation rock is required for the entire length and width ofthe impervious core. Foundation treatment within the rock excavationarea will include removal of all loose and highly fractured rockand soft materials, cleanup, and dental treatment. If there are anyzones where more than an 8 foot width of soft materials is removed, thedental concrete will be contact grouted to the adjoining rock. Strippingto rock will also be required under the remainder of the embankment area.However, in this area excavation will not include removal of the inplacerock. Only the loose and severly weathered surface rock will be removed.Steep or overhanging rock walls will be trimmed to a smooth shape forproper placement of embankment materials. Exploratory drilling in 1978has shown the materials in the river channel to be a well graded mixtureof gravels and cobbles as good, or better, than the materials thatwould be used to replace them. As the exploration program continues,these gravels will be more completely explored and it may be demonstratedat that time that there is no need for their removal beneath the shellzones. Should this prove to be the case, the change can be made duringfeature design.Provision has been made for a 6- by 8-foot concrete grouting gallerywith concrete lining to be constructed in foundation rock under theimpervious core. This gallery will begin at elevation 1,900 feet onthe left abutment and will terminate at elevation 1,800 feet on theright abutment. It will provide access for drilling and grouting which,in some areas may be delayed to allow thawing of permafrost. Accessto the gallery will be provided from the powerhouse on the left abutmentand, by adit, from the downstream toe of the right abutment. Groutingw'ill be on a single line of holes utilizing split spacing, stage groutingtechniques. Grout holes will be slanted upstream and may be included0-26
to intercept the dominant high angle northwest tending fracture system.Preliminary grout hole depths are estimated at two-thirds the heightof the embankment to a maximum depth of 300 feet with primary spacingof 20 feet, secondary spacing of 10 feet. and tertiary spacing of 5feet with additional holes as required.Determination of final grout hole depths, spacing, inclination,grout mixtures, and grouting methods will be dependent on the resultsof future explorations, permeability studies, test grouting, and permafrostthawing investigations.Rock permeability test results are shown on the drill logs presentedon Plates 0-28 through 0-37. Coefficients of permeability (K) werecomputed in feet per minute times 10-4, Permeability coefficientsranged from 0.0 to 23.1 and average 4.9 for those holes that were tested.Drill holes in the left abutment area indicated very low permeabilitydue to permafrost. River section hole DH-l had variable permeabilitycoefficients that range from 0.48 to 2.52 and averaged 1.98. Drillwater returns in the river holes were quite variable throughout theentire hole depths and tended to drop off to low percentages at thegreater depths in the axis area. Right abutment drill holes had permeabilitycoefficients that ranged from 0.0 to 23.09 and averaged 5.47.DH-10 was the only hole tested that had relatively low permeabilitycoefficients throughout. Drill water returns had similar patterns withvariable percentage losses. DH-7 and DH-9 had 0 percent returns throughoutand DH-8 and DH-ll maintained high percentages of drill water returnsthroughout.The existence of permafrost in the left abutment and the possibilityof minor amounts in the right abutment necessitates assessment ofthe problem of thawing a zone in the foundation bedrock sufficientlywide and deep to allow proper installation of the grout curtain. Inanticipation of this need, the U.S. Army Cold Regions Research andEngineering Laboratory was asked to do a desk study on thawing the permanentlyfrozen bedrock. The Technical Note which was submitted inresponse to the request is included as Exhibit 0-4.Embankment DesignDesign of the dam embankment at Watana damsite has been based onthe availability and proximity of construction materials in addition totheir suitability as engineering materials. As a result of these considerations,the embankment contains a central section consisting of animpervious core buttressed on the downstream side by a semi pervious zone.D-27
This central section is supported, both upstream and downstream, bysuitable fine and coarse filters and rockfill shells. A typical crosssectionof the embankment is shown on Plate D-9.The impervious core and semipervious zone will be constructed usingthe glacial till which is readily available in the area. The semiperviousmaterial will be obtained by selecting the coarser grainedmaterials while the finer materials will be placed in the imperviouszone. These materials, as discussed under IIEmbankment Materials,1I havebeen shown by exploration and test to be a well graded mixture, which,when compacted, has a very good shear strength and a high degree ofimpermeability. Tests have shown that this material is quite sensitiveto moisture control; therefore, special attention must be paid to thisaspect of the design and construction. The 14,000,000 cubic yardsrequired are available within a very reasonable haul distance and willonly require removal of oversize boulders prior to use.The fine filter material can be obtained from the gravelly sanddeposit at the mouth of Tsusena Creek. Chart D-3 shows an envelope ofgradations from this source superimposed onto the envelope for the finefilter as established by engineering design criteria. This comparisonindicates that the Tsusena Creek source can provide material within theranges of sizes necessary to protect the core and semipervious zoneagainst piping or migration of fines into the filter material.Proven sources of gravel which can yield large quantities of materialare scarce within short haul distances of the project. For this reason,the decision was made to use material from the rockfill source as acoarse filter. Chart D-5 is an envelope of the required gradationwhich will provide proper filtering action for the fine filter material.A curve has been superimposed on this envelope which represents thematerials expected from the rockfill source. As indicated, the rockfillwill provide the proper filter action. The maximum size material inthe coarse filter and the lift thickness for placement will, of course,be limited to ensure design criteria are met.The decision to utilize rockfill rather than gravel for the embankmentshells was made when reconnaissance and exploration indicated thatdependable deposits of gravels which would provide the necessary quantitiescould not be verified within reasonable haul distances of the damsite.On the other hand, rockfil1 can be readily obtained as discussedunder IIEmbankment Materials." Riprap for wave protection can be obtainedfrom the same source.It is recognized that the 1 vertical on 2 to 2.25 horizontal sideslopesshown on the typical cross section for the dam are conservativefor a rockfill dam, and, if rockfill is used, these slopes will be refinedin accordance with sound engineering practice. Refraction seismicD-28
lines in the borrow areas show velocities which could represent largedeposits of gravels or glacial materials but rather extensive explorationswill be required to verify the true nature and quantity of thematerials. Should these explorations reveal that suitable graveldeposits in the area are sufficiently extensive to provide the largequantities required for the dam shell sections, the gravel will beused in preference to borrowing quarried rock for rockfill.Powerhouse and Underground StructuresAn underground powerhouse is well suited to meet the restrictionsof subarctic weather and other environmental factors. Topographically,the narrow Susitna Canyon is well situated for this type of undergroundconstruction. The diorite pluton that underlies the foundation areais expected to be competent for excavation and support of undergroundfacilites, but the location and design of the various structures may haveto be adjusted in some areas. liThe Finsll and "Fingerbuster ll Shear Zonesshown on Plate 0-3 and discussed in paragraph "Rock Structure" are thetwo most significant shears within the damsite area. Other northwesttrending steep angled minor shears involving displacements of a fractionof an inch up to a few feet are common in the site area and were notedin many of the dri 11 holes. These minor shears appear to represent massadjustments to regional stress and compensation can be made for them indesign and construction of the underground structures.Prior to powerhouse excavation, exploratory adits located near thecrown of the various chambers will be driven to confirm final designcriteria. The chambers will be constructed with straight walls asrequired for maximum dimensions, and not notched or cut irregualarlyfor support of interior powerhouse facilities. Rock support will includepattern bolts consistent with wall and crown conditions. Use of steelchanneling and remedial concrete is anticipated in local areas wherefallout may occur or in fracture zones having a substantial width ofcrushed rock. Wire mesh will be utilized where necessary as a temporaryfacility prior to placing concrete. A thin layer of wire reinforcedshotcrete may be placed on the main powerhouse chamber walls and crownas a protective measure against rock raveling. Additional shotcretewill be utilized, as required, to seal surfaces and retain rock strengths.Construction methods in the large chambers will include controlled blastingand rock removal in lifts from the top downward. Gutter and floorsloping for drainage will be provided in the interior structures betweenchambers.Intake StructureConsolidation grouting may be necessary for the intake structurefoundation and the bridge pier footings. The higher bridge pierfootings will also be recessed into sound rock. Tunnel portals will0-29
e designed so that there is a minimum of two tunnel diameters of soundrock above the heading where they go underground. Initial tunnelsupport will be by pattern bolts, with steel channeling and wire meshwhere necessary in closely fractured areas. Major shear zones willrequire steel supports. Hydraulic and geologic considerations willnecessitate final concrete linings for all but the access tunnels, andsteel liners for the penstocks. Grout rings will be required in thepenstock portal areas.The two diversion tunnels are to be separated by a minimum of fourtunnel diameters to provide greater structural stability. Downstreamdiversion tunnel portals will have to be located to avoid the "FingerBuster" shear zone to insure adequate portal construction conditions.SpillwayThe gated spillway has been relocated about 800 feet southeast of thealinement presented in the 1976 report so that it will be constructedin a through rock cut. The spillway will be unlined beyond the spillwaygate structure and apron. The new spillway alinement extendingfrom the Susitna north valley wall to Tsusena Creek and the spillwaygradient are shown on Plates B-2 and B-5. It is anticipated that, withthe exception of minor amounts of waste, all the excavated materialsfrom the spillway will be used in the dam embankment. The major partof the excavation is in rock and this material will be used in theshell sections. The overburden materials are glacial till which, whenseparated from the boulders can be used in the impervious or semi perviouszones.Seepage Control - Relict ChannelThe relict channel area is an overburden terrace underlain by abedrock depression, and extends northward from the right abutment forabout 6,000 feet. This terrace is composed of glacial till, some ofwhich has been reworked by alluvial action. For this reason, considerationwas given to the possibility of seepage through the area whererock contours are below the proposed reservoir elevation. However,preliminary seepage calculations indicate that even in the relictchannel area, where the head differential approaches 350 feet, andusing a very conservative 'k' value of 500 feet per day, the seepagewould be less than 0.02 cubic feet per second per foot of width fora pervious layer assumed to be 80 feet thick. Assuming such a layerto be 200 feet wide, the seepage would be in the order of 4 cubic feetper second, which is a minor amount. The exit velocities associatedwith such seepage w0Yrd be too low to cause serious piping or erosion.Investigations during the summer of 1978 support this conclusion. Inho 1 es DR-13 and DR-14, located in the vi ci nity of Borrow Area "0, IIground water was encountered in alluvial layers between elevation 2,2400-30
and 2,280 feet with an artesian head which exceeded the proposed reservoirlevel by 100 feet. In spite of this high head condition, noevidence was found indicating seepage out of this layer into eitherDeadman Creek or Tsusena Creek. Indeed, it is probable that the effectof this artesian water, which evidently has its access to the alluviallayer in the upper reaches of Tsusena or Oeadman Creek, would be toresist flow from the reservoir into the aquifer. Because mud lossesin OR-22, located at the center of the relict channel, indicated thepossibility of permeable layers at approximate elevations 1,900 and2,000 feet, a falling head permeability test was performed at this hole.The permeabilities calculated from this test are a further indicationthe seepage through the terrace would be minor or nonexistent. Consequently,it was unnecessary to include any cutoff through the saddleand relict channel area.CONSTRUCTION MATERIALSMaterial RequirementsEmbankment: Approximately 57,792,000 cubic yards of embankmentmaterials will be required to construct an earthfill dam at Watana site.The impervious core is estimated to require 7,373,000 cubic yards andthe semipervious fill zone 6,077,000 cubic yards of material. The finefilters are estimated to require 5,621,000 cubic yards of material andthe coarse filters 2,201,000 cubic yards. The pervious rock shells,which make up the largest portion of the dam, will require approximately36,297,000 cubic yards. Slope protection on the upstream side of thedam is estimated to require 223,000 cubic yards of riprap.Sources of MaterialsGeneral: Several sources of embankment materials were investigatedin the damsite area. These sources included two quarry locations whichcould yield rock shell and coarse filter materials, a source of glacialtill which could produce core material, and two areas containing relativelyclean sands and gravels for the fine filter material. Additionalembankment materials will be generated by required excavation for thedam foundation, underground facilities, and the spillway channel. Allrock excavation from the spillway channel will be incorporated into therock shell zone of the dam. The overburden encountered in the excavationfor the spillway channel will be glacial till which can be processed byremoval of oversize material for use as core material.Rock Shell Materials: Rock shell materials may be obtained fromtwo quarry locations shown on Plates 0-10 and 0-11.0-31
Quarry sites were located on the left abutment of the dam (QuarrySource 'AI) and in the northwest quadrant of the confluence of DeadmanCreek and the Susitna River (Quarry Source'B'). The Quarry Source (A)on the left abutment is an outcrop of igneous rock ranging in elevationfrom approximately 2,300 to 2,630 feet. The total volume of the hillabove the surrounding terrain is approximately 200 million cubic yardsof rock. Development would consist of open faces on the north flankof the dome with the final quarry floor at an elevation of 2,300 feet.This type of development would maintain the visible profile of the hillessentially as it is now. The resulting quarry floor could provide anideal site for parking areas, visitor facilities, and perhaps, theswitchyard.The material in the hill is a diorite on the western side and arhyodacite porphory on the eastern half. The appearance of outcropingsand exposed faces of each material indicates that the hill is composedof sound rock.The product of this quarry will be used for the rockfill shellzones of the dam and in the coarse filter and riprap. This site(Quarry IA') represents the nearest source of adequate quantities ofrock materials for the dam. From the approximate center of the quarryto the approximate center of the dam is a distance of 4,000 feet andmovement of material would be downhill. If properly developed, virtuallyall of the material removed from the quarry will be used in the damand the oversize material, overburden and weathered waste material canbe disposed of immediately adjacent to the quarry in the reservoirarea upstream of the dam.The quarry source at the confluence of Deadman Creek and theSusitna River (Source IBI) could be developed by excavating rock fromthe open faces visible on Deadman Creek and continuing the developmentof a face to the westward, maintaining the face between elevation1,700 and 2,000 feet. Stripping and clearing would be minimized bydeveloping a long, narrow quarry paralleling the river and using thequarry floor as a haul road for the length of development. If exploitedin this way, the quarry could yield 17,000,000 cubic yards of material.The rock exposed in this area is a moderately weathered diorite.The product of this quarry could be used on the rockfill shell sectionsof the dam. The distance from the center of the Quarry IB' to thecenter of the dam ;s approximately 2 miles.The only reason for utilizing this quarry source instead of theQuarry IAI on the left abutment would be the lessened environmentalimpact since the quarry at Deadman Creek would be entirely in thereservoir area. However, since the haul distance is greater and theD-32
net environmental impact of the Quarry 'A' on the left abutment issmall, this area is a less desirable source of embankment materials.Core Material: Impervious and semi pervious materials can be excavatedfrom the glacial tills which are present at the damsite. The most logicalsource of glacial till appears to be in an area denoted as Borrow Area'0' which lies between Deadman Creek and the saddle on the north sideof the dam (see Plate D-11).Exploration in this area was accomplished by drilling with a trackmounted,self-propelled auger and a Failing 1500 rotary drill, by testpitting with a backhoe, and by use of seismic refraction methods. Fiveholes were completed using the air rotary drill, 14 holes were completedusing the auger, 14 pits were completed with the backhoe, and 4 seismicrefraction lines were extended across the proposed limits of the borrowarea. The material in the area is composed of a surface layer of naturalground cover of roots and moss, approximately 2 feet of boulders andorganic silts underlain by the tills which are classified as gravellysilty sands. The tills range from 15 to 25 feet thick and usually overliea clay. sandy gravelly clay and silty sandy gravel.Sack samples from the test pits (in Borrow Area D) were tested atthe North Pacific Division Materials Laboratory to determine gradations,compaction, consolidation characteristics, permeability', and triaxialshear strength.Gradation tests were run on each sample from each test pit. Anenvelope of the gradation curves derived from the tests of samples fromTest Pits 8 through 19 is shown on Chart D-2. Because the range ofgradations of materials from the test pits centrally located in the areais limited. a composite sample was formed. Use of a composite samplewas necessary to provide adequate material for a representative testingprogram since retrieval of large bu"lk samples from the site was notpossible.The coefficient of permeability (K20) for the minus l-inch fractionof the till material, compacted to 95 percent of maximum density withan optimum water content of 7.5 percent equals 10.90 X 10⁻⁶ cm/sec.This relatively low coefficient of permeability is coupled with anadequate shear strength at the optimum water content, acceptable consolidationvalues even when loaded to 32 tons/sq ft and a narrow bandof gradation throughout the central portion of the outlined borrowarea. The shape of the compaction curves indicates that moisturecontent is critical in obtaining maximum densities with a pronouncedpeak at the relatively low optimum moisture content of 7.5 percent.The results of the triaxial compression tests indicate that in theunsaturated and undrained condition the glacial tills will be sensitiveD-33
to moisture contents higher than optimum but that if placed on the dryside of optimum they will maintain strength essentially equal to thoseobtained when placed at optimum.The results of this testing program indicate that the glacial tillscan be placed and compacted to provide a suitable material for both theimpervious and semipervious zones. The specifications will need toprovide for close controls of the moisture content and the qualityassurance programs will have to be adequately staffed to provide forcareful checks of moisture content in the pervious and semi perviousfill. Deta"iled laboratory reports of the tests conducted are includedas Charts D-6 through D-29.The materials from Borrow Area 0 can be used with very littleprocessing. The ground cover and organic silts and boulders will bestripped from the surface and disposed of as designated near the mouthof Deadman Creek in the reservoir area. The remainder of the materialcan be utilized in the core of the embankment if oversize (12 inch plus)material is removed by mechanically raking in the pit or on the embankmentfill. Less than 10 percent of the material will be too large touse in the core. Since removal of only the silty, sandy gravel abovethe clays will result in the floor of Borrow Area IDI being abovereservoir elevation, it will be necessary to contour and seed theborrow area after the completion of removal of materials as a restorationmeasure. Approximately 630 acres will be restored.Filter Material: The nearest source of clean sands and gravelsfor use in the fine filter of the embankment dam is an alluvial depositformed by materials washed out of Tsusena Creek and deposited at theconfluence of Tsusena Creek and the Susitna River on the right bankof the Susitna (Borrow Area lEI, see Plate 0-12). Haul distance to thedam ranges from 3 to 5 miles. This area was explored by digging 5 testpits to a depth of 8 feet using a backhoe mounted on a small tractor.The material in this area is composed of approximately 2 feet oforganic, sandy silt overlaying 6 feet of clean, well graded sands andgravels having maximum size particles of up to 4 inches in diameter.The materials are sound, well rounded particles. The bottoms of thetest pits indicate the possibility that the materials deeper than 8feet below the ground surface contain up to 50 percent of boulders inexcess of 8 inches in diameter and ranging up to 24 inches in diameter.The 6 feet of material which lies above the boulders may be used inthe embankment with required processing limited to some blending andremoval of material larger than 12 inches to produce fine filtermaterial. An envelope of gradation curves derived from tests ofsamples from TP-l through TP-5 is shown in Chart 0-1. All of the samplesare from the first 8 feet of material. All of this material lies above0-34
the water table and can be taken by front loaders. The quantity ofmaterial available in the first 8 feet is approximately 3.7 million cubicyards. After the boulders are encountered at a depth of 8 feet, theoversize material will have to be removed and material below the watertable will have to be bailed from the area. A dike will be maintainedto separate the borrow operations from the river so that all turbiditycreated by the excavation of materials will be filtered or settle priorto entering the Susitna River. In terms of grading, particle soundnessand proximity, this area represents an excellent source of essentialfilter materials.The second area in which clean sands and gravels were located isin the upper reaches of Tsusena Creek, north of Tsusena Butte (BorrowArea 'C'). The materials are sound, well rounded particles and arewell graded with maximum sizes generally less than 4 inches. Considerableexploratory effort would be necessary to ensure quality and quantityof materials before this could be considered an acceptable source.Because of the haul distance of 12 miles, this source will not be consideredunless further explorations and testing indicate that adequatematerials may not be obtained from the sources closer to the damsite.Exploration at Site 'C' was accomplished by digging one test pit,reconnaissance of the area on foot and from helicopter, and with aseismic survey.Concrete Agaregates: Approximately 310,000 cubic yards of concretewill be require to construct the appurtenant structures for an embankmentdam at Watana damsite. Most of this will be structural concreteplaced in tunnel linings, the powerp1ant, gate structures, intake structures,and spillway channel lining. Maximum size aggregate will be 3inches in all but the smaller structures or those with closely spacedreinforcing. The most readily available source of concrete aggregate isavailable at the confluence of Tususena Creek and the Susitna River(Borrow Area 'E'). The materials from the first 8 feet in the alluviumcan be utilized with only limited screening. As oversize materials areencountered at greater depths, the larger particles will be crushed foruse in the concrete aggregate, thereby achieving maximum utilizationof gravels from the area and also to increase the tensile strain resistanceof the concrete which will lessen problems with thermal crackingin the more massive sections. Since Borrow Area E represents the mosteconomical source of concrete aggregate and the nearest acceptablesource of essential filter material, maximum utilization of the materialin this area ;s required.A petrographic analysis of sands and gravels from Borrow Area Ewas conducted by the Missouri River Division Laboratory at Omaha,Nebraska. The results show the material to be approximately 70 percent0-35
granitic rock with the remainder composed of basalt, andesite, andryholite. Chert is present in such small quantities as to be nondeleterious.The quarry site on the left abutment (Quarry Source IAI) is consideredan alternate source of concrete aggregate. If material fromthe quarry were used in the embankment dam aggregate could be producedby placing a crushing and screening plant in the quarry and producingthe concrete aggregate incidental to the production of embankment material.The concrete aggregates would be produced from the diorites in thequarry to avoid the potential of problems caused by the reaction ofthe alkalis in the concrete with the rhyodacite porphory in the easternhalf of the hill.The materials in upper Tsusena Creek (Borrow Source IC I ) wouldproduce excellent concrete aggregate; however, because of the hauldistance involved (10 miles), it is not anticipated that this sourcewould be exploited to produce concrete aggregate unless embankmentmaterials are also taken from the same source.It is anticipated that because of the relatively small quantitiesof required concrete aggregate compared to the large quantities of thevarious classes of embankment materials, that concrete aggregates willbe produced incidental to the production of embankment material andstockpiled adjacent to the batch plants used.The first concrete required on the project will be that requiredto line the diversion tunnels and form gate and trashrack structuresfor river diversion. The aggregate for this work could be producedfrom Borrow Area E with a resulting haul distance of 2.3 miles.0-36
'0IW-....j,-90107060.....03020100500U.s. STNoI»oM) sal ONI.C .. ICta U.s. STANDMD save Nl!PUIS6• :t 2 1 t\ "',. " • 10 1 16 20 30 40 SO 70 100 140 200ICOIILESII 1\ '", II I I', I ! II I I I I i i1 , • , ..\ "1\1\ 1\[\"-\I",\. "\1\ t-.I'o.\ .....\ , " f'.."'-1\1\ i'..'"I '\.I' r--..'"1\''\"'-I "-i I "'",,- "\"i''I'..r--10"'"o. , o.os 0.01 0.005 O.100 50 s 1 0.5GRAIN SIll MlLLIMETDSCOdIfIsa, 01 ClAY0102030Iu.0 liSO I60A701090 ,.100001IEnvelope of gradation curves derived from tests of samples from test pits 1 thru 5, Borrow area E.
-1I~u.s. Sf.MC)AID SII\I! ~ .. ICIB U.s. SfAN')All) R¥! NUl"• • : 2 1~ 1 " Va.l=i!ll3 • 6 • 10 ,... 20 30 ... .so 70 100 ,. 200(I...II -r r-r r-r , I I I 1 [l--f-l..l"'-t-t- ~90 ......~... r- r--.......... """-..10 ....., ......."r-.."- .......... ~70I• r6050.0302010iIttti1 1\" I'\.I'~, Ii '"-....;;1\.i,,~,! i\.I \I't'-,0500 100COIIUSI i 1\"'\.........I'\."f'....r"-.---- .i 1 I I t I, ,tttt#B50 10IIIr--.tt 0.5GRAIN SIZE MillIMETERSII"'" -- .0.1'"~r--.-..... "0.05 0.01 0.005lilT 01 ClAY0102030I.a Ii•50 I860~70 I1090100O.OOtEnvelope of gradation curves derived from tests of samples from test pits 8 tllTU 19, Borrow area D.
~.-,50oIW1.0i1009010Ku.s. ST~ .... 0f1&afG .... I«HI!S U.s. STNoDAID SIf¥I HUMlas6, 3 ~ 1t\ 1" t\" S 6 1 10 1" 16 20 30 410 50 70 100 '410 200I I I•I I I I I I I I I I II"~,'" \. '"..........", ~...F INI - FI ~R I JI-.\.~ ... ~ - I-"',-" ,i'...K1"V \.""~ ~,70 "'\J 60/'~I'-.... 1' ..........10-B IOF ~RO' i~ R IE ~Ii I I V \ :>; ~I 50 "../"cV I,,,~~ r"\ " I " ,r"I I~.0'\ ~•"', ,r ............30"-\."'\I \. '\2010: I '\" '" 1"-- ----'--, I........... ~ i'-...'"0 ""500 100 50 10 5, 0.5 O. , 0.05ICOUI.fSIGlAVII.GRAIN SIZE MILllM£JfRSSANOCOAltSf I PM ICOMM IMlDIUM I PMSAMI'U NO. NY 01 Def1M ClASS."'" 'Il()N NAT W'JI. Ll 1'1. PIIr--1---1-- ..., -IIIOJKTslG~,IE IIiIIf\"CIOMIIHI0102030i40 J~•I ~I~60 i~•70 r1090-=-- 1- t:: 1000.01 0.005 0.001S!tT ~ ClAYIAltAGRADATION ENVELOPES - BORROW AREA EGltADATION CURVESSUPERIMPOSED ON FINE FILTERlOllING NO.DAn.... __ '_11$_ .. __ -_ .••
oI..j:::.oI ; . ~ ~.~.ST~,wt~i.~ .'~toU.s. STNC)tW) lIlY! NUM:Et5• 10 , .. 16 20 30 .0 50 70 100 140 200H'f'DIIOM!YH10 ...... ~""10--~r-."-~ I£...~ .;x ....... r-.... I-"'~ I\..V !'-o"- "11=" "~V"~ " 'i ~ Vrro-." f-IMt ~\[f I 0: J~ C( ~I~!"'~-J,"liP I I , _ PIPI' 1 I 1 I I ~ I I , I 0"-i'-~......-....i"-~.......!'-or-...r-........;;;!/I'II&""" - 11r..! 1= IL lfER lUI :$11...., 3N............ ~ ........ -.......60""40i"'-:iIii,!" Ij r\. i•"- , 50 :II "50~t'\'".-¥".-.~-~-I!J'\.0\ ~~ UI : Iu '\60%I"f\. I'. to...IoU• vIt!"-,1\'"....~ •30,It!'II..... i\"'10\.. II \. i ['\...20" ""i ': 1r\'"80i I ,'~~,,I ! i I:I'", I :10.... " ~'~5 II~ IE S "- I r...::::::: 90to-I"""r-."I" , : a0 -r--. No. I 100500 100 50 10 5 1 0.5 0.1 0.05 0.01 0.005 O.OOiGRAIN SIZE MIllIMETERSGJAVilSANO---"""COMUSSIlT 01 ClAYI I COAIII IPM IcoADI IIIIfDIUMI fINl I ISIoMIUNO. 8f'I 01 CtI"l'H o..us.lC.AlIOH NAT W"JI. U PI. PI'IOJKT102030iAlIAGRADATION ENVELOPES -GltADA110N CUIVISHNE FILTERS AND IMPERVIOUS COREIIOIit..o NODA'Iti!»11.,- ..__ _ .. _w-_ ...
oI-+=>~100 I [I90"I II ,10 I! I.----70i 60V ~!\,i ! I Vt Ii! ! ! Ll.V V' I [\t I ,1'"~• I !, I i I ~I :II ~! 50Z~,Iii! : ! I ' I' 1 . j I I t 1\ I i% I ! I I 11\ i \1 I I~ 40F~' D~ iSPA lL L ~101:t I 1 I! I \ \3020101 r I , I,I~~ I" IIi I i\ 1\'\I\.~I'\--- 10I\. "\,r\""i'\. tlh~ ~F ~Sl FII f DI ~S GN20\ I'\. ~ I'\.I I \ '\. i-'1\~.I ! ! I I \ V"- IEK ~H t
-•jI20,c:;I~l- :r!260~1lDIl5so zG:l-em iPOS IT ~b 1Z...~40~N 3010T -11 1T -1.: 1&2•.i.L -.L11.30--~ilDa:iEAI...,!i ...ua:~10 900 100500 0.001IC08BlESSANDIiIEOIUI4 I fINESample No. ElIN Of [)esJftI DassiI'iaIIion HIlt w" Ll Pl PI. Sompos~t~_.~N._o ___.~1_~_____ ~ __ G.r __. __ S~i~. __ SA_N_D __(~S_M~)---------+----1-----+-------~~~~--~~SIlT OR Q.AY.. JWATANA _D__AM _________ ~ _________;----~-~---_t~-----------.; --------.--.~----I__.- -----i-.-.... ~-----.. --.---.---------------____t~-----r---------------------------+---+---+----~.---~~ ___. ______ ~~ ________________-;~-----~ .----.-----+--.--.-----.---.-------.--+----+---~-+--~-- ------ Composite No. 1t-------L..---.......I.-G~RA~D~A-T-I-O-N-C-U-R-V-ES-L....--...J.----I.-~o-- ~rin&ioA---__________...;;;.,;;..;;;;...7~_:;;.;;...;..;:..;.;;;.;..;.....;;;.;:;.;:..;...;...;;;;,;;;;;...,________& ________·1\'D,\/19··--Z--S-·----- i9 =·s -404',• ...:;;1!FD •• .2!.~ .\ ,
U.S. STANDAID SIEY! OPENING It{ INOiES U.S. STANDAIIS) saM NUMlt!I$ HYDIOMfTER6• 3 2 'YJ 1 J.4 YJ ~ 3• 6 • 10 '.'6 20 30 .0 SO 70 100 ,.to 200100 I r, I I I I I I I I I I I I IIto\.--010oI..j::oW8070\\\'\.\ I~Ilo.l'\.I- _.1I i I60~ II jtD',,- II ,•I IIII .50 !!'-, ! iz ~Co ~posi ~( irr::i jII ~i ~ IIIIIv.. 0 Lr-LPI' jOe I::>,t--..... TP-3""tL !TP-3,III: I",tnT'> '"Ilo.lTP-5 ~ ( ~ 220 "'.1: 'v .'" I : 1,,-,I !II I I II~,II i I~ II I I-T----,0 i I l I U.l .10I'"Ii'~'j ! :N-; ,-t--I.. ~-~--t--'"__ ..._1~:,..J:._~;500 '00 50 10 5 1 0.5 0.1 0.05 0.01 0.005GRAIN SIZE MilliMETERSGRAVELCOIILfSS"I"to..'--~--SILT 01 CLAYI I COAltSf IFlNlI COAASf Mf~I !FINE~.- ......SNUtE NO. tLfV 01 OEP'IW ClAS$.1CA TION NATW'% U 1'1. 1'1PilOJfCT WATANA DAMComposite No. 2 Sa. GRAVEL (GP)--ENGFORM 20871 M.f>.'( 6l,.-- MEA-- -- ""'~-------.~~,-~,~-~,-_ ..... _-'.. , , __ .'"",'mDOIlrcjC P'
NPDEN-GS-L(79-S-404)14 NOV 1978WATANA DAMComposite No. 1Report of Specific Gravity & Permeability Tests1. Specific Gravity & Absorption (ASTM Cl27 & C128)BulkBulk, SSDApparent10 Absorption3/4 in. - No.42.6332.6712.7371.44Minus No.42.6832. Coefficient of Permeability (Minus 1 inch material)Remolded Density 126.6 P.C.F.Optimum Water Content = 7.5%Permeability KZO 10.90 x 10- 6 cm/sec.0-44Chart D-8
13~ I--+-+-I-+-ft::a"-d)1Z.5....;..:t:onZIUQ1';;Q I 'Z. ()I) 6 I-+-+--+-+-+-I-+-+--+--+-+---II-+-+-~lor-5 10 15WATER CONTENT, PER CENT Of DRY WEIGHT_________ StandardCOMPACTION TEST25 3 5.5BLOWS PER EACH Of LAYERS, WITH _________ LB RAMMER ANDINCH DROP. 4.0 INCH DIAMETER MOLDSAMPLE ElEV ORCLASSifiCATIONNO. DEPTHG lLCompo ite No 1 Si. SAND (SM) 2.68PL%>NO . .4NATURAL WATER CONTENT IN PER CENTSAMPLE NO. Composite N . 1OI'fIMUM WATER CONTENT IN PER CENT 9.3MAX DRY DENSITY IN lB/CU fT 128.9REMARKS PROJECT WATANA DAMAASHTO T-99Method AENG FORM 20911 MAY 63AREABORING NO. Composite No.1NPDCOMPACTION TEST REPORTPREVIOUS EDITIONS ARE OBSOLETE. (TRANSLUCENT)GPO. ~954 OF-7J$-1180-45 Chart D-9
.:..:;;)u"' ....,;>-'...;:;;z~';>-'"' 0I~O12512.0AA1\ r1'it ~~ ,,1- Jr, ~ w-,,. -"'1 V\\ Z Ie I1:J glt fa Id .5\ ~ r"'t VIt\. G Ie:;. 2. .e;: :9 i- '\8 \I II \ \If~ \~ \!""r!\V \ \ !0 \ \=1;JA \..1\ ..., \= \\ _'\h...... -!I() 5 /0 /5 2.0WATER CONTENT, PER CENT OF DRY WEIGHT....;::.S~t:..:.a:..:.n:..:.d:..:.a:..:.r....;d ____ COMPACTION TEST_;::.5c;..6___ 8LOWS PER EACH Of ___ 3 _____ LAYERS, WITH ___ 5_._5 ____ lB RAMMER AND_ 12-.....:. 0,,--_ INCH DROP, _....;6~. 0::..-___ INCH DIAMETER MOLDSAMPLE fLEV ORCLASSIFICA nON PL %>NO, DEPTH G LLNO,4ite No 1 Gr.Si. SAND (SM) 2.69 13.1NATURAL WATER CONTENT IN PER CENTSAMPLE NO,.1OPTIMUM WATER CONTENT IN PEl! CENT 7.5MAX DRY DENSITY IN L8/CU FT 133.3REMARKS PROJECT WATANA DAMAASHTO T-99Method DAREABORINGNO'Com osite No.1ENG FORM 2091I MAY 63NPDCOMPACTION TEST REPORTPREVIOUS EDITIONS ARE OBSOLETE, (TRA NSLUCENT)GPO: 1944 OF-715-j740-46 Chart D-IO
~u ________________.... 60'" 0'~E-I~I)IMI)Ito H::~.1it ·1~~ -t +-f4c ~:it .4.~ ~~~E:;~~ IE +++++-H....""to + ~vo 5 10 15Axial Strain, ,.Shear Strengtp. Par!¥l!eter§33.5••0tan ... _0_. 6_6_2_c" ____ 0.66 T'/ 'sq ......Method of saturation __ _NoneTest No. 1 2 3Water content Vo 7.7 ;, 7.6 ;, ,.7.5cd Void ratio...; eo 0.329 0.326 0.326.......;Saturation So 63 ;, 62 ;, 62,.~,~Q)-v~( dens1 ty ,lb cu :rt7d 126.3Water content Vcr:- 7.7 ;,.t::tilVoid ratio eo: 0.317Q)Saturation So; ~0'"65....Q) 7J.nal ~i~k pres-!Xl sure T so :rt Uocd Water content Vf 7.5 ;,I::...;ra.Void ratio ef 0.307liHnor priiclPaJ.stress, T sq fta 3 4.00Max deviatorstress, T/sq ft (01-a3)max 12.41Time to failure, min t f 26Rate of/train,percent min 0.39Ulstress.t deviB:~
"t.-ax. ~H (l: ritJ/-O l:U:U~+.t:"~i4-;.tl, :t.;.-~tlZ+~E:4+....o~-rt"'EI' o 20 4-0 ~o 't:O /0 Dt±tt11t ~:-t- +Normal Stress, 0, T/eq ft
~~ ______________I()Normal Stress, 0,T/sq ftoShear 5trengtb Parameter!•• 1. 75 0tan ... 0.0307c .. _0~.4_4__ T/sq t't20Test No.Water contentWo';j..... Void ra.tio eo.p.....Saturation 50s::I-iiJry a.ensl'ty,1bicu t't7d~ Water content we;;;Q).c:to Void ratio eultInitial diameter, in.Initial height, in.'l',ype of' test Q I 'l',ype of specimen Remold. Clasa1f'lcation Gr. Si. SAND (SM)Lt PI11.155.8712.811.50 1. 915.87 5.8712.81 12.81G s 2.69ReJIIIU'u Remolded at 95/0ProjectWA TANA DAMStandard Compaction Density!126.6 P.C.F.) and Optimum AreaWater Content plus 4/0 (11. 5/0) Boring No. S~:Pem~g.s1te NO. _1_Lost water during compaction ~~~e~pt~h~---------------r-D-at~e~14~NrMU~rrV~I~~r~'tl~-4I!NG 'ORM'JUHU 2089 (EM 1110-2·1902)L-______________ ~NPDTRIAXIAL COMPRESSION TEST REPORTPRI'VIOUS EDITIONS ARE OBSOLETEChart D-13TRANSLUCENTD-49
~------------------------------------------------------------------------------.--~+' IZ'"'CI'~E-4~.tr-:~tt r±±tl tlCi.:H+-:: CI'("~lJ8 i~I +-.:. t ~ ~,.... ..lJ~CD~CDcoco.;-t:tJ+'~~i4CDU}-~+~II+' ~' '. '0,+.. ~ ... ~ ,i .~. +- , t . . ;.., • +-. t t ,. t ,. ,. , t t iStandard Compaction Density(126.6 P.C.F;) and OptimumWater Content (7.5%).~--------------------------~~----EHG I'ORMPI'! E"'OU~ EO' T'ONS ARE OIlSO~ E T Et JUN U 2089 (EM lJ1().;l-1902)TRANSLUCENT 0-50:-------,,---,------------------1Areai-.--------------------r-----~----~-~_.~Bor1.n4!; No.Sample Jc$mposite No.1~h---' Datel4~NPD TRIAXIAL COMPRESSION TEST ~Chart D-14r".,L
(79-S -404)"R III , ,It,..'n", ",,"' b"I~_~_,~~ II,,~.... : ,, I, , , 'I '
______ +-S_Bmp---"-_1_e_N_o_-C_o_m_n-'--p1o_s_i-et-ee_N_o_.-1,]:: t:.. -+t ~, '1 !.... t '*..... ~1''' ••t t ...... , 1,., ...t t .. """ t• +, • 1 t.-'---++-........ -+4, ~ .... ,1 + ...t -+ t .." t 1 • f t tt t '+ •• ~")' +• i i'11 t t••• 1t .... tI' l'.. t .. t,I" ..., i j• I I j,. I •I. t t• \ I ,' t It I I !t t + f, I ~ II. \ !* 1 1 t0, Tjsq ftTest No. : 1 2Water content ."'0 i 3 . 9 31 "Dry d.ens ity , rd 'I 126.2::"b/cU ft 126.2~ Water content Wc ! 11.7 0;,11.0 "~ Void ratio e c ; 0.314 0.298~ Saturation Sc l 100 ~ 100 'I>20 ~F~nal ~~ck pressure.TI so ftUo is, 765.7633.9 %0.331 I32 %126.110.5'1>0.282100 'I>o 5 10 155.76Axial Strain, "~ Water content _-4_W=-f+_l_1_._7_"-I-___ 11.0 'I> +-__ 10 .5% ~'----_1 'I>Sbear Strengtp Parameters~ Void ratio ef 0.313 0.297 0.282• = 12.8Minor priqcip81 C1 4 000stress, T/sq ft 3' 8,00 16.00Max deviator c~(_--L)~+----+--__ ~-------+------~tan • = 0.228stress. T/sq r-tl lC1 1- C1 3 max 3.08 6.21 10.45c = _0.:;....;..:.5'-2__ T/sq ft Time to failure, mic t f 12 19 12Rate of strain,percent/min 0.08 0.08 0.08Method. of saturation ___ 1""-- -.-------1--.----4----4-----4------1Back Pressure----.--.~ I'-U--:1-t-d-ev-:i--:a--:to-r----1T~1-(13)stress, T!sq ~JL_~~ul~t~~1~.~7~5_~~4~.~7_2-4 __ 9_._6_6~r-____ ~o Controlled stress Initial diameter, in. Do 5.87 5.87 5.87lliJ Controlled strain In1 tial he ight, j n. Ho 12 .81 12.81 12 .81Type of test RClassifica.tionLLI Type of specimenGr. Si. SANDI PLRemarks Remolded at 95 %Standard CompactionDensity (126.6 P.C.F.) a l1d.-=O.£p...:t...:i:.::m::..:u=m=-W.....:a_t~e_r __ C~o~n~t_e_n_t_m_i_n_u_sRemold .. --._,(8M)PII ~ojectI--eI-- .WATANA DAMf-----.. --e.-.--------------------------iArea~-----------------r_--------------------~Boring __ N_o_ .... e'I>"_ --'-=---i::-=..=--'-C"'--' 4 10 (3.5 (0).- __.__- ___.- 'I ~~pth ~;l Da.te 0(l ~ NOV 19'-'iElle FOAM1 JUN f.5 2089 (EM lJ1()"2-1902)1 NPDPREVICU'> (O:TIOI'
,l'/C(rtm& ,~re.!i$, I'"I' ,I , ~." i I'"--1','- $-~ :- ~ ,,,;"
Coefficient of Permeapility, ~O' 10- em/sec0.1 0.2 0.30.40.5 1 2 3 4 5 10ImEI ,IIrn 1"1 J 'e '/ I(fit ,/r- - -r (:;). . Ir- r
~.SHEET NO. 10 0102,0.1 O. 2 OS~ ..... -....-..... .. . ..'-J-1-. ·t .. ·~,f..--.. ...... . ...)•...TIME IN MINUTES· It· ' I 1.111 .+. I2 5 10 20 50 100 200 SOO 1000 2000! I lit !tlffiIt-t Ldl++···++~+·_4!+"l-+-I--H11 ::.-11r. l .. I r '.' N+--+- I I \+--r .. r!:+-. rH· 7 --+-+-t-t-+-t+IBiTo..H+Ii.i, . IITIME IN MINUTES(TRANSLUCENT)0-55* GPO: It ... 0'-..115-'05Chart D-19
TIME IN MINUTESos 2 S 10 20 so 100 200 SOO 1000 2000; ,II Ii i I IiNOTE, NUMBERS BESIDE CURVES ~~-+ +--L~+--H-+I++h+f-..-~i-T~j-,r++++-"*!+---f--+-t--tTti+t:Hl 1ARE PRESSURES, IN lisa FT. HI I I ~+-;"';"+-~+"'+"1f-H"T++ -i-+1+--+--...I.-..t-t++H'+'-""~,, i I!, I i i : I, I j0.1 0.2 O.S 2 S 10 20 SO 100 200 SOO 1000 2000~"'ll i I I 'i'" 11rTIME IN MINUTES! i I I i I i I,II;! ID-56* GPO: "U OF-llS-sun5Chart D-20
6Coeff'ieient of Pemeal>llit;y, ~O' 10" em/see°r·1-r'-rrOT·2-,_01·~3rO,',4_~1511T1rrr1rr'-rTT2-.~3-.~4~5111l-r,lr°-..-,,2,0-,25! I(). '37 I Co_n_So_ I •t .,... -:r:!.. I / I I.: "(f...';r '.-111 ttl
SHEET NO. 1TIME IN MINUTES2.05\I)~To-'fa50~--~+-~~H+~~~-T~++H~+T~~.~~~~~~~~~--TIME IN MINUTES* GPO: .... 0'-715-111D-58 Chart D-22
SHEET NO. 2TIME IN MINUTES05 100 200 500 1000 2000~To...90 ! ' I i 1&J I ~ i I I !: I, H:iI I I - -\-+-~+-t' ~~' :lI-+++++-I--+--'---HI-+H-b-l--rH--,-r-'Hl' !ti--:--] ~iif-- - -- :~!- '-t i'N i •"~- I !!,~ - ++++-------1---,-- _1--+-J-+++-H---H+....II'Id--, +-+-+++++++H+- -l--+-t+Wf--L--i--t+i1\ i I....-~ I I IIII I I Ii II!5 10 20 50 100 200TIME IN MINUTESi-- -,~------~-.----~---~--~------"~0-59
O,j'/_6 /Coefficient of Permeapllity, k:!o' 10 cm. sec0.1 0.2 0.3 0.40.5 1 2 3 4- 5 10 20 250;0Can50i.~tJ tl~ I .' II ;--( ~ V e0.% l- I-t--Kr--.. r--.0 • .5'0f(~r-- Li~ 1 0 •25(1,~jS t--~~ 1& fl'0.:1'1(II..0 o.~~....4Ql~'tl.....~OJ 2-( D iO.!,I0 .. :,(.;0 • .'.. 'I~\I"I'-"I~-I I' t 2..5! I "- I(Il. I'i l/ -1')I I •• :;f'-, 'I lI~ l\~i 2.3SII ~'I1\if!; {,~r\3.37,:\t~1I \i V I- k0. ~~~II.,0.1 0.2 0.30.40.5 1 2 3 4- 5 10 20 25Pressure, p, T/sq ftIIIIType or SpecimenRemoldDia.m. 4. 445 in. Ht 1.006 in.Overburden Pressure, Po T/sq ftPreeonso1. Pressure, Pc T/sq ftCCll\Pression Index, C c0.10ClassificationLLPLSi. SAND (SM)G 2.68sD IOBefore TestAfter TestWater Content, Wo 5.3 ~ w f 12.0 ~Void RatiO, eo 0.365e f 0.321Saturation, So 39 1> Sf 100 'I>Dry Denai ty, r d 122.5 1b/tt 3 126.6k 20a.t eo =: X 10- em./seeProjectWATANA DAMHerarks Remolded at 95/QStandard Compaction Density(122.5 P.C.F.) and OptimumWater Content minus 4% (5.3%)ENG !'ORM1 MAYU2090 PREVIOIJS EDITIONS ARE OBSOLETE.Area.BOring No.DepthE1Sa.mpIe o.
SHEET NO. 1DO.1 0210ZOf.--~--- ----r-+--f.-------~--__ w_'_05I1f-f.- ,I- -- j +f---iTIME IN MINUTES2 S 10 20I i\- j------+.. _--I'-T+~------ -- t---~--0-, , ,SO 100 200IIIISOO 1000 2000++~++!, -t-j-IIi!~_j ______________ ~_~~~Hi~I~'4~-+~~1L+++HrHI: T !i----"t 1- ---,--++-:-+H-t-t-YT I i' I I2TobOI0.1 0.2 O.S2 5 10 20 SO 100 200 SOO 1000 2000TIME IN MINUTESPROJECTWATANA DAMD-61(TRANSLUCENT).. GPO: ,,,-4 0'-111-H'Chart D-2S
SHEET No. 2~0.1 0.2__ I. fl~ + - t'TIME IN MINUTES05 2 5 10 20 50 100 200 500 1000 2000! !~ ''''h.. 'f IU# 70 ""'~, r iii i if----+-+. f'>.n If.. _ .. j-.- .... 1 i Ii. !i-~~ I ~~ t ~,~, "";'-i-' 1;.....1, w..~' W-J-+i·l.j. f-.-.L··~r-_+-.l-i Hi 1+' +--,+-1+++++++-f-i-1!-----+1.--11.--+1.....,'Kf-"k.-t- f- --. f'-"I'-, +,,++-,-+1+---+-++++ ++++,-t-i , +-- t i iI i!:...J+jt--+1-t-+I, +t-H-H • ~Ii,ji I , ,I!1.., I ,iTIME IN MINUTESII'! r
t) .?~,)_ 1 /Coefflcient of Permellb1l1ty, ~O' 10 cm seco 1 0.2 0.3 0.40.5 1 2 3 4 5 10 20 25\N- 'rft- 11, laj .' I I, l!cnSo!.%--Q)0.85 I-0.3'16.3)0 D.~;;;''1"1(t)- t--/.3bKp.... II 1.53f'.,"it ~~ Z. ]'2..f'...l'-,iI\:p-" ~ 2..17~ I'c~ ~3.540:;" I'd'1"16.:" Ih.."~II~ (~ If. 'f-C;O,~,()o. ' ,I(~ ~~,f'....'r--- t-- r--...:.. ,""iIIIIi"'\I\Q\ S,57o. z.:? !--..-t- -{I\.J~b'\L~ ["\0.270.1 0.2 0.3 0.40.5 1 2 3 4 5 10 20 25 "!>Z-Pressure, p, T/sq ftType of SpecimenRemold Before Test After TestD1em4.445 In. Rt 1.006 in.Overburden Pressure, Po T/sq ftPreconsol. Pressure, Pc T/sq ftCCIII;Iression Index, C c0.06Classif1cat10nLLPLSi. SAND (SM)G2.68sD 10Water Content, Vo 13.3 '1> v f 10.9 '1>Void RatiO, eo 0.365! e, f 0.289Saturation, So 98 '1> Sf 100 1-Dry Density, ']' d 122.5 lb/ft 3 129.8k20 at eo =ProjectX 10 - em/secWATANA DAMRemarksRemolded at 95% StandardCompaction Density (122.5 P. C . Fand Optimum Water Content plus4%(13.3%)IMG 1'011101I !olAV 6J2090 PREVIQUS EDITIONS ARE OBSOL.ETE.Area)eoriDg No.DepthElComposite No.1Sample No.DateI4 NOV 1978NPDCONSOLIDATION TEST REPORT(TRANSLUCENT)" ~424D-63 Chart D-27
2.0 0 .1~O l--0.2j-TIME IN MINUTESt .. SHEET NO. 12 5 I 0 20 50 100 200 500 1000 2000! . Ii !!....._1I i;It J-l--,_++-1--i -h'-+-i- - f---- ..I--I-4..1--++++
SHEET No. 2TIME IN MINUTES02 05 2 5 10 20 50 100 200 500 1000 20000.1 0.2 0.5 2 5 10 20 50 100 200 500 1000 2000TIME IN MINUTESPROJECTWA TANA DAMAIlEAlOlliNG NO. ~... JS~:e~~~ne·~r-. J ~~l'TH-~---~ __'IJ ~ N gVJ~]8~r:~~.M2088 :v~O:C:~:.IONt:lp D CONSOLIDATION TEST -TIME CURVES (TRANSLUCENT)0-65 Chart D-29
0'C-oS'-ZvCONCRETE AGGREGATE SOURCE-Al~'" >:l&'b/''''P...(~9z"ifSWITCHYARDEL,14:0:::....IV ON 2,5 H- -~'OH - COlill8lNAT1OH CORE til DRIVE SAMPLE HOLE.TT": - DOZER TRENCHES R:ft MAtERIAL !XPLORATION.TPt( - HAt{O DUG TEST PITSsw - SEISM'C LI"'iES.w·SOUTHCENTRAL RAILBELT AREA. ALASKASUPPLEMENTAL FEASIBILITY STUDYUPPER SUSITNA RIVER BASINDEVIL CANYONSITE PLAN Ii EXPLORATIONS\ALASKA DISTRICT, CORPS OF £~GIN££RSANCHORAGE, ALASKA
CORPS OF ENGINEERSU S ARMY. 1' tESTPIJ. 0\,. lutEIi IiOlfe llll CO RE Ol!: lll MOlESe OIi ~o r'R Y DR ill ~GlE$O~.... SEISMIC I.I N E~NO[£SI lOC UIO'I Of 01W l ~ HI ~ 1 1t.'.I"£S lIIE S I\O ' ~ ON orUllS~Hn ~NO E),"I~ll O~ 1.lOCI 11 (),I. Dr lltCUI\iOLES111£ S';O"' 0Ji SlItE! 0 rlSOU THCENTRAL RAILBELTAREA. ALASKASUPPLEMENTAL FEASIBILITY STUDYNUPPER SUSITNA RIVER BASINWATANA DAMSITEEXPLORATION PLANSC ALEALASKA DISTR ICT, CORPS OF ENGINEERSANCHORAGE. ALA5l'(AIN V. NO. DACW85·PLATE
U. S. ARMY..6,000-\'\., J t\/ __"J""~..'1 >~~, '.,,/'1/'>[UJ)< )
SOUTHCENTRA L RAlL8ELSUPPLEMENTAL T AREA ALASKAUPPERFEASIBILITY STUDYSUSITNAWATANA DA~VER BASINSURACIAL G SITEEAST EOLOGYAlASKA O.ST".CT SHEET, CORPS OFANC!"K)A:AGE, ALASKA ENGIN([fltSPLATE 0-4
CORPS OF ENGINEERSU~ S~ ARMYooooo0II 0,~1>4 00 0 0,~~c(}1> 0:00,~ ,,' 00 ,cIfl' (Ii; ;'E'H CA_ 12)SEDSLOCH I'!!', OF >t.tlL TOR SliE.6RDIP OF S:IEAR FLA'IUAPprWXlt1AH OIPOR FLOW STRUCTLlRf: WI1H(21Sl'NCL !~E. SIW\ilIN~ A:(1S (,f,PP[lO~HI"TE l..:)CAiIONlANlIC:,INE. S'101'l1"'::O C'lES; !APPRO~:p~,I,TESCHI$";OSI-". I '1CL l'i( \ I);JOltFS; ikCllliEO IlL VERTICAL DIPS 121~CCA;IOtnGLACIALLI tllOLOC1C SYlj80lS1~2212.. 2,1'l'PA.BYSSAl l'IifWSlvES~ iABASE, DACITE, .l,PL ITEAl-lS NEAP.-SI~RfA::€PORPIlR" ,o-'""-':',,:-,~,ortOPOGRAI:!H' C;. TALfiEEPIA l'OUNHlhAI:! AND G~OC!IRONOLOGY, TAU
CORPS OF ENGINEERSU. S. ARMYUPSTREAMNonsSINGLE rOlf UPP~R IIUISPHfllf I'II:OHC11011. Of JlWH ANn SkHI! 'lANES1 PERCflFA(;E or FOHiTS COSTOJIH:OJ 1I1'I'ER CIAGII4jI$ !I[}I![S[Hi Rt~~R • .vPI~G FROI BOlli) rEfT IJfSiIlEUOf ~XiS OO'NS';'lI:t~. TC TSUSENA CRH~4 HilER :IIAGR.I.III IS A BOllE H(lLE Ci.II£IIi CC.,llsm Of T~RH N~ CDR~!IDLES I!E?~ESENTIN~ 518 PtllilH IN 352 ~ I.!Mt~R FEET OF IIlJle NOSEPARATiON 0- In'hTS ANO SriUIIS lADE (DIH\' 2l, 2.),5 STEIIEO"R,vtlIC PROJEt:~-ON.S ,m. ~SEC HI !lUlfi!£ ANY PtAM£. JY CONSTII:UCTHIIIA I'Qlt PfliP[NOIClil~1I TO A PLANE ANC Pu::ru .. HIE POU !'IIOlfCTIQN ON ~HIi:SPhEIH ;y. T~IS CASE TilE IWIITII£II/II 11£11$1'11[:1:£) 711£ ORIENUTI!lN(If 1 PLANE ::AN at OEflNHI AS .. i/;SCIiEH POIMT RfG.AROlfSS Of 5f'ACtAlCCOROIN,ms ~OR EXU1'.E • POll CIIIIS'IU1C1ED ~RO. A P~Q!E ,IT\! .(S"'R K£ Of H550, AIIO A Ol~ OF N!loDE ';~L H~~E SPhERICU COO!!lIlk~m OF03'i1·, 050*; A F".(~ paME IL,L Plll! AT TME IIOIITH peLE OF THE KEIU"HER£'_1_ HATICAl PLAMe 'IU pun u: TIO- OtSC1HP POIM1S l1li Tile £t'l1;.'01l, aOTHPOt~iS P[RPE~ICUll.R TO STRIKE PDL{ PRO,tCTl!»l$ UE TilEI' ZOIlTOIJRED TOn(;I1~€ 001ilHAIII1 .um S:UIIOROINAItT ~L.H~R fUTURESSHEARSIII POINTSJOINTS495 POINTS.JJOI! N~OW '{£II" tell r~O"'Hi5f aO~"l!5SJN6(1~ 'HllilCll (N4~E-IOIE 7~-f!jS;IIINeR S6.5'i1' 7D~ '1rI60t M70f e5VIMi,!t30E miTI:~lSOUTHCENTRAL RAiLBELT MEA. ALASKASUPPlEMENTALFEA_LITY STUDYUPPER SUSITNA RIVER BAStNWATANA OAMSITESTEREOGRAPHIC PROJECTIONSBORE HOLE CAMERA COMPOSITEPLATE 0-6
CORPS OF ENGINEERSU, S. ARMYLEGENDSURFACE LINETOP OF ROCK LIN EFOUNDATION BEDROCK EXCAVATION LINESHEAR ZONE-DISUISO/BWE,DHIEDOWNSTREAMUPSTREAMOVERBURDENWATERS EDGEDRILL HOLEINVERT ELEVATIONTOP OF ROCKEXCAVATION LINENOTE'TOP OF ROCK LINE a EXCAVATION LINESUBJECT TO CHANGE.2500 90+00240023002200210020001900• ISOO17001600I- 1500l!l1400I.L.;!;; 1300z 12000!i 1100>~ 1000LIJ900100,+00 105:,"00GRID BASE STATIONINGN 3,224,S9S,674E 744.915.063100+00110i-00 115tOO 120+00 125,+00 135+00 140,+.00.FOR EMBANKMENT SECTIONS 20 SEPT 1978TILLQUARH'--g'"DIORITE/"ANDESITE ,/ ....INTRUSION, ~iDH - 23 BOTTOML57' DIS '"QUARTZDIORITEGLACIAL TILL73' OIBLIGHT TO MODERATELY / .FRACTURED ZONE~~-/CREST ELEV 2195WE\ I17' GLACIAl;.DH-IO.. DH-II,,// >~.7S' OF RIVER' DH:S. ..;>- ,:QUART2 DIORITE/ ALLUVIUM lR&LACIAL DH 9 ",'_46imE1- ~ANDESITE DIKEWE DH-6 .. - GE !-tl \~)DH'II BOTTOM 160' DISi DH-7 /~RTI! !1! Y 'MODERATELY TO HIGHLY FRACTURED/ /t7~l~Wg FRACTUR~ED" FELSITE DIKE (HIGHLY FRACTURED)5' GLACIAL .. [5IQRITE ..TILL .. DIORITE ~,f'fLSITE DIKE~~ if ~ODERATE TO HIGHLY FRAC11JRED ZONE1. DH-4 ~ 'DH'9 BOTTOM 175' DIS0;•• __ \;: 5 _ /. :I ELEV WS 1463 SUSITNA RIVER ":..~ _ _~ _'\.,[ I \DH-7 BOTTOM 45' DIS ! "'" ·~IVERSION TUNNELS_"... ' ' ''-. If: 144S.75\"'QUARH 'I.E, 144S.53\pIORITE~ANDESITE PORPHORY'~DIKE "DH- 21 BOT TOM70' DIS.2500240023002200.21002000.1900.ISOO.1700.1600.1500.14001300.1200.11001000900FOR LOCATION OF CROSS, SECTION SEEPLATE D-4SOOSOOSECTION A-ASOUTHCENTRAL RAILBELT AREA, ALASKASUPPLEMENTAL FEA SIBILITY STUDYUPPER SUSITNA RIVER BASINWATANA DAMSECTION ALONG DAM AXISALASKA DISTRICT, CORPS OF ENGINEEJ:l:SANCHORAGE,ALt.SI".APLATE D-1
CORPS OF ENGll'.tERSU. S. ARMY,,,,' •••• t'500',SDUTHCENTRAL R~LBELTAREA, ALASKASUPPLEMENTAL FEASIBILITY STUDYUPPER SUSITNA RIVER BASINWATANA EMBANKMENTPLANVIEWALASKA DISTRICT, (XlIII'S Of' [NGM(IISANCHORAGE,Al... .. SKAAPPEiNDIX IPLATE D·I
- 2200- 2100- 2000~~v~, ~-,~IN.!M\It.l POWER POOL EL 1940-1900 ~:I(COFFERDAM(SEE DETAIL A)(\~ROCK FILLSEMIIPERVIOUSFILL~I'\I.J\,~IMPERVIOUSCORE--'~\ROCK12' CQARSE-1800 !~>'"-1700 iZ-1600-1500I140012' COARSE FILTERGROLTING GALLERYROCK LINE~~-------D~IO~R~IT~E~----------------~~~~~------L------------t----~ ~ ______-,',-______ ~J r~---L~~~~~-------·~-
...,..---SCALEo roo' 1000' !!)OO' 2000SOUTHCENTRAL RAIL BELT AREA. ALASKASUPPLEMENTAL FEASIBILITY STUDYUPPER SUSITNA RIVER BASINWATANA DAMSITEQUARRY SOURCE AALASKA DISTRICT, CORPS OF ENGINEERSAHCt1OfiAGE,ALASKAPLATE 0-10
QTP-I2.• v BORROW.TP-IOTP-19~'"'-~----.--.------- -:sus/rNARIVER~!l..EGEND.,. TEST PITS.DR.A.Os ..ORILI.. HOLEAUGER HOLESEiSWIC LIN£1. 5EIS.~I[ U'I£ PROFILES- ~AY BE rau,w lIi rXH18n D-1.IiiiiiiIiISCALE~o' iOOO I!;OO' 2000'2. AUGER HOLES 16-19 LIE ~ORTH or BORfI()Jj AREA D. Wro TO I.:i MILE~ORTH OF AND aETWWI Ar-l~ AND AP·20. SEE PLATE D-2.3. AP-l AND AP-2 ARE NEAR DR_20 TN SPIlU/AY AREA. SEE PLATE 0-1.4. rOR LOCATION Of TP 6-7 AIID Tn n-26,:;H PLATtSOUTHCENTRAl.. RAILBELT AREA. ALASKASUPPLEMENTAL FEASIBILITY STUDYUPPER SUSITNA RIVER BASINWATANA DAMSITEQUARRY SOURCE B 6 BORROW AREA 0ALASKA DIST~ICT. CORPS OF ENGINEERS~NCHORAG[.ALASKAPLATE 0-11
IBoe.. +5O(T..... ---SCALEo 500' 1000' 1500' 2000'ThSTPff~LINE FIurru:S W\Y HI- FUft.1l PiD~LSOUTHCENTRAL RAlL8ELT AIIIEA. ALASKASUPPLEMENTAL FUSIBILITY STUtrI'UPPER SUSITNA RIVER BASINWATANA DAMSITEBORROW AREA EPLATE D-12
CORPS OF ENGINEERSU. S, ARMYTOP Of PIP~1942.01932.0 401922.01912.01902.02322.8 ~-2312.8 302302.82292.82282.8 601882.02272.2 701872.01862.0 1101852.0 120,0,4,0.6 0',8 I~O,12TEMPERATURE ~C-1·0,"800 02TEMPERA"'URE "c1842.000 o. 0,. ,0TEMPERATURE "tSOUTHCENTRAL RAILBELTAREA. ALASKASUPPLEMENTAL FEASIBILITY STUDYUPPER SUSITNA RIVER BASIN., ,'06 -06 '0.4 -0,2 000'TEMPERA-rURE "C0,4 0.' 0 .• '0WATANA DAM SITEGROUND TEMPERATURE DATA IALASKA DISTRICT, CORPS OF ENGINEERSANCHORAGE.ALASKAPLATE 0-13
CORPS OF ENGINEERS~----~~~~------~~~-------------------a 8 10 12TEMPERATURE ~CTEMPERATURE" "I.'2 0 22'02 00 02 o. 06 0'8 10 \ 2 I.TEMPERATURE ·C" "20 22SOUTHCENTRAL RAILBELTAREA, ALASKASUPPLEMENTAL FEASIBILITY STUDYUPPER SUSITNA RIVER BASIN00 0.2 04 06 08 10TEMPERATuRE "C"1.6 1.6 2.0 22WATANA DAM SITEGROUND TEMPERATURE DATA n:ALASKA OISTRIC'f, CORPS OF ENGiNEERSPLATE D-14
CORPS OF ENGINEERSU. $. ARMYTOP OF PIPETOP OF PIPE2258.4 401432.0 2248.4 501422.0 601412.01392.01382.01372.01362.0 120A 26 18_1352.0 GI 30 ~y 181342.0i l ,1312.0-,' "10 '0.8 -06 -04 -0.2 DO 0.2 OA 06 0.8 1.0 '.2TEMPERATURE 'CTEMPERATUREbeSOUTHCE~TRAL RAILBELT AREA, ALASKASUPPLEMENTAL FEASIBIL~TY STUDYUPPER SUSITNA RIVER BASINWATANA DAM SITEGROUND TEMPERATURE DATAMALASKA i)ISTR1CT. CORPS OF ENGINEERSAIliCt
CORPS OF ENGINEERSVALUE ENGINEERING PAYSU. S. ARMYPIEZOMETER DATALOCATION: DR-14ll 1/2")PIEZOMETER DATALOCATION: DR-16PIEZOMETER DATALOCATION: DR-14 l4")PIEZOMETER DATALOCATION: DR -17.. 'SOUTHCENTRAL RAILBELT AREA. ALASKASUPPLEMENTAL FEASIBILITY STUDYUPPER SUSITNA RIVER BASINWATANA DAM SITEPIEZOMETER DATA IALASKA DISTRICT, CoRPS OF ENGINEERS,UiCHORAG€. A~ASI
CORPS OF ENGINEERSVALUE ENGINEERING PAYSU, S, ARMY...PIEZOMETER DATALOCATION: DR-19PIEZOMETER DATALOCATION: DR-22SOUTHCENTRAL RAILBELT AREA, "ALASKASUPPLEMENTAL FEASIBILITY STUDYUPPER SUSITNA RIVER BASINWATANA DAM SITEPIEZOMETER DATA IlALASKA DISTRICT, CORPS OF ENGINEERSANCHORAG[, ALASKAiii SAFETY PAYSiiiPLATE 0-17
CORPS OF ENGINEERSVALUE ENGINEERING PAYSU. S. ARMYPIEZOMETER DATALOCATION:DR-26PIEZOMETER DATALOCATION:AP-IPIEZOMETER DATALOCATION: AP-2SOUTHCENTRAL RAILBELTAREA. ALASKASUPPLEMENTAL FEASIBILITY STUDYUPPER SUSITNA RIVER BASINWATANA DAM SITEPIEZOMETER DATA mALASKA DISTRICT, CORPS OF ENGINEERSANCHORAGE,ALASKAiii SAFETY PAYSiiiPLATE 0-18
DEPARTMENT OF THE ARMY ~~;~~5"'''''-- ~' Glu s A~~~TtN(/:EC~~ COl~;~'~~~ALAS~A ~~l~L!J -_L22&?m.,,," ,........;.. 1EXPLOR~T Lrj lOG c=JoTHII" I.,,' Tl'-l "" ::::::",'" IP-l ,~::< --=-IPLrffi;"~ I~~~-'";";,, "''':-~!£; 2;:."-'-"',:~;':;;-F~~-"-Y:"~ ":'~---i;~,,,r;?~4OVT" ~,,;,," .... P" 'OIL'!:(T 0"1"0 ~EG(NO I CLAU"lC,If,QOiMOl(.:~ rOR .. ATiOI'I O£SCR'"'OIl Ii ~E"A"'S ,, I ~ SANDY SILT2 ,, J-t i SP I GRAVELLY $MIDJSILTY GRAVELLY SAND114"I II SP SILTY SAND i1l2" CLEAN~i I16: 111'1 SIlT' $MID: VERY UTILE SNmIi No GRAVELSANDY GRAVELi :'»-30% GPAVELSANDY GRAVELIi BOOLDERS 3CI% wI LOTS Cf" ROOT~, • , 1: Pws ih 4-39%I MINUS ~Io 4-51%&mCM OF HOLE (BruLDERS),NOT"E: bCAT TO 5'PA:KJ10E TO 8'IiWATANA DA'\ PE~AN~T TP-l----"==-'--___ HOLE NO ___ _18 ---:;,' i I GP SPJ,my GRAVEL. PWs ~~O 4- 57%~ , MINUS No. 4-43%10 1: I ~~~~;~~~O(~LllORS) Ii 1 IL' !lAc"",, TO 9.2' Jj1 __ l~L;::~ :;;: '. ,.,,1 --i'-T'-NI\-D-""-L----P(,.,..~N(NT TP-2-_---"=-'--____ HOLE'IO ___ _PLUS No. ~- 59%IMJN!!5 No U-4J%I B
DEFA"'TM(NT OF THE ARMYPf'!Il!I~"TF-7HOl.l~ ____I>[~ TP-84O!..['t), ___DEPARTMENT DF THE ARMYGRAVE: .. F SHID )HaLE S_:::uJI-iES IN, WATE>;INF:l '!'RAn:]'! FRCM THE SlOES, ~SOUTHCENTRAL RAILBELT AREA. ALASKASUPPLEMENTALFEASIBILITY STUDYUPPER SUSITNA RIVER BASINWATANA DAMSITEBORROW AREA C 6 0LOGS: TEST PITS 7 THRU 14ALASKA DISTRICT. CORPS OF ENGINEERSAr.GHOfIItAGE,ALASf(APLATE 0-20
DEPARTMENT OF THE ARMY~ORTH PACifiC DIVISIONU.S ARhlY EN
PoRNt.NmT'1CLr:~ __m,,_.. _HOI.£'«) ___ _TP-23 ·__SOUTHCENTRAL RAILBELTAREA. ALASKASUPPLEMENTAL FEASIBILITY STUDYUPPER SUSITNA RIVER BASINWATANA DAMSITEBORROW AR!:A FLOGS' TEST PITS 6 AND 22 THRU 26A:..ASKA DISTRICT, CORPS ENGINEERSANCHORAGE,ALASKAPLATE 0-22
PfP¥M/CII~pp_~"1:U:I\IO __- ___=="'-_____PERMflMN
18PLAST!C~ wro;ihlE-GREY&.\~...E AT 22'5-.... j.,., C'i:){IE,.£S; FRCZE,Ij$fROST,HIT B:X.!OER .AT 7,0II IAP-8ICl- , SILTY CLAYf"L II,Cl"I,KLSlLT':'I.so38SOUTHCENTRAL RAILBELTAREA, ALASKASUPPLEMENTAL FEASIBILITY STUDYUPPER SUSITNA RIVER BASINWATANA DAMSITEBORROW AREA 0LOGS: AUGER HOLES 6 (COOT.) THRU 9(CONALASI(A DISTRICT. CQIOPS OF ENG.NEERSANCt«)RAGE, ALASKAPLATE 0-24
II~J1 01 SOUTHCENTRAL RAILBELT AREA. ALASKA122ISUPPLEMENTAL FEASIBILITY STUDYUPPER SUSITNA RIVER BASINWATANA DAMSITEBORROW AREA 0LOGS: AUGER HOLES 9 (CONT.) THRU 14ALASKA DISTRICT, CORPS OF ENGINEERSAfIICHORAG!'::,ALASKAPkATE 0-25
5'GR4V~lSSAI4DYflCJ:-'DEDPROBAlRY FflCZENAP-16P(RO.W.ENf'f.U::,",,~...__-,,,,,-,,,,,-,",,,_. ___ ~~_' _;~_P-_lo_. _i"SAliD'"It.S'SOUTHCENTRAL RAlU!ELT AREA. ALASKASUPPLEMEN'D.L FEASIBILITY STUDYUPPER SUSITNA RIVER BASINWATANA DAMSITEBORROW AREA 0LOGS: AUGER HOLES 15 THRU 22iIl.ASKA DISTRICT, COllI'S Of EI«lIHE~'ANCHOftAG[, ~lA$(~~PLATE 0-26
SOUTHCENTRAL RAILBELT AREA. ALASKASLPPLEMENTAL FEASIBILITY STUDYUPPER SUSITNA RIVER BASINWATANA DAMSITEBORROW AREA DLOGS: AUGER HOLES 23 THRU 24ALASKA OISTI
-siJifMt..RYLOG"OLE t< , :'-"PROJECTLEGENDIhCl'.10'NGnHlROCK FRAGItIE~TSBOU\.OHr-::J,~SA.N!)SiLT--~I ~: ~~~:~h~li~~~~/~~~ ROiUY CQIIIN!. IN iHORO~[(2 HOLES Oli I THROUGH Ok 5 O~illF.O rROIll R:Wt ICE O~ERBURD€W THICKNESS Illl VA-IIYFOR CORE lOSS SHO'~ ON OR HOlf S, SEE REMAH~S COLUMt-ILIGHTLY ffi~CTUI
i '7OATES- S,TAIft:7 APRv. _4START 13 A?R 78 COM'.3 I"AY01"". OF HOLE NQPROJECTi HOLE HO, DH-&iDRILL DATtS' START 28="-=",----,,,0£.1'1< ~ M!IIIU"O£N 3.5'C()f!E "£COVEREO 1~3,9SHEAH lONE 114,0' Tv 47,1}'70' To gO'I ISOUTHC£NTRAL RAlL.I£L.T MU, ... I. .... k ...SUf'Pl..EM£NT ... L. FU ..... ITY STUO'fUPPER SUStTNA RIVER BASINDRILL HOLE LOGS NO, 2DH-4 (CONT ) THRU DH - 7...... A OIITIKT, 00It" 04' I_Hili~~~ ____ ~.~.OJE~~T __ W_A_TA_N_A_D_AM ____________ ~H~O~l~E~HO~,~D_"_-7--JPROrSECTWATANA DA'1A~", ILMAAPLATE .D' 2 9
v. :90ORH..L OATES' STAftT 21 ,"'lAY 7 COMPo 29 ~AY 7'-"='-"'~,~+'DE=PT"'H.~MR8URO£" D ..... OfI' HOLE NeD="'--'..:LWl.,.-+'"COR=E-"~ECO.ERED ll.8' ,,. ~ECOVERY lOGAZ IWUTH FftOM HOfn'HCHLORITlZAflON BELOW 65,0'v 2C33~Y 1978 COMP. r~v 78Ol ... ,.t OF HOL.E NX% RECOVERYsnSOUTHCENTFtAl FtAILBElT AFtEA, ALASKASUPPLEMENTAL FEASIBILITY STUDYUPPER SUSITNA RIVER BASINDRILL HOLE LOGS NO. 3DH-8 THRU DH_lo.=-J4. ASKA Olsr~CT C(HtP;;; OF _' 'G,"Er'SPROJECT WATAHA Dt..>.IHo!'E HO. 11HOHOi.£ NO. i1'AS"_~'".="'o~._~.,,=~,.="'~------------------------------------------------------------------------------------------------------------~-------------PLAT~-30.
Dt.'I OAtLt,. DATES' $TART ~AY 1978'D£PTt< !11' CMRIURD£N 13,5' ClAM. 01' _E rlX 'CORE R£covtREO '... RECOVERY ~IN NEAl:(leNt:,~~jJ,111, j,-'J-:1.. ~~LOST ALL OWR AT 42, C''.0 N , ;Jj-1O~1JSOUTHCENTRAL RAil BELT AREA. ALASKASUPPLE MENTAL F EASII!ILlTY STUOYUPPER SUSITNA RIVER BASINDRILL HOLE LOGS NO.4DH-IO (CONT.) THRU DH-12PROJECT W;\TMA DAM . MOLE AO. CH-12~~~~~~------------------~-J----r-------~~,~~~ __ -L~~~~ ________________ ~~~~ __ ~'IPL,AII: 0-31
R ~ '"UN /oCOMP.3 J0L 72 ORtLL DATE,I START ~DEPTH CE OVERBURDEN. CORE RECOVEREDvCONP. ! •')~~.11: HOLE "Jl~ ·12J1SOUTHClNT"AL IWLIIl.T MIA. ALASKASUll'Pl..llllbTAL flA-..ITY lTUD'(UPPER SUSITNA "lYE" lA_DRILL HOLE LOGS NO. 5DH -12 (CONT.) THRU DR 15PRO,JECT W.l>,TAHA J.W.1 HOLE NO" DR-15:;
HOL£ . DEPTH OF CWERlURDENROCK DRILLED ~~QftE RECOVEREDANGLE _~~ VERT, C" _1 AltMUTH fROM ftORTHDISTANCES' VEft!1CAL. ') I 'HQFUZ rALSEE PLATEFOR LEGE:>:DSOUTHCENTIlAl.. IlAILHLT AMA. ALAIKA!llJlllPLEIII[NTAL I'EA-'ITY lTV'"UPPER SUSITNA "IVER BASINDRILL HOLE LOGS NO. SDR-IS THRU DR:20HOLE NO [12-18 PROJECi 'WATANA IN
;.. SHE£!-2J ~FA II iM -' CT 'tfA"'ANA DA~~ I ORlll ~~.U' ~~'RT 3 J0L 78 tOMP.lE AUG 78; .. ~-~F-.~~ __ ~~.~T" ()F OYER~700.-~84.s."· !(nAIII. OF HO~.E NCO- JI..-!-'?~,"'_~, R_I_~,~O,' _....51S~.~ CORE ft£COVEREP~ ,r ~ RECOV£lty 1O~ 1~(:,~E _F~_~_~~T.32,'.:~iAZI"i.iT~"'OMHORTH .. P3 ?~ ~OBl. OAT!:', DISTANCES' vERTICAL 5 q 7" HORIZONTAL 323,5' -~ T.;a~?fJ >I iIi. !PROJECT I, "ISUMMARY LOGHOLS N . ,.lIOUTItCINTItAt. ItM..KLT _A. ALAlKASUPPL.IIII€NTALFU-'ITY lTUOVUPP[" SUSITN. RIVER .....DRILL HOLE LOGS NO.7DR-20 (CONT.) AND 'DH-21....... DlSTI!ICT, COllI'" Mi r __~_,lL'"PLATE c!":M~._
RF. v.1978 CQMP. 3 Atr,OIAM. OF HOLE :EJ 7, E' ... R[COV[R'r' lOGLEGlc.\!SOUTHCENTRAL RAIL8ELT MEA. ALASKASUPPLEMENTAL FEASI8ILITY STUOYUPPER SUSITNA RIVER BASINDRILL HOLE LOGS NO.8DH-21 (CONT.) AND DR,.22ALASKA DISTRICT CO~PS 0' EfrCO ... EERSPLATE D-35
PROJECT COMP, -D£P1~ .. 5?F tfOLE 139,9' DEPTH Of 0"f£R8UROENROCK !;I.!f!~~.. CORE RECOVEREO5PAClt.GIS81.8:'-86.:); !);;;COMP:)~1 .IU.'HOLE Ho_D~-22..fUtT 2l.! JUL 1978 COUP. 31 78DEPTH Of CN'ERBUADEN G.g' DId. OF HOt..E Nm! ~~~~7 SPA:;;,'t;: {0.1' TO 0.8't;;;;;-;'=-""-=-t-----~ L,------1SOUTHCENTAAL RAIL8ELT AREA. ALASKASUPPLEMENTAL FEASIBILITY STUI)'(UPPER SUSITNA RIVER BASINDRILL HOLE LOGS NO.9DR-22 (CONT.) THRU DR-26~OLE NO. [}!-2i,PLATE D-36
"OL!.OwS NEA":SHEAR ZONE,pc.ATE ll· 2@FORSOUTHCENTRAL RAIL8ELT AREA. ALASKASUl'f'LEMENTAL FEASI81L1TY STUOYUPPER SUSITNA RIVER BASINDRILL HOLE LOGS NO. 10DR-27 AND DH-28PLATE 0-37
0'1 _'.II ;'PR-2; APR m3"8. '1 1
I' [+r0017 3Z'l3'10.8SIB11'7. ~132 BI ~' 0BOHSOUTHC ENTRAL RAILBE LTAREA. ALASKASUPPLEME NTAL FEASIBILITY ST UDYUPPER SUSITNA RIVER BASINWATANA DAMSITECORE PHOTOS NO.2DH-5 THRU DH-6ALASKA DIST RICT, CORPS OF ENGINEERSANC f1()fIAGE .AL ASKAPLATE 0-3_9 __
OH- io i
', J' II cH-llSOUTNCUT'''IL .... IILJ IMA. AU .. A,."..",.EIiIOffAL 'U-.rTY IT\IO'I'UPPER 9USfTNA RIV[R IASIHWATANA DAMSITECORE PHOTOS NO. 4DH-9 (cent.! THRU DH-II.ou.A~, _ .. .-PLATE 0-41
~I. 'CC. ;! '"JII-11D \-1.'SOUTHCEHT"AL ".KLT ,.,.10. ALAIKASUPf'l..E fIlE NT AL "U-' ITY S T\IOfUPPER SUSITNA ~IVE~ IA_WATANA DAMSITECORE PHOTOS NO.5DH -II (conU THRU DH - 12PLATE.Q-42
[)I
I:' ;,.ll l j"jOH-11!Jh '-1CO'W DU :il'D251. "- .'''1 ~.;c.. -"~ '. ':-. .1 '? ' P.' ..JIIIIIII'~ ,,"1"- 4 • '.-. .... ., .... ..,... 1(\1\ "i l - \." ".w. J .\4 , o( \ ., i . ,"1\~'''·\ : · • " ...... . , .3 1'1 . 2. --'---_.'f.!!'l s ·u"111 J 1 . ij '/ '1.: . ~ 3, ,;:[ .,.- ·li'".\: . \ \.l ":-~\\.,t. .,'M ,X .Tll: / .' _.\ '.' J ... '• . L · :, ~. ii.~ ,.~IT.J:: .f: >~ ...:"-,:::"'='31132'.8]\ f :., , .it' ... ......... .. ·J.1f 1l.:~.;.;]~Jt' ,~ 'y .'":'-' \ .~~." "...:y~l ':-::'f.i."= "·' ~ 1f}_"".'-. :.. " "/:T.1~ ' ~,··.i ••..\;c . _"" .Ii. .-. ,,,. '" ."..... : .. ",.,,-,-,.~:... ;;.a:..;.-..:;.;. .C I · ·.A~~l,: '-'~'·111'1' '1l i~ :J!; L:ti. -.: }' ""-(.:0: ",: •.•,.J_!.o!! ~I ~ ·.n - t..~~l ~'i ~.~,~. :.~'!' -.. d tI.L .i: .... ~C'" ::' · .L.~ I,~It. ~ s.. .i ./.. ~ (·. Tl~~lIIE.;..1;:.'.. ,.- .,. OT .......,.~-.:;;- -r:':;~ J ''-,; '1: .;.~T. "' 1:&'~{l ~ . c·; ~ & = .'lUI!:&.?'" "F~ ',i'~, .. , ., ." ;. " . ,." : ..37'1.1!If ~,~~:-:o.:L t· s: l iii .... r'" '- . ,.~.'- :.J'l "-\ '..': .); .~"'l. l:r:~r::r cJ.: .. ~ ,- . [j .1;. • ~1IL: -~ ;;'::£ . -~.,"(, ... J"".'. ,'" ~ I-;;;;- - - .:"387 ~'.;;-. :::E?'. ,..- '"~~ .'.. '-:-oJ, _Ul' WJ '~ ~ .1' .-': ." :.f ·,_ ~li. J_ '.' •.,. ~: =,' 'J" .,. ..-, .:\ ,rI. I:.~ "'"- ":>. .. ~ , ' .' , .,\ .•.. : .... ' .' .;C:oO·OX'·, 1 ~1 ·\ .:l:. -::. -.1 ~. ::!.,,: ~'~l.i',..&. ~ . J .- 1 1:'--...."" . ~_. It i~"h ..::~•. ~ ~ ..--.:.';t",:.(.. ~ ~ ·'!~ e'''·L''.~" 080N'rl '" '1 ,,}; ... "~{'V ;i a~ ..! .:, ,'!' '''' ;,.~~__ B..Z ,.,;:~-"':~."'''£:.;(.;;iiIi, .III::iif...,.-~ .. ~"., .~..-1( ". -.. ; . '.•• ,_' J :N ~", ....,• •.• ,: ...." ...,'" . •I-"'" --:-- ~ir":. = [ lito.:11 ~ ~. JC "" .il. ......L!lH:.1il .Jj - ['" ~' :-TI .,,'I .5' 1 )I;. .~.....'/¥3. I'","a::': '..II \':!'.IL rj' YOl: JJ UJ r .:.'lF;'" .:, .,;"•'N. .~I. --i ,\1 \ [,1 --.;:- -1"-1.J. ~ .~ ~-::- .:. Z /'/.:.1' :>; •• ..::.:t'1573 . ) .....,'t/,"-.£X..." , ',.j,,_ , "I .. -"'I " •••',; .....,\ ••••---'(" IISOUTHCENTRAL RAILBELTSUPPL.F.:MENTALAREA , ALASKAFEASIBiliTY ST UDYUPPER SUSITNA RIVER BASINWATANA DAMSITECORE PHOTOS NO.7DH- 21AL ASKA DIST RICT. CORPS Of ENG INEERS~NC HORAG E , AUaSKAPLATE 0-44
UR-249 BOXES'"ATAiiA OA:"SITE.. ) JUL·j~ J ,L b7",DiI -2-.lSOUTHCENTRAL RAILBELTAREA . ALASKASUPPLEMEN TAL FEASIBILITY STUDYUPPER SUSITNA RIVER BASINWATANA DAMSITECORE PHOTOS NO. 8DR-22 THRU DH-28ALASKA DISTRICT . CORPS Of E NGI NEE~SANC t
EXHIBIT 0-1Location Maps and Seismic Refraction VelocityProfiles; Watana and Devil Canyon Oamsites.
CORPS OF ENGINEERSVALUE ENGINEERING PAYSU. S. ARMYr=3,238,S51lX"'7'!6,6JO34 + 50RELICT CHANNEL AREASW-6148 + 91Y"3,23''u1211"751,021'\23+ 00SW-41ISW-50+00Svil6, 5 + 23SIIV·3. 138 +32!"'3.2J5,123(:756,6JOo 00 ()'01 ' ()'~J,2jJ,5211"752,020SW-5, 11 + 50SW3, 1091 97't"'3,23(,3331"'15>4.155o 00't"J,ZJ3,IBl1=1!J4,lIltiABUTMENT AREAo 0016-,- 121=3,129,992I"'H5.l
CORPS OF ENGINEERSVALUE ENGINEERING PAYSU. S. ARMYY"'3,Z;lL650X"'75tl,S1!l::M + 5;:'RELICT CHANNEL AREASW-6Y=3,23',633X=75.4,16934 + 50I148 + 910+ 00----DR-14SW-6. 5 + 23SW3. 138 + 32f"'3,235,123{:75S,630ABUTMENT AREAUNDSAYPOIt>.T"A"v "3,229,1?55.134)( "744.609.00934 + 5016+ 12'("'J.WI, ~a2X"'HS,a.t9-'=3,227,919I.'."H1 ,15~2o + 00SW·2--23+ 00&Y"3,2l1,i301=743,552@DH-1OIAPpqOX.lOCATIf;NIR I V E RCONTRACTOR ____ ~ __cn-t.OHCIUJ>1JONCONTRACT NO, ______ ... __ ,~ ____ ..tv APP'D.\ 0--o ~ 00Y"'3,228,81l1X"H5,Jl0oIY=3,119.511X"'146,!5S400 800 1200......! ! !SCALE IN FEET23 + 00,"''''3.215,691X"142,331SW-1N8S"·56'·JQ" Eo 400 800 1290I •• ~ ISCALE IN FEEToDH-28""'3,225,724X"H3.5BIIY~3, 125, 718X"7U , a.. 60+00\I)DH-12Y"3,225,r39X''1401,620CORPS OF ENGINEEA$ANCHORAGE. ALASKASUSITNA HYDROELECTRIC PROJECTWAT ANA D/,,'/SITE1978 SEISMIC REFRACTION SLJRVEYLOCATION MAPSAFETYPAYSINV. NO. DACW85- 78 - C - 0027
CORPS OF ENGINEERSNOTE ~O LOCAL CONTROL CI)(IROINATE POINTS AVAILA!UVALUE ENGINEERING PAYSUPPER TSUSENABORROW SITEU, S, ARMYSW-90+00------ ---SCALE IN FEET22 "8828 + 75LOWER TSUSENABORROW SITE23 + 001''''3,229.2701"131,6'$23 + 0011 + 50SW1023 - 00SW-1123 001''''3,221.,1&4X'-'i14.S:S/+ 00U3,2'26,15.X"'n8,~e4R I V E R---CONTRACTORC1IY ____ .~.~ __.DESCRIPTIONCONTRACT NO" ... "., ____ ,,,lY 'A~'O,ALASKADISTRICTCORPS OF ENGINEERSANCHORAGE, At..ASKA--,-----------~---t......=:-_~SUSITNl\ flYDROELECTRIC PROJECTWATflNfI DAIViSITE1978 SEISMiC REFRACTION SURVEYLOC/\, i'lor~ MAPISUSE\A BORROVV SITES,~=-""-'----I APPROVED:L-________________________________________________________________________________________ ~~=_----~~~--__________ ~~----_=~~----------------------------------------------l-----------------------~~SH~'~2~ __ ~~~ ____ ~SAFETY PAYS INV. NO. DACW85-7S-C-0027
CORPS OF ENGINEERSVALUEENGINEERING PAYSu. S. ARMY"I--wL..ZZ0r-200019501900«> 1850w-1w1800DH-12~! .GOGDH-28I12502000I-1950wWLLZ1900 z0I--«18jD >W-1w180017500+0 5 00 10 + 00UPS REAMSW-'15 + 00 20 + 00DOW~:STREAMA205020001,25C1,250f),020I 2050..I--wLL 1950~zz0 1900I-->«--), w ,/185010,200 f-1'I, /w"-c /\ /\ ,/10,20013,30012,5001950190018501800UJ~-z0I--«>wDOWNSTREAM5 + + 00/SW-215 + 0025 + 00 1750. A205t~""2000.- 1I--w 1950w I wz :~z01900 :r::ul-I-- «« ::;:> 1850wAwI 6,07016,500 f 13.5COJ 2050200013,500 I--·,950 wz1900 z0I--«1850 >w-1Lie1800 1800+ 00 30 + 00SW-2i75035 + 00UPSTREAMLEG':ND~ POSITION OF LATERALVELOCITY CHM;GENUMBEHS I~: PROFILES AREVELOCiTIES, I~J FEET PER SECONDDH·12 BORING DES,GNATIONi-APPROXI MATELOCATIO~ OFCHANGE IN MATERIALo 50 100 150...... I .....---jVERTICAL SCALE IN FEETo 100 200 3001 •• .....1HORIZONTAL SCALE IN FEETCONTRA.CT NOO~SC'UPTIONALASKA D1STRICTCORPS OF ENGINEERSIl.NCHORAGE. ALASKASUSITNA HYDROELECTRIC PROJECTWATANA DAMSITE1978 SEISMIC REFRACTION SURVEYSEISMIC VELOCITY PROFILESSW-1 SW·2IVAP"O.3'--""--=-:.. __--l~-----------------------------------------------------------= .. ~_-.. --_~S~A~F~E~!-Y~~P-A~Y~S--~~--------------------------------~----IN-V-.-NO-.-D-A-CW~8-5-~7~8 C-0027
CORPS OF ENGINEERSVALUE ENGINEERING PAYSU. S. ARMY2300 ~I-L.lJL.lJLLz0I- q>w-'L.lJ220021002000DR-191fi;I ewLZZo18000 00DOWNSTREAM10+SW-32300INTERSECTIONSW4I2300..I- ww.z0i=q>L.lJ-'w2200210020001900i :'0.00011.9587,5C101 7 ,7C~12200 I-wLL2100 zz0200C I- q>w-'1900 w0 100 200 300I .... u I I IVERTICAL SCALE IN FEET0 200 400 6001 •• ...1 I IHORIZONTAL SCALE IN FEET..80 + 00180011 + 00SW-3I willLLzoI q>'"' -'w24002300 L Bg,SDO JI2200 i~l:2100 L~~I2000;- ~. ,.;' """ ..... ' __ '-'1'1000 ~1900 f- BINTERSECTIONSW·6DR·14 24001800 -~------_. ______________ L-____________________ ~ ______________________ ~ ______________________ ~--,1800110+00 120+00 130+00 140+00 150c-00UPSTREAMSW-323002200210020001900LEGENDlLLWLLzo; q>L:.;-'wPOSITION OF LATERALVELOCITY CHANGENU~'.';BERSN PROF LES AREVELOCITIES, ~i FEET PER SECONDDR-15f-BORI NG DESiGNATIONAPPROXIMATELOCATION OFCHA'JGE IN MATERIALTRA-0
-APPROXIMATE~~R~ ________________CORPS OF ENGINEERSVALUE ENGINEERING PAYSU. S. ARMY=>=rTER~cn~SW·3 13002300 87 + 007000.=7000nOII- 17.400w 74,000wu..z 2100zQI- 2000W...Jw19°ol1800 .....0+00 10 + 00SOUTHSW-424001 DR·15IHTERSECTlIJiSW·3,109 + 91230014502200I-w 2100UJu..Z2000z0l-UJ...JW180070GO1300; ~ :::::> =c:::::::::::nQc1.:150700020 + 0015,400230017,000 ,2100NORTH7000~22002200 l- wu..Zz0l-2000 19001800w...Jw,450 ] 2400,23002100200019001800I- wUJu..zz0f::W...JUJLEGENDPOSITION OF LATERALVELOCITY CHANGENUMBERS IN PROFILES AREVELOCITIES, IN FEET PER SECONDDR-15t....BORING DESIGNATIONLOCATION OFCHANGE IN MATERIALo 100 200 300b-w==:' , IVERTICAL SCALE IN FEETo 200 400 600hr........I ! /HORIZONTAL SCALE IN FEET17000+ 10 + 00SOUTHSW-520 + 00 30+ 00NORTH1700I-UJUJu..z2400~2300 r"2200~12502100z0I- 22.000W...Jw1900DR·14rNTER~CTl~SW·3 138 + 357000410018000+00 10 + 00SOUTH1250SW-612,5024004100230070002200,5,000 21002200190020 + 00 30 + 001800NORTHI-UJwu..zz0f::UJ...JUJDUCII:II"TIONCONTkACT NO. __ ~ __...._~__GEOTECHNICI'U. (;CNSUL TANTSFA,nRAt.K$ALASKA DISTRICTCORPS OF ENGINEERSANCHORAGL ALASKASUSITNA HYDROELECTRIC PROJECTWATANA DAMSITE1978 SEISMIC REFRACTION SURVEYSEISMIC VELOCITY PROFILESSW·4 SW·5 SW·6SCAU!:SAFETY PAYS w""" 5 0' 21INV. NO. DACW85-78 - C - 0027
~~~R __________________CORPS OF ENGINEERSVALUE ENGINEERING PAYSUPPER TSUSENA BORROW SITEU. S. ARMY24502450240015002400I-UJwLL.z20i=~>L......JUJ2350230058502350230022502200I-LULULL.Zz0!;(>LU...JLU2150WEST5 + 00SW-9+EAST2100I- LUUJLL.Zz0i=~>LU...JLU2400 ~235023002250~1,2505,75013,1005,75015,300~ 2400,2350I-UJUJLL.z2300 z0I-~2250 >UJ...JLU220021500+WEST5 + 00 10 + 0015 + 00 20 ,I 00SW-814,50025 + 00EAST22002-50IUJUJLL.ZZoI.4->UJ...JUJSW-7+1,25015 + 00EAST2500j 24502400J 23502300220021502100I-wUJLL.zz0I-~>ill...JUJLEGEI\:ODR-15~_-POSITION OF LATERALVELOCITY CHANGENUMBERS II\: PROFI LES AREVELOCITIES, IN FEET PER SECONDBORI NG DESIGNATIONAPPROXIMATELOCATION OFCFrtmGE 1111 MATERIALo 50 100 150.aM! ! IVERTICAL SCALE IN FEETo 100 200 300I • ......I 'HORIZOI\:TAL SCALE IN FEETCITY ., __ ._._., .....,..,DESC«II"HOt4CONTRACT NO. ____.___~GEOTECHNICAL CQNSUlTAI'>TSfAIRBANKSALASKA DISTRICTCORPS OF ENQINE:£RSANCHORAGE. AL.ASKASUSITNA HYDROELECTRIC PROJECT\,ItATANA DAM SITE1978SEISMIC REFRACTION SURVEYSEISMIC VELOCITY PROFILESSW-7 SW-a SW-g__ 6 Of 21OATE:SAFETYPAYSINV_ NO. DACW85-78-C-0027
CORPS OF ENGINEERS VALUE ENGINEERING PAYSU. S. ARMYLOWER TSUSENA BORROW SITE1500--SUSITNAl1500---RIVER=1450~r...,..,-14501450 '- 145014508080 8080----I--I--UJ..uw 1400 1400 UJu.. 12,300u..Z 8080Z 1350 1350z0QI--I-- 16,700« «> 1300 1300 >UJ-'UJ1250 1250UJ",JUJLEGEND~ DOSITION OF LATERALVELOCITY CH!\'\GE~UMBERS I'J PllOF'LES AREVELOCITIES, IN f'EET PER SECor~D1200 1200DR-15 BORING DESIGNATIONI'11 1150APPROXIMATE0+00 5+ 00 10+ 00 15 + 00 20 + 00 LOCATION OFCHANGE IN MATERIALSW-12roo15001~ SUSITNA-----RIVER~0 50 100 1501450, 1450 !10: •• I I1250I-- 7500 7500 I-- VERTICAL SCALE IN FEETtJJUJIJJ 1400[1400 LlJLL LL 0 100 200 300!1 ••z z ......1 1z zHORIZONTAL SCALE IN FEET1350 13500 0i= 13,970 13,970 I--« «> 1300 > 1300LlJ",JLlJ1250 1250W",JLlJ1200 12000+00 5 + 00 10 + 00SW-111650 16501600 1600I-- 1550 1550 t-llJllJLLllJllJLL2760zZ 1500 SUSITNA-1500z RIVER 1000m. !)AlI:! c.o. ,ACTION DUCUPTIONZ0 7400 0 CONTRAer NO. ___......____2200 1000 14,370I--I--CONT'JlitACTOR1450. 1450« «crrt' ...__.. ~~,_,_,_~ ...._ 'STA.Tl _____~,> 2760>....llJ",JllJ 1400 7400 1400SHANNON & WILSON, INC.GEOTECHNICAL COr"SUl T ANTS14.370 14,370IJJ",JtJJ..'"~J~~ .__.- ---_._._-_.._-- .i"""irMiNiiilFA1RBA'Ii
CORPS OF ENGINEERSVALUE ENGINEERING PAYSU, S, ARMYLOWER TSUSENA BORROW SITE1550 r 15501500 ~SUSITNA-I-UJ 1450 RIVERillu..~ 1000z 1400 ~0I-
CORPS OF ENGINEERSVALUE ENGINEERING PAYSU, S, ARMY0+00i I I III II I ! I f-! IIf't.: DAn; co, ACllOt
CORPS OF ENGINEERSVALUE ENGINEERING PAYS1000 I950 I ;'"r --3185900 II- UJUJu..850 I-Zz0800nooI- UJ 750...JUJ0UJ 7002':JU)(/)
EXHIBIT D-2Reconnaissance of the Recent Geology of theProposed Devil's Canyon and Watana Damsites,Susitna River, <strong>Alaska</strong>.
RECONNAISSANCE OF THE RECENT GEOLOGYOF THE PROPOSED DEVILS CANYON AND WATANADAMSITES, SUSITNA RIVER, ALASKAbyReuben KachadoorianandHenry J. Moore
CONTENTSABSRACT-------------------------------------------------------------- 1INTRODUCTION--------------------------------------------------------- 3GEOLOGIC BACKGROUND-------------------------------------------------- 6PROCEDURES----------------------------------------------------------- 9Ground and aerial observations-----------------------------------12Visual observations during helicopter overflights----------------20First order leveling observations--------------------------------31Additional observations------------------------------------------33Seismic activity-------------------------------------------------35SUMMARY--------------------------------------------------------------38RECOMMENDATIONS------------------------------------------------------39REFERENCES CITED-----------------------------------------------------40ii
IllustrationsFigu~1. Overlay showing actual and inferred faults-----------------in backTables1. Inferred faults------------------------------------------------- 82. Partial list of scarps and landforms----------------------------ll3. Location of selected examples of scarps-------------------------224. Selected examples of landforms----------------------------------235. Location of old and potential landslides------------------------276. Location of patterned ground------------------------------------287. First order leveling results------------------------------------32iii
PRELIMINARY REPORT OF THE RECENT GEOLOGYOF THE PROPOSED DEVILS CANYON AND WATANADAMSITES, SUSITNA RIVER, ALASKAbyReuben Kachadoorian and Henry J. MooreABSTRACTAt the request of the Corps of Engineers, the U.S. GeologicalSurvey conducted a reconnaissance of the recent geology of the proposedDevils Canyon and Watana damsite areas, Susitna River. <strong>Alaska</strong>.Thepurposes of the reconnaissance were to look for active faults and othergeologic hazards.Field work by the Geological Survey was conductedbetween July 25, 1978 and August 7, 1978 using a helicopter which wasshared jointly and in cooperation with personnel of the Corps ofEngineers.The geologic reconnaissance of the proposed Devils Canyon andWatana damsite and reservoir areas did not uncover any evidence forrecent or active faulting along any of the known or inferred faults.Recent movement of surficial deposits has occurred as the result of masswasting processes and, possibly, by seismic shaking and minordisplacements of bedrock along joints.Landsliding has occurred in the past and future landsliding appearsprobable.The occurrence of unconsolidated glacial debris, alluvium,and Tertiary sediments at elevations below the proposed reservoir waterlevels may slump and slide into the reservoirs when they are inundated.Some of these sediments may be permanently frozen and, locally, may be1
ice-rich which increases the probability of slumping and sliding whenthe sediments are thawed by the water impounded behind the dams.The tectonic framework of the Devils Canyon and Watana damsiteareas is not well understood.The present knowledge of the areaindicates that the seismicity of the region ranges in depth from lessthan 10 km to greater than 175 km.Additional detailed geologic and seismic studies are necessary inorder to reliably evaluate the potential geologic hazards in the regionof the proposed dam and reservoir sites.2
INTRODUCTIONThe feasibility of two dams on the Susitna River, <strong>Alaska</strong>, iscurrently under evaluation by the U.S. Army Corps of Engineers.TheCorps of Engineers has proposed two dams for the purpose of developingthe hydroelectric power potential of the Susitna River:one at DevilsCanyob and the other at the Watana site. The proposed Devils Canyonsite is located about 29 km (l8 miles) upstream from Gold Creek Stationon The <strong>Alaska</strong> Railroad.This dam would be 194 m (635 ft) high and thereservoir formed would have a water altitude of 442 m (1,450 ft) abovesea level and would extend about 45 km (28 miles) upstream to theproposed Watana site. The height of the proposed Watana dam would be247 m (810 ft) and its reservoir would have a maximum water altitude of671 m (2,200 ft) and extend upstream 87 km (54 miles). The total powerproduced by both structures would be about 600 megawatts (MW);approximately 270 MW at Devils Canyon and the remaining 330 (MW)atWatana·The current proposed locations for the damsites are shown inFigure 1.The study of active faults, seismic activity, potential and recentlandslides, and other potential geologic hazards are of particularconcern in the preliminary evaluation of the proposed Devils Canyon andWatana damsites and their reservoirs. The U.S. Army Corps of Engineersrequested the U.S. Geological Survey to make such a study.Authorization for the Geological Survey to make the study is embodied ina letter from F. R. Brown, Technical Director, Corps of EngineersWaterways Experiment Station to Dr. Dallas Peck, Chief Geologist,Geological Survey (Appendix A) and a proposal letter to Dr. Ellis3
Krinitzsky, Corps of Engineers, by Reuben Kachadoorian (Appendix B).Inpractice, the scope of this reconnaissance was modified to include amuch larger area than that stated in Appendix B.This report is based essentially on reconnaissance geologicobservations, both on the surface and from overflights, between July 25.1978 and August 7. 1978. Field work was conducted using a helicopterwhich'was shared jointly and in cooperation with Corps of Engineerspersonnel who were conducting detailed studies at the proposed Watanadamsite.Unfortunately, adverse weather significantly curtailed thenumber of surface observations during the limited amount of time thatthe helicopter was available to us.Details of the bedrock geology are beyond the scope of this reportbut the geologic map and report of Csejtey and others (1978) is includedin this report as Appendix C for the sake of completeness and because werefer to some of the geologic map units. The geologic map in the reportwas important to our reconnaissance and wherever we field checked it. wefound it to be correct and commensurate ~th its scale. It should berealized that mapping at a larger scale would permit finer subdivisionof the map units and portrayal in more detail. Additionally, thedefinitions of the map units are not directed toward engineeringproblems, but rather geologic ones; and. therefore, this fact must beconsidered when using the enclosed geologic map.The map should be usedonly to determine the gross geologic setting of the proposed DevilsCanyon and Watana damsites and their reservoirs. The map includes allof the Talkeetna Mountains, <strong>Alaska</strong>, Quadrangle, and small segments ofthe Healy, <strong>Alaska</strong>. Quadrangle, in the northwest part of the map and theAnchorage. <strong>Alaska</strong>. Quadrangle in the south.4
Figure 1 is intended to clarify the discussions and data presentedin this report. It has three parts: (1) a 1:250,000 scale topographicmap of the Healy, <strong>Alaska</strong>, Quadrangle, (2) a 1:250,000 scale topographicmap of the Talkeetna Mountains, <strong>Alaska</strong>, Quadrangle, and (3) atransparent overlay depicting the inferred and actual faults in thereconnaissance area.The overlay includes the northern three-fourths ofthe Talkeetna Mountains Quadrangle and the southern one-fourth of theHealy Quadrangle.the transparent overlay may be superposed on thetopographic maps to locate the inferred and actual faults and otheritems in the text. Additionally, certain features discussed in the textcan be located on the topographic maps by Townships, Ranges, andSections. The geologic map in Appendix C also has the same scale as thetopographic maps and transparent overlay.We must emphasize that the data and conclusions presented in thisreport are based on a reconnaissance study of the proposed Devils Canyonand Watana dam and reservoir sites. To evaluate thoroughly the proposeddamsites and their reservoirs additional studies must be made.Wespecify some of these studies later in this report.5
GEOLOGIC BACKGROUNDThe geology of the Susitna River area (Csejtey and others, 1978;Appendix C) is rather complex.Bedrock consists chiefly of tightlyfolded, metamorphosed, and faulted volcanic and sedimentary sequencesthat range in age from late Paleozoic to late Cretaceous and of lateCretaceous to Early Tertiary granodiorite (55 to 75 m.y. old). Theserocks are overlain by Tertiary volcanic and sedimentary rocks (about 50to 58 m.y. old). Tertiary sediments of possibly late Oligocene age(about 25 m.y. old) (Wolfe, written communication, 1977) are exposed inWatana Creek about 7 km (4.5 miles) upstream of its confluence with theSusitna River.The Tertiary sediments are gently tilted and possiblyfaul ted.Unconsolidated sediments of late Wisconsin glaciation (8,000-12,000-years ago; Pewe, 1975) cover much of the study area. These lateWisconsin glacial sediments consist of unconsolidated tills, moraines,sand and gravel deposits and eskers. Glacial scour features caused bythis glaciation are also present. The glacial sediments, in turn, havebeen and are being eroded, cut, and modified by the Susitna Riverdrainage system and by mass wasting.These recent geologic events arerepresented by V-shaped valleys, river sands and gravels, terracesediments, solifluction, slumps, landslides, talus, lakes, streamchannels, and other features due to mass wasting processes.The late Wisconsin glaciation (8,000 to 12,000 y. old) covered theDevils Canyon, Watana dam, and reservoir sites. Kachadoorian (1974)reported field evidence from Devils Canyon indicating that the SusitnaRiver occupies the same channel at the present as it did prior to the6
Late Wisconsin glacial period.Recent discovery of glacial debris onthe floor of the Susitna River Canyon upstream from the Watana damsiteconfirms Kachadoorian's previous observation at Devils Canyon.Of particular interest here are the faults that have been inferredto exist by various investigators in the area. These faults are shownin Figure 1 and are listed in Table 1.Table 1 also includes thedesignation, type, and the reference from which we obtained theinformation about these faults.7
table 1.Inferred faulta in the general area of the Devil. Canyonand Watana damaite., Susitna River, <strong>Alaska</strong>YlIuaberDealgnatlonReferenceTypeRelllarb2.3.s.6.7.8.9.10.11.12.13.u.15.16.Zone of intenaeIh.arinatalkeetna ThrustHear Watana CreekNear Portage CreekChulitna It1verNorth of VABH SheepWest of VABM SheepSuaitna FaultNear Clarence LakeNear VABH WinduaCsejtey and others, 1978Caejtey and others. 1978Caejtey and others, 1978Caejtey ano. others, 1978Caej tey and others, 1978Caejtey and others, 1978Caejtcy ana others, 1978Anon., 1974a. Turner andothers, 1974; Gedney andShapiro, 1975; Turner andSmith, 1974Beikman, 1974; Smith andothers, 1975; Turner andSm! th, 1974Belkman, 1974; Smith andothers, 1975, Turner andSmith, 1974North of VABMa Crebe- Anon., 1974a; Beikman,Ht. Watana Salith and others, 1975,Turner and Smith, 1974East of VABH SumartidasonWatana CreekNorth of DenaliCretaceous to recentahearingAnon., 1974aAnon., 1974a; Turner au~Soaitb. 197 .. , Smith andothers, 1975r,~e~t~v, p~r8~nal c~.,1975. Lahr andt:achadoorian. 1975Anon., 1974a; Beikman, 1974;Turner and Smith, 1974Csejtey, personal commun.,1975: Lahr andKacharloorian, 1975JfTracea of theae inferred faulta are shown in Figure 1 ~ndThrustThrustThrustThrustThrust &VerticalEvidence is stratigraphic'andpetrograpllic.Evidence is stratigraphic.Evidence is stratigraphic.Evidence is stratigraphic.Evidence is stratigraphic.Strike Slip Right lateral with aome vertica:d ispl acemen t.Strike Slip Two faults; left lateral andright lateral.Strike Slip Evidence is topographic lineament;inferred to be right lateral fromseismic data.High AngleHigh AngleThrustDisplacement apparently vertical.Displacement apparently vertical.Evidence is apparently stratigraphic.Strike Slip Existence is questioned by the authors.NorwalEvidence is stratigraphic.'I'lrust Alternate trace ~or number 4ThrustComplexEvidence is apparently stratigraphic.Evidence partly stratigraphic.indicated by corresponding number.8
PROCEDURESFour kinds of information have been gathered in this preliminaryreconnaissance'(1) ground and aerial observations on the traces ofknown and inferred faults, (2) visual observations of surficial depositsand landforms made during helicopter overflights and locallysupplemented by ground observations, (3) a comparison of first orderleveling elevations conducted in 1922 and 1965, and (4) the location ofepicenters and hypocenters of seismic events in the general area.Additionally, relevant reports in the literature have been consulted forcertain areas where our observations were incomplete due to inclementweather and lack of time.Ground and aerial observations from a helicopter were intended toseek or confirm stratigraphic evidence for faults in the general areaand to seek topograpic and geomorphic evidence for recent faulting alongthe mapped and inferred traces. These fault traces were obtained fromthe available literature and unpublished reports (Csejtey and others,1978 and Appendix C; Anon., 1974a; Gedney and Shapiro, 1975; Turner andothers. ~1974;Beikman, 1974; Turner and Smith, 1974; Smith and others,1975; Lahr and Kachadoorian, 1975).Visual observations during helicopter overflights involvedsearching for scarps, topographic lineations, and offsets of landformsthat might be the result of faulting--particularly active faulting-Thecriteria required to establish active faulting and recent movementswere: (1) offsets of glacial landforms, (2) offsets of other landformssuch as stream courses, (3) fresh scarps that were devoid of vegetation.and (4) superposition of landforms over preexisting ones.A partial9
list of the kinds of scarps and landforms that one might expect toobserve are listed in Table 2.First order leveling elevation data were obtained from literaturesupplied by Thomas Taylor, Topographic Division, U.S. Geological Survey,Anchorage, <strong>Alaska</strong>.The section on Seismic Activity was written by John Lahr andChristopher Stephens, Center for Earthquake Studies, U.S. GeologicalSurvey, Menlo Park, California.John Lahr made his unpublished dataavailable to us.Our criteria for designating a fault as active were constrained bythe local geology.Much of the area around the Devils Canyon and Watanadam sites is mantled by late Wisconsin (8,000 to 12,000 y. ago) glacialsediments.In such cases our definition of an active fault necessarilyis one that has moved within the last 8,000 to 12,000 years.In areasunderlain by bedrock, a fault would be considered active if there werefresh scarps. Most inferred fault traces were locally mantled by lateWisconsin and younger surficial deposits.10
Table 2.Partial list of scarps and landforms that maybe found in asearch for active faults.PrimaryVolcanoes, flow frontsRock structuresJOint scarps (mass wasting, rock terraces, shear zones, folds,foliations, etc·Glacial featuresMoraines (lateral. end, ground), eskers, kames, kettles.lee contact features (scours, channels, U-shaped valleys, rockterraces, roches mountonnee, etc.)RiverBars, terraces, meander scars, valleysLakeWave cut cliffs, bars, deltas, thaw scarpsOther unconsolidated depositsSoil creep scarps, solifluction lobes, gravity slumpsRock flowLandslides, avalanches, rock glaciersTectonicFault scarps, sag features, offset drainage, etc.WindSand dunes11
Ground and aerial observations along traces of knownand inferred faultsDuring this part of our reconnaissance we found no evidence foractive faulting that could be unequivocally related to the inferred oractual faults in the general area.Each of the faults is discussedbelow by their corresponding number in Table 1.1. Zone of intense shearing. The zone of intense shearing wasexamined on the ground near the Talkeetna River (T28N, R5E, S34,NW1/4). At this locality, cataclastically deformed Jurassicgranodiorite was observed to be in contact with late Paleozoicmetavolcanics rocks (unit Pzv, Appendix C) along an intense zone ofshearing.oxidized.The contact or faulted zone between these two units wasThus, we concur with the existence of this shear zone asmapped by Csejtey and others (1978).No evidence for active faulting was observed on the ground.Nearthe Talkeetna River, the flat top of the mountain was not verticallyoffset where it was intersected by the shear zone. In addition,observations during an overflight of the shear zone a few miles to thesouthwest across the Talkeetna River and to the northwest along TsisiCreek to ROsina Creek and then to VABM Sumartidason yielded no evidenceof fresh scarps and drainage offsets. Stratigraphic evidence indicatesno movement has occurred since early Tertiary (Csejtey and others, 1978;Appendix C).2. Talkeetna Thrust. This thrust fault is inferred to beconcealed throughout almost all of its length.It is exposed along its12
southwest trace (T27N, RIW, S6) where late Paleozoic metavolcanic rocks(unit Pzv, Appendix C) form the hanging wall and phyllites and schists(unit Kag, Appendix C) form the footwall.Unfaulted Tertiary volcanicsoverlie the thrust (T28N, RIW).The fault and Tertiary volcanics asmapped by Csejtey and others (1978) appear to be correct.No evidence for scarps or active faulting along the inferred tracefrom Prairie Creek. by Fog Lakes, and along Watana Creek were found byus·Tertiary (Oligocene?) sediments in Watana Creek are gently tiltedand possibly faulted, but not recently.3. Near Watana Creek. This thrust is well exposed (T33N, T22S,RlW) and. where we examined it, Triassic metavolcanic rocks (unit TRv,Appendix C) make up the hanging wall and Jurassic sediments (unit Js,Appendix C) constitute the footwall.Near the fault trace, slickensidedJurassic sediments are abundant.We agree with both the existence andlocation of this fault as mapped by Csejtey and others (1978).Aerialreconnaissance suggests the fault continues into the Healy Quadrangle asindicated in Figure 1.We found no evidence for active faulting at the locality examinedor along the fault trace to the northeast in the Healy Quadrangle.4. Near Portage Creek. This thrust is well exposed along itsmapped length (T33N, R9W, RBW) and Triassic metabasalts and slates (unitlRvs, Appendix C) are found to the north of the fault trace whileCretaceous phyllites (unit Keg, Appendix C) are found to the south ofthe trace. Unfaulted Tertiary volcanics and sediments overlie thethrust to the east (T22S, R7W, R6W) and the thrust is terminated byintrusion of Tertiary granodiorite to the west (T33N, RIE, SI8).13
Wefound no evidence of active faulting along this trace and agreethat movement occurred before the early Tertiary (Csejtey and others,1978).5. Chulitna River. Time and inclement weather did not permitadequate reconnaissance of this area but stratigraphic evidence shows avariety of faults are present (Csejtey and others, 1978).Existing mapsindicate there is no active to recent faulting (Csejtey and others,1978), Appendix C; Reed and Nelson, 1977). First order levelingelevations were measured across the Chulitna River; the results of thesemeasurements are discussed later in this report.6. North of VABM Sheep- Ground observations were not made by us.Evidence for strike slip and vertical movement is represented by offsetof contacts between Tertiary granodiorites and older Cretaceous andPaleozoic rocks (Csejtey and others, 1978).During overfl ights along the trace of the fault, no evidence foractive faulting was found either over the wooded areas or along theTalkeetna River.7. West of VABM Sheep. Ground observations were not made by us.Evidence for these faults is similar to that in 6 above.Duringoverflights along the traces of these faults, no evidence for activefaulting was found.8. Susitna fault. The trace of this inferred fault passes fromthe vicinity of Stephan Lake, along Deadman Creek to Butte Lake in theHealy Quadrangle, and then across the west fork of the Susitna River(Anon., 1974a).Evidence for this fault is primarily geomorphic, andcomprises a prominent linear on LANDSAT imagery (Gedney and Shapiro,14
1975). Right lateral displacement has been postulated on the basis ofseismic evidence (Gedney and Shapiro, 1975).In contrast to Gedney andShapiro (1975), we find no compelling evidence for this fault in theseismic data reported by them or available to us (see Appendix D).Thisposition is based on two factors. First, plots of our data and theirdata do not show a striking correlation, if any, of epicenters with theinferred trace of the fault. Second, the data are not complete enoughor precise enough to be used in this way beca~sethe coverage of theseismic net is inadequate for precise determination of epicenter andhypocenter locations in the Susitna fault area. Additional seismicstations could resolve the problem-Stratigraphic evidence for this fault is weak to non-existent.Thegeologic map of Turner and Smith (1974) indicates stratigraphicevidence which is contradicted by Csejtey and others (1978).Tertiarygranodiorites and their border phases (unit Tsmg or migmatized rocks,Appendix C) lie along the trace of the fault. Tertiary volcanic rocks(unit Tv, Appendix C) occur at relatively low altitudes in Fog Creek(T31N, R4E, R5E) and may be down-faulted.Lack of time prevented usfrom making detailed studies of the volcanic rocks in Fog Creek.Overflights along the inferred trace of this inferred faultindicate that active faulting has not occurred along the trace.Evidence for scarps and horizontal offsets are absent from Stephan Lakenortheast to a point across the Susitna River.Numerous fresh scarpsoccur along lower Tsusena Creek and upper Deadman Creek to Butte Lake.Fresh scarps and horizontal offsets are absent northeast of Butte Lakewhere late Wisconsin re-advance (8,000 y. ago) glacial ground moraines15
are present. The fresh scarps observed are believed to be due tolandsliding, slumping. solifluction, and stream erosion.Orientation ofthe scarps and the localized hummocky topography at the edge of TsusenaCreek near Watana the damsite (T32N, R5E, 521, 28, 29) are consistentwith a landslide. In upper Deadman Creek, fresh scarps have a varietyof orientations but they tend to face in southerly or in a downslopedirection. The traces of the scarps are commonly arcuate and akilometer (about 0.6 of a mile) or less in length.For these reasons,we believe these scarps are the result of recent slumping, solifluctionand Boil creep.It is noteworthy that fresh scarps are absent in themoraines northeast of Butte Lake.If these scarps were interpreted toresult from faulting, it would follow that the faulting was pre-moraine(older than about 8,000 yrs and younger than 12,000 yrs). Other freshscarps on Deadman Creek are clearly meander scars.In summary, we find no conclusive evidence for a fault or activefaulting along the inferred trace of the Susitna fault but ratherlandsliding, slumping, solifluction, and soil creep.The production ofthe fresh scarps may be partly related to general seismic activity inthe area, however.9. Near Clarence Lake. The evidence for this inferred fault isapparently stratigraphic (Turner and Smith, 1974), but no suchstratigraphic evidence was found by Csejtey and others. (1978;Appendix C).Jurassic amphibolites (unit Jam, Appendix C) occur on bothsides of the inferred fault trace but there is a change in metamorphicgrade in zones parallel to it (Csejtey, personal comm., 1978).A fewscarps occur along the hillsides near the trace but these are best16
attributed to solifluction and slumping.10. Near VABM Windus. This fault runs parallel to the SusitnaRiver and passes to the south of VABM Windus.Here again, Turner andSmith (1974) report stratigraphic evidence for it whereas Csejtey andothers (1978) do not report evidence for the fault. Jurassicamphibolites (unit Jam, Appendix C) occur on both sides of the inferredtrace over nearly its entire length.We found no evidence for active faults along the trace of thisinferred fault. The eastern part of the trace transects glacial groundmoraines and eskers. No vertical or horizontal offsets of theassociated landforms were observed.Fresh scarps with 3 to 4.6 m (10 to15 ft) of relief are particularly abundant near the trace in thevicinity of VABM Windus.Traces of these fresh scarps parallel thelocal elevation contours and a few occur on the northeast slopes of theWindus hill. This, combined with large amounts of surface and springwater runoff observed during the overflight, suggest that the scarps aredue to slumping, solifluction, and soil creep. Tilted trees south ofthe scarp suggest movement of surface materials occurred within the last40 to 50 years.11. North of VABMs Grebe and Mt. Watana. This inferred faulttransects Paleozoic rocks (unit Pzv, Appendix C) north of VABMs Grebeand Mt. Watana, crosses the Susitna River, and then more or lessparallels the contact between the Paleozoic rocks (unit Pzv) andTriassic metavolcanics (DV, Appendix C).Stratigraphic evidence forthis fault is generally lacking, although the contact between thePaleozoic rocks and Triassic metavolcanics might be inferred to be a17
fault. Csejtey and others (1978) do not report a fault along theinferred trace. When we checked this fault on the ground, we found nostratigraphic or geomorphic evidence for it.During the overflight along the trace of the inferred fault, freshscarps and horizontal offsets of glacial features (moraines, eskers,etc.) and other surficial deposits were not observed.Thus, activefaulting has not occurred along the inferred trace after the glacialfeatures were formed.12. East of VABM Sumartidason. The existence of this fault isquestioned by the authors (Anon., 1974a).The trace was not examinedduring an overflight because it was unknown to us prior to thereconnaissance.13. Watana Creek. The trace of this fault generally coincideswith the inferred traces of the Talkeetna thrust (see 2 above) and the"Near Watana Creek" (see 3 above) faults and has been inferred to havevertical displacement (north-side up) (Anon_, 1974a; Turner and Smith,1974). Stratigraphic evidence in support of this fault includesJurassic sediments (unit Js, Appendix C) in fault contact with Triassicvolcanics (unit TRv, Appendix C) and the occurrence of tilted Tertiarysediments (unit Tsu, Appendix C; T32N, R7E) at low altitudes.We found no evidence for active faulting along the trace of thisfaul t.14. Along Portage Creek. This fault trace was an alternate traceto the eastern part of the thruat fault in 4 above (Csejtey, personalcomm., 1975).We found no evidence for active faulting along PortageCreek.18
15. North of Denali. Evidence for this fault is apparentlystratigraphic and its trace is truncated by intrusives (Cretaceous inage?) (Anon .• 1974a; Turner and Smith, 1974).Both the mapping andoverflights in the general area indicate this fault is inactive.16. Cretaceous to recent shearing. Time and inclement weather didnot permit adequate reconnaissance of this area which is the same areaas number 5 above.The reasons for inferring recent faulting are twopoorly exposed normal faults in the Chulitna River valley (Csejtey andothers, 1978).Csejtey (personal comm-, 1978) states that apparentlymiddle Tertiary or younger sediments have been displaced by the faults.However, existing maps indicate there is no active to recent faulting(Csejtey and others, 1978; Appendix C; Reed and Nelson. 1977).As stated earlier, lack of time and inclement weather did notpermit us to investigate these faults thoroughly.Therefore, it isunknown to us whether any active faulting has occurred along thesefaults in the Chulitna valley. We attempt, however, to evaluate thisfault zone by studying first order leveling data. The results of firstorder leveling surveys across the fault zone are discussed later.19
Visual observations during helicopter flightsWithin the study area, a number of geologic phenomena were observedfrom the air which are relevant to the geologic problems related to damconstruction. The most important are: 1) very steeply dipping join~sets and shear zones are common, 2) there are a significant number ofshort fresh scarps, 3) landslides have occurred in the past and new onesmay occur in the future, 4) permafrost is present, at least locally, and5) locally tills, alluvium, and Tertiary sediments with very lowcohesions occur at altitudes near and below the expected water level ofthe Devils Canyon and Watana dam reservoirs.1. Very steeply dipping joint sets and shear zones are common (seefor example Kachadoorian, 1974).Although these joint sets and shearzones do not necessarily pose dam construction problems, theirimplications to active tectonic movements and 1ands1iding are important.In regard to active tectonic movements, it seems conceivable that minorvertical and horizontal adjustments during tectonic activity could occuralong them without producing long continuous faults but rather shortscarps with small displacement (4.6 m, 15 ft). Thus, uplift anddeformation could be accomplished by small vertical and horizontalmovements along a myriad of joints. In some places, joint sets are sonumerous that the Tertiary granodiorites superficially resemble columnarbasalt (such as in T31N, R3E, S17).In many places both fresh scarpsand graben-like structures appear to be controlled by these joints whilein other places, fresh scarps parallel the shear zones.In addition to providing planes of weakness for minor tectonicmovements, the joint sets will also partly control landsliding and rock20
falls.2. Fresh scarps are conspicuously abundant in the general area.None of these can be unequivocally ascribed to active faulting but localminor vertical adjustments of the order of 1.5 to 3 m (5 to 10 ft)cannot be excluded for some of them.Others are best attributed toslumping, solifluction, soil creep, and 1ands1ip.a. Solifluction and slump scarps. Fresh scarps near VABM Wind usare a good example of scarps produced by slumping and solifluction.They are fresh and unvegetated with reliefs to about 4.6 m (15 ft).They appear to be the result of recent movement by solifluction becausesegmented traces of scarps to the south of VABM Windus trend parallel tothe topographic contours, a few of them occur on the northeast side ofthe Windus hill, and trees downslope have a variety of orientations.Judging from the tilted trees, movement has occurred within the last 40to 50 years. Numerous springs were observed during the overflight andpolygons are present 2.5 km (1.5 miles) west of VABM Windus.Additional places where the fresh scarps can be attributed tosolifluction and slumping are listed in Table 3.b. Other scarps. A variety of other types of scarps are present(Table 4) and some of these need special discussion.In general, freshappearing scarps face in southerly directions. A group of such scarpsnear the Watana damsite deserve special comment because detailedgeologic studies and aerial observations reveal nearly vertical shearzones that trend northwest (Glen Greely, Corps of Engineers, personalcommun., 1978) and the traces of nearby fresh scarps also trend innorthwesterly directions. These scarps appear to be of two types whichare unrelated to the shear zones.The first type (item 2, Table 4) is21
Table 3.Location of selected examples of scarps in theTaleetna Mountains Quadrangle.Number Township Range Section1- C-l T 30 N R 11 E 1, 2, 11, 13, 142. VABM Windus C-2 T 31 N R 10 E 26 through 3033 through 363. C-2 T 30 N R 10 E 224. C-2 T 30 N R 9 E 15, 165. C-2 T 30 N R 8 E 3, 9, 15, 146. C-2 T 29 N R 1 E 19, 20, 21,. 28, 297. D-2 T 33 N R 10 E 228. D-3 T 22 S R 4 W 21, 28, 29, 31, 339. D-3 T 33 N R 5 E 19, 20, 25, 26, 27, 3410. Watana Site D-4 T 32 N R 5 E 2111- D-4 T 33 N R 4 E 28, 29, 3112. D-4 T 33 N R 3 E 27, 28, 34, 3613. D-4 T 32 N R 4 E 29, 3222
Table 4.Selected examples of landforms with steepscarp-like surfaces.FeatureLocationYContentsFresh appearingL Meander scars/cut banks2. Meander scars/thaw lakeshores3. Thaw lake shores4. A1 tiplanation scarpsS. Landslide6. Eskers7. Moraines8. Kames and KettlesOld appearing9. Glac ial Scour10. Old River channels(D-3) T33N R6E 519(D-3) T32N R5E 514(C-2) T30N R9E S 7,8(C-5) T29N R1E 521(D-4) T32N RSE 529,528(C-l) T30N RIlE, R12E,524,2S(C-1) T30N R12E 59,16,17(C-3) T30N RSE 524(C-3) T30N R7E 519(C-4) T30N RSE 530(D-2) T 31N R8E 59,16,17(C-4) T30N RSE 55,8,17(D-3) T225 RSW 536(D-3 ) T225 R4W 530(C-3) T30N R8E 85,6,7,8Healy Quad. T205 R1W54,S,6(C-4) T30N R2E 524(C-1) T30N RIlE 523(D-4) T31N R3E 57,8,17(C-2) T31N R9E 52S,36(C-2) T30N R10E 511(D-S) T32N R2E 533In Deadman CreekNear Watana damsiteNear Watana damsiteClose to 5usitna RiverLateralEndLateralJlLetter designations refer to 1:63,360 scale topographic maps ofthe Talkeetna Mountains.23
elieved to be due to the combined effects of ancient streams and thawlakes.Excavation of the materials in one of the scarps revealed it isunderlain by bedded, pebbly to cobbly fine- to medium-grained sandsdeposited by streams.The complex array of the scarps suggest that th~yare former meander scars. Additionally, many of the scarps partlysurround thaw lakes and bouldery beds of former thaw lakes. Althoughfresh scarps in the area tend to face southwest, some vegetated onesthat face in north to northeast directions are present. Thus, weattribute this type of scarp to the combined action of ancient lakes andstreams and to recent thawing and freezing.The second type (item 5, Table 4) is classified as a landslidebecause the hummocky surface of southwest facing scarps and benches areconfined to a small area and are consistent with soil movement towardthe southwest.The landslide is not related to the shear zones becausesediments comprise the material of the slide and no bedrock occurs init. Freezing and thawing may have been the major cause of movmentsproducing these scarps and benches but we have classed them aslandslides because of the relatively large amount of movement.24
The origin of some fresh scarps is unclear and the relatively largeabundance of scarps might be partly the result of mild tectonic activityand seismic shaking.Many scarps, both fresh and old, are alignedparallel to local joint directions (C-5, T31N, R1E, S34, 35; and C-5,T31N, R2E, S33) and could represent the results of local tectonicadjustments.The fresh scarps associated with joint sets and slumpingare clearly recent as shown by their lack of vegetation and tiltedtrees. Seismic waves may be partly responsible for these recentmovements.2. Older Scarps. Older vegetated and lichen covered scarps aresimilar to the fresh scarps, but here, two additional types have beenobserved:. graben-like structures in bedrock and old river channels.The graben-like structures (item 10, Table 4) are generally short inlength (a fraction of a km) and shallow.Their lengths trend westerlywhich is the general direction of glacial movement in the area. Becauseof the short length, orientation, and graben-like form, we attributethem to glacial plucking and scouring.Old river channels also occur(item 9, Table 4). These old channels are arcuate graben-like landformssubparallel to the present course of the Susitna River.3. Landslides. Although not particularly abundant throughout theDevils Canyon and Watana area, landslides have occurred in the past andnew ones may occur in the future. We noted several large landslidesalong the Susitna River in the proposed Devils Canyon and Watanareservoir sites. The evidence for old landslides is straightforward.Those composed chiefly of rock occur as isolated blocks (or hills)downslope of arcuate SCars with about the same aerial dimensions as the25
lock. Two such slides were observed and are listed in Table 5 (items1 and 2). Landslides in unconsolidated sediments, such as alluvium andglacial till, form hummocky surfaces of scarps, terraces, and ridges(item 3, Table 5).Identification of potential landslides using geomorphic evidencefrom overflights is problematical and the number of potential landslideslisted in Table 5 could either be an overestimate or an underestimate ofthe potential landslides in the Devils Canyon and Watana reservoirareas. We have, however, listed them to indicate the potential forfuture landsliding in the area.Also, those listed do not includepossible landsliding of bedrock and unconsolidated sediments once theybecome saturated with water during reservoir filling.It was not within our charter to map in detail the abutments of theproposed Watana damsite as Kachadoorian (1974) did at the proposedDevils Canyon damsite.Therefore, the abutments of the Watana siteshould be thoroughly examined for possible potential landslides.4. Permafrost. Permanently frozen ground or permafrost is presentin the proposed dam and reservoir areas. During our overflightsnumerous ice wedge polygons were noted, some of which are listed inTable 6. We also noted slumping of surficial· debris on permafrost inthe Susitna River canyon at about altitude 580 m (1,900 ft) (T31N, R4E,S21), about 11 km (7 miles) downstream of the proposed Watana damsite.Permafrost was also reported in the surficial deposits during drillingat the proposed Vee Canyon damsite (Anon., 1962) about 65 km (40 miles)upstream of the Watana site and in unconsolidated sediments and bedrockof the left abutment of the proposed Watana damsite (Corps of Engineers,personal commun., 1978).26
Table 5.Locations of old landslides and potential landslides.LocationJ'CommentsOld Landslides.1. (0-3) T32N R6E 5-28 (5E 1/4)Block of rocks is severalhundred feet across.2. (0-4) T32N R4E 5-33 (NE 1/2)& S34 (NW 1/4)Block of rocks is severalhundred feet across.3. (0-4) T32N R5E 5-28 (NW 1/4)& 5-29 (NE 1/4)North of Watana damsite,slide material is alluviumand fill.Potential Landslides4. (0-3) T32N R6E S-32 (N 1/2)Weakly developed scarp at549 m (1800 ft).5. (0-4) T31N R2E 5-12 (E 1/2)Weakly developed scarp at366 m (1200 ft).6. (C-2) T31N R9E 5-26 (5 1/2)Top of mass at 610 m(2000 ft).YLetter designations refer to 1:63,360 scale topographic maps of theTalkeetna Mountains Quadrangle.27
Table 6.Locations where patterned ground was observed.LocationJl(D-4) T32N R5E S28(C-2) T31N RI0E S28,33(C-2 ) T30N R9E S10,15(C-4 ) T30N R5E S 7.8(C-4 ) T29N R4E S2(C-5) T30N RIW S3(C-5) T30N RIE S19~Letterdesignations refer to 1:63,360 scale topographic maps of theTalkeetna Mountains Quadrangle.28
In order to evaluate the permafrost-related geotechnical problemsin the proposed Devils Canyon and Watana dam and reservoir sites, adetailed study of the nature, character, and distribution of permafrostshould be made.Of particular importance is the permafrost thatunderlies the left abutment of the proposed Watana damsite.5. Tjll. alluvium. and Tertiary sediments. Locally, poorlyconsolidated tills, alluvium, and Tertiary sediments occur at waterlevels that are lower than the planned altitudes of the filledreservoirs of the two dams (Devils Canyon: 442 m (1,450 ft); Watana 666m (2,185 ft). Wetting of the materials and thawing of ice in them willcause weakening of the materials and may cause subsequent slumping, mudslides, and other mass movements.This problem is more probable for theWatana reservoir than it is for the Devils Canyon reservoir.For theDevils Canyon reservoir, the frequency of outcrops of rock belowaltitudes of 442 m (1,450 ft) is striking along the entire length of theSusitna River valley that would be occupied by the reservoir.Tillsappear to occur above about 610 m (2,000 ft) but some alluvial fanswould be innundated.For the Watana reservoir, the occurrence of till and sedimentsbegins within 3 km (about 2 miles) upstream of the proposed damsite.Here, tills and sediments overlie bedrock and the contact between themis near 579 to 610 m (1,900 to 2,000 ft). The amount of bedrock exposedalong the Susitna River upstream of the planned damsite is impressivebut at altitudes near 610 m (2,000 ft) and higher, tills and othersediments are conspicuous.Eskers occur upstream at an altitude of549 m (1,800 ft). Alluvium and talus are also common below 671 m(2,200 ft) along the river.29
Both tills and Tertiary fluviatile sediments that would beinundated by the reservoir occur in Watana Creek.Some of thefluviatile Tertiary sediments are clays which, when wetted, become veryweak and may even disaggregate.30
First Order Leveling ObservationsThe results of first order leveling are included here because(1) the traverse passes across the zone of Cretaceous to recent shearing'and faulting in the Chulitna River valley (Table 1, number 16) andacross the Denali fault (Lahr and Kachadoorian, 1975), and (2) becausethe l~velingwas accomplished before and after the <strong>Alaska</strong>n earthquake of1964. Comparisons of the first order altitudes, mea,sured in the summersof 1922 and 1965 along The <strong>Alaska</strong> Railway from Sunshine to McKinley Park(Rappleye, 1930; Anon., 1973) reveal that differences in altitudes ofbench marks measured in the two surveys cannot be attributed to faultswith large displacements.These altitudes, which are tabulated in Table7, are everywhere within 0.21 m (0.7 ft) of one another. According toThomas Taylor of the Topographic Division of the Geological Survey inAnchorage. <strong>Alaska</strong>, differences in excess of 0.30 m (1 ft) would probablyexceed the uncertainties in altitude changes of some benchmarks due tofrost heaving.A tentative analysis of the data indicate, however, thatthere may be a systematic change in altitudes between the two surveys.The data indicate that there appears to be some tilting, 'of the order ofa foot (0.3 m) with the south side down between Sunshine on the south toYanert to the north.Because we do not know which of the benchmarks arein unconsolidated sediment and subject to frost heaving and which arenot, we do not believe an analysis of the data can permit us to statethat there has been any active faulting between 1922 and 1965.Because of the differences in altitudes detected during the firstorderleveling, we believe the Vertical Angle Bench Marks should beremeasured in order to detect possible displacements with the DevilsCanyon and Watana damsite areas subsequent to the initial surveys.31
Table 7.First-Order leveling from the vicinity of Sunshine to McKinley Park.Altitude (in feet)YStation Designation 1922 1965 DifferenceJ-2 Sunshine 285.895 285.219 -0.676M-2 Talkeetna 346.259 345.675 -0.5840-2 Chase 411.239 410.718 -0.521U-2 Curry 543.358 543.004 -0.354V-2 Sherman 587.200 586.908 -0.292X-2 Gold Creek 691.764 691.610 -0.154Z-2 Canyon 856.173 856.015 -0.158A-3 Canyon 1044.555 1044.417 -0.138E-3 Hurricane Gulch 1629.974 1629.951 -0.023F-3 Honolulu 1495.322 1495.381 +0.059K-3 Colorado 2063.090 2063.247 +0.157L-3 Broadpass 2059.569 2059.720 +0.151P-3 Cantwell 2246.373 2246.547 +0.174S-3 Windy 2076.036 2076.285 +0.249T-3 Windy 1996.873 1996.974 +0.101U-3 Carlo 1956.367 1956.627 +0.260V-3 Yanert 1950.357 1950.678 +0.321W-3 Yanert 1950.574 1950.905 +0.331Y-3 McKinley Park 171 7.201 171 7.382 +0.181~Altttudereported in feet because First-Orderleveling recorded in feet.The conversion factor is 0.3048 meters/foot.- indicates decrease in altitude from 1922 to 1965.+ indicates increase in altitude from 1922 to 1965.32
Additional ObservationsAlthough it may not be within our charter, we would like to commentabout the sediment load in the glacially fed Susitna River. Of.particular interest here is the rate at Which the Watana reservoir mightbe filled by the suspended load and the bed load of the river. Ourestimates of the time to fill the reservoir using nominal values of therates and suspended load (Anon., 1974b),are near one or two thousandyears.However, suspended and bed loads of glacially fed streams arehighly variable. Thus, we feel that there may be insufficient detaileddata to provide an adequate estimate of the lifetime of the dam and thatsuch data should be gathered and analyzed to insure that there is anadequate lifetime for the Watana dam.During our aerial and ground observations, we found no evidence forrecent volcanism.Scoriaceous rocks do occur in the Tertiary sedimentsof Watana Creek but these are the result of heating by subsurfaceburning of the lignite beds in the distant past.Henry Moore noted evidence for icing on or near the left abutmentof the proposed Watana damsite.Such icing was verified by Glen Greely,Corps of Engineers (personal comm., 1978).We do not know the source ofwater for this icing. Therefore, we recommend that the left abutment bethoroughly investigated to determine the source and location of thewater relative to the proposed dam.We detected some lineaments in the active outwash plain of the WestFork Glacier. These lineaments occur about 5 km (3 miles) south of thepresent terminus of the glacier and are about 97 km (60 miles) northeastof the proposed Watana damsite.The lineaments are interpreted to be33
sand dikes that developed during seismic shaking from an earthquake.The age of the sand dikes is unknown but they are considered to berelatively young because they are well preserved and occur 1n the activeoutwash plain of the West Fork Glacier. Lack of time did not permit ~sto make an extensive investigation of the area to adequately determinethe extent and distribution of the sand dikes.34
Seismic ActivityThe Devils Canyon and Watana damsite area lies within a regioncharacterized by a high rate of seismic activity that is the result oftectonic interaction between the Pacific and North American lithosphericplates. The Pacific plate is being thrust to the northwest beneath theNorth American plate (Lahr and Kachadoorian, 1975).affecting this region are generally of three types:The earthquakes(1) shallow (depthless than about 50 km) earthquakes (such as the 1964 <strong>Alaska</strong> earthquake)which occur on the surface of contact between the Pacific and NorthAmerican plates to accommodate their relative motion; (2) shallowearthquakes which occur within the North American plate (including<strong>Alaska</strong>) in response to the stresses produced by interaction with thePacific plate; and (3) deeper earthquakes (depths from 50 to 200 km)that occur within the portion of the Pacific plate that has been thrustbeneath <strong>Alaska</strong>.Benioff zone.These latter earthquakes define a region called theEarthquakes which are occurring in the region of theproposed damsites are of the types described in the last two categories,although earthquakes of all three types are capable of producing strongground shaking at the proposed sites.Lahr and Kachadoorian (1975) reviewed the seismic data availablefrom the U.S.G.S. (formerly N.O.A.A.) Earthquake <strong>Data</strong> File for theperiod 1900 to February 1975.Using only the more reliable earthquakelocations, they showed that the depth of earthquakes in the region ofthe proposed reservoirs range from less than 10 km to greater than175 km. The depth to the Benioff zone directly beneath the proposeddamsites is about 50 km to 80 km.Distribution of epicenters of shallow35
earthquakes, according to presently available data, is too scattered toreliably associate them with individual faults.For design purposes there are two questions of major importance.First, are there potential active faults or other zones of weaknessbeneath the proposed structures which could cause direct structuraldamage during an earthquake?Second, what are the spatial, temporal,and magnitude distributions of earthquakes in the region and as aresult, what accelerations will the proposed structures probablyexperience during their lifetime?The process of identifying active faults on the basis of earthquakelocations is limited by the accuracy to which the locations can bedetermined. as well as by the smallest magnitude earthquake that can berecorded.These two parameters are highly dependent upon the number anddistribution of seismograph stations used in determining a location. Aregional seismograph network did not exist in southern <strong>Alaska</strong> before1967. Prior to that time, the accuracy of epicentral coordinates was50 km or more, errors in depth were on the order of 100 km or more, andthe smallest magnitude events that had been detected were about 4 1/2 onthe Richter scale.Since 1967, routine locations for earthquakes assmall in magnitude as about 3 have been determined with accuracies of10-15 km in epicenter and about 25 km in depth. Since 1971 the U.S.G.S.has operated a network of seismic stations in southern <strong>Alaska</strong>.Thedistribution of earthquake hypocenters and magnitudes detemined usingthis network generally confirms the conclusions reached by Lahr andKachadoorian (1975).Recent U.S.G.S. data allow more precise resolutionof the depth to the top of the Benioff zone and of the extent of shallowcrustal activity. The distribution of the epicenters of the shallow36
earthquakes does not show a strong correlation with mapped faults,although the current accuracy to which these epicenters are determineddoes not preclude the possibility that the earthquakes are occurringalong mapped or as yet unknown faults. To obtain the number ofaccurately located earthquakes necessary to resolve this question itwill be necessary to establish a local network of seismic stations inthe r'egion of the proposed damsites.The tectonics of the region are too poorly known at this time tomake a reliable prediction for the distribution of events that maystrongly shake the damsites. Certainly the Benioff zone activity willcontinue as will the shallow regional activity. In addition, the Denalifault, which lies less than 80 km north of the proposed damsites, is amajor strike-slip fault with geologic evidence for a 3 cm/yr averageHolocene slip. This fault could sustain a magnitude 8.0 event.In addition to the naturally occurring earthquake activity in theregion, there is also the hazard that filling of a reservoir may triggerpotentially damaging earthquakes (as large as magnitude 6 or greater) inthe immediate vicinity of the damsites (Lahr and Kachadoorian, 1975).Continuous monitoring by a local network of seismic stations in theregion beginning well in advance of filling the reservoirs would allowthe level of natural ambient seismicity to be determined.Unless thenatural level is well established, an important opportunity to studythis phenomena will be lost, and possibly unwarranted conclusionsconcerning induced seismicity may be made in the future.37
SUMMARYOur geologic reconnaissance of the proposed Devils Canyon andWatana damsites and reservoir areas, Susitna River, <strong>Alaska</strong>, did notuncover evidence for recent or active faulting along any of the knownand inferred faults.Recent movement of surficial deposits has occurredas the result of mass wasting processes that have produced scarps anddownslope movement of surficial debris.It is possible that some freshscarps may have been triggered or produced by seismic shaking and minordisplacements of bedrock along joints.Lands1iding into the Susitna River has occurred in the past andfuture 1ands1iding appears probable. Additionally, the occurrence ofpoorly consolidated glacial debris, alluvium, and Tertiary sediments ataltitudes below the proposed reservoir water levels, especially at theWatana Dam reservoir, may slump and slide into the reservoirs.Some ofthese sediments contain permafrost and may be ice-rich which increasesthe probability of slumping and sliding when they are thawed by thewater impounded behind the dams.The proposed Devils Canyon and Watana dams are located in a regionof high seismicity.The tectonic framework of the region is not wellunderstood because of the lack of local seismic monitoring stations.Our present knowledge of the region indicates that hypocenters of earthquakesin the region of the proposed dams ranges in depth from less than 10 kmto greater than 175 km.We are unable at this time to reliably predict thelocation and magnitude of future crustal earthquakes that could effectthe proposed structures.38
RECOMMENDATIONSThe conclusions presented in this report are based on areconnaissance study of the proposed Devils Canyon and Watana dam andreservoir sites, and, therefore, should be considered to be preliminary.A thorough evaluation of the geotechnical problems of the proposed damand reservoir sites will require more data.It will be necessary to(1) map the Healy, <strong>Alaska</strong>, Quadrangle, at a scale of 1:250,000, from theTalkteena Mountains Quadrangle to the Denali Fault, about 80 km(48 miles) north of the damsites, (2) map the proposed Devils Canyon andWatana damsites at an appropriate scale to determine the bedrockstructure and distribution of unconsolidated sediments overlying thebedrock, (3) map the reservoir sites at a scale of 1:63,360 in order to(a) establish the type and distribution of unconsolidated sediments andbedrock, (b) locate additional potential landslide areas, and(c) determine the nature and distribution of permafrost, (4) initiate aseismic monitoring program of the dam and reservoir areas, (5) continuethe active fault study, (6) redetermine the altitudes of the VerticalAngle Benchmarks, and (7) collect detailed data on the suspended loadsand bed loads of the Susitna River in order to determine if thereservoir filling rates are acceptable.39
REFERENCES CITEDAnon., 1962, Engineering Geology of the Vee Canyon Damsite:Bureau ofReclamation unpublished report 37, p.4, Appendices.Anon., 1973a, Vertical Control <strong>Data</strong>:National Geodetic Survey,U.S. Department of Commerce, National Oceanic and AtmosphericAdministration, National Ocean Survey.Anon., 1974a, Annual Report 1973:Division of Geologic andGeophysical Survey, Department of National Reserve, State of<strong>Alaska</strong>, 59 p.Anon., 1974b, Water Resources <strong>Data</strong> for <strong>Alaska</strong>, Part 1, Surface WaterRecords, Part 2, Water Quality Records:U.S. Geological Survey,299 p.Beikman, Helen M., 1974, Preliminary Geologic Map of the SoutheastQuadrant of <strong>Alaska</strong>:U.S. Geological Survey Miscellaneous FieldStudies Map 612, 2 sheets.Csejtey, B~la,Jr., Nelson, W. H., Jones, D. L., Siberling, N. J.,Dean, R. M., Morris, M. S., Lamphere, M. A., Smith, J. G., andSilberman, M. L., 1978, Reconnaissance Geologic Map andGeochronology, Talkeetna Mountains Quadrangle, northern part ofAnchorage Quadrangle, and southwest corner of Healy Quadrangle,<strong>Alaska</strong>:U.S. Geological Survey Open-file Report 78-558-A.40
Gedney, Larry and Shapiro, Lewis, 1975, Structural Lineaments,Seismicity, and Geology of the Talkeetna Mountains Area, <strong>Alaska</strong>:Geophysical Institute, University of <strong>Alaska</strong>, Fairbanks, <strong>Alaska</strong>;18 p., 5 plates. Report prepared for the U.S. Army Corps ofEngineers (N.A.S.A. Contract NAS 5-20803, NASA Grant NGL 02-001-092 and U.S.G.S. Contract 14-08-0001-14857).f~chadoorian,Reuben, 1974, Geology of the nevils Canyon damsite,<strong>Alaska</strong>, U.S. Geological Survey Open-file Report 74-40, 17 p.Lahr, John C. and Kachadoorian, Reuben, 1975, Preliminary geologic andseismic evaluation of the proposed Devils Canyon and WatanaReservoir areas, Susitna River. <strong>Alaska</strong>:Informal report to theU.S. Army Corps of Engineers, 24 p.PAwA, Troy L., 1974, Quaternary geology of <strong>Alaska</strong>:U.S. GeologicalSurvey Professional Paper 835, 145 p., 3 plates.Rappleye, Howard S., 1930, First-order leveling in <strong>Alaska</strong>:U.S.Department of Commerce, Coast and Geodetic Survey SpecialPublication 169, p.Smith, Thomas E., Bundtzan, Thomas K., and Trible, Thomas C., 1975,Stratabound copper-gold occurrence, Northern Talkeetna Mountains,<strong>Alaska</strong>:<strong>Alaska</strong> Division of Geologic and Geophysical Surveys,Miscellaneous Paper 3, 7 p.Reed, B. L. and Nelson, S. W., 1977, Geologic map of the TalkeetnaQuadrangle, <strong>Alaska</strong>:U.S. Geological Survey Miscellaneous FieldStudies Map MF-870-A.41
Turner, D. L. and Smith, T. E., 1974, Geochronology and generalizedgeology of the Central <strong>Alaska</strong> Range, Clearwater Mountain, andNorthern Talkeetna Mountains:<strong>Alaska</strong> Division of Geological andGeophysical Surveys, Open-file Report 72, 11 p., 1 map.Turner, D. L., Smith, T. E., and Forbes, R. B., 1974, Geochronologyand offset along the Denali Fault Syst (abs.), in Abstracts withprograms 70th Annual Meeting, Cordillerian Section, GeologicalSociety of America, v. 6, no. 3, p. 268-269.42
EXHIBIT 0-3Earthquake Assessment of the Susitna Project
EARTHQUAKE ASSESSMENT AT THESUSITNA PROJECT, ALASKAbyE. L. KrinitzskyGeotechnical LaboratoryU. S. Army Engineer Waterways Experiment StationVicksburg, Mississippi 3918010 November 1978
CONTENTSPART I: INTRODUCTION . . • • • . , . . • . .1PART 11:PROCEDURE;S FOR ASSIGNING EARTHQUAKE MOTIONS2PART III: EARTHQUAKE EVALUATION11PAR'I' IV:INTERPRE'l'ED PEAK MOTIONSAn Earthquake Originating at the Denali FaultA Local Floating Earthquake with Fault Breakagethat does not Occur at the DamsitesAn Earthquake at the DamsitesPART V: ASSOCIATED MOTIONS . . . .17Induced Seismicity from Reservoir LoadingWater Waves from Earthquake ShakingEarthquake-Induced Landslides .....Tectonic Strain and Overstressed Conditions in RockPART VI:PAWl' VII:nGURESCONCLUSIONSREFERENCES.1921
PART I: INTRODUCTION1. The following sections of this report will assess the possibleoccurrence of earthquakes at the dam sites and the motions that are likelyto be associated with earthquake activity.2. The assessments are preliminary since the investigations on whichthey are based were done on a reconnaissance level and are necessarilyincomplete.1
PART II: PROCEDURES FOR ASSIGNING EARTHQUAKE ~OTIONSJ. Earthquake,; are associated with faults. Tectonism causesdifferential movements in the earth's crust. The rock is subjected tostrain and the buildup of stresses. Relief then may come abruptly asslippaGe ulong a fault. When occurs, the adjacent rocks may rebou.ndelastically with vibratory motions. The shaking constitutestne earthquake.1+. Earthquakes may be asswned to result from movement existingfaults rather than from rock rupture that produces :lew faults.While new faults cannot be eliminated entirely, information extendingthrough geological time and the ubiquitous occurrence of faultsthat for practical purposes earthquakes can be considered to be associatedwith along existing faults.). Since faults are found everywhere, the engineering isfaced with the problem of determining which faults are active, or subjectto movement, and which are inactive. Of faults that are active, movementcan be occurring steadily and slowly by creep and without earthquakes.The engineering geologist must determine which are the "capable" faults,capable meaning that they can generate earthquakes.6. Corps ot' Engineers criteria for a capable fault (see ER 1110-2-1806 of 30 April 19'7'7) are as rollows:a. Movement at or near the ground surface at least once withinthe past 35,000 years.b. Macro-seismicity (3.5 magnitude or greater) instrumentallydetermined with records of sufficient precision to demonstrate a directrelationship with the fault.c. A structural relationship to a capable fault such that movementon one fault could be reasonably expected to cause movement on theother.7. 'I'he geological investigation of faults uses all of the techniquesthat are available:aerial and satellite imagery, inspection from2
overflights, low sun angle photography, reviews of regional and localgeology, geophysical surveys, details of geomorphology and relevant informationfrom the seismic history.8. For a careful investigation of a construction site, the fieldevidence may be checked further by borings, geophysical profiles, trenches,and stripping.9. Monitoring programs for corroborative evidence may include straingages, leveling points, geodimeter readings, and microearthquake monitoring.10. Often, it is desirable to make a critical restudy of historicearthquake events using the original documentation in newspapers, diaries,etc. Relocation of epicenters may result and they may accord better withgeologic information and possibly with specific faults. The maximumintensities of events may be subject to revision also.11. The direction of future movement on an active fault is predictablesince the past is a very good guide to the future. However, secondaryand tertiary faults may have motions that are different from that ofa major fault. Where such data are available, one can readily guardagainst the effects of fault movement under a structure simply by movingthe structure.12. Once a fault is identified as capable of generating earthquakes,and its dimensions are ascertained, the next factor to determine is theworst earthquake that the fault will produce. Toward this end, there area number of relationships and assumptions that involve the size of faulting,or dimension of maximum movement, with the maximum earthquake thatmight reasonably be expected. The data are best for major strike-slipfaults. The dispersion of data is much greater for normal and thrustfaults. However, the variants in field conditions can be enveloped witha reasonable degree of dependability. Relationships between fault lengthand earthquake magnitude have been summarized for Corps use in a reportby Slemmons (1977).13. Though major active faults and major centers of earthquakes canbe accounted for, small faults may be missed in any investigation so thatoften a floating earthquake of appropriate size may be provided in orderto account for them.3
14. The earthquakes that are thus determined can be expressed interms of magnitude* but they need also to be expressed in ModifiedMercalli (MIvI) interisity in order to relate to historic earthquake effects.The 1\11\1 scale is shown in Table 1.Table 1MODIFIED MERCALLI INTENSITY SCALE OF 1931(Abridged)1. Not felt except by a very few under especially favorablecircumstances.II. Felt only by a few persons at rest, especially on upperfloors of buildings. Delicately suspended objects mayswing.III. Felt quite noticeably indoors, especially on upper floorsof buildings, but many people do not recognize it as anearthquake. Standing motor cars may rock slightly.Vibration like passing of truck. Duration estimated.IV. During the day felt indoors by many, outdoors by few. Atnight some awakened. Dishes, windows, doors disturbed;walls made cracking sound. Sensation like heavy truckstriking building. Standing motor cars rocked noticeably.V. Felt by nearly everyone; many awakened. Some dishes, windows,etc., broken; a few instances of cracked plaster;unstable objects overturned. Disturbance of' trees, polesand other tall objects sometimes noticed. Pendulum clocksmay stop.VI. Felt by all; many frightened and run outdoors. Some heavyfurniture moved; a few instances of fallen plaster ordamaged chimneys. Damage slight.* Magnitude (Richter scale) is calculated from a standard earthquake,one which provides a maximum trace amplitude of one micrometer on aWood-Anderson torsion seismograph at a distance of 100 km. Magnitudeis the 10glO of the ratio of the amplitude of any earthquake at thestandard distance to that of the standard earthquake. Though thescale is open-ended, the largest earthquake may be at a limit of magnitude8.7. Each full numeral step in the scale (2 to 3, for example)represents an energy increase of about times.4
VII. ~yerybody runs outdoors. Damage negligible in buildings ofgood design and construction; slight to moderate in wellbuiltordinary structures; considerable in poorly built orbadly designed structures; some chimneys broken. Noticedby persons driving motor cars.VIII. Damage slight in specially designed structures; considerablein ordinary substantial buildings with partial collapse; .great in poorly built structures. Panel walls thrown outof frame structures. Fall of chimneys, factory stacks,columns, monuments, walls. Heavy furniture overturned.Sand and mud ejected in small amounts. Changes in wellwater. Disturbed persons driving motor cars.IX. Damage considerable in specially designed structures; welldesignedframe structures thrown out of plumb; great in substantialbuildings, with partial collapse. Buildingsshifted off foundations. Ground cracked conspicuously.Underground pipes broken.X. Some well-built wooden structures destroyed; most masonryand frame structures destroyed with foundations; groundbadly cracked. Rails bent. Landslides considerable fromriver banks and steep slopes. Shifted sand and mud.Water splashed (slopped) over banks.XI. Few, if any (masonry), structures remain standing. Bridgesdestroyed. Broad fissures in ground. Underground pipelines completely out of service. Earth slumps and landslips in soft ground. Rails bent greatly.XII. Damage total. Waves seen on ground surfaces. Lines ofsight and level distorted. Objects thrown upward intothe air.15. Thus, a fault can be judged for its capacity to generate earthquakesand the maximum event it might produce expressed both in magnitudeand intensity. The intensity can be attenuated from a source to a site.16. Predicting the time of the maximum earthquake is of interestfor other purposes but is of no interest for the design of a major5
structure such as a dam. A dam has to be designed on the basis of themaximum earthquake without regard for its time of occurrence or itsinterval of recurrence, since a maximum earthquake may come at any time.Cost-risk benefits can be sought for appurtenant structures which, iffaiLed, pose no hazard to life. For these lesser structures, probabilitiesmay be used in order to select smaller events that will then serve asoperational basis eartnquakes. Arbitrarily lower numbers, such as afraction of the motions for the maximum earthquake, can be equallysuitable.17. The foregoing considerations bring us to the point where motionsmust be selected to define the effects of earthquakes on a dam. Thesemotions should be conservative so that the designs developed for a damare safe for any eventuality. The motions are in the following categories;a. Those that cause relative displacement in the foundationand consequently displacements in the dam, andb. Those that induce unacceptable strains in a dam or liquefR.etiunif it is an earth structure.18. The examination of a major dam for the effects of earthquakeshaking requires a dynamic analysis. If there are potentials for strainbeneath the structure, earth fill may be specified as the constructionmaterial. For an earth dam it is essential to provide appropriate timehiBtories of earthquake motion. The time histories are needed becausethe material is nonlinearly elastic. Each cycle of shaking may impartan effect on the material and the effects are cumulative. Thus, thetime histories must be as realistic as possible in simulating the maximumearthquake.19. In order to generate time histories, a synthesis may be madeof motions recorded during earthquakes in order to develop peak motions(aceeleration, velocity, displacement, duration and predominant period).In Corps of Engineers practice, the time histories are developed firstand response spectra are made from the time histories.20. Any large collection of strong motion records has a tremendousspread in the values for earthquake motions. There are many CaUses:6
differences in fault mechanism and fault shape, rock types and configuration,refraction and reflection of waves, superposition and buildupof waves, or diminution, etc. Such factors contribute to an infinityof differences in the resulting motions. The accelerations for ModifiedMercalli Intensity V range from 0.01 g to 0.61 g, a spread of 60 times.Mean values, in such circumstances, have no real significance.21. The solution is to work with a large body of strong motionrecords and to provide envelopes that encompass the spread in the data.22. Specific parameters, such as a given fault type plus somespecified distance from epicenter, tend to restrict the number of recordsavailable to only a very few. They may have less spread. However, ifthere were more records, even for those limited conditions, there is everyreason to believe there would be more spread. It is best not to be. restrictive but t.o envelope a wide variety of conditions.23. An extensive statistical analysis of strong motion data fromthe western United States in terms of intensity was made by Trifunac andBrady (191). Their analyses included acceleration, velocity and displacement,and they distinguished vertical and horizontal components ofmotion. They showed the mean value for each intensity level and themean with one standard deviation. The latter provides a measure of thedispersion. A problem arises with the sparseness of data for the higherintensities beginning with MM VIII. There are no data for MM IX, andone record for MM X. 'l'he latter is the Pacoima record with its peakhorizontal acceleration of 1.25 g.2t l.'rhe same western United States data uniformly processed atthe California Institute of Technology were used in studies made at theWaterways Experiment Station (see Krinitzsky and Chang, 1977) to findmeans for assigning motions for dynamic analyses of dams. The valueswere expressed in MM intensity.25. The CIT data were separated by Krinitzsky and Chang (1977) into"near field" and "far field."26. In the near field, complicated reflection and refraction ofwaves occur in the subsurface with resonance effects and a large range7
i~ the scale of ground motions. Intense ground motions and high-frequencycomponents of motion are present.In the far field the wave patterns areorderly; the oscillations in wave forms are more muted and more predictable;and frequencies are lower.27. The distance from epicenter to the limits of the near field,and beginning of the far field, vary with the magnitude of the earthquake,consequently with the maximum epicentral intensity, and with the regionin which the earthquake occurs.field attenuates linearly ~ndattenuation for intensity becomes smaller.28. Limits of the near field are as follows:Usually, the intensity in the nearrapidly; in the far field, the rate ofMMRichter Maximum Radius ofMagnitude Intensity Near FieldM 10 KM5.0 VI 55.5 VII 156.0 Vln 256.5 IX 35r(.o X 407.5 XI 452Y. Figures 1 and 2 show the relation between MM intensity andacceleration for near field and far field, respectively.Figures 3 and4 show intensity versus velocity, near and far field, and Figures 5 and6 for displacement, near and far field. The motions are horizontal.Vertical components of motion are taken to be two-thirds the horizontal.The spread of data were divided into equal 10 percent increments between50 percent, taken at the median line, and 100 percent, taken along a linewhich approximates the limit of observed data.The curves for theseincrements are suitable for obtaining peak motions at levels selectedeither at the maximum or at lesser levels determined by decisions on theseismic risk that is acceptable.30. Figures 1 to 6 also show the mean-plus-one standard deviationfor the respective intensity levels. Figure 1 shows that mean plus adrops as the intensity increases from MM VII to VIII.The drop-off is8
not from lesser motions but simply from a decrease in the quantity ofdata.The projection of the 10 percent lines attempts to compensate forthi:> Jack of datu.31. No distinction was made between data from soil and rock sincethe values overlap too greatly to provide useful comparison. The Figures 1to G are intended to provide peak components of ground motion on bedrockat the surface.3;!. rl'he nlean-plus-a values show that the data points are concentratedfar below the 100-percent line. In effect, the 70- to 80-percentband brackets an upper boundary for the great body of da.ta.at this level are conservative for nearly all designs.Peak motionsHowever, if at asite there was a cupable fault seen at the ground surface, then the100-percent motion, or even a higher value, might be appropriate.duration.33. The next element in developing a time history of motion is theDuration was taken as the bracketed time interval in whichthe acceleration is greater than 0.05 g.34. Some examinations of the data are appropriate. Figure 7 showsnear field durations in terms of earthquake magnitude.There is a largedispersion with distinctly higher peak values for soil as compared torock.Peak durations increase steeply with increase of earthquake magnitude.The same data are shown in Figure 8 by local MM intensity.Again, soil shows greater peak durations than rock.However, the slopeof the peak duration for rock does not increase as steeply with greaterintensity as it does for magnitude.The discrepancy results from incompletenessof data and the inexactness that is inherent in intensity and adifference in the comparability of the scales.Figure 8 provides conservativeupper limits for duration to be used with 14M intensities in the nearfield.3 r: ).Far field durations are shown in Figure 9.The earthquake records selected for use or for rescaling may beeither actual strong motion records or synthetic ones designed for specifiedgeological settings. They should be for field conditions that areanalogous to those for the site under study.They should be for comparabletypes of faults, comparable geology (whether crystalline rocks,9
sedimentary basin, etc.), and similar distances from causative faults.Records should be selected also with predominant periods that may correspondto periods of engineering works that are being evaluated.36. The time histories developed from rescaling earthquake recordsare preferable for such structures as earth dams since the structuresare nonlinearly elastic and actual earthquake records are both morerealistic and have fewer motions than the synthetic ones. For concreteportions of a structure, the necessary response spectra can be made fromthe time history or it can be obtained independently following the guidelinesof the Nuclear Regulatory Commission.31. The scaling for large motions (in the region of 1 g) presentsa problem because there is only one record (Pacoima, San Fernando earthquakeof 1971) and the rescaling of lesser records to this level mayproduce unrealistic motions. Instead of straight scaling, high-frequencymotions may be added to lower earthquakes in combination with a processof scaling. Multiple records should be examined. Strong motion recordsshould be selected that require as little rescaling as possible. Chang(1978) provided a first step toward cataloging earthquakes in a mannerthat will facilitate their selection for scaling. If a record has to bescaled as much as 4x, the record should be discarded.38. The spectral composition and predominant period of a record issite dependent (whether soil or rock) and is dependent also on distancefrom source. Here again judgments must be made not on a few records butby envelopes of extensive collections of data. Some guidance is pro~vided in compilations by Chang and Krinitzsky (1977).10
PART III: EARTHQUAKE EVALUATION39. A geological reconnaissance of the general area in which theDevils Canyon and Watana damsites are located was performed for this studyby Drs. Reuben Kachadoorian and Henry J. Moore of the U.S. GeologicalSurvey.Their study entitled "Preliminary Report of the Recent Geologyof the Proposed Devils Canyon and Watana Damsites, Susitna River,<strong>Alaska</strong>," is included in the present overall report.40. Drs. Kachadoorian and Moore were charged primarily with thetask of investigating the area for the presence of absence of activefaults.In addition, observations were made on the seismicity of thearea and on the possibilities of landslides into the potential lakes.41. Prior to the work done by Drs. Kachadoorian and Moore, a studyhas been made for the Corps of Engineers by Gedney and Shapiro (1975)of lineations interpretable for this area from Landsat and Slar imagery.The lineations were presented along with the seismic history and thegeneral geology.42. Gedney and Shapiro show a large number of lineations includingones that trend along the Susitna Valley and pass through the DevilsCanyon and Watana damsites.Lineations may be caused by faults but theymay be caused also by processes that have no relation to tectonism.Inno case can a lineation be accepted as a fault unless confirmation isfound on the ground by a process that is called "ground truthing."Thus the work by Kachadoorian and Moore was an important step in validatingthe earlier work.The judgments concerning faults should bethose of the latter work.43. Kachadoorian and Moore report a group of 16 faults. For themost part, these faults are identified by stratigraphic evidence.There11
was no surface evidence of recent movement along any of these faults;consequently, the faults were tentatively judged to be inactive.However,confirmation of this judgment will require more detailed fieldwork.The nearest known active fualt is the Denali fault, 80 km away,with the capacity to produce magnitufe B.O earthquakes.44. Gedney and Shapiro generally found no relation between seismicevents in the region and faults.However, for the Susitna fault (FaultNo.8 of Kachadoorian and Moore), Gedney and Shapiro associated twoearthquakes of 1 October 1972 and 5 February 1974 (magnitudes 4.7 and5.0 respectively). Gedney and Shapiro reported no associated breakagealong the Susitna fault but these events gave suitable fault planesolutions indicating right-lateral offset. Kachadoorian and Moorequestion the reliability of associating these earthquakes with the mappedfault. Kachadoorian and Moore found no relation between seismicity andmapped faults, however they point out that a closer grid of seismometersmay uncover such relationships.45. In summary:a. No faults of important regional extent were found to bepresent at the damsites.b. Major faults in the region were reconnoitered and no evidencewas found of recent movement.c. The region is one of relatively high seismicity, however,no association was established between seismic events and specific faults.d. The nearest positive capability for an earthquake is alongthe Denali faault, approximately 80 km distant, where a maximum magnitudeof 8.0 can be expected.e. Except for the conclusions concerning the Denali fault, thework done so far is preliminary.More work is needed.12
PART IV:INTERPRETED PEAK MOTIONS46. On the basis of the present incomplete geological and seismologicalinformation, earthquake motions at the damsites must be postulatedby making certain conservative assumptions.47. Potential earthquakes are as follows:a. An earthquake originating at the Denali fault. The maximummagnitude is 8.0 in accordance with assumptions made by the U.S.Geological Survey in their Trans-<strong>Alaska</strong> Pipeline Study (see Page, et at,1972). The earthquake is attenuated 80 km to the Devils Canyon andWatana damsites.Using the Krinitzsky-Chang (1977) attenuation forwestern United States, the event will produce a MM intensity of IX atthese sites. The motions are far field. It is conservative to basethe motions on the 70 percent spread level of the charts of Figures 2,4, and 6 since that level encompasses over 95 percent of the data in thevelocities (see Figure 4). The duration is taken for rock from Figure 9.The corresponding peak motions are acceleration, velocity, displacement,and duration are tabulated in Table 2.TABLE 2PEAK EARTHQUAKE MOTIONS AT DEVILS CANYON AND WATANA DAMSITESSiteEarthquakeIntensitySource Magnitude Field MMAccel.gPeak Motions (hor.*)on Bedrock at SurfaceVel. Displ. Durationem/sec em secDenali fault 8.0 Far IXLocal floatingevent 7.0 Near X0.280.6840 22 1068 30 12* Vertical motion may be taken as two-thirdsof horizontal.13
. A local floating earthquake with fault breakage that doesnot occur at the damsites.The inconclusive nature of the geologicseismologicstudies requires that a floating earthquake be assigned.The earthquake may occur anywhere in the general vicinities of the damsitesbut not immediately under the dams themselves.The eliminationof an earthquake beneath the dams is based ont hework of Kachadoorianand Moore for this study in which they identify no appropriate faults.The magnitude of the floating earthquake is 7.0.This magnitude is inaccordance with the earthquake used for this area in the Trans-<strong>Alaska</strong>Pipeline Study of Page, et al (1972).The magnitude accords satisfactorilywith the possible fault lengths presented by Kachadoorian andMoore, which are on the order of a hundred or more km.Such faultscorrespond to magnitude 7 earthquakes according to available worldwidedata presented by Slemmons (1977) in his Figure 27.Since the nearfield for an earthquake of this size extends 40 km from the source, andKachadoorian and Moore have located major fault trends within 3 to 15 kmof the dams, the motions at the dams must be taken as near field. It isconservative to use the 70-percent spread lines of the moitons in Figures1, 3, and 5 since that level envelopes all but a few extreme values. Theduration for bedrock at the surface is taken from Figure 8.The peakmotions are tabulated in Table 2.c. An earthquake at the damsites. On the basis of presentinformation, an earthquake from a major fault rupture at the damsite isnot expected to occur.However, it is understood that present informationmay be subject to revision when further studies are made.14
48. The motions in Table 2 of this report were developed somewhatdifferently from those of the USGS Trans-<strong>Alaska</strong> Pipeline Study (Page, etaI, 1972).The floating earthquake for the near field but not at the sitehas no equivalent in the USGS analysis.The USGS values are for earthquakesthat occur at a site. Also, the USGS peaks were reduced fromwhat they might be by a filtering that they applied to the Pacoima recordof the 1971 San Fernando earthquake.Their objective was to providemotions for a quasi-static analysis of the pipeline in which the inputwas restricted to a range of 2 to 8 Hz.Their resulting magnitude 7 ata site has values that are higher than ours (1.05 vs 0.68g) in acceleration,higher in velocity (120 vs 68 em/sec) and higher in displacement (55 vs45 em). The durations also are greatly different. The USGS duration is25 sec against 12 sec for ours. The difference is that their durationincludes soils whereas ours is for bedrock alone.49. Predominant period and records for rescaling are not recommendedat this point since specification of types of faulting and distance fromfaulting are yet to be made.50. The operating basis earthquake, which is lesser earthquakethan that taken for the design of the dam, may be tested with peakmotions that begin at half those of the maximum earthquakes.15
PART V:ASSOCIATED MOTIONS51. Reservoir loading has in some cases induced significant earthquakesand earthquakes have triggered landslides and caused water wavesor seiches. Also, in regions of tectonism there may be problems duringexcavation from overstressed conditions in rock.Induced seismicity from reservoir loading52. A few large reservoirs in the world have induced appreciableearthquakes. Simpson (1976) has provided a summary and critical review.The reservoir is a triggering agent. It does not cause earthquakesgreater than the ones that may be expected from the normal tectonism.The maximum earthquakes will be the ones used in design. An inducedearthquake, if such should occur, would not be greater though it mayoccur at a different time. Further, the worldwide experience, accordingto Simpson (1976), suggests that induced effects may be highest in regionsof low to moderate natural seismicity. In areas of high levels of naturalseismicity, as in <strong>Alaska</strong>, the stress changes induced by the reservoir aresmall compared to natural variations. Thus, induced seismicity shouldnot add any input to design. Nonetheless, observations relating toinduced seismicity made before and after reservoir filling are appropriateand will be valuable on a research level.Water waves from earthquake shaking53. Water waves produced by earthquake shaking, under certain circumstances,may be a factor though hardly comparable to the effects oflarge landslides and ordinarily not more severe than wind effects. Theeffects are dependent on the spectral composition of the horizontalground motions, the shape and size of the reservoir, and the durationof shaking. If a resonance is developed there may be significant resultingwave amplitudes. Lee and Hwang (1977), in assessing this problem,suggest that wave heights of half the amplitude of horizontal groundmotions are possible but they do not assess resonance. In practice,protection against the effects of landslides will probably more thanadequately provide protection against water waves as well.16
~;arthquake-inducedlancisli(ies51 1. Landslides are a pronounced feature at the sites of majorearthquake;;. Kachadoorian and Moore have noted appreciable landslidesin the Susitna Valley. These, and others that may be judged to be presentas potential hazards, should be evaluated. The worst known potentialslides can be monitored and remedial measures can be specified, includingthe removal of the potential slide material.J:). The problem when dealing with a maj or earthquake is that onecannot be sure that slides that might be generated have been anticipated.Given sufficient topocraphic relief and large masses of loose or fracturedmaterial, one should take into account major slides for which noprevention can be specified. Developments along the borders of thereservoir, the freeboard of the dam, etc., should be planned so thatpossible disasters are avoided.56. Studies of the effects of landslides into reservoirs may beeither theoretical, using a numerical model (see Raney and Butler, 1975),or they may be empirical. The latter is perhaps the most practicalapproach. They involve using undistorted hydraulic models (cf Davidsonand Whalin, 197h). For both methods, the slide geometry, volume, velocityand reservoir configuration are essentials. Field investigationswhere actual landslides have occurred may aid in developing estimatesof velocities (see Banks and Strohm, 197h). The procedures will produceassessments of wave heights and wave runups.Tectonic strain and overstressed conditions in rock57. A totally unknown set of conditions are those that relate totectonic strain and resulting possible overstressing in the rock. Residualstresses from the movements of active faults can affect the makingof excavations and the stability of the structure. At present there areno data. It is anticipated that field measurements relating to stressesand the buildup of strain will be made as part of any continuinginvestigations.17
PART VI:CONCLUSIONS58. The geological-seismological investigations to date weremade on reconnaissance levels.The Devils Canyon and Watana damsitesare in a region of high seismicity and major faults. However, no movementswere found on the faults that might be indicative of earthquakes.Also, no seismic activity was identified as associated with these faults,though the data suffers from inexactness in the accuracy of locations.No active faults were found at the damsites.Active faults of appreciablelength are required if large earthquakes are to be generated in closeproximity of the proposed structures.59. The area was provided with a floating earthquake of magnitude7 placed at a short distance from the damsites. The magnitude 7 is inconformity with general fault lengths in this area and with worldwideexperiences between such faults and resulting earthquakes.However,further field studies will be made to determine conclusively whetheror not there are faults closer to the sites with possible more severemotions.An earthquake of magnitude 8 from the Denali fault at a distanceof 80 km was evaluated by attenuating the event to the damsites.60. Peak motions were assigned for the earthquakes following thepractices of the Corps of Engineers.The magnitude 7 earthquake nearthe damsites has motions that are: acceleration 0.68 g, velocity 68em/sec, displacement 30 em, and duration 12 sec.An earthquake at theDenali fault attenuated to the sites provides motions of 0.28 g, 40 cm/sec, 22 em, and 10 sec.61. A closer specification of which sets of peak motions to applyand the appropriate time histories will await further field studies.18
()2. Possible induced seismicity from reservoir loading is not afactor needing additional design but is accounted for in the existingmotions. However, water waves from possible earthquake-triggered landGlide!J and possible overstressed conditions in rock pose problems forwhich at present there is a paucity of data and a need for furtherevaluation.19
PARTREFERENCES1. l3anks, Don C. anci William E, Strohm (1974), Calculations of RockGlilie VeJocities. Advances in Rock Mechanics, National Academy of:;ciencec;, Washine;ton, D. C., pp 839-847.2. California Institute of Technology, Earthquake Engineering ResearchLaboratory (19'{1-1975), Strong Motion Earthquake Accelerograms;Correcteli Acceleroc;rams and Integrated Ground Velocities and Displacements,Vol 2, Parts A-N, Pasadena, California.3. Chang, Frank K. (1978),Vol 1, Western United States, 1933-1971, State-of-the-Art for Assessins;Earthquake Hazards in the United States, MP S-73-1, Report 9,Waterways Experiment Station, Vicksburg, Mississippi, 28 pp and2 appen.11. Chang, l"rank K. and E. L. Krinitzsky (1977), Duration, SpectralContent and Predominant Period of Strong Motion Earthquake Recordsfrom Western United States, State-of-the-Art for Assessing EarthquakeHazards in the United States, MP S-73-1, Report 8, WaterwaysExperiment Station,, Mississippi, 58 pp and 2 appen.7. Davidson, D. DonaldGenerated Water Waves,11-74-15, WaterwaysW. Whalin (1974), Potential LandslideDam and Lake Koocanusa, Montana. TRStation, Vicksburg, Mississippi, 33 pp.6. Gedney, Larry and Lewis (1975), Structural Lineaments,Seismicity, and Geology of the Talkeetna Mountains Area, <strong>Alaska</strong>,Geophysical Institute, University of <strong>Alaska</strong>, Fairbanks, <strong>Alaska</strong>,18 pp and 5 ~lates.7. Krinitzsky, E. L. and Frank K. Chang (1977), Specifying Peak Motionsfor Design Earthquakes, State-of-the-Art for Assessing EarthquakelJn.zards in the United States, MP S-73-1, Report 7, Waterways ExperimentStation, Vicksburg, Mississippi, 34 pp.U. Lee, Y. Keen and Li-San Hwang (1977), Waves Generated by HorizontalOGcillations in Bays. Journ. Waterways, Port, Coastal and OceanDiv., ASCE, Vol 103, No. ww4, pp 411-422.9. M. Boore, William B. Joyner, and Henry W.for Use in the Seismic DesignU. S. Geological Survey,10. Haney, Donald C. and H. Lee Butler (1975), A Numerical Model forPredicting the Effects of Landslide-Generated Water Waves. TRWaterways Experiment Station, Vicksburg, Mississippi, 22 pp.20
L1. Simpson, David W. (1976), Seismicity Changes Associated withReservoir Loading, Elsevier, Engineering Geology, 10:123-150.1;2. ~.acmlTlons, David B. (191'7), Faults and Earthquake Magnitude, Stateof-the-Artfor Assessing Earthquake Hazards in the United States,Report 6, Waterways Experiment Station, Vicksburg, Mississippi,129 pp plus Appendix, 37 pp.13. 'J'rifunac, M. D. and A. G. Brady (1975), On the Correlation ofSeismic Intensity Scales with the Peaks of Recorded Strong GroundMotion, B. Seism. Soc. Am., Vol 65, No.1, pp 139-162.21
ooowACCELERATION, 9o(Jt. ocoo-- ~ --"- " "z0----1rnl>~ ~::0 fT1 fT1...... "- I ~ " '" -\\ "\ "',',,- "- i' ..,,-"» »z zrn. 0q...." 0;('',,- o~[S ~ '\ ""I ',,- " ~~~... ~\~t\ ~. ',,- ~~ ~K.""- -,.\'- ~'\ 1\ '\.~ " ..~'~ o~1"'0,,~o~~'\. ~"0"'\~".. _. . ..Figure 1. Acceleration versus Mi:-1 Intensity in the Near Field. Percentages areten percent increments in the spread between the mean (50%) and theirn't of observed data (100%),,'" \'- "\'""",,-I\~~',,- "'"\0 f\""-\\ ", ""'\......',,-
mz ....0~a:::I&J...JI&JUU-
1201101009080uUJ 70~~U>-" 60t-Uo...JUJ 50>40302010iIb MEAN+CTMEANINEAR FIELDIIIiI~I .IIII/ //{' /1I / 1/! V )ifw'/ i/I to, ~~/. / I~' / ~o/ -1~~ 1.0/ / I~ ..~/ I'/ / 1\0/'i~ / /,)0/ ~6< / /// ~./ I.II/I L/ / v/ t df O /V 'b~'viI / / ~/ /,. /. v~!]/I..i/J; V; (~ V"I I /'/ h' ~ VIJ ~'/ 0 • 1ti~ "~ ~ +Io~I t !Im IX xFigure 3.MMVelocity versus MM Intensity in the Near Field.Percentages are ten percent increments in thespread between the mean (50%) and the limit ofobserved data (100%).j
6050ItviEAN+ c:rtvi EANFAR FIELDu 40w(/)":::eu> .... 30;-u9ILl> 20MMFigure 4. Velocity versus W~ Intensity in the Far Field.Percentages are ten percent increments in thespread between the mean (50%) and the limit ofobserved data (100%).
5040IMEANt CTMEAN~u1-'"Zw~LLJU«..Ja..CI)-c3020NEAR FIELD10OL-~------~----~~----~m IX xFigure 5. Displacement versus i>1t-i Intensity in the Near Field.Perc are ten percent increments in the spreadbetween the mean (50%) and the limit of observeddata (100%).
40r-~------~----~------.-----~------,-----~,---,T MEAN +CT"6 MEAN;:;! 30·UFAR FIELDf-'"Zwa 20~--~-----4-------+-----~.....Ja..U)o 10~--+-----~~------~~---=~--~~mOL-~L------L------~----~~----~------~------~~MM:::rx:6. Displacement versus MM Intensity in the Far Field.Percentages are ten percent increments in thebetween the mean ( ) and the limit of observeddata (100%).
10080 /'110(')0 ~~«;()O~/s~ ...... 0 ~
30NEAR FIELD20--. ...II)oAI 3U~u 2ILlIIIzoi=.:a::5 1.00.8•b.IIi0.'0 ..50 ....0.30.2•• ooLEGENDINSTRCOMPONENTHORIZONTAL• VERTICALt::. HORIZONTAL• VERTICALo HORIZONTAL• VERTICALSITECONDITIONSOFTINTERMEDIATEHARD ROCKO.IL---~----~--~----~--~----~--~----~--~----~--~~--~MM INTENSITYFigure 8.Duration versus MM Intensity in the Near Field.
t:nII)302010FAR FIELD---l~-g:,L.UPPER BOUND DURATIONFOR SOIL--0-- --0~8UPPER BOUNDDURATION6 FOR HARD ROCK tJ. CD05..tJ.•~rf0 ,p30IAtJ.00•...... «2i0 01&.1•en... tJ. •tJ.Z0I-•1.0«cr: 0:::>0 0.80.6 LEGEI~D0000O.~0."0.30.2INSTRCOMPONENT0 HORIZONTALVERTICAL•tJ. HORIZONTALA VERTICAL0 HORIZONTAL•VERTICAL0 ASITECONDITIONSOFTINTERMEDIATEHARD ROCK0.1 ~--~----~----~---D~--~--~~--~----~----~--~----~MM INTENSITY7y. Duration versus MM Intensity in the Far Field.
EXHIBIT 0-4Procedure for Estimating Borehole Spacing andThaw Water Pumping Requirements for ArtificiallyThawing the Bedrock Permafrost at the WatanaOamsite.
Technical NotePROCEDURE FOR ESTIMATING BOREHOLE SPACINGAND THAW-WATER PUMPING REQUIREMENTSFOR ARTIFICIALLY THAWING THE BEDROCK PERMAFROSTAT THE WATANA DAM SITEF. H. Sayles'October 1978Corps of Engineers, U.S. ArmyCOLD REGIONS RESEARCH fu~D ENGINEERING I.ABORATORYHanover, New Hampshire
IntroductionThe procedure outlined in this note for estimating the time toartificially thaw permafrost bedrock assumes that water will be pumpedinto a pattern of boreholes drilled to the bottom of the permafrostzone.The water would flow down a feed pipe to the bottom of the boreholeand back up the annulus between the outside of the feed pipe andthe wall of the borehole.During the upward flow, heat from the waterwould flow radially through the borehole wall to melt the existing iceand raise the temperature of the surrounding rock.During the first stageof this thawing process a series of essentially vertical parallel thawedcylinders would be formed~ the diameter of which would grow with timeuntil the surface of adjacent cylinders touched.Upon touching a flutedwall would exist which then will thicken as additional heat is suppliedby the thaw-water in the boreholes until either the desired wall thickness isattained or a thermal equilibrium is established.Once the desired wallthickness is reached, the rate of thaw-water flow (i.e., pumping) can bereduced to establish thermal equilibrium.To avoid freezing back the bedrockit may be necessary to continu~pumping water until grouting isinitiated or until it is unnecessary to maintain the wall in a thawedcondition.If the permafrost is at 32°F at the Watana dam site, it probablywould not be necessary to use maintenance pumping since freeze-back wouldbe quite slow.The purpose of this note is to furnish procedures for establishing adrilling pattern; estimating the time to thaw a 20 ft. wide zone of rock
permafrost along the alignment of the Watana Dam; and estimating thethaw-water pumping requirements for the thawing operation.AssumptionsThe graphs used in this procedure were developed using the thermalcomputational methods outlined in the paper, "Thermal ,and RheologicalComputations for Artificially Frozen Ground Construction," which isattached as Appendix B.are listed in Appendix A.The assumed rock properties and thermal conditionsGraphs in figures I and 2 were developed forl~ inch diameter boreholes. Use of larger diameter boreholes would reducethe thawing time (e.g., a 3 inch diameter borehole will reduce the thaw timeby less than 10%).It should be emphasized that this procedure assumes a uniform distributionof ice in the bedrock with an overall ice saturated porosity of l~%and thatit is quite probable that some of the rock will contain much larger volumes qfice. At locations where large volumes of ice do exist, the thawing would bemuch slower than predicted by Figure 1. More accurate predictions of thethawing times can be made when details of the amount and location of the icefilledcracks are determined.The temperature of the permafrost bedrock atthe dam site has not been established precisely.In this note, bedrocktemperature is assumed to be 32 0 F with all water frozen.To control the thawing process during construction, it is essential tomonitor the bedrock temperature at several locations both horizontally andvertically. Good temperature and pumping records will assist in improvingthe thawing operations as the work progresses and will provide data forrefining the procedure for predicting subsequent thawing times and pumping2
equirements.Procedure(1) From the curves on Figure 1 choose a borehole arrangement (i.e.,single row or two rows of boreholes) and spacing.The choice would bebased on the time available for thawing, the temperature of the availablethaw-water and the economic trade-offs between additional holes vs heatingthe water and pumping water.(2) After selecting the borehole spacing, enter the graph on Figure2 using the borehole spacing and thaw-water temperature chosen in (1) toobtain a time at which the thawing cylinders will just touch each other.This time (t r ) is given in days on the abscissa.(3) Using (t r) from (2), enter the abscissa of the graph on Figure3 and obtain an estimate of the number of gallons per minute (GPM) thatmust be supplied to each borehole for the thaw-water temperature selected.Note that this is the thaw-water flow required when the thawed cylinders justtouch.This is more than that required to continue thawing until the wallobtains its full width but it is a conservative average value to use inestimating.The maximum flow rate is required at the start of pumping.Theoretically it is infinite but in practice it is close to the valuesshown at time zero on Figure 3.Therefore, after the first few days ofpumping, the pumping capacity can be reduced, e.g., one or more of the pumpscan be used somewhere else. The curves on this graph are based on thetemperature gradient or temperature loss shown on the graph.rf sufficient3
flow is not supplied to the boreholes, the temperature gradient will riseand the time r~quiredto thaw will increase.(4) After the rate of flow for each borehole is estimated, thevelocity of the thaw-water flow in the feed pipes and the annulus betweenthe outside of the feed pipe and the borehole wall should be computed todetermine if either the velocity or pressure drop is excessive.(5) The total rate of flow for determining the size and number ofpumps is determined by summing up the number of boreholes that are usedfor thawing at one time.It might be noted that if water is artificially heated, there will be alarge energy loss if the overflow from the borehole is not captured andreused.Ponding of water in a location where the sun can warm it is one way toget higher thaw-water temperatures than would be obtained by taking water directlyfrom the river.4
NO. 340-104 DIETZGEN G~APH PAPERMILL1METERDI£TZGEN CORPOR.TIDNlu:u-i· ... ·.:···:u·*_~ ·st~l~ ~~~~l:I~EE+'!~ui 100 0 F--:~--i=-.--~,:':--I· T w~ Rows I O' ft.Ap~;t~ 'r'" ,.. 0 50° F ...-~ ............ ,,,".J ." .: ... L._: ... ...: .NOTE:For borehole spacing inexcess of 10 ft, predicted times • 40°F.may be considerably shorter thanactual - particularly for thehigher temperature thaw water., ... . _ .. _ ... · .. ----·---F·}--i--~+-~+--;-+_-_i_-__r_-Thaw Water Temp.1.6 BTU/hr Ft ofI .;..._lQ.OWATANA DAM SITEFOUNDATION THAIHNGBOREHOLE SPACING VS HINlt1ill1 TUfETO THAW A 20 FOOT WIDTH OF FRCZEH ROCK FIGURE 1
-....'+-100 of Thaw Water Temp.i--50 °F~----~~-------------l- -------.,,t?20 z
-W-1oIWa::oenrr:wCL0:::WI 3:glL.MILLIMETER MAOC: .111 u. _.A.!,I•20 S---;--l..-..-..~-'-+--~-'-+--'-~f----10" : I40°F THAW WATER TEMP. WITH 1°F TEMP DROP IN 250 FT OF DEPTa 50°F THAW WATER TEMP. WITH 2°F TEMP DROP IN 250 FT OF DEPTH"o lOOoF THAW WATER TEMP. WITH lOaF TEMP DROP IN 250 FT OF DEPTH, 1fl. _-:.,[1 '. --" ";·1"'",T':: :" ", i-- ---,'"" "'"IWATANA DAM SITEFOUNDATION THAWINGTHAW WATER FLOW RATE VS TIMEFOR THAWING CYLINDRICAL SURFACES TO TOIFIGURE 3
APPENDIX AASSL~EDROCK PROPERTIES AND THERMAL VALUESROCK PROPERTIESUniform porositySpecific GravityDry Unit Weight1.5%2.68165 lb/ft 3Ice SaturateTHERMAL VALUESVolumetric Specific HeatUnfrozen RockFrozen Rock33.9 BTU/ft 333.4 BTU/ft 3Conductivity for Unfrozen Rock1.6 BTU/hr. ft. OFLatent Heat of Ice Saturated Rock124 BTU/ft 3
EXHIBIT 0-5U.S. Geologicaly Survey Reconnaissance Geologic Mapand Geochronology, Talkeetna Mountains Quadrangle,Northern Part of Anchorage Quadrangle, and SouthwesternPortion of Healy Quadrangle, <strong>Alaska</strong>.
UNITED STATESDEPARTMENT OF THE INTERIORGEOLOGICAL SURVEYRECONNAISSANCE GEOLOGIC MAP AND GEOCHRONOLOGY, TALKEETNA MOUNTAINSQUADRANGLE, NORTHERN PART OF ANCHORAGE QUADRANGLE, AND SOUTHWESTCORNER OF HEALY QUADRANGLE, ALASKAOPEN-FILE REPORT 78-558-AThis report is preliminary and has notbeen edited or reviewed for conformitywith Geological Survey standards andnomenclatureMenlo Park, California1978
UNITED STATES DEPARTMENT OF THE INTERIORGEOLOGICAL SURVEYRECONNAISSANCE GEOLOGIC MAP AND GEOCHRONOLOGY, TALKEETNA MOUNTAINSQUADRANGLE, NORTHERN PART OF ANCHORAGE QUADRANGLE, AND SOUTHWESTCORNER OF HEALY QUADRANGLE, ALASKAByBela Csejtey, Jr., W. H. Nelson, D. L. Jones, N. J. Silberling,R. M. Dean, M. S. Morris, M. A. Lanphere, J. G. Smith,and M. L. SilbermanDescription of map units, Structure, Tectonics, Reference list,and tables to accompany ~pen-fileReportThis report is preliminary and hasnot been edited or reviewed forconformity with Geological Surveystandards and nomenclature
DESCRIPTION OF MAP UNIT&SEDIMENTARY AND VOLCANIC ROCKSQsTvSURFICIAL DEPOSITS, UNDIFFERENTIATED (Quaternary)--Glacial andalluvial deposits, chiefly unconsolidated gravel, sand, andclay.VOLCANIC ROCKS, UNDIFFERENTIATED (Paleocene to Miocene, uppermostpart may be as young as Pleistocene)--Over 1,500-m-thick sequenceof felsic to mafic subaerial volcanic rocks and related shallowintrusives. Lower part of sequence consists of small stocks,irregular dikes, lenticular flows, and thick layers of pyroclasticrocks; made up dominantly of medium- to fine-grained,generally medium-gray quartz latite, rhyolite, and latite. Afew dikes and intercalated flows of brown andesite are also present.Rocks of the lower part of the sequence, occurring mostlyin the upper Talkeetna River area, are interpreted to be ventfacies deposits and near vent deposits of stratovolcanos. Theupper part of the sequence consists of gently dipping brown andesiteand basalt flows interlayered with minor amounts of tuffs.A few lenses of fluviatile conglomerate are also present. Locally,at Yellowjacket Creek for instance, the feeder dikes of the maficflows make up more than half the volume of the underlyingcountry rocks. According to E. M. MacKevett, Jr. (oral commun.,1975), the andesite and basalt flows are lithologically identicalto the basal andesites of the Wrangell Lava in eastern <strong>Alaska</strong>.
Contact between the dominantly felsic lower part and maficTimTifTtwupper part of the sequence is gradational through intertongu~ing of the two rock types. The three samples for potassiumargonage determinations (map numbers 7, 8, 13 in table 1),indicating Paleocene and Eocene ages, were obtained from andesiteflows near the middle of this sequence.HYPABYSSAL MAFIC INTRUSIVES (Paleocene to Miocene, youngest rocksmay be Pleistocene)--Small stocks and irregular dikes of dioriteporphyry, diabase, and basalt. They probably are the subvolcanicequivalents of the andesite and basalt flows of unit Tv.HYPABYSSAL FELSIC INTRUSIVES (Paleocene to Miocene, some rocksmay be as young as Pleistocene}--Small stocks and irregulardikes of rhyolite, quartz latite, and latite. Lithologically,they are identical to, and thus probably correlative with thefelsic subvolcanic rocks of unit Tv.TSADAKA (Miocene) AND vHSHBONE (Paleocene and Eocene) FORMATIONS,UNDIVIDED--Tsadaka Formation, occurring only at Wishbone Hill,consists of cobble-boulder conglomerate with thin interbeds ofsandstone, siltstonei and shale; about 200 m thick. The WishboneFormation, which unconformably underlies the Tsadaka, compriseswell-indurated fluviatile conglomerate with thick interbedsof sandstone, siltstone, and claystone; about 600 to 900m thick (Detterman and others, 1976; Barnes, 1962). The presentmap unit also includes over 150 111 of fluviatile conglomerate2
TcTsuTgdThgdand coaly sandstone (unit Tf of Grantz, 1960a, b) in the easternTalkeetna Mountains.CHICKALOON FORMATION {Paleocene)--Well-indurated, continental,dominantly fluviatile sequence of massive feldspathic sandstone,siltstone, claystone, and conglomerate, containing numerous bedsof bituminous coal; over 1,500 m thick (Barnes, 1962).SEDIMENTARY ROCKS, UNDIFFERENTIATED {Tertiary)--Fluviatile conglomerate,sandstone, and claystone with a few thin interbedsof lignitic coal. Lithologically, these rocks look similar tothe Tertiary sedimentary rocks of the southern Talkeetna Mountains,but lack of fossil evidence does not permit more definitivecorrelation. The largest exposure of these rocks is alongWatana Creek, and, according to Smith (1974a), the sequence isover 160 m thick. Lithologically, it resembles the PaleoceneChickaloon Formation of the Matanuska Valley.PLUTONIC AND METAMORPHIC ROCKSTERTIARY GRANODIORITE (Eocene)--Contains hornblende and biotite.This granodiorite is part of a small pluton along the northernedge of the map area. Turner and Smith (1974) report an Eoceneage for this pluton, determined by the potassium-argon methodon biotite (48.8~1.5 m.y.) and on hornblende (44.8~1.3 m.y.)from a sample just north of the present map area.BIOTITE-HORNBLENDE GRANODIORITE (Paleocene, in part may be Eocene)--Rocks of this unit occur in one large and several smaller,3
poorly exposed plutons in the western and northern TalkeetnaTbgdMountains. All of the plutons were forcibly intruded in theepizone of Buddington (1959). Granodiorite is the dominantrock, but locally it grades into adamellite (= granite withplagioclase and alkali feldspar in approximately equal proportions),tonalite, and quartz diorite. All these rocks aremedium to dark gray, medium grained, generally structureless,and have granitic to seriate textures. In all of them. hornblendeis the chief mafic mineral. Biotite- and hornblenderichxenoliths of reconstituted country rock are common inevery pluton. The lithologic compositions and available agedeterminations (see table 1) indicate that these granitic rocksare the plutonic equivalents of some of the felsic rocks in thelower portion of unit Tv.BIOTITE GRANODIORITE (Paleocene, in part may be Eocene)--Biotitegranodiorite and adamellite in approximately equal proportions.Biotite is the chief mafic mineral, hornblende is occasionallypresent. Color is light to medium gray, grain size is frommedium to coarse, texture is granitic to seriate. Very faintflow structures have developed only locally. These rocks occurin shallow, forcibly emplaced epizonal plutons in the northwesternTalkeetna Mountains. Aplitic and pegmatitic dikes arecommon in all the plutons. Just north of the map area, theseplutonic rocks grade into felsic volcanic rocks. Potassium-4
Tsmgargon age determinations (see table 1) indicate that the biotitegranodiorite and adamellite of the present unit are essentiallyof the same age as the biotite-hornblende granodiorite(unit Thgd). Thus, the rocks of these two units, in view oftheir spatial proximity, probably are the products of differentiationof the same parent magma, either in situ or at somedeeper levels in the Earth's crust. The biotite granodioriteintrusives are also considered to be the plutonic equivalentsof some of the felsic volcanic rocks in the lower portion ofunit Tv.SCHIST, MIGMATITE, AND GRANITE {Paleocene intrusive and metamorphicages)--Undifferentiated terrane of andalusite and (or)sillimanite-bearing pelitic schist, lit-par-lit type migmatite,and small granitic bodies with moderately to well-developedflow foliation. These rocks occur in approximately equal proportions,and the contacts between them are generally gradational,as is the contact between the schist and its unmetamorphosedpelitic rock equivalents (unit Kag) outside the present mapunit.The pelitic schist is medium to dark gray, medium grained,has well-developed but wavy foliation, and contains lit-par-1ittype granitic injections in greatly varying amounts. Rockformingminerals of the schist include biotite (pleochroismNz = dark reddish brown, Nx = pale brown), quartz, plagioclase,5
TKtminor K-feldspar, muscovite, garnet, and sillimanite whichlocally coexists with andalusite.The lit-par-lit type granitic injections within the schistare medium gray, medium grained, and consist of feldspar, quartz,and biotite.The rocks of the small, granitic bodies range in compositionfrom biotite adamellite to biotite-hornblende granodiorite.They are medium gray and medium grained, generally have granitictextures, and, in addition to the flow foliation, locallydisplay flow banding of felsic and mafic minerals. These graniticbodies appear to be the source of the lit-par-lit intrusions.The proximity of the schist to the small granitic bodies,the occurrence of the lit-par-lit injections, and the presenceof andalusite in the schist indicate that the schist is theresult of contact metamorphism. Perhaps this metamorphism tookplace in the roof zone of a large pluton, the cupolas of whichmay be the small granitic bodies.TONALITE (Upper Cretaceous and Lower Paleocene)--Dominantly biotitehornblendetonalite, locally grades into quartz diorite. Thetonalite is medium gray, coarse to medium grained, has a granitictexture and a fairly well-developed primary foliation. Itoccurs in a large, possibly composite, batholith, approximately75 to 61 m.y. old (see table 1), which was emplaced in the epizoneand mesozone of Buddington (1959). The tonalite is describedin more detail in Csejtey (1974).6
TKaTKgrTKlgADAMELLITE (Upper Cretaceous and Lower Paleocene)--Occurs in alarge epizonal pluton in the southwestern part of the map area.The dominant rock type is adamellite but locally includes granodiorite.8iotite is the chief mafic mineral, muscovite occursin subordinate amounts. The typical adamellite is medium tolight gray, medium to coarse grained, its texture ranges fromgranitic to seriate. The adamellite appears to be intrusiveinto the tonalite (unit TKt). but concordant potassium-argonages on one sample (map no. 24~ table 1) indicate the adamelliteto be essentially the same age as the tonalite. These rocksapparently are comagmatic.GRANITIC ROCKS, UNDIVIDED (Cretaceous and (or) Tertiary)--Theserocks of uncertain age occur in four smaller epizonal plutonsof granodiorite and tonalite. Their color is medium to darkgray, grain size is medium, texture is granitic. Mafic mineralsare hornblende and (or) biotite. The largest of these plutons,in the northeast corner of the map area, is reported by Smithand others (1975) to be of Cretaceous age.LEUCOGABBRO (Cretaceous and (or) Tertiary)--Small, poorly exposedintrusive of uncertain age in west-central part of map area,essentially consisting of plagioclase (around An70 and about80 percent of volume), and pale-green hornblende. The leucogabbrois medium to light gray, coarse to medium grained, witha granitic to seriate texture.7
KarKmSOUTHEASTERN TALKEETNA MOUNTAINSSedimentary and volcanic rocksARKOSE RIDGE FORMATION (Cretaceous)--Arkosic sandstone, conglomerate,graywacke, siltstone, and shale (Detterman and others,1976; Grantz and Wolfe, 1961). Clastic components consistchiefly of granitic and metamorphic rock fragments, quartz,feldspar, and biotite, indicating a dominantly plutonic and,to a lesser extent, metamorphic provenance (G. R. Winkler, oralcommun., 1977). Numerous plant fragments suggest a dominantlyterrestrial origin. Recent field and petrographic studies~sejteyand others, 1977) indicate that this formation is ofCretaceous age. A pre-Tertiary age is also indicated by apotassium-argon age determination on biotite (map no. 37, table1). The biotite was separated from a sample of graywacke withsecondary biotite, obtained from near the tonalite pluton (unitTKt). The formation rests unconformably on Jurassic graniticand metamorphic rocks and is as much as 700 m thick. In thisreport the Arkose Ridge is considered to be a dominantly nonmarinefacies of the Cretaceous Matanuska Formation.MATANUSKA FORMATION (Lower and Upper Cretaceous)--Well-induratedshale, siltstone, sandstone, graywacke, with subordinate conglomerateinterbeds; occurs along the southern edge of the maparea, mostly in the Matanuska Valley. These rocks, having atotal thickness in excess of 1,200 m, are generally dark gray8
KsuInand thinly bedded, and for the most part were deposited in amarine environment of moderate to shallow depths. Some of thesandstone beds contain fragmentary plant remains. Age of theformation ranges from Maestrichtian at the top to Albian atthe base (Grantz, 1964). The formation rests with a pronouncedangular unconformity on Lower Cretaceous and older strata. Inpart, the MatanlJska Forniation correlates with the Kennicott,the Shulze, the Chititna, and the MacCall Ridge Formations ofthe southern \~rangell r10untains (Jones, 1967).SEDIMENTARY ROCKS, UNDIVIDED (Lower Cretaceous)--A shallow watermarine sequence of thinly bedded calcareous sandstone, siltstone,claystone, minor conglomerate, and thick-bedded to massiveclastic limestone; interpreted as a continental shelf-typedeposit; Over 100 m thick. These strata occur in the southeasternTalkeetna Mountains, and they have been previously mappedand dated by Grantz (1960a, b). The present undivided unitincludes Grantz' units Ks, Kc, and the Nelchina Limestone. Thecontact between these strata and the underlying Jurassic NaknekFormation (unit In) is a slightly angular unconformity. TheNelchina Limestone correlates with the Berg Creek Formation ofthe southern Wrangell Mountains (E. M. MacKevett, Jr., oralconunun., 1977).NAKNEK FORMATION (Upper Jurassic)--Shallow water marine, thin tothick bedded, intercalated strata of fossiliferous gray9
siltstone, shale, sandstone, and conglomerate; over 1,400 mJctthick. Previously mapped and dated by Grantz (1960a, b). TheNaknek Formation is restricted to the southeastern TalkeetnaMountains, lacks any contemporaneous volcanic material, andappears to have been deposited in a continental shelf environment.Its contact with the underlying Chinitna Formation is avery slightly angular unconformity. The Naknek correlates withthe Root Glacier Formation of the southern Wrangell. Mountains(E. M. MacKevett, Jr., oral commun., 1977).CHINITNA FORMATION (Upper Jurassic) AND TUXEDNI GROUP (MiddleJurassic), UNDIVIDED--The Chinitna Formation consists of a shallowmarine, intercalated sequence of dark-gray shale, siltstone,and subordinate-graywacke; contains numerous large limestoneconcretions; it is as much as 600 m thick. The Tuxedni Groupunconformably underlies the Chinitna,and consists of shallowmarine, well-indurated, thinly to thickly bedded graywacke,sandstone, and massive conglomerate in its lower part, and thinlyto thickly bedded dark siltstone and shale in its upper part.The Tuxedni is about 300 to 400 m thick. Both the Chinitnaand Tuxedni have been previously mapped and dated by Grantz(1960a, b; 1961a, b), by Grantz and others (1963), and by Dettermanand others (1976). Both formations occur in the southeasternpart of the map area, are devoid of coeval volcanicmaterial. and are interpreted to have been deposited in a10
JtkJlscontinental shelf environment. The contact between the TuxedniGroup and the underlying Talkeetna Formation (unit Jtk) is amajor angular unconformity. The Chinitna and Tuxedni are partlycorrelative with the Nizina Mountain Formation of the southernWrangell Mountains (E. M. MacKevett, Jr., oral commun., 1977).TALKEETNA FORMATION (Lower Jurassic)--Andesitic flows, flow breccia,tuff, and agglomerate; subordinate interbeds of sandstone,siltstone, and limestone (mapped separate1y as unit Jls), especiallyin upper part of the formation. A dominantly shallowmarine sequence, about 1,000 to 2,000 m thick (Grantz, 1960a, b;1961a, b; Grantz and others, 1963; Detterman and others, 1976).This formation occurs only in the southeastern half of the mappedarea and its base is nowhere exposed. The occurrence of marble(units Jmb and Jmbr) within the plutonic and metamorphic rocksjust northwest of the Talkeetna Formation outcrop area suggeststhat the formation is underlain by volcanogenic rocks of Triassic(unit lRv) and of Paleozoic age (unit Pzv).LIMESTONE (Lower Jurassic)--Light- to dark-gray, fine- to mediurngrainedunfoss1liferous limestone; near granitic rocks recrystallizedto medium- to coarse-grained marble. Forms discontinuouslenticular bodies, as much as 30 m thick, within TalkeetnaFormation.11
Plutonic and metamorphic rocksKumSERPENTINIZED ULTRAMAFIC ROCKS (Lower and (or) Upper Cretaceous)--These rocks occur in small, tectonically emplaced, discordantbodies (protrusions) within the probably Lower to Middle Jurassicpelitic schist (unit Jps) near Willow Creek. They aremedium greenish gray to black in color, and are composed ofaphanitic masses of serpentine, talc, minor amounts of actinolitetremolite,chlorite, and opaque minerals. Relict textures werenowhere observed, and all these bodies are strongly sheared.Semiquantitative spectrographic analyses indicate chromium contentsto be between 1,000 and 5,000 ppm and nickel between 1,000and 2,000 ppm (analyses by D. F. Siems and J. M. Motooka, 1973).Fire assay analyses of ten samples show both platinum and palladiumcontents to range from 0.0 ppm to 0.030 ppm (analysesby R. R. Carlson, 1973). However, the average platinum to palladiumratio is only about three to one. Potassium-argon agedeterminations on actinolite-tremolite from two samples yieldedearly Late Cretaceous minimum ages (map nos. 32,36, table 1).These minimum ages coincide in time with a middle to Late Cretaceousperiod of intense, alpine-type orogenic deformation(see Structure and Tectonics sections) of the Talkeetna Mountainsregion. Thus, the serpentinite bodies, whose originalage is unknown, are assumed to have been emplaced during thisorogeny.12
JtrJgdTRONDHJEMITE (Upper Jurassic)--Forms a discordant, northeasttrending,elongate, epizona1 pluton of fairly uniform lithologyin the central Talkeetna Mountains. Large portions of the plutonhave been sheared and saussuritized. Typically, the trondhjemiteis light gray, medium to coarse grained with a granitic texture.A faint flow foliation is locally developed. Major rock formingminerals are plagioclase (oligoclase to sodic andesine),quartz, K-fe1dspar (between 0 to 10 percent of volume), andbiotite, with subordinate amounts of muscovite, and opaque minerals.Color index ranges from 3 to 9. Average oxide percentages,by weight, of seven trondhjemite analyses are: Si0 2-70.30, A1 20 3- 16.74, K 20 - 1.27, Na 20 - 5.07, CaO - 3.33.Potassium-argon age determinations (map nos. 21,22,26,31,table 1) from the southern part of the pluton show considerablevariation in age, which is attributed to resetting. However,three age determinations from the northern half of the pluton(map nos. 10,11,14, table 1), including concordant ages ona mineral pair of muscovite and biotite, yielded very similar numbersindicating the emplacement of the trondhjemite pluton between145 to 150 m.y. ago. The trondhjemite is the youngest memberof a group of Jurassic plutonic and metamorphic rocks in theTalkeetna Mountains.GRANODIORITE (Middle to Upper Jurassic)--Dominant1y granodioritebut includes minor amounts of tonalite and quartz diorite.13
These epizonal plutonic rocks, underlying considerable areasJgdmin the central and eastern Talkeetna Mountains, were probablyemplaced as multiple intrusion of consanguineous magmas. Theyare medium to dark gray, medium grained, and in undeformed rocksthe texture is granitic. Mafic minerals are hornblende andbiotite in various proportions. Along the northwestern borderof its exposure area, the granodiorite and related rocks havebeen cataclastically deformed, resulting in a pronounced northeast-trendingsecondary foliation and, to a lesser degree,lineation. The width of the deformed zone varies from about2 km to 25 km. Isotopic age determinations (map numbers 15-17,27, tables 1, 2) from four separate localities indicate thatemplacement, probably multiple intrusions, took place approximately150 and 175 m.y. ago. While the Upper Jurassic trondhjemiteintrudes the granodiorite, the granodiorite itselfintrudes the Talkeetna Formation of Lower Jurassic age (Grantzand others, 1963).MIGMATITIC BORDER ZONE OF GRANODIORITE (Middle to Upper Jurassic)--Forms a terrane of poorly exposed, intricately intermixed contactschist, amphibolite, and small dikes and veinlets of granodiorite;all of these rock types occur in approximately equalproportions.The contact schist is dark to medium gray, medium grained;rock-forming minerals are quartz, biotite, and subordinateplagioclase.14
Jmrb~qdThe amphibolite is dark gray, medium grained, and consistsof hornblende and plagioclase; megascopic schistosity is seldomconspicuous.The granodiorite is the same as that of unit Jgd; most ofthe veinlets have been intruded along foliation planes.The metamorphic rocks of this unit were probably derivedfrom either the Talkeetna Formation (unit Jtk) or from the upperPaleozoic volcanogenic sequence (unit Pzv), or possibly in partfrom the Upper Triassic basaltic sequence (unit TRv).MARBLE (Middle to Upper Jurassic metamorphic age)--Contact metamorphosedmarble bed more than 40 m thick within migmatiticborder zone (unit Jgdm). The marble is poorly exposed andoccurs only along John Creek, a tributary of upper Kosina Creek.The rock is white, coarse to medium grained, and contains numerousporphyroblastic crystals of andradite garnet and diopside.The marble was derived from a limestone bed, probably withinthe upper Paleozoic volcanogenic sequence (unit Pzv) or possiblywithin the Upper Triassic basaltic sequence (unit lRv).QUARTZ DIORITE (Lower to Middle Jurassic)--Epizonal intrusive inthe southern Talkeetna Mountains. Dominantly quartz dioritebut also includes diorite and tonalite. Large portions of thisrock have been sheared and intensively altered. The freshquartz diorite is medium to dark greenish gray, medium to coarsegrained, and has a granitic texture. Rock-forming minerals areplagioclase (andesine), quartz, hornblende, subordinate biotite15
Jamand K-feldspar. Where altered, the quartz diorite consists ofmineral aggregates of epidote, chlorite, and sericite, as wellas some remnants of the primary minerals. The age of thequartz diorite is probably late Early Jurassic or early MiddleJurassic because it intrudes the Talkeetna Formation and isintruded by the Middle to Upper Jurassic granodiorite of unitJgd.AMPHIBOLITE (Lower to Middle Jurassic metamorphic age)--Forms ametamorphic terrane consisting dominantly of amphibolite butincludes subordinate amounts of greenschist and foliated diorite.This metamorphic terrane also includes several interbeds ofcoarsely crystalline marble which are mapped and described separately(unit Jmb).The amphibolite is generally dark greenish gray, mediumto coarse grained, but fine-grained varieties also occur. Foliationand lineation are generally poorly developed, and segregationlayering is rare. Major rock-forming minerals are. inapproximately equal proportions, anhedral to euhedral hornblende(Z = dark green to brownish green, occasionally bluish green)and anhedral, generally twinned plagioclase ranging from labradoriteto calcic andesine. Accessory minerals are quartz,garnet, sphene, apatite, opaques, occasional epidote, and, insome of the rocks, shreds of biotite.The greenschist is dark greenish gray, fine to medium grained,with a moderately well-developed schistosity. Major minerals16
are actinolite, untwinned plagioclase (probably albite), epidote,chlorite, quartz, and opaques. Some of the actinolite-likeamphibole may actually be aluminous hornblende, thus some ofthese rocks may be transitional to amphibolite.The foliated diorite is very similar .to the amphibolite inappearance. It is dark greenish gray, medium to coarse grained,with a generally well-developed shear foliation. A remnantgranitic texture is always discernible in thin section. Rockformingminerals are hornblende, twinned and occasionally zonedplagioclase (andesine to sadic labradorite), with subordinateamounts of chlorite and epidote, minor quartz and biotite, andopaques.All of the above rocks, as well as the quartz diorite ofunit Jqd, apparently are the earliest products of a Jurassicplutonic and metamorphic event which appears to have startedin the Talkeetna Mountains in late Early Jurassic time afterthe deposition of the Talkeetna Formation (unit Jtk). A potassium-argonage determination on hornblende of a diorite oramphibolite sample (map no. 5, table 1) from the northeast partof the map area yielded an age of 176.6 m.y. (Turner and Smith,1974), suggesting an Early to Middle Jurassic age for the amphiboliteand associated rocks. The quartz diorite of unit Jqd inthe southern Talkeetna Mountains is probably correlative withthe sheared diorite of the amphibolite terrane.17
JmbJmiThe metamorphic rocks of the amphibolite terrane probablywere derived from any or all of the following dominantly basicvolcanic formations: Talkeetna Formation (unit Jtk), upperPaleozoic volcanogenic sequence (unit Pzv), or the Upper Triassicbasaltic sequence (unit lRv). The pods of greenschist,intercalated with the amphibolite, suggest that the metamorphismin the amphibolite terrane was not of uniform intensity.MARBLE (Lower to Middle Jurassic metamorphic age)--White, mediumtocoarse-grained marble. It occurs in massive interbeds, asmuch as 30 m thick, within the amphibolite terrane of unit Jam.The marble contains subordinate amounts of garnet and diopside.Its parent rock was a limestone bed, probably within the TalkeetnaFormation (unit Jtk) or within the upper Paleozoic volcanogenicsequence (unit Pzv), or, least likely, within theUpper Triassic basaltic sequence (unit lRv).AMPHIBOLITE AND QUARTZ DIORITE (Lower to Middle Jurassic metamorphicand plutonic ages)--Forms a terrane of intricatelyintermixed amphibolite and quartz diorite in about equal amountsin the southern Talkeetna Mountains.The amphibolite ;s very similar to the amphibolite of unitJam, thus the two amphibolites are considered to be correlative,and no description ;s given here. One difference is that segretionlayering of mafic and felsic components is more prevalentin the amphibolite of unit Jm;. A thin wedge of biotite-quartzfeldspargneiss, probably derived from a nonvolcanic clastic18
Jgsinterbed, is intercalated with the amphibolite along -lowerGranite Creek (Detterman and others, 1976; Travis Hudson, oralcommun., 1978).The quartz diorite is petrographically identical to thequartz diorite in adjacent unit Jqd (see rock description there),and the two rocks are considered to be correlative. The quartzdiorite of the present unit is generally more altered than thatof unit Jqd.GREENSTONE (Probably Lower to Middle Jurassic metamorphic age)--The basic metavolcanic rocks of this unit form small, isolatedhills along the eastern edge of the map area near the SusitnaRiver. The typical greenstone is a dark greenish gray, finegrained, generally structureless rock. Original rock-formingminerals were pyroxene, amphibole, and plagioclase (andesine tolabradorite) which more or less altered to chlorite, epidote,serpentine, calcite, and minor sericite and quartz. The proximityof the amphibolite terrane (unit Jam) strongly suggeststhat the metavolcanic greenstones of the present unit representa low-grade facies of the same metamorphism which produced theamphibolite. The relative position of the greenstone withinthe northeasterly structural trend of the Talkeetna Mountainssuggests that the greenstone was probably derived from theTalkeetna Formation (unit Jtk) or, possibly, from either theupper Paleozoic volcanogenic sequence (unit Pzv) or the UpperTriassic basaltic sequence (unit lRv).19
JpsPELITIC MICA SCHIST (Probably Lower to Middle Jurassic metamorphicage)--This rock occurs only in the southwestern corner ofthe map area near the headwaters of Willow Creek.The schistis medium to dark gray, medium grained, with uniform lithologythroughout its exposure area.Its ubiquitous mineral constituentsare quartz, muscovite, albite, chlorite, chloritizedcrystals of garnet and subordinate biotite.of carbonaceous material occur sparsely.Very thin laminaeSmall open folds andcrenulations form an incipient slip cleavage at a large angleIto the primary schistosity.Numerous thin veins and stringersof hydrothermal quartz occur throughout the schist.Detailedpetrographic descriptions of the mica schist are given in Ray(1954) .The present mineralogy of the schist is indicative of thegreenschist metamorphic facies of Turner (1968). However, it isprobably retrograde from higher metamorphism, possibly the amphibolitefacies. Evidence for this is the chloritized garnet andbiotite crystals and the sparse mineral outlines consisting ofchlorite which probably are pseudomorphs after hornblende.The age of the schist is imperfectly known, but, based onregional geologic interpretations, the primary metamorphism isconsidered to be Early to Middle Jurassic in age. Thus, theschist and the amphibolite of unit Jam are interpreted to bethe products of the same metamorphism. The retrograde metamorphismis assumed to be of middle to Late Cretaceous in age and20
Jpmurelated to an al pine-type oro'geny in the Talkeetna Mountains atthat time. However. the Late Cretaceous Arkose Ridge Formation,which lies unconfonnably on the schist, has not been affectedby this retrograde metamorphism. The three potassium-argon agedeterminations, measured on muscovite from the schist (map nos.33-35, table 1), yielded obviously reset Paleocene ages.The parent rock of the schist is unknown because no peliticrocks of comparable thickness (the schist is at least severalhundred meters thick) are known to occur in the pre-MiddleJurassic rocks of the Ta 1 keetna t1ountains.PLUTONIC AND METAMORPHIC ROCKS, UNDIFFERENTIATED (Lower to UpperJurassic plutonic and metamorphic ages)--This unit consists ofan intricately intermixed mosaic of most of the previously discussedJurassic metamorphic and plutonic rocks (units Jtr, Jgd,Jgdm, Jqd, Jam, Jgs, and Jps). Within the terrane of the presentunit, the exposure area of an individual rock type is notmore than a few square kilometers. Two rock types, amphyboliteand sheared quartz diorite, comprise approximately 60 percentof the terrane. Next in importance are sheared granodioriteand associated migmatites. Subordinate amounts of pelitic micaschist and greenstone also occur. Numerous apophyses of trondhjemite,as much as several meters thick. occur along the easternedge of the terrane adjacent to the large trondhjemitepluton (unit Jtr). All of these rocks are lithologically very21
similar to their correlative map units, and they will not bedescribed here. At two localities, the sheared granodiorite(unit Jgd) was mapped separately to show the proximity ofsheared Jurassic granitic rocks to the Late Cretaceous andearly Paleocene unsheared tonalite (unit TKt).NORTHWESTERN TALKEETNA MOUNTAINS AND UPPER CHULITNA RIVER AREASedimentary and volcanic rocks; rocks of each column occur in separatefault blocks.Central and northern Talkeetna Mountains~v BASALTIC METAVOLCANIC ROCKS (Upper Triassic)--This shallow watermarine unit consists of amygdaloidal metabasalt flows with verysubordinate amounts of thin interbeds of metachert, argillite,metavolcaniclastic rocks, and marble (Smith and others, 1975).Rocks of this unit have been mapped only in the northeast portionof the map area. However, small blocks of the basalticrocks may occur within the complexly deformed late Paleozoicvolcanogenic sequence (unit Pzv) toward the southwest. Thebasaltic rocks rest with angular unconformity on the late Paleozoicvolcanics (unit Pzv); the top of the basalts is unexposed.The minimal thickness of the basaltic metavolcanic rocks is800 m.The individual metabasalt flows are as much as 10 m thick,and,according to Smith and others (1975), display columnar jointingand locally pillow structures. The typical metabasalt is dark22
Pzvgreenish gray, fine grained, and generally contains numerousamygdules. Thin sections show the metabasalts to consist oflabrodorite, augite, and opaques in an intergranular or subophitictexture. Secondary minerals are chlorite, epidote,clinozoisite, very subordinate allanite, sericite, and possiblysome kaolin. The amygdules consist of chlorite, silica, andzeolites. The present mineralogy is probably the result ofdeuteric alteration and low-grade regional metamorphism whichapparently did not reach the intensity of the greenschist faciesof Turner (1968).From a marble interbed in upper Watana Creek (locality 1,table 3), T. E. Smith (unpub. data, 1974) collected fossil specimenswhich were identified and interpreted by K. M. Nichols andN. J. Si1berling to be Halobia cf. H. symmetrica Smith. indicatinga latest Karnian or early Norian age. Previously, Smith(1974a) and Smith and others (1975) have correlated the basalticmetavolcanic rocks of the present unit with the AmphitheaterGroup of the central <strong>Alaska</strong> Range. Accordingly, the fossilscollected by T. E. Smith suggest that the Amphitheater Groupis younger than,and thus not correlative with the lithologicallyvery similar Nikolai Greenstone of pre-late Karnian age ineastern <strong>Alaska</strong> (Jones and others. 1977).BASALTIC TO ANDESITIC METAVOLCANOGENIC ROCKS (Pennsylvanian(?)and Early Permian)--Rocks of this unit occur in a northeasttrendingbelt across the center of the Talkeetna Mountains, and23
they form an interlayered heterogeneous, dominantly marinesequence over 5,000 m thick. The base of the sequence isnowhere exposed, and the contact with the overlying Triassicmetabasalts is an angular unconformity. The metavolcanogenicsequence consists dominantly of metamorphosed flows and tuffsof basaltic to andesitic composition, and of coarse- to finegrainedmetavolcaniclastic rocks with clasts composed chieflyof mafic volcanic rocks. Mudstone, bioclastic marble (mappedand described separately as unit Pls), and dark-gray to blackphyllite are subordinate. The various rock types of the sequenceform conformable but lenticular units of limited areal extent.The crudely layered and poorly sorted metavolcaniclastic unitshave thicknesses in excess of 1,000 m, and the thickness of thephyllites ranges from a few meters to several hundred meters.The whole sequence has been tightly folded and complexly faulted,and the rocks have been regionally metamorphosed into mineralassemblages mostly of the greenschist and the prehnite-pumpellyitefacies, but locally along Tsisi Creek of the amphybolitefacies of Turner (1968). Detailed petrographic descriptionsof these rocks were given by Csejtey (1974).The age of the metamorphism ;s uncertain. The most intensivemetamorphism in the mapped area probably took place inEarly to Middle Jurassic time, contemporaneously with thedevelopment of the amphibolite terrane (unit Jam). Subsequent24
Plsbut less severe metamorphism, primarily shearing, occurredprobably in middle to Late Cretaceous time during the alpinetypeorogenic deformation of the Talkeetna Mountains (seediscussions in Structure and Tectonics sections).The composition and lithologic character of the metavolcanogenicsequence strongly suggest that this sequence is aremnant of a complex volcanic arc system (Csejtey, 1974, 1976).Fossil evidence (see description of unit Pls) from a marbleinterbed near the top of the sequence indicates an Early Permianage. However, because of the considerable thickness ofthe sequence, its lowermost portion may be as old as LatePennsylvanian.MARBLE (Pennsylvanian(?) and Early Permian)--Forms lenticularinterbeds, as much as a few tens of meters thick, within thebasaltic to andesitic late Paleozoic metavolcanogenic sequence(unit Pzv). Most of the rock is light gray to white, mediumto coarse grained, thick-bedded to massive marble, but some lessmetamorphosed varieties also occur. Still discernible organicremains and bedding features indicate that the marble interbedswere derived from bioclastic limestone which probably wasdeposited by high energy currents on shallow banks of limitedareal extent. A number of the marble interbeds contain poorlypreserved and generically unidentifiable crinoid columnals,brachiopods, bryozoans, and rarely corals (see table 3) of25
Jslate Paleozoic or probable late Paleozoic ages. However, oneof the marble interbeds near the top of the sequence (locality8, table 3) yielded well-preserved brachiopods and crinoidcolumnals which were identified and interpreted by J. T. Dutro,Jr. (Csejtey, 1976) to be late Early Permian, that is, lateLeonardian to early Guadalupian in age. The regional correlationof these rocks and that of the late Paleozoic metavo1canogenicsequence (unit Pzv) has been previously discussed byCsejtey (1976).Northern Watana Creek areaSEDIMENTARY AND VOLCANIC ROCKS, UNDIVIDED (Upper Jurassic)--Theserocks only occur in a small, apparently tectonic sliver alongthe northern edge of the map area. They comprise a section ofintercalated argillite and graywacke, pebble conglomerate, andflows and dikes of andesitic to 1atitic feldspar porphyry. Someof these rocks are sheared but some, mostly the pebble conglomerates,are not sheared.The argillite and fine-grained graywacke are thinly to moderatelythickly bedded and generally are dark gray. However,dark-greenish-gray varieties also occur, suggesting the presenceof volcanic ash or fine-grained tuffaceous material. The conglomeratesare massive, and the well-rounded to subrounded pebblesconsist chiefly of unmetamorphosed andesite, latite, and26
subordinate amounts of dacite. A minority of the pebbles arecomposed of dark-gray argillite and white quartz. The feldsparporphyry is dark gray, with flow alined phenocrysts of zonedandesine and oligoclase as much as 1 cm long, and some hornblendeand biotite, in -an aphanitic matrix.An argillite bed at the top of the 5,053-ft hill in theHealy A-2 quadrangle, just north of the present map area,yie1ded well-preserved fossils of Buchia rugosa (Fischer),indicating a Late Jurassic age for these rocks (D. L. Jones,oral commun., 1977). On the basis of lithology and age, therocks of the present unit are considered to be the westernmostoccurrence of the Gravina-Nutzotin terrane of Berg and others(1972) .KagNorthwest Talkeetna MountainsARGILLITE AND LITHIC GRAYWACKE {Lower Cretaceous)--These rocksoccur in a monotonous, intensely deformed flyschlike turbiditesequence, probably severa1 thousand meters thick, in the northwestpart of the mapped area, north of the Talkeetna thrustfault. The-whole sequence has been compressed into tight andisoclinal folds and probably has been complexly faulted as well.The rocks are highly indurated, and many are sheared and pervasivelycleaved as a result of low-grade dynamometamorphism,the intensity of which is only locally as high as the lowermostportion of the greenschist metamorphic facies of Turner (1968).27
Most of the cleavage is probably axial plane cleavage. Neitherthe base nor the top of the sequence is exposed and, because ofthe intense deformation, even its minimal thickness is only anestimate.The argillite is dark gray or black. Commonly it containssmall grains of detrital mica as much as 1 mm in diameter.Because of the dynamometamorphism, in large areas the argilliteis actually a slate or fine-grained phyllite. Thin sectionsshow that some of the argillites are derived from very finegrained siltstone and that they contain considerable carbonaceousmaterial.The typical lithic graywacke is dark to medium gray, fineto medium grained, and occurs intercalated with the argillitein graded beds ranging in thickness from laminae to about 1.5 m.The individual graywacke beds are not uniformly distributedthroughout the whole sequences of which they comprise about 30to 40 percent by volumes but tend to be clustered in zones 1to 5 m thick. Thin sections of graywacke samples show them tobe composed of angular or subrounded detrital grains of lithicfragments~quartz, moderately fresh plagioclase, and some,generally altered s mica in a very fine grained matrix; euhedralopaque grains~thin sections.probably authigenic pyrite, are present in mostThe lithic fragments consist in various proportionsof little altered, fine-grained to aphanitic volcanicrocks of mafic to intermediate composition; fine-grained, weaklyfoliated low-grade metamorphic rocks; chert; and some fine-28t
lRvs·grained unmetamorphosed sedimentary rocks possibly of intraformationalorigin. No carbonate grains were seen. The matrixconstitutes about 20 to 30 percent of the rock by volume, generallycontains some secondary sericite and chlorite, and, inthe more metamorphosed rocks, biotite and possibly someamphibole.Analyses of paleocurrent features. such as small-scalecross-stratification. found in several exposures near the westernedge of the mapped area, suggest that depositional currentscame from the east or northeast (A. T. Ovenshine. oral commun.,1974).Because fossils are extremely sparse. the exact age of theargillite and lithic graywacke sequence is imperfectly known.A poor specimen of Inoceramus Sp. of Cretaceous age was foundjust west of the map area between the Chulitna and Susitna Rivers,and a block of Buchia-bearing limestone of Valanginian age wasfound in float near Caribou Pass in the Healy quadrangle northof the mapped area (D. L. Jones, oral commun., 1978).Northwestern Talkeetna MountainsMETABASALT AND SLATE (Upper Triassic)--Shallow water marine,interbedded sequence of amygdaloidal metabasalt flows and slate,found only in two allochthonous klippen near the northwest cornerof the mapped area. The sequence is tightly folded, alongwith the underlying Cretaceous rocks (unit Kag), and ;s slightlymetamorphosed and unevenly sheared.The basalt and slate are29
intercalated in approximately equal proportions in individualunits as much as 15 m thick.The metabasalt is dark greenish gray, aphanitic, with numerousamygdules. In thin sections the primary minerals aretwinned labradorite, augite, and opaques which probably are,for the most part, ilmenite. Secondary minerals are chlorite(much of it after glass), epidote, clinozo;site, minor zoisite,calcite, leucoxene, very minor sericite, very fine grainedfelty amphibole (probably uralite after augite), and possiblysome very subordinate albite. The original texture was intersertaland subophitic. The amygdules consist of chlorite, zeolites(primarily prehnite), quartz, and some feldspar.The slate is dark gray to black. Thin sections show thatsome of the rock is fine-grained metasiltstone. All of therocks contain considerable carbonaceous material and some amountsof fine-grained, secondary sericite. Secondary biotite ;s presentin some of the slates.The secondary mineral assemblages suggest that, in additionto deuteric alteration, the metabasalt and slate sequenceunderwent very low grade regional metamorphism.The metabasalt and slate sequence has been dated in theHealy quadrangle, north of the present map area, near the EastFork of the Chulitna River where D. L. Jones and N. J. Silberling(oral commun., 1977) found upper Norian fossils of Monotis subcircularisand Heterostridium sp. in slightly metamorphosed30
DSgaargillaceous beds. Thus. the age of the present sequence issimilar to. and the lithology of its basalt is identical to,that of the Upper Triassic metabasaltic sequence (unit IRv)in the northeast Talkeetna Mountains. These two rock sequencesmay represent different facies, brought closer by thrusting.of the same geologic terrane.Upper Chulitna River areaGRAYWACKE, ARGILLITE, AND SHALE (Silurian(?) to Middle Devonian)--These rocks occur in an apparently allochthonous tectonicblock along the western side of the Chulitna Valley and comprisea poorly and inaccessibly exposed, complexly deformedand sheared sequence. As a result, the sequence is poorly known;it was briefly examined in outcrop only along Long Creek. Therethe component rocks are medium to dark gray, sheared and tightlyfolded with vertical dips, and occur intercalated in beds asmuch as 1 m thick. The graywackes are fine grained and appearto contain some volcanogenic detritus. Reconnaissance fieldchecking by D. L. Jones (oral commun., 1977) further to thenorth indicates that the sequence also includes some chert,cherty tuff. and phyllite.In Long Creek, two fossiliferous limestone beds (mappedand described separately as unit DSls) were found; they probablyare in depositional contact with, and thus date. the envel~oping unfossi1iferous clastic rocks. It is possible, however,that some of the limestone contacts are tectonic and that some31
of the enveloping rocks are of a different age.DSlsJtaLIMESTONE (Silurian(?) to Middle Devonian)--Mass;ve to thickbedded.medium-gray. fine-grained, moderately sheared bioclasticlimestone. probably formed in patch reefs. It occurs at threeseparate localities, in apparent depositional interbeds as muchas 20 m thick, within fine-grained clastic rocks (unit DSga).Of the two limestone beds in Long Creek. one yielded fossilsof Devonian, probably Middle Devonian, age, the other of Silurianor Devonian age (map nos. 12. 13, respectively, table 3). Thefossils also indicate shallow marine deposition. The typesof fossils and the characteristics of the host limestones andthe enveloping clastic rocks suggest deposition along an ancientcontinental margin. These continental margin-type depositscrop out only about 6 km to the southeast of Upper Devonianophiolitic rocks (unit Dbs) that are indicative of ocean floordeposition. The proximity of these rocks that are close in agebut different in depositional environment is additional evidencefor large-scale Alpine-type orogenic deformation in southcentral<strong>Alaska</strong> (Csejtey and others, 1977; Jones and others.1978).Upper Chulitna River areaCRYSTAL TUFF, ARGILLITE, CHERT, GRAYWACKE, AND LIMESTONE (Lowerto Upper Jurass;c)--Sha1low to moderately deep marine sequence.tightly folded and internally faulted, at least several thousandmeters thick. These rocks are interpreted to occur in a32
thrust block along the western slope of the upper ChulitnaValley. Four-fifths of the sequence is comprised of the massive,cliff-forming crystal tuff, while the remaining rocksform only a narrow outcrop belt along the western margin ofthe map unit. The contact between these two groups of rocksmay be tectonic.The crystal tuff is light to dark gray~ locally with agreenish tint, and weathers to various shades of brown. It ismassive with obscure rhythmic laminations and thin bedding.The tuff is composed of abundant small feldspar crystals(albite?) set in a very fine grained matrix of devitrified volcanicglass in which some shards can be recognized. Sparsebut unidentifiable fragments of radiolaria were also found.A thin interbed of volcaniclastic sandstone yielded the followingfossils: Arctoasteroceras jeletskyi Frebo1d, Paltechioceras(Orthechioceras?) sp., and Weyla sp. (Jones and others, 1978;fossil locality in Silber1ing and others, 1978). According toR. W. Imlay (written commun. to D. L. Jones, 1976), these fossilsindicate a late Sinemurian age.The argillite, chert, graywacke, and limestone occur interbeddedin various proportions in individual units as much asseveral tens of meters thick. The argillite and chert are darkgray to black; the graywacke is medium to dark gray, very fine33
Dsbto medium grained, locally with graded bedding. The limestoneis medium gray, generally phosphatic, in part sandy, locallyis associated with limy siltstone and conglomerate; formsblocks and lenticular beds as much as several kilometers inextent. Some of the chert beds yielded radiolaria oflate Kimmeridgian or early Tithonian age (Late Jurassic), andat five different localities, the limy rocks yielded EarlyJurassic ammonite faunas of early Sinemurian age (Jones andothers, 1978; fossil localities in Silberling and others, 1978).Probably these Lower and Upper Jurassic rocks originally formeda coherent stratigraphic sequence which subsequently was disruptedby folding and faulting.Ohio Creek areaSERPENTINITE, BASALT, CHERT, AND GABBRO (Upper Devonian)--Tectonicallyintermixed assemblage that forms a northeast-trendingbelt of apparent thrust slivers in the northwest corner of themapped area. Sheared serpentinite is the most abundant rocktype; the remaining component rocks occur in various proportionsin lenticular and podiform tectonic blocks as much as severalhundred meters in extent. Many chert lenses occur intercalatedwith basalt flows which locally show poorly preserved pillowstructures. Rocks of this map unit have been previously describedand interpreted as a dismembered ophiolite assemblageby Clark and others (1972) and by Jones and others (1978).34
The serpentinite is dark gray to dark greenish gray,always sheared, and consists almost entirely of clinochrysotileand lizardite with subordinate brucite, talc, and chromite.Sparse relict olivine crystals and a bastite texture suggestthat the serpentinite originally was a pyroxene-olivine ultramaficrock.Basalt is dark gray, aphanitic to fine grained with a fewphenocrysts, as much as 4 mm in maximum dimension, of alteredplagioclase, pyroxene, and olivine. The rock is locally vesicularor amygdaloidal and generally is fragmental; many of thefragments are palagonite. Some of the vesicles and amygdulesare concentrated along spherical surfaces which may be partsof pillow structures. Depositionally intercalated marine chertbeds further indicate that the basalts were formed as submarineflows.The chert is generally red, but reddish-brown and greenishgrayvarieties also occur. It is commonly in beds a few millimetersto a few centimeters in thickness, and contains abundantradiolaria.The gabbro is medium to dark greenish gray, fine to coarsegrained, and ;s composed of altered plagioclase, pyroxene,olivine, and opaques. Compositional layering, interpreted tobe cumulate textures, is common, and the layers range in thicknessfrom a few millimeters to a few centimeters. The best35
exposed gabbro occurs in a lens about 100 m thick and about 11Rrpzsvkm long on the ridge north of the unnamed northern branch ofShotgun Creek.Age determinations of radiolaria and conodonts in chertsamples from eight separate localities reliably indicate a LateDevonian (Famennian) age for the ophiolitic rocks (Jones andothers, 1978; Silberling and others, 1978).Long Creek areaRED BEDS (probably Upper Triassic)--Red sandstone, siltstone,argillite, and conglomerate similar to the red beds of unitJ1Rrs. Clasts of gabbro, serpentinite, and fossiliferous Permian(?)limestone are present in these rocks but have not beenidentified in rocks of unit J1Rs. Also, a thin conglomeratebed containing angular clasts of rhyolite is locally present atthe base. These rocks lie with depositional unconformity onlate Paleozoic, possibly Triassic, and older strata in the maparea. Just north of the map area, the red beds rest on LowerTriassic limestone (Jones and others, 1978). The red beds lackfossils and, therefore, have not been dated, but they are assumedto be equivalent in age to the Upper Triassic red beds of unitJ1Rrs (Jones and others, 1978).VOLCANOGENIC AND SEDIMENTARY ROCKS, UNDIVIDED (Upper Devonian toLower Perrnian)--Heterogeneous intercalated sequence of green;shgrayto black tuffaceous chert, lesser amounts of maroon volcanic36
J1Rsmudstone, breccia composed largely of basaltic detritus, laminatedflyschlike graywacke and shale, and large lenses of 1ightgray,thick-bedded limestone. Fossils from the thick-beddedlimestone are Early Permian in age; brachiopods from the conglomerateare also of Early Permian age; and fossils from thechert are Devonian and Carboniferous, but some poorly preservedfossils may possibly, though not likely, be as young as Triassic(Jones and others, 1978). The stratigraphic and structuralrelations between these diverse rocks are obscured by abundantfolds and poor exposures. A detailed discussion of these rocksis given by Jones and others (1978), and fossil localities areshown in Silberling and others (1978).Ohio Creek areaRED AND BROWN SEDIMENTARY ROCKS AND BASALT, UNDIVIDED {UpperTriassic and Lower Jurassic)--The basal part of this unit consistsof a red-colored sequence 9f sandstone, siltstone, argillite,and conglomerate, with a few thin interbeds of brown fossiliferoussandstone, pink to light-gray dense limestone, andintercalated massive basalt flows. This red bed sequence gradesupward into highly fossiliferous brown sandstone, which in turngrades upward into brownish-gray siltstone with yellowish-brownlimy concretions.Clasts in the red beds are dominantly basalt grains and37
lRlbpebbles which probably were derived from basalt flows of unitlRlb that lies unconformably below the red beds and from massivebasalt flows within the red bed sequence. Subordinate amountsof the clasts consist of white, in part foliated, metaquartzitepebbles; flakes of white mica which, along with the metaquartzite,must have been derived from an unidentified siliceousmetamorphic terrane; and red radiolarmnchert pebbles and grains,which probably were derived from the ophiolitic rocks of unitDsb. No other clasts that can be identified as coming fromthe ophiolitic rocks have been recognized.Fossils from the limestone and the overlying brown sandstoneare of Upper Triassic age, and those from the yellowishbrownlimy concretions are of Upper Triassic and Lower Jurassicage.Detailed discussions of both the red and brown beds aregiven by Jones and others (1978), and fossil localities areshown in Silberling and others (1978).LIMESTONE AND BASALT (Upper Triassic)--Interlayered sequence oflimestone, partly recrystallized to marble, and flows of alteredamygdaloidal basalt. Individual units are as much as severaltens of meters thick. These rocks occur in a complexly faultedzone in the northwest corner of the mapped area.The limestone is medium gray, massive to thick bedded,but locally it has altered to fine- to medium-grained marble.38
It contains sparse fragments of poorly preserved corals andthick-shelled Megalodontid{?) bivalves up to 20 cm in length.A single specimen of Spondylospira sp.~ in conjunction withthe Megalodontid bivalves, suggests a Norian age for the sequence(Jones and others t 1978; fossil localities shown in Si1berlingand others, 1978).The amygdaloida1 basalt is dark gray to greenish gray,aphanitic, with numerous amygdu1es. Locally, it displays wel1-developed pillow structures. Primary rock-forming minerals arefine-grained labradorite, titanium-rich augite, and opaques inan originally interserta1 or subophitic texture. The originalmineral assemblage has been more or less altered to an aggregateof chlorite (much of it after glass), epidote, calcite,sericite~ and some zeolite, probably prehnite. The amygdu1esconsist of chlorite, calcite, prehnite, and minor quartz. Mostof the secondary minerals are probably the result of deutericalteration, but some might be the product of very low-graderegional metamorphism. Fifteen chemical analyses of leastaltered basalt samples indicate that the basalts are somewhatlow in silica (normalized Si0 2contents average 46.7 percentby weight, ranging from 43.7 to 48.7 percent)~ high in alkalis(normalized Na 20 contents average 3.06 percent by weight, rangingfrom 1.3 to 5.2 percent; and normalized K20 contents average0.47 weight percent, ranging from 0.07 to 1.5 percent),39
and are high in titanium (normalized Ti0 2contents average 3.8KJsweight percent, ranging from 2.5 to 5.0 percent). The chemistryand mineralogy suggest that these basalts had alkali affinitiesprior to alteration.The fossils and the lithologies of the limestones and thebasalts indicate shallow water marine deposition. The probablealkali affinity of the basalts further suggests that they eitherwere part of an ocean island shield volcano, perhaps associatedwith a barrier reef, or that they were formed on a continentalmargin.Upper Copeland Creek areaARGILLITE, CHERT, SANDSTONE, AND LIMESTONE (Upper Jurassic andLower Cretaceous)--This unit consists of dark-gray argillite,dark-gray to greenish-gray bedded chert, thick-bedded sandstone,thin-bedded gray sandstone, and rare thin beds of shelly limestone.Both Upper Jurassic and Lower Cretaceous radiolariaswere obtained from the chert. The thick-bedded sandstone containsabundant fragments of Inoceramus sp. of Hauterivian toBarremian age, and some of the 1 imestone beds contain Buchi,asublaevis of Valanginian age. Some of the thin-bedded sandstonecontains abundant detrital white mica and may be as young asA"lbian (mid-Cretaceous). Thicknesses and the stratigraphicrelations within these rocks and with adjacent rocks are unknown40
ecause of complex folding and faulting and poor exposures. Amore detailed discussion of these rocks is given by Jones andothers (1978). and fossil localities are shown in Silberlingand others (1978).41
StructureThe rocks of the Talkeetna Mountains region have undergone complexand intense thrusting, folding, faulting, shearing, and differentialuplifting with associated regional metamorphism and plutonism. At leastthree major periods of deformation are recognized: a period of intensemetamorphism, plutonism, and uplifting in the late Early to MiddleJurassic, the plutonic phase of which persisted into Late Jurassic; amiddle to Late Cretaceous alpine-type orogeny, the most intense and importantof the three; and a period of normal and high-angle reverse faultingand minor folding in the middle Tertiary, possibly extending into theQuaternary.Most of the structural features in the Talkeetna Mountains regionare the result of the Cretaceous orogeny which produced a pronouncednortheast-southwest-trending structural grain of the region. The vergenceof this structural grain is steeply to moderately toward the northwest,but across the Chulitna Valley in the northwest part of the maparea, it abruptly reverses toward the southeast with steep attitudes.This Cretaceous deformation ;s most intense in the central and northwesternpart of the map area, and it rapidly decreases toward the southeast.The complex fault pattern along and near the southern edge of the TalkeetnaMountains is part of the late Cenozoic Castle Mountain-Cariboufault systems, consisting chiefly of high-angle reverse and normal faultsof probably local significance.Evidence for the Jurassic deformation is provided by the postTalkeetna Formation major unconformity and the apparently coeval regional42
metamorphism. up to the amphibolite grade. and associated plutonic rocks(all the Lower to Middle Jurassic metamorphic and plutonic units). Thehigher crustal level manifestation of this Jurassic tectonic event wasregional uplift and cons~quent rapid denudation of the intruded epizonalplutons.Complex folding produced by the Cretaceous orogeny is especiallypronounced in the areas northwest of the belt of Jurassic metamorphicand plutonic rocks. The folds are chiefly tight or isoclinal, with amplitudesof several hundred to several thousand meters. The limbs are generallysheared out or faulted out. As a result. no individual beds can betraced in the field for more than a few kilometers. Many of the largefolds, especially in the Cretaceous argillites and graywackes (unit Kag).have a well-developed axial plane slaty cleavage. Fine-grained sericiteand biotite are commonly developed along these cleavages. The foldingmust have taken place in several episodes during the orogeny because thrustfaults not only truncate folds within both the upper and lower plates butare themselves folded. The folded thrusts are especially evident in theChulitna area where, in contrast to the regional northwest vergence, theaxial planes of the folds steeply dip toward the northwest.Most prominent of the Cretaceous faults is the Talkeetna thrust whichhas placed Paleozoic, Triassic. and, locally, Jurassic rocks over Cretaceoussedimentary rocks across the whole map area. The thrust is generallypoorly exposed except near the Lower Talkeetna River. There it43
dips steeply toward the southeast. Another thrust, the one delineatingthe klippe of rocks of unit TRvs, has been sharply folded. The thrustsin the northwest corner of the map area are very complex, also have beenintensely folded, and are more numerous than could be shown on the presentmap. A number of them are not fully understood, and thus their subsurfaceconfiguration is speculative. It is certain, however, that these thrustsstack and bring together on top of the Kag unit a wide variety of rocksequences of different ages and depositional environment. The root zoneof all the thrusts in the northwest half of the map area is herein interpretedto be the Talkeetna thrust (see cross section).Another Cretaceous feature is an intense shear zone, locally as muchas 25 kin wide, trending across the Talkeetna Mountains, parallel to, butsoutheast of the Talkeetna thrust. Although not supported by any evidence,it is possible that the shear zone marks a thrust zone of significantdisplacement. (The center of this shear zone is shown as a postulatedthrust on the map.) The dips in the zone are generally southeasterly.The shearing is penetrative, and its most spectacular result is that portionsof all the Jurassic plutonic rocks, including the Upper Jurassictrondhjemite, have been transformed to catacl astic gnei ss. The 75 to61 m.y. old Upper Cretaceous and lower Paleocene tonalite pluton (unitTKt) truncates this shear zone and is not affected by it.The age of the 'Cretaceous orogeny, or at least its major phase, israther well bracketed by stratigraphic evidence. The youngest rocksinvolved are the Cretaceous argillites and graywackes (unit Kag) which44
are as young as Valanginian or possibly even younger in age. A maximumupper age bracket is provided by the late Paleocene granitic plutons,whichare structurally unaffected, and intrude the already folded and faultedcountry rocks in the northwest half of the map area. Two of the Cretaceousthrusts, including the Talkeetna thrust, are actually intruded bythese plutons. A slightly older upper age bracket is provided by the previouslydiscussed 61 to 75 m.y. old tonalite pluton (unit TKt) that cutsand is unaffected by the prominent shear zone in the central Ta1keetnas.Thus, the most important orogenic deformation in the Talkeetna Mountainsregion must have taken place during middle to Late Cretaceous time. Suchan age assignment for the orogeny is further supported by potassium-argonage determinations of 88 and 91 m.y. for the serpentinite protrusions inthe southwest corner of the map area (unit Kum).The dominant features of the middle Tertiary to Quaternary deformationare the already mentioned Castle Mountain-Caribou fault systems,along which the southern Talkeetna Mountains have been uplifted locallyas much as 2.800 m (Detterman and others, 1976). The only other featuresof this Cenozoic deformation recognized within the map area are the twopoorly exposed normal faults in the Chulitna River valley (see map andcross section). In addition to field observations, the existence of thesefaults is also supported by gravity data (R. L. Mor;n, oral commun., 1977;N. B. Harris, oral commun., 1977). No other Cenozoic faults, or any otherfaults with obvious Recent movement, were observed within the map area.45
TectonicsThe Talkeetna Mountains and adjacent areas are part of the dominantlyallochthonous terrane of southern <strong>Alaska</strong>. Previously, this terrane hasbeen interpreted to have developed by accretion of allochthonous continentalblocks to the ancient North American plate (Richter and Jones,1973; Csejtey, 1974) in late Mesozoic time (Csejtey, 1976; Jones and others,1978). Although the exact number or even the extent of these allochthonousblocks is still imperfectly known, they appear to have moved northwardconsiderable distances prior to their collision with the North Americanplate. For one of the blocks in eastern <strong>Alaska</strong> (Wrangellia of Jones andothers, 1977), a probable northward movement of several thousand kilometershas been shown by Hillhouse (1977). The results of the present investigationsand those of Jones and others (1978) not only lend credence tothe accretionary concept of southern <strong>Alaska</strong> but also provide additionalevidence for the time, method, and direction of emplacement.One of the keys to the tectonic history of the Talkeetna Mountainsreg1on, and to southern <strong>Alaska</strong> as well, is the occurrence of the tectonicallyemplaced diverse rock packages in the Chulitna area in the northwestpart of the map area. Most of the Triassic and Jurassic rocks there,especially the Triassic red beds, do not occur anywhere else in <strong>Alaska</strong>,and the fossil faunas and lithologic characteristics of these Mesozoicrocks strongly suggest deposition in warm water at low paleolatitudes(Jones and others, 1978). Furthermore, the pre-middle Cretaceous rocksabove the Talkeetna thrust, above the root zone of the Chulitna faults,46
are either structurally part of the allochthonous Wrangellia terrane ofJones and others (1977) or belong to a different terrane lying south (thatis outboard) of Wrangellia. Thus, all available evidence strongly indicatesthat. with the exception of unit Kag, all pre-middle Cretaceousrocks of the Talkeetna Mountains region are allochthonous, and, afterthe collision of their parent continental blocks with the middle CretaceousNorth American continent, they were thrust upon, that is obductedonto the margin of the continent. In turn, the middle Cretaceous <strong>Alaska</strong>nmargin of the continental North American plate itself probably developedby still earlier accretions (D. L. Jones, oral commun., 1977). The distancethe allochthonous rocks of the Talkeetna Mountains region werethruste~beyondthe edge of the continent is not known with certainty,but it must be at least several hundred kilometers. In accordance withthe present obduction concept. all the tectonic and depositional rockassemblages normally associated with the continental upper plate of asubducting system, especially trench deposits and volcanic arc rocks, arenow hidden by the overthrust rock masses. Possibly the small tectonicsliver of Upper Jurassic sedimentary and volcanic rocks (unit Js) alongthe Talkeetna thrust ;s the only exposed ,remnant of these hidden assemblages.As shown on the cross section, the main thrust along which mostmovement presumably occurred is the Talkeetna thrust, and all other thrustsnorthwest of it are interpreted to be slivers below it.The northeast-southwest-trending compressional structural features.that is the folding and thrusting. indicate a general northwestward47
tectonic transport. This is further supported by the sharp character ofthe suture zone in eastern <strong>Alaska</strong>, along which the allochthonous rocksof southern <strong>Alaska</strong>, especially the Wrangellia terrane, are in contactwith the pre-middle Cretaceous North American continent. This suturezone in eastern <strong>Alaska</strong> trends northwesterly and is devoid of the structuralcomplexities of the Chulitna area. This part of the suture, thepart southeast of Paxson, which also coincides with the middle Tertiaryto Holocene Denali fault, is thus interpreted to have been a transform ora wrench fault. In contrast, the great variety of tectonically juxtaposedrock packages in the Chul itna area may be the result of "bulldozingllby a large continental block drifting toward the northwest.The age of this orogenic period of continental collision and subsequentobduction is indicated by the age of its structural features,which are discussed in the Structure section, to be middle to Late Cretaceous.In summary, southern <strong>Alaska</strong> is interpreted to have developed geologicallyby the accretion of an 'indeterminate number of northwestward driftingcontinental blocks to the North American continent. After collision,at least parts of these blocks were thrust several hundred kilometersonto the North American continent in middle to Late Cretaceous time. Theresulting structural features are truly alpine in character and comparefavorably with the classic structures of the Alps in their grandeur andcomplexity.48
A corollary of the present tectonic interpretation of southern <strong>Alaska</strong>is that the present Denali fault, a middle Tertiary and younger feature(Richter and Jones, 1973), has not played a significant role in the tectonicdevelopment of southern <strong>Alaska</strong>. The eastern, that is strike-slipportion of the Denali fault (Csejtey, 1976), may not have more than a fewtens of kilometers of total movement.An interesting, but still unresolved, tectonic problem in the TalkeetnaMountains region is the shallow depth of the present Benioff zone(Lahr, 1975). The 50-km contour (below sea level) for the upper surfaceof the Benioff zone strikes northeasterly and ;s approximately below theJurassic trondhjemite batholith (unit Jtr). The 100-km contour, alsostriking northeasterly, is located approximately under the northwest cornerof the map area. According to plate tectonic concepts, in conjunction witha subducting system, the top of the undergoing slab should descend atleast 100 km below sea level for magma generation. It appears that inthe Talkeetna Mountains region there is not enough thickness of upper platefor magma to form. For the Jurassic and older igneous rocks the problemcan be explained that these rocks are allochthonous and have been tectonicallycut off and transported away from their roots. However, for theUpper Cretaceous and younger igneous rocks, this mechanism cannot beinvoked. Two explanations are possible. First, that the present shallowposition of the Benioff zone is a relatively recent phenomenon achievedby shearing and cutting away of the base of the upper plate by the downgoingslab. Perhaps the development of the present Denali fault and49
other middle Tertiary and younger faults of southern <strong>Alaska</strong> could berelated to this process. The other possibility is that all the UpperCretaceous and younger igneous rocks of the Talkeetna Mountains regionwere formed in a thin upper plate by exceptionally high heat flow ofunknown origin and mechanism (atectonic anatexis by Reed and Lanphere.1974).50
Anderson, R.References citedE., 1969, Geology and geochemistry of the Diana Lakes area,western Talkeetna Mountains, <strong>Alaska</strong>:Geol. Rept. 34, 27 p.<strong>Alaska</strong> Oiv. Mines and GeologyBarnes, F. F., 1962, Geologic map of lower Matanuska Valley, <strong>Alaska</strong>:Berg, H.U.S. Geo1. Survey Misc. Geol. Inv. Map I-359.C., Jones, O. L., and Richter, O. H., 1972, Gravina-Nutzotinbelt-~Tectonicsignificance of an upper Mesozoic sedimentary andvolcanic sequence in southern and southeastern <strong>Alaska</strong>, inGeological Survey research 1972:800-0, p. 01-024.U.S. Geol. Survey Prof. PaperBuddington, A. F., 1959, Granite emplacement with special reference toNorth America: Geo1. Soc. America Bull., v. 70, p. 671-747.Clark, A. L., Clark, S. H. B., and Hawley, C. C., 1972, Significanceof upper Paleozoic oceanic crust in the Upper Chulitna district,west-central <strong>Alaska</strong> Range, in Geological Survey research 1972:U.S. Geol. Survey Prof. Paper 800-C, p. C95-Cl01.Csejtey, Bela, Jr., 1974, Reconnaissance geologic investigations in theTalkeetna Mountains, <strong>Alaska</strong>:74-147, 48 p.U.S. Geo1. Survey Open-file Rept.1976, Tectonic implications of a late Paleozoic volcanic arc in--the Talkeetna Mountains, south-central <strong>Alaska</strong>: Geology, v. 4,p. 49-52.51
Csejtey, 8~la, Jr., Nelson, W. H., Eberlein. G. D., Lanphere, M. A.,and Smith, J. G., 1977, New data concerning age of the ArkoseRidge Formation, south-central <strong>Alaska</strong>, ~ 8lean, K. M., ed., TheUnited States Geological Survey in <strong>Alaska</strong>: Accomplishments during1976: U.S. Geo1. Survey Circ. 751-B, p. B62-864.Oetterman, R. L., Plafker, George, Tysda1, R. G., Hudson, Travis, 1976,Geology and surface features along part of the Talkeetna segmentof the Castle Mountains-Caribou fault system, <strong>Alaska</strong>: U.S. Geol.Survey Map MF-738.Oetterman, R. L., Reed, B. L., and Lanphere, M. A., 1965, Jurassicplutonism in the Cook Inlet region, <strong>Alaska</strong>, ~ Geological Surveyresearch, 1965: U.S. Geol. Survey Prof. Paper 525-0, p. 016-021.Evernden, J. F., Curtis, G. H., Obradovich, J. D., and Kistler, R. W.,1961. On the evaluation of glauconite and illite for dating sedimentaryrocks by the potassium-argon method: Geochim. et Cosmochim.Acta, v. 23, p. 78-99.Grantz, Arthur, 1960a. Geologic map of the Talkeetna Mountains A-lquadrangle and the south third of the Talkeetna Mountains B~lquadrangle, <strong>Alaska</strong>: U.S. Geol. Survey Misc. Geol. Inv. Map 1-314,scale 1:48,000.______ 960b, Geologic map of the Talkeetna Mountains A-2 quadrangle,<strong>Alaska</strong> and the contiguous area to the north and northwest: U.S.Geol. Survey Misc. Geol. Inv. Map 1-313, scale 1:48,000.52
Grantz. Arthur. 1961a, Geologic map of the north two-thirds of Anchorage0-1 quadrangle, <strong>Alaska</strong>: U.S. Geo1. Survey Misc. Geol. Inv. Map1-343. scale 1:48,000.__ 196"lb. Geologic map and cross sections of the Anchorage 0-2 quadrangleand northernmost part of the Anchorage 0-3 quadrangle.<strong>Alaska</strong>:1 :48.000.U.S. Geo1. Survey Misc. Geol. Inv. Map 1-342. scale1964. Stratigraphic reconnaissance of the Matanuska Formation in--the Matanuska Valley. <strong>Alaska</strong>: U.S. Geol. Survey Bull. 1181-1.33 p.Grantz. Arthur. Thomas. Herman. Stern, T. W .• and Sheffey. N. B., 1963,Potassium-argon and lead-alpha ages for stratigraphically bracketedplutonic rocks in the Talkeetna Mountains. <strong>Alaska</strong>, ~ U.S. GeologicalSurvey Research 1963:p. 856-B59.U.S. Geo1. Survey Prof. Paper 475-B,Grantz, Arthur, and Wolfe, J. A .• 1961, Age of Arkose Ridge Formation,south-central <strong>Alaska</strong>: Am. Assoc. Petroleum Geologists Bull., v.45, p. 1762-1765.Hillhouse. J. W., 1977, Paleomagnetism of the Triassic Nikolai Greenstone,McCarthy quadrangle, <strong>Alaska</strong>:v. 14, p. 2578-2592.Canadian Jour. Earth Sci.,Jones. O. L., 1967. Cretaceous ammonites from the lower part of theMatanuska Formation, southern <strong>Alaska</strong>:Paper 547, 49 p.53U.S. Geol. Survey Prof.
Jones, D. L., Silberling, N. J., Csejtey, Bela, Jr., Nelson, W.and Blome, C. D., 1978, Age and structural significance of theChulitna ophiolite and adjoining rocks, south-central <strong>Alaska</strong>:U.S. Geol. Survey Prof. Paper.(in press).Jones, D. L., Silberling, N. J., and Hillhouse, John, 1977, Wrangellia--A displaced terrane in northwestern North America:Jour. Earth Sci., v. 14, p. 2565-2577.H.,CanadianLahr, J. C., 1975, Detailed seismic investigation of Pacific-NorthAmerican plate interaction in southern <strong>Alaska</strong>:Columbia Univ., Ph.D. thesis, 141 p.New York City,Ray, R. G., 1954, Geology and ore deposits of the Willow Creek miningdistrict, <strong>Alaska</strong>: U.S. Geol. Survey Bull. 1004, 86 p.Reed, B. L., and Lanphere, M.<strong>Alaska</strong>-Aleutian Range batholith:v. 2, p. 343-352.A., 1974, Chemical variations across theU.S. Geol. Survey Jour. Research,Richter, D. H., and Jones, D. L., 1973, Structure and stratigraphy ofeastern <strong>Alaska</strong> Range, <strong>Alaska</strong>:19, p. 408-420.Am. Assoc. Petroleum Geologists Mem.Rose, A. W., 1967, Geology of an area on the upper Talkeetna River,Talkeetna Mountains quadrangle, <strong>Alaska</strong>:Minerals Geol. Rept. 32, 7 p.<strong>Alaska</strong> Div. Mines andISilberling, N. J., Jones, D. L., Csejtey, Bela, Jr., and Nelson, W.1978, Interpretive bedrock geologic map of part of the Upper Chulitnadistrict (Healy A-6 quadrangle), <strong>Alaska</strong> Range, <strong>Alaska</strong>:Survey Open-file Rept.54H.,U.S. Geol.
Smi~h,T. E., 1974a, Newly discovered Tertiary sedimentary basin nearDenali: <strong>Alaska</strong> Div. Geol. and Geophys. Surveys Ann. Rept., 1973,p. 19.______ 1974b, Regional geology of the Susitna-MacLaren River area: <strong>Alaska</strong>Div. Geol. and Geophys. Surveys Ann. Rept., 1973, p. 3-6.Smith, T. E., Bundtzen, T. K., and Trible, T. C., 1975, Strataboundcopper-gold occurrence, northern Talkeetna Mountains, <strong>Alaska</strong>:<strong>Alaska</strong> Div. Geo1. and Geophys. Surveys Misc. Paper 3, 7 p.Turner, D. L., and Smith, T. E., 1974, Geochronology and generalizedgeology of the central <strong>Alaska</strong> Range, Clearwater Mountains, andnorthern Talkeetna Mountains: <strong>Alaska</strong> Div. Geo1. and Geophys.Surveys Open-file Rept. 72, 11 p.Turner, F. J., 1968, Metamorphic petrology, mineralogical and fieldaspects: New York, McGraw-Hill, 403 p.55
T.~I.I.--rot ••• lua-.c,oo .,. dot.ratoatloo. tro. tho'hlk.. tno HouDtoln. ~uadr.n,l. .od tho aorthoro part oftho o\llcho tal. 'l.uoduolle, o\taolt.~OCalcuhtodlaO· o\rrod ., ....~HAp Locatloo • hld ••• loclt Illaarol (.,ol,ht totd (.Hllo" •00. Lit. (HI Loo,. (W) t,,1 d.tod ,orCOllt) .t , .... , l.ferlRcl1. 62°,,· SO" lUoU'"'' 7,.C,92 Gulllri Ilotttl 7.'4(21 6.ZI' 0.49 51.St.I.1 Tbtl uport(.dl.dUnl2. uo,,'n" U8 0 U'U" 15;l.CrU6 GUliod tor tto Itotltl 9.08UI I.S&3 0." 5"'1::.1.1 Thta uport), nOu'za" IUoU'SO" u-I-n Grandlortu atotitl SS.ltl,1 Turllir .. dSatth (1.7414. 102°",'46" 14,°,.'20" Uo\Cr2 Groottl Itottu ....(2) 6.910 0.11 S6.)tl, I Tbtl u,ort(odo.. UIU)
KapLoc.tlon lidd 110. locllnQ, Lat. (II) \.001' {WI t,pe-----_.T.ble l.-·ContinuedtUner"ldateditOCal" luadtoGA,,:"2°-Arc.d'I1f..--.......{wel,httotalCQ-l~:l~(aUl1on.puceot)of ,.au)'1'''.Iduao"e11. 112"U' ~OM U8 0 0lo')5M S901Gd12. Q ... uu Ilotlta In ,,,.r,,de.. aDddlorl ... ntb .... (1961)Il"tlta l1Gt,6 Oac.t.aIWA,4 804otlleu (1'.165)ILnUn 161 Crace I &Adotha .. (1961)ll"rDblenil" 16lt.6 Oattaraa..an .. ndothara (l9QU18. 62"09'00" 149°11'10" lUC,1I1 Quarto UotlU 9.]] 9.201 O,J9 U.lt.l c.eju,. 191,dlodLelIornbI. n4 .. 1.041(2) 9.869 o.n 64.6t,1 C .. jte,. 191419. 61"08'4/0" 149°18')0" 1:u.C, 121 Too.Ute BLotlte 9.10 9.0H 0.11 6(o.4:!:.1 c..Jt." 1914Hornblende 0.182(%) 0.1)11 0.18 h.)!'.2 Ca.Ju" 1914(J1 ZO. 62 % ' 21" 148 0 S9'44" JUCJ9S CranO(2) 20.44 0.89 ",a!'.s .0 tilL. t.pyre.~8 • ~lu49"l6n 149"14')0" GO.IG.40 t..."n411cd notnDl.!n~w:t O.lH(!) O.IUB 1).14 1l.1;t2,2 till. r.puttSee footnotes at en~ of table
Table 1.··ContlnuedU'lCOI \l'lIap Locatio .. .hU DO. lock "lo,ul ,,,,.f,ht..... Lat.(II) LOOI' ell) t" • datld p ...Celeulou44O.\r,..4 ••••••~ e_Ulloo.: ... t) rbi.J of r .. re)u. ~loU'"'' 149°12'41" 6UG,1I2 Tonallu 110UtI '.61(2) 1.111 0.19 69. 0:t.2.11I0fllll ..... 0.810(2) o.,.n 0.16 U.,:!:.P2.Z]0. 61"U'U" IU o U'Q6M 66AGcW4 T" .. U" 110Uto 7,lZ(2) 1.624 0.91 12.O:!:.Z.!Horlllll.odo 0.U2:t0.OO:J(l) O.51H 0.41 H.4:t2.2lI. 101°49',." ulon' 50· 74,AC,151 Trondhj •• Uo II .. oco"". 10.51(2) 21.21 0.95 1l':t4.0l2 61"U'O]" 149"25'0'· 7]AC,n S.fpUU ..,," AcUlloHu O.OlZ" O.DUh 0.01>4 '1.':t4.4n. 61°41'00" 149")2')0· nAC,U lI"acovlte lIuacovlU 1.]4(2) 1.119 O.BS st.O:!:.I ••achlot14, 61°4]' SO" 149"26'05" llAC,27 lIuocovlU 1I".coviU '.16(2) I.SS4 0.89 U.':t).O.elllitn. 61 0 44')2" I49"U'U" 73AC,II. lIuocovlU Huaco"l to ,.10(2) 1.911 0.14 St.':!:.I,... blat)6. 61 o U'O)" 149"U')1" H"SJIDOo SupI.tlnlU AcUII .. llu O.OU" 0,0]191 0.10 9l.1I±,4,6)1. 61°U'20" 14'''10' 20· 76"C,19 Hat .. orph".,d II"Utl 1.071(2) 1.061 O.U 61"1.Z•4I "yveck.a.huoelthh uport'l'hh reportThlo report'l'hl. report'l'hll raportthl. report'l'hh up .. rtthl. reportTille rep .. rttil II reportthh repart·"'•• n and, whare .ore thaA two ..... urtaent' "1,1 IMde., ... Ind.r" dlvlathta. thoUab.r 01 1I1'IUre.entl I. 10 per.nth.i •••··Fotaaaium de,ef81nl, "l ll"top' dll~'lor' Pota •• lua dotfoa1nrd bl fl ••• pbotoGI,rl (or athar .a.pl••••• 'l a ·0.S72110· yr· ,1 ·1.71110· yr-, 1~ • 4.963110· yr-. ~/~· !.lb7XIO· .01/.01. Tb. ~ (laur •• ara •• tlaa, •• ofan.lytlca. precilloD It tt. 'I p.reeQt l.val of caofld.pc •• All p.aylaualy publl.b.d .1". w.rl fec.lcula'ed u.lPI ,h ••• doc a,tOO.'.O'". For thlo '.pOtt,-pot ••• l ... Inaly ••• ","r. donI b, L. D. Schlockaf, G. E. Amb.,a, J. G. S.lth, R. C. Whltlb •• d, S. T.Hltl. aad H. L. Silber.,pt lad Ir,QD .... vrc •• ot. vera doni by K. A. Lanphere, J. C. ~on tl.eo, A. L •• "ry. I. K. Kllr •• S. I.51 .. , J. C, '.ltb, ODd II. L. Sllbe ... II.
Table 2.--Lead-alpha age determinations on zircon from southeastern part ofTalkeetna Mountains quadrangle, <strong>Alaska</strong>f>1ap Location Apparentno. Lat.(N} Long. (W) Field no. Rock type age (m.y.) References15 62°21' 2211 147°49'18" 59AGzM58 Granodiorite 165+20 Grantz and others (1973)16 62°21'1 ]'I 147°49'12" 59AGzM57 Granodiorite 125+15 Grantz and others (1973 )
""'I) nUlliberd1 .. 1_~L-un!!field"-'!"*>~r:foss ils__ A~ __Itltfltificatlol1 4.\I!~j~_ ~.~·1~':!!~~·~~ .~!~1 l:lAStlIv63latest Kamidnor farly HorianK. H. "lcOoI, dndN. J, 51 Ib"r1 hog1. E. Silitll. 10' I tl ""eOftlllUn .• 1914.2 16ACy-PIs 473 13ASt-PIs 1400Crinoid col ..... ls 2 c. In dictllleter; echlnodera.nd brdch iopod debrls, indet.[cMnode". debris. indet.Platycrinltld, Indet. (partial cup andculUllllal s).llorn coral, Indet.fenestrdte and r ... ose bryozoans, Indet.(dbuntl~nt) •.suh.·ox~tctPU.;i? sp ..Rhynchonelloid brachiopod. indet.Productold br"dtiopod (Iaq,e, Indeterillinate).Splrlferold braclilopod (perhaps ';pirUclrdl,,).Hart inlold brdciliopod (perh
DEPARTMENT Of THE INTERIORUNITED STATES GEOLOGICAL SURVEYOPEN FILE REPORT78-558AC(mRElATIOH 01" WAP VI'OITSE);PLANAnON Of MAP SVMaotS"",",,~'_te .. "UtI ~, ,""I'lll .... H~~------\--;;t--~--int ..' .... d """.. 'wn>~IM'''h IOCAtooi. '~"n •• ~ w'" ,MoM',s,b!,1T&o
SECTION EENVIRONMENTAL ASSESSMENT
SECTION EENVIRONMENTAL ASSESSMENTTABLE OF CONTENTSItem P~INTRODUCTIONSUMMARY OF CHANGES E-2ENVIRONMENTAL SETTING E-3Biological Characteristics E-3Mamma 1 s - Moose E-3Cultural Characteristics E-3Archeological Resources E-3ENVIRONMENTAL IMPACTS OF THE DEVIL CANYON - WATANAHYDROPOWER PLAN E-5Mammals - ~1oose E-5Archeological Resources E-6Section 404(b) Evaluation E-6Executive Order 11988 (Flood Plain) Evaluation E-6RELATIONSHIP OF THE PROPOSED DEVELOPMENT TO LAND USE PLANS E-8LITERATURE CITED E-10E-li
INTRODUCTIONIn the almost 4 years since the original environmental assessment(EA) was prepared, much new information has been made available throughthe efforts of various Federal and State agencies. Some of the informationwould result in minor changes in the EA if incorporated. Theseminor changes would not substantially alter the reader's perceptionof the proposed project or its environmental impacts. Such informationhas therefore not been incorporated in this supplement. Some of thenew information, however, could substantially alter the reader's perceptionof the proposed project or its environmental impacts. Thistype of new information has been summarized in this supplement. Itshould be noted, however, that the information obtained to date ;s onlypreliminary and lacks needed details and that additional biological andsocial information remains to be gathered in the future in order tocomplete an adequate and meaningful assessment of environmental impacts.E-l
SUMMARY OF CHANGESThere is new biological information related to moose. In general,moose occupy the upper Susitna River basin to a greater degree thanpreviously thought.Also, archeological studies conducted by the <strong>Alaska</strong> District haveresulted in archeological finds of potentially significant cultural value.As a result of this new information, the potential for additionalenvironmental impacts has been recognized, and the importance of previouslyidentified impacts has been reevaluated. Impacts to moose willprobably be far more significant than previously believed. Impacts onarcheological resources could be potentially significant if not properlymitigated.A discussion of the recognition of the need for a Section 404(b)evaluation has been added to address the requirements of the FederalWater Pollution Control Act and the Clean Water Act. An evaluation offlood plain considerations as per Executive Order 11988 has also beenadded.Land use is in a constant state of change because of the <strong>Alaska</strong>Native Claims Settlement Act, the Federal Land Policy and ManagementAct, and various other regulations related to wilderness. A shortupdate on these land use considerations has been added.E-2
BIOLOGICAL CHARACTERISTICSMammals - MooseENVIRONMENTAL SETTINGMoose range throughout the entire Susitna River basin, and theirnumbers in the basin have fluctuated widely since the early 1900's.The population reached a peak in the early 1960's, then began a declinethat has continued to the present time. Factors contributing to thedecline have included loss of productive browse habitat as a result ofeffective fire suppression over the past two decades, a rapid increasein predator populations following cessation of control efforts in themid-1950's, and a number of severe winters with deep accumulations ofsnow.The preliminary movement data gathered thus far by the <strong>Alaska</strong>Department of Fish and Game (ADF&G) indicate that moose from severalsurround"ing areas migrate across or util ize the portion of the upperSusitna River basin adjacent to the river during some portion of theyear. ADF&G recorded observations of 2,037 moose during the fall 1977counts. Studies indicate that an observer generally sees between 43 to68 percent of the moose in an area during an aerial survey. USing 50percent to extrapolate roughly, the resident population using the upperSusitna basin probably falls between 4,000 and 5,000 moose. This is asubstantial increase when compared with 1973 figures which estimatedthe upper bas"in population at approximately 1,800 animals. This widediversity in population estimates can be attributed to better researchtechniques and improved population estimating methods.Present information indicates that moose depend heavily upon theriver bottom and adjacent areas for winter habitat and calving areas,both above and below the Watana and Devil Canyon damsites. Increasingsnow depths above timberline trigger moose migrations to the winteringareas in the lowlands. Additional observations of moose during normaland severe winter conditions are necessary to determine the importanceof the area as critical winter range.CULTURAL CHARACTERISTICSArcheological ResourcesAn archeological reconnaissance was conducted by the Corps ofEngineers in 1978 for the purpose of clearing specific sites withinthe project area so that geological investigations could be conducted.Four sites were found in the Watana damsite area which range in ageE-3
from 3,700 to 12,000 years old. These sites, generally located on topof small knolls, were probably associated with the hunting activitiesof primitive man. No base camps or kill sites were found but theymust also exist. The number of sites found shows that the potentialfor other finds is extremely high and indicates that prehistoric useof the area appears to have been considerable. At the present time,the sites found have not been nominated for inclusion on the NationalReg; ster.E-4
ENVIRONMENTAL IMPACTS OF THE DEVIL CANYON - WATANA HYDROPOWER PLANMAMMALS - MOOSEAccording to ADF&G surveys conducted ;n 1977, construction of theWatana dam would have a highly detrimental effect on moose populationsin that inundation of the lower, spruce-covered reaches of the WatanaCreek valley, which are probably critical moose habitat, would substantiallyreduce the carrying capacity of the area. In addition, constructionof the Devil Canyon dam would also adversely impact moosepopulations and substantially reduce the carrying capacity of a majorportion of the Devil Creek drainages. The Devil Canyon impacts arenot expected to be as significant as the Watana impacts because of themarginal habitat and limited moose populations in the Devil Canyon area.Present information indicates moose depend heavily upon the riverbottoms and adjacent areas for winter habitat both above and belowthe Watana and Devil Canyon damsites. Lack of adequate winteringareas in the lower Susitna valley below the Devil Canyon damsite hasbeen a major limiting factor to moose population growth in the past.Most existing winter range is along the major rivers where periodicflooding has caused rechanneling of the main stream, allowing riparianwillow to colonize the dry streambeds. Regulating the flow of waterfrom the dam at Devil Canyon may have a highly detrimental effect ongrowth of riparian vegetation downstream to the mouth of the Susitna.It is possible that maintaining a steady flow of 8,000 to 10,000 cubicfeet per second from the Devil Canyon dam would effectively preventthe flooding activity that presently occurs periodically. This couldcreate a short-term abundance of winter range along the riverbanks thatmight last 30 or more years. The net long-term effect could well be anegative one, however, as it is suspected that the present naturalflooding activity of the Susitna River produces favorable conditionsfor browse production. Without the annual floods. these riparian areascould become mature stands of hardwoods after 25 or 30 years and providelittle or no winter forage. Research on riparian vegetationhabitat types and associated moose usage downstream of dam constructionis essential to determine potential impacts on moose populations.Construction of the Devil Canyon dam would flood approximately7.500 acres. The riverbanks along this portion of the river aregenerally steep and provide marginal moose habitat. Since water levelsin the Devil Canyon reservoir will remain fairly constant, low mortalityrates associated with ice shelving and steep mudbanks would beexpected.E-5
Construction of the Watana dam would result in the flooding ofapproximately 43,000 acres along Watana Creek and the Susitna River.Approximately 35,000 acres sustain moderate to heavy utilization bymoose during an average winter. <strong>Data</strong> gathered by ADF&G indicate thatmoose from several surrounding areas of the Susitna basin migrateacross or utilize this portion of the river during some period of theyear. Effects of the construction of the Watana dam on moose populationscould be substantial. The resident nonmigratory segment of thepopulation could be eliminated. Migratory moose could also be substantiallyeffected in that the reservoir could be an effectivebarrier to migrations during some seasons. Due to large fluctuatingwater levels, ice shelving and steep mud banks could be expected tocause high mortality among moose, especially calves.This discussion of impacts on moose populations within the upperSusitna River basin is substantially different from the discussioncontained in the 1976 Interim Feasibility Report, which predictedthat the proposed project "would affect only a small percentage of theupper Susitna moose population." The newly gathered information hasresulted in the reevaluation of previously identified impacts and therecognition that additional impacts potentially exist which may beimportant.ARCHEOLOGICAL RESOURCESAn archeological reconnaissance conducted by the Corps of Engineersin 1978 resulted in the finding of several previously unknown archeologicalsites in the Watana damsite area. This reconnaissance indicatesthat the potential for other finds is extremely high. Intensive archeologicalsurveys will be conducted during the project feasibility analysisto conform with cultural resource regulations. If the project isdetermined to be feasible, a program will be conducted to salvagearcheological sites which will be impacted by the project.SECTION 404(b} EVALUATIONTo date a Section 404(b} evaluation (Discharge of Dredged or FillMaterials into Waters of the United States) under the Federal WaterPollution Control Act of 1972 (Public Law 92-500) as ammended has notbeen performed. A 404(b} evaluation will be performed with datagathered during the project feasibility analysis.EXECUTIVE ORDER 11988 (FLOOD PLAIN) EVALUATIONIn compliance with Executive Order 11988 the items under Paragraph8 of General Procedures have been considered as follows:E-6
1. The project ;s designed to impound water behind two dams inthe natural channel of the river. The basic conditions of this hydropowerproject present no economically feasible alternatives.2. The construction of the project will cause only minor induceddevelopment in the immediate area since the product (energy) will betransmitted to existing population centers far removed from the projectsite.3. The natural and beneficial values of the flood plain will bedisrupted only at the site of the reservoir and powerplant. Revegetationprograms will be adopted to restore slopes along construction sitesand roadways.4. As the project progresses from its initial phase to the designand construction phases, there will be a continuing evaluation anddialogue with local interests and concerned agencies who will haveconstant input to the study.E-7
RELATIONSHIP OF THE PROPOSED DEVELOPMENT TO LAND USE PLANSLands within the upper Susitna River basin are essentially in largeblock ownership with the majority under the control of the Departmentof the Interior, Bureau of Land Management (BLM). These lands aregenerally in their natural state and undeveloped with improvements orland access routes. Air transportation is the primary means of accessto and within the area. There are some scattered small parcels of landin private ownership as homestead sites or mining claims. Many ofthese private parcels have no developed overland access. For the mostpart, development in the area is concentrated along the establishedtransportation routes such as the Parks Highway and the <strong>Alaska</strong> Railroadon the west and the Denali Highway on the north.Because of the absence of roads and other development in the basin,the area is subject to Section 603 of P.L. 94-579, "The Federal LandPolicy and Management Act of 1976." This section provides for theprotection and study by BLM of roadless areas of public land containing5,000 or more acres. The intent is the protection of potential wildernessarea values pending a determination of the ultimate classificationand use of such lands. During the allotted 15 year study period, anyuse of the lands is subject to BLM authorization and must be conducted"..• in a manner so as not to impair the suitability of such areas forpreservation as wilderness ...".Consequently, any development or constructionin the area would be precluded pending a determination andclassification by BLM.Most of the public lands in the basin have been selected by Nativecorporations under the <strong>Alaska</strong> Native Claims Settlement Act (ANCSA),as amended of 18 December 1971. These selected lands remain under thejurisdiction of BLM pending final conveyance of fee simple title tothe various Native corporations. Any use of these lands prior toconveyance of title is subject to specific permission from BLM withthe concurrence of the various concerned Native groups.The gross land area required (lands which must be acquired) forcontainment of the proposed Devil Canyon and Watana reservoirs isapproximately 157,440 acres. Of this land, 67,200 acres are to beconveyed to the Cook Inlet Region, Incorporated (CIRI) for laterreconveyance to various village corporations. This transfer of landsis directed by a 1976 amendment to ANCSA, P.L. 94-456 and will includeboth the surface and subsurface interests. This transfer also includeslands within Power Site Classification No. 443 which was establishedin 1958 for potential future development of the Susitna River for hydroelectricpower production.E-8
In addition to the lands discussed above, as many as 53,760 acreshave been selected for conveyance to satisfy any deficiencies that mayexist in total acreage entitlements under ANCSA. These "deficiency"selections in the area have a selection priority of nine (9) and, inall probability, will not be conveyed to CIRI on behalf of the villagecorporations. These lands have, however, been overselected by CIRIfor its own benefit and could conceivably be conveyed to CIRI. Aportion of these lands south of the Susitna River (24,686 acres) hasbeen made available for selection by the State of <strong>Alaska</strong> pursuant tothe agreement titled "Terms and Conditions for Land Consolidation andManagement in the Cook Inlet Area" (Cook Inlet Land Swap Agreement).The State's right to select these lands for conveyance is superior tothat of CIRI but is inferior to valid village corporation selections.Since the village corporation selections are priority nine (9) it isprobable that the State could receive the title to the lands.The remaining area within the proposed reservoir boundaries (36,480acres) is controlled by BLM and has been withdrawn from appropriationfor either study and classification or for selection by CIRI as aIIdeficiencyll selection area. Again, this "deficiency" selection ;san excess, or overselection, to make lands available for satisfactionof total acreage entitlements. Conveyance of any portion of suchselected lands is limited.to fulfillment of acreage entitlements andis indeterminable at this time. As discussed above, the State of<strong>Alaska</strong> will have a right to select a portion of this area south ofthe Susitna River (5,120 acres), and such a selection would be superiorto that of CIRI.E-9
LITERATURE CITEDBacon, Glenn. Archeology in the Upper Susitna River Basin 1978. ArmyCorps of Engineers, <strong>Alaska</strong> District, 1978.Riis, James C., and Nancy V. Friese. IIFisheries and Habitat Investigationsof the Susitna River-~A Preliminary Study of PotentialImpacts of the Devils Canyon and Watana Hydroelectric Projects,"Pre1iminar~ Environmental Assessment of Hydroelectric Developmenton the Susltna River. <strong>Alaska</strong> Department of Fish and Game for theU.S. Fish and Wildlife Service, March 1978.Taylor, Kenton P. and Warren B. Ballard. IIMoose Movements and HabitatUse Along the Upper Susitna River--A Preliminary Study of PetentialImpact of the Devils Canyon Hydroelectric Project," PreliminaryEnvironmental Assessment of Hydroelectric Development on theSusitna River. <strong>Alaska</strong> Department of Fish and Game for the U.S.Fish and Wildlife Service, March 1978.U.S. Army Corps of Engineers, <strong>Alaska</strong> District.Susitna Hydropower Feasibility Analysis.or <strong>Alaska</strong>, June 1978.Plan of Study forPrepared for the StateE-10
SECTION FRECREATIONAL ASSESSMENTNone of the OMB comments were directed at therecreational aspects of the project. Therefore,no additional recreation studies were undertaken.