E-CAMP - Encina Wastewater Authority
E-CAMP - Encina Wastewater Authority
E-CAMP - Encina Wastewater Authority

Create successful ePaper yourself
Turn your PDF publications into a flip-book with our unique Google optimized e-Paper software.
ENCINAWASTEWATERAUTHORITYFY 2014ENCINA WATER POLLUTIONCONTROL FACILITYCOMPREHENSIVEASSETMANAGEMENTPLAN (E-<strong>CAMP</strong>)“With acomprehensive assetmanagement planwe remain steadfastin meeting ourcommitment to theEWA Mission”
This page intentionally left blank
This page intentionally left blank
<strong>Encina</strong> Water Pollution Control Facility E‐<strong>CAMP</strong>Table of ContentsTABLE OF CONTENTS ......................................................................................................................... ISECTION 1: EXECUTIVE SUMMARY .................................................................................................... 1SECTION 2: INTRODUCTION TO EWA COMPREHENSIVE ASSET MANAGEMENT PLANNING ................ 92.1 Background ............................................................................................................................ 92.2 Purpose .................................................................................................................................. 92.3 <strong>CAMP</strong> Process Overview ...................................................................................................... 102.3.1 History ..................................................................................................................... 102.3.2 Capital Projects ....................................................................................................... 102.3.3 Asset Register .......................................................................................................... 102.3.4 Condition Assessment ............................................................................................. 102.3.5 <strong>CAMP</strong> Methodology ................................................................................................ 102.3.6 Schedule .................................................................................................................. 112.3.7 Project Numbering System ..................................................................................... 11SECTION 3: CONDITION ASSESSMENTS SUMMARY ......................................................................... 133.1 Assets at End of Service Life, Project Pending ..................................................................... 133.2 Condition Assessments – FY 2014 ........................................................................................ 13CA‐8.1.002 Fire Main Supply ................................................................................................ 13CA‐8.1.003 FY 2014 Assessments Triggered by Asset Age .................................................. 143.3 Condition Assessments – FY 2015 ........................................................................................ 14CA‐8.1.004 FY 2015 Assessments Triggered by Asset Age .................................................. 14CA‐8.1.005 Underground Structures – Part 1 ..................................................................... 153.4 Condition Assessments – FY 2016 ........................................................................................ 15CA‐8.1.006 FY 2016 Assessments Triggered by Asset Age .................................................. 15CA‐8.1.007 Underground Structures – Part 2 ..................................................................... 16CA‐8.1.008 Bridges .............................................................................................................. 163.5 Condition Assessments – FY 2017 ........................................................................................ 16CA‐8.1.009 FY 2017 Assessments Triggered by Asset Age .................................................. 163.6 Condition Assessments – FY 2018 ........................................................................................ 17CA‐8.1.010 FY 2018 Assessments Triggered by Asset Age .................................................. 17SECTION 4: STUDIES, UPDATES AND ENGINEERING SERVICES ......................................................... 194.1 Studies ................................................................................................................................. 194.1.1 Conceptual Studies.................................................................................................. 19S‐1.1.006 GRS Isolation Improvements .................................................................. 19S‐1.2.006 PSB Struct and Mech Rehab ................................................................... 20S‐1.2.009 PE Pipeline Rehab ................................................................................... 22S‐1.3.013 SC Concrete Evaluation .......................................................................... 23S‐3.1.002 DAFT System Replacement .................................................................... 24S‐5.1.005 Primary Odor Control Expansion............................................................ 26E FY2014 E‐<strong>CAMP</strong> Report 2012‐12Dec.docx I December 26, 2012
<strong>Encina</strong> Water Pollution Control Facility E‐<strong>CAMP</strong>Table of Contents4.1.2 Special Studies......................................................................................................... 26S‐8.2.004 Comprehensive Energy Rates Study ...................................................... 26S‐8.2.005 <strong>Wastewater</strong> Characterization Study ...................................................... 26S‐8.2.006 Exterior Asset Corrosion Control ........................................................... 27S‐8.2.007 Offsite Wetlands Restoration ................................................................. 27S‐8.2.008 R&D Projects Support ............................................................................ 274.1.3 Updates ................................................................................................................... 27S‐8.2.003 Biosolids Management Business Plan Update ....................................... 274.2 Other Professional Services ................................................................................................. 274.2.1 Engineering Services ............................................................................................... 27ES‐8.3.001 E‐<strong>CAMP</strong> Update .................................................................................... 28ES‐8.4.002 Extension of Staff Services ................................................................... 28ES‐8.4.008 Electronic O&M Manual and Document Mgmt ................................... 28ES‐8.4.009 Map Underground Piping > 12‐inch ..................................................... 28ES‐8.4.010 Research and Development ................................................................. 284.2.2 Legal and Other Services ......................................................................................... 28OS‐8.5.001 Legal and Misc Services ....................................................................... 28SECTION 5: IDENTIFICATION OF E‐<strong>CAMP</strong> PROJECTS ......................................................................... 295.1 Liquid Process Improvements .............................................................................................. 295.1.1 Headworks .............................................................................................................. 29P‐1.1.005 Grit and Screenings Handling Facility Rehab ......................................... 29P‐1.1.006 GRS Isolation Improvements ................................................................. 32P‐1.1.007 Vactor Receiving Station ........................................................................ 33P‐1.1.008 GRS Rehab .............................................................................................. 34P‐1.1.009 Influent Flow Metering Installation ....................................................... 35P‐1.1.010 Influent Pipeline Rehab with/Addl 2012 Major Rehab .......................... 365.1.2 Primary Treatment .................................................................................................. 37P‐1.2.002 Primary Sludge Pumping Upgrades ....................................................... 37P‐1.2.003 PE Second Pipeline ................................................................................. 38P‐1.2.004 PE Emergency Discharge Pipeline Rehab ............................................... 39P‐1.2.006 PSB Struct and Mech Rehab ................................................................... 40P‐1.2.009 PE Pipeline Rehab .................................................................................. 42P‐1.2.010 PSB Scum Pipeline .................................................................................. 435.1.3 Secondary Treatment .............................................................................................. 44P‐1.3.003 AB‐Selector Implementation and Cover Replacement .......................... 44P‐1.3.004 AB‐Mech Rehab and RAS Pump Addition .............................................. 45P‐1.3.006 Secondary Polymer System Replacement ............................................. 46P‐1.3.007 SCs 5 and 6 Mech Rehab ........................................................................ 47P‐1.3.008 SC 7 – Conversion from EQ to Clarifier .................................................. 48P‐1.3.010 WAS Pipeline Replacement .................................................................... 49P‐1.3.012 AB DO Probe Replacement .................................................................... 50P‐1.3.013 SC Concrete Cracking Prevention .......................................................... 51P‐1.3.014 SCs 1 – 4 Inf and Eff Gate Replacement ................................................. 52P‐1.3.015 AB Flow Eq Feed and Return Pipeline Rehab ......................................... 535.1.4 Effluent .................................................................................................................... 54P‐1.4.001 EPS Rehab .............................................................................................. 54E FY2014 E‐<strong>CAMP</strong> Report 2012‐12Dec.docx II December 26, 2012
<strong>Encina</strong> Water Pollution Control Facility E‐<strong>CAMP</strong>Table of ContentsP‐1.4.002 EPS MCC and Conductors Replacement ................................................ 54P‐1.4.004 EPS Pipe Lining and Abandoned Pipe Coating Repair ............................ 55P‐1.4.005 PD Blower Addition, Aeration/Agitation ................................................ 555.2 Outfall ................................................................................................................................. 565.2.1 Outfall ...................................................................................................................... 56P‐2.1.001 Land Outfall Inspection and Cleaning ‐ Internal .................................... 56P‐2.1.002 Sea Outfall Maintenance and Inspection ‐ External .............................. 57P‐2.1.004 Sea Outfall Ballast Restoration .............................................................. 58P‐2.1.005 Sea Outfall Bathymetric Survey – External ............................................ 585.3 Solids Process Improvements .............................................................................................. 595.3.1 Biosolids Thickening ................................................................................................ 59P‐3.1.001 DAFTs Nos. 1, 2 and 3 Scum Collector Replacement ............................. 59P‐3.1.002 DAF System Replacement ...................................................................... 60P‐3.1.003 TWAS Pipeline Replacement .................................................................. 61P‐3.1.004 DAFT Polymer System Replacement ...................................................... 625.3.2 Biosolids Digestion .................................................................................................. 63P‐3.2.001 Biofuel Receiving Facilities ..................................................................... 63P‐3.2.003 Digesters Nos. 5 and 6 Pump/Piping Foundation Stabilization ............. 64P‐3.2.004 Sludge Screening Facility ........................................................................ 65P‐3.2.005 Digesters Nos. 5 and 6 Mixing Pumps Replacement ............................. 65P‐3.2.006 Cell Lysis Facilities .................................................................................. 66P‐3.2.007 Digesters Nos. 1 and 3 Retrofit for Sludge/Gas Storage ........................ 66P‐3.2.008 Waste Gas Flare Operation Mods .......................................................... 67P‐3.2.009 Digester No. 4 – Interior Coating ........................................................... 68P‐3.2.010 Digesters Nos. 5 and 6 Cover – Interior Coating .................................... 68P‐3.2.011 Second Waste Gas Flare and Pipeline .................................................... 695.3.3 Biosolids Processing ................................................................................................ 70P‐3.3.001 MCC and Conductors Replacement – DW and Power Bldg ................... 70P‐3.3.002 Pellet Storage Facility Improvements .................................................... 71P‐3.3.003 Struvite Control Facilities ....................................................................... 72P‐3.3.004 Pellet Bagging Facilities .......................................................................... 74P‐3.3.005 Cake Pump Mods ................................................................................... 74P‐3.3.006 Dryer Addition and Centrifuges Replacement ....................................... 75P‐3.3.007 Centrifuges Major Maint ........................................................................ 75P‐3.3.008 Dryer Major Maint ................................................................................. 76P‐3.3.009 Drying Safety Upgrades ......................................................................... 77P‐3.3.010 Drying Building Coded Locks .................................................................. 78P‐3.3.012 RTO Media Replacement ....................................................................... 78P‐3.3.013 RTO Replacement .................................................................................. 79P‐3.3.014 RTO Flush Drain Relocation ................................................................... 79P‐3.3.016 Cake Conveyance Equipment Improvements ........................................ 80P‐3.3.017 DW Polymer Storage Tank Replacement ............................................... 80P‐3.3.018 Centrate Pipeline Replacement ............................................................. 81P‐3.3.019 Centrifuge Drive Replacement ............................................................... 81P‐3.3.020 Dryer Drum Repair ................................................................................. 815.6 Energy Management ............................................................................................................ 825.6.1 Energy Management ............................................................................................... 82E FY2014 E‐<strong>CAMP</strong> Report 2012‐12Dec.docx III December 26, 2012
<strong>Encina</strong> Water Pollution Control Facility E‐<strong>CAMP</strong>Table of ContentsP‐4.1.001 Cogen Communications Redundancy .................................................... 82P‐4.1.003 Cogen Engine Catalyst ............................................................................ 83P‐4.1.004 Natural Gas Dilution Equipment Servicing ............................................. 84P‐4.1.005 Cogen Engine Top‐End Overhaul ........................................................... 85P‐4.1.006 Cogen Engine In‐Frame Overhaul .......................................................... 87P‐4.1.007 Cogen Engine Full Overhaul ................................................................... 89P‐4.1.008 Cogen Engine 5 ...................................................................................... 91P‐4.1.010 Cogen Engine 6 ...................................................................................... 91P‐4.1.011 ORC Generator ....................................................................................... 91P‐4.1.012 Heat Loop Bypass Installation ................................................................ 92P‐4.1.013 Cogen Bldg Floor Repair ......................................................................... 93P‐4.1.014 VFDs on Misc Pumps .............................................................................. 94P‐4.1.015 Gas Conditioning Facilities ..................................................................... 95P‐4.1.016 Blower Replacement with High Efficiency Type .................................... 95P‐4.1.018 Lighting and Controls Improvements .................................................... 96P‐4.1.019 Chilled Water and Hot Water Systems .................................................. 96P‐4.1.020 Net Metering .......................................................................................... 965.7 General Improvements ........................................................................................................ 975.7.1 Odor Control ........................................................................................................... 97P‐5.1.001 ORF I System Rehabilitaion .................................................................... 97P‐5.1.002 ORF I Carbon Relacement ...................................................................... 98P‐5.1.003 ORF III Carbon Replacement .................................................................. 99P‐5.1.004 Odor Monitoring Facilities ..................................................................... 99P‐5.1.005 HW/GRT/PSB Odor Control Eval .......................................................... 100P‐5.1.006 IJS Odor Control Improvements ........................................................... 100P‐5.1.007 Drying Bldg Odor Control Improvements ............................................ 101P‐5.1.008 ORF III Chem Feed System Improvements ........................................... 1015.7.2 Plant‐Wide Systems .............................................................................................. 102P‐5.2.001 Natural Gas Pipeline Replacement ...................................................... 102P‐5.2.002 High Risk and Critical Asset Rehabilitation .......................................... 103P‐5.2.004 3WLC Strainer Replacement ................................................................ 104P‐5.2.005 3WHP Strainer Replacement ................................................................ 105P‐5.2.006 3WLC Intertie to 3WHP System ........................................................... 106P‐5.2.007 3WL Pump No. 3 Installation ............................................................... 106P‐5.2.008 Underground Piping Rehabilitation – Multi‐Phase .............................. 107P‐5.2.009 Structure Settlement Stablization ........................................................ 108P‐5.2.010 3WHP Pump Control Improvements ................................................... 108P‐5.2.011 1W System Rehab ................................................................................ 109P‐5.2.012 Site Security Facilities .......................................................................... 110P‐5.2.014 Perimeter Fence Replacement ............................................................ 110P‐5.2.015 Northwest Storm Water Drain Sump to South DAF Pit ....................... 111P‐5.2.016 2W System Upgrades ........................................................................... 112P‐5.2.017 Service Air and Instrument Air Piping Repairs ..................................... 113P‐5.2.019 Plant Beautification .............................................................................. 114P‐5.2.021 Climate Control at MCCs ...................................................................... 114P‐5.2.024 Exterior Asset Corrosion Control ......................................................... 115P‐5.2.025 Tech Master Plan Recommendations Implementation ....................... 115E FY2014 E‐<strong>CAMP</strong> Report 2012‐12Dec.docx IV December 26, 2012
<strong>Encina</strong> Water Pollution Control Facility E‐<strong>CAMP</strong>Table of ContentsP‐5.2.026 Plant Waste Stream Rerouting ............................................................ 116P‐5.2.027 Plant‐Wide Seal Coating....................................................................... 1165.7.3 Buildings ................................................................................................................ 117P‐5.3.001 Ops Bldg Locker Replacement ............................................................. 117P‐5.3.002 Ops Bldg Air Intake Relocation ............................................................ 117P‐5.3.003 Construction Office Upgrade ............................................................... 118P‐5.3.004 Ops Bldg Chiller Replacement .............................................................. 118P‐5.3.006 Secondary Scum Pit Roof Removal ...................................................... 119P‐5.3.008 Roof Access Safety Facilities ................................................................ 1195.7.4 Miscellaneous ....................................................................................................... 120P‐5.4.004 Vallecitos Sample Vault Installation ..................................................... 120SECTION 6: PROJECT PRIORITY RANKING ...................................................................................... 122SECTION 7: RECOMMENDED PROJECT IMPLEMENTATION SCHEDULE AND COST SUMMARY ........ 124APPENDICES:Appendix A: Historical Comprehensive Asset Management and Master Plan Projects by YearAppendix B: FY 2013 E‐<strong>CAMP</strong> Historical, Current and Future Potential Project ListAppendix C: EWA Comprehensive Asset Management Plan MethodologyAppendix D: Project Cost TablesAppendix E: Major Asset Register ProfileLIST OF TABLES:1‐1 E‐<strong>CAMP</strong> Project Priority Ranking Summary ........................................................................... 31‐2 E‐<strong>CAMP</strong> Condition Assessments Summary ............................................................................ 51‐3 E‐<strong>CAMP</strong> Studies, Updates and Engineering Services Summary ............................................. 51‐4 E‐<strong>CAMP</strong> Five‐Year Program Scheduling with Cost Estimates ................................................. 62‐1 Project Numbering System .................................................................................................. 126‐1 FY 2013 E‐<strong>CAMP</strong> Projects Sorted by Score ......................................................................... 1227‐1 FY 2014 EWA Capital Improvement Program .................................................................... 1267‐2 FY 2015 EWA Capital Improvement Program .................................................................... 1277‐3 FY 2016 EWA Capital Improvement Program .................................................................... 1287‐4 FY 2017 EWA Capital Improvement Program .................................................................... 1297‐5 FY 2018 EWA Capital Improvement Program .................................................................... 130LIST OF FIGURES:2‐1 E‐<strong>CAMP</strong> Evaluation Criteria .................................................................................................. 102‐2 E‐<strong>CAMP</strong> Task Elements......................................................................................................... 112‐3 Annual Update Milestones and Schedule ............................................................................ 11S‐1.1.006 Grit Tanks Effluent Channel ......................................................................................... 19S‐1.2.006a PSB – Top of Wall Corrosion ....................................................................................... 20S‐1.2.006b PSB Helical Scum Skimmer .......................................................................................... 20S‐1.2.006c PSB Effluent Stop Plate Guide Wall ............................................................................. 20S‐1.2.006d PSB Previous Concrete Coated Over ........................................................................... 20E FY2014 E‐<strong>CAMP</strong> Report 2012‐12Dec.docx V December 26, 2012
<strong>Encina</strong> Water Pollution Control Facility E‐<strong>CAMP</strong>Table of ContentsS‐1.2.006e Primary Influent Gate Guide Corrosion ...................................................................... 21S‐1.2.006f Primary Influent Channel ............................................................................................. 21S‐1.2.009 Crown of PE Pipeline ..................................................................................................... 22S‐1.3.013 Secondary Clarifier Cracking ......................................................................................... 23S‐3.1.002a Roof supports and hardware in DAFT 3 are corroded ................................................ 24S‐3.1.002b Highly Corroded Skimmer Wear surface ................................................................... 24S‐3.1.002c Aluminum roof coating is failed in DAFT 1 .................................................................. 25S‐3.1.002d Many mech and struct components require ongoing maintenance .......................... 25S‐3.1.002e The DAFT system is composed of many components EWA maintains ....................... 25S‐3.1.002f Operating the DAFT system includes operation of many systems .............................. 25S‐8.2.007 Plant Overview .............................................................................................................. 27P‐1.1.005 Bar Screen Conveyor ..................................................................................................... 29P‐1.1.006 Grit Tanks Effluent Channel .......................................................................................... 32P‐1.1.007 Vactor Receiving Location ............................................................................................ 33P‐1.1.008a Grit Tank Nos. 1 and 2 Influent Gates ......................................................................... 34P‐1.1.008b Gate Delamination ...................................................................................................... 34P‐1.1.009 Flowshark Plus Flowmeter System ............................................................................... 35P‐1.2.002 Primary Sludge Pump Gallery ....................................................................................... 37P‐1.2.003 Primary Effluent Channel .............................................................................................. 38P‐1.2.004a Primary Effluent Bypass Gate ..................................................................................... 39P‐1.2.004b Primary Effluent – Secondary Bypass Flow Control Gate ........................................... 39P‐1.2.006a PSB – Top of Wall Corrosion ....................................................................................... 40P‐1.2.006b PSB Helical Scum Skimmer ......................................................................................... 40P‐1.2.006c PSB Effluent Stop Plate ............................................................................................... 40P‐1.2.006d PSB Previous Concrete Coated Over .......................................................................... 40P‐1.2.006e Primary Influent Gate Guide Corrosion ...................................................................... 41P‐1.2.006f Primary Influent Channel ............................................................................................. 41P‐1.2.009 Crown of PE Pipeline ..................................................................................................... 42P‐1.3.003 Aeration Basins ............................................................................................................. 44P‐1.3.004 RAS Pumps .................................................................................................................... 45P‐1.3.006 Secondary Polymer System .......................................................................................... 46P‐1.3.007 Secondary Clarifier Nos. 5 and 6 Corrosion .................................................................. 47P‐1.3.008 Secondary Clarifier No. 7 Tank ..................................................................................... 48P‐1.3.010 WAS Pipeline ................................................................................................................. 49P‐1.3.013 Secondary Clarifier Cracking ......................................................................................... 51P‐1.3.014 Secondary Clarifier Effluent Gates ................................................................................ 52P‐1.4.001 Final Effluent Pumps ..................................................................................................... 54P‐1.4.002 Final Effluent MCC Room .............................................................................................. 54P‐2.1.002 View towards Sea Outfall.............................................................................................. 57P‐2.1.004 View towards Sea Outfall ............................................................................................. 58P‐3.1.001 DAFT Collector and Launder ......................................................................................... 59P‐3.1.003 TWAS Pump and Discharge Piping ................................................................................ 61P‐3.1.004 DAF Polymer System ..................................................................................................... 62P‐3.2.003 Soil Settling at Digester No. 5 Pumps and Piping ......................................................... 64P‐3.2.005 Digester Mixing Pumps ................................................................................................. 65P‐3.2.007 Digester No. 1 ............................................................................................................... 66P‐3.2.008 Waste Gas Flare ............................................................................................................ 67E FY2014 E‐<strong>CAMP</strong> Report 2012‐12Dec.docx VI December 26, 2012
<strong>Encina</strong> Water Pollution Control Facility E‐<strong>CAMP</strong>Table of ContentsP‐3.3.001 Power Building MCC ..................................................................................................... 70P‐3.3.002 Pellet Storage and Hauling ........................................................................................... 71P‐3.3.003 Pellet Storage and Hauling ........................................................................................... 73P‐3.3.005 Cake Pump .................................................................................................................... 74P‐3.3.009 Drying Building Bag House (blue structure) .................................................................. 77P‐3.3.010 Drying Building Door ..................................................................................................... 78P‐3.3.012 RTO Media .................................................................................................................... 78P‐3.3.013 RTO at Heat Drying Facility ........................................................................................... 79P‐3.3.014a RTO Flush Drain .......................................................................................................... 79P‐3.3.014b TWAS Pit ..................................................................................................................... 79P‐3.3.017 Dewatering Polymer Storage Tank ............................................................................... 80P‐4.1.004 Existing Eclipse Units .................................................................................................... 84P‐4.1.005 Cogeneration Engine Nos. 1 and 2................................................................................ 85P‐4.1.006 Cogeneration Engine Nos. 1 and 2................................................................................ 87P‐4.1.007 Cogeneration Engine Nos. 1 and 2................................................................................ 89P‐4.1.008 Future Co‐Gen Engine 5 Location ................................................................................. 91P‐4.1.009 Potential Location Identified for Future Co‐Gen Engine .............................................. 91P‐4.1.012 Plated Heat Exchangers (in blue) .................................................................................. 92P‐4.1.013 Water leaks through from above ................................................................................. 93P‐5.1.001 Existing Headworks Facility........................................................................................... 97P‐5.1.002 ORF I Facility ................................................................................................................. 98P‐5.1.004 EWPCF Aerial View ....................................................................................................... 99P‐5.1.008a ORF III Chemical Storage Facility .............................................................................. 101P‐5.1.008b ORF III Recirc Pumps ................................................................................................. 101P‐5.2.001 Natural Gas Piping (lower pipe, one‐inch) at Bridge Crossing .................................... 102P‐5.2.004 3WLC Strainer ............................................................................................................. 104P‐5.2.005 Overview of the 3WHP and 3WCL Pumps and Strainers ............................................ 105P‐5.2.006 Proposed Intertie Location ......................................................................................... 106P‐5.2.009 Structure Settlement .................................................................................................. 108P‐5.2.010 3WHP Pumps MCC ...................................................................................................... 108P‐5.2.011 Plant Water Piping ...................................................................................................... 109P‐5.2.012 Contractor’s Entrance to Site ...................................................................................... 110P‐5.2.014 Perimeter Chain Link Fence ........................................................................................ 110P‐5.2.015 Stormdrain near DAF Pit ............................................................................................. 111P‐5.2.016 Existing 2W System Sand Filter ................................................................................... 112P‐5.2.017 Service Air/Washdown Station ................................................................................... 113P‐5.2.021 SEEPS MCC Facility ...................................................................................................... 114P‐5.3.001 Locker with Standard Hanger ..................................................................................... 117P‐5.3.002 Ops Bldg Air Intake ..................................................................................................... 117P‐5.3.006 Secondary Scum Pit .................................................................................................... 1196‐1 Priority Project Ranking System ......................................................................................... 122E FY2014 E‐<strong>CAMP</strong> Report 2012‐12Dec.docx VII December 26, 2012
<strong>Encina</strong> Water Pollution Control Facility E‐<strong>CAMP</strong>Table of ContentsThis page intentionally left blank.E FY2014 E‐<strong>CAMP</strong> Report 2012‐12Dec.docx VIII December 26, 2012
<strong>Encina</strong> Water Pollution Control Facility E‐<strong>CAMP</strong>Abbreviations and Acronyms ListEWA Process and Facility Abbreviations1W Potable Water (City Water)1WS Potable Water (Softened)2W Filtered Secondary Effluent2WS Filtered Secondary Effluent (Softened)3W Plant Water (Secondary Effluent)3WCL Plant Water (Secondary Effluent), Chlorinated, Low Pressure3WHP Plant Water (Secondary Effluent), High Pressure3WL Plant Water (Secondary Effluent), Low Pressure3WS Plant Water (Secondary Effluent), Spray WaterA Aeration Air System (Process)AA Agitation Air System (Mixing)AB Aeration BasinAFE Dissolved Air Flotation EffluentARV Air Relief ValveAPCD Air Pollution Control DistrictCCC Chlorine Contact ChamberCMMS Computerized Maintenance Management SystemCEPT Chemical Enhanced Primary TreatmentCG Cogeneration SystemCIP Capital Improvement ProjectsCLS Chlorine SolutionCWR Chilled Water ReturnCWRF Carlsbad Water Reclamation FacilityCWS Chilled Water SupplyD Digester, DrainDAF Dissolved Air Flotation (Process)DAFT Dissolved Air Flotation Thickener (Tank)DRY Drying BuildingDS Digested SludgeDW Dewatering BuildingE EffluentE‐<strong>CAMP</strong> EWPCF Comprehensive Asset Management PlanEMP Energy Management ProjectES Engineering ServicesEWA <strong>Encina</strong> <strong>Wastewater</strong> <strong>Authority</strong>EWPCF <strong>Encina</strong> Water Pollution Control FacilityFA Foul AirFC Ferrous Chloride SolutionFY Fiscal YearG GritGRS Grit Removal SystemGRT Grit Removal TankGS Grit SeparatorsHRR Heat Reservoir ReturnHRS Heat Reservoir SupplyHVAC Heating, Ventilation and Air ConditioningE FY2014 E‐<strong>CAMP</strong> Report 2012‐12Dec.docx IX December 26, 2012
<strong>Encina</strong> Water Pollution Control Facility E‐<strong>CAMP</strong>Abbreviations and Acronyms ListHWIAICIJSLAENRCCILSGMCCMCUMISMjAMLMPIMROMSNGNPDESO&MOFORCORFPAR IMPRPSBPDPEPOLPOWPSPSCPVPVSIRASRTOSSASCSDSCADASCMSESFTYSPTGSSSSCTBDTDTWASVFDHeadworksInstrument AirInternal CombustionInfluent Junction StructureLos Angeles Engineering News Record Construction Cost IndexLow Pressure Sludge GasMotor Control CenterMiscellaneous Control UpgradesManagement Information SystemsMajor AssetsMixed LiquorMiscellaneous Plant ImprovementsMaintenance Repair and Operations SoftwareMixed SludgeNatural GasNational Pollutant Discharge Elimination SystemOperations and MaintenanceOverflowOrganic Rankine Cycle EngineOdor Reduction FacilityPlanned Asset Replacement ImplementationPrimary Sedimentation BasinsPumped DrainagePrimary EffluentPolyelectrolyte (Polymer)Power BuildingPrimary SludgePrimary ScumPhase V related facilityPhase V Site ImprovementsReturn activated sludgeRegenerative Thermal OxidizerStudyService AirSecondary Clarifier, ScumSanitary DrainSupervisory Control and Data AcquisitionScum Collection SystemSecondary EffluentSafetySeptage ReceivingSite securitySecondary ScumTo be determinedTank DrainThickened Waste Activated SludgeVariable frequency driveE FY2014 E‐<strong>CAMP</strong> Report 2012‐12Dec.docx X December 26, 2012
<strong>Encina</strong> Water Pollution Control Facility E‐<strong>CAMP</strong>Abbreviations and Acronyms ListWWASVCPlant Water (see 3WHP, 3W, 3WLC)Waste Activated SludgeVista Carlsbad pipelineGeneral AbbreviationsAHUscfmCIPPCISPCPVCDIP, DIftFRPgpmhpmgdOSHAppmpsiPVCRCPscfmsfSSPSTLair handling unitscubic feet per minutecured‐in‐place‐pipingcast iron soil pipechlorinated polyvinyl chlorideductile iron pipefeet or footfiberglass reinforced plasticgallons per minutehorsepowermillion gallons per dayOccupational Safety and Health Administrationparts per millionpounds per square inchpolyvinyl chloridereinforced concrete pipestandard cubic feet per minutesquare feetstainless steel pipesteel pipeE FY2014 E‐<strong>CAMP</strong> Report 2012‐12Dec.docx XI December 26, 2012
This page intentionally left blank.E FY2014 E‐<strong>CAMP</strong> Report 2012‐12Dec.docx XII December 26, 2012
ENCINA WATER POLLUTION CONTROL FACILITYCOMPREHENSIVE ASSET MANAGEMENT PLAN(E‐<strong>CAMP</strong>)SECTION 1:EXECUTIVE SUMMARYThe <strong>Encina</strong> <strong>Wastewater</strong> <strong>Authority</strong> (EWA) is a public joint powers authority located in the Southern CaliforniaCity of Carlsbad that provides regulatory and wastewater treatment services to approximately 325,000 NorthSan Diego County residents and industrial users. The EWA is owned by six member agencies that include: theCity of Carlsbad, City of Vista, City of Encinitas, the Buena Sanitation District, the Leucadia <strong>Wastewater</strong>District, and the Vallecitos Water District.The <strong>Encina</strong> Water Pollution Control Facility (EWPCF) was constructed in 1963 to treat wastewater from theCities of Carlsbad and Vista. Original construction of the EWPCF consisted of preliminary treatment facilities,anaerobic digesters, sludge drying beds and an ocean outfall. Since its original design and construction, theEWPCF has completed five major expansion phases with the latest major expansion (Phase V) constructioncompleted in 2009. Phase V upgrades included enhanced solids processing as well as significantimprovements to its energy management facilities. The EWPCF current treatment capacity is 40.51 milliongallons per day (mgd) liquid and 43.53 mgd solids.The E‐<strong>CAMP</strong> is a comprehensive asset management plan (<strong>CAMP</strong>) for the EWPCF. It is updated annually priorto establishing the budget for the upcoming fiscal year. The annual update is utilized in planning capitalrehabilitation projects with the consideration of anticipated changes in regulatory compliance, cost‐savingopportunities and ongoing O&M requirements. The implementation schedule is prepared after consideringthe project priority ranking and other factors, such as regulatory compliance deadlines and economy of scale.The E‐<strong>CAMP</strong> provides the EWA the ability to forecast and schedule the replacement and/or rehabilitation ofEWPCF major assets. The E‐<strong>CAMP</strong> contains detailed supporting documents that provide an organized registerof major assets, estimated useful life of each asset, and scheduled replacement or rehabilitation of eachasset. The E‐<strong>CAMP</strong> allows EWA to project future expenditures for capital improvement projects, in both theshort and long term, and communicate the proposed improvements to the Member Agency Managers, EWABoard of Directors, and <strong>Encina</strong> Joint Advisory Committee.The FY 2014 major asset register includes roughly 250 assets, each with a replacement value of greater than$50,000. Seventeen major assets are approaching the end of their assessed useful life. Replacement of theseassets is currently included in a planned project. Eighty‐one additional major assets will reach the end oftheir estimated useful life in the next ten years. Field assessment of these assets is planned either as part of astudy or an equipment condition assessment over the next five years. The results of the studies andassessments will determine if each asset condition is favorable and an extended assessed useful life can beassumed, or if the asset requires rehabilitation or replacement.The E‐<strong>CAMP</strong> process consists of: Maintaining the major asset register Conducting condition assessments Conducting facility needs assessments Developing and maintaining needed project lists including cost estimates Prioritizing and scheduling needed capital projectsE FY2014 E‐<strong>CAMP</strong> Report 2012‐12Dec.docx I December 26, 2012
The complete list of capital improvement projects numbers approximately 120 and is found in Appendix B.These projects are categorized as top priority capital projects (TP), ranked capital projects, or plannedmaintenance (PM) projects scheduled on a recurring basis. Projects planned for execution over the next fiveyears are presented as follows: Table 1‐1: Sixty capital improvement and preventative maintenance projects Table 1‐2: Nine asset condition assessments Table 1‐3: Twelve special studies, updates, and professional services tasks needed to support the E‐<strong>CAMP</strong> programTable 1‐1: E‐<strong>CAMP</strong> Project Priority Ranking SummaryProject TotalProjectProject TitleProject No.Classification ScoreRank(1)(highest score indicates highest priority) (max 63)TP P‐1.1.006 Grit Tanks Effluent Channel Isolation Improvements CIP TPTP P‐1.1.009 Influent Flow Metering Installation CIP TPTP P‐1.1.010 Influent Pipeline Rehab w/Addl 2012 Major Rehab CIP TPTP P‐1.3.006 Secondary Polymer System Replacement CIP TPTP P‐1.3.007 SCs 5 and 6 Mech Rehab CIP TPTP P‐2.1.002 Sea Outfall Maintenance and Inspection – External CIP TPTP P‐2.1.005 Sea Outfall Bathymetric Survey ‐ External CIP TPTP P‐3.3.002 Pellet Storage Facility Improvements CIP TPTP P‐3.3.009 Drying Safety Upgrades CIP TPTP P‐3.3.010 Drying Building Coded Locks CIP TPTP P‐4.1.003 Cogen Engine Catalyst CIP TPTP P‐4.1.013 Cogen Bldg Floor Repair CIP TPTP P‐4.1.015 Gas Conditioning Facilities CA TPTP P‐5.1.008 ORF III Chem Feed System Improvements CIP TPTP P‐5.3.006 Secondary Scum Pit Roof Removal CIP TPTP P‐5.3.008 Roof Access Safety Facilities CIP TPTP P‐5.3.009 DW Bldg Roof Repairs CIP TP1 P‐5.2.012 Site Security Facilities CIP 372 P‐3.3.020 Dryer Drum Repair CIP 353 P‐4.1.004 NG Dilution Equipment Servicing CIP 344 P‐5.2.002 High Risk and Critical Asset Rehabilitation CIP 345 P‐1.2.006 PSB Struct and Mech Rehab CIP 336 P‐3.2.009 Digester 4 – Interior Coating CIP 337 P‐3.2.010 Digester 5 and 6 – Interior Coating CIP 338 P‐5.2.001 Natural Gas Pipeline Replacement CIP 339 P‐5.1.004 Odor Monitoring Facilities CA 3210 P‐3.1.002 DAF System Replacement CIP 2911 P‐5.2.024 Exterior Asset Corrosion Control CIP 2912 P‐1.3.003 AB – Selector Implementation and Cover Replacement CIP 2613 P‐3.3.019 Centrifuge Drive Replacement CIP 2514 P‐5.2.004 3WLC Strainer Replacement CIP 2515 P‐1.1.005 Grit and Screenings Handling Facility Rehab CIP 2416 P‐1.1.008 GRS Rehab CIP 24E FY2014 E‐<strong>CAMP</strong> Report 2012‐12Dec.docx 2 December 26, 2012
Project TotalProjectProject TitleProject No.Classification ScoreRank(1)(highest score indicates highest priority) (max 63)17 P‐5.1.005 HW/GRT/PSB Odor Control CIP 2418 P‐5.2.017 Service Air and Instrument Air Piping Repairs CIP 2319 P‐3.1.003 TWAS Pipeline Replacement CIP 2220 P‐1.2.009 PE Pipeline Rehab CIP 2121 P‐1.3.013 SC Concrete Cracking Prevention CIP 2122 P‐1.3.012 AB DO Probe Replacement CIP 2023 P‐5.2.019 Plant Beautification CIP 2024 P‐1.3.004 AB Mech Rehab and RAS Pump Addition CIP 1925 P‐3.3.012 RTO Media Replacement CIP 1926 P‐3.3.014 RTO Flush Drain Relocation CIP 1827 P‐4.1.020 Net Metering CIP 1828 P‐1.2.010 PSB Scum Pipeline CIP 1729 P‐2.1.004 Sea Outfall Ballast Restoration CIP 1730 P‐4.1.008 Cogen Engine 5 CIP 1631 P‐5.2.025 Tech Master Plan Recommendations Implementation CIP 1632 P‐1.3.014 SCs 1 – 4 Inf and Eff Gate Replacement CIP 1433 P‐3.2.001 Biofuel Receiving Facilities CIP 1434 P‐3.3.008 Dryer Major Maint CIP 1435 P‐4.1.001 Cogen Communications Redundancy CIP 1436 P‐5.2.010 3WHP Pump Control Improvements CIP 1237 P‐5.2.006 3WLC Intertie to 3WHP System CIP 1138 P‐5.2.026 Plant Waste Stream Rerouting CIP 1139 P‐3.3.007 Centrifuges Major Maint CIP 840 P‐5.3.002 Ops Bldg Air Intake Relocation CIP 3PM P‐4.1.005 Cogen Engine Top‐End Overhaul (2016, 2017, 2 eng/yr) PM PMPM P‐4.1.006 Cogen Engine In‐Frame Overhaul (2014, 2015, 2 eng/yr) PM PMPM P‐4.1.007 Cogen Engine Full Overhaul (2018, 2019, 2 eng/yr) PM PMPM P‐5.1.002 ORF I Carbon Replacement (2015, every other year) PM PM(1) CIP – Capital Improvement Projects; PM ‐ Planned Maintenance; CA – Capital Acquisition, MjA – Major AssetReplacement (≥$50K), IS = Information Systems; IMPR – Improved Technology, Wear, Age(2) TP – Top Priority Projects are not scored(3) PM – Ongoing Planned Maintenance Projects are not scored(4) Refer to Table 2‐1, Project Numbering SystemE FY2014 E‐<strong>CAMP</strong> Report 2012‐12Dec.docx 3 December 26, 2012
Table 1‐2: E‐<strong>CAMP</strong> Condition Assessments (not associated with specific projects) SummaryFY Project No. (1) Condition Assessment Title2014 CA‐8.1.002 Fire Main Supply2014 CA‐8.1.003 FY2014 Asset Condition Assessments2015 CA‐8.1.004 FY2015 Asset Condition Assessments2015 CA‐8.1.005 Underground Structures – Part 12016 CA‐8.1.006 FY2016 Asset Condition Assessments2016 CA‐8.1.007 Underground Structures – Part 22016 CA‐8.1.008 Bridges2017 CA‐8.1.009 FY2017 Asset Condition Assessments2018 CA‐8.1.009 FY2017 Asset Condition Assessments(1) Refer to Table 2‐1, Project Numbering SystemTable 1‐3: E‐<strong>CAMP</strong> Studies, Updates and Engineering Services SummaryFY Project No. (2) Studies, Updates and Engineering ServicesSpecial Studies2015 S‐8.2.003 Biosolids Management Business Plan Update2015 S‐8.2.004 Comprehensive Energy Rates Study2016 S‐8.2.005 <strong>Wastewater</strong> Characterization Study2016 S‐8.2.006 Exterior Asset Corrosion Control2017 S‐1.3.012 Offsite Wetlands RestorationStudy Updates2014+ S‐8.3.002 E‐<strong>CAMP</strong> Update (Annual)Engineering Services2014+ ES‐8.4.001 Extension of Staff Engineering Services (Annual)2014+ ES‐8.4.002 R&D Projects Support (Ongoing)2014 ES‐8.4.004 Map Underground Piping >12‐Inch2014 ES‐8.4.006 Electronic O&M Manual and Document Mgmt – Part 22015 ES‐8.4.007 Electronic O&M Manual and Document Mgmt – Part 3Other Services2014+ OS‐8.5.001 Legal and Misc Services (Annual)(1) CIP – Capital Improvement Projects(2) Refer to Table 2‐1, Project Numbering SystemE FY2014 E‐<strong>CAMP</strong> Report 2012‐12Dec.docx 4 December 26, 2012
TABLE 1‐4: E‐<strong>CAMP</strong> Five‐Year Program Scheduling with Cost Estimates ($1,000)ProjectRank (2) Project No. Project NameImplementation Year 2014Main Project Costs (1)(in 1000s)TP P‐1.1.009 Influent Flow Metering Installation $ 152TP P‐1.1.010 Influent Pipeline Rehab with 2012 Major Rehab $ 1,839TP P‐2.1.005 Sea Outfall Bathymetric Survey ‐ External $ 6432 P‐3.2.001 Biofuel Receiving Facilities * $ 1,9726 P‐3.2.009 Digester 4 – Interior Coating $ 3177 P‐3.2.010 Digesters 5 and 6 – Interior Coating $ 778TP P‐3.3.002 Pellet Storage Facility Improvements $ 502TP P‐3.3.010 Drying Building Coded Locks $ 4624 P‐3.3.012 RTO Media Replacement $ 9725 P‐3.3.014 RTO Flush Drain Relocation $ 1262 P‐3.3020 Dryer Drum Rehabilitation $ 553 P‐4.1.004 NG Dilution Equipment Servicing $ 137PM P‐4.1.006 Cogeneration Engine In‐Frame Overhaul $ 415TP P‐4.1.013 Cogen Bldg Floor Repair $ 5026 P‐4.1.020 Net Metering $ 4009 P‐5.1.004 Odor Monitoring Facilities $ 4928 P‐5.2.001 Natural Gas Pipeline Replacement $ 65114 P‐5.2.004 3WLC Strainer Replacement $ 23540 P‐5.3.002 Operations Building Air Intake Relocation $ 149TP P‐5.3.006 Secondary Scum Pit Roof Removal $ 141TP P‐5.3.008 Roof Access Safety Facilities $ 110Various Remote Facilities Projects (refer to R‐<strong>CAMP</strong>) $ 546‐ Total FY 2014 Condition Assessments (6) $ 257‐ Total FY 2014 Studies and Services $ 763‐ Total FY 2014 Egr (Design, Constr Egr, Const Mgmt) $ 1,919Total Fiscal Year 2014 $ 12,213Alternative Funding Projects (denoted with *, includes some studies and design budget) $ 2,350Total Fiscal Year 2014 Less Alternative Funding Projects $ 9,863E FY2014 E‐<strong>CAMP</strong> Report 2012‐12Dec.docx 5 December 26, 2012
ProjectRank (2) Project No. Project NameImplementation Year 2015Main Project Costs (1)(in 1000s)TP P‐1.1.006 GRS Isolation Improvements $ 76616 P‐1.1.008 GRS Rehabilitation $ 3505 P‐1.2.006 PSB Struct and Mech Rehab $ 2,00028 P‐1.2.010 PSB Scum Pipeline $ 69TP P‐3.3.009 Drying Safety Upgrades (2) $ 1,955TP P‐4.1.003 Cogen Engine Catalyst * $ 103PM P‐4.1.006 Cogeneration Engine In‐Frame Overhaul $ 415TP P‐4.1.015 Gas Conditioning Facilities * $ 3,387PM P‐5.1.002 ORF I Carbon Replacement $ 13836 P‐5.2.010 3WHP Pump Control Improvements $ 7111 P‐5.2.024 Exterior Asset Corrosion Control $ 200Various Remote Facilities Projects (refer to R‐<strong>CAMP</strong>) $ 380‐ Total FY 2015 Condition Assessments $ 431‐ Total FY 2015 Studies (project conceptual and special studies) $ 696‐ Total FY 2015 Engineering (Design, Constr Egr, Const Mgmt) $ 3,051Total Fiscal Year 2015 $ 14,012Alternative Funding Projects (denoted with *, includes some studies and design budget) $ 4,178Total Fiscal Year 2015 Less Alternative Funding Projects $ 9,834E FY2014 E‐<strong>CAMP</strong> Report 2012‐12Dec.docx 6 December 26, 2012
Implementation Year 201615 P‐1.1.005 Grit and Screenings Handling Facility Rehab(1) $ 3,3005 P‐1.2.006 PSB Structural & Mechanical Rehab(2) $ 2,000TP P‐1.3.006 Secondary Polymer System Replacement $ 30621 P‐1.3.013 SC Concrete Cracking Prevention $ 22432 P‐1.3.014 SCs 1 – 4 Inf and Eff Gate Replacement $ 27025 P‐3.3.012 RTO Media Replacement $ 9713 P‐3.3.019 Centrifuge Drive Replacement $ 200PM P‐4.1.005 Cogeneration Engine Top‐End Overhaul $ 20930 P‐4.1.008 Cogen Engine 5* $ 1,50317 P‐5.1.005 HW/GRT/PSB Odor Control $ 443TP P‐5.1.008 ORF III Chemical Feed System Improvements $ 28037 P‐5.2.006 3WLC Interie to 3WHP System $ 511 P‐5.2.012 Site Security Facilities $ 40018 P‐5.2.017 Service Air and Instrument Air Piping Repairs(1) $ 198Various Total Remote Facilities Projects (refer to R‐<strong>CAMP</strong>) $ 115‐ Total FY 2016 Condition Assessments $ 240‐ Total FY 2016 Studies (project conceptual and special studies) $ 322‐ Total FY 2016 Engineering (Design, Constr Egr, Const Mgmt) $ 1,540Total Fiscal Year 2016 $ 11,698Alternative Funding Projects (denoted with *, includes some studies and design budget) $ 1,853Total Fiscal Year 2016 Less Alternative Funding Projects $ 9,845Implementation Year 201715 P‐1.1.005 Grit and Screenings Handling Facility Rehab(2) $ 3,41520 P‐1.2.009 PE Pipeline Rehab $ 859PM P‐4.1.005 Cogeneration Engine Top‐End Overhaul $ 209PM P‐5.1.002 ORF I Carbon Replacement $ 1384 P‐5.2.002 High Risk and Critical Asset Rehabilitation $ 84618 P‐5‐2.017 Service Air and Instrument Air Piping Repairs (2) $ 19823 P‐5.2.019 Plant Beautification $ 20531 P‐5.2.025 Tech Master Plan Recommended Improvements $ 1,00038 P‐5.2.026 Plant Waste Stream Rerouting $ 150Various Total Remote Facilities Projects (refer to R‐<strong>CAMP</strong>) $ 957‐ Total FY 2017 Condition Assessments $ 186‐ Total FY 2017 Studies (project conceptual and special studies) $ 301‐ Total FY 2017 Engineering (Design, Constr Egr, Const Mgmt) $ 1,534Total Fiscal Year 2017 $ 9,998E FY2014 E‐<strong>CAMP</strong> Report 2012‐12Dec.docx 7 December 26, 2012
Implementation Year 201812 P‐1.3.003 AB Selector and Cover Replacement (Part 1) $ 1,39124 P‐1.3.004 AB Rehabilitation and RAS Pump Addition (Part 1) $ 1,592TP P‐1.3.007 SCs 5 and 6 Mech Rehab $ 1,58722 P‐1.3.012 AB DO Probe Replacement $ 44229 P‐2.1.004 Sea Outfall Ballast Restoration $ 67339 P‐3.3.007 Centrifuges Major Maint $ 30034 P‐3.3.008 Dryer Major Maint $ 75325 P‐3.3.012 RTO Media Replacement $ 9735 P‐4.1.001 Cogen Communications Redundancy $ 192PM P‐4.1.005 Cogeneration Engine Top‐End Overhaul $ 2094 P‐5.2.002 High Risk and Critical Asset Rehabilitation (2) $ 306Various Total Remote Facilities Projects (refer to R‐<strong>CAMP</strong>) $ 118‐ Total FY 2018 Condition Assessments $ 85‐ Total FY 2018 Studies (project conceptual and special studies) $ 370‐ Total FY 2018 Engineering (Design, Constr Egr, Const Mgmt) $ 1,930Total Fiscal Year 2018 $ 10,045Total Fiscal Year 2013‐2018 (including alterative funding projects) $ 57,966Total Fiscal Year 2013‐2018 (not including alterative funding projects) $ 49,585(1) For most projects Main Project cost is construction cost, however Main Project Cost may include bypass pumping orsimilar costs. Numbered Project Cost does not include condition assessment, study, const egr or const mgmt cost. Thesecosts are grouped together in line items at the bottom of the table.(2) TP – Top Priority Projects are not scored; PM – Ongoing Plant Maintenance Projects are not scored(3) The schedule year for a project refers to the year construction starts.(4) Refer to Section 7 for detailed costs associated with extension of staff, condition assessment, studies and engineering.(5) Refer to Appendix D for detailed costs by project.(6) Cost includes Remote Facilities and Projects with alternative funding.E FY2014 E‐<strong>CAMP</strong> Report 2012‐12Dec.docx 8 December 26, 2012
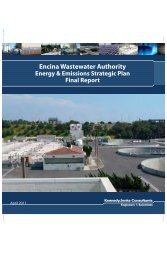
SECTION 2:INTRODUCTION TO EWA COMPREHENSIVE ASSET MANAGEMENT PLANNING (<strong>CAMP</strong>)The <strong>Encina</strong> <strong>Wastewater</strong> <strong>Authority</strong> (EWA) is a public joint powers authority located in the Southern CaliforniaCity of Carlsbad that provides regulatory and wastewater treatment services to approximately 325,000 NorthSan Diego County residents and industrial users. The EWA is owned by six member agencies that include: theCity of Carlsbad, City of Vista, City of Encinitas, the Buena Sanitation District, the Leucadia <strong>Wastewater</strong>District, and the Vallecitos Water District.2.1 BackgroundThe EWA was formed to operate and administer the <strong>Encina</strong> Water Pollution Control Facility (EWPCF). TheEWPCF, an award winning facility, is a secondary activated sludge type treatment facility with the existingdesign capacity of 40.5 million gallons per day (mgd) liquid and 43.5 mgd solids.The EWPCF was constructed in 1963 to treat wastewater from the Cities of Carlsbad and Vista. Originalconstruction of the EWPCF consisted of preliminary treatment facilities, anaerobic digesters, sludge dryingbeds and an ocean outfall. Since its original design and construction, the EWPCF has completed five majorexpansion phases with the latest major expansion (Phase V) construction completed in 2009. Phase Vupgrades included enhanced solids processing as well as significant improvements to the energymanagement facilities.As reported in the EWA Fiscal Year 2011 Comprehensive Annual Financial Report, member agencyinfrastructure investment in the EWPCF has exceeded $219,000,000 since its inception. With this significantlevel of investment, the EWA is committed to maintaining a comprehensive asset management approach formanaging the EWPCF infrastructure.2.2 PurposeThe purpose of this asset management plan is to develop a comprehensive roadmap to address the EWPCFinfrastructure challenges. Member agencies have invested significant resources in the EWPCF. With thisinvestment, the EWA places the highest importance on preserving asset reliability while protecting the healthand safety of workers and the public. The E‐<strong>CAMP</strong> process maintains a current, organized register of majorassets and associated estimated asset useful life remaining. This allows EWA to plan ongoing assessment andreplacement of assets to realize full use of service life and to replace assets prior to the end of assesseduseful life. We look to best management practice applications that will assist EWA in facing these rewardingchallenges. The Fiscal Year 2014 E‐<strong>CAMP</strong> addresses the emerging challenges and will continue to renew andextend EWA’s commitment in maintaining a reliable and effective infrastructure. With a comprehensiveasset management plan we remain steadfast in meeting our commitment to the EWA Mission:As an environmental leader, EWA provides sustainable and fiscally responsiblewastewater services to the communities it serves while maximizing the use ofalternative and renewable resources.E FY2014 E‐<strong>CAMP</strong> Report 2012‐12Dec.docx 9 December 26, 2012
2.3 <strong>CAMP</strong> Process Overview2.3.1 HistoryIn Fiscal Year 2008, EWA transitioned management of its EWPCF infrastructure from the former facilityMaster Plan Process to the EWPCF Comprehensive Asset Management Plan (E‐<strong>CAMP</strong>) program.2.3.2 Capital ProjectsThe <strong>CAMP</strong> process results in a list of prioritized recommended improvement projects. Evaluation criteria areused to prioritize projects. The project evaluation criteria established in the Master Plan were broughtforward and supplemented in the <strong>CAMP</strong> process. These criteria take into consideration the useful life of eachphysical asset and place high importance on safety, odor control, regulatory requirements, energy efficiency,plant capacity, cost efficiency and consequence of failure of assets. The evaluation criteria established for theE‐<strong>CAMP</strong> are identified in Figure 2‐1.Figure 2‐1: E‐<strong>CAMP</strong> Evaluation CriteriaAssetUsefulLifeFacilityCapacityCostEfficiencySafety &WorkingEnvironmentOdorControlRegulatoryComplianceEnergyEfficiencyConsequenceof FailureCompleted E‐<strong>CAMP</strong> projects from 1994 through present are listed in Appendix A. A new project numberingsystem was implemented in the FY 2013 E‐<strong>CAMP</strong>, and a comprehensive list of past, current and future capitalprojects identified under this system are presented in Appendix B.2.3.3 Asset RegisterThe asset register provides an organized list of major assets, estimated useful life of each asset, estimatedreplacement cost, and scheduled replacement or rehabilitation date of each asset. Major assets are definedas assets with a replacement cost of $50,000 or more. Minor assets, with values less than $50,000 aregenerally replaced or upgraded through preventative or corrective maintenance activities which the GeneralServices Department tracks using the Computerized Maintenance Management System (CMMS). The MajorAsset Register with recent condition assessment information is found in Appendix E.2.3.4 Condition AssessmentIn FY 2011, EWA initiated a formal process to assess the condition of major assets nearing the end of theiruseful life. The condition assessment documents the current condition of each asset and recommends eitherextending the estimated useful life or defining a project to replace the aging assets.2.3.5 <strong>CAMP</strong> MethodologyThe E‐<strong>CAMP</strong> program methodology is through the Task Elements outlined in Figure 2‐2. A more detaileddiscussion of the <strong>CAMP</strong> methodology is found in Appendix C.E FY2014 E‐<strong>CAMP</strong> Report 2012‐12Dec.docx 10 December 26, 2012
Figure 2‐2: E‐<strong>CAMP</strong> Task Elements1. Conduct ConditionAssessments↕↕↕↕2. Update Asset Register3. Conduct FacilityNeedsAssessments4. Update CapitalProjects List5. DeterminePriority Projects6. Estimate ProjectCosts7. RecommendProjectImplementationSchedule2.3.6 ScheduleEach year a series of tasks is completed to update the E‐<strong>CAMP</strong>, with the purpose of providing projectdefinition, cost and prioritization for EWA’s overall budget process, as illustrated in Figure 2‐3.Figure 2‐3: Annual Update Milestones and ScheduleE‐<strong>CAMP</strong> PROCESS Jul Aug Sep Oct Nov Dec Jan Feb MarEstablish E‐Camp TeamAsset Register Update/Sort by Asset AgeCondition Assessment for Select EquipmentFacility Needs AssessmentUpdate Project Summaries and ListsPrioritize Projects and Draft SchedulePrepare E‐Camp ReportMember Agency ReviewDetermination Agency Fiscal ResourcesBudget DevelopmentDraft Agency‐Wide BudgetBudget Review and FinalizeAdopt Budget ‐ JuneAGENCY‐WIDE BUDGET PROCESS Jul Aug Sep Oct Nov Dec Jan Feb Mar2.3.7 Project Numbering SystemProjects are given unique numbers which relate to the appropriate plant process. Condition Assessments,Studies, Updates, Engineering Services and Other Services are also numbered in accordance with the projectnumbering system. Conceptual studies for specific projects will be designated with an “S” prefix followed bythe same numerical designation as the project.The project number consists of four segments, for example P‐1.3.004: The first “prefix” is an alpha reference representing the phase of the improvement. In the example P‐1.3.004, the letter “P” designates that it is a capital project construction or planned maintenanceproject. Other alpha abbreviations include: CA – Condition Assessment, S – Study (conceptual studyspecific to the project), The second segment is a one‐digit number associated with the general process. In the example, thenumber 1 represents the general process “Liquid Process” The third segment is a one digit number associated with the specific unit process or area of theplant. In the example, the number 3 represents the specific process “Secondary Treatment” Fourth segment is a three digit sequential number for projects within the specific process.E FY2014 E‐<strong>CAMP</strong> Report 2012‐12Dec.docx 11 December 26, 2012
The following is a summary of the general and specific project is presented in Table 2‐1:Table 2‐1: Project Numbering SystemP‐1: Liquid Process ImprovementsP‐1.1: HeadworksP‐1.2: Primary TreatmentP‐1.3: Secondary TreatmentP‐1.4: EffluentP‐2: OutfallP‐2.1: OutfallP‐3: Solids Process ImprovementsP‐3.1: Biosolids ThickeningP‐3.2: Biosolids DigestionP‐3.3: Biosolids Dewatering and DryingP‐4: Energy ManagementP‐4.1: Energy ManagementP‐5: General ImprovementsP‐5.1: Odor ControlP‐5.2: Plant‐Wide SystemsP‐5.3: BuildingsP‐5.4: MiscellaneousP‐6: Reserved for FutureP‐7: Reserved for FutureP‐8: Professional Services (not associated with specific projects)CA‐8.1: Condition AssessmentsS‐8.2: Studies and UpdatesS‐8.3: E‐<strong>CAMP</strong> UpdatesES‐8.4: Engineering ServicesOS‐8.5: Other ServicesP‐9: Remote Facility Improvements – refer to the R‐<strong>CAMP</strong>P‐9.1: Raceway Basin Pump StationP‐9.2: Agua Hedionda Pump StationP‐9.3: Buena Vista Pump StationP‐9.4: Buena Creek Pump StationP‐9.5: Carlsbad Water Recycling FacilityP‐9.6: Reserved for FutureP‐9.7: Reserved for FutureP‐9.8: Remote Facilities – General ProjectsP‐9.9: Studies, Updates, Condition Assessments, R‐<strong>CAMP</strong> UpdateE FY2014 E‐<strong>CAMP</strong> Report 2012‐12Dec.docx 12 December 26, 2012
SECTION 3:CONDITION ASSESSMENT SUMMARYCondition assessments are triggered when an asset nears the end of its useful life or by staff observations ofcondition. For major assets, professional assistance is normally utilized to conduct a formal conditionassessment.When a condition assessment is completed, either the assessed useful life is extended based on observationof estimated remaining service life assuming a cost effective level of maintenance, or a project is identified toreplace or upgrade the asset. In this section, assets nearing the end of their assessed useful life are identifiedin subsection 3.1, with the associated project addressing asset upgrade referenced. In subsections 3.2through 3.6, assets nearing the replacement year as listed in the Major Asset Registry in Appendix E arescheduled for condition assessment.3.1 Assets at End of Service Life, Projects PendingGDW‐1503‐000 Grit Dewatering Screw Conveyor: to be replaced with P‐1.1.005COL‐8505‐000 Secondary Sludge and Scum Collector 5: to be replaced with P‐1.3.007COL‐8506‐000 Secondary Sludge and Scum Collector 6: to be replaced with P‐1.3.00702330 Maintenance Building Server: Pending findings of Tech Master PlanCOL‐7101‐000 Collector, DAF No. 1: Addressed with P‐3.1.001 and P‐3.1.002.COL‐7201‐000 Collector, DAF No. 2: Addressed with P‐3.1.001 and P‐3.1.002.COL‐7301‐000 Collector, DAF No. 3: Addressed with P‐3.1.001 and P‐3.1.002.HU‐1506‐000 Hydraulic Unit – Screenings Press: to be replaced with P‐1.1.005T‐2401‐000 Primary Sedimentation Basin 1: Pending S‐1.2.006BLD‐4200‐000 Building, Spare Office (orig Maint Bldg): Upgrades with P‐5.3.003DU‐2512b‐000 Primary Sludge and Scum Collector 4: Pending S‐1.2.006DU‐2513a‐000 Primary Sludge and Scum Collector 5: Pending S‐1.2.006DU‐2513b‐000 Primary Sludge and Scum Collector 6: Pending S‐1.2.006MME‐2502‐B00 Helical Scum Skimmer 4: Pending S‐1.2.006MME‐2503‐A00 Helical Scum Skimmer 5: Pending S‐1.2.006MME‐2503‐B00 Helical Scum Skimmer 6: Pending S‐1.2.006SCR‐8507‐000 Barscreen 3: to be replaced with P‐1.1.005B‐5064‐000 Blower, #2 Diluted Natural Gas (Eclipse Unit): Pending P‐4.1.0043.2 Condition Assessments – FY 2014CA – 8.1.002Fire Main SupplyThis project will provide condition assessment of the fire main water supply line to ensure the firemain will provide necessary capacity and pressure as required by the Local Fire Department. S ‐8.2.002, Plant and Potable Water Supply Study scheduled for FY 2013 should be reviewed todetermine conclusions, if any, that impact the fire main supply prior to this condition assessment.E FY2014 E‐<strong>CAMP</strong> Report 2012‐12Dec.docx 13 December 26, 2012
CA – 8.1.003FY 2014 Assessments Triggered by Asset AgeThis project will provide condition assessment of the EWA assets with nominal replacement date ofFY 2018, as follows:CHR‐4044‐000Chiller (Power Building)The following assets nearing end of assessed service life will be replaced as part of projects orassessed as part of specific studies:T‐2402‐000FLT‐0030‐000SCR‐1512‐000VEH‐4057‐000VEH‐4058‐000Primary Sedimentation Basin 2: Pending S‐1.2.006Filter‐3WHP/2W Sandfilter: Pending S‐8.2.002 (in process)Barscreen 2: to be replaced with P‐1.1.005Vehicle ‐ #57 (Forklift/Yale): Vehicles addressed by General Services and notincluded in E‐<strong>CAMP</strong> processVehicle ‐ #58 Trailer Jockey: Vehicles addressed by General Services and notincluded in E‐<strong>CAMP</strong> process3.3 Condition Assessments – FY 2015CA – 8.1.004FY 2015 Assessments Triggered by Asset AgeThis project will provide condition assessment of the EWA assets with nominal replacement date ofFY 2019, as follows:24” SE Pipe – 24” Secondary EffluentCHF‐6921‐000 CEPT Polymer Blending Units (East)CHF‐6922‐000 CEPT Polymer Blending Units (West)VS‐510‐000 Venturi Scrubber, Biosolids DryingVFD‐6100‐001 VFD Maindrive Centrifuge Nos. 1 (East) (coordinate with P‐3.3.019)VFD‐6200‐001 VFD Maindrive Centrifuge Nos. 2 (West) (coordinate with P‐3.3.019)VFD‐6100‐002 VFD Backdrive Centrifuge Nos. 1 (East) (coordinate with P‐3.3.019)VFD‐6200‐002 VFD Backdrive Centrifuge Nos. 2 (West) (coordinate with P‐3.3.019)CND‐500‐000 Condenser/SaturatorThe following assets nearing end of assessed service life will be replaced as part of projects orassessed as part of specific studies:DU‐2511a‐000 Primary Sludge and Scum Collector 1: Pending S‐1.2.006DU‐2511b‐000 Primary Sludge and Scum Collector 2: Pending S‐1.2.006DU‐2512a‐000 Primary Sludge and Scum Collector 3: Pending S‐1.2.006MME‐2501‐A00 Helical Scum Skimmer 1: Pending S‐1.2.006MME‐2501‐A00 Helical Scum Skimmer 2: Pending S‐1.2.006MME‐2502‐A00 Helical Scum Skimmer 3: Pending S‐1.2.006The centrifuge scrolls will also be assessed in FY 2015.E FY2014 E‐<strong>CAMP</strong> Report 2012‐12Dec.docx 14 December 26, 2012
CA – 8.1.005 Underground Structures ‐ Part 1This project will provide the first part of the condition assessment of the underground structurefacilities to provide EWA a clear understanding of the underground asset’s condition and therehabilitation needs to preserve asset reliability. A list of underground structures to be included inthe underground structures condition assessment projects (CA‐8.1.005 and CA‐8.1.007) is as follows:Electrical Underground Structures:Electrical duct banks connecting all the Electrical MHs in the plantMH‐18 (North of Screenings Bldg)HH‐18 (North of Screenings Bldg)MH‐8 and adjacent MH (West of Power Building)MH‐19 (East of Maintenance Bldg)MH‐13 (East of Power Bldg)MH‐14 (South‐West of Power Bldg)MH‐9 (South‐West of Primary Clarifier No. 6)MH‐10 (South of Primary Clarifier No. 2)MH‐11 (East of Effluent Pump Station)MH‐17 (North of Chlorination Bldg)MH‐12 (North of Maintenance Bldg)MH‐1 and HH‐1 (West of Administration Bldg)MH‐20 (South‐West of DAF‐1)MH‐16 (South‐East of Phase III Dewatering Bldg)MH‐15 and HH‐15 (South‐East of DAF and Centrifuge Polymer Area)MH‐2 and HH‐2 (East of Waste Gas Flare)MH‐3 and HH‐3 (North‐East of Secondary Clarifier No. 7)MH‐4 (South‐East of Secondary Clarifier No. 7)HH‐5 and HH‐6 (East of ORFIII)Other Unidentified Manhole and Handhole StructuresFlow Control Structures:Influent Junction Structure (recently assessed and being replaced)Primary Sedimentation Primary Effluent Junction Box (assessed with PE Conveyance System)Primary Effluent Equalization Junction Box (assessed with PE Conveyance System)Secondary Effluent Equalization Split Structure (assessed with PE Conveyance System)Effluent Splitting Structure (assessed with PE Conveyance System)Valve Vaults3.4 Condition Assessments – FY 2016CA – 8.1.006FY 2016 Assessments Triggered by Asset AgeThis project will provide condition assessment of the EWA assets with nominal replacement date ofFY 2020. This project will provide condition assessment of the following assets:P‐8004‐000 WAS Pump 1P‐8005‐000 WAS Pump 2P‐8008‐000 WAS Pump 5E FY2014 E‐<strong>CAMP</strong> Report 2012‐12Dec.docx 15 January 2, 2013
P‐3062‐000 Final Effluent Pump 2P‐8023‐000 RAS Pump 1P‐8024‐000 RAS Pump 2P‐8025‐000 RAS Pump 3P‐8026‐000 RAS Pump 4AHU‐8054‐000 AHU – Secondary BuildingAHU‐4510‐000 AHU – WarehouseAHU‐3720‐000 AHU – Chlorine Bldg, MCC (coordinate with P‐5.2.021)AHU‐1610‐000 AHU – Fan Room, ORF I, Primary GalleryAHU‐6692‐000 AHU – Second Floor Supply Fan (Dewatering)AHU‐1601‐000 AHU – Screenings RoomAHU‐1606‐000 AHU – MCC Room, Screenings (coordinate with P‐5.2.021)AHU‐4067‐000 AHU – MCC Room, Power Bldg (coordinate with P‐5.2.021)FLT‐8830‐000 ORF III, Secondary Carbon Filters (East)FLT‐8831‐000 ORF III, Secondary Carbon Filters (West)MCC‐4000‐R00 MCC‐R (Power and Maint Bldg)MCC‐4000‐P00 MCC‐P (Power and Maint Bldg)MCC‐4000‐N00 MCC‐N (Blowers)MCC‐4000‐M00 MCC‐M (Blowers)MCC‐4000‐K00 MCC‐K (Digesters)MCC‐6000‐H00 MCC‐H (Sludge Dewatering Bldg)MCC‐1500‐G00 MCC‐G (Headworks‐Screenings Bldg)MCC‐1500‐F00 MCC‐F (Headworks‐Screenings Bldg)MCC‐3500‐E00 MCC‐E (Chlorine Bldg)MCC‐3500‐D00 MCC‐D (Chlorine Bldg)21” D 21” Drain Pipe (Pellet Loading to EPS to IJS)12” 3WL 12” No. 3 Water Low Pressure (Refer to Plant Water Study, EPS to Drying Buildingand ORF I30” D 30” Drain Pipe (East of EPS)16” FA Pipe – 16” Foul Air (Screenings Building, vicinity of Digester Nos. 1 – 3)The following assets nearing end of assessed service life will be replaced as part of projects orassessed as part of specific studies:DU‐2514a‐000 Primary Sludge and Scum Collector 7: Pending S‐1.2.006DU‐2514b‐000 Primary Sludge and Scum Collector 8: Pending S‐1.2.006DU‐2515a‐000 Primary Sludge and Scum Collector 9: Pending S‐1.2.006DU‐2515b‐000 Primary Sludge and Scum Collector 10: Pending S‐1.2.006MME‐2504‐A00 Helical Scum Skimmer 7: Pending S‐1.2.006MME‐2504‐B00 Helical Scum Skimmer 8: Pending S‐1.2.006MME‐2505‐A00 Helical Scum Skimmer 9: Pending S‐1.2.006MME‐2505‐B00 Helical Scum Skimmer 10: Pending S‐1.2.006P‐7310‐000 TWAS Pump 3E FY2014 E‐<strong>CAMP</strong> Report 2012‐12Dec.docx 16 January 2, 2013
CA – 8.1.007 Underground Structures ‐ Part 2This project will provide the second part of the condition assessment of the underground structurefacilities to provide EWA a clear understanding of the underground assets condition and therehabilitation needs to preserve asset reliability. Refer to CA 8/1/005CA – 8.1.008BridgesCA‐8.1.008 will assess the bridges over the flood control channel. There is one bridge for vehiculartraffic and one bridge for pedestrian traffic that will be assessed. The bridges will be inspectedvisually for corrosion and structural integrity.3.5 Condition Assessments – FY 2017CA – 8.1.009FY 2017 Assessments Triggered by Asset AgeThis project will provide condition assessment of the EWA assets with nominal replacement date ofFY 2021:P‐3063‐000 Final Effluent Pump 3P‐3064‐000 Final Effluent Pump 4P‐5530‐000 Digester Mixing Pump 5A (North)P‐5531‐000 Digester Mixing Pump 5B (South)P‐5630‐000 Digester Mixing Pump 6A (North)P‐5631‐000 Digester Mixing Pump 6B (South)The following assets nearing end of assessed service life will be replaced as part of projects orassessed as part of specific studies:GDW‐1501‐000 Grit Dewatering Screw 1: to be replaced in P‐1.1.005GDW‐1502‐000 Grit Dewatering Screw 2: to be replaced in P‐1.1.0053.6 Condition Assessments – FY 2018CA – 8.1.010FY 2018 Assessments Triggered by Asset AgeThis project will provide condition assessment of the EWA assets with nominal replacement date ofFY 2022.P‐8027‐000 RAS Pump 5P‐8028‐000 RAS Pump 6P‐8027‐A00 RAS Pump SpareP‐8029‐000 RAS Pump 8E FY2014 E‐<strong>CAMP</strong> Report 2012‐12Dec.docx 17 January 2, 2013
This page intentionally left blank.E FY2014 E‐<strong>CAMP</strong> Report 2012‐12Dec.docx 18 January 2, 2013
SECTION 4:STUDIES, UPDATES AND OTHER PROFESSIONAL SERVICES4.1 StudiesMaintaining EWA facilities requires studies to provide planning information. A description of “ConceptualStudies” related to complex capital projects that have been prioritized to be funded in the near term areprovided in subsection 4.1.1. In subsection 4.1.2, descriptions of “Special Studies” are provided. SpecialStudies are studies addressing general EWA or plant‐wide issues. “Study Updates” are described insubsection 4.1.3.4.1.1 Conceptual StudiesConceptual Studies are designated with an “S” prefix and are numbered corresponding to their associatedcapital project. Refer to Section 5 for a description of the corresponding project for each conceptual study.For some projects, the scope of work has been defined by staff and is included in the project write‐up. Formore complex projects with multiple options, a conceptual study is planned. The conceptual study definesoptions to meet the project needs, includes life‐cycle analysis of options, and considers non‐monetaryfactors. A description of each conceptual study that has been identified for completion within the next fiscalyear as well as other key studies is presented as follows:S – 1.1.006GRS Isolation ImprovementsThe Grit Removal System (GRS) uses three aerated grit tanks toseparate and remove grit prior to primary treatment. The currentoutlet weir on the shared wall between the grit tanks and the grittank effluent channel is a concrete barrier wall with a fixed heightand 24 foot length. When plant flows are high, the water surfaceelevation in the effluent channel exceeds the barrier wall heightand backflows into the out‐of‐service grit tank, which is a safetyconcern for personnel working in the grit tank. General Servicespersonnel isolate the grit tanks at least one time per year for aone week duration to complete planned maintenance. Personnelalso isolate the tanks weekly to remove rags and pieces of coatingworked loose from upstream structures, and to clear the hopperand grit pump suction piping.Figure S‐1.1.006Grit Tanks Effluent ChannelThe GRS Isolation Improvements Study will develop and compare options to isolate each grit tank from thegrit effluent channel. One alternative identified is the installation of an isolation gate with two motorizedoperators on the upstream side of the wall between each grit tank and the grit tank effluent channel.Alternative means of isolating the tank, such as installation of an isolation gate between the grit tank effluentchannel and the primary influent channel may be preferred from an operational standpoint, but would bemore difficult and possibly more costly to install because there is no current means to isolate the primaryinfluent channel.E FY2014 E‐<strong>CAMP</strong> Report 2012‐12Dec.docx 19 December 26, 2012
S – 1.2.006PSB Struct and Mech RehabThe Primary Sedimentation Basin (PSB) system was constructed in phases, as follows:PSBs 1 and 2: 1965PSB 3:1969 (approx)PSB 4: 1971PSBs 5 and 6: 1975 (approx, PSB 1‐6 existing on Phase III dwgs, 1980)PSBs 7 through 10: 1984 (Phase IV expansion)The replacement of Helical Scum Skimmers as well as Sludge and Scum Collectors was completed in thePrimary Sedimentation Basins as follows:PSB 1 ‐ 3:PSB 4 – 6:PSB 7 – 10:1984 replaced, 1999 replaced1984 replaced, 1996 replaced1992 replaced, 2000 replacedPhotos showing the current condition of the facilities are shown in Figure S‐1.2.006.Figure S‐1.2.006aPSB – Top of Wall CorrosionFigure S‐1.2.006bPSB Helical Scum SkimmerFigure S‐1.2.006cPSB Effluent Stop Plate Guide WallFigure S‐1.2.006dPSB Previous Concrete Coated OverE FY2014 E‐<strong>CAMP</strong> Report 2012‐12Dec.docx 20 December 26, 2012
Figure S‐1.2.006ePrimary Influent Gate Guide CorrosionFigure S‐1.2.006fPrimary Influent ChannelThe following table summarizes the PSB components and current condition and observations:Facility ElementCondition DescriptionA. PSB Influent Channel Channel condition below the water level is unknown. The facility is notequipped with means of isolating the channel for inspection and maintenance.B. PSB Influent Gates Primary influent gate guide stems and shafts are corroded, and gates cannotbe used to isolate the basins. There are two influent gates for each primarysedimentation basins, for a total of 20 influent gates. Each gate was designedto seal an 18‐inch diameter opening.C. PSB Structures – general Cracks have been observed in Primary Sedimentation Basin (PSB) wallsbetween the basins, between PSB Nos. 2 and 3 in particular. When a PSB isisolated for maintenance, staff reports that cracks in the wall allow flow tomove from the full basin to the empty basin. Concrete damage observed onthe top of walls can also prevent covers from sealing, causing odors to bereleased. Additional testing is required to determine which tanks are damaged,extent of damage, such as corrosion of steel reinforcing.D. PSB 1‐6 Concrete Assessment video dated 10/2012 shows urethane coating over deterioratedconcrete on vertical walls and concrete damage 0.75 to 1‐inch deep at effluentstop plate locations.E. PSB 1‐6 Covers Covers were replaced in 2012.F. PSB 7‐10 Covers Covers are in acceptable condition.G. PSB 1‐10 Sludge and Scum Equipment has been in service approximately 15 years, which is typical serviceCollectorslife. Some flights and other parts have been replaced, as needed.H. Weirs and Launders No known deficiencies based on general observationI. Helical Skimmers The original skimmers were constructed of carbon steel with 15 year servicelife. The skimmers were replaced with stainless steel type. The skimmersappear to be in good condition but may require refurbishment of rotatingassemblies or seals.J. Scum conveyance Primary scum is conveyed to the primary influent gallery through an 8‐inchpipeline parallel to the drainline from MH‐4. Based on CCTV, settlement in thearea has impacted the drain pipeline and there is concern that settlement mayhave impacted the scum pipeline. Refer to Project P – 1.2.010 which addressesthe scum pipeline. Additionally, staff has recommended the automation ofscum flow control. Scum pumps are in acceptable condition and aremaintained through annual refurbishment.E FY2014 E‐<strong>CAMP</strong> Report 2012‐12Dec.docx 21 December 26, 2012
K. PSBs 1‐6 PE Channel Urethane coating was previously applied over damaged concrete. Damage isobserved in approximately 5 to 10 percent of the coating/concrete surfacearea, primarily at openings and transitions. Pinging of concrete in someuncoated sections sounds hollow indicating potential deterioration of theconcrete condition.L. PSB PE EQ Structure Coating has failed and concrete is in poor conditionM. PSB PE EQ Bypass Structure Coating has failed and concrete is in poor conditionN. PSB PE EQ Bypass Gate Gate operator was replaced in 2012, but gate is the original gate, cast irontype. It is uncertain if the gate is movable. However, the gate adequatelyserves to seal the opening to the original PE pipeline, the only intended use atthis time.Scope of Study:The first phase of this study will evaluate the deficiencies in the primary treatment area, including structuraland mechanical components identified in A through N in this description. The study will provide options forrehabilitation of the primary treatment system. The scope includes establishment of structural designcriteria, methods to address concrete damage, means of reinforcing the structure as required, replacementof mechanical equipment as needed, recommended suppliers for gate and other equipment, recommendedmaterials, constructability, development of a sample outage plan including bypass pumping requirements,and construction constraints.S – 1.2.009PE Pipeline RehabilitationThe Primary Effluent Pipeline was constructed around 1979 aspart of the Phase III project which provided secondary treatmentat the EWPCF in accordance with the Clean Water Act. The 72‐inch pipeline conveys primary effluent to the aeration basin. Asecond primary effluent pipeline may be needed in the future toprovide additional capacity, depending on flow projections andthe hydraulic impacts associated with rehabilitation of the existingPrimary Effluent Pipeline.Figure S‐1.2.009Crown of PE PipelineIn October 2012, EWA conducted a condition assessment of thePE conveyance system including the PE pipeline. The majority of the pipeline was in good condition.However, the inspection team observed damage to the concrete in sixteen localized areas in the crown of thepipe due to corrosion. In some location the damage extended into the rebar. The damage was locatedbeginning at joints and extending downstream. The damaged area concrete loss was in most cases one totwo inches of depth, ranged from four to eight inches wide, and between six inches to two feet long.However in two locations, the damage at the crown of the pipe extended approximately 10 to 12 feet.This study would: Identify feasible rehabilitation alternatives for the existing primary effluent pipeline including the use ofspot repairs (SIKA or mechanical) and coating/non‐structural liner, as well as structural pipe rehabilitationsystems such as Cured‐In‐Place Pipe (CIPP), Slip Lining, Spiral Wound Lining, and Panel Lining. Determineresultant hydraulic capacity, cost, advantages/disadvantages for three to five alternatives. Onealternative must be a localized repair and coating/non‐structural liner option.E FY2014 E‐<strong>CAMP</strong> Report 2012‐12Dec.docx 22 December 26, 2012
Determine feasibility and develop planning level cost for a second primary effluent pipeline. Identify andcompare options for alignment, construction method, pipe material, junction structure configurations,connection to the aeration basins, capacity needs, groundwater level and other design considerations fora second primary effluent pipeline. The pipeline alignment will consider underground utilities such asduct banks, gas pipelines, and critical process piping. Identify methods to cross the flood control channel,such as pilot tube guided auger drilling or directional drilling. Develop a plant to maintain access to theplant for operations and emergencies.Complete a life cycle analysis of primary effluent pipeline alternatives including rehab of existing pipe andconstruction, if needed, of a second primary effluent pipeline. Capacity requirements will be based on FY2013 Facility Master Plan flow projections.Identify construction schedule and outage schedule for recommended alternativePresent opinion of probable construction cost for the recommended alternativeIdentify facilities to facilitate isolating and monitoring of pipe and repair condition. Identify suitabletechnologies such as remote operating device (ROV) equipped with sonar, or launchable “smart balls”.Identify potential to minimize or remove air from the pipe.The PE pipeline is critical to the operation of the EWPCF performing the following functions:• Conveys flow forward for treatment and reuse/discharge. If the PE pipeline were to fail, primary effluentwould overflow at the primary sedimentation basins. Flow may drain to the flood control channel of notcontained and redirected through emergency pumping.• Conveys flow to the secondary process as required to meet the EWPCF NPDES permit.• The secondary process is also required to provide treated effluent to the Carlsbad Water ReclamationPlant and the Leucadia Water Reclamation Plant for further treatment and reuse. The existing pipeline is located below major plant roadways and is buried in the vicinity of criticalunderground utilities such as duct banks, gas pipelines and critical process piping. Failure of the pipelinemay impact facilities near the pipeline.S ‐ 1.3.013SC Concrete EvaluationEWA’s secondary clarifiers are routinely emptied for maintenance.Cracks in the SC 1‐4 tank floors along with groundwaterinfiltration have been observed. The cracks interfere with theoperation of the sludge scrapper, which can get stuck on theuneven surface. The tanks floors are equipped with groundwaterpop‐off valves to relieve groundwater pressure and preventdamage to the tanks from uplift forces. The pop‐off valves havebeen observed to contain debris, which may be a result ofconstruction activities. A potential cause of cracking is thermalstress on the concrete. When the tanks are empty, the coldgroundwater on outer (buried) face and the hot sun heating up theinterior face can cause a temperature gradient in the concrete.The temperature difference can cause differential expansionwithin the tank resulting in cracking.Figure S‐1.3.013Secondary Clarifier CrackingE FY2014 E‐<strong>CAMP</strong> Report 2012‐12Dec.docx 23 December 26, 2012
EWA currently has two dewatering pump stations installed near Clarifier No. 5 and No. 6. The dewateringpump stations are used to prevent groundwater from entering the clarifiers. Discharge from dewateringpump stations is currently conveyed to the mixed liquor channel for secondary clarification.A condition assessment and structural evaluation of the tanks will be performed to identify the cause of thecracks in the tank. The conceptual study will provide the basis for an improvement project to fix the existingcracks and minimize the potential for future cracks. The existing groundwater pumping operation shall alsobe evaluated, including impact of groundwater in the treatment process, and condition of the existingsystem. A scope and capital cost estimate for improvements/repair of the tanks will be developed after theevaluation is completed.S ‐ 3.1.002DAFT System ReplacementThe Dissolved Air Flotation Thickeners (DAFT) 1 and 2 were installed in 1980 under Phase III. DAFT 3 was builtin 1989 under Phase IV. The DAFT operates under harsh conditions. Many system components are requiredto operate the DAFT system, such as air compressors, compressed air storage tanks, large tanks, rotatingcollectors, tank covers and supports, tank level monitoring, polymer storage and feed, and odor controlassociated with large air volume. Conveyance of thickened sludge has been problematic. The “dump valve”which serves as a pressure relief valve on the Thickened Waste Activated Sludge discharge piping is oldertechnology, and staff have expressed concern over the functionality of this device.Photos of current condition of the DAFT System are provided in Figure S‐3.1.002.Figure S‐3.1.002aRoof supports and hardware in DAFT 3are corrodedFigure S‐3.1.002bHighly Corroded Skimmer Wear surfacewas rehabilitated by EWA Gen ServicesE FY2014 E‐<strong>CAMP</strong> Report 2012‐12Dec.docx 24 December 26, 2012
Figure S‐3.1.002cAluminum roof coating is failed inDAFT 1Figure S‐3.1.002dMany mechanical and structuralcomponents require ongoing maintenanceFigure S‐3.1.002eOperating the DAFT system includesoperation of many systemsFigure S‐3.1.002fThe DAFT system is composed of manycomponents EWA maintainsGeneral Services Personnel complete ongoing projects replacing corroded components and recoatingsurfaces. Equipment components are nearing the end of useful life and the cost of maintaining the system isincreasing.This study will compare alternative thickening technologies which may reduce the equipment componentssuch as centrifuges, gravity belt thickeners, and rotary drum thickeners. Considerations shall include electricalrequirements, polymer use, maintenance requirements, thickening performance, impact on digestercapacity, relative life cycle cost, building requirements, staff requirements for operation and maintenance.The study will provide design criteria, control integration concepts, constructability, sequencing, capacity,demolition of existing facilities, and other requirements. The study will present a life cycle cost comparisonand non‐monetary considerations, and will provide a capital cost estimate for budgeting.E FY2014 E‐<strong>CAMP</strong> Report 2012‐12Dec.docx 25 December 26, 2012
S ‐ 5.1.005Primary Odor Control ExpansionThe Project P‐1.1.005 pre‐design report recommended reconfiguration and addition of odor control for themanhole upstream of drain pump at the influent junction structure. In the screenings building, by coveringchannels and process units, and increasing air changes in the area surrounding the flow, the overall buildingair change requirement will be reduced, allowing the current odor control system capacity to meet therequirements of the revised facility.However, the pre‐design report also recommended an odor control system evaluation in the headworks area,as follows.- Verify foul air exhaust rates and requirements for existing and new facilities- Determine capacity of existing odor reduction facility, compare to requirements- Evaluate alternative technologies for additional odor treatment capacity- Provide conceptual design: process flow diagrams, design criteria, siting, foul air collection, utilityconnections, electrical and instrumentation- Consider odor control ductwork to draw off front end of the primary clarifiers.Additionally, the hydraulic controls (gates, weirs) in the primary influent area, the upstream end of theprimary sedimentation basins, and the PSB primary effluent channels and junction structures, preventeffective ventilation, odor control and removal of corrosive constituents in the air space above the watersurface. In contrast, at the downstream end of the PSBs, ductwork is provided from each basin.This study would complete the recommended evaluation from the P‐1.1.005 pre‐design report and wouldevaluate the odor control effectiveness in the primary influent area, primary sedimentation basin andprimary effluent channels and junction structures. The study would also identify alternatives, design capacityand potential location options to provide additional odor scrubbing capacity, if needed.4.1.2 Special StudiesSpecial studies focus on Organizational or Facility‐Wide planning needs. A description of each near termSpecial Study identified is provided in this sub‐section.S ‐ 8.2.004Comprehensive Energy Rates StudyThe Phase V Expansion Construction completed in 2009 provided significant improvements to the EWAcogeneration system. The Energy and Emissions Plan evaluated actions that could move EWPCF towardindependence from purchased energy. This study will determine if EWA is structured under the most costeffective SDG&E tariff plan. The recommendations from this study will be evaluated and included in thefuture E‐<strong>CAMP</strong> projects.S – 8.2.005<strong>Wastewater</strong> Characterization StudyThe purpose of the <strong>Wastewater</strong> Characterization Study is to provide a comparative analysis of memberagency wastewater constituency and strength to support historical cost allocation methodology implementedby the EWA. The <strong>Wastewater</strong> Characterization Study will establish an effective and accurate methodology indetermining future cost allocation for EWA’s member agencies.E FY2014 E‐<strong>CAMP</strong> Report 2012‐12Dec.docx 26 December 26, 2012
S – 8.2.006Exterior Asset Corrosion ControlThis project will identify the extent of coating needs of exterior equipment and piping at the plant site. Thestudy will prioritize and develop a multi‐year plan and cost estimate to complete the coating work. The studywill also establish a color coding chart for piping systems.S – 8.2.007Offsite Wetlands RestorationA flood control channel conveys stormwater through the EWPCFsite and drains to a wetlands site to the west of <strong>Encina</strong>sBoulevard. This study will evaluate the condition, operation,restoration options and other options for the wetlands. Concernssuch as standing water and potential for odors will be considered.S – 8.2.008R&D Projects SupportFigure S‐8.2.007Plant OverviewThe R&D Projects Support study includes research and development associated with potential energy orresource recovery related facilities. Examples would be cell lysis technology, phosphorus recovery, alternativemethods of gas utilization, and other emerging technologies.4.1.3 UpdatesUpdates provide current planning information for <strong>Authority</strong> work that evolves over time.S ‐ 8.2.003Biosolids Management Business Plan UpdateIn December of 2007, the EWA received and filed the EWA Biosolids Management Business Plan. The EWABiosolids Management Business Plan provides the <strong>Authority</strong> with a comprehensive document forimplementation of best management practices to manage, beneficially use, and dispose of Class A biosolidspellets and Class B biosolids cake.The Biosolids Management Business Plan Update should periodically be updated to verify assumptions andidentify needed program redirection.4.2 Other Professional ServicesOther professional services include Engineering Services, Legal Services and other services such as materialstesting, survey and geotechnical services.4.2.1 Engineering ServicesEngineering Services projects complete tasks to support the function of EWA, but do not include constructionof facilities.E FY2014 E‐<strong>CAMP</strong> Report 2012‐12Dec.docx 27 December 26, 2012
ES ‐ 8.3.001E‐<strong>CAMP</strong> UpdateEach year the E‐<strong>CAMP</strong> is updated. EWA managers solicit input from staff to determine needs that havesurfaced since the previous update. New projects are defined and all projects are ranked and prioritized.Projects completed during the previous fiscal year are also documented. A five year plan is presented forconsideration during the budget process.ES ‐ 8.4.002Extension of StaffThe As‐Needed Services contract is an annual contract for Engineering Support for needs that developthroughout the fiscal year. Tasks generally are 20 hrs or less of engineering support effort each as well asstrategic planning meetings with EWA Managers.ES ‐ 8.4.008Electronic O&M Manual and Document MgmtIn FY 2013, EWA initiated Phase 1 of the Electronic O&M Manual and Document Management project. Thegoal of the project is to consolidate previous O&M Manuals, develop additional O&M content as needed, andto format the material into an electronic format. The project also is developing a system for organization andpopulation of documents into EWAs LaserFiche electronic document storage and retrieval system.ES ‐ 8.4.009Map Underground Piping > 12‐inchIn 2012 consolidated plant piping maps were developed for piping 12‐inch diameter and smaller. This projectwill complete the mapping and produce figures reflecting consolidated record of pipes installed by phase forpiping larger than 12‐inch in diameter.ES ‐ 8.4.010Research and DevelopmentThis project is in support of research and development efforts at the EWPCF.4.1.2 Legal and Other ServicesOS ‐ 8.5.001Legal and Miscellaneous ServicesLegal and miscellaneous services include the review of contracts and other legal documents, materialstesting, survey, geotechnical services, copying and other services.E FY2014 E‐<strong>CAMP</strong> Report 2012‐12Dec.docx 28 December 26, 2012
SECTION 5:IDENTIFICATION OF E‐<strong>CAMP</strong> PROJECTSThis section provides project background, description, justification and project delivery information forpotential projects that have been identified through the E‐<strong>CAMP</strong> process. The purpose of this section is toprovide an organized reference for E‐<strong>CAMP</strong> projects both that are recommended for funding in the next fiveyears and for potential future projects. In general, more detail has been developed for the projects that areanticipated for implementation in near term. A more conceptual description is provided for projectscurrently planned for implementation beyond the next five years.E‐<strong>CAMP</strong> projects are developed based on a needs assessment, triggered by either asset age or EWA staffobservations. Needs based on asset age are assessed through a condition assessment of the equipment,which determines the assessed useful life remaining and considers the criticality of the equipment. Somestaff observations result in a project with design criteria in which the Agency management team reachesconsensus during the E‐<strong>CAMP</strong> process, and these projects are added to the list. These projects include adesign phase prior to the project implementation phase. Other observations require a special study toaddress an issue or concern that is identified, which will identify a specific E‐<strong>CAMP</strong> project at a later time.Potential projects are given a unique project number. As projects are completed, the project descriptions areremoved from this Section and projects are listed by year completed in Appendix A. Projects may beremoved from consideration for other reasons; for example the project may not meet the $50,000 E‐<strong>CAMP</strong>project threshold and may addressed by the General Services Group, the project may be combined with adifferent project, or the project may not meet cost/benefit requirements and therefore be eliminated fromconsideration. The Comprehensive Project List in Appendix B provides a listing of historical, current, futureand eliminated projects.5.1 Liquid Process ImprovementsThis sub‐section identifies potential liquid process improvement projects.5.1.1 HeadworksP‐1.1.005Grit and Screenings Handling Facility RehabBackgroundThe existing grit and screen handling facilities wereinstalled as part of the 1980 Phase III Expansion. BarScreen No. 2 was replaced in 1998 and Bar Screen No. 4was replaced in 2006. Components of Bar Screen No. 4were also replaced in 2011 after they were damaged. InFY 2012 the Grit and Screenings Handling Study wascompleted, including a condition assessment of thefacility. In addition to recommendations based on assetcondition, the study evaluated alternative screeningsremoval and handling, grit removal and handling, andventilation. The study recommended additionalevaluation of odor control requirements.Figure P‐1.1.005Bar Screen ConveyorE FY2014 E‐<strong>CAMP</strong> Report 2012‐12Dec.docx 29 December 26, 2012
DescriptionBar Screen and Grit Processing Building Replace four existing bar screens with new climber screens with ¾‐inch bar spacing. Repair concrete and liner in the bar screen channels Replace bar screen drainage pump bubbler with ultrasonic level sensor for level monitoring Modify the sloped floor in the existing bin area to match screenings building floor to improveaccess. Provide a Grit and Screenings Building extension immediately west of the existing ScreeningBuilding to house combined grit and screenings handling equipment and roll‐off bin. Provide new shaftless screw conveyor for screenings and a diverter chute from each screen. Cover channel openings with plates Provide two new washer compactors to provide intermediate level of washing. Replace all channel aeration piping and diffusers. Add manifold isolation valves.Grit Removal Process Replace the MCCs serving the headworks and primary clarifier facilities Connect the manhole upstream of the drainage pump station to the Odor Reduction Facility. Replace existing Grit Tank No. 3 influent stop plate with motor‐operated gate. Replace peeling coating in Grit Tank Nos. 1 and 2. Replace pipe supports in Grit Tanks. Replace scum gates (stop plates) in the grit tank effluent channel Implement improvements to the grit withdrawal facilities including water fluff piping in hopper,pump suction shortening/straightening, backflush connection, replace standard with long radiuselbow, portable pump connection for dewatering grit tanks, discharge pipe resizing, flushingconnections Replace grit pumps with recessed impeller types, and overhead wiring. Provide spare pump.Odor Control Provide enclosures on screens and conveyor to contain odors. Modify building ventilation system to maintain negative pressure and draw exhaust from coveredchannels.E FY2014 E‐<strong>CAMP</strong> Report 2012‐12Dec.docx 30 December 26, 2012
Recommend reducing the air changes for the building from 33 air changes per hour to 15 airchanges per hour as a result of changes in ventilation including higher air withdrawal fromcovered channels. Modify grit tank inlet structure and add baffle wall. Eliminate existing crossbaffle wall and add longitudinal wall. Increase length of grit tank effluent weir.Conduct an odor control system evaluation and incorporate recommended improvements.- Verify foul air exhaust rates and requirements for existing and new facilities- Determine capacity of existing odor reduction facility, compare to requirements- Evaluate alternative technologies for additional odor treatment capacity- Provide conceptual design: process flow diagrams, design criteria, siting, foul air collection,utility connections, electrical and instrumentation- Consider odor control ductwork to draw off front end of the primary clarifiers.JustificationAssets are in poor condition because of age and corrosive environment. Improved equipment isavailable to provide cleaner and dryer grit and screenings. Improvements will facilitate maintenanceand provide operational flexibility. Odors in the workplace and fugitive odors will be reduced.Project DeliveryTraditional Design – Bid ‐ ConstructCould be combined with P‐1.1.006 (Grit Tank Isolation Improvements) orP‐1.1.008 (Grit System Rehabilitation), or P‐1.2.006 (PSB Rehabilitation)E FY2014 E‐<strong>CAMP</strong> Report 2012‐12Dec.docx 31 December 26, 2012
P‐1.1.006GRS Isolation ImprovementsBackgroundThe current outlet weir on the shared wall between thegrit tanks and the grit tank effluent channel is a concretebarrier wall with a fixed height and 24 foot length. Whenplant flows are high, the water surface elevation in theeffluent channel exceeds the barrier wall height andbackflow into the out‐of‐service grit tank, which is asafety concern for workers in the grit tank. Maintenancepersonnel isolate the grit tanks at least one time per yearfor one week duration to complete planned maintenance.Personnel also isolate the tanks approximately weekly toremove rags, pieces of coating worked loose fromupstream structures and to clear the hopper and gritpump suction piping.Figure P‐1.1.006Grit Tanks Effluent ChannelDescription Provide isolation between each grit tank and the grit tank effluent channel, based onrecommendations from the study S‐1.1.006, refer to Section 4.1.1 of this E‐<strong>CAMP</strong> for additionaldiscussion.JustificationThis project is a top priority for safety reasons and would reduce the risk of inundation of staffperforming maintenance in off‐line grit tanks.Project DeliveryTraditional Design – Bid ‐ ConstructCould be combined with P‐1.1.005 (Grit and Screenings Handling Facility Modifications) orP‐1.1.008 (Grit System Rehabilitation), or P‐1.2.006 (PSB Rehabilitation)E FY2014 E‐<strong>CAMP</strong> Report 2012‐12Dec.docx 32 December 26, 2012
P‐1.1.007Vactor Receiving StationBackgroundThere is a demand for vactor/septage receiving in theEWA service area. Currently the EWPCF receives limiteddeliveries from combination (vactor) trucks at a locationadjacent to the Influent Junction Structure (IJS) as shownin Figure P‐1.1.007. The current deposition area isdesigned to be replaced in the 2012 Major Plant RehabProject which will improve the operation. It is noted thatat one time, EWA considered receiving septage at theEWPCF. Receiving septage is no longer underconsideration.Figure P‐1.1.007Vactor Receiving LocationThis project proposes to implement a receiving station tofacilitate discharge of combination truck tanks into the EWPCF. Project considerations includelocation, odor control, separation of rocks from discharge, security, sampling, control of substancesflowing to IJS, rock/debris handling. Project could be constructed in conjunction with P‐3.2.001(Waste to Energy Facilities) to achieve economies of scale in conjunction with the grease receivingstation associated with the grease to gas project.E FY2014 E‐<strong>CAMP</strong> Report 2012‐12Dec.docx 33 December 26, 2012
P‐1.1.008GRS RehabBackgroundGrit Removal System (GRS) Tank Nos. 1 and 2 wereinstalled with Phase III around 1980, and Grit RemovalTank No. 3 was installed with Phase IV around 1990.Upgrades to these facilities, specifically the installation ofinfluent gates and motor operators on Grit Tank Nos. 1and 2, have been completed. It is noted that compositeframes and gates were installed. While the frames haveprovided suitable service, the gates have delaminated atthe top and require repair.Additional GRS upgrades have been identified as E‐<strong>CAMP</strong>Project P‐1.1.006 Grit System Isolation Improvements, andas part of Project P‐1.1.005 including replacement of:‐ MCCs serving the headworks‐ Grit Tank 3 influent stop plate w/motor‐operated gate‐ coating in Grit Tank Nos. 1 and 2‐ pipe supports in Grit Tanks‐ scum gates in the grit tank effluent channel‐ grit pumps with recessed impeller types‐ overhead wiringFigure P‐1.1.008aGrit Tank Nos. 1 and 2 Influent GatesProject P‐1.1.005 also will implement improvements tothe grit withdrawal facilities including water fluff piping inhopper, pump suction shortening/ straightening,backflush connection, replace standard with long radiuselbow, portable pump connection for dewatering grittanks, discharge pipe resizing, and flushing connections.The P‐1.1.005 study phase included a condition assessment of the grit tanks.The assessmentconcluded that the grit chamber structure and concrete is in good condition. The grit tank effluentchannels are continuous with the primary influent channel, and are not equipped with means ofisolation. Therefore, the condition of the concrete below the water surface needs to be assessed.Description Replace the Grit Tank Nos 1 and 2 inlet gates (frame replacement not required) Rehabilitate as needed the grit tank effluent channels.JustificationProject P‐1.1.008 is needed to maintain the facility in good operating condition.Figure P‐1.1.008bGate DelaminationProject DeliveryTraditional Design – Bid – Construct. This work may be included in P‐1.1.005 or P‐1.1.006E FY2014 E‐<strong>CAMP</strong> Report 2012‐12Dec.docx 34 December 26, 2012
P‐1.1.009Influent Flow Metering InstallationBackgroundEWPCF NPDES Permit No. R9‐2011‐0019 AddendumNo. 1 requires flow monitoring: “At a location where allinfluent flows to <strong>Encina</strong> Water Pollution Control Facility(EWPCF) are accounted for in monitoring events;upstream of any in‐plant return flows; and whererepresentative samples of influent can be collected.”Currently, the influent flow is computed based on flowmeter readings at multiple locations, including someFigure P‐1.1.009Flowshark Plus Flowmeter systemreturn flow meters in the EWPCF. During past inspections, the Regional Board Inspectors havecommented that the current practice of computing influent flow does not meet the permitrequirement. Permit requirements are as follows: “Appropriate flow measurement devices andmethods consistent with accepted scientific practices shall be selected and used to ensure theaccuracy and reliability of measurements of the volume of monitored discharges. The devices shall beinstalled, calibrated and maintained to ensure that the accuracy of the measurement is consistentwith the accepted capability of that type of device. Devices selected shall be capable of measuringflows with a maximum deviation of less than ±5 percent from true discharge rates throughout therange of expected discharge volumes.”The 2012 Major Plant Rehabilitation Project includes reconstruction of the Influent Junction Structure(IJS), and the construction of associated structures and manholes. The manholes will be configuredon the two EWPCF influent pipelines just upstream on the East and on the West side of the new IJS.This configuration is suitable for installation of newer technology open channel flow measurementcross correlation velocity technology.Description Provide a 2‐inch conduit for signal/power cable from the electrical room to each vault. The cablepower/SCADA connection must be within 800 feet of the flow system. Install two flowmetering systems, Flowshark Plus or equal, with accuracy to 2 to 3 percent. It isanticipated that this work will be added to the existing ADS flow monitoring contract. Complete wiring and/or provide a wireless signal configuration Complete SCADA programming to compute the total influent flow to the EWPCF Provisions for pH and ORP probes, and chemical injection systemsJustificationThe new system will satisfy EWA’s NPDES permit requirements for influent flow monitoring.Additionally, the direct measurement of influent flow will be designed to measure a wider range ofinfluent flow including peak flows, and will provide a better measurement to be used for operationalpurposes such as flow pacing.Project DeliveryInclude manhole configuration in P‐1.1.001 (2012 Major Plant Rehab), contract for conduit andprogramming, and contract with ADS for flowmeter installation and ongoing service. Procure metersthrough the existing ADS service contract.E FY2014 E‐<strong>CAMP</strong> Report 2012‐12Dec.docx 35 December 26, 2012
P‐1.1.010Influent Pipeline Rehab w/Addl 2012 Major RehabBackgroundThe 2012 Major Plant Rehabilitation Project incorporated multiple E‐<strong>CAMP</strong> projects in addition to therehabilitation of the four influent pipelines from the Influent Junction Structure (IJS) to the bar screenchannels. The construction cost budget developed during final design exceeded the funding allocatedin FY 2013. This Project P‐1.1.010 rehabilitates the influent pipelines and provides additional budgetto fully fund the project per the 90 percent design:Previous RevisedDescriptionBudget Cost Estimate2012 Major Plant Rehab Project updated budget, P‐1.1.001 $ 3,445,000E‐<strong>CAMP</strong> EstimatesP‐1.1.001 Influent Junction Structure Rehabilitation $ 1,232,000P‐1.1.002 HW Agitation/Aeration Piping and Diff Replacement $ 327,000P‐2.1.003 Outfall ARV Vault Replacement $ 47,000Total $1,606,000 $ 1,606,000P‐1.1.010 Influent Pipe Rehab and addl 2012 Major Rehab $ 1,839,000DescriptionThis Project P‐1.1.010 replaces four 60‐inch pipelines conveying influent from the Influent JunctionStructure to the Bar Screen Channels. In addition to funding the replacement of these pipelines, thisproject provides additional budget to fully fund P‐1.1.001 for the 2012 Major Plant Rehab Project P‐1.1.001. The complete project P‐1.1.001 includes:Replacement of the Influent Junction Structure.Construction of bypass vaults to facilitate construction while maintaining plant operation.Replacement four 48‐inch pipelines from the IJS to the bar screen channels.Misc modifications to the IJS ancillary facilities such as the drain pump station.Replacement and reconfiguration of agitation and aeration piping from the blower room to theheadworks. This project provides additional motor operated valves, flow metering and provisionsfor future modifications such as installation of dedicated positive displacement blowers.Replacement of the ARV vault situated over the land outfall just west of the EWPCF.JustificationThe replacement of the IJS and the influent pipelines are top priority projects replacing facilities thathave reached the end of their service life, and that provide singular, critical function at the EWPCF. Inaddition to conveying all influent into the treatment facility, one of the main plant access roads iscurrently closed to prevent stress on the four influent pipelines located beneath the road. Theagitation and aeration pipeline replacement will result in significant reduction of air loss, thusproviding cost and energy savings. The ARV vault access modifications are required to provide safeaccess to the outfall vault for regular access and maintenance.Project DeliveryTraditional Design – Bid – ConstructE FY2014 E‐<strong>CAMP</strong> Report 2012‐12Dec.docx 36 December 26, 2012
5.1.2 Primary TreatmentP ‐ 1.2.002Primary Sludge Pumping UpgradesBackgroundThe Primary Sedimentation Basins are equipped with tenprogressing cavity pumps with 125 gpm capacity each. Sixof these pumps were installed during Phase III and fourwere installed during Phase IV. With the current pumpcapacity and current thickening occurring in the basins, theplant at times experiences an inability to maintain a lowsludge blanket in the primary sedimentation basins, with allpumps operating continuously. In order to reduce solidsload on the primary sedimentation basins, staff hasimplemented return flow pretreatment, such as diversionof centrate to a DAF tank for removal of solids prior toreturn to the process flow. As plant influent increases inthe future, this constrained primary sludge pumpingcapacity will further impact operation.Figure P‐1.2.002Primary Sludge Pump GalleryThis project will implement improvements, as needed, to provide suitable primary sludge wasting forthe EWPCF including sidestreams and ultimate plant flow rates. The FY 2013 Facility Master Plan willidentify design flows, long‐term plans for CEPT, and side streams routed to the primary treatmentarea. A study will be completed as the first step of this project to identify alternatives formodifications to pump capacity and pump configuration. The study will also evaluate the costs andbenefits associated with alternative control schemes such as sludge density metering, incorporationof sludge blanket, and flow pacing.Description Modify or replace the ten sludge pumps to increase sludge pumping capacity and reliability. Modification of the progressing cavity pumps to operate at higher speed or modify the pumpswith the installation of different sheaves may provide needed capacity. One pump is obsoleteand requires replacement. Modify sludge pump control, if recommended.Justification Project will provide operator flexibility, redundancy, improved treatment Project required to adequately treat future flows. Replacement of obsolete pump will complete upgrade of primary pump facility to pump modelthat can be maintained and matches other pumps.Project DeliveryTraditional Design – Bid ‐ ConstructE FY2014 E‐<strong>CAMP</strong> Report 2012‐12Dec.docx 37 December 26, 2012
P ‐ 1.2.003PE Second PipelineBackgroundOne 72‐inch pipeline conveys primary effluent fromthe primary sedimentation basins to the aerationbasins. A second pipeline would provide redundancyand may be needed to convey flows under futurebuild‐out conditions.Based on the 2012 Primary Effluent (PE) ConveyanceSystem condition assessment, concrete corrosion wasfound in the crown of the existing PE pipeline. Pipelining or other repair methods may further reduce theFigure P‐1.2.003capacity of the existing PE Pipeline. Timing of the Primary Effluent Channelsecond PE pipeline is a factor in the evaluation of alternative methods for rehab of the existingpipeline. A study is scheduled to identify, compare and make recommendations for existing pipelinerehabilitation as well as the timing of the construction of the second PE pipeline.Description Construct a second primary effluent pipelineJustificationThe primary effluent pipeline is a one‐of‐a‐kind facility with a high criticality rating because it is theonly pipeline that conveys primary process flows to the aeration basins. A new parallel pipelinewould improve the operational reliability at the plant, increase the primary effluent conveyancecapacity, and allow for the inspection, maintenance and repair of the existing pipeline.Project DeliveryTraditional Design – Bid ‐ ConstructE FY2014 E‐<strong>CAMP</strong> Report 2012‐12Dec.docx 38 December 26, 2012
P‐1.2.004PE Emergency Discharge Pipeline RehabBackgroundPrior to the Phase III Plant Expansion, the EWPCFprovided primary wastewater treatment and primaryeffluent was conveyed to the ocean outfall. Secondarytreatment was added in 1983 with the Phase IIIExpansion to the plant. A blend of primary andsecondary effluent was discharged until the Phase IVexpansion was completed in 1992. Under Phase IV, anisolation gate was installed on the 72‐inch primaryeffluent discharge pipeline to the outfall. It is notknown whether the 72‐inch primary effluent dischargepipe has been plugged or remains connected to theoutfall.Description Review record drawings of 72‐inch gate at primaryeffluent junction box, intermediate junction box,and surge tower outlet intertie. Determine feasibility of entering original pipelinefrom PSB to outfall. Pipeline may be under samepressure as outfall. Assess condition of gate, pipeline and connection tothe outfall. Investigate NPDES permit requirements to maintainability to use the emergency bypass. Design modifications to ensure isolation and allowemergency bypass. Construct improvements to the pipeline.Figure P‐1.2.004aPrimary Effluent Bypass GateJustificationRehabilitation of the primary effluent emergencydischarge gate and pipeline will provide a means ofdischarging primary effluent to the outfall underextreme emergency conditions such as failure of theprimary effluent pipeline to the secondary process. Amajor earthquake or flood could cause this failure. Thisflexibility could prevent spills of primary effluent fromthe plant into the creek under extreme emergencyconditions, thus reducing health risks, environmentalimpacts and potential for fines under suchconditions.Project DeliveryTraditional Design – Bid ‐ ConstructFigure P‐1.2.004bPrimary Effluent – Secondary BypassFlow Control GateE FY2014 E‐<strong>CAMP</strong> Report 2012‐12Dec.docx 39 December 26, 2012
P‐1.2.006PSB Struct and Mech RehabBackgroundThe Primary Sedimentation Basin system has been constructed in phases, as follows:PSBs 1 and 2: 1966PSB 3: 1969 (approx)PSB 4: 1971PSBs 5 and 6: 1975 (approx, PSB 1‐6 existing on Phase III dwgs, 1980)PSBs 7 through 10: 1980 (Phase IV expansion)PSB 1 ‐ 3 Sludge and Scum Collectors, Helical Scum Skimmers: 1984 replaced, 1999 replacedPSB 4 ‐ 6 Sludge and Scum Collectors, Helical Scum Skimmers: 1984 replaced, 1996 replacedPSB 7 ‐ 10 Sludge and Scum Collectors, Helical Scum Skimmers: 1992 replaced, 2000 replacedPhotos of corrosion in the primary treatment area are shown in Figure P‐1.2.006.Figure P‐1.2.006aPSB – Top of Wall CorrosionFigure P‐1.2.006bPSB Helical Scum SkimmerFigure P‐1.2.006cPSB Effluent Stop PlateFigure P‐1.2.006dPSB Previous Concrete Coated OverE FY2014 E‐<strong>CAMP</strong> Report 2012‐12Dec.docx 40 December 26, 2012
Figure P‐1.2.006ePrimary Influent Gate Guide CorrosionFigure P‐1.2.006fPrimary Influent ChannelThe primary treatment area of the EWPCF is an aging facility operating in a harsh and corrosiveenvironment associated with the presence of hydrogen sulfide off‐gassing typical of flow in the frontend of a treatment plant. Some facilities such as the influent gates are no longer operable. The finalscope of work and budget for this project will be identified in study S‐1.2.006, Refer to Section 4.1.1of this E‐<strong>CAMP</strong> for addition background and details.The major components to be addressed with this project are: Rehab concrete in PSB Influent Channel and provide means of isolation for future inspection andmaintenance PSB Influent Gates – replace all 20 gates. Each gate seals an 18‐inch diameter opening PSB Structures – rehabilitate concrete and coating, repair cracks, provide additional structuralsupport as needed PSB 1‐6 Sludge and Scum Collectors – replace equipment Minor repairs to Weirs, Launders, and rotating mechanisms on the helical skimmers Automation of scum flow control Evaluation and repairs, as needed, to the scum conveyance pipeline PSBs 1‐6 PE Channel – rehabilitate concrete, provide protective coating PSB PE EQ Structure and Bypass Structure – rehabilitate concrete and coating. Provide structuralreinforcement as needed. Relocation of a new structure may be preferred option, pending resultsof the study. Project may include provisions for future second PE pipeline and rehabilitation of existing PEpipeline.Project JustificationSome PSBs have been in operation for nearly 50 years and a range of deficiencies have been noted.The current downstream facilities are designed based on effective primary treatment. Based on assetlife and observed conditions, a comprehensive assessment and rehab, as needed is warranted tomaintain the reliability of the existing facility.Project DeliveryTraditional Design – Bid – ConstructE FY2014 E‐<strong>CAMP</strong> Report 2012‐12Dec.docx 41 December 26, 2012
P‐1.2.009PE Pipeline RehabBackgroundThe Primary Effluent Pipeline was constructedaround 1979 during the Phase III projectimplementing secondary treatment at the EWPCF inaccordance with the Clean Water Act. The 72‐inchpipeline conveys primary effluent to the aerationbasin. A second primary effluent pipeline may beneeded in the future to provide additional capacity,depending on flow projections and the hydraulicimpacts, if any, associated with rehabilitation of theexisting Primary Effluent Pipeline.Figure P‐1.2.009Crown of PE PipelineIn October 2012, EWA conducted a condition assessment of the PE conveyance system including thePE pipeline. The majority of the pipe was in good condition. However, the inspection team observeddamage to the concrete due to corrosion in sixteen localized areas in the crown of the pipe. In someareas, there was also damage to the steel reinforcement. The damage was located beginning at jointsand extending downstream. The damaged area concrete loss was in most cases one to two inchesdeep, an average of six to eight inches wide, and between six inches to two feet long. However in twolocations, the damage at the crown of the pipe extended approximately ten to twelve feet.Description Design existing system modifications and temporary bypass system for use during pipelinerehabilitation Clean and inspect the existing pipeline Rehab the existing pipeline and provide protection against future corrosionThe rehabilitation of the PE pipeline will require bypass pumping of the PE effluent from the PSBs tothe Aeration Basins. The 2012 condition assessment was completed during an eight hour low flowperiod at the EWPCF and required 25 mgd of bypass pumping. It is anticipated that bypass pumpingwill be required for an extended period of approximately two to three weeks. This duration will beverified during the study phase, and will depend on the repair methods selected.JustificationThe Primary Effluent Pipeline is a critical, one‐of‐a‐kind facility that must remain in service for EWA tomeet the current NPDES permit and prevent spills.Project DeliveryTraditional Design – Bid ‐ ConstructE FY2014 E‐<strong>CAMP</strong> Report 2012‐12Dec.docx 42 December 26, 2012
P‐1.2.010PSB Scum PipelineBackgroundPrimary scum is conveyed to the primary influent gallery through an 8‐inch black steel/ductile ironglass‐lined pipeline buried in the corridor between PSB 10 and PSB 1, parallel to several pipelinesincluding 10‐inch and 12‐inch drainlines (Ph IV Sheet PM‐1). Based on CCTV of the drainline from MH‐4, settlement in the area has caused a dip in the pipeline, and there is concern that the settlementmay have impacted the scum pipeline. Refer to Conceptual Study S – 1.2.010 which addresses thescum pipe.DescriptionPending results of further study, this project may involve excavation of the area with settling,recompaction of material, and replacement of a section of the pipeline. Alternatives to correction ofthe settled area and impact on pipelines include rerouting of pipelines.JustificationThe primary scum pipeline is a one‐of‐a kind facility. If the scum cannot be removed from theprocess, it may impact the primary effluent quality, increase loading on downstream facilities, causeodors and increase maintenance requirements.Project DeliveryTraditional Design – Bid ‐ ConstructE FY2014 E‐<strong>CAMP</strong> Report 2012‐12Dec.docx 43 December 26, 2012
5.1.3 Secondary TreatmentP‐1.3.003AB Selector Implementation and Cover ReplacementBackgroundThe secondary process with Aeration Basin Nos. 1 and 2was installed at the EWPCF as part of the 1980 Phase IIIExpansion. Aeration Basin Nos. 3 and 4 were addedthrough the 1989 Phase IV expansion. EWA operates ABNos. 1, 2 and 3 as active aeration basins and uses ABNo. 4 for primary effluent equalization. In FY 2012, EWAcontracted to complete design of aeration basinmodifications to implement process improvements,cover replacement and other rehabilitation.EWA has been operating the aeration basins in a quasi‐anaerobic selector mode, by turning off theaeration air to the first zone of the aeration basins. This project will provide baffles, anaerobic mixersand other modifications needed to implement a true anaerobic selector. Anaerobic selectors willimprove sludge settleability and maximize secondary clarifier capacity. These zones “selectively”grow microorganisms which have better settleability. Two anaerobic selector zones will be installedin each of the three active aeration basins. A selector zone is not needed in the fourth basin as it isreserved for flow equalization.The existing fiberglass reinforced plastic (FRP) covers were installed around 1994. The covers weredesigned to provide odor containment, but are difficult to remove and pose safety concerns. Thebasin covers will be reconfigured with aluminum access plates to provide ease of safe basin access.Additional modifications will be incorporated into the project based on a condition assessment andprocess evaluation.Description Provide access point platforms with aluminum checker plate covering, access hatches, removablehandrail, and access gates Provide anaerobic selector facilities Provide piping, gates and channel repair where neededJustificationCover replacement and reconfiguration improves worker safety around and inside the basins.Anaerobic selector will improve process performance and minimize risk of process upset such asfoaming.Project DeliveryTraditional Design – Bid – ConstructFigure P‐1.3.003Aeration BasinsE FY2014 E‐<strong>CAMP</strong> Report 2012‐12Dec.docx 44 December 26, 2012
P‐1.3.004AB Mech Rehab and RAS Pump AdditionBackgroundRAS is pumped from the Secondary Clarifiers to theAeration Basins through dedicated RAS pumps. If apump requires repair, the corresponding clarifier isrequired to be taken out of service. This limitsoperational flexibility. Also, facility gates, piping andchannels have deteriorated because of corrosion andneed refurbishment to maintain facility functionalityand reliability.Figure P‐1.3.004DescriptionRAS Pumps Provide standby RAS pump with piping to backupany of the existing RAS pumps Rehab influent channels and RAS channel with new barrier walls, repair mortar, provideexpansion joint filler, repair leaks and coat with polyurethane coating; expand walkway aroundnew walls Provide new sump and sump pump at the south end of each influent channel for drainage Replace carbon steel rebates with aluminum type. Remove existing channel air piping and pipe supports Relocate discharge of Carlsbad Water Reclamation Plant reject pipelines from influent channelsto basins Demolish intermediate step‐feed and contact stabilization gates, and cover openings withstainless steel plate Replace slide gates between Influent Channel Nos. 1 and 2 and effluent channel with concretewall. Replace 3WHP water lines with PVC type and replace water supply stations to a location nearnew access hatches. Replace existing diffuser membranesJustificationThe additional RAS pump and piping will increase available equipment capacity. The project willreduce operation and maintenance costs associated removing the associated clarifier from serviceand expediting repairs. This project rehabilitates and replaces equipment and facilities assessed to bein poor condition. A new sump pump to provide channel drainage, will reduce down time.Reconfiguration of pipelines, channels and gates will support fully functional operation of the facility.Replacement of the air diffuser membranes is based on service life recommended by themanufacturer to provide energy efficient operation. New membranes will provide increased oxygentransfer at lower blower operating costs.Project DeliveryTraditional Design – Bid – ConstructE FY2014 E‐<strong>CAMP</strong> Report 2012‐12Dec.docx 45 December 26, 2012
P‐1.3.006Secondary Polymer System ReplacementBackgroundAn existing polymer system was installed by EWAstaff to provide the ability to add polymer to mixedliquor prior to secondary clarification during processupset events. This system is used to aid in suspendedsolids removal. The existing polymer system islocated north of the ORF III facility and is housed in atemporary facility. This project is to provide forpermanent installation of the secondary polymersystem with proper containment, electrical controlsand SCADA monitoring. The project was initiallyintended for occasional use however it is now usedFigure P‐1.3.006regularly as a means of improving processSecondary Polymer Systemperformance. Currently, SCADA monitoring capabilityis limited to a general fault alarm only, and does not provide operational information such as thestatus of the batch polymer system. New controls are proposed to facilitate monitoring andoperation.DescriptionDesign and construct the following:Evaluate converting polymer delivery from tote transfer to chemical truck unloading stationEquip with a new complete polymer blending systemModify to a permanent facility including equipment and structureModify injection point as neededProvide permanent secondary polymer system with necessary containment and shade structureProvide electrical and controls to facilitate monitoring and operationJustificationThis project is a top priority for safety and regulatory reasons. It would improve worker safety,reduce the risk of a chemical spill on the plant site, and make provisions to comply with regulatoryrequirements for double containment. A chemical unloading station would improve safety byreducing the chemical handling required. Expanded monitoring and control capability would reduceoperating labor.Project DeliveryTraditional Design – Bid – ConstructE FY2014 E‐<strong>CAMP</strong> Report 2012‐12Dec.docx 46 December 26, 2012
P‐1.3.007SCs 5 and 6 Mech RehabBackgroundSecondary Clarifier Nos. 5 and 6 were installed in 1992.The condition of the clarifier components was assessedduring FY 2011 and the mechanical equipment was foundto be in corroded and worn. The collection equipmentinstalled in Secondary Clarifier Nos. 5 and 6 is similar tothe equipment installed in Secondary Clarifier Nos. 1through 4. Clarifier Nos. 1 through 4 equipmentreplacement was completed during FY 2011 – FY 2012,and similar equipment replacement is anticipated forSecondary Clarifier Nos. 5 and 6.DescriptionProject work will include the following:Figure P‐1.3.007Secondary Clarifier Nos. 5 and 6CorrosionDemolish and remove existing clarifier mechanism and appurtenancesInstall new clarifier mechanism including removal and disposal of all support structures requiredfor the installation of the clarifier mechanismRemove and replace anchor bolts to install new clarifier mechanism and perform concrete repairRemove and replace the sludge and scum collectorRemove and replace the feed wellApply three‐coat epoxy coating system to all steel portions of the clarifierProtect and reuse the bridge and ancillary equipmentClean and repair the concrete wallsRepair, patch with steel plate, or replace portions of launder trough and support system asneeded.Abrasive blast clean launder trough and supports in place; Abrasive blast clean steel portions ofthe bridge. Apply epoxy coating system to all steel on the launders, supports, and bridge.Replace existing rectangular FRP weirsRemove and replace the drain gates for all clarifiersRemove and replace the influent gateRemove and replace the density bafflesJustificationThe clarifier equipment is recommended for replacement based on a condition assessment whichconcluded that it is in poor condition. Mechanical or corrosion failure would reduce secondarytreatment capacity and impact water quality.Project DeliveryTraditional Design – Bid – ConstructE FY2014 E‐<strong>CAMP</strong> Report 2012‐12Dec.docx 47 December 26, 2012
P‐1.3.008SC 7 – Conversion from EQ to ClarifierBackgroundThere are eight existing secondary clarifier tanks;however, Secondary Clarifier No. 7 is currently not inoperation as shown in Figure P‐1.3.008. The basincurrently does not have a RAS pump or a clarifiermechanism. The basin is currently being used forflow equalization. With completion of the new FlowEqualization Facilities this basin can be converted forprocess treatment use. However, operation ofSecondary Clarifier No. 7 is currently not required tomaintain plant rated capacity. This project will includeinstallation of a new RAS pump and associatedcontrols, new clarifier mechanism, lauders, weirs andremoval of the equalization pump. Modifications arealso required to the Secondary Effluent EqualizationStructure.Figure P‐1.3.008Secondary Clarifier No. 7 TankE FY2014 E‐<strong>CAMP</strong> Report 2012‐12Dec.docx 48 December 26, 2012
P‐1.3.010WAS Pipeline ReplacementBackgroundThe exposed 8‐inch WAS pipeline on the south side of thestorm channel is observed to have corrosion at fittingsand along the pipeline. The condition of the buried pipingis unknown, but there is concern given the corrosivecharacteristics of the soil on the plant site and EWPCF’shistory of extensive corrosion of buried ferrous pipesystems. The buried WAS piping on the north side of thechannel was replaced during the Phase V ExpansionBiosolids Facilities Construction (refer to Vol 4, sheetY15A).DescriptionPotholing is recommended to determine the condition ofthe existing buried piping. Buried ductile iron pipe isgenerally coated and may be encapsulated inpolyethylene wrap. If the existing buried piping condition is good, thisFigure P‐1.3.010project should focus on the replacement of exposedWAS Pipelinefittings in poor condition, and repair and coating of exposed piping. If the buried piping is determined to be in poor condition, this project would complete a WASpipeline replacement of the piping across the bridge, and from the bridge south to the WASpumps. However, the modification or replacement of the DAFT system may impact the alignmentof the WAS pipeline. New sludge thickening equipment options are available that would require asmaller footprint, and the WAS pipeline alignment may change. Refer to Study S‐3.1.002.JustificationThe WAS pipeline is aging and the condition of buried piping is unknown. Other buried metallicpiping at the EWPCF has deteriorated as a result of the corrosive soils on the site. Conveyance ofWAS is required to maintain the secondary process in operation.Project DeliveryTraditional Design – Bid – ConstructE FY2014 E‐<strong>CAMP</strong> Report 2012‐12Dec.docx 49 December 26, 2012
P‐1.3.012AB DO Probe ReplacementBackgroundDissolved oxygen concentration is measured in the aeration basins for biological process monitoringand air flow control. The dissolved oxygen probes require routine maintenance and calibration forproper operation.DescriptionProject work will include the following: Evaluate and select the appropriate dissolved oxygen probe type. Demolish the existing dissolved oxygen probes and transmitters. Install new dissolved oxygen probes and transmitters Update SCADA program to accommodate the new dissolved oxygen probes (if required).The details of mounting the probes and maintenance access under the aeration basin covers shouldbe considered. Replacement of the dissolved oxygen probes may be done in conjunction with or aspart of P‐1.3.003 AB Selector Implementation and Cover Replacement; however replacement of thedissolved oxygen probes is not current in the scope of work for that project.JustificationThe existing dissolved oxygen probes have reached the end of their service life and need to bereplaced. EWA is also interested in reducing the maintenance requirement the dissolved oxygenprobes, therefore replacement options should be evaluated prior to design/construction.Project DeliveryTraditional Design – Bid – ConstructE FY2014 E‐<strong>CAMP</strong> Report 2012‐12Dec.docx 50 December 26, 2012
P‐1.3.013SC Concrete Cracking PreventionBackgroundEWA’s secondary clarifiers are routinely emptied formaintenance. Cracks in the tank floors along withgroundwater infiltration have been observed. Thecracks interfere with the operation of the sludgescrapper, which can get stuck on the uneven surface.The tanks have groundwater pop‐off valves installed inthe floor of the tank to relieve groundwater pressureand prevent damage to the tanks from uplift forces.During recent rehabilitation projects, debris has falleninto the pop‐off valves, preventing them fromoperating. A potential cause of cracking is thermalstress on the concrete. When the tanks are empty,the cold groundwater on outer (buried) face andFigure P‐1.3.013Secondary Clarifier Crackingthe hot sun heating up the interior face can cause a temperature gradient in the concrete. Thetemperature difference can cause differential expansion within the tank resulting in cracking.EWA currently has two dewatering pump stations installed near Clarifier No. 5 and No. 6. Thedewatering pump stations are used to prevent groundwater from entering the clarifiers. Dischargefrom dewatering pump stations is currently conveyed to the mixed liquor channel for secondaryclarification.DescriptionA condition assessment and structural evaluation of the tanks will be performed to identify the causeof the cracks in the tank. A project conceptual study will provide the basis for an improvementproject to fix the existing cracks and minimize the potential for future cracks. The existinggroundwater pumping operation shall also be evaluated, including impact of groundwater in thetreatment process, and condition of the existing system. A scope and capital cost estimate forimprovements/repair of the tanks will be developed after the evaluation is completed.JustificationFurther evaluation of the secondary clarifier cracking will assist EWA in identifying the mostappropriate approach for repair/rehabilitation.Project DeliveryCondition assessment and evaluation of the secondary clarifiers to further define project scope for apotential repair or improvement project.E FY2014 E‐<strong>CAMP</strong> Report 2012‐12Dec.docx 51 December 26, 2012
P‐1.3.014SCs 1 ‐ 4 Inf and Eff Gate ReplacementBackgroundSecondary Clarifier Nos. 1, 2, 3 and 4, were built in1984 and were rehabilitated during FY 2011 – FY 2012.The rehabilitation did not include replacement of theinfluent or effluent gates. During the SE ConveyanceSystem condition assessment, the effluent gates wereobserved to leak and were unable to completelyisolate the basins.DescriptionProject work will include the following: Assess the influent gates Remove and replace effluent gates Replace influent gates as neededJustificationThe condition of the influent gates impacts the abilityto remove the clarifiers from service for maintenance.The effluent gates allow isolation of the clarifiers fromthe SE conveyance system when the clarifiers are full.Project DeliveryTraditional Design – Bid – ConstructFigure P‐1.3.014Secondary Clarifier Effluent GatesE FY2014 E‐<strong>CAMP</strong> Report 2012‐12Dec.docx 52 December 26, 2012
P‐1.3.015AB Flow Eq Feed and Return Pipeline RehabBackgroundPrimary Effluent is conveyed through the Primary Effluent Equalization Structure (PE EQ Structure)just upstream of the aeration basins. This structure is equipped with an aeration basin 36‐inchdiameter feed, 20‐inch diameter return pipeline and flow control system which uses AB 4 to equalizediurnal flows. The pipeline is ductile iron material. During the October 2012 Primary EffluentConveyance System Condition Assessment, discoloration and potential defects were observed in twolocations. The specific nature of the inconsistency could not be determined. Based on thedeterioration of other buried ferrous piping at the EWPCF as a result of corrosive soils, rehabilitationor spot repairs of these pipelines may be required.DescriptionRepair or rehabilitate the AB Flow Equalization Feed and Return Pipelines.JustificationThe PE flow equalization system improves the operation of the secondary treatment process. Peakflows are diverted during the day, and flow is returned back to the process during low flow times.This flow equalization allows a more uniform flow for treatment at the EWPCF and the CarlsbadWater Reclamation Facility, and also provides adequate plant water for use in the cogen system andother plant demands during low flow periods.Project DeliveryTraditional Design – Bid – Construct. Could be combined with P‐1.3.003 or P‐1.3.004.E FY2014 E‐<strong>CAMP</strong> Report 2012‐12Dec.docx 53 December 26, 2012
5.1.4 EffluentP‐1.4.001EPS RehabBackgroundWith the installation of additional equalization storage in2003, the capacity of the existing outfall and pumpingequipment is expected to be adequate for the ultimateprojected flows.Piping modifications were recommended in the November2001 Phase V Final Preliminary Design Report, to raise thecenterline elevation of the 60‐inch discharge header froman elevation of 121.5 feet to 141.5 feet. This wasproposed to eliminate the possibility of cavitation andFigure P‐1.4.001vibration, and force the pumps to operate closer to their Final Effluent Pumpsbest efficiency point while maintaining the overall capacity of the Effluent Pump Station. However,EWA staff has not noted excessive wear as a result of cavitation or vibration. The Effluent Pumps areoperated infrequently. The pumps should be monitored for excessive wear, and this project reprioritizedif the pump condition deteriorates.P‐1.4.002EPS MCC and Conductors ReplacementBackgroundEWA has identified the following MCCs to be monitoredand assessed for replacement:Screenings/Primary ProcessSecondary ProcessEffluent Pump StationSEEPs (Secondary Effluent Equalization Pumps)Dewatering BuildingCogeneration/Power BuildingFigure P‐1.4.002Final Effluent MCC RoomThe existing Motor Control Centers (MCCs) andconductors for the effluent pump station and the chlorine contact basins were installed as part ofPhase III Expansion in 1980 and are reaching the typical life expectancy of MCC equipment.Replacement parts have become difficult to find. The replacement of the MCCs will provide a morereliable operation of the effluent pump station. This project will also include the removal of thewiring and exposed conduit of the abandoned equipment. Verification of wiring replacement duringPhase V is required. This project may be coordinated with P‐5.2.021 (Installation of Climate Controlon MCCs).E FY2014 E‐<strong>CAMP</strong> Report 2012‐12Dec.docx 54 December 26, 2012
P‐1.4.004EPS Pipe Lining and Abandoned Pipe Coating RepairBackgroundThe Effluent Pump Station (EPS) pumps treated effluent through the outfall system when the tide andflow conditions are such that all flow does not discharge by gravity. During the FY 2012 land outfallinspection, the lining in the EPS discharge piping was observed to be failing. Additionally, theabandoned Primary Effluent pipeline from the original effluent discharge configuration was observedto have coating failure. This pipeline passes through the surge tower, and coating separated from thepipeline falls into the structures at the start of the land outfall. The lining and coating systems areconcrete mortar. Material that had separated from the piping systems was removed during a followupmaintenance project in the surge tower.DescriptionRehabilitate the EPS discharge pipeline lining with a liner or other method. Recoat the abandoned PEpipeline in the surge tower. As an alternative, this pipeline may be removed and the openingsblocked. This work will require outage planning.JustificationThe pipe lining provides protection to the pipe system. Without this protection, the pipe system willcorrode and over time may fail. The effluent pumping system is critical to maintaining the effluentdischarge capacity of the EWPCF. Additionally, separated lining and coating must be removed fromthe outfall system.Project DeliverySpecify – Bid – Construct. Combine with Land Outfall internal inspection.P‐1.4.005PD Blower Addition, Aeration/AgitationThe aeration and agitation blower systems were originally configured to operate as separate systems.During the Phase V Expansion and Upgrade and subsequent in‐house modifications, the system wasmodified with crossover piping to allow operational flexibility. Additional projects were completeand are in progress to rehabilitate the buried air delivery piping because of extensive corrosion andleaks.The new air piping to the headworks has provisions for installation of a future higher efficiencyblower to provide aeration and agitation air. This project would implement installation of a newpositive displacement blower to provide aeration air and agitation air to the headworks.E FY2014 E‐<strong>CAMP</strong> Report 2012‐12Dec.docx 55 December 26, 2012
5.2 Outfall5.2.1 OutfallP‐2.1.001Land Outfall Inspection and Cleaning ‐ InternalBackgroundEWA conducts regularly scheduled outfall inspection to monitor outfall condition. Internal inspectionand cleaning of the land outfall was completed in 2012. Construction debris was removed from thewye structure as well as portions of the effluent pump discharge pipe lining and other coatingmaterial.Description Plan outfall outage to allow entry into the surge tower, wye structure and land outfall. Conduct inspection of gates, concrete condition, pipe lining/coating Remove debris Perform minor repairs such as hardware replacement Complete assessment reportJustificationThis project is part of the program to maintain outfall function and capacity. Regular inspection of theoutfall allows EWA to identify potential risks, if any, and correct issues before they impact the outfalloperation. Gradual or sudden failure of the outfall asset would be extremely serious. The ability toremove treated water from the site could be interrupted for long periods or possibly permanently ifthe land outfall were to become inoperable.Project DeliverySpecify – Bid – CompleteThis project requires outage planning and coordination with EWA operations and general servicesstaff.E FY2014 E‐<strong>CAMP</strong> Report 2012‐12Dec.docx 56 December 26, 2012
P‐2.1.002Sea Outfall Maintenance and Inspection ‐ ExternalBackgroundRegularly scheduled sea outfall inspection is required tomonitor the condition of the outfall. Scheduled outfallinspections are every two years for external inspection.This project implements the recommendations for minorrepair from the inspection reports. Major ballast repairwill be completed by Project P‐2.1.004 (Sea Outfall BallastRestoration – External)DescriptionFigure P‐2.1.002Study Phase:View towards Sea Outfall Provide general overview inspection of the pipeexterior including ballast condition Perform condition assessment of the cathodic protection system Clear excessive kelp growth Perform video documentation, outfall monumentation, and cross‐section measurements ofballast (rock supporting pipe on ocean floor), and prepare inspection reportImplementation: Complete the recommendations provided in the inspection report which may include minorrepair or debris removal.JustificationThis project will provide regular monitoring of the outfall condition to avoid pipe capacity reductionor failure. Gradual or sudden failure of the outfall asset would be extremely serious. The ability toremove treated water from the site could be interrupted for long periods of time or possiblypermanently. It is anticipated that regular inspection will be added to the terms of the new leaseissued by the State Lands Commission for the EWA Ocean Outfall.Project DeliveryProcurementE FY2014 E‐<strong>CAMP</strong> Report 2012‐12Dec.docx 57 December 26, 2012
P‐2.1.004Sea Outfall Ballast RestorationBackgroundBallast surrounds the outfall to provide protection of thepiping which is located on the ocean floor. Over time,ballast material can move and require replenishment andrepair. Project P‐2.1.002, Sea Outfall Maintenance andInspection – External, will document the extent ofrestoration required.Description Restore sea outfall ballast as recommended by theinspection to be completed in FY 2013.Figure P‐2.1.004View towards Sea OutfallJustificationThis project will provide sea outfall maintenance to avoid pipe capacity reduction or failure. Gradualor sudden failure of the outfall asset would be extremely serious. The ability to remove treated waterfrom the site could be interrupted for long periods of time or possibly permanently.Project DeliveryTraditional Design – Bid – ConstructP‐2.1.005Sea Outfall Bathymetric Survey – ExternalBackgroundThis project would complete a Bathymetric Survey of the exterior of the Sea Outfall, providing anexact location of the outfall and documentation of the pipeline and ballast material as well as abathymetric chart of the surrounding area. Multi‐beam technology measures the depth andquantifies a three‐dimensional image of the underwater facility. This information can be used togenerate cross‐sections and other analysis.Description Conduct a Bathymetric survey of the sea outfallJustificationThe survey will precisely locate the sea outfall, provide a baseline of the facility and surrounding area,and indicate overall condition. The baseline survey may be used to compare future surveys with thebaseline condition, for example following a seismic event.Project DeliveryRFP ‐ ContractE FY2014 E‐<strong>CAMP</strong> Report 2012‐12Dec.docx 58 December 26, 2012
5.3 Solids Process Improvements5.3.1 Biosolids ThickeningP‐3.1.001DAFTs Nos. 1, 2 and 3 Scum Collector ReplacementBackgroundThe Dissolved Air Flotation Thickener (DAFT) scumcollectors are internal components of the DAFT tanks.Currently the plant operates two of the DAFT tanks inoriginal configuration while the third DAFT tank isbeing used as holding tank for centrate. In January2011, the condition assessment of the DAFT scumcollectors identified that the three scum collectorswere replaced with stainless steel type in 1995 andthe scum collectors were found in fair condition andfully functional. The useful life was extended fiveyears allowing time for monitoring of condition aswell as evaluation of the process.Description In‐kind replacement of the dissolved air flotationscum collector, drive, beach and skimmer arms.JustificationFigure P‐3.1.001DAFT Collector and LaunderDAFT collector is aging and replacement should beimplemented when equipment cannot be maintained cost effectively through replacement parts.Project DeliveryTraditional Design – Bid – Construct; Coordinate with P‐3.1.002 which may replace the DAFT system.If the system is replaced, this project will be eliminated.E FY2014 E‐<strong>CAMP</strong> Report 2012‐12Dec.docx 59 December 26, 2012
P‐3.1.002DAF System ReplacementBackgroundThree DAF units provide thickening of Waste Activated Sludge, with provision and space to add afourth unit. The original two DAFs were installed in 1982 during the Phase III expansion and the thirdDAF was installed in 1984 during the Phase IV expansion. One DAF is currently used to remove solidsfrom centrate before it is returned to the plant. Alternative mechanical thickening equipment isavailable and could be implemented to provide backup, replacement or additional capacity, if neededin the future.A Facility Master Plan is scheduled for FY 2013 and will evaluate future phases and process upgradesto meet future flow projections and influent characteristic changes. The Facility Master Plan will alsoidentify and evaluate alternative treatment technologies which may result in a preliminary evaluationof alternative WAS thickening equipment. However, a more detailed evaluation of the thickeningprocess may be required before a decision on whether to rehabilitate or replace the existing DAFprocess can be made.DescriptionThis project will implement the recommendations of Study S‐3.1.002. Refer to subsection 4.1.1 of thisE‐<strong>CAMP</strong> for more description of the proposed study. The project will include installation of newequipment and demolition of old facilities.Justification DAF system replacement or expansion with alternative newer technology may be justified bylower operations and maintenance costs. DAF collector is aging and replacement should be implemented when equipment cannot bemaintained cost effectively through replacement parts.Project DeliveryTraditional Design – Bid – ConstructE FY2014 E‐<strong>CAMP</strong> Report 2012‐12Dec.docx 60 December 26, 2012
P‐3.1.003TWAS Pipeline ReplacementBackgroundThe DAF is capable of producing thicker solids than theTWAS pumping system can convey. This project wouldmodify the discharge of the TWAS piping to reducehydraulic losses and allow a higher flowrate of higherconcentration solids to be conveyed to the digesters. Thepreliminary concept includes pipe replacement from theTWAS pumps at the DAF complex to Digester Nos. 4, 5and 6. The existing line size is 8‐inch and the replacementline size needs verification but may be 10‐inch. TWASpiping from the DAFs to the pipeline adjacent to thedigesters was replaced in Phase V, Biosolids Facilities(refer to sheet Y13B)Figure P‐3.1.003TWAS Pump and Discharge PipingDescription Replace approximately 600 feet of existing piping with larger diameter of pipe, per hydrauliccalculations Eliminate bends, use long radius elbows, reduce minor losses in pipe system.JustificationIncreased flow and increased solids concentration of thickened sludge conveyed to the digestersresults in increased digester capacity, thicker digested sludge and reduced centrate volumes.Project DeliveryTraditional Design – Bid – Construct; Coordinate with Project P‐3.1.002E FY2014 E‐<strong>CAMP</strong> Report 2012‐12Dec.docx 61 December 26, 2012
P‐3.1.004DAFT Polymer System ReplacementBackgroundThe existing batch type polymer system is aging andcomponents, such as the existing progressing cavitypump model, are outdated and difficult to maintain.Newer polymer blender technology alternatives offeradvantages of ease of operation and maintenance.Newer model pumps are equipped with mechanicalseals that do not require seal water. Seal water has thedisadvantage of early activation of the polymer in theneat polymer piping system.Coordinate with P‐3.1.002 which may replace the DAFTsystem. If the system is replaced, this project will beeliminated.Figure P‐3.1.004DAF Polymer SystemE FY2014 E‐<strong>CAMP</strong> Report 2012‐12Dec.docx 62 December 26, 2012
5.3.2 Biosolids DigestionP‐3.2.001Biofuel Receiving FacilitiesBackgroundBiogas produced in EWPCF’s digesters is used in combination with purchased natural gas to fuel thedryer and internal combustion engines which produce electricity. Increased quantities of biogas couldbe used in this equipment if more was available. Biofuel Receiving Facilities would provide analternative to landfill disposal of grease trap waste and possibly food scrap waste which are ideal foranaerobic digestion, and which would increase biogas production.DescriptionThis project consists of construction of: Biofuel receiving tanks with piping, pumping, odor control Connection to Digester Nos. 5 and 6 A third mixed gas blowerJustificationStrategic Focus Area 1 of the 2013 Tactical Plan includes the Goal of “Maximizing the use ofrenewable resources …. and working towards energy independence.” The project meets this goal byincreasing biogas production for engine generators and the dryer and reducing the quantity ofpurchased energy. The Energy & Emissions Strategic Plan (EESP) projected the facility would havepayback of less than five years.Project Delivery OptionsDesign/Build/FinanceE FY2014 E‐<strong>CAMP</strong> Report 2012‐12Dec.docx 63 December 26, 2012
P‐3.2.003Digesters Nos. 5 and 6 Pump/Piping Foundation StabilizationBackgroundSettlement in the vicinity of Digester Nos. 5 and 6 hasimpacted the operation of the pump mix system andother associated facilities such as piping. In 2009, EWAconducted a geotechnical investigation including soilboring and analysis to identify the cause of settlement,potential for continued settlement, and designparameters required to proceed with varied remedies.The results of the soil analysis showed non‐uniform fillmaterials and compaction not to recommended levels.Design data was provided for the design andimplementation of geopiles, grout injection or otherremedial methods should continued settlement beexperienced. EWA established a monitoring program toFigure P‐3.2.003Soil Settling at Digester No. 5 Pumpsand Pipingdetermine the level of additional settling experienced over time.Description Analyze results of foundation settlement monitoring program. Propose specific stabilization techniques. Stabilize local area through geopiles, grout injection or other remedial method.JustificationThe digesters are a critical component to the EWPCF treatment process, in both stabilizing the sludgebyproduct and producing biogas for energy efficient power generation. If continued settlement isobserved and predicted to jeopardize the operation of the mix pumps and other digester equipment,investment is justified to maintain the system in operable condition to provide reliable sludge mixingand digester gas production capacity. This gas production capacity is required for energy efficiencyand cost savings at the EWPCF.Project DeliveryDesign – BuildE FY2014 E‐<strong>CAMP</strong> Report 2012‐12Dec.docx 64 December 26, 2012
P‐3.2.004Sludge Screening FacilityBackgroundIn 2010, a study established a basis of design for a sludge screening facility. This facility would screendigested sludge prior to the centrifuges and upstream of the dryer. This type of facility would reducethe hairlike material, metal shavings, plastics and other debris that currently is observed in the shakerportion of the dryer system. A “strainpress” type system was recommended and would requiretransfer pumps, grinders, screenings handling, odor control and utilities such as electrical. Therecommended location of the facility is between Digester Nos. 2 and 3. The 2012 Grit and ScreeningsHandling Study examined the possibility of using finer screens at the headworks which would likelyhave eliminated the need for sludge screening. The study found that hydraulic limitations madeheadworks finer screens not practical.DescriptionThe project would include the following components: Strainpress equipment installed on an elevated platform Debris collection room and bin located below the strainpress Odor control Associated pumps and mechanical piping Associated electrical and instrumentation componentsJustificationIf pellets from the dryer facility are marketed more as a soil amendment, sludge screening will berequired.Project DeliveryDesign – Build ‐ ConstructP‐3.2.005Digesters Nos. 5 and 6 Mixing Pumps ReplacementBackgroundDigester Nos. 5 and 6 Mixing Pumps were installed in1991 and have an assessed useful life of 30 yearscorresponding to replacement in 2021. EWA hasmaintained these pumps including rebuilding andreplacing impellers which is an industry practice toextend equipment life. Eventually the pump body willwear and pump performance will decline. Periodiccondition assessment and performance monitoring arerecommended to determine timing for pumpreplacement.Figure P‐3.2.005Digester Mixing PumpsE FY2014 E‐<strong>CAMP</strong> Report 2012‐12Dec.docx 65 December 26, 2012
P‐3.2.006Cell Lysis FacilitiesBackgroundThe incomplete breakdown of WAS in the digester limits gas production and reduces biosolidsdewaterability. Cell lysis would increase gas production and improve dewaterability. Lysis technologyis under development and may be ready for testing in the next few years.P‐3.2.007Digesters Nos. 1 and 3 Retrofit forSludge/Gas StorageBackgroundThis effort would consist of a conceptual study to evaluatethe gas or liquid sludge storage capacity that may begained from using Digester Nos. 1 and 3. The study wouldidentify the scope of improvements needed for thesestructures to be used for either purpose. A conditionassessment would also be conducted.This project would implement the recommendations ofthe conceptual study.Figure P‐3.2.007Digester No. 1E FY2014 E‐<strong>CAMP</strong> Report 2012‐12Dec.docx 66 December 26, 2012
P‐3.2.008Waste Gas Flare Operation ModsBackgroundThe waste gas flare was constructed and placed intooperation in 2011. Under the current operating mode,the natural gas pilot is continuously lit. This projectwould implement operational and equipmentmodifications such that the pilot could operateintermittently or be fueled with digester gas, thusreducing natural gas consumption.Recently, SDG&E has advised of potential curtailmentof natural gas delivery. The flare requires natural gasdelivery for operation and if it is likely that delivery willbe curtailed in the future, an alternative pilot fuelwould allow continued operation of the flare.Description:Figure P‐3.2.008Waste Gas FlareModify operation of gas management system and digester/sludge holding tank waste gas bypassto flare to prevent low volume and low quality gas from continuous flow or intermittent flow ona frequent basis.Upgrade the pilot flame detection system to reliably provide instant detection of a pilot flame.Flame detection system must not require a cool‐down period to detect flame as is the case with athermocouple. The flame detection system must be capable of operation when wind is present,which may blow flame from position in front of sensor, as may be the case with a radar detector.Revise APCD Permit to Operate to allow alternative to continuous pilot as means of ensuring flarewill be lit when waste gas is present.Implement equipment, programming and monitoring changes as required by revised Permit toOperate.Provide an alternative pilot fuel, such as digester gas pilot. This modification could be installed asa redundant system allowing either fuel to be used to keep the pilot lit. System componentswould include piping, valves and orifice sized for digester gas.JustificationThe intermittent pilot system would provide savings of natural gas purchases and would beconsistent with EWA’s goal for energy efficiency and independence.A backup pilot system would provide flare operation reliability under abnormal operations. Flareoperation is important because if waste gas is not being burned in the cogen facility and/or by thedryers, it can cause pressure buildup in the digesters, potential damage to J‐tubes and otherequipment, and potential release of methane gas into the environment, which is an unsafe condition.Project DeliveryEquipment manufacturer has offered to assist with standard drawings of digester gas pilot fuel pipingand appurtenant equipment. Modifications may be made by EWA staff or by a General Contractor.E FY2014 E‐<strong>CAMP</strong> Report 2012‐12Dec.docx 67 December 26, 2012
P‐3.2.009Digester No. 4 – Interior CoatingBackgroundDigester No. 4 has not been in service for the last few years. Rehabilitation of the gas mixing systemand cleaning of the digester was performed in 2012. Coating of the digester cover interior andinterior process piping was noted as a need during the recent cleaning.Description: Clean interior of inert contents that cannot be drained from the tank. Remove debris from digester. Remove existing coating and prepare surface for coating including minor repairs. Apply prime coat to all steel surfaces. Apply coating to digester cover interior and interior process piping.JustificationAnaerobic digestion occurs in a highly corrosive environment. Digesters should be cleaned andinspected every 10 years. Regular maintenance including coating of the digester cover is required tomaximize the service life of the digesters.Project DeliveryDesign – Build ‐ ConstructP‐3.2.010Digesters Nos. 5 and 6 Cover – Interior CoatingBackgroundDigesters No. 5 and 6 were last cleaned in 2012. Coating of the digester cover interior and interiorprocess piping was noted as a need during the recent cleaning.Description: Clean interior of inert contents that cannot be drained from the tank. Remove debris from digester. Remove built up debris from center column of Digester No. 5 Remove existing coating and prepare surface for coating including minor repairs. Apply prime coat to all steel surfaces. Apply coating to digester cover interior and interior process piping.JustificationAnaerobic digestion occurs in a highly corrosive environment. Digesters should be cleaned andinspected every 10 years. Regular maintenance including coating of the digester cover is required tomaximize the service life of the digesters.Project DeliveryDesign – Build ‐ ConstructE FY2014 E‐<strong>CAMP</strong> Report 2012‐12Dec.docx 68 December 26, 2012
P‐3.2.011Second Waste Gas Flare and PipelineBackgroundThe waste gas flare system is a backup to the equipment that uses digester gas as a fuel at theEWPCF, including cogen engines and the biosolids drying system. If this equipment is unavailable touse the digester gas, waste gas is conveyed to the flare system.EWA plans to implement a biofuel receiving facility project which will increase the gas production atthe EWPCF. This second waste gas flare and pipeline may be needed in the future if the currentpipeline and flare capacity is not sufficient to flare a waste gas design flow. The waste gas design flowwill be determined during the biofuel receiving facility design. It is assumed that in anticipation ofplanned cogen system outages, the biofuel receiving facility may suspend operation to effect areduction of gas production.The following is a plot of the system curve of the waste gas pipeline. The plotted values should befield verified before they are used for design purposes.7.0Digester Gas (LSG) to Flare ‐ System Curve6.05.0Headloss (in. WC)4.03.02.01.00.00 100 200 300 400 500 600 700 800 900 1000Flow (CFM)E FY2014 E‐<strong>CAMP</strong> Report 2012‐12Dec.docx 69 December 26, 2012
5.3.3 Biosolids Dewatering and DryingP‐3.3.001MCC and Conductors Replacement – DW and Power BldgBackgroundThe existing Motor Control Centers (MCCs) andconductors for the dewatering and power building MCCsare reaching the typical life expectancy of MCCequipment. Replacement parts have become difficult tofind. The replacement of the MCCs will provide a morereliable operation. This project will also include theremoval of the wiring and exposed conduit of theabandoned equipment.Figure P‐3.3.001Power Building MCCE FY2014 E‐<strong>CAMP</strong> Report 2012‐12Dec.docx 70 December 26, 2012
P‐3.3.002Pellet Storage Facility ImprovementsBackgroundThe dryer uses a recycle bin to store seed pellets duringthe drying process. The facility stores final product pelletsin storage silos, each with a capacity of 4,500 cubic feet.Storage of pellets for more than a day has resulted in hotspots in the storage vessels. Hot spots can lead tosmoldering of product and possible thermal runaway.This is problematic as the dryer system uses a two‐dayoutage for weekly maintenance. Additionally, the siloswere sized to provide up to two weeks of storage ofpellets for flexibility in the disposal of the product.Currently, EWA is operating the system to minimize thepotential for development of hot spots and thermalrunaway in the system. During the weekly outage, therecycle bin is emptied to the minimum level, asrequired to restart the dryer system. Finished pelletsare loaded into trucks and hauled off site daily keepingthe silo storage volume at a minimum. In at least oneinstance, hotspots were detected in the recycle bin.EWA emptied the recycle bin quickly to dissipate theheat, which resulted in pellets on the floor of thedrying building and flow of washdown and pellets intothe drain system which returns flow to the plant. Inorder to restart the dryer, EWA staff manuallytransferred pellets to the bucket elevator for return tothe bin.Figure P‐3.3.002Pellet Storage and HaulingIn FY 2011, EWA initiated a project with the goal ofequipping the system to empty the recycle bin uponsystem shutdown, and to refill the recycle bin with pellets from the silos prior to restarting thesystem. The project scope also planned to install two additional temperature ropes per silo toprovide additional temperature monitoring.The conceptual design scope development is ongoing with alternatives under consideration. Inabilityto store pellets in the silo because of risk of thermal events prevents the transfer of pellets from thesilo to the recycle bin as being a viable alternative. Additional research and other avenues ofcontrolling the heat are under consideration. Additional goals have been identified in providing ameans of recycle bin drainage during washdown.Description Implement recommendations of the pellet storage system improvements to reduce incidenceand risk of thermal events resulting from pellet storageE FY2014 E‐<strong>CAMP</strong> Report 2012‐12Dec.docx 71 December 26, 2012
Recommendations may include equipment to recirculate the pellets within the silo, additionaltemperature monitoring for early detection of heat buildup, and provisions to facilitate thewashdown of the recycle bin.JustificationImprovements to the silo storage to prevent thermal runaway are justified because the ability tostore pellets in the silo would allow EWA to maximize the use of the silo investment and associatedequipment. Use of the silos expands the number of potential pellet customers by providing a greaterrange of scheduling for trucking off site.Improvements to the recycle bin pellet storage operation would provide ease of operation during thetime of dryer system shutdown and startup. Under current operations, the recycle bin is keptpartially filled with pellets, with some potential for developing hotspots or thermal runaway whenthe system is down for maintenance. Startup of the system is time consuming because the bin ispartially empty. Pellet production to final quality is not possible until solids have been recycledthrough the bin numerous times in order to fill the bin to operating levels. This project is justified bysafety and potentially cost efficiency, depending on the project implemented.Project DeliveryTraditional Design – Bid – ConstructE FY2014 E‐<strong>CAMP</strong> Report 2012‐12Dec.docx 72 December 26, 2012
P‐3.3.003Struvite Control FacilitiesBackgroundThe proposed project facilities consist of a process toremove phosphorus from the centrate flow stream inorder to reduce the potential amount of precipitation ofstruvite (magnesium ammonium phosphate) in plantpipelines and equipment.DescriptionThe process under consideration is the Pearl processdeveloped by Ostara, Inc. or Multi‐form Harvest process.The process consists of controlled precipitation ofstruvite within a fluidized bed reactor. This isaccomplished by dosing centrate with magnesium, thelimiting ion, to encourage precipitation. The precipitatedstruvite (pearls) would be marketed to the inorganicfertilizer industry by Ostara.Process facilities consist of centrate pumping, thefluidized bed reactor, pellet dryer, dry pearls storage andbagging equipment, chemical storage and dosing equipment, and monitoring and control equipment.Equipment would be housed in the northeast corner of the old Dewatering Building on the first floor.The reactor and the pearls storage are tall units and would extend through the first floor ceiling intothe second floor. Waste heat from the hot water loop or cleaned flue gas may be used to supplyenergy to the dryer. Dry pearls would be loaded into super sacks and stored in the old MaintenanceAnnex.JustificationPrevention of struvite blockages in the centrate pipelines is necessary for normal operation of thecentrifuges and thus the dryer system. Periodic removal of struvite from the centrate piping is costly,and unanticipated blockages cause costly system shutdown and cleanup operations. If phosphorus isnot removed through deposition, such as is currently occurring in the solids processing equipmentand sludge, it continues to recirculate through the plant through return flows. The proposedequipment would reduce deposition and recycling of phosphorus through the plant.Project DeliveryAlternative project delivery such as design‐build‐finance is under consideration.Figure P‐3.3.003Pellet Storage and HaulingE FY2014 E‐<strong>CAMP</strong> Report 2012‐12Dec.docx 73 December 26, 2012
P‐3.3.004Pellet Bagging FacilitiesBackgroundBiosolids pellets produced at by the dryer are currently hauled off‐site where approximately 90percent are used as an alternative fuel, while the rest are applied to agricultural land. A pelletbagging facility would enable distribution of the pellets for commercial or local use as a fertilizer. Theproposed pellet bagging system includes a portable bagging system with scale, sealer, conveyor andbase, stretch wrapper, and a hopper, and would require a pellet transporter with appurtenantequipment such as an air compressor. An alternative to onsite bagging is offsite contract bagging.P‐3.3.005Cake Pump ModsBackgroundThe Phase V Expansion Technical Memorandum 1 specifiedprogressive cavity (PC) pumps with “receiving hopper, cakebreaker, screw feeder” together with a “pipe lubricationsystem” which would consist of “injection rings, mixing tanks forpolymer, injection pumps, and piping and controls”. Moyno 2‐stage progressive cavity pumps were specified for thedewatered cake conveyance pumps. These pumps provedinadequate for the application in the early stages.The pumps were upgraded to 4‐stage pumps which improved Figure P‐3.3.005performance. <strong>Encina</strong> maintenance staff report that they haveCake Pumpto increase the pump speed over time in order to maintainadequate cake feed to the drying process. It has been found that when the pump speed reachesapproximately 75% speed, the pump has reached maximum capacity and the stators experience wearand require replacement. This replacement is necessary between 600‐3000 hours of equipment runtime and is well before normal stator replacement recommended by Moyno (approximately 50,000hours of run time). The addition of lubrication rings will reduce the thixotropic effects of pumping drycake (24% moisture content) particularly when starting against a stationary pipeline of cake. Theaddition of new feed hopper to the pumps will assure that the pumps are not running dry.DescriptionThe project consists of two parts:Phase 1: Addition of lubrication rings in accordance with the original Phase V TechnicalMemorandum 1.Phase 2: Reorientation of the pumps, piping and addition of new, rectangular feed hoppers withbridge breakers.JustificationThis project will significantly reduce maintenance cost and remove the operational limitationsassociated with adjusting the dewatering system based on the sludge pump capacity limitations.Project DeliveryTraditional Design – Bid ‐ ConstructE FY2014 E‐<strong>CAMP</strong> Report 2012‐12Dec.docx 74 December 26, 2012
P‐3.3.006Dryer Addition and Centrifuges ReplacementBackgroundThe drying facility was implemented with provisions for a second dryer, which will be needed whenplant flows increase in the future. Based on current flow projections, the second dryer will be neededin 2016. EWA expects that the Master Plan Update planned for 2013 will revise flow projections andconclude that the second dryer will not be needed until after 2018. When the second dryer isinstalled, replacement of the centrifuges with higher capacity units will be required. Currently, twoduty centrifuges operate to feed the dryer. One additional centrifuge is being added to providestandby capacity. When the second dryer is installed, three larger centrifuges, each capable offeeding one dryer, will be required.P‐3.3.007Centrifuges Major MaintBackgroundPlanned maintenance activities of the Centrifuges, will allow EWA to realize the full service life of theequipment. Manufacturer recommendations for planned maintenance include full bearing overhaulevery 8,000 hours of operation and rotating assembly refurbishment as needed, generally every16,000 hours of operation. As equipment ages, EWA may elect to maintain additional spare partssuch as a feed tube ($9,000) and a gearbox ($71,000).Description Full bearing overhaul (every 8,000 hours or approximately annually, estimated $8,000 parts) Rotating assembly refurbishment (scheduling based on annual inspection, approximately every16,000 hours or every two years, estimated $40,000). Includes tile replacement, feed zone repairas needed, conveyor flight hard surfacing as needed, dimensions check, rebalance, gearbox tuneup)JustificationCompletion of planned maintenance allows EWA to realize the longer service life, more reliableoperation and better return on investment in assets.Project DeliveryIn‐House, parts purchased from manufacturer, rotating assembly refurbishment by manufacturer.E FY2014 E‐<strong>CAMP</strong> Report 2012‐12Dec.docx 75 December 26, 2012
P‐3.3.008Dryer Major MaintBackgroundPlanned maintenance activities of the dryer are completed to maintain reliable operation and realizeservice life of the equipment. The manufacturer, Andritz Separation Inc, recommends thereplacement of the dryer drum duct approximately every seven to ten years, and the replacement ofthe dryer drum support rollers approximately every ten years. Other manufacturer recommendationsand repair parts include the following:StatorsElevator Gear BoxCentrifuge Repair PartsRupture DiscShaker MotorPlow HeadsCake Pump Rebuild SparesMist Eliminator PanelsBag House Filter SocksSlide Gate Repair PartsRecirculation Pump Feed Pit SparesMisc. IE belts, hoses, gaugesCompressor and Air Dryer (redundancy)DescriptionComplete maintenance activities per manufacturer recommendationsJustificationCompletion of planned maintenance allows EWA to realize the longer service life, more reliableoperation and better return on investment in assets.Project DeliveryIn‐House procurement of servicesE FY2014 E‐<strong>CAMP</strong> Report 2012‐12Dec.docx 76 December 26, 2012
P‐3.3.009Drying Safety UpgradesBackgroundSafety and regulatory concerns have come underconsideration as a result of further review of NFPA 654,the standard for prevention of fire and dust explosionsfrom the manufacturing, processing and handling ofcombustible particulate solids. In the Drying Building,further consideration is warranted on the bag houselocated inside the building. Consideration would includefeasibility of relocating the bag house outdoors,advantages that may be gained through relocation,consequences that may be experienced (such as delay intravel time to bag house) and other means of hazardmitigation.NFPA 654 requires that bag houses such as the oneoperated by EWA and located in the Drying Building, belocated outside of a building. However, there aremodifications that could be made to the bag house tomitigate explosion hazard, including:‐ Explosion suppression systems which discharge asuppressant in milliseconds withing the vessel, when triggered by a spark or pressure‐ Isolation devices on all ducts at the bag house to prevent propogation of flame and pressue toupstream equipment when triggered by a spark or pressure.In addition to evaluation of bag house location options, other potential improvements have beenidentified: Rotation of dust collector so deflagration panel does not face exit Installation of deflagration vent combination flame arrestor unit instead of current style Installation of angled deflector plates to deflect flame front (industry experts have found that thisis not the most reliable option because the flame can engulf the deflector and continue to movein the same direction)Description Complete study/evaluation of safety concerns and compliance with NFPA 65. As recommended by study, relocate bag house and/or implement mitigation measures Rotate dust collector. Install deflagration vent combination flame arrestor unit. Reroute recycle bin nitrogen purge vent to discharge outside.JustificationThe project is needed to comply with anticipated regulatory changes and to protect personnel andequipment from explosion potential.Project DeliveryTraditional Design – Bid ‐ ConstructFigure P‐3.3.009Drying Building Bag House(blue structure)E FY2014 E‐<strong>CAMP</strong> Report 2012‐12Dec.docx 77 December 26, 2012
P‐3.3.010Drying Building Coded LocksBackgroundProject P‐3.3.010 would install coded entry on theDrying Building. Because it is difficult to secure theplant site, there is potential for intruders to enterfacilities on site.DescriptionInstall coded locks on nine outside doors of the DryingBuilding and Dewatering Building. The locks wouldwork in conjunction with the plant‐wide securitysystem proposed with Project 5.2.012.JustificationInstallation of coded entry on the drying buildingwould prevent intruders from easily entering thesebuildings and harming themselves or the treatmentprocess.Figure P‐3.3.010Drying Building DoorProject DeliveryIn‐House; this project may be combined with P‐5.2.022 (Coded Entry for all MCCs)P‐3.3.012RTO Media ReplacementBackgroundRTO media is subject to plugging and breakage.Regular water flushing is practiced but eventuallymedia becomes plugged to a degree that waterflushing becomes ineffective. The media was lastcompletely replaced in 2010.Description Remove and dispose of old media Repair RTO housing as required Replace insulation as required Tune burners and adjust operating pressureJustificationThe RTO is a critical one of a kind facility in that thedryer cannot be operated without a functioning RTO. IfFigure P‐3.3.012the dryer is unavailable because of RTO functionality,RTO Mediabiosolids must be transported for reuse as Class Bbiosolids at approximately four times the cost of transporting Class A biosolids.Project DeliveryTraditional Design‐Bid‐InstallE FY2014 E‐<strong>CAMP</strong> Report 2012‐12Dec.docx 78 December 26, 2012
P‐3.3.013RTO ReplacementThe RTO operates at 1500 deg F. This severe dutyresults in deterioration of the media and shell. Atsome point it will become cost effective to replace theRTO in its entirety rather than replacing the shell andmechanical components.P‐3.3.014RTO Flush Drain RelocationFigure P‐3.3.013RTO at Heat Drying FacilityBackgroundRTO maintenance requires drainage of the unit duringwater flushing. EWA has installed a temporary drainsystem with a highline to the adjacent TWAS pitsump. This project would install a permanent flushdrain. This project will likely not reach the $50,000threshold, and could be combined with other RTOprojects.Description Determine drain flows and drain pipe size Install permanent drain pipe from RTO facility toadjacent TWAS pit, approximately 50 feet of pipe Accommodate continued access in area by eitherburying the drain pipe or providing ramp overdrain pipe. Address UV exposure through pipe materialselection or coatingFigure P‐3.3.014aRTO Flush DrainJustificationThis project will reduce staff time required for RTOmaintenance and eliminate tripping hazard associatedwith temporary piping.Project DeliveryTraditional Design – Bid – Construct, could be groupedinto a general maintenance project contract.Figure P‐3.3.014bTWAS PitE FY2014 E‐<strong>CAMP</strong> Report 2012‐12Dec.docx 79 December 26, 2012
P‐3.3.016Cake Conveyance Equipment ImprovementsSludge Cake pumps convey dewatered biosolids from the centrifuges to the dryer. The sludge cakepumps have been costly to maintain and problematic to operate. A study of alternatives may resultin a recommendation to replace the existing sludge cake pumps with an alternative type ortechnology, such as a conveyor.P‐3.3.017DW Polymer Storage Tank ReplacementBackgroundThe dewatering (DW) polymer storage tank with a capacityof 7,000 gallons was installed as part of the Phase Vexpansion. A number of factors have resulted in constraintin receiving a full delivery of polymer. These factorsinclude:• High demand for polymer corresponds to limitednumber of days of storage provided• Polymer supplier’s location results in significant traveltime and corresponding lead time in polymer ordering• Elevation of pumps and configuration of tank bottomdo not allow bottom volume of tank to be used asoperational storage• Weekend and holiday schedules may require additionallead time in ordering of polymer.• Polymer delivery occurs within a delivery window.EWA must plan for the outside end of the deliverytime, but the delivery may arrive soonerFigure P‐3.3.017Dewatering Polymer Storage TankBased on these factors, there are occasions when there is not sufficient volume in the polymerstorage tank to receive a full delivery of polymer. The delivery company charges EWA for excesspolymer that must be transported back to the source or to an alternate location if available.DescriptionSeveral options have been identified to provide greater flexibility for the polymer storagemanagement. Given the significant cost of polymer, life cycle costs should be considered in thedetermination of system improvements recommended, if any.Options for system improvements include:1) Conversion of polymer type for the DAF process to the same type as the centrifuge operation,resulting in overall higher volume of type polymer currently used for the centrifuges.2) Replacement of existing polymer tank with new, larger tank. Consideration must be given tocontainment area and other appurtenant equipment.3) Addition of another polymer storage tank4) Conversion of other existing tanks, currently not being used, for polymer storage. A polymertransfer system would likely also be required with this option.Implement most cost effective option based on additional analysis. For budgeting purposes, it isassumed that an additional polymer storage tank will be installed.E FY2014 E‐<strong>CAMP</strong> Report 2012‐12Dec.docx 80 December 26, 2012
JustificationProject will improve operational efficiency by allowing for larger volumes of polymer to be deliveredwhile maintaining operation. This reduces the risk of disrupting operation by running out of polymer,and avoids wasting excess polymer.P‐3.3.018Centrate Pipeline ReplacementCentrate and DAFT drainage are conveyed through Manhole No. 4. Valving on the system can beconfigured to convey flow to the PE pipeline or the primary influent gallery. EWA conducted CCTV ofthe pipeline to the primary influent gallery. It was observed that the pipeline dips as the CCTVsubmerged while moving along the alignment. It is assumed that there is settlement along thealignment and the impact to the centrate pipeline is unknown. This project address the deficienciesof the system.P‐3.3.019Centrifuge Drive ReplacementBackgroundEWA operates three centrifuges to dewater stabilized sludge prior to drying. The centrifuge driveshave required more maintenance than anticipated, and also has resulted in extended outage time.The General Services Department has identified alternate centrifuge drives to reduce outage timeand provide advantageous life cycle costs.DescriptionReplace Centrifuge Drives with new from alternative manufacturer.JustificationThis project will realize cost savings through reduced maintenance. The project also will result in amore reliable centrifuge operation, which is required for drying system operation.Project DeliveryTraditional Design – Bid – ConstructCoordinate with the condition assessments of Centrifuge Nos. 1 and 2, Maindrive and Backdrive,condition assessment scheduled as CA‐8.1.004 in FY 2015. Refer to E‐<strong>CAMP</strong> Section 3.3.P‐3.3.020Dryer Drum RepairBackgroundBased on field assessment, repairs are needed to the dryer drum.DescriptionComplete dryer drum repairs in accordance with manufacturer recommendations.JustificationThe dryer is a singular facility critical to the process of biosolids reuse.Project DeliveryService Contract with ManufacturerE FY2014 E‐<strong>CAMP</strong> Report 2012‐12Dec.docx 81 December 26, 2012
5.4 Energy Management5.4.1 Energy ManagementP‐4.1.001Cogen Communications RedundancyBackgroundThe existing communication equipment for the Cogeneration System does not have a backup. If theexisting communication equipment were to become inoperable, both the Cogeneration System andthe Drying System would not be operable. It is estimated that the outage would last a minimum oftwo days to allow for procurement of new equipment, configuration, and setup. To prevent this,installation of redundant fiber optics, conduit, and MIS Servers to the existing communication devicesis proposed.This project will also provide redundant switches for two of the most important network switchesassociated with the Cogeneration System and the Drying System.DescriptionDesign and provide redundant fiber optics, conduit, and MIS Servers to the existing communicationdevices. Provide redundant switches for two of the most important network switches associated withthe Cogeneration System and the Dryer System.JustificationThis project improves redundancy required to maintain operation of the co‐gen and dryer systems.Outage of the co‐gen system would be costly, requiring purchase of peak power. Outage of the dryersystem may require hauling of liquid digested sludge in lieu of pellets. The preservation ofcommunication devices protects the equipment.Project DeliveryTraditional Design – Bid – ConstructE FY2014 E‐<strong>CAMP</strong> Report 2012‐12Dec.docx 82 December 26, 2012
P‐4.1.003Cogen Engine CatalystBackgroundThe operating hours of Internal Combustion (IC) Cogeneration engines at EWA are currently limitedby the amount of carbon monoxide (CO) emitted during operation. The Energy & Emissions Planidentified the installation of engine exhaust catalysts to reduce the engine carbon monoxideemissions rate and remove the operating hours constraint.DescriptionThe project includes installation of the Cogen Engine Catalyst system for four engines.JustificationThis project implements the engine catalyst system installation in accordance with the Energy &Emissions Strategic Plan recommendations and the 2012 E‐<strong>CAMP</strong>. The engine catalyst systemsproposed will also allow EWPCF to meet regulatory requirements for unlimited use of either biogasor natural gas for operation of the IC engines. This allows EWPCF to maximize site generatedelectricity which moves EWPCF further toward energy independence in accordance with a 2013Tactical Plan goal.Project ImplementationDesign‐BuildE FY2014 E‐<strong>CAMP</strong> Report 2012‐12Dec.docx 83 December 26, 2012
P‐4.1.004Natural Gas Dilution Equipment ServicingBackground:The natural gas dilution system (eclipse) is used byEWA to protect the digesters from negative pressureand to infrequently boost the BTU content of biogas.The existing eclipse units are aging and requireservicing and parts replacement.Description:Contract with manufacturer or certified servicetechnician to service the equipment, includingreplacement of parts as needed.Figure P‐4.1.004Existing Eclipse UnitsJustification:This system protects digester gas storage space from becoming subject to negative pressure in theevent that protective devices fail to prevent gas compressors from over‐drawing gas. Negativepressure could cause damage to or failure of digester covers.Project Delivery:Purchase orderE FY2014 E‐<strong>CAMP</strong> Report 2012‐12Dec.docx 84 December 26, 2012
P‐4.1.005Cogen Engine Top‐End OverhaulBackgroundFour engine‐generator sets were installed as part ofPhase V Expansion in 2009. The engine‐generatormanufacturer (Caterpillar) recommends the followingroutine overhaul maintenance services to beperformed on the engines:1. Top‐End overhauls: after 8,000 service hours;2. In‐Frame overhauls: after 24,000 service hours;3. Full overhauls: after 40,000 service hours.Figure P‐4.1.005Cogeneration Engine Nos. 1 and 2Based on the existing air permit it is estimated that the total engine run hours for the four engineswill be approximately 16,650 hours per year. To spread out the expense of the engine maintenanceit is anticipated that two of the four engines will be primarily operated each year. This allows for thescheduling of engine overhauls of the four engines are shown in Table 4‐1. Shading indicates theengine is due for overhaul in the corresponding year.Table 4.1.005 Engine‐Generator Operating Scenarios and Overhaul ScheduleFYYear2014Operating Hours for this Period / Total Operating HoursEngine No. 1 Engine No. 2 Engine No. 3 Engine No. 48,000/24,650In‐Frame8,000/24,650In‐Frame2015 325/24,975 325/24,97520168,000/32,975Top‐End8,000/32,975Top‐End2017 325/33,300 325/33,30020188,000/41,300Full8,000/41,300Full325/16,650 325/16,6508,000/24,650In‐Frame8,000/24,650In‐Frame325/24,975 325/24,9758,000/32,975Top‐End8,000/32,975Top‐End325/33,300 325/33,300E FY2014 E‐<strong>CAMP</strong> Report 2012‐12Dec.docx 85 December 26, 2012
Total Operating Hours Per Year:On‐Peak:Summer = 3 engines x 7 hours/day x 109 days = 2,289 HoursWinter = 3 engines x 3 hours/day x 152 days = 1,368 HoursSemi‐Peak:Summer = 2 engines x 9 hours/day x 109 days = 1,962 HoursWinter = 2 engines x 13 hours/day x 152 days = 3,952 HoursOff‐Peak:Summer = 1 engines x 8 hours/day x 109 days = 872 HoursWinter = 1 engines x 8 hours/day x 152 days = 1,216 HoursWeekends = 2 engines x 24 hours/day x 104 days = 4,992 HoursTotal Operating Hours Per Year =16,651 HoursDescriptionThe top‐end overhaul service includes: replacing cylinder heads with remanufactured Engine heads cleaning block deck and manifold flange surfaces rebuilding exhaust bypass and digester gas regulators cleaning and testing cooler cores replacing lube oil temperature regulators cleaning of the engine oil sump and oil suction screen before refilling engine with new oil remanufacturing of two engine turbochargers replacing after‐cooler water pumps and jacket water pumps installing new spark plugs other cleaning and inspection services.The heat shield on the engines can only be seen during disassembly during a top‐end overhaul,therefore it is not possible to know if a heat shield needs to be replaced until the top‐end overhaul isunderway. A separate service would be needed if replacement of the heat shield is required, due tothe lead time involved with obtaining a replacement heat shield. The additional labor for replacingthe heat shield could be reduced if a heat shield (~$10,000) was purchased in advance of the top‐endoverhaul. If the heat shield does not need to be replaced during the top‐end overhaul then the partwould be stored for potential use during the next engine top‐end overhaul, or the heat shield couldbe replaced and the part removed could be salvaged for spare parts or refurbishment and reuse.JustificationThe engine overhaul work is necessary to maintain proper operating efficiency, maximize useful lifeof the equipment and to maintain APCD permit compliance.Project DeliveryReceive bids for service contract.E FY2014 E‐<strong>CAMP</strong> Report 2012‐12Dec.docx 86 December 26, 2012
P‐4.1.006Cogen Engine In‐Frame OverhaulBackgroundFour engine‐generator sets were installed as part ofPhase V Expansion in 2009. The engine‐generatormanufacturer (Caterpillar) recommends the followingroutine overhaul maintenance services to beperformed on the engines:1. Top‐End overhauls: after 8,000 service hours;2. In‐Frame overhauls: after 24,000 service hours;3. Full overhauls: after 40,000 service hours.Figure P‐4.1.006Cogeneration Engine Nos. 1 and 2Based on the existing air permit it is estimated thatthe total engine run hours for the four engines will be approximately 16,650 hours per year. Tospread out the expense of the engine maintenance it is anticipated that two of the four engines willbe primarily operated each year. This allows for the scheduling of engine overhauls of the fourengines are shown in Table 4‐1. Shading indicates the engine is due for overhaul in the correspondingyear.Table 4.1.006 Engine‐Generator Operating Scenarios and Overhaul ScheduleFYYear2014Operating Hours for this Period / Total Operating HoursEngine No. 1 Engine No. 2 Engine No. 3 Engine No. 48,000/24,650In‐Frame8,000/24,650In‐Frame2015 325/24,975 325/24,97520168,000/32,975Top‐End8,000/32,975Top‐End2017 325/33,300 325/33,30020188,000/41,300Full8,000/41,300Full325/16,650 325/16,6508,000/24,650In‐Frame8,000/24,650In‐Frame325/24,975 325/24,9758,000/32,975Top‐End8,000/32,975Top‐End325/33,300 325/33,300E FY2014 E‐<strong>CAMP</strong> Report 2012‐12Dec.docx 87 December 26, 2012
Total Operating Hours Per Year:On‐Peak:Summer = 3 engines x 7 hours/day x 109 days = 2,289 HoursWinter = 3 engines x 3 hours/day x 152 days = 1,368 HoursSemi‐Peak:Summer = 2 engines x 9 hours/day x 109 days = 1,962 HoursWinter = 2 engines x 13 hours/day x 152 days = 3,952 HoursOff‐Peak:Summer = 1 engines x 8 hours/day x 109 days = 872 HoursWinter = 1 engines x 8 hours/day x 152 days = 1,216 HoursWeekends = 2 engines x 24 hours/day x 104 days = 4,992 HoursTotal Operating Hours Per Year =16,651 HoursDescriptionThe in‐frame overhaul service includes all the services included with the top‐end overhaul plus thefollowing: megger and generator inspection exhaust bypass and gas regulators rebuild cleaning/testing oil cooler core replacement of piston, liner packs, crankshaft bearings, and crankshaft connecting rod bearings engine oil pump replacement.JustificationThe engine overhaul work is necessary to maintain proper operating efficiency, maximize useful lifeof the equipment and to maintain APCD permit compliance.Project DeliveryReceive bids for service contract.E FY2014 E‐<strong>CAMP</strong> Report 2012‐12Dec.docx 88 December 26, 2012
P‐4.1.007Cogen Engine Full OverhaulBackgroundFour engine‐generator sets were installed as part ofPhase V Expansion in 2009. The engine‐generatormanufacturer (Caterpillar) recommends the followingroutine overhaul maintenance services to beperformed on the engines:1. Top‐End overhauls: after 8,000 service hours;2. In‐Frame overhauls: after 24,000 service hours;3. Full overhauls: after 40,000 service hours.Figure P‐4.1.007Cogeneration Engine Nos. 1 and 2Based on the existing air permit it is estimated that the total engine run hours for the four engineswill be approximately 16,650 hours per year. To spread out the expense of the engine maintenanceit is anticipated that two of the four engines will be primarily operated each year. This allows for thescheduling of engine overhauls of the four engines are shown in Table 4.1.007. Shading indicates theengine is due for overhaul in the corresponding year.Table 4.1.007 Engine‐Generator Operating Scenarios and Overhaul ScheduleFYYear2014Operating Hours for this Period / Total Operating HoursEngine No. 1 Engine No. 2 Engine No. 3 Engine No. 48,000/24,650In‐Frame8,000/24,650In‐Frame2015 325/24,975 325/24,97520168,000/32,975Top‐End8,000/32,975Top‐End2017 325/33,300 325/33,30020188,000/41,300Full8,000/41,300Full325/16,650 325/16,6508,000/24,650In‐Frame8,000/24,650In‐Frame325/24,975 325/24,9758,000/32,975Top‐End8,000/32,975Top‐End325/33,300 325/33,300E FY2014 E‐<strong>CAMP</strong> Report 2012‐12Dec.docx 89 December 26, 2012
Total Operating Hours Per Year:On‐Peak:Summer = 3 engines x 7 hours/day x 109 days = 2,289 HoursWinter = 3 engines x 3 hours/day x 152 days = 1,368 HoursSemi‐Peak:Summer = 2 engines x 9 hours/day x 109 days = 1,962 HoursWinter = 2 engines x 13 hours/day x 152 days = 3,952 HoursOff‐Peak:Summer = 1 engines x 8 hours/day x 109 days = 872 HoursWinter = 1 engines x 8 hours/day x 152 days = 1,216 HoursWeekends = 2 engines x 24 hours/day x 104 days = 4,992 HoursTotal Operating Hours Per Year =16,651 HoursDescriptionThe full overhaul services are those top‐end overhaul and the in‐frame overhaul services plus thefollowing: replacement of camshafts with remanufactured camshafts removal and transporting of crankshaft to be cut and polished.JustificationThe engine overhaul work is necessary to maintain proper operating efficiency, maximize useful lifeof the equipment and to maintain APCD permit compliance.Project DeliveryReceive bids for service contract.E FY2014 E‐<strong>CAMP</strong> Report 2012‐12Dec.docx 90 December 26, 2012
P‐4.1.008 Cogen Engine 5BackgroundFour engine‐generator sets were installed as part of PhaseV Expansion in 2009. The installation of the fifth enginegeneratorset will be necessary in near future to meet theplant self‐generation energy goals as recommended in theEnergy & Emissions Strategic Plan Report prepared in2011.Figure P‐4.1.008Future Co‐Gen Engine 5 locationP‐4.1.010 Cogen Engine 6BackgroundAdditional engine generator capacity is required beyondfive engine‐generators as established in the 2011 Energy& Emissions Strategic Plan Report to fully utilize projectedincreases in biogas from waste‐to‐energy projects.Increase in capacity of the five engine‐generators may bea cost‐effective alternative to adding a sixth enginegenerator,which would require a building expansion.P‐4.1.011ORC GeneratorFigure P‐4.1.009Potential Location Identified for FutureCo‐Gen EngineAn organic Rankine cycle (ORC) power generating system works in a similar way to a water Rankinecycle (tradition steam power plant). The Rankine cycle is a thermodynamic cycle which converts heatinto work. The heat cycle is external and the working fluid, in this case refrigerant, is a closed loop.The work is extracted and converted to electricity using a turbine generator. This project wouldimplement an ORC system to generate electricity.E FY2014 E‐<strong>CAMP</strong> Report 2012‐12Dec.docx 91 December 26, 2012
P‐4.1.012Heat Loop Bypass InstallationBackgroundThe new plated heat exchangers transfer heat fromthe cogen cooling water to hot water that is used toheat sludge in the digesters. This project wouldprovide heat loop bypass piping to maintain thecogen facility in operation in the event of a heatexchanger outage. Bypass piping would be fabricatedand stored on site, such that in the event of a heatexchanger outage, the piping could be installed tobypass the system heat exchanger. 3WCL waterFigure P‐4.1.012would absorb the heat from the cogen engines and Plated Heat Exchangers (in blue)then be discharged to drainage. This system would betemporary and repair of the system heat exchangers would be a high priority because the digestersludge heating also relies on the system heat exchangers. An extended outage would cause adigester upset and deterioration or failure of the digestion process. An alternative temporary pipingconfiguration may be conceivable to use the cogen waste heat to directly heat the digester sludge.Description Modify existing piping with fittings to allow disconnection of heat exchanger and disposal of3WCL water from cogen heat exchangers to drainage Provide temporary piping to connect to existing piping and convey heated 3WCL water fromcogen heat exchangers to drainage Investigate ability to use heated 3WCL water as hot water for digester heat exchangers. This mayinvolve blending heated 3WCL water with another plant water supply.JustificationThis project would provide heat loop bypass piping to maintain the cogen facility in operation in theevent of a heat exchanger outage. The cogen facility provides cost effective power production anduses the digester gas. Provision of a backup heated water supply for the digester heat exchangerswould avoid digester upset and deterioration or failure of the digestion process. Failure of thedigestion process would impact the ability to dewater and dry biosolids which could result in highcost associated with hauling sludge for disposal and reseeding the digesters. Operation of the heatloop plated heat exchanger, which was installed in 2011, should be monitored. Frequent operationalissues or maintenance requirements will provide justification of this backup system.Project DeliveryTraditional Design – Bid ‐ ConstructE FY2014 E‐<strong>CAMP</strong> Report 2012‐12Dec.docx 92 December 26, 2012
P‐4.1.013Cogen Bldg Floor RepairBackgroundIn the area surrounding the chiller in the Cogen building,cracks, leaks and corrosion is observed. Water leaks downinto the blower room which is a safety concern. Thisproject would repair the floor damage. This project maybe a maintenance project given a project cost less thanthe $50,000 threshold, or it could be combined with otherprojects in the area.DescriptionRepair floor to prevent leakingFigure P‐4.1.013Water leaks through from aboveJustificationThis project is justified based on safety. Dripping of water in the vicinity of high power equipment isa safety concern.Project DeliveryTraditional Design – Bid – Construct, or contract maintenanceE FY2014 E‐<strong>CAMP</strong> Report 2012‐12Dec.docx 93 December 26, 2012
P‐4.1.014VFDs on Misc EquipmentBackgroundThe Energy & Emissions Plan includes recommendations to improve the efficiency of the existingelectricity usage within the EWPCF. This project installs Variable Frequency Drive (VFD) units in selectlocations. VFDs can be used to reduce motor speed where process demands vary, which reducespower consumption. Areas with this opportunity include various Heating, Ventilating, AirConditioning (HVAC) equipment, the Digester Mixing Pumps, and the plant water pumping systems.Description Design and install VFD controls for selected HVAC equipment.- Fan 1602 Exhaust Fan, 100 hp- Fan 6660 OCF Fan 1, 60 hp- Fan 4019 Blower Room Fan, 30 hp- Fan 8830 Foul Air Fan, 60 hp- Fan 6610 BFP Room AHU, 20 hp- Fan 4022 Engine Room Fan, 15 hp- Fan 4023 Solids Digestion Engine Room Fan, 15 hp- Fan 1601 Supply Fan, 7.5 hp- Fan 4081 Blower Room Fan, 10 hp- Fan 6691 Supply Fan, 5 hp- Fan 8055 Gallery Fan, 5 hp- Fan 4067 Air Handler, 3 hp- Fan 8054 Air Handler, 3 hp Design and install VFD controls for Digester Mixing Pumps.- 5530, 5531, 5630, 5631 Digester Mix Pumps, 50 hp each Design and install VFD controls for Plant Water Pumping Systems.- 3031, 3032, 3033 Plant Water (3WHP) Pumps, 50 hp each- 3051, 3052 Plant Water (3WL) 60 and 75 hp- 3021, 3022, 3023 Plant Water (3W) 25 hp each- 20 Plant Water (2W) 25 hp- 3041, 3042 Plant Water (3WCL) 15 hp eachJustificationThis project implements the recommendations of an Energy & Emissions Strategic Plan.installation can reduce electrical power demand without impacting process needs.VFDProject DeliveryTraditional Design – Bid – ConstructE FY2014 E‐<strong>CAMP</strong> Report 2012‐12Dec.docx 94 December 26, 2012
P‐4.1.015Gas Conditioning FacilitiesBackgroundThe operation of Internal Combustion (IC) Cogeneration engines at EWA are currently limited by theamount of carbon monoxide (CO) emitted during operation. The Energy & Emissions Plan identifiedthe installation of engine exhaust catalysts to reduce engine carbon monoxide emissions.Pretreatment of biogas is required to avoid poisoning of exhaust catalysts. In order to use biogas witha catalyst; moisture, siloxanes, H 2 S and other contaminants must be removed from the gas streamusing a gas treatment system. H 2 S is removed using an iron sponge or similar equipment, moisture isremoved using a refrigerated dryer, and siloxane is removed using an activated carbon filter.Description Construct an integrated gas conditioning system to remove the moisture, siloxanes, hydrogensulfide, and other contaminants from the biogas streamJustificationThis project implements the recommendations of an Energy & Emissions Strategic Plan. Biogastreatment allows the use of catalysts on engine exhaust which reduces CO emissions. Reducing COemissions removes the constraints on engine run time which allows increased site generatedelectricity at lower cost than purchased electricity. The proposed biogas treatment systems arerequired in order to use biogas as a fuel in the IC engines with the catalyst systems. Without the gastreatment the biogas would poison the catalyst.Project DeliveryTraditional Design – Bid ‐ ConstructP‐4.1.016Blower Replacement with High Efficiency TypeThe Energy & Emissions Strategic Plan identified a Turbo Blower or other high efficiency blower as acost saving and energy efficient alternative to current centrifugal blowers in use.E FY2014 E‐<strong>CAMP</strong> Report 2012‐12Dec.docx 95 December 26, 2012
P‐4.1.018Lighting and Controls ImprovementsThis project would implement the recommendations from the lighting efficiency survey.P‐4.1.019Chilled Water and Hot Water SystemsThis project would capture waste heat from heat exchanges in the co‐generation system, and wouldoptimize the capacity of the chiller in the power building.E FY2014 E‐<strong>CAMP</strong> Report 2012‐12Dec.docx 96 December 26, 2012
5.5 General Improvements5.5.1 Odor ControlP‐5.1.001ORF I System RehabilitationBackgroundThe existing Headworks facilities were constructed inthe 1982 as part of Phase III project and someimprovements were completed during Phase IVExpansion project. Ductwork modifications wereconstructed in 1995 and in 1997 to improve odorcontrol in the headworks. The Odor Reducing Facility(ORF) I requires replacement of activated carbonbiennially due to high sulfur content in the airremoved. The ORF I unit was recently removed fromservice for media replacement, at which time the unitwas assessed to be in good working condition.DescriptionDesign and construct odor control improvement resulting from P‐5.1.004, Odor Monitoring Facilities.Project DeliveryTraditional Design – Bid ‐ ConstructFigure P‐5.1.001Existing Headworks FacilityE FY2014 E‐<strong>CAMP</strong> Report 2012‐12Dec.docx 97 December 26, 2012
P‐5.1.002ORF I Carbon ReplacementBackgroundThe ORF I carbon filter is located on the north‐east sideof the Screening Building and was placed in service at theend of Phase III Construction in 1984. The ORF I carbonfilter utilizes activated carbon to remove noxious odorsfrom the preliminary and primary wastewater treatmentprocess. The Air Pollution Control District (APCD)requires replacement of activated carbon when sulfurcontent exceeds four percent. The sulfur content in ORFI will typically exceed the limit biennially based on sulfurcontent of the air removed.The APCD permit requires EWA to replace the activatedcarbon within 180 days of exceeding the sulfur limit. Theactivated carbon in ORF I carbon filter was replaced in FY2011. It is anticipated that the removal, disposal and replacement of the carbon media from ORF Iwith the new media will be necessary every two years.DescriptionRemove and dispose of the existing carbon media from ORF I and replace with the new carbonmedia.JustificationReplacement of the media is necessary to maintain APCD permit compliance. Proper maintenance ofthe odor control system also is necessary to control odors at the plant which promotes workerproductivity and safety, as well as avoiding negative impact on the area surrounding the EWPCF.Project DeliveryIn‐house procurement of services after receipt of quotesFigure P‐5.1.002ORF I FacilityE FY2014 E‐<strong>CAMP</strong> Report 2012‐12Dec.docx 98 December 26, 2012
P‐5.1.003ORF III Carbon ReplacementORF III carbon media is regularly inspected and sampled. Based on the inspection, carbon media loss,if any, can be determined. Samples are analyzed to verify that odor absorption characteristicsmaintain an established level. This project will be scheduled when the results of media inspectionand testing indicate that additional media or media replacement is needed. The historical list ofprojects since 1994 (see appendix A) does not list ORF III media replacement. In 2006, repairs to ORFIII were completed and about 10 percent of media loss was observed. The replacement andreplenishment of carbon media historically has been very infrequent.P‐5.1.004Odor Monitoring FacilitiesBackgroundThis project will use technology such as ODO Watch(Cruder Technology) to develop data around odors.Portable monitors would be installed around theplant to establish an odor baseline and identify areaswhere odor levels are above the baseline. Thissurvey will measure and record the odor at varioustimes during days and nights, weekday and weekenddays, and different seasons. The survey will alsoaddress and document odor sources outside thefence line within half a mile from the EWPCF.Figure P‐5.1.004EWPCF Aerial ViewBased on the results of the plant‐wide monitoring, project priorities would be updated for odorcontrol projects throughout the plant (P‐5.1.005 – Primary Clarifier Odor Control Improvements; P‐5.1.006 ‐ Influent Junction Structure Odor Control Improvements; P‐5.1.007 – Dryer Building OdorControl Improvements)Description Develop a plan for odor monitoring identifying methods, equipment, personnel, location andfrequency requirements Install equipment required to complete the monitoring Conduct field monitoring Analyze data to determine baseline olfactory characteristics within the plant boundary and withinone‐half mile of the plant boundary Provide report with baseline characteristics and recommendations on locations and level of odorremediation neededJustificationA byproduct of wastewater treatment is odor production, and EWA is responsible for maintaining anenvironment that controls odors so as not to negatively impact public health and a positive workingenvironment.Project DeliveryTraditional Design‐Bid‐ConstructE FY2014 E‐<strong>CAMP</strong> Report 2012‐12Dec.docx 99 December 26, 2012
P‐5.1.005HW/GRT/PSB Odor Control EvalBackgroundOdor Reduction Facility I (ORF I) provides odor control for the headworks, aerated grit tanks and theprimary clarifier influent and effluent channels. The original design capacity of ORF I is 40,000 CFM.A preliminary capacity evaluation of ORF I was performed as part of the grit and screenings handlingstudy to determine if additional odor control capacity was needed for the grit and screeningshandling expansion. With some reconfiguration of the odor control strategy, it was determined thatan additional 7,900 CFM of odor control capacity would be needed. The grit and screening handlingimprovement project (P‐1.1.005) included costs for a standalone, package odor control unit toprovide the required additional odor control capacity. However, the odor control evaluationperformed was preliminary and it was recommended that a more detailed odor control study beperformed. In addition, there may be a need to provide odor control for the main tank headspace inthe primary clarifiers (~7,800 cubic feet per tank). If the primary clarifiers were scrubbed at the samerate as the primary influent and effluent channels (10 air changes per hour), the required odorcontrol capacity would be 13,000 CFM for all 10 primary clarifiers (1,300 CFM per clarifier).Description Verify required foul air exhaust rates for existing and new facilities, including the main primaryclarifier headspace. Determine capacity of existing odor reduction facility and evaluate whether the capacity of theexisting odor reduction facility can be increased to match required exhaust rates. Evaluate alternatives for providing odor treatment capacity, including packaged biologicalscrubbers. Determine which sources of foul air should be treated by the existing odor reduction facilityversus a new odor reduction facility. For example, evaluate treating foul air from the primaryclarifiers with a new odor control facility to free up capacity at the existing screening buildingodor reduction facility (ORF I) Develop conceptual design of the proposed odor reduction facilities, including process flowdiagrams, design criteria, siting, layout, four air collection and routing, utility connections,electrical, and instrumentation.JustificationAdditional evaluation is needed to identify the necessary odor control upgrades required. Theeffectiveness of the current odor control arrangement for the primary clarifiers also warrants furtherconsideration.Project DeliveryTraditional Design – Bid – ConstructP‐5.1.006IJS Odor Control ImprovementsBased on the results of the plant‐wide odor monitoring study, P‐5.1.004, odor control improvementswill be implemented in areas identified with odors significantly above the odor baseline.E FY2014 E‐<strong>CAMP</strong> Report 2012‐12Dec.docx 100 December 26, 2012
P‐5.1.007Drying Bldg Odor Control ImprovementsBased on the results of the plant‐wide odor monitoring study, P‐5.1.004, odor control improvementswill be implemented in areas identified with odors significantly above the odor baseline.P‐5.1.008ORF III Chem Feed System ImprovementsBackgroundThe ORF III facility uses Sodium Hydroxide (Caustic Soda)and Sodium Hypochlorite (Bleach) in the second stage oftreatment. Chemicals are stored in a facility near ORF III,and are conveyed to the ORF with piping that is notdouble‐walled for chemical containment. The chemicalfeed facility and conveyance piping requires upgrade forsafety and regulatory compliance. This project wouldcover the containment pit to protect from damageassociated with UV degradation.ORF III requires repair to the concrete slab and upgradeof piping and appurtenant equipment. The wet scrubberportion of the ORF III system leaked a highly corrosivedrainage which damaged the side of the ORF structureand the concrete slab. The drainage problem has beencorrected and this project would repair the damageremaining.Figure P‐5.1.008aORF III Chemical Storage Facility(unloading connection in containmentarea)Description Replace existing piping with double‐wall type Reconfigure unloading stations so they are accessiblefrom outside of the containment area. Repair leaks and damaged concrete Replace pipe damaged by UV exposureFigure P‐5.1.008b Provide shade cover over facility (similar to CEPTORF III Recirc Pumpspolymer feed system) Reconfigure pump/piping to reduce risk of staff exposure to chemical at the eye level. Repair concrete at ORF III Recirculation PumpsJustificationThis project is ranked the number one safety improvement project. Pipe leaks could endanger staff,Storage and piping failures leading to spills can lead to regulatory actions. Protection of plasticmaterials, typically used in chemical storage and feed, will allow EWA to realize the life expectancy ofthe facility.Project DeliveryTraditional Design – Bid – ConstructE FY2014 E‐<strong>CAMP</strong> Report 2012‐12Dec.docx 101 December 26, 2012
5.7.2 Plant‐Wide SystemsP‐5.2.001Natural Gas Pipeline ReplacementBackgroundThe natural gas pipeline conveys high pressure andreduced pressure gas throughout the plant site.Natural gas is used at the co‐gen facility, the dryer,the Operations Building and the flare. Most of thenatural gas pipeline system is buried and subjected tohighly corrosive soils at the EWPCF. This is a one‐of‐akindfacility and is critical to the operation of thetreatment plant. Exposed portions of the bridge areFigure P‐5.2.001observed to be in poor condition.Natural Gas Piping (lower pipe, oneinch)at Bridge CrossingDescription Provide a new natural gas conveyance system on the plant site. Abandon in place the existingnatural gas piping. Select piping materials suitable for pressure requirements of each process served. Select piping configuration to provide long‐term service not impacted by corrosive soils, tomaintain plant access and not obstruct vehicle or pedestrian traffic, to be accessible for conditionassessment, with adequate protection against future excavation and construction activities onthe plant site Determine feasibility of provisions for connection to a temporary stored gas vessel in the event ofa natural gas delivery curtailment.JustificationNatural gas delivery is essential to the operation of the co‐gen facility, the dryer, the flare and otherprocesses. Interruption of natural gas service would be extremely costly in loss of operation of theco‐gen and drying operations. Loss of natural gas to the flare could result in discharge of methanegas, an unsafe condition. If leaks were to develop in the natural gas pipeline, there would bepotential for dangerous exposure for personnel and the public to natural gas, as well as potential forexplosion.Project DeliveryTraditional Design – Bid ‐ ConstructE FY2014 E‐<strong>CAMP</strong> Report 2012‐12Dec.docx 102 December 26, 2012
P‐5.2.002High Risk and Critical Asset RehabilitationBackgroundThe failure of a high risk asset can cause high impacts on the EWA’s ability to maintain the planttreatment capacity and to comply with the regulatory requirements. High risk assets include assetsthat are critical for plant operations and regulatory compliance and assets that have higherprobabilities of failure or accident to occur.DescriptionThe condition assessments of the high risk assets are anticipated in FY 2013 and FY 2014. This projectwill provide first identify the one‐of‐a‐kind and high risk assets and subsequently perform conditionassessment. Necessary rehabilitation work required per the recommendations provided by thecondition assessments. Design and construct high risk and critical asset rehabilitation tasks.JustificationHigh risk and critical asset rehabilitation justification is reduction of risk from: major equipment failure major loss of treatment long term difficulty in reestablishing treatmentProject DeliveryTraditional Design – Bid – ConstructE FY2014 E‐<strong>CAMP</strong> Report 2012‐12Dec.docx 103 December 26, 2012
P‐5.2.0043WLC Strainer ReplacementBackgroundThe 3WLC system is used for utility water supply to thecold water system of the heat exchangers for EWA’scogeneration system. The plated heat exchangersinstalled in 2011 include a manual strainer upstream ofthe unit, and the strainer is of finer mesh than the straineron the 3WLC system. The existing 3WLC strainer is amanual dual‐basket type and was installed as part ofPhase III expansion project in 1980. The existing 3WLCstrainer is located downstream from the two 3WLCdistribution pumps.In 2010, a study was conducted to identify the benefitsand costs associated with the upgrade of the existing 3WLC strainer. The upgrade of the 3WLCstrainer will minimize the headloss through the 3WLC system, reduce operations and maintenancecosts by converting from a manual strainer to an automated strainer, and reduce the frequency ofcleaning of the strainer at the plated heat exchanger at the co‐gen facility.Description Replace the existing manual strainer with a new automated type strainer. Strainer installation will require utility connections and drainage handling. Modify the existing bypass piping to eliminate the complicated elbows to reduce headloss.JustificationThe project would reduce staff time requirements for manual cleaning of the 3WLC strainers and theplate and frame heat exchanger filters. The pressure drop across the automatic filter would bereduced through continuous cleaning, which would improve energy efficiency.Project DeliveryTraditional Design – Bid – ConstructFigure P‐5.2.0043WLC StrainerE FY2014 E‐<strong>CAMP</strong> Report 2012‐12Dec.docx 104 December 26, 2012
P‐5.2.0053WHP Strainer ReplacementBackgroundThe 3WHP system is equipped with a manual strainersimilar to the 3WCL Strainer. Replacement of the manualstrainer will reduce operations and maintenance costs byconverting from a manual type to an automatic typestrainer.Description Replace the existing manual strainer with a newautomated type strainer. Strainer installation will require utility connectionsand drainage handling.JustificationThe project would reduce staff time requirements for manual cleaning of the 3WHP strainers. Thepressure drop across the automatic filter would be reduced through continuous cleaning, whichwould improve energy efficiency.Project DeliveryTraditional Design – Bid – ConstructFigure P‐5.2.005Overview of the 3WHP and 3WCLPumps and StrainersE FY2014 E‐<strong>CAMP</strong> Report 2012‐12Dec.docx 105 December 26, 2012
P‐5.2.0063WLC Intertie to 3WHP SystemBackgroundThe 3WLC system used to be backed up by the 3WLsystem, in the event that the 3WLC system was notoperational. The 3WCL system is critical to the operationof the co‐gen facility and also to the digesters which usethe heat from the co‐gen system to heat the sludge in thedigesters.DescriptionProvide an intertie between the 3WHP and the 3WLCsystems, in the vicinity of the final effluent pumps.Figure P‐5.2.006Proposed Intertie LocationJustificationAddition of a backup water supply to the heat exchanger for the co‐gen system would provide morereliability to the system. Loss of the cogen system would require EWA to purchase power which maybe subject to peak time of use charges.Project DeliveryTraditional Design – Bid – Construct; could be combined with P‐5.2.004, 3WLC Strainer Replacementor P‐5.2.005, 3WHP Strainer ReplacementP‐5.2.0073WL Pump No. 3 InstallationBackgroundThe 3WL system supplies water to the DAF as well as ORF I and 2A. When DAF water usage is high,there is concern that the ORF units will not receive the flow required for treatment and to meetregulatory requirements. This issue may be controlled by avoiding high flow usage at the DAF duringmaintenance operations.E FY2014 E‐<strong>CAMP</strong> Report 2012‐12Dec.docx 106 December 26, 2012
P‐5.2.008Underground Piping Rehabilitation – Multi‐PhaseBackgroundThe EWPCF major plant expansion projects (Phase III and Phase IV) were constructed in 1980 and1989. Assets installed during these phases have been in service for 20 to 30 years, with other assetsinstalled in previous phases having been in service longer. During FY 2012, an assessment processbegan to determine condition and/or recommend replacement of underground piping 12‐inches andlarger, and the natural gas piping system. Some of the assessments have been completed and othersare still pending, as listed below:Complete:1) Influent Pipelines between IJS and Bar Screens (Four CISP pipelines, 48‐inch diameter)2) Primary Effluent Pipeline from Primary Sedimentation Basins to Secondary Process (one RCP, 72‐inch diameter). System includes DI pipe from junction box to AB 4 for equalization. This does notinclude the currently dormant secondary bypass pipeline from the PSB to the outfall, refer to P‐1.2.004, Emergency Discharger Pipeline Rehabilitation – Primary Effluent.3) Secondary Effluent from Clarifiers to Effluent Pump Station (72‐inch and two 54‐inch RCP) andClarifiers to Flow Equalization/Carlsbad Recycling Facility4) Natural Gas to cogen, dryer, RTO, flare, Ops Bldg (1‐inch to 4‐inch steel pipe) (to be replaced)5) Air Piping, agitation and aeration air from Blower Building to Aeration Basins and to Headworks.(replaced/rehabilitated)Pending:6) Mixed Liquor from channel into each clarifier (42‐inch RCP)7) RAS from each clarifier to RAS pumps (12‐inch DI)8) Mixed Sludge at Digester Nos. 5 and 6 (primarily 16‐inch RCP)9) Mixed Gas from Gas Management System to Power Bldg (16‐inch steel pipe)10) Low Pressure Sludge Gas from digesters to Gas Management System and to Flare (12‐inch and16‐inch steel pipe, some stainless steel)11) Foul Air piping from Phase III and Phase IV (16‐inch and 18‐inch FRP)12) Drains from treatment basins (size ranging from 12 to 36 inch, DI, PVC)13) Plant Water, some piping 12‐inch DI (3WL), but mostly smaller diameter14) Agitation air piping to Aeration Basins is known to be in poor condition, and encased piping underthe Blower Building condition is unknown.Additional assessment and implementation of rehabilitation or replacement of piping will follow theinitial condition assessment work started in FY 2012.Description Excavate and repair or replace pipelines identified with deficiencies during the FY 2012underground piping condition assessment task. Complete underground piping condition assessment for pipelines larger than 12‐inches.JustificationAssessment and repair of underground piping systems is needed to avoid spills, process disruption,regulatory actions, costly emergency repairs and to allow for planned maintenance.Project Delivery Procurement of servicesE FY2014 E‐<strong>CAMP</strong> Report 2012‐12Dec.docx 107 December 26, 2012
P‐5.2.009Structure Settlement StabilizationBackgroundEWA is currently monitoring settlement of structureson site. Some settlement has been observed andprovisions made to prevent damage due to settling. Ifadditional settling is observed, equipment and pipingmay need to be stabilized.Figure P‐5.2.009Structure SettlementP‐5.2.0103WHP Pump Control ImprovementsBackgroundThree constant speed 3WHP pumps were installedduring the 1983 Phase III Expansion. Each pump has a50 hp motor. One of the three pumps was upgradedwith a VFD and new Motor Control Center (MCC) in1992. Upgrading to compact VFDs and replacing theMCCs for the other two remaining constant speedpumps will reduce power usage and provide improvedoperational control.DescriptionThe project will require: Demolition of the existing electrical controls,including the motor starters Installation of three new compact VFDs andassociated controls for 3WHP Pumps Nos. 3031,3032 and 3033 in the empty buckets of theexisting MCC, shown in Figure P‐5.2.010. Replace MCCs for the two pumps not upgraded in1992.Figure P‐5.2.0103WHP Pumps MCCJustificationThis project will reduce power usage and improve operational control.Project DeliveryTraditional Design‐Bid‐ConstructE FY2014 E‐<strong>CAMP</strong> Report 2012‐12Dec.docx 108 December 26, 2012
P‐5.2.0111W System RehabDuring E‐<strong>CAMP</strong> 2011 inspection, it is observed thatthe exposed 1W piping and air gap tank located at thenorth side of the EWPCF is corroded. This projectwould replace approximately 150 feet of 1W pipingupstream of the Air Gap Tank, would rehabilitate theAir Gap Tank, and would replace approximately 200feet of 1W piping downstream of the Air Gap Tank. Amore detailed analysis of the 1W system needs andrecommendations will be included in the FY 2013Plant and Non‐Potable Water Study.Figure P‐5.2.011Plant Water PipingE FY2014 E‐<strong>CAMP</strong> Report 2012‐12Dec.docx 109 December 26, 2012
P‐5.2.012Site Security FacilitiesBackgroundAccess to the EWPCF must be restricted to authorizedpersonnel to ensure the safety of the public and EWAstaff, as well as prevention of vandelism or damage tofacilities. Severe damage by intruders to areas such ascontrol rooms or MCC facilities could cause a plantshutdown.Description:This project would implement the following facilities: Centralized control console for monitoring andprogramming card or coded entry to front gate,Figure P‐5.2.012MCC rooms, and buildings. Once the system is in Contractor’s Entrance to Siteplace, implementation of door hardware andremote control panels can be added to the system. This console would be configured to monitorremote facilities also. Implementation of integration of monitoring and control of the EWPCF vehicle access gates. PA system improvements and integration into the new system Surveillance video or plant perimeter intrusion system Specific hardware and configuration pending the results of a study phase.JustificationThis project is justified based on the safety of the public and EWA staff, as well as prevention ofvandalism that could cause plant shutdown.Project DeliveryTraditional Design‐Bid‐ConstructP‐5.2.014Perimeter Fence ReplacementThis project will replace the perimeter chain‐link fencelocated on the north, east, and south side of theEWPCF. The existing fence has sections withoutbarbed wire on top, and sections that are in poorcondition.Figure P‐5.2.014Perimeter Chain Link FenceE FY2014 E‐<strong>CAMP</strong> Report 2012‐12Dec.docx 110 December 26, 2012
P‐5.2.015Northwest Storm Water Drain Sump to South DAF PitA catch basin located between the south gate and thevehicular crossing of the flood control channel,captures stormwater flowing south from theOperations Building vicinity, east from the plantentrance, and west from the vehicular crossing.During dry weather and during the first hour of a rainevent, flow from the catch basin is diverted to theTWAS pit where sump pumps return flows to thetreatment process. After the first hour, flows may bediverted to the flood control channel.During very heavy storms, the sump pumps in theTWAS pit may not keep up with the inflow from thiscatch basin, creating the potential for flooding in theTWAS pit. Additionally, the piping and fittings in thiscatch basin may not be of adequate size to captureand convey all the flow during the first hour of thestorm to the TWAS pit.The study phase of this project would determineappropriate storm design criteria, determine therunoff flow generated in the drainage area, andcalculate the size of piping and catch basin required.The study would determine if the flow rate generatedby the design storm exceeds the firm capacity of thesump pumps in the TWAS pit. Recommendations forupgrades to the system would be implemented duringthe construction phase of the project.Figure P‐5.2.015Stormdrain near DAF PitE FY2014 E‐<strong>CAMP</strong> Report 2012‐12Dec.docx 111 December 26, 2012
P‐5.2.0162W System UpgradesBackgroundThe 2W system distributes filtered secondary effluent to the drying process and other ancillaryprocesses such as polymer system makeup water. Filtration is achieved on‐site through a sand filter.The sand filter was installed in 1993. Since that time, the dryingprocess has been installed and other processes have changed atthe plant site. This project will include a condition assessment ofthe existing equipment. Based on design criteria anddocumentation developed in the FY 2013 Special Study 8.2.003(Plant and Potable Water Study), the conceptual study willevaluate alternative technologies such as microfiltration,additional system recommendations which may include watersoftening or storage, and other required improvements, eg pumpsystem upgrades, to meet process demands.DescriptionCondition Assessment Sand Filter Exposed piping 2W pumps 1W Non‐Potable System for backupFigure P‐5.2.016Existing 2W System Sand FilterConceptual Study Evaluate alternative secondary effluent filtration technologies such as microfiltration Determine pumping requirements to meet process demands Identify layout, utility, ancillary system recommendations Develop costs for proposed upgradesProject Implement recommendations of the conceptual study.JustificationThe 2W system provides process water for the drying system and other processes essential to theoperation of the EWPCF. Disruption of the treatment system would require purchase of backup Citywater. Unreliable or inadequate pump supply could cause an outage of the drying system andrequire alternative disposal of biosolids, which would be very costly.Project DeliveryTraditional Design‐Bid‐ConstructE FY2014 E‐<strong>CAMP</strong> Report 2012‐12Dec.docx 112 December 26, 2012
P‐5.2.017Service Air and Instrument Air Piping RepairsBackgroundHigh pressure service and instrument air systemsserve instruments and support maintenance atlocations throughout the EWPCF. Given the highlevel of corrosion observed at other buried ferrouspipe system within the plant site, there is concernregarding the condition of the service air pipingsystem. Some of the needs of the system needs mayalso have changed over the years as upgrades havebeen implemented. For example for exampleultrasonic level sensors have replaced bubblers forlevel instrumentation. This study will identify thecurrent and future uses of service air and instrument air, as well as consideration of options such asrepair vs replacement of the systems.DescriptionConceptual Study Document current service and instrument air requirements Determine condition of existing system Identify replacement piping configuration, pipe materials, capacity requirements Develop costs for proposed upgradesProject Implement recommendations of the conceptual study.JustificationFailure of the instrument air system supporting monitoring such as level sensors could result inprocess disruption or overflow of basins on the plant site. Unavailable instrument air utility stationsmay increase time required by staff or prevent the ability to maintain treatment facilities.Project DeliveryTraditional Design‐Bid‐ConstructFigure P‐5.2.017Service Air/Washdown StationE FY2014 E‐<strong>CAMP</strong> Report 2012‐12Dec.docx 113 December 26, 2012
P‐5.2.019 Plant BeautificationLandscape irrigation systems are aging and require regular maintenance. Additionally, constructionactivity and site modifications have left some areas of the EWPCF landscape that requiresimprovement. This project would replace existing irrigation systems that are reaching the end oftheir service life, and would provide additional or improved landscaping at the plant, especially areasthat are visible to the public.P‐5.2.021Climate Control at MCCsBackgroundMCC equipment generates heat, and most buildingshousing MCCs at the EWPCF are not equipped with climatecontrol such as HVAC units. Doors to the MCC buildingscan be left open to provide cooling for the equipment andpersonnel working in the building. However, leaving thedoor open creates potential for intruders to enter andharm themselves and the facility. Open doors also exposeequipment to dust, moisture and corrosion which couldshorten the life of equipment, particularly electronicequipment. This project would provide climate control onMCCs and other electronic facilities.Figure P‐5.2.021SEEPS MCC FacilityDescription Identify needs of each MCC building and facility location, including cooling system and heaters- Cogen/Power MCC Room- Primary/Screenings MCC Room- Secondary Process MCC Room- Dewatering Process MCC Room- Secondary Effluent Pump Station (SEEPS) MCC Room- Effluent Pump Station/Chlorination MCC Room- Drying Building process control lab Provide Climate Control, as neededJustificationClimate control will maintain electronic equipment such as MCCs within design temperature rangeoperating parameters to realize longer service life. Currently, doors are opened to cool the rooms.Maintaining doors closed will minimize exposure of equipment to dust and extend equipment servicelife. In conjunction with P‐5.2.022 – Install Coded Entry on MCCs, this project will reduce potentialfor intruders to enter and cause harm to themselves, equipment or the treatment process.Project DeliveryTraditional Design – Bid – Construct. This project may be implemented with P‐5.2.022 – Install CodedEntry on MCCs.E FY2014 E‐<strong>CAMP</strong> Report 2012‐12Dec.docx 114 December 26, 2012
P – 5.2.024Exterior Asset Corrosion ControlThis project provides coating or replacement as needed of exterior equipment and piping at the plantsite. A study will prioritize and develop a multi‐year plan and cost estimate to complete the coatingwork. The study will also establish color coding chart for piping systems.P‐5.2.025Technology Master Plan Recommendations ImplementationEWA has contracted for the development of a Technology Master Plan. Project elements may includePLC System Upgrades, I/O reconnections, IP Phones and improved electronic access to information.P‐5.2.026Plant Waste Stream ReroutingBackgroundThe treatment plant at EWA generates several waste or recycle streams, which are currently routedback through the treatment process. The recycling of these waste streams is common practice atmost wastewater treatment facilities; however, some of the process waste stream can causetreatment difficulties when they are recycled. In particular, the centrate and odor reduction facilitydrainage are high‐strength waste streams. Previously EWA has tried routing centrate to the primaryinfluent, which caused difficulties due to the additional solids loading to the primary sedimentationbasins. Routing the centrate to the primary effluent channel was also investigated; however doing socaused problems with the secondary treatment process. An evaluation of treatment plant wastestreams should be performed.DescriptionThe evaluation would consist of the following: Summarize and characterize the major plant recycle streams including flows and loads Evaluate current routing and routing alternatives Evaluate potential treatment options for recycle streamsJustificationThe optimization of waste stream routing and treatment (if necessary) will help to minimize thecurrent process impacts from the waste streams and may improve overall treatment processperformance.Project DeliveryTraditional Design – Bid – ConstructE FY2014 E‐<strong>CAMP</strong> Report 2012‐12Dec.docx 115 December 26, 2012
P‐5.2.027Plant‐Wide Seal CoatingBackgroundA large portion of the EWA treatment plant site is covered with asphalt pavement. Period re‐sealing(slurry seal) of the asphalt is required to maximize the service life of the pavement.Description Joint seal existing cracks Re‐seal the existing paved areas Re‐paint parking outlines and other road markingsJustificationAsphalt pavement maintenance is required to provide safe and adequate access to the to treatmentplant facilities. Proper maintenance and repair will help maximize the service life of the existingpavement.Project DeliveryTraditional Design – Bid ‐ ConstructE FY2014 E‐<strong>CAMP</strong> Report 2012‐12Dec.docx 116 December 26, 2012
5.7.3 BuildingsP‐5.3.001Ops Bldg Locker ReplacementThe Operations Facility locker rooms for men and womenwere constructed as part of “Operations and MaintenanceFacilities” contract dated January 2005. The lockersinstalled do not accommodate the standard hanger that isused for employee uniforms. A technical memorandumdated January 4 th , 2011 had identified the criteria for thenew lockers, the considerations for the layoutmodifications, and the cost options. This project willreplace the lockers with new lockers sized to hold thestandard hanger.P‐5.3.002Operations Building Air Intake RelocationFigure P‐5.3.001Locker with Standard HangerBackgroundThe Operations Building air handling units draw air from theeast side of the building in the vicinity of the primarytreatment process. The air taken in from this area can becharacterized as unpleasant odors which are transferred tothe working environment of staff and visitors inside thebuilding. This environment has the potential to raise workerhealth concerns and can create a negative workingenvironment as well as a negative impression to visitors. Themoisture in the air also damages the filters.Description Design, fabricate and install an aesthetically pleasing airintake to the two separate air handling units in theOperations Building. One intake serves the first floor andthe other serves the second floor.Figure P‐5.3.002 Provide intake ducts that originate in the location of the Ops Bldg Intake Filters Damaged byexisting louvers, extend up the outside of the building,Moistureand cross the roof to pick up fresh air from the west on top of the roof. The unit would be custom designed, single or dual heavy gauge construction, and includeprotection from entry of birds, insects and water Provide moisture removal for the intake airJustificationThis project would create a more positive working environment for staff, visitors and would reducethe potential for health concerns associated with breathing foul air.Project DeliveryDesign – Bid ‐ ConstructE FY2014 E‐<strong>CAMP</strong> Report 2012‐12Dec.docx 117 December 26, 2012
P‐5.3.003Construction Office UpgradeThe building previously used by the maintenance group now has building space that EWA has madeavailable to contractors, thus reducing construction costs associated with providing temporaryconstruction trailers. With building upgrades, this space is suitable for office space for Contractorsduring construction work. The building space available includes three offices, a conference room, akitchen, records storage and a locker room. The following table summarizes the work proposed to becompleted through this project. Completion of this work is needed for this asset to be functional forits repurposed use. The provision of this space will provide savings to Contractors in field office costswhich will be passed on to EWA in a competitive bid process.Room FloorCoveringWalls Ceiling WindowCoveringLightingOffices Replace Repair & Replace Replace Evaluate/PaintReplaceElect Room Replace Repair & ReplaceEvaluate/PaintReplaceConf Room Replace Repair & ReplaceEvaluate/PaintReplaceKitchen Replace Repair & ReplaceEvaluate/PaintReplaceLocker Repair Repair & ReplaceEvaluate/RoomPaintReplaceRecordsRepair & ReplaceEvaluate/StoragePaintReplaceCorridors Replace Repair & ReplaceEvaluate/PaintReplaceBuildingOtherPartitionequipmentRepair wallsRemovecabinetsEvaluateHVAC system– test andbalanceP‐5.3.004Ops Bldg Chiller ReplacementProject P‐5.3.004 will supplement the Operations Building chiller with a new absorption chiller andhot water loop utilizing heat waste from the IC engines hot water recovery system. This project willrequire both the chiller and piping from the Cogen facility to the Operations Building.E FY2014 E‐<strong>CAMP</strong> Report 2012‐12Dec.docx 118 December 26, 2012
P‐5.3.006Secondary Scum Pit Roof RemovalBackgroundThe secondary scum pit requires cleanout periodically which is accomplished using a combinationtruck. The existing structure roof above the pit provides limited clearance between the combinationtruck and the structure. Personnel are required to enter the cramped space below the roof toremove the cover plates and guide the combination truck hose into the pit below. This project wouldmodify the structure removing the roof and making other modifications to facilitate removal of scumfrom the pit.Description Modify the roof including lighting to provide adequateclearance for a combination truck and appurtenancesto access the scum pit Provide access platform and handrail Provide davit lifting for pit cover plateJustificationThis project will minimize the risk of injury to personnelworking in the awkward location, and will reduce the riskFigure P‐5.3.006of damage to the structure from the combination truck asSecondary Scum Pitwell as associated injury which may occur to personnel inthe vicinity of the structure if impacted by a combination truck extension.Project DeliveryTraditional Design – Bid ‐ ConstructP‐5.3.008Roof Access Safety FacilitiesThe Drying Building is equipped with HVAC equipment located on the roof. The HVAC equipmentrequires monitoring and periodic maintenance such as replacement of filters. The Drying Building isaccessed by climbing up a portable ladder from the roof of the Dewatering Building, but this area isobstructed by air piping which prevents properly securing a portable ladder for access. This projectwould provide permanent access to improve safety of workers transporting tools and materials tothe roof for maintenance work. In addition to the permanent access to the Drying Building, a fallprotection system is needed for the Maintenance Building and Operations Building.Description Provide permanent access to the roof of the Drying Building Provide fall protection skid for the Maintenance Building and the Operations BuildingJustificationPermanent access to roofs would reduce the potential for injury when maintaining equipment onbuilding roofs. Fall protection would reduce potential for injury from falling while servicingequipment on facility roofs.Project DeliveryProcurement by EWA staffE FY2014 E‐<strong>CAMP</strong> Report 2012‐12Dec.docx 119 December 26, 2012
5.7.4 MiscellaneousP‐5.4.004Vallecitos Sample Vault InstallationVallecitos Water District, one of the EWA’s member agency, is located east of the EWPCF and treatswastewater to produce secondary effluent. The treated secondary effluent is conveyed to EWPCF,eventually entering the outfall pipeline. Secondary effluent from the Vallecitos wastewater treatmentplant travels through a 24‐inch pipe, enters the east side of the <strong>Encina</strong> property and heads towardthe west side of the property. The 24‐inch line runs in front of the maintenance building to a failsafevault, where it then turns into a 30‐inch line and travels to a surge tower. The surge tower collectsthe secondary effluent from Vallecitos and from the EWPCF and discharges into an 84‐inch oceanoutfall pipeline. The existing sampling station is located along the 84‐inch ocean outfall pipeline.Currently there is no water quality testing on the secondary effluent from Vallecitos. In order forEWA to have a better understanding of all its water quality constituents that are discharged, testingof the secondary effluent from Vallecitos will be necessary. This project will provide the secondsampling station along the 24‐inch Vallecitos line.E FY2014 E‐<strong>CAMP</strong> Report 2012‐12Dec.docx 120 December 26, 2012
SECTION 6:PROJECT PRIORITY RANKINGProposed E‐<strong>CAMP</strong> projects are first screened based on Safety, Assessed Condition or Regulatory Compliance.Projects required to maintain a safe working environment, to prevent eminent equipment failure in the nexttwo years, and to maintain regulatory compliance are designated “Top Priority” (TP). Certain major assets,such as engine generators, undergo regularly scheduled contracted major maintenance to preserve assetfunctionality. These projects are designated “Preventative Maintenance” (PM). TP and PM projects arerecommended for near‐term funding. Remaining projects are prioritized as described in this section.The project prioritization process utilizes the established evaluation categories and assigns a weighted valuebetween 1 and 6 with 1 being the lowest importance and 6 being the highest importance. Each project israted utilizing the seven evaluation categories with priority value assignment ranging from 0 to 3 with 1representing low relevance, 2 representing medium relevance and 3 representing high relevance. If a specificevaluation category bears no relevance to the project, the project is assigned a rating of 0.The resulting priority score for each project is determined as the product of the category weight value andthe priority value assigned. The composite score for each project is the sum of its priority scores in eachevaluation category. Recommendation of project implementation is based on each project’s compositescore. The priority project rating can vary from year to year based on specific circumstances at the EWPCF inthat particular year.Figure 6‐1 presents the Priority Ranking System used, and Table 6‐1 provides the scoring of the FY 2013potential projects.Figure 6‐1: Priority Project Ranking SystemEVALUATION CATEGORYSafetyAssessed Asset Useful Lifereached within 2 yearsRegulatory ComplianceCATEGORY WEIGHT(1 = Lowest Priority)Top PriorityTop PriorityTop PriorityConsequence of Failure 6Odor Control 5Energy Efficiency 4Cost Efficiency 3Assessed Asset Useful Life 2Organizational Efficiency 1E FY2014 E‐<strong>CAMP</strong> Report 2012‐12Dec.docx 121 December 26, 2012
This page intentionally left blankE FY2014 E‐<strong>CAMP</strong> Report 2012‐12Dec.docx 122 December 26, 2012
RefProjectNo.1.0 Liquid Process Improvements1.1 HeadworksENCINA WASTEWATER AUTHORITYTABLE 6‐1, FY 2014 E‐<strong>CAMP</strong> PROJECTS SORTED BY SCORECapital ProjectYearProjectStart(egconstr)1 P - 1.1.005 Grit and Screenings Handling Facility Rehab 2016+ 24 1 2 0 1 1 32 P - 1.1.006 GRS Isolation Improvements 2015 TP yes - - - - - -3 P - 1.1.007 Vactor Receiving Station ≥2019 15 0 2 0 1 0 24 P - 1.1.008 GRS Rehab 2015 24 1 1 1 1 2 25 P - 1.1.009 Influent Flow Metering Installation 2014 TP yes - - - - - -6 P - 1.1.010 Influent Pipeline Rehab w/Addl 2012 Major Rehab 2014 TP yes - - - - - -1.2 Primary Treatment7 P - 1.2.002 Primary Sludge Pumping Upgrades ≥2019 23 2 0 1 1 1 28 P - 1.2.003 PE Second Pipeline ≥2019 8 1 0 0 0 1 09 P - 1.2.004 PE Emergency Discharge Pipeline Rehab ≥2019 6 1 0 0 0 0 010 P - 1.2.006 PSB Struct and Mech Rehab 2015+ 33 2 1 1 1 3 311 P - 1.2.009 PE Pipeline Rehab 2017 21 3 0 0 0 1 112 P - 1.2.010 PSB Scum Pipeline 2015 17 1 0 0 2 1 31.3 Secondary Treatment13 P - 1.3.003 AB Selector Implementation and Cover Replacement 2018 26 1 0 2 2 2 214 P - 1.3.004 AB Mech Rehab and RAS Pump Addition 2018 19 1 0 1 1 2 215 P - 1.3.006 Secondary Polymer System Replacement 2016 TP yes - - - - - -16 P - 1.3.007 SCs 5 and 6 Mech Rehab 2018 TP yes - - - - - -17 P - 1.3.008 SC 7 - Conversion from EQ to Clarifier ≥2019 1 0 0 0 0 0 1E Mstr Proj List Tbl6‐1 AppB TOCAppD 2012‐12Dec.xlsxRMC Water and Environment Table 6‐1 Page 1 Last Updated 12/26/2012Prel.TotalScoreSftyTPYes/NoAULTPYes/NoRegTPYes/No6 cnsq fail5 Odor Cntrl4 Engy Eff3 Cost Eff2 A Use Life1 Org Eff
RefProjectNo.ENCINA WASTEWATER AUTHORITYTABLE 6‐1, FY 2014 E‐<strong>CAMP</strong> PROJECTS SORTED BY SCORECapital ProjectYearProjectStart(egconstr)18 P - 1.3.010 WAS Pipeline Replacement ≥2019 20 2 0 0 1 2 119 P - 1.3.012 AB DO Probe Replacement 2018 20 1 0 1 1 2 320 P - 1.3.013 SC Concrete Cracking Prevention 2016 21 2 0 0 2 1 121 P - 1.3.014 SCs 1 - 4 Inf and Eff Gate Replacement 2016 14 1 0 0 1 2 122 P - 1.3.015 AB Flow Eq Feed and Return Pipeline Rehab ≥2019 16 1 0 0 2 1 21.4 Effluent23 P - 1.4.001 EPS Rehab ≥2019 11 1 0 0 1 1 024 P - 1.4.002 EPS MCC and Conductors Replacement ≥2019 12 1 0 1 0 1 025 P - 1.4.004 EPS Pipe Lining and Abandoned Pipe Coating Repair ≥2019 16 1 0 0 2 2 026 P - 1.4.005 PD Blower Addition, Aeration/Agitation ≥2019 16 1 0 0 2 2 02.0 Outfall2.1 Outfall27 P - 2.1.001 Land Outfall Inspection and Cleaning - Internal ≥2019 15 2 0 0 1 0 028 P - 2.1.002 Sea Outfall Maintenance and Inspection - External 2015 TP yes - - - - - -29 P - 2.1.004 Sea Outfall Ballast Restoration 2018 17 2 0 0 1 1 030 P - 2.1.005 Sea Outfall Bathymetric Survey - External 2014 TP yes - - - - - -3.0 Solids Processing Improvements3.1 Biosolids Thickening31 P - 3.1.001 DAFTs 1 - 3 Scum Collector Replacement ≥2019 13 1 0 0 1 1 232 P - 3.1.002 DAF System Replacement ≥2019 29 1 1 2 1 2 333 P - 3.1.003 TWAS Pipeline Replacement ≥2019 22 1 0 2 1 1 3E Mstr Proj List Tbl6‐1 AppB TOCAppD 2012‐12Dec.xlsxRMC Water and Environment Table 6‐1 Page 2 Last Updated 12/26/2012Prel.TotalScoreSftyTPYes/NoAULTPYes/NoRegTPYes/No6 cnsq fail5 Odor Cntrl4 Engy Eff3 Cost Eff2 A Use Life1 Org Eff
RefProjectNo.ENCINA WASTEWATER AUTHORITYTABLE 6‐1, FY 2014 E‐<strong>CAMP</strong> PROJECTS SORTED BY SCORECapital ProjectYearProjectStart(egconstr)34 P - 3.1.004 DAF Polymer System Replacement ≥2019 14 1 0 0 1 1 33.2 Biosolids Digestion35 P - 3.2.001 Biofuel Receiving Facilities 2014 14 0 0 2 2 0 036 P - 3.2.003 Digesters 5 and 6 Pump/Piping Foundation Stabilization ≥2019 8 1 0 0 0 1 037 P - 3.2.004 Sludge Screening Facility ≥2019 11 0 0 0 2 1 338 P - 3.2.005 Digesters 5 and 6 Mixing Pumps Replacement ≥2019 8 1 0 0 0 1 039 P - 3.2.006 Cell Lysis Facilities ≥2019 7 0 0 1 1 0 040 P - 3.2.007 Digesters 1 and 3 Retrofit for Sludge/Gas storage ≥2019 16 0 0 2 2 0 241 P - 3.2.008 Waste Gas Flare Operation Mods ≥2019 16 1 0 1 1 0 342 P - 3.2.009 Digester 4 Cover - Interior Coating 2014 33 2 1 1 1 3 343 P - 3.2.010 Digesters 5 and 6 Covers - Interior Coating 2014 33 2 1 1 1 3 344 P - 3.2.011 Second Waste Gas Flare and Pipeline ≥2019 15 1 0 1 1 0 23.3 Biosolids Dewatering and Drying45 P - 3.3.001 MCC and Conductors Replacement - DW and Power Bldg ≥2019 4 0 0 0 0 2 046 P - 3.3.002 Pellet Storage Facility Improvements 2014 TP Yes - - - - - -47 P - 3.3.003 Struvite Control Facilities ≥2019 5 0 0 0 0 1 348 P - 3.3.004 Pellet Bagging Facilities ≥2019 4 0 0 0 1 0 149 P - 3.3.005 Cake Pump Mods ≥2019 12 1 0 0 1 0 350 P - 3.3.006 Dryer Addition and Centrifuges Replacement ≥2019 14 1 0 0 1 1 351 P - 3.3.007 Centrifuges Major Maint 2018 8 1 0 0 0 1 052 P - 3.3.008 Dryer Major Maint 2018 14 2 0 0 0 1 0E Mstr Proj List Tbl6‐1 AppB TOCAppD 2012‐12Dec.xlsxRMC Water and Environment Table 6‐1 Page 3 Last Updated 12/26/2012Prel.TotalScoreSftyTPYes/NoAULTPYes/NoRegTPYes/No6 cnsq fail5 Odor Cntrl4 Engy Eff3 Cost Eff2 A Use Life1 Org Eff
RefProjectNo.ENCINA WASTEWATER AUTHORITYTABLE 6‐1, FY 2014 E‐<strong>CAMP</strong> PROJECTS SORTED BY SCORECapital ProjectYearProjectStart(egconstr)53 P - 3.3.009 Drying Safety Upgrades 2015 TP Yes - - - - - -54 P - 3.3.010 Drying Building Coded Locks 2014 TP Yes - - - - - -55 P - 3.3.012 RTO Media Replacement 2014+ 19 1 0 0 2 2 356 P - 3.3.013 RTO Replacement ≥2019 14 1 0 0 1 1 357 P - 3.3.014 RTO Flush Drain Relocation 2014 18 1 0 0 1 3 358 P - 3.3.016 Cake Conveyance Equipment Improvements ≥2019 15 1 0 0 2 0 359 P - 3.3.017 DW Polymer Storage Tank Replacement ≥2019 9 0 0 1 1 0 260 P - 3.3.018 Centrate Pipeline Replacement ≥2019 18 2 0 0 0 2 261 P - 3.3.019 Centrifuge Drive Replacement 2016 25 2 0 0 2 2 362 P - 3.3.020 Dryer Drum Repair 2014 35 3 0 1 2 3 14.0 Energy Management4.1 Energy Management63 P - 4.1.001 Cogen Communications Redundancy 2018 14 2 0 0 0 0 264 P - 4.1.003 Cogen Engine Catalyst 2015 TP Yes - - - - - -65 P - 4.1.004 NG Dilution Equipment Servicing 2014 34 2 0 2 2 3 266 P - 4.1.005 Cogen Engine Top-End Overhaul (2016, 2017, 2 eng/yr) 2016+ PM - - - - - -67 P - 4.1.006 Cogen Engine In-Frame Overhaul (2014, 2015, 2 eng/yr) 2014+ PM - - - - - -68 P - 4.1.007 Cogen Engine Full Overhaul (2018, 2019, 2 eng/yr) 2018+ PM - - - - - -69 P - 4.1.008 Cogen Engine 5 2016 16 0 0 2 2 0 270 P - 4.1.010 Cogen Engine 6 ≥2019 1 0 0 0 0 0 171 P - 4.1.011 ORC Generator ≥2019 4 0 0 1 0 0 0E Mstr Proj List Tbl6‐1 AppB TOCAppD 2012‐12Dec.xlsxRMC Water and Environment Table 6‐1 Page 4 Last Updated 12/26/2012Prel.TotalScoreSftyTPYes/NoAULTPYes/NoRegTPYes/No6 cnsq fail5 Odor Cntrl4 Engy Eff3 Cost Eff2 A Use Life1 Org Eff
RefProjectNo.ENCINA WASTEWATER AUTHORITYTABLE 6‐1, FY 2014 E‐<strong>CAMP</strong> PROJECTS SORTED BY SCORECapital ProjectYearProjectStart(egconstr)72 P - 4.1.012 Heat Loop Bypass Installation ≥2019 15 0 1 1 1 0 373 P - 4.1.013 Cogen Bldg Floor Repair 2014 TP yes - - - - - -74 P - 4.1.014 VFDs on Misc Equipment ≥2019 19 0 0 3 2 0 175 P - 4.1.015 Gas Conditioning Facilities 2015 TP yes - - - - - -76 P - 4.1.016 Blower Replacement with High Efficiency Type ≥2019 8 0 0 1 1 0 177 P - 4.1.017 Annunciator Panels Replacement - Power Bldg PAR 23 2 0 0 1 3 278 P - 4.1.018 Lighting and Controls Improvements ≥2019 12 0 0 1 1 1 379 P - 4.1.019 Chilled Water and Hot Water Systems ≥2019 10 0 0 1 1 1 180 P - 4.1.020 Net Metering 2014 18 0 0 2 2 1 25.0 General Improvements5.1 Odor Control81 P - 5.1.001 ORF I System Rehabilitation ≥2019 14 1 1 0 0 1 182 P - 5.1.002 ORF I Carbon Replacement (2013, every other year) 2015+ PM - - - - - -83 P - 5.1.003 ORF III Carbon Replacement ≥2019 PM - - - - - -84 P - 5.1.004 Odor Monitoring Facilities 2014 32 1 3 0 2 1 385 P - 5.1.005 HW/GRT/PSB Odor Control 2016 24 1 2 0 1 1 386 P - 5.1.006 IJS Odor Control Improvements ≥2019 18 1 2 0 0 1 087 P - 5.1.007 Drying Bldg Odor Control Improvements ≥2019 16 1 2 0 0 0 088 P - 5.1.008 ORF III Chem Feed System Improvements 2016 TP Yes - - - - - -5.2 Plant-Wide Systems89 P - 5.2.001 Natural Gas Pipeline Replacement 2014 33 3 0 0 2 3 3E Mstr Proj List Tbl6‐1 AppB TOCAppD 2012‐12Dec.xlsxRMC Water and Environment Table 6‐1 Page 5 Last Updated 12/26/2012Prel.TotalScoreSftyTPYes/NoAULTPYes/NoRegTPYes/No6 cnsq fail5 Odor Cntrl4 Engy Eff3 Cost Eff2 A Use Life1 Org Eff
RefProjectNo.ENCINA WASTEWATER AUTHORITYTABLE 6‐1, FY 2014 E‐<strong>CAMP</strong> PROJECTS SORTED BY SCORECapital ProjectYearProjectStart(egconstr)90 P - 5.2.002 High Risk and Critical Asset Rehabilitation 2017+ 34 3 0 0 3 2 391 P - 5.2.004 3WLC Strainer Replacement 2014 25 2 0 0 2 2 392 P - 5.2.005 3WHP Strainer Replacement ≥2019 19 1 0 0 2 2 393 P - 5.2.006 3WLC Intertie to 3WHP System 2016 11 1 0 0 1 0 294 P - 5.2.007 3WL Pump No. 3 Installation ≥2019 1 0 0 0 0 0 195 P - 5.2.008 Underground Piping Rehabilitation - Multi-Phase ≥2019 21 2 0 0 1 2 296 P - 5.2.009 Structure Settlement Stabilization ≥2019 12 2 0 0 0 0 097 P - 5.2.010 3WHP Pump Control Improvements 2015 12 1 0 0 1 0 398 P - 5.2.011 1W System Rehab ≥2019 24 3 0 0 0 2 299 P - 5.2.012 Site Security Facilities 2016 37 3 0 1 2 3 3100 P - 5.2.014 Perimeter Fence Replacement ≥2019 6 0 0 0 0 2 2101 P - 5.2.015 Northwest Storm Water Drain Sump to South DAF Pit ≥2019 1 0 0 0 0 0 1102 P - 5.2.016 2W System Upgrades ≥2019 21 2 0 0 1 2 2103 P - 5.2.017 Service Air and Instrument Air Piping Repairs 2016+ 23 1 0 1 2 2 3104 P - 5.2.019 Plant Beautification 2017 20 0 2 0 1 2 3105 P - 5.2.021 Climate Control at MCCs ≥2019 23 1 0 1 2 2 3106 P - 5.2.024 Exterior Asset Corrosion Control 2015 29 2 0 1 2 2 3107 P - 5.2.025 Technology Master Plan Recommendations Implementation 2017 16 1 0 0 1 2 3108 P - 5.2.026 Plant Waste Stream Rerouting 2017 11 0 0 1 1 1 2109 P - 5.2.027 Plant-Wide Seal Coating ≥2019 29 2 0 1 2 2 35.3 BuildingsE Mstr Proj List Tbl6‐1 AppB TOCAppD 2012‐12Dec.xlsxRMC Water and Environment Table 6‐1 Page 6 Last Updated 12/26/2012Prel.TotalScoreSftyTPYes/NoAULTPYes/NoRegTPYes/No6 cnsq fail5 Odor Cntrl4 Engy Eff3 Cost Eff2 A Use Life1 Org Eff
RefProjectNo.ENCINA WASTEWATER AUTHORITYTABLE 6‐1, FY 2014 E‐<strong>CAMP</strong> PROJECTS SORTED BY SCORECapital ProjectYearProjectStart(egconstr)110 P - 5.3.001 Ops Bldg Locker Replacement ≥2019 3 0 0 0 0 0 3111 P - 5.3.002 Ops Bldg Air Intake Relocation 2014 3 0 0 0 0 0 3112 P - 5.3.003 Construction Office Upgrade ≥2019 3 0 0 0 0 0 3113 P - 5.3.004 Ops Bldg Chiller Replacement ≥2019 16 1 0 0 2 1 2114 P - 5.3.006 Secondary Scum Pit Roof Removal 2014 TP yes - - - - - -115 P - 5.3.008 Roof Access Safety Facilities 2014 TP yes - - - - - -116 P - 5.3.009 DW Bldg Roof Repair 2014 TP yes - - - - - -5.4 Miscellaneous117 P - 5.4.004 Vallecitos Sample Vault Installation ≥2019 5 0 0 0 1 0 26.0 Reserved for Future7.0 Reserved for Future8.0 Professional Services8.1 Condition AssessmentsCA-8.1.002 Fire Main Supply 2014CA-8.1.003 FY 2014 Assessments Triggered by Asset Age 2014CA-8.1.004 FY 2015 Assessments Triggered by Asset Age 2015CA-8.1.005 Underground Structures - Part 1 2015CA-8.1.006 FY 2016 Assessments Triggered by Asset Age 2016CA-8.1.007 Underground Structures - Part 2 2016CA-8.1.008 Bridges 2016Prel.TotalScoreSftyTPYes/NoAULTPYes/NoRegTPYes/No6 cnsq fail5 Odor Cntrl4 Engy Eff3 Cost Eff2 A Use Life1 Org EffE Mstr Proj List Tbl6‐1 AppB TOCAppD 2012‐12Dec.xlsxRMC Water and Environment Table 6‐1 Page 7 Last Updated 12/26/2012
ENCINA WASTEWATER AUTHORITYTABLE 6‐1, FY 2014 E‐<strong>CAMP</strong> PROJECTS SORTED BY SCORERefProjectNo.Capital ProjectYearProjectStart(egconstr)Prel.TotalScoreSftyTPYes/NoAULTPYes/NoRegTPYes/No6 cnsq fail5 Odor Cntrl4 Engy Eff3 Cost Eff2 A Use Life1 Org EffCA-8.1.009 FY 2017 Assessments Triggered by Asset Age 2017CA-8.1.010 FY 2018 Assessments Triggered by Asset Age 20188.2 Studies and UpdatesS-8.2.003 Biosolids Management Business Plan Update 2015S-8.2.004 Comprehensive Energy Rates Study 2015S-8.2.005 <strong>Wastewater</strong> Characterization Study 2016S-8.2.006 Exterior Asset Corrosion Control 2014+S-8.2.007 Offsite Wetlands Restoration 20178.3 E-<strong>CAMP</strong> UpdatesES-8.3.001E-<strong>CAMP</strong> Updates (Annual)ES-8.4 Engineering ServicesES-8.4.001 As-Needed Engineering Services (Annual) 2013+ES-8.4.002 R&D Projects Support 2014+ES-8.4.004 Map Underground Piping > 12-inch 2014ES-8.4.006 Electronic O&M and Document Management - Phase 2 2014ES-8.4.007 Electronic O&M and Document Management - Phase 3 2015OS-8.5 Other ServicesOS-8.5.001 Legal and Misc Services (Annual) 2014+9.0 Remote Major Rehab Improvements - Refer to R-<strong>CAMP</strong>E Mstr Proj List Tbl6‐1 AppB TOCAppD 2012‐12Dec.xlsxRMC Water and Environment Table 6‐1 Page 8 Last Updated 12/26/2012
SECTION 7:RECOMMENDED PROJECT IMPLEMENTATION SCHEDULE & COST SUMMARYThe Recommended Project Implementation Schedule and Cost Summary for FY 2013 through FY 2018 ispresented on the following pages. This schedule is based on project priority ranking. These tablespresent each phase of projects scheduled for funding, as well as condition assessments, special studies,and engineering services.E FY2014 E‐<strong>CAMP</strong> Report 2012‐12Dec.docx 123 December 26, 2012
This page intentionally left blankE FY2014 E‐<strong>CAMP</strong> Report 2012‐12Dec.docx 124 December 26, 2012
2014ConditionAssessmentsTable 7‐1: FY 2014 EWA Capital Improvement ProgramFY 2014 Multi‐Year ProjectsStudiesand Services Design ConstructionConstructionEngineeringConstructionManagement Total TotalProposed Budget Proposed Budget Proposed Budget Proposed Budget Proposed Budget Proposed Budget by Project Element Project BudgetLiquid Process Improvements $ 2,474,000P ‐ 1.1.006 GRS Isolation Improvements $ ‐ $ 11,000 $ ‐ $ ‐ $ ‐ $ ‐ $ 11,000P ‐ 1.1.008 GRS Rehab $ ‐ $ 15,000 $ ‐ $ ‐ $ ‐ $ ‐ $ 15,000P ‐ 1.1.009 Influent Flow Metering Installation $ ‐ $ ‐ $ ‐ $ 152,000 $ 10,000 $ 10,000 $ 172,000P ‐ 1.1.010 Influent Pipeline Rehab with 2012 Major Rehab $ ‐ $ ‐ $ ‐ $ 1,839,000 $ 85,000 $ 140,000 $ 2,064,000P ‐ 1.2.006 PSB Struct and Mech Rehab $ 52,000 $ 75,000 $ ‐ $ ‐ $ ‐ $ ‐ $ 127,000P ‐ 1.2.010 PSB Scum Pipeline $ 10,000 $ ‐ $ ‐ $ ‐ $ ‐ $ ‐ $ 10,000P ‐ 1.3.006 Secondary Polymer System Replacement $ ‐ $ ‐ $ 60,000 $ ‐ $ ‐ $ ‐ $ 60,000P ‐ 1.3.014 SCs 1 ‐ 4 Inf and Eff Gate Replacement $ 15,000 $ ‐ $ ‐ $ ‐ $ ‐ $ ‐ $ 15,000Outfall $ 89,000P ‐ 2.1.005 Sea Outfall Bathymetric Survey ‐ External $ ‐ $ ‐ $ 10,000 $ 64,000 $ 5,000 $ 10,000 $ 89,000Solids Process Improvements $ 4,701,000P ‐ 3.2.001 Biofuel Receiving Facilities $ ‐ $ ‐ $ 273,000 $ 1,972,000 $ ‐ $ 105,000 $ 2,350,000P ‐ 3.2.009 Digester 4 ‐ Interior Coating $ ‐ $ ‐ $ 20,000 $ 317,000 $ 10,000 $ 20,000 $ 367,000P ‐ 3.2.010 Digesters 5 and 6 ‐ Interior Coating $ ‐ $ ‐ $ 30,000 $ 778,000 $ 10,000 $ 30,000 $ 848,000P ‐ 3.3.002 Pellet Storage Facility Improvements $ ‐ $ ‐ $ 33,000 $ 502,000 $ 19,000 $ 32,000 $ 586,000P ‐ 3.3.009 Drying Safety Upgrades (1) $ ‐ $ ‐ $ 126,000 $ ‐ $ ‐ $ ‐ $ 126,000P ‐ 3.3.010 Drying Building Coded Locks $ ‐ $ ‐ $ ‐ $ 46,000 $ ‐ $ ‐ $ 46,000P ‐ 3.3.012 RTO Media Replacement $ ‐ $ ‐ $ ‐ $ 97,000 $ ‐ $ 30,000 $ 127,000P ‐ 3.3.014 RTO Flush Drain Relocation $ ‐ $ ‐ $ ‐ $ 126,000 $ 10,000 $ 30,000 $ 166,000P ‐ 3.3.019 Centrifuge Drive Replacement $ ‐ $ 20,000 $ ‐ $ ‐ $ ‐ $ ‐ $ 20,000P ‐ 3.3.020 Dryer Drum Rehabilitation $ ‐ $ 10,000 $ ‐ $ 55,000 $ ‐ $ ‐ $ 65,000Energy Management $ 1,130,000P ‐ 4.1.004 NG Dilution Equipment Servicing $ ‐ $ ‐ $ ‐ $ 137,000 $ 10,000 $ ‐ $ 147,000P ‐ 4.1.006 Cogeneration Engine In‐Frame Overhaul $ ‐ $ ‐ $ ‐ $ 415,000 $ ‐ $ ‐ $ 415,000P ‐ 4.1.013 Cogen Bldg Floor Repair $ ‐ $ ‐ $ 20,000 $ 50,000 $ 15,000 $ ‐ $ 85,000P ‐ 4.1.020 Net Metering $ ‐ $ 18,000 $ 25,000 $ 400,000 $ 20,000 $ 20,000 $ 483,000General Improvements $ 2,460,000P ‐ 5.1.004 Odor Monitoring Facilities $ ‐ $ 10,000 $ 32,000 $ 492,000 $ 18,000 $ ‐ $ 552,000P ‐ 5.1.005 HW/GRT/PSB Odor Control $ ‐ $ 40,000 $ ‐ $ ‐ $ ‐ $ ‐ $ 40,000P ‐ 5.1.008 ORF III Chemical Feed System Improvements $ ‐ $ ‐ $ 40,000 $ ‐ $ ‐ $ ‐ $ 40,000P ‐ 5.2.001 Natural Gas Pipeline Replacement $ ‐ $ ‐ $ ‐ $ 651,000 $ 35,000 $ 42,000 $ 728,000P ‐ 5.2.002 High Risk & Critical Asset Rehabilitation $ 15,000 $ ‐ $ ‐ $ ‐ $ ‐ $ ‐ $ 15,000P ‐ 5.2.004 3WLC Strainer Replacement $ ‐ $ ‐ $ ‐ $ 235,000 $ 35,000 $ 30,000 $ 300,000P ‐ 5.2.010 3WHP Pump Control Improvements $ ‐ $ ‐ $ 30,000 $ ‐ $ ‐ $ ‐ $ 30,000P ‐ 5.2.012 Site Security Facilities $ ‐ $ 20,000 $ ‐ $ ‐ $ ‐ $ 40,000 $ 60,000P ‐ 5.2.017 Service Air and Instrument Air Piping Repairs $ 5,000$ ‐ $ ‐ $ ‐ $ ‐ $ 5,000P ‐ 5.2.024 Extreior Asset Corrosion Control $ ‐ $ 50,000 $ 40,000 $ ‐ $ ‐ $ ‐ $ 90,000E‐R Section 7 Tables 1‐5 r4.xlsx 12/26/2012
2014ConditionAssessmentsTable 7‐1: FY 2014 EWA Capital Improvement ProgramFY 2014 Multi‐Year ProjectsStudiesand Services Design ConstructionConstructionEngineeringConstructionManagement Total TotalProposed Budget Proposed Budget Proposed Budget Proposed Budget Proposed Budget Proposed Budget by Project Element Project BudgetP ‐ 5.2.025 Tech Master Plan Recommended Improvements $ ‐ $ 50,000 $ ‐ $ ‐ $ ‐ $ ‐ $ 50,000P ‐ 5.2.026 Plant Waste Stream Rerouting $ 20,000 $ ‐ $ ‐ $ ‐ $ ‐ $ ‐ $ 20,000P ‐ 5.3.002 Operations Building Air Intake Relocation $ ‐ $ ‐ $ 20,000 $ 149,000 $ 10,000 $ ‐ $ 179,000P ‐ 5.3.006 Secondary Scum Pit Roof Removal $ ‐ $ ‐ $ 40,000 $ 141,000 $ 10,000 $ 20,000 $ 211,000P ‐ 5.3.008 Roof Access Safety Facilities $ ‐ $ ‐ $ 20,000 $ 110,000 $ 10,000 $ ‐ $ 140,000Professional Services (not associated with specific projects) $ 419,000CA ‐ 8.1.002 Fire Main Supply $ 10,000 $ ‐ $ ‐ $ ‐ $ ‐ $ ‐ $ 10,000CA ‐ 8.1.003 FY 2014 Asset Condition Assessments ‐ EWPCF $ 10,000 $ ‐ $ ‐ $ ‐ $ ‐ $ ‐ $ 10,000ES ‐ 8.4.002 Extension of Staff Engineering Services $ ‐ $ 137,000 $ ‐ $ ‐ $ ‐ $ ‐ $ 137,000ES ‐ 8.4.008 Electronic O&M Manual and Document Mgmt $ ‐ $ 120,000 $ ‐ $ ‐ $ ‐ $ ‐ $ 120,000ES ‐ 8.4.009 Map Underground Piping > 12‐inch $ ‐ $ 25,000 $ ‐ $ ‐ $ ‐ $ ‐ $ 25,000ES ‐ 8.4.010 Research and Development Services $ ‐ $ 50,000 $ ‐ $ ‐ $ ‐ $ ‐ $ 50,000OS ‐ 8.5.001 Legal and Misc Services $ ‐ $ 12,000 $ ‐ $ ‐ $ ‐ $ ‐ $ 12,000ES ‐ 8.3.002 E‐<strong>CAMP</strong> Update $ ‐ $ 55,000 $ ‐ $ ‐ $ ‐ $ ‐ $ 55,000Remote Facility Major Plant Rehabilitation: General Improvements (refer to the R‐<strong>CAMP</strong>) $ 940,000CA ‐ 9.9.001 FY 2014 Condition Assessments ‐ Remote Facilities $ 120,000 $ ‐ $ ‐ $ ‐ $ ‐ $ ‐ $ 120,000P ‐ 9.1.002 RBPS ‐ Asphalt Pavement Repair $ ‐ $ ‐ $ 20,000 $ ‐ $ ‐ $ ‐ $ 20,000P ‐ 9.1.004 RBPS ‐ Redundant PLC $ ‐ $ ‐ $ 20,000 $ 135,000 $ 10,000 $ 30,000 $ 195,000P ‐ 9.5.001 CWRF ‐ Failsafe Pipeline (additional) $ ‐ $ ‐ $ 60,000 $ 55,000 $ 15,000 $ 30,000 $ 160,000P ‐ 9.5.002 CWRF ‐ MF Module Replacement $ ‐ $ 20,000 $ 10,000 $ 356,000 $ 14,000 $ ‐ $ 400,000P ‐ 9.5.004 CWRF ‐ RO Chem System Mods $ ‐ $ 25,000 $ 20,000 $ ‐ $ ‐ $ ‐ $ 45,000Sub‐Totals FY 2014 Multi‐Year Projects $ 257,000 $ 763,000 $ 949,000 $ 9,274,000 $ 351,000 $ 619,000 $ 12,213,000 $ 12,213,000Less Alternative Funding Projects $ ‐ $ ‐ $ 273,000 $ 1,972,000 $ ‐ $ 105,000 $ 2,350,000 $ 2,350,000Total FY 2014 Funded by MA $ 257,000 $ 763,000 $ 676,000 $ 7,302,000 $ 351,000 $ 514,000 $ 9,863,000 $ 9,863,000E‐R Section 7 Tables 1‐5 r4.xlsx 12/26/2012
Table 7‐2: FY 2015 EWA Capital Improvement ProgramFY 2015 Multi‐Year Projects2015ConditionStudiesConstruction ConstructionDesign ConstructionAssessments and ServicesEngineering ManagementTotalTotalProposed Budget Proposed Budget Proposed Budget Proposed Budget Proposed Budget Proposed Budget by Project Element Project BudgetLiquid Process Improvements $ 5,052,000P ‐ 1.1.005 Grit and Screenings Handling Facility Rehab (1) $ ‐ $ ‐ $ 485,000 $ ‐ $ ‐ $ ‐ $ 485,000P ‐ 1.1.006 GRS Isolation Improvements $ ‐ $ ‐ $ 50,000 $ 766,000 $ 28,000 $ 49,000 $ 893,000P ‐ 1.1.008 GRS Rehab $ ‐ $ ‐ $ 50,000 $ 350,000 $ 35,000 $ 50,000 $ 485,000P ‐ 1.2.006 PSB Struct and Mech Rehab (1) $ ‐ $ ‐ $ 400,000 $ 2,000,000 $ 180,000 $ 300,000 $ 2,880,000P ‐ 1.2.009 PE Pipeline Rehab $ ‐ $ 60,000 $ ‐ $ ‐ $ ‐ $ ‐ $ 60,000P ‐ 1.2.010 PSB Scum Pipeline $ ‐ $ ‐ $ 30,000 $ 69,000 $ 10,000 $ 30,000 $ 139,000P ‐ 1.3.013 SC Concrete Cracking Prevention $ 10,000 $ 30,000 $ 50,000 $ ‐ $ ‐ $ ‐ $ 90,000P ‐ 1.3.014 SCs 1 ‐ 4 Inf and Eff Gate Replacement $ ‐ $ ‐ $ 20,000 $ ‐ $ ‐ $ ‐ $ 20,000Outfall $ 71,000P ‐ 2.1.002 Sea Outfall Maintenance and Inspection ‐ External $ 71,000 $ ‐ $ ‐ $ ‐ $ ‐ $ ‐ $ 71,000Solids Process Improvements $ 2,200,000P ‐ 3.3.002 Pellet Storage Facility Improvements $ ‐ $ ‐ $ ‐ $ ‐ $ ‐ $ ‐ $‐P ‐ 3.3.007 Centrifuges Major Maint $ 30,000 $ ‐ $ ‐ $ ‐$ 30,000P ‐ 3.3.009 Drying Safety Upgrades (2) $ ‐ $ ‐ $ ‐ $ 1,955,000 $ 71,000 $ 124,000 $ 2,150,000P ‐ 3.3.019 Centrifuge Drive Replacement $ ‐ $ ‐ $ 20,000 $ ‐ $ ‐ $ ‐ $ 20,000Energy ManagementP ‐ 4.1.003 Cogen Engine Catalyst $ ‐ $ ‐ $ 14,000 $ 103,000 $ ‐ $ 10,000 $ 127,000P ‐ 4.1.006 Cogeneration Engine In‐Frame Overhaul $ ‐ $ ‐ $ ‐ $ 415,000 $ ‐ $ ‐ $ 415,000P ‐ 4.1.015 Gas Conditioning Facilities $ ‐ $ ‐ $ 468,000 $ 3,387,000 $ ‐ $ 196,000 $ 4,051,000$4,593,000General Improvements $ 847,000P ‐ 5.1.002 ORF I Carbon Replacement $ ‐ $ ‐ $ ‐ $ 138,000 $ ‐ $ ‐ $ 138,000P ‐ 5.1.005 HW/GRT/PSB Odor Control $ ‐ $ ‐ $ 40,000 $ ‐ $ ‐ $ ‐ $ 40,000P ‐ 5.2.006 3WLC Intertie to 3WHP System $ ‐ $ ‐ $ 30,000 $ ‐ $ ‐ $ ‐ $ 30,000P ‐ 5.2.002 High Risk & Critical Asset Rehabilitation $ ‐ $ 28,000 $ ‐ $ ‐ $ ‐ $ ‐ $ 28,000P ‐ 5.2.008 Underground Piping Rehabilitation ‐ Multi‐Phase $ 50,000 $ ‐ $ ‐ $ ‐ $ ‐ $ ‐ $ 50,000P ‐ 5.2.010 3WHP Pump Control Improvements $ ‐ $ ‐ $ ‐ $ 71,000 $ 30,000 $ 30,000 $ 131,000P ‐ 5.2.012 Site Security Facilities $ ‐ $ ‐ $ 40,000 $ ‐ $ ‐ $ ‐ $ 40,000P ‐ 5.2.017 Service Air and Instrument Air Piping Repairs $ ‐ $ 10,000 $ ‐ $ ‐ $ ‐ $ ‐ $ 10,000P ‐ 5.2.024 Exterior Asset Corrosion Control $ ‐ $ ‐ $ ‐ $ 200,000 $ 20,000 $ 30,000 $ 250,000P ‐ 5.3.025 Tech Master Plan Recommended Improvements $ ‐ $ ‐ $ 50,000 $ ‐ $ ‐ $ ‐ $ 50,000P ‐ 5.2.026 Plant Waste Stream Rerouting $ ‐ $ 30,000 $ 50,000 $ ‐ $ ‐ $ ‐ $ 80,000E‐R Section 7 Tables 1‐5 r4.xlsx 12/26/2012
Table 7‐2: FY 2015 EWA Capital Improvement ProgramFY 2015 Multi‐Year Projects2015ConditionStudiesConstruction ConstructionDesign ConstructionAssessments and ServicesEngineering ManagementTotalTotalProposed Budget Proposed Budget Proposed Budget Proposed Budget Proposed Budget Proposed Budget by Project Element Project BudgetEngineering Services (not associated with specific projects) $ 718,000CA ‐ 8.1.004 FY 2015 Asset Condition Assessments ‐ EWPCF $ 50,000 $ ‐ $ ‐ $ ‐ $ ‐ $ ‐ $ 50,000CA ‐ 8.1.005 Underground Structures ‐ Part 1 $ 200,000 $ ‐ $ ‐ $ ‐ $ ‐ $ ‐ $ 200,000ES ‐ 8.4.003 Extension of Staff Engineering Services $ ‐ $ 66,000 $ ‐ $ ‐ $ ‐ $ ‐ $ 66,000ES ‐ 8.4.008 Electronic O&M Manual and Document Mgmt $ ‐ $ 120,000 $ ‐ $ ‐ $ ‐ $ ‐ $ 120,000OS ‐ 8.5.001 Legal and Misc Services $ ‐ $ 12,000 $ ‐ $ ‐ $ ‐ $ ‐ $ 12,000S ‐ 8.2.003 Biosolids Management Business Plan Update $ ‐ $ 180,000 $ ‐ $ ‐ $ ‐ $ ‐ $ 180,000S ‐ 8.2.004 Comprehensive Energy Rates Study $ ‐ $ 35,000 $ ‐ $ ‐ $ ‐ $ ‐ $ 35,000ES ‐ 8.3.003 E‐<strong>CAMP</strong> Update $ ‐ $ 55,000 $ ‐ $ ‐ $ ‐ $ ‐ $ 55,000Remote Facility Major Plant Rehabilitation: General Improvements (refer to the R‐<strong>CAMP</strong>) $ 531,000P ‐ 9.1.001 RBPS ‐ Containment Basin Repair $ ‐ $ ‐ $ 20,000 $ ‐ $ ‐ $ ‐ $ 20,000P ‐ 9.1.002 RBPS ‐ Asphalt Pavement Repair $ ‐ $ ‐ $ ‐ $ 283,000 $ 11,000 $ 30,000 $ 324,000P ‐ 9.3.001 BVPS ‐ In‐Channel Grinders $ ‐ $ 30,000 $ ‐ $ ‐$ 30,000P ‐ 9.5.004 CWRF ‐ RO Chem System Mods $ ‐ $ ‐ $ ‐ $ 97,000 $ ‐ $ ‐ $ 97,000CA ‐ 9.9.002 FY 2015 Condition Assessments ‐ Remote Facilities $ 20,000 $ ‐ $ ‐ $ ‐ $ ‐ $ ‐ $ 20,000ES ‐ 9.8.001 R‐<strong>CAMP</strong> Update (2015, 2017, etc) $ ‐ $ 40,000 $ ‐ $ ‐ $ ‐ $ ‐ $ 40,000Sub‐Totals FY 2015 Multi‐Year Projects $ 431,000 $ 696,000 $ 1,817,000 $ 9,834,000 $ 385,000 $ 849,000 $ 14,012,000 $ 14,012,000Less Alternative Funding Projects $ ‐ $ ‐ $ 482,000 $ 3,490,000 $ ‐ $ 206,000 $ 4,178,000 $ 4,178,000Total FY 2015 Funded by MA $ 431,000 $ 696,000 $ 1,335,000 $ 6,344,000 $ 385,000 $ 643,000 $ 9,834,000 $ 9,834,000E‐R Section 7 Tables 1‐5 r4.xlsx 12/26/2012
2016ConditionAssessmentsTable 7‐3: FY 2016 EWA Capital Improvement ProgramFY 2016 Multi‐Year ProjectsStudiesand Services Design ConstructionConstructionEngineeringConstructionManagement Total TotalProposed Budget Proposed Budget Proposed Budget Proposed Budget Proposed Budget Proposed Budget by Project Element Project BudgetLiquid Process Improvements $ 6,801,000P ‐ 1.1.005 Grit and Screenings Handling Facility Rehab (2) $ ‐ $ ‐ $ ‐ $ 3,300,000 $ 135,000 $ 235,000 $ 3,670,000P ‐ 1.2.006 PSB Struct and Mech Rehab (2) $ ‐ $ ‐ $ ‐ $ 2,000,000 $ ‐ $ ‐ $ 2,000,000P ‐ 1.2.009 PE Pipeline Rehab $ ‐ $ ‐ $ 100,000 $ ‐ $ ‐ $ ‐ $ 100,000P ‐ 1.3.006 Secondary Polymer System Replacement $ ‐ $ ‐ $ 60,000 $ 306,000 $ 40,000 $ 30,000 $ 436,000P ‐ 1.3.012 AB DO Probe Replacement $ 20,000 $ ‐ $ ‐ $ ‐ $ ‐ $ ‐ $ 20,000P ‐ 1.3.013 SC Concrete Cracking Prevention $ ‐ $ ‐ $ ‐ $ 224,000 $ 10,000 $ 30,000 $ 264,000P ‐ 1.3.014 SCs 1 ‐ 4 ‐ Inf and Eff Gate Replacement $ ‐ $ ‐ $ ‐ $ 270,000 $ 11,000 $ 30,000 $ 311,000Outfall $ 75,000P ‐ 2.1.004 Sea Outfall Ballast Restoration $ ‐ $ 75,000 $ ‐ $ ‐ $ ‐ $ ‐ $ 75,000Solids Process Improvements $ 381,000P ‐ 3.3.007 Centrifuges Major Maint $ ‐ $ 30,000 $ ‐ $ ‐ $ ‐ $ ‐ $ 30,000P ‐ 3.3.012 RTO Media Replacement $ ‐ $ ‐ $ ‐ $ 97,000 $ ‐ $ 30,000 $ 127,000P ‐ 3.3.019 Centrifuge Drive Replacement $ ‐ $ ‐ $ ‐ $ 200,000 $ 9,000 $ 15,000 $ 224,000Energy Management $ 2,072,000P ‐ 4.1.001 Cogen Communications Redundancy $ ‐ $ 10,000 $ ‐ $ ‐ $ ‐ $ ‐ $ 10,000P ‐ 4.1.005 Cogeneration Engine Top‐End Overhaul $ ‐ $ ‐ $ ‐ $ 209,000 $ ‐ $ ‐ $ 209,000P ‐ 4.1.008 Cogen Engine 5 $ ‐ $ ‐ $ 150,000 $ 1,503,000 $ 100,000 $ 100,000 $ 1,853,000General Improvements $ 1,712,000P ‐ 5.1.005 HW/GRT/PSB Odor Control $ ‐ $ ‐ $ ‐ $ 443,000 $ 17,000 $ 30,000 $ 490,000P ‐ 5.1.008 ORF III Chemical Feed System Improvements $ ‐ $ ‐ $ ‐ $ 280,000 $ 20,000 $ 30,000 $ 330,000P ‐ 5.2.002 High Risk & Critical Asset Rehabilitation $ ‐ $ ‐ $ 93,000 $ ‐ $ ‐ $ ‐ $ 93,000P ‐ 5.2.006 3WLC Intertie to 3WHP System $ ‐ $ ‐ $ ‐ $ 51,000 $ 10,000 $ 20,000 $ 81,000P ‐ 5.2.012 Site Security Facilities $ ‐ $ ‐ $ ‐ $ 400,000 $ 20,000 $ 40,000 $ 460,000P ‐ 5.2.017 Service Air and Instrument Air Piping Repairs $ ‐ $ ‐ $ 20,000 $ 198,000 $ 10,000 $ 30,000 $ 258,000E‐R Section 7 Tables 1‐5 r4.xlsx 12/26/2012
2016ConditionAssessmentsTable 7‐3: FY 2016 EWA Capital Improvement ProgramFY 2016 Multi‐Year ProjectsStudiesand Services Design ConstructionConstructionEngineeringConstructionManagement Total TotalProposed Budget Proposed Budget Proposed Budget Proposed Budget Proposed Budget Proposed Budget by Project Element Project BudgetEngineering Services (not associated with specific projects) $ 397,000CA ‐ 8.1.006 FY 2016 Asset Condition Assessments ‐ EWPCF $ 100,000 $ ‐ $ ‐ $ ‐ $ ‐ $ ‐ $ 100,000CA ‐ 8.1.007 Underground Structures ‐ Part 2 $ 100,000 $ ‐ $ ‐ $ ‐ $ ‐ $ ‐ $ 100,000CA ‐ 8.1.008 Bridges $ 10,000 $ ‐ $ ‐ $ ‐ $ ‐ $ ‐ $ 10,000ES ‐ 8.4.004 Extension of Staff Engineering Services $ ‐ $ 70,000 $ ‐ $ ‐ $ ‐ $ ‐ $ 70,000OS ‐ 8.5.001 Legal and Misc Services $ ‐ $ 12,000 $ ‐ $ ‐ $ ‐ $ ‐ $ 12,000S ‐ 8.2.005 <strong>Wastewater</strong> Characterization Study $ ‐ $ 50,000 $ ‐ $ ‐ $ ‐ $ ‐ $ 50,000ES ‐ 8.3.004 E‐<strong>CAMP</strong> Update $ ‐ $ 55,000 $ ‐ $ ‐ $ ‐ $ ‐ $ 55,000Remote Facility Major Plant Rehabilitation: General Improvements (refer to the R‐<strong>CAMP</strong>) $ 260,000P ‐ 9.1.001 RBPS ‐ Containment Basin Repair $ ‐ $ ‐ $ ‐ $ 115,000 $ 10,000 $ 30,000 $ 155,000P ‐ 9.1.003 RBPS ‐ Security (Razor Wire and Cameras) $ ‐ $ ‐ $ 20,000 $ ‐ $ ‐ $ ‐ $ 20,000P ‐ 9.3.001 BVPS ‐ In‐Channel Grinders $ ‐ $ ‐ $ 55,000 $ ‐ $ ‐ $ ‐ $ 55,000P ‐ 9.3.002 BVPS ‐ Rehab Orig Forcemain Section over Creek $ ‐ $ 20,000 $ ‐ $ ‐ $ ‐ $ ‐ $ 20,000CA ‐ 9.9.003 FY 2016 Condition Assessments ‐ Remote Facilities $ 10,000 $ ‐ $ ‐ $ ‐ $ ‐ $ ‐ $ 10,000Sub‐Totals FY 2016 Multi‐Year Projects $ 240,000 $ 322,000 $ 498,000 $ 9,596,000 $ 392,000 $ 650,000 $ 11,698,000 $ 11,698,000Less Alternative Funding Projects $ ‐ $ ‐ $ 150,000 $ 1,503,000 $ 100,000 $ 100,000 $ 1,853,000 $ 1,853,000Total FY 2016 Funded by MA $ 240,000 $ 322,000 $ 348,000 $ 8,093,000 $ 292,000 $ 550,000 $ 9,845,000 $ 9,845,000E‐R Section 7 Tables 1‐5 r4.xlsx 12/26/2012
Table 7‐4: FY 2017 EWA Capital Improvement ProgramFY 2017 Multi‐Year Projects2017ConditionStudiesConstruction ConstructionDesign ConstructionAssessmentsand ServicesEngineering ManagementTotalTotalProposed Budget Proposed Budget Proposed Budget Proposed Budget Proposed Budget Proposed Budget by Project Element Project BudgetLiquid Process Improvements $ 5,009,000P ‐ 1.1.005 Grit and Screenings Handling Facility Rehab $ ‐ $ ‐ $ ‐ $ 3,415,000 $ 138,000 $ 240,000 $ 3,793,000P ‐ 1.2.009 PE Pipeline Rehab $ ‐ $ ‐ $ ‐ $ 859,000 $ 50,000 $ 50,000 $ 959,000P ‐ 1.3.003 AB Selector Implementation and Cover Replacement $ ‐ $ ‐ $ 40,000 $ ‐ $ ‐ $ ‐ $ 40,000P ‐ 1.3.004 AB Mechanical Rehabilitation and RAS Pump Addition $ ‐ $ ‐ $ 40,000 $ ‐ $ ‐ $ ‐ $ 40,000P ‐ 1.3.005 AB Nos. 1,2 and 3 Diffuser Membrane Replacement $ 10,000 $ ‐ $ ‐ $ ‐ $ ‐ $ ‐ $ 10,000P ‐ 1.3.007 SCs 5 and 6 Mech Rehab $ ‐ $ ‐ $ 115,000 $ ‐ $ ‐ $ ‐ $ 115,000P ‐ 1.3.010 WAS Pipeline Replacement $ 20,000 $ ‐ $ ‐ $ ‐ $ ‐ $ ‐ $ 20,000P ‐ 1.3.012 AB DO Probe Replacement $ ‐ $ ‐ $ 32,000 $ ‐ $ ‐ $ ‐ $ 32,000Outfall $ 171,000P ‐ 2.1.002 Sea Outfall Maintenance and Inspection ‐ External $ 71,000 $ ‐ $ ‐ $ ‐ $ ‐ $ ‐ $ 71,000P ‐ 2.1.004 Sea Outfall Ballast Restoration $ ‐ $ ‐ $ 100,000 $ ‐ $ ‐ $ ‐ $ 100,000Solids Process Improvements $ 225,000P ‐ 3.1.002 DAFT System Replacement $ ‐ $ 100,000 $ ‐ $ ‐ $ ‐ $ ‐ $ 100,000P ‐ 3.1.003 TWAS Pipeline Replacement $ ‐ $ 10,000 $ ‐ $ ‐ $ ‐ $ ‐ $ 10,000P ‐ 3.3.007 Centrifuges Major Maint $ ‐ $ ‐ $ 50,000$ ‐ $ ‐ $ 50,000P ‐ 3.3.008 Dryer Major Maint $ 10,000 $ 55,00065,000$ ‐ $ ‐ $ ‐ $ ‐ $ ‐ $ ‐ $‐Energy Management $ 229,000P ‐ 4.1.001 Cogen Communication Redundancy $ ‐ $ ‐ $ 20,000 $ ‐ $ ‐ $ ‐ $ 20,000P ‐ 4.1.005 Cogeneration Engine Top‐End Overhaul $ ‐ $ ‐ $ ‐ $ 209,000 $ ‐ $ ‐ $ 209,000General Improvements $ 3,021,000P ‐ 5.1.002 ORF I Carbon Replacement $ ‐ $ ‐ $ ‐ $ 138,000 $ ‐ $ ‐ $ 138,000P ‐ 5.2.002 High Risk & Critical Asset Rehabilitation $ ‐ $ ‐ $ ‐ $ 846,000 $ 40,000 $ 40,000 $ 926,000P ‐ 5.2.017 Service Air and Instrument Air Piping Repairs $ ‐ $ ‐ $ ‐ $ 198,000 $ 10,000 $ 30,000 $ 238,000P ‐ 5.2.019 Plant Beautification $ ‐ $ ‐ $ 20,000 $ 205,000 $ 10,000 $ 30,000 $ 265,000P ‐ 5.2.021 Climate Control at MCCs $ 30,000 $ ‐ $ ‐ $ ‐ $ ‐ $ ‐ $ 30,000P ‐ 5.2.025 Tech Master Plan Recommended Improvements $ ‐ $ ‐ $ 92,000 $ 1,000,000 $ 52,000 $ 90,000 $ 1,234,000P ‐ 5.2.026 Plant Waste Stream Rerouting $ ‐ $ ‐ $ ‐ $ 150,000 $ 10,000 $ 30,000 $ 190,000Engineering Services (not associated with specific projects) $ 181,000CA ‐ 8.1.009 FY 2017 Asset Condition Assessments ‐ EWPCF $ 40,000 $ ‐ $ ‐ $ ‐ $ ‐ $ ‐ $ 40,000ES ‐ 8.4.005 Extension of Staff Engineering Services $ ‐ $ 74,000 $ ‐ $ ‐ $ ‐ $ ‐ $ 74,000OS ‐ 8.5.001 Legal and Misc Services $ ‐ $ 12,000 $ ‐ $ ‐ $ ‐ $ ‐ $ 12,000ES ‐ 8.3.005 E‐<strong>CAMP</strong> Update $ ‐ $ 55,000 $ ‐ $ ‐ $ ‐ $ ‐ $ 55,000Remote Facility Major Plant Rehabilitation: General Improvements (refer to the R‐<strong>CAMP</strong>) $ 1,162,000CA ‐ 9.9.004 FY 2017 Condition Assessments ‐ Remote Facilities $ 15,000 $ ‐ $ ‐ $ ‐ $ ‐ $ ‐ $ 15,000ES ‐ 9.8.001 R‐<strong>CAMP</strong> Update (2015, 2017, etc) $ ‐ $ 40,000 $ ‐ $ ‐ $ ‐ $ ‐ $ 40,000P ‐ 9.1.003 RBPS ‐ Security $ ‐ $ ‐ $ ‐ $ 121,000 $ 10,000 $ 30,000 $ 161,000P ‐ 9.3.001 BVPS ‐ In‐Channel Grinders $ ‐ $ ‐ $ ‐ $ 836,000 $ 30,000 $ 60,000 $ 926,000P ‐ 9.3.003 BVPS ‐ Rehab Orig Forcemain Section over Creek $ ‐ $ ‐ $ 20,000$ ‐ $ ‐ $ 20,000Sub‐Totals FY 2017 Multi‐Year Projects $ 186,000 $ 301,000 $ 584,000 $ 7,977,000 $ 350,000 $ 600,000 $ 9,998,000 $ 9,998,000E‐R Section 7 Tables 1‐5 r4.xlsx FY2017 12/31/2012
Table 7‐5: FY 2017 EWA Capital Improvement ProgramFY 2018 Multi‐Year ProjectsConditionStudiesConstruction Construction2018Design ConstructionTotalTotalAssessments and ServicesEngineering ManagementProposed Budget Proposed Budget Proposed Budget Proposed Budget Proposed Budget Proposed Budget by Project Element Project BudgetLiquid Process Improvements $ 6,031,000P ‐ 1.2.002 Primary Sludge Pumping Upgrades $ 25,000 $ 50,000 $ ‐ $ ‐ $ ‐ $ ‐ $ 75,000P ‐ 1.3.003 AB Selector and Cover Replacement (Part 1) $ ‐ $ ‐ $ ‐ $ 1,391,000 $ 139,000 $ 242,000 $ 1,772,000P ‐ 1.3.004 AB Rehabilitation and RAS Pump Addition (Part 1) $ ‐ $ ‐ $ ‐ $ 1,592,000 $ 65,000 $ 112,000 $ 1,769,000P ‐ 1.3.007 SCs 5 and 6 Mech Rehab $ ‐ $ ‐ $ ‐ $ 1,587,000 $ 65,000 $ 112,000 $ 1,764,000P ‐ 1.3.010 WAS Pipeline Replacement $ ‐ $ ‐ $ 50,000 $ ‐ $ ‐ $ ‐ $ 50,000P ‐ 1.3.012 AB DO Probe Replacement $ ‐ $ ‐ $ ‐ $ 442,000 $ 18,000 $ 31,000 $ 491,000P ‐ 1.3.015 AB Flow Eq Feed and Return Pipeline Rehab $ ‐ $ 20,000 $ 50,000$ 70,000P ‐ 1.4.004 EPS Pipe Lining and Abandoned Pipe Coating Repair $ ‐ $ 20,000 $ 20,000 $ ‐ $ ‐ $ ‐ $ 40,000Outfall $ 773,000P ‐ 2.1.004 Sea Outfall Ballast Restoration $ ‐ $ ‐ $ ‐ $ 673,000 $ 50,000 $ 50,000 $ 773,000Solids Process Improvements $ 1,786,000P ‐ 3.1.002 DAFT System Replacement $ ‐ $ ‐ $ 276,000 $ ‐ $ ‐ $ ‐ $ 276,000P ‐ 3.1.003 TWAS Pipeline Replacement $ ‐ $ ‐ $ 60,000 $ ‐ $ ‐ $ 40,000 $ 100,000P ‐ 3.2.004 Sludge Screening Facility $ ‐ $ ‐ $ 100,000 $ ‐ $ ‐ $ ‐ $ 100,000P ‐ 3.3.007 Centrifuges Major Maint $ ‐ $ ‐ $ ‐ $ 300,000 $ 10,000 $ 10,000 $ 320,000P ‐ 3.3.008 Dryer Major Maint $ ‐ $ ‐ $ ‐ $ 753,000 $ 31,000 $ 54,000 $ 838,000P ‐ 3.3.012 RTO Media Replacement $ ‐ $ ‐ $ ‐ $ 97,000 $ ‐ $ 30,000 $ 127,000P ‐ 3.3.018 Centrate Pipeline Replacement $ ‐ $ 25,000 $ ‐ $ ‐ $ ‐ $ ‐ $ 25,000Energy Management $ 491,000P ‐ 4.1.001 Cogen Communications Redundancy $ ‐ $ ‐ $ ‐ $ 192,000 $ 10,000 $ 30,000 $ 232,000P ‐ 4.1.005 Cogeneration Engine Top‐End Overhaul $ ‐ $ ‐ $ ‐ $ 209,000 $ ‐ $ ‐ $ 209,000P ‐ 4.1.017 Annunciator Panels Replacement ‐ Power Building $ ‐ $ ‐ $ 25,000 $ ‐ $ ‐ $ ‐ $ 25,000P ‐ 4.1.019 Chilled Water and Hot Water Systems $ ‐25,000$ ‐$ ‐$‐$ ‐ $ ‐ $ ‐ $ 25,000General Improvements $ 601,000P ‐ 5.2.002 High Risk & Critical Asset Rehabilitation (2) $ ‐ $ ‐ $ ‐ $ 306,000 $ 40,000 $ 40,000 $ 386,000P ‐ 5.2.008 Underground Piping Rehabilitation ‐ Multi‐Phase $ ‐ $ ‐ $ 50,000 $ ‐ $ ‐ $ ‐ $ 50,000P ‐ 5.2.011 1W Pipeline Replacement $ ‐ $ ‐ $ 30,000 $ ‐ $ ‐ $ ‐ $ 30,000P ‐ 5.2.016 2W System Upgrades $ ‐ $ ‐ $ 50,000 $ ‐ $ ‐ $ ‐ $ 50,000P ‐ 5.2.021 Climate Control at MCCs $ ‐ $ 60,000 $ ‐ $ ‐ $ ‐ $ ‐ $ 60,000P ‐ 5.3.003 Construction Office Upgrade $ ‐ $ 25,000 $ ‐ $ ‐ $ ‐ $ ‐ $ 25,000Engineering Services (not associated with specific projects) $ 175,000CA ‐ 8.1.010 FY 2018 Asset Condition Assessments ‐ EWPCF $ 30,000 $ ‐ $ ‐ $ ‐ $ ‐ $ ‐ $ 30,000ES ‐ 8.4.005 Extension of Staff Engineering Services $ ‐ $ 78,000 $ ‐ $ ‐ $ ‐ $ ‐ $ 78,000OS ‐ 8.5.001 Legal and Misc Services $ 12,000$ 12,000ES ‐ 8.3.005 E‐<strong>CAMP</strong> Update $ ‐ $ 55,000 $ ‐ $ ‐ $ ‐ $ ‐ $ 55,000Remote Facility Major Plant Rehabilitation: General Improvements (refer to the R‐<strong>CAMP</strong>) $ 188,000CA ‐ 9.9.005 FY 2018 Condition Assessments ‐ Remote Facilities $ 30,000 $ ‐ $ ‐ $ ‐ $ ‐ $ ‐ $ 30,000P ‐ 9.3.003 BVPS ‐ Rehab Orig Forcemain Section over Creek $ ‐ $ ‐ $ ‐ $ 118,000 $ 10,000 $ 30,000 $ 158,000Sub‐Totals FY 2018 Multi‐Year Projects $ 85,000 $ 370,000 $ 711,000 $ 7,660,000 $ 438,000 $ 781,000 $ 10,045,000 $ 10,045,000E‐R Section 7 Tables 1‐5 r4.xlsx FY2018 12/31/2012
APPENDIX AHISTORICAL PROJECT LIST
This page intentionally left blank
FISCAL YEAR 2013 PROJECTSProjects selected for implementation during FY 2013 are listed below. These projects have beencompleted unless otherwise noted.1. P ‐ 1.1.001 IJS Rehab (2012 Major Plant Rehab) (Part 1)2. P ‐ 1.1.002 HW Ag/Aer Piping and Diffusers Replacement (2012 Major Plant Rehab)3. P ‐ 1.1.004 Grit Separator Nos.1 and 2 Replacement4. P ‐ 1.3.001 Blower Electrical Improvements5. P ‐ 2.1.001 Land Outfall Inspection and Cleaning ‐ Internal – PM6. P ‐ 2.1.002 Sea Outfall Maintenance and Inspection ‐ External ‐ PM7. P ‐ 2.1.003 Outfall ARV Vault Replacement (2012 Major Plant Rehab)8. P ‐ 3.2.002 Digesters 5 and 6 Cleaning9. P ‐ 4.1.002 Cogen UPS Upgrade ‐ completed in house10. P ‐ 4.1.005 Cogen Engine Top‐End Overhaul (2016, 2017, 2 engines each year)11. P ‐ 5.1.002 ORF I Carbon Replacement – PM12. P ‐ 5.2.023 South Parcel Fence13. P ‐ 5.3.002 Ops Bldg Air Intake Relocation14. P ‐ 5.3.008 Roof Access Safety FacilitiesFISCAL YEAR 2012 PROJECTSProjects selected for implementation during FY 2012 are listed below. These projects have beencompleted unless otherwise noted.1. Biogas Treatment Facilities (EMP3)2. Cogen Communications Redundancy (POW3)3. Digester 4 Rehab (D5)4. Third Centrifuge Facilities (DRY2)5. Cogen Engines Catalyst (Part A) (EMP2A)6. Cake Pump Bleedoff Line (DRY4)7. Centrate Polymer Control System Upgrades (DRY5)8. Cogen Engine Top‐End OH1 and 2 ‐ PM (PV1C)9. Centrifuge Polymer Storage Tank Expansion (DRY7)FISCAL YEAR 2011 PROJECTSProjects selected for implementation during FY 2011 are listed below. These projects have beencompleted unless otherwise noted.1. Cogeneration Engine Top‐End OH 3 and 4 (PV1B)2. Rehab of 42” Aeration Air Piping (AIR3)3. ORF I Carbon Replacement Project ‐ PM (ORF1)4. Grit Screw Nos. 1 and 2 (HW4)5. Centrate Line Improvement Project (DRY2)6. Agitation Air Blower conversion to Aeration Air Blower (POW1)7. Primary Clarifier Cover Replacement (Tanks 1‐6) (PC16)8. Regenerated Thermal Oxidizer Media Replacement (DRY1)E FY2014 E‐<strong>CAMP</strong> Report 2012‐12Dec.docx A‐1 December 26, 2012
9. Energy Mgmt ‐ Miscellaneous Energy Efficiency Project (EMP3)10. Post Phase V Site Improvements – Plant Paving Repair (PVSI1)11. Misc Plant Improvements ‐ Additional Bulk Hypochlorite Storage Tank Chlorine ContactBasin (MPI1)12. Rehabilitate of Digester No. 4 Gas Mixing System – Design Only (D5)13. Gas Compressors Control Upgrades (MCU1)14. Aeration Basin Rehabilitation – Design Only (A13)15. Plant Safety Projects (SFTY2)16. Post Phase V Follow‐Up Improvements (IMP4)FISCAL YEAR 2010 PROJECTSProjects selected for implementation during FY 2010 are listed below. These projects have beencompleted unless otherwise noted.1. Waste Gas Flare System Replacement (Final Design, Bid and Construction) (FLR1)2. ORF III Rehabilitation (East Tower) (ORFIII)3. Co‐Gen Engines, Top End Overhaul, Engines 1 and 24. Safety Enhancements (fall protection and platform by wet bins area, rebuild steps fromfirst floor of dewatering, task lighting and receptacles at dryer platforms, polymer areasecondary containment and drains – Phase III Building)5. Secondary Clarifier Nos. 1 through 4FISCAL YEAR 2009 PROJECTSProjects selected for implementation during FY 2009 are listed below. These projects have beencompleted unless otherwise noted.1. Waste Gas Flare System Replacement (Preliminary Design only) (FLR1)2. ORF III Rehabilitation (West Tower Only) (ORFIII)FISCAL YEAR 2008 PROJECTSProjects selected for implementation during FY 2008 are listed below. These projects have beencompleted unless otherwise noted.1. Starting Air System (Cogeneration) (AIR1)2. Rehabilitation of Aeration Blower 4006 (BLR1)FISCAL YEAR 2007 PROJECTSProjects selected for implementation during FY 2007 are listed below. These projects have beencompleted unless otherwise noted.1. Cogeneration Engine Overhaul (4) (CG2)E FY2014 E‐<strong>CAMP</strong> Report 2012‐12Dec.docx A‐2 December 26, 2012
FISCAL YEAR 2006 PROJECTSProjects selected for implementation during FY 2006 are listed below. These projects have beencompleted unless otherwise noted.1. Replace Media in ORF III (OD6)2. Rehab Clarifier Mechanism for Basin No. 8 (SC5)3. Replace Bar Screen No. 4 (HW5)4. Replace Dome Cover Insulation for Digester Nos. 4, 5 and 6 (D4)5. Replace Grit Drain Line (G5)6. Replace Dome Diffusers in Aeration Basin No. 3 (A12)7. Roof Replacement/Repair on Select Buildings (R1)FISCAL YEAR 2005 PROJECTSProjects selected for implementation during FY 2005 are listed below. These projects have beencompleted unless otherwise noted.1. Replace Secondary MCCs and RAS Pump VFDs (SC6)FISCAL YEAR 2004 PROJECTSProjects selected for implementation during FY 2004 are listed below. These projects have beencompleted unless otherwise noted.1. Replace and Upgrade the Skylights and Roof Hatches Throughout the Plant (SFTY1)2. Replace Building Fresh Ductwork (HVAC9)FISCAL YEAR 2003 PROJECTSProjects selected for implementation during FY 2003 are listed below. These projects have beencompleted unless otherwise noted.1. Clean Digester Nos. 5 and 6 (D3)2. Replace Aeration Air Header to Aeration Basin Nos. 1 and 2 (A11)FISCAL YEAR 2002 PROJECTSProjects selected for implementation during FY 2002 are listed below. These projects have beencompleted unless otherwise noted.1. Replace Dome Diffusers in Aeration Basin No. 2 (A9)2. Supply 2W Softened Water to Secondary Area (SFT1)E FY2014 E‐<strong>CAMP</strong> Report 2012‐12Dec.docx A‐3 December 26, 2012
FISCAL YEAR 2001 PROJECTSProjects selected for implementation during FY 2001 are listed below. These projects have beencompleted unless otherwise noted.1. Rebuild Three (3) Cogeneration System Engines (CG1)2. Replace Dome Diffusers in Aeration Basin No. 1 (A8)FISCAL YEAR 2000 PROJECTSProjects selected for implementation during FY 2000 are listed below. These projects have beencompleted unless otherwise noted.1. Groundwater Infiltration Through Electrical Conduits into Secondary Gallery (GW1)2. Replace V‐Notch Weir Plates in Primary Clarifier Nos. 1 through 6 (PC14)3. Replace Effluent Troughs – Primary Clarifier Nos. 1, 2 and 3 (PC15)4. Replace Mechanical Bar Screen No. 1 (HW3)5. Replace Air Handling Unit – Cogen Building (HVAC1)6. Replace Air Handling Unit – Headworks Building (HVAC2)7. Replace Air Handling Unit – Dewatering Building (HVAC3)8. Aeration Basin Channel Piping Rehabilitation (A4)9. Improve Drainage System at DAF Thickener and Chlorine Building Areas (DRN1)FISCAL YEAR 1999 PROJECTSProjects selected for implementation during FY 1999 are listed below. These projects have beencompleted unless otherwise noted.1. Primary Clarifier Nos. 1, 2 and 3 Scum Removal Mechanism (PC1‐3)2. Replace Dilute Natural Gas Mix. and Associated Equipment (CS3)3. Replace Carbon and Carbon Bed Support Beams ORT‐I & ORT IIA (OD5)4. Replace Influent Gates – Grit Tank Nos. 1 and 2 (G3)5. Replace Influent Junction Gate (HW4)6. Replace Influent Flow Dist. In Primary Clarifier Nos. 1 through 6 (PC13)7. Replace Wall Bearings and Shafting for Primary Clarifier No. 3 (PC8)FISCAL YEAR 1998 PROJECTSProjects selected for implementation during FY 1998 are listed below. These projects have beencompleted unless otherwise noted.1. Upgrade Electrical System for Cogeneration (CS1)2. Provide Additional Adsorption Chiller Capacity (CS2)3. Modify Ductwork in Dewatering Building to Improve Air Quality (DW3)4. Replace Mechanical Bar Screen No. 2 (HW2)5. Recoat Secondary Clarifier Nos. 1 and 3 Hardware (SC2)6. Recoat Secondary Clarifier Nos. 2 and 4 Hardware (SC1)E FY2014 E‐<strong>CAMP</strong> Report 2012‐12Dec.docx A‐4 December 26, 2012
FISCAL YEAR 1997 PROJECTSProjects selected for implementation during FY 1997 are listed below. These projects have beencompleted unless otherwise noted.1. Modify Supply and Exhaust Ductwork in Headworks (HW1)2. Install Foul Air Ducting to Influent Junction Structure (OD2)3. Repair Carbon Towers (OD4)4. Replace Chlorine Gas with Hydrogen Peroxide and Sodium HypochloriteFISCAL YEAR 1996 PROJECTSProjects selected for implementation during FY 1996 are listed below. These projects have beencompleted unless otherwise noted.1. Recoat Interior of Grit Chamber No. 2 (G2)2. Replace Steel Floor Rails for Primary Clarifier No. 2 (PC7)3. Replace Scum Skimmer Mechanism in Primary Clarifier No. 4 (PC4)4. Replace Scum Skimmer Mechanism in Primary Clarifier No. 5 (PC5)5. Replace Scum Skimmer Mechanism in Primary Clarifier No. 6 (PC6)6. Recoat the Interior of Digester No. 4 (D1)FISCAL YEAR 1995 PROJECTSProjects selected for implementation during FY 1995 are listed below. These projects have beencompleted unless otherwise noted.1. Replace Aeration Basin Nos. 1 and 2 Diffuser Air Piping (A1 and A2)2. Rehabilitation of DAF Hardware (DAF2)3. Screenings Building Ductwork Rehabilitation (HVAC2)FISCAL YEAR 1994 PROJECTSProjects selected for implementation during FY 1994 are listed below. These projects have beencompleted unless otherwise noted.1. Process and Channel Air Cross Connection (A3)2. Repair Process and Channel Air Piping (A4)3. Rehabilitation of DAF Hardware (DAF1)4. Underground Storage Tank Removal and Replacement (U1)E FY2014 E‐<strong>CAMP</strong> Report 2012‐12Dec.docx A‐5 December 26, 2012
This page intentionally left blankE FY2014 E‐<strong>CAMP</strong> Report 2012‐12Dec.docx A‐6 December 26, 2012
APPENDIX BCOMPREHENSIVE PROJECT LIST
This page left intentionally blank
RefProjectNo.ENCINA WASTEWATER AUTHORITYFY 2014 E‐<strong>CAMP</strong> HISTORICAL, CURRENT AND FUTURE PROJECT LISTCapital Project(Blue, Italics Text IndicatesProject Completed or Eliminated )E-<strong>CAMP</strong>Rev YearProjectAdded toE-<strong>CAMP</strong>Status(YearConstStarted)1.0 Liquid Process Improvements1.1 Headworks1 P - 1.1.001 Infl Junction Structure Rehab (2012 Major Plant Rehab) pre-2014 20132 P - 1.1.002 HW Ag/Aer Piping and Diffusers Replacement pre-2014 20133 P - 1.1.003 HW CEPT Sys Air Delivery Rehab - (w/P-1.1.002) pre-2014 eliminated4 P - 1.1.004 Grit Separators 1 and 2 Replacement pre-2014 20135 P - 1.1.005 Grit and Screenings Handling Facility Rehab pre-20146 P - 1.1.006 GRS Isolation Improvements pre-20147 P - 1.1.007 Vactor Receiving Station pre-20148 P - 1.1.008 GRS Rehab pre-2014 20139 P - 1.1.009 Influent Flow Metering Installation pre-201410 P - 1.1.010 Influent Pipeline Rehab w/Addl 2012 Major Rehab 20141.2 Primary Treatment11 P - 1.2.001 Primary Process Annunciator Panel Replacement pre-201412 P - 1.2.002 Primary Sludge Pumping Upgrades pre-201413 P - 1.2.003 PE Second Pipeline pre-201414 P - 1.2.004 PE Emergency Discharge Pipeline Rehab pre-201415 P - 1.2.005 PSB Helical Scum Skimmer Replace - (w/P-1.2.006) pre-201416 P - 1.2.006 PSB Struct and Mech Rehab pre-201417 P - 1.2.007 CEPT Neat Polymer Flow Meter Installation - eliminated pre-201418 P - 1.2.008 PSB Influent Gate Replacement - (w/P-1.1.006 ) pre-2014E Mstr Proj List Tbl6‐1 AppB TOCAppD 2012‐12Dec.xlsxRMC Water and Environment B ‐ 1 Last Updated 12/26/2012
RefProjectNo.ENCINA WASTEWATER AUTHORITYFY 2014 E‐<strong>CAMP</strong> HISTORICAL, CURRENT AND FUTURE PROJECT LISTCapital Project(Blue, Italics Text IndicatesProject Completed or Eliminated )E-<strong>CAMP</strong>Rev YearProjectAdded toE-<strong>CAMP</strong>19 P - 1.2.009 PE Pipeline Rehab 201420 P - 1.2.010 PSB Scum Pipeline 20141.3 Secondary TreatmentStatus(YearConstStarted)21 P - 1.3.001 Blower Electrical Improvements pre-2014 201322 P - 1.3.002 Annunciator Panels Replace - Second Process (w/P-1.3.004) pre-2014 eliminated23 P - 1.3.003 AB Selector Implementation and Cover Replacement pre-201424 P - 1.3.004 AB Mech Rehab and RAS Pump Addition pre-201425 P - 1.3.005 AB Diffuser Membrane Replacement - w/1.3.003 pre-201426 P - 1.3.006 Secondary Polymer System Replacement pre-2014 Design 201327 P - 1.3.007 SCs 5 and 6 Mech Rehab pre-201428 P - 1.3.008 SC 7 - Conversion from EQ to Clarifier pre-201429 P - 1.3.009 Sec Splitter Box Gate Motor Operators Install - eliminated pre-2014 eliminated30 P - 1.3.010 WAS Pipeline Replacement pre-201431 P - 1.3.011 AB No. 3 Diffusers Membrane Replacement -(w/P-1.3.005) pre-2014 eliminated32 P - 1.3.012 AB DO Probe Replacement 2014 PAR ongoing33 P - 1.3.013 SC Concrete Cracking Prevention 201434 P - 1.3.014 SCs 1 - 4 Inf and Eff Gate Replacement 201435 P - 1.3.015 AB Flow Eq Feed and Return Pipeline Rehab 20141.4 Effluent36 P - 1.4.001 EPS Rehab pre-201437 P - 1.4.002 EPS MCC and Conductors Replacement pre-2014E Mstr Proj List Tbl6‐1 AppB TOCAppD 2012‐12Dec.xlsxRMC Water and Environment B ‐ 2 Last Updated 12/26/2012
RefProjectNo.ENCINA WASTEWATER AUTHORITYFY 2014 E‐<strong>CAMP</strong> HISTORICAL, CURRENT AND FUTURE PROJECT LISTCapital Project(Blue, Italics Text IndicatesProject Completed or Eliminated )E-<strong>CAMP</strong>Rev YearProjectAdded toE-<strong>CAMP</strong>Status(YearConstStarted)38 P - 1.4.003 SE Gate Motor Operator Installation - eliminated pre-2014 eliminated38 P - 1.4.004 EPS Pipe Lining and Abandoned Pipe Coating Repair 201439 P - 1.4.005 PD Blower Addition, Aeration/Agitation 20142.0 Outfall2.1 Outfall40 P - 2.1.001 Land Outfall Inspection and Cleaning - Internal pre-2014 201241 P - 2.1.002 Sea Outfall Maintenance and Inspection - External pre-2014 201342 P - 2.1.003 Outfall ARV Vault Replacement - (w/P-1.1.001) pre-2014 201343 P - 2.1.004 Sea Outfall Ballast Restoration pre-201444 P - 2.1.005 Sea Outfall Bathymetric Survey - External 20143.0 Solids Processing Improvements3.1 Biosolids Thickening45 P - 3.1.001 DAFTs 1 - 3 Scum Collector Replacement pre-201446 P - 3.1.002 DAF System Replacement pre-201447 P - 3.1.003 TWAS Pipeline Replacement pre-201448 P - 3.1.004 DAF Polymer System Replacement pre-20143.2 Biosolids Digestion49 P - 3.2.001 Biofuel Receiving Facilities pre-201450 P - 3.2.002 Digesters 5 and 6 Cleaning pre-2014 201351 P - 3.2.003 Digesters 5 and 6 Pump/Piping Foundation Stabilization pre-201452 P - 3.2.004 Sludge Screening Facility pre-2014E Mstr Proj List Tbl6‐1 AppB TOCAppD 2012‐12Dec.xlsxRMC Water and Environment B ‐ 3 Last Updated 12/26/2012
RefProjectNo.ENCINA WASTEWATER AUTHORITYFY 2014 E‐<strong>CAMP</strong> HISTORICAL, CURRENT AND FUTURE PROJECT LISTCapital Project(Blue, Italics Text IndicatesProject Completed or Eliminated )E-<strong>CAMP</strong>Rev YearProjectAdded toE-<strong>CAMP</strong>53 P - 3.2.005 Digesters 5 and 6 Mixing Pumps Replacement pre-201454 P - 3.2.006 Cell Lysis Facilities pre-201455 P - 3.2.007 Digesters 1 and 3 Retrofit for Sludge/Gas storage pre-201456 P - 3.2.008 Waste Gas Flare Operation Mods pre-201457 P - 3.2.009 Digester 4 Cover - Interior Coating 201458 P - 3.2.010 Digesters 5 and 6 Covers - Interior Coating 201459 P - 3.2.011 Second Waste Gas Flare and Pipeline3.3 Biosolids Dewatering and Drying60 P - 3.3.001 MCC and Conductors Replacement - DW and Power Bldg pre-2014Status(YearConstStarted)61 P - 3.3.002 Pellet Storage Facility Improvements pre-2014 Design 201362 P - 3.3.003 Struvite Control Facilities pre-201463 P - 3.3.004 Pellet Bagging Facilities pre-201464 P - 3.3.005 Cake Pump Mods pre-201465 P - 3.3.006 Dryer Addition and Centrifuges Replacement pre-201466 P - 3.3.007 Centrifuges Major Maint pre-201467 P - 3.3.008 Dryer Major Maint pre-201468 P - 3.3.009 Drying Safety Upgrades pre-2014 Design 201369 P - 3.3.010 Drying Building Coded Locks pre-201470 P - 3.3.011 Recycle Bin Purge Vent Relocation - (w/P-3.3.009) pre-201471 P - 3.3.012 RTO Media Replacement pre-201472 P - 3.3.013 RTO Replacement pre-2014E Mstr Proj List Tbl6‐1 AppB TOCAppD 2012‐12Dec.xlsxRMC Water and Environment B ‐ 4 Last Updated 12/26/2012
RefProjectNo.ENCINA WASTEWATER AUTHORITYFY 2014 E‐<strong>CAMP</strong> HISTORICAL, CURRENT AND FUTURE PROJECT LISTCapital Project(Blue, Italics Text IndicatesProject Completed or Eliminated )E-<strong>CAMP</strong>Rev YearProjectAdded toE-<strong>CAMP</strong>Status(YearConstStarted)73 P - 3.3.014 RTO Flush Drain Relocation pre-2014 Design 201374 P - 3.3.015 RTO Equipment Corrosion Control pre-201475 P - 3.3.016 Cake Conveyance Equipment Improvements pre-201476 P - 3.3.017 DW Polymer Storage Tank Replacement pre-201477 P - 3.3.018 Centrate Pipeline Replacement 201478 P - 3.3.019 Centrifuge Drive Replacement 201479 P - 3.3.020 Dryer Drum Repair 20144.0 Energy Management4.1 Energy Management80 P - 4.1.001 Cogen Communications Redundancy pre-201481 P - 4.1.002 Cogen UPS Upgrade - completed in house. pre-2014 201282 P - 4.1.003 Cogen Engine Catalyst pre-2014 201383 P - 4.1.004 NG Dilution Equipment Servicing pre-2014 201384 P - 4.1.005 Cogen Engine Top-End Overhaul (2016, 2017, 2 eng/yr) pre-2014 201385 P - 4.1.006 Cogen Engine In-Frame Overhaul (2014, 2015, 2 eng/yr) pre-201486 P - 4.1.007 Cogen Engine Full Overhaul (2018, 2019, 2 eng/yr) pre-201487 P - 4.1.008 Cogen Engine 5 pre-201488 P - 4.1.009 Cogen Top-End OH 1 and 2 - (w/P-4.1.005) pre-2014 eliminated89 P - 4.1.010 Cogen Engine 6 pre-201490 P - 4.1.011 ORC Generator pre-201491 P - 4.1.012 Heat Loop Bypass Installation pre-2014 Study 2013E Mstr Proj List Tbl6‐1 AppB TOCAppD 2012‐12Dec.xlsxRMC Water and Environment B ‐ 5 Last Updated 12/26/2012
RefProjectNo.ENCINA WASTEWATER AUTHORITYFY 2014 E‐<strong>CAMP</strong> HISTORICAL, CURRENT AND FUTURE PROJECT LISTCapital Project(Blue, Italics Text IndicatesProject Completed or Eliminated )E-<strong>CAMP</strong>Rev YearProjectAdded toE-<strong>CAMP</strong>92 P - 4.1.013 Cogen Bldg Floor Repair pre-201493 P - 4.1.014 VFDs on Misc Equipment pre-201494 P - 4.1.015 Gas Conditioning Facilities pre-201495 P - 4.1.016 Blower Replacement with High Efficiency Type pre-2014Status(YearConstStarted)96 P - 4.1.017 Annunciator Panels Replacement - Power Bldg pre-2014 PAR97 P - 4.1.018 Lighting and Controls Improvements 201498 P - 4.1.019 Chilled Water and Hot Water Systems 201499 P - 4.1.020 Net Metering 20145.0 General Improvements5.1 Odor Control100 P - 5.1.001 ORF I System Rehabilitation pre-2014101 P - 5.1.002 ORF I Carbon Replacement (2013, every other year) pre-2014 2013102 P - 5.1.003 ORF III Carbon Replacement pre-2014103 P - 5.1.004 Odor Monitoring Facilities pre-2014104 P - 5.1.005 HW/GRT/PSB Odor Control pre-2014105 P - 5.1.006 IJS Odor Control Improvements pre-2014106 P - 5.1.007 Drying Bldg Odor Control Improvements pre-2014107 P - 5.1.008 ORF III Chem Feed System Improvements pre-2014 Study 2013108 P - 5.1.009 ORF III Recirc Pump Facility Repairs - (w/P-5.1.008) 2013 eliminatedE Mstr Proj List Tbl6‐1 AppB TOCAppD 2012‐12Dec.xlsxRMC Water and Environment B ‐ 6 Last Updated 12/26/2012
RefProjectNo.5.2 Plant-Wide SystemsENCINA WASTEWATER AUTHORITYFY 2014 E‐<strong>CAMP</strong> HISTORICAL, CURRENT AND FUTURE PROJECT LISTCapital Project(Blue, Italics Text IndicatesProject Completed or Eliminated )E-<strong>CAMP</strong>Rev YearProjectAdded toE-<strong>CAMP</strong>Status(YearConstStarted)109 P - 5.2.001 Natural Gas Pipeline Replacement pre-2014 Study 2013110 P - 5.2.002 High Risk and Critical Asset Rehabilitation pre-2014111 P - 5.2.003 High Risk & Critical Asset Rehab- (w/P-5.2.002) pre-2014112 P - 5.2.004 3WLC Strainer Replacement pre-2014 Design 2013113 P - 5.2.005 3WHP Strainer Replacement pre-2014 Study 2013114 P - 5.2.006 3WLC Intertie to 3WHP System pre-2014 Study 2013115 P - 5.2.007 3WL Pump No. 3 Installation pre-2014 Study 2013116 P - 5.2.008 Underground Piping Rehabilitation - Multi-Phase pre-2014 PE, SE 2013117 P - 5.2.009 Structure Settlement Stabilization pre-2014 Study 2013118 P - 5.2.010 3WHP Pump Control Improvements pre-2014 Study 2013119 P - 5.2.011 1W System Rehab pre-2014 Study 2013120 P - 5.2.012 Site Security Facilities pre-2014121 P - 5.2.013 Crane Truck Replacement - elim., veh replace PAR pre-2014 eliminated122 P - 5.2.014 Perimeter Fence Replacement pre-2014123 P - 5.2.015 Northwest Storm Water Drain Sump to South DAF Pit pre-2014124 P - 5.2.016 2W System Upgrades pre-2014 Study 2013125 P - 5.2.017 Service Air and Instrument Air Piping Repairs pre-2014126 P - 5.2.018 UG piping to new pipe galleries - eliminated, not practical pre-2014 eliminated127 P - 5.2.019 Plant Beautification 2014128 P - 5.2.020 Facility Vehicle Replacement - eliminated, veh replace PAR pre-2014 eliminatedE Mstr Proj List Tbl6‐1 AppB TOCAppD 2012‐12Dec.xlsxRMC Water and Environment B ‐ 7 Last Updated 12/26/2012
RefProjectNo.ENCINA WASTEWATER AUTHORITYFY 2014 E‐<strong>CAMP</strong> HISTORICAL, CURRENT AND FUTURE PROJECT LISTCapital Project(Blue, Italics Text IndicatesProject Completed or Eliminated )E-<strong>CAMP</strong>Rev YearProjectAdded toE-<strong>CAMP</strong>129 P - 5.2.021 Climate Control at MCCs pre-2014130 P - 5.2.022 Coded Entry at MCCs - (w/P-5.2.012) pre-2014Status(YearConstStarted)131 P - 5.2.023 South Parcel Fence pre-2014 2013132 P - 5.2.024 Exterior Asset Corrosion Control 2014133 P - 5.2.025 Technology Master Plan Recommendations Implementation 2014134 P - 5.2.026 Plant Waste Stream Rerouting 2014135 P - 5.2.027 Plant-Wide Seal Coating 20145.3 Buildings136 P - 5.3.001 Ops Bldg Locker Replacement pre-2014137 P - 5.3.002 Ops Bldg Air Intake Relocation pre-2014138 P - 5.3.003 Construction Office Upgrade pre-2014139 P - 5.3.004 Ops Bldg Chiller Replacement pre-2014140 P - 5.3.005 Chlorine Storage Facility Floor Repairs - eliminated, < $50k pre-2014 PAR141 P - 5.3.006 Secondary Scum Pit Roof Removal pre-2014142 P - 5.3.007 RAS Channel Vapor Barrier (w/P-1.3.004) pre-2014143 P - 5.3.008 Roof Access Safety Facilities pre-2014 2013144 P - 5.3.009 DW Bldg Roof Repair pre-2014 20135.4 Miscellaneous145 P - 5.4.001 Treatment Plant Model - eliminated,
ENCINA WASTEWATER AUTHORITYFY 2014 E‐<strong>CAMP</strong> HISTORICAL, CURRENT AND FUTURE PROJECT LISTRefProjectNo.Capital Project(Blue, Italics Text IndicatesProject Completed or Eliminated )E-<strong>CAMP</strong>Rev YearProjectAdded toE-<strong>CAMP</strong>148 P - 5.4.004 Vallecitos Sample Vault Installation pre-20146.0 Reserved for Future7.0 Reserved for Future8.0 Professional Services8.1 Condition AssessmentsCA-8.1.001 FY 2013 Asset Condition AssessmentsCA-8.1.002 Fire Main SupplyCA-8.1.003 FY 2014 Assessments Triggered by Asset AgeCA-8.1.004 FY 2015 Assessments Triggered by Asset AgeCA-8.1.005 Underground Structures - Part 1CA-8.1.006 FY 2016 Assessments Triggered by Asset AgeCA-8.1.007 Underground Structures - Part 2CA-8.1.008 BridgesCA-8.1.009 FY 2017 Assessments Triggered by Asset AgeCA-8.1.010 FY 2018 Assessments Triggered by Asset Age8.2 Studies and UpdatesS-8.2.001S-8.2.002S-8.2.003S-8.2.004EWPCF 2040 Facility Master Plan StudyPlant and Non-Potable Water StudyBiosolids Management Business Plan UpdateComprehensive Energy Rates StudyStatus(YearConstStarted)E Mstr Proj List Tbl6‐1 AppB TOCAppD 2012‐12Dec.xlsxRMC Water and Environment B ‐ 9 Last Updated 12/26/2012
ENCINA WASTEWATER AUTHORITYFY 2014 E‐<strong>CAMP</strong> HISTORICAL, CURRENT AND FUTURE PROJECT LISTRefProjectNo.S-8.2.005S-8.2.006S-8.2.007S-8.2.008S-8.2.009S-8.2.0108.3 E-<strong>CAMP</strong> UpdatesES-8.3.001ES-8.4 Engineering ServicesCapital Project(Blue, Italics Text IndicatesProject Completed or Eliminated )<strong>Wastewater</strong> Characterization StudyExterior Asset Corrosion ControlOffsite Wetlands RestorationR&D Projects Support (moved to ES-8.4.002)Agency Merger Studies - not part of capital programPlant Flooding StudyE-<strong>CAMP</strong> Updates (Annual)ES-8.4.001 As-Needed Engineering Services (Annual)ES-8.4.002 R&D Projects SupportES-8.4.003 Map Underground Piping ≤ 12-inchES-8.4.004 Map Underground Piping > 12-inchES-8.4.005 Electronic O&M and Document Management - Phase 1ES-8.4.006 Electronic O&M and Document Management - Phase 2ES-8.4.007 Electronic O&M and Document Management - Phase 3OS-8.5 Other ServicesOS-8.5.001Legal and Misc Services (Annual)9.0 Remote Major Rehab Improvements - Refer to R-<strong>CAMP</strong>E-<strong>CAMP</strong>Rev YearProjectAdded toE-<strong>CAMP</strong>Status(YearConstStarted)E Mstr Proj List Tbl6‐1 AppB TOCAppD 2012‐12Dec.xlsxRMC Water and Environment B ‐ 10 Last Updated 12/26/2012
APPENDIX CEWA COMPREHENSIVE ASSET MANAGEMENT PLAN METHODOLOGY
This page left intentionally blank
Appendix C: EWA Comprehensive Asset Management Plan MethodologyC.1 BackgroundThe <strong>Encina</strong> Water Pollution Control Facility (EWPCF) has a successful history of asset management throughits Master Plan of Rehabilitation and Major Improvement Projects (Master Plan). Originally developed in1993, the Master Plan became the vehicle to communicate to the EWA Board of Directors the future EWPCFinfrastructure improvements and the anticipated resources required for implementation. The Master Planfor the EWPCF utilized a comprehensive ranking system that included seven evaluation categories todetermine infrastructure rehabilitation and replacement needs. Those evaluation categories were:1. Replacement Required2. Maintain Plant Rated Capacity3. Cost Efficiency4. Improve Safety and Working Environment5. Improve Odor Control6. Compliance with Regulatory Requirements7. Improve Energy EfficiencyEach evaluation category was appropriately weighted to an established level of importance ranging from 1to 10 with 1 being the lowest importance and 10 being the highest importance. Previous Master Planprojects are listed in Appendix A.C.2 Introduction to the EWPCF Comprehensive Master Plan (E‐<strong>CAMP</strong>) ProcessThis appendix outlines the EWA’s approach and basic framework behind the EWPCF Comprehensive AssetManagement Plan (E‐<strong>CAMP</strong>) process. The <strong>CAMP</strong> process was developed from the previous Master Planprocess, incorporating project needs identification based on asset‐based inventory and ongoing conditionassessment triggered by approaching of the end of useful life.EWA developed an initial major asset registry which was used as a basis for the <strong>CAMP</strong> process. The <strong>CAMP</strong>process consists of seven unique task elements that provide staff and consultant with a logical framework ofprogression from beginning to its ultimate conclusion with final publishing and distribution of the E‐<strong>CAMP</strong>update each year.The E‐<strong>CAMP</strong> is updated prior to establishing the budget for the upcoming fiscal year. While the E‐<strong>CAMP</strong> isindependent of the budgeting process, it is used as a reference in developing one, five and twenty yearbudgets. The annual update is utilized in planning capital rehabilitation projects with the consideration ofanticipated changes in regulatory compliance, cost‐saving opportunities, available funding and ongoingO&M requirements of the EWPCF.The implementation schedule is prepared after considering the project priority ranking and other factors,such as regulatory compliance deadlines and economy of scale. Typical scheduling of project phases include:Condition AssessmentFeasibility StudyDesignBid and ConstructionC - 1
Typically the condition assessment for major assets is completed at least five years prior to reaching theestimated end of the estimated useful life of major assets. A feasibility study or in‐kind replacement isscheduled when the asset is confirmed to be nearing the end of its assessed useful life. The study and designphases will consider conventional and alternative delivery methods including design‐build (DB), design‐buildoperate(DBO), design‐build‐own‐operate (DBOO), etc. Construction is typically scheduled for the year afterthe design phase.At the beginning of each fiscal year, the E‐<strong>CAMP</strong> projects selected for funding are initiated. If the cost ofimplementing an approved project during a fiscal year exceeds the budgeted amount, or if the project is notstarted in its respective fiscal year, the project can then be re‐evaluated for priority ranking andimplementation in the following fiscal year.The E‐<strong>CAMP</strong> contains condition assessments, studies, and other capital plan updates. It is primarily focusedon rehabilitation and improvements needed for the existing facilities. Projects that are considered in the E‐<strong>CAMP</strong> are those needed to maintain the existing facilities, reduce operating costs, meet regulatoryrequirements, improve odor control, improve plant safety or improve energy efficiency. The cost of eachproject included in the E‐<strong>CAMP</strong> is estimated to exceed $50,000. However, EWA staff may select lower costprojects to be included in the E‐<strong>CAMP</strong> if those projects are considered high priority.Professional services including condition assessments, studies, and other capital plan updates included inthe E‐<strong>CAMP</strong> are included based upon the probability that the outcome of each assessment, study, andupdate will most likely exceed the $50,000 threshold for E‐<strong>CAMP</strong> project inclusion.Remote facility capital asset related projects are identified under the Remote Comprehensive AssetManagement Plan (R‐<strong>CAMP</strong>) and are not evaluated in the E‐<strong>CAMP</strong>. However, the remote facility projectsrecommended in the most recent R‐<strong>CAMP</strong> are included in Section 7 of the E‐<strong>CAMP</strong>.Implementation of the E‐<strong>CAMP</strong> is through the following seven Task Elements:• Task Element 1 – Conduct Condition Assessments• Task Element 2 – Update Asset Lists• Task Element 3 – Conduct Needs Assessments• Task Element 4 – Update Capital Projects Lists• Task Element 5 – Determine Priority Projects• Task Element 6 – Estimate Project Costs• Task Element 7 – Recommend Project Implementation ScheduleThe EWA budgeting process includes several designations to group capital projects. These are referenced inE‐<strong>CAMP</strong> project summary tables and are described as follows: Capital Improvement Projects (CIP): Improvement projects that increase or maintain systemcapacity. The EWA budgeting process defines Capital Improvement Projects as those valued greaterthan $20,000. Projects valued between $20,000 and $50,000 will generally not be included in the E‐<strong>CAMP</strong>. Planned Asset Replacement (PAR): Asset replacement projects extend the useful life of facilities.The EWA budgeting process defines PAR projects as those valued greater than $20,000. Projectsvalued between $20,000 and $50,000 will generally not be included in the E‐<strong>CAMP</strong>. Capital Acquisition (CA): New assets or facility repair projects valued greater than $2,000 but lessthan $20,000. Major Assets (MjA): Assets valued greater than $50KC - 2
Minor Assets (MnA): Assets valued less than $50K Information Systems (IS) Improved Technology (IMPR)The E‐<strong>CAMP</strong> contains detailed supporting documents that provide an organized listing of major assets,estimated useful life of each asset, and scheduled replacement or rehabilitation of each asset. Through theE‐<strong>CAMP</strong>, EWA staff project future expenditures for capital improvement projects, in both the short and longterm, and communicates proposed improvements to the EWA Board of Directors. Discussion of each TaskElement occurs in the subsequent paragraphs.C.3 Major Asset RegisterThe cornerstone of the EWA’s E‐<strong>CAMP</strong> is an accurate inventory of the EWPCF assets placed in its appropriateasset classification. The EWPCF Infrastructure was placed in service over various major expansion phases ofconstruction that began in 1963. Major asset inventory and historical asset auditing is a continuing processfor EWA staff. Assets inventoried in FY 2009 and FY 2010 included above ground and below ground piping12‐inches and larger. Assets inventoried in FY 2011 include the new operations and maintenance facilities,biosolids facilities and energy management facilities. In FY 2012, below ground piping less than 12‐inches indiameter were added to the major asset register.Major assets currently inventoried for the EWPCF can be found in the Appendix E. The EWPCF major assetregister will be reviewed annually to account for in‐house and contracted rehabilitation projects.Information that is provided in the asset register includes:• Asset ID• Asset Description• Asset Classification• Asset Location• Asset Installation Date• Last Rehabilitation Date of Asset• Estimated Asset Useful Life• Estimated Asset Replacement Date• Estimated Replacement CostC.3.1Asset ClassificationAsset classification within the E‐<strong>CAMP</strong> effectively organizes EWPCF assets according to functionality. The E‐<strong>CAMP</strong> includes six unique asset classifications that are categorized in Figure C‐1.Figure C‐1: Asset ClassificationsC - 3
C.3.2Asset Useful Life ExpectancyAsset useful life expectancy is an estimation of how long an asset is expected to function in its environment.Initially, the useful life was estimated. Assets utilized in the wastewater treatment process are generallyrecognized as “severe‐duty” assets routinely exposed to a wide variety of harmful elements. Asset usefullife estimates for the EWPCF were determined through in‐house staff consultation, benchmarking otherwastewater treatment facilities and conducting online research.Once asset useful life estimations were determined they were placed in the E‐<strong>CAMP</strong> Major Asset Registerand are used as a basis for rehabilitation or replacement budgeting. As assets near the end of theirestimated useful life, a condition assessment is completed to determine the “assessed” useful life. Based onthe assessed useful life, either replacement of the asset is scheduled or deferred until later in the assessedservice life.Table C‐1 lists general asset useful life estimates utilized for the EWPCF.Table C‐1: General Asset Useful Life EstimatesAssetUsefulLife(years)AssetUsefulLife(years)Actuator 15 Burner – Waste Gas 30Air Conditioner 15 Catalyst, Oxidation 10Air Drier 10 Centrifuge 25Air Handling Units 20 Chiller (Power Bldg) 20Air Compressor 10 Chute 25Air Dryer 25 Collector – DAF Tank 15Aluminum Covers, for process areas 20 Collector – Secondary Clarifier 20Analyzer (Meter), Dissolved Oxygen 10 Communication Radio 7Analyzer, CO 2 and CO 10 Condenser/Saturator 10Backflow Preventer 15 Conveyor – Screw 25Bar Screens 20 Conveyor – Belt 20Battery Bank 7 CPU 7Belt Filter Presses 20 Crane 25Bin, Wet Cake and Recycle Material 25 Crusher, Pellet Roller 25Blower, RTO Exhaust 25 Digester Gas Boiler 15Blower, Furnace Combustion 25 Door, Roll up 25Blowers – Aeration Air (engine driven) 20 Defribrillator 10Blowers – Aeration Air (electric) 30 Drill 7Blowers – Agitation Air 30 Drum Dryer 30Blower ‐ Digester Mix Gas 20 Drying oven, paint shop 12Bookcase, File Drawer, Cabinet, Desk,Hutch10 Dust Collector 20Boiler 15 Electric Conduit, Wiring, and Fixtures 25Building, Structure 50 Electric Cart 7Burner, RTO 30 Electric Switch Gear 20C - 4
AssetUsefulLife(years)Electric Transformer 20 Laboratory Equipment, Hood, Fume 20Elevator, Bucket 25 Laboratory Equipment, Kiln 15Elevator 25AssetLaboratory Equipment, MiscellaneousMixers, Stirrers, BurnersEngine – Cogen 20 Laboratory Equipment, Bottle Washer 10Engine Related Equipment 20 Laptop 7Ethernet Switch 7 Leak Detector 10Explosion Vent 20 Level Sensor 7Fan 25 Lighting, Yard 15Filter – 3WHP/2W Sandfilter 25 Heater, Pellet Oil Tank 10Filter – Carbon 20 Main Switchgear 30Fire Hydrant 10 Mixer, Static Polymer 10Flame Arrester 15 Meter, chemical flow 7FRP Weirs 15 Mixer, Dryer 25FRP Tanks 15 Meter, Magnetic Flow 15Fugitive Dust Rupture Disk Monitor 15 Meter, portable 10Furnace 30 Monitor 7Furnace Flame Detector 30 Motor Control Centers 40Gates ‐ slide gate 30 Panel 15Gates ‐ sluice gate, stainless steel 30 Pellet Cooler 25Gates ‐ sluice gate, cast iron 20 Piping ‐ Ductile Iron, exposed 30General Distribution Panel (Power Bldg) 20 Piping ‐ Ductile Iron, underground 40Grinder – Sludge 15 Piping ‐ PVC, exposed 15Grit Dewatering Screw 20 Piping ‐ PVC, underground 35Hand‐hole 25 Piping ‐ RCP, underground, sewers 50Heat Exchanger, shell and tube steel 30Piping ‐ RCP, underground, stormdrains & outfallsHeat Exchanger, Plate & Frame 30 Piping ‐ Stainless Steel 30Heat Recovery Silancer 20 Piping ‐ Steel, underground 30Hydraulic Unit – Screenings Press 10 Plumbing – General 20Instrumentation Analyzers, turbidmeters,level sensorsUsefulLife(years)5 Plumbing ‐ Laboratory Piping 20Instrumentation Controls 15 Pneumatic Transport System 25Laboratory Equipment, Furnace 12 Polycyclone Screw Feed 25750C - 5
AssetUsefulLife(years)AssetUsefulLife(years)Polycyclone Separator 25 Tank – Silo 40Preseparator 25 Tank – Water Air Break 20Product Diverter 25 Tank – Ferric Chloride Storage 15Printer 7 Tank – Raw Polymer Storage 15Pulsatin Dampener 8 Tape Drive 7Pump – WAS, Oil, 3WHP, Primary Sludge,Drain, GritPump – Scum, Chemical 8Pump – TWAS, 3W, Sump, Storm Water,Sludge Circulating, CakePump – RAS, PE, SE, 2W, Digester Mixing,Vertical Turbine10 Thermocouple 10Transmitters/Switches ‐ Pressure,Temperature, Level, Flow, Vibration15 Transformer 4020 UPS 10Receiver 20 Valves ‐ Air Release Valves 10Recycle Bin Activator/ Vibrator 25 Valves ‐ Butterfly Valves 20Refrigerator 10 Valve ‐ Ball (chemical) 15Regenerative Thermal Oxidizer 3 Valve ‐ Check Valve 15Regulator, Air or Pressure 10 Valve ‐ Double Blocking Main Gas 20Rotary Screen 20 Valve ‐ Hopper Outlet 25Scale 25 Valve ‐ Light Duty 25Server 7 Valve ‐ Plug (Air or Digester Gas) 20Skimmer 15 Valve ‐ Plug (Solids or Liquid) 15Spout, Dustless Load 15 Valve ‐ Pressure Relief 10Stormwater Brow Ditch 50 Valve, Purge 10Strainer, Basket 10 Valves ‐ Raw wastewater 15Strainer, Automatic 15 Valve, Rotary 15Structures – Concrete 50 Valves – Sludge 15Tank – Concrete 50 Valve ‐ Solenoid 10Tank – Expansion 20 Vehicle 7Tank – Filtration 15 Variable Frequency Drive (VFD) 10Tank – Nitrogen 15 Venturi Scrubber 10Tank – Oil 20 Saw 10Tank – Pneumatic Air 15 Shaker Screen 25Tank – Polymer Mixing 15 Wet Bin Live Bottom Screw 257C - 6
C.4 <strong>CAMP</strong> Task ElementsC.4.1Task Element 1 – Conduct Condition AssessmentsInfrastructure planning and condition assessment provides a solid foundation for future decision making. Itis critical that the EWA has a clear understanding of the condition of its infrastructure and how it isperforming. Management decisions leading to the replacement and rehabilitation of the EWPCF assetsrevolve around these two aspects. Not knowing the current condition or performance level of an asset maylead to the premature failure of the asset, leaving the EWA with only one option: to replace the asset –usually the most expensive option in the asset management life‐cycle chain.The unforeseen failure of an asset can have significant consequences that constitute a business risk orpotential loss to the EWA. By conducting regular condition assessments, and by monitoring assetperformance, rehabilitation strategies can be updated and refined, and ultimate replacement schedules canbe determined more accurately. Condition assessment allows the EWA to better understand the remaininguseful life of the EWPCF assets. This fundamental understanding drives future expenditure patterns.In FY 2011, EWA initiated a formal condition assessment process for the EWPCF major assets. The conditionassessment documents the current condition of each asset and recommends one of the following:1) For assets in with remaining useful life, recommend extending the estimated useful life andredesignating to an assessed useful life.2) Assets with end of useful life projected in the near term, recommend a needs assessment to define aproject.C.4.2Task Element 2 – Update Major Asset RegisterThe Major Asset Register is updated with assessed useful life information determined during the conditionassessment conducted as Task Element 1. Additional updates to the Asset Register may include addition orreplacement of assets during the previous year capital project work.C.4.3Task Element 3 – Conduct Needs AssessmentsNeeds assessments are identified both from the condition assessments and from EWA staff observation.When an asset condition assessment determines that an asset is within five years of its assessed useful life,that asset may be recommended for in‐kind replacement or for a more detailed study to determine ifalternative technologies are more suitable for upgrade. Staff observations are investigated andrecommendations summarized in new project definitions.C.4.4Task Element 4 – Update Capital Projects ListA comprehensive list of capital projects is maintained and updated with new projects during each <strong>CAMP</strong>cycle. The projects are numbered by process area.C - 7
C.4.5Task Element 5 – Priority Project AssignmentProposed E‐<strong>CAMP</strong> projects are first screened based on Safety, Assessed Condition or Regulatory Compliance.Projects required to maintain a safe working environment, to prevent eminent equipment failure in the nexttwo years, and to maintain regulatory compliance are designated “Top Priority” and are recommended forfunding. Remaining projects are prioritized as described in this section.The project prioritization process utilizes the established evaluation categories and assigns a weighted valuebetween 1 and 6 with 1 being the lowest importance and 6 being the highest importance. Each project israted utilizing the seven evaluation categories with priority value assignment ranging from 0 to 3 with 1representing low relevance, 2 representing medium relevance and 3 representing high relevance. If aspecific evaluation category bears no relevance to the project, the project is assigned a rating of 0.The resulting priority score for each category is determined as the product of the category weight value andthe priority value assigned. The composite score for each project is the sum of its priority scores in eachevaluation category. Recommendation of project implementation is based on each project’s compositescore. The priority project rating can vary from year to year based on specific circumstances at the EWPCF inthat particular year.Figure C‐2: Priority Project Ranking MethodologyEVALUATION CATEGORYCATEGORY WEIGHT(1 = Lowest Priority)Safety Top PriorityAssessed Asset Useful Lifereached within 2 yearsTop PriorityRegulatory Compliance Top PriorityConsequence of Failure 6Odor Control 5Energy Efficiency 4Cost Efficiency 3Assessed Asset Useful Life 2Organizational Efficiency 1C - 8
Evaluation Category DiscussionThe following paragraphs describe each prioritization category and the scoring process. First, projects arescreened for applicability of the first three categories. If a project receives a “yes” score for thesecategories, it is classified as a “top priority” project and is recommended for funding in the near term. If aproject receives a “no” score for these categories, it is then scored for the following categories.C.4.5.1 SafetyThe safety category is used to assess improvements needed to maintain a safe working environmentfor facility personnel. If a project will significantly reduce the risk of an accident occurring or willsignificantly improve the working environment then it would screen as a safety project.C.4.5.2 Assessed Useful LifeThe asset useful life evaluation category addresses the need to replace an existing asset that iswithin two years of the end of its assessed useful life.C.4.5.3 Regulatory ComplianceThe regulatory compliance evaluation category is used to assess the relative impact of a project andits ability to comply with current or anticipated regulatory requirements such as:• Effluent discharge criteria• Air pollution control rules and regulations• Regulation for storage and handling of hazardous material• Storm water regulations• OSHA and other safety regulationsA project would be identified as a top priority project based on regulatory compliance if there is ahigh level of risk of non‐compliance with established regulatory criteria.C.4.5.4 Consequence of FailureThe consequence of failure category is used to determine the criticality of an asset. Some assets aremore critical than other assets in maintaining the plant capacity, having higher risk of a failure or anaccident occurring, or having higher impacts on the ability to comply with regulatory requirements.These critical assets should be managed and/or maintained to a greater degree than less criticalassets because of the probability of a failure occurring and the resulting consequences of thatfailure.C.4.5.5 Odor ControlThe odor control evaluation category is used to assess whether a project has a significant effect onimproving odor control at the EWPCF. In order for an odor source to be rated, it must be noticeableto odor receptors beyond the EWPCF plant boundary.C - 9
C.4.5.6 Energy EfficiencyThe energy efficiency evaluation category is used to assess the energy effectiveness of each project.Energy effectiveness can be realized through a reduction of energy usage and costs resulting fromthe implementation of a project. If a project significantly reduces the EWPCF energy requirementsor increases the capability to meet on‐site energy demands it would receive a higher rating.C.4.5.7 Cost EfficiencyThe cost efficiency evaluation category is used to assess the cost effectiveness of each project. Costeffectiveness can be realized through a reduction of operational costs resulting from theimplementation of a project. In addition, if a project has a relatively short payback period then itwould be designated as cost effective and receive a higher rating.C.4.5.8 Assessed Useful LifeThe assessed useful life category is used to assess projects related to aging assets. If an asset iswithin five years of assessed useful life, it will score higher in this category.C.4.5.9 Organizational EfficiencyThe organizational efficiency evaluation category is used to assess the improvement in safety andworking environment for the EWPCF plant personnel if the project is implemented. If a project willimprove organizational efficiency by creating a more positive working environment, it receives ahigh rating.C.5 Cost Control ConsiderationsFor implementation of each E‐<strong>CAMP</strong> project, the following issues should be considered to control projectcosts:1. Where practical, projects should be combined into a single construction contract. This would reducethe volume of contract documents, contract management costs, construction inspection costs, EWAstaff time and the general contractor’s overhead and supervision costs.2. Pre‐purchase major assets to eliminate Contractor mark‐up.3. Bid projects at the beginning of the fiscal year if bidding climate is favorable.4. Design and bid similar projects together. This will allow EWA to obtain a favorable bid for multipleunits of each asset. O&M costs would be reduced due to simplified training of personnel and asmaller amount of parts inventory.C - 10
APPENDIX DPROJECT COST TABLES
This page left intentionally blank
Appendix D - Table of Contents0Table No.Capital ProjectYearConstrPage1.0 Liquid Process Improvements1.1 HeadworksProject 1.1.005 Grit and Screenings Handling Facility Rehab 2016, 2017 D-1Project 1.1.006 GRS Isolation Improvements 2015 D-2Project 1.1.008 GRS Rehab 2015 D-3Project 1.1.009 Influent Flow Metering Installation 2014 D-4Project 1.1.010 Influent Pipe Rehab with 2012 Major Rehab 2014 D-51.2 Primary TreatmentProject 1.2.006 PSB Struct and Mech Rehab 2015, 2016 D-6Project 1.2.009 PE Pipeline Rehab 2017 D-7Project 1.2.010 PSB Scum Pipeline 2015 D-81.3 Secondary TreatmentProject 1.3.004 AB MechRehab and RAS Pump Addition 2018 D-10Project 1.3.007 SCs 5 and 6 Rehabilitation 2018 D-11Project 1.3.010 WAS Pipeline Replacement ≥2019 D-12Project 1.3.012 AB DO Probe Replacement 2018 D-13Project 1.3.013 SC Concrete Cracking Prevention 2016 D-14Project 1.3.014 SCs 1 ‐ 4 Inf and Eff Gate Replacemnt 2016 D-15Project 1.3.015 AB Flow Eq Feed and Return Pipeline Rehab ≥2019 D-161.4 EffluentProject 1.4.004 EPS Pipe Lining and Abandoned Pipe Coating Repair 2019 D-172.0 Outfall2.1 OutfallProject 2.1.001 Land Outfall Inspection and Cleaning ‐ Internal ‐ PM ≥2019 D-18Project 2.1.002 Sea Outfall Inspection and Maintenance ‐ External 2015, 2017 D-19Project 2.1.004 Sea Outfall Ballast Restoration 2018 D-20Project 2.1.005 Sea Outfall Bathymetric Survey ‐ External 2014 D-213.0 Solids Processing Improvements3.1 Biosolids ThickeningProject 3.1.002 DAF System Replacement ≥2019 D-22Project 3.1.003 TWAS Pipeline Replacement ≥2019 D-233.2 Biosolids DigestionProject 3.2.001 Biofuel Receiving Faciities 2014 D-24Project 3.2.004 Sludge Screening Facility ≥2019 D-25Project 3.2.009 Digester No. 4 Cover ‐ Interior Coating 2014 D-26FY 2013 E‐<strong>CAMP</strong> Dec‐27 Draft App D TOC Page 1 Last Updated 12/26/2012
Table No.Appendix D - Table of ContentsCapital Project0YearConstrPageProject 3.2.010 Digester No. 5 and 6 Covers ‐ Interior Coating 2014 D-273.3 Biosolids Dewatering and DryingProject 3.3.002 Pellet Storage Facility Improvements 2014 D-28Project 3.3.003 Struvite Control Facilities ≥2019 D-29Project 3.3.005 Cake Pump Improvements ≥2019 D-30Project 3.3.007 Centrifuges Major Maintenance 2018 D-31Project 3.3.008 Dryer Major Maintenance 2018 D-32Project 3.3.009 Special Study 2015 D-33Project 3.3.010 Drying Building Coded Locks 2014 D-34Project 3.3.012 RTO Media Replacement 2014, 2016, D-35Project 3.3.014 RTO Flush Drain Relocation 20142018D-36Project 3.3.019 Centrifute Drive Replacement 2016 D-37Project 3.3.020 Dryer Drum Rehabilitation 2014 D-384.0 Energy Management4.1 Energy ManagementProject 4.1.001 Cogeneration Communications Redundancy 2018 D-39Project 4.1.003 Cogen Engine Catalyst 2015 D-40Project 4.1.004 NG Dilution Equipment Servicing 2014 D-41Project 4.1.005 Cogeneration Engine Top‐End Overhaul 2016, 2017, D-42Project 4.1.006 Cogeneration Engine In‐Frame Overhaul 2014,20182015 D-43Project 4.1.007 Co‐gen Engine Full Overhaul 2018 D-44Project 4.1.008 Cogeneration Engine 5 2016 D-45Project 4.1.013 Cogen Building Floor Repair 2014 D-46Project 4.1.014 VFDs on Misc Equipment ≥2019 D-47Project 4.1.015 Gas Conditioning Facilities 2015 D-48Project 4.1.020 Net Metering 2014 D-495.0 General Improvements5.1 Odor ControlProject 5.1.002 ORF I Carbon Replacement 2015, 2017, D-50Project 5.1.004 Odor Monitoring Facilities 20142019D-51Project 5.1.005 PSB Odor Control Improvements 2016 D-52Project 5.1.008 ORF III Chemical Feed System Improvements 2016 D-535.2 Plant-Wide SystemsProject 5.2.001 Natural Gas Pipeline Replacement 2014 D-54Project 5.2.002 High Risk & Critical Asset Rehabilitation 2017, 2018 D-55FY 2013 E‐<strong>CAMP</strong> Dec‐27 Draft App D TOC Page 2 Last Updated 12/26/2012
Table No.Appendix D - Table of ContentsCapital Project0YearConstrPageProject 5.2.004 3WLC Strainer Replacement 2014 D-56Project 5.2.005 3WHP Strainer Replacement ≥2019 D-57Project 5.2.006 3WLC Intertie to 3WHP System 2016 D-58Project 5.2.010 3WHP Pump Control Improvements 2015 D-59Project 5.2.011 1W System Rehab ≥2019 D-60Project 5.2.012 Site Security Facilities 2016 D-61Project 5.2.017 Service Air and Instrument Air Piping Repairs 2016 D-62Project 5.2.019 Plant Beautification 2017 D-63Project 5.2.024 Exterior Asset Corrosion Control 2014, 2015 D-64Project 5.2.025 Tech Master Plan Recommendations Implementation 2017 D-65Project 5.2.026 Plant Waste Stream Routing 2017 D-66Project 5.2.027 Plantwide Seal Coating ≥2019 D-675.3 BuildingsProject 5.3.001 Operations Building Locker Replacement ≥2019 D-68Project 5.3.002 Ops Bldg Air Intake Relocation 2015 D-69Project 5.3.004 Operations Building Chiller Replacement ≥2019 D-70Project 5.3.006 Secondary Scum Pit Roof Removal 2014 D-71Project 5.3.008 Roof Access Safety Facilities 2014 D-72Project 5.3.009 DW Bldg Roof Repair ≥2019 D-735.4 MiscellaneousProject 5.4.001 Treatment Plant Model 2014 D-74FY 2013 E‐<strong>CAMP</strong> Dec‐27 Draft App D TOC Page 3 Last Updated 12/26/2012
FY 2013 E‐<strong>CAMP</strong> Dec‐27 Draft Last Updated 12/26/2012
Project 1.1.005Grit and Screenings Handling Facility RehabMain Project TypeKey DatesNew Facility X <strong>CAMP</strong> Report Jan‐14Facility Rehabilitation X Initial Estimate Nov‐11Major Maintenance Estimate Update Sep‐12Asset Replacement Const Year 2016, 2017Special StudyMain Project Cost (1) Quantity Material Cost Labor CostNo. Units Unit Cost Total % of Mat'l TotalTotal CostProject Task ElementsScreening (existing headworks)Demolition 1 LS $ ‐ $ ‐$ ‐$ 93,471Influent Channel Repair 1 LS $ ‐ $ ‐$ ‐$ 41,600Screens (Four climber sceens) 1 LS $ ‐ $ ‐$ ‐$ 1,102,400Ventilation and Ducting 1 LS $ ‐ $ ‐$ ‐$ 124,800Cutthroat Flume Modifications 1 LS $ ‐ $ ‐$ ‐$ 28,704Electrical 1 LS $ ‐ $ ‐$ ‐$ 232,023Instrumentation 1 LS $ ‐ $ ‐$ ‐$ 46,405Grit and Screenings Building 1 LS $ ‐ $ ‐$ ‐Demolition 1 LS $ ‐ $ ‐$ ‐$ 28,042Site Work 1 LS $ ‐ $ ‐$ ‐$ 21,708Concrete 1 LS $ ‐ $ ‐$ ‐$ 122,554Building (Masonry/Roof/Handrails) 1 LS $ ‐ $ ‐$ ‐$ 155,766Washer/Compactor (2 units) 1 LS $ ‐ $ ‐$ ‐$ 256,256Classifier (2 units) 1 LS $ ‐ $ ‐$ ‐$ 503,360Roto Strainer (1 unit) 1 LS $ ‐ $ ‐$ ‐$ 95,680Odor Control (1 unit) 1 LS $ ‐ $ ‐$ ‐$ 355,160Screenings Conveyor 1 LS $ ‐ $ ‐$ ‐$ 234,416Mechanical Piping 1 LS $ ‐ $ ‐$ ‐$ 149,240Electrical 1 LS $ ‐ $ ‐$ ‐$ 299,259Instrumentation 1 LS $ ‐ $ ‐$ ‐$ 59,852Grit RemovalDemolition 1 LS $ ‐ $ ‐$ ‐$ 15,095Concrete 1 LS $ ‐ $ ‐$ ‐$ 461Grit Chamber No. 3 Influent ‐ Motorized Sluice Gate 1 LS $ ‐ $ ‐$ ‐$ 58,280Grit Pumps (6 units) 1 LS $ ‐ $ ‐$ ‐$ 166,620Mechanical Piping 1 LS $ ‐ $ ‐$ ‐$ 159,959Electrical 1 LS $ ‐ $ ‐$ ‐$ 66,792Instrumentation 1 LS $ ‐ $ ‐$ ‐$ 13,358Subtotal $ 4,432,000Contractor Overhead & Profit @ 15% (per Carollo Tech Memo) $ 665,000Shipping Rate 40% of total is shipped @ 15% includedSales Tax 50% of total is taxed @ 7.75% $ 172,000Project Contingency @ 25% (per Carollo Tech Memo) $ 1,318,000Total Main Project Cost (Year of Estimate or Estimate Update) $ 6,587,000ENR CCI Corresponding to Year of Estimate 10088ENR CCI Corresponding to <strong>CAMP</strong> Report Year 10283 1.019Total Main Project Cost (<strong>CAMP</strong> Report Year) $ 6,715,000Project Phases Cost Rate (2) Amount Contingency Subtotal Minimum Total1.1.005 CA Condition Assessment 0.0% $ ‐ 20% $ ‐ $ ‐ $5,000 Completed1.1.005 CS Conceptual Study 0.0% $ ‐ 20% $ ‐ $ ‐ $10,000 Completed1.1.005 DS Design 8.0% $ 421,520 15% $ 63,228 $ 485,000 $20,000 $ 485,0001.1.005 EDC Engr During Construction 4.5% $ 237,105 15% $ 35,566 $ 273,000 $10,000 $ 273,0001.1.005 CM Construction Mgt 7.5% $ 395,175 20% $ 79,035 $ 475,000 $30,000 $ 475,000Total Project Cost (Present Value in 2013 Dollars) $ 7,948,000Notes:1. For most projects Main Project cost is construction cost, however Main Project Cost could be bypass pumping or similar costs.2. Percent of Total Main Project Cost3. Carollo Tech Memo No. 6 Grit and Screening Handling Study, November 2011.1.1.005D - 1
Project 1.1.006GRS Isolation ImprovementsMain Project TypeKey DatesNew Facility X <strong>CAMP</strong> Report Jan‐14Facility Rehabilitation Initial Estimate Nov‐11Major Maintenance Estimate Update Nov‐11Asset Replacement Const Year 2015Special StudyMain Project Cost (1) Quantity Material Cost Labor CostNo. Units Unit Cost Total % of Mat'l TotalTotal CostProject Task ElementsInstall adjustable weir gate (estimated 24' x 12" gate) 3 EA $ 30,000 $ 90,000 100% $ 90,000$ 180,000Motor Operators (2 motor operators per gate) 6 EA $ 15,000 $ 90,000 100% $ 90,000$ 180,000Channel Isolation 1 LS $ ‐ $ ‐ 0% $ ‐$ 30,000Subtotal $ 390,000Contractor Overhead & Profit @ 27% $ 106,000Shipping Rate 40% of total is shipped @ 15% $ 24,000Sales Tax 50% of total is taxed @ 7.75% $ 16,000Project Contingency @ 40% $ 215,000Total Main Project Cost(Year of Estimate or Estimate Update) $ 751,000ENR CCI Corresponding to Year of Estimate 10088ENR CCI Corresponding to <strong>CAMP</strong> Report Year 10283 1.019Total Main Project Cost (<strong>CAMP</strong> Report Year) $ 766,000Project Phases Cost Rate (2) Amount Contingency Subtotal Minimum Total1.1.006 CA Condition Assessment 1.5% $ 8,040 20% $ 1,608 $ 10,000 $5,000 not reqd1.1.006 CS Conceptual Study 2.5% $ 9,025 20% $ 1,805 $ 11,000 $10,000 $ 11,0001.1.006 DS Design 8.0% $ 42,880 15% $ 6,432 $ 50,000 $20,000 $ 50,0001.1.006 EDC Engr During Construction 4.5% $ 24,120 15% $ 3,618 $ 28,000 $10,000 $ 28,0001.1.006 CM Construction Mgt 7.5% $ 40,200 20% $ 8,040 $ 49,000 $30,000 $ 49,000Total Project Cost (Present Value in 2013 Dollars) $ 904,000Notes:1. For most projects Main Project cost is construction cost, however Main Project Cost could be bypass pumping or similar costs.2. Percent of Total Main Project Cost3. Estimated weir gate cost from OCSD Peak Flow Mngt project escalated to 2011 cost.4. Maybe more cost effective to install isolation gates at the end of each grit effluent channel.1.1.006D - 2
Project 1.1.008GRS RehabMain Project TypeKey DatesNew Facility X <strong>CAMP</strong> Report Jan‐14Facility Rehabilitation Initial Estimate Nov‐12Major Maintenance Estimate Update Nov‐12Asset Replacement Const Year 2015Special StudyMain Project Cost (1) Quantity Material Cost Labor CostNo. Units Unit Cost Total % of Mat'l TotalTotal CostProject Task ElementsGrit Tank Nos 1 and 2 Inlet Gates 2 EA $ 5,000 $ 10,000 50% $ 5,000$ 15,000(2'‐8" x 7'‐3" Slide Gates, new stainless steel plate,reuse extg frame, stem and operator)Rehababiliation grit tank effluent channel 22 CY $ 1,200 $ 26,400 75% $ 19,800$ 46,200(Length 210' x Width 5' x Depth 8.25' ‐ assumed 2" ofconcrete on the surface needs rehab = 591.25 CY)Coating effluent channel 3550 SF $ 11 $ 39,050 0% $ ‐$ 39,050Bypass Pumping 1 LS $ 85,000Subtotal $ 186,000Contractor Overhead & Profit @ 27% $ 51,000Shipping Rate 20% of total is shipped @ 15% $ 6,000Sales Tax 45% of total is taxed @ 7.75% $ 7,000Project Contingency @ 40% $ 100,000Total Main Project Cost(Year of Estimate or Estimate Update) $ 350,000ENR CCI Corresponding to Year of Estimate 10283ENR CCI Corresponding to <strong>CAMP</strong> Report Year 10283 1.000Total Main Project Cost (<strong>CAMP</strong> Report Year) $ 350,000Project Phases Cost Rate (2) Amount Contingency Subtotal Minimum Total1.1.008 CA Condition Assessment 1.5% $ 3,750 20% $ 750 $ 5,000 $5,000 not reqd1.1.008 CS Conceptual Study 2.5% $ 4,100 20% $ 820 $ 5,000 $10,000 $ 15,0001.1.008 DS Design 17.2% $ 43,000 15% $ 6,450 $ 50,000 $20,000 $ 50,0001.1.008 EDC Engr During Construction 12.0% $ 30,000 15% $ 4,500 $ 35,000 $10,000 $ 35,0001.1.008 CM Construction Mgt 16.5% $ 41,250 20% $ 8,250 $ 50,000 $30,000 $ 50,000Total Project Cost (Present Value in 2013 Dollars) $ 500,000Notes:1. For most projects Main Project cost is construction cost, however Main Project Cost could be bypass pumping or similar costs.2. Percent of Total Main Project Cost3. Slide gate cost from IEUA, RP‐1 Gate Replacement Project, Waterman quotes escalated to 2013 dollars.4. Concrete rehab cost estimate from IJS 90% Cost Estimate.1.1.008D - 3
Project 1.1.009Influent Flow Metering InstallationMain Project TypeKey DatesNew Facility X <strong>CAMP</strong> Report Jan‐14Facility Rehabilitation Initial Estimate Jan‐11Major Maintenance Estimate Update Oct‐12Asset Replacement Const Year 2014Special StudyMain Project Cost (1) Quantity Material Cost Labor CostNo. Units Unit Cost Total % of Mat'l TotalTotal CostProject Task ElementsFlowmeter systems 2 ea $ 14,000 $ 28,000 40% $ 11,200$ 39,200Conduit and wiring 1 LS $ 10,000 $ 10,000 0% $ ‐$ 10,000SCADA Programming 1 LS $ 10,000 $ 10,000 0% $ ‐$ 10,000Manhole Configuration 1 LS $ 5,000 $ 5,000 0% $ ‐$ 5,000Manholes 2 ea $ 5,000 $ 10,000 50% $ 5,000$ 15,000Subtotal $ 80,000Contractor Overhead & Profit @ 27% $ 22,000Shipping Rate 10% of total is shipped @ 15% $ 2,000Sales Tax 50% of total is taxed @ 7.75% $ 4,000Project Contingency @ 40% $ 44,000Total Main Project Cost(Year of Estimate or Estimate Update) $ 152,000ENR CCI Corresponding to Year of Estimate 10283ENR CCI Corresponding to <strong>CAMP</strong> Report Year 10283 1.000Total Main Project Cost (<strong>CAMP</strong> Report Year) $ 152,000Project Phases Cost Rate (2) Amount Contingency Subtotal Minimum Total1.1.009 CA Condition Assessment 0.0% $ ‐ 20% $ ‐ $ ‐ $5,000 completed1.1.009 CS Conceptual Study 0.0% $ ‐ 20% $ ‐ $ ‐ $10,000 completed1.1.009 DS Design 10.0% $ 10,800 15% $ 1,620 $ 13,000 $10,000 completed1.1.009 EDC Engr During Construction 4.5% $ 4,860 15% $ 729 $ 6,000 $10,000 $ 10,0001.1.009 CM Construction Mgt 4.5% $ 4,860 20% $ 972 $ 6,000 $10,000 $ 10,000Total Project Cost (Present Value in 2013 Dollars) $ 172,000Notes:1. For most projects Main Project cost is construction cost, however Main Project Cost could be bypass pumping or similar costs.2. Percent of Total Main Project Cost3. Estimated weir gate cost from OCSD Peak Flow Mngt project escalated to 2011 cost.4. Maybe more cost effective to install isolation gates at the end of each grit effluent channel.1.1.009D - 4
Project 1.1.010Influent Pipe Rehab with 2012 Major RehabMain Project TypeKey DatesNew Facility <strong>CAMP</strong> Report Jan‐14Facility Rehabilitation X Initial Estimate Sep‐12Major Maintenance Estimate Update Oct‐12Asset Replacement Const Year 2014Special StudyMain Project Cost (1) Quantity Material Cost Labor CostNo. Units Unit Cost Total % of Mat'l TotalTotal CostProject Task Elements2012 Major Plant Rehab updated budget, P‐1.1.010 1 LS $ ‐ $ ‐$ ‐$ 3,445,000Previous E‐<strong>CAMP</strong> budgeted project cost estimates:P‐1.1.001 Influent Junction Structure Rehabilitation 1 LS $ ‐ $ ‐$ ‐$ (1,232,000)P‐1.1.002 HW Agitation/Aeration Piping and Diff Replacement 1 LS $ ‐ $ ‐$ ‐$ (327,000)P‐1.1.003 Outfall ARV Vault Replacement 1 LS $ ‐ $ ‐$ ‐$ (47,000)Subtotal $ 1,839,000Contractor Overhead & Profit @ 0% (Already Included) $‐Shipping Rate 0% of total is shipped @ 15% $‐Sales Tax 0% of total is taxed @ 7.75% $‐Project Contingency @ 0% (Already Included) $‐Total Main Project Cost(Year of Estimate or Estimate Update) $ 1,839,000ENR CCI Corresponding to Year of Estimate 10283ENR CCI Corresponding to <strong>CAMP</strong> Report Year 10283 1.000Total Main Project Cost (<strong>CAMP</strong> Report Year) $ 1,839,000Project Phases Cost Rate (2) Amount Contingency Subtotal Minimum Total1.1.009 CA Condition Assessment 0.0% $ ‐ 20% $ ‐ $ ‐ $5,000 completed1.1.009 CS Conceptual Study 0.0% $ ‐ 20% $ ‐ $ ‐ $10,000 completed1.1.009 DS Design 0.0% $ ‐ 15% $ ‐ $ ‐ $20,000 completed1.1.009 EDC Engr During Construction 0.0% $ ‐ 15% $ ‐ $ ‐ $10,000 $ 85,0001.1.009 CM Construction Mgt 0.0% $ ‐ 20% $ ‐ $ ‐ $30,000 $ 140,000Total Project Cost (Present Value in 2013 Dollars) $ 2,064,000Notes:1. This project will provides additional budget to fully fund the previously budgeted project and the rehabilitation of four influent pipelines per final design costestimates by the design engineer.1.1.010D - 5
Project 1.2.006PSB Struct and Mech RehabMain Project TypeKey DatesNew Facility <strong>CAMP</strong> Report Jan‐14Facility Rehabilitation X Initial Estimate Nov‐12Major Maintenance Estimate Update Nov‐12Asset Replacement Const Year 2015, 2016Special StudyMain Project Cost (1) Quantity Material Cost Labor CostNo. Units Unit Cost Total % of Mat'l TotalTotal CostProject Task ElementsPSB 1‐6 Structural Repair (Assumed top 2‐inch of concrete 120 CY $ 1,200 $ 144,000$ ‐$ 144,000need repairs. Each PSB has 3200 sf of vertical surface area.)PSB 1‐6 Coating (Each PSB Dim 160' L x 20' W x 9' D) 19200 SF $ 11 $ 211,200$ ‐$ 211,200PSB 1‐10 (20 influent gates, 18‐inch dia, ss) 20 EA $ 10,000 $ 200,000 25% $ 50,000$ 250,000PSB 1‐10 Sludge and Scum Collectors Rehab 10 EA $ 100,000 $ 1,000,000 20% $ 200,000$ 1,200,000Bypass Pumping 1 LS $ ‐ $ ‐$ ‐$ 177,000Helical Skimmers Refurbishment 10 EA $ 5,000 $ 50,000 25% $ 12,500$ 62,500PSB PE EQ Structure Coating (240' L x 4.5' W x 7' D) 3500 SF $ 11 $ 38,500$ ‐$ 38,500PSB PE EQ Bypass Structure Coating (5' L x 4' W x 13.5' D) 250 SF $ 11 $ 2,750$ ‐$ 2,750Subtotal $ 2,086,000Contractor Overhead & Profit @ 27% $ 564,000Shipping Rate 40% of total is shipped @ 15% $ 126,000Sales Tax 50% of total is taxed @ 7.75% $ 81,000Project Contingency @ 40% $ 1,143,000Total Main Project Cost(Year of Estimate or Estimate Update) $ 4,000,000ENR CCI Corresponding to Year of Estimate 10283ENR CCI Corresponding to <strong>CAMP</strong> Report Year 10283 1.000Total Main Project Cost (<strong>CAMP</strong> Report Year) $ 4,000,000Project Phases Cost Rate (2) Amount Contingency Subtotal Minimum Total1.2.006 CA Condition Assessment 1.5% $ 42,855 20% $ 8,571 $ 52,000 $5,000 $ 52,0001.2.006 CS Conceptual Study 1.6% $ 62,000 20% $ 12,400 $ 75,000 $10,000 $ 75,0001.2.006 DS Design 12.2% $ 347,126 15% $ 52,069 $ 400,000 $20,000 $ 400,0001.2.006 EDC Engr During Construction 5.5% $ 155,707 15% $ 23,356 $ 180,000 $10,000 $ 180,0001.2.006 CM Construction Mgt 8.8% $ 249,988 20% $ 49,998 $ 300,000 $30,000 $ 300,000Total Project Cost (Present Value in 2013 Dollars) $ 5,007,000Notes:1. For most projects Main Project cost is construction cost, however Main Project Cost could be bypass pumping or similar costs.2. Percent of Total Main Project Cost3. Cost estimated based on FY 2012 IJS 90% Cost Estimate and NSD Expansion Project.1.2.006D - 6
Project 1.2.009PE Pipeline RehabMain Project TypeKey DatesNew Facility <strong>CAMP</strong> Report Jan‐14Facility Rehabilitation X Initial Estimate Oct‐12Major Maintenance Estimate Update Oct‐12Asset Replacement Const Year 2017Special StudyMain Project Cost (1) Quantity Material Cost Labor CostNo. Units Unit Cost Total % of Mat'l TotalTotal CostProject Task ElementsBypass Pumping 1 LS $ 300,000 $ 300,000$ ‐$ 300,000Pipe Repairs (4) 60 LF $ 2,300 $ 138,000$ ‐$ 138,000Subtotal $ 438,000Contractor Overhead & Profit @ 27% $ 119,000Shipping Rate 40% of total is shipped @ 15% $ 27,000Sales Tax 50% of total is taxed @ 7.75% $ 17,000Project Contingency @ 40% $ 241,000Total Main Project Cost(Year of Estimate or Estimate Update) $ 842,000ENR CCI Corresponding to Year of Estimate 10088ENR CCI Corresponding to <strong>CAMP</strong> Report Year 10283 1.019Total Main Project Cost (<strong>CAMP</strong> Report Year) $ 859,000Project Phases Cost Rate (2) Amount Contingency Subtotal Minimum Total1.2.006 CA Condition Assessment 1.5% $ 9,015 20% $ 1,803 $ 11,000 $5,000 completed1.2.006 CS Conceptual Study 2.5% 20% $ ‐ $ ‐ $10,000 $ 60,0001.2.006 DS Design 12.0% $ 72,120 15% $ 10,818 $ 83,000 $20,000 $ 100,0001.2.006 EDC Engr During Construction 4.5% $ 27,045 15% $ 4,057 $ 32,000 $10,000 $ 50,0001.2.006 CM Construction Mgt 7.5% $ 45,075 20% $ 9,015 $ 55,000 $30,000 $ 50,000Total Project Cost (Present Value in 2013 Dollars) $ 1,119,000Notes:1. For most projects Main Project cost is construction cost, however Main Project Cost could be bypass pumping or similar costs.2. Percent of Total Main Project Cost3. Cost estimated. A more detailed cost will be available after the study phase.4. Unit cost based on air piping repair per foot, EWA 20111.2.009D - 7
Project 1.2.010PSB Scum PipelineMain Project TypeKey DatesNew Facility <strong>CAMP</strong> Report Jan‐14Facility Rehabilitation Initial Estimate Dec‐12Major Maintenance Estimate Update Dec‐12Asset Replacement Const Year 2015Special StudyMain Project Cost (1) Quantity Material Cost Labor CostNo. Units Unit Cost Total % of Mat'l TotalTotal CostProject Task ElementsSawcut, remove, and dispose AC above scum pipeline/drain (1) 10 CY $ 100 $ 1,000 Includ. $ 1,000Remove and dispose native soil as neceessary (1) 100 CY $ 35 $ 3,500 Includ. $ 3,500Repair pipeline, add supports (2) 160 FT $ 40 $ 6,400 Includ. $ 6,400Place Pipe Bedding (Crushed Stone 3/4" to 1/2") (3) 50 CY $ 47 $ 2,350 Includ. $ 2,350Backfill and Compaction (1) 60 CY $ 21 $ 1,260 Includ. $ 1,260Pour new concrete walkway (1) 800 SF $ 5 $ 4,000 Includ. $ 4,000Mob/Demobilization 1 LS $ 5,000Construction Sequencing 1 LS $ 10,000Subtotal $ 34,000Contractor Overhead & Profit @ 27% $ 10,000Shipping Rate 50% of total is shipped @ 15% $ 3,000Sales Tax 50% of total is taxed @ 7.75% $ 2,000Project Contingency @ 40% $ 20,000Total Main Project Cost(Year of Estimate or Estimate Update) $ 69,000ENR CCI Corresponding to Year of Estimate 10283ENR CCI Corresponding to <strong>CAMP</strong> Report Year, FY 2014 10283 1.000Total Main Project Cost (<strong>CAMP</strong> Report Year) $ 69,000Project Phases Cost Rate (2) Amount Contingency Subtotal Minimum Total1.1.001 CA Condition Assessment 0.0% $ ‐ 20% $ ‐ $ ‐ $5,000 $ 10,0001.1.001 CS Conceptual Study 0.0% $ ‐ 20% $ ‐ $ ‐ $10,000 Not Req'd1.1.001 DS Design 0.0% $ ‐ 15% $ ‐ $ ‐ $20,000 $ 30,0001.1.001 EDC Engr During Construction 4.5% $ 2,205 15% $ 331 $ 3,000 $10,000 $ 10,0001.1.001 CM Construction Mgt 7.5% $ 3,675 20% $ 735 $ 5,000 $30,000 $ 30,000Total Project Cost (Present Value in 2013 Dollars) $ 149,000Notes:1. Novato Sanitary District <strong>Wastewater</strong> Facility Upgrade Project, August 2006, unit costs escalated to 2012 costs.2. Estimated the replacement cost of $13,000 (assumed $10/inch/foot). Assumed only 50% cost to repairs most portion of the piping.3. RS Means 2012, Utility Bedding Fill cost estimate, Page 236.1.2.010D - 8
Project 1.3.003AB Selector Implementation and Cover ReplacementMain Project TypeKey DatesNew Facility <strong>CAMP</strong> Report Jan‐14Facility Rehabilitation X Initial Estimate May‐11Major Maintenance Estimate Update Nov‐11Asset Replacement Const Year 2018Special StudyMain Project Cost (1) Quantity Material Cost Labor CostNo. Units Unit Cost Total % of Mat'l TotalTotal CostProject Task Elements1. General and Site Work 1 LS $ 10,000 $ 10,000 0% $ ‐$ 10,0002. Basin Covers and Access 1 LS $ 818,613 $ 818,613 0% $ ‐$ 818,6133. Basin Selector Zones 1 LS $ 1,281,755 $ 1,281,755 0% $ ‐$ 1,281,755Anaerobic Selector Implementation and basin coveraccess platforms replacementSubtotal $ 2,111,000Contractor Overhead & Profit @ 27% $ 570,000Shipping Rate ‐ included of total is shipped @ 15% $ ‐Sales Tax ‐ included of total is taxed @ 7.75% $ ‐Project Contingency @ 15% $ 403,000Total Main Project Cost(Year of Estimate or Estimate Update) $ 3,084,000ENR CCI Corresponding to Year of Estimate 10000ENR CCI Corresponding to <strong>CAMP</strong> Report Year 10283 1.028Total Main Project Cost (<strong>CAMP</strong> Report Year) $ 3,172,000Project Phases Cost Rate (2) Amount Contingency Subtotal Minimum Total1.3.003 CA Condition Assessment 0.0% $ ‐ 20% $ ‐ $ ‐ $5,000 Completed1.3.003 CS Conceptual Study 0.0% $ ‐ 20% $ ‐ $ ‐ $10,000 Completed1.3.003 DS Design (4) 0.0% $ ‐ 15% $ ‐ $ ‐ $20,000 $ 40,0001.3.003 EDC Engr During Construction 4.5% $ 120,645 15% $ 18,097 $ 139,000 $10,000 $ 139,0001.3.003 CM Construction Mgt 7.5% $ 201,075 20% $ 40,215 $ 242,000 $30,000 $ 242,000Total Project Cost (Present Value in 2013 Dollars) $ 3,593,000Notes:1. For most projects Main Project cost is construction cost, however Main Project Cost could be bypass pumping or similar costs.2. Percent of Total Main Project Cost3. Secondary Aeration Basin Rehabilitation Tech Memo No. 8, May 2011, Carollo and Updated cost estimate dated 3/12/20124. Design completed in 2012, addl budget allocated for minor revisions and bid process1.3.003D - 9
Project 1.3.004AB MechRehab and RAS Pump AdditionMain Project TypeKey DatesNew Facility <strong>CAMP</strong> Report Jan‐14Facility Rehabilitation X Initial Estimate Nov‐11Major Maintenance Estimate Update Nov‐11Asset Replacement Const Year 2018Special StudyMain Project Cost (1) Quantity Material Cost Labor CostNo. Units Unit Cost Total % of Mat'l TotalTotal CostProject Task Elements1. General and Site Work 1 LS $ 11,000 $ 11,000$ ‐$ 11,0002. 3WHP Water Pipe 1 LS $ 91,656 $ 91,656$ ‐$ 91,6563. Influent Channel 1 LS $ 765,934 $ 765,934$ ‐$ 765,9344. Slide Gates 1 LS $ 328,248 $ 328,248$ ‐$ 328,2485. RAS Pumping 1 LS $ 222,703 $ 222,703$ ‐$ 222,7036. EIC 1 LS $ 375,850 $ 375,850$ ‐$ 375,850Subtotal $ 1,796,000Contractor Overhead & Profit @ 27% $ 485,000Shipping Rate ‐ included of total is shipped @ 15% $‐Sales Tax ‐ included of total is taxed @ 7.75% $‐Project Contingency @ 15% $ 343,000Total Main Project Cost(Year of Estimate or Estimate Update) $ 2,624,000ENR CCI Corresponding to Year of Estimate 10000ENR CCI Corresponding to <strong>CAMP</strong> Report Year 10283 1.028Total Main Project Cost (<strong>CAMP</strong> Report Year) $ 2,699,000Project Phases Cost Rate (2) Amount Contingency Subtotal Minimum Total1.3.004 CA Condition Assessment 0.0% $ ‐ 20% $ ‐ $ ‐ $5,000 Completed1.3.004 CS Conceptual Study 0.0% $ ‐ 20% $ ‐ $ ‐ $10,000 Completed1.3.004 DS Design 0.0% $ ‐ 15% $ ‐ $ ‐ $20,000 $ 40,0001.3.004 EDC Engr During Construction 4.5% $ 102,645 15% $ 15,397 $ 119,000 $10,000 $ 119,0001.3.004 CM Construction Mgt 7.5% $ 171,075 20% $ 34,215 $ 206,000 $30,000 $ 206,000Total Project Cost (Present Value in 2013 Dollars) $ 3,064,000Notes:1. For most projects Main Project cost is construction cost, however Main Project Cost could be bypass pumping or similar costs.2. Percent of Total Main Project Cost3. Secondary Aeration Basin Rehabilitation Tech Memo No. 8, May 2011, Carollo and Updated cost estimate dated 3/12/20124. Design completed in 2012, addl budget allocated for minor revisions and bid process1.3.004D - 10
Project 1.3.007SCs 5 and 6 RehabilitationMain Project TypeKey DatesNew Facility <strong>CAMP</strong> Report Jan‐14Facility Rehabilitation X Initial Estimate Sep‐11Major Maintenance Estimate Update Oct‐12Asset Replacement Const Year 2018Special StudyMain Project Cost (1) Quantity Material Cost Labor CostNo. Units Unit Cost Total % of Mat'l TotalTotal CostProject Task ElementsDemo Existing Clarifiers $ 35,057Abbrasive blast/Paint Existing Knee Brackets, Troughs, Bridges $ 120,275Repair Concrete Cracks $ 7,100Repair Concrete Holes $ 5,650Fab and Deliver Clarifier Mechanisms $ 391,909Install New Clarifiers ‐ Includes Sandblast/Painting of New Equipment $ 207,895Replace Launders/Trough $ 41,580Replace Launder Supports $ 13,902Replace Wiers $ 24,168Replace Drain Gates $ 12,920Replace Influent Gates $ 80,000Electrical $ 34,050Density Baffles $ 78,462$‐Change Order #2 $ 6,226Change Order #3 $ 21,179Subtotal $ 1,081,000Contractor Overhead & Profit @ 15% $ 163,000Shipping Rate 80% of total is shipped @ 15% IncludedSales Tax 80% of total is taxed @ 7.75% IncludedProject Contingency @ 25% $ 311,000Total Main Project Cost(Year of Estimate or Estimate Update) $ 1,555,000ENR CCI Corresponding to Year of Estimate 10077ENR CCI Corresponding to <strong>CAMP</strong> Report Year 10283 1.020Total Main Project Cost (<strong>CAMP</strong> Report Year) $ 1,587,000Project Phases Cost Rate (2) Amount Contingency Subtotal Minimum Total1.3.007 CA Condition Assessment 0.0% $ ‐ 20% $ ‐ $ ‐ $5,000 Completed1.3.007 CS Conceptual Study 0.0% $ ‐ 20% $ ‐ $ ‐ $10,000 Not Applicable1.3.007 DS Design 8.0% $ 99,520 15% $ 14,928 $ 115,000 $20,000 $ 115,0001.3.007 EDC Engr During Construction 4.5% $ 55,980 15% $ 8,397 $ 65,000 $10,000 $ 65,0001.3.007 CM Construction Mgt 7.5% $ 93,300 20% $ 18,660 $ 112,000 $30,000 $ 112,000Total Project Cost (Present Value in 2013 Dollars) $ 1,879,000Notes:1. For most projects Main Project cost is construction cost, however Main Project Cost could be bypass pumping or similar costs.2. Percent of Total Main Project Cost3. Cost estimated based on Filanc Pay Request for Clarifier 1‐4 Rehab Project dated September 2011.1.3.007D - 11
Project 1.3.010WAS Pipeline ReplacementMain Project TypeKey DatesNew Facility <strong>CAMP</strong> Report Jan‐14Facility Rehabilitation X Initial Estimate Nov‐12Major Maintenance Estimate Update Nov‐12Asset Replacement Const Year ≥2019Special StudyMain Project Cost (1) Quantity Material Cost Labor CostNo. Units Unit Cost Total % of Mat'l TotalTotal CostProject Task ElementsTrench excavation, backfilling, shoring, pipe sub‐base, etc. 250 LF $ 200 $ 50,000 Incl. $ ‐$ 50,000Assumed average 8 feet depth and 3 feet wide trench.Temporary bypass piping 1 LS $ ‐$ ‐$ 40,000New WAS pipe (8" DI Pipe) 250 LF $ 160 $ 40,000$ ‐$ 40,000Paving/restoration 750 SF $ 5 $ 3,750 Incl. $ ‐$ 3,750Existing piping and pavement demolition 1 LS $ ‐$ ‐$ 20,000Subtotal $ 154,000Contractor Overhead & Profit @ 27% $ 42,000Shipping Rate 50% of total is shipped @ 15% $ 12,000Sales Tax 50% of total is taxed @ 7.75% $ 6,000Project Contingency @ 40% $ 86,000Total Main Project Cost(Year of Estimate or Estimate Update) $ 300,000ENR CCI Corresponding to Year of Estimate 10296ENR CCI Corresponding to <strong>CAMP</strong> Report Year 10283 0.999Total Main Project Cost (<strong>CAMP</strong> Report Year) $ 300,000Project Phases Cost Rate (2) Amount Contingency Subtotal Minimum Total1.3.010 CA Condition Assessment 0.0% $ ‐ 20% $ ‐ $ ‐ $5,000 $ 20,0001.3.010 CS Conceptual Study 0.0% $ ‐ 20% $ ‐ $ ‐ $10,000 not reqd1.3.010 DS Design 20.0% $ 42,800 15% $ 6,420 $ 50,000 $20,000 $ 50,0001.3.010 EDC Engr During Construction 12.0% $ 25,680 15% $ 3,852 $ 30,000 $10,000 $ 30,0001.3.010 CM Construction Mgt 7.5% $ 16,050 20% $ 3,210 $ 20,000 $30,000 $ 30,000Total Project Cost (Present Value in 2013 Dollars) $ 430,000Notes:1. For most projects Main Project cost is construction cost, however Main Project Cost could be bypass pumping or similar costs.2. Percent of Total Main Project Cost3. Cost estimates from RS Means 2012 and Novato Sanitary District <strong>Wastewater</strong> Facility Upgrade Cost Estimates estcalated to 2013 dollars.4. Length of pipe is estimated per Phase IV, SPM2, Sheet 139, WAS pipe exits from pump room at CL EL 118. TOC EL 124.1.3.010D - 12
Project 1.3.012AB DO Probe ReplacementMain Project TypeKey DatesNew Facility <strong>CAMP</strong> Report Jan‐14Facility Rehabilitation X Initial Estimate Sep‐12Major Maintenance Estimate Update Oct‐12Asset Replacement Const Year 2018Special StudyMain Project Cost (1) Quantity Material Cost Labor CostNo. Units Unit Cost Total % of Mat'l TotalTotal CostProject Task ElementsDemolition 32 $ ‐ $ ‐ ‐ $ 7,680$ 7,680Probe mounting modifications 32 $ 500 $ 16,000 75% $ 12,000$ 28,000Dissolved Oxygen System (Clark Type) 32 $ 3,829 $ 122,528 75% $ 91,896$ 214,424SCADA Programming $ ‐ $ ‐$ ‐$ 5,000Subtotal $ 256,000Contractor Overhead & Profit @ 27% $ 70,000Shipping Rate 5% of total is shipped @ 15% $ 2,000Sales Tax 60% of total is taxed @ 7.75% $ 12,000Project Contingency @ 30% $ 102,000Total Main Project Cost(Year of Estimate or Estimate Update) $ 442,000ENR CCI Corresponding to Year of Estimate 10283ENR CCI Corresponding to <strong>CAMP</strong> Report Year 10283 1.000Total Main Project Cost (<strong>CAMP</strong> Report Year) $ 442,000Project Phases Cost Rate (2) Amount Contingency Subtotal Minimum Total1.3.012 CA Condition Assessment 1.5% $ ‐ 20% $ ‐ $ ‐ $5,000 $ 20,0001.3.012 CS Conceptual Study 2.5% $ 4,650 20% $ 930 $ 6,000 $10,000 not reqd1.3.012 DS Design 8.0% $ 27,200 15% $ 4,080 $ 32,000 $20,000 $ 32,0001.3.012 EDC Engr During Construction 4.5% $ 15,300 15% $ 2,295 $ 18,000 $10,000 $ 18,0001.3.012 CM Construction Mgt 7.5% $ 25,500 20% $ 5,100 $ 31,000 $30,000 $ 31,000Total Project Cost (Present Value in 2013 Dollars) $ 543,000Notes:(1) Material cost based on instrument supplier (HACH) website. Estimated Labor for installation and control connection.1.3.012D - 13
Project 1.3.013SC Concrete Cracking PreventionMain Project TypeKey DatesNew Facility <strong>CAMP</strong> Report Jan‐14Facility Rehabilitation X Initial Estimate Sep‐12Major MaintenanceEstimate UpdateAsset Replacement Const Year 2016Special StudyMain Project Cost (1) Quantity Material Cost Labor CostNo. Units Unit Cost Total % of Mat'l TotalTotal CostProject Task ElementsRepair Cracks 500 LF $ 40 $ 20,000 0% 0 $ 20,000Install new mud valves 8 EA $ 5,000 $ 40,000 100% $ 40,000$ 80,000Regrout clarifiers 2 EA $ 5,000 $ 10,000 100% $ 10,000$ 20,000Subtotal $ 120,000Contractor Overhead & Profit @ 27% $ 33,000Shipping Rate 5% of total is shipped @ 15% $ 1,000Sales Tax 60% of total is taxed @ 7.75% $ 6,000Project Contingency @ 40% $ 64,000Total Main Project Cost(Year of Estimate or Estimate Update) $ 224,000ENR CCI Corresponding to Year of Estimate 10296ENR CCI Corresponding to <strong>CAMP</strong> Report Year 10283 0.999Total Main Project Cost (<strong>CAMP</strong> Report Year) $ 224,000Project Phases Cost Rate (2) Amount Contingency Subtotal Minimum Total1.3.013 CA Condition Assessment LS $ 15,000 20% $ 3,000 $ 18,000 $10,000 $ 10,0001.3.013 CS Conceptual Study LS $ 20,000 20% $ 4,000 $ 24,000 $10,000 $ 30,0001.3.013 DS Design 8.0% $ 12,800 15% $ 1,920 $ 15,000 $20,000 $ 50,0001.3.013 EDC Engr During Construction 4.5% $ 7,200 15% $ 1,080 $ 9,000 $10,000 $ 10,0001.3.013 CM Construction Mgt 7.5% $ 12,000 20% $ 2,400 $ 15,000 $30,000 $ 30,000Total Project Cost (Present Value in 2013 Dollars) $ 354,000Notes:1. For most projects Main Project cost is construction cost, however Main Project Cost could be bypass pumping or similar costs.2. Percent of Total Main Project Cost3. Cost present only include assessement and initial evaluation. Estimates for the physical repair will be developed after the evaluation has been completed.1.3.013D - 14
Project 1.3.014SCs 1 ‐ 4 ‐ Inf and Eff Gate ReplacemntMain Project TypeKey DatesNew Facility <strong>CAMP</strong> Report Jan‐14Facility Rehabilitation X Initial Estimate Oct‐12Major Maintenance Estimate Update Oct‐12Asset Replacement Const Year 2016Special StudyMain Project Cost (1) Quantity Material Cost Labor CostNo. Units Unit Cost Total % of Mat'l TotalTotal CostProject Task ElementsDemolition 4 $ ‐ $ ‐ ‐ $ 4,840$ 4,840Replace Effluent Gates 4 $ 25,000 $ 100,000 50% $ 50,000$ 150,000Subtotal $ 155,000Contractor Overhead & Profit @ 27% $ 42,000Shipping Rate 5% of total is shipped @ 15% $ 2,000Sales Tax 60% of total is taxed @ 7.75% $ 8,000Project Contingency @ 30% $ 63,000Total Main Project Cost(Year of Estimate or Estimate Update) $ 270,000ENR CCI Corresponding to Year of Estimate 10283ENR CCI Corresponding to <strong>CAMP</strong> Report Year 10283 1.000Total Main Project Cost (<strong>CAMP</strong> Report Year) $ 270,000Project Phases Cost Rate (2) Amount Contingency Subtotal Minimum Total1.3.014 CA Condition Assessment 1.5% $ ‐ 20% $ ‐ $ ‐ $5,000 complete1.3.014 CS Conceptual Study 2.5% $ 2,875 20% $ 575 $ 4,000 $10,000 Not Required1.3.014 DS Design 8.0% $ 16,560 15% $ 2,484 $ 20,000 $20,000 $ 20,0001.3.014 EDC Engr During Construction 4.5% $ 9,315 15% $ 1,397 $ 11,000 $10,000 $ 11,0001.3.014 CM Construction Mgt 7.5% $ 15,525 20% $ 3,105 $ 19,000 $30,000 $ 30,000Total Project Cost (Present Value in 2013 Dollars) $ 331,000Notes:1.3.014D - 15
Project 1.3.015AB Flow Eq Feed and Return Pipeline RehabMain Project TypeKey DatesNew Facility <strong>CAMP</strong> Report Jan‐14Facility Rehabilitation x Initial Estimate Dec‐12Major Maintenance Estimate Update Dec‐12Asset Replacement Const Year ≥2019Special StudyMain Project Cost (1) Quantity Material Cost Labor CostNo. Units Unit Cost Total % of Mat'l TotalTotal CostProject Task ElementsMobilization 1 LS $ 30,000 $ 30,000 0% $ ‐$ 30,000Outage/install plug 1 EA $ 50,000 $ 50,000 0% $ ‐$ 50,000Install isolation gate/valve 1 EA $ 5,000 $ 5,000 100% $ 5,000$ 10,000Replace/Rehab 36‐inch PE EQ Feed 200 LF $ 500 $ 100,000 100% $ 100,000$ 200,000Replace/Rehab 20‐inch PE EQ Return 200 LF $ 240 $ 48,000 100% $ 48,000$ 96,000Subtotal $ 386,000Contractor Overhead & Profit @ 27% $ 105,000Shipping Rate 50% of total is shipped @ 15% $ 29,000Sales Tax 50% of total is taxed @ 7.75% $ 15,000Project Contingency @ 40% $ 214,000Total Main Project Cost(Year of Estimate or Estimate Update) $ 749,000ENR CCI Corresponding to Year of Estimate 10088ENR CCI Corresponding to <strong>CAMP</strong> Report Year, FY 2014 10283 1.019Total Main Project Cost (<strong>CAMP</strong> Report Year) $ 764,000Project Phases Cost Rate (2) Amount Contingency Subtotal Minimum Total1.1.001 CA Condition Assessment 2.5% $ 13,375 20% $ 2,675 $ 16,100 $5,000 $ 10,0001.1.001 CS Conceptual Study 2.5% $ 9,075 20% $ 1,815 $ 11,000 $10,000 $ 20,0001.1.001 DS Design 8.0% $ 42,800 15% $ 6,420 $ 50,000 $20,000 $ 50,0001.1.001 EDC Engr During Construction 4.5% $ 24,075 15% $ 3,611 $ 28,000 $10,000 $ 28,0001.1.001 CM Construction Mgt 7.5% $ 40,125 20% $ 8,025 $ 49,000 $30,000 $ 49,000Total Project Cost (Present Value in 2013 Dollars) $ 921,000Notes:1.3.015D - 16
Project 1.4.004EPS Pipe Lining and Abandoned Pipe Coating RepairMain Project TypeKey DatesNew Facility <strong>CAMP</strong> Report Jan‐14Facility Rehabilitation x Initial Estimate Dec‐12Major Maintenance Estimate Update Dec‐12Asset Replacement Const Year 2019Special StudyMain Project Cost (1) Quantity Material Cost Labor CostNo. Units Unit Cost Total % of Mat'l TotalTotal CostProject Task ElementsMobilization/Demobilization 1 LS 30,000 $ 30,000 0% $ ‐$ 30,000Repair Lining, 60‐inch Disch Piping at EPS 100 LF 1,200 $ 120,000 0% $ ‐$ 120,000Repair Coating60‐inch Abandoned PE Piping in Surge Tower 10 LF 1,200 $ 12,000 0% $ ‐$ 12,000Construction Outages 1 LS 30,000 $ 30,000 0% $ ‐$ 30,000Subtotal $ 192,000Contractor Overhead & Profit @ 27% $ 52,000Shipping Rate 50% of total is shipped @ 15% $ 15,000Sales Tax 50% of total is taxed @ 7.75% $ 8,000Project Contingency @ 40% $ 107,000Total Main Project Cost(Year of Estimate or Estimate Update) $ 374,000ENR CCI Corresponding to Year of Estimate 10088ENR CCI Corresponding to <strong>CAMP</strong> Report Year, FY 2014 10283 1.019Total Main Project Cost (<strong>CAMP</strong> Report Year) $ 382,000Project Phases Cost Rate (2) Amount Contingency Subtotal Minimum Total1.1.001 CA Condition Assessment 0.0% $ ‐ 20% $ ‐ $ ‐ $5,000 complete1.1.001 CS Conceptual Study 0.0% $ ‐ 20% $ ‐ $ ‐ $10,000 not reqd1.1.001 DS Design 0.0% $ ‐ 15% $ ‐ $ ‐ $20,000 $ 30,0001.1.001 EDC Engr During Construction 4.5% $ 12,015 15% $ 1,802 $ 14,000 $10,000 $ 15,0001.1.001 CM Construction Mgt 7.5% $ 20,025 20% $ 4,005 $ 25,000 $30,000 $ 30,000Total Project Cost (Present Value in 2013 Dollars) $ 457,000Notes:1.4.004D - 17
Project 2.1.001Land Outfall Inspection and Cleaning ‐ Internal ‐ PMMain Project TypeKey DatesNew Facility <strong>CAMP</strong> Report Jan‐14Facility Rehabilitation Initial Estimate Nov‐11Major Maintenance Estimate Update Nov‐11Asset Replacement Const Year ≥2019Special StudyXMain Project Cost (1) Quantity Material Cost Labor CostNo. Units Unit Cost Total % of Mat'l TotalTotal CostProject Task ElementsInterior Inspection, debris removal, and minor repair 1 LS $ ‐ 0% $ ‐$ 30,000Subtotal $ 30,000Contractor Overhead & Profit @ 27% $ 9,000Shipping Rate 0% of total is shipped @ 15% IncludedSales Tax 0% of total is taxed @ 7.75% IncludedProject Contingency @ 40% $ 16,000Total Main Project Cost(Year of Estimate or Estimate Update) $ 55,000ENR CCI Corresponding to Year of Estimate 10088ENR CCI Corresponding to <strong>CAMP</strong> Report Year 10283 1.019Total Main Project Cost (<strong>CAMP</strong> Report Year) $ 57,000Project Phases Cost Rate (2) Amount Contingency Subtotal Minimum Total2.1.001 CA Condition Assessment 0.0% $ ‐ 20% $ ‐ $ ‐ $5,000 Included2.1.001 CS Conceptual Study 0.0% $ ‐ 20% $ ‐ $ ‐ $10,000 Not applicable2.1.001 DS Design 0.0% $ ‐ 15% $ ‐ $ ‐ $20,000 Not applicable2.1.001 EDC Engr During Construction 4.5% $ 1,755 15% $ 263 $ 3,000 $10,000 $ 10,0002.1.001 CM Construction Mgt 0.0% $ ‐ 20% $ ‐ $ ‐ $30,000 IncludedTotal Project Cost (Present Value in 2013 Dollars) $ 67,000Notes:1. For most projects Main Project cost is construction cost, however Main Project Cost could be bypass pumping or similar costs.2. Percent of Total Main Project Cost3. Cost provided D. Larson on November 2011, based on 2011 work by Jamison Egr2.1.001D - 18
Project 2.1.002Sea Outfall Inspection and Maintenance ‐ ExternalMain Project TypeKey DatesNew Facility <strong>CAMP</strong> Report Jan‐14Facility Rehabilitation Initial Estimate Nov‐11Major Maintenance X Estimate Update Nov‐11Asset Replacement Const Year 2015, 2017Special StudyMain Project Cost (1) Quantity Material Cost Labor CostNo. Units Unit Cost Total % of Mat'l TotalTotal CostProject Task ElementsUnderwater inspection and minor maintenance 1 LS $ ‐ 0% $ ‐$ 43,000Subtotal $ 43,000Contractor Overhead & Profit @ 27% $ 12,000Shipping Rate 0% of total is shipped @ 15% IncludedSales Tax 0% of total is taxed @ 7.75% IncludedProject Contingency @ 25% $ 14,000Total Main Project Cost(Year of Estimate or Estimate Update) $ 69,000ENR CCI Corresponding to Year of Estimate 10088ENR CCI Corresponding to <strong>CAMP</strong> Report Year 10283 1.019Total Main Project Cost (<strong>CAMP</strong> Report Year) $ 71,000Project Phases Cost Rate (2) Amount Contingency Subtotal Minimum Total2.1.002 CA Condition Assessment (4) 0.0% $ ‐ 20% $ ‐ $ ‐ $5,000 Included2.1.002 CS Conceptual Study 0.0% $ ‐ 20% $ ‐ $ ‐ $10,000 Included2.1.002 DS Design 0.0% $ ‐ 15% $ ‐ $ ‐ $20,000 Not Applicable2.1.002 EDC Engr During Construction 0.0% $ ‐ 15% $ ‐ $ ‐ $10,000 Not Applicable2.1.002 CM Construction Mgt 0.0% $ ‐ 20% $ ‐ $ ‐ $30,000 Not ApplicableTotal Project Cost (Present Value in 2013 Dollars) $ 71,000Notes:1. For most projects Main Project cost is construction cost, however Main Project Cost could be bypass pumping or similar costs.2. Percent of Total Main Project Cost3. Cost estimated.A more detail cost will be available after condition assessment.4. Cost based on last project cost provided by D. Larson December 2011.2.1.002D - 19
Project 2.1.004Sea Outfall Ballast RestorationMain Project TypeKey DatesNew Facility <strong>CAMP</strong> Report Jan‐14Facility Rehabilitation Initial Estimate Nov‐11Major Maintenance X Estimate Update Nov‐11Asset Replacement Const Year 2018Special StudyMain Project Cost (1) Quantity Material Cost Labor CostNo. Units Unit Cost Total % of Mat'l TotalTotal CostProject Task ElementsMobilize Derrek Barge and Rock Barge 1 LS $ 250,000 $ 250,000 0% $ ‐$ 250,000Place new ballast rock4,000 LF * 10 ft wide * 1 ft deep * 165lb/cf 3,300 ton $ 50 $ 165,000 0% $ ‐$ 165,000Subtotal $ 415,000Contractor Overhead & Profit @ 27% $ 113,000Shipping Rate 0% of total is shipped @ 15% IncludedSales Tax 30% of total is taxed @ 7.75% IncludedProject Contingency @ 25% $ 132,000Total Main Project Cost(Year of Estimate or Estimate Update) $ 660,000ENR CCI Corresponding to Year of Estimate 10088ENR CCI Corresponding to <strong>CAMP</strong> Report Year 10283 1.019Total Main Project Cost (<strong>CAMP</strong> Report Year) $ 673,000Project Phases Cost Rate (2) Amount Contingency Subtotal Minimum Total2.1.004 CA Condition Assessment 0.0% $ ‐ 20% $ ‐ $ ‐ $5,000 complete2.1.004 CS Conceptual Study 25.0% $ 61,250 20% $ 12,250 $ 74,000 $10,000 $ 75,0002.1.004 DS Design 8.0% $ 42,240 15% $ 6,336 $ 49,000 $20,000 $ 100,0002.1.004 EDC Engr During Construction 4.5% $ 23,760 15% $ 3,564 $ 28,000 $10,000 $ 50,0002.1.004 CM Construction Mgt 7.5% $ 39,600 20% $ 7,920 $ 48,000 $30,000 $ 50,000Total Project Cost (Present Value in 2013 Dollars) $ 948,000Notes:1. For most projects Main Project cost is construction cost, however Main Project Cost could be bypass pumping or similar costs.2. Percent of Total Main Project Cost3. Cost estimated.A more detail cost will be available after condition assessment.4. Based on information from Alan Alcorn, Moffat and Nichols, Dec 20122.1.004D - 20
Project 2.1.005Sea Outfall Bathymetric Survey ‐ ExternalMain Project TypeKey DatesNew Facility <strong>CAMP</strong> Report Jan‐14Facility Rehabilitation Initial Estimate Dec‐12Major Maintenance Estimate Update Dec‐12Asset Replacement Const Year 2014Special StudyxMain Project Cost (1)Quantity Material Cost Labor CostNo. Units Unit Cost Total % of Mat'l TotalTotal CostProject Task ElementsMob/Demob 1 LS $ 10,000 $ 10,000 0% $ ‐$ 10,000Field Work, equipment and labor 1 LS $ 9,000 $ 9,000 0% $ ‐$ 9,000Data Processing 1 LS $ 10,000 $ 10,000 0% $ ‐$ 10,000Reporting and Charting 1 LS $ 5,000 $ 5,000 0% $ ‐$ 5,000Subtotal $ 34,000Contractor Overhead & Profit @ 27% $ 10,000Shipping Rate 0% of total is shipped @ 15% $ ‐Sales Tax 0% of total is taxed @ 7.75% $ ‐Project Contingency @ 40% $ 18,000Total Main Project Cost(Year of Estimate or Estimate Update) $ 62,000ENR CCI Corresponding to Year of Estimate 10088ENR CCI Corresponding to <strong>CAMP</strong> Report Year, FY 2014 10283 1.019Total Main Project Cost (<strong>CAMP</strong> Report Year) $ 64,000Project Phases Cost Rate (2) Amount Contingency Subtotal Minimum Total1.1.001 CA Condition Assessment 0.0% $ ‐ 20% $ ‐ $ ‐ $5,000 not reqd1.1.001 CS Conceptual Study 0.0% $ ‐ 20% $ ‐ $ ‐ $10,000 included1.1.001 DS Design 0.0% $ ‐ 15% $ ‐ $ ‐ $20,000 $ 10,0001.1.001 EDC Engr During Construction 4.5% $ 1,980 15% $ 297 $ 3,000 $10,000 $ 5,0001.1.001 CM Construction Mgt 7.5% $ 3,300 20% $ 660 $ 4,000 $30,000 $ 10,000Total Project Cost (Present Value in 2013 Dollars) $ 89,000Notes:2.1.005D - 21
Project 3.1.002DAF System ReplacementMain Project TypeKey DatesNew Facility X <strong>CAMP</strong> Report Jan‐14Facility Rehabilitation Initial Estimate Nov‐12Major Maintenance Estimate Update Nov‐12Asset Replacement Const Year ≥2019Special StudyMain Project Cost (1) Quantity Material Cost Labor CostNo. Units Unit Cost Total % of Mat'l TotalTotal CostProject Task ElementsScope of replacement system to be determined after 1 LS $ ‐ 0% $ ‐$ 3,000,000Study.Subtotal $ 3,000,000Contractor Overhead & Profit @ 0% (Included) $‐Shipping Rate 0% of total is shipped @ 15% (Included) $‐Sales Tax 0% of total is taxed @ 7.75% (Included) $‐Project Contingency @ 0% (Included) $‐Total Main Project Cost(Year of Estimate or Estimate Update) $ 3,000,000ENR CCI Corresponding to Year of Estimate 10283ENR CCI Corresponding to <strong>CAMP</strong> Report Year 10283 1.000Total Main Project Cost (<strong>CAMP</strong> Report Year) $ 3,000,000Project Phases Cost Rate (2) Amount Contingency Subtotal Minimum Total3.1.004 CA Condition Assessment 0.0% $ 10,000 20% $ 2,000 $ 12,000 $5,000 not reqd3.1.004 CS Conceptual Study 2.8% $ 83,100 20% $ 16,620 $ 100,000 $10,000 $ 100,0003.1.004 DS Design (4) 8.0% $ 240,000 15% $ 36,000 $ 276,000 $20,000 $ 276,0003.1.004 EDC Engr During Construction (4) 4.5% $ 135,000 15% $ 20,250 $ 156,000 $10,000 $ 156,0003.1.004 CM Construction Mgt 7.5% $ 225,000 20% $ 45,000 $ 270,000 $30,000 $ 270,000Total Project Cost (Present Value in 2013 Dollars) $ 3,802,000Notes:1. For most projects Main Project cost is construction cost, however Main Project Cost could be bypass pumping or similar costs.2. Percent of Total Main Project Cost3. Cost estimate will be further defined after the scope of work is identified.3.1.002D - 22
Project 3.1.003TWAS Pipeline ReplacementMain Project TypeKey DatesNew Facility <strong>CAMP</strong> Report Jan‐14Facility Rehabilitation Initial Estimate Nov‐11Major Maintenance Estimate Update Nov‐11Asset Replacement X Const Year ≥2019Special StudyMain Project Cost (1) Quantity Material Cost Labor CostNo. Units Unit Cost Total % of Mat'l TotalTotal CostProject Task ElementsTWAS Pipeline ‐ Replace pipeline from DAF to Digesters 800 LF $ 200 $ 160,000 100% $ 160,000$ 320,000Subtotal $ 320,000Contractor Overhead & Profit @ 27% $ 87,000Shipping Rate 40% of total is shipped @ 15% $ 20,000Sales Tax 50% of total is taxed @ 7.75% $ 13,000Project Contingency @ 40% $ 176,000Total Main Project Cost(Year of Estimate or Estimate Update) $ 616,000ENR CCI Corresponding to Year of Estimate 10088ENR CCI Corresponding to <strong>CAMP</strong> Report Year 10283 1.019Total Main Project Cost (<strong>CAMP</strong> Report Year) $ 628,000Project Phases Cost Rate (2) Amount Contingency Subtotal Minimum Total3.1.003 CA Condition Assessment 0.0% $ ‐ 20% $ ‐ $ ‐ $5,000 Not Applicable3.1.003 CS Conceptual Study 2.5% $ 7,400 20% $ 1,480 $ 9,000 $10,000 $ 10,0003.1.003 DS Design (4) 8.0% $ 35,200 15% $ 5,280 $ 41,000 $20,000 $ 60,0003.1.003 EDC Engr During Construction (4) 4.5% $ 19,800 15% $ 2,970 $ 23,000 $10,000 $ 30,0003.1.003 CM Construction Mgt 7.5% $ 33,000 20% $ 6,600 $ 40,000 $30,000 $ 40,000Total Project Cost (Present Value in 2013 Dollars) $ 768,000Notes:1. For most projects Main Project cost is construction cost, however Main Project Cost could be bypass pumping or similar costs.2. Percent of Total Main Project Cost3. Cost estimated based on actual pipe length.3.1.003D - 23
Project 3.2.001Biofuel Receiving FaciitiesMain Project TypeKey DatesNew Facility X <strong>CAMP</strong> Report Jan‐14Facility Rehabilitation Initial Estimate Nov‐10Major Maintenance Estimate Update Nov‐12Asset Replacement Const Year 2014Special StudyMain Project Cost (1) Quantity Material Cost Labor CostNo. Units Unit Cost Total % of Mat'l TotalTotal CostProject Task ElementsBiofuel (FOG) receiving tanks w/piping, pumping, odor 1 LS $ 678,000 $ 678,000 64% $ 434,000$ 1,112,000control, connection to Dig 5&6, third mixed gas blower (4)(Previously called Waste to Energy)(In Phase 1 of energy projects)Div 1 costs 1 LS $ 111,000 $ 111,000 0% $ ‐$ 111,000Markup on subs 1 LS $ 30,000 $ 30,000 0% $ ‐$ 30,000Subtotal $ 1,253,000Contractor Overhead & Profit @ 18% $ 226,000Shipping Rate 0% of total is shipped @ 15% IncludedSales Tax 0% of total is taxed @ 7.75% $ 98,000Project Contingency @ 25% $ 395,000Total Main Project Cost(Year of Estimate or Estimate Update) $ 1,972,000ENR CCI Corresponding to Year of Estimate 10283ENR CCI Corresponding to <strong>CAMP</strong> Report Year 10283 1.000Total Main Project Cost (<strong>CAMP</strong> Report Year) $ 1,972,000Project Phases Cost Rate (2) Amount Contingency Subtotal Minimum Total3.2.001 CA Condition Assessment 0.0% $ ‐ 20% $ ‐ $ ‐ $5,000 Not Applicable3.2.001 CS Conceptual Study 0.0% $ ‐ 20% $ ‐ $ ‐ $10,000 Completed3.2.001 DS Design‐Build 15.0% $ 236,550 15% $ 35,483 $ 273,000 $20,000 $ 273,0003.2.001 EDC Engr During Construction 1.5% $ 23,655 15% $ 3,548 $ 28,000 $10,000 included3.2.001 CM Construction Mgt 5.5% $ 86,735 20% $ 17,347 $ 105,000 $30,000 $ 105,000Total Project Cost (Present Value in 2013 Dollars) $ 2,350,000Notes:1. For most projects Main Project cost is construction cost, however Main Project Cost could be bypass pumping or similar costs.2. Percent of Total Main Project Cost3. Costs based on 2010 Energy Management Strategic Plan Update dated 11/30/2010.4. Cost from Kennedy Jenks Report is $1M ‐ 1.5M for Grease Receiving and Storage Facilities3.2.001D - 24
Project 3.2.004Sludge Screening FacilityMain Project TypeKey DatesNew Facility X <strong>CAMP</strong> Report Jan‐14Facility Rehabilitation Initial Estimate Apr‐10Major Maintenance Estimate Update Apr‐10Asset Replacement Const Year ≥2019Special StudyMain Project Cost (1) Quantity Material Cost Labor CostNo. Units Unit Cost Total % of Mat'l TotalTotal CostProject Task ElementsTempoary Utilities 1 LS $ ‐ 0% $ ‐$ 16,000Sludge Screening Platform 1 LS $ ‐ 0% $ ‐$ 70,660Strainpress 1 LS $ ‐ 0% $ ‐$ 350,000Sludge Feed Pump 1 LS $ ‐ 0% $ ‐$ 94,990Grinder 1 LS $ ‐ 0% $ ‐$ 39,200Odor Control 1 LS $ ‐ 0% $ ‐$ 8,638Mechanical Piping and Valves 1 LS $ ‐ 0% $ ‐$ 35,925Instrumentation 1 LS $ ‐ 0% $ ‐$ 3,000Electrical 1 LS $ ‐ 0% $ ‐$ 22,500Debris Collection Room 1 LS $ ‐ 0% $ ‐$ 36,850Subtotal $ 678,000Contractor Overhead & Profit @ 27% $ 184,000Shipping Rate 50% of total is shipped @ 15% $ 51,000Sales Tax 75% of total is taxed @ 7.75% $ 40,000Project Contingency @ 25% $ 239,000Total Main Project Cost(Year of Estimate or Estimate Update) $ 1,192,000ENR CCI Corresponding to Year of Estimate 9772ENR CCI Corresponding to <strong>CAMP</strong> Report Year 10283 1.052Total Main Project Cost (<strong>CAMP</strong> Report Year) $ 1,255,000Project Phases Cost Rate (2) Amount Contingency Subtotal Minimum Total3.2.004 CA Condition Assessment 1.5% $ 14,295 20% $ 2,859 $ 18,000 $5,000 Complete3.2.004 CS Conceptual Study 2.5% $ 12,850 20% $ 2,570 $ 16,000 $10,000 Complete3.2.004 DS Design 9.1% $ 86,723 15% $ 13,008 $ 100,000 $20,000 $ 100,0003.2.004 EDC Engr During Construction 4.5% $ 42,885 15% $ 6,433 $ 50,000 $10,000 $ 50,0003.2.004 CM Construction Mgt 7.5% $ 71,475 20% $ 14,295 $ 86,000 $30,000 $ 86,000Total Project Cost (Present Value in 2013 Dollars) $ 1,491,000Notes:1. For most projects Main Project cost is construction cost, however Main Project Cost could be bypass pumping or similar costs.2. Percent of Total Main Project Cost3. Cost estimate based on April 26, 2010 Black & Veatch Screening Facility Basis of Design Report3.2.004D - 25
Project 3.2.009Digester No. 4 Cover ‐ Interior CoatingMain Project TypeKey DatesNew Facility <strong>CAMP</strong> Report Jan‐14Facility Rehabilitation X Initial Estimate Oct‐12Major Maintenance Estimate Update Oct‐12Asset Replacement Const Year 2014Special StudyMain Project Cost (1) Quantity Material Cost Labor CostNo. Units Unit Cost Total % of Mat'l TotalTotal CostProject Task ElementsMob/Dembo 1 LS $ 25,000 $ 25,000 0% $ ‐$ 25,000Digester Dewatering 1 LS $ 25,000 $ 25,000 0% $ ‐$ 25,000Digester Debris Removal 1 LS $ 15,000 $ 15,000 0% $ ‐$ 15,000Surface Preperation/Repairs ‐ Cover 9,000 SF $ 5 $ 45,000 0% $ ‐$ 45,000Coating ‐ Cover 9,000 SF $ 12 $ 108,000 0% $ ‐$ 108,000Surface Preperation ‐ Interior Piping 1 LS $ 10,000 $ 10,000 0% $ ‐$ 10,000Coating ‐ Interior Piping 1 LS $ 25,000 $ 25,000 0% $ ‐$ 25,000Scaffolding 1 LS $ 25,000 $ 25,000 0% $ ‐$ 25,000Subtotal $ 253,000Contractor Overhead & Profit @ 27% includedShipping Rate 5% of total is shipped @ 15% includedSales Tax 50% of total is taxed @ 7.75% includedProject Contingency @ 25% $ 64,000Total Main Project Cost(Year of Estimate or Estimate Update) $ 317,000ENR CCI Corresponding to Year of Estimate 10283ENR CCI Corresponding to <strong>CAMP</strong> Report Year 10283 1.000Total Main Project Cost (<strong>CAMP</strong> Report Year) $ 317,000Project Phases Cost Rate (2) Amount Contingency Subtotal Minimum Total3.2.009 CA Condition Assessment 1.5% $ 3,795 20% $ 759 $ 5,000 $5,000 complete3.2.009 CS Conceptual Study 2.5% $ 1,600 20% $ 320 $ 2,000 $10,000 Not Required3.2.009 DS Design 8.0% $ 20,240 15% $ 3,036 $ 24,000 $20,000 $ 20,0003.2.009 EDC Engr During Construction 4.5% $ 11,385 15% $ 1,708 $ 14,000 $10,000 $ 10,0003.2.009 CM Construction Mgt 7.5% $ 18,975 20% $ 3,795 $ 23,000 $30,000 $ 20,000Total Project Cost (Present Value in 2013 Dollars) $ 367,000Notes:1. For most projects Main Project cost is construction cost, however Main Project Cost could be bypass pumping or similar costs.2. Percent of Total Main Project Cost3. Estimates based on digester cleaning bid results from District and Yucaipa Valley Water District and EWA.4. Estimates based on digester cover coating estimates Novato Sanitary District and Yucaipa Valley Water District.3.2.009D - 26
Project 3.2.010Digester No. 5 and 6 Covers ‐ Interior CoatingMain Project TypeKey DatesNew Facility <strong>CAMP</strong> Report Jan‐14Facility Rehabilitation X Initial Estimate Oct‐12Major Maintenance Estimate Update Oct‐12Asset Replacement Const Year 2014Special StudyMain Project Cost (1) Quantity Material Cost Labor CostNo. Units Unit Cost Total % of Mat'l TotalTotal CostProject Task ElementsMob/Dembo 1 LS $ 50,000 $ 50,000 0% $ ‐$ 50,000Digester Dewatering 2 LS $ 25,000 $ 50,000 0% $ ‐$ 50,000Digester Debris Removal 2 LS $ 15,000 $ 30,000 0% $ ‐$ 30,000Surface Preperation/Repairs ‐ Cover 18,000 SF $ 5 $ 90,000 0% $ ‐$ 90,000Coating ‐ Cover 18,000 SF $ 12 $ 216,000 0% $ ‐$ 216,000Surface Preperation ‐ Interior Piping 1 LS $ 10,000 $ 10,000 0% $ ‐$ 10,000Coating ‐ Interior Piping 1 LS $ 25,000 $ 25,000 0% $ ‐$ 25,000Scaffolding 2 LS $ 25,000 $ 50,000 0% $ ‐$ 50,000Subtotal $ 471,000Contractor Overhead & Profit @ 27% $ 128,000Shipping Rate 5% of total is shipped @ 15% $ 4,000Sales Tax 50% of total is taxed @ 7.75% $ 19,000Project Contingency @ 25% $ 156,000Total Main Project Cost(Year of Estimate or Estimate Update) $ 778,000ENR CCI Corresponding to Year of Estimate 10283ENR CCI Corresponding to <strong>CAMP</strong> Report Year 10283 1.000Total Main Project Cost (<strong>CAMP</strong> Report Year) $ 778,000Project Phases Cost Rate (2) Amount Contingency Subtotal Minimum Total3.2.007 CA Condition Assessment 1.5% $ 9,330 20% $ 1,866 $ 12,000 $5,000 $ 12,0003.2.007 CS Conceptual Study 2.5% $ 7,675 20% $ 1,535 $ 10,000 $10,000 Not Required3.2.007 DS Design 8.0% $ 49,760 15% $ 7,464 $ 58,000 $20,000 $ 30,0003.2.007 EDC Engr During Construction 4.5% $ 27,990 15% $ 4,199 $ 33,000 $10,000 $ 10,0003.2.007 CM Construction Mgt 7.5% $ 46,650 20% $ 9,330 $ 56,000 $30,000 $ 30,000Total Project Cost (Present Value in 2013 Dollars) $ 860,000Notes:1. For most projects Main Project cost is construction cost, however Main Project Cost could be bypass pumping or similar costs.2. Percent of Total Main Project Cost3. Estimates based on digester cleaning bid results from District and Yucaipa Valley Water District and EWA.4. Estimates based on digester cover coating estimates Novato Sanitary District and Yucaipa Valley Water District.3.2.010D - 27
Project 3.3.002Pellet Storage Facility ImprovementsMain Project TypeKey DatesNew Facility X <strong>CAMP</strong> Report Jan‐14Facility Rehabilitation Initial Estimate Apr‐11Major Maintenance Estimate Update Nov‐11Asset Replacement Const Year 2014Special StudyMain Project Cost (1) Quantity Material Cost Labor CostNo. Units Unit Cost Total % of Mat'l TotalTotal CostProject Task ElementsCarbon Steel Conveyor with stainless steel cover 20 FT $ 500 $ 10,000 100% $ 10,000$ 20,000Building wall penerations and modifications 1 LS $ 20,000 $ 20,000 0% $ ‐$ 20,000New pellet transporter 1 LS $ 40,000 $ 40,000 100% $ 40,000$ 80,000New air compressor/air storage tank 1 LS $ 20,000 $ 20,000 100% $ 20,000$ 40,000Enclosure to house transporter and compressor 1 LS $ 20,000 $ 20,000 100% $ 20,000$ 40,000Connection from new transporter and compressor 1 LS $ 10,000 $ 10,000 0% $ ‐$ 10,000Electrical 1 LS $ 25,000 $ 25,000 0% $ ‐$ 25,000Temperature monitoring probes 1 LS $ 10,000 $ 10,000 100% $ 10,000$ 20,000Subtotal $ 255,000Contractor Overhead & Profit @ 27% $ 69,000Shipping Rate 40% of total is shipped @ 15% $ 16,000Sales Tax 50% of total is taxed @ 7.75% $ 10,000Project Contingency @ 40% $ 140,000Total Main Project Cost(Year of Estimate or Estimate Update) $ 490,000ENR CCI Corresponding to Year of Estimate 10045ENR CCI Corresponding to <strong>CAMP</strong> Report Year 10283 1.024Total Main Project Cost (<strong>CAMP</strong> Report Year) $ 502,000Project Phases Cost Rate (2) Amount Contingency Subtotal Minimum Total3.3.002 CA Condition Assessment 0.0% $ ‐ 20% $ ‐ $ ‐ $5,000 Not Applicable3.3.002 CS Conceptual Study 0.0% $ ‐ 20% $ ‐ $ ‐ $10,000 Completed3.3.002 DS Design 8.0% $ 28,000 15% $ 4,200 $ 33,000 $20,000 $ 33,0003.3.002 EDC Engr During Construction 4.5% $ 15,750 15% $ 2,363 $ 19,000 $10,000 $ 19,0003.3.002 CM Construction Mgt 7.5% $ 26,250 20% $ 5,250 $ 32,000 $30,000 $ 32,000Total Project Cost (Present Value in 2013 Dollars) $ 586,000Notes:1. For most projects Main Project cost is construction cost, however Main Project Cost could be bypass pumping or similar costs.2. Percent of Total Main Project Cost3. Costs from RMC's Pellet Recycle Option TM, Option 3. Rev Date April 2011.3.3.002D - 28
Project 3.3.003Struvite Control FacilitiesMain Project TypeKey DatesNew Facility X <strong>CAMP</strong> Report Jan‐14Facility Rehabilitation Initial Estimate Jan‐11Major Maintenance Estimate Update Sep‐12Asset Replacement Const Year ≥2019Special StudyMain Project Cost (1) Quantity Material Cost Labor CostNo. Units Unit Cost Total % of Mat'l TotalTotal CostProject Task ElementsProvide facilities for Struvite Control design‐buildBuilding Modifications 1 LS $ ‐ $ ‐ 0% $ ‐$ 246,225Equipment 1 LS $ ‐ $ ‐ 0% $ ‐$ 1,349,865Mechanical and Electrical Installation 1 LS $ ‐ $ ‐ 0% $ ‐$ 743,750Commissioning and Testing 1 LS $ ‐ $ ‐ 0% $ ‐$ 95,465Bonding 1 LS $ ‐ $ ‐ 0% $ ‐$ 150,000Commincation System Change (Adder) 1 LS $ ‐ $ ‐ 0% $ ‐$ 36,400Change from CO2 based control to sulfuric acid control (Adde 1 LS $ ‐ $ ‐ 0% $ ‐$ 28,210Subtotal $ 2,650,000Contractor Overhead & Profit @ 27% IncludedShipping Rate 40% of total is shipped @ 15% IncludeddSales Tax 50% of total is taxed @ 7.75% $ 103,000Project Contingency @ 15% $ 413,000Total Main Project Cost(Year of Estimate or Estimate Update) $ 3,166,000ENR CCI Corresponding to Year of Estimate 10285ENR CCI Corresponding to <strong>CAMP</strong> Report Year 10283 1.000Total Main Project Cost (<strong>CAMP</strong> Report Year) $ 3,166,000Project Phases Cost Rate (2) Amount Contingency Subtotal Minimum Total3.3.003 CA Condition Assessment 0.0% $ ‐ 20% $ ‐ $ ‐ $5,000 Not Applicable3.3.003 CS Conceptual Study 0.0% $ ‐ 20% $ ‐ $ ‐ $10,000 Completed3.3.003 DS Design 0.0% $ ‐ 15% $ ‐ $ ‐ $288,384 $ 288,3843.3.003 EDC Engr During Construction 4.5% $ 123,885 15% $ 18,583 $ 143,000 $10,000 $ 143,0003.3.003 CM Construction Mgt 0.0% $ ‐ 20% $ ‐ $ ‐ $113,344 $ 113,344Total Project Cost (Present Value in 2013 Dollars) $ 3,710,728Notes:1. For most projects Main Project cost is construction cost, however Main Project Cost could be bypass pumping or similar costs.2. Percent of Total Main Project Cost3. Estimated cost based on Ostara facility, April 2012.3.3.003D - 29
Project 3.3.005Cake Pump ImprovementsMain Project TypeKey DatesNew Facility <strong>CAMP</strong> Report Jan‐14Facility Rehabilitation X Initial Estimate Jan‐11Major Maintenance Estimate Update Nov‐11Asset Replacement Const Year ≥2019Special StudyMain Project Cost (1) Quantity Material Cost Labor CostNo. Units Unit Cost Total % of Mat'l TotalTotal CostProject Task ElementsPhase I ‐ Installation of an annular lubrication system 1 LS $ ‐ $ ‐ 0% $ ‐$ 80,600using polymer versus the current water systemPhase II ‐ Modify the throat and feed to the cake pumps 1 LS $ ‐ $ ‐ 0% $ ‐$ 151,200Subtotal $ 232,000Contractor Overhead & Profit @ 27% $ 63,000Shipping Rate 40% of total is shipped @ 15% $ 14,000Sales Tax 50% of total is taxed @ 7.75% $ 9,000Project Contingency @ 25% $ 80,000Total Main Project Cost(Year of Estimate or Estimate Update) $ 398,000ENR CCI Corresponding to Year of Estimate 10088ENR CCI Corresponding to <strong>CAMP</strong> Report Year 10283 1.019Total Main Project Cost (<strong>CAMP</strong> Report Year) $ 406,000Project Phases Cost Rate (2) Amount Contingency Subtotal Minimum Total3.3.005 CA Condition Assessment 0.0% $ ‐ 20% $ ‐ $ ‐ $5,000 Not Applicable3.3.005 CS Conceptual Study 0.0% $ ‐ 20% $ ‐ $ ‐ $10,000 Completed3.3.005 DS Design 8.0% $ 25,440 15% $ 3,816 $ 30,000 $20,000 $ 30,0003.3.005 EDC Engr During Construction 4.5% $ 14,310 15% $ 2,147 $ 17,000 $10,000 $ 17,0003.3.005 CM Construction Mgt 7.5% $ 23,850 20% $ 4,770 $ 29,000 $30,000 $ 30,000Total Project Cost (Present Value in 2013 Dollars) $ 483,000Notes:1. For most projects Main Project cost is construction cost, however Main Project Cost could be bypass pumping or similar costs.2. Percent of Total Main Project Cost3. Estimated cost based on Sludge Cake Pumping Alternative Study by Dudek , January 2012.3.3.005D - 30
Project 3.3.007Centrifuges Major MaintenanceMain Project TypeKey DatesNew Facility <strong>CAMP</strong> Report Jan‐14Facility Rehabilitation X Initial Estimate Nov‐12Major Maintenance Estimate Update Nov‐12Asset Replacement Const Year 2018Special StudyMain Project Cost (1) Quantity Material Cost Labor CostNo. Units Unit Cost Total % of Mat'l TotalTotal CostProject Task ElementsCentrifuges Major Maintenance 1 LS $ 153,500Subtotal $ 154,000Contractor Overhead & Profit @ 27% $ 42,000Shipping Rate 50% of total is shipped @ 15% $ 12,000Sales Tax 50% of total is taxed @ 7.75% $ 6,000Project Contingency @ 40% $ 86,000Total Main Project Cost(Year of Estimate or Estimate Update) $ 300,000ENR CCI Corresponding to Year of Estimate 10283ENR CCI Corresponding to <strong>CAMP</strong> Report Year, FY 2014 10283 1.000Total Main Project Cost (<strong>CAMP</strong> Report Year) $ 300,000Project Phases Cost Rate (2) Amount Contingency Subtotal Minimum Total1.1.001 CA Condition Assessment 0.0% $ ‐ 20% $ ‐ $ ‐ $5,000 $ 30,0001.1.001 CS Conceptual Study 0.0% $ ‐ 20% $ ‐ $ ‐ $10,000 $ 30,0001.1.001 DS Design 0.0% $ ‐ 15% $ ‐ $ ‐ $20,000 $ 50,0001.1.001 EDC Engr During Construction 0.0% $ ‐ 15% $ ‐ $ ‐ $10,000 $ 10,0001.1.001 CM Construction Mgt 0.0% $ ‐ 20% $ ‐ $ ‐ $30,000 $ 10,000Total Project Cost (Present Value in 2013 Dollars) $ 430,000Notes:3.3.007D - 31
Project 3.3.008Dryer Major MaintenanceMain Project TypeKey DatesNew Facility <strong>CAMP</strong> Report Jan‐14Facility Rehabilitation Initial Estimate Nov‐11Major Maintenance Estimate Update Oct‐12Asset Replacement X Const Year 2018Special StudyMain Project Cost (1) Quantity Material Cost Labor CostNo. Units Unit Cost Total % of Mat'l TotalTotal CostProject Task ElementsManufacturer provided major repairs/replacement partsinclude the following:Stators 1 LS $ 90,169 $ 90,169 50% $ 45,085$ 135,254Elevator Gear Box 1 LS $ 3,376 $ 3,376 50% $ 1,688$ 5,064Centrifuge Repairs 1 LS $ 9,783 $ 9,783 50% $ 4,892$ 14,675Rupture Disc 1 LS $ 43,598 $ 43,598 50% $ 21,799$ 65,397Shaker Motors 1 LS $ 2,806 $ 2,806 50% $ 1,403$ 4,209Plow Heads 1 LS $ 39,203 $ 39,203 50% $ 19,602$ 58,805Cake Pump Rebuild spares 1 LS $ 15,286 $ 15,286 50% $ 7,643$ 22,929Mist Eliminator Panels 1 LS $ 10,398 $ 10,398 50% $ 5,199$ 15,597Bag House Filter Socks 1 LS $ 1,363 $ 1,363 50% $ 682$ 2,045Slide Gate Repair Parts 1 LS $ 4,771 $ 4,771 50% $ 2,386$ 7,157Recirc. Pump Feed Pit Spares 1 LS $ 5,128 $ 5,128 50% $ 2,564$ 7,692Misc. IE belts, hoses, gauges 1 LS $ 21,024 $ 21,024 50% $ 10,512$ 31,536Compressor and Air Dryer (redundancy) 1 LS $ 28,653 $ 28,653 50% $ 14,327$ 42,980Subtotal $ 414,000Contractor Overhead & Profit @ 27% $ 112,000Shipping Rate 67% of total is shipped @ 15% $ 42,000Sales Tax 67% of total is taxed @ 7.75% $ 22,000Project Contingency @ 25% $ 148,000Total Main Project Cost(Year of Estimate or Estimate Update) $ 738,000ENR CCI Corresponding to Year of Estimate 10088ENR CCI Corresponding to <strong>CAMP</strong> Report Year 10283 1.019Total Main Project Cost (<strong>CAMP</strong> Report Year) $ 753,000Project Phases Cost Rate (2) Amount Contingency Subtotal Minimum Total3.3.008 CA Condition Assessment 1.5% $ 8,850 20% $ 1,770 $ 11,000 $5,000 complete3.3.008 CS Conceptual Study 2.5% $ 8,100 20% $ 1,620 $ 10,000 $10,000 $ 10,0003.3.008 DS Design 8.0% $ 47,200 15% $ 7,080 $ 55,000 $20,000 $ 55,0003.3.008 EDC Engr During Construction 4.5% $ 26,550 15% $ 3,983 $ 31,000 $10,000 $ 31,0003.3.008 CM Construction Mgt 7.5% $ 44,250 20% $ 8,850 $ 54,000 $30,000 $ 54,000Total Project Cost (Present Value in 2013 Dollars) $ 903,000Notes:1. Estimates based on the March 6‐8, 2012 Andritz Service Report.3.3.008 D - 32
Project 3.3.009Drying Safety UpgradesMain Project TypeKey DatesNew Facility <strong>CAMP</strong> Report Jan‐14Facility Rehabilitation Initial Estimate Nov‐11Major Maintenance Estimate Update Nov‐11Asset Replacement Const Year 2015Special StudyXMain Project Cost (1) Quantity Material Cost Labor CostNo. Units Unit Cost Total % of Mat'l TotalTotal CostProject Task ElementsHeat Drying Safety Upgrades 1 LS $ ‐ 0% $ ‐$ 1,000,000Subtotal $ 1,000,000Contractor Overhead & Profit @ 27% $ 270,000Shipping Rate 40% of total is shipped @ 15% $ 60,000Sales Tax 50% of total is taxed @ 7.75% $ 39,000Project Contingency @ 40% $ 548,000Total Main Project Cost(Year of Estimate or Estimate Update) $ 1,917,000ENR CCI Corresponding to Year of Estimate 10088ENR CCI Corresponding to <strong>CAMP</strong> Report Year 10283 1.019Total Main Project Cost (<strong>CAMP</strong> Report Year) $ 1,955,000Project Phases Cost Rate (2) Amount Contingency Subtotal Minimum Total3.3.009 CA Condition Assessment 0.0% $ ‐ 20% $ ‐ $ ‐ $5,000 Not Applicable3.3.009 CS Conceptual Study 2.5% $ 22,925 20% $ 4,585 $ 28,000 $10,000 Complete3.3.009 DS Design 8.0% $ 109,520 15% $ 16,428 $ 126,000 $20,000 $ 126,0003.3.009 EDC Engr During Construction 4.5% $ 61,605 15% $ 9,241 $ 71,000 $10,000 $ 71,0003.3.009 CM Construction Mgt 7.5% $ 102,675 20% $ 20,535 $ 124,000 $30,000 $ 124,000Total Project Cost (Present Value in 2013 Dollars) $ 2,276,000Notes:1. For most projects Main Project cost is construction cost, however Main Project Cost could be bypass pumping or similar costs.2. Percent of Total Main Project Cost3. Estimated cost. A more detailed cost estimate will be available after completion of the FY 2013 study.3.3.009D - 33
Project 3.3.010Drying Building Coded LocksMain Project TypeKey DatesNew Facility <strong>CAMP</strong> Report Jan‐14Facility Rehabilitation Initial Estimate Nov‐11Major Maintenance Estimate Update Nov‐11Asset Replacement X Const Year 2014Special StudyMain Project Cost (1) Quantity Material Cost Labor CostNo. Units Unit Cost Total % of Mat'l TotalTotal CostProject Task ElementsReplace existing door locks with coded locks 9 EA $ 2,500 $ 22,500 40% $ 9,000$ 32,000Subtotal $ 32,000Contractor Overhead & Profit @ 0% $‐Shipping Rate 70% of total is shipped @ 15% $ 3,000Sales Tax 70% of total is taxed @ 7.75% $ 2,000Project Contingency @ 25% $ 9,000Total Main Project Cost(Year of Estimate or Estimate Update) $ 46,000ENR CCI Corresponding to Year of Estimate 10283ENR CCI Corresponding to <strong>CAMP</strong> Report Year 10283 1.000Total Main Project Cost (<strong>CAMP</strong> Report Year) $ 46,000Project Phases Cost Rate (2) Amount Contingency Subtotal Minimum Total3.3.010 CA Condition Assessment 0.0% $ ‐ 20% $ ‐ $ ‐ $5,000 Not Applicable3.3.010 CS Conceptual Study 0.0% $ ‐ 20% $ ‐ $ ‐ $10,000 Not Applicable3.3.010 DS Design 0.0% $ ‐ 15% $ ‐ $ ‐ $20,000 Not Applicable3.3.010 EDC Engr During Construction 0.0% $ ‐ 15% $ ‐ $ ‐ $10,000 Not Applicable3.3.010 CM Construction Mgt 0.0% $ ‐ 20% $ ‐ $ ‐ $30,000 Not ApplicableTotal Project Cost (Present Value in 2013 Dollars) $ 46,000Notes:1. For most projects Main Project cost is construction cost, however Main Project Cost could be bypass pumping or similar costs.2. Percent of Total Main Project Cost3. Estimated cost. Assume 9 doors, not connected with SCADA. PAR Project.3.3.010D - 34
Project 3.3.012RTO Media ReplacementMain Project TypeKey DatesNew Facility <strong>CAMP</strong> Report Jan‐14Facility Rehabilitation Initial Estimate Nov‐11Major Maintenance X Estimate Update Nov‐11Asset Replacement Const Year 2014, 2016, 2018Special StudyMain Project Cost (1) Quantity Material Cost Labor CostNo. Units Unit Cost Total % of Mat'l TotalTotal CostProject Task ElementsRTO Scheduled Maintenance/Media Replacement 1 LS $ ‐ 0% $ ‐$ 50,000Subtotal $ 50,000Contractor Overhead & Profit @ 27% $ 14,000Shipping Rate 40% of total is shipped @ 15% $ 3,000Sales Tax 50% of total is taxed @ 7.75% $ 2,000Project Contingency @ 40% $ 28,000Total Main Project Cost(Year of Estimate or Estimate Update) $ 97,000ENR CCI Corresponding to Year of Estimate 10283ENR CCI Corresponding to <strong>CAMP</strong> Report Year 10283 1.000Total Main Project Cost (<strong>CAMP</strong> Report Year) $ 97,000Project Phases Cost Rate (2) Amount Contingency Subtotal Minimum Total3.3.012 CA Condition Assessment 0.0% $ ‐ 20% $ ‐ $ ‐ $5,000 Not Applicable3.3.012 CS Conceptual Study 0.0% $ ‐ 20% $ ‐ $ ‐ $10,000 Not Applicable3.3.012 DS Design 0.0% $ ‐ 15% $ ‐ $ ‐ $20,000 Not Applicable3.3.012 EDC Engr During Construction 0.0% $ ‐ 15% $ ‐ $ ‐ $10,000 Not Applicable3.3.012 CM Construction Mgt 7.5% $ 5,175 20% $ 1,035 $ 7,000 $30,000 $ 30,000Total Project Cost (Present Value in 2013 Dollars) $ 127,000Notes:1. For most projects Main Project cost is construction cost, however Main Project Cost could be bypass pumping or similar costs.2. Percent of Total Main Project Cost3. Estimated Costs. Need to confirm with EWA staff.3.3.012D - 35
Project 3.3.014RTO Flush Drain RelocationMain Project TypeKey DatesNew Facility <strong>CAMP</strong> Report Jan‐14Facility Rehabilitation Initial Estimate Nov‐11Major Maintenance Estimate Update Nov‐11Asset Replacement X Const Year 2014Special StudyMain Project Cost (1) Quantity Material Cost Labor CostNo. Units Unit Cost Total % of Mat'l TotalTotal CostProject Task ElementsRTO Flush Drain Relocation 50 LF $ 200 $ 10,000 50% $ 5,000$ 15,000Miscellaneous Structural Repairs 1 LS $ ‐ $ ‐ 0% $ ‐$ 50,000Subtotal $ 65,000Contractor Overhead & Profit @ 27% $ 18,000Shipping Rate 40% of total is shipped @ 15% $ 4,000Sales Tax 50% of total is taxed @ 7.75% $ 3,000Project Contingency @ 40% $ 36,000Total Main Project Cost(Year of Estimate or Estimate Update) $ 126,000ENR CCI Corresponding to Year of Estimate 10283ENR CCI Corresponding to <strong>CAMP</strong> Report Year 10283 1.000Total Main Project Cost (<strong>CAMP</strong> Report Year) $ 126,000Project Phases Cost Rate (2) Amount Contingency Subtotal Minimum Total3.3.014 CA Condition Assessment 0.0% $ ‐ 20% $ ‐ $ ‐ $5,000 Not Applicable3.3.014 CS Conceptual Study 2.5% $ 1,525 20% $ 305 $ 2,000 $10,000 In progress3.3.014 DS Design 8.0% $ 7,200 15% $ 1,080 $ 9,000 $20,000 In progress3.3.014 EDC Engr During Construction 4.5% $ 4,050 15% $ 608 $ 5,000 $10,000 $ 10,0003.3.014 CM Construction Mgt 7.5% $ 6,750 20% $ 1,350 $ 9,000 $30,000 $ 30,000Total Project Cost (Present Value in 2013 Dollars) $ 166,000Notes:1. For most projects Main Project cost is construction cost, however Main Project Cost could be bypass pumping or similar costs.2. Percent of Total Main Project Cost3. Estimated cost. A better detial will be available after Conceptual Study. The project involves cutting into RTO and undergound piping to DAF.3.3.014D - 36
Project 3.3.019Centrifute Drive ReplacementMain Project TypeKey DatesNew Facility <strong>CAMP</strong> Report Jan‐14Facility Rehabilitation Initial Estimate Nov‐12Major Maintenance Estimate Update Nov‐12Asset Replacement X Const Year 2016Special StudyMain Project Cost (1) Quantity Material Cost Labor CostNo. Units Unit Cost Total % of Mat'l TotalTotal CostProject Task ElementsCentrifute Drive Replacement $ 200,000Subtotal $ 200,000Contractor Overhead & Profit @ 0% (Included) $ ‐Shipping Rate 0% of total is shipped @ 15% (Included) $ ‐Sales Tax 0% of total is taxed @ 7.75% (Included) $ ‐Project Contingency @ 0% (Included) $ ‐Total Main Project Cost(Year of Estimate or Estimate Update) $ 200,000ENR CCI Corresponding to Year of Estimate 10283ENR CCI Corresponding to <strong>CAMP</strong> Report Year, FY 2014 10283 1.000Total Main Project Cost (<strong>CAMP</strong> Report Year) $ 200,000Project Phases Cost Rate (2) Amount Contingency Subtotal Minimum Total1.1.001 CA Condition Assessment 0.0% $ ‐ 20% $ ‐ $ ‐ $5,000 Not Applicable1.1.001 CS Conceptual Study 0.0% $ ‐ 20% $ ‐ $ ‐ $10,000 $ 20,0001.1.001 DS Design 0.0% $ ‐ 15% $ ‐ $ ‐ $20,000 $ 20,0001.1.001 EDC Engr During Construction 0.0% $ ‐ 15% $ ‐ $ ‐ $10,000 $ 9,0001.1.001 CM Construction Mgt 0.0% $ ‐ 20% $ ‐ $ ‐ $30,000 $ 15,000Total Project Cost (Present Value in 2013 Dollars) $ 264,000Notes:3.3.019D - 37
Project 3.3.020Dryer Drum RehabilitationMain Project TypeKey DatesNew Facility <strong>CAMP</strong> Report Jan‐14Facility Rehabilitation X Initial Estimate Nov‐12Major Maintenance Estimate Update Nov‐12Asset Replacement Const Year 2014Special StudyMain Project Cost (1) Quantity Material Cost Labor CostNo. Units Unit Cost Total % of Mat'l TotalTotal CostProject Task ElementsDryer Drum Rehabilitation 1 LS $ 55,000Subtotal $ 55,000Contractor Overhead & Profit @ 0% (Included) $‐Shipping Rate 0% of total is shipped @ 15% (Included) $‐Sales Tax 0% of total is taxed @ 7.75% (Included) $‐Project Contingency @ 0% (Included) $‐Total Main Project Cost(Year of Estimate or Estimate Update) $ 55,000ENR CCI Corresponding to Year of Estimate 10283ENR CCI Corresponding to <strong>CAMP</strong> Report Year, FY 2014 10283 1.000Total Main Project Cost (<strong>CAMP</strong> Report Year) $ 55,000Project Phases Cost Rate (2) Amount Contingency Subtotal Minimum Total1.1.001 CA Condition Assessment 0.0% $ ‐ 20% $ ‐ $ ‐ $5,000 Not Applicable1.1.001 CS Conceptual Study 0.0% $ ‐ 20% $ ‐ $ ‐ $10,000 $ 10,0001.1.001 DS Design 0.0% $ ‐ 15% $ ‐ $ ‐ $20,000 Not Applicable1.1.001 EDC Engr During Construction 4.5% $ 2,475 15% $ 371 $ 3,000 $10,000 Not Applicable1.1.001 CM Construction Mgt 7.5% $ 4,125 20% $ 825 $ 5,000 $30,000 Not ApplicableTotal Project Cost (Present Value in 2013 Dollars) $ 65,000Notes:3.3.020D - 38
Project 4.1.001Cogeneration Communications RedundancyMain Project TypeKey DatesNew Facility X <strong>CAMP</strong> Report Jan‐14Facility Rehabilitation Initial Estimate Nov‐11Major Maintenance Estimate Update Nov‐11Asset Replacement Const Year 2018Special StudyMain Project Cost (1) Quantity Material Cost Labor CostNo. Units Unit Cost Total % of Mat'l TotalTotal CostProject Task ElementsRedundancy for cogeneration communciation system 1 LS $ ‐ 0% $ ‐$ 100,000Subtotal $ 100,000Contractor Overhead & Profit @ 27% $ 27,000Shipping Rate 40% of total is shipped @ 15% $ 6,000Sales Tax 50% of total is taxed @ 7.75% $ 4,000Project Contingency @ 40% $ 55,000Total Main Project Cost(Year of Estimate or Estimate Update) $ 192,000ENR CCI Corresponding to Year of Estimate 10283ENR CCI Corresponding to <strong>CAMP</strong> Report Year 10283 1.000Total Main Project Cost (<strong>CAMP</strong> Report Year) $ 192,000Project Phases Cost Rate (2) Amount Contingency Subtotal Minimum Total4.1.001 CA Condition Assessment 0.0% $ ‐ 20% $ ‐ $ ‐ $5,000 Not Applicable4.1.001 CS Conceptual Study 0.0% $ ‐ 20% $ ‐ $ ‐ $10,000 $ 10,0004.1.001 DS Design 0.0% $ ‐ 15% $ ‐ $ ‐ $20,000 $ 20,0004.1.001 EDC Engr During Construction 4.5% $ 6,165 15% $ 925 $ 8,000 $10,000 $ 10,0004.1.001 CM Construction Mgt 7.5% $ 10,275 20% $ 2,055 $ 13,000 $30,000 $ 30,000Total Project Cost (Present Value in 2013 Dollars) $ 262,000Notes:1. For most projects Main Project cost is construction cost, however Main Project Cost could be bypass pumping or similar costs.2. Percent of Total Main Project Cost3. Estimated cost. Need to verify with EWA staffs for a more detailed cost estimate.4.1.001D - 39
Project 4.1.003Cogen Engine CatalystMain Project TypeKey DatesNew Facility X <strong>CAMP</strong> Report Jan‐14Facility Rehabilitation Initial Estimate Dec‐10Major Maintenance Estimate Update Nov‐12Asset Replacement Const Year 2015Special StudyMain Project Cost (1) Quantity Material Cost Labor CostNo. Units Unit Cost Total % of Mat'l TotalTotal CostProject Task ElementsGas conditioning facilities on engine exhaust (4 engines) (3) 1 LS $ 34,000 $ 34,000 48% $ 16,400$ 60,000(Project is in Phase 2 of Energy Projects)Div 1 costs 1 LS $ 6,000 $ 6,000 0% $ ‐$ 10,000Subtotal $ 70,000Contractor Overhead & Profit @ 12% $ 9,000Shipping Rate 0% of total is shipped @ 15% includedSales Tax 0% of total is taxed @ 7.75% $ 6,000Project Contingency @ 25% $ 18,000Total Main Project Cost(Year of Estimate or Estimate Update) $ 103,000ENR CCI Corresponding to Year of Estimate 10008ENR CCI Corresponding to <strong>CAMP</strong> Report Year 10283 1.028Total Main Project Cost (<strong>CAMP</strong> Report Year) $ 106,000Project Phases Cost Rate (2) Amount Contingency Subtotal Minimum Total4.1.003 CA Condition Assessment 0.0% $ ‐ 20% $ ‐ $ ‐ $5,000 Not Applicable4.1.003 CS Conceptual Study 0.0% $ ‐ 20% $ ‐ $ ‐ $10,000 Complete4.1.003 DS Design‐Build 14.0% $ 11,900 15% $ 1,785 $ 14,000 $10,000 $ 14,0004.1.003 EDC Engr During Construction 0.0% $ ‐ 15% $ ‐ $ ‐ $10,000 included4.1.003 CM Construction Mgt 8.0% $ 6,800 20% $ 1,360 $ 9,000 $10,000 $ 10,000Total Project Cost (Present Value in 2013 Dollars) $ 130,000Notes:1. For most projects Main Project cost is construction cost, however Main Project Cost could be bypass pumping or similar costs.2. Percent of Total Main Project Cost3. Costs based on draft tech memo, October 2012, provided via email by Kennedy Jenks4.1.003D - 40
Project 4.1.004NG Dilution Equipment ServicingMain Project TypeNew Facility <strong>CAMP</strong> ReportKey DatesJan‐12Facility Rehabilitation Initial Estimate Nov‐11Major Maintenance Estimate Update Nov‐11Asset Replacement X Const Year 2014Special StudyMain Project Cost (1) Quantity Material Cost Labor CostNo. Units Unit Cost Total % of Mat'l TotalTotal CostProject Task ElementsSystem Evaluation, Repair and Training 1 LS $ 90,000 $ 90,000 0% $ ‐$ 90,000Subtotal $ 90,000Contractor Overhead & Profit @ 27% $ 25,000Shipping Rate 10% of total is shipped @ 15% $ 2,000Sales Tax 10% of total is taxed @ 7.75% $ 1,000Project Contingency @ 15% $ 18,000Total Main Project Cost(Year of Estimate or Estimate Update) $ 136,000ENR CCI Corresponding to Year of Estimate 10283ENR CCI Corresponding to <strong>CAMP</strong> Report Year 10283 1.000Total Main Project Cost (<strong>CAMP</strong> Report Year) $ 137,000Project Phases Cost Rate (2) Amount Contingency Subtotal Minimum Total4.1.004 CA Condition Assessment 0.0% $ ‐ 20% $ ‐ $ ‐ $5,000 Not Applicable4.1.004 CS Conceptual Study 0.0% $ ‐ 20% $ ‐ $ ‐ $10,000 Completed4.1.004 DS Design 0.0% $ ‐ 15% $ ‐ $ ‐ $20,000 In Progress4.1.004 EDC Engr During Construction 4.5% $ 5,310 15% $ 797 $ 7,000 $10,000 $ 10,0004.1.004 CM Construction Mgt 7.5% $ 8,850 20% $ 1,770 $ 11,000 $30,000 by EWATotal Project Cost (Present Value in 2013 Dollars) $ 147,000Notes:1. For most projects Main Project cost is construction cost, however Main Project Cost could be bypass pumping or similar costs.2. Percent of Total Main Project Cost3. Estimated cost. A more detailed cost estimate will be available after KJ completed design.4.1.004D - 41
Project 4.1.005Cogeneration Engine Top‐End OverhaulMain Project TypeKey DatesNew Facility <strong>CAMP</strong> Report Jan‐12Facility Rehabilitation Initial Estimate Nov‐08Major Maintenance X Estimate Update Oct‐12Asset Replacement Const Year 2016, 2017,Special Study 2018Main Project Cost (1) Quantity Material Cost Labor CostNo. Units Unit Cost Total % of Mat'l TotalTotal CostProject Task ElementsTop‐end Overhaul for two engines (reqd after 8,000 servicehours for each engine)2 EA $ 42,100 $ 84,200 78% $ 65,676$ 149,876Spare heat shield (in case replacement is needed) 1 EA $ 10,000 $ 10,000 0% $ ‐$ 10,000Subtotal $ 160,000Contractor Overhead & Profit @ 0% IncludedShipping Rate 0% of total is shipped @ 15% IncludedSales Tax 0% of total is taxed @ 7.75% IncludedProject Contingency @ 25% $ 40,000Total Main Project Cost(Year of Estimate or Estimate Update) $ 200,000ENR CCI Corresponding to Year of Estimate 9876ENR CCI Corresponding to <strong>CAMP</strong> Report Year 10283 1.041Total Main Project Cost (<strong>CAMP</strong> Report Year) $ 209,000Project Phases Cost Rate (2) Amount Contingency Subtotal Minimum Total4.1.005 CA Condition Assessment 0.0% $ ‐ 20% $ ‐ $ ‐$0 Complete4.1.005 CS Conceptual Study 0.0% $ ‐ 20% $ ‐ $ ‐$0 Not Applicable4.1.005 DS Design 0.0% $ ‐ 15% $ ‐ $ ‐$0 Not Applicable4.1.005 EDC Engr During Construction 0.0% $ ‐ 15% $ ‐ $ ‐$0 Not Applicable4.1.005 CM Construction Mgt 0.0% $ ‐ 20% $ ‐ $ ‐$0 Not ApplicableTotal Project Cost (Present Value in 2013 Dollars) $ 209,000Notes:1. For most projects Main Project cost is construction cost, however Main Project Cost could be bypass pumping or similar costs.2. Percent of Total Main Project Cost3. Quote was provided by Hawthorne Power Systems in Nov 25, 2008. Refer to Table 7‐2.4. Engine overhaul top‐end shall be performed on 2 of 4 engines after every 8,000 service hours. At 24,000 hrs an in‐frame overhaul is reqd for each engine. The in‐frameoverhaul includes a top‐end overhaul so separate top‐end is not reqd on those years. At 40,000 hrs, major overhaul reqd5. In 2013 and 2017, Engine Nos. 3 and 4 are due for Top End overhaul service. In 2016, Engine Nos. 1 and 2 are due for Top End overhaul maintenance service.4.1.005D - 42
Project 4.1.006Cogeneration Engine In‐Frame OverhaulMain Project TypeKey DatesNew Facility <strong>CAMP</strong> Report Jan‐14Facility Rehabilitation Initial Estimate Nov‐08Major Maintenance X Estimate Update Nov‐11Asset Replacement Const Year 2014, 2015Special StudyMain Project Cost (1) Quantity Material Cost Labor CostNo. Units Unit Cost Total % of Mat'l TotalTotal CostProject Task ElementsIn‐frame Overhaul for two engines (reqd after 24,000 servicehours for each engine)2 EA $ 117,500 $ 235,000 20.7% $ 48,645$ 283,645Price includes replacing the exhaust bellows and heat shields aswell as replacing the generator coupler and new turbochargersSubtotal $ 284,000Contractor Overhead & Profit included in quote 0% $‐Shipping Rate 50% of total is shipped @ 15% $ 22,000Sales Tax 50% of total is taxed @ 7.75% $ 12,000Project Contingency @ 25% $ 80,000Total Main Project Cost(Year of Estimate or Estimate Update) $ 398,000ENR CCI Corresponding to Year of Estimate 9876ENR CCI Corresponding to <strong>CAMP</strong> Report Year 10283 1.041Total Main Project Cost (<strong>CAMP</strong> Report Year) $ 415,000Project Phases Cost Rate (2) Amount Contingency Subtotal Minimum Total4.1.006 CA Condition Assessment 0.0% $ ‐ 20% $ ‐ $ ‐$0 Complete4.1.006 CS Conceptual Study 0.0% $ ‐ 20% $ ‐ $ ‐$0 Not Applicable4.1.006 DS Design 0.0% $ ‐ 15% $ ‐ $ ‐$0 Not Applicable4.1.006 EDC Engr During Construction 0.0% $ ‐ 15% $ ‐ $ ‐$0 Not Applicable4.1.006 CM Construction Mgt 0.0% $ ‐ 20% $ ‐ $ ‐$0 Not ApplicableTotal Project Cost (Present Value in 2013 Dollars) $ 415,000Notes:1. For most projects Main Project cost is construction cost, however Main Project Cost could be bypass pumping or similar costs.2. Percent of Total Main Project Cost3. Quote was provided by Hawthorne Power Systems good for work through 20144. Engine overhaul top‐end shall be performed on 2 of 4 engines after every 8,000 service hours. At 24,000 hrs an in‐frame overhaul is reqd for each engine. The in‐frameoverhaul includes a top‐end overhaul so separate top‐end is not reqd on those years. At 40,000 hrs, major overhaul reqd5. In 2014 Engine Nos. 1 and 2 are due for in‐frame overhaul service. In 2015, Engine Nos. 3 and 4 are due for in‐frame overhaul maintenance service.4.1.006D - 43
Project 4.1.007Co‐gen Engine Full OverhaulMain Project TypeKey DatesNew Facility <strong>CAMP</strong> Report Jan‐14Facility RehabilitationInitial EstimateMajor MaintenanceEstimate UpdateAsset ReplacementConst YearSpecial StudyMain Project Cost (1) Quantity Material Cost Labor CostNo. Units Unit Cost Total % of Mat'l TotalTotal CostProject Task ElementsIn‐frame Overhaul for two engines (reqd after 24,000 servicehours for each engine)2 EA $ 117,500 $ 235,000 20.7% $ 48,645$ 283,645Price includes replacing the exhaust bellows and heat shields aswell as replacing the generator coupler and new turbochargersFull overhaul includes the in‐frame overhaul plus:Replacement of Camshafts and Lifters as‐needed 2 EA $ 30,000 $ 60,000 25.0% $ 15,000$ 75,000Based on observations during in‐frame overhauls,the crankshafts will be evaluated. Replacement is notanticipated but may be required.Subtotal $ 359,000Contractor Overhead & Profit @ 27% $ 97,000Shipping Rate 50% of total is shipped @ 15% $ 27,000Sales Tax 50% of total is taxed @ 7.75% $ 14,000Project Contingency @ 25% $ 125,000Total Main Project Cost(Year of Estimate or Estimate Update) $ 622,000ENR CCI Corresponding to Year of Estimate 10088ENR CCI Corresponding to <strong>CAMP</strong> Report Year, FY 2014 10283 1.019Total Main Project Cost (<strong>CAMP</strong> Report Year) $ 635,000Project Phases Cost Rate (2) Amount Contingency Subtotal Minimum Total1.1.001 CA Condition Assessment 0.0% $ ‐ 20% $ ‐ $ ‐ $5,000 $ 5,0001.1.001 CS Conceptual Study 0.0% $ ‐ 20% $ ‐ $ ‐ $10,000 $ 10,0001.1.001 DS Design 0.0% $ ‐ 15% $ ‐ $ ‐ $20,000 $ 20,0001.1.001 EDC Engr During Construction 4.5% $ 22,365 15% $ 3,355 $ 26,000 $10,000 $ 26,0001.1.001 CM Construction Mgt 7.5% $ 37,275 20% $ 7,455 $ 45,000 $30,000 $ 45,000Total Project Cost (Present Value in 2013 Dollars) $ 741,000Notes:4.1.007D - 44
Project 4.1.008Cogeneration Engine 5Main Project TypeKey DatesNew Facility X <strong>CAMP</strong> Report Jan‐14Facility Rehabilitation Initial Estimate May‐06Major Maintenance Estimate Update Nov‐12Asset Replacement Const Year 2016Special StudyMain Project Cost (1) Quantity Material Cost Labor CostNo. Units Unit Cost Total % of Mat'l TotalTotal CostProject Task ElementsEngine Generator Set 1 EA $ 417,000 $ 417,000$ ‐$ 417,000Fuel Gas System 2 EA $ 18,500 $ 37,000$ ‐$ 37,000Local Data Panel 1 EA $ 91,300 $ 91,300$ ‐$ 91,300Aux Cooling Cir. Heat Transfer Equipment 1 EA $ 5,800 $ 5,800$ ‐$ 5,800JW System Heat Transfer Equipment 1 EA $ 15,130 $ 15,130$ ‐$ 15,130Exhaust System, HRU & Silencer 1 EA $ 77,000 $ 77,000$ ‐$ 77,000Custom Master Controls 1 LS $ 40,000 $ 40,000$ ‐$ 40,000Facility Interface 1 LS $ 10,000 $ 10,000$ ‐$ 10,000Gas Chromatograph 1 LS $ 15,000 $ 15,000$ ‐$ 15,000Spare Parts 1 LS $ 7,000 $ 7,000$ ‐$ 7,000First Fill Fluids 1 LS $ 2,500 $ 2,500$ ‐$ 2,500Subtotal $ 718,000Contractor Overhead & Profit @ 27% $ 194,000Shipping Rate 0% of total is shipped @ 15% (Included) $‐Sales Tax 0% of total is taxed @ 7.75% (Included) $‐Project Contingency @ 37% $ 338,000Total Main Project Cost(Year of Estimate or Estimate Update) $ 1,250,000ENR CCI Corresponding to Year of Estimate 8554ENR CCI Corresponding to <strong>CAMP</strong> Report Year 10283 1.202Total Main Project Cost (<strong>CAMP</strong> Report Year) $ 1,503,000Project Phases Cost Rate (2) Amount Contingency Subtotal Minimum Total4.1.008 CA Condition Assessment 1.5% $ 13,680 20% $ 2,736 $ 17,000 $5,000 Not Applicable4.1.008 CS Conceptual Study 2.5% $ 13,300 20% $ 2,660 $ 16,000 $10,000 Not Applicable4.1.008 DS Design 14.2% $ 129,774 15% $ 19,466 $ 150,000 $20,000 $ 150,0004.1.008 EDC Engr During Construction 9.5% $ 86,357 15% $ 12,954 $ 100,000 $10,000 $ 100,0004.1.008 CM Construction Mgt 9.1% $ 82,643 20% $ 16,529 $ 100,000 $30,000 $ 100,000Total Project Cost (Present Value in 2013 Dollars) $ 1,853,000Notes:1. For most projects Main Project cost is construction cost, however Main Project Cost could be bypass pumping or similar costs.2. Percent of Total Main Project Cost3. Cost estimate pper Hawthorne Power Systems Invoice for the first 4 sets of Enginee Generator for 3700 kWs Electrical Power dated 5/18/2006.4.1.008D - 45
Project 4.1.013Cogen Building Floor RepairMain Project TypeKey DatesNew Facility <strong>CAMP</strong> Report Jan‐14Facility Rehabilitation X Initial Estimate Nov‐11Major Maintenance Estimate Update Nov‐11Asset Replacement Const Year 2014Special StudyMain Project Cost (1) Quantity Material Cost Labor CostNo. Units Unit Cost Total % of Mat'l TotalTotal CostProject Task ElementsInvestigate damage and repair damage 1 LS $ ‐ $ ‐$ ‐$ 50,000Subtotal $ 50,000Contractor Overhead & Profit included 0% (Included) $‐Shipping Rate included 0% of total is shipped @ 15% (Included) $‐Sales Tax included 0% of total is taxed @ 7.75% (Included) $‐Project Contingency included 0% (Included) $‐Total Main Project Cost(Year of Estimate or Estimate Update) $ 50,000ENR CCI Corresponding to Year of Estimate 10283ENR CCI Corresponding to <strong>CAMP</strong> Report Year 10283 1.000Total Main Project Cost (<strong>CAMP</strong> Report Year) $ 50,000Project Phases Cost Rate (2) Amount Contingency Subtotal Minimum Total4.1.013 CA Condition Assessment 0.0% $ ‐ 20% $ ‐ $ ‐ $5,000 Completed4.1.013 CS Conceptual Study 0.0% $ ‐ 20% $ ‐ $ ‐ $10,000 Not Applicable4.1.013 DS Design 8.0% $ 4,000 15% $ 600 $ 5,000 $20,000 $ 20,0004.1.013 EDC Engr During Construction 25.0% $ 12,500 15% $ 1,875 $ 15,000 $10,000 $ 15,0004.1.013 CM Construction Mgt 0.0% $ ‐ 20% $ ‐ $ ‐ $30,000 Not ApplicableTotal Project Cost (Present Value in 2013 Dollars) $ 85,000Notes:1. For most projects Main Project cost is construction cost, however Main Project Cost could be bypass pumping or similar costs.2. Cost estimated include concrete crack injection, sealer, and other miscellaneous repairs.3. Cost esimate will be further defined after the extent of damage is evaluated and the repair method is identified.4.1.013D - 46
Project 4.1.014VFDs on Misc EquipmentMain Project TypeKey DatesNew Facility <strong>CAMP</strong> Report Jan‐14Facility Rehabilitation Initial Estimate Nov‐10Major Maintenance Estimate Update Nov‐11Asset Replacement X Const Year ≥2019Special StudyMain Project Cost (1) Quantity Material Cost Labor CostNo. Units Unit Cost Total % of Mat'l TotalTotal CostProject Task ElementsRetrofit HVAC Fans with VFD Controls 1 LS $ ‐$ 100,000Retrofit Solids Digestion Pumps with VFD Controls 1 LS $ ‐$ 115,000Retrofit other Water Pumps with VFD Controls 1 LS $ ‐$ 73,000Subtotal $ 288,000Contractor Overhead & Profit @ 27% $ 78,000Shipping Rate 40% of total is shipped @ 15% $ 18,000Sales Tax 50% of total is taxed @ 7.75% $ 12,000Project Contingency @ 40% $ 159,000Total Main Project Cost(Year of Estimate or Estimate Update) $ 555,000ENR CCI Corresponding to Year of Estimate 10008ENR CCI Corresponding to <strong>CAMP</strong> Report Year 10283 1.028Total Main Project Cost (<strong>CAMP</strong> Report Year) $ 571,000Project Phases Cost Rate (2) Amount Contingency Subtotal Minimum Total4.1.014 CA Condition Assessment 1.5% $ 5,940 20% $ 1,188 $ 8,000 $5,000 Not Applicable4.1.014 CS Conceptual Study 2.5% $ 6,675 20% $ 1,335 $ 9,000 $10,000 Completed4.1.014 DS Design 8.0% $ 31,680 15% $ 4,752 $ 37,000 $20,000 $ 37,0004.1.014 EDC Engr During Construction 4.5% $ 17,820 15% $ 2,673 $ 21,000 $10,000 $ 21,0004.1.014 CM Construction Mgt 7.5% $ 29,700 20% $ 5,940 $ 36,000 $30,000 $ 36,000Total Project Cost (Present Value in 2013 Dollars) $ 665,000Notes:1. For most projects Main Project cost is construction cost, however Main Project Cost could be bypass pumping or similar costs.2. Percent of Total Main Project Cost3. Cost estimate per Table 6 of Draft Energy Management Strategic Plan dated 11/30/2010.D - 47
Project 4.1.015Gas Conditioning FacilitiesMain Project TypeKey DatesNew Facility X <strong>CAMP</strong> Report Jan‐14Facility Rehabilitation Initial Estimate Nov‐12Major Maintenance Estimate Update Nov‐12Asset Replacement Const Year 2015Special StudyMain Project Cost (1) Quantity Material Cost Labor CostNo. Units Unit Cost Total % of Mat'l TotalTotal CostProject Task ElementsInstall sulfur and siloxane removal facilities plus 1 LS $ 1,333,000 $ 1,333,000 53% $ 700,000$ 2,033,000new biogas moisture removal system (3)(Phase 3 of energy projects)Div 1 costs 1 LS $ 200,000 $ 200,000 0% $ ‐$ 200,000Markup on Subs 1 LS $ 45,000 $ 45,000 0% $ ‐$ 45,000Subtotal $ 2,278,000Contractor Overhead & Profit @ 15% $ 342,000Shipping Rate 40% of total is shipped @ 15% includedSales Tax 50% of total is taxed @ 7.75% $ 89,000Project Contingency @ 25% $ 678,000Total Main Project Cost(Year of Estimate or Estimate Update) $ 3,387,000ENR CCI Corresponding to Year of Estimate 10283ENR CCI Corresponding to <strong>CAMP</strong> Report Year 10283 1.000Total Main Project Cost (<strong>CAMP</strong> Report Year) $ 3,387,000Project Phases Cost Rate (2) Amount Contingency Subtotal Minimum Total4.1.015 CA Condition Assessment 0.0% $ ‐ 20% $ ‐ $ ‐$0 Not Applicable4.1.015 CS Conceptual Study 0.0% $ ‐ 20% $ ‐ $ ‐$0 Completed4.1.015 DS Design‐Build 15.0% $ 406,350 15% $ 60,953 $ 468,000 $0 $ 468,0004.1.015 EDC Engr During Construction 0.0% $ ‐ 15% $ ‐ $ ‐ $10,000 included4.1.015 CM Construction Mgt 6.0% $ 162,540 20% $ 32,508 $ 196,000 $0 $ 196,000Total Project Cost (Present Value in 2013 Dollars) $ 4,051,000Notes:1. For most projects Main Project cost is construction cost, however Main Project Cost could be bypass pumping or similar costs.2. Percent of Total Main Project Cost3. Costs based on draft tech memo, October 2012, provided via email by Kennedy Jenks4.1.015D - 48
Project 4.1.020Net MeteringMain Project TypeKey DatesNew Facility X <strong>CAMP</strong> Report Jan‐14Facility Rehabilitation Initial Estimate Dec‐12Major Maintenance Estimate Update Dec‐12Asset Replacement Const Year 2014Special StudyMain Project Cost (1) Quantity Material Cost Labor CostNo. Units Unit Cost Total % of Mat'l TotalTotal CostProject Task ElementsNet Metering 1 LS $ 400,000Subtotal $ 400,000Contractor Overhead & Profit @ 0% (Included) $ ‐Shipping Rate 0% of total is shipped @ 15% (Included) $ ‐Sales Tax 0% of total is taxed @ 7.75% (Included) $ ‐Project Contingency @ 0% (Included) $ ‐Total Main Project Cost(Year of Estimate or Estimate Update) $ 400,000ENR CCI Corresponding to Year of Estimate 10283ENR CCI Corresponding to <strong>CAMP</strong> Report Year, FY 2014 10283 1.000Total Main Project Cost (<strong>CAMP</strong> Report Year) $ 400,000Project Phases Cost Rate (2) Amount Contingency Subtotal Minimum Total1.1.001 CA Condition Assessment 0.0% $ ‐ 20% $ ‐ $ ‐ $5,000 Not Applicable1.1.001 CS Conceptual Study 0.0% $ ‐ 20% $ ‐ $ ‐ $10,000 $ 18,0001.1.001 DS Design 0.0% $ ‐ 15% $ ‐ $ ‐ $20,000 $ 25,0001.1.001 EDC Engr During Construction 4.5% $ 18,000 15% $ 2,700 $ 21,000 $10,000 $ 20,0001.1.001 CM Construction Mgt 7.5% $ 30,000 20% $ 6,000 $ 36,000 $30,000 $ 20,000Total Project Cost (Present Value in 2013 Dollars) $ 483,000Notes:1. From KJ report, 2011.4.1.020D - 49
Project 5.1.002ORF I Carbon ReplacementMain Project TypeNew Facility <strong>CAMP</strong> ReportKey DatesJan‐14Facility Rehabilitation Initial Estimate Aug‐08Major Maintenance Estimate Update Nov‐11Asset Replacement X Const Year 2015, 2017,Special Study≥2019Main Project Cost (1) Quantity Material Cost Labor CostNo. Units Unit Cost Total % of Mat'l TotalTotal CostProject Task ElementsCarbon Replacement on ORF I FY 2011 32000 EA $1.375 $ 44,000 50% $ 22,000$ 66,000Testing, Disposal, Misc Cost 1 LS $ 12,000 $ 12,000 0% $ ‐$ 12,000Subtotal $ 78,000Contractor Overhead & Profit @ 27% $ 22,000Shipping Rate 0% of total is shipped @ 15% IncludedSales Tax 0% of total is taxed @ 7.75% IncludedProject Contingency @ 25% $ 25,000Total Main Project Cost(Year of Estimate or Estimate Update) $ 125,000ENR CCI Corresponding to Year of Estimate 9342ENR CCI Corresponding to <strong>CAMP</strong> Report Year 10283 1.101Total Main Project Cost (<strong>CAMP</strong> Report Year) $ 138,000Project Phases Cost Rate (2) Amount Contingency Subtotal Minimum Total5.1.002 CA Condition Assessment 0.0% $ ‐ 20% $ ‐ $ ‐$0 Not Applicable5.1.002 CS Conceptual Study 0.0% $ ‐ 20% $ ‐ $ ‐$0 Not Applicable5.1.002 DS Design 0.0% $ ‐ 15% $ ‐ $ ‐$0 Not Applicable5.1.002 EDC Engr During Construction 0.0% $ ‐ 15% $ ‐ $ ‐$0 Not Applicable5.1.002 CM Construction Mgt 0.0% $ ‐ 20% $ ‐ $ ‐$0 Not ApplicableTotal Project Cost (Present Value in 2013 Dollars) $ 138,000Notes:1. For most projects Main Project cost is construction cost, however Main Project Cost could be bypass pumping or similar costs.2. Percent of Total Main Project Cost3. Quote (unit cost) provided by Carbon Activated Corporation for ORF III project in August 2008. Applied unit cost to vol ORF 14. Analysis of Peroxide useage vs carbon regen5.1.002D - 50
Project 5.1.004Odor Monitoring FacilitiesMain Project TypeKey DatesNew Facility X <strong>CAMP</strong> Report Jan‐14Facility Rehabilitation Initial Estimate Dec‐10Major Maintenance Estimate Update Nov‐11Asset Replacement Const Year 2014Special StudyMain Project Cost (1) Quantity Material Cost Labor CostNo. Units Unit Cost Total % of Mat'l TotalTotal CostProject Task ElementsPlant‐wide Odor Monitoring Program Implementation 1 LS $ ‐ 0% $ ‐$ 300,000Subtotal $ 300,000Contractor Overhead & Profit @ 0% $‐Shipping Rate 60% of total is shipped @ 15% $ 27,000Sales Tax 60% of total is taxed @ 7.75% $ 14,000Project Contingency @ 40% $ 137,000Total Main Project Cost(Year of Estimate or Estimate Update) $ 478,000ENR CCI Corresponding to Year of Estimate 10004ENR CCI Corresponding to <strong>CAMP</strong> Report Year 10283 1.028Total Main Project Cost (<strong>CAMP</strong> Report Year) $ 492,000Project Phases Cost Rate (2) Amount Contingency Subtotal Minimum Total5.1.004 CA Condition Assessment 0.0% $ ‐ 20% $ ‐ $ ‐ $5,000 Not Applicable5.1.004 CS Conceptual Study 2.5% $ 4,450 20% $ 890 $ 6,000 $10,000 $ 10,0005.1.004 DS Design (4) 8.0% $ 27,280 15% $ 4,092 $ 32,000 $20,000 $ 32,0005.1.004 EDC Engr During Construction 4.5% $ 15,345 15% $ 2,302 $ 18,000 $10,000 $ 18,0005.1.004 CM Construction Mgt 0.0% $ ‐ 20% $ ‐ $ ‐ $30,000 Not ApplicableTotal Project Cost (Present Value in 2013 Dollars) $ 552,000Notes:1. For most projects Main Project cost is construction cost, however Main Project Cost could be bypass pumping or similar costs.2. Percent of Total Main Project Cost3. Cost provided by D Larson on December 2010.4. Cost for Contract Documents preparation.5.1.004D - 51
Project 5.1.005PSB Odor Control ImprovementsMain Project TypeKey DatesNew Facility <strong>CAMP</strong> Report Jan‐14Facility Rehabilitation X Initial Estimate Oct‐12Major Maintenance Estimate Update Oct‐12Asset Replacement Const Year 2016Special StudyMain Project Cost (1) Quantity Material Cost Labor CostNo. Units Unit Cost Total % of Mat'l TotalTotal CostProject Task ElementsScope of work for the improvement to be determined.Potential scope of work includes the following:Odor ducts and connections 1 LS $ ‐ $ ‐ 0% $ ‐$ 30,000New Odor Control Units 1 LS $ ‐ $ ‐ 0% $ ‐$ 200,000Subtotal $ 230,000Contractor Overhead & Profit @ 27% $ 63,000Shipping Rate 40% of total is shipped @ 15% $ 14,000Sales Tax 50% of total is taxed @ 7.75% $ 9,000Project Contingency @ 40% $ 127,000Total Main Project Cost(Year of Estimate or Estimate Update) $ 443,000ENR CCI Corresponding to Year of Estimate 10283ENR CCI Corresponding to <strong>CAMP</strong> Report Year 10283 1.000Total Main Project Cost (<strong>CAMP</strong> Report Year) $ 443,000Project Phases Cost Rate (2) Amount Contingency Subtotal Minimum Total5.1.005 CA Condition Assessment 0.0% $ ‐ 20% $ ‐ $ ‐ $5,000 Not Applicable5.1.005 CS Conceptual Study LS $ 40,000 20% $ ‐ $ 40,000 $10,000 $ 40,0005.1.005 DS Design 8.0% $ 24,560 15% $ 3,684 $ 29,000 $20,000 $ 40,0005.1.005 EDC Engr During Construction 4.5% $ 14,220 15% $ 2,133 $ 17,000 $10,000 $ 17,0005.1.005 CM Construction Mgt 7.5% $ 23,700 20% $ 4,740 $ 29,000 $30,000 $ 30,000Total Project Cost (Present Value in 2013 Dollars) $ 570,000Notes:1. For most projects Main Project cost is construction cost, however Main Project Cost could be bypass pumping or similar costs.2. Percent of Total Main Project Cost3. Estimated cost. A more detailed cost estimate will available after condition assessment or conceptual study.5.1.005D - 52
Project 5.1.008ORF III Chemical Feed System ImprovementsMain Project TypeNew Facility <strong>CAMP</strong> ReportKey DatesJan‐14Facility Rehabilitation Initial Estimate Nov‐11Major Maintenance Estimate Update Nov‐11Asset Replacement X Const Year 2016Special StudyMain Project Cost (1) Quantity Material Cost Labor CostNo. Units Unit Cost Total % of Mat'l TotalTotal CostProject Task ElementsReplace existing piping with double contained piping 100 LF $ 100 $ 10,000 50% $ 5,000$ 15,000Relocate and reconfigure chemical pumps 1 LS $ ‐ 0% $ ‐$ 20,000Shade Structure 1 LS $ ‐ 0% $ ‐$ 50,000Electrical 1 LS $ ‐ 0% $ ‐$ 10,000Miscellaneous 1 LS $ ‐ 0% $ ‐$ 25,000ORF III Recirc Pump Facility Concrete Repairs 1 LS $ ‐ 0% $ ‐$ 25,000Subtotal $ 145,000Contractor Overhead & Profit @ 27% $ 40,000Shipping Rate 40% of total is shipped @ 15% $9,000Sales Tax 50% of total is taxed @ 7.75% $6,000Project Contingency @ 40% $ 80,000Total Main Project Cost(Year of Estimate or Estimate Update) $ 280,000ENR CCI Corresponding to Year of Estimate 10283ENR CCI Corresponding to <strong>CAMP</strong> Report Year 10283 1.000Total Main Project Cost (<strong>CAMP</strong> Report Year) $ 280,000Project Phases Cost Rate (2) Amount Contingency Subtotal Minimum Total5.1.008 CA Condition Assessment 0.0% $ ‐ 20% $ ‐ $ ‐ $5,000 Not Applicable5.1.008 CS Conceptual Study 2.5% $ 3,375 20% $ 675 $ 5,000 $10,000 Complete5.1.008 DS Design (4) 8.0% $ 16,000 15% $ 2,400 $ 19,000 $20,000 $ 40,0005.1.008 EDC Engr During Construction (4) 4.5% $ 9,000 15% $ 1,350 $ 11,000 $10,000 $ 20,0005.1.008 CM Construction Mgt 7.5% $ 15,000 20% $ 3,000 $ 18,000 $30,000 $ 30,000Total Project Cost (Present Value in 2013 Dollars) $ 370,000Notes:1. For most projects Main Project cost is construction cost, however Main Project Cost could be bypass pumping or similar costs.2. Percent of Total Main Project Cost3. Estimated cost based on Manning Chem Facility Upgrade project.4. Higher than standard cost associated with capital project percentage.5.1.008D - 53
Project 5.2.001Natural Gas Pipeline ReplacementMain Project TypeKey DatesNew Facility <strong>CAMP</strong> Report Jan‐14Facility Rehabilitation Initial Estimate Nov‐11Major Maintenance Estimate Update Nov‐11Asset Replacement X Const Year 2014Special StudyMain Project Cost (1) Quantity Material Cost Labor CostNo. Units Unit Cost Total % of Mat'l TotalTotal CostProject Task ElementsReplace Natural Gas Supply Piping to Operations Bldg, 1500 LF $ 150 $ 225,000 50% $ 112,500$ 337,500Dryer Bldg, Flare, Co‐Gen, RTO(4‐inch and smaller steel pipe)Subtotal $ 338,000Contractor Overhead & Profit @ 27% $ 92,000Shipping Rate 40% of total is shipped @ 15% $ 21,000Sales Tax 50% of total is taxed @ 7.75% $ 14,000Project Contingency @ 40% $ 186,000Total Main Project Cost(Year of Estimate or Estimate Update) $ 651,000ENR CCI Corresponding to Year of Estimate 10283ENR CCI Corresponding to <strong>CAMP</strong> Report Year 10283 1.000Total Main Project Cost (<strong>CAMP</strong> Report Year) $ 651,000Project Phases Cost Rate (2) Amount Contingency Subtotal Minimum Total5.2.001 CA Condition Assessment 0.0% $ ‐ 20% $ ‐ $ ‐ $5,000 Not applicable5.2.001 CS Conceptual Study 2.5% $ 7,825 20% $ 1,565 $ 10,000 $10,000 In progress5.2.001 DS Design (4) 8.0% $ 37,200 15% $ 5,580 $ 43,000 $20,000 In progress5.2.001 EDC Engr During Construction (4) 4.5% $ 20,925 15% $ 3,139 $ 25,000 $10,000 $ 35,0005.2.001 CM Construction Mgt (4) 7.5% $ 34,875 20% $ 6,975 $ 42,000 $30,000 $ 42,000Total Project Cost (Present Value in 2013 Dollars) $ 728,000Notes:1. For most projects Main Project cost is construction cost, however Main Project Cost could be bypass pumping or similar costs.2. Percent of Total Main Project Cost3. Estimated cost. Additional research and pricing required.4. Higher than standard costs because of construction sequencing, outage coord, safety concerns5.2.001D - 54
Project 5.2.002High Risk & Critical Asset RehabilitationMain Project TypeKey DatesNew Facility <strong>CAMP</strong> Report Jan‐14Facility Rehabilitation X Initial Estimate Nov‐11Major Maintenance Estimate Update Nov‐11Asset Replacement Const Year 2017, 2018Special StudyMain Project Cost (1) Quantity Material Cost Labor CostNo. Units Unit Cost Total % of Mat'l TotalTotal CostProject Task ElementsRehabilitation of high risk and critical assets 1 LS $ ‐ $ ‐$ ‐$ 600,000Cost estimate to be revised when study is completeSubtotal $ 600,000Contractor Overhead & Profit @ 27% $ 162,000Shipping Rate 40% of total is shipped @ 15% $ 36,000Sales Tax 50% of total is taxed @ 7.75% $ 24,000Project Contingency @ 40% $ 329,000Total Main Project Cost(Year of Estimate or Estimate Update) $ 1,151,000ENR CCI Corresponding to Year of Estimate 10283ENR CCI Corresponding to <strong>CAMP</strong> Report Year 10283 1.000Total Main Project Cost (<strong>CAMP</strong> Report Year) $ 1,151,000Project Phases Cost Rate (2) Amount Contingency Subtotal Minimum Total5.2.002 CA Condition Assessment 1.5% $ 12,330 20% $ 2,466 $ 15,000 $5,000 $ 15,0005.2.002 CS Conceptual Study (4) 2.5% $ 13,775 20% $ 2,755 $ 17,000 $10,000 $ 28,0005.2.002 DS Design (4) 8.0% $ 65,760 15% $ 9,864 $ 76,000 $20,000 $ 93,0005.2.002 EDC Engr During Construction (4) 4.5% $ 36,990 15% $ 5,549 $ 43,000 $10,000 $ 80,0005.2.002 CM Construction Mgt (4) 7.5% $ 61,650 20% $ 12,330 $ 74,000 $30,000 $ 80,000Total Project Cost (Present Value in 2013 Dollars) $ 1,447,000Notes:1. For most projects Main Project cost is construction cost, however Main Project Cost could be bypass pumping or similar costs.2. Percent of Total Main Project Cost3. Cost estimated. More detailed cost estimate will be available after condition assessment.4. Higher than standard costs because of construction sequencing, outage coord, safety concerns5.2.002D - 55
Project 5.2.0043WLC Strainer ReplacementMain Project TypeKey DatesNew Facility <strong>CAMP</strong> Report Jan‐14Facility Rehabilitation Initial Estimate Feb‐10Major Maintenance Estimate Update Nov‐11Asset Replacement X Const Year 2014Special StudyMain Project Cost (1) Quantity Material Cost Labor CostNo. Units Unit Cost Total % of Mat'l TotalTotal CostProject Task ElementsSitework 1 LS $ 5,000 $ 5,000 0% $ ‐$ 5,000Coating 1 LS $ 5,000 $ 5,000 0% $ ‐$ 5,000Strainer incl spare parts, service 1 LS $ 25,000 $ 25,000 40% $ 10,000$ 35,000Mechanical 1 LS $ 40,000 $ 40,000 0% $ ‐$ 40,000Electrical 1 LS $ 20,000 $ 20,000 0% $ ‐$ 20,000Staging 1 LS $ 10,000 $ 10,000 0% $ ‐$ 10,000Subtotal $ 115,000Contractor Overhead & Profit @ 27% $ 32,000Shipping Rate 40% of total is shipped @ 15% $ 7,000Sales Tax 50% of total is taxed @ 7.75% $ 5,000Project Contingency @ 40% $ 64,000Total Main Project Cost(Year of Estimate or Estimate Update) $ 223,000ENR CCI Corresponding to Year of Estimate 9764ENR CCI Corresponding to <strong>CAMP</strong> Report Year 10283 1.053Total Main Project Cost (<strong>CAMP</strong> Report Year) $ 235,000Project Phases Cost Rate (2) Amount Contingency Subtotal Minimum Total5.2.004 CA Condition Assessment 0.0% $ ‐ 20% $ ‐ $ ‐ $5,000 Completed5.2.004 CS Conceptual Study 0.0% $ ‐ 20% $ ‐ $ ‐ $10,000 Completed5.2.004 DS Design (4) 8.0% $ 12,720 15% $ 1,908 $ 15,000 $20,000 In progress5.2.004 EDC Engr During Construction (5) 4.5% $ 7,155 15% $ 1,073 $ 9,000 $10,000 $ 35,0005.2.004 CM Construction Mgt 7.5% $ 11,925 20% $ 2,385 $ 15,000 $30,000 $ 30,000Total Project Cost (Present Value in 2013 Dollars) $ 300,000Notes:1. For most projects Main Project cost is construction cost, however Main Project Cost could be bypass pumping or similar costs.2. Percent of Total Main Project Cost3. Costs from RMC memo Feb 2010.4. Estimated Engineering Cost based on anticipated efforts including electrical engineering and bid support services.5. Estimated Engineering During Construction Cost based on anticipated efforts.5.2.004D - 56
Project 5.2.0053WHP Strainer ReplacementMain Project TypeKey DatesNew Facility <strong>CAMP</strong> Report Jan‐14Facility Rehabilitation Initial Estimate Feb‐10Major Maintenance Estimate Update Nov‐11Asset Replacement X Const Year >= 2019Special StudyMain Project Cost (1) Quantity Material Cost Labor CostNo. Units Unit Cost Total % of Mat'l TotalTotal CostProject Task ElementsSitework 1 LS $ 5,000 $ 5,000 0% $ ‐$ 5,000Coating 1 LS $ 5,000 $ 5,000 0% $ ‐$ 5,000Strainer incl spare parts, service 1 LS $ 25,000 $ 25,000 40% $ 10,000$ 35,000Mechanical 1 LS $ 40,000 $ 40,000 0% $ ‐$ 40,000Electrical 1 LS $ 20,000 $ 20,000 0% $ ‐$ 20,000Staging 1 LS $ 10,000 $ 10,000 0% $ ‐$ 10,000Subtotal $ 115,000Contractor Overhead & Profit @ 27% $ 32,000Shipping Rate 40% of total is shipped @ 15% $ 7,000Sales Tax 50% of total is taxed @ 7.75% $ 5,000Project Contingency @ 40% $ 64,000Total Main Project Cost(Year of Estimate or Estimate Update) $ 223,000ENR CCI Corresponding to Year of Estimate 9764ENR CCI Corresponding to <strong>CAMP</strong> Report Year 10283 1.053Total Main Project Cost (<strong>CAMP</strong> Report Year) $ 235,000Project Phases Cost Rate (2) Amount Contingency Subtotal Minimum Total5.2.005 CA Condition Assessment 0.0% $ ‐ 20% $ ‐ $ ‐ $5,000 Completed5.2.005 CS Conceptual Study 2.5% $ 2,700 20% $ 540 $ 4,000 $10,000 $ 10,0005.2.005 DS Design (4) 8.0% $ 12,720 15% $ 1,908 $ 15,000 $20,000 $ 45,0005.2.005 EDC Engr During Construction (5) 4.5% $ 7,155 15% $ 1,073 $ 9,000 $10,000 $ 35,0005.2.005 CM Construction Mgt 7.5% $ 11,925 20% $ 2,385 $ 15,000 $30,000 $ 30,000Total Project Cost (Present Value in 2013 Dollars) $ 355,000Notes:1. For most projects Main Project cost is construction cost, however Main Project Cost could be bypass pumping or similar costs.2. Percent of Total Main Project Cost3. Costs from RMC memo of 3WLC system Feb 2010.4. Estimated Engineering Cost based on anticipated efforts including electrical engineering and bid support services.5. Estimated Engineering During Construction Cost based on anticipated efforts.5.2.005D - 57
Project 5.2.0063WLC Intertie to 3WHP SystemMain Project TypeKey DatesNew Facility <strong>CAMP</strong> Report Jan‐14Facility Rehabilitation x Initial Estimate Dec‐12Major Maintenance Estimate Update Dec‐12Asset Replacement Const Year 2016Special StudyMain Project Cost (1) Quantity Material Cost Labor CostNo. Units Unit Cost Total % of Mat'l TotalTotal CostProject Task ElementsPiping and Valves 1 LS $ 50,000 $ 50,000 0% $ ‐$ 50,000Subtotal $ 50,000Contractor Overhead & Profit included 0% $ ‐Shipping Rate Included 50% of total is shipped @ 0% $ ‐Sales Tax Included 50% of total is taxed @ 0.00% $ ‐Project Contingency Included 0% $ ‐Total Main Project Cost(Year of Estimate or Estimate Update) $ 50,000ENR CCI Corresponding to Year of Estimate 10283ENR CCI Corresponding to <strong>CAMP</strong> Report Year, FY 2014 10283 1.000Total Main Project Cost (<strong>CAMP</strong> Report Year) $ 51,000Project Phases Cost Rate (2) Amount Contingency Subtotal Minimum Total1.1.001 CA Condition Assessment 0.0% $ ‐ 20% $ ‐ $ ‐ $5,000 not reqd1.1.001 CS Conceptual Study 0.0% $ ‐ 20% $ ‐ $ ‐ $10,000 not reqd1.1.001 DS Design 0.0% $ ‐ 15% $ ‐ $ ‐ $20,000 $ 30,0001.1.001 EDC Engr During Construction 4.5% $ 2,250 15% $ 338 $ 3,000 $10,000 $ 10,0001.1.001 CM Construction Mgt 7.5% $ 3,750 20% $ 750 $ 5,000 $30,000 $ 20,000Total Project Cost (Present Value in 2013 Dollars) $ 111,000Notes:5.2.006D - 58
Project 5.2.0103WHP Pump Control ImprovementsMain Project TypeKey DatesNew Facility <strong>CAMP</strong> Report Jan‐14Facility Rehabilitation Initial Estimate Nov‐10Major Maintenance Estimate Update Nov‐11Asset Replacement X Const Year 2015Special StudyMain Project Cost (1) Quantity Material Cost Labor CostNo. Units Unit Cost Total % of Mat'l TotalTotal CostProject Task ElementsRetrofit Plant Water 3WHP Pumps with VFD Controls 1 LS $ ‐$ 34,000Subtotal $ 34,000Contractor Overhead & Profit @ 27% $ 10,000Shipping Rate 40% of total is shipped @ 15% $ 3,000Sales Tax 50% of total is taxed @ 7.75% $ 2,000Project Contingency @ 40% $ 20,000Total Main Project Cost(Year of Estimate or Estimate Update) $ 69,000ENR CCI Corresponding to Year of Estimate 10008ENR CCI Corresponding to <strong>CAMP</strong> Report Year 10283 1.028Total Main Project Cost (<strong>CAMP</strong> Report Year) $ 71,000Project Phases Cost Rate (2) Amount Contingency Subtotal Minimum Total5.2.010 CA Condition Assessment 0.0% $ ‐ 20% $ ‐ $ ‐ $5,000 Not Applicable5.2.010 CS Conceptual Study 2.5% $ 875 20% $ 175 $ 2,000 $10,000 Complete5.2.010 DS Design (4) 8.0% $ 3,920 15% $ 588 $ 5,000 $20,000 $ 30,0005.2.010 EDC Engr During Construction (4) 4.5% $ 2,205 15% $ 331 $ 3,000 $10,000 $ 30,0005.2.010 CM Construction Mgt 7.5% $ 3,675 20% $ 735 $ 5,000 $30,000 $ 30,000Total Project Cost (Present Value in 2013 Dollars) $ 161,000Notes:1. For most projects Main Project cost is construction cost, however Main Project Cost could be bypass pumping or similar costs.2. Percent of Total Main Project Cost3. Cost estimate per Table 6 of Draft Energy Management Strategic Plan dated 11/30/2010.4. Higher than standard cost includes electrical design and controls5.2.010D - 59
Project 5.2.0111W System RehabMain Project TypeKey DatesNew Facility <strong>CAMP</strong> Report Jan‐14Facility Rehabilitation Initial Estimate Nov‐11Major Maintenance Estimate Update Nov‐11Asset Replacement X Const Year >=2019Special StudyMain Project Cost (1) Quantity Material Cost Labor CostNo. Units Unit Cost Total % of Mat'l TotalTotal CostProject Task ElementsNorth Side Plant Water (1W) Pipeline Replacement 150 LF $ 72 $ 10,800 50% $ 5,400$ 16,200(6‐inch CW exposed pipe ‐ galvanized steel with coating)8‐inch pipe 200 LF $ 96 $ 19,200 50% $ 9,600$ 28,800Tank repairs 1 LS $ 10,000 $ 10,000 0% $ ‐$ 10,000Interior coating 1 LS $ 10,000 $ 10,000 0% $ ‐$ 10,000Exterior coating 1 LS $ 10,000 $ 10,000 0% $ ‐$ 10,000Subtotal $ 75,000Contractor Overhead & Profit @ 27% $ 21,000Shipping Rate 40% of total is shipped @ 15% $ 5,000Sales Tax 50% of total is taxed @ 7.75% $ 3,000Project Contingency @ 40% $ 42,000Total Main Project Cost(Year of Estimate or Estimate Update) $ 146,000ENR CCI Corresponding to Year of Estimate 10088ENR CCI Corresponding to <strong>CAMP</strong> Report Year 10283 1.019Total Main Project Cost (<strong>CAMP</strong> Report Year) $ 149,000Project Phases Cost Rate (2) Amount Contingency Subtotal Minimum Total5.2.011 CA Condition Assessment 0.0% $ ‐ 20% $ ‐ $ ‐ $5,000 Not Applicable5.2.011 CS Conceptual Study 0.0% $ ‐ 20% $ ‐ $ ‐ $10,000 Not Applicable5.2.011 DS Design 0.0% $ ‐ 15% $ ‐ $ ‐ $20,000 $ 30,0005.2.011 EDC Engr During Construction 4.5% $ 4,680 15% $ 702 $ 6,000 $10,000 $ 10,0005.2.011 CM Construction Mgt 7.5% $ 7,800 20% $ 1,560 $ 10,000 $30,000 $ 30,000Total Project Cost (Present Value in 2013 Dollars) $ 219,000Notes:1. For most projects Main Project cost is construction cost, however Main Project Cost could be bypass pumping or similar costs.2. Percent of Total Main Project Cost3. Estimated costs based on actual pipe length.5.2.011D - 60
Project 5.2.012Site Security FacilitiesMain Project TypeKey DatesNew Facility <strong>CAMP</strong> Report Jan‐14Facility Rehabilitation X Initial Estimate Nov‐12Major Maintenance Estimate Update Nov‐12Asset Replacement Const Year 2016Special StudyMain Project Cost (1) Quantity Material Cost Labor CostNo. Units Unit Cost Total % of Mat'l TotalTotal CostProject Task ElementsCentralized control and monitoring console 1 LS $ ‐ 0% $ ‐$ 30,000(Serves EWPCF and Remote Facilities)Surveillance video monitoring system and installationVideo camara 30 EA $ 500 $ 15,000 50% $ 7,500$ 22,500Receivers 30 EA $ 500 $ 15,000 50% $ 7,500$ 22,500Software and recording 1 LS $ ‐ 0% $ ‐$ 50,000PA System 1 LS $ ‐ 0% $ ‐$ 50,000Gates retrofit and connect to system 2 EA $ 20,000 $ 40,000 0% $ ‐$ 40,000Doors retrofit and connect to system 1 LS $ ‐ 0% $ ‐$ 80,000Subtotal $ 265,000Contractor Overhead & Profit @ 0% (included) $‐Shipping Rate 22% of total is shipped @ 15% $ 9,000Sales Tax 50% of total is taxed @ 7.75% $ 11,000Project Contingency @ 40% $ 115,000Total Main Project Cost(Year of Estimate or Estimate Update) $ 400,000ENR CCI Corresponding to Year of Estimate 10283ENR CCI Corresponding to <strong>CAMP</strong> Report Year 10283 1.000Total Main Project Cost (<strong>CAMP</strong> Report Year) $ 400,000Project Phases Cost Rate (2) Amount Contingency Subtotal Minimum Total5.2.012 CA Condition Assessment 0.0% $ ‐ 20% $ ‐ $ ‐ $5,000 not reqd5.2.012 CS Conceptual Study 4.0% $ 16,000 20% $ 3,200 $ 20,000 $10,000 $ 20,0005.2.012 DS Design 12.0% $ 34,200 15% $ 5,130 $ 40,000 $20,000 $ 40,0005.2.012 EDC Engr During Construction 6.0% $ 17,100 15% $ 2,565 $ 20,000 $10,000 $ 20,0005.2.012 CM Construction Mgt 11.5% $ 32,775 20% $ 6,555 $ 40,000 $30,000 $ 40,000Total Project Cost (Present Value in 2013 Dollars) $ 520,000Notes:1. For most projects Main Project cost is construction cost, however Main Project Cost could be bypass pumping or similar costs.2. Percent of Total Main Project Cost3. Cost estimate based on information from "http://www.fixr.com/costs/install‐video‐surveillance‐cameras".4. Scope will be further defined after study of the project needs is complete.5.2.012D - 61
Project 5.2.017Service Air and Instrument Air Piping RepairsMain Project TypeKey DatesNew Facility <strong>CAMP</strong> Report Jan‐14Facility Rehabilitation X Initial Estimate Nov‐11Major Maintenance Estimate Update Nov‐11Asset Replacement Const Year 2016Special StudyMain Project Cost (1) Quantity Material Cost Labor CostNo. Units Unit Cost Total % of Mat'l TotalTotal CostProject Task ElementsService Air and Instrument Air Piping Repairs 1 LS $ ‐ $ ‐$ ‐$ 100,000Subtotal $ 100,000Contractor Overhead & Profit @ 27% $ 27,000Shipping Rate 40% of total is shipped @ 15% $ 8,000Sales Tax 50% of total is taxed @ 7.75% $ 6,000Project Contingency @ 40% $ 57,000Total Main Project Cost(Year of Estimate or Estimate Update) $ 198,000ENR CCI Corresponding to Year of Estimate 10088ENR CCI Corresponding to <strong>CAMP</strong> Report Year 10088 1.000Total Main Project Cost (<strong>CAMP</strong> Report Year) $ 198,000Project Phases Cost Rate (2) Amount Contingency Subtotal Minimum Total5.2.017 CA Condition Assessment 1.5% $ 2,115 20% $ 423 $ 3,000 $5,000 $ 5,0005.2.017 CS Conceptual Study 2.5% $ 2,450 20% $ 490 $ 3,000 $10,000 $ 10,0005.2.017 DS Design 8.0% $ 11,280 15% $ 1,692 $ 13,000 $20,000 $ 20,0005.2.017 EDC Engr During Construction 4.5% $ 6,345 15% $ 952 $ 8,000 $10,000 $ 10,0005.2.017 CM Construction Mgt 7.5% $ 10,575 20% $ 2,115 $ 13,000 $30,000 $ 30,000Total Project Cost (Present Value in 2013 Dollars) $ 273,000Notes:1. For most projects Main Project cost is construction cost, however Main Project Cost could be bypass pumping or similar costs.2. Percent of Total Main Project Cost3. Cost estimated. More detail cost estimate will be available after condition assessment.5.2.017D - 62
Project 5.2.019Plant BeautificationMain Project TypeKey DatesNew Facility <strong>CAMP</strong> Report Jan‐14Facility Rehabilitation x Initial Estimate Dec‐12Major Maintenance Estimate Update Dec‐12Asset Replacement Const Year 2017Special StudyMain Project Cost (1) Quantity Material Cost Labor CostNo. Units Unit Cost Total % of Mat'l TotalTotal CostProject Task ElementsReplace Irrigation Piping (assume 1.5‐inch piping) 20,000 SF $ 1.16 $ 23,200 0% $ ‐$ 23,200Replace Irrigation Heads 300 EA $ 18 $ 5,400 0% $ ‐$ 5,400New Landscaping 75,000 SF $ 1.00 $ 75,000 0% $ ‐$ 75,000Subtotal $ 104,000Contractor Overhead & Profit @ 27% $ 29,000Shipping Rate 50% of total is shipped @ 15% $ 8,000Sales Tax 50% of total is taxed @ 7.75% $ 5,000Project Contingency @ 40% $ 59,000Total Main Project Cost(Year of Estimate or Estimate Update) $ 205,000ENR CCI Corresponding to Year of Estimate 10283ENR CCI Corresponding to <strong>CAMP</strong> Report Year, FY 2014 10283 1.000Total Main Project Cost (<strong>CAMP</strong> Report Year) $ 205,000Project Phases Cost Rate (2) Amount Contingency Subtotal Minimum Total1.1.001 CA Condition Assessment 0.0% $ ‐ 20% $ ‐ $ ‐ $5,000 Not Applicable1.1.001 CS Conceptual Study 0.0% $ ‐ 20% $ ‐ $ ‐ $10,000 Not Applicable1.1.001 DS Design 8.0% $ 11,680 15% $ 1,752 $ 14,000 $20,000 $ 20,0001.1.001 EDC Engr During Construction 4.5% $ 6,570 15% $ 986 $ 8,000 $10,000 $ 10,0001.1.001 CM Construction Mgt 7.5% $ 10,950 20% $ 2,190 $ 14,000 $30,000 $ 30,000Total Project Cost (Present Value in 2013 Dollars) $ 265,000Notes:5.2.019D - 63
Project 5.2.024Exterior Asset Corrosion ControlMain Project TypeKey DatesNew Facility <strong>CAMP</strong> Report Jan‐14Facility Rehabilitation Initial Estimate Nov‐12Major Maintenance Estimate Update Nov‐12Asset Replacement Const Year 2014, 2015Special StudyXMain Project Cost (1) Quantity Material Cost Labor CostNo. Units Unit Cost Total % of Mat'l TotalTotal CostProject Task ElementsRecoating equipment and piping 1 LS $ ‐ 0% $ ‐$ 200,000(Scope of work for current and future phases will befurther defined after the condition assessment and studyare compete.)Subtotal $ 200,000Contractor Overhead & Profit @ 0% (included) $‐Shipping Rate 0% of total is shipped @ 15% (included) $‐Sales Tax 0% of total is taxed @ 7.75% (included) $‐Project Contingency @ 0% (included) $‐Total Main Project Cost(Year of Estimate or Estimate Update) $ 200,000ENR CCI Corresponding to Year of Estimate 10283ENR CCI Corresponding to <strong>CAMP</strong> Report Year 10283 1.000Total Main Project Cost (<strong>CAMP</strong> Report Year) $ 200,000Project Phases Cost Rate (2) Amount Contingency Subtotal Minimum Total5.2.024 CA Condition Assessment 12.5% $ 25,000 20% $ 5,000 $ 30,000 $5,000 incl in study5.2.024 CS Conceptual Study 8.0% $ 16,000 20% $ 3,200 $ 20,000 $10,000 $ 50,0005.2.024 DS Design 17.0% $ 34,000 15% $ 5,100 $ 40,000 $20,000 $ 40,0005.2.024 EDC Engr During Construction 8.5% $ 17,000 15% $ 2,550 $ 20,000 $10,000 $ 20,0005.2.024 CM Construction Mgt 7.5% $ 15,000 20% $ 3,000 $ 18,000 $30,000 $ 30,000Total Project Cost (Present Value in 2013 Dollars) $ 340,000Notes:1. For most projects Main Project cost is construction cost, however Main Project Cost could be bypass pumping or similar costs.2. Percent of Total Main Project Cost5.2.024D - 64
Project 5.2.025Tech Master Plan Recommendations ImplementationMain Project TypeKey DatesNew Facility <strong>CAMP</strong> Report Jan‐14Facility Rehabilitation Initial Estimate Dec‐12Major Maintenance Estimate Update Dec‐12Asset Replacement X Const Year 2017Special StudyMain Project Cost (1) Quantity Material Cost Labor CostNo. Units Unit Cost Total % of Mat'l TotalTotal CostProject Task ElementsElements to be defined by study 1 LS $ 1,000,000 $ 1,000,000 0% $ ‐$ 1,000,000Scope may includePLC System UpgradesI/O reconnectionsIP PhonesElectronic AccessSubtotal $ 1,000,000Contractor Overhead & Profit included 0% $‐Shipping Rate 0% of total is shipp 15% $‐Sales Tax 0% of total is taxed 7.75% $‐Project Contingency included 0% $‐Total Main Project Cost(Year of Estimate or Estimate Update) $ 1,000,000ENR CCI Corresponding to Year of Estimate 9764ENR CCI Corresponding to <strong>CAMP</strong> Report Year 10283 1.053Total Main Project Cost (<strong>CAMP</strong> Report Year) $ 1,054,000Project Phases Cost Rate (2) Amount Contingency Subtotal Minimum Total5.2.019 CA Condition Assessment 1.5% $ 15,000 20% $ 3,000 $ 18,000 $5,000 not reqd5.2.019 CS Conceptual Study 2.5% $ 25,000 20% $ 5,000 $ 30,000 $10,000 in process5.2.019 DS Design 8.0% $ 80,000 15% $ 12,000 $ 92,000 $20,000 $ 92,0005.2.019 EDC Engr During Constructio 4.5% $ 45,000 15% $ 6,750 $ 52,000 $10,000 $ 52,0005.2.019 CM Construction Mgt 7.5% $ 75,000 20% $ 15,000 $ 90,000 $30,000 $ 90,000Total Project Cost (Present Value in 2013 Dollars) $ 1,288,000Notes:5.2.025D - 65
Project 5.2.026Plant Waste Stream RoutingMain Project TypeKey DatesNew Facility <strong>CAMP</strong> Report Jan‐14Facility Rehabilitation Initial Estimate Nov‐12Major Maintenance Estimate Update Nov‐12Asset Replacement Const Year 2017Special StudyXMain Project Cost (1) Quantity Material Cost Labor CostNo. Units Unit Cost Total % of Mat'l TotalTotal CostProject Task ElementsPiping and Valves 1 LS $ ‐ 0% $ ‐$ 150,000Cost estimate to be revised when study completeSubtotal $ 150,000Contractor Overhead & Profit @ 0% (Included) $‐Shipping Rate 0% of total is shipped @ 15% (Included) $‐Sales Tax 0% of total is taxed @ 7.75% (Included) $‐Project Contingency @ 0% (Included) $‐Total Main Project Cost(Year of Estimate or Estimate Update) $ 150,000ENR CCI Corresponding to Year of Estimate 10283ENR CCI Corresponding to <strong>CAMP</strong> Report Year 10283 1.000Total Main Project Cost (<strong>CAMP</strong> Report Year) $ 150,000Project Phases Cost Rate (2) Amount Contingency Subtotal Minimum Total5.2.031 CA Condition Assessment 0.0% $ ‐ 20% $ ‐ $ ‐ $5,000 not reqd5.2.031 CS Conceptual Study 16.5% $ 24,750 20% $ 4,950 $ 30,000 $10,000 $ 30,0005.2.031 DS Design 28.5% $ 42,750 15% $ 6,413 $ 50,000 $20,000 $ 50,0005.2.031 EDC Engr During Construction 4.5% $ 6,750 15% $ 1,013 $ 8,000 $10,000 $ 10,0005.2.031 CM Construction Mgt 7.5% $ 11,250 20% $ 2,250 $ 14,000 $30,000 $ 30,000Total Project Cost (Present Value in 2013 Dollars) $ 270,000Notes:1. For most projects Main Project cost is construction cost, however Main Project Cost could be bypass pumping or similar costs.2. Percent of Total Main Project Cost3. Cost estimate will be further defined after the scope of work is identified.5.2.026D - 66
Project 5.2.027Plantwide Seal CoatingMain Project TypeKey DatesNew Facility <strong>CAMP</strong> Report Jan‐14Facility Rehabilitation X Initial Estimate Jan‐11Major Maintenance Estimate Update Nov‐12Asset Replacement Const Year >= 2019Special StudyMain Project Cost (1) Quantity Material Cost Labor CostNo. Units Unit Cost Total % of Mat'l TotalTotal CostProject Task ElementsAsphalt Pavement Resealing Entire Plant 311,735 SF $ 1 $ 233,801 0% $ ‐$ 233,801Subtotal $ 234,000Contractor Overhead & Profit @ 27% $ 64,000Shipping Rate 0% of total is shipped @ 15% (Included) $‐Sales Tax 0% of total is taxed @ 7.75% (Included) $‐Project Contingency @ 20% $ 60,000Total Main Project Cost(Year of Estimate or Estimate Update) $ 358,000ENR CCI Corresponding to Year of Estimate 10000ENR CCI Corresponding to <strong>CAMP</strong> Report Year 10283 1.028Total Main Project Cost (<strong>CAMP</strong> Report Year) $ 369,000Project Phases Cost Rate (2) Amount Contingency Subtotal Minimum Total5.2.032 CA Condition Assessment 0.0% $ ‐ 20% $ ‐ $ ‐ $5,000 not reqd5.2.032 CS Conceptual Study 0.0% $ ‐ 20% $ ‐ $ ‐ $10,000 not reqd5.2.032 DS Design 8.0% $ 23,840 15% $ 3,576 $ 28,000 $20,000 $ 28,0005.2.032 EDC Engr During Construction 4.5% $ 13,410 15% $ 2,012 $ 16,000 $10,000 $ 16,0005.2.032 CM Construction Mgt 7.5% $ 22,350 20% $ 4,470 $ 27,000 $30,000 $ 30,000Total Project Cost (Present Value in 2013 Dollars) $ 443,000Notes:1. For most projects Main Project cost is construction cost, however Main Project Cost could be bypass pumping or similar costs.2. Percent of Total Main Project Cost3. Cost estimate based on Bid Results of Post Phase V Improvements Project.5.2.027D - 67
Project 5.3.001Operations Building Locker ReplacementMain Project TypeKey DatesNew Facility <strong>CAMP</strong> Report Jan‐14Facility RehabilitationInitial EstimateMajor MaintenanceEstimate UpdateAsset Replacement X Const Year >= 2019Special StudyMain Project Cost (1) Quantity Material Cost Labor CostNo. Units Unit Cost Total % of Mat'l TotalTotal CostProject Task ElementsMob/Demob 1 LS $ 7,100 $ 7,100 0% $ ‐$ 7,100Remove and haul away extg lockers 1 LS $ 10,200 $ 10,200 0% $ ‐$ 10,200Extend concrete base of lockers 1 LS $ 2,600 $ 2,600 0% $ ‐$ 2,600Relocate benches 1 LS $ 1,000 $ 1,000 0% $ ‐$ 1,000Repair tile in front of lockers and at benches 1 LS $ 5,100 $ 5,100 0% $ ‐$ 5,100Provide and install new lockers, delivered 1 LS $ 51,000 $ 51,000 50% $ 25,500$ 76,500Provide temporary shower facility 1 LS $ 6,120 $ 6,120 50% $ 3,060$ 9,180Provide temporary storage trailor for lockers 1 LS $ 1,000 $ 1,000 50% $ 500$ 1,500Subtotal $ 114,000Contractor Overhead & Profit @ 27% $ 31,000Shipping Rate 10% of total is shipped @ 15% $ 2,000Sales Tax 65% of total is taxed @ 7.75% $ 6,000Project Contingency @ 40% $ 62,000Total Main Project Cost(Year of Estimate or Estimate Update) $ 215,000ENR CCI Corresponding to Year of Estimate 10148ENR CCI Corresponding to <strong>CAMP</strong> Report Year 10283 1.013Total Main Project Cost (<strong>CAMP</strong> Report Year) $ 218,000Project Phases Cost Rate (2) Amount Contingency Subtotal Minimum Total5.3.001 CA Condition Assessment 1.5% $ 2,295 20% $ 459 $ 3,000 $5,000 completed5.3.001 CS Conceptual Study 2.5% $ 2,525 20% $ 505 $ 4,000 $10,000 completed5.3.001 DS Design 8.0% $ 12,240 15% $ 1,836 $ 15,000 $20,000 $ 20,0005.3.001 EDC Engr During Construction 4.5% $ 6,885 15% $ 1,033 $ 8,000 $10,000 $ 10,0005.3.001 CM Construction Mgt 7.5% $ 11,475 20% $ 2,295 $ 14,000 $30,000 $ 30,000Total Project Cost (Present Value in 2013 Dollars) $ 278,000Notes:1) Costs based on TM Operations Facility Locker Replacement Memo, RMC, dated Jan 4, 20112) Original report uses a Contractor O&P value of 20%. This cost sheet uses a value of 27%, consistent with the <strong>CAMP</strong> process for similarly‐sized projects.3) Original report uses a contingency of 15%. This cost sheet uses a contingency of 40%, consistent with the <strong>CAMP</strong> process for long range projects.5.3.001D - 68
Project 5.3.002Ops Bldg Air Intake RelocationMain Project TypeKey DatesNew Facility <strong>CAMP</strong> Report Jan‐12Facility Rehabilitation Initial Estimate Nov‐11Major Maintenance X Estimate Update Nov‐11Asset Replacement Const Year 2015Special StudyMain Project Cost (1) Quantity Material Cost Labor CostNo. Units Unit Cost Total % of Mat'l TotalTotal CostProject Task ElementsAir Intake Relocation 1 LS $ 50,000 $ 50,000 50% $ 25,000$ 75,000Subtotal $ 75,000Contractor Overhead & Profit @ 27% $ 21,000Shipping Rate 40% of total is shipped @ 15% $ 5,000Sales Tax 50% of total is taxed @ 7.75% $ 3,000Project Contingency @ 40% $ 42,000Total Main Project Cost(Year of Estimate or Estimate Update) $ 146,000ENR CCI Corresponding to Year of Estimate 10088ENR CCI Corresponding to <strong>CAMP</strong> Report Year 10283 1.019Total Main Project Cost (<strong>CAMP</strong> Report Year) $ 149,000Project Phases Cost Rate (2) Amount Contingency Subtotal Minimum Total5.3.002 CA Condition Assessment 0.0% $ ‐ 20% $ ‐ $ ‐ $5,000 Not Applicable5.3.002 CS Conceptual Study 2.5% $ 1,775 20% $ 355 $ 3,000 $10,000 Not Applicable5.3.002 DS Design 8.0% $ 8,320 15% $ 1,248 $ 10,000 $20,000 $ 20,0005.3.002 EDC Engr During Construction 4.5% $ 4,680 15% $ 702 $ 6,000 $10,000 $ 10,0005.3.002 CM Construction Mgt 7.5% $ 7,800 20% $ 1,560 $ 10,000 $30,000 Not ApplicableTotal Project Cost (Present Value in 2013 Dollars) $ 179,000Notes:1. For most projects Main Project cost is construction cost, however Main Project Cost could be bypass pumping or similar costs.2. Percent of Total Main Project Cost3. Cost estimated. A more detailed estimate will be available after conceptual study.5.3.002D - 69
Project 5.3.004Operations Building Chiller ReplacementMain Project TypeKey DatesNew Facility <strong>CAMP</strong> Report Jan‐14Facility Rehabilitation Initial Estimate Nov‐11Major Maintenance Estimate Update Nov‐11Asset Replacement X Const Year >=2019Special StudyMain Project Cost (1) Quantity Material Cost Labor CostNo. Units Unit Cost Total % of Mat'l TotalTotal CostProject Task ElementsReplace existing Chiller (4) 1 LS $ 180,000 $ 180,000 35% $ 63,000$ 243,000Piping, Valves, and other equip 1 LS $ 24,000 $ 24,000 50% $ 12,000$ 36,000Cooling Tower 1 LS $ 16,500 $ 16,500 50% $ 8,250$ 25,000Installation of hot water piping from Power Bldg to 1 LS $ 510,000 $ 510,000 43% $ 219,300$ 730,000Operation BldgSubtotal $ 1,034,000Contractor Overhead & Profit @ 27% $ 280,000Shipping Rate 70% of total is shipped @ 15% $ 109,000Sales Tax 70% of total is taxed @ 7.75% $ 57,000Project Contingency @ 40% $ 592,000Total Main Project Cost(Year of Estimate or Estimate Update) $ 2,072,000ENR CCI Corresponding to Year of Estimate 10283ENR CCI Corresponding to <strong>CAMP</strong> Report Year 10283 1.000Total Main Project Cost (<strong>CAMP</strong> Report Year) $ 2,072,000Project Phases Cost Rate (2) Amount Contingency Subtotal Minimum Total5.3.004 CA Condition Assessment 0.0% $ ‐ 20% $ ‐ $ ‐ $5,000 Not Applicable5.3.004 CS Conceptual Study 2.5% $ 25,950 20% $ 5,190 $ 32,000 $10,000 $ 32,0005.3.004 DS Design 8.0% $ 118,400 15% $ 17,760 $ 137,000 $20,000 $ 137,0005.3.004 EDC Engr During Construction 4.5% $ 66,600 15% $ 9,990 $ 77,000 $10,000 $ 77,0005.3.004 CM Construction Mgt 7.5% $ 111,000 20% $ 22,200 $ 134,000 $30,000 $ 134,000Total Project Cost (Present Value in 2013 Dollars) $ 2,452,000Notes:1. For most projects Main Project cost is construction cost, however Main Project Cost could be bypass pumping or similar costs.2. Percent of Total Main Project Cost3. Cost estimated. A more detailed estimate will be available after conceptual study.4. Assume Eco‐Max Adsorption Chiller option per Draft Energy Management Strategic Plan dated 11/30/2010.5.3.004D - 70
Project 5.3.006Secondary Scum Pit Roof RemovalMain Project TypeKey DatesNew Facility <strong>CAMP</strong> Report Jan‐14Facility Rehabilitation Initial Estimate Dec‐12Major Maintenance Estimate Update Dec‐12Asset Replacement Const Year 2014Special StudyXMain Project Cost (1) Quantity Material Cost Labor CostNo. Units Unit Cost Total % of Mat'l TotalTotal CostProject Task ElementsDemolish Existing Roof, labor included 1 LS $ 10,000 $ 10,000 0% $ ‐$ 10,000Relocate or provide new lighting 2 EA $ 5,000 $ 10,000 50% $ 5,000$ 15,000Provide access platform 1 LS $ 20,000 $ 20,000 0% $ ‐$ 20,000Handrail 100 LS $ 100 $ 10,000 0% $ ‐$ 10,000Davit for cover removal 1 LS $ 10,000 $ 10,000 0% $ ‐$ 10,000Modify covers to be compatible with davit 1 LS $ 2,000 $ 2,000 0% $ ‐$ 2,000Subtotal $ 67,000Contractor Overhead & Profit @ 27% $ 19,000Shipping Rate 50% of total is shipped @ 15% $ 6,000Sales Tax 50% of total is taxed @ 7.75% $ 3,000Project Contingency @ 40% $ 38,000Total Main Project Cost(Year of Estimate or Estimate Update) $ 133,000ENR CCI Corresponding to Year of Estimate 9764ENR CCI Corresponding to <strong>CAMP</strong> Report Year 10283 1.053Total Main Project Cost (<strong>CAMP</strong> Report Year) $ 141,000Project Phases Cost Rate (2) Amount Contingency Subtotal Minimum Total5.3.006 CA Condition Assessment 1.5% $ 1,425 20% $ 285 $ 2,000 $5,000 not reqd5.3.006 CS Conceptual Study 2.5% $ 1,650 20% $ 330 $ 2,000 $10,000 not reqd5.3.006 DS Design 8.0% $ 7,600 15% $ 1,140 $ 9,000 $20,000 $ 40,0005.3.006 EDC Engr During Construction 4.5% $ 4,275 15% $ 641 $ 5,000 $10,000 $ 10,0005.3.003 CM Construction Mgt 7.5% $ 7,125 20% $ 1,425 $ 9,000 $30,000 $ 20,000Total Project Cost (Present Value in 2013 Dollars) $ 211,000Notes:5.3.006D - 71
Project 5.3.008Roof Access Safety FacilitiesMain Project TypeKey DatesNew Facility X <strong>CAMP</strong> Report Jan‐12Facility Rehabilitation Initial Estimate Nov‐11Major Maintenance Estimate Update Nov‐11Asset Replacement Const Year 2014Special StudyMain Project Cost (1) Quantity Material Cost Labor CostNo. Units Unit Cost Total % of Mat'l TotalTotal CostProject Task ElementsPermanent Roof Access Stair 1 EA $ 15,000 $ 15,000 100% $ 15,000$ 30,000Fall protection skids 2 EA $ 10,000 $ 20,000 25% $ 5,000$ 25,000Subtotal $ 55,000Contractor Overhead & Profit @ 27% $ 15,000Shipping Rate 40% of total is shipped @ 15% $ 5,000Sales Tax 50% of total is taxed @ 7.75% $ 3,000Project Contingency @ 40% $ 32,000Total Main Project Cost(Year of Estimate or Estimate Update) $ 110,000ENR CCI Corresponding to Year of Estimate 10088ENR CCI Corresponding to <strong>CAMP</strong> Report Year 10088 1.000Total Main Project Cost (<strong>CAMP</strong> Report Year) $ 110,000Project Phases Cost Rate (2) Amount Contingency Subtotal Minimum Total5.3.008 CA Condition Assessment 0.0% $ ‐ 20% $ ‐ $ ‐ $5,000 Not Applicable5.3.008 CS Conceptual Study 0.0% $ ‐ 20% $ ‐ $ ‐ $10,000 Not Applicable5.3.008 DS Design 8.0% $ 6,240 15% $ 936 $ 8,000 $20,000 $ 20,0005.3.008 EDC Engr During Construction 4.5% $ 3,510 15% $ 527 $ 5,000 $10,000 $ 10,0005.3.008 CM Construction Mgt 0.0% $ ‐ 20% $ ‐ $ ‐ $30,000 Not ApplicableTotal Project Cost (Present Value in 2013 Dollars) $ 140,000Notes:1. For most projects Main Project cost is construction cost, however Main Project Cost could be bypass pumping or similar costs.2. Percent of Total Main Project Cost3. Cost Estimated.5.3.008D - 72
Project 5.3.009DW Bldg Roof RepairMain Project TypeKey DatesNew Facility <strong>CAMP</strong> Report Jan‐14Facility Rehabilitation X Initial Estimate Nov‐12Major Maintenance Estimate Update Nov‐12Asset Replacement Const Year ≥2019Special StudyMain Project Cost (1) Quantity Material Cost Labor CostNo. Units Unit Cost Total % of Mat'l TotalTotal CostProject Task ElementsRoof repair 1 LS $ ‐$ ‐$ 30,000Subtotal $ 30,000Contractor Overhead & Profit @ 27% $ 9,000Shipping Rate 40% of total is shipped @ 15% $ 2,000Sales Tax 50% of total is taxed @ 7.75% $ 2,000Project Contingency @ 25% $ 11,000Total Main Project Cost(Year of Estimate or Estimate Update) $ 54,000ENR CCI Corresponding to Year of Estimate 10283ENR CCI Corresponding to <strong>CAMP</strong> Report Year 10283 1.000Total Main Project Cost (<strong>CAMP</strong> Report Year) $ 54,000Project Phases Cost Rate (2) Amount Contingency Subtotal Minimum Total5.3.009 CA Condition Assessment 0.0% $ ‐ 20% $ ‐ $ ‐ $5,000 not reqd5.3.009 CS Conceptual Study 0.0% $ ‐ 20% $ ‐ $ ‐ $10,000 not reqd5.3.009 DS Design 8.0% $ 3,440 15% $ 516 $ 4,000 $20,000 $ 20,0005.3.009 EDC Engr During Construction 4.5% $ 1,935 15% $ 290 $ 3,000 $10,000 $ 10,0005.3.009 CM Construction Mgt 7.5% $ 3,225 20% $ 645 $ 4,000 $30,000 $ 30,000Total Project Cost (Present Value in 2013 Dollars) $ 114,000Notes:5.3.009D - 73
Project 5.4.001Treatment Plant ModelMain Project TypeKey DatesNew Facility X <strong>CAMP</strong> Report Jan‐14Facility Rehabilitation Initial Estimate Oct‐11Major Maintenance Estimate Update Nov‐11Asset Replacement Const Year 2014Special StudyMain Project Cost (1) Quantity Material Cost Labor CostNo. Units Unit Cost Total % of Mat'l TotalTotal CostProject Task ElementsTreatment Plant Model 1 LS $ ‐ $ ‐ 0% $ ‐$ 15,000Subtotal $ 15,000Contractor Overhead & Profit @ 0% $‐Shipping Rate 40% of total is shipped @ 15% $ 1,000Sales Tax 50% of total is taxed @ 7.75% $ 1,000Project Contingency @ 40% $ 7,000Total Main Project Cost(Year of Estimate or Estimate Update) $ 24,000ENR CCI Corresponding to Year of Estimate 9999ENR CCI Corresponding to <strong>CAMP</strong> Report Year 10283 1.028Total Main Project Cost (<strong>CAMP</strong> Report Year) $ 25,000Project Phases Cost Rate (2) Amount Contingency Subtotal Minimum Total5.4.001 CA Condition Assessment 0.0% $ ‐ 20% $ ‐ $ ‐ $5,000 Not Applicable5.4.001 CS Conceptual Study 0.0% $ ‐ 20% $ ‐ $ ‐ $10,000 Not Applicable5.4.001 DS Design 0.0% $ ‐ 15% $ ‐ $ ‐ $20,000 Not Applicable5.4.001 EDC Engr During Construction 0.0% $ ‐ 15% $ ‐ $ ‐ $10,000 Not Applicable5.4.001 CM Construction Mgt 0.0% $ ‐ 20% $ ‐ $ ‐ $30,000 Not ApplicableTotal Project Cost (Present Value in 2013 Dollars) $ 25,000Notes:1. For most projects Main Project cost is construction cost, however Main Project Cost could be bypass pumping or similar costs.2. Percent of Total Main Project Cost3. Cost estimate from K. McHorney on October 2011.5.4.001D - 74
APPENDIX EMAJOR ASSET REGISTER
This page intentionally left blank
Table E‐1: <strong>Encina</strong> Water Pollution Control Facility Major Asset List, FY 2014 E‐<strong>CAMP</strong>Item No. Asset ID Asset DescriptionAssetClassesLocationInstallDateLastRefurb orReplaceDate(Year)EstimatedReplace CostBook Value(Mar 2010)Cost toReplace @ LAENR(Nov 2012)9770 1028350 COL‐8505‐000 COLLECTOR‐SLUDGE & SCUM No. 05 Mech SECONDARIES 1992 22 to be replaced w/P‐1.3.007 2014 $426,000 $448,000 $618,00051 COL‐8506‐000 COLLECTOR‐SLUDGE & SCUM No. 06 Mech SECONDARIES 1992 22 to be replaced w/P‐1.3.007 2014 $426,000 $448,000 $618,0001150 02330 SERVER Misc MAINT. BLDG. 2007 7 pending tech master plan 2014 $100,000 $105,000 $145,00034 BLD‐4200‐000 CONST OFFICES (OLD MAINT BUILDING) Struc COGENERATION 1965 50 Upgrade project P‐5.3.003 2015 $2,451,000 $2,574,000 $3,552,000113 HU‐1506‐000 HYDRAULIC UNIT‐SCREENINGS PRESS Mech HEADWORKS 1984 2005 10 to be replaced w/P‐1.1.005 2015 $55,000 $58,000 $80,000480 T‐2401‐000 TANK‐#1 PRIMARY SEDIMENTATION Struc PRIMARIES 1965 50 rehab incl in P‐1.1.006 2015 $55,000 $58,000 $80,000481 T‐2402‐000 TANK‐#2 PRIMARY SEDIMENTATION Struc PRIMARIES 1965 50 Identified P‐1.2.006 2015 $55,000 $58,000 $80,000143 MME‐2502‐B00 HELICAL SCUM SKIMMER‐#4 PRI.TANK Struc PRIMARIES 1984 1996 20 Appendix A; P‐1.1.006 2016 $50,000 $53,000 $73,000144 MME‐2503‐A00 HELICAL SCUM SKIMMER‐#5 PRI.TANK Struc PRIMARIES 1984 1996 20 Appendix A; P‐1.1.006 2016 $50,000 $53,000 $73,000145 MME‐2503‐B00 HELICAL SCUM SKIMMER‐#6 PRI.TANK Struc PRIMARIES 1984 1996 20 Appendix A; P‐1.1.006 2016 $50,000 $53,000 $73,000376 SCR‐1513‐000 BARSCREEN #3 Mech HEADWORKS 1984 1996 20 to be replaced w/P‐1.1.005 2016 $148,000 $156,000 $215,000DU‐2512‐000 SLUDGE COLLECTOR ‐ #4 PRI. TANK Mech PRIMARIES 1984 1996 20 Cost provided by J. Fetu 2011 2016 $41,777 $44,000 $61,000DU‐2513‐000 SLUDGE COLLECTOR ‐ #5 PRI. TANK Mech PRIMARIES 1984 1996 20 Cost provided by J. Fetu 2011 2016 $41,777 $44,000 $61,000DU‐2513‐000 SLUDGE COLLECTOR ‐ #6 PRI. TANK Mech PRIMARIES 1984 1996 20 Cost provided by J. Fetu 2011 2016 $41,777 $44,000 $61,00041 CHR‐4044‐000 CHILLER‐ (POWER BLDG.) Mech COGENERATION 1984 1998 20 Appendix A 2018 $83,000 $88,000 $121,00098 FLT‐0030‐000 FILTER‐3WHP/2W SANDFILTER Mech 1W & 2W 1993 25 pending plant water study 2018 $110,000 $116,000 $160,000375 SCR‐1512‐000 BARSCREEN #2 Mech HEADWORKS 1984 1998 20 to be replaced w/P‐1.1.005 2018 $148,000 $156,000 $215,000558 VEH‐4057‐000 VEHICLE‐#57 (FORKLIFT/YALE) Fleet NON‐SPECIFIC 2003 15 veh not managed in E‐<strong>CAMP</strong> 2018 $55,000 $58,000 $80,000559 VEH‐4058‐000 VEHICLE‐#58 TRAILER JOCKEY Fleet NON‐SPECIFIC 2003 15 veh not managed in E‐<strong>CAMP</strong> 2018 $72,000 $76,000 $105,000Sub‐total for Projects Requiring Replacement in next 5 years (prior to 2018) $6,471,00024 B‐5064‐000 BLOWER, #2 DILUTED NATURAL GAS Mech DIGESTERS 1984 1999 20 2019 $165,000 $174,000 $240,000140 MME‐2501‐A00 HELICAL SCUM SKIMMER‐#1 PRI.TANK Mech PRIMARIES 1984 1999 20 Appendix A; P‐1.1.006 2019 $50,000 $53,000 $73,000141 MME‐2501‐B00 HELICAL SCUM SKIMMER‐#2 PRI.TANK Mech PRIMARIES 1984 1999 20 Appendix A; P‐1.1.006 2019 $50,000 $53,000 $73,000142 MME‐2502‐A00 HELICAL SCUM SKIMMER‐#3 PRI.TANK Mech PRIMARIES 1984 1999 20 Appendix A; P‐1.1.006 2019 $50,000 $53,000 $73,000630 24" SE PIPE‐24" SECONDARY EFFLUENT, DI Mech SECONDARIES 1979 40 2019 $195,000 $205,000 $283,000700 24" SE PIPE‐24" SECONDARY EFFLUENT, DI Mech SECONDARIES 1979 40 2019 $56,000 $59,000 $81,000789 CHF‐6921‐000CEPT POLYMER BLENDING UNIT,DYNABLENDCEPT. CHEMICALMech(EAST)STORAGE2009 10 2019 $132,000 $139,000 $192,000790 CHF‐6922‐000CEPT POLMER BLENDING UNIT,DYNABLENDCEPT. CHEMICALMech(WEST)STORAGE2009 10 2019 $132,000 $139,000 $192,0001220 VFD‐6100‐001 VFD MAINDRIVE CENTRIFUGE #1 (EAST) Ele/InstDRYING/CENTRIFUGESYSTEM2009 10 2019 $50,000 $53,000 $73,0001221 VFD‐6200‐001 VFD MAIN DRIVE CENTRIFUGE #2 (WEST) Ele/InstDRYING/CENTRIFUGESYSTEM2009 10 2019 $50,000 $53,000 $73,0001223 VFD‐6100‐002 VFD BACK DRIVE CENTRIFUGE #1 (EAST) Ele/InstDRYING/CENTRIFUGESYSTEM2009 10 2019 $50,000 $53,000 $73,0001224 VFD‐6200‐002 VFD BACK DRIVE CENTRIFUGE #2 (WEST) Ele/InstDRYING/CENTRIFUGESYSTEM2009 10 2019 $50,000 $53,000 $73,0001580 CND‐500‐000 CONDENSER / SATURATOR MiscDRYING/EMISSIONSCONTROL2009 10 2019 $79,000 $83,000 $115,000NominalUsefulLife(Years)AssessedUsefulLife(Years)CommentsReplaceDate(Year)Cost Total @15% O&P and20% ContMajor Asset Table (Revised Nov 2012) E-1: Page 1 of 8 12/26/2012
Table E‐1: <strong>Encina</strong> Water Pollution Control Facility Major Asset List, FY 2014 E‐<strong>CAMP</strong>Item No. Asset ID Asset DescriptionAssetClassesLocationInstallDateLastRefurb orReplaceDate(Year)NominalUsefulLife(Years)AssessedUsefulLife(Years)CommentsReplaceDate(Year)EstimatedReplace CostBook Value(Mar 2010)Cost toReplace @ LAENR(Nov 2012)9770 10283Cost Total @15% O&P and20% Cont1581 VS‐510‐000 VENTURI SCRUBBER MiscDRYING/EMISSIONSCONTROL2009 10 2019 $85,000 $90,000 $124,000DU‐2511‐000 SLUDGE COLLECTOR ‐ #1 PRI. TANK Mech PRIMARIES 1984 1999 20 Cost provided by J. Fetu 2011 2019 $41,777 $44,000 $61,000DU‐2511‐000 SLUDGE COLLECTOR ‐ #2 PRI. TANK Mech PRIMARIES 1984 1999 20 Cost provided by J. Fetu 2011 2019 $41,777 $44,000 $61,000DU‐2512‐000 SLUDGE COLLECTOR ‐ #3 PRI. TANK Mech PRIMARIES 1984 1999 20 Cost provided by J. Fetu 2011 2019 $41,777 $44,000 $61,0001 AHU‐1601‐000 AHU‐SCREENINGS ROOM AGP HEADWORKS 1984 2000 20 20 Appendix A 2020 $55,000 $58,000 $80,0002 AHU‐1606‐000 AHU‐MCC ROOM‐SCREENINGS AGP HEADWORKS 1984 2000 20 20 Appendix A 2020 $55,000 $58,000 $80,0003 AHU‐1610‐000 FAN‐ROOM, ORF, & PRIMARY GALLERY AGP HEADWORKS 1984 2000 20 20 Appendix A 2020 $55,000 $58,000 $80,0004 AHU‐3720‐000 AHU‐CHLORINE BLD. MCC AGP CHLORINE 1984 2000 20 20 2020 $55,000 $58,000 $80,0007 AHU‐4067‐000 AHU‐MCC ROOM (POWER BLDG.) AGP COGENERATION 1984 2000 20 20 Appendix A 2020 $55,000 $58,000 $80,0008 AHU‐4510‐000 AHU ‐ WAREHOUSE AGP SECONDARIES 1984 2000 20 20 2020 $55,000 $58,000 $80,00014 AHU‐6692‐000 AHU‐SECOND FLOOR SUPPLY FAN (DEWAT) AGP DEWATERING 1984 2000 20 20 Appendix A 2020 $55,000 $58,000 $80,00015 AHU‐8054‐000 AHU‐SEC.BLDG. AGP SECONDARIES 1984 2000 20 20 2020 $55,000 $58,000 $80,00043 COL‐7101‐000 COLLECTOR‐#1 DAF.TANK SCUM Mech DAFT 1984 1995 25 25 Appendix A 2020 $66,000 $70,000 $97,00044 COL‐7201‐000 COLLECTOR‐#2 DAF.TANK SCUM Mech DAFT 1984 1995 25 25 Appendix A 2020 $66,000 $70,000 $97,00045 COL‐7301‐000 COLLECTOR‐#3 DAF TANK SCUM Mech DAFT 1992 1995 25 25 2020 $66,000 $70,000 $97,000101 FLT‐8830‐000 FILTER‐CARBON FILTER (EAST) Mech SECONDARIES. 1992 2000 20 20 2020 $55,000 $58,000 $80,000102 FLT‐8831‐000 FILTER‐CARBON FILTER (WEST) Mech SECONDARIES. 1992 2000 20 20 2020 $55,000 $58,000 $80,000116 MCC‐1500‐F00 MCC‐F (HEADWORKS‐SCREENINGS BLD) Ele/Inst HEADWORKS 1980 40 40 2020 $110,000 $116,000 $160,000117 MCC‐1500‐G00 MCC‐G (HEADWORKS‐SCREENINGS BLD) Ele/Inst HEADWORKS 1980 40 40 2020 $110,000 $116,000 $160,000118 MCC‐3500‐D00 MCC‐D (CHLORINE BLDG.) Ele/Inst CHLORINE 1980 40 40 2020 $110,000 $116,000 $160,000119 MCC‐3500‐E00 MCC‐E (CHLORINE BDLG.) Ele/Inst CHLORINE 1980 40 40 2020 $110,000 $116,000 $160,000120 MCC‐4000‐K00 MCC‐K (DIGESTERS) Ele/Inst DIGESTERS 1980 40 40 2020 $110,000 $116,000 $160,000122 MCC‐4000‐M00 MCC‐M (BLOWERS) Ele/Inst COGENERATION 1980 40 40 2020 $110,000 $116,000 $160,000123 MCC‐4000‐N00 MCC‐N (BLOWERS) Ele/Inst COGENERATION 1980 40 40 2020 $110,000 $116,000 $160,000124 MCC‐4000‐P00 MCC‐P (POWER & MAINT.BLDG.) Ele/Inst COGENERATION 1980 40 40 2020 $110,000 $116,000 $160,000125 MCC‐4000‐R00 MCC‐R (POWER & MAINT.BLDG.) Ele/Inst COGENERATION 1980 40 40 2020 $110,000 $116,000 $160,000126 MCC‐6000‐H00 MCC‐H (SLUDGE DEWATERING BLDG.) Ele/Inst DEWATERING 1980 40 40 2020 $110,000 $116,000 $160,000146 MME‐2504‐A00 HELICAL SCUM SKIMMER‐#7 PRI.TANK Struc PRIMARIES 1992 2000 20 20 Appendix A; P‐1.1.006 2020 $50,000 $53,000 $73,000147 MME‐2504‐B00 HELICAL SCUM SKIMMER‐#8 PRI.TANK Struc PRIMARIES 1992 2000 20 20 Appendix A; P‐1.1.006 2020 $50,000 $53,000 $73,000148 MME‐2505‐A00 HELICAL SCUM SKIMMER‐#9 PRI.TANK Struc PRIMARIES 1992 2000 20 20 Appendix A; P‐1.1.006 2020 $50,000 $53,000 $73,000149 MME‐2505‐B00 HELICAL SCUM SKIMMER‐#10 PRI.TANK Struc PRIMARIES 1992 2000 20 20 Appendix A; P‐1.1.006 2020 $50,000 $53,000 $73,000201 P‐3062‐000 PUMP‐#2 FINAL EFFLUENT Mech EFFLUENT 1984 2000 20 20 2020 $66,000 $70,000 $97,000282 P‐7310‐000 PUMP‐#3 TWAS Mech DAFT 1981 2000 20 20 2020 $74,000 $78,000 $108,000286 P‐8004‐000 PUMP‐#1 WAS Mech SECONDARIES 1984 2000 20 20 2020 $45,000 $48,000 $66,000287 P‐8005‐000 PUMP‐#2 WAS Mech SECONDARIES 1984 2000 20 20 2020 $45,000 $48,000 $66,000289 P‐8008‐000 PUMP‐#5 WAS Mech SECONDARIES 1984 2000 20 20 2020 $45,000 $48,000 $66,000294 P‐8023‐000 PUMP‐# 1 RAS PUMP Mech SECONDARIES 1984 2000 20 20 2020 $55,000 $58,000 $80,000295 P‐8024‐000 PUMP‐# 2 RAS PUMP Mech SECONDARIES 1984 2000 20 20 2020 $55,000 $58,000 $80,000Major Asset Table (Revised Nov 2012) E-1: Page 2 of 8 12/26/2012
Table E‐1: <strong>Encina</strong> Water Pollution Control Facility Major Asset List, FY 2014 E‐<strong>CAMP</strong>Item No. Asset ID Asset DescriptionAssetClassesLocationInstallDateLastRefurb orReplaceDate(Year)NominalUsefulLife(Years)AssessedUsefulLife(Years)CommentsReplaceDate(Year)EstimatedReplace CostBook Value(Mar 2010)Cost toReplace @ LAENR(Nov 2012)9770 10283Cost Total @15% O&P and20% Cont296 P‐8025‐000 PUMP‐# 3 RAS PUMP Mech SECONDARIES 1984 2000 20 20 2020 $55,000 $58,000 $80,000297 P‐8026‐000 PUMP‐# 4 RAS PUMP Mech SECONDARIES 1984 2000 20 20 2020 $55,000 $58,000 $80,000669 16" FA PIPE‐16" FOUL AIR, FRP Mech NON‐SPECIFIC 1980 40 40 2020 $70,000 $74,000 $102,000678 21" D PIPE‐21"DRAIN, DI Mech NON‐SPECIFIC 1980 40 40 2020 $89,000 $94,000 $130,000679 12" 3WL PIPE‐12" NO. 3 WATER LOW PRESSURE, DI Mech NON‐SPECIFIC 1980 40 40 2020 $58,000 $61,000 $84,000697 30" D PIPE‐30" DRAIN, DI Mech NON‐SPECIFIC 1980 40 40 2020 $71,000 $75,000 $104,000710 OUTFALL PRE‐PIII PIPE‐OUTFALL PRE‐PHASE III Mech NON‐SPECIFIC 1970 50 50 2020 $13,856,000 $ 14,548,000 $ 20,076,000DU‐2514‐000 SLUDGE COLLECTOR ‐ #7 PRI. TANK Mech PRIMARIES 1992 2000 20 20 Cost provided by J. Fetu 2011 2020 $41,777 $44,000 $61,000DU‐2514‐000 SLUDGE COLLECTOR ‐ #8 PRI. TANK Mech PRIMARIES 1992 2000 20 20 Cost provided by J. Fetu 2011 2020 $41,777 $44,000 $61,000DU‐2515‐000 SLUDGE COLLECTOR ‐ #9 PRI. TANK Mech PRIMARIES 1992 2000 20 20 Cost provided by J. Fetu 2011 2020 $41,777 $44,000 $61,000DU‐2515‐000 SLUDGE COLLECTOR ‐ #10 PRI. TANK Mech PRIMARIES 1992 2000 20 20 Cost provided by J. Fetu 2011 2020 $41,777 $44,000 $61,000107 GDW‐1501‐000 GRIT DEWATERER‐#1 ‐ SCREW Mech HEADWORKS 1984 2001 20 20 2021 $55,000 $58,000 $80,000108 GDW‐1502‐000 GRIT DEWATERER‐#2 ‐ SCREW Mech HEADWORKS 1984 2001 20 20 2021 $55,000 $58,000 $80,000202 P‐3063‐000 PUMP‐#3 FINAL EFFLUENT Mech EFFLUENT 1991 30 30 2021 $66,000 $70,000 $97,000203 P‐3064‐000 PUMP‐#4 FINAL EFFLUENT Mech EFFLUENT 1991 30 30 2021 $66,000 $70,000 $97,000230 P‐5530‐000 PUMP‐#5‐A DIGESTER MIXING (NORTH) Mech DIGESTERS 1991 30 30 2021 $256,000 $269,000 $371,000231 P‐5531‐000 PUMP‐#5‐B DIGESTER MIXING (SOUTH) Mech DIGESTERS 1991 30 30 2021 $256,000 $269,000 $371,000234 P‐5630‐000 PUMP‐#6‐A DIGESTER MIXING (NORTH) Mech DIGESTERS 1991 30 30 2021 $256,000 $269,000 $371,000235 P‐5631‐000 PUMP‐#6‐B DIGESTER MIXING (SOUTH) Mech DIGESTERS 1991 30 30 2021 $256,000 $269,000 $371,0001579 RTO‐540‐000 REGENERATIVE THERMAL OXIDIZER MiscDRYING/EMISSIONSCONTROL2009 2011 10 ongoing maintenance 2021 $50,000 $53,000 $73,000298 P‐8027‐000 PUMP‐# 5 RAS PUMP Mech SECONDARIES 1992 30 30 2022 $55,000 $58,000 $80,000299 P‐8027‐A00 PUMP‐# RAS (SPARE) Mech SECONDARIES 1992 30 30 2022 $55,000 $58,000 $80,000300 P‐8028‐000 PUMP‐# 6 RAS PUMP Mech SECONDARIES 1992 30 30 2022 $55,000 $58,000 $80,000301 P‐8029‐000 PUMP‐# 8 RAS PUMP Mech SECONDARIES 1992 30 30 2022 $55,000 $58,000 $80,000Sub‐total for Projects Requiring Replacement in next 5 to 10 yrs (2019 to 2023) $28,598,00021 B‐4009‐000 BLOWER‐#1 AGITATION AIR Mech COGENERATION 1984 40 40 6,000 cfm, 250 Hp 2024 $328,000 $345,000 $476,00022 B‐4010‐000 BLOWER‐#2 AGITATION AIR Mech COGENERATION 1984 40 40 6,000 cfm, 250 Hp 2024 $328,000 $345,000 $476,000204 P‐3065‐000 PUMP‐#5 FINAL EFFLUENT Mech EFFLUENT 1984 40 40 2024 $66,000 $70,000 $97,000283 P‐7410‐000 PUMP‐#4 TWAS Mech DAFT 1992 2009 15 15 2024 $74,000 $78,000 $108,000617 12" D PIPE‐12" TANK DRAIN, PVC Mech NON‐SPECIFIC 1989 35 35 2024 $95,000 $100,000 $138,000797 T‐6910‐000 FERRIC CHLORIDE STORAGE TANK MechCEPT. CHEMICALSTORAGE2009 15 15 2024 $55,000 $58,000 $80,000798 T‐6920‐000 CEPT POLYMER STORAGE TANK MechCEPT. CHEMICALSTORAGE2009 15 15 2024 $42,000 $45,000 $62,000997 PNL‐PLC‐CFP PLC CONTROLS FOR CENTRIFUGE FEED PIT Ele/Inst CENTRIFUGE FEED PIT 2009 15 15 2024 $50,000 $53,000 $73,0001008 P‐5100‐000 DIG#2 RECIRCULATION PUMP Mech CENTRIFUGE FEED PIT 2009 15 15 2024 $50,000 $53,000 $73,0001213 PNL‐CCP‐6100 PLC PANEL CENTRIFUGE #1 (EAST) Ele/InstDRYING/CENTRIFUGESYSTEM2009 15 15 2024 $155,000 $163,000 $225,000Major Asset Table (Revised Nov 2012) E-1: Page 3 of 8 12/26/2012
Table E‐1: <strong>Encina</strong> Water Pollution Control Facility Major Asset List, FY 2014 E‐<strong>CAMP</strong>Item No. Asset ID Asset DescriptionAssetClassesLocationInstallDateLastRefurb orReplaceDate(Year)NominalUsefulLife(Years)AssessedUsefulLife(Years)CommentsReplaceDate(Year)EstimatedReplace CostBook Value(Mar 2010)Cost toReplace @ LAENR(Nov 2012)9770 10283Cost Total @15% O&P and20% Cont1241 PNL‐CCP‐6200 PLC PANEL CENTRIFUGE #2 (WEST) Ele/InstDRYING/CENTRIFUGESYSTEM2009 15 15 2024 $155,000 $163,000 $225,0001416 YS‐30‐1‐1 FUGITIVE DUT RUPTURE DISK MONITOR MiscDRYING/CENTRIFUGESYSTEM2009 15 15 2024 $50,000 $53,000 $73,0001476 T‐600‐100 NITROGEN STORAGE TANK MechDRYING/NITROGENSYSTEM2009 15 15 2024 $65,000 $69,000 $95,00057 CON‐6203‐000 CONVEYOR‐#1 SCREW (NORTH) Mech DEWATERING 1984 2000 25 25 2025 $55,000 $58,000 $80,00058 CON‐6204‐000 CONVEYOR‐#2 SCREW (SOUTH) Mech DEWATERING 1984 2000 25 25 2025 $55,000 $58,000 $80,000278 P‐7110‐000 PUMP‐#1 TWAS Mech DAFT 1991 2010 15 15 2025 $74,000 $78,000 $108,000280 P‐7210‐000 PUMP‐#2 TWAS Mech DAFT 1992 2010 15 15 2025 $74,000 $78,000 $108,000378 SEP‐1505‐000 ROTARY SCREEN Mech HEADWORKS 1984 2006 20 20 Cond. Assessment ES1 2026 $55,000 $58,000 $80,0005 AHU‐3750‐000 AHU‐CHLORINATOR ROOM AGP CHLORINE 1984 2007 20 20 2027 $55,000 $58,000 $80,000726 CH‐1 CHILLER FOR ADMIN BLD Mech ADMIN. BLDG. 2007 20 20 2027 $98,000 $103,000 $142,000727 AH‐1AIR HANDLER UNIT FIRST FLOOR SUPPLY &RETURNMech ADMIN. BLDG. 2007 20 20 2027 $105,000 $111,000 $153,000730 AH‐2 AIR HANDLER UNIT SUPPLY 2ND FLOOR Mech ADMIN. BLDG. 2007 20 20 2027 $105,000 $111,000 $153,000731 AH‐3AHU SUPPLY & RETURN 2ND FLR BOARD ROOMROOFMech ADMIN. BLDG. 2007 20 20 2027 $105,000 $111,000 $153,000288 P‐8007‐000 PUMP‐#4 WAS Mech SECONDARIES 1984 2009 20 20 2029 $45,000 $48,000 $66,000674 54" WW PIPE‐54" WASTEWATER, CISP Mech NON‐SPECIFIC 1979 50 50 2029 $121,000 $128,000 $177,000677 30" WW PIPE‐30" WASTEWATER, CISP Mech NON‐SPECIFIC 1979 50 50 2029 $75,000 $79,000 $109,000695 84" SE PIPE‐84" SECONDARY EFFLUENT, RCP Mech SECONDARIES 1979 50 50 2029 $277,000 $291,000 $402,000711 OUTFALL PIII PIPE‐OUTFALL PHASE III Mech NON‐SPECIFIC 1979 50 50 2029 $2,869,000 $ 3,013,000 $ 4,158,000865 AIT‐4000‐100 GAS CHROMATOGRAPH FOR ENGINES Misc POWER BLDG. 2009 20 20 2029 $60,000 $63,000 $87,000866 AHU‐4019‐000 SUPPLY AIR FOR BLOWER ROOM NEXT TO CHILLER Mech POWER BLDG. 2009 20 20 2029 $91,000 $96,000 $132,000881 EG‐4610‐000 ENGINE GENERATOR # 1 Mech POWER BLDG. 2009 20 20 2029 $538,000 $565,000 $780,000882 EG‐4620‐000 ENGINE GENERATOR # 2 Mech POWER BLDG. 2009 20 20 2029 $538,000 $565,000 $780,000883 EG‐4630‐000 ENGINE GENERATOR # 3 Mech POWER BLDG. 2009 20 20 2029 $538,000 $565,000 $780,000884 EG‐4640‐000 ENGINE GENERATOR # 4 Mech POWER BLDG. 2009 20 20 2029 $538,000 $565,000 $780,000965 B‐5110‐000 MIXED GAS BLOWER # 1 Mech DIGESTER PHASE 2009 20 20 2029 $225,000 $237,000 $327,000966 B‐5120‐000 DIGESTER GAS BLOWER # 2 Mech DIGESTER PHASE 2009 20 20 2029 $225,000 $237,000 $327,000967 P‐5000‐000 DIG#2 DIGESTED SLUDGE TRANSFER PUMP Mech DIGESTER PHASE 2009 20 20 2029 $62,000 $66,000 $91,0001266 T‐2760‐620‐200 MINERAL OIL TANK MechDRYING/CENTRIFUGESYSTEM2009 20 20 2029 $54,000 $57,000 $79,0001462 DST‐031‐000 SILO AREA DUST COLLECTOR MiscDRYING/PELLETTRANSFER AND STORAGE2009 20 20 2029 $65,000 $69,000 $95,000680 72" SE PIPE‐72" SECONDARY EFFLUENT, RCP Mech SECONDARIES 1980 50 50 2030 $70,000 $74,000 $102,000699 72" PE PIPE‐72" PRIMARY EFFLUENT, RCP Mech PRIMARIES 1980 50 50 2030 $158,000 $166,000 $229,000Major Asset Table (Revised Nov 2012) E-1: Page 4 of 8 12/26/2012
Table E‐1: <strong>Encina</strong> Water Pollution Control Facility Major Asset List, FY 2014 E‐<strong>CAMP</strong>Item No. Asset ID Asset DescriptionAssetClassesLocationInstallDateLastRefurb orReplaceDate(Year)NominalUsefulLife(Years)AssessedUsefulLife(Years)CommentsReplaceDate(Year)EstimatedReplace CostBook Value(Mar 2010)Cost toReplace @ LAENR(Nov 2012)9770 10283Cost Total @15% O&P and20% Cont703 24" SE PIPE‐24" SIPHON, RCP Mech NON‐SPECIFIC 1980 50 50 2030 $84,000 $89,000 $123,000704 16" SE PIPE‐16" SIPHON, RCP Mech NON‐SPECIFIC 1980 50 50 2030 $57,000 $60,000 $83,00046 COL‐8501‐000 COLLECTOR‐SLUDGE & SCUM No. 01 Mech SECONDARIES. 1984 2012 20 20 Appendix A 2032 $426,000 $448,000 $618,00047 COL‐8502‐000 COLLECTOR‐SLUDGE & SCUM No. 02 Mech SECONDARIES. 1984 2012 20 20 Appendix A 2032 $426,000 $448,000 $618,00048 COL‐8503‐000 COLLECTOR‐SLUDGE & SCUM No. 03 Mech SECONDARIES. 1984 2012 20 20 Appendix A 2032 $426,000 $448,000 $618,00049 COL‐8504‐000 COLLECTOR‐SLUDGE & SCUM No. 04 Mech SECONDARIES. 1984 2012 20 20 Appendix A 2032 $426,000 $448,000 $618,00054 COL‐8508‐000 COLLECTOR‐SLUDGE & SCUM No. 08 Mech SECONDARIES. 1992 2007 25 25 Replaced drive & recoated 2032 $426,000 $448,000 $618,000109 GDW‐1503‐000 GRIT DEWATERER‐#3 ‐ SCREW Mech HEADWORKS 1992 2012 20 Replaced by EWA 2032 $55,000 $58,000 $80,000121 MCC‐4000‐L00 MCC‐L (DIGESTERS) Ele/Inst DIGESTERS 1992 40 40 2032 $110,000 $116,000 $160,000127 MCC‐6000‐J00 MCC‐J (SLUDGE DEWATERING BLDG.) Ele/Inst DEWATERING 1992 40 40 2032 $110,000 $116,000 $160,000476 T‐0021‐000 TANK‐1W WATER AIR BREAK Struc 1W & 2W 1982 50 50 2032 $55,000 $58,000 $80,000724 ELV‐4700‐000 ADMINISTRATION BUILDING ELEVATOR Mech ADMIN. BLDG. 2007 25 25 2032 $57,000 $60,000 $83,000152 MME‐6213‐000 SCALE‐#1 TRAILER (SOUTH) Misc. DEWATERING 1984 2008 25 25 2033 $83,000 $88,000 $121,000153 MME‐6214‐000 SCALE‐#2 TRAILER (NORTH) Misc. DEWATERING 1984 2008 25 25 2033 $83,000 $88,000 $121,000Sub‐total for Projects Requiring Replacement in next 10 to 20 yrs (2024 to 2033) $16,940,00029 BLD‐1500‐000 BUILDING‐SCREENINGS Struc HEADWORKS 1984 50 50 3150 SF, Est. $200/SF 2034 $687,000 $722,000 $996,00030 BLD‐3500‐000 BUILDING‐CHLORINE Struc CHLORINE 1984 50 50 2275 SF, Est. $200/SF 2034 $496,000 $521,000 $719,00031 BLD‐4000‐PWR BUILDING‐CO‐GEN POWER Struc COGENERATION 1984 50 50 16000 SF, Est. $200/SF 2034 $3,486,000 $3,660,000 $5,051,00032 BLD‐4000‐SHP BUILDING‐MAINTENANCE SHOP Struc COGENERATION 1984 50 50 2325 SF, Est. $200/SF 2034 $507,000 $533,000 $736,00033 BLD‐4100‐000 BUILDING‐MAINTENANCE ANNEX Struc COGENERATION 1984 50 50 2500 SF, Est. $200/SF 2034 $545,000 $573,000 $791,00036 BLD‐6000‐000 BUILDING‐SLUDGE DEWATERING PHASE III Struc DEWATERING 1984 50 50 9375 SF, Est. $200/SF 2034 $2,043,000 $2,145,000 $2,960,00038 BLD‐8000‐000 BUILDING‐SECONDARY Struc SECONDARIES 1984 50 50 5040 SF, Est. $200/SF 2034 $1,099,000 $1,154,000 $1,593,000457 STR‐0001‐000 STRUCTURE‐BRIDGE OVER CHAN. EAST Struc NON‐SPECIFIC 1984 50 50 2034 $437,000 $459,000 $633,000458 STR‐0002‐000 STRUCTURE‐BRIDGE OVER CHAN. WEST Struc NON‐SPECIFIC 1984 50 50 2034 $219,000 $230,000 $317,000459 STR‐0012‐000 STRUCTURE‐STORM WATER PUMP Struc NON‐SPECIFIC 1984 50 50 Estimated Repair cost 2034 $55,000 $58,000 $80,000460 STR‐0032‐000 STRUCTURE‐PLANT DRAINAGE Struc NON‐SPECIFIC 1984 50 50 Estimated Repair cost 2034 $55,000 $58,000 $80,000461 STR‐0035‐000 STRUCTURE‐INFLUENT STRUCTURE Struc HEADWORKS 1984 50 50 Estimated Repair cost 2034 $55,000 $58,000 $80,000462 STR‐0100‐000 STORM WATER BROW DITCH Struc SECONDARIES 1984 50 50 Estimated Repair cost 2034 $55,000 $58,000 $80,000464 STR‐3000‐000 STRUCTURE‐EFF.PUMPING STATION Struc EFFLUENT 1984 50 50 Estimated Repair cost 2034 $55,000 $58,000 $80,000465 STR‐3001‐000 STRUCTURE‐FAIL SAFE VAULT Struc EFFLUENT 1984 50 50 Estimated Repair cost 2034 $55,000 $58,000 $80,000466 STR‐3100‐000 STRUCTURE‐EFF.SAMPLER PUMP PIT Struc EFFLUENT 1984 50 50 Estimated Repair cost 2034 $55,000 $58,000 $80,000467 STR‐3200‐000 STRUCTURE‐FAIL SAFE LINE (WEST) Struc EFFLUENT 1984 50 50 Estimated Repair cost 2034 $55,000 $58,000 $80,000477 T‐2101‐000 TANK‐#1 GRIT ‐ CENTER Struc PRIMARIES 1984 50 50 Estimated Repair cost 2034 $55,000 $58,000 $80,000478 T‐2102‐000 TANK‐#2 GRIT ‐ EAST. Struc PRIMARIES 1984 50 50 Recoat Interior 1996 2034 $55,000 $58,000 $80,000479 T‐2103‐000 TANK‐#3 GRIT ‐ WEST Struc PRIMARIES 1984 50 50 Estimated Repair cost 2034 $55,000 $58,000 $80,000486 T‐2407‐000 TANK‐#7 PRIMARY SEDIMENTATION Struc PRIMARIES 1984 50 50 Estimated Repair cost 2034 $55,000 $58,000 $80,000487 T‐2408‐000 TANK‐#8 PRIMARY SEDIMENTATION Struc PRIMARIES 1984 50 50 Estimated Repair cost 2034 $55,000 $58,000 $80,000488 T‐2409‐000 TANK‐#9 PRIMARY SEDIMENTATION Struc PRIMARIES 1984 50 50 Estimated Repair cost 2034 $55,000 $58,000 $80,000489 T‐2410‐000 TANK‐#10 PRIMARY SEDIMENTATION Struc PRIMARIES 1984 50 50 Estimated Repair cost 2034 $55,000 $58,000 $80,000Major Asset Table (Revised Nov 2012) E-1: Page 5 of 8 12/26/2012
Table E‐1: <strong>Encina</strong> Water Pollution Control Facility Major Asset List, FY 2014 E‐<strong>CAMP</strong>Item No. Asset ID Asset DescriptionAssetClassesLocationInstallDateLastRefurb orReplaceDate(Year)NominalUsefulLife(Years)AssessedUsefulLife(Years)CommentsReplaceDate(Year)EstimatedReplace CostBook Value(Mar 2010)Cost toReplace @ LAENR(Nov 2012)9770 10283Cost Total @15% O&P and20% Cont490 T‐3001‐000 TANK‐#1 CHLORINE CONTACT (EAST) Struc EFFLUENT 1984 50 50 Estimated Repair cost 2034 $55,000 $58,000 $80,000491 T‐3002‐000 TANK‐#2 CHLORINE CONTACT (WEST) Struc EFFLUENT 1984 50 50 Estimated Repair cost 2034 $55,000 $58,000 $80,000516 T‐8100‐000 TANK‐#1 A & B AERATION Struc SECONDARIES 1984 50 50 Estimated Repair cost 2034 $55,000 $58,000 $80,000517 T‐8200‐000 TANK‐#2 A & B AERATION Struc SECONDARIES 1984 50 50 Estimated Repair cost 2034 $55,000 $58,000 $80,000520 T‐8501‐000 TANK‐#1 SECONDARY SEDIMENTATION Struc SECONDARIES 1984 50 50 Estimated Repair cost 2034 $55,000 $58,000 $80,000521 T‐8502‐000 TANK‐#2 SECONDARY SEDIMENTATION Struc SECONDARIES 1984 50 50 Estimated Repair cost 2034 $55,000 $58,000 $80,000522 T‐8503‐000 TANK‐#3 SECONDARY SEDIMENTATION Struc SECONDARIES 1984 50 50 Estimated Repair cost 2034 $55,000 $58,000 $80,000523 T‐8504‐000 TANK‐#4 SECONDARY SEDIMENTATION Struc SECONDARIES 1984 50 50 Estimated Repair cost 2034 $55,000 $58,000 $80,0001256 CFG‐6100‐000 CENTRIFUGE # 1 MechDRYING/CENTRIFUGESYSTEM2009 25 25 2034 $353,000 $371,000 $512,0001257 CFG‐6200‐000 CENTRIFUGE # 2 MechDRYING/CENTRIFUGESYSTEM2009 25 25 2034 $353,000 $371,000 $512,0001260 CON‐6200‐000 WET CAKE SCREW CONVEYOR CAKE BIN # 2 MechDRYING/CENTRIFUGESYSTEM2009 25 25 2034 $41,000 $44,000 $61,0001264 CON‐6100‐000 WET CAKE SCREW CONVEYOR TO CAKE BIN # 1 MechDRYING/CENTRIFUGESYSTEM2009 25 25 2034 $41,000 $44,000 $61,0001267 CON‐016‐200LIVE BOTTOM SCREW CONVEYOR TO CAKE PMP #DRYING/CENTRIFUGEMech2SYSTEM2009 25 25 2034 $73,000 $77,000 $106,0001268 BIN‐015‐100 WET CAKE MATERIAL BIN # 1 MechDRYING/CENTRIFUGESYSTEM2009 25 25 2034 $53,000 $56,000 $77,0001269 BIN‐015‐200 WET CAKE MATERIAL BIN # 2 MechDRYING/CENTRIFUGESYSTEM2009 25 25 2034 $53,000 $56,000 $77,0001270 CON‐016‐100LIVE BOTTOM SCREW CONVEYOR TO CAKE PMP #DRYING/CENTRIFUGEMech1SYSTEM2009 25 25 2034 $73,000 $77,000 $106,0001356 MIX‐017‐000 DRYER MIXER Mech DRYER SYSTEM 2009 25 25 2034 $87,000 $92,000 $127,0001359 F‐001‐100 DRYER COMBUSTION BLOWER Mech DRYER SYSTEM 2009 25 25 2034 $50,000 $53,000 $73,0001384 SCR‐009‐000 SHAKER SCREEN Mech DRYER SYSTEM 2009 25 25 2034 $61,000 $65,000 $90,0001386 PCY‐004‐000 POLYCYCLONE SEPARATOR Mech DRYER SYSTEM 2009 25 25 2034 $65,000 $69,000 $95,0001426 RC‐010‐000 PELLET ROLLER CRUSHER Mech DRYER SYSTEM 2009 25 25 2034 $59,000 $62,000 $86,0001429 BIN‐013‐000 RECYCLE MATERIAL BIN Mech DRYER SYSTEM 2009 25 25 2034 $88,000 $93,000 $128,0001430 ELV‐012‐000 RECYCLE FEED BUCKET ELEVATOR Mech DRYER SYSTEM 2009 25 25 2034 $58,000 $61,000 $84,0001441 PDV‐9‐1‐1 PRODUCT DIVERTER Mech DRYER SYSTEM 2009 25 25 2034 $50,000 $53,000 $73,0001461 CLR‐060‐000 PELLET COOLER MiscDRYING/PELLETTRANSFER AND STORAGE2009 25 25 2034 $133,000 $140,000 $193,0001463 ELV‐019‐000 FINAL PRODUCT BUCKET ELEVATOR Mech1464 TRN‐070‐000 PNEUMATIC TRANSPORT SYSTEM MiscDRYING/PELLETTRANSFER AND STORAGEDRYING/PELLETTRANSFER AND STORAGE2009 25 25 2034 $48,000 $51,000 $70,0002009 25 25 2034 $58,000 $61,000 $84,000Major Asset Table (Revised Nov 2012) E-1: Page 6 of 8 12/26/2012
Table E‐1: <strong>Encina</strong> Water Pollution Control Facility Major Asset List, FY 2014 E‐<strong>CAMP</strong>Item No. Asset ID Asset DescriptionAssetClassesLocationInstallDateLastRefurb orReplaceDate(Year)NominalUsefulLife(Years)AssessedUsefulLife(Years)CommentsReplaceDate(Year)EstimatedReplace CostBook Value(Mar 2010)Cost toReplace @ LAENR(Nov 2012)9770 10283Cost Total @15% O&P and20% Cont1577 B‐540‐000 RTO COMBUSTION BLOWER MechDRYING/EMISSIONSCONTROL2009 25 25 2034 $50,000 $53,000 $73,0001582 F‐005‐000 MAIN INDUCED DRAFT FAN MechDRYING/EMISSIONSCONTROL2009 25 25 2034 $48,000 $51,000 $70,0001629 F‐DF‐1 INLINE FAN Mech DRYING/UTILITIES 2009 25 25 2034 $118,000 $124,000 $171,00018 B‐4006‐000 BLOWER‐#3 AERATION AIR Mech COGENERATION 1984 2008 30 30 Rehab for Phase V 2038 $55,000 $58,000 $80,000628 72" PE PIPE‐72" PRIMARY EFFLUENT, RCP Mech PRIMARIES 1989 50 50 2039 $251,000 $264,000 $364,000867 B‐4011‐000 AGITATION AIR BLOWER Mech POWER BLDG. 2009 30 30 2039 $100,000 $105,000 $145,000872 HEX‐4150‐000 PLATE HEAT EXCHANGER Mech POWER BLDG. 2009 30 30 2039 $82,000 $87,000 $120,000873 HEX‐4160‐000 PLATE HEAT EXCHANGER Mech POWER BLDG. 2009 30 30 2039 $82,000 $87,000 $120,000885 HEX‐4710‐000HEAT EXCHANGER ENG # 1 PLATE AND FRAMEHEAT EXCHANMech POWER BLDG. 2009 30 30 2039 $82,000 $87,000 $120,000886 HEX‐4730‐000 HEAT EXCHANGER ENG # 3 PLATE AND FRAME Mech POWER BLDG. 2009 30 30 2039 $82,000 $87,000 $120,000901 HEX‐4610‐000 HEAT EXCHANGER ENGINE 1 Mech POWER BLDG. 2009 30 30 2039 $55,000 $58,000 $80,000907 HEX‐4720‐000 HEAT EXCHANGER # 2 PLATE AND FRAME Mech POWER BLDG. 2009 30 30 2039 $82,000 $87,000 $120,000948 HEX‐4620‐000 HEAT EXCHANGER ENGINE 2 Mech POWER BLDG. 2009 30 30 2039 $55,000 $58,000 $80,000949 HEX‐4630‐000 HEAT EXCHANGER FOR ENGINE 3 Mech POWER BLDG. 2009 30 30 2039 $55,000 $58,000 $80,000950 HEX‐4640‐000 HEAT EXCHANGER ENGINE 4 Mech POWER BLDG. 2009 30 30 2039 $55,000 $58,000 $80,0001357 DD‐002‐000 ROTARY DRUM DRYER Mech DRYER SYSTEM 2009 30 30 2039 $301,000 $317,000 $437,0001358 FUR‐001‐000 FURNACE Misc DRYER SYSTEM 2009 30 30 2039 $249,000 $262,000 $362,00040 BNR‐5007‐000 BURNER WASTE GAS Mech DIGESTERS 2011 30 30 2041 $874,000 $918,000 $1,267,000469 STR‐7000‐000 STRUCTURE‐TWAS.PUMP PIT Struc DAFT 1991 50 50 Estimated Repair cost 2041 $55,000 $58,000 $80,000470 STR‐7300‐000 STRUCTURE‐TWAS.PUMP PIT Struc DAFT 1991 50 50 Estimated Repair cost 2041 $55,000 $58,000 $80,000472 STR‐8400‐000 STRUCTURE‐PRI.FLOW EQUALIZATION Struc SECONDARIES 1991 50 50 Estimated Repair cost 2041 $55,000 $58,000 $80,000495 T‐5500‐000 TANK‐#5 DIGESTER Struc DIGESTERS 1992 1991 50 50 Cleaned in 2003 2041 $165,000 $174,000 $240,000496 T‐5600‐000 TANK‐#6 DIGESTER Struc DIGESTERS 1992 1991 50 50 Cleaned in 2003 2041 $165,000 $174,000 $240,000518 T‐8300‐000 TANK‐#3 A & B AERATION Struc SECONDARIES 1991 50 50 Estimated Repair cost 2041 $55,000 $58,000 $80,000519 T‐8400‐000 TANK‐#4 A & B AERATION Struc SECONDARIES 1991 50 50 Estimated Repair cost 2041 $55,000 $58,000 $80,00035 BLD‐4500‐000 BUILDING‐(WAREHOUSE) Struc COGENERATION 1992 50 50 2625 SF, Est. $200/SF 2042 $573,000 $602,000 $831,00037 BLD‐6000‐001 BUILDING‐SLUDGE DEWATERING Phase IV Struc DEWATERING 1992 50 50 5184 SF, Est. $200/SF 2042 $1,130,000 $1,187,000 $1,638,000471 STR‐8000‐000 STRUCTURE‐MIX LIQUOR CHANNEL Struc SECONDARIES 1992 50 50 Estimated Repair cost 2042 $55,000 $58,000 $80,000473 STR‐8500‐000 STRUCTURE‐SEC.CLARIFIER TANK AREA Struc SECONDARIES. 1992 50 50 Estimated Repair cost 2042 $55,000 $58,000 $80,000474 STR‐8800‐000 STRUCTURE‐SECONDARY CHEM. PIT Struc SECONDARIES 1992 50 50 Estimated Repair cost 2042 $55,000 $58,000 $80,000475 T‐0016‐000 TANK‐2W WATER AIR BREAK Struc 1W & 2W 1992 50 50 2042 $55,000 $58,000 $80,000524 T‐8505‐000 TANK‐#5 SECONDARY SEDIMENTATION Struc SECONDARIES 1992 50 50 Estimated Repair cost 2042 $55,000 $58,000 $80,000525 T‐8506‐000 TANK‐#6 SECONDARY SEDIMENTATION Struc SECONDARIES 1992 50 50 Estimated Repair cost 2042 $55,000 $58,000 $80,000526 T‐8507‐000 TANK‐#7 SECONDARY SEDIMENTATION Struc SECONDARIES 1992 50 50 Estimated Repair cost 2042 $55,000 $58,000 $80,000527 T‐8508‐000 TANK‐#8 SECONDARY SEDIMENTATION Struc SECONDARIES 1992 50 50 Estimated Repair cost 2042 $55,000 $58,000 $80,00052 COL‐8507‐000 COLLECTOR‐SLUDGE & SCUM No. 07 Mech SECONDARIES 2020 25 Future equipment 2045 $426,000 $448,000 $618,000Major Asset Table (Revised Nov 2012) E-1: Page 7 of 8 12/26/2012
Table E‐1: <strong>Encina</strong> Water Pollution Control Facility Major Asset List, FY 2014 E‐<strong>CAMP</strong>Item No. Asset ID Asset DescriptionAssetClassesLocationInstallDateLastRefurb orReplaceDate(Year)NominalUsefulLife(Years)AssessedUsefulLife(Years)CommentsReplaceDate(Year)EstimatedReplace CostBook Value(Mar 2010)Cost toReplace @ LAENR(Nov 2012)9770 10283Cost Total @15% O&P and20% Cont138 MCC‐8000‐B00 MCC‐B (SEC.BLDG.) EAST‐MCC Ele/Inst SECONDARIES 1984 2005 40 40 Appendix A 2045 $110,000 $116,000 $160,000139 MCC‐8000‐C00 MCC‐C (SEC.BLDG.) WEST‐MCC Ele/Inst SECONDARIES 1984 2005 40 40 Appendix A 2045 $110,000 $116,000 $160,000494 T‐5400‐000 TANK‐#4 DIGESTER Struc DIGESTERS 1984 1996 50 50 Recoat Interior in 1996 2046 $165,000 $174,000 $240,000468 STR‐6300‐000 STRUCTURE‐CHEMICAL STORAGE AREA Struc DEWATERING 1997 50 50 Estimated Repair cost 2047 $55,000 $58,000 $80,0001101 MCC‐4600‐000 MCC MAINTENANCE BUILDING Ele/Inst MAINT. BLDG. 2007 40 40 2047 $50,000 $53,000 $73,000992 MCC‐6000‐003 MCC‐3 CENTRIFUGE FEED PIT Ele/Inst CENTRIFUGE FEED PIT 2009 40 40 2049 $52,000 $55,000 $76,0001700 T‐021‐100 PRODUCT STORAGE TANK SILO # 2 Mech DRYING/FINAL LOAD OUT 2009 40 40 2049 $150,000 $158,000 $218,0001701 T‐021‐000 PRODUCT STORAGE TANK SILO # 1 Mech DRYING/FINAL LOAD OUT 2009 40 40 2049 $150,000 $158,000 $218,000463 STR‐2000‐000 STRUCTURE‐PRIMARY GALLERY Struc PRIMARIES 2007 50 50 Exterior Walls Repaired 2007 2057 $55,000 $58,000 $80,000759 BLD‐4700‐000 BUILDING‐ADMINISTRATION / NEW Struc ADMIN. BLDG. 2007 50 50 2057 $5,256,000 $5,519,000 $7,616,000760 BLD‐4700‐0PS BUILDING‐OPERATIONS DEPT / NEW Struc ADMIN. BLDG. 2007 50 50 2057 $4,043,000 $4,245,000 $5,858,000761 BLD‐4700‐LAB BUILDING ‐ LABORATORY DEPT / NEW Struc ADMIN. BLDG. 2007 50 50 2057 $2,022,000 $2,123,000 $2,930,0001209 BLD‐4600‐000 BUILDING‐MAINTENANCE/ NEW Struc MAINT. BLDG. 2007 50 50 2057 $1,820,000 $1,911,000 $2,637,0001210 BLD‐4600‐SHP BUILDING‐MAINTENANCE SHOP/ NEW Struc MAINT. BLDG. 2007 50 50 2057 $1,001,000 $1,051,000 $1,450,0001289BLD‐6000‐DRYERBUILDING‐HEAT DRYINGStruc1473 BLD‐6000‐FINAL HEAT DRYING FINAL LOAD OUT BUILDING StrucDRYING/CENTRIFUGESYSTEMDRYING/PELLETTRANSFER AND STORAGE2009 50 50 2059 $3,884,000 $4,078,000 $5,628,0002009 50 50 2059 $561,000 $589,000 $813,000625 42" AIR PIPE‐42" AIR PIPE, STEEL w/36" COMP LINER Mech SECONDARIES 1980 2011 50 50 2061 $900,000 $945,000 $1,304,000Sub‐total for Projects Requiring Replacement in over 20 years (past 2033)TOTAL COST$56,288,000$108,297,000Major Asset Table (Revised Nov 2012) E-1: Page 8 of 8 12/26/2012