Traffic - Forecast Operations Report - Caltrans
Traffic - Forecast Operations Report - Caltrans
Traffic - Forecast Operations Report - Caltrans

Create successful ePaper yourself
Turn your PDF publications into a flip-book with our unique Google optimized e-Paper software.
Dowling Associates, Inc.<br />
Transportation Engineering Planning Research Education<br />
Table of Contents<br />
EXECUTIVE SUMMARY ..................................................................................... .1<br />
Freeway Operational Analysis .................................................................................1<br />
Freeway Operational Results ...................................................................................2<br />
Intersection Operational Analysis ...........................................................................4<br />
Intersection Operational Results .............................................................................4<br />
INTRODUCTION .............................................................................................. .7<br />
Project Description ..................................................................................................7<br />
Analysis Years .........................................................................................................8<br />
Baseline Data Collection ..........................................................................................8<br />
FREEWAY MACRO-SIMULATION CALIBRATION..................................................... 10<br />
Freeway Modeling <strong>Operations</strong> Selection ................................................................ 10<br />
FREQ Input Data ................................................................................................... 11<br />
FREQ Model Validation Criteria .............................................................................. 14<br />
FREQ Model Validation Procedure ......................................................................... 14<br />
FREQ Model Baseline Model Results ...................................................................... 14<br />
FREQ Model Validation Results .............................................................................. 23<br />
FREEWAY FUTURE OPERATIONS ANALYSIS ......................................................... 28<br />
FREQ Macro-Simulation <strong>Forecast</strong> Analysis Inputs ................................................. 28<br />
TA-A and TA-B FREQ Feedback Process - Peak Spreading ..................................... 32<br />
TA-A and TA-B FREQ 2020 Operational Results ..................................................... 34<br />
TA-A and TA-B FREQ 2040 Operational Results ..................................................... 49<br />
TA-A and TA-B 2020 and 2040 FREQ Performance Measure Summary .................. 50<br />
TA-C Operational Analysis ..................................................................................... 65<br />
TA-C Operational Analysis Results (Without Ramp Metering) ............................... 74<br />
TA-C Operational Analysis Results (With Ramp Metering) ..................................... 77<br />
INTERSECTION FORECAST OPERATIONAL ANALYSIS ............................................. 79<br />
Intersection Operational Performance Criteria ...................................................... 79<br />
Future AM/PM Peak Hour Turning Movements ...................................................... 80<br />
Future Intersection Turning Movement Development Process .............................. 81<br />
Final Intersection Future Turning Movements ....................................................... 84<br />
FORECAST INTERSECTION OPERATIONAL RESULTS ............................................. 109<br />
Project Impact Assessment ................................................................................. 149<br />
SC101 HOV <strong>Traffic</strong> Study – <strong>Forecast</strong> <strong>Operations</strong> <strong>Report</strong> Page i
Dowling Associates, Inc.<br />
Transportation Engineering Planning Research Education<br />
List of Figures<br />
Figure 1. FREQ Freeway Daily Vehicle Hours of Delay ........................................................... 2<br />
Figure 2. Project Area and Study Area ................................................................................. 9<br />
Figure 3. FREQ Macro-Simulation Validation Process .......................................................... 11<br />
Figure 4. FREQ Calibration to Travel Time Surveys: Northbound AM Peak Period................ 17<br />
Figure 5. FREQ Calibration to Travel Time Surveys: Southbound AM Peak Period ............... 18<br />
Figure 6. FREQ Calibration to Travel Time Surveys: Northbound PM Peak Period ................ 19<br />
Figure 7. FREQ Calibration to Travel Time Surveys: Southbound PM Peak Period ............... 20<br />
Figure 8. Northbound AM Peak Period Travel Time (FREQ vs. Observed) ............................ 22<br />
Figure 9. Southbound PM Peak Period Travel Time (FREQ vs. Observed) ............................ 22<br />
Figure 10. 2040 Highway 101 Daily Volume <strong>Forecast</strong> (No Build vs. Build) .......................... 29<br />
Figure 11. Hourly Distribution of Travel Demand ................................................................ 31<br />
Figure 12. FREQ <strong>Forecast</strong> Process ....................................................................................... 33<br />
Figure 13. Sample FREQ Output Description ....................................................................... 36<br />
Figure 14. FREQ 2020 No Build <strong>Forecast</strong>: Northbound AM Peak Period ............................... 37<br />
Figure 15. FREQ 2020 Build <strong>Forecast</strong>: Northbound AM Peak Period .................................... 38<br />
Figure 16. FREQ 2020 No Build <strong>Forecast</strong>: Northbound PM Peak Period ............................... 40<br />
Figure 17. FREQ 2020 Build <strong>Forecast</strong>: Northbound PM Peak Period .................................... 41<br />
Figure 18. FREQ 2020 No Build <strong>Forecast</strong>: Southbound AM Peak Period ............................... 43<br />
Figure 19. FREQ 2020 Build <strong>Forecast</strong>: Southbound AM Peak Period .................................... 44<br />
Figure 20. FREQ 2020 No Build <strong>Forecast</strong>: Southbound PM Peak Period ............................... 46<br />
Figure 21. FREQ 2020 Build <strong>Forecast</strong>: Southbound PM Peak Period .................................... 47<br />
Figure 22. FREQ 2040 No Build <strong>Forecast</strong>: Northbound AM Peak Period ............................... 51<br />
Figure 23. FREQ 2040 Build <strong>Forecast</strong>: Northbound AM Peak Period .................................... 52<br />
Figure 24. FREQ 2040 No Build <strong>Forecast</strong>: Northbound PM Peak Period ............................... 54<br />
Figure 25. FREQ 2040 Build <strong>Forecast</strong>: Northbound PM Peak Period .................................... 55<br />
Figure 26. FREQ 2040 No Build <strong>Forecast</strong>: Southbound AM Peak Period ............................... 57<br />
Figure 27. FREQ 2040 Build <strong>Forecast</strong>: Southbound AM Peak Period .................................... 58<br />
Figure 28. FREQ 2040 No Build <strong>Forecast</strong>: Southbound PM Peak Period ............................... 60<br />
Figure 29. FREQ 2040 Build <strong>Forecast</strong>: Southbound PM Peak Period .................................... 61<br />
Figure 30. FREQ Vehicle Delay Reduction (2008-2040) ....................................................... 64<br />
Figure 31. TA-C 2020 Build Conditions AM Peak Hour Volumes ........................................... 66<br />
Figure 32. TA-C 2020 Build Conditions PM Peak Hour Volumes ........................................... 68<br />
Figure 33. TA-C 2040 Build Conditions AM Peak Hour Volumes ........................................... 70<br />
Figure 34. TA-C 2040 Build Conditions PM Peak Hour Volumes ........................................... 72<br />
Figure 35. 2020 No Build AM/PM Peak Hour Turning Movements ....................................... 85<br />
Figure 36. 2020 Build AM/PM Peak Hour Turning Movements ............................................ 89<br />
Figure 37. 2040 No Build AM/PM Peak Hour Turning Movements ....................................... 93<br />
Figure 38. 2040 Build AM/PM Peak Hour Turning Movements ............................................ 97<br />
Figure 39. 2020/2040 AM/PM Peak Hour Right Turn On Red Turning Movements ............ 101<br />
Figure 40. 2040 Change in Peak Hour Ramp Volumes (Build vs. No Build)........................ 105<br />
Figure 41. 2020 and 2040 Intersection LOS Results (HCM Operational Method) ............... 145<br />
SC101 HOV <strong>Traffic</strong> Study – <strong>Forecast</strong> <strong>Operations</strong> <strong>Report</strong> Page ii
Dowling Associates, Inc.<br />
Transportation Engineering Planning Research Education<br />
List of Tables<br />
Table 1. FREQ 2020 & 2040 Freeway <strong>Operations</strong> Performance Results Summary ................. 2<br />
Table 2. FREQ Peak Direction MOE Summary ........................................................................ 3<br />
Table 3. 2020 Final Project Level Impact Summary .............................................................. 5<br />
Table 4. 2040 Final Project Plus Cumulative Impact Summary ............................................. 6<br />
Table 5. US 101 Northbound Geometry - Existing (2008) ................................................... 12<br />
Table 6. US 101 Southbound Geometry - Existing (2008) ................................................... 13<br />
Table 7. Northbound AM Peak Period Travel Time (FREQ vs. Observed) ............................. 21<br />
Table 8. Southbound PM Peak Period Travel Time (FREQ vs. Observed) ............................. 21<br />
Table 9. Freeway and Ramp LOS Criteria ............................................................................ 23<br />
Table 10. Northbound AM Peak Period FREQ LOS Summary by 15 min Time Slice ............... 24<br />
Table 11. Southbound PM Peak Period FREQ LOS Summary by 15 min Time Slice ............... 25<br />
Table 12. Northbound AM Peak Period Highway 101 FREQ Existing Condition Results ........ 26<br />
Table 13. Southbound AM Peak Period Highway 101 FREQ Existing Condition Results ....... 26<br />
Table 14. Northbound PM Peak Period Highway 101 FREQ Existing Condition Results ........ 27<br />
Table 15. Southbound PM Peak Period Highway 101 FREQ Existing Condition Results ........ 27<br />
Table 16. SC101 HOV Travel <strong>Forecast</strong> Analysis Summary .................................................... 28<br />
Table 17. Future Baseline Roadway Improvements Assumptions ....................................... 31<br />
Table 18. 2020 No-Build Northbound AM Peak Period Travel Time (FREQ) ......................... 39<br />
Table 19. 2020 Build Northbound AM Peak Period Travel Time (FREQ) ............................... 39<br />
Table 20. 2020 No-Build Northbound PM Peak Period Travel Time (FREQ) ......................... 42<br />
Table 21. 2020 Build Northbound PM Peak Period Travel Time (FREQ) ............................... 42<br />
Table 22. 2020 No-Build Southbound AM Peak Period Travel Time (FREQ) ......................... 45<br />
Table 23. 2020 Build Southbound AM Peak Period Travel Time (FREQ) ............................... 45<br />
Table 24. 2020 No-Build Southbound PM Peak Period Travel Time (FREQ) ......................... 48<br />
Table 25. 2020 Build Southbound PM Peak Period Travel Time (FREQ) ............................... 48<br />
Table 26. 2040 No-Build Northbound AM Peak Period Travel Time (FREQ) ......................... 53<br />
Table 27. 2040 Build Northbound AM Peak Period Travel Time (FREQ) ............................... 53<br />
Table 28. 2040 No-Build Northbound PM Peak Period Travel Time (FREQ) ......................... 56<br />
Table 29. 2040 Build Northbound PM Peak Period Travel Time (FREQ) ............................... 56<br />
Table 30. 2040 No-Build Southbound AM Peak Period Travel Time (FREQ) ......................... 59<br />
Table 31. 2040 Build Southbound AM Peak Period Travel Time (FREQ) ............................... 59<br />
Table 32. 2040 No-Build Southbound PM Peak Period Travel Time (FREQ) ......................... 62<br />
Table 33. 2040 Build Southbound PM Peak Period Travel Time (FREQ) ............................... 62<br />
Table 34. FREQ <strong>Forecast</strong> Travel Delay Results Summary ..................................................... 63<br />
Table 35. FREQ <strong>Forecast</strong> Travel Time Results Summary ...................................................... 63<br />
Table 36. FREQ <strong>Forecast</strong> Peak Direction MOE Summary ...................................................... 64<br />
Table 37. <strong>Forecast</strong>ed <strong>Traffic</strong> Volumes on Highway 101 Mainline ......................................... 74<br />
Table 38. TA-C 2020 & 2040 <strong>Forecast</strong>ed HOV <strong>Traffic</strong> Volumes Worksheet........................... 75<br />
Table 39. TA-C 2020 Build Conditions w/o Ramp Metering Weave Analysis LOS Results .... 76<br />
Table 40. TA-C 2040 Build Conditions w/o Ramp Metering Weave Analysis LOS Results .... 76<br />
Table 41. TA-C 2020 & 2040 Ramp Meter Discharge Rate and Queue Spillbacks ................. 78<br />
Table 42. TA-C 2020 Build Conditions Weave Analysis LOS Results .................................... 78<br />
Table 43. TA-C 2040 Build Conditions Weave Analysis LOS Results .................................... 78<br />
Table 44. Intersection Parameter Values for <strong>Operations</strong> Analysis ....................................... 79<br />
Table 45. Intersection Measure of Effectiveness (MOE) for <strong>Operations</strong> Analysis ................. 79<br />
Table 46. Performance Criteria for <strong>Operations</strong> Analysis ...................................................... 80<br />
Table 47. Future Baseline Intersection Improvements ....................................................... 80<br />
Table 48. RGF-2002 vs. RGF-2007 Growth Comparisons ..................................................... 82<br />
Table 49. Total Intersection Entering <strong>Traffic</strong> Volumes – AM Peak ..................................... 103<br />
Table 50. Total Intersection Entering <strong>Traffic</strong> Volumes – PM Peak ..................................... 104<br />
Table 51. 2020 & 2040 PM Peak Hour Estimated Saturation Flow Rates ........................... 110<br />
Table 52. 2020 Build: 95 th Percentile Highway 101 Off-Ramp Queue Spill Back Checks .... 111<br />
Table 53. 2040 Build: 95 th Percentile Highway 101 Off-Ramp Queue Spill Back Checks .... 112<br />
SC101 HOV <strong>Traffic</strong> Study – <strong>Forecast</strong> <strong>Operations</strong> <strong>Report</strong> Page iii
Dowling Associates, Inc.<br />
Transportation Engineering Planning Research Education<br />
List of Tables (cont.)<br />
Table 54. 2020 No Build AM Peak Hour LOS Results .......................................................... 113<br />
Table 55. 2020 No Build PM Peak Hour LOS Results .......................................................... 117<br />
Table 56. 2020 Build AM Peak Hour LOS Results ............................................................... 121<br />
Table 57. 2020 Build PM Peak Hour LOS Results ............................................................... 125<br />
Table 58. 2040 No Build AM Peak Hour LOS Results .......................................................... 129<br />
Table 59. 2040 No Build PM Peak Hour LOS Results .......................................................... 133<br />
Table 60. 2040 Build AM Peak Hour LOS Results ............................................................... 137<br />
Table 61. 2040 Build PM Peak Hour LOS Results ............................................................... 141<br />
Table 62. 2020 HCM Project Level Impact Summary ......................................................... 152<br />
Table 63. 2020 ICU Project Level Impact Summary .......................................................... 152<br />
Table 64. 2020 Final Project Level Impact Summary ........................................................ 153<br />
Table 65. 2040 HCM Project Plus Cumulative Impact Summary ........................................ 154<br />
Table 66. 2040 ICU Project Plus Cumulative Impact Summary ......................................... 155<br />
Table 67. 2040 Final Project Plus Cumulative Impact Summary ....................................... 156<br />
APPENDICES (Provided in Separate Documents)<br />
APPENDIX A. FREQ CALIBRATION OUTPUT SHEETS<br />
APPENDIX B. FREQ 2020 and 2040 FORECAST OUTPUT SHEETS<br />
APPENDIX C. SYNCHRO-7 INTERSECTION LOS WORKSHEETS (HCM ANALYSIS)<br />
APPENDIX D. TRAFFIX INTERSECTION LOS WORKSHEETS (ICU & ROUNDABOUTS)<br />
APPENDIX E. INTERSECTION SIGNAL WARRANT<br />
APPENDIX F. TA-C WEAVE ANALYSIS WORKSHEETS<br />
SC101 HOV <strong>Traffic</strong> Study – <strong>Forecast</strong> <strong>Operations</strong> <strong>Report</strong> Page iv
Dowling Associates, Inc.<br />
Transportation Engineering Planning Research Education<br />
Executive Summary<br />
The proposed Highway 101 HOV Widening Project (EA 05-0N7000) will widen Highway 101 to provide an<br />
HOV lane in each direction from 0.4 miles south of Carpinteria Creek Bridge (Post Mile 2.0) in Carpinteria<br />
to Sycamore Creek Bridge (Post Mile 12.30) in Santa Barbara. The project limits span 10.3 1 miles of<br />
Highway 101. The study area encompasses 27.5 miles of freeway mainline with the southern limit<br />
beginning at Post Mile 0.0 (south of the Rincon Point/Bates Road Interchange) with the northern limit<br />
extending to Post Mile 27.5 (north of the Hollister Avenue Interchange).<br />
The purpose of the South Coast 101 HOV <strong>Traffic</strong> Study is to provide requisite technical traffic support<br />
information for the PS&E and environmental phases of the Highway 101 HOV Widening Project. Prior<br />
study deliverables established the study methodology assumptions, existing operating conditions and<br />
travel demand forecasts. This <strong>Forecast</strong> <strong>Operations</strong> <strong>Report</strong> documents the future 2020 (Opening Day<br />
Analysis) and 2040 (Design Year Analysis) freeway and intersection operational analyses and results.<br />
This forecast operations analysis is comprised of the following sections:<br />
1. Freeway FREQ Macro-simulation Baseline Calibration Analysis<br />
2. Freeway FREQ Macro-simulation <strong>Forecast</strong> Analysis<br />
3. <strong>Forecast</strong> Intersection <strong>Operations</strong> Analysis<br />
Freeway Operational Analysis<br />
The operational macro-simulation software FREQ was used to analyze freeway operations. FREQ<br />
simulation requires forecast travel demand data and future freeway geometry data. As described in the<br />
Travel <strong>Forecast</strong>ing <strong>Report</strong> (February 9, 2009), the most recently adopted version of the Santa Barbara<br />
County Association of Governments (SBCAG) Travel Demand Model (at the time the analysis was<br />
completed) was used to generate the 24-hour daily demand volume sets for analysis.<br />
Separate and distinct 24-hour volume demand sets were developed for the future No-Build and Build<br />
scenarios respectively. This approach was taken to appropriately reflect how the operational benefits of<br />
adding highway capacity may be partially off-set by induced and/or diverted travel demand.<br />
The forecast No Build and Build 24-hour volume sets generated with the SBCAG regional travel model<br />
were iteratively processed using a FREQ feedback procedure to determine peak spreading characteristics<br />
and “serviceable” hourly traffic volumes for future operations analyses. The following three traffic<br />
assessments (TA) were analyzed:<br />
TA-A No-Build (No HOV Project);<br />
TA-B Build (HOV Project);and,<br />
TA-C Build + 4 auxiliary lanes within project limits that currently meet design standards.<br />
Future year freeway simulation analysis measures of effectiveness (MOE) include:<br />
Total Peak Period Delay (FREQ)<br />
Peak Hour Trip Time (FREQ)<br />
Peak Hour and Peak Period Average Mainline Speed (FREQ)<br />
1 The project limits were subsequently expanded to 10.9 miles to address a storm water drainage issue near the Bailard Interchange<br />
(PM 1.4 to PM 12.3). Given that this component of the project does not affect traffic operations – the original project limit of 10.3<br />
miles was retained herein and in other supporting SC101 HOV <strong>Traffic</strong> Study documents.<br />
SC101 HOV <strong>Traffic</strong> Study – <strong>Forecast</strong> <strong>Operations</strong> <strong>Report</strong> Page 1
Dowling Associates, Inc.<br />
Transportation Engineering Planning Research Education<br />
Freeway Operational Results<br />
Table 1 provides a Measure of Effectiveness (MOE) summary comparison between the TA-A (No-Build)<br />
and TA-B (Build) for the 2020 Opening Day and 2040 Design Year freeway operational analyses. FREQ<br />
simulation results indicate that on a daily basis, vehicular delay will be reduced from 2008 baseline levels<br />
by 2,812 hours in 2020 (47% delay reduction benefit) growing to 11,435 hours of delay reduction by 2040<br />
(62% delay reduction benefit). Total projected hours of delay reduction as a result of the SC101 HOV<br />
project is graphically shown in Figure 1.<br />
Table 2 provides the 2040 summary for the AM and PM peak directions. The Build analysis indicates that<br />
10,000 vehicle hours of delay will be eliminated on a daily basis during the Northbound AM and<br />
Southbound PM peak period as a result of the HOV widening project (delay reduction of 7,766 vehicle<br />
hours under Northbound AM peak period and 2,261 vehicle hours under Southbound PM peak period).<br />
Travel time needed to traverse the 27.5 mile study area will be reduced by 24.8 minutes in the northbound<br />
AM peak hour and 10.3 minutes in the southbound PM peak hour.<br />
Table 1. FREQ Peak Period Freeway <strong>Operations</strong> Performance Results Summary<br />
Direction of Travel<br />
Total<br />
Mainline<br />
Delay<br />
Existing<br />
Average<br />
Mainline<br />
Delay<br />
Average<br />
Speed<br />
Total<br />
Mainline<br />
Delay<br />
2020 2040<br />
Average<br />
Mainline<br />
Delay<br />
Average<br />
Speed<br />
Total<br />
Mainline<br />
Delay<br />
Average<br />
Mainline<br />
Delay<br />
Average<br />
Speed<br />
Veh-Hrs Min/Veh MPH Veh-Hrs Min/Veh MPH Veh-Hrs Min/Veh MPH<br />
NO BUILD<br />
Northbound AM 937 2.0 54.4 1,613 5.8 53.6 9,258 15.5 34.0<br />
Northbound PM 324 0.5 60.8 1,375 6.1 54.4 4,261 13.1 42.2<br />
Southbound AM 154 0.4 62.2 611 2.2 59.4 1,507 5.0 55.8<br />
Southbound PM 871 1.6 55.1 2,412 6.3 53.5 3,383 6.6 47.7<br />
Bi-directional AM 1,091 1.3 58.3 2,224 4.3 56.5 10,765 11.0 44.9<br />
Bi-directional PM 1,195 1.1 58.0 3,788 6.2 53.9 7,644 9.6 44.9<br />
BUILD<br />
Northbound AM 1,022 4.5 57.6 1,492 5.7 57.0<br />
Northbound PM 1,167 3.9 56.0 3,574 3.9 56.0<br />
Southbound AM 572 2.1 60.0 786 2.1 60.2<br />
Southbound PM 438 1.9 61.8 1,122 2.2 58.6<br />
Bi-directional AM 1,595 3.5 58.8 2,278 4.1 58.6<br />
Bi-directional PM 1,605 2.8 58.9 4,696 3.0 57.3<br />
BENEFIT<br />
Northbound AM 37% 23% 7% 84% 63% 68%<br />
Northbound PM 15% 35% 3% 16% 70% 33%<br />
Southbound AM 6% 4% 1% 48% 58% 8%<br />
Southbound PM 82% 70% 16% 67% 66% 23%<br />
Bi-directional AM 28% 19% 4% 79% 62% 30%<br />
Bi-directional PM 58% 54% 9% 39% 69% 27%<br />
Figure 1. FREQ Freeway Daily Vehicle Hours of Delay<br />
SC101 HOV <strong>Traffic</strong> Study – <strong>Forecast</strong> <strong>Operations</strong> <strong>Report</strong> Page 2
Dowling Associates, Inc.<br />
Transportation Engineering Planning Research Education<br />
Table 2. FREQ Peak Direction MOE Summary<br />
2008<br />
Measure Existing No Build Build<br />
Average Speed, in miles per hour^**<br />
Northbound AM Peak Hour 44.9 26.2 40.5<br />
Southbound PM Peak Hour 49.3 39.8 52.2<br />
Average Trip Time, in minutes^*<br />
Northbound AM Peak Hour 22.3 48.5 29.3<br />
Southbound PM Peak Hour 23.0 34.7 24.5<br />
Total Vehicle Hours of Delay**<br />
Northbound AM Peak Period 937 9,258 1,492<br />
Southbound PM Peak Period 871 3,383 1,122<br />
Total Person Hours of Delay**<br />
Northbound AM Peak Period 1,190 12,776 2,462<br />
Southbound PM Peak Period 1,219 4,804 1,907<br />
* = For trips traveling between Linden Avenue in Carpinteria and Los Carneros in<br />
Goleta (20.7 miles)<br />
** = For trips traveling between the Ventura/Santa Barbara County Line and northern<br />
Goleta (27.5 miles)<br />
SC101 HOV <strong>Traffic</strong> Study – <strong>Forecast</strong> <strong>Operations</strong> <strong>Report</strong> Page 3<br />
2040<br />
^ = Peak hour refers to the "worst hour" in a given peak period when travel through<br />
the corridor takes the longest<br />
For TA-C, the operational benefit of adding auxiliary lanes at the following five locations within the project<br />
limits (PM 2.0 to PM 12.30) was analyzed. These five locations were identified on the basis of design<br />
standards. All are characterized as weave sections with ramp-to-ramp distances of less than 2,500 feet.<br />
PM 3.3 - SB Reynolds to Linden<br />
PM 4.5 - SB Santa Claus to Carpinteria<br />
PM 8.6 - SB Sheffield to Evans (after median off ramp is relocated to right of lanes)<br />
PM 10.3 - SB Olive Mill to San Ysidro<br />
PM 10.3 - NB San Ysidro to Olive Mill Road<br />
Where the provision of auxiliary lanes was determined to provide operational benefit, mainline weave area<br />
operations were re-evaluated based on metered discharge rates to determine if ramp meters could provide<br />
sufficient operational benefit in lieu of auxiliary lanes.<br />
Results indicate that the 2020 (Opening Day) operational benefits of providing an auxiliary lane on<br />
northbound Highway 101 between San Ysidro Road and Olive Mill Road and southbound Highway 101<br />
between Olive Mill Road and San Ysidro Road will improve weave operational performance by two full<br />
LOS grades. Both segments are projected to operate within <strong>Caltrans</strong> threshold criteria of LOS C.<br />
The operational benefits of an auxiliary lane are projected to persist in 2040 build conditions. However,<br />
LOS will exceed the <strong>Caltrans</strong> LOS threshold by operating at LOS D or worse with the exception of the<br />
southbound Hwy 101 between Reynolds Avenue and Linden Avenue.<br />
Under 2020 and 2040 build conditions (i.e., HOV lane) without auxiliary lanes, results indicate that the<br />
study weave sections will operate at the same LOS with or without ramp metering. Therefore, provision of<br />
ramp metering in lieu of an auxiliary lane is not anticipated to produce operational benefits. Under 2020<br />
and 2040 build conditions (i.e., HOV lane) with auxiliary lanes, results indicate that the study weave<br />
sections will also operate at the same LOS with or without ramp metering except for one segment. The<br />
southbound freeway section between Olive Mill Road and San Ysidro Road is projected to improve by one<br />
LOS grade (LOS E to LOS D) during the PM peak hour. However, the state LOS threshold (LOS C or<br />
better) will be exceeded in either scenario.
Dowling Associates, Inc.<br />
Transportation Engineering Planning Research Education<br />
Intersection Operational Analysis<br />
Given that Highway 101 freeway operations are projected to significantly improve within the study area as<br />
a result of the project, project impacts were primarily focused on the freeway interface with the local<br />
agency transportation systems i.e., ramp intersections and local study area intersections adjacent to<br />
ramps. A total of 104 study area intersections were analyzed. Of these, 70 are state operated facilities<br />
while 34 are locally operated. Within the 10.3 mile project limits, 34 intersections were analyzed.<br />
To develop the intersection turning movement forecasts a combination of existing turning movement count<br />
distributions, SBCAG’s AM/PM peak hour model forecasts, FREQ freeway simulation software results, and<br />
supplemental forecasts performed as part of other studies were utilized. Peak hour turning movement<br />
forecasts were generated the No-Build and Build (i.e., Highway 101 HOV Widening Project) conditions.<br />
The following adjustments were required to produce peak hour volumes suitable for operational analysis:<br />
NCHRP-255 (Model Baseline Link Adjustments)<br />
Furness Method (Turn Movement Adjustments)<br />
SBCAG Regional Growth <strong>Forecast</strong> Adjustment<br />
FREQ Ramp Volume Delta Adjustment<br />
SBCAG Regional Growth <strong>Forecast</strong> Based 2030 to 2040 Extrapolation<br />
Volume Balancing (for adjacent intersections).<br />
For purposes of assessing project impacts under CEQA, the 2020 Opening Day analysis provided the<br />
basis for identifying project level impacts. The 2040 Design Year analysis provided the basis for<br />
identifying cumulative plus project impacts. Distinguishing between project specific and cumulative impacts<br />
under CEQA is necessary to establish the fair share responsibilities for mitigation improvement projects (to<br />
be determined as part of environmental review).<br />
Final 2040 turning movements were used with the 2008 baseline traffic counts to interpolate to 2020<br />
conditions. All final 2020 and 2040 turning movements were input into the intersection operation analysis<br />
software SYNCHRO-7 or (HCM Operational Analysis) TRAFFIX (ICU or Roundabout) to estimate peak<br />
hour intersection level of service.<br />
Existing signal timing sheets were applied to the future intersection LOS analysis to ensure a reasonable<br />
worst case analysis of future operations. Signal timing adjustments will be considered as a mitigation<br />
option during the subsequent environmental phase of the project and will be based on location specific<br />
conditions and engineering assessments.<br />
A supplemental traffic analysis was performed to identify the preferred design features for the<br />
reconstruction of the Cabrillo/Hot Springs Interchange. A total of 19 interchange configurations were<br />
analyzed including the operational implications to nearby interchanges at Garden Street, Milpas Street,<br />
Cabrillo and Olive Mill Road. This analysis is documented under separate cover in the Cabrillo-Hot Springs<br />
Interchange Configuration Screening Analysis Memorandum (Dowling Associates, April 9, 2010),<br />
Cabrillo/Hot Springs Interchange Configuration <strong>Traffic</strong> Analysis (Dowling Associates, March 21, 2011) and<br />
Cabrillo Boulevard I/C Modified Configuration Analysis Memorandum (Dowling Associates, July 19, 2011).<br />
These studies supersede the operational assessments documented herein.<br />
Intersection Operational Results<br />
Based on state and local impact criteria, Table 3 lists all study area intersections identified with 2020<br />
project level impacts. A total of nine intersections are shown to have project level impacts as a result of<br />
the Highway 101 Widening Project (EA 05-0N7000).<br />
Table 4 lists all candidate study area intersections identified with 2040 cumulative plus project impacts.<br />
This final candidate list of cumulative plus project impact locations is based on the application of state and<br />
local impact criteria. A total of 15 intersections are shown to have cumulative project impacts resulting<br />
from the Highway 101 Widening Project (EA 05-0N7000).<br />
SC101 HOV <strong>Traffic</strong> Study – <strong>Forecast</strong> <strong>Operations</strong> <strong>Report</strong> Page 4
Table 3. 2020 Final Project Level Impact Summary<br />
ID Intersection Control 1<br />
Existing No Build Build Delta 2<br />
Delay<br />
(seconds)<br />
OR V/C 3<br />
SC101 HOV <strong>Traffic</strong> Study – <strong>Forecast</strong> <strong>Operations</strong> <strong>Report</strong> Page 5<br />
LOS 4<br />
Delay<br />
(seconds)<br />
OR V/C 3<br />
LOS 4 No Build Build<br />
18 Linden Ave & Sawyer Ave TWSC Project Area No No State<br />
AM Peak 944 990 1,069 79 20 C 33.7 D<br />
21 NB on/off ramp & Via Real AWSC Project Area No No State<br />
AM Peak 1,187 1,225 1,346 121 43.7 F 78.4 F<br />
23 Via Real & S. Padaro Ln TWSC Project Area No No State<br />
AM Peak 868 884 884 0 24.9 C 26 D<br />
44 SB on/off ramp & NB off ramp & Cabrillo Blvd AWSC Study Area No No State<br />
AM Peak 1,198 1,052 1,151 99 36 E 41.5 E<br />
49 SB on ramp & Milpas St Signal Study Area N/A N/A State<br />
AM Peak 1,910 1,932 2,167 235 29.8 C 35.5 D<br />
PM Peak 2,625 2,625 2,763 138 56.8 E 77.7 E<br />
55 NB on ramp & Castillo St Signal Study Area N/A N/A State<br />
PM Peak 2,205 2,342 2,355 13 103.3 F 104 F<br />
64 SB on/off ramp & Mission St Signal Study Area N/A N/A State<br />
PM Peak 2,473 2,593 2,627 34 33.9 C 36 D<br />
79 SB on ramp & State St & Rt 154 TWSC Study Area --- --- State<br />
AM Peak 1,941 1,983 1,994 11 72.2 F 75.5 F<br />
PM Peak 1,635 1,704 1,722 18 53.3 F 58.7 F<br />
106 Milpas St & Quinientos St Signal Study Area N/A N/A City of SB<br />
PM Peak 2,518 2,743 2,767 24 0.772 C 0.788 C<br />
1 TWSC - Tw o Way Stop Control, AWSC - All Way Stop Control<br />
2 As defined by difference betw een 2020 build and 2020 no build volume sets<br />
Location<br />
Total Entering <strong>Traffic</strong> Volumes<br />
3 Delay is based on HCM 2000, Chapter 16 and 17 methodology. V/C based on Transportation Research Board Special <strong>Report</strong> 209<br />
4 HCM LOS is reported for the w orst movement at TWSC intersections and for the overall intersection at AWSC and signalized intersections<br />
5 Based on Peak Hour Warrants (Signal Warrant #3) as described in California Manual on Uniform <strong>Traffic</strong> Control Devices at unsignalized intersections<br />
No Build Results Build Results<br />
Signal Warrant<br />
Met? 5<br />
Project<br />
Impact<br />
Threshold<br />
Criteria
Table 4. 2040 Final Project Plus Cumulative Impact Summary<br />
ID Intersection Control 1<br />
Location<br />
Total Entering <strong>Traffic</strong> Volumes<br />
Existing No Build Build Delta 2<br />
Delay<br />
(seconds)<br />
OR V/C 3<br />
SC101 HOV <strong>Traffic</strong> Study – <strong>Forecast</strong> <strong>Operations</strong> <strong>Report</strong> Page 6<br />
LOS 4<br />
Delay<br />
(seconds)<br />
OR V/C 3<br />
LOS 4 No Build Build<br />
4 SB on/off ramp & SR 150 TWSC Study Area No No State<br />
PM Peak 644 644 672 28 30 D 36.3 E<br />
7 NB on/off ramp & Bailard Ave TWSC Study Area No No State<br />
PM Peak 1,123 1,215 1,390 175 21 C 27 D<br />
14 Carpinteria Ave & Casitas Pass Rd Signal Study Area N/A N/A City of Carpinteria<br />
PM Peak 1,805 2,193 2,329 136 29.9 C 37.4 D<br />
18 Linden Ave & Sawyer Ave TWSC Project Area No No State<br />
AM Peak 944 1,066 1,277 211 25.8 D 41.3 E<br />
33 SB on/off ramp & Sheffield TWSC Project Area No No State<br />
AM Peak 390 483 579 96 19.9 C 29.3 D<br />
49 SB on ramp & Milpas St Signal Study Area N/A N/A State<br />
AM Peak 1,910 1,968 2,596 628 30 C 43.2 D<br />
PM Peak 2,625 2,625 2,994 369 64.2 E 103.2 F<br />
55 NB on ramp & Castillo St Signal Study Area N/A N/A State<br />
PM Peak 2,205 2,571 2,605 34 129.4 F 131.4 F<br />
57 SB on/off ramp & Castillo St Signal Study Area N/A N/A State<br />
PM Peak 2,557 3,092 3,117 25 52.6 D 55.7 E<br />
59 SB on/off ramp & Carrillo St Signal Study Area N/A N/A State<br />
AM Peak 3,435 3,677 3,689 12 56.8 E 62.7 E<br />
PM Peak 3,778 4,141 4,164 23 33.6 C 35.6 D<br />
60 Carrillo St & Castillo St Signal Study Area N/A N/A City of SB<br />
AM Peak 2,742 2,995 3,082 87 0.757 C 0.779 C<br />
64 SB on/off ramp & Mission St Signal Study Area N/A N/A State<br />
AM Peak 2,705 2,817 2,838 21 34.5 C 35.9 D<br />
PM Peak 2,473 2,793 2,883 90 53.1 D 65 E<br />
65 Mission St & Castillo St Signal Study Area N/A N/A City of SB<br />
PM Peak 2,451 2,887 3,001 114 0.787 C 0.849 D<br />
79 SB on ramp & State St & Rt 154 TWSC Study Area N/A N/A State<br />
AM Peak 1,941 2,054 2,081 27 101.1 F 112.4 F<br />
PM Peak 1,635 1,818 1,867 49 96.9 F 119.4 F<br />
90 NB on/off ramp & Los Carneros Rd Signal Study Area N/A N/A State<br />
AM Peak 1,596 1,942 2,045 103 33.9 C 40 D<br />
106 Milpas St & Quinientos St Signal Study Area N/A N/A City of SB<br />
PM Peak 2,518 3,118 3,181 63 0.866 D 0.909 E<br />
1 TWSC - Two Way Stop Control, AWSC - All Way Stop Control<br />
2 As defined by difference between 2040 build and 2040 no build volume sets<br />
3 Delay is based on HCM 2000, Chapter 16 and 17 methodology. V/C based on Transportation Research Board Special <strong>Report</strong> 209<br />
4 HCM LOS is reported for the worst movement at TWSC intersections and for the overall intersection at AWSC and signalized intersections<br />
5 Based on Peak Hour Warrants (Signal Warrant #3) as described in California Manual on Uniform <strong>Traffic</strong> Control Devices at unsignalized intersections<br />
No Build Results Build Results<br />
Signal Warrant<br />
Met? 5<br />
Project Impact<br />
Threshold<br />
Criteria
Dowling Associates, Inc.<br />
Transportation Engineering Planning Research Education<br />
Introduction<br />
The purpose of the South Coast 101 HOV <strong>Traffic</strong> Study is to provide requisite technical traffic support<br />
information for the PS&E and environmental phases of the Highway 101 Widening Project (EA 05-<br />
0N7000). Prior study deliverables have established the study methodology assumptions, existing operating<br />
conditions and forecast daily travel demand within the study area.<br />
The report documents the future operational analysis and findings for both freeway operations and<br />
intersection operations. The following three SC101 HOV <strong>Traffic</strong> Study traffic assessments (TA) were<br />
analyzed:<br />
TA-A No-Build (No HOV Project);<br />
TA-B Build (HOV Project); and,<br />
TA-C Build + 4 auxiliary lanes within project limits that currently meet design standards.<br />
Freeway macro-simulation output as defined by total delay, travel speed and trip time measures of<br />
effectiveness (MOE) were used to evaluate and compare the operational performance of the TA-A and TA-<br />
B. Macro-simulation was used to iteratively process the forecast 24-hour volume sets to determine peak<br />
spreading characteristics and “serviceable” hourly traffic volumes for future operations analyses. The<br />
following macro-simulation analysis steps were performed:<br />
FREQ Macro-Simulation Calibration/Validation of Baseline Conditions<br />
FREQ Macro-Simulation Feedback Process – Peak Spreading<br />
FREQ Macro-Simulation Future Operational Results for TA-A and TA-B.<br />
For TA-C, the operational benefit of providing auxiliary lanes at specific locations within the project limits as<br />
determined by design criteria was also determined based on the Highway Design Manual method.<br />
Lastly, forecast turning movement volumes generated by the SBCAG travel demand AM/PM peak hour<br />
models were used to estimate intersection level of service relative to state and local operational criteria. A<br />
total of 104 study area intersections were analyzed. Turning movement volumes at ramp intersections<br />
were adjusted based on the freeway macro-simulation results.<br />
This SC101 HOV <strong>Forecast</strong> <strong>Operations</strong> <strong>Report</strong> is comprised of the following sections:<br />
1. Freeway Macro-simulation Baseline Calibration Analysis<br />
2. Freeway Macro-simulation <strong>Forecast</strong> Analysis<br />
3. Auxiliary Lane Analysis<br />
4. Future Intersection <strong>Operations</strong> Analysis<br />
Existing conditions are documented in the Existing Conditions <strong>Operations</strong> Analysis (Dowling Associates,<br />
December 9, 2011). Analysis of the Cabrillo-Hot Springs Interchange and nearby interchanges (Garden to<br />
Olive Mill Road) is documented in Cabrillo-Hot Springs Interchange Configuration Screening Analysis<br />
Memorandum (Dowling Associates, April 9, 2010), Cabrillo/Hot Springs Interchange Configuration <strong>Traffic</strong><br />
Analysis (Dowling Associates, March 21, 2011) and Cabrillo Boulevard I/C Modified Configuration Analysis<br />
Memorandum (Dowling Associates, July 19, 2011).<br />
Project Description<br />
The project limits of the proposed widening of Highway 101 are from Post Mile 2.0 to Post Mile 12.30. The<br />
project proposes to construct improvements to Highway 101 in Santa Barbara County from 0.4 miles south<br />
of Carpinteria Creek Bridge (Post Mile 2.0) in Carpinteria to Sycamore Creek Bridge (Post Mile 12.30) in<br />
Santa Barbara. The project proposes to add a High Occupancy Vehicle (HOV) lane within the existing<br />
median (inside and outside medians are to be evaluated) in both the northbound and southbound<br />
SC101 HOV <strong>Traffic</strong> Study – <strong>Forecast</strong> <strong>Operations</strong> <strong>Report</strong> Page 7
Dowling Associates, Inc.<br />
Transportation Engineering Planning Research Education<br />
directions. The project limits of the HOV lane will mesh with the following three Highway 101 improvement<br />
projects currently under development:<br />
The southern limit of the project will connect to the adjacent SB/VEN 101 HOV capacity<br />
improvement project (EA 07-26070/05-0P980). This project will construct an HOV lane in each<br />
direction from the Mussel Shoals in Ventura County to Post Mile 2.0 within Santa Barbara County.<br />
The Highway 101/Linden Avenue (Post Mile 3.04-3.17) and Highway 101/Casitas Pass Road<br />
Interchange (Post Mile 2.52-2.94) Improvement Project will reconfigure the ramps at both these<br />
interchanges and construct a new local/frontage roadway extension north of Highway 101 (Via<br />
Real Extension between Vallecito Road and Linden Avenue).<br />
The northern limit of the project will connect to the adjacent Route 101/Milpas Street to Hot<br />
Springs Road operational improvement project (EA 05-44780). This project extends the<br />
southbound 3-lane section from the Highway 101 interchange with Milpas Street to Cabrillo Hot<br />
Springs (Post Mile 12.30) and constructs a 3 rd northbound lane from the Cabrillo Hot Springs<br />
interchange adjoining the existing northbound three lane section just north of the Milpas Street<br />
bridge. Other components include reconstruction of the Cabrillo Hot Springs interchange, an<br />
under-crossing at Casique Street, construction of three sound-walls and a multi-purpose path.<br />
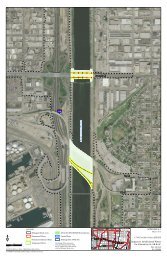
The Highway 101 HOV widening project spans 10.3 miles of freeway. The study area encompasses 27.5<br />
miles of Highway 101. The southern limit of the traffic study begins at Post Mile 0.0 (South of the Rincon<br />
Point/Bates Road Interchange) while the northern limit concludes at Post Mile 27.5 (North of the Hollister<br />
Avenue Interchange). Figure 2 shows the study area and project limits.<br />
Given that the Highway 101 HOV Widening project will mesh with the SB/VEN 101 HOV capacity<br />
improvement project (EA 07-26070/05-0P980), the macro-simulation study area was extended to just<br />
south of Mussel Shoals in Ventura County to reflect continuous HOV operation within both project areas.<br />
It should be noted that this SC101 <strong>Traffic</strong> Study (EA 05-0N7000) was conducted concurrently with the<br />
Corridor System Management Plan (EA 51-A0369, TO D5-07-101-002) prepared by DKS Associates<br />
under contract with <strong>Caltrans</strong> District 7. The latter study includes 54 miles of Highway 101 including the<br />
study areas of both the SB/VEN 101 HOV capacity improvement project (EA 07-26070/05-0P980) and the<br />
SC101 <strong>Traffic</strong> Study (EA 05-0N7000).<br />
Analysis Years<br />
Highway 101 24-hour volume sets and peak hour turning movements for all study area intersections were<br />
developed for the following analysis years:<br />
2020 No-Build/Build Opening Day Analysis<br />
2040 No-Build/Build Design Year Analysis<br />
Baseline Data Collection<br />
Data collection for this study was performed in April 2008. These data established the baseline data and<br />
technical parameters used for developing the macro-simulation freeway operational analyses, the auxiliary<br />
lane Design Manual (HDM) analyses and, the intersection LOS operations analyses.<br />
Key freeway geometric features were identified and freeway vehicle counts stratified by classification and<br />
occupancy were collected. These baseline data provided inputs for freeway macro-simulation. Simulated<br />
vehicle speeds were compared with actual travel speed data for model calibration purposes. For<br />
intersections, surveyed AM and PM peak hour turning movements were used to adjust future year turning<br />
movement forecasts. Existing signal timing sheets submitted by state and local agencies were used as a<br />
basis for determining signal timing and phasing information for future operational analyses.<br />
SC101 HOV <strong>Traffic</strong> Study – <strong>Forecast</strong> <strong>Operations</strong> <strong>Report</strong> Page 8
Figure 2. Project Area and Study Area<br />
SC101 HOV <strong>Traffic</strong> Study – <strong>Forecast</strong> <strong>Operations</strong> <strong>Report</strong> Page 9
Dowling Associates, Inc.<br />
Transportation Engineering Planning Research Education<br />
Freeway Macro-Simulation Baseline Calibration<br />
Existing AM and PM peak period freeway operating conditions were evaluated using macro-simulation.<br />
For calibration purposes, freeway operations were evaluated for Highway 101 within the study area from<br />
6:00 AM to 10:00 AM and from 3:00 PM to 7:00 PM. These time periods include the majority of the busiest<br />
weekday commute hours in the morning and afternoon.<br />
All existing freeway mainline counts were collected as part of this study and are reported in the Existing<br />
Conditions <strong>Operations</strong> Analysis (December, 2008). Data collection for this study was performed in April<br />
2008. The data collected included: freeway mainline counts; 24-hour ramp tube counts; intersection turning<br />
movement counts; classification counts; vehicle occupancy counts; and, speed surveys. The data<br />
collection period was characterized by fair weather with no observed vehicle incidents. These data<br />
establish the technical parameters utilized for this macro-simulation calibration analysis. A 24-hour set of<br />
balanced freeway traffic counts were produced using this data for input into the FREQ models.<br />
Highway 101 speed data was collected by floating car surveys using GPS devises along the entire study<br />
area (27.5 miles) during AM/PM peak periods. Seven to ten runs were made to evaluate travel time, stops,<br />
delays and average speed. Historical <strong>Caltrans</strong> floating car survey data and speed survey information from<br />
the State Highway Congestion Monitoring Program (HICOMP) was used to supplement this new data.<br />
Freeway operational analysis performance was based on the following three measures of effectiveness<br />
(MOE) as output by the FREQ macro-simulation software.<br />
Total Peak Period Delay (FREQ)<br />
Peak Hour Trip Time (FREQ)<br />
Peak Hour and Peak Period Average Mainline Speed (FREQ)<br />
Freeway <strong>Operations</strong> Modeling Selection<br />
The FREQ modeling software, developed by the Institute for Transportation Studies at the University of<br />
California at Berkeley, was used to simulate peak period freeway operations on the Highway 101 within the<br />
study area. The FREQ software was selected given it can quickly produce traffic operations results using<br />
planning model inputs. The FREQ model can generate speeds, densities, volume/capacity ratios, levels of<br />
service (based on the Highway Capacity Manual criteria), bottleneck locations, queue lengths, and delays<br />
by each time slice and study section. The freeway model network included the freeway mainline, freeway<br />
ramps (both freeway-to-freeway and surface street ramps to/from freeway), and the HOV facility (analysis<br />
combines both the EA 05-0N7000 HOV project and the EA 07-26070/05-0P980 HOV project).<br />
The latest 2007 edition of FREQ, the FREQ12 model with combined HOV lane module was used in this<br />
analysis.<br />
FREQ is a macroscopic freeway facility operations simulation model based on the classical speed-flow and<br />
density-flow relationships. FREQ evaluates one direction of freeway travel at a time. The analyst inputs<br />
on-ramp and off-ramp demands for a single direction by time slice within each peak period. FREQ<br />
estimates an origin-destination table from the ramp volumes for each time slice. FREQ then propagates<br />
the vehicles down the length of the freeway - queuing vehicles when demand exceeds capacity and<br />
reducing volumes reaching downstream off-ramps when traffic is trapped at a bottleneck. Excess demand<br />
is stored on the freeway at the end of each time slice and released in the following time slice, if capacity<br />
permits. FREQ predicts speeds and densities of traffic based on the volume/capacity ratios and the<br />
classical speed-flow and flow-density curves.<br />
Before its application for future operations analysis, FREQ must be calibrated to reflect local conditions.<br />
This was performed by iteratively running FREQ under the existing condition and comparing the model<br />
predicted queues and travel times with those observed in the field. Capacity adjustments are made to the<br />
SC101 HOV <strong>Traffic</strong> Study – <strong>Forecast</strong> <strong>Operations</strong> <strong>Report</strong> Page 10
Dowling Associates, Inc.<br />
Transportation Engineering Planning Research Education<br />
freeway sections until the congestion onset time, congestion clearance time, and length of queues match<br />
observed field data.<br />
As stated previously, the South Coast 101 HOV <strong>Traffic</strong> Study FREQ Models were validated for this project<br />
based on field observations from floating car surveys conducted in April, 2008.<br />
FREQ Input Data<br />
The FREQ model requires demand data and freeway geometry data.<br />
The demand data consists of total vehicles (plus percent high occupant vehicles and percent trucks)<br />
entering/exiting the study area on the freeway plus on-ramp and off-ramp volumes by time slice. Based on<br />
the Highway 101 ramp and mainline count data collected in April 2008, 15-minute time slices (96 times<br />
slices total) reflecting a complete 24-hour period was developed.<br />
Percentage of 1-person, 2-person and 3+ percent vehicle occupancy was based on vehicle occupancy<br />
counts collected in April 2008. Truck percentages by ramp and mainline location were based on<br />
classification counts performed in April 2008. These data are reported in the Existing Conditions<br />
<strong>Operations</strong> Analysis (December, 2008).<br />
For FREQ calibration purposes only the following 4-hour AM and PM peak periods were used for analysis:<br />
• AM Peak Period = 06:00-10:00 AM (60 15-min time slices)<br />
• PM Peak Period = 03:00-07:00 PM (60 15-min time slices)<br />
These time periods reflect the “book ends” of observed existing congestion on Highway 101 within the<br />
study area.<br />
The geometric data required by FREQ consists of number of lanes, lengths of freeway mainline sections<br />
between ramps and lane/grade changes, percent grades, and number of lanes on each ramp. The input<br />
geometries are shown in the following tables:<br />
• Table 5. US 101 Northbound Geometry – Existing (2008)<br />
• Table 6. US 101 Southbound Geometry – Existing (2008)<br />
Figure 3 below illustrates the FREQ calibration process. The results of the calibration process are<br />
described in the following section.<br />
Figure 3. FREQ Macro-Simulation Validation Process<br />
SC101 HOV <strong>Traffic</strong> Study – <strong>Forecast</strong> <strong>Operations</strong> <strong>Report</strong> Page 11
Dowling Associates, Inc.<br />
Transportation Engineering Planning Research Education<br />
Table 5. US 101 Northbound Geometry – Existing (2008)<br />
Sub- Segment Description Number Section Section Speed 1<br />
Truck Section Percent<br />
Section Lanes Capacity Length (mph) Factor 2<br />
Grade Trucks<br />
(vph) (feet) (%) (%)<br />
1 US Mainline to Bates Off 3 5,700 866 65 0.99 0 8<br />
2 Bates Off to Bates On 3 6,600 1,845 65 0.99 0 8<br />
3 Bates On to Rincon Off 3 6,600 1,359 65 0.93 0 7<br />
4 Rincon Off to Rincon On 3 6,600 2,291 65 0.93 0 7<br />
5 Rincon On to Lane Drop 3 5,700 580 65 0.99 0 8<br />
6 Lane Drop to Bailard Off 2 3,800 1,802 65 0.99 0 8<br />
7 Bailard Off to Bailard On 2 3,800 2,081 65 0.99 0 8<br />
8 Bailard On to Casitas Off 2 3,800 3,504 65 0.99 0 8<br />
9 Casitas Off to Vallecito On 2 3,800 2,504 65 0.99 0 9<br />
10 Vallecito On to Linden On 2 3,800 476 65 0.99 0 8<br />
11 Linden On to Santa Monica Off 2 3,900 3,733 65 0.93 0 7<br />
12 Santa Monica Off to Santa Monica On 2 3,850 1,330 65 0.93 0 7<br />
13 Santa Monica On to South Padaro Off 2 3,850 5,458 65 0.93 0 7<br />
14 South Padaro Off to South Padaro On 2 3,850 2,664 65 0.93 0 7<br />
15 South Padaro On to North Padaro Off 2 3,850 7,203 65 0.93 0 7<br />
16 North Padaro Off to North Padaro On 2 4,000 2,355 65 0.93 0 7<br />
17 North Padaro On to Evans Off 2 4,000 3,598 65 0.94 0 6<br />
18 Evans Off to Evans On 2 4,000 2,275 60 0.66 4 6<br />
19 Evans On to Sheffield Off 2 4,000 2,047 60 0.66 4 6<br />
20 Sheffield Off to Sheffield On 2 4,000 1,326 65 0.66 4 6<br />
21 Sheffield On to San Ysidro Off 2 4,000 3,852 65 0.94 0 6<br />
22 San Ysidro Off to San Ysidro On 2 3,900 1,557 65 0.94 0 6<br />
23 San Ysidro On to Olive Mill Road Off 2 3,950 1,148 65 0.94 0 6<br />
24 Olive Mill Road Off to Hermosilla Road Off 2 3,800 3,338 65 0.94 0 6<br />
25 Hermosilla Road Off to Cabrillo Off 2 3,800 1,174 65 0.94 0 6<br />
26 Cabrillo Off to Cabrillo Right On 2 3,800 1,636 65 0.94 0 6<br />
27 Cabrillo Right On to Salinas Street Off 2 3,800 2,416 65 0.94 0 6<br />
28 Salinas Street Off to Salinas Street On 2 3,800 909 65 0.94 0 6<br />
29 Salinas Street On to Milpas Street Off 2 4,000 1,993 65 0.95 0 5<br />
30 Milpas Street Off to Milpas Street On 2 3,800 2,153 65 0.95 0 5<br />
31 Milpas Street On to Laguna Street Off 3 6,000 1,296 65 0.94 0 6<br />
32 Laguna Street Off to Garden Street On 3 6,000 2,578 65 0.94 0 6<br />
33 Garden Streetn On to Bath Street Off 3 6,000 1,538 65 0.94 0 6<br />
34 Bath Street Off to Haley Street On 3 6,000 1,787 65 0.93 0 7<br />
35 Haley Street On to Carrillo Street Off 3 6,000 1,463 65 0.94 0 6<br />
36 Carrillo Street Off to Carrillo Street On 3 6,000 1,732 65 0.94 0 6<br />
37 Carrillo Street On to Arrellaga Street Off 3 5,850 1,818 65 0.95 0 5<br />
38 Arrellaga Street Off to Arrellaga Street On 3 5,850 828 65 0.95 0 5<br />
39 Arrellaga Street On to Mission Street Off 3 5,850 907 65 0.95 0 5<br />
40 Mission Street Off to Mission Street On 3 5,850 1,463 65 0.95 0 5<br />
41 Mission Street On to West Pueblo Street Off 4 6,600 530 65 0.95 0 5<br />
42 West Pueblo Street Off to Las Positas Off 3 5,850 1,339 65 0.95 0 5<br />
43 Las Positas Off to Las Positas On 3 5,850 2,726 65 0.95 0 5<br />
44 Las Positas On to Hope Street Off 3 5,900 3,105 65 0.95 0 5<br />
45 Hope Street Off to Hope Street On 3 6,000 950 65 0.95 0 5<br />
46 Hope Street On to State Street Off 4 6,900 1,913 65 0.95 0 5<br />
47 State Street Off to State Street On 3 6,450 1,775 65 0.95 0 5<br />
48 State Street On to El Sueno Road Off 3 6,450 3,050 65 0.95 0 5<br />
49 El Sueno Road Off to El Sueno Road On 3 6,450 997 65 0.95 0 5<br />
50 El Sueno Road On to Turnpike Road Off 3 6,450 4,394 65 0.95 0 5<br />
51 Turnpike Road Off to Turnpike Road On 3 6,450 2,323 65 0.95 0 5<br />
52 Turnpike Road On to Patterson Road Off 3 6,450 3,885 65 0.95 0 5<br />
53 Patterson Road Off to SR-217 Off 3 6,450 806 65 0.95 0 5<br />
54 SR-217 Off to Patterson Road On 3 6,450 2,076 65 0.95 0 5<br />
55 Patterson Road On to Fairview Off 3 6,450 3,543 65 0.95 0 5<br />
56 Fairview Off to Fairview On 2 3,800 1,466 65 0.95 0 5<br />
57 Fairview On to Los Carneros Off 2 3,800 5,080 65 0.93 0 7<br />
58 Los Carneros Off to Los Carneros On 2 3,800 2,559 65 0.93 0 7<br />
59 Los Carneros On to Glenn Annie Off 2 3,800 1,429 65 0.99 0 10<br />
60 Glenn Annie Off to Glen Annie On 2 3,800 3,173 65 0.99 0 10<br />
61 Glen Annie On to Winchester Canyon Off 2 3,800 7,996 65 0.99 0 11<br />
62 Winchester Canyon Off to Hollister Avenue On 2 3,800 4,103 65 0.99 0 11<br />
63 Hollister Avenue On to US Mainline 101 2 3,800 6,832 65 0.99 0 11<br />
Footnote 1 Reflects Free Flow Speeds<br />
Footnote 2 HCM Heavy Duty Truck Factor - reflects the affect that heavy vehicles have on capacity based grade and vehicle composition<br />
SC101 HOV <strong>Traffic</strong> Study – <strong>Forecast</strong> <strong>Operations</strong> <strong>Report</strong> Page 12
Dowling Associates, Inc.<br />
Transportation Engineering Planning Research Education<br />
Table 6. US 101 Southbound Geometry – Existing (2008)<br />
Sub- Segment Description Number Section Section Speed 1<br />
Truck Section Percent<br />
Section Lanes Capacity Length (mph) Factor 2<br />
Grade Trucks<br />
(vph) (feet) (%) (%)<br />
1 Calle Real to Hollister Avenue Off 2 4,300 6,666 65 0.99 0 14<br />
2 Hollister Avenue Off to Hollister Avenue On 2 3,800 2,527 65 0.99 0 14<br />
3 Hollister Avenue On to Storke Road Off 2 3,800 8,949 65 0.99 0 11<br />
4 Storke Road Off to Storke Road On 2 4,300 2,682 65 0.99 0 11<br />
5 Storke Road On to Los Carneros Off 3 4,700 2,775 65 0.96 0 4<br />
6 Los Carneros Off to Los Carneros On 2 4,300 3,466 65 0.96 0 4<br />
7 Los Carneros On to Fairview Avenue Off 2 4,300 3,064 65 0.97 0 3<br />
8 Fairview Avenue Off to Fairview Avenue On 2 4,300 2,348 65 0.97 0 3<br />
9 Fairview Avenue On to Patterson Off 3 6,600 4,052 65 0.98 0 2<br />
10 Patterson Off to SR-217 On 3 5,700 1,688 65 0.98 0 2<br />
11 SR-217 On to Patterson On 3 5,700 1,841 65 0.98 0 2<br />
12 Patterson On to Turnpike Off 3 6,000 3,196 65 0.98 0 2<br />
13 Turnpike Off to Turnpike On 3 6,450 2,406 65 0.98 0 2<br />
14 Turnpike On to State Street Off 3 6,450 5,137 65 0.98 0 2<br />
15 State Street Off to SR-154 On 3 6,450 3,452 65 0.98 0 2<br />
16 SR-154 On to La Cumbre Off 4 6,900 1,220 65 0.98 0 2<br />
17 La Cumbre Off to La Cumbre On 3 5,500 1,860 65 0.98 0 2<br />
18 La Cumbre On to Las Positas Off 3 6,000 4,580 65 0.98 0 2<br />
19 La Positas Off to Las Positas On 3 5,700 2,221 65 0.98 0 2<br />
20 Las Positas On to Mission Street Off 3 6,450 1,778 65 0.98 0 2<br />
21 Mission Street Off to Mission Street On 3 6,000 1,967 65 0.98 0 2<br />
22 Mission Street On to Carrillo Street Off 3 6,000 3,221 65 0.98 0 2<br />
23 Carrillo Street Off to Carrillo Street On 3 6,000 1,864 65 0.98 0 2<br />
24 Carrillo Street On to Castillo Street Off 3 6,000 1,220 65 0.98 0 2<br />
25 Castillo Street Off to Castillo Street On 3 6,000 2,108 65 0.98 0 2<br />
26 Castillo Street On to Garden Street Off 3 6,000 1,709 65 0.97 0 3<br />
27 Garden Street Off to Garden Street On 3 5,700 1,921 65 0.97 0 3<br />
28 Garden Street On to Milpas Street Off 3 4,700 1,849 65 0.97 0 3<br />
29 Milpas Street Off to Milpas Street On 2 3,500 2,945 65 0.97 0 3<br />
30 Milpas Street On to Cabrillo Street Off Right 2 3,500 3,277 65 0.97 0 3<br />
31 Cabrillo Street Off Right to Cabrillo Street Off Left 2 3,450 644 65 0.97 0 3<br />
32 Cabrillo Street Off Left to Cabrillo Street On 2 3,500 2,122 65 0.97 0 3<br />
33 Cabrillo Street On to Olive Mill Off 2 3,650 2,383 65 0.97 0 3<br />
34 Olive Mill Off to Olive Mill Road On 2 3,750 2,410 65 0.97 0 3<br />
35 Olive Mill Road On to San Ysidro Off 2 4,100 1,035 65 0.75 4 3<br />
36 San Ysidro Off to San Ysidro On 2 4,000 2,656 65 0.75 4 3<br />
37 San Ysidro On to North Jameson Off 2 3,900 2,864 65 0.75 4 3<br />
38 North Jameson Off to North Jameson On 2 3,800 1,392 65 0.75 4 3<br />
39 North Jameson On to Evans Off 2 3,800 1,813 65 0.75 4 3<br />
40 Evans Off to Evans On 2 3,800 3,699 65 0.75 4 3<br />
41 Evans On to North Padaro Off 2 3,800 2,445 65 0.97 0 3<br />
42 North Padero Off to North Padaro On 2 3,800 2,007 65 0.97 0 3<br />
43 North Padero On to South Padaro Off 2 3,800 7,545 65 0.97 0 3<br />
44 South Padaro Off to Santa Claus Lane On 2 3,800 4,440 65 0.97 0 3<br />
45 Santa Clause Lane On to Carpinteria Avenue Off 2 3,675 1,621 65 0.97 0 3<br />
46 Carptinteria Avenue Off to Reynolds Road Off 2 3,800 3,771 65 0.97 0 3<br />
47 Reynolds Road Off to Reynolds Road On 2 3,800 775 65 0.97 0 3<br />
48 Reynolds Road On to Linden Off 2 3,800 1,574 65 0.97 0 3<br />
49 Linden Off to Casitas Pass Off 2 3,800 2,099 65 0.96 0 4<br />
50 Casitas Pass Off to Casitas Pass On 2 3,800 1,539 65 0.96 0 4<br />
51 Casitas Pass On to Bailard Off 2 3,800 3,511 65 0.96 0 4<br />
52 Bailard Off to Bailard On 2 3,800 2,128 65 0.96 0 4<br />
53 Bailard On to Rincon Off 2 3,800 2,197 65 0.96 0 4<br />
54 Rincon Off to Rincon On 2 3,800 2,346 65 0.96 0 4<br />
55 Rincon On to Bates Off 2 3,700 1,269 65 0.96 0 4<br />
56 Bates Off to Bates On 2 3,700 2,301 65 0.96 0 4<br />
57 Bates On to Old Pacific Highway Off 2 3,800 13,026 65 0.96 0 4<br />
Footnote 1 Reflects Free Flow Speeds<br />
Footnote 2 HCM Heavy Duty Truck Factor - reflects the affect that heavy vehicles have on capacity based grade and vehicle composition<br />
SC101 HOV <strong>Traffic</strong> Study – <strong>Forecast</strong> <strong>Operations</strong> <strong>Report</strong> Page 13
Dowling Associates, Inc.<br />
Transportation Engineering Planning Research Education<br />
FREQ Model Validation Criteria<br />
The following validation criteria were used for the Highway 101 study corridor FREQ model:<br />
Correctly identify the location of every bottleneck<br />
Correctly identify the starting and ending time of congestion at every bottleneck within plus or<br />
minus one time interval<br />
Identify the maximum length and time of occurrence of congested area as best possible<br />
Match the trip travel time in each time interval with actual trip travel time as best possible<br />
FREQ Model Validation Procedure<br />
The FREQ model for existing conditions was validated by adjusting the capacity of the freeway sections<br />
until the congestion onset time, congestion clearance time, and length of queues matched that observed in<br />
the field for the day the data was collected.<br />
Consistent with the Modeling Methodology <strong>Report</strong>, a default capacity of 1,900 vehicles per hour per lane<br />
(vphpl) was initially assumed for the 4-lane mainline freeway segments south of Milpas Street and 2,150<br />
vphpl for the 6-lane sections north of Milpas. The capacity for freeway segments that include an auxiliary<br />
lane were set to the capacity of the through lanes plus 900 vphpl. The default capacity of 2000 vphpl was<br />
assumed for all on-ramps and off-ramps on the study corridor. Additional adjustments to the capacity were<br />
not required since the hourly traffic count volumes on the ramps did not exceed this value.<br />
The model was calibrated by adjusting capacities at specific bottlenecks to match the observed queues.<br />
This included increasing capacity for segments where the model predicted a bottleneck that was not<br />
observed in the field, and decreasing capacity for segments where the model did not predict a bottleneck<br />
or underestimated the congestion. Capacity adjustments were not performed indiscriminately and were<br />
predicated upon supporting physical features e.g., non-standard design features, heavily impacted mergediverge<br />
influence areas, isolated or consecutive weave sections. As a reasonableness rule, no single lane<br />
capacity was reduced below 1,750 vehicles per hour or greater than 2,150 vehicles per hour as part of the<br />
calibration process.<br />
Calibration was principally performed for the AM/PM peak directions of travel (i.e., AM northbound peak<br />
period and the PM southbound peak period) followed by reasonableness checks of the off-peak directions.<br />
FREQ Baseline Model Results<br />
The FREQ 2008 baseline model simulation results were compared with “ground truth” travel time and<br />
travel speed survey data. Simulated bottlenecks and queues were identified to examine the location,<br />
magnitude, extent and duration of queuing i.e., congestion. Summary performance measures and travel<br />
time comparison were also examined to ensure that the baseline simulation was adequately calibrated to<br />
baseline conditions.<br />
Simulated Bottlenecks and Queues<br />
Figure 4 through Figure 7 provide graphical summaries of the FREQ model validation.<br />
The top portion of each figure contains the FREQ model output. The following color coding was used to<br />
provide a visual aid of vehicle speed results within freeway subsection and time slice:<br />
Freeway Sections with vehicle travel speeds greater than 55 mph: white<br />
Freeway Sections with vehicle speeds less than 55 mph but greater than 35 mph: yellow<br />
Freeway Sections with vehicle speeds less than 35 mph but greater than 15 mph: orange<br />
Freeway Sections with vehicle speeds less than 15 mph: red.<br />
SC101 HOV <strong>Traffic</strong> Study – <strong>Forecast</strong> <strong>Operations</strong> <strong>Report</strong> Page 14
Dowling Associates, Inc.<br />
Transportation Engineering Planning Research Education<br />
These colors generally illustrate under capacity conditions (white), near-capacity conditions and/or<br />
bottleneck conditions (yellow), unstable flow conditions (orange), extreme unstable stop and go conditions<br />
(red).<br />
Below the FREQ model output reflects the same color convention as applied to the travel speed surveys<br />
conducted on Highway 101 within the study area. The “calibration” travel speed survey is located directly<br />
below the FREQ simulation results and reflects conditions observed in April 2008. Given that the freeway<br />
mainline and ramp volume inputs used for this calibration analysis directly correspond to the days the<br />
travel speed surveys were collected – FREQ replication of this data set is considered the calibration goal.<br />
Historical <strong>Caltrans</strong> floating car survey data collected as part of the Highway Congestion Monitoring<br />
Program (HICOMP) is also provided below the “calibration” 2008 travel speed survey graphic for<br />
comparison purposes. As seen, these data typically entail limited time slices. It should also be noted that<br />
in some cases the instrumented vehicle runs were conducted for the existing 2-lane section and 3-lane<br />
sections separately - on different days and time of year. To reflect a continuous speed profile for the study<br />
area as a whole, the data was spliced together and meshed at the Garden Street subsection (denoted by a<br />
rectangle box). Given that a perfect time match was not possible at the mesh point – a one to one time-ofday<br />
correspondence with the FREQ results is not possible. In general, these historical travel speed<br />
surveys reflect more congested conditions than those observed - and calibrated to – for this analysis.<br />
The bottom of the schematic (x-axis) reflects the freeway segments (freeway subsections) and the<br />
numbers on the left-hand side (y-axis) represent the hours within the peak period that were analyzed (15<br />
minute time slices). As shown, the baseline FREQ simulation was applied to a total of four peak period<br />
hours and the calibration 2008 travel time survey spans a total of two hours per peak period. The<br />
expanded simulated peak period analysis was performed to ensure that the entire peak period was<br />
captured.<br />
Figure 4 presents the FREQ model output and observed traffic conditions of the Highway 101 study<br />
corridor in the northbound direction during the AM peak period. The observed area of congestion<br />
spanning the length of the 2-lane section from just north of the Rincon ramps to the Milpas interchange<br />
was modeled reasonably well by FREQ in terms of both length of queue and bottleneck location. The<br />
constriction effect along the 2-lane section which meters the release of the queue entering the 3-lane<br />
section just north of the Milpas interchange reasonably replicates observed speed data upstream (unstable<br />
flow) and downstream (stable flow) of the Milpas interchange. Duration of congestion is also modeled<br />
accurately and generally matches observed data within 15 minutes. Modeling identifies a relatively minor<br />
bottleneck location near the Las Positas interchange although it was slightly overestimated in terms of<br />
duration. As shown by the <strong>Caltrans</strong> 2004 and 2006 speed data, congested conditions have in previous<br />
years spanned from the Garden Street interchange to the Hope Avenue ramps. Although these data are<br />
not the basis for this calibration effort, it does suggest that although these segments were free flowing<br />
during the AM peak period in April 2008 – they were likely near or nearing capacity.<br />
Figure 5 presents the FREQ model output and observed traffic conditions of the US-101 study corridor in<br />
the southbound direction during the AM peak period. Observed congestion is generally non-existent with<br />
only brief sporadic occurrences in scattered locations. These occurrences were generally not replicated by<br />
simulation. Given that the observed data indicate near free flow conditions and that the more congested<br />
southbound PM peak period was reasonably replicated – this was not considered significant.<br />
Figure 6 presents the FREQ model output and observed traffic conditions of the Highway 101 study<br />
corridor in the southbound direction during the PM peak period. The observed area of congestion<br />
spanning just south of the transition from 3- to 2-lanes and queuing upstream past the Garden Street<br />
interchange (between Castillo and Garden) is accurately replicated in terms of magnitude, extent and<br />
duration of queue. It should be noted that the modeled duration of congestion prior to 4:00 PM appears<br />
reasonable given that the front end of the congested condition appears to have been truncated by the 4:00<br />
PM floating car start run time. Another choke point of interest is the system interchange merger of<br />
northbound SR-217 with southbound Highway 101. Although barely indicated in 2008, this location shows<br />
up more prominently in the 2007 <strong>Caltrans</strong> data. As such, this result was considered reasonable.<br />
SC101 HOV <strong>Traffic</strong> Study – <strong>Forecast</strong> <strong>Operations</strong> <strong>Report</strong> Page 15
Dowling Associates, Inc.<br />
Transportation Engineering Planning Research Education<br />
Congested conditions were also modeled between the La Cumbre and Mission interchanges within the<br />
City of Santa Barbara. These segments are characterized by high volumes and tightly spaced<br />
interchanges in the southbound direction (i.e., weave sections). Although location and length of<br />
congestion appear reasonable, duration is overestimated. It should be noted that the <strong>Caltrans</strong> speed<br />
survey data for 2007 and 2006 show the constriction point further north between the State Street and La<br />
Cumbre interchanges. South of Cabrillo to just north of Reynolds, modeling indicates sustained<br />
occurrences of travel speed reduction for over an hours duration (3:15 PM to 5:45 PM). Observed data for<br />
2008 indicate slightly less congestion for these sections both in terms of location and duration. However,<br />
modeled conditions for these sections of freeway do more closely match 2007 <strong>Caltrans</strong> data and were<br />
therefore considered reasonable.<br />
Figure 7 presents the FREQ model output and observed traffic conditions of the Highway 101 study<br />
corridor in the northbound direction during the PM peak period. The observed area of congestion within<br />
the City of Santa Barbara between Hope Avenue and Carrillo ramps was modeled reasonably well but with<br />
the duration of congestion slightly overestimated – extending into the earlier time slices. Conversely,<br />
extension of the duration of congestion 15 minutes past 5:30 PM appeared reasonable given that the<br />
survey period did not appear to capture the full temporal extent of congestion (i.e., truncates at 5:30 PM).<br />
A minor bottleneck within the 2-lane section just south of the Milpas interchange was also reasonably<br />
replicated.<br />
SC101 HOV <strong>Traffic</strong> Study – <strong>Forecast</strong> <strong>Operations</strong> <strong>Report</strong> Page 16
Figure 4. FREQ Calibration to Travel Time Surveys: Northbound AM Peak Period<br />
SC101 HOV <strong>Traffic</strong> Study – <strong>Forecast</strong> <strong>Operations</strong> <strong>Report</strong> Page 17
Figure 5. FREQ Calibration to Travel Time Surveys: Southbound AM Peak Period<br />
SC101 HOV <strong>Traffic</strong> Study – <strong>Forecast</strong> <strong>Operations</strong> <strong>Report</strong> Page 18
Figure 6. FREQ Calibration to Travel Time Surveys: Northbound PM Peak Period<br />
SC101 HOV <strong>Traffic</strong> Study – <strong>Forecast</strong> <strong>Operations</strong> <strong>Report</strong> Page 19
Figure 7. FREQ Calibration to Travel Time Surveys: Southbound PM Peak Period<br />
SC101 HOV <strong>Traffic</strong> Study – <strong>Forecast</strong> <strong>Operations</strong> <strong>Report</strong> Page 20
Dowling Associates, Inc.<br />
Transportation Engineering Planning Research Education<br />
Performance Measures<br />
Table 7 and Table 8 provide a summary of the peak direction northbound AM and southbound PM travel<br />
time validation results respectively. These data are also graphically displayed in Figure 8 and Figure 9.<br />
The comparison in observed travel times and those estimated in FREQ reflects the study area between<br />
the Ventura County Line to the Hollister interchange.<br />
Table 7. Northbound AM Peak Period Travel Time (FREQ vs Observed)<br />
Northbound Peak Period - Existing Conditions<br />
Freq Model<br />
Time<br />
Total Freeway Travel Time Total Travel Distance AVG Speed Observed (Survey) +/- 85% Range<br />
Slice Time Veh-Hr Pass-Hr Veh-Mi Pass-Mi (mph) AVG Speed (mph) Low (mph) High (mph)<br />
3 6:30 381 480 21,685 27,303 56.9 61.00 51.85 70.15<br />
4 6:45 405 512 22,020 27,846 54.4 61.60 52.36 70.84<br />
5 7:00 423 536 21,799 27,573 51.5 57.20 48.62 65.78<br />
6 7:15 478 606 22,818 28,954 47.7 55.50 47.18 63.83<br />
7 7:30 516 657 23,787 30,278 46.1 45.80 38.93 52.67<br />
8 7:45 514 657 22,491 28,735 43.7 44.50 37.83 51.18<br />
9 8:00 468 597 22,299 28,399 47.6 51.30 43.61 59.00<br />
10 8:15 422 539 21,667 27,636 51.3 57.30 48.71 65.90<br />
TOTAL 3,607 4,584 178,566 226,724 49.90 54.28 44.14 59.72<br />
Table 8. Southbound PM Peak Period Travel Time (FREQ vs Observed)<br />
Southbound Peak Period - Existing Conditions<br />
Freq Model<br />
Time<br />
Total Freeway Travel Time Total Travel Distance AVG Speed Observed (Survey) +/- 85% Range<br />
Slice Time Veh-Hr Pass-Hr Veh-Mi Pass-Mi (mph) AVG Speed (mph) Low (mph) High (mph)<br />
5 16:00 527 767 26,284 38,256 50.9 48.30 41.06 55.55<br />
6 16:15 546 795 26,226 38,192 48.6 54.10 45.99 62.22<br />
7 16:30 512 744 25,441 36,962 49.8 54.70 46.50 62.91<br />
8 16:45 485 705 24,900 36,251 51.4 59.60 50.66 68.54<br />
9 17:00 476 694 24,884 36,240 52.6 58.60 49.81 67.39<br />
10 17:15 452 659 24,577 35,807 54.9 58.20 49.47 66.93<br />
11 17:30 405 590 23,602 34,410 58.8 63.50 53.98 73.03<br />
TOTAL 3,403 4,954 175,914 256,118 52.43 56.71 48.21 65.22<br />
For each time slice, the FREQ model average speed output for both the northbound AM and southbound<br />
PM peak direction falls within the observed average travel speed error tolerance of +/- 15% (as shown in<br />
last two columns). As such, both the AM and PM peak period and direction FREQ models meet the 85%<br />
of observed speed criterion. The FREQ model also reasonably indicates when congestion begins to build<br />
and dissipate with the exception of the southbound PM peak where FREQ suggests congestion builds<br />
slightly earlier than what was observed in the field.<br />
Table 9 presents the criteria used to determine the level of service for basic freeway segment and ramp<br />
merge-diverge facilities.<br />
According to the Transportation Research Board's Special <strong>Report</strong> 209, Highway Capacity Manual, 2000<br />
Chapter 20 Basic Freeway Segments, a particular freeway segment reaches its capacity when vehicle<br />
densities begin to exceed 35 passenger cars per lane per mile (for facilities characterized by 65 mph free<br />
flow speeds). At these vehicle densities, minimum speeds will drop to 52.2 mph. Beyond 45 passenger<br />
car per lane per mile, unstable flow conditions will occur. This allows for the following LOS translation:<br />
<strong>Traffic</strong> traveling at or above 55 mph reflects at or under capacity conditions: LOS A - LOS E.<br />
<strong>Traffic</strong> traveling between 55 and 35 mph reflects over-capacity unstable flow: LOS F.<br />
<strong>Traffic</strong> traveling below 35 mph denotes extreme forced flow conditions: LOS F<br />
SC101 HOV <strong>Traffic</strong> Study – <strong>Forecast</strong> <strong>Operations</strong> <strong>Report</strong> Page 21
Dowling Associates, Inc.<br />
Transportation Engineering Planning Research Education<br />
Figure 8. Northbound AM Peak Period Travel Time (FREQ vs Observed)<br />
Speed<br />
80<br />
70<br />
60<br />
50<br />
40<br />
30<br />
20<br />
10<br />
0<br />
6:30<br />
AM<br />
Northbound AM - Model Predicted Vs Observed Speed<br />
6:45<br />
AM<br />
7:00<br />
AM<br />
7:15<br />
AM<br />
7:30<br />
AM<br />
Time Slice<br />
SC101 HOV <strong>Traffic</strong> Study – <strong>Forecast</strong> <strong>Operations</strong> <strong>Report</strong> Page 22<br />
7:45<br />
AM<br />
8:00<br />
AM<br />
8:15<br />
AM<br />
Figure 9. Southbound PM Peak Period Travel Time (FREQ vs Observed)<br />
Speed<br />
80<br />
70<br />
60<br />
50<br />
40<br />
30<br />
20<br />
10<br />
0<br />
Freq Model Predicted<br />
Observed<br />
Southbound PM - Model Predicted Vs Observed Speed<br />
4:00 PM 4:15 PM 4:30 PM 4:45 PM 5:00 PM 5:15 PM 5:30 PM<br />
Time Slice<br />
-VE 85 Percent<br />
+Ve 85 Percent<br />
Model Predicted<br />
Observed<br />
-VE 85 Percent<br />
+VE 85 Percent
Dowling Associates, Inc.<br />
Transportation Engineering Planning Research Education<br />
Table 9. Freeway and Ramp LOS Criteria<br />
Level of Service Criteria For Basic Freeway Segments<br />
Level of Density Density Density Density<br />
Service pc/mi/ln pc/mi/ln pc/mi/ln pc/mi/ln<br />
FFS = 70 FFS = 65 FFS = 60 FFS = 55<br />
A 11 11 11 11<br />
B 18 18 18 18<br />
C 26 26 26 26<br />
D 35 35 35 35<br />
E 45 45 45 45<br />
F - - - -<br />
Level of Service Criteria For Ramp Merge-Diverge Areas<br />
Level of Density<br />
Service pc/mi/ln<br />
A ≤ 10<br />
B > 10-20<br />
C > 20-28<br />
D > 28-35<br />
E > 35<br />
F -<br />
Based on the vehicle density criteria shown in Table 9 above, Table 10 and Table 11 provide the<br />
baseline freeway LOS results for each 15 minute time slice during the AM northbound and PM<br />
southbound peak travel periods respectively. The AM peak period reflects the hours of 6:30 AM to 8:30<br />
AM while the PM peak hour reflects the hours of 4:00 PM to 6:00 PM. The northbound AM and<br />
southbound PM represent the peak traffic conditions typically observed on Highway 101 within the study<br />
area.<br />
Based on vehicle density criteria, the FREQ simulation indicates that capacity constrained conditions<br />
persist throughout the two hour AM peak period on northbound Highway 101. Vehicle densities within the<br />
constricted 2-lane section indicate LOS F conditions. Vehicle densities denoting LOS F conditions are<br />
also indicated at Las Positas. In the southbound direction during the PM peak period, vehicle densities<br />
that form upstream of bottlenecks at the Milpas and Cabrillo interchanges result in LOS F conditions.<br />
Other freeway locations characterized by LOS F vehicle density conditions include La Cumbre and the<br />
SR-217 system interchange.<br />
Table 12 through Table 15 present the vehicle speed and delay FREQ output by 15 minute time slice.<br />
These results correspond with the vehicle densities reported above.<br />
Complete freeway performance summaries of the final AM and PM peak period calibrated models<br />
computed by FREQ for each freeway segment for each 15 minute time slice are provided in Appendix A.<br />
FREQ Validation Results<br />
The FREQ models for the US-101 study corridor existing conditions were satisfactorily validated.<br />
Although the queues do not exactly match, the major bottlenecks are modeled in the correct locations and<br />
the queues build up and dissipate approximately as observed. Freeway performance, in terms of LOS, is<br />
also reasonably consistent with field observations. The corridor travel times predicted in FREQ are also<br />
reasonably consistent with field data.<br />
SC101 HOV <strong>Traffic</strong> Study – <strong>Forecast</strong> <strong>Operations</strong> <strong>Report</strong> Page 23
Dowling Associates, Inc.<br />
Transportation Engineering Planning Research Education<br />
Table 10. Northbound AM Peak Period FREQ LOS Summary by 15 Minute Time Slice<br />
6:30 AM 6:45 AM 7:00 AM 7:15 AM 7:30 AM 7:45 AM 8:00 AM 8:15 AM 8:30 AM<br />
Sub- Segment Description LOS LOS LOS LOS LOS LOS LOS LOS LOS<br />
Section LEVEL LEVEL LEVEL LEVEL LEVEL LEVEL LEVEL LEVEL LEVEL<br />
1 US Mainline to Bates Off C C C B B B B B B<br />
2 Bates Off to Bates On C C C B B B B B B<br />
3 Bates On to Rincon Off C C C B B B B B B<br />
4 Rincon Off to Rincon On F C B B B A A B A<br />
5 Rincon On to Lane Drop F F B B B A B B A<br />
6 Lane Drop to Bailard Off F D D C C B B C B<br />
7 Bailard Off to Bailard On F F F E B B B B B<br />
8 Bailard On to Casitas Off E E F F C B C C B<br />
9 Casitas Off to Vallecito On F F F F F B B B B<br />
10 Vallecito On to Linden On F F F F F B B C B<br />
11 Linden On to Santa Monica Off F F F F F E C C C<br />
12 Santa Monica Off to Santa Monica On F F F F F F C C B<br />
13 Santa Monica On to South Padaro Off E E E E E C C C C<br />
14 South Padaro Off to South Padaro On D D F F F E C C C<br />
15 South Padaro On to North Padaro Off E E E E F D C C C<br />
16 North Padaro Off to North Padaro On D D D F F F C C C<br />
17 North Padaro On to Hollister Off E E E F F F D C C<br />
18 Hollister Off to Ortega On D E F F F F F C C<br />
19 Ortega On to North Jameson Off E E E E F F F C C<br />
20 North Jameson Off to North Jameson On D D E E F F F D C<br />
21 North Jameson On to San Ysidro Off D E E E F F F F C<br />
22 San Ysidro Off to San Ysidro On D D E F F F F F F<br />
23 San Ysidro On to Olive Mill Road Off D D E E E E F F F<br />
24 Olive Mill Road Off to Hermosilla Road Off D D D D F F F F E<br />
25 Hermosilla Road Off to Cabrillo Off D D D D F F F F F<br />
26 Cabrillo Off to Cabrillo Right On D D D F F F F F F<br />
27 Cabrillo Right On to Salinas Street Off D D D E F F F F F<br />
28 Salinas Street Off to Salinas Street On D D D F F F F F F<br />
29 Salinas Street On to Milpas Street Off D D D E E E E E E<br />
30 Milpas Street Off to Milpas Street On C C D D D D D D D<br />
31 Milpas Street On to Laguna Street Off C C C C C C C C C<br />
32 Laguna Street Off to Garden Street On B B B C B B C C C<br />
33 Garden Streetn On to Bath Street Off B C C C C C C C C<br />
34 Bath Street Off to Haley Street On B B B C C C C C C<br />
35 Haley Street On to Carrillo Street Off B C C C C C C C C<br />
36 Carrillo Street Off to Carrillo Street On B B B C C C C C C<br />
37 Carrillo Street On to Arrellaga Street Off B C C C C C D C C<br />
38 Arrellaga Street Off to Arrellaga Street On B C C C C C C C C<br />
39 Arrellaga Street On to Mission Street Off C C C C D D D D C<br />
40 Mission Street Off to Mission Street On B C C C C F D C C<br />
41 Mission Street On to West Pueblo Street Off B B B C C E D C C<br />
42 West Pueblo Street Off to Las Positas Off B C C C D D D D C<br />
43 Las Positas Off to Las Positas On B C C C F F F F E<br />
44 Las Positas On to Hope Street Off B C C D E E E E D<br />
45 Hope Street Off to Hope Street On B C C C D D D D C<br />
46 Hope Street On to State Street Off B B B B C C C C C<br />
47 State Street Off to State Street On B B B C C C C C C<br />
48 State Street On to El Sueno Road Off B C B C D D D C C<br />
49 El Sueno Road Off to El Sueno Road On B C B C C D C C C<br />
50 El Sueno Road On to Turnpike Road Off B C C C D D D C C<br />
51 Turnpike Road Off to Turnpike Road On B C B C C D C C C<br />
52 Turnpike Road On to Patterson Road Off B C C C D D D D C<br />
53 Patterson Road Off to SR-217 Off B B B C C D C C C<br />
54 SR-217 Off to Patterson Road On A B A B B B B B B<br />
55 Patterson Road On to Fairview Off B B B B C C B B B<br />
56 Fairview Off to Fairview On B B B B C C B B B<br />
57 Fairview On to Los Carneros Off B B B B C C C C B<br />
58 Los Carneros Off to Los Carneros On B B A A B B B B B<br />
59 Los Carneros On to Glenn Annie Off B B A B B B B B B<br />
60 Glenn Annie Off to Glen Annie On A A A A A A A A A<br />
61 Glen Annie On to Winchester Canyon Off A A A A A A A A A<br />
62 Winchester Canyon Off to Hollister Avenue On A A A A A A A A A<br />
63 Hollister Avenue On to US Mainline 101 A A A A A A A A A<br />
* Based on baseline (2008) data.<br />
SC101 HOV <strong>Traffic</strong> Study – <strong>Forecast</strong> <strong>Operations</strong> <strong>Report</strong> Page 24
Dowling Associates, Inc.<br />
Transportation Engineering Planning Research Education<br />
Table 11. Southbound PM Peak Period FREQ LOS Summary by 15 Minute Time Slice<br />
4:00 PM 4:15 PM 4:30 PM 4:45 PM 5:00 PM 5:15 PM 5:30 PM 5:45 PM 6:00 PM<br />
Sub- Segment Description LOS LOS LOS LOS LOS LOS LOS LOS LOS<br />
Section LEVEL LEVEL LEVEL LEVEL LEVEL LEVEL LEVEL LEVEL LEVEL<br />
1 Calle Real to Hollister Avenue Off A A A A A A A A A<br />
2 Hollister Avenue Off to Hollister Avenue On A A A A A A A A A<br />
3 Hollister Avenue On to Storke Road Off A A A A A A A A A<br />
4 Storke Road Off to Storke Road On A A A A A A A A A<br />
5 Storke Road On to Los Carneros Off B A A A A B A A A<br />
6 Los Carneros Off to Los Carneros On B B B B B B B B B<br />
7 Los Carneros On to Fairview Avenue Off C C C C C C C C B<br />
8 Fairview Avenue Off to Fairview Avenue On C C C C C C C B B<br />
9 Fairview Avenue On to Patterson Off B B C C C C B B B<br />
10 Patterson Off to SR-217 On B B B B B B B B B<br />
11 SR-217 On to Patterson On C C C F F F C C B<br />
12 Patterson On to Turnpike Off D D D E E E D C C<br />
13 Turnpike Off to Turnpike On C C C C C D C C C<br />
14 Turnpike On to State Street Off D D D D D D D C C<br />
15 State Street Off to SR-154 On C C C D D D C C C<br />
16 SR-154 On to La Cumbre Off C C C D D D C C B<br />
17 La Cumbre Off to La Cumbre On D D D F D D D C C<br />
18 La Cumbre On to Las Positas Off D D D E E E D D C<br />
19 La Positas Off to Las Positas On D D D D D D C C C<br />
20 Las Positas On to Mission Street Off E D D E E D D C C<br />
21 Mission Street Off to Mission Street On C C C C C C C C B<br />
22 Mission Street On to Carrillo Street Off D D D D D D C C C<br />
23 Carrillo Street Off to Carrillo Street On C C C C C C B B B<br />
24 Carrillo Street On to Castillo Street Off C C C C C C C C B<br />
25 Castillo Street Off to Castillo Street On C F B B B B B B B<br />
26 Castillo Street On to Garden Street Off F F F D C C B B B<br />
27 Garden Street Off to Garden Street On F F F F F F B B B<br />
28 Garden Street On to Milpas Street Off F F F F F F E B B<br />
29 Milpas Street Off to Milpas Street On F F F F F F F D B<br />
30 Milpas Street On to Cabrillo Street Off Right F F F F F F F F C<br />
31 Cabrillo Street Off Right to Cabrillo Street Off Left E E E E E E E D C<br />
32 Cabrillo Street Off Left to Cabrillo Street On D D D D D C D C C<br />
33 Cabrillo Street On to Olive Mill Off D D D D D D D D C<br />
34 Olive Mill Off to Olive Mill Road On D D D D D D C C C<br />
35 Olive Mill Road On to San Ysidro Off D E D D D D D D C<br />
36 San Ysidro Off to San Ysidro On D D D D D D C C C<br />
37 San Ysidro On to North Jameson Off D E D D D D D C C<br />
38 North Jameson Off to North Jameson On D F E D D D C C C<br />
39 North Jameson On to Evans Off D E D D D D D C C<br />
40 Evans Off to Evans On D D D D D C C C C<br />
41 Evans On to North Padaro Off D E D D D D C C C<br />
42 North Padero Off to North Padaro On D D D D D C C C B<br />
43 North Padero On to South Padaro Off D D D D D C C C B<br />
44 South Padaro Off to Santa Claus Lane On F F F D C C C C B<br />
45 Santa Clause Lane On to Carpinteria Avenue Off E E E D D C C C B<br />
46 Carptinteria Avenue Off to Reynolds Road Off D D D C C C C C B<br />
47 Reynolds Road Off to Reynolds Road On D D D C C C C C B<br />
48 Reynolds Road On to Linden Off D D D C C C C C B<br />
49 Linden Off to Casitas Pass Off D D C C C C C C B<br />
50 Casitas Pass Off to Casitas Pass On C C C C C B B B B<br />
51 Casitas Pass On to Bailard Off D D C C C C C C B<br />
52 Bailard Off to Bailard On D D C C C C C C B<br />
53 Bailard On to Rincon Off D D C C C C C C B<br />
54 Rincon Off to Rincon On D D C C C C C C B<br />
55 Rincon On to Bates Off D D D C C C C C B<br />
56 Bates Off to Bates On D D D C C C C C B<br />
57 Bates On to Old Pacific Highway Off D D D C C C C C B<br />
* Based on baseline (2008) data.<br />
SC101 HOV <strong>Traffic</strong> Study – <strong>Forecast</strong> <strong>Operations</strong> <strong>Report</strong> Page 25
Dowling Associates, Inc.<br />
Transportation Engineering Planning Research Education<br />
Table 12. Northbound AM Peak Period Highway 101 FREQ Existing Condition Results<br />
Time<br />
Slice Time<br />
EXISTING CONDITIONS - NORTHBOUND AM<br />
Total<br />
Mainline<br />
Delay<br />
Average<br />
Mainline<br />
Freeway Travel<br />
Total Freeway Total Travel<br />
Time Ramp Delay<br />
Delay Travel Time<br />
Distance Average<br />
Veh-Hr Pass-Hr Veh-Hr Pass-Hr Veh-Hrs Min/Veh Veh-Hr Pass-Hr Veh-Mi Pass-Mi Speed<br />
1 6:00 192 242 0 0 0.58 0.02 192 242 12461 15680 64.8<br />
2 6:15 288 362 0 0 7.95 0.14 288 362 18191 22882 63.2<br />
3 6:30 381 480 0 0 47.26 0.77 381 480 21685 27303 56.9<br />
4 6:45 405 512 0 0 66.09 1.10 405 512 22020 27846 54.4<br />
5 7:00 423 536 0 0 88.10 1.50 423 536 21799 27573 51.5<br />
6 7:15 478 606 0 0 126.91 2.29 478 606 22818 28954 47.7<br />
7 7:30 516 657 0 0 150.09 2.68 516 657 23787 30278 46.1<br />
8 7:45 514 657 0 0 168.27 2.99 514 657 22491 28735 43.7<br />
9 8:00 468 597 0 0 125.33 2.07 468 597 22299 28399 47.6<br />
10 8:15 422 539 0 0 88.97 1.46 422 539 21667 27636 51.3<br />
11 8:30 359 458 0 0 48.31 0.85 359 458 20215 25760 56.3<br />
12 8:45 304 387 0 0 15.96 0.29 304 387 18725 23863 61.6<br />
13 9:00 256 326 0 0 0.99 0.02 256 326 16597 21131 64.7<br />
14 9:15 230 294 0 0 0.64 0.02 230 294 14907 19036 64.8<br />
15 9:30 238 304 0 0 0.67 0.02 238 304 15447 19684 64.8<br />
16 9:45 233 297 0 0 0.60 0.02 233 297 15079 19259 64.8<br />
Total 5,707 7,254 0 0 936.71 2.00 5,707 7,254 310,188 394,019 54.4<br />
Table 13. Southbound AM Peak Period Highway 101 FREQ Existing Condition Results<br />
Time<br />
Slice Time<br />
EXISTING CONDITIONS - SB AM<br />
Total<br />
Mainline<br />
Delay<br />
Average<br />
Mainline Total Freeway Travel Total Travel<br />
Delay Time<br />
Distance<br />
Average<br />
Freeway Travel<br />
Time Ramp Delay<br />
Veh-Hr Pass-Hr Veh-Hr Pass-Hr Veh-Hrs Min/Veh Veh-Hr Pass-Hr Veh-Mi Pass-Mi Speed<br />
1 6:00 121 168 0 0 0.66 0.05 121 168 7,804 10,842 64.6<br />
2 6:15 188 262 0 0 0.84 0.05 188 262 12,155 16,935 64.7<br />
3 6:30 206 285 0 0 0.89 0.05 206 285 13,316 18,445 64.7<br />
4 6:45 229 318 0 0 1.01 0.05 229 318 14,847 20,597 64.7<br />
5 7:00 259 359 0 0 1.06 0.05 259 359 16,773 23,234 64.7<br />
6 7:15 360 500 0 0 16.97 0.25 360 500 22,305 30,997 61.9<br />
7 7:30 391 542 0 0 42.84 0.57 391 542 22,629 31,352 57.9<br />
8 7:45 389 539 0 0 46.89 0.60 389 539 22,214 30,786 57.2<br />
9 8:00 333 460 0 0 24.79 0.34 333 460 20,024 27,682 60.2<br />
10 8:15 296 409 0 0 8.39 0.14 296 409 18,694 25,838 63.2<br />
11 8:30 293 405 0 0 4.79 0.09 293 405 18,750 25,917 63.9<br />
12 8:45 283 392 0 0 2.74 0.07 283 392 18,215 25,239 64.4<br />
13 9:00 288 401 0 0 2.41 0.06 288 401 18,583 25,821 64.5<br />
Total 3,636 5,040 0 0 154 0.44 3,636 5,040 226,309 313,685 62.2<br />
* Presented results based on No Build Network and No Build Volumes (serving 100 percent demand)<br />
SC101 HOV <strong>Traffic</strong> Study – <strong>Forecast</strong> <strong>Operations</strong> <strong>Report</strong> Page 26
Dowling Associates, Inc.<br />
Transportation Engineering Planning Research Education<br />
Table 14. Northbound PM Peak Period Highway 101 FREQ Existing Condition Results<br />
Time<br />
Slice Time<br />
EXISTING CONDITIONS - NORTHBOUND PM<br />
Total<br />
Mainline<br />
Delay<br />
Average<br />
Mainline<br />
Freeway Travel<br />
Total Freeway Total Travel<br />
Time Ramp Delay<br />
Delay Travel Time<br />
Distance Average<br />
Veh-Hr Pass-Hr Veh-Hr Pass-Hr Veh-Hrs Min/Veh Veh-Hr Pass-Hr Veh-Mi Pass-Mi Speed<br />
1 15:00 317 444 0 0 7.39 0.09 317 444 20102 28174 63.5<br />
2 15:15 324 454 0 0 8.10 0.10 324 454 20564 28793 63.4<br />
3 15:30 351 492 1 1 20.49 0.27 352 493 21493 30088 61.1<br />
4 15:45 327 458 0 0 19.06 0.26 327 458 19989 28047 61.2<br />
5 16:00 347 485 0 0 22.77 0.28 347 485 21043 29471 60.7<br />
6 16:15 328 460 0 0 15.57 0.19 328 460 20307 28453 61.9<br />
7 16:30 346 485 1 2 15.76 0.20 348 487 21492 30109 61.8<br />
8 16:45 335 469 4 6 17.20 0.21 339 475 20646 28941 60.9<br />
9 17:00 372 522 12 18 42.37 0.55 385 540 21454 30095 55.7<br />
10 17:15 382 535 23 32 66.01 0.88 405 567 20508 28741 50.7<br />
11 17:30 382 536 33 46 64.71 0.85 415 582 20632 28915 49.7<br />
12 17:45 312 437 39 54 24.28 0.33 350 491 18682 26175 53.3<br />
13 18:00 260 365 35 49 0.52 0.01 295 414 16893 23697 57.2<br />
14 18:15 246 345 21 29 0.00 0.00 267 373 15991 22393 60<br />
15 18:30 225 315 6 8 0.00 0.00 230 323 14606 20466 63.4<br />
16 18:45 197 276 0 0 0.00 0.00 197 276 12775 17932 65<br />
Total 5,051 7,078 175 245 324.23 0.53 5,226 7,322 307,177 430,490 60.8<br />
Table 15. Southbound PM Peak Period Highway 101 FREQ Existing Condition Results<br />
Time<br />
Slice Time<br />
EXISTING CONDITIONS - SB PM<br />
Total<br />
Mainline<br />
Delay<br />
Average<br />
Mainline Total Freeway Travel Total Travel<br />
Delay Time<br />
Distance<br />
Average<br />
Freeway Travel<br />
Time Ramp Delay<br />
Veh-Hr Pass-Hr Veh-Hr Pass-Hr Veh-Hrs Min/Veh Veh-Hr Pass-Hr Veh-Mi Pass-Mi Speed<br />
1 15:00 361 524 0 0 10.83 0.20 361 524 22,777 33,057 63.1<br />
2 15:15 433 630 0 0 38.56 0.65 433 630 25,642 37,290 59.2<br />
3 15:30 457 664 0 0 57.39 1.03 457 664 25,953 37,731 56.8<br />
4 15:45 480 699 0 0 81.01 1.48 480 699 25,936 37,782 54.0<br />
5 16:00 517 753 0 0 112.25 2.04 517 753 26,330 38,323 50.9<br />
6 16:15 538 783 0 0 135.54 2.39 538 783 26,145 38,074 48.6<br />
7 16:30 509 740 0 0 118.46 2.09 509 740 25,400 36,901 49.9<br />
8 16:45 485 706 0 0 101.18 1.78 485 706 24,930 36,295 51.4<br />
9 17:00 473 689 0 0 89.61 1.51 473 689 24,924 36,298 52.7<br />
10 17:15 447 652 0 0 69.35 1.14 447 652 24,572 35,801 54.9<br />
11 17:30 400 583 0 0 37.83 0.68 400 583 23,514 34,281 58.8<br />
12 17:45 351 512 0 0 17.03 0.33 351 512 21,704 31,671 61.8<br />
13 18:00 287 419 0 0 1.85 0.05 287 419 18,555 27,067 64.6<br />
Total 5,738 8,354 0 0 871 1.65 5,738 8,354 316,382 460,571 55.1<br />
* Presented results based on No Build Network and No Build Volumes (serving 100 percent demand)<br />
SC101 HOV <strong>Traffic</strong> Study – <strong>Forecast</strong> <strong>Operations</strong> <strong>Report</strong> Page 27
Dowling Associates, Inc.<br />
Transportation Engineering Planning Research Education<br />
Freeway Future <strong>Operations</strong> Analysis<br />
This section describes the future 2020 and 2040 freeway macro-simulation analysis for TA-A (No Build)<br />
and TA-B (Build). Given that the only difference between TA-B and TA-C is the provision of auxiliary lanes,<br />
the operational benefits of TA-C focus on weave operations using the Highway Design Manual.<br />
Simulation forecasts provide the basis for determining the mainline operational benefits of the South Coast<br />
101 HOV Project. The freeway macro-simulation model FREQ model was applied to evaluate and<br />
compare the operational performance of the future No-build and Build freeway travel assessments. The<br />
following three simulation analysis steps are described:<br />
FREQ Macro-Simulation <strong>Forecast</strong> Analysis Inputs<br />
FREQ Macro-Simulation Feedback Process and Peak Spreading Adjustments<br />
FREQ Macro-Simulation 2040 Future Operational Results: No-Build (TA-A) and Build (TA-B).<br />
FREQ Macro-Simulation <strong>Forecast</strong> Analysis Inputs<br />
The future year FREQ model requires forecast travel demand data and future freeway geometry data. As<br />
described in the Travel <strong>Forecast</strong>ing <strong>Report</strong> (February 9, 2009), the most recently adopted version of the<br />
Santa Barbara County Association of Governments (SBCAG) Travel Demand Model was used to generate<br />
the 24-hour daily demand volume sets for analysis 2 .<br />
Travel demand modeling performed for this study reflects all programmed projects documented in the<br />
2008 Regional Transportation Plan (adopted September 2008) and the 2007 Federal Transportation<br />
Improvement Program (adopted September 2006). Phasing of all future programmed infrastructure<br />
improvements are also coded consistent with SBCAG’s 2007 FTIP and 2008 RTP project implementation<br />
schedules. This also includes significant portions of the 101 In-Motion package of long-term multi-modal<br />
improvements identified to address long-term traffic congestion within the Highway 101 corridor of the<br />
South Coast.<br />
A travel forecast approach summary relative to existing SBCAG forecasts is provided in Table 16 below.<br />
Table 16. SC101 HOV Travel <strong>Forecast</strong> Analysis Summary<br />
HIGHWAY 101 RTP 1 FORECASTS<br />
● Model Mainline Volumes (unadjusted)<br />
● Based on 2002 Regional Growth <strong>Forecast</strong><br />
● 2030 Planned - Includes HOV Lane in SB County & Full 101 In-Motion Benefits (except Commuter Rail)<br />
SOUTH COAST 101 HOV STUDY HIGHWAY 101 FORECASTS<br />
● Mainline Volumes Developed by "seeding" endpoints with adjusted on- and off-ramp volumes<br />
● <strong>Forecast</strong> Volumes Adjusted to Reflect 2007 RGF<br />
● Build <strong>Forecast</strong> - Includes SC101 HOV Project<br />
● 2040 <strong>Forecast</strong> - Grown from 2030 Model by applying 2007 RGF Based Extrapolation<br />
● 2040 <strong>Forecast</strong> - Reflects Partial 101 In-Motion Benefits based on Measure A & other avaiable funding<br />
1. Vision 2030 - 2008 RTP, SBCAG, September, 2008<br />
2 The SBCAG Travel Demand Model is based on the TransCAD software platform developed by Caliper Corporation. The same<br />
model version used for this study was used to generate the most recent SBCAG travel forecasts for the 101 In-Motion Study<br />
(SBCAG, July 2006) and the 2008 Regional Transportation Plan (SBCAG, September 2008)<br />
SC101 HOV <strong>Traffic</strong> Study – <strong>Forecast</strong> <strong>Operations</strong> <strong>Report</strong> Page 28
Dowling Associates, Inc.<br />
Transportation Engineering Planning Research Education<br />
Separate and distinct 24-hour volume demand sets were developed for the future No-Build and Build<br />
scenarios respectively. This approach was taken to appropriately reflect how the operational benefits of<br />
adding highway capacity may be partially off-set by the introduction of induced and diverted travel demand<br />
that may result when travel accessibility improvements are implemented (i.e., Build scenario).<br />
The transportation and academic literature define induced travel as vehicle activity resulting from new trip<br />
generation or longer trips as a response to new highway capacity i.e., an individual will make more or<br />
longer vehicle trips after highway capacity is increased. <strong>Traffic</strong> generated by new growth (increase in jobs,<br />
housing, or population) or diversion from other time periods or parallel facilities, is not by definition,<br />
induced travel activity. With the exception of diversion from other modes (e.g., transit users who switch to<br />
single occupant vehicles), time-of-day or route diversion do not result in a net daily increase in vehicle<br />
activity or highway use.<br />
Traditional 4-step travel demand models with mode choice capability (i.e., SBCAG Travel Model) will<br />
capture the following behavioral changes that can result from adding new highway capacity: 1) diversion<br />
from other facilities; 2) longer trip lengths resulting from improved accessibility; and, 3) shifts from high<br />
occupancy vehicles (busses, vanpools and carpools) to single occupant vehicles as a result of improved<br />
accessibility. Travel demand models currently do not capture induced travel as a result of new trip<br />
generation. However, the latter component of induced travel demand has been found to be insignificant<br />
based on travel demand elasticity studies. For a more complete discussion of induced vs. diverted travel<br />
and a literature review of travel demand elasticity studies see 2008 Regional Transportation Plan EIR,<br />
SBCAG, October 2009; and, Highway 101 Deficiency Plan – Attachment F, SBCAG, June 2002).<br />
Figure 10 depicts the modeled difference in daily freeway traffic volumes on Highway 101 between the<br />
2040 No Build and Build conditions. The bars at the bottom of the graph isolate the amount of additional<br />
daily traffic forecast to occur as a result of the HOV widening project. Although impossible to completely<br />
distinguish, the induced portion can be approximated by comparing the No-Build to Build daily traffic<br />
volumes on Highway 101 at the two extreme endpoints of the study area i.e., Hollister Avenue and the<br />
Ventura County Line. Given that there are no alternative routes available along these two portions of<br />
Highway 101 - the difference in volumes would primarily be due to induced travel – i.e., less than 5%.<br />
Conversely, the greatest volume increases are shown to occur within the project limits. These are<br />
primarily the result of diverted traffic from parallel facilities. Examination of model volume difference plots<br />
between the No Build and Build model runs indicate that approximately 90-95% (depending on location) of<br />
the traffic increment on Highway 101 is the result of traffic diversion from lower order roadways.<br />
Figure 10. 2040 Highway 101 Daily Volume <strong>Forecast</strong> (No-Build vs. Build)<br />
Daily Volume<br />
200000<br />
180000<br />
160000<br />
140000<br />
120000<br />
100000<br />
80000<br />
60000<br />
40000<br />
20000<br />
0<br />
n/o Hollister Ave<br />
n/o Los Carneros Rd<br />
n/o Patterson Ave<br />
n/o Rte 154<br />
n/o Mission St<br />
n/o Castillo St<br />
Daily Comparison<br />
n/o Milpas St<br />
n/o Cabrillo Blvd<br />
Location<br />
n/o Sheffield Dr<br />
n/o Linden Ave<br />
n/o Bailard Ave<br />
n/o Ventura Co. Line<br />
Diff. Build vs No Build<br />
2008 Counts<br />
2040 No Build<br />
2040 Build<br />
SC101 HOV <strong>Traffic</strong> Study – <strong>Forecast</strong> <strong>Operations</strong> <strong>Report</strong> Page 29
Dowling Associates, Inc.<br />
Transportation Engineering Planning Research Education<br />
<strong>Forecast</strong> summary tables comparing total study area intersection AM and PM peak hour No Build and<br />
Build approach volumes are provided in the intersection operations section of this report. These tables<br />
show where future peak hour volumes under the Build condition are projected to be either greater or lower<br />
than the No Build condition. Volume decreases at study area intersections between the Build and No<br />
Build conditions particularly within the project area reflect diversion off the local roadway approaches back<br />
onto the freeway and/or greater utilization of the closest available ramp resulting in less utilization at ramps<br />
served by parallel routes to Highway 101. Volume increases at study area intersections between the Build<br />
and No Build conditions reflect either induced and/or diverted traffic on one or more legs of the<br />
intersection.<br />
Although travel demand models are the best tool for capturing diversion from parallel facilities or changing<br />
trip distributions that result from improved accessibility, FREQ simulation is a more appropriate tool to<br />
approximate the extent of traffic that will divert or shift from-to other time periods. For this purpose, a<br />
FREQ feedback process step was used. This step is described in the following section.<br />
Travel demand data consists of total vehicles entering/exiting the study area on the freeway plus on-ramp<br />
and off-ramp volumes by time slice. Future year truck percentages by ramp and mainline location were<br />
based on existing classification percentages derived from counts performed in April 2008. Vehicle<br />
occupancy under the No-Build analysis was based on existing occupancy counts performed in 2008. With<br />
the HOV lane (Build analysis) a 20% conversion of existing occupancy was assumed consistent with the<br />
101 In-Motion Study (SBCAG, 2006).<br />
To ensure the temporal extent of congestion was fully captured an 8-hour AM and 7-hour PM peak periods<br />
were used for analysis. To reduce problem size, analysis time slices were increased from 15 minutes<br />
(used as part of the calibration analysis) to 30 minute time slices. The AM/PM peak periods are as follows:<br />
AM Peak Period = 5:00 AM -1:00 PM (16 30-min time slices)<br />
PM Peak Period = 2:00 PM - 9:00 PM (14 30-min time slices)<br />
In order to simulate up to 15 hours of freeway operations, a full temporal profile of travel demand for<br />
Highway 101 was needed. Future year peak period hourly distribution of travel demand were based on<br />
available 24-hour Highway 101 mainline counts and “smoothing” the 2001 Statewide Travel Survey results<br />
for Santa Barbara County with existing 24-hour ramp count data (April 2008). The generalized distribution,<br />
shown in Figure 11 was used to help “seed” the initial FREQ macro-simulation runs for both peak periods.<br />
Future volumes were checked to ensure volumes were greater than counts at all ramp locations.<br />
Future Baseline FREQ Network Assumptions<br />
Future FREQ model networks were coded to reflect all future baseline network improvements assumed as<br />
part of the travel forecasting step (see SC101 HOV Travel <strong>Forecast</strong> <strong>Report</strong>, December 2008). Consistent<br />
with <strong>Caltrans</strong> <strong>Traffic</strong> Impact Study Guidelines (December 2002), projects were assumed part of the future<br />
baseline network if any project phase (e.g., PS&E, environmental, construction etc) is currently<br />
programmed – i.e., has a formal funding commitment. All programmed projects documented in the 2008<br />
Regional Transportation Plan (SBCAG, 2008) and the 2009 Federal Transportation Improvement Program<br />
were coded on the No Build and Build FREQ networks. Phasing of all future programmed improvements<br />
was coded consistent with SBCAG’s 2007 FTIP and 2008 RTP project implementation schedules. Future<br />
2020 and 2040 baseline roadway improvement assumptions are provided are shown Table 17.<br />
SC101 HOV <strong>Traffic</strong> Study – <strong>Forecast</strong> <strong>Operations</strong> <strong>Report</strong> Page 30
Dowling Associates, Inc.<br />
Transportation Engineering Planning Research Education<br />
Figure 11. Hourly Distribution of Travel Demand<br />
Trip Distribution<br />
12.00%<br />
10.00%<br />
8.00%<br />
6.00%<br />
4.00%<br />
2.00%<br />
0.00%<br />
00:00<br />
01:00<br />
02:00<br />
03:00<br />
04:00<br />
05:00<br />
06:00<br />
Weekday Trip Distribution<br />
2000-2001 Statewide Travel Survey 2008 <strong>Traffic</strong> Counts at Hwy 101 Ramps Smoothened Values<br />
07:00<br />
08:00<br />
09:00<br />
SC101 HOV <strong>Traffic</strong> Study – <strong>Forecast</strong> <strong>Operations</strong> <strong>Report</strong> Page 31<br />
10:00<br />
11:00<br />
Time of Day<br />
Table 17. Future Baseline Roadway Improvements Assumptions<br />
Lead Agency Location Project Description 2020 2030<br />
<strong>Caltrans</strong> HWY101 (Mussel Shoals to Carpinteria Creek Bridge) Add HOV lane in each direction Yes Yes<br />
<strong>Caltrans</strong> SR-150 (Near Carpinteria & Co Line) Replace two bridges over Rincon Creek n/a n/a<br />
<strong>Caltrans</strong> SR-192 (Parida Creek Bridge near Carpinteria) Replace bridge n/a n/a<br />
<strong>Caltrans</strong> HWY101 (Milpas to Hotsprings) Add 1 Mixed Flow Lane (SB Milpas to Cabrillo; NB Milpas to Salinas) Yes Yes<br />
<strong>Caltrans</strong> HWY101 (Milpas to Hotsprings) Add new Milpas Ave SB loop off-ramp Yes Yes<br />
<strong>Caltrans</strong> HWY101 (Milpas to Hotsprings) Construct Cacique Street undercrossing Yes Yes<br />
<strong>Caltrans</strong> HWY101 (Milpas to Hotsprings) Replace bridge at Sycamore Creek n/a n/a<br />
<strong>Caltrans</strong> HWY101 (Milpas to Hotsprings) Add NB Aux-lane Cabrillo to Salinas Yes Yes<br />
<strong>Caltrans</strong> HWY101 (Milpas to Hotsprings) Reconstruct Cabrillo/Hot Springs Interchange Yes Yes<br />
<strong>Caltrans</strong> HWY101 (Milpas to Hotsprings) Construct Bike/Ped tunnel at Cabrillo underpass n/a n/a<br />
<strong>Caltrans</strong> HWY101 (Milpas to Hotsprings) Construct Roundabout: Hot Srings/Old Coast Highway/Coast Village Rd. Yes Yes<br />
<strong>Caltrans</strong> HWY 101/Carrillo NB-Ramp Widen ramp to two lanes - tapering to one before merge Yes Yes<br />
<strong>Caltrans</strong> HWY 101/Linden & Casitas Pass I/C Reconstruct Linden Ave & Casitas Pass I/Cs Yes Yes<br />
Carpinteria Via Real Extension Construct Frontage Road between Linden Ave and Casitas Pass Yes Yes<br />
Goleta Ellwood Freeway Crossing Construct bridge over HWY 101 with termini at Hollister and Calle Real Yes Yes<br />
Goleta HWY 101/Hollister Avenue I/C Relocate I/C & OH to align with Cathedral Oaks Road Yes Yes<br />
<strong>Caltrans</strong>,<br />
SBCAG, Local<br />
Agencies<br />
<strong>Caltrans</strong>,<br />
SBCAG, Local<br />
Agencies/MTD<br />
<strong>Caltrans</strong>,<br />
SBCAG, Local<br />
Agencies<br />
<strong>Caltrans</strong>,<br />
SBCAG, Local<br />
Agencies<br />
South Coast (Cities of Ventura, Carpinteria, Santa<br />
Barbara, Goleta)<br />
South Coast (Cities of Ventura, Carpinteria, Santa<br />
Barbara, Goleta)<br />
South Coast (Cities of Ventura, Carpinteria, Santa<br />
Barbara, Goleta)<br />
South Coast (Cities of Ventura, Carpinteria, Santa<br />
Barbara, Goleta)<br />
n/a: Coding to Model Network is not required.<br />
12:00<br />
13:00<br />
14:00<br />
15:00<br />
Inter-City Rail (Pacific Surfliner): Add two additional round-trip of passenger rail<br />
service -designed to serve commuters. Infrastructure improvements to existing<br />
Amtrak facilities to facilitate effective inter-city passenger rail service during<br />
peak commute periods (e.g., rail sidings, crossing lights, signs etc.).<br />
Increased frequency of express transit services in the South Coast during<br />
AM/PM peak periods to 10-20 min headways within peak periods.<br />
Carpool/vanpool and TDM Program: New incentives for carpooling/vanpooling.<br />
New telecommuting and flexwork programs.<br />
ITS implementation: ITS field deployment including: field detectors, telemetry<br />
devices, message signs, traveler information systems. Freeway Service Patrol.<br />
511 Service.<br />
16:00<br />
17:00<br />
18:00<br />
19:00<br />
20:00<br />
21:00<br />
22:00<br />
Partial Yes<br />
Partial Yes<br />
23:00<br />
Yes Yes<br />
Yes Yes
Dowling Associates, Inc.<br />
Transportation Engineering Planning Research Education<br />
2020 & 2040 Future Build FREQ Network Assumptions<br />
Network coding to reflect the Build scenario (Future Baseline + HOV Project) entailed coding the HOV lane<br />
within the project limits. The default capacity of 1,650 vph was assumed for the HOV lane along the study<br />
corridor. Adjustments to the capacity were not required since the hourly traffic volume on the HOV lane<br />
did not exceed this value. For purposes of this analysis, the proposed HOV facility was assumed to<br />
operate from 6:00 to 9:00 AM and from 4:00 PM to 7:00 PM. During the off-peak periods, it was assumed<br />
to operate as a mixed flow lane with a capacity of 2,150 vph.<br />
For segments outside the Project Area, capacity adjustments performed as part of the FREQ model<br />
calibration were retained as part of the future year analysis. Capacity adjustments performed during<br />
calibration were predicated upon supporting physical features e.g., non-standard design features, heavily<br />
impacted merge-diverge influence areas, isolated or consecutive weave sections. As a reasonableness<br />
rule, no single lane capacity was reduced below 1,750 vehicles per hour or greater than 2,150 vehicles per<br />
hour as part of the calibration process.<br />
FREQ macro-simulation was then used to quantify how these operational improvements will accommodate<br />
and affect peak hour/period travel demand. It should be noted that the trip reduction benefits resulting<br />
from the multi-modal improvements identified in the 101 In-Motion Study (SBCAG, July 2006) are reflected<br />
in the 24-hour volumes sets. Descriptions of the 101 In-Motion multi-modal improvements are described in<br />
the Travel <strong>Forecast</strong> <strong>Report</strong> (February 2009).<br />
TA-A and TA-B FREQ Feedback Process – Peak Spreading<br />
The No-Build and Build Volume Sets were applied to the No Build and Build FREQ networks respectively.<br />
As previously described, to develop future year 2020 and 2040 hourly distributions of traffic demand<br />
needed for macro-simulation, location specific 2008 24-hour traffic count distributions were applied to the<br />
2020 and 2040 daily travel demand volume sets forecast at each ramp and freeway mainline endpoint.<br />
This initial seed reflects a 2008 demand distribution as applied to a 2020 and 2040 travel forecast. To<br />
systematically gauge how the existing hourly demand distribution will change as a result of future year<br />
congestion levels, a FREQ feedback process was used. Based on the initial seed hourly distribution of<br />
demand, FREQ estimates and records any volume that is not served within a given time slice. The FREQ<br />
feedback process is based on iteratively shifting a portion of this un-served volume to adjoining time slices<br />
until all demand can be served within the analysis period as a whole (i.e., 8-hour AM period or 7-hour PM<br />
period). Volume adjustments were only performed on those freeway segments that feed into identified<br />
bottleneck locations within the “tail” of the queue. Once the spreading results in a viable FREQ run (i.e.,<br />
100% of demand served within the analysis period that reflects a reasonable balance between travel<br />
time/delay among origins and destinations) the process terminates. This approach is predicated on the<br />
assumption that motorists will adjust their travel departure times to avoid extreme congestion.<br />
The 24-hour volume sets reflect future travel demand during a typical weekday. The following travel<br />
demand forecasts were developed:<br />
2020 & 2040 No Build Daily Travel Demand Volume Sets;<br />
2020 Build Opening Day Daily Travel Demand Volume Set;<br />
2040 Build Design Year Daily Travel Demand Volume Set.<br />
Using the FREQ feedback process, the above forecast 24-hour volume sets were iteratively processed to<br />
determine “serviceable” hourly traffic volumes for the following two traffic assessments (TA):<br />
TA-A 2020 & 2040 No-Build (No HOV Project)<br />
TA-B 2020 & 2040 Build (HOV Project)<br />
The FREQ forecast process is shown in Figure 12 below. TA-F reflects the travel demand forecasting step<br />
while TA-0 reflects operational output for a given travel assessment.<br />
SC101 HOV <strong>Traffic</strong> Study – <strong>Forecast</strong> <strong>Operations</strong> <strong>Report</strong> Page 32
Figure 12. FREQ <strong>Forecast</strong> Process<br />
SC101 HOV <strong>Traffic</strong> Study – <strong>Forecast</strong> <strong>Operations</strong> <strong>Report</strong> Page 33
Dowling Associates, Inc.<br />
Transportation Engineering Planning Research Education<br />
TA-A and TA-B FREQ 2020 Operational Results<br />
The FREQ 2020 forecast simulation results for each direction of travel on Highway 101 are described in<br />
this section. Simulated bottlenecks and queues were identified to examine the location, magnitude, extent<br />
and duration of queuing. Summary performance measures and average travel speed comparisons are<br />
examined between the No-Build (TA-A) and Build (TA-B) conditions.<br />
Interpreting FREQ Simulation Output<br />
Figure 13 provides a graphic sample of FREQ output. Vehicles have been added for interpretative<br />
purposes. The top portion of each figure contains the FREQ model output. The following conditions are<br />
denoted as follows:<br />
Green illustrates free-flow conditions (60-65 mph)<br />
Blue illustrates near-capacity conditions (55-60 mph)<br />
Yellow illustrates freeway bottlenecks (35-55 mph)<br />
Red illustrates unstable congested flow sections (< 35 mph ~unstable flow/queuing),<br />
The numbers below the schematic drawing of the freeway represent freeway segments (freeway<br />
subsections) and the numbers on the left-hand side represent the hours within the peak period that we are<br />
analyzing (30 minute time slices). As stated previously, the future 2020 FREQ simulation was applied to a<br />
total of eight hours during the AM peak period and seven hours during the PM peak period. The expanded<br />
simulated peak period analysis was performed to ensure that the entire peak period was captured.<br />
Simulated Bottlenecks and Queues<br />
Future 2020 FREQ simulation was applied to a total of eight hours during the AM peak period and seven<br />
hours during the PM peak period. The expanded simulated peak period analysis was performed to ensure<br />
that the entire peak period was captured.<br />
Figure 14 and Figure 15 present the 2020 FREQ simulation output for the northbound AM peak period<br />
No-Build and Build analyses respectively. The constriction effect along the 2-lane section which meters<br />
the release of the queue entering the 3-lane section just north of the Cabrillo-Hot Springs interchange is<br />
projected to cause unstable flow conditions and queuing from the Cabrillo Interchange upstream to just<br />
beyond the North Padero ramp. Several other bottleneck locations are projected to appear before 8:00<br />
AM within the project limits e.g., lane drop north of Bailard, high volume merge-diverge areas between<br />
Santa Monica and Padero, Ortega Hill grade near Evans. These bottlenecks dissipate after 7:00 AM.<br />
Duration of congestion is projected to last from approximately 6:00 AM to 9:00 AM (i.e., three hour peak<br />
period). North of the project limits, high volume multiple weave sections create bottleneck conditions just<br />
south and north of the Mission Street interchange. High volume merge-diverge influence areas near the<br />
Las Positas interchange is also projected to create queues that extend upstream just beyond the Pueblo<br />
Street off-ramp - lasting approximately one hour (7:00 AM to 8:00 AM). Under the Build condition, the<br />
queuing created by the lane drop at Cabrillo is eliminated. The increased flow rate caused by the removal<br />
of this bottleneck is projected to create slightly longer queuing conditions downstream at Las Positas.<br />
Table 18 and Table 19 provide a summary of the peak direction northbound AM No-Build and Build travel<br />
speed results respectively. Under the Build condition – average travel speed is projected to improve from<br />
54 mph to 58 mph.<br />
Figure 16 and Figure 17 presents the 2020 FREQ simulation output for the northbound PM peak period<br />
No Build and Build analyses respectively. Under the No Build condition, several bottlenecks are projected<br />
to occur within the project limits in 2020. This locations include the lane drop just north of the Bailard offramp<br />
and the merge-diverge influence areas near the Linden interchange and the South and North Padero<br />
Lane ramp junctures. Further north, the 2-lane constriction point meters the release of the queue entering<br />
the 3-lane section just north of the Cabrillo-Hot Springs interchange. This is projected to cause unstable<br />
flow conditions that last for approximately two hours (4:00 PM to 6:00 PM). The extent of queue begins at<br />
SC101 HOV <strong>Traffic</strong> Study – <strong>Forecast</strong> <strong>Operations</strong> <strong>Report</strong> Page 34
Dowling Associates, Inc.<br />
Transportation Engineering Planning Research Education<br />
the Cabrillo Interchange upstream and extends just past the North Padero Lane off-ramp. This back of<br />
queue is projected to recede quickly however – fully flushing by 6:00 PM. Within the City of Santa<br />
Barbara, multiple upstream weave sections near the Mission Street interchange are projected to cause<br />
unstable flow conditions that propagate upstream to nearly the Bath Street off-ramp. The high volume<br />
merge-diverge influence area coupled with upstream weave sections contribute to turbulence near Las<br />
Positas interchange. Under the Build condition, the queuing created by the lane drop at Cabrillo is<br />
eliminated. However, the increased flow rate caused by the removal of this bottleneck is projected to<br />
create significantly longer queuing conditions downstream at Mission Street and Las Positas where<br />
unstable flow is projected to extend to the Salinas off-ramp.<br />
Table 20 and Table 21 provide a summary of the off-peak direction northbound PM No-Build and Build<br />
travel speed results respectively. Under the Build condition – average travel speed is projected to improve<br />
from 54 mph to 56 mph. The less than significant over-all travel speed benefit during the northbound PM<br />
period is the result of the off-peak direction coupled with an off-set between the significant travel benefits<br />
experienced within the project limits relative to a general worsening of freeway flow conditions outside the<br />
project limit primarily within the downtown portion of the City of Santa Barbara.<br />
Figure 18 and Figure 19 presents the 2020 FREQ simulation output for the southbound AM peak period<br />
No Build and Build analyses respectively. Given the acceptable flow conditions within the project limits<br />
under the No Build condition, the build condition has little impact on vehicle operating conditions within the<br />
project limits. The only freeway congestion that is projected to occur is outside the project limits within the<br />
City of Santa Barbara where two high volume merge-diverge areas near Las Positas are modeled.<br />
Unstable flow resulting from this bottleneck is projected to extend to the Turnpike interchange and last<br />
approximately two hours. Under the build condition, similar queuing characteristics are projected to occur.<br />
Table 22 and Table 23 provide a summary of the off-peak direction southbound PM No-Build and Build<br />
travel speed results respectively. Given the lack of congestion projected under no build condition, under<br />
the Build condition – average travel speed is projected to only improve from 59 mph to 60 mph.<br />
Figure 20 and Figure 21 presents the 2020 FREQ model output for the southbound PM peak period No-<br />
Build and Build analyses respectively. Projected bottleneck locations on Highway 101 include: La Cumbre,<br />
Las Positas, Cabrillo, Carpinteria Avenue and Bates. Other than the Cabrillo bottleneck which is the result<br />
of a lane drop, the other bottleneck locations are primarily due to tight weave sections which coupled with<br />
high mainline volumes create unstable flow conditions. Unstable flow conditions are projected to last up to<br />
four hours (3:00 PM to 7:00 PM). Under the Build analysis, bottleneck locations are forecast to persist<br />
within the City of Santa Barbara at Las Positas and Milpas. Unstable flow is projected to last two hours<br />
north of Olive (3:00 PM to 5:00 PM) and two hours north of Las Positas (2:00 PM to 4:00 PM).<br />
Table 24 and Table 25 provide a summary of the peak direction southbound PM No-Build and Build travel<br />
speed results respectively. Average travel speed is projected to improve from 53.2 mph to 62 mph.<br />
Complete freeway performance summaries of the final 2020 AM and PM peak period forecast models<br />
computed by FREQ for each freeway segment for each 30 minute time slice are provided in Appendix A.<br />
SC101 HOV <strong>Traffic</strong> Study – <strong>Forecast</strong> <strong>Operations</strong> <strong>Report</strong> Page 35
Figure 13. Sample FREQ Output Description<br />
SC101 HOV <strong>Traffic</strong> Study – <strong>Forecast</strong> <strong>Operations</strong> <strong>Report</strong> Page 36
Figure 14. FREQ 2020 No-Build <strong>Forecast</strong>: Northbound AM Peak Period<br />
SC101 HOV <strong>Traffic</strong> Study – <strong>Forecast</strong> <strong>Operations</strong> <strong>Report</strong> Page 37
Figure 15. FREQ 2020 Build <strong>Forecast</strong>: Northbound AM Peak Period<br />
SC101 HOV <strong>Traffic</strong> Study – <strong>Forecast</strong> <strong>Operations</strong> <strong>Report</strong> Page 38
Dowling Associates, Inc.<br />
Transportation Engineering Planning Research Education<br />
Table 18. 2020 No-Build Northbound AM Peak Period Travel Time (FREQ)<br />
Time<br />
Slice<br />
Time<br />
Northbound AM Peak Period - No Build Network, No Build Volumes<br />
Total<br />
Mainline<br />
Delay<br />
Average<br />
Mainline Total Freeway Travel Total Travel<br />
Delay Time<br />
Distance Average<br />
Freeway Travel<br />
Time Ramp Delay<br />
Veh-Hr Pass-Hr Veh-Hr Pass-Hr Veh-Hrs Min/Veh Veh-Hr Pass-Hr Veh-Mi Pass-Mi Speed<br />
1 5:00 192 242 0 0 0.42 0.03 192 242 12,472 15,715 64.9<br />
2 5:30 339 428 0 0 0.84 0.03 339 428 22,009 27,731 64.8<br />
3 6:00 603 760 0 0 4.74 0.09 603 760 38,886 48,997 64.5<br />
4 6:30 959 1,208 0 0 117.58 1.88 959 1,208 54,675 68,891 57.0<br />
5 7:00 1,140 1,436 0 0 335.70 5.30 1,140 1,436 52,269 65,859 45.9<br />
6 7:30 1,242 1,565 0 0 501.15 8.47 1,242 1,565 48,144 60,662 38.8<br />
7 8:00 1,055 1,330 0 0 364.45 6.17 1,055 1,330 44,909 56,586 42.6<br />
8 8:30 821 1,034 0 0 211.93 3.88 821 1,034 39,573 49,861 48.2<br />
9 9:00 655 825 0 0 70.63 1.45 655 825 37,979 47,853 58.0<br />
10 9:30 553 697 0 0 1.30 0.03 553 697 35,870 45,196 64.8<br />
11 10:00 529 667 0 0 1.16 0.03 529 667 34,309 43,230 64.9<br />
12 10:30 558 702 0 0 1.21 0.03 558 702 36,160 45,562 64.9<br />
13 11:00 567 714 0 0 1.48 0.03 567 714 36,747 46,301 64.8<br />
Total 9,213 11,608 0 0 1,613 5.84 9,213 11,608 494,002 622,444 53.6<br />
* Presented results based on No Build Network and No Build Volumes (serving 100 percent demand) 975,532<br />
Table 19. 2020 Build Northbound AM Peak Period Travel Time (FREQ)<br />
Time<br />
Slice<br />
Time<br />
Northbound AM Peak Period - Build Network, Build Volumes<br />
Total<br />
Mainline<br />
Delay<br />
Average<br />
Mainline Total Freeway Travel Total Travel<br />
Delay Time<br />
Distance Average<br />
Freeway Travel<br />
Time Ramp Delay<br />
Veh-Hr Pass-Hr Veh-Hr Pass-Hr Veh-Hrs Min/Veh Veh-Hr Pass-Hr Veh-Mi Pass-Mi Speed<br />
1 5:00 204 256 0 0 0.47 0.03 204 256 13,198 16,629 64.8<br />
2 5:30 359 452 0 0 0.95 0.03 359 452 23,273 29,324 64.8<br />
3 6:00 664 837 0 0 1.84 0.03 664 837 43,034 54,223 64.8<br />
4 6:30 1,019 1,284 0 0 92.37 1.21 1,019 1,284 60,255 75,922 59.1<br />
5 7:00 1,195 1,506 0 0 374.75 5.73 1,195 1,506 53,323 67,187 44.6<br />
6 7:30 1,131 1,426 0 0 386.65 5.12 1,131 1,426 48,415 61,003 42.8<br />
7 8:00 875 1,103 0 0 156.54 2.33 875 1,103 46,708 58,852 53.4<br />
8 8:30 602 759 0 0 1.58 0.03 602 759 39,031 49,179 64.8<br />
9 9:00 585 737 0 0 1.54 0.03 585 737 37,937 47,801 64.8<br />
10 9:30 580 731 0 0 1.45 0.03 580 731 37,627 47,411 64.8<br />
11 10:00 553 696 0 0 1.30 0.03 553 696 35,834 45,151 64.8<br />
12 10:30 582 733 0 0 1.35 0.03 582 733 37,714 47,520 64.8<br />
13 11:00 569 717 0 0 1.63 0.04 569 717 36,892 46,484 64.8<br />
Total 8,918 11,237 0 0 1,022 4.50 7,767 11,237 513,241 646,686 57.6<br />
* Presented results based on No Build Network and No Build Volumes (serving 100 percent demand)<br />
SC101 HOV <strong>Traffic</strong> Study – <strong>Forecast</strong> <strong>Operations</strong> <strong>Report</strong> Page 39
Figure 16. FREQ 2020 No-Build <strong>Forecast</strong>: Northbound PM Peak Period<br />
SC101 HOV <strong>Traffic</strong> Study – <strong>Forecast</strong> <strong>Operations</strong> <strong>Report</strong> Page 40
Figure 17. FREQ 2020 Build <strong>Forecast</strong>: Northbound PM Peak Period<br />
SC101 HOV <strong>Traffic</strong> Study – <strong>Forecast</strong> <strong>Operations</strong> <strong>Report</strong> Page 41
Dowling Associates, Inc.<br />
Transportation Engineering Planning Research Education<br />
Table 20. 2020 No-Build Northbound PM Peak Period Travel Time (FREQ)<br />
Time<br />
Slice Time<br />
Northbound PM Peak Period - No Build Network, No Build Volumes<br />
Total<br />
Mainline<br />
Delay<br />
Average<br />
Mainline Total Freeway Travel Total Travel<br />
Delay Time<br />
Distance Average<br />
Freeway Travel<br />
Time Ramp Delay<br />
Veh-Hr Pass-Hr Veh-Hr Pass-Hr Veh-Hrs Min/Veh Veh-Hr Pass-Hr Veh-Mi Pass-Mi Speed<br />
1 14:00 646 814 0 0 5.94 0.09 646 814 41,584 52,396 64.4<br />
2 14:30 695 875 0 0 11.01 0.16 695 875 44,432 55,985 64.0<br />
3 15:00 703 886 0 0 15.24 0.21 703 886 44,731 56,361 63.6<br />
4 15:30 728 918 0 0 24.89 0.32 728 918 45,726 57,615 62.8<br />
5 16:00 748 943 0 0 50.22 0.65 748 943 45,378 57,176 60.6<br />
6 16:30 1,132 1,426 0 0 289.81 4.50 1,132 1,426 54,711 68,936 48.4<br />
7 17:00 1,297 1,634 0 0 464.27 7.41 1,297 1,634 54,106 68,173 41.7<br />
8 17:30 998 1,258 0 0 360.76 8.24 998 1,258 41,437 52,211 41.5<br />
9 18:00 661 833 0 0 151.75 4.05 661 833 33,125 41,738 50.1<br />
10 18:30 421 530 0 0 0.78 0.03 421 530 27,313 34,414 64.9<br />
11 19:00 370 466 0 0 0.64 0.03 370 466 23,986 30,222 64.9<br />
Total 8,399 10,583 0 0 1,375 6.09 8,399 10,583 456,529 575,227 54.4<br />
* Presented results based on No Build Network and No Build Volumes (serving 100 percent demand)<br />
Table 21. 2020 Build Northbound PM Peak Period Travel Time (FREQ)<br />
Time<br />
Slice Time<br />
Northbound PM Peak Period - Build Network, Build Volumes<br />
Total<br />
Mainline<br />
Delay<br />
Average<br />
Mainline Total Freeway Travel Total Travel<br />
Delay Time<br />
Distance Average<br />
Freeway Travel<br />
Time Ramp Delay<br />
Veh-Hr Pass-Hr Veh-Hr Pass-Hr Veh-Hrs Min/Veh Veh-Hr Pass-Hr Veh-Mi Pass-Mi Speed<br />
1 14:00 666 839 0 0 6.47 0.09 666 839 42,877 54,025 64.4<br />
2 14:30 713 898 0 0 10.09 0.13 713 898 45,694 57,575 64.1<br />
3 15:00 720 907 0 0 14.44 0.19 720 907 45,876 57,803 63.7<br />
4 15:30 743 936 0 0 26.47 0.32 743 936 46,555 58,659 62.7<br />
5 16:00 783 986 0 0 57.17 0.68 783 986 47,174 59,440 60.3<br />
6 16:30 1,122 1,414 0 0 221.09 2.96 1,122 1,414 58,580 73,810 52.2<br />
7 17:00 1,276 1,608 0 0 392.58 5.29 1,276 1,608 57,427 72,358 45.0<br />
8 17:30 924 1,164 0 0 301.10 4.97 924 1,164 40,463 50,984 43.8<br />
9 18:00 664 837 0 0 135.86 2.41 664 837 34,335 43,262 51.7<br />
10 18:30 439 553 0 0 0.89 0.03 439 553 28,447 35,843 64.9<br />
11 19:00 381 480 0 0 0.73 0.03 381 480 24,697 31,118 64.9<br />
Total 8,431 10,622 0 0 1,167 3.95 8,431 10,622 472,125 594,877 56.0<br />
* Presented results based on No Build Network and No Build Volumes (serving 100 percent demand)<br />
SC101 HOV <strong>Traffic</strong> Study – <strong>Forecast</strong> <strong>Operations</strong> <strong>Report</strong> Page 42
Figure 18. FREQ 2020 No-Build <strong>Forecast</strong>: Southbound AM Peak Period<br />
SC101 HOV <strong>Traffic</strong> Study – <strong>Forecast</strong> <strong>Operations</strong> <strong>Report</strong> Page 43
Figure 19. FREQ 2020 Build <strong>Forecast</strong>: Southbound AM Peak Period<br />
SC101 HOV <strong>Traffic</strong> Study – <strong>Forecast</strong> <strong>Operations</strong> <strong>Report</strong> Page 44
Dowling Associates, Inc.<br />
Transportation Engineering Planning Research Education<br />
Table 22. 2020 No-Build Southbound AM Peak Period Travel Time (FREQ)<br />
Time<br />
Slice Time<br />
Southbound AM Peak Period - No Build Network, No Build Volumes<br />
Total<br />
Mainline<br />
Delay<br />
Average<br />
Mainline Total Freeway Total Travel<br />
Delay Travel Time<br />
Distance Average<br />
Freeway Travel<br />
Time Ramp Delay<br />
Veh-Hr Pass-Hr Veh-Hr Pass-Hr Veh-Hrs Min/Veh Veh-Hr Pass-Hr Veh-Mi Pass-Mi Speed<br />
1 5:00 204 257 0 0 0.00 0.00 204 257 13,235 16,676 65.0<br />
2 5:30 317 399 0 0 0.00 0.00 317 399 20,574 25,923 65.0<br />
3 6:00 572 720 0 0 0.00 0.00 572 720 37,160 46,822 65.0<br />
4 6:30 758 955 0 0 6.83 0.12 758 955 48,814 61,506 64.4<br />
5 7:00 931 1,173 0 0 103.48 1.28 931 1,173 53,770 67,750 57.8<br />
6 7:30 943 1,188 0 0 222.12 2.83 943 1,188 46,866 59,051 49.7<br />
7 8:00 870 1,096 0 0 204.64 2.54 870 1,096 43,230 54,470 49.7<br />
8 8:30 752 948 0 0 73.57 0.94 752 948 44,125 55,598 58.6<br />
9 9:00 598 754 0 0 0.41 0.01 598 754 38,872 48,978 65.0<br />
10 9:30 589 742 0 0 0.00 0.00 589 742 38,292 48,248 65.0<br />
11 10:00 577 727 0 0 0.00 0.00 577 727 37,526 47,283 65.0<br />
Total 7,111 8,959 0 0 611 2.21 7,111 8,959 422,464 532,305 59.4<br />
* Presented results based on No Build Netw ork and No Build Volumes (serving 100 percent demand)<br />
Table 23. 2020 Build Southbound AM Peak Period Travel Time (FREQ)<br />
Time<br />
Slice Time<br />
Southbound AM Peak Period - Build Network, Build Volumes<br />
Total<br />
Mainline<br />
Delay<br />
Average<br />
Mainline Total Freeway Total Travel<br />
Delay Travel Time<br />
Distance<br />
Average<br />
Freeway Travel<br />
Time Ramp Delay<br />
Veh-Hr Pass-Hr Veh-Hr Pass-Hr Veh-Hrs Min/Veh Veh-Hr Pass-Hr Veh-Mi Pass-Mi Speed<br />
1 5:00 223 281 0 0 0.00 0.00 223 281 14,478 18,242 65.0<br />
2 5:30 341 430 0 0 0.00 0.00 341 430 22,182 27,949 65.0<br />
3 6:00 644 811 0 0 0.00 0.00 644 811 41,849 52,730 65.0<br />
4 6:30 805 1,014 0 0 1.76 0.02 805 1,014 52,199 65,771 64.9<br />
5 7:00 909 1,145 0 0 96.02 1.17 909 1,145 52,837 66,575 58.1<br />
6 7:30 949 1,196 0 0 211.47 2.69 949 1,196 47,970 60,442 50.5<br />
7 8:00 885 1,115 0 0 195.01 2.42 885 1,115 44,867 56,533 50.7<br />
8 8:30 773 974 0 0 67.31 0.85 773 974 45,869 57,795 59.3<br />
9 9:00 630 794 0 0 0.50 0.01 630 794 40,943 51,588 64.9<br />
10 9:30 617 778 0 0 0.00 0.00 617 778 40,114 50,543 65.0<br />
11 10:00 608 766 0 0 0.00 0.00 608 766 39,503 49,773 65.0<br />
Total 7,384 9,304 0 0 572 2.12 7,384 9,304 442,811 557,941 60.0<br />
* Presented results based on No Build Netw ork and No Build Volumes (serving 100 percent demand)<br />
SC101 HOV <strong>Traffic</strong> Study – <strong>Forecast</strong> <strong>Operations</strong> <strong>Report</strong> Page 45
Figure 20. FREQ 2020 No-Build <strong>Forecast</strong>: Southbound PM Peak Period<br />
SC101 HOV <strong>Traffic</strong> Study – <strong>Forecast</strong> <strong>Operations</strong> <strong>Report</strong> Page 46
Figure 21. FREQ 2020 Build <strong>Forecast</strong>: Southbound PM Peak Period<br />
SC101 HOV <strong>Traffic</strong> Study – <strong>Forecast</strong> <strong>Operations</strong> <strong>Report</strong> Page 47
Dowling Associates, Inc.<br />
Transportation Engineering Planning Research Education<br />
Table 24. 2020 No-Build Southbound PM Peak Period Travel Time (FREQ)<br />
Time<br />
Slice Time<br />
Southbound PM Peak Period - No Build Network, No Build Volumes<br />
Total<br />
Mainline<br />
Delay<br />
Average<br />
Mainline Total Freeway Total Travel<br />
Delay Travel Time<br />
Distance Average<br />
Freeway Travel<br />
Time Ramp Delay<br />
Veh-Hr Pass-Hr Veh-Hr Pass-Hr Veh-Hrs Min/Veh Veh-Hr Pass-Hr Veh-Mi Pass-Mi Speed<br />
1 14:00 705 889 0 0 2.59 0.04 705.00 889.00 45,684 57,562 65<br />
2 14:30 764 963 0 0 8.85 0.15 764.00 963.00 49,107 61,875 64<br />
3 15:00 814 1,025 0 0 21.29 0.36 814.00 1,025.00 51,519 64,914 63<br />
4 15:30 914 1,152 0 0 55.97 0.90 914.00 1,152.00 55,782 70,285 61<br />
5 16:00 930 1,172 0 0 72.84 1.20 930.00 1,172.00 55,706 70,189 60<br />
6 16:30 1,152 1,452 2 2 233.50 3.26 1,154.00 1,454.00 59,702 75,224 52<br />
7 17:00 1,400 1,764 4 5 499.28 6.93 1,404.00 1,769.00 58,552 73,776 42<br />
8 17:30 1,478 1,862 0 0 619.30 8.46 1,478.00 1,862.00 55,808 70,318 38<br />
9 18:00 1,344 1,693 0 0 523.48 7.43 1,344.00 1,693.00 53,309 67,169 40<br />
10 18:30 1,067 1,345 0 0 303.14 4.92 1,067.00 1,345.00 49,669 62,583 47<br />
11 19:00 678 854 0 0 72.16 1.48 678.00 854.00 39,372 49,609 58<br />
Total 11,246 14,171 6 7 2,412 6.25 11,252 14,178 574,210 723,504 53.5<br />
* Presented results based on No Build Netw ork and No Build Volumes (serving 100 percent demand)<br />
Table 25. 2020 Build Southbound PM Peak Period Travel Time (FREQ)<br />
Time<br />
Slice Time<br />
Southbound PM Peak Period - Build Network, Build Volumes<br />
Total<br />
Mainline<br />
Delay<br />
Average<br />
Mainline Total Freeway Travel Total Travel<br />
Delay Time<br />
Distance Average<br />
Freeway Travel<br />
Time<br />
Ramp Delay<br />
Veh-Hr Pass-Hr Veh-Hr Pass-Hr Veh-Hrs Min/Veh Veh-Hr Pass-Hr Veh-Mi Pass-Mi Speed<br />
1 14:00 867 1,093 0 0 5.78 0.07 867 1,093 55,985 70,541 64.6<br />
2 14:30 880 1,109 0 0 5.82 0.07 880 1,109 56,847 71,628 64.6<br />
3 15:00 896 1,129 0 0 8.28 0.10 896 1,129 57,688 72,687 64.4<br />
4 15:30 913 1,150 0 0 14.98 0.18 913 1,150 58,367 73,542 63.9<br />
5 16:00 925 1,166 0 0 85.99 1.13 925 1,166 54,556 68,741 59.0<br />
6 16:30 1,019 1,284 0 0 210.24 2.99 1,019 1,284 52,556 66,221 51.6<br />
7 17:00 896 1,129 0 0 88.59 1.06 896 1,129 52,463 66,104 58.6<br />
8 17:30 709 893 0 0 16.46 0.23 709 893 45,006 56,708 63.5<br />
9 18:00 645 813 0 0 1.17 0.02 645 813 41,867 52,752 64.9<br />
10 18:30 625 788 0 0 0.33 0.00 625 788 40,609 51,168 65.0<br />
11 19:00 585 738 0 0 0.00 0.00 585 738 38,047 47,939 65.0<br />
Total 8,960 11,292 0 0 438 1.89 8,960 11,292 553,991 698,031 61.8<br />
* Presented results based on No Build Network and No Build Volumes (serving 100 percent demand)<br />
SC101 HOV <strong>Traffic</strong> Study – <strong>Forecast</strong> <strong>Operations</strong> <strong>Report</strong> Page 48
Dowling Associates, Inc.<br />
Transportation Engineering Planning Research Education<br />
TA-A and TA-B FREQ 2040 Operational Results<br />
The FREQ 2040 forecast simulation results for each direction of travel on Highway 101 are described in<br />
this section. Simulated bottlenecks and queues are identified to examine the location, magnitude, extent<br />
and duration of queuing. Summary performance measures and average travel speed comparisons are<br />
examined between the No-Build and Build analysis scenarios.<br />
Simulated Bottlenecks and Queues<br />
Future 2040 FREQ simulation was applied to a total of eight hours during the AM peak period and seven<br />
hours during the PM peak period. The expanded simulated peak period analysis was performed to ensure<br />
that the entire peak period was captured.<br />
Figure 22 and Figure 23 presents the 2040 FREQ simulation output for the northbound AM peak period<br />
No-Build and Build analyses respectively. The constriction effect along the 2-lane section which meters<br />
the release of the queue entering the 3-lane section just north of the Cabrillo-Hot Springs interchange is<br />
projected to cause unstable flow conditions and queuing from the Cabrillo Interchange upstream to just<br />
beyond the Bates on-ramp. Several other bottleneck locations are projected to appear before 8:00 AM<br />
within the project limits (e.g., lane drop north of Bailard, Ortega Hill grade near Evans). These eventually<br />
become “hidden” bottlenecks after 8:00 AM as a result of the shockwave effect traveling upstream<br />
extending the back of queue beyond these locations. Duration of congestion is projected to last from<br />
approximately 6:00 AM to 1:00 PM (i.e., 6 hr Peak Period). North of the project limits, modeling projects a<br />
bottleneck condition location near the Las Positas interchange that creates queues that extend upstream<br />
to the Bath Street ramp - lasting approximately two hours (7:00 AM to 9:00 AM). Turbulence at this<br />
location is primarily due to high volumes of traffic coupled with several adjacent weave sections just south<br />
of Las Positas. Under the Build condition, the queuing created by the lane drop at Cabrillo is eliminated.<br />
The increased flow rate caused by the removal of this bottleneck is projected to create slightly longer<br />
queuing conditions downstream at Las Positas.<br />
Table 26 and Table 27 provide a summary of the peak direction northbound AM No-Build and Build travel<br />
speed results respectively. Under the Build condition – average travel speed on Highway 101 through the<br />
27.5 mile study area is projected to improve from 34 mph to 57 mph.<br />
Figure 24 and Figure 25 presents the 2040 FREQ simulation output for the northbound PM peak period<br />
No Build and Build analyses respectively. Under the No Build condition, several bottlenecks are projected<br />
to occur within the project limits by 2040. This locations include the lane drop just north of the Bailard offramp<br />
and the merge-diverge influence area near the Linden interchange. Further north, the 2-lane<br />
constriction point meters the release of the queue entering the 3-lane section just north of the Cabrillo-Hot<br />
Springs interchange. This is projected to cause unstable flow conditions that last for approximately four<br />
hours (2:30 PM to 6:30 PM). The extent of queue begins at the Cabrillo Interchange upstream and<br />
extends just past the North Padero Lane off-ramp. The tail of this queue is projected to persist for<br />
approximately one hour (5:00 PM to 6:00 PM) until the queue can completely flush/dissipate after 6:30 PM.<br />
Within the City of Santa Barbara, multiple upstream weave sections coupled with the high volume mergediverge<br />
influence area near Las Positas also creates unstable flow conditions. These unstable flow<br />
conditions are projected to propagate upstream just beyond the Bath Street off-ramp. Under the Build<br />
condition, the queuing created by the lane drop at Cabrillo is eliminated. However, the increased flow rate<br />
caused by the removal of this bottleneck is projected to create significantly longer queuing conditions<br />
downstream at Las Positas where unstable flow is projected to extend just past the San Ysidro off-ramp.<br />
Table 28 and Table 29 provide a summary of the off-peak direction northbound PM No-Build and Build<br />
travel speed results respectively. Under the Build condition – average travel speed is projected to improve<br />
from 42 mph to 45 mph. The smaller over-all travel speed benefit during the northbound PM period is the<br />
result of an off-set between significant travel benefits experienced within the project limits versus a<br />
worsening of freeway flow conditions outside the project limit primarily within the City of Santa Barbara.<br />
SC101 HOV <strong>Traffic</strong> Study – <strong>Forecast</strong> <strong>Operations</strong> <strong>Report</strong> Page 49
Dowling Associates, Inc.<br />
Transportation Engineering Planning Research Education<br />
Figure 26 and Figure 27 presents the 2040 FREQ simulation output for the southbound AM peak period<br />
No Build and Build analyses respectively. Other than the Cabrillo bottleneck which is the result of a lane<br />
drop, there are two bottleneck locations within the City of Santa Barbara - at Las Positas and just south of<br />
the Mission Street ramps. Turbulence occurs at the latter locations due to high volume weave section<br />
between Las Positas and Mission Street ramps coupled with high mainline volumes merge influence area<br />
between the Mission and Carrillo interchanges. Unstable flow conditions start at Cabrillo with the lane<br />
drop and is projected to persist for approximately two hours (7:00 AM to 9:00 AM). Unstable freeway flow<br />
conditions within downtown Santa Barbara are projected to last approximately three hours (7:00 AM to<br />
10:00 AM). Under the Build condition, the queuing created by the lane drop at Cabrillo is eliminated.<br />
However, the increased flow rate caused by the removal of this bottleneck is projected to create longer<br />
queue conditions downstream of Las Positas where unstable flow extends nearly to the Turnpike ramps.<br />
Table 30 and Table 31 provide a summary of the off-peak direction northbound PM No-Build and Build<br />
travel speed results respectively. Under the Build condition – average travel speed is projected to improve<br />
from 55 mph to 60 mph. Again, the over-all travel speed benefit experienced within the project limits is offset<br />
by unstable flow conditions outside the project limit within the City of Santa Barbara.<br />
Figure 28 and Figure 29 presents the 2040 FREQ model output for the southbound PM peak period No-<br />
Build and Build analyses respectively. Projected bottleneck locations on Highway 101 include: La Cumbre,<br />
Las Positas, Cabrillo, Carpinteria Avenue and Bates. Other than the Cabrillo bottleneck which is the result<br />
of a lane drop, the other bottleneck locations are primarily due to tight weave sections which coupled with<br />
high mainline volumes create unstable flow conditions. Unstable flow conditions are projected to last up to<br />
5 hours (2:00 PM to 7:00 PM). Under the Build analysis, bottleneck locations are forecast to persist within<br />
the City of Santa Barbara at Las Positas and Milpas. Unstable flow is projected to last one hour north of<br />
Milpas and just over three hours north of Las Positas (3:30 PM to 6:30 PM).<br />
Table 32 and Table 33 provide a summary of the peak direction southbound PM No-Build and Build travel<br />
speed results respectively. Average travel speed is projected to improve from 47 mph to 58 mph.<br />
TA-A and TA-B 2020 and 2040 FREQ Performance Measure Summary<br />
Table 34 provides a Measure of Effectiveness (MOE) summary comparison between the TA-A (No-Build)<br />
and TA-B (Build) for the 2020 Opening Day and 2040 Design Year freeway operational analyses. FREQ<br />
simulation results indicate that on a daily basis, vehicular delay will be reduced from 2008 baseline levels<br />
by 2,812 vehicle hours in 2020 (47% delay reduction benefit) growing to 11,435 hours of vehicle hours of<br />
delay reduction by 2040 (62% delay reduction benefit). Total projected hours of delay reduction as a result<br />
of the SC101 HOV project is graphically shown in Figure 30.<br />
Table 35 provides two peak hour travel time comparisons between the TA-A (No-Build) and TA-B (Build)<br />
for the 2020 and 2040. One example reflects freeway driving between the Cities of Carpinteria and Santa<br />
Barbara (through the project limits between the Linden and Garden interchanges) and another between<br />
the Cities of Carpinteria and Goleta (through the project limits and downtown Santa Barbara freeway<br />
portions of Highway 101). Results indicate significant travel time benefits for both the northbound AM and<br />
southbound PM peak directions. Results also reflect how the relative travel time benefits experienced<br />
within the project limits are partially off-set by delays experienced traversing Highway 101 through the City<br />
of Santa Barbara.<br />
Table 36 provides the 2040 summary for the AM and PM peak directions. The Build analysis indicates<br />
that 10,000 vehicle hours of delay will be eliminated on a daily basis during the Northbound AM and<br />
Southbound PM peak period as a result of the HOV widening project (delay reduction of 7,766 vehicle<br />
hours under Northbound AM peak period and 2,261 vehicle hours under Southbound PM peak period).<br />
Travel time needed to traverse the 27.5 mile study area will be reduced by 24.8 minutes in the northbound<br />
AM peak hour and 10.3 minutes in the southbound PM peak hour.<br />
Complete freeway performance summaries of the final AM and PM peak period calibrated models<br />
computed by FREQ for each freeway segment for each 30 minute time slice are provided in Appendix A.<br />
SC101 HOV <strong>Traffic</strong> Study – <strong>Forecast</strong> <strong>Operations</strong> <strong>Report</strong> Page 50
Figure 22. FREQ 2040 No-Build <strong>Forecast</strong>: Northbound AM Peak Period<br />
SC101 HOV <strong>Traffic</strong> Study – <strong>Forecast</strong> <strong>Operations</strong> <strong>Report</strong> Page 51
Figure 23. FREQ 2040 Build <strong>Forecast</strong>: Northbound AM Peak Period<br />
SC101 HOV <strong>Traffic</strong> Study – <strong>Forecast</strong> <strong>Operations</strong> <strong>Report</strong> Page 52
Dowling Associates, Inc.<br />
Transportation Engineering Planning Research Education<br />
Table 26. 2040 No-Build Northbound AM Peak Period Travel Time (FREQ)<br />
Time<br />
Slice<br />
Time<br />
Freeway Travel Time<br />
Northbound AM Peak Period - No Build Network, No Build Volumes<br />
Ramp Delay<br />
Total Mainline<br />
Delay<br />
Average Total Freeway Total Travel<br />
Mainline Delay Travel Time<br />
Distance Average<br />
Veh-Hr Pass-Hr Veh-Hr Pass-Hr Veh-Hrs Min/Veh Veh-Hr Pass-Hr Veh-Mi Pass-Mi Speed<br />
1 5:00 175 220 0 0 0.45 0.03 175 220 11339 14288 64.8<br />
2 5:30 346 436 0 0 0.91 0.03 346 436 22438 28272 64.8<br />
3 6:00 595 750 0 0 13.51 0.24 595 750 37818 47651 63.5<br />
4 6:30 914 1151 0 0 199.64 3.31 914 1151 46417 58485 50.8<br />
5 7:00 1212 1527 0 0 470.20 8.42 1212 1527 48211 60746 39.8<br />
6 7:30 1687 2125 0 0 840.34 15.17 1687 2125 55012 69315 32.6<br />
7 8:00 1858 2341 0 0 1029.64 17.84 1858 2341 53844 67843 29<br />
8 8:30 1843 2322 0 0 1077.14 19.08 1843 2322 49760 62698 27<br />
9 9:00 1749 2204 0 0 1068.40 20.55 1749 2204 44244 55747 25.3<br />
10 9:30 1620 2042 0 0 949.48 18.40 1620 2042 43604 54941 26.9<br />
11 10:00 1491 1879 0 0 834.98 16.16 1491 1879 42661 53753 28.6<br />
12 10:30 1437 1810 0 0 784.08 15.23 1437 1810 42418 53446 29.5<br />
13 11:00 1308 1648 0 0 631.90 11.81 1308 1648 43962 55392 33.6<br />
14 11:30 1280 1613 0 0 611.56 11.95 1280 1613 43464 54765 33.9<br />
15 12:00 1263 1592 0 0 562.77 11.03 1263 1592 45547 57389 36<br />
16 12:30 646 813 0 0 183.35 7.52 646 813 30040 37851 46.5<br />
Total 19,424 24,473 0 0 9,258 15.50 19,424 24,473 660,779 832,582 34.0<br />
Table 27. 2040 Build Northbound AM Peak Period Travel Time (FREQ)<br />
Time<br />
Slice Time<br />
Freeway Travel Time Ramp Delay<br />
Total Mainline<br />
Delay<br />
Average Total Freeway Total Travel<br />
Mainline Delay Travel Time<br />
Distance Average<br />
Veh-Hr Pass-Hr Veh-Hr Pass-Hr Veh-Hrs Min/Veh Veh-Hr Pass-Hr Veh-Mi Pass-Mi Speed<br />
1 5:00 180 226 0 0 0.50 0.03 180 226 11,649 14,678 64.8<br />
2 5:30 356 448 0 0 1.00 0.03 356 448 23,043 29,034 64.8<br />
3 6:00 612 772 0 0 1.88 0.03 612 772 39,681 49,998 64.8<br />
4 6:30 926 1,166 0 0 43.80 0.49 926 1,166 57,315 72,217 61.9<br />
5 7:00 928 1,170 0 0 40.71 0.45 928 1,170 57,686 72,684 62.1<br />
6 7:30 1,143 1,440 0 0 203.62 2.91 1,143 1,440 61,048 76,921 53.4<br />
7 8:00 1,367 1,723 0 0 491.60 7.27 1,367 1,723 56,920 71,719 41.6<br />
8 8:30 1,306 1,646 0 0 516.63 7.30 1,306 1,646 51,309 64,649 39.3<br />
9 9:00 935 1,179 0 0 177.10 2.77 935 1,179 49,290 62,105 52.7<br />
10 9:30 675 851 0 0 1.90 0.03 675 851 43,777 55,159 64.8<br />
11 10:00 615 775 0 0 1.64 0.03 615 775 39,882 50,251 64.8<br />
12 10:30 642 809 0 0 1.71 0.03 642 809 41,635 52,460 64.8<br />
13 11:00 658 830 0 0 1.70 0.03 658 830 42,681 53,778 64.8<br />
14 11:30 677 853 0 0 2.26 0.04 677 853 43,842 55,241 64.8<br />
15 12:00 711 896 0 0 4.86 0.07 711 896 45,895 57,827 64.6<br />
16 12:30 365 460 0 0 0.85 0.03 365 460 23,649 29,798 64.8<br />
Total 12,096 15,244 0 0 1,492 5.68 12,096 15,244 689,302 868,519 57.0<br />
* Presented results based on Build Netw ork and Build Volumes<br />
Northbound AM Peak Period - Build Network, Build Volumes<br />
SC101 HOV <strong>Traffic</strong> Study – <strong>Forecast</strong> <strong>Operations</strong> <strong>Report</strong> Page 53
Figure 24. FREQ 2040 No-Build <strong>Forecast</strong>: Northbound PM Peak Period<br />
SC101 HOV <strong>Traffic</strong> Study – <strong>Forecast</strong> <strong>Operations</strong> <strong>Report</strong> Page 54
Figure 25. FREQ 2040 Build <strong>Forecast</strong>: Northbound PM Peak Period<br />
SC101 HOV <strong>Traffic</strong> Study – <strong>Forecast</strong> <strong>Operations</strong> <strong>Report</strong> Page 55
Dowling Associates, Inc.<br />
Transportation Engineering Planning Research Education<br />
Table 28. 2040 No-Build Northbound PM Peak Period Travel Time (FREQ)<br />
Time<br />
Slice Time<br />
Northbound PM Peak Period - No Build Network, No Build Volumes<br />
Total<br />
Mainline<br />
Delay<br />
Average<br />
Mainline Total Freeway Travel Total Travel<br />
Delay Time<br />
Distance Average<br />
Freeway Travel<br />
Time Ramp Delay<br />
Veh-Hr Pass-Hr Veh-Hr Pass-Hr Veh-Hrs Min/Veh Veh-Hr Pass-Hr Veh-Mi Pass-Mi Speed<br />
1 14:00 722 909 0 0 10.40 0.15 722 909 46,243 58,266 64.1<br />
2 14:30 812 1,023 0 0 53.84 0.77 812 1,023 49,278 62,090 60.7<br />
3 15:00 861 1,085 0 0 107.87 1.53 861 1,085 48,963 61,694 56.9<br />
4 15:30 969 1,221 0 0 209.22 2.97 969 1,221 49,380 62,218 51.0<br />
5 16:00 1,071 1,350 0 0 334.88 4.80 1,071 1,350 47,861 60,305 44.7<br />
6 16:30 1,601 2,017 0 0 721.86 11.27 1,601 2,017 57,151 72,011 35.7<br />
7 17:00 2,075 2,614 0 0 1,219.80 19.98 2,075 2,614 55,574 70,023 26.8<br />
8 17:30 1,723 2,171 0 0 926.58 15.86 1,723 2,171 51,767 65,226 30.0<br />
9 18:00 1,197 1,508 0 0 530.78 10.74 1,197 1,508 43,286 54,541 36.2<br />
10 18:30 706 889 0 0 145.15 4.39 706 889 36,438 45,912 51.6<br />
11 19:00 432 545 0 0 0.76 0.03 432 545 28,049 35,342 64.9<br />
Total 12,169 15,332 0 0 4,261 13.14 12,169 15,332 513,990 647,628 42.2<br />
* Presented results based on No Build Network and No Build Volumes (serving 100 percent demand)<br />
Table 29. 2040 Build Northbound PM Peak Period Travel Time (FREQ)<br />
Time<br />
Slice Time<br />
Northbound PM Peak Period - Build Network, Build Volumes<br />
Total<br />
Mainline<br />
Delay<br />
Average<br />
Mainline Total Freeway Travel Total Travel<br />
Delay Time<br />
Distance Average<br />
Freeway Travel<br />
Time Ramp Delay<br />
Veh-Hr Pass-Hr Veh-Hr Pass-Hr Veh-Hrs Min/Veh Veh-Hr Pass-Hr Veh-Mi Pass-Mi Speed<br />
1 14:00 750 944 0 0 9.94 0.13 750 944 48,074 60,574 64.1<br />
2 14:30 827 1,042 0 0 45.14 0.60 827 1,042 50,817 64,030 61.5<br />
3 15:00 861 1,085 0 0 87.98 1.15 861 1,085 50,242 63,305 58.4<br />
4 15:30 958 1,207 0 0 179.73 2.35 958 1,207 50,566 63,713 52.8<br />
5 16:00 1,075 1,355 0 0 311.43 4.27 1,075 1,355 49,635 62,540 46.2<br />
6 16:30 1,623 2,045 0 0 636.13 9.70 1,623 2,045 64,148 80,826 39.5<br />
7 17:00 1,916 2,414 0 0 951.60 13.84 1,916 2,414 62,692 78,992 32.7<br />
8 17:30 1,508 1,900 0 0 770.14 11.13 1,508 1,900 47,982 60,457 31.8<br />
9 18:00 1,100 1,386 0 0 419.80 6.50 1,100 1,386 44,207 55,701 40.2<br />
10 18:30 743 936 0 0 161.55 3.04 743 936 37,777 47,599 50.9<br />
11 19:00 464 584 0 0 1.02 0.03 464 584 30,071 37,890 64.9<br />
Total 11,825 14,898 0 0 3,574 9.23 11,825 14,898 536,211 675,627 45.3<br />
* Presented results based on No Build Network and No Build Volumes (serving 100 percent demand)<br />
SC101 HOV <strong>Traffic</strong> Study – <strong>Forecast</strong> <strong>Operations</strong> <strong>Report</strong> Page 56
Figure 26. FREQ 2040 No-Build <strong>Forecast</strong>: Southbound AM Peak Period<br />
SC101 HOV <strong>Traffic</strong> Study – <strong>Forecast</strong> <strong>Operations</strong> <strong>Report</strong> Page 57
Figure 27. FREQ 2040 Build <strong>Forecast</strong>: Southbound AM Peak Period<br />
SC101 HOV <strong>Traffic</strong> Study – <strong>Forecast</strong> <strong>Operations</strong> <strong>Report</strong> Page 58
Dowling Associates, Inc.<br />
Transportation Engineering Planning Research Education<br />
Table 30. 2040 No-Build Southbound AM Peak Period Travel Time (FREQ)<br />
Time<br />
Slice Time<br />
Southbound AM Peak Period - No Build Network, No Build Volumes<br />
Total<br />
Mainline<br />
Delay<br />
Average<br />
Mainline Total Freeway Total Travel<br />
Delay Travel Time<br />
Distance Average<br />
Freeway Travel<br />
Time Ramp Delay<br />
Veh-Hr Pass-Hr Veh-Hr Pass-Hr Veh-Hrs Min/Veh Veh-Hr Pass-Hr Veh-Mi Pass-Mi Speed<br />
1 5:00 199 289 0 0 0.00 0.00 199 289 12,957 18,771 65.0<br />
2 5:30 284 413 0 0 0.00 0.00 284 413 18,478 26,832 65.0<br />
3 6:00 490 709 0 0 1.25 0.02 490 709 31,747 45,999 64.8<br />
4 6:30 514 748 0 0 0.00 0.00 514 748 33,397 48,594 65.0<br />
5 7:00 724 1,054 0 0 9.11 0.15 724 1,054 46,491 67,620 64.2<br />
6 7:30 1,106 1,612 0 0 223.65 3.06 1,106 1,612 57,324 83,573 51.9<br />
7 8:00 1,306 1,899 0 0 466.97 6.51 1,306 1,899 54,509 79,269 41.8<br />
8 8:30 1,276 1,855 0 0 455.04 6.15 1,276 1,855 53,332 77,562 41.8<br />
9 9:00 1,054 1,532 0 0 266.27 3.52 1,054 1,532 51,219 74,447 48.6<br />
10 9:30 843 1,226 0 0 74.55 0.95 843 1,226 49,963 72,639 59.3<br />
11 10:00 679 987 0 0 0.91 0.02 679 987 44,063 64,064 64.9<br />
12 10:30 728 1,057 0 0 2.40 0.04 728 1,057 47,138 68,504 64.8<br />
13 11:00 717 1,043 0 0 1.42 0.02 717 1,043 46,489 67,652 64.9<br />
14 11:30 767 1,116 0 0 5.14 0.08 767 1,116 49,540 72,065 64.6<br />
Total 10,687 15,540 0 0 1,507 5.00 10,687 15,540 596,647 867,591 55.8<br />
* Presented results based on No Build Netw ork and No Build Volumes (serving 100 percent demand)<br />
Table 31. 2040 Build Southbound AM Peak Period Travel Time (FREQ)<br />
Time<br />
Slice Time<br />
Southbound AM Peak Period - Build Network, No Build Volumes<br />
Total<br />
Mainline<br />
Delay<br />
Average<br />
Mainline Total Freeway Travel Total Travel<br />
Delay Time<br />
Distance Average<br />
Freeway Travel<br />
Time Ramp Delay<br />
Veh-Hr Pass-Hr Veh-Hr Pass-Hr Veh-Hrs Min/Veh Veh-Hr Pass-Hr Veh-Mi Pass-Mi Speed<br />
1 5:00 211 266 0 0 0.00 0.00 211 266 13,745 17,318 65.0<br />
2 5:30 292 368 0 0 0.00 0.00 292 368 18,965 23,896 65.0<br />
3 6:00 506 638 0 0 1.19 0.02 506 638 32,845 41,384 64.8<br />
4 6:30 560 705 0 0 0.00 0.00 560 705 36,379 45,837 65.0<br />
5 7:00 786 990 0 0 11.54 0.18 786 990 50,331 63,417 64.0<br />
6 7:30 1,158 1,459 0 0 173.15 2.28 1,158 1,459 63,992 80,630 55.3<br />
7 8:00 1,177 1,482 0 0 232.70 2.92 1,177 1,482 61,349 77,300 52.1<br />
8 8:30 1,000 1,260 0 0 152.92 1.79 1,000 1,260 55,059 69,374 55.1<br />
9 9:00 946 1,192 0 0 139.65 1.66 946 1,192 52,390 66,011 55.4<br />
10 9:30 858 1,081 0 0 65.85 0.83 858 1,081 51,511 64,903 60.0<br />
11 10:00 728 917 0 0 0.53 0.01 728 917 47,271 59,561 65.0<br />
12 10:30 779 981 0 0 2.50 0.04 779 981 50,457 63,576 64.8<br />
13 11:00 775 976 0 0 1.12 0.01 775 976 50,292 63,368 64.9<br />
14 11:30 823 1,036 0 0 5.21 0.07 823 1,036 53,124 66,937 64.6<br />
Total 10,599 13,351 0 0 786 2.08 10,599 13,351 637,710 803,512 60.2<br />
* Presented results based on No Build Network and No Build Volumes (serving 100 percent demand)<br />
SC101 HOV <strong>Traffic</strong> Study – <strong>Forecast</strong> <strong>Operations</strong> <strong>Report</strong> Page 59
Figure 28. FREQ 2040 No-Build <strong>Forecast</strong>: Southbound PM Peak Period<br />
SC101 HOV <strong>Traffic</strong> Study – <strong>Forecast</strong> <strong>Operations</strong> <strong>Report</strong> Page 60
Figure 29. FREQ 2040 Build <strong>Forecast</strong>: Southbound PM Peak Period<br />
SC101 HOV <strong>Traffic</strong> Study – <strong>Forecast</strong> <strong>Operations</strong> <strong>Report</strong> Page 61
Dowling Associates, Inc.<br />
Transportation Engineering Planning Research Education<br />
Table 32. 2040 No-Build Southbound PM Peak Period Travel Time (FREQ)<br />
Time<br />
Slice Time<br />
Southbound PM Peak Period - No Build Network, No Build Volumes<br />
Total<br />
Mainline<br />
Delay<br />
Average<br />
Mainline Total Freeway Total Travel<br />
Delay Travel Time<br />
Distance Average<br />
Freeway Travel<br />
Time Ramp Delay<br />
Veh-Hr Pass-Hr Veh-Hr Pass-Hr Veh-Hrs Min/Veh Veh-Hr Pass-Hr Veh-Mi Pass-Mi Speed<br />
1 14:00 999 1258 0 0 104.41 1.58 999 1258 58132 73247 58.2<br />
2 14:30 1176 1481 0 0 263.9 4.11 1176 1481 59258 74665 50.4<br />
3 15:00 1284 1618 0 0 378.6 6.01 1284 1618 58874 74182 45.8<br />
4 15:30 1421 1791 0 0 512.16 8.04 1421 1791 59089 74452 41.6<br />
5 16:00 1440 1814 0 0 545.26 7.81 1440 1814 58159 73281 40.4<br />
6 16:30 1505 1896 0 0 599.9 8.27 1505 1896 58813 74104 39.1<br />
7 17:00 1414 1782 0 0 492.1 6.63 1414 1782 59948 75535 42.4<br />
8 17:30 1193 1503 0 0 348.35 4.99 1193 1503 54888 69159 46<br />
9 18:00 926 1167 0 0 135.19 2.34 926 1167 51428 64799 55.5<br />
10 18:30 686 864 0 0 2.76 0.04 686 864 44401 55945 64.7<br />
11 19:00 638 803 0 0 0.22 0.00 638 803 41427 52198 65<br />
Total 12,682 15,979 0 0 3,383 6.56 12,682 15,979 604,418 761,566 47.7<br />
* Presented results based on No Build Netw ork and No Build Volumes (serving 100 percent demand)<br />
Table 33. 2040 Build Southbound PM Peak Period Travel Time (FREQ)<br />
Time<br />
Slice Time<br />
Southbound PM Peak Period - Build Network, Build Volumes<br />
Total<br />
Mainline<br />
Delay<br />
Average<br />
Mainline Total Freeway Travel Total Travel<br />
Delay Time<br />
Distance Average<br />
Freeway Travel<br />
Time<br />
Ramp Delay<br />
Veh-Hr Pass-Hr Veh-Hr Pass-Hr Veh-Hrs Min/Veh Veh-Hr Pass-Hr Veh-Mi Pass-Mi Speed<br />
1 14:00 1,040 1,310 0 0 25.17 0.29 1,040 1,310 65,954 83,102 63.4<br />
2 14:30 1,088 1,371 0 0 32.30 0.37 1,088 1,371 68,634 86,479 63.1<br />
3 15:00 1,087 1,369 0 0 31.76 0.36 1,087 1,369 68,580 86,410 63.1<br />
4 15:30 1,144 1,441 0 0 87.61 1.03 1,144 1,441 68,639 86,486 60.0<br />
5 16:00 1,186 1,494 0 0 185.70 2.26 1,186 1,494 65,022 81,927 54.8<br />
6 16:30 1,259 1,587 0 0 263.37 3.26 1,259 1,587 64,744 81,578 51.4<br />
7 17:00 1,188 1,497 0 0 221.94 2.52 1,188 1,497 62,777 79,099 52.9<br />
8 17:30 1,050 1,323 0 0 197.99 2.30 1,050 1,323 55,365 69,760 52.7<br />
9 18:00 866 1,092 0 0 70.87 0.88 866 1,092 51,714 65,159 59.7<br />
10 18:30 741 933 0 0 4.47 0.06 741 933 47,866 60,311 64.6<br />
11 19:00 688 867 0 0 0.67 0.01 688 867 44,681 56,298 64.9<br />
Total 11,337 14,284 0 0 1,122 2.21 11,337 14,284 663,976 836,609 58.6<br />
SC101 HOV <strong>Traffic</strong> Study – <strong>Forecast</strong> <strong>Operations</strong> <strong>Report</strong> Page 62
Dowling Associates, Inc.<br />
Transportation Engineering Planning Research Education<br />
Table 34. FREQ <strong>Forecast</strong> Travel Delay Results Summary<br />
Direction of Travel<br />
Total<br />
Mainline<br />
Delay<br />
Existing<br />
Average<br />
Mainline<br />
Delay<br />
Average<br />
Speed<br />
Total<br />
Mainline<br />
Delay<br />
2020 2040<br />
Average<br />
Mainline<br />
Delay<br />
Average<br />
Speed<br />
Total<br />
Mainline<br />
Delay<br />
Average<br />
Mainline<br />
Delay<br />
Average<br />
Speed<br />
Veh-Hrs Min/Veh MPH Veh-Hrs Min/Veh MPH Veh-Hrs Min/Veh MPH<br />
NO BUILD<br />
Northbound AM 937 2.0 54.4 1,613 5.8 53.6 9,258 15.5 34.0<br />
Northbound PM 324 0.5 60.8 1,375 6.1 54.4 4,261 13.1 42.2<br />
Southbound AM 154 0.4 62.2 611 2.2 59.4 1,507 5.0 55.8<br />
Southbound PM 871 1.6 55.1 2,412 6.3 53.5 3,383 6.6 47.7<br />
Bi-directional AM 1,091 1.3 58.3 2,224 4.3 56.5 10,765 11.0 44.9<br />
Bi-directional PM 1,195 1.1 58.0 3,788 6.2 53.9 7,644 9.6 44.9<br />
BUILD<br />
Northbound AM 1,022 4.5 57.6 1,492 5.7 57.0<br />
Northbound PM 1,167 3.9 56.0 3,574 3.9 56.0<br />
Southbound AM 572 2.1 60.0 786 2.1 60.2<br />
Southbound PM 438 1.9 61.8 1,122 2.2 58.6<br />
Bi-directional AM 1,595 3.5 58.8 2,278 4.1 58.6<br />
Bi-directional PM 1,605 2.8 58.9 4,696 3.0 57.3<br />
BENEFIT<br />
Northbound AM 37% 23% 7% 84% 63% 68%<br />
Northbound PM 15% 35% 3% 16% 70% 33%<br />
Southbound AM 6% 4% 1% 48% 58% 8%<br />
Southbound PM 82% 70% 16% 67% 66% 23%<br />
Bi-directional AM 28% 19% 4% 79% 62% 30%<br />
Bi-directional PM 58% 54% 9% 39% 69% 27%<br />
Table 35. FREQ <strong>Forecast</strong> Travel Time Results Summary<br />
Analysis Year/Scenario<br />
Northbound Direction Travel Time Summary in Minutes Minutes Percent Minutes Percent<br />
Existing - AM No Build 22.3 13.1 NA NA NA NA<br />
2020 - AM No Build 32.8 21.3<br />
2020 - AM Build 29.7 10.8<br />
2040 - AM No Build 48.5 36.1<br />
2040 - AM Build 29.3 11.6<br />
Existing - PM No Build 19.4 9.8 NA NA NA NA<br />
2020 - PM No Build 32.6 21.2<br />
2020 - PM Build 29.0 14.8<br />
2040 - PM No Build 44.5 28.3<br />
2040 - PM Build 43.7 26.0<br />
Southbound Direction Travel Time Summary in Minutes Minutes Percent Minutes Percent<br />
Existing - AM No Build 19.2 9.5 NA NA NA NA<br />
2020 - AM No Build 24.4 9.7<br />
2020 - AM Build 24.2 9.7<br />
2040 - AM No Build 31.6 14.5<br />
2040 - AM Build 23.7 9.8<br />
Existing - PM No Build 23.0 13.0 NA NA NA NA<br />
2020 - PM No Build 34.7 16.0<br />
2020 - PM Build 22.9 9.7<br />
2040 - PM No Build 34.7 16.6<br />
2040 - PM Build 24.5 10.1<br />
Linden Avenue Linden Avenue Travel Time Savings B/W No Build and Build<br />
to Los Carneros to Garden Street Linden Ave to Los Carneros Linden Ave to Garden St<br />
3.1 9%<br />
SC101 HOV <strong>Traffic</strong> Study – <strong>Forecast</strong> <strong>Operations</strong> <strong>Report</strong> Page 63<br />
19.2<br />
40%<br />
3.6 11%<br />
0.8 2%<br />
0.2 1%<br />
7.9 25%<br />
11.8 34%<br />
10.6<br />
24.5<br />
6.4<br />
2.3<br />
0.0<br />
4.7<br />
6.3<br />
10.2 29% 6.5<br />
*Travel time w as calculated by dividing the length of each subsection by the average speed (forecast by FREQ softw are) for that subsection during<br />
corresponding peak hours. Travel time for all sub-sections w as then added to calculate total travel time.<br />
50%<br />
68%<br />
30%<br />
8%<br />
0%<br />
32%<br />
40%<br />
39%
Dowling Associates, Inc.<br />
Transportation Engineering Planning Research Education<br />
Figure 30. FREQ Vehicle Delay Reduction (2008 – 2040)<br />
Table 36. FREQ <strong>Forecast</strong> MOE Summary<br />
Measure of Effectiveness (MOE)<br />
Existing<br />
(2008)<br />
2020 No<br />
Build<br />
2020<br />
Build<br />
2040 No<br />
Build<br />
2040<br />
Build<br />
NB AM Avg Speed (mph) 54.4 53.6 57.6 34.0 57.0<br />
NB PM Avg Speed (mph) 60.8 54.4 56.0 42.2 56.0<br />
SB AM Avg Speed (mph) 62.2 59.4 60.0 55.8 60.2<br />
SB PM Avg Speed (mph) 55.1 53.5 61.8 47.7 58.6<br />
NB AM Peak Hour Avg Speed (mph) 1<br />
NB PM Peak Hour Avg Speed (mph) 1<br />
SB AM Peak Hour Avg Speed (mph) 1<br />
SB PM Peak Hour Avg Speed (mph) 1<br />
NB AM Peak Hour Travel Time (min) 2,3<br />
NB PM Peak Hour Travel Time (min) 2,3<br />
SB AM Peak Hour Travel Time (min) 2,3<br />
SB PM Peak Hour Travel Time (min) 2,3<br />
44.9 40.7 43.7 26.2 40.5<br />
50.2 41.6 44.4 28.4 32.3<br />
57.6 49.7 50.6 41.8 53.6<br />
49.3 39 55.1 39.8 52.2<br />
37 41.5 38.4 67.5 42.7<br />
28.3 42.5 37.7 63.7 52.5<br />
30.2 35.9 35.7 43.2 35.3<br />
34.3 46.3 34.4 46.6 36.4<br />
NB AM Vehicle Hours of Delay 937 1,613 1,022 9,258 1,492<br />
NB PM Vehicle Hours of Delay 324 1,375 1,167 4,261 3,574<br />
SB AM Vehicle Hours of Delay 154 611 572 1,507 786<br />
SB PM Vehicle Hours of Delay 871 2,412 438 3,383 1,122<br />
NB AM Person Hours of Delay 4<br />
NB PM Person Hours of Delay 4<br />
SB AM Person Hours of Delay 4<br />
SB PM Person Hours of Delay 4<br />
1,190 2,225 1,687 12,776 2,462<br />
454 1,953 1,984 6,051 6,076<br />
196 843 944 2,080 1,297<br />
1,219 3,426 744 4,804 1,907<br />
Note 1: Peak hour refers to the "w orst hour" in a given peak period w hen travel through the corridor takes the<br />
longest.<br />
Note 2: Travel time estimated based on FREQ netw ork length of 30.3 miles in the NB direction and 32.98 miles in<br />
SB direction for existing, no-build and build conditions.<br />
Note 3:Study area corridor is divided into 63 segments. Travel time is determined by adding up travel time for<br />
each individual segment based on segment length and segment speed.<br />
Note 4: Follow ing vehicle occupancy w as used to estimate person hours of delay<br />
Existing Conditions - NB AM/SB AM = 1.27, NB PM/SB PM = 1.40<br />
2020/2040 No Build - NB AM/SB AM = 1.38, NB PM/SB PM = 1.42<br />
2020/2040 Build - NB AM/SB AM = 1.65, NB PM/SB PM = 1.70<br />
SC101 HOV <strong>Traffic</strong> Study – <strong>Forecast</strong> <strong>Operations</strong> <strong>Report</strong> Page 64
Dowling Associates, Inc.<br />
Transportation Engineering Planning Research Education<br />
TA-C Operational Analysis<br />
The following additional travel assessment was analyzed:<br />
TA-C Build + 4 auxiliary lanes within project limits that currently meet design standards<br />
The purpose of TA-C was to evaluate the operational benefits of adding an auxiliary lane at the following<br />
five locations within the project limits (PM 2.0 to PM 12.30). These five locations were identified on the<br />
basis of design standards. All are characterized by ramp-to-ramp distances of less than 2,500 feet and<br />
are therefore identified weave sections.<br />
PM 3.3 - SB Reynolds to Linden<br />
PM 4.5 - SB Santa Claus to Carpinteria<br />
PM 8.6 - SB Sheffield to Evans (after median off ramp is relocated to right of lanes)<br />
PM 10.3 - SB Olive Mill to San Ysidro<br />
PM 10.3 - NB San Ysidro to Olive Mill Road<br />
Level of Service (LOS) for weave sections was estimated using Chapter 500 (nomograph 504.7A) of<br />
Highway Design Manual (HDM), 6 th Edition. All traffic volumes were adjusted to reflect passenger car<br />
equivalents based on the truck classification data collected at/near each respective location.<br />
To determine if ramp meters could provide sufficient operational benefits in lieu of implementing auxiliary<br />
lanes, mainline weave area operations were re-evaluated based on metered discharge rates.<br />
TA-C AM/PM Peak Hour <strong>Traffic</strong> <strong>Forecast</strong>ing<br />
The most recently adopted version of the Santa Barbara County Association of Governments (SBCAG)<br />
Travel Demand Model was used to develop AM/PM peak hour intersection turning movement forecasts.<br />
Turning movements were refined using FREQ freeway simulation results, existing turning movement<br />
count distributions and supplemental forecasts performed as part of other studies in the South Coast<br />
region. All currently programmed transportation improvements as listed in the Methodology <strong>Report</strong><br />
(December 15, 2008) were assumed to be implemented by 2020.<br />
Freeway mainline volumes at the project area end points (i.e. at Bates Road for northbound and Cabrillo<br />
Boulevard/Olive Mill Road for southbound Highway 101) were based on FREQ freeway macro-simulation<br />
results. These results reflect hourly mainline volumes served relative to capacity constraints. Once the<br />
ramp and end points traffic volumes were finalized, intermediate mainline volumes between each ramp<br />
juncture were automatically calculated by balancing mainline and ramp volumes inputs. Estimated<br />
mainline traffic volumes at intermediate locations were then validated with the FREQ freeway macrosimulation<br />
results. This process was conducted for both 2020 and 2040 build conditions during the<br />
AM/PM peak hours.<br />
Figure 31 and Figure 32 shows 2020 build conditions traffic volumes during the AM and PM peak hour<br />
respectively. Figure 33 and Figure 34 presents 2040 build conditions traffic volumes during the AM and<br />
PM peak hours respectively.<br />
SC101 HOV <strong>Traffic</strong> Study – <strong>Forecast</strong> <strong>Operations</strong> <strong>Report</strong> Page 65
Figure 31. TA-C 2020 Build Conditions AM Peak Hour <strong>Traffic</strong> Volumes<br />
2823 428 760 3155 326 88 2917 154 406 3170 23 8 3155<br />
Casitas Pass Rd Bailard Ave<br />
Casitas Pass Rd<br />
Bailard Ave<br />
US 101<br />
2553 344 330 2539 491 57 2106 78 69 2097 35 19 2081<br />
146 126 3905 519 269 3655 831 2823<br />
SC101 HOV <strong>Traffic</strong> Study – <strong>Forecast</strong> <strong>Operations</strong> <strong>Report</strong> Page 66<br />
Rincon Rd<br />
Rincon Rd<br />
S Padero Ln Santa Monica Rd Linden Ave<br />
Santa Claus Ln Carpinteria Ave<br />
US 101<br />
S Padero Ln Reynolds Ave Linden Ave<br />
166 2867 74 2941 156 2785 33 161 2913 360 2553<br />
Bates Rd<br />
Bates Rd
Figure 31 cont. TA-C 2020 Build Conditions AM Peak Hour <strong>Traffic</strong> Volumes<br />
4456 199 198 4455 227 4228 54 4281 423 66 3925<br />
N Jameson Ln<br />
Ortega Hill Rd<br />
Wallace Ave<br />
Evans St N Padero Ln<br />
3426 366 95 3155 104 3051 32 3083 134 84 3033<br />
4434 304 4738 382 100<br />
Olive Mill Rd<br />
Channel Dr<br />
US 101<br />
San Ysidro Rd<br />
Eucalyptus Ln<br />
S Jameson Ln<br />
3796 371 390 3815 453 3362 64<br />
SC101 HOV <strong>Traffic</strong> Study – <strong>Forecast</strong> <strong>Operations</strong> <strong>Report</strong> Page 67<br />
Hollister St<br />
US 101<br />
N Padero Ln
Figure 32. 2020 TA-C Build Conditions PM Peak Hour <strong>Traffic</strong> Volumes<br />
3499 359 534 3674 488 66 3251 105 55 3201 31 25 3196<br />
Casitas Pass Rd Bailard Ave<br />
Casitas Pass Rd<br />
Bailard Ave<br />
US 101<br />
3405 412 503 3496 331 151 3316 197 369 3489 13 22 3498<br />
146 72 3958 299 286 3945 445 3499<br />
SC101 HOV <strong>Traffic</strong> Study – <strong>Forecast</strong> <strong>Operations</strong> <strong>Report</strong> Page 68<br />
Rincon Rd<br />
Rincon Rd<br />
S Padero Ln Santa Monica Rd Linden Ave<br />
Santa Claus Ln Carpinteria Ave<br />
US 101<br />
S Padero Ln Reynolds Ave Linden Ave<br />
283 3847 99 3946 248 3698 139 337 3897 492 3405<br />
Bates Rd<br />
Bates Rd
Figure 32 cont. TA-C 2020 Build Conditions PM Peak Hour <strong>Traffic</strong> Volumes<br />
4523 295 105 4333 212 4121 87 4209 225 49 4033<br />
N Jameson Ln<br />
Ortega Hill Rd<br />
Wallace Ave<br />
Evans St N Padero Ln<br />
4446 156 112 4402 200 4202 53 4255 231 105 4130<br />
4642 219 4861 463 126<br />
Olive Mill Rd<br />
Channel Dr<br />
US 101<br />
San Ysidro Rd<br />
Eucalyptus Ln<br />
S Jameson Ln<br />
4177 177 680 4680 311 4369 77<br />
SC101 HOV <strong>Traffic</strong> Study – <strong>Forecast</strong> <strong>Operations</strong> <strong>Report</strong> Page 69<br />
Hollister St<br />
US 101<br />
N Padero Ln
Figure 33. 2040 TA-C Build Conditions AM Peak Hour <strong>Traffic</strong> Volumes<br />
3212 448 933 3697 394 76 3379 160 406 3625 24 8 3609<br />
Casitas Pass Rd Bailard Ave<br />
Casitas Pass Rd<br />
Bailard Ave<br />
US 101<br />
3640 417 479 3702 698 68 3072 87 70 3055 35 20 3040<br />
151 126 4553 728 273 4098 886 3212<br />
SC101 HOV <strong>Traffic</strong> Study – <strong>Forecast</strong> <strong>Operations</strong> <strong>Report</strong> Page 70<br />
Rincon Rd<br />
Rincon Rd<br />
S Padero Ln Santa Monica Rd Linden Ave<br />
Santa Claus Ln Carpinteria Ave<br />
US 101<br />
S Padero Ln Reynolds Ave Linden Ave<br />
221 4108 80 4188 246 3942 34 195 4103 463 3640<br />
Bates Rd<br />
Bates Rd
Figure 33 cont. TA-C 2040 Build Conditions AM Peak Hour <strong>Traffic</strong> Volumes<br />
5181 231 199 5149 277 4872 61 4933 427 72 4578<br />
N Jameson Ln<br />
Ortega Hill Rd<br />
Wallace Ave<br />
Evans St N Padero Ln<br />
4753 443 136 4446 106 4340 32 4372 134 91 4329<br />
5135 392 5527 449 103<br />
Olive Mill Rd<br />
Channel Dr<br />
US 101<br />
San Ysidro Rd<br />
Eucalyptus Ln<br />
SC101 HOV <strong>Traffic</strong> Study – <strong>Forecast</strong> <strong>Operations</strong> <strong>Report</strong> Page 71<br />
Hollister St<br />
S Jameson Ln<br />
5056 371 445 5130 454 4676 77<br />
US 101<br />
N Padero Ln
Figure 34. TA-C 2040 Build Conditions PM Peak Hour <strong>Traffic</strong> Volumes<br />
4183 378 646 4451 544 63 3970 105 56 3921 34 26 3913<br />
Casitas Pass Rd Bailard Ave<br />
Casitas Pass Rd<br />
Bailard Ave<br />
US 101<br />
4269 521 599 4347 469 165 4043 214 368 4197 15 71 4253<br />
200 82 4696 450 430 4676 493 4183<br />
SC101 HOV <strong>Traffic</strong> Study – <strong>Forecast</strong> <strong>Operations</strong> <strong>Report</strong> Page 72<br />
Rincon Rd<br />
Rincon Rd<br />
S Padero Ln Santa Monica Rd Linden Ave<br />
Santa Claus Ln Carpinteria Ave<br />
US 101<br />
S Padero Ln Reynolds Ave Linden Ave<br />
359 4795 109 4904 351 4553 221 511 4843 574 4269<br />
Bates Rd<br />
Bates Rd
Figure 34 cont. TA-C 2040 Build Conditions PM Peak Hour <strong>Traffic</strong> Volumes<br />
5332 426 191 5097 246 4851 154 5005 272 81 4814<br />
N Jameson Ln<br />
Ortega Hill Rd<br />
Wallace Ave<br />
Evans St N Padero Ln<br />
5480 185 134 5429 225 5204 51 5255 225 124 5154<br />
5322 311 5633 472 171<br />
Olive Mill Rd<br />
Channel Dr<br />
US 101<br />
San Ysidro Rd<br />
Eucalyptus Ln<br />
SC101 HOV <strong>Traffic</strong> Study – <strong>Forecast</strong> <strong>Operations</strong> <strong>Report</strong> Page 73<br />
Hollister St<br />
S Jameson Ln<br />
5107 213 902 5796 393 5403 77<br />
US 101<br />
N Padero Ln
Dowling Associates, Inc.<br />
Transportation Engineering Planning Research Education<br />
HOV Lane <strong>Traffic</strong> Reduction<br />
The HDM weave LOS method does not account for special purpose lanes (e.g., HOV lanes, truck<br />
climbing lanes etc.). To remedy, these lane types must be controlled for when applying the procedure.<br />
Given that HOV lane traffic does not typically interact with vehicles within a freeway weave section, the<br />
HOV lane and its estimated TA-C HOV lane traffic can be simply be removed for analysis purposes.<br />
The percent of existing Highway 101 traffic that is comprised of high occupancy vehicles was based on<br />
Average Vehicle Occupancy (AVO) surveys documented in the SC-101 HOV <strong>Traffic</strong> Study Existing<br />
Conditions <strong>Operations</strong> <strong>Report</strong> (December 15, 2008). AVO surveys were only performed for the<br />
predominant travel directions, i.e. northbound in AM peak and southbound in PM peak.<br />
Consistent with the 101 In-Motion Study (SBCAG, 2006), a 20 percent conversion of single occupancy<br />
vehicles into high occupancy due to an HOV lane was assumed. To estimate future year HOV utilization,<br />
the percent of high occupancy vehicles from the baseline survey data was increased by an additional 20<br />
percent. Estimated HOV lane traffic volume was capped at 1,650 - the ideal saturation flow rate of an<br />
HOV lane operating at LOS C. The resultant HOV utilization percentages were then validated against<br />
those of SBCAG model and were found to match closely.<br />
Since occupancy surveys were only performed for the peak travel directions, SBCAG’s AM and PM peak<br />
hour travel demand models were used to directly estimate utilization of an HOV lane for the off-peak<br />
travel directions (i.e. northbound in PM peak and southbound in AM peak).<br />
Table 37 provides the forecasted mainline traffic volumes for 2020 and 2040 build conditions during the<br />
AM and PM peak hours. A more detailed HOV lane traffic volume worksheet is provided in Table 38.<br />
Table 37. <strong>Forecast</strong>ed <strong>Traffic</strong> Volumes on Highway 101 Mainline<br />
HOV Lane <strong>Traffic</strong> Mixed Flow Lane<br />
Total <strong>Traffic</strong> Volumes Volume<br />
Volumes<br />
Hwy 101 Location<br />
2020 Build Conditions<br />
Northbound<br />
AM Peak PM Peak AM Peak PM Peak AM Peak PM Peak<br />
San Ysidro and Olive Mill<br />
Southbound<br />
4,738 4,861 1,579 1,507 3,159 3,354<br />
Olive Mill to San Ysidro 3,815 4,680 572 1,650 3,243 3,030<br />
Sheffield and Evans 3,155 4,402 726 1,629 2,429 2,773<br />
Santa Claus and Carpinteria 2,941 3,946 706 1,460 2,235 2,486<br />
Reynolds and Linden<br />
2040 Build Conditions<br />
Northbound<br />
2,913 3,897 699 1,461 2,214 2,436<br />
San Ysidro and Olive Mill<br />
Southbound<br />
5,527 5,633 1,650 1,650 3,877 3,983<br />
Olive Mill to San Ysidro 5,130 5,796 770 1,650 4,361 4,146<br />
Sheffield and Evans 4,446 5,429 1,023 1,650 3,423 3,779<br />
Santa Claus and Carpinteria 4,188 4,904 1,005 1,650 3,183 3,254<br />
Reynolds and Linden 4,103 4,843 985 1,650 3,118 3,193<br />
TA-C Weave Analysis Results (Without Ramp Metering)<br />
At each auxiliary lane candidate location, Highway 101 mainline mixed-flow lane volumes and ramp<br />
volumes as presented in Figure 44 through Figure 47 were applied to the HDM weave LOS analysis<br />
method. All locations were analyzed without and with auxiliary lanes to gauge operational benefits.<br />
Table 39 and Table 40 show weave analysis results for 2020 and 2040 build conditions during the AM<br />
and PM peak hours. Detailed worksheets containing weave and non-weave volume sets and nomographs<br />
are provided in Appendix F.<br />
SC101 HOV <strong>Traffic</strong> Study – <strong>Forecast</strong> <strong>Operations</strong> <strong>Report</strong> Page 74
Table 38. TA-C 2020 & 2040 <strong>Forecast</strong>ed HOV <strong>Traffic</strong> Volumes Worksheet<br />
RESULTANT Mixed<br />
HOV Lane<br />
Flow Lane Volumes<br />
2020 Build Conditions<br />
Northbound<br />
Capacity AM Peak PM Peak AM Peak PM Peak AM Peak PM Peak AM Peak PM Peak AM Peak PM Peak AM Peak PM Peak AM Peak PM Peak AM Peak PM Peak AM Peak PM Peak<br />
San Ysidro and Olive Mill<br />
Southbound<br />
1,650 4,738 4,861 1.20 NA 31% 31% 790 --- 790 1,507 1,579 1,507 1,579 1,507 33% 31% 3,159 3,354<br />
Olive Mill to San Ysidro 1,650 3,815 4,680 NA 1.26 15% 33% --- 966 572 743 572 1,709 572 1,650 15% 35% 3,243 3,030<br />
Sheffield and Evans 1,650 3,155 4,402 NA 1.27 23% 34% --- 936 726 693 726 1,629 726 1,629 23% 37% 2,429 2,773<br />
Santa Claus and Carpinteria 1,650 2,941 3,946 NA 1.27 24% 32% --- 839 706 621 706 1,460 706 1,460 24% 37% 2,235 2,486<br />
Reynolds and Linden<br />
2040 Build Conditions<br />
Northbound<br />
1,650 2,913 3,897 NA 1.28 24% 32% --- 852 699 609 699 1,461 699 1,461 24% 38% 2,214 2,436<br />
San Ysidro and Olive Mill<br />
Southbound<br />
1,650 5,527 5,633 1.20 NA 31% 31% 921 --- 921 1,746 1,842 1,746 1,650 1,650 30% 29% 3,877 3,983<br />
Olive Mill to San Ysidro 1,650 5,130 5,796 NA 1.26 15% 33% --- 1,196 770 920 770 2,116 770 1,650 15% 28% 4,361 4,146<br />
Sheffield and Evans 1,650 4,446 5,429 NA 1.27 23% 34% --- 1,154 1,023 855 1,023 2,009 1,023 1,650 23% 30% 3,423 3,779<br />
Santa Claus and Carpinteria 1,650 4,188 4,904 NA 1.27 24% 32% --- 1,043 1,005 772 1,005 1,815 1,005 1,650 24% 34% 3,183 3,254<br />
Reynolds and Linden 1,650 4,103 4,843 NA 1.28 24% 32% --- 1,059 985 757 985 1,816 985 1,650 24% 34% 3,118 3,193<br />
1<br />
HOV Lane Volume<br />
Reduction (Future) 5<br />
SBCAG Model HOV<br />
Total HOV Lane<br />
RESULTANT HOV<br />
Utilization Volume Reduction<br />
Lane Utilization (%)<br />
4<br />
Total <strong>Traffic</strong> Volumes<br />
ADJUSTED Total<br />
HOV Lane Volume<br />
2<br />
Reduction<br />
Hwy 101 Location<br />
6<br />
Existing AVO Data 3<br />
HOV Lane Volume<br />
Reduction (Existing)<br />
Notes<br />
1 Indicates Ideal Saturation Flow Rate at LOS C. Approved in Methodology <strong>Report</strong> (December 15, 2008)<br />
2 Total <strong>Traffic</strong> Volumes (Mixed-Flow + HOV Lane) as developed by DA seeding spreadsheet<br />
3 Average Vehicle Occupancy counts in the predominant traffic direction as reported in Existing Conditions <strong>Operations</strong> <strong>Report</strong> (December 15, 2008)<br />
4 2030 Raw <strong>Traffic</strong> forecasts based on SBCAG's AM and PM peak hour models<br />
5 Based on 20% conversion (101 In-Motion Study <strong>Report</strong> adopted in 2006) in the predominant travel direction and SBCAG model for the off-peak travel direction<br />
6 Adjusted with respect to capacity of 1,650 vphvl<br />
Predominant travel direction - Northbound in AM peak and Southbound in PM peak. Off-peak travel direction - Southbound in AM peak and Northbound in PM peak<br />
SC101 HOV <strong>Traffic</strong> Study – <strong>Forecast</strong> <strong>Operations</strong> <strong>Report</strong> Page 75
Dowling Associates, Inc.<br />
Transportation Engineering Planning Research Education<br />
Table 39. TA-C 2020 Build Conditions Without Ramp Metering Weave Analysis LOS Results<br />
Hwy 101 -<br />
Direction of Hwy 101 - Location<br />
Travel<br />
AM Peak PM Peak AM Peak PM Peak AM Peak PM Peak<br />
Northbound San Ysidro Rd / Olive Mill Rd 1,150 E A E E C C<br />
Southbound Olive Mill Rd / San Ysidro Rd 900 C E E E C C<br />
Southbound Sheffield Dr / Evans St 1,900 NA NA NA NA NA NA<br />
Southbound Santa Claus Ln / Carpinteria Ave 1,600 NA NA NA NA NA NA<br />
Southbound Reynolds Ave / Linden Ave 1,700 NA A NA C NA B<br />
NOTES<br />
Distance<br />
(feet)<br />
Baseline Conditions<br />
Level of Service 1<br />
Without Auxiliary<br />
Lane<br />
1 Based on Chapter 500 of <strong>Caltrans</strong> publication Highway Design Manual (6th edition)<br />
NA Peak hour weave volumes and weave length fall outside the realm of the weave area<br />
2020 Build Conditions Level of Service 1<br />
Without Auxiliary<br />
Lane<br />
With Auxiliary Lane<br />
Table 40. TA-C 2040 Build Conditions Without Ramp Metering Weave Analysis LOS Results<br />
Hwy 101 -<br />
Direction of Hwy 101 - Location<br />
Travel<br />
AM Peak PM Peak AM Peak PM Peak AM Peak PM Peak<br />
Northbound San Ysidro Rd / Olive Mill Rd 1,150 E A E F D D<br />
Southbound Olive Mill Rd / San Ysidro Rd 900 C E F F E E<br />
Southbound Sheffield Dr / Evans St 1,900 NA NA NA NA NA NA<br />
Southbound Santa Claus Ln / Carpinteria Ave 1,600 NA NA NA NA NA NA<br />
Southbound Reynolds Ave / Linden Ave 1,700 NA A NA E NA C<br />
NOTES<br />
Distance<br />
(feet)<br />
Baseline Conditions<br />
Level of Service 1<br />
Without Auxiliary<br />
Lane<br />
1 Based on Chapter 500 of <strong>Caltrans</strong> publication Highway Design Manual (6th edition)<br />
NA Peak hour weave volumes and weave length fall outside the realm of the weave area<br />
2040 Build Conditions Level of Service 1<br />
Without Auxiliary<br />
Lane<br />
With Auxiliary Lane<br />
Results indicate that the 2020 (Opening Day) operational benefits of providing an auxiliary lane on the<br />
northbound Highway 101 between San Ysidro Road and Olive Mill Road and southbound Highway 101<br />
between Olive Mill Road and San Ysidro Road will improve weave operational performance by two full<br />
LOS grades. Both segments are projected to operate within <strong>Caltrans</strong> threshold criteria of LOS C.<br />
The operational benefits of an auxiliary lane are projected to persist in 2040 build conditions. However,<br />
LOS will exceed the <strong>Caltrans</strong> LOS threshold by operating at LOS D or worse with the exception of the<br />
southbound Hwy 101 between Reynolds Avenue and Linden Avenue.<br />
Under both forecast year conditions, peak hour traffic volumes and weave lengths for the southbound Hwy<br />
101 sections between Sheffield Drive and Evans Street; Santa Claus Lane and Carpinteria Avenue; and<br />
Reynolds Avenue and Linden Avenue fall outside the limits for weave analysis. In such cases, design<br />
criteria should dictate requirements of an auxiliary lane.<br />
TA-C Ramp Metering Analysis<br />
Only those ramp locations that were shown to provide operational benefits with the provision of an<br />
auxiliary lane were evaluated for ramp metering. Whether ramp metering could provide sufficient<br />
operational benefit in lieu of constructing an auxiliary lane was the key consideration. Three of the five TA-<br />
C ramp locations were examined. These locations are as follows:<br />
PM 3.3 - SB Reynolds to Linden<br />
PM 10.3 - SB Olive Mill to San Ysidro<br />
PM 10.3 - NB San Ysidro to Olive Mill Road<br />
SC101 HOV <strong>Traffic</strong> Study – <strong>Forecast</strong> <strong>Operations</strong> <strong>Report</strong> Page 76
Dowling Associates, Inc.<br />
Transportation Engineering Planning Research Education<br />
Metering analysis was performed using guidelines provided in Chapter 500 (section 504.3) of Highway<br />
Design Manual (HDM), 6 th Edition. All traffic volumes were adjusted to reflect passenger car equivalents<br />
based on the truck classification data collected at each ramp location. Ramp meter discharge rates were<br />
iteratively tested to identify the lowest possible rate without causing vehicle queues to compromise<br />
available ramp storage capacity (i.e., preclude queue spill back at ramp intersection). This analysis was<br />
performed for an equivalent hourly rate during the peak 15 minutes. Once the optimum flow rate (lower<br />
bound) at the ramp was determined, hourly traffic volumes was re-computed for weave analysis.<br />
TA-C Ramp Meter Discharge Rate and Queue Spillback Evaluation<br />
Ramp meter discharge rates were determined using peak 15-min arrival flow rate (vph) and available<br />
storage length at an on-ramp. The peak 15-min arrival flow rate was computed based on hourly traffic<br />
volumes as presented previously. A peak hour factor (PHF) of 0.92 and empirically based heavy duty<br />
vehicles and RVs percentages were applied. Available storage length at an on-ramp was measured using<br />
available aerials.<br />
The ramp meter discharge flow rate was then iteratively adjusted downwards until any further reduction<br />
would result in queue spillbacks conditions at the upstream ramp intersection. The resultant peak 15-min<br />
discharge flow rate was converted into hourly volumes for input into the weave analysis to gauge<br />
operational benefits of the ramp meter.<br />
Table 41 presents the parameters used to determine the optimum ramp meter discharge rate relative to<br />
queue spillback status.<br />
TA-C Weave Analysis Results (With Ramp Metering)<br />
For the three locations listed previously, Highway 101 mainline mixed-flow lane volumes and discharge<br />
ramp volumes (see Table 41) were re-analyzed for weave operations. Each location was analyzed<br />
without and with auxiliary lane to gauge operational benefits. Table 42 and Table 43 show complete<br />
weave analysis results for 2020 and 2040 build conditions without and with an auxiliary lane and ramp<br />
metering during the AM and PM peak hours.<br />
Under 2020 and 2040 build conditions (i.e., HOV lane) without auxiliary lanes, results indicate that the<br />
study weave sections will operate at the same LOS with or without ramp metering. Therefore, provision of<br />
ramp metering in lieu of an auxiliary lane is not anticipated to produce operational benefits. Under 2020<br />
and 2040 build conditions (i.e., HOV lane) with auxiliary lanes, results indicate that the study weave<br />
sections will also operate at the same LOS with or without ramp metering except for one segment. The<br />
southbound freeway section between Olive Mill Road and San Ysidro Road is projected to improve by one<br />
LOS grade (LOS E to LOS D) during the PM peak hour. However, the state LOS threshold (LOS C or<br />
better) will be exceeded in either scenario.<br />
Detailed worksheets containing weave and non-weave volume sets and nomographs are provided in<br />
Appendix F.<br />
SC101 HOV <strong>Traffic</strong> Study – <strong>Forecast</strong> <strong>Operations</strong> <strong>Report</strong> Page 77
Dowling Associates, Inc.<br />
Transportation Engineering Planning Research Education<br />
Table 41. TA-C 2020 and 2040 Ramp Meter Discharge Rate and Queue Spillbacks<br />
2020 Ramp Meter Discharge Rate and Queue Spillbacks<br />
Step<br />
Task<br />
Number<br />
Description / Calculations<br />
Olive Mill Road SB<br />
On-Ramp<br />
AM Peak PM Peak<br />
Reynolds Ave SB<br />
On-Ramp<br />
AM Peak PM Peak<br />
San Ysidro NB On-<br />
Ramp<br />
AM Peak PM Peak<br />
Computation of Arrival Rate:<br />
1 Arrival <strong>Traffic</strong> Volumes (vehicles per hour) <strong>Forecast</strong> Results 390 680 161 337 382 463<br />
2 Peak Hour Factor HCM Default 0.92 0.92 0.92 0.92 0.92 0.92<br />
3 Proportion of Heavy Vehicle 1 April 2008 Counts 1% 1% 3% 1% 1% 1%<br />
4 Proportion of RVs Assumed 1% 1% 1% 1% 1% 1%<br />
5 Factor for Heavy Vehicles and RVs 2 HCM 2000 0.98 0.98 0.95 0.98 0.98 0.98<br />
6 Peak 15-min Arrival Flow Rate (passenger cars per hour) 3 HCM 2000 - (1) / (2) x (5) 435 758 185 375 426 516<br />
7 Average Arrival Rate (vehicles per second) (1) / 3,600 0.11 0.19 0.04 0.09 0.11 0.13<br />
Assumptions/Given:<br />
8 Average Car Length (ft) Assumed 25 25 25 25 25 25<br />
9 Available Storage Length on Ramp (ft) 4 Measured (approximate) 880 880 475 475 450 450<br />
10 Number of Lanes Given 1 1 1 1 1 1<br />
11 Total Storage Capacity (ft) (9) x (10) 880 880 475 475 450 450<br />
Determination of Discharge Rate:<br />
12 Peak 15-min Discharge Flow Rate (passenger cars per hour) Iterative Method until "OK" in (18) 400 723 240 357 408 498<br />
13 Discharge <strong>Traffic</strong> Volumes (vehicles per hour) 3 HCM 2000 - (12) x (2) x (5) 359 649 161 320 366 447<br />
14 Average Discharge Rate (passenger cars per second) (13) / 3,600 0.10 0.18 0.04 0.09 0.10 0.12<br />
15 Average Service Time (seconds per vehicle) 1 / (14) 10.03 5.55 22.36 11.23 9.83 8.05<br />
Peak 15-min Queue Spillback Results:<br />
16 Queue Length (veh) 5 (6) - (12) 35 35 0 18 18 18<br />
17 Queue Length (ft) (16) x (8) 863 865 0 462 440 446<br />
18 Queue Length Status If (17) < (11), OK, Overflow OK OK OK OK OK OK<br />
2040 Ramp Meter Discharge Rate and Queue Spillbacks<br />
Olive Mill Road SB<br />
Step<br />
Task Description / Calculations On-Ramp<br />
Number<br />
AM Peak PM Peak AM Peak PM Peak AM Peak PM Peak<br />
Computation of Arrival Rate:<br />
1 Arrival <strong>Traffic</strong> Volumes (vehicles per hour) <strong>Forecast</strong> Results 445 902 195 511 449 472<br />
2 Peak Hour Factor HCM Default 0.92 0.92 0.92 0.92 0.92 0.92<br />
3 Proportion of Heavy Vehicle 1 April 2008 Counts 1% 1% 3% 1% 1% 1%<br />
4 Proportion of RVs Assumed 1% 1% 1% 1% 1% 1%<br />
5 Factor for Heavy Vehicles and RVs 2 HCM 2000 0.98 0.98 0.95 0.98 0.98 0.98<br />
6 Peak 15-min Arrival Flow Rate (passenger cars per hour) 3 HCM 2000 - (1) / (2) x (5) 496 1,005 224 569 500 526<br />
7 Average Arrival Rate (vehicles per second) (1) / 3,600 0.12 0.25 0.05 0.14 0.12 0.13<br />
Assumptions/Given:<br />
8 Average Car Length (ft) Assumed 25 25 25 25 25 25<br />
9 Available Storage Length on Ramp (ft) 4 Measured (approximate) 880 880 475 475 450 450<br />
10 Number of Lanes Given 1 1 1 1 1 1<br />
11 Total Storage Capacity (ft) (9) x (10) 880 880 475 475 450 450<br />
Determination of Discharge Rate:<br />
12 Peak 15-min Discharge Flow Rate (passenger cars per hour) Iterative Method until "OK" in (18) 461 970 240 551 483 508<br />
13 Discharge <strong>Traffic</strong> Volumes (vehicles per hour) 3 HCM 2000 - (12) x (2) x (5) 414 871 195 495 434 456<br />
14 Average Discharge Rate (passenger cars per second) (13) / 3,600 0.11 0.24 0.05 0.14 0.12 0.13<br />
15 Average Service Time (seconds per vehicle) 1 / (14) 8.70 4.13 18.46 7.28 8.30 7.90<br />
Peak 15-min Queue Spillback Results:<br />
16 Queue Length (veh) 5 (6) - (12) 35 35 0 18 17 18<br />
17 Queue Length (ft) (16) x (8) 870 874 0 458 431 447<br />
18 Queue Length Status If (17) < (11), OK, Overflow OK OK OK OK OK OK<br />
1 - Based on actual data collected in April 2008<br />
2 - Based on Heavy Vehicle Factor equation of HCM 2000 for Level Terrain<br />
3 - Based Flow Rate equation of HCM 2000. Reflects equivalent hourly rate<br />
4 - Approximate estimates based on the aerial picutures<br />
5 - Difference of corresponding arrival rate and departure rate<br />
Reflects Trigger Discharge Flow Rates that are to be studied for weave analysis<br />
Table 42. TA-C 2020 Build Conditions Weave Analysis LOS Results<br />
Hwy 101 -<br />
Direction of Hwy 101 - Location<br />
Travel<br />
Distance<br />
(feet)<br />
Baseline Conditions<br />
Without Auxiliary<br />
Lane and Ramp<br />
Meter<br />
Reynolds Ave SB<br />
On-Ramp<br />
San Ysidro NB On-<br />
Ramp<br />
AM Peak PM Peak AM Peak PM Peak AM Peak PM Peak AM Peak PM Peak AM Peak PM Peak<br />
Northbound San Ysidro Rd / Olive Mill Rd 1,150 E A E E E E C C C C<br />
Southbound Olive Mill Rd / San Ysidro Rd 900 C E E E E E C C C C<br />
Southbound Reynolds Ave / Linden Ave 1,700 NA A NA C NA C NA B NA B<br />
NOTES<br />
1 Based on Chapter 500 of <strong>Caltrans</strong> publication Highway Design Manual (6th edition)<br />
NA Peak hour weave volumes and weave length fall outside the realm of the weave area<br />
2020 Build Conditions Level of Service 1<br />
Without Auxiliary Lane<br />
With Auxiliary Lane<br />
Without Ramp Meter With Ramp Meter Without Ramp Meter With Ramp Meter<br />
Table 43. TA-C 2040 Build Conditions Weave Analysis LOS Results<br />
Hwy 101 -<br />
Direction of Hwy 101 - Location<br />
Travel<br />
Distance<br />
(feet)<br />
Baseline Conditions<br />
Without Auxiliary<br />
Lane and Ramp<br />
Meter<br />
AM Peak PM Peak AM Peak PM Peak AM Peak PM Peak AM Peak PM Peak AM Peak PM Peak<br />
Northbound San Ysidro Rd / Olive Mill Rd 1,150 E A E F E F D D D D<br />
Southbound Olive Mill Rd / San Ysidro Rd 900 C E F F F F E E E D<br />
Southbound Reynolds Ave / Linden Ave 1,700 NA A NA E NA E NA C NA C<br />
NOTES<br />
1 Based on Chapter 500 of <strong>Caltrans</strong> publication Highway Design Manual (6th edition)<br />
NA Peak hour weave volumes and weave length fall outside the realm of the weave area<br />
2040 Build Conditions Level of Service 1<br />
Without Auxiliary Lane With Auxiliary Lane<br />
Without Ramp Meter With Ramp Meter Without Ramp Meter With Ramp Meter<br />
SC101 HOV <strong>Traffic</strong> Study – <strong>Forecast</strong> <strong>Operations</strong> <strong>Report</strong> Page 78
Dowling Associates, Inc.<br />
Transportation Engineering Planning Research Education<br />
Intersection Future <strong>Operations</strong> Analysis<br />
This section describes the 2020 and 2040 intersection turning movement forecasts and operational level of<br />
service analysis for the 2020 and 2040 TA-A (No Build) and TA-B (Build). Given that the only difference<br />
between TA-B and TA-C is the provision of auxiliary lanes, the intersection operations results for TA-B are<br />
also applicable to TA-C.<br />
A total of 104 study area intersections were analyzed. Of the 104 study area intersections, 70 are state<br />
operated facilities while 34 are locally operated. Within the 10.3 mile project limits, 34 intersections were<br />
analyzed. The following three analysis steps are described:<br />
TA-A and TA-B 2020 and 2040 AM/PM Peak Hour Turning Movement <strong>Forecast</strong>s<br />
TA-A and TA-B Intersection Level of Service Analysis<br />
Identification of project impacts.<br />
Generalized study parameter assumptions that were used for this study are provided in Table 44. Table<br />
45 lists the primary/secondary/tertiary measures of effectiveness for the intersection operational analysis.<br />
Table 44. Intersection Parameter Values for <strong>Operations</strong> Analysis<br />
Parameter Value To Be Used for Future Conditions Analysis<br />
Ideal Saturation Flow Rate: HCM Intersections: 1,900 vphpl<br />
Ideal Saturation Flow Rate: ICU Locally controlled Intersections: 1,600 vphpl; with Lost Time Adjustment of 10%<br />
Peak Hour Factor (PHF): Future Condition: HCM Default of 0.92<br />
Peak Hour Directional Factor (D) Future Condition: SBCAG Peak Hour Model<br />
2020 Turning Movements Interpolated between baseline counts and Final 2040 turning movements<br />
2040 Turning Movements Furness Method – using SBCAG 2030 AM/PM Peak Hour approach volumes extrapolated and adjusted based on<br />
RGF factors to 2040. Ramp approaches further adjusted based on FREQ software results.<br />
Pedestrian Calls: Future Condition: Existing condition<br />
Lane Width: Field Data, If No Field Data then use 12 ft, or Consult District 5 staff<br />
Heavy Vehicle Percentage: Future Condition: % measured under existing condition<br />
Signal Cycle Length Future Condition: Based on existing condition cycle length<br />
Signal Timing: Future Condition: Apply existing signal timing plans to future year analyses; where future year intersection<br />
improvements are reflected; retain existing cycle length while optimizing green time splits based on SYNCHRO-7<br />
software; if SYNCHRO-7 “#” flag accompanies a 95th percentile queue result for a freeway off-ramp intersection,<br />
reallocate green time until volume to capacity ratio of the off-ramp approach is less than 1.00.<br />
Signal Coordination: Future; Coordinate if coordination exists presently;<br />
Right Turn On Red (RTOR) Future Condition: Absolute volume measured under existing condition<br />
Lane Utilization Factor: Field Data, If Field Data is not available then use HCM defaults or engineering judgment.<br />
Length of Queue 95 th Percentile Queue<br />
Turn Storage As determined by the Highway Design Manual<br />
Intersection Delay Future Condition: SYNCHRO-7 software<br />
Project Evaluation Years 2020 (Opening Day) 2040 (Design Year)<br />
Table 45. Intersection Measures of Effectiveness (MOE) for <strong>Operations</strong> Analysis<br />
Analysis Primary<br />
MOE<br />
Secondary<br />
MOE<br />
Static Intersection Analysis (State Controlled) Delay(HCM) V/C (ICU)<br />
Static Intersection Analysis (Locally Controlled) Delay(HCM) V/C (ICU)<br />
Static Intersection Length of Queue Analysis 95 Percentile Queue 50 th Percentile Queue Simulated Queues<br />
Static Intersection Left Turn Storage Analysis Distance (ft) (HDM) Simulated Queues<br />
Tertiary<br />
MOE<br />
As noted previously, the operational results for the Cabrillo-Hot Springs interchange study area (Garden<br />
Street to Olive Mill Road) are superseded by the results presented in the Cabrillo-Hot Springs Interchange<br />
Configuration Screening Analysis Memorandum (Dowling Associates, April 9, 2010), Cabrillo/Hot Springs<br />
Interchange Configuration <strong>Traffic</strong> Analysis (Dowling Associates, March 21, 2011) and Cabrillo Boulevard<br />
I/C Modified Configuration Analysis Memorandum (Dowling Associates, July 19, 2011).<br />
Intersection Operational Performance Criteria<br />
Intersection operational performance is based on maintaining LOS C conditions. For locally operated<br />
facilities, operational performance was based on local jurisdictions locally adopted criteria. The SBCAG<br />
CMP LOS threshold criterion was also applied to local facilities designated as part of the Congestion<br />
SC101 HOV <strong>Traffic</strong> Study – <strong>Forecast</strong> <strong>Operations</strong> <strong>Report</strong> Page 79
Dowling Associates, Inc.<br />
Transportation Engineering Planning Research Education<br />
Management System. LOS performance criteria are listed by analysis type in Table 46. For state<br />
controlled intersections – the <strong>Caltrans</strong> LOS criteria was applied to each individual movement. For locally<br />
controlled intersection facilities – local agency LOS criteria applied to the intersection as a whole.<br />
Table 46. Performance Criteria for <strong>Operations</strong> Analysis<br />
Analysis Primary Criteria Secondary Criteria Tertiary Criteria<br />
State/Local Controlled Intersection LOS Delay (HCM): > 35 sec LOS C V/C (ICU): > .90 LOS D: CMP Locations<br />
Locally Controlled Intersection LOS<br />
City of Carpinteria Delay (HCM): > 35 sec LOS C V/C (ICU) > .80 LOS C V/C (ICU): > .90 LOS D: CMP<br />
City of Santa Barbara Delay (HCM): > 35 sec LOS C V/C (ICU) > .77 LOS C V/C (ICU): > .90 LOS D: CMP<br />
City of Goleta Delay (HCM): > 35 sec LOS C V/C (ICU) > .80 LOS C V/C (ICU): > .90 LOS D: CMP<br />
County of Santa Barbara Delay (HCM): > 35 sec LOS C V/C (ICU) > .80 LOS C V/C (ICU): > .90 LOS D: CMP<br />
Future AM/PM Peak Hour Turning Movements<br />
To develop intersection turning movement forecasts – a combination of SBCAG’s AM/PM peak hour model<br />
forecasts, existing turning movement count distributions, FREQ freeway simulation software results and<br />
supplemental forecasts performed as part of other studies were utilized. This process is described below.<br />
Travel Demand <strong>Forecast</strong>ing Model<br />
The latest adopted Santa Barbara County Association of Governments (SBCAG) calibrated regional<br />
transportation model was used to perform the peak hour traffic forecasts for this analysis. This same<br />
model was used to generate the travel forecasts for the 101 In-Motion traffic study and the 2008 Regional<br />
Transportation Plan (SBCAG, 2008) travel forecasts. In the currently adopted SBCAG model, inputs<br />
(housing and employment) have been developed by SBCAG to allow a 2030 forecast at 10-year<br />
increments (e.g., 2000, 2010, 2020 and 2030). Phasing of all future programmed infrastructure<br />
improvements are coded consistent with SBCAG’s FTIP project implementation schedules as well as local<br />
agency Capital Improvement Programs.<br />
Given that the model’s forecast horizon is 2030, all out-year model results required extrapolation to reflect<br />
2040 conditions. Given that similar future baseline network assumptions are used for both the 2020 and<br />
2040 analysis years, development of the 2020 future turning movements was based on linear interpolation<br />
between the final 2040 forecasted turning movements and baseline turning movement traffic counts.<br />
Future Baseline Network Assumptions<br />
Consistent with <strong>Caltrans</strong> <strong>Traffic</strong> Impact Study Guidelines (December 2002), projects were assumed part of<br />
the future baseline modeling if any project phase (e.g., PS&E, environmental, construction etc) is currently<br />
programmed – i.e., has a formal funding commitment. Intersections with currently programmed<br />
improvements are shown in Table 47.<br />
Table 47. Future Baseline Intersection Improvements<br />
Int # Location Project Description<br />
11 Casitas Pass & Via Real Signalize, Add SB LT, WB LT & RT, NB Thru-RT, EB RT & Convert LT-RT to Thru-LT<br />
12 Via Real & Vellocito Provide EB Approach as Thru-LT<br />
13 Casitas Pass & HWY 101 SB on/off ramps Signalize, Convert NB RT to Thru-RT, Add SB LT and Thru, Convert EB to LT and Thru-RT<br />
15 Ogan Rd & Via Real & HWY 101 NB on-ramp Re-construct to Roundabout<br />
16 Via Real & Linden Signalize, Add NB RT, WB LT, SB LT<br />
17 Linden & HWY 101 SB off-ramp Signalize, Add NB Thru, SB Thru and Convert LT-RT to dedicated RT and LT<br />
100 HWY 101 NB on/off ramps at Via Real Add new signalized intersection<br />
48 Milpas & HWY 101 SB off-ramp Eliminate left-turn movement<br />
49 Milpas & HWY 101 SB on-ramp Add WB channelized right-turn lane<br />
58 Carrillo & HWY 101 NB Ramp Allow free SB right-turn – widen ramp for two receiving lanes<br />
96 Hollister & Calle Real & HWY 101 NB on ramp Eliminate south leg approaches per Cathedral Oaks interchange improvement<br />
99 Hollister Ave & HWY 101 SB on-ramp Remove intersection - Replace with reconfigured SB ramps at new Cathedral Oaks I/C<br />
84 Patterson & HWY 101 NB Ramps Add SB thru (leads to SB left-turn pocket at adjacent intersection)<br />
85 Patterson & HWY 101 SB Ramps Add SB left-turn, EB right-turn and NB thru lanes<br />
87 Fairview & HWY 101 NB Ramps Add WB thru and EB left-turn lanes<br />
88 Fairview & Calle Real Add NB left and EB thru lanes. Overlap NB right-turn<br />
89 Fairview & HWY 101 SB Ramps Add NB right-turn lane<br />
91 Los Carneros & HWY 101 SB Ramps Add NB right-turn lane<br />
92 Los Carneros & Calle Real Signalize<br />
Source for 84, 85, 87, 88, 91, 92: City of Goleta proposed GTIP.<br />
SC101 HOV <strong>Traffic</strong> Study – <strong>Forecast</strong> <strong>Operations</strong> <strong>Report</strong> Page 80
Dowling Associates, Inc.<br />
Transportation Engineering Planning Research Education<br />
Future Intersection Turning Movement Development Process<br />
Furness Method<br />
The SBCAG Travel Model generates AM/PM peak hour approach volumes and turning movement<br />
volumes for each study intersection. For study intersections, a refinement process called the Furness<br />
Method was applied. This adjustment is based on the premise that travel models are calibrated to produce<br />
more accurate results for roadway segments than for individual turn movements. The Furness Method<br />
iteratively adjusts turning movement ground counts until the directional sum of the movements balance to<br />
the NCHRP-255 adjusted SBCAG future link volumes. This factoring process produces forecast turn<br />
distributions that resemble the count distribution, but turn movement proportions will change in response to<br />
different growth rates on different legs as produced by the SBCAG Travel Model.<br />
Given that this factoring process may dampen the effects of traffic changes that impact one movement<br />
more strongly than the others, care was taken at locations characterized by future capital improvements<br />
that cause changes in turn distributions. Three such locations with the South Coast 101 HOV project area<br />
include:<br />
Linden and Casitas Pass Interchanges (due to the Via Real Extension portion of the Linden-<br />
Casitas Pass Interchange Improvement Project<br />
Cabrillo Hot-Springs Interchange (due to the assumed removal of the southbound on-ramp<br />
and Milpas SB ramp improvements) and<br />
Storke/Glen Annie Interchange (due to the freeway crossing improvement west of the<br />
interchange).<br />
At the Linden and Casitas Pass Interchanges – modeled future year turning movement turn distributions<br />
documented in the <strong>Traffic</strong> Analysis <strong>Report</strong> for the U.S. 101 Casitas Pass Road and U.S. 101/Linden<br />
Avenue Interchange Improvements Project (May, 2003 Fehr & Peers) was used to seed the Furness<br />
process. These projected turn distributions – which reflect the trip diversion impact of the Via Real<br />
extension and interchange improvements were considered more representative than existing traffic counts<br />
distributions. It should be noted that this South Coast 101 HOV project was assumed as part of the future<br />
baseline analysis for the Linden/Casitas Pass Interchange traffic study. Hence the widening of Highway<br />
101 from Post Miles 2.0 to 12.3 is reflected in both the no-build and build analyses in that particular study.<br />
At the Cabrillo-Hot Springs Interchange, the SBCAG AM/PM peak hour model turn distributions were used<br />
to seed the Furness process in lieu of existing traffic counts. Modeled distributions were considered a<br />
better “seed” than existing traffic counts given the anticipated traffic diversion resulting from the assumed<br />
Cabrillo-Hot Springs southbound on-ramp closure. As previously noted, the definitive operational results<br />
for this interchange are provided in the Cabrillo-Hot Springs Interchange Configuration Screening Analysis<br />
Memorandum (Dowling Associates, April 9, 2010), Cabrillo/Hot Springs Interchange Configuration <strong>Traffic</strong><br />
Analysis (Dowling Associates, March 21, 2011) and Cabrillo Boulevard I/C Modified Configuration Analysis<br />
Memorandum (Dowling Associates, July 19, 2011).<br />
At the Storke/Glen Annie Interchange – modeled future year turning movement turn distributions<br />
documented in the draft Goleta Freeway Crossing Feasibility Study <strong>Traffic</strong> Analysis (April, 2009 Dowling<br />
Associates) was used to seed the Furness process. These turn distributions – which reflect the trip<br />
diversion impact of the freeway crossing were considered more representative than existing traffic count<br />
turn distributions.<br />
RGF and Extrapolation Turning Movement Adjustments<br />
As described in the South Coast 101 HOV <strong>Traffic</strong> Study Methodology <strong>Report</strong> (December 2008), SBCAG<br />
model volumes were adjusted to reflect the most recent SBCAG adopted socioeconomic projections for<br />
Santa Barbara County. Turn movement volumes were adjusted based on percent difference population<br />
factors between the RGF 2002 and RGF 2007. After the RGF adjustment, 2030 volumes were<br />
extrapolated to 2040 based on RGF population projections. These adjustment factors by sub-area are<br />
shown in Table 48.<br />
SC101 HOV <strong>Traffic</strong> Study – <strong>Forecast</strong> <strong>Operations</strong> <strong>Report</strong> Page 81
Dowling Associates, Inc.<br />
Transportation Engineering Planning Research Education<br />
Table 48. RGF-2002 vs RGF-2007 Growth Comparisons<br />
SBCAG Population <strong>Forecast</strong>s<br />
2030 2030 % 2040 2030-2040<br />
Jurisdiction RGF 2002 RGF 2007 Factor RGF 2007 Factor<br />
City of Carpinteria 16,000 15,000 0.9375 15,300 1.0200<br />
Carp - Unincorp 6,900 5,400 0.7826 5,500 1.0185<br />
Carp - Sum 22,900 20,400 0.8908 20,800 1.0196<br />
City of Santa Barbara 101,700 92,800 0.9125 93,000 1.0022<br />
City of Goleta n/a 37,300 n/a 37,300 1.0000<br />
SB-Unincorp 115,700 65,400 0.8876 65,800 1.0061<br />
Total South Coast 263,200 236,300 0.8978 237,700 1.0059<br />
SB-Unincorp % Diff includes City of Goleta<br />
Ramp Volume Adjustments<br />
In order to “mesh” the freeway operational analysis with the Highway 101 ramp intersection analysis and<br />
more accurately reflect future year peak spreading characteristics at study intersections, the following<br />
ramp volume adjustment was also performed at each ramp intersection:<br />
Build Ramp Volume = (FREQ Ramp (Build) – FREQ Ramp (No Build)) + No Build Ramp Volume<br />
The basis for this calculation is that ramp volumes will change under the Build condition relative to No<br />
Build condition and that these differences are best captured by applying the delta (or difference) between<br />
the No Build and Build freeway macro-simulation generated ramp volumes from FREQ. This adjustment<br />
was applied to the off-ramp volume as a whole while on-ramp volume adjustments were applied to the<br />
individual movements that sum to the on-ramp volume. Given that the FREQ results reflect the<br />
operational effect of peak spreading as opposed to a travel demand estimate, the FREQ ramp adjustment<br />
generally served to reduce the peak hour volume difference between the No Build and Build conditions<br />
relative to what the SBCAG travel model forecasts. As reasonableness check, this adjustment was not<br />
performed at ramp locations where the FREQ adjustment resulted in a larger ramp volume than the<br />
Furness adjusted Build peak hour travel model ramp volume.<br />
Not-Less than Baseline Turning Movement Checks/Adjustments<br />
Unless justified by a future baseline improvement that significantly redistributes traffic, no future year<br />
individual turning movement was allowed to be less than its base year turning movement count.<br />
Balancing Turn Movement Checks/Adjustments<br />
All future year turning movement volumes were checked for balancing. Between ramp intersections with<br />
no intermediate access, perfect balance was maintained while less than 15 percent was considered<br />
acceptable for arterial intersections with limited access. As a conservative approach, all balancing was<br />
initially performed by increasing the lower volume to balance to the higher volume. At some locations, this<br />
resulted in unreasonable growth. In these cases, a bi-proportional balancing adjustment was applied.<br />
Right-Turn-On-Red Turning Movement Volume Reductions<br />
For intersections with right-turn-on-red (RTOR) counts, future RTOR reductions were set equal to the<br />
count. For intersections with no RTOR counts – RTOR movements was calculated within the SYNCHRO-<br />
7 software. Free right turn movement reductions were applied during the LOS calculation as appropriate.<br />
Reasonableness Checks<br />
It was determined that within the Carpinteria and Goleta areas, several interchange locations showed<br />
differences in AM/PM turning movement between the No Build and Build analyses that were difficult to<br />
intuitively justify. These non-intuitive forecasted turning movements were resolved as follows:<br />
SC101 HOV <strong>Traffic</strong> Study – <strong>Forecast</strong> <strong>Operations</strong> <strong>Report</strong> Page 82
Dowling Associates, Inc.<br />
Transportation Engineering Planning Research Education<br />
Goleta Area Adjustments<br />
The Highway 101 interchanges at Storke/Glen Annie, Los Carneros and Patterson – all located in the City<br />
of Goleta - each showed higher AM/PM peak hour southbound off-ramp volumes in the Build condition<br />
relative to the No Build condition. All else being equal, motorists driving from northern Santa Barbara<br />
County destined for the City of Goleta would be not be anticipated to increase (i.e., affecting higher<br />
southbound off-ramp volumes) as a result of a widening project occurring roughly 10 miles south (i.e.,<br />
downstream) of these interchanges. Similarly, it was considered unreasonable for the northbound onramp<br />
at Storke/Glen Annie interchange to show an increase in peak hour volume under the Build condition<br />
relative to the No Build. This would suggest that the capacity increase 10 miles south (i.e., downstream) of<br />
this interchange effectuates a behavioral change in motorists to travel north to Santa Barbara County.<br />
The genesis for these discrepancies was determined to be a travel model trip re-distribution response to<br />
the build condition combined with balancing adjustments performed during the turning movement<br />
refinement process. To remedy, the Build southbound off-ramp volumes at Storke/Glen Annie, Los<br />
Carneros and Patterson and northbound on-ramp volumes at Storke/Glen Annie were set equal to the No<br />
Build volumes at these respective interchange ramp locations.<br />
Similarly, future year AM/PM peak hour segment volumes forecasts for Patterson, Calle Real and Fairview<br />
were checked relative to the 2005 Calibrated City of Goleta Travel Model 2030 out year forecasts. Based<br />
on these comparisons, additional off-model adjustments were applied to the SBCAG model output to make<br />
the projected growth more commensurate between these respective forecasts.<br />
Carpinteria Area Adjustments<br />
At the Bailard interchange, the southbound off-ramp showed lower than expected volumes under the No<br />
Build condition relative to the Build condition. Modeled volumes indicated a significant number of AM/PM<br />
southbound trips (~200 vph) avoiding the Bailard southbound off-ramp by exiting at Casitas Pass and<br />
traveling east along Via Real to Bailard. Based on model constructs, this diversion does make sense. With<br />
constrained flow conditions on the 2-lane section of Highway 101 north of the Casitas Pass southbound<br />
on-ramp combined with the relatively unconstrained flow conditions along Casitas Pass and Via Real, this<br />
more circuitous route is a plausible alternative under the No Build condition.<br />
However, given that the Corridor Mobility Improvement Account (CMIA) Highway 101 widening project<br />
picks up at the Casitas Pass southbound on-ramp – it seemed questionable that motorists would decide to<br />
exit from the unstable flow freeway conditions at the Casitas Pass off-ramp knowing that conditions would<br />
soon be opening up a mere 1,235 feet downstream (i.e., start of the 3-lane section at the on-ramp). In<br />
addition, the perceived and likely “real world” AM/PM peak hour stop delay that would occur at the<br />
numerous intersections along the surface street diversion route (Casitas Pass-to-Via Real-to-Bailard) is<br />
likely under-stated by the model coded link impedances. Another complicating issue is the use of Fehr &<br />
Peers Linden Casitas Pass <strong>Traffic</strong> Study future peak hour turn distributions to seed the Furness<br />
procedure. Under the Build condition – this is an apples-to-apples application in terms of future network<br />
assumptions. However, different network assumption exist under the No Build condition given that the<br />
U.S. 101 Casitas Pass Road and U.S. 101/Linden Avenue Interchange Improvements Project (May, 2003<br />
Fehr & Peers) assumes the SC101 HOV project as part of its future baseline.<br />
To remedy, an off-model adjustment was performed for the No Build analysis only. The adjustment<br />
manually reassigned trips using the Casitas southbound off-ramp to the Bailard southbound off-ramp.<br />
Turning movement volumes were re-balanced along Casitas Pass and Via Real as appropriate.<br />
SC101 HOV <strong>Traffic</strong> Study – <strong>Forecast</strong> <strong>Operations</strong> <strong>Report</strong> Page 83
Dowling Associates, Inc.<br />
Transportation Engineering Planning Research Education<br />
Final Intersection Future Turning Movement Volumes<br />
Final 2040 turning movements were used with the 2008 baseline traffic counts to interpolate to 2020<br />
conditions. All final 2020 and 2040 turning movements were input into the intersection operation analysis<br />
software SYNCHRO-7 or (HCM Operational Analysis) TRAFFIX (ICU or Roundabout) to estimate peak<br />
hour intersection level of service. Figure 35 through Figure 38 provide the No Build and Build intersection<br />
lane geometry, control type, and AM/PM peak hour turning movement volumes under the for the 2020 and<br />
2040 analysis years. Figure 39 provides the right-turn-on-red (RTOR) movements assumed as part of<br />
both the 2020 and 2040 operations analysis.<br />
Total approach volume comparisons between the 2008 Baseline and the 2020 and 2040 forecasts for<br />
each study intersection during the AM and PM peak hours are provided in Table 49 and Table 50<br />
respectively. Shaded intersections indicate where peak hour approach volumes are projected to decrease<br />
as a result of the HOV widening project. In general, intersections located near or within the project area<br />
(Post Mile 2.0 to Post Mile 12.30) are projected to experience greater degrees of project benefit while<br />
intersections located further west/north of the project area (e.g., City Santa Barbara and City of Goleta) are<br />
projected to experience moderate increases in peak hour volumes for a number of intersections.<br />
Intersection approach volume reductions are primarily attributable to trip diversion off local roadways that<br />
serve as parallel facilities to Highway 101. By summing across each intersection approach, these volume<br />
reductions as a result of diversion are shown.<br />
Peak hour 2040 ramp volume changes resulting from the HOV widening project is illustrated in Figure 40.<br />
Holistically, total new ramp activity resulting from the HOV widening project is projected to increase by<br />
approximately 4,600 trips during the AM peak hour and by approximately 2,700 trips in the PM peak hour.<br />
The lower increase in PM peak hour ramp activity relative to the AM peak hour is attributable to greater<br />
peak spreading that occurs during the PM peak period. It should be noted that the AM and PM peak hour<br />
ramp volume increases reflect a combination of induced travel (i.e., longer trip lengths, new trip origindestination<br />
pairs) and diverted travel (i.e., from other modes, time periods or facilities).<br />
As anticipated, ramp activity results indicate a directional influence. Most new AM peak hour activity is<br />
projected to occur at northbound off-ramps and southbound on-ramps. Most new PM peak hour activity is<br />
projected to occur at southbound on-ramps and northbound off-ramps. New ramp activity is generally<br />
concentrated within the City of Carpinteria (see Figure 2.A), between the Garden Street interchange and<br />
Olive Mill ramps within the City of Santa Barbara (see Figures 2.B and 2.C) and eastern Goleta area (see<br />
Figures 2.D). Specific sub-areas where new ramp activity is projected tend to “mirror” locations where new<br />
interchange improvement projects are assumed as part of the future baseline. These improvement<br />
locations include the Linden-Casitas Pass interchanges, Milpas and Cabrillo-Hot Springs interchanges and<br />
the Los Carneros and Patterson ramp intersections.<br />
Other factors affecting new ramp activity include the assumed future baseline improvements to the<br />
Highway 101 mainline. The 6-lane widening of Highway 101 from Mussel Shoals in Ventura County to<br />
Casitas Pass interchange (CMIA Project) tends to dampen southbound on-ramp activity resulting from the<br />
HOV project within the Carpinteria area. Conversely, under the Build condition, more northbound ramp<br />
utilization north of Casitas pass is projected. This is plausible given the added northbound capacity<br />
provided by the project. The 6-lane widening of Highway 101 between Milpas and Cabrillo-Hot Springs<br />
(Cabrillo-Hot Springs Operational Improvement Project) dampens the effect of the Build condition at the<br />
Hot Springs, Salinas and Milpas on-ramps - especially is the northbound direction. More ramp utilization<br />
at Milpas under the Build scenario in the southbound direction is projected which is plausible given the<br />
added capacity south of Milpas and given the assumed closure of the southbound ramp at Cabrillo-Hot<br />
Springs (due to diversion).<br />
SC101 HOV <strong>Traffic</strong> Study – <strong>Forecast</strong> <strong>Operations</strong> <strong>Report</strong> Page 84
Figure 35. 2020 No Build AM/PM Peak Hour Turning Movements<br />
SC101 HOV <strong>Traffic</strong> Study – <strong>Forecast</strong> <strong>Operations</strong> <strong>Report</strong> Page 85
Figure 35 cont. 2020 No Build AM/PM Peak Hour Turning Movements<br />
SC101 HOV <strong>Traffic</strong> Study – <strong>Forecast</strong> <strong>Operations</strong> <strong>Report</strong> Page 86
Figure 35 cont. 2020 No Build AM/PM Peak Hour Turning Movements<br />
SC101 HOV <strong>Traffic</strong> Study – <strong>Forecast</strong> <strong>Operations</strong> <strong>Report</strong> Page 87
Figure 35 cont. 2020 No Build AM/PM Peak Hour Turning Movements<br />
SC101 HOV <strong>Traffic</strong> Study – <strong>Forecast</strong> <strong>Operations</strong> <strong>Report</strong> Page 88
Figure 36. 2020 Build AM/PM Peak Hour Turning Movements<br />
SC101 HOV <strong>Traffic</strong> Study – <strong>Forecast</strong> <strong>Operations</strong> <strong>Report</strong> Page 89
Figure 36 cont. 2020 Build AM/PM Peak Hour Turning Movements<br />
SC101 HOV <strong>Traffic</strong> Study – <strong>Forecast</strong> <strong>Operations</strong> <strong>Report</strong> Page 90
Figure 36 cont. 2020 Build AM/PM Peak Hour Turning Movements<br />
SC101 HOV <strong>Traffic</strong> Study – <strong>Forecast</strong> <strong>Operations</strong> <strong>Report</strong> Page 91
Figure 36 cont. 2020 Build AM/PM Peak Hour Turning Movements<br />
SC101 HOV <strong>Traffic</strong> Study – <strong>Forecast</strong> <strong>Operations</strong> <strong>Report</strong> Page 92
Figure 37. 2040 No Build AM/PM Peak Hour Turning Movements<br />
SC101 HOV <strong>Traffic</strong> Study – <strong>Forecast</strong> <strong>Operations</strong> <strong>Report</strong> Page 93
Figure 37 cont. 2040 No Build AM/PM Peak Hour Turning Movements<br />
SC101 HOV <strong>Traffic</strong> Study – <strong>Forecast</strong> <strong>Operations</strong> <strong>Report</strong> Page 94
Figure 37 cont. 2040 No Build AM/PM Peak Hour Turning Movements<br />
SC101 HOV <strong>Traffic</strong> Study – <strong>Forecast</strong> <strong>Operations</strong> <strong>Report</strong> Page 95
Figure 37 cont. 2040 No Build AM/PM Peak Hour Turning Movements<br />
SC101 HOV <strong>Traffic</strong> Study – <strong>Forecast</strong> <strong>Operations</strong> <strong>Report</strong> Page 96
Figure 38. 2040 Build AM/PM Peak Hour Turning Movements<br />
SC101 HOV <strong>Traffic</strong> Study – <strong>Forecast</strong> <strong>Operations</strong> <strong>Report</strong> Page 97
Figure 38 cont. 2040 Build AM/PM Peak Hour Turning Movements<br />
SC101 HOV <strong>Traffic</strong> Study – <strong>Forecast</strong> <strong>Operations</strong> <strong>Report</strong> Page 98
Figure 38 cont. 2040 Build AM/PM Peak Hour Turning Movements<br />
SC101 HOV <strong>Traffic</strong> Study – <strong>Forecast</strong> <strong>Operations</strong> <strong>Report</strong> Page 99
Figure 38 cont. 2040 Build AM/PM Peak Hour Turning Movements<br />
SC101 HOV <strong>Traffic</strong> Study – <strong>Forecast</strong> <strong>Operations</strong> <strong>Report</strong> Page 100
Figure 39. 2020/2040 AM/PM Peak Hour Right Turn On Red Turning Movements<br />
SC101 HOV <strong>Traffic</strong> Study – <strong>Forecast</strong> <strong>Operations</strong> <strong>Report</strong> Page 101
Figure 39 cont. 2020/2040 AM/PM Peak Hour Right Turn On Red Turning Movements<br />
SC101 HOV <strong>Traffic</strong> Study – <strong>Forecast</strong> <strong>Operations</strong> <strong>Report</strong> Page 102
Dowling Associates, Inc.<br />
Transportation Engineering Planning Research Education<br />
Table 49. Total Intersection Entering <strong>Traffic</strong> Volumes - AM Peak<br />
ID<br />
Intersection<br />
Existing<br />
Volumes Volumes<br />
Change from<br />
Existing Volumes<br />
Change from<br />
Existing<br />
Change from<br />
No Build Volumes<br />
Change from<br />
Existing Volumes<br />
Change from<br />
Existing<br />
1 NB on/off ramp & Bates Rd 39 42 3 42 3 0 47 8 47 8 0<br />
2 SB on/off ramp & Bates Rd 76 78 2 78 2 0 82 6 82 6 0<br />
3 NB on/off ramp & SR 150 713 717 4 722 9 5 723 10 736 23 13<br />
4 SB on/off ramp & SR 150 378 378 0 384 6 6 378 0 393 15 15<br />
5 Via Real & SR 150 568 575 7 580 12 5 587 19 600 32 13<br />
6 Carpinteria Ave & SR 150 285 285 0 285 0 0 285 0 286 1 1<br />
7 NB on/off ramp & Bailard Ave 915 996 81 1,021 106 26 1,117 202 1,185 270 68<br />
8 SB on/off ramp & Bailard Ave 756 882 126 891 135 9 1,093 337 1,116 360 23<br />
9 Via Real & Bailard Ave 866 1,019 153 1,043 177 24 1,273 407 1,338 472 65<br />
10 Carpinteria Ave & Bailard Ave 677 737 60 743 66 6 836 159 853 176 17<br />
11 Casitas Pass Rd & Via Real 1,182 1,336 154 1,879 697 543 1,617 435 2,160 978 543<br />
12 Vellocito & Via Real 548 338 -211 366 -183 28 465 -83 493 -55 28<br />
13 SB on/off ramp & Casitas Pass Rd 1,121 1,207 86 1,772 651 565 1,436 315 2,001 880 565<br />
14 Carpinteria Ave & Casitas Pass Rd 1,417 1,511 94 1,769 352 258 1,668 251 1,926 509 258<br />
15 NB on ramp & Ogan Rd & Via Real 697 799 102 1,260 563 461 960 263 1,421 724 461<br />
16 Linden Ave & Ogan Rd 1,180 1,285 105 1,542 362 257 1,512 332 1,769 589 257<br />
17 SB off ramp & Linden Ave 1,005 1,110 105 1,342 337 232 1,284 279 1,516 511 232<br />
18 Linden Ave & Sawyer Ave 944 990 46 1,069 125 79 1,066 122 1,277 333 211<br />
19 SB on/off ramp & Carpinteria Ave 669 749 80 742 73 -7 882 213 863 194 -19<br />
20 Santa Ynez Ave/7th St & Carpinteria Ave 943 1,005 62 996 53 -9 1,107 164 1,084 141 -23<br />
21 NB on/off ramp & Via Real 1,187 1,225 38 1,346 159 120 1,289 102 1,610 423 321<br />
22 NB on/off ramp & Padaro Ln 443 449 6 462 19 13 455 12 493 50 38<br />
23 Via Real & Padaro Ln 868 884 16 884 16 0 910 42 910 42 0<br />
24 SB off ramp & Santa Claus Ln/Padaro Ln 276 276 0 309 33 33 276 0 364 88 88<br />
25 NB on/off ramp & Padaro Ln 649 657 8 661 12 3 649 0 680 31 31<br />
26 Padaro Ln & Via Real 868 921 53 881 13 -39 1,008 140 903 35 -105<br />
27 SB on/off ramp & Padaro Ln 242 245 3 247 5 2 250 8 255 13 5<br />
28 NB off ramp & Ortega Hill Rd 411 434 23 416 5 -18 472 61 423 12 -49<br />
29 Evans Ave & Ortega Hill Rd 575 647 72 608 33 -38 766 191 664 89 -102<br />
30 NB on ramp & Ortega Hill Rd 403 485 82 443 40 -42 621 218 510 107 -111<br />
31 SB off ramp & Evans Ave 177 191 14 182 5 -9 214 37 189 12 -25<br />
32 NB on/off ramp & Sheffield 744 802 58 834 90 32 880 136 983 239 103<br />
33 SB on/off ramp & Sheffield 390 425 35 461 71 36 483 93 579 189 96<br />
34 Jameson & Sheffield 867 965 98 956 89 -9 1,128 261 1,105 238 -23<br />
35 NB on/off ramp & San Ysidro Rd 973 1,002 29 1,030 57 27 1,051 78 1,124 151 73<br />
36 San Ysidro Rd & N. Jameson Ln 1,227 1,333 106 1,288 61 -45 1,509 282 1,390 163 -119<br />
37 SB off ramp & San Ysidro Rd/Eucalyptus Ln 700 729 29 733 33 5 777 77 789 89 12<br />
38 S. Jameson Ln & San Ysidro Rd/Eucalyptus Ln 199 226 27 226 27 0 270 71 270 71 0<br />
39 NB off ramp & Olive Mill Rd 1,108 1,195 87 1,173 65 -22 1,341 233 1,282 174 -59<br />
40 SB on ramp & Olive Mill Rd 1,017 1,108 91 1,054 37 -54 1,259 242 1,116 99 -143<br />
41 SB off ramp & Depot 380 431 51 380 0 -51 515 135 380 0 -135<br />
42 Olive Mill Rd & Spring 611 667 56 615 4 -51 759 148 622 11 -137<br />
43 NB off ramp & Coast Village Rd/Hermosillo Dr 887 946 59 925 38 -21 1,044 157 987 100 -57<br />
44 SB on/off ramp & NB off ramp & Cabrillo Blvd 1,038 1,052 14 1,151 113 98 1,076 38 1,338 300 262<br />
45 NB on ramp & Cabrillo Blvd 1,345 1,382 37 1,390 45 8 1,444 99 1,465 120 21<br />
46 NB on/off ramp & S. Salinas St 629 633 4 659 30 27 639 10 710 81 71<br />
47 NB on/off ramp & Milpas St 2,991 3,028 37 3,175 184 147 3,090 99 3,482 491 392<br />
48 SB off ramp & Milpas St 2,165 2,202 37 2,251 86 48 2,284 119 2,399 234 115<br />
49 SB on/off ramp & Milpas St 1,910 1,932 22 2,167 257 236 1,968 58 2,596 686 628<br />
50 NB on/off ramp & Garden St 2,235 2,305 70 2,356 121 51 2,420 185 2,556 321 136<br />
51 NB off ramp & Palm Ave 365 407 42 427 62 21 476 111 531 166 55<br />
52 SB on/off ramp & Garden St 1,981 2,107 126 2,162 181 55 2,318 337 2,464 483 146<br />
53 Garden St & E/ Yanonali St 1,363 1,441 78 1,459 96 19 1,570 207 1,620 257 50<br />
54 NB off ramp & Bath St 423 434 11 441 18 6 453 30 470 47 17<br />
55 NB on ramp & Castillo St 1,587 1,672 85 1,669 82 -3 1,814 227 1,806 219 -8<br />
56 W. Haley St & Bath St 981 1,025 44 1,023 42 -1 1,097 116 1,094 113 -3<br />
57 SB on/off ramp & Castillo St 2,257 2,368 111 2,368 111 0 2,552 295 2,551 294 -1<br />
58 NB on/off ramp & Carrillo St 3,239 3,341 102 3,350 111 9 3,510 271 3,534 295 24<br />
59 SB on/off ramp & Carrillo St 3,435 3,528 93 3,532 97 5 3,677 242 3,689 254 12<br />
60 Cabrillo St & Castillo St 2,742 2,837 95 2,870 128 33 2,995 253 3,082 340 87<br />
61 Cabrillo St & San Pascual St 2,241 2,252 11 2,247 6 -5 2,271 30 2,258 17 -13<br />
62 NB on/off ramp & Arrellaga St 861 864 3 872 11 8 869 8 890 29 21<br />
63 NB on/off ramp & Mission St 2,930 2,982 52 2,992 62 9 3,068 138 3,093 163 25<br />
64 SB on/off ramp & Mission St 2,705 2,747 42 2,755 50 8 2,817 112 2,838 133 21<br />
65 Mission St & Castillo St 2,363 2,429 66 2,423 60 -5 2,529 166 2,515 152 -14<br />
66 Mission St & San Pascual St 1,359 1,368 9 1,365 6 -4 1,384 25 1,374 15 -10<br />
67 NB off ramp & Pueblo St & Calle Real 815 817 2 818 3 1 821 6 824 9 3<br />
68 NB on ramp & Calle Real & Las Positas 1,564 1,600 36 1,625 61 25 1,663 99 1,729 165 66<br />
69 Calle Real & Las Positas Rd 3,328 3,370 42 3,399 71 29 3,439 111 3,516 188 77<br />
70 SB on/off ramp & Las Positas Rd 2,855 2,893 38 2,920 65 27 2,955 100 3,027 172 72<br />
71 Las Pasitas Rd & Modoc Rd 2,652 2,678 26 2,665 13 -13 2,722 70 2,687 35 -35<br />
72 NB on/off ramp & Calle Real & Hope 1,677 1,693 16 1,727 50 35 1,719 42 1,811 134 92<br />
73 SB on/off ramp & La Cumbre Rd 2,125 2,136 11 2,135 10 -1 2,154 29 2,152 27 -2<br />
74 La Cumbre Rd & Calle Real 2,030 2,053 23 2,051 21 -2 2,091 61 2,086 56 -5<br />
75 NB off ramp & State St & Calle Real 2,388 2,472 84 2,485 97 12 2,613 225 2,646 258 33<br />
76 NB on ramp & State St 1,403 1,409 6 1,407 4 -2 1,419 16 1,414 11 -5<br />
77 Calle Real & Rt 154 & San Macros Pass Rd 2,813 2,891 78 2,902 89 11 3,021 208 3,051 238 30<br />
78 SB off ramp & State St 1,735 1,783 48 1,788 53 5 1,864 129 1,876 141 12<br />
79 SB on ramp & State St & Rt 154 1,941 1,983 42 1,994 53 10 2,054 113 2,081 140 27<br />
80 NB on/off ramp & Calle Real & El Sueno Rd 949 986 37 988 39 2 1,047 98 1,052 103 5<br />
81 NB on/off ramp & Turnpike Rd 2,354 2,400 46 2,434 80 35 2,476 122 2,568 214 92<br />
82 SB on/off ramp & Turnpike Rd 2,850 2,878 28 2,909 59 31 2,918 68 3,001 151 83<br />
83 Turnpike Rd & Calle Real 1,829 1,871 42 1,900 71 29 1,940 111 2,017 188 77<br />
84 NB on/off ramp & Patterson Ave 2,670 2,762 92 2,847 177 85 2,914 244 3,141 471 227<br />
85 SB on/off ramp & Patterson Ave 2,785 2,859 74 2,956 171 97 2,983 198 3,241 456 258<br />
86 Patterson Ave & Calle Real 2,188 2,220 32 2,248 60 27 2,274 86 2,347 159 73<br />
87 NB on/off ramp & Fairview Ave 2,860 2,888 28 2,907 47 19 2,935 75 2,985 125 50<br />
88 Calle Real & Fairview Ave 2,349 2,371 22 2,378 29 7 2,408 59 2,427 78 19<br />
89 SB on/off ramp & Fairview Ave 2,836 2,897 61 2,907 71 10 2,996 160 3,022 186 26<br />
90 NB on/off ramp & Los Carneros Rd 1,596 1,726 130 1,764 168 39 1,942 346 2,045 449 103<br />
91 SB on/off ramp & Los Carneros Rd 2,083 2,226 143 2,271 188 45 2,460 377 2,579 496 119<br />
92 Los Carneros Rd & Calle Real 778 874 96 872 94 -2 1,034 256 1,028 250 -6<br />
93 NB on/off ramp & Glen Annie Rd & Calle Real 2,907 3,048 141 3,048 141 0 3,282 375 3,282 375 0<br />
94 Glen Annie Rd & Del Norte Rd 1,064 1,085 21 1,086 22 0 1,121 57 1,122 58 1<br />
95 SB on/off ramp & Glen Annie Rd 3,280 3,517 237 3,517 237 0 3,912 632 3,911 631 -1<br />
96 NB ramp & Hollister Ave 284 335 51 335 51 0 420 136 419 135 -1<br />
97 SB on/off ramp & Hollister Ave 921 922 1 923 2 0 924 3 925 4 1<br />
98 NB off ramp/Calle Real & Winchester Canyon 430 433 3 433 3 0 439 9 439 9 0<br />
100 NB on/off ramps & Via Real NA 886 NA 1,304 NA 418 1,292 NA 1,710 NA 418<br />
102 Garden St & Gutierrez St 2,587 2,664 77 2,665 78 1 2,792 205 2,794 207 2<br />
103 Castillo St & Montecito St 2,337 2,470 133 2,463 126 -6 2,691 354 2,674 337 -17<br />
104 Carrillo St & San Andres St 2,311 2,330 19 2,324 13 -6 2,362 51 2,346 35 -16<br />
105 Mission St & Modoc St 1,504 1,515 11 1,521 17 6 1,532 28 1,549 45 17<br />
106 Milpas St & Quinientos St 2,531 2,572 41 2,578 47 6 2,640 109 2,655 124 15<br />
391 N. Jameson Ln & Olive Mill Rd 882 942 60 924 42 -18 1,041 159 993 111 -48<br />
792 State St & San Marcos Pass Road 1,931 1,975 44 1,979 48 4 2,048 117 2,058 127 10<br />
Notes<br />
Indicates negative change in traffic volumes<br />
NA Data not available<br />
2020 No Build 2020 Build<br />
2040 No Build 2040 Build<br />
Change from<br />
No Build<br />
SC101 HOV <strong>Traffic</strong> Study – <strong>Forecast</strong> <strong>Operations</strong> <strong>Report</strong> Page 103
Dowling Associates, Inc.<br />
Transportation Engineering Planning Research Education<br />
Table 50. Total Intersection Entering <strong>Traffic</strong> Volumes - PM Peak<br />
ID<br />
Intersection<br />
Existing<br />
Volumes Volumes<br />
Change from<br />
Change from Change from<br />
Existing Volumes Existing No Build Volumes<br />
Change from<br />
Existing Volumes<br />
2040 Change Build<br />
from<br />
Existing<br />
1 NB on/off ramp & Bates Rd 78 90 12 90 12 0 110 32 110 32 0<br />
2 SB on/off ramp & Bates Rd 74 87 13 87 13 0 138 64 138 64 0<br />
3 NB on/off ramp & SR 150 617 619 2 629 12 11 621 4 649 32 28<br />
4 SB on/off ramp & SR 150 644 644 0 655 11 10 644 0 672 28 28<br />
5 Via Real & SR 150 636 638 2 648 12 11 640 4 668 32 28<br />
6 Carpinteria Ave & SR 150 257 257 0 257 0 0 257 0 257 0 0<br />
7 NB on/off ramp & Bailard Ave 1,123 1,158 35 1,223 100 66 1,215 92 1,390 267 175<br />
8 SB on/off ramp & Bailard Ave 876 917 41 967 91 50 986 110 1,119 243 133<br />
9 Via Real & Bailard Ave 1,015 1,217 202 1,228 213 11 1,554 539 1,583 568 29<br />
10 Carpinteria Ave & Bailard Ave 865 873 8 894 29 21 887 22 943 78 56<br />
11 Casitas Pass Rd & Via Real 1,081 1,601 520 1,735 654 134 2,495 1,414 2,462 1,381 -33<br />
12 Vellocito & Via Real 461 549 88 366 -95 -182 1,306 845 663 202 -643<br />
13 SB on/off ramp & Casitas Pass Rd 1,445 1,705 260 1,988 543 283 2,138 693 2,421 976 283<br />
14 Carpinteria Ave & Casitas Pass Rd 1,804 1,950 146 2,086 282 136 2,193 389 2,329 525 136<br />
15 NB on ramp & Ogan Rd & Via Real 583 945 362 737 154 -208 1,510 927 1,196 613 -314<br />
16 Linden Ave & Ogan Rd 1,129 1,403 274 1,135 6 -268 1,892 763 1,624 495 -268<br />
17 SB off ramp & Linden Ave 1,042 1,135 93 1,248 206 113 1,292 250 1,405 363 113<br />
18 Linden Ave & Sawyer Ave 958 1,010 52 1,024 66 14 1,097 139 1,133 175 36<br />
19 SB on/off ramp & Carpinteria Ave 979 1,163 184 1,167 188 4 1,470 491 1,480 501 10<br />
20 Santa Ynez Ave/7th St & Carpinteria Ave 1,423 1,622 199 1,567 144 -55 1,954 531 1,808 385 -146<br />
21 NB on/off ramp & Via Real 1,114 1,348 234 1,314 200 -34 1,737 623 1,646 532 -91<br />
22 NB on/off ramp & Padaro Ln 606 780 174 659 53 -121 1,069 463 746 140 -323<br />
23 Via Real & Padaro Ln 741 927 186 780 39 -147 1,237 496 846 105 -391<br />
24 SB off ramp & Santa Claus Ln/Padaro Ln 580 663 83 627 47 -35 800 220 706 126 -94<br />
25 NB on/off ramp & Padaro Ln 439 540 101 485 46 -54 707 268 562 123 -145<br />
26 Padaro Ln & Via Real 512 762 250 572 60 -191 1,179 667 671 159 -508<br />
27 SB on/off ramp & Padaro Ln 341 342 1 358 17 17 341 0 387 46 46<br />
28 NB off ramp & Ortega Hill Rd 425 613 188 475 50 -138 926 501 557 132 -369<br />
29 Evans Ave & Ortega Hill Rd 625 826 201 663 38 -163 1,161 536 726 101 -435<br />
30 NB on ramp & Ortega Hill Rd 412 592 180 453 41 -139 891 479 520 108 -371<br />
31 SB off ramp & Evans Ave 333 353 20 356 23 3 386 53 393 60 7<br />
32 NB on/off ramp & Sheffield 504 633 129 634 130 0 849 345 850 346 1<br />
33 SB on/off ramp & Sheffield 236 248 12 267 31 19 269 33 319 83 50<br />
34 Jameson & Sheffield 622 886 264 721 99 -165 1,325 703 885 263 -440<br />
35 NB on/off ramp & San Ysidro Rd 947 1,091 144 1,005 58 -86 1,330 383 1,101 154 -229<br />
36 San Ysidro Rd & N. Jameson Ln 1,155 1,362 207 1,216 61 -146 1,706 551 1,318 163 -388<br />
37 SB off ramp & San Ysidro Rd/Eucalyptus Ln 588 852 264 666 78 -186 1,292 704 796 208 -496<br />
38 S. Jameson Ln & San Ysidro Rd/Eucalyptus Ln 238 379 141 281 43 -98 614 376 353 115 -261<br />
39 NB off ramp & Olive Mill Rd 942 1,051 109 1,098 156 47 1,233 291 1,359 417 126<br />
40 SB on ramp & Olive Mill Rd 1,138 1,296 158 1,299 161 3 1,559 421 1,567 429 8<br />
41 SB off ramp & Depot 170 314 144 191 21 -123 555 385 227 57 -328<br />
42 Olive Mill Rd & Spring 511 743 232 541 30 -202 1,130 619 592 81 -538<br />
43 NB off ramp & Coast Village Rd/Hermosillo Dr 1,212 1,356 144 1,284 72 -72 1,597 385 1,404 192 -193<br />
44 SB on/off ramp & NB off ramp & Cabrillo Blvd 1,093 1,195 102 1,218 125 23 1,365 272 1,426 333 61<br />
45 NB on ramp & Cabrillo Blvd 1,573 1,740 167 1,760 187 20 2,018 445 2,072 499 54<br />
46 NB on/off ramp & S. Salinas St 477 560 83 582 105 23 698 221 758 281 60<br />
47 NB on/off ramp & Milpas St 3,381 3,419 38 3,575 194 156 3,482 101 3,897 516 415<br />
48 SB off ramp & Milpas St 2,696 2,746 50 2,816 120 71 2,828 132 3,016 320 188<br />
49 SB on/off ramp & Milpas St 2,625 2,625 0 2,763 138 138 2,625 0 2,994 369 369<br />
50 NB on/off ramp & Garden St 2,626 2,826 200 2,827 201 0 3,156 530 3,157 531 1<br />
51 NB off ramp & Palm Ave 220 301 81 313 93 13 435 215 469 249 34<br />
52 SB on/off ramp & Garden St 2,257 2,436 179 2,483 226 47 2,734 477 2,859 602 125<br />
53 Garden St & E/ Yanonali St 1,718 1,832 114 1,890 172 58 2,023 305 2,177 459 154<br />
54 NB off ramp & Bath St 559 610 51 614 55 5 694 135 706 147 12<br />
55 NB on ramp & Castillo St 2,205 2,342 137 2,355 150 13 2,571 366 2,605 400 34<br />
56 W. Haley St & Bath St 1,449 1,502 53 1,500 51 -2 1,591 142 1,586 137 -5<br />
57 SB on/off ramp & Castillo St 2,557 2,759 202 2,769 212 9 3,092 535 3,117 560 25<br />
58 NB on/off ramp & Carrillo St 3,947 4,121 174 4,130 183 9 4,412 465 4,435 488 23<br />
59 SB on/off ramp & Carrillo St 3,778 3,915 137 3,924 146 9 4,141 363 4,164 386 23<br />
60 Cabrillo St & Castillo St 3,618 3,814 196 3,810 192 -4 4,141 523 4,130 512 -11<br />
61 Cabrillo St & San Pascual St 2,580 2,637 57 2,631 51 -6 2,732 152 2,717 137 -15<br />
62 NB on/off ramp & Arrellaga St 1,028 1,050 22 1,055 27 5 1,087 59 1,099 71 12<br />
63 NB on/off ramp & Mission St 2,725 2,886 161 2,932 207 47 3,150 425 3,274 549 124<br />
64 SB on/off ramp & Mission St 2,473 2,593 120 2,627 154 34 2,793 320 2,883 410 90<br />
65 Mission St & Castillo St 2,451 2,621 170 2,663 212 43 2,887 436 3,001 550 114<br />
66 Mission St & San Pascual St 1,436 1,484 48 1,501 65 17 1,565 129 1,610 174 45<br />
67 NB off ramp & Pueblo St & Calle Real 764 810 46 784 20 -26 887 123 817 53 -70<br />
68 NB on ramp & Calle Real & Las Positas 1,616 1,681 65 1,685 69 4 1,789 173 1,800 184 11<br />
69 Calle Real & Las Positas Rd 3,588 3,683 95 3,672 84 -12 3,842 254 3,811 223 -31<br />
70 SB on/off ramp & Las Positas Rd 3,086 3,140 54 3,153 67 13 3,230 144 3,264 178 34<br />
71 Las Pasitas Rd & Modoc Rd 2,635 2,685 50 2,686 51 1 2,769 134 2,772 137 3<br />
72 NB on/off ramp & Calle Real & Hope 2,029 2,101 72 2,137 108 36 2,222 193 2,318 289 96<br />
73 SB on/off ramp & La Cumbre Rd 2,254 2,283 29 2,282 28 -2 2,332 78 2,328 74 -4<br />
74 La Cumbre Rd & Calle Real 2,493 2,523 30 2,521 28 -2 2,573 80 2,567 74 -6<br />
75 NB off ramp & State St & Calle Real 2,837 3,048 211 3,057 220 9 3,400 563 3,424 587 24<br />
76 NB on ramp & State St 1,581 1,704 123 1,692 111 -12 1,908 327 1,876 295 -32<br />
77 Calle Real & Rt 154 & San Macros Pass Rd 2,637 2,772 135 2,784 147 12 2,996 359 3,028 391 32<br />
78 SB off ramp & State St 1,798 1,878 80 1,874 76 -4 2,010 212 2,000 202 -10<br />
79 SB on ramp & State St & Rt 154 1,635 1,704 69 1,722 87 18 1,818 183 1,867 232 49<br />
80 NB on/off ramp & Calle Real & El Sueno Rd 978 1,077 99 1,082 104 5 1,242 264 1,256 278 14<br />
81 NB on/off ramp & Turnpike Rd 2,415 2,520 105 2,567 152 47 2,694 279 2,819 404 125<br />
82 SB on/off ramp & Turnpike Rd 2,509 2,635 126 2,677 168 42 2,838 329 2,949 440 111<br />
83 Turnpike Rd & Calle Real 2,006 2,151 145 2,185 179 34 2,393 387 2,484 478 91<br />
84 NB on/off ramp & Patterson Ave 3,230 3,339 109 3,451 221 113 3,520 290 3,820 590 300<br />
85 SB on/off ramp & Patterson Ave 3,438 3,588 150 3,647 209 59 3,839 401 3,995 557 156<br />
86 Patterson Ave & Calle Real 2,850 2,948 98 3,027 177 80 3,111 261 3,323 473 212<br />
87 NB on/off ramp & Fairview Ave 2,704 2,779 75 2,805 101 26 2,904 200 2,973 269 69<br />
88 Calle Real & Fairview Ave 2,946 2,990 44 3,007 61 17 3,064 118 3,109 163 45<br />
89 SB on/off ramp & Fairview Ave 2,785 2,859 74 2,883 98 24 2,981 196 3,045 260 64<br />
90 NB on/off ramp & Los Carneros Rd 1,867 2,053 186 2,127 260 74 2,363 496 2,561 694 198<br />
91 SB on/off ramp & Los Carneros Rd 2,544 2,736 192 2,805 261 70 3,054 510 3,240 696 186<br />
92 Los Carneros Rd & Calle Real 1,143 1,270 127 1,310 167 40 1,481 338 1,588 445 107<br />
93 NB on/off ramp & Glen Annie Rd & Calle Real 3,088 3,327 239 3,324 236 -3 3,724 636 3,716 628 -8<br />
94 Glen Annie Rd & Del Norte Rd 851 897 46 902 51 5 974 123 987 136 13<br />
95 SB on/off ramp & Glen Annie Rd 3,493 3,650 157 3,639 146 -12 3,911 418 3,880 387 -31<br />
96 NB ramp & Hollister Ave 414 438 24 437 23 -1 477 63 475 61 -2<br />
97 SB on/off ramp & Hollister Ave 871 903 32 910 39 7 955 84 974 103 19<br />
98 NB off ramp/Calle Real & Winchester Canyon 590 590 0 590 0 0 590 0 590 0 0<br />
100 NB on/off ramps & Via Real NA 854 NA 932 NA 78 1,443 NA 1,521 NA 78<br />
102 Garden St & Gutierrez St 2,775 2,978 203 2,981 206 3 3,315 540 3,323 548 8<br />
103 Castillo St & Montecito St 2,789 2,989 200 2,990 201 1 3,323 534 3,326 537 3<br />
104 Carrillo St & San Andres St 2,548 2,632 84 2,622 74 -10 2,771 223 2,744 196 -27<br />
105 Mission St & Modoc St 1,664 1,686 22 1,695 31 9 1,723 59 1,746 82 23<br />
106 Milpas St & Quinientos St 2,518 2,743 225 2,767 249 24 3,118 600 3,181 663 63<br />
391 N. Jameson Ln & Olive Mill Rd 703 757 54 823 120 65 848 145 1,022 319 174<br />
792 State St & San Marcos Pass Road 1,967 2,048 81 2,053 86 5 2,183 216 2,197 230 14<br />
Notes<br />
Indicates negative change in traffic volumes<br />
NA Data not available<br />
2020 No Build 2020 Build 2040 No Build<br />
SC101 HOV <strong>Traffic</strong> Study – <strong>Forecast</strong> <strong>Operations</strong> <strong>Report</strong> Page 104<br />
Change<br />
from No<br />
Build
Figure 40. 2040 Change in Peak Hour Ramp Volumes (Build vs. No Build)<br />
SC101 HOV <strong>Traffic</strong> Study – <strong>Forecast</strong> <strong>Operations</strong> <strong>Report</strong> Page 105
Figure 40 cont. 2040 Change in Peak Hour Ramp Volumes (Build vs. No Build)<br />
SC101 HOV <strong>Traffic</strong> Study – <strong>Forecast</strong> <strong>Operations</strong> <strong>Report</strong> Page 106
Figure 40 cont. 2040 Change in Peak Hour Ramp Volumes (Build vs. No Build)<br />
SC101 HOV <strong>Traffic</strong> Study – <strong>Forecast</strong> <strong>Operations</strong> <strong>Report</strong> Page 107
Figure 40 cont. 2040 Change in Peak Hour Ramp Volumes (Build vs. No Build)<br />
SC101 HOV <strong>Traffic</strong> Study – <strong>Forecast</strong> <strong>Operations</strong> <strong>Report</strong> Page 108
Dowling Associates, Inc.<br />
Transportation Engineering Planning Research Education<br />
<strong>Forecast</strong> Intersection Operational Results<br />
Complete 2020 and 2040 No Build and Build AM/PM peak hour LOS results by movement were computed<br />
for all study area intersections using the SYNCHRO-7 (HCM Method) and TRAFFIX (ICU Method)<br />
operational software as appropriate. It should be noted that existing signal timing sheets were applied to<br />
the future condition analysis to ensure a reasonable worst case analysis of future operations. Signal<br />
timing adjustments will be considered as a mitigation option during the subsequent environmental phase of<br />
the project and will be based on location specific conditions and engineering assessments.<br />
Several operational reasonableness checks were performed for signalized study intersections. These are<br />
described below.<br />
HCM SYNCHRO-7 estimated saturation flow rates and the ICU a priori saturation flow rate assumption for<br />
signalized intersections were compared with the PM peak hour field measured saturation flow rates<br />
documented as part of SBCAG’s CMP process in 2003. Comparisons indicate a reasonable<br />
correspondence. These comparisons for 2020 and 2040 are provided in Table 51.<br />
As stated above and in the methodology section – existing signal timing sheets were applied to the HCM<br />
2020 and 2040 future year analysis for signalized intersections. Modifications to the existing signal timing<br />
plans were performed only under the following two circumstances:<br />
If calculated 95 th percentile queues indicate potential for queue spill back conditions onto the<br />
freeway mainline (i.e., queue exceeds storage capacity of an off-ramp). These conditions<br />
were checked under 2020 and 2040 No Build and Build conditions at all freeway off-ramp<br />
intersections. When the estimated 95 th percentile flow rate exceeds the capacity for a given<br />
movement – denoted by “#” – traffic is simulated for two cycles to report 95 th percentile<br />
queues. As such, actual queues can exceed the 95 th percentile estimate. In these cases,<br />
SYNCHRO-7 recommends checking to ensure the peak hour v/c for the movement in question<br />
is less than 1.00. If it is not - green time should be re-allocated until the peak hour volume-tocapacity<br />
ratio for the movement is less than or equal to 1.00. When the volume-to-capacity<br />
ratio meets this condition, the queue length as originally reported can be considered stable.<br />
These checks are shown for 2020 and 2040 in Table 52 and Table 53 respectively.<br />
Highlighted approaches indicate where green time adjustments were required to the original<br />
signal timing plans (i.e., more green time allocated to the off-ramp approach) to ensure<br />
flushing of the off-ramps. This signal timing adjustment was required at seven intersections<br />
under 2020 conditions and eleven intersections under 2040 conditions. Signal timing<br />
adjustment checks to ensure adequate ramp discharge were checked under both No Build<br />
and Build conditions at these intersections.<br />
If future programmed improvements would modify the geometry of an intersection. Given the<br />
latter condition, the existing signal timing plan’s cycle length was held constant. The green<br />
time splits however were re-optimized using the SYNCHRO-7 operational software in order to<br />
properly reflect the proposed intersection geometry.<br />
Final HCM level of service results including baseline conditions are graphically shown in Figure 41.<br />
Complete 2020 No Build and Build AM/PM peak hour operational results by movement are provided in<br />
Table 54 through Table 57. Complete 2040 No Build and Build AM/PM peak hour LOS results by<br />
movement for all study intersection are provided in Table 58 through Table 61.<br />
All SYNCHRO-7 software HCM intersection LOS worksheets are provided in Appendix C. All 2020 and<br />
2040 TRAFFIX software ICU intersection LOS worksheets are provided in Appendix D. TRAFFIX signal<br />
warrant worksheets are provided in Appendix E.<br />
SC101 HOV <strong>Traffic</strong> Study – <strong>Forecast</strong> <strong>Operations</strong> <strong>Report</strong> Page 109
Dowling Associates, Inc.<br />
Transportation Engineering Planning Research Education<br />
Table 51. 2020 and 2040 PM Peak Hour Estimated Saturation Flow Rates<br />
ID<br />
Intersection<br />
Control ICU 2003 Field<br />
Type Assumed Measured 1<br />
2020 Build<br />
2040 Build<br />
PM PM<br />
11 Casitas Pass Rd & Via Real Signal 1,600 1799 1,719 1,721<br />
13 SB on/off ramp & Casitas Pass Rd Signal 1,600 1799 1,719 1,721<br />
14 Carpinteria Ave & Casitas Pass Rd Signal 1,600 1799 1,744 1,744<br />
15 NB on ramp & Ogan Rd & Via Real Roundabout 1,600 1799 1,742 1,788<br />
16 Linden Ave & Ogan Rd Signal 1,600 1799 1,750 1,750<br />
17 SB off ramp & Linden Ave Signal 1,600 1799 1,740 1,740<br />
20 Santa Ynez Ave/7th St & Carpinteria Ave Signal 1,600 1799 1,751 1,750<br />
47 NB on/off ramp & Milpas St Roundabout 1,600 1799 1,626 1,627<br />
48 SB off ramp & Milpas St Signal 1,600 1799 1,637 1,637<br />
49 SB on/off ramp & Milpas St Signal 1,600 1799 1,642 1,642<br />
50 NB on/off ramp & Garden St Signal 1,600 1799 1,708 1,708<br />
52 SB on/off ramp & Garden St Signal 1,600 1799 1,695 1,690<br />
53 Garden St & E/ Yanonali St Signal 1,600 1799 1,707 1,707<br />
55 NB on ramp & Castillo St Signal 1,600 1799 1,675 1,676<br />
56 W. Haley St & Bath St Signal 1,600 1799 1,707 1,707<br />
57 SB on/off ramp & Castillo St Signal 1,600 1799 1,730 1,726<br />
58 NB on/off ramp & Carrillo St Signal 1,600 1799 1,628 1,624<br />
59 SB on/off ramp & Carrillo St Signal 1,600 1799 1,647 1,646<br />
60 Cabrillo St & Castillo St Signal 1,600 1799 1,622 1,622<br />
63 NB on/off ramp & Mission St Signal 1,600 1799 1,649 1,648<br />
64 SB on/off ramp & Mission St Signal 1,600 1799 1,625 1,629<br />
65 Mission St & Castillo St Signal 1,600 1799 1,616 1,617<br />
68 NB on ramp & Calle Real & Las Positas Signal 1,600 1799 1,714 1,713<br />
69 Calle Real & Las Positas Rd Signal 1,600 1799 1,626 1,626<br />
70 SB on/off ramp & Las Positas Rd Signal 1,600 1799 1,694 1,694<br />
71 Las Pasitas Rd & Modoc Rd Signal 1,600 1799 1,694 1,694<br />
72 NB on/off ramp & Calle Real & Hope Signal 1,600 1799 1,723 1,722<br />
73 SB on/off ramp & La Cumbre Rd Signal 1,600 1799 1,712 1,712<br />
74 La Cumbre Rd & Calle Real Signal 1,600 1799 1,624 1,623<br />
75 NB off ramp & State St & Calle Real Signal 1,600 1799 1,732 1,730<br />
77 Calle Real & Rt 154 & San Macros Pass Rd Signal 1,600 1799 1,688 1,687<br />
78 SB off ramp & State St Signal 1,600 1799 1,713 1,715<br />
81 NB on/off ramp & Turnpike Rd Signal 1,600 1799 1,730 1,732<br />
82 SB on/off ramp & Turnpike Rd Signal 1,600 1799 1,740 1,741<br />
83 Turnpike Rd & Calle Real Signal 1,600 1799 1,729 1,729<br />
84 NB on/off ramp & Patterson Ave Signal 1,600 1799 1,681 1,678<br />
85 SB on/off ramp & Patterson Ave Signal 1,600 1799 1,674 1,674<br />
86 Patterson Ave & Calle Real Signal 1,600 1799 1,692 1,692<br />
87 NB on/off ramp & Fairview Ave Signal 1,600 1799 1,648 1,648<br />
88 Calle Real & Fairview Ave Signal 1,600 1799 1,732 1,732<br />
89 SB on/off ramp & Fairview Ave Signal 1,600 1799 1,679 1,678<br />
90 NB on/off ramp & Los Carneros Rd Signal 1,600 1799 1,724 1,720<br />
91 SB on/off ramp & Los Carneros Rd Signal 1,600 1799 1,720 1,719<br />
92 Los Carneros Rd & Calle Real Signal 1,600 1799 1,739 1,739<br />
93 NB on/off ramp & Glen Annie Rd & Calle Real Signal 1,600 1799 1,669 1,667<br />
95 SB on/off ramp & Glen Annie Rd Signal 1,600 1799 1,689 1,688<br />
100 NB on/off ramps & Via Real Signal 1,600 1799 1,746 1,749<br />
102 Garden St & Gutierrez St Signal 1,600 1799 1,693 1,692<br />
103 Castillo St & Montecito St Signal 1,600 1799 1,688 1,688<br />
104 Carrillo St & San Andres St Signal 1,600 1799 1,612 1,611<br />
106 Milpas St & Quinientos St Signal 1,600 1799 1,684 1,682<br />
792 State St & San Marcos Pass Road Signal 1,600 1799 1,667 1,667<br />
1 Weighted Avg. for South Coast Intersections (16 obs)<br />
SC101 HOV <strong>Traffic</strong> Study – <strong>Forecast</strong> <strong>Operations</strong> <strong>Report</strong> Page 110
Dowling Associates, Inc.<br />
Transportation Engineering Planning Research Education<br />
Table 52. 2020 Build: 95 th Percentile Highway 101 Off-Ramp Queue Spill Back Checks<br />
No. Intersection Dir Off Ramp<br />
Weekday AM Peak Hour Weekday PM Peak Hour<br />
95th Queue<br />
(ft.) V/C<br />
95th Queue<br />
(ft.) V/C<br />
1 NB on/off ramp & Bates Rd NB WB App 1,000 0 2<br />
2 SB on/off ramp & Bates Rd SB EB App 1,350 2 1<br />
3 NB on/off ramp & SR 150 NB WB App 1,150 30 5<br />
4 SB on/off ramp & SR 150 SB EB App 1,050 11 94<br />
7 NB on/off ramp & Bailard Ave NB WB App 1,000 26 19<br />
8 SB on/off ramp & Bailard Ave SB EB App 1,150 286 270<br />
13 SB on/off ramp & Casitas Pass Rd SB EB App 750 71 81<br />
17 SB off ramp & Linden Ave SB EB App 950 103 121<br />
19 SB on/off ramp & Carpinteria Ave SB SB App 700 13 172<br />
21 NB on/off ramp & Via Real NB NB App 700 N/A N/A<br />
22 NB on/off ramp & S. Padaro Ln NB WB App 1,250 10 6<br />
24 SB off ramp & Santa Claus Ln/Padaro Ln SB EB App 1,050 14 100<br />
25 NB on/off ramp & N. Padaro Ln NB WB App 1,250 10 6<br />
27 SB on/off ramp & Padaro Ln SB EB App 1,000 18 35<br />
28 NB off ramp & Ortega Hill Rd NB NB App 850 8 16<br />
31 SB off ramp & Evans Ave SB EB App 1,000 11 34<br />
32 NB on/off ramp & Sheffield NB WB App 750 30 9<br />
33 SB on/off ramp & Sheffield SB EB App 450 87 25<br />
35 NB on/off ramp & San Ysidro Rd NB WB App 700 12 11<br />
37 SB off ramp & San Ysidro Rd/Eucalyptus Ln SB EB App 650 163 82<br />
39 NB off ramp & Olive Mill Rd NB WB App 750 N/A N/A<br />
41 SB off ramp & Depot SB EB App 750 0 0<br />
43 NB off ramp & Coast Village Rd/Hermosillo Dr NB NB App 550 19 47<br />
44 SB on/off ramp & NB off ramp & Cabrillo Blvd NB WB App 1,000 N/A N/A<br />
44 SB on/off ramp & NB off ramp & Cabrillo Blvd SB EB App 1,200 N/A N/A<br />
46 NB on/off ramp & S. Salinas St NB WB App 850 N/A N/A<br />
47 NB on/off ramp & Milpas St NB WB App 1,100 N/A N/A<br />
48 SB off ramp & Milpas St SB EB App 1,100 136 211<br />
49 SB on/off ramp & Milpas St SB WB App # 361 0.85 # 403 0.9<br />
50 NB on/off ramp & Garden St NB WB App 1,650 # 130 0.75 # 178 0.86<br />
51 NB off ramp & Palm Ave NB NB App 450 0 0<br />
52 SB on/off ramp & Garden St SB EB App 850 # 263 0.86 # 249 1.13<br />
54 NB off ramp & Bath St NB NB App 800 0 0<br />
57 SB on/off ramp & Castillo St SB EB App 1,000 304 # 424 0.89<br />
58 NB on/off ramp & Carrillo St NB WB App 900 # 256 0.82 # 345 0.99<br />
59 SB on/off ramp & Carrillo St SB EB App 950 # 560 0.9 # 399 1.02<br />
62 NB on/off ramp & Arrellaga St NB NB App 800 16 22<br />
63 NB on/off ramp & Mission St NB WB App 750 # 208 0.98 # 193 0.81<br />
64 SB on/off ramp & Mission St SB EB App 1,000 # 468 1.02 # 460 1.01<br />
67 NB off ramp & Pueblo St & Calle Real NB WB App 500 21 26<br />
70 SB on/off ramp & Las Positas Rd SB EB App 1,000 # 438 0.91 # 704 1.15<br />
72 NB on/off ramp & Calle Real & Hope NB NB App 750 272 338<br />
73 SB on/off ramp & La Cumbre Rd SB EB App 900 152 253<br />
75 NB off ramp & State St & Calle Real NB NB App 1,000 283 353<br />
78 SB off ramp & State St SB SB App 1,950 210 321<br />
80 NB on/off ramp & Calle Real & El Sueno Rd NB NB App 550 N/A N/A<br />
81 NB on/off ramp & Turnpike Rd NB WB App 1,150 # 307 0.96 # 197 0.74<br />
82 SB on/off ramp & Turnpike Rd SB EB App 1,100 175 # 196 1.12dl<br />
84 NB on/off ramp & Patterson Ave NB WB App 750 258 212<br />
85 SB on/off ramp & Patterson Ave SB EB App 1,950 # 167 0.73 # 326 0.84<br />
87 NB on/off ramp & Fairview Ave NB WB App 1,000 337 337<br />
89 SB on/off ramp & Fairview Ave SB EB App 1,150 169 180<br />
90 NB on/off ramp & Los Carneros Rd NB WB App 1,250 # 469 0.94 289<br />
91 SB on/off ramp & Los Carneros Rd SB EB App 1,800 217 150<br />
93 NB on/off ramp & Glen Annie Rd & Calle Real NB WB App 2,800 # 570 1.6 # 854 2.3<br />
95 SB on/off ramp & Glen Annie Rd SB EB App 1,400 # 331 1.02 79<br />
97 SB on/off ramp & Hollister Ave SB EB App 1,450 37 19<br />
98 NB off ramp/Calle Real & Winchester Canyon NB WB App 650 N/A N/A<br />
100 NB on/off ramp & Via Real NB NB App 900 109 65<br />
# 95th percentile volume exceeds capacity, queue may be longer.<br />
Storage<br />
Length<br />
(ft)<br />
SC101 HOV <strong>Traffic</strong> Study – <strong>Forecast</strong> <strong>Operations</strong> <strong>Report</strong> Page 111
Dowling Associates, Inc.<br />
Transportation Engineering Planning Research Education<br />
Table 53. 2040 Build: 95 th Percentile Highway 101 Off-Ramp Queue Spill Back Checks.<br />
No. Intersection Dir Off Ramp<br />
Weekday AM Peak Hour Weekday PM Peak Hour<br />
95th Queue<br />
(ft.) V/C<br />
95th Queue<br />
(ft.) V/C<br />
1 NB on/off ramp & Bates Rd NB WB App 1,000 0 2<br />
2 SB on/off ramp & Bates Rd SB EB App 1,350 2 1<br />
3 NB on/off ramp & SR 150 NB WB App 1,150 31 5<br />
4 SB on/off ramp & SR 150 SB EB App 1,050 12 115<br />
7 NB on/off ramp & Bailard Ave NB WB App 1,000 27 25<br />
8 SB on/off ramp & Bailard Ave SB EB App 1,150 806 654<br />
13 SB on/off ramp & Casitas Pass Rd SB EB App 750 96 121<br />
17 SB off ramp & Linden Ave SB EB App 950 141 165<br />
19 SB on/off ramp & Carpinteria Ave SB SB App 700 17 N/A<br />
21 NB on/off ramp & Via Real NB NB App 700 N/A N/A<br />
22 NB on/off ramp & S. Padaro Ln NB WB App 1,250 11 7<br />
24 SB off ramp & Santa Claus Ln/Padaro Ln SB EB App 1,050 20 153<br />
25 NB on/off ramp & N. Padaro Ln NB WB App 1,250 11 10<br />
27 SB on/off ramp & Padaro Ln SB EB App 1,000 18 35<br />
28 NB off ramp & Ortega Hill Rd NB NB App 850 9 35<br />
31 SB off ramp & Evans Ave SB EB App 1,000 11 39<br />
32 NB on/off ramp & Sheffield NB WB App 750 36 17<br />
33 SB on/off ramp & Sheffield SB EB App 450 190 35<br />
35 NB on/off ramp & San Ysidro Rd NB WB App 700 13 19<br />
37 SB off ramp & San Ysidro Rd/Eucalyptus Ln SB EB App 650 206 136<br />
39 NB off ramp & Olive Mill Rd NB WB App 750 N/A N/A<br />
41 SB off ramp & Depot SB EB App 750 0 0<br />
43 NB off ramp & Coast Village Rd/Hermosillo Dr NB NB App 550 20 56<br />
44 SB on/off ramp & NB off ramp & Cabrillo Blvd NB WB App 1,000 N/A N/A<br />
44 SB on/off ramp & NB off ramp & Cabrillo Blvd SB EB App 1,200 N/A N/A<br />
46 NB on/off ramp & S. Salinas St NB WB App 850 N/A N/A<br />
47 NB on/off ramp & Milpas St NB WB App 1,100 N/A N/A<br />
48 SB off ramp & Milpas St SB EB App 1,100 189 232<br />
49 SB on/off ramp & Milpas St SB WB App # 471 0.88 # 459 0.97<br />
50 NB on/off ramp & Garden St NB WB App 1,650 # 155 0.84 # 290 1.47<br />
51 NB off ramp & Palm Ave NB NB App 450 0 0<br />
52 SB on/off ramp & Garden St SB EB App 850 # 279 0.88 # 240 1.08<br />
54 NB off ramp & Bath St NB NB App 800 0 0<br />
57 SB on/off ramp & Castillo St SB EB App 1,000 303 # 490 0.93<br />
58 NB on/off ramp & Carrillo St NB WB App 900 # 288 0.85 # 387 1.04<br />
59 SB on/off ramp & Carrillo St SB EB App 950 # 556 0.9 # 399 1.02<br />
62 NB on/off ramp & Arrellaga St NB NB App 800 18 24<br />
63 NB on/off ramp & Mission St NB WB App 750 # 224 1.06 # 225 0.88<br />
64 SB on/off ramp & Mission St SB EB App 1,000 # 482 1.05 # 501 1.08<br />
67 NB off ramp & Pueblo St & Calle Real NB WB App 500 21 27<br />
70 SB on/off ramp & Las Positas Rd SB EB App 1,000 # 438 0.91 # 726 1.18<br />
72 NB on/off ramp & Calle Real & Hope NB NB App 750 290 395<br />
73 SB on/off ramp & La Cumbre Rd SB EB App 900 154 266<br />
75 NB off ramp & State St & Calle Real NB NB App 1,000 350 434<br />
78 SB off ramp & State St SB SB App 1,950 242 338<br />
80 NB on/off ramp & Calle Real & El Sueno Rd NB NB App 550 N/A N/A<br />
81 NB on/off ramp & Turnpike Rd NB WB App 1,150 # 314 0.98 # 208 0.76<br />
82 SB on/off ramp & Turnpike Rd SB EB App 1,100 180 # 221 1.21dl<br />
84 NB on/off ramp & Patterson Ave NB WB App 750 # 365 0.87 276<br />
85 SB on/off ramp & Patterson Ave SB EB App 1,950 # 171 0.74 # 378 0.9<br />
87 NB on/off ramp & Fairview Ave NB WB App 1,000 345 # 419 0.79<br />
89 SB on/off ramp & Fairview Ave SB EB App 1,150 222 197<br />
90 NB on/off ramp & Los Carneros Rd NB WB App 1,250 # 540 1.01 # 388 0.82<br />
91 SB on/off ramp & Los Carneros Rd SB EB App 1,800 244 268<br />
93 NB on/off ramp & Glen Annie Rd & Calle Real NB WB App 2,800 # 592 1.66 # 940 2.53<br />
95 SB on/off ramp & Glen Annie Rd SB EB App 1,400 # 490 1.42 105<br />
97 SB on/off ramp & Hollister Ave SB EB App 1,450 39 48<br />
98 NB off ramp/Calle Real & Winchester Canyon NB WB App 650 N/A N/A<br />
100 NB on/off ramp & Via Real NB NB App 900 142 142<br />
# 95th percentile volume exceeds capacity, queue may be longer.<br />
Storage<br />
Length<br />
(ft)<br />
SC101 HOV <strong>Traffic</strong> Study – <strong>Forecast</strong> <strong>Operations</strong> <strong>Report</strong> Page 112
Dowling Associates, Inc.<br />
Transportation Engineering Planning Research Education<br />
Table 54. 2020 No Build AM Peak Hour LOS Results<br />
InID Intersection<br />
Control<br />
Type<br />
Overall V/C<br />
/ ICU LOS 1<br />
Overall<br />
HCM 2<br />
Eastbound Westbound Northbound Southbound<br />
Southeastbound<br />
LT T RT LT T RT LT T RT LT T RT LT T RT<br />
1 NB on/off ramp & Bates Rd TWSC<br />
Delay (seconds) 9 8.9 9.0 N/A N/A 5.5 0.1<br />
Level of Service A --- --- --- A A N/A N/A A --- --- A --- --- --- ---<br />
2 SB on/off ramp & Bates Rd TWSC<br />
Delay (seconds) 8.8 8.8 8.5 N/A 0.1 N/A 3.9<br />
Level of Service A A A N/A --- --- --- --- A --- N/A A --- --- --- ---<br />
3 NB on/off ramp & SR 150 TWSC<br />
Delay (seconds) 12.2 12.2 10.0 N/A N/A 0.3 0.1 N/A<br />
Level of Service B --- --- --- B A N/A N/A A --- --- A N/A --- --- ---<br />
4 SB on/off ramp & SR 150 TWSC<br />
Delay (seconds) 12.1 12.1 11.0 N/A 0.1 N/A 1.3<br />
Level of Service B B B N/A --- --- --- --- A --- N/A A --- --- --- ---<br />
5 Via Real & SR 150 TWSC<br />
Delay (seconds) 18.8 N/A 12.4 N/A 18.8 N/A 6.8 0.1<br />
Level of Service C N/A B --- N/A C --- N/A A --- --- A --- --- --- ---<br />
6 Carpinteria Ave & SR 150 TWSC<br />
Delay (seconds) 9.8 N/A 9.8 9.8 N/A 0.2<br />
Level of Service A N/A A --- --- A N/A --- --- --- --- A --- --- --- ---<br />
7 NB on/off ramp & Bailard Ave TWSC<br />
Delay (seconds) 18.6 N/A 18.6 N/A 0.6 0.1 0.1<br />
Level of Service C --- --- --- N/A C --- N/A A --- --- A A --- --- ---<br />
8 SB on/off ramp & Bailard Ave TWSC<br />
Delay (seconds) 44 N/A 44.0 N/A 0.1 N/A 1.0<br />
Level of Service E N/A E N/A --- --- --- --- A --- N/A A --- --- --- ---<br />
9 Via Real & Bailard Ave AWSC<br />
Delay (seconds) 12 N/A 9.9 9.9 N/A 12.6 7.9 N/A 9.7 14.3 N/A 11.3 7.6<br />
Level of Service B N/A A A N/A B A N/A A B N/A B A --- --- ---<br />
10 Carpinteria Ave & Bailard Ave AWSC<br />
Delay (seconds) 11.8 N/A 11.2 N/A N/A 9.8 N/A N/A 8.5 N/A N/A 13.0 N/A<br />
Level of Service B N/A B N/A N/A A N/A N/A A N/A N/A B N/A --- --- ---<br />
11 Via Real & Casitas Pass Rd Signal<br />
Delay (seconds) 16.9 N/A 27.3 24.7 15.9 15.9 13.5 24.4 8.8 N/A 35.3 19.1 N/A<br />
Level of Service 0.492 / A B N/A C C B B B C A N/A D B N/A --- --- ---<br />
12 Vellocito & Via Real TWSC<br />
Delay (seconds) 10.5 N/A 0.7 0.1 N/A N/A 10.5 N/A<br />
Level of Service B N/A A --- --- A N/A --- --- --- N/A B N/A --- --- ---<br />
13 SB on/off ramp & Casitas Pass Rd Signal<br />
Delay (seconds) 11.9 24.0 22.3 N/A 9.2 N/A 22.4 2.8<br />
Level of Service 0.435 / A B C C N/A --- --- --- A N/A C A --- --- ---<br />
14 Carpinteria Ave & Casitas Pass Rd Signal<br />
Delay (seconds) 18.6 24.8 6.8 22.6 17.8 19.1 24.4<br />
Level of Service 0.628 / B B C A --- --- C B --- --- --- B --- C --- --- ---<br />
15 NB on ramp & Ogan Rd 3<br />
City of Carpinteria<br />
City of Carpinteria<br />
Roundabout<br />
Delay (seconds) 4.8<br />
Level of Service A<br />
16 Linden Ave & Ogan Rd Signal<br />
City of Carpinteria<br />
Delay (seconds) 10.8 27.4 27.4 9.1 2.7 24.2 2.1<br />
Level of Service 0.345 / A B --- --- --- C --- C --- A A C A --- --- --- ---<br />
17 SB off ramp & Linden Ave Signal<br />
Delay (seconds) 8.9 26.0 23.1 3.5 2.2<br />
Level of Service 0.342 / A A C --- C --- --- --- --- A --- --- A --- --- --- ---<br />
18 Linden Ave & Sawyer Ave TWSC<br />
City of Carpinteria<br />
Delay (seconds) 20 N/A 20.0 N/A N/A 0.2 0.1 N/A<br />
Level of Service C N/A C N/A --- --- --- N/A A --- --- A N/A --- --- ---<br />
19 SB on/off ramp & Carpinteria Ave TWSC<br />
Delay (seconds) 22.7 8.3 0.1 7.9 0.1 N/A 15.2 N/A N/A 22.7 N/A<br />
Level of Service C A A --- A A --- N/A C N/A N/A C N/A --- --- ---<br />
20 Santa Ynez Ave/7th St & Carpinteria Ave Signal<br />
City of Carpinteria<br />
Delay (seconds) 20.3 26.4 11.3 10.6 19.0 20.7 N/A 24.6 21.2 20.1 17.3 N/A<br />
Level of Service 0.476 / A C C B B --- B C N/A C C C B N/A --- --- ---<br />
21 NB on/off ramp & Via Real AWSC<br />
Delay (seconds) 43.7 N/A 13.9 6.3 N/A 84.5 8.6 N/A 19.0 N/A N/A 17.5 N/A<br />
Level of Service E N/A B A N/A F A N/A C N/A N/A C N/A --- --- ---<br />
22 NB on/off ramp & S. Padaro Ln TWSC<br />
Delay (seconds) 9.5 N/A 9.5 N/A 1.4 0.1<br />
Level of Service A --- --- --- N/A A --- N/A A --- --- A --- --- --- ---<br />
23 Via Real & S. Padaro Ln TWSC<br />
City of Carpinteria<br />
Delay (seconds) 24.9 0.1 0.1 N/A 3.1 N/A 24.9 N/A<br />
Level of Service C --- A A N/A A --- N/A C N/A --- --- --- --- --- ---<br />
24 SB off ramp & Santa Claus Ln/S. Padaro Ln TWSC<br />
Delay (seconds) 11.3 11.3 10.9 N/A N/A 8.6 N/A 0.1 0.1 N/A 6.2<br />
Level of Service B B B N/A N/A A N/A --- A A N/A A --- --- --- ---<br />
25 NB on/off ramp & N. Padaro Ln TWSC<br />
Delay (seconds) 12.2 N/A 12.2 N/A N/A 1.3 0.1<br />
Level of Service B --- --- --- N/A B N/A N/A A --- --- A --- --- ---<br />
26 N. Padaro Ln & Via Real TWSC<br />
County of Santa Barbara<br />
Delay (seconds) 18.8 0.1 N/A N/A 6.7 N/A 18.8 N/A<br />
Level of Service C --- A N/A N/A A --- N/A C N/A --- --- --- --- --- ---<br />
SC101 HOV <strong>Traffic</strong> Study – <strong>Forecast</strong> <strong>Operations</strong> <strong>Report</strong> Page 113
Dowling Associates, Inc.<br />
Transportation Engineering Planning Research Education<br />
Table 54 cont. 2020 No Build AM Peak Hour LOS Results<br />
InID Intersection<br />
Control<br />
Type<br />
Overall V/C<br />
/ ICU LOS 1<br />
Overall<br />
HCM 2<br />
Eastbound Westbound Northbound Southbound<br />
Southeastbound<br />
LT T RT LT T RT LT T RT LT T RT LT T RT<br />
27 SB on/off ramp & N. Padaro Ln TWSC<br />
Delay (seconds) 10.8 N/A 10.8 N/A 0.1 N/A 6.2<br />
Level of Service B N/A B N/A --- --- --- --- A --- N/A A --- --- --- ---<br />
28 NB off ramp & Ortega Hill Rd TWSC<br />
Delay (seconds) 12.2 N/A 0.1 0.1 N/A 12.2 0.1<br />
Level of Service B N/A A --- --- A --- N/A B --- --- A --- --- --- ---<br />
29 Evans Ave & Ortega Hill Rd AWSC<br />
Delay (seconds) 10.2 N/A 8.6 N/A N/A 11.6 N/A N/A 8.9 N/A N/A 8.7 N/A<br />
Level of Service B N/A A N/A N/A B N/A N/A A N/A N/A A N/A --- --- ---<br />
30 NB on ramp & Ortega Hill Rd TWSC<br />
Delay (seconds) 16.8 16.8 14.8 N/A 4.6<br />
Level of Service C --- C B N/A A --- --- --- --- --- --- --- --- --- ---<br />
31 SB off ramp & Evans Ave TWSC<br />
Delay (seconds) 10.2 N/A 10.2 N/A 8.5 N/A 0.1 N/A 5.8<br />
Level of Service B N/A B --- N/A A N/A --- A --- N/A A --- --- --- ---<br />
32 NB on/off ramp & Sheffield TWSC<br />
Delay (seconds) 12.5 N/A 12.5 N/A 0.1 0.1 0.1<br />
Level of Service B --- --- --- N/A B --- N/A A --- --- A A --- --- ---<br />
33 SB on/off ramp & Sheffield TWSC<br />
Delay (seconds) 15 N/A 15.0 7.4<br />
Level of Service B N/A B --- --- --- --- --- --- --- A --- --- --- --- ---<br />
34 Jameson & Sheffield TWSC<br />
Delay (seconds) 12.8 0.1 0.1 N/A 5.5 N/A 12.8 N/A<br />
Level of Service B --- A A N/A A --- N/A B N/A --- --- --- --- --- ---<br />
35 NB on/off ramp & San Ysidro Rd TWSC<br />
Delay (seconds) 13.3 N/A 13.3 N/A 1.6 0.1 0.1<br />
Level of Service B --- --- --- N/A B --- N/A A --- --- A A --- --- ---<br />
36 San Ysidro Rd & N. Jameson Ln AWSC<br />
Delay (seconds) 37.8 N/A 17.4 9.6 N/A 14.9 9.9 N/A 72.6 8.5 N/A 24.4 9.5<br />
Level of Service E N/A C A N/A B A N/A F A N/A C A --- --- ---<br />
37 SB off ramp & San Ysidro Rd/Eucalyptus Ln TWSC<br />
Delay (seconds) 26.3 26.3 10.4 N/A N/A 9.8 N/A 0.1 N/A 4.6<br />
Level of Service D D B N/A N/A A N/A --- A --- N/A A --- --- --- ---<br />
38 S. Jameson Ln & San Ysidro Rd/Eucalyptus Ln TWSC<br />
Delay (seconds) 9.8 N/A 9.8 N/A N/A 0.7 0.1 N/A<br />
Level of Service A N/A A N/A --- --- --- N/A A --- --- A N/A --- --- ---<br />
39 NB off ramp & Olive Mill Rd AWSC<br />
Delay (seconds) 35 N/A 15.3 N/A N/A 54.7 16.1 N/A<br />
Level of Service D --- --- --- N/A C N/A N/A F --- --- C N/A --- --- ---<br />
39a N. Jameson Ln & Olive Mill Rd AWSC<br />
Delay (seconds) 17.3 N/A 12.1 N/A 21.7 N/A N/A 11.2<br />
Level of Service C --- --- --- N/A B N/A --- C N/A N/A B --- --- --- ---<br />
40 SB on ramp & Olive Mill Rd AWSC<br />
Delay (seconds) 18.3 13.1 15.3 N/A 24.7 N/A N/A 13.0<br />
Level of Service C B C N/A --- --- --- --- C N/A N/A B --- --- --- ---<br />
41 SB off ramp & Depot TWSC<br />
Delay (seconds) 11.1 0.1 0.1 8.3 11.1<br />
Level of Service B --- A A A --- --- --- --- B --- --- --- --- --- ---<br />
42 Olive Mill Rd & Spring TWSC<br />
Delay (seconds) 17 N/A 17.0 N/A N/A 0.1 0.1 N/A<br />
Level of Service C N/A C N/A --- --- --- N/A A --- --- A N/A --- --- ---<br />
43 NB off ramp & Coast Village Rd/Hermosillo Dr TWSC<br />
Delay (seconds) 24.7 N/A 0.3 N/A 24.7 14.0 N/A 16.2 N/A<br />
Level of Service C N/A A --- --- N/A --- C B --- N/A C N/A --- --- ---<br />
44 SB on/off ramp & NB off ramp & Cabrillo Blvd AWSC<br />
Delay (seconds) 36 62.0 7.6 N/A 14.4 N/A 16.4 13.8<br />
Level of Service E F --- A N/A B N/A --- C --- --- B --- --- --- ---<br />
45 NB on ramp & Cabrillo Blvd TWSC<br />
Delay (seconds) 21.8 7.5 0.1 21.8 14.3<br />
Level of Service C --- --- --- A A --- C --- B --- --- --- --- --- ---<br />
46 NB on/off ramp & S. Salinas St TWSC<br />
Delay (seconds) 8.7 6.9 8.7<br />
Level of Service A --- --- --- --- --- A --- --- --- --- --- A --- --- ---<br />
47 NB on/off ramp & Milpas St 3<br />
County of Santa Barbara<br />
County of Santa Barbara<br />
County of Santa Barbara<br />
County of Santa Barbara<br />
County of Santa Barbara<br />
Roundabout<br />
Delay (seconds) 3.4<br />
Level of Service A<br />
48 SB off ramp & Milpas St Signal<br />
Delay (seconds) 7.4 27.9 2.1 5.7<br />
Level of Service 0.648 / B A --- --- C --- --- --- --- A --- --- A --- --- --- ---<br />
49 SB on ramp & Milpas St Signal<br />
Delay (seconds) 29.8 27.2 27.3 N/A 43.7 16.2 N/A 36.5 N/A<br />
Level of Service 0.670 / B C --- --- --- --- --- C --- C N/A D B --- N/A D N/A<br />
50 NB on/off ramp & Garden St Signal<br />
Delay (seconds) 13.4 N/A 30.6 50.5 36.5 2.0 12.1 13.3<br />
Level of Service 0.480 / A B N/A C D D A B B<br />
51 NB off ramp & Palm Ave TWSC<br />
Delay (seconds) 9.9 9.9 N/A 0.3 0.1<br />
Level of Service A A --- --- --- --- --- N/A A --- --- A --- --- --- ---<br />
SC101 HOV <strong>Traffic</strong> Study – <strong>Forecast</strong> <strong>Operations</strong> <strong>Report</strong> Page 114
Dowling Associates, Inc.<br />
Transportation Engineering Planning Research Education<br />
Table 54 cont. 2020 No Build AM Peak Hour LOS Results<br />
InID Intersection<br />
Control<br />
Type<br />
Overall V/C<br />
/ ICU LOS 1<br />
Overall<br />
HCM 2<br />
Eastbound Westbound Northbound Southbound<br />
Southeastbound<br />
LT T RT LT T RT LT T RT LT T RT LT T RT<br />
52 SB on/off ramp & Garden St Signal<br />
Delay (seconds) 21.8 33.2 37.2 20.9 15.7 N/A 21.6 7.3<br />
Level of Service 0.543 / A C C D C --- --- --- --- B N/A C A --- --- --- ---<br />
53 Garden St & E/ Yanonali St Signal<br />
City of Santa Barbara<br />
Delay (seconds) 27.7 42.7 17.6 15.9 33.4 21.7 22.6 37.2 17.9 N/A 52.8 10.0 N/A<br />
Level of Service 0.480 / A C D B B C C C D B N/A D A N/A --- --- ---<br />
54 NB off ramp & Bath St TWSC<br />
Delay (seconds) 12.5 N/A 12.5 11.0 N/A N/A 0.1 5.1<br />
Level of Service B N/A B --- --- B N/A N/A A --- A --- --- --- --- ---<br />
55 NB on ramp & Castillo St Signal<br />
Delay (seconds) 41.1 124.0 71.7 N/A 7.3 2.8 6.8 N/A 52.2 47.7<br />
Level of Service 0.558 / A D --- --- --- F E N/A A A A N/A D D --- --- ---<br />
56 W. Haley St & Bath St Signal<br />
City of Santa Barbara<br />
Delay (seconds) 9.2 7.9 9.6 N/A N/A 8.4 7.2 N/A 10.1 N/A<br />
Level of Service 0.519 / A A A A N/A N/A A A N/A B N/A --- --- --- --- --- ---<br />
57 SB on/off ramp & Castillo St Signal<br />
Delay (seconds) 21.5 N/A 33.4 43.6 12.4 N/A 86.9 4.9<br />
Level of Service 0.650 / B C N/A C D --- --- --- --- B N/A F A --- --- --- ---<br />
58 NB on/off ramp & Carrillo St Signal<br />
Delay (seconds) 21 54.2 55.5 N/A 42.5 5.6 19.2 23.6<br />
Level of Service 0.713 / C C --- --- --- D E N/A D A --- --- B C --- --- ---<br />
59 SB on/off ramp & Carrillo St Signal<br />
Delay (seconds) 36.9 43.3 44.3 21.7 28.6 28.8 126.1 5.3<br />
Level of Service 0.861 / D D D D C --- --- --- --- C C F A --- --- --- ---<br />
60 Carrillo St & Castillo St Signal<br />
City of Santa Barbara<br />
Delay (seconds) 20 36.1 41.2 44.6 21.6 N/A 67.0 4.5<br />
Level of Service 0.736 / C B D D D --- --- --- --- C N/A E A --- --- --- ---<br />
61 Carrillo St & San Pascual St TWSC<br />
City of Santa Barbara<br />
Delay (seconds) 13.6 N/A 11.7 N/A 0.1 0.1 13.6 0.1<br />
Level of Service B --- --- --- N/A B N/A --- A A B A --- --- --- ---<br />
62 NB on/off ramp & Castillo St TWSC<br />
Delay (seconds) 54 N/A 0.9 0.1 11.4 N/A N/A 54.0<br />
Level of Service F N/A A A --- --- --- --- B N/A N/A F --- --- --- ---<br />
63 NB on/off ramp & Mission St Signal<br />
Delay (seconds) 21.3 N/A 75.6 32.0 N/A 27.1 2.3 3.0<br />
Level of Service 0.839 / D C --- --- --- N/A E C N/A C --- --- A A --- --- ---<br />
64 SB on/off ramp & Mission St Signal<br />
Delay (seconds) 32 54.5 51.4 N/A 11.2 N/A N/A 25.0<br />
Level of Service 0.954 / E C D D N/A --- --- --- --- B N/A N/A C --- --- --- ---<br />
65 Mission St & Castillo St Signal<br />
City of Santa Barbara<br />
Delay (seconds) 5.2 N/A 28.4 33.2 N/A 2.5 N/A N/A 3.9 N/A<br />
Level of Service 0.578 / A A N/A C C --- --- --- N/A A N/A N/A A N/A --- --- ---<br />
66 Mission St & Modoc Rd TWSC<br />
City of Santa Barbara<br />
Delay (seconds) 15.6 N/A 15.6 N/A 0.1 N/A N/A 3.5<br />
Level of Service C --- --- --- N/A C N/A --- A N/A N/A A --- --- --- ---<br />
67 NB off ramp & Pueblo St & Calle Real TWSC<br />
Delay (seconds) 39.1 5.0 33.9 N/A 39.1<br />
Level of Service E A --- --- --- D N/A --- --- --- --- --- E --- --- ---<br />
68 NB on ramp & Calle Real Signal<br />
Delay (seconds) 21.8 N/A 61.7 N/A 16.4 2.1 N/A N/A 66.4 N/A<br />
Level of Service 0.837 / D C N/A E N/A B A N/A --- --- --- N/A E N/A --- --- ---<br />
69 Calle Real & Las Positas Rd Signal<br />
City of Santa Barbara<br />
Delay (seconds) 36.1 130.0 21.6 71.9 64.1 90.4 15.6 2.7 58.5 52.4<br />
Level of Service 0.676 / B D F C E E F B A --- --- E D --- --- ---<br />
70 SB on/off ramp & Las Positas Rd Signal<br />
Delay (seconds) 28.9 75.7 46.1 N/A 19.4 14.4 52.2 2.7<br />
Level of Service 0.822 / D C E D N/A --- --- --- --- B B D A --- --- --- ---<br />
71 Las Pasitas Rd & Modoc Rd Signal<br />
City of Santa Barbara<br />
Delay (seconds) 129.4 462.7 47.1 46.8 63.1 54.7 405.7 81.7 22.8 N/A 99.7 25.0 N/A<br />
Level of Service 0.873 / D F F D D E D F F C N/A F C N/A --- --- ---<br />
72 NB on/off ramp & Calle Real Signal<br />
Delay (seconds) 25.8 26.2 22.7 N/A 30.6 26.8 N/A 26.5 26.1 19.4 27.4 28.2 26.5<br />
Level of Service 0.499 / A C C C N/A C C N/A C C B C C C --- --- ---<br />
73 SB on/off ramp & La Cumbre Rd Signal<br />
Delay (seconds) 14.4 17.6 17.8 15.3 15.4 16.4 17.8 6.3<br />
Level of Service 0.524 / A B B B B --- --- --- --- B B B A --- --- --- ---<br />
74 La Cumbre Rd & Calle Real Signal<br />
City of Santa Barbara<br />
Delay (seconds) 9.3 13.5 13.8 8.8 8.7 20.6 4.5<br />
Level of Service 0.402 / A A --- --- --- B --- B --- A A C A --- --- --- ---<br />
75 NB off ramp & State St & Calle Real Signal<br />
Delay (seconds) 22.7 33.8 18.8 24.0 22.8 19.5 23.2 N/A 28.5 28.4 N/A<br />
Level of Service 0.536 / A C C B --- --- C C B C N/A C C N/A --- --- ---<br />
76 NB on ramp & State St TWSC<br />
Delay (seconds) 0<br />
Level of Service ---<br />
77 Calle Real & Rt 154 & San Macros Pass Rd Signal<br />
Delay (seconds) 30.8 57.6 32.5 31.7 41.3 22.9 29.1 41.2 29.9 N/A 39.5 27.3 N/A<br />
Level of Service 0.604 / B C E C C D C C D C N/A D C N/A --- --- ---<br />
78 SB off ramp & State St Signal<br />
Delay (seconds) 16.7 17.0 N/A 29.1 10.3 28.8 21.2 21.3 17.2<br />
Level of Service 0.505 / A B --- B N/A C B --- --- C --- C C B --- --- ---<br />
SC101 HOV <strong>Traffic</strong> Study – <strong>Forecast</strong> <strong>Operations</strong> <strong>Report</strong> Page 115
Dowling Associates, Inc.<br />
Transportation Engineering Planning Research Education<br />
Table 54 cont. 2020 No Build AM Peak Hour LOS Results<br />
InID Intersection<br />
LT T RT LT T RT LT T RT LT T RT LT T RT<br />
79 SB on ramp & State St & Rt 154 TWSC<br />
Delay (seconds) 72.2 72.2<br />
Level of Service F --- --- --- --- --- --- --- --- --- F --- --- --- --- ---<br />
792 State St & San Marcos Pass Road Signal<br />
Delay (seconds) 24.2 25.5 6.8 N/A N/A 29.4 26.1 N/A 47.4 N/A N/A 31.0 27.0<br />
Level of Service 0.619 / B C C A N/A N/A C C N/A D N/A N/A C C --- --- ---<br />
80 NB on/off ramp & Calle Real & El Sueno Rd AWSC<br />
Delay (seconds) 18.2 N/A 12.7 N/A N/A 24.4 N/A N/A 15.7 8.3 N/A 12.6 N/A<br />
Level of Service C N/A B N/A N/A C N/A N/A C A N/A B N/A --- --- ---<br />
81 NB on/off ramp & Turnpike Rd Signal<br />
Delay (seconds) 30.9 80.0 76.1 34.1 32.3 4.7 21.3 N/A<br />
Level of Service 0.676 / B C --- --- --- E E C C A --- --- C N/A --- --- ---<br />
82 SB on/off ramp & Turnpike Rd Signal<br />
Delay (seconds) 24.3 N/A 39.0 N/A 25.4 N/A 43.4 6.9<br />
Level of Service 0.800 / C C N/A D N/A --- --- --- --- C N/A D A --- --- --- ---<br />
83 Turnpike Rd & Calle Real Signal<br />
County of Santa Barbara<br />
Delay (seconds) 23.5 46.8 35.5 41.2 48.8 26.5 N/A 25.1 7.9 N/A 43.2 19.9 N/A<br />
Level of Service 0.500 / A C D D D D C N/A C A N/A D B N/A --- --- ---<br />
84 NB on/off ramp & Patterson Ave Signal<br />
Delay (seconds) 24.2 44.5 46.9 31.8 47.0 9.3 15.0 18.1<br />
Level of Service 0.690 / B C --- --- --- D D C D A --- --- B B --- --- ---<br />
85 SB on/off ramp & Patterson Ave Signal<br />
Delay (seconds) 19.5 45.1 49.7 48.0 13.2 14.1 33.4 1.1<br />
Level of Service 0.476 / A B D D D --- --- --- --- B B C A --- --- --- ---<br />
86 Patterson Ave & Calle Real Signal<br />
City of Goleta<br />
Delay (seconds) 17.3 37.3 42.3 32.1 2.2 11.4 N/A<br />
Level of Service 0.545 / A B D --- D --- --- --- C A --- --- B N/A --- --- ---<br />
87 NB on/off ramp & Fairview Ave Signal<br />
Delay (seconds) 21.5 23.6 0.1 42.4 27.9 50.4 0.3<br />
Level of Service 0.544 / A C C --- A --- D C --- --- --- --- D A --- --- ---<br />
88 Calle Real & Fairview Ave Signal<br />
City of Goleta<br />
Delay (seconds) 36.7 64.0 34.5 52.1 58.9 31.4 N/A 57.4 16.9 15.5 31.6 34.8 N/A<br />
Level of Service 0.664 / B D E C D E C N/A E B B C C N/A --- --- ---<br />
89 SB on/off ramp & Fairview Ave Signal<br />
Delay (seconds) 14 N/A 16.9 19.7 19.4 17.7 18.4 8.0<br />
Level of Service 0.599 / A B N/A B B --- --- --- --- B B B A --- --- --- ---<br />
90 NB on/off ramp & Los Carneros Rd Signal<br />
Delay (seconds) 32.3 52.3 52.3 N/A 39.3 8.1 8.8 N/A<br />
Level of Service 0.566 / A C --- --- --- D D N/A D A --- --- A N/A --- --- ---<br />
91 SB on/off ramp & Los Carneros Rd Signal<br />
Delay (seconds) 14.2 N/A 36.7 42.0 8.1 10.3 37.3 6.4<br />
Level of Service 0.558 / A B N/A D D --- --- --- --- A B D A --- --- --- ---<br />
92 Los Carneros Rd & Calle Real Signal<br />
City of Goleta<br />
Delay (seconds) 15 38.9 27.7 2.9 1.8 44.7 5.4<br />
Level of Service 0.431 / A B --- --- --- D --- C --- A A D A --- --- --- ---<br />
93 NB on/off ramp & Glen Annie Rd & Calle Real Signal<br />
Delay (seconds) 122.4 36.1 389.7 404.1 84.7 67.1 N/A 66.7 15.0 N/A 45.4 26.6 N/A<br />
Level of Service 0.752 / C F D F F F E N/A E B N/A D C N/A --- --- ---<br />
94 Glen Annie Rd & Del Norte Rd TWSC<br />
City of Goleta<br />
Delay (seconds) 11.1 11.1 0.1 0.1 N/A<br />
Level of Service B --- --- B --- --- --- --- A --- --- A N/A --- --- ---<br />
95 SB on/off ramp & Glen Annie Rd Signal<br />
Delay (seconds) 115.6 N/A 31.9 76.9 13.4 1.6 367.6 8.7<br />
Level of Service 0.695 / B F N/A C E --- --- --- --- B A F A --- --- --- ---<br />
96 Calle Real & NB on ramp TWSC<br />
Delay (seconds) 10.8 9.8 N/A N/A 10.8<br />
Level of Service B --- A N/A N/A B --- --- --- --- --- --- --- --- --- ---<br />
97 SB on/off ramp & Hollister Ave TWSC<br />
Delay (seconds) 18.5 N/A 18.5 0.1 0.1 0.1 N/A 5.1<br />
Level of Service C N/A C A --- --- --- --- A A N/A A --- --- --- ---<br />
98 NB off ramp & Winchester Canyon Rd AWSC<br />
Delay (seconds) 8.4 8.2 8.7 N/A 7.9<br />
Level of Service A A --- --- --- A N/A --- --- --- --- --- A --- --- ---<br />
100 NB on/off ramps & Via Real Signal<br />
Delay (seconds) 6.5 6.8 6.4 N/A 6.5 6.4<br />
Level of Service 0.470 / A A --- A A N/A A --- --- A --- --- --- --- --- --- ---<br />
102 Guteirrez St & Garden St Signal<br />
City of Santa Barbara<br />
Delay (seconds) 20 25.4 21.7 N/A 31.3 6.4 22.2 N/A<br />
Level of Service 0.691 / B B --- --- --- C C N/A C A --- --- C N/A --- --- ---<br />
103 Montecito St & Castillo St Signal<br />
City of Santa Barbara<br />
Delay (seconds) 61 101.8 31.7 N/A 57.0 48.6 43.0 60.2 17.5 N/A 57.1 20.3 83.3<br />
Level of Service 0.803 / D E F C N/A E D D E B N/A E C F --- --- ---<br />
104 San Andres & Carrillo St Signal<br />
City of Santa Barbara<br />
Delay (seconds) 29.6 47.4 45.6 N/A N/A 46.2 35.0 15.3 22.0 N/A 25.0 21.7 N/A<br />
Level of Service 0.673 / B C D D F N/A D C B C N/A C C N/A --- --- ---<br />
105 Modoc St & Mission St AWSC<br />
City of Santa Barbara<br />
Delay (seconds) 44.3 21.7 10.8 12.5 93.0 24.0 10.6<br />
Level of Service E C --- B --- --- --- B F --- --- C B --- --- ---<br />
106 Quinientos St & Milpas St Signal<br />
City of Santa Barbara<br />
Delay (seconds) 9.4 18.2 18.4 N/A 19.3 18.6 N/A 5.3 8.1 N/A 5.0 8.8 N/A<br />
Level of Service<br />
Note: --- indicates corresponding movement does not exist.<br />
0.583 / A A B B N/A B B N/A A A N/A A A N/A --- --- ---<br />
N/A indicates delay same as the adjacent movement due to shared approach.<br />
AWSC = All Way Stop Control, TWSC = Two Way Stop Control<br />
1 - ICU LOS is reported for signalized intersections only<br />
2 - Based on HCM 2000, Chapter 16 Signalized Intersections and Chapter 17 Unsignalized Intersections methodology<br />
3 - Based on methodology developed by FHWA publication Roundabouts: An Information Guide, June 2000<br />
Indicates that LOS exceeds LOS threshold<br />
Control<br />
Type<br />
Overall V/C<br />
/ ICU LOS 1<br />
Overall<br />
HCM 2<br />
Eastbound Westbound Northbound Southbound<br />
Southeastbound<br />
SC101 HOV <strong>Traffic</strong> Study – <strong>Forecast</strong> <strong>Operations</strong> <strong>Report</strong> Page 116
Dowling Associates, Inc.<br />
Transportation Engineering Planning Research Education<br />
Table 55. 2020 No Build PM Peak Hour LOS Results<br />
InID Intersection<br />
Control<br />
Type<br />
Overall V/C<br />
/ ICU LOS 1<br />
Overall<br />
HCM 2<br />
Eastbound Westbound Northbound Southbound Southeastbound<br />
LT T RT LT T RT LT T RT LT T RT LT T RT<br />
1 NB on/off ramp & Bates Rd TWSC<br />
Delay (seconds) 9.2 9.2 8.4 N/A N/A 4.6 0.1<br />
Level of Service A --- --- --- A A N/A N/A A --- --- A --- --- --- ---<br />
2 SB on/off ramp & Bates Rd TWSC<br />
Delay (seconds) 9.7 9.2 9.7 N/A 0.1 N/A 3.1<br />
Level of Service A A A N/A --- --- --- --- A --- N/A A --- --- --- ---<br />
3 NB on/off ramp & SR 150 TWSC<br />
Delay (seconds) 13.8 13.8 9.8 N/A N/A 0.3 0.1 N/A<br />
Level of Service B --- --- --- B A N/A N/A A --- --- A N/A --- --- ---<br />
4 SB on/off ramp & SR 150 TWSC<br />
Delay (seconds) 30 30.0 12.4 N/A 0.1 N/A 7.3<br />
Level of Service D D B N/A --- --- --- --- A --- N/A A --- --- --- ---<br />
5 Via Real & SR 150 TWSC<br />
Delay (seconds) 14.8 N/A 10.6 N/A 14.8 N/A 0.9 0.1<br />
Level of Service B N/A B --- N/A B --- N/A A --- --- A --- --- --- ---<br />
6 Carpinteria Ave & SR 150 TWSC<br />
Delay (seconds) 8.9 N/A 10.0 8.9 N/A 1.0<br />
Level of Service A N/A A --- --- A N/A --- --- --- --- A --- --- --- ---<br />
7 NB on/off ramp & Bailard Ave TWSC<br />
Delay (seconds) 19.2 N/A 19.2 N/A 3.1 0.1 0.1<br />
Level of Service C --- --- --- N/A C --- N/A A --- --- A A --- --- ---<br />
8 SB on/off ramp & Bailard Ave TWSC<br />
Delay (seconds) 45.2 N/A 45.2 N/A 0.1 N/A 1.7<br />
Level of Service E N/A E N/A --- --- --- --- A --- N/A A --- --- --- ---<br />
9 Via Real & Bailard Ave AWSC<br />
Delay (seconds) 36 N/A 10.9 10.1 N/A 69.5 8.0 N/A 21.0 10.8 N/A 11.3 9.0<br />
Level of Service E N/A B B N/A F A N/A C B N/A B A --- --- ---<br />
10 Carpinteria Ave & Bailard Ave AWSC<br />
Delay (seconds) 14.8 N/A 18.7 N/A N/A 9.8 N/A N/A 9.4 N/A N/A 11.5 N/A<br />
Level of Service B N/A C N/A N/A A N/A N/A A N/A N/A B N/A --- --- ---<br />
11 Via Real & Casitas Pass Rd Signal<br />
Delay (seconds) 21.8 N/A 26.9 24.7 16.2 17.2 13.9 62.8 12.3 N/A 28.5 22.6 N/A<br />
Level of Service 0.583 / A C N/A C C B B B E B N/A C C N/A --- --- ---<br />
12 Vellocito & Via Real TWSC<br />
Delay (seconds) 13.7 N/A 0.4 0.1 N/A N/A 13.7 N/A<br />
Level of Service B N/A A --- --- A N/A --- --- --- N/A B N/A --- --- ---<br />
13 SB on/off ramp & Casitas Pass Rd Signal<br />
Delay (seconds) 14.4 23.3 21.8 N/A 14.7 N/A 19.7 2.7<br />
Level of Service 0.639 / B B C C N/A --- --- --- B N/A B A --- --- ---<br />
14 Carpinteria Ave & Casitas Pass Rd Signal<br />
Delay (seconds) 22.9 29.8 7.0 28.7 20.7 29.8 28.7<br />
Level of Service 0.726 / C C C A --- --- C C --- --- --- C --- C --- --- ---<br />
15 NB on ramp & Ogan Rd 3<br />
City of Carpinteria<br />
City of Carpinteria<br />
Roundabout<br />
Delay (seconds) 4.9<br />
Level of Service A<br />
16 Linden Ave & Ogan Rd Signal<br />
City of Carpinteria<br />
Delay (seconds) 13.7 24.2 22.8 11.3 2.8 28.1 2.9<br />
Level of Service 0.625 / B B --- --- --- C --- C --- B A C A --- --- --- ---<br />
17 SB off ramp & Linden Ave Signal<br />
Delay (seconds) 8.8 23.4 20.1 3.9 3.0<br />
Level of Service 0.354 / A A C --- C --- --- --- --- A --- --- A --- --- --- ---<br />
18 Linden Ave & Sawyer Ave TWSC<br />
City of Carpinteria<br />
Delay (seconds) 19.9 N/A 19.9 N/A N/A 0.8 0.1 N/A<br />
Level of Service C N/A C N/A --- --- --- N/A A --- --- A N/A --- --- ---<br />
19 SB on/off ramp & Carpinteria Ave TWSC<br />
Delay (seconds) 59.2 9.3 0.1 8.2 0.1 N/A 25.2 N/A N/A 59.2 N/A<br />
Level of Service F A A --- A A --- N/A D N/A N/A F N/A --- --- ---<br />
20 Santa Ynez Ave/7th St & Carpinteria Ave Signal<br />
City of Carpinteria<br />
Delay (seconds) 31.2 75.6 16.9 15.2 22.4 34.6 N/A 30.8 27.2 31.3 20.4 N/A<br />
Level of Service 0.668 / B C E B B --- C C N/A C C C C N/A --- --- ---<br />
21 NB on/off ramp & Via Real AWSC<br />
Delay (seconds) 46.2 N/A 82.5 6.2 N/A 37.2 10.2 N/A 26.5 N/A N/A 21.7 N/A<br />
Level of Service E N/A F A N/A E B N/A D N/A N/A C N/A --- --- ---<br />
22 NB on/off ramp & S. Padaro Ln TWSC<br />
Delay (seconds) 12.2 N/A 12.2 N/A 2.7 0.1<br />
Level of Service B --- --- --- N/A B --- N/A A --- --- A --- --- --- ---<br />
23 Via Real & S. Padaro Ln TWSC<br />
City of Carpinteria<br />
Delay (seconds) 17.7 0.1 0.1 N/A 5.9 N/A 17.7 N/A<br />
Level of Service C --- A A N/A A --- N/A C N/A --- --- --- --- --- ---<br />
24 SB off ramp & Santa Claus Ln/S. Padaro Ln TWSC<br />
Delay (seconds) 53 53.0 22.1 N/A N/A 9.7 N/A 0.1 0.1 N/A 7.7<br />
Level of Service F F C N/A N/A A N/A --- A A N/A A --- --- --- ---<br />
25 NB on/off ramp & N. Padaro Ln TWSC<br />
Delay (seconds) 9.9 N/A 9.9 N/A N/A 2.3 0.1<br />
Level of Service A --- --- --- N/A A N/A N/A A --- --- A --- --- ---<br />
26 N. Padaro Ln & Via Real TWSC<br />
County of Santa Barbara<br />
Delay (seconds) 14.4 0.1 N/A N/A 5.1 N/A 14.4 N/A<br />
Level of Service B --- A N/A N/A A --- N/A B N/A --- --- --- --- --- ---<br />
SC101 HOV <strong>Traffic</strong> Study – <strong>Forecast</strong> <strong>Operations</strong> <strong>Report</strong> Page 117
Dowling Associates, Inc.<br />
Transportation Engineering Planning Research Education<br />
Table 55 cont. 2020 No Build PM Peak Hour LOS Results<br />
InID Intersection<br />
Control<br />
Type<br />
Overall V/C<br />
/ ICU LOS 1<br />
Overall<br />
HCM 2<br />
Eastbound Westbound Northbound Southbound Southeastbound<br />
LT T RT LT T RT LT T RT LT T RT LT T RT<br />
27 SB on/off ramp & N. Padaro Ln TWSC<br />
Delay (seconds) 11.7 N/A 11.7 N/A 0.1 N/A 5.9<br />
Level of Service B N/A B N/A --- --- --- --- A --- N/A A --- --- --- ---<br />
28 NB off ramp & Ortega Hill Rd TWSC<br />
Delay (seconds) 16.1 N/A 0.1 0.1 N/A 16.1 10.1<br />
Level of Service C N/A A --- --- A --- N/A C --- --- B --- --- --- ---<br />
29 Evans Ave & Ortega Hill Rd AWSC<br />
Delay (seconds) 12.4 N/A 10.0 N/A N/A 14.9 N/A N/A 10.5 N/A N/A 9.3 N/A<br />
Level of Service B N/A A N/A N/A B N/A N/A B N/A N/A A N/A --- --- ---<br />
30 NB on ramp & Ortega Hill Rd TWSC<br />
Delay (seconds) 19.9 19.9 14.2 N/A 4.0<br />
Level of Service C --- C B N/A A --- --- --- --- --- --- --- --- --- ---<br />
31 SB off ramp & Evans Ave TWSC<br />
Delay (seconds) 12.9 N/A 12.9 N/A 8.5 N/A 0.1 N/A 6.4<br />
Level of Service B N/A B --- N/A A N/A --- A --- N/A A --- --- --- ---<br />
32 NB on/off ramp & Sheffield TWSC<br />
Delay (seconds) 9.6 N/A 9.6 N/A 0.5 0.1 0.1<br />
Level of Service A --- --- --- N/A A --- N/A A --- --- A A --- --- ---<br />
33 SB on/off ramp & Sheffield TWSC<br />
Delay (seconds) 11.8 N/A 11.8 7.4<br />
Level of Service B N/A B --- --- --- --- --- --- --- A --- --- --- --- ---<br />
34 Jameson & Sheffield TWSC<br />
Delay (seconds) 13.8 0.1 0.1 N/A 6.7 N/A 13.8 N/A<br />
Level of Service B --- A A N/A A --- N/A B N/A --- --- --- --- --- ---<br />
35 NB on/off ramp & San Ysidro Rd TWSC<br />
Delay (seconds) 13.8 N/A 13.8 N/A 3.2 0.1 0.1<br />
Level of Service B --- --- --- N/A B --- N/A A --- --- A A --- --- ---<br />
36 San Ysidro Rd & N. Jameson Ln AWSC<br />
Delay (seconds) 37 N/A 17.3 9.9 N/A 19.3 9.5 N/A 22.3 9.6 N/A 73.5 9.3<br />
Level of Service E N/A C A N/A C A N/A C A N/A F A --- --- ---<br />
37 SB off ramp & San Ysidro Rd/Eucalyptus Ln TWSC<br />
Delay (seconds) 55.8 55.8 10.4 N/A N/A 11.7 N/A 0.1 N/A 6.3<br />
Level of Service F F B N/A N/A B N/A --- A --- N/A A --- --- --- ---<br />
38 S. Jameson Ln & San Ysidro Rd/Eucalyptus Ln TWSC<br />
Delay (seconds) 10.6 N/A 10.6 N/A N/A 0.5 0.1 N/A<br />
Level of Service B N/A B N/A --- --- --- N/A A --- --- A N/A --- --- ---<br />
39 NB off ramp & Olive Mill Rd AWSC<br />
Delay (seconds) 24.2 N/A 11.9 N/A N/A 24.2 14.5 N/A<br />
Level of Service C --- --- --- N/A B N/A N/A C --- --- B N/A --- --- ---<br />
39a N. Jameson Ln & Olive Mill Rd AWSC<br />
Delay (seconds) 11 N/A 10.5 N/A 11.6 N/A N/A 10.5<br />
Level of Service B --- --- --- N/A B N/A --- B N/A N/A B --- --- --- ---<br />
40 SB on ramp & Olive Mill Rd AWSC<br />
Delay (seconds) 28.1 15.8 46.8 N/A 18.0 N/A N/A 15.8<br />
Level of Service D C E N/A --- --- --- --- C N/A N/A C --- --- --- ---<br />
41 SB off ramp & Depot TWSC<br />
Delay (seconds) 10.1 0.1 0.1 8.0 10.1<br />
Level of Service B --- A A A --- --- --- --- B --- --- --- --- --- ---<br />
42 Olive Mill Rd & Spring TWSC<br />
Delay (seconds) 17.3 N/A 17.3 N/A N/A 0.1 0.1 N/A<br />
Level of Service C N/A C N/A --- --- --- N/A A --- --- A N/A --- --- ---<br />
43 NB off ramp & Coast Village Rd/Hermosillo Dr TWSC<br />
Delay (seconds) 62.7 N/A 0.4 0.1 62.7 19.2 N/A 38.1 N/A<br />
Level of Service F N/A A --- --- A --- F C --- N/A E N/A --- --- ---<br />
44 SB on/off ramp & NB off ramp & Cabrillo Blvd AWSC<br />
Delay (seconds) 37.9 43.7 9.0 N/A 19.4 N/A 51.4 21.3<br />
Level of Service E E --- A N/A C N/A --- F --- --- C --- --- --- ---<br />
45 NB on ramp & Cabrillo Blvd TWSC<br />
Delay (seconds) 250.6 7.6 0.1 250.6 12.9<br />
Level of Service F --- --- --- A A --- F --- B --- --- --- --- --- ---<br />
46 NB on/off ramp & S. Salinas St TWSC<br />
Delay (seconds) 7.6 7.2 7.6<br />
Level of Service A --- --- --- --- --- A --- --- --- --- --- A --- --- ---<br />
47 NB on/off ramp & Milpas St 3<br />
County of Santa Barbara<br />
County of Santa Barbara<br />
County of Santa Barbara<br />
County of Santa Barbara<br />
County of Santa Barbara<br />
Roundabout<br />
Delay (seconds) 4.3<br />
Level of Service A<br />
48 SB off ramp & Milpas St Signal<br />
Delay (seconds) 12.2 40.4 2.8 9.4<br />
Level of Service 0.844 / D B --- --- D --- --- --- --- A --- --- A --- --- --- ---<br />
49 SB on ramp & Milpas St Signal<br />
Delay (seconds) 56.8 41.5 93.4 N/A 55.1 16.0 N/A 52.4 N/A<br />
Level of Service 0.888 / D E --- --- --- --- --- D --- F N/A E B --- N/A D N/A<br />
50 NB on/off ramp & Garden St Signal<br />
Delay (seconds) 21.2 N/A 59.6 49.4 47.7 0.6 16.3 17.6<br />
Level of Service 0.690 / B C N/A E D D A B B<br />
51 NB off ramp & Palm Ave TWSC<br />
Delay (seconds) 9.5 9.5 N/A 0.1 0.1<br />
Level of Service A A --- --- --- --- --- N/A A --- --- A --- --- --- ---<br />
SC101 HOV <strong>Traffic</strong> Study – <strong>Forecast</strong> <strong>Operations</strong> <strong>Report</strong> Page 118
Dowling Associates, Inc.<br />
Transportation Engineering Planning Research Education<br />
Table 55 cont. 2020 No Build PM Peak Hour LOS Results<br />
InID Intersection<br />
Control<br />
Type<br />
Overall V/C<br />
/ ICU LOS 1<br />
Overall<br />
HCM 2<br />
Eastbound Westbound Northbound Southbound Southeastbound<br />
LT T RT LT T RT LT T RT LT T RT LT T RT<br />
52 SB on/off ramp & Garden St Signal<br />
Delay (seconds) 28.3 82.7 91.1 30.0 16.2 N/A 20.8 9.3<br />
Level of Service 0.830 / D C F F C --- --- --- --- B N/A C A --- --- --- ---<br />
53 Garden St & E/ Yanonali St Signal<br />
City of Santa Barbara<br />
Delay (seconds) 78.3 325.4 16.7 14.9 41.8 21.5 25.0 39.7 21.5 N/A 25.3 17.9 N/A<br />
Level of Service 0.591 / A E F B B D C C D C N/A C B N/A --- --- ---<br />
54 NB off ramp & Bath St TWSC<br />
Delay (seconds) 15.3 N/A 15.3 12.8 N/A N/A 0.2 5.9<br />
Level of Service C N/A C --- --- B N/A N/A A --- A --- --- --- --- ---<br />
55 NB on ramp & Castillo St Signal<br />
Delay (seconds) 103.3 294.7 252.4 N/A 6.4 4.5 6.7 N/A 42.7 38.6<br />
Level of Service 0.690 / B F --- --- --- F F N/A A A A N/A D D --- --- ---<br />
56 W. Haley St & Bath St Signal<br />
City of Santa Barbara<br />
Delay (seconds) 15.1 13.9 13.3 N/A N/A 15.3 9.3 N/A 17.0 N/A<br />
Level of Service 0.771 / C B B B N/A N/A B A N/A B N/A --- --- --- --- --- ---<br />
57 SB on/off ramp & Castillo St Signal<br />
Delay (seconds) 32.8 N/A 27.1 49.7 27.0 N/A 92.1 22.1<br />
Level of Service 0.787 / C C N/A C D --- --- --- --- C N/A F C --- --- --- ---<br />
58 NB on/off ramp & Carrillo St Signal<br />
Delay (seconds) 28.4 70.4 68.1 N/A 62.0 1.9 18.6 43.3<br />
Level of Service 0.815 / D C --- --- --- E E N/A E A --- --- B D --- --- ---<br />
59 SB on/off ramp & Carrillo St Signal<br />
Delay (seconds) 28.9 41.5 41.9 58.9 22.5 20.8 33.9 13.2<br />
Level of Service 0.759 / C C D D E --- --- --- --- C C C B --- --- --- ---<br />
60 Carrillo St & Castillo St Signal<br />
City of Santa Barbara<br />
Delay (seconds) 21.3 22.0 25.2 31.4 27.3 N/A 153.4 9.3<br />
Level of Service 0.764 / C C C C C --- --- --- C N/A F A --- --- --- ---<br />
61 Carrillo St & San Pascual St TWSC<br />
City of Santa Barbara<br />
Delay (seconds) 12.4 N/A 12.3 N/A 0.1 N/A 12.4 0.1<br />
Level of Service B --- --- --- N/A B N/A --- A N/A B A --- --- --- ---<br />
62 NB on/off ramp & Castillo St TWSC<br />
Delay (seconds) 142.9 N/A 0.5 0.1 11.7 N/A N/A 142.9<br />
Level of Service F N/A A A --- --- --- --- B N/A N/A F --- --- --- ---<br />
63 NB on/off ramp & Mission St Signal<br />
Delay (seconds) 10.8 N/A 40.8 49.0 N/A 7.1 3.6 4.5<br />
Level of Service 0.747 / C B --- --- --- N/A D D N/A A --- --- A A --- --- ---<br />
64 SB on/off ramp & Mission St Signal<br />
Delay (seconds) 33.9 51.2 50.0 N/A 9.9 N/A N/A 30.3<br />
Level of Service 0.858 / D C D D N/A --- --- --- --- A N/A N/A C --- --- --- ---<br />
65 Mission St & Castillo St Signal<br />
City of Santa Barbara<br />
Delay (seconds) 9 N/A 26.2 31.2 N/A 5.8 N/A N/A 7.1 N/A<br />
Level of Service 0.657 / B A N/A C C --- --- --- N/A A N/A N/A A N/A --- --- ---<br />
66 Mission St & Modoc Rd TWSC<br />
City of Santa Barbara<br />
Delay (seconds) 16.3 N/A 16.3 N/A 0.1 N/A N/A 5.2<br />
Level of Service C --- --- --- N/A C N/A --- A N/A N/A A --- --- --- ---<br />
67 NB off ramp & Pueblo St & Calle Real TWSC<br />
Delay (seconds) 114.5 6.2 38.9 N/A 114.5<br />
Level of Service F A --- --- --- E N/A --- --- --- --- --- F --- --- ---<br />
68 NB on ramp & Calle Real Signal<br />
Delay (seconds) 21.7 N/A 53.1 N/A 8.9 6.8 N/A N/A 61.5 N/A<br />
Level of Service 0.654 / B C N/A D N/A A A N/A --- --- --- N/A E N/A --- --- ---<br />
69 Calle Real & Las Positas Rd Signal<br />
City of Santa Barbara<br />
Delay (seconds) 39.8 94.6 43.5 51.3 46.8 46.3 33.2 10.2 57.9 44.6<br />
Level of Service 0.733 / C D F --- D D D D C B --- --- E D --- --- ---<br />
70 SB on/off ramp & Las Positas Rd Signal<br />
Delay (seconds) 37.3 78.3 38.3 N/A 31.1 23.6 49.0 10.5<br />
Level of Service 0.787 / C D E D N/A --- --- --- --- C C D B --- --- --- ---<br />
71 Las Pasitas Rd & Modoc Rd Signal<br />
City of Santa Barbara<br />
Delay (seconds) 67.5 320.7 44.1 40.7 61.0 47.0 56.9 237.0 24.2 N/A 74.8 13.7 N/A<br />
Level of Service 0.708 / C E F D D E D E F C N/A E B N/A --- --- ---<br />
72 NB on/off ramp & Calle Real Signal<br />
Delay (seconds) 31.5 34.5 32.8 N/A 33.7 29.3 N/A 31.3 31.3 23.6 31.2 34.3 29.3<br />
Level of Service 0.608 / B C C C N/A C C N/A C C C C C C --- --- ---<br />
73 SB on/off ramp & La Cumbre Rd Signal<br />
Delay (seconds) 18 20.5 20.6 14.6 21.2 20.7 20.3 8.8<br />
Level of Service 0.589 / A B C C B --- --- --- --- C C C A --- --- --- ---<br />
74 La Cumbre Rd & Calle Real Signal<br />
County of Santa Barbara<br />
Delay (seconds) 11.6 15.7 16.6 11.4 11.2 23.6 5.3<br />
Level of Service 0.477 / A B --- --- --- B --- B --- B B C A --- --- --- ---<br />
75 NB off ramp & State St & Calle Real Signal<br />
Delay (seconds) 28.4 41.7 20.9 27.1 31.3 26.0 31.4 N/A 38.7 38.7 N/A<br />
Level of Service 0.620 / B C D C --- --- C C C C N/A D D N/A --- --- ---<br />
76 NB on ramp & State St TWSC<br />
Delay (seconds) 0<br />
Level of Service ---<br />
77 Calle Real & Rt 154 & San Macros Pass Rd Signal<br />
Delay (seconds) 27.3 28.1 30.5 29.2 23.0 25.9 27.6 34.0 26.6 N/A 34.1 26.3 N/A<br />
Level of Service 0.533 / A C C C C C C C C C N/A C C N/A --- --- ---<br />
78 SB off ramp & State St Signal<br />
Delay (seconds) 25.8 27.0 N/A 34.4 16.2 32.1 30.5 30.4 21.2<br />
Level of Service 0.597 / A C --- C N/A C B --- --- C --- C C C --- --- ---<br />
SC101 HOV <strong>Traffic</strong> Study – <strong>Forecast</strong> <strong>Operations</strong> <strong>Report</strong> Page 119
Dowling Associates, Inc.<br />
Transportation Engineering Planning Research Education<br />
Table 55 cont. 2020 No Build PM Peak Hour LOS Results<br />
InID Intersection<br />
LT T RT LT T RT LT T RT LT T RT LT T RT<br />
79 SB on ramp & State St & Rt 154 TWSC<br />
Delay (seconds) 53.3 53.3<br />
Level of Service F --- --- --- --- --- --- --- --- --- F --- --- --- --- ---<br />
792 State St & San Marcos Pass Road Signal<br />
Delay (seconds) 17.3 21.4 5.7 N/A N/A 22.2 20.4 N/A 38.0 N/A N/A 24.6 25.6<br />
Level of Service 0.521 / A B C A N/A N/A C C N/A D N/A N/A C C --- --- ---<br />
80 NB on/off ramp & Calle Real & El Sueno Rd AWSC<br />
Delay (seconds) 18.7 N/A 24.3 N/A N/A 18.0 N/A N/A 13.8 9.2 N/A 12.6 N/A<br />
Level of Service C N/A C N/A N/A C N/A N/A B A N/A B N/A --- --- ---<br />
81 NB on/off ramp & Turnpike Rd Signal<br />
Delay (seconds) 18.4 31.9 31.5 25.5 30.5 8.5 14.6 N/A<br />
Level of Service 0.588 / A B --- --- --- C C C C A --- --- B N/A --- --- ---<br />
82 SB on/off ramp & Turnpike Rd Signal<br />
Delay (seconds) 16.6 N/A 27.1 N/A 20.9 N/A 23.5 1.4<br />
Level of Service 0.745 / C B N/A C N/A --- --- --- --- C N/A C A --- --- --- ---<br />
83 Turnpike Rd & Calle Real Signal<br />
City of Santa Barbara<br />
Delay (seconds) 211 33.4 25.1 26.7 1006.3 24.0 N/A 170.1 19.1 N/A 31.0 12.5 N/A<br />
Level of Service 0.593 / A F C C C F C N/A F B N/A C B N/A --- --- ---<br />
84 NB on/off ramp & Patterson Ave Signal<br />
Delay (seconds) 18.3 49.6 54.9 51.9 37.4 2.9 9.9 9.8<br />
Level of Service 0.630 / B B --- --- --- D D D D A --- --- A A --- --- ---<br />
85 SB on/off ramp & Patterson Ave Signal<br />
Delay (seconds) 26.8 44.8 47.6 31.1 18.8 23.9 32.5 16.8<br />
Level of Service 0.663 / B C D D C --- --- --- --- B C C B --- --- --- ---<br />
86 Patterson Ave & Calle Real Signal<br />
City of Goleta<br />
Delay (seconds) 28.8 48.7 37.2 55.1 4.3 18.8 N/A<br />
Level of Service 0.650 / B C D --- D --- --- --- E A --- --- B N/A --- --- ---<br />
87 NB on/off ramp & Fairview Ave Signal<br />
Delay (seconds) 17.2 23.7 0.1 28.3 20.5 31.9 0.2<br />
Level of Service 0.758 / C B C --- A --- C C --- --- --- --- C A --- --- ---<br />
88 Calle Real & Fairview Ave Signal<br />
City of Goleta<br />
Delay (seconds) 36.4 94.0 27.2 30.2 104.2 31.1 N/A 53.6 7.7 9.7 49.6 30.4 N/A<br />
Level of Service 0.691 / B D F C C F C N/A D A A D C N/A --- --- ---<br />
89 SB on/off ramp & Fairview Ave Signal<br />
Delay (seconds) 15.4 N/A 22.5 19.2 18.1 14.8 21.9 5.2<br />
Level of Service 0.594 / A B N/A C B --- --- --- --- B B C A --- --- --- ---<br />
90 NB on/off ramp & Los Carneros Rd Signal<br />
Delay (seconds) 18.6 23.9 24.1 N/A 24.3 7.5 22.7 N/A<br />
Level of Service 0.602 / B B --- --- --- C C N/A C A --- --- C N/A --- --- ---<br />
91 SB on/off ramp & Los Carneros Rd Signal<br />
Delay (seconds) 15.2 N/A 56.8 39.6 7.1 22.1 46.4 3.3<br />
Level of Service 0.776 / C B N/A E D --- --- --- --- A C D A --- --- --- ---<br />
92 Los Carneros Rd & Calle Real Signal<br />
City of Goleta<br />
Delay (seconds) 12.1 14.6 9.4 10.8 9.6 112.7 6.5<br />
Level of Service 0.589 / A B --- --- --- B --- A --- B A F A --- --- --- ---<br />
93 NB on/off ramp & Glen Annie Rd & Calle Real Signal<br />
Delay (seconds) 83.7 37.4 102.8 109.9 108.4 94.5 N/A 145.3 22.8 N/A 43.8 29.1 N/A<br />
Level of Service 0.744 / C F D F F F F N/A F C N/A D C N/A --- --- ---<br />
94 Glen Annie Rd & Del Norte Rd TWSC<br />
City of Goleta<br />
Delay (seconds) 10 10.0 0.1 0.1 N/A<br />
Level of Service A --- --- A --- --- --- --- A --- --- A N/A --- --- ---<br />
95 SB on/off ramp & Glen Annie Rd Signal<br />
Delay (seconds) 9.9 N/A 38.6 43.7 10.2 2.4 28.4 6.6<br />
Level of Service 0.563 / A A N/A D D --- --- --- --- B A C A --- --- --- ---<br />
96 Calle Real & NB on ramp TWSC<br />
Delay (seconds) 12.2 9.1 N/A N/A 12.2<br />
Level of Service B --- A N/A N/A B --- --- --- --- --- --- --- --- --- ---<br />
97 SB on/off ramp & Hollister Ave TWSC<br />
Delay (seconds) 14.4 N/A 14.4 0.1 0.1 0.1 N/A 3.2<br />
Level of Service B N/A B A --- --- --- --- A A N/A A --- --- --- ---<br />
98 NB off ramp & Winchester Canyon Rd AWSC<br />
Delay (seconds) 9.7 8.5 10.4 N/A 8.4<br />
Level of Service A A --- --- --- B N/A --- --- --- --- --- A --- --- ---<br />
100 NB on/off ramps & Via Real Signal<br />
Delay (seconds) 6.2 6.2 5.6 N/A 6.0 6.5<br />
Level of Service 0.427 / A A --- A A N/A A --- --- A --- --- --- --- --- --- ---<br />
102 Guteirrez St & Garden St Signal<br />
City of Santa Barbara<br />
Delay (seconds) 35.1 24.4 21.6 N/A 25.5 15.8 61.2 N/A<br />
Level of Service 0.754 / A D --- --- --- C C N/A C B --- --- E N/A --- --- ---<br />
103 Montecito St & Castillo St Signal<br />
City of Santa Barbara<br />
Delay (seconds) 50.8 59.2 27.2 N/A 47.0 42.7 35.8 55.2 23.7 N/A 150.5 37.3 51.7<br />
Level of Service 0.892 / D D E C N/A D D D E C N/A F D D --- --- ---<br />
104 San Andres & Carrillo St Signal<br />
City of Santa Barbara<br />
Delay (seconds) 30.9 34.4 36.3 N/A N/A 33.1 24.1 21.8 17.1 N/A 21.0 37.6 N/A<br />
Level of Service 0.745 / C C C D F N/A C C C B N/A C D N/A --- --- ---<br />
105 Modoc St & Mission St AWSC<br />
City of Santa Barbara<br />
Delay (seconds) 46.4 17.6 12.9 14.3 29.2 105.0 13.4<br />
Level of Service E C --- B --- --- --- B D --- --- F B --- --- ---<br />
106 Quinientos St & Milpas St Signal<br />
City of Santa Barbara<br />
Delay (seconds) 13.4 16.8 16.8 N/A 21.3 16.3 N/A 6.9 14.6 N/A 13.5 9.8 N/A<br />
Level of Service<br />
Note: --- indicates corresponding movement does not exist.<br />
0.772 / C B B B N/A C B N/A A B N/A B A N/A --- --- ---<br />
N/A indicates delay same as the adjacent movement due to shared approach.<br />
AWSC = All Way Stop Control, TWSC = Two Way Stop Control<br />
1 - ICU LOS is reported for signalized intersections only<br />
2 - Based on HCM 2000, Chapter 16 Signalized Intersections and Chapter 17 Unsignalized Intersections methodology<br />
3 - Based on methodology developed by FHWA publication Roundabouts: An Information Guide, June 2000<br />
Indicates that LOS exceeds LOS threshold<br />
Control<br />
Type<br />
Overall V/C<br />
/ ICU LOS 1<br />
Overall<br />
HCM 2<br />
Eastbound<br />
Westbound Northbound<br />
Southbound<br />
Southeastbound<br />
SC101 HOV <strong>Traffic</strong> Study – <strong>Forecast</strong> <strong>Operations</strong> <strong>Report</strong> Page 120
Dowling Associates, Inc.<br />
Transportation Engineering Planning Research Education<br />
Table 56. 2020 Build AM Peak Hour LOS Results<br />
InID Intersection<br />
Control<br />
Type<br />
Overall V/C<br />
/ ICU LOS 1<br />
Overall<br />
HCM 2<br />
Eastbound Westbound Northbound<br />
Southbound Southeastbound<br />
LT T RT LT T RT LT T RT LT T RT LT T RT<br />
1 NB on/off ramp & Bates Rd TWSC<br />
Delay (seconds) 9 8.9 9.0 N/A N/A 5.5 0.1<br />
Level of Service A --- --- --- A A N/A N/A A --- --- A --- --- --- ---<br />
2 SB on/off ramp & Bates Rd TWSC<br />
Delay (seconds) 8.8 8.8 8.5 N/A 0.1 N/A 3.9<br />
Level of Service A A A N/A --- --- --- --- A --- N/A A --- --- --- ---<br />
3 NB on/off ramp & SR 150 TWSC<br />
Delay (seconds) 12.3 12.3 10.0 N/A N/A 0.2 0.1 N/A<br />
Level of Service B --- --- --- B A N/A N/A A --- --- A N/A --- --- ---<br />
4 SB on/off ramp & SR 150 TWSC<br />
Delay (seconds) 12.2 12.2 11.0 N/A 0.1 N/A 1.3<br />
Level of Service B B B N/A --- --- --- --- A --- N/A A --- --- --- ---<br />
5 Via Real & SR 150 TWSC<br />
Delay (seconds) 19 N/A 12.5 N/A 19.0 N/A 6.8 0.1<br />
Level of Service C N/A B --- N/A C --- N/A A --- --- A --- --- --- ---<br />
6 Carpinteria Ave & SR 150 TWSC<br />
Delay (seconds) 9.8 N/A 9.8 9.8 N/A 0.2<br />
Level of Service A N/A A --- --- A N/A --- --- --- --- A --- --- --- ---<br />
7 NB on/off ramp & Bailard Ave TWSC<br />
Delay (seconds) 19.2 N/A 19.2 N/A 0.6 0.1 0.1<br />
Level of Service C --- --- --- N/A C --- N/A A --- --- A A --- --- ---<br />
8 SB on/off ramp & Bailard Ave TWSC<br />
Delay (seconds) 46.3 N/A 46.3 N/A 0.1 N/A 1.1<br />
Level of Service E N/A E N/A --- --- --- --- A --- N/A A --- --- --- ---<br />
9 Via Real & Bailard Ave AWSC<br />
Delay (seconds) 12.3 N/A 9.9 10.2 N/A 13.1 7.9 N/A 9.8 14.6 N/A 11.8 7.7<br />
Level of Service B N/A A B N/A B A N/A A B N/A B A --- --- ---<br />
10 Carpinteria Ave & Bailard Ave AWSC<br />
Delay (seconds) 12 N/A 11.3 N/A N/A 9.8 N/A N/A 8.5 N/A N/A 13.2 N/A<br />
Level of Service B N/A B N/A N/A A N/A N/A A N/A N/A B N/A --- --- ---<br />
11 Via Real & Casitas Pass Rd Signal<br />
Delay (seconds) 19.1 N/A 33.6 30.7 19.4 19.4 15.0 41.2 14.1 N/A 29.0 20.0 N/A<br />
Level of Service 0.626 / B B N/A C C B B B D B N/A C B N/A --- --- ---<br />
12 Vellocito & Via Real TWSC<br />
Delay (seconds) 10.8 N/A 1.1 0.1 N/A N/A 10.8 N/A<br />
Level of Service B N/A A --- --- A N/A --- --- --- N/A B N/A --- --- ---<br />
13 SB on/off ramp & Casitas Pass Rd Signal<br />
Delay (seconds) 11.7 28.2 27.5 N/A 9.3 N/A 33.7 1.0<br />
Level of Service 0.551 / A B C C N/A --- --- --- A N/A C A --- --- ---<br />
14 Carpinteria Ave & Casitas Pass Rd Signal<br />
Delay (seconds) 21.8 28.9 7.3 26.4 20.5 21.3 28.0<br />
Level of Service 0.682 / B C C A --- --- C C --- --- --- C --- C --- --- ---<br />
15 NB on ramp & Ogan Rd 3<br />
City of Carpinteria<br />
City of Carpinteria<br />
Roundabout<br />
Delay (seconds) 7.9<br />
Level of Service A<br />
16 Linden Ave & Ogan Rd Signal<br />
City of Carpinteria<br />
Delay (seconds) 12.4 25.4 24.5 9.6 7.7 26.0 2.5<br />
Level of Service 0.671 / B B --- --- --- C --- C --- A A C A --- --- --- ---<br />
17 SB off ramp & Linden Ave Signal<br />
Delay (seconds) 8.7 23.6 20.6 4.3 3.0<br />
Level of Service 0.437 / A A C --- C --- --- --- --- A --- --- A --- --- --- ---<br />
18 Linden Ave & Sawyer Ave TWSC<br />
City of Carpinteria<br />
Delay (seconds) 33.7 N/A 33.7 N/A N/A 0.2 0.1 N/A<br />
Level of Service D N/A D N/A --- --- --- N/A A --- --- A N/A --- --- ---<br />
19 SB on/off ramp & Carpinteria Ave TWSC<br />
Delay (seconds) 22.5 8.3 0.1 7.8 0.1 N/A 15.1 N/A N/A 22.5 N/A<br />
Level of Service C A A --- A A --- N/A C N/A N/A C N/A --- --- ---<br />
20 Santa Ynez Ave/7th St & Carpinteria Ave Signal<br />
City of Carpinteria<br />
Delay (seconds) 20.1 26.0 11.2 10.5 18.9 20.5 N/A 24.2 20.9 20.0 17.3 N/A<br />
Level of Service 0.471 / A C C B B --- B C N/A C C B B N/A --- --- ---<br />
21 NB on/off ramp & Via Real AWSC<br />
Delay (seconds) 78.4 N/A 14.2 6.3 N/A 160.8 8.7 N/A 19.6 N/A N/A 20.1 N/A<br />
Level of Service F N/A B A N/A F A N/A C N/A N/A C N/A --- --- ---<br />
22 NB on/off ramp & S. Padaro Ln TWSC<br />
Delay (seconds) 9.6 N/A 9.6 N/A 1.4 0.1<br />
Level of Service A --- --- --- N/A A --- N/A A --- --- A --- --- --- ---<br />
23 Via Real & S. Padaro Ln TWSC<br />
City of Carpinteria<br />
Delay (seconds) 26 0.1 0.1 N/A 3.1 N/A 26.0 N/A<br />
Level of Service D --- A A N/A A --- N/A D N/A --- --- --- --- --- ---<br />
24 SB off ramp & Santa Claus Ln/S. Padaro Ln TWSC<br />
Delay (seconds) 11.5 11.5 11.0 N/A N/A 8.7 N/A 0.1 0.1 N/A 6.2<br />
Level of Service B B B N/A N/A A N/A --- A A N/A A --- --- --- ---<br />
25 NB on/off ramp & N. Padaro Ln TWSC<br />
Delay (seconds) 12 N/A 12.0 N/A N/A 1.3 0.1<br />
Level of Service B --- --- --- N/A B N/A N/A A --- --- A --- --- ---<br />
26 N. Padaro Ln & Via Real TWSC<br />
County of Santa Barbara<br />
Delay (seconds) 18 0.1 N/A N/A 6.5 N/A 18.0 N/A<br />
Level of Service C --- A N/A N/A A --- N/A C N/A --- --- --- --- --- ---<br />
SC101 HOV <strong>Traffic</strong> Study – <strong>Forecast</strong> <strong>Operations</strong> <strong>Report</strong> Page 121
Dowling Associates, Inc.<br />
Transportation Engineering Planning Research Education<br />
Table 56 cont. 2020 Build AM Peak Hour LOS Results<br />
InID Intersection<br />
Control<br />
Type<br />
Overall V/C<br />
/ ICU LOS 1<br />
Overall<br />
HCM 2<br />
Eastbound Westbound Northbound<br />
Southbound Southeastbound<br />
LT T RT LT T RT LT T RT LT T RT LT T RT<br />
27 SB on/off ramp & N. Padaro Ln TWSC<br />
Delay (seconds) 10.8 N/A 10.8 N/A 0.1 N/A 6.3<br />
Level of Service B N/A B N/A --- --- --- --- A --- N/A A --- --- --- ---<br />
28 NB off ramp & Ortega Hill Rd TWSC<br />
Delay (seconds) 12 N/A 0.1 0.1 N/A 12.0 0.1<br />
Level of Service B N/A A --- --- A --- N/A B --- --- A --- --- --- ---<br />
29 Evans Ave & Ortega Hill Rd AWSC<br />
Delay (seconds) 10 N/A 8.3 N/A N/A 11.2 N/A N/A 8.7 N/A N/A 8.6 N/A<br />
Level of Service A N/A A N/A N/A B N/A N/A A N/A N/A A N/A --- --- ---<br />
30 NB on ramp & Ortega Hill Rd TWSC<br />
Delay (seconds) 15.4 15.4 15.0 N/A 4.7<br />
Level of Service C --- C B N/A A --- --- --- --- --- --- --- --- --- ---<br />
31 SB off ramp & Evans Ave TWSC<br />
Delay (seconds) 10 N/A 10.0 N/A 8.5 N/A 0.1 N/A 6.0<br />
Level of Service A N/A A --- N/A A N/A --- A --- N/A A --- --- --- ---<br />
32 NB on/off ramp & Sheffield TWSC<br />
Delay (seconds) 12.9 N/A 12.9 N/A 0.1 0.1 0.1<br />
Level of Service B --- --- --- N/A B --- N/A A --- --- A A --- --- ---<br />
33 SB on/off ramp & Sheffield TWSC<br />
Delay (seconds) 16.2 N/A 16.2 7.4<br />
Level of Service C N/A C --- --- --- --- --- --- --- A --- --- --- --- ---<br />
34 Jameson & Sheffield TWSC<br />
Delay (seconds) 12.7 0.1 0.1 N/A 5.7 N/A 12.7 N/A<br />
Level of Service B --- A A N/A A --- N/A B N/A --- --- --- --- --- ---<br />
35 NB on/off ramp & San Ysidro Rd TWSC<br />
Delay (seconds) 13.3 N/A 13.3 N/A 1..5 0.1 0.1<br />
Level of Service B --- --- --- N/A B --- N/A --- --- --- A A --- --- ---<br />
36 San Ysidro Rd & N. Jameson Ln AWSC<br />
Delay (seconds) 33.2 N/A 13.9 9.5 N/A 14.4 9.6 N/A 58.0 8.1 N/A 25.8 8.9<br />
Level of Service D N/A B A N/A B A N/A F A N/A D A --- --- ---<br />
37 SB off ramp & San Ysidro Rd/Eucalyptus Ln TWSC<br />
Delay (seconds) 28.5 28.5 10.6 N/A N/A 9.8 N/A 0.1 N/A 4.5<br />
Level of Service D D B N/A N/A A N/A --- A --- N/A A --- --- --- ---<br />
38 S. Jameson Ln & San Ysidro Rd/Eucalyptus Ln TWSC<br />
Delay (seconds) 9.8 N/A 9.8 N/A N/A 0.7 0.1 N/A<br />
Level of Service A N/A A N/A --- --- --- N/A A --- --- A N/A --- --- ---<br />
39 NB off ramp & Olive Mill Rd AWSC<br />
Delay (seconds) 25.9 N/A 17.2 N/A N/A 37.1 17.0 N/A<br />
Level of Service D --- --- --- N/A C N/A N/A E --- --- C N/A --- --- ---<br />
39a N. Jameson Ln & Olive Mill Rd AWSC<br />
Delay (seconds) 16.5 N/A 12.1 N/A 20.5 N/A N/A 11.1<br />
Level of Service C --- --- --- N/A B N/A --- C N/A N/A B --- --- --- ---<br />
40 SB on ramp & Olive Mill Rd AWSC<br />
Delay (seconds) 15.6 12.2 15.2 N/A 18.8 N/A N/A 12.9<br />
Level of Service C B C N/A --- --- --- --- C N/A N/A B --- --- --- ---<br />
41 SB off ramp & Depot TWSC<br />
Delay (seconds) 10.6 0.1 0.1 8.1 10.6<br />
Level of Service B --- A A A --- --- --- --- B --- --- --- --- --- ---<br />
42 Olive Mill Rd & Spring TWSC<br />
Delay (seconds) 15.1 N/A 15.1 N/A N/A 0.1 0.1 N/A<br />
Level of Service C N/A C N/A --- --- --- N/A A --- --- A N/A --- --- ---<br />
43 NB off ramp & Coast Village Rd/Hermosillo Dr TWSC<br />
Delay (seconds) 23.7 N/A 0.3 N/A 23.7 13.6 N/A 15.9 N/A<br />
Level of Service C N/A A --- --- N/A --- C B --- N/A C N/A --- --- ---<br />
44 SB on/off ramp & NB off ramp & Cabrillo Blvd AWSC<br />
Delay (seconds) 41.5 76.1 8.0 N/A 20.2 N/A 18.5 14.9<br />
Level of Service E F --- A N/A C N/A --- C --- --- B --- --- --- ---<br />
45 NB on ramp & Cabrillo Blvd TWSC<br />
Delay (seconds) 22.3 7.5 0.1 22.3 14.5<br />
Level of Service C --- --- --- A A --- C --- B --- --- --- --- --- ---<br />
46 NB on/off ramp & S. Salinas St TWSC<br />
Delay (seconds) 8.7 7.0 8.7<br />
Level of Service A --- --- --- --- --- A --- --- --- --- --- A --- --- ---<br />
47 NB on/off ramp & Milpas St 3<br />
County of Santa Barbara<br />
County of Santa Barbara<br />
County of Santa Barbara<br />
County of Santa Barbara<br />
County of Santa Barbara<br />
Roundabout<br />
Delay (seconds) 3.7<br />
Level of Service A<br />
48 SB off ramp & Milpas St Signal<br />
Delay (seconds) 8.2 32.8 2.1 5.8<br />
Level of Service 0.644 / /B A --- --- C --- --- --- --- A --- --- A --- --- --- ---<br />
49 SB on ramp & Milpas St Signal<br />
Delay (seconds) 35.5 32.0 33.8 N/A 48.6 16.1 N/A 42.6 N/A<br />
Level of Service 0.744 / C D --- --- --- --- --- C --- C N/A D B --- N/A N/A N/A<br />
50 NB on/off ramp & Garden St Signal<br />
Delay (seconds) 13.4 N/A 27.1 38.2 36.7 2.2 13.3 14.6<br />
Level of Service 0.487 / A B N/A C D D A B B<br />
51 NB off ramp & Palm Ave TWSC<br />
Delay (seconds) 10 10.0 N/A 0.3 0.1<br />
Level of Service A A --- --- --- --- --- N/A A --- --- A --- --- --- ---<br />
SC101 HOV <strong>Traffic</strong> Study – <strong>Forecast</strong> <strong>Operations</strong> <strong>Report</strong> Page 122
Dowling Associates, Inc.<br />
Transportation Engineering Planning Research Education<br />
Table 56 cont. 2020 Build AM Peak Hour LOS Results<br />
InID Intersection<br />
Control<br />
Type<br />
Overall V/C<br />
/ ICU LOS 1<br />
Overall<br />
HCM 2<br />
Eastbound Westbound Northbound<br />
Southbound Southeastbound<br />
LT T RT LT T RT LT T RT LT T RT LT T RT<br />
52 SB on/off ramp & Garden St Signal<br />
Delay (seconds) 22.1 33.3 37.7 20.8 16.1 N/A 22.7 7.2<br />
Level of Service 0.543 / A C C D C --- --- --- --- B N/A C A --- --- --- ---<br />
53 Garden St & E/ Yanonali St Signal<br />
City of Santa Barbara<br />
Delay (seconds) 28.2 45.5 17.5 15.9 33.4 21.6 22.6 37.2 18.0 N/A 53.8 9.9 N/A<br />
Level of Service 0.486 / A C D B B C C C D B N/A D A N/A --- --- ---<br />
54 NB off ramp & Bath St TWSC<br />
Delay (seconds) 12.6 N/A 12.6 11.1 N/A N/A 0.1 5.1<br />
Level of Service B N/A B --- --- B N/A N/A A --- A --- --- --- --- ---<br />
55 NB on ramp & Castillo St Signal<br />
Delay (seconds) 41.9 127.1 71.7 N/A 7.2 2.8 6.5 N/A 52.2 47.7<br />
Level of Service 0.559 / A D --- --- --- F E N/A A A A N/A D D --- --- ---<br />
56 W. Haley St & Bath St Signal<br />
City of Santa Barbara<br />
Delay (seconds) 9.2 8.0 9.6 N/A N/A 8.5 7.3 N/A 10.0 N/A<br />
Level of Service 0.517 / A A A A N/A N/A A A N/A A N/A --- --- --- --- --- ---<br />
57 SB on/off ramp & Castillo St Signal<br />
Delay (seconds) 21.8 N/A 33.6 43.5 12.7 N/A 86.5 4.9<br />
Level of Service 0.650 / B C N/A C D --- --- --- --- B N/A F A --- --- --- ---<br />
58 NB on/off ramp & Carrillo St Signal<br />
Delay (seconds) 21.1 54.8 55.4 N/A 43.1 6.2 18.6 22.7<br />
Level of Service 0.717 / C C --- --- --- D E N/A D A --- --- B C --- --- ---<br />
59 SB on/off ramp & Carrillo St Signal<br />
Delay (seconds) 38.2 43.3 44.3 21.7 28.9 28.6 139.7 5.3<br />
Level of Service 0.865 / D D D D C --- --- --- --- C C F A --- --- --- ---<br />
60 Carrillo St & Castillo St Signal<br />
City of Santa Barbara<br />
Delay (seconds) 20.2 36.0 40.9 44.8 21.8 N/A 77.1 4.5<br />
Level of Service 0.742 / C C D D D --- --- --- --- C N/A E A --- --- --- ---<br />
61 Carrillo St & San Pascual St TWSC<br />
City of Santa Barbara<br />
Delay (seconds) 13.6 N/A 11.8 N/A 0.1 0.1 13.6 0.1<br />
Level of Service B --- --- --- N/A B N/A --- A A B A --- --- --- ---<br />
62 NB on/off ramp & Castillo St TWSC<br />
Delay (seconds) 55.2 N/A 0.9 0.1 11.5 N/A N/A 55.2<br />
Level of Service F N/A A A --- --- --- --- B N/A N/A F --- --- --- ---<br />
63 NB on/off ramp & Mission St Signal<br />
Delay (seconds) 22.1 N/A 89.8 32.8 N/A 26.5 2.3 3.1<br />
Level of Service 0.840 / D C --- --- --- N/A F C N/A C --- --- A A --- --- ---<br />
64 SB on/off ramp & Mission St Signal<br />
Delay (seconds) 32.5 55.3 51.4 N/A 11.2 N/A N/A 26.1<br />
Level of Service 0.960 / E C E D N/A --- --- --- --- B N/A N/A C --- --- --- ---<br />
65 Mission St & Castillo St Signal<br />
City of Santa Barbara<br />
Delay (seconds) 5.2 N/A 28.4 33.0 N/A 2.5 N/A N/A 4.0 N/A<br />
Level of Service 0.575 / A A N/A C C --- --- --- N/A A N/A N/A A N/A --- --- ---<br />
66 Mission St & Modoc Rd TWSC<br />
City of Santa Barbara<br />
Delay (seconds) 15.6 N/A 15.6 N/A 0.1 N/A N/A 3.5<br />
Level of Service C --- --- --- N/A C N/A --- A N/A N/A A --- --- --- ---<br />
67 NB off ramp & Pueblo St & Calle Real TWSC<br />
Delay (seconds) 39.2 5.0 33.8 N/A 39.2<br />
Level of Service E A --- --- --- D N/A --- --- --- --- --- E --- --- ---<br />
68 NB on ramp & Calle Real Signal<br />
Delay (seconds) 23.1 N/A 61.7 N/A 18.2 2.2 N/A N/A 66.4 N/A<br />
Level of Service 0.853 / D C N/A E N/A B A N/A --- --- --- N/A E N/A --- --- ---<br />
69 Calle Real & Las Positas Rd Signal<br />
City of Santa Barbara<br />
Delay (seconds) 35.8 125.1 22.2 71.4 63.5 88.1 15.4 2.5 59.4 53.4<br />
Level of Service 0.687 / B D F C E E F B A --- --- E D --- --- ---<br />
70 SB on/off ramp & Las Positas Rd Signal<br />
Delay (seconds) 29.2 75.7 46.1 N/A 19.9 14.7 52.3 2.7<br />
Level of Service 0.828 / D C E D N/A --- --- --- --- B B D A --- --- --- ---<br />
71 Las Pasitas Rd & Modoc Rd Signal<br />
City of Santa Barbara<br />
Delay (seconds) 127.9 462.7 46.9 47.3 63.3 54.7 401.8 81.7 22.6 N/A 87.4 24.9 N/A<br />
Level of Service 0.863 / D F F D D E D F F C N/A F C N/A --- --- ---<br />
72 NB on/off ramp & Calle Real Signal<br />
Delay (seconds) 26 26.8 23.0 N/A 31.1 27.0 N/A 26.3 26.5 19.6 27.8 28.6 26.9<br />
Level of Service 0.503 / A C C C N/A C C N/A C C B C C C --- --- ---<br />
73 SB on/off ramp & La Cumbre Rd Signal<br />
Delay (seconds) 14.4 17.7 18.0 15.4 15.3 16.3 17.9 6.3<br />
Level of Service 0.524 / A B B B B --- --- --- --- B B B A --- --- --- ---<br />
74 La Cumbre Rd & Calle Real Signal<br />
City of Santa Barbara<br />
Delay (seconds) 9.3 13.4 13.8 8.7 8.6 20.8 4.5<br />
Level of Service 0.401 / A A --- --- --- B --- B --- A A C A --- --- --- ---<br />
75 NB off ramp & State St & Calle Real Signal<br />
Delay (seconds) 22.8 34.0 18.9 24.1 23.0 19.4 23.3 N/A 28.7 28.7 N/A<br />
Level of Service 0.540 / A C C B --- --- C C B C N/A C C N/A --- --- ---<br />
76 NB on ramp & State St TWSC<br />
Delay (seconds) 0<br />
Level of Service ---<br />
77 Calle Real & Rt 154 & San Macros Pass Rd Signal<br />
Delay (seconds) 30.9 59.4 32.6 31.9 41.4 22.9 29.3 41.5 30.0 N/A 39.7 27.5 N/A<br />
Level of Service 0.608 / B C E C C D C C D C N/A D C N/A --- --- ---<br />
78 SB off ramp & State St Signal<br />
Delay (seconds) 16.8 17.1 N/A 29.3 10.4 28.9 21.2 21.2 17.2<br />
Level of Service 0.506 / A B --- B N/A C B --- --- C --- C C B --- --- ---<br />
SC101 HOV <strong>Traffic</strong> Study – <strong>Forecast</strong> <strong>Operations</strong> <strong>Report</strong> Page 123
Dowling Associates, Inc.<br />
Transportation Engineering Planning Research Education<br />
Table 56 cont. 2020 Build AM Peak Hour LOS Results<br />
InID Intersection<br />
LT T RT LT T RT LT T RT LT T RT LT T RT<br />
79 SB on ramp & State St & Rt 154 TWSC<br />
Delay (seconds) 75.5 75.5<br />
Level of Service F --- --- --- --- --- --- --- --- --- F --- --- --- --- ---<br />
792 State St & San Marcos Pass Road Signal<br />
Delay (seconds) 24.2 25.5 6.9 N/A N/A 29.5 26.2 N/A 47.4 N/A N/A 30.9 27.0<br />
Level of Service 0.619 / B C C A N/A N/A C C N/A D N/A N/A C C --- --- ---<br />
80 NB on/off ramp & Calle Real & El Sueno Rd AWSC<br />
Delay (seconds) 18.2 N/A 12.7 N/A N/A 24.5 N/A N/A 15.7 8.3 N/A 12.6 N/A<br />
Level of Service C N/A B N/A N/A C N/A N/A C A N/A B N/A --- --- ---<br />
81 NB on/off ramp & Turnpike Rd Signal<br />
Delay (seconds) 31.6 82.9 78.8 34.3 32.5 4.7 21.4 N/A<br />
Level of Service 0.683 / B C --- --- --- F E C C A --- --- C N/A --- --- ---<br />
82 SB on/off ramp & Turnpike Rd Signal<br />
Delay (seconds) 24.5 N/A 39.3 N/A 25.6 N/A 44.0 7.0<br />
Level of Service 0.809 / D C N/A D N/A --- --- --- --- C N/A D A --- --- --- ---<br />
83 Turnpike Rd & Calle Real Signal<br />
County of Santa Barbara<br />
Delay (seconds) 23.5 46.8 35.4 41.5 48.8 26.4 N/A 25.2 8.2 N/A 43.2 20.1 N/A<br />
Level of Service 0.505 / A C D D D D C N/A C A N/A D C N/A --- --- ---<br />
84 NB on/off ramp & Patterson Ave Signal<br />
Delay (seconds) 25.5 44.0 46.8 30.8 46.3 8.8 16.8 20.5<br />
Level of Service 0.753 / C C --- --- --- D D C D A --- --- B C --- --- ---<br />
85 SB on/off ramp & Patterson Ave Signal<br />
Delay (seconds) 19.7 45.1 49.7 48.0 14.1 15.9 32.0 1.1<br />
Level of Service 0.519 / A B D D D --- --- --- --- B B C A --- --- --- ---<br />
86 Patterson Ave & Calle Real Signal<br />
City of Goleta<br />
Delay (seconds) 17.5 37.1 42.1 32.3 2.2 11.7 N/A<br />
Level of Service 0.550 / A B D --- D --- --- --- C A --- --- B N/A --- --- ---<br />
87 NB on/off ramp & Fairview Ave Signal<br />
Delay (seconds) 21.1 26.6 0.1 42.4 24.8 42.0 0.3<br />
Level of Service 0.550 / A C C --- A --- D C --- --- --- --- D A --- --- ---<br />
88 Calle Real & Fairview Ave Signal<br />
City of Goleta<br />
Delay (seconds) 37.1 62.7 34.4 52.2 59.0 31.3 N/A 59.8 17.2 15.8 31.9 35.1 N/A<br />
Level of Service 0.667 / B D E C D E C N/A E B B C D N/A --- --- ---<br />
89 SB on/off ramp & Fairview Ave Signal<br />
Delay (seconds) 13.8 N/A 17.1 19.6 19.3 17.6 18.3 7.8<br />
Level of Service 0.595 / A B N/A B B --- --- --- --- B B B A --- --- --- ---<br />
90 NB on/off ramp & Los Carneros Rd Signal<br />
Delay (seconds) 35 56.9 55.9 N/A 39.7 8.2 9.1 N/A<br />
Level of Service 0.579 / A C --- --- --- E E N/A D A --- --- A N/A --- --- ---<br />
91 SB on/off ramp & Los Carneros Rd Signal<br />
Delay (seconds) 14.1 N/A 36.7 42.0 8.2 10.5 37.2 6.5<br />
Level of Service 0.570 / A B N/A D D --- --- --- --- A B D A --- --- --- ---<br />
92 Los Carneros Rd & Calle Real Signal<br />
City of Goleta<br />
Delay (seconds) 15 38.9 27.7 2.9 1.9 44.7 5.4<br />
Level of Service 0.431 / A B --- --- --- D --- C --- A A D A --- --- --- ---<br />
93 NB on/off ramp & Glen Annie Rd & Calle Real Signal<br />
Delay (seconds) 122 36.1 402.1 389.2 84.7 67.1 N/A 66.7 15.0 N/A 45.7 26.6 N/A<br />
Level of Service 0.752 / C F D F F F E N/A E B N/A D C N/A --- --- ---<br />
94 Glen Annie Rd & Del Norte Rd TWSC<br />
City of Goleta<br />
Delay (seconds) 11.1 11.1 0.1 0.1 N/A<br />
Level of Service B --- --- B --- --- --- --- A --- --- A N/A --- --- ---<br />
95 SB on/off ramp & Glen Annie Rd Signal<br />
Delay (seconds) 115.5 N/A 31.9 75.7 13.4 1.6 367.6 8.7<br />
Level of Service 0.694 / B F N/A C E --- --- --- --- B A F A --- --- --- ---<br />
96 Calle Real & NB on ramp TWSC<br />
Delay (seconds) 10.8 9.8 N/A N/A 10.8<br />
Level of Service B --- A N/A N/A B --- --- --- --- --- --- --- --- --- ---<br />
97 SB on/off ramp & Hollister Ave TWSC<br />
Delay (seconds) 18.5 N/A 18.5 0.1 0.1 0.1 N/A 5.1<br />
Level of Service C N/A C A --- --- --- --- A A N/A A --- --- --- ---<br />
98 NB off ramp & Winchester Canyon Rd AWSC<br />
Delay (seconds) 8.4 8.2 8.7 N/A 7.9<br />
Level of Service A A --- --- --- A N/A --- --- --- --- --- A --- --- ---<br />
100 NB on/off ramps & Via Real Signal<br />
Delay (seconds) 7.7 8.6 8.5 N/A 8.7 7.0<br />
Level of Service 0.645 / B A --- A A N/A A --- --- A --- --- --- --- --- --- ---<br />
102 Guteirrez St & Garden St Signal<br />
City of Santa Barbara<br />
Delay (seconds) 20.1 25.1 21.4 N/A 30.8 6.6 23.1 N/A<br />
Level of Service 0.694 / B C --- --- --- C C N/A C A --- --- C N/A --- --- ---<br />
103 Montecito St & Castillo St Signal<br />
City of Santa Barbara<br />
Delay (seconds) 60.1 98.7 31.8 N/A 57.0 48.3 43.0 59.7 17.5 N/A 55.0 20.3 83.5<br />
Level of Service 0.801 / D E F C N/A E D D E B N/A D C F --- --- ---<br />
104 San Andres & Carrillo St Signal<br />
City of Santa Barbara<br />
Delay (seconds) 29.5 47.3 46.4 N/A N/A 46.3 34.9 15.2 21.9 N/A 24.7 21.5 N/A<br />
Level of Service 0.672 / B C D D F N/A D C B C N/A C C N/A --- --- ---<br />
105 Modoc St & Mission St AWSC<br />
City of Santa Barbara<br />
Delay (seconds) 45.3 22.4 10.8 12.6 95.6 24.4 10.6<br />
Level of Service E C --- B --- --- --- B F --- --- C B --- --- ---<br />
106 Quinientos St & Milpas St Signal<br />
City of Santa Barbara<br />
Delay (seconds) 9.4 18.3 18.3 N/A 19.4 18.6 N/A 5.4 8.1 N/A 4.8 8.9 N/A<br />
Level of Service<br />
Note: --- indicates corresponding movement does not exist.<br />
0.590 / A A B B N/A B B N/A A A N/A A A N/A --- --- ---<br />
N/A indicates delay same as the adjacent movement due to shared approach.<br />
AWSC = All Way Stop Control, TWSC = Two Way Stop Control<br />
1 - ICU LOS is reported for signalized intersections only<br />
2 - Based on HCM 2000, Chapter 16 Signalized Intersections and Chapter 17 Unsignalized Intersections methodology<br />
3 - Based on methodology developed by FHWA publication Roundabouts: An Information Guide, June 2000<br />
Indicates that LOS exceeds LOS threshold<br />
Control<br />
Type<br />
Overall V/C<br />
/ ICU LOS 1<br />
Overall<br />
HCM 2<br />
Eastbound Westbound Northbound Southbound<br />
Southeastbound<br />
SC101 HOV <strong>Traffic</strong> Study – <strong>Forecast</strong> <strong>Operations</strong> <strong>Report</strong> Page 124
Dowling Associates, Inc.<br />
Transportation Engineering Planning Research Education<br />
Table 57. 2020 Build PM Peak Hour LOS Results<br />
InID Intersection<br />
Control<br />
Type<br />
Overall V/C<br />
/ ICU LOS 1<br />
Overall<br />
HCM 2<br />
Eastbound Westbound Northbound Southbound Southeastbound<br />
LT T RT LT T RT LT T RT LT T RT LT T RT<br />
1 NB on/off ramp & Bates Rd TWSC<br />
Delay (seconds) 9.2 9.2 8.4 N/A N/A 4.6 0.1<br />
Level of Service A --- --- --- A A N/A N/A A --- --- A --- --- --- ---<br />
2 SB on/off ramp & Bates Rd TWSC<br />
Delay (seconds) 9.7 9.2 9.7 N/A 0.1 N/A 3.1<br />
Level of Service A A A N/A --- --- --- --- A --- N/A A --- --- --- ---<br />
3 NB on/off ramp & SR 150 TWSC<br />
Delay (seconds) 13.9 13.9 9.8 N/A N/A 0.3 0.1 N/A<br />
Level of Service B --- --- --- B A N/A N/A A --- --- A N/A --- --- ---<br />
4 SB on/off ramp & SR 150 TWSC<br />
Delay (seconds) 32 32.0 12.4 N/A 0.1 N/A 7.3<br />
Level of Service D D B N/A --- --- --- --- A --- N/A A --- --- --- ---<br />
5 Via Real & SR 150 TWSC<br />
Delay (seconds) 15.1 N/A 10.7 N/A 15.1 N/A 1.1 0.1<br />
Level of Service C N/A B --- N/A C --- N/A A --- --- A --- --- --- ---<br />
6 Carpinteria Ave & SR 150 TWSC<br />
Delay (seconds) 10 N/A 10.0 8.9 N/A 1.0<br />
Level of Service A N/A A --- --- A N/A --- --- --- --- A --- --- --- ---<br />
7 NB on/off ramp & Bailard Ave TWSC<br />
Delay (seconds) 20.9 N/A 20.9 N/A 3.4 0.1 0.1<br />
Level of Service C --- --- --- N/A C --- N/A A --- --- A A --- --- ---<br />
8 SB on/off ramp & Bailard Ave TWSC<br />
Delay (seconds) 71.8 N/A 71.8 N/A 0.1 N/A 1.9<br />
Level of Service F N/A F N/A --- --- --- --- A --- N/A A --- --- --- ---<br />
9 Via Real & Bailard Ave AWSC<br />
Delay (seconds) 34.6 N/A 10.7 10.4 N/A 66.0 8.1 N/A 23.2 11.1 N/A 11.5 9.1<br />
Level of Service D N/A B B N/A F A N/A C B N/A B A --- --- ---<br />
10 Carpinteria Ave & Bailard Ave AWSC<br />
Delay (seconds) 15.4 N/A 19.7 N/A N/A 10.0 N/A N/A 9.5 N/A N/A 11.8 N/A<br />
Level of Service C N/A C N/A N/A A N/A N/A A N/A N/A B N/A --- --- ---<br />
11 Via Real & Casitas Pass Rd Signal<br />
Delay (seconds) 17.3 N/A 32.8 27.9 17.6 17.5 13.8 34.5 11.7 N/A 28.6 21.4 N/A<br />
Level of Service 0.544 / A B N/A C C B B B N/A B N/A C C N/A --- --- ---<br />
12 Vellocito & Via Real TWSC<br />
Delay (seconds) 10.5 N/A 1.1 0.1 N/A N/A 10.5 N/A<br />
Level of Service B N/A A --- --- A N/A --- --- --- N/A B N/A --- --- ---<br />
13 SB on/off ramp & Casitas Pass Rd Signal<br />
Delay (seconds) 13.9 23.2 21.6 N/A 15.1 N/A 22.2 1.5<br />
Level of Service 0.685 / B B C C N/A --- --- --- B N/A C A --- --- ---<br />
14 Carpinteria Ave & Casitas Pass Rd Signal<br />
Delay (seconds) 27.5 34.9 8.1 35.6 24.8 30.5 37.3<br />
Level of Service 0.773 / C C C A --- --- D C --- --- --- C --- D --- --- ---<br />
15 NB on ramp & Ogan Rd 3<br />
City of Carpinteria<br />
City of Carpinteria<br />
Roundabout<br />
Delay (seconds) 4.3<br />
Level of Service A<br />
16 Linden Ave & Ogan Rd Signal<br />
City of Carpinteria<br />
Delay (seconds) 8.6 25.7 24.1 5.9 1.0 31.6 2.2<br />
Level of Service 0.483 / A A --- --- --- C --- C --- A A C A --- --- --- ---<br />
17 SB off ramp & Linden Ave Signal<br />
Delay (seconds) 10.9 23.0 19.2 4.9 3.7<br />
Level of Service 0.425 / A B C --- B --- --- --- --- A --- --- A --- --- --- ---<br />
18 Linden Ave & Sawyer Ave TWSC<br />
City of Carpinteria<br />
Delay (seconds) 21.6 N/A 21.6 N/A N/A 0.5 0.1 N/A<br />
Level of Service C N/A C N/A --- --- --- N/A A --- --- A N/A --- --- ---<br />
19 SB on/off ramp & Carpinteria Ave TWSC<br />
Delay (seconds) 90.3 9.2 0.1 8.2 0.1 N/A 30.6 N/A N/A 90.3 N/A<br />
Level of Service F A A --- A A --- N/A D N/A N/A F N/A --- --- ---<br />
20 Santa Ynez Ave/7th St & Carpinteria Ave Signal<br />
City of Carpinteria<br />
Delay (seconds) 31.9 81.2 17.2 14.8 23.2 32.6 N/A 30.2 26.6 30.6 19.5 N/A<br />
Level of Service 0.661 / B C F B B --- C C N/A C C C B N/A --- --- ---<br />
21 NB on/off ramp & Via Real AWSC<br />
Delay (seconds) 39.6 N/A 54.0 6.3 N/A 49.9 10.1 N/A 27.4 N/A N/A 21.4 N/A<br />
Level of Service E N/A F A N/A E B N/A D N/A N/A C N/A --- --- ---<br />
22 NB on/off ramp & S. Padaro Ln TWSC<br />
Delay (seconds) 11.1 N/A 11.1 N/A 1.9 0.1<br />
Level of Service B --- --- --- N/A B --- N/A A --- --- A --- --- --- ---<br />
23 Via Real & S. Padaro Ln TWSC<br />
City of Carpinteria<br />
Delay (seconds) 13.5 0.1 0.1 N/A 6.0 N/A 13.5 N/A<br />
Level of Service B --- A A N/A A --- N/A B N/A --- --- --- --- --- ---<br />
24 SB off ramp & Santa Claus Ln/S. Padaro Ln TWSC<br />
Delay (seconds) 32.4 32.4 19.6 N/A N/A 9.5 N/A 0.1 0.1 N/A 7.5<br />
Level of Service D D C N/A N/A A N/A --- A A N/A A --- --- --- ---<br />
25 NB on/off ramp & N. Padaro Ln TWSC<br />
Delay (seconds) 10 N/A 10.0 N/A N/A 2.3 0.1<br />
Level of Service A --- --- --- N/A A N/A N/A A --- --- A --- --- ---<br />
26 N. Padaro Ln & Via Real TWSC<br />
County of Santa Barbara<br />
Delay (seconds) 11.1 0.1 N/A N/A 5.8 N/A 11.1 N/A<br />
Level of Service B --- A N/A N/A A --- N/A B N/A --- --- --- --- --- ---<br />
SC101 HOV <strong>Traffic</strong> Study – <strong>Forecast</strong> <strong>Operations</strong> <strong>Report</strong> Page 125
Dowling Associates, Inc.<br />
Transportation Engineering Planning Research Education<br />
Table 57 cont. 2020 Build PM Peak Hour LOS Results<br />
InID Intersection<br />
Control<br />
Type<br />
Overall V/C<br />
/ ICU LOS 1<br />
Overall<br />
HCM 2<br />
Eastbound Westbound Northbound Southbound Southeastbound<br />
LT T RT LT T RT LT T RT LT T RT LT T RT<br />
27 SB on/off ramp & N. Padaro Ln TWSC<br />
Delay (seconds) 11.8 N/A 11.8 N/A 0.1 N/A 5.9<br />
Level of Service B N/A B N/A --- --- --- --- A --- N/A A --- --- --- ---<br />
28 NB off ramp & Ortega Hill Rd TWSC<br />
Delay (seconds) 13.3 N/A 0.1 0.1 N/A 13.3 9.4<br />
Level of Service B N/A A --- --- A --- N/A B --- --- A --- --- --- ---<br />
29 Evans Ave & Ortega Hill Rd AWSC<br />
Delay (seconds) 9.7 N/A 9.1 N/A N/A 10.6 N/A N/A 9.6 N/A N/A 8.6 N/A<br />
Level of Service A N/A A N/A N/A B N/A N/A A N/A N/A A N/A --- --- ---<br />
30 NB on ramp & Ortega Hill Rd TWSC<br />
Delay (seconds) 17.3 17.3 13.7 N/A 5.5<br />
Level of Service C --- C B N/A A --- --- --- --- --- --- --- --- --- ---<br />
31 SB off ramp & Evans Ave TWSC<br />
Delay (seconds) 12.9 N/A 12.9 N/A 8.5 N/A 0.1 N/A 6.4<br />
Level of Service B N/A B --- N/A A N/A --- A --- N/A A --- --- --- ---<br />
32 NB on/off ramp & Sheffield TWSC<br />
Delay (seconds) 9.7 N/A 9.7 N/A 1.1 0.1 0.1<br />
Level of Service A --- --- --- N/A A --- N/A A --- --- A A --- --- ---<br />
33 SB on/off ramp & Sheffield TWSC<br />
Delay (seconds) 12.2 N/A 12.2 7.4<br />
Level of Service B N/A B --- --- --- --- --- --- --- A --- --- --- --- ---<br />
34 Jameson & Sheffield TWSC<br />
Delay (seconds) 11.5 0.1 0.1 N/A 7.5 N/A 11.5 N/A<br />
Level of Service B --- A A N/A A --- N/A B N/A --- --- --- --- --- ---<br />
35 NB on/off ramp & San Ysidro Rd TWSC<br />
Delay (seconds) 12.4 N/A 12.4 N/A 3.0 0.1 0.1<br />
Level of Service B --- --- --- N/A B --- N/A A --- --- A A --- --- ---<br />
36 San Ysidro Rd & N. Jameson Ln AWSC<br />
Delay (seconds) 25.7 N/A 14.7 9.2 N/A 12.8 9.2 N/A 18.2 8.3 N/A 44.1 8.3<br />
Level of Service D N/A B A N/A B A N/A C A N/A E A --- --- ---<br />
37 SB off ramp & San Ysidro Rd/Eucalyptus Ln TWSC<br />
Delay (seconds) 23.9 23.9 10.1 N/A N/A 10.3 N/A 0.1 N/A 5.4<br />
Level of Service C C B N/A N/A B N/A --- A --- N/A A --- --- --- ---<br />
38 S. Jameson Ln & San Ysidro Rd/Eucalyptus Ln TWSC<br />
Delay (seconds) 10 N/A 10.0 N/A N/A 0.7 0.1 N/A<br />
Level of Service A N/A A N/A --- --- --- N/A A --- --- A N/A --- --- ---<br />
39 NB off ramp & Olive Mill Rd AWSC<br />
Delay (seconds) 19.3 N/A 13.2 N/A N/A 24.0 17.2 N/A<br />
Level of Service C --- --- --- N/A B N/A N/A C --- --- C N/A --- --- ---<br />
39a N. Jameson Ln & Olive Mill Rd AWSC<br />
Delay (seconds) 12 N/A 11.0 N/A 12.9 N/A N/A 11.4<br />
Level of Service B --- --- --- N/A B N/A --- B N/A N/A B --- --- --- ---<br />
40 SB on ramp & Olive Mill Rd AWSC<br />
Delay (seconds) 29.8 15.0 50.9 N/A 18.2 N/A N/A 16.9<br />
Level of Service D B F N/A --- --- --- --- C N/A N/A C --- --- --- ---<br />
41 SB off ramp & Depot TWSC<br />
Delay (seconds) 9.3 0.1 0.1 7.6 9.3<br />
Level of Service A --- A A A --- --- --- --- A --- --- --- --- --- ---<br />
42 Olive Mill Rd & Spring TWSC<br />
Delay (seconds) 12.3 N/A 12.3 N/A N/A 0.1 0.1 N/A<br />
Level of Service B N/A B N/A --- --- --- N/A A --- --- A N/A --- --- ---<br />
43 NB off ramp & Coast Village Rd/Hermosillo Dr TWSC<br />
Delay (seconds) 50.9 N/A 0.4 0.1 50.9 17.0 N/A 32.9 N/A<br />
Level of Service F N/A A --- --- A --- F C --- N/A D N/A --- --- ---<br />
44 SB on/off ramp & NB off ramp & Cabrillo Blvd AWSC<br />
Delay (seconds) 36.1 43.2 9.3 N/A 26.0 N/A 44.7 24.9<br />
Level of Service E E --- A N/A D N/A --- E --- --- C --- --- --- ---<br />
45 NB on ramp & Cabrillo Blvd TWSC<br />
Delay (seconds) 214.6 7.7 0.1 214.6 12.9<br />
Level of Service F --- --- --- A A --- F --- B --- --- --- --- --- ---<br />
46 NB on/off ramp & S. Salinas St TWSC<br />
Delay (seconds) 7.6 7.3 7.6<br />
Level of Service A --- --- --- --- --- A --- --- --- --- --- A --- --- ---<br />
47 NB on/off ramp & Milpas St 3<br />
County of Santa Barbara<br />
County of Santa Barbara<br />
County of Santa Barbara<br />
County of Santa Barbara<br />
County of Santa Barbara<br />
Roundabout<br />
Delay (seconds) 4.7<br />
Level of Service A --- --- --- --- --- --- --- --- --- --- --- --- --- --- ---<br />
48 SB off ramp & Milpas St Signal<br />
Delay (seconds) 10.7 36.7 1.8 9.1<br />
Level of Service 0.826 / D B --- --- D --- --- --- --- A --- --- A --- --- --- ---<br />
49 SB on ramp & Milpas St Signal<br />
Delay (seconds) 77.7 44.0 133.5 N/A 84.2 15.8 N/A 46.6 N/A<br />
Level of Service 0.933 / E E --- --- --- --- --- D --- F N/A F B --- N/A D N/A<br />
50 NB on/off ramp & Garden St Signal<br />
Delay (seconds) 22.2 N/A 61.6 63.0 48.3 0.5 15.8 17.2<br />
Level of Service 0.692 / B C N/A E E D A B B<br />
51 NB off ramp & Palm Ave TWSC<br />
Delay (seconds) 9.6 9.6 N/A 0.1 0.1<br />
Level of Service A A --- --- --- --- --- N/A A --- --- A --- --- --- ---<br />
SC101 HOV <strong>Traffic</strong> Study – <strong>Forecast</strong> <strong>Operations</strong> <strong>Report</strong> Page 126
Dowling Associates, Inc.<br />
Transportation Engineering Planning Research Education<br />
Table 57 cont. 2020 Build PM Peak Hour LOS Results<br />
InID Intersection<br />
Control<br />
Type<br />
Overall V/C<br />
/ ICU LOS 1<br />
Overall<br />
HCM 2<br />
Eastbound Westbound Northbound Southbound Southeastbound<br />
LT T RT LT T RT LT T RT LT T RT LT T RT<br />
52 SB on/off ramp & Garden St Signal<br />
Delay (seconds) 27.2 79.0 86.4 30.0 16.6 N/A 20.6 9.2<br />
Level of Service 0.847 / D C E F C --- --- --- --- B N/A C A --- --- --- ---<br />
53 Garden St & E/ Yanonali St Signal<br />
City of Santa Barbara<br />
Delay (seconds) 115.3 457.4 16.6 14.9 41.8 21.5 24.9 40.4 21.5 N/A 25.5 17.9 N/A<br />
Level of Service 0.625 / B F F B B D C C D C N/A C B N/A --- --- ---<br />
54 NB off ramp & Bath St TWSC<br />
Delay (seconds) 15.4 N/A 15.4 12.8 N/A N/A 0.2 5.9<br />
Level of Service C N/A C --- --- B N/A N/A A --- A --- --- --- --- ---<br />
55 NB on ramp & Castillo St Signal<br />
Delay (seconds) 104.0 298.4 252.4 N/A 6.4 4.5 6.8 N/A 42.8 38.5<br />
Level of Service 0.692 / B F --- --- --- F F N/A A A A N/A D D --- --- ---<br />
56 W. Haley St & Bath St Signal<br />
City of Santa Barbara<br />
Delay (seconds) 15 13.8 13.2 N/A N/A 15.2 9.2 N/A 16.9 N/A<br />
Level of Service 0.769 / C B B B N/A N/A B A N/A B N/A --- --- --- --- --- ---<br />
57 SB on/off ramp & Castillo St Signal<br />
Delay (seconds) 33 N/A 27.2 50.0 26.9 N/A 94.5 22.1<br />
Level of Service 0.788 / C C N/A C D --- --- --- --- C N/A F C --- --- --- ---<br />
58 NB on/off ramp & Carrillo St Signal<br />
Delay (seconds) 28.4 70.4 68.8 N/A 62.1 2.0 18.8 42.6<br />
Level of Service 0.818 / D C --- --- --- E E N/A E A --- --- B D --- --- ---<br />
59 SB on/off ramp & Carrillo St Signal<br />
Delay (seconds) 29.2 42.0 42.5 58.9 22.2 20.2 36.2 13.2<br />
Level of Service 0.767 / C C D D E --- --- --- --- C C D B --- --- --- ---<br />
60 Carrillo St & Castillo St Signal<br />
City of Santa Barbara<br />
Delay (seconds) 20.8 22.0 25.4 31.3 26.1 N/A 153.4 9.3<br />
Level of Service 0.761 / C C C C C --- --- --- C N/A F A --- --- --- ---<br />
61 Carrillo St & San Pascual St TWSC<br />
City of Santa Barbara<br />
Delay (seconds) 12.4 N/A 12.4 N/A 0.1 N/A 12.4 0.1<br />
Level of Service B --- --- --- N/A B N/A --- A N/A B A --- --- --- ---<br />
62 NB on/off ramp & Castillo St TWSC<br />
Delay (seconds) 142.3 N/A 0.5 0.1 11.8 N/A N/A 142.3<br />
Level of Service F N/A A A --- --- --- --- B N/A N/A F --- --- --- ---<br />
63 NB on/off ramp & Mission St Signal<br />
Delay (seconds) 11.5 N/A 44.3 49.8 N/A 7.7 3.7 4.6<br />
Level of Service 0.765 / C B --- --- --- N/A D D N/A A --- --- A A --- --- ---<br />
64 SB on/off ramp & Mission St Signal<br />
Delay (seconds) 36 51.6 53.7 N/A 9.9 N/A N/A 34.2<br />
Level of Service 0.868 / D D D D N/A --- --- --- --- A N/A N/A C --- --- --- ---<br />
65 Mission St & Castillo St Signal<br />
City of Santa Barbara<br />
Delay (seconds) 9.8 N/A 25.9 31.3 N/A 7.2 N/A N/A 7.4 N/A<br />
Level of Service 0.680 / B A N/A C C --- --- --- N/A A N/A N/A A N/A --- --- ---<br />
66 Mission St & Modoc Rd TWSC<br />
City of Santa Barbara<br />
Delay (seconds) 18 N/A 18.0 N/A 0.1 N/A N/A 5.2<br />
Level of Service C --- --- --- N/A C N/A --- A N/A N/A A --- --- --- ---<br />
67 NB off ramp & Pueblo St & Calle Real TWSC<br />
Delay (seconds) 114.5 6.2 31.9 N/A 114.5<br />
Level of Service F A --- --- --- D N/A --- --- --- --- --- F --- --- ---<br />
68 NB on ramp & Calle Real Signal<br />
Delay (seconds) 21.7 N/A 53.1 N/A 9.4 6.3 N/A N/A 61.5 N/A<br />
Level of Service 0.673 / B C N/A D N/A A A N/A --- --- --- N/A E N/A --- --- ---<br />
69 Calle Real & Las Positas Rd Signal<br />
City of Santa Barbara<br />
Delay (seconds) 39.8 94.6 43.7 49.9 46.4 46.3 33.6 10.2 57.9 44.3<br />
Level of Service 0.738 / C D F --- D D D D C B --- --- E D --- --- ---<br />
70 SB on/off ramp & Las Positas Rd Signal<br />
Delay (seconds) 37.3 79.3 39.4 N/A 30.7 23.5 48.9 10.4<br />
Level of Service 0.784 / C D E D N/A --- --- --- --- C C D B --- --- --- ---<br />
71 Las Pasitas Rd & Modoc Rd Signal<br />
City of Santa Barbara<br />
Delay (seconds) 67.8 326.3 44.0 40.7 61.0 47.0 56.7 234.1 24.3 N/A 74.2 13.7 N/A<br />
Level of Service 0.708 / C E F D D E D E F C N/A E B N/A --- --- ---<br />
72 NB on/off ramp & Calle Real Signal<br />
Delay (seconds) 32.1 35.5 33.3 N/A 34.2 29.2 N/A 32.3 32.0 23.6 32.4 35.1 30.4<br />
Level of Service 0.615 / B C D C N/A C C N/A C C C C D C --- --- ---<br />
73 SB on/off ramp & La Cumbre Rd Signal<br />
Delay (seconds) 18 20.4 20.5 14.5 21.3 20.7 20.2 8.8<br />
Level of Service 0.587 / A B C C B --- --- --- --- C C C A --- --- --- ---<br />
74 La Cumbre Rd & Calle Real Signal<br />
City of Santa Barbara<br />
Delay (seconds) 11.6 15.6 16.5 11.4 11.3 23.6 5.3<br />
Level of Service 0.475 / A B --- --- --- B --- B --- B B C A --- --- --- ---<br />
75 NB off ramp & State St & Calle Real Signal<br />
Delay (seconds) 28.8 42.3 21.3 27.4 32.1 26.1 31.8 N/A 39.4 39.4 N/A<br />
Level of Service 0.628 / B C D C --- --- C C C C N/A D D N/A --- --- ---<br />
76 NB on ramp & State St TWSC<br />
Delay (seconds) 0<br />
Level of Service ---<br />
77 Calle Real & Rt 154 & San Macros Pass Rd Signal<br />
Delay (seconds) 27.4 28.5 31.1 29.5 23.1 26.1 27.8 34.7 26.5 N/A 34.8 26.3 N/A<br />
Level of Service 0.537 / A C C C C C C C C C N/A C C N/A --- --- ---<br />
78 SB off ramp & State St Signal<br />
Delay (seconds) 26 27.2 N/A 34.6 16.3 32.5 30.5 30.5 21.3<br />
Level of Service 0.598 / A C --- C N/A C B --- --- C --- C C C --- --- ---<br />
SC101 HOV <strong>Traffic</strong> Study – <strong>Forecast</strong> <strong>Operations</strong> <strong>Report</strong> Page 127
Dowling Associates, Inc.<br />
Transportation Engineering Planning Research Education<br />
Table 57 cont. 2020 Build PM Peak Hour LOS Results<br />
InID Intersection<br />
LT T RT LT T RT LT T RT LT T RT LT T RT<br />
79 SB on ramp & State St & Rt 154 TWSC<br />
Delay (seconds) 58.7 58.7<br />
Level of Service F --- --- --- --- --- --- --- --- --- F --- --- --- --- ---<br />
792 State St & San Marcos Pass Road Signal<br />
Delay (seconds) 17.4 21.4 5.7 N/A N/A 22.1 20.6 N/A 37.9 N/A N/A 24.6 25.6<br />
Level of Service 0.520 / A B C A N/A N/A C C N/A D N/A N/A C C --- --- ---<br />
80 NB on/off ramp & Calle Real & El Sueno Rd AWSC<br />
Delay (seconds) 18.8 N/A 24.5 N/A N/A 18.2 N/A N/A 13.8 9.3 N/A 12.7 N/A<br />
Level of Service C N/A C N/A N/A C N/A N/A B A N/A B N/A --- --- ---<br />
81 NB on/off ramp & Turnpike Rd Signal<br />
Delay (seconds) 18.3 32.7 32.6 25.9 29.1 7.9 14.7 N/A<br />
Level of Service 0.595 / A B --- --- --- C C C C A --- --- B N/A --- --- ---<br />
82 SB on/off ramp & Turnpike Rd Signal<br />
Delay (seconds) 17 N/A 26.1 N/A 21.9 N/A 24.9 2.2<br />
Level of Service 0.755 / C B N/A C N/A --- --- --- --- C N/A C A --- --- --- ---<br />
83 Turnpike Rd & Calle Real Signal<br />
County of Santa Barbara<br />
Delay (seconds) 213.5 34.2 25.2 26.8 ##### 24.0 N/A 182.5 18.7 N/A 31.0 12.5 N/A<br />
Level of Service 0.600 / A F C C C F C N/A F B N/A C B N/A --- --- ---<br />
84 NB on/off ramp & Patterson Ave Signal<br />
Delay (seconds) 22.3 42.9 45.3 44.4 44.1 8.9 14.5 14.7<br />
Level of Service 0.652 / B C --- --- --- D D D D A --- --- B B --- --- ---<br />
85 SB on/off ramp & Patterson Ave Signal<br />
Delay (seconds) 27.6 46.4 48.9 31.3 19.2 25.4 35.0 15.2<br />
Level of Service 0.689 / B C D D C --- --- --- --- B C C B --- --- --- ---<br />
86 Patterson Ave & Calle Real Signal<br />
City of Goleta<br />
Delay (seconds) 34.4 49.3 37.5 70.6 6.7 18.7 N/A<br />
Level of Service 0.659 / B C D --- D --- --- --- E A --- --- B N/A --- --- ---<br />
87 NB on/off ramp & Fairview Ave Signal<br />
Delay (seconds) 17.5 23.9 0.1 28.1 20.6 34.4 0.2<br />
Level of Service 0.760 / C B C --- A --- C C --- --- --- --- C A --- --- ---<br />
88 Calle Real & Fairview Ave Signal<br />
City of Goleta<br />
Delay (seconds) 35 94.0 27.3 30.7 85.2 30.2 N/A 55.0 7.9 9.9 53.1 31.3 N/A<br />
Level of Service 0.693 / B C F C C F C N/A D A A D C N/A --- --- ---<br />
89 SB on/off ramp & Fairview Ave Signal<br />
Delay (seconds) 15.5 N/A 22.8 19.4 18.2 14.8 22.2 5.3<br />
Level of Service 0.600 / A B N/A C B --- --- --- --- B B C A --- --- --- ---<br />
90 NB on/off ramp & Los Carneros Rd Signal<br />
Delay (seconds) 19.3 24.6 24.0 N/A 25.7 8.2 23.8 N/A<br />
Level of Service 0.623 / B B --- --- --- C C N/A C A --- --- C N/A --- --- ---<br />
91 SB on/off ramp & Los Carneros Rd Signal<br />
Delay (seconds) 16.3 N/A 58.2 38.3 7.5 24.2 47.8 3.6<br />
Level of Service 0.789 / C B N/A E D --- --- --- --- A C D A --- --- --- ---<br />
92 Los Carneros Rd & Calle Real Signal<br />
City of Goleta<br />
Delay (seconds) 11.6 14.3 9.2 11.0 9.9 79.3 6.6<br />
Level of Service 0.601 / B B --- --- --- B --- A --- B A E A --- --- --- ---<br />
93 NB on/off ramp & Glen Annie Rd & Calle Real Signal<br />
Delay (seconds) 81.5 37.8 107.9 111.2 104.4 90.0 N/A 145.3 22.8 N/A 43.9 29.1 N/A<br />
Level of Service 0.741 / C F D F F F F N/A F C N/A D C N/A --- --- ---<br />
94 Glen Annie Rd & Del Norte Rd TWSC<br />
City of Goleta<br />
Delay (seconds) 10.1 10.1 0.1 0.1 N/A<br />
Level of Service B --- --- B --- --- --- --- A --- --- A N/A --- --- ---<br />
95 SB on/off ramp & Glen Annie Rd Signal<br />
Delay (seconds) 9.9 N/A 38.6 43.7 10.2 2.4 28.6 6.6<br />
Level of Service 0.561 / A A N/A D D --- --- --- --- B A C A --- --- --- ---<br />
96 Calle Real & NB on ramp TWSC<br />
Delay (seconds) 12.2 9.1 N/A N/A 12.2<br />
Level of Service B --- A N/A N/A B --- --- --- --- --- --- --- --- --- ---<br />
97 SB on/off ramp & Hollister Ave TWSC<br />
Delay (seconds) 14.5 N/A 14.5 0.1 0.1 0.1 N/A 3.2<br />
Level of Service B N/A B A --- --- --- --- A A N/A A --- --- --- ---<br />
98 NB off ramp & Winchester Canyon Rd AWSC<br />
Delay (seconds) 9.7 8.5 10.4 N/A 8.4<br />
Level of Service A A --- --- --- B N/A --- --- --- --- --- A --- --- ---<br />
100 NB on/off ramps & Via Real Signal<br />
Delay (seconds) 6.9 6.5 6.5 N/A 7.4 6.9<br />
Level of Service 0.558 / A A --- A A N/A A --- --- A --- --- --- --- --- --- ---<br />
102 Guteirrez St & Garden St Signal<br />
City of Santa Barbara<br />
Delay (seconds) 34.2 24.3 21.3 N/A 26.0 13.6 59.0 N/A<br />
Level of Service 0.755 / C C --- --- --- C C N/A C B --- --- E N/A --- --- ---<br />
103 Montecito St & Castillo St Signal<br />
City of Santa Barbara<br />
Delay (seconds) 50.6 59.9 27.1 N/A 47.0 42.4 35.8 55.2 23.8 N/A 145.8 38.0 51.5<br />
Level of Service 0.887 / D D E C N/A D D D E C N/A F D D --- --- ---<br />
104 San Andres & Carrillo St Signal<br />
City of Santa Barbara<br />
Delay (seconds) 30.7 34.8 35.9 N/A N/A 33.4 24.0 21.8 17.1 N/A 20.9 37.1 N/A<br />
Level of Service 0.745 / C C C D F N/A C C C B N/A C D N/A --- --- ---<br />
105 Modoc St & Mission St AWSC<br />
City of Santa Barbara<br />
Delay (seconds) 48.1 17.6 12.9 14.3 29.3 109.5 13.5<br />
Level of Service E C --- B --- --- --- B D --- --- F B --- --- ---<br />
106 Quinientos St & Milpas St Signal<br />
City of Santa Barbara<br />
Delay (seconds) 13.8 16.4 16.8 N/A 23.2 16.0 N/A 7.2 15.0 N/A 14.8 10.1 N/A<br />
Level of Service<br />
Note: --- indicates corresponding movement does not exist.<br />
0.788 / C B B B N/A C B N/A A B N/A B B N/A --- --- ---<br />
N/A indicates delay same as the adjacent movement due to shared approach.<br />
AWSC = All Way Stop Control, TWSC = Two Way Stop Control<br />
1 - ICU LOS is reported for signalized intersections only<br />
2 - Based on HCM 2000, Chapter 16 Signalized Intersections and Chapter 17 Unsignalized Intersections methodology<br />
3 - Based on methodology developed by FHWA publication Roundabouts: An Information Guide, June 2000<br />
Indicates that LOS exceeds LOS threshold<br />
Control<br />
Type<br />
Overall V/C<br />
/ ICU LOS 1<br />
Overall<br />
HCM 2<br />
Eastbound<br />
Westbound Northbound<br />
Southbound<br />
Southeastbound<br />
SC101 HOV <strong>Traffic</strong> Study – <strong>Forecast</strong> <strong>Operations</strong> <strong>Report</strong> Page 128
Dowling Associates, Inc.<br />
Transportation Engineering Planning Research Education<br />
Table 58. 2040 No Build AM Peak Hour LOS Results<br />
InID Intersection<br />
Control<br />
Type<br />
Overall V/C<br />
/ ICU LOS 1<br />
Overall<br />
HCM 2<br />
Eastbound Westbound Northbound<br />
Southbound Southeastbound<br />
LT T RT LT T RT LT T RT LT T RT LT T RT<br />
1 NB on/off ramp & Bates Rd TWSC<br />
Delay (seconds) 9.1 8.9 9.1 N/A N/A 5.5 0.1<br />
Level of Service A --- --- --- A A N/A N/A A --- --- A --- --- --- ---<br />
2 SB on/off ramp & Bates Rd TWSC<br />
Delay (seconds) 8.8 8.8 8.5 N/A 0.1 N/A 3.7<br />
Level of Service A A A N/A --- --- --- --- A --- N/A A --- --- --- ---<br />
3 NB on/off ramp & SR 150 TWSC<br />
Delay (seconds) 12.3 12.3 10.0 N/A N/A 0.3 0.1 N/A<br />
Level of Service B --- --- --- B A N/A N/A A --- --- A N/A --- --- ---<br />
4 SB on/off ramp & SR 150 TWSC<br />
Delay (seconds) 12.1 12.1 9.6 N/A 0.1 N/A 1.3<br />
Level of Service B B A N/A --- --- --- --- A --- N/A A --- --- --- ---<br />
5 Via Real & SR 150 TWSC<br />
Delay (seconds) 19 N/A 12.5 N/A 19.0 N/A 6.8 0.1<br />
Level of Service C N/A B --- N/A C --- N/A A --- --- A --- --- --- ---<br />
6 Carpinteria Ave & SR 150 TWSC<br />
Delay (seconds) 9.8 N/A 9.8 9.8 N/A 0.2<br />
Level of Service A N/A A --- --- A N/A --- --- --- --- A --- --- --- ---<br />
7 NB on/off ramp & Bailard Ave TWSC<br />
Delay (seconds) 20.8 N/A 20.8 N/A 1.3 0.1 0.1<br />
Level of Service C --- --- --- N/A C --- N/A A --- --- A A --- --- ---<br />
8 SB on/off ramp & Bailard Ave TWSC<br />
Delay (seconds) 165.8 N/A 165.8 N/A 0.1 N/A 1.2<br />
Level of Service F N/A F N/A --- --- --- --- A --- N/A A --- --- --- ---<br />
9 Via Real & Bailard Ave AWSC<br />
Delay (seconds) 17.6 N/A 15.2 10.9 N/A 15.0 8.8 N/A 11.2 25.9 N/A 13.7 8.5<br />
Level of Service C N/A C B N/A B A N/A B D N/A B A --- --- ---<br />
10 Carpinteria Ave & Bailard Ave AWSC<br />
Delay (seconds) 14.6 N/A 12.0 N/A N/A 10.4 N/A N/A 8.8 N/A N/A 17.2 N/A<br />
Level of Service B N/A B N/A N/A B N/A N/A A N/A N/A C N/A --- --- ---<br />
11 Via Real & Casitas Pass Rd Signal<br />
Delay (seconds) 26.2 N/A 28.6 23.0 21.3 21.0 16.6 78.6 27.2 N/A 53.3 21.1 N/A<br />
Level of Service 0.599 / A C N/A C C C C B E C N/A D C N/A --- --- ---<br />
12 Vellocito & Via Real TWSC<br />
Delay (seconds) 10.9 N/A 0.4 0.1 N/A N/A 10.9 N/A<br />
Level of Service B N/A A --- --- A N/A --- --- --- N/A B N/A --- --- ---<br />
13 SB on/off ramp & Casitas Pass Rd Signal<br />
Delay (seconds) 13.2 26.1 24.2 N/A 10.8 N/A 22.5 1.0<br />
Level of Service 0.539 / A B C C N/A --- --- --- B N/A C A --- --- ---<br />
14 Carpinteria Ave & Casitas Pass Rd Signal<br />
Delay (seconds) 18.9 25.1 6.7 22.9 18.0 19.6 24.9<br />
Level of Service 0.634 / B B C A --- --- C B --- --- --- B --- C --- --- ---<br />
15 NB on ramp & Ogan Rd 3<br />
City of Carpinteria<br />
City of Carpinteria<br />
Roundabout<br />
Delay (seconds) 6.3<br />
Level of Service A<br />
16 Linden Ave & Ogan Rd Signal<br />
City of Carpinteria<br />
Delay (seconds) 10.7 24.8 25.0 10.1 4.0 23.7 2.4<br />
Level of Service 0.620 / B B --- --- --- C --- C --- B A C A --- --- --- ---<br />
17 SB off ramp & Linden Ave Signal<br />
Delay (seconds) 9.7 23.1 17.9 5.3 3.2<br />
Level of Service 0.424 / A A C --- B --- --- --- --- A --- --- A --- --- --- ---<br />
18 Linden Ave & Sawyer Ave TWSC<br />
City of Carpinteria<br />
Delay (seconds) 25.8 N/A 25.8 N/A N/A 0.2 0.1 N/A<br />
Level of Service D N/A D N/A --- --- --- N/A A --- --- A N/A --- --- ---<br />
19 SB on/off ramp & Carpinteria Ave TWSC<br />
Delay (seconds) 28.1 8.5 0.1 8.0 0.1 N/A 17.9 N/A N/A 28.1 N/A<br />
Level of Service D A A --- A A --- N/A C N/A N/A D N/A --- --- ---<br />
20 Santa Ynez Ave/7th St & Carpinteria Ave Signal<br />
City of Carpinteria<br />
Delay (seconds) 21.8 29.5 12.4 11.6 20.8 22.2 N/A 26.5 22.8 21.6 17.1 N/A<br />
Level of Service 0.514 / A C C B B --- C C N/A C C C B N/A --- --- ---<br />
21 NB on/off ramp & Via Real AWSC<br />
Delay (seconds) 49.4 N/A 15.2 6.3 N/A 99.6 9.0 N/A 20.6 N/A N/A 21.0 N/A<br />
Level of Service E N/A C A N/A F A N/A C N/A N/A C N/A --- --- ---<br />
22 NB on/off ramp & S. Padaro Ln TWSC<br />
Delay (seconds) 9.5 N/A 9.5 N/A 1.4 0.1<br />
Level of Service A --- --- --- N/A A --- N/A A --- --- A --- --- --- ---<br />
23 Via Real & S. Padaro Ln TWSC<br />
City of Carpinteria<br />
Delay (seconds) 26 0.1 0.1 N/A 3.1 N/A 26.0 N/A<br />
Level of Service D --- A A N/A A --- N/A D N/A --- --- --- --- --- ---<br />
24 SB off ramp & Santa Claus Ln/S. Padaro Ln TWSC<br />
Delay (seconds) 11.3 11.3 10.9 N/A N/A 8.6 N/A 0.1 0.1 N/A 6.2<br />
Level of Service B B B N/A N/A A N/A --- A A N/A A --- --- --- ---<br />
25 NB on/off ramp & N. Padaro Ln TWSC<br />
Delay (seconds) 9.4 N/A 9.4 N/A N/A 1.3 0.1<br />
Level of Service A --- --- --- N/A A N/A N/A A --- --- A --- --- ---<br />
26 N. Padaro Ln & Via Real TWSC<br />
County of Santa Barbara<br />
Delay (seconds) 24.7 0.1 N/A N/A 7.2 N/A 24.7 N/A<br />
Level of Service C --- A N/A N/A A --- N/A C N/A --- --- --- --- --- ---<br />
SC101 HOV <strong>Traffic</strong> Study – <strong>Forecast</strong> <strong>Operations</strong> <strong>Report</strong> Page 129
Dowling Associates, Inc.<br />
Transportation Engineering Planning Research Education<br />
Table 58 cont. 2040 No Build AM Peak Hour LOS Results<br />
InID Intersection<br />
Control<br />
Type<br />
Overall V/C<br />
/ ICU LOS 1<br />
Overall<br />
HCM 2<br />
Eastbound Westbound Northbound<br />
Southbound Southeastbound<br />
LT T RT LT T RT LT T RT LT T RT LT T RT<br />
27 SB on/off ramp & N. Padaro Ln TWSC<br />
Delay (seconds) 10.9 N/A 10.9 N/A 0.1 N/A 6.3<br />
Level of Service B N/A B N/A --- --- --- --- A --- N/A A --- --- --- ---<br />
28 NB off ramp & Ortega Hill Rd TWSC<br />
Delay (seconds) 12.8 N/A 0.1 0.1 N/A 12.8 0.1<br />
Level of Service B N/A A --- --- A --- N/A B --- --- A --- --- --- ---<br />
29 Evans Ave & Ortega Hill Rd AWSC<br />
Delay (seconds) 11.1 N/A 9.5 N/A N/A 13.0 N/A N/A 9.6 N/A N/A 9.7 N/A<br />
Level of Service B N/A A N/A N/A B N/A N/A A N/A N/A A N/A --- --- ---<br />
30 NB on ramp & Ortega Hill Rd TWSC<br />
Delay (seconds) 28.7 28.7 17.4 N/A 5.1<br />
Level of Service D --- D C N/A A --- --- --- --- --- --- --- --- --- ---<br />
31 SB off ramp & Evans Ave TWSC<br />
Delay (seconds) 10.5 N/A 10.5 N/A 8.5 N/A 0.1 N/A 5.4<br />
Level of Service B N/A B --- N/A A N/A --- A --- N/A A --- --- --- ---<br />
32 NB on/off ramp & Sheffield TWSC<br />
Delay (seconds) 12.6 N/A 12.6 N/A 0.1 0.1 0.1<br />
Level of Service B --- --- --- N/A B --- N/A A --- --- A A --- --- ---<br />
33 SB on/off ramp & Sheffield TWSC<br />
Delay (seconds) 19.9 N/A 19.9 7.4<br />
Level of Service C N/A C --- --- --- --- --- --- --- A --- --- --- --- ---<br />
34 Jameson & Sheffield TWSC<br />
Delay (seconds) 16.5 0.1 0.1 N/A 5.9 N/A 16.5 N/A<br />
Level of Service C --- A A N/A A --- N/A C N/A --- --- --- --- --- ---<br />
35 NB on/off ramp & San Ysidro Rd TWSC<br />
Delay (seconds) 13.7 N/A 13.7 N/A 2.3 0.1 0.1<br />
Level of Service B --- --- --- N/A B --- N/A A --- --- A A --- --- ---<br />
36 San Ysidro Rd & N. Jameson Ln AWSC<br />
Delay (seconds) 57.8 N/A 40.5 10.1 N/A 16.6 10.7 N/A 117.2 9.4 N/A 36.1 10.7<br />
Level of Service F N/A E B N/A C B N/A F A N/A E B --- --- ---<br />
37 SB off ramp & San Ysidro Rd/Eucalyptus Ln TWSC<br />
Delay (seconds) 17.6 30.5 10.4 N/A N/A 10.2 N/A 0.1 N/A 4.6<br />
Level of Service C D B N/A N/A B N/A --- A --- N/A A --- --- --- ---<br />
38 S. Jameson Ln & San Ysidro Rd/Eucalyptus Ln TWSC<br />
Delay (seconds) 10.1 N/A 10.1 N/A N/A 0.5 0.1 N/A<br />
Level of Service B N/A B N/A --- --- --- N/A A --- --- A N/A --- --- ---<br />
39 NB off ramp & Olive Mill Rd AWSC<br />
Delay (seconds) 77.3 N/A 15.5 N/A N/A 129.9 16.6 N/A<br />
Level of Service F --- --- --- N/A C N/A N/A F --- --- C N/A --- --- ---<br />
39a N. Jameson Ln & Olive Mill Rd AWSC<br />
Delay (seconds) 24 N/A 12.9 N/A 32.2 N/A N/A 12.1<br />
Level of Service C --- --- --- N/A B N/A --- D N/A N/A B --- --- --- ---<br />
40 SB on ramp & Olive Mill Rd AWSC<br />
Delay (seconds) 33.3 15.5 17.5 N/A 55.1 N/A N/A 14.6<br />
Level of Service D C C N/A --- --- --- --- F N/A N/A B --- --- --- ---<br />
41 SB off ramp & Depot TWSC<br />
Delay (seconds) 11.9 0.1 0.1 8.6 11.9<br />
Level of Service B --- A A A --- --- --- --- B --- --- --- --- --- ---<br />
42 Olive Mill Rd & Spring TWSC<br />
Delay (seconds) 22.7 N/A 22.7 N/A N/A 0.1 0.1 N/A<br />
Level of Service C N/A C N/A --- --- --- N/A A --- --- A N/A --- --- ---<br />
43 NB off ramp & Coast Village Rd/Hermosillo Dr TWSC<br />
Delay (seconds) 29.5 N/A 0.3 N/A 29.5 15.5 N/A 18.0 N/A<br />
Level of Service D N/A A --- --- N/A --- D C --- N/A C N/A --- --- ---<br />
44 SB on/off ramp & NB off ramp & Cabrillo Blvd AWSC<br />
Delay (seconds) 40.2 71.1 7.6 N/A 14.3 N/A 16.6 13.7<br />
Level of Service E F --- A N/A B N/A --- C --- --- B --- --- --- ---<br />
45 NB on ramp & Cabrillo Blvd TWSC<br />
Delay (seconds) 25.7 7.5 0.1 25.7 14.3<br />
Level of Service D --- --- --- A A --- D --- B --- --- --- --- --- ---<br />
46 NB on/off ramp & S. Salinas St TWSC<br />
Delay (seconds) 8.7 6.9 8.7<br />
Level of Service A --- --- --- --- --- A --- --- --- --- --- A --- --- ---<br />
47 NB on/off ramp & Milpas St 3<br />
County of Santa Barbara<br />
County of Santa Barbara<br />
County of Santa Barbara<br />
County of Santa Barbara<br />
County of Santa Barbara<br />
Roundabout<br />
Delay (seconds) 4.1<br />
Level of Service A<br />
48 SB off ramp & Milpas St Signal<br />
Delay (seconds) 7.8 27.7 2.4 6.1<br />
Level of Service 0.669 / B A --- --- C --- --- --- --- A --- --- A --- --- --- ---<br />
49 SB on ramp & Milpas St Signal<br />
Delay (seconds) 30 27.0 27.9 N/A 44.3 16.4 N/A 37.0 N/A<br />
Level of Service 0.676 / B C --- --- --- --- --- C --- C N/A D B --- N/A D N/A<br />
50 NB on/off ramp & Garden St Signal<br />
Delay (seconds) 12.9 N/A 26.5 33.5 35.9 2.3 13.6 14.5<br />
Level of Service 0.481 / A B N/A C C D A B B<br />
51 NB off ramp & Palm Ave TWSC<br />
Delay (seconds) 10.2 10.2 N/A 0.3 0.1<br />
Level of Service B B --- --- --- --- --- N/A A --- --- A --- --- --- ---<br />
SC101 HOV <strong>Traffic</strong> Study – <strong>Forecast</strong> <strong>Operations</strong> <strong>Report</strong> Page 130
Dowling Associates, Inc.<br />
Transportation Engineering Planning Research Education<br />
Table 58 cont. 2040 No Build AM Peak Hour LOS Results<br />
InID Intersection<br />
Control<br />
Type<br />
Overall V/C<br />
/ ICU LOS 1<br />
Overall<br />
HCM 2<br />
Eastbound Westbound Northbound<br />
Southbound Southeastbound<br />
LT T RT LT T RT LT T RT LT T RT LT T RT<br />
52 SB on/off ramp & Garden St Signal<br />
Delay (seconds) 23.5 33.2 39.5 24.1 18.2 N/A 24.2 7.2<br />
Level of Service 0.557 / A C C D C --- --- --- --- B N/A C A --- --- --- ---<br />
53 Garden St & E/ Yanonali St Signal<br />
City of Santa Barbara<br />
Delay (seconds) 38.8 78.2 17.7 15.7 33.4 21.4 22.7 37.2 18.0 N/A 80.6 9.5 N/A<br />
Level of Service 0.527 / A D E B B C C C D B N/A F A N/A --- --- ---<br />
54 NB off ramp & Bath St TWSC<br />
Delay (seconds) 12.8 N/A 12.8 11.2 N/A N/A 0.1 5.2<br />
Level of Service B N/A B --- --- B N/A N/A A --- A --- --- --- --- ---<br />
55 NB on ramp & Castillo St Signal<br />
Delay (seconds) 46.1 149.1 75.9 N/A 7.8 3.0 7.4 N/A 52.9 47.0<br />
Level of Service 0.590 / A D --- --- --- F E N/A A A A N/A D D --- --- ---<br />
56 W. Haley St & Bath St Signal<br />
City of Santa Barbara<br />
Delay (seconds) 9.8 8.2 10.4 N/A N/A 8.8 7.5 N/A 10.7 N/A<br />
Level of Service 0.547 / A A A B N/A N/A A A N/A B N/A --- --- --- --- --- ---<br />
57 SB on/off ramp & Castillo St Signal<br />
Delay (seconds) 22.3 N/A 33.3 43.4 14.9 N/A 85.0 5.6<br />
Level of Service 0.699 / B C N/A C D --- --- --- --- B N/A F A --- --- --- ---<br />
58 NB on/off ramp & Carrillo St Signal<br />
Delay (seconds) 22.8 47.7 58.2 N/A 44.0 6.5 22.6 26.5<br />
Level of Service 0.730 / C C --- --- --- D E N/A D A --- --- C C --- --- ---<br />
59 SB on/off ramp & Carrillo St Signal<br />
Delay (seconds) 56.8 43.6 43.8 21.7 29.6 33.6 301.3 4.3<br />
Level of Service 0.923 / E E D D C --- --- --- --- C C F A --- --- --- ---<br />
60 Carrillo St & Castillo St Signal<br />
City of Santa Barbara<br />
Delay (seconds) 21.1 35.2 40.1 45.0 23.1 N/A 106.6 4.9<br />
Level of Service 0.757 / C C D D D --- --- --- --- C N/A F A --- --- --- ---<br />
61 Carrillo St & San Pascual St TWSC<br />
City of Santa Barbara<br />
Delay (seconds) 13.9 N/A 11.7 N/A 0.1 0.1 13.9 0.1<br />
Level of Service B --- --- --- N/A B N/A --- A A B A --- --- --- ---<br />
62 NB on/off ramp & Castillo St TWSC<br />
Delay (seconds) 55.6 N/A 0.9 0.1 11.5 N/A N/A 55.6<br />
Level of Service F N/A A A --- --- --- --- B N/A N/A F --- --- --- ---<br />
63 NB on/off ramp & Mission St Signal<br />
Delay (seconds) 27.2 N/A 76.7 38.3 N/A 37.8 2.4 3.0<br />
Level of Service 0.858 / D C --- --- --- N/A E D N/A D --- --- A A --- --- ---<br />
64 SB on/off ramp & Mission St Signal<br />
Delay (seconds) 34.5 56.7 52.6 N/A 11.4 N/A N/A 30.9<br />
Level of Service 0.985 / E C E D N/A --- --- --- --- B N/A N/A C --- --- --- ---<br />
65 Mission St & Castillo St Signal<br />
City of Santa Barbara<br />
Delay (seconds) 5.9 N/A 28.3 33.8 N/A 3.7 N/A N/A 4.2 N/A<br />
Level of Service 0.613 / B A N/A C C --- --- --- N/A A N/A N/A A N/A --- --- ---<br />
66 Mission St & Modoc Rd TWSC<br />
City of Santa Barbara<br />
Delay (seconds) 15.8 N/A 15.8 N/A 0.1 N/A N/A 3.5<br />
Level of Service C --- --- --- N/A C N/A --- A N/A N/A A --- --- --- ---<br />
67 NB off ramp & Pueblo St & Calle Real TWSC<br />
Delay (seconds) 40.4 33.9 5.0 N/A 40.4<br />
Level of Service E D --- --- --- A N/A --- --- --- --- --- E --- --- ---<br />
68 NB on ramp & Calle Real Signal<br />
Delay (seconds) 24.2 N/A 61.5 N/A 18.3 2.4 N/A N/A 68.7 N/A<br />
Level of Service 0.854 / D C N/A E N/A B A N/A --- --- --- N/A E N/A --- --- ---<br />
69 Calle Real & Las Positas Rd Signal<br />
City of Santa Barbara<br />
Delay (seconds) 37.1 121.1 24.0 75.2 66.2 92.8 16.0 2.9 59.3 52.9<br />
Level of Service 0.705 / C D F C E E F B A --- --- E D --- --- ---<br />
70 SB on/off ramp & Las Positas Rd Signal<br />
Delay (seconds) 29.8 75.7 46.4 N/A 20.5 15.1 53.2 2.6<br />
Level of Service 0.833 / D C E D N/A --- --- --- --- C B D A --- --- --- ---<br />
71 Las Pasitas Rd & Modoc Rd Signal<br />
City of Santa Barbara<br />
Delay (seconds) 133.2 462.7 47.5 46.9 63.3 54.8 417.0 81.7 22.8 N/A 136.9 24.1 N/A<br />
Level of Service 0.890 / D F F D D E D F F C N/A F C N/A --- --- ---<br />
72 NB on/off ramp & Calle Real Signal<br />
Delay (seconds) 25.9 26.5 22.8 N/A 30.8 26.8 N/A 26.7 26.3 19.7 27.6 28.4 26.6<br />
Level of Service 0.499 / A C C C N/A C C N/A C C B C C C --- --- ---<br />
73 SB on/off ramp & La Cumbre Rd Signal<br />
Delay (seconds) 14.5 17.7 17.9 15.4 15.5 16.4 17.9 6.4<br />
Level of Service 0.526 / A B B B B --- --- --- --- B B B A --- --- --- ---<br />
74 La Cumbre Rd & Calle Real Signal<br />
City of Santa Barbara<br />
Delay (seconds) 10 14.4 14.8 9.8 9.6 18.8 4.3<br />
Level of Service 0.421 / A A --- --- --- B --- B --- A A B A --- --- --- ---<br />
75 NB off ramp & State St & Calle Real Signal<br />
Delay (seconds) 25.3 37.2 21.4 26.8 25.5 20.4 25.3 N/A 31.0 31.1 N/A<br />
Level of Service 0.580 / A C D C --- --- C C C C N/A C C N/A --- --- ---<br />
76 NB on ramp & State St TWSC<br />
Delay (seconds) 0<br />
Level of Service ---<br />
77 Calle Real & Rt 154 & San Macros Pass Rd Signal<br />
Delay (seconds) 33.3 48.2 34.1 32.9 44.4 24.1 36.2 44.3 31.7 N/A 42.8 28.9 N/A<br />
Level of Service 0.642 / B C D C C D C D D C N/A D C N/A --- --- ---<br />
78 SB off ramp & State St Signal<br />
Delay (seconds) 20.9 21.8 N/A 31.4 11.8 32.1 25.9 26.2 20.7<br />
Level of Service 0.555 / A C --- C N/A C B --- --- C --- C C C --- --- ---<br />
SC101 HOV <strong>Traffic</strong> Study – <strong>Forecast</strong> <strong>Operations</strong> <strong>Report</strong> Page 131
Dowling Associates, Inc.<br />
Transportation Engineering Planning Research Education<br />
Table 58 cont. 2040 No Build AM Peak Hour LOS Results<br />
InID Intersection<br />
LT T RT LT T RT LT T RT LT T RT LT T RT<br />
79 SB on ramp & State St & Rt 154 TWSC<br />
Delay (seconds) 101.1 101.1<br />
Level of Service F --- --- --- --- --- --- --- --- --- F --- --- --- --- ---<br />
792 State St & San Marcos Pass Road Signal<br />
Delay (seconds) 25.1 26.1 6.7 N/A N/A 31.0 26.9 N/A 49.1 N/A N/A 33.0 28.6<br />
Level of Service 0.637 / B C C A N/A N/A C C N/A D N/A N/A C C --- --- ---<br />
80 NB on/off ramp & Calle Real & El Sueno Rd AWSC<br />
Delay (seconds) 20.4 N/A 14.1 N/A N/A 28.9 N/A N/A 16.7 8.7 N/A 13.7 N/A<br />
Level of Service C N/A B N/A N/A D N/A N/A C A N/A B N/A --- --- ---<br />
81 NB on/off ramp & Turnpike Rd Signal<br />
Delay (seconds) 30.6 75.4 79.9 34.7 32.7 4.6 21.7 N/A<br />
Level of Service 0.687 / B C --- --- --- E E C C A --- --- C N/A --- --- ---<br />
82 SB on/off ramp & Turnpike Rd Signal<br />
Delay (seconds) 24.3 N/A 39.1 N/A 25.9 N/A 42.5 6.8<br />
Level of Service 0.811 / D C N/A D N/A --- --- --- --- C N/A D A --- --- --- ---<br />
83 Turnpike Rd & Calle Real Signal<br />
County of Santa Barbara<br />
Delay (seconds) 23.2 46.8 35.5 41.2 48.8 26.5 N/A 25.3 8.3 N/A 43.2 20.2 N/A<br />
Level of Service 0.513 / A C D D D D C N/A C A N/A D C N/A --- --- ---<br />
84 NB on/off ramp & Patterson Ave Signal<br />
Delay (seconds) 26.4 46.2 48.9 31.2 47.2 8.7 17.3 21.9<br />
Level of Service 0.729 / C C --- --- --- D D C D A --- --- B C --- --- ---<br />
85 SB on/off ramp & Patterson Ave Signal<br />
Delay (seconds) 19.2 46.0 50.0 48.2 13.3 14.1 34.5 0.6<br />
Level of Service 0.476 / A B D D D --- --- --- --- B B C A --- --- --- ---<br />
86 Patterson Ave & Calle Real Signal<br />
City of Goleta<br />
Delay (seconds) 17.6 36.9 42.3 32.1 2.4 11.8 N/A<br />
Level of Service 0.559 / A B D --- D --- --- --- C A --- --- B N/A --- --- ---<br />
87 NB on/off ramp & Fairview Ave Signal<br />
Delay (seconds) 21.8 23.8 0.1 42.9 28.8 51.9 0.3<br />
Level of Service 0.553 / A C C --- A --- D C --- --- --- --- D A --- --- ---<br />
88 Calle Real & Fairview Ave Signal<br />
City of Goleta<br />
Delay (seconds) 36.8 66.5 34.6 52.1 58.9 31.5 N/A 58.0 16.3 14.9 32.4 35.0 N/A<br />
Level of Service 0.667 / B D E C D E C N/A E B B C C N/A --- --- ---<br />
89 SB on/off ramp & Fairview Ave Signal<br />
Delay (seconds) 16.3 N/A 17.1 22.5 22.1 19.7 21.3 9.6<br />
Level of Service 0.639 / B B N/A B C --- --- --- --- C B C A --- --- --- ---<br />
90 NB on/off ramp & Los Carneros Rd Signal<br />
Delay (seconds) 32.9 53.6 56.0 N/A 40.6 7.6 11.2 N/A<br />
Level of Service 0.627 / B C --- --- --- D E N/A D A --- --- B N/A --- --- ---<br />
91 SB on/off ramp & Los Carneros Rd Signal<br />
Delay (seconds) 17.7 N/A 40.5 37.9 10.3 13.0 39.2 9.0<br />
Level of Service 0.633 / B B N/A D D --- --- --- --- B B D A --- --- --- ---<br />
92 Los Carneros Rd & Calle Real Signal<br />
City of Goleta<br />
Delay (seconds) 14.2 38.5 26.4 2.9 1.4 44.7 6.2<br />
Level of Service 0.467 / A B --- --- --- D --- C --- A A D A --- --- --- ---<br />
93 NB on/off ramp & Glen Annie Rd & Calle Real Signal<br />
Delay (seconds) 135.7 36.1 444.6 456.6 95.6 79.1 N/A 62.6 16.8 N/A 50.6 27.0 N/A<br />
Level of Service 0.783 / C F D F F F E N/A E B N/A D C N/A --- --- ---<br />
94 Glen Annie Rd & Del Norte Rd TWSC<br />
City of Goleta<br />
Delay (seconds) 11.3 11.3 0.1 0.1 N/A<br />
Level of Service B --- --- B --- --- --- --- A --- --- A N/A --- --- ---<br />
95 SB on/off ramp & Glen Annie Rd Signal<br />
Delay (seconds) 134.6 N/A 29.2 76.3 17.2 2.1 436.0 9.3<br />
Level of Service 0.789 / C F N/A C E --- --- --- --- B A F A --- --- --- ---<br />
96 Calle Real & NB on ramp TWSC<br />
Delay (seconds) 12.2 9.9 N/A N/A 12.2<br />
Level of Service B --- A N/A N/A B --- --- --- --- --- --- --- --- --- ---<br />
97 SB on/off ramp & Hollister Ave TWSC<br />
Delay (seconds) 18.8 N/A 18.8 0.1 0.1 0.1 N/A 5.1<br />
Level of Service C N/A C A --- --- --- --- A A N/A A --- --- --- ---<br />
98 NB off ramp & Winchester Canyon Rd AWSC<br />
Delay (seconds) 8.4 8.2 8.8 N/A 8.0<br />
Level of Service A A --- --- --- A N/A --- --- --- --- --- A --- --- ---<br />
100 NB on/off ramps & Via Real Signal<br />
Delay (seconds) 7.8 8.2 7.0 N/A 7.1 8.0<br />
Level of Service 0.549 / A A --- A A N/A A --- --- A --- --- --- --- --- --- ---<br />
102 Guteirrez St & Garden St Signal<br />
City of Santa Barbara<br />
Delay (seconds) 21 26.7 22.4 N/A 31.5 6.7 24.0 N/A<br />
Level of Service 0.712 / C C --- --- --- C C N/A C A --- --- C N/A --- --- ---<br />
103 Montecito St & Castillo St Signal<br />
City of Santa Barbara<br />
Delay (seconds) 69.7 140.5 31.1 N/A 58.7 50.2 42.3 60.5 18.5 N/A 60.8 21.2 80.1<br />
Level of Service 0.857 / D E F C N/A E D D E B N/A E C F --- --- ---<br />
104 San Andres & Carrillo St Signal<br />
City of Santa Barbara<br />
Delay (seconds) 30.4 47.7 45.6 N/A N/A 46.4 35.0 15.7 22.8 N/A 26.9 23.0 N/A<br />
Level of Service 0.683 / B C D D F N/A D C B C N/A C C N/A --- --- ---<br />
105 Modoc St & Mission St AWSC<br />
City of Santa Barbara<br />
Delay (seconds) 45.8 21.9 10.8 12.7 97.3 24.7 10.7<br />
Level of Service E C --- B --- --- --- B F --- --- C B --- --- ---<br />
106 Quinientos St & Milpas St Signal<br />
City of Santa Barbara<br />
Delay (seconds) 9.7 19.4 19.9 N/A 20.8 20.0 N/A 5.4 8.7 N/A 4.7 8.4 N/A<br />
Level of Service<br />
Note: --- indicates corresponding movement does not exist.<br />
0.601 / B A B B N/A C B N/A A A N/A A A N/A --- --- ---<br />
N/A indicates delay same as the adjacent movement due to shared approach.<br />
AWSC = All Way Stop Control, TWSC = Two Way Stop Control<br />
1 - ICU LOS is reported for signalized intersections only<br />
2 - Based on HCM 2000, Chapter 16 Signalized Intersections and Chapter 17 Unsignalized Intersections methodology<br />
3 - Based on methodology developed by FHWA publication Roundabouts: An Information Guide, June 2000<br />
Indicates that LOS exceeds LOS threshold<br />
Control<br />
Type<br />
Overall V/C<br />
/ ICU LOS 1<br />
Overall<br />
HCM 2<br />
Eastbound Westbound Northbound Southbound<br />
Southeastbound<br />
SC101 HOV <strong>Traffic</strong> Study – <strong>Forecast</strong> <strong>Operations</strong> <strong>Report</strong> Page 132
Dowling Associates, Inc.<br />
Transportation Engineering Planning Research Education<br />
Table 59. 2040 No Build PM Peak Hour LOS Results<br />
InID Intersection<br />
Control<br />
Type<br />
Overall V/C<br />
/ ICU LOS 1<br />
Overall<br />
HCM 2<br />
Eastbound<br />
Westbound Northbound<br />
Southbound Southeastbound<br />
LT T RT LT T RT LT T RT LT T RT LT T RT<br />
1 NB on/off ramp & Bates Rd TWSC<br />
Delay (seconds) 9.3 9.3 8.4 N/A N/A 4.6 0.1<br />
Level of Service A --- --- --- A A N/A N/A A --- --- A --- --- --- ---<br />
2 SB on/off ramp & Bates Rd TWSC<br />
Delay (seconds) 10.1 9.5 10.1 N/A 0.1 N/A 4.1<br />
Level of Service B A B N/A --- --- --- --- A --- N/A A --- --- --- ---<br />
3 NB on/off ramp & SR 150 TWSC<br />
Delay (seconds) 13.8 13.8 9.8 N/A N/A 0.3 0.1 N/A<br />
Level of Service B --- --- --- B A N/A N/A A --- --- A N/A --- --- ---<br />
4 SB on/off ramp & SR 150 TWSC<br />
Delay (seconds) 30 30.0 12.0 N/A 0.1 N/A 7.3<br />
Level of Service D D B N/A --- --- --- --- A --- N/A A --- --- --- ---<br />
5 Via Real & SR 150 TWSC<br />
Delay (seconds) 14.9 N/A 10.6 N/A 14.9 N/A 1.0 0.1<br />
Level of Service B N/A B --- N/A B --- N/A A --- --- A --- --- --- ---<br />
6 Carpinteria Ave & SR 150 TWSC<br />
Delay (seconds) 10 N/A 10.0 8.9 N/A 1.0<br />
Level of Service A N/A A --- --- A N/A --- --- --- --- A --- --- --- ---<br />
7 NB on/off ramp & Bailard Ave TWSC<br />
Delay (seconds) 21 N/A 21.0 N/A 3.0 0.1 0.1<br />
Level of Service C --- --- --- N/A C --- N/A A --- --- A A --- --- ---<br />
8 SB on/off ramp & Bailard Ave TWSC<br />
Delay (seconds) 80.1 N/A 80.1 N/A 0.1 N/A 1.7<br />
Level of Service F N/A F N/A --- --- --- --- A --- N/A A --- --- --- ---<br />
9 Via Real & Bailard Ave AWSC<br />
Delay (seconds) 91.1 N/A 16.3 10.6 N/A 204.4 8.7 N/A 29.0 12.2 N/A 12.2 9.8<br />
Level of Service F N/A C B N/A F A N/A D B N/A B A --- --- ---<br />
10 Carpinteria Ave & Bailard Ave AWSC<br />
Delay (seconds) 15 N/A 19.2 N/A N/A 10.0 N/A N/A 9.6 N/A N/A 11.6 N/A<br />
Level of Service B N/A C N/A N/A A N/A N/A A N/A N/A B N/A --- --- ---<br />
11 Via Real & Casitas Pass Rd Signal<br />
Delay (seconds) 35.3 N/A 41.1 26.9 22.5 53.5 18.7 78.7 16.9 N/A 29.6 30.6 N/A<br />
Level of Service 0.904 / E D N/A D C C D B E B N/A C C N/A --- --- ---<br />
12 Vellocito & Via Real TWSC<br />
Delay (seconds) 33.9 N/A 0.4 0.1 N/A N/A 33.9 N/A<br />
Level of Service D N/A A --- --- A N/A --- --- --- N/A D N/A --- --- ---<br />
13 SB on/off ramp & Casitas Pass Rd Signal<br />
Delay (seconds) 18.8 29.2 24.8 N/A 21.0 N/A 25.6 3.0<br />
Level of Service 0.740 / C B C C N/A --- --- --- C N/A C A --- --- ---<br />
14 Carpinteria Ave & Casitas Pass Rd Signal<br />
Delay (seconds) 29.9 38.5 9.0 37.9 27.0 31.7 40.7<br />
Level of Service 0.796 / C C D A --- --- D C --- --- --- C --- D --- --- ---<br />
15 NB on ramp & Ogan Rd 3<br />
City of Carpinteria<br />
City of Carpinteria<br />
Roundabout<br />
Delay (seconds) 10.5<br />
Level of Service B<br />
16 Linden Ave & Ogan Rd Signal<br />
City of Carpinteria<br />
Delay (seconds) 22.2 34.2 30.7 20.5 3.8 37.4 3.1<br />
Level of Service 0.871 / D C --- --- --- C --- C --- C A D A --- --- --- ---<br />
17 SB off ramp & Linden Ave Signal<br />
Delay (seconds) 12.6 33.2 24.9 5.2 4.6<br />
Level of Service 0.417 / A B C --- C --- --- --- --- A --- --- A --- --- --- ---<br />
18 Linden Ave & Sawyer Ave TWSC<br />
City of Carpinteria<br />
Delay (seconds) 25.8 N/A 25.8 N/A N/A 1.3 0.1 N/A<br />
Level of Service D N/A D N/A --- --- --- N/A A --- --- A N/A --- --- ---<br />
19 SB on/off ramp & Carpinteria Ave TWSC<br />
Delay (seconds) 537.1 10.5 0.1 8.2 0.1 N/A 51.6 N/A N/A 537.1 N/A<br />
Level of Service F B A --- A A --- N/A F N/A N/A F N/A --- --- ---<br />
20 Santa Ynez Ave/7th St & Carpinteria Ave Signal<br />
City of Carpinteria<br />
Delay (seconds) 39.6 145.7 18.6 16.9 22.9 42.8 N/A 34.2 29.8 36.3 22.0 N/A<br />
Level of Service 0.739 / C D F B B --- C D N/A C C D C N/A --- --- ---<br />
21 NB on/off ramp & Via Real AWSC<br />
Delay (seconds) 155 N/A 283.5 6.2 N/A 98.9 12.7 N/A 139.0 N/A N/A 58.8 N/A<br />
Level of Service F N/A F A N/A F B N/A F N/A N/A F N/A --- --- ---<br />
22 NB on/off ramp & S. Padaro Ln TWSC<br />
Delay (seconds) 16.9 N/A 16.9 N/A 4.5 0.1<br />
Level of Service C --- --- --- N/A C --- N/A A --- --- A --- --- --- ---<br />
23 Via Real & S. Padaro Ln TWSC<br />
City of Carpinteria<br />
Delay (seconds) 71.1 0.1 0.1 N/A 6.6 N/A 71.1 N/A<br />
Level of Service F --- A A N/A A --- N/A F N/A --- --- --- --- --- ---<br />
24 SB off ramp & Santa Claus Ln/S. Padaro Ln TWSC<br />
Delay (seconds) 245.8 245.8 32.1 N/A N/A 10.5 N/A 0.1 0.1 N/A 8.0<br />
Level of Service F F D N/A N/A B N/A --- A A N/A A --- --- --- ---<br />
25 NB on/off ramp & N. Padaro Ln TWSC<br />
Delay (seconds) 10.7 N/A 10.7 N/A N/A 2.6 0.1<br />
Level of Service B --- --- --- N/A B N/A N/A A --- --- A --- --- ---<br />
26 N. Padaro Ln & Via Real TWSC<br />
County of Santa Barbara<br />
Delay (seconds) 56.4 0.1 N/A N/A 5.2 N/A 56.4 N/A<br />
Level of Service F --- A N/A N/A A --- N/A F N/A --- --- --- --- --- ---<br />
SC101 HOV <strong>Traffic</strong> Study – <strong>Forecast</strong> <strong>Operations</strong> <strong>Report</strong> Page 133
Dowling Associates, Inc.<br />
Transportation Engineering Planning Research Education<br />
Table 59 cont. 2040 No Build PM Peak Hour LOS Results<br />
InID Intersection<br />
Control<br />
Type<br />
Overall V/C<br />
/ ICU LOS 1<br />
Overall<br />
HCM 2<br />
Eastbound<br />
Westbound Northbound<br />
Southbound Southeastbound<br />
LT T RT LT T RT LT T RT LT T RT LT T RT<br />
27 SB on/off ramp & N. Padaro Ln TWSC<br />
Delay (seconds) 11.6 N/A 11.6 N/A 0.1 N/A 6.0<br />
Level of Service B N/A B N/A --- --- --- --- A --- N/A A --- --- --- ---<br />
28 NB off ramp & Ortega Hill Rd TWSC<br />
Delay (seconds) 35.6 N/A 0.1 0.1 N/A 35.6 11.8<br />
Level of Service E N/A A --- --- A --- N/A E --- --- B --- --- --- ---<br />
29 Evans Ave & Ortega Hill Rd AWSC<br />
Delay (seconds) 51.3 N/A 12.0 N/A N/A 78.2 N/A N/A 12.3 N/A N/A 10.6 N/A<br />
Level of Service F N/A B N/A N/A F N/A N/A B N/A N/A B N/A --- --- ---<br />
30 NB on ramp & Ortega Hill Rd TWSC<br />
Delay (seconds) 44.3 44.3 17.8 N/A 3.5<br />
Level of Service E --- E C N/A A --- --- --- --- --- --- --- --- --- ---<br />
31 SB off ramp & Evans Ave TWSC<br />
Delay (seconds) 13.1 N/A 13.1 N/A 8.6 N/A 0.1 N/A 6.4<br />
Level of Service B N/A B --- N/A A N/A --- A --- N/A A --- --- --- ---<br />
32 NB on/off ramp & Sheffield TWSC<br />
Delay (seconds) 10.1 N/A 10.1 N/A 1.0 0.1 0.1<br />
Level of Service B --- --- --- N/A B --- N/A A --- --- A A --- --- ---<br />
33 SB on/off ramp & Sheffield TWSC<br />
Delay (seconds) 12.3 N/A 12.3 7.4<br />
Level of Service B N/A B --- --- --- --- --- --- --- A --- --- --- --- ---<br />
34 Jameson & Sheffield TWSC<br />
Delay (seconds) 340.7 0.1 0.1 N/A 7.3 N/A 340.7 N/A<br />
Level of Service F --- A A N/A A --- N/A F N/A --- --- --- --- --- ---<br />
35 NB on/off ramp & San Ysidro Rd TWSC<br />
Delay (seconds) 20.5 N/A 20.5 N/A 3.7 0.1 0.1<br />
Level of Service C --- --- --- N/A C --- N/A A --- --- A A --- --- ---<br />
36 San Ysidro Rd & N. Jameson Ln AWSC<br />
Delay (seconds) 85.6 N/A 25.6 11.3 N/A 77.0 10.5 N/A 43.6 12.4 N/A 182.4 11.3<br />
Level of Service F N/A D B N/A F B N/A E B N/A F B --- --- ---<br />
37 SB off ramp & San Ysidro Rd/Eucalyptus Ln TWSC<br />
Delay (seconds) 585.3 585.3 13.0 N/A N/A 20.4 N/A 0.1 N/A 7.9<br />
Level of Service F F B N/A N/A C N/A --- A --- N/A A --- --- --- ---<br />
38 S. Jameson Ln & San Ysidro Rd/Eucalyptus Ln TWSC<br />
Delay (seconds) 12.8 N/A 12.8 N/A N/A 0.9 0.1 N/A<br />
Level of Service B N/A B N/A --- --- --- N/A A --- --- A N/A --- --- ---<br />
39 NB off ramp & Olive Mill Rd AWSC<br />
Delay (seconds) 36.9 N/A 13.5 N/A N/A 55.8 21.0 N/A<br />
Level of Service E --- --- --- N/A B N/A N/A F --- --- C N/A --- --- ---<br />
39a N. Jameson Ln & Olive Mill Rd AWSC<br />
Delay (seconds) 12.4 N/A 11.9 N/A 13.3 N/A N/A 11.5<br />
Level of Service B --- --- --- N/A B N/A --- B N/A N/A B --- --- --- ---<br />
40 SB on ramp & Olive Mill Rd AWSC<br />
Delay (seconds) 57.2 21.3 115.5 N/A 28.4 N/A N/A 22.3<br />
Level of Service F C F N/A --- --- --- --- D N/A N/A C --- --- --- ---<br />
41 SB off ramp & Depot TWSC<br />
Delay (seconds) 12.2 0.1 0.1 8.7 12.2<br />
Level of Service B --- A A A --- --- --- --- B --- --- --- --- --- ---<br />
42 Olive Mill Rd & Spring TWSC<br />
Delay (seconds) 130.4 N/A 130.4 N/A N/A 0.1 0.1 N/A<br />
Level of Service F N/A F N/A --- --- --- N/A A --- --- A N/A --- --- ---<br />
43 NB off ramp & Coast Village Rd/Hermosillo Dr TWSC<br />
Delay (seconds) 136.2 N/A 0.5 0.1 136.2 24.6 N/A 68.1 N/A<br />
Level of Service F N/A A --- --- A --- F C --- N/A F N/A --- --- ---<br />
44 SB on/off ramp & NB off ramp & Cabrillo Blvd AWSC<br />
Delay (seconds) 81.7 84.5 9.1 N/A 20.6 N/A 129.3 23.3<br />
Level of Service F F --- A N/A C N/A --- F --- --- C --- --- --- ---<br />
45 NB on ramp & Cabrillo Blvd TWSC<br />
Delay (seconds) 999 7.6 0.1 999.0 12.9<br />
Level of Service F --- --- --- A A --- F --- B --- --- --- --- --- ---<br />
46 NB on/off ramp & S. Salinas St TWSC<br />
Delay (seconds) 8.1 7.6 8.1<br />
Level of Service A --- --- --- --- --- A --- --- --- --- --- A --- --- ---<br />
47 NB on/off ramp & Milpas St 3<br />
County of Santa Barbara<br />
County of Santa Barbara<br />
County of Santa Barbara<br />
County of Santa Barbara<br />
County of Santa Barbara<br />
Roundabout<br />
Delay (seconds) 5.2<br />
Level of Service A<br />
48 SB off ramp & Milpas St Signal<br />
Delay (seconds) 13 35.7 4.4 10.5<br />
Level of Service 0.892 / D B --- --- D --- --- --- --- A --- --- B --- --- --- ---<br />
49 SB on ramp & Milpas St Signal<br />
Delay (seconds) 64.2 37.8 114.7 N/A 61.6 14.9 N/A 46.6 N/A<br />
Level of Service 0.886 / D E --- --- --- --- --- D --- F N/A E B --- N/A D N/A<br />
50 NB on/off ramp & Garden St Signal<br />
Delay (seconds) 25.5 N/A 56.1 76.4 45.9 0.2 20.9 21.1<br />
Level of Service 0.764 / C C N/A E E D A C C<br />
51 NB off ramp & Palm Ave TWSC<br />
Delay (seconds) 10 10.0 N/A 0.1 0.1<br />
Level of Service A A --- --- --- --- --- N/A A --- --- A --- --- --- ---<br />
SC101 HOV <strong>Traffic</strong> Study – <strong>Forecast</strong> <strong>Operations</strong> <strong>Report</strong> Page 134
Dowling Associates, Inc.<br />
Transportation Engineering Planning Research Education<br />
Table 59 cont. 2040 No Build PM Peak Hour LOS Results<br />
InID Intersection<br />
Control<br />
Type<br />
Overall V/C<br />
/ ICU LOS 1<br />
Overall<br />
HCM 2<br />
Eastbound<br />
Westbound Northbound<br />
Southbound Southeastbound<br />
LT T RT LT T RT LT T RT LT T RT LT T RT<br />
52 SB on/off ramp & Garden St Signal<br />
Delay (seconds) 29.2 80.5 96.5 30.3 18.2 N/A 25.5 9.2<br />
Level of Service 0.926 / E C F F C --- --- --- --- B N/A C A --- --- --- ---<br />
53 Garden St & E/ Yanonali St Signal<br />
City of Santa Barbara<br />
Delay (seconds) 104.4 439.9 15.9 13.8 41.8 20.5 26.4 40.4 22.3 N/A 34.2 19.9 N/A<br />
Level of Service 0.661 / B F F B B D C C D C N/A C B N/A --- --- ---<br />
54 NB off ramp & Bath St TWSC<br />
Delay (seconds) 17.1 N/A 17.1 13.9 N/A N/A 0.2 6.1<br />
Level of Service C N/A C --- --- B N/A N/A A --- A --- --- --- --- ---<br />
55 NB on ramp & Castillo St Signal<br />
Delay (seconds) 129.4 400.2 252.4 N/A 7.0 4.9 7.5 N/A 41.9 35.6<br />
Level of Service 0.753 / C F --- --- --- F F N/A A A A N/A D D --- --- ---<br />
56 W. Haley St & Bath St Signal<br />
City of Santa Barbara<br />
Delay (seconds) 18.3 18.6 15.4 N/A N/A 17.9 10.6 N/A 20.9 N/A<br />
Level of Service 0.826 / D B B B N/A N/A B B N/A C N/A --- --- --- --- --- ---<br />
57 SB on/off ramp & Castillo St Signal<br />
Delay (seconds) 52.6 N/A 26.1 57.3 29.3 N/A 367.2 27.1<br />
Level of Service 0.901 / E D N/A C E --- --- --- --- C N/A F C --- --- --- ---<br />
58 NB on/off ramp & Carrillo St Signal<br />
Delay (seconds) 30.6 58.7 69.1 N/A 77.2 3.0 43.3 0.7<br />
Level of Service 0.892 / D C --- --- --- E E N/A E A --- --- D A --- --- ---<br />
59 SB on/off ramp & Carrillo St Signal<br />
Delay (seconds) 30 41.7 42.0 59.4 25.2 26.3 35.6 14.4<br />
Level of Service 0.802 / D C D D E --- --- --- --- C C D B --- --- --- ---<br />
60 Carrillo St & Castillo St Signal<br />
City of Santa Barbara<br />
Delay (seconds) 37.9 20.5 23.1 44.2 62.9 N/A 171.0 11.2<br />
Level of Service 0.849 / D D C C D --- --- --- E N/A F B --- --- --- ---<br />
61 Carrillo St & San Pascual St TWSC<br />
City of Santa Barbara<br />
Delay (seconds) 13.2 N/A 12.0 N/A 0.1 N/A 13.2 0.1<br />
Level of Service B --- --- --- N/A B N/A --- A N/A B A --- --- --- ---<br />
62 NB on/off ramp & Castillo St TWSC<br />
Delay (seconds) 168.2 N/A 0.5 0.1 11.7 N/A N/A 168.2<br />
Level of Service F N/A A A --- --- --- --- B N/A N/A F --- --- --- ---<br />
63 NB on/off ramp & Mission St Signal<br />
Delay (seconds) 14 N/A 41.5 57.2 N/A 13.0 4.1 5.0<br />
Level of Service 0.806 / D B --- --- --- N/A D E N/A B --- --- A A --- --- ---<br />
64 SB on/off ramp & Mission St Signal<br />
Delay (seconds) 53.1 57.2 52.2 N/A 10.5 N/A N/A 75.7<br />
Level of Service 0.926 / E D E D N/A --- --- --- --- B N/A N/A E --- --- --- ---<br />
65 Mission St & Castillo St Signal<br />
City of Santa Barbara<br />
Delay (seconds) 32.3 N/A 24.4 37.2 N/A 57.9 N/A N/A 9.5 N/A<br />
Level of Service 0.787 / C C N/A C D --- --- --- N/A E N/A N/A A N/A --- --- ---<br />
66 Mission St & Modoc Rd TWSC<br />
City of Santa Barbara<br />
Delay (seconds) 19.8 N/A 19.8 N/A 0.1 N/A N/A 5.3<br />
Level of Service C --- --- --- N/A C N/A --- A N/A N/A A --- --- --- ---<br />
67 NB off ramp & Pueblo St & Calle Real TWSC<br />
Delay (seconds) 129.5 89.6 6.2 N/A 129.5<br />
Level of Service F F --- --- --- A N/A --- --- --- --- --- F --- --- ---<br />
68 NB on ramp & Calle Real Signal<br />
Delay (seconds) 22.2 N/A 52.9 N/A 9.6 8.8 N/A N/A 61.5 N/A<br />
Level of Service 0.660 / B C N/A D N/A A A N/A --- --- --- N/A E N/A --- --- ---<br />
69 Calle Real & Las Positas Rd Signal<br />
City of Santa Barbara<br />
Delay (seconds) 40.7 94.7 44.0 53.2 48.7 46.3 37.5 9.7 57.9 47.3<br />
Level of Service 0.756 / C D F --- D D D D D A --- --- E D --- --- ---<br />
70 SB on/off ramp & Las Positas Rd Signal<br />
Delay (seconds) 52.4 163.3 46.7 N/A 30.2 22.7 49.4 7.7<br />
Level of Service 0.821 / D D F D N/A --- --- --- --- C C D A --- --- --- ---<br />
71 Las Pasitas Rd & Modoc Rd Signal<br />
City of Santa Barbara<br />
Delay (seconds) 76.3 337.3 42.7 39.6 61.6 46.6 65.5 346.0 25.4 N/A 72.8 14.7 N/A<br />
Level of Service 0.737 / C E F D D E D E F C N/A E B N/A --- --- ---<br />
72 NB on/off ramp & Calle Real Signal<br />
Delay (seconds) 35.1 39.6 36.7 N/A 37.4 30.3 N/A 35.8 35.7 26.7 32.5 38.9 30.6<br />
Level of Service 0.655 / B D D D N/A D C N/A D D C C D C --- --- ---<br />
73 SB on/off ramp & La Cumbre Rd Signal<br />
Delay (seconds) 18.6 21.5 21.7 14.8 21.8 21.1 20.8 9.0<br />
Level of Service 0.607 / B B C C B --- --- --- --- C C C A --- --- --- ---<br />
74 La Cumbre Rd & Calle Real Signal<br />
City of Santa Barbara<br />
Delay (seconds) 11.7 15.9 16.7 11.6 11.2 24.0 5.3<br />
Level of Service 0.487 / A B --- --- --- B --- B --- B B C A --- --- --- ---<br />
75 NB off ramp & State St & Calle Real Signal<br />
Delay (seconds) 33.8 47.6 24.4 30.4 37.1 30.5 38.7 N/A 46.9 46.5 N/A<br />
Level of Service 0.690 / B C D C --- --- C D C D N/A D D N/A --- --- ---<br />
76 NB on ramp & State St TWSC<br />
Delay (seconds) 0<br />
Level of Service ---<br />
77 Calle Real & Rt 154 & San Macros Pass Rd Signal<br />
Delay (seconds) 31.2 33.5 38.0 36.0 25.7 31.1 32.5 37.0 27.2 N/A 41.4 30.4 N/A<br />
Level of Service 0.596 / A C C D D C C C D C N/A D C N/A --- --- ---<br />
78 SB off ramp & State St Signal<br />
Delay (seconds) 28.9 31.3 N/A 34.8 16.6 37.3 34.8 34.4 23.6<br />
Level of Service 0.632 / B C --- C N/A C B --- --- D --- C C C --- --- ---<br />
SC101 HOV <strong>Traffic</strong> Study – <strong>Forecast</strong> <strong>Operations</strong> <strong>Report</strong> Page 135
Dowling Associates, Inc.<br />
Transportation Engineering Planning Research Education<br />
Table 59 cont. 2040 No Build PM Peak Hour LOS Results<br />
InID Intersection<br />
LT T RT LT T RT LT T RT LT T RT LT T RT<br />
79 SB on ramp & State St & Rt 154 TWSC<br />
Delay (seconds) 96.9 96.9<br />
Level of Service F --- --- --- --- --- --- --- --- --- F --- --- --- --- ---<br />
792 State St & San Marcos Pass Road Signal<br />
Delay (seconds) 18.2 22.8 5.5 N/A N/A 22.6 21.3 N/A 41.0 N/A N/A 26.1 27.1<br />
Level of Service 0.541 / A B C A N/A N/A C C N/A D N/A N/A C C --- --- ---<br />
80 NB on/off ramp & Calle Real & El Sueno Rd AWSC<br />
Delay (seconds) 30.9 N/A 46.4 N/A N/A 29.7 N/A N/A 19.0 10.5 N/A 18.2 N/A<br />
Level of Service D N/A E N/A N/A D N/A N/A C B N/A C N/A --- --- ---<br />
81 NB on/off ramp & Turnpike Rd Signal<br />
Delay (seconds) 17.3 31.0 31.8 25.4 27.3 7.4 15.1 N/A<br />
Level of Service 0.614 / B B --- --- --- C C C C A --- --- B N/A --- --- ---<br />
82 SB on/off ramp & Turnpike Rd Signal<br />
Delay (seconds) 19.4 N/A 25.3 N/A 25.9 N/A 29.5 4.6<br />
Level of Service 0.798 / C B N/A C N/A --- --- --- --- C N/A C A --- --- --- ---<br />
83 Turnpike Rd & Calle Real Signal<br />
County of Santa Barbara<br />
Delay (seconds) 238.5 36.6 24.2 25.8 1080.1 23.1 N/A 231.8 20.6 N/A 32.0 13.7 N/A<br />
Level of Service 0.653 / B F D C C F C N/A F C N/A C B N/A --- --- ---<br />
84 NB on/off ramp & Patterson Ave Signal<br />
Delay (seconds) 21.2 43.2 46.6 44.8 43.2 7.8 14.4 14.6<br />
Level of Service 0.654 / B C --- --- --- D D D D A --- --- B B --- --- ---<br />
85 SB on/off ramp & Patterson Ave Signal<br />
Delay (seconds) 27.8 47.5 51.7 31.9 19.5 27.1 33.2 15.9<br />
Level of Service 0.707 / C C D D C --- --- --- --- B C C B --- --- --- ---<br />
86 Patterson Ave & Calle Real Signal<br />
City of Goleta<br />
Delay (seconds) 32.2 49.1 36.5 65.0 7.5 19.6 N/A<br />
Level of Service 0.672 / B C D --- D --- --- --- E A --- --- B N/A --- --- ---<br />
87 NB on/off ramp & Fairview Ave Signal<br />
Delay (seconds) 19.2 27.3 0.1 27.6 21.3 38.5 0.2<br />
Level of Service 0.793 / C B C --- A --- C C --- --- --- --- D A --- --- ---<br />
88 Calle Real & Fairview Ave Signal<br />
City of Goleta<br />
Delay (seconds) 37.7 94.0 27.1 30.1 104.2 33.3 N/A 62.5 7.6 9.6 51.3 30.5 N/A<br />
Level of Service 0.715 / C D F C C F C N/A E A A D C N/A --- --- ---<br />
89 SB on/off ramp & Fairview Ave Signal<br />
Delay (seconds) 15.9 N/A 23.6 19.9 18.7 15.2 22.9 5.6<br />
Level of Service 0.610 / B B N/A C B --- --- --- --- B B C A --- --- --- ---<br />
90 NB on/off ramp & Los Carneros Rd Signal<br />
Delay (seconds) 26.4 40.2 39.3 N/A 29.3 6.7 32.8 N/A<br />
Level of Service 0.738 / C C --- --- --- D D N/A C A --- --- C N/A --- --- ---<br />
91 SB on/off ramp & Los Carneros Rd Signal<br />
Delay (seconds) 29.5 N/A 86.9 37.7 9.6 49.8 50.4 4.9<br />
Level of Service 0.891 / D C N/A F D --- --- --- --- A D D A --- --- --- ---<br />
92 Los Carneros Rd & Calle Real Signal<br />
City of Goleta<br />
Delay (seconds) 15.2 15.6 9.5 11.8 10.0 273.6 7.3<br />
Level of Service 0.617 / B B --- --- --- B --- A --- B A F A --- --- --- ---<br />
93 NB on/off ramp & Glen Annie Rd & Calle Real Signal<br />
Delay (seconds) 122.7 36.4 101.3 107.8 184.6 169.2 N/A 142.8 28.3 N/A 47.3 29.2 N/A<br />
Level of Service 0.793 / C F D F F F F N/A F C N/A D C N/A --- --- ---<br />
94 Glen Annie Rd & Del Norte Rd TWSC<br />
City of Goleta<br />
Delay (seconds) 10.2 10.2 0.1 0.1 N/A<br />
Level of Service B --- --- B --- --- --- --- A --- --- A N/A --- ---<br />
95 SB on/off ramp & Glen Annie Rd Signal<br />
Delay (seconds) 10.7 N/A 37.4 48.7 11.6 2.8 27.0 7.4<br />
Level of Service 0.597 / A B N/A D D --- --- --- --- B A C A --- --- --- ---<br />
96 Calle Real & NB on ramp TWSC<br />
Delay (seconds) 12.9 9.1 N/A N/A 12.9<br />
Level of Service B --- A N/A N/A B --- --- --- --- --- --- --- --- --- ---<br />
97 SB on/off ramp & Hollister Ave TWSC<br />
Delay (seconds) 18.7 N/A 18.7 0.1 0.1 0.1 N/A 3.2<br />
Level of Service C N/A C A --- --- --- --- A A N/A A --- --- --- ---<br />
98 NB off ramp & Winchester Canyon Rd AWSC<br />
Delay (seconds) 9.7 8.5 10.4 N/A 8.4<br />
Level of Service A A --- --- --- B N/A --- --- --- --- --- A --- --- ---<br />
100 NB on/off ramps & Via Real Signal<br />
Delay (seconds) 7.8 7.8 5.7 N/A 7.3 9.4<br />
Level of Service 0.732 / C A --- A A N/A A --- --- A --- --- --- --- --- --- ---<br />
102 Guteirrez St & Garden St Signal<br />
City of Santa Barbara<br />
Delay (seconds) 64.4 25.2 22.2 N/A 28.1 17.5 141.6 N/A<br />
Level of Service 0.827 / D E --- --- --- C C N/A C B --- --- F N/A --- --- ---<br />
103 Montecito St & Castillo St Signal<br />
City of Santa Barbara<br />
Delay (seconds) 63.7 86.2 26.9 N/A 48.1 43.4 35.6 57.7 24.2 N/A 273.3 40.7 40.3<br />
Level of Service 0.963 / E E F C N/A D D D E C N/A F D D --- --- ---<br />
104 San Andres & Carrillo St Signal<br />
City of Santa Barbara<br />
Delay (seconds) 34.5 33.0 38.4 N/A N/A 33.4 24.1 22.7 18.7 N/A 24.0 45.1 N/A<br />
Level of Service 0.760 / C C C D F N/A C C C B N/A C D N/A --- --- ---<br />
105 Modoc St & Mission St AWSC<br />
City of Santa Barbara<br />
Delay (seconds) 49.1 17.7 13.2 15.1 29.7 113.5 14.0<br />
Level of Service E C --- B --- --- --- C D --- --- F B --- --- ---<br />
106 Quinientos St & Milpas St Signal<br />
City of Santa Barbara<br />
Delay (seconds) 18.1 18.6 18.3 N/A 64.5 15.7 N/A 8.8 18.6 N/A 17.1 13.5 N/A<br />
Level of Service<br />
Note: --- indicates corresponding movement does not exist.<br />
0.866 / D B B B N/A E B N/A A B N/A B B N/A --- --- ---<br />
N/A indicates delay same as the adjacent movement due to shared approach.<br />
AWSC = All Way Stop Control, TWSC = Two Way Stop Control<br />
1 - ICU LOS is reported for signalized intersections only<br />
2 - Based on HCM 2000, Chapter 16 Signalized Intersections and Chapter 17 Unsignalized Intersections methodology<br />
3 - Based on methodology developed by FHWA publication Roundabouts: An Information Guide, June 2000<br />
Indicates that LOS exceeds LOS threshold<br />
Control<br />
Type<br />
Overall V/C<br />
/ ICU LOS 1<br />
Overall<br />
HCM 2<br />
Eastbound<br />
Westbound Northbound<br />
Southbound<br />
Southeastbound<br />
SC101 HOV <strong>Traffic</strong> Study – <strong>Forecast</strong> <strong>Operations</strong> <strong>Report</strong> Page 136
Dowling Associates, Inc.<br />
Transportation Engineering Planning Research Education<br />
Table 60. 2040 Build AM Peak Hour LOS Results<br />
InID Intersection<br />
Control<br />
Type<br />
Overall V/C<br />
/ ICU LOS 1<br />
Overall<br />
HCM 2<br />
Eastbound Westbound Northbound Southbound<br />
Southeastbound<br />
LT T RT LT T RT LT T RT LT T RT LT T RT<br />
1 NB on/off ramp & Bates Rd TWSC<br />
Delay (seconds) 9.1 8.9 9.1 N/A N/A 5.5 0.1<br />
Level of Service A --- --- --- A A N/A N/A A --- --- A --- --- --- ---<br />
2 SB on/off ramp & Bates Rd TWSC<br />
Delay (seconds) 8.8 8.8 8.5 N/A 0.1 N/A 3.7<br />
Level of Service A A A N/A --- --- --- --- A --- N/A A --- --- --- ---<br />
3 NB on/off ramp & SR 150 TWSC<br />
Delay (seconds) 12.5 12.5 10.1 N/A N/A 0.2 0.1 N/A<br />
Level of Service B --- --- --- B B N/A N/A A --- --- A N/A --- --- ---<br />
4 SB on/off ramp & SR 150 TWSC<br />
Delay (seconds) 12.3 12.3 11.0 N/A 0.1 N/A 1.3<br />
Level of Service B B B N/A --- --- --- --- A --- N/A A --- --- --- ---<br />
5 Via Real & SR 150 TWSC<br />
Delay (seconds) 12.6 N/A 12.6 N/A 19.6 N/A 6.8 0.1<br />
Level of Service B N/A B --- N/A C --- N/A A --- --- A --- --- --- ---<br />
6 Carpinteria Ave & SR 150 TWSC<br />
Delay (seconds) 9.9 N/A 9.8 9.9 N/A 0.2<br />
Level of Service A N/A A --- --- A N/A --- --- --- --- A --- --- --- ---<br />
7 NB on/off ramp & Bailard Ave TWSC<br />
Delay (seconds) 22.7 N/A 22.7 N/A 1.4 0.1 0.1<br />
Level of Service C --- --- --- N/A C --- N/A A --- --- A A --- --- ---<br />
8 SB on/off ramp & Bailard Ave TWSC<br />
Delay (seconds) 181.1 N/A 181.1 N/A 0.1 N/A 1.3<br />
Level of Service F N/A F N/A --- --- --- --- A --- N/A A --- --- --- ---<br />
9 Via Real & Bailard Ave AWSC<br />
Delay (seconds) 19 N/A 15.8 12.3 N/A 17.3 9.0 N/A 11.5 28.5 N/A 15.8 8.7<br />
Level of Service C N/A C B N/A C A N/A B D N/A C A --- --- ---<br />
10 Carpinteria Ave & Bailard Ave AWSC<br />
Delay (seconds) 15.3 N/A 12.1 N/A N/A 10.4 N/A N/A 8.8 N/A N/A 18.4 N/A<br />
Level of Service C N/A B N/A N/A B N/A N/A A N/A N/A C N/A --- --- ---<br />
11 Via Real & Casitas Pass Rd Signal<br />
Delay (seconds) 28 N/A 37.6 25.6 37.9 37.6 19.6 134.1 22.0 N/A 24.1 16.2 N/A<br />
Level of Service 0.710 / C C N/A D C D D B F C N/A C B N/A --- --- ---<br />
12 Vellocito & Via Real TWSC<br />
Delay (seconds) 11.5 N/A 0.5 0.1 N/A N/A 11.5 N/A<br />
Level of Service B N/A A --- --- A N/A --- --- --- N/A B N/A --- --- ---<br />
13 SB on/off ramp & Casitas Pass Rd Signal<br />
Delay (seconds) 13.2 24.6 25.9 N/A 14.7 N/A 20.7 1.1<br />
Level of Service 0.645 / B B C C N/A --- --- --- B N/A C A --- --- ---<br />
14 Carpinteria Ave & Casitas Pass Rd Signal<br />
Delay (seconds) 26.3 34.4 9.3 31.6 24.9 21.4 33.5<br />
Level of Service 0.740 / C C C A --- --- C C --- --- --- C --- C --- --- ---<br />
15 NB on ramp & Ogan Rd 3<br />
City of Carpinteria<br />
City of Carpinteria<br />
Roundabout<br />
Delay (seconds) 13.8<br />
Level of Service B<br />
16 Linden Ave & Ogan Rd Signal<br />
City of Carpinteria<br />
Delay (seconds) 14.5 25.4 24.6 9.5 11.1 33.7 2.6<br />
Level of Service 0.716 / C B --- --- --- C --- C --- A B C A --- --- --- ---<br />
17 SB off ramp & Linden Ave Signal<br />
Delay (seconds) 10.2 23.2 17.7 6.1 4.4<br />
Level of Service 0.490 / A B C --- B --- --- --- --- A --- --- A --- --- --- ---<br />
18 Linden Ave & Sawyer Ave TWSC<br />
City of Carpinteria<br />
Delay (seconds) 41.3 N/A 41.3 N/A N/A 0.2 0.1 N/A<br />
Level of Service E N/A E N/A --- --- --- N/A A --- --- A N/A --- --- ---<br />
19 SB on/off ramp & Carpinteria Ave TWSC<br />
Delay (seconds) 27.4 8.5 0.1 7.9 0.1 N/A 17.5 N/A N/A 27.4 N/A<br />
Level of Service D A A --- A A --- N/A C N/A N/A D N/A --- --- ---<br />
20 Santa Ynez Ave/7th St & Carpinteria Ave Signal<br />
City of Carpinteria<br />
Delay (seconds) 21.4 28.3 12.2 11.4 20.7 21.8 N/A 25.9 22.2 21.1 16.9 N/A<br />
Level of Service 0.503 / A C C B B --- C C N/A C C C B N/A --- --- ---<br />
21 NB on/off ramp & Via Real AWSC<br />
Delay (seconds) 165.7 N/A 16.0 6.4 N/A 344.7 9.5 N/A 22.7 N/A N/A 35.7 N/A<br />
Level of Service F N/A C A N/A F A N/A C N/A N/A E N/A --- --- ---<br />
22 NB on/off ramp & S. Padaro Ln TWSC<br />
Delay (seconds) 2.9 N/A 9.9 N/A 1.4 0.1<br />
Level of Service A --- --- --- N/A A --- N/A A --- --- A --- --- --- ---<br />
23 Via Real & S. Padaro Ln TWSC<br />
City of Carpinteria<br />
Delay (seconds) 27.9 0.1 0.1 N/A 3.1 N/A 27.9 N/A<br />
Level of Service D --- A A N/A A --- N/A D N/A --- --- --- --- --- ---<br />
24 SB off ramp & Santa Claus Ln/S. Padaro Ln TWSC<br />
Delay (seconds) 9.3 11.9 11.3 N/A N/A 8.7 N/A 0.1 0.1 N/A 6.2<br />
Level of Service A B B N/A N/A A N/A --- A A N/A A --- --- --- ---<br />
25 NB on/off ramp & N. Padaro Ln TWSC<br />
Delay (seconds) 11.8 N/A 11.8 N/A N/A 1.3 0.1<br />
Level of Service B --- --- --- N/A B N/A N/A A --- --- A --- --- ---<br />
26 N. Padaro Ln & Via Real TWSC<br />
County of Santa Barbara<br />
Delay (seconds) 21 0.1 N/A N/A 6.6 N/A 21.0 N/A<br />
Level of Service C --- A N/A N/A A --- N/A C N/A --- --- --- --- --- ---<br />
SC101 HOV <strong>Traffic</strong> Study – <strong>Forecast</strong> <strong>Operations</strong> <strong>Report</strong> Page 137
Dowling Associates, Inc.<br />
Transportation Engineering Planning Research Education<br />
Table 60 cont. 2040 Build AM Peak Hour LOS Results<br />
InID Intersection<br />
Control<br />
Type<br />
Overall V/C<br />
/ ICU LOS 1<br />
Overall<br />
HCM 2<br />
Eastbound Westbound Northbound Southbound<br />
Southeastbound<br />
LT T RT LT T RT LT T RT LT T RT LT T RT<br />
27 SB on/off ramp & N. Padaro Ln TWSC<br />
Delay (seconds) 11 N/A 11.0 N/A 0.1 N/A 6.3<br />
Level of Service B N/A B N/A --- --- --- --- A --- N/A A --- --- --- ---<br />
28 NB off ramp & Ortega Hill Rd TWSC<br />
Delay (seconds) 12.1 N/A 0.1 0.1 N/A 12.1 0.1<br />
Level of Service B N/A A --- --- A --- N/A B --- --- A --- --- --- ---<br />
29 Evans Ave & Ortega Hill Rd AWSC<br />
Delay (seconds) 10.3 N/A 8.5 N/A N/A 11.7 N/A N/A 8.9 N/A N/A 9.1 N/A<br />
Level of Service B N/A A N/A N/A B N/A N/A A N/A N/A A N/A --- --- ---<br />
30 NB on ramp & Ortega Hill Rd TWSC<br />
Delay (seconds) 19.1 19.1 17.9 N/A 5.4<br />
Level of Service C --- C C N/A A --- --- --- --- --- --- --- --- --- ---<br />
31 SB off ramp & Evans Ave TWSC<br />
Delay (seconds) 10 N/A 10.0 N/A 8.5 N/A 0.1 N/A 5.8<br />
Level of Service A N/A A --- N/A A N/A --- A --- N/A A --- --- --- ---<br />
32 NB on/off ramp & Sheffield TWSC<br />
Delay (seconds) 14.4 N/A 14.4 N/A 0.2 0.1 0.1<br />
Level of Service B --- --- --- N/A B --- N/A A --- --- A A --- --- ---<br />
33 SB on/off ramp & Sheffield TWSC<br />
Delay (seconds) 29.3 N/A 29.3 7.4<br />
Level of Service D N/A D --- --- --- --- --- --- --- A --- --- --- --- ---<br />
34 Jameson & Sheffield TWSC<br />
Delay (seconds) 16.3 0.1 0.1 N/A 6.3 N/A 16.3 N/A<br />
Level of Service C --- A A N/A A --- N/A C N/A --- --- --- --- --- ---<br />
35 NB on/off ramp & San Ysidro Rd TWSC<br />
Delay (seconds) 13.7 N/A 13.7 N/A 1.9 0.1 0.1<br />
Level of Service B --- --- --- N/A B --- N/A A --- --- A A --- --- ---<br />
36 San Ysidro Rd & N. Jameson Ln AWSC<br />
Delay (seconds) 44.9 N/A 15.2 9.8 N/A 15.1 9.9 N/A 72.8 8.4 N/A 48.3 9.2<br />
Level of Service E N/A C A N/A C A N/A F A N/A E A --- --- ---<br />
37 SB off ramp & San Ysidro Rd/Eucalyptus Ln TWSC<br />
Delay (seconds) 38.7 38.7 11.1 N/A N/A 10.2 N/A 0.1 N/A 4.5<br />
Level of Service E E B N/A N/A B N/A --- A --- N/A A --- --- --- ---<br />
38 S. Jameson Ln & San Ysidro Rd/Eucalyptus Ln TWSC<br />
Delay (seconds) 10.1 N/A 10.1 N/A N/A 0.5 0.1 N/A<br />
Level of Service B N/A B N/A --- --- --- N/A A --- --- A N/A --- --- ---<br />
39 NB off ramp & Olive Mill Rd AWSC<br />
Delay (seconds) 37.9 N/A 28.0 N/A N/A 56.3 23.1 N/A<br />
Level of Service E --- --- --- N/A D N/A N/A F --- --- C N/A --- --- ---<br />
39a N. Jameson Ln & Olive Mill Rd AWSC<br />
Delay (seconds) 20.1 N/A 12.8 N/A 26.2 N/A N/A 11.9<br />
Level of Service C --- --- --- N/A B N/A --- D N/A N/A B --- --- --- ---<br />
40 SB on ramp & Olive Mill Rd AWSC<br />
Delay (seconds) 17.1 12.6 17.3 N/A 20.6 N/A N/A 14.4<br />
Level of Service C B C N/A --- --- --- --- C N/A N/A B --- --- --- ---<br />
41 SB off ramp & Depot TWSC<br />
Delay (seconds) 10.6 0.1 0.1 8.1 10.6<br />
Level of Service B --- A A A --- --- --- --- B --- --- --- --- --- ---<br />
42 Olive Mill Rd & Spring TWSC<br />
Delay (seconds) 15.3 N/A 15.3 N/A N/A 0.1 0.1 N/A<br />
Level of Service C N/A C N/A --- --- --- N/A A --- --- A N/A --- --- ---<br />
43 NB off ramp & Coast Village Rd/Hermosillo Dr TWSC<br />
Delay (seconds) 26 N/A 0.3 N/A 26.0 14.1 N/A 17.0 N/A<br />
Level of Service D N/A A --- --- N/A --- D B --- N/A C N/A --- --- ---<br />
44 SB on/off ramp & NB off ramp & Cabrillo Blvd AWSC<br />
Delay (seconds) 71.6 121.3 8.9 N/A 68.2 N/A 25.2 17.7<br />
Level of Service F F --- A N/A F N/A --- D --- --- C --- --- --- ---<br />
45 NB on ramp & Cabrillo Blvd TWSC<br />
Delay (seconds) 27.7 7.5 0.1 27.7 14.8<br />
Level of Service D --- --- --- A A --- D --- B --- --- --- --- --- ---<br />
46 NB on/off ramp & S. Salinas St TWSC<br />
Delay (seconds) 8.7 7.2 8.7<br />
Level of Service A --- --- --- --- --- A --- --- --- --- --- A --- --- ---<br />
47 NB on/off ramp & Milpas St 3<br />
County of Santa Barbara<br />
County of Santa Barbara<br />
County of Santa Barbara<br />
County of Santa Barbara<br />
County of Santa Barbara<br />
Roundabout<br />
Delay (seconds) 5.8<br />
Level of Service A<br />
48 SB off ramp & Milpas St Signal<br />
Delay (seconds) 13.5 47.7 9.0 6.3<br />
Level of Service 0.649 / B B --- --- D --- --- --- --- A --- --- A --- --- --- ---<br />
49 SB on ramp & Milpas St Signal<br />
Delay (seconds) 43.2 45.3 62.4 N/A 46.5 11.5 N/A 62.0 N/A<br />
Level of Service 0.874 / D D --- --- --- --- --- D --- E N/A D B --- N/A N/A N/A<br />
50 NB on/off ramp & Garden St Signal<br />
Delay (seconds) 14.9 N/A 30.5 49.4 35.9 2.2 14.4 15.0<br />
Level of Service 0.524 / A B N/A C D D A B B<br />
51 NB off ramp & Palm Ave TWSC<br />
Delay (seconds) 10.4 10.4 N/A 0.2 0.1<br />
Level of Service B B --- --- --- --- --- N/A A --- --- A --- --- --- ---<br />
SC101 HOV <strong>Traffic</strong> Study – <strong>Forecast</strong> <strong>Operations</strong> <strong>Report</strong> Page 138
Dowling Associates, Inc.<br />
Transportation Engineering Planning Research Education<br />
Table 60 cont. 2040 Build AM Peak Hour LOS Results<br />
InID Intersection<br />
Control<br />
Type<br />
Overall V/C<br />
/ ICU LOS 1<br />
Overall<br />
HCM 2<br />
Eastbound Westbound Northbound Southbound<br />
Southeastbound<br />
LT T RT LT T RT LT T RT LT T RT LT T RT<br />
52 SB on/off ramp & Garden St Signal<br />
Delay (seconds) 25.6 34.0 40.0 23.8 19.0 N/A 32.9 6.9<br />
Level of Service 0.603 / B C C D C --- --- --- --- B N/A C A --- --- --- ---<br />
53 Garden St & E/ Yanonali St Signal<br />
City of Santa Barbara<br />
Delay (seconds) 44 97.4 17.4 15.5 33.4 21.1 22.7 37.2 18.2 N/A 92.6 9.6 N/A<br />
Level of Service 0.550 / A D F B B C C C D B N/A F A N/A --- --- ---<br />
54 NB off ramp & Bath St TWSC<br />
Delay (seconds) 13 N/A 13.0 11.3 N/A N/A 0.1 5.2<br />
Level of Service B N/A B --- --- B N/A N/A A --- A --- --- --- --- ---<br />
55 NB on ramp & Castillo St Signal<br />
Delay (seconds) 48.1 157.4 75.9 N/A 7.4 2.8 6.5 N/A 53.0 47.1<br />
Level of Service 0.592 / A D --- --- --- F E N/A A A A N/A D D --- --- ---<br />
56 W. Haley St & Bath St Signal<br />
City of Santa Barbara<br />
Delay (seconds) 9.8 8.4 10.3 N/A N/A 9.0 7.6 N/A 10.6 N/A<br />
Level of Service 0.535 / A A A B N/A N/A A A N/A B N/A --- --- --- --- --- ---<br />
57 SB on/off ramp & Castillo St Signal<br />
Delay (seconds) 23.1 N/A 34.0 43.8 15.9 N/A 83.8 5.4<br />
Level of Service 0.699 / B C N/A C D --- --- --- --- B N/A F A --- --- --- ---<br />
58 NB on/off ramp & Carrillo St Signal<br />
Delay (seconds) 22.1 45.2 57.2 N/A 43.2 7.1 21.6 24.8<br />
Level of Service 0.741 / C C --- --- --- D E N/A D A --- --- C C --- --- ---<br />
59 SB on/off ramp & Carrillo St Signal<br />
Delay (seconds) 62.7 43.6 43.8 21.7 29.4 32.6 344.6 4.8<br />
Level of Service 0.935 / E E D D C --- --- --- --- C C F A --- --- --- ---<br />
60 Carrillo St & Castillo St Signal<br />
City of Santa Barbara<br />
Delay (seconds) 22.3 34.8 39.4 45.8 24.8 N/A 144.3 5.1<br />
Level of Service 0.779 / C C C D D --- --- --- --- C N/A F A --- --- --- ---<br />
61 Carrillo St & San Pascual St TWSC<br />
City of Santa Barbara<br />
Delay (seconds) 13.7 N/A 11.7 N/A 0.1 0.1 13.7 0.1<br />
Level of Service B --- --- --- N/A B N/A --- A A B A --- --- --- ---<br />
62 NB on/off ramp & Castillo St TWSC<br />
Delay (seconds) 58.5 N/A 0.9 0.1 11.8 N/A N/A 58.5<br />
Level of Service F N/A A A --- --- --- --- B N/A N/A F --- --- --- ---<br />
63 NB on/off ramp & Mission St Signal<br />
Delay (seconds) 30.1 N/A 74.4 35.4 N/A 43.3 2.6 3.4<br />
Level of Service 0.859 / D C --- --- --- N/A E D N/A D --- --- A A --- --- ---<br />
64 SB on/off ramp & Mission St Signal<br />
Delay (seconds) 35.9 58.2 53.7 N/A 11.5 N/A N/A 33.4<br />
Level of Service 1.002 / F D E D N/A --- --- --- --- B N/A N/A C --- --- --- ---<br />
65 Mission St & Castillo St Signal<br />
City of Santa Barbara<br />
Delay (seconds) 6.1 N/A 28.0 34.0 N/A 3.8 N/A N/A 4.3 N/A<br />
Level of Service 0.602 / B A N/A C C --- --- --- N/A A N/A N/A A N/A --- --- ---<br />
66 Mission St & Modoc Rd TWSC<br />
City of Santa Barbara<br />
Delay (seconds) 15.8 N/A 15.8 N/A 0.1 N/A N/A 3.5<br />
Level of Service C --- --- --- N/A C N/A --- A N/A N/A A --- --- --- ---<br />
67 NB off ramp & Pueblo St & Calle Real TWSC<br />
Delay (seconds) 40.7 33.7 5.0 N/A 40.7<br />
Level of Service E D --- --- --- A N/A --- --- --- --- --- E --- --- ---<br />
68 NB on ramp & Calle Real Signal<br />
Delay (seconds) 29.7 N/A 61.5 N/A 26.4 2.8 N/A N/A 68.7 N/A<br />
Level of Service 0.897 / D C N/A E N/A C A N/A --- --- --- N/A E N/A --- --- ---<br />
69 Calle Real & Las Positas Rd Signal<br />
City of Santa Barbara<br />
Delay (seconds) 36.3 122.6 23.9 74.5 65.0 88.1 14.2 1.8 61.7 57.5<br />
Level of Service 0.735 / C D F C E E F B A --- --- E E --- --- ---<br />
70 SB on/off ramp & Las Positas Rd Signal<br />
Delay (seconds) 30.7 75.7 46.4 N/A 21.8 16.1 54.4 2.5<br />
Level of Service 0.850 / D C E D N/A --- --- --- --- C B D A --- --- --- ---<br />
71 Las Pasitas Rd & Modoc Rd Signal<br />
City of Santa Barbara<br />
Delay (seconds) 127.2 462.7 47.1 48.3 63.3 54.7 401.8 81.7 22.6 N/A 88.2 24.1 N/A<br />
Level of Service 0.865 / D F F D D E D F F C N/A F C N/A --- --- ---<br />
72 NB on/off ramp & Calle Real Signal<br />
Delay (seconds) 26.5 27.6 23.7 N/A 32.0 27.5 N/A 27.0 26.9 20.2 28.6 29.3 27.5<br />
Level of Service 0.511 / A C C C N/A C C N/A C C C C C C --- --- ---<br />
73 SB on/off ramp & La Cumbre Rd Signal<br />
Delay (seconds) 14.5 17.9 18.1 15.5 15.3 16.4 18.0 6.4<br />
Level of Service 0.526 / A B B B B --- --- --- --- B B B A --- --- --- ---<br />
74 La Cumbre Rd & Calle Real Signal<br />
City of Santa Barbara<br />
Delay (seconds) 10 14.3 14.7 9.7 9.6 19.0 4.4<br />
Level of Service 0.418 / A A --- --- --- B --- B --- A A B A --- --- --- ---<br />
75 NB off ramp & State St & Calle Real Signal<br />
Delay (seconds) 25.8 38.3 22.4 27.8 26.4 19.9 25.1 N/A 32.4 32.2 N/A<br />
Level of Service 0.590 / A C D C --- --- C C B C N/A C C N/A --- --- ---<br />
76 NB on ramp & State St TWSC<br />
Delay (seconds) 0<br />
Level of Service ---<br />
77 Calle Real & Rt 154 & San Macros Pass Rd Signal<br />
Delay (seconds) 33.9 53.7 34.0 33.4 45.7 24.1 36.9 45.4 32.0 N/A 43.6 29.6 N/A<br />
Level of Service 0.652 / B C D C C D C D D C N/A D C N/A --- --- ---<br />
78 SB off ramp & State St Signal<br />
Delay (seconds) 21.1 21.9 N/A 31.6 11.9 32.7 26.1 26.2 20.7<br />
Level of Service 0.559 / A C --- C N/A C B --- --- C --- C C C --- --- ---<br />
SC101 HOV <strong>Traffic</strong> Study – <strong>Forecast</strong> <strong>Operations</strong> <strong>Report</strong> Page 139
Dowling Associates, Inc.<br />
Transportation Engineering Planning Research Education<br />
Table 60 cont. 2040 Build AM Peak Hour LOS Results<br />
InID Intersection<br />
LT T RT LT T RT LT T RT LT T RT LT T RT<br />
79 SB on ramp & State St & Rt 154 TWSC<br />
Delay (seconds) 112.4 112.4<br />
Level of Service F --- --- --- --- --- --- --- --- --- F --- --- --- --- ---<br />
792 State St & San Marcos Pass Road Signal<br />
Delay (seconds) 25.1 25.9 6.7 N/A N/A 31.2 27.2 N/A 49.3 N/A N/A 33.3 29.0<br />
Level of Service 0.638 / B C C A N/A N/A C C N/A D N/A N/A C C --- --- ---<br />
80 NB on/off ramp & Calle Real & El Sueno Rd AWSC<br />
Delay (seconds) 20.5 N/A 14.2 N/A N/A 29.1 N/A N/A 16.8 8.7 N/A 13.9 N/A<br />
Level of Service C N/A B N/A N/A D N/A N/A C A N/A B N/A --- --- ---<br />
81 NB on/off ramp & Turnpike Rd Signal<br />
Delay (seconds) 32.2 86.8 82.8 35.6 33.0 4.7 22.0 N/A<br />
Level of Service 0.704 / C C --- --- --- F F D C A --- --- C N/A --- --- ---<br />
82 SB on/off ramp & Turnpike Rd Signal<br />
Delay (seconds) 25.2 N/A 39.6 N/A 27.0 N/A 45.0 6.9<br />
Level of Service 0.838 / D C N/A D N/A --- --- --- --- C N/A D A --- --- --- ---<br />
83 Turnpike Rd & Calle Real Signal<br />
County of Santa Barbara<br />
Delay (seconds) 23.3 48.1 35.4 41.6 48.5 26.3 N/A 25.6 9.0 N/A 43.2 20.6 N/A<br />
Level of Service 0.528 / A C D D D D C N/A C A N/A D C N/A --- --- ---<br />
84 NB on/off ramp & Patterson Ave Signal<br />
Delay (seconds) 30.6 45.1 49.9 28.9 51.0 9.5 22.1 29.1<br />
Level of Service 0.791 / C C --- --- --- D D C D A --- --- C C --- --- ---<br />
85 SB on/off ramp & Patterson Ave Signal<br />
Delay (seconds) 19.6 46.0 50.0 48.2 16.2 19.8 29.0 0.5<br />
Level of Service 0.589 / A B D D D --- --- --- --- B B C A --- --- --- ---<br />
86 Patterson Ave & Calle Real Signal<br />
City of Goleta<br />
Delay (seconds) 17.6 36.7 42.2 31.1 2.5 12.5 N/A<br />
Level of Service 0.572 / A B D --- D --- --- --- C A --- --- B N/A --- --- ---<br />
87 NB on/off ramp & Fairview Ave Signal<br />
Delay (seconds) 21.5 29.5 0.1 42.7 23.5 40.5 0.3<br />
Level of Service 0.569 / A C C --- A --- D C --- --- --- --- D A --- --- ---<br />
88 Calle Real & Fairview Ave Signal<br />
City of Goleta<br />
Delay (seconds) 37.5 65.4 34.2 52.2 59.1 31.1 N/A 62.2 16.8 15.4 32.9 35.9 N/A<br />
Level of Service 0.678 / B D E C D E C N/A E B B C D N/A --- --- ---<br />
89 SB on/off ramp & Fairview Ave Signal<br />
Delay (seconds) 16 N/A 17.7 22.4 21.7 19.3 21.0 9.2<br />
Level of Service 0.629 / B B N/A B C --- --- --- --- C B C A --- --- --- ---<br />
90 NB on/off ramp & Los Carneros Rd Signal<br />
Delay (seconds) 40 67.2 65.2 N/A 41.2 8.0 12.2 N/A<br />
Level of Service 0.659 / B D --- --- --- E E N/A D A --- --- B N/A --- --- ---<br />
91 SB on/off ramp & Los Carneros Rd Signal<br />
Delay (seconds) 17.4 N/A 40.5 37.9 10.4 13.4 39.4 9.1<br />
Level of Service 0.665 / B B N/A D D --- --- --- --- B B D A --- --- --- ---<br />
92 Los Carneros Rd & Calle Real Signal<br />
City of Goleta<br />
Delay (seconds) 14.4 38.5 26.4 2.9 1.7 44.7 6.2<br />
Level of Service 0.467 / A B --- --- --- D --- C --- A A D A --- --- --- ---<br />
93 NB on/off ramp & Glen Annie Rd & Calle Real Signal<br />
Delay (seconds) 135.3 36.1 442.1 456.6 95.6 79.1 N/A 62.6 16.9 N/A 49.5 27.0 N/A<br />
Level of Service 0.783 / C F D F F F E N/A E B N/A D C N/A --- --- ---<br />
94 Glen Annie Rd & Del Norte Rd TWSC<br />
City of Goleta<br />
Delay (seconds) 11.3 11.3 0.1 0.1 N/A<br />
Level of Service B --- --- B --- --- --- --- A --- --- A N/A --- --- ---<br />
95 SB on/off ramp & Glen Annie Rd Signal<br />
Delay (seconds) 134.4 N/A 29.2 74.1 17.2 2.1 436.0 9.3<br />
Level of Service 0.788 / C F N/A C E --- --- --- --- B A F A --- --- --- ---<br />
96 Calle Real & NB on ramp TWSC<br />
Delay (seconds) 12.2 9.9 N/A N/A 12.2<br />
Level of Service B --- A N/A N/A B --- --- --- --- --- --- --- --- --- ---<br />
97 SB on/off ramp & Hollister Ave TWSC<br />
Delay (seconds) 18.8 N/A 18.8 0.1 0.1 0.1 N/A 5.1<br />
Level of Service C N/A C A --- --- --- --- A A N/A A --- --- --- ---<br />
98 NB off ramp & Winchester Canyon Rd AWSC<br />
Delay (seconds) 8.4 8.2 8.8 N/A 8.0<br />
Level of Service A A --- --- --- A N/A --- --- --- --- --- A --- --- ---<br />
100 NB on/off ramps & Via Real Signal<br />
Delay (seconds) 9.4 10.7 9.5 N/A 10.1 9.0<br />
Level of Service 0.708 / C A --- B A N/A B --- --- A --- --- --- --- --- --- ---<br />
102 Guteirrez St & Garden St Signal<br />
City of Santa Barbara<br />
Delay (seconds) 20.8 25.4 21.6 N/A 31.7 7.3 24.3 N/A<br />
Level of Service 0.715 / C C --- --- --- C C N/A C A --- --- C N/A --- --- ---<br />
103 Montecito St & Castillo St Signal<br />
City of Santa Barbara<br />
Delay (seconds) 67.2 128.9 31.1 N/A 58.7 50.1 42.3 60.5 18.5 N/A 57.7 21.4 83.8<br />
Level of Service 0.850 / D E F C N/A E D D E B N/A E C F --- --- ---<br />
104 San Andres & Carrillo St Signal<br />
City of Santa Barbara<br />
Delay (seconds) 30.3 47.4 46.2 N/A N/A 46.3 34.6 15.6 22.5 N/A 26.4 23.0 N/A<br />
Level of Service 0.680 / B C D D F N/A D C B C N/A C C N/A --- --- ---<br />
105 Modoc St & Mission St AWSC<br />
City of Santa Barbara<br />
Delay (seconds) 48.8 24.1 10.9 12.9 104.3 25.9 10.7<br />
Level of Service E C --- B --- --- --- B F --- --- D B --- --- ---<br />
106 Quinientos St & Milpas St Signal<br />
City of Santa Barbara<br />
Delay (seconds) 9.6 18.8 18.9 N/A 20.1 19.3 N/A 5.7 7.9 N/A 4.7 9.1 N/A<br />
Level of Service<br />
Note: --- indicates corresponding movement does not exist.<br />
0.620 / B A B B N/A C B N/A A A N/A A A N/A --- --- ---<br />
N/A indicates delay same as the adjacent movement due to shared approach.<br />
AWSC = All Way Stop Control, TWSC = Two Way Stop Control<br />
1 - ICU LOS is reported for signalized intersections only<br />
2 - Based on HCM 2000, Chapter 16 Signalized Intersections and Chapter 17 Unsignalized Intersections methodology<br />
3 - Based on methodology developed by FHWA publication Roundabouts: An Information Guide, June 2000<br />
Indicates that LOS exceeds LOS threshold<br />
Control<br />
Type<br />
Overall V/C<br />
/ ICU LOS 1<br />
Overall<br />
HCM 2<br />
Eastbound Westbound Northbound Southbound<br />
Southeastbound<br />
SC101 HOV <strong>Traffic</strong> Study – <strong>Forecast</strong> <strong>Operations</strong> <strong>Report</strong> Page 140
Dowling Associates, Inc.<br />
Transportation Engineering Planning Research Education<br />
Table 61. 2040 Build PM Peak Hour LOS Results<br />
InID Intersection<br />
Control<br />
Type<br />
Overall V/C<br />
/ ICU LOS 1<br />
Overall<br />
HCM 2<br />
Eastbound<br />
Westbound Northbound<br />
Southbound Southeastbound<br />
LT T RT LT T RT LT T RT LT T RT LT T RT<br />
1 NB on/off ramp & Bates Rd TWSC<br />
Delay (seconds) 9.3 9.3 8.4 N/A N/A 4.6 0.1<br />
Level of Service A --- --- --- A A N/A N/A A --- --- A --- --- --- ---<br />
2 SB on/off ramp & Bates Rd TWSC<br />
Delay (seconds) 10.1 9.5 10.1 N/A 0.1 N/A 4.1<br />
Level of Service B A B N/A --- --- --- --- A --- N/A A --- --- --- ---<br />
3 NB on/off ramp & SR 150 TWSC<br />
Delay (seconds) 14.3 14.3 10.0 N/A N/A 0.3 0.1 N/A<br />
Level of Service B --- --- --- B A N/A N/A A --- --- A N/A --- --- ---<br />
4 SB on/off ramp & SR 150 TWSC<br />
Delay (seconds) 36.3 36.3 12.0 N/A 0.1 N/A 7.3<br />
Level of Service E E B N/A --- --- --- --- A --- N/A A --- --- --- ---<br />
5 Via Real & SR 150 TWSC<br />
Delay (seconds) 15.8 N/A 10.8 N/A 15.8 N/A 1.5 0.1<br />
Level of Service C N/A B --- N/A C --- N/A A --- --- A --- --- --- ---<br />
6 Carpinteria Ave & SR 150 TWSC<br />
Delay (seconds) 10 N/A 10.0 8.9 N/A 1.0<br />
Level of Service A N/A A --- --- A N/A --- --- --- --- A --- --- --- ---<br />
7 NB on/off ramp & Bailard Ave TWSC<br />
Delay (seconds) 27 N/A 27.0 N/A 4.0 0.1 0.1<br />
Level of Service D --- --- --- N/A D --- N/A A --- --- A A --- --- ---<br />
8 SB on/off ramp & Bailard Ave TWSC<br />
Delay (seconds) 233.4 N/A 233.4 N/A 0.1 N/A 2.2<br />
Level of Service F N/A F N/A --- --- --- --- A --- N/A A --- --- --- ---<br />
9 Via Real & Bailard Ave AWSC<br />
Delay (seconds) 83.4 N/A 15.2 11.4 N/A 190.0 9.0 N/A 40.5 13.0 N/A 12.6 9.8<br />
Level of Service F N/A C B N/A F A N/A E B N/A B A --- --- ---<br />
10 Carpinteria Ave & Bailard Ave AWSC<br />
Delay (seconds) 16.9 N/A 22.2 N/A N/A 10.5 N/A N/A 9.8 N/A N/A 12.6 N/A<br />
Level of Service C N/A C N/A N/A B N/A N/A A N/A N/A B N/A --- --- ---<br />
11 Via Real & Casitas Pass Rd Signal<br />
Delay (seconds) 21.8 N/A 27.8 25.8 30.7 30.6 17.3 32.8 11.6 N/A 31.8 21.7 N/A<br />
Level of Service 0.755 / C C N/A C C C C B N/A B N/A C C N/A --- --- ---<br />
12 Vellocito & Via Real TWSC<br />
Delay (seconds) 13 N/A 0.5 0.1 N/A N/A 13.0 N/A<br />
Level of Service B N/A A --- --- A N/A --- --- --- N/A B N/A --- --- ---<br />
13 SB on/off ramp & Casitas Pass Rd Signal<br />
Delay (seconds) 18.7 23.3 21.5 N/A 20.3 N/A 40.0 2.4<br />
Level of Service 0.800 / C B C C N/A --- --- --- C N/A D A --- --- ---<br />
14 Carpinteria Ave & Casitas Pass Rd Signal<br />
Delay (seconds) 37.4 53.8 10.8 46.6 31.5 31.0 50.4<br />
Level of Service 0.869 / D D D B --- --- D C --- --- --- C --- D --- --- ---<br />
15 NB on ramp & Ogan Rd 3<br />
City of Carpinteria<br />
City of Carpinteria<br />
Roundabout<br />
Delay (seconds) 6.2<br />
Level of Service A<br />
16 Linden Ave & Ogan Rd Signal<br />
City of Carpinteria<br />
Delay (seconds) 17.3 26.6 24.5 13.8 6.2 36.9 3.0<br />
Level of Service 0.734 / C B --- --- --- C --- C --- B A D A --- --- --- ---<br />
17 SB off ramp & Linden Ave Signal<br />
Delay (seconds) 12.1 24.3 18.4 6.4 4.5<br />
Level of Service 0.448 / A B C --- B --- --- --- --- A --- --- A --- --- --- ---<br />
18 Linden Ave & Sawyer Ave TWSC<br />
City of Carpinteria<br />
Delay (seconds) 25.7 N/A 25.7 N/A N/A 0.6 0.1 N/A<br />
Level of Service D N/A D N/A --- --- --- N/A A --- --- A N/A --- --- ---<br />
19 SB on/off ramp & Carpinteria Ave TWSC<br />
Delay (seconds) 999 10.5 0.1 8.2 0.1 N/A 135.5 N/A N/A 999.0 N/A<br />
Level of Service F B A --- A A --- N/A F N/A N/A F N/A --- --- ---<br />
20 Santa Ynez Ave/7th St & Carpinteria Ave Signal<br />
City of Carpinteria<br />
Delay (seconds) 43.6 170.9 19.8 15.8 25.2 35.6 N/A 32.3 28.2 34.3 19.4 N/A<br />
Level of Service 0.719 / C D F B B --- C D N/A C C C B N/A --- --- ---<br />
21 NB on/off ramp & Via Real AWSC<br />
Delay (seconds) 117.3 N/A 105.7 6.3 N/A 186.4 12.1 N/A 125.8 N/A N/A 42.9 N/A<br />
Level of Service F N/A F A N/A F B N/A F N/A N/A E N/A --- --- ---<br />
22 NB on/off ramp & S. Padaro Ln TWSC<br />
Delay (seconds) 11.7 N/A 11.7 N/A 2.4 0.1<br />
Level of Service B --- --- --- N/A B --- N/A A --- --- A --- --- --- ---<br />
23 Via Real & S. Padaro Ln TWSC<br />
City of Carpinteria<br />
Delay (seconds) 14.7 0.1 0.1 N/A 6.3 N/A 14.7 N/A<br />
Level of Service B --- A A N/A A --- N/A B N/A --- --- --- --- --- ---<br />
24 SB off ramp & Santa Claus Ln/S. Padaro Ln TWSC<br />
Delay (seconds) 44.4 44.4 22.2 N/A N/A 9.7 N/A 0.1 0.1 N/A 7.5<br />
Level of Service E E C N/A N/A A N/A --- A A N/A A --- --- --- ---<br />
25 NB on/off ramp & N. Padaro Ln TWSC<br />
Delay (seconds) 10.5 N/A 10.5 N/A N/A 2.7 0.1<br />
Level of Service B --- --- --- N/A B N/A N/A A --- --- A --- --- ---<br />
26 N. Padaro Ln & Via Real TWSC<br />
County of Santa Barbara<br />
Delay (seconds) 11.8 0.1 N/A N/A 5.5 N/A 11.8 N/A<br />
Level of Service B --- A N/A N/A A --- N/A B N/A --- --- --- --- --- ---<br />
SC101 HOV <strong>Traffic</strong> Study – <strong>Forecast</strong> <strong>Operations</strong> <strong>Report</strong> Page 141
Dowling Associates, Inc.<br />
Transportation Engineering Planning Research Education<br />
Table 61 cont. 2040 Build PM Peak Hour LOS Results<br />
InID Intersection<br />
Control<br />
Type<br />
Overall V/C<br />
/ ICU LOS 1<br />
Overall<br />
HCM 2<br />
Eastbound<br />
Westbound Northbound<br />
Southbound Southeastbound<br />
LT T RT LT T RT LT T RT LT T RT LT T RT<br />
27 SB on/off ramp & N. Padaro Ln TWSC<br />
Delay (seconds) 12 N/A 12.0 N/A 0.1 N/A 6.1<br />
Level of Service B N/A B N/A --- --- --- --- A --- N/A A --- --- --- ---<br />
28 NB off ramp & Ortega Hill Rd TWSC<br />
Delay (seconds) 15.3 N/A 0.1 0.1 N/A 15.3 9.5<br />
Level of Service C N/A A --- --- A --- N/A C --- --- A --- --- --- ---<br />
29 Evans Ave & Ortega Hill Rd AWSC<br />
Delay (seconds) 10.4 N/A 9.4 N/A N/A 11.7 N/A N/A 10.0 N/A N/A 8.9 N/A<br />
Level of Service B N/A A N/A N/A B N/A N/A A N/A N/A A N/A --- --- ---<br />
30 NB on ramp & Ortega Hill Rd TWSC<br />
Delay (seconds) 23.2 23.2 16.0 N/A 5.9<br />
Level of Service C --- C C N/A A --- --- --- --- --- --- --- --- --- ---<br />
31 SB off ramp & Evans Ave TWSC<br />
Delay (seconds) 13.2 N/A 13.2 N/A 8.6 N/A 0.1 N/A 6.4<br />
Level of Service B N/A B --- N/A A N/A --- A --- N/A A --- --- --- ---<br />
32 NB on/off ramp & Sheffield TWSC<br />
Delay (seconds) 10.2 N/A 10.2 N/A 2.6 0.1 0.1<br />
Level of Service B --- --- --- N/A B --- N/A A --- --- A A --- --- ---<br />
33 SB on/off ramp & Sheffield TWSC<br />
Delay (seconds) 13.7 N/A 13.7 7.4<br />
Level of Service B N/A B --- --- --- --- --- --- --- A --- --- --- --- ---<br />
34 Jameson & Sheffield TWSC<br />
Delay (seconds) 12.5 0.1 0.1 N/A 7.9 N/A 12.5 N/A<br />
Level of Service B --- A A N/A A --- N/A B N/A --- --- --- --- --- ---<br />
35 NB on/off ramp & San Ysidro Rd TWSC<br />
Delay (seconds) 13.6 N/A 13.6 N/A 2.9 0.1 0.1<br />
Level of Service B --- --- --- N/A B --- N/A A --- --- A A --- --- ---<br />
36 San Ysidro Rd & N. Jameson Ln AWSC<br />
Delay (seconds) 35.4 N/A 15.6 9.6 N/A 13.3 10.0 N/A 24.1 8.6 N/A 66.0 8.7<br />
Level of Service E N/A C A N/A B A N/A C A N/A F A --- --- ---<br />
37 SB off ramp & San Ysidro Rd/Eucalyptus Ln TWSC<br />
Delay (seconds) 37.9 37.9 10.7 N/A N/A 11.2 N/A 0.1 N/A 5.9<br />
Level of Service E E B N/A N/A B N/A --- A --- N/A A --- --- --- ---<br />
38 S. Jameson Ln & San Ysidro Rd/Eucalyptus Ln TWSC<br />
Delay (seconds) 10.6 N/A 10.6 N/A N/A 1.3 0.1 N/A<br />
Level of Service B N/A B N/A --- --- --- N/A A --- --- A N/A --- --- ---<br />
39 NB off ramp & Olive Mill Rd AWSC<br />
Delay (seconds) 47.9 N/A 21.2 N/A N/A 58.0 53.6 N/A<br />
Level of Service E --- --- --- N/A C N/A N/A F --- --- F N/A --- --- ---<br />
39a N. Jameson Ln & Olive Mill Rd AWSC<br />
Delay (seconds) 16.7 N/A 13.7 N/A 19.4 N/A N/A 15.0<br />
Level of Service C --- --- --- N/A B N/A --- C N/A N/A B --- --- --- ---<br />
40 SB on ramp & Olive Mill Rd AWSC<br />
Delay (seconds) 66.9 17.6 137.0 N/A 29.4 N/A N/A 28.8<br />
Level of Service F C F N/A --- --- --- --- D N/A N/A D --- --- --- ---<br />
41 SB off ramp & Depot TWSC<br />
Delay (seconds) 9.5 0.1 0.1 7.7 9.5<br />
Level of Service A --- A A A --- --- --- --- A --- --- --- --- --- ---<br />
42 Olive Mill Rd & Spring TWSC<br />
Delay (seconds) 13.5 N/A 13.5 N/A N/A 0.1 0.1 N/A<br />
Level of Service B N/A B N/A --- --- --- N/A A --- --- A N/A --- --- ---<br />
43 NB off ramp & Coast Village Rd/Hermosillo Dr TWSC<br />
Delay (seconds) 67.8 N/A 0.4 0.1 67.8 17.5 N/A 42.4 N/A<br />
Level of Service F N/A A --- --- A --- F C --- N/A E N/A --- --- ---<br />
44 SB on/off ramp & NB off ramp & Cabrillo Blvd AWSC<br />
Delay (seconds) 87.7 100.6 10.5 N/A 84.8 N/A 108.6 47.6<br />
Level of Service F F --- B N/A F N/A --- F --- --- E --- --- --- ---<br />
45 NB on ramp & Cabrillo Blvd TWSC<br />
Delay (seconds) 999 7.8 0.1 999.0 13.0<br />
Level of Service F --- --- --- A A --- F --- B --- --- --- --- --- ---<br />
46 NB on/off ramp & S. Salinas St TWSC<br />
Delay (seconds) 8.1 8.0 8.1<br />
Level of Service A --- --- --- --- --- A --- --- --- --- --- A --- --- ---<br />
47 NB on/off ramp & Milpas St 3<br />
County of Santa Barbara<br />
County of Santa Barbara<br />
County of Santa Barbara<br />
County of Santa Barbara<br />
County of Santa Barbara<br />
Roundabout<br />
Delay (seconds) 8.3<br />
Level of Service A --- --- --- --- --- --- --- --- --- --- --- --- --- --- ---<br />
48 SB off ramp & Milpas St Signal<br />
Delay (seconds) 11.8 38.5 1.7 10.9<br />
Level of Service 0.845 / D B --- --- D --- --- --- --- A --- --- B --- --- --- ---<br />
49 SB on ramp & Milpas St Signal<br />
Delay (seconds) 103.2 58.8 137.0 N/A 138.0 14.1 N/A 49.4 N/A<br />
Level of Service 1.005 / F F --- --- --- --- --- E --- F N/A F B --- N/A D N/A<br />
50 NB on/off ramp & Garden St Signal<br />
Delay (seconds) 26.5 N/A 40.3 77.9 47.4 0.2 22.8 22.8<br />
Level of Service 0.783 / C C N/A D E D A C C<br />
51 NB off ramp & Palm Ave TWSC<br />
Delay (seconds) 10.2 10.2 N/A 0.1 0.1<br />
Level of Service B B --- --- --- --- --- N/A A --- --- A --- --- --- ---<br />
SC101 HOV <strong>Traffic</strong> Study – <strong>Forecast</strong> <strong>Operations</strong> <strong>Report</strong> Page 142
Dowling Associates, Inc.<br />
Transportation Engineering Planning Research Education<br />
Table 61 cont. 2040 Build PM Peak Hour LOS Results<br />
InID Intersection<br />
Control<br />
Type<br />
Overall V/C<br />
/ ICU LOS 1<br />
Overall<br />
HCM 2<br />
Eastbound<br />
Westbound Northbound<br />
Southbound Southeastbound<br />
LT T RT LT T RT LT T RT LT T RT LT T RT<br />
52 SB on/off ramp & Garden St Signal<br />
Delay (seconds) 27.9 70.5 84.3 30.1 21.1 N/A 24.9 9.6<br />
Level of Service 0.970 / E C E F C --- --- --- --- C N/A C A --- --- --- ---<br />
53 Garden St & E/ Yanonali St Signal<br />
City of Santa Barbara<br />
Delay (seconds) 222.7 798.7 15.9 13.9 41.8 20.8 26.2 42.2 22.2 N/A 32.4 19.6 N/A<br />
Level of Service 0.753 / C F F B B D C C D C N/A C B N/A --- --- ---<br />
54 NB off ramp & Bath St TWSC<br />
Delay (seconds) 17.3 N/A 17.3 14.1 N/A N/A 0.2 6.1<br />
Level of Service C N/A C --- --- B N/A N/A A --- A --- --- --- --- ---<br />
55 NB on ramp & Castillo St Signal<br />
Delay (seconds) 131.4 410.1 252.4 N/A 7.1 5.0 7.5 N/A 42.0 35.4<br />
Level of Service 0.759 / C F --- --- --- F F N/A A A A N/A D D --- --- ---<br />
56 W. Haley St & Bath St Signal<br />
City of Santa Barbara<br />
Delay (seconds) 18.1 18.1 15.2 N/A N/A 17.7 10.5 N/A 20.7 N/A<br />
Level of Service 0.822 / D B B B N/A N/A B B N/A C N/A --- --- --- --- --- ---<br />
57 SB on/off ramp & Castillo St Signal<br />
Delay (seconds) 55.7 N/A 26.1 56.3 29.3 N/A 407.3 27.3<br />
Level of Service 0.905 / E E N/A C E --- --- --- --- C N/A F C --- --- --- ---<br />
58 NB on/off ramp & Carrillo St Signal<br />
Delay (seconds) 31.9 68.1 70.6 N/A 75.1 2.9 44.9 0.7<br />
Level of Service 0.899 / D C --- --- --- E E N/A E A --- --- D A --- --- ---<br />
59 SB on/off ramp & Carrillo St Signal<br />
Delay (seconds) 31.9 43.0 43.0 59.4 23.8 23.5 57.5 14.3<br />
Level of Service 0.820 / D C D D E --- --- --- --- C C E B --- --- --- ---<br />
60 Carrillo St & Castillo St Signal<br />
City of Santa Barbara<br />
Delay (seconds) 35.9 20.6 23.2 42.3 58.8 N/A 171.0 11.2<br />
Level of Service 0.840 / D D C C D --- --- --- E N/A F B --- --- --- ---<br />
61 Carrillo St & San Pascual St TWSC<br />
City of Santa Barbara<br />
Delay (seconds) 13.3 N/A 12.5 N/A 0.1 N/A 13.3 0.1<br />
Level of Service B --- --- --- N/A B N/A --- A N/A B A --- --- --- ---<br />
62 NB on/off ramp & Castillo St TWSC<br />
Delay (seconds) 167.5 N/A 0.5 0.1 11.9 N/A N/A 167.5<br />
Level of Service F N/A A A --- --- --- --- B N/A N/A F --- --- --- ---<br />
63 NB on/off ramp & Mission St Signal<br />
Delay (seconds) 18.5 N/A 53.6 64.4 N/A 19.4 4.3 5.2<br />
Level of Service 0.853 / D B --- --- --- N/A D E N/A B --- --- A A --- --- ---<br />
64 SB on/off ramp & Mission St Signal<br />
Delay (seconds) 65 55.7 58.6 N/A 10.8 N/A N/A 103.1<br />
Level of Service 0.953 / E E E E N/A --- --- --- --- B N/A N/A F --- --- --- ---<br />
65 Mission St & Castillo St Signal<br />
City of Santa Barbara<br />
Delay (seconds) 48.2 N/A 23.9 40.7 N/A 94.1 N/A N/A 10.2 N/A<br />
Level of Service 0.849 / D D N/A C D --- --- --- N/A F N/A N/A B N/A --- --- ---<br />
66 Mission St & Modoc Rd TWSC<br />
City of Santa Barbara<br />
Delay (seconds) 25.6 N/A 25.6 N/A 0.1 N/A N/A 5.4<br />
Level of Service D --- --- --- N/A D N/A --- A N/A N/A A --- --- --- ---<br />
67 NB off ramp & Pueblo St & Calle Real TWSC<br />
Delay (seconds) 129.7 6.2 39.7 N/A 129.7<br />
Level of Service F A --- --- --- E N/A --- --- --- --- --- F --- --- ---<br />
68 NB on ramp & Calle Real Signal<br />
Delay (seconds) 22 N/A 52.8 N/A 10.5 7.2 N/A N/A 61.5 N/A<br />
Level of Service 0.700 / C C N/A D N/A B A N/A --- --- --- N/A E N/A --- --- ---<br />
69 Calle Real & Las Positas Rd Signal<br />
City of Santa Barbara<br />
Delay (seconds) 39.8 94.7 45.0 51.6 47.2 46.3 32.5 9.8 57.9 45.8<br />
Level of Service 0.770 / C D F --- D D D D C A --- --- E D --- --- ---<br />
70 SB on/off ramp & Las Positas Rd Signal<br />
Delay (seconds) 37.8 76.7 38.9 N/A 33.1 25.1 49.1 11.6<br />
Level of Service 0.814 / D D E D N/A --- --- --- --- C C D B --- --- --- ---<br />
71 Las Pasitas Rd & Modoc Rd Signal<br />
City of Santa Barbara<br />
Delay (seconds) 77.3 356.8 45.3 41.6 58.6 47.3 71.9 326.7 24.8 N/A 75.4 13.0 N/A<br />
Level of Service 0.736 / C E F D D E D E F C N/A E B N/A --- --- ---<br />
72 NB on/off ramp & Calle Real Signal<br />
Delay (seconds) 36.1 41.6 37.8 N/A 41.9 30.9 N/A 36.1 35.9 26.0 35.0 40.1 33.0<br />
Level of Service 0.677 / B D D D N/A D C N/A D D C C D C --- --- ---<br />
73 SB on/off ramp & La Cumbre Rd Signal<br />
Delay (seconds) 18.4 21.1 21.1 14.5 21.7 21.1 20.5 9.1<br />
Level of Service 0.611 / B B C C B --- --- --- --- C C C A --- --- --- ---<br />
74 La Cumbre Rd & Calle Real Signal<br />
City of Santa Barbara<br />
Delay (seconds) 11.7 15.8 16.6 11.5 11.4 23.9 5.3<br />
Level of Service 0.482 / A B --- --- --- B --- B --- B B C A --- --- --- ---<br />
75 NB off ramp & State St & Calle Real Signal<br />
Delay (seconds) 34.9 48.8 25.9 31.4 40.3 29.7 38.8 N/A 48.6 48.3 N/A<br />
Level of Service 0.709 / C C D C --- --- C D C D N/A D D N/A --- --- ---<br />
76 NB on ramp & State St TWSC<br />
Delay (seconds) 0<br />
Level of Service ---<br />
77 Calle Real & Rt 154 & San Macros Pass Rd Signal<br />
Delay (seconds) 31.7 34.3 39.2 35.9 26.1 31.7 33.3 38.1 27.2 N/A 43.2 30.8 N/A<br />
Level of Service 0.606 / B C C D D C C C D C N/A D C N/A --- --- ---<br />
78 SB off ramp & State St Signal<br />
Delay (seconds) 29 31.4 N/A 35.1 16.7 37.6 34.3 34.2 23.4<br />
Level of Service 0.633 / B C --- C N/A D B --- --- D --- C C C --- --- ---<br />
SC101 HOV <strong>Traffic</strong> Study – <strong>Forecast</strong> <strong>Operations</strong> <strong>Report</strong> Page 143
Dowling Associates, Inc.<br />
Transportation Engineering Planning Research Education<br />
Table 61 cont. 2040 Build PM Peak Hour LOS Results<br />
InID Intersection<br />
LT T RT LT T RT LT T RT LT T RT LT T RT<br />
79 SB on ramp & State St & Rt 154 TWSC<br />
Delay (seconds) 119.4 119.4<br />
Level of Service F --- --- --- --- --- --- --- --- --- F --- --- --- --- ---<br />
792 State St & San Marcos Pass Road Signal<br />
Delay (seconds) 18.4 22.7 5.6 N/A N/A 22.8 22.4 N/A 38.5 N/A N/A 26.0 27.1<br />
Level of Service 0.540 / A B C A N/A N/A C C N/A D N/A N/A C C --- --- ---<br />
80 NB on/off ramp & Calle Real & El Sueno Rd AWSC<br />
Delay (seconds) 32.5 N/A 49.1 N/A N/A 31.7 N/A N/A 19.4 10.8 N/A 19.2 N/A<br />
Level of Service D N/A E N/A N/A D N/A N/A C B N/A C N/A --- --- ---<br />
81 NB on/off ramp & Turnpike Rd Signal<br />
Delay (seconds) 18 33.9 33.9 26.4 27.4 7.6 15.4 N/A<br />
Level of Service 0.632 / B B --- --- --- C C C C A --- --- B N/A --- --- ---<br />
82 SB on/off ramp & Turnpike Rd Signal<br />
Delay (seconds) 20.6 N/A 25.2 N/A 29.1 N/A 31.1 4.6<br />
Level of Service 0.825 / D C N/A C N/A --- --- --- --- C N/A C A --- --- --- ---<br />
83 Turnpike Rd & Calle Real Signal<br />
County of Santa Barbara<br />
Delay (seconds) 245.1 35.4 24.2 25.9 ##### 23.1 N/A 255.8 21.1 N/A 31.6 13.8 N/A<br />
Level of Service 0.673 / B F D C C F C N/A F C N/A C B N/A --- --- ---<br />
84 NB on/off ramp & Patterson Ave Signal<br />
Delay (seconds) 25.1 41.7 46.9 44.7 46.3 10.0 18.1 18.3<br />
Level of Service 0.714 / C C --- --- --- D D D D A --- --- B B --- --- ---<br />
85 SB on/off ramp & Patterson Ave Signal<br />
Delay (seconds) 30.9 53.0 59.2 32.6 20.3 33.4 37.8 15.0<br />
Level of Service 0.778 / C C D E C --- --- --- --- C C D B --- --- --- ---<br />
86 Patterson Ave & Calle Real Signal<br />
City of Goleta<br />
Delay (seconds) 43.3 49.4 37.2 101.1 6.9 19.5 N/A<br />
Level of Service 0.701 / C D D --- D --- --- --- F A --- --- B N/A --- --- ---<br />
87 NB on/off ramp & Fairview Ave Signal<br />
Delay (seconds) 19.4 27.0 0.2 28.8 23.1 38.5 0.2<br />
Level of Service 0.798 / C B C --- A --- C C --- --- --- --- D A --- --- ---<br />
88 Calle Real & Fairview Ave Signal<br />
City of Goleta<br />
Delay (seconds) 37.4 94.0 27.1 30.6 89.6 31.3 N/A 68.1 8.0 10.2 55.9 31.6 N/A<br />
Level of Service 0.721 / C D F C C F C N/A E A B E C N/A --- --- ---<br />
89 SB on/off ramp & Fairview Ave Signal<br />
Delay (seconds) 16.2 N/A 24.6 20.5 18.9 15.2 24.0 5.7<br />
Level of Service 0.624 / B B N/A C C --- --- --- --- B B C A --- --- --- ---<br />
90 NB on/off ramp & Los Carneros Rd Signal<br />
Delay (seconds) 29.1 41.4 41.6 N/A 34.8 8.6 35.6 N/A<br />
Level of Service 0.773 / C C --- --- --- D D N/A C A --- --- D N/A --- --- ---<br />
91 SB on/off ramp & Los Carneros Rd Signal<br />
Delay (seconds) 35 N/A 88.8 35.8 11.1 65.4 51.7 6.0<br />
Level of Service 0.926 / E C N/A F D --- --- --- --- B E D A --- --- --- ---<br />
92 Los Carneros Rd & Calle Real Signal<br />
City of Goleta<br />
Delay (seconds) 13 17.5 10.2 12.6 10.1 100.1 7.2<br />
Level of Service 0.648 / B B --- --- --- B --- B --- B B F A --- --- --- ---<br />
93 NB on/off ramp & Glen Annie Rd & Calle Real Signal<br />
Delay (seconds) 115.2 37.3 105.2 108.1 170.3 155.2 N/A 142.8 28.3 N/A 52.0 29.2 N/A<br />
Level of Service 0.791 / C F D F F F F N/A F C N/A D C N/A --- --- ---<br />
94 Glen Annie Rd & Del Norte Rd TWSC<br />
City of Goleta<br />
Delay (seconds) 10.2 10.2 0.1 0.1 N/A<br />
Level of Service B --- --- B --- --- --- --- A --- --- A N/A --- --- ---<br />
95 SB on/off ramp & Glen Annie Rd Signal<br />
Delay (seconds) 10.9 N/A 37.4 48.7 11.6 2.7 28.3 7.3<br />
Level of Service 0.590 / A B N/A D D --- --- --- --- B A C A --- --- --- ---<br />
96 Calle Real & NB on ramp TWSC<br />
Delay (seconds) 12.9 9.1 N/A N/A 12.9<br />
Level of Service B --- A N/A N/A B --- --- --- --- --- --- --- --- --- ---<br />
97 SB on/off ramp & Hollister Ave TWSC<br />
Delay (seconds) 19.3 N/A 19.3 0.1 0.1 0.1 N/A 3.2<br />
Level of Service C N/A C A --- --- --- --- A A N/A A --- --- --- ---<br />
98 NB off ramp & Winchester Canyon Rd AWSC<br />
Delay (seconds) 9.7 8.5 10.4 N/A 8.4<br />
Level of Service A A --- --- --- B N/A --- --- --- --- --- A --- --- ---<br />
100 NB on/off ramps & Via Real Signal<br />
Delay (seconds) 8.9 7.9 6.9 N/A 8.9 10.2<br />
Level of Service 0.679 / B A --- A A N/A A --- --- B --- --- --- --- --- --- ---<br />
102 Guteirrez St & Garden St Signal<br />
City of Santa Barbara<br />
Delay (seconds) 64.2 25.1 21.8 N/A 30.7 16.1 140.4 N/A<br />
Level of Service 0.830 / D E --- --- --- C C N/A C B --- --- F N/A --- --- ---<br />
103 Montecito St & Castillo St Signal<br />
City of Santa Barbara<br />
Delay (seconds) 63.5 88.8 27.0 N/A 47.9 43.1 35.7 57.3 24.2 N/A 261.3 43.8 37.5<br />
Level of Service 0.952 / E E F C N/A D D D E C N/A F D D --- --- ---<br />
104 San Andres & Carillo St Signal<br />
City of Santa Barbara<br />
Delay (seconds) 33.4 33.9 37.7 N/A N/A 33.8 23.9 22.6 18.7 N/A 23.0 42.6 N/A<br />
Level of Service 0.760 / C C C D F N/A C C C B N/A C D N/A --- --- ---<br />
105 Modoc St & Mission St AWSC<br />
City of Santa Barbara<br />
Delay (seconds) 53.7 17.8 13.2 15.1 29.9 126.0 14.4<br />
Level of Service F C --- B --- --- --- C D --- --- F B --- --- ---<br />
106 Quinientos St & Milpas St Signal<br />
City of Santa Barbara<br />
Delay (seconds) 21.8 16.0 19.5 N/A 97.2 14.6 N/A 12.4 22.6 N/A 23.5 15.4 N/A<br />
Level of Service<br />
Note: --- indicates corresponding movement does not exist.<br />
0.909 / E C B B N/A F B N/A B C N/A C B N/A --- --- ---<br />
N/A indicates delay same as the adjacent movement due to shared approach.<br />
AWSC = All Way Stop Control, TWSC = Two Way Stop Control<br />
1 - ICU LOS is reported for signalized intersections only<br />
2 - Based on HCM 2000, Chapter 16 Signalized Intersections and Chapter 17 Unsignalized Intersections methodology<br />
3 - Based on methodology developed by FHWA publication Roundabouts: An Information Guide, June 2000<br />
Indicates that LOS exceeds LOS threshold<br />
Control<br />
Type<br />
Overall V/C<br />
/ ICU LOS 1<br />
Overall<br />
HCM 2<br />
Eastbound<br />
Westbound Northbound<br />
Southbound<br />
Southeastbound<br />
SC101 HOV <strong>Traffic</strong> Study – <strong>Forecast</strong> <strong>Operations</strong> <strong>Report</strong> Page 144
Figure 41. 2020 and 2040 Intersection LOS Results (HCM Operational Method)<br />
SC101 HOV <strong>Traffic</strong> Study – <strong>Forecast</strong> <strong>Operations</strong> <strong>Report</strong> Page 145
Figure 41 cont. 2020 and 2040 Intersection Level of Service Results (HCM Operational Method)<br />
SC101 HOV <strong>Traffic</strong> Study – <strong>Forecast</strong> <strong>Operations</strong> <strong>Report</strong> Page 146
Figure 41 cont. 2020 and 2040 Intersection Level of Service Results (HCM Operational Method)<br />
SC101 HOV <strong>Traffic</strong> Study – <strong>Forecast</strong> <strong>Operations</strong> <strong>Report</strong> Page 147
Figure 41 cont. 2020 and 2040 Intersection Level of Service Results (HCM Operational Method)<br />
SC101 HOV <strong>Traffic</strong> Study – <strong>Forecast</strong> <strong>Operations</strong> <strong>Report</strong> Page 148
Dowling Associates, Inc.<br />
Transportation Engineering Planning Research Education<br />
Project Impact Assessment<br />
For purposes of assessing project impacts, the 2020 Opening Day analysis provides the basis for<br />
identifying project level impacts while the 2040 Design Year analysis provides the basis for identifying<br />
cumulative plus project impacts. Distinguishing between project specific and cumulative impacts under<br />
CEQA is necessary in order to establish the financial fair share responsibilities for mitigation improvement<br />
projects.<br />
Project impacts were based on measured operations between the future No-Build condition and the future<br />
Build condition. If the future with-project condition worsens operations relative to the future no-project<br />
condition, a project impact was identified. As stated above, a 2020 impact is considered a project level<br />
impact while a 2040 impact is considered a cumulative plus project impact. Given that Highway 101<br />
freeway operations were shown to improve within the study area as a result of the project (see FREQ<br />
Freeway Analysis; pp. 34-64), project specific impacts were primarily focused on the freeway interface with<br />
the local agency transportation systems i.e., ramp intersections and local study area intersections adjacent<br />
to ramps.<br />
All applicable state and local agency traffic impact criteria are described below.<br />
State Facilities<br />
For state operated facilities, the <strong>Caltrans</strong> LOS standard of LOS C was the basis for identifying impacts<br />
associated with the project. For state facilities, any non-signalized or signalized intersections shown to<br />
operate at LOS C or better under the No Build analysis whose LOS drops to LOS D or worse under the<br />
Build analysis would be identified as an impact.<br />
For facilities shown to operate at LOS D or worse under the No Build analysis that remain at LOS D or<br />
worse under the Build analysis - the following CMP criteria were used to define impacts:<br />
Local Facilities<br />
LOS Added Peak Trips<br />
D 20<br />
E 10<br />
F 10<br />
For locally owned intersections, assessment of impacts was analyzed using the HCM method and the ICU<br />
method consistent with each respective local agency’s policies. For state operated and locally operated<br />
facilities designated as part of the adopted Congestion Management Program for Santa Barbara County,<br />
the CMP LOS standards were also analyzed for information purposes.<br />
These definitions for each local agency and SBCAG are provided below.<br />
City of Carpinteria<br />
For signalized intersections operating at or below LOS C (ICU Method), if the with-project<br />
condition causes the location to exceed LOS C, it is considered an impact.<br />
For non-signalized intersections operating at or below LOS C (HCM Method), if the with-project<br />
condition causes the location to exceed LOS C, it is considered an impact.<br />
For intersections operating at LOS A, a decrease in v/c of .20 as computed by the ICU Method<br />
For intersections operating at LOS B, a decrease in v/c of .15 as computed by the ICU Method<br />
For intersections operating at LOS C, a decrease in v/c of .10 as computed by the ICU Method<br />
For intersections operating at LOS D, the addition of 15 or more peak hour trips<br />
For intersections operating at LOS E, the addition of 10 or more peak hour trips<br />
For intersections operating at LOS F, the addition of 5 or more peak hour trips<br />
SC101 HOV <strong>Traffic</strong> Study – <strong>Forecast</strong> <strong>Operations</strong> <strong>Report</strong> Page 149
Dowling Associates, Inc.<br />
Transportation Engineering Planning Research Education<br />
City of Santa Barbara<br />
For signalized intersections operating at or below a v/c of .77 (ICU Method), if the with-project<br />
condition causes the location to exceed the v/c of .77, it is considered an impact.<br />
For signalized intersections operating over a v/c of .77, if the with-project condition causes the v/c<br />
to increase by .01 (1%) or more, it is considered an impact.<br />
For signalized intersections operating at or below a v/c of .77, if the with-project cumulative<br />
condition causes the location to exceed the v/c of .77, it is considered an impact.<br />
For non-signalized intersections, if with-project condition triggers peak hour signal warrants.<br />
County of Santa Barbara<br />
For signalized intersections operating at or below LOS C (ICU Method), if the with-project<br />
condition causes the location to exceed LOS C, it is considered an impact.<br />
For non-signalized intersections operating at or below LOS C (HCM Method), if the with-project<br />
condition causes the location to exceed LOS C, it is considered an impact.<br />
For intersections operating at LOS A, a decrease in v/c of .20 as computed by the ICU Method<br />
For intersections operating at LOS B, a decrease in v/c of .15 as computed by the ICU Method<br />
For intersections operating at LOS C, a decrease in v/c of .10 as computed by the ICU Method<br />
For intersections operating at LOS D, the addition of 15 or more peak hour trips<br />
For intersections operating at LOS E, the addition of 10 or more peak hour trips<br />
For intersections operating at LOS F, the addition of 5 or more peak hour trips<br />
Under cumulative conditions, criteria described below will be used to measure impacts.<br />
City of Goleta<br />
v/c range Increase in v/c<br />
0.80 – 0.85 0.03<br />
0.86 – 0.89 0.02<br />
> 0.89 0.01<br />
For signalized intersections operating at or below LOS C (ICU Method), if the with-project<br />
condition causes the location to exceed LOS C, it is considered an impact.<br />
For non-signalized intersections operating at or below LOS C (HCM Method), if the with-project<br />
condition causes the location to exceed LOS C, it is considered an impact.<br />
For the intersection of Storke/Hollister, if the with-project condition causes this intersection to<br />
exceed LOS D (ICU Method), it is considered an impact.<br />
CMP Designated Facilities (includes state owned facilities and some locally owned intersections)<br />
For intersections operating at LOS A/B, a decrease of two LOS grades from project added traffic.<br />
For any intersection operating at LOS C, project added traffic that results in LOS D or worse.<br />
For intersections with existing congestion, the following criteria define an impact:<br />
LOS Added Peak Trips<br />
D 20<br />
E 10<br />
F 10<br />
SC101 HOV <strong>Traffic</strong> Study – <strong>Forecast</strong> <strong>Operations</strong> <strong>Report</strong> Page 150
Dowling Associates, Inc.<br />
Transportation Engineering Planning Research Education<br />
Identification of 2020 Project-Level Impact Locations<br />
Based on the 2020 AM/PM HCM LOS results relative to state traffic impact criteria, a total of 11 study area<br />
intersections are projected to experience project level impacts (Table 62). Six of these intersections are<br />
stop-controlled. One of the six stop controlled intersections (Intersection #8 Southbound on/off ramp &<br />
Bailard) meets peak hour signal warrants under No Build conditions. Given that warrants are triggered<br />
without the project – a project specific impact finding is not justified at this location. This reduces the total<br />
number of impacted locations to 10 intersections.<br />
Based on the 2020 AM/PM ICU LOS results relative to local/regional impact threshold criteria, a total five<br />
study area intersections are projected to experience project level impacts (Table 63). However, given that<br />
four of these intersections are state owned and operated, the HCM LOS results supersede local/regional<br />
criteria for determining traffic impacts. A single locally operated intersection within the City of Santa<br />
Barbara (Intersection #106 Milpas & Quinientos) indicates a project level impact based on the ICU Method.<br />
Combining the HCM and ICU impact analysis results described above, Table 64 lists all intersections<br />
identified with project level impacts. This final list of project level impact locations is based on the<br />
application of state and local impact criteria. A total of nine intersections are shown to have project level<br />
impacts as a result of the Highway 101 Widening Project (EA 05-0N7000).<br />
Identification of 2040 Cumulative Project-Level Impact Locations<br />
Under 2040 cumulative traffic conditions, 26 intersections are identified where project added traffic<br />
contributes to a cumulative impact (Table 65). Of these intersections, 14 are stop-controlled of which 9<br />
are shown to meet peak hour signal warrants under the No Build condition. Given that warrants are<br />
triggered under cumulative conditions without the project – cumulative plus project impact findings are not<br />
justified at these locations. This reduces the total number of cumulative impact locations to 17<br />
intersections.<br />
Based on the AM/PM ICU LOS results relative to local/regional impact threshold criteria described earlier,<br />
2040 cumulative impacts are summarized in Table 66. A total of 13 signalized intersections are identified<br />
where project added traffic violates local/regional impact criteria under 2040 cumulative conditions. All but<br />
three of these intersections are owned by the state – where state criteria would supersede local/regional<br />
criteria. The three locally owned/operated intersections shown to experience impacts include: 1)<br />
Carpinteria Avenue / Casitas Pass Road (Intersection #14 City of Carpinteria); 2) Cabrillo Blvd / Castillo<br />
Street (Intersection #60 City of Santa Barbara); and, 3) Mission Street / Castillo Street (Intersection #65<br />
City of Santa Barbara). Although local agency significance criteria are met at these three intersections,<br />
regional CMP thresholds are not exceeded.<br />
Combining the HCM and ICU cumulative plus project impact analysis results described above, Table 67<br />
lists all intersections identified with cumulative plus project impacts. This final list of cumulative plus<br />
project impact locations is based on the application of state and local impact criteria. A total of 15<br />
intersections are shown to have cumulative plus project impacts resulting from the Highway 101 Widening<br />
Project (EA 05-0N7000).<br />
SC101 HOV <strong>Traffic</strong> Study – <strong>Forecast</strong> <strong>Operations</strong> <strong>Report</strong> Page 151
Table 62. 2020 HCM Project Level Impact Summary<br />
ID Intersection Control 1<br />
Total Entering <strong>Traffic</strong> Volumes<br />
3<br />
2 Delay<br />
Existing No Build Build Delta<br />
(seconds)<br />
LOS 4 Delay 3<br />
(seconds) LOS 4 No Build Build<br />
8 SB on/off ramp & Bailard Ave TWSC Yes Yes State<br />
PM Peak 876 917 967 50 45.2 E 71.8 F<br />
18 Linden Ave & Sawyer Ave TWSC No No State<br />
AM Peak 944 990 1,069 79 20 C 33.7 D<br />
21 NB on/off ramp & Via Real AWSC No No State<br />
AM Peak 1,187 1,225 1,346 121 43.7 F 78.4 F<br />
23 Via Real & Padaro Ln TWSC No No State<br />
AM Peak 868 884 884 0 24.9 C 26 D<br />
44 SB on/off ramp & NB off ramp & Cabrillo Blvd AWSC No No State<br />
AM Peak 1,198 1,052 1,151 99 36 E 41.5 E<br />
49 SB on ramp & Milpas St Signal N/A N/A State<br />
AM Peak 1,910 1,932 2,167 235 29.8 C 35.5 D<br />
PM Peak 2,625 2,625 2,763 138 56.8 E 77.7 E<br />
53 Garden St & E/ Yanonali St Signal N/A N/A State<br />
PM Peak 1,718 1,832 1,890 58 78.3 E 115.2 F<br />
55 NB on ramp & Castillo St Signal N/A N/A<br />
PM Peak 2,205 2,342 2,355 13 103.3 F 104 F<br />
64 SB on/off ramp & Mission St Signal N/A N/A State<br />
PM Peak 2,473 2,593 2,627 34 33.9 C 36 D<br />
79 SB on ramp & State St & Rt 154 TWSC --- --- State<br />
AM Peak 1,941 1,983 1,994 11 72.2 F 75.5 F<br />
PM Peak 1,635 1,704 1,722 18 53.3 F 58.7 F<br />
83 Turnpike Rd & Calle Real Signal N/A N/A State<br />
PM Peak 2,006 2,151 2,185 34 211 F 213.5 F<br />
1 TWSC - Two Way Stop Control, AWSC - All Way Stop Control<br />
2<br />
As defined by difference between 2020 build and 2020 no build volume sets<br />
3<br />
Based on HCM 2000, Chapter 16 and 17 methodology<br />
4<br />
HCM LOS is reported for the worst movement at TWSC intersections and for the overall intersection at AWSC and signalized intersections<br />
5<br />
Based on Peak Hour Warrants (Signal Warrant #3) as described in California Manual on Uniform <strong>Traffic</strong> Control Devices at unsignalized intersections<br />
Table 63. 2020 ICU Project Level Impact Summary<br />
2 Volume to Capacity Ratio<br />
3 ICU LOS is reported for Signalized intersections based on Transportation Research Board Special <strong>Report</strong> 209<br />
Signal Warrant<br />
Met? 5<br />
No Build Results Build Results Project<br />
Impact<br />
Threshold<br />
Criteria<br />
Project Impact Statement<br />
Addition of 10 or more peak hour trips when the state<br />
facility is operating at LOS E.<br />
Project added traffic results in LOS D or worse from LOS<br />
C or better.<br />
Addition of 10 or more peak hours trips when the state<br />
facility is operating at LOS F.<br />
Project added traffic results in LOS D or worse from LOS<br />
C or better.<br />
Addition of 10 or more peak hour trips when the state<br />
facility is operating at LOS E.<br />
Project added traffic results in LOS D or worse from LOS<br />
C or better (AM). Addition of 10 ore more peak hour trips<br />
when the state facility is operating at LOS E (PM).<br />
Addition of 10 or more peak hour trips when the state<br />
facility is operating at LOS E.<br />
Addition of 10 or more peak hours trips when the state<br />
facility is operating at LOS F.<br />
Project added traffic results in LOS D or worse from LOS<br />
C or better<br />
Addition of 10 or more peak hour trips when the state<br />
facility is operating at LOS F.<br />
Addition of 10 or more peak hour trips when the state<br />
facility is operating at LOS F.<br />
Existing No Build Build Delta 1<br />
V/C 2<br />
LOS 3<br />
V/C 2<br />
LOS 3<br />
ID Intersection Control<br />
Total Entering <strong>Traffic</strong> Volumes No Build Results Build Results<br />
Jurisdiction<br />
Project Impact<br />
Threshold Criteria<br />
Project Impact Statement<br />
49 SB on ramp & Milpas St Signal State City of SB For intersection operating over v/c of 0.77, project<br />
PM Peak 2,625 2,625 2,763 138 0.888 D 0.933 E<br />
added traffic increases v/c by 0.01 or more<br />
52 SB on/off ramp & Garden St Signal State City of SB For intersection operating over v/c of 0.77, project<br />
PM Peak 2,257 2,436 2,483 47 0.83 D 0.847 D<br />
added traffic increases v/c by 0.01 or more<br />
64 SB on/off ramp & Mission St Signal State City of SB For intersection operating over v/c of 0.77, project<br />
PM Peak 2,473 2,593 2,627 34 0.858 D 0.868 D<br />
added traffic increases v/c by 0.01 or more<br />
68 NB on ramp & Calle Real Signal State City of SB For intersection operating over v/c of 0.77, project<br />
AM Peak 1,654 1,600 1,625 25 0.837 D 0.853 D<br />
added traffic increases v/c by 0.01 or more<br />
106 Milpas St & Quinientos St Signal City of SB City of SB For intersection operating over v/c of 0.77, project<br />
PM Peak 2,518 2,743 2,767 24 0.772 C 0.788 C<br />
added traffic increases v/c by 0.01 or more<br />
1<br />
As defined by difference between 2040 build and 2040 no build volume sets<br />
SC101 HOV <strong>Traffic</strong> Study – <strong>Forecast</strong> <strong>Operations</strong> <strong>Report</strong> Page 152
Table 64. 2020 Final Project Level Impact Summary<br />
ID Intersection Control 1<br />
Existing No Build Build Delta 2<br />
Delay<br />
(seconds)<br />
OR V/C 3<br />
SC101 HOV <strong>Traffic</strong> Study – <strong>Forecast</strong> <strong>Operations</strong> <strong>Report</strong> Page 153<br />
LOS 4<br />
Delay<br />
(seconds)<br />
OR V/C 3<br />
LOS 4 No Build Build<br />
18 Linden Ave & Sawyer Ave TWSC Project Area No No State<br />
AM Peak 944 990 1,069 79 20 C 33.7 D<br />
21 NB on/off ramp & Via Real AWSC Project Area No No State<br />
AM Peak 1,187 1,225 1,346 121 43.7 F 78.4 F<br />
23 Via Real & S. Padaro Ln TWSC Project Area No No State<br />
AM Peak 868 884 884 0 24.9 C 26 D<br />
44 SB on/off ramp & NB off ramp & Cabrillo Blvd AWSC Study Area No No State<br />
AM Peak 1,198 1,052 1,151 99 36 E 41.5 E<br />
49 SB on ramp & Milpas St Signal Study Area N/A N/A State<br />
AM Peak 1,910 1,932 2,167 235 29.8 C 35.5 D<br />
PM Peak 2,625 2,625 2,763 138 56.8 E 77.7 E<br />
55 NB on ramp & Castillo St Signal Study Area N/A N/A State<br />
PM Peak 2,205 2,342 2,355 13 103.3 F 104 F<br />
64 SB on/off ramp & Mission St Signal Study Area N/A N/A State<br />
PM Peak 2,473 2,593 2,627 34 33.9 C 36 D<br />
79 SB on ramp & State St & Rt 154 TWSC Study Area --- --- State<br />
AM Peak 1,941 1,983 1,994 11 72.2 F 75.5 F<br />
PM Peak 1,635 1,704 1,722 18 53.3 F 58.7 F<br />
106 Milpas St & Quinientos St Signal Study Area N/A N/A City of SB<br />
PM Peak 2,518 2,743 2,767 24 0.772 C 0.788 C<br />
1 TWSC - Tw o Way Stop Control, AWSC - All Way Stop Control<br />
2 As defined by difference betw een 2020 build and 2020 no build volume sets<br />
Location<br />
Total Entering <strong>Traffic</strong> Volumes<br />
3 Delay is based on HCM 2000, Chapter 16 and 17 methodology. V/C based on Transportation Research Board Special <strong>Report</strong> 209<br />
4 HCM LOS is reported for the w orst movement at TWSC intersections and for the overall intersection at AWSC and signalized intersections<br />
5 Based on Peak Hour Warrants (Signal Warrant #3) as described in California Manual on Uniform <strong>Traffic</strong> Control Devices at unsignalized intersections<br />
No Build Results Build Results<br />
Signal Warrant<br />
Met? 5<br />
Project<br />
Impact<br />
Threshold<br />
Criteria
Table 65. 2040 HCM Project Plus Cumulative Impact Summary<br />
ID Intersection Control 1<br />
Total Entering <strong>Traffic</strong> Volumes<br />
3<br />
2 Delay<br />
Existing No Build Build Delta<br />
(seconds)<br />
LOS 4<br />
3<br />
Delay<br />
(seconds)<br />
LOS 4 No Build Build<br />
4 SB on/off ramp & SR 150 TWSC No No State<br />
PM Peak 644 644 672 28 30 D 36.3 E<br />
7 NB on/off ramp & Bailard Ave TWSC No No State<br />
PM Peak 1,123 1,215 1,390 175 21 C 27 D<br />
8 SB on/off ramp & Bailard Ave TWSC Yes Yes State<br />
AM Peak 756 1,093 1,116 23 165.8 F 181.1 F<br />
PM Peak 876 986 1,119 133 80.1 F 233.4 F<br />
14 Carpinteria Ave & Casitas Pass Rd Signal N/A N/A State<br />
PM Peak 1,805 2,193 2,329 136 29.9 C 37.4 D<br />
18 Linden Ave & Sawyer Ave TWSC No No State<br />
AM Peak 944 1,066 1,277 211 25.8 D 41.3 E<br />
19 SB on/off ramp & Carpinteria Ave TWSC Yes Yes State<br />
PM Peak 979 1,470 1,480 10 537.1 F >1,000 F<br />
21 NB on/off ramp & Via Real AWSC Yes Yes State<br />
AM Peak 1,187 1,289 1,610 321 49.4 E 165.7 F<br />
33 SB on/off ramp & Sheffield TWSC No No State<br />
AM Peak 390 483 579 96 19.9 C 29.3 D<br />
39 NB off ramp & Olive Mill Rd AWSC Yes Yes State<br />
PM Peak 942 1,233 1,359 126 36.9 E 47.9 E<br />
44 SB on/off ramp & NB off ramp & Cabrillo Blvd AWSC Yes Yes State<br />
AM Peak 1,038 1,076 1,338 262 40.2 E 71.6 F<br />
PM Peak 1,093 1,365 1,426 61 81.7 F 87.7 F<br />
45 NB on ramp & Cabrillo Blvd TWSC Yes Yes State<br />
AM Peak 1,345 1,444 1,465 21 25.7 D 27.7 D<br />
PM Peak 1,573 2,018 2,072 54 >1,000 F >1,000 F<br />
49 SB on ramp & Milpas St Signal N/A N/A State<br />
AM Peak 1,910 1,968 2,596 628 30 C 43.2 D<br />
PM Peak 2,625 2,625 2,994 369 64.2 E 103.2 F<br />
53 Garden St & E/ Yanonali St Signal N/A N/A State<br />
AM Peak 1,363 1,570 1,620 50 38.8 D 44 D<br />
PM Peak 1,718 2,023 2,177 154 104.4 F 222.8 F<br />
55 NB on ramp & Castillo St Signal N/A N/A State<br />
PM Peak 2,205 2,571 2,605 34 129.4 F 131.4 F<br />
57 SB on/off ramp & Castillo St Signal N/A N/A State<br />
PM Peak 2,557 3,092 3,117 25 52.6 D 55.7 E<br />
59 SB on/off ramp & Carrillo St Signal N/A N/A State<br />
AM Peak 3,435 3,677 3,689 12 56.8 E 62.7 E<br />
PM Peak 3,778 4,141 4,164 23 33.6 C 35.6 D<br />
62 NB on/off ramp & Castillo St TWSC Yes Yes State<br />
AM Peak 861 869 890 21 55.6 F 58.5 F<br />
64 SB on/off ramp & Mission St Signal N/A N/A State<br />
AM Peak 2,705 2,817 2,838 21 34.5 C 35.9 D<br />
PM Peak 2,473 2,793 2,883 90 53.1 D 65 E<br />
65 Mission St & Castillo St Signal N/A N/A State<br />
PM Peak 2,451 2,887 3,001 114 32.3 C 48.2 D<br />
66 Mission St & San Pascual St TWSC Yes Yes State<br />
PM Peak 1,436 1,565 1,610 45 19.8 C 25.6 D<br />
79 SB on ramp & State St & Rt 154 TWSC N/A N/A State<br />
AM Peak 1,941 2,054 2,081 27 101.1 F 112.4 F<br />
PM Peak 1,635 1,818 1,867 49 96.9 F 119.4 F<br />
83 Turnpike Rd & Calle Real Signal N/A N/A State<br />
PM Peak 2,006 2,393 2,484 91 238.5 F 245.1 F<br />
86 Patterson Ave & Calle Real Signal N/A N/A State<br />
PM Peak 2,850 3,111 3,323 212 32.2 C 43.3 D<br />
88 Calle Real & Fairview Ave Signal N/A N/A State<br />
AM Peak 2,349 2,408 2,427 19 36.8 D 37.5 D<br />
90 NB on/off ramp & Los Carneros Rd Signal N/A N/A State<br />
AM Peak 1,596 1,942 2,045 103 33.9 C 40 D<br />
105 Mission St & Modoc St AWSC Yes Yes State<br />
AM Peak 1,504 1,532 1,549 17 45.8 E 48.8 E<br />
PM Peak 1,664 1,723 1,746 23 49.1 E 53.7 E<br />
1 TWSC - Two Way Stop Control, AWSC - All Way Stop Control<br />
2<br />
As defined by difference between 2040 build and 2040 no build volume sets<br />
3<br />
Based on HCM 2000, Chapter 16 and 17 methodology<br />
4<br />
HCM LOS is reported for the worst movement at TWSC intersections and for the overall intersection at AWSC and signalized intersections<br />
5<br />
Based on Peak Hour Warrants (Signal Warrant #3) as described in California Manual on Uniform <strong>Traffic</strong> Control Devices at unsignalized intersections<br />
No Build Results Build Results<br />
Signal Warrant<br />
Met? 5<br />
Addition of 20 or more peak hour trips when the state facility is<br />
operating at LOS D<br />
Project added traffic results in LOS D or worse from LOS C or<br />
better<br />
Addition of 10 or more peak hour trips when the state facility is<br />
operating at LOS F.<br />
Project added traffic results in LOS D or worse from LOS C or<br />
better.<br />
Addition of 20 or more peak hour trips when the state facility is<br />
operating at LOS D<br />
Addition of 10 or more peak hour trips when the state facility is<br />
operating at LOS F.<br />
Addition of 10 or more peak hour trips when the state facility is<br />
operating at LOS E.<br />
Project added traffic results in LOS D or worse from LOS C or<br />
better.<br />
Addition of 10 or more peak hour trips when the state facility is<br />
operating at LOS E.<br />
Addition of 10 or more peak hour trips when the state facility is<br />
operating at LOS E and F.<br />
Addition of 20 or more peak hour trips when the state facility is<br />
operating at LOS D (AM). Addition of 10 or more peak hour<br />
trips when the state facility is operating at LOS F (PM).<br />
Project added traffic results in LOS D or worse from LOS C or<br />
better (AM). Addition of 10 or more peak hour trips when the<br />
state facility if operating at LOS E (PM).<br />
Addition of 20 or more peak hour trips when the state facility is<br />
operating at LOS D (AM). Addition of 10 or more peak hour<br />
trips when the state facility is operating at LOS F (PM).<br />
Addition of 10 or more peak hour trips when the state facility is<br />
operating at LOS F.<br />
Addition of 20 or more peak hour trips when the state facility is<br />
operating at LOS D<br />
Addition of 10 or more peak hour trips when the state facility if<br />
operating at LOS E (AM). Project added traffic results in LOS<br />
D or worse from LOS C or better (PM).<br />
Addition of 10 or more peak hour trips when the state facility is<br />
operating at LOS F<br />
Project added traffic results in LOS D or worse from LOS C or<br />
better (AM). Addition of 20 or more peak hour trips when the<br />
state facility is operating at LOS D (PM).<br />
Project added traffic results in LOS D or worse from LOS C or<br />
better<br />
Project added traffic results in LOS D or worse from LOS C or<br />
better.<br />
Addition of 10 or more peak hour trips when the state facility is<br />
operating at LOS F.<br />
Addition of 10 or more peak hour trips when the state facility is<br />
operating at LOS F.<br />
Project added traffic results in HCM LOS D or worse from LOS<br />
C or better.<br />
Addition of 20 or more peak hour trips when the state facility is<br />
operating at LOS D<br />
Project added traffic results in HCM LOS D or worse from LOS<br />
C or better.<br />
Addition of 10 or more peak hour trips when the state facility is<br />
operating at LOS E.<br />
SC101 HOV <strong>Traffic</strong> Study – <strong>Forecast</strong> <strong>Operations</strong> <strong>Report</strong> Page 154<br />
Project<br />
Impact<br />
Threshold<br />
Criteria<br />
Project Impact Statement
Table 66. 2040 ICU Project Plus Cumulative Impact Summary<br />
Existing No Build Build Delta 1<br />
V/C 2<br />
LOS 3<br />
V/C 2<br />
LOS 3<br />
ID Intersection Control<br />
Total Entering <strong>Traffic</strong> Volumes No Build Results Build Results<br />
Jurisdiction<br />
Project Impact<br />
Threshold Criteria<br />
Project Impact Statement<br />
14 Carpinteria Ave & Casitas Pass Rd Signal City of Carpinteria City of Carpinteria Project added traffic results in ICU LOS D or worse<br />
PM Peak 1,804 2,193 2,329 136 0.796 C 0.869 D<br />
from LOS C or better<br />
49 SB on ramp & Milpas St<br />
AM Peak<br />
PM Peak<br />
Signal<br />
1,910<br />
2,625<br />
1,968<br />
2,625<br />
2,596<br />
2,994<br />
628<br />
369<br />
0.676<br />
0.886<br />
B<br />
D<br />
0.874<br />
1.005<br />
D<br />
F<br />
State City of SB<br />
For intersection operating at or below v/c of 0.77,<br />
project added traffic causes to exceed v/c of 0.77<br />
50 NB on/off ramp & Garden St Signal State City of SB For intersection operating at or below v/c of 0.77,<br />
PM Peak 2,626 3,156 3,157 1 0.764 C 0.783 C<br />
project added traffic causes to exceed v/c of 0.77<br />
52 SB on/off ramp & Garden St Signal State City of SB For intersection operating over v/c of 0.77, project<br />
PM Peak 2,257 2,734 2,859 125 0.926 E 0.970 E<br />
added traffic increases v/c by 0.01 or more<br />
59 SB on/off ramp & Carrillo St<br />
AM Peak<br />
PM Peak<br />
Signal<br />
3,435<br />
3,778<br />
3,677<br />
4,141<br />
3,689<br />
4,164<br />
12<br />
23<br />
0.923<br />
0.802<br />
E<br />
D<br />
0.935<br />
0.820<br />
E<br />
D<br />
State City of SB<br />
For intersection operating over v/c of 0.77, project<br />
added traffic increases v/c by 0.01 or more<br />
60 Carrillo St & Castillo St Signal City of SB City of SB For intersection operating at or below v/c of 0.77,<br />
AM Peak 2,742 2,995 3,082 87 0.757 C 0.779 C<br />
project added traffic causes to exceed v/c of 0.77<br />
63 NB on/off ramp & Mission St Signal State City of SB For intersection operating over v/c of 0.77, project<br />
PM Peak 2,725 3,150 3,274 124 0.806 D 0.853 D<br />
added traffic increases v/c by 0.01 or more<br />
64 SB on/off ramp & Mission St<br />
AM Peak<br />
PM Peak<br />
Signal<br />
2,705<br />
2,477<br />
2,817<br />
2,793<br />
2,838<br />
2,883<br />
21<br />
90<br />
0.985<br />
0.926<br />
E<br />
E<br />
1.002<br />
0.953<br />
F<br />
E<br />
State City of SB<br />
For intersection operating over v/c of 0.77, project<br />
added traffic increases v/c by 0.01 or more<br />
65 Mission St & Castillo St Signal City of SB City of SB For intersection operating over v/c of 0.77, project<br />
PM Peak 2,451 2,887 3,001 114 0.787 C 0.849 D<br />
added traffic increases v/c by 0.01 or more<br />
68 NB on ramp & Calle Real Signal State City of SB For intersection operating over v/c of 0.77, project<br />
AM Peak 1,564 1,663 1,729 66 0.854 D 0.897 D<br />
added traffic increases v/c by 0.01 or more<br />
70 SB on/off ramp & Las Positas Rd Signal State City of SB For intersection operating over v/c of 0.77, project<br />
AM Peak 2,865 2,955 3,027 72 0.833 D 0.850 D<br />
added traffic increases v/c by 0.01 or more<br />
82 SB on/off ramp & Turnpike Rd<br />
AM Peak<br />
PM Peak<br />
Signal<br />
2,849<br />
2,487<br />
2,918<br />
2,838<br />
3,001<br />
2,949<br />
83<br />
111<br />
0.811<br />
0.798<br />
D<br />
D<br />
0.838<br />
0.825<br />
D<br />
D<br />
State City of SB<br />
For intersection operating at ICU LOS D, the<br />
addition of 15 or more peak hour trips<br />
106 Milpas St & Quinientos St Signal State City of SB For intersection operating over v/c of 0.77, project<br />
PM Peak 2,518 3,118 3,181 63 0.866 D 0.909 E<br />
added traffic increases v/c by 0.01 or more<br />
1<br />
As defined by difference between 2040 build and 2040 no build volume sets<br />
2 Volume to Capacity Ratio<br />
3 ICU LOS is reported for Signalized intersections based on Transportation Research Board Special <strong>Report</strong> 209<br />
SC101 HOV <strong>Traffic</strong> Study – <strong>Forecast</strong> <strong>Operations</strong> <strong>Report</strong> Page 155
Table 67. 2040 Final Project Plus Cumulative Impact Summary<br />
ID Intersection Control 1<br />
Location<br />
Total Entering <strong>Traffic</strong> Volumes<br />
Existing No Build Build Delta 2<br />
Delay<br />
(seconds)<br />
OR V/C 3<br />
SC101 HOV <strong>Traffic</strong> Study – <strong>Forecast</strong> <strong>Operations</strong> <strong>Report</strong> Page 156<br />
LOS 4<br />
Delay<br />
(seconds)<br />
OR V/C 3<br />
LOS 4 No Build Build<br />
4 SB on/off ramp & SR 150 TWSC Study Area No No State<br />
PM Peak 644 644 672 28 30 D 36.3 E<br />
7 NB on/off ramp & Bailard Ave TWSC Study Area No No State<br />
PM Peak 1,123 1,215 1,390 175 21 C 27 D<br />
14 Carpinteria Ave & Casitas Pass Rd Signal Study Area N/A N/A City of Carpinteria<br />
PM Peak 1,805 2,193 2,329 136 29.9 C 37.4 D<br />
18 Linden Ave & Sawyer Ave TWSC Project Area No No State<br />
AM Peak 944 1,066 1,277 211 25.8 D 41.3 E<br />
33 SB on/off ramp & Sheffield TWSC Project Area No No State<br />
AM Peak 390 483 579 96 19.9 C 29.3 D<br />
49 SB on ramp & Milpas St Signal Study Area N/A N/A State<br />
AM Peak 1,910 1,968 2,596 628 30 C 43.2 D<br />
PM Peak 2,625 2,625 2,994 369 64.2 E 103.2 F<br />
55 NB on ramp & Castillo St Signal Study Area N/A N/A State<br />
PM Peak 2,205 2,571 2,605 34 129.4 F 131.4 F<br />
57 SB on/off ramp & Castillo St Signal Study Area N/A N/A State<br />
PM Peak 2,557 3,092 3,117 25 52.6 D 55.7 E<br />
59 SB on/off ramp & Carrillo St Signal Study Area N/A N/A State<br />
AM Peak 3,435 3,677 3,689 12 56.8 E 62.7 E<br />
PM Peak 3,778 4,141 4,164 23 33.6 C 35.6 D<br />
60 Carrillo St & Castillo St Signal Study Area N/A N/A City of SB<br />
AM Peak 2,742 2,995 3,082 87 0.757 C 0.779 C<br />
64 SB on/off ramp & Mission St Signal Study Area N/A N/A State<br />
AM Peak 2,705 2,817 2,838 21 34.5 C 35.9 D<br />
PM Peak 2,473 2,793 2,883 90 53.1 D 65 E<br />
65 Mission St & Castillo St Signal Study Area N/A N/A City of SB<br />
PM Peak 2,451 2,887 3,001 114 0.787 C 0.849 D<br />
79 SB on ramp & State St & Rt 154 TWSC Study Area N/A N/A State<br />
AM Peak 1,941 2,054 2,081 27 101.1 F 112.4 F<br />
PM Peak 1,635 1,818 1,867 49 96.9 F 119.4 F<br />
90 NB on/off ramp & Los Carneros Rd Signal Study Area N/A N/A State<br />
AM Peak 1,596 1,942 2,045 103 33.9 C 40 D<br />
106 Milpas St & Quinientos St Signal Study Area N/A N/A City of SB<br />
PM Peak 2,518 3,118 3,181 63 0.866 D 0.909 E<br />
1 TWSC - Two Way Stop Control, AWSC - All Way Stop Control<br />
2 As defined by difference between 2040 build and 2040 no build volume sets<br />
3 Delay is based on HCM 2000, Chapter 16 and 17 methodology. V/C based on Transportation Research Board Special <strong>Report</strong> 209<br />
4 HCM LOS is reported for the worst movement at TWSC intersections and for the overall intersection at AWSC and signalized intersections<br />
5 Based on Peak Hour Warrants (Signal Warrant #3) as described in California Manual on Uniform <strong>Traffic</strong> Control Devices at unsignalized intersections<br />
No Build Results Build Results<br />
Signal Warrant<br />
Met? 5<br />
Project Impact<br />
Threshold<br />
Criteria