Copyright
©The Author(s) 2022.
World J Gastroenterol. Nov 21, 2022; 28(43): 6109-6130
Published online Nov 21, 2022. doi: 10.3748/wjg.v28.i43.6109
Published online Nov 21, 2022. doi: 10.3748/wjg.v28.i43.6109
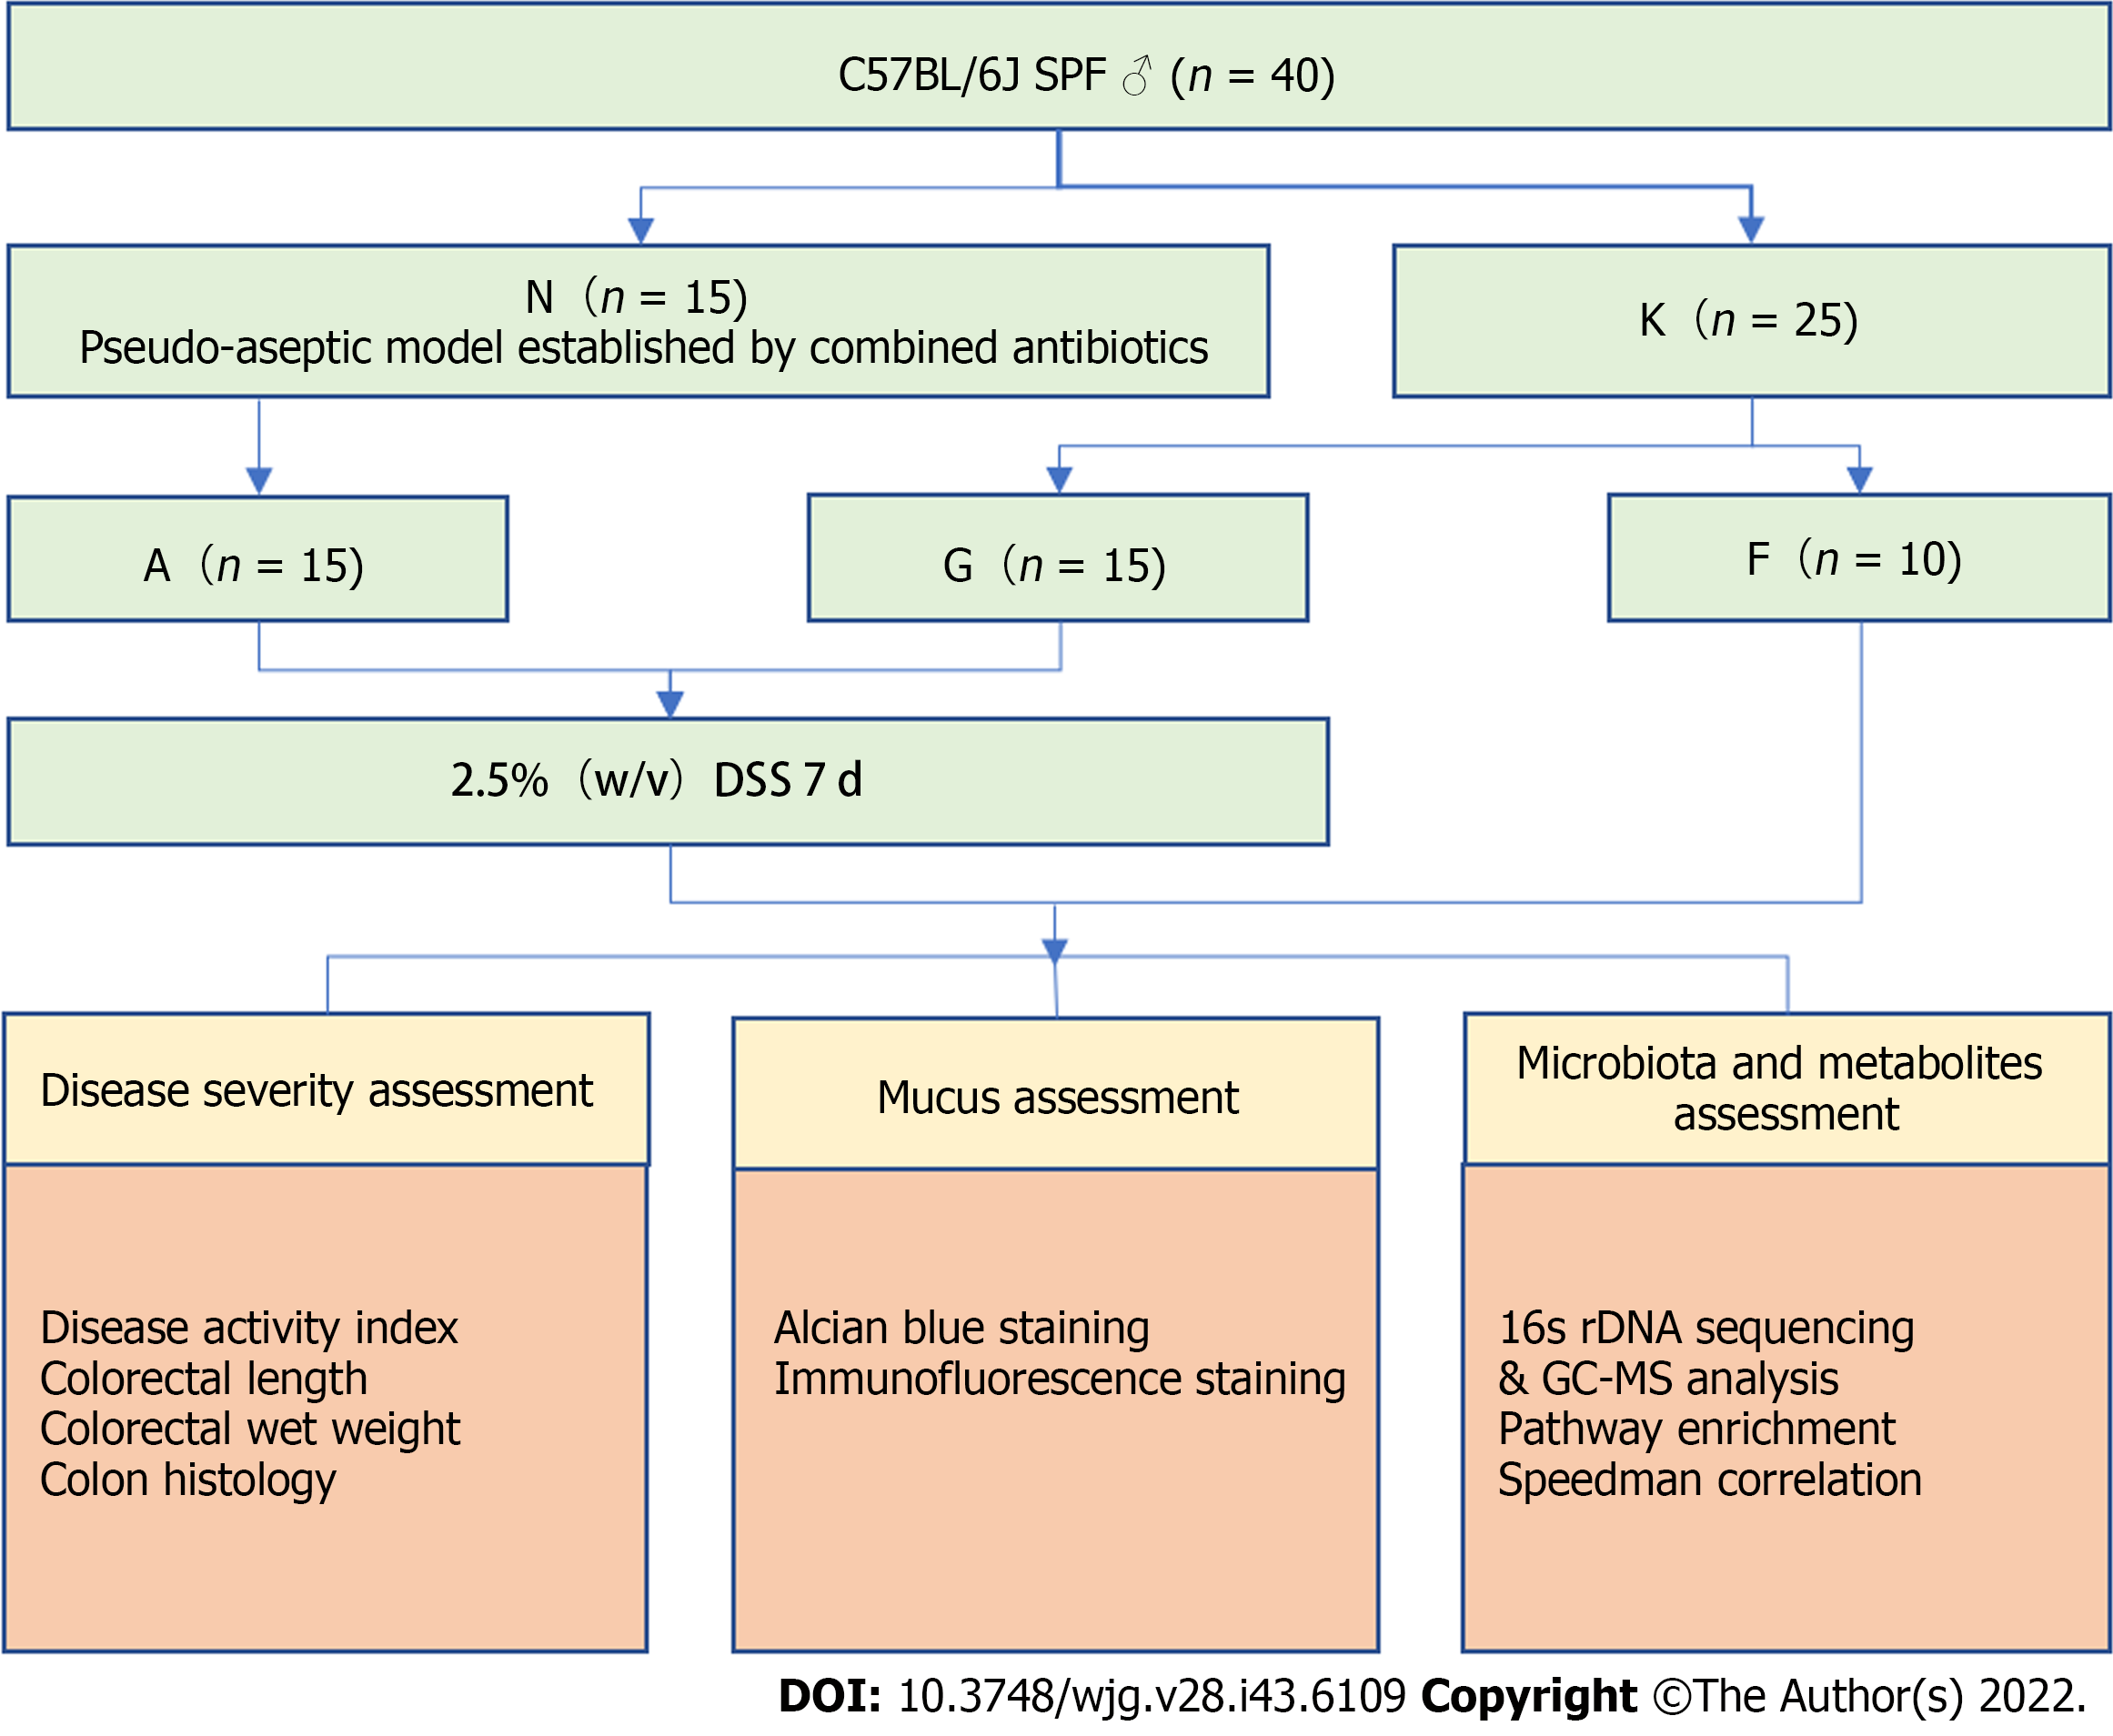
Figure 1 Study design.
N: Pseudo-aseptic group; K: Blank group; A: Microbiota- colitis group; F: Blank group; G: Microbiota+ colitis group; DSS: Dextran sulfate sodium; GC-MS: Gas chromatography-mass spectrometry.
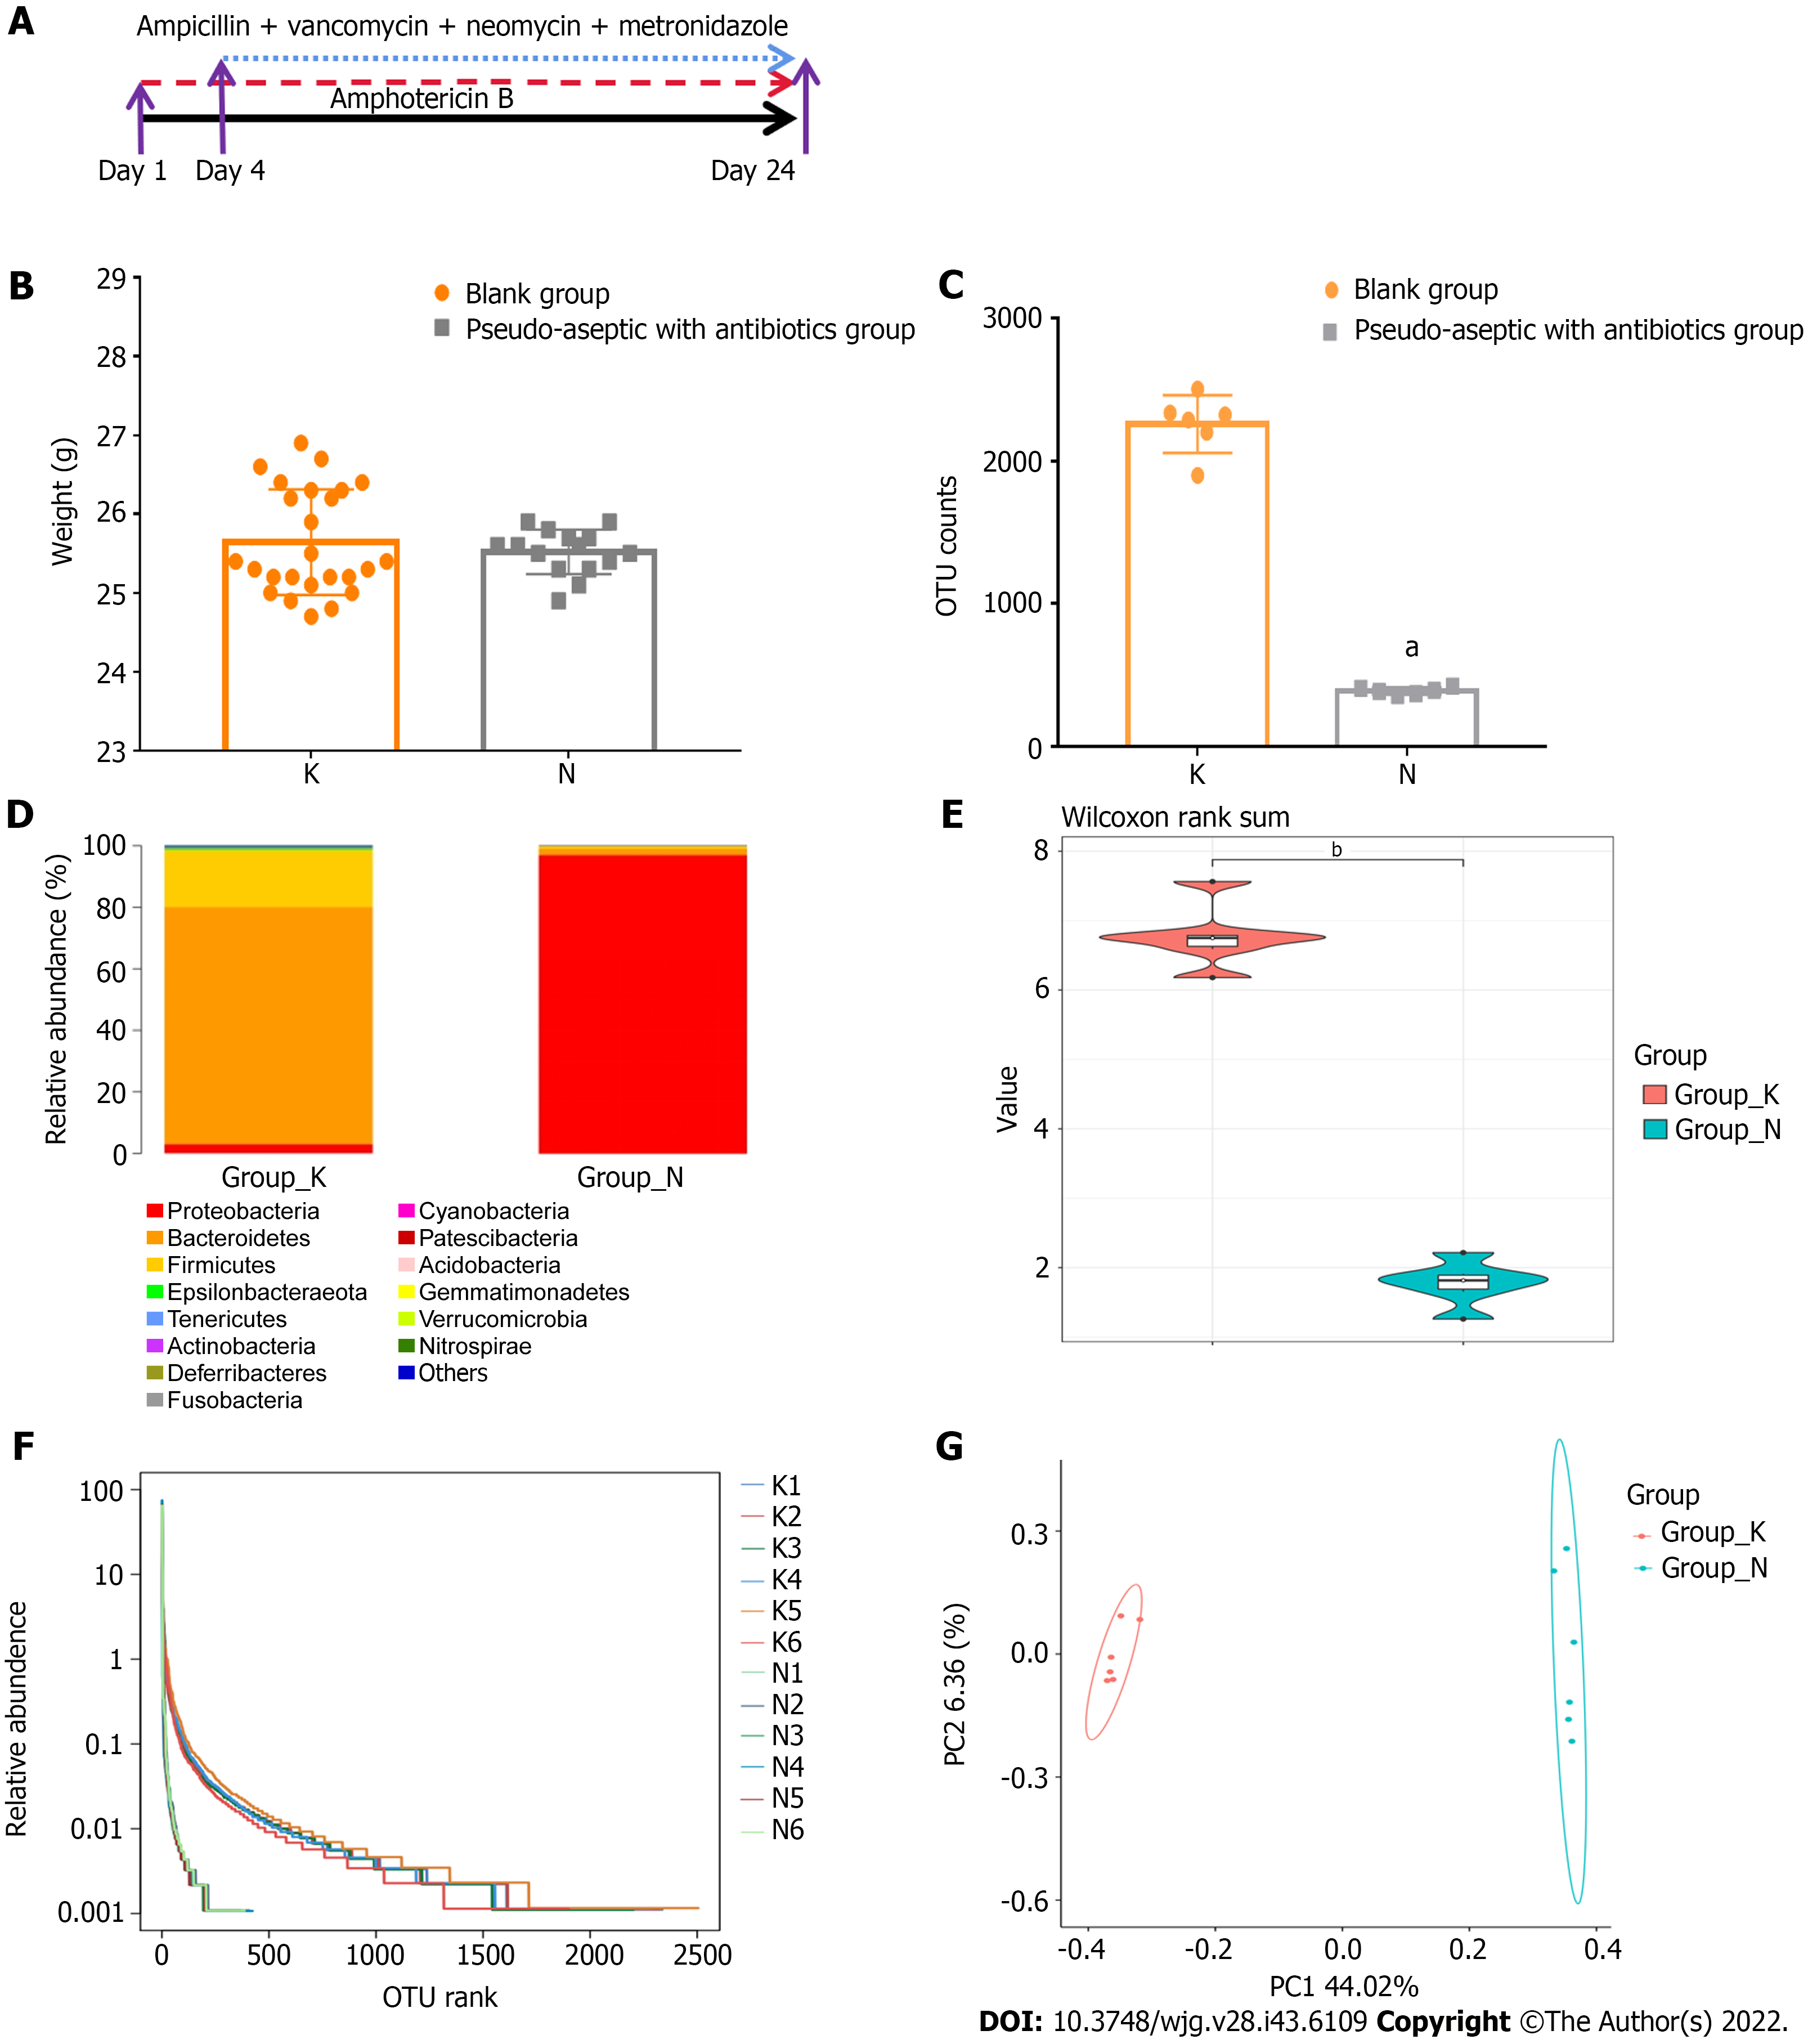
Figure 2 The combination of five antibiotics could effectively build an intestinal pseudo-aseptic mouse model.
A: Antibiotics applied; B: Body weight; C: Operational taxonomic unit counts; D: Microbiota structure; E: Shannon index of alpha-diversity; F: Rank abundance of alpha-diversity; G: Beta-diversity. N: Pseudo-aseptic with antibiotics group; K: Blank group. Compared with the blank group, aP < 0.01, bP < 0.05.
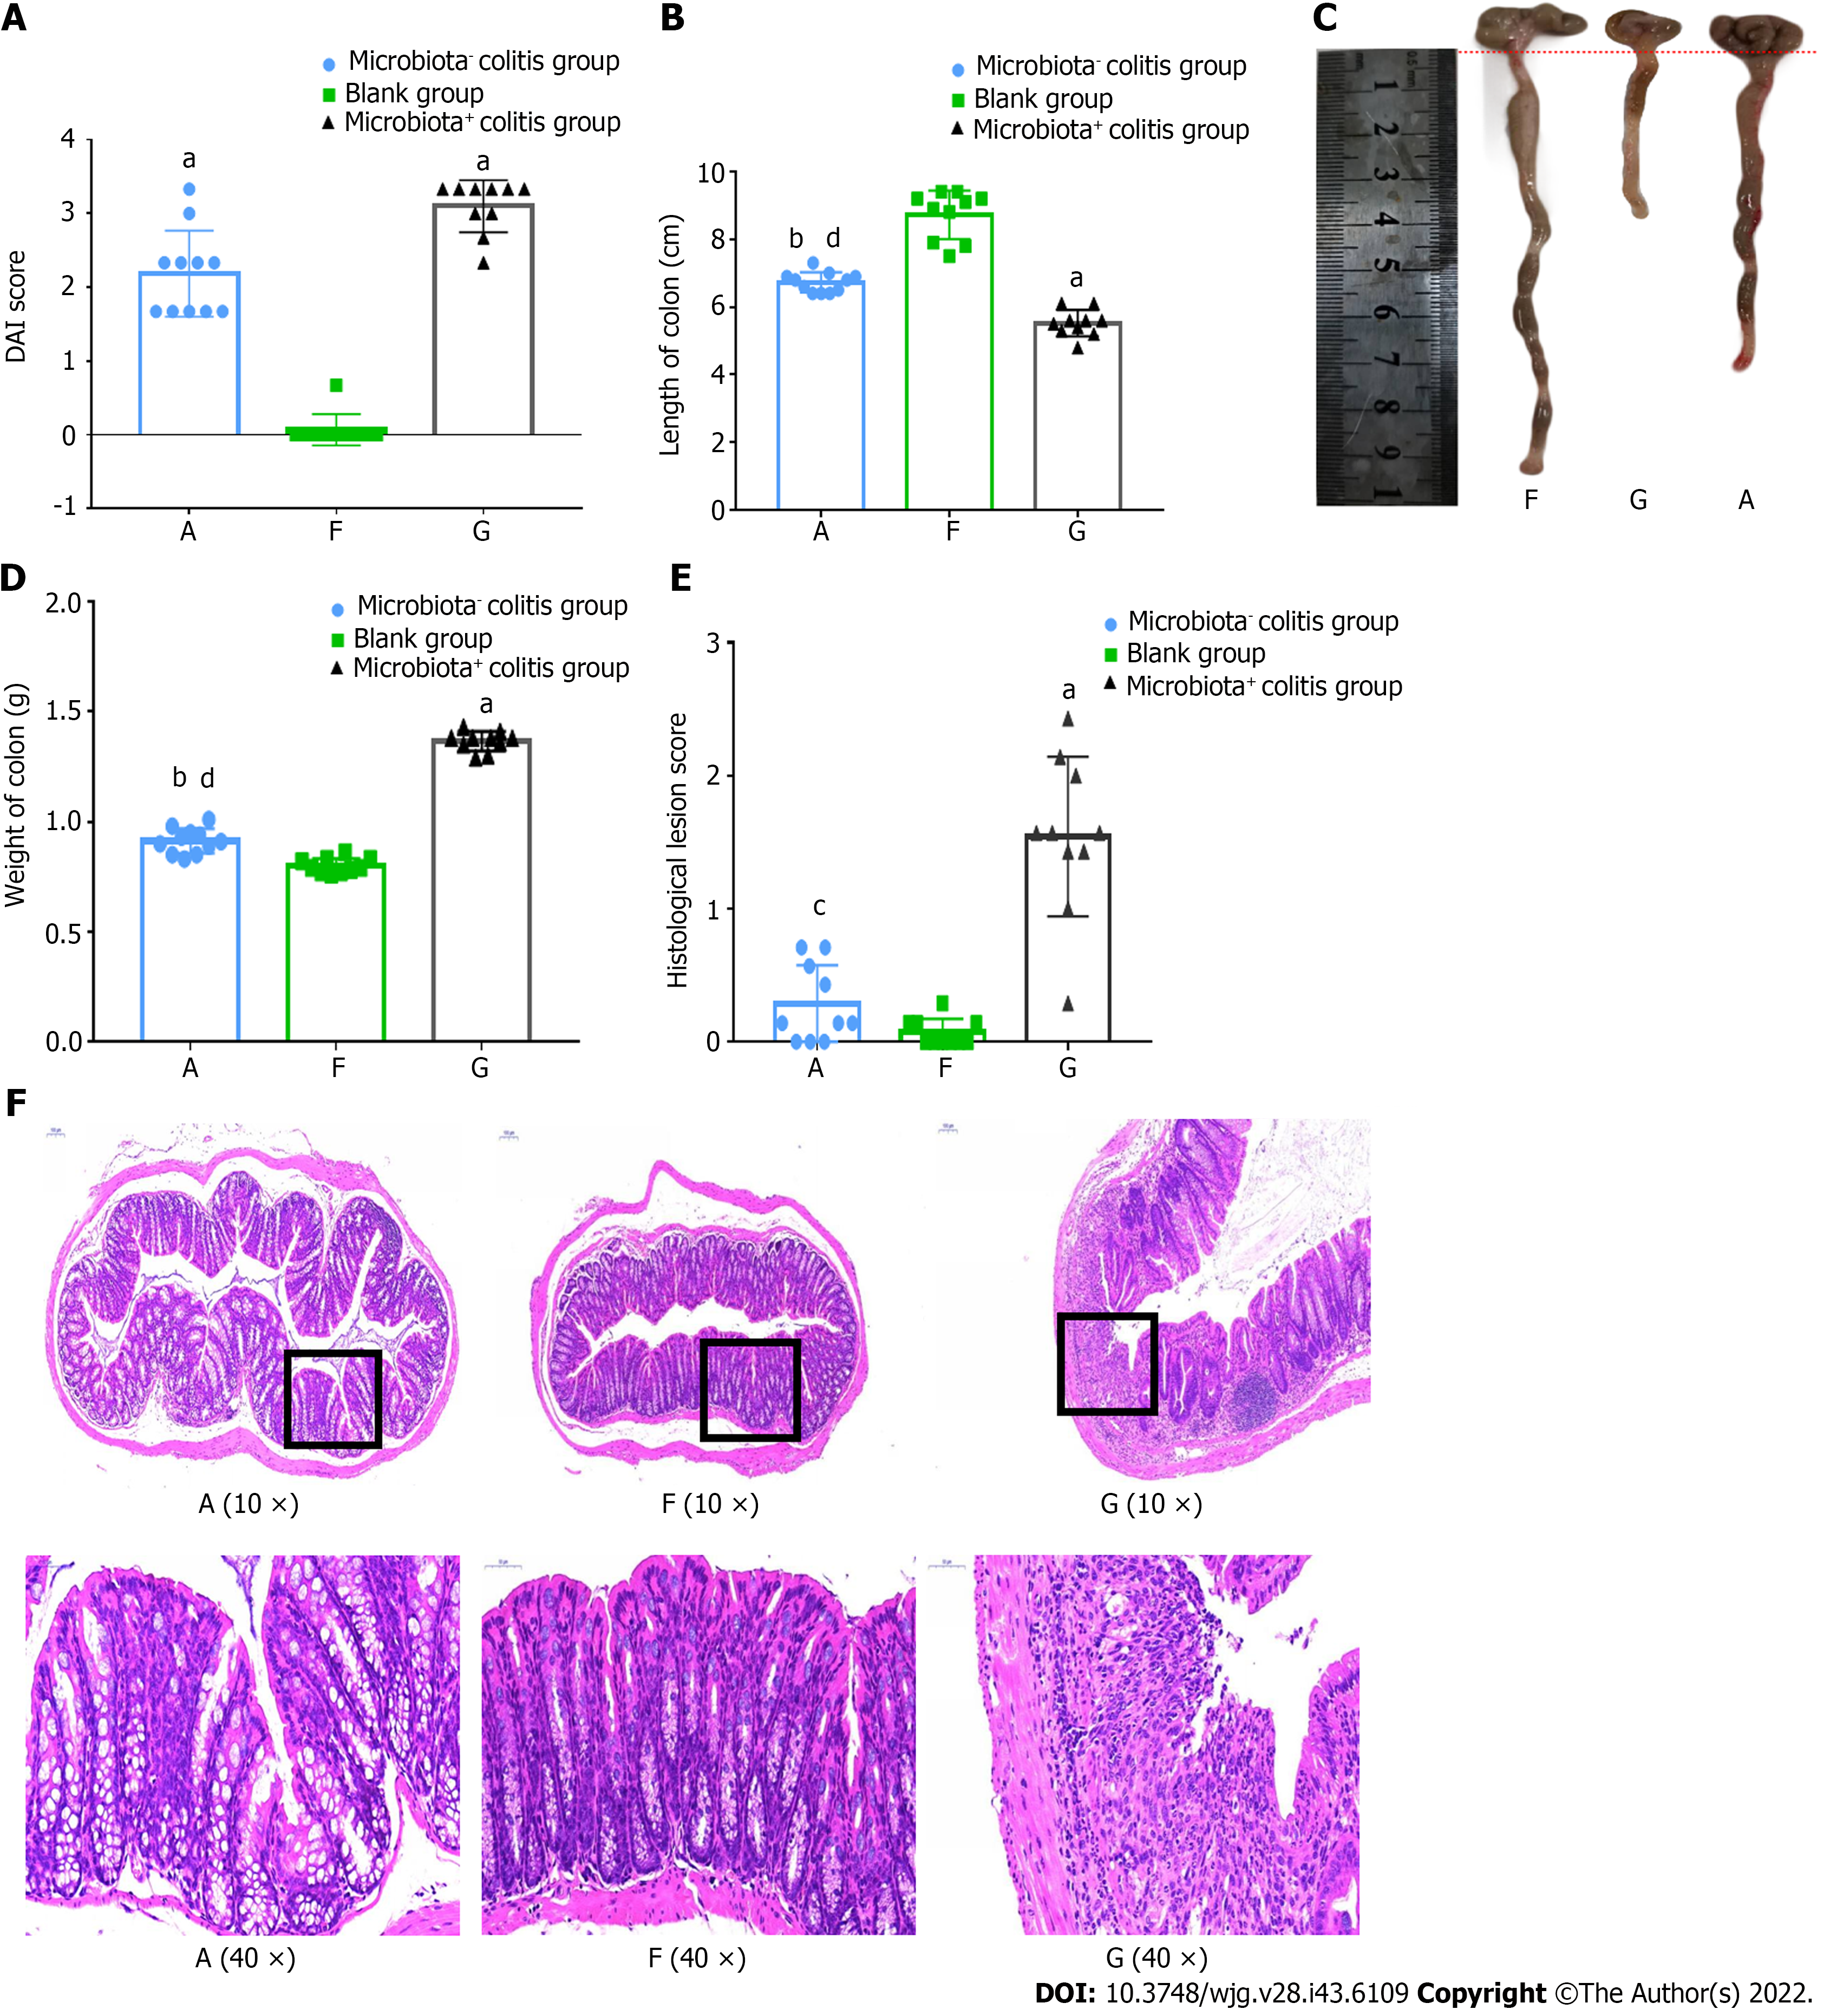
Figure 3 Mice with bacteria were more severely ill in dextran sulfate sodium-induced colitis.
A: Disease activity index score; B: Colon length; C: Colon photos; D: Colon weight; E: Histological lesions score; F: Hematoxylin-eosin staining. A: Microbiota- colitis group, F: Blank group, G: Microbiota+ colitis group. DAI: Disease activity index. Compared with the blank group, aP < 0.01, bP < 0.05. Compared with microbiota+ colitis group, cP < 0.01, dP < 0.05.
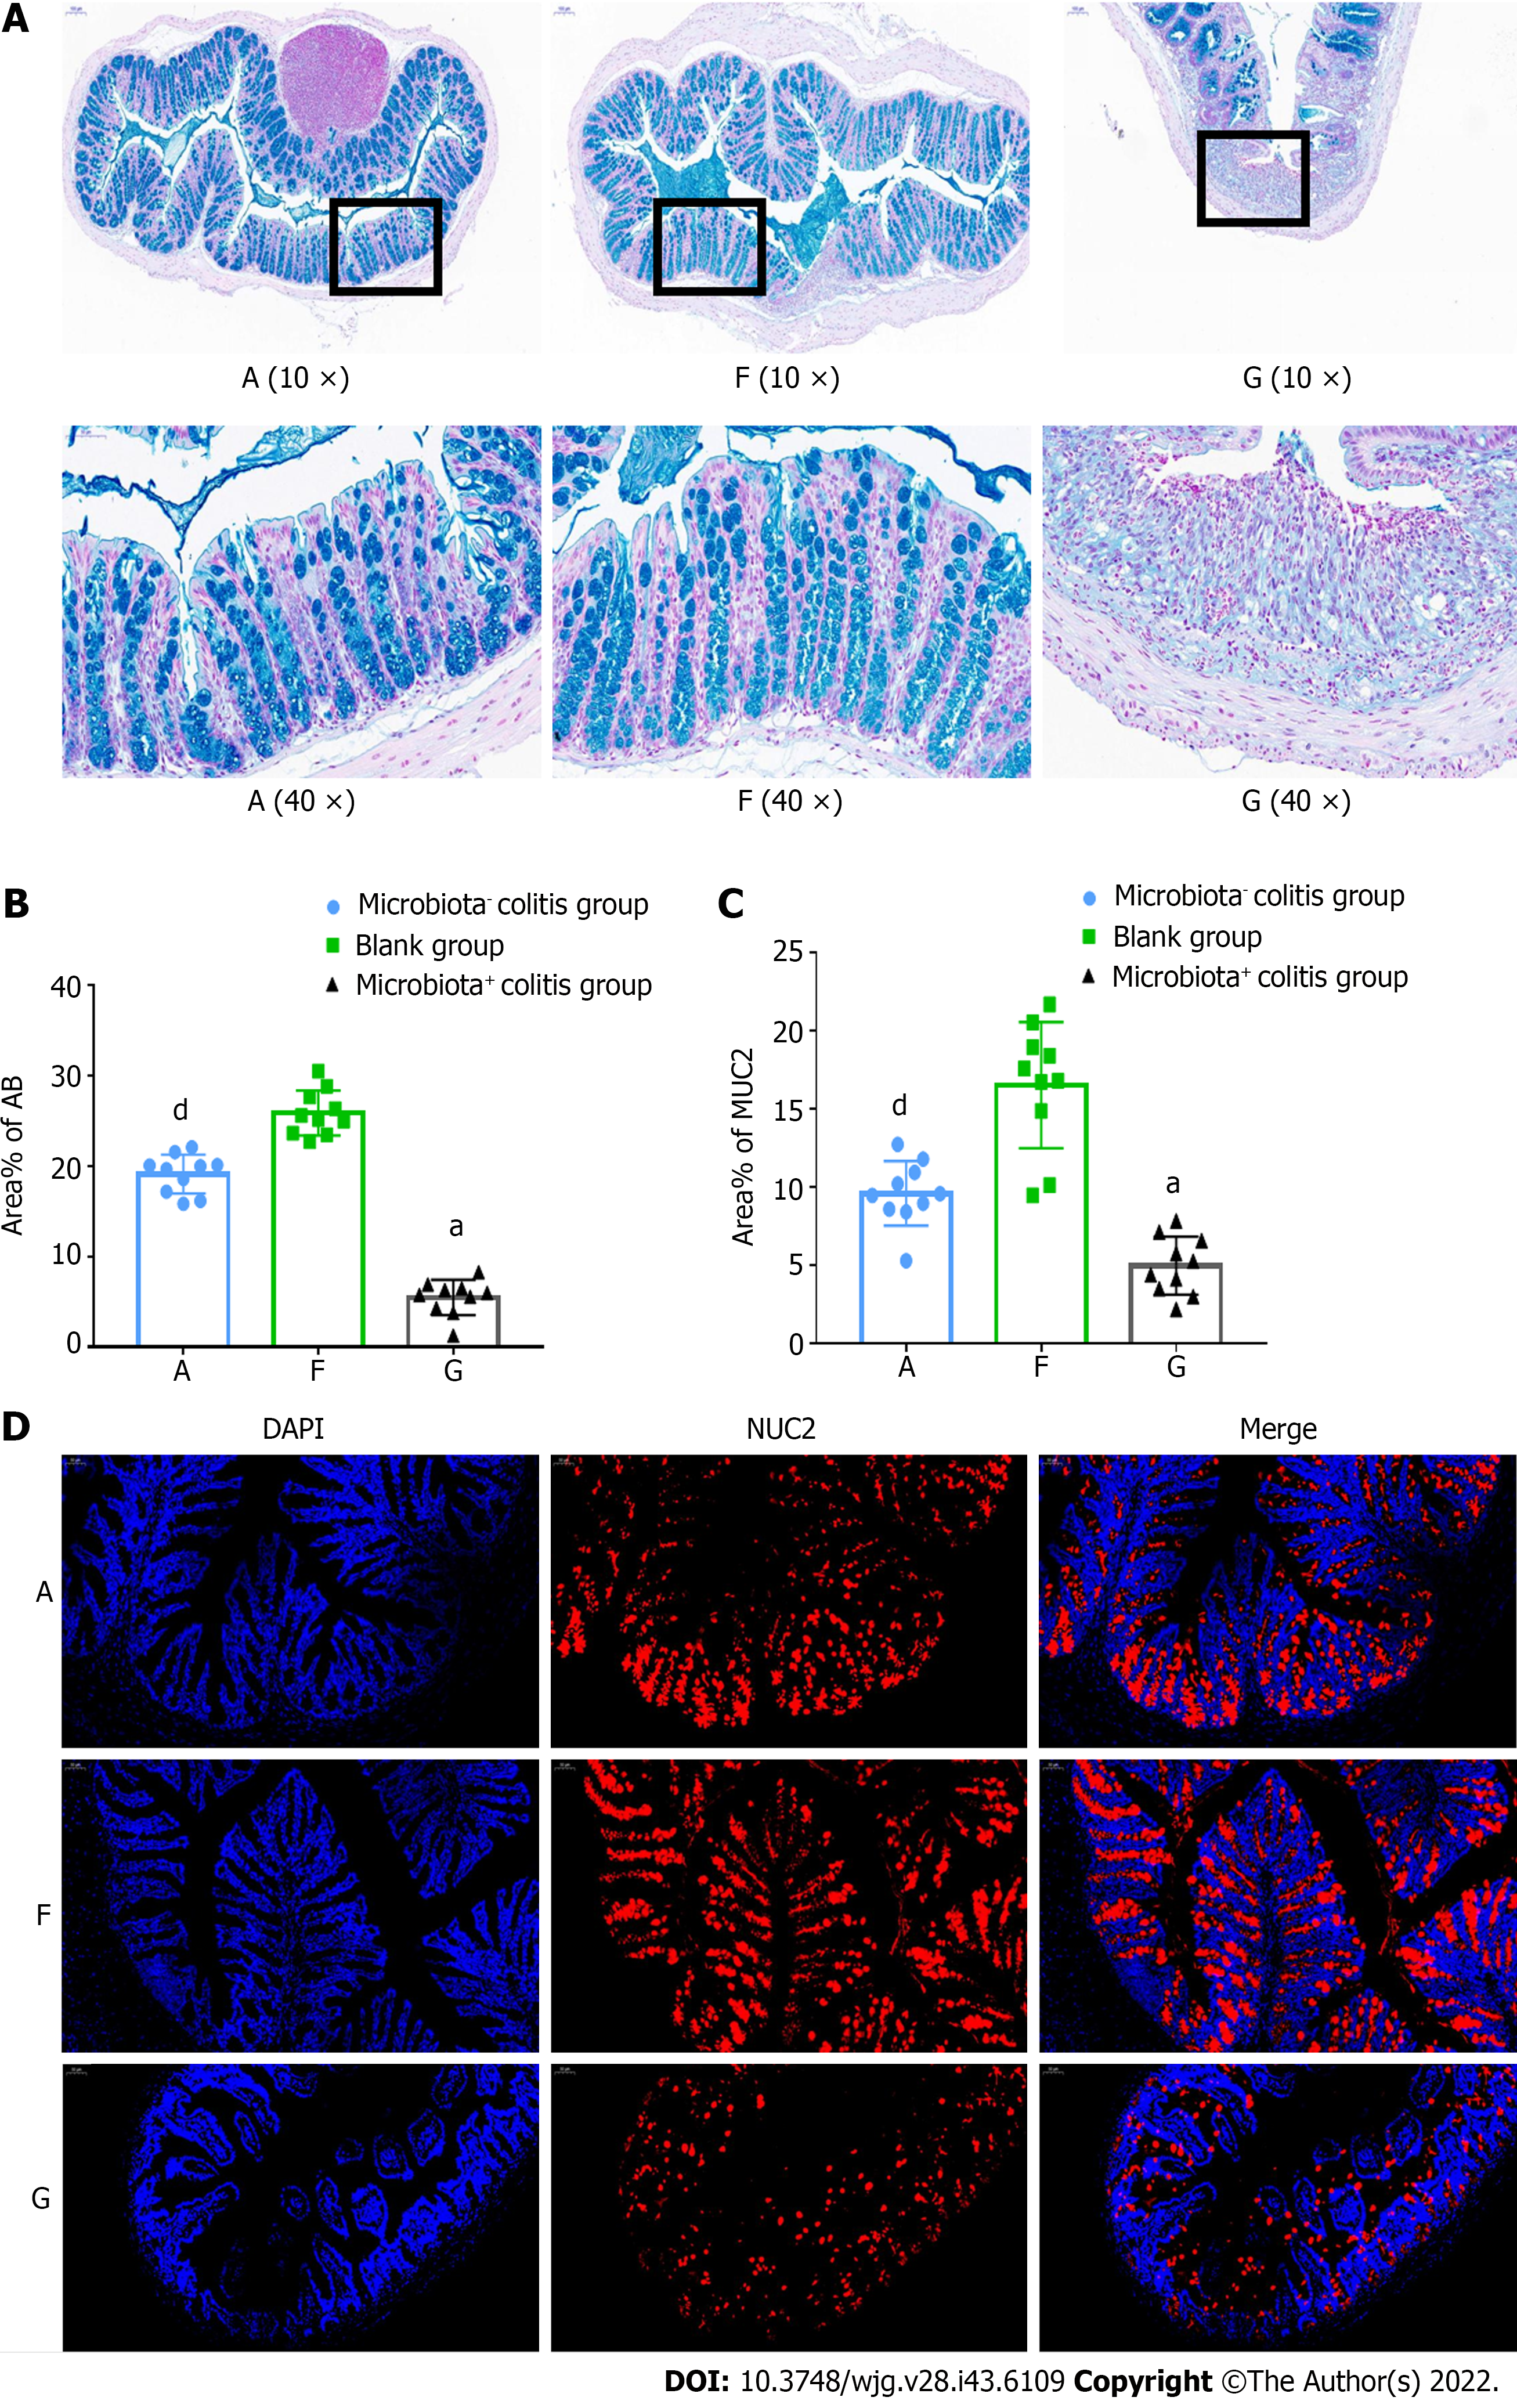
Figure 4 Intestinal mucus loss was more pronounced in dextran sulfate sodium-induced colitis mice with bacteria.
A: Alcian blue staining; B: Percentage of positively stained areas; C: Percentage of MUC2-positive stained areas; D: Mucin2 (MUC2) immunofluorescence staining. A: Microbiota- colitis group, F: Blank group, G: Microbiota+ colitis group. MUC2: Mucin2. Compared with the blank group, aP < 0.01. Compared with the microbiota+ colitis group, dP < 0.05.
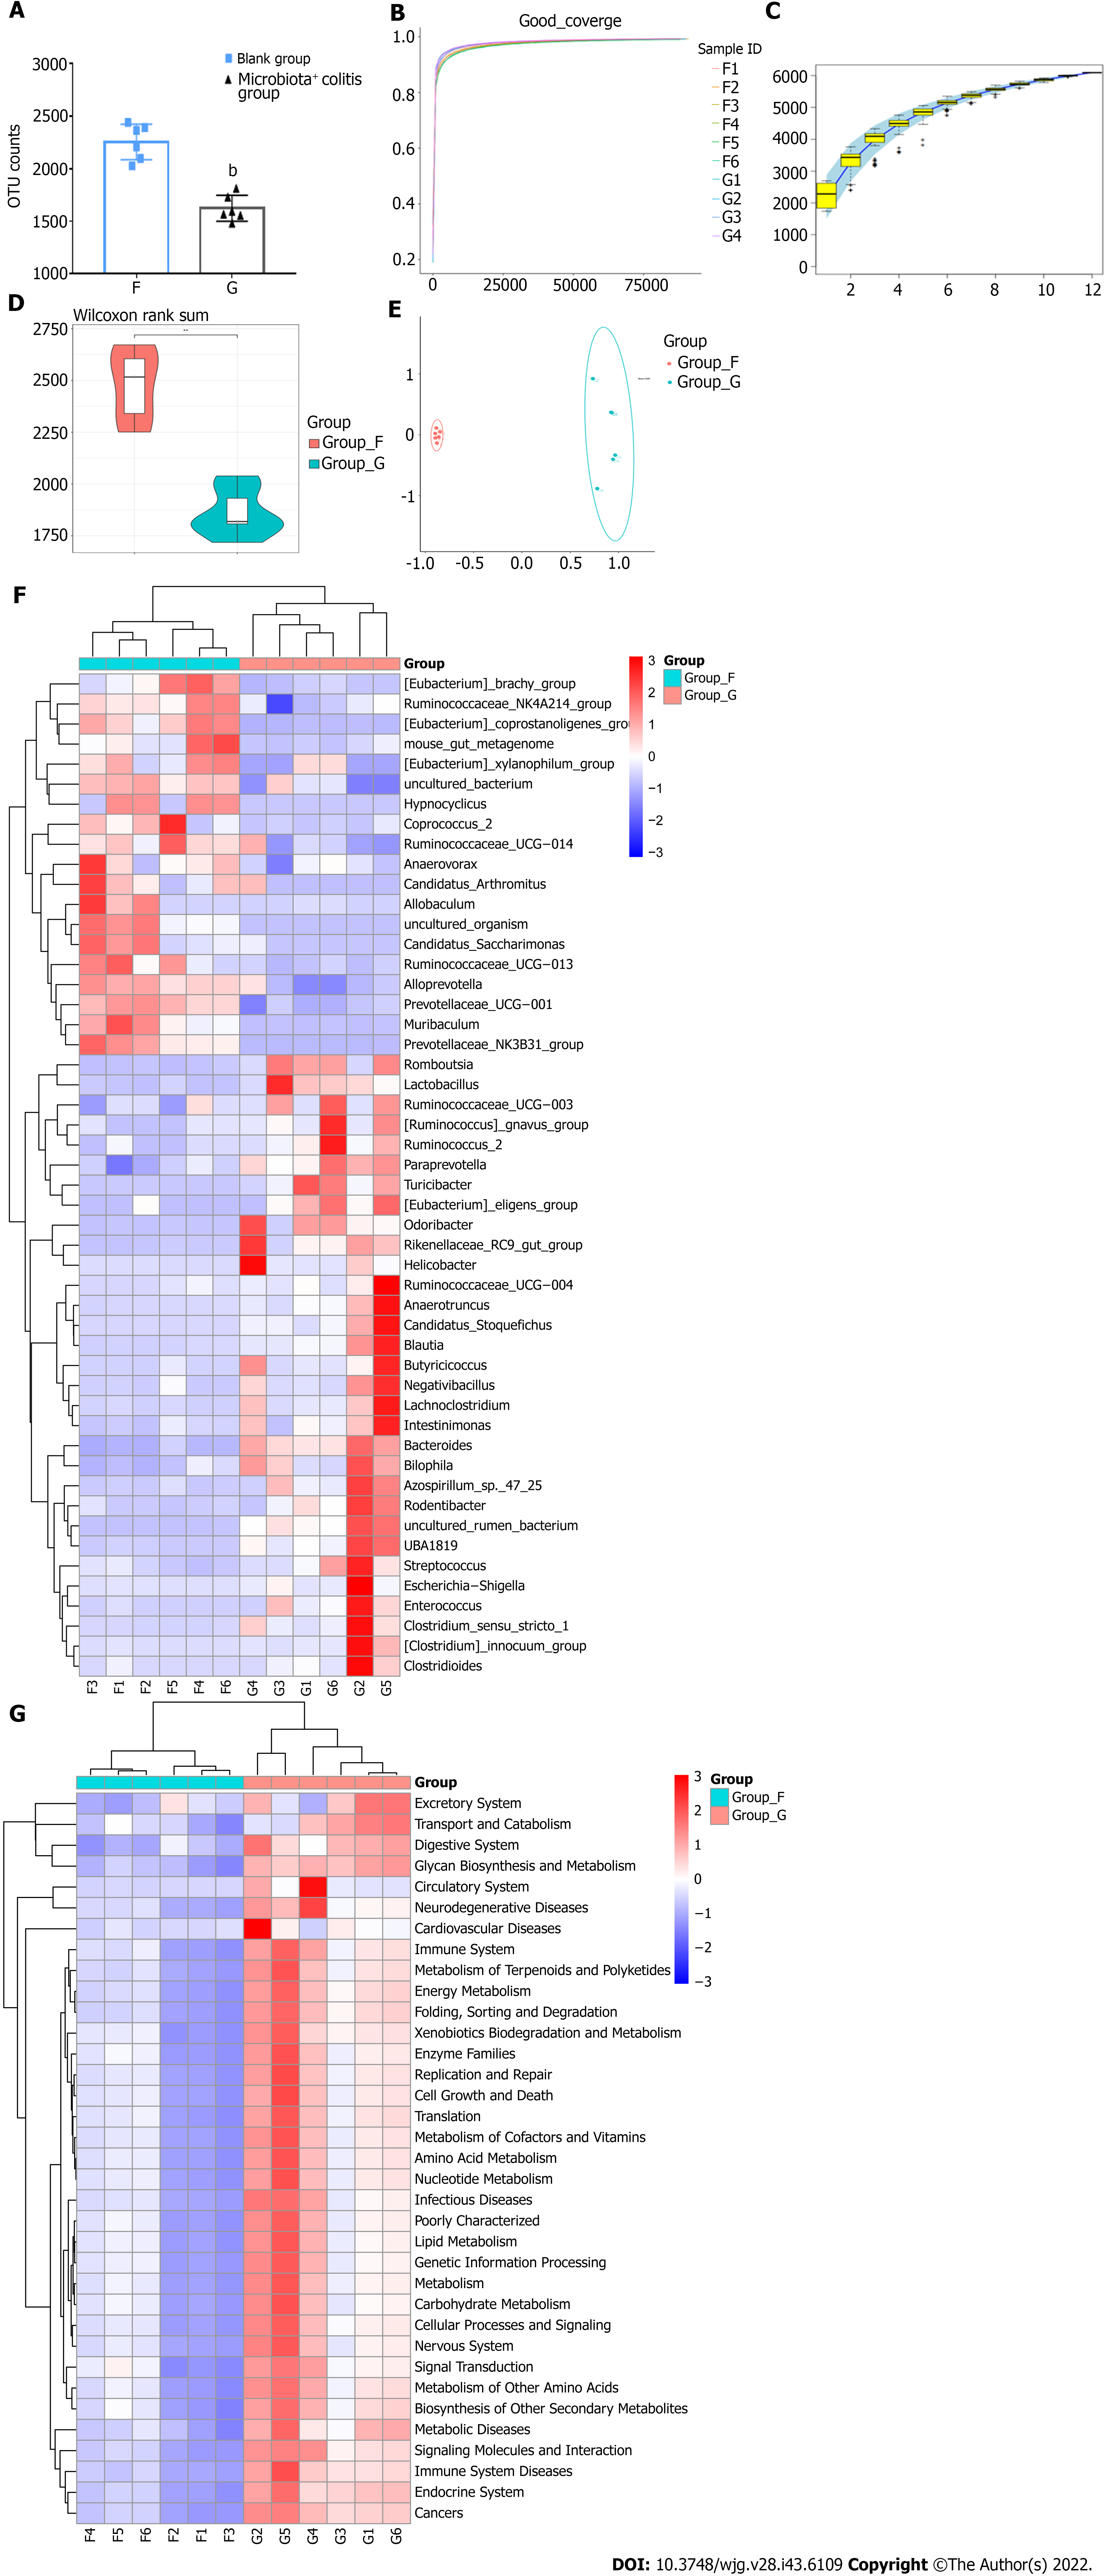
Figure 5 Analysis of different characteristic microbiota in dextran sulfate sodium-induced colitis mice.
A: Operational taxonomic unit counts; B: Goods coverage index dilution curve; C: Specaccum species accumulation curve; D: Observed species violin graph of alpha-diversity; E: Beta-diversity; F: Heat map cluster analysis of 50 different species at the genus level; G: Heat map cluster analysis of Phylogenetic Investigation of Communities by Reconstruction of Unobserved States analysis with Kyoto Encyclopedia of Genes and Genomes pathways at the phylum level. F: Blank group; G: Microbiota+ colitis group. Compared with the blank group, bP < 0.01.
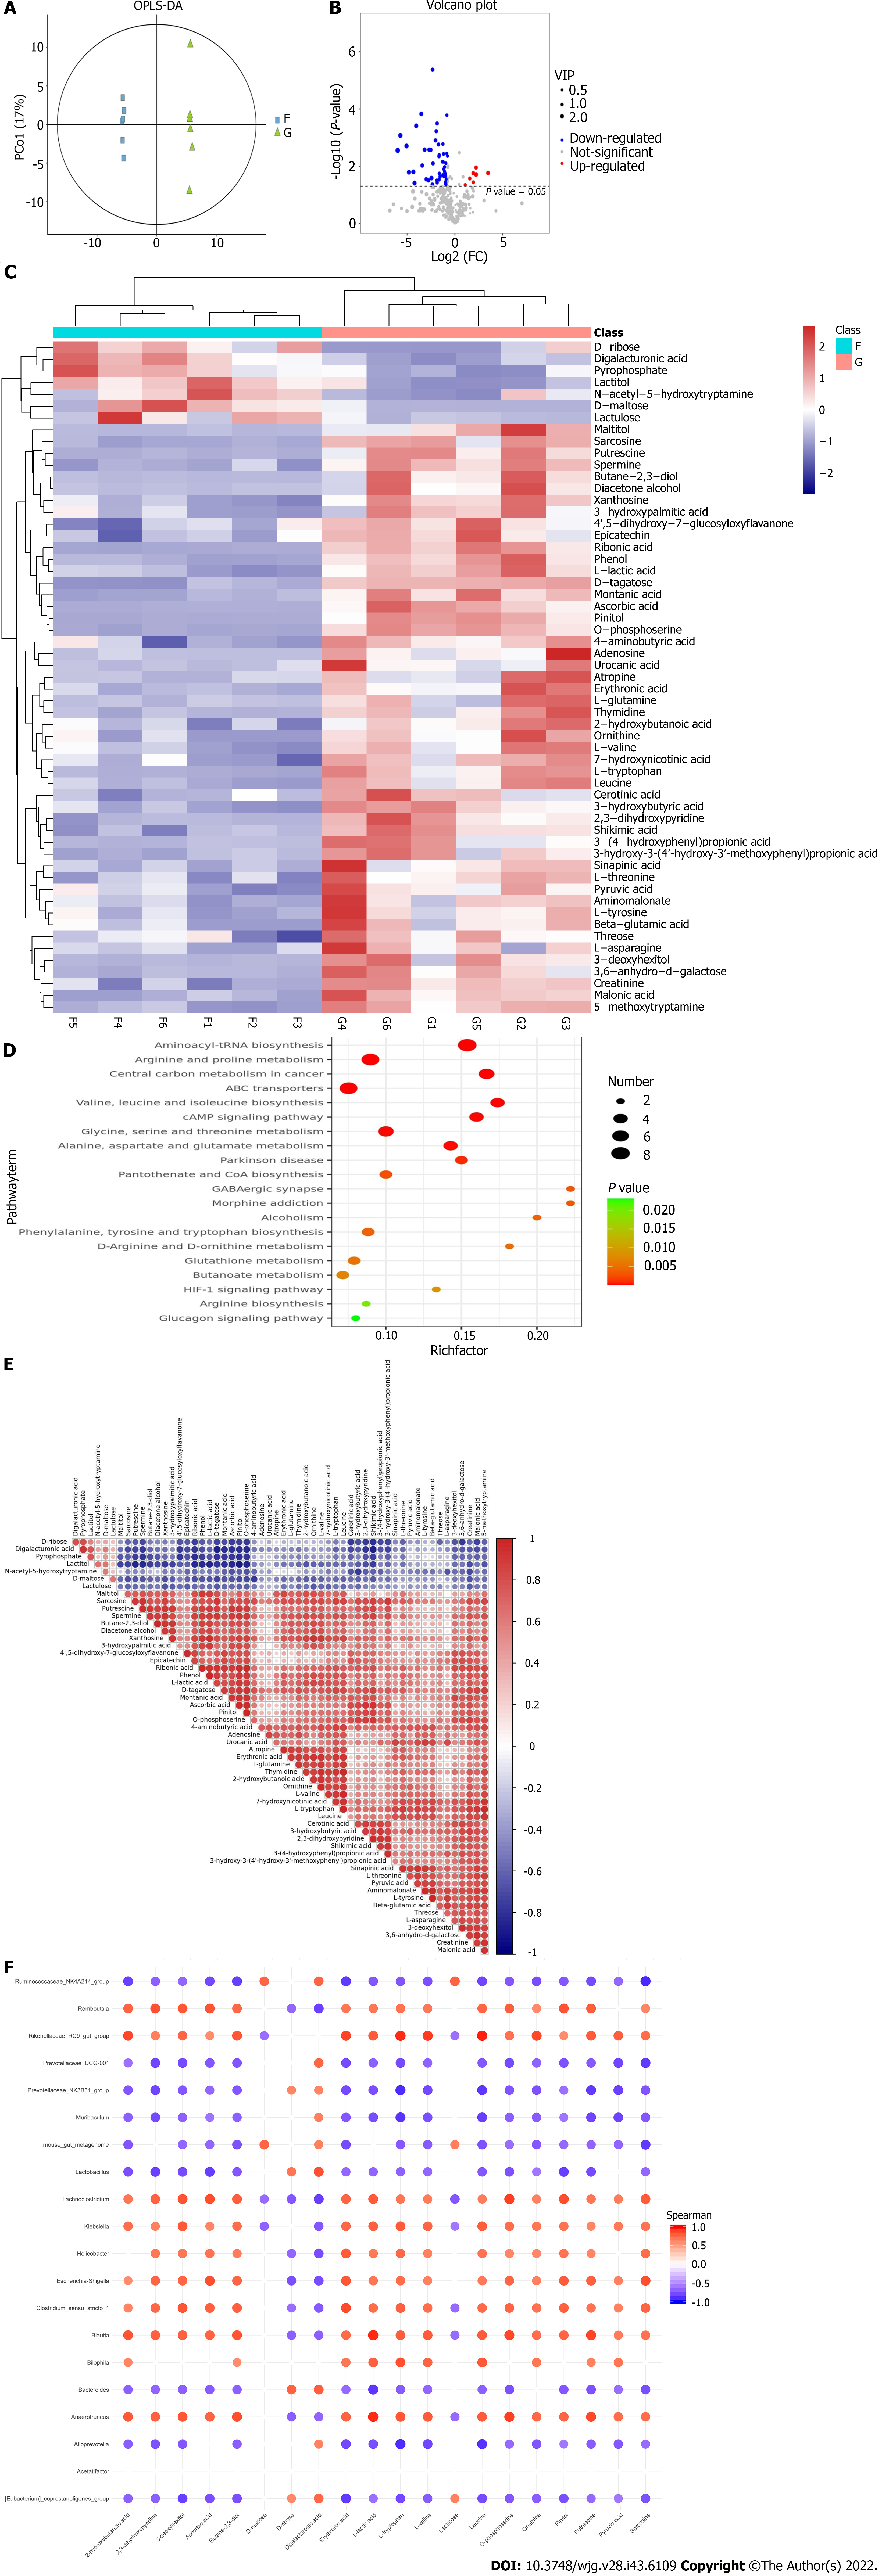
Figure 6 Analysis of different microbiota metabolites in dextran sulfate sodium-induced colitis mice.
A: Orthogonal partial least-squares discrimination analysis; B: Metabolite volcano plot; C: Clustered heat map of significantly expressed metabolites; D: Bubble mapping of the top 20 significant Kyoto Encyclopedia of Genes and Genomes pathways of metabolites; E: Correlation matrix analysis with significant metabolites; F: Correlation matrix of the top 20 differential metabolites and the microbiota at the genus levels. F: Blank group; G: Microbiota+ colitis group.
- Citation: Wang JL, Han X, Li JX, Shi R, Liu LL, Wang K, Liao YT, Jiang H, Zhang Y, Hu JC, Zhang LM, Shi L. Differential analysis of intestinal microbiota and metabolites in mice with dextran sulfate sodium-induced colitis. World J Gastroenterol 2022; 28(43): 6109-6130
- URL: https://www.wjgnet.com/1007-9327/full/v28/i43/6109.htm
- DOI: https://dx.doi.org/10.3748/wjg.v28.i43.6109


