1. Introduction
Due to the rising demand for raw materials, deep-sea mining is becoming increasingly important [
1]. An accurate knowledge of the elemental composition of raw materials on the seabed allows for an economic and environmentally friendly mining of these raw materials. Furthermore, this knowledge enables the development of a fundamental understanding of the deep-sea floor, and thus it is also of great interest for other scientific fields such as ocean research. Therefore, analytical methods in the deep sea are of increasing importance.
A promising analytical method for underwater elemental analysis is laser-induced breakdown spectroscopy (LIBS). In this method, by focusing a laser pulse on a material surface, the energy is locally coupled into the material. The material is vaporized in this area and a plasma is generated in this material vapor. As the plasma decays, it emits element-specific radiation that can be analyzed using a spectrometer. At this, LIBS enables the analysis of solid, liquid and gaseous samples. One of the greatest advantages of the LIBS technique is the ability to analyze samples in situ and remotely without sample preparation [
2,
3,
4,
5,
6]. Studies on underwater LIBS have shown that the emission spectra of laser ablation plasmas in liquids are characterized by a continuous emission spectrum and emission lines strongly deformed with respect to the ideal atomic line profiles [
7,
8,
9]. This spectral deformation could be due to the high atomic density of the plasma and includes broadening, shifting and intensity decrease of the emission lines. Thus, the interactions underwater are not ideal for spectroscopy [
10,
11]. To overcome this problem and obtain narrow and intense emission lines suitable for elemental analysis, studies have used a double-pulse technique that could improve LIBS analysis in water. The first laser pulse generates a cavity so that the second laser pulse forms the plasma in the resulting gas-vapor environment. Due to this gaseous state mechanisms similar to LIBS in gas can occur, resulting in a plasma with low density and long persistent time, so that narrow and intense emission lines can be observed [
12,
13,
14,
15,
16].
In addition to the double-pulse technique, experiments have been conducted with long laser pulses, which were also suitable for elemental analysis [
17].
Further experiments have shown that the volume and the lifetime of the cavity were influenced by the water pressure. With increasing water pressure, the volume and lifetime decrease. These studies were conducted at a water pressure of up to 30 MPa [
14,
17,
18].
In Ref. [
19], water pressures of up to 60 MPa were generated using a pressure chamber to simulate the application of double-pulse LIBS in the deep sea at 6000 m. The studies have revealed that the measured spectra show a significantly increased line broadening and an increase in the continuum emission at high water pressure, which must be attributed to the short delay between the laser pulses. Due to the short lifetime of the cavity at high water pressure, the delay between the laser pulses must be short enough to generate the plasma before the cavity collapses. Spectra obtained at low water pressure around 0.1 MPa with the same pulse delay have shown a similar course despite the enormous difference in pressure. This suggests that the pressure inside the cavity is approximately the same at the time of plasma generation for both situations [
19].
To create the cavity underwater at 60 MPa, the pressure inside the cavity must be higher than the water pressure. This pressure inside the cavity decreases as the cavity expands, with a decreasing maximum expansion as the water pressure increases. For an optimization of the spectral evaluation in the form of a reduced linewidth, the partial pressure of the evaporated target material inside the cavity must be reduced. This can be achieved by increasing the volume and thus extending the lifetime of the cavity, thereby reducing the density of the evaporated target material. In this paper, the influence of pulse energy and laser focus on the cavity’s size and lifetime at shallow water depth has been investigated to gain a basic understanding of cavity formation. In addition, the influence of the laser pulse delay on the measurement signal of the spectrometer was investigated. These results will be used in upcoming studies at different water pressures.
2. Experimental Setup
For the investigations, a double-pulse
InnoLas Laser GmbH (Krailling, Germany) Nd:YAG (neodymium-doped yttrium aluminum garnet, Nd:Y
3Al
5O
12) laser with a wavelength of 1064 nm is used. The laser system provides pulse energies of up to 266 mJ in single pulse mode and a pulse width of 5–7 ns for each laser pulse.
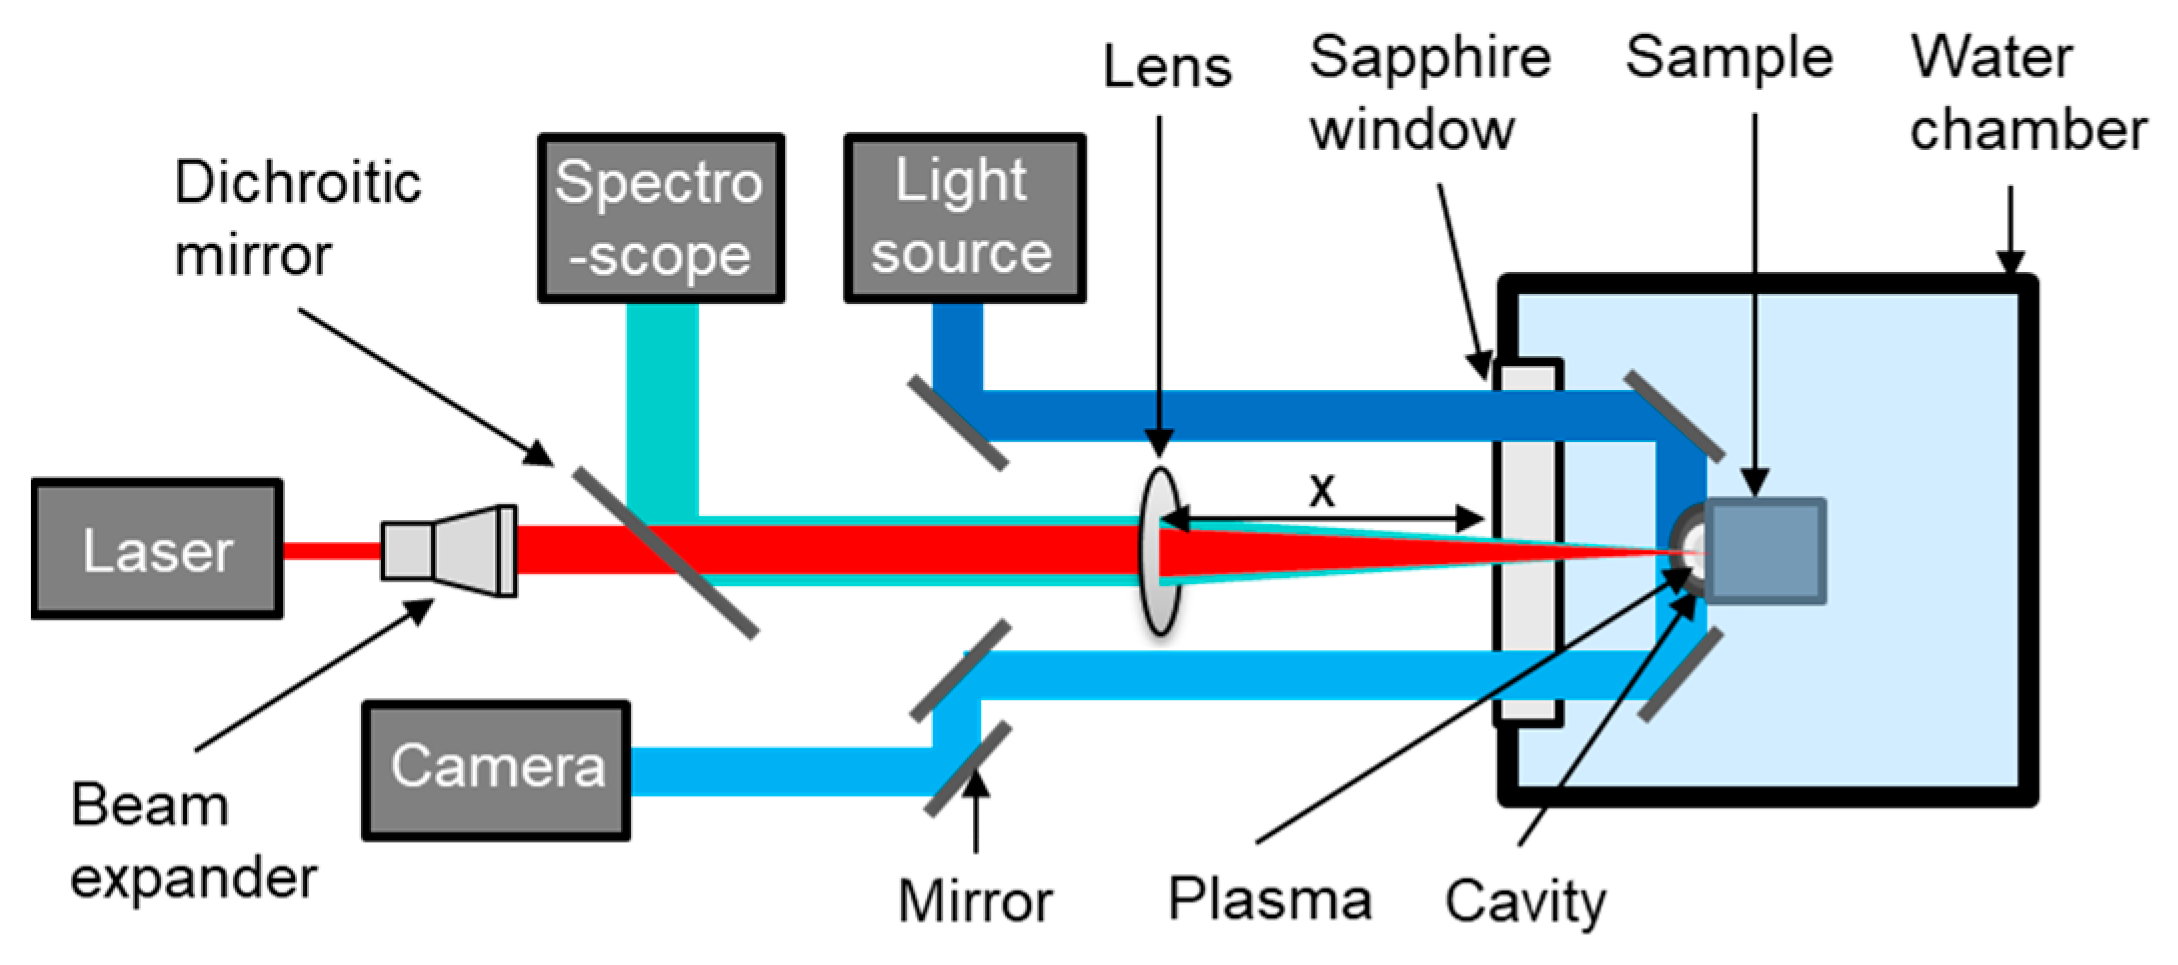
Figure 1 shows the schematic experimental setup. Both laser pulses, an
Avantes (Apeldoorn, The Netherlands) AvaSpec-ULS750F-USB2 spectrometer and a high-speed camera
IDT (
Integrated Design Tools, Pasadena, CA, USA) MotionPro Y7-S3 camera can be triggered by a
Quantum Composers (Bozeman, MT, USA) 9400 series (model 9428) delay generator.
To avoid the destruction of the sapphire window in the water chamber by the laser beam, the power density has to be reduced. Therefore, a beam expander with 3× magnification is used to expand the beam diameter from 6 mm to 18 mm. The laser beam transmits a dichroic mirror, where the emitted plasma radiation coming from the sample surface is reflected. In this way, the plasma radiation is guided coaxially to the spectrometer. The laser beam enters the sample surface through a 30 mm thick sapphire window in the water chamber and is focused on the copper sample using a lens. Additionally, two mirrors are placed near the sample in the water tank, which are both adjusted at an angle of 45° to the sample surface. This setup enables the investigation of the emission parallel to the surface, e.g., taking high-speed images of the cavity using the shadowgraph technique with the GODOX (Shenzhen, China) SL60W light source. The light source is a white LED (light-emitting diode) that emits a continuous spectrum in continuous wave mode.
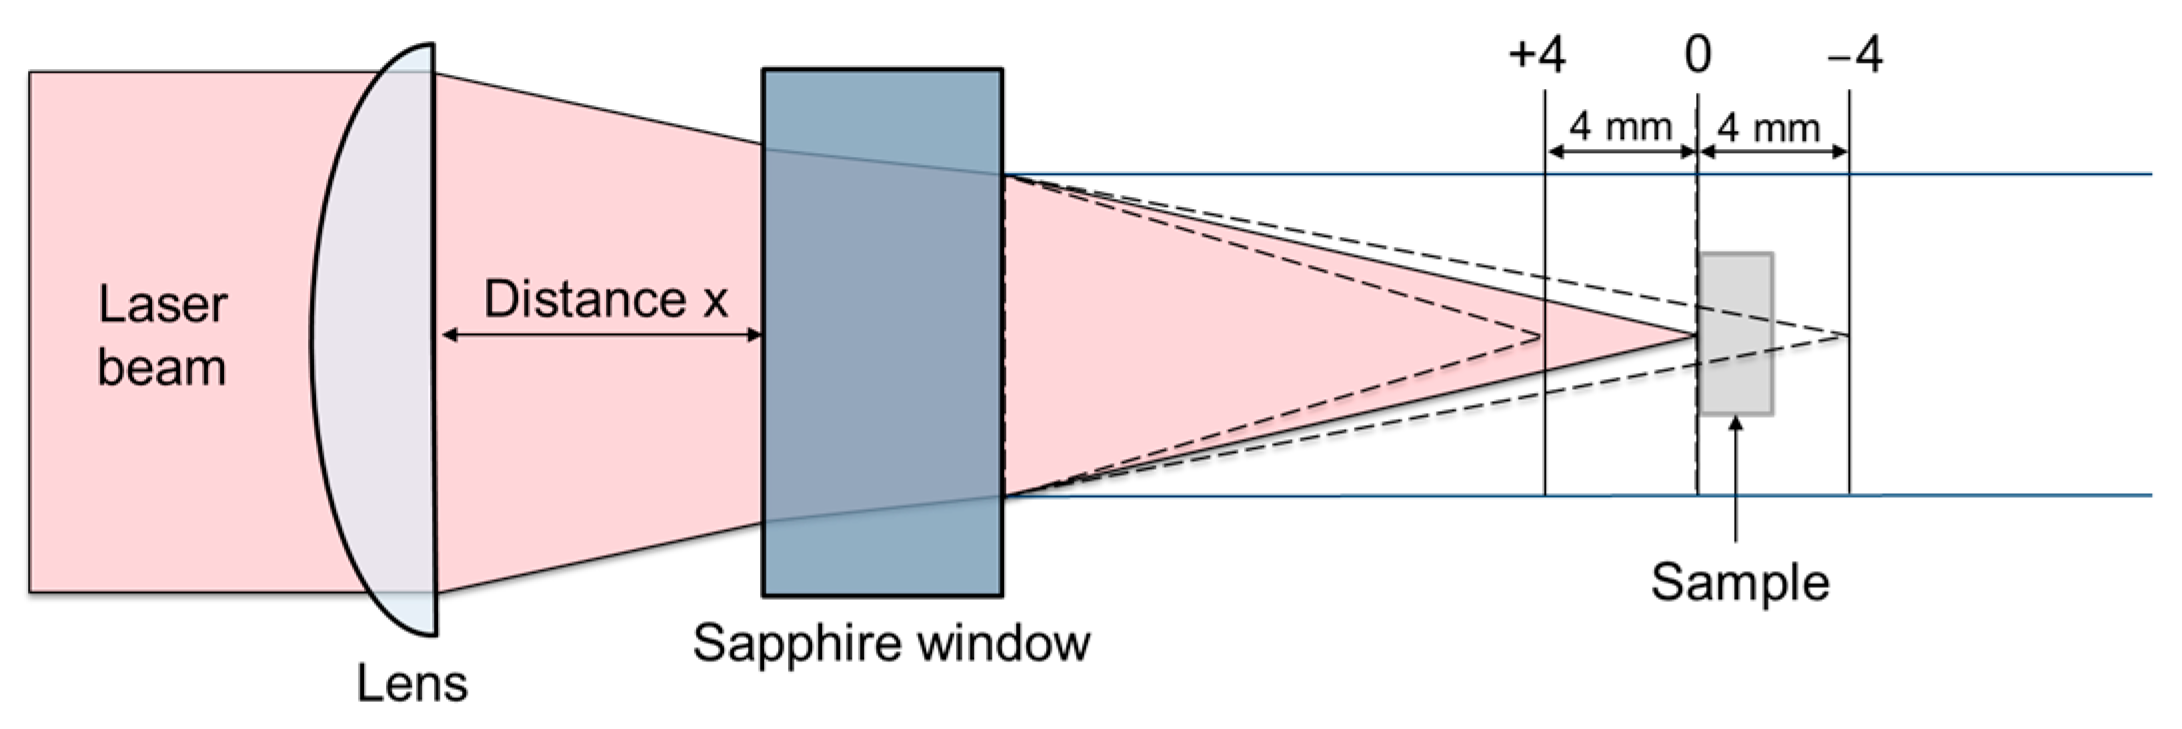
As shown in
Figure 2, the focus position is adjusted by varying the x-distance between the lens and the sapphire window, i.e., outside the water. The focus position describes the position of the focus point with respect to the sample surface. The focus diameter is 38 µm for a focal length of 50 mm and 56 µm for a focal length of 75 mm. If the focus point lies in the material behind the sample surface, the value for the focus position is negative; if the focus point lies on the sample surface, the value is 0, and if the focus point lies in front of the sample surface in the water, the value is positive. In this way, the distance in the water remains the same, so that a constant absorption in the water can be assumed. The experiments are carried out in shallow water at a water pressure of 1 bar.
The experimental setup shown in
Figure 1 is used to carry out both single-pulse and double-pulse experiments. First, single-pulse LIBS experiments are carried out in
Section 4.1,
Section 4.2 and
Section 4.3 to investigate cavity formation. In this way, the respective phases of cavity formation can be assigned to the spectra generated using double-pulse LIBS in
Section 4.4.
3. Procedure for the Investigation of Cavity Formation
High-speed images are taken with a repetition interval of 30,000 frames per second to investigate the cavity formation. The laser beam is focused by a lens with a focal length of either 50 mm or 75 mm for comparison. The focused laser beam creates the cavity to be examined. The distance between the sapphire window and the sample surface is 30 mm.
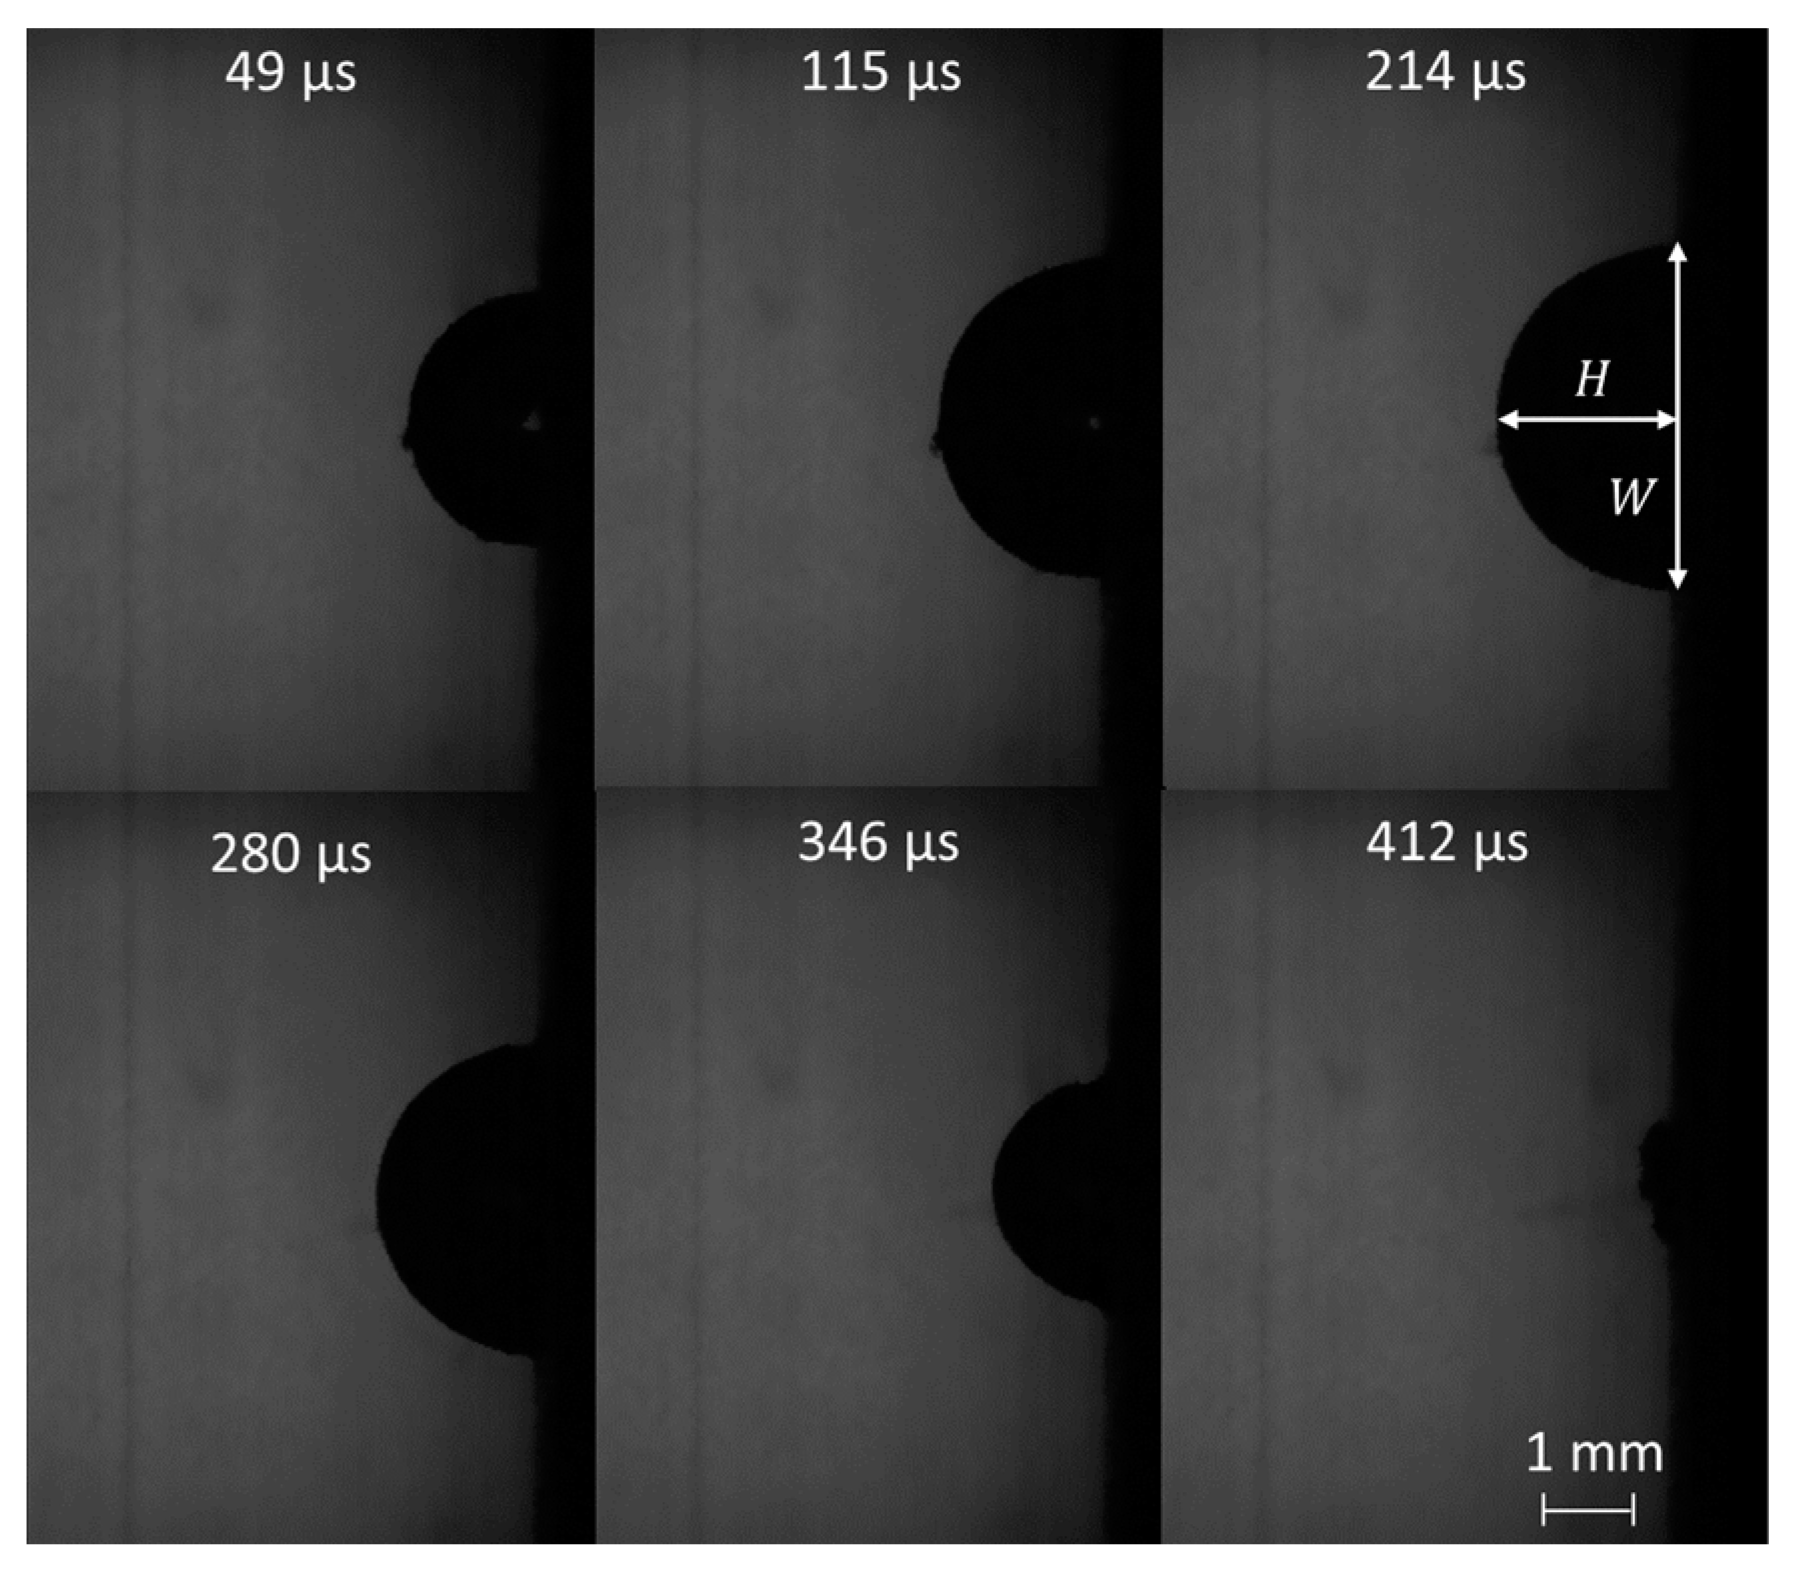
Figure 3 shows the formation of the cavity at a pulse energy of 36 mJ of the first laser pulse at different times.
In principle, it should be noted that double pulses are required for LIBS analysis. However, to optimize the cavity generated by the first pulse in terms of volume and lifetime, only a single pulse is used initially. In
Section 4.4, double-pulse LIBS is subsequently used for the investigation of the spectra, since the second pulse is required to generate the plasma in the cavity. The high-speed images are evaluated by determining the height H and width W of the cavity according to
Figure 3 and calculating the corresponding volume of the cavity. The equation for an ellipsoid
VE,
is used to calculate the volume since the height of the cavity is not exactly half the width of the cavity. In Equation (1),
a,
b and
c denote the semi-axes of the ellipsoid. Here,
c corresponds to the height
H of the cavity,
a corresponds to half the width
W of the cavity and
b corresponds to half the depth of the cavity, which cannot be taken directly from the images.
For the calculation, it is assumed that the cavity has a circular shape on the sample surface. For this reason,
a =
b applies to the calculation, which corresponds to half the width of the cavity. Finally, the calculated volume of the cavity
VC,
results from the halved volume of the ellipsoid.
4. Results
4.1. Influence of Focus Position on Cavity Formation
First, the influence of the focus position on the cavity formation is investigated. The aim is to determine which focus position is most suitable for the different pulse energies to achieve the largest possible volume and lifetime of the cavity. Since it is assumed that a large maximum volume of the cavity is associated with a large lifetime of the cavity, the maximum volumes of the cavities are compared to investigate the influence of the focus position. As explained in
Section 2, the distance between the focusing lens and the sapphire window is varied to set different focus positions (
Figure 2, distance x). In this way, the distance in water between the sapphire window and the sample surface remains at 30 mm, so absorption in water can be assumed to be constant.
The following
Table 1 shows the corresponding intensities resulting from the different pulse energies, focal lengths and focus positions. The corresponding formulas from Ref. [
20] are used to calculate the intensities. For the focus positions +4 mm and +2 mm, the focus point is in front of the sample surface. The maximum intensity, which corresponds to the intensity at the focal point at 0 mm, is therefore already reached before the sample surface and therefore does not correspond to the calculated values and is therefore omitted here.
Five measurements are made for each combination of pulse energy of the laser beam and the set focus position. The average value is formed from the maximum volumes calculated according to Equation (2).
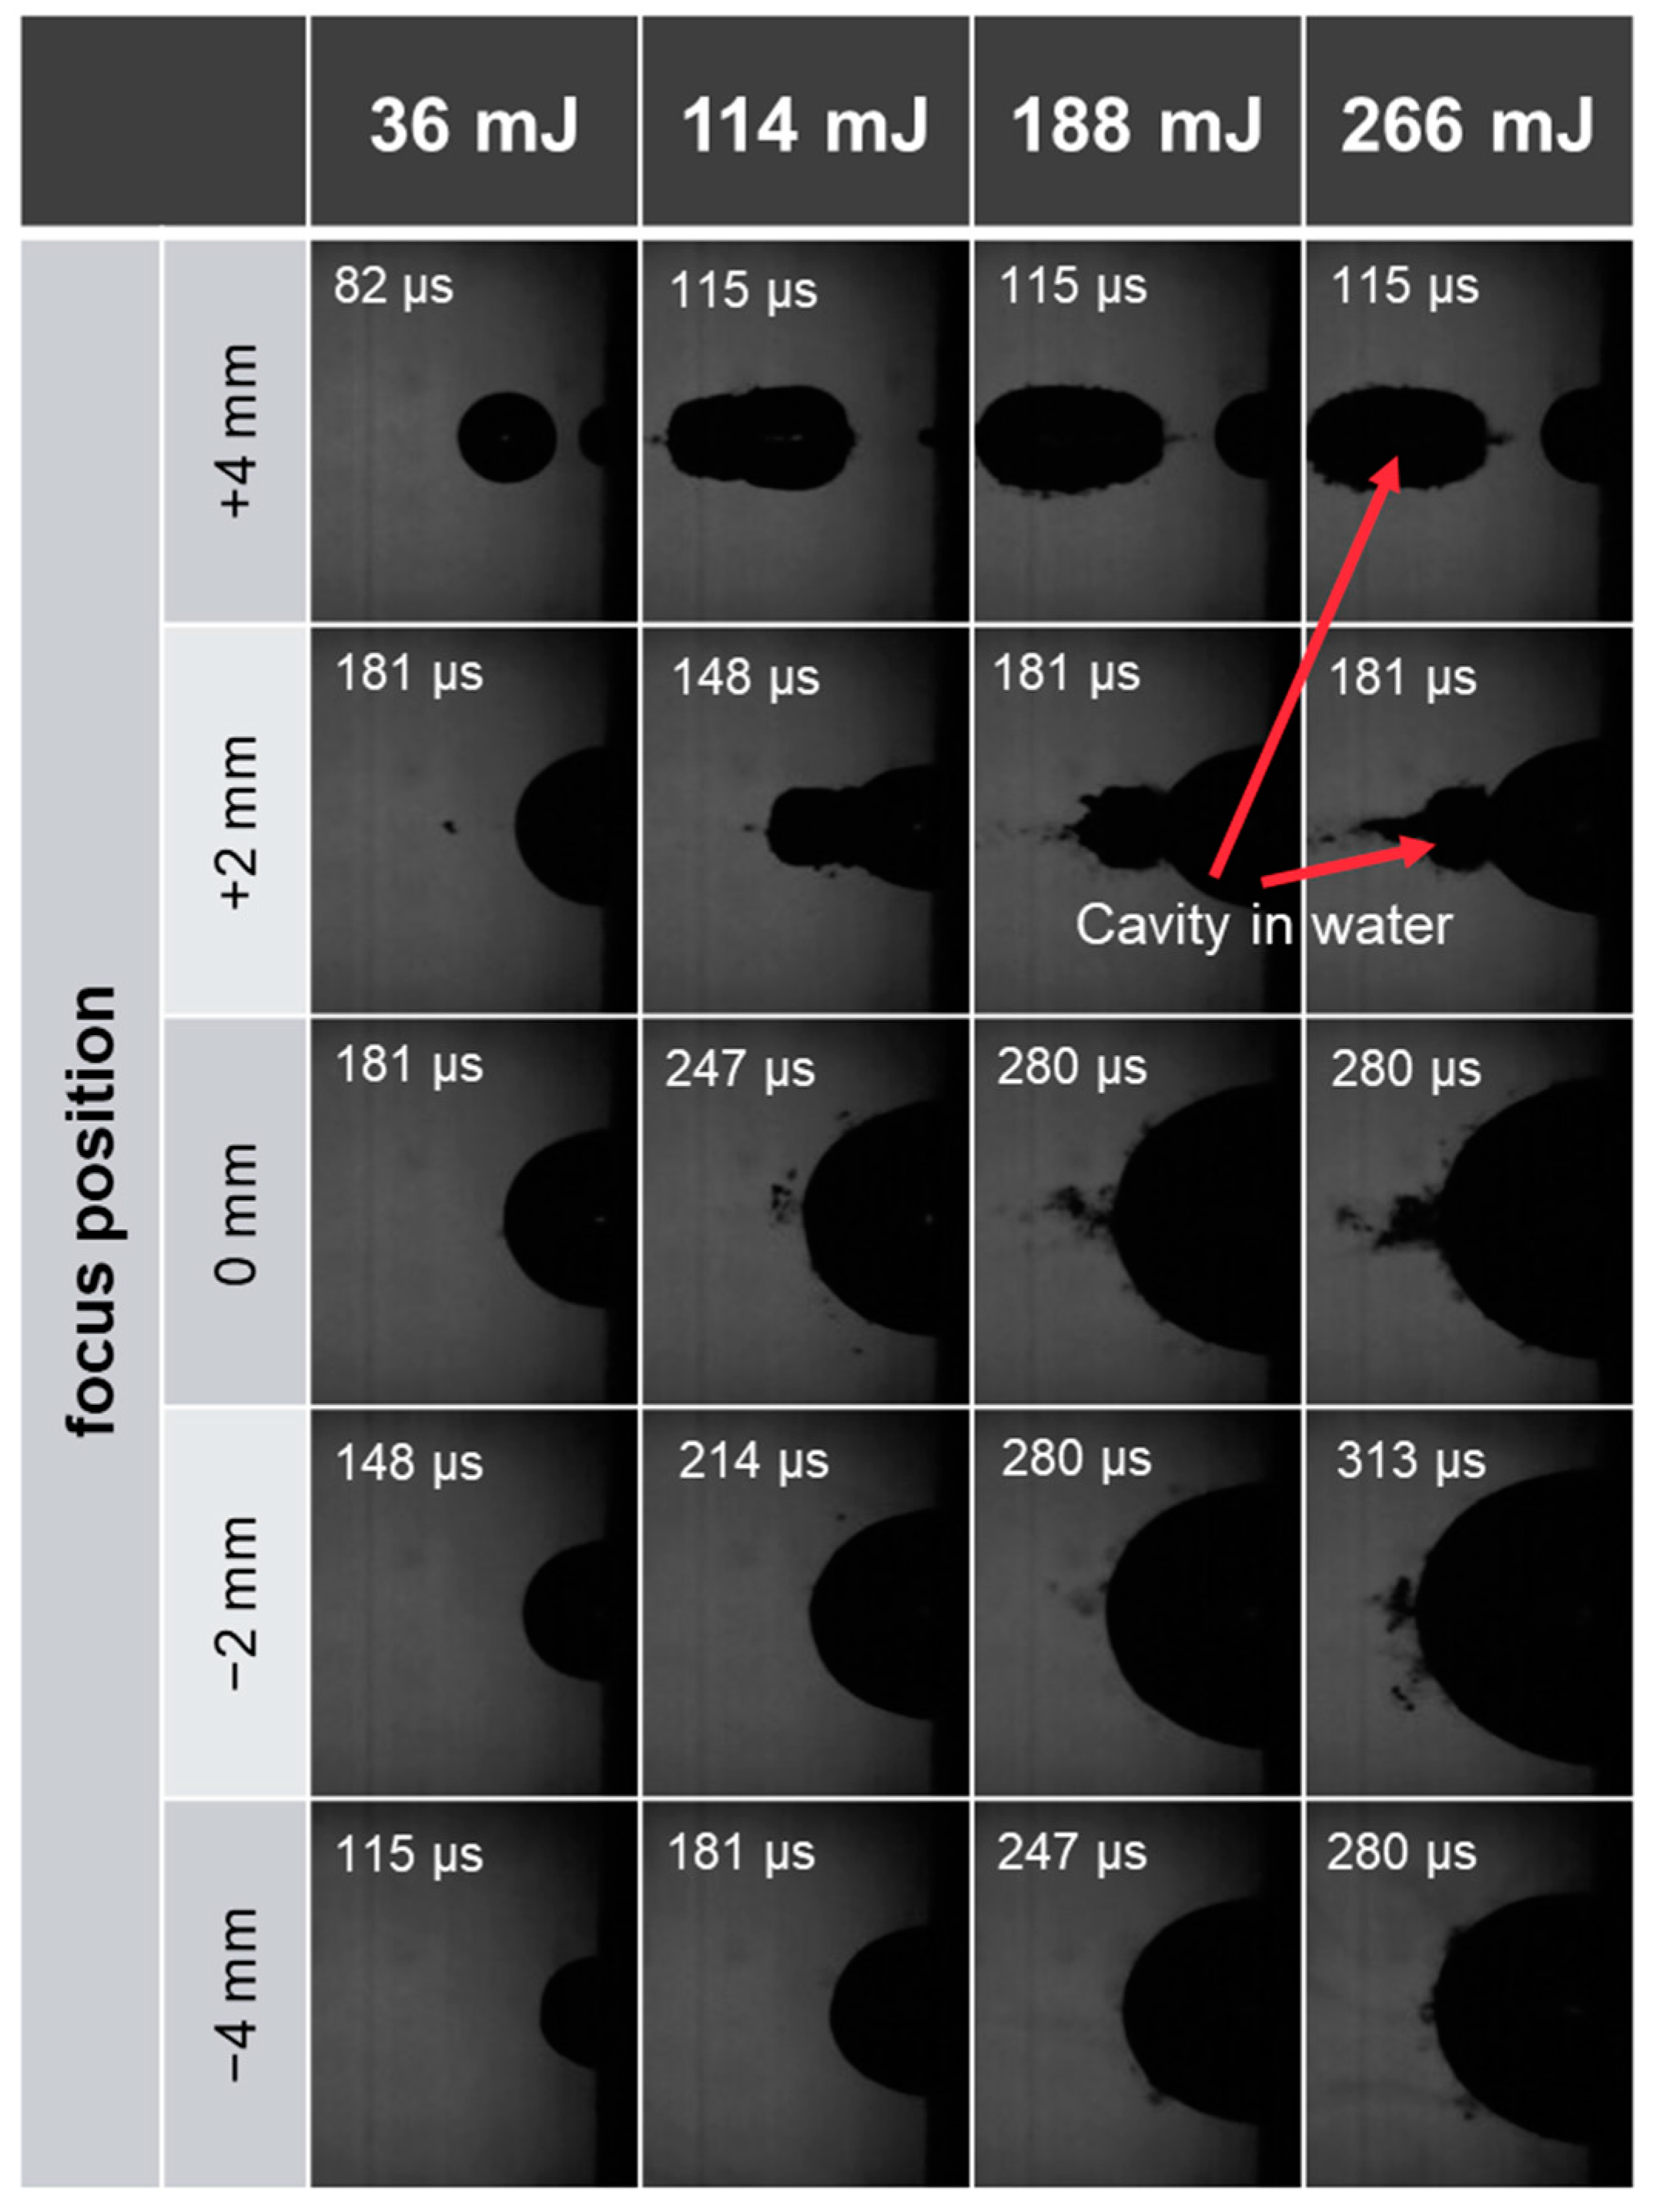
Figure 4 shows one of the measurements of the maximum cavity from the high-speed images for each combination.
In
Figure 4, the sample surface is on the right and the laser direction is from left to right. The images at focus position +4 mm show that a cavity is already formed in the water in front of the sample surface. This also occurs at a focus position +2 mm for energies above 36 mJ. At higher energies such as 266 mJ, an additional cavity is also formed in the water in front of the ellipsoid at focus positions 0 mm and −2 mm, although it is much smaller. As mentioned in
Section 1, a focused laser pulse can likewise create a cavity directly in the liquid. Such a cavity formation in the water in front of the actual sample body poses a challenge for LIBS analysis if the plasma is not generated or is weaker on the sample surface. In this case, no element-specific emission lines from the sample can be analyzed. For some combinations of focus position and pulse energy, the cavity cannot be evaluated unambiguously because either the largest cavity is already created in the water or the cavity at the sample surface cannot be evaluated as an ellipsoid due to the cavity in the water. This affects all measurements at focus position +4 mm and all measurements for pulse energies larger than 36 mJ at focus position +2 mm. Therefore, these combinations are not used for the evaluation.
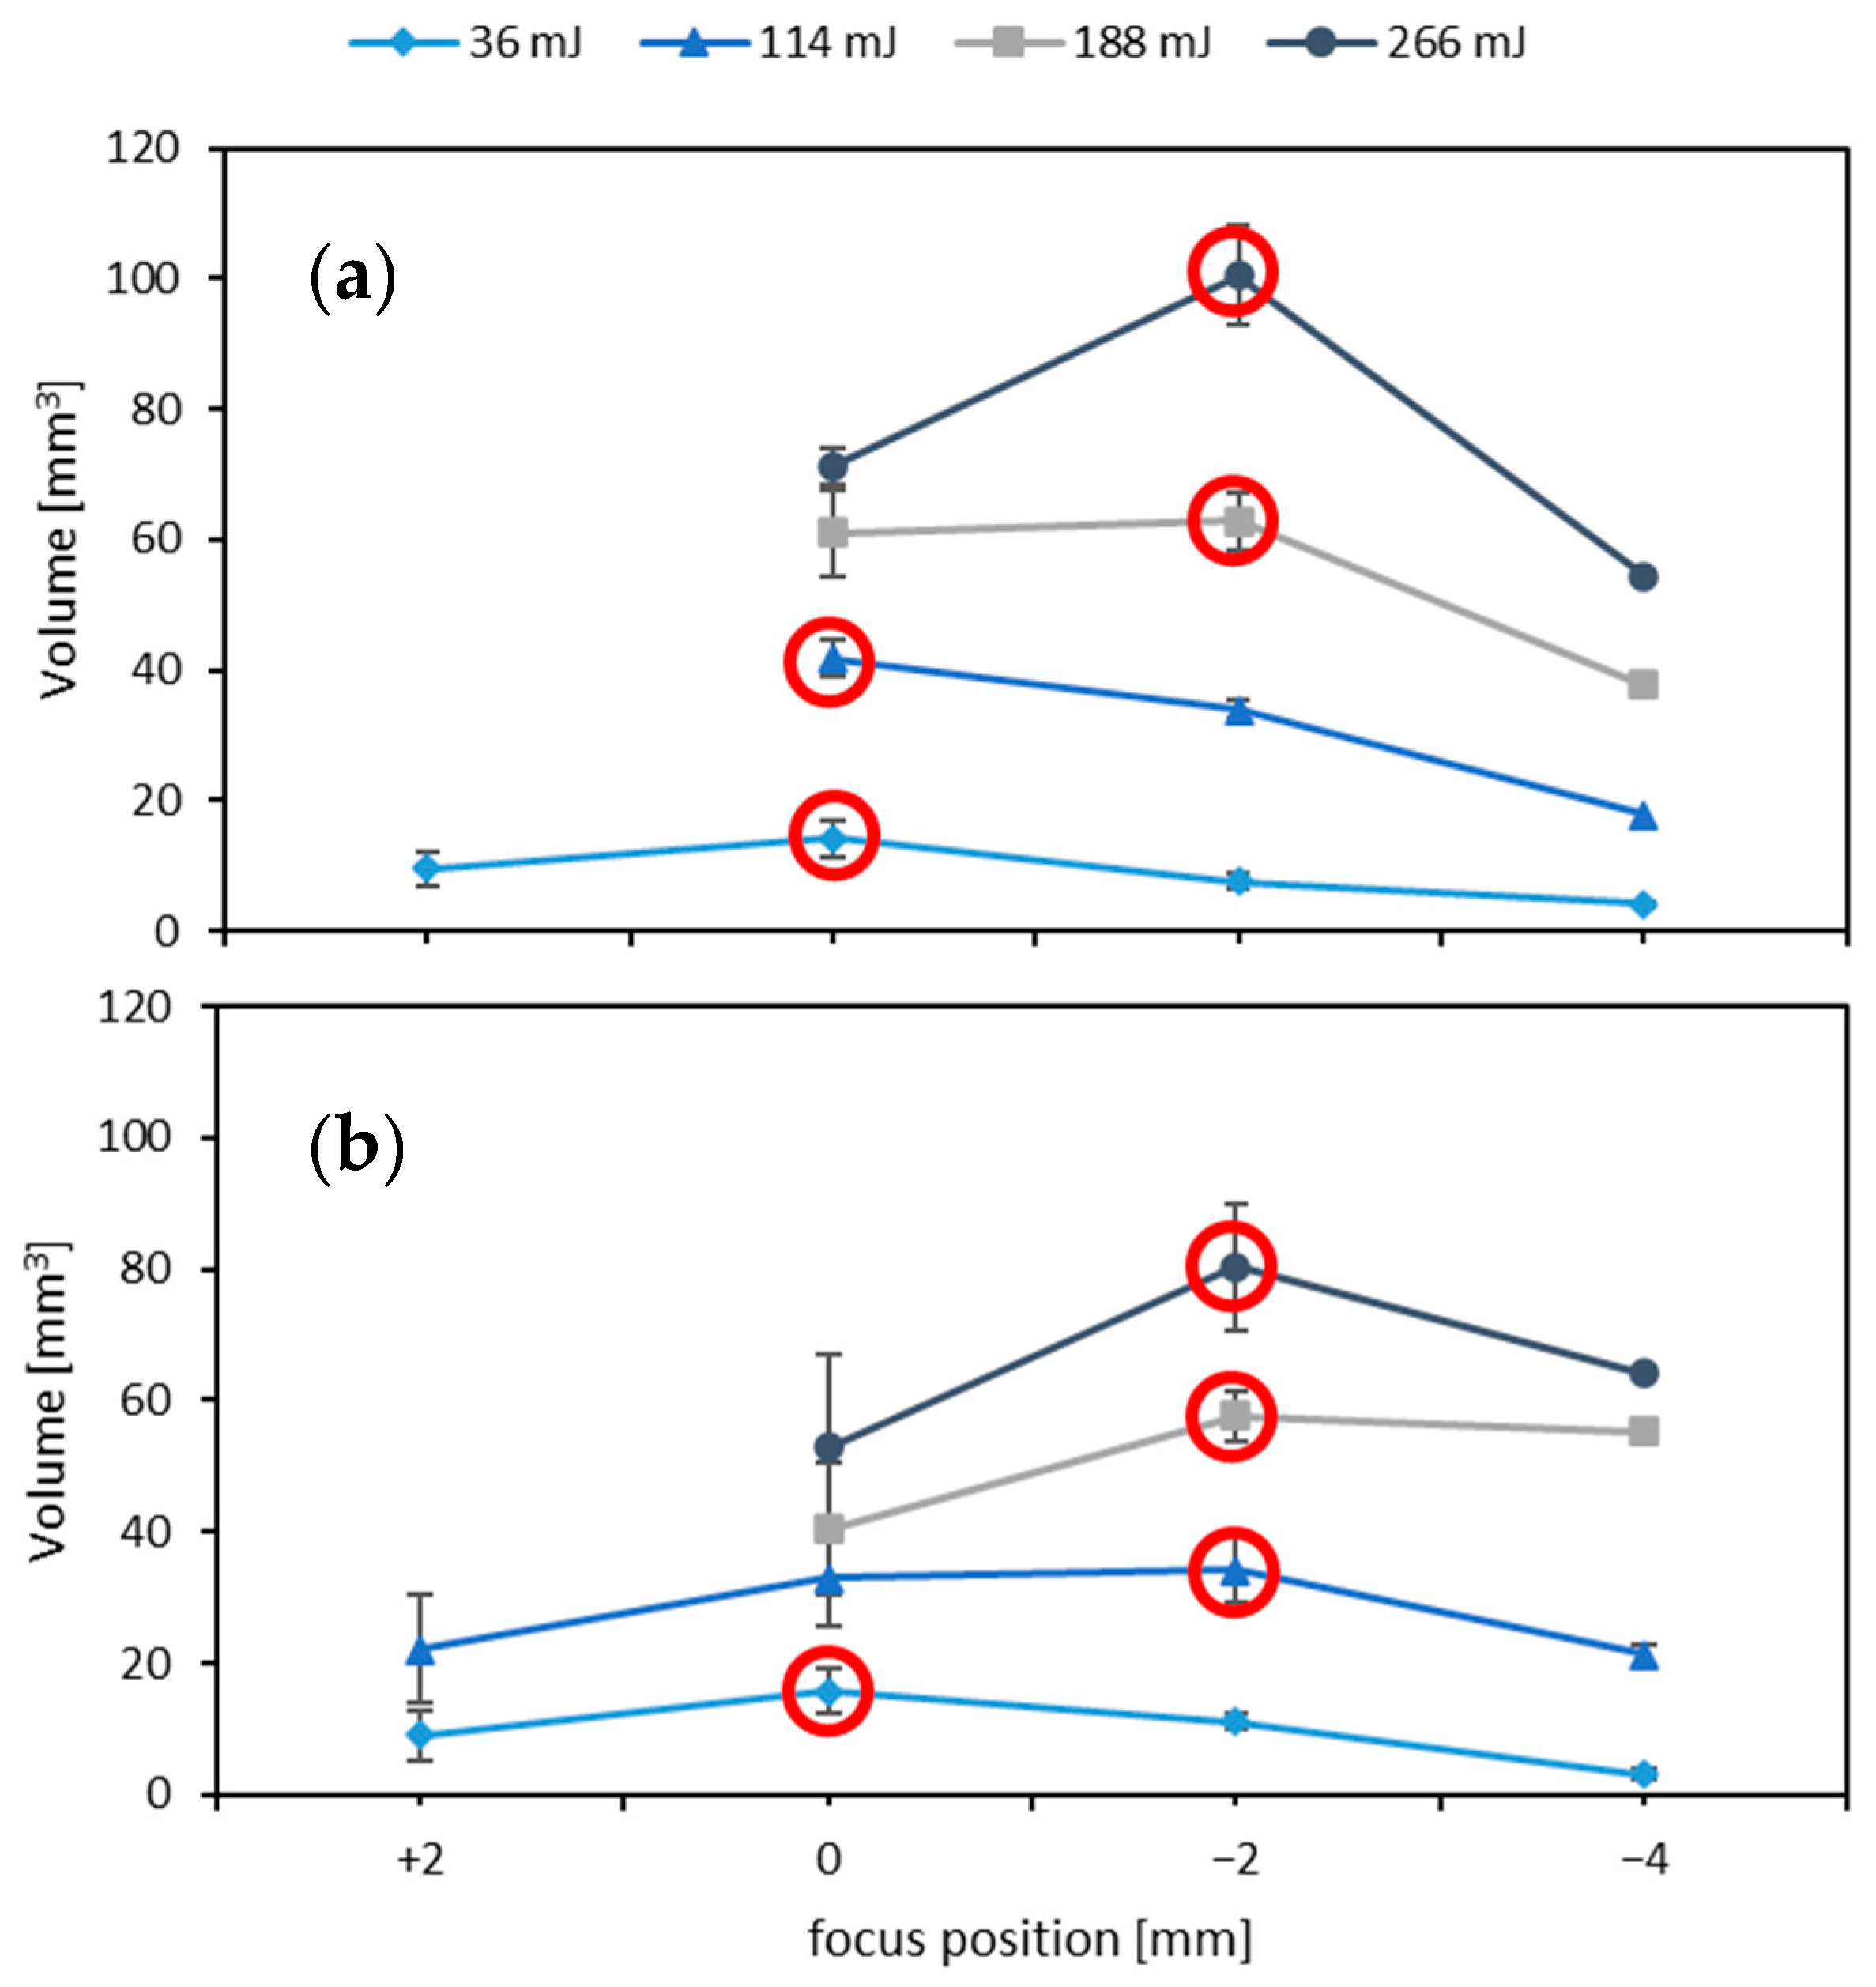
Figure 5 shows the average volume of the maximum cavity for the different focus positions and pulse energies. The corresponding intensities are given in
Table 1.
The ideal focus position for achieving the maximum cavity (indicated by red circles) changes depending on the pulse energy. For the pulse energies 36 mJ and 114 mJ, the focus position 0 mm results in the largest volume of the maximum cavity, while for pulse energies of 188 mJ and 266 mJ, this is the case at a focus position of −2 mm. To investigate the influence of the focal length of the focusing lens, the lens with a 50 mm focal length is replaced by a lens with a 75 mm focal length. The diagram shows a similar curve, whereby the ideal focus position for 114 mJ shifts to a focus position of −2 mm. The discussed observation can be explained by the increased probability of cavity formation in water with increasing laser pulse energy and increased focal length. Due to the breakdowns at higher energies, less energy reaches the sample surface. By moving the focus position into the sample, less energy is lost in front of the sample surface, resulting in a larger cavity volume. However, if the focus position is moved further into the sample, the intensity of the laser radiation decreases, resulting in a smaller cavity volume. The experiments show that for single pulse energies of up to 266 mJ, there is a significant influence of the focus position on the maximum volume of the cavity.
4.2. Influence of Pulse Energy on Cavity Formation
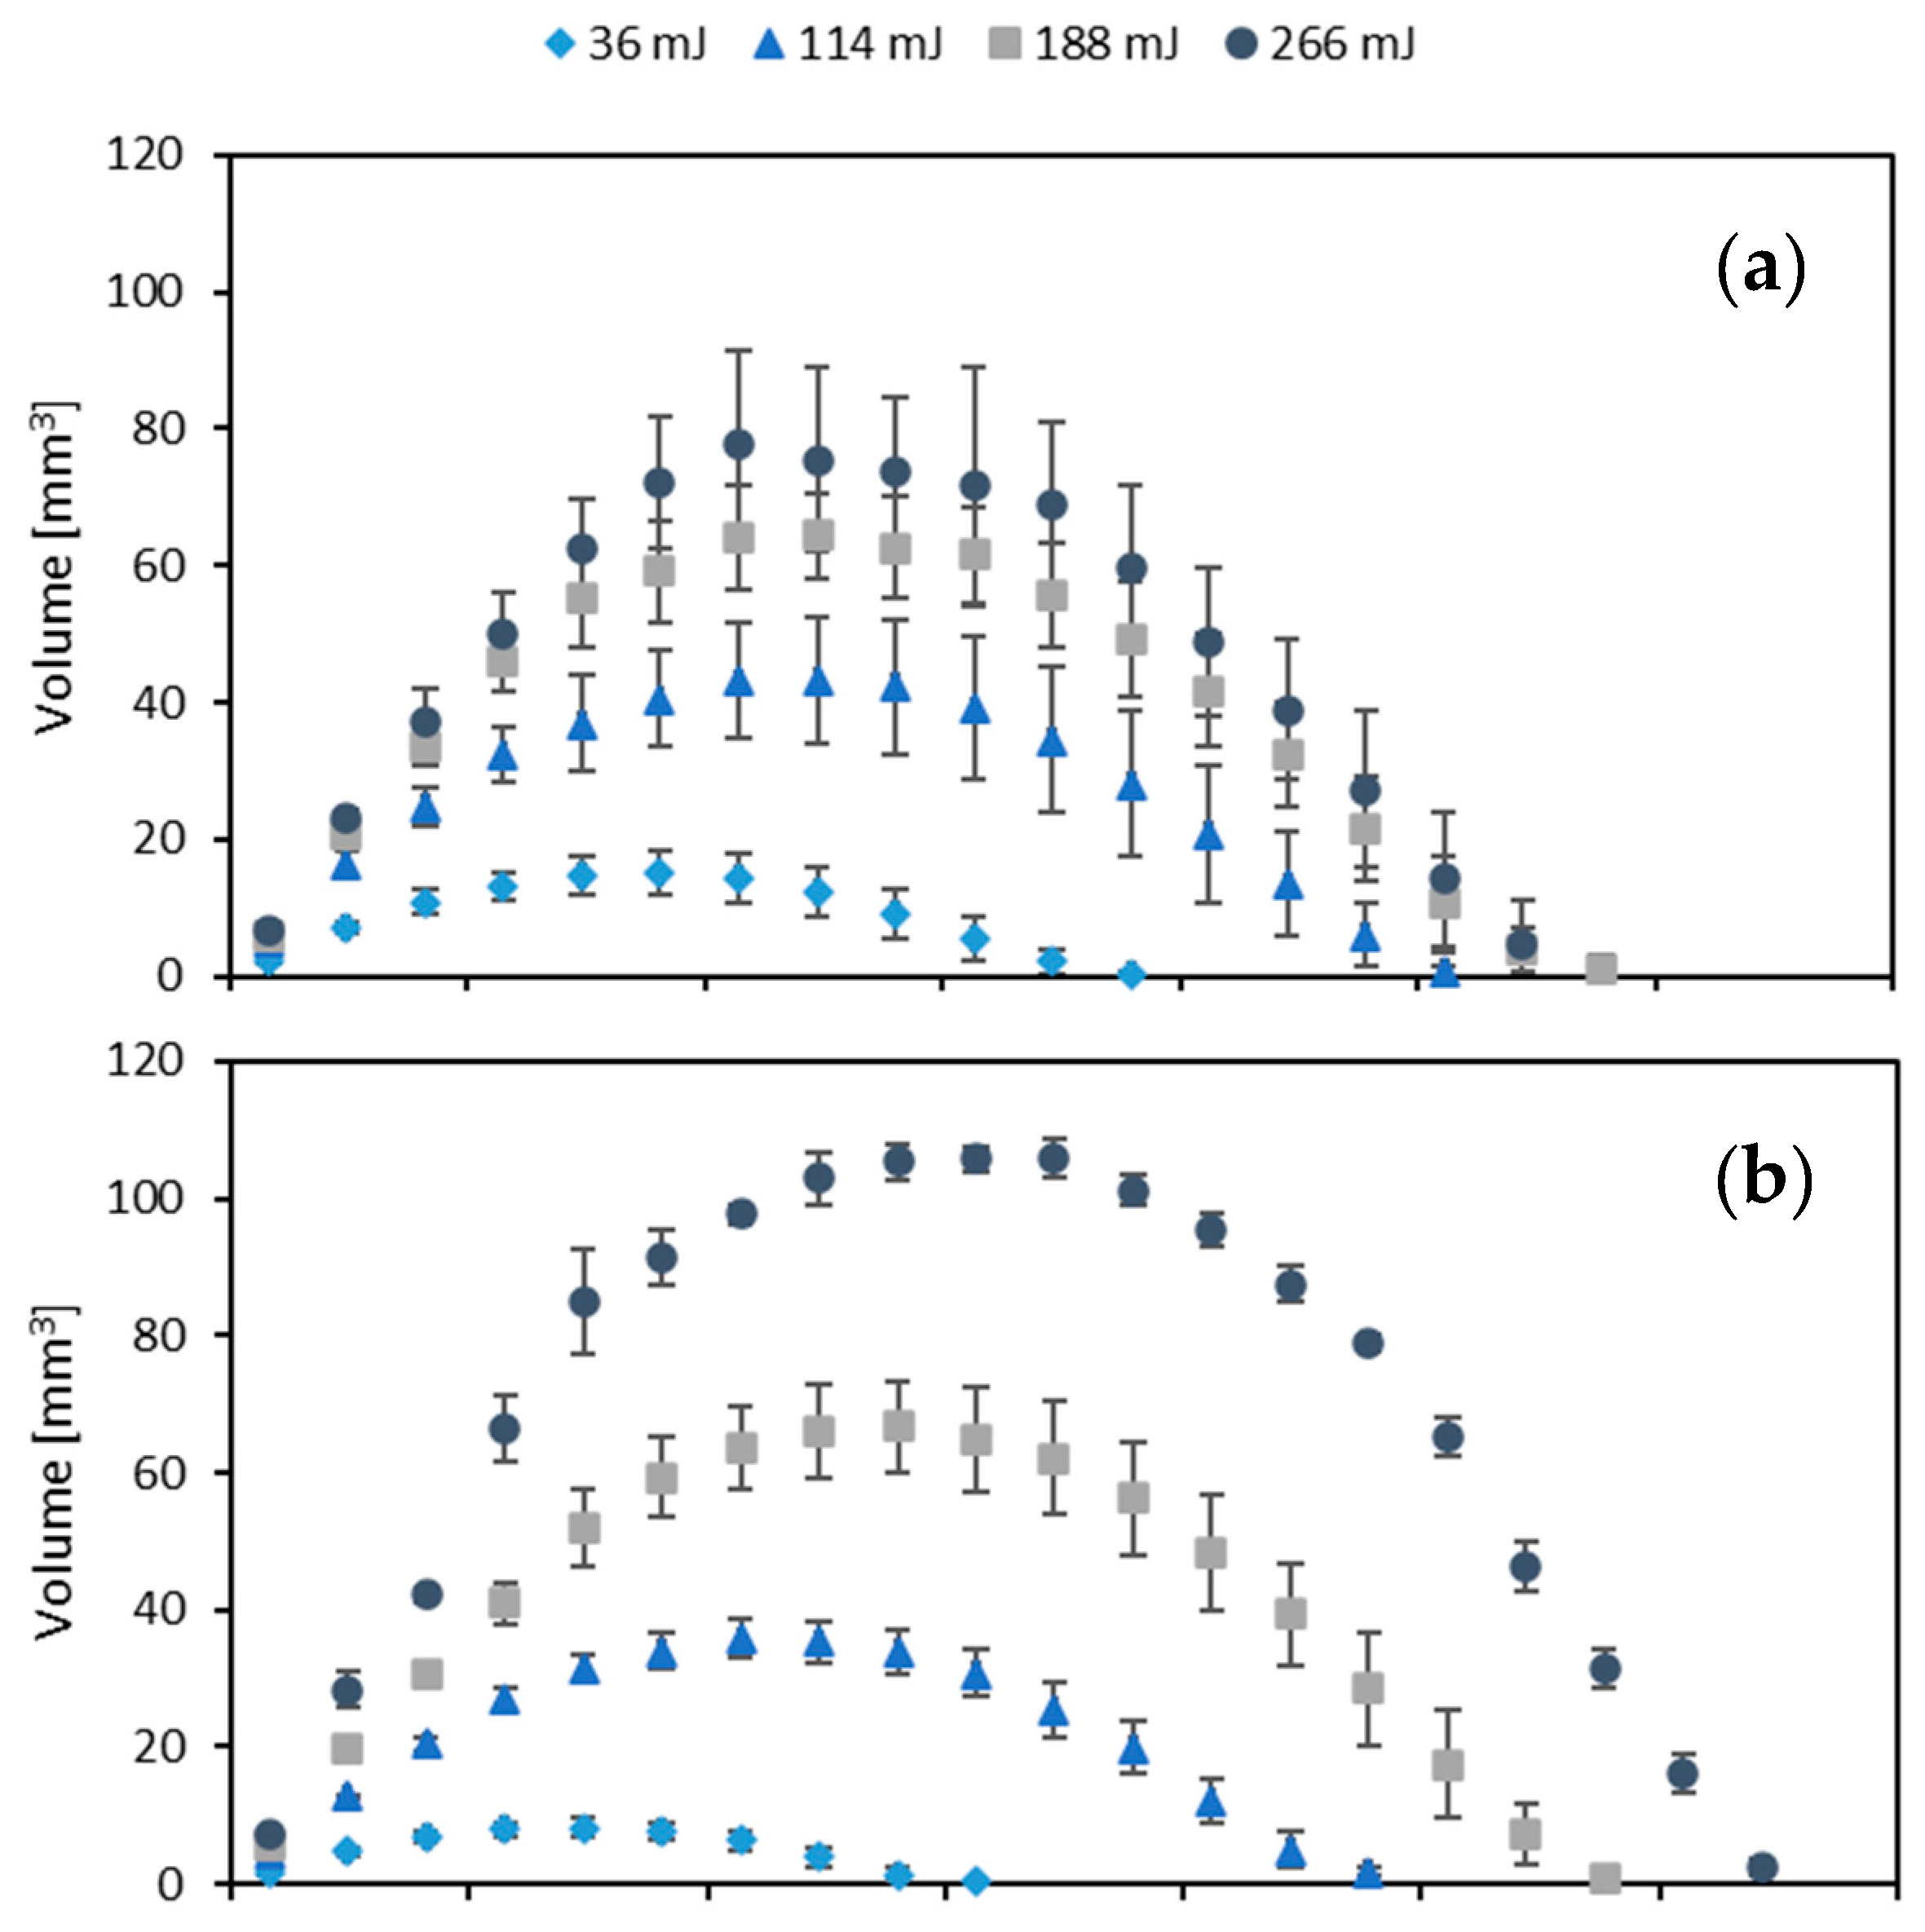
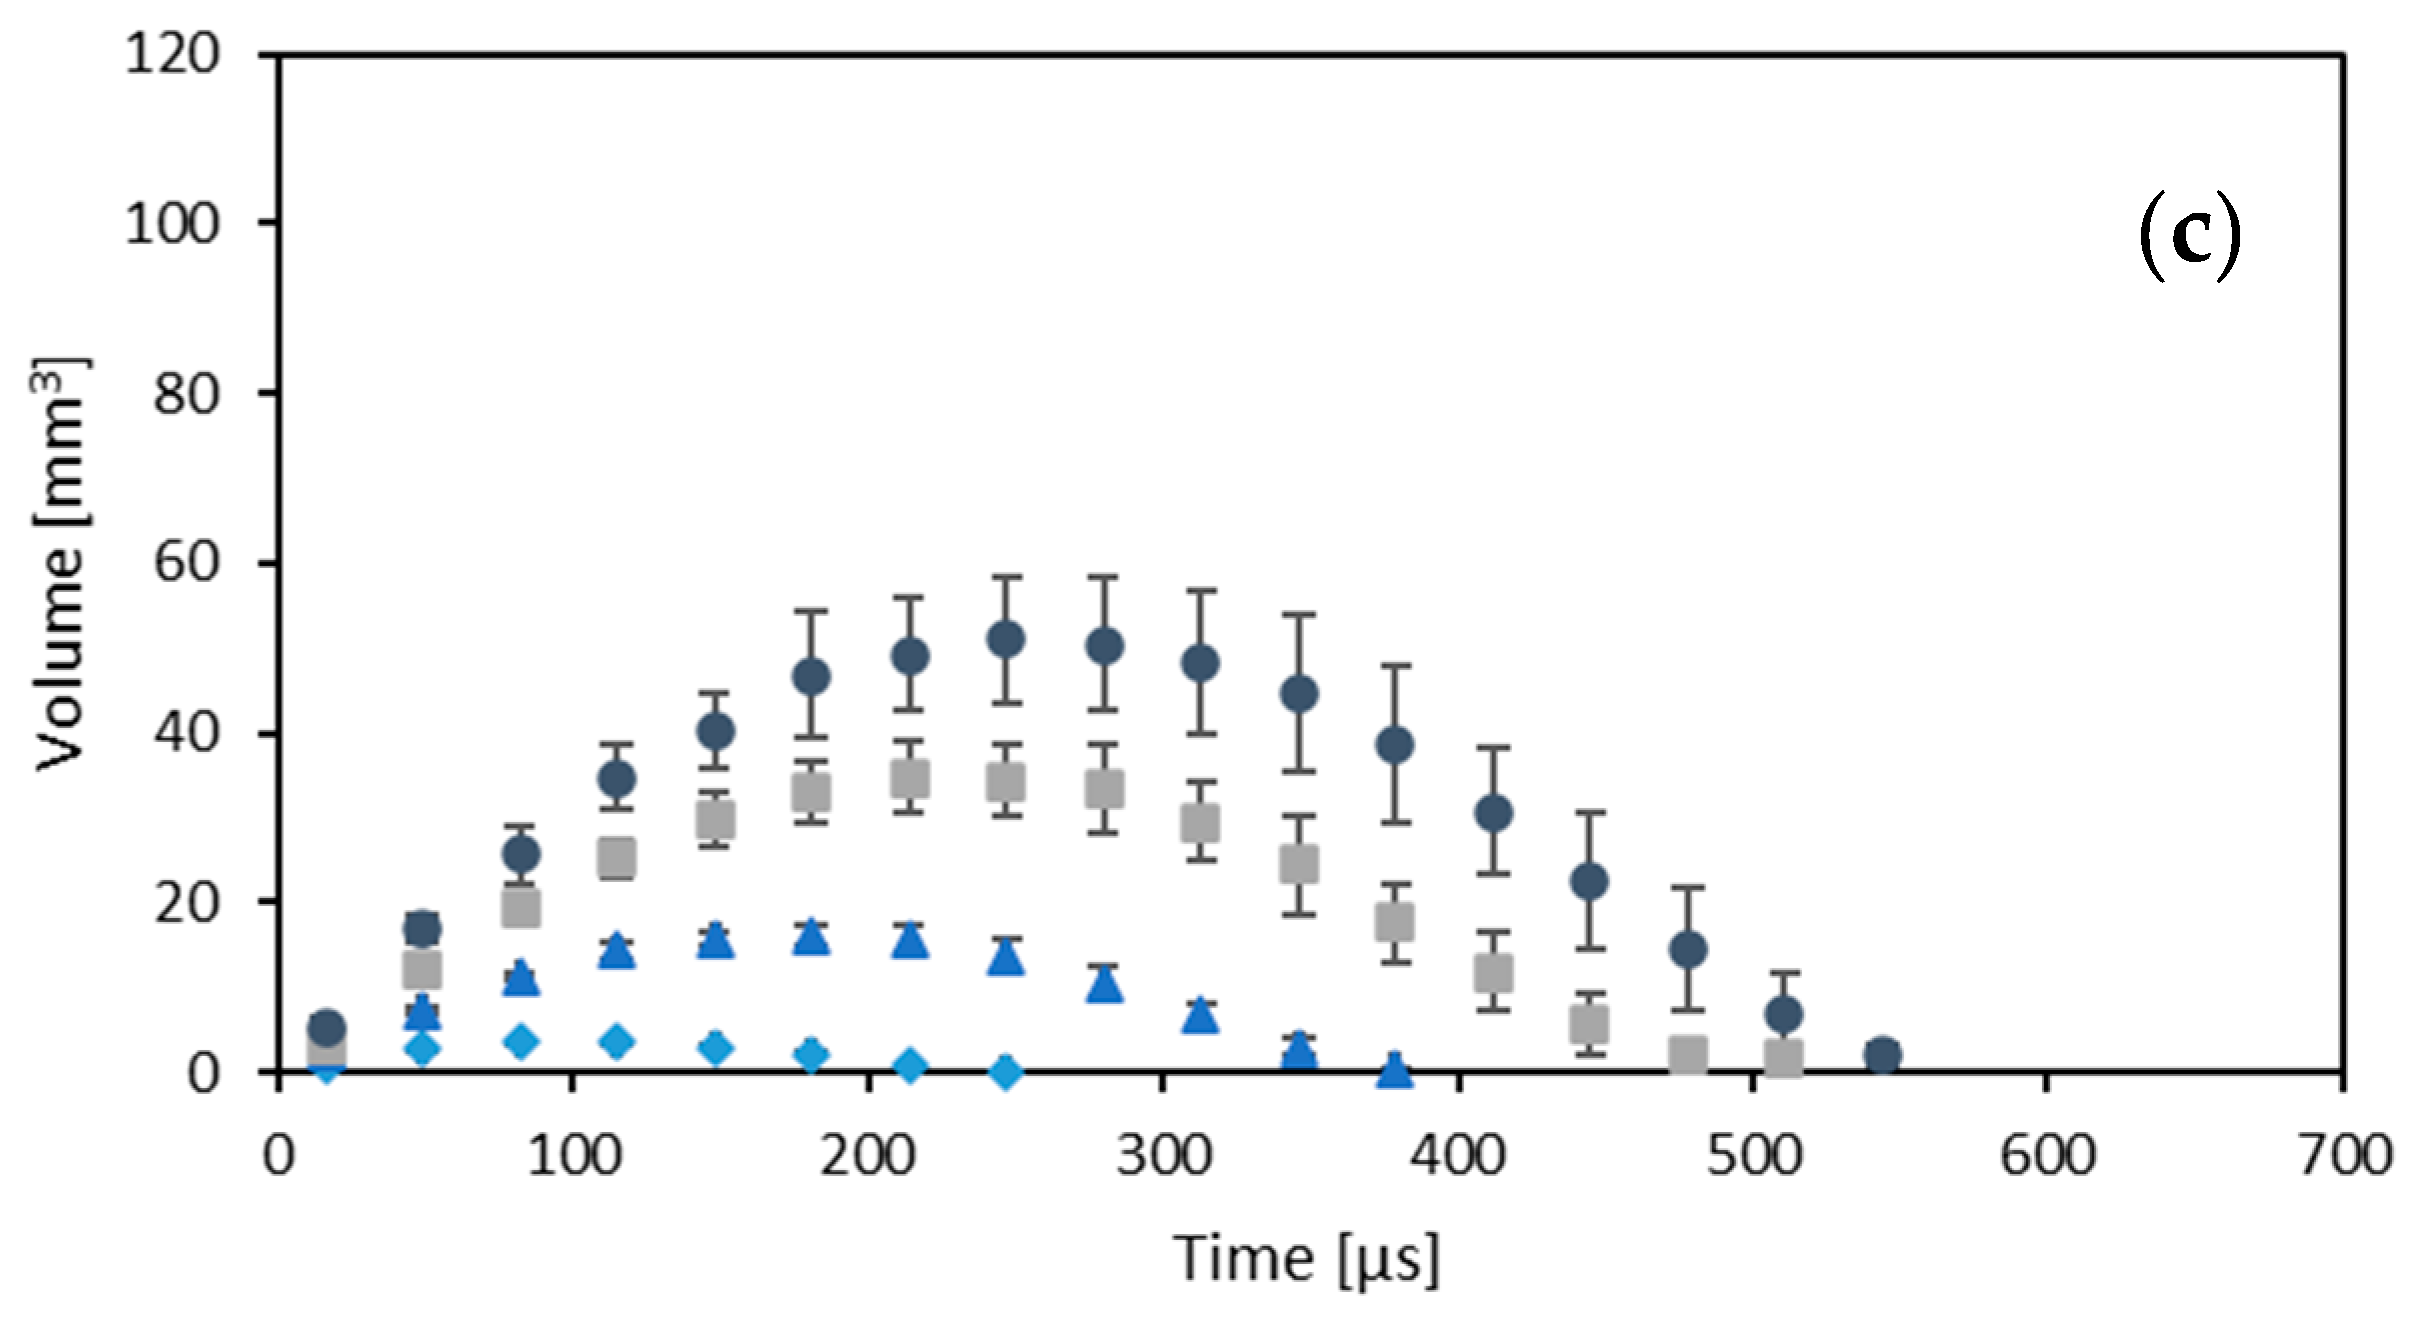
In the next step, the temporal development of the cavity formation as well as the volume change rate of the cavity are considered. Based on the temporal development, the influence of pulse energy on the volume of the maximum cavity and the lifetime of the cavity is also investigated. The experiments are performed with a lens focal length of 50 mm. To show the temporal development of the cavity formation, the average value of the calculated maximum volumes (2) of five measurements for each set-up is calculated for different focus positions and pulse energies at each point of time. The calculated volumes of the cavities are plotted as a function of time for laser pulse energies of 36 mJ, 114 mJ, 188 mJ and 266 mJ in
Figure 6 and the corresponding intensities are given in
Table 1.
Figure 6 shows that there is a lower standard deviation of the measurement points for focus position −2 mm (
Figure 6b) for pulse energies above 36 mJ. This can be attributed to the fact that fewer breakdowns occur in the water in front of the sample surface. In addition,
Figure 6 shows that for all focus positions the maximum volume and the lifetime of the cavity rise with increasing pulse energy. Here, the lifetime describes the time between the generation of the cavity by the laser pulse and the time when the cavity is no longer visible in high-speed images and is thus expected to collapse. Both the volume of the cavity and the lifetime of the cavity are of the same order of magnitude as the values given in the literature [
18,
21,
22].
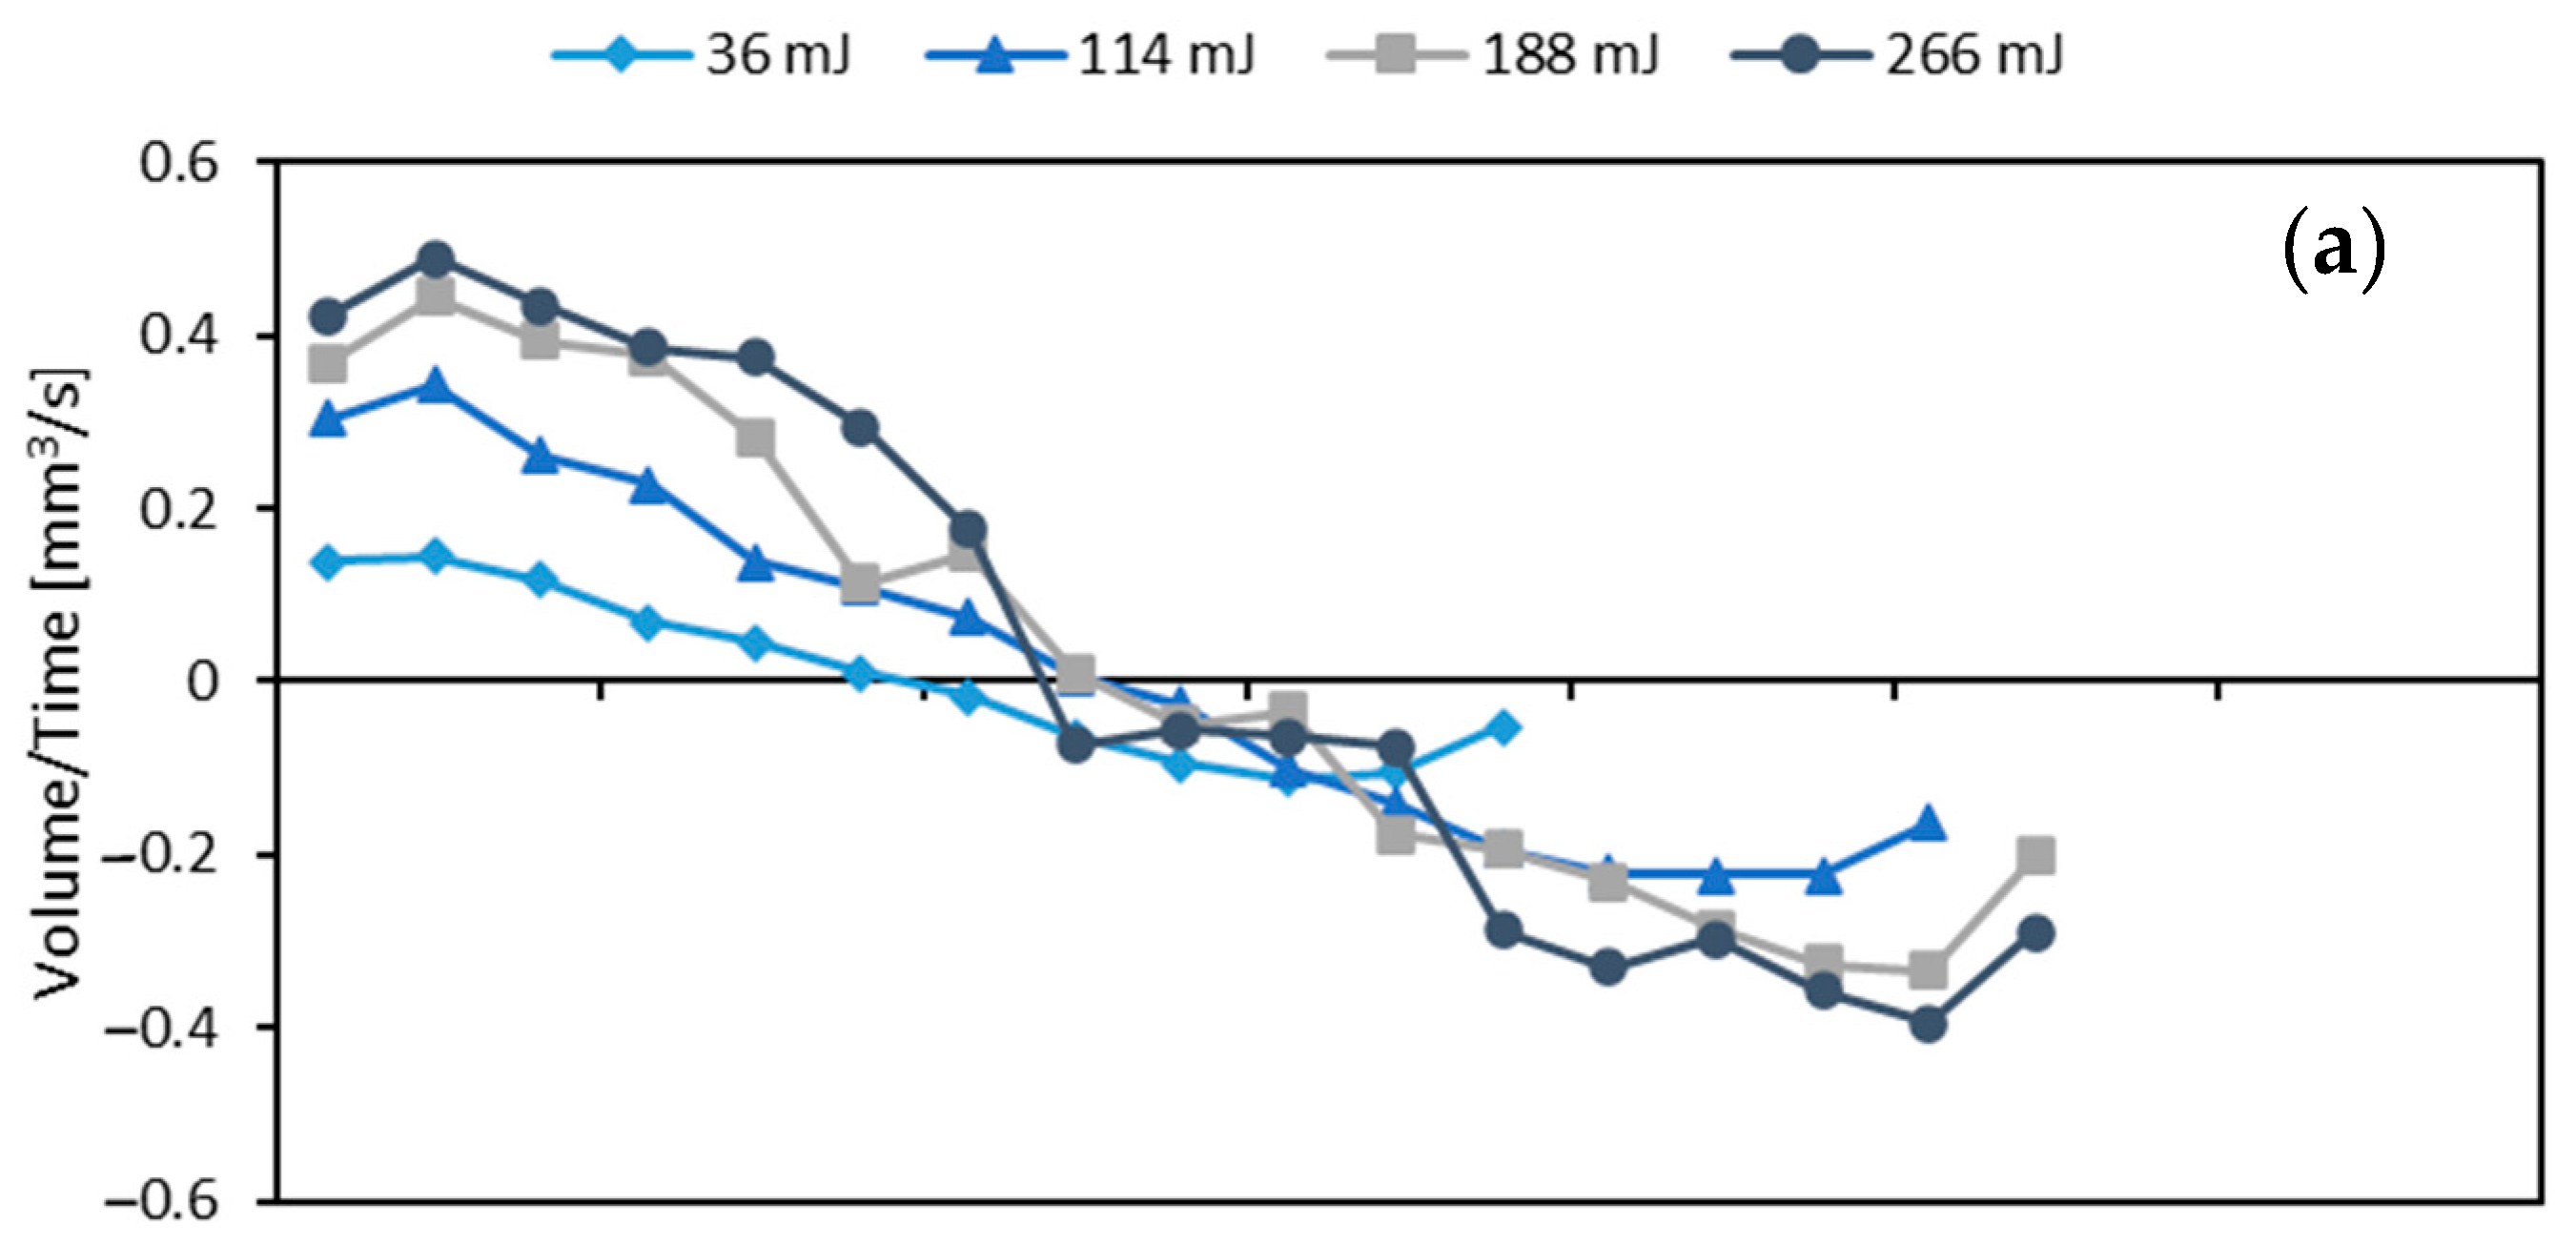
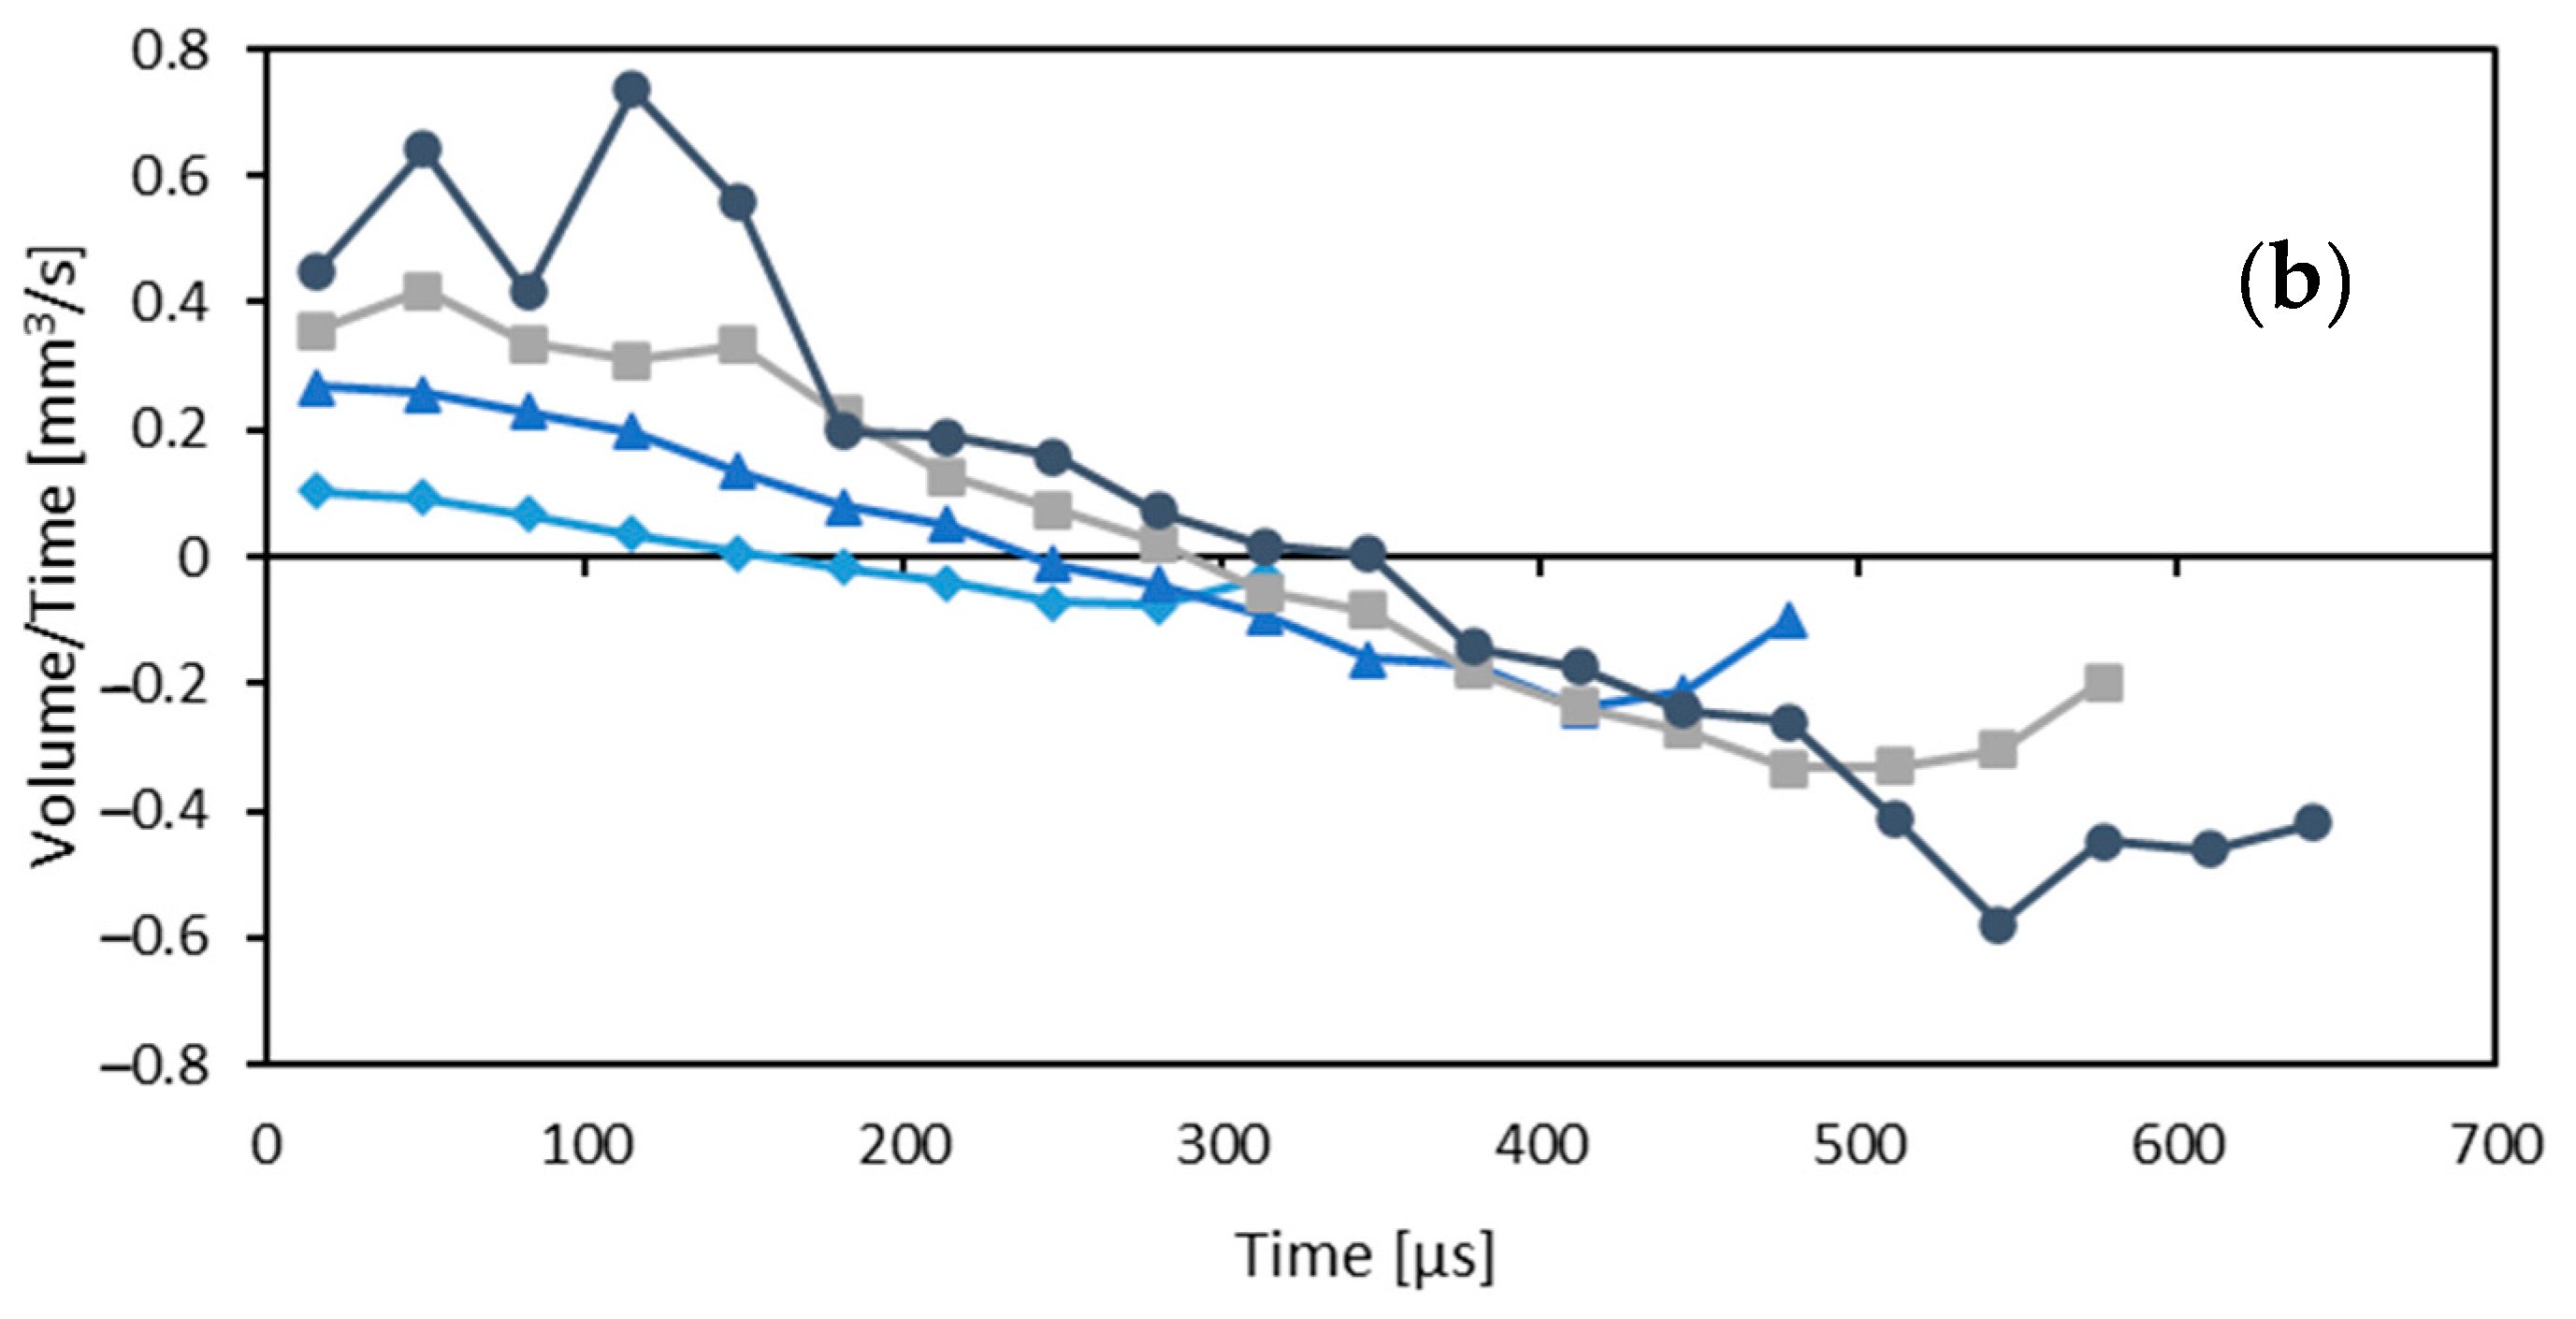
Figure 7 shows that the absolute value of the volume change rate of the cavity turns out to be highest at the beginning (phase of cavity growth) and end (decay) of the cavity lifetime and rises with increasing pulse energy. The intersection of the graph with the x-axis is interpreted as the time at which the maximum cavity is reached. Thus, the maximum expansion of the cavity is reached after about half of the lifetime, i.e., the growth and decay of the cavity occur rather similarly.
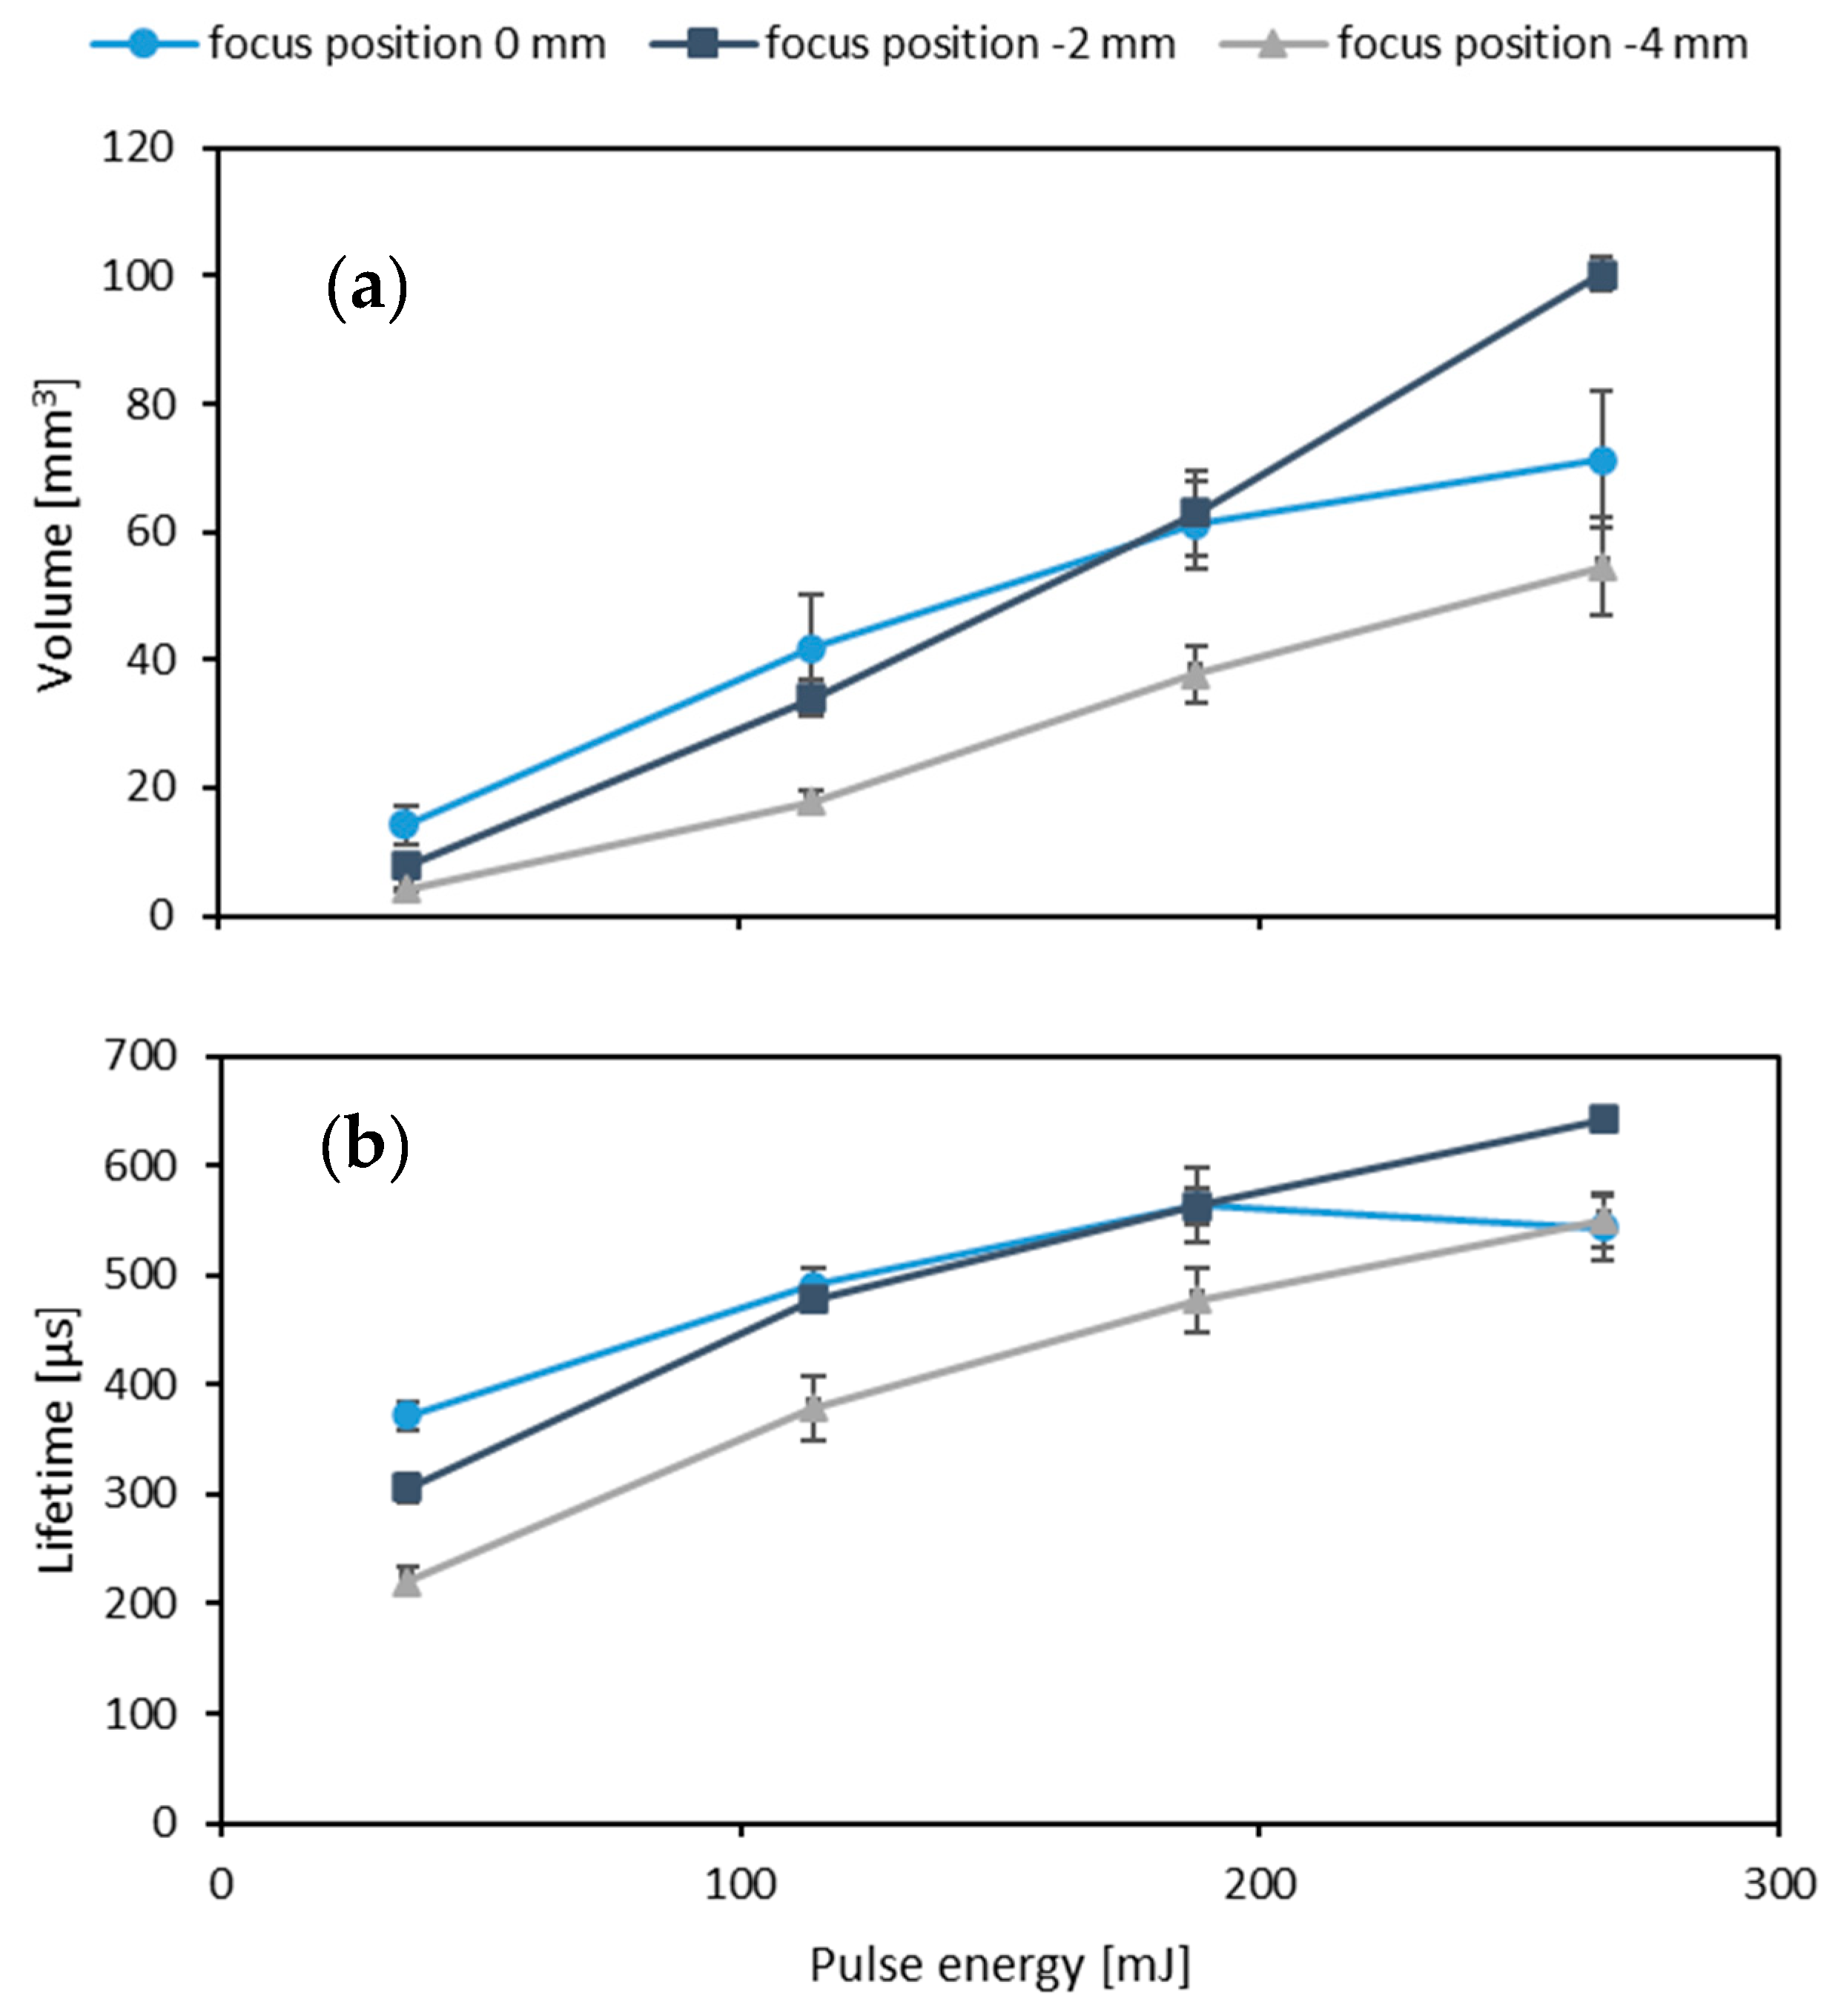
To better estimate the increase in volume and lifetime of the cavity due to the pulse energy, the two measured variables, maximum volume and lifetime, are plotted against the pulse energy in
Figure 8. The volume again describes the average volume of the maximum cavity from five measurements.
The volume of the maximum cavity as a function of the pulse energy follows an almost linear increase for the focus positions −2 mm and −4 mm. When the pulse energy is increased from 36 mJ to 266 mJ and thus by a factor of 7, about 13 times the cavity volume is achieved for both focus positions. For focus position 0 mm, the increase in cavity volume for higher pulse energies is not linear anymore. Here, only about five times the volume results from a seven-fold higher pulse energy. This behavior can be explained by additional breakdowns in the water, which can be attributed to the focus position as described in
Section 4.1.
For the lifetime of the cavity as a function of the pulse energy, the increase rate in lifetime decreases with rising pulse energy for all focus positions. This effect occurs more strongly for focus position 0 mm and can again be attributed to breakdowns in water as described in
Section 4.1. A 7-fold higher pulse energy leads to a 2.5-fold lifetime for a focus position of −4 mm, a 2-fold lifetime for a focus position of −2 mm and a 1.4-fold lifetime for a focus position of 0 mm. The pulse energy thus has a significant influence on the maximum volume of the cavity, but only a moderate influence on the lifetime of the cavity.
4.3. Breakdown in Water
In this Section, the cavity formation directly in the water without a sample is investigated.
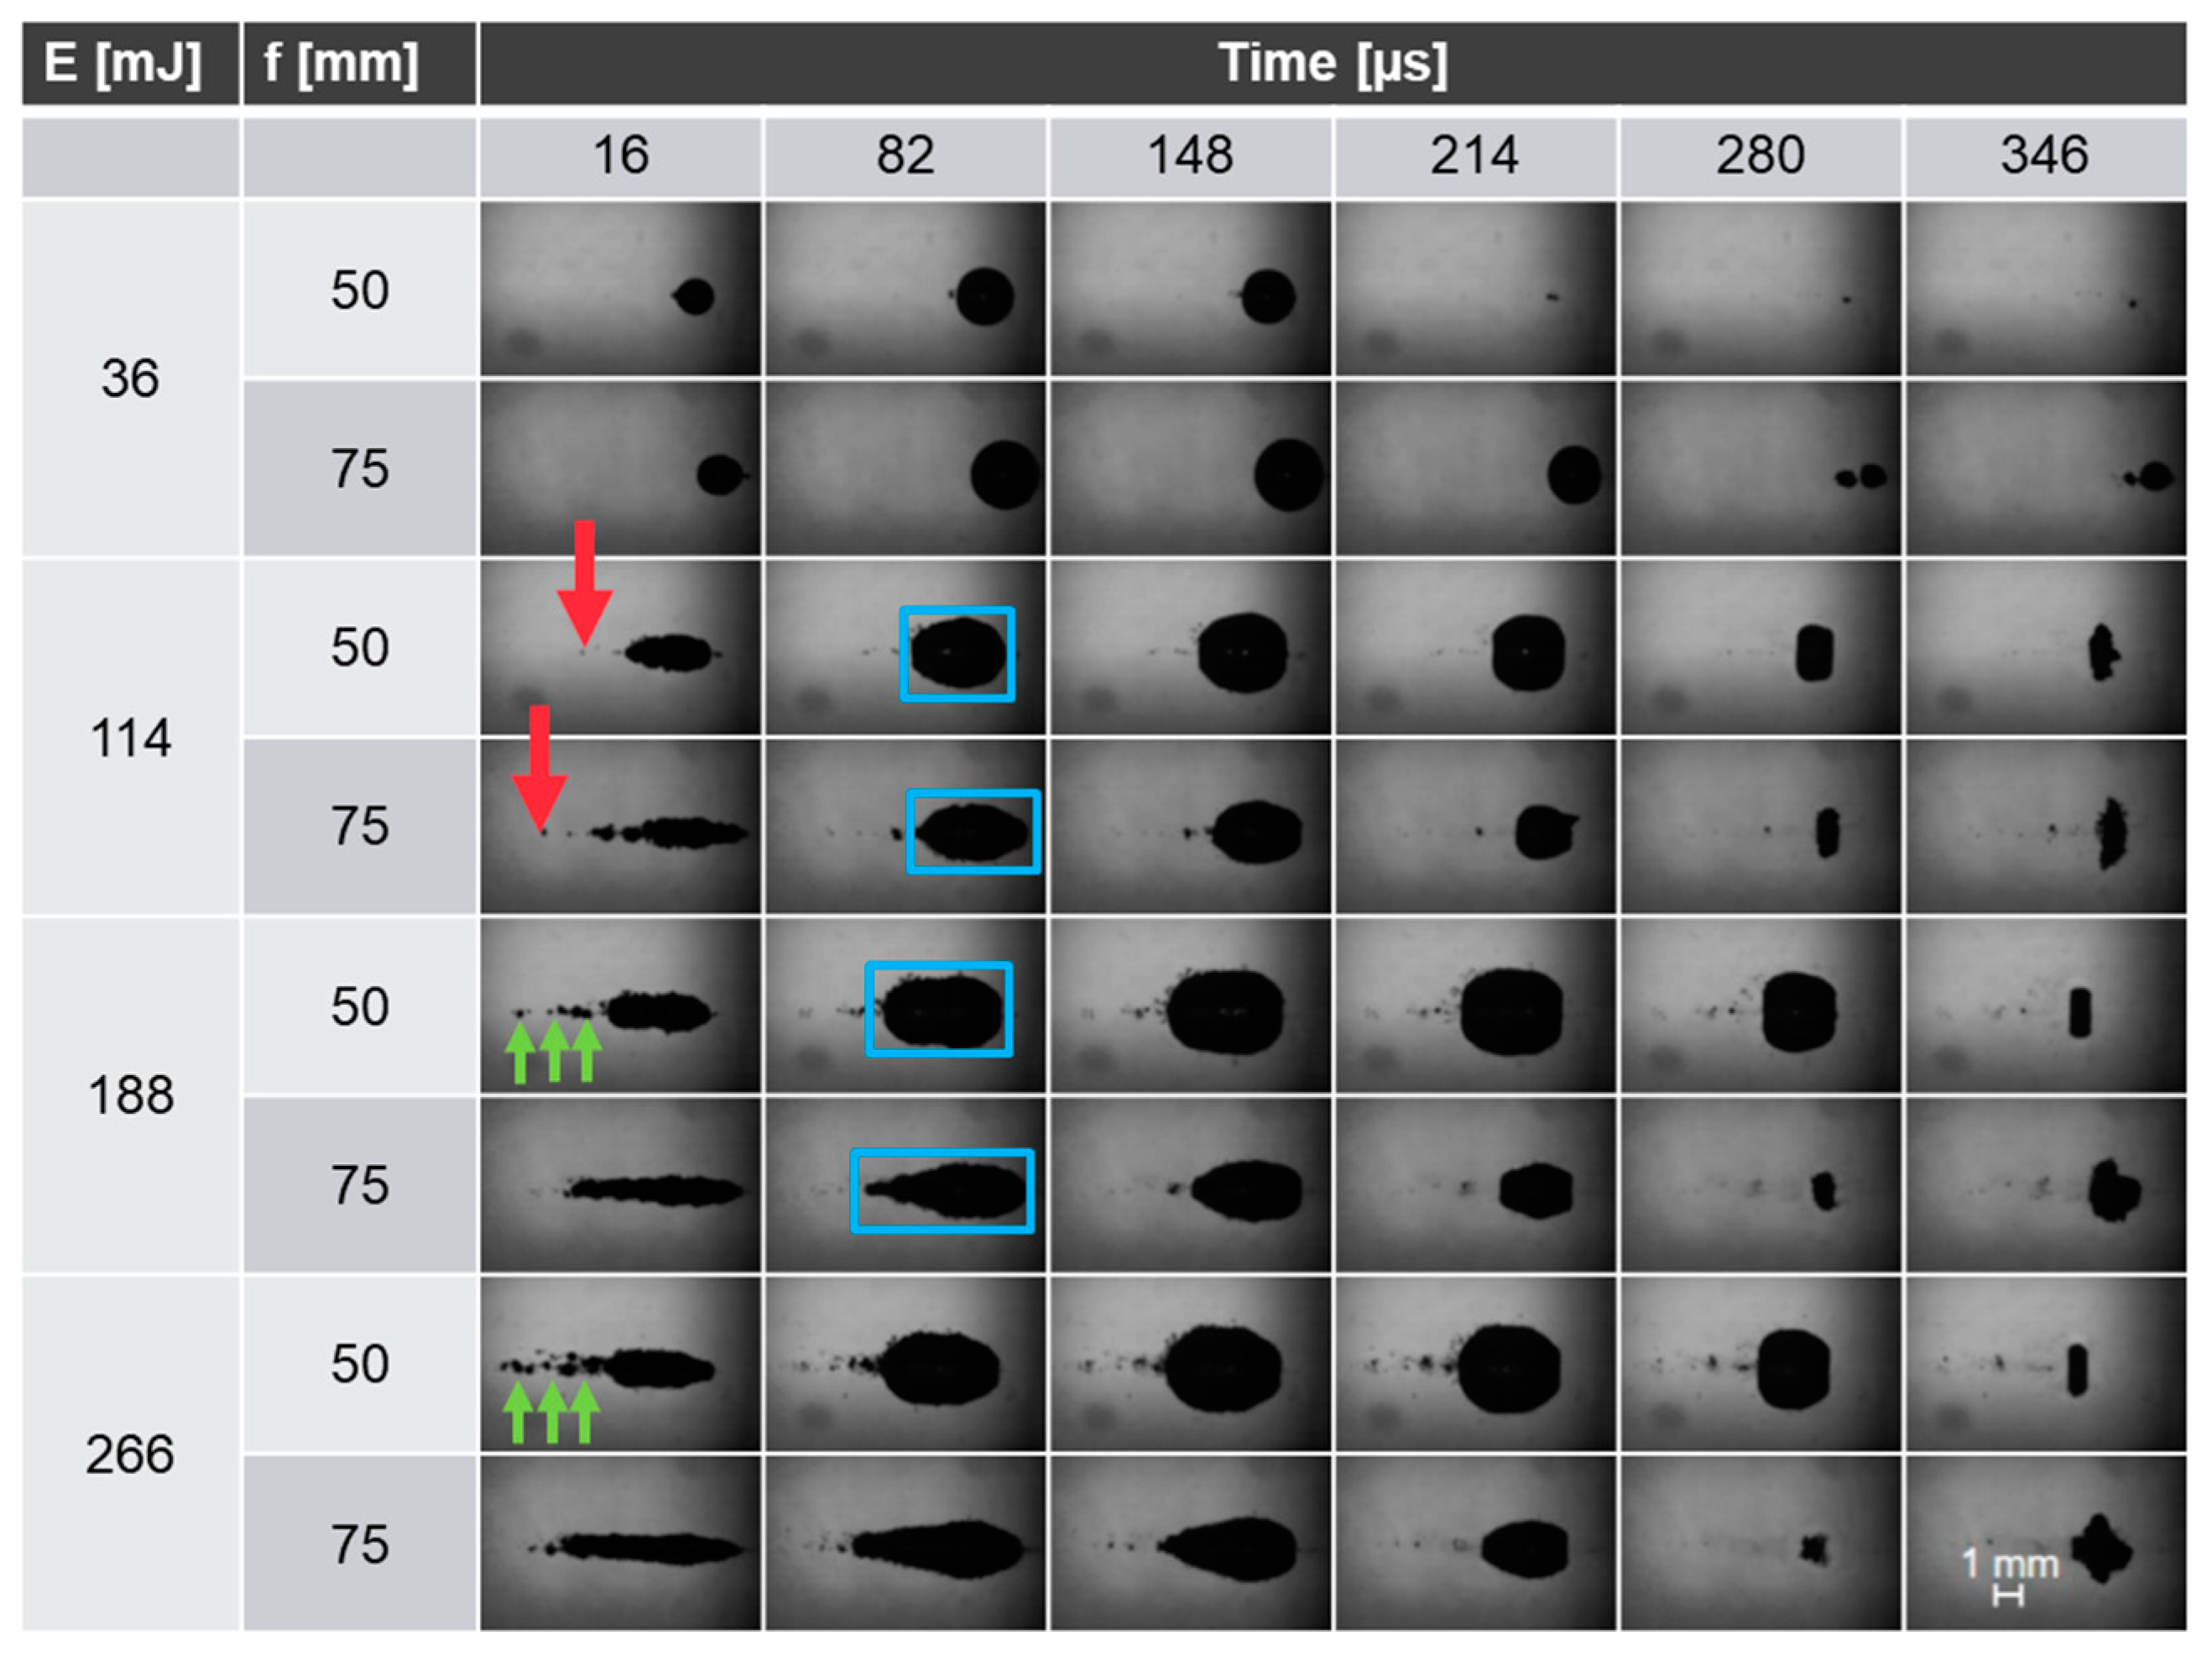
Figure 9 shows high-speed images of the cavities generated at six different times using different pulse energies and two focal lengths of the focusing lens. The laser direction is from left to right.
With a larger focal length of 75 mm, the cavity spreads out more in a horizontal direction, i.e., along the direction of the incoming laser radiation, while the cavity is shaped more spherically with a smaller focal length of 50 mm (indicated exemplarily in blue in
Figure 9). Isolated, small breakdowns can be seen for the 50 mm focal length (indicated exemplarily by green arrows in
Figure 9). At the focal length of 75 mm, fewer isolated breakdowns can be seen; instead, the largest contiguous cavity exhibits a significantly greater length. To determine the energy density at which a breakdown occurs in the water, the distance of the first breakdown (indicated exemplarily by red arrows in
Figure 9) to the focus point is measured. Considering the focal length used, the area of the laser beam at this distance from the focus point is calculated. The energy density results from the respective pulse energy and area of the laser beam. Five measurements each at pulse energies of 114 mJ, 188 mJ and 266 mJ are used to calculate the energy density for both focal lengths. For a focal length of 50 mm, this results in an energy density of about 7 J/cm
2 (1.17 × 10
9 W/cm
2) and for a focal length of 75 mm in an energy density of about 13.2 J/cm
2 (2.25 × 10
9 W/cm
2).
The values determined for the energy density and intensity should match. The distance to the first breakdown in water was used for the calculation. The first breakdown corresponds to the “shadow” that can be seen furthest to the left in the image and is therefore closest to the origin of the laser beam. Due to the differing intensities determined, it can be assumed that the isolated breakdowns seen for the focal length of 50 mm are no longer within the limited image section of the camera when using a focal length of 75 mm.
4.4. Influence of Cavity Formation on Spectra
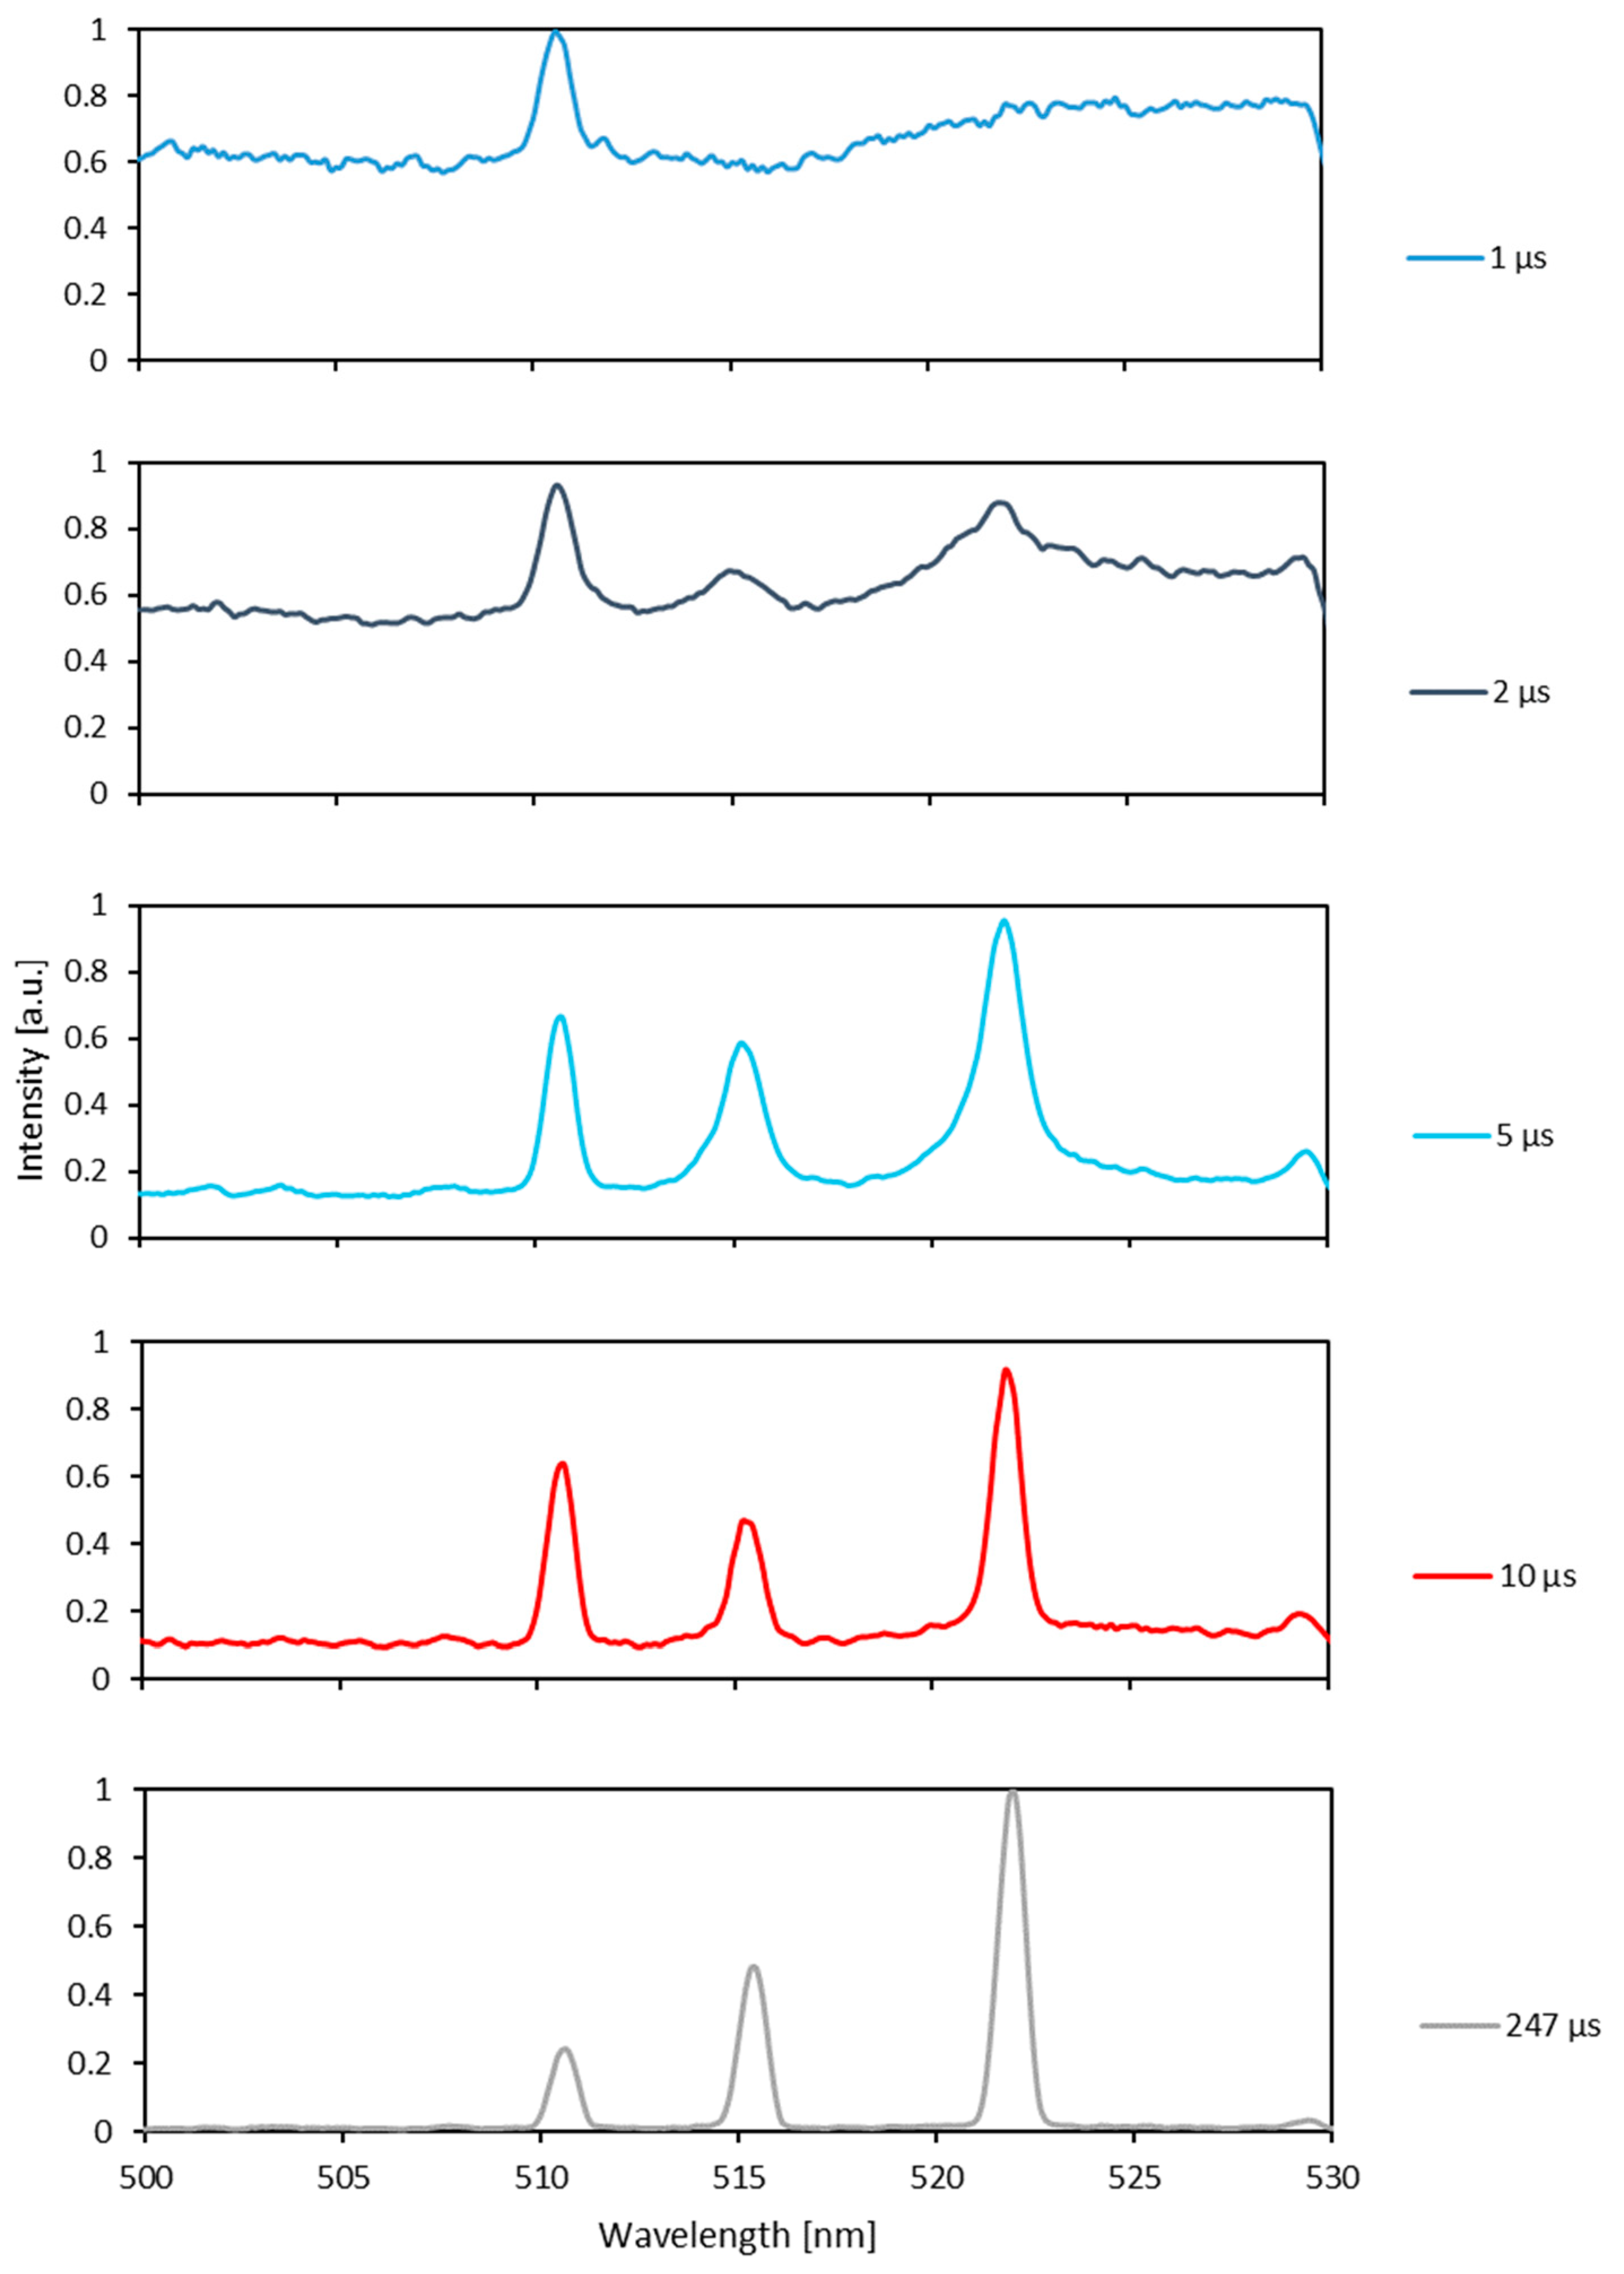
In this Section, the influence of cavity formation on the measured spectral emission of the copper sample is investigated using double-pulse LIBS underwater. This is performed by setting different delays between the first and the second laser pulse. In this way, the second laser pulse, which generates the plasma within the cavity by ablation of the sample surface, reaches the sample at different stages of cavity formation. For each pulse delay set, five measurements were taken, at a pulse energy of 36 mJ (5.39 × 10¹¹ W/cm2) for the first laser pulse and 49 mJ (7.34 × 10¹¹ W/cm2) for the second laser pulse. The measurements were performed at the determined optimal focus position of 0 mm for a pulse energy of 36 mJ. The exposure time of the spectrometer is 1 ms. As explained in the introduction, at high water pressure, the delay between laser pulses must be quite short to generate the plasma before the cavity collapses. Therefore, short pulse delays below 10 µs are particularly investigated for the measurements.
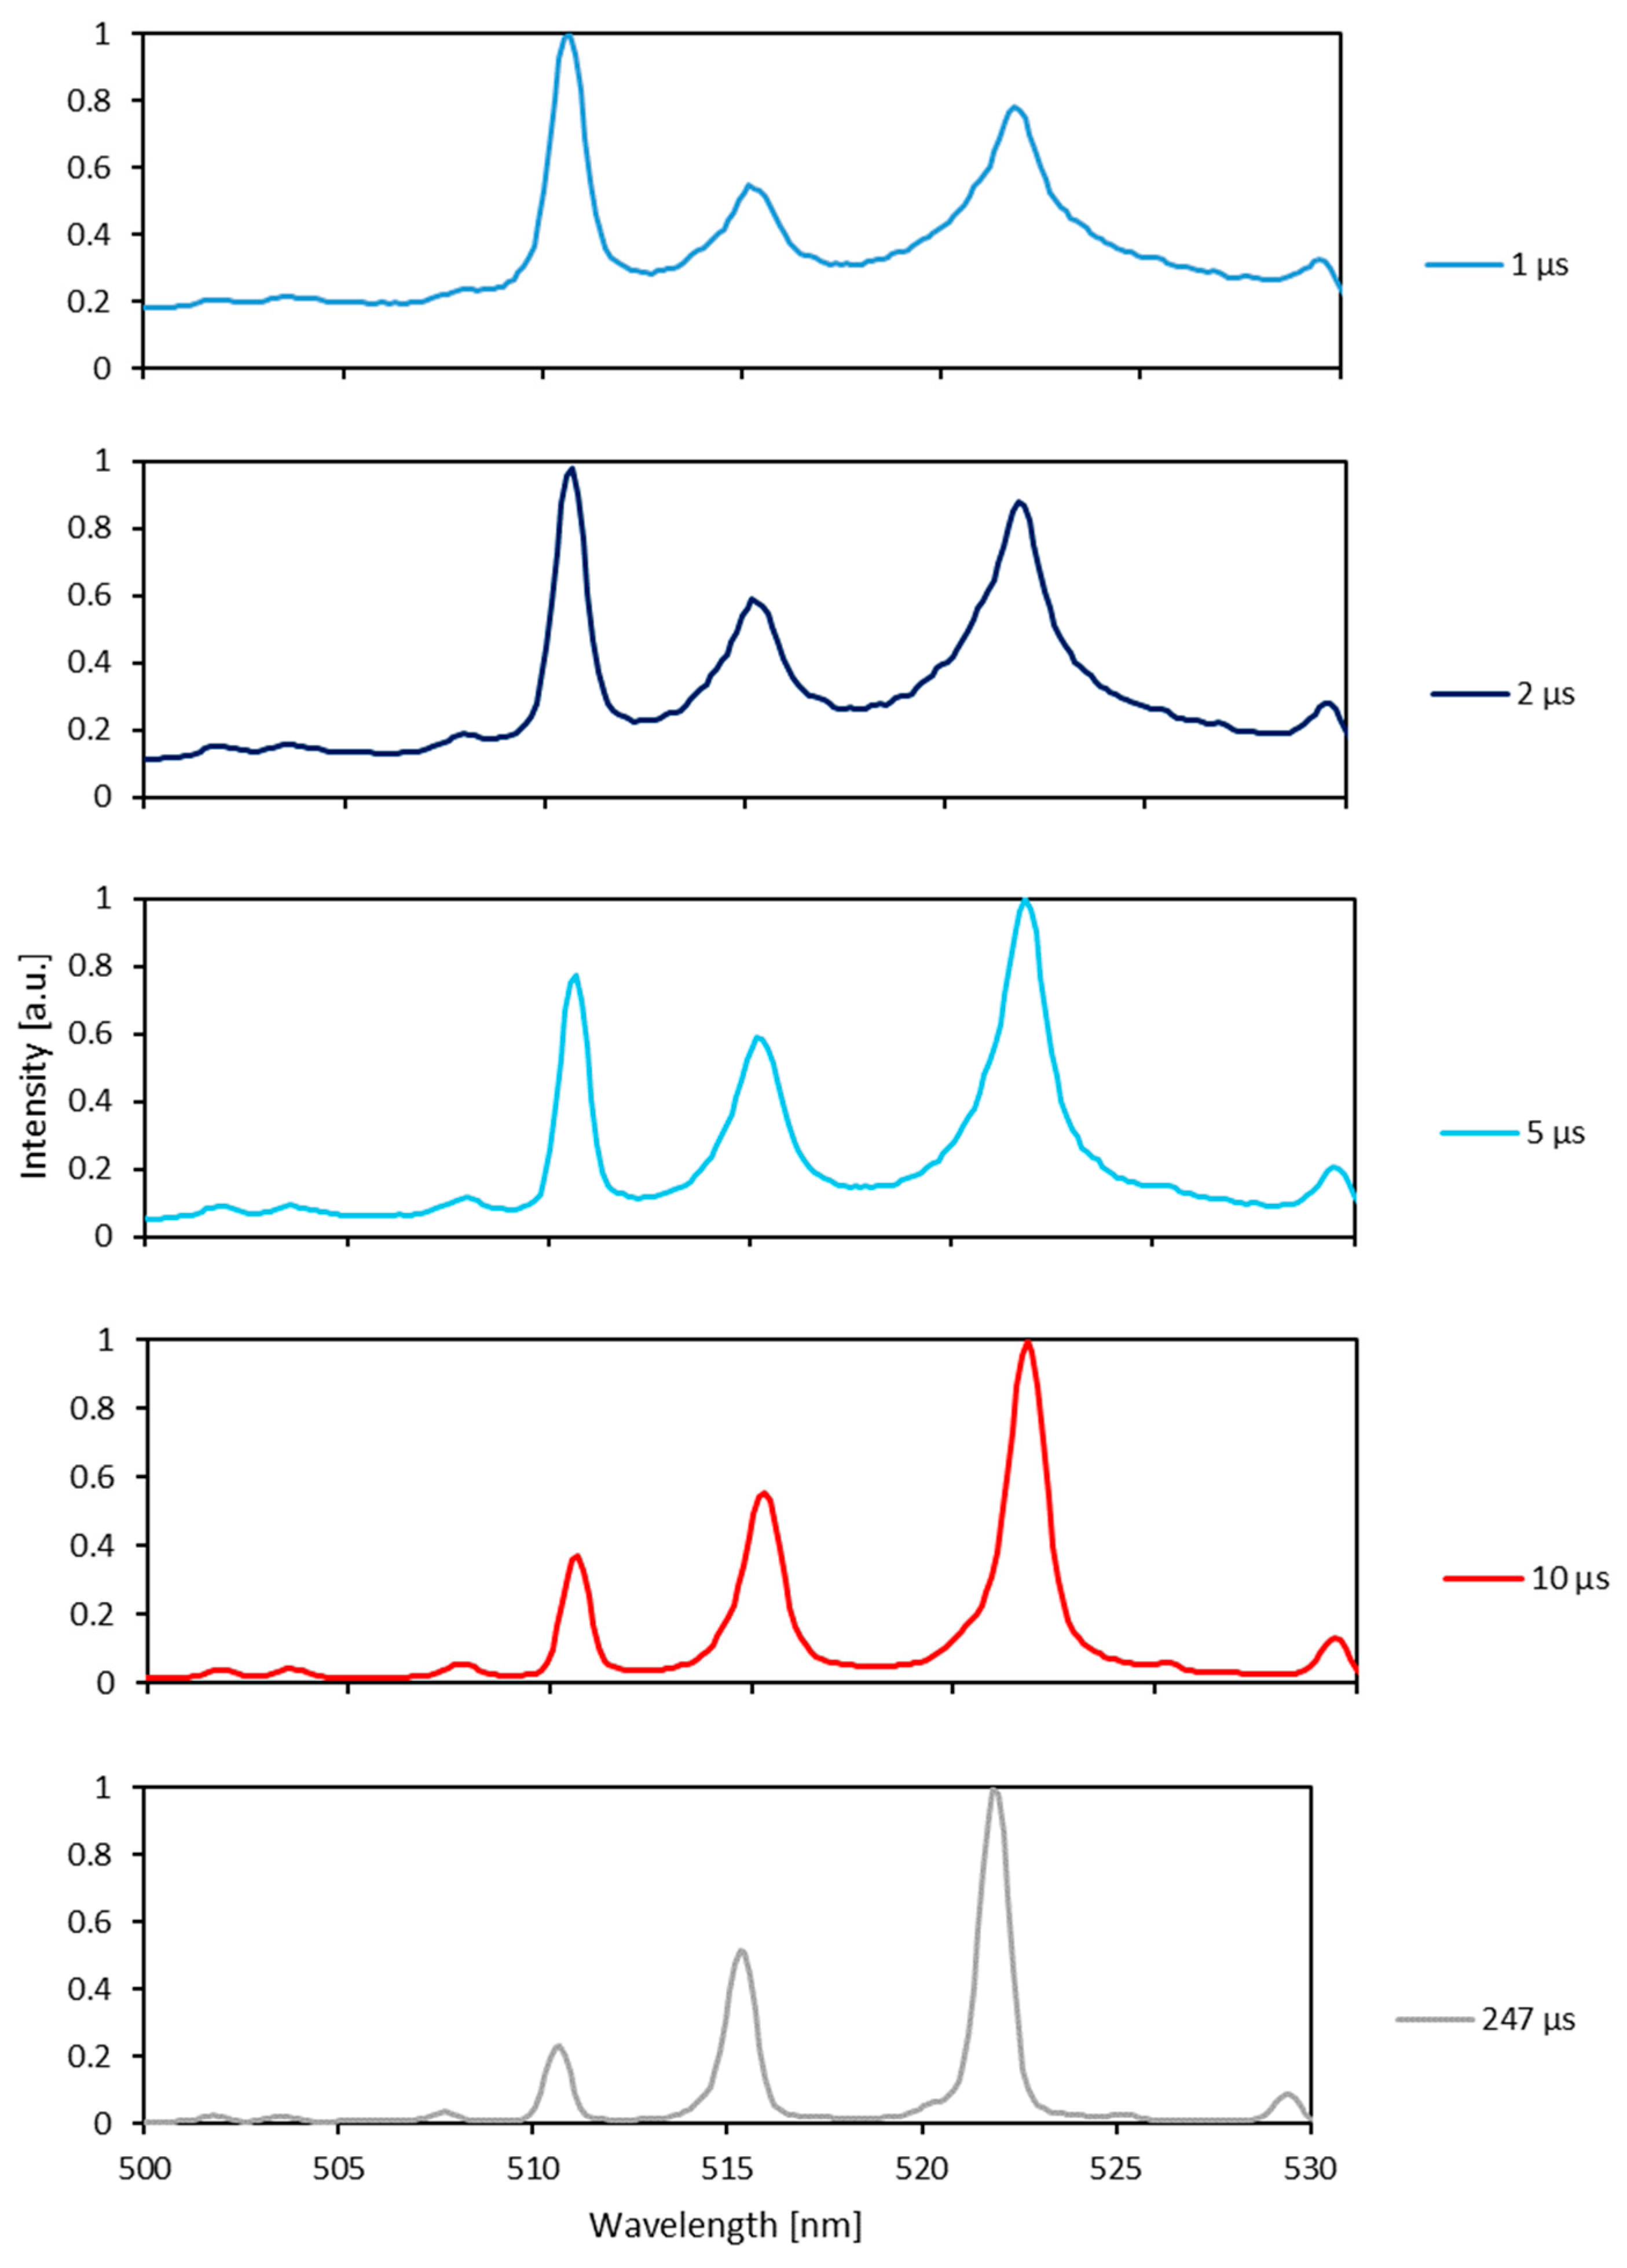
Figure 10 shows spectra for different pulse delays. Generally, they are dominated by several atomic lines of the sample material copper with different line broadening. The intensity is normalized to the maximum intensity of the respective signal. The intensity of the Cu line at 510 nm continuously decreases in comparison to the line at 522 nm, indicating a change in average plasma temperature in the investigated volume.
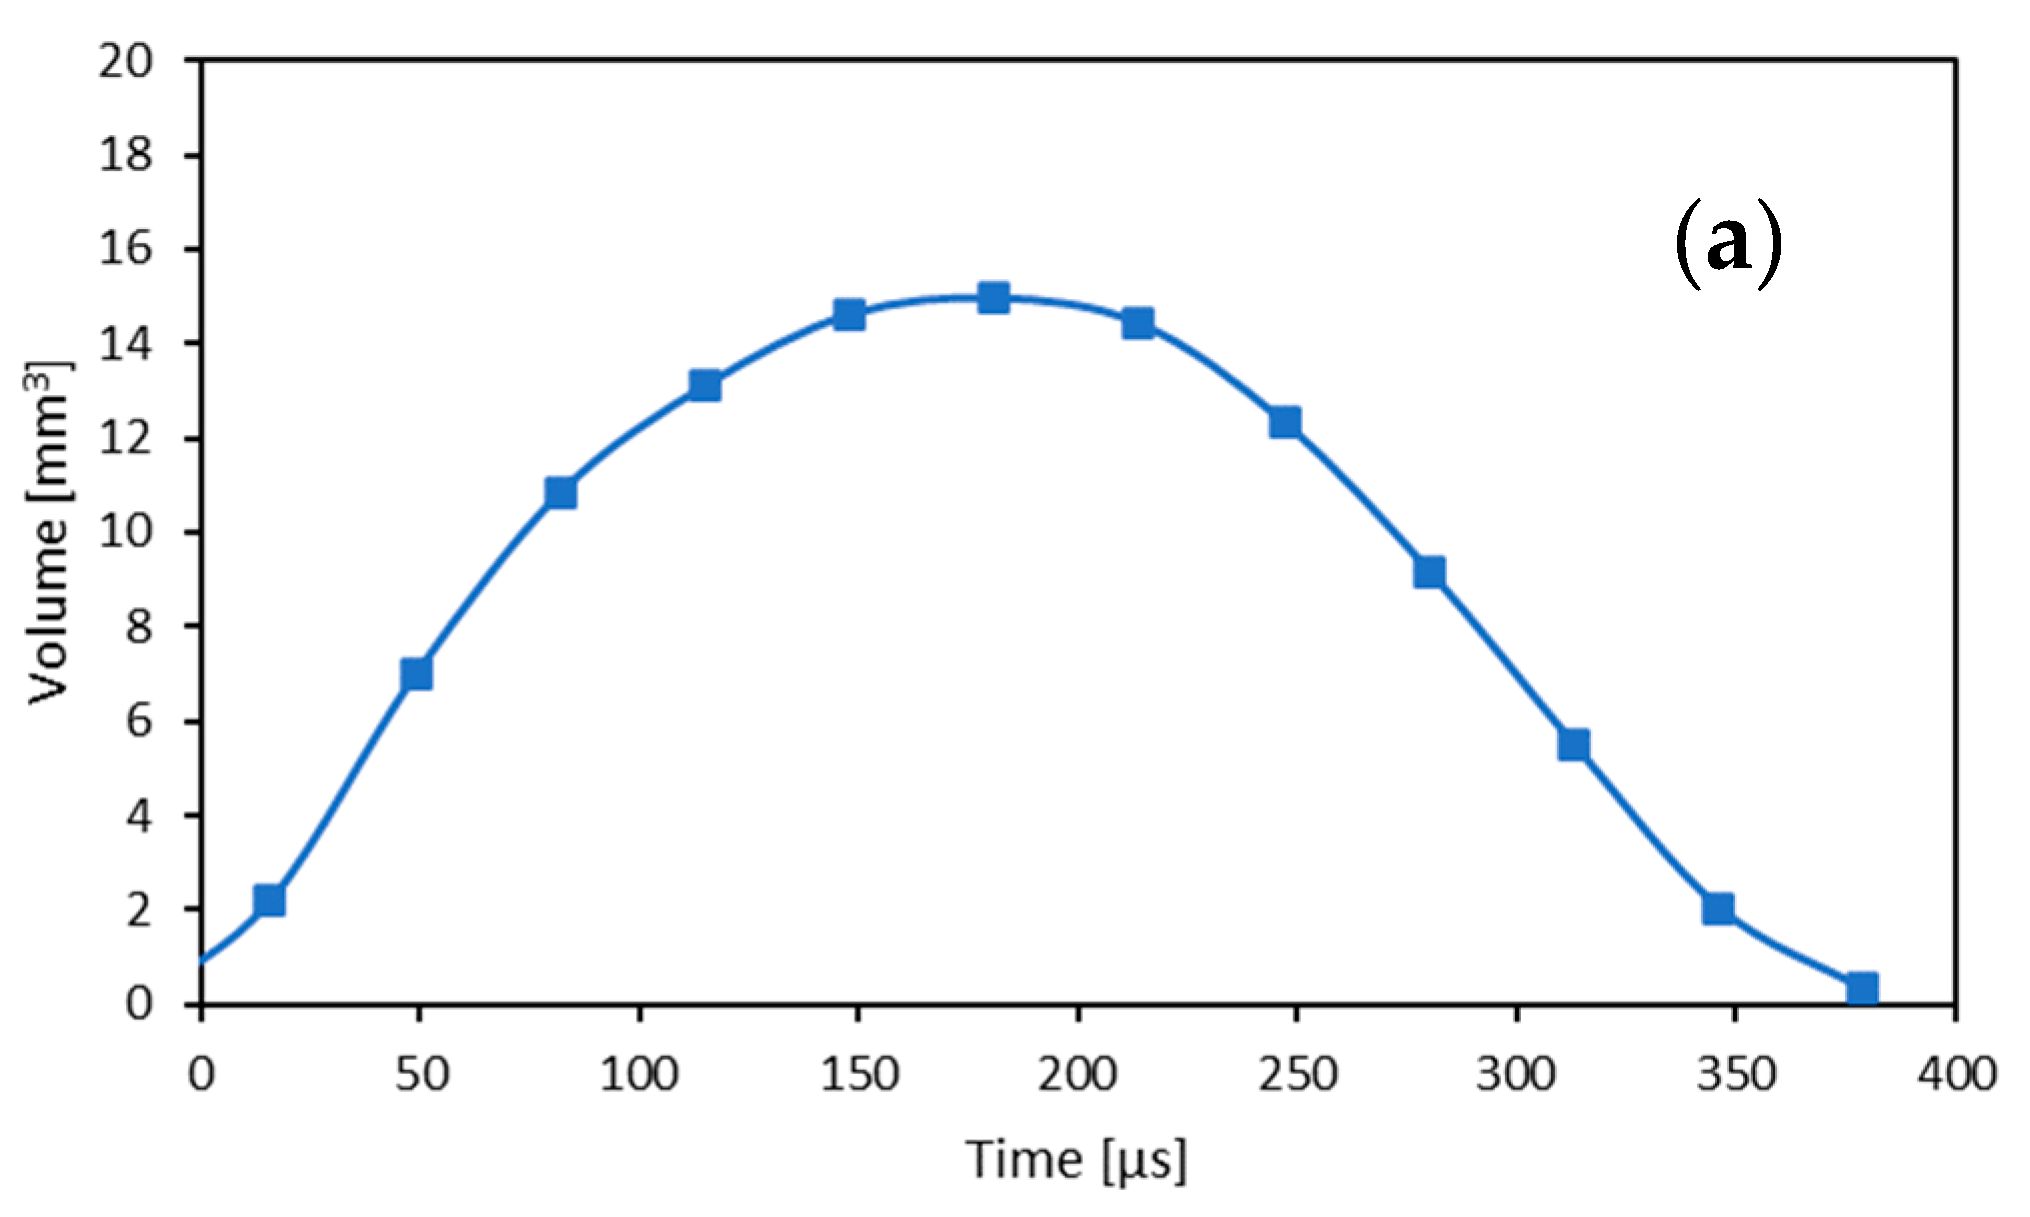
Figure 10 shows that mostly short pulse delays, as required for investigations under high water pressure, lead to a strong line broadening of the measurement signal, which can be explained by the high pressure inside the cavity at the beginning of the expansion. In
Figure 11a, the volume of the cavity is plotted versus time to illustrate the phase of formation of the cavity when different delays are examined for the second laser pulse. For example, with a pulse delay of 100 µs after the first laser pulse, the cavity created by the first laser pulse would have a volume of approximately 12 mm
3 when the second laser pulse reaches the sample surface. While the cavity grows and decays relatively smoothly over a timescale of several hundreds of microseconds, the linewidth of the copper line at 522 nm decreases much faster, as can be seen in
Figure 11b. From a pulse delay of about 50 µs, a final full width at a half maximum of about 0.8 nm is reached, which does not change despite different stages of the cavity. This minimum value corresponds with the apparatus profile of the spectrometer.
Figure 11c shows the plasma temperature and
Figure 11d shows the electron density as a function of the pulse delay. Both lines show the same behavior regarding the transition at about 50 µs and reach their maximum or minimum value here. This can be explained by the fact that the line width in this case depends primarily on Stark broadening and the line width scales linearly with the electron density. From the range in which the plasma temperature no longer changes, an optically thin plasma can be assumed. In the range of the variable temperature, however, there are probably increased plasma pressures, which is why an optically thin plasma or LTE (local thermodynamic equilibrium) can no longer be assumed, which has an unfavorable effect on the evaluation.
To investigate whether a larger maximum volume of the cavity generated by the first laser pulse is advantageous for the spectra obtained using double-pulse LIBS, experiments are carried out with an increased pulse energy of 114 mJ for the first laser pulse. As
Figure 8a shows for the focus position 0 mm, the cavity using a pulse energy of 114 mJ has approximately three times the maximum volume of the cavity using a pulse energy of 36 mJ. For the higher pulse energy of 114 mJ (17.08 × 10
11W/cm
2) for the first laser pulse and a constant second laser pulse energy of 49 mJ (7.34 × 10
11 W/cm
2), a similar dependence is obtained, as shown in
Figure 12, with short pulse delays showing a significantly larger line broadening. However, since quite short pulse delays are required for higher water pressures, the evaluation of the spectrometer signal is further complicated by a higher pulse energy of the first laser pulse due to the larger line broadening at short pulse delays.
5. Conclusions and Outlook
In this study, the influence of pulse energy and laser focus position of a single laser pulse on the cavity’s size and lifetime at shallow water depth has been investigated to gain a basic understanding of cavity formation. In addition, the influence of the pulse delay on the optical emission spectra was investigated using double-pulse LIBS. With up to 266 mJ, significantly higher pulse energies were used compared to previous studies [
14,
17,
18,
19]. To investigate the cavity formation, high-speed images were taken using the shadowgraph technique. The width and height of the cavity were measured to determine the volume at different times.
In the first step, the influence of the focus position on the cavity formation was investigated. It was found that the ideal focus position for achieving the maximum cavity changes depending on the pulse energy. At higher energies, breakdowns in the water occur more frequently, which is why a negative focus position is preferred for pulse energies above 114 mJ. The experiments show that for single pulse energies of up to 266 mJ, there is a significant influence of the focus position on the maximum volume of the cavity. In the next step, the temporal development of the cavity formation as well as the volume change rate were considered. Based on the temporal development, the influence of the pulse energy on the volume of the maximum cavity and the lifetime of the cavity was investigated as well. It was found that the pulse energy has a significant influence on the maximum cavity volume, but only a moderate influence on the cavity lifetime. For example, for focus position −2 mm, about 13 times the cavity volume and about 2 times the lifetime is achieved at a 7-fold higher pulse energy. In contrast, the breakdowns in water, which occur at focus position 0 mm, lead to a smaller increase in volume and lifetime for high energies.
The investigation of the cavity formation directly in the water shows that the cavity spreads out more in the horizontal direction, i.e., along the direction of the incoming laser radiation, for a larger focal length, while the cavity is shaped more spherically for a smaller focal length. A focal length of 50 mm results in an energy density of about 7 J/cm2 (1.17 × 10⁹ W/cm2) and for 75 mm in an energy density of about 13.2 J/cm2 (2.25 × 10⁹ W/cm2).
Finally, the influence of cavity formation on the optical emission spectra using double-pulse LIBS underwater was investigated by varying the pulse delay and the first laser pulse energy. Quite short pulse delays, which are required for investigations under high water pressure, are associated with high pressure inside the cavity and therefore lead to a strong line broadening of the measurement signal. When the pulse energy is increased from 36 mJ (5.39 × 10¹¹ W/cm2) to 114 mJ (17.08 × 10¹¹ W/cm2), the line broadening increases significantly with short pulse delays. Therefore, a high pulse energy of the first laser pulse additionally complicates the evaluation of the spectrometer signal and is therefore not useful for double-pulse LIBS underwater at high pressure.
Based on these results for normal pressure conditions, further investigations under high water pressure up to 60 MPa will be carried out following this paper.
Author Contributions
Conceptualization, M.S. and B.E.; methodology, M.S. and B.E.; data curation, M.S. and M.H.; formal analysis and investigation, M.S.; writing—original draft preparation, M.S.; writing—review and editing, B.E., M.H., R.M., S.F., D.G. and J.H.; funding acquisition, B.E., J.H. and S.F.; supervision, D.G. and J.H. All authors have read and agreed to the published version of the manuscript.
Funding
The investigations were funded by “Deutsche Forschungsgemeinschaft (DFG)” within the research project “Investigation of laser-induced plasma formation in water during double-pulse LIBS at a hydrostatic pressure of 60 MPa (LIBS60)” under project number 454848899 (HE 8492/4-1|FR 3270/4-1).
Data Availability Statement
Conflicts of Interest
The authors declare no conflicts of interest. The funders had no role in the design of the study; in the collection, analyses, or interpretation of data; in the writing of the manuscript; or in the decision to publish the results.
References
- Durden, J.M.; Murphy, K.; Jaeckel, A.; Van Dover, C.L.; Christiansen, S.; Gjerde, K.; Ortega, A.; Jones, D.O.B. A procedural framework for robust environmental management of deep-seamining projects using a conceptual model. Mar. Policy 2017, 84, 193–201. [Google Scholar] [CrossRef]
- Noll, R. Laser-Induced Breakdown Spectroscopy. Fundamentals and Applications; Springer: Berlin/Heidelberg, Germany, 2012. [Google Scholar] [CrossRef]
- Cremers, D.A.; Radziemski, L.J. Handbook of Laser-Induced Breakdown Spectroscopy; John Wiley & Sons, Ltd.: Chichester, UK, 2013. [Google Scholar] [CrossRef]
- Miziolek, A.W.; Palleschi, V.; Schechter, I. Laser-Induced Breakdown Spectroscopy; Cambridge University Press: Cambridge, UK, 2006. [Google Scholar] [CrossRef]
- Musazzi, S.; Perini, U. Laser-Induced Breakdown Spectroscopy: Theory and Applications; Springer: Berlin/Heidelberg, Germany, 2014. [Google Scholar] [CrossRef]
- Hahn, D.W.; Omenetto, N. Laser-induced breakdown spectroscopy (LIBS). Part II: Review of instrumental and methodological approaches to material analysis and applications to different fields. Appl. Spectrosc. 2012, 66, 347–419. [Google Scholar] [CrossRef] [PubMed]
- Sakka, T.; Takatani, K.; Ogata, Y.H.; Mabuchi, M. Laser ablation at the solid-liquid interface: Transient absorption of continuous spectral emission by ablated aluminium atoms. J. Phys. D 2001, 35, 65–73. [Google Scholar] [CrossRef]
- Suzuki, H.; Nishikawa, H.; Lee, I.-Y.S. Laser-induced breakdown spectroscopy at metal–water interfaces. PhysChemComm 2002, 5, 88–90. [Google Scholar] [CrossRef]
- Tsuji, T.; Okazaki, Y.; Tsuboi, Y.; Tsuji, M. Nanosecond time-resolved observations of laser ablation of silver in water. Jpn. J. Appl. Phys. 2007, 46, 1533–1535. [Google Scholar] [CrossRef]
- Matsumoto, A.; Sakka, T. A review of underwater laser-induced breakdown spectroscopy of submerged solids. Anal. Sci. 2021, 37, 1061–1072. [Google Scholar] [CrossRef] [PubMed]
- Thornton, B.; Takahashi, T.; Sato, T.; Sakka, T.; Tamura, A.; Matsumoto, A.; Nozaki, T.; Ohki, T.; Ohki, K. Development of a deep-sea laser-induced breakdown spectrometer for in situ multi-element chemical analysis. Deep Sea Res. I Oceanogr. Res. Pap. 2015, 95, 20–36. [Google Scholar] [CrossRef]
- Pichahchy, A.E.; Cremers, D.A.; Ferris, M.J. Elemental analysis of metals under water using laser-induced breakdown spectroscopy. Spectrochim. Acta B Atom. Spectrosc. 1997, 52, 25–39. [Google Scholar] [CrossRef]
- Lazic, V.; Jovićević, S. Laser induced breakdown spectroscopy inside liquids: Processes and analytical aspects. Spectrochim. Acta B Atom. Spectrosc. 2014, 101, 288–311. [Google Scholar] [CrossRef]
- Thornton, B.; Ura, T. Effects of pressure on the optical emissions observed from solids immersed in water using a single pulse laser. Appl. Phys. Express 2011, 4, 022702. [Google Scholar] [CrossRef]
- Nyga, R.; Neu, W. Double-pulse technique for optical emission spectroscopy of ablation plasmas of samples in liquids. Opt. Lett. 1993, 18, 747–749. [Google Scholar] [CrossRef] [PubMed]
- De Giacomo, A.; Dell’Aglio, M.; Colao, F.; Fantoni, R.; Lazic, V. Double-pulse LIBS in bulk water and on submerged bronze samples. Appl. Surf. Sci. 2005, 247, 157–162. [Google Scholar] [CrossRef]
- Thornton, B.; Sakka, T.; Takahashi, T.; Tamura, A.; Masamura, T.; Matsumoto, A. Spectroscopic Measurements of Solids Immersed in Water at High Pressure Using a Long-Duration Nanosecond Laser Pulse. Appl. Phys. Express 2013, 6, 82401. [Google Scholar] [CrossRef]
- Thornton, B.; Takahashi, T.; Ura, T.; Sakka, T. Cavity Formation and material Ablation for Single-Pulse Laser-Ablated Solids Immersed in Water at High Pressure. Appl. Phys. Express 2012, 5, 102402. [Google Scholar] [CrossRef]
- Emde, B.; Spiekermann, S.; Huse, M.; Hermsdorf, J.; Neumann, J.; Frede, M.; Kaierle, S. Double pulse laser induced breakdown spectroscopy at 600 bar water pressure. Procedia CIRP 2020, 94, 791–795. [Google Scholar] [CrossRef]
- Yaroshchyk, P.; Morrison, R.J.S.; Body, D.; Chadwick, B.L. Theoretical modeling of optimal focusing conditions using laser-induced breakdown spectroscopy in liquid jets. Appl. Spectrosc. 2004, 58, 1353–1359. [Google Scholar] [CrossRef] [PubMed]
- Zhang, Z.; Wu, J.; Li, J.; Yan, W.; Jiangbo, Z.; Qiu, Y.; Li, X.; Qiu, A. Spatial restriction on properties of nanosecond pulsed laser ablation of aluminum in water. J. Phys. D 2020, 53, 475204. [Google Scholar] [CrossRef]
- Lazic, V.; Laserna, J.; Jovičević, S. Insights in the laser-induced breakdown spectroscopy signal generation underwater using dual pulse excitation—Part I: Vapor bubble, shockwaves and plasma. Spectrochim. Acta B Atom. Spectrosc. 2013, 82, 42–49. [Google Scholar] [CrossRef]
Figure 1.
Schematic experimental setup for double-pulse laser-induced breakdown spectroscopy (LIBS) at shallow water depth.
Figure 1.
Schematic experimental setup for double-pulse laser-induced breakdown spectroscopy (LIBS) at shallow water depth.
Figure 2.
Scheme for adjusting the focus position.
Figure 2.
Scheme for adjusting the focus position.
Figure 3.
Cavities at different times at a pulse energy of 36 mJ using shadowgraph imaging. For the case of 214 µs the definition of the cavity’s height and width is shown. Parameters: focus position: 0 mm, focal length: 50 mm, first laser pulse energy: 36 mJ, exposure time: 1 µs.
Figure 3.
Cavities at different times at a pulse energy of 36 mJ using shadowgraph imaging. For the case of 214 µs the definition of the cavity’s height and width is shown. Parameters: focus position: 0 mm, focal length: 50 mm, first laser pulse energy: 36 mJ, exposure time: 1 µs.
Figure 4.
Influence of focus position on cavity formation for different pulse energies. Time instant of the maximum size of the cavity. Focal length: 50 mm, exposure time: 1 µs.
Figure 4.
Influence of focus position on cavity formation for different pulse energies. Time instant of the maximum size of the cavity. Focal length: 50 mm, exposure time: 1 µs.
Figure 5.
Volume of the cavity as a function of optimal focus position for different pulse energies and focal length of (a) 50 mm and (b) 75 mm. The red circles indicate the maximum cavities.
Figure 5.
Volume of the cavity as a function of optimal focus position for different pulse energies and focal length of (a) 50 mm and (b) 75 mm. The red circles indicate the maximum cavities.
Figure 6.
Volume of the cavity as a function of time for different pulse energies for focus position (a) 0 mm, (b) −2 mm, and (c) −4 mm.
Figure 6.
Volume of the cavity as a function of time for different pulse energies for focus position (a) 0 mm, (b) −2 mm, and (c) −4 mm.
Figure 7.
Volume change rate of the cavity for focus position (a) 0 mm and (b) −2 mm.
Figure 7.
Volume change rate of the cavity for focus position (a) 0 mm and (b) −2 mm.
Figure 8.
Influence of pulse energy on cavity’s (a) maximum volume and (b) lifetime for different focus positions.
Figure 8.
Influence of pulse energy on cavity’s (a) maximum volume and (b) lifetime for different focus positions.
Figure 9.
Cavity formation directly in water for different times with different pulse energies E and focal lengths f. Exposure time: 3 µs. The red arrows indicate the distance of the first breakdown, the green arrows indicate the breakdowns and the blue areas indicate the shape of the cavity for the different focal lengths of 50 mm and 75 mm.
Figure 10.
Spectra for first laser pulse energy of 36 mJ and second laser pulse energy of 49 mJ at different pulse delays of 1 µs, 2 µs, 5 µs, 10 µs and 247 µs (top to bottom). Spectrometer exposure time: 1 ms.
Figure 10.
Spectra for first laser pulse energy of 36 mJ and second laser pulse energy of 49 mJ at different pulse delays of 1 µs, 2 µs, 5 µs, 10 µs and 247 µs (top to bottom). Spectrometer exposure time: 1 ms.
Figure 11.
Cavity volume after the first laser pulse at different times of cavity formation (a), line width (full width at half maximum, FWHM) (b), plasma temperature (c) and electron density (d) for characteristic line at 522 nm with the first laser pulse energy of 36 mJ and the second laser pulse energy of 49 mJ for different pulse delays.
Figure 12.
Spectra for first laser pulse energy of 114 mJ and second laser pulse energy of 49 mJ at different pulse delays of 1 µs, 2 µs, 5 µs, 10 µs and 247 µs (top to bottom). Spectrometer exposure time: 1 ms.
Figure 12.
Spectra for first laser pulse energy of 114 mJ and second laser pulse energy of 49 mJ at different pulse delays of 1 µs, 2 µs, 5 µs, 10 µs and 247 µs (top to bottom). Spectrometer exposure time: 1 ms.
Table 1.
Intensities of different combinations of pulse energy, focus position and focal length (f).
Table 1.
Intensities of different combinations of pulse energy, focus position and focal length (f).
| Focus Position [mm] | f [mm] | Pulse Energy [mJ] |
|---|
| 36 | 114 | 188 | 266 |
|---|
| 0 | 50 | | | | |
| 75 | | | | |
| −2 | 50 | | | | |
| 75 | | | | |
| −4 | 50 | | | | |
| 75 | | | | |
| Disclaimer/Publisher’s Note: The statements, opinions and data contained in all publications are solely those of the individual author(s) and contributor(s) and not of MDPI and/or the editor(s). MDPI and/or the editor(s) disclaim responsibility for any injury to people or property resulting from any ideas, methods, instructions or products referred to in the content. |
© 2024 by the authors. Licensee MDPI, Basel, Switzerland. This article is an open access article distributed under the terms and conditions of the Creative Commons Attribution (CC BY) license (https://creativecommons.org/licenses/by/4.0/).

 ,
, 


