
Demonstration of Dynamics of Nanosecond Discharge in Liquid Water Using Four-Channel Time-Resolved ICCD Microscopy


Department of Pulse Plasma Systems, Institute of Plasma Physics of the Czech Academy of Sciences (IPP CAS), 18200 Prague, Czech Republic
*
Authors to whom correspondence should be addressed.
Plasma 2021, 4(1), 183-200; https://doi.org/10.3390/plasma4010011
Submission received: 22 January 2021
/
Revised: 22 February 2021
/
Accepted: 11 March 2021
/
Published: 16 March 2021
Abstract
:The microscopic physical mechanisms of micro-discharges produced in liquid waters by nanosecond high-voltage pulses are quite complex phenomena, and relevant coherent experimentally supported theoretical descriptions are yet to be provided. In this study, by combining a long-distance microscope with a four-channel image splitter fitted with four synchronised intensified charge-coupled device detectors, we obtained and analysed sequences of microscopic discharge images acquired with sub-nanosecond temporal resolution during a single event. We tracked luminous filaments either through monochromatic images at two specific wavelengths (532 and 656 nm) or through broadband integrated UV–vis–near infrared (NIR) discharge emission. An analysis of the sequences of images capturing discharge filaments in subsequent time windows facilitated the tracking of movement of the luminous fronts during their expansion. The velocity of expansion progressively decreased from the maximum of ~2.3 × 10⁵ m/s observed close to the anode pin until the propagation stopped due to the drop in the anode potential. We demonstrate the basic features characterising the development of the luminous discharge filaments. Our study provides an important insight into the dynamics of micro-discharges during the primary and successive reflected high-voltage pulses in de-ionised water.
1. Introduction
The initiation and formation of micro-discharges in liquid water driven by nanosecond high-voltage (HV) pulses are conditioned by the ultrafast (fs/ps) response of the structure of the H-bonded matrix to very high (~GV/m) non-uniform transient electric fields. The physical processes behind very likely include the collective re-orientation of individual molecular dipoles and the subsequent disruption of the cohesion due to the ponderomotive electrostrictive forces followed by the formation of nanovoids and the multiplication of charged species [1,2,3,4,5,6,7,8,9,10]. Experiments performed using extremely short pulses (~100 ps) have shown that discharges in liquid water can be formed in the absence of formation of gas bubbles and with minimal thermal effects [3,11]. However, a relevant coherent theoretical description supported by the unambiguous and undisputable experimental demonstration is still missing. From an experimental point of view, such a lack of description is conditioned by the sub-micrometre and sub-nanosecond scales associated with the events and the stochastic and irreproducible nature of filamentary discharge structures often studied under insufficient spatio-temporal resolutions. The poor event-to-event spatial reproducibility of the bush-like/tree-like dark/luminous discharge structures makes the use of diagnostic techniques challenging and requires the acquisition of data from a large number of events to draw conclusions based on the statistical averaging of parameters evaluated from different events.
For example, in our recent studies, we employed time-resolved emission and shadowgraphic microscopy to reveal fundamental morphologic signatures and estimated the average propagation velocity of expanding dark and luminous filaments [7,8,12]. We established that the dark or non-luminous discharge event is initiated at a certain delay after the onset of the HV pulse through a few isolated, tiny tree-like structures emerging from the surface of the anode tip. Subsequently, they continue growing and branching at an average velocity of ~1 × 10⁵–2 × 10⁵ m/s, forming dense bush-like structures made of thin (characteristic diameter of ≤1 μm) hair-like filaments. The dark discharge event is followed nearly simultaneously (with characteristic delay of several hundreds of picosecond and propagation velocity of ~2 × 10⁵ m/s) by the luminous discharge events, revealing a much simpler tree-like morphology determined by the extension of non-luminous bush-like structures and visually characterized by larger diameters (several tens of micrometres) of luminous filaments.
Notably, all the aforementioned conclusions were drawn after processing and analysing hundreds of microscopic images (acquired either in the emission, interferometric or shadowgraphic modes) exclusively obtained as one image acquired from a triggered discharge event. Furthermore, in [9], we demonstrated that water needs to be carefully degassed to exclude bubble-assisted discharge events, even when working with single HV pulses. This approach makes a fundamental difference compared with the experimental findings reported by other authors and obtained through experiments performed by discharging non-degassed water and often employing a periodic regime (the HV pulses applied continuously with repetition rates ≥1 Hz) [3,5,13,14], which necessarily increases the probability of occurrence of the bubble-assisted mechanism [15,16,17,18,19,20].
In this study, we demonstrate the basic features characterising the development of luminous filaments. Such a demonstration was facilitated by combining a long-distance microscope with a four-channel image splitter fitted with four synchronised intensified charge-coupled device (ICCD) detectors, registering four magnified images per event. For the first time, we obtained and analysed sequences of ICCD microscopic images acquired during the evolution of isolated single discharge events with sub-nanosecond temporal resolution, as described in Section 2. In Section 3, we analyse sequences of four time-resolved ICCD images acquired by synchronising the intensifier gates of the individual ICCD detectors with the HV pulse that reflect selected phases within any single triggered discharge event. A comprehensive summary of the dynamics of the luminous discharge phase developing in liquid water, as evidenced in the present study, is presented in Section 4.
2. Experimental Setup and Methods
2.1. Discharge Reactor
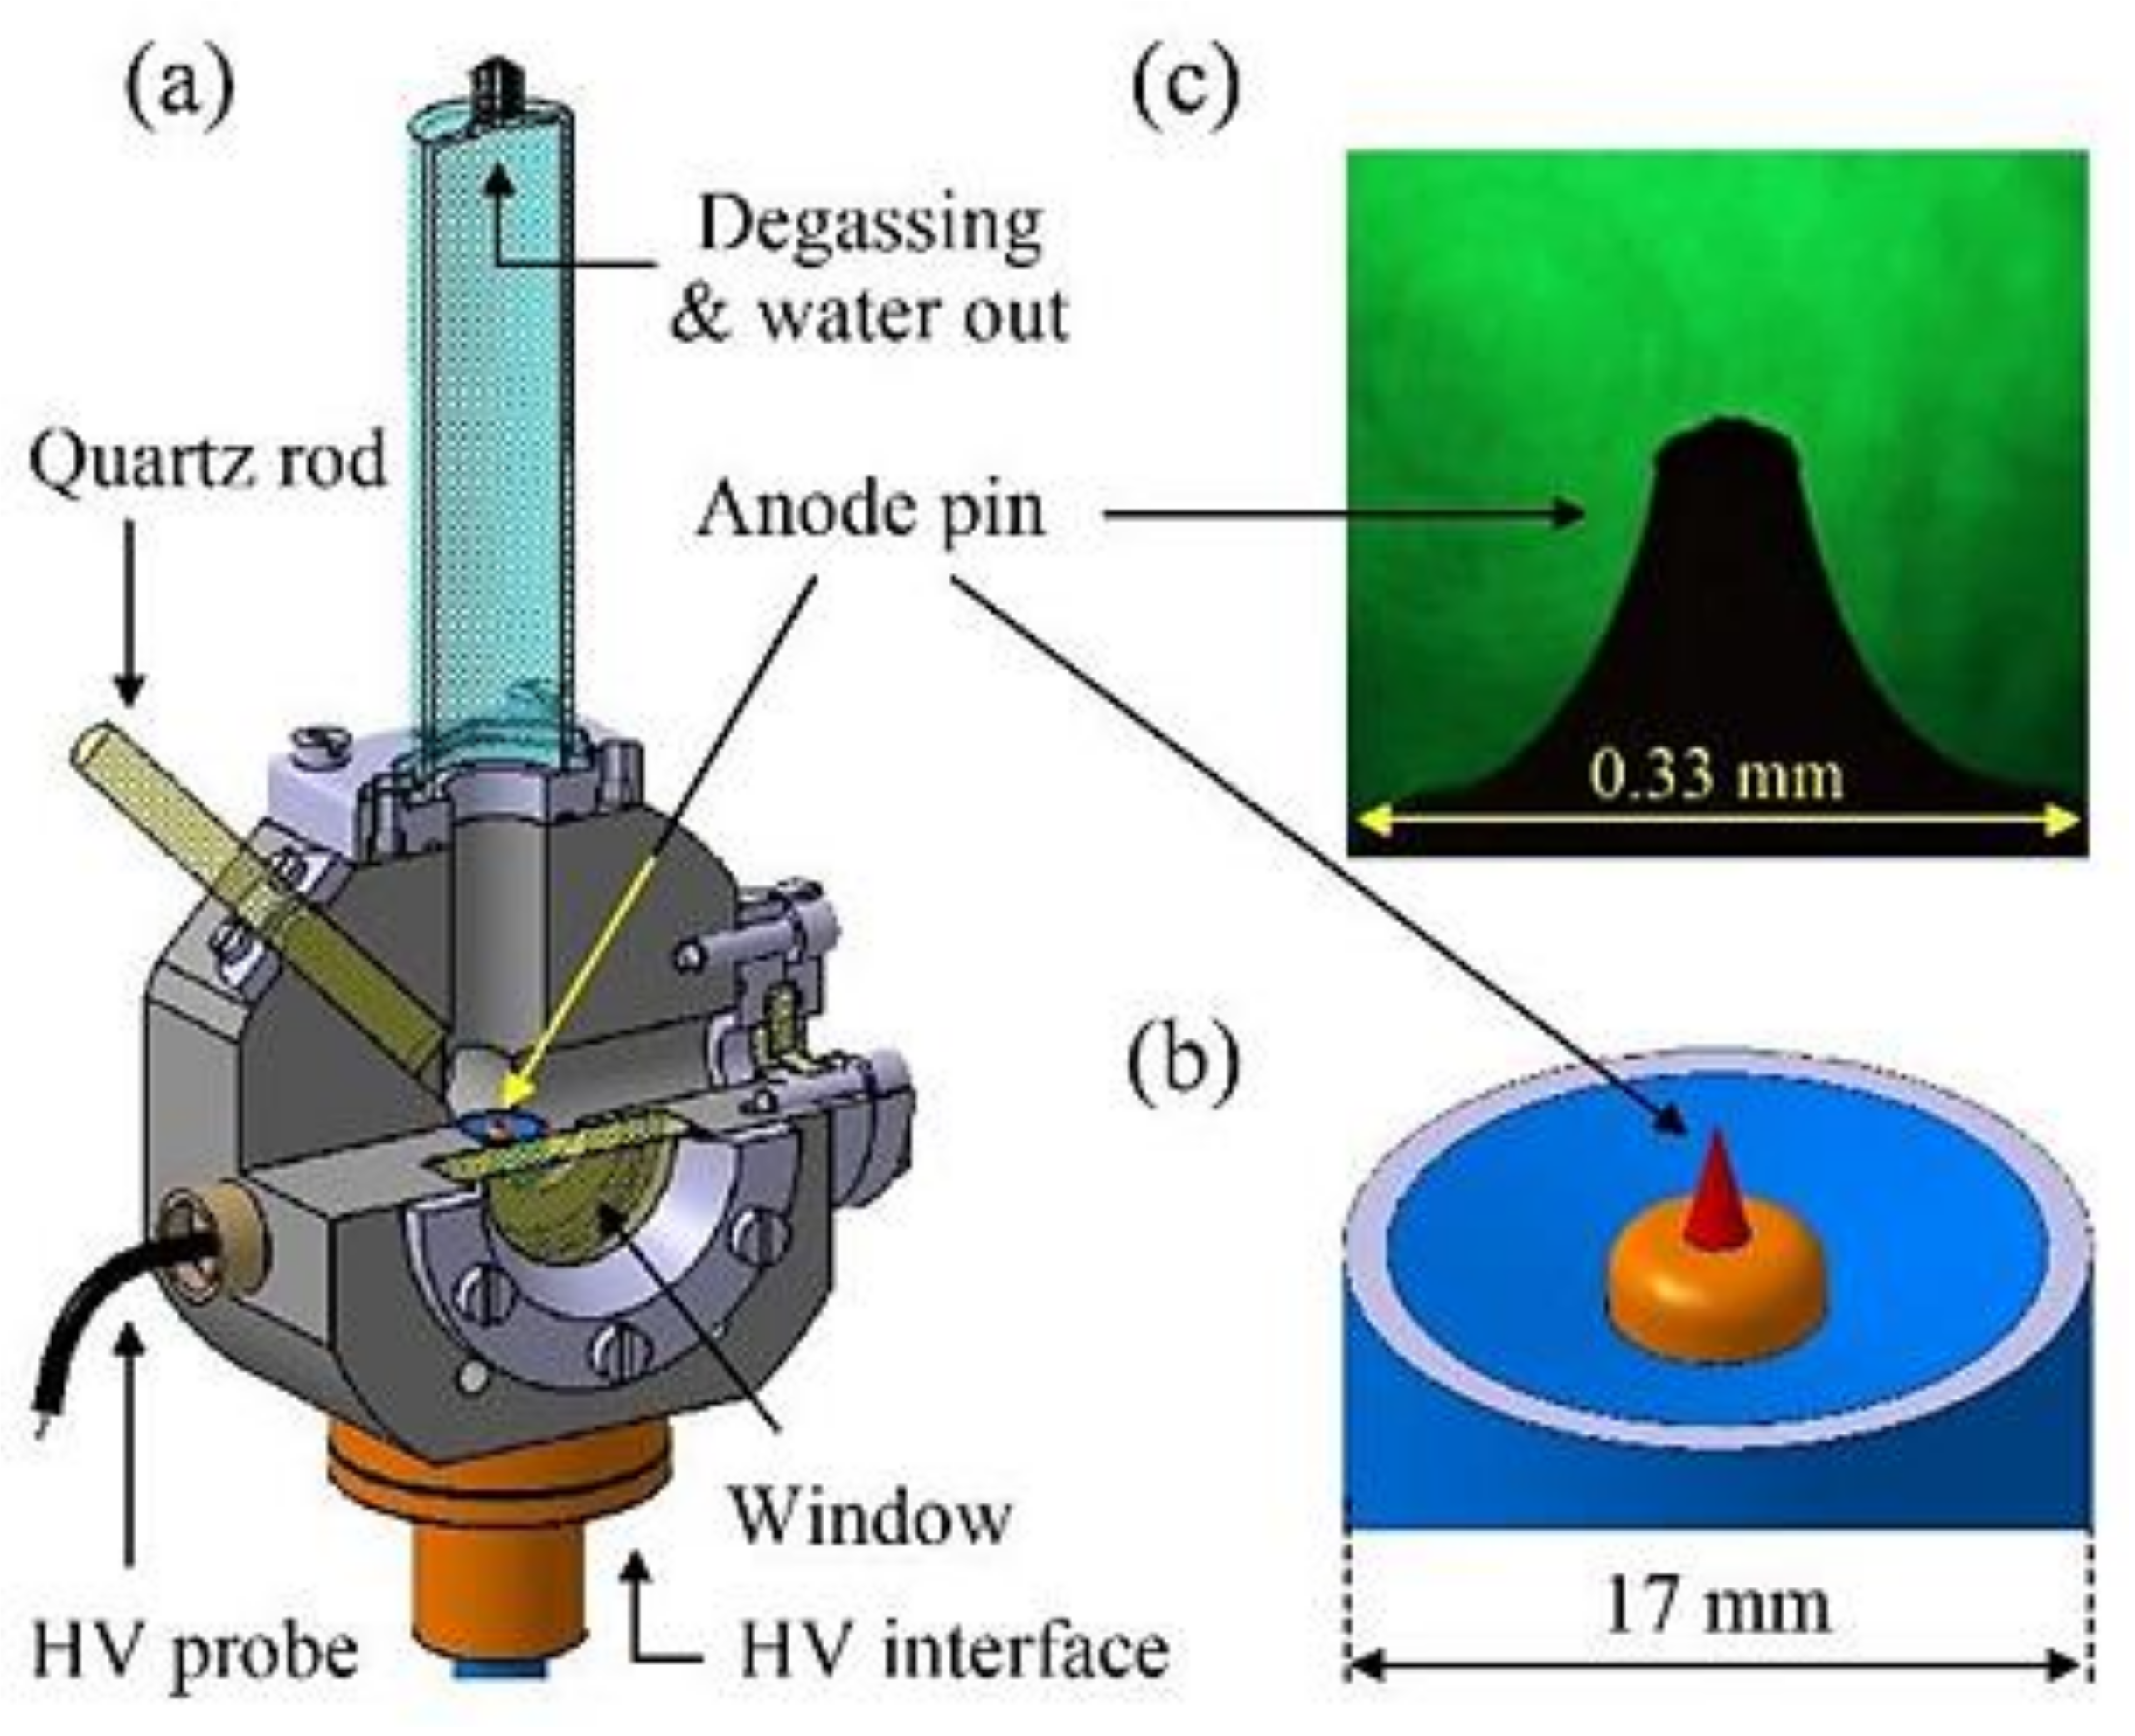
We conducted the present experiments using the discharge reactor described in detail in recent works [9,10,12] and illustrated in Figure 1. The discharge reactor consists of a stainless-steel body equipped with HV and capacitive probe interfaces, optical windows, and a combined inlet/outlet for the working liquid. The electrode system used in this study was composed of an electrochemically sharpened tungsten anode pin and grounded metallic chamber walls. We used the hyperboloid-like anode pin applied in [12] with a slightly more flattened tip, owing to progressive consumption caused by thousands of shots. The anode was stressed using positive nanosecond HV pulses transmitted through a coaxial cable. The primary HV pulse at the anode side results from a superposition of the forward and reflected HV waveforms [9]. The full width at half maximum (FWHM) duration of the HV waveform is ~7 ns with a rise time of ~3.5 ns. After passing the peak value, the HV pulse decays to ~25% of the amplitude in ~4 ns. Subsequently, the initial fast decay slows down, and the pulse reaches zero after a long plateau of ~10 ns. A capacitive probe monitors the HV waveforms delivered to the pin anode.
The HV pulse power generator FPG 150-01NM6 (FID Technology GmbH), produced short positive HV pulses (with an amplitude of 160 kV at the unmatched anode side) that were delivered to the discharge reactor through a 2.9 m long HV coaxial cable in a single-shot regime. This regime was exclusively used in this study to ensure that no micro-bubbles remained in the vicinity or on the surface of the anode, thus facilitating the bubble-assisted breakdown mechanism. Pre-degassed de-ionised (DI) water was supplied to the chamber, and an additional degassing cycle was performed before applying an HV pulse. One working cycle typically consisted of 10 s of vacuum pumping followed by 5 s of the aeration of the chamber, followed by a single discharge event and data acquisition/storage. Additionally, after 50 consecutive shots, the discharge chamber was refilled with ‘fresh’ pre-degassed DI water to avoid the drift of the initial conductivity/temperature of the water (compared with the initial conductivity of ~1 μS/cm, the conductivity of the discharged water never exceeded ~3 μS/cm).
2.2. Diagnostics and Data Acquisition
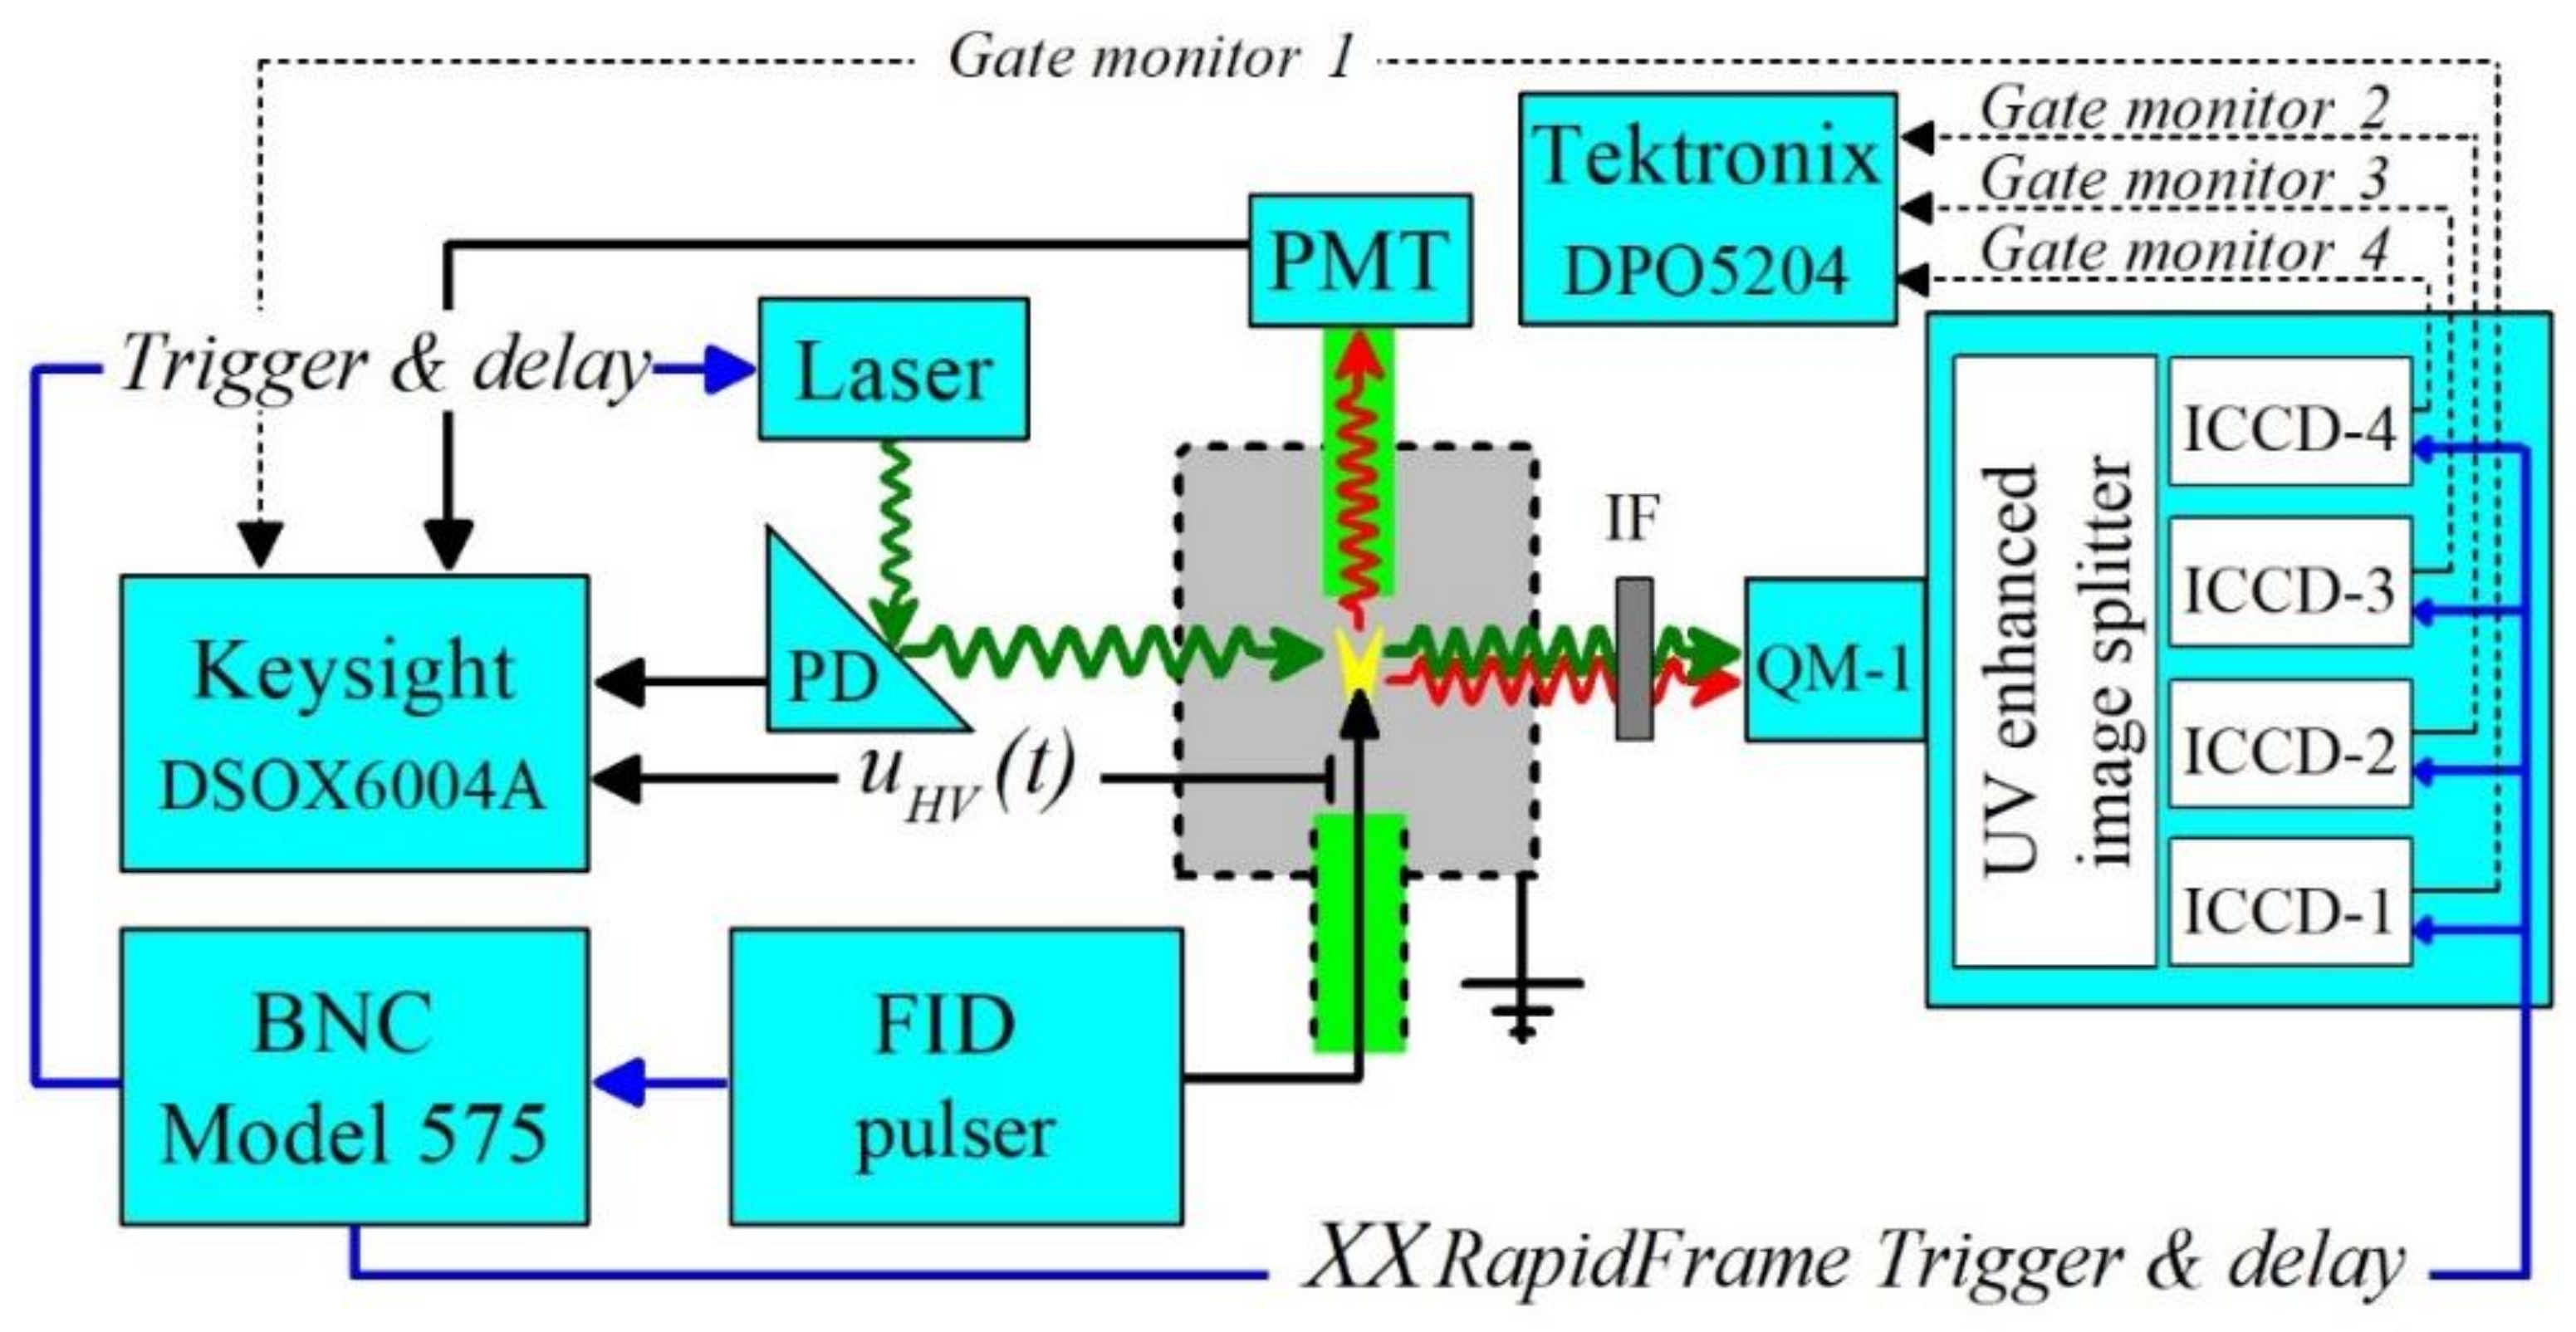
The block scheme of the complete diagnostic setup is shown in Figure 2. The imaging system was made of a Questar QM-1 long-distance microscope and Stanford Computer Optics high-speed four-channel framing camera XXRapidFrame. The XXRapidFrame consists of a single optical input, UV-enhanced mirror-based image splitter, and four ICCD (4-Picos) cameras. The image splitter guarantees a flat spectral response over the UV, visible, and near infrared (NIR) ranges and splits the arriving flux of photons equally among the four exit channels (Ch1–Ch4). Each ICCD detector is equipped with an 18 mm dual-stage microchannel plate (MCP) image intensifier (S20 photocathode) allowing the acquisition of time-resolved images taken with a pre-selected MCP gating time (a minimum nominal gating time of 200 ps). This enables the registration of four successive time-resolved images taken with a required frame rate.
The Katana-05 (Onefive) laser system (with a pulse duration of 35 ps and a pulse energy of 6.4 nJ at 532 nm) was used for the timing/synchronisation purposes and as the backlight for acquiring shadowgraphic images of the anode pin and verifying the timing of the imaging experiments. The laser beam was directed to the discharge reactor chamber via mirrors, and a small fraction of the laser beam was registered using a fast photodiode (PD, FDS015 Thorlabs, a rise time 35 ps), which serves as a precise time-stamp for calibrating the delay of the acquired images with respect to the onset of the HV pulse (and the relative positions of the Ch1–Ch4 ICCD gates). A fast photomultiplier (PMT, Photek PMT210) was used to calibrate the delays of the emission produced by the discharge events with respect to the onset of the HV pulse (and with respect to all the ICCD gates). The block scheme in Figure 2 also shows an interference filter (IF) used to adjust the relative intensities of the laser and discharge emission when acquired simultaneously.
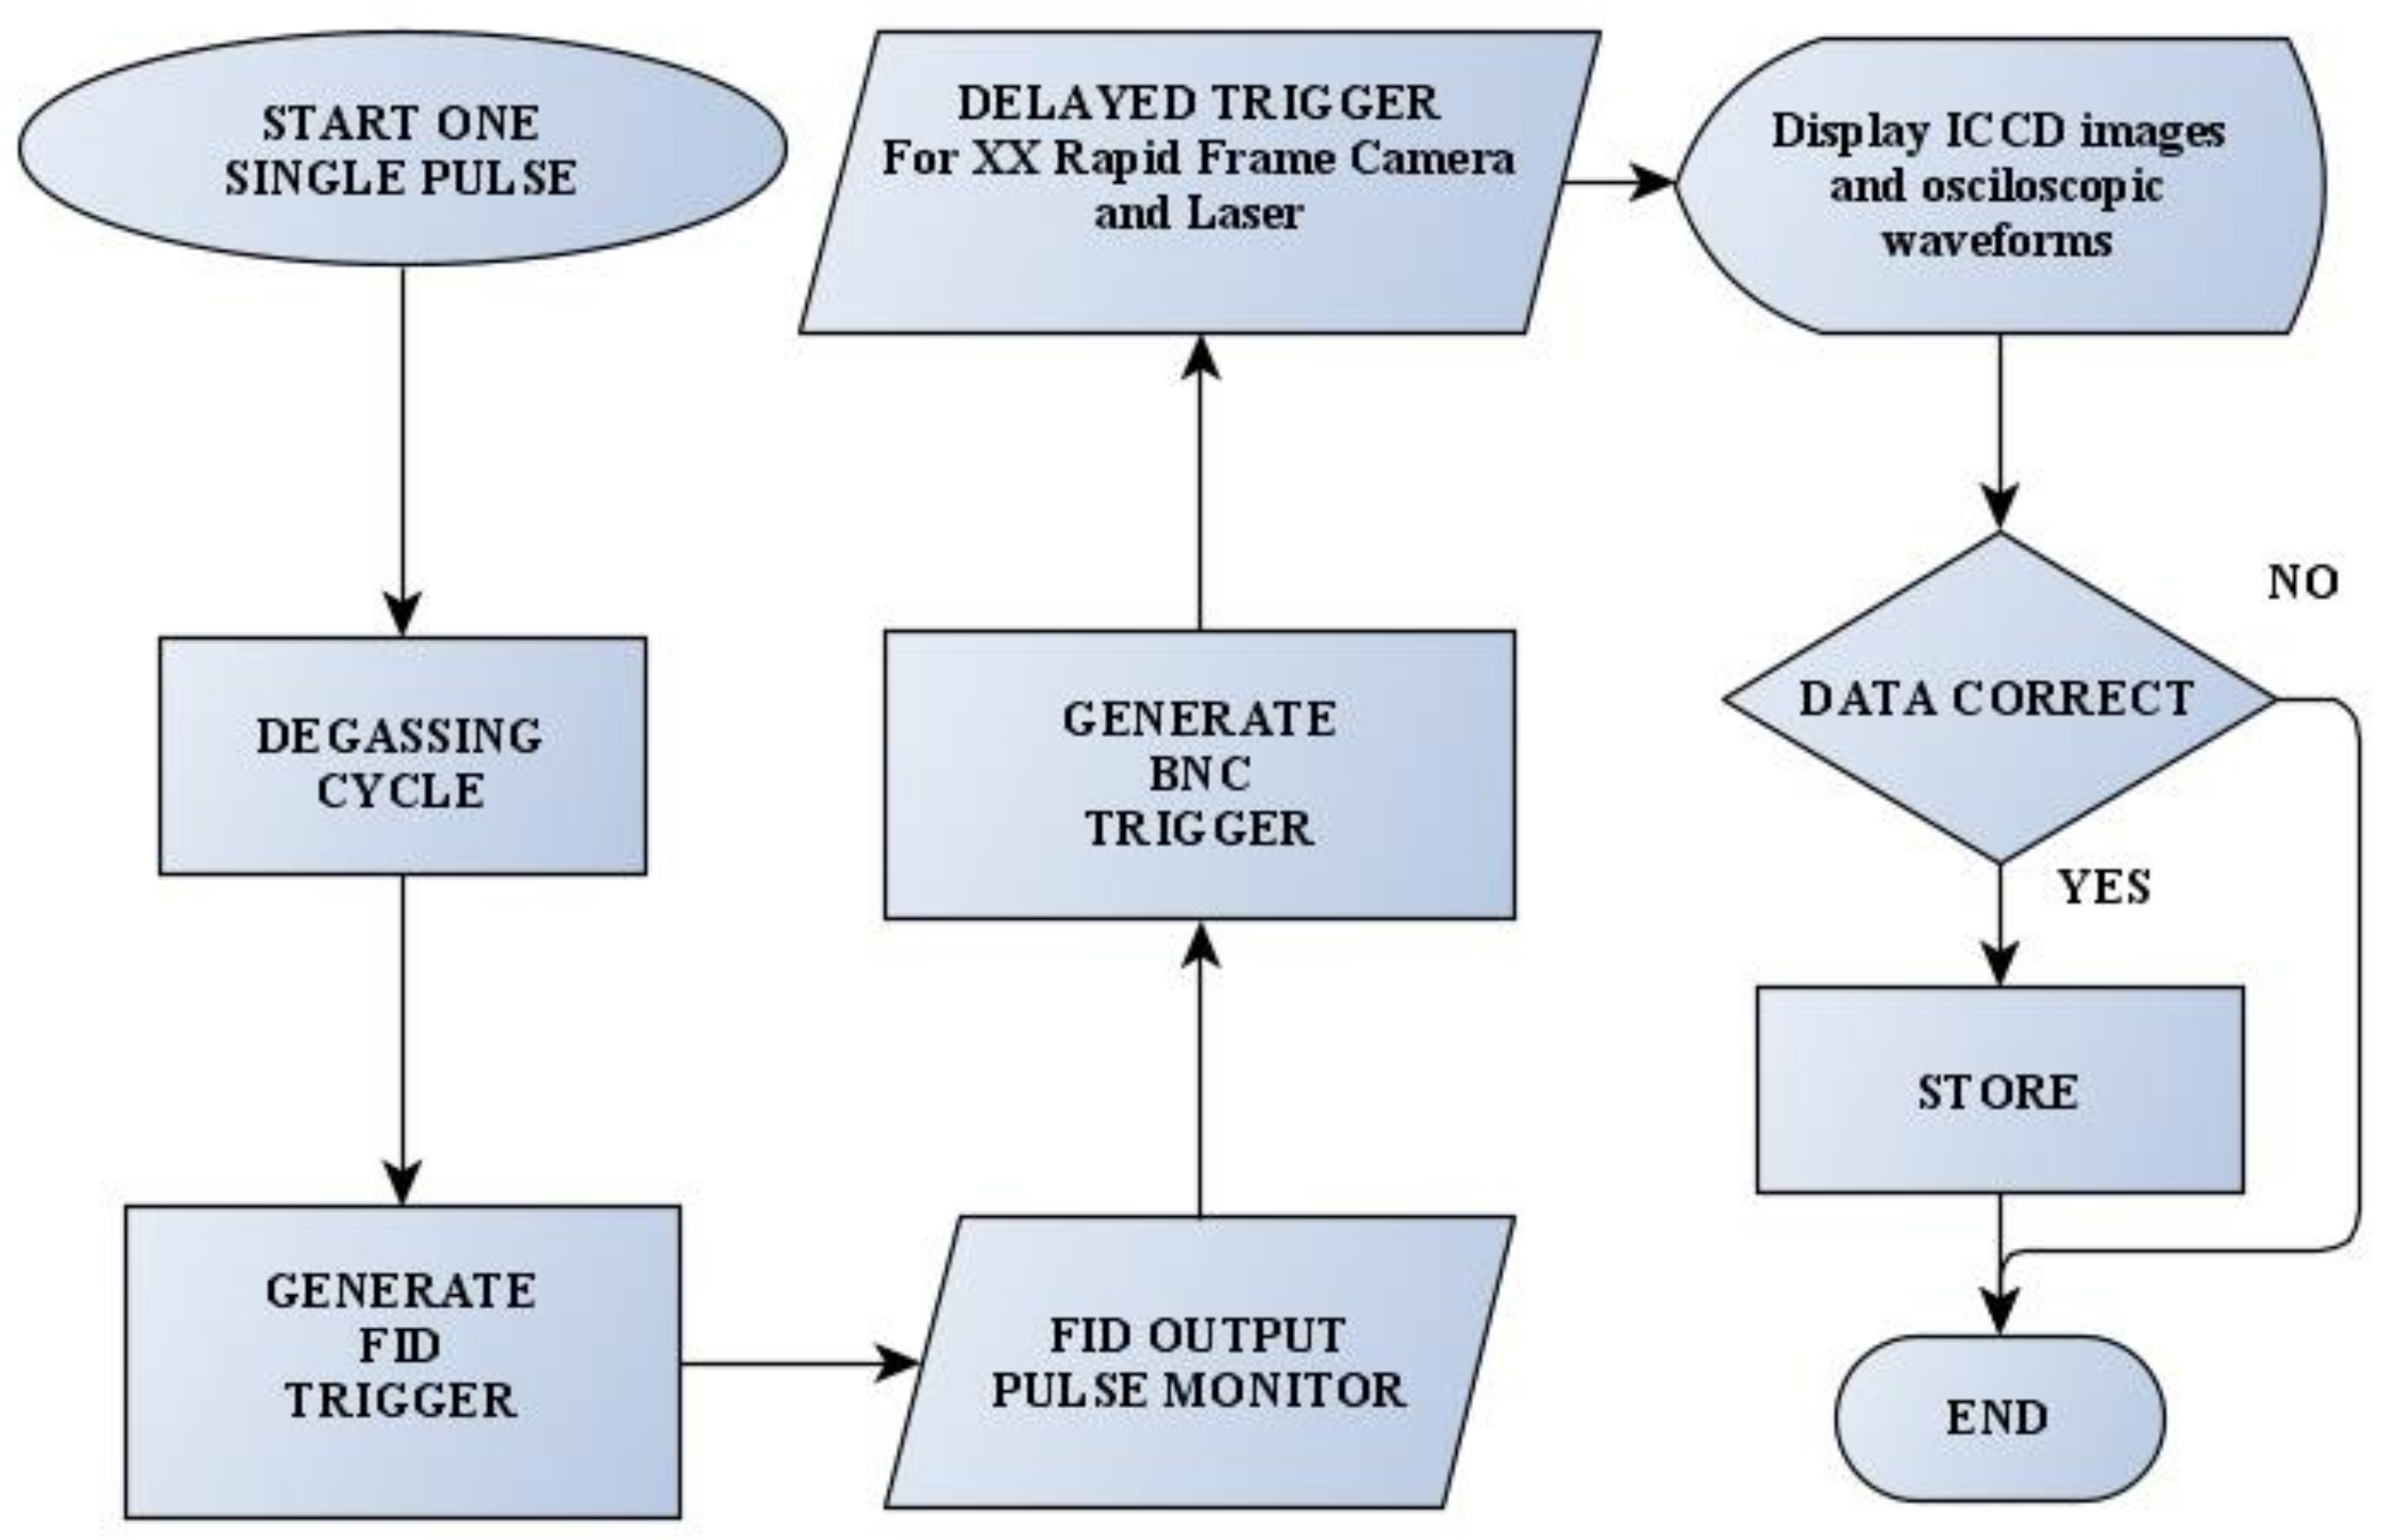
This experiment is based on the acquisition of hundreds of sequences of four ICCD images together with the corresponding oscilloscopic and PMT waveforms synchronously with the DI water degassing cycle performed before triggering any discharge event. We focused on capturing the morphology of the luminous filaments developing during the primary HV pulse and on the replication of the luminous filamentary structures occurring during the subsequent reflected HV pulses. The experiment was fully computer-controlled to acquire data from a statistically significant number of single discharge events at reproducible conditions for the analysis. Figure 3 complements Figure 2 and shows the flowchart of the automated experimental sequence consisting of the DI water conditioning, discharge event trigger, and laser pulse trigger, followed by data acquisition and storage. A personal computer (PC) running a LabVIEW 2016 virtual instrument (VI) program controls the entire sequence associated with one discharge cycle. This sequence starts by conditioning the DI water inside the discharge chamber, sending appropriately delayed trigger signals, displaying the acquired images and waveforms, and storing the validated data for further post-processing.
The LabVIEW programme was used as a control for a bus-powered multifunction data acquisition (DAQ) universal serial bus (USB) device (National Instruments NI USB-6008) and two (DSOX60004A/DPO5204) oscilloscopes. The NI USB-6008 first performs a degassing/aeration cycle through two alternately operating coupled electromagnetic valves (before triggering any single discharge event), and then, it sends the trigger for the FID HV pulse generator. The pulse monitor output of the FID then triggers the digital pulse/delay generator (BNC 575). The BNC 575 produces two delayed and independent triggers to synchronise the framing XXRapidFrame camera and laser pulse with the HV pulse.
The relative positions of the MCP gates of the four ICCD detectors were controlled through the internal delay generators of the respective 4-Picos cameras. The MCP gate monitor of one of the 4-Picos ICCD cameras and the output signal from the capacitive probe were recorded using a Keysight InfiniiVision DSOX6004A oscilloscope (6 GHz, 20 GSa/s). The remaining two channels of the oscilloscope were used to register the PMT (plasma-induced emission) and PD (laser pulse) waveforms. The MCP gates of the remaining three ICCD cameras were monitored using another Tektronix DPO5204 oscilloscope (2 GHz, 10 GSa/s).
2.3. Data Post-Processing
The post-processing of the recorded datasets was performed as follows. Any dataset related to a single discharge event consists of a sequence of four ICCD images and several oscilloscopic waveforms. The recorded oscilloscopic waveforms (HV, PIE, laser pulse, MCP gate monitors) were corrected for various propagation delays, as described in detail in [12]. At the end of this procedure, each ICCD image was associated with a precise time window (with respect to the HV onset) during which the exposure of a given image was performed. Similarly, precise delays of the PIE and laser pulse waveforms were obtained.
Subsequently, the relative intensity of the images acquired through the four different ICCD detectors needed to be calibrated. The resolution of each 4-Picos ICCD detector is 780 × 580 pixels with a bit depth of 12 bits. The performance of the MCP intensifier slightly varies among the channels 1–4; therefore, the registered background levels and optical signals are different, even with the identical MCP settings for all the channels. Furthermore, the QM-1 magnifies the asymmetric (with respect to the QM-1—XXRapidFrame optical axis) discharge structures that are subsequently divided by the mirror-based image splitter. Therefore, a series of calibration experiments was performed at the beginning of each measurement campaign. During the calibration measurements, all the four ICCD channels (MCP parameters) were set to provide the best possible overlap (amplifications, delays, and exposures). In ideal case of identical detectors and no optical distortions, the above operation would yield four identical Ch1–Ch4 images. However, in the real case, due to the aforementioned reasons, the resulting Ch1–Ch4 images show certain differences, namely spatial shifts, different background levels, and different signal levels on the pixels capturing identical parts of the luminous filaments.
The spatial shifts among the four imaging channels did not exceed +/− 10 pixels. In the subsequent step, the background levels of each imaging channel were determined and subtracted from the relevant discharge image. Finally, the relative calibration (correction) factors of the discharge intensities registered through channels 1–4 were determined (as the integrals over selected groups of ICCD pixels capturing identical elements of the discharge filament in the Ch1–Ch4 images) and applied. These coefficients were obtained as an average over approximately 20 calibration discharge images. As the Ch4 detector provides the highest level of ICCD pixel counts with equivalent settings of Ch1–Ch4 MCP parameters, the Ch4 signal was used as the calibration reference. Consequently, the Ch1–C3 ICCD pixel counts were calibrated to match the Ch4 levels.
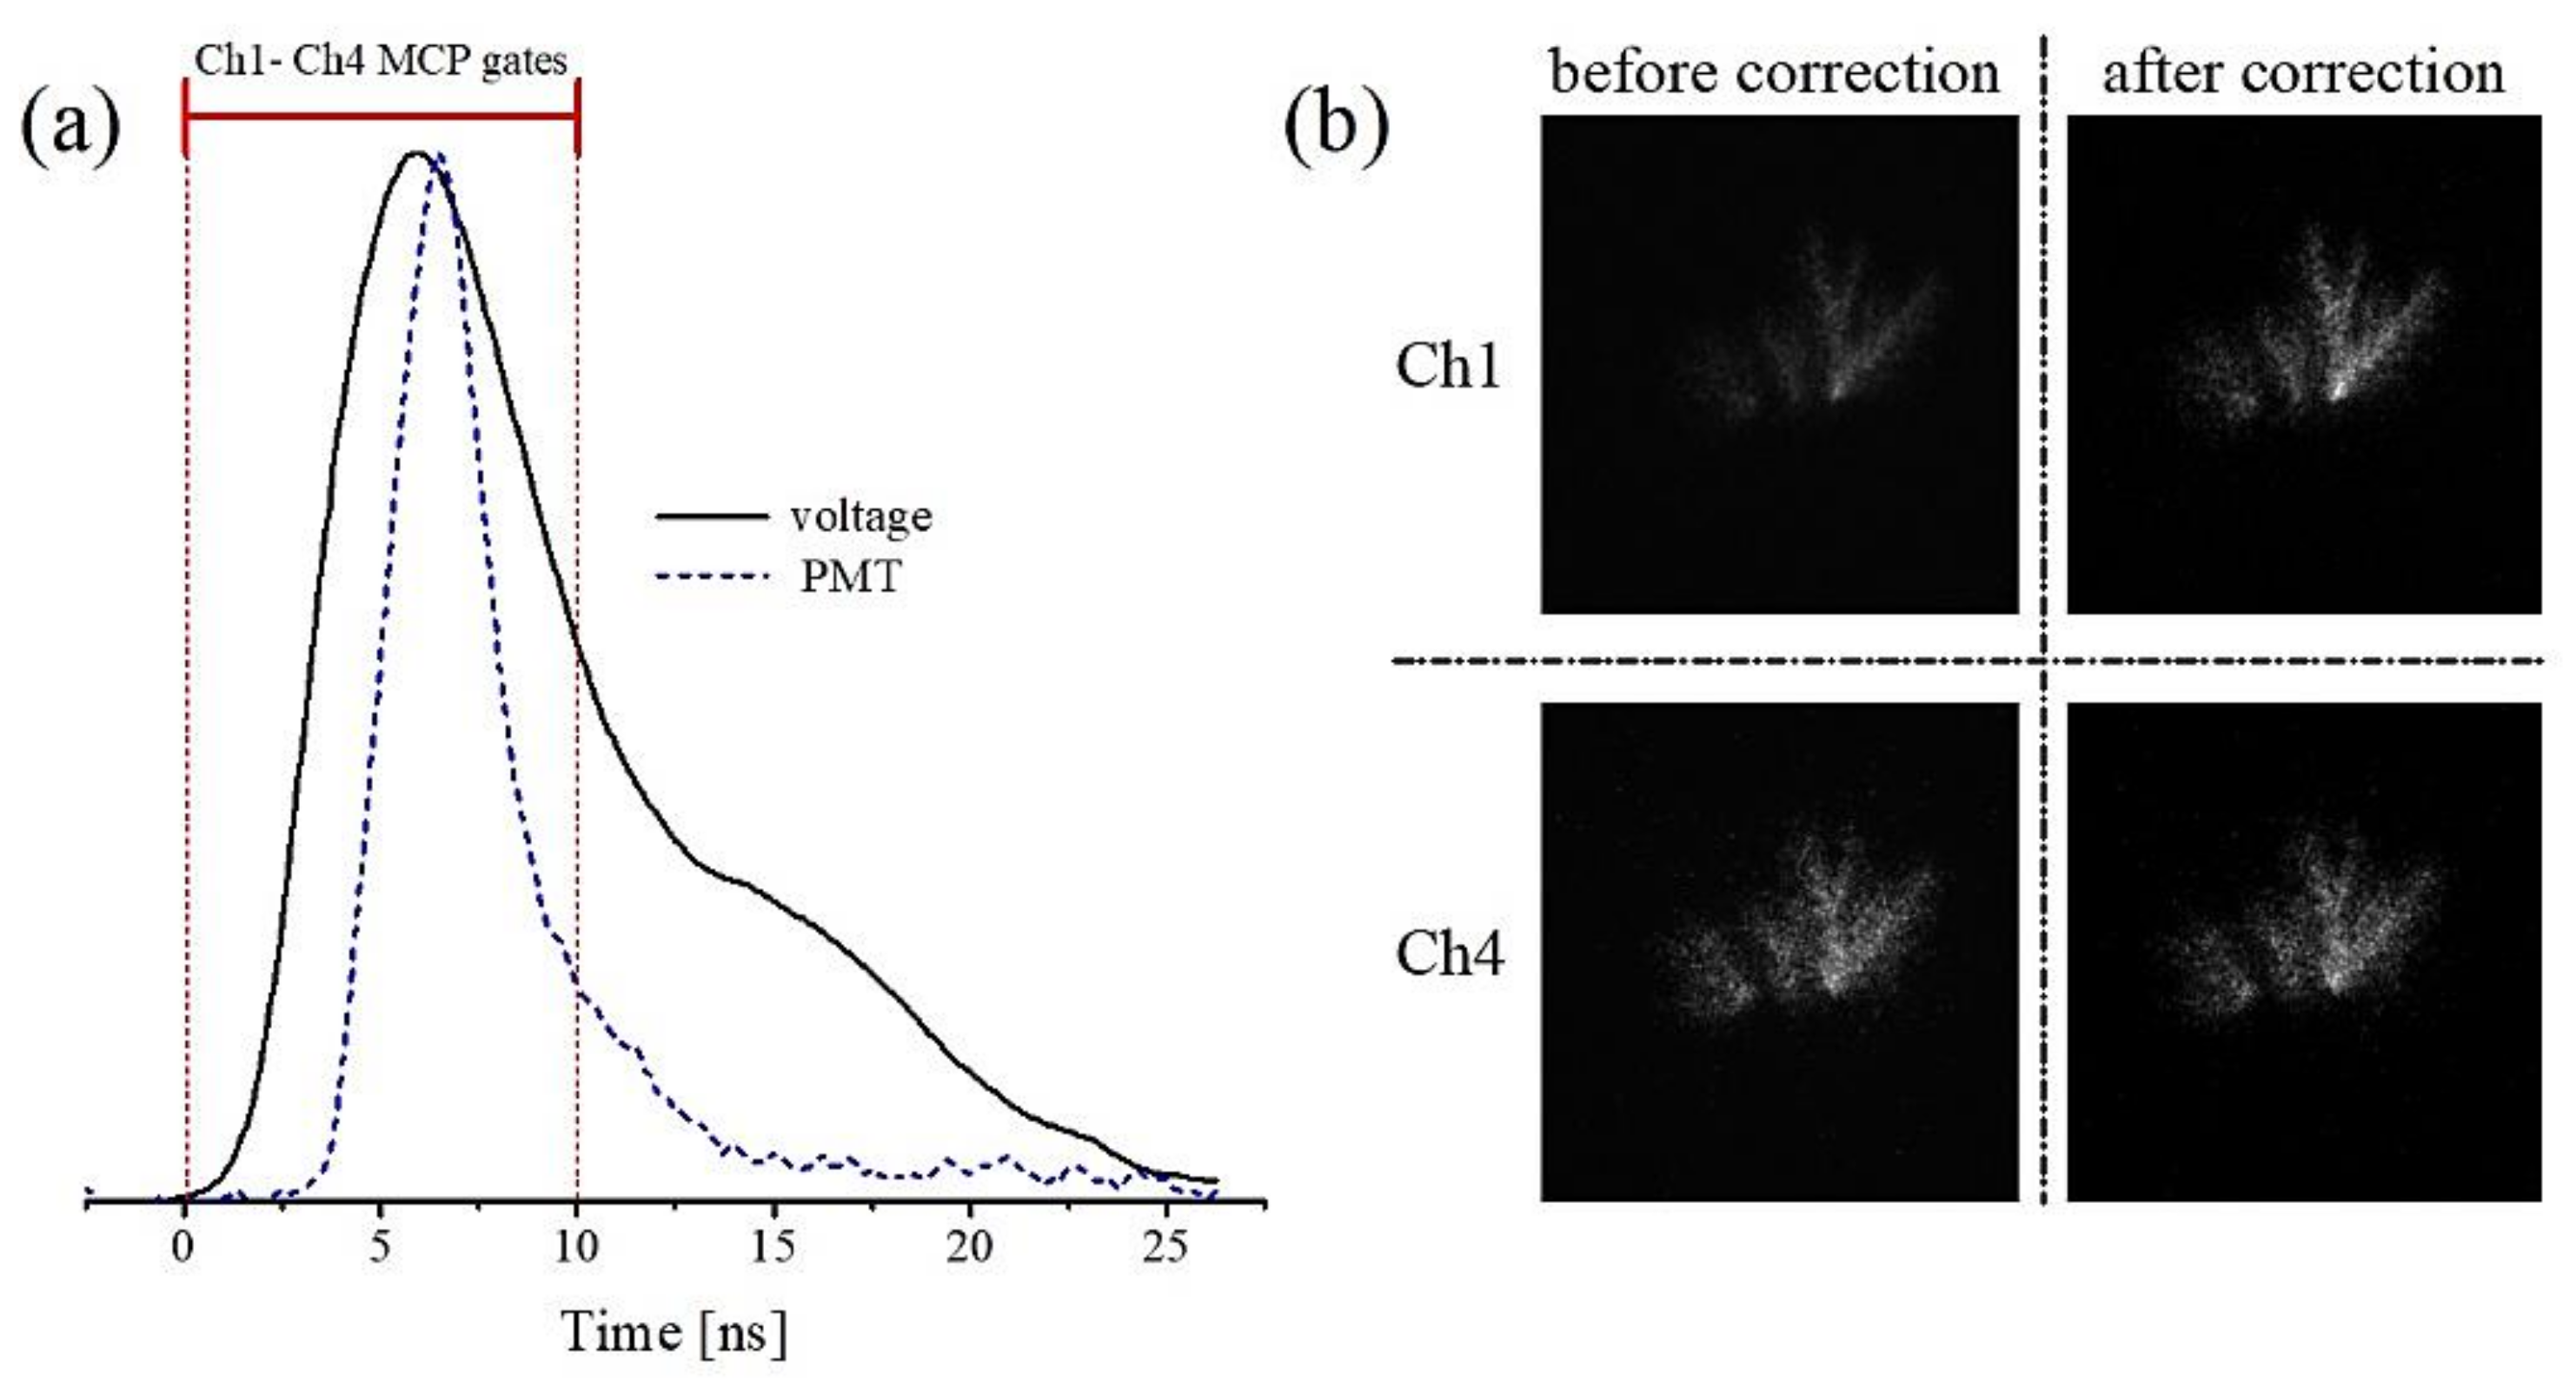
After applying the averaged calibration intensity coefficients, the equivalent ICCD images from any of the channels can be obtained, as illustrated in Figure 4. Figure 4a shows the conditions used to acquire a set of calibration images—that is, the position of identical Ch1–Ch4 MCP gates with respect to both the HV waveform and the discharge luminosity evolution (monitored through the PMT signal). The MCP gates (gate width of 10 ns) ensured the collection of discharge emission from the fully expanded and developed luminous filaments. Figure 4b illustrates the calibration images before and after applying the correction. The Ch4 image used as a reference shows no modification (background subtraction is not visible on a linear scale), whereas the Ch1 image shows a notable increase in the luminosity of the captured filaments.
3. Results and Discussion
3.1. Case Study A: Luminous Phase Evolving during Primary HV Pulse Registered with Equal MCP Gate Widths
The time-resolved microscopic images of the luminous filament evolving during the primary HV pulse provide fundamental signatures reflecting the discharge mechanism, i.e., the expansion velocity of the luminous fronts, radial dimensions, and the branching dynamics of the luminous filaments. These parameters were recently investigated in [7,8] by employing single-channel ICCD microscopy. Basic outcomes related to the expansion velocity of the luminous front obtained by using ‘one ICCD image per one discharge pulse’ approach revealed an initial expansion characterised by a constant velocity of ~2 × 10⁵ m/s (i.e., 200 μm/ns). Hundreds of images were acquired and analysed to obtain sufficient statistics for the selection of representative image sequences. However, as the analysed images originate from different discharge events, the evolution of the branching and radial expansion of the luminous filaments is difficult to follow because of the stochastic nature of the branching process. This disadvantage can be eliminated after splitting a single microscopic image of the region of interest into four equivalent images produced at the splitter output, with each output image channel sampled by one ICCD detector in the preselected time-window.
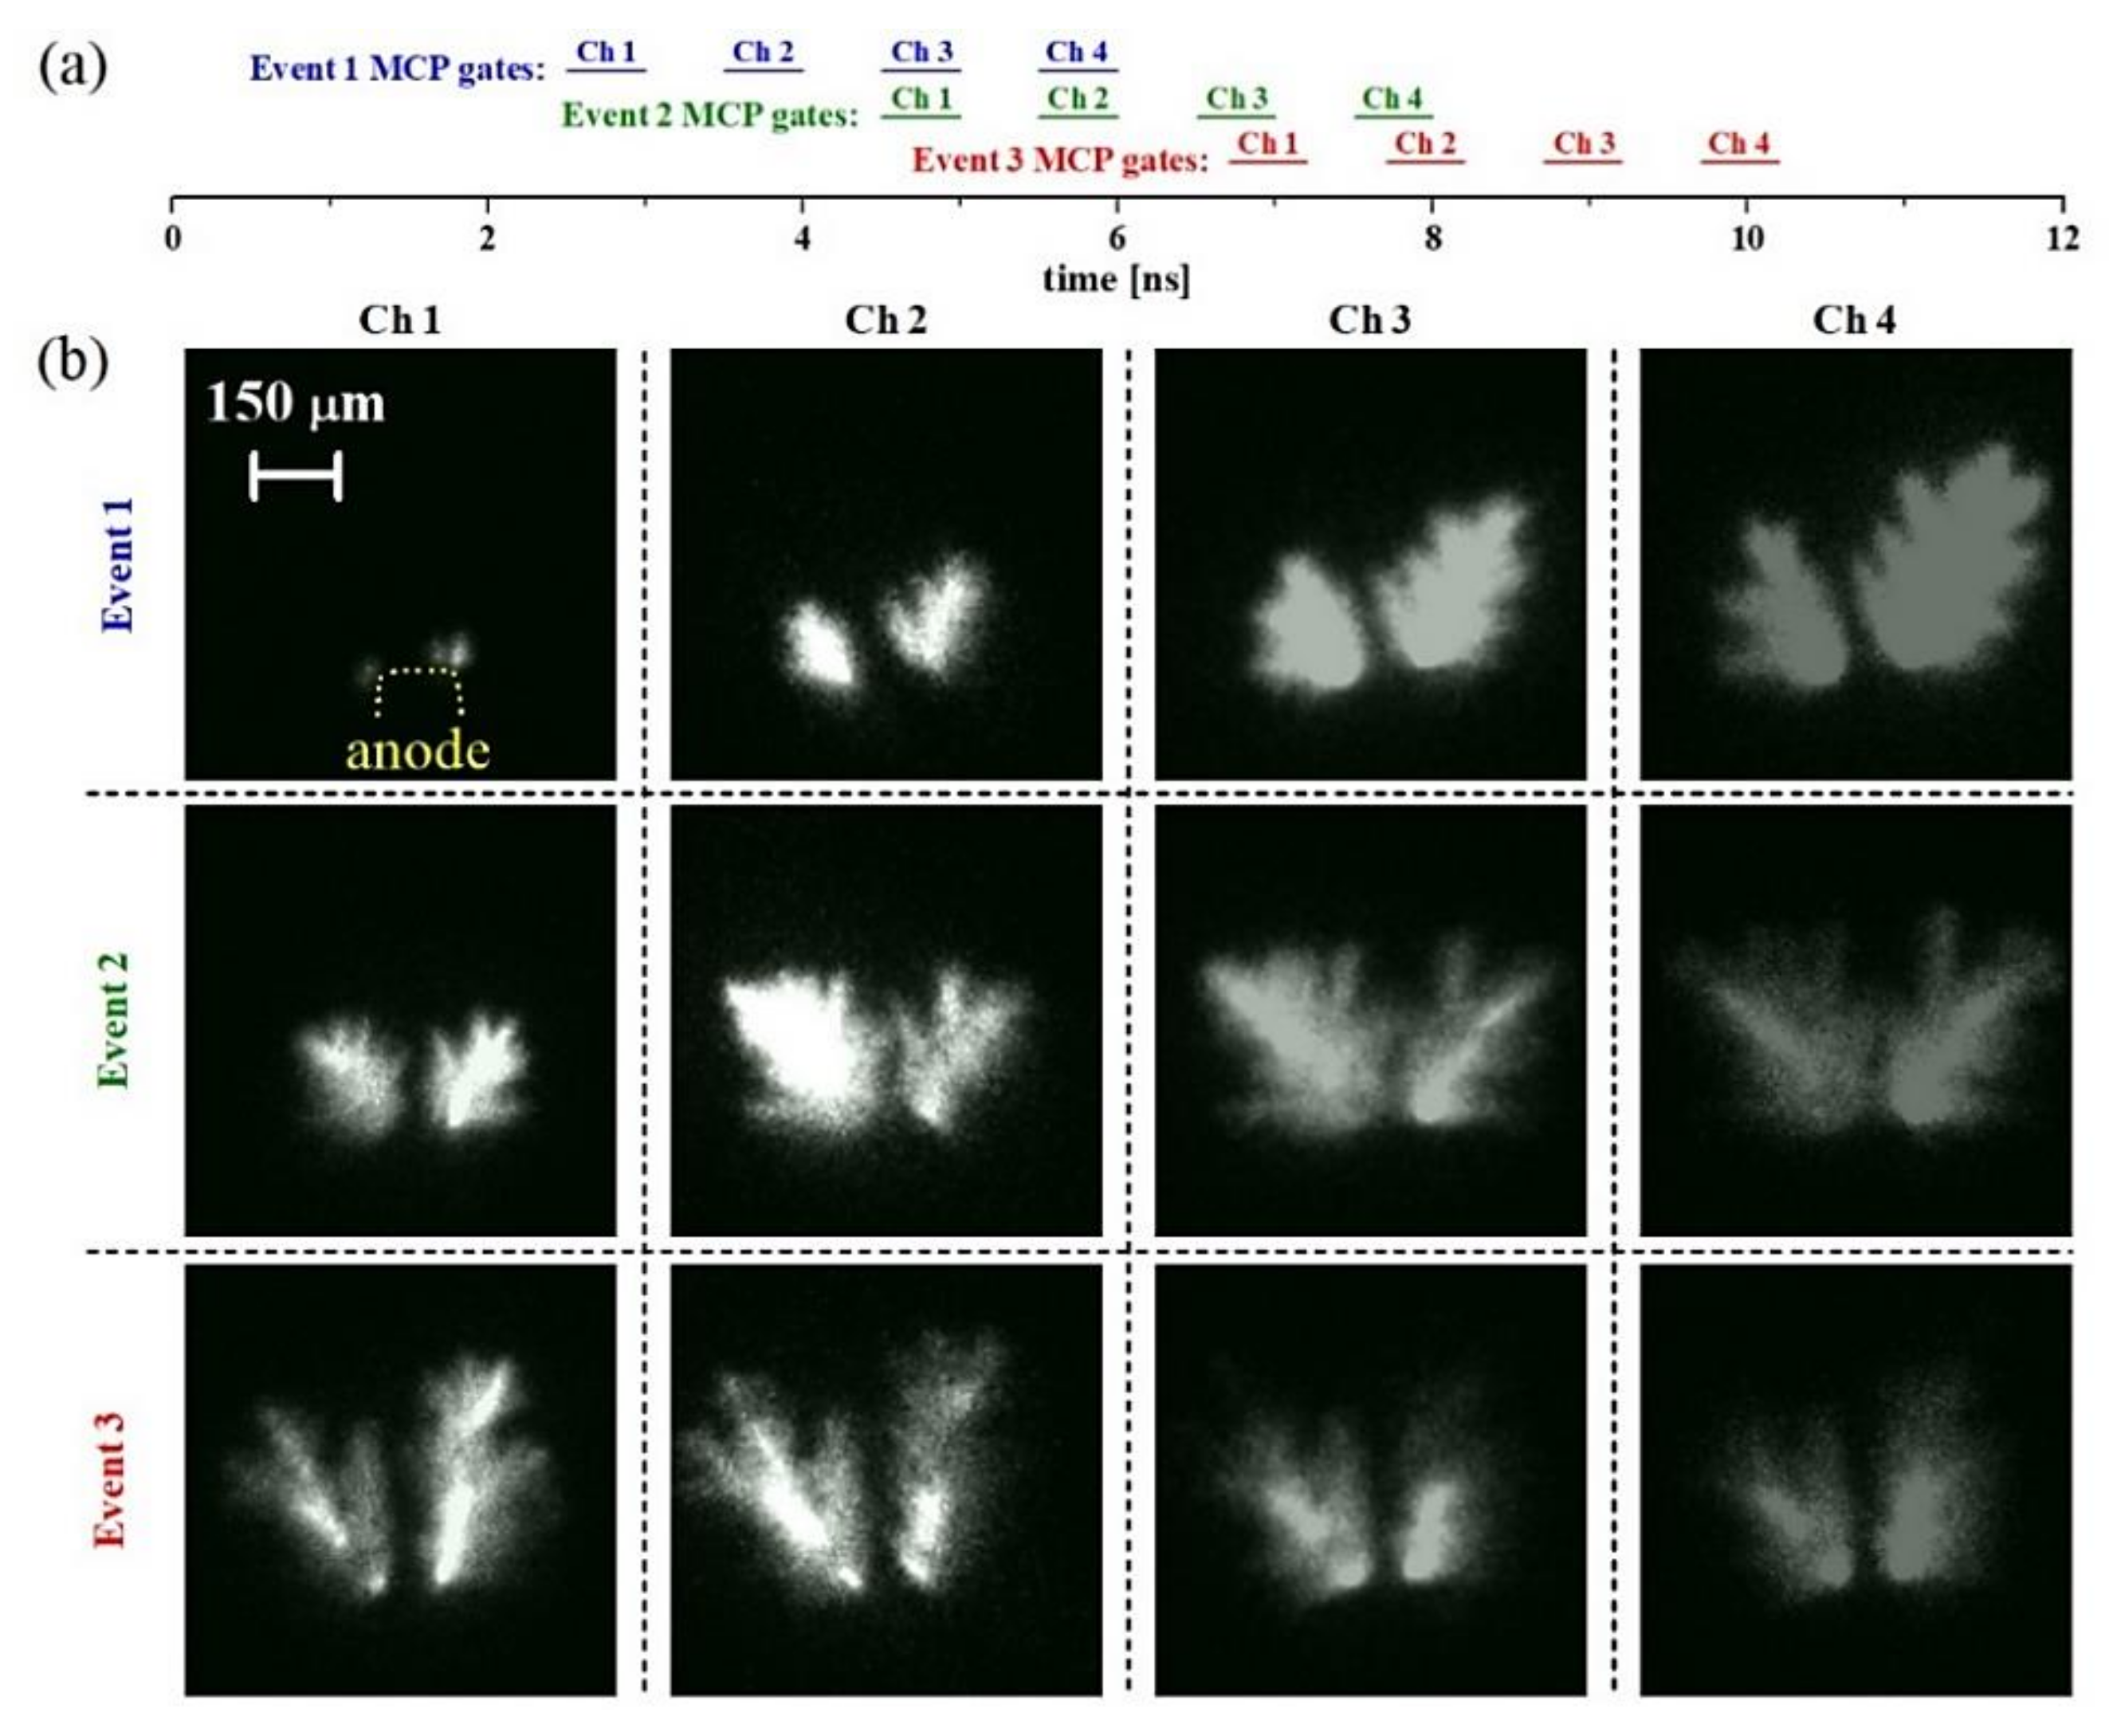
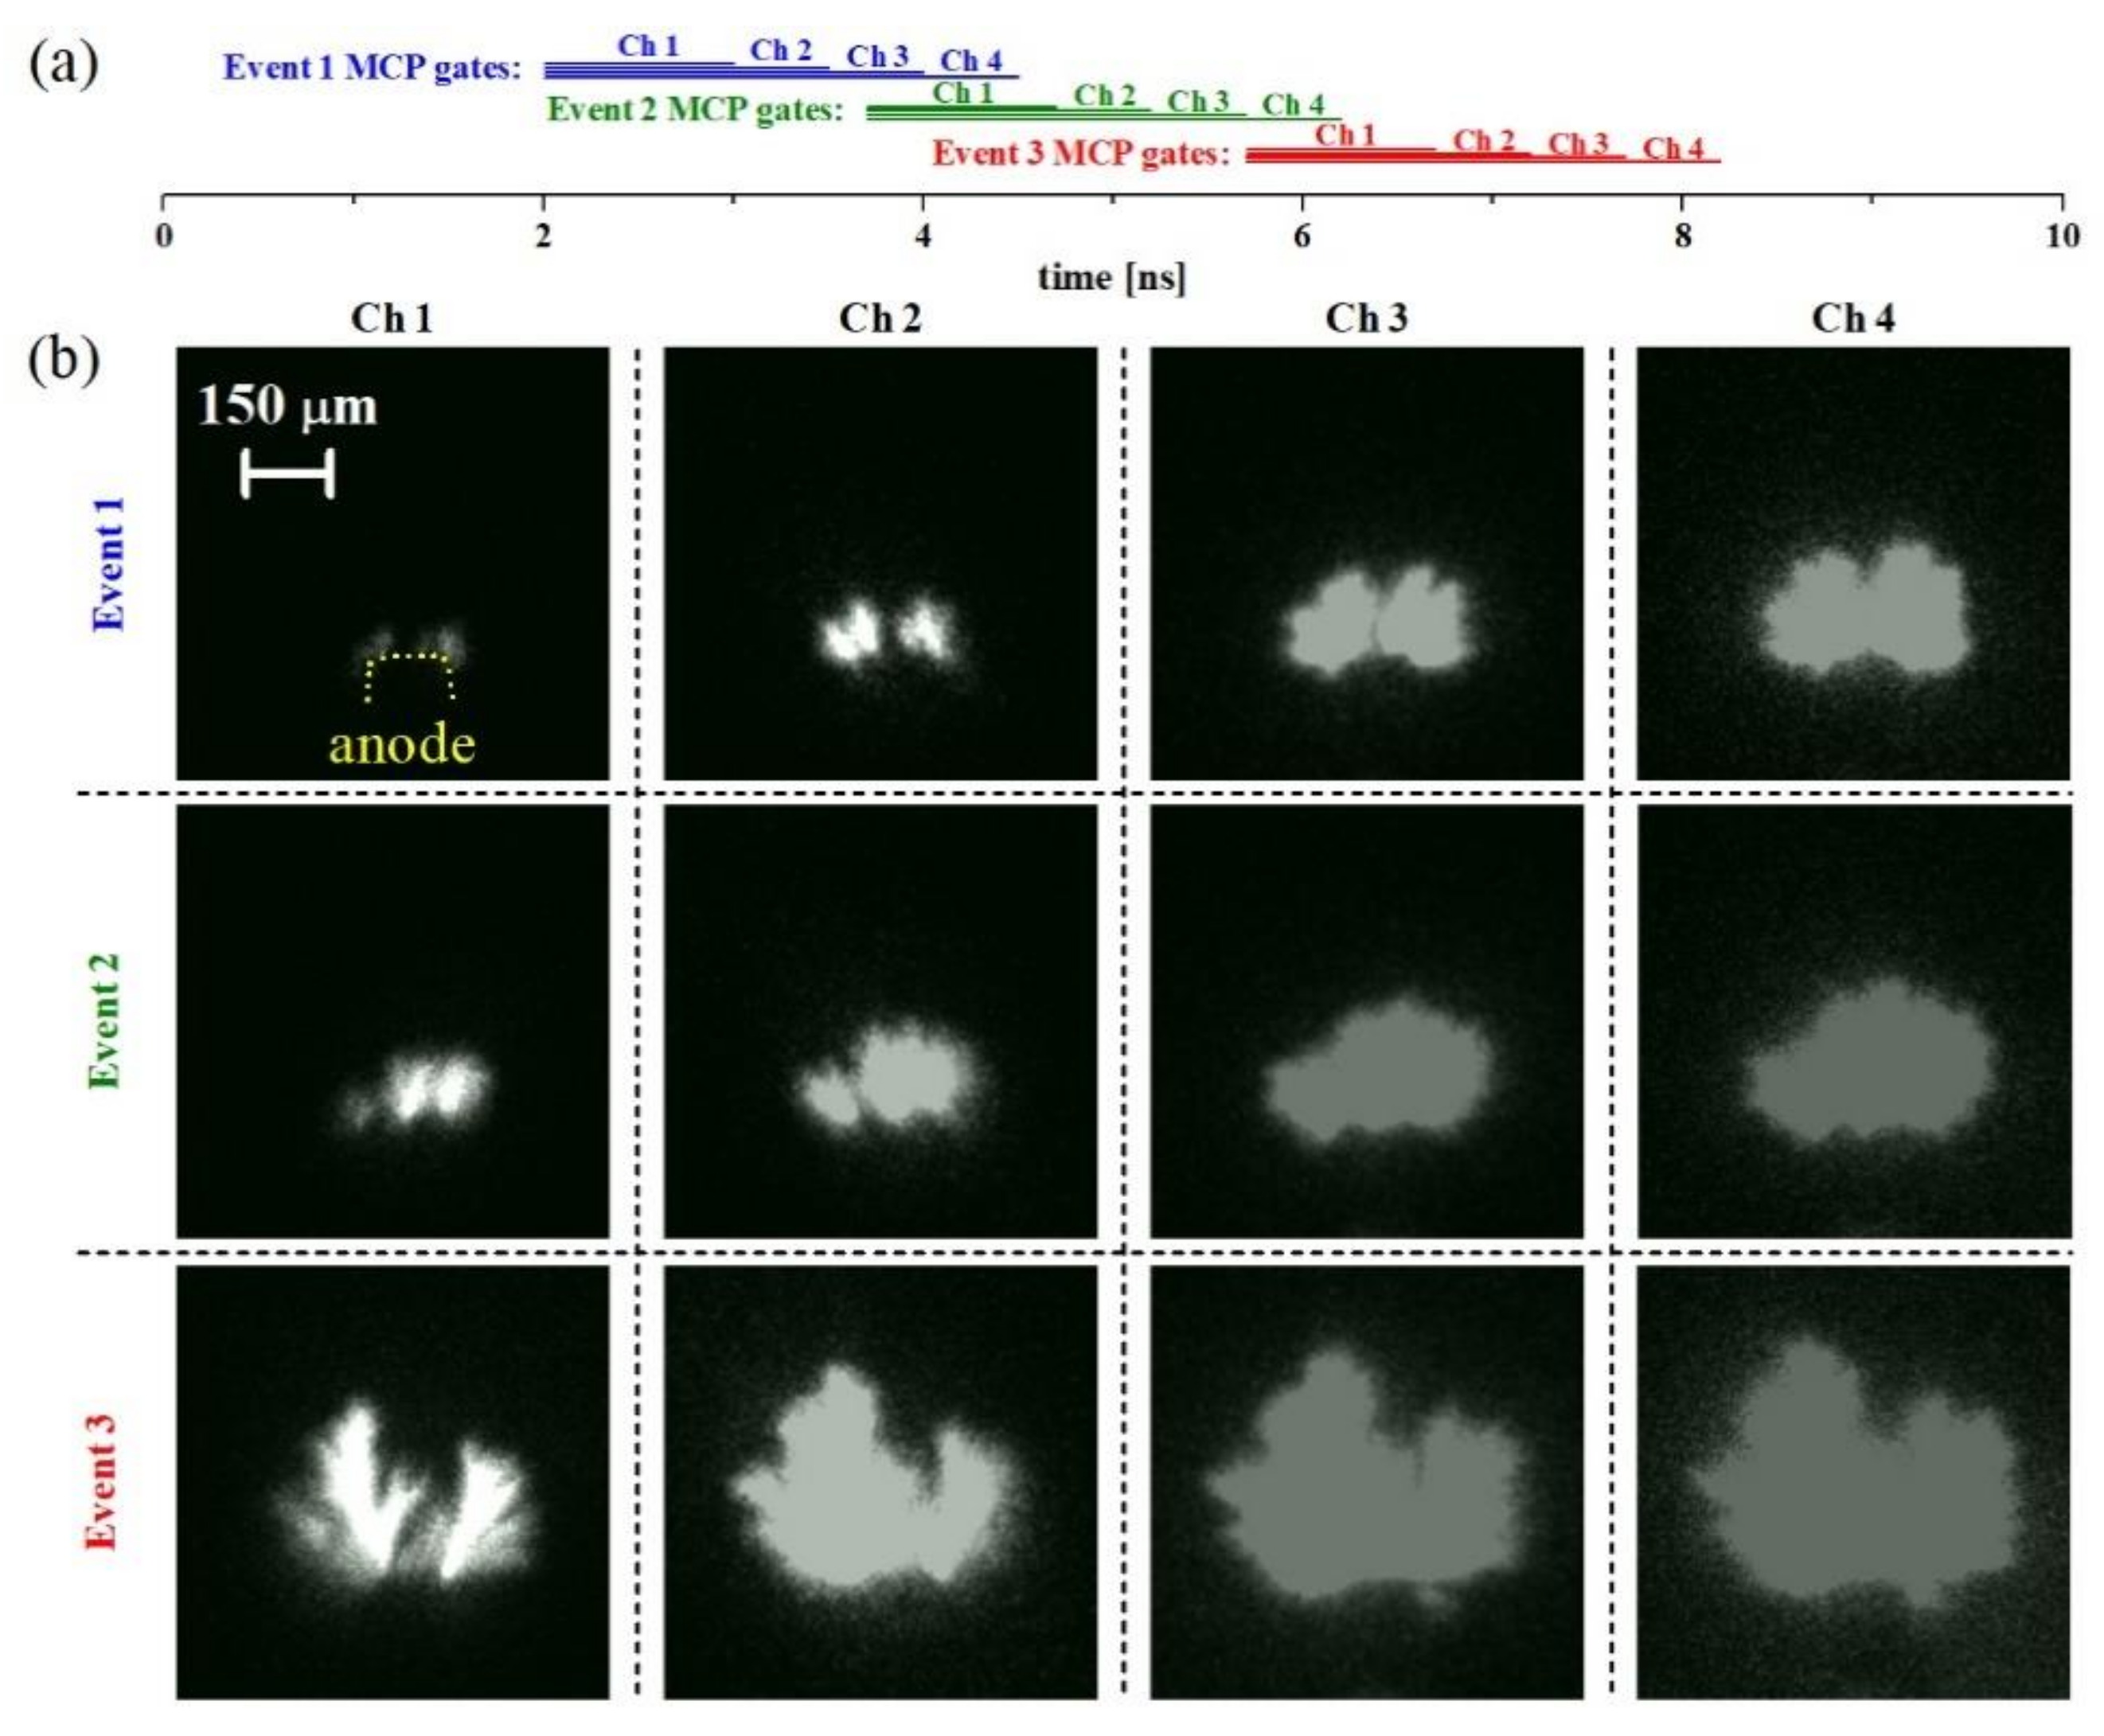
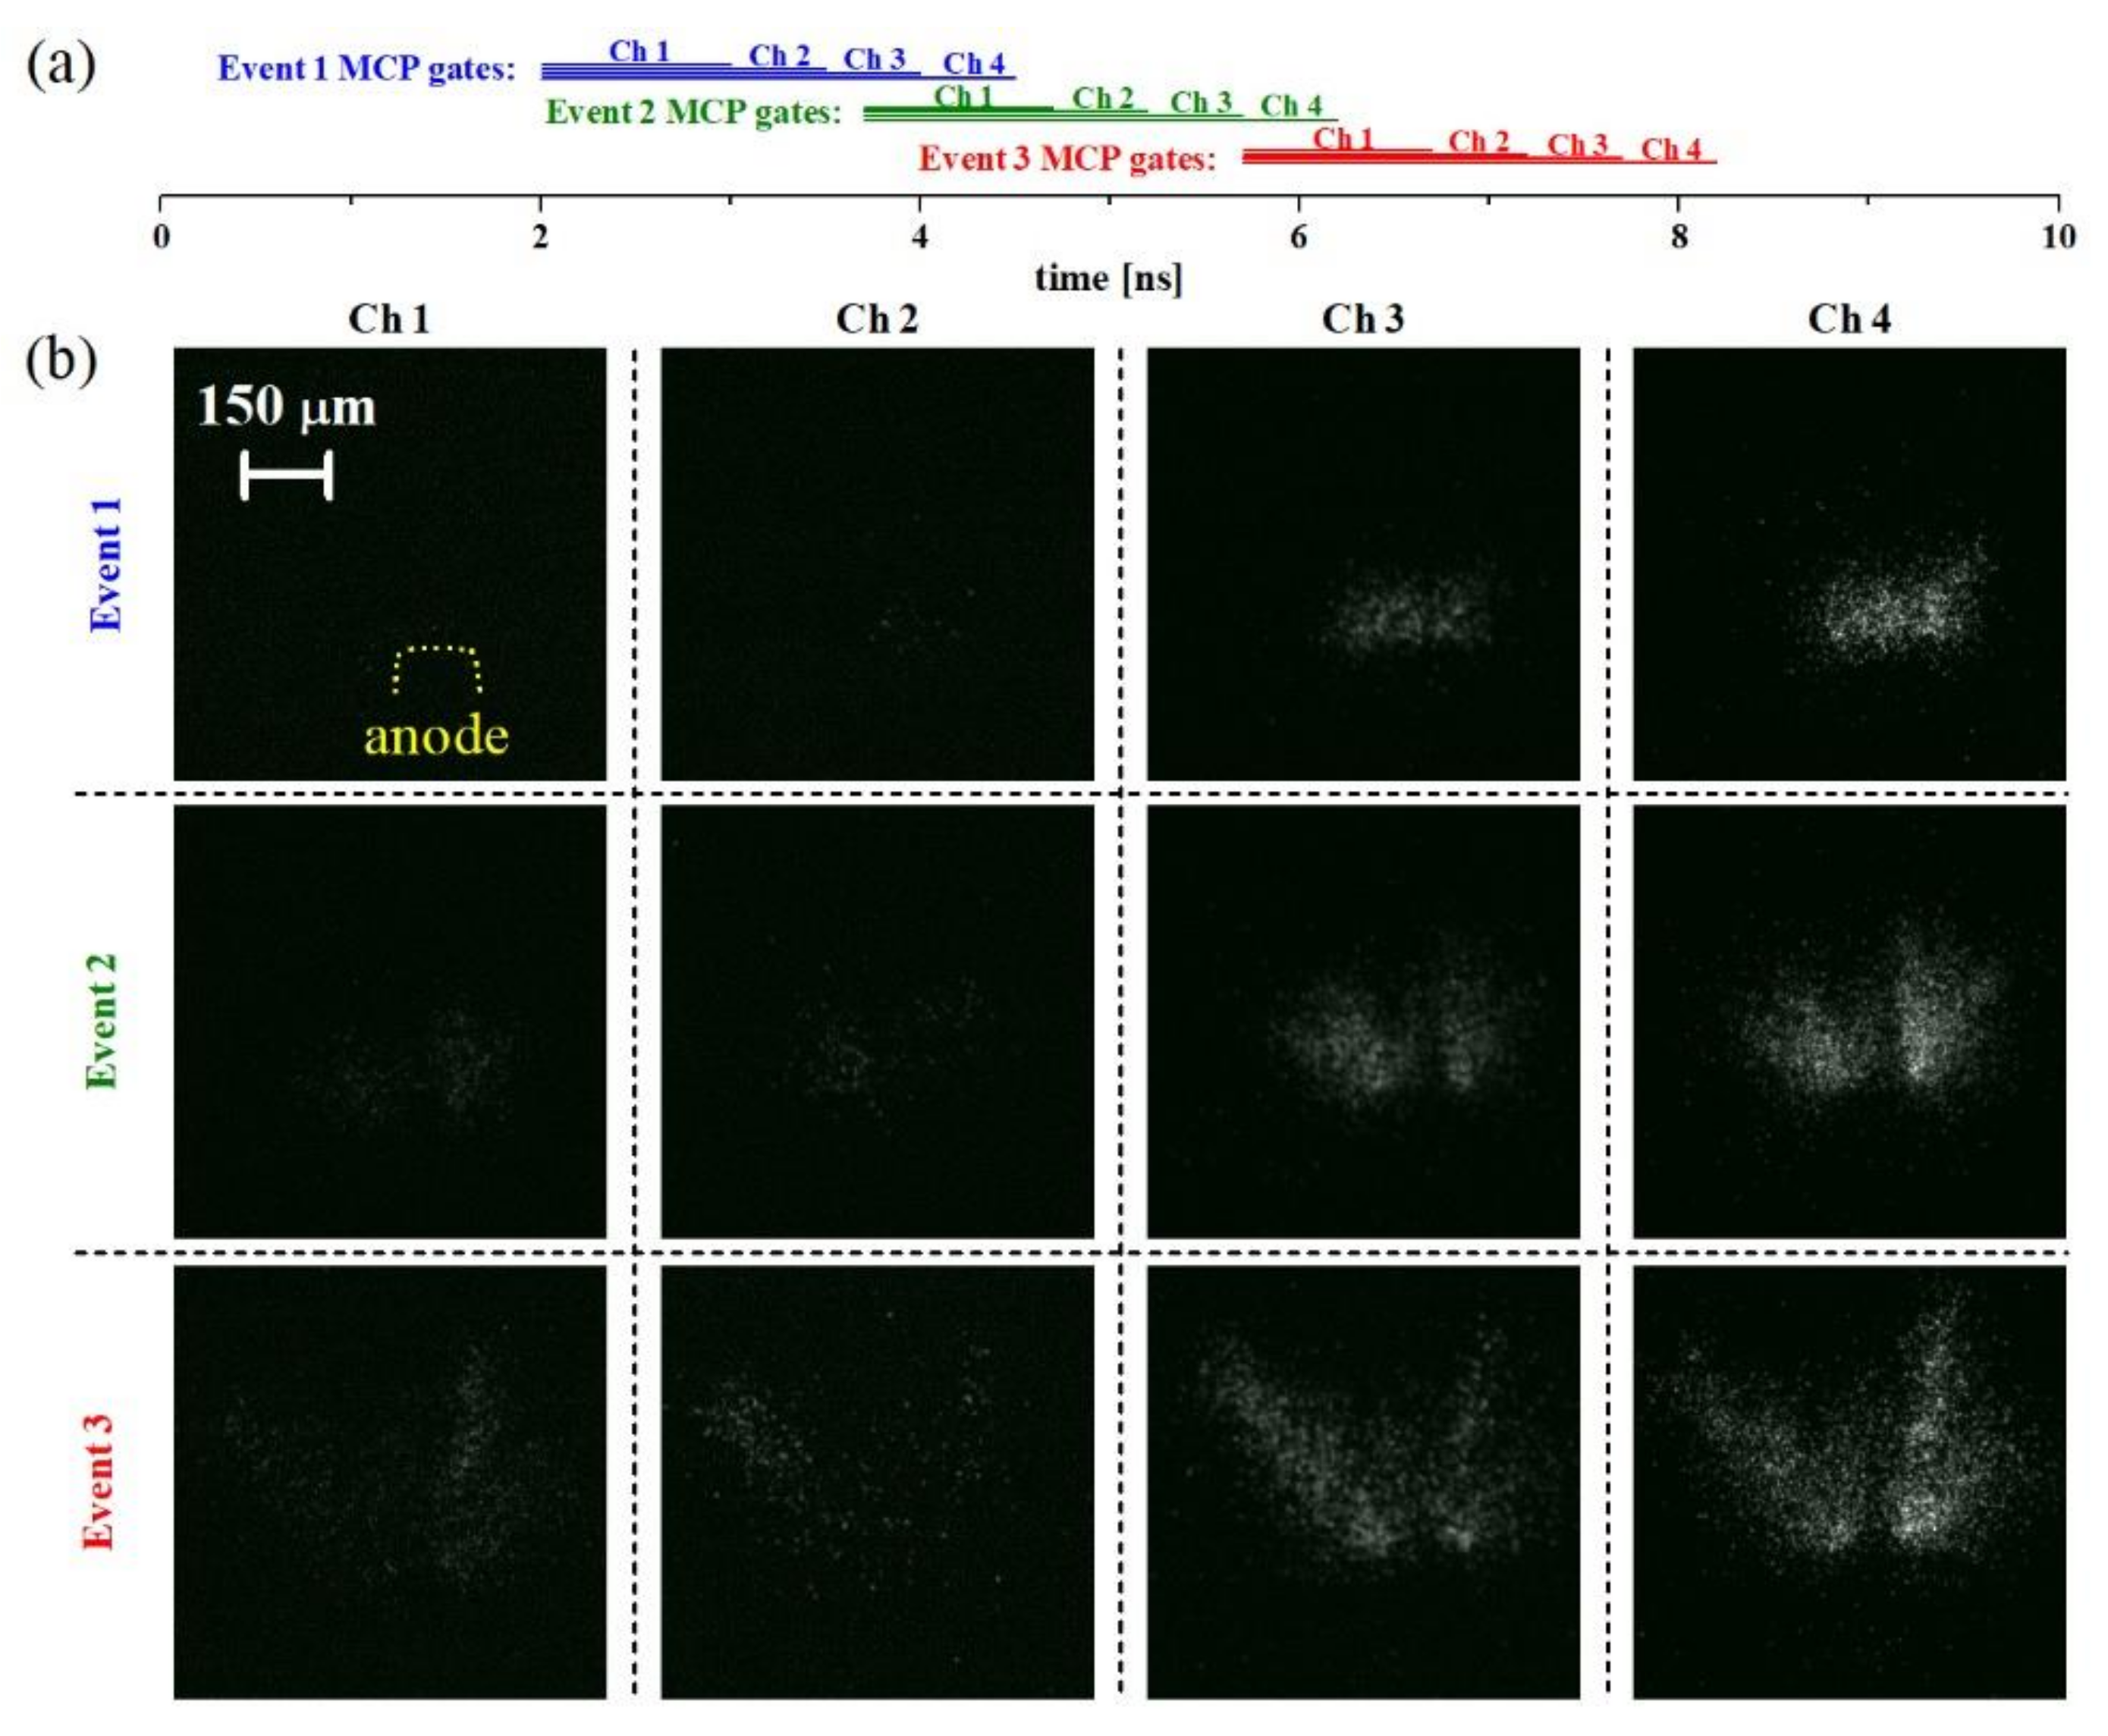
The four images captured during any given event in four consecutive time windows allow the tracking of the branching dynamics of the selected filaments and their expansion velocities. Figure 5, Figure 6 and Figure 7 display a series of four consecutive images captured during the luminous discharge phase caused by the primary HV pulse. They were acquired using equal MCP gate widths (0.5 or 1 ns) for all the channels and were appropriately delayed with respect to the onset of the HV pulse and with respect to each other (∆T = 1 ns). Events 1–3 were selected from all captured discharge pulses to illustrate the characteristics of different intervals during the primary HV pulse. Figure 7 illustrates the luminous structures captured by integrating broadband discharge emission (determined by the transmittance of collecting and imaging optics and the quantum efficiency of the MCP S20 photocathode). Even after the image splitting, the signal levels allowed the reduction of the MCP gates to 500 ps. A sequence obtained during Event 1 captures the initial onset of two luminous filaments at the two anode edges, which subsequently expands, as revealed by the Ch2–Ch4 images. In the case of Event 2, the first Ch1 image captures already expanded filaments (approximately 150 μm long), whereas the Ch3–Ch4 images monitor the phase of maximum extension and the stopping phase. Finally, the Event 3 sequence illustrates the progressive decay of the luminous structures developed during the descending phase of the anode potential.
Figure 6 and Figure 7 show sequences of images acquired by inserting selected IFs (λc = 532 and 656 nm) in the optical setup. This indicates that, compared with Figure 5, The Ch1-Ch4 detectors were exposed by much lower photon fluxes; therefore, the gate width 1 ns of the MCP gates appeared to be a reasonable minimum for revealing the shining cores of the main luminous filaments with a reasonable signal-to-noise ratio. The wavelengths (λc = 532 and 656 nm) used to acquire monochromatic images were selected based on previously reported results [7,12]. The first wavelength (532 nm) coincides well with the short wavelength edge (~500 nm) of the continuum emission registered during the first few nanoseconds [7], whereas the second wavelength (656 nm) allows the tracking of the emission intensity of the Hα line superposed with the NIR continuum [12].
3.2. Case Study B: Luminous Phase Evolving during Primary HV Pulse Registered with Progressive MCP Gate Widths
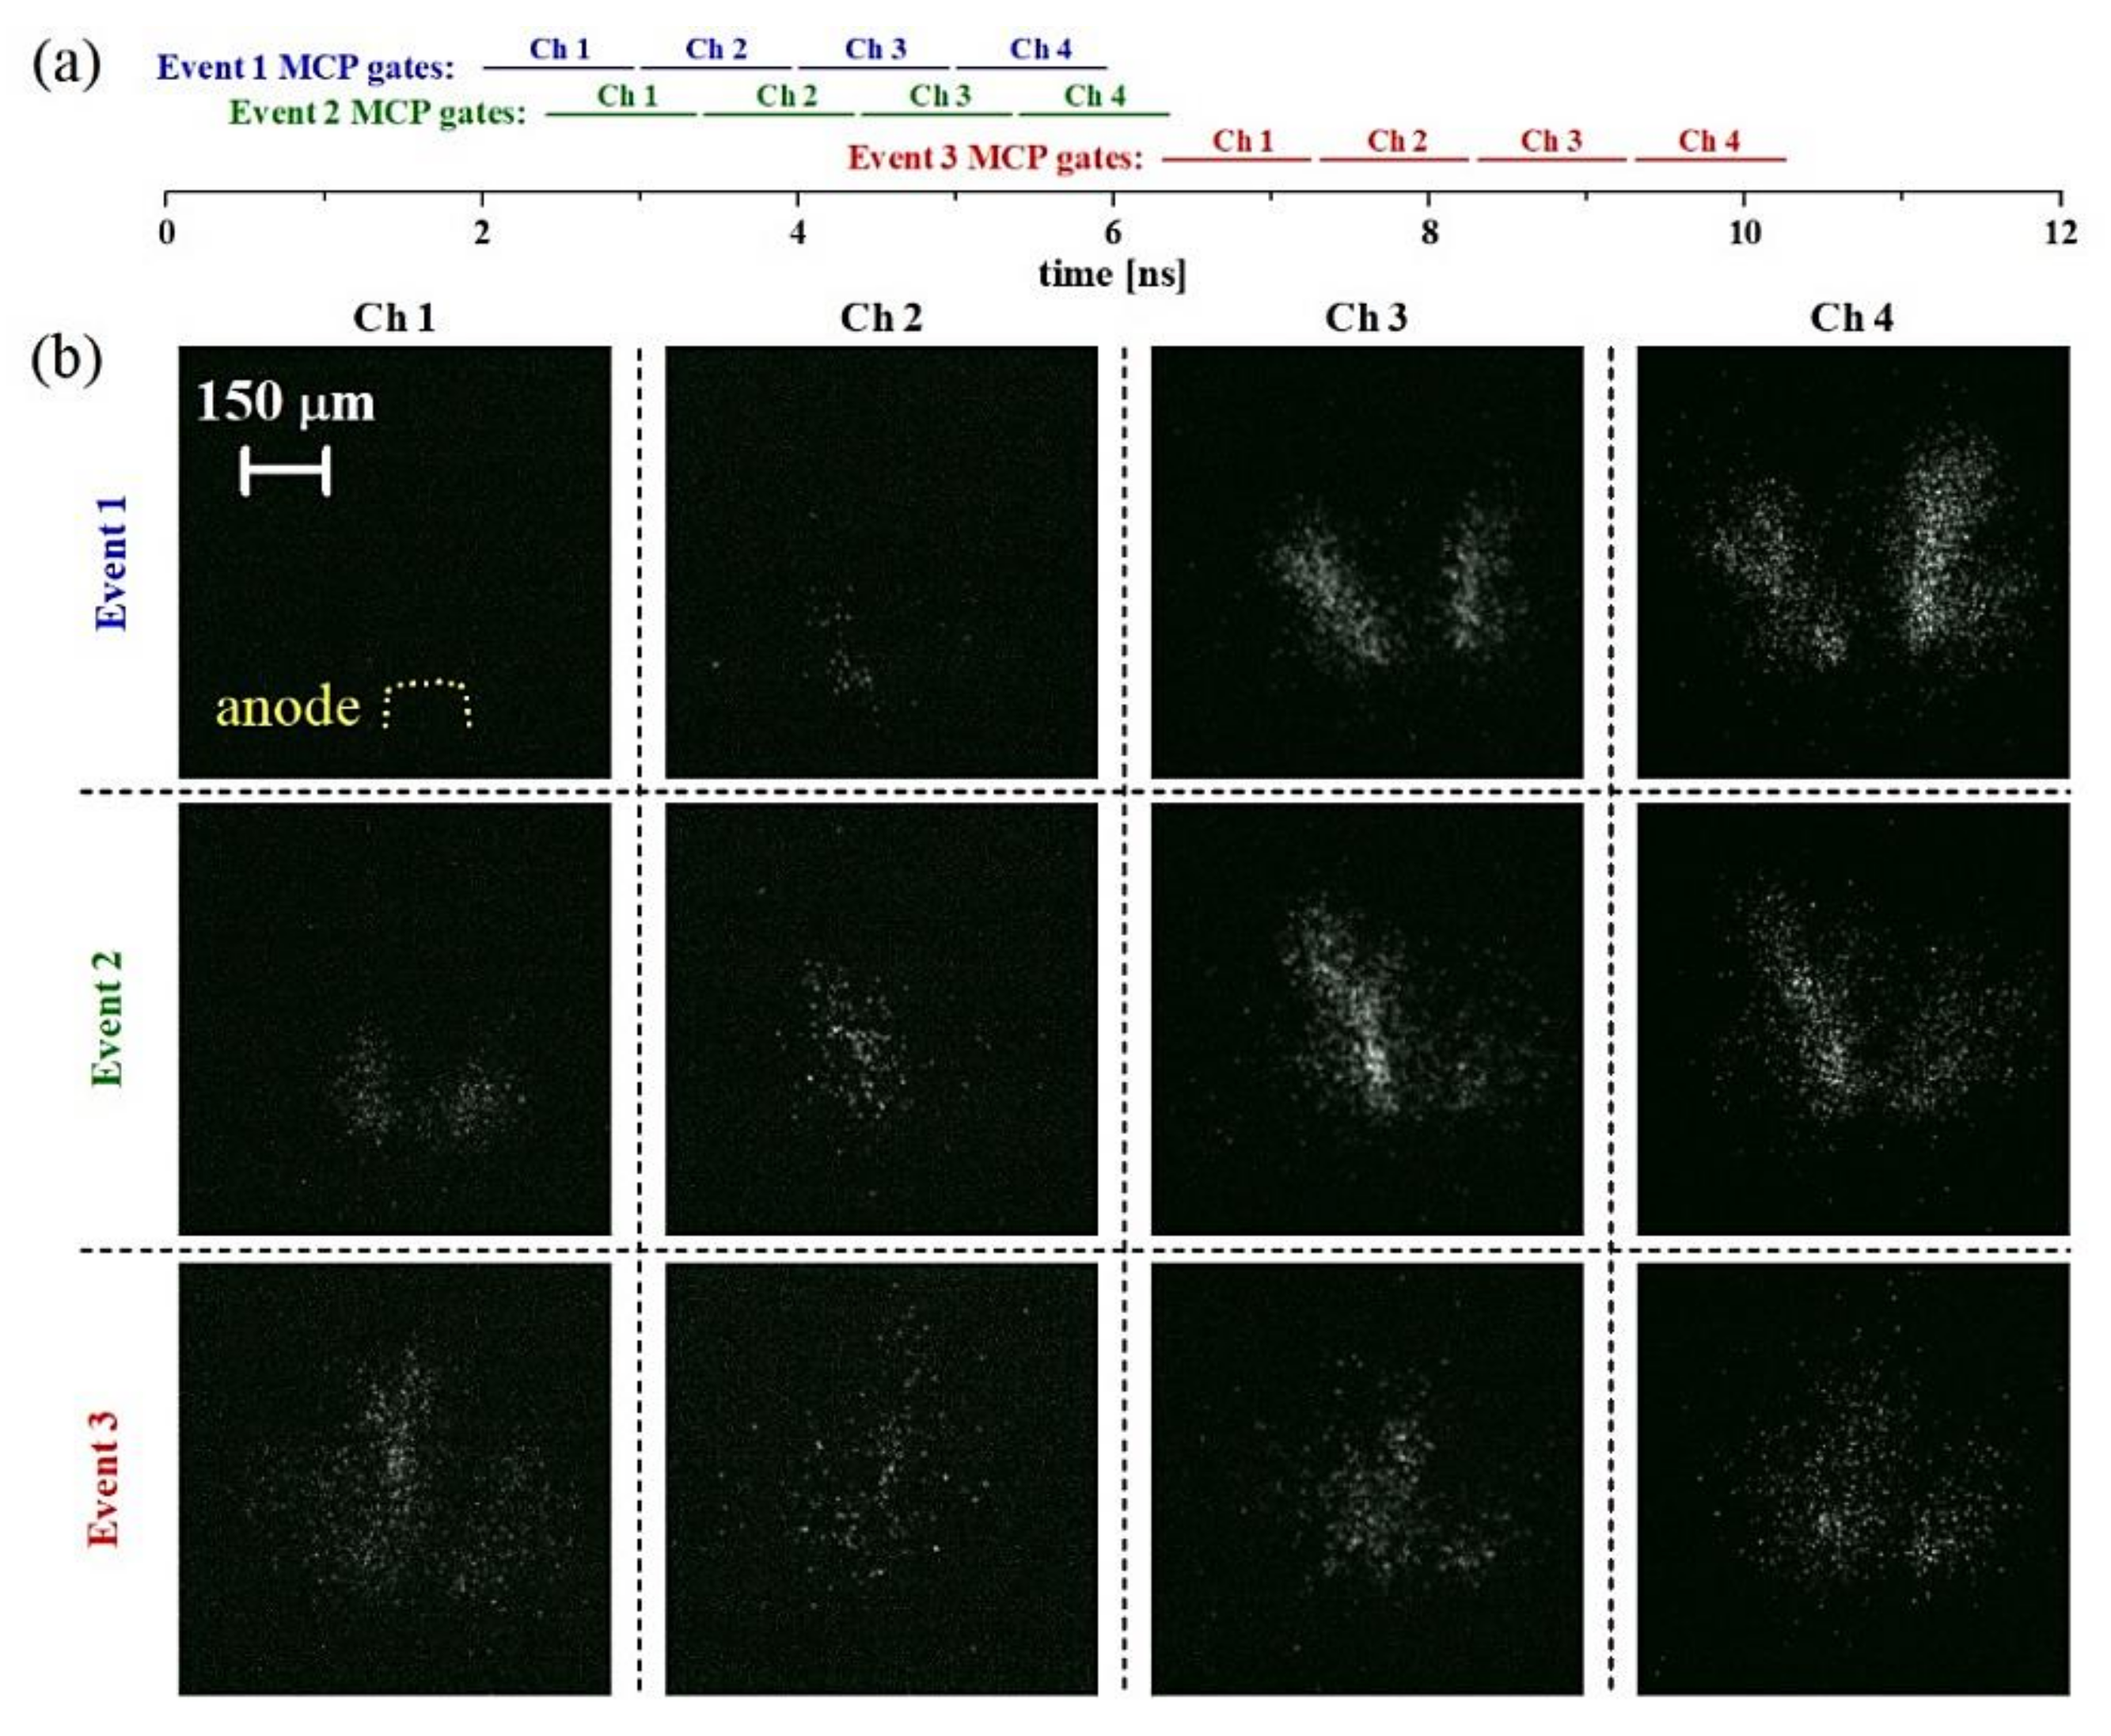
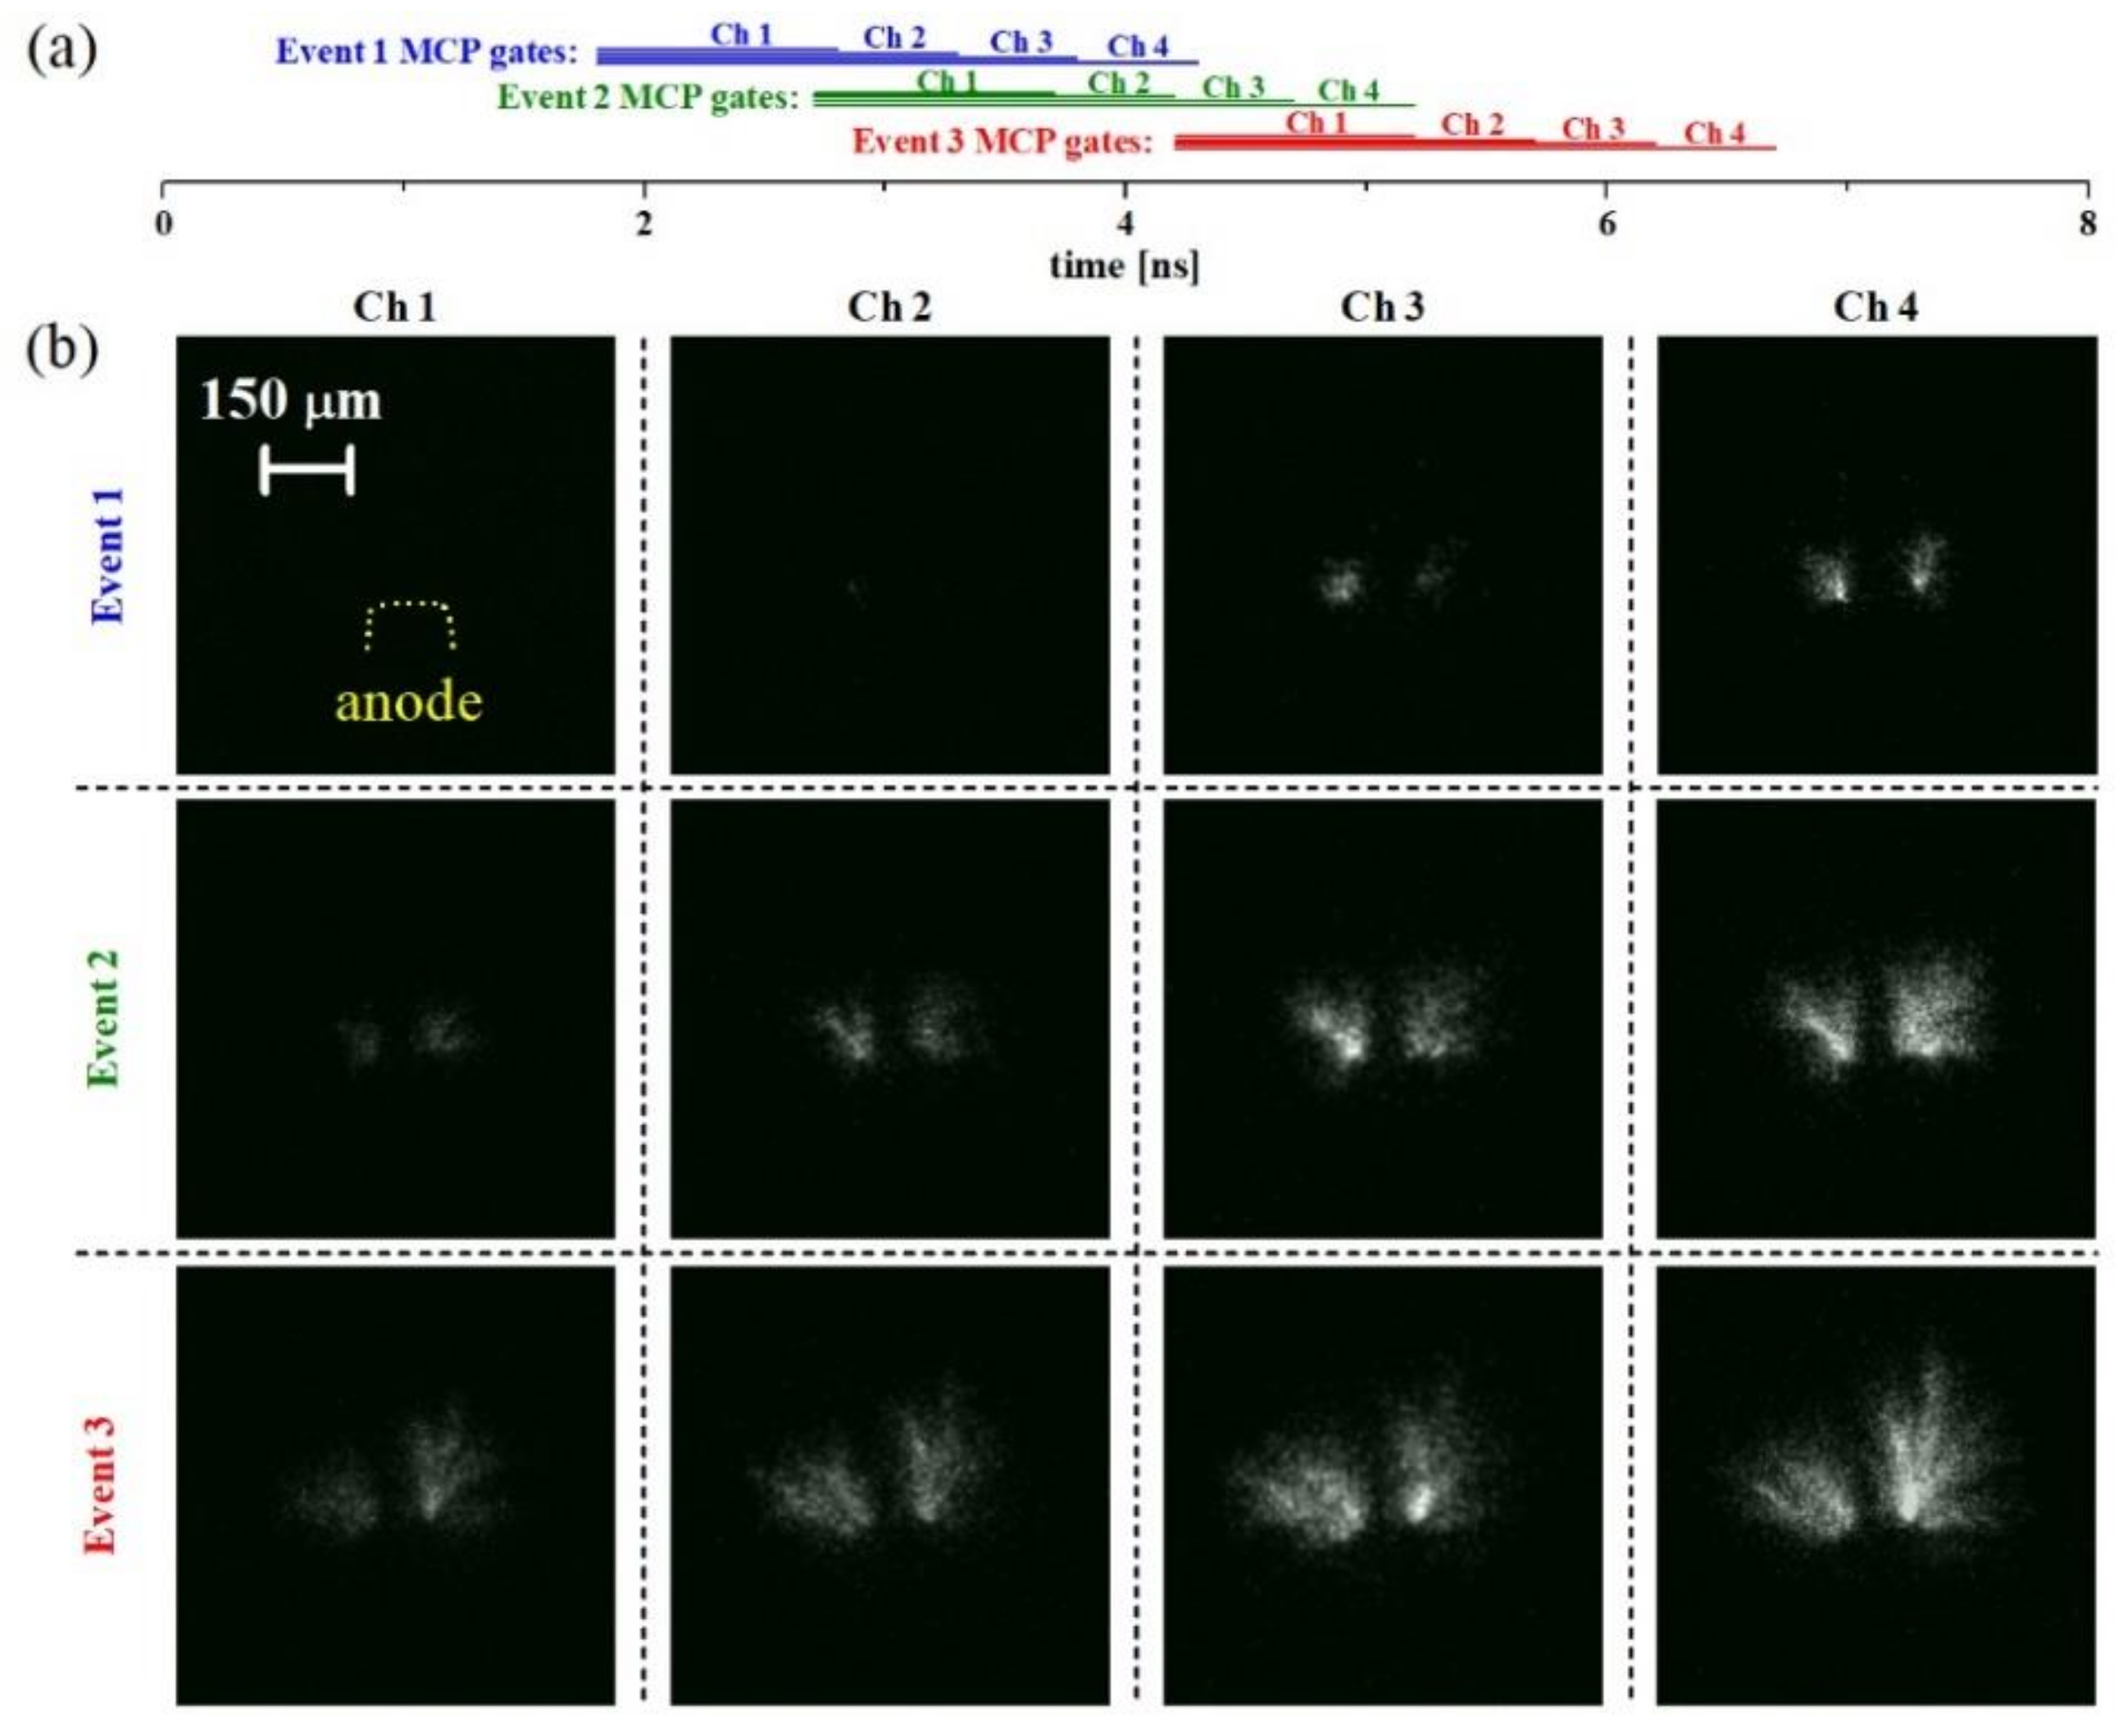
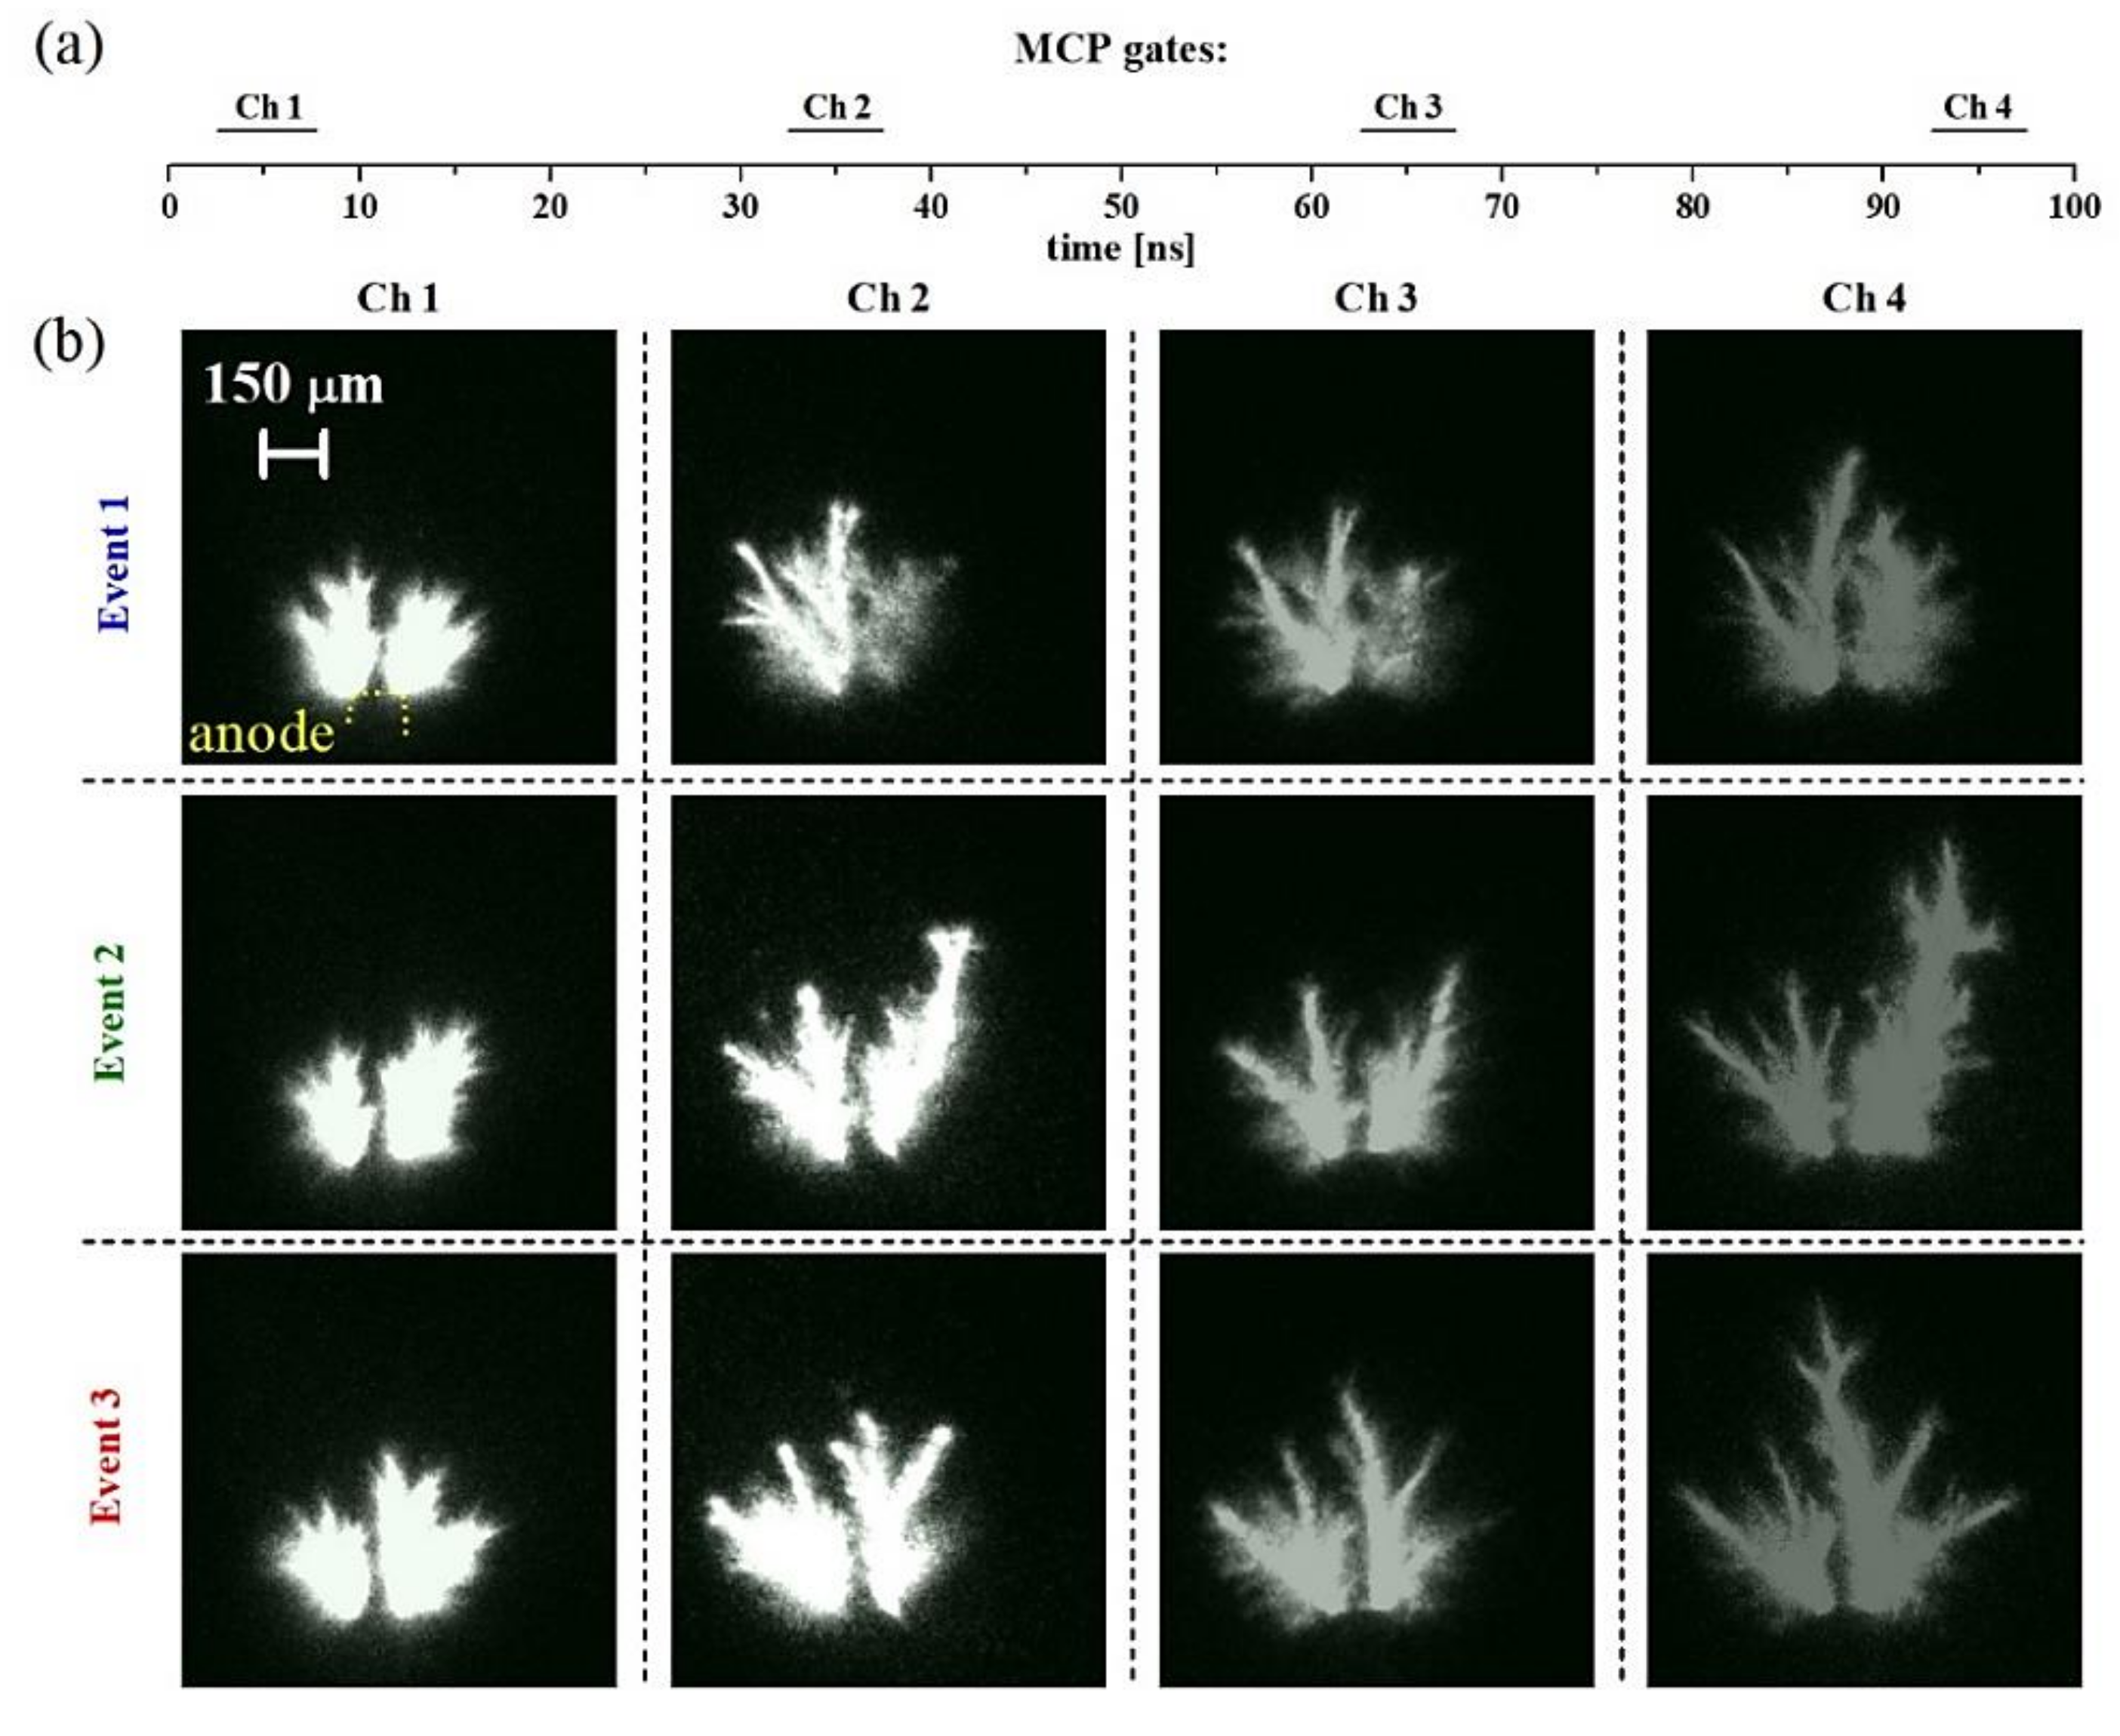
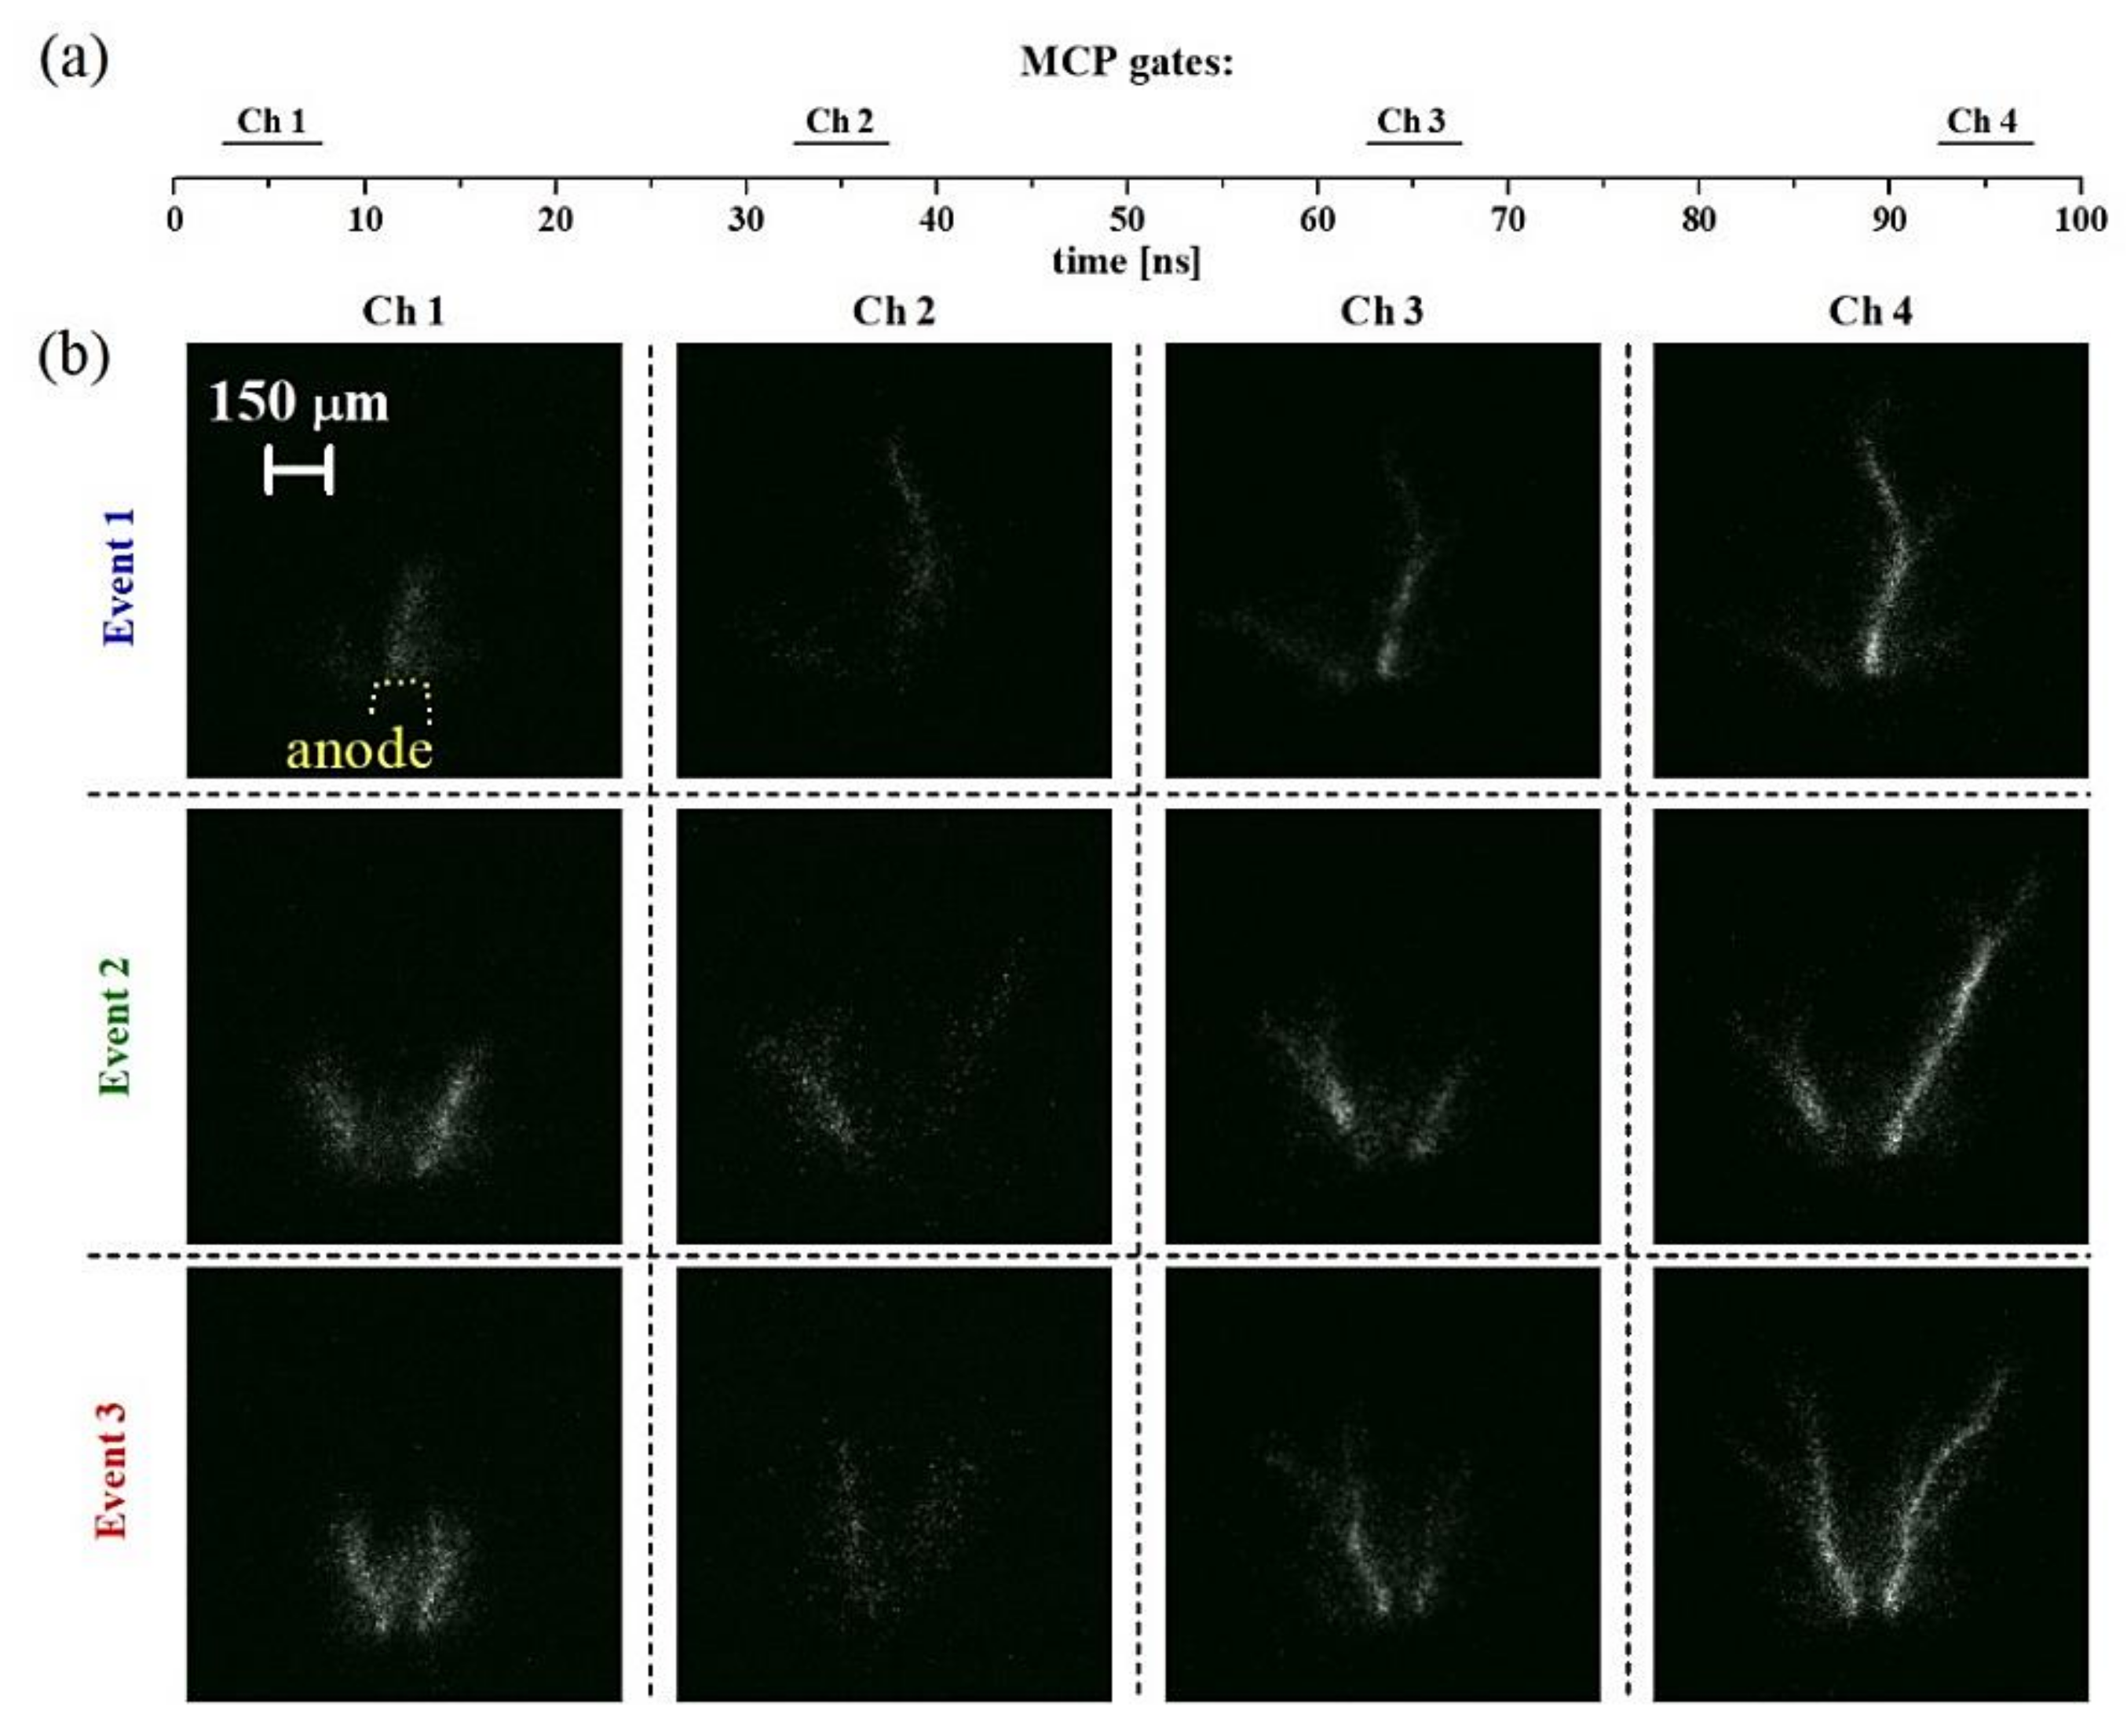
An alternative approach for revealing the progressive growth of filaments is based on the simultaneous opening of the Ch1–Ch4 MCP gates while progressively increasing the MCP gate widths (1, 1.5, 2, and 2.5 ns for Ch1, Ch2, Ch3 and Ch4, respectively). Equal delays of the Ch1–Ch4 MCP gates guarantee the accumulation of photon fluxes in the identical 1 ns intervals. Then, the Ch1 gate is closed while the Ch2–Ch4 gates allow continuous signal accumulation for further 0.5, 1, and 1.5 ns, respectively. As in the previous section, the Ch1–Ch4 images reflect the extension of the luminous structures at the moment of closure of the MCP gate. The series of images displayed in Figure 8 were obtained by integrating broadband discharge emission and capturing the process of expansion in the same way as in Figure 5. As longer MCP gates were used, the CCD pixels covering the luminous filament appeared strongly saturated; therefore, the structure of the branches became unresolved. Nevertheless, the edges of the luminous fronts appear to be well defined as in the case of Figure 5. Figure 9 and Figure 10 display images obtained using the 532 and 656 nm filters, respectively. Because of the progressively increasing length of the MCP gates, these images show the brighter parts of the main filament cores (see the events in Figure 9). The very weak luminosity of the monochromatic images of the filaments at 656 nm in Figure 10 (compared with that of the images at 532 nm in Figure 9) is caused by the missing contribution of the Hα line, which is known to be important during successive reflected events [7,21].
3.3. Case Study C: Luminous Phases Registered with Equal 5 ns Gate Widths and Averaged Over the Primary and Successive Reflected HV Pulses
The characteristic series of four consecutive images of the luminous discharge phase was acquired using equal MCP gate widths (5 ns) of the ICCD 1–4 detectors. The delays of the four MCP gates were set with respect to the onset of the HV pulse in such a way that the Ch1 integrates emission (over a 5 ns interval) produced during the primary HV pulse starting from the onset of the luminous filaments, whereas Ch2–Ch4 provide equivalent images produced during the first three reflections. Opening the MCP gates at the moment of onset of the luminous discharge with an integration interval of 5 ns guarantees that the obtained images capture the maximum extension of the luminous filaments. The Ch1–Ch4 sequences from selected events are displayed in Figure 11, Figure 12 and Figure 13. As in the previous two sections, the images were obtained by integrating broadband discharge emission (Figure 11), or by inserting the 532 and 656 nm filters (Figure 12 and Figure 13).
A comparison of the Ch1 images with the Ch2–Ch3 images in Figure 11, Figure 12 and Figure 13 reveals that the filamentary structures formed during the primary HV pulse (Ch1) are replicated and further enhanced during subsequent reflections (Ch2–Ch4). The images in Figure 11 integrate the broadband emission; consequently, the saturation of the CCD pixels produced black and white images that also captured regions illuminated by secondary branches. In contrast, using the 532/656 nm filters reveals only the brightest core of the main filaments. During the reflected HV pulses, the discharge develops in the post-discharge structures left by the previous event (i.e., the first reflection evolves in the remains of the primary pulse, the second reflection evolves in the remains of the first reflection, etc.). Notably, a comparison of the Ch4 images with the Ch1–Ch3 images (events in Figure 12; Figure 13) reveals the longest extension of the luminous filaments during the third reflection, in contrast with the previous (Ch1–Ch3) phases. The driving HV pulse dissipates during the forth and back reflections in the coaxial cable; therefore, the HV waveform during the third (the last captured) reflection must be characterised by a much lower amplitude compared with that of the primary HV pulse (and lower than that of the first and second reflections). The image sequences obtained using the 532 nm filter (events in Figure 12) reveal the longest extensions in the Ch2 images. On the contrary, the sequences obtained using the 656 nm filter (events in Figure 13) reveal the longest extensions in the Ch4 images. This is consistent with recent results [12] confirming the increasing weight of atomic emission (HI, OI) during the progression of reflections in comparison with other wavelengths. It is very likely that the HI and OI atomic emission tracks the liquid-to-vapour phase transition, as proposed in [7,9,21]; hence, the discharge may be driven by the reflected HV pulses with much lower amplitudes (compared with the primary HV pulse).
3.4. Expansion Velocity of Filaments Observed during Primary HV Pulse
The image sequences obtained in Case studies A and B studies reflect not only the filamentary branched morphology but also the instantaneous state of the expansion of the luminous filaments at the moment of closing of the Ch1–Ch4 MCP gates (the collected discharge photons can produce the photoelectrons only during the MCP gate). Hence, any set of four successive images, such as those shown in Figure 5; Figure 8, can be used to estimate the variation in the length of any individual luminous structure in four consecutive time intervals. The initial orientation of the filament with respect to the anode axis was certainly influenced by the shape of the anode tip. As the actual anode tip is flattened at the top with a smaller curvature radius at the edges (Figure 1c), the filaments are mostly initiated at these edges. This determines the preferential initial angle of the dark filaments. Therefore, the luminous filaments (propagating along the traces of the dark ones) are usually tilted with respect to the vertical axis of the chamber.
As shown in Figure 5, Figure 6, Figure 7, Figure 8, Figure 9, Figure 10, Figure 11, Figure 12 and Figure 13, the expansion of the luminous structures evidently proceeded predominantly in the direction of the initial filament axis (comparing Ch1 with the Ch2–Ch3 images). Thus, both the axial and radial velocity components that can be evaluated from the projected images critically depend on the orientation of the filament axis with respect to the projection direction [12]. Only those filaments propagating in the plane perpendicular to the projection direction yield the correct value of the length/velocity of the projected filament. Statistically, some of the captured filaments must satisfy this geometrical criterion, and an analysis of these filaments must produce higher length/velocity values compared with those of the filaments propagating out of the plane that is perpendicular with respect to the projection.
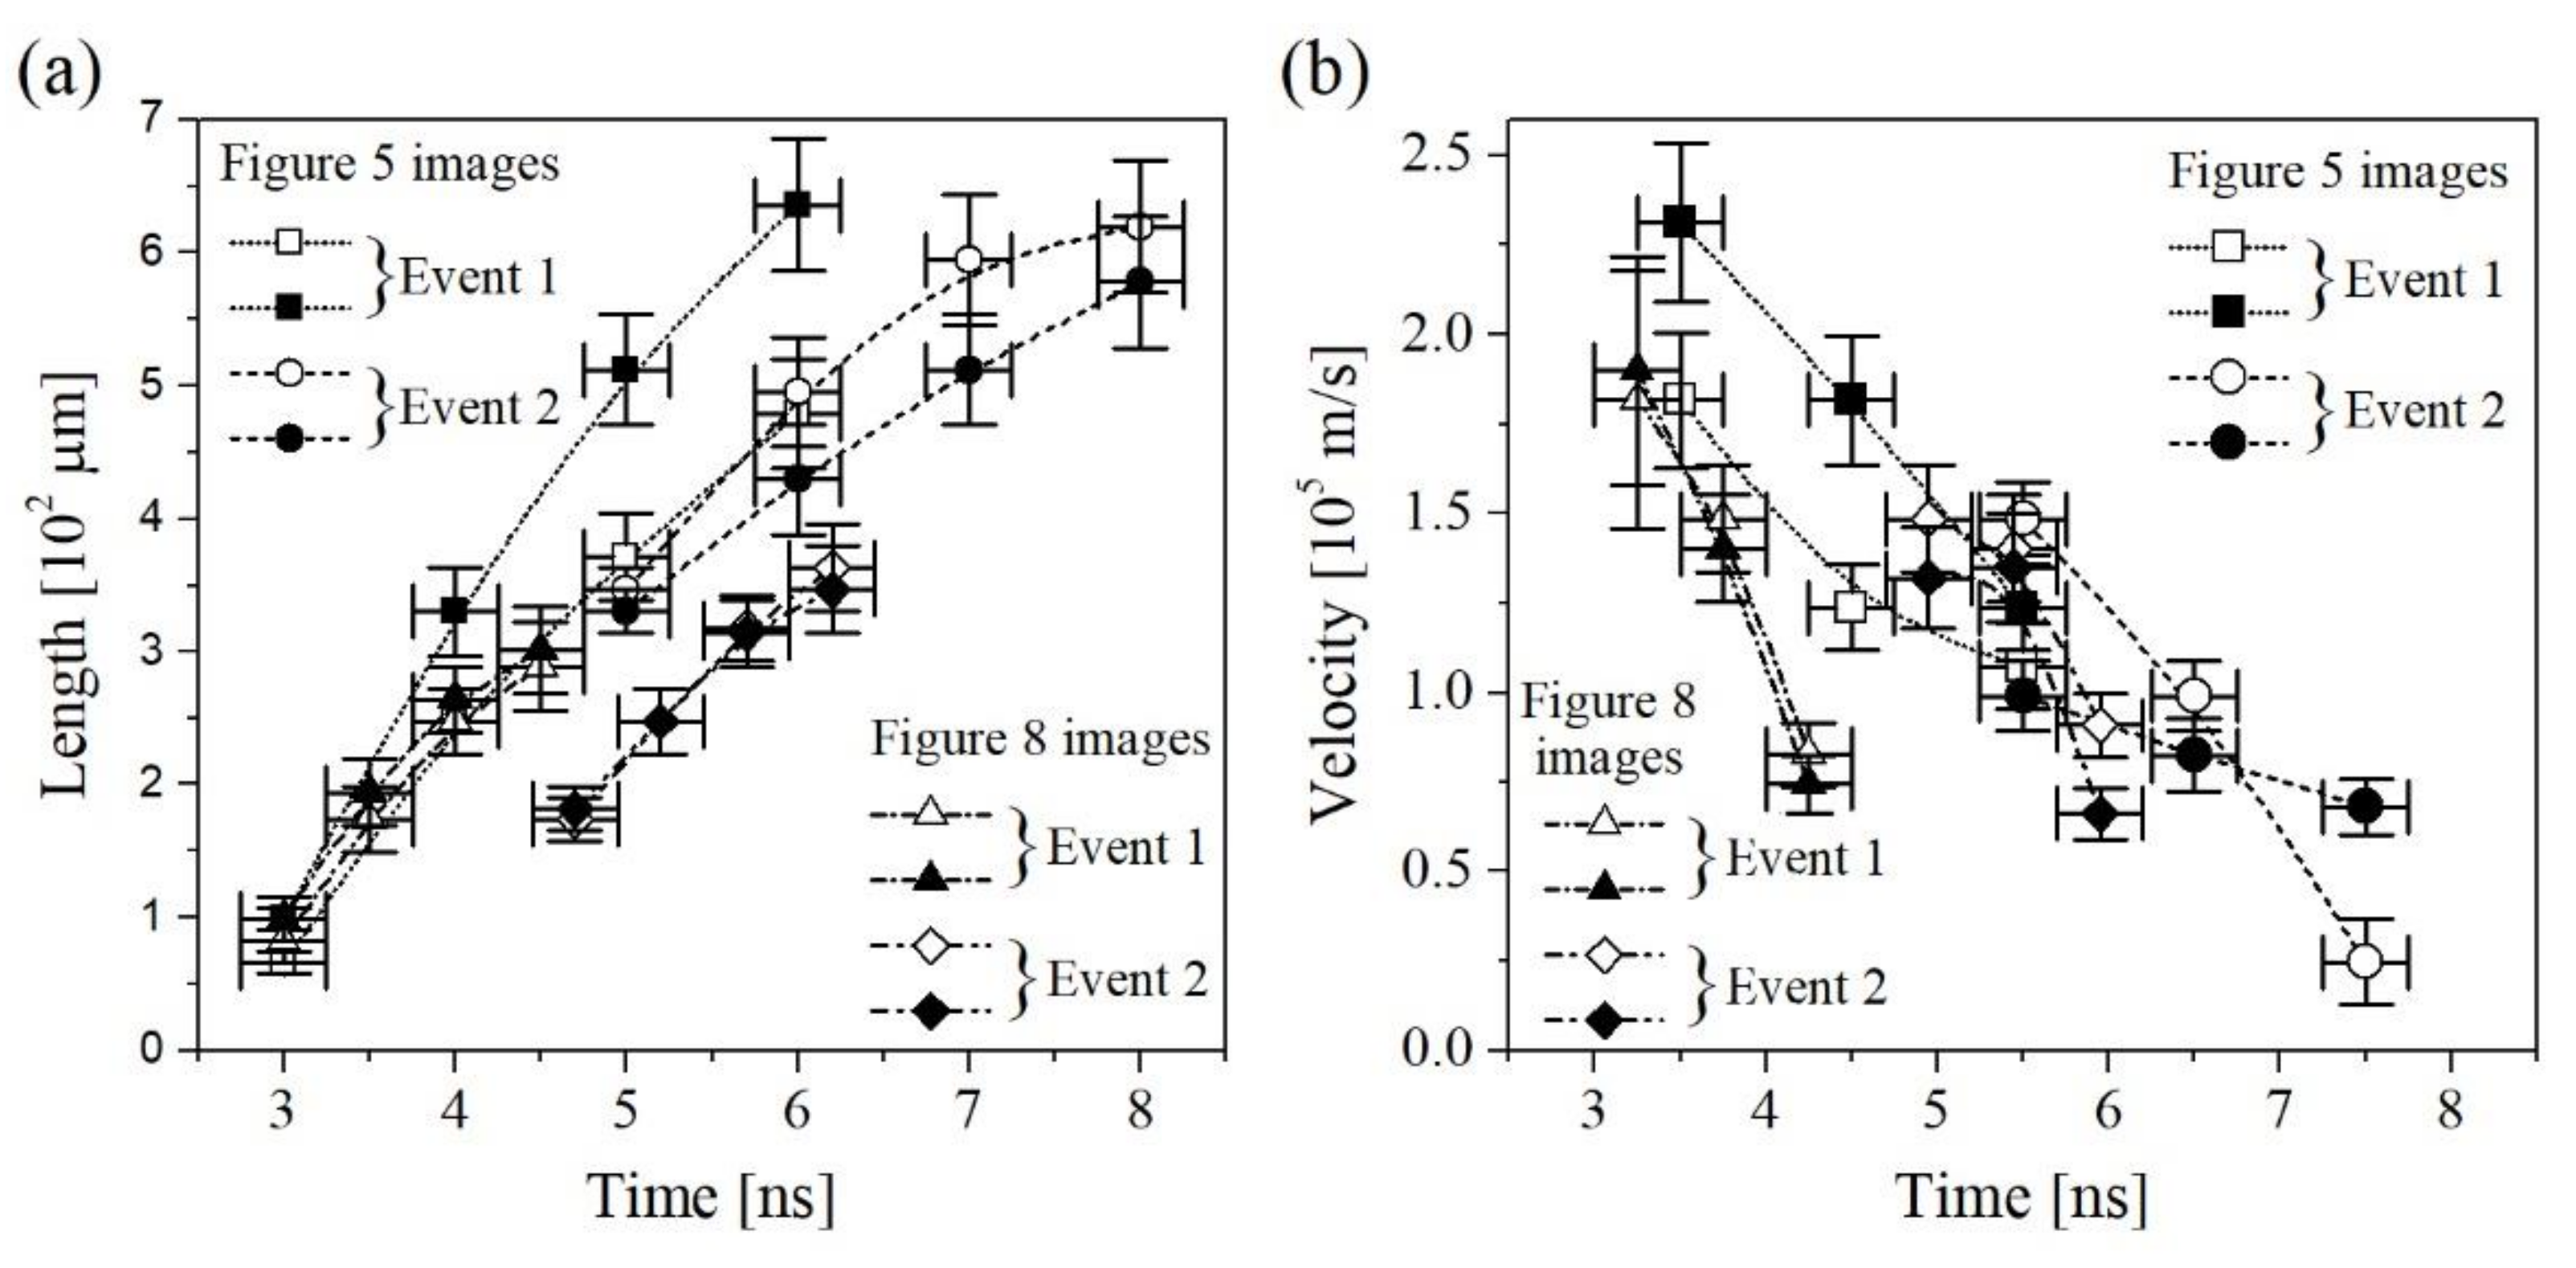
Consequently, we can evaluate the mean expansion velocity of any luminous front as the ratio between the geometrical distance of two luminous fronts captured by two subsequent images and the time interval between the closing edges of the corresponding MCP gates. The typical results obtained by analysing Event 1 and 2 filaments from Figure 5; Figure 8 are displayed in Figure 14. In each of the four analysed events, we selected two initial filaments captured in the Ch1 image and followed their expansion through the Ch2–Ch4 images. Consequently, for each selected filament, we obtained the dependence of the four length and three velocity points on time (the time coordinate for each point is given by its delay with respect to the onset of the HV pulse). The highest expansion velocity is observed close to the anode tip during the first nanosecond of the discharge onset. The expansion then slows down with increasing distance from the anode tip (see Event 2 in Figure 8) until the growth of the filament stops during the descending slope of the HV pulse (see Event 3 in Figure 5; Figure 8). The range of obtained velocities displayed in Figure 14b is fully consistent with the values estimated based on the single-image data reported in previous studies [7,8,12] for both dark and luminous discharge phases.
An unambiguous determination of the propagation velocity of the fronts of the luminous filaments allows a discussion on the axial morphology of the luminous filaments. As the expansion velocity lies between ~1 × 10⁵ and 2.3 × 10⁵ m/s and considering a temporal resolution of 500 ps in Figure 5; Figure 8, the moving front of the cylindrical filament should be imaged as the section of a luminous cylinder approximately 50–250 μm long. If the sources of the luminosity of the expanding filament were localised at the moving front, then the initial part of the filament close to the anode tip would become darker after a certain time needed for the displacement of the luminous front far from the tip. However, this is not the case, as evident from the Event 2 and 3 sequences in Figure 5; Figure 8. It appears that the entire branched filament maintains a homogeneous luminosity along the filament until it reaches the point of maximum expansion and then starts to contract (as discussed in [7]). The sources of emitted photons remain distributed within the entire volume of the growing and expanding filament. In other words, the dominant sources of the discharge luminosity are not predominantly localised on the moving luminous front, as in the case of classical ionising streamer fronts developing in gaseous dielectrics [22,23]. Similar conclusions are supported by the Event 2 and 3 sequences shown in Figure 6; Figure 9 obtained using MCP gates of gate width 1 ns. Therefore, the experimental results obtained and discussed in this section are inconsistent with the concept recently proposed by von Keudell et al. [24] based on a similarity with the gas-phase positive streamer mechanism (explaining new ionising events as effects occurring at the boundary of the positive space charge). Our present findings and those reported in [12] unfortunately do not support such a concept.
3.5. Estimation of Photon Flux Contributions Registered from the Anode Region and Bulk Liquid
Another important problem to be resolved is the origin and interpretation of the discharge luminosity in terms of elementary radiative processes that might be responsible for the experimentally observed emission occurring in the UV–vis–NIR spectral range. Once identified, the specific radiative processes can be used as the signatures of the specific physical processes and mechanisms behind the formation of luminous filaments. Several studies have addressed the emission spectra produced during pulsed nanosecond discharges in liquid water [7,9,14,21,24,25]. A consensus that can be observed throughout the reported results is that UV–vis–NIR emission spectra are characterised by broadband continua superposed with HI and OI atomic lines. However, no apparent consensus exists concerning the possible origins of the observed spectral signatures. For example, Marinov et al. [5] and Grosse et al. [14] based their spectral analysis on thermal black-body radiation. On the other hand, Šimek et al. [7,9] and Bílek et al. [26] explained their observations based on non-equilibrium free-free and free-bound radiative processes. Other fundamental disagreements have arisen in relation to the spatio-temporal distributions of the dominant sources of the discharge luminosity. Grosse et al. [14] and von Keudell et al. [24] postulated that the onset of the discharge luminosity coincides with the onset of the HV pulse and that the dominant source of the observed continuum is a hot tungsten surface. On the other hand, Šimek et al. [7,9,12] showed that the onset of the discharge luminosity with respect to the HV pulse occurs with a delay of several nanoseconds, and all the emissions originate from the luminous filament developing in bulk liquid.
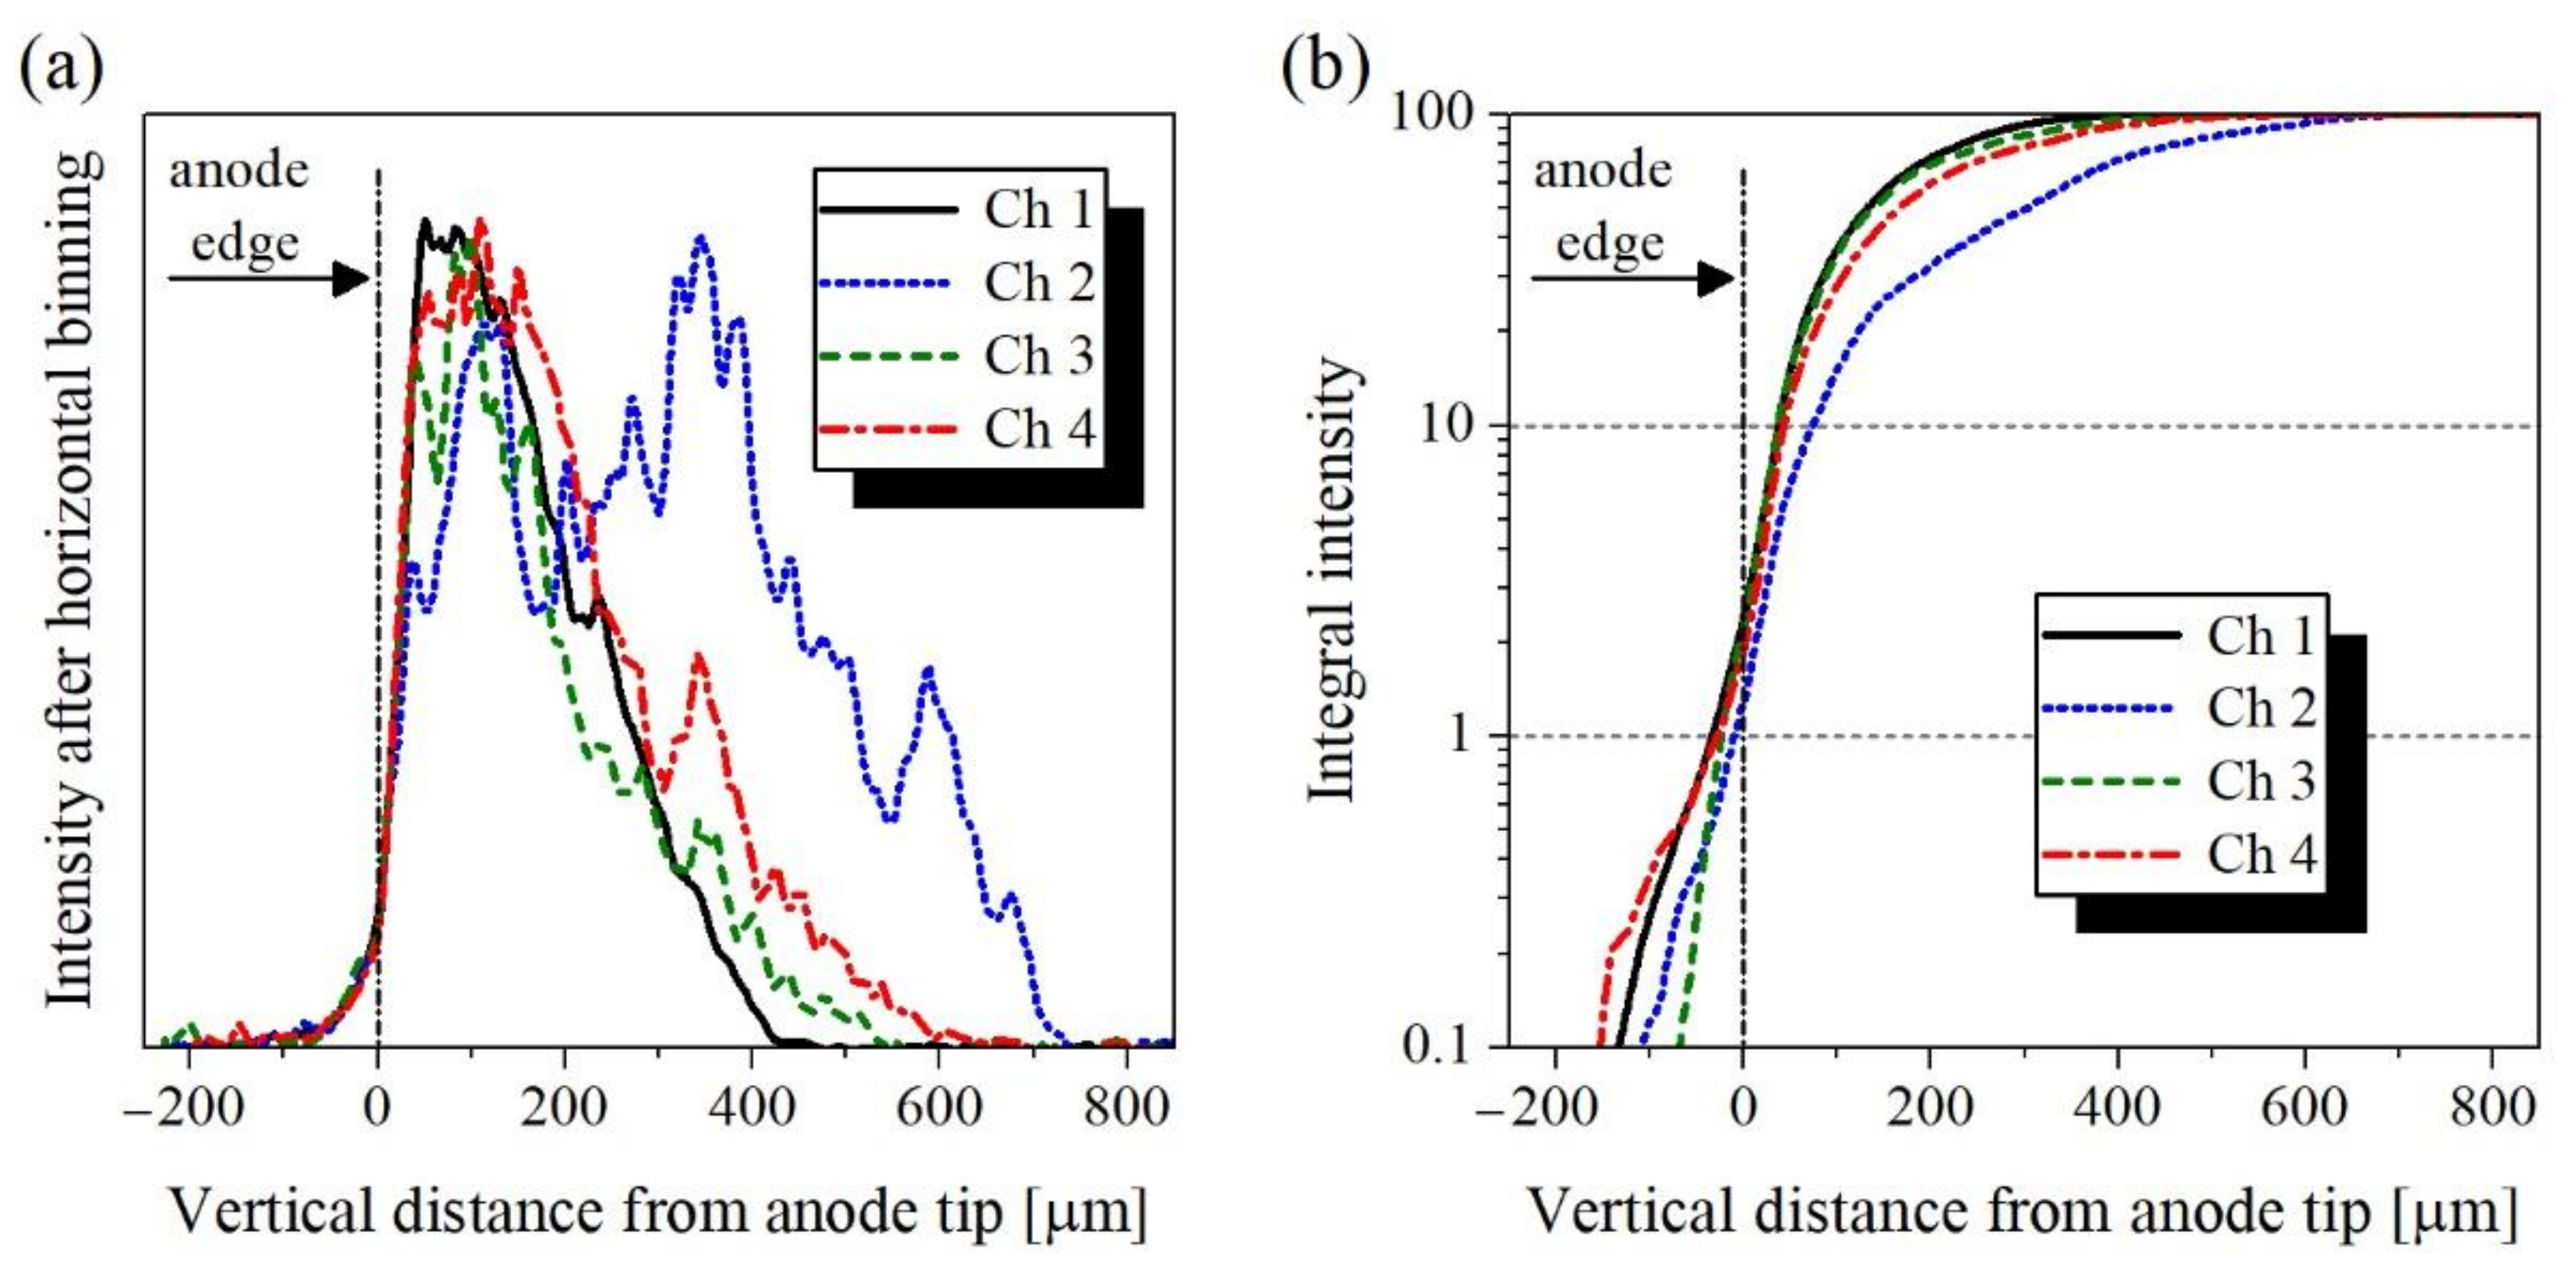
The image sequences obtained in this study provide an ideal tool to evaluate the luminosity collected from the anode and bulk filament regions. To perform this test, we used the Event 1 image sequence from Figure 12 (luminosity captured through the λc = 532 nm IF). The Ch1–Ch4 images were processed via full horizontal binning (i.e., the 2D ICCD matrix was reduced to a single column by integrating the ICCD pixels along each row). Subsequently, the resulting columns were integrated from bottom to top and then normalised to 100. Whereas the first procedure (full horizontal binning) integrates emission from the line-of-sight projections collected by individual ICCD rows (i.e., from various planes perpendicular to the anode axis and at various distances from the anode tip plane), the second integral reveals the percentage of the total monochromatic radiation collected in the given image as a function of the distance from the anode tip. The results obtained from the Ch1–Ch4 images are shown in Figure 15. The curves resulting from horizontal binning (Figure 15a) reflect the maximum extension of the luminous filaments. The full black line tracks the filaments produced during the primary HV pulse (Ch1) and expanding up to 400 μm away from the anode tip. The other curves track the follow-up filaments produced during the first three reflections (Ch2–Ch4) with the longest extension (up to 700 μm) occurring during the first HV reflection. Considering a nominal spatial resolution of the ICCD images (3.6 μm/pixel), we define the volume delimited by two horizontal planes below (−10 μm) and above (+10 μm) the anode tip as the well-resolved anode region. Then, the fraction of luminosity collected from the anode region does not exceed 3–4% of the aggregate, and more than 90% of the aggregate originates from regions with the anode tip distances larger than 50 μm. Moreover, all the curves in Figure 15 show a very smooth growth in the anode region (±10 μm), which practically excludes the possible existence of significant hot spots on the anode surface that might produce intense thermal black-body radiation (such as that reported in [14]).
4. Conclusions
In this study, we examined the evolution of micro-discharges in DI water produced by positive HV pulses of nanosecond duration applied to a sharp tungsten anode pin. We applied the diagnostic technique of image splitting with subsequent detection using independent image detectors, as a basic tool. This approach has already been used to study the propagation behaviour and formation of the vapour phase in microsecond discharge in water by Wen et al. [19,20] with a temporal resolution down to 20 ns and a spatial resolution of approximately 13 μm/pixel. We employed a technique based on image splitting to produce four equivalent images registered by four synchronised ICCD detectors with a temporal resolution down to 500 ps and a spatial resolution of 3.6 μm/pixel.
By conducting carefully designed experiments thoroughly under reproducible conditions (a series of triggered single-discharge events in DI water degassed before any single event), we succeeded in tracking the ongoing expansion of a given luminous filament within a few nanoseconds with a specific delay after the onset of the HV pulse, as illustrated in Figure 5, Figure 6, Figure 7, Figure 8, Figure 9, Figure 10, Figure 11, Figure 12, Figure 13, Figure 14 and Figure 15. Figure 5, Figure 6, Figure 7, Figure 8, Figure 9, Figure 10, Figure 11, Figure 12 and Figure 13 show three representative events that were selected from a subset of approximately 100 registered events (i.e., a set of approximately 900 registered events considered in this study, excluding all calibration images). Therefore, the conclusions made in this study reflect reproducible observations. The results obtained by analysing the synchronised sequences of the Ch1–Ch4 images with the corresponding HV and PIE waveforms can be summarised as follows:
- The first luminous structures start occurring with a delay of ~3–4 ns after the onset of the HV pulse and subsequently expand. The velocity of expansion progressively decreases from a maximum of ~2.3 × 10⁵ m/s (observed close to the anode pin) until the propagation of the filament stops (~500–800 μm away from the anode pin) due to the drop in the anode potential.
- The sequences of synchronised images registered with the MCP gate width 500 ps do not provide any evidence of propagation of a sharp or well-defined luminous front; rather, they indicate a smooth growth of filaments characterised by a homogeneously distributed luminosity within their volume for the entire period of their expansion. This observation is inconsistent with the concept of the discharge mechanism based on the direct analogy with gaseous streamers (i.e., the propagation of a very bright streamer head that leaves only a weakly luminous streamer channel behind).
- The analysis of the luminous filaments developed during the primary HV pulse and the subsequently reflected HV pulses confirmed the similarity of the corresponding luminous structures. This fully confirms our hypothesis made in previous studies that all the reflected discharge events develop exclusively in the tracks left by the primary discharge event. The extensions of the luminous filaments (formed during the HV reflections) significantly beyond the areas reached by the primary discharge event indicate the progressive transformation of liquid water into the conductive vapour phase. This might effectively shift the anode potential from the tungsten surface to the tip of the ionised filament (characterised by a much lower radius of curvature) and ensure a further discharge extension even with much lower amplitudes of the reflected HV pulses.
- The monochromatic images acquired using 532/656 nm IFs reveal an opposite behaviour during the reflected events. The 532 nm filament images appear the strongest and longest during the first reflection. In contrast, the 656 nm images appear much brighter and longer during the last registered reflection. This confirms our conclusions based on the spatially averaged spectrometric analysis that revealed the increasing weight of the Hα line emission with the ongoing reflections compared with a continuum emission.
- An overwhelming fraction (>95%) of the total registered photon flux originates from the bulk liquid regions, indicating that the sources of radiation are predominantly the luminous filaments developing far away from the anode surface. Only a minor fraction (<5%) of the aggregate luminosity can be attributed to the anode tip region (±10 μm). This finding excludes the formation of luminous hot spots on the anode surface, which might be sources of intense thermal black-body radiation. In contrast, the present results support hypotheses based on the free-free and free-bound radiative transitions as the dominant sources of the filament radiation.
The outcomes of this study add another important piece to the persisting puzzle that is the complex mechanism of direct plasma generation in liquid water by confirming and validating the studies performed by using single ICCD detector-based techniques and approaches. Furthermore, the reported methodology opens new prospects for the time-resolved 2D imaging spectroscopy, which has the potential to provide the local characteristics of luminous discharge filaments, thus superseding the results obtained using spatially integrated approaches. The corresponding experimental studies are in progress.
Author Contributions
Methodology, M.Š. and V.P.; software, V.P.; investigation, V.P., J.S., P.H. and M.Š.; writing—original draft preparation, M.Š. and V.P.; writing—review and editing, M.Š. All authors have read and agreed to the published version of the manuscript.
Funding
This study was supported by the Grant Agency of the Czech Republic (GA 18-04676S).
Institutional Review Board Statement
Not applicable.
Informed Consent Statement
Not applicable.
Data Availability Statement
The data presented in this study are available on request from the corresponding author.
Conflicts of Interest
The authors declare no conflict of interest.
References
- Starikovskiy, A.; Yang, Y.; Cho, Y.I.; Fridman, A. Non-Equilibrium plasma in liquid water: Dynamics of generation and quenching. Plasma Sources Sci. Technol. 2011, 20, 024003. [Google Scholar] [CrossRef]
- Starikovskiy, A. Pulsed nanosecond discharge development in liquids with various dielectric permittivity constants. Plasma Sources Sci. Technol. 2013, 22, 012001. [Google Scholar] [CrossRef]
- Dobrynin, D.; Seepersad, Y.; Pekker, M.; Shneider, M.; Friedman, G.; Fridman, A. Non-Equilibrium nanosecond-pulsed plasma generation in the liquid phase (water, PDMS) without bubbles: Fast imaging, spectroscopy and leader-type model. J. Phys. D Appl. Phys. 2013, 46, 105201. [Google Scholar] [CrossRef]
- Marinov, I.; Guaitella, O.; Rousseau, A.; Starikovskaia, S.M. Modes of underwater discharge propagation in a series of nanosecond successive pulses. J. Phys. D Appl. Phys. 2013, 46. [Google Scholar] [CrossRef]
- Marinov, I.; Starikovskaia, S.; Rousseau, A. Dynamics of plasma evolution in a nanosecond underwater discharge. J. Phys. D Appl. Phys. 2014, 47, 224017. [Google Scholar] [CrossRef]
- Seepersad, Y.; Fridman, A.; Dobrynin, D. Anode initiated impulse breakdown in water: The dependence on pulse rise time for nanosecond and sub-nanosecond pulses and initiation mechanism based on electrostriction. J. Phys. D Appl. Phys. 2015, 48, 424012. [Google Scholar] [CrossRef] [Green Version]
- Šimek, M.; Pongrác, B.; Babický, V.; Člupek, M.; Lukeš, P. Luminous phase of nanosecond discharge in deionized water: Morphology, propagation velocity and optical emission. Plasma Sources Sci. Technol. 2017, 26, 07LT01. [Google Scholar] [CrossRef]
- Pongrác, B.; Šimek, M.; Ondáč, P.; Člupek, M.; Babický, V.; Lukeš, P. Velocity of initial propagation of positive nanosecond discharge in liquid water: Dependence on high voltage amplitude and water conductivity. Plasma Sources Sci. Technol. 2019, 28, 02LT02. [Google Scholar] [CrossRef]
- Šimek, M.; Hoffer, P.; Tungli, J.; Prukner, V.; Schmidt, J.; Bílek, P.; Bonaventura, Z. Investigation of the initial phases of nanosecond discharges in liquid water. Plasma Sources Sci. Technol. 2020, 29, 064001. [Google Scholar] [CrossRef]
- Hoffer, P.; Prukner, V.; Schmidt, J.; Šimek, M. Picosecond interferometry and analysis of pressure fields around nanosecond microdischarge filaments that develop in deionized water. Jpn. J. Appl. Phys. 2020, 59, SHHA08. [Google Scholar] [CrossRef]
- Shneider, M.N.; Pekker, M. Liquid Dielectrics in an Inhomogeneous Pulsed Electric Field: Dynamics, Cavitation and Related Phenomena, 2nd ed.; IOP Publishing: Bristol, UK, 2019. [Google Scholar]
- Šimek, M.; Hoffer, P.; Prukner, V.; Schmidt, J. Disentangling dark and luminous phases of nanosecond discharges developing in liquid water. Plasma Sources Sci. Technol. 2020, 29, 095001. [Google Scholar] [CrossRef]
- Grosse, K.; Held, J.; Kai, M.; von Keudell, A. Nanosecond plasmas in water: Ignition, cavitation and plasma parameters. Plasma Sources Sci. Technol. 2019, 28, 085003. [Google Scholar] [CrossRef]
- Grosse, K.; Schulz-von der Gathen, V.; von Keudell, A. Nanosecond pulsed discharges in distilled water: I. Continuum radiation and plasma ignition. Plasma Sources Sci. Technol. 2020, 29, 095008. [Google Scholar] [CrossRef]
- De Baerdemaeker, F.; Šimek, M.; Schmidt, J.; Leys, C. Characteristics of ac capillary discharge produced in electrically conductive water solution. Plasma Sources Sci. Technol. 2007, 16, 341–354. [Google Scholar] [CrossRef]
- An, W.; Baumung, K.; Bluhm, H. Underwater streamer propagation analyzed from detailed measurements of pressure release. J. Appl. Phys. 2007, 101, 053302. [Google Scholar] [CrossRef]
- Fujita, H.; Kanazawa, S.; Ohtani, K.; Komiya, A.; Kaneko, T.; Sato, T. Initiation process and propagation mechanism of positive streamer discharge in water. J. Appl. Phys. 2014, 116, 213301. [Google Scholar] [CrossRef]
- Kumagai, R.; Kanazawa, S.; Ohtani, K.; Komiya, A.; Kaneko, T.; Nakajima, T.; Sato, T. Propagation and branching process of negative streamers in water. J. Appl. Phys. 2018, 124, 163301. [Google Scholar] [CrossRef] [Green Version]
- Wen, X.; Xue, X.; Liu, X.; Li, J.; Zhou, Y. Propagation behavior of microsecond pulsed positive streamer discharge in water. J. Appl. Phys. 2019, 125, 133302. [Google Scholar] [CrossRef]
- Wen, X.; Zhou, Y.; Xue, X.; Yang, Y. Study on the residual gaseous filament of microsecond pulsed positive streamer discharge in water. Phys. Plasmas 2021, 28, 013507. [Google Scholar] [CrossRef]
- Pongrác, B.; Šimek, M.; Člupek, M.; Babický, V.; Lukeš, P. Spectroscopic characteristics of Hα/OI atomic lines generated by nanosecond pulsed corona-like discharge in deionized water. J. Phys. D Appl. Phys. 2018, 51, 124001. [Google Scholar] [CrossRef]
- Šimek, M. Optical diagnostics of streamer discharges in atmospheric gases. J. Phys. D Appl. Phys. 2014, 47, 463001. [Google Scholar] [CrossRef]
- Hoder, T.; Bonaventura, Z.; Bourdon, A.; Šimek, M. Sub-nanosecond delays of light emitted by streamer in atmospheric pressure air: Analysis of N2(C3Πu) and N2+(B2Σu+) emissions and fundamental streamer structure. J. Appl. Phys. 2015, 117, 073302. [Google Scholar] [CrossRef] [Green Version]
- von Keudell, A.; Grosse, K.; Schulz-von der Gathen, V. Nanosecond pulsed discharges in distilled water—Part II: Line emission and plasma propagation. Plasma Sources Sci. Technol. 2020. [Google Scholar] [CrossRef]
- Shneider, M.N.; Seepersad, Y.; Fridman, A.; Pekker, M.; Dobrynin, D. On the electrostrictive mechanism of nanosecond-pulsed breakdown in liquid phase. J. Phys. D Appl. Phys. 2013, 46, 162001. [Google Scholar] [CrossRef] [Green Version]
- Bílek, P.; Tungli, J.; Hoder, T.; Šimek, M.; Bonaventura, Z. Electron-neutral bremsstrahlung radiation fingerprints the initial stage of nanosecond discharge in liquid water. Plasma Sources Sci. Technol. submitted.
Figure 1.
Simplified sketch of (a) the reactor chamber composed of a grounded stainless-steel body, fused silica windows for optical diagnostics, and a water inlet/outlet, (b) coax-based high-voltage (HV) electrode. Image (c) shows the tip of the anode pin used in this study.
Figure 1.
Simplified sketch of (a) the reactor chamber composed of a grounded stainless-steel body, fused silica windows for optical diagnostics, and a water inlet/outlet, (b) coax-based high-voltage (HV) electrode. Image (c) shows the tip of the anode pin used in this study.

Figure 2.
Block scheme of the experimental setup for electrical and optical emission, and XXRapidFrame-based microscopic diagnostics.
Figure 2.
Block scheme of the experimental setup for electrical and optical emission, and XXRapidFrame-based microscopic diagnostics.

Figure 3.
Flowchart of the LabVIEW VI programme that controls the performance of a complete discharge cycle with subsequent data acquisition and storage.
Figure 3.
Flowchart of the LabVIEW VI programme that controls the performance of a complete discharge cycle with subsequent data acquisition and storage.

Figure 4.
Example of the intensity calibration of the Ch1–Ch4 images through the reference discharge images obtained with equal Ch1–Ch4 MCP gate settings. The anode voltage and PMT waveforms (a) illustrate conditions used for acquiring all (calibration and experimental) image sequences. Ch1 and Ch4 images before and after the correction in (b) illustrate the calibration results considering Ch4 image as the reference.

Figure 5.
Case study A; image sequences obtained with broadband discharge emission. Horizontal bars in (a) labelled as Ch1–Ch4 illustrate the timing of the Ch1–Ch4 MCP gates with respect to the onset (time t = 0 ns) of the HV pulse. Images in panel (b) show the evolution of selected events during the primary HV pulse acquired by using equal Ch1–Ch4 MCP gates of 500 ps.

Figure 6.
Case study A; image sequences obtained with the discharge emission that passes through the λc = 532 nm interference filter. Horizontal bars in (a) labelled as Ch1–Ch4 illustrate the timing of the Ch1–Ch4 MCP gates with respect to the onset (time t = 0 ns) of the HV pulse. Images in panel (b) show the evolution of selected events during the primary HV pulse acquired by using equal Ch1–Ch4 MCP gates of 1 ns.

Figure 7.
Case study A; image sequences obtained with the discharge emission that passes through the λc = 656 nm interference filter. Horizontal bars in (a) labelled as Ch1–Ch4 illustrate timing of the Ch1–Ch4 MCP gates with respect to the onset (time t = 0 ns) of the HV pulse. Images in panel (b) show the evolution of selected events during the primary HV pulse acquired by using equal Ch1–Ch4 MCP gates of 1 ns.

Figure 8.
Case study B; image sequences obtained with broadband discharge emission. Horizontal bars in (a) labelled as Ch1–Ch4 illustrate the timing of the Ch1–Ch4 MCP gates with respect to the onset (time t = 0 ns) of the HV pulse. Images in panel (b) show the evolution of selected events during the primary HV pulse acquired by using the Ch1, Ch2, Ch3, and Ch4 MCP gates of 1, 1.5, 2, and 2.5 ns, respectively.

Figure 9.
Case study B; image sequences obtained with the discharge emission that passes through the λc = 532 nm interferential filter. Horizontal bars in (a) labelled as Ch1–Ch4 illustrate the timing of the Ch1–Ch4 MCP gates with respect to the onset (time t = 0 ns) of the HV pulse. Images in panel (b) show the evolution of selected events during the primary HV pulse acquired by using the Ch1, Ch2, Ch3, and Ch4 MCP gates of 1, 1.5, 2, and 2.5 ns, respectively.

Figure 10.
Case study B; image sequences obtained using the discharge emission that passes through the λc = 656 nm interferential filter. Horizontal bars in (a) labelled as Ch1–Ch4 illustrate the timing of the Ch1–Ch4 MCP gates with respect to the onset (time t = 0 ns) of the HV pulse. Images in panel (b) show the evolution of selected events during the primary HV pulse acquired by using the Ch1, Ch2, Ch3, and Ch4 MCP gates of 1, 1.5, 2, and 2.5 ns, respectively.

Figure 11.
Case study C; image sequences obtained using broadband discharge emission. Horizontal bars in (a) labelled as Ch1–Ch4 illustrate the timing of the Ch1–Ch4 MCP gates with respect to the onset (time t = 0 ns) of the HV pulse. Images in panel (b) show the evolution of selected events during the primary and first three reflected HV pulses acquired by using equal Ch1–Ch4 MCP gates of 5 ns.

Figure 12.
Case study C; image sequences obtained using the discharge emission that passes through the λc = 532 nm interference filter. Horizontal bars in (a) labelled as Ch1–Ch4 illustrate the timing of the Ch1–Ch4 MCP gates with respect to the onset (time t = 0 ns) of the HV pulse. Images in panel (b) show the evolution of selected events during the primary and first three reflected HV pulses acquired by using appropriately delayed Ch1–Ch4 MCP gates of equal duration of 5 ns.

Figure 13.
Case study C; image sequences obtained using the discharge emission that passes through the λc = 656 nm interferential filter. Horizontal bars in (a) labelled as Ch1–Ch4 illustrate the timing of the Ch1–Ch4 MCP gates with respect to the onset (t = 0 ns) of the HV pulse. Images in panel (b) show the evolution of selected events during the primary and first three reflected HV pulses acquired by using equal Ch1–Ch4 MCP gates of 5 ns.

Figure 14.
Length (a) and expansion velocity (b) of the fronts of the primary luminous filaments. Length obtained as a geometrical distance of the luminous front from the root of the filament at the anode tip. Expansion velocity obtained from geometrical distance of two captured luminous fronts and the time interval between the closing edges of the corresponding MCP gates. Evaluated from the Event 1 and 2 image sequences shown in Figure 5; Figure 8.

Figure 15.
Distribution of the total registered luminous flux at a wavelength of 532 nm along the axis of symmetry of the anode pin after (a) horizontal binning and (b) subsequent integration from bottom to top. Vertical distance equal zero corresponds to the tip of the anode. Evaluated from the Event 1 image sequence shown in Figure 12.

Publisher’s Note: MDPI stays neutral with regard to jurisdictional claims in published maps and institutional affiliations. |
© 2021 by the authors. Licensee MDPI, Basel, Switzerland. This article is an open access article distributed under the terms and conditions of the Creative Commons Attribution (CC BY) license (http://creativecommons.org/licenses/by/4.0/).
Share and Cite
MDPI and ACS Style
Prukner, V.; Schmidt, J.; Hoffer, P.; Šimek, M. Demonstration of Dynamics of Nanosecond Discharge in Liquid Water Using Four-Channel Time-Resolved ICCD Microscopy. Plasma 2021, 4, 183-200. https://doi.org/10.3390/plasma4010011
AMA Style
Prukner V, Schmidt J, Hoffer P, Šimek M. Demonstration of Dynamics of Nanosecond Discharge in Liquid Water Using Four-Channel Time-Resolved ICCD Microscopy. Plasma. 2021; 4(1):183-200. https://doi.org/10.3390/plasma4010011
Chicago/Turabian StylePrukner, Václav, Jiří Schmidt, Petr Hoffer, and Milan Šimek. 2021. "Demonstration of Dynamics of Nanosecond Discharge in Liquid Water Using Four-Channel Time-Resolved ICCD Microscopy" Plasma 4, no. 1: 183-200. https://doi.org/10.3390/plasma4010011