The Complete Chloroplast Genome Sequencing and Comparative Analysis of Reed Canary Grass (Phalaris arundinacea) and Hardinggrass (P. aquatica)


1
College of Animal Science and Technology, Sichuan Agricultural University, Chengdu 611130, China
2
College of Grassland Science and Technology, China Agricultural University, Beijing 100193, China
3
Key Laboratory of Pratacultural Science, Beijing Municipality, Yuanmingyuan West Road, Haidian District, Beijing 100193, China
*
Authors to whom correspondence should be addressed.
†
These authors contributed equally to this work.
Plants 2020, 9(6), 748; https://doi.org/10.3390/plants9060748
Submission received: 16 May 2020
/
Revised: 8 June 2020
/
Accepted: 10 June 2020
/
Published: 14 June 2020
(This article belongs to the Special Issue Plant Molecular Phylogenetics and Evolutionary Genomics)
Abstract
:There are 22 species in the Phalaris genera that distribute almost all over the temperate regions of the world. Among them, reed canary grass (Phalaris arundinacea, tetraploid and hexaploid) and hardinggrass (P. aquatica, tetraploid) have been long cultivated as forage grass and have received attention as bio-energy materials in recent years. We aimed to facilitate inter-species/ploidies comparisons, and to illuminate the degree of sequence variation within existing gene pools, chloroplast (cp) genomes of three Phalaris cytotypes (P. aquatica/4x, P. arundinacea/4x and P. arundinacea/6x) were sequenced and assembled. The result indicated that certain sequence variations existed between the cp genomes of P. arundinacea and P. aquatica. Several hotspot regions (atpI~atpH, trnT-UGU~ndhJ, rbcL~psaI, and ndhF~rpl32) were found, and variable genes (infA, psaI, psbK, etc.) were detected. SNPs (single nucleotide polymorphisms) and/or indels (insertions and deletions) were confirmed by the high Ka/Ks and Pi value. Furthermore, distribution and presence of cp simple sequence repeats (cpSSRs) were identified in the three Phalaris cp genomes, although little difference was found between hexaploid and tetraploid P. arundinacea, and no rearrangement was detected among the three Phalaris cp genomes. The evolutionary relationship and divergent time among these species were discussed. The RNA-seq revealed several differentially expressed genes (DEGs), among which psaA, psaB, and psbB related to leaf color were further verified by leaf color differences.
1. Introduction
To fully understand the evolutionary paths of Phalaris species, it is necessary to know the information coded in their nuclear genome and the accompanying organelle genomic (mitochondria and/or chloroplast) sequence [1]. Given that the nuclear genome assembly is costly and difficult, the genome sequences of mitochondria and chloroplast are much smaller and thus appropriate for genetic information mining. Chloroplast (cp) genome sequences have been proven useful in genetic studies like differential gene detection, polymorphic probe development, and phylogenetic analysis [1]. Mutation or structural variation in cp genome is of great significance in studying plant evolution, classification, genetic diversity, mechanism of plant photosynthesis, plant energy metabolism, plant antioxidants, and secondary metabolism [2]. Especially, the cp genes in plants are specifically inherited from the maternal line and not disturbed by gene recombination; hence, the evolutionary route is relatively independent from the nuclear genome. This makes it good material for the study of plant genealogy geography, systematics, gene and intron losses, and population history, as well as excellent substrates for genetic transformation [1,2,3]. A typical plant cp genome size ranges from 120 kb to 217 kb. It usually has a quadripartite structure consisting of two copies of an inverted repeat (IR) region, a large single-copy (LSC) region, and a small single-copy (SSC) region [1,4]. Recent studies showed that the non-coding intergenic spacer regions of the cp genome have considerable diversity and may function in regulation of gene expression [5,6].
Phalaris L. (Poaceae) wildly distributes in temperate regions of both hemispheres and in the mountains of tropical Africa and South America. At least 22 Phalaris species have been identified [7,8,9,10]. Among them, Phalaris aquatica and P. arundinacea both originated in the Mediterranean region and are closely allied with each other in the lineage with x = 7 basic chromosomes. The P. arundinacea (6x) was reported genetically closer to P. aquatica (4x) than to P. arundinacea (4x) because of a higher hybridization rate between P. arundinacea (6x) and P. aquatica (4x) [10]. Hence, the hypothesis was once made that P. arundinacea (6x) was the outcome of the hybridization of P. aquatica (4x) and P. arundinacea (4x). However, more genetic and fossil evidence is needed to support this hypothesis [11].
Phalaris species are not only very important for grazing, but also receive close attention as a biomass and bio-energy crop which showed great yield potential in consideration of both dry matter and crude protein via seed dispersal or extensive rhizome systems [9,12]. Moreover, the Phalaris species possess adaptation to cold, drought, and flooding, as well as all kinds of soils; therefore, they are mainly planted on marginal land that is unsuitable for other agricultural uses [7,10]. Additionally, because Phalaris have evident variation in morphological traits, plus the vital role of polyploidy in their evolution (e.g., tetraploid and hexaploid P. arundinacea), their potential value in terms of speciation, chromosomal evolution, and biogeography in Poaceae were manifested [8]. The problem is, however, that most available accessions do not exhibit good palatability due to the existence of poisonous alkaloids, poor digestibility in comparison with other forage species, and low seed yield because of high seed shattering [13]. According to previous studies, alkaloid concentration of P. arundinacea is related to the moisture stress and nitrogen application, as well as clipping and light intensity, which react as a response to the external environmental changes and work as stimulating or regulating factors in plant growth, metabolism, and reproduction [13,14,15]. Moreover, alkaloid in P. arundinacea was reported to be accumulated mainly in the leaf blades with a percentage of more than 59% of the concentration [13]. A previous study on lupins also indicated that the lysine-derived quinolizidine alkaloids appeared to occur within the mesophyll chloroplasts of green leaves [16]. Hence, we believe that more or less hereditary factor controlling alkaloid synthesis lies in the cp genome of Phalaris or resulted from the interaction of nuclear and plastids genes. In this case, cp genome modification of Phalaris is feasible because engineering the cp genome for biotechnology applications was reported to succeed in many other species [4].
Identification of genomic variation provides an opportunity for the uncovering of correlation between genotype and phenotypes [17]. Given the fully transcribed character of the cp genome [18], transcriptome sequencing (RNA-seq), along with cp genome sequencing, can be considered as a powerful tool to gain functional genomic data and to identify the function of candidate cp genes in specific biological process [17,18,19]. That will supply valuable information for further gene function research.
In this study, cp genomes of two Phalaris species were sequenced and compared. We revealed sequence synteny and rearrangements, gene loss/pseudogenization, and IR expansions and contractions among these species. Divergence times of the sequenced Phalaris species from other complete sequenced Pooideae grass were estimated. Our analyses of the three Phalaris cp genomes (P. arundinacea (tetraploid and hexaploid) and P. aquatica (tetraploid)) provide detailed genetic information distinguishing different Phalaris ploidies and facilitate breeding programs and species identification. In addition, RNA-seq was carried out to detect the differentially expressed genes (DEGs) and to explore their corresponding functions.
2. Results
2.1. Genomic Features of Three Phalaris Chloroplast Genomes
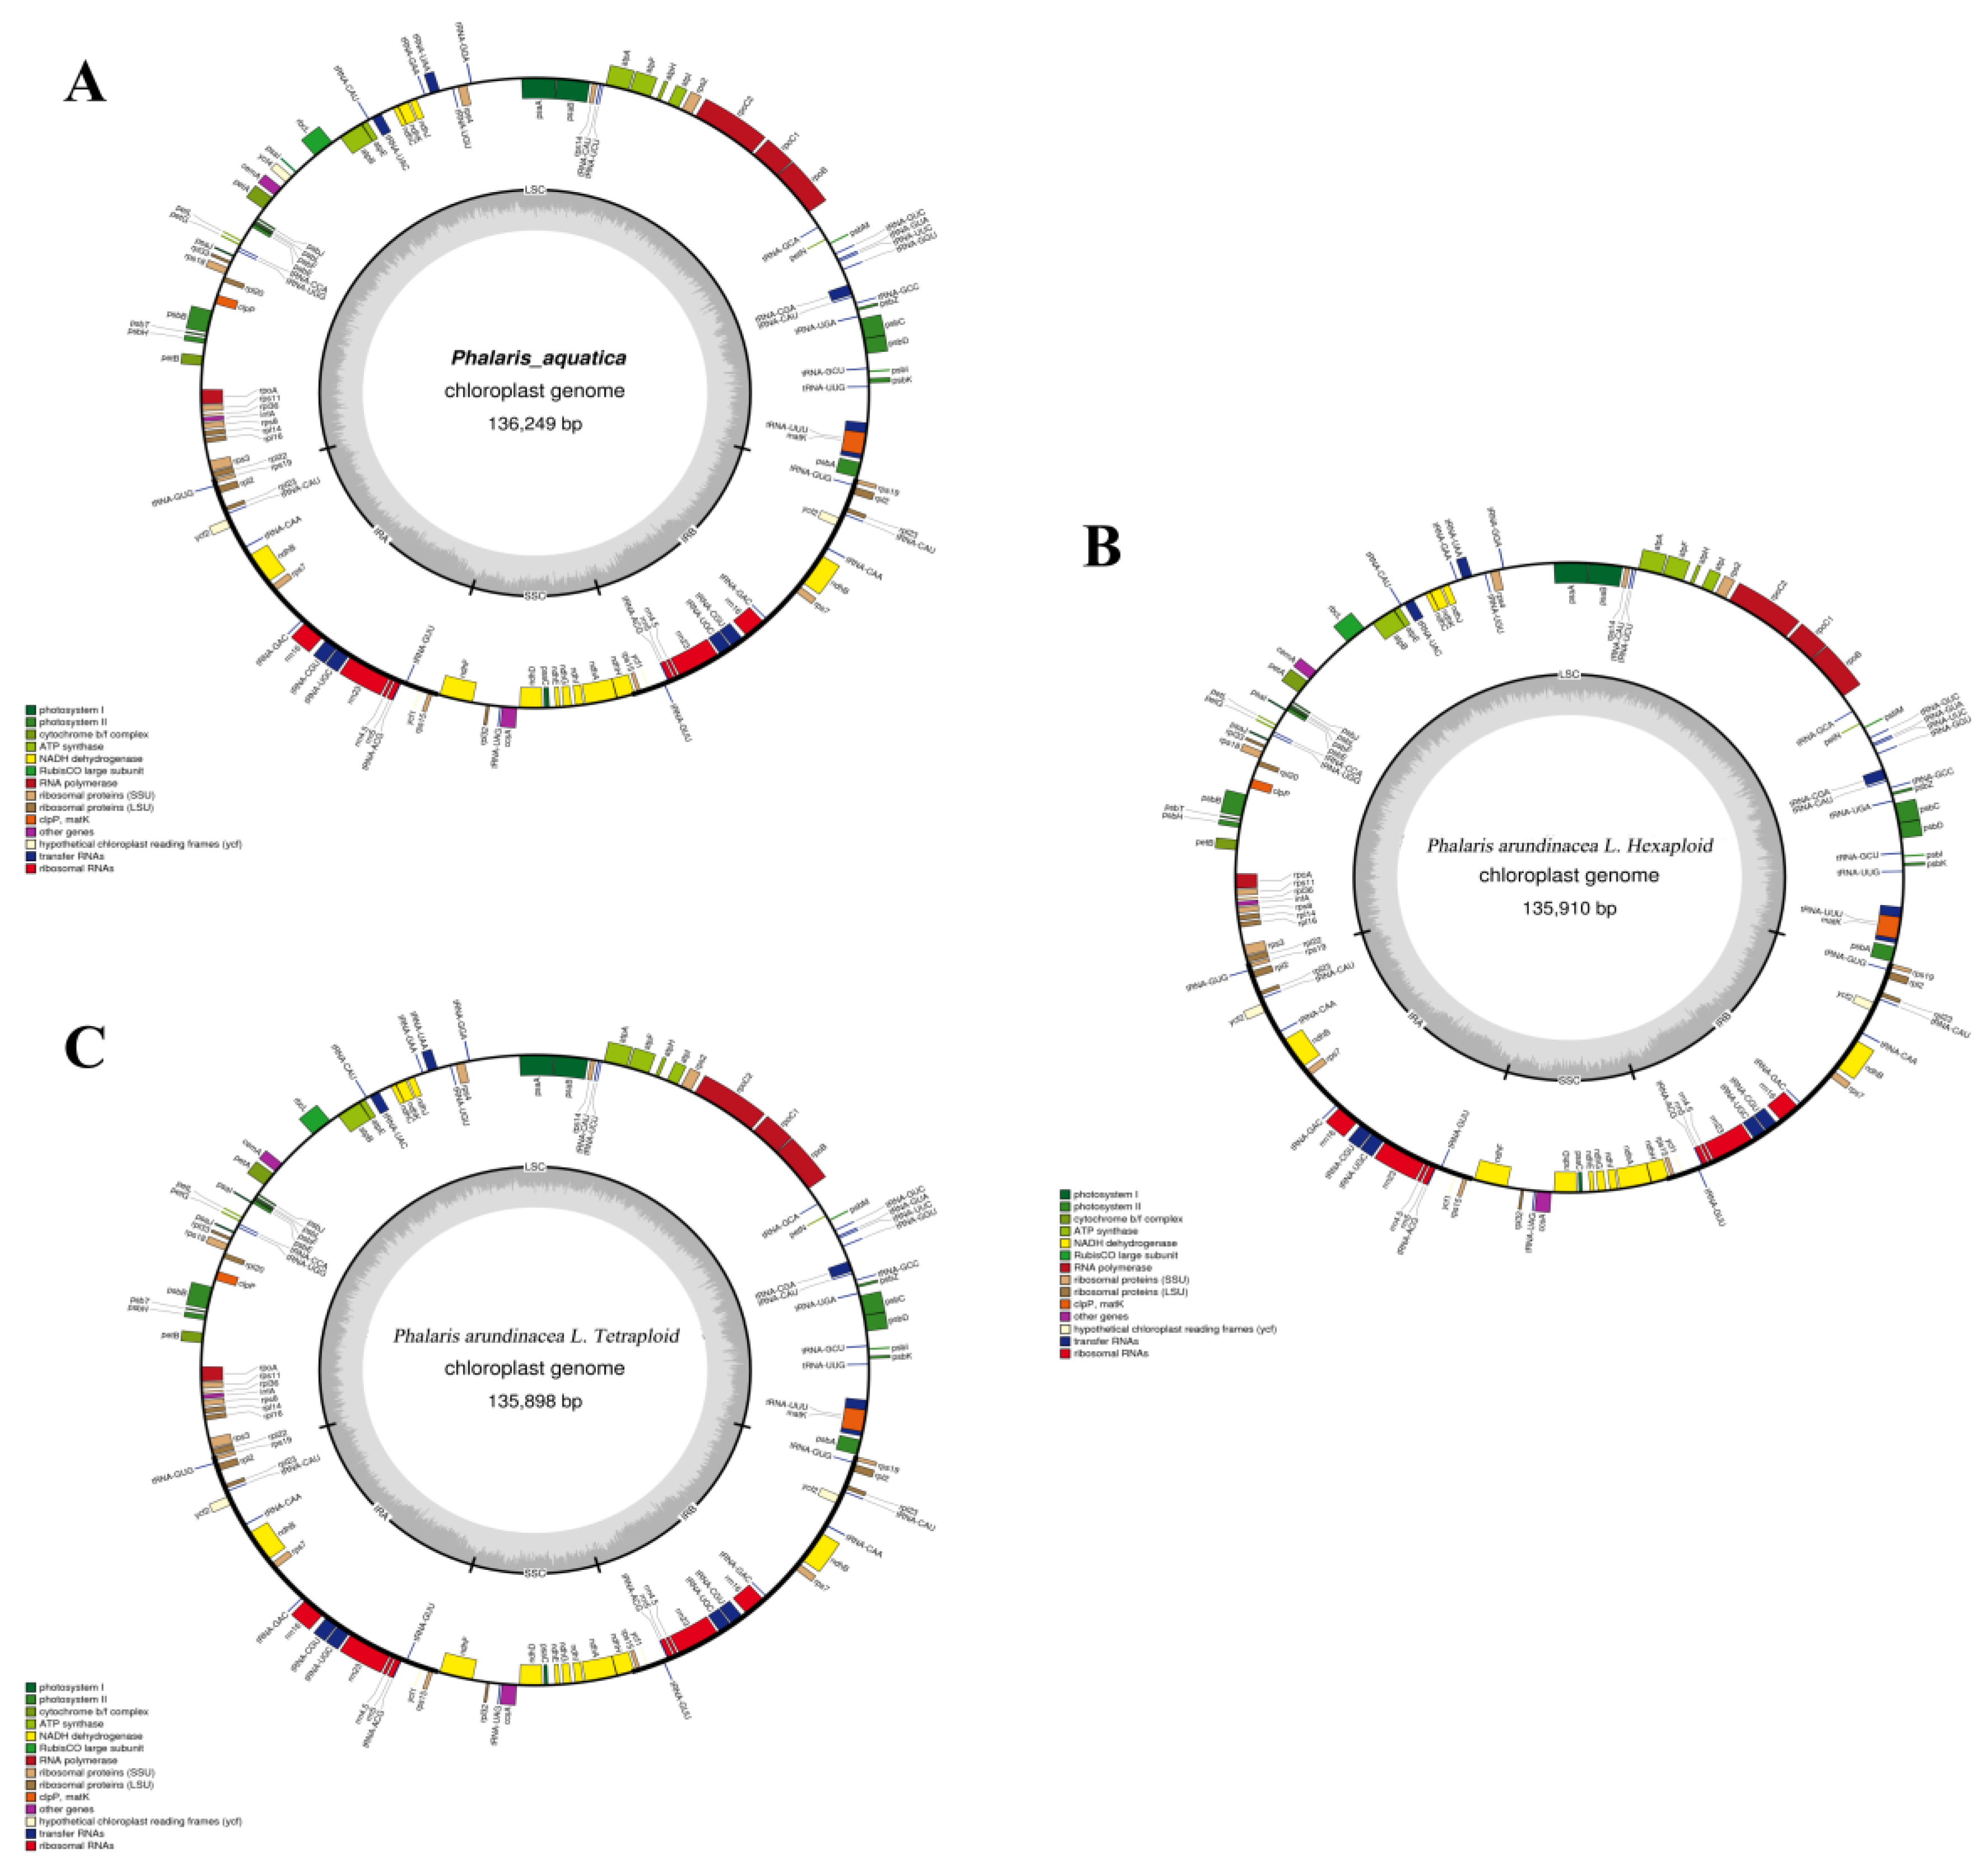
The assembled cp genomes of P. arundinacea (4x), P. arundinacea (6x), and P. aquatica (4x) were 135,898 base pairs (bp), 135,910 bp, and 136,249 bp, respectively (Table 1). All of them had a typical quadripartite structure. The pair of inverted repeats (IRs, including IRA and IRB) regions of the three cp genomes were 21,653 bp, 21,653 bp, and 21,703 bp, separated by an LSC region and an SSC region (Table 1 and Figure 1). The guanine and cytosine (GC)contents of the cp genomes were 38.52%, 38.52%, and 38.45%, and the percentages of GC nucleotides were unevenly distributed throughout the cp genomes of those with the highest GC content in IRs.
The total numbers of unique cp genes were 104, 104, and 105, respectively, in the three Phalaris cp genomes. P. arundinacea (4x) and P. arundinacea (6x) both had 28 tRNAs, 4 rRNAs, and 72 mRNA genes (Table 1), while one additional gene, ycf4, was found in P. aquatica (Table 2). The three cp genomes all contain 19 genes duplicated in the IR region, including all four kinds of rRNAs (16S, 23S, 5S, 4.5S), seven tRNAs, six translation-/transcription-/photosynthesis-related genes, ycf1, and ycf2. The 72 common mRNA genes in the three cp genomes consisted of 24 unique transcription- and translation-related genes, 43 (P. arundinacea) and 44 (P. aquatica) unique photosynthesis-related genes, and five other genes: matK, clpP, cemA, ycf1, and ycf2 (Table 3).
In all the three Phalaris cp genomes, 12 genes had one single intron (Table 2), which was highly conserved in the two P. arundinacea ploidies, and small differences were observed for intron size between P. aquatica and P. arundinacea. The intron-containing genes could be categorized into three types corresponding to electron transfer, protein synthesis, and ATP synthesis (Table 2 and Table 3).
2.2. Variation among Three Chloroplast Genomes
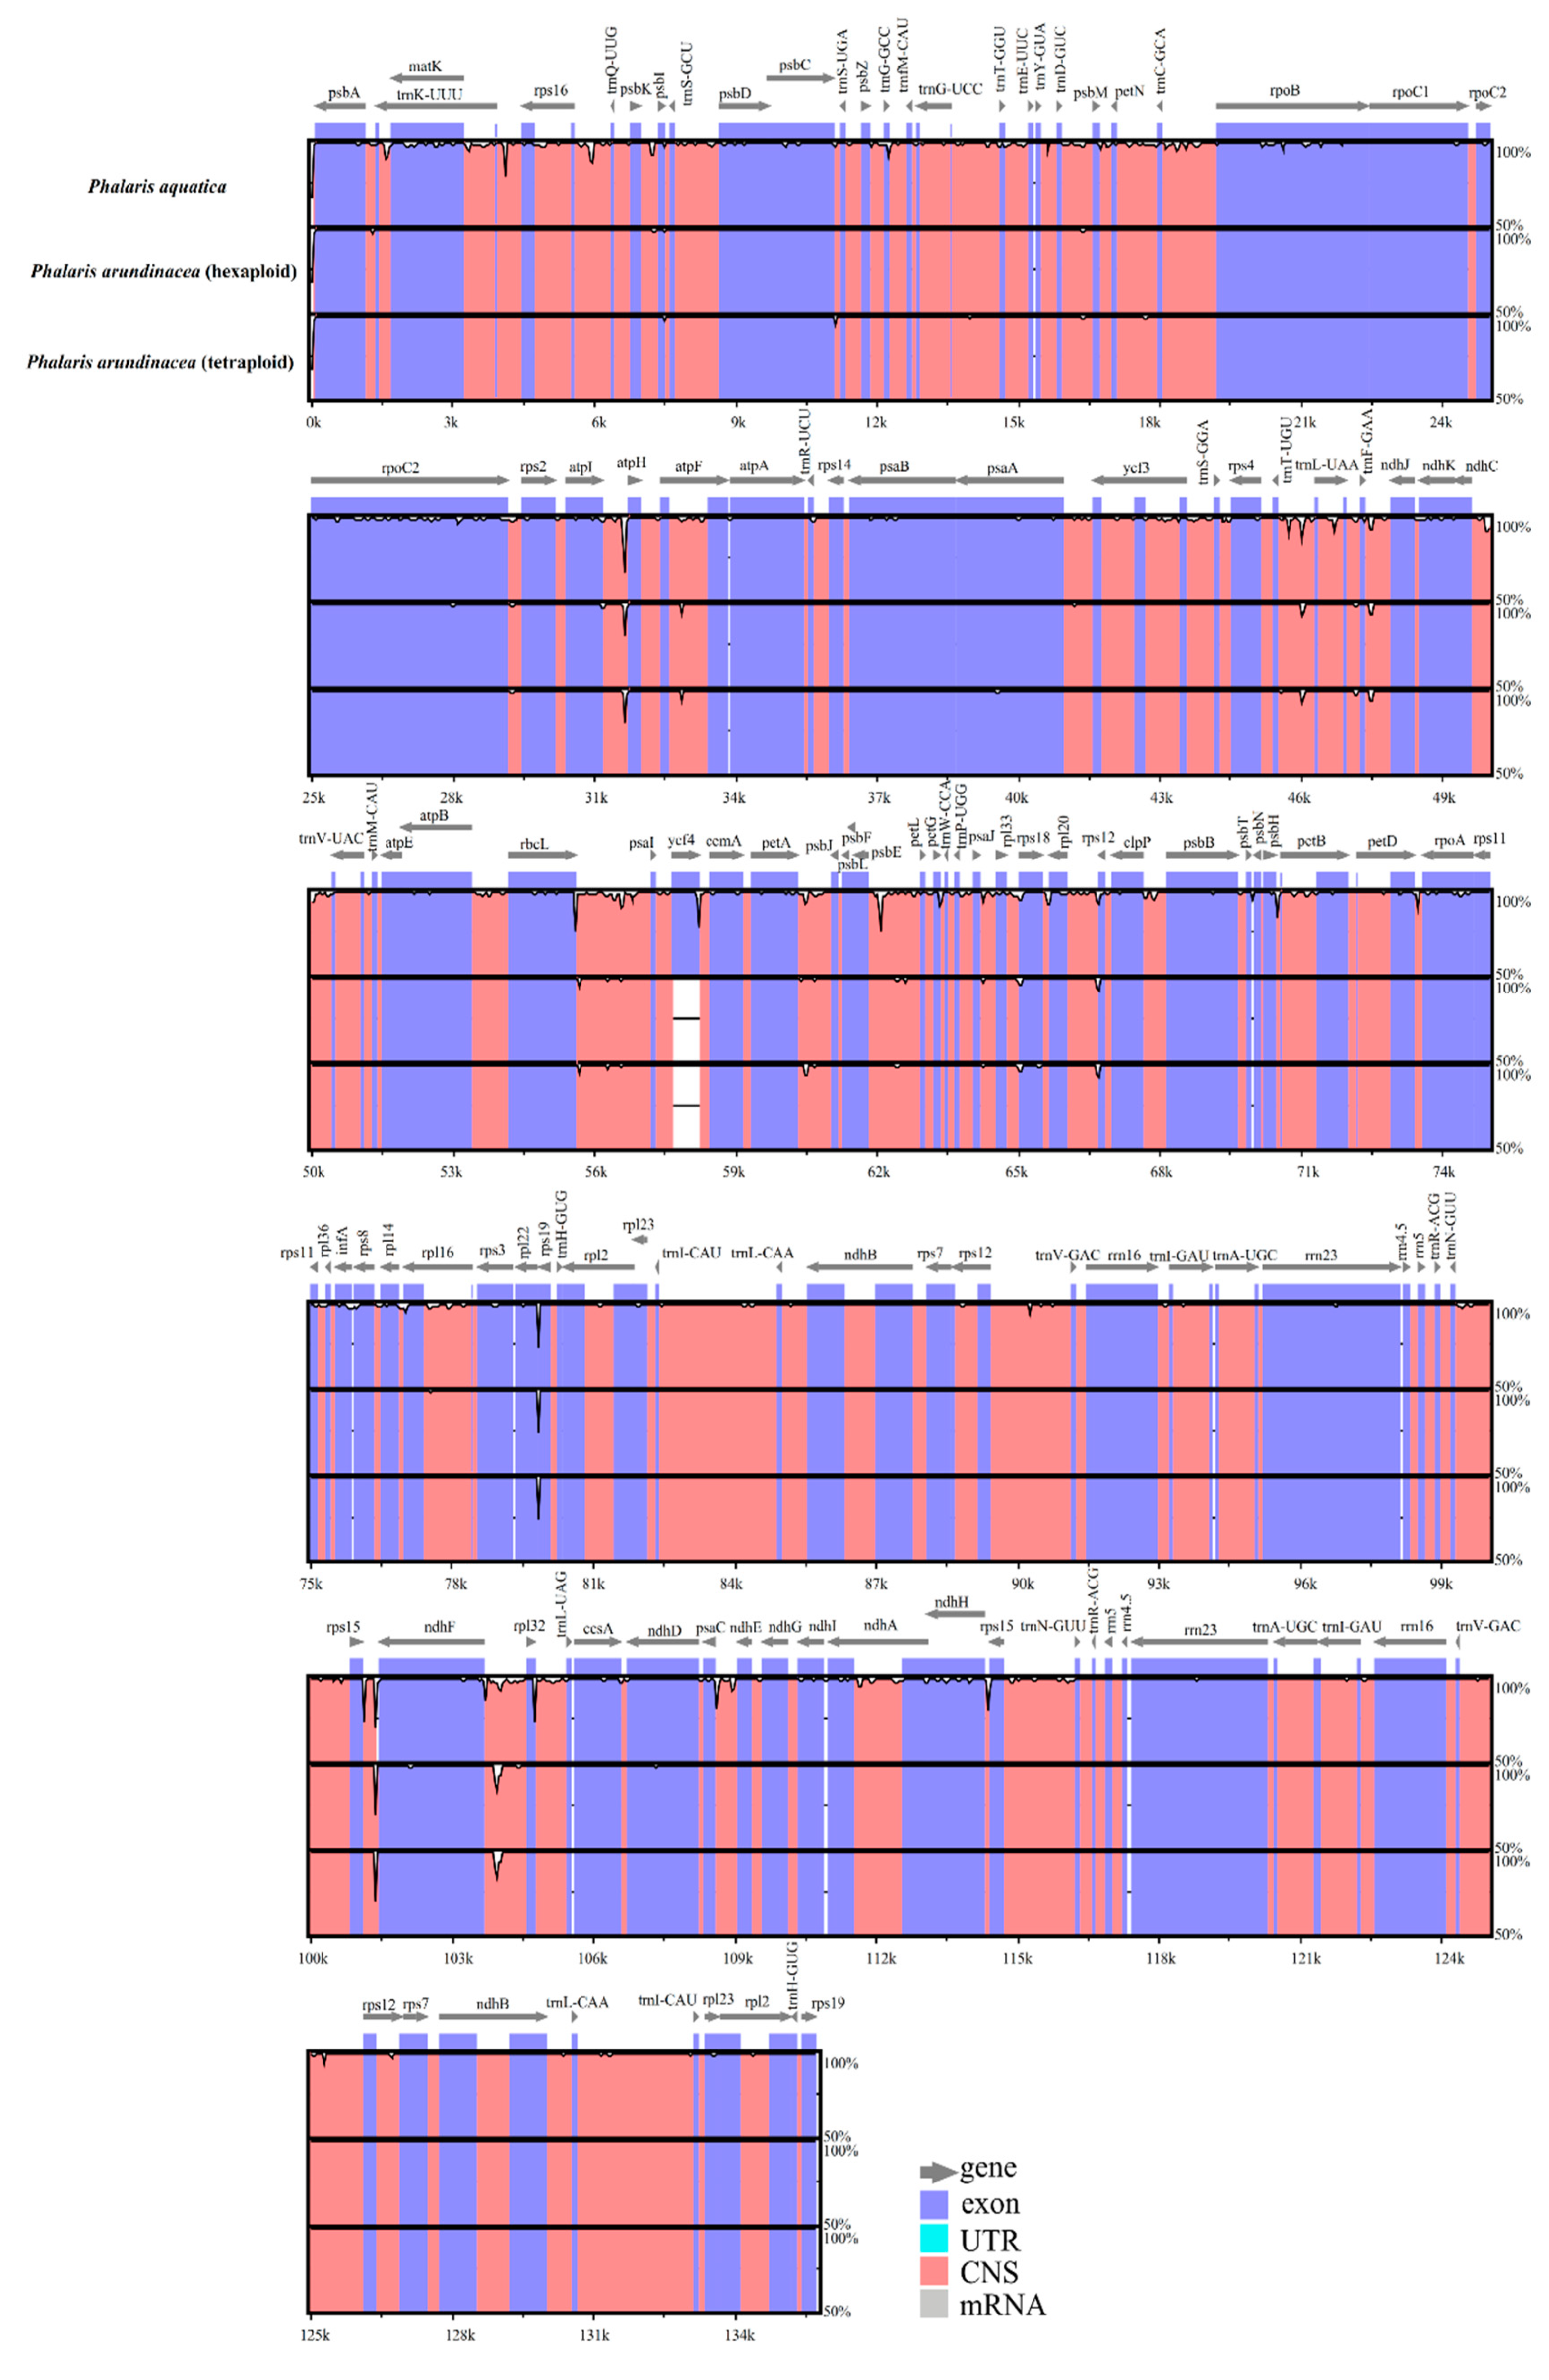
Overall genic variation among the three Phalaris cp genomes was revealed by mVISTA [20] and Mauve [21]. We found more conservation in the coding regions than that in non-coding regions, and higher divergence in LSC regions than in SSC and IR regions (Figure 2). The cp genomes of the two different ploidy levels of P. arundinacea species showed high conservation, while P. aquatica varied from P. arundinacea, especially in the non-coding sequence of LSC regions. Hotspot regions highly enriched with variations were identified in the whole genome, which included atpI~atpH, trnT-UGU~ndhJ, rbcL~psaI, ndhF~rpl32, etc. (Figure 2). However, no rearrangement or inversion events were found among the three Phalaris cp genomes as depicted in the locally collinear blocks (LCBs) (Figure S1).
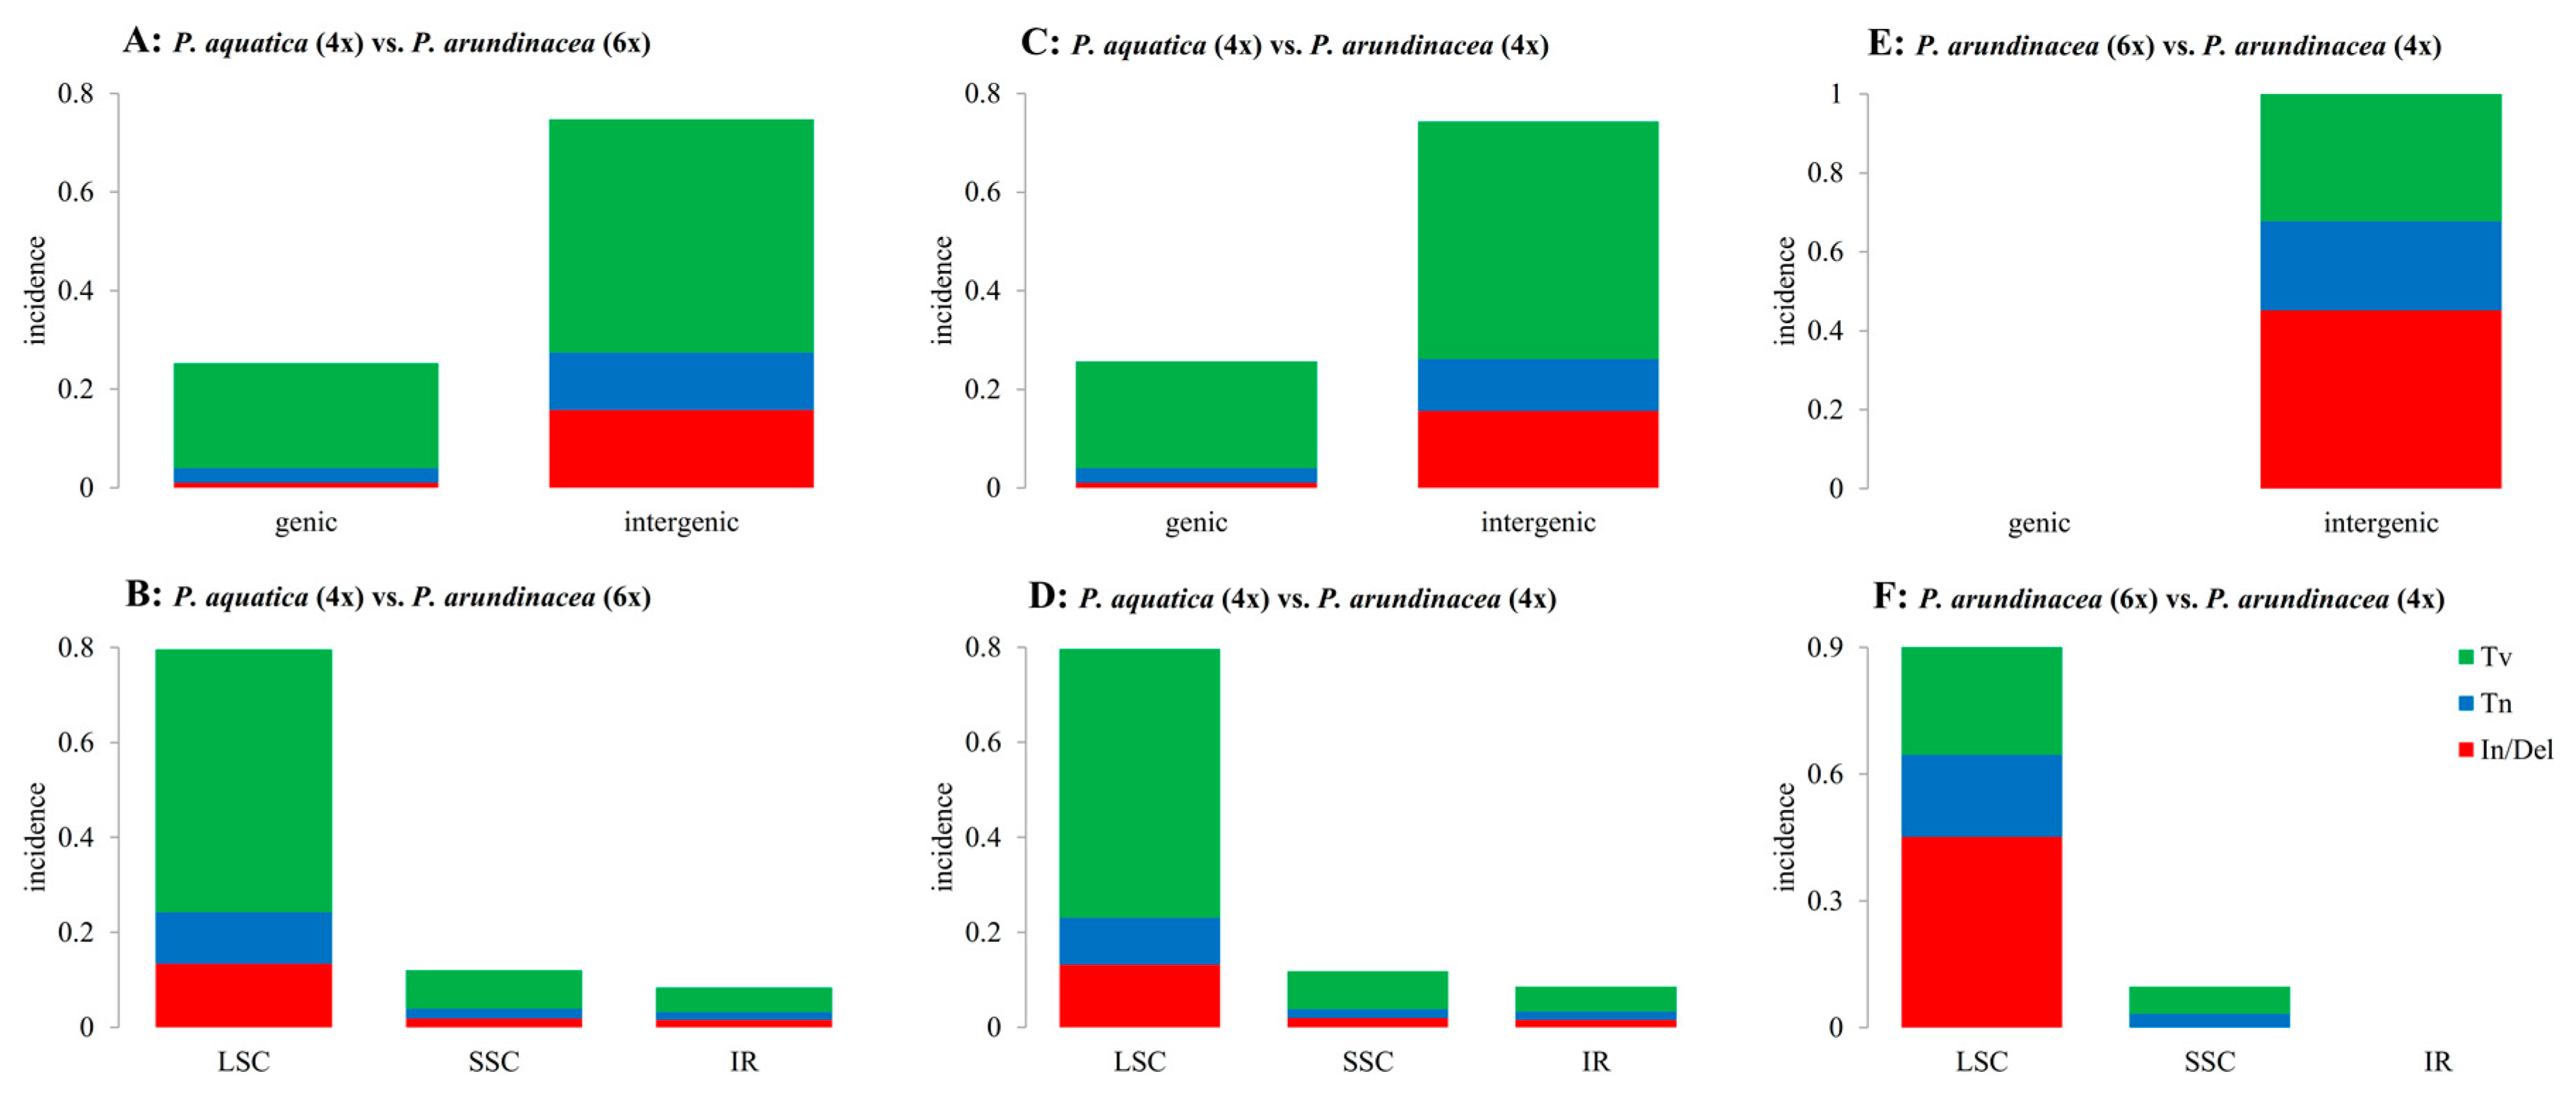
The indels (insertions and deletions) and SNPs (single nucleotide polymorphisms, including Tv (transversion) and Tn (transition)) were identified among the three Phalaris cp genomes using mafft software [22] (Tables S2 and S3). In total, 98 and 95 indels were predicted in comparisons of P. aquatica (4x) vs. P. arundinacea (6x), and P. aquatica (4x) vs. P. arundinacea (4x), among which 6 indels were observed in the coding sequences. There were 14 indels between P. arundinacea (6x) and P. arundinacea (4x) existing in the noncoding sequence (Table S2). Similarly, there was approximately the same number of Tv and Tn in P. aquatica vs. P. arundinacea (6x) (Tv = 399, Tn = 85) and P. aquatica vs. P. arundinacea (4x) (Tv = 397, Tn = 77). It is worth noting that both Tv and Tn were dominantly located in the intergenic region, and more Tvs were found than Tns in both the genic and intergenic regions (Figure 3A,C). Additionally, we identified many more SNPs than indels in P. aquatica vs. P. arundinacea. However, no SNPs were found in the genic region in a comparison of the two P. arundinacea ploidies.
SNPs and indels were also counted in the quadripartite structure (LSC, SSC, and IRs, Figure 3). Obviously, the variations occurred mainly in the LSC region when P. aquatica and P. arundinacea were compared (Figure 3B,D). However, in the two P. arundinacea ploidies (4x vs. 6x), there were no SNPs/indels in the genic region (Figure 3E) and no indels in the SSC and IR regions (Figure 3F). The genes of matK, rpoB, and rpoC2 all contain more than ten variations (indels and/or SNPs), indicating high divergence.
We used the 72 common protein-coding genes in the three cp genomes to calculate non-synonymous (Ka) and synonymous (Ks) rates and the Ka/Ks ratio (Supplementary Materials). The result showed that the values of Ka/Ks for most of those genes were < 1 or failed to be calculated because of Ka or Ks = 0 between P. aquatica and P. arundinacea, which indicated their conservation without any non-synonymous or synonymous nucleotide substitution. However, the gene rbcL had a Ka/Ks > 1 between P. aquatica and P. arundinacea, suggesting a possible positive selection. There were no non-synonymous substitutions between P. arundinacea (6x) and P. arundinacea (4x). In addition, the identified non-synonymous substitutions between P. aquatica and P. arundinacea were involved in 14 (6x) and 15 (4x) genes (Table S2).
2.3. IR Scope Characteristics
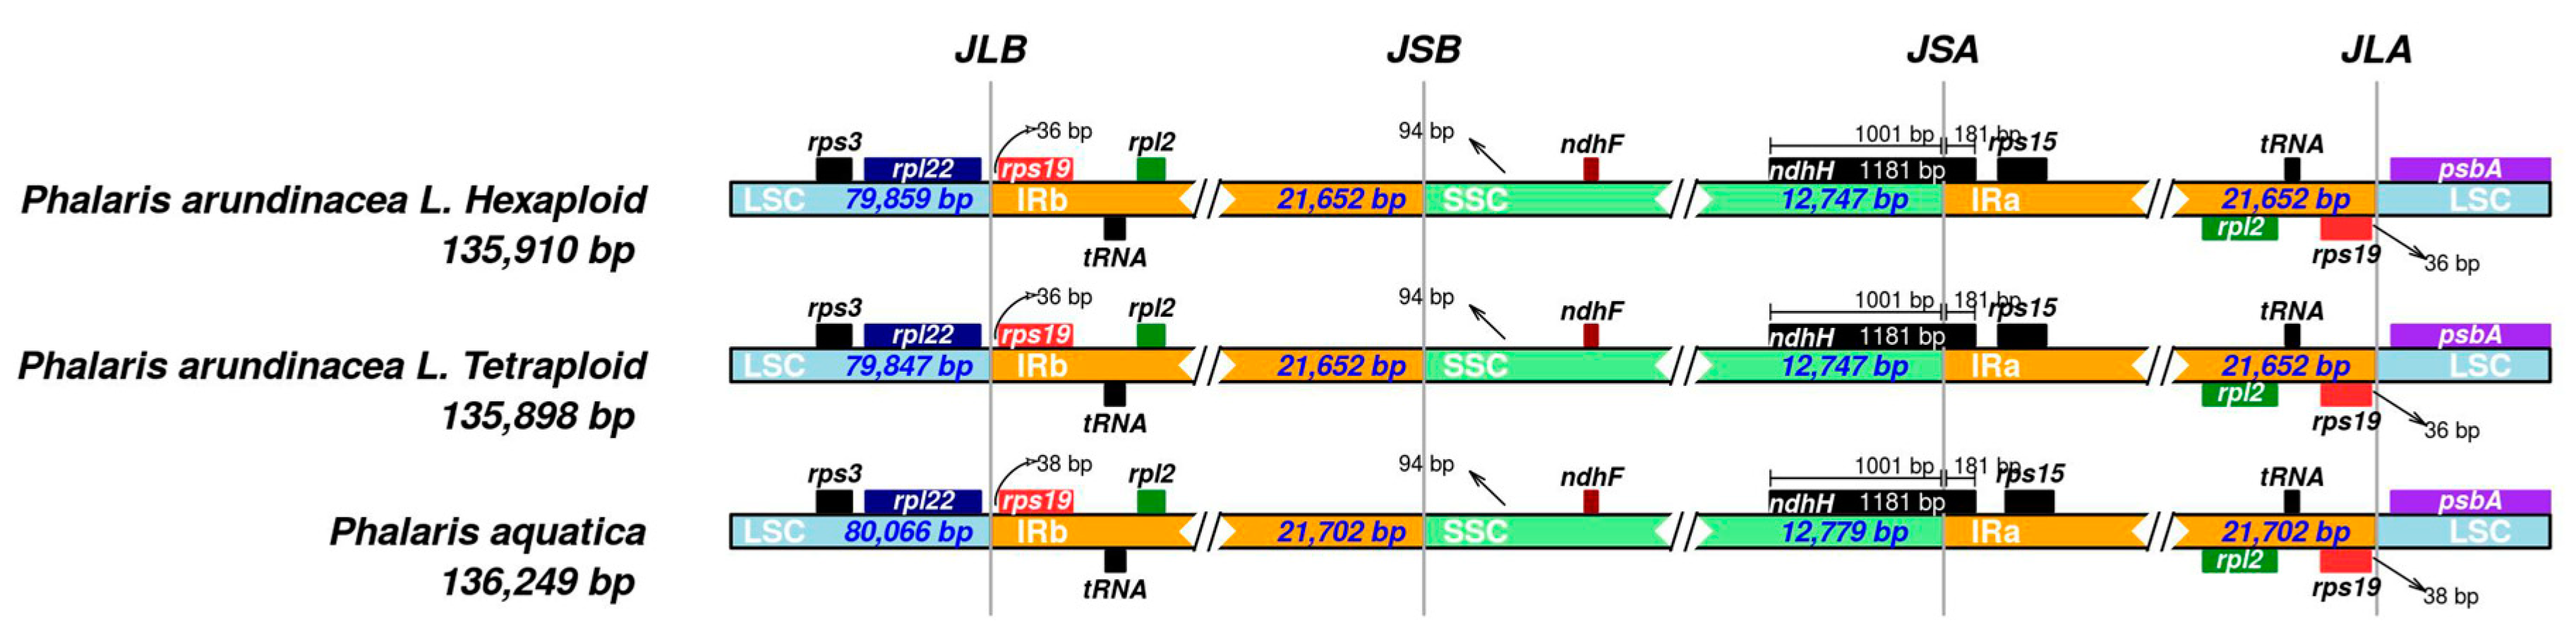
The shrinkage and expansion of IR regions in the three Phalaris cp genomes were compared with each other. As shown in Figure 4, there was a small difference at the junction positions among the three acquired cp genome sequences. The genes ndhF-ndhH and rpl22-rps19-psbA were located at the junctions of IR and single copy regions. The ndhH gene spanned the SSC/IRA region with 181 bp located at the IRB region. Spacers ranged from 36 (P. arundinacea) to 38 bp (P. aquatica), separating the rps19 gene from the LSC/IRA border and from the LSC/IRB border. In addition, a 94 bp spacer separated the ndhF gene from the SSC/IRB border in all three Phalaris species.
2.4. Nucleotide Diversity
Genetic distance among Phalaris cp genomes was evaluated by the calculation of nucleotide diversity (Pi) of 107 common genes unique in every quadripartite region using DnaSP v5.0 software [23]. The mean Pi value of three Phalaris cp genomes was 0.01628, showing a high level of intergeneric differentiation. The SSC region exhibited the highest nucleotide diversity in view of its average Pi value (PiSSC = 0.04606), while the IR regions had the lowest level of Pi (PiIR = 0.00012), suggesting a much higher conservation of the IR region (Figure S2). The comparison of three Phalaris cp genomes identified seven genes with Pi > 0.006. Two genes, psaC and rpl32, were located in the SSC regions, and the other five (infA, psaI, psbK, rpl16, and rpoB) were located in the LSC region.
2.5. Repetitive Sequences
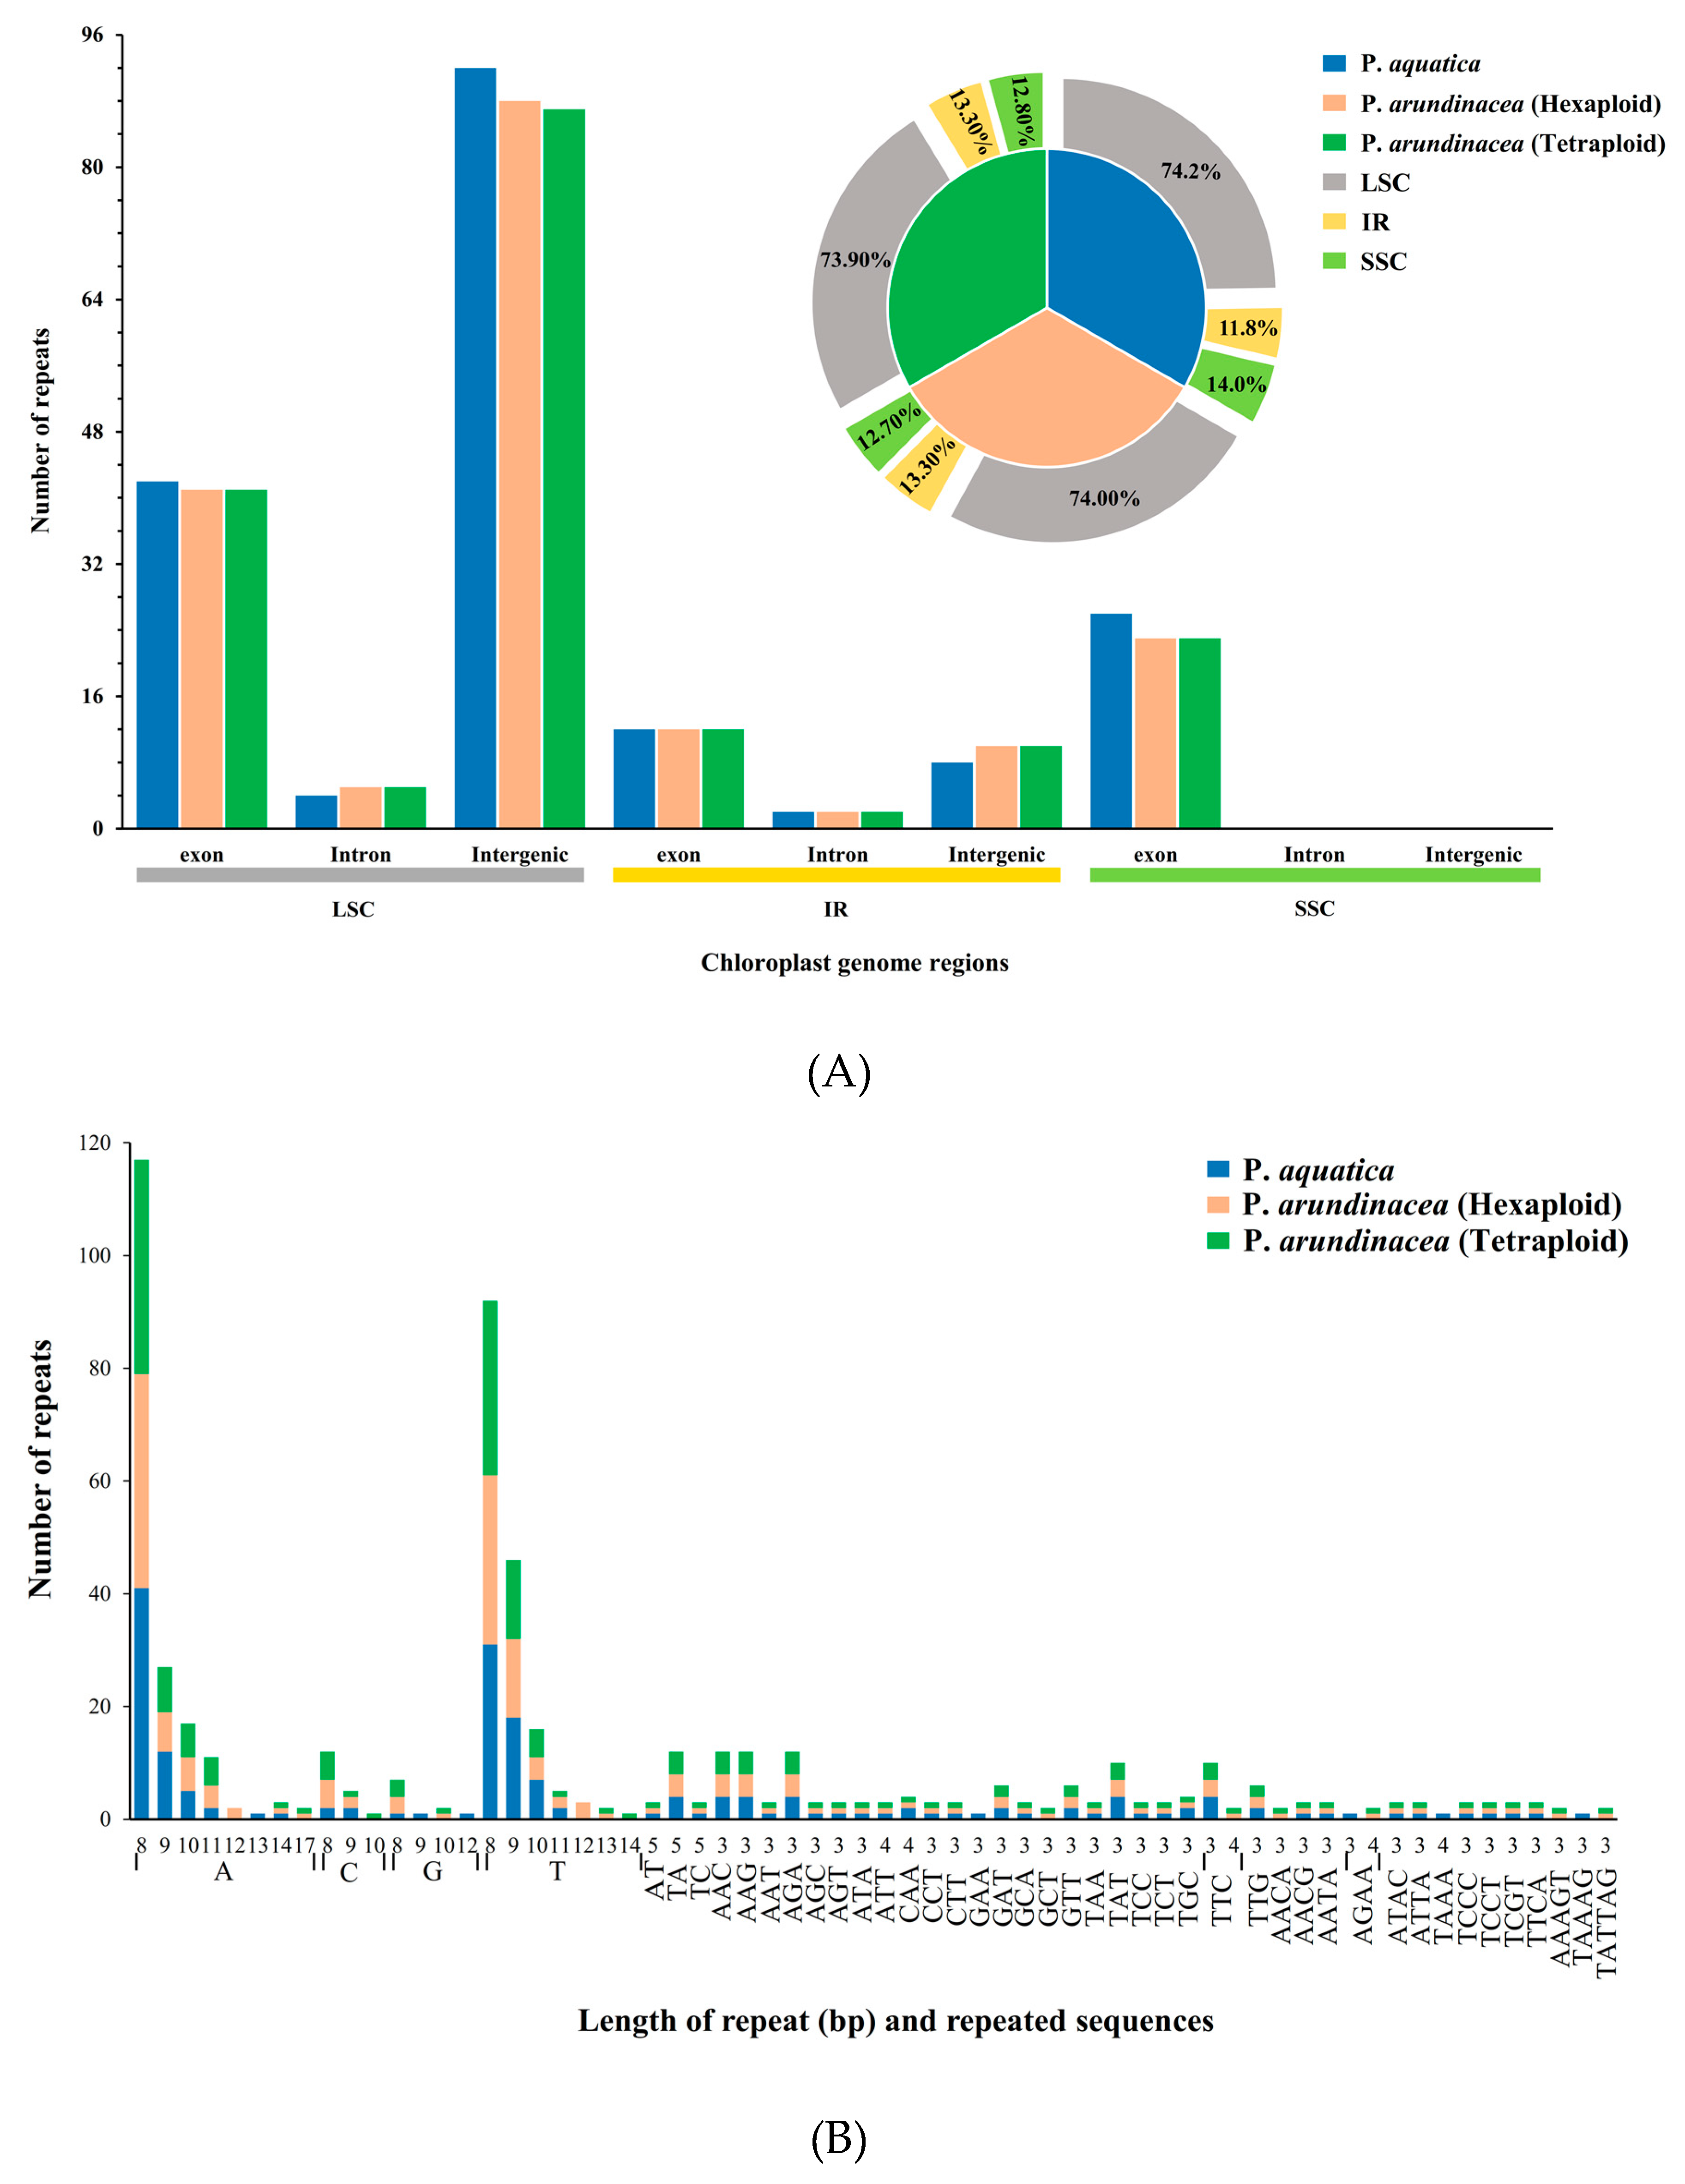
The analysis of repetitive sequences identified 186, 181, and 180 perfect simple sequence repeats (SSRs) in total in the cp genomes of P. aquatica, P. arundinacea (6x), and P. arundinacea (4x), respectively. Most SSRs were found to be at the LSC region within its intergenic areas, while there were no SSRs found in intron and intergenic portion within SSC region. We found that the percentage of SSRs was higher at the LSC or SSC region, but lower at the IR regions in P. aquatica than those of the others (Figure 5A). Among these SSRs, all kinds of repeats, including mononucleotides, di-, tri-, tetra-, and pentanucleotides, were found to exist in either P. aquatica or P. arundinacea. The exception of hexanucleotides was only found in the two P. arundinacea ploidies (Figure 5B).
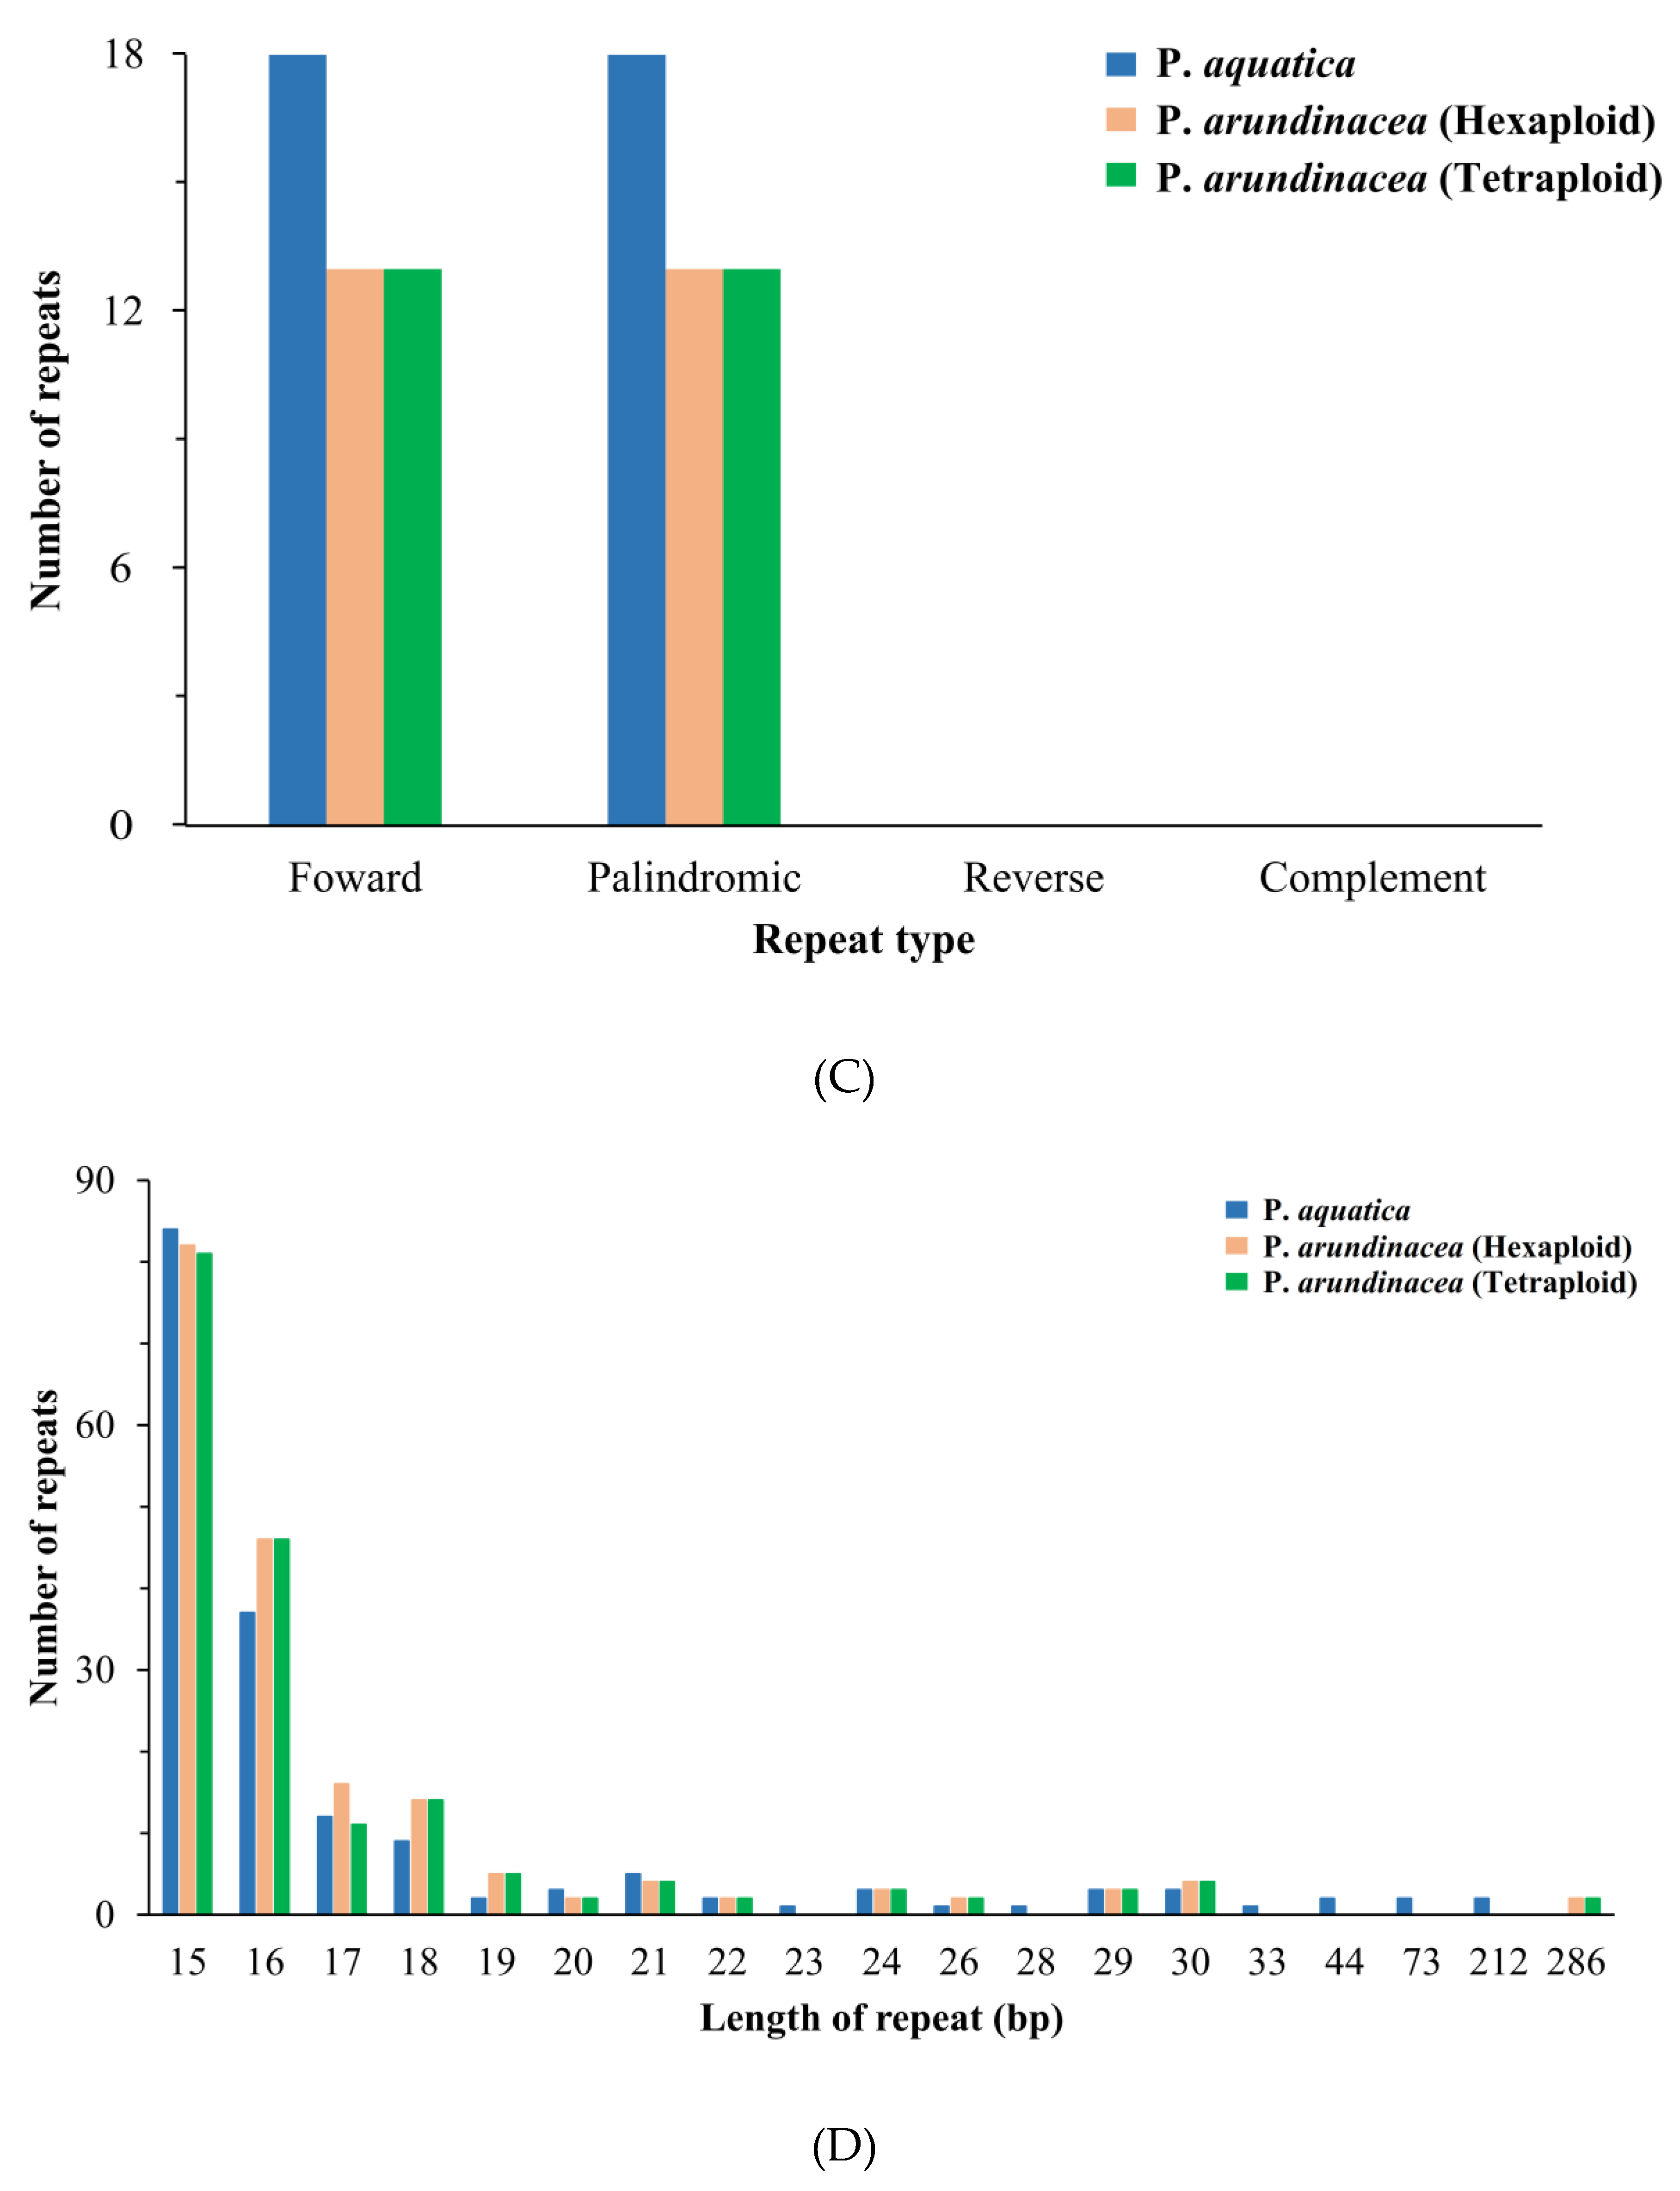
In total, 173 (P. aquatica), 185 (P. arundinacea/6x), and 179 (P. arundinacea/4x) pairs of repeats (15 bp or longer) were detected using the program REPuter [24]. There were nearly equal numbers of forward and palindromic repeats in all these Phalaris cp genomes (Figure 5C). Additionally, the result showed that 15–22 bp repeats, as well as 24 bp, 26 bp, 29 bp, and 30 bp repeats, occurred in all three chloroplast genomes, while 23, 28, 33, 34, 73, and 212 bp repeats were only detected in the P. aquatica cp genome, and 286 bp long repeats were only found in P. arundinacea (6x and 4x) cp genomes (Figure 5D).
2.6. Codon Usage
The codon usage frequency and relative synonymous codon usage (RSCU) were thought to be a combination of natural selection, mutation, and genetic drift. Here, the RSCU values were calculated based on 72 protein-coding genes of the three Phalaris cp genomes. The most abundant amino acid was leucine, whose numbers of codons were 2097 (10.866%), 2098 (10.872%), and 2125 (10.862%) in P. arundinacea (4x), P. arundinacea (6x), and P. aquatica, respectively. The least abundant amino acid was cysteine, which possessed 211 (1.079%), 208 (1.078%), and 208 (1.078%) codons in each genome, respectively (Figure S2 and Table S4). Codon usage was observed biased towards A/U-ending codons (RSCU > 1) in the three cp genomes, which was consistent with the study of angiosperm cp genome [25]. In addition, we found that the only codon that had no bias in the Phalaris species (RSCU = 1) was UGG, which encoded tryptophan (Table S4).
2.7. Phylogenetic Divergence Time
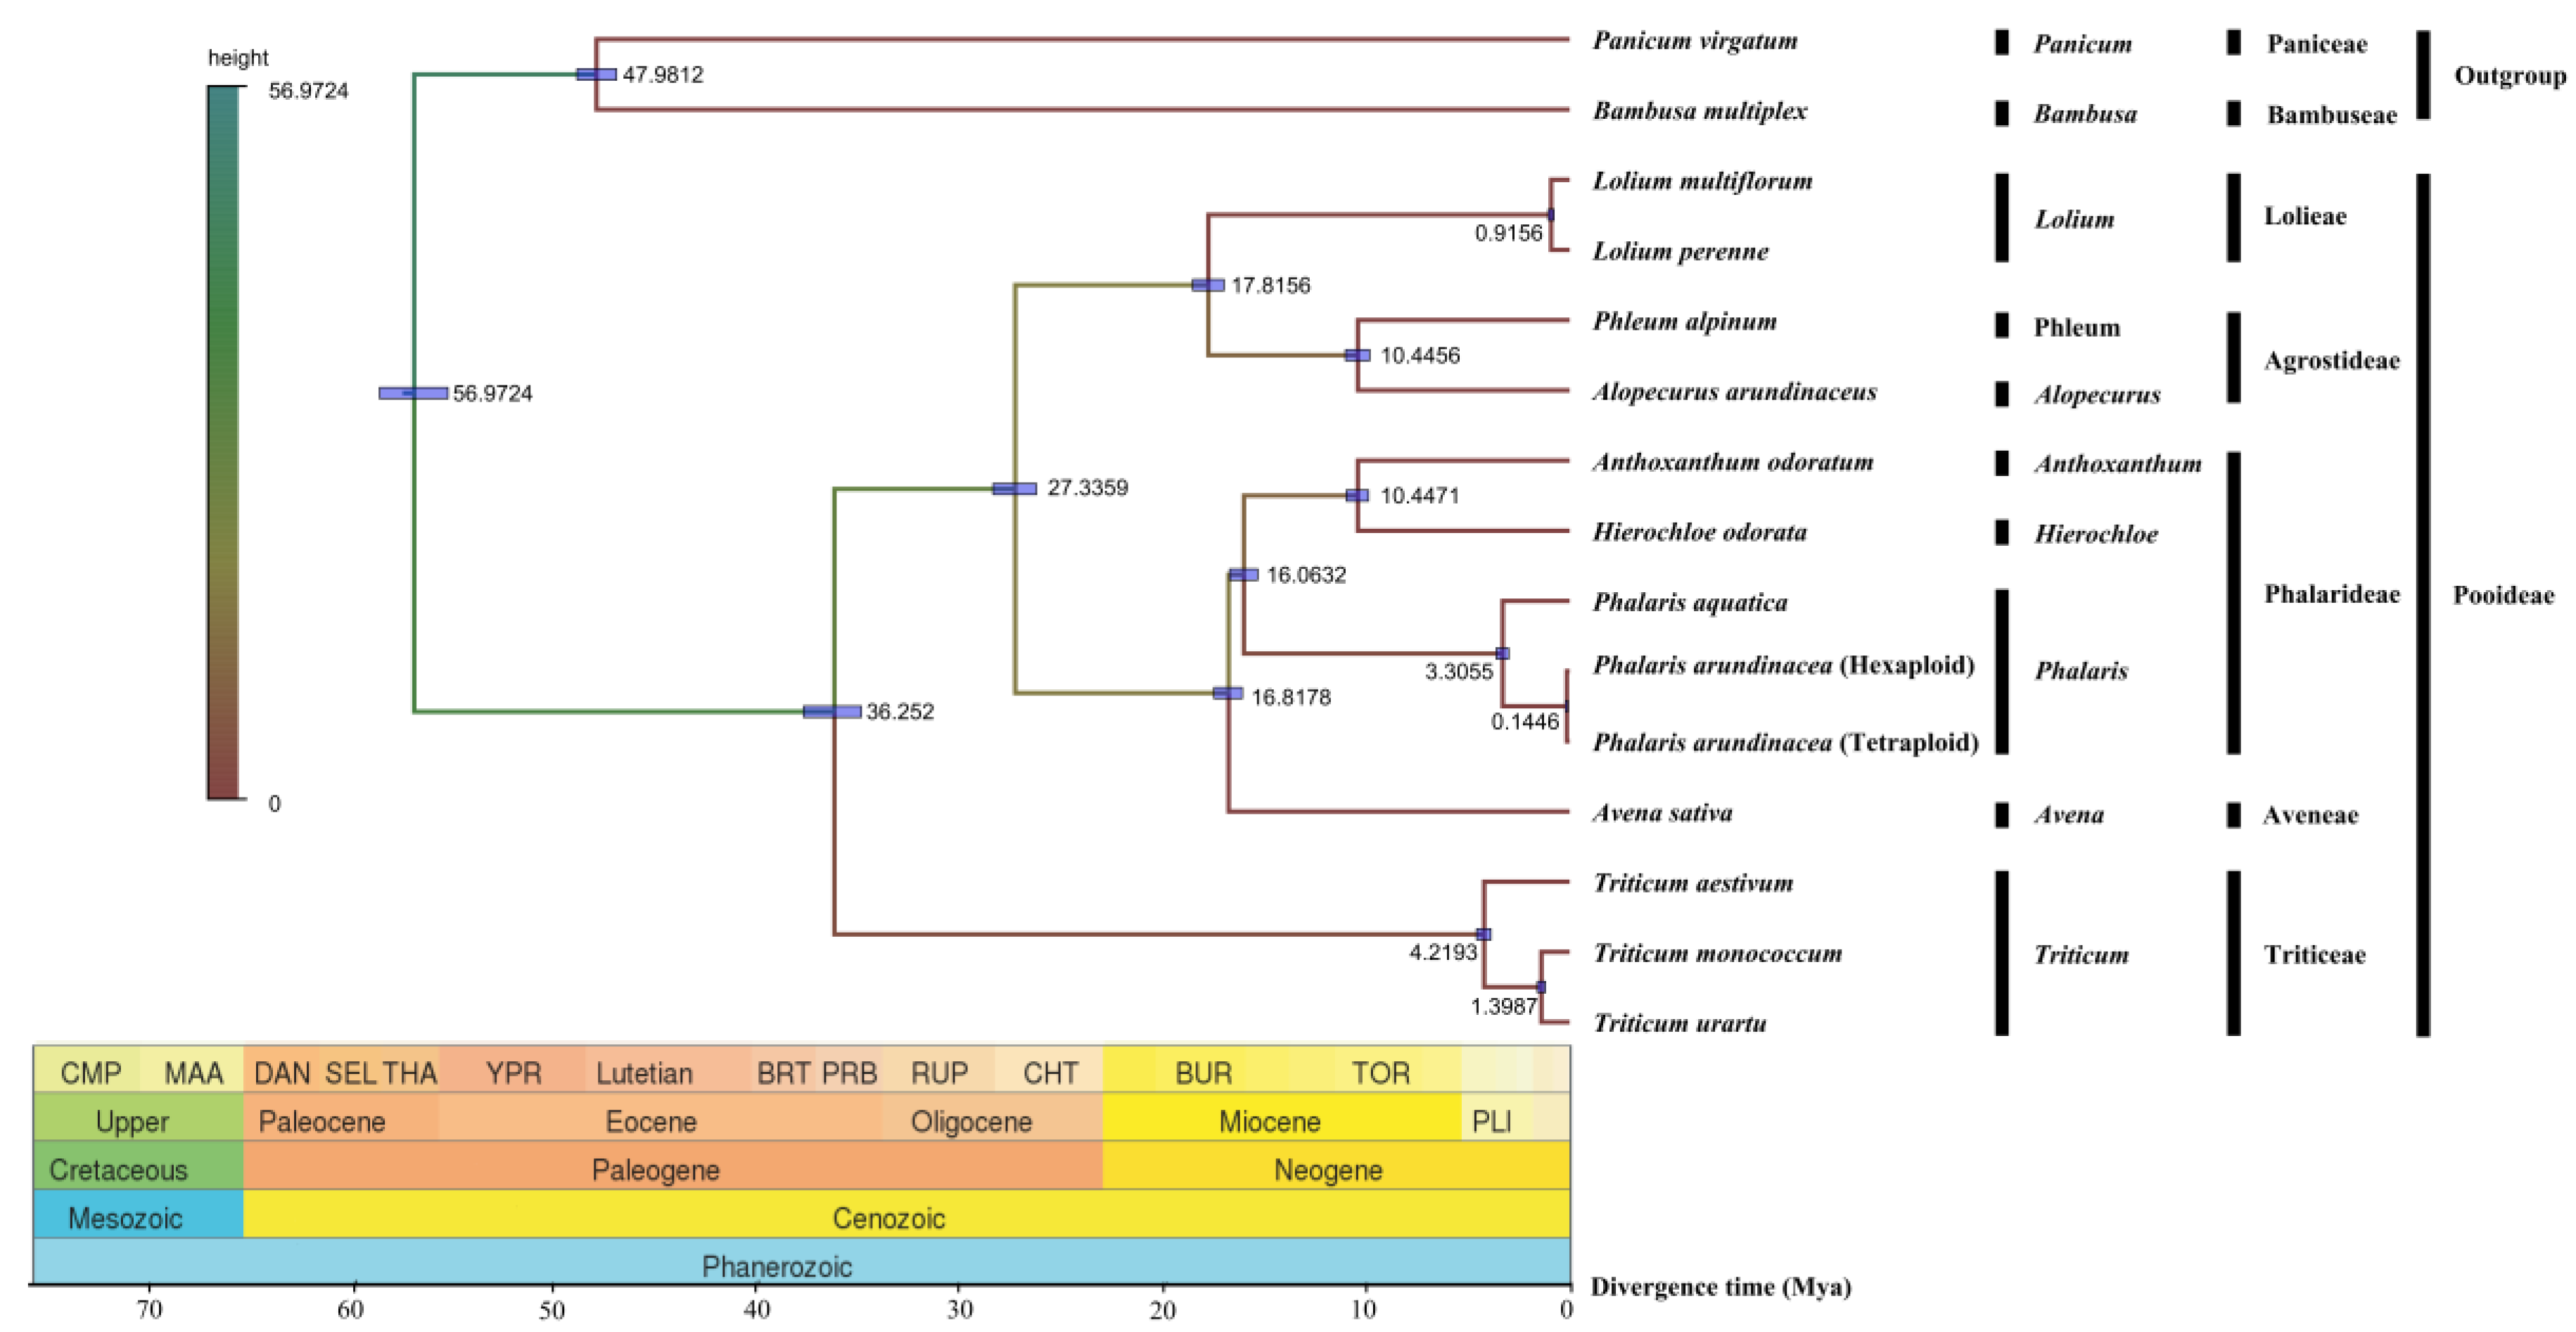
Evolutionary divergence of the two Phalaris species along with other 12 Poaceae species were estimated based on their cp genomes. Obviously, the phylogeny of these species was in consistence with the classical botanical classification (Figure 6). As expected, P. aquatica, P. arundinacea (6x), and P. arundinacea (4x) clustered together in the Phalaris clade. The divergence time between P. aquatica and P. arundinacea was about 3.3055 million years (Mya), and P. arundinacea (6x) and P. arundinacea (4x) were separated from each other about 0.1446 Mya ago.
2.8. Diversity and Expression of Chloroplast Genes
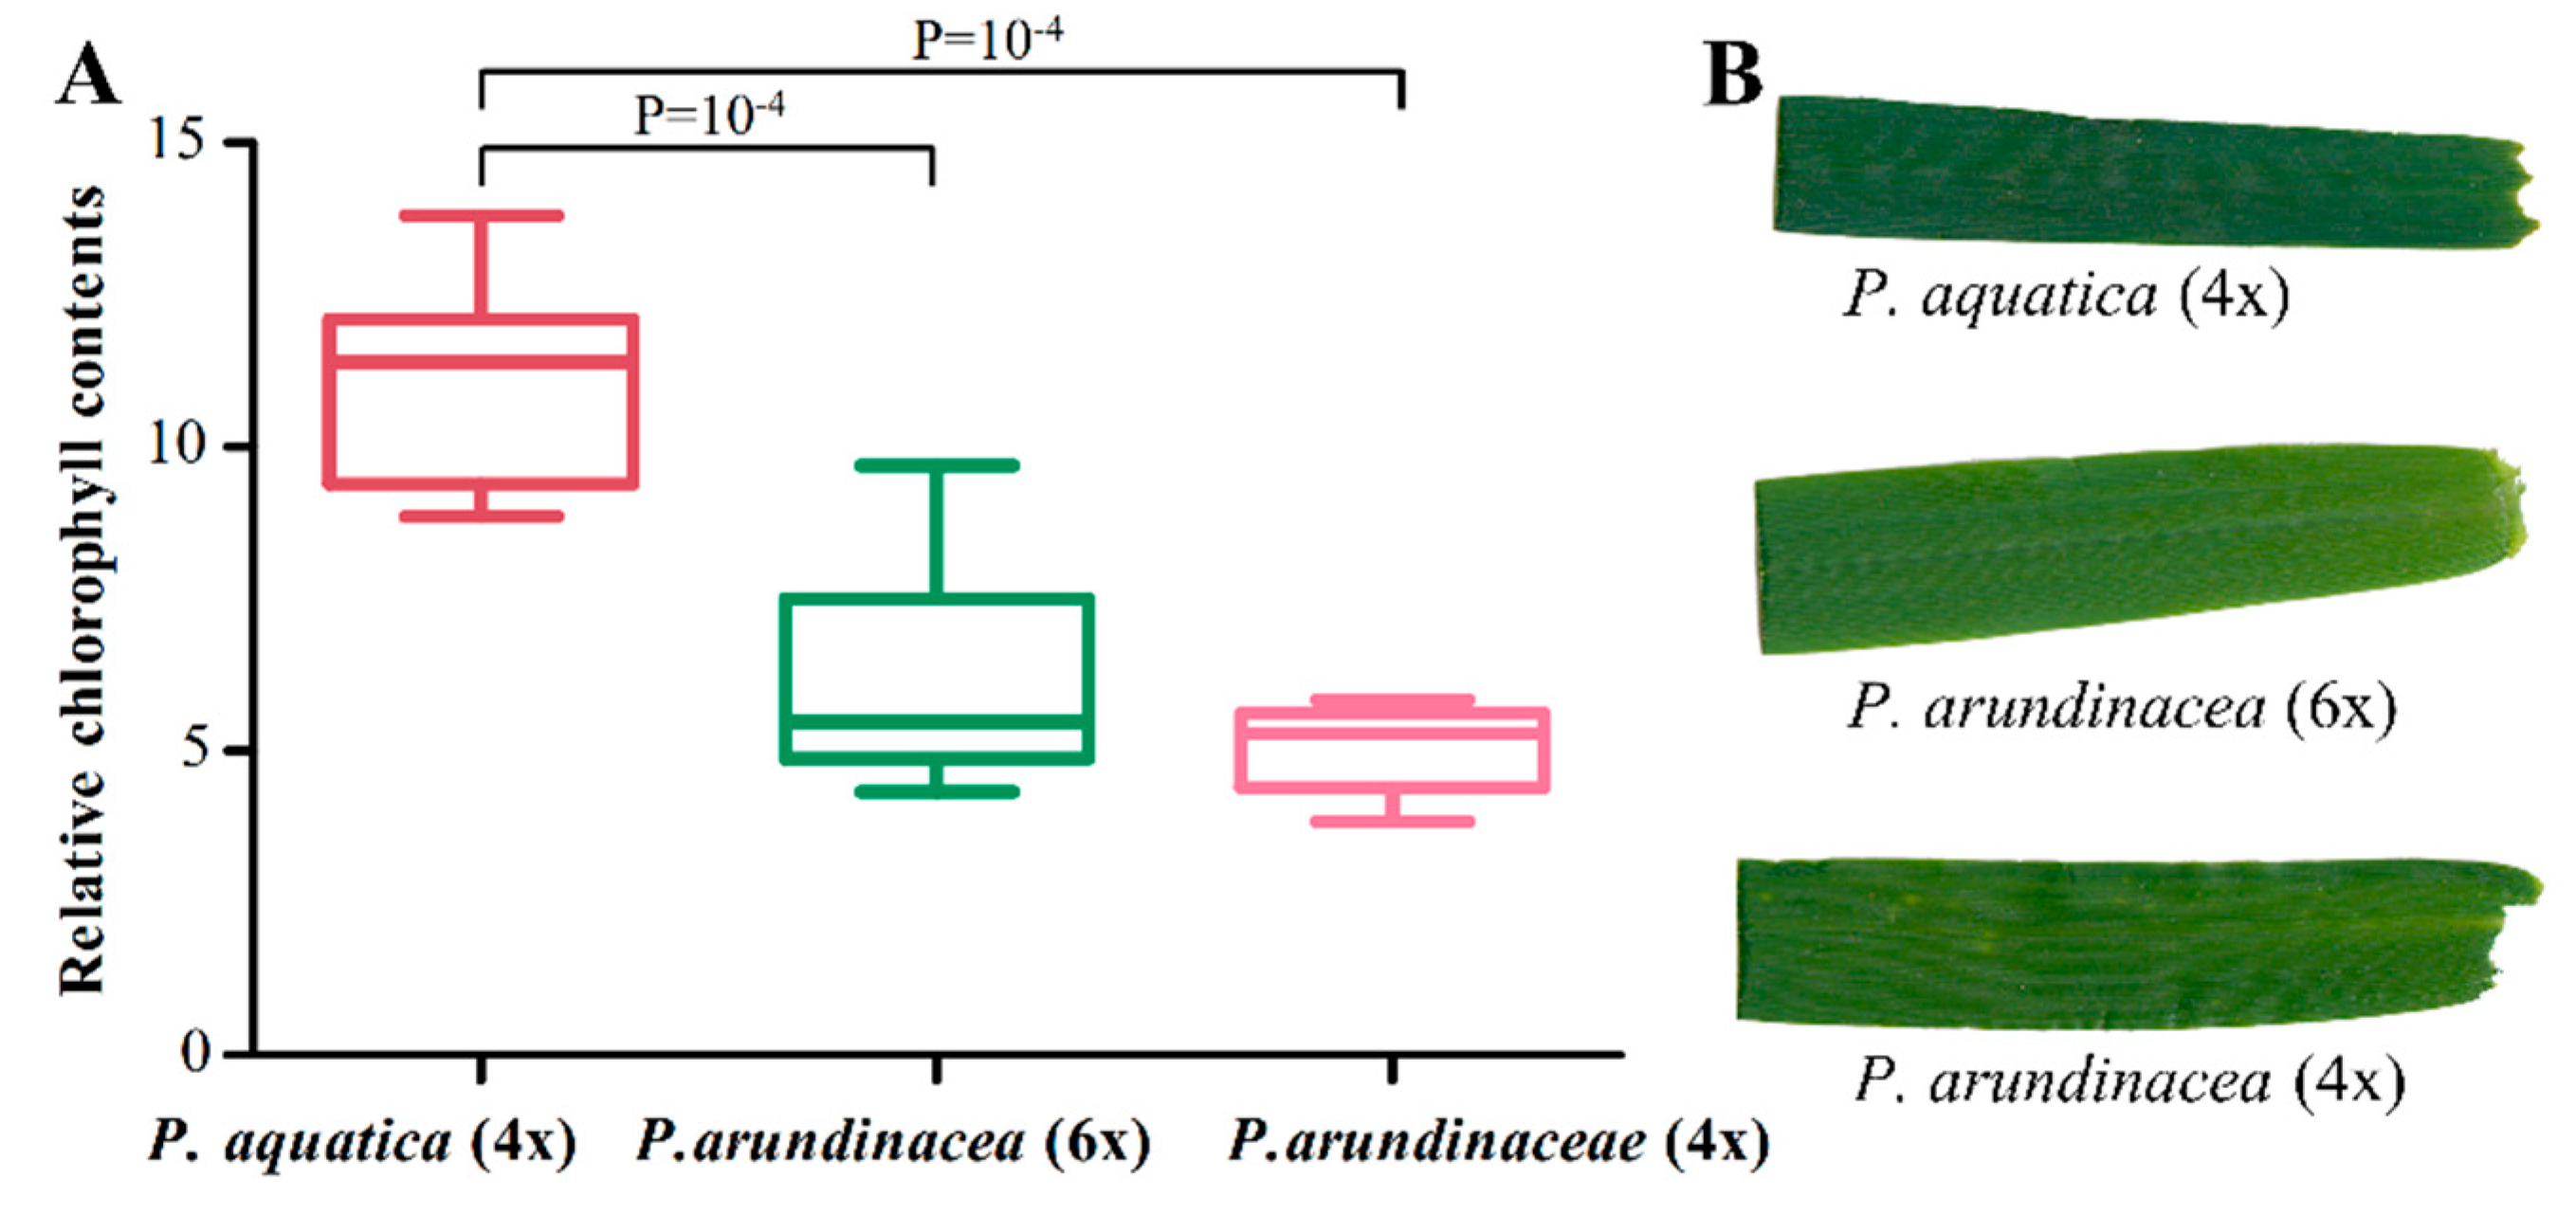
We employed RNA-seq to look into the cp gene expressions. The result showed the transcript abundances of cp genes ranged from 3.0 to 2602,005.9 FPKMs (fragments per kbp of gene per million mapped reads); especially the psbM gene showed a much higher level of expression in all cp genomes, followed by psaC, psbD, and psbA (Table S5). The inter-genome differentially expressed genes (DEGs) were identified based on the fold change (FC ≥ 2), and most of the up-regulated DEGs in P. arundinacea (6x) vs. P. arundinacea (4x) and P. arundinacea (6x) vs. P. aquatica were tRNA-/rRNA- genes, especially trnfM-CAU with a high FC value. In addition, three genes of psaA, psaB, and psbB, which were annotated with a gene ontology (GO) molecular function of chlorophyll binding and photosynthesis, were found up-regulated in P. aquatica, compared to P. arundinacea (6x) and P. arundinacea (4x) (Table S5). This result was further verified by the darker green leaf color of P. aquatica (Figure 7B). The relative chlorophyll content also indicated a significant difference between P. aquatica and P. arundinacea (Figure 7A).
Meanwhile, abundant variations were also detected within each Phalaris cp genome applying RNA-seq dataset, among which RNA editing (RE) was dominant. With a cut-off value of at least 5% edited reads, 407, 76, and 83 RE sites were identified in total in the cp genomes of P. aquatica, P. arundinacea (4x), and P. arundinacea (6x), respectively, among which 214 (52.58%), 54 (71.05%), and 56 (67.47%) were located in the genic region (Table S6), and the nonsynonymous mutation rates in genic regions were 80.84%, 22.22% and 26.79%, respectively.
3. Discussion
3.1. Chloroplast Genome Characteristics of Three Phalaris Cultivars
The cp genomes of Phalaris species with different ploidies were assembled and compared to each other in this study. Interestingly, more differences were observed between P. aquatica and P. arundinacea species but not between different ploidy of P. arundinacea. The sizes of the whole cp genome, LSC, SSC, and IRs of P. aquatica were larger than those of the two P. arundinacea cp genomes, while the GC content in these regions were a little bit lower in P. aquatica. Although cp genomes among Poaceae are highly conserved, the existing differences would provide insight into unique variations among species or subspecies [5,6]. Furthermore, there was higher amino acid abundance of Phe, Tyr, Trp, and Lys in P. aquatica than that in both tetraploid and hexaploid P. arundinacea (Table S4), which might be related to alkaloid synthesis [26]. According to Vincenzo et al. [26], the quinolizidine skeleton is constructed in chloroplast, although the further modifications of Lys-obtained quinolizidine alkaloids should be completed after intracellular transport to the cytosol and mitochondria. Therefore, the genes of chloroplast might participate in this biological process of alkaloid synthesis. The ycf4 gene, as a photosystem I assembly protein, was unique in P. aquatica while absent in P. arundinacea. It suggested a more stable accumulation of photosystem I complex within the thylakoid membranes [27], and the ycf4 gene might play an important role in biosynthesis process of different alkaloids.
3.2. Sequences Variation and Gene Mutation
Several protein-coding genes (infA, psaI, psbK, rpl16, rpoB, psaC, and rpl23) showed high Pi value would have the potential to be good markers for DNA barcoding and phylogenetic analyses, and to expand the cytoplasmic gene pool related to yield enhancement, seed retention, alkaloid reduction, and so on. It is remarkable that the infA gene was found in all the three Phalaris cp genomes, as it is commonly lost in angiosperm groups due to its hydrophilicity [28]. These hotspot regions with mutation events would provide crucial genetic information for the further research in the evolutionary history of Phalaris or Poaceae species [1]. IR-size variation and gene loss are of the main reasons for variation of the cp genome size. As inverted repeats extended into neighboring single copy regions, differences occurred near the boundary of the IR/SC. These are possible reasons for gene fragmentation and incorporation of large chunks of single copy regions within the IR [1]. However, no rearrangement was found among the three Phalaris cp genomes, while the extension of IRs/SC boundaries neighboring ndhH and rps19 in the IR regions was observed. Although expansions and contractions of the IRs/SC junctions in angiosperm cp genomes are well investigated, the ones in the Pooideae are unique and still useful [29,30] for the evolutionary studies.
The Ka/Ks value is an important indication of natural selection and molecular sequence evolution, which is a result of both frameshift and missense mutations [31]. Comparison of SNPs and indels among the three cp genomes indicated that they occurred mainly in the intergenic or LSC regions. SNPs or indels between P. aquatica and P. arundinacea (6x) or P. arundinacea (4x) were roughly similar to each other, while those between two P. arundinacea cp genomes showed a different pattern. No SNPs or indels were found in the genic or IRs regions between the two P. arundinacea cp genomes, which indicated that IR regions were the most conservative quadripartite structure in the cp genome, and the detailed reason is still unknown [1].
3.3. CpSSRs and RSCU
One of the most valuable tools in population genetics is cpSSRs marker, which has unique characters such as, non-recombination, haploidy, and so on [32]. Several cpSSRs identified in this study could be used for further genetic polymorphism detection of Phalaris species. The RSCU is thought to be influenced by a combination of natural selection, mutation, and genetic drift [33]. In this study, RSCU value was calculated using common coding genes of three Phalaris cp genomes, and our result indicated that the most and least abundant amino acids were leucine and cysteine, respectively, which is consistent with the previous study in the angiosperm cp genomes [34]. Besides, we found that almost all the A/U-ending codons hold a bigger usage frequency (RSCU > 1), and the C/G-ending codons were on the contrary, suggesting a significant avoidance of C/G pairs in highly conserved regions [25].
3.4. Phylogeny Analysis and Divergence Time
We conducted a phylogenetic analysis based on the three whole Phalaris cp genomes and other Pooideae species, and the phylogenetic clades in Bayesian tree were in consistence with the classical botanical taxonomy. The divergence of P. aquatica and P. arundinacea was estimated to be approximately 3.3055 million years (Mya) ago with the arrival of quaternary glacial period, which may partly explain why the tetraploid P. arundinacea is more cold-resistant [10,35]. Furthermore, our result showed a closer maternal relationship of hexaploidy P. arundinacea to tetraploidy P. arundinacea than to tetraploidy P. aquatica, though a closer kinship on the production traits between P. arundinacea (6x) and P. aquatica was reported [10], which were probably caused by the similarities of nuclear genomes rather than maternal cp genomes.
3.5. Gene Expression in Chloroplast Genomes
RE sites were considered as mismatches between RNA-seq reads and the cp genome sequence, that would account for the majority of within-genome polymorphism and indicated multi-haplotypes in each of the three sequenced Phalaris cp genomes [36]. The RE phenomenon was reported to enlarge the genetic information and make organisms better adapted to their environment [36]. Given the same germination and growth condition until sampling, the within-genome variation of the two Phalaris species may be inherited from their ancestors or caused by the nonconservative replication of enzymes. In view of the cp genes expression pattern revealed by RNA-seq, the down-regulated DEGs were almost related to replication and transcription function in P. aquatica compared to P. arundinacea (4x) and P. arundinacea (6x), while the up-regulated DEGs were mostly enriched in photosynthesis, energy metabolism, and chlorophyll synthesis. In addition, the RE pattern of P. arundinacea (6x) and P. arundinacea (4x) were more alike, as the cp DNA of P. arundinacea (6x) may be inherited from P. arundinacea (4x) in maternal inheritance way [32]. The leaf color of three Phalaris cultivars was observed different, and the related genes psaA, psaB, and psbB are worth to be studied with regard to their significantly increased expression in P. aquatica.
4. Materials and Methods
4.1. DNA Extraction and Genome Sequencing
Three Phalaris cultivars, Phalaris arundinacea L. (including tetraploid and hexaploid) and Phalaris aquatica L. (tetraploid), were all NPGS (National Plant Germplasm System of the United States) collections (Table 4). Totally 100 mg fresh leaves from seed germination were applied for total genomic DNA extraction using the Plant DNA Extraction Kit (Tiangen, Beijing, China). The DNA quality were verified by 1% agarose gel before libraries construction and library quality testing. Finally, total genomic DNA sequencing was conducted on the Illumina Novaseq PE150 platform.
4.2. Chloroplast Genome Assembly and Annotation
The three studied Phalaris cp genomes were assembled using SPAdes v3.10.1 (Saint Petersburg state University, Saint, Russia) [37] and Gapfiller v2.1.1 (BaseClear BV, Einsteinweg, Leiden, The Netherlands) [38] software, based on the reference of Phalaris arundinacea (NC027481.1, unknown ploidy) cp sequence [39] from NCBI. The SEED sequence of cp genome was firstly obtained by assembling cp DNA sequence with SPAdes software. The pseudo contigs were identified through kmer iterative extend seed. Then the obtained contig sequences were connected to obtain scaffolds via SSPACE v2.0 (BaseClear BV, Einsteinweg, Leiden, The Netherlands) [40]. The Gapfiller v2.1.1 procedure was used to make up the gaps and then the GC content was calculated. On the other hand, Blast v2.2.25 (U.S. National Library of Medicine 8600 Rockville Pike, Bethesda MD, 20894 USA) [41] pipeline was used to compare against the chloroplast genome coding sequences (cds) in NCBI, and the final gene annotation results of cp genome were obtained after manual correction. Hmmer v3.1b2 (HHMI/Harvard University, Boston, USA; The European Bioinformatics Institute, Cambridge, UK) [42] software was used to compare the rRNA sequence of the above chloroplast genomes. Aragorn v1.2.38 (Murdoch University, Western Australia, Australia; Lund University, Lund, Sweden) [43] software was used to predict the tRNA sequence of chloroplast genomes. A circular cp genome map of Phalaris was drawn with the Organellar Genome DRAW 1.3.1 (Max-Planck-Institut fur Molekulare Pflanzenphysiologie, Am Muhlenberg 1, D-14476 Potsdam-Golm, Germany) [44].
4.3. Multiple Chloroplast Genome Alignments
The mVISTA (National energy research scientific computing center, San Francisco, USA) [20] program with LAGAN mode (Department of Computer Science, Stanford University, California, USA) was applied to do multiple alignments between the three studied Phalaris cp genomes, using the cp genome of NPGS Phalaris arundinacea (NC027481.1) as a reference. Synteny and rearrangement analysis of above-mentioned species were performed based on Mauve [21] pipeline. Variation in size of IR regions is crucial in evolution, the boundaries in the junction of IR and SC regions of these three cp genomes were compared using the IRscope (University of Helsinki, Helsinki, Finland) [45] online software. Nucleotide diversity (Pi) can reveal the variation of nucleic acid sequences in different species, and the sites with high variability indicated potential molecular markers for population genetics. Here, Mafft 7.037 (Pennsylvania State University, Pennsylvania, USA; Kyoto University, Kyoto, Japan) [22] software was used to conduct global comparison of cds sequences of the common genes in different Phalaris cp genomes, and DNAsp 5.0 (Universitat de Barcelona, Barcelona, Spain) [23] was used to calculate the Pi value of each gene.
4.4. Identification of Repetitive Sequences
MISA v1.0 (Leibniz Institute of Plant Genetics and Crop Plant Research (IPK) Gatersleben, Corrensstr. 3, 06466 Seeland, Germany) [46] software was used to identify chloroplast Simple Sequence Repeats (cpSSRs) following the parameter that ‘1-8’ mean single-base repeat 8 or more times, ‘2-5’ means double bases repeat 5 or more times, and ‘3-3’, ‘4-3’, ‘5-3’, ‘6-3’ may be deduced by analogy. In addition, interspersed repetitive sequences, that distributed in a disperse way throughout the genome, including direct (forward), inverted (palindromic), complement and reverse repeats, were searched by REPuter 3.0 (University of Bielefeld, Bielefeld, Germany; Max Planck institute for molecular genetics, Berlin, Germany) [24] software with a minimum repeat size of 15 bp and sequence identity greater than 90%.
4.5. Relative Synonymous Codon Usage Analysis
Because of the degeneracy of codons, each amino acid was coded by one to six codons. The utilization rate of genomic codon varies greatly among different species and organisms. This unequal use of synonymous codons is known as Relative Synonymous Codon Usage (RSCU), which was thought to be influenced by natural selection, mutation, and genetic drift. The RSCU analysis was performed using CodonW 1.4.4 (University of Nottingham, Nottingham, UK) software [16].
4.6. Analysis of Non-Synonymous/Synonymous Substitution
When base variation results in changes in amino acids, it is non-synonymous substitution (Ka), or else, synonymous substitution (Ks). Non-synonymous mutations are generally affected by natural selection. The ratio of non-synonymous mutation rate to synonymous mutation rate (Ka/Ks) indicates the selection effect: Ka/Ks ratio > 1, indicated positive selection effect; Ka/Ks ratio < 1, indicated purification selection effect; and Ka/Ks ratio = 1, mean neutral evolution. Here, mafft 7.037 software [22] was used to perform gene (protein-coding exon) sequence alignment of three Phalaris cp genomes, and the Ka/Ks rates of these common coding genes were calculated using the KaKs Calculator v2.0 (CAS Key Laboratory of Genome Sciences and Information, Beijing Institute of Genomics, Chinese Academy of Sciences, Beijing 100029, PR China; Plant Stress Genomics Research Center, Division of Chemical and Life Sciences & Engineering, King Abdullah University of Science and Technology, Thuwal 23955-6900, Kingdom of Saudi Arabia) [47].
4.7. Phylogenetic Analysis
Twelve published Poaceae genomes in NCBI (Table S1) and three Phalaris cp genomes sequenced in this study were collected to conduct the phylogenetic analysis, with Bambusa multiplex (NC024668.1) and Panicum virgatum (HQ731441.1) as outgroups [8]. BEAUti (Department of Computer Science, University of Auckland, Auckland, New Zealand) was applied to construct a Priors tree following the strict clock and Yule model under GTR + G + I substitution assumption [48]. The MCMC setting was 10,000,000 of Chain length, 1000 of Tracelog, 1000 of screenlog and 1000 of treelog. Tracer v 1.5 (Institute of Evolutionary Biology, University of Edinburgh, Edinburgh, UK) [49] was performed to test the value of effective sample size (>200). Finally, the tree was visualized in Figtree v1.4.3 (Institute of Evolutionary Biology, The University of Edinburgh, Edinburgh Scotland) [50].
4.8. Chloroplast RNA-Seq and Chlorophyll Measurement
For transcriptome analysis, fresh young plant leaves of each accessions were cut and used to construct cDNA libraries, respectively. Total RNA was extracted using Trizol Reagent and treated with RNase-free DNase I (TIANGEN BIOTECH CO., LTD, Beijing, China), and then a NanoDrop ND1000 spectrophotometer (Thermo Scientific, Wilmington, DE, USA) along with 1% agarose gel electrophoresis were used for quality examination of the total RNA. The sequencing of RNA samples was performed in Illumina Novaseq PE150 platform by Biomarker Technologies (Beijing, China). FPKM values for cp genes of each accession were used for transcript abundance calculation by mapped the RNA-seq reads to their own cp genome.
The relative chlorophyll (chl) content of the leaves was recorded with a chl content colorimeter CL-01 (Hansatech Instruments Ltd., Norfolk, UK). The instrument determines the relative chl content on the basis of dual wavelengths of the spectral absorbance at 620 and 940 nm [51]. Three clones of each Phalaris accession were chosen in vegetative growth stage which was the same to that of RNA-seq sampling. In each plant, ten leaves from the apex of different tillers were randomly selected to measure at base of leaf blade. Significant differences for the relative chlorophyll average values were determined based on the least significant difference (LSD) test at p ≤ 0.05.
5. Conclusions
The cp genomes of two Phalaris species P. aquatica and P. arundinacea (including tetraploid and hexaploid) were firstly sequenced and annotated in this study, which was beneficial to the evolutionary study of Phalaris genus. Though gene content were highly conserved and no arrangement among those three Phalaris cp genomes, some hotspot regions and variable genes were identified. Furthermore, the divergence time and evolutionary relationship among these three Phalaris cp genomes along with other Gramineae species was discussed. The DEGs obtained by RNA-seq might be one of the explanations for the differences in leaf color among those three accessions.
Supplementary Materials
The following are available online at https://www.mdpi.com/2223-7747/9/6/748/s1. Table S1: Sampled Gramineae species along with their GenBank accession for cp genomes in this study. Table S2: Summary of polymorphisms detected among three Phalaris cp genomes. Note: Tn, Transition; Tv, Transversion; In/Del, insertion or deletion. Table S3: Large indels among three Phalaris cp genomes. Note: A, Position numbers refer to the Phalaris aquatica cp genome; B, Position numbers refer to the Phalaris arundinacea (Tetraploid) cp genome; C, Position numbers refer to the Phalaris arundinacea (Hexaploid) cp genome; The listed indels were filtered with the criterion that more than 15 bp length, or occurs at the coding regions. Table S4: RSCU summary of the three Phalaris cp genomes. Table S5: Chloroplast transcripts by RNA-Seq of the three Phalaris accessions. Table S6: Transcript diversity revealed by RNA editing (RE). Figure S1: MAUVE alignment of three Phalaris cp genomes. Within each of the alignment, local collinear blocks are represented by blocks of the same color connected by lines. Figure S2: Nucleotide variability (Pi) values among three Phalaris cp genomes. Figure S3: Codon usage of the three Phalaris cp genomes using 72 protein-coding genes.
Author Contributions
Data curation, Y.X. (Yi Xiong); Formal analysis, Y.X. (Yi Xiong) and Y.X. (Yanli Xiong); Funding acquisition, X.M.; Software, Y.X. (Yanli Xiong); Supervision, S.J.; Validation, X.M.; Visualization, S.J.; Writing—original draft, Y.X. (Yi Xiong) and Y.X. (Yanli Xiong); Writing—review & editing, S.J. and X.M. All authors have read and agreed to the published version of the manuscript.
Funding
This research was supported by the Key Laboratory of Superior Forage Germplasm in the Qinghai-Tibetan plateau (2020-ZJ-Y03), the earmarked fund for Modern Agro-industry Technology Research System (No. CARS-34), the Key R & D project of Sichuan Science and Technology Program (2019YFN0170) and National Natural Science Foundation of China (3177131276).
Acknowledgments
The authors would like to acknowledge Zhixiao Dong, Jian Yang, Qingqing Yu and Xiong Lei from Sichuan Agricultural University and Wendan Wu from Sichuan Grass industry Technology Research and Promotion Center, Chengdu, China, and Jun He from Citrus Research Institute, Southwest University, Chongqing, China for their excellent advice on this paper. We thank the support of laboratory staff in the Department of Grassland Science, Animal Science and Technology College, Sichuan Agricultural University.
Conflicts of Interest
The authors declare that they have no competing interest.
Availability of Data and Materials
The annotated chloroplast genomes of Phalaris arundinacea L. (tetraploid/4×), P. arundinacea L. (hexaploidy/6×) and P. aquatica L. (tetraploid/4×) have been deposited in the NCBI Genbank with the accession numbers MT274594, MT274595 and MT274596.
References
- Ravi, V.; Khurana, J.P.; Tyagi, A.K.; Khurana, P. An update on chloroplast genomes. Plant Syst. Evol. 2008, 271, 101–122. [Google Scholar] [CrossRef]
- Allen, F.J. The function of genomes in bioenergetic organelles. Philos. Trans. R. Soc. B 2003, 358, 19–38. [Google Scholar] [CrossRef]
- Liu, L.X.; Wang, Y.W.; He, P.Z.; Li, P.; Fu, C.X. Chloroplast genome analyses and genomic resource development for epilithic sister genera Oresitrophe and Mukdenia (Saxifragaceae), using genome skimming data. BMC Genom. 2018, 19, 235. [Google Scholar] [CrossRef] [PubMed]
- Daniell, H.; Lin, C.S.; Yu, M.; Chang, W.J. Chloroplast genomes: Diversity, evolution, and applications in genetic engineering. Genome Biol. 2016, 17, 134. [Google Scholar] [CrossRef] [Green Version]
- Miller, J.T.; Bayer, R.J. Molecular phylogenetics of Acacia (Fabaceae: Mimosoideae) based on the chloroplast MATK coding sequence and flanking TRNK intron spacer regions. Am. J. Bot. 2001, 88, 697–705. [Google Scholar] [CrossRef] [PubMed]
- Doyle, J.A.; Scharaschkin, T. Phylogeny and historical biogeography of Anaxagorea (Annonaceae) using morphology and non-coding chloroplast aequence data. Syst. Bot. 2005, 30, 712–735. [Google Scholar]
- Sahramaa, M.; Hömmö, L.; Jauhiainen, L. Variation in seed production traits of reed canarygrass germplasm. Crop Sci. 2004, 44, 988–996. [Google Scholar] [CrossRef]
- Voshell, S.M.; Baldini, R.M.; Hilu, K.W. Infrageneric treatment of Phalaris (Canary grasses, Poaceae) based on molecular phylogenetics and floret structure. Aust. Syst. Bot. 2016, 6, 355–367. [Google Scholar] [CrossRef] [Green Version]
- Perdereau, A.; Klaasm, M.; Barth, S.; Hodkinson, T.R. Plastid genome sequencing reveals biogeographical structure and extensive population genetic variation in wild populations of Phalaris arundinacea L. in north-western Europe. GCB Bioenergy 2017, 1, 46–56. [Google Scholar] [CrossRef] [Green Version]
- Johnson, R.C.; Evans, M. Comparative growth and development of hexaploid and tetraploid reed canarygrass. Crop Sci. 2014, 54, 1062. [Google Scholar] [CrossRef]
- Mcwilliam, J.R.; Nealsmith, C.A. Tetraploid and hexaploid chromosome races of Phalaris arundinacea L. Aust. J. Agric. Res. 1962, 13, 1–9. [Google Scholar] [CrossRef]
- Jansone, B.; Rancane, S.; Berzins, P.; Stesele, V. Reed canary grass (Phalaris arundinacea L.) in natural biocenosis of Latvia, research experiments and production fields. Renew. Energy Energy Effic. Int. Sci. Conf. 2012. [Google Scholar]
- Oram, R.N.; Williams, J.D. Variation in concentration and composition of toxic alkaloids among strains of Phalaris tuberosa L. Nature 1967, 213, 946–947. [Google Scholar] [CrossRef]
- Frelich, J.R.; Marten, G.C. Quick test for reed canarygrass (Phalaris arundinacea L.) alkaloid concentration. Crop Sci. 1973, 13, 548–551. [Google Scholar] [CrossRef]
- Ball, D.M.; Hoveland, C.S. Alkaloid levels in Phalaris aquatica L. as affected by environment. Agron. J. 1978, 70, 977–981. [Google Scholar] [CrossRef]
- Das, S.; Ghosh, S.; Pan, A.; Dutta, C. Compositional variation in bacterial genes and proteins with potential expression level. FEBS Lett. 2005, 579, 5210. [Google Scholar] [CrossRef]
- Piskol, R.; Ramaswami, G.; Li, J.B. Reliable identification of genomic variants from RNA-Seq data. Am. J. Hum. Genet. 2013, 93, 641–651. [Google Scholar] [CrossRef] [Green Version]
- Shi, C.; Wang, S.; Xia, E.H.; Jiang, J.J.; Zeng, F.C. Full transcription of the chloroplast genome in photosynthetic eukaryotes. Sci. Rep. 2016, 6, 30135. [Google Scholar] [CrossRef]
- Silva, S.R.; Pinheiro, D.G.; Penha, H.A.; Płachno, B.J.; Michael, T.P.; Meer, E.J.; Miranda, V.F.O.; Varani, A.M. Intraspecific variation within the Utricularia amethystina species morphotypes based on chloroplast genomes. Int. J. Mplecular Sci. 2019, 24, 6130. [Google Scholar] [CrossRef] [Green Version]
- Frazer, K.A.; Lior, P.; Alexander, P.; Rubin, E.M.; Inna, D. VISTA: Computational tools for comparative genomics. Nucleic Acids Res. 2004, 32, W273–W279. [Google Scholar] [CrossRef]
- Darling, A.E.; Craven, M.; Mau, B.; Perna, N.T. Multiple Alignment of Rearranged Genomes. In Proceedings of the 2004 IEEE Computational Systems Bioinformatics Conference, Stanford, CA, USA, 19 August 2004. [Google Scholar]
- Kazutaka, K.; Standley, D.M. MAFFT Multiple Sequence Alignment Software Version 7: Improvements in Performance and Usability. Mol. Biol. Evol. 2013, 4, 722–780. [Google Scholar]
- Rozas, J.; Ferrer-Mata, A.; Sánchez-Delbarrio, J.C.; Guirao-Rico, S.; Librado, P.; Ramos-Onsins, S.E.; Sánchez-Gracia, A. DnaSP 6: DNA sequence polymorphism analysis of large data sets. Mol. Biol. Evol. 2017, 12, 3299–3302. [Google Scholar] [CrossRef] [PubMed]
- Kurtz, S.; Choudhuri, J.V.; Ohlebusch, E.; Schleiermacher, C.; Stoye, J.; Giegerich, R. REPuter: The manifold applications of repeat analysis on a genomic scale. Nucleic Acids Res. 2001, 29, 4633–4642. [Google Scholar] [CrossRef] [PubMed] [Green Version]
- Shah, P.; Gilchrist, M.A. Explaining complex codon usage patterns with selection for translational efficiency, mutation bias, and genetic drift. Proc. Natl. Acad. Sci. USA 2011, 108, 10231–10236. [Google Scholar] [CrossRef] [PubMed] [Green Version]
- Luca, V.D.; Pierre, B.S. The cell and developmental biology of alkaloid biosynthesis. Trends Plant Sci. 2000, 5, 168–173. [Google Scholar] [CrossRef]
- Ozawa, S.I.; Nield, J.; Terao, A.; Stauber, E.J.; Hippler, M.; Koike, H.; Rochaix, J.D.; Takahashi, Y. Biochemical and structural studies of the large ycf4-photosystem I assembly complex of the green alga Chlamydomonas reinhardtii. Plant Cell 2009, 21, 2424–2442. [Google Scholar] [CrossRef] [Green Version]
- Millen, R.S.; Olmstead, R.G.; Adams, K.L.; Palmer, J.D.; Lao, N.T.; Heggie, L.; Kavanagh, T.A.; Hibberd, J.M.; Gray, J.C.; Morden, C.W.; et al. Many parallel losses of infA from chloroplast DNA during angiosperm evolution with multiple independent transfers to the nucleus. Plant Cell 2001, 13, 645–658. [Google Scholar] [CrossRef] [Green Version]
- Young, H.A.; Lanzatella, C.L.; Sarath, G.; Tobias, C.M.; Newbigin, E. Chloroplast genome variation in upland and lowland switchgrass. PLoS ONE 2011, 8, e23980. [Google Scholar] [CrossRef] [Green Version]
- Wang, W.C.; Chen, S.Y.; Zhang, X.Z. Whole-genome comparison reveals divergent IR borders and mutation hotspots in chloroplast genomes of herbaceous Bamboos (Bambusoideae: Olyreae). Molecules 2018, 7, 1537. [Google Scholar] [CrossRef] [Green Version]
- Loewe, L.; Charlesworth, B.; Bartolomé, C.; Nöel, V. Estimating selection on nonsynonymous mutations. Genetics 2006, 2, 1079–1092. [Google Scholar] [CrossRef] [Green Version]
- Yamane, K.; Kawahara, T. Size homoplasy and mutational behavior of chloroplast simple sequence repeats (cpSSRs) inferred from intra- and interspecific variations in four chloroplast regions of diploid and polyploid Triticum and Aegilops species. Genet. Resour. Crop Evol. 2017, 3, 1–17. [Google Scholar] [CrossRef]
- Ma, Q.P.; Li, C.; Wang, J.; Wang, Y.; Ding, Z.T. Analysis of synonymous codon usage in FAD7 genes from different plant species. Genet. Mol. Res. 2015, 14, 1414–1422. [Google Scholar] [CrossRef] [PubMed]
- Orei, M.; Shalloway, D. Specific correlations between relative synonymous codon usage and protein secondary structure. J. Mol. Biol. 1998, 281, 31–48. [Google Scholar]
- Omura, A.; Maeda, Y.; Kawana, T.; Siringan, F.P.; Berdin, R.D. U-series dates of Pleistocene corals and their implications to the paleo-sea levels and the vertical displacement in the Central Philippines. Quat. Int. 2004, 3, 3–13. [Google Scholar] [CrossRef]
- Lin, C.P.; Ko, C.Y.; Kuo, C.I.; Liu, M.S.; Schafleitner, R.; Chen, L.F.O. Transcriptional slippage and RNA editing increase the diversity of transcripts in chloroplasts: Insight from deep sequencing of Vigna radiata genome and transcriptome. PLoS ONE 2015, 6, e129396. [Google Scholar] [CrossRef] [Green Version]
- Safonova, Y.; Bankevich, A.; Pevzner, P.A. DipSPAdes: Assembler for highly polymorphic diploid genomes. J. Comput. Biol. 2015, 6, 265–279. [Google Scholar] [CrossRef] [Green Version]
- Boetzer, M.; Pirovano, W. Toward almost closed genomes with GapFiller. Genome Biol. 2012, 13, R56. [Google Scholar] [CrossRef] [Green Version]
- Forster, J.W.; Jones, E.S.; Kölliker, R.; Drayton, M.C.; Smith, K.F. Development and Implementation of Molecular Markers for Forage Crop Improvement; Springer: Dordrecht, The Netherlands, 2001. [Google Scholar]
- Pirovano, W. Scaffolding pre-assembled contigs using SSPACE. Bioinformatics 2011, 27, 578–579. [Google Scholar]
- Kent, W.J. BLAT—The BLAST-like alignment tool. Genome Res. 2002, 12, 656–664. [Google Scholar] [CrossRef] [Green Version]
- Finn, R.D.; Clements, J.; Eddy, S.R.; Finn, R.D.; Clements, J.; Eddy, S.R. HMMER web server: Interactive sequence similarity searching. Nucleic Acids Res. 2011, 39, W29–W37. [Google Scholar] [CrossRef] [Green Version]
- Laslett, D. ARAGORN, a program to detect tRNA genes and tmRNA genes in nucleotide sequences. Nucleic Acids Res. 2004, 32, 11–16. [Google Scholar] [CrossRef] [PubMed]
- Marc, L.; Oliver, D.; Sabine, K.; Ralph, B. OrganellarGenomeDRAW—A suite of tools for generating physical maps of plastid and mitochondrial genomes and visualizing expression data sets. Nucleic Acids Res. 2013, 44, W575–W581. [Google Scholar]
- Ali, A.; Jaakko, H.; Peter, P. IRscope: An online program to visualize the junction sites of chloroplast genomes. Bioinformatics 2018, 17, 3030–3031. [Google Scholar]
- Beier, S.; Thiel, T.; Münch, T.; Scholz, U.; Mascher, M. MISA-web: A web server for microsatellite prediction. Bioinformatics 2017, 16, 2583–2585. [Google Scholar] [CrossRef] [Green Version]
- Wang, D.P.; Zhang, Y.B.; Zhang, Z.; Zhu, J.; Yu, J. KaKs_Calculator 2.0: A toolkit incorporating gamma-series methods and sliding window strategies. Genom. Proteom. Bioinf. 2010, 8, 77–80. [Google Scholar] [CrossRef] [Green Version]
- Drummond, A.J. Bayesian phylogenetics with BEAUti and the BEAST 1.7. Mol. Biol. Evol. 2012, 29, 1969–1973. [Google Scholar] [CrossRef] [Green Version]
- Rambaut, A.; Drummond, A.J.; Dong, X.; Baele, G.; Suchard, M.A. Posterior summarization in Bayesian phylogenetics using Tracer 1.7. Syst. Biol. 2018, 67, 901. [Google Scholar] [CrossRef] [Green Version]
- Chen, S.C.; Aaron, O.; Alekseyenko, A.V. MixtureTree annotator: A program for automatic colorization and visual annotation of MixtureTree. PLoS ONE 2015, 10, e118893. [Google Scholar] [CrossRef]
- Cassol, D.; Silva, F.S.P.; Falqueto, A.R.; Bacarin, M.A. An evaluation of non-destructive methods to estimate total chlorophyll content. Photosynthetica 2008, 46, 634–636. [Google Scholar] [CrossRef]
Figure 1.
Gene maps of the Phalaris chloroplast genomes. Genes inside and outside of the circle are transcribed in clockwise and counterclockwise directions, respectively. The GC content and adenylate and thymine (AT) content are shown in dark gray and light gray, respectively. (A) P. aquatica; (B) hexaploid P. arundinacea; (C) tetraploid P. arundinacea.

Figure 2.
Alignment of the Phalaris chloroplast genome sequences. Exon, untranslated region (UTR), conserved noncoding sequences (CNS), and mRNA were color-marked. The x-axis and horizontal bars represent the coordinate and sequences similarity in the chloroplast genome, and the peaks indicate hotspot regions.

Figure 3.
Summary of single nucleotide polymorphisms (SNPs) and indels. Tv, transversion; Tn, transition; In/Del, insertion and deletion; LSC, large single-copy region; SSC, small single-copy region; IR, inverted repeat region; (A,B), (C,D), and (E,F) reflect differences between P. aquatica (4x) vs. P. arundinacea (6x), P. aquatica (4x) vs. P. arundinacea (4x), and P. arundinacea (6x) vs. P. arundinacea (4x), respectively.

Figure 4.
IRscope analysis of the three Phalaris cp genomes. JLB, junction of LSC and IRB region; JSB, junction of SSC and IRB region; JSA, junction of SSC and IRA region; JLA, junction of LSC and IRA region.
Figure 4.
IRscope analysis of the three Phalaris cp genomes. JLB, junction of LSC and IRB region; JSB, junction of SSC and IRB region; JSA, junction of SSC and IRA region; JLA, junction of LSC and IRA region.

Figure 5.
Simple sequence repeats (SSRs) and repeated sequences in the three Phalaris cp genomes. (A), SSRs in the different region of Phalaris cp genome; (B), motifs in the cp genome of Phalaris; (C), frequency of repeat types; (D), frequency of repeats length.
Figure 5.
Simple sequence repeats (SSRs) and repeated sequences in the three Phalaris cp genomes. (A), SSRs in the different region of Phalaris cp genome; (B), motifs in the cp genome of Phalaris; (C), frequency of repeat types; (D), frequency of repeats length.


Figure 6.
Divergence time among fifteen chloroplast genomes of seven tribes. Node values of the tree represent the average divergence time and blue bars of every node represent 95% credible interval.
Figure 6.
Divergence time among fifteen chloroplast genomes of seven tribes. Node values of the tree represent the average divergence time and blue bars of every node represent 95% credible interval.

Figure 7.
Comparison of the relative chlorophyll content of the leaves (A) and the leave color (B) of three Phalaris cultivars.
Figure 7.
Comparison of the relative chlorophyll content of the leaves (A) and the leave color (B) of three Phalaris cultivars.


Table 1.
Comparison of the three Phalaris chloroplast (cp) genomes.
| Species/Ploidies | Size (bp) | GC Content (%) | tRNA | rRNA | mRNA | Genes | Number of Genes Duplicated in IR | ||||||
|---|---|---|---|---|---|---|---|---|---|---|---|---|---|
| cp | LSC | SSC | IR | cp | LSC | SSC | IR | ||||||
| P arundinacea (4x) | 135,898 | 79,846 | 12,746 | 21,653 | 38.52 | 36.45 | 32.88 | 44.00 | 28 | 4 | 72 | 104 | 19 |
| P arundinacea (6x) | 135,910 | 79,858 | 12,746 | 21,653 | 38.52 | 36.44 | 32.87 | 44.00 | 28 | 4 | 72 | 104 | 19 |
| P aquatica (4x) | 136,249 | 80,065 | 12,778 | 21,703 | 38.45 | 36.36 | 32.84 | 43.94 | 28 | 4 | 73 | 105 | 19 |
Table 2.
List of cp genes annotated in the three Phalaris cp genomes sequenced in this study.
| Category | Function | Name of Gene | |||||
|---|---|---|---|---|---|---|---|
| Self-replication | Ribosomal RNA Genes | rrn4.5 | rrn5 | rrn16 | rrn23 | ||
| Transfer RNA genes | trnA-ACG | trnL-CAA | trnV-GAC | trnH-GUG | trnA-GUU | trnA-UGC * | |
| trnT-CGU * | trnS-CGA * | trnL-UAA * | trnV-UAC * | trnL-UUU * | trnM-CAU # | ||
| trnT-CCA | trnP-GAA | trnC-GCA | trnG-GCC | trnS-GCU | trnS-GGA | ||
| trnT-GGU | trnT-GUA | trnA-GUC | trnL-UAG | trnA-UCU | trnS-UGA | ||
| trnP-UGG | trnT-UGU | trnG-UUC | trnG-UUG | ||||
| Ribosomal proteins (translation) | Small subunit of ribosome (SSU) | rps2 | rps3 | rps4 | rps7 | rps8 | rps11 |
| rps14 | rps15 | rps18 | rps19 | ||||
| Transcription | Large subunit of ribosome (LSU) | rpl2 | rpl14 | rpl16 | rpl20 | rpl22 | rpl23 |
| rpl32 | rpl33 | rpl36 | |||||
| RNA polymerase subunits | rpoA | rpoB | rpoC1 | rpoC2 | |||
| Translation initiation factor | infA | ||||||
| Photosynthesis related genes | Large subunit of Rubisco | rbcL | |||||
| Subunits of Photosystem I | psaA | psaB | psaC | psaI | psaJ | ycf4aq | |
| Subunits of Photosystem II | psbA | psbB | psbC | psbD | psbE | psbF | |
| psbH | psbI | psbJ | psbK | psbL | psbM | ||
| psbT | psbZ | ||||||
| Subunits of ATP synthase | atpA | atpB | atpE | atpF * | atpH | atpI | |
| Cytochrome b/f complex | petA | petB | petG | petL | petN | ||
| C-type cytochrome synthesis gene | ccsA | ||||||
| Subunits of NADH dehydrogenase | ndhA * | ndhB * | ndhC | ndhD | ndhE | ndhF | |
| ndhG | ndhH | ndhI | ndhJ | ndhK | |||
| Other genes | Maturase | matK | |||||
| Protease | clpP | ||||||
| Chloroplast envelope membrane protein | cemA | ||||||
| Hypothetical protein | ycf1 | ||||||
| Hypothetical open reading frames | ycf2 | ||||||
Note: #, one gene copy in each IR; *, gene containing a single intron; genes in bold correspond to genes that are located in the IRs and hence are duplicated; aq, genes that are particular for P. aquatica.
Table 3.
Intron-containing genes in the three Phalaris cp genomes.
| Gene | P. aquatica | P. arundinacea (4x & 6x) | ||||||
|---|---|---|---|---|---|---|---|---|
| Location | Exon (bp) | Intron I (bp) | Exon II (bp) | Location | Exon I (bp) | Intron I (bp) | Exon II (bp) | |
| atpF | LSC | 160 | 818 | 407 | LSC | 160 | 826 | 407 |
| ndhA | SSC | 550 | 1020 | 539 | SSC | 550 | 1023 | 539 |
| ndhB | IRA | 775 | 712 | 758 | IRA | 775 | 712 | 758 |
| ndhB | IRB | 775 | 712 | 758 | IRB | 775 | 712 | 758 |
| trnS-CGA | LSC | 32 | 655 | 63 | LSC | 32 | 655 | 63 |
| trnT-CGU | IRA | 32 | 787 | 59 | IRA | 32 | 786 | 59 |
| trnT-CGU | IRB | 33 | 785 | 60 | IRB | 33 | 784 | 60 |
| trnL-UAA | LSC | 36 | 543 | 51 | LSC | 36 | 549 | 51 |
| trnV-UAC | LSC | 39 | 579 | 54 | LSC | 39 | 579 | 54 |
| trnA-UGC | IRA | 37 | 811 | 36 | IRA | 37 | 811 | 36 |
| trnA-UGC | IRB | 38 | 809 | 37 | IRB | 38 | 809 | 37 |
| trnK-UUU | LSC | 39 | 2465 | 37 | LSC | 39 | 2463 | 37 |
Table 4.
Accession information for three Phalaris cultivars.
| Species | NPGS ID | Improvement Status | GenBank Accession |
|---|---|---|---|
| Phalaris arundinacea L. (tetraploid) | PI 272122 | Cultivar | MT274594 |
| Phalaris arundinacea L. (hexaploid) | PI 422031 | Cultivar | MT274595 |
| Phalaris aquatica L. (tetraploid) | PI 434985 | Cultivar | MT274596 |
© 2020 by the authors. Licensee MDPI, Basel, Switzerland. This article is an open access article distributed under the terms and conditions of the Creative Commons Attribution (CC BY) license (http://creativecommons.org/licenses/by/4.0/).
Share and Cite
MDPI and ACS Style
Xiong, Y.; Xiong, Y.; Jia, S.; Ma, X. The Complete Chloroplast Genome Sequencing and Comparative Analysis of Reed Canary Grass (Phalaris arundinacea) and Hardinggrass (P. aquatica). Plants 2020, 9, 748. https://doi.org/10.3390/plants9060748
AMA Style
Xiong Y, Xiong Y, Jia S, Ma X. The Complete Chloroplast Genome Sequencing and Comparative Analysis of Reed Canary Grass (Phalaris arundinacea) and Hardinggrass (P. aquatica). Plants. 2020; 9(6):748. https://doi.org/10.3390/plants9060748
Chicago/Turabian StyleXiong, Yi, Yanli Xiong, Shangang Jia, and Xiao Ma. 2020. "The Complete Chloroplast Genome Sequencing and Comparative Analysis of Reed Canary Grass (Phalaris arundinacea) and Hardinggrass (P. aquatica)" Plants 9, no. 6: 748. https://doi.org/10.3390/plants9060748
Note that from the first issue of 2016, this journal uses article numbers instead of page numbers. See further details here.