Article

A New 360° Framework to Predict Customer Lifetime Value for Multi-Category E-Commerce Companies Using a Multi-Output Deep Neural Network and Explainable Artificial Intelligence

Department of Management Information Systems, Boğaziçi University Bebek, Istanbul 34342, Turkey
*
Author to whom correspondence should be addressed.
Information 2022, 13(8), 373; https://doi.org/10.3390/info13080373
Submission received: 21 June 2022 / Revised: 28 July 2022 / Accepted: 2 August 2022 / Published: 4 August 2022

Abstract

:
Online purchasing has developed rapidly in recent years due to its efficiency, convenience, low cost, and product variety. This has increased the number of online multi-category e-commerce retailers that sell a variety of product categories. Due to the growth in the number of players, each company needs to optimize its own business strategy in order to compete. Customer lifetime value (CLV) is a common metric that multi-category e-commerce retailers usually consider for competition because it helps determine the most valuable customers for the retailers. However, in this paper, we introduce two additional novel factors in addition to CLV to determine which customers will bring in the highest revenue in the future: distinct product category (DPC) and trend in amount spent (TAS). Then, we propose a new framework. We utilized, for the first time in the relevant literature, a multi-output deep neural network (DNN) model to test our proposed framework while forecasting CLV, DPC, and TAS together. To make this outcome applicable in real life, we constructed customer clusters that allow the management of multi-category e-commerce companies to segment end-users based on the three variables. We compared the proposed framework (constructed with multiple outputs: CLV, DPC, and TAS) against a baseline single-output model to determine the combined effect of the multi-output model. In addition, we also compared the proposed model with multi-output Decision Tree (DT) and multi-output Random Forest (RF) algorithms on the same dataset. The results indicate that the multi-output DNN model outperforms the single-output DNN model, multi-output DT, and multi-output RF across all assessment measures, proving that the multi-output DNN model is more suitable for multi-category e-commerce retailers’ usage. Furthermore, Shapley values derived through the explainable artificial intelligence method are used to interpret the decisions of the DNN. This practice demonstrates which inputs contribute more to the outcomes (a significant novelty in interpreting the DNN model for the CLV).

1. Introduction

In recent years, online shopping has become far more important than offline shopping for several reasons: it is more efficient, convenient, and cost-effective, and offers more product categories than offline shopping. Companies that sell multiple product categories emerge due to convenience and offer a variety of products at varying prices. These stores have become online malls [1].
This has resulted in a massive increase in online shopping, and consequently in the number of online retailers. Competition increases as more online retailers enter the market. Therefore, companies must optimize their business strategies to compete with other companies in the e-commerce market.
While every company is attempting to remain one step ahead of the competition, they must ensure that they consider all variables that contribute to their long-term success. Customer lifetime value (CLV) is a critical factor that multi-category e-commerce businesses should leverage as a competitive advantage.
CLV is a metric used to assess a customer’s worth in a company. It is the customer’s net present value based on future transactions with the company [2]. The CLV assists businesses in ranking customers based on their contributions to earnings. This can be used to develop and implement customer-level strategies to maximize lifetime profitability and lengthen lifetime duration. That is, rather than treating all consumers identically, the CLV helps the company treat each one differently based on their contribution.
Determining the CLV of a company’s customers is the first step toward implementing a customer-specific strategy. The CLV can be used to justify a company’s ongoing marketing and infrastructure upgrades. Businesses can use the CLV framework to evaluate which customers are most likely to generate the highest profit in the future, the elements that contribute to a higher CLV, and the ideal amount of resource allocation across multiple communication channels. The lifetime value of a customer is critical in determining their importance to online retailers. However, according to Kumar [3], the CLV should not be the only factor used to determine which customers generate the most revenue for a company. Companies must consider other criteria that distinguish each customer to determine the genuinely valuable ones. Consequently, particular models and methodologies for predicting and evaluating CLV are necessary. According to the literature, CLV models come in a wide range of shapes and sizes [2,4]. However, our literature review revealed significant research gaps in this topic for multi-category e-commerce businesses.
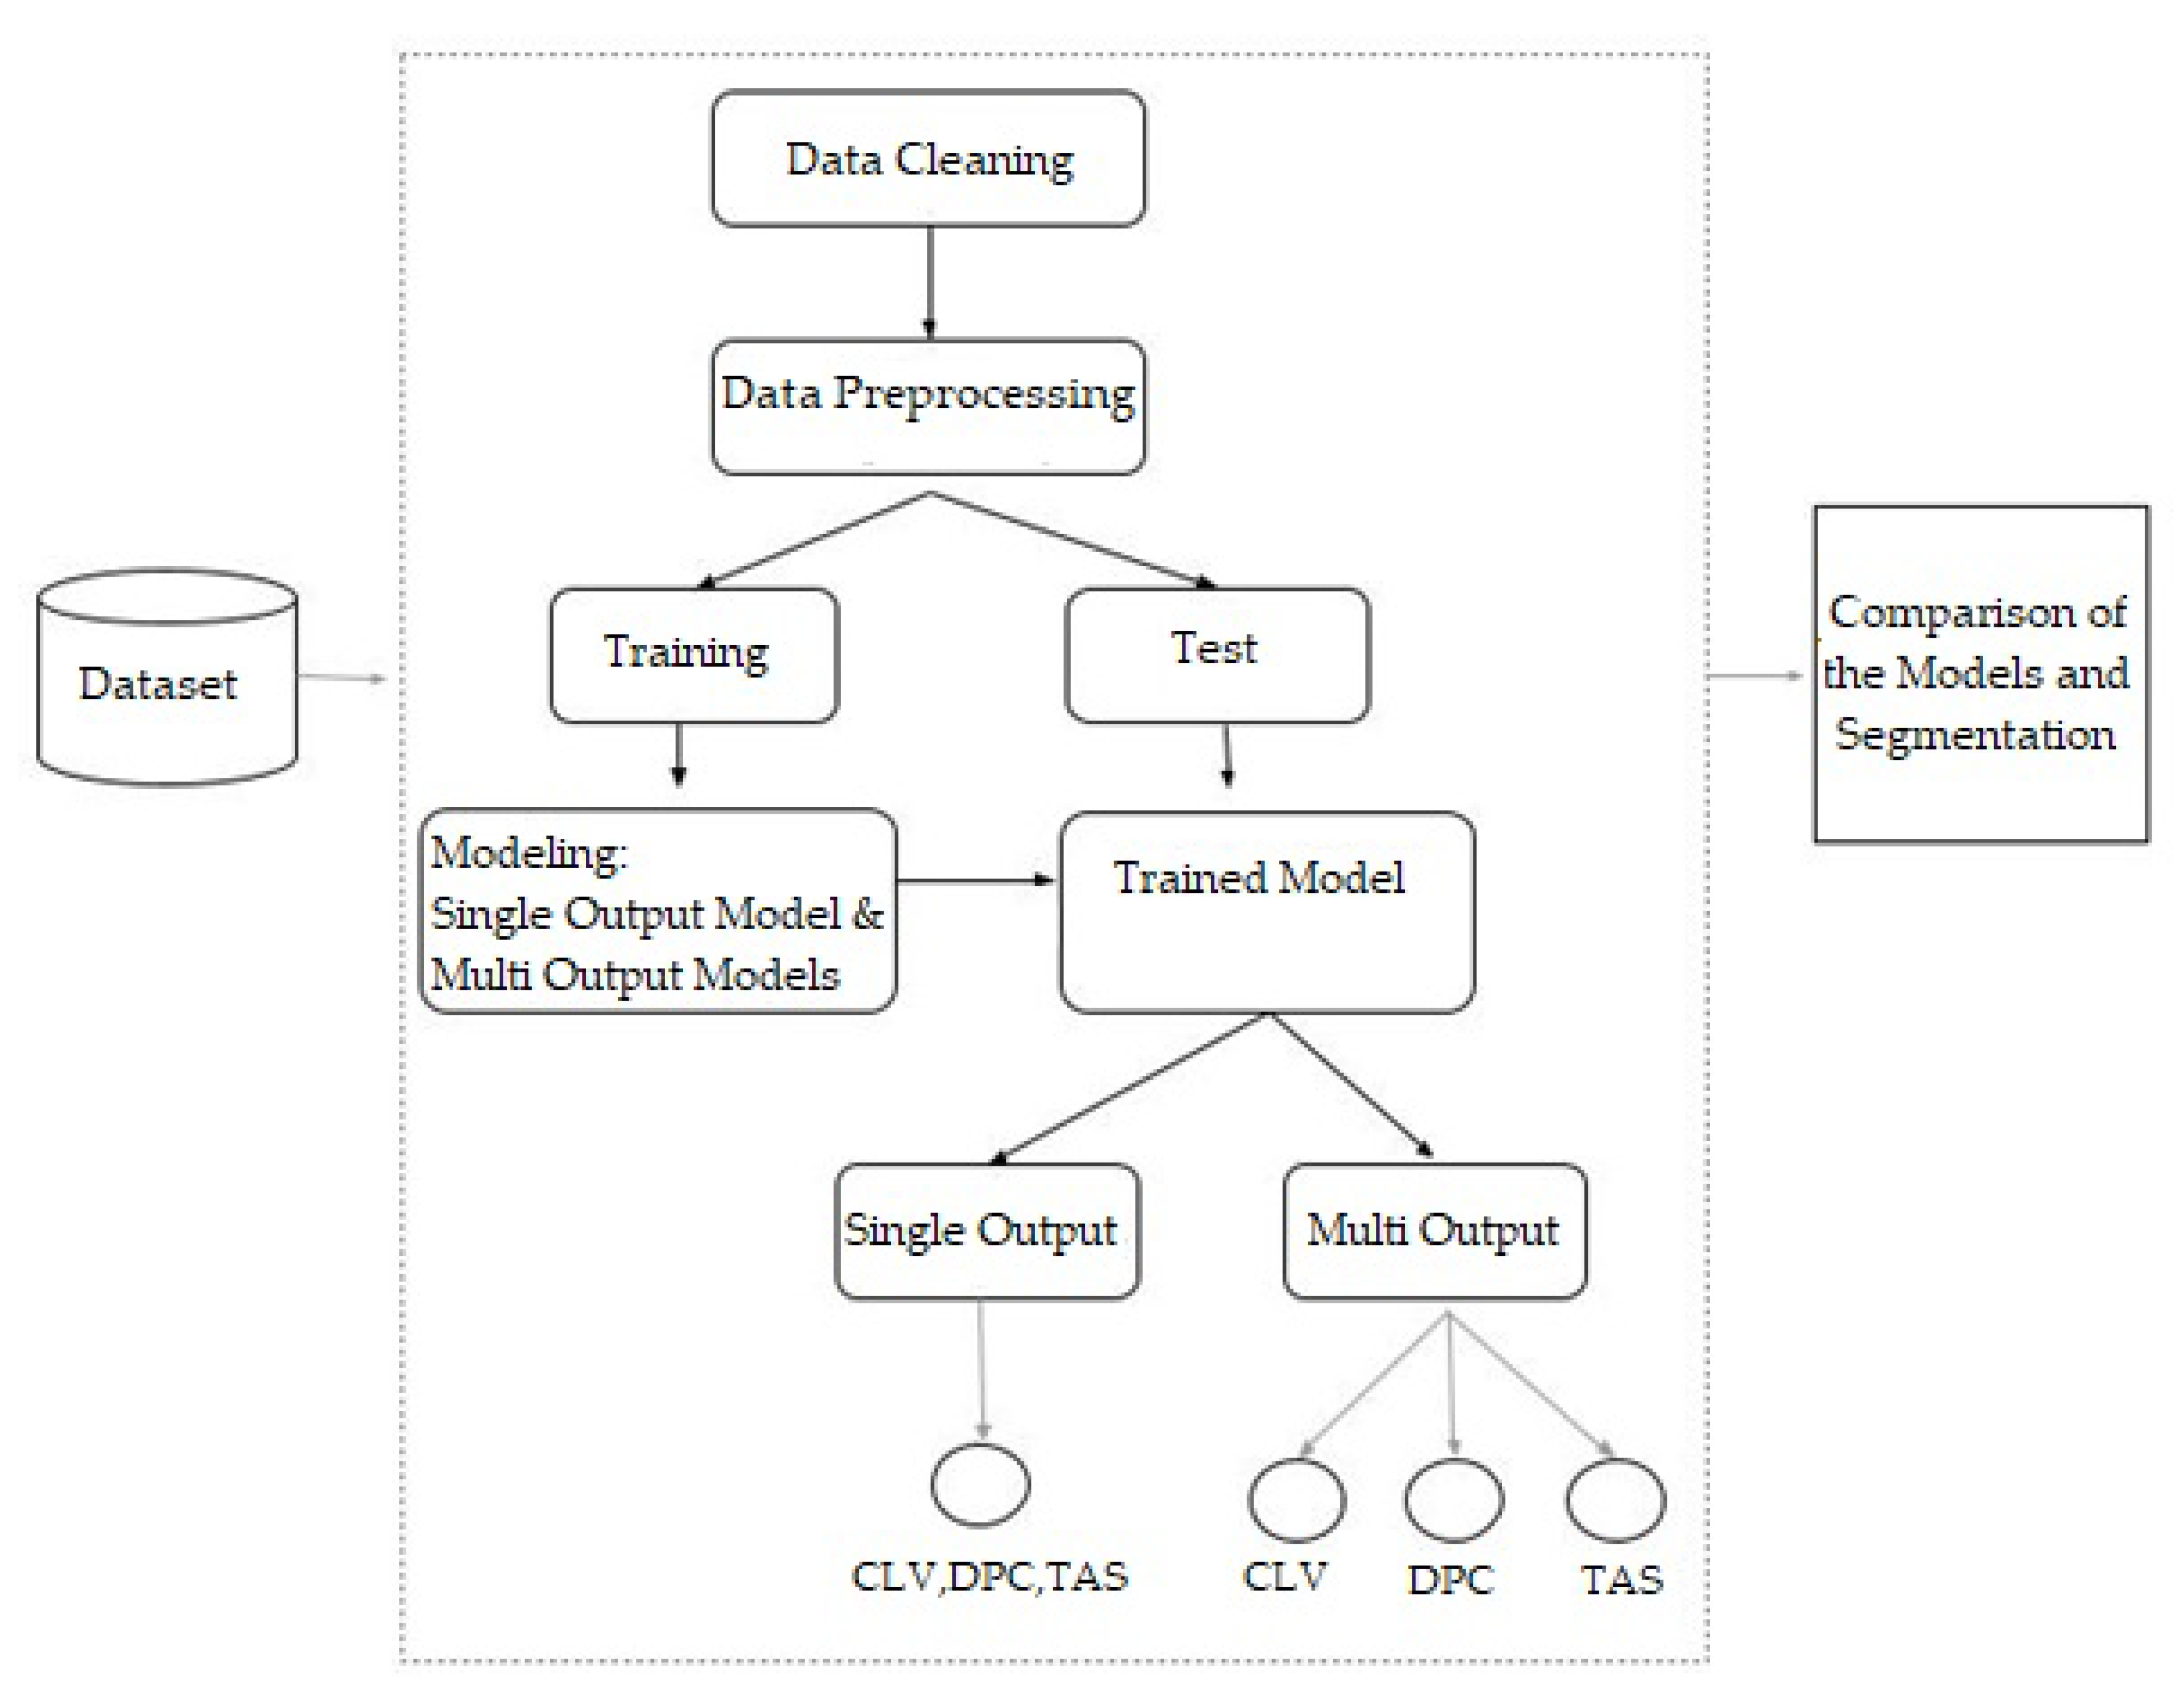
To address these research gaps and to assist multi-category e-commerce retailers in handling every area of CLV for their businesses and gaining a competitive advantage over other firms, we propose a novel 360° framework for CLV prediction and customer segmentation. We separated the framework into four components to answer the following four questions:
  • Does forecasting CLV along with other variables better predict customer value and segment consumers than predicting CLV alone?
  • Which algorithm is the best to use while predicting additional output features along with CLV?
  • How to interpret the deep neural network (DNN) model results?
  • Which customers will be the most profitable in the future for multi-category e-commerce companies?
The remainder of this paper is organized as follows. Section 2 presents a sample of literature on this topic. Section 3 discusses the details of the proposed framework, models utilized in this study, the data used, the models’ explainability, and how the outcome measures can be used to segment users and design customer-centric strategies. In Section 4, the results are discussed. Finally, in Section 5, the research conclusions, problems, and future study recommendations are discussed and presented.

2. Literature Background

Customers are at the heart of a company’s marketing efforts as they not only create revenue, but also boost the company’s market worth. Kotler [5] stated that customer relationship management (CRM) is an illustration of how marketing emphasizes the interconnectedness of all processes and activities involved in the production, communication, and provision of value to consumers.
According to Ryals et al. [6], CRM efforts are primarily designed to retain current customers, develop long-term relationships, and attract new ones. The calculation and usage of CLV are critical in this process because they allow organizations to group their customers and identify those who generate the most value over time [7].
Jasek et al. [8] stated that with the growth of technology and online shopping in recent years, conventional patterns in relationship management, such as brand equity, transactions, and product centricity, have shifted to a customer-centric strategy in which the customer is a valued asset of the organization. According to Heldt et al. [9], companies have become more customer-centric, with the inclusion of a customer perspective in the analysis of anticipated revenues, which were formerly forecasted primarily based on expected product sales. Regardless of the importance of this new customer-oriented strategy, the product adaptability perspective should not be disregarded. Even when a customer-centric approach is critical, businesses require their products to fulfil consumers’ needs. Most managers want to analyze and make decisions based on both product (and brand) and consumer perceptions [9].
According to [10], both points of view are critical because branded products are marketed to customers and those customers purchase them. This means that combining product and customer evaluations would produce better results than conducting the two analyses separately.
Add-on selling is another important product-based strategy commonly used by businesses to maximize customer equity. Sales are boosted through the provision of additional items or product categories to customers and through providing more highly priced (enhanced) products or a greater supply of the same product; this common practice helps to increase customer spending [11]. This is especially important for multi-category e-commerce companies. It enables the end-user to find all their needs on the firm’s website. They become more loyal to the company and boost their spending and CLV proportionately. Switching costs are significant when customers buy different products from an online retailer selling multiple product categories [12]. Customers may be less likely to visit other retailers, especially when they find everything they are looking for on one website [12].
Businesses must understand the quality of their customers, which best explains why one is more valuable than the other. According to [13], this condition can be influenced by several circumstances. The three variables considered are worth examining—the extent to which consumers make cross-purchases, time between transactions, and number of product returns. The number of distinct product categories that customers purchase indicates the degree of cross-buying, which is an important aspect for CLV prediction. As proof, Reinartz et al. [14] found that customers shopping within only one category have a lower CLV compared to multi-category shoppers. In addition, a study of catalogue retailers found that customers increased their CLV by an average of 5% for each add-on product category they purchased.
This is also a crucial metric for determining a customer’s worth, as purchasing a wide range of products from the same company demonstrates loyalty, and loyal customers spend more during their lifetime according to [12].
Consequently, we hypothesize that distinct product category (DPC) is a significant element in determining which customers are the most valuable and should also be predicted as an additional output while predicting CLV.
Separately, it was noted in [13] that there is an inverted U-shape in the effect of time between purchases on the longevity of earnings. Customers with a moderate but steady inter-purchase time between consecutive purchases may have a longer period of profitability than other customers.
In this study, we also consider inter-purchase times and calculate the trend in amount spent (TAS) with each succeeding purchase, using the inter-purchase time to determine how customers’ transaction trends evolve.
Although considering information on the product category sold and the trends regarding the amount spent with each subsequent transaction are significant practices when determining high-value consumers, many CLV-related studies have failed to consider these factors [11]. As a novel approach, we created these two features as additional output features to our model and introduced them to the literature.
CLV prediction has received considerable research interest, and numerous accessible models are available. For decades, the statistical modelling of customer lifetime value has been explored. Due to insufficient data, early models were typically limited to adapting basic parametric statistical models, such as the negative binomial distribution (NBD) model of Morrison et al. [15] and the Pareto/NBD model. The Pareto/NBD model is a classic recency, frequency, and monetary (RFM) model that is widely used for calculating the CLV, concentrating exclusively on the number of purchases made over a lifetime [16,17,18,19].
Probability models have been extensively utilized for CLV prediction; however, as technology advances, large-scale e-commerce platforms arise, and businesses begin to collect and store more data. This has drawn the attention of machine learning (ML) specialists. Recent studies have shown that ML-based CLV models can outperform probability models [20,21,22]. ML models, unlike conventional probability models, can integrate a large number of parameters or features and thus might produce better results with greater precision. For instance, a two-stage Random Forest model was used to predict the CLV of all users of e-commerce sites with the same model [20,21]. Sifa et al. [23] compared Random Forest, Decision Tree, and DNN algorithms. Malthouse and Blattberg [24] employed a neural network to predict CLV. Moro et al. [25] used a neural network, SVM, logistic regression, and Decision Tree (DT) to predict the success of marketing measures undertaken by a business. They discovered that the NN performed better than the other approaches. Wang et al. [22] employed a DNN with a new loss function, claiming that the DNN with the ZILN loss function outperformed the other models.
To our knowledge, no studies have been undertaken in which researchers used multi-output prediction models to forecast CLV and other related features to segment users. According to [26], most classical machine learning algorithms are designed for single-output prediction, which is a time-consuming task because of the requirement for separate training processes for each output and the low performance of the models. In addition, these methods exhibit a significant degree of nonlinearity between the input and output, indicating that their robustness, predictability, and adaptability can be enhanced.
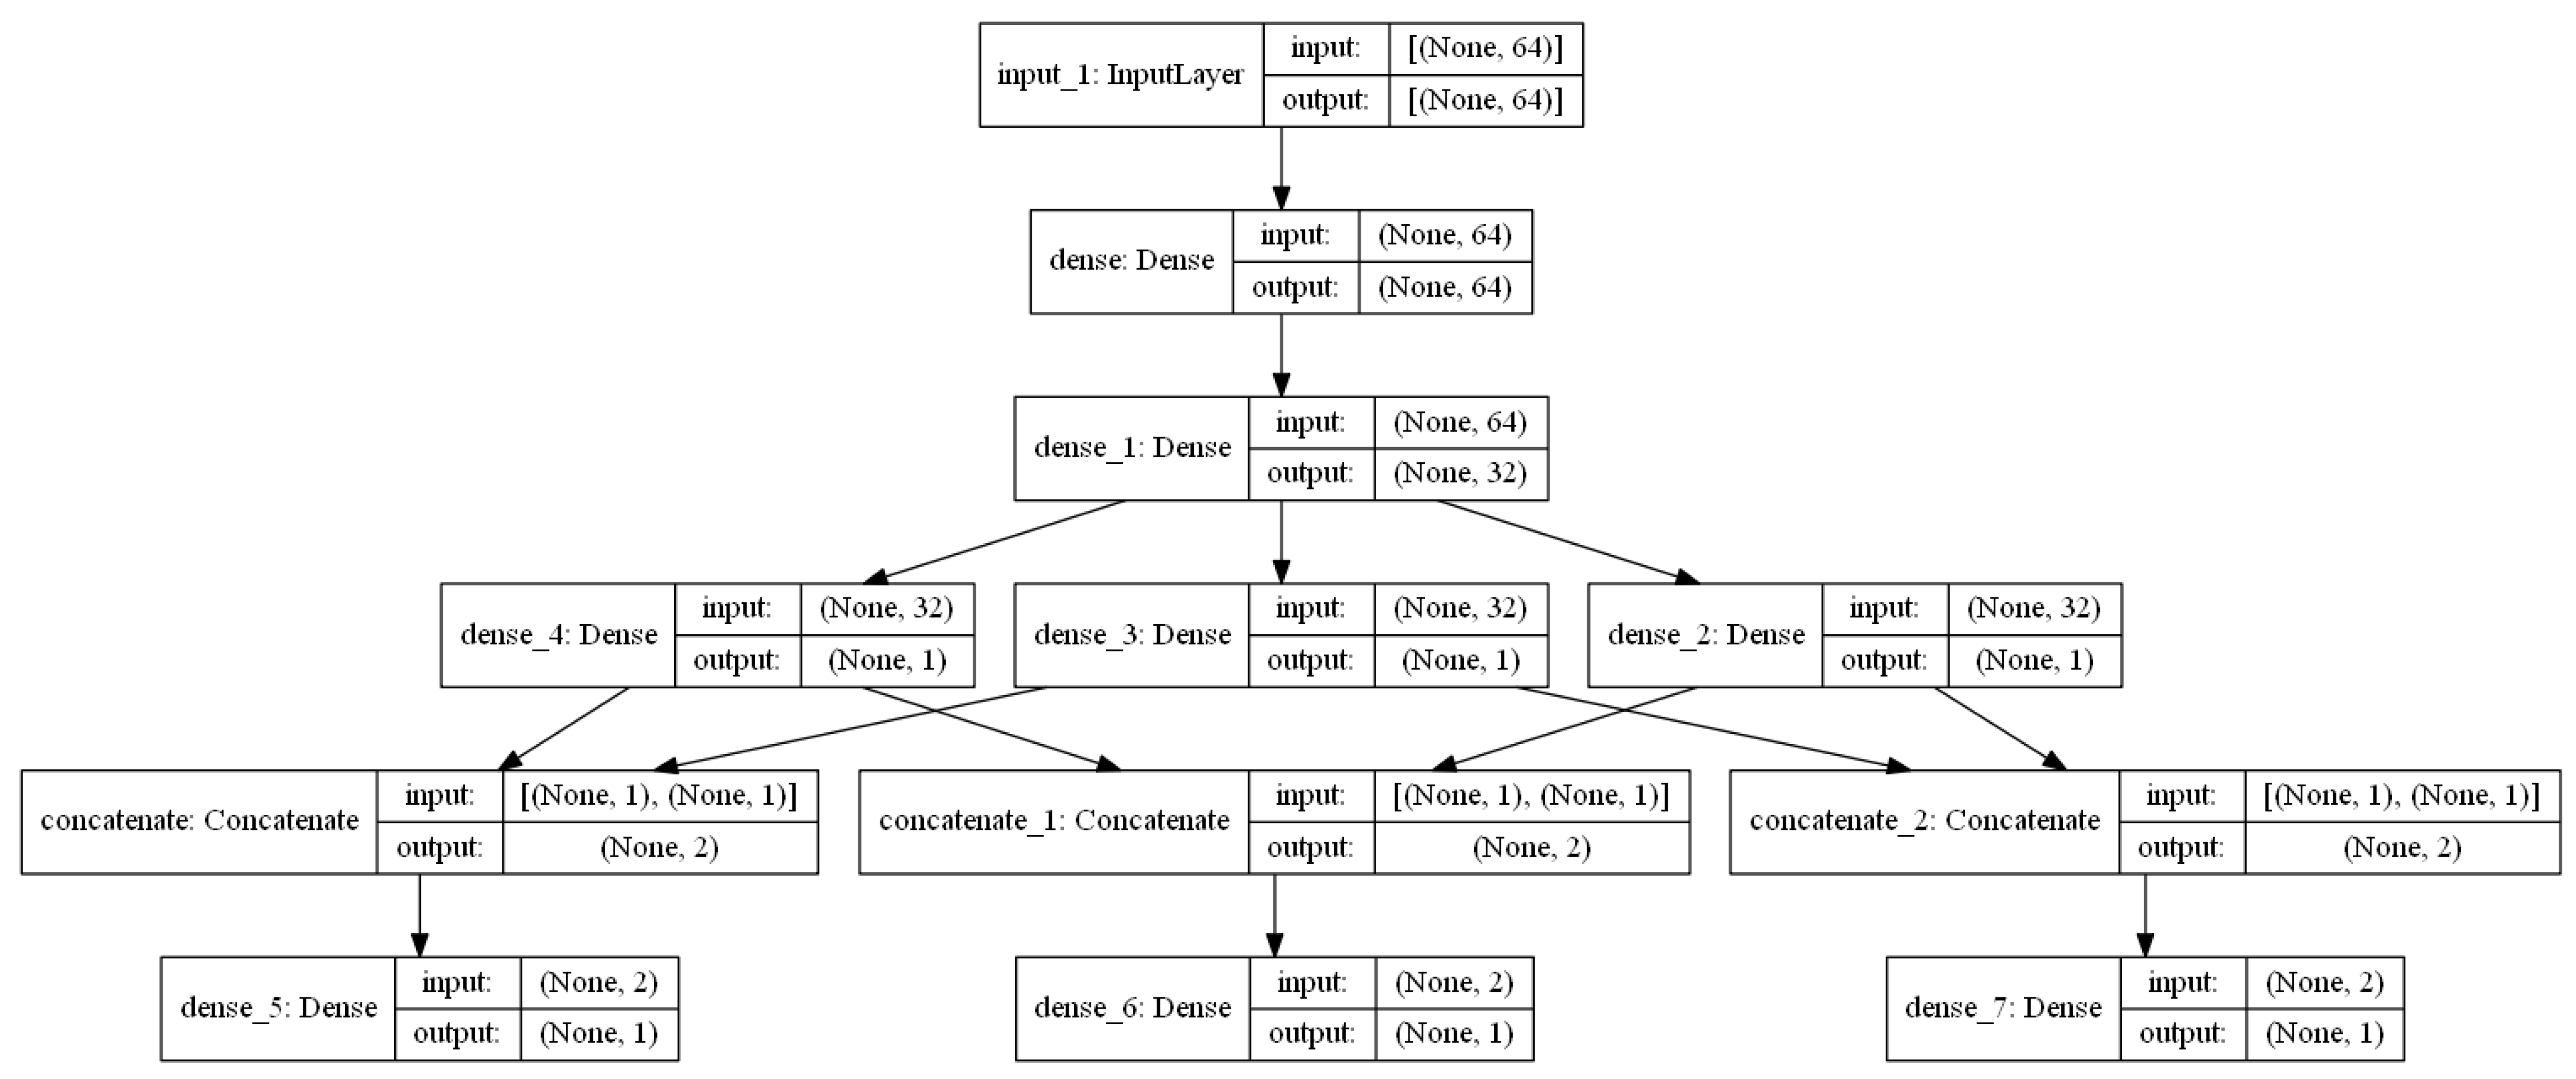
Developing a single neural network model that can predict multiple outputs from the same input features is a straightforward strategy. These models are simpler to create and test than managing one single-output neural network model for each output feature separately. Authors in [26] suggested a multi-output deep neural network (DNN) technique to address these challenges, which successfully predicted their two output variables simultaneously. They ran multiple experiments comparing single-output ML models to multi-output ML models, and the suggested multi-output model outperformed all the other single-output models.
Other studies have used the computer science approaches outlined above to model CLV directly. However, to our knowledge no studies exist that predict CLV and other output features together.
In this study, we tested our data with a multi-output DNN model, in which we predicted three outputs–CLV, DPC, and TAS–and compared the results with the baseline single-output DNN model where we built one for each output separately. Additionally, to prove the superiority of the multi-output DNN models over other ML models, we selected Random Forest and Decision Trees. These two models have been used multiple times as single-output models to predict CLV. Thus, we wanted to compare the multi-output DNN model with the multi-output versions of Random Forest and Decision Tree algorithms.
DNNs are incredibly accurate; however, because they are black-box models, it has been difficult for some firms to embrace them. Users are unaware of the underlying logic and internal dynamics of these models, which is a significant drawback because it prohibits a person from verifying, interpreting, and comprehending a system’s thinking and how certain decisions are reached. XAI is an AI topic of research that is designed to interpret complex models and focuses on understanding ML models and interpreting their outcomes. Numerous methods have been proposed to accomplish this goal, however, many of them suffer from an inherent flaw: they lack theoretical underpinning, except for the SHAP method developed by [27]. According to [28], SHAP combines the benefits of the Shapley values [29] and LIME [30] by creating Shapley values for the conditional expectation function of the original model. The Shapley values are based on game theory. When a feature is included in the “coalition,” its importance is defined as its average contribution to the variance. The significance of a variable is assessed by averaging the (absolute) SHAP values overall observations, according to [31]. Furthermore, no work has employed XAI for DNNs to determine the relevance of marketing features specific to CLV prediction, which makes our study unique in this area.
Finally, this study also aims to help businesses determine the importance of each customer. Management can create customized customer strategies by segmenting customers into different groups. CLV-based segmentation has been investigated for several years [3,7,32]. In our scenario, we will not only separate customers based on CLV, as in earlier studies, but also based on DPC and TAS. In this study, k-means clustering was performed to segment customers.
Predicting trends and separate product categories are additional essential subjects in this study, as we aim to present a 360° framework that includes every area of CLV prediction to focus on a more profitable group of high-value customers. We utilize a multi-output model instead of separately predicting each feature. To the best of our knowledge, a multi-output model for predicting extra factors together with CLV and determining the user segment based on these outputs has never been examined, nor have the results been projected as additional CLV outcomes.

Contribution to the Literature

Using the 360° framework we introduce, our contribution to the literature is as below:
  • The two new output features–namely DPC and TAS, created and added to the model for prediction in addition to CLV–allow multi-category e-commerce companies to focus on strategies that will bring them more valuable customers. CLV should not be the only indicator for determining a customer’s worth, and predicting CLV, DPC, and TAS together is important to understand the actual high-value customers as it increases the accuracy of the results.
  • The multi-output DNN model is suggested and tested to take advantage of a more robust model that is easy to maintain and better in terms of capturing the relationships among the three outputs–CLV, DPC, and TAS–against to build a single-output model for each output separately or against the commonly used Decision Tree (DT) and Random Forest (RF) algorithms.
  • XAI was used for the first time while predicting CLV to interpret the multi-output DNN model results to explain the feature importance details and increase user confidence in DNN models that were previously regarded as black-box models.
  • Finally, customer segmentation is conducted based on the three output features instead of using only the CLV. Segmentation based on the combined results of the three outcomes provides a useful guide for multi-category e-commerce businesses to focus on the right customers and define their strategies accordingly.

3. Methodology and Data Collection

This section discusses the proposed 360° framework. The steps are as follows, as illustrated in Figure 1: (1) data collection, cleaning, and preprocessing; (2) separating the data into training and test sets; (3) modeling using the single-output and multi-output models that we have proposed; and (4) comparing the models and segmenting consumers based on the predictions. The following steps outline the research analysis process in detail.

3.1. Data

Numerous researchers have long investigated CLV and have stated that to calculate it, a large amount of information about consumers’ purchasing habits is required in addition to transaction information [20,21,23]. Sifa et al. [23] emphasized the need to combine a variety of consumer characteristics and variables when calculating perceived customer value. Their technique includes additional variables relevant to e-commerce and condenses numerous critical factors into a single model.
In this study, for one online multi-category e-commerce retailer, web analytics and CRM data sources were used to train the model and estimate the CLV, the ratio of different product categories purchased, and the trends in purchase amounts. All actions on the multi-category e-commerce retailer’s website were tracked and recorded. As a result, they collected analytics data on each customer’s previous orders and extra actions such as web and app engagement data, information about purchased products, and click-through activities.

3.1.1. Data Source

Web analytics includes both anonymous and identifiable data regarding visitor behavior on a company’s website and mobile apps. Chamberlain et al. [21] found that web and app session logs were the most comprehensive dataset available for CLV prediction at ASOS. Web analytics encompasses data and interactions regarding marketing channels, content engagement, purchase intent, user product affinity, content choices, devices, behavioral recency, frequency, and monetary indicators. This multi-category e-commerce firm that we obtained additionally combined web analytics data with CRM and product-related data.
In this study, data were gathered from an online retailer selling items in a variety of product categories. There were 150,421,192 transactions in the dataset for the period between 4 July 2018 and 1 August 2020. In addition, 8,900,215 unique users were identified. This dataset also contained data from both web and app analytics that were matched using a unique user identifier.
The period July 2018 to August 2020, which contains data from a multi-category e-commerce company in this analysis, contains the period of COVID-19 where customers mostly turned to e-commerce websites because of the epidemic, and the volume of transactions increased, according to studies [33]. This is also true for the multi-category e-commerce company studied here. Thus, for this study, we omitted data after 31 March 2020. Hence, rather than 24 months, the number of months eligible for the analysis was reduced to 18. The final amount of data points that were used in this study was 1,372,249.

3.1.2. Time Window of Prediction

The first output label indicates total consumer spending over a certain timeframe based on previous purchases. To avoid seasonal oscillations, the forecast horizon should be a fixed number of years; in practice, this should be one, two, or three years [22]. A lengthy model is often impracticable because of the number of prior records required to build the training labels. For example, [20,21] performed forecasts for a timeframe of 1 year.
Based on previous purchases, we evaluated the problem of estimating each customer’s total purchase value, distinct product category purchase ratio, and trend regarding the amount spent in the following 12 months. The number of sessions, page views, time spent on the site, and other online activity variables were included in the model, as was amounts spent, the number of items purchased, and the seller and product category of each individual purchased item. We limited our evaluation period from 4 July 2018 to 31 March 2020. The purchase period was between 31 March 2019 and 31 March 2020, which is exactly before the full 12-month cycle. The historical purchasing period was set to 6 months before 31 March 2019.

3.1.3. Data Description

From the entire dataset, 34 features were extracted, as shown in Appendix A (Table A1). After pre-processing, 34 features were converted into 64 input features. Past purchases were mined for recency, frequency, and monetary quantity. Information on the total product categories from which purchases were made, boutiques from which purchases were made, and the distinct number of boutiques and product categories from which each user bought products were all calculated and added as extra features. Finally, for each existing user, a trend variable was calculated.

3.1.4. Data Pre-Processing

The model’s outputs had to be in different forms for the different models (single-output, multi-output DNN models, multi-output Decision Tree, and multi-output Random Forest), so the output variables of each model had to be pre-processed separately. All models, however, went through the same pre-processing steps for the input features:
  • As several purchases could be made during the observation period, continuous variables were calculated as the average of all variables for each user.
  • One column was generated for each distinct value of the categorical features. Then, the ratio of one specific value to all transaction numbers for each user was attributed to that column. One example, opSystem, is a categorical feature that shows the operating system used by the user while visiting the website. The operating system variable had five distinct values (Macintosh, IOS, Windows, Android, and others). Five distinct columns were generated for each value. Suppose that a user completes five different transactions–two of them on an IOS device, two on a Macintosh device, and one on a Windows operating system. The values would be 0.4 for IOS, 0.4 MAC, and 0.2 for Windows. Android and other operating systems would have values of 0.
  • Missing values existed in the variables of sex, timeonsite, and page views, and missing values in sex were replaced by 2. The mean of the available page view values was used to replace the missing values in the page view category. In addition, missing data related to timeonsite were removed from the entire dataset.
  • Another input variable, distinctcategoryp, was introduced. It contained the total number of distinct categories from which purchases were made during each transaction.
  • Two new input variables, totalpurchasedcategory and totalpurchasedboutique, were added to represent the total number of categories and boutiques from which products are bought during a transaction.
  • Additionally, we performed one-hot encoding to convert categorical data to a numerical representation. This method distributes the data in a column among many flag columns and assigns them a value of 0 or 1. These binary values convey information regarding the relationships between the grouped and encoded columns [34].
In addition to these factors, we retrieved three additional variables for each customer: recency, frequency, and monetary value. This information was obtained from the historical transaction data in our dataset. The number of purchases during the days between the customer’s most recent purchase and the end of the observation period (31 March 2019), was denoted by recency. The overall number of repeat purchases over the observation period was denoted by frequency, and the mean purchase value in dollars was expressed as a monetary value.
One-time buyers were excluded from the dataset in order for this model to work because they had no previous purchases.

Pre-Processing for Multi-Output ML Models

Using multi-output ML models, we predicted two additional output features in addition to CLV. We analyzed the separate product category purchasing ratio and the trend regarding the amount spent by each user, in addition to CLV.
In addition to the pre-processing described above, three output metrics were produced as model outputs:
  • A new variable–total revenue–was added as the first output label, indicating the total amount of customer’s spending within 1 year.
  • For the second output label, a new variable called DPC was added. This variable expresses the ratio of the total number of distinct categories purchased to the total number of transactions in a given year. This value was calculated for both the observation and test periods.
  • For each user, the third output label, which indicates the trend in the amount spent variable, was calculated. We ran a regression model for each user’s purchases individually, with the number of days between consecutive transactions as the independent variable and the difference in purchase amount between consecutive transactions as the dependent variable. The slope of this regression model is then used as the trend value for each user. Two customers with the same CLV may have had different trend values, providing us another piece of critical information for assessing a customer’s genuine value. Borle et al. [35] used an “advanced type of RFM grading” similar to that of [14]. They regressed purchase amounts (in the validation data sample) on previous purchase amounts, time intervals between purchases, and cumulative purchase frequency. Subsequently, the computed coefficients were used to forecast future purchase volumes.

3.2. Performance Measures

Multiple distinct performance measurements can be performed for various models. We examined prior studies on this topic.
Tsiptsis and Chorianopoulos [36] emphasized the importance of examining a wide number of residual diagnostic plots and measurements to determine the prediction accuracy of the model. Typical error measures include mean errors across all analyzed records. These error metrics can be the squared mean-squared error (MSE), assessed in absolute values as the mean absolute error (MAE), and can be the root-mean-squared error (RMSE). Correlation coefficients, such as the Pearson correlation coefficient or Spearman rank-order correlation coefficient, quantify the relationship between actual and projected values.
According to [36,37], the most commonly used error measures for evaluating CLV forecasts are MSE, MAE, and RMSE.
Glady et al. [38] projected the CLV using training-set data and compared their predictions with the actual CLV in the test set using both the RMSE and MAE. They also predicted the CLV for each individual and compared it to their genuine ranking by examining the strength of a monotonic relationship between these two variables. This measurement is referred to as Spearman’s correlation coefficient.
The MAE, MSE, RMSE, and Spearman correlation were also selected for use in this study.

3.3. Models

To use the models, we first divided the data into two sets: the training (%70) set and the test set (%30). The code was written in Python, and all models were appended to it: single-output DNN, multi-output DNN, multi-output DT, and multi-output RF. In the remainder of this section, a description of the model’s set-up is given, followed by a description of the hyperparameter tuning process.

3.3.1. DNN Models

A neural network structure was used to create various types of models. The DNN model, for example, comprises numerous non-linear hidden layers that allow it to deal with extremely complex input–output interactions [39]. DNNs have been used to forecast both churn and purchases, according to [23,40], in the field of data science.
Although it is typical to construct a deep learning neural network model for regression or classification tasks, one may want to develop a single model that can make both the predictions for predictive modelling applications.
Regression is a type of predictive modelling that involves the prediction of a numerical result from a set of inputs. Various issues may arise when several values need to be predicted. One solution to this challenge is to create a distinct single-output model for each prediction that needs to be made. The problem with this method is that the predictions of the various models may differ. When employing neural network models, an alternative method is to create a single model that can make separate predictions for many outputs for the same input. This is known as a multi-output neural network model.
The advantage of this model is that there is only one model to design and maintain, rather than numerous models, and that training and updating the model on all output types simultaneously may lead to higher consistency in predictions across different output types. In our study, the multi-output DNN’s intermediate layers represent three related tasks: the regression of the distinct product purchase ratio, trend in the amount spent, and customer spending prediction. According to [41], this structure allows the model to generalize more for each task, in line with multi-output learning. Numerous ML methods provide intrinsic support for multi-output regression. Examples of popular approaches are Decision Trees and ensembles. In this study, in addition to comparing the multi-output DNN model with the baseline single-output DNN models, we are also comparing the multi-output DNN model with multi-output Decision Tree (DT) and multi-output Random Forest (RF) models.
Neural networks can directly support multi-output regression by defining the number of target variables in the problem as the number of nodes in the output layer. For example, a job with three output variables requires a neural network output layer with three nodes in the output layer, each with an activation function.

3.3.2. Multi-Output DNN Model Structure

In this study, a neural network with 64 input layers and two hidden layers with 114 and 45 units, were used, respectively, based on Bayesian Optimization hyperparameter tuning. Single-output models have different number of nodes and parameters again based on hyperparameter tuning. For single output models, only one output node is added to predict the output variable. On the other hand, for multi-output models, to capture the relationship among the three output variables, three output nodes were first predicted and then the concatenated weights of each of the two output node pair was sent to the third output. The model’s architecture is shown in Figure 2.
The number of nodes, batch size, epochs, and learning rate parameters were modified using hyperparameter tuning to determine the best and optimum parameters separately for both single and multi-output DNN models.
Table 1 lists the optimal hyperparameters used for DNN models in this study.
A popular rectified linear unit (RELU) activation function is used in the hidden layers. The MSE loss for all outputs and the Adam version of the stochastic gradient descent were used to fit the model.

3.3.3. Multi-Output Decision Tree

Decision Trees (DTs) are supervised learning techniques for regression and classification. By learning straightforward decision rules derived from the data attributes, the objective is to develop a model that predicts the value of a target variable. DTs are easy to understand and interpret. They are also well-suited for predicting multiple outputs and, because of this, a good lead for our case to predict CLV, DPC, and TAS at the same time and for comparison with the multi-output DNN models. Given the highly nonlinear and multidimensional nature of our data, Decision Tree regression seemed like a viable option to select as another model to compare with our proposed model.
The relative simplicity of tuning is one of the Decision Tree implementation’s main benefits. The hyperparameters we used in this study for DT are max_features (the number of features to consider when looking for the best split), max_depth (the depth of a tree), min_samples_leaf (the minimum number of samples required for a node to become a leaf), and min_samples_split (the minimum number of samples required to split). Table 2 shows the optimal hyperparameters and range of the hyperparameters for multi-output DT.

3.3.4. Multi-Output Random Forest

Random Forest (RF) is an ensemble learning technique that combines numerous Decision Trees on subsamples of the dataset to increase forecast accuracy and prevent overfitting [42]. The model uses all training data variables and attempts every possible combination of splitting a sample from a leaf node into two groups. The mean squared error (MSE) between the dividing line and each sample is computed for each possible split and the split with the lowest MSE is selected. At some point, the quantity of leaf samples will drop below a certain minimal threshold, at which point the process of dividing leaf nodes will stop. The average of the predictions made by the trees is then used to make the final forecast [42]. RFs are also applicable for both classification and regression. Given that CLV, DPC, and TAS are continuous variables, the study in this paper focuses on a multi-output regression problem. We are using multi-output Random Forest Regressor in this study to predict the multiple outputs CLV, DPC, and TAS. Like DTs, Random Forest is also a powerful tool algorithm when predicting multiple outputs. In one example, González et al. [43] used multi-output RF to forecast electricity pricing and demand simultaneously. The study showed that multi-output Random Forests outperform single-output Random Forests in terms of accuracy. In our case, we are comparing multi-output RF with our proposed multi-output DNN model.
We also applied hyperparameter tuning to find the optimal parameters for multi-output RF. We used the same four hyperparameters with the multi-output DT algorithm. In addition to those four, we also added the n_estimators parameter that indicates the number of trees. Table 3 shows the optimal parameters and the ranges that we used while tuning the hyperparameters for multi-output Random Forest.

3.3.5. Hyperparameter Tuning

Optimizing hyperparameters for machine learning models is a critical step in obtaining accurate results. The parameters of a model are values calculated during the training process that specify how to translate the input data into the intended output, whereas hyperparameters define the structure of the model and may affect model accuracy and computing efficiency [34]. According to Win et al. [34], the models can include a large number of hyperparameters, and determining the ideal combination of parameters is known as hyperparameter tuning.
In this study we used Bayesian Optimization hyperparameter tuning for all four models (single-output DNN, multi-output DNN, multi-output DT, and multi-output RF) while tuning the hyperparameters. According to [44], Bayesian optimization is a powerful technique for dealing with computationally expensive functions. The Bayesian theorem is the foundation of Bayesian optimization. They completed multiple experiments using standard test datasets. Experimental findings demonstrate that the suggested method can identify the optimal hyperparameters for commonly used machine learning models, such as the Random Forest algorithm and neural networks [44]. Additionally, in applied machine learning, cross-validation is generally used to estimate the skill of a machine learning model on a new dataset. That is, a small sample size is used to test how the model would perform in general when used to make predictions on data that were not used during training. To prevent overfitting and to find the optimal hyperparameters, as recommended by [3], we employed Bayesian Optimization hyper-parameter tuning via Repeated 5-Fold cross-validation.
For the DNN models, the training performance and structure of DNNs are highly influenced by the hyperparameter values [45]. As a result, determining the appropriate settings for the hyperparameters is critical to realizing the full potential of DNNs [46].
For our study, four crucial DNN hyperparameters were considered: the number of processing nodes in each layer, batch size, epochs, and the learning rate similar to [47,48].
The popular rectified linear unit (RELU) activation function is used in the hidden layers. The MSE loss for all outputs and the Adam version of the stochastic gradient descent were used to fit the model and not in hyperparameter tuning since these are the most common functions.
For both of the multi-output DT and multi-output RF algorithms, we chose the hyperparameters and the ranges for tuning based in part on earlier research in [49]. For all models, some parameters are tuned while other parameters are left fixed because it would be computationally difficult to test all possible parameter value combinations. The most common parameters are selected based on previous studies for each model type.
We tested and compared the accuracy of the models after analyzing the performance of our machine learning models and identifying the best hyperparameters.
To achieve this, we trained the models using a 5-fold cross validation on all the training data. Then, we used the best hyperparameters that we discovered for each of the models and evaluated and compared how well our models performed on the unseen test set.

4. Results and Evaluation

The purpose of this study was to compare the prediction ability and quality of the proposed multi-output DNN model to a single-output DNN model, multi-output DT, and multi-output RF models using statistical metrics. In this section, we present the results for each model for the multi-category e-commerce dataset using the MSE, MAE, RMSE, and Spearman correlation metrics. Section 3.2 has already provided an overview of the evaluation measures and methodology used for comparisons. Section 5 expands on these findings and their consequences.
Table 4 shows that the multi-output DNN model was the best-performing model based on every metric. The relationship between CLV, the distinct product category, and the trend in the amount purchased is important, providing better results when they are predicted together and being captured better with the proposed DNN algorithm.
We also aimed to show that the model could distinguish high-value customers from others, in addition to the above measures. The hit-ratio metric was used because we aimed to segment users of e-commerce companies into multiple categories, and the ability to distinguish high-value users is critical when predicting multiple outcomes with the same model. Donkers et al. [50] proposed this hit-ratio measure, which is the percentage of consumers who’s anticipated CLV is the same as their genuine CLV. If the most valuable 20% of customers have a CLV above a certain amount, the hit-ratio determines how many of these customers have a predicted CLV above that amount. An ordering-based hit-ratio was also considered in [24]. Chiang and Yang [51] also evaluated the performance of the CLV prediction model using the hit-ratio.
First the hit-ratio of the multi-output DNN model, that is, the percentage of properly predicted observations, was compared to the hit ratio of the single-output DNN model, multi-output DT, and multi-output RF models in this study. The findings regarding the hit-ratios for the CLV, DPC ratio, and TAS metrics are shown separately in Table 5.
Each of the three outputs was calculated by comparing the projected and actual top 20% of customers. The hit-ratio obtained for the multi-output DNN model performed better across all three outcomes than for each model alone, as shown in Table 5. CLV exhibited the highest hit-ratio, followed by the distinct product category ratio and trend prediction for the amount spent. Specifically, 29% of the 20% comprising the most profitable customers (the top 20%) could not be identified using the multi-output DNN model for CLV. With a 71% accuracy rate, the multi-output model performed well.
The results were lower for the distinct product category purchase ratio and the trend in the amount spent with hit ratios of 64% and 41% for the multi-output model projections for the DPC and TAS output predictions, respectively.
The single-output DNN model, however, scored worse than the multi-output DNN model in predicting the percentage of customers with a true CLV, DPC, and TAS in the top 20% based on the calculated numbers than the predicted CLV, DPC, and TAS, which was likewise in the top 20% based on the projected CLV, DPC, and TAS. The hit ratios for the single-output models’ CLV, DPC, and TAS measures were 70%, 30%, and 28%, respectively. However, on the other hand, the single-output DNN performed better compared to the multi-output DT and RF in terms of CLV prediction.
Second, we chose this hit-ratio criterion to compare our proposed model results with those of existing studies that utilized the same criterion, such as [24,51]. Malthouse and Blattberg [24] developed a hit-ratio rule (20–55) for CLV prediction. They sorted the CLV values and divided all clients into four equal-sized groups based on their actual CLV. They replicated this process for the predicted CLV values. Then, the hit ratio was calculated as the proportion of consumers whose anticipated CLV and their actual CLV groups match. They found that about 55% of the actual top 20% will be misclassified. Chiang and Yang [51] also used the hit ratio to evaluate their model prediction accuracy for CLV. They made a comparison between the predicted top 20% of customers and the actual top 20% of customers, and 35% of the top 20% of most profitable customers (top 20%) could not be identified with their CLV prediction methodology. Their study outperforms other studies with a 35% misclassification ratio. Based on these results, our multi-output DNN model’s hit ratio for the CLV output–which has a 29% misclassification rate–is quite competitive, compared to both Malthouse and Blattberg’s [24] and Chiang and Yang’s [51] studies. A comparison between our proposed model and the two previous studies can be seen in Table 6.
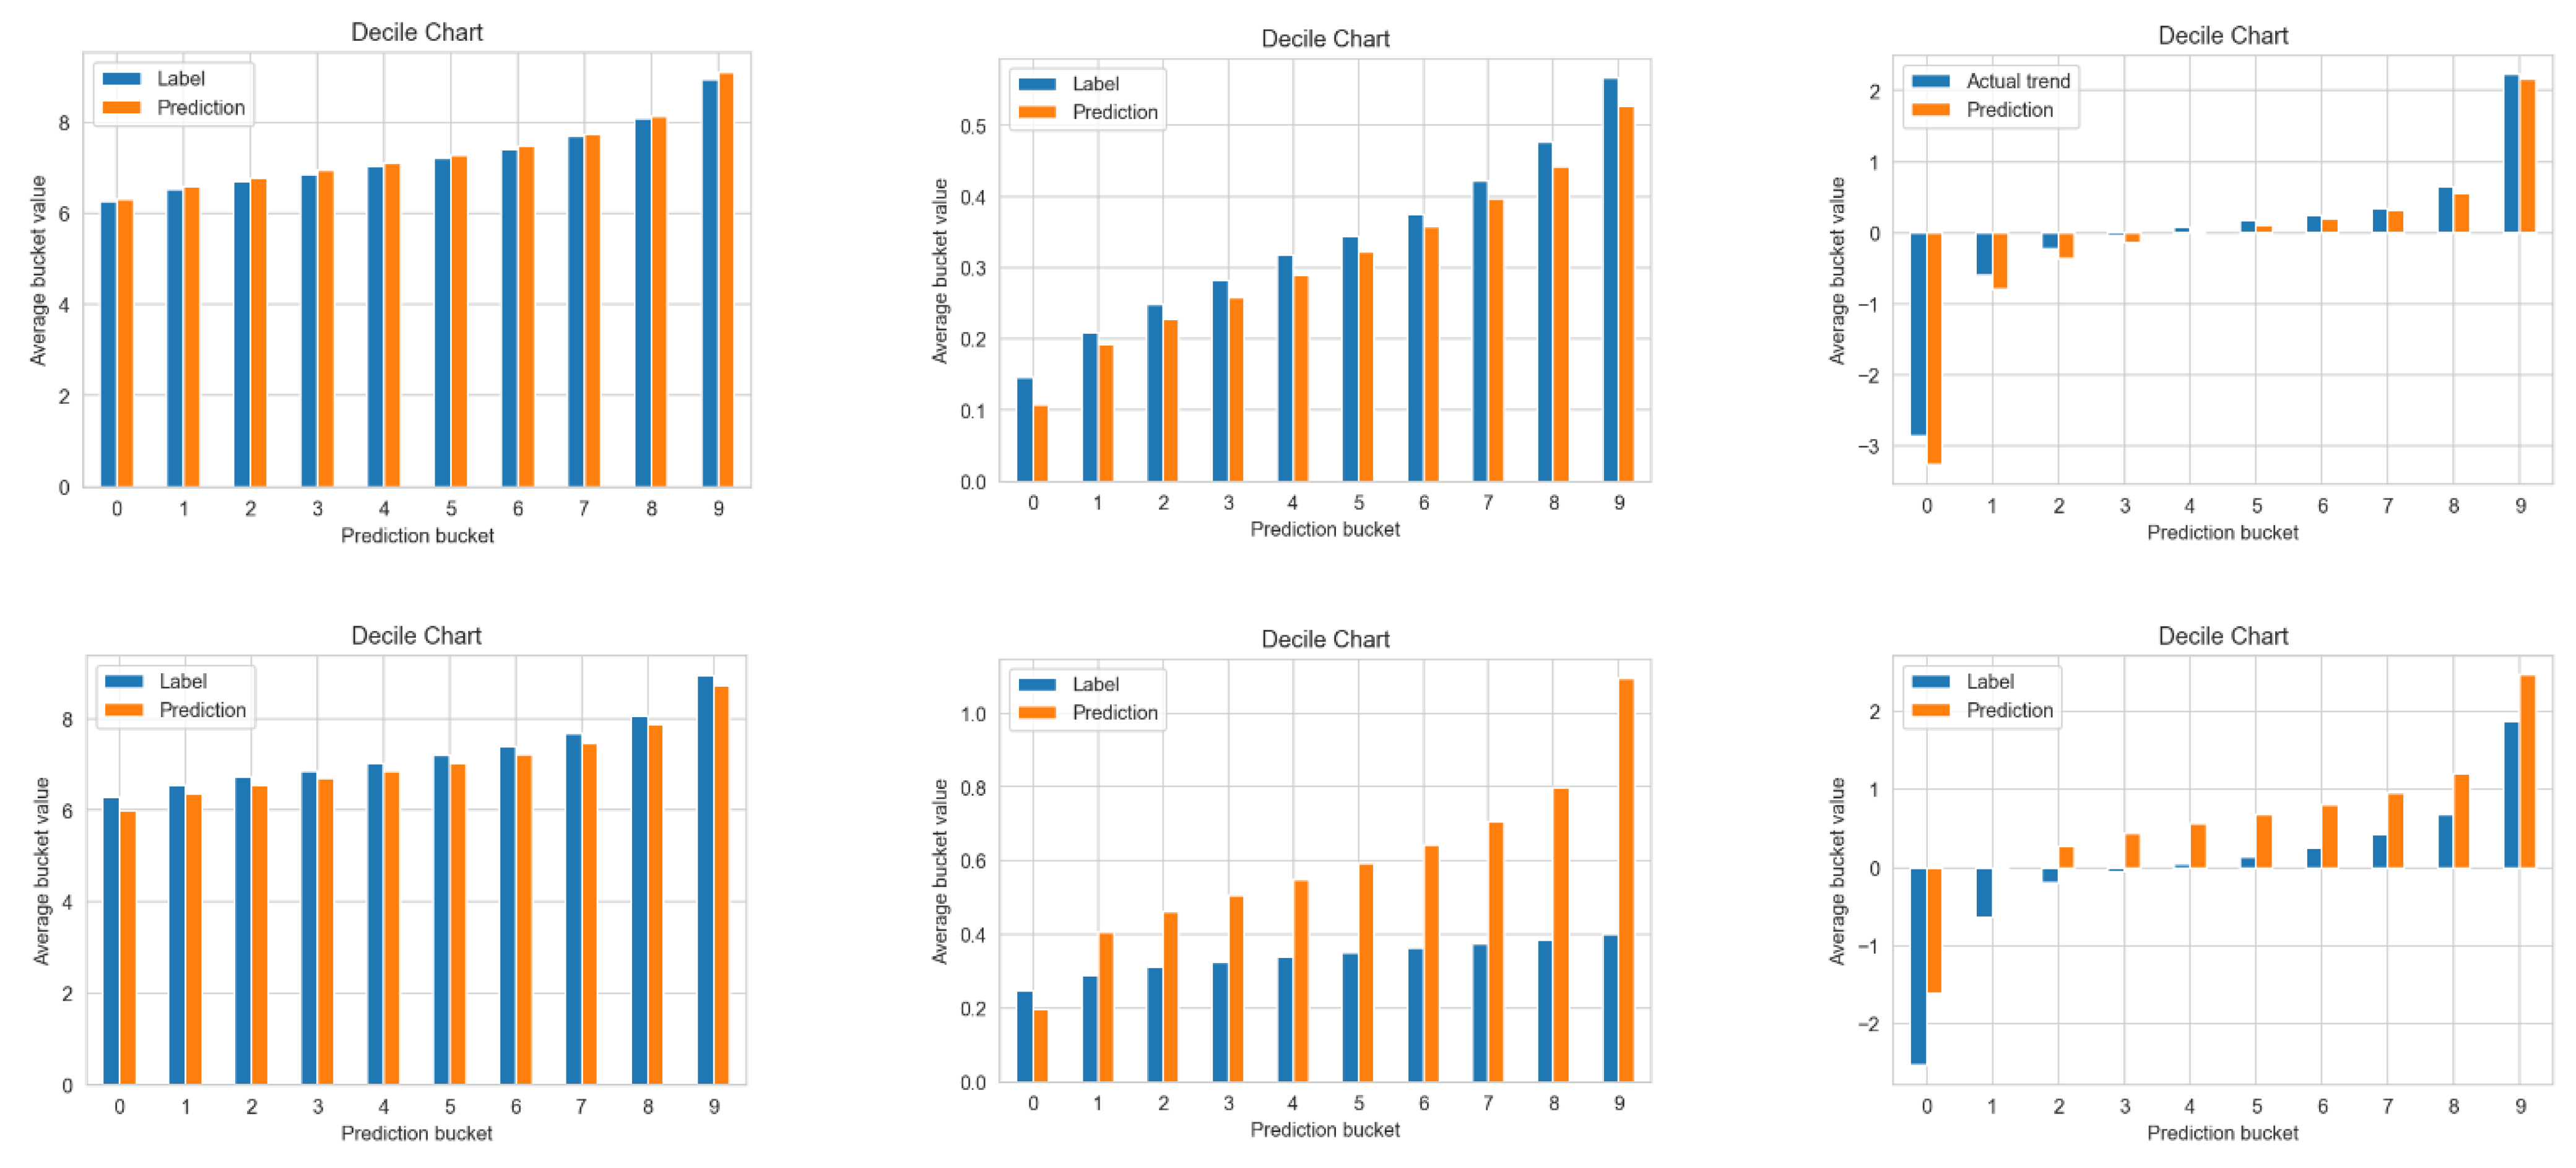
We also added calibration plots (decile charts), which are graphs of the goodness of fit that illustrate the anticipated probability and the fraction of positive labels [22]. According to Wang et al. [22], for example, if we predict that 20% of customers will be high-value customers, the observed frequency of high-value customers should be approximately 20% and the predictions should correspond to the 45° line.
We used decile charts to plot the labels of forecasts by decile and compared the average prediction and average label for each decile of the forecasts.
The predicted mean for each prediction decile in a properly calibrated model should be close to the actual mean. Figure 3 illustrates the model calibrations for each of the three outputs for the best performing multi-output DNN model and the baseline single-output DNN models. The projected CLV values from the multi-output DNN model were extremely similar to the actual values, as indicated by the charts. The DPC forecasts for the top and bottom 10% of the higher ratios for the multi-output model deteriorated. However, for the DPC, the predictions of the single-output DNN model were higher than the actual values. The trend had negative values, stable values near zero, and positive values. Model calibration for the trend was poor for both the single- and multi-output DNN models, particularly for the single-output and for the top and bottom 10%. However, the predicted mean from the multi-output DNN model for the remaining variables was close to the real mean for the trend output variable.

4.1. Marketing Segmentation Strategies

According to [28], CLV prediction expresses the total value of each customer. This helps companies because it enables them to identify specific customers regarding the target. However, to devise a marketing plan, companies must obtain knowledge about several different consumer groups rather than just one. As a result, it is important to group data into clusters or segments, which makes it easier to build marketing strategies.
Customers must be treated uniquely in order to manage a profitable customer relationship, and it is critical to consider how to allocate resources, choose customers, analyze purchase sequences, and acquire and retain the right customers in each segment. Companies must first understand the key characteristics that distinguish each group. This explains why some customers are more profitable than others, according to [3].
According to [3], firms want to know how much their customers are worth over time and what factors they can influence to increase their value. Reinartz and Kumar [14] discovered aspects of the duration of consumer lifetime profitability. Feature exchange and customer diversity drive profitable lifespans. Customer–company exchange characteristics can be used to identify and describe customer–firm exchanges, whereas demographic factors capture customer variability. Companies’ mailing efforts and customer spending levels have all been identified as helpful drivers of profitable lifespan length in both the B2C and B2B contexts.
Knowing the factors that contribute toward the development of a lucrative life cycle enables managers to take tangible steps to enhance drivers and, as a result, increase customer profitability. Using the antecedents to the profitability life cycle linked to a specific customer, managers can also identify customers who may be valuable in the future and determine when it is time to stop investing in those consumers. Profitable lifetime driver/customer lifetime values (CLVs) are an important component of any marketing plan [3].
According to [32], several CLV segmentation strategies have been proposed, but they can be broadly classified into three categories: category one is segmentation using only CLV values; category two is segmentation using both CLV values and other data, such as purchase history; and category three is segmentation using only CLV components, such as current value, potential value, and loyalty. In our case, similar to Category 2 above, we use other information (the dynamic product category ratio and the trend in the amount spent) in addition to CLV as our drivers to segment users of multi-category e-commerce companies.
Other variables, as mentioned above, can be used by multi-category e-commerce companies to categorize their visitors. The purchased product category is a critical variable for businesses that sell a variety of products. Customers who have recently acquired an additional service in addition to what they previously purchased are more inclined to purchase even more, according to [44]. Another study of a catalog retailer found that the CLV increased by 5% on average for each extra product category purchased by a consumer [13]. The distinct product category purchase ratio was one of our output variables because, in this study, we collected data from a multi-category e-commerce retailer that sells items in 10 distinct main product categories (Apparel, Kids and Baby, Beauty and Health, Shoes and Bags, Watches and Jewelry, Home and Furniture, Electronics, Sports and Outdoor, Grocery and Multi). The product price range of this retailer was very wide. This is because the retailer was selling low-priced items and luxury/premium and other highly priced product categories such as electronics.
Due to this wide price range, a challenge is that if the retailer segments its customers according to the CLV signals only, because only the total amount spent by a certain customer is considered:, (e.g., a customer who has purchased only one expensive item could be categorized as “high-value customer”, while a customer who purchased from multiple categories and still spent the same total amount will also be categorized as “high-value customer”, but this categorization will be missing one important factor), the person spending the same amount of money in different categories will actually have a higher value to the retailer. This is because they will be more loyal to the retailer in the future. Therefore, segmenting customers only according to the total amount spent at a certain time misses customers who are potentially more loyal and are therefore higher valued customers. Due to the reasons above, our premise was that a consumer who buys products from numerous different categories is a more valuable customer, because buying from multiple categories shows loyalty and switching costs are significant when customers buy products from multiple categories in one store; therefore, they may be less likely to visit other stores [12].
Another consideration is the trend in terms of the money spent. A consumer’s worth can be determined by the amount of money they spend. However, the amount spent on each transaction also plays a significant role in assessing a customer’s value. Each purchase may result in an increase in a user’s spending, culminating in a large overall value. Additionally, if we focus exclusively on the amount spent in dollars, a customer who spends a lot on their initial purchase but then spends less on subsequent purchases might also be considered a valuable customer. The value and segmentation of a customer may fluctuate because of an increasing, decreasing, or stable trend.
In our study, K-means clustering was used to create groups based on the actual CLV, DPC, and TAS values. The dataset was separated into five clusters based on the elbow method. Table 7 shows the final cluster centers.
Cluster 1, representing 30% of customers, included those with the highest total amount of spend and second highest distinct product category ratios but with a negative purchase amount trend. These customers are expected to spend significantly more than average as they make purchases from a variety of unique product categories, although their spending will likely decrease over time. Thus, to retain these important customers, multi-category e-commerce enterprises may employ retention-based techniques and strategies that appeal to them.
Cluster 4 represents the majority of customers with close to 45% of the total customers, including those with a moderate amount of spend, lowest degree of different product category purchases, and a stable spending pattern. This is the company’s core group, and numerous methods, such as discounts, should be implemented to ensure that Cluster 4 does not churn. The multi-category e-commerce business must develop a strategy to attract these types of customers by utilizing cross- and upselling methods to boost the specific product category from which each user is purchasing, resulting in a higher average order value. Companies can generate more compelling up- and cross-selling opportunities for targeted customers through further analysis. For the upsell and cross-sell opportunities, companies can use these results and then leverage recommendation systems by using a relatively new method–the latent factor-based approach (LF) [52].
Cluster 5 represents 23% of customers. This set of customers spends less and purchases from different product categories with the highest DPC ratio, but they have the most stable spend trend. With appropriate methods, they can spend more and grow their purchase trend with each subsequent purchase because they are more loyal than other clusters based on the DPC ratio.
Finally, Cluster 2 and Cluster 3 are 2% of the overall customers in total. They have the second and third highest average spend, respectively. Trend values for these two clusters are the highest and lowest. Cluster 2 has the highest increasing trend and shows a low amount at the first purchase and then a significant increase in the respective purchases. On the contrary, Cluster 3 has the highest decreasing trend, which shows a high amount at the first purchase and then an important decline in the consecutive purchases. These two groups of customers may be more expensive to retain than Clusters 1, 4, and 5; thus, multi-category e-commerce businesses must conduct a cost-benefit analysis of these customers. They may wish to assign resources to Clusters 1, 4, and 5 rather than to these two groups (Cluster 2 and Cluster 3).
The results reported in this ectionn demonstrate that the multi-output DNN model consistently outperformed the single-output DNN model, multi-output DT model, and multi-output RF model across a wide variety of evaluation metrics, and hence is suitable and reliable for multi-category e-commerce firms. Furthermore, segmentation based on the outcomes of the multi-output DNN model can provide a useful guide for multi-category e-commerce businesses.

4.2. Explainability

In this study, we employed DNN models to predict lifetime values and customers segmentation. DNNs frequently outperform other ML algorithms (DNNs). However, due to the complex structure of DNNs, it can be difficult to understand and trust their choices. We employed XAI and Shapley values to describe the DNN model and gain a better understanding of the most important features to consider when forecasting the CLV, DPC, and TAS. We show that our system can grasp consumer value disparities and their impact on future value. However, future practitioners must understand the data necessary to construct such models. Consequently, we examined the variable importance of DNN models with multiple and single outputs.
The SHAP feature importance graphs for the CLV output of the multi-output and single-output DNN model are shown in Figure 4. Although both models predicted the same outputs, the important features were different for the multi-output and single-output models. For CLV prediction, RFM variables recency, monetary, and frequency are the most important ones according to multi-output models. On the other hand, the single-output model places a greater emphasis on website behaviors such as time spent on site and number of interactions on the website. Product category and seller information are of greater importance in the multi-output model, whereas these variables are not that important for the single-output model. This demonstrates the importance of collaboration between the different outputs.
As presented in Appendix A (Figure A1), the total number of previously purchased distinct categories from which customers made purchases (distinctcategory) was critical for the multi-output model for the DPC ratio. On the other hand, website behavior and time-on-site again had higher importance for the single-output model. The discrepancy in the order of importance of website behavior data (e.g., hits, time-on-site) was a somewhat surprising feature. These were more critical features in the single-output model than in the multi-output one. In addition, because multi-category firms have many product categories and sellers, seller information and previously purchased distinct product categories are undoubtedly important for both models, but are also more significant to multi-output models, which shows the power of predicting these features simultaneously. Another indicator of the multi-output model’s ability to predict the features we proposed is that the operating system (osios and osandroid-clients, whether purchased from an app via IOS or Android operating systems) was highly important for the models to predict DPC. This means that apps are an important medium for multi-category companies since people using a company’s mobile application purchase from different categories more and are more loyal to the company [53].
Appendix A, Figure A2, shows the TAS. Although the multi-output algorithm appeared to learn some types of information slightly differently from the single-output model, both models valued similar input features, except the single-output model surprisingly placed the highest importance value on the seller information. Most importantly, the time spent on the company’s website, user interaction, and past trends were the most important features for both models in predicting the trend in a user’s subsequent purchases; that is, whether they would display an increasing, decreasing, or stable spending trend in their subsequent purchases.
Every output had its own feature importance table, as shown in Figure 4, Figure A1 and Figure A2. Overall, this is a good practice and a robust feature that is useful for explaining the model parameters for DNNs, which have been a black box for decades.

5. Discussions and Conclusions

In this study, we developed a new 360° framework for CLV prediction specific to multi-category e-commerce companies so that they can address all aspects of CLV prediction and user segmentation. Providing a solution to this issue may result in greater revenue because companies can focus their attention on certain consumers, for example, by allocating additional marketing resources to them. Customer behavior data from a multi-category e-commerce company was used. Our study was motivated by four components.
The first is that we developed the proposed framework in addition to CLV to anticipate a distinct product category ratio (DPC) and a trend in the amount spent (TAS) as additional outcomes. CLV can be used to predict a company’s most profitable customers; however, this metric alone is insufficient for businesses that sell products across multiple categories. Therefore, we suggested predicting DPC and TAS along with CLV to increase the accuracy of CLV prediction and to segment customers of multi-category e-commerce companies more accurately.
The second component was to choose the best approach for predicting CLV for a multi-category business. We employed a multi-output DNN model that used the same inputs to predict many outputs to obtain predictions for multiple variables. This new approach has not been previously used for CLV prediction. This is a robust approach for companies that aim to construct and maintain ML models more easily, and is a better way to capture the relationships between output attributes.
The third component is the interpretation of the multi-output DNN model results to explain the feature importance details and increase user confidence in DNN models. According to [54], interpretability is a prerequisite for the success of ML and artificial intelligence because, despite the high prediction accuracy, people would like to understand why a certain prediction was made and the rationale behind it.
The final component is to segment customers based on the proposed output features: DPC and TAS along with CLV (rather than using only CLV).
The findings of each phase are stated below, along with a model comparison and possible reasons for their performance.
We compared the performance of the proposed multi-output DNN model with the baseline single-output DNN, multi-output Decision Tree (DT), and multi-output Random Forest (RF) models. First, we employed performance measures–namely MAE, MSE, RMSE, and Spearman coefficients–to evaluate the models and found that the multi-output DNN model outperformed other models for all output variables. The results indicated that the DNN model, which predicted CLV, DPC, and TAS simultaneously, achieved reductions in the RMSE of up to 6%, 70%, and 7%, respectively, compared to separate single-output (CLV, DPC, and TAS) DNN modelling. In particular, DPC values showed significant improvements when predicted together. Additionally, when compared to the multi-output DT and RF algorithms, we achieved 21% and 7% reduction in the RMSE for CLV prediction, respectively. Furthermore, for these metrics, we used the hit ratio to demonstrate the capacity of the model to distinguish high-value customers from others. The multi-output DNN model resulted consistently well in forecasting the hit-ratio measure as well, with a 71% hit-ratio that has a 29% misclassification rate for CLV forecasts. According to the hit-ratio, the other two outcome variables–DPC and TAS–performed somewhat worse, at 64% and 41%, respectively, compared to CLV. Further, to construct an empirically valid and generally applicable model for predicting CLV for multi-category e-commerce companies, we compared the hit-ratio results with those of previous studies. When compared to that in [24,51], the performance of the multi-output DNN model was also found to be highly competitive. With this novel approach, we showed that the two new output features, DPC and TAS, are important metrics that improve the CLV prediction accuracy and must also be considered when focusing on initiatives that will bring in more valuable consumers.
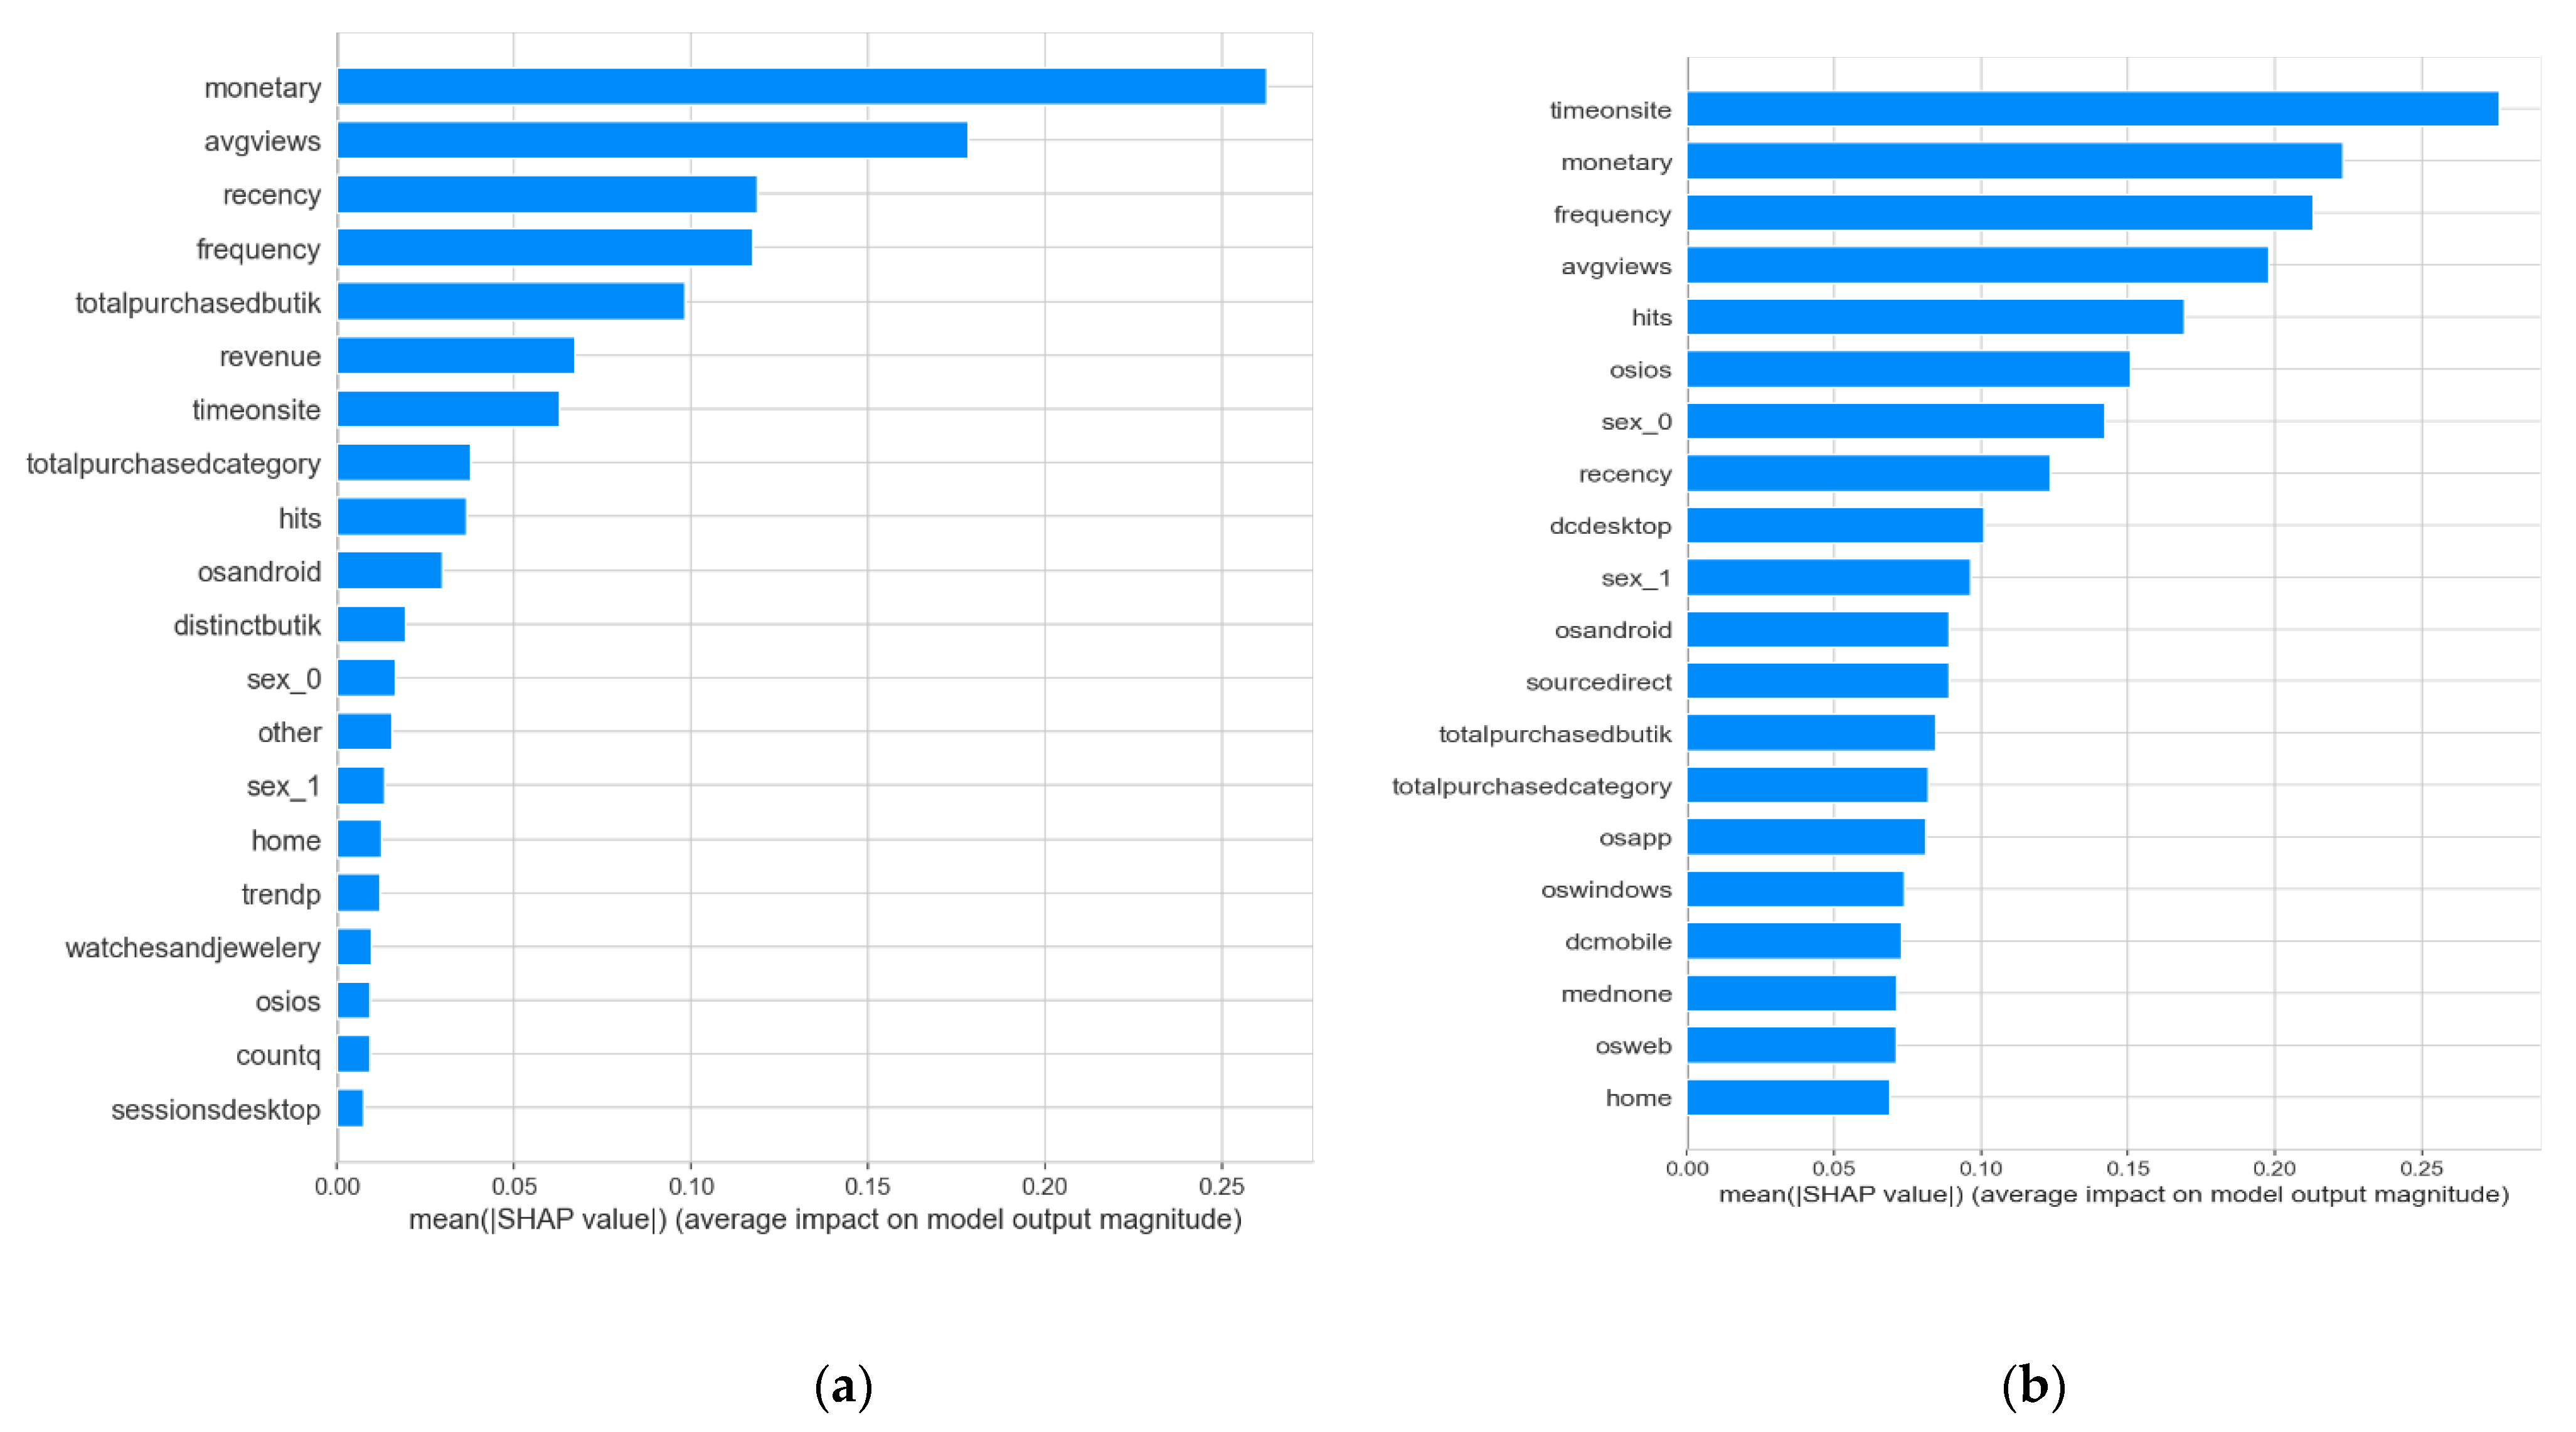
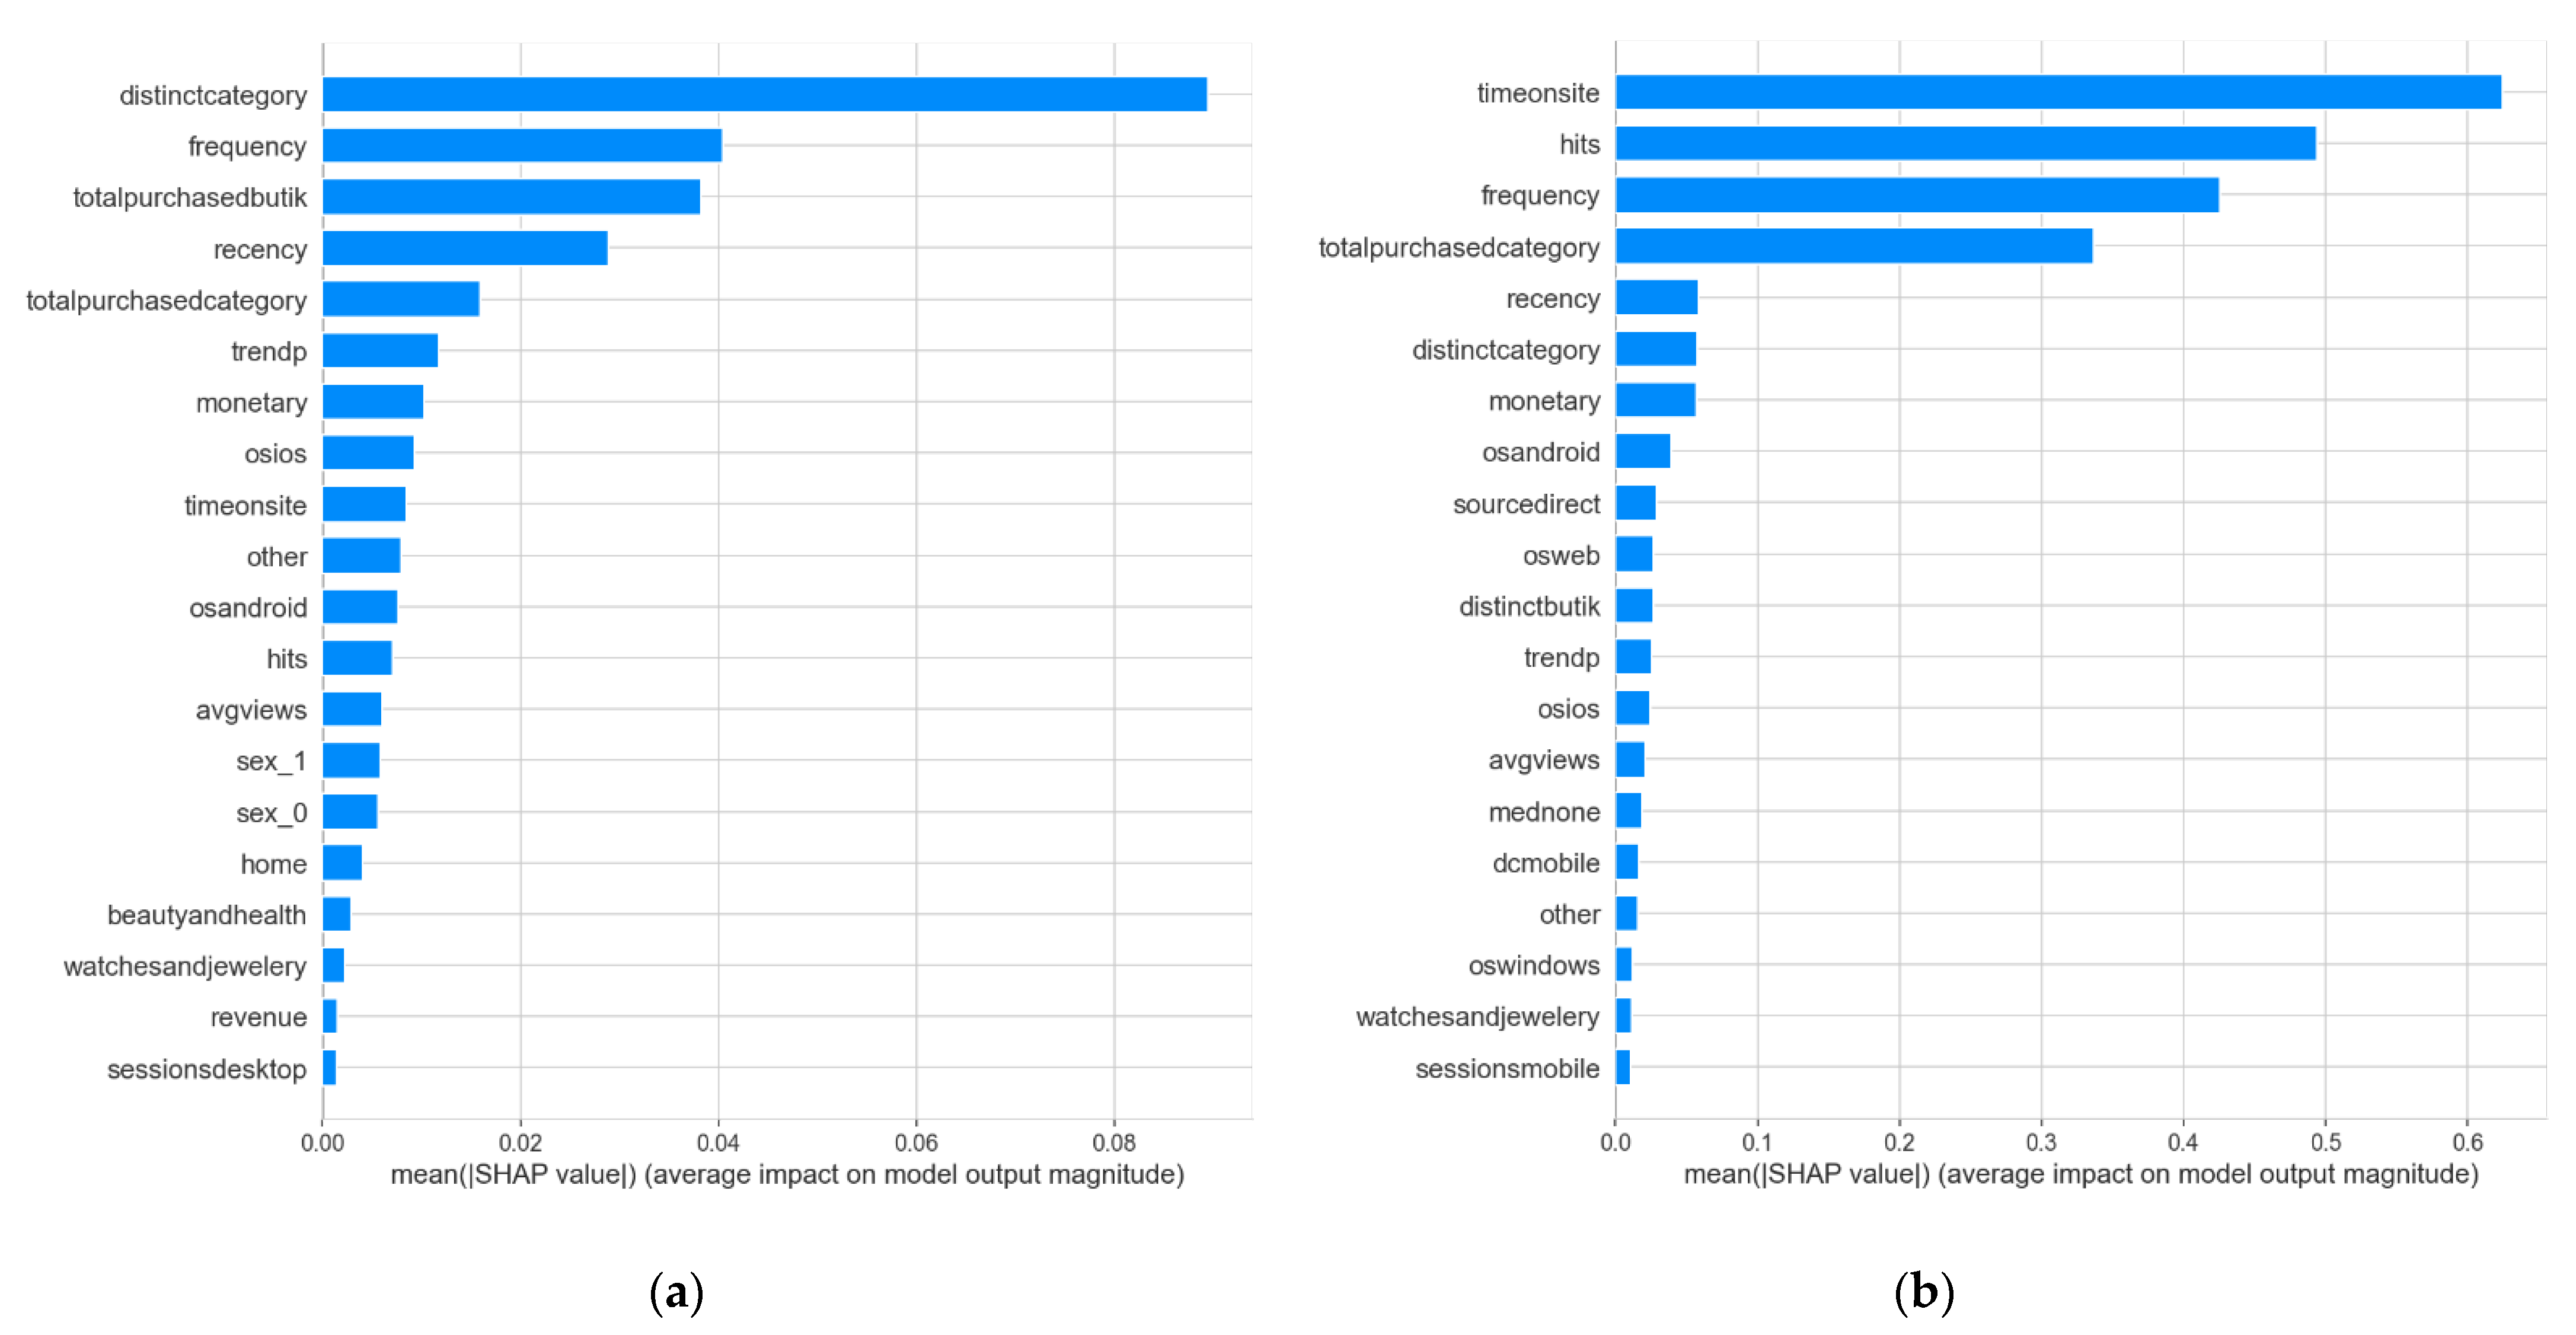
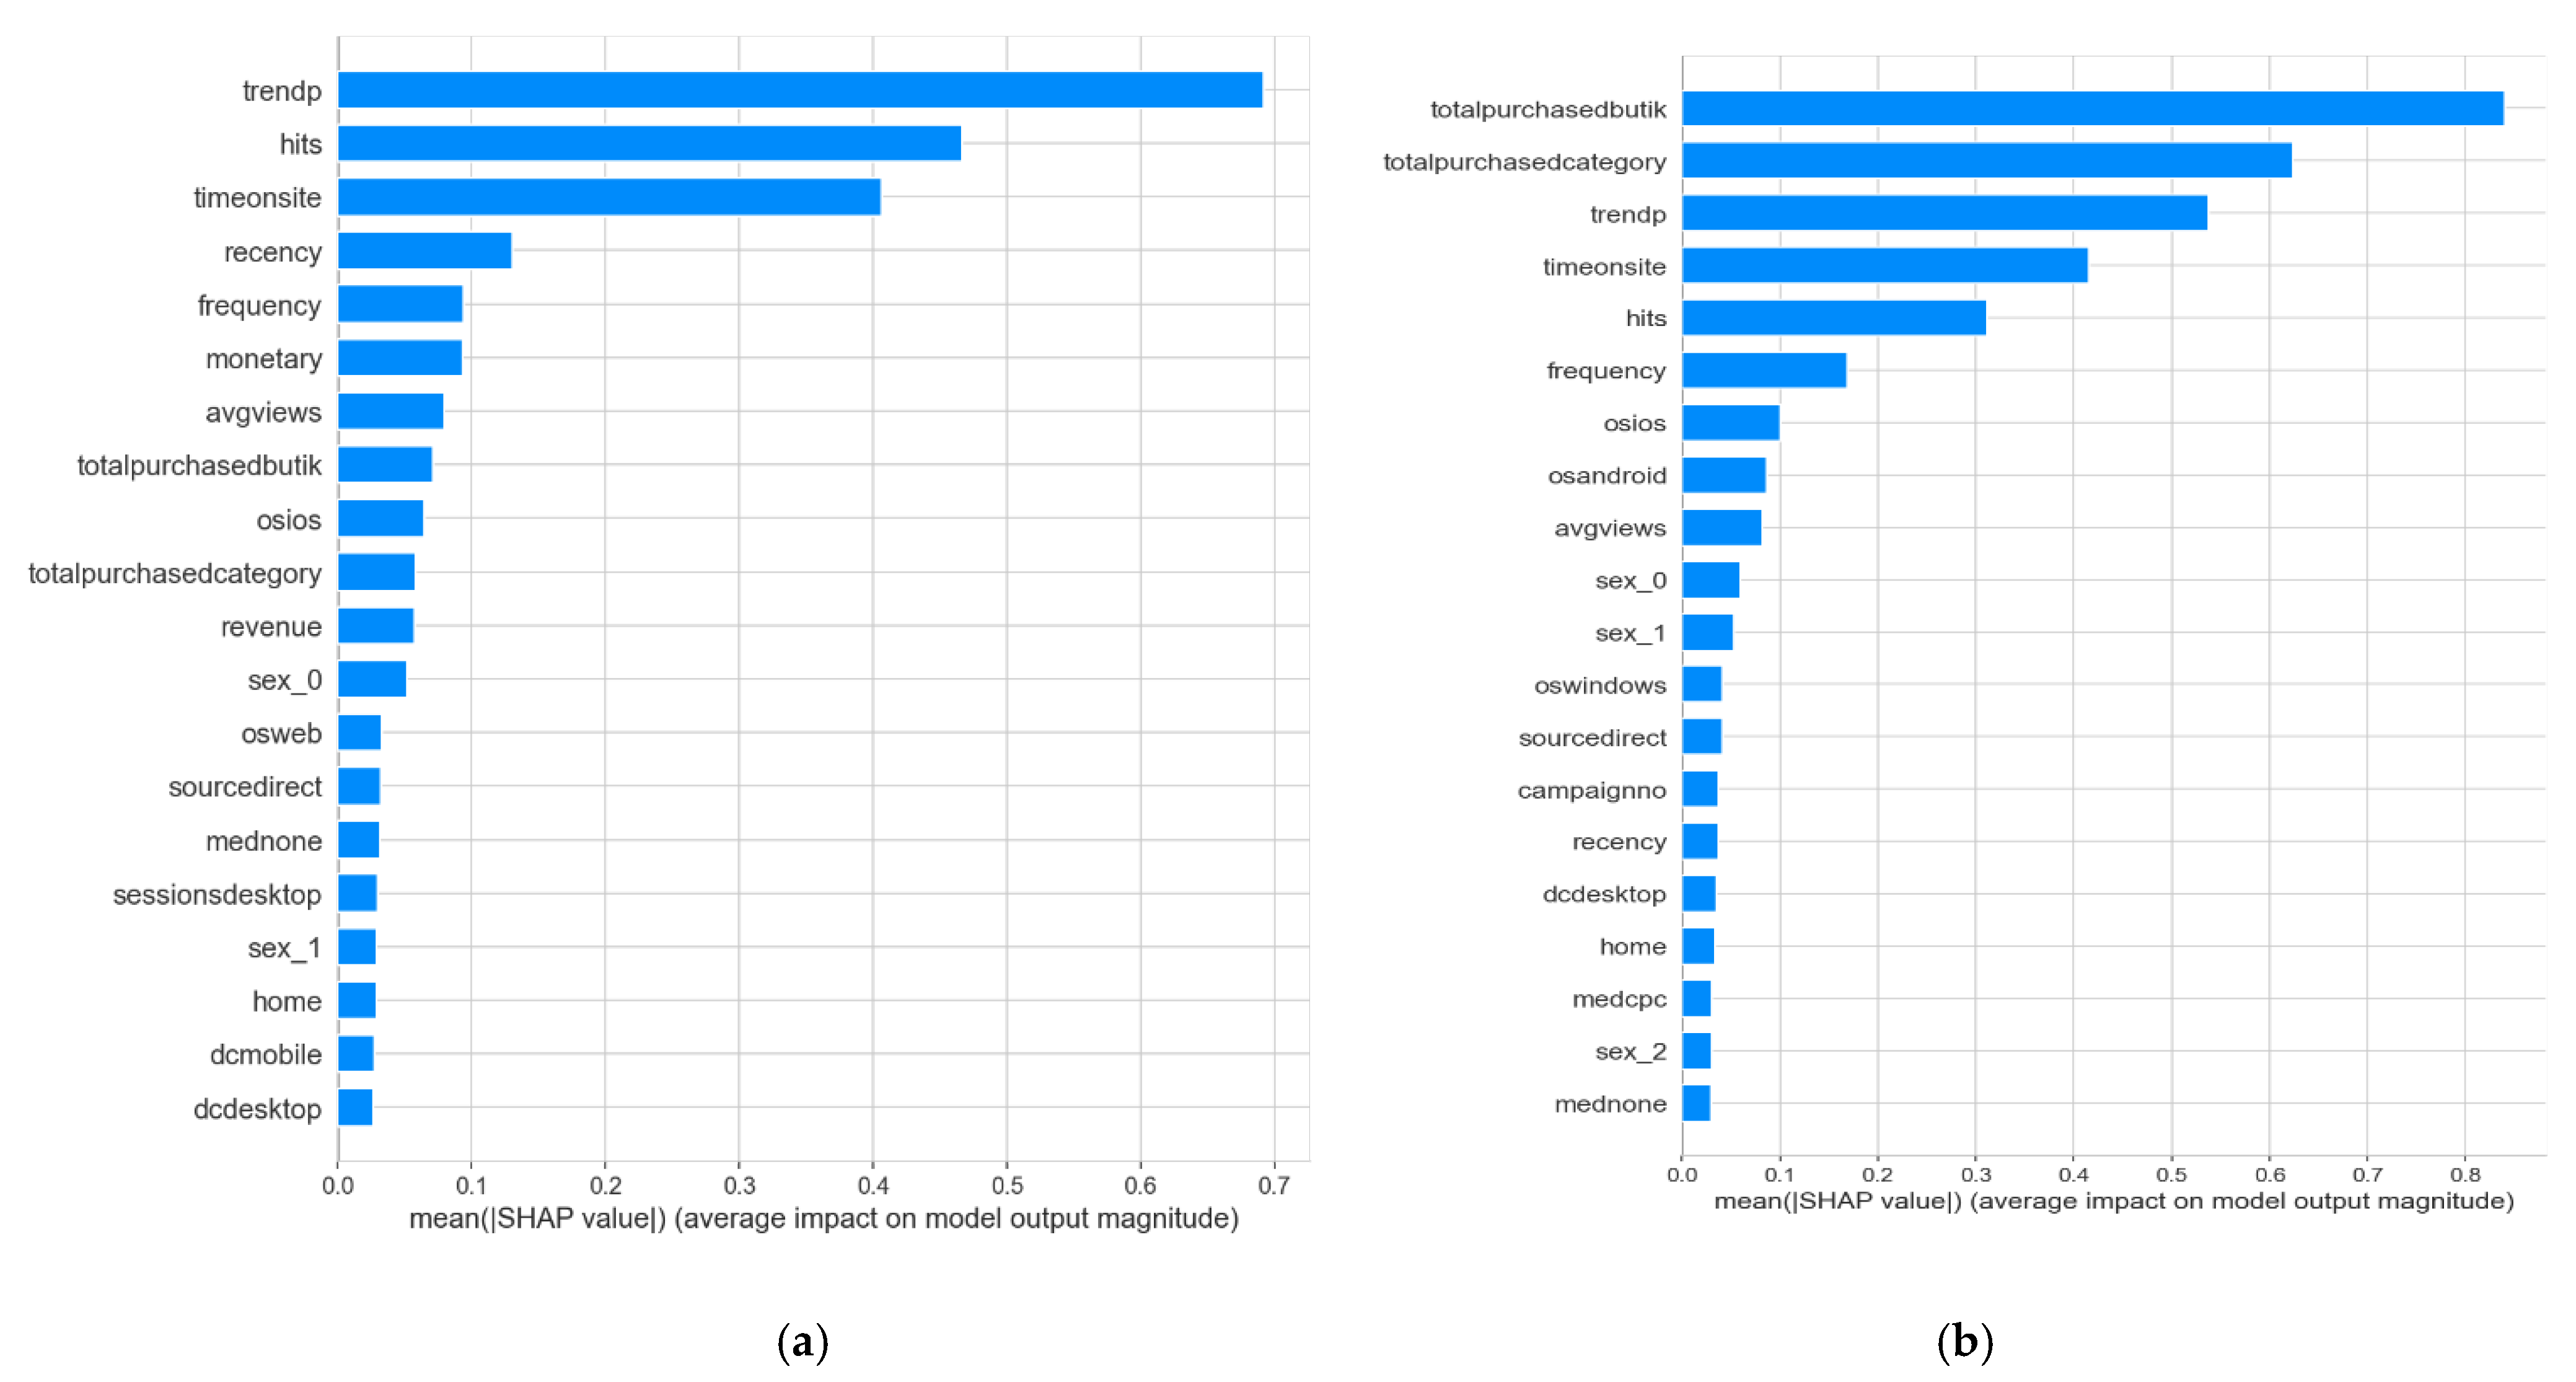
In terms of explainability, we used the Shapley values technique to build feature significance tables, which can provide management with excellent visualization and an emphasis on the key factors. For example, although time spent on the website was significant for each of the outputs, one of the most important aspects for the different categories appeared to be the separate sellers at which clients were shopping. As a result, concentrating on the seller variety might be a key indicator for increasing the number of unique product categories purchased.
Lastly, we showed that the projected outcomes of our multi-output DNN model can be used to segment clients. Our primary conclusion is that each cluster should have separate marketing strategies and be targeted separately. For instance, Cluster 1 clients were forecasted to have a high CLV and a highly distinct product category ratio, but a low spending trend. These clients can be targeted with up- and cross-selling tactics to increase their anticipated spending. Results also showed that customers spend more money while buying from a wider range of product categories. Purchasing from many categories is a form of loyalty and is directly connected with high spending, especially for multi-category e-commerce businesses. Therefore, we recommend that multi-category e-commerce businesses focus not only on CLV but also on product information when segmenting their customers.
Another important finding is that an increasing purchase trend is not always linked to higher spending. Cluster 1 had the lowest trend values, indicating that consumers who spent a large amount of money and bought products from various categories may reduce their spending over time if the management does not devise special strategies for this group. Meanwhile, Cluster 4 showed medium CLV, medium DPC, and a stable trend. These are the most important customers, and management must please them to avoid losing them.

5.1. Managerial Implications

The various uses of customer segmentation based on CLV, DCP, and TAS range from marketing campaign selection to customer service preferences. This entails developing distinct tactics for various groups and deciding whether to include or omit clients from marketing efforts.
As discussed in Section 5, our proposed model has distinct advantages that should be considered by managers when evaluating their key output.
The multi-output strategy achieved outstanding results in the multi-category e-commerce business setting, generating not only CLV but also distinct product categories and spending trends for upcoming purchases. Hence, including CLV drivers and other significant product-related factors is crucial when deploying and implementing CLV models. This is because product-related information functions as a valuable reference for management when establishing cross- and up-selling strategies. This technique is critical for retaining high-value clients and avoiding churn. However, single-output models performed poorly and require the development and maintenance of many models for the same input variables, which is costly and not efficient for the companies.
According to the aforementioned results and comparisons, the multi-output DNN model outperformed both single-output DNN model and multi-output DT and multi-output RF models in all assessment criteria. In addition, it is easy and less costly to manage and maintain one model compared to one separate model for each output. Therefore, the multi-output DNN model can be considered a better option for multi-category e-commerce companies in online shopping.

5.2. Limitations and Future Research

This study has certain limitations. We used a real dataset from a multi-category e-commerce company. Preferably, the research findings should be supported by datasets from other multi-category e-commerce companies. Further, users with one-time purchase records are excluded from our database, and our study is based on users with multiple purchase histories. Hence, we cannot suggest a specific strategy for one-time purchasers. Finally, we used k-means clustering while segmenting customers, but it would be ideal to test and compare several segmentation techniques.
Further research should investigate the theoretical and empirical consequences of using CLV and other attributes in customer-based strategies. Researchers may seek new features for forecasting in addition to the CLV, which will aid in the prediction and segmentation of high-value clients. Additionally, this study covers the prediction of the distinct product category ratio. However, it would be helpful for companies to predict category-based CLV metrics and integrate this information into their strategies so that they know which specific product category should be cross-sold to each segment.
Our findings are based on the examination of a real multi-category online e-commerce store dataset and a comparison of different CLV calculation methods, among other types of information. As a follow-up to the current research, multi-category companies from other industries should be investigated. Finally, due to their strong performance in this study, similar empirical evaluations of alternative multi-output DNN models are also recommended as a future research direction.

Author Contributions

Conceptualization and methodology G.Y.B., B.B. and S.M.; data curation and analysis, G.Y.B.; visualization, G.Y.B.; supervision, B.B. and S.M.: writing—original draft, G.Y.B.; writing—review and editing, G.Y.B., B.B. and S.M. All authors have read and agreed to the published version of the manuscript.

Funding

This research received no external funding.

Institutional Review Board Statement

Not applicable.

Informed Consent Statement

Not applicable.

Data Availability Statement

The sample of the data presented in this study are available upon request from the corresponding author. The data are not publicly available due to a Non-Disclosure Agreement.

Conflicts of Interest

The authors declare no conflict of interest.

Appendix A

Table A1. Features extracted from the dataset.
Field NameTypeDescription
totalRevenueFLOATTotal transaction revenue.
sessionsDirectINTEGERTrue if the source of the session was direct (meaning the user typed the name of the website URL into the browser or came to the site via a bookmark).
sessionsMobileINTEGERThe type of device (mobile).
sessionsDesktopINTEGERThe type of device (desktop).
sessionsTabletINTEGERThe type of device (tablet).
sourceSTRINGThe source of the traffic source. Could be the name of the search engine, the referring hostname, or a value of the utm_source URL parameter. Three new features generated from the source feature after preprocessing: sourceother, sourcegoogle, sourcedirect.
mediumSTRINGThe medium of the traffic source. Could be “organic”, “cpc”, “referral”, or the value of the utm_medium URL parameter. Six new features generated from the medium feature after preprocessing: medorganic, mednone, medretargeting, medreferral, medcpc, medother.
campaignSTRINGThe campaign value. Usually set by the utm_campaign URL parameter. Two new features generated from the campaign feature after preprocessing: campaignyes, campaignno.
browserSTRINGThe browser used (e.g., “Chrome” or “Firefox”).
operatingSystemSTRINGThe operating system of the device (e.g., “Macintosh” or “Windows”). Five new features generated from the operatingSyste, feature after preprocessing: osios, osandroid, oswindows, osmacintosh, osother
mobileDeviceSTRINGThe brand or manufacturer of the device.
deviceCategorySTRINGThe category of the device. Three new features generated from the deviceCategory feature after preprocessing: osMobile, osDesktop, osTablet.
countrySTRINGThe country from which sessions originated, based on IP address.
productCategorySTRINGThe name of the product category purchased. Ten new features generated from the productCategory feature after preprocessing: clothing, kidsandbaby, home, grocery, beautyandhealth, shoesandbacgs, watchesandjewelery, electronics, sportsandoutdoor, other.
productBrandSTRINGThe brand associated with the product.
productPriceSTRINGThe price of the product, expressed as the value passed to Analytics.
dataSourceSTRINGWeb or app. Two new features generated from the source feature after preprocessing: dsapp, dsweb.
TransactionsSTRINGTotal number of e-commerce transactions within the session.
hitsINTEGERTotal number of specific interactions between a user and your website within the session.
timeOnSiteINTEGERTotal time of the session, expressed in seconds.
sessionsINTEGERThe number of sessions. This value is one for sessions with interaction events. The value is null if there are no interaction events in the session.
boutiqueSTRINGSeller that sells products under the multi category e-commerce company. Nine new features generated from the boutique feature after preprocessing: isapparel, iselectronics, ismulti, isfurnitureandhome, isaccesories, issupermarket, isshoesandbags, iscosmetics, issportsandoutdoor, isother.
totalboutiquepurchased INTEGERTotal number of distinct boutiques from which clients purchased.
distinctProductCategoryINTEGERTotal number of distinct product categories from which clients purchased.
trendINTEGERTrend in amount spent with each successive purchase.
recencyINTEGERThe number of days between the customer’s most recent purchase and the end of the observation period.
frequencyINTEGERThe overall number of repeat purchases over the observation period.
monetaryINTEGERThe mean purchase value.
avgViewsINTEGERAverage number of pageviews.
SexINTEGERFemale—0, Male—1, Other—2.
countqINTEGERNumber of products purchased
revenueFLOATFirst purchase revenue.
Figure A1. Feature importance levels defined by average SHAP values for Distinct Product Category (DPC). (a) Multi-output model DPC SHAP values, (b) single-output model DPC SHAP values.
Information 13 00373 g0a1
Figure A2. Feature importance levels defined by average SHAP values trend in amount spent (TAS) (a) Multi-output model TAS SHAP values, (b) single-output model DPC TAS values.
Information 13 00373 g0a2

References

  1. Jiang, L.A.; Yang, Z.; Jun, M. Measuring Consumer Perceptions of Online Shopping Convenience. J. Serv. Manag. 2013, 24, 191–214. [Google Scholar] [CrossRef]
  2. Kumar, V.; Reinartz, W. Creating enduring customer value. J. Mark. 2016, 80, 36–68. [Google Scholar] [CrossRef]
  3. Kumar, V. Customer lifetime value. In Handbook of Marketing Research; Sage Publications: Thousand Oaks, CA, USA, 2006; pp. 602–627. [Google Scholar]
  4. Zhang, Y.; Bradlow, E.T.; Small, D.S. Predicting customer value using clumpiness: From RFM to RFMC. Mark. Sci. 2015, 34, 195–208. [Google Scholar] [CrossRef] [Green Version]
  5. Kotler, P.; Keller, K.L. Marketing Management, 15th ed.; Prentice Hall: Hoboken, NJ, USA, 2015. [Google Scholar]
  6. Ryals, L.; Knox, S. Measuring and managing customer relationship risk in business markets. Ind. Mark. Manag. 2007, 36, 823–833. [Google Scholar] [CrossRef] [Green Version]
  7. Kim, S.Y.; Jung, T.S.; Suh, E.H.; Hwang, H.S. Customer segmentation and strategy development based on customer lifetime value: A case study. Expert Syst. Appl. 2006, 31, 101–107. [Google Scholar] [CrossRef]
  8. Jasek, P.; Vrana, L.; Sperkova, L.; Smutny, Z.; Kobulsky, M. Modeling and Application of Customer Lifetime Value in Online Retail. Informatics 2018, 5, 2. [Google Scholar] [CrossRef] [Green Version]
  9. Heldt, R.; Silveira, C.S.; Luce, F.B. Predicting customer value per product: From RFM to RFM/P. J. Bus. Res. 2021, 127, 444–453. [Google Scholar] [CrossRef]
  10. Leone, R.P.; Rao, V.R.; Keller, K.L.; Luo, A.M.; McAlister, L.; Srivastava, R. Linking brand equity to customer equity. J. Serv. Res. 2006, 9, 125–138. [Google Scholar] [CrossRef] [Green Version]
  11. Villanueva, J.; Hanssens, D.M. Customer equity: Measurement, management and research opportunities. Found. Trends Mark. 2007, 1, 1–95. [Google Scholar] [CrossRef] [Green Version]
  12. González-Benito, Ó.; Martos-Partal, M. Role of retailer positioning and product category on the relationship between store brand consumption and store loyalty. J. Retail. 2012, 88, 236–249. [Google Scholar] [CrossRef]
  13. Kumar, V.; Ramani, G.; Bohling, T. Customer lifetime value approaches and best practice applications. J. Interact. Mark. 2004, 18, 60–72. [Google Scholar] [CrossRef]
  14. Kumar, V.; Reinartz, W. Applications of CRM in B2B and B2C Scenarios Part II. In Springer Texts in Business and Economics; Customer Relationship Management, Ed.; Springer: Berlin/Heidelberg, Germany, 2018. [Google Scholar] [CrossRef]
  15. Morrison, D.G.; David, C.S. Generalizing the NBD model for customer purchases: What are the implications and is it worth the effort? J. Bus. Econ. Stat. 1988, 6, 145–159. [Google Scholar] [CrossRef]
  16. Schmittlein, D.C.; Morrison, D.G.; Colombo, R. Counting your customers: Who are they and what will they do next? Manag. Sci. 1987, 33, 1–24. [Google Scholar] [CrossRef]
  17. Fader, P.S.; Hardie, B.G.S.; Lee, K.L. “Counting your customers” the easy way: An alternative to the pareto/NBD model. Mark. Sci. 2005, 24, 275–284. [Google Scholar] [CrossRef] [Green Version]
  18. Fader, P.S.; Hardie, B.G.S.; Lee, K.L. RFM and CLV: Using iso-value curves for customer base analysis. J. Mark. Res. 2005, 42, 415–430. [Google Scholar] [CrossRef]
  19. Fader, P.S.; Hardie, B.G.S.; Shang, J. Customer-base analysis in a discrete-time noncontractual setting. Mark. Sci. 2010, 29, 1086–1108. [Google Scholar] [CrossRef] [Green Version]
  20. Vanderveld, A.; Pandey, A.; Han, A.; Parekh, R. An engagement-based customer lifetime value system for e-commerce. In Proceedings of the 22nd ACM SIGKDD International Conference on Knowledge Discovery and Data Mining, New York, NY, USA, 13–17 August 2016; pp. 293–302. [Google Scholar]
  21. Chamberlain, B.P.; Cardoso, A.; Liu, C.B.; Pagliari, R.; Deisenroth, M.P. Customer Lifetime Value Prediction Using Embeddings. In Proceedings of the 23rd ACM SIGKDD International Conference on Knowledge Discovery and Data Mining, New York, NY, USA, 13–17 August 2017; pp. 1753–1762. [Google Scholar]
  22. Wang, X.; Liu, T.; Miao, J. A Deep Probabilistic Model for Customer Lifetime Value Prediction. 2019. Available online: https://arxiv.org/abs/1912.07753 (accessed on 13 May 2022).
  23. Sifa, R.; Runge, J.; Bauckhage, C.; Klapper, D. Customer lifetime value prediction in non-contractual freemium settings: Chasing high-value users using deep neural networks and smote. In Proceedings of the 51st Hawaii International Conference on System Sciences, Hilton Waikoloa Village, HI, USA, 3–6 January 2018. [Google Scholar]
  24. Malthouse, E.C.; Blattberg, R.C. Can we predict customer lifetime value? J. Interact. Mark. 2005, 19, 2–16. [Google Scholar] [CrossRef] [Green Version]
  25. Moro, S.; Cortez, P.; Rita, P. A data-driven approach to predict the success of bank telemarketing. Decis. Support Syst. 2014, 62, 22–31. [Google Scholar] [CrossRef] [Green Version]
  26. Sajjad, M.; Khan, S.U.; Khan, N.; Haq, I.U.; Ullah, A.; Lee, M.Y.; Baik, S.W. Towards efficient building designing: Heating and cooling load prediction via multi-output model. Sensors 2020, 20, 6419. [Google Scholar] [CrossRef] [PubMed]
  27. Lundberg, S.M.; Lee, S.I. A unified approach to interpreting model predictions. In Advances in Neural Information Processing Systems; MIT Press: Cambridge, MA, USA, 2017; pp. 4765–4774. [Google Scholar]
  28. Venkatakrishna, M.R.; Mishra, M.P.; Tiwari, M.S.P. Customer Lifetime Value Prediction and Segmentation using Machine Learning. Int. J. Res. Eng. Sci. 2021, 9, 36–48. [Google Scholar]
  29. Shapley, L.S. A value for n-person games. In Contributions to the Theory of Games II, Annals of Mathematics Studies; Kuhn, H.W., Tucker, A.W., Eds.; Princeton University Press: Princeton, NJ, USA, 1953; pp. 307–317. [Google Scholar]
  30. Ribeiro, M.T.; Singh, S.; Guestrin, C. Anchors: High-Precision Model-Agnostic Explanations. In Proceedings of the AAAI Conference on Artificial Intelligence (AAAI), New Orleans, LA, USA, 2–7 February 2018; pp. 1527–1535. [Google Scholar]
  31. Janssens, B.; Bogaert, M.; Bagué, A.; Poel, D.V.D. B2Boost: Instance-dependent profit-driven modelling of B2B churn. Ann. Oper. Res. 2022, 310, 1–27. [Google Scholar] [CrossRef]
  32. Estrella-Ramón, A.; Sánchez-Pérez, M.; Swinnen, G.; VanHoof, K. A model to improve management of banking customers. Ind. Manag. Data Syst. 2017, 117, 250–266. [Google Scholar] [CrossRef] [Green Version]
  33. Bhatti, A.; Akram, H.; Basit, H.M.; Khan, A.U.; Raza, S.M.; Naqvi, M.B. E-commerce trends during COVID-19 Pandemic. Int. J. Future Gener. Commun. Netw. 2020, 13, 1449–1452. [Google Scholar]
  34. Win, T.T.; Bo, K.S. Predicting customer class using customer lifetime value with random forest algorithm. In Proceedings of the 2020 International Conference on Advanced Information Technologies (ICAIT), Yangon, Myanmar, 4–5 November 2020; pp. 236–241. [Google Scholar]
  35. Borle, S.; Singh, S.S.; Jain, D.C. Customer Lifetime Value Measurement. Manag. Sci. 2008, 54, 100–112. [Google Scholar] [CrossRef]
  36. Tsiptsis, K.; Chorianopoulos, A. Data Mining Techniques in CRM: Inside Customer Segmentation; John Wiley and Sons, Ltd.: Hoboken, NJ, USA, 2010. [Google Scholar] [CrossRef]
  37. Berka, P. Dobývánί Znalostί z Databázί; Academia: Praha, Czech Rebublic, 2005; p. 368. [Google Scholar]
  38. Glady, N.; Baesens, B.; Croux, C. A modified Pareto/NBD approach for predicting customer lifetime value. Expert Syst. Appl. 2009, 36, 2062–2071. [Google Scholar] [CrossRef]
  39. Srivastava, N.; Hinton, G.E.; Krizhevsky, A.; Sutskever, I.; Salakhutdinov, R. Dropout: A Simple Way to Prevent Neural Networks from Overfitting. J. Mach. Learn. Res. 2014, 15, 1929–1958. [Google Scholar]
  40. Kim, S.; Choi, D.; Lee, E.; Rhee, W. Churn prediction of mobile and online casual games using play log data. PLoS ONE 2017, 12, e0180735. [Google Scholar] [CrossRef] [PubMed] [Green Version]
  41. Ruder, S. An overview of multi-task learning in deep neural networks. arXiv 2017, arXiv:1706.05098. Available online: https://arxiv.org/pdf/1706.05098.pdf?ref=https://githubhelp.com (accessed on 12 May 2022).
  42. Breiman, L. Random Forests. Mach. Learn. 2001, 45, 5–32. [Google Scholar] [CrossRef] [Green Version]
  43. González, C.; Mira, J.; Ojeda, J. Applying Multi-Output Random Forest Models to Electricity Price Forecast. Preprints 2016, 2016090053. [Google Scholar] [CrossRef] [Green Version]
  44. Wu, J.; Chen, X.-Y.; Zhang, H.; Xiong, L.-D.; Lei, H.; Deng, S.-H. Hyperparameter optimization for machine learning models based on Bayesian optimization. J. Electron. Sci. Technol. 2019, 17, 26–40. [Google Scholar]
  45. Dobslaw, F. A Parameter Tuning Framework for Metaheuristics based on Design of Experiments and Artificial Neural Networks. In Proceedings of the International Conference on Computer Mathematics and Natural Computing, Almería, Spain, 26–30 June 2010. [Google Scholar]
  46. Li, K.; Malik, J. Learning to Optimize Neural Nets. arXiv 2017, arXiv:1703.00441. [Google Scholar]
  47. Kapanova, K.G.; Dimov, I.; Sellier, J.M. A genetic approach to automatic neural network architecture optimization. Springer Neural Comput. Appl. 2018, 29, 1481–1492. [Google Scholar] [CrossRef]
  48. Ulrich, A.; Korn, O. Model Selection in Neural Networks. Neural Netw. 1999, 12, 309–323. [Google Scholar]
  49. Lee, S.; Bae, J.H.; Hong, J.; Yang, D.; Panagos, P.; Borrelli, P.; Yang, J.E.; Kim, J.; Lim, K.J. Estimation of rainfall erosivity factor in Italy and Switzerland using Bayesian optimization-based machine learning models. Catena 2022, 211, 105957. [Google Scholar] [CrossRef]
  50. Donkers, B.; Verhoef, P.C.; de Jong, M.G. Modeling CLV: A test of competing models in the insurance industry. Quant. Mark. Econ. 2007, 5, 163–190. [Google Scholar] [CrossRef] [Green Version]
  51. Chiang, L.L.; Yang, C.S. Does country-of-origin brand personality generate retail customer lifetime value? A Big Data analytics approach. Technol. Forecast. Soc. Chang. 2018, 130, 177–187. [Google Scholar] [CrossRef]
  52. Wu, D.; Shang, M.; Luo, X.; Wang, Z. An L1-and-L2-Norm-Oriented Latent Factor Model for Recommender Systems. IEEE Trans. Neural Netw. Learn. Syst. 2021, 1–14. [Google Scholar] [CrossRef] [PubMed]
  53. Dirsehan, T.; Cankat, E. Role of mobile food-ordering applications in developing restaurants’ brand satisfaction and loyalty in the pandemic period. J. Retail. Consum. Serv. 2021, 62, 102608. [Google Scholar] [CrossRef]
  54. Carvalho, D.V.; Pereira, E.M.; Cardoso, J.S. Machine learning interpretability: A survey on methods and metrics. Electronics 2019, 8, 832. [Google Scholar] [CrossRef] [Green Version]
Figure 1. Steps in the proposed process; CLV-customer lifetime value, DPC-distinct product category, TAS-trend of amount spent.
Information 13 00373 g001
Figure 2. Multi-output model architecture.
Information 13 00373 g002
Figure 3. Decile charts for CLV, DPC, and TAS, respectively (top row: multi-output model, bottom row: single-output model result).
Information 13 00373 g003
Figure 4. Feature importance levels defined by average SHAP values for Customer Lifetime Value (CLV). (a) Multi-output model CLV SHAP values, (b) single-output model CLV SHAP values.
Information 13 00373 g004
Table 1. Optimal hyperparameters and range of hyperparameters for DNN models.
Model Configuration Parameters
Single-Output ModelMulti-Output Model
NameRangeOptimal ValueOptimal Value
CLVDPCTASCLV, DPC, TAS
Batch Size(512, 1024)916948734960
#of Nodes(32, 128)100, 5194, 5072, 36114, 45
Learning Rate(0.1, 0.999)1 × 10−21 × 10−21 × 10−21 × 10−2
Epochs(100, 200)143133148136
OptimizerAdamAdamAdam
Loss FunctionMSEMSEMSE
Table 2. Optimal hyperparameters and range of hyperparameters for multi-output DT.
Model Configuration Parameters
NameRangeOptimal Value
max_depth(3, 30)4
max_feature(0.1, 0.999)0.1
min_samples_leaf(2, 30)3
min_samples_split(3, 40)34
Table 3. Optimal hyperparameters and range of hyperparameters for multi-output RF.
Model Configuration Parameters
NameRangeOptimal Value
max_depth(5, 30)5
max_feature(0.1, 0.999)0.9
min_samples_leaf(2, 30)11
min_samples_split(3, 40)29
N_estimator(10, 100)37
Table 4. Model results based on MAE, MSE, RMSE, and Spearman (Spe).
Model Results
CLVDPCTAS
MAEMSERMSESpeMAEMSERMSESpeMAEMSERMSESpe
Single-Output DNN0.500.440.660.720.310.260.510.321.7612.383.510.33
Multi-Output DNN0.480.390.620.740.110.020.140.631.5110.743.270.39
Multi-Output DT0.560.630.790.630.130.030.170.381.5812.703.560.17
Multi-Output RF0.520.450.670.700.140.030.170.291.5211.093.330.38
Table 5. Hit-ratios (Top 20%) for single-output vs. multi-output model results.
Model Results
CLVDPCTAS
Single-Output DNN0.700.300.28
Multi-Output DNN0.710.640.41
Multi-Output DT0.630.410.28
Multi-Output RF0.680.320.42
Table 6. Hit-ratios (top 20%) for multi-output model, Malthouse and Blattberg’s study [24], and Chian and Yang’s study [51].
Multi-Output DNNMalthouse and Bratterbeg’sChiang and Yang’s
ModelModelModel
Hit-ratio0.710.450.65
Table 7. Cluster results.
Cluster NoCLVDPCTASNumber of Clusters
14386.930.46−0.12412,096–30%
23362.350.3917.2318,280–1%
32647.500.18−19.8312,897–1%
41073.780.300.03612,885–45%
5551.570.61−0.08319,291–23%
Publisher’s Note: MDPI stays neutral with regard to jurisdictional claims in published maps and institutional affiliations.

