Unveiling the Antioxidant Arsenal of Colored Sorghum: A Path to Functional Food Development
by
Kanti Meena
1, 
Dharmendra K. Meena
2,
Jinu Jacob
1,
Chandrasekhar Aruna
1 and
Kurella Bala Rama Saraswati Visarada
1,* 1
ICAR-Indian Institute for Millets Research, Rajendranagar, Hyderabad 500030, India
2
ICAR-Central Inland Fisheries Research Institute, Barrackpore, Kolkata 700120, India
*
Author to whom correspondence should be addressed.
Agriculture 2024, 14(4), 566; https://doi.org/10.3390/agriculture14040566
Submission received: 22 January 2024
/
Revised: 3 March 2024
/
Accepted: 26 March 2024
/
Published: 2 April 2024
(This article belongs to the Section Agricultural Product Quality and Safety)
Abstract
:This study investigates the antioxidant potential of over 20 sorghum genotypes, spanning popular lines, inter-specific hybrids, and inter-generic crosses. Parameters such as free radical scavenging, flavonoid and phenolic content, and nitrous oxide (NO) neutralization were meticulously assessed. Leading the pack, ISC2020-C and SPV2612 demonstrated exceptional DPPH and ABTS radical scavenging, highlighting their prowess against oxidative stress. ISC812-C stood out for its highest total phenolic content, linking phenolic abundance to overall antioxidant strength. Positive correlations between NO scavenging, DPPH, ABTS, and total phenolic content emphasized the synergistic role of bioactive components in colored sorghum grains. Principal Component Analysis (PCA) revealed distinct patterns, with ISC202-C, ISC812-W, 27B, and SPV2612 displaying potent antioxidant profiles. UPGMA analysis of solvent extracts unveiled clusters, hinting at untapped diversity in inter-specific and inter-generic crosses. ISC304-C shared similarities with SM2288-G, while ISC812-C formed a unique cluster, suggesting unexplored bioactive profiles. In conclusion, this exploration showcases colored sorghum grains as rich sources of bioactive antioxidants. Utilizing inter-specific and inter-generic hybridization strategies can enhance sorghum’s nutritional value, fostering the development of safe and functional food products. The research sets the stage for optimizing sorghum breeding and processing techniques, maximizing antioxidant potential for practical applications in human health and food security.
1. Introduction
Sorghum (Sorghum bicolor (L.) Moench) is a drought-tolerant, nutrient-rich cereal crop endowed with high phytochemical content [1]. In terms of global production and consumption, sorghum stands in the fifth position, with a total world production 60,384 (1000 MT) [2], after rice, wheat, barley, and maize. Because of its adaptability to a wide range of environments and simplicity of cultivation, it is a potential source of human nourishment and a staple food for poor people living in semi-arid regions of the world. It is also being used as a ration for livestock and is linked to industries known to provide many health benefits, such as antioxidant, anti-diabetic, anti-inflammatory, anti-proliferative, and other health-beneficial activities. It is typically cultivated in Asian and African countries, where rainfall is low and other food crops cannot be cultivated. Nutritionally, it is identified as an important source of vitamin B, fiber, starch, proteins, vitamin E, bioactive components, minerals, policosanols, and a valuable source of phytosterols [3,4,5]. It is a gluten-free cereal [6], and increasing demand for gluten-free starch made sorghum bloom in the gluten-free markets [7]. It could be used to produce beverages analogs to milk, with health potential benefits [8]. It is promoted as an alternative to cereals like barley, wheat, and rye for human consumption, especially for celiac patients.
Generally, white sorghum is preferred for food purposes rather than colored grains; however, colored grains are rich in polyphenols and are preferred for their antioxidant activity [9]. The structure of sorghum grain is composed of the pericarp (outermost layer), testa, endosperm, and germ (innermost). Pigmentation in the pericarp gives different colors (red, brown, black, yellow) to the grain, and hence they are treated as colored seeds, whereas in white grains, the pericarp is non-pigmented (white). It is the pericarp that mainly contains bioactive antioxidant compounds [10], and a wide range of compounds, including phenolic acids, flavonoids, and condensed tannins, have been found in sorghum grain [11,12].
Sorghum is rich in proanthocyanidins, not detected in other cereal crops like corn, rice, and wheat [13]. Other bioactive compounds include polyphenols such as phenolic acids (ferulic, tannic, and p-coumaric acids), flavonoids (luteolin, apigenin, catechin gallate, epigallocatechin gallate, and 3-Deoxyanthocyanidins) [14,15], and tannins [16]. Phenolic acids and flavonoids are the most diverse kinds of natural antioxidants found in plants and are generally safe to take as dietary supplements [17]. It is well known that these compounds play an important role in protecting plants from diseases. They also contribute to antifungal, antibacterial, and antiviral properties [18].
Numerous studies have connected plant polyphenol components to a plant-based diets’ ability to prevent sickness [19], and the overproduction of reactive oxygen species (ROS) via metabolic processes and other means has been related to a variety of degenerative disorders, such as diabetes, cardiovascular disease, Alzheimer’s disease, and aging. The ability of antioxidants to scavenge free radicals confers therapeutic effects (anti-inflammatory, anti-viral, immunomodulatory, and anti-cancer) through a number of mechanisms [20].
The benefits of sorghum bioactive compounds make sorghum grain occupy a space in the pharma industry, as they are associated with reducing the risk of important diseases like obesity [21], the inhibition of cell growth [22], etc. Several studies on sorghum to promote human health are in the pipeline, and the effect of sorghum extracts on diseases such as obesity, cardiovascular disease, hypertension, and dyslipidemia and on the growth inhibition of cancer cells proves that sorghum has great potential in promoting health [23,24,25,26,27,28]. The presence of these beneficial bioactive compounds may explain their substantial LDL-inhibitory [29], antioxidant, and antibacterial capabilities.
There is a rising interest in understanding the active molecules in plants that can act as natural antioxidants and help preserve food, without damaging human health or the environment. A wide range of synthetic antioxidant compounds like butylated hydroxyanisole (BHA) and butylated hydroxytoluene (BHT) are reported to be carcinogenic [30,31] and hence have only been employed in a few cases [32]. Screening natural antioxidants from plant sources needs to be undertaken in a more efficient way, In India, only the white and yellow grains of sorghum are used as food, though interspecific and intergeneric crosses in sorghum with a range of colored lines with a good yield are being developed [33,34].
The current study evaluates the antioxidant capacity, free radical-scavenging potential, and total flavonoid and total phenolic content of sorghum lines of diverse origins, including elite lines, germplasm, intergeneric, and interspecific derivatives, and their suitability for different end-uses. It provides a greater understanding of the role of sorghum grain in human nutrition and health, as well as in industrial use, and the latent potential to make sorghum more profitable for farmers in arid and semi-arid regions throughout the world.
2. Material and Methods
2.1. Collection of Sorghum Lines and Seed Characteristics
In the present study, 22 sorghum lines varying in color were selected, with different genetic backgrounds comprising germplasm lines, cultivated lines, and improved derivatives from interspecific and intergeneric crosses (Figure 1). Details of the sorghum lines used in the present study are represented (Table 1). The crop was raised on the research farm at ICAR–Indian Institute of Millet Research (ICAR-IIMR), Rajendranagar, Hyderabad, India.
2.2. Extraction of Plant Material
Seeds of the selected genotypes were collected from a crop grown in the post-rainy season to obtain dry and clean seeds. Grain was harvested from field experimental plots at ICAR-IIMR, Hyderabad. It was dried and threshed to remove glumes and rachis. The seeds were thoroughly washed under tap water to remove undesired debris and dirt and sun-dried until all moisture was removed (72 h). Dried seeds were then blended in a mixer and sieved through a 50-micron sieve, and the coarse components were ground again into a fine powder.
About 50 g of the fine powder from each sample was immersed in a 1:5 (seed powder/solvent) ratio in four different solvents, hexane, dichloromethane, acetone, and methanol, in a serial fashion. Initially, the samples were incubated in hexane for 36 h at 36 °C in a shaking incubator to remove the oily components, before being serially kept in other solvents (24 h), beginning with one polar aprotic (dichloromethane and acetone) and finishing with one polar protic (methanol) solvent. The extracts were centrifuged for 5 min at 8000 rpm in a ReMi R-24 (ReMi, Mumbai, India) to settle down the coarse particles. The supernatant was separated and strained through filter paper using Whatman No.1 (40), and the residue was kept overnight in the same solvent. The same process was followed with other solvents. The supernatant was vacuum-dried in a rotary evaporator to a final volume of 1/10 of its initial volume. Figure 2 shows a graphical representation of the extraction of material in different sorghum lines. The extracts were air-dried at room temperature, before being stored at 4 °C until use. The color of the solvent after extraction was recorded visually.
Preliminary Phytochemical Screening
Initially, a 0.5% stock concentration of each solvent extract was generated, by taking 0.5 g of solvent extract and dissolving it in 100 mL of the solvent of choice (methanol) to characterize tannins, alkaloids, steroids, flavonoids, and other phytochemicals qualitatively using conventional procedures published by Sofowora [35] and Trease and Evans [36].
For the presence of alkaloids, about 5 mL of extract was mixed with 2 mM HCl and 1 mL of Dragendroff’s reagent, and the development of orange or red precipitate indicated the presence of alkaloids in the sample. The flavonoids in the sample were detected by adding a few drops (4–5) of dilute sodium hydroxide to 1 mL of extract. The presence of flavonoids was suggested by the strong yellow color of the extract, which turned colorless following the addition of a few drops (5–6) of dilute acid. To test tannin by ferric chloride, 5 mL of extract was mixed with 1 mL of a 5% ferric chloride solution. The development of a blackish-green color indicated the presence of tannin in the sample. To detect the presence of steroids in the sample, about 1 mL of chloroform was used to dissolve one mL of extract, and the test tube was filled with an equivalent quantity of concentrated sulfuric acid. The green layer of sulfuric acid and the red layer of chloroform at the top indicated that steroids were present in the sample.
2.3. Quantification of TPC and TFC in Sorghum Lines
2.3.1. Total Phenolic Content Determination (TPC)
To identify the total phenolic content in each sorghum line, a modified Folin–Ciocalteu reagent method was used [37]. About 10 µL of seed extract from the stock (0.5 mg mL−1) was mixed with 1.5 mL reagent (Folin–Ciocalteu) and 5.5 mL of triple-distilled water in test tubes, and the experiment was repeated thrice. The initial reaction was set up and incubated at room temperature (RT) in the dark for 30 min. Thereafter, 1.0 mL of 1 M sodium carbonate was added to the reaction mixture and kept for 20 min at 40 °C in a water bath, with intermittent agitation for 1 h. Then the absorbance for each seed extract was measured at 760 nm using an EpochTM2 Microplate Spectrophotometer, Biotek, New Castle, DE, USA. Blank and control were taken to calibrate the spectrophotometer at zero. Gallic acid (1 mg mL−1) was used as a standard to assess the TPC of the solvent extracts (25–1250 µg mL−1). The TPC was expressed as the gallic acid equivalent μg mL−1 (GAE) of the dry extract.
2.3.2. Total Flavonoids Content (TFC)
The TFC in each seed extract was calculated by applying the aluminum chloride (AlCl3) method with slight adjustments [38]. About 10 µL of the sample concentration was drawn out of the stock of extracts (500 µg mL−1), kept in triplicate in a test tube having 200 µL DW and 150 µL NaNO2, and incubated for 10 min in the dark at room temperature. After 10 min, 200 µL of 10% AlCl3 was added and kept at RT for another 10 min in a dark place. To this reaction mixture, 2 mL of 4% NaOH was added to make the volume 5 mL, which was kept for 20 min at RT in a dark place. The appearance of a pink color in the sample after 20 min indicated the presence of flavonoids. The OD at 510 nm was taken in a spectrophotometer, and about 1 mg mL−1 Quercetin was used as the standard to estimate the total flavonoid content in the samples, and the total content was represented as µg mL−1 Quercetin equivalents (QEs).
2.4. Antioxidant Activity (Free Radical-Scavenging Activity)
2.4.1. DPPH Assay
Free radical-scavenging activity in each sorghum extract was assessed by a DPPH radical-scavenging assay by a slightly modified method [39]. The decolorization of a 2,2-diphenyl-1-picrylhydrazyl solution in methanol was used to gauge the plant extractives’ capacity to donate hydrogen atoms (DPPH). When DPPH is dissolved in methanol, it gives a violet or purple tint that, when present with antioxidants, fades to varying degrees of yellow. About 10 µL of each stock concentration (500 µg mL−1 of extracts) was taken into test tubes in triplicate, and to this, 1 mL of newly prepared reagent DPPH (1 mg mL−1 in methanol) was added. The volume was made up to 5 mL by adding distilled water (DW), and the test tubes were kept for 30 min at RT in a dark environment, and the absorbance was taken at 536 nm in the spectrophotometer, and methanol was used as blank. Ascorbic acid was used as a reference, and by using the equation below, the inhibition percentage for each line was determined.
Inhibition (%) = (A0 − A1/A0) × 100
A0: absorbance of control; A1: absorbance of test material.
2.4.2. ABTS (2,2′-Azino-Bis (3-Ethylbenzothiazoline-6-Sulfonic Acid) Assay
The ABTS was measured using a standard procedure with slight modifications [40]. Briefly, 10 µL of each stock concentration of extracts (500 µg mL−1) was taken in triplicate, to which 3 mL of ABTS (this oxidation mixture is prepared by mixing 7.0 mM ABTS and 2.44 mM Potassium persulfate in a 1:1 ratio) was added and stored in the dark for about 12–16 h at room temperature before use. The volume was made up to 5 mL by adding methanol, and the test tube was held at RT for 30 min before measuring the absorbance at 734 nm. Trolox was used as a standard, and the inhibition percentage was computed with the below-mentioned formula. The results were expressed as Trolox equivalents (TEs) per gram dry weight (mol TE g DW).
Inhibition (%) = (A0 − A1/A0) × 100
A0: absorbance of control; A1: absorbance of test material.
2.4.3. Nitrous Oxide-Scavenging Activity
The scavenging activity of nitrous oxide was measured using the Griess IlIosvoy reaction [41]. Sodium nitroprusside (10 mM) in phosphate-buffered saline was added in different proportions of extract and placed at 30 °C for 2 h. A sample volume of 10 µL from each concentration was taken in three marked concentrations, in phosphate-buffered saline, sodium nitroprusside (10 mM), and mixed with samples. In this mixture, 10–20 µL of newly prepared Griess reagent (composition: 0.1% naphthylethylene diamine dihydrochloride in 2.5% phosphoric acid and 1% sulphanilamide in 2.5% phosphoric acid) was mixed with the sample and, after 1 h absorbance, was deliberated at 546 nm. Gallic acid was taken as standard. The NO-scavenging percentage was measured by the below-mentioned formula.
Inhibition (%) = (A0 − A1/A0) × 100
A0: absorbance of control; A1: absorbance of test material.
2.5. In Vitro Antioxidant Potential
Ferrous-Reducing Antioxidant Potential (FRAP)
Ferrous-Reducing Antioxidant Potential (FRAP) was measured following the standard method [42] with a slight modification. About 10 µL of each stock concentration of extracts was added into the test tube in triplicate. To this, 1.5 mL of FRAP reagent (10:1:1 of 300 mM sodium acetate buffer/20 mM FeCl3/freshly prepared TPTZ in 40 mM HCl) was added and adjusted to a final volume of 5 mL by distilled water. Similarly, a standard (ascorbic acid) was set up in triplicate with various concentrations (25–1250 µg mL−1), and a blank without a sample was used as the standard. This reaction mixture was allowed to stand for 30 min in a dark room at room temperature. The absorbance at 593 nm was measured, and the FRAP was estimated and expressed as µM Fe II/g of extracts.
2.6. Statistical Analysis
Data were obtained in triplicate and are reported as the mean ± standard deviation. Analysis was performed using SPSS v.16 and Microsoft Excel v.2016. Images were edited in Paint 3D of V.16. The Pearson correlation coefficient, principal component analysis, and hierarchical cluster analysis (HCA) dendrogram, created by setting the bootstrap value as 100 to quantify the distance between the sorghum lines, were accomplished in PAST v.4.09.
3. Results
3.1. Solvent Extract Characteristics
A variation in the color of the solvent extract and properties was observed compared to their original seed colors (Figure 3). The white grains methanolic extract of 27B, 126B, and MR750 showed a lemon-yellow color. The yellow grain of Pacha Jonna showed a reddish-brown color in the extract, whereas the extract of M35–1 was colorless. The extract of an intergeneric derivative showed a pale yellow color for both gray (SM2288-G) and white (SM2288-W), whereas, the colored grain SM2251 gave a reddish-brown color to the extract. The extracts of the breeding lines SPV2612 and BN108 showed reddish-orange and bright red colors, respectively. Extract color varied a lot among the interspecific lines, lemon yellow-colored extract was observed in white-colored grains (ISC202, ISC304, and ISC320), whereas yellow tint-colored extract was noted in white (ISC603, ISC615) and colored grain (ISC304). The colored line ISC812 showed a tint of red-colored extract. Colored grain ISC202-C, ISC320, and ISC615 showed different shades of a reddish-brown color. The extracts of both ISC408-C and ISC812-W were colorless. It is seen that there was no relationship between the pericarp color and the solvent extract color except in a few lines. In the present study, for the first time, we used a wide range of colored grains from elite and wide cross derivatives, and the solvent extract color also varied from colorless to bright red. Although the presence of different bioactive compounds has been confirmed in various plant materials, including sorghum, based on a standard qualitative assay [43,44,45,46], the color of the extract may vary slightly depending on the plant material used and the intensity of the bioactive compounds present in the solvent extract. These qualitative tests are performed based on color or precipitation responses as a positive signal of the presence of those specific chemical components [47,48]. Any color reaction can only identify whether or not unique chemical groups are present in different aqueous extracts, not how much quantity is present.
3.2. Qualitative Phytochemical Profiling
The presence of different bioactive substances (tannins and phenolics, saponins, alkaloids, flavonoids, and steroids) was analyzed for phytochemical profiling among different lines, and there was a huge variation in terms of the qualitative analysis among the 22 sorghum lines (Figure 4). Red grain variety SPV2612, and four interspecific derivatives (ISC408-C, ISC202-W, ISC615-C, and ISC812-W) showed the highest concentrations of tannins and phenolics, whereas the remaining samples showed low-to-moderate concentrations. No tannins and phenols were detected in SM2288-G and ISC304-C. Steroids and alkaloids were found in all lines, except ISC812-W and ISC304-W. The lines SPV2612, 27B, ISC202-C, ISC202-W, ISC615-W, and ISC603-W had the highest flavonoid content, whereas high saponins were present in SM2251, SPV2612, and BN108. In SM2288-G, ISC304-W, and ISC320-W, neither flavonoids and saponins were detected.
3.2.1. Quantification of Total Flavonoid Content (TFC) of Selected Sorghum Lines
The flavonoid content differed significantly (p < 0.05) across the sorghum lines, ranging from 153.26 ± 4.64 QE μg/mL to 1.27 ± 1.27 QE μg/mL. The highest flavonoid content was reported in the popular parental line 27B (153.26 ± 4.64 QE μg/mL), and the lowest was recorded in the intergeneric line SM2288-G (1.27 ± 1.27 QE (μg/mL)). Noticeably, the interspecific line ISC202-C (133.82 ± 6.36 QE μg/mL) showed a flavonoid content on a par with SPV2612 (134.1 ± 5.2 QE μg/mL), a colored variety of sorghum. Large variation was observed with the interspecific lines with respect to TFC, and the values ranged from 133.82 ± 6.36 QE μg/mL (ISC202-C) to 8.01 ± 1.18 QE μg/mL (ISC320-W), whereas, in intergeneric lines, the value ranged from 73.12 ± 5.63 (SM2251) to 1.27 ± 1.27 QE μg/mL (SM2288-G). The four-order polynomial equation for TFC among sorghum lines is as follows: y = −0.0107x4 + 0.4885x3 − 7.538x2 + 45.675x − 21.899, R2 = 0.1482. Total flavonoid contents were expressed in terms of the Quercetin equivalent, QE (Table 2, Figure 5).
3.2.2. Quantification of Total Phenolic Content (TPC) of Selected Sorghum Lines
Total phenolic content was significantly (p < 0.05) different across sorghum lines, ranging from 759.69 ± 12. 5 to 24.97 ± 3.47 GAE μg/mL. The maximum value was observed in the interspecific derivative with a colored pericarp ISC202-C (759.69 ± 12. 5 GAE μg/mL) followed by a line with a white pericarp, ISC812-W (710.25 ± 5.91 GAE μg/mL), and ISC615-C (687.19 ± 7.95 GAE μg/mL). The lowest value was observed in the intergeneric line SM2288-G (24.97 ± 3.47 GAE μg/mL). The TPC value for interspecific crosses showed significant differences compared to parental lines. A local variety, the Pacha Jonna, showed a significantly higher (p < 0.05) TPC value (523.58 ± 6.36 μg/mL) compared to another local variety, M35-1 (452.19 ± 10.24 μg/mL) (Table 2, Figure 5). Significant differences were seen between the interspecific line ISC202-C and SPV2612, the colored sorghum variety, in terms of total phenolic content. The four-order polynomial equation for TPC among sorghum lines is as follows: y = −0.0622x4 + 2.9117x3 − 46.601x2 + 295.7x − 123.91, R2 = 0.2009. Total phenolic contents were expressed in terms of gallic acid equivalent, GAE.
3.3. Assessment of Antioxidant Potential
Sorghum is a rich source of phytochemicals; as of today, many reports are available showing the TPC, TFC, and antioxidant activity of sorghum. In this study, the antioxidant properties viz. FRAP, DPPH, ABTS, and the NO, TPC, and TFC, were evaluated for 22 sorghum lines collected from different sources.
3.3.1. Ferrous-Reducing Antioxidant Potential (FRAP) Assay
The antioxidant potential was assessed by the flavonoid content, and a significant difference was observed in the values of FRAP across the sorghum lines (Table 2, Figure 5). The values ranged from 61.78 ± 7.12 to 4 ± 2.1 µM Fe II/g of extracts. The maximum value was recorded in 27B (61.78 ± 7.12 µM (Fe II)/g, parental line), followed by SPV2612 (56.5 ± 9.22 µM (Fe II)/g, red grain variety) and ISC202-W (49.53 ± 5.46 µM (Fe II)/g, an interspecific derivative), and the lowest FRAP was reported in SM2288-G (4 ± 2.1 µM Fe II/g of extracts). All three intergeneric lines, SM2251, SM2288-W, and SM2288-G, differed significantly (p < 0.05) with respect to the FRAP value. The interspecific lines also showed significant differences among themselves, except a few with marginal similarity. Both the cultivated varieties and parental lines were non-significant for the FRAP assay. The four-order polynomial equation for the FRAP among sorghum lines was generated as follows: y = −0.0052x4 + 0.243x3 − 3.8878x2 + 24.42x − 15.464, R2 = 0.2513.
3.3.2. Assessment of Free Radical-Scavenging Activity
DPPH Free Radical-Scavenging Assay (%)
A DPPH (%) analysis showed a significant difference (p < 0.05) among the studied lines. The DPPH-scavenging potential of the seed extracts from all the accessions ranged from 79.71 ± 0.97 to 8.21 ± 2.25%, with the maximum DPPH activity in ISC202-C (79.71 ± 0.97%) and the minimum in ISC304-C (8.21 ± 2.25%). The activity of interspecific line ISC202-C was significant with red sorghum variety SPV2612 (79.66 ± 1.42%). Both intergeneric line ISC202-W, and one of the parental lines 27B, showed quite high values of 73.91 ± 0.97 and 70.19 ± 2.77, respectively, which were less than ISC202-C and SPV2612. Among the three intergeneric lines, SM2251 and SM2288-W showed no significant difference (p > 0.05), but SM2288-G differed significantly (p < 0.05); whereas, between the two cultivated lines, Pacha Jonna showed a significantly (p < 0.05) higher value as compared to M35-1 (Table 2, Figure 5). The four-order polynomial regression equation for DPPH is as follows, y = −8 × 10−5x4 + 0.0109x3 − 0.5022x2 + 9.073x, R2 = 0.123.
Nitrous Oxide-Scavenging Activity (%)
The assay showed a significant difference (p < 0.05) among the sorghum lines studied (Table 2, Figure 5). The maximum value was reported in ISC202-C (79.71 ± 0.97%), followed by ISC812-W (53.03 ± 4.6%), and ISC615-W (52.71 ± 3.94%); thus, a significant difference was observed among them. SPV2612 (47.36 ± 4.35%) and BN108 (41.59 ± 3.05%) differed significantly (p < 0.05) with respect to NO-scavenging activity. Parental lines 27B (43.27 ± 3.8%) and 126B (42.39 ± 3.4%) were on a par, while MR750 (22.7 ± 2.44%) exhibited significantly (p < 0.05) lower scavenging activity. Both cultivated lines, Pacha Jonna (523.58 ± 6.36%) and M35-1(452.19 ± 10.24%), showed a significant variation. Similarly, intergeneric lines were also found to differ significantly (p < 0.05), the maximum value being in SM2251 (39.98 ± 5.23%), followed by SM2288-W (32.74 ± 2.32%), and SM2288-G (6.02 ± 3.1%). The NO-scavenging activity ranged from 3.85 ± 1.78% (ISC304-C) to 53.73 ± 2.79% (ISC202-C). Among the two cultivated lines, Pacha Jonna showed a significantly higher (p < 0.05) value than M35-1; whereas, within the three intergeneric lines, SM2251 and SM2288-W showed no difference, but 2288-G differed significantly (p < 0.05). The four-order polynomial regression equation for NO-scavenging (%) is as follows: y = −4 × 10−5x4 + 0.0058x3 − 0.2549x2 + 4.3113x + 9.715, R2 = 0.1337.
2,2′-and-Bis (3-Ethylbenzothiazoline-6-Sulfonic Acid)-Scavenging Assay (ABTS%)
The ABTS-scavenging activity (%) values showed a significant difference among the sorghum lines used in the study. They ranged from 68.27 ± 2.91 to 5.31 ± 2.02%, with the maximum value 68.27 ± 2.91% represented by ISC304-C to and the minimum value 5.31 ± 2.02% represented by ISC202-C. Among the three parental lines, 27B and 126B showed a similar type of activity; however, MR750 was highly non-significant. Both the colored grain lines and two cultivated lines differed significantly (p < 0.05) from each other for ABTS%. Intergeneric derivatives SM2251 and SM2288-W did not differ in ABTS% significantly, but SM2288-G showed a significant difference (p < 0.05) from the other two derivatives. The ABTS% of none of the interspecific crosses were significantly different from each other. Pacha Jonna showed a significantly higher (p < 0.05) ABTS value than M35-1. The four-order polynomial regression equation for the NO of sorghum lines is y = −5 × 10−5x4 + 0.0064x3 − 0.2835x2 + 5.0238x + 14.122, R2 = 0.1615. The comparative analysis of quantitative parameters TPC and TFC, ABTS, DPPH, and NO inhibition percentage are represented in graphical form (Figure 5). It is seen that the value for TPC, TFC, FRAP, DPPH, ABTS, and NO differed significantly among the samples; thus, the data does not fit in the linear model, and a four-order polynomial equation among sorghum lines was generated. This equation depicts the distribution of results from several tests for distinct sorghum lines. An R2 value less than 1.0 indicates that the model is unable to fully explain at least some of the data variability, and an R2 of 0.5 indicates that the model is unable to fully explain 50% of the result data variability.
3.4. Networking and PCA Biplot for Solvent Extracts of Sorghum Lines
Based on free radical-scavenging, antioxidant capability, flavonoid concentration, and total phenolic content, a network plot was generated (Figure 6). A network plot represents the relationship between the nodes (variables) using edges (link). At a 60% edge cutoff, the solvent extract networking displayed greater than 50% similarity between the node connecting edges. Edge thickness was related to the similarity of the sorghum solvent extracts, and node width was proportional to the number of edges connecting to it.
There are two clusters in the network plot; the first cluster consists of 7 sorghum lines, which grouped lines with low values for FRAP, TPC, TFC, DPPH, ABTS, and NO, whereas cluster two is represented by 15 lines, which grouped lines with medium and high values for the assay. Parental line 27B, breeding line SPV2612, and interspecific lines ISC202-C and ISC812-W were closely related. The two groups in the network were connected with each other by linking the solvent extracts of M35-1 with ISC320-W, MR750 with 320-C, and 304-W with ISC812-C. The central position in the network is represented by Pacha Jonna and SM2251. Although parental lines 27B and 126B were part of the same network, they were separated based on the assay values, indicating that their activity is distinct. Both the cultivated lines were highly similar, as indicated by the thick edges between them; however, the parental lines showed less similarity to the cultivated lines. Interspecific crosses like ISC202-C, ISC202-W ISC615-C, and ISC812-W were more closely related to 27B, Pacha Jonna, SPV2612, SM2251, and 126B.
The antioxidant parameters such as DPPH-scavenging, ABTS, and NO were highly correlated with TPC, as this activity has credence mainly due to the TPC content of the extracts and is therefore less attributed to the flavonoid content, showed non-significance with FRAP. The order of correlation with TPC was as follows, ABTS (%) ≥NO (%) > DPPH (%) > TFC >FRAP, with matrix values as 0.97 ≥ 0.97 > 0.93 > 0.49 > 0.39, respectively. On the other hand, FRAP was highly correlated with flavonoid content (0.93), followed by DPPH (%), and ABTS (%), while non-significant with NO (%) and TPC.
3.5. Principal Component Analysis (PCA)
To understand the relationship between characteristics and accessions, we may use PCA, a multivariate method, to identify patterns in the data and elucidate any relationships between parameters. PCA was used to reduce dimensionality and explain linkages between data items in 22 lines of sorghum from elite and broad cross derivatives. A PCA biplot was framed between sorghum lines and antioxidant parameters to establish a relationship. The PCA component 1 and component 2 exhibited 68.45% and 21.37% of the total variation. Along axis 1 of the PCA analysis, popular parental line 27 B, red sorghum variety SPV2612, and two interspecific lines ISC202-c and ISC202-W formed a clear group on the positive side and were associated with high antioxidant properties (DPPH, NO, and ABTS), TFC (FLV) and FRAP, indicating that lines in this group are closely related based on these assays. Along axis 2 of the PCA analysis, one each cultivated (Pacha Jonna) and parental line (126B), one breeding line (BN108), two intergeneric lines (SM2288-W and SM2251), and three interspecific lines (ISC408, ISC615-C, and ISC812-W) were mainly characterized by TPC, indicating that lines in this group have a close relation (Figure 7).
3.6. UPGMA Cluster Analysis
A hierarchical cluster analysis (HCA) dendrogram was produced to measure the similarity between the clustered accessions, using Ward’s method in PAST software 4.01. At a bootstrap value 100, all 22 sorghum lines were divided into two major clusters, Cluster I and II. A larger number of sorghum lines were grouped in Cluster II (15) than in Cluster I (7). Cluster I was further subclustered into two minor clusters, clusters Ia and Ib. Subcluster Ia grouped five lines, among which ISC812-C was distinct and grouped separately, whereas subcluster Ib grouped two lines (IG2288-G and ISC304-C) showing low activity. Cluster II was further divided into two subclusters IIa and IIb. Subcluster IIa grouped 10 lines, which were further divided into two minor clusters (IIaA and IIaB) based on the values 27B and ISC202-C, which were distinct in minor cluster IIaA. Minor cluster IIAB grouped four lines, where ISC408-C was distinct among the group members. Subcluster IIb grouped five lines, in which ISC320-C was distinct from the other members of the group (Figure 8).
4. Discussion
Plant metabolites are reported with free radical-scavenging activities associated with different properties such as anti-cancer [49], anti-inflammatory [50], anti-diabetic [51], anti-microbial [52], anti-scavenging [53], etc. In recent years, attention has been focused on the potential role of phytochemicals as an antioxidative, which can be used for improving both human health and food quality. Therapeutic properties bestowed through these compounds can be used in treatment and in linking farm produce to the pharma industry. Many reports on in vivo and in vitro studies on the bioactive compounds isolated from different sorghum lines have offered health benefits related to cancer, diabetes, dyslipidemia [1,23], and many chronic diseases. It is the only source of a unique bioactive compound called 3 deoxyanthocyanidins (3DXA) [54], correlated with both anti-cancer and anti-proliferative properties [55]. Breeding sorghum lines for specific end-uses can bring a greater value and higher returns for farmers, especially the marginal farmers in semi-arid zones. The chemical composition of sorghum grain is interesting due to the presence of health-benefiting compounds phenols and sterols, according to many available studies [56].
Genetic factors, climatic conditions, origin, habitat, altitudinal variation, extraction techniques, solvent systems, the material used, and the period of plant maturity all have a substantial influence on the bioactive chemical concentration in sorghum [57] and other crops like Valeriana jatamansi [58] and Terminalia arjuna [59,60]. In the current study, we have used the samples from crops cultivated in a single plot, in a single location, for one season and one year; however, the material is generated by different methods.
The sorghum solvent extracts in the current study had a varying quantitative phytochemical profiling, antioxidant potential, and free radical-scavenging activity, which is similar to data reported by Ghimire et al. [61], who mentioned the seed characteristics, antioxidant activity, and total phenolic and flavonoid content in Sorghum bicolor (L.) Moench accessions collected from 15 countries differing significantly, which clearly indicates that the geographical distribution of material is associated with variation in the quality of bioactive compounds.
Our objective was, for the first time, a comprehensive study of the antioxidant properties resulting from the bioactive compounds of different categories present in the grain of a set of 22 sorghum lines with diverse origins, consisting of popular varieties of food, parental lines, improved breeding lines, and derivatives of intergeneric and interspecific hybrids involving different colored grains. The genotypes we selected in this study had variations in seed size. The cautiously bred elite lines had more seed weight in comparison to the interspecific derivatives. Bioactive compounds and extract color are influenced by the seed pericarp color that gives color to the grain in sorghum [10]. In the current study, the original seed color and the methanolic extract color were either variable or showed strong coloration. This might be due to the presence of varied quantities of bioactive compounds.
In cereals, methanol is believed to be the best solvent for the extraction of phenolics, flavonoids, and other polar compounds [62]. In the present study, we used methanol to extract the active components present in sorghum flour. The qualitative phytochemical profiling exhibits alkaloids, saponins, steroids, tannin, phenolics, and flavonoids, which corresponds to the bioactive property of a solvent extract. In the qualitative study, the most variable parameter was DPPH, which was followed by NO-scavenging, flavonoid content, ABTS, total phenolic content, and FRAP, which might be linked to genetics and agronomic conditions. This is consistent with a prior study, which explains that TPC variation may be due to several variables such as extraction procedures, solvent types, and ecological location, which might explain the vast range of antioxidant activity and antioxidant accumulation patterns across sorghum accessions [12,63].
Rao et al. [64] reported the maximum TPC as 11.50 ± 1.81 mg/g GAE in the black pericarp and 3.58 ± 1.63 GAE mg/g GAE in the brown pericarp, whereas red and white pericarp grains showed no significant differences. In both white and red sorghum grains, the TPC was reported as 0.461 ± 0.10 mg/g GAE and 3.38 ± 0.20 mg/g GAE by Kamath et al. [65] and Khoddami et al. [9], respectively. In our study, the value ranged from 710.25 ± 5.91 to 177.19 ± 10 GAE (μg/mL) in white pericarp grains, whereas grains with a colored pericarp showed a maximum value of 759.69 ± 12.5 GAE (μg/mL) in interspecific line ISC202-C and a minimum value of 24.97 ± 3.47 GAE (μg/mL) in intergeneric line SM2288-G. These values were lower compared to other reports on colored grains. Overall, there was a significant difference in the values of TPC among white and colored grains, and antioxidant measures such as TPC and TFC were found to be mainly non-significant among the various lines. Ghimire et al. [61] reported a significant variation among 78 sorghum accessions collected from 15 different countries, with TPC values ranging from 9.97 ± 0.05 to 333.58 ± 1.49 mg GAE g of dry material and a TFC ranging from 10.35 ± 0.07 to 252.67 ± 24.99 (mg QE g) of dry material. They also reported a low TPC and TFC in white-colored seeds, which displayed the weakest antioxidant activity for the ABTS assay among different sorghum accessions studied. However, in our case, TPC values in both white and colored grains were high, but the value was greater for colored grains, except for ISC304-C and SM2288-G. Higher values for TFC and TPC were mentioned by Shen et al. [66] for eight sorghum grains as 11.72 ± 1.69 to 61.10 ± 5.46 mg RE/100 g grain and 174.40 ± 4.09 to 1238.83 ± 31.67 mg GAE/100 g grain, respectively. Bouargalne et al. [67] reported 125.86 ± 1.36 to 314.91 ± 3.60 mg GAE/g dw (TPC), and TFC ranged from 4.53 ± 0.91 to 14.04 ± 1.71 mg GAE/g dw. The TPC value for black and brown sorghums was 11.50 and 3.58 mg GAE/g, respectively, whereas the red sorghum hybrids and variety showed a TPC ranging from 218 to 239 mg GAE/100 g and 0.66 to 0.88 mg GAE/g, for red varieties [7]. Differences in the TPC and TFC values have been observed in various reports; these differences may be due to the type of sample, extraction procedures, and extraction solvent being used for the study [63]. Both dark brown and black sorghum had higher antioxidant activity compared to white sorghum brans, and black sorghums were endowed with the highest levels of 3-deoxyanthocyanin, as reported by Awika et al. [68].
Flavonoids and other polyphenols with free radical-scavenging activities may be present in different extracts [69]. Reducing power is widely used to evaluate the antioxidant potential of plant polyphenols. Reducants, which have antioxidant effects by adding a hydrogen atom to free radical chains to break them, are usually associated with the presence of reductants, which have a reducing power. Reductants are present in the antioxidant sample after reducing the Fe3+/ferricyanide complex to the Fe2+/ferrous form in this assay. The capacity of the methanolic extracts of the different sorghum samples to convert the Fe3+-ferricyanide complex into the ferrous form by donating an electron was employed in this study to measure the samples’ iron-reducing capabilities. Significant differences in the reducing ability of the extracts in our study ranged from 4 ± 2.1 to 61.78 ± 7.12 µM Fe II/g of extracts. Such variations were reported, ranging from 2.02 ± 0.05 to 11.66 ± 0.39 mg/g VcE [70], 3.11 ± 0.50 to 15.34 ± 0.10 mg/g TE mg/g [1], 2.31 ± 1.55 to 20.92 ± 2.69 mg/g Trolox Equivalent [71]. Bouargalne et al. [67] also reported a very high variation in antioxidant potential in their samples, ranging from 341.31 ± 2.91 to 103.15 ± 2.81 mg AAE/g dw. Xiong et al. [70] reported the lowest values for white grains, and the maximum value was reported in brown grain, followed by black and red. Because polyphenols have the potential to scavenge free radicals by giving an electron or hydrogen, we conclude that the extracts’ antioxidant activity and reduced power capacity were likely caused by their presence.
Antioxidants’ capacity to donate hydrogen is hypothesized to have an impact on DPPH [71]. Radical-scavenging activities must be used to avoid the damaging effects of free radicals in a variety of diseases, including cancer. The DPPH free radical-scavenging technique is commonly used to assess the antioxidant activity of plant extracts. The extract lowers the violet-colored DPPH solution to diphenylpicryl hydrazine, which produces a yellow-colored result in the DPPH test. This method has been often used to predict antioxidant activity because of the comparatively rapid turnaround time for analysis. According to Baumann et al. [71], tocopherols and polyphenol concentrations have hydrogen-donating capabilities that allow them to scavenge DPPH radicals, and there is a substantial link between total polyphenol content and antioxidant activity that neutralizes radicals [72]. The results obtained in this study suggest that all the extracts from sorghum showed radical-scavenging activity by their electron-transfer or hydrogen-donating ability. In our study, the maximum value reported was 79.71 ± 0.97 to 8.21 ± 2.25 in %. Different colored sorghum studied by Punia et al. [1] showed a value ranging from 3.23 ± 0.12 to 20.55 ± 0.11 mg TE/100 g, whereas Bouargalne et al. [67] reported IC50 values ranging from 0.02 ± 0.00 to 0.11 ± 0.00 mg/mL in sorghum lines.
Li et al. [73] reported significant differences among sorghum varieties, with radical-scavenging activities of ABTS and DPPH ranging from 0.31 to 0.95 and 0.33 to 1.80 mg TE/g, respectively. Punia et al. [1] reported the maximum ABTS value for the red variety at 45.66 ± 0.23% and the lowest for white grains at 15.47 ± 0.15%. Similarly, Xiong et al. [70] also showed the lowest DPPH values for white and the highest with brown, followed by black and red. In our study, the maximum value, 68.27 ± 2.91%, was represented by colored grain from an interspecific derivative. One of the interspecific lines ISC202-W with white-colored grain showed values similar to the red-colored variety and other interspecific lines. Ofosu et al. [74] reported IC50 values of 203.4 to 352.6 mg/mL.
Nitric oxide is a cellular signaling molecule that plays a role in many physiological and pathological processes. It is a powerful vasodilator, with a blood half-life of only a few seconds [75]). The nitric oxide radical (NO•) is dangerous because of its interaction with oxygen or superoxide anion radicals. Several sorghum extracts reduced NO• generation based on concentration. Bioactive compounds such as kaempferol, catechin, resveratrol, delphinidin, and pelargonidin have the ability to neutralize NO radicals, according to a published study [76]. In our study, two interspecific lines, ISC202-C and ISC812-W, showed a good response to the NO assay, followed by ISC615-C, with values ranging from 3.85 to 53.73%. All other lines showed a moderate-to-low response to the assay. These values in sorghum extracts ranged from 4.8 3% to 40.10% in different types of sorghum, depending on concentration [77].
The ABTS, DPPH, and NO assays showed non-uniform values for both colored and white grains; however, overall values were higher for colored variety SPV2612, white grain 27B, and interspecific lines ISC202-C, ISC408-C, ISC615-C, and ISC812-W. In a nutshell, these samples showed the highest antioxidant activity with the above-mentioned tests. Miafo et al. [78] showed free phenolic acid from bran, with significant antioxidant and free radical-scavenging activities among six sorghum extracts and the highest antioxidant activity, and mentioned the quantity and composition of phenolic acid highly influenced the antioxidant activity of the sample.
According to the correlation matrix and PCA biplot, DPPH, ABT, and NO have a significant relationship with TPC, whereas a significant relationship was seen between FRAP and flavonoid content. TPC exhibited only a little association with antioxidant capacity, although DPPPH, ABTS, and NO had a significant link with flavonoid content. Flavonoid concentration appears to impart both free radical and antioxidant potential, whereas TPC appears to be responsible largely for free radical-scavenging. Clustering based on distributional similarity indicated that interspecific line ISC304-C had no comparable features with any other sorghum line used in the study, which is reflected in the quantitative potential of the sorghum lines. While other interspecific lines shared properties with the cultivated lines, this could be due to the interspecific lines’ adaptive characteristics; intrageneric lines were found to be distributed among cultivated lines, parental lines, and germplasm, implying that those lines require additional trials to assess their stability and potential in vivo. The genotypes identified in this study can be used in sorghum improvement programs aiming at developing genotypes with enhanced health benefits.
5. Conclusions
Sorghum grain is endowed with many health benefits, which has forced it to be a part of our diets in recent years. Sorghum can be a part of our balanced diet as the grain is rich in protein, starch, vitamins, minerals, and fatty acids. In addition to these, it is enriched with many phytochemicals/bioactive compounds with a wide range of biological activities (such as antioxidant, anti-cancer, etc.). Sorghum has been believed to be a crop for a sustainable mankind due to its versatile nature; despite this, unlike other cereals, few efforts have been made for the improvement of the crop. There is a need to make collaborative efforts in better methods of human consumption and to link sorghum to other industries (biofuel, pharma, etc.) and develop product-oriented programs. This study adds information to sorghum research on the variations in levels of different bioactive compounds, such as total phenolic and flavonoid content, as well as the antioxidant potential of different colored sorghum grains. The study also provides knowledge about the lines that are rich in antioxidant properties, which can be selected for further laboratory studies involving both in vivo and in vitro, to provide more data for selecting sorghum lines for application in human and animal food, as well as in pharmaceutical applications. It also indicates that sorghum, a cereal grain (either colored or white), could offer an important source of natural compounds endowed with antioxidant properties.
Author Contributions
Conceptualization, K.M. and K.B.R.S.V.; Methodology, K.M. and D.K.M.; Software, D.K.M.; Formal analysis, K.M. and D.K.M.; Investigation, K.M.; Resources, J.J., C.A. and K.B.R.S.V.; Data curation, K.M. and C.A.; Writing—original draft, K.M. and D.K.M.; Writing—review & editing, K.B.R.S.V.; Visualization, J.J.; Supervision, K.B.R.S.V.; Project administration, K.B.R.S.V.; Funding acquisition, K.B.R.S.V. All authors have read and agreed to the published version of the manuscript.
Funding
Science and Engineering Research Board (SERB)-DST, Government of India. Grant number SPG/2021/001958.
Institutional Review Board Statement
Not applicable.
Data Availability Statement
Data will be available on request.
Acknowledgments
The authors are highly thankful to the Director, IIMR, Rajendranagar, Hyderabad, for providing the facilities to carry out the research.
Conflicts of Interest
None of the author has declared conflicts of interest.
Abbreviations
C—colored; W—white; FRAP—ferrous-reducing antioxidant potential; TFC—total flavonoid content; TPC—total phenolic content; FLV—flavonoids; DPPH—1,1-diphenyl-2-picrylhydrazyl; ABTS-2,2′-azinobis 3-ethylbenzothiazoline-6-sulfonate; NO—nitrous oxide-scavenging assay.
References
- Punia, H.; Tokas, J.; Malik, A.; Sangwan, S. Characterization of phenolic compounds and antioxidant activity in sorghum [Sorghum bicolor (L.) Moench] grains. Cereal Res. Comm. 2021, 49, 343–353. [Google Scholar] [CrossRef]
- International Production Assessment Division. Available online: https://ipad.fas.usda.gov/cropexplorer/cropview/commodityView.aspx?cropid=0459200 (accessed on 5 January 2024).
- Llopart, E.E.; Drago, S.R. Physicochemical properties of sorghum and technological aptitude for popping nutritional changes after popping. LWT Food Sci. Technol. 2016, 71, 316–322. [Google Scholar] [CrossRef]
- Chavez, D.W.H.; Ascheri, J.L.R.; Carvalho, C.W.P.; Godoy, R.L.O.; Pacheco, S. Sorghum and roasted coffee blends as a novel extruded product: Bioactive compounds and antioxidant capacity. J. Funct. Foods 2017, 29, 93–103. [Google Scholar] [CrossRef]
- Przybylska-Balcerek, A.; Frankowski, J.; Sieracka, D.; Sázavská, T.; Wacławek, S.; Raczak, B.K.; Szwajkowska-Michałek, L.; Bu’sko, M.; Graczyk, M.; Niedziela, G.; et al. The Content of Antioxidant Compounds and VOCs in Sorghum Grain Grown in Central and Eastern Europe. Agronomy 2024, 14, 217. [Google Scholar] [CrossRef]
- Pontieri, P.; Mamone, G.; De Caro, S.; Tuinstra, M.R.; Roemer, E.; Okot, J. Sorghum, a healthy and gluten-free food for celiac patients as demonstrated by genome, biochemical, and immunochemical analyses. J. Agric. Food Chem. 2013, 61, 2565–2571. [Google Scholar] [CrossRef]
- de Oliveira, L.L.; Guilherme, T.O.; Ernandes, R.A.; Queiroz, V.A.P.; Figueired, L.F.D. Physical, chemical, and antioxidant analysis of sorghum grain and flour from five hybrids to determine the drivers of liking of gluten-free sorghum breads. LWT 2022, 153, 112407. [Google Scholar] [CrossRef]
- Garzón, A.G.; Albarracín, M.; Drago, S.R. Bioactive Properties of Sorghum-based Beverages from Whole or Refined Grains. Recent Prog. Nutr. 2023, 3, 13. [Google Scholar] [CrossRef]
- Khoddami, A.; Truong, H.H.; Liu, S.Y.; Thomas, H.; Roberts Selle, P.H. Concentrations of specific phenolic compounds in six red sorghums influence nutrient utilisation in broiler chickens. Anim. Feed Sci. Technol. 2015, 210, 190–199. [Google Scholar] [CrossRef]
- Dykes, L.; Rooney, L.; Waniska, R.; Rooney, W. Phenolic Compounds and Antioxidant Activity of Sorghum Grains of Varying Genotypes. J. Agric. Food Chem. 2005, 53, 6813–6818. [Google Scholar] [CrossRef]
- Stefoska-Needham, A.; Beck, E.J.; Johnson, S.K.; Tapsell, L.C. Sorghum: An underutilized cereal whole grain with the potential to assist in the prevention of chronic disease. Food Rev. Int. 2015, 31, 401–437. [Google Scholar] [CrossRef]
- Wu, G.; Johnson, S.K.; Bornman, J.F.; Bennett, S.J.; Fang, Z. Changes in whole grain polyphenols and antioxidant activity of six sorghum genotypes under different irrigation treatments. Food Chem. 2017, 214, 199–207. [Google Scholar] [CrossRef] [PubMed]
- Gu, L.; Kelm, M.A.; Hammerstone, J.F.; Beecher, G.; Holden, J.; Haytowitz, D.; Susan, G.; Prior, R.L. Concentration of proanthocyanidins in common foods and estimations of normal consumptions. J. Nutr. 2004, 134, 613–617. [Google Scholar]
- Kortei, N.K.; Odamtten, G.T.; Appiah, V.; Obodai, M.; Adu-Gyamfi, A.; Wiafe-Kwagyan, M. Comparative occurrence of resident fungi on gamma irradiated and steam sterilized sorghum grains (Sorghum bicolor L.) for spawn production in Ghana. Br. Biotechnol. 2015, 7, 21–32. [Google Scholar] [CrossRef]
- Wu, Y.; Wang, Y.; Liu, Z.; Wang, J. Extraction, Identification and Antioxidant Activity of 3-Deoxyanthocyanidins from Sorghum bicolor L. Moench Cultivated in China. Antioxidants 2023, 12, 468. [Google Scholar] [CrossRef] [PubMed]
- Awika, J.M.; Rooney, L.W. Sorghum phytochemical and their potential impact on human health. Phytochemistry 2004, 65, 1199–1221. [Google Scholar] [CrossRef] [PubMed]
- Arts, I.C.W.; Hollman, P.C.H. Polyphenols and disease risk in epidemiologic studies. Am. J. Clin. Nutr. 2005, 81, 317–325. [Google Scholar] [CrossRef] [PubMed]
- Harborne, J.B.; Williams, C.A. Advances in flavonoids research since 1992. Phytochemistry 2000, 55, 481–504. [Google Scholar] [CrossRef] [PubMed]
- Alfadda, A.A.; Sallam, R.M. Reactive oxygen species in health and disease. J. Biomed. Biotechnol. 2012, 2012, 936486. [Google Scholar] [CrossRef] [PubMed]
- Squarcina, A.; Santoro, A.; Hickey, N.; Zorzi, R.D.; Carraro, M.; Geremia, S.; Bortolus, M.; Valentin, M.D.; Bonchio, M.M. Neutralization of Reactive Oxygen Species at Dinuclear Cu(II)-Cores: Tuning the Antioxidant Manifold in Water by Ligand Design. ACS Catal. 2020, 10, 7295–7306. [Google Scholar] [CrossRef]
- Arbex, P.M.; de Moreira, M.E.C.; Toledo, R.C.L.; de Morais Cardo, L.; Pinheiro-Sant’ana, H.M.; dos Benjamin, L.A.; de Oliveria, L.L.; Carvalho, C.W.P.; Queiroz, V.A.V.; Martino, H. Extruded Sorghum Flour (Sorghum bicolor L.) Modulate Adiposity and Inflammation in High Fat Diet-Induced Obese Rats. J. Funct. Foods 2018, 42, 346–355. [Google Scholar] [CrossRef]
- Chen, X.; Shen, J.; Xu, J.; Herald, T.; Smolensky, D.; Perumal, R.; Wang, W. Sorghum phenolic compounds are associated with cell growth inhibition through cell cycle arrest and apoptosis in human hepatocarcinoma and colorectal adenocarcinoma cells. Foods 2021, 10, 993. [Google Scholar] [CrossRef] [PubMed]
- de Morais, L.C.; Pinheiro, S.S.S.; Martino, H.S.D.S.; Pinheiro-Sant’Ana, H.M.M. Sorghum (Sorghum bicolor L.): Nutrients, bioactive compounds, and potential impact on human health. Crit. Rev. Food Sci. Nutr. 2017, 57, 372–390. [Google Scholar] [CrossRef]
- Visarada, K.B.R.S.; Aruna, C. Sorghum: A Bundle of Opportunities in the 21st Century. In Breeding Sorghum for Diverse End Uses; Aruna, C., Visarada, K.B.R.S., Bhat, B.V., Tonapi, V.A., Eds.; Elsevier: Amsterdam, The Netherlands, 2018; pp. 1–14. [Google Scholar]
- Lee, S.H.; Lee, J.; Herald, T.; Cox, S.; Noronha, L.; Perumal, R.; Lee, H.-S.; Smolensky, D. Anticancer Activity of a Novel High Phenolic Sorghum Bran in Human Colon Cancer Cells. Oxid. Med. Cell. Longev. 2020, 2020, 2890536. [Google Scholar] [CrossRef]
- Lee, H.; Jeong, W.T.; So, Y.S.; Lim, H.B.; Lee, J. Taxifolin and Sorghum Ethanol Extract Protect against Hepatic Insulin Resistance via the miR-195/IRS1/PI3K/AKT and AMPK Signalling Pathways. Antioxidants 2021, 10, 1331. [Google Scholar] [CrossRef] [PubMed]
- Ducksbury, C.; Neale, E.P.; Stefoska-Needham, A. The effect of sorghum consumption on markers of chronic disease: A systematic review. Crit. Rev. Food Sci. Nutr. 2021, 63, 159–177. [Google Scholar] [CrossRef]
- Hassan, S.M. Nutritional, Functional and Bioactive Properties of Sorghum (Sorghum Bicolor I. Moench) with its Future Outlooks: A Review. Open J. Nutr. Food Sci. 2023, 5, 1030. [Google Scholar]
- Vita, J.A. Polyphenols and cardiovascular disease: Effects on endothelial and platelet function. Am. J. Clin. Nutr. 2005, 81, 292S–297S. [Google Scholar] [CrossRef]
- Wu, L.T.; Chu, C.C.; Chung, J.G.; Chen, C.H.; Hsu, L.S.; Liu, J.K.; Chen, S.C. Effects of tannic acid and its related compounds on food mutagens or hydrogen peroxide-induced DNA strands breaks in human lymphocytes. Mut. Res. 2004, 556, 75. [Google Scholar] [CrossRef] [PubMed]
- Biparva, P.; Ehsani, M.; Hadjmohammadi, M.R. Dispersive liquid–liquid microextraction using extraction solvents lighter than water combined with high phigh-performanced chromatography for determination of synthetic antioxidants in fruit juice samples. J. Food Compos. Anal. 2012, 27, 87–94. [Google Scholar] [CrossRef]
- Shahidi, F.; Zhong, Y. Novel antioxidants in food preservation and health promotion. Eur. J. Lipid Sci. Technol. 2010, 112, 930–940. [Google Scholar] [CrossRef]
- Visarada, K.B.R.S. Variations are introduced in sorghum through pollination with maize. Curr. Sci. 2019, 119, 1540–1548. [Google Scholar] [CrossRef]
- Visarada, K.B.R.S. Overcoming interspecific barriers in Sorghum and molecular characterization of the derivatives. Plant Breed. 2020, 139, 892–905. [Google Scholar] [CrossRef]
- Sofowora, E.A. Medicinal Plants and Traditional Medicine in Africa; John Wiley and Sons Ltd.: Hoboken, NJ, USA, 1982; pp. 64–79. [Google Scholar]
- Trease, G.E.; Evans, W.C. Pharmacognosy, 11th ed.; Bailliere Tindall: London, UK, 1989; pp. 45–50. [Google Scholar]
- Singleton, V.; Rossi, J. Colorimetry of Total Phenolic Compounds with Phosphomolybdic-Phosphotungstic Acid Reagents. Am. J. Enol. Viticult. 1965, 16, 144–158. [Google Scholar] [CrossRef]
- Harborne, J.B. Textbook of Phytochemical Methods. In A Guide to Modern Techniques of Plant Analysis, 5th ed.; Chapman and Hall Ltd.: London, UK, 1998; pp. 21–72. [Google Scholar]
- Bozin, B.; Mimica-Dukic, N.; Simin, N.; Anackov, G. Characterization of the volatile composition of essential oils of some lamiaceae spices and the antimicrobial and antioxidant activities of the entire oils. J. Agric. Food Chem. 2006, 54, 1822–1828. [Google Scholar] [CrossRef] [PubMed]
- Ilyasov, I.; Beloborodov, V.; Antonov, D.; Dubrovskaya, A.; Terekhov, R.; Zhevlakova, A.; Saydasheva, A.; Evteev, V.; Selivanova, I. Flavonoids with Glutathione Antioxidant Synergy: Influence of Free Radicals Inflow. Antioxidants 2020, 9, 695. [Google Scholar] [CrossRef] [PubMed]
- Garrat, D.C. The Quantitative Analysis of Drugs Japan, 3rd ed.; Chapman and Hall: Tokyo, Japan, 1964; pp. 456–458. [Google Scholar]
- Benzie, I.; Strain, J. The Ferric Reducing Ability of Plasma (FRAP) as a Measure of “Antioxidant Power: The FRAP Assay”. Anal. Biochem. 1996, 239, 70–76. [Google Scholar] [CrossRef] [PubMed]
- Hossain, M.A.; Al-Raqmi, K.A.; AL-Mijizy, Z.H.; Weli, A.M.; Al-Riyami, Q. Study of total phenol, flavonoids contents and phytochemical screening of various leaves crude extracts of locally grown Thymus vulgaris. Asian Pac. J. Trop. Biomed. 2013, 3, 705–710. [Google Scholar] [CrossRef] [PubMed]
- Ali, K.S.; Elsheikh, A.M.; Ahmed, H.M.; Hassan, H.A.; Hamza, N.B.; Osman, M.G.; Daffalla, H.M.; Osman, H.M.H. Phytochemical screening and antibacterial activities of Sorghum bicolor leaves derived from in vitro culture. GSC Biol. Pharm. Sci. 2020, 10, 65–72. [Google Scholar]
- Meena, K. Modified Mechanical and Methodological Attributes Interplay for Isolating Antioxidant Concomitant in Herbal Materials: An Innovative Concept. Res. Biot. 2021, 3, 158–163. [Google Scholar] [CrossRef]
- Tyagi, V.; Saravanan, C.; Wang, Y.; Bhattacharya, B. Solvent Dependency of Sorghum Bran Phytochemicals Acting as Potential Antioxidants and Antibacterial Agents. Food Technol. Biotechnol. 2021, 59, 31–43. [Google Scholar] [CrossRef]
- Fahey, J.W. Reference Module in Food Science. In Encyclopedia of Food and Health, 1st ed.; Elsevier Ltd.: Oxford, UK, 2016; p. 469. [Google Scholar]
- Choi, S.; Beuchat, L.R.; Kim, H.; Ryu, J.H. Viability of sprout seeds as affected by treatment with aqueous chlorine dioxide and dry heat, and reduction of Escherichia coli O157:H7 and Salmonella enterica on pak choi seeds by sequential treatment with chlorine dioxide, drying and dry heat. Food Microbiol. 2016, 54, 127–132. [Google Scholar] [CrossRef]
- Ramakrishna, W.; Anuradha, K.; Rahman, N.; Mandave, P. Anticancer Activities of Plant Secondary Metabolites: Rice Callus Suspension Culture as a New Paradigm. Rice Sci. 2021, 28, 13–30. [Google Scholar] [CrossRef]
- Afrin, S.; Sidhu, S. In vitro study to evaluate anti-inflammatory properties of sorghum extract supplemented bread. Future Foods. 2021, 4, 100039. [Google Scholar] [CrossRef]
- Kim, J.; Park, Y. Anti-diabetic effect of sorghum extract on hepatic gluconeogenesis of streptozotocin-induced diabetic rats. Nutr. Metab. 2012, 9, 106. [Google Scholar] [CrossRef] [PubMed]
- Schnur, S.E.; Amachawadi, R.G.; Baca, G.; Sexton-Bowser, S.; Rhodes, D.H.; Smolensky, D.; Herald, T.J.; Perumal, R.; Thomson, D.U.; Nagaraja, T.G. Antimicrobial Activity of Sorghum Phenolic Extract on Bovine Foodborne and Mastitis-Causing Pathogens. Antibiotics 2021, 10, 594. [Google Scholar] [CrossRef] [PubMed]
- Kim, J.; Hyun, T.K.; Kim, M. Anti-oxidative activities of sorghum, foxtail millet and proso millet extracts. Afr. J. Biotechnol. 2010, 9, 2683–2690. [Google Scholar]
- Luo, M.; Hou, F.; Dong, L.; Huang, F.; Zhang, R.; Su, D. Comparison of microwave and high-pressure processing on bound phenolic composition and antioxidant activities of sorghum hull. Int. J. Food Sci. Technol. 2020, 55, 3190–3202. [Google Scholar] [CrossRef]
- Suganyadevi, P.; Saravanakumar, M.; Sundhar, M. The antiproliferative activity of 3-deoxyanthocyanins extracted from red sorghum (Sorghum bicolor) bran through P53-dependent and Bcl-2 gene expression in breast cancer cell line. Life Sci. 2013, 92, 379–382. [Google Scholar] [CrossRef]
- Alfieri, M.; Balconi, C.; Cabassi, G.; Habyarimana, E.; Redaelli, R. Antioxidant activity in a set of sorghum landraces and breeding lines. Maydica 2017, 62, 3–32. [Google Scholar]
- Mawouma, S.; Condurache, N.N.; Turturica, M.; Constantin, O.E.; Croitoru, C.; Rapeanu, G. Chemical Composition and Antioxidant Profile of Sorghum (Sorghum bicolor (L.) Moench) and Pearl Millet (Pennisetum glaucum (L.) R.Br.) Grains Cultivated in the Far-North Region of Cameroon. Foods 2022, 11, 2026. [Google Scholar] [CrossRef]
- Jugran, A.K.; Bahukhandi, A.; Dhyani, P.; Bhatt, I.D.; Rawal, R.S.; Nandi, S.K. Impact of altitudes and habitats on valerenic acid, total phenolics, flavonoids, tannins, and antioxidant activity of Valeriana jatamansi. Appl. Biochem. Biotechnol. 2016, 179, 911–926. [Google Scholar] [CrossRef] [PubMed]
- Meena, D.K.; Sahoo, A.K.; Chowdhury, H.; Swain, H.S.; Sahu, N.P.; Behera, B.K. Effects of extraction methods and solvent systems on extract yield, proximate composition and mineral profiling of Terminalia arjuna (Arjuna) dry powders and solvent extracts. J. Innov. Pharm. Biol. Sci. 2019, 7, 22–31. [Google Scholar]
- Meena, D.K.; Sahoo, A.K.; Srivastava, P.P.; Sahu, N.P.; Jadhav, M.; Gandhi, M. On valorization of solvent extracts of Terminalia arjuna (arjuna) upon DNA scission and free radical scavenging improves coupling responses and cognitive functions under in vitro conditions. Sci. Rep. 2021, 11, 10656. [Google Scholar] [CrossRef] [PubMed]
- Ghimire, B.K.; Seo, J.W.; Yu, C.Y.; Kim, S.H.; Chung, I.M. Comparative Study on Seed Characteristics, Antioxidant Activity, and Total Phenolic and Flavonoid Contents in Accessions of Sorghum bicolor (L.) Moench. Molecules 2021, 26, 3964. [Google Scholar] [CrossRef] [PubMed]
- Watanabe, M. Catechins as antioxidants from buckwheat (Fagopyrum esculentum Moench) groats. J. Agric. Food Chem. 1998, 46, 839–845. [Google Scholar] [CrossRef]
- Dia, V.P.; Pangloli, P.; Jones, L.; McClure, A.; Patel, A. Phytochemical concentrations and biological activities of Sorghum bicolor alcoholic extracts. Food Funct. 2016, 7, 3410–3420. [Google Scholar] [CrossRef] [PubMed]
- Rao, S.; Santhakumar, A.B.; Chinkwo, K.A.; Gangcheng, W.; Johnson, S.K.; Blanchard, C.L. Characterization of phenolic compounds and antioxidant activity in sorghum grains. J. Cereal Sci. 2018, 84, 103–111. [Google Scholar] [CrossRef]
- Kamath, V.G.; Chandrashekar, A.; Rajini, P.S. Antiradical properties of sorghum (Sorghum bicolor L. Moench) flour extracts. J. Cereal Sci. 2004, 40, 283–288. [Google Scholar] [CrossRef]
- Shen, S.; Huang, R.; Li, C.; Wu, W.; Chen, H.; Shi, J.; Chen, S.; Ye, X. Phenolic Compositions and Antioxidant Activities Differ Significantly among Sorghum Grains with Different Applications. Molecules 2018, 23, 1203. [Google Scholar] [CrossRef]
- Bouargalne, Y.; Ben Mrid, R.; Bouchmaa, N.; Zouaoui, N.; Benmrid, B.; Kchikich, A.; El Omari, R.; Kabach, I.; Mohamed, N. Genetic diversity for agromorphological traits, phytochemical profile, and antioxidant activity in Moroccan sorghum ecotypes. Sci. Rep. 2022, 12, 5895. [Google Scholar] [CrossRef]
- Awika, J.M.; Mc, D.; Cassandra, M.; Rooney, L.W. Decorticating sorghum to concentrate healthy phytochemicals. J. Agric. Food Chem. 2005, 53, 6230–6234. [Google Scholar] [CrossRef] [PubMed]
- Lalhminghlui, K.; Jagetia, G.C. Evaluation of the free-radical scavenging and antioxidant activities of Chilauni, Schima wallichii Korth in vitro. Future Sci. OA 2018, 4, FSO272. [Google Scholar] [CrossRef] [PubMed]
- Xiong, Y.; Teixeira, T.; Zhang, P.; Warner, R.; Shen, S.; Fang, Z. Cellular antioxidant activities of phenolic extracts from five sorghum grain genotypes. Food Biosci. 2021, 41, 101068. [Google Scholar] [CrossRef]
- Baumann, J.; Wurn, G.; Bruchlausen, F.V. Prostaglandin synthetase inhibiting O2 radical scavenging properties of some flavonoids and related phenolic compounds. Deutsche Pharmakologische Gesellschaft abstracts of the 20th spring meeting, Naunyn-Schmiedebergs abstract no: R27 cited. Arch. Pharmacol. 1979, 307, R1–R77. [Google Scholar]
- Huang, D.; Ou, B.; Prior, R.I. The chemistry behind antioxidant capacity assays. J. Agric. Food Chem. 2005, 53, 1841–1856. [Google Scholar] [CrossRef] [PubMed]
- Li, M.; Xu, T.; Zheng, W.; Gao, B.; Zhu, H.; Xu, R.; Deng, H.; Wang, B.; Wu, Y.; Sun, X.; et al. Triacylglycerols compositions, soluble and bound phenolics of red sorghums, and their radical scavenging and anti-inflammatory activities. Food Chem. 2021, 340, 128123. [Google Scholar] [CrossRef] [PubMed]
- Ofosu, F.K.; Elahi, F.; Daliri, E.B.M.; Tyagi, A.; Chen, X.Q.; Chelliah, R.; Joong-Hark, K.; Sang-Ik, H.; Deog-Hwan, O. UHPLC-ESI-QTOF-MS/MS Characterization, Antioxidant and Antidiabetic Properties of Sorghum Grains. Food Chem. 2021, 337, 127788. [Google Scholar] [CrossRef] [PubMed]
- Lushchak, V.I. Free radicals, reactive oxygen species, oxidative stress and its classification. Chem. Biol. Int. 2014, 224, 164–175. [Google Scholar] [CrossRef]
- Marković, J.M.D.; Boris, P.; Dejan, M.; Dragan, A.; Nebojša, B.; Miloš, M. Antiradical activity of delphinidin, pelargonidin and malvin towards hydroxyl and nitric oxide radicals: The energy requirements calculations as a prediction of the possible antiradical mechanisms. Food Chem. 2017, 218, 440–446. [Google Scholar] [CrossRef]
- Hong, S.; Pangloli, P.; Perumal, R.; Cox, S.; Noronha, L.E.; Dia, V.P.; Smolensky, D.A. Comparative Study on Phenolic Content, Antioxidant Activity and Anti-Inflammatory Capacity of Aqueous and Ethanolic Extracts of Sorghum in Lipopolysaccharide-Induced RAW 264.7 Macrophages. Antioxidants 2020, 9, 1297. [Google Scholar] [CrossRef]
- Miafo, A.P.; Benoît, K.; Germain, K.; Muralikrishna, G. Antioxidant properties of free and bound phenolic acids from bran, spent grain, and sorghum seeds. Cereal Chem. 2020, 97, 1236–1243. [Google Scholar] [CrossRef]
Figure 1.
Showing 22 different colored sorghum grains used for the study. It includes five different combinations of sorghum lines (parental lines, interspecific cross). The different color of the pericarp of the sorghum line shows the presence of different types of biochemical composition, including the presence of antioxidant bioactive compounds. The pericarp contains a high amount of its bioactive principles, and it corresponds to the intensity of the efficacy of the bioactive credentials of these lines.

Figure 2.
Graphical representation of solvent extraction of material from different sorghum lines. The seed material of 22 sorghum lines was collected from the experimental field of ICAR-IIMR, Hyderabad. Seed material was cleaned from any extraneous debris and was converted into fine powder. The sample power was kept in the desired solvent system, starting from nonpolar to polar hexane, in 1:5 for 24 h at room temperature in a shaking incubator. The liquid mixture was filtered through Whatman 40(1) filter paper. The filtrate was evaporated in an automatic rotary evaporator until 1/5 of the original volume. The solid residue was allowed to dry and again mixed with the next polar solvent, and the same process was followed. The solvent extract was kept at room temperature for drying and then stored at 4 °C for further use.

Figure 3.
Showing characteristics of methanolic solvent extracts of sorghum lines. This figure shows the results of a study to determine the color of methanolic solvent extracts of 22 sorghum lines. The results showed that the color of the methanolic solvent extracts of sorghum lines varied widely. This figure shows the distribution of colors of methanolic solvent extracts of 22 sorghum lines. The x-axis represents the 22 sorghum lines, and the y-axis represents the color of the solvent extract. The colors are represented by the color of the bars. Six lines (27%) produced lemon yellow extracts, 5 lines (23%) produced reddish-brown extracts, 3 lines (14%) were colorless, 2 lines (9%) were tinted yellow, 2 lines (9%) were pale yellow, and 1 line each produced reddish-orange, light reddish-brown, bright red, and tinted red extracts. The variation in color of the methanolic solvent extracts of sorghum lines is likely due to the different concentrations of phenolic compounds present in the sorghum grains. Phenolic compounds are known to give plant extracts a yellow or brown color. The presence of other compounds, such as carotenoids, may also contribute to the color of the extracts. The results of this study provide valuable information about the diversity of color in the methanolic solvent extracts of sorghum lines. This information could be used to develop new sorghum varieties with desired color characteristics.

Figure 4.
Qualitative phytochemical analysis of solvent extracts of different sorghum lines. One or more rows of data can be plotted as stacked bar chart or stacked area chart. Each bar represents one row, and the data along columns are plotted cumulatively. The ‘Percentage’ option converts to percentages of the row total, so that all bars will be of equal height (100%). In this figure, the presence of five phytochemicals is represented based on their intensity of color.

Figure 5.
This figure shows the comparative analysis of the antioxidant parameters TPC, FLV, FRAP, DPPH, ABTS, and NO inhibition percentage (%) in 22 sorghum lines. The methanolic solvent extract of the sorghum lines is depicted on the x-axis, and the primary y-axis represents the TPC and FLV, while the secondary y-axis represents the NO (%), DPPH (%), ABTS (%), and FRAP through lines. The values are represented as mean ± standard error, and significance is shown at p < 0.05. The significance is depicted with superscripts above the error bars of the columns and lines.

Figure 6.
Showing interaction network plot for solvent extracts of different sorghum lines. A network plot is a graphical representation of the relationships between entities. In this study, the entities were the solvent extracts of 22 sorghum lines, and the relationships were the similarities between the extracts. The network plot was created by using a 60% edge cutoff, which means that only edges with a similarity greater than 50% were included in the plot. The 60% edge cutoff was chosen because it was a reasonable balance between including enough edges to show the relationships between the lines and too many edges to make the plot cluttered. The center of the network plot is the most densely connected area, which means that the lines in this area are the most similar to each other. The network plot revealed two clusters of sorghum lines. The first cluster consisted of 7 lines with low values for the FRAP, TPC, TFC, DPPH, ABTS, and NO assays. These lines were all closely related to each other, and they had similar chemical compositions. The second cluster consisted of 15 lines with medium and high values for the assays. These lines were also closely related to each other, but they had different chemical compositions than the lines in the first cluster. The parental line 27B, the breeding line SPV2612, and the interspecific lines ISC202-C and ISC812-W were all closely related to each other. These lines were all located in the center of the network plot, and they had the highest similarity scores. The network plot provides a visual representation of the relationships between the solvent extracts of the 22 sorghum lines. This information can be used to identify lines with similar chemical compositions, and to select lines with desirable properties for breeding programs.

Figure 7.
PCA scatter biplot of antioxidants and solvent extracts of Sorghum lines. Principal component analysis (PCA) is a statistical technique that can be used to reduce the dimensionality of a dataset, while preserving the most important information. In this study, PCA was used to analyze the data on seed characteristics, antioxidant activity, and total phenolic and flavonoid content. The results of the PCA showed that two components, PC1 and PC2, described most of the variation in the data. PC1 explained 68.35% of the variation, while PC2 explained 21.37%. This means that these two components were able to capture the most important information in the dataset. The scores for PC1 and PC2 were plotted in a biplot, which is a graphical representation of the PCA results. The biplot shows how the different variables are related to each other. For example, the variables that are located close together in the biplot are more strongly correlated with each other. The biplot shows that PC1 is primarily associated with the seed characteristics, while PC2 is primarily associated with antioxidant activity and total phenolic and flavonoid content. This suggests that the seed characteristics and the antioxidant activity are two distinct but related aspects of sorghum. The PCA results provide valuable insights into the relationship between seed characteristics, antioxidant activity, and total phenolic and flavonoid content in sorghum. This information can be used to improve the breeding of sorghum with improved agronomic traits and bioactive properties.

Figure 8.
Paired group association of methanolic solvent extract of sorghum lines based on antioxidant properties. Unweighted pair-group average (UPGMA). Clusters are joined based on the average distance between all members in the two groups. The hierarchical clustering routine produces a ‘dendrogram’ showing how data points (rows) can be clustered. For ‘R’ mode clustering, putting weight on groupings of antioxidant parameters, parameters should go in rows. It is also possible to find groupings of variables or associations (Q mode), by entering taxa in columns. Switching between the two is done by transposing the matrix. In the present plot, the values varied from 1.27 to 760, which is depicted on the secondary y-axis of the cluster. The above figure is a two-way representation of the relationship between the methanolic solvent extracts of sorghum lines, which is depicted with vertical clusters, while antioxidant activity is depicted as horizontal clusters. The color band above the sorghum extract and in front of the antioxidant parameters shows the intensity of the relationship between the parameters and sorghum lines.


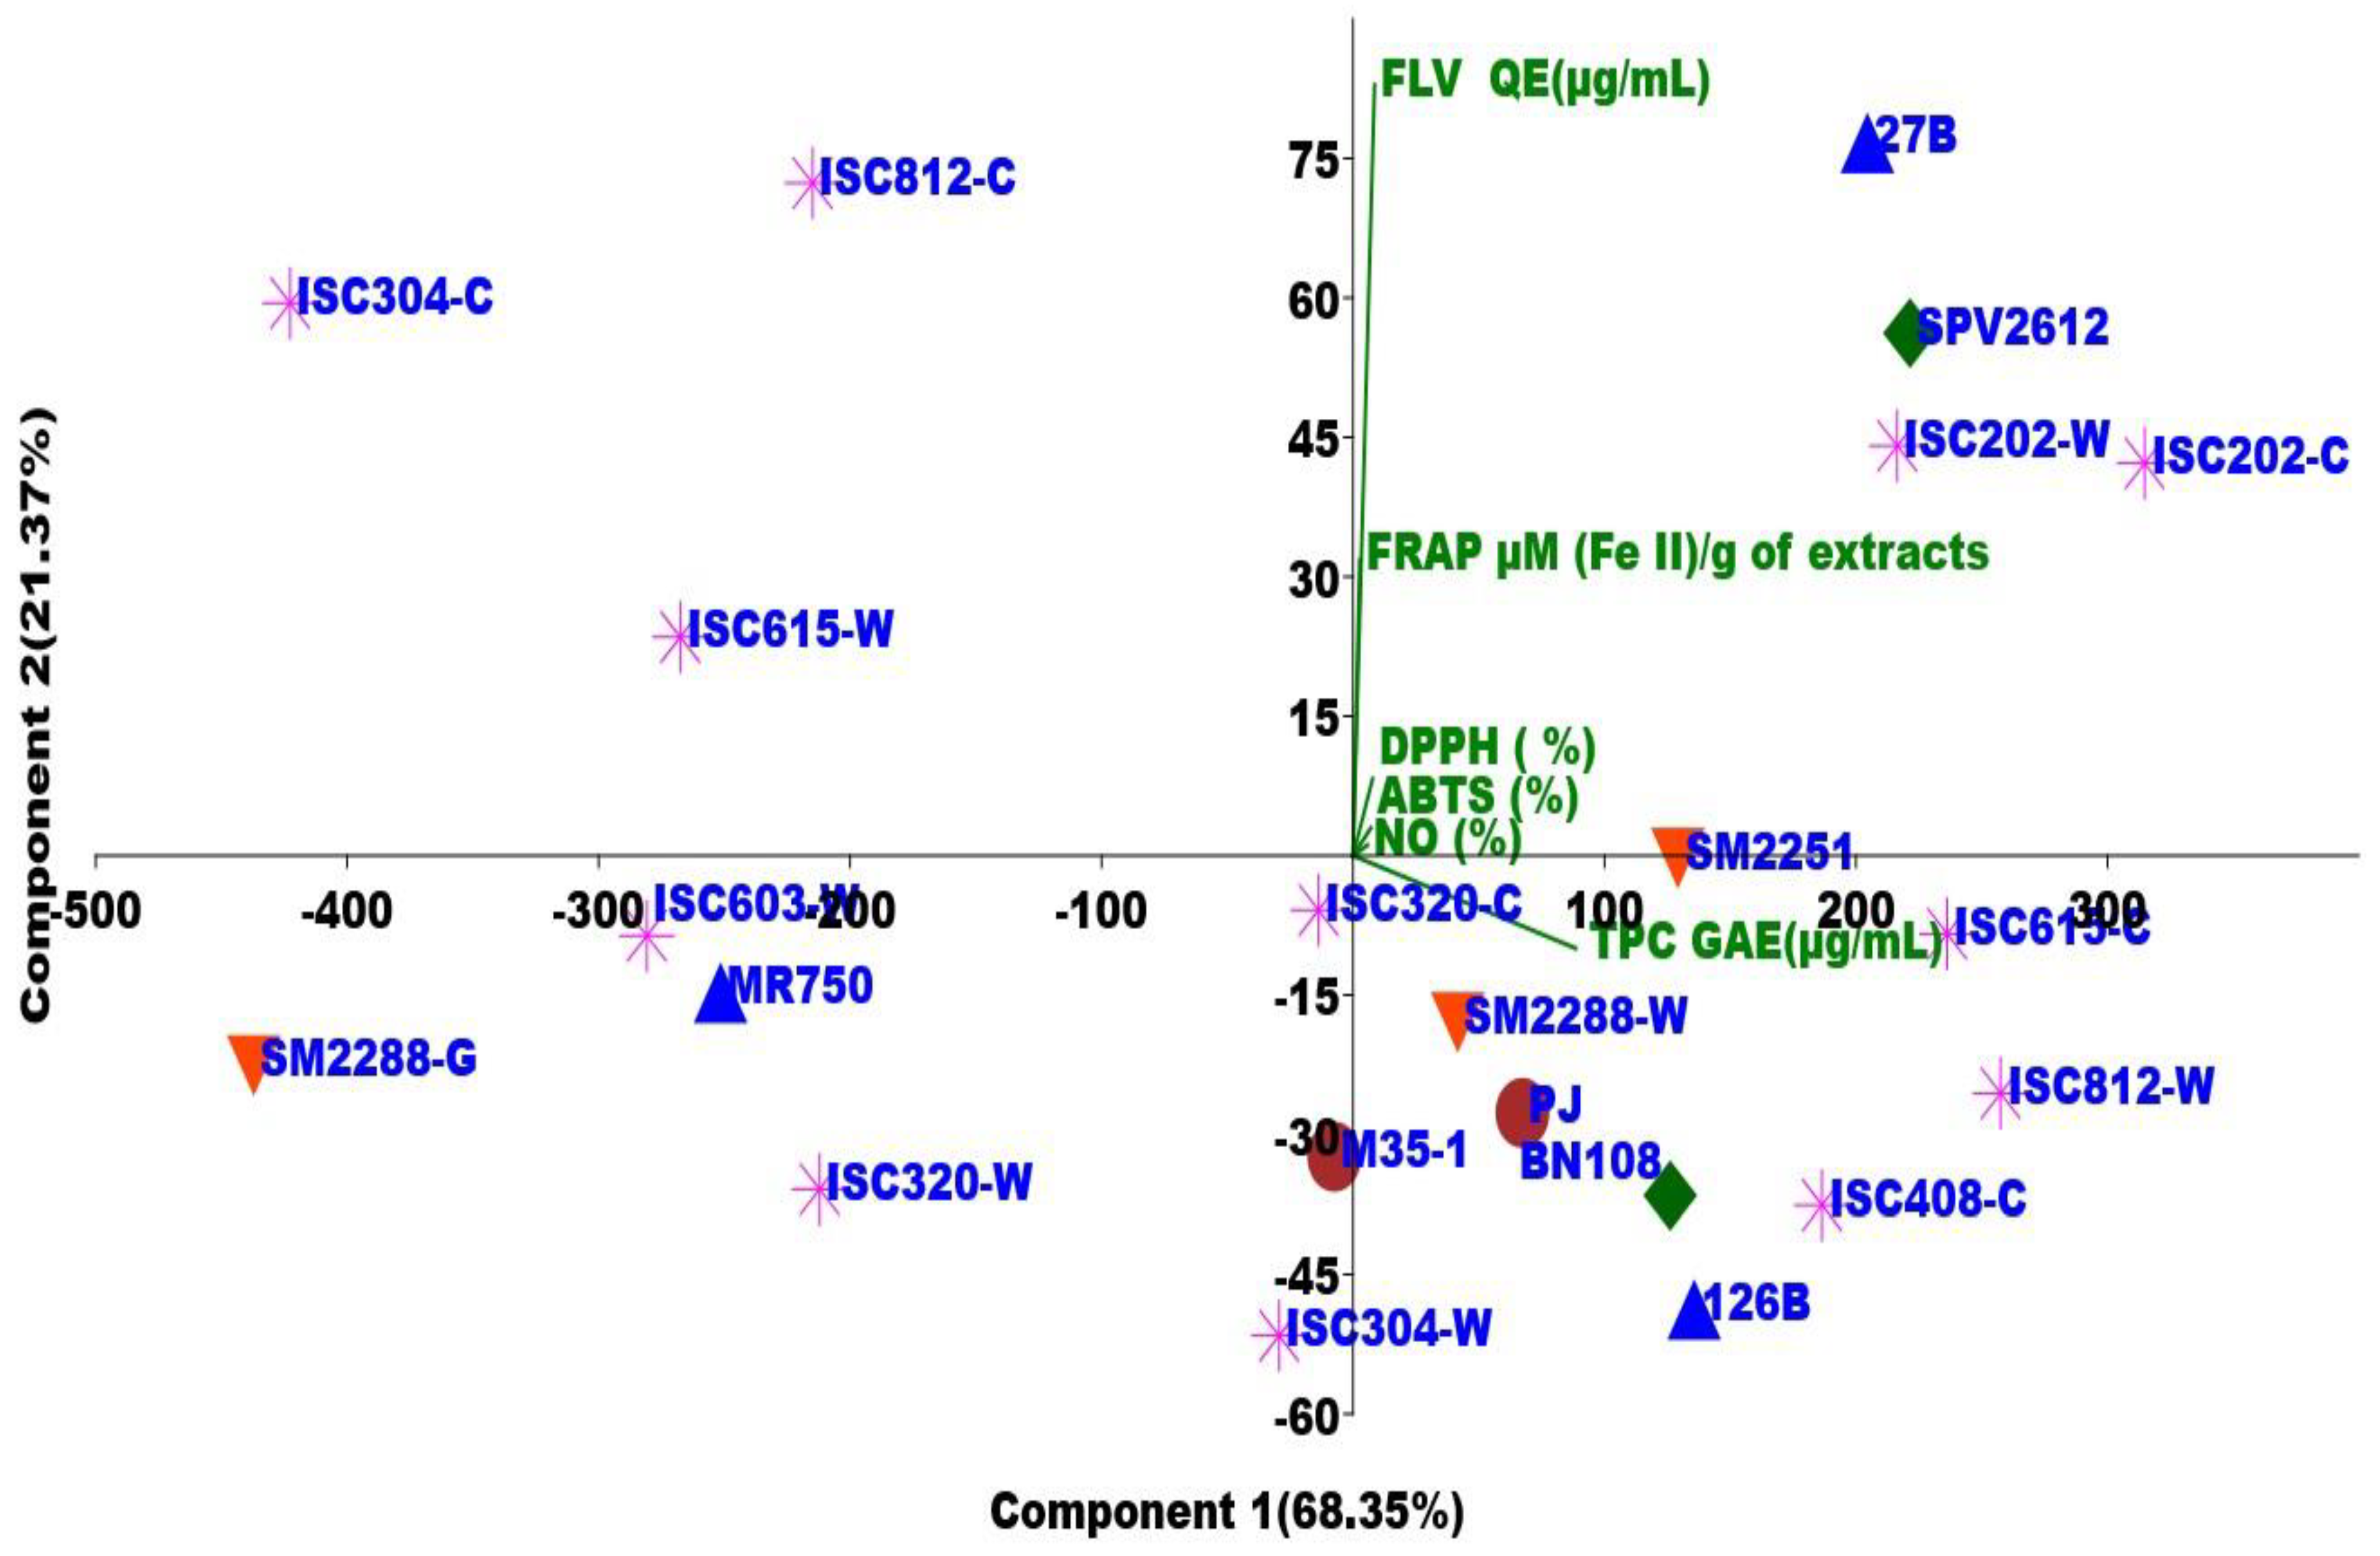
Table 1.
Details of different colored sorghum lines used in the current study.
| S. No. | Sample | Description | Pedigree | Pericarp |
|---|---|---|---|---|
| 1 | MR750 | Parental line | - | White |
| 2 | 27B | Parental line | - | White |
| 3 | 126B | Parental line | - | White |
| 4 | Pacha Jonna | Cultivated | - | Yellow |
| 5 | M35-1 | Cultivated | - | White |
| 6 | SM2288-G | Intergeneric | MR750 X CM218 | Grey |
| 7 | SM2288-W | Intergeneric | MR750 X CM218 | White |
| 8 | SM2251 | Intergeneric | 126B X CM108 | Reddish-brown |
| 9 | SPV2612 | Improved breeding line | - | Red |
| 10 | BN108 | Improved breeding line | - | Bright red |
| 11 | ISC202-C | Interspecific | 27B X S. halepens | Red |
| 12 | ISC202-W | Interspecific | 27B X S. halepens | White |
| 13 | ISC304-C | Interspecific | 27B X S. versicolor | Pinkish |
| 14 | ISC304-W | Interspecific | 27B X S. versicolor | White |
| 15 | ISC320-C | Interspecific | 126B X S. versicolor | Reddish-brown |
| 16 | ISC320-W | Interspecific | 126B X S. versicolor | White |
| 17 | ISC408-C | Interspecific | AKMS X S. purpuresericeum | Orangish red |
| 18 | ISC603-W | Interspecific | SSV84 X S. australians | White |
| 19 | ISC615-C | Interspecific | SSV84 X S. australians | Bronze |
| 20 | ISC615-W | Interspecific | SSV84 X S. australians | White |
| 21 | ISC812-C | Interspecific | 27B X S. usumberanse | Whitish-brown |
| 22 | ISC812-W | Interspecific | 27B X S. usumberanse | White |
Table 2.
Quantitative analysis of solvent extracts of different sorghum lines.
| Extracts | DPPH (%) | ABTS (%) | NO (%) | TPC GAE (μg/mL) | TFC QE (μg/mL) | FRAP µM (Fe II)/g of Extracts |
|---|---|---|---|---|---|---|
| MR750 | 35.27 ± 2.58 h | 26.53 ± 1.79 ij | 22.7 ± 2.44 g | 206.08 ± 15.46 m | 26.49 ± 4.43 l | 8.59 ± 1.65 jk |
| 27B | 70.19 ± 2.77 bc | 59.28 ± 1.11 c | 43.27 ± 3.8 bcd | 647.75 ± 10.42 ef | 153.26 ± 4.64 a | 61.78 ± 7.12 a |
| 126B | 57.97 ± 1.93 d | 53.11 ± 2.42 d | 42.39 ± 3.36 bcd | 592.75 ± 10.08 g | 30.26 ± 5.46 kl | 14.81 ± 4.04 hi |
| Pacha Jonna | 55.56 ± 3.22 de | 43.34 ± 2.19 f | 35.01 ± 4.03 ef | 523.58 ± 6.36 h | 42.15 ± 6.36 hi | 23.45 ± 3.33 fg |
| M35-1 | 28.99 ± 2.9 i | 37.08 ± 2.95 g | 24.38 ± 4.41 g | 452.19 ± 10.24 j | 33.71 ± 6.81 jk | 17.67 ± 4.79 h |
| SPV2612 | 79.66 ± 1.42 a | 63.66 ± 2.34 b | 47.36 ± 4.35 b | 665.53 ± 18.87 d | 134.1 ± 5.2 b | 56.5 ± 9.22 a |
| BN108 | 54.69 ± 1.51 de | 48.22 ± 1.11 e | 41.59 ± 3.05 cd | 582.75 ± 12.97 g | 38.32 ± 5.62 ij | 26.45 ± 8.01 ef |
| ISC202-C | 79.71 ± 0.97 a | 68.27 ± 2.91 a | 53.73 ± 2.79 a | 759.69 ± 12.5 a | 133.82 ± 6.36 b | 46.53 ± 5.46 b |
| ISC202-W | 73.91 ± 0.97 b | 63.35 ± 1.72 b | 45.93 ± 2.52 bc | 662.19 ± 7.41 de | 123.82 ± 6.36 c | 49.56 ± 5.29 b |
| ISC304-C | 8.21 ± 2.25 j | 5.31 ± 2.02 l | 3.85 ± 1.78 j | 31.92 ± 3.94 op | 75.49 ± 5.55 e | 45.39 ± 8.55 b |
| ISC304-W | 34.3 ± 2.58 h | 30.87 ± 3.07 h | 24.52 ± 2.46 g | 432.19 ± 3.82 k | 12.71 ± 2.1 m | 11.09 ± 1.84 ij |
| ISC320-C | 46.96 ± 1.45 f | 36.34 ± 2.29 g | 25.01 ± 2.96 g | 441.92 ± 4.74 jk | 54.65 ± 5.42 g | 30.11 ± 3.31 de |
| ISC320-W | 30.92 ± 1.61 hi | 26.53 ± 1.79 ij | 14.73 ± 1.4 i | 248.58 ± 10.84 l | 8.01 ± 1.18 mn | 11.78 ± 3.33 ij |
| ISC408-C | 71.01 ± 2.9 bc | 63.97 ± 3.9 b | 43.02 ± 3.82 bcd | 640.8 ± 14.68 f | 41.51 ± 7.19 hi | 27.67 ± 7.38 ef |
| ISC603-W | 26.57 ± 2.58 i | 24.27 ± 2.96 j | 17.52 ± 3.45 hi | 177.19 ± 10 n | 30.76 ± 8.78 kl | 8.34 ± 1.05 jk |
| ISC615-C | 69.18 ± 2.64 bc | 64.99 ± 1.99 ab | 52.71 ± 3.94 a | 687.19 ± 7.95 c | 75.9 ± 4.57 e | 34.95 ± 3.15 cd |
| ISC615-W | 33.82 ± 1.61 h | 27.75 ± 2.37 hij | 17.24 ± 3.43 hi | 186.64 ± 8.39 n | 55.04 ± 7.38 g | 36.5 ± 7.52 c |
| ISC812-C | 40.1 ± 1.61 g | 29.89 ± 2.99 hi | 20.15 ± 2.99 gh | 233.58 ± 16.78 l | 108.54 ± 7.56 d | 47.7 ± 3 b |
| ISC812-W | 68.12 ± 0.97 c | 64.48 ± 3.53 b | 53.03 ± 4.6 a | 710.25 ± 5.91 b | 66.76 ± 6.59 f | 17.89 ± 4.77 gh |
| SM2251 | 52.42 ± 1.58 e | 46.74 ± 1.82 ef | 39.98 ± 5.23 de | 582.47 ± 13.57 g | 73.12 ± 5.63 e | 38.81 ± 4.92 c |
| SM2288-G | 10.63 ± 1.61 j | 9.34 ± 1.79 k | 6.02 ± 3.1 j | 24.97 ± 3.47 op | 1.27 ± 1.27 n | 4 ± 2.1 k |
| SM2288-W | 56.04 ± 2.25 de | 46.85 ± 1.79 ef | 32.74 ± 2.32 f | 496.64 ± 13.8 i | 46.9 ± 4.98 h | 29.73 ± 5.26 de |
Here data are being represented as Average± standard error, n = 3. The different superscript in same column represents significant difference at 5% level (p < 0.05).
Disclaimer/Publisher’s Note: The statements, opinions and data contained in all publications are solely those of the individual author(s) and contributor(s) and not of MDPI and/or the editor(s). MDPI and/or the editor(s) disclaim responsibility for any injury to people or property resulting from any ideas, methods, instructions or products referred to in the content. |
© 2024 by the authors. Licensee MDPI, Basel, Switzerland. This article is an open access article distributed under the terms and conditions of the Creative Commons Attribution (CC BY) license (https://creativecommons.org/licenses/by/4.0/).
Share and Cite
MDPI and ACS Style
Meena, K.; Meena, D.K.; Jacob, J.; Aruna, C.; Visarada, K.B.R.S. Unveiling the Antioxidant Arsenal of Colored Sorghum: A Path to Functional Food Development. Agriculture 2024, 14, 566. https://doi.org/10.3390/agriculture14040566
AMA Style
Meena K, Meena DK, Jacob J, Aruna C, Visarada KBRS. Unveiling the Antioxidant Arsenal of Colored Sorghum: A Path to Functional Food Development. Agriculture. 2024; 14(4):566. https://doi.org/10.3390/agriculture14040566
Chicago/Turabian StyleMeena, Kanti, Dharmendra K. Meena, Jinu Jacob, Chandrasekhar Aruna, and Kurella Bala Rama Saraswati Visarada. 2024. "Unveiling the Antioxidant Arsenal of Colored Sorghum: A Path to Functional Food Development" Agriculture 14, no. 4: 566. https://doi.org/10.3390/agriculture14040566
Note that from the first issue of 2016, this journal uses article numbers instead of page numbers. See further details here.