
Locating Two-Level Systems in a Superconducting Xmon Qubit
by
 , , , and
Xin-Xin Yang
1,
Xiao-Yan Yang
1,
Liang-Liang Guo
1,
Lei Du
1,
Peng Duan
1,
Zhi-Long Jia
1,
Hai-Ou Li
1,* and
Guo-Ping Guo
1,2,* 1
CAS Key Laboratory of Quantum Information, University of Science and Technology of China, Hefei 230026, China
2
Origin Quantum Computing Company Limited, Hefei 230088, China
*
Authors to whom correspondence should be addressed.
Appl. Sci. 2023, 13(11), 6672; https://doi.org/10.3390/app13116672
Submission received: 30 March 2023
/
Revised: 5 May 2023
/
Accepted: 29 May 2023
/
Published: 30 May 2023
(This article belongs to the Special Issue Superconducting Quantum Computing and Devices)
Abstract
:One significant source of decoherence in superconducting circuits is known as two-level systems (TLSs), found in amorphous oxide layers. These circuits can, however, also be utilized as spectral and temporal TLS probes. Comprehensive investigations on the physics of TLSs are now possible thanks to recent advancements in superconducting qubits. Here, we simultaneously measure the tunable Xmon qubit decoherence time as well as the resonance frequency for more than 3 days to investigate stochastic fluctuations. Time-domain Allan deviation and frequency-domain power spectral density analysis indicate that two TLSs in near resonance with the qubit are responsible for the fluctuations. From the extracted oscillation in decay, we locate the two TLSs near the junctions.
1. Introduction
Superconducting qubits are attractive candidates for the construction of quantum computers. They are now moving into the era of ‘noisy intermediate-scale quantum’ (NISQ) technology [1], and preliminary error correction algorithms have been implemented [2,3,4,5,6]. In the NISQ region, qubit fluctuations directly limit the circuit depth of the algorithm. Therefore, further progress in this system requires not only instant high-fidelity single- and two-qubit gates but also longer coherence times and stable performance.
Generally, fluctuations in decoherence time and qubit frequency have been attributed to quasiparticles or TLS defects [7,8]. The intrinsic properties of quasiparticles have been deeply investigated in recent decades [9,10,11,12,13,14,15,16]. However, the microscopic nature and locations of the TLSs still remain undetermined [17]. Although the inherent losses induced by TLSs restrict the performance of superconducting circuits made of aluminum or niobium, these circuits, including superconducting coplanar waveguide (CPW) resonators and superconducting qubits, are effective tools to investigate TLSs.
TLS defects have been investigated using different methods based on superconducting qubits, such as direct microwave spectroscopy [18,19,20,21,22,23,24,25], strain spectroscopy [26,27,28], long-term time-domain measurement [29,30,31,32,33,34], dielectric loss and participation ratio [35,36,37]. These works partially analyze spectral or temporal data, or demonstrate with fixed-frequency qubits. Here, we both spectrally and temporally analyze the relaxation time fluctuations and qubit frequency fluctuations of a frequency-tunable Xmon qubit and discover that two independent Lorentzians are needed to describe the fluctuations. We then focus on the original data of fluctuations and find two unusual oscillations. From the fitting of the oscillation data, we calculate the couplings between the qubit and TLS and find that two near-resonant TLSs are possibly located near the junctions.
2. Device and Methods
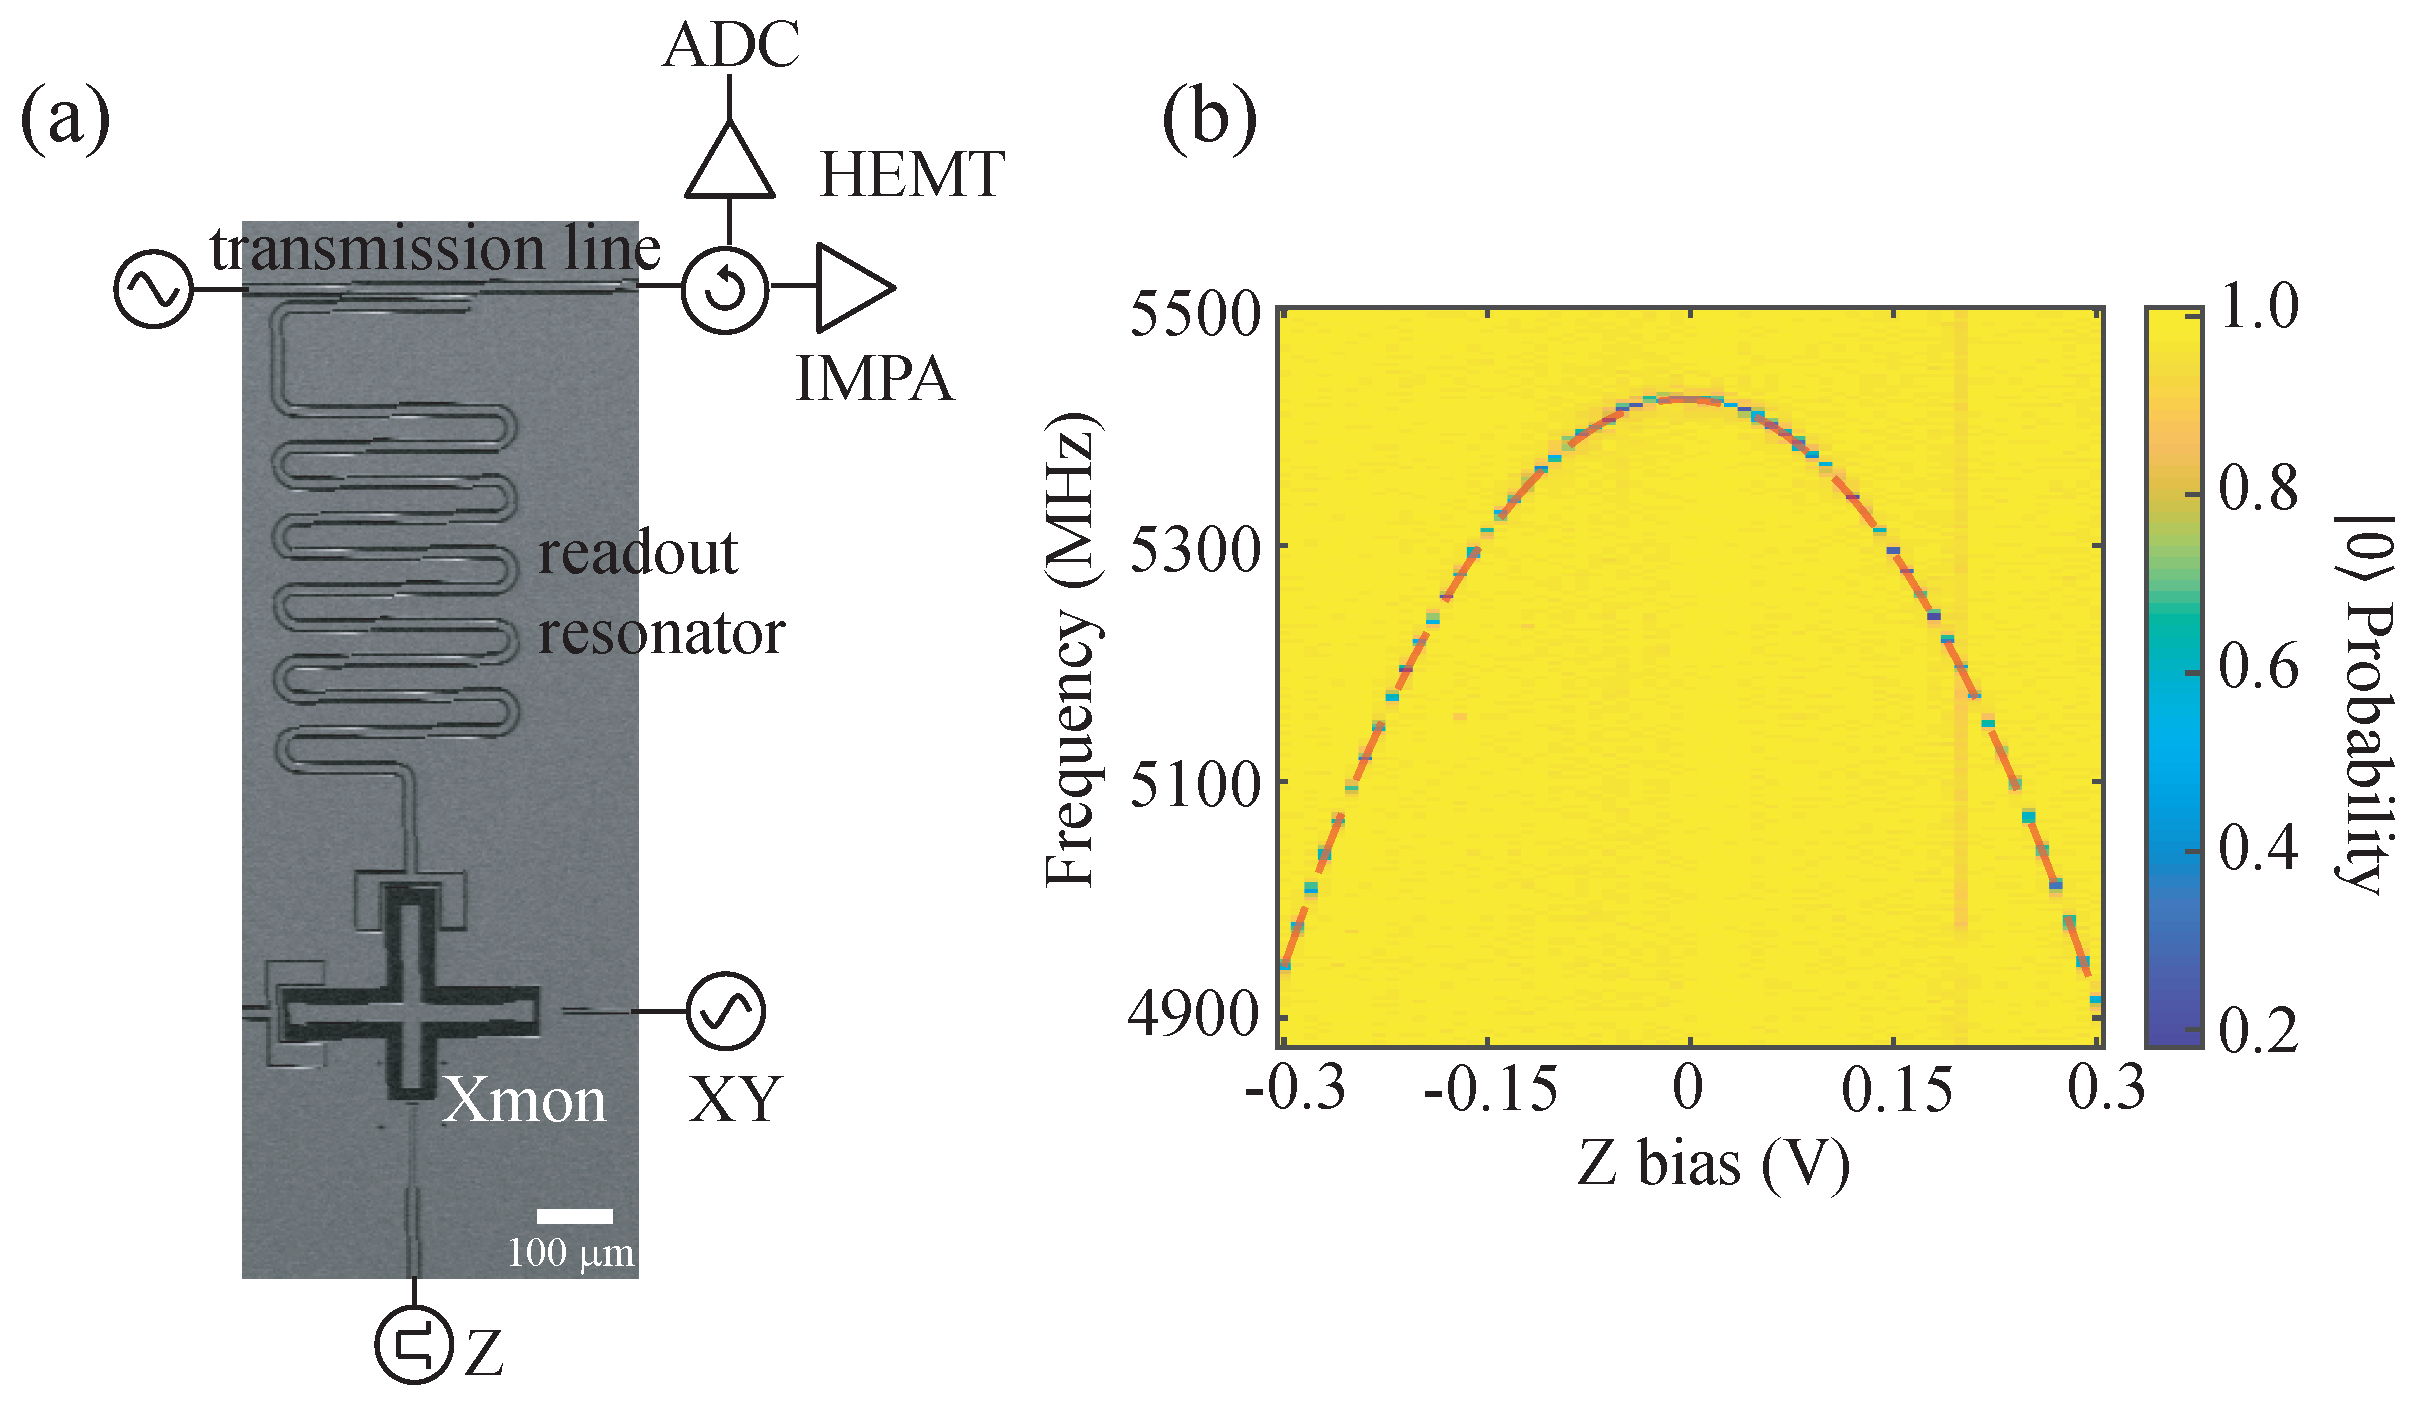
We use the endmost qubit of a tunable six-Xmon-qubit-chain device to probe the TLS defects [38,39] as shown in Figure 1a. The qubit is made of aluminum on silicon, with a large shunt capacitor to decouple the charge noise. The qubit is equipped with a microwave XY control line, a flux bias Z line for tuning the frequency, and an individual readout resonator. The maximum transition frequency of the qubit is , and the qubit anharmonicity is . The bare frequency of the readout resonator is MHz, which lies in the dispersive regime. The other five qubits are modulated to the lowest frequencies with significant frequency differences from the operating qubit, leaving them fully uncoupled.
By adding a Z bias pulse behind the driving, we demonstrate the frequency spectroscopy of the qubit. The result is shown in Figure 1b. The frequency of the qubit versus Z bias amplitude is extracted and fitted by
where 5423.5 MHz, 23.7 MHz, 0.2447, 2.062, and −0.0043 V, respectively. Due to the large junction area (≈1 µm2), previous experiments have revealed characteristic level avoidance or anti-crossing on superconducting phase qubits [18,19,20,21,22], flux qubits [23,24], and Quantronium [25]. However, the junction area of the Xmon qubit used in this experiment is ≈200 nm2, and the spectroscopy in Figure 1b shows no obvious anti-crossing. The result implies that the TLS density per junction area is too low to be detected with a 1 MHz frequency resolution and 1 min timescale.
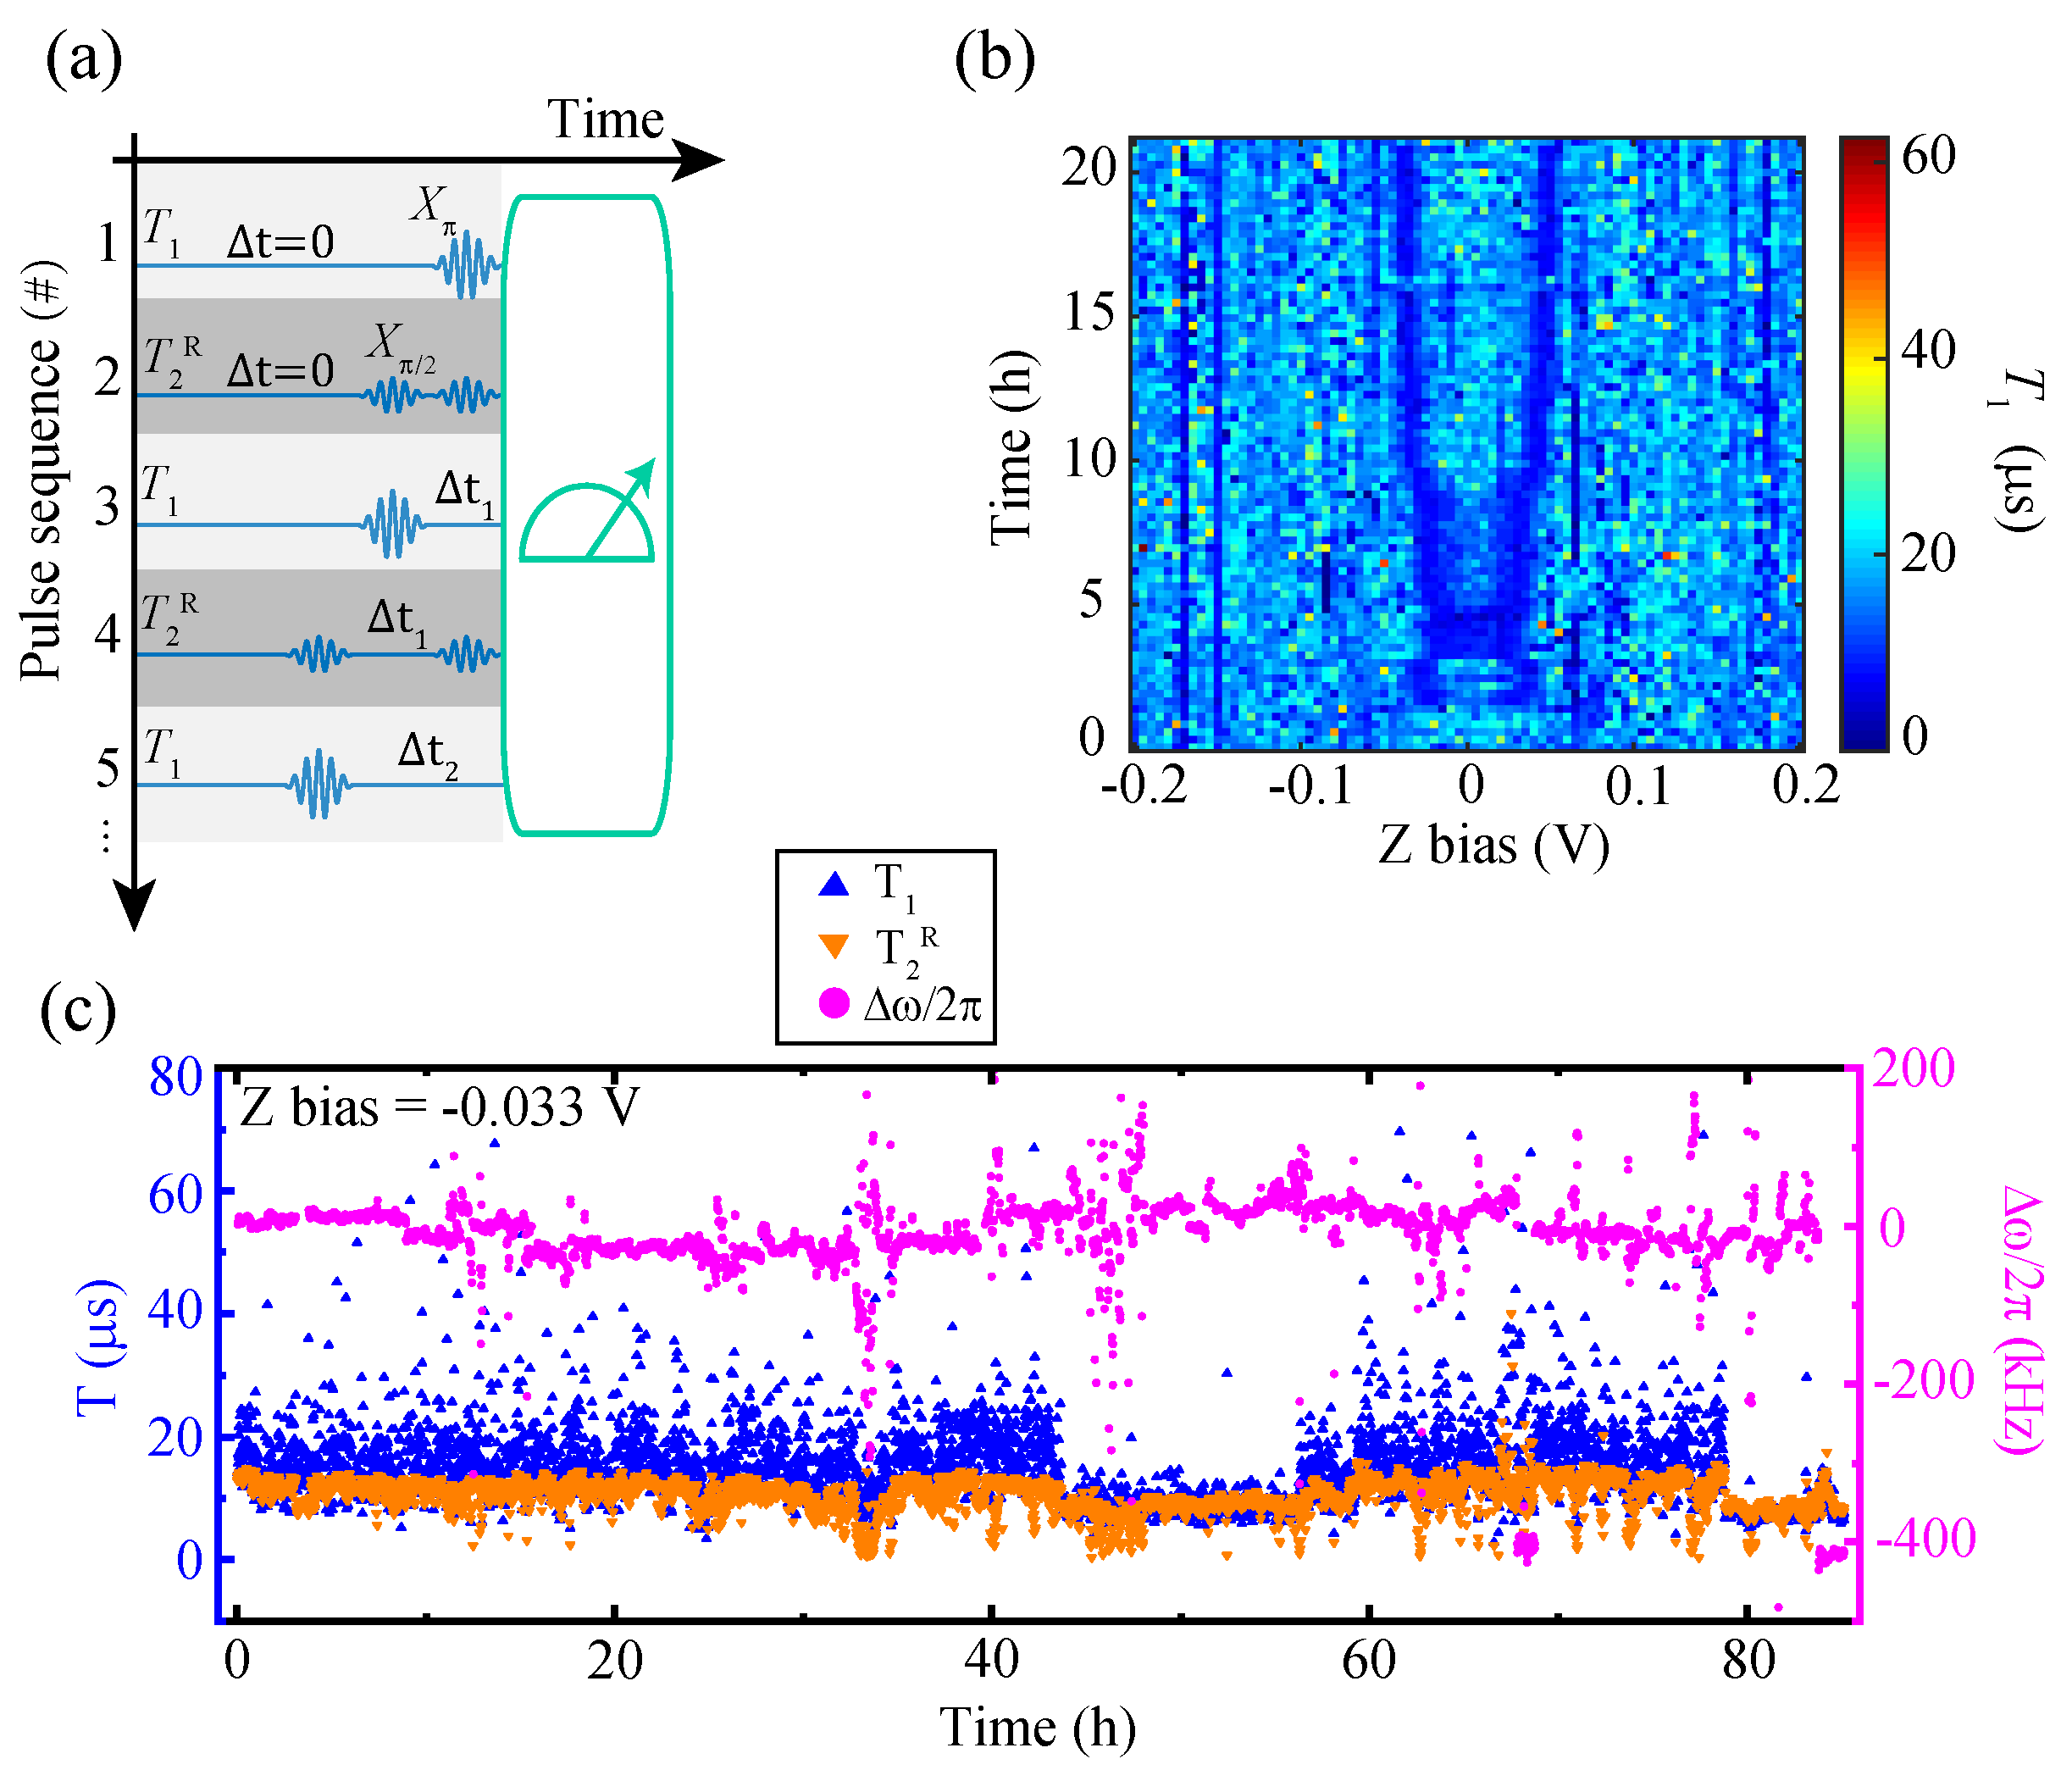
Then, we evaluate the fluctuations of the qubit relaxation time with different qubit frequencies, both by sweeping the Z bias and by consecutive measurements. The experimental pulse sequence that we use to measure at a single frequency is shown in Figure 2a with odd pulse sequences. The qubit is driven to the first-excited state by a calibrated pulse. After waiting for a variable free evolution time , the population of the excited state is measured. is determined by fitting the population to a single-exponential decay as a function of . We sweep a frequency range across 230 MHz and a spanning time of up to 21 h with 0.005 V and 16 min step sizes. There is an obvious time-varying reduction in between −0.05 V and 0.05 V as shown in Figure 2b.
To elucidate the origin of the observed time-varying reduction of , we tune the qubit to , where the qubit frequency is . Using the interleaved sequences shown in Figure 2a, we acquire the qubit parameters at once, including the lifetime , decoherence time , and qubit frequency shift . The whole sequence takes approximately 65 s. While the interleaved sequences prolong the time to obtain a single parameter, which leads to an increased noise window, it ensures that each data point of , , and is exposed to the same noise environment. By repeatedly running the sequences shown in Figure 2a, we monitored the stability of the parameters. Figure 2c shows the results of 4700 sequence repetitions over 85 h.
3. Time and Frequency Domain Analyses
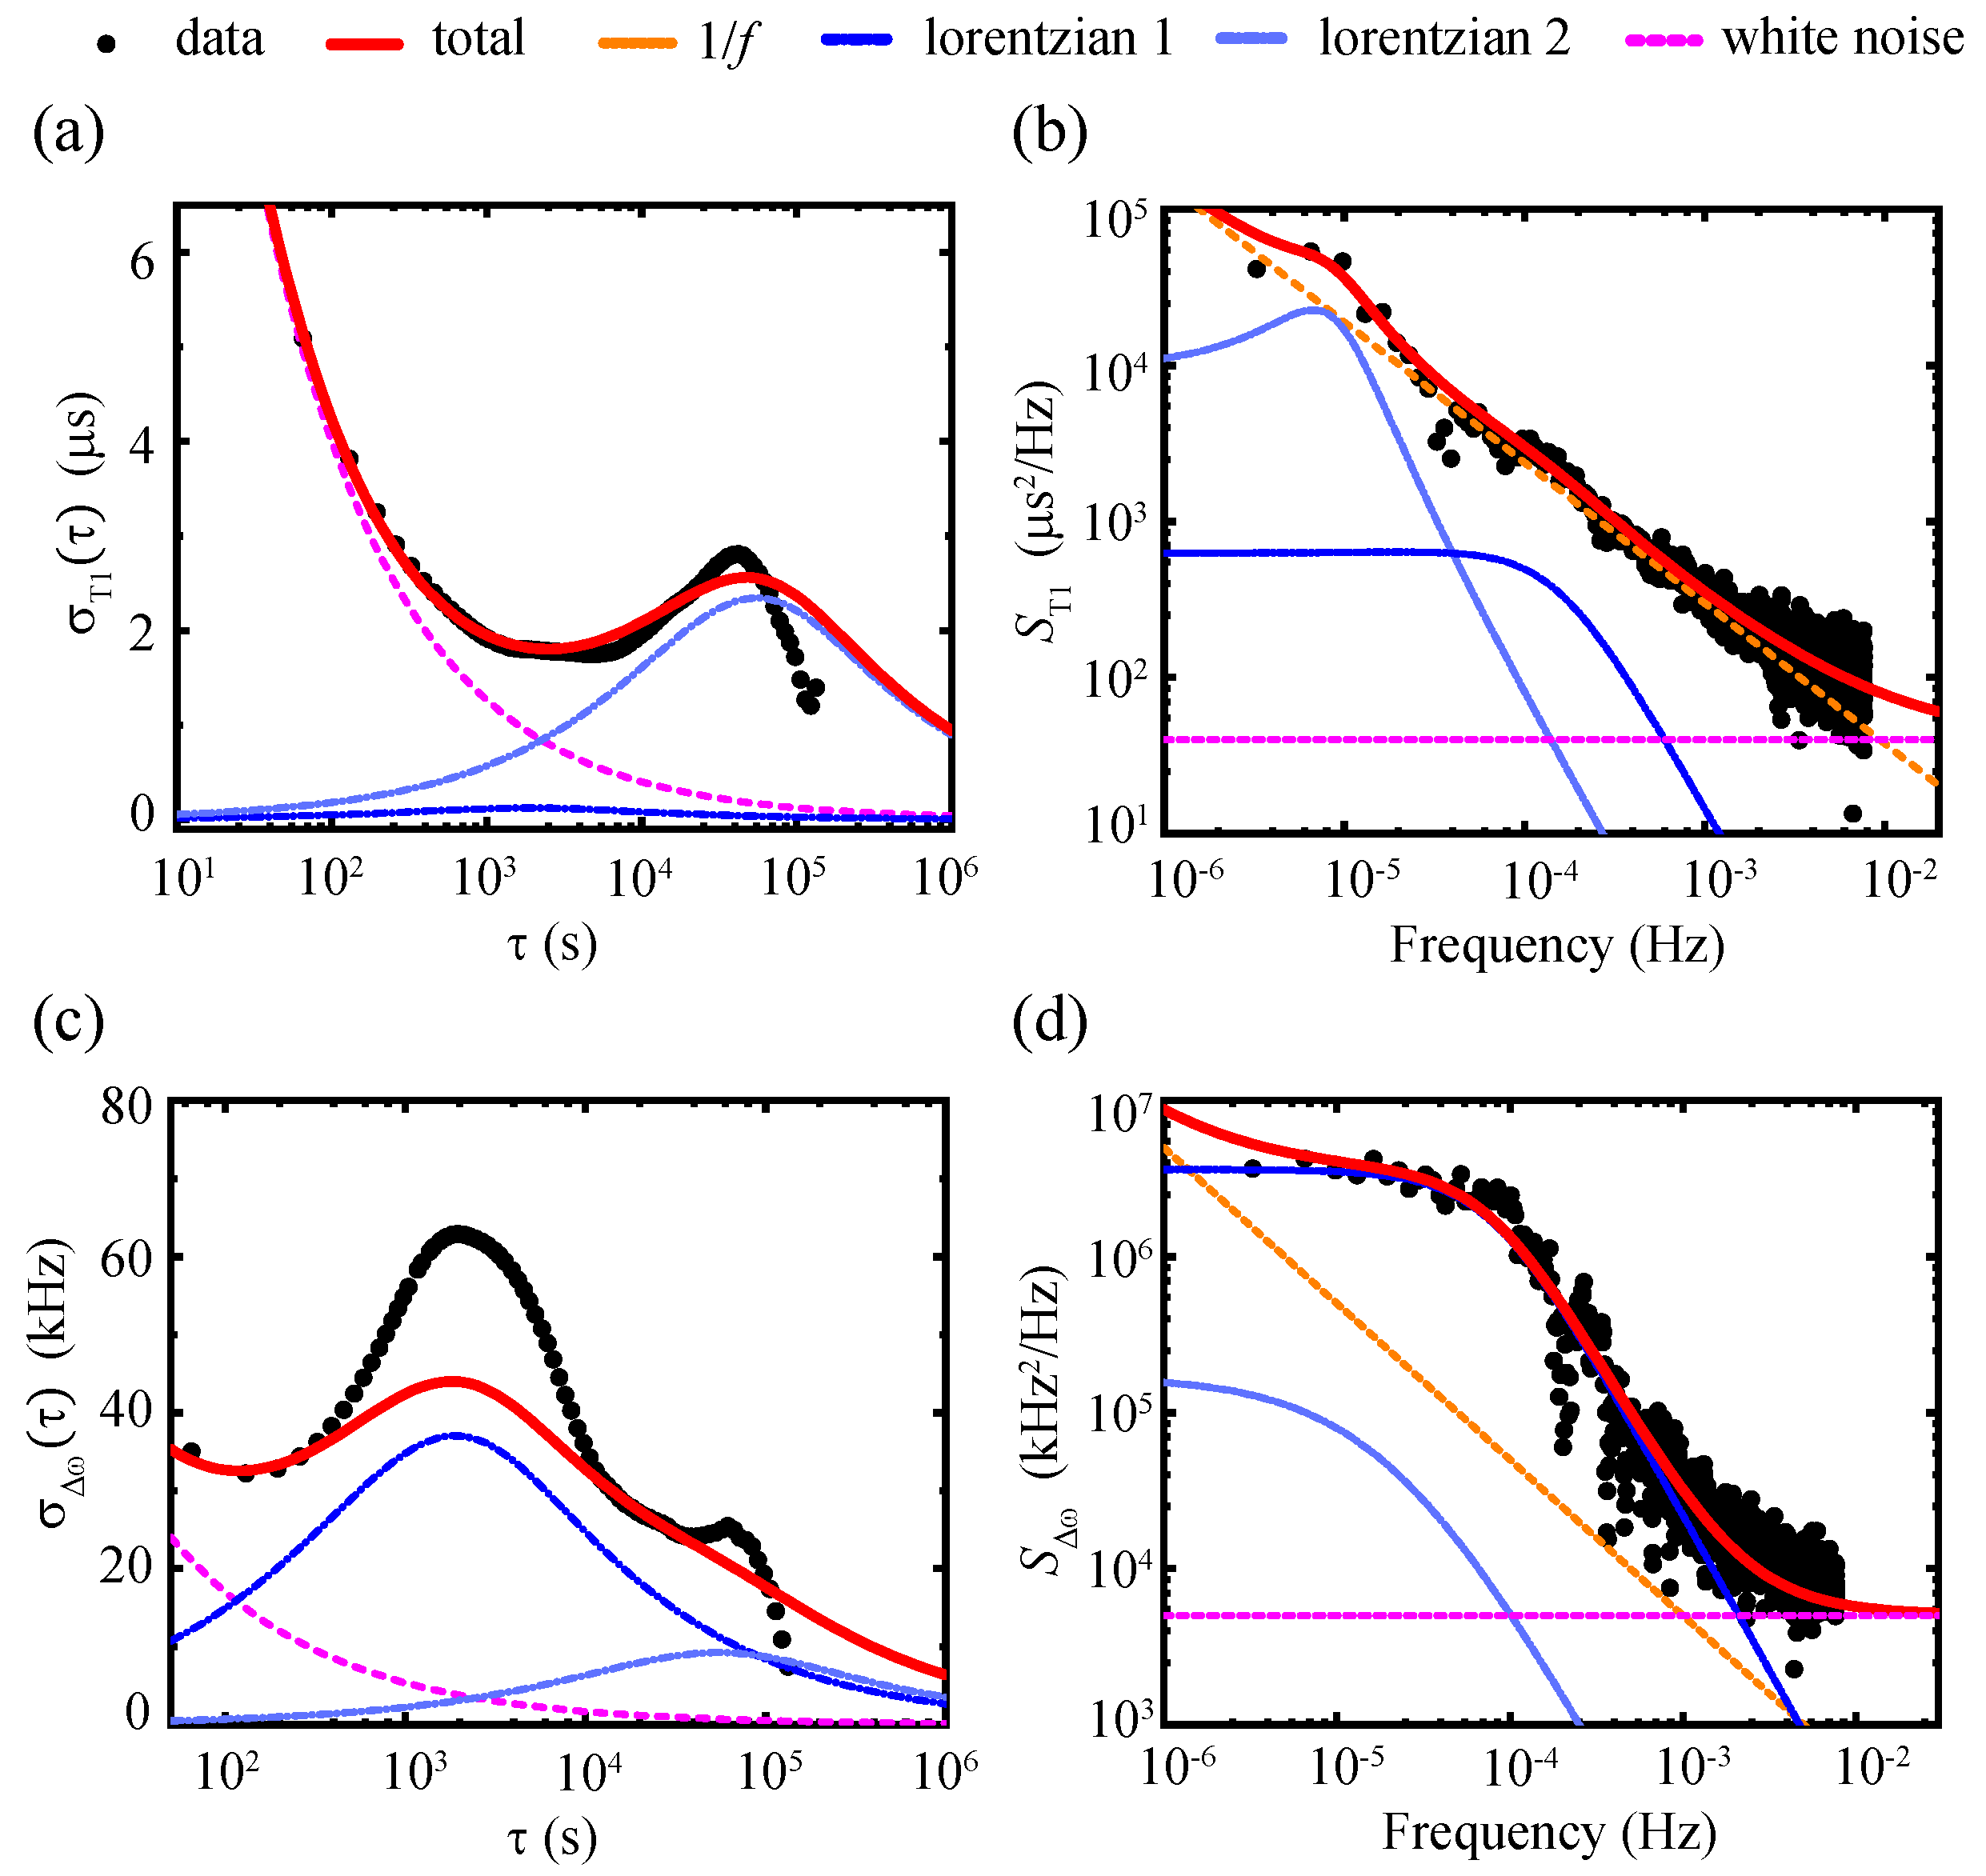
In this work, we conduct statistical analyses that are commonly used in frequency metrology [40]. We investigate both the Allan deviation and the power spectrum density of and fluctuations in Figure 2c, respectively, and the results are displayed in Figure 3.
The Allan deviation is a commonly used parameter in time-domain analysis, which helps to determine the nature of the stochastic processes responsible for data noise [41]. The slope of the Allan deviation, which corresponds to different kinds of noise, can be fitted to
where the first three terms represent white noise, noise, and random walk noise, respectively, and is the corresponding noise amplitude [42]. The last term stands for the exponentially correlated (Lorentzian) noise, which is the only noise process that can explain the single peak in the Allan analysis, where A is the noise amplitude and is the characteristic timescale [31]. In Figure 3a, we model the fluctuations by two Lorentzians with a white noise floor, and we obtain correlation times of approximately s and s. For the Allan deviation in Figure 3c, the correlation times are the same as the fluctuations but with different amplitudes. Considering that the typical quasiparticle tunneling rate in transmons is in the range of 0.1 kHz to 30 kHz, we conclude that the two Lorentzians correspond to two TLSs.
Another typical frequency domain analysis technique is the power spectral density (PSD) [43]. Similar to Equation (2), the noise PSD can also be represented by
where the four terms represent white noise, noise, random telegraph noise, and exponentially correlated (Lorentzian) noise [42], with denoting the noise amplitude for the first three terms. is the full width at half of the maximum (FWHM) of the Lorentzian, and is the characteristic frequency. Similar to the results of Allan variance, the PSD of the and fluctuations can also be modeled by two Lorentzians of the same characteristic frequencies but different FWHMs, with and a white noise floor. Again, it is confirmed that there are two TLSs affecting the qubit.
4. TLS Location
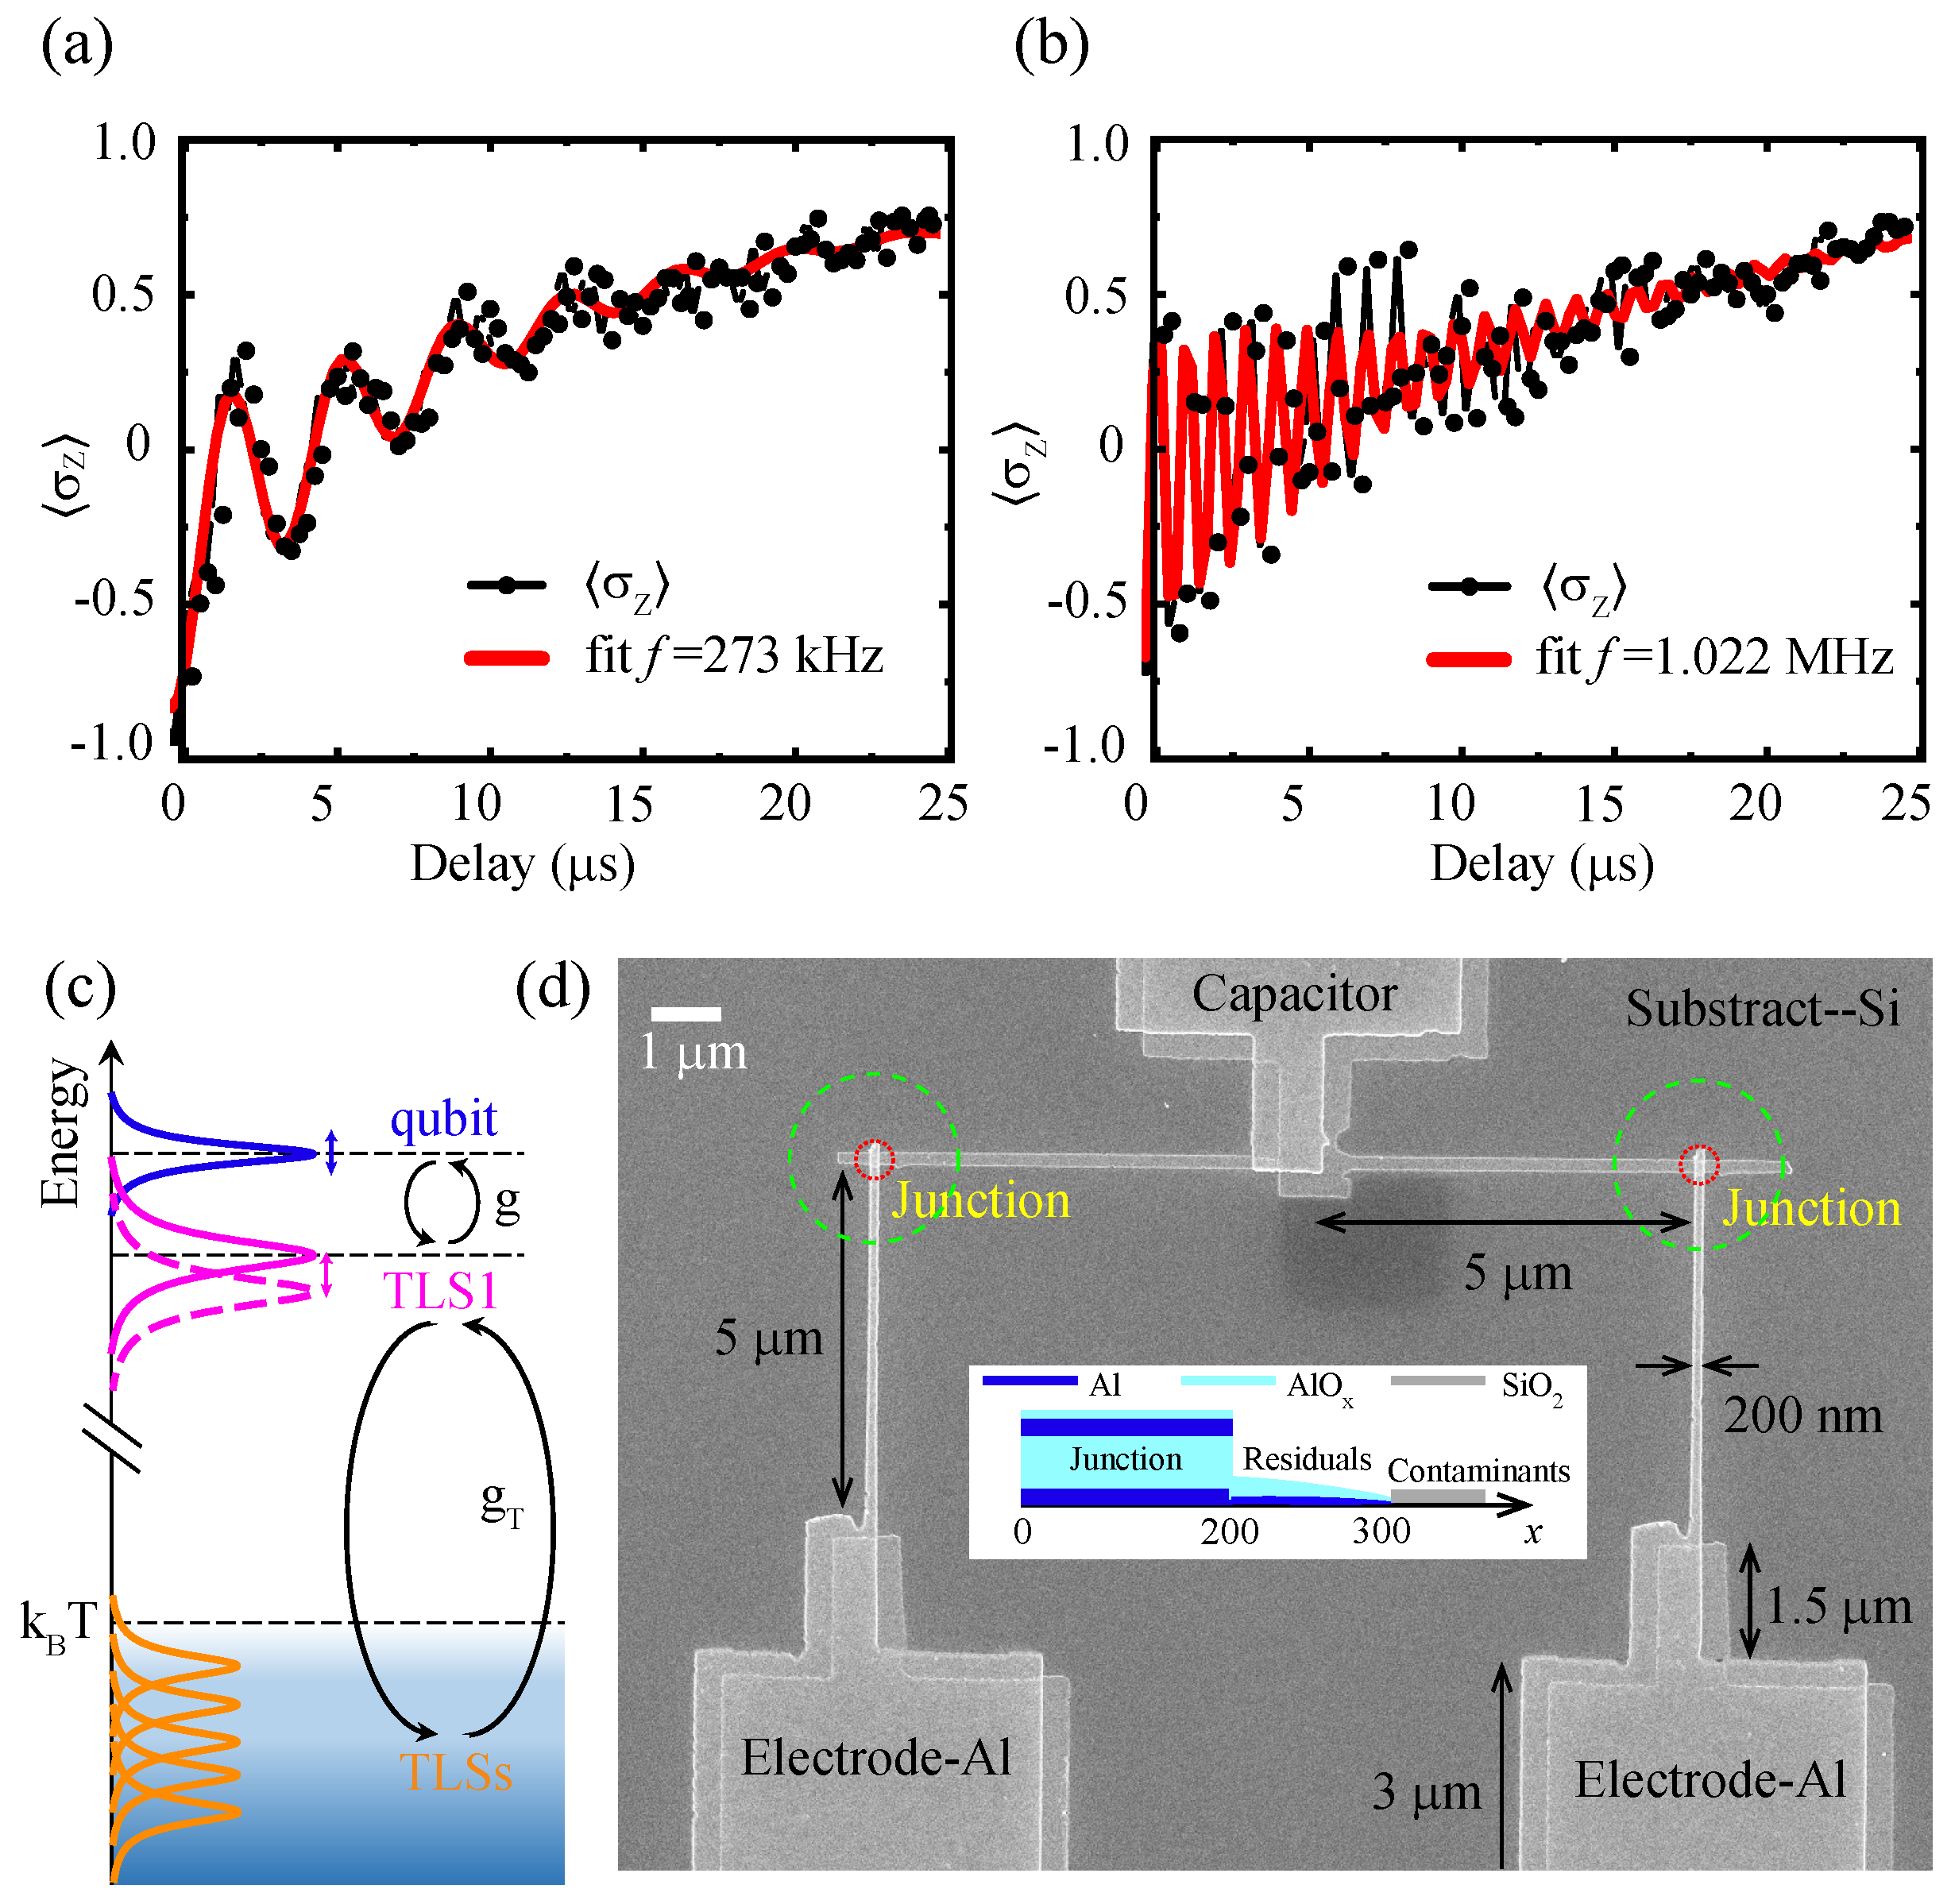
We can explain the fluctuations in Figure 2c using the interacting TLS model, where defects can not only interact with the qubit but also mutually interact with themselves [17], as shown in Figure 4c. If the transition energy of a TLS is below or near the thermal level , it undergoes stochastic state switching that is thermally activated. Longitudinal coupling between the TLS with high transition energy near the qubit frequency (labeled as ‘TLS1’) and TLSs with energies below the thermal level causes telegraphic fluctuation or spectral diffusion of the TLS1 frequency. This temporal frequency fluctuation of TLS1 results in the qubit parameters variations. In cases where the frequency of TLS1 is close to the qubit frequency, the coupling strength g becomes larger than , and we can simplify the model to two-qubit resonant coupling, where energy swap between the TLS1 and the qubit will happen.
To locate the TLSs, we re-examine the raw data. Typically, the qubit decays exponentially to the state due to spontaneous emission as the delay after the pulse increases. However, we find two types of revival oscillations as shown in Figure 4a,b. All the other qubits in this device are tuned far away from the operation qubit, so the interaction between the qubits can be neglected. For quasiparticles, we discuss in the previous section that the quasiparticle tunneling rate is higher than the characteristic frequency of Allan deviation. The effect of quasiparticles on the qubit relaxation time usually remains in the form of exponential decay [13]. Both phase and flux qubits have also been found to exhibit these revivals [21,24], which were explained by coherently coupled TLSs residing in the qubit junctions. Accordingly, the revival oscillations are attributed to the energy exchange between the qubit and the two-level systems. The coupling strength g between a single TLS and the qubit can be extracted by fitting the oscillation to
where is the measured expected value of the Pauli matrix, is the thermal equilibrium background, and are the amplitude and relaxation rate of the two hybridized degenerate states to , and , f, describe the amplitude, frequency, and decay rate of the oscillation in [32], respectively. The two oscillation frequencies in Figure 4a,b are , and , respectively.
These parameters can be rewritten by the coupling strength g as
where is the energy gap between the TLS and the qubit. From this model, we find that the coupling strengths of the two TLSs are and . The energy differences between the two TLSs and the qubit are and , respectively. The coupling strengths and the energy differences are smaller than the scanning steps of Figure 1b, so we cannot find any anti-crossings in the spectroscopy.
By assuming the qubit is coupled with the TLS through an electric field and considering that the TLS dipole moment is [19], the minimal length of the electric field line, x, can be estimated by
where is the qubit’s charging energy, h is the Planck constant and is the working frequency of the qubit. In this work, µm, and µm. The coupling strength between the qubit and the TLS lying in the amorphous tunnel barrier of the qubit junction is generally tens to hundreds of megahertz, much larger than the coupling strengths we measured. The junction area of the sample is approximately 200 nm2, and there also exist fabrication residuals, atmospheric contaminants, and substrate surface amorphization resulting from circuit patterning around the junction electrodes as shown in the insert of Figure 4d [27,44,45]. Overall, we consider that these two TLSs are located in the area of the SQUID close to the junctions, marked with green and red concentric circles in Figure 4d.
5. Conclusions
In this study, we first observed the modulation of qubit energy levels with Z bias and did not find any obvious anti-crossings in the spectroscopy in Figure 1b. Then, we measured the long-term stability of the qubit relaxation time at different frequencies and found that there exists an obvious time-varying reduction in . To elucidate the causation of the observed reduction in , we used a time-multiplexed protocol to measure the stability in , , and the qubit frequency shift of a tunable Xmon qubit during a time exceeding 85 h. By time-domain Allan deviation and frequency-domain power spectral density analyses, we conclude that there exist two spectrally unstable TLSs which are mainly responsible for the qubit parameters’ fluctuations. Additionally, we calculated the coupling strengths and energy differences between the qubit and the TLSs, and we located these two TLSs within the range of 2 µm in the junction area.
The analytical methods used in this paper are effective tools to analyze the long-term stability of the quantum system parameters, such as decoherence times of quantum dots [46], optical gains of laser diodes using quantum wires [47,48], and spontaneous currents in superconducting rings [49,50], and are not limited to the superconducting qubit system discussed here. The presence of fluctuations in , and qubit frequency highlights the importance of recalibrating qubits frequently, as these fluctuations contribute to errors in quantum gate fidelities and quantum teleportation fidelities [51,52], and this study provides an approach for selecting the ideal working points of tunable superconducting Xmon qubits to avoid the unstable area. Basically, this emphasizes that in order to accurately evaluate the quality of a qubit, not only the exceptional coherence time, but also the long-term average value should be estimated.
Additionally, the methods provide a way to locate the main source of system noise via the Allan deviation and frequency-domain power spectral density. The observed coherent qubit–TLS couplings (Figure 4) are an unambiguous indication that there exist near-resonant TLSs. The occurring frequency of revivals is close to the frequency of decay, indicating the instability of the spectrum, which is consistent with the interacting TLS model in Figure 2c. Therefore, we attribute the reduction in in Figure 2b to the near-resonant TLSs. However, the Allan deviation and frequency-domain power spectral density analyses require a vast amount of data, which is time consuming. Other fast and accurate noise analysis methods still need to be developed.
Author Contributions
Conceptualization, X.-X.Y.; Data curation, X.-Y.Y. and L.-L.G.; Formal analysis, X.-X.Y. and X.-Y.Y.; Funding acquisition, H.-O.L. and G.-P.G.; Resources, L.D. and Z.-L.J.; Writing—original draft, X.-X.Y.; Writing—review & editing, P.D. and H.-O.L. All authors have read and agreed to the published version of the manuscript.
Funding
This work was supported by the National Natural Science Foundation of China (Grants No. 12034018, 12074368 and 92165207), the Anhui Province Natural Science Foundation (Grants No. 2108085J03) and the USTC Tang Scholarship. This work was partially carried out at the USTC Center for Micro and Nanoscale Research and Fabrication.
Institutional Review Board Statement
Not applicable.
Informed Consent Statement
Not applicable.
Data Availability Statement
Not applicable.
Acknowledgments
We thank Wei-Cheng Kong for helpful discussions and improving the paper.
Conflicts of Interest
The authors declare no conflict of interest.
References
- Preskill, J. Quantum Computing in the NISQ era and beyond. Quantum 2018, 2, 79. [Google Scholar] [CrossRef]
- Google Quantum AI. Exponential suppression of bit or phase errors with cyclic error correction. Nature 2021, 595, 383–387. [Google Scholar] [CrossRef]
- Krinner, S.; Lacroix, N.; Remm, A.; Di Paolo, A.; Genois, E.; Leroux, C.; Hellings, C.; Lazar, S.; Swiadek, F.; Herrmann, J.; et al. Realizing repeated quantum error correction in a distance-three surface code. Nature 2022, 605, 669–674. [Google Scholar] [CrossRef]
- Marques, J.; Varbanov, B.; Moreira, M.; Ali, H.; Muthusubramanian, N.; Zachariadis, C.; Battistel, F.; Beekman, M.; Haider, N.; Vlothuizen, W.; et al. Logical-qubit operations in an error-detecting surface code. Nat. Phys. 2022, 18, 80–86. [Google Scholar] [CrossRef]
- Zhao, Y.; Ye, Y.; Huang, H.L.; Zhang, Y.; Wu, D.; Guan, H.; Zhu, Q.; Wei, Z.; He, T.; Cao, S.; et al. Realization of an Error-Correcting Surface Code with Superconducting Qubits. Phys. Rev. Lett. 2022, 129, 030501. [Google Scholar] [CrossRef]
- Google Quantum AI. Suppressing quantum errors by scaling a surface code logical qubit. Nature 2023, 614, 676–681. [Google Scholar] [CrossRef]
- Oliver, W.D.; Welander, P.B. Materials in superconducting quantum bits. MRS Bull. 2013, 38, 816–825. [Google Scholar] [CrossRef]
- Siddiqi, I. Engineering high-coherence superconducting qubits. Nat. Rev. Mater. 2021, 6, 875–891. [Google Scholar] [CrossRef]
- Sun, L.; DiCarlo, L.; Reed, M.D.; Catelani, G.; Bishop, L.S.; Schuster, D.I.; Johnson, B.R.; Yang, G.A.; Frunzio, L.; Glazman, L.; et al. Measurements of Quasiparticle Tunneling Dynamics in a Band-Gap-Engineered Transmon Qubit. Phys. Rev. Lett. 2012, 108, 230509. [Google Scholar] [CrossRef]
- Ristè, D.; Bultink, C.; Tiggelman, M.J.; Schouten, R.N.; Lehnert, K.W.; DiCarlo, L. Millisecond charge-parity fluctuations and induced decoherence in a superconducting transmon qubit. Nat. Commun. 2013, 4, 1913. [Google Scholar] [CrossRef]
- Wang, C.; Gao, Y.Y.; Pop, I.M.; Vool, U.; Axline, C.; Brecht, T.; Heeres, R.W.; Frunzio, L.; Devoret, M.H.; Catelani, G.; et al. Measurement and control of quasiparticle dynamics in a superconducting qubit. Nat. Commun. 2014, 5, 5836. [Google Scholar] [CrossRef]
- de Visser, P.J.; Goldie, D.J.; Diener, P.; Withington, S.; Baselmans, J.J.A.; Klapwijk, T.M. Evidence of a Nonequilibrium Distribution of Quasiparticles in the Microwave Response of a Superconducting Aluminum Resonator. Phys. Rev. Lett. 2014, 112, 047004. [Google Scholar] [CrossRef]
- Gustavsson, S.; Yan, F.; Catelani, G.; Bylander, J.; Kamal, A.; Birenbaum, J.; Hover, D.; Rosenberg, D.; Samach, G.; Sears, A.P.; et al. Suppressing relaxation in superconducting qubits by quasiparticle pumping. Science 2016, 354, 1573–1577. [Google Scholar] [CrossRef]
- McEwen, M.; Faoro, L.; Arya, K.; Dunsworth, A.; Huang, T.; Kim, S.; Burkett, B.; Fowler, A.; Arute, F.; Bardin, J.C.; et al. Resolving catastrophic error bursts from cosmic rays in large arrays of superconducting qubits. Nat. Phys. 2022, 18, 107–111. [Google Scholar] [CrossRef]
- Pan, X.; Zhou, Y.; Yuan, H.; Nie, L.; Wei, W.; Zhang, L.; Li, J.; Liu, S.; Jiang, Z.H.; Catelani, G.; et al. Engineering superconducting qubits to reduce quasiparticles and charge noise. Nat. Commun. 2022, 13, 7196. [Google Scholar] [CrossRef]
- Dong, Y.; Li, Y.; Zheng, W.; Zhang, Y.; Ma, Z.; Tan, X.; Yu, Y. Measurement of Quasiparticle Diffusion in a Superconducting Transmon Qubit. Appl. Sci. 2022, 12, 8461. [Google Scholar] [CrossRef]
- Müller, C.; Cole, J.H.; Lisenfeld, J. Towards understanding two-level-systems in amorphous solids: Insights from quantum circuits. Rep. Prog. Phys. 2019, 82, 124501. [Google Scholar] [CrossRef]
- Simmonds, R.W.; Lang, K.M.; Hite, D.A.; Nam, S.; Pappas, D.P.; Martinis, J.M. Decoherence in Josephson Phase Qubits from Junction Resonators. Phys. Rev. Lett. 2004, 93, 077003. [Google Scholar] [CrossRef]
- Martinis, J.M.; Cooper, K.B.; McDermott, R.; Steffen, M.; Ansmann, M.; Osborn, K.D.; Cicak, K.; Oh, S.; Pappas, D.P.; Simmonds, R.W.; et al. Decoherence in Josephson Qubits from Dielectric Loss. Phys. Rev. Lett. 2005, 95, 210503. [Google Scholar] [CrossRef]
- Kline, J.S.; Wang, H.; Oh, S.; Martinis, J.M.; Pappas, D.P. Josephson phase qubit circuit for the evaluation of advanced tunnel barrier materials. Supercond. Sci. Tech. 2008, 22, 015004. [Google Scholar] [CrossRef]
- Sun, G.; Zhou, Z.; Mao, B.; Wen, X.; Wu, P.; Han, S. Entanglement dynamics of a superconducting phase qubit coupled to a two-level system. Phys. Rev. B 2012, 86, 064502. [Google Scholar] [CrossRef]
- Tan, X.; Yu, H.; Yu, Y.; Han, S. Rapid characterization of microscopic two-level systems using Landau-Zener transitions in a superconducting qubit. Appl. Phys. Lett. 2015, 107, 102601. [Google Scholar] [CrossRef]
- Plourde, B.L.T.; Robertson, T.L.; Reichardt, P.A.; Hime, T.; Linzen, S.; Wu, C.E.; Clarke, J. Flux qubits and readout device with two independent flux lines. Phys. Rev. B 2005, 72, 060506. [Google Scholar] [CrossRef]
- Kemp, A.; Saito, S.; Munro, W.J.; Nemoto, K.; Semba, K. Superconducting qubit as a quantum transformer routing entanglement between a microscopic quantum memory and a macroscopic resonator. Phys. Rev. B 2011, 84, 104505. [Google Scholar] [CrossRef]
- Ithier, G.; Collin, E.; Joyez, P.; Meeson, P.J.; Vion, D.; Esteve, D.; Chiarello, F.; Shnirman, A.; Makhlin, Y.; Schriefl, J.; et al. Decoherence in a superconducting quantum bit circuit. Phys. Rev. B 2005, 72, 134519. [Google Scholar] [CrossRef]
- Grabovskij, G.J.; Peichl, T.; Lisenfeld, J.; Weiss, G.; Ustinov, A.V. Strain Tuning of Individual Atomic Tunneling Systems Detected by a Superconducting Qubit. Science 2012, 338, 232–234. [Google Scholar] [CrossRef] [PubMed]
- Lisenfeld, J.; Bilmes, A.; Megrant, A.; Barends, R.; Kelly, J.; Klimov, P.; Weiss, G.; Martinis, J.M.; Ustinov, A.V. Electric field spectroscopy of material defects in transmon qubits. npj Quantum Inf. 2019, 5, 105. [Google Scholar] [CrossRef]
- Lisenfeld, J.; Bilmes, A.; Ustinov, A.V. Enhancing the coherence of superconducting quantum bits with electric fields. npj Quantum Inf. 2023, 9, 8. [Google Scholar] [CrossRef]
- Müller, C.; Lisenfeld, J.; Shnirman, A.; Poletto, S. Interacting two-level defects as sources of fluctuating high-frequency noise in superconducting circuits. Phys. Rev. B 2015, 92, 035442. [Google Scholar] [CrossRef]
- Klimov, P.V.; Kelly, J.; Chen, Z.; Neeley, M.; Megrant, A.; Burkett, B.; Barends, R.; Arya, K.; Chiaro, B.; Chen, Y.; et al. Fluctuations of Energy-Relaxation Times in Superconducting Qubits. Phys. Rev. Lett. 2018, 121, 090502. [Google Scholar] [CrossRef]
- Schlör, S.; Lisenfeld, J.; Müller, C.; Bilmes, A.; Schneider, A.; Pappas, D.P.; Ustinov, A.V.; Weides, M. Correlating Decoherence in Transmon Qubits: Low Frequency Noise by Single Fluctuators. Phys. Rev. Lett. 2019, 123, 190502. [Google Scholar] [CrossRef] [PubMed]
- Burnett, J.J.; Bengtsson, A.; Scigliuzzo, M.; Niepce, D.; Kudra, M.; Delsing, P.; Bylander, J. Decoherence benchmarking of superconducting qubits. npj Quantum Inf. 2019, 5, 54. [Google Scholar] [CrossRef]
- Béjanin, J.H.; Earnest, C.T.; Sharafeldin, A.S.; Mariantoni, M. Interacting defects generate stochastic fluctuations in superconducting qubits. Phys. Rev. B 2021, 104, 094106. [Google Scholar] [CrossRef]
- Carroll, M.; Rosenblatt, S.; Jurcevic, P.; Lauer, I.; Kandala, A. Dynamics of superconducting qubit relaxation times. npj Quantum Inf. 2022, 8, 132. [Google Scholar] [CrossRef]
- Wang, C.; Axline, C.; Gao, Y.Y.; Brecht, T.; Chu, Y.; Frunzio, L.; Devoret, M.H.; Schoelkopf, R.J. Surface participation and dielectric loss in superconducting qubits. Appl. Phys. Lett. 2015, 107, 162601. [Google Scholar] [CrossRef]
- Dial, O.; McClure, D.T.; Poletto, S.; Keefe, G.A.; Rothwell, M.B.; Gambetta, J.M.; Abraham, D.W.; Chow, J.M.; Steffen, M. Bulk and surface loss in superconducting transmon qubits. Supercond. Sci. Tech. 2016, 29, 044001. [Google Scholar] [CrossRef]
- Gambetta, J.M.; Murray, C.E.; Fung, Y.K.K.; McClure, D.T.; Dial, O.; Shanks, W.; Sleight, J.W.; Steffen, M. Investigating Surface Loss Effects in Superconducting Transmon Qubits. IEEE Trans. Appl. Superconductivity 2017, 27, 1–5. [Google Scholar] [CrossRef]
- Duan, P.; Chen, Z.F.; Zhou, Q.; Kong, W.C.; Zhang, H.F.; Guo, G.P. Mitigating Crosstalk-Induced Qubit Readout Error with Shallow-Neural-Network Discrimination. Phys. Rev. Appl. 2021, 16, 024063. [Google Scholar] [CrossRef]
- Yang, X.X.; Guo, L.L.; Zhang, H.F.; Du, L.; Zhang, C.; Tao, H.R.; Chen, Y.; Duan, P.; Jia, Z.L.; Kong, W.C.; et al. Experimental Implementation of Short-Path Nonadiabatic Geometric Gates in a Superconducting Circuit. Phys. Rev. Appl. 2023, 19, 044076. [Google Scholar] [CrossRef]
- Riley, W.; Howe, D. Handbook of Frequency Stability Analysis; National Institute of Standards and Technology: Gaithersburg, MD, USA, 2008.
- Allan, D. Statistics of atomic frequency standards. Proc. IEEE 1966, 54, 221–230. [Google Scholar] [CrossRef]
- IEEE Std 952-1997; IEEE Standard Specification Format Guide and Test Procedure for Single-Axis Interferometric Fiber Optic Gyros. IEEE: New York, NY, USA, 1998; pp. 1–84. [CrossRef]
- Wiener, N. Generalized harmonic analysis. Acta Math. 1930, 55, 117–258. [Google Scholar] [CrossRef]
- Pop, I.M.; Fournier, T.; Crozes, T.; Lecocq, F.; Matei, I.; Pannetier, B.; Buisson, O.; Guichard, W. Fabrication of stable and reproducible submicron tunnel junctions. J. Vac. Sci. Technol. B 2012, 30, 010607. [Google Scholar] [CrossRef]
- Moskalev, D.O.; Zikiy, E.V.; Pishchimova, A.A.; Ezenkova, D.A.; Smirnov, N.S.; Ivanov, A.I.; Korshakov, N.D.; Rodionov, I.A. Improving Josephson junction reproducibility for superconducting quantum circuits: Shadow evaporation and oxidation. arXiv 2022, arXiv:2212.06692. [Google Scholar] [CrossRef]
- Zhang, X.; Li, H.O.; Cao, G.; Xiao, M.; Guo, G.C.; Guo, G.P. Semiconductor quantum computation. Natl. Sci. Rev. 2018, 6, 32–54. [Google Scholar] [CrossRef]
- Ridene, S. GaSbBi/GaSb quantum-well and wire laser diodes. Chem. Phys. Lett. 2018, 702, 44–48. [Google Scholar] [CrossRef]
- Ridene, S. Novel T-shaped GaSb/InAsN quantum wire for mid-infrared laser applications. Phys. Lett. A 2017, 381, 3324–3331. [Google Scholar] [CrossRef]
- Croitoru, M.D.; Mironov, S.V.; Lounis, B.; Buzdin, A.I. Toward the Light-Operated Superconducting Devices: Circularly Polarized Radiation Manipulates the Current-Carrying States in Superconducting Rings. Adv. Quantum Technol. 2022, 5, 2200054. [Google Scholar] [CrossRef]
- Croitoru, M.D.; Lounis, B.; Buzdin, A.I. Influence of a nonuniform thermal quench and circular polarized radiation on spontaneous current generation in superconducting rings. Phys. Rev. B 2022, 105, L020504. [Google Scholar] [CrossRef]
- Sakhouf, H.; Daoud, M.; Laamara, R.A. Quantum process tomography of the single-shot entangling gate with superconducting qubits. J. Phys. B 2023, 56, 105501. [Google Scholar] [CrossRef]
- Zidan, N.; ur Rahman, A.; Haddadi, S. Quantum teleportation in a two-superconducting qubit system under dephasing noisy channel: Role of Josephson and mutual coupling energies. Laser Phys. Lett. 2023, 20, 025204. [Google Scholar] [CrossRef]
Figure 1.
(a) An electron microscope image of a single cross-shaped Xmon qubit and the corresponding simplified measurement circuit. (b) Dependence of the qubit frequency on the Z bias. The peaks are extracted and fitted to Equation (1) (red dotted line). The frequency resolution is 1 MHz. No anti-crossings can be found in these spectroscopy results.

Figure 2.
(a) Time-domain measurement sequences: Simultaneous acquisition of relaxation and Ramsey measurements is achieved by interleaving single pulse sequences. The time is the free evolution time. (b) Spectrally and temporally resolved . This dataset comprises 6480 measurements, spanning 230 MHz and 21 h with 0.005 V and 16 min step sizes, respectively. (c) An interleaved series of 4700 relaxation and Ramsey measurements, spanning 85 h with a 65 s step size.

Figure 3.
(a,c) Allan deviations of fluctuations and frequency shift () fluctuations in Figure 2c, respectively. (b,d) PSDs of fluctuations and frequency shift () fluctuations in Figure 2c, respectively. All the plots feature a red line indicating the overall noise which comprises noise (orange lines), two different Lorentzians (blue lines), and white noise (magenta lines).

Figure 4.
(a) A dataset with a sinusoidal decay profile. (b) Another dataset with a much larger oscillation frequency. Resonant exchange with TLSs is the reason for the emergence of revivals. (c) Illustration of the interacting TLS model. The interaction between the TLS1 and TLSs with energies at or below kBT (blue area) leads to frequency fluctuations of TLS1, which are then transformed into the qubit parameters fluctuations through coupling g. (d) Electron microscope image of the qubit’s SQUID. The dimensions are indicated in the image. The red and green concentric circles have radii of 0.27 µm and 1.2 µm, respectively, indicating the locations of the TLSs. The insert depicts a schematic cross-sectional view of the junction and its native aluminum oxide layer that contains structural TLS (not depicted to scale). In addition to this, surface defects can also arise from fabrication residuals, atmospheric contaminants, and substrate surface amorphization resulting from circuit patterning.

Disclaimer/Publisher’s Note: The statements, opinions and data contained in all publications are solely those of the individual author(s) and contributor(s) and not of MDPI and/or the editor(s). MDPI and/or the editor(s) disclaim responsibility for any injury to people or property resulting from any ideas, methods, instructions or products referred to in the content. |
© 2023 by the authors. Licensee MDPI, Basel, Switzerland. This article is an open access article distributed under the terms and conditions of the Creative Commons Attribution (CC BY) license (https://creativecommons.org/licenses/by/4.0/).
Share and Cite
MDPI and ACS Style
Yang, X.-X.; Yang, X.-Y.; Guo, L.-L.; Du, L.; Duan, P.; Jia, Z.-L.; Li, H.-O.; Guo, G.-P. Locating Two-Level Systems in a Superconducting Xmon Qubit. Appl. Sci. 2023, 13, 6672. https://doi.org/10.3390/app13116672
AMA Style
Yang X-X, Yang X-Y, Guo L-L, Du L, Duan P, Jia Z-L, Li H-O, Guo G-P. Locating Two-Level Systems in a Superconducting Xmon Qubit. Applied Sciences. 2023; 13(11):6672. https://doi.org/10.3390/app13116672
Chicago/Turabian StyleYang, Xin-Xin, Xiao-Yan Yang, Liang-Liang Guo, Lei Du, Peng Duan, Zhi-Long Jia, Hai-Ou Li, and Guo-Ping Guo. 2023. "Locating Two-Level Systems in a Superconducting Xmon Qubit" Applied Sciences 13, no. 11: 6672. https://doi.org/10.3390/app13116672
Note that from the first issue of 2016, this journal uses article numbers instead of page numbers. See further details here.