
In Comparison to Pathological Q Waves, Selvester Score Is a Superior Diagnostic Indicator of Increased Long-Term Mortality Risk in ST Elevation Myocardial Infarction Patients Treated with Primary Coronary Intervention

 ,
,  , ,
, ,
Abstract
:1. Introduction
2. Methods
2.1. Patient Population
2.2. Clinical Measurements
2.3. Follow-Up
2.4. ECG Assessment
2.5. Statistics and Data Presentation
3. Results
4. Discussion
5. Conclusions
Supplementary Materials
Author Contributions
Funding
Institutional Review Board Statement
Informed Consent Statement
Data Availability Statement
Conflicts of Interest
References
- Antman, E.M.; Fox, K.M. Guidelines for the diagnosis and management of unstable angina and non-Q-wave myocardial infarction: Proposed revisions. International Cardiology Forum. Am. Heart J. 2000, 139, 461–475. [Google Scholar] [CrossRef]
- Goodman, S.G.; Barr, A.; Langer, A.; Wagner, G.S.; Fitchett, D.; Armstrong, P.W.; Naylor, C.D. Development and prognosis of non-Q-wave myocardial infarction in the thrombolytic era. Am. Heart J. 2002, 144, 243–250. [Google Scholar] [CrossRef] [PubMed] [Green Version]
- Keeley, E.C.; Boura, J.A.; Grines, C.L. Primary angioplasty vs. intravenous thrombolytic therapy for acute myocardial infarction: A quantitative review of 23 randomized trials. Lancet 2003, 361, 13–20. [Google Scholar] [CrossRef]
- Widimsky, P.; Budesinsky, T.; Vorac, D.; Groch, L.; Zelizko, M.; Aschermann, M.; Branny, M.; Stastek, J.; Formanek, P. Long distance transport for primary angioplasty vs. immediate thrombolysis in acute myocardial infarction. Final results of the randomized national multicentre trial PRAGUE-2. Eur. Heart J. 2003, 24, 94–104. [Google Scholar] [CrossRef] [Green Version]
- Halkin, A.; Fourey, D.; Roth, A.; Boyko, V.; Behar, S. Incidence and prognosis of non-Q-wave vs. Q-wave myocardial infarction following catheter-based reperfusion therapy. Q. J. Med. 2009, 102, 401–406. [Google Scholar] [CrossRef] [PubMed] [Green Version]
- Raunio, H.; Rissanen, V.; Romppanen, T.; Jokinen, Y.; Rehnberg, S.; Helin, M.; Pyorala, K. Changes in the QRS complex and ST segment in transmural and subendocardial myocardial infarctions. A clinicopathologic study. Am. Heart J. 1979, 98, 176–184. [Google Scholar] [CrossRef]
- Delewi, R.; Ijff, G.; Hoef, T.P.; Hirsch, A.; Robbers, L.F.; Nijveldt, R.; Laan, A.M.; Vleuten, P.A.; Lucas, C.; Tijssen, J.G.P.; et al. Pathological Q waves in myocardial infarction in patients treated by primary PCI. J. Am. Coll. Cardiol. Img. 2013, 6, 324–331. [Google Scholar] [CrossRef] [PubMed] [Green Version]
- Selvester, R.H.; Wagner, J.O.; Rubin, H.B. Quantitation of myocardial infarct size and location by electrocardiogram and vectorcardiogram. In Quantitation in Cardiology; Snellen, H.A., Hemker, H.C., Hugenholtz, P.G., Van Bemmel, J.H., Eds.; Springer: Dordrecht, The Netherlands, 1971; Volume 8, pp. 33–44. ISBN 978-94-010-2929-2. [Google Scholar]
- Ideker, R.E.; Wagner, G.S.; Ruth, W.K.; Alonso, D.R.; Bishop, S.P.; Bloor, C.M.; Fallon, J.T.; Gottlieb, G.J.; Hackel, D.B.; Phillips, H.R.; et al. Evaluation of a QRS scoring system for estimating myocardial infarct size. II. Correlation with quantitative anatomic findings for anterior infarcts. Am. J. Cardiol. 1982, 49, 1604–1614. [Google Scholar] [CrossRef]
- Strauss, D.G.; Selvester, R.H. The QRS complex—A biomarker that “images” the heart: QRS scores to quantify myocardial scar in the presence of normal and abnormal ventricular conduction. J. Electrocardiol. 2009, 42, 85–96. [Google Scholar] [CrossRef]
- Tjandrawidjaja, M.C.; Fu, Y.; Westerhout, C.M.; Wagner, G.S.; Granger, C.B.; Armstrong, P.W. APEX-AMI Investigators. Usefulness of the QRS score as a strong prognostic marker in patients discharged after undergoing primary percutaneous coronary intervention for ST-segment elevation myocardial infarction. Am. J. Cardiol. 2010, 106, 630–634. [Google Scholar] [CrossRef]
- Steg, G.; James, S.K.; Atar, D.; Badano, L.P.; Blömstrom-Lundqvist, C.; Borger, M.A.; Di Mario, C.; Dickstein, K.; Ducrocq, G.; Fernandez-Aviles, F.; et al. ESC guidelines for the management of acute myocardial infarction in patients presenting with ST-segment elevation. Eur. Heart J. 2012, 33, 2569–2619. [Google Scholar] [CrossRef]
- Ibanez, B.; James, S.; Agewall, S.; Antunes, M.J.; Bucciarelli-Ducci, C.; Bueno, H.; Caforio, A.L.P.; Crea, F.; Goudevenos, J.A.; Halvorsen, S.; et al. 2017 ESC Guidelines for the management of acute myocardial infarction in patients presenting with ST-segment elevation. The Task Force for the management of acute myocardial infarction in patients presenting with ST-segment elevation of the European Society of Cardiology (ESC). Eur. Heart J. 2018, 39, 119–177. [Google Scholar] [CrossRef] [Green Version]
- O.´Gara, M.T.; Kushner, F.G.; Ascheim, D.D.; Casey, D.E.; Chung, M.K.; Lemos, J.A.; Ettinger, S.M.; Fang, J.C.; Fesmire, F.M.; Franklin, B.A.; et al. 2013 ACCF/AHA guideline for the management of ST-elevation myocardial infarction. Circulation 2013, 127, 362–425. [Google Scholar] [CrossRef] [Green Version]
- Thygesen, K.; Alpert, J.S.; Jaffe, A.S.; Chaitman, B.R.; Bax, J.J.; Morrow, D.A.; White, H.D.; Executive Group on behalf of the Joint European Society of Cardiology (ESC)/American College of Cardiology (ACC)/ American Heart Association (AHA)/World Heart Federation (WHF) Task Force for the Universal Definition of Myocardial Infarction). Fourth universal definition of myocardial infarction. Glob. Heart 2018, 13, 305–338. [Google Scholar] [CrossRef] [PubMed]
- Pardee, H.E. The significance of an electrocardiogram with a large Q in lead 3. Arch. Intern. Med. 1930, 46, 470–481. [Google Scholar] [CrossRef]
- Thygesen, K.; Alpert, J.S.; White, H.D.; Joint ESC/ACCf/AHA/WHF Task Force for the Redefinition of Myocardial Infarction. Universal definition of myocardial infarction. Eur. Heart J. 2007, 28, 2525–2538. [Google Scholar] [CrossRef] [PubMed]
- Phibbs, B.P.; Marcus, F.I. Perpetuation of the myth of the Q-wave versus the non-Q-wave myocardial infarction. J. Am. Coll. Cardiol. 2002, 39, 556–558. [Google Scholar] [CrossRef] [Green Version]
- Roes, S.D.; Borleffs, C.J.; van der Geest, R.J.; Westenberg, J.J.; Marsan, N.A.; Kaandorp, T.A.; Reiber, J.H.; Zeppenfeld, K.; Lamb, H.J.; de Roos, A.; et al. Infarct tissue heterogeneity assessed with contrast-enhanced MRI predicts spontaneous ventricular arrhythmia in patients with ischemic cardiomyopathy and implantable cardioverter-defibrillator. Circ. Cardiovasc. Imaging 2009, 2, 183–190. [Google Scholar] [CrossRef] [Green Version]
- Yokota, H.; Heidary, S.; Katikireddy, C.K.; Nguyen, P.; Pauly, J.M.; McConnell, M.V.; Yang, P.C. Quantitative characterization of myocardial infarction by cardiovascular magnetic resonance predicts future cardiovascular events in patients with ischemic cardiomyopathy. J. Cardiovasc. Magn. Reson. 2008, 10, 10:1–10:17. [Google Scholar] [CrossRef] [PubMed] [Green Version]
- Pahlm, U.S.; Chaitman, B.R.; Rautaharju, P.M.; Selvester, R.H.; Wagner, G.S. Comparison of the various electrocardiographic scoring codes for estimating anatomically documented sizes of single and multiple infarcts of the left ventricle. Am. J. Cardiol. 1998, 81, 809–938. [Google Scholar] [CrossRef]
- Carey, M.G.; Luisi, A.J.; Baldwa, S.; Al-Zaiti, S.; Veneziano, M.J.; deKemp, R.A.; Canty, J.M.; Fallavollita, J.A. The Selvester QRS Score is more accurate than Q waves and fragmented QRS complexes using the Mason-Likar configuration in estimating infarct volume in patients with ischemic cardiomyopathy. J. Electrocardiol. 2010, 43, 318–325. [Google Scholar] [CrossRef] [Green Version]
- Fukuoka, S.; Kurita, T.; Dohi, K.; Masuda, J.; Seko, T.; Tanigawa, T.; Saito, Y.; Kakimoto, H.; Makino, K.; Ito, M. Untangling the obesity paradox in patients with acute myocardial infarction after primary percutaneous coronary intervention (detail analysis by age). Int. J. Cardiol. 2019, 289, 12–18. [Google Scholar] [CrossRef] [PubMed]
- Mohammad, M.A.; Koul, S.; Thomsen Lønborg, J.; Nepper-Christensen, L.; Høfsten, D.E.; Ahtarovski, K.A.; Bang, L.E.; Helqvist, S.; Kyhl, K.; Køber, L.; et al. Usefulness of high sensitivity troponin T to predict long-term left ventricular dysfunction after ST-elevation myocardial infarction. Am. J. Cardiol. 2020, 134, 8–13. [Google Scholar] [CrossRef] [PubMed]
- Kala, P.; Novotny, T.; Andrsova, I.; Benesova, K.; Holicka, M.; Jarkovsky, J.; Hnatkova, K.; Koc, L.; Mikolaskova, M.; Novakova, T.; et al. Higher incidence of hypotension episodes in women during the sub-acute phase of ST elevation myocardial infarction and relationship to covariates. PLoS ONE 2017, 12, e0173699:1–e0173699:12. [Google Scholar] [CrossRef] [Green Version]
- Lichtman, J.H.; Krumholz, H.M.; Wang, Y.; Radford, M.J.; Brass, L.M. Risk and predictors of stroke after myocardial infarction among the elderly: Results from the cooperative cardiovascular project. Circulation 2002, 105, 1082–1087. [Google Scholar] [CrossRef] [Green Version]
- Sabau, M.; Bungau, S.; Buhas, C.L.; Carp, G.; Daina, L.G.; Judea-Pusta, C.T.; Buhas, B.A.; Jurca, C.M.; Daina, C.M.; Tit, D.M. Legal medicine implications in fibrinolytic therapy of acute ischemic stroke. BMC Med. Ethics 2019, 20, 70. [Google Scholar] [CrossRef]
- White, H.D.; Reynolds, H.R.; Carvalho, A.C.; Pearte, C.A.; Liu, L.; Martin, C.E.; Knatterud, G.L.; Džavík, V.; Kruk, M.; Steg, P.G.; et al. Reinfarction after percutaneous coronary intervention or medical management using the universal definition in patients with total occlusion after myocardial infarction: Results from long-term follow-up of the Occluded Artery Trial (OAT) cohort. Am. Heart J. 2012, 163, 563–571. [Google Scholar] [CrossRef] [Green Version]
- Jenča, D.; Melenovský, V.; Stehlik, J.; Staněk, V.; Kettner, J.; Kautzner, J.; Adámková, V.; Wohlfahrt, P. Heart failure after myocardial infarction: Incidence and predictors. ESC Heart Fail 2021, 8, 222–237. [Google Scholar] [CrossRef] [PubMed]


| Sex (n = 283) | Women/Men | 103 (36.4%)/180 (63.6%) |
|---|---|---|
| Age (years) | 63.07 ± 11.91 | |
| 62.4 (IQR 54.90; 71.88) | ||
| BMI (kg/m3) | 28.38 ± 4.59 | |
| 27.97 (IQR 24.87; 30.81) | ||
| Previous MI Previous PCI/CABG | 23 (8.13%) | |
| 27 (9.54%) | ||
| Hypertension Dyslipidemia Diabetes mellitus | 170 (60.07%) | |
| 160 (56.53%) | ||
| 61 (21.56%) | ||
| AMI localization * | Anterior | 124 (43.81%) |
| Inferior | 138 (48.76%) | |
| Lateral | 46 (16.25%) | |
| Septal | 5 (1.76%) | |
| Posterior | 10 (3.53%) | |
| Q wave after 72 h | 184 (65.02%) | |
| TnT max. (ng/mL) | (n = 281) | 3.36 ± 3.36 |
| 2.25 (IQR 0.98; 4.98) | ||
| BNP (pg/mL) | (n = 266) | 414 ± 406.66 |
| 283.25 (IQR 153.23; 546.15) | ||
| LVEF (%) at discharge | (n = 282) | 52 ± 10.19 |
| 55 (45; 60) | ||
| Lenght of follow-up (years) | 5.69 ± 0.66 | |
| 5.60 years (IQR 5.18; 6.22) | ||
| Total mortality | 36 (12.7%) |
| 72 h Q Wave Present (n = 184) | 72 h Q not Present (n = 99) | p Value | 72 h Selvester Score ≥6 (n = 143) | 72 h Selvester Score ˂6 (n = 140) | p Value | |
|---|---|---|---|---|---|---|
| Age | 63.1 ± 12.2 | 63.0 ± 11.5 | NS | 63.1 ± 12.8 | 63.0 ± 11.0 | NS |
| BMI | 28.3 ± 4.6 | 28.6 ± 4.6 | NS | 28.5 ± 4.8 | 28.3 ± 4.4 | NS |
| TnT (μg/L) | 4.0 ± 3.7 | 2.2 ± 2.3 | <0.001 | 4.2 ± 3.7 | 2.5 ± 2.8 | <0.001 |
| BNP (pg/L) | 412.8 ± 365.2 | 416.3 ± 477.2 | NS | 454.5 ± 410.6 | 374.7 ± 401.9 | NS |
| LVEF | 50.6 ± 10.7 | 55.1 ± 10.0 | 0.001 | 49.7 ± 11.4 | 54.7 ± 9.2 | <0.001 |
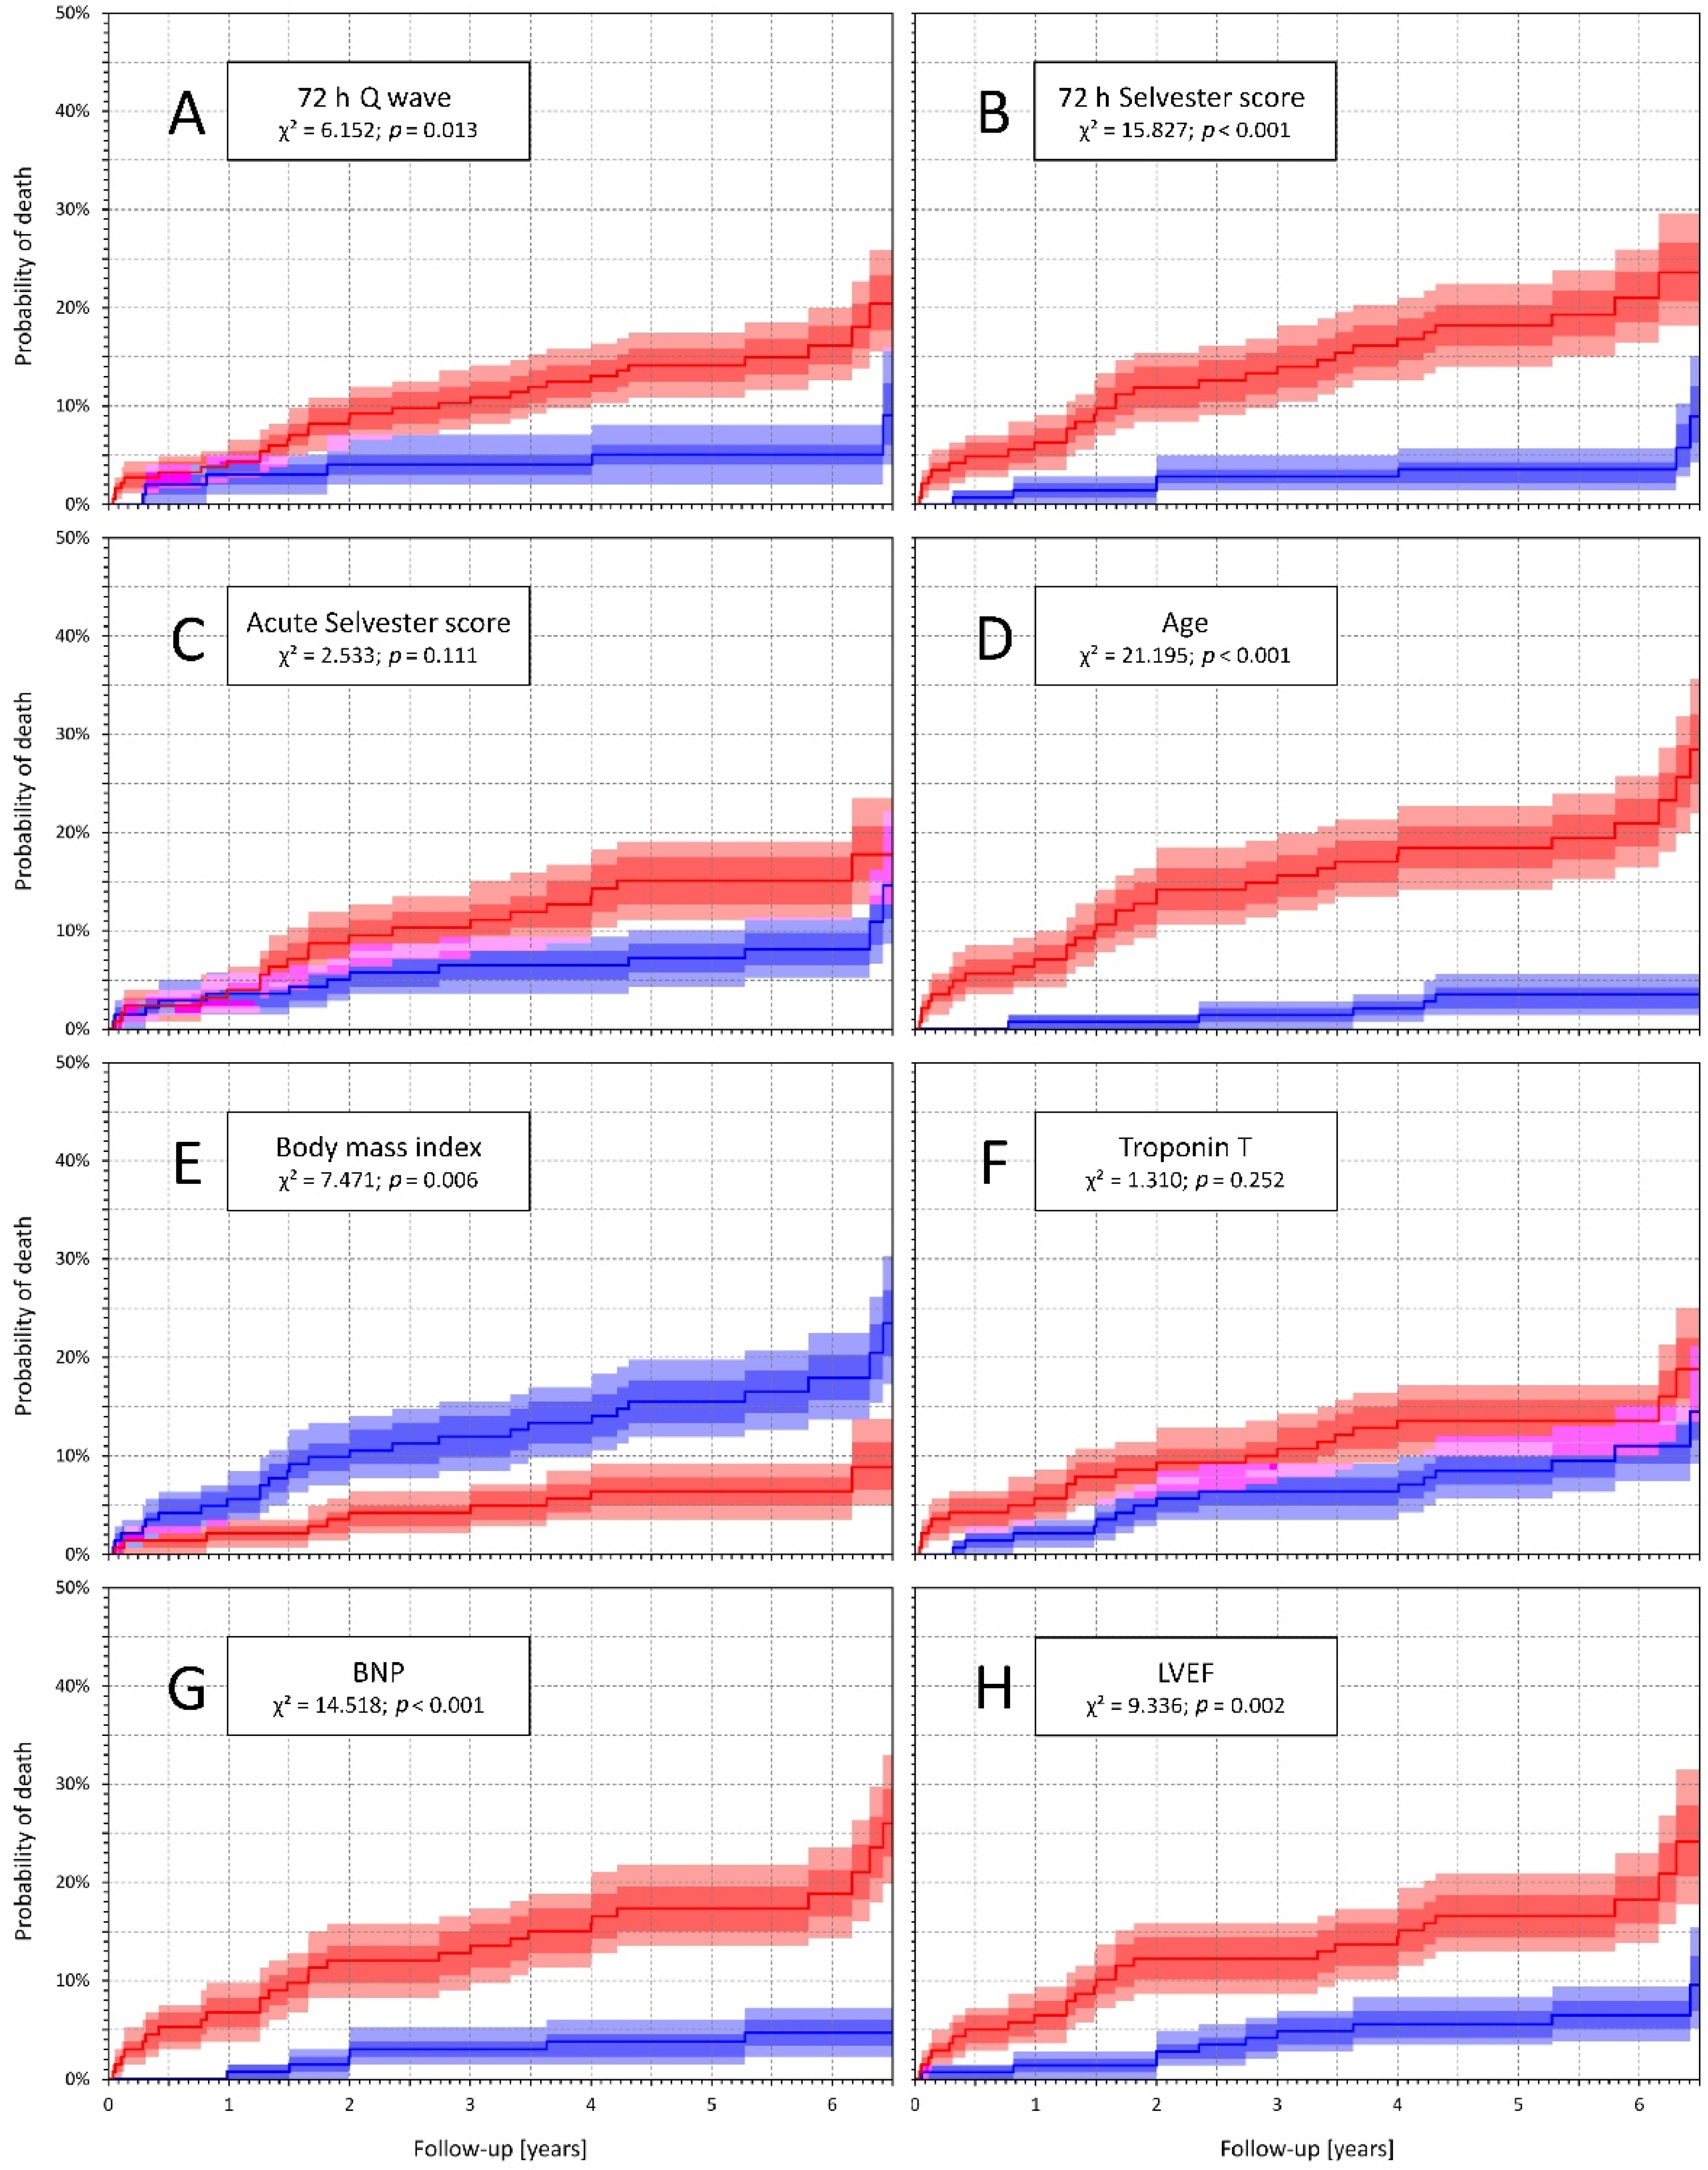
| Variable | Univariable Analysis | Multivariable Analysis | ||||
|---|---|---|---|---|---|---|
| p-Value | HR | 95% CI of HR | p-Value | HR | 95% CI of HR | |
| Age above median | <0.001 | 6.780 | 2.636–17.443 | <0.001 | 9.804 | 2.967–32.258 |
| TnT above median | 0.256 | 1.469 | 0.757–2.849 | |||
| BNP above median | 0.001 | 4.756 | 1.962–11.528 | |||
| LVEF below median | 0.004 | 2.956 | 1.425–6.132 | |||
| BMI above median | 0.009 | 0.376 | 0.181–0.780 | 0.048 | 0.454 | 0.208–0.992 |
| 72 h Q wave present | 0.018 | 2.885 | 1.200–6.936 | |||
| 72 h Selvester Score ≥6 | <0.001 | 4.601 | 2.013–10.513 | 0.001 | 4.184 | 1.792–9.804 |
| Acute Selvester Score ≥6 | 0.116 | 1.750 | 0.870–3.519 | |||
| Age ≥ 70 years | <0.001 | 5.813 | 2.859–11.818 | <0.001 | 4.950 | 2.237–10.989 |
| TnT ≥ 3 µg/L | 0.098 | 0.575 | 0.299–1.107 | |||
| BNP ≥ 500 ng/L | 0.034 | 2.101 | 1.058–4.167 | |||
| LVEF ≤ 40% | <0.001 | 3.800 | 1.955–7.388 | 0.044 | 2.179 | 1.021–4.63 |
| BMI ≥ 25 kg/m2 | 0.331 | 0.709 | 0.354–1.419 | |||
| 72 h Q wave present | 0.018 | 2.885 | 1.200–6.936 | |||
| 72 h Selvester score ≥6 | <0.001 | 4.601 | 2.013–10.513 | 0.007 | 3.226 | 1.376–7.576 |
| Acute Selvester score ≥6 | 0.116 | 1.750 | 0.870–3.519 | |||
Publisher’s Note: MDPI stays neutral with regard to jurisdictional claims in published maps and institutional affiliations. |
© 2021 by the authors. Licensee MDPI, Basel, Switzerland. This article is an open access article distributed under the terms and conditions of the Creative Commons Attribution (CC BY) license (https://creativecommons.org/licenses/by/4.0/).
Share and Cite
Holicka, M.; Cuckova, P.; Hnatkova, K.; Koc, L.; Ondrus, T.; Lokaj, P.; Parenica, J.; Novotny, T.; Kala, P.; Malik, M. In Comparison to Pathological Q Waves, Selvester Score Is a Superior Diagnostic Indicator of Increased Long-Term Mortality Risk in ST Elevation Myocardial Infarction Patients Treated with Primary Coronary Intervention. Diagnostics 2021, 11, 799. https://doi.org/10.3390/diagnostics11050799
Holicka M, Cuckova P, Hnatkova K, Koc L, Ondrus T, Lokaj P, Parenica J, Novotny T, Kala P, Malik M. In Comparison to Pathological Q Waves, Selvester Score Is a Superior Diagnostic Indicator of Increased Long-Term Mortality Risk in ST Elevation Myocardial Infarction Patients Treated with Primary Coronary Intervention. Diagnostics. 2021; 11(5):799. https://doi.org/10.3390/diagnostics11050799
Chicago/Turabian StyleHolicka, Maria, Pavla Cuckova, Katerina Hnatkova, Lumir Koc, Tomas Ondrus, Petr Lokaj, Jiri Parenica, Tomas Novotny, Petr Kala, and Marek Malik. 2021. "In Comparison to Pathological Q Waves, Selvester Score Is a Superior Diagnostic Indicator of Increased Long-Term Mortality Risk in ST Elevation Myocardial Infarction Patients Treated with Primary Coronary Intervention" Diagnostics 11, no. 5: 799. https://doi.org/10.3390/diagnostics11050799