Article

Contrasts in the Evolution and Microphysical Features of Two Convective Systems during a Heavy Rainfall Event along the Coast of South China

1
Jiangmen Meteorological Bureau, Jiangmen 529030, China
2
Institute of Tropical and Marine Meteorology of China Meteorological Administration, Guangzhou 510641, China
*
Author to whom correspondence should be addressed.
Atmosphere 2022, 13(10), 1549; https://doi.org/10.3390/atmos13101549
Submission received: 1 August 2022 / Revised: 31 August 2022 / Accepted: 19 September 2022 / Published: 22 September 2022
(This article belongs to the Section Meteorology)

Abstract

:
On 1 June 2021, a heavy rainstorm hit the coast of South China (148.6 mm in 1 h, 361 mm over 12 h). The storm process was successively affected by two convective systems (CSs). The initial convection of the two CSs occurred at a similar location; however, they subsequently showed different evolution characteristics. Based on multi-source data, including dual-polarimetric radars, wind profiling radars, sounding, and automatic weather stations, we explored the differences in the key characteristics of these two CSs. It was found that the convection was initially triggered at a similar location for both CSs, closely related to the mesoscale boundary and the hilly terrain. After formation, CS1 moved eastward to the regions with lower surface temperature and weaker lower-level convergence but similar humidity, which means the environmental conditions for sustaining the CS became less favorable. As a result, CS1 dissipated rapidly and only lasted for about 90 min, resulting in 5% of the total precipitation of the overall storm. In contrast, during the lifespan of CS2, the southerly wind over the South China Sea became stronger. This caused an intense lower-level convergence zone along the coastal region of Guangdong Province, which provided favorable dynamic conditions for maintaining CS2. Favored by the strong coastal convergence and abundant moisture, new convective cells (CCs) were generated continuously and merged with CS2, acting as another favorable condition for its sustainment. Overall, CS2 lasted for 8 h, and its precipitation accounted for 95% of the total rainfall. In CS1, CCs showed a notable evaporation process below 4 km, manifested by the large raindrops. However, in CS2, the CCs had a higher concentration of small raindrops and higher ice and liquid water content. Since CS2 was close to the coastal region, the warm local environment promoted convection, leading to intense precipitation. In addition, the riming and melting processes were active, leading to a high precipitation efficiency and strong local precipitation during a short period of time.

1. Introduction

Heavy rainfall events (HREs) are some of the most damaging natural disasters in China [1]. Under the influences of the East Asian summer monsoon, the rainy season in China begins the earliest in South China, and the precipitation intensity of South China is the strongest among the three major heavy rain belts in China [2]. Among HREs in South China, events with heavier intensity tend to occur along the coastal regions [3,4]. These HREs are closely related to local underlying surface characteristics [5,6] and mesoscale processes [7,8], with the mechanisms being very complicated [1,9]. Of these, the mesoscale boundaries [10] play a key role in the convection initiation and evolution. The mesoscale boundaries are usually shallow and along the coast, formed mainly through the contrast between the ocean and land. At night, the oceanic surface remains warm, promoting a warm and humid air flow, whereas the outgoing long-wave radiation from the land surface cools the inland near-surface air. The mesoscale boundary contributes to the development of coastal convection. This produces a mesoscale boundary between the relatively warmer and cooler air. The continuous triggering effects of the mesoscale boundaries on precipitation have become a major research topic.
Precipitation intensity is primarily determined by whether or not the convection can develop into an organized mesoscale convective system [11,12]. Some MCSs tend to weaken when moving and only produce normally heavy precipitation [1], but some MCSs develop more vigorously and move slowly or remain quasi-stationary for a time, resulting in local heavy precipitation. The phenomena of back propagation and train effects, resulting in MCSs staying at a local place for a long time, have been observed in many HREs in South China [13,14,15]. Liang et al. [16] statistically analyzed the development patterns of heavy MCSs in the pre-flood season in South China and found that the merging of multiple cells was the primary developmental pattern of MCSs. Wu and Luo [10] proposed that, without influences from other weather systems, the cold downdraft due to convection can be maintained for a long time and trigger convection along the coastal regions, which produces HREs. Wang et al. [17] and Liu et al. [18] investigated the development of convective systems in a monsoon environment and highlighted the influences of different convective development and evolution processes, such as rapid cell splitting, reconstruction, and rainband train effects. Du et al. [19,20] reported the role of the formation of surface cold pools on the evolution of the convection system in a heavy precipitation process that occurred along the coast of South China. The findings of the above studies have indicated the diversity and complexity of the evolution of MCSs, and thus, more case studies are needed.
Studies on the evolutionary mechanisms of different MCSs from the perspectives of microphysical processes are also important to enhance the understanding of HREs. For instance, Chen et al. [21] investigated 148 convective cells observed by the Zhoushan radar station and found that the cells tended to become stronger or maintain their strength near the coastline, which could be reflected by the increased range of strong echoes, echo cloud tops, and liquid water content. Wen et al. [22] analyzed the relationship between the dynamical and microphysical characteristics of the MCSs during the period from its initial stage to the mature stage. Lang et al. [23] found that strong convective updrafts facilitated the riming process by transporting liquid water above the 0 °C isotherm, which resulted in graupel/hail, and the melting of graupel/hail led to higher water content. The main point here is to emphasize the higher content of liquid water material below the melting layer. Generally, the higher the liquid water content near the surface, the more intense the rain. Rowe et al. [24,25,26] proposed that differences in dynamical forcing and thermodynamical conditions of different underlying surfaces might lead to differences in warm or cold cloud processes, which ultimately results in different microphysical characteristics.
Dual-polarimetric radars can provide microphysical information, such as the shape, size, and direction of raindrops [27,28], and have been widely used to study the microphysical characteristics of different types of strong convective storms worldwide [22,29,30,31]. Guangdong Province has recently established a dual-polarimetric radar monitoring network; however, there remains a lack of studies examining the evolution of different MCSs in the coastal zone of Guangdong based on dual-polarimetric radars. In the early morning of 1 June 2021, a strong HRE occurred in a local area of Zhuhai City, Guangdong Province. The maximum hourly precipitation during this event reached 148 mm, and the maximum 12-h accumulated precipitation was 360 mm. The precipitation was mainly caused by two separate CSs, which were observed well by the regional automatic stations, dual-polarimetric radars, and wind profilers. Therefore, this study analyzes the evolution and microphysical features of these two CSs, so as to improve the understanding of this type of event along the coast of South China.

2. Data and Methods

2.1. Data

The observation data from 7 dual-polarimetric radars (Figure 1a) in Guangdong Province (i.e., Zhuhai, Shenzhen, Guangzhou, Yangjiang, Zhaoqing, Shanwei, and Heyuan) were used as an important source of information in this analysis. The quality-controlled radar observations were interpolated into a Cartesian grid with a vertical resolution of 500 m and a horizontal resolution of 250 m over 0.5–20 km above mean sea level by using the vertical linear and the nearest interpolation methods [32]. The convective cells (CCs) identified method [33] was used in this study.
The data were then used for the analysis of the development and the microphysical characteristics of the CSs. The lightning data taken from the Earth Networks (EN) lightning detectors (including cloud lightning and ground lightning) were also used in our analyses. The detection frequency range of the lightning detectors was between 1 Hz and 12 MHz. The intensity, longitude, and latitude of lightning activities were obtained. Observation data from automatic weather stations (AWSs, including wind direction, wind speed, temperature, and precipitation) were used to analyze the characteristics of small and mesoscale meteorological fields. In addition, sounding data of Yangjiang and Hong Kong at 2000 (LST, the same below) and the hourly wind profiling radar data of Zhuhai (Figure 1a) were also collected and used in this study. The six-hourly 0.25° × 0.25° final (FNL) reanalysis data from the National Environmental Prediction Center of the United States were used to conduct synoptic analyses.

2.2. Estimation of Liquid and Ice Water Contents

The liquid water content and ice water content were calculated from the gridded data of the seven dual-polarimetric radars in Guangdong Province. For pure precipitation, the constrained Gamma raindrop size distribution inversion method [34] was used to invert the water content. For mixed-phase precipitation, the differential reflectivity (ZDP, dB) method [35] was used to estimate the horizontally polarized reflectance (ZH) of rain (Zrain) and ice (Zice), respectively. The Zrain–ZDP relationship was obtained from the two-year raindrop observation data in Guangdong.
Zrain = 0.0044 × ZDP2 + 0.58054 × ZDP + 16.591
Zice= ZH− Zrain
The Z–M relationship from previous studies [36] was used to calculate the liquid water content (Mw) and ice water content (Mi).
Mw = 3.44 × 10⁻³ (Zrain) 4/7
Mi = 1000πρiN03/7 ((5.28 × 10⁻¹⁸Zice)/720)4/7
where ρi is the density of ice and N0 is the intercept index, assuming that the ice follows an inverse exponential distribution. For pure ice, the ice water content was calculated using Equation (4). The relative mean calculated error of the Mw is about 9% and is about 12% for Mi.

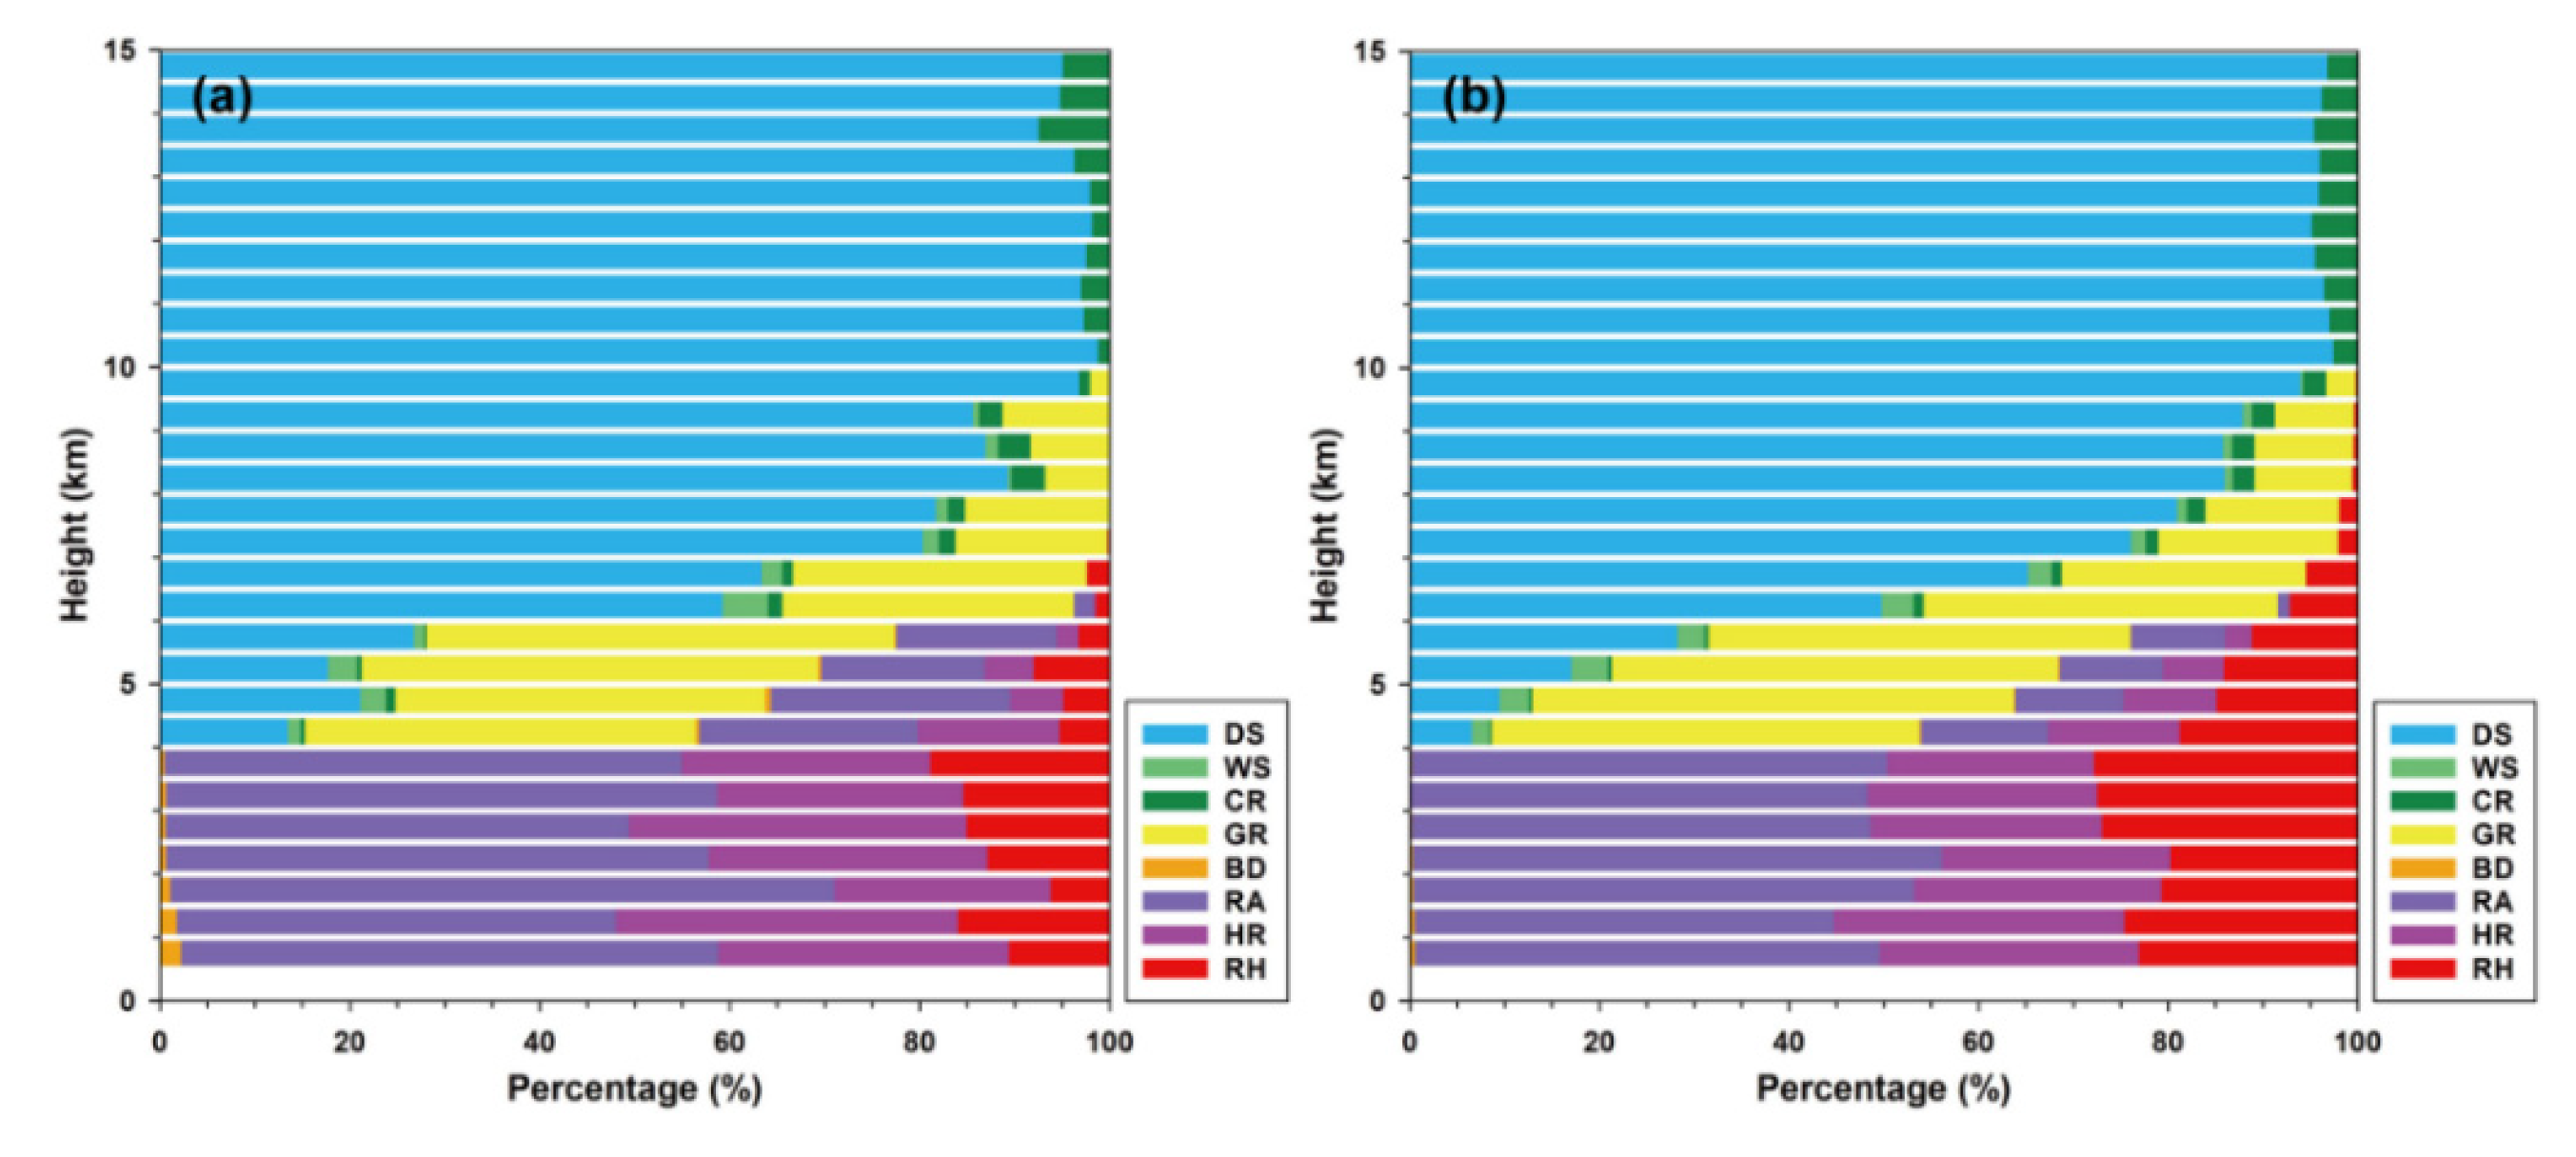
2.3. Identification and Classification of Hydrometeors

Based on the six polarization variables of the grid data of seven dual-polarimetric radar stations in Guangdong Province, we were able to perform phase identification and classification of hydrometeors [37] based on the improved hydrometeor classification algorithm (HCA) developed by Wu et al. [38]. This algorithm classifies radar echoes into ten categories: ground clutter or anomalous propagation (GC/AP), biological scattering (BS), dry snow (DS), wet snow (WS), ice crystals (CR), graupel (GR), big drops (BD), light and moderate rain (RA), heavy rain (HR), and a mixture of rain and hail (RH). Microphysical processes can be inferred from the type of hydrometeor; for instance, DS indicates aggregation, WS indicates melting, and GR indicates congealing.

2.4. Inversion of the Raindrop Size Distribution

The three-parameter Γ function can well reflect the characteristics of the drop size distribution (DSD). Its scale distribution function is expressed as:
N(D) = N0Dμexp(−ΛD)
where N0 (mm−1–μm−3) is the intercept, μ is the shape factor, and Λ (mm−1) is the slope. When μ > 0, the curve is convex, and when μ < 0, the curve is concave. When μ = 0, it becomes an exponential distribution, i.e., the M–P distribution (Marshall and Palmer, 1948). When N(D) is known, the radar reflectivity (Z; dBZ), precipitation rate (R; mm h−1), precipitation content (W; g m−3), and total raindrop concentration (Nt; m−3) can be calculated.
A total of 6966 2DVD (2D-Video-Distrometer) observation samples in South China from May to August 2016 were included, and the data filtering method (R > 5 mm h−1, Nt > 1000) proposed by Zhang et al. [39] was used to reduce the error caused by the sampling. The μ – Λ relation was obtained by polynomial least squares fitting:
Λ = 0.0241μ2 + 0.867μ + 2.453
A constrained gamma (C-G) model proposed by Liu et al. [18] was used to invert DSD. The specific fitting equation is as follows:
Λ = 2.111 × ZDR−1.044
N0 = ZH × 10−0.00188Λ4 + 0.0447Λ3 − 0.372Λ2 + 1.898Λ − 3.065

3. Precipitation Process and Synoptic Analyses

From Figure 1b, it can be seen that the main rain belt (≥50 mm) was in the coastal area of central Guangdong, with a length of 45 km from east to west and a width of 35 km from north to south. The center of the precipitation was located in the relatively flat coastal areas. The precipitation process started at 2100 LST on 31 May and ended at 1000 LST on 1 June. Heavy precipitation was observed between 0200–0800 LST on 1 June (Figure 1c). The 12-h cumulative precipitation at three representative stations, Tanzhou Station (No. G2003), Hengqin Station (No. G1217), and Dachikan Station (No. G1255), were 361.0 mm, 322.9 mm, and 38.2 mm, respectively. Precipitation at Dachikan Station mainly occurred from 2100 to 2300 LST on 31 May, and it was mainly caused by CS1. The per-hour precipitation evolution of the two automatic stations located near the coast showed similar features. The precipitation at Tanzhou Station occurred at 0300–0600 LST on 1 June, and the precipitation at Hengqin Station was slightly later, at 0600–0800 LST on 1 June. The precipitation at these two stations was primarily caused by CS2. In the peak stage of CS2, the horizontal scale of the intense convective zone (40 dBZ or more) reached 100 km, and it developed into a mesoscale convective system (MCS). The research area of this study was selected to include most of the stations recording heavy precipitation during the event (as shown in Figure 1b black dashed box).
Figure 2 shows the evolution of radar reflectivity. CS1 lasted for about 90 min (Figure 2a–c). Two CCs were generated around 2124 LST on 31 May (Figure 2a). After formation, the CCs gradually moved eastward and merged into CS1 in Zhuhai within 1 h. As a result, the strongest hourly precipitation at this stage, 19.5 mmh1, was observed at Dachikan Station (No. G1255); the average cumulative rainfall is 2.4 mm, accounting for about 5% of the total precipitation of the process at this particular station. At 2254 LST on 31 May, CS1 weakened and moved eastward to the sea, and the precipitation diminished. In the second stage (CS2), which lasted for about 8 h, the convection had high intensity and large coverage. At around 2348 LST on 31 May, two CCs were regenerated at a similar location as CS1 (Figure 2d) and gradually moved to the southeast. In the process of continuous generation, development, and consolidation, the CCs merged into a 100 km-scale band-like system. The cells moved along a similar path within 8 h, and CS2 mainly maintained a quasi-stationary behavior, resulting in a maximum rain rate of 148.6 mmh1 during 0600–0700 LST on 1 June at the G1217 station (Figure 1c). The average rain rate was 47.7 mm, accounting for about 95% of the total cumulative precipitation. In the next section, we discuss the development and evolution of CS1 and CS2 in detail.
Figure 3 shows the synoptic conditions before CS1. At 2000 LST on 31 May, a surface high-pressure system developed from East China to Guangdong, and a northerly cold current prevailed in northern Guangdong and merged with a southerly warm current from the South China Sea in central and northern Guangdong Province (Figure 3a). The weak cold front led to the formation of a precipitation system in central and northern Guangdong on the evening of 31 May. The key area was located about 100 km southward of the weak cold front, with an 850 hPa warm and humid airflow (pseudo-equivalent potential temperature ≥ 350 K, Figure 3b), and was located in front of the 500 hPa weak trough line (figure not included). There was no precipitation in the key area at this time. At 0200 LST on 1 June, the wind in the boundary layer (925 hPa) strengthened, and the wind direction changed from the southwest wind to the southward wind, which was more conducive to the development of coastal convection (Figure 3c,d).
The atmospheric thermodynamical and dynamical conditions along the coast of central Guangdong were analyzed using the sounding data from Yangjiang (170 km to the west of the key area) and Hong Kong (65 km to the east of the key area). At 2000 LST on 31 May (Figure 3e,f), the coast of South China had low LCL (170–532 m MSL) and low LFC (449–729 m MSL). The surface-based CAPE reached 3548–3890 J/kg, the total precipitable water was 67–70 mm, and the convection inhibition energy was weak. Thus, convection can easily be triggered in the coastal areas of Guangdong with slight uplift. In addition, Zhuhai wind profiling data showed that after 2100 LST on 31 May, the airflow below 1500 m switched from a westerly wind to a uniform southerly wind, which was conducive to the transport of low-altitude warm and humid airflow.

4. Comparison of The Evolution of The Two CSs

According to the analysis in Section 3, the triggering locations of CS1 and CS2 were similar, but the evolution of convection and the resulting precipitation were considerably different. For CS1, the convection was short and had a small scale, with a maximum rain rate intensity of only 19.5 mm h1. For CS2, the convection lasted much longer, had high intensity, and covered a large area, and the maximum precipitation intensity reached 148.6 mm h1. In this section, we analyze the evolution process and microphysical characteristics of the two CSs.

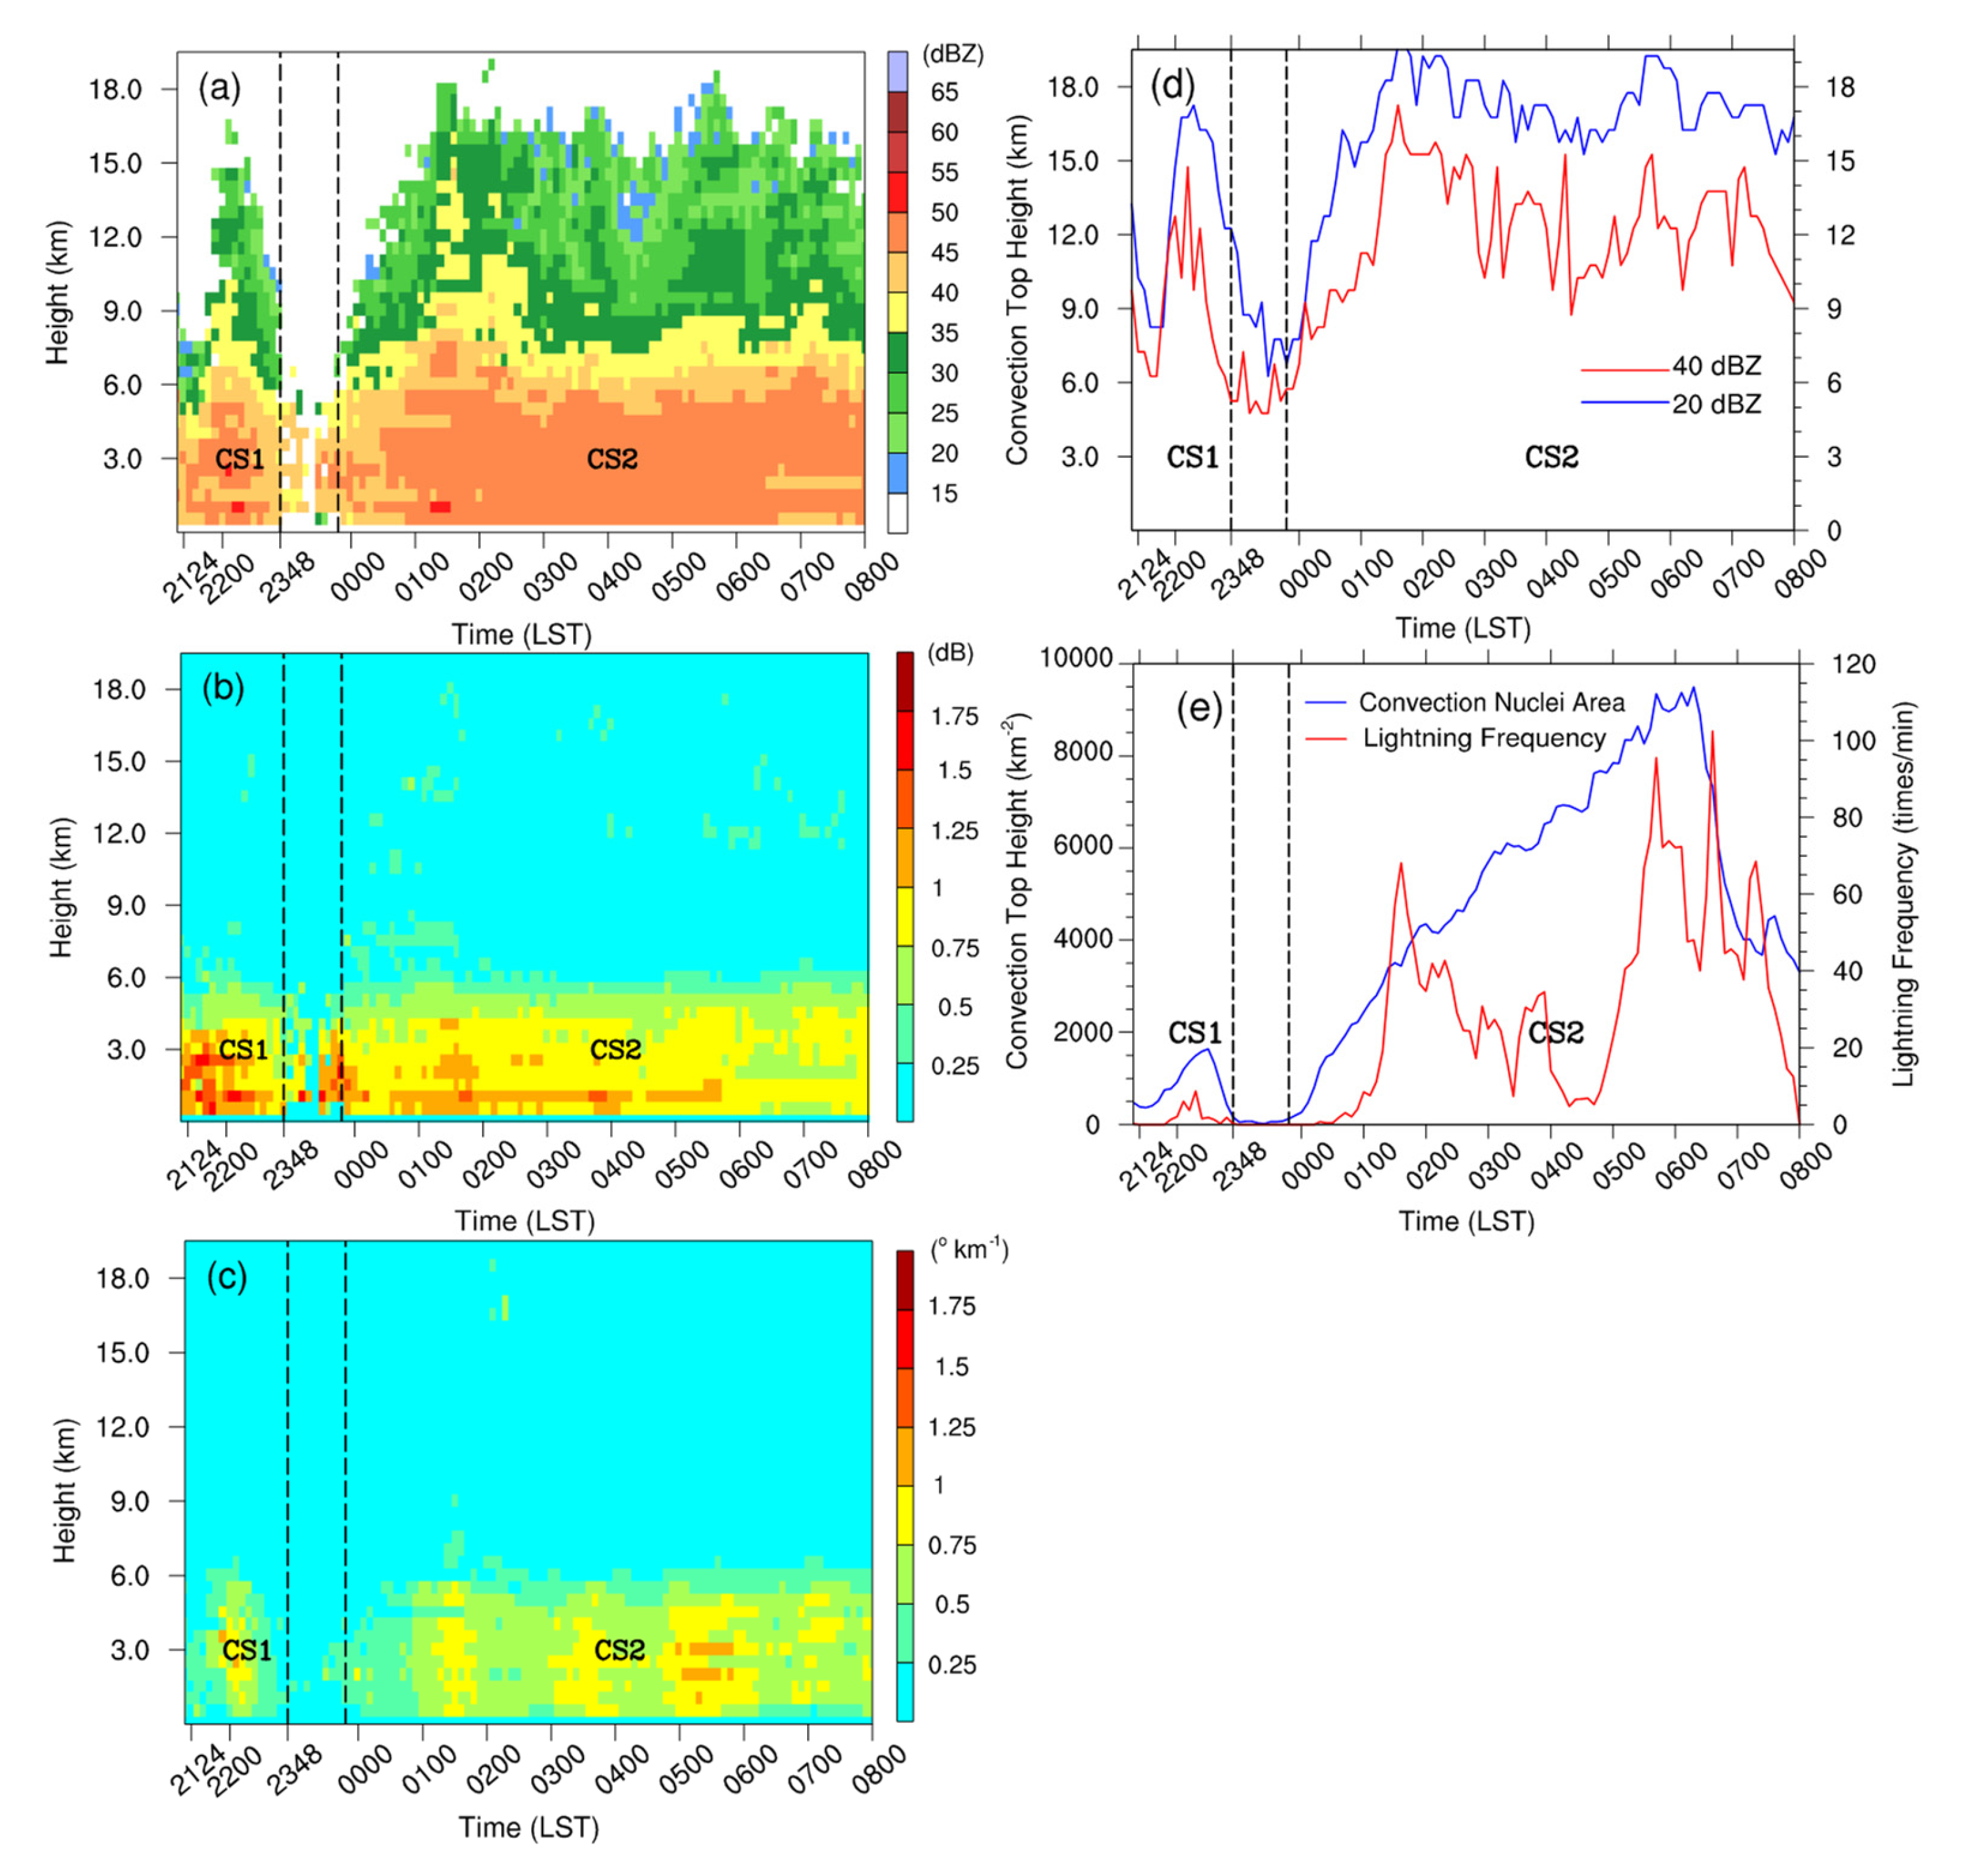
4.1. Triggering and Evolution of Convection

According to automatic station data, heavy precipitation occurred in the central and northern parts of Guangdong on the afternoon of 31 May 2021, and the ground temperature on the evening dropped to only 27–28 °C. At the same time, cooling at night leads to the development of mountain winds (northerly winds). However, there was almost no precipitation in the key area and to the south of it. As a result, the temperature (29–30°C) to the south of the key area was 2–3 °C higher than that to the north. At 2100 LST, a mesoscale boundary was formed in the northern section of the key area (Figure 4a). The speed of the northerly wind associated with the mesoscale boundary was relatively low, whereas the speed of the southerly wind associated with the boundary was notable (about 3–4 m s1), and the north-to-south temperature gradient was about 1.5 °C/10 km. Sun et al. [40] reported that when the horizontal temperature gradient is in the order of 1 °C/10 km, the response time to form a strong convective shear environment is only 10 min to 1 h. At 2124 LST, two CCs were formed on the west side of Beifeng Mountain (922 m above sea level) and the northwest side of Huangyang Mountain (581 m above sea level) (Figure 2a). The two cells moved eastward and merged, forming CS1, with a diameter of about 20 km. Because the cold outflow of CS1 was weak, the northerly wind recorded by the AWSs in the surrounding area was less than 5 m s1 (Figure 4b). At the same time, the convection system quickly moved onto the colder underlying surface area in the east. At the AWSs (Qingnianshuiku Station, No. G1237), downstream of CS1, the wind direction at 2000 LST changed from southwesterly to northeasterly (Figure 5a). Moreover, the air pressure increased by 2 hPa between 1800 and 2100 LST, and the surface temperature was only 26–27 °C, indicating that weak cold air may have infiltrated into the area from the Pearl River Estuary, generating an unfavorable mesoscale environment and resulting in a rapid weakening of CS1. Hence, CS1 did not trigger further new cells and only produced precipitation.
About 2 h later, the initial convection of CS2 was triggered at a similar location. As a result of the evaporative cooling effect of precipitation during CS1, the temperature on the east side of Huangyang Mountain at 2300 LST on May 31 dropped to about 27 °C (Figure 4c). The temperature on the south side of the key area did not change substantially, and the mesoscale boundary moved 5–10 km southward. At this time, the wind speed on the north side of the mesoscale boundary increased to 2–3 m s1, indicating that a thick layer of cold air had formed near the ground, which converged with the southwest airflow on the south side of the mesoscale boundary. Two other CCs appeared at a similar position at 2348 LST (Figure 2d), which were both about 5 km south of the convection initiation location for CS1. The two CCs merged into CS2 with a length of 50 km at 0124 LST on 1 June (Figure 2e), and the AWS G2003 recorded its maximum precipitation of 97.8 mm during 0200–0300 LST. Moreover, the cold outflow of CS2 was strong (Figure 4e), and the wind speed increased to 4–5 m s1.
The synoptic analysis (Figure 5e) shows that in the middle troposphere, the most significant feature was that a shortwave trough controlled the southern section of Guangdong Province. CS1 and CS2 formed within the trough regions, which were dominated by the westerly wind. The westerly wind, on the one hand, steered CS2 eastward, and on the other hand, it caused a cold advection (as there was a cold center of −3.6 °C behind the shortwave trough) which enhanced the instability of the air column and contributed to the convective activities. As Figure 5a, c shows, CS1 formed in a region with a relatively higher surface temperature, abundant moisture, weak convergence, and notable vorticity. After formation, CS1 moved eastward to a region with lower surface temperature, weaker lower-level convergence, and weaker cyclonic vorticity than those of its formation stage (c.f., Figure 5a–d).This means that the environmental conditions for sustaining the CSs became less favorable, and thus, CS1 dissipated rapidly. During the lifespan of CS2, the southerly wind over the South China Sea became stronger (Figure 5c,d). This caused an intense lower-level convergence zone along the coastal region of Guangdong Province, which provided favorable dynamic conditions for maintaining CS2. Favored by the strong coastal convergence (Figure 5d) and abundant moisture (Figure 5b), new convective cells (CCs) were generated continuously and merged with CS2 (Figure 2f–j), acting as another favorable condition for its maintenance. Overall, the dynamical conditions for maintaining CS2 were much better than those of CS1 (Figure 5d), which made CS2 last for a much longer lifespan than that of CS1, although the thermal conditions for both were similar (Figure 5b).
The surface observations are further analyzed. The Shenwan Stationand Daqiao Station observed easterly winds with speeds of 10.7 and 11.8 m s1, respectively. Moreover, the surface temperature downstream of CS2 was high (Figure 6a,b). The temperature at Baosuiqu Station (No. G1230) at 0100 LST on 1 June was 28.7°C, which was 2.6°C higher than that of Qingnianshuiku Station (No. G1237), located downstream of CS1. The specific humidity distribution in Figure 6c indicates that the southwest part of the key area had high specific humidity, indicating that the southwest side of the CS2 mesoscale environment had conditions that were conducive to convective precipitation. The Zhuhai wind profile data indicate that the boundary layer at 0000–0600 LST on 1 June consistently had southerly wind, and the wind speed gradually increased (Figure 6d). The continuous convergence of the northeast cold outflow and the southwesterly wind drove the mesoscale boundary slowly to the south. New cells were continuously generated on the southwestern side of the boundary, which then merged and strengthened (Figure 4f–j).
According to the method of Luo et al. [13], the CCs were numbered in chronological in order to analyze the merging process. At 0230 LST, a new convective cell, Cell1, was formed 10 km to the southwest of CS2 (Figure 2g). Cell1 merged into CS2 after about 24 min. At the same time, Cell 2 was generated 8 km to the west of CS2. At 0400 LST on 1 June, Cell2 merged into CS2 (Figure 2i), and Cell 3 and Cell 4 appeared 5 km and 20 km to the west of CS2, respectively. Cell3 merged into CS2 after about 42 min (Figure 2i), and Cell4 merged into CS2 after about 2 h, forming a quasi-stationary convective belt of about 100 km (Figure 2j). The maximum reflectivity in CS2 was 65 dBZ, causing 148.6 mm h1 precipitation at station G1217. Cell 5 was formed at 0618 LST 10 km to the west of CS2, which merged into CS2 about 30 min later (Figure 2k).
The above analysis indicates that the two convective systems were both triggered in the hilly terrain area on the mesoscale boundary, and weak cold air infiltrated the eastern area from the Pearl River Estuary in advance, resulting in the rapid weakening of CS1. The CS2 was generated close to the coast and moved to an area with more favorable temperature and humidity conditions for the continuation of the precipitation. The strong cold outflow triggered five new cells on its southwestern side, which then merged into CS2, enhancing the convection intensity and causing extreme precipitation.

4.2. Differences in the Convective Cells

Convection usually acts as the primary reason for heavy precipitation. In this section, we analyze the characteristics of the convective cells of CS1 and CS2. According to the statistical method of Wang et al. [17], if the number of points with radar reflectivity >40 dBZ exceeds one-third of the total number of grids in each column, then the particular column is considered a CC. Figure 7a–c shows the variation of the vertical profile of the CS convective cells, and Figure 7d–e shows the convective cells’ area, convective top height, and lightning frequency in CS1 and CS2. There was a considerable gap at 2300 LST on 31 May to distinguish the two systems. In CS1, the duration of convection was short, and the area of the convective cells was less than 100 km2. However, the convection developed vigorously, the intensity reached up to more than 50 dBZ, and the heights with radar reflectivity of 20 and 40 dBZ were 16 and 8 km, respectively. The lightning frequency was 10 times/min. It should be noted that the automatic stations did not record large cumulative precipitation, which may be due to the small influencing area of the convective nucleus, sparse distribution of the stations, and the short duration of CS1. In addition, the ZDR value was high, reflecting a large raindrop size. In CS2, the convective nucleus was characterized by continuous and high-efficiency precipitation. The convection above 45 dBZ lasted for more than 7 h, and the heights of 20 and 40 dBZ radar reflectivity reached 18 and 15 km, respectively. There was little lighting for CS1, but the lightning frequency reached up to 100 times/min for CS2, which indicates that CS2 was more intense than CS1. From the perspective of temporal evolution, ZDR indicated small raindrops in the near-surface layer from 0230 LST (Figure 7b), and KDP values showed increased liquid water content (Figure 7c), reflecting high-efficiency precipitation in CS2. Figure 7e shows that the convective area reached up to 500 km2 at 0600–0700 LST, which was the time at which the five CCs merged into CS2 to form a 100 km long convective belt. The continuous train effect led to the extreme precipitation recorded at station G1217.

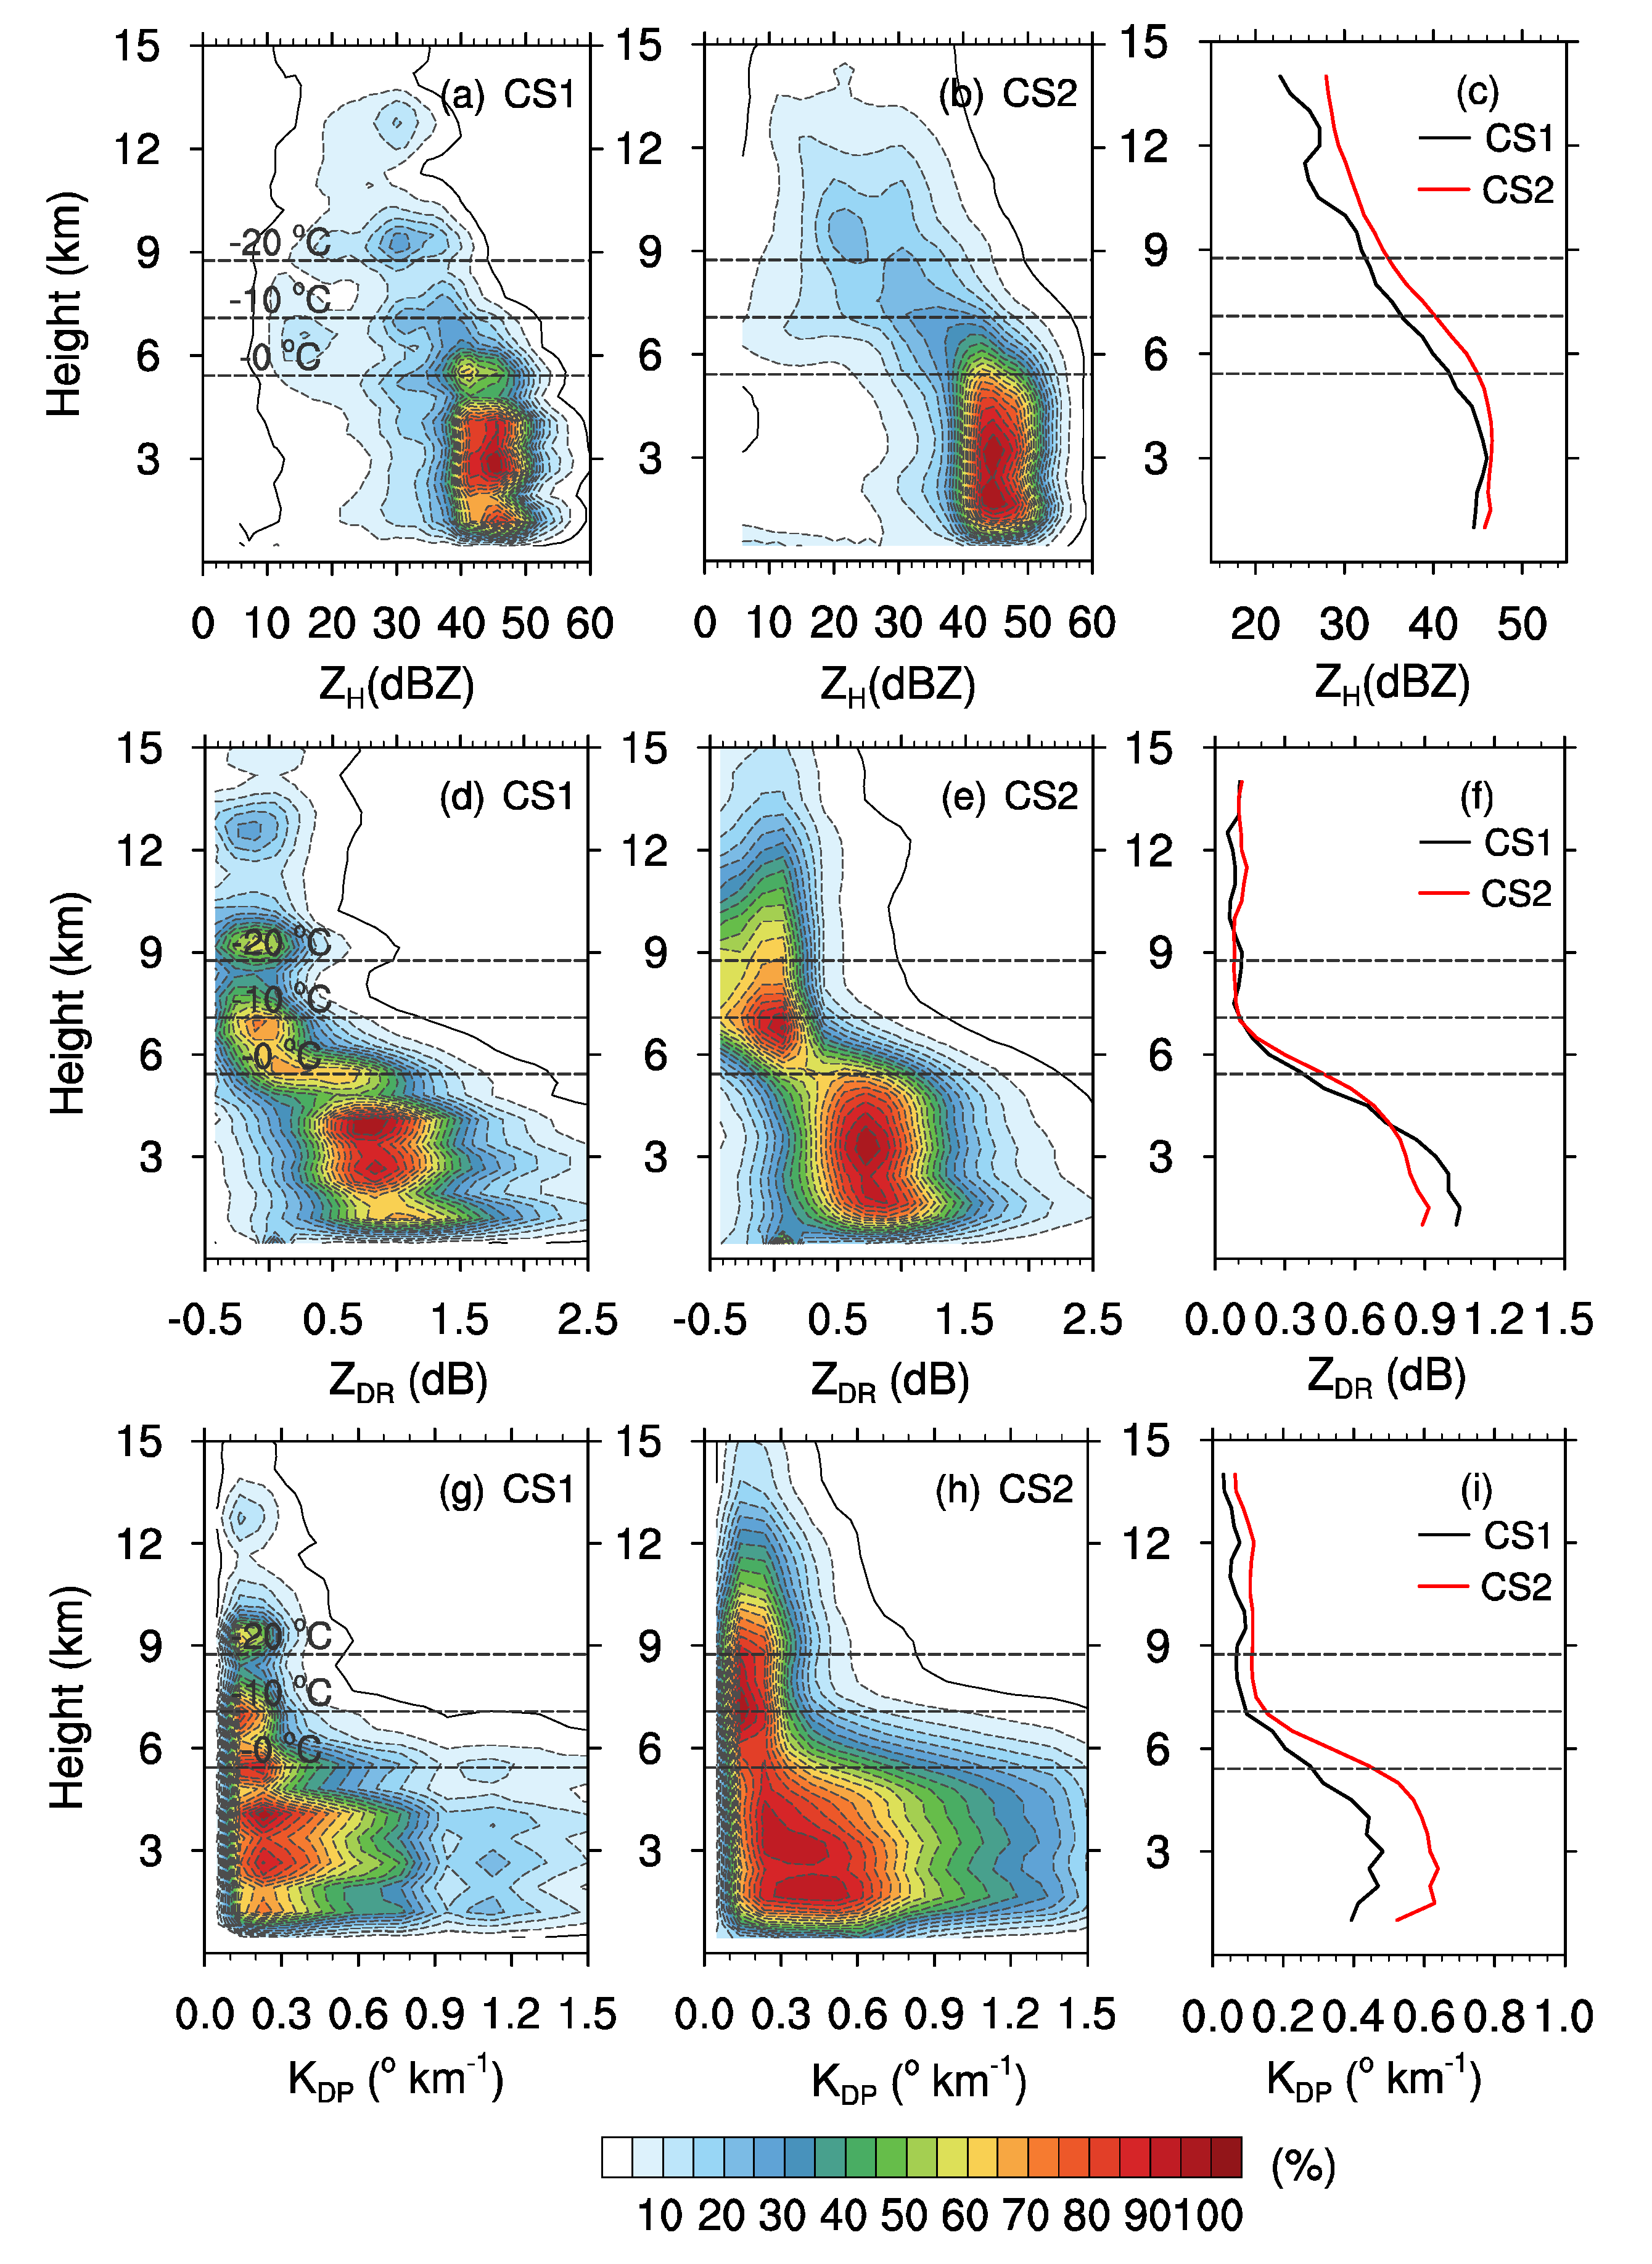
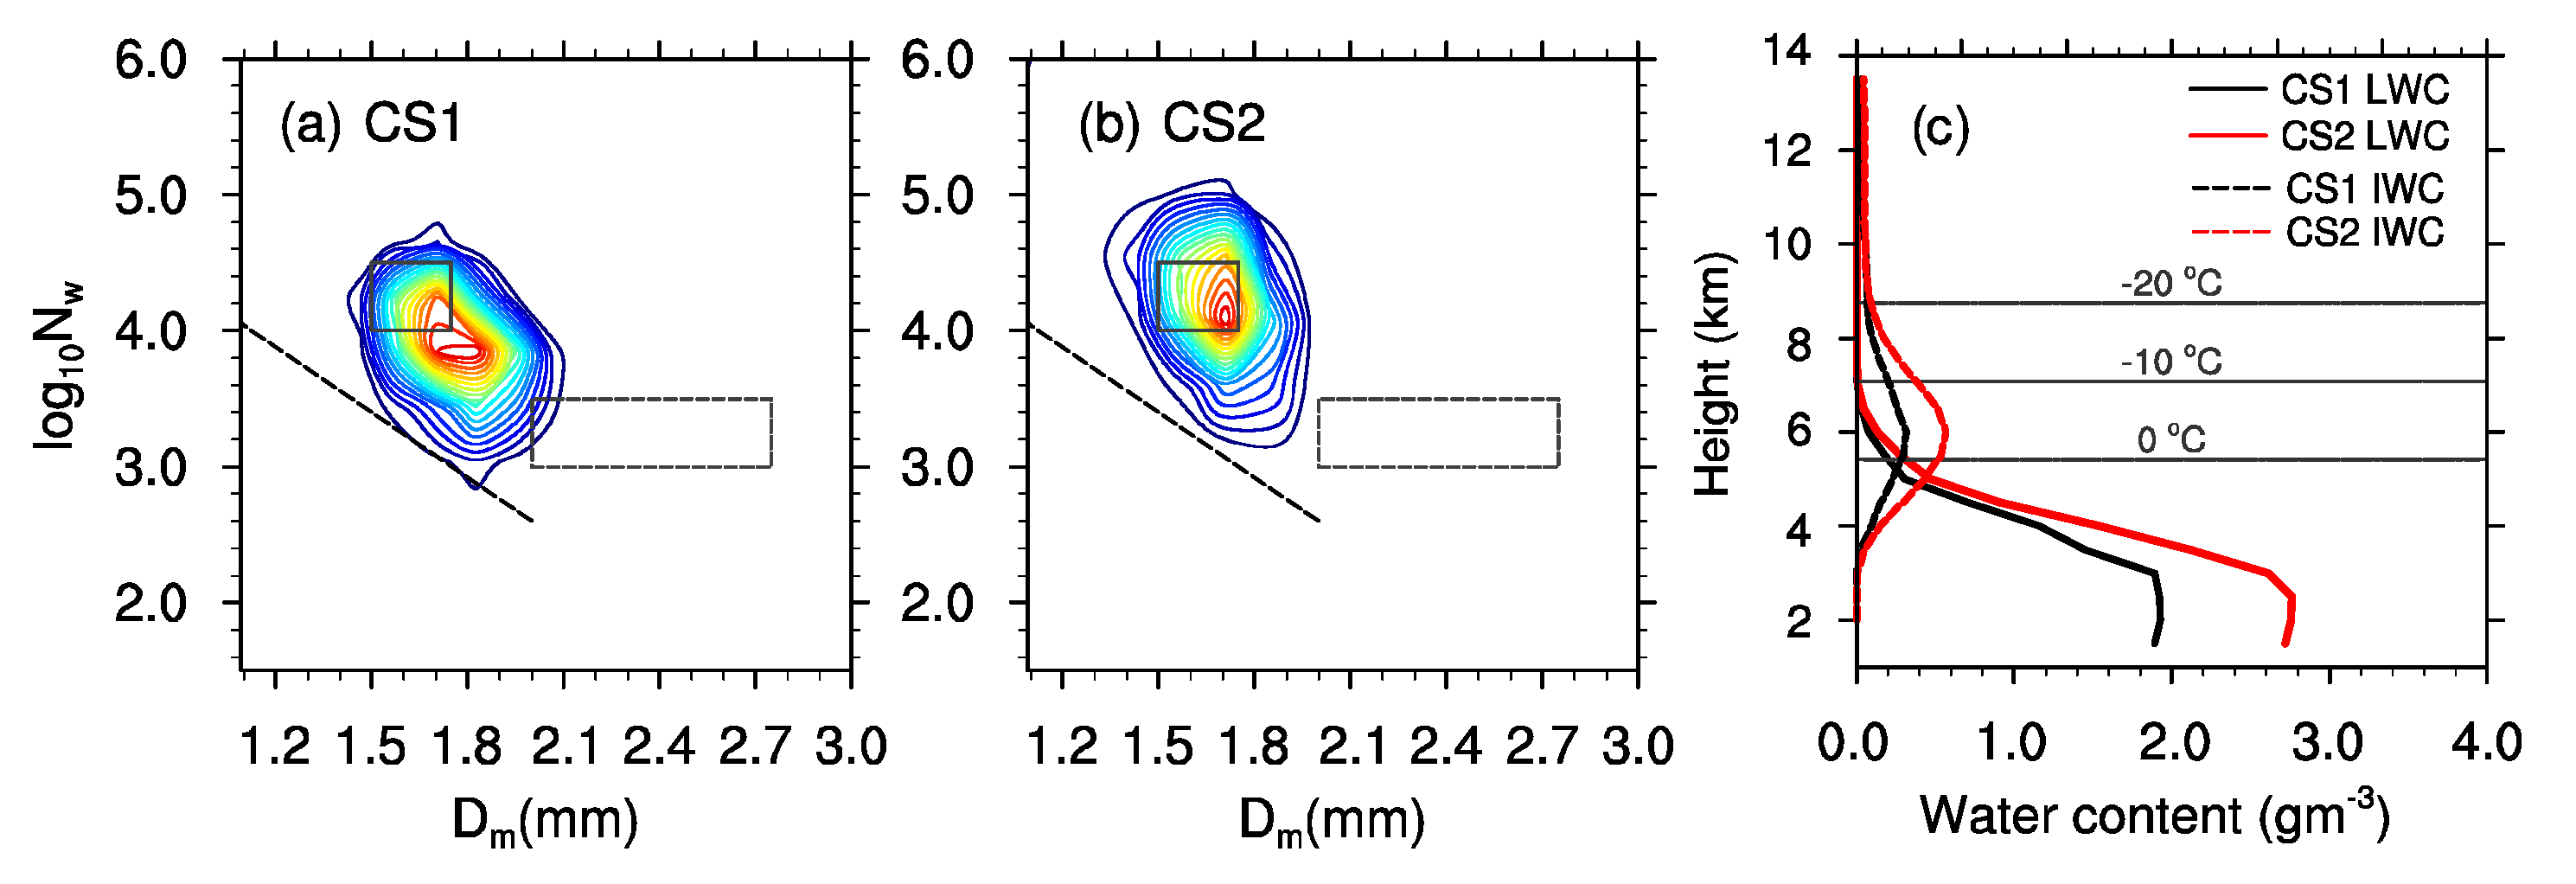
4.3. Differences in Microphysical Characteristics

In order to further analyze the microphysical characteristics of CS1 and CS2, the frequency curves of all identified CCs in CS1 and CS2 over the 10-h period are shown in Figure 8. For CS1, the ZH distribution of CCs below the 0 °C isotherm was between 40 and 50 dBZ, and the frequency reached 60%. In contrast, for CS2, ZH was mainly between 42 and 53 dBZ, and the frequency reached 80%. Above 10 km, most of the ZH values of the CCs in CS1 dropped to 20 dBZ (Figure 8a), whereas some ZH values in CS2 still reached 30 dBZ (Figure 8b). This suggests that the convection in CS2 reached a higher height, and the intensity was stronger, which is consistent with the results discussed above. Below 7 km, ZDR decreased considerably with altitude in both systems, although the magnitude was different; below 4 km, ZDR of CCs greater than 1 dB was more frequent in CS1 (Figure 8d), indicating a larger raindrop size than that in CS2 (Figure 8e). In addition, the average ZH value in CS1decreased when below 3 km and ZDR value increased (Figure 8a,b), which is probably related to the size sorting evaporation process. Above 7 km, the KDP distributions of CS1 and CS2 were notably similar to each other. However, in CS2, the KDP value of 1.0 °·km−1was widely distributed below the melting layer (Figure 8h), indicating that the CCs in CS2 had a high water content.
From the logarithmic joint probability distribution functions (PDFs) of the mass-weighted mean diameter Dm and the normalized intercept log10Nw (Figure 9a,b). Due to the size sorting evaporation process in CS1, the small size raindrops evaporated rapidly when falling to the surface, resulting in larger average raindrop sizes and lower number concentrations. The average Dm of CS2 was 1.64 mm, about 0.1 mm smaller than that of CS1, and the log10Nw was 4.14 mm−1 m−3, about 0.2 mm−1 m−3 higher than that of CS1, indicating that the CC samples of CS2 featured smaller raindrops and higher concentration, which were close to the tropical marine precipitation. Even though the systems happen in the same synoptic environment in similar locations, the mesoscale environment is substantially different with more maritime conditions and thus more humidity and less evaporation affecting CS2.
The average vertical profiles of LWC (Liquid Water Content) and IWC (Ice Water Content) in the two CSs are shown in Figure 9c. A large LWC was observed below the 0 °C isotherm, which was consistent with the larger KDP features in Figure 8. The maximum IWC and LWC of CCs in CS2 were 0.6 and 2.7 g m−3, about 0.3 and 0.9 g m−3 larger than those in CS1. The CCs produced more IWC in CS2 than in CS1, which might be caused by stronger local updrafts in CS2 that continuously lifted small cloud droplets above the freezing level and enhanced the ice phase process.
Figure 10 shows a comparison of the vertical distribution of hydrometeors in CS1 and CS2. For CS2, the CCs contained more graupel particles, and the mixing frequency of rain and hail accounted for about 48% at 4–5 km, which was only 40% in CS1 (Figure 10a,b). In other words, the convection development in CS2 was more vigorous than that of CS1, and the strong updraft in CS2 transported liquid water composed with a smaller drop size above the 0 °C isotherm, enhancing the riming process and forming more graupel particles. As the graupel particles increased in size and began to fall, they melted into raindrops, resulting in an increase in LWC. Due to the strong size sorting evaporation process in CS1, the small raindrops evaporated rapidly, and some big raindrops (~2%) were formed near the surface, resulting in a larger average raindrop diameter in CS1 than in CS2.

5. Conclusions and Discussion

In this study, we investigated the HRE along the coastal region of South China on 1 June 2021 by using multi-source of observational data, with a particular focus on the development and evolution features of two CSs, as well as the differences in the microphysical characteristics of their convective cells. The main conclusions are as follows.
(1) The HRE was mainly produced by two CSs. The CS1 lasted for only 90 min and accounted foronly~5% of the total precipitation, whereas the quasi-stationary, long-lived CS2 produced~95% of the total precipitation. The triggering locations of the initial CCs of CS1 and CS2 were both located near Beifeng Mountain in Taishan and Huangyang Mountain in Doumen. A mesoscale boundary was formed between the warm and humid air from the ocean surface at night and the cold air stack due to previous precipitation. This mesoscale boundary played an important role in the convection initiation.
(2) For CS1, the intensity of its convective cells exceeded 50 dBZ, and the lightning frequency reached 10 times/min, which indicates that the merging process of the two CCs resulted in strong convection. However, CS1 quickly moved toward the cold underlying surface area in the east and did not trigger more new cells. For CS2, the convection above 45 dBZ lasted for more than 7 h, and the lightning frequency reached up to 100 times/min. Its CCs showed the characteristics of continuous and efficient rainfall. During the life span of CS2, the southerly wind over the South China Sea became stronger and kept a strong intensity. This caused an intense lower-level convergence zone along the coastal region of Guangdong Province, which provided favorable dynamic conditions for maintaining CS2. Favored by the strong coastal convergence and abundant moisture, new convective cells (CCs) were generated continuously and merged with the CS2, acting as another favorable condition for its maintenance.
(3) For CS1, there was considerable evaporation below 4 km, as CS1 was situated more inland from the coast than CS2, where the humidity was relatively low, and some small raindrops were evaporated close to the ground. In CS2, CCs showed a large ZH and KDP, a high concentration of small raindrops, and high LWC. The overall precipitation of CS2 belonged to the maritime type. In addition, the convective intensity of CS2 was relatively high, graupel dominated above the freezing point, and the riming and melting processes were active, resulting in extremely high precipitation efficiency and strong local precipitation over a short period of time.
Due to the limitations in the observational data and analytical methods, some deficiencies still remain in the understanding of the HRE. For example, there were some differences in the microphysical characteristics at different times in CS2, and it remains unknown whether this was related to the underlying surface. In addition, the differences in the microphysical characteristics in this study were only based on a single HRE, which may have limitations for its representativeness.

Author Contributions

Conceptualization, L.Y. and X.L.; Data curation, X.L., Y.P. and B.X.; Formal analysis, L.Y. and H.L.; Methodology, X.L.; Validation, X.L. and F.X.; Writing—original draft, L.Y., Y.P. and B.X.; Writing—review and editing, X.L. and Y.P. All authors have read and agreed to the published version of the manuscript.

Funding

This work was jointly supported by the National Natural Science Foundation of China (Grant No. 41975138 and 41905047), the Natural Science Foundation of Guangdong Province (Grant No. 2019A1515010814), the Jiangmen Science and Technology Project (Grant No. 2020JC03009), and the Science and Technology Development Fund Project of Guangdong Meteorological Bureau (Grant No. GRMC2020M27).

Institutional Review Board Statement

Not applicable.

Informed Consent Statement

Not applicable.

Data Availability Statement

The data presented in study are available from China Meteorological Data Service Center at the website of http://data.cma.cn.

Conflicts of Interest

The authors declare no conflict of interest.

References

  1. Sun, J.; Zhang, Y.; Liu, R.; Fu, S.; Tian, F. A review of research on warm-sector heavy rainfall in China. Adv. Atmos. Sci. 2019, 36, 1299–1307. [Google Scholar] [CrossRef]
  2. Tao, S. Rainstorms in China; Science Press: Beijing, China, 1980; pp. 45–46. (In Chinese) [Google Scholar]
  3. Liu, R.; Sun, J.; Wei, J.; Fu, S. Classification of persistent heavy rainfall events over South China and associated moisture source analysis. J. Meteor. Res. 2016, 30, 678–693. [Google Scholar] [CrossRef]
  4. Meng, W.; Wang, A.; Li, J.; Fong, S.; Hou, E. Moist potential vorticity analysis of the heavy rainfall and mesoscale convective systems in South China. Chin. J. Atmos. Sci. 2004, 28, 330–341, (In Chinese with English abstract). [Google Scholar] [CrossRef]
  5. Sun, J.; Zhao, S. A study of mesoscale convective systems and its environmental fields during the June 1994 record heavy rainfall in South China Part II: Effect of physical processes, initial environmental fields and topography on meso-β convective system. Chin. J. Atmos. Sci. 2002, 26, 633–646. (In Chinese) [Google Scholar] [CrossRef]
  6. Xia, R.; Zhao, S. Diagnosis and modeling of meso-β-scale systems of heavy rainfall in warm sector ahead of front in South China (middle part of Guangdong Province) in June 2005. Chin. J. Atmos. Sci. 2009, 33, 468–488. (In Chinese) [Google Scholar] [CrossRef]
  7. Chen, X.; Zhao, K.; Xue, M. Spatial and temporal characteristics of warm season convection over Pearl River Delta region, China, based on 3 years of operational radar data. J. Geophys. Res. Atmos. 2014, 119, 12447–12465. [Google Scholar] [CrossRef]
  8. Du, Y.; Chen, G. Heavy rainfall associated with double low-level jets over Southern China. Part II: Convection initiation. Mon. Weather Rev. 2019, 147, 543–565. [Google Scholar] [CrossRef]
  9. Fu, S.-M.; Li, D.-S.; Sun, J.-H.; Si, D.; Ling, J.; Tian, F.-Y. A 31-year trend of the hourly precipitation over South China and the associated mechanisms. Atmos. Sci. Lett. 2016, 17, 216–222. [Google Scholar] [CrossRef]
  10. Wu, M.; Luo, Y. Mesoscale observational analysis of lifting mechanism of a warm sector convective system producing the maximal daily precipitation in China mainland during the 2015 pre-rainy season. J. Meteorol. Res. 2016, 30, 719–736. [Google Scholar] [CrossRef]
  11. Yang, R.; Zhang, Y.; Sun, J.; Fu, S.; Li, J. The characteristics and classification of eastward-propagating mesoscale convective systems generated over the second-step terrain in the Yangtze River Valley. Atmos. Sci. Lett. 2018, 20, e874. [Google Scholar] [CrossRef] [Green Version]
  12. Mai, Z.; Fu, S.; Sun, J.; Hu, L.; Wang, X. Key statistical characteristics of the mesoscale convective systems generated over the Tibetan Plateau and their relationship to precipitation and southwest vortices. Int. J. Climatol. 2020, 36, 3148–3160.30. [Google Scholar] [CrossRef]
  13. Luo, Y.; Gong, Y.; Zhang, D. Initiation and organizational modes of an extreme-rain-producing mesoscale convective system along a Mei-Yu Front in East China. Mon. Wea. Rev. 2014, 142, 203–221. [Google Scholar] [CrossRef]
  14. Fu, P.; Hu, D.; Zhang, Y. Microphysical Characteristics, Initiation and Maintenance of Record Heavy Rainfall over Guangzhou Region on 7 May 2017. Meteorol. Mon. 2019, 44, 500–510. [Google Scholar]
  15. Guo, Z.; Wu, Z.; Cai, J.; Zhang, H.; Chen, X. Analysis of water vapor transport characteristics of a monsoon low-pressure continuous heavy rain event at the end of August 2018 in Guangdong area. J. Torrential Rain Disasters 2019, 38, 587–596. [Google Scholar]
  16. Liang, Q.; Xiang, S.; Lin, L. Activity characteristics and organizational development of MCS during the first flood season in South China. J. Trop. Meteorol. 2012, 28, 541–551. [Google Scholar]
  17. Wang, H.; Luo, Y.; Jou, B.J.D. Initiation, maintenance and properties of convection in an extreme rainfall event during SCMREX: Observational analysis. J. Geophys. Res. Atmos. 2014, 119, 206–232. [Google Scholar] [CrossRef]
  18. Liu, X.; Luo, Y.; Guan, Z.; Zhang, D. An extreme rainfall event in coastal south China during SCMREX-2014: Formation and roles of rainband and echo trainings. J. Geophys. Res. Atmos. 2018, 123, 9256–9278. [Google Scholar] [CrossRef]
  19. Li, H.; Liu, X.; Xiao, H. Assimilation of Polarimetric Radar Data Using an Ensemble Kalman Filter for the Analysis and Forecast of Tropical Storm Ewiniar. J. Trop. Meteorol. 2021, 27, 94–108. [Google Scholar] [CrossRef]
  20. Du, Y.; Chen, G. Heavy Rainfall Associated with Double Low-Level Jets over Southern China. Part I: Ensemble-Based Analysis. Mon. Weather Rev. 2018, 146, 3827–3844. [Google Scholar] [CrossRef]
  21. Chen, S.; Huang, H. Analysis of the intensity variation of convective cells when they enter the Hangzhou Bay. Meteorol. Monthly. 2011, 37, 889–896. (In Chinese) [Google Scholar]
  22. Wen, J.; Zhao, K.; Huang, H.; Zhou, B.; Yang, Z.; Chen, G.; Lee, W.C. Evolution of microphysical structure of a subtropical squall line observed by a polarimetric radar and a disdrometer during OPACC in Eastern China. J. Geophys. Res. –D Atmos. 2017, 122, 8033–8050. [Google Scholar] [CrossRef]
  23. Lang, T.J.; Rutledge, S.A.; Cifelli, R. Polarimetric radar observations of convection in northwestern Mexico during the North American Monsoon Experiment. J. Hydrometeorol. 2010, 11, 1345–1357. [Google Scholar] [CrossRef]
  24. Rowe, A.; Rutledge, S.; Lang, T. Investigation of microphysical processes occurring in isolated convection during NAME. Monthly Weather Rev. 2011, 139, 424–443. [Google Scholar] [CrossRef]
  25. Han, B.; Du, Y.; Wu, C.; Liu, X. Microphysical characteristics of the coexisting frontal and warm-sector heavy rainfall in South China. J. Geophys. Res. Atmos. 2021, 126, e2021JD035446. [Google Scholar] [CrossRef]
  26. Ulbrich, C.W.; Atlas, D. Microphysics of raindrop size spectra: Tropical continental and maritime storms. J. Appl. Meteorol. Climatol. 2007, 46, 1777–1791. [Google Scholar] [CrossRef]
  27. Bringi, V.N.; Chandrasekar, V. Polarimetric Doppler Weather Radar: Principles and Applications; Cambridge University Press: Cambridge, UK, 2001; p. 636. [Google Scholar]
  28. Zrnic, D.; Ryzhkov, A. Polarimetry for weather surveillance radars. Bull. Am. Meteorol. Soc. 1999, 80, 389–406. [Google Scholar] [CrossRef]
  29. Barnes, H.C.; Houze, R.A., Jr. Precipitation hydrometeor type relative to the mesoscale airflow in oceanic deep convection of the Madden–Julian oscillation. J. Geophys. Res. Atmos. 2014, 119, 13990–14014. [Google Scholar] [CrossRef]
  30. Kumjian, M.R.; Ryzhkov, A.V. Polarimetric signatures in supercell thunderstorms. J. Appl. Meteorol. Climatol. 2008, 47, 1940–1961. [Google Scholar] [CrossRef]
  31. Li, H.; Wan, Q.; Peng, D.; Liu, X.; Xiao, H. Multiscale analysis of a record-breaking heavy rainfall event in Guangdong, China. Atmos. Res. 2020, 232, 104703. [Google Scholar] [CrossRef]
  32. Yu, S.; Luo, Y.; Zheng, D.; Wu, C.; Liu, X.; Xu, W. Convective and microphysical characteristics of extreme precipitation revealed by multisource observations over the Pearl River Delta at monsoon coast. Geophy. Res. Let. 2022, 49, e2021GL097043. [Google Scholar]
  33. Wang, H.; Kong, F.; Wu, N.; Lan, H.; Yin, J. An investigation into microphysical structure of a squall line in South China observed with a polarimetric radar and a disdrometer. Atmos. Res. 2019, 226, 171–180. [Google Scholar] [CrossRef]
  34. Zhang, G.; Vivekanandan, J.; Brandes, E. A method for estimating rain rate and drop size distribution from polarimetric radar measurements. IEEE Trans. Geosci. Remote Sens. 2001, 39, 830–841. [Google Scholar] [CrossRef]
  35. Golestani, Y.; Chandrasekar, V.; Bringi, V.N. Intercomparison of multiparameter radar measurements. In Proceedings of the 24th Conference on Radar Meteorology of the American Meteorological Society, Tallahassee, FL, USA, 27–31 March 1989; pp. 309–314. [Google Scholar]
  36. Wu, D.; Zhao, K.; Kumjian, M.; Chen, X.; Huang, H.; Wang, M.; Didlake, A., Jr.; Duan, Y.; Zhang, F. Kinematics and microphysics of convection in the outer rainband of typhoon Nida (2016) revealed by polarimetric radar. Mon. Weather Rev. 2018, 146, 2147–2159. [Google Scholar] [CrossRef]
  37. Park, H.S.; Ryzhkov, A.V.; Zrnić, D.S.; Kim, K.-E. The Hydrometeor Classification Algorithm for the Polarimetric WSR-88D: Description and Application to an MCS. Weather Forecast. 2009, 24, 730–748. [Google Scholar] [CrossRef]
  38. Wu, C.; Liu, L.; Wei, M.; Xi, B.; Yu, M. Statistics-based optimization of the polarimetric radar hydrometeor classification algorithm and its application for a squall line in South China. Adv. Atmos. Sci. 2018, 35, 296–316. [Google Scholar] [CrossRef]
  39. Zhang, G.; Vivekanandan, J.; Brandes, E.; Meneghini, R.; Kozu, T. The shape-slope relation in observed Gamma raindrop size distributions: Statistical error or useful information. J. Atmos. Ocean. Technol. 2003, 20, 1106–1119. [Google Scholar] [CrossRef]
  40. Sun, J.; Yang, B. Meso-β scale torrential rain affected by topography and the urban circulation. Chin. J. Atmos. Sci. 2008, 32, 1352–1364. (In Chinese) [Google Scholar] [CrossRef]
  41. Bringi, V.; Chandrasekar, V.; Hubbert, J.; Gorgucci, E.; Randeu, W.; Schoenhuber, M. Raindrop size distribution in different climatic regimes from disdrometer and dual-polarized radar analysis. J. Atmos. Sci. 2003, 60, 354–365. [Google Scholar] [CrossRef]
Figure 1. (a) Locations of seven dual-polarization radars in South China (purple star denotes the location of radar) and terrain height (shaded, units: m). The red circle denotes the sounding at Yangjiang (YJ) and Hong Kong (HK). The red triangles denote the wind profiling radar at Zhuhai (ZH). The solid black box shows (b) area. (b) 12-h precipitation from 2200 LST on 31 May 2021 (colored dots; unit: mm) observed by AWSs. Terrain is shaded in gray. The black dashed box is the key area in this study, which contained most of the heavy-precipitation stations in the HRE. (c) Hourly precipitation (mm) at Henqing, Tanzhou, and Dachikan stations and cumulative precipitation (broken line, right coordinate).
Atmosphere 13 01549 g001
Figure 2. Radar reflectivity (ZH, dBZ) of Shenzhen (SZ) radar (1.5° elevation) (asterisk represents the location of SZ radar station) and lightning data of Earth Networks lightning detectors (black × represents lightning) at (a) 2124 LST 31, (b) 2148 LST 31, (c) 2242 LST 31, (d) 2348 LST 31, (e) 0124 LST 1, (f) 0230 LST 1, (g) 0254 LST 1, (h) 0400 LST 1, (i) 0442 LST 1, (j) 0618 LST 1, (k) 0642 LST 1, (l) 0806 LST 1.
Atmosphere 13 01549 g002
Figure 3. Weather background at 2000 LST on 31 May 2021 (ac,e,f), 0200 LST on 01 June 2021 (d): (a) Surface pressure field (contour), air temperature (color; unit: °C), and surface horizontal wind. The solid black line represents the position of the front; (b) 850 hPa temperature advection (color; unit:10−4 K s−1), 850 hPa horizontal wind, and pseudo-equivalent potential temperature line of 350 K (red thick solid line; (c,d) 925 hPa horizontal wind (color; unit: m s−1), and height field (contour); (e) The skew T-LogP diagram of Yangjiang (dew point curve in blue, temperature cure in black and parcel trajectory in red); (f) Skew T-LogP chart of Hong Kong. Purple box indicates location of rainfall of interest.
Atmosphere 13 01549 g003
Figure 4. Temperature (colored dots; unit: °C) and winds (vector) observed by AWSs at (a) 2100 LST 31, (b) 2200 LST 31, (c) 2300 LST 31, (d) 0000 LST 1, (e) 0100 LST 1, (f) 0200 LST 1, (g) 0300 LST 1, (h) 0400 LST 1. Green solid line represents the position of mesoscale convergence line. Terrain is shaded in gray as in Figure 1b.
Atmosphere 13 01549 g004
Figure 5. Synoptic background at 2100 LST on 31 May 2021(a,c), 2300 LST on 31 May 2021 (b,d,e): (a,b) Temperature (contour; unit:°C) and specific humidity(color; unit: g kg−1) at level 1000hPa (red triangle represents the center of CS1; red point represents the center of CS2). (c,d) Divergence (color; unit: 10−5 s−1), relative vorticity (contour; unit: 10−5 s−1), and wind (stream; unit: m s−1) at level 1000 hPa (red color: wind speed ≥ 4 m s−1). (e) Vertical velocity (color; unit: Pa s−1), geopotential height field (black contour; unit: gpm), air temperature (red contour; unit: °C), and wind (barb unit: m s−1) at level 500 hPa (red color: wind speed ≥ 10 m s−1; green triangle represents the center of CS1; green point represents the center of CS2). The thick green dashed line represents the trough line.
Atmosphere 13 01549 g005
Figure 6. Time sequence diagram of meteorological elements of AWSs from 1800 LST on 31 May 2021 to 0600 LST on 1 June 2021. (a) Wind field and pressure; (b) Air temperature and specific humidity; (c) Specific moisture distribution. The solid line is the CS1 moving path. The dashed line is the CS2 moving path; (d) Zhuhai wind profiler from 2000 LST on 31 May 2021 to 0800 LST on 1 June 2021 (wind barbs, a full barb is 4 m s−1; wind speed ≥ 12 m s−1 are marked in red, respectively).
Atmosphere 13 01549 g006
Figure 7. The time–height distributions of (a) ZH (unit: dBZ), (b) ZDR (unit: dB), and (c) KDP (unit: °·km−1) averaged over the CS CCs. The black dashed lines in (ac) mark the time to separate the two stages for the CS CCs. (d) Height map of convection echo. The green line represents the level of 20 dBZ. The red line represents the level of 40 dBZ. (e) Convective area and lightning frequency. The green line represents the convective area. The red line represents the lightning frequency.
Atmosphere 13 01549 g007
Figure 8. The CFADs(unit: %) of (a,b) Z, (d,e) ZDR, and (g,f) KDP for the CS1 CCs (first column), and for the CS2 CCs (second column).Contours and shadings represent the frequency of occurrence relative to the maximum absolute frequency in the data sample represented in the CFAD, contoured every 5%. (c,f,i) The percentile profiles of Z, ZDR, and KDP for the CS1 CCs (black solid lines) and CS2 CCs (red solid lines).The black dashed lines represent the level of 0 °C, −10 °C, and −20 °C from bottom to top, respectively. The CS1analysis period is from 2124 LST on 31 May 2021 to 2254 LST on 31 May 2021. The CS2analysis period is from 2348 LST on 31 May 2021 to 0800 LST on 1 June 2021.
Atmosphere 13 01549 g008
Figure 9. Frequency of occurrences of Dm (mm) and log10Nw (units of Nw: mm−1 m−3) at 1-km altitude for (a) CS1 CCs and (b) CS2 CCs. The outermost line represents 5% contours, contour ranges from 5 to 100% with an interval of 5%.The gray dashed line denotes the fitting line for stratiform precipitation, while two gray rectangles represent the maritime and continental convective clusters in Dm–log10Nw space from Bringi et al. [41]; (c) The vertical profiles of LWC (solid lines; unit: g m−3) and IWC (dashed lines; unit: g m−3) averaged over the CS1 CCs (black lines) and CS2 CCs (red lines). The black dashed lines represent the level of 0 °C, −10 °C, and −20 °C from bottom to top, respectively. The analysis period of CS1 and CS2 is as in Figure 8.
Atmosphere 13 01549 g009
Figure 10. The stacked frequency (unit: %) of each identified hydrometeor by altitude for the CCs at (a) CS1 and (b) CS2. The meanings of each color for identified hydrometeors are listed in the legend. The analysis period of CS1 and CS2 is as in Figure 8.
Atmosphere 13 01549 g010
Publisher’s Note: MDPI stays neutral with regard to jurisdictional claims in published maps and institutional affiliations.

