
In Cerebellar Atrophy of 12-Month-Old ATM-Null Mice, Transcriptome Upregulations Concern Most Neurotransmission and Neuropeptide Pathways, While Downregulations Affect Prominently Itpr1, Usp2 and Non-Coding RNA
 , , , , and
Abstract
:1. Introduction
2. Materials and Methods
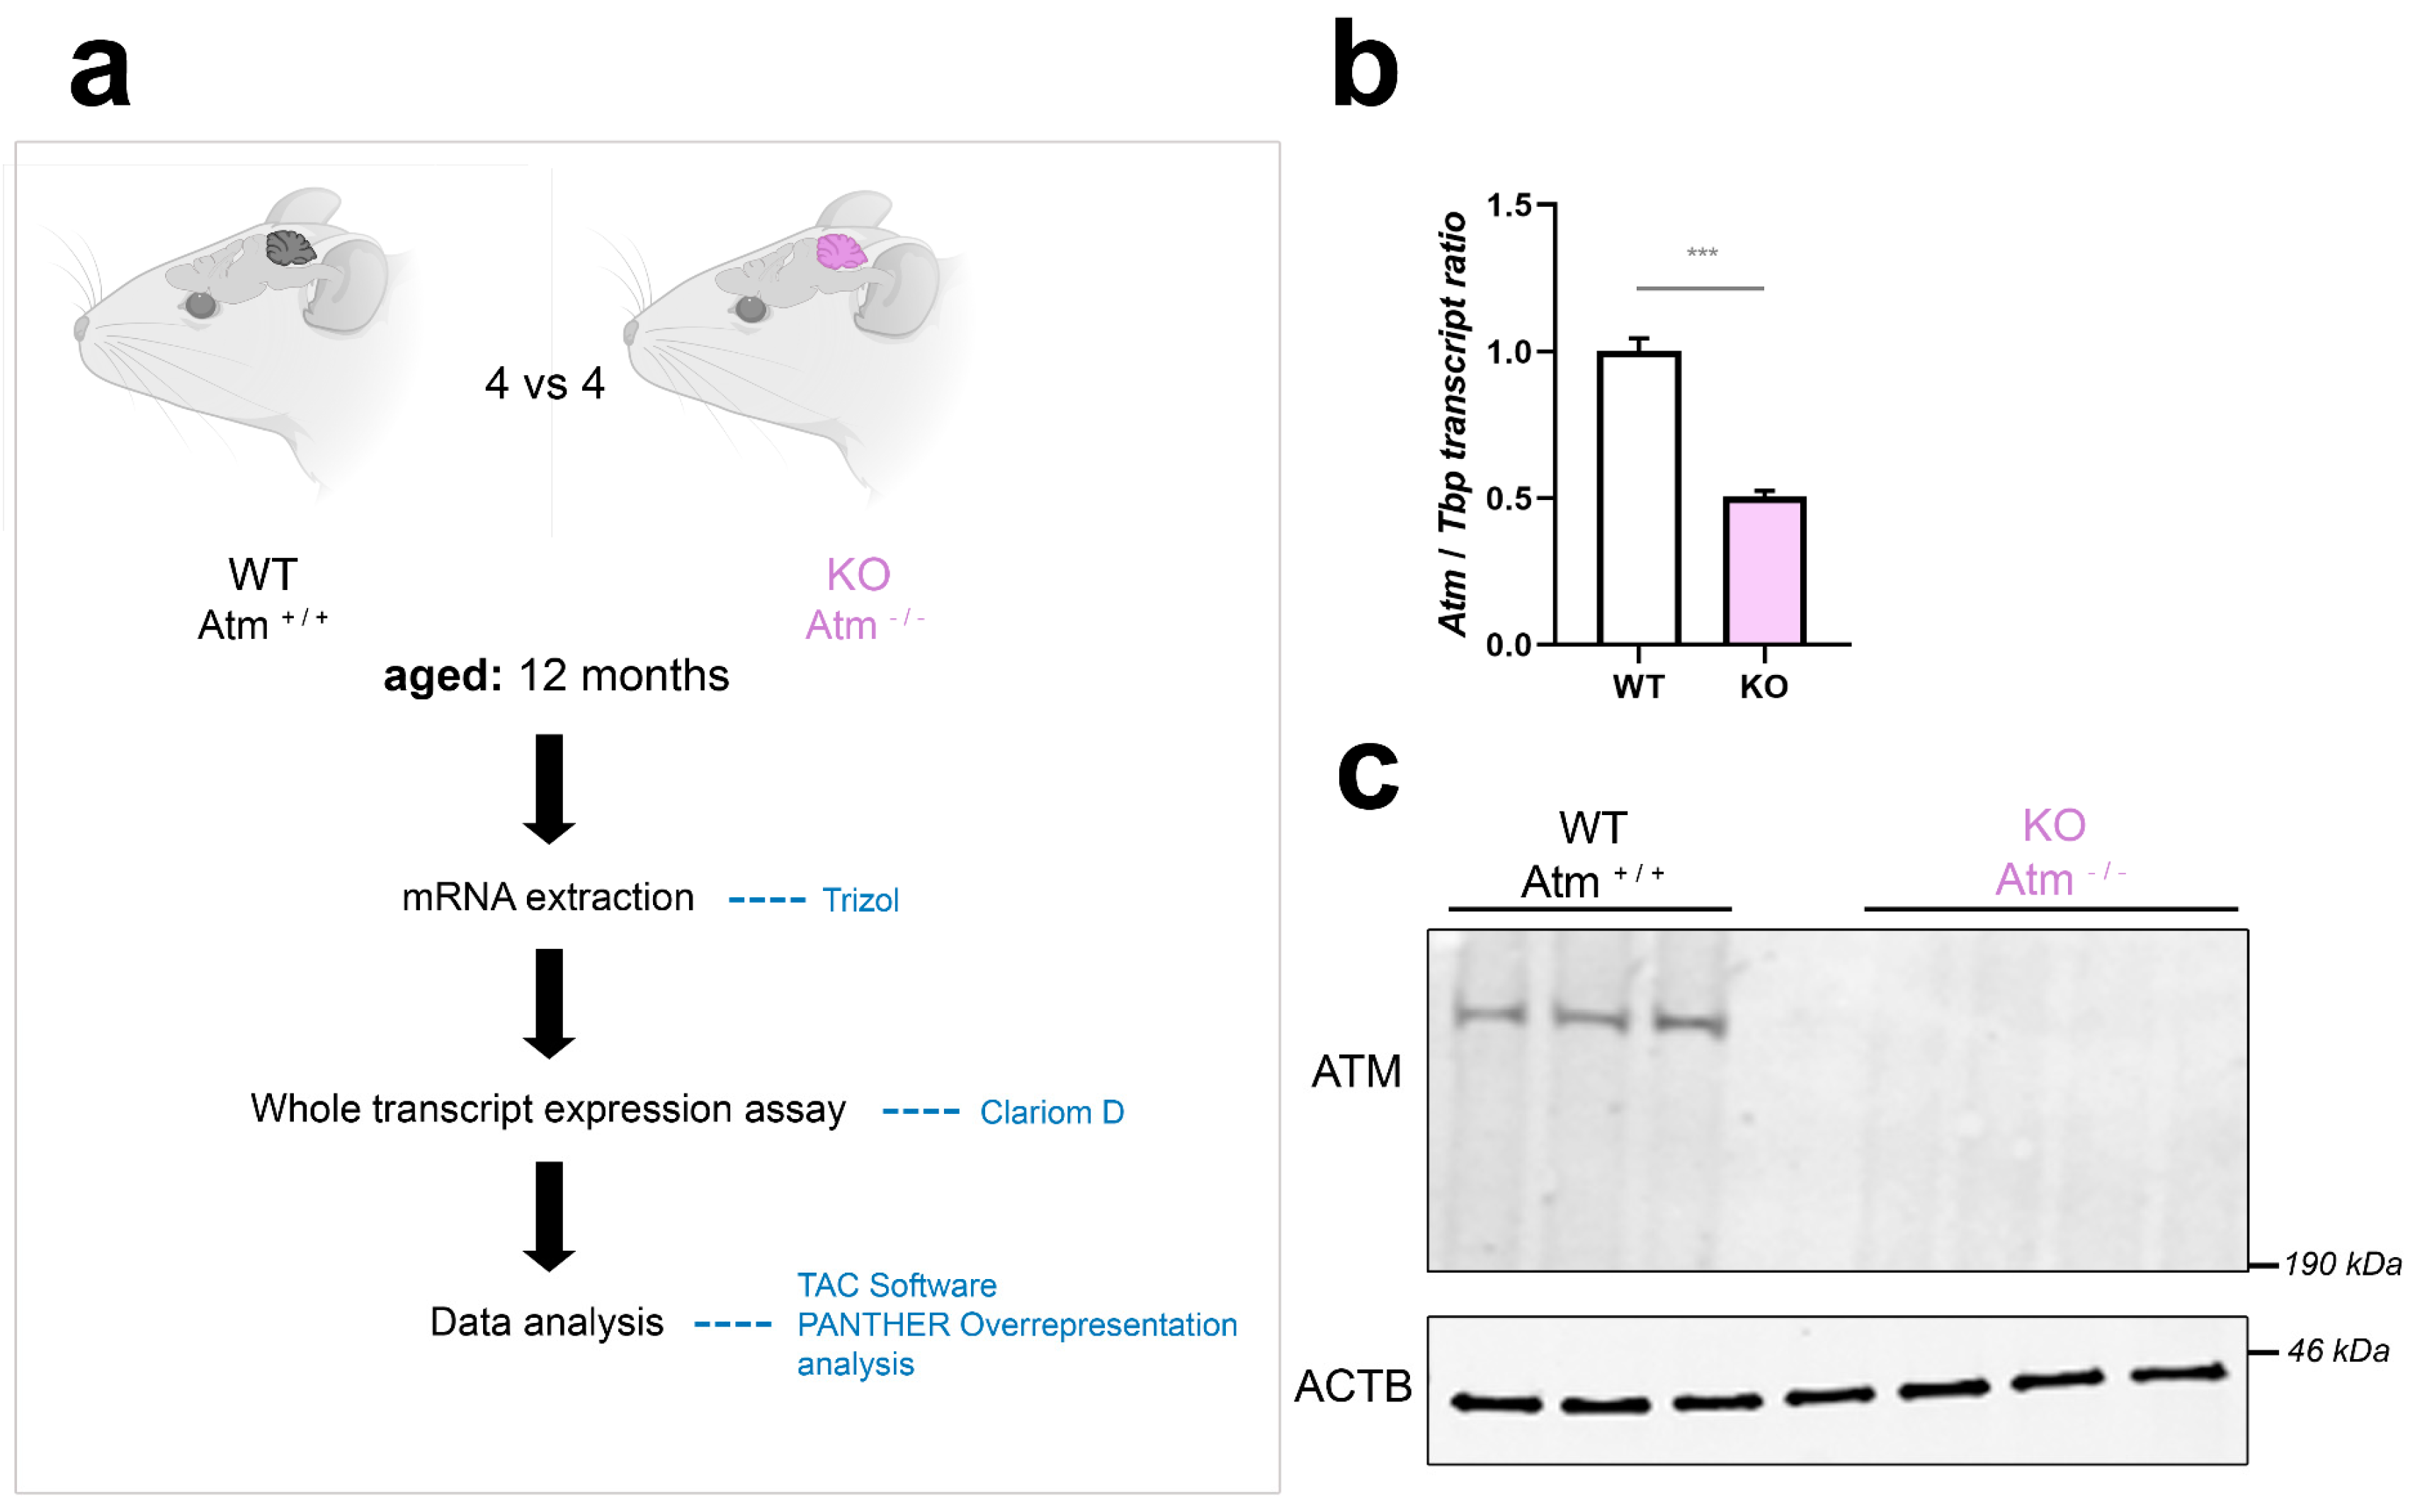
2.1. Animal Model of Ataxia-Telangiectasia
2.2. Intravenous Transplantation of Whole Bone Marrow Cells
2.3. Global Transcriptome Survey
2.4. Bioinformatics Analysis of Global Transcriptome Data
2.5. Neuroblastoma Cell Culture and Treatments
- shATM#1–5′CCGGCCAAGGTCTATGATATGCTTACTCGAGTAAGCATATCATAGACCTTGGTTTTTTG-3′ (cat.no. TRCN0000194861),
- shATM#2–5′CCGGTGGTCAAATACTTCATCAAATCTCGAGATTTGATGAAGTATTTGACCATTTTTG-3′ (cat.no. TRCN0000245108),
- shATM#3–5′CCGGTGATGGTCTTAAGGAACATCTCTCGAGAGATGTTCCTTAAGACCATCATTTTTG-3′ (cat.no. TRCN0000010299),
- shATM#4–5′CCGGCCTTTCATTCAGCCTTTAGAACTCGAGTTCTAAAGGCTGAATGAAAGGTTTTTG-3′ (cat.no TRCN0000039948),
- shATM#5–5′CCGGGCCTCCAATTCTTCACAGTAACTCGAGTTACTGTGAAGAATTGGAGGCTTTTTG-3′ (cat.no. TRCN0000039951).
2.6. Reverse Transcriptase Real-Time Quantitative Polymerase Chain Reaction (RT-qPCR)
- Atm–Mm01177457_m1; Atmin–Mm01251229_m1; Ecel1–Mm00469610_m1;
- Foxo3–Mm01185722_m1; Grid2–Mm00515053_m1; Grin2b–Mm00433820_m1;
- Grin2c–Mm00439180_m1; Grm4–Mm01306128_m1; Itpr1–Mm00439907_m1;
- Mme–Mm00485040_m1; Nr4a1–Mm01300401_m1; Nr4a2–Mm01278507_g1;
- Nr4a3–Mm00450074_m1; Oprm1 (Exon 2–3)–Mm01188089_m1;
- Oprm1 (Exon 5–6)–Mm01188387_m1; Per1–Mm00501813_m1;
- Rora–Mm01173766_m1; Slc17a6–Mm00499876_m1; Slc32a1–Mm00494138_m1;
- Sst–Mm00436671_m1; Tac1–Mm00436880_m1; Tacr1–Mm00436892_m1;
- Tbp–Mm00446973_m1; Usp2–Mm00497452_m1.
- ATM–Hs01112311_m1; ATMIN–Hs00739820_m1; CAMK2A–Hs00947041_m1;
- CAMK4–Hs00174318_m1; ECEL1–Hs00191400_m1; FOXO3–Hs00818121_m1;
- GRID2–Hs00910017_m1; ITPR1–Hs00976045_m1; MME–Hs01115452_m1;
- NR4A1–Hs00374226_m1; OPRM1–Hs01053957_m1; OPRM1 (Exon 1–2)–Hs01053956_m1;
- OPRM1 (Exon 3–4)–Hs00168570_m1; PER1–Hs00242988_m1; RORA–Hs00536545_m1;
- RRAGD–Hs00222001_m1; SGK1–Hs00178612_m1; TBP–Hs9999910_m1;
- USP2–Hs00275859_m1.
2.7. Immunoblotting
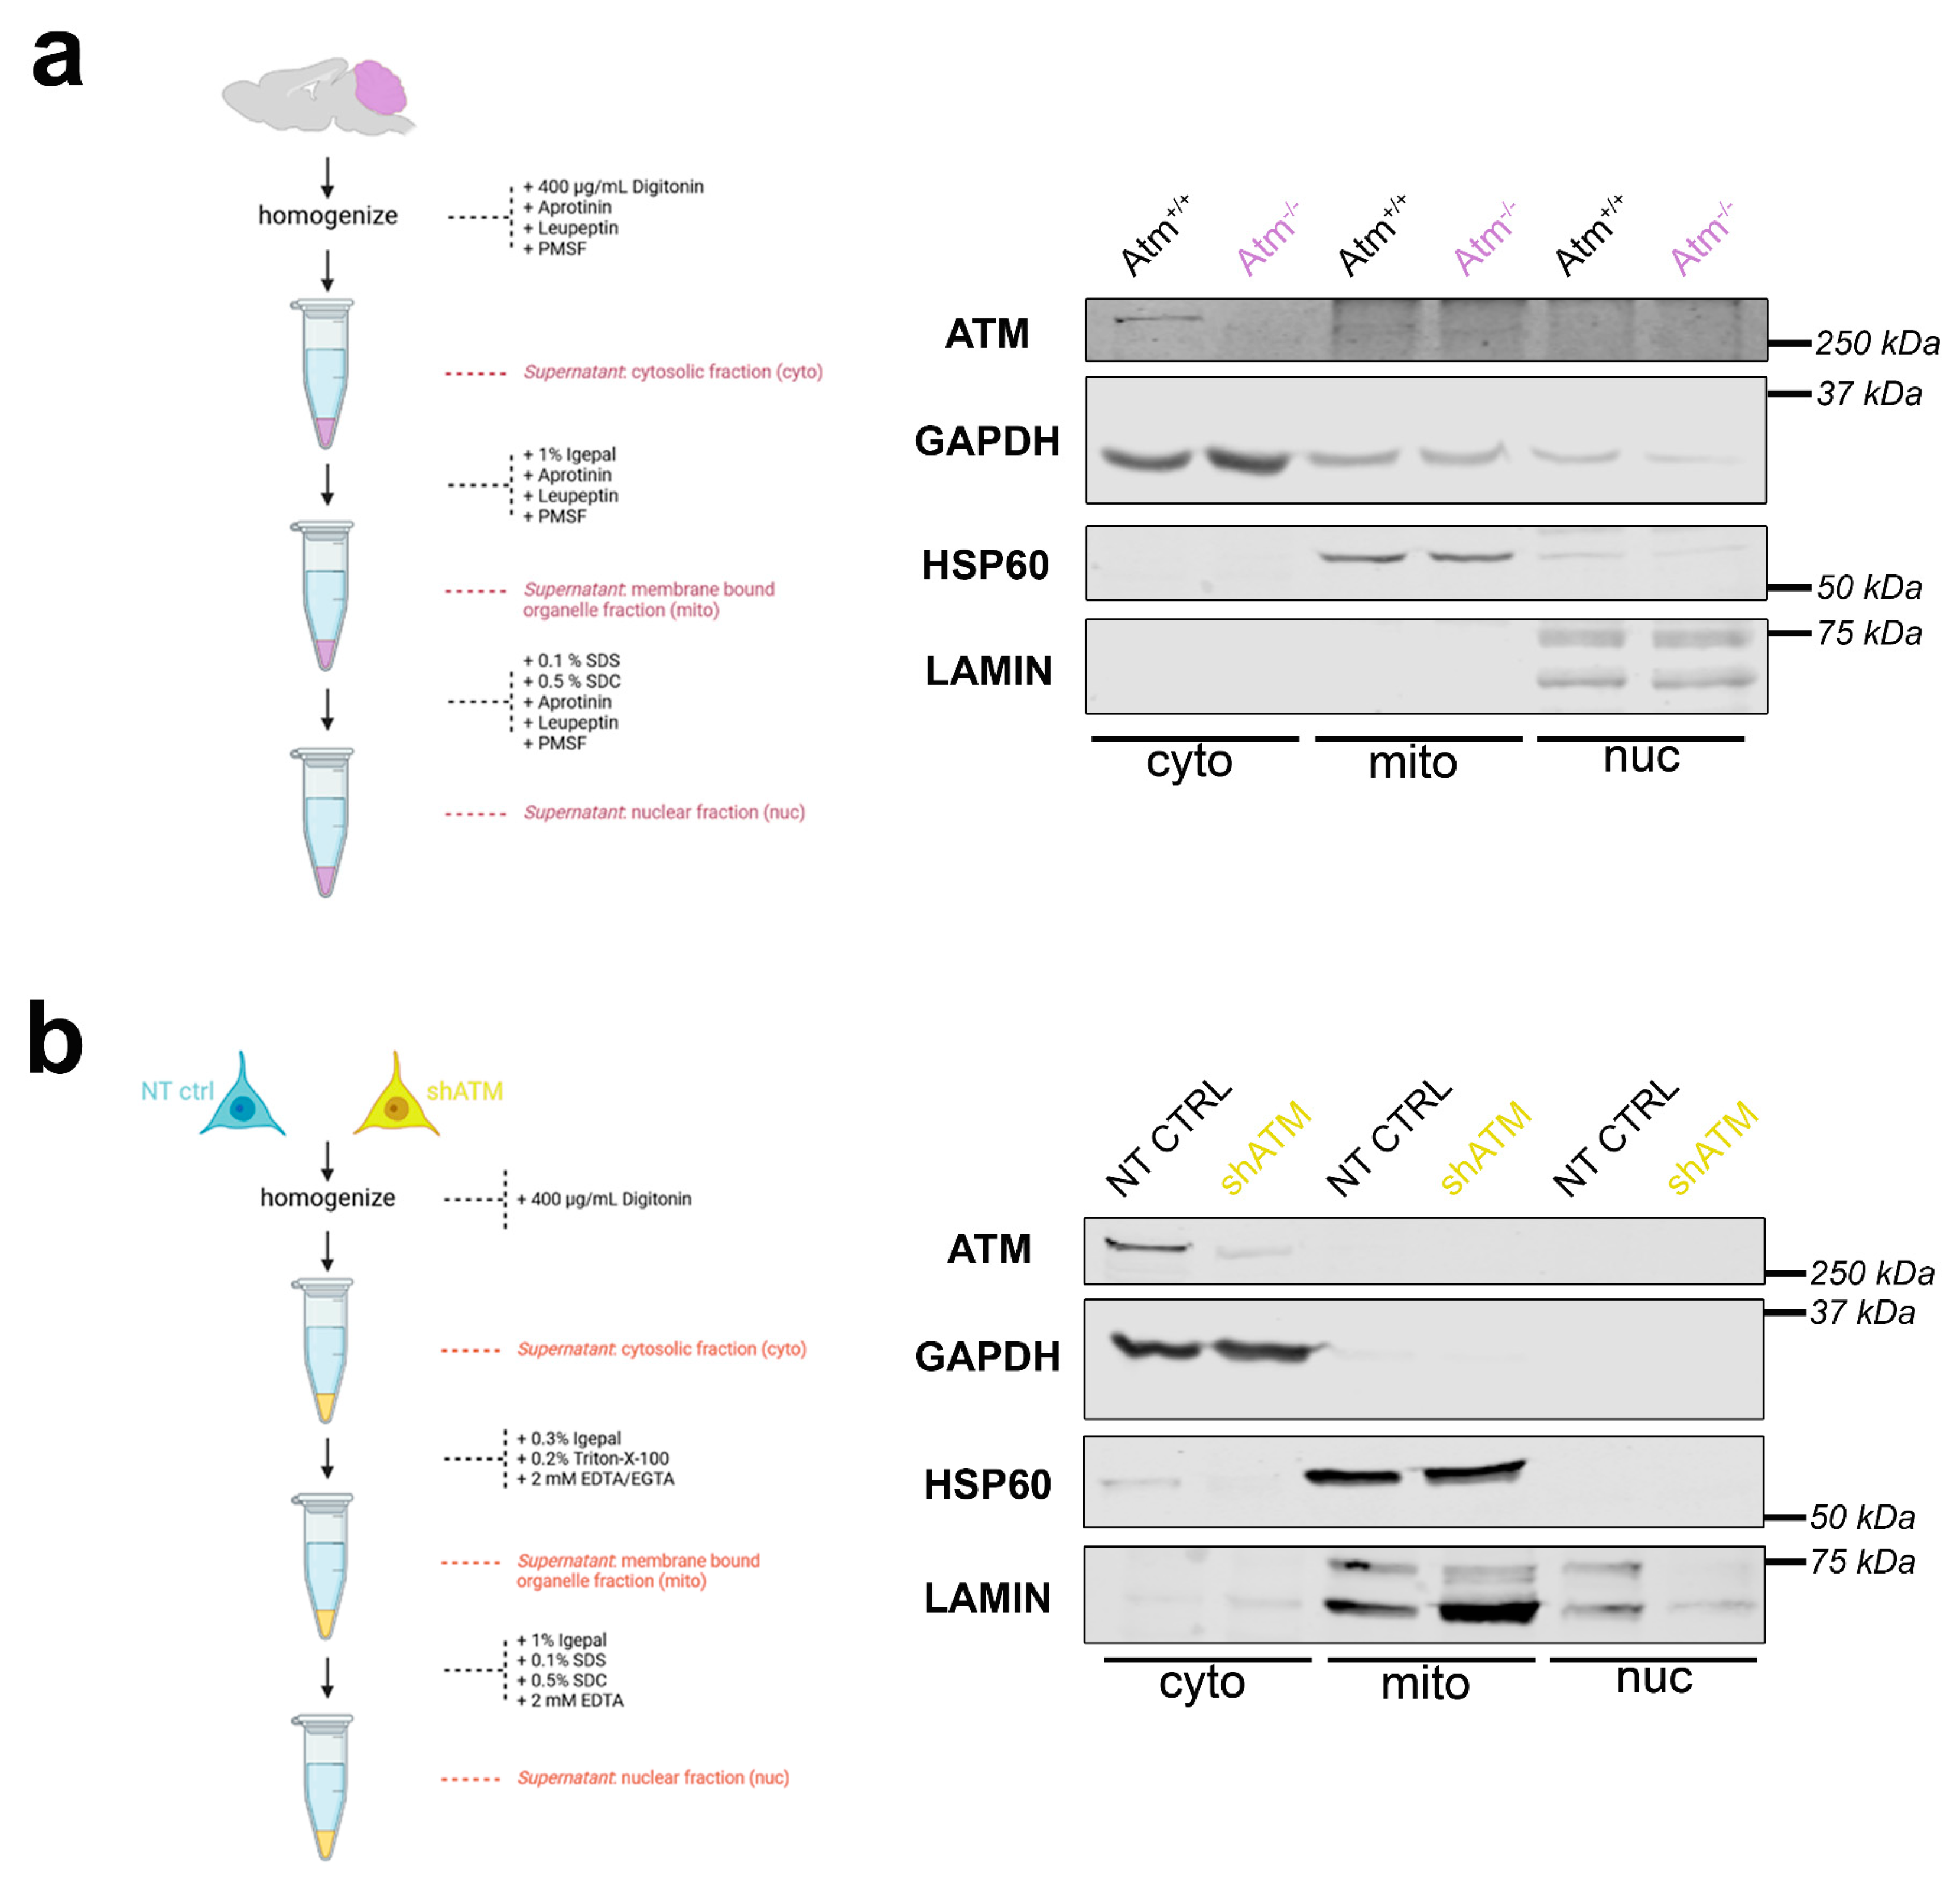
2.8. Fractionation
2.9. Statistics
3. Results
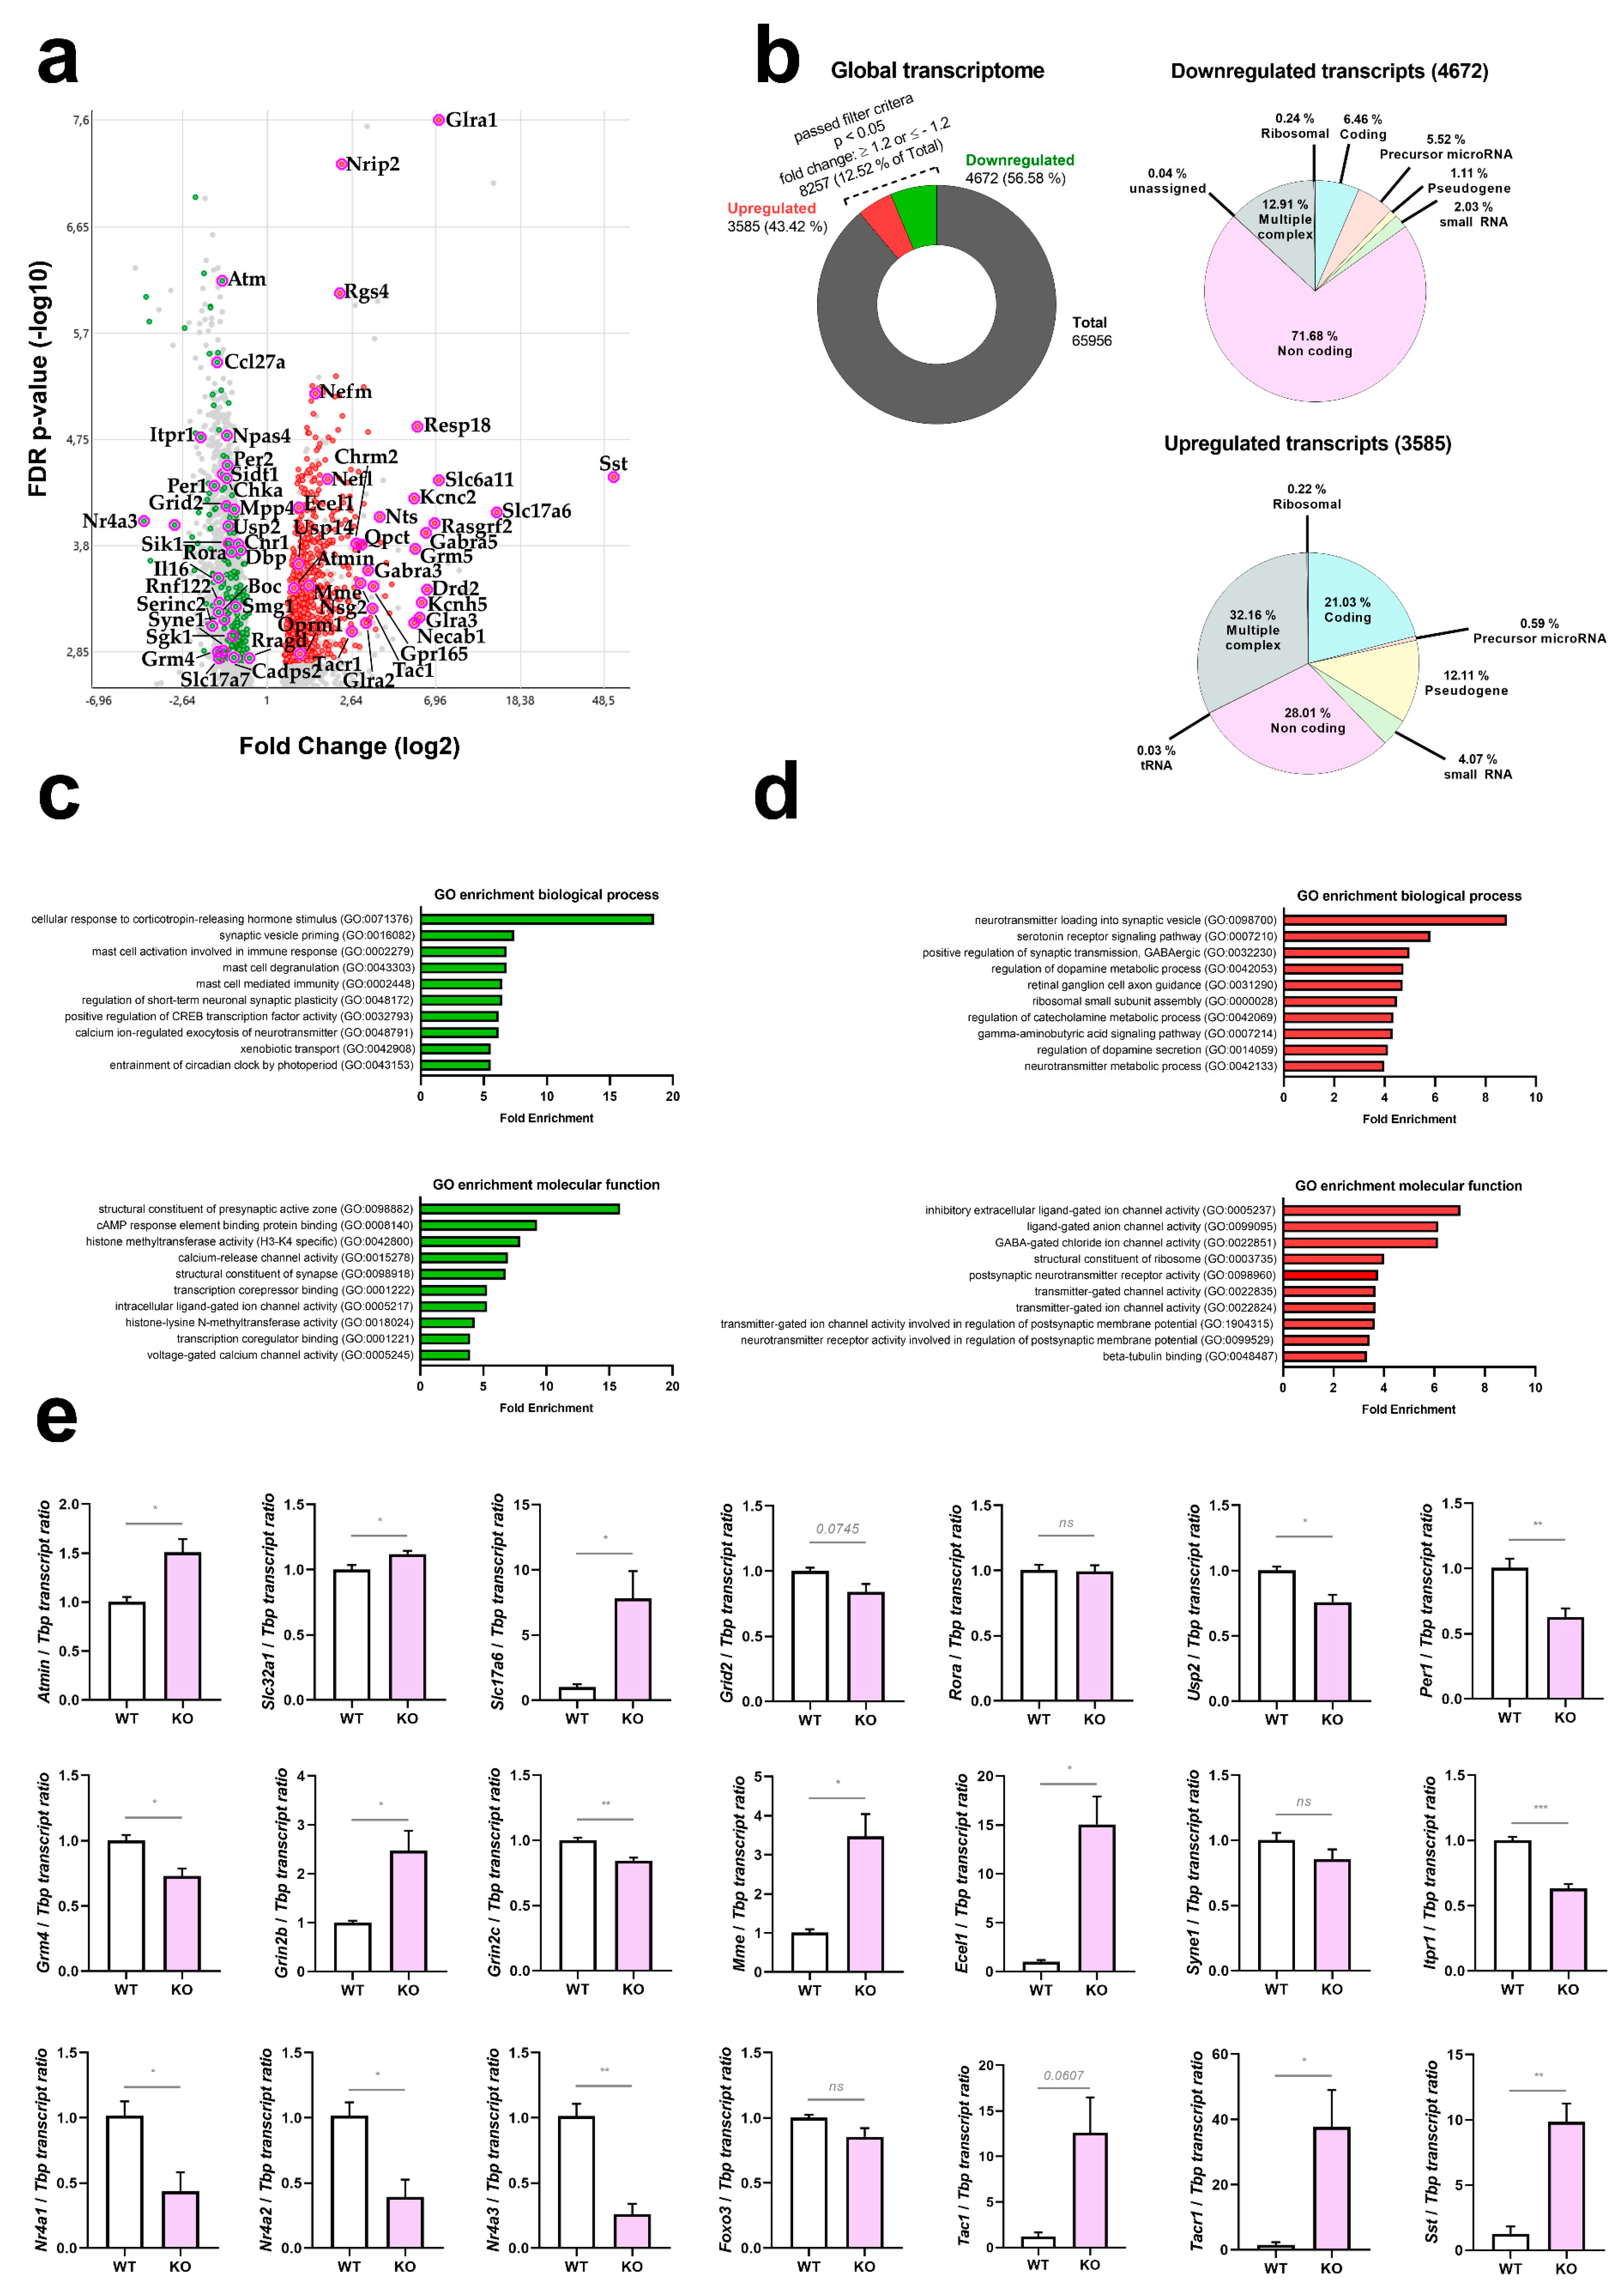
3.1. The Cerebellar Transcriptome Profile of ATM-Null Mice at 12 Months of Age
3.2. In Human Neural Cells with Stable ATM-Knockdown, Cerebellar Hallmark Dysregulations Are Recapitulated Best after Osmotic Stress, and Partially after Trophic Stress
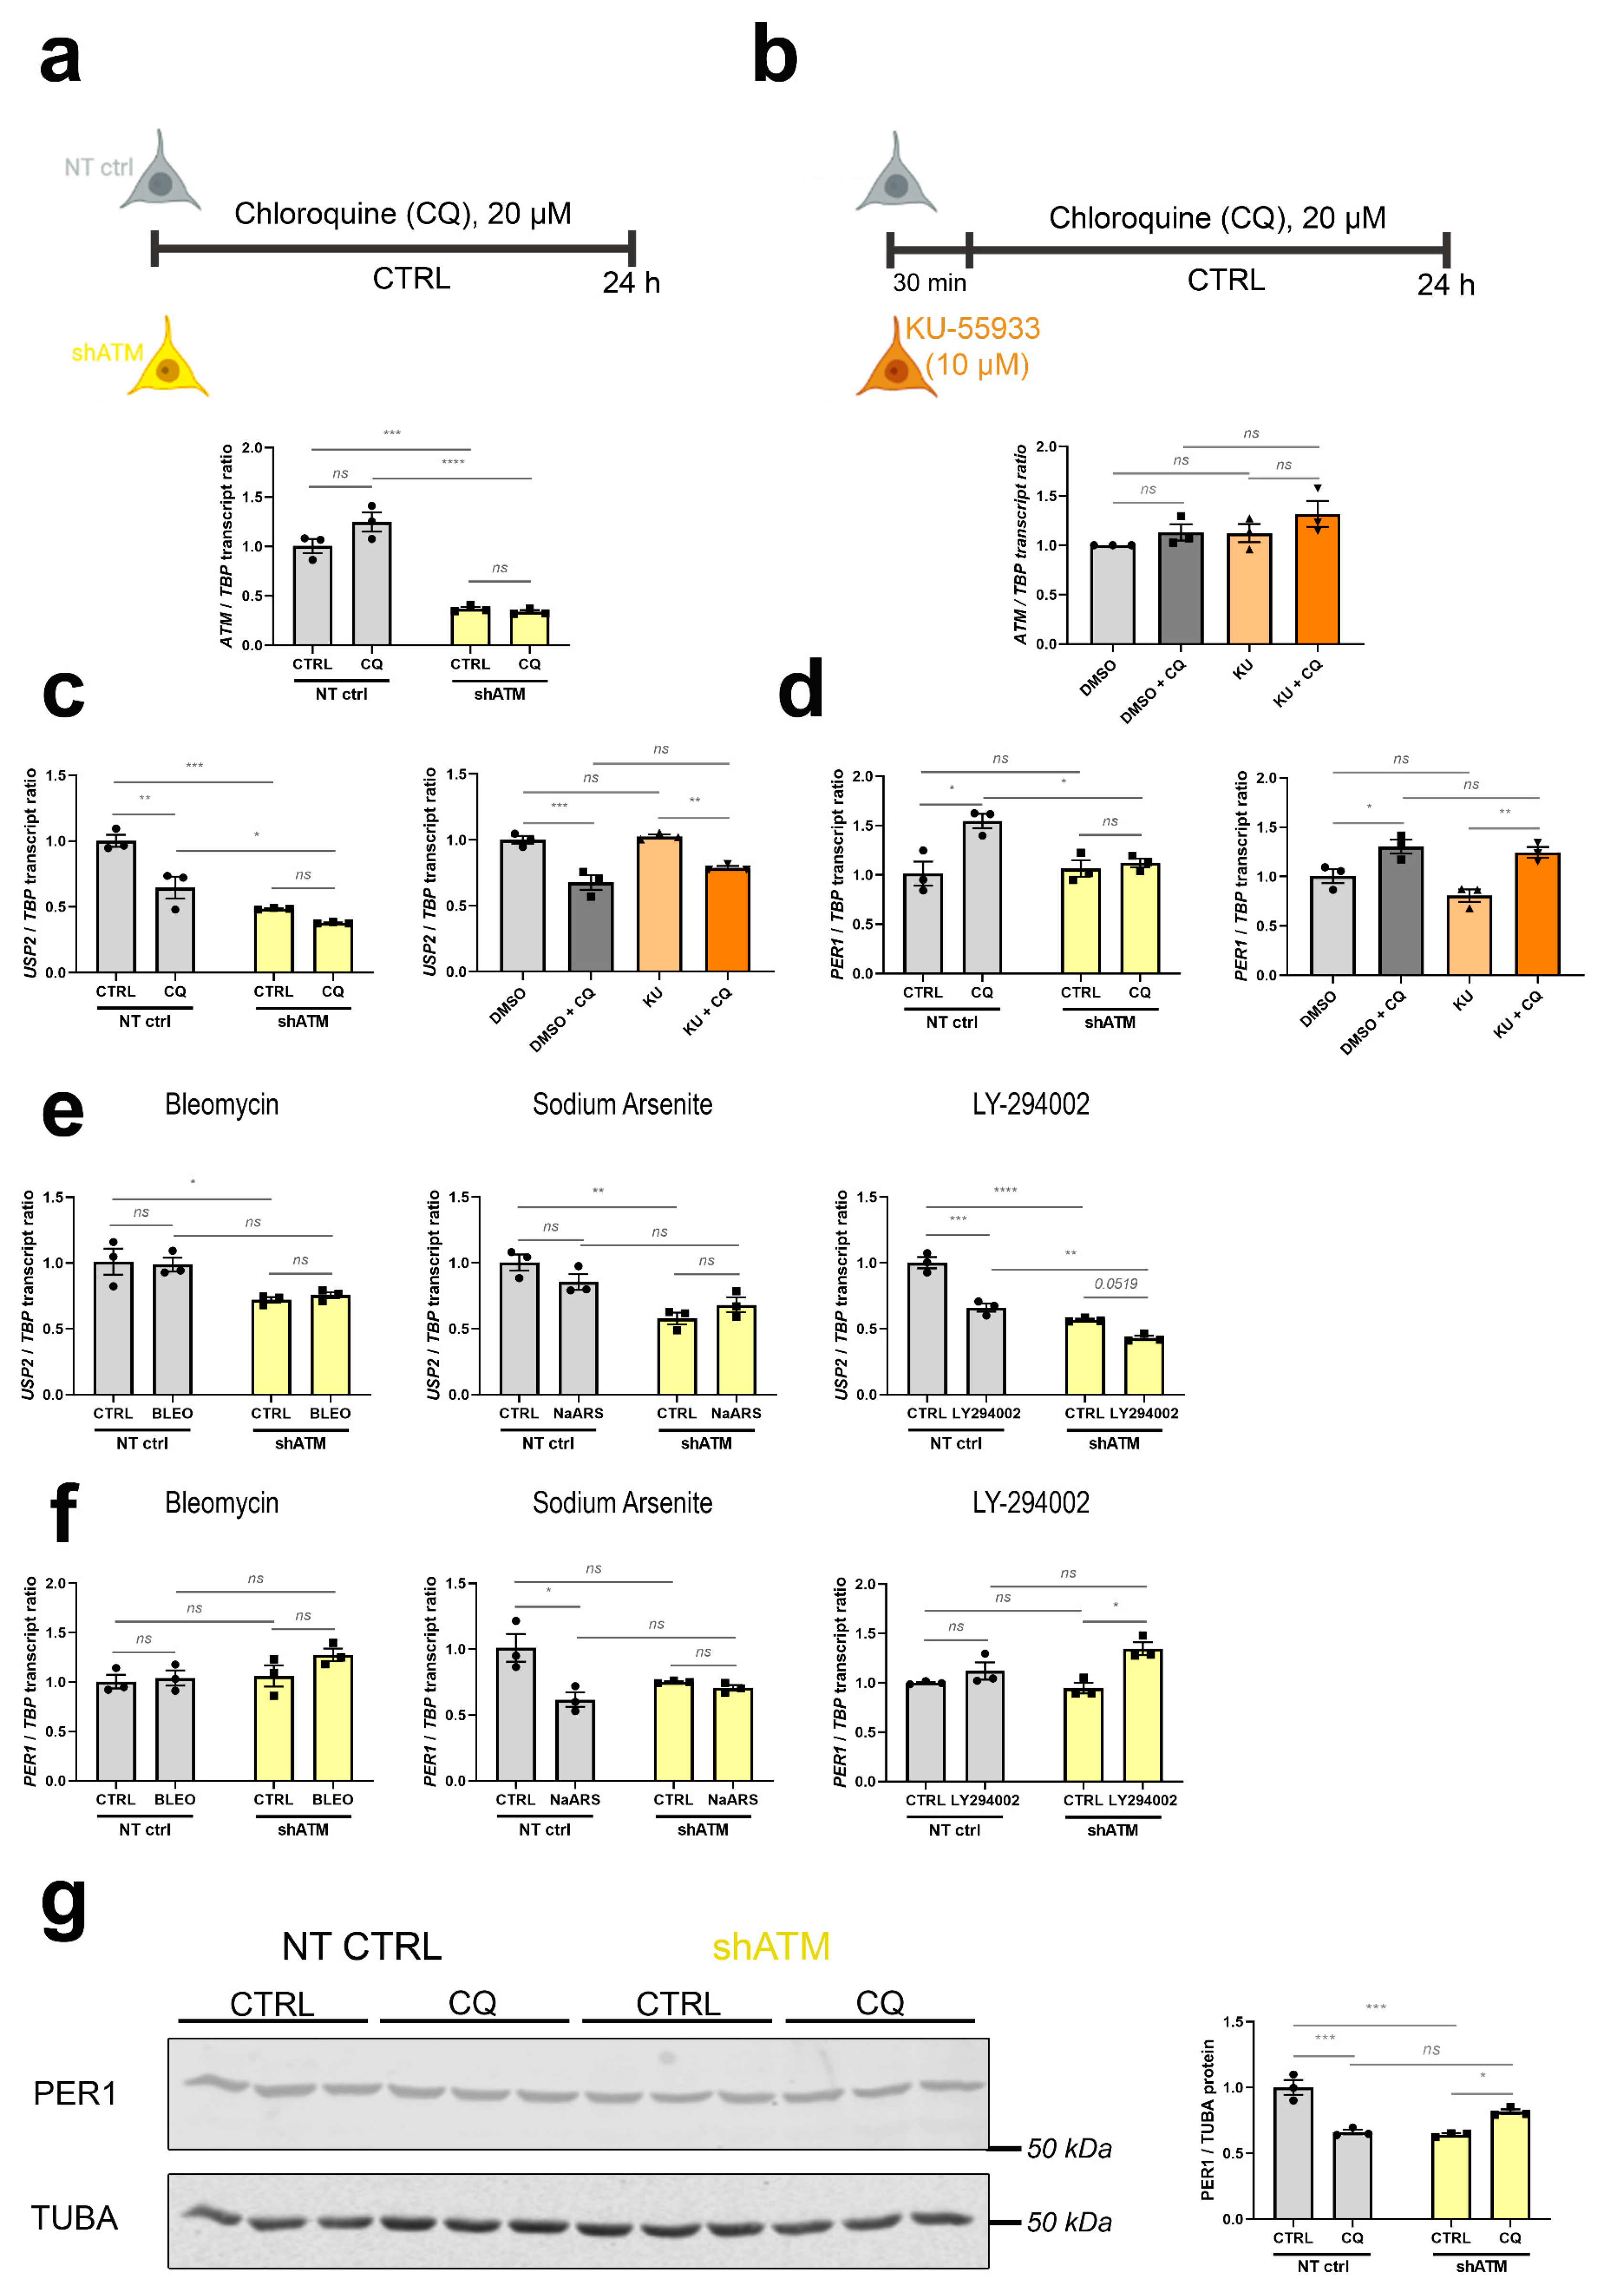
3.3. The ATM-Null Cerebellar mRNA Dysregulations Are Mimicked in SH-SH5Y Cells by ATM Knockdown Rather Than ATM Kinase Antagonism, and by CQ Better Than Trophic/Oxidative/Genotoxic Stress
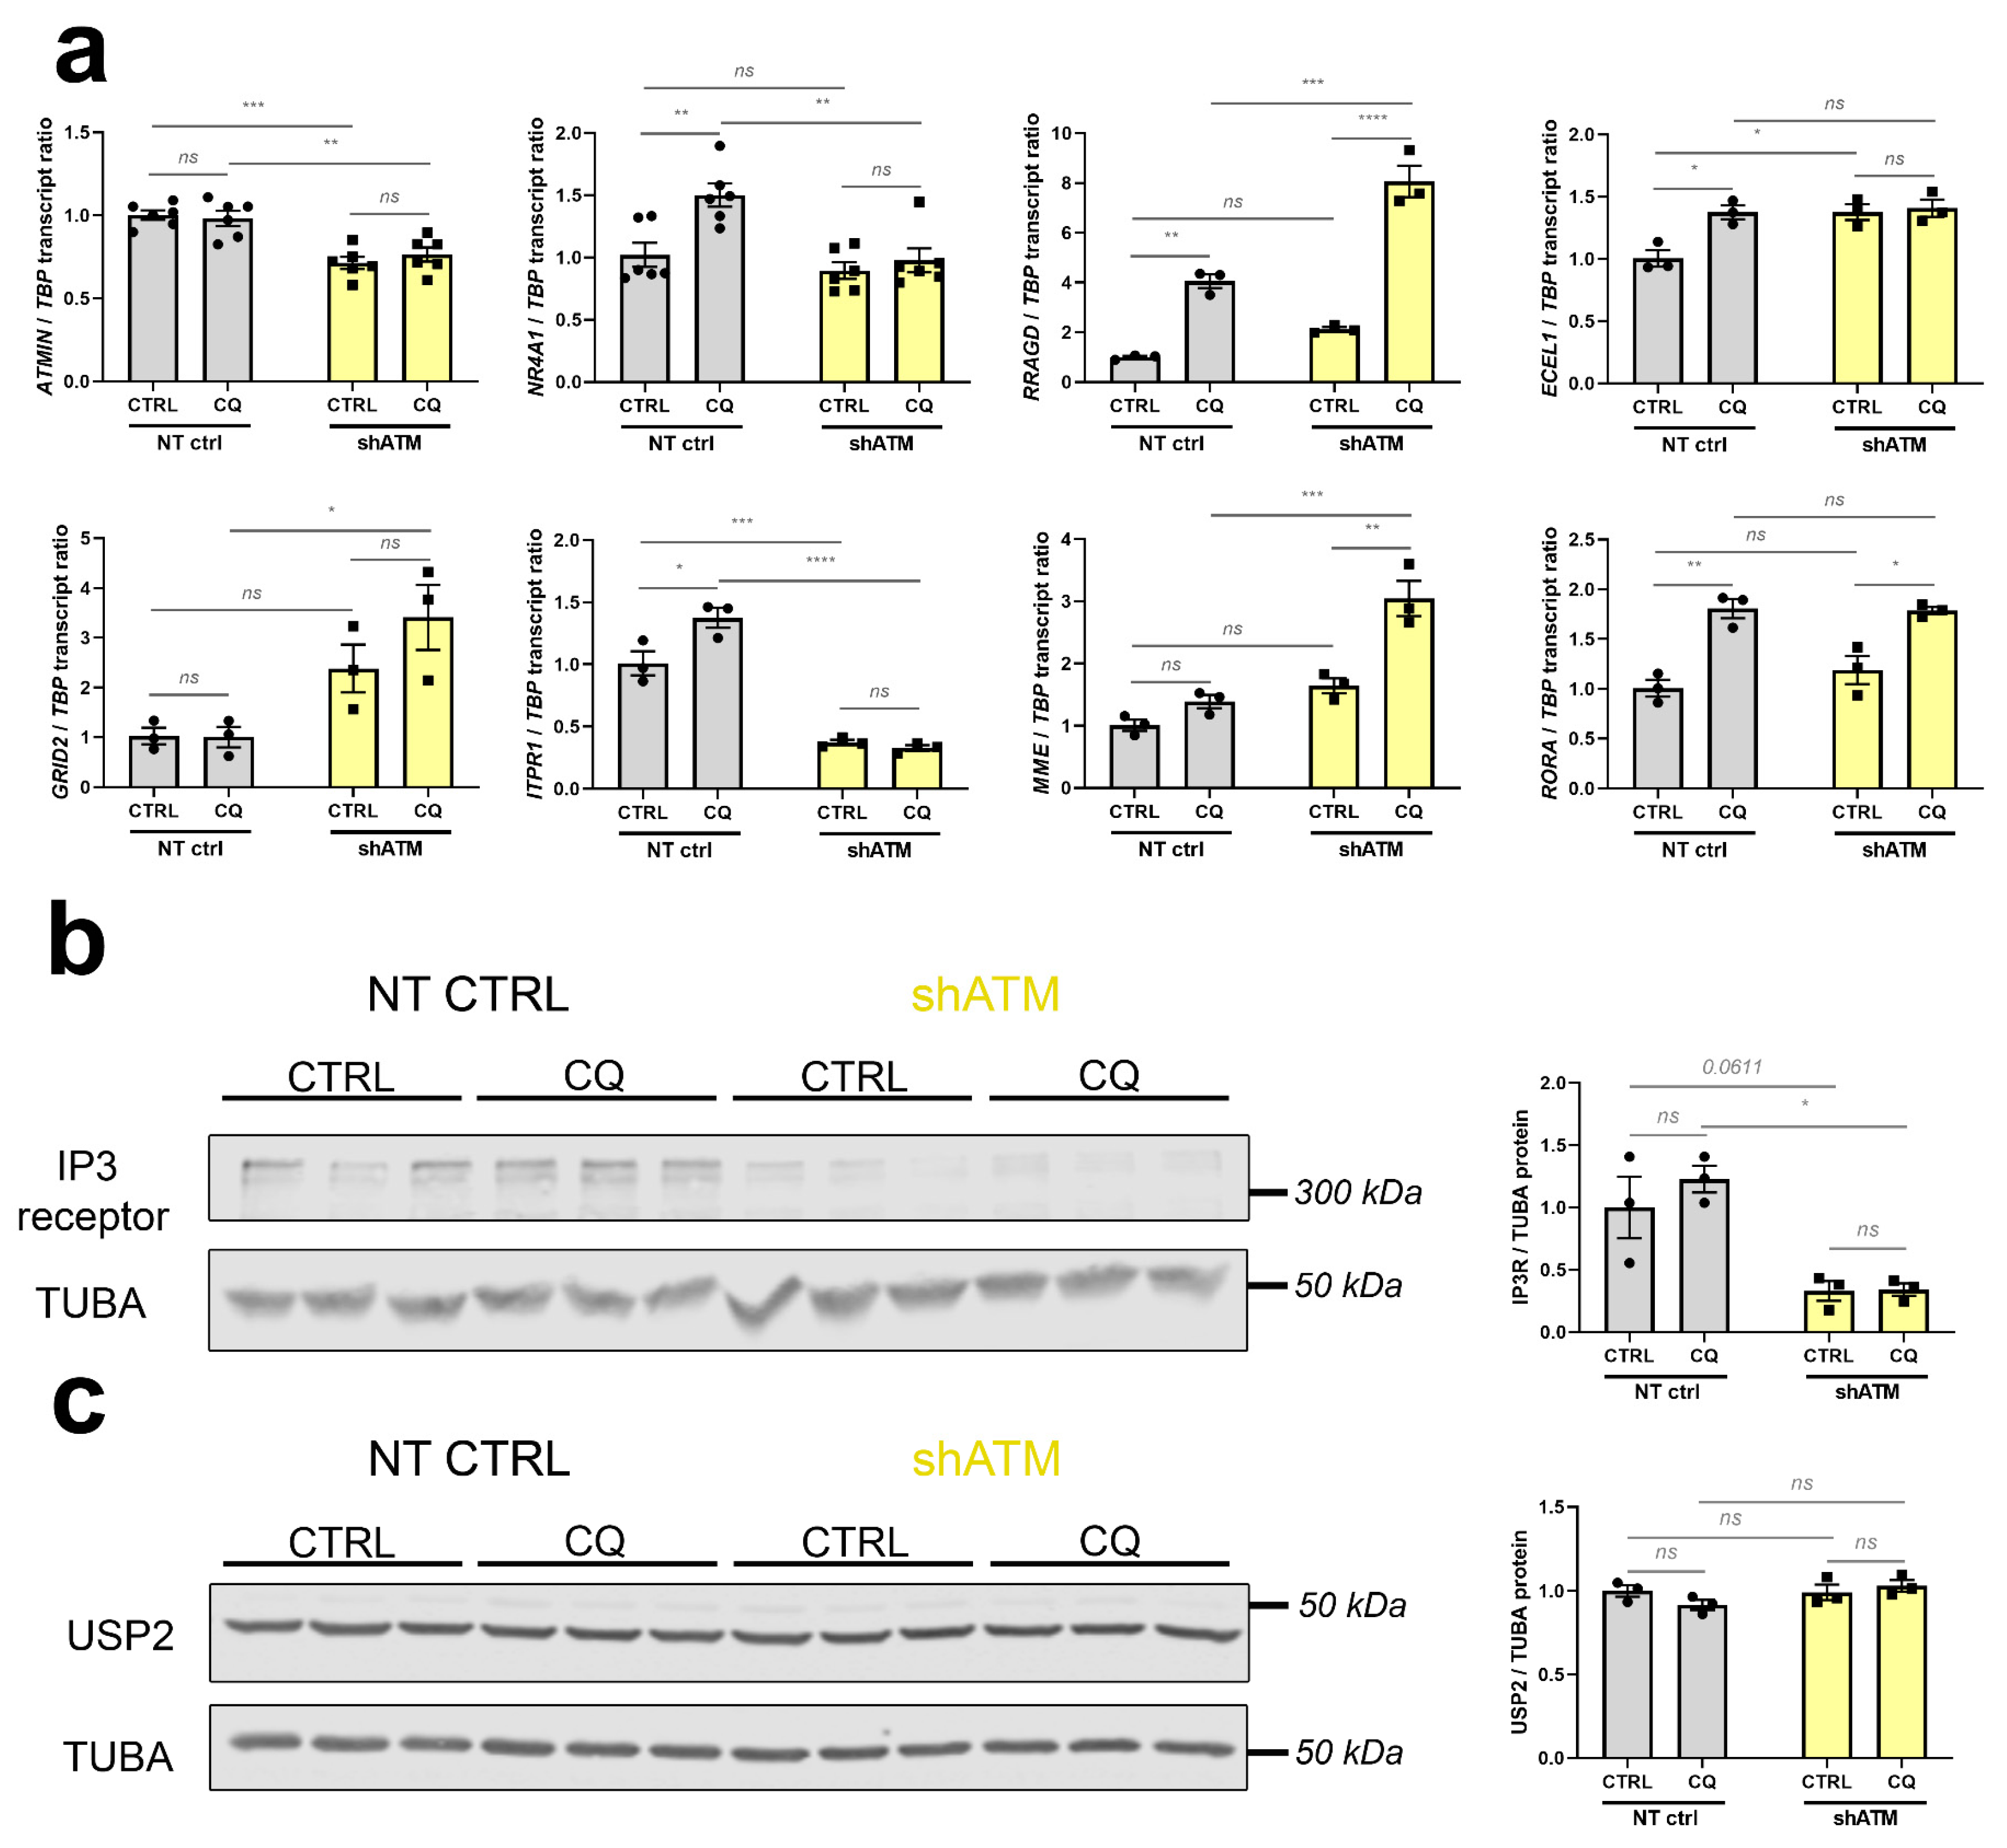
3.4. Also in Human Cells, ATM-Deficiency Impacts Key Pathomechanism Factors Like Interactor ATMIN, Immediate-Early mRNA FOXO3, Osmotic Regulator RRAGD, Vasoconstriction Regulator ECEL1, and Ataxia Transcripts GRID2, ITPR1 and MME
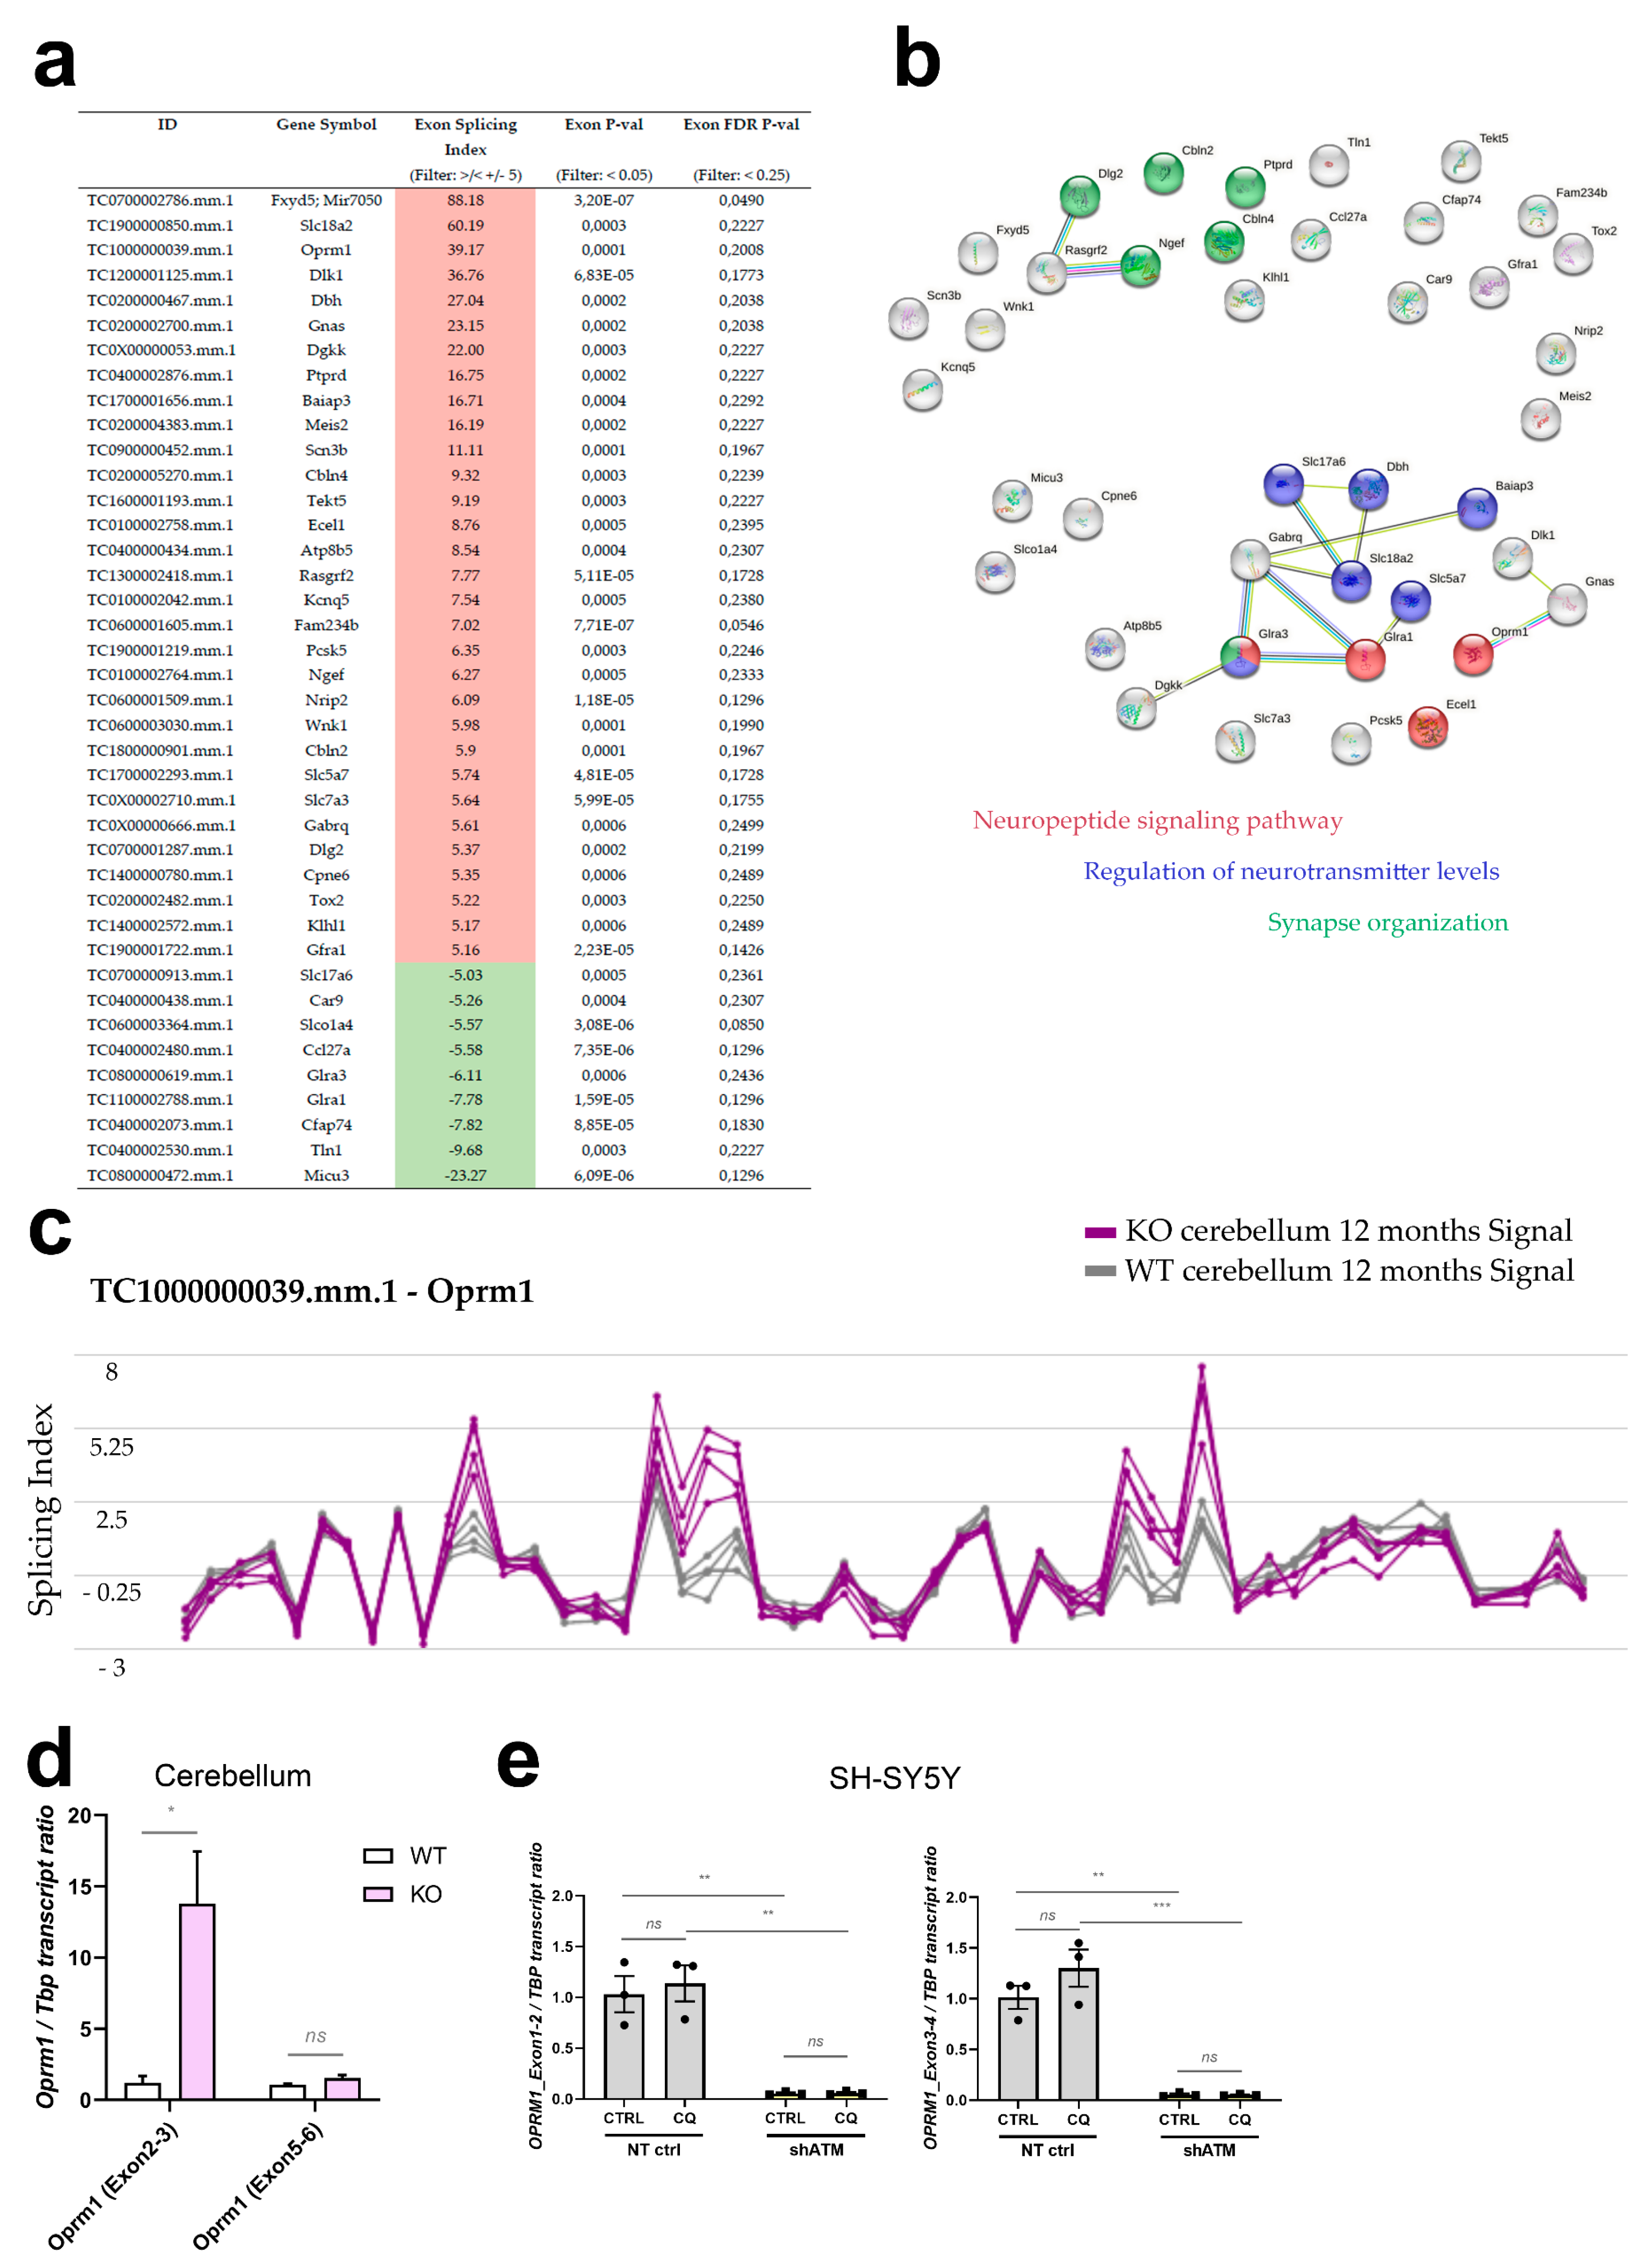
3.5. ATM-Null Mouse Cerebellum Alternatively Spliced mRNAs Are Enriched for Neurotransmission and Neuropeptide Signalling Factors
4. Discussion
4.1. The Cerebellar Transcriptome Profile of ATM-Null Mice at 12 Months of Age
4.2. The Alternative Splice Profile of ATM-Null Mouse Cerebellum at 12 Months of Age
4.3. Differential Detergent Fractionation of Adult Mouse Cerebellum and SH-SY5Y Neuroblastoma Cells Detects ATM Mainly in Cytosol
4.4. Validation Work in SH-SY5Y Cells Shows ATM-Deficiency to Impair the CQ-Triggered Regulation of Postsynaptic Calcium Release Channel ITPR1, in Parallel to Immediate-Early Transcripts PER1/NR4A1
5. Conclusions
Supplementary Materials
Author Contributions
Funding
Institutional Review Board Statement
Informed Consent Statement
Data Availability Statement
Acknowledgments
Conflicts of Interest
Abbreviations
| ACTB | β-Actin |
| AFP | Alpha-Fetoprotein |
| AKT | AKT serine/threonine kinase |
| AMPA | α-amino-3-hydroxy-5-methyl-4-isoxazolepropionic acid |
| ANOVA | Analysis of variance |
| AOA2 | Ataxia with oculomotor apraxia type 2 |
| AP1B1 | Adaptor Related Protein Complex 1 Subunit Beta 1 |
| AP2B1 | Adaptor Related Protein Complex 2 Subunit Beta 1 |
| ARNT2 | Aryl Hydrocarbon Receptor Nuclear Translocator 2 |
| ASTN2 | Astrotactin 2 |
| A-T | Ataxia Telangiectasia |
| ATM | Ataxia Telangiectasia Mutated |
| ATMIN | ATM Interactor |
| ATP2B2 | ATPase Plasma Membrane Ca2+ Transporting 2 |
| ATP2B4 | ATPase Plasma Membrane Ca2+ Transporting 4 |
| ATR | Ataxia Telangiectasia And Rad3-Related Protein |
| ATXN2 | Ataxin 2 |
| BAIAP3 | BAI1 Associated Protein 3 |
| BCA | Bicinchoninic acid |
| beta-NAP | Neuronal Adaptin-like beta-subunit Protein |
| BLEO | Bleomycin |
| BMP1 | Bone Morphogenetic Protein 1 |
| BMP2 | Bone Morphogenetic Protein 2 |
| BMP7 | Bone Morphogenetic Protein 7 |
| BMPR1B | Bone Morphogenetic Protein Receptor Type 1B |
| BMT | Bone Marrow transplantation |
| BSA | Bovine Serum Albumin |
| C4B | Complement Component 4B |
| CA8 | Carbonic Anhydrase 8 |
| CACNA1A | Calcium Voltage-Gated Channel Subunit Alpha1 A |
| CACNA1C | Calcium Voltage-Gated Channel Subunit Alpha1 C |
| CACNA1D | Calcium Voltage-Gated Channel Subunit Alpha1 D |
| CACNA1G | Calcium Voltage-Gated Channel Subunit Alpha1 G |
| CADPS2 | Calcium Dependent Secretion Activator 2CAMK2A |
| CAMK4 | Calcium/Calmodulin Dependent Protein Kinase IV |
| Car9 | murine Carbonic Anhydrase 9 |
| CBLN2 | Cerebellin 2 Precursor |
| CBLN4 | Cerebellin 4 Precursor |
| CCL27A | C-C Motif Chemokine Ligand 27 |
| CCNL2 | Cyclin L2 |
| CDH10 | Cadherin 10 |
| CDH19 | Cadherin 19 |
| CDH6 | Cadherin 6 |
| CDH9 | Cadherin 9 |
| cDNA | complementary DNA |
| CEB | cytosolic extract buffer |
| CHK2 | Checkpoint Kinase 2 |
| CHKA | Choline Kinase Alpha |
| CHRM2 | Cholinergic Receptor Muscarinic 2 |
| CHRM3 | Cholinergic Receptor Muscarinic 3 |
| CHRM5 | Cholinergic Receptor Muscarinic 5 |
| CHRNA4 | Cholinergic Receptor Nicotinic Alpha 4 Subunit |
| CHRNA6 | Cholinergic Receptor Nicotinic Alpha 6 Subunit |
| CHRNA7 | Cholinergic Receptor Nicotinic Alpha 7 Subunit |
| CHRNB3 | Cholinergic Receptor Nicotinic Beta 3 Subunit |
| CHRNB4 | Cholinergic Receptor Nicotinic Beta 4 Subunit |
| CNR1 | Cannabinoid Receptor 1 |
| CNTN4 | Contactin 4 |
| CNTN5 | Contactin 5 |
| CNTN6 | Contactin 6 |
| CNTNAP5A | Contactin Associated Protein Family Member 5 |
| CPNE6 | Copine 6 |
| CQ | Chloroquine |
| CREB5 | CAMP Responsive Element Binding Protein 5 |
| CREBL2 | CAMP Responsive Element Binding Protein Like 2 |
| CRTC2 | CREB Regulated Transcription Coactivator 2 |
| CRY1 | Cryptochrome Circadian Regulator 1 |
| CRY2 | Cryptochrome Circadian Regulator 2 |
| CSF1R | Colony Stimulating Factor 1 Receptor |
| CYP46A1 | Cytochrome P450 Family 46 Subfamily A Member 1 |
| DBH | Dopamine Beta-Hydroxylase |
| DBP | D-Box Binding PAR BZIP Transcription Factor |
| DDR | DNA Damage Response |
| DGKK | Diacylglycerol Kinase Kappa |
| DLG2 | Discs Large MAGUK Scaffold Protein 2 |
| DLK1 | Delta Like Non-Canonical Notch Ligand 1 |
| DMSO | Dimethyl sulfoxide |
| DNA | Deoxyribonucleic acid |
| DOCK10 | Dedicator Of Cytokinesis 10 |
| DRD2 | Dopamine Receptor D2 |
| DRD5 | Dopamine Receptor D5 |
| DSB | Double-Strand Breaks |
| DUSP1 | Dual Specificity Phosphatase 1 |
| EBF3 | EBF Transcription Factor 3 |
| ECEL1 | Endothelin Converting Enzyme Like 1 |
| EFNA2 | Ephrin A2 |
| EFNA3 | Ephrin A3 |
| EFNA5 | Ephrin A5 |
| EFNB3 | Ephrin B3 |
| EPHA3 | EPH Receptor A3 |
| EPHA4 | EPH Receptor A4 |
| EPHA5 | EPH Receptor A5 |
| ERBB2 | Erb-B2 Receptor Tyrosine Kinase 2 |
| ERBB3 | Erb-B2 Receptor Tyrosine Kinase 3 |
| ERBB4 | Erb-B2 Receptor Tyrosine Kinase 4 |
| FAT2 | FAT Atypical Cadherin 2 |
| FATC | FRAP, ATM, TRRAP C-terminal |
| FCS | Fetal Calf Serum |
| FDR | False Discovery Rate |
| FGF13 | Fibroblast Growth Factor 13 |
| FGF14 | Fibroblast Growth Factor 14 |
| FGF18 | Fibroblast Growth Factor 18 |
| FGF5 | Fibroblast Growth Factor 5 |
| FGFR1OP2 | FGFR1 Oncogene Partner 2 |
| FGFR3 | Fibroblast Growth Factor Receptor 3 |
| FOS | Fos Proto-Oncogene |
| FOSL2 | FOS Like 2 |
| FOXO1 | Forkhead Box O1 |
| FOXO3 | Forkhead Box O3 |
| FRDA | Friedreich’s Ataxia |
| FSCN1 | Fascin Actin-Bundling Protein 1 |
| FXYD5 | FXYD Domain Containing Ion Transport Regulator 5 |
| FZD4 | Frizzled Class Receptor 4 |
| FZD8 | Frizzled Class Receptor 8 |
| GABA | Gamma-aminobutyric acid |
| GABARAPL1 | GABA Type A Receptor Associated Protein Like 1 |
| GABRA2 | Gamma-Aminobutyric Acid Type A Receptor Subunit Alpha2 |
| GABRA3 | Gamma-Aminobutyric Acid Type A Receptor Subunit Alpha3 |
| GABRA5 | Gamma-Aminobutyric Acid Type A Receptor Subunit Alpha5 |
| GABRA6 | Gamma-Aminobutyric Acid Type A Receptor Subunit Alpha6 |
| GABRB1 | Gamma-Aminobutyric Acid Type A Receptor Subunit Beta1 |
| GABRE | Gamma-Aminobutyric Acid Type A Receptor Subunit Epsilon |
| GABRG1 | Gamma-Aminobutyric Acid Type A Receptor Subunit Gamma1 |
| GABRG2 | Gamma-Aminobutyric Acid Type A Receptor Subunit Gamma2 |
| GABRG3 | Gamma-Aminobutyric Acid Type A Receptor Subunit Gamma3 |
| GABRQ | Gamma-Aminobutyric Acid Type A Receptor Subunit Theta |
| GAPDH | Glyceraldehyde-3-Phosphate Dehydrogenase |
| GBA2 | Glucosylceramidase Beta 2 |
| GFRA1 | GDNF Family Receptor Alpha 1 |
| GFRA2 | GDNF Family Receptor Alpha 2 |
| GH | growth hormone |
| GLRA1 | Glycine Receptor Alpha 1 |
| GLRA2 | Glycine Receptor Alpha 2 |
| GLRA3 | Glycine Receptor Alpha 3 |
| GLRA4 | Glycine Receptor Alpha 4 |
| GNAS | GNAS Complex Locus |
| GO | Gene Ontology |
| GPR165 | G Protein-Coupled Receptor 165 |
| GRID1 | Glutamate Ionotropic Receptor Delta Type Subunit 1 |
| GRID2 | Glutamate Ionotropic Receptor Delta Type Subunit 2 |
| GRID2IP | Grid2 Interacting Protein |
| GRIK2 | Glutamate Ionotropic Receptor Kainate Type Subunit 2 |
| GRIN2B | Glutamate Ionotropic Receptor NMDA Type Subunit 2B |
| GRIN2C | Glutamate Ionotropic Receptor NMDA Type Subunit 2C |
| GRIN3A | Glutamate Ionotropic Receptor NMDA Type Subunit 3A |
| GRIP1 | Glutamate Receptor Interacting Protein 1 |
| GRM3 | Glutamate Metabotropic Receptor 3 |
| GRM4 | Glutamate Metabotropic Receptor 4 |
| GRM5 | Glutamate Metabotropic Receptor 5 |
| GRM8 | Glutamate Metabotropic Receptor 8 |
| GRP75/HSPA9 | Heat Shock Protein Family A (Hsp70) Member 9 |
| GSK3β | Glycogen Synthase Kinase 3 Beta |
| H2O2 | Hydrogen peroxide |
| HDMX | Human ortholog of mouse MDMX (also known as MDM4) |
| HIF3A | Hypoxia Inducible Factor 3 Subunit Alpha |
| HOMER1 | Homer Scaffold Protein 1 |
| HSP60 | 60 KDa Heat Shock Protein, Mitochondrial |
| HSP70 | Heat Shock 70 KDa Protein 4 |
| HSPA12A | Heat Shock Protein Family A (Hsp70) Member 12A |
| IGF1 | Insulin Like Growth Factor 1 |
| IGF2 | Insulin Like Growth Factor 2 |
| IGF2R | Insulin Like Growth Factor 2 Receptor |
| IGFLR1 | IGF Like Family Receptor 1 |
| IgG | Immunoglobulin G |
| IL16 | Interleukin 16 |
| IL18 | Interleukin 18 |
| IL20RB | Interleukin 20 Receptor Subunit Beta |
| IL33 | Interleukin 33 |
| IL34 | Interleukin 34 |
| INPP5A | Type I Inositol 1,4,5-Trisphosphate 5-Phosphatase |
| ITPR1/IP3R1 | Inositol 1,4,5-Trisphosphate Receptor Type 1 |
| JUN | Jun Proto-Oncogene |
| KAT5 | Lysine Acetyltransferase 5 |
| KCNQ5 | Potassium Voltage-Gated Channel Subfamily Q Member 5 |
| KD | knockdown |
| KDR | Kinase Insert Domain Receptor |
| KIT | KIT Proto-Oncogene |
| KO | knockout |
| KU | KU-55933 |
| LCDV | Large Dense Core Vesicles |
| LIFR | LIF Receptor Subunit Alpha |
| LY | LY-294002 |
| MAPK9/JNK2 | Mitogen-Activated Protein Kinase 9 |
| MDM4 | MDM4 Regulator Of P53 |
| MICU3 | Mitochondrial Calcium Uptake Family Member 3 |
| miR | microRNA |
| MLB | mitochondrial lysis buffer |
| MME | Membrane Metalloendopeptidase |
| MPP4 | MAGUK P55 Scaffold Protein 4 |
| MRE11 | Double-Strand Break Repair Protein MRE11 |
| MRN | MRE11-RAD50-NBS1 |
| mRNA | messenger RNA |
| NaARS | Sodium Arsenite |
| NBS1 | Nibrin |
| NECAB1 | N-Terminal EF-Hand Calcium Binding Protein 1 |
| NEFL | Neurofilament Light Chain |
| NEFM | Neurofilament Medium Chain |
| ng | nanogram |
| NGEF | Neuronal Guanine Nucleotide Exchange Factor |
| NGFRAP1 | Nerve Growth Factor Receptor Associated Protein 1 |
| NPAS4 | Neuronal PAS Domain Protein 4 |
| NPY | Neuropeptide Y |
| NPY1R | Neuropeptide Y Receptor Y1 |
| NPY4R | Neuropeptide Y Receptor Y4 |
| NR4A1 | Nuclear Receptor Subfamily 4 Group A Member 1 |
| NR4A2 | Nuclear Receptor Subfamily 4 Group A Member 2 |
| NR4A3 | Nuclear Receptor Subfamily 4 Group A Member 3 |
| NRG1 | Neuregulin 1 |
| NRG3 | Neuregulin 3 |
| NRIP2 | Nuclear Receptor Interacting Protein 2 |
| NRIP3 | Nuclear Receptor Interacting Protein 3 |
| NSG2 | Neuronal Vesicle Trafficking Associated 2 |
| NT CTRL | Non-targeting control shRNA |
| NTF3 | Neurotrophin 3 |
| NTRK3 | Neurotrophic Receptor Tyrosine Kinase 3 |
| NTS | Neurotensin |
| NTSR1 | Neurotensin Receptor 1 |
| NTSR2 | Neurotensin Receptor 2 |
| OMD | Osteomodulin |
| OPRK1 | Opioid Receptor Kappa 1 |
| OPRL1 | Opioid Related Nociceptin Receptor 1 |
| OPRM1 | Opioid Receptor Mu 1 |
| PBS | Phosphate Buffered Saline |
| PCDH10 | Protocadherin 10 |
| PCDH11X | Protocadherin 11 X-Linked |
| PCDH17 | Protocadherin 17 |
| PCDH18 | Protocadherin 18 |
| PCDH19 | Protocadherin 19 |
| PCDH7 | Protocadherin 7 |
| PCSK1 | Proprotein Convertase Subtilisin/Kexin Type 1 |
| PCSK1N | Proprotein Convertase Subtilisin/Kexin Type 1 Inhibitor |
| PCSK5 | Proprotein Convertase Subtilisin/Kexin Type 5 |
| PDGFC | Platelet Derived Growth Factor C |
| PDGFRA | Platelet Derived Growth Factor Receptor Alpha |
| PDGFRL | Platelet Derived Growth Factor Receptor Like |
| PER1 | Period Circadian Regulator 1 |
| PER2 | Period Circadian Regulator 2 |
| PER3 | Period Circadian Regulator 3 |
| PI3K | Phosphoinositide 3-kinase |
| PIKK | Phosphoinositide 3-kinase-related kinases |
| PMSF | Phenylmethylsulfonyl fluoride |
| PP2A | Protein phosphatase 2A |
| PPP2R2B | Protein Phosphatase 2 Regulatory Subunit Bbeta |
| PTPRD | Protein Tyrosine Phosphatase Receptor Type D |
| QPCT | Glutaminyl-Peptide Cyclotransferase |
| RAD50 | RAD50 Double Strand Break Repair Protein |
| RASGRF2 | Ras Protein Specific Guanine Nucleotide Releasing Factor 2 |
| RELN | Reelin |
| RESP18 | Regulated Endocrine Specific Protein 18 |
| RGS4 | Regulator Of G Protein Signaling 4 |
| RIN | RNA integrity number |
| RNA | Ribonucleic acid |
| RNF122 | Ring Finger Protein 122 |
| RORA | RAR Related Orphan Receptor A |
| RORB | RAR Related Orphan Receptor B |
| RRAGD | Ras Related GTP Binding D |
| RTN4 | Reticulon 4 |
| RT-qPCR | Reverse transcription-quantitative polymerase chain reaction |
| SAM68 | Src-Associated In Mitosis 68 KDa Protein |
| SCN3B | Sodium Voltage-Gated Channel Beta Subunit 3 |
| SDS-PAGE | Sodium dodecyl-sulfate polyacrylamide gel electrophoresis |
| SEM | Standard error of the mean |
| SEPT9 | Septin 9 |
| SERINC2 | Serine Incorporator 2 |
| SFRP1 | Secreted Frizzled Related Protein 1 |
| SFRP5 | Secreted Frizzled Related Protein 5 |
| SGK1 | Serum/Glucocorticoid Regulated Kinase 1 |
| shATM | shRNA targeting ATM |
| shRNA | Short hairpin RNA |
| SIDT1 | SID1 Transmembrane Family Member 1 |
| SIK1 | Salt Inducible Kinase 1 |
| SLC17A6/VGLUT 2 | Solute Carrier Family 17 Member 6 |
| SLC17A7/VGLUT1 | Solute Carrier Family 17 Member 7 |
| SLC18A2 | Solute Carrier Family 18 Member A2 |
| SLC1A1 | Solute Carrier Family 1 Member 1 |
| SLC1A2 | Solute Carrier Family 1 Member 2 |
| SLC1A3 | Solute Carrier Family 1 Member 3 |
| SLC1A4 | Solute Carrier Family 1 Member 4 |
| SLC1A6 | Solute Carrier Family 1 Member 6 |
| SLC25A22 | Solute Carrier Family 25 Member 22 |
| SLC2A12 | Solute Carrier Family 2 Member 12 |
| SLC32A1 | Solute Carrier Family 32 Member 1 |
| SLC5A7 | Solute Carrier Family 5 Member 7 |
| SLC6A11 | Solute Carrier Family 6 Member 11 |
| SLC7A3 | Solute Carrier Family 7 Member 3 |
| SLCO1A4 | Solute Carrier Organic Anion Transporter Family Member 1A2 |
| SLITRK3 | SLIT And NTRK Like Family Member 3 |
| SLITRK5 | SLIT And NTRK Like Family Member 5 |
| SLITRK6 | SLIT And NTRK Like Family Member 6 |
| SMG1 | SMG1 Nonsense Mediated MRNA Decay Associated PI3K Related Kinase |
| SOCS7 | Suppressor Of Cytokine Signaling 7 |
| SORCS1 | Sortilin Related VPS10 Domain Containing Receptor 1 |
| SORCS2 | Sortilin Related VPS10 Domain Containing Receptor 2 |
| SORL1 | Sortilin Related Receptor 1 |
| SOX10 | SRY-Box Transcription Factor 10 |
| ss-cDNA | single-stranded cDNA |
| SST | Somatostatin |
| SSTR1 | Somatostatin Receptor 1 |
| SSTR2 | Somatostatin Receptor 2 |
| SVBP | Small Vasohibin Binding Protein |
| SYNE1 | Spectrin Repeat Containing Nuclear Envelope Protein 1 |
| TAC | Transcriptome Analysis Console |
| TAC1 | Tachykinin Precursor 1 |
| TACR1 | Tachykinin Receptor 1 |
| TACR3 | Tachykinin Receptor 3 |
| TBP | TATA-Box Binding Protein |
| TBS | Tris Buffered Saline |
| TBS-T | TBS with 0.1% Tween-20 detergent |
| TCF4 | Transcription Factor 4 |
| TGFBR1 | Transforming Growth Factor Beta Receptor 1 |
| TGFBR2 | Transforming Growth Factor Beta Receptor 2 |
| TNFRSF13C | TNF Receptor Superfamily Member 13C |
| TNFRSF21 | TNF Receptor Superfamily Member 21 |
| TOP1cc | Topoisomerase-1 cleavage complexes |
| TP53 | Tumor Protein P53 |
| tRNA | transfer RNA |
| TUBA | α-tubulin |
| USP2 | Ubiquitin Specific Peptidase 2 |
| UVB | Ultraviolet-B |
| V(D)J | Variability–Diversity–Joining Rearrangement |
| VAMP1 | Vesicle Associated Membrane Protein 1 |
| VCL | Vinculin |
| VDAC1 | Voltage Dependent Anion Channel 1 |
| WNK1 | WNK Lysine Deficient Protein Kinase 1 |
| WNT3 | Wnt Family Member 3 |
| WNT7A | Wnt Family Member 7A |
| WT | Wildtype |
| ZFHX3 | Zinc Finger Homeobox 3 |
| αNAC | Nascent Polypeptide Associated Complex Subunit Alpha |
| γTX | γ-taxilin |
| μg | microgram |
| µm | micrometer |
References
- Nissenkorn, A.; Ben-Zeev, B. Ataxia telangiectasia. Handb. Clin. Neurol. 2015, 132, 199–214. [Google Scholar]
- Gatti, R.; Perlman, S. Ataxia-Telangiectasia. In GeneReviews((R)); Adam, M.P., Pagon, R.A., Eds.; University of Washington: Seattle, WA, USA, 1993. [Google Scholar]
- Taylor, A.M.R.; Rothblum-Oviatt, C.; Ellis, N.A.; Hickson, I.D.; Meyer, S.; Crawford, T.O.; Smogorzewska, A.; Pietrucha, B.; Weemaes, C.; Stewart, G.S. Chromosome instability syndromes. Nat. Rev. Dis. Prim. 2019, 5, 64. [Google Scholar] [CrossRef] [PubMed]
- Schieving, J.; de Vries, M.; van Vugt, J.; Weemaes, C.; van Deuren, M.; Nicolai, J.; Wevers, R.; Willemsen, M. Alpha-fetoprotein, a fascinating protein and biomarker in neurology. Eur. J. Paediatr. Neurol. 2014, 18, 243–248. [Google Scholar] [CrossRef] [PubMed]
- Woelke, S.; Schrewe, R.; Donath, H.; Theis, M.; Kieslich, M.; Duecker, R.; Auburger, G.; Schubert, R.; Zielen, S. Altered Cerebrospinal Fluid (CSF) in Children with Ataxia Telangiectasia. Cerebellum 2021, 20, 31–40. [Google Scholar] [CrossRef] [PubMed]
- Donath, H.; Woelke, S.; Schubert, R.; Kieslich, M.; Theis, M.; Auburger, G.; Duecker, R.P.; Zielen, S. Neurofilament Light Chain Is a Biomarker of Neurodegeneration in Ataxia Telangiectasia. Cerebellum 2022, 21, 39–47. [Google Scholar] [CrossRef] [PubMed]
- Veenhuis, S.; Gupta, A.; de Gusmão, C.; Thornton, J.; Margus, B.; Rothblum-Oviatt, C.; Otto, M.; Halbgebauer, S.; van Os, N.; van de Warrenburg, B.; et al. Neurofilament light chain: A novel blood biomarker in patients with ataxia telangiectasia. Eur. J. Paediatr. Neurol. 2021, 32, 93–97. [Google Scholar] [CrossRef]
- Schroeder, S.A.; Zielen, S. Infections of the respiratory system in patients with ataxia-telangiectasia. Pediatr. Pulmonol. 2014, 49, 389–399. [Google Scholar] [CrossRef]
- Zielen, S.; Duecker, R.P.; Woelke, S.; Donath, H.; Bakhtiar, S.; Buecker, A.; Kreyenberg, H.; Huenecke, S.; Bader, P.; Mahlaoui, N.; et al. Simple Measurement of IgA Predicts Immunity and Mortality in Ataxia-Telangiectasia. J. Clin. Immunol. 2021, 41, 1878–1892. [Google Scholar] [CrossRef]
- Xu, Y.; Ashley, T.; Brainerd, E.E.; Bronson, R.T.; Meyn, M.S.; Baltimore, D. Targeted disruption of ATM leads to growth retardation, chromosomal fragmentation during meiosis, immune defects, and thymic lymphoma. J. Bone Jt. Surg. 1996, 10, 2411–2422. [Google Scholar] [CrossRef]
- Plug, A.W.; Peters, A.H.; Xu, Y.; Keegan, K.S.; Hoekstra, M.F.; Baltimore, D.; de Boer, P.; Ashley, T. ATM and RPA in meiotic chromosome synapsis and recombination. Nat. Genet. 1997, 17, 457–461. [Google Scholar] [CrossRef]
- Natale, V.A.I.; Cole, T.J.; Rothblum-Oviatt, C.; Wright, J.; Crawford, T.O.; Lefton-Greif, M.A.; McGrath-Morrow, S.A.; Schlechter, H.; Lederman, H.M. Growth in ataxia telangiectasia. Orphanet. J. Rare Dis. 2021, 16, 123. [Google Scholar] [CrossRef] [PubMed]
- Voss, S.; Pietzner, J.; Hoche, F.; Taylor, A.M.R.; Last, J.I.; Schubert, R.; Zielen, S. Growth retardation and growth hormone deficiency in patients with Ataxia telangiectasia. Growth Factors 2014, 32, 123–129. [Google Scholar] [CrossRef] [PubMed]
- Schubert, R.; Reichenbach, J.; Zielen, S. Growth factor deficiency in patients with ataxia telangiectasia. Clin. Exp. Immunol. 2005, 140, 517–519. [Google Scholar] [CrossRef] [PubMed]
- Khanna, K.K. Cancer Risk and the ATM Gene: A Continuing Debate. JNCI J. Natl. Cancer Inst. 2000, 92, 795–802. [Google Scholar] [CrossRef] [PubMed]
- Bakhtiar, S.; Salzmann-Manrique, E.; Donath, H.; Woelke, S.; Duecker, R.P.; Fritzemeyer, S.; Schubert, R.; Huenecke, S.; Kieslich, M.; Klingebiel, T.; et al. The incidence and type of cancer in patients with ataxia-telangiectasia via a retrospective single-centre study. Br. J. Haematol. 2021, 194, 879–887. [Google Scholar] [CrossRef] [PubMed]
- Lee, J.-H.; Paull, T.T. Cellular functions of the protein kinase ATM and their relevance to human disease. Nat. Rev. Mol. Cell Biol. 2021, 22, 796–814. [Google Scholar] [CrossRef] [PubMed]
- Rotman, G.; Shiloh, Y. ATM: From gene to function. Hum. Mol. Genet. 1998, 7, 1555–1563. [Google Scholar] [CrossRef] [PubMed]
- Weitering, T.J.; Takada, S.; Weemaes, C.M.; van Schouwenburg, P.A.; van der Burg, M. ATM: Translating the DNA Damage Response to Adaptive Immunity. Trends Immunol. 2021, 42, 350–365. [Google Scholar] [CrossRef] [PubMed]
- Choy, K.R.; Watters, D.J. Neurodegeneration in ataxia-telangiectasia: Multiple roles of ATM kinase in cellular homeostasis. Dev. Dyn. 2018, 247, 33–46. [Google Scholar] [CrossRef]
- Guleria, A.; Chandna, S. ATM kinase: Much more than a DNA damage responsive protein. DNA Repair 2016, 39, 1–20. [Google Scholar] [CrossRef]
- Hoche, F.; Seidel, K.; Theis, M.; Vlaho, S.; Schubert, R.; Zielen, S.; Kieslich, M. Neurodegeneration in ataxia telangiectasia: What is new? What is evident? Neuropediatrics 2012, 43, 119–129. [Google Scholar] [CrossRef] [PubMed]
- Shiloh, Y. The cerebellar degeneration in ataxia-telangiectasia: A case for genome instability. DNA Repair 2020, 95, 102950. [Google Scholar] [CrossRef] [PubMed]
- Kuljis, R.O.; Chen, G.; Lee, E.Y.-H.; Aguila, M.; Xu, Y. ATM immunolocalization in mouse neuronal endosomes: Implications for ataxia-telangiectasia. Brain Res. 1999, 842, 351–358. [Google Scholar] [CrossRef] [PubMed]
- Gueven, N.; Fukao, T.; Luff, J.; Paterson, C.; Kay, G.; Kondo, N.; Lavin, M.F. Regulation of theAtm promoter in vivo. Genes Chromosom. Cancer 2006, 45, 61–71. [Google Scholar] [CrossRef] [PubMed]
- Oka, A.; Takashima, S. Expression of the ataxia-telangiectasia gene (ATM) product in human cerebellar neurons during development. Neurosci. Lett. 1998, 252, 195–198. [Google Scholar] [CrossRef]
- Li, J.; Han, Y.R.; Plummer, M.R.; Herrup, K. Cytoplasmic ATM in neurons modulates synaptic function. Curr. Biol. 2009, 19, 2091–2096. [Google Scholar] [CrossRef] [PubMed]
- Sommer, L.A.M.; Schaad, M.; Dames, S.A. NMR- and circular dichroism-monitored lipid binding studies suggest a general role for the FATC domain as membrane anchor of phosphatidylinositol 3-kinase-related kinases (PIKK). J. Biol. Chem. 2013, 288, 20046–20063. [Google Scholar] [CrossRef] [PubMed]
- Rahim, M.S.A.; Cherniavskyi, Y.K.; Tieleman, D.P.; Dames, S.A. NMR– and MD simulation–based structural characterization of the membrane-associating FATC domain of ataxia telangiectasia mutated. J. Biol. Chem. 2019, 294, 7098–7112. [Google Scholar] [CrossRef]
- Yeo, A.J.; Chong, K.L.; Gatei, M.; Zou, D.; Stewart, R.; Withey, S.; Wolvetang, E.; Parton, R.G.; Brown, A.D.; Kastan, M.B.; et al. Impaired endoplasmic reticulum-mitochondrial signaling in ataxia-telangiectasia. iScience 2021, 24, 101972. [Google Scholar] [CrossRef]
- Watters, D.; Kedar, P.; Spring, K.; Bjorkman, J.; Chen, P.; Gatei, M.; Birrell, G.; Garrone, B.; Srinivasa, P.; Crane, D.I.; et al. Localization of a portion of extranuclear ATM to peroxisomes. J. Biol. Chem. 1999, 274, 34277–34282. [Google Scholar] [CrossRef]
- Barlow, C.; Ribaut-Barassin, C.; Zwingman, T.A.; Pope, A.J.; Brown, K.D.; Owens, J.W.; Larson, D.; Harrington, E.A.; Haeberle, A.-M.; Mariani, J.; et al. ATM is a cytoplasmic protein in mouse brain required to prevent lysosomal accumulation. Proc. Natl. Acad. Sci. USA 2000, 97, 871–876. [Google Scholar] [CrossRef]
- Lim, D.S.; Kirsch, D.G.; Canman, C.E.; Ahn, J.H.; Ziv, Y.; Newman, L.S.; Darnell, R.B.; Shiloh, Y.; Kastan, M.B. ATM binds to beta-adaptin in cytoplasmic vesicles. Proc. Natl. Acad. Sci. USA 1998, 95, 10146–10151. [Google Scholar] [CrossRef] [PubMed]
- Ambrose, M.; Gatti, R.A. Pathogenesis of ataxia-telangiectasia: The next generation of ATM functions. Blood 2013, 121, 4036–4045. [Google Scholar] [CrossRef] [PubMed]
- Xie, X.; Zhang, Y.; Wang, Z.; Wang, S.; Jiang, X.; Cui, H.; Zhou, T.; He, Z.; Feng, H.; Guo, Q.; et al. ATM at the crossroads of reactive oxygen species and autophagy. Int. J. Biol. Sci. 2021, 17, 3080–3090. [Google Scholar] [CrossRef] [PubMed]
- Subramanian, G.N.; Yeo, A.J.; Gatei, M.H.; Coman, D.J.; Lavin, M.F. Metabolic Stress and Mitochondrial Dysfunction in Ataxia-Telangiectasia. Antioxidants 2022, 11, 653. [Google Scholar] [CrossRef] [PubMed]
- Herrup, K. ATM and the epigenetics of the neuronal genome. Mech. Ageing Dev. 2013, 134, 434–439. [Google Scholar] [CrossRef] [PubMed]
- Vail, G.; Cheng, A.; Han, Y.R.; Zhao, T.; Du, S.; Loy, M.M.T.; Herrup, K.; Plummer, M.R. ATM protein is located on presynaptic vesicles and its deficit leads to failures in synaptic plasticity. J. Neurophysiol. 2016, 116, 201–209. [Google Scholar] [CrossRef] [PubMed]
- Cheng, A.; Zhao, T.; Tse, K.-H.; Chow, H.-M.; Cui, Y.; Jiang, L.; Du, S.; Loy, M.M.T.; Herrup, K. ATM and ATR play complementary roles in the behavior of excitatory and inhibitory vesicle populations. Proc. Natl. Acad. Sci. USA 2018, 115, E292–E301. [Google Scholar] [CrossRef] [PubMed]
- Wilson, N.R.; Kang, J.; Hueske, E.V.; Leung, T.; Varoqui, H.; Murnick, J.G.; Erickson, J.D.; Liu, G. Presynaptic regulation of quantal size by the vesicular glutamate transporter VGLUT1. J. Neurosci. 2005, 25, 6221–6234. [Google Scholar] [CrossRef]
- Kuljis, R.O.; Xu, Y.; Aguila, M.C.; Baltimore, D. Degeneration of neurons, synapses, and neuropil and glial activation in a murine Atm knockout model of ataxia-telangiectasia. Proc. Natl. Acad. Sci. USA 1997, 94, 12688–12693. [Google Scholar] [CrossRef]
- Chiesa, N.; Barlow, C.; Wynshaw-Boris, A.; Strata, P.; Tempia, F. Atm-deficient mice Purkinje cells show age-dependent defects in calcium spike bursts and calcium currents. Neuroscience 2000, 96, 575–583. [Google Scholar] [CrossRef]
- Yamamoto, K.; Wang, Y.; Jiang, W.; Liu, X.; Dubois, R.L.; Lin, C.-S.; Ludwig, T.; Bakkenist, C.J.; Zha, S. Kinase-dead ATM protein causes genomic instability and early embryonic lethality in mice. J. Cell Biol. 2012, 198, 305–313. [Google Scholar] [CrossRef] [PubMed]
- Daniel, J.A.; Pellegrini, M.; Lee, B.-S.; Guo, Z.; Filsuf, D.; Belkina, N.V.; You, Z.; Paull, T.T.; Sleckman, B.P.; Feigenbaum, L.; et al. Loss of ATM kinase activity leads to embryonic lethality in mice. J. Cell Biol. 2012, 198, 295–304. [Google Scholar] [CrossRef]
- Barlow, C.; Hirotsune, S.; Paylor, R.; Liyanage, M.; Eckhaus, M.; Collins, F.; Shiloh, Y.; Crawley, J.N.; Ried, T.; Tagle, D.; et al. Atm-Deficient Mice: A Paradigm of Ataxia Telangiectasia. Cell 1996, 86, 159–171. [Google Scholar] [CrossRef]
- Pietzner, J.; Baer, P.C.; Duecker, R.P.; Merscher, M.B.; Satzger-Prodinger, C.; Bechmann, I.; Wietelmann, A.; Del Turco, D.; Doering, C.; Kuci, S.; et al. Bone marrow transplantation improves the outcome of Atm-deficient mice through the migration of ATM-competent cells. Hum. Mol. Genet. 2013, 22, 493–507. [Google Scholar] [CrossRef] [PubMed]
- Bakkenist, C.J.; Kastan, M.B. DNA damage activates ATM through intermolecular autophosphorylation and dimer dissociation. Nature 2003, 421, 499–506. [Google Scholar] [CrossRef]
- Berkovich, E.; Monnat, R.J., Jr.; Kastan, M.B. Roles of ATM and NBS1 in chromatin structure modulation and DNA double-strand break repair. Nat. Cell. Biol. 2007, 9, 683–690. [Google Scholar] [CrossRef] [PubMed]
- Sun, Y.; Xu, Y.; Roy, K.; Price, B.D. DNA damage-induced acetylation of lysine 3016 of ATM activates ATM kinase activity. Mol. Cell. Biol. 2007, 27, 8502–8509. [Google Scholar] [CrossRef]
- Sordet, O.; Redon, C.E.; Guirouilh-Barbat, J.; Smith, S.; Solier, S.; Douarre, C.; Conti, C.; Nakamura, A.J.; Das, B.B.; Nicolas, E.; et al. Ataxia telangiectasia mutated activation by transcription- and topoisomerase I-induced DNA double-strand breaks. EMBO Rep. 2009, 10, 887–893. [Google Scholar] [CrossRef] [PubMed]
- Mabb, A.M.; Simon, J.M.; King, I.F.; Lee, H.-M.; An, L.-K.; Philpot, B.D.; Zylka, M.J. Topoisomerase 1 Regulates Gene Expression in Neurons through Cleavage Complex-Dependent and -Independent Mechanisms. PLoS ONE 2016, 11, e0156439. [Google Scholar] [CrossRef]
- Yeo, A.J.; Becherel, O.J.; Luff, J.E.; Cullen, J.K.; Wongsurawat, T.; Jenjaroenpoon, P.; Kuznetsov, V.A.; McKinnon, P.J.; Lavin, M.F. R-Loops in proliferating cells but not in the brain: Implications for AOA2 and other autosomal recessive ataxias. PLoS ONE 2014, 9, e90219. [Google Scholar] [CrossRef]
- Tresini, M.; Warmerdam, D.O.; Kolovos, P.; Snijder, L.; Vrouwe, M.G.; Demmers, J.A.A.; van Ijcken, W.F.J.; Grosveld, F.G.; Medema, R.H.; Hoeijmakers, J.H.J.; et al. The core spliceosome as target and effector of non-canonical ATM signalling. Nature 2015, 523, 53–58. [Google Scholar] [CrossRef] [PubMed]
- Stagni, V.; Orecchia, S.; Mignini, L.; Beji, S.; Antonioni, A.; Caggiano, C.; Barilà, D.; Bielli, P.; Sette, C. DNA Damage Regulates the Functions of the RNA Binding Protein Sam68 through ATM-Dependent Phosphorylation. Cancers 2022, 14, 3847. [Google Scholar] [CrossRef] [PubMed]
- Ostrowski, L.A.; Hall, A.C.; Mekhail, K. Ataxin-2: From RNA Control to Human Health and Disease. Genes 2017, 8, 157. [Google Scholar] [CrossRef] [PubMed]
- Arsović, A.; Halbach, M.V.; Canet-Pons, J.; Esen-Sehir, D.; Döring, C.; Freudenberg, F.; Czechowska, N.; Seidel, K.; Baader, S.L.; Gispert, S.; et al. Mouse Ataxin-2 Expansion Downregulates CamKII and Other Calcium Signaling Factors, Impairing Granule—Purkinje Neuron Synaptic Strength. Int. J. Mol. Sci. 2020, 21, 6673. [Google Scholar] [CrossRef]
- Tada, M.; Nishizawa, M.; Onodera, O. Roles of inositol 1,4,5-trisphosphate receptors in spinocerebellar ataxias. Neurochem. Int. 2016, 94, 1–8. [Google Scholar] [CrossRef] [PubMed]
- Kanu, N.; Behrens, A. ATMINistrating ATM signalling: Regulation of ATM by ATMIN. Cell Cycle 2008, 7, 3483–3486. [Google Scholar] [CrossRef]
- Paull, T.T. Mechanisms of ATM Activation. Annu. Rev. Biochem. 2015, 84, 711–738. [Google Scholar] [CrossRef] [PubMed]
- Kanu, N.; Penicud, K.; Hristova, M.; Wong, B.; Irvine, E.; Plattner, F.; Raivich, G.; Behrens, A. The ATM cofactor ATMIN protects against oxidative stress and accumulation of DNA damage in the aging brain. J. Biol. Chem. 2010, 285, 38534–38542. [Google Scholar] [CrossRef]
- Barlow, C.; Dennery, P.A.; Shigenaga, M.K.; Smith, M.A.; Morrow, J.D.; Roberts, L.J.; Wynshaw-Boris, A.; Levine, R.L. Loss of the ataxia–telangiectasia gene product causes oxidative damage in target organs. Proc. Natl. Acad. Sci. USA 1999, 96, 9915–9919. [Google Scholar] [CrossRef]
- Bagley, J.; Cortes, M.L.; Breakefield, X.O.; Iacomini, J. Bone marrow transplantation restores immune system function and prevents lymphoma in Atm-deficient mice. Blood 2004, 104, 572–578. [Google Scholar] [CrossRef] [PubMed]
- Schmittgen, T.D.; Livak, K.J. Analyzing real-time PCR data by the comparative C(T) method. Nat. Protoc. 2008, 3, 1101–1108. [Google Scholar] [CrossRef]
- Adrain, C.; Creagh, E.M.; Martin, S.J. Apoptosis-associated release of Smac/DIABLO from mitochondria requires active caspases and is blocked by Bcl-2. EMBO J. 2001, 20, 6627–6636. [Google Scholar] [CrossRef] [PubMed]
- Baghirova, S.; Hughes, B.G.; Hendzel, M.J.; Schulz, R. Sequential fractionation and isolation of subcellular proteins from tissue or cultured cells. MethodsX 2015, 2, 440–445. [Google Scholar] [CrossRef] [PubMed]
- Lee, J.-H.; Ryu, S.W.; Ender, N.A.; Paull, T.T. Poly-ADP-ribosylation drives loss of protein homeostasis in ATM and Mre11 deficiency. Mol. Cell 2021, 81, 1515–1533.e5. [Google Scholar] [CrossRef]
- Canet-Pons, J.; Schubert, R.; Duecker, R.P.; Schrewe, R.; Wölke, S.; Kieslich, M.; Schnölzer, M.; Chiocchetti, A.; Auburger, G.; Zielen, S.; et al. Ataxia telangiectasia alters the ApoB and reelin pathway. Neurogenetics 2018, 19, 237–255. [Google Scholar] [CrossRef]
- Capauto, D.; Colantoni, A.; Lu, L.; Santini, T.; Peruzzi, G.; Biscarini, S.; Morlando, M.; Shneider, N.A.; Caffarelli, E.; Laneve, P.; et al. A Regulatory Circuitry Between Gria2, miR-409, and miR-495 Is Affected by ALS FUS Mutation in ESC-Derived Motor Neurons. Mol. Neurobiol. 2018, 55, 7635–7651. [Google Scholar] [CrossRef]
- Li, W.; Yang, Y.; Hou, X.; Zhuang, H.; Wu, Z.; Li, Z.; Guo, R.; Chen, H.; Lin, C.; Zhong, W.; et al. MicroRNA-495 regulates starvation-induced autophagy by targeting ATG3. FEBS Lett. 2016, 590, 726–738. [Google Scholar] [CrossRef]
- Chen, X.; Li, C.; Zeng, R.; Qiu, L.; Huang, J.; Wang, N.; Ren, X.; Lin, X. Inhibition of miR-495-3p ameliorated sevoflurane induced damage through BDNF/ERK/CREB signaling pathways in HT22 cells. Transpl. Immunol. 2022, 75, 101708. [Google Scholar] [CrossRef]
- Inouye, M.O.; Colameo, D.; Ammann, I.; Winterer, J.; Schratt, G. miR-329– and miR-495–mediated Prr7 down-regulation is required for homeostatic synaptic depression in rat hippocampal neurons. Life Sci. Alliance 2022, 5, e202201520. [Google Scholar] [CrossRef]
- Meng, Y.; Hao, Z.; Zhang, H.; Bai, P.; Guo, W.; Tian, X.; Xu, J. lncRNA NEAT1/miR-495-3p regulates angiogenesis in burn sepsis through the TGF-beta1 and SMAD signaling pathways. Immun. Inflamm. Dis. 2023, 11, e758. [Google Scholar] [CrossRef] [PubMed]
- Zhang, L.; Wu, H.; Zhang, Y.; Xiao, X.; Chu, F. Induction of lncRNA NORAD accounts for hypoxia-induced chemoresistance and vasculogenic mimicry in colorectal cancer by sponging the miR-495-3p/ hypoxia-inducible factor-1α (HIF-1α). Bioengineered 2021, 13, 950–962. [Google Scholar] [CrossRef] [PubMed]
- Shi, Y.; Cao, J.; Gao, J.; Zheng, L.; Goodwin, A.; An, C.H.; Patel, A.; Lee, J.S.; Duncan, S.R.; Kaminski, N.; et al. Retinoic acid-related orphan receptor-alpha is induced in the setting of DNA damage and promotes pulmonary emphysema. Am. J. Respir. Crit. Care Med. 2012, 186, 412–419. [Google Scholar] [CrossRef]
- Kwak, Y.D.; Shaw, T.I.; Downing, S.M.; Tewari, A.; Jin, H.; Li, Y.; Dumitrache, L.C.; Katyal, S.; Khodakhah, K.; Russell, H.R.; et al. Chromatin architecture at susceptible gene loci in cerebellar Purkinje cells characterizes DNA damage–induced neurodegeneration. Sci. Adv. 2021, 7, eabg6363. [Google Scholar] [CrossRef] [PubMed]
- Yeo, A.; Subramanian, G.; Chong, K.; Gatei, M.; Parton, R.; Coman, D.; Lavin, M. An anaplerotic approach to correct the mitochondrial dysfunction in ataxia-telangiectasia (A-T). Mol. Metab. 2021, 54, 101354. [Google Scholar] [CrossRef] [PubMed]
- Focchi, E.; Cambria, C.; Pizzamiglio, L.; Murru, L.; Pelucchi, S.; D’andrea, L.; Piazza, S.; Mattioni, L.; Passafaro, M.; Marcello, E.; et al. ATM rules neurodevelopment and glutamatergic transmission in the hippocampus but not in the cortex. Cell Death Dis. 2022, 13, 616. [Google Scholar] [CrossRef]
- Gade, A.K.; Olariu, E.; Douthit, N.T. Carcinoid Syndrome: A Review. Cureus 2020, 12, e7186. [Google Scholar] [CrossRef]
- Eilam, R.; Peter, Y.; Groner, Y.; Segal, M. Late degeneration of nigro-striatal neurons in ATM-/- mice. Neuroscience 2003, 121, 83–98. [Google Scholar] [CrossRef] [PubMed]
- Hannah-Shmouni, F.; Stratakis, C.A.; Koch, C.A. Flushing in (neuro)endocrinology. Rev. Endocr. Metab. Disord. 2016, 17, 373–380. [Google Scholar] [CrossRef]
- Said, S.I. Vasoactive peptides. State-of-the-art review. Hypertension 1983, 5 Pt 2, I17–I26. [Google Scholar] [CrossRef]
- Ghigo, E.; Arvat, E.; Bellone, J.; Ramunni, J.; Camanni, F. Neurotransmitter control of growth hormone secretion in humans. J. Pediatr. Endocrinol. Metab. 1993, 6, 263–266. [Google Scholar] [CrossRef] [PubMed]
- Kanu, N.; Behrens, A. ATMIN defines an NBS1-independent pathway of ATM signalling. EMBO J. 2007, 26, 2933–2941. [Google Scholar] [CrossRef] [PubMed]
- Yang, Y.; Xie, F.; Qin, D.; Zong, C.; Han, F.; Pu, Z.; Liu, D.; Li, X.; Zhang, Y.; Liu, Y.; et al. The orphan nuclear receptor NR4A1 attenuates oxidative stress-induced beta cells apoptosis via up-regulation of glutathione peroxidase 1. Life Sci. 2018, 203, 225–232. [Google Scholar] [CrossRef] [PubMed]
- Shi, Y.Y.; Meng, X.T.; Xu, Y.N.; Tian, X.J. Role of FOXO protein’s abnormal activation through PI3K/AKT pathway in platinum resistance of ovarian cancer. J. Obstet. Gynaecol. Res. 2021, 47, 1946–1957. [Google Scholar] [CrossRef] [PubMed]
- Kim, H.; Kim, D.; Choi, H.; Shin, G.; Lee, J.-K. Deubiquitinase USP2 stabilizes the MRE11–RAD50–NBS1 complex at DNA double-strand break sites by counteracting the ubiquitination of NBS1. J. Biol. Chem. 2023, 299, 102752. [Google Scholar] [CrossRef]
- Matsuoka, S.; Ballif, B.A.; Smogorzewska, A.; McDonald, E.R., III; Hurov, K.E.; Luo, J.; Bakalarski, C.E.; Zhao, Z.; Solimini, N.; Lerenthal, Y.; et al. ATM and ATR substrate analysis reveals extensive protein networks responsive to DNA damage. Science 2007, 316, 1160–1166. [Google Scholar] [CrossRef]
- Bensimon, A.; Schmidt, A.; Ziv, Y.; Elkon, R.; Wang, S.-Y.; Chen, D.J.; Aebersold, R.; Shiloh, Y. ATM-dependent and -independent dynamics of the nuclear phosphoproteome after DNA damage. Sci. Signal. 2010, 3, rs3. [Google Scholar] [CrossRef] [PubMed]
- Schlam-Babayov, S.; Bensimon, A.; Harel, M.; Geiger, T.; Aebersold, R.; Ziv, Y.; Shiloh, Y. Phosphoproteomics reveals novel modes of function and inter-relationships among PIKKs in response to genotoxic stress. EMBO J. 2021, 40, e104400. [Google Scholar] [CrossRef] [PubMed]
- Petrinovic, M.M.; Hourez, R.; Aloy, E.M.; Dewarrat, G.; Gall, D.; Weinmann, O.; Gaudias, J.; Bachmann, L.C.; Schiffmann, S.N.; Vogt, K.E.; et al. Neuronal Nogo-A negatively regulates dendritic morphology and synaptic transmission in the cerebellum. Proc. Natl. Acad. Sci. USA 2012, 110, 1083–1088. [Google Scholar] [CrossRef]
- Jaudon, F.; Raynaud, F.; Wehrlé, R.; Bellanger, J.-M.; Doulazmi, M.; Vodjdani, G.; Gasman, S.; Fagni, L.; Dusart, I.; Debant, A.; et al. The RhoGEF DOCK10 is essential for dendritic spine morphogenesis. Mol. Biol. Cell 2015, 26, 2112–2127. [Google Scholar] [CrossRef]
- Bell, S.; Rousseau, J.; Peng, H.; Aouabed, Z.; Priam, P.; Theroux, J.-F.; Jefri, M.; Tanti, A.; Wu, H.; Kolobova, I.; et al. Mutations in ACTL6B Cause Neurodevelopmental Deficits and Epilepsy and Lead to Loss of Dendrites in Human Neurons. Am. J. Hum. Genet. 2019, 104, 815–834. [Google Scholar] [CrossRef] [PubMed]
- Cruz-Solis, I.; Zepeda, R.C.; Ortiz, S.; Aguilera, J.; López-Bayghen, E.; Ortega, A. Glutamate-dependent transcriptional control in Bergmann glia: Sox10 as a repressor. J. Neurochem. 2009, 109, 899–910. [Google Scholar] [CrossRef] [PubMed]
- Karasmanis, E.P.; Phan, C.T.; Angelis, D.; Kesisova, I.A.; Hoogenraad, C.C.; McKenney, R.J.; Spiliotis, E.T. Polarity of Neuronal Membrane Traffic Requires Sorting of Kinesin Motor Cargo during Entry into Dendrites by a Microtubule-Associated Septin. Dev. Cell 2018, 46, 204–218. [Google Scholar] [CrossRef]
- Berke, J.D.; Sgambato, V.; Zhu, P.P.; Lavoie, B.; Vincent, M.; Krause, M.; Hyman, S.E. Dopamine and glutamate induce distinct striatal splice forms of Ania-6, an RNA polymerase II-associated cyclin. Neuron 2001, 32, 277–287. [Google Scholar] [CrossRef] [PubMed]
- van Essen, M.J.; Nayler, S.; Becker, E.B.; Jacob, J. Deconstructing cerebellar development cell by cell. PLoS Genet. 2020, 16, e1008630. [Google Scholar] [CrossRef] [PubMed]
- Rahimi-Balaei, M.; Bergen, H.; Kong, J.; Marzban, H. Neuronal Migration During Development of the Cerebellum. Front. Cell. Neurosci. 2018, 12, 484. [Google Scholar] [CrossRef] [PubMed]
- van der Heijden, M.E.; Gill, J.S.; Sillitoe, R.V. Abnormal Cerebellar Development in Autism Spectrum Disorders. Dev. Neurosci. 2021, 43, 181–190. [Google Scholar] [CrossRef] [PubMed]
- Ceylan, A.C.; Arslan, E.A.; Erdem, H.B.; Kavus, H.; Arslan, M.; Topaloğlu, H. Autosomal recessive spinocerebellar ataxia 18 caused by homozygous exon 14 duplication in GRID2 and review of the literature. Acta Neurol. Belg. 2021, 121, 1457–1462. [Google Scholar] [CrossRef] [PubMed]
- Coutelier, M.; Burglen, L.; Mundwiller, E.; Abada-Bendib, M.; Rodriguez, D.; Chantot-Bastaraud, S.; Rougeot, C.; Cournelle, M.-A.; Milh, M.; Toutain, A.; et al. GRID2 mutations span from congenital to mild adult-onset cerebellar ataxia. Neurology 2015, 84, 1751–1759. [Google Scholar] [CrossRef]
- Depondt, C.; Donatello, S.; Rai, M.; Wang, F.C.; Manto, M.; Simonis, N.; Pandolfo, M. MME mutation in dominant spinocerebellar ataxia with neuropathy (SCA43). Neurol. Genet. 2016, 2, e94. [Google Scholar] [CrossRef] [PubMed]
- Boukhtouche, F.; Doulazmi, M.; Frederic, F.; Dusart, I.; Brugg, B.; Mariani, J. Rorα, a pivotal nuclear receptor for Purkinje neuron survival and differentiation: From development to ageing. Cerebellum 2006, 5, 97–104. [Google Scholar] [CrossRef] [PubMed]
- Jolly, S.; Journiac, N.; Garabedian, B.V.-D.; Mariani, J. RORalpha, a key to the development and functioning of the brain. Cerebellum 2012, 11, 451–452. [Google Scholar] [CrossRef] [PubMed]
- Betz, C.; Hall, M.N. Where is mTOR and what is it doing there? J. Cell Biol. 2013, 203, 563–574. [Google Scholar] [CrossRef] [PubMed]
- Gollwitzer, P.; Grützmacher, N.; Wilhelm, S.; Kümmel, D.; Demetriades, C. A Rag GTPase dimer code defines the regulation of mTORC1 by amino acids. Nature 2022, 24, 1394–1406. [Google Scholar] [CrossRef]
- Schweizer, A.; Valdenaire, O.; Köster, A.; Lang, Y.; Schmitt, G.; Lenz, B.; Bluethmann, H.; Rohrer, J. Neonatal lethality in mice deficient in XCE, a novel member of the endothelin-converting enzyme and neutral endopeptidase family. J. Biol. Chem. 1999, 274, 20450–20456. [Google Scholar] [CrossRef]
- Kiryu-Seo, S.; Nagata, K.; Saido, T.C.; Kiyama, H. New Insights of a Neuronal Peptidase DINE/ECEL1: Nerve Development, Nerve Regeneration and Neurogenic Pathogenesis. Neurochem. Res. 2019, 44, 1279–1288. [Google Scholar] [CrossRef] [PubMed]
- Wang, C.-L.; Wang, J.-Y.; Liu, Z.-Y.; Ma, X.-M.; Wang, X.-W.; Jin, H.; Zhang, X.-P.; Fu, D.; Hou, L.-J.; Lu, Y.-C. Ubiquitin-specific protease 2a stabilizes MDM4 and facilitates the p53-mediated intrinsic apoptotic pathway in glioblastoma. Carcinogenesis 2014, 35, 1500–1509. [Google Scholar] [CrossRef]
- Pereg, Y.; Shkedy, D.; de Graaf, P.; Meulmeester, E.; Edelson-Averbukh, M.; Salek, M.; Biton, S.; Teunisse, A.F.A.S.; Lehmann, W.D.; Jochemsen, A.G.; et al. Phosphorylation of Hdmx mediates its Hdm2- and ATM-dependent degradation in response to DNA damage. Proc. Natl. Acad. Sci. USA 2005, 102, 5056–5061. [Google Scholar] [CrossRef] [PubMed]
- Moore, C.; Cevikbas, F.; Pasolli, H.A.; Chen, Y.; Kong, W.; Kempkes, C.; Parekh, P.; Lee, S.H.; Kontchou, N.-A.; Yeh, I.; et al. UVB radiation generates sunburn pain and affects skin by activating epidermal TRPV4 ion channels and triggering endothelin-1 signaling. Proc. Natl. Acad. Sci. USA 2013, 110, E3225–E3234. [Google Scholar] [CrossRef]
- Bernard, J.J.; Cowing-Zitron, C.; Nakatsuji, T.; Muehleisen, B.; Muto, J.; Borkowski, A.W.; Martinez, L.; Greidinger, E.L.; Yu, B.D.; Gallo, R.L. Ultraviolet radiation damages self noncoding RNA and is detected by TLR3. Nat. Med. 2012, 18, 1286–1290. [Google Scholar] [CrossRef] [PubMed]
- Sarkar, S.; Gaddameedhi, S. Solar ultraviolet-induced DNA damage response: Melanocytes story in transformation to environmental melanomagenesis. Environ. Mol. Mutagen. 2020, 61, 736–751. [Google Scholar] [CrossRef]
- Mavrogonatou, E.; Angelopoulou, M.; Rizou, S.V.; Pratsinis, H.; Gorgoulis, V.G.; Kletsas, D. Activation of the JNKs/ATM-p53 axis is indispensable for the cytoprotection of dermal fibroblasts exposed to UVB radiation. Cell Death Dis. 2022, 13, 647. [Google Scholar] [CrossRef]
- Kawasumi, M.; Lemos, B.; Bradner, J.E.; Thibodeau, R.; Kim, Y.-S.; Schmidt, M.; Higgins, E.; Koo, S.-W.; Angle-Zahn, A.; Chen, A.; et al. Protection from UV-induced skin carcinogenesis by genetic inhibition of the ataxia telangiectasia and Rad3-related (ATR) kinase. Proc. Natl. Acad. Sci. USA 2011, 108, 13716–13721. [Google Scholar] [CrossRef] [PubMed]
- Panda, P.K.; Sharawat, I.K.; Dawman, L. GRID2 Mutation-Related Spinocerebellar Ataxia Type 18: A New Report and Literature Review. J. Pediatr. Genet. 2022, 11, 099–109. [Google Scholar] [CrossRef] [PubMed]
- Matsuda, K.; Matsuda, S.; Gladding, C.M.; Yuzaki, M. Characterization of the delta2 glutamate receptor-binding protein delphilin: Splicing variants with differential palmitoylation and an additional PDZ domain. J. Biol. Chem. 2006, 281, 25577–25587. [Google Scholar] [CrossRef] [PubMed]
- Yousaf, H.; Fatima, A.; Ali, Z.; Baig, S.M.; Toft, M.; Iqbal, Z. A Novel Nonsense Variant in GRM1 Causes Autosomal Recessive Spinocerebellar Ataxia 13 in a Consanguineous Pakistani Family. Genes 2022, 13, 1667. [Google Scholar] [CrossRef]
- Watson, L.M.; Bamber, E.; Schnekenberg, R.P.; Williams, J.; Bettencourt, C.; Lickiss, J.; Jayawant, S.; Fawcett, K.; Clokie, S.; Wallis, Y.; et al. Dominant Mutations in GRM1 Cause Spinocerebellar Ataxia Type 44. Am. J. Hum. Genet. 2017, 101, 866. [Google Scholar] [CrossRef] [PubMed]
- Jen, J.C.; Wan, J.; Palos, T.P.; Howard, B.D.; Baloh, R.W. Mutation in the glutamate transporter EAAT1 causes episodic ataxia, hemiplegia, and seizures. Neurology 2005, 65, 529–534. [Google Scholar] [CrossRef] [PubMed]
- Wu, Q.; Akhter, A.; Pant, S.; Cho, E.; Zhu, J.X.; Garner, A.; Ohyama, T.; Tajkhorshid, E.; van Meyel, D.J.; Ryan, R.M. Ataxia-linked SLC1A3 mutations alter EAAT1 chloride channel activity and glial regulation of CNS function. J. Clin. Investig. 2022, 132, e154891. [Google Scholar] [CrossRef] [PubMed]
- Ikeda, Y.; Dick, K.A.; Weatherspoon, M.R.; Gincel, D.; Armbrust, K.R.; Dalton, J.C.; Stevanin, G.; Dürr, A.; Zühlke, C.; Bürk, K.; et al. Faculty Opinions recommendation of Spectrin mutations cause spinocerebellar ataxia type 5. Nat. Genet. 2006, 38, 184–190. [Google Scholar] [CrossRef]
- Perkins, E.M.; Clarkson, Y.L.; Suminaite, D.; Lyndon, A.R.; Tanaka, K.; Rothstein, J.D.; Skehel, P.A.; Wyllie, D.J.A.; Jackson, M. Loss of cerebellar glutamate transporters EAAT4 and GLAST differentially affects the spontaneous firing pattern and survival of Purkinje cells. Hum. Mol. Genet. 2018, 27, 2614–2627. [Google Scholar] [CrossRef] [PubMed]
- Hioki, H.; Fujiyama, F.; Taki, K.; Tomioka, R.; Furuta, T.; Tamamaki, N.; Kaneko, T. Differential distribution of vesicular glutamate transporters in the rat cerebellar cortex. Neuroscience 2003, 117, 1–6. [Google Scholar] [CrossRef] [PubMed]
- Chander, P.; Kennedy, M.J.; Winckler, B.; Weick, J.P. Neuron-Specific Gene 2 (NSG2) Encodes an AMPA Receptor Interacting Protein That Modulates Excitatory Neurotransmission. eNeuro 2019, 6, 1–13. [Google Scholar] [CrossRef] [PubMed]
- Takamiya, K.; Mao, L.; Huganir, R.L.; Linden, D.J. The glutamate receptor-interacting protein family of GluR2-binding proteins is required for long-term synaptic depression expression in cerebellar Purkinje cells. J. Neurosci. 2008, 28, 5752–5755. [Google Scholar] [CrossRef] [PubMed]
- Lévénès, C.; Daniel, H.; Soubrié, P.; Crépel, F. Cannabinoids decrease excitatory synaptic transmission and impair long-term depression in rat cerebellar Purkinje cells. J. Physiol. 1998, 510, 867–879. [Google Scholar] [CrossRef]
- Bloomquist, B.; Darlington, D.; Mains, R.; Eipper, B. RESP18, a novel endocrine secretory protein transcript, and four other transcripts are regulated in parallel with pro-opiomelanocortin in melanotropes. J. Biol. Chem. 1994, 269, 9113–9122. [Google Scholar] [CrossRef]
- Zhang, G.; Hirai, H.; Cai, T.; Miura, J.; Yu, P.; Huang, H.; Schiller, M.R.; Swaim, W.D.; Leapman, R.D.; Notkins, A.L. RESP18, a homolog of the luminal domain IA-2, is found in dense core vesicles in pancreatic islet cells and is induced by high glucose. J. Endocrinol. 2007, 195, 313–321. [Google Scholar] [CrossRef]
- Toledo, P.L.; Torkko, J.M.; Müller, A.; Wegbrod, C.; Sönmez, A.; Solimena, M.; Ermácora, M.R. ICA512 RESP18 homology domain is a protein-condensing factor and insulin fibrillation inhibitor. J. Biol. Chem. 2019, 294, 8564–8576. [Google Scholar] [CrossRef]
- Huang, K.-F.; Liu, Y.-L.; Cheng, W.-J.; Ko, T.-P.; Wang, A.H.-J. Crystal structures of human glutaminyl cyclase, an enzyme responsible for protein N-terminal pyroglutamate formation. Proc. Natl. Acad. Sci. USA 2005, 102, 13117–13122. [Google Scholar] [CrossRef]
- Wang, Q.; Traynor, J.R. Opioid-induced down-regulation of RGS4: Role of ubiquitination and implications for receptor cross-talk. J. Biol. Chem. 2011, 286, 7854–7864. [Google Scholar] [CrossRef]
- Traynor, J. μ-Opioid receptors and regulators of G protein signaling (RGS) proteins: From a symposium on new concepts in mu-opioid pharmacology. Drug Alcohol. Depend. 2012, 121, 173–180. [Google Scholar] [CrossRef] [PubMed]
- Santhappan, R.; Crowder, A.T.; Gouty, S.; Cox, B.M.; Côté, T.E. Mu opioid receptor activation enhances regulator of G protein signaling 4 association with the mu opioid receptor/G protein complex in a GTP-dependent manner. J. Neurochem. 2015, 135, 76–87. [Google Scholar] [CrossRef] [PubMed]
- Senese, N.B.; Kandasamy, R.; Kochan, K.E.; Traynor, J.R. Regulator of G-Protein Signaling (RGS) Protein Modulation of Opioid Receptor Signaling as a Potential Target for Pain Management. Front. Mol. Neurosci. 2020, 13, 5. [Google Scholar] [CrossRef] [PubMed]
- Trupp, M.; Raynoschek, C.; Belluardo, N.; Ibáñez, C.F. Multiple GPI-anchored receptors control GDNF-dependent and independent activation of the c-Ret receptor tyrosine kinase. Mol. Cell. Neurosci. 1998, 11, 47–63. [Google Scholar] [CrossRef] [PubMed]
- Burazin, T.C.; Gundlach, A.L. Localization of GDNF/neurturin receptor (c-ret, GFRalpha-1 and alpha-2) mRNAs in postnatal rat brain: Differential regional and temporal expression in hippocampus, cortex and cerebellum. Brain Res. Mol. Brain Res. 1999, 73, 151–171. [Google Scholar] [CrossRef] [PubMed]
- Aruga, J.; Mikoshiba, K. Identification and characterization of Slitrk, a novel neuronal transmembrane protein family controlling neurite outgrowth. Mol. Cell. Neurosci. 2003, 24, 117–129. [Google Scholar] [CrossRef] [PubMed]
- Takahashi, H.; Katayama, K.I.; Sohya, K.; Miyamoto, H.; Prasad, T.; Matsumoto, Y.; Ota, M.; Yasuda, H.; Tsumoto, T.; Aruga, J.; et al. Selective control of inhibitory synapse development by Slitrk3-PTPdelta trans-synaptic interaction. Nat. Neurosci. 2012, 15, 389–398. [Google Scholar] [CrossRef]
- Song, M.; Giza, J.; Proenca, C.C.; Jing, D.; Elliott, M.; Dincheva, I.; Shmelkov, S.V.; Kim, J.; Schreiner, R.; Huang, S.-H.; et al. Slitrk5 Mediates BDNF-Dependent TrkB Receptor Trafficking and Signaling. Dev. Cell 2015, 33, 690–702. [Google Scholar] [CrossRef]
- Matsumoto, Y.; Katayama, K.-I.; Okamoto, T.; Yamada, K.; Takashima, N.; Nagao, S.; Aruga, J. Impaired auditory-vestibular functions and behavioral abnormalities of Slitrk6-deficient mice. PLoS ONE 2011, 6, e16497. [Google Scholar] [CrossRef]
- Lane, R.F.; George-Hyslop, P.S.; Hempstead, B.L.; Small, S.A.; Strittmatter, S.M.; Gandy, S. Vps10 family proteins and the retromer complex in aging-related neurodegeneration and diabetes. J. Neurosci. 2012, 32, 14080–14086. [Google Scholar] [CrossRef]
- Savas, J.N.; Ribeiro, L.F.; Wierda, K.D.; Wright, R.; DeNardo-Wilke, L.A.; Rice, H.C.; Chamma, I.; Wang, Y.-Z.; Zemla, R.; Lavallée-Adam, M.; et al. The Sorting Receptor SorCS1 Regulates Trafficking of Neurexin and AMPA Receptors. Neuron 2015, 87, 764–780. [Google Scholar] [CrossRef] [PubMed]
- Gospodinova, K.O.; Olsen, D.; Kaas, M.; Anderson, S.M.; Phillips, J.; Walker, R.M.; Bermingham, M.L.; Payne, A.L.; Giannopoulos, P.; Pandya, D.; et al. Loss of SORCS2 is Associated with Neuronal DNA Double-Strand Breaks. Cell. Mol. Neurobiol. 2023, 43, 237–249. [Google Scholar] [CrossRef] [PubMed]
- Kebede, M.A.; Oler, A.T.; Gregg, T.; Balloon, A.J.; Johnson, A.; Mitok, K.; Rabaglia, M.; Schueler, K.; Stapleton, D.; Thorstenson, C.; et al. SORCS1 is necessary for normal insulin secretory granule biogenesis in metabolically stressed beta cells. J. Clin. Investig. 2014, 124, 4240–4256. [Google Scholar] [CrossRef] [PubMed]
- Coffey, E.T.; Smiciene, G.; Hongisto, V.; Cao, J.; Brecht, S.; Herdegen, T.; Courtney, M.J. c-Jun N-terminal protein kinase (JNK) 2/3 is specifically activated by stress, mediating c-Jun activation, in the presence of constitutive JNK1 activity in cerebellar neurons. J. Neurosci. 2002, 22, 4335–4345. [Google Scholar] [CrossRef]
- Ham, J.; Eilers, A.; Whitfield, J.; Neame, S.J.; Shah, B. c-Jun and the transcriptional control of neuronal apoptosis. Biochem. Pharmacol. 2000, 60, 1015–1021. [Google Scholar] [CrossRef]
- Mukai, J.; Hachiya, T.; Shoji-Hoshino, S.; Kimura, M.T.; Nadano, D.; Suvanto, P.; Hanaoka, T.; Li, Y.; Irie, S.; Greene, L.A.; et al. NADE, a p75NTR-associated cell death executor, is involved in signal transduction mediated by the common neurotrophin receptor p75NTR. J. Biol. Chem. 2000, 275, 17566–17570. [Google Scholar] [CrossRef]
- Mukai, J.; Shoji, S.; Kimura, M.T.; Okubo, S.; Sano, H.; Suvanto, P.; Li, Y.; Irie, S.; Sato, T.A. Structure-function analysis of NADE: Identification of regions that mediate nerve growth factor-induced apoptosis. J. Biol. Chem. 2002, 277, 13973–13982. [Google Scholar] [CrossRef]
- Zhang, D.; Sliwkowski, M.X.; Mark, M.; Frantz, G.; Akita, R.; Sun, Y.; Hillan, K.; Crowley, C.; Brush, J.; Godowski, P.J. Neuregulin-3 (NRG3): A novel neural tissue-enriched protein that binds and activates ErbB4. Proc. Natl. Acad. Sci. USA 1997, 94, 9562–9567. [Google Scholar] [CrossRef] [PubMed]
- Pallesen, L.T.; Vaegter, C.B. Sortilin and SorLA regulate neuronal sorting of trophic and dementia-linked proteins. Mol. Neurobiol. 2012, 45, 379–387. [Google Scholar] [CrossRef] [PubMed]
- Segal, R.A.; Takahashi, H.; McKay, R.D. Changes in neurotrophin responsiveness during the development of cerebellar granule neurons. Neuron 1992, 9, 1041–1052. [Google Scholar] [CrossRef]
- Bates, B.; Rios, M.; Trumpp, A.; Chen, C.; Fan, G.; Bishop, J.M.; Jaenisch, R. Neurotrophin–3 is required for proper cerebellar development. Nat. Neurosci. 1999, 2, 115–117. [Google Scholar] [CrossRef] [PubMed]
- Katoh-Semba, R.; Takeuchi, I.K.; Semba, R.; Kato, K. Neurotrophin-3 controls proliferation of granular precursors as well as survival of mature granule neurons in the developing rat cerebellum. J. Neurochem. 2000, 74, 1923–1930. [Google Scholar] [CrossRef] [PubMed]
- Sadakata, T.; Kakegawa, W.; Mizoguchi, A.; Washida, M.; Katoh-Semba, R.; Shutoh, F.; Okamoto, T.; Nakashima, H.; Kimura, K.; Tanaka, M.; et al. Impaired cerebellar development and function in mice lacking CAPS2, a protein involved in neurotrophin release. J. Neurosci. 2007, 27, 2472–2482. [Google Scholar] [CrossRef] [PubMed]
- Sadakata, T.; Mizoguchi, A.; Sato, Y.; Katoh-Semba, R.; Fukuda, M.; Mikoshiba, K.; Furuichi, T. The secretory granule-associated protein CAPS2 regulates neurotrophin release and cell survival. J. Neurosci. 2004, 24, 43–52. [Google Scholar] [CrossRef] [PubMed]
- Skaper, S.D.; Floreani, M.; Negro, A.; Facci, L.; Giusti, P. Neurotrophins rescue cerebellar granule neurons from oxidative stress-mediated apoptotic death: Selective involvement of phosphatidylinositol 3-kinase and the mitogen-activated protein kinase pathway. J. Neurochem. 2002, 70, 1859–1868. [Google Scholar] [CrossRef] [PubMed]
- Lindholm, D.; Dechant, G.; Heisenberg, C.-P.; Thoenen, H. Brain-derived neurotrophic factor is a survival factor for cultured rat cerebellar granule neurons and protects them against gluta-mate-induced neurotoxicity. Eur. J. Neurosci. 1993, 5, 1455–1464. [Google Scholar] [CrossRef] [PubMed]
- Morrison, M.E.; Mason, C.A. Granule neuron regulation of Purkinje cell development: Striking a balance between neurotrophin and glutamate signaling. J. Neurosci. 1998, 18, 3563–3573. [Google Scholar] [CrossRef]
- Lindholm, D.; Castrén, E.; Tsoulfas, P.; Kolbeck, R.; Berzaghi, M.d.P.; Leingärtner, A.; Heisenberg, C.; Tessarollo, L.; Parada, L.; Thoenen, H. Neurotrophin-3 induced by tri-iodothyronine in cerebellar granule cells promotes Purkinje cell differentiation. J. Cell Biol. 1993, 122, 443–450. [Google Scholar] [CrossRef]
- Mount, H.T.J.; Elkabes, S.; Dreyfus, C.F.; Black, I.B. Differential involvement of metabotropic and p75 neurotrophin receptors in effects of nerve growth factor and neurotrophin-3 on cultured Purkinje cell survival. J. Neurochem. 2002, 70, 1045–1053. [Google Scholar] [CrossRef]
- Schwechter, B.; Rosenmund, C.; Tolias, K.F. RasGRF2 Rac-GEF activity couples NMDA receptor calcium flux to enhanced synaptic transmission. Proc. Natl. Acad. Sci. USA 2013, 110, 14462–14467. [Google Scholar] [CrossRef]
- Gloriam, D.E.; Schiöth, H.B.; Fredriksson, R. Nine new human Rhodopsin family G-protein coupled receptors: Identification, sequence characterisation and evolutionary relationship. Biochim. Biophys. Acta (BBA)-Gen. Subj. 2005, 1722, 235–246. [Google Scholar] [CrossRef] [PubMed]
- Jaarsma, D.; Blot, F.G.C.; Wu, B.; Venkatesan, S.; Voogd, J.; Meijer, D.; Ruigrok, T.J.H.; Gao, Z.; Schonewille, M.; De Zeeuw, C.I. The basal interstitial nucleus (BIN) of the cerebellum provides diffuse ascending inhibitory input to the floccular granule cell layer. J. Comp. Neurol. 2018, 526, 2231–2256. [Google Scholar] [CrossRef] [PubMed]
- Jarius, S.; Bräuninger, S.; Chung, H.Y.; Geis, C.; Haas, J.; Komorowski, L.; Wildemann, B.; Roth, C. Inositol 1,4,5-trisphosphate receptor type 1 autoantibody (ITPR1-IgG/anti-Sj)-associated autoimmune cerebellar ataxia, encephalitis and peripheral neuropathy: Review of the literature. J. Neuroinflamm. 2022, 19, 196. [Google Scholar] [CrossRef] [PubMed]
- Storey, E. Spinocerebellar Ataxia Type 15. In GeneReviews((R)); Adam, M.P., Ardinger, H.H., Pagon, R.A., Wallace, S.E., Bean, L.J.H., Stephens, K., Eds.; University of Washington: Seattle, WA, USA, 1993. [Google Scholar]
- Zambonin, J.L.; Bellomo, A.; Ben-Pazi, H.; Everman, D.B.; Frazer, L.M.; Geraghty, M.T.; Harper, A.D.; Jones, J.R.; Kamien, B.; Kernohan, K.; et al. Spinocerebellar ataxia type 29 due to mutations in ITPR1: A case series and review of this emerging congenital ataxia. Orphanet J. Rare Dis. 2017, 12, 121. [Google Scholar] [CrossRef] [PubMed]
- Speidel, D.; Varoqueaux, F.; Enk, C.; Nojiri, M.; Grishanin, R.N.; Martin, T.F.; Hofmann, K.; Brose, N.; Reim, K. A family of Ca2+-dependent activator proteins for secretion: Comparative analysis of structure, expression, localization, and function. J. Biol. Chem. 2003, 278, 52802–52809. [Google Scholar] [CrossRef] [PubMed]
- Lorenzo-Betancor, O.; Galosi, L.; Bonfili, L.; Eleuteri, A.M.; Cecarini, V.; Verin, R.; Dini, F.; Attili, A.; Berardi, S.; Biagini, L.; et al. Homozygous CADPS2 Mutations Cause Neurodegenerative Disease with Lewy Body-like Pathology in Parrots. Mov. Disord. 2022, 37, 2345–2354. [Google Scholar] [CrossRef]
- Perlman, S. Hereditary Ataxia Overview. In GeneReviews((R)); Adam, M.P., Ardinger, H.H., Pagon, R.A., Eds.; University of Washington: Seattle, WA, USA, 1993. [Google Scholar]
- Yang, J.; Pawlyk, B.; Wen, X.-H.; Adamian, M.; Soloviev, M.; Michaud, N.; Zhao, Y.; Sandberg, M.A.; Makino, C.L.; Li, T. Mpp4 is required for proper localization of plasma membrane calcium ATPases and maintenance of calcium homeostasis at the rod photoreceptor synaptic terminals. Hum. Mol. Genet. 2007, 16, 1017–1029. [Google Scholar] [CrossRef]
- Ni, T.; Harlos, K.; Gilbert, R. Structure of astrotactin-2: A conserved vertebrate-specific and perforin-like membrane protein involved in neuronal development. Open Biol 2016, 6, 160053. [Google Scholar] [CrossRef]
- Richards, T.; Modarage, K.; Dean, C.; McCarthy-Boxer, A.; Hilton, H.; Esapa, C.; Norman, J.; Wilson, P.; Goggolidou, P. Atmin modulates Pkhd1 expression and may mediate Autosomal Recessive Polycystic Kidney Disease (ARPKD) through altered non-canonical Wnt/Planar Cell Polarity (PCP) signalling. Biochim. Biophys. Acta (BBA)-Mol. Basis Dis. 2019, 1865, 378–390. [Google Scholar] [CrossRef]
- Basu, R.; Taylor, M.R.; Williams, M.E. The classic cadherins in synaptic specificity. Cell Adhes. Migr. 2015, 9, 193–201. [Google Scholar] [CrossRef]
- Srikanta, S.B.; Stojkovic, K.; Cermakian, N. Behavioral phenotyping of mice lacking the deubiquitinase USP2. PLoS ONE 2021, 16, e0241403. [Google Scholar] [CrossRef] [PubMed]
- Harris-Gauthier, N.; Srikanta, S.B.; Cermakian, N. Deubiquitinases: Key regulators of the circadian clock. Am. J. Physiol. Physiol. 2022, 323, C1539–C1547. [Google Scholar] [CrossRef]
- Liu, R.; Lee, J.-H.; Li, J.; Yu, R.; Tan, L.; Xia, Y.; Zheng, Y.; Bian, X.-L.; Lorenzi, P.L.; Chen, Q.; et al. Choline kinase alpha 2 acts as a protein kinase to promote lipolysis of lipid droplets. Mol. Cell 2021, 81, 2722–2735.e9. [Google Scholar] [CrossRef]
- Klöckner, C.; Fernández-Murray, J.P.; Tavasoli, M.; Sticht, H.; Stoltenburg-Didinger, G.; Scholle, L.M.; Bakhtiari, S.; Kruer, M.C.; Darvish, H.; Firouzabadi, S.G.; et al. Bi-allelic variants in CHKA cause a neurodevelopmental disorder with epilepsy and microcephaly. Brain 2022, 145, 1916–1923. [Google Scholar] [CrossRef] [PubMed]
- Chauvet, C.; Bois-Joyeux, B.; Berra, E.; Pouyssegur, J.; Danan, J.-L. The gene encoding human retinoic acid-receptor-related orphan receptor α is a target for hypoxia-inducible factor 1. Biochem. J. 2004, 384, 79–85. [Google Scholar] [CrossRef] [PubMed]
- Guissart, C.; Latypova, X.; Rollier, P.; Khan, T.N.; Stamberger, H.; McWalter, K.; Cho, M.T.; Kjaergaard, S.; Weckhuysen, S.; Lesca, G.; et al. Dual Molecular Effects of Dominant RORA Mutations Cause Two Variants of Syndromic Intellectual Disability with Either Autism or Cerebellar Ataxia. Am. J. Hum. Genet. 2018, 102, 744–759. [Google Scholar] [CrossRef] [PubMed]
- Sun, X.; Lin, Y. Npas4: Linking Neuronal Activity to Memory. Trends Neurosci. 2016, 39, 264–275. [Google Scholar] [CrossRef] [PubMed]
- Hong, H.; Su, J.; Huang, C.; Lu, X.; Cui, Z. Comprehensive insights into the function and molecular and pharmacological regulation of neuron-derived orphan receptor 1, an orphan receptor. Front. Pharmacol. 2022, 13, 981490. [Google Scholar] [CrossRef]
- Cheon, S.; Park, N.; Cho, S.; Kim, K. Glucocorticoid-mediated Period2 induction delays the phase of circadian rhythm. Nucleic Acids Res. 2013, 41, 6161–6174. [Google Scholar] [CrossRef]
- Sun, X.; Jing, L.; Li, F.; Zhang, M.; Diao, X.; Zhuang, J.; Rastinejad, F.; Wu, D. Structures of NPAS4-ARNT and NPAS4-ARNT2 heterodimers reveal new dimerization modalities in the bHLH-PAS transcription factor family. Proc. Natl. Acad. Sci. USA 2022, 119, e2208804119. [Google Scholar] [CrossRef]
- Hao, N.; Bhakti, V.L.; Peet, D.J.; Whitelaw, M.L. Reciprocal regulation of the basic helix-loop-helix/Per-Arnt-Sim partner proteins, Arnt and Arnt2, during neuronal differentiation. Nucleic Acids Res. 2013, 41, 5626–5638. [Google Scholar] [CrossRef] [PubMed]
- Mueller, C.R.; Liu, B.; Bell, A.W.; Paranjpe, S.; Bowen, W.C.; Khillan, J.S.; Luo, J.-H.; Mars, W.M.; Michalopoulos, G.K.; Park, J.K.; et al. The down-regulation of albumin transcription during regeneration is due to the loss of HNF-1 and the D-site transcription factors. DNA Cell Biol. 1992, 11, 559–566. [Google Scholar] [CrossRef] [PubMed]
- Klugmann, M.; Leichtlein, C.B.; Symes, C.W.; Klaussner, B.C.; Brooks, A.I.; Young, D.; During, M.J. A novel role of circadian transcription factor DBP in hippocampal plasticity. Mol. Cell. Neurosci. 2006, 31, 303–314. [Google Scholar] [CrossRef] [PubMed]
- Stratmann, M.; Stadler, F.; Tamanini, F.; van der Horst, G.T.; Ripperger, J.A. Flexible phase adjustment of circadian albumin D site-binding protein (Dbp) gene expression by CRYPTOCHROME1. Genes Dev. 2010, 24, 1317–1328. [Google Scholar] [CrossRef] [PubMed]
- Gat, Y.; Schuller, J.M.; Lingaraju, M.; Weyher, E.; Bonneau, F.; Strauss, M.; Murray, P.J.; Conti, E. InsP6 binding to PIKK kinases revealed by the cryo-EM structure of an SMG1–SMG8–SMG9 complex. Nat. Struct. Mol. Biol. 2019, 26, 1089–1093. [Google Scholar] [CrossRef] [PubMed]
- Darling, N.J.; Cohen, P. Nuts and bolts of the salt-inducible kinases (SIKs). Biochem. J. 2021, 478, 1377–1397. [Google Scholar] [CrossRef] [PubMed]
- Jang, H.; Park, Y.; Jang, J. Serum and glucocorticoid-regulated kinase 1: Structure, biological functions, and its inhibitors. Front. Pharmacol. 2022, 13, 1036844. [Google Scholar] [CrossRef]
- Homey, B.; Alenius, H.; Müller, A.; Soto, H.; Bowman, E.P.; Yuan, W.; McEvoy, L.; Lauerma, A.I.; Assmann, T.; Bünemann, E.; et al. CCL27-CCR10 interactions regulate T cell-mediated skin inflammation. Nat. Med. 2002, 8, 157–165. [Google Scholar] [CrossRef]
- Nguyen, T.A.; Smith, B.R.C.; Elgass, K.D.; Creed, S.J.; Cheung, S.; Tate, M.D.; Belz, G.T.; Wicks, I.P.; Masters, S.L.; Pang, K.C. SIDT1 Localizes to Endolysosomes and Mediates Double-Stranded RNA Transport into the Cytoplasm. J. Immunol. 2019, 202, 3483–3492. [Google Scholar] [CrossRef]
- Kurschner, C.; Yuzaki, M. Neuronal Interleukin-16 (NIL-16): A Dual Function PDZ Domain Protein. J. Neurosci. 1999, 19, 7770–7780. [Google Scholar] [CrossRef]
- Wang, W.; Jiang, M.; Liu, S.; Zhang, S.; Liu, W.; Ma, Y.; Zhang, L.; Zhang, J.; Cao, X. RNF122 suppresses antiviral type I interferon production by targeting RIG-I CARDs to mediate RIG-I degradation. Proc. Natl. Acad. Sci. USA 2016, 113, 9581–9586. [Google Scholar] [CrossRef] [PubMed]
- Xu, S.; Zheng, Z.; Pathak, J.L.; Cheng, H.; Zhou, Z.; Chen, Y.; Wu, Q.; Wang, L.; Zeng, M.; Wu, L. The Emerging Role of the Serine Incorporator Protein Family in Regulating Viral Infection. Front. Cell Dev. Biol. 2022, 10, 856468. [Google Scholar] [CrossRef] [PubMed]
- Kang, J.-S.; Feinleib, J.L.; Knox, S.; Ketteringham, M.A.; Krauss, R.S. Promyogenic members of the Ig and cadherin families associate to positively regulate differentiation. Proc. Natl. Acad. Sci. USA 2003, 100, 3989–3994. [Google Scholar] [CrossRef]
- Zhang, X.; Jiang, S.; Mitok, K.A.; Li, L.; Attie, A.D.; Martin, T.F. BAIAP3, a C2 domain–containing Munc13 protein, controls the fate of dense-core vesicles in neuroendocrine cells. J. Cell Biol. 2017, 216, 2151–2166. [Google Scholar] [CrossRef]
- Rodríguez-Muñoz, M.; Garzón, J. Nitric oxide and zinc-mediated protein assemblies involved in mu opioid receptor signaling. Mol. Neurobiol. 2013, 48, 769–782. [Google Scholar] [CrossRef]
- Yang, Y.; Bai, J.; Sun, J.-Y.; Ye, T.; Zhang, L.; Wu, F.-Y.; Nan, J.; Lan, Y. Mechanisms Underlying Mu Opioid Receptor Effects on Parallel Fiber-Purkinje Cell Synaptic Transmission in Mouse Cerebellar Cortex. Front. Synaptic Neurosci. 2022, 14, 862704. [Google Scholar] [CrossRef] [PubMed]
- Bai, J.; Ye, T.; Wei, Y.-B.; Yang, Y.; Yang, H.-M.; Lan, Y. Opioid receptors modulate parallel fiber-Purkinje cell synaptic transmission in mouse cerebellum. Neurosci. Lett. 2021, 770, 136356. [Google Scholar] [CrossRef]
- Hoxha, E.; Tempia, F.; Lippiello, P.; Miniaci, M.C. Modulation, Plasticity and Pathophysiology of the Parallel Fiber-Purkinje Cell Synapse. Front. Synaptic Neurosci. 2016, 8, 35. [Google Scholar] [CrossRef] [PubMed]
- Robinson, K.J.; Watchon, M.; Laird, A.S. Aberrant Cerebellar Circuitry in the Spinocerebellar Ataxias. Front. Neurosci. 2020, 14, 707. [Google Scholar] [CrossRef]
- Xi, L.; Peng, M.; Liu, S.; Liu, Y.; Wan, X.; Hou, Y.; Qin, Y.; Yang, L.; Chen, S.; Zeng, H.; et al. Hypoxia-stimulated ATM activation regulates autophagy-associated exosome release from cancer-associated fibroblasts to promote cancer cell invasion. J. Extracell. Vesicles 2021, 10, e12146. [Google Scholar] [CrossRef]
- Koneru, B.; Farooqi, A.; Nguyen, T.H.; Chen, W.H.; Hindle, A.; Eslinger, C.; Makena, M.R.; Burrow, T.A.; Wilson, J.; Smith, A.; et al. ALT neuroblastoma chemoresistance due to telomere dysfunction–induced ATM activation is reversible with ATM inhibitor AZD0156. Sci. Transl. Med. 2021, 13, eabd5750. [Google Scholar] [CrossRef] [PubMed]
- Piacentini, M.; Piredda, L.; Starace, D.; Annicchiarico-Petruzzelli, M.; Mattei, M.; Oliverio, S.; Farrace, M.G.; Melino, G. Differential growth of N- and S-type human neuroblastoma cells xenografted into scid mice. correlation with apoptosis. J. Pathol. 1996, 180, 415–422. [Google Scholar] [CrossRef]
- Bell, N.; Hann, V.; Redfern, C.P.; Cheek, T.R. Store-operated Ca2+ entry in proliferating and retinoic acid-differentiated N- and S-type neuroblastoma cells. Biochim. Biophys. Acta (BBA)-Mol. Cell Res. 2013, 1833, 643–651. [Google Scholar] [CrossRef] [PubMed]
- Walton, J.D.; Kattan, D.R.; Thomas, S.K.; Spengler, B.A.; Guo, H.-F.; Biedler, J.L.; Cheung, N.-K.V.; Ross, R.A. Characteristics of stem cells from human neuroblastoma cell lines and in tumors. Neoplasia 2004, 6, 838–845. [Google Scholar] [CrossRef]
- Kovalevich, J.; Langford, D. Considerations for the use of SH-SY5Y neuroblastoma cells in neurobiology. Methods Mol. Biol. 2013, 1078, 9–21. [Google Scholar] [CrossRef] [PubMed]
- Fernandes, N.D.; Sun, Y.; Price, B.D. Activation of the kinase activity of ATM by retinoic acid is required for CREB-dependent differentiation of neuroblastoma cells. J. Biol. Chem. 2007, 282, 16577–16584. [Google Scholar] [CrossRef] [PubMed]
- Wen, Z.; Pan, T.; Yang, S.; Liu, J.; Tao, H.; Zhao, Y.; Xu, D.; Shao, W.; Wu, J.; Liu, X.; et al. Up-regulated NRIP2 in colorectal cancer initiating cells modulates the Wnt pathway by targeting RORbeta. Mol. Cancer 2017, 16, 20. [Google Scholar] [CrossRef] [PubMed]
- Gudas, L.J.; Wagner, J.A. Retinoids regulate stem cell differentiation. J. Cell. Physiol. 2011, 226, 322–330. [Google Scholar] [CrossRef]
- Kim, T.-S.; Kawaguchi, M.; Suzuki, M.; Jung, C.-G.; Asai, K.; Shibamoto, Y.; Lavin, M.F.; Khanna, K.K.; Miura, Y. The ZFHX3 (ATBF1) transcription factor induces PDGFRB, which activates ATM in the cytoplasm to protect cerebellar neurons from oxidative stress. Dis. Model. Mech. 2010, 3, 752–762. [Google Scholar] [CrossRef]
- Yamada, N.; Makino, Y.; Clark, R.A.; Pearson, D.W.; Mattei, M.G.; Guénet, J.L.; Ohama, E.; Fujino, I.; Miyawaki, A.; Furuichi, T.; et al. Human inositol 1,4,5-trisphosphate type-1 receptor, InsP3R1: Structure, function, regulation of expression and chromosomal localization. Biochem. J. 1994, 302, 781–790. [Google Scholar] [CrossRef]
- Takeo, Y.H.; Kakegawa, W.; Miura, E.; Yuzaki, M. ROR Regulates Multiple Aspects of Dendrite Development in Cerebellar Purkinje Cells In Vivo. J. Neurosci. 2015, 35, 12518–12534. [Google Scholar] [CrossRef] [PubMed]
- Dar, I.; Biton, S.; Shiloh, Y.; Barzilai, A. Analysis of the ataxia telangiectasia mutated-mediated DNA damage response in murine cerebellar neurons. J. Neurosci. 2006, 26, 7767–7774. [Google Scholar] [CrossRef] [PubMed]
- Gorodetsky, E.; Calkins, S.; Ahn, J.; Brooks, P. ATM, the Mre11/Rad50/Nbs1 complex, and topoisomerase I are concentrated in the nucleus of Purkinje neurons in the juvenile human brain. DNA Repair 2007, 6, 1698–1707. [Google Scholar] [CrossRef] [PubMed]
- Hotokezaka, Y.; Katayama, I.; Nakamura, T. ATM-associated signalling triggers the unfolded protein response and cell death in response to stress. Commun. Biol. 2020, 3, 378. [Google Scholar] [CrossRef] [PubMed]
- Novak, M.J.; Sweeney, M.G.; Li, A.; Treacy, C.; Chandrashekar, H.S.; Giunti, P.; Goold, R.G.; Davis, M.B.; Houlden, H.; Tabrizi, S.J. An ITPR1 gene deletion causes spinocerebellar ataxia 15/16: A genetic, clinical and radiological description. Mov. Disord. 2010, 25, 2176–2182. [Google Scholar] [CrossRef] [PubMed]
- Synofzik, M.; Helbig, K.L.; Harmuth, F.; Deconinck, T.; Tanpaiboon, P.; Sun, B.; Guo, W.; Wang, R.; Palmaer, E.; Tang, S.; et al. De novo ITPR1 variants are a recurrent cause of early-onset ataxia, acting via loss of channel function. Eur. J. Hum. Genet. 2018, 26, 1623–1634. [Google Scholar] [CrossRef]
- Yang, A.W.; Sachs, A.J.; Nystuen, A.M. Deletion of Inpp5a causes ataxia and cerebellar degeneration in mice. Neurogenetics 2015, 16, 277–285. [Google Scholar] [CrossRef]
- Paternoster, L.; Soblet, J.; Aeby, A.; De Tiège, X.; Goldman, S.; Yue, W.W.; Coppens, S.; Smits, G.; Vilain, C.; Deconinck, N. Novel homozygous variant of carbonic anhydrase 8 gene expanding the phenotype of cerebellar ataxia, mental retardation, and disequilibrium syndrome subtype 3. Am. J. Med. Genet. Part A 2020, 182, 2685–2693. [Google Scholar] [CrossRef]
- Türkmen, S.; Guo, G.; Garshasbi, M.; Hoffmann, K.; Alshalah, A.J.; Mischung, C.; Kuss, A.; Humphrey, N.; Mundlos, S.; Robinson, P.N. CA8 mutations cause a novel syndrome characterized by ataxia and mild mental retardation with predisposition to quadrupedal gait. PLOS Genet. 2009, 5, e1000487. [Google Scholar] [CrossRef]
- Madsen, P.; Isaksen, T.J.; Siupka, P.; Tóth, A.E.; Nyegaard, M.; Gustafsen, C.; Nielsen, M.S. HSPA12A targets the cytoplasmic domain and affects the trafficking of the Amyloid Precursor Protein receptor SorLA. Sci. Rep. 2019, 9, 611. [Google Scholar] [CrossRef]
- Glerup, S.; Lume, M.; Olsen, D.; Nyengaard, J.R.; Vaegter, C.B.; Gustafsen, C.; Christensen, E.I.; Kjolby, M.; Hay-Schmidt, A.; Bender, D.; et al. SorLA controls neurotrophic activity by sorting of GDNF and its receptors GFRalpha1 and RET. Cell Rep. 2013, 3, 186–199. [Google Scholar] [CrossRef]
- Zhang, J.; Liu, S.; Li, Q.; Shi, Y.; Wu, Y.; Liu, F.; Wang, S.; Zaky, M.Y.; Yousuf, W.; Sun, Q.; et al. The deubiquitylase USP2 maintains ErbB2 abundance via counteracting endocytic degradation and represents a therapeutic target in ErbB2-positive breast cancer. Cell Death Differ. 2020, 27, 2710–2725. [Google Scholar] [CrossRef] [PubMed]
- Pietilä, M.; Sahgal, P.; Peuhu, E.; Jäntti, N.Z.; Paatero, I.; Närvä, E.; Al-Akhrass, H.; Lilja, J.; Georgiadou, M.; Andersen, O.M.; et al. SORLA regulates endosomal trafficking and oncogenic fitness of HER2. Nat. Commun. 2019, 10, 2340. [Google Scholar] [CrossRef] [PubMed]
- Tao, Y.; Chen, Y.J.; Shen, C.; Luo, Z.; Bates, C.R.; Lee, D.; Marchetto, S.; Gao, T.M.; Borg, J.P.; Xiong, W.C.; et al. Erbin interacts with TARP gamma-2 for surface expression of AMPA receptors in cortical interneurons. Nat. Neurosci. 2013, 16, 290–299. [Google Scholar] [CrossRef] [PubMed]
- Pizzamiglio, L.; Focchi, E.; Murru, L.; Tamborini, M.; Passafaro, M.; Menna, E.; Matteoli, M.; Antonucci, F. New Role of ATM in Controlling GABAergic Tone During Development. Cereb. Cortex 2016, 26, 3879–3888. [Google Scholar] [CrossRef] [PubMed]
- Pizzamiglio, L.; Focchi, E.; Cambria, C.; Ponzoni, L.; Ferrara, S.; Bifari, F.; Desiato, G.; Landsberger, N.; Murru, L.; Passafaro, M.; et al. The DNA repair protein ATM as a target in autism spectrum disorder. JCI Insight 2021, 6, e133654. [Google Scholar] [CrossRef] [PubMed]
- Kano, M.; Watanabe, T. Type-1 metabotropic glutamate receptor signaling in cerebellar Purkinje cells in health and disease. F1000Research 2017, 6, 416. [Google Scholar] [CrossRef] [PubMed]


| ID | Cerebellum 12 Months Avg (log2) | Fold Change | FDR p-Val | Gene Symbol | |
|---|---|---|---|---|---|
| KO | WT | ||||
| TC1100002122.mm.1 | 10.58 | 9.71 | 1.83 | 0.0081 | Nefh |
| TC1400000965.mm.1 | 13.04 | 12.06 | 1.98 | 0.0101 | Nefl |
| TC0300001124.mm.1 | 11.24 | 10.59 | 1.57 | 0.0133 | Gstm5 |
| TC0200003051.mm.1 | 11.62 | 11.12 | 1.41 | 0.0145 | Pip4k2a |
| TC1500001133.mm.1 | 8.34 | 7.02 | 2.51 | 0.0165 | Pde1b |
| TC1700002629.mm.1 | 10.81 | 10.14 | 1.59 | 0.0168 | Cox7a2l |
| TC0800001522.mm.1 | 10.82 | 9.81 | 2.01 | 0.0176 | Tubb3 |
| TC1700002597.mm.1 | 9.83 | 9.41 | 1.34 | 0.0182 | Slc8a1 |
| TC0900001605.mm.1 | 13.96 | 13.37 | 1.51 | 0.0234 | Rpl14 |
| TC1100002119.mm.1 | 10.38 | 9.67 | 1.64 | 0.0238 | Uqcr10 |
| TC0400001770.mm.1 | 6.92 | 6.39 | 1.45 | 0.0249 | Padi2 |
| TC0500000640.mm.1 | 10.76 | 9.47 | 2.44 | 0.0249 | Uchl1 |
| TC1100000302.mm.1 | 13.33 | 12.97 | 1.29 | 0.0274 | Rtn4 |
| TC1800001198.mm.1 | 10.35 | 9.74 | 1.53 | 0.029 | Ndufa2 |
| TC1200000990.mm.1 | 11.21 | 10.81 | 1.32 | 0.0297 | Psmc1 |
| TC1100002486.mm.1 | 13.52 | 13.03 | 1.4 | 0.0303 | Npm1 |
| TC0800002382.mm.1 | 7.67 | 7.12 | 1.46 | 0.0307 | Ncan |
| TC0600001689.mm.1 | 9.15 | 8.64 | 1.42 | 0.031 | Cmas |
| TC0100000551.mm.1 | 12.24 | 11.8 | 1.36 | 0.0321 | Map2 |
| TC0100000519.mm.1 | 11.71 | 11.35 | 1.29 | 0.0325 | Eef1b2 |
| TC0500001724.mm.1 | 7.45 | 6.74 | 1.64 | 0.0327 | Fscn1 |
| TC1000001298.mm.1 | 12.64 | 12.15 | 1.4 | 0.0348 | Nap1l1 |
| TC1400000485.mm.1 | 12.45 | 12.12 | 1.25 | 0.0351 | Psmc6 |
| TC0X00001071.mm.1 | 12.79 | 12.39 | 1.33 | 0.0362 | Pgk1 |
| TC1600001590.mm.1 | 12.29 | 12.81 | −1.43 | 0.0365 | Stxbp5l |
| TC1000000571.mm.1 | 10.77 | 10.32 | 1.37 | 0.04 | Ppa1 |
| TC1600000750.mm.1 | 12.72 | 12.34 | 1.3 | 0.0408 | Tomm70a |
| TC1300001779.mm.1 | 13.02 | 12.04 | 1.98 | 0.0413 | Tubb2a |
| TC1000001684.mm.1 | 13.14 | 13.88 | −1.67 | 0.0447 | Syne1 |
| TC1700001012.mm.1 | 10.78 | 9.87 | 1.87 | 0.0447 | Rpl36 |
| TC1200001971.mm.1 | 14.08 | 13.67 | 1.33 | 0.0449 | Atp6v1d |
| TC0900000705.mm.1 | 13.46 | 13.07 | 1.31 | 0.0458 | Cox5a |
| TC0600001931.mm.1 | 12.22 | 12.71 | −1.41 | 0.0474 | Cadps2 |
| TC0700000832.mm.1 | 11.29 | 12.09 | −1.74 | 0.0481 | Slc17a7 |
| TC0700001988.mm.1 | 8.65 | 9.08 | −1.34 | 0.0481 | Dpysl4 |
| TC1200001568.mm.1 | 13.51 | 13.15 | 1.28 | 0.05 | Rps7 |
Disclaimer/Publisher’s Note: The statements, opinions and data contained in all publications are solely those of the individual author(s) and contributor(s) and not of MDPI and/or the editor(s). MDPI and/or the editor(s) disclaim responsibility for any injury to people or property resulting from any ideas, methods, instructions or products referred to in the content. |
© 2023 by the authors. Licensee MDPI, Basel, Switzerland. This article is an open access article distributed under the terms and conditions of the Creative Commons Attribution (CC BY) license (https://creativecommons.org/licenses/by/4.0/).
Share and Cite
Reichlmeir, M.; Canet-Pons, J.; Koepf, G.; Nurieva, W.; Duecker, R.P.; Doering, C.; Abell, K.; Key, J.; Stokes, M.P.; Zielen, S.; et al. In Cerebellar Atrophy of 12-Month-Old ATM-Null Mice, Transcriptome Upregulations Concern Most Neurotransmission and Neuropeptide Pathways, While Downregulations Affect Prominently Itpr1, Usp2 and Non-Coding RNA. Cells 2023, 12, 2399. https://doi.org/10.3390/cells12192399
Reichlmeir M, Canet-Pons J, Koepf G, Nurieva W, Duecker RP, Doering C, Abell K, Key J, Stokes MP, Zielen S, et al. In Cerebellar Atrophy of 12-Month-Old ATM-Null Mice, Transcriptome Upregulations Concern Most Neurotransmission and Neuropeptide Pathways, While Downregulations Affect Prominently Itpr1, Usp2 and Non-Coding RNA. Cells. 2023; 12(19):2399. https://doi.org/10.3390/cells12192399
Chicago/Turabian StyleReichlmeir, Marina, Júlia Canet-Pons, Gabriele Koepf, Wasifa Nurieva, Ruth Pia Duecker, Claudia Doering, Kathryn Abell, Jana Key, Matthew P. Stokes, Stefan Zielen, and et al. 2023. "In Cerebellar Atrophy of 12-Month-Old ATM-Null Mice, Transcriptome Upregulations Concern Most Neurotransmission and Neuropeptide Pathways, While Downregulations Affect Prominently Itpr1, Usp2 and Non-Coding RNA" Cells 12, no. 19: 2399. https://doi.org/10.3390/cells12192399