
Remote Sensing to Study Mangrove Fragmentation and Its Impacts on Leaf Area Index and Gross Primary Productivity in the South of Peninsular Malaysia


Abstract
:
1. Introduction
2. Materials and Methods
2.1. Study Area
2.2. Data and Methodology
2.2.1. Remote Sensing Data and Pre-Processing
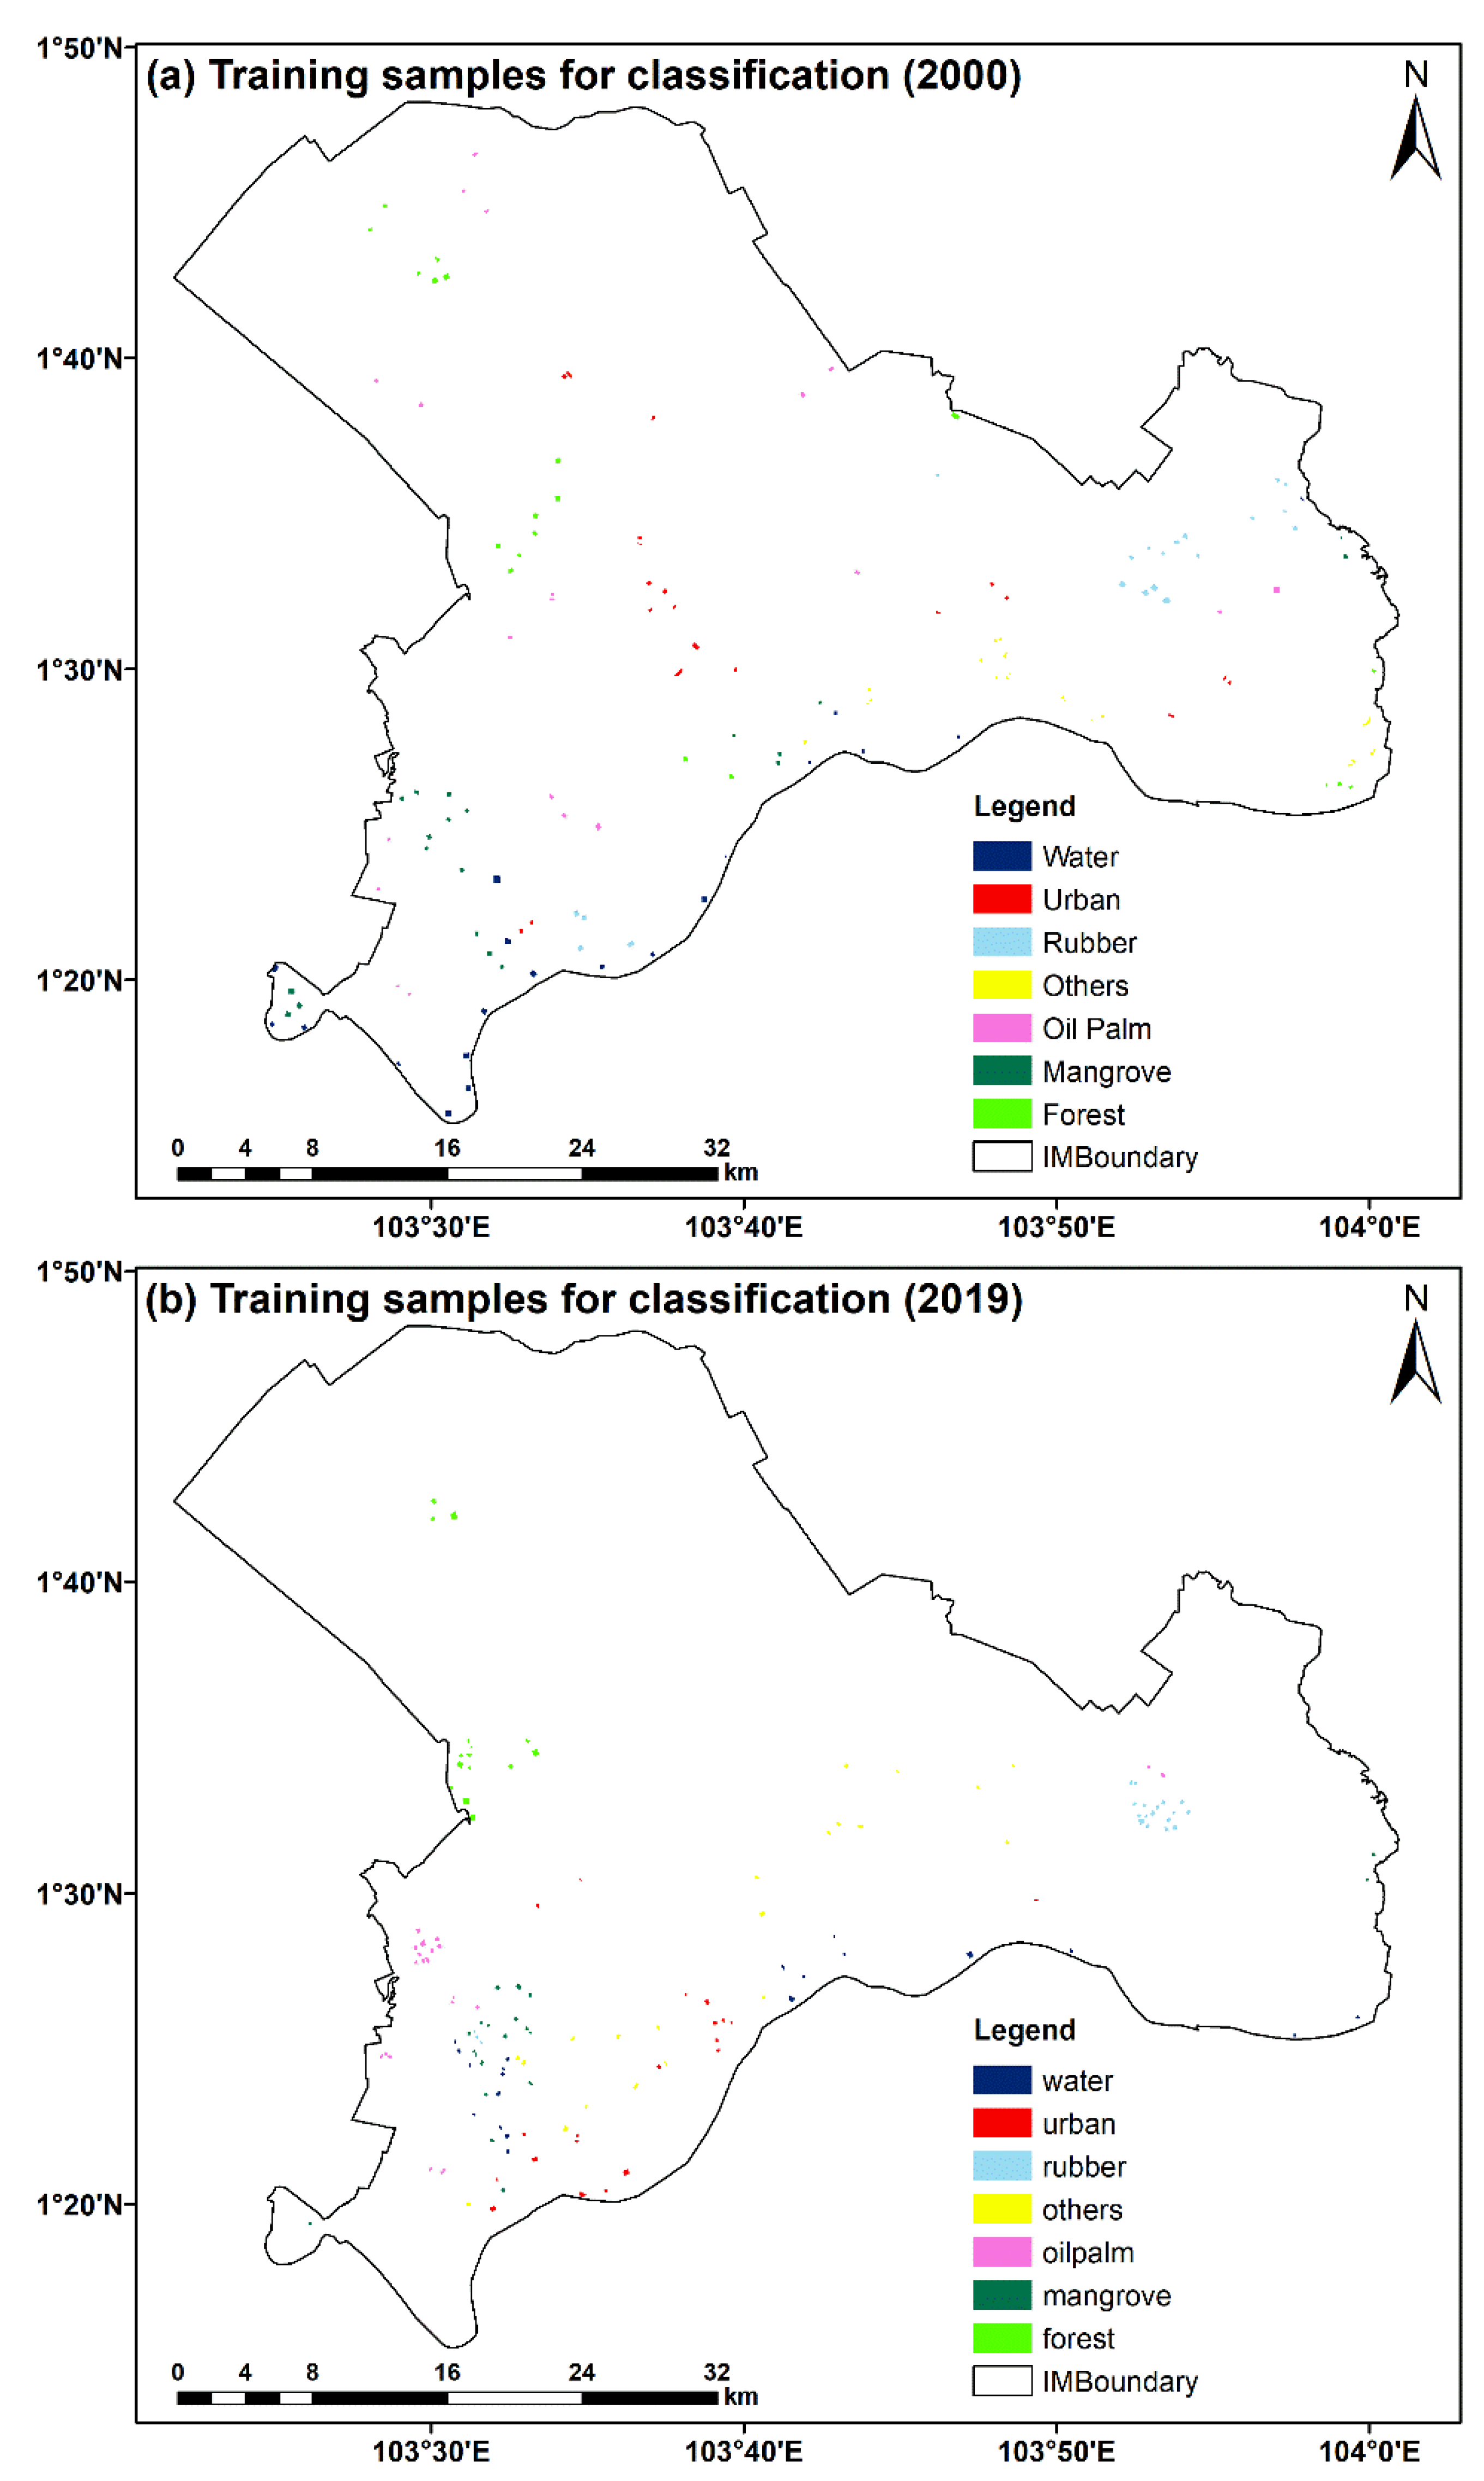
2.2.2. Image Classification and Assessment
2.2.3. Mangrove Cover Change and Fragmentation
2.2.4. Mangrove LAI and GPP
3. Results
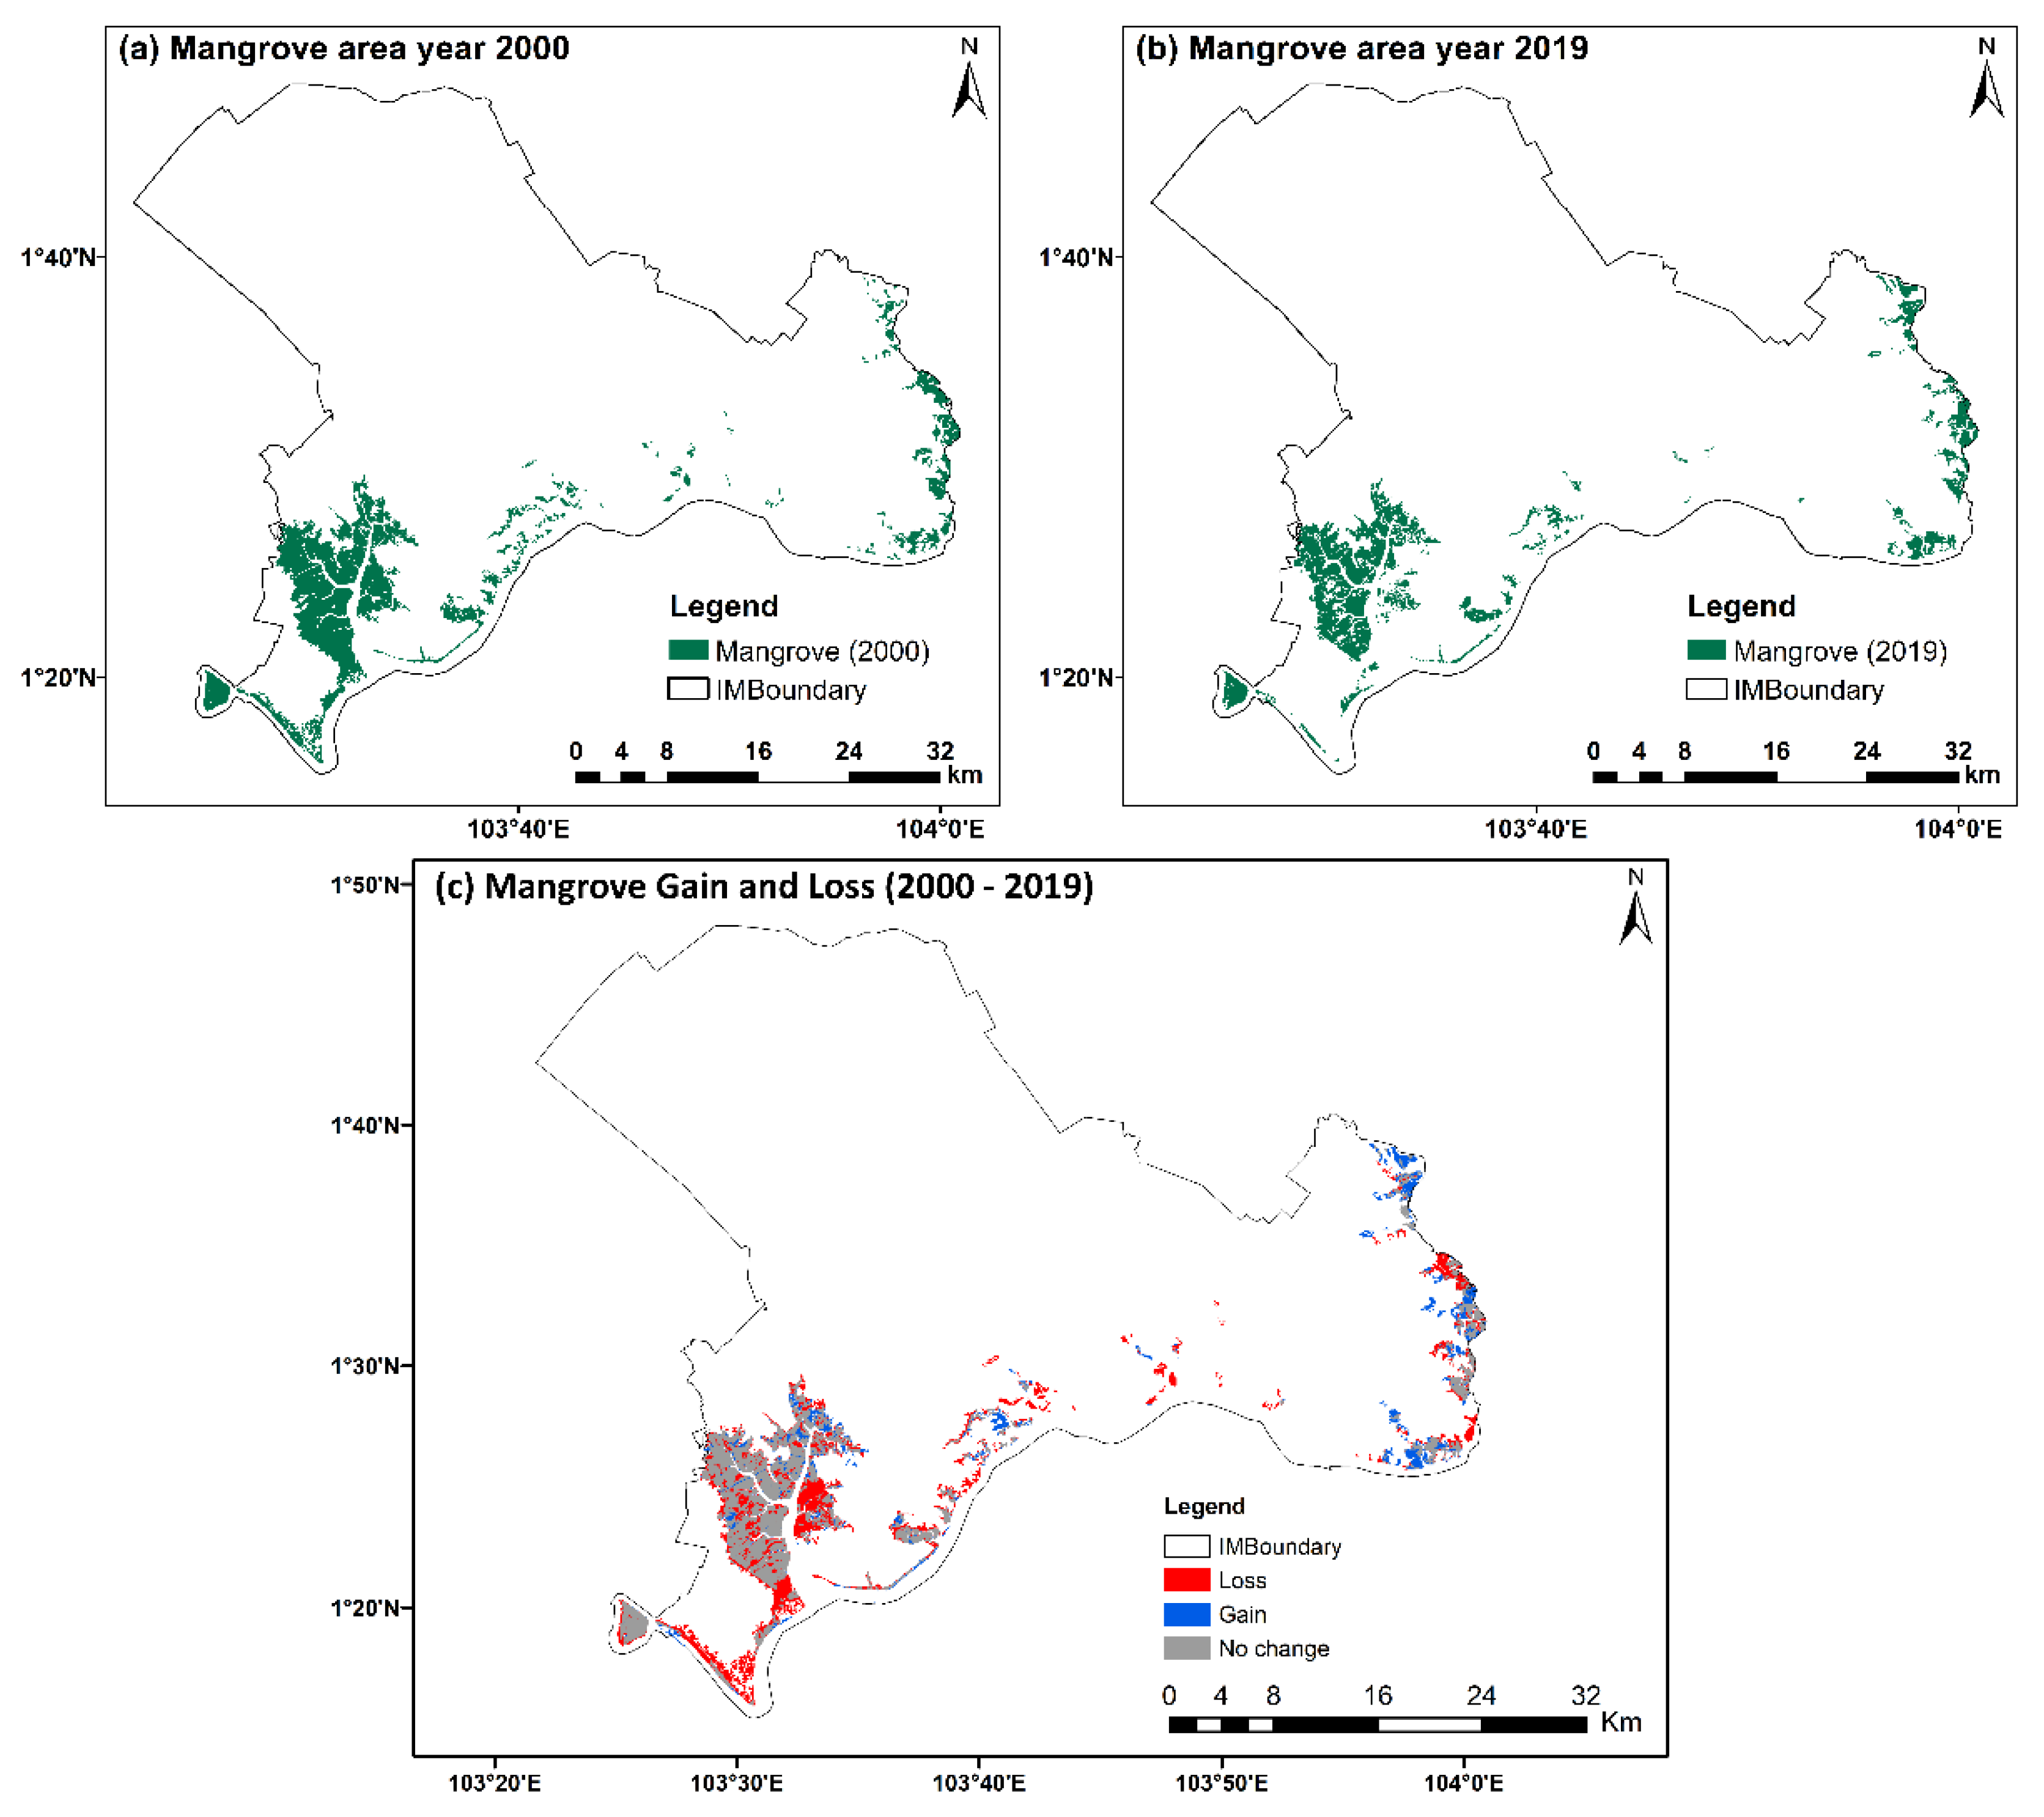
3.1. Classification Accuracy and Mangrove Cover Changes
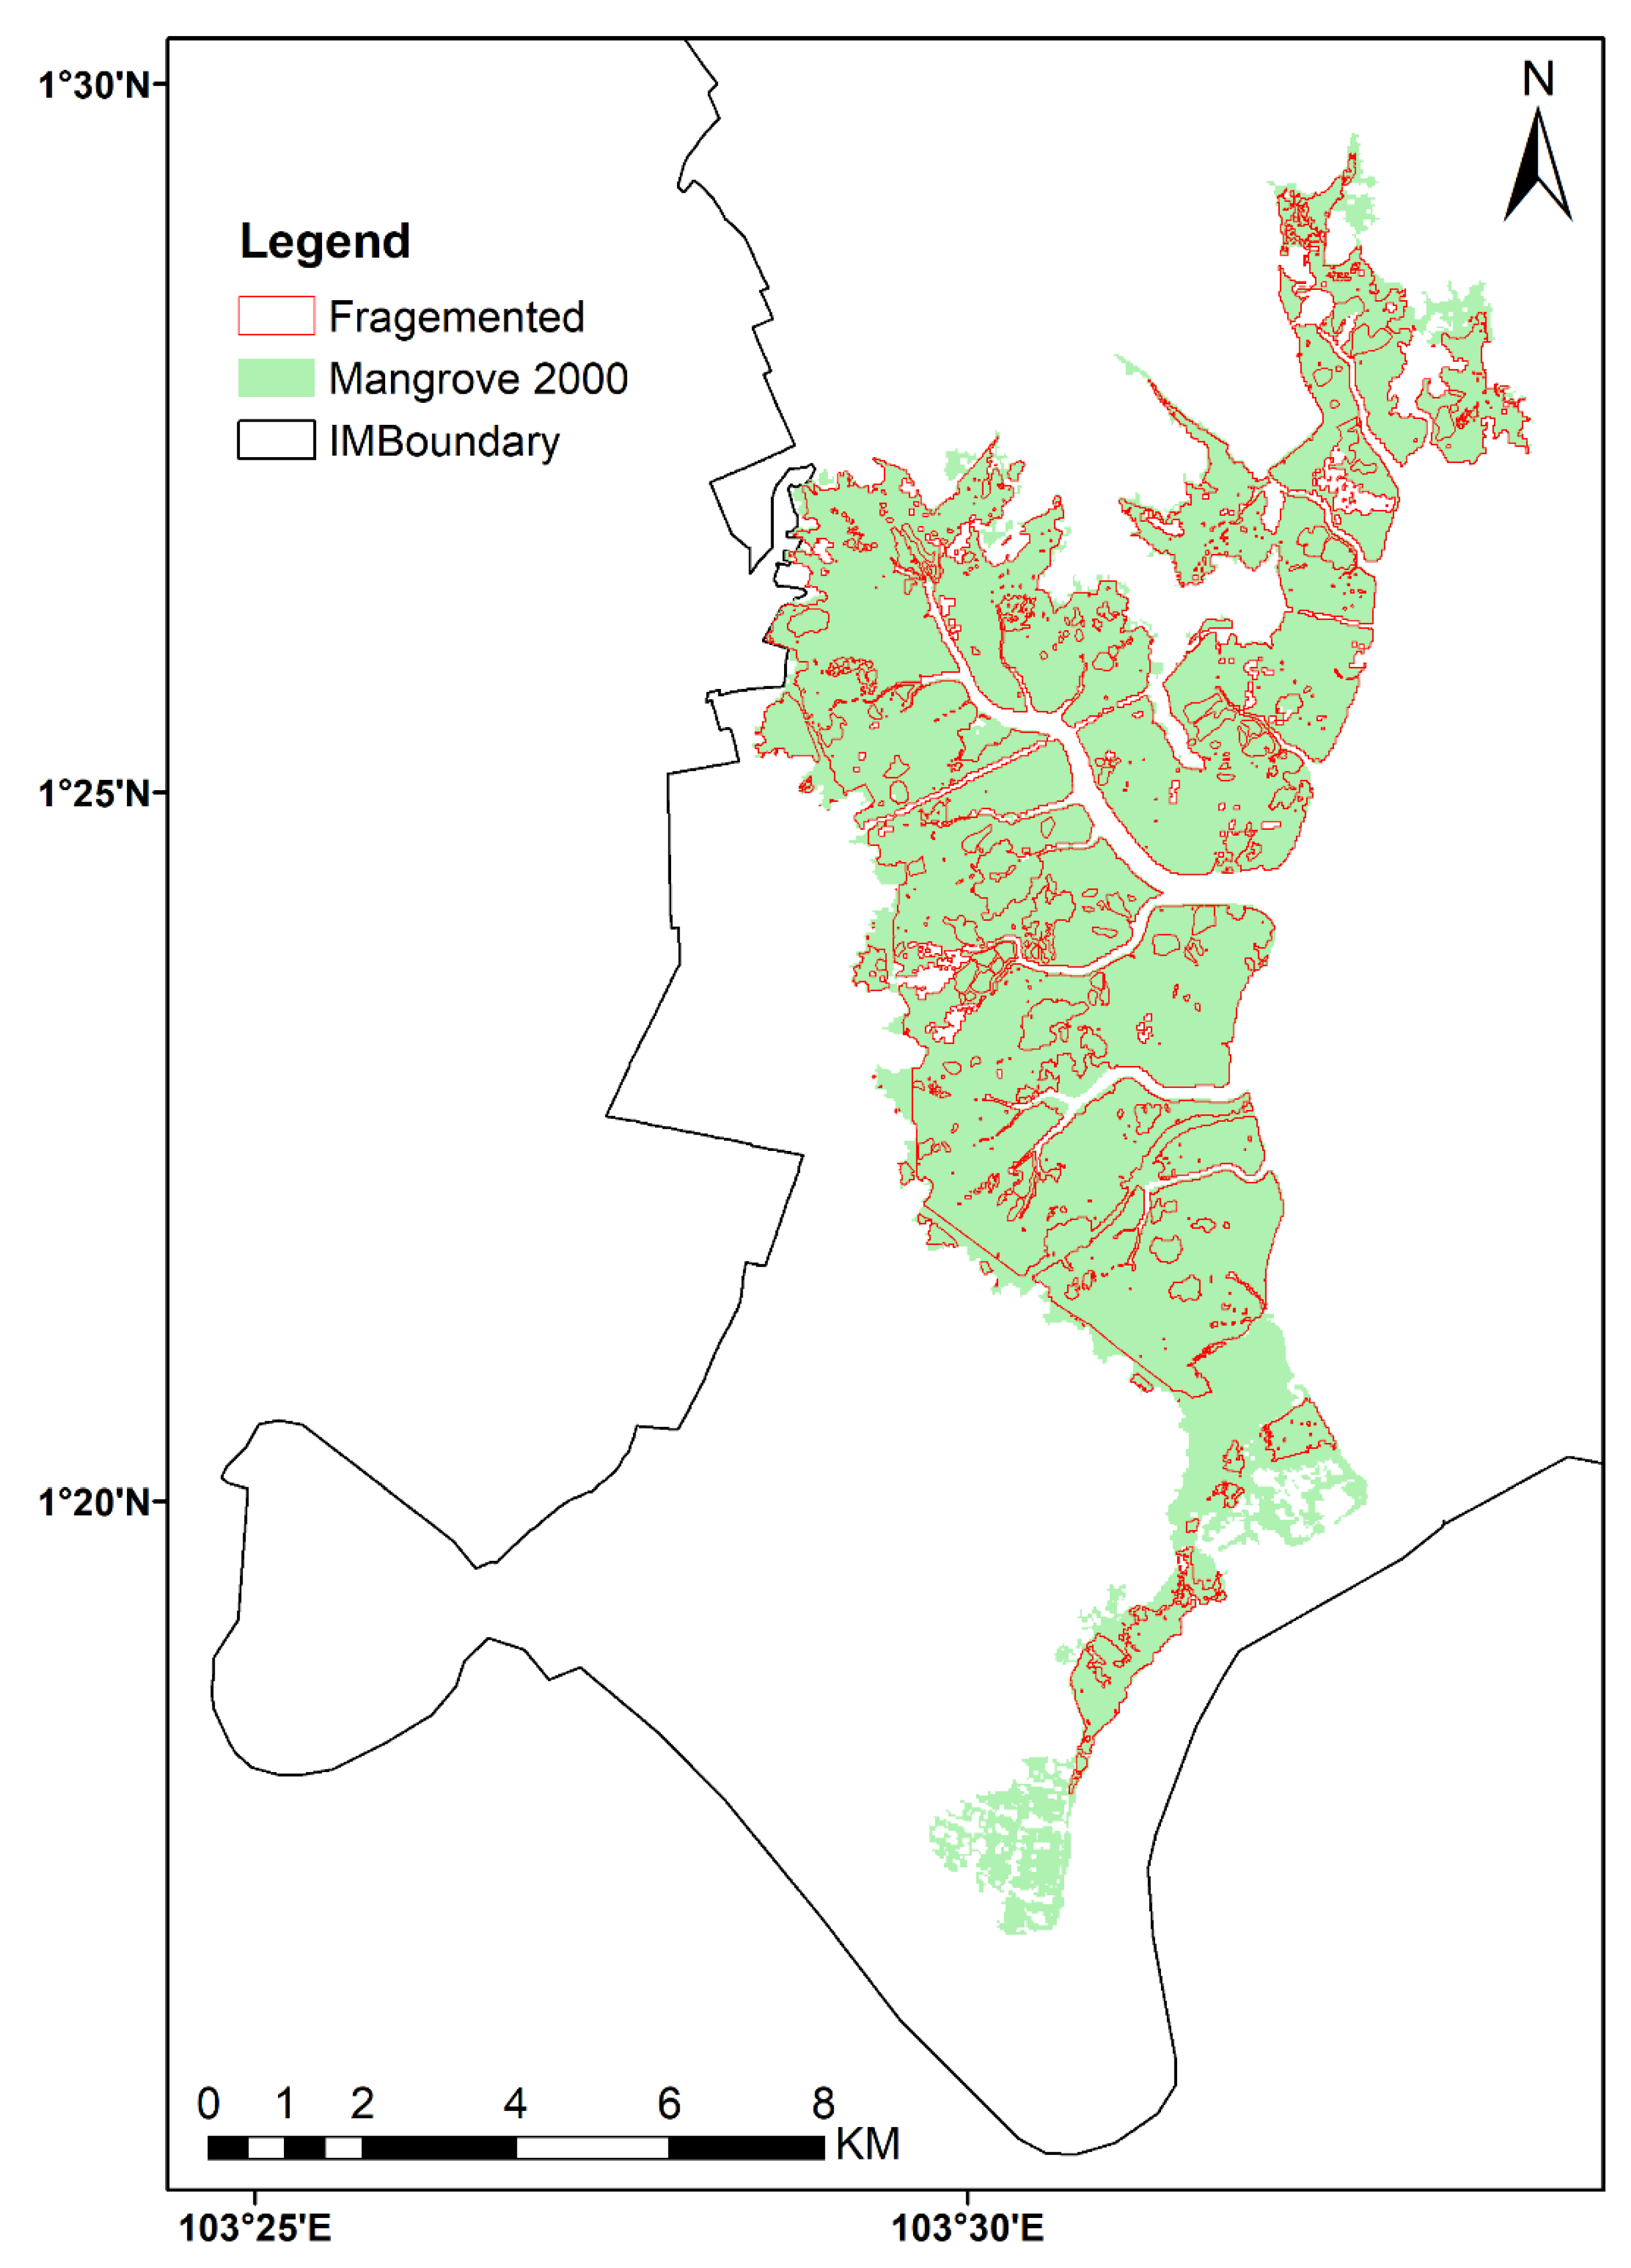
3.2. Fragmentation Analysis
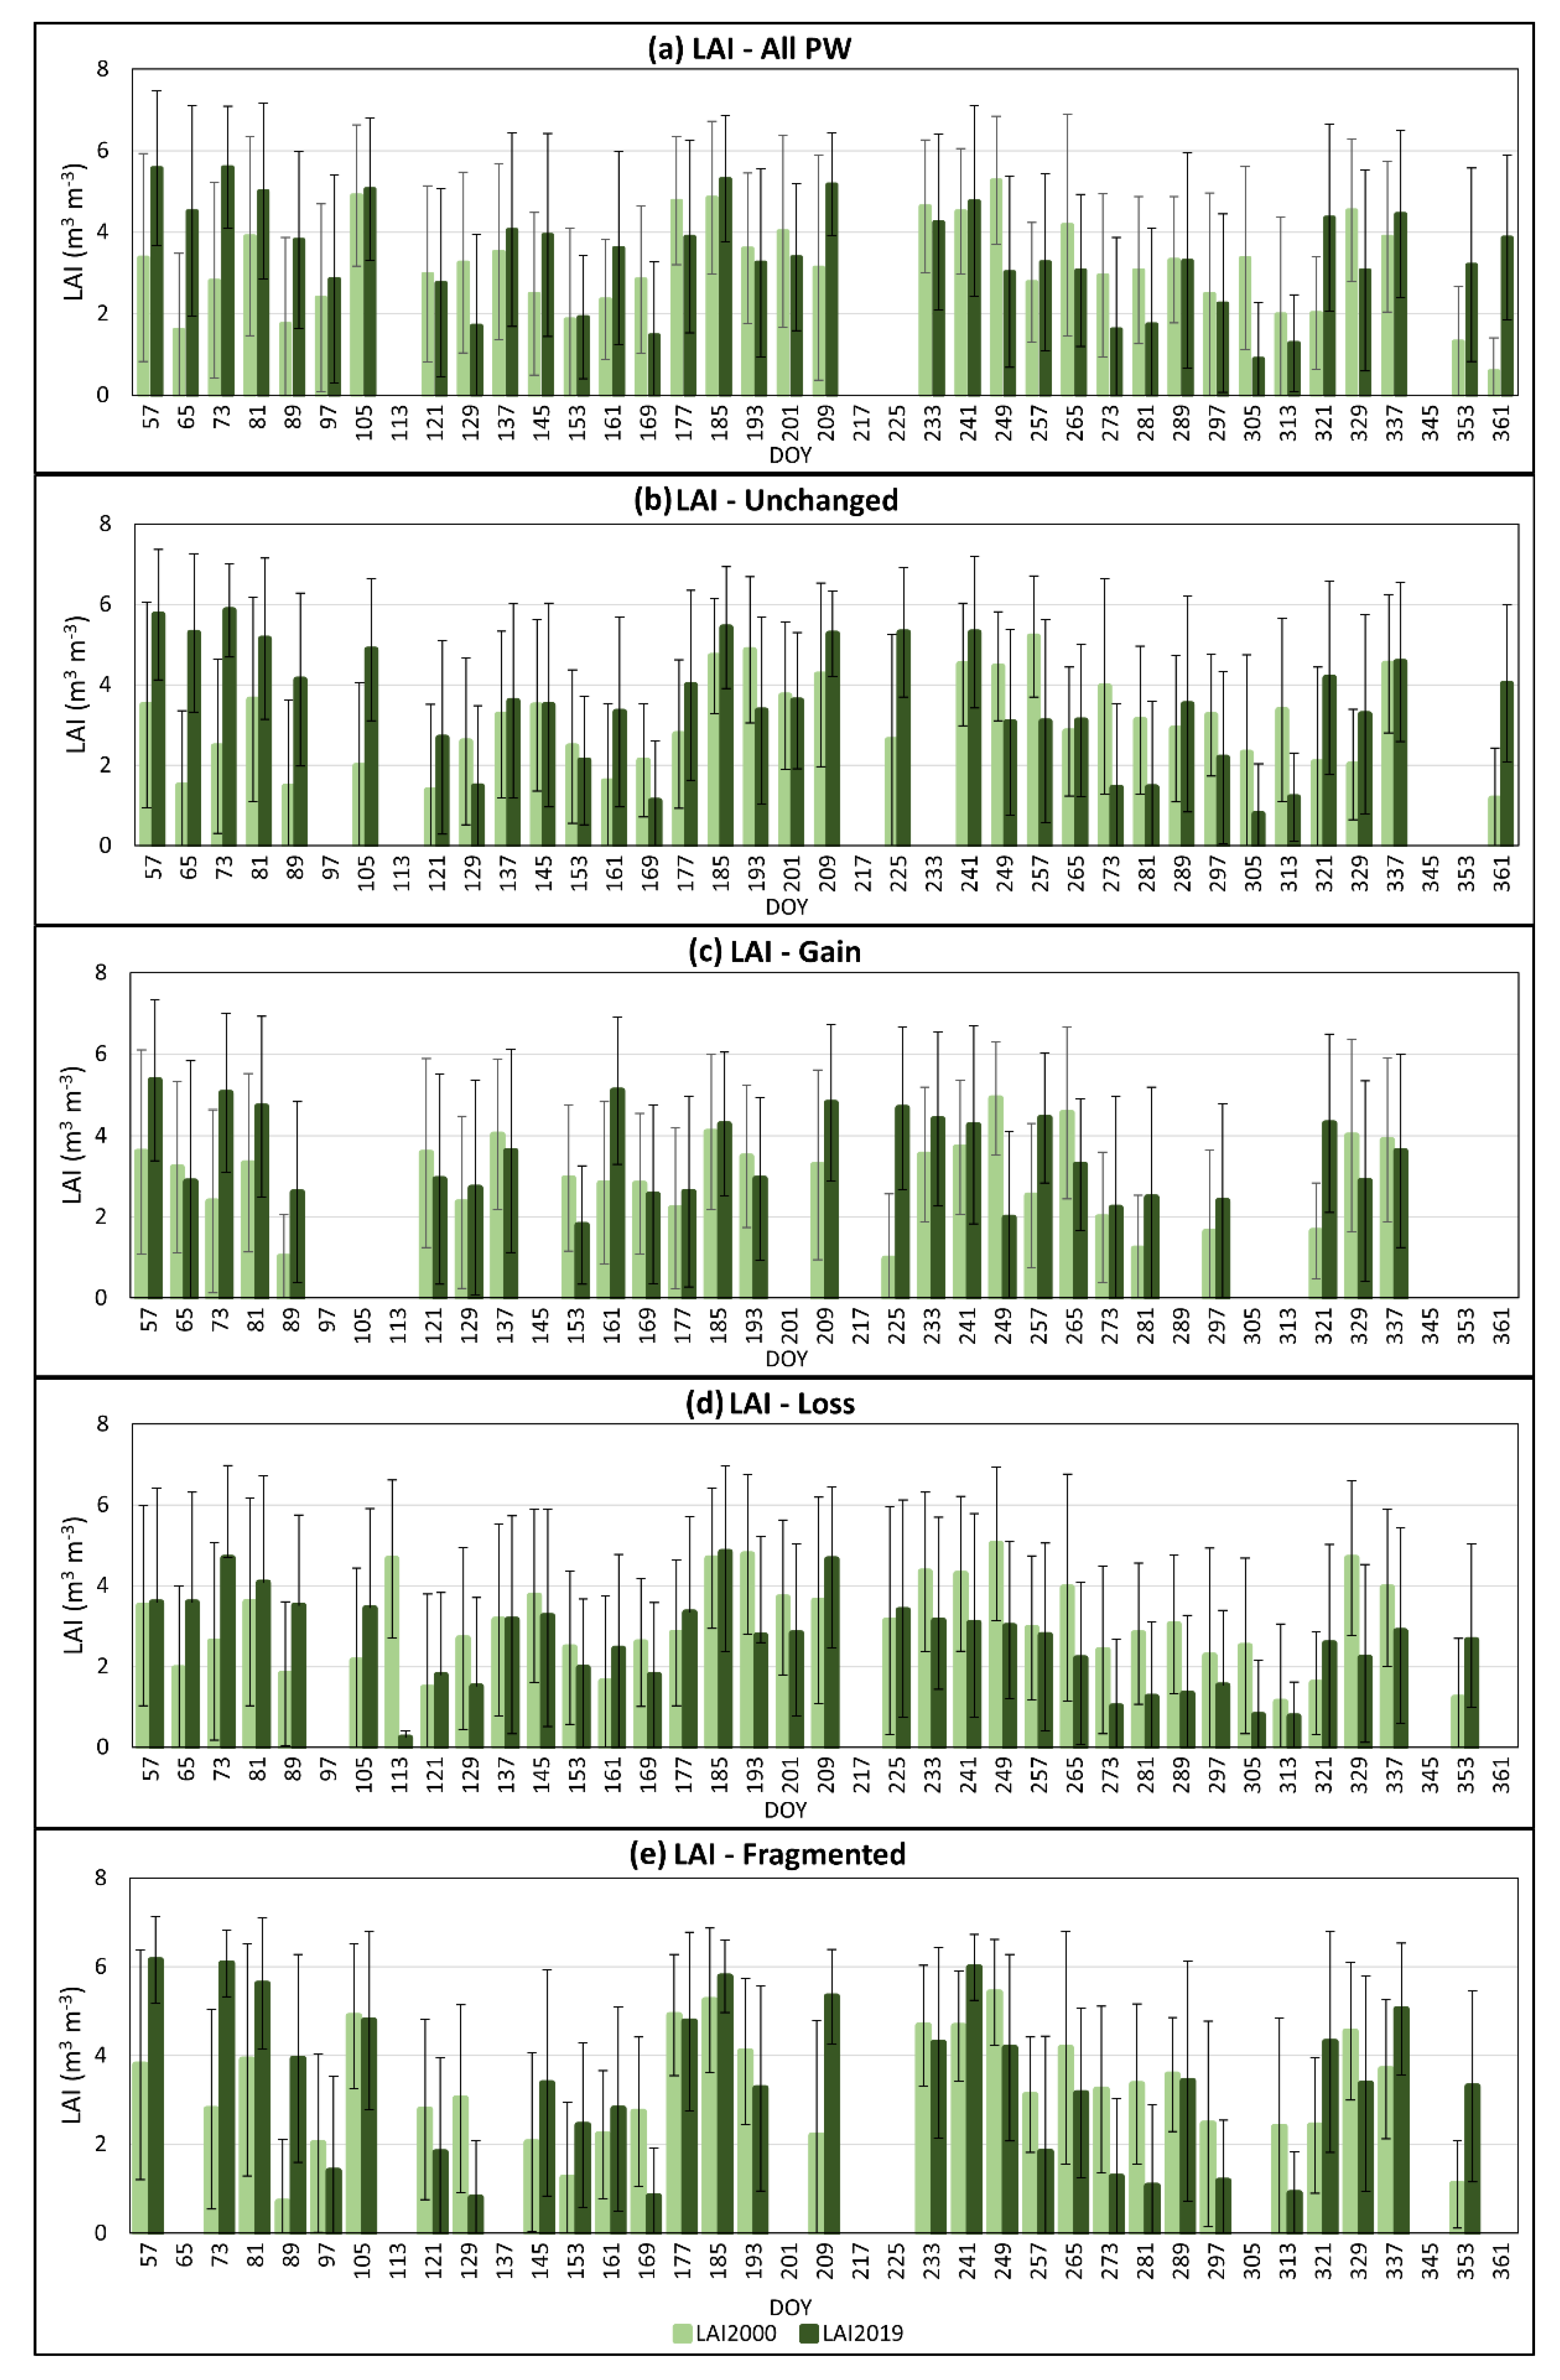
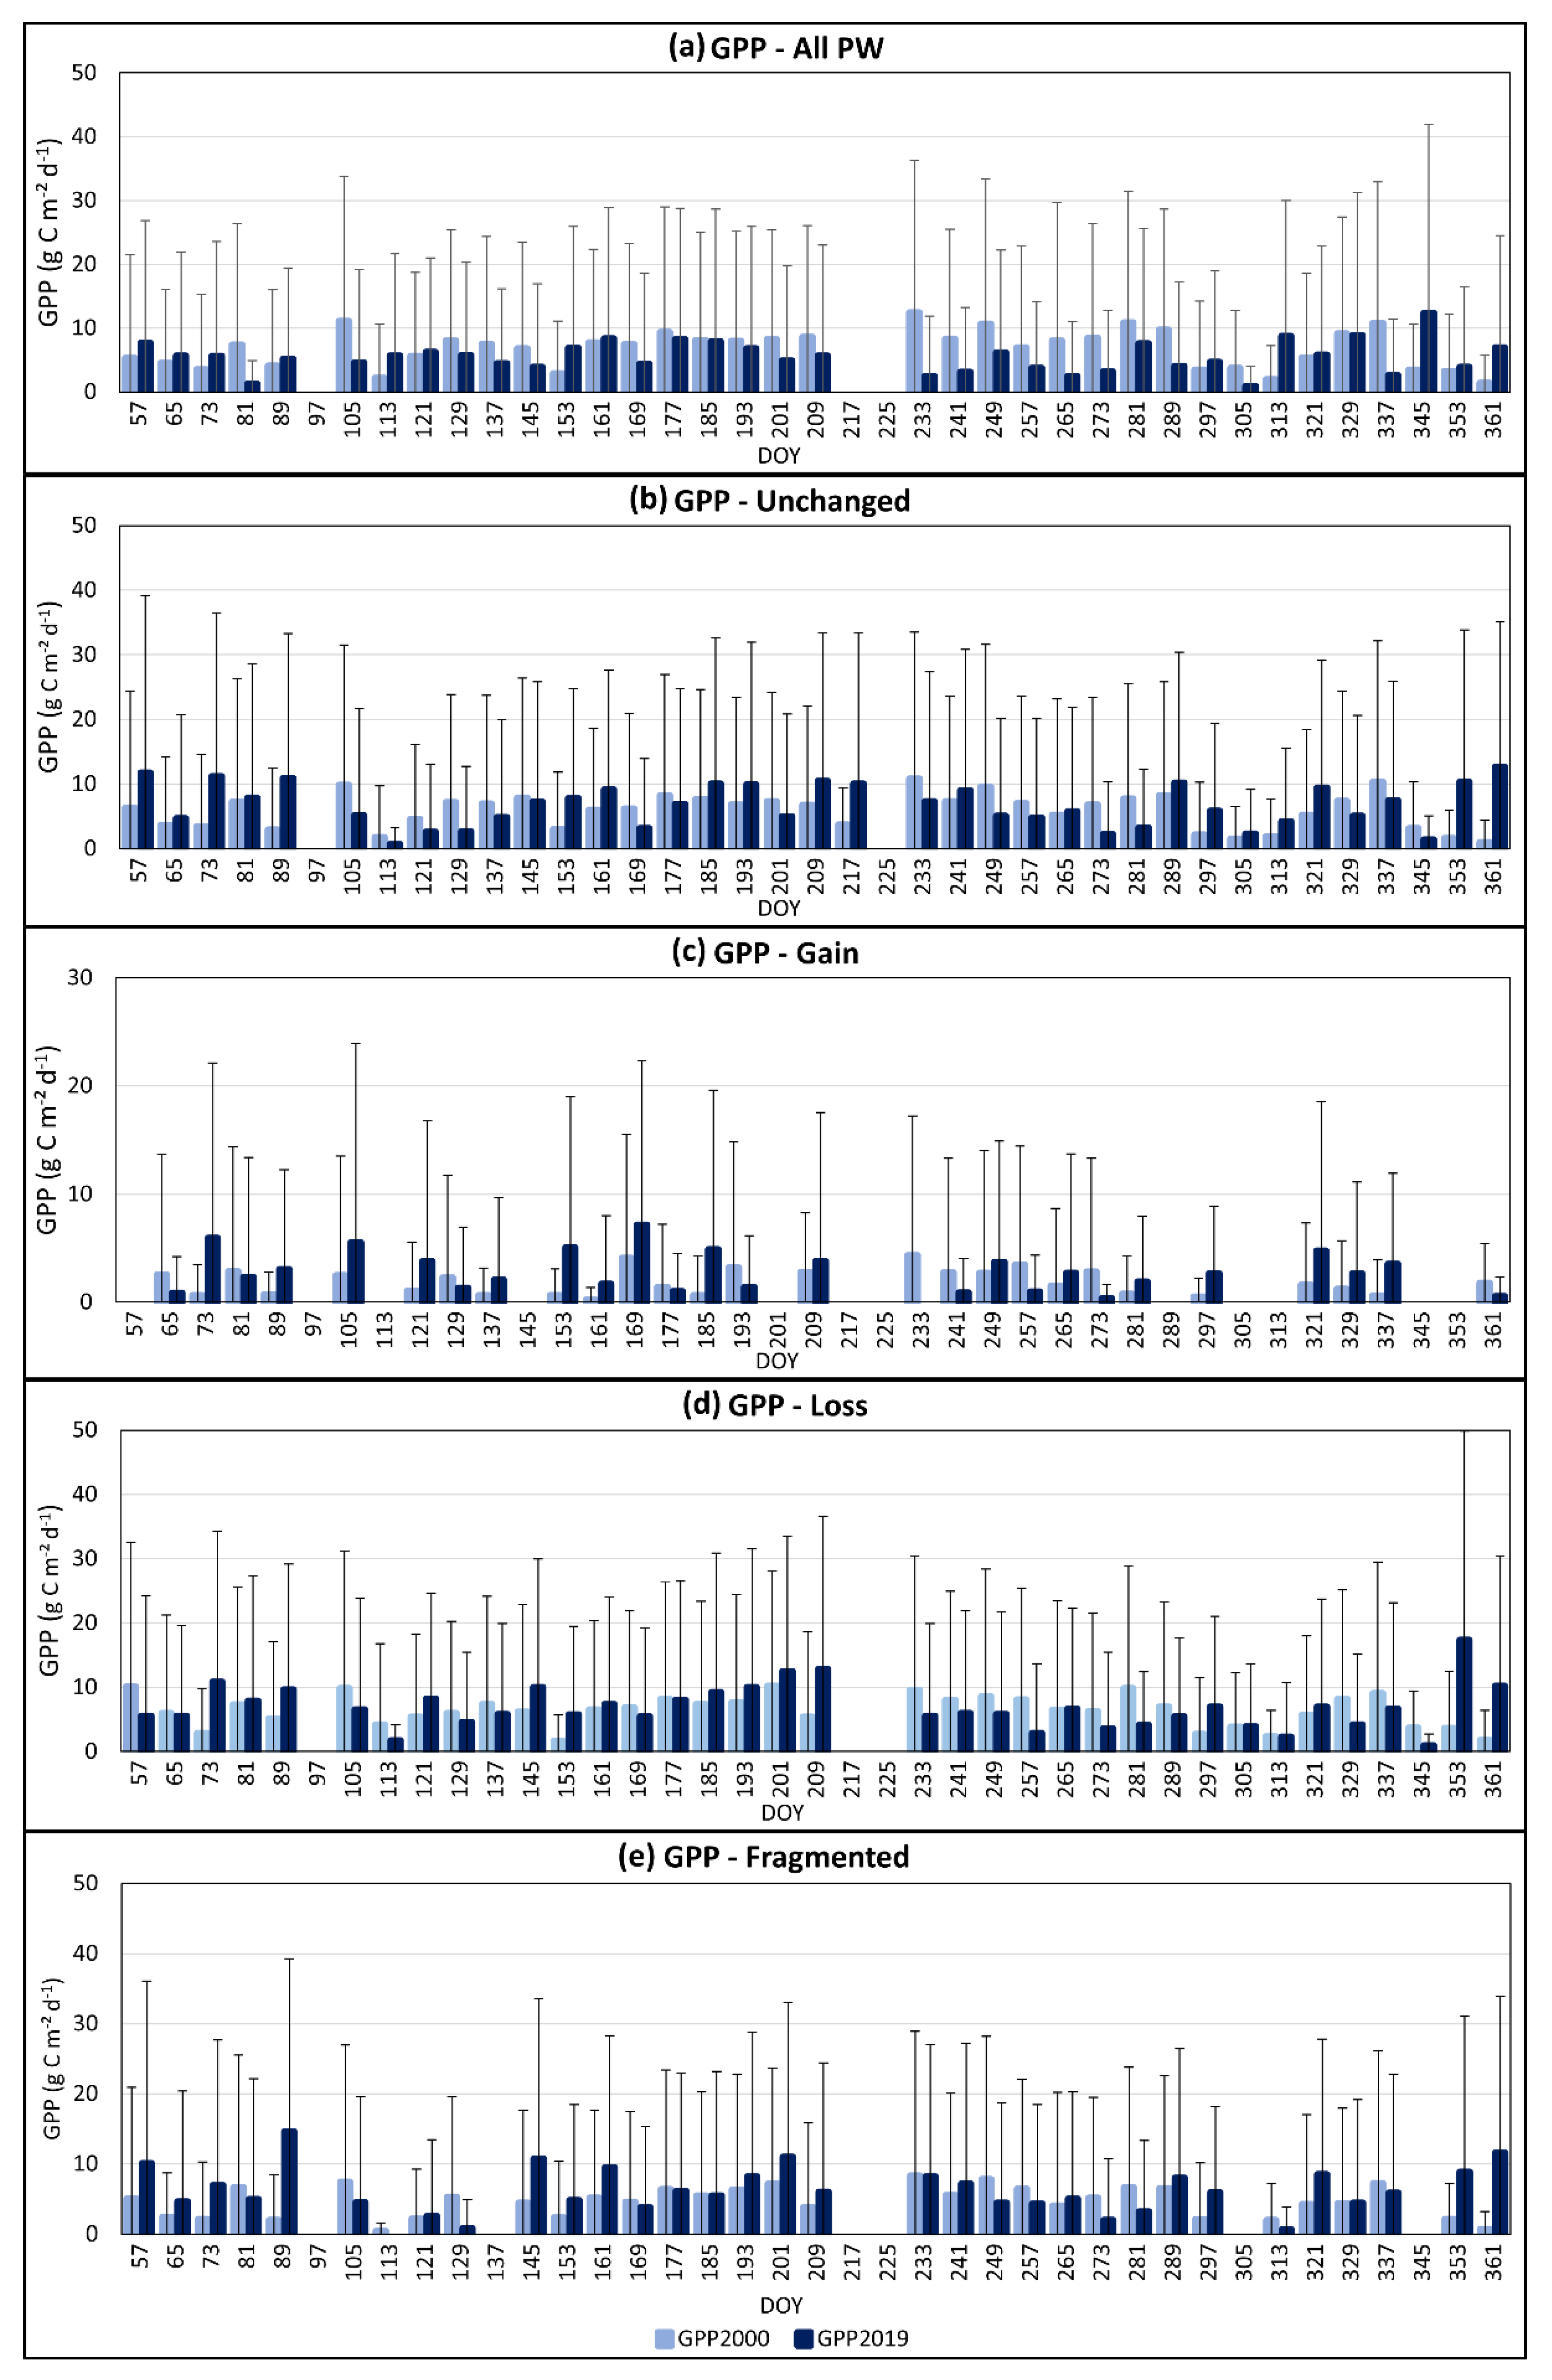
3.3. LAI and GPP Analysis
4. Discussion
4.1. Mangrove Classification and Loss
4.2. Fragmentation
4.3. Mangrove LAI and GPP
5. Conclusions
Author Contributions
Funding
Institutional Review Board Statement
Informed Consent Statement
Data Availability Statement
Acknowledgments
Conflicts of Interest
Appendix A

| Land Cover Type | Characteristics |
|---|---|
| Forest | Primary and secondary forests area with high density of natural trees |
| Mangrove | Mangrove forests |
| Oil Palm | Oil palm trees at different ages |
| Rubber | Rubber trees |
| Urban | Urban area including residential, road networks, industrial and buildings |
| Water Bodies | Water surfaces including rivers and lakes |
| Others | Orchards, shrubs, bush, abandoned lands, aquaculture farms, etc. |


References
- Bryan-Brown, D.N.; Connolly, R.M.; Richards, D.R.; Adame, F.; Friess, D.A.; Brown, C.J. Global trends in mangrove forest fragmentation. Sci. Rep. 2020, 10, 1–8. [Google Scholar] [CrossRef]
- Herbeck, L.S.; Krumme, U.; Andersen, T.J.; Jennerjahn, T.C. Decadal trends in mangrove and pond aquaculture cover on Hainan (China) since 1966: Mangrove loss, fragmentation and associated biogeochemical changes. Estuar. Coast. Shelf Sci. 2020, 233, 106531. [Google Scholar] [CrossRef]
- Ponnampalam, L.S.; Izmal, J.H.F.; Adulyanukosol, K.; Ooi, J.L.S.; Reynolds, J.E. Aligning conservation and research priorities for proactive species and habitat management: The case of dugongs Dugong dugon in Johor, Malaysia. Oryx 2014, 49, 743–749. [Google Scholar] [CrossRef] [Green Version]
- Reyes-Arroyo, N.; Camacho-Valdez, V.; Saenz-Arroyo, A.; Infante-Mata, D. Socio-cultural analysis of ecosystem services provided by mangroves in La Encrucijada Biosphere Reserve, southeastern Mexico. Local Environ. 2021, 26, 86–109. [Google Scholar] [CrossRef]
- Alemu, I.J.B.; Richards, D.R.; Gaw, L.Y.-F.; Masoudi, M.; Nathan, Y.; Friess, D.A. Identifying spatial patterns and interactions among multiple ecosystem services in an urban mangrove landscape. Ecol. Indic. 2021, 121, 107042. [Google Scholar] [CrossRef]
- Seddon, N.; Daniels, E.; Davis, R.; Chausson, A.; Harris, R.; Hou-Jones, X.; Huq, S.; Kapos, V.; Mace, G.M.; Rizvi, A.R.; et al. Global recognition of the importance of nature-based solutions to the impacts of climate change. Glob. Sustain. 2020, 3, 1–12. [Google Scholar] [CrossRef]
- Inácio, M.; Karnauskaitė, D.; Mikša, K.; Gomes, E.; Kalinauskas, M.; Pereira, P. Nature-Based Solutions to Mitigate Coastal Floods and Associated Socioecological Impacts; Metzler, J.B., Ed.; Springer: Berlin/Heidelberg, Germany, 2020; pp. 1–24. [Google Scholar]
- Dahdouh-Guebas, F.; Ajonina, G.N.; Amir, A.A.; Andradi-Brown, D.A.; Aziz, I.; Balke, T.; Barbier, E.B.; Cannicci, S.; Cragg, S.M.; Cunha-Lignon, M.; et al. Public Perceptions of Mangrove Forests Matter for Their Conservation. Front. Mar. Sci. 2020, 7, 901. [Google Scholar] [CrossRef]
- Sharma, S.; MacKenzie, R.A.; Tieng, T.; Soben, K.; Tulyasuwan, N.; Resanond, A.; Blate, G.; Litton, C.M. The impacts of degradation, deforestation and restoration on mangrove ecosystem carbon stocks across Cambodia. Sci. Total. Environ. 2020, 706, 135416. [Google Scholar] [CrossRef]
- Sasmito, S.D.; Sillanpää, M.; Hayes, M.A.; Bachri, S.; Saragi-Sasmito, M.F.; Sidik, F.; Hanggara, B.B.; Mofu, W.Y.; Rumbiak, V.I.; Hendri; et al. Mangrove blue carbon stocks and dynamics are controlled by hydrogeomorphic settings and land-use change. Glob. Chang. Biol. 2020, 26, 3028–3039. [Google Scholar] [CrossRef] [Green Version]
- Zeng, Y.; Friess, D.A.; Sarira, T.V.; Siman, K.; Koh, L.P. Global potential and limits of mangrove blue carbon for climate change mitigation. Curr. Biol. 2021, in press. [Google Scholar] [CrossRef]
- Sánchez-Núñez, D.A.; Pineda, J.E.M.; Osorio, A.F. From local-to global-scale control factors of wave attenuation in mangrove environments and the role of indirect mangrove wave attenuation. Estuar. Coast. Shelf Sci. 2020, 245, 106926. [Google Scholar] [CrossRef]
- Kibler, K.M.; Kitsikoudis, V.; Donnelly, M.; Spiering, D.W.; Walters, L. Flow–Vegetation Interaction in a Living Shoreline Restoration and Potential Effect to Mangrove Recruitment. Sustainability 2019, 11, 3215. [Google Scholar] [CrossRef] [Green Version]
- Friess, D.A.; Yando, E.S.; Abuchahla, G.M.; Adams, J.B.; Cannicci, S.; Canty, S.W.; Cavanaugh, K.C.; Connolly, R.M.; Cormier, N.; Dahdouh-Guebas, F.; et al. Mangroves give cause for conservation optimism, for now. Curr. Biol. 2020, 30, R153–R154. [Google Scholar] [CrossRef] [PubMed] [Green Version]
- Worthington, T.A.; Andradi-Brown, D.A.; Bhargava, R.; Buelow, C.; Bunting, P.; Duncan, C.; Fatoyinbo, L.; Friess, D.A.; Goldberg, L.; Hilarides, L.; et al. Harnessing Big Data to Support the Conservation and Rehabilitation of Mangrove Forests Globally. One Earth 2020, 2, 429–443. [Google Scholar] [CrossRef]
- Jacobson, A.P.; Riggio, J.; Tait, A.M.; Baillie, J.E.M. Global areas of low human impact (‘Low Impact Areas’) and fragmentation of the natural world. Sci. Rep. 2019, 9, 1–13. [Google Scholar] [CrossRef] [PubMed]
- Rogan, J.E.; Lacher, T.E. Impacts of Habitat Loss and Fragmentation on Terrestrial Biodiversity. In Reference Module in Earth Systems and Environmental Sciences; Elsevier: Amsterdam, The Netherlands, 2018. [Google Scholar]
- Peh, K.S.H.; Lin, Y.; Luke, S.H.; Foster, W.A.; Turner, E.C. Forest fragmentation and ecosystem function. Glob. For. Fragm. 2014, 96–114. [Google Scholar] [CrossRef]
- Chapin, F.S.; Woodwell, G.M.; Randerson, J.T.; Rastetter, E.B.; Lovett, G.M.; Baldocchi, D.D.; Clark, D.A.; Harmon, M.E.; Schimel, D.S.; Valentini, R.; et al. Reconciling Carbon-cycle Concepts, Terminology, and Methods. Ecosystems 2006, 9, 1041–1050. [Google Scholar] [CrossRef] [Green Version]
- Braghiere, R.K.; Quaife, T.; Black, E.; He, L.; Chen, J.M. Underestimation of Global Photosynthesis in Earth System Models Due to Representation of Vegetation Structure. Glob. Biogeochem. Cycles 2019, 33, 1358–1369. [Google Scholar] [CrossRef]
- Wang, L.; Jia, M.; Yin, D.; Tian, J. A review of remote sensing for mangrove forests: 1956–2018. Remote Sens. Environ. 2019, 231, 111223. [Google Scholar] [CrossRef]
- Wicaksono, P.; Danoedoro, P.; Hartono; Nehren, U. Mangrove biomass carbon stock mapping of the Karimunjawa Islands using multispectral remote sensing. Int. J. Remote Sens. 2015, 37, 26–52. [Google Scholar] [CrossRef]
- Hamdan, O.; Khairunnisa, M.; Ammar, A.; Hasmadi, I.M.; Aziz, H.K. Mangrove carbon stock assessment by optical satellite imagery. J. Trop. For. Sci. 2013, 25, 554–565. [Google Scholar]
- Pham, T.D.; Yokoya, N.; Bui, D.T.; Yoshino, K.; Friess, D.A. Remote Sensing Approaches for Monitoring Mangrove Species, Structure, and Biomass: Opportunities and Challenges. Remote Sens. 2019, 11, 230. [Google Scholar] [CrossRef] [Green Version]
- Pham, T.D.; Xia, J.; Ha, N.T.; Bui, D.T.; Le, N.N.; Tekeuchi, W. A Review of Remote Sensing Approaches for Monitoring Blue Carbon Ecosystems: Mangroves, Seagrassesand Salt Marshes during 2010–2018. Sensors 2019, 19, 1933. [Google Scholar] [CrossRef] [Green Version]
- Running, S.; Mu, Q.; Zhao, M. MOD17A2H MODIS/Terra Gross Primary Productivity 8-Day L4 Global 500m SIN Grid VNASA EOSDIS Land Processes DAAC. 2015. Available online: https://doi.org/10.5067/MODIS/MOD17A2H.006 (accessed on 15 March 2021).
- Patil, V.; Singh, A.; Naik, N.; Unnikrishnan, S. Estimation of Mangrove Carbon Stocks by Applying Remote Sensing and GIS Techniques. Wetlands 2015, 35, 695–707. [Google Scholar] [CrossRef]
- Ishii, T.; Tateda, Y.; Ishil, T. Leaf area index and biomass estimation for mangrove plantation in Thailand. In Proceedings of the IGARSS 2004, 2004 IEEE International Geoscience and Remote Sensing Symposium, Anchorage, AK, USA, 20–24 September 2004; pp. 2323–2326. [Google Scholar]
- Seto, K.C.; Fragkias, M. Mangrove conversion and aquaculture development in Vietnam: A remote sensing-based approach for evaluating the Ramsar Convention on Wetlands. Glob. Environ. Chang. 2007, 17, 486–500. [Google Scholar] [CrossRef]
- Liu, D.; Li, S.; Fu, D.; Shen, C. Remote sensing analysis of mangrove distribution and dynamics in Zhanjiang from 1991 to 2011. J. Oceanol. Limnol. 2018, 36, 1597–1603. [Google Scholar] [CrossRef]
- Shapiro, A.C.; Trettin, C.C.; Küchly, H.; Alavinapanah, S.; Bandeira, S. The Mangroves of the Zambezi Delta: Increase in Extent Observed via Satellite from 1994 to 2013. Remote Sens. 2015, 7, 16504–16518. [Google Scholar] [CrossRef] [Green Version]
- Kanniah, K.D.; Sheikhi, A.; Cracknell, A.P.; Goh, H.C.; Tan, K.P.; Ho, C.S.; Rasli, F.N. Satellite Images for Monitoring Mangrove Cover Changes in a Fast Growing Economic Region in Southern Peninsular Malaysia. Remote Sens. 2015, 7, 14360–14385. [Google Scholar] [CrossRef] [Green Version]
- De Alban, J.D.T.; Jamaludin, J.; De Wen, D.W.; Than, M.M.; Webb, E.L. Improved estimates of mangrove cover and change reveal catastrophic deforestation in Myanmar. Environ. Res. Lett. 2020, 15, 034034. [Google Scholar] [CrossRef]
- Hansen, M.C.; Potapov, P.V.; Moore, R.; Hancher, M.; Turubanova, S.A.; Tyukavina, A.; Thau, D.; Stehman, S.V.; Goetz, S.J.; Loveland, T.R.; et al. High-Resolution Global Maps of 21st-Century Forest Cover Change. Science 2013, 342, 850–853. [Google Scholar] [CrossRef] [Green Version]
- Kuenzer, C.; Bluemel, A.; Gebhardt, S.; Quoc, T.V.; Dech, S. Remote Sensing of Mangrove Ecosystems: A Review. Remote Sens. 2011, 3, 878–928. [Google Scholar] [CrossRef] [Green Version]
- Omar, H.; Husin, T.M.; Parlan, I. Status of Mangroves in Malaysia; Forest Research Institute Malaysia: Selangor, Malaysia, 2020.
- Friedl, M.; Sulla-Menashe, D. MCD12C1 MODIS/Terra+Aqua Land Cover Type Yearly L3 Global 0.05Deg CMG V006. NASA EOSDIS Land Processes DAAC. 2015. Available online: https://doi.org/10.5067/MODIS/MCD12C1.006 (accessed on 15 March 2021).
- Myneni, R.; Knyazikhin, T.Y.; Park, T. MOD15A2H MODIS/Terra Leaf Area Index/FPAR 8-Day L4 Global 500m SIN Grid VNASA EOSDIS Land Processes DAAC. 2015. Available online: https://doi.org/10.5067/MODIS/MOD15A2H.006 (accessed on 15 March 2021).
- Congedo, L. Semi-automatic classification plugin documentation. Release 2016, 4, 29. [Google Scholar]
- Yuan, H.; Dai, Y.; Xiao, Z.; Ji, D.; Shangguan, W. Reprocessing the MODIS Leaf Area Index products for land surface and climate modelling. Remote Sens. Environ. 2011, 115, 1171–1187. [Google Scholar] [CrossRef]
- Heumann, B.W. An Object-Based Classification of Mangroves Using a Hybrid Decision Tree—Support Vector Machine Approach. Remote Sens. 2011, 3, 2440–2460. [Google Scholar] [CrossRef] [Green Version]
- Yu, L.; Gong, P. Google Earth as a virtual globe tool for Earth science applications at the global scale: Progress and perspectives. Int. J. Remote Sens. 2011, 33, 3966–3986. [Google Scholar] [CrossRef]
- Dorais, A.; Cardille, J. Strategies for Incorporating High-Resolution Google Earth Databases to Guide and Validate Classifications: Understanding Deforestation in Borneo. Remote Sens. 2011, 3, 1157–1176. [Google Scholar] [CrossRef] [Green Version]
- Kanniah, K.D. Quantifying green cover change for sustainable urban planning: A case of Kuala Lumpur, Malaysia. Urban. For. Urban. Green. 2017, 27, 287–304. [Google Scholar] [CrossRef]
- Congalton, R.G.; Green, K. Assessing the Accuracy of Remotely Sensed Data: Principles and Practices; CRC Press: Boca Raton, FL, USA, 2019. [Google Scholar]
- McGarigal, K. FRAGSTATS: Spatial Pattern Analysis Program for Quantifying Landscape Structure; US Forest Service Pacific Northwest Research Station: Portland, OR, USA, 1995; Volume 351.
- Chen, J.M.; Ju, W.; Ciais, P.; Viovy, N.; Liu, R.; Liu, Y.; Lu, X. Vegetation structural change since 1981 significantly enhanced the terrestrial carbon sink. Nat. Commun. 2019, 10, 1–7. [Google Scholar] [CrossRef] [PubMed]
- Li, Q.; Lu, X.; Wang, Y.; Huang, X.; Cox, P.M.; Luo, Y. Leaf area index identified as a major source of variability in modeled CO2 fertilization. Biogeosciences 2018, 15, 6909–6925. [Google Scholar] [CrossRef] [Green Version]
- Vitale, L.; Di Tommasi, P.; D’Urso, G.; Magliulo, V. The response of ecosystem carbon fluxes to LAI and environmental drivers in a maize crop grown in two contrasting seasons. Int. J. Biometeorol. 2015, 60, 411–420. [Google Scholar] [CrossRef] [Green Version]
- Amir, A.A.; Duke, N.C. Distinct characteristics of canopy gaps in the subtropical mangroves of Moreton Bay, Australia. Estuar. Coast. Shelf Sci. 2019, 222, 66–80. [Google Scholar] [CrossRef]
- Kamal, M.; Phinn, S.; Johansen, K. Assessment of multi-resolution image data for mangrove leaf area index mapping. Remote Sens. Environ. 2016, 176, 242–254. [Google Scholar] [CrossRef]
- Tian, Y.; Woodcock, C.E.; Wang, Y.; Privette, J.L.; Shabanov, N.V.; Zhou, L.; Zhang, Y.; Buermann, W.; Dong, J.; Veikkanen, B. Multiscale analysis and validation of the MODIS LAI productII. Sampling strategy. Remote Sens. Environ. 2002, 83, 431–441. [Google Scholar] [CrossRef]
- Hamilton, S.E.; Casey, D. Creation of a high spatio-temporal resolution global database of continuous mangrove forest cover for the 21st century (CGMFC-21). Glob. Ecol. Biogeogr. 2016, 25, 729–738. [Google Scholar] [CrossRef]
- Ewers, R.M.; Didham, R.K. The Effect of Fragment Shape and Species’ Sensitivity to Habitat Edges on Animal Population Size. Conserv. Biol. 2007, 21, 926–936. [Google Scholar] [CrossRef] [PubMed]
- Vaz, E. Managing urban coastal areas through landscape metrics: An assessment of Mumbai’s mangrove system. Ocean Coast. Manag. 2014, 98, 27–37. [Google Scholar] [CrossRef]
- Beer, C.; Reichstein, M.; Tomelleri, E.; Ciais, P.; Jung, M.; Carvalhais, N.; Rödenbeck, C.; Arain, M.A.; Baldocchi, D.; Bonan, G.B.; et al. Terrestrial gross carbon dioxide uptake: Global distribution and covariation with climate. Science 2010, 329, 834–838. [Google Scholar] [CrossRef] [PubMed] [Green Version]
- Alongi, D.M. Carbon Cycling and Storage in Mangrove Forests. Annu. Rev. Mar. Sci. 2014, 6, 195–219. [Google Scholar] [CrossRef] [PubMed]
- Gnanamoorthy, P.; Selvam, V.; Burman, P.K.D.; Chakraborty, S.; Karipot, A.; Nagarajan, R.; Ramasubramanian, R.; Song, Q.; Zhang, Y.; Grace, J. Seasonal variations of net ecosystem (CO2) exchange in the Indian tropical mangrove forest of Pichavaram. Estuar. Coast. Shelf Sci. 2020, 243, 106828. [Google Scholar] [CrossRef]
- Li, Q.; Lu, W.; Chen, H.; Luo, Y.; Lin, G. Differential Responses of Net Ecosystem Exchange of Carbon Dioxide to Light and Temperature between Spring and Neap Tides in Subtropical Mangrove Forests. Sci. World J. 2014, 2014, 1–11. [Google Scholar] [CrossRef] [Green Version]
- Proisy, C.; Viennois, G.; Sidik, F.; Andayani, A.; Enright, J.A.; Guitet, S.; Gusmawati, N.; Lemonnier, H.; Muthusankar, G.; Olagoke, A.; et al. Monitoring mangrove forests after aquaculture abandonment using time series of very high spatial resolution satellite images: A case study from the Perancak estuary, Bali, Indonesia. Mar. Pollut. Bull. 2018, 131, 61–71. [Google Scholar] [CrossRef] [Green Version]
- Bijsterveldt, C.E.J.V.; Wesenbeeck, B.V.; Wal, D.V.D.; Afiati, N.; Pribadi, R.; Brown, B.; Bouma, T. How to restore mangroves for greenbelt creation along eroding coasts with abandoned aquaculture ponds. Estuar. Coast. Shelf Sci. 2020, 235, 1–13. [Google Scholar] [CrossRef]
- Collinge, S.K. Ecological consequences of habitat fragmentation: Implications for landscape architecture and planning. Landsc. Urban. Plan. 1996, 36, 59–77. [Google Scholar] [CrossRef]
- Laurance, W.F.; Goosem, M.; Laurance, S.G. Impacts of roads and linear clearings on tropical forests. Trends Ecol. Evol. 2009, 24, 659–669. [Google Scholar] [CrossRef] [PubMed]
- Sheykhmousa, M.; Mahdianpari, M.; Ghanbari, H.; Mohammadimanesh, F.; Ghamisi, P.; Homayouni, S. Support Vector Machine Versus Random Forest for Remote Sensing Image Classification: A Meta-Analysis and Systematic Review. IEEE J. Sel. Top. Appl. Earth Obs. Remote Sens. 2020, 13, 6308–6325. [Google Scholar] [CrossRef]
- Mountrakis, G.; Im, J.; Ogole, C. Support vector machines in remote sensing: A review. ISPRS J. Photogramm. Remote Sens. 2011, 66, 247–259. [Google Scholar] [CrossRef]
- Huang, X.; Zhang, L.; Wang, L. Evaluation of Morphological Texture Features for Mangrove Forest Mapping and Species Discrimination Using Multispectral IKONOS Imagery. IEEE Geosci. Remote Sens. Lett. 2009, 6, 393–397. [Google Scholar] [CrossRef] [Green Version]
- Heumann, B.W. Satellite remote sensing of mangrove forests: Recent advances and future opportunities. Prog. Phys. Geogr. Earth Environ. 2011, 35, 87–108. [Google Scholar] [CrossRef]
- Thomas, N.; Bunting, P.; Lucas, R.; Hardy, A.; Rosenqvist, A.; Fatoyinbo, T. Mapping Mangrove Extent and Change: A Globally Applicable Approach. Remote Sens. 2018, 10, 1466. [Google Scholar] [CrossRef] [Green Version]
- Giri, C.; Ochieng, E.; Tieszen, L.L.; Zhu, Z.; Singh, A.; Loveland, T.; Masek, J.; Duke, N. Status and distribution of mangrove forests of the world using earth observation satellite data. Glob. Ecol. Biogeogr. 2011, 20, 154–159. [Google Scholar] [CrossRef]
- Malaysia, S.A. Impacts of Coastal Reclamation in Malaysia; Sahabat Alam Malaysia: Penang, Malaysia, 2020. [Google Scholar]
- MEPC. Identification and Protection of Special Areas and Particularly Sensitive Sea Areas: Protection of Pulau Kukup (Kukup Island) and Tanjung Piai (Cape Piai); submitted by Malaysia, Singapore; Centre of International Law, National University of Singapore: Singapore, 28 April 2017. [Google Scholar]
- McCreath, M. Burgeoning Practice of Southeast Asian States to Protect the Marine Environment from the Effects of International Shipping. Asia-Pac. J. Ocean Law Policy 2017, 2, 268–295. [Google Scholar] [CrossRef]
- Murdiyarso, D.; Purbopuspito, J.; Kauffman, J.B.; Warren, M.W.; Sasmito, S.D.; Donato, D.C.; Manuri, S.; Krisnawati, H.; Taberima, S.; Kurnianto, S. The potential of Indonesian mangrove forests for global climate change mitigation. Nat. Clim. Chang. 2015, 5, 1089–1092. [Google Scholar] [CrossRef]
- Haddad, N.M.; Brudvig, L.A.; Clobert, J.; Davies, K.F.; Gonzalez, A.; Holt, R.D.; Lovejoy, T.E.; Sexton, J.O.; Austin, M.P.; Collins, C.D.; et al. Habitat fragmentation and its lasting impact on Earth’s ecosystems. Sci. Adv. 2015, 1, e1500052. [Google Scholar] [CrossRef] [PubMed] [Green Version]
- Wang, D.; Wan, B.; Liu, J.; Su, Y.; Guo, Q.; Qiu, P.; Wu, X. Estimating aboveground biomass of the mangrove forests on northeast Hainan Island in China using an upscaling method from field plots, UAV-LiDAR data and Sentinel-2 imagery. Int. J. Appl. Earth Obs. Geoinf. 2020, 85, 101986. [Google Scholar] [CrossRef]
- Rodda, S.R.; Thumaty, K.C.; Jha, C.S.; Dadhwal, V.K. Seasonal Variations of Carbon Dioxide, Water Vapor and Energy Fluxes in Tropical Indian Mangroves. Forests 2016, 7, 35. [Google Scholar] [CrossRef] [Green Version]
- Clough, B.; Ong, J.; Gong, W. Estimating leaf area index and photosynthetic production in canopies of the mangrove Rhizophora apiculata. Mar. Ecol. Prog. Ser. 1997, 159, 285–292. [Google Scholar] [CrossRef] [Green Version]
- Shrestha, S.; Miranda, I.; Kumar, A.; Pardo, M.L.E.; Dahal, S.; Rashid, T.; Remillard, C.; Mishra, D.R. Identifying and forecasting potential biophysical risk areas within a tropical mangrove ecosystem using multi-sensor data. Int. J. Appl. Earth Obs. Geoinf. 2019, 74, 281–294. [Google Scholar] [CrossRef]
- Spalding, M.; Parrett, C.L. Global patterns in mangrove recreation and tourism. Mar. Policy 2019, 110, 103540. [Google Scholar] [CrossRef]
- Glaser, M. Interrelations between mangrove ecosystem, local economy and social sustainability in Caeté Estuary, North Brazil. Wetl. Ecol. Manag. 2003, 11, 265–272. [Google Scholar] [CrossRef]
- Giri, C.; Muhlhausen, J. Mangrove Forest Distributions and Dynamics in Madagascar (1975–2005). Sensors 2008, 8, 2104–2117. [Google Scholar] [CrossRef] [Green Version]
- Das, S. Does mangrove plantation reduce coastal erosion? Assessment from the west coast of India. Reg. Environ. Chang. 2020, 20, 1–12. [Google Scholar] [CrossRef]
- Ouyang, X.; Lee, S.Y. Improved estimates on global carbon stock and carbon pools in tidal wetlands. Nat. Commun. 2020, 11, 1–7. [Google Scholar] [CrossRef] [PubMed] [Green Version]
- Kanniah, K.D.; Tan, K.P.; Cracknell, A.P.; Huete, A.R.; Idris, N.H.; Lau, A.M.S.; Rahman, M.Z.A.; Rasib, A.W.; Ahmad, A. Assessment of biophysical properties of Royal Belum tropical forest, Malaysia. Singap. J. Trop. Geogr. 2017, 39, 90–106. [Google Scholar] [CrossRef]
- Richards, D.R.; Thompson, B.S.; Wijedasa, L. Quantifying net loss of global mangrove carbon stocks from 20 years of land cover change. Nat. Commun. 2020, 11, 1–7. [Google Scholar] [CrossRef] [PubMed]


| Parameter | Type/Value |
|---|---|
| Kernel type | Radial Basis Function (RBF) |
| Gamma in kernel function | 1.00 |
| Penalty | 100 |
| Pyramid levels | 0 |
| Region of Interests (ROI) | 140 (20 polygons for each class) |
| Group | Fragmentation Index | Definition |
|---|---|---|
| Area | Class Area (CA) | Sum of areas of all patches of a given class |
| Total Landscape Area (TLA) | Sum of areas of all patches in the landscape | |
| Patch size | Number of Patches (NP) | Total number of patches in the class/landscape |
| Mean Patch Size (MPS) | Average patch size | |
| Edge | Total Edge (TE) | Total perimeter of patches |
| Edge Density (ED) | Amount of edge relative to the landscape area | |
| Shape | Mean Shape Index (MSI) | Average perimeter-to-area ratio |
| Average Weighted MSI (AWMSI) | MSI divided by weighted patches area | |
| Mean Perimeter Area Ratio (MPAR) | Average of patch perimeter to patch area ratio | |
| Mean Patch Fractal Dimension (MPFD) | Average of log-transformed patch perimeter to log-transformed patch area ratio |
| Class | Landsat 7 (2000) | Sentinel-2A (2019) | ||
|---|---|---|---|---|
| PA (%) | UA (%) | PA (%) | UA (%) | |
| Forest | 89.25 | 92.45 | 78.22 | 87.93 |
| Mangrove | 97.52 | 90.64 | 87.85 | 99.70 |
| Oil Palm | 88.66 | 78.35 | 73.02 | 84.47 |
| Rubber | 43.17 | 78.15 | 96.40 | 53.49 |
| Urban | 64.56 | 93.12 | 95.44 | 93.88 |
| Water Bodies | 98.56 | 99.57 | 92.55 | 98.17 |
| Others | 46.32 | 19.19 | 91.42 | 62.67 |
| OA | 89.96% | 90.51% | ||
| KC | 0.85 | 0.88 | ||
| Z-statistic | 271.37 | 109.35 | ||
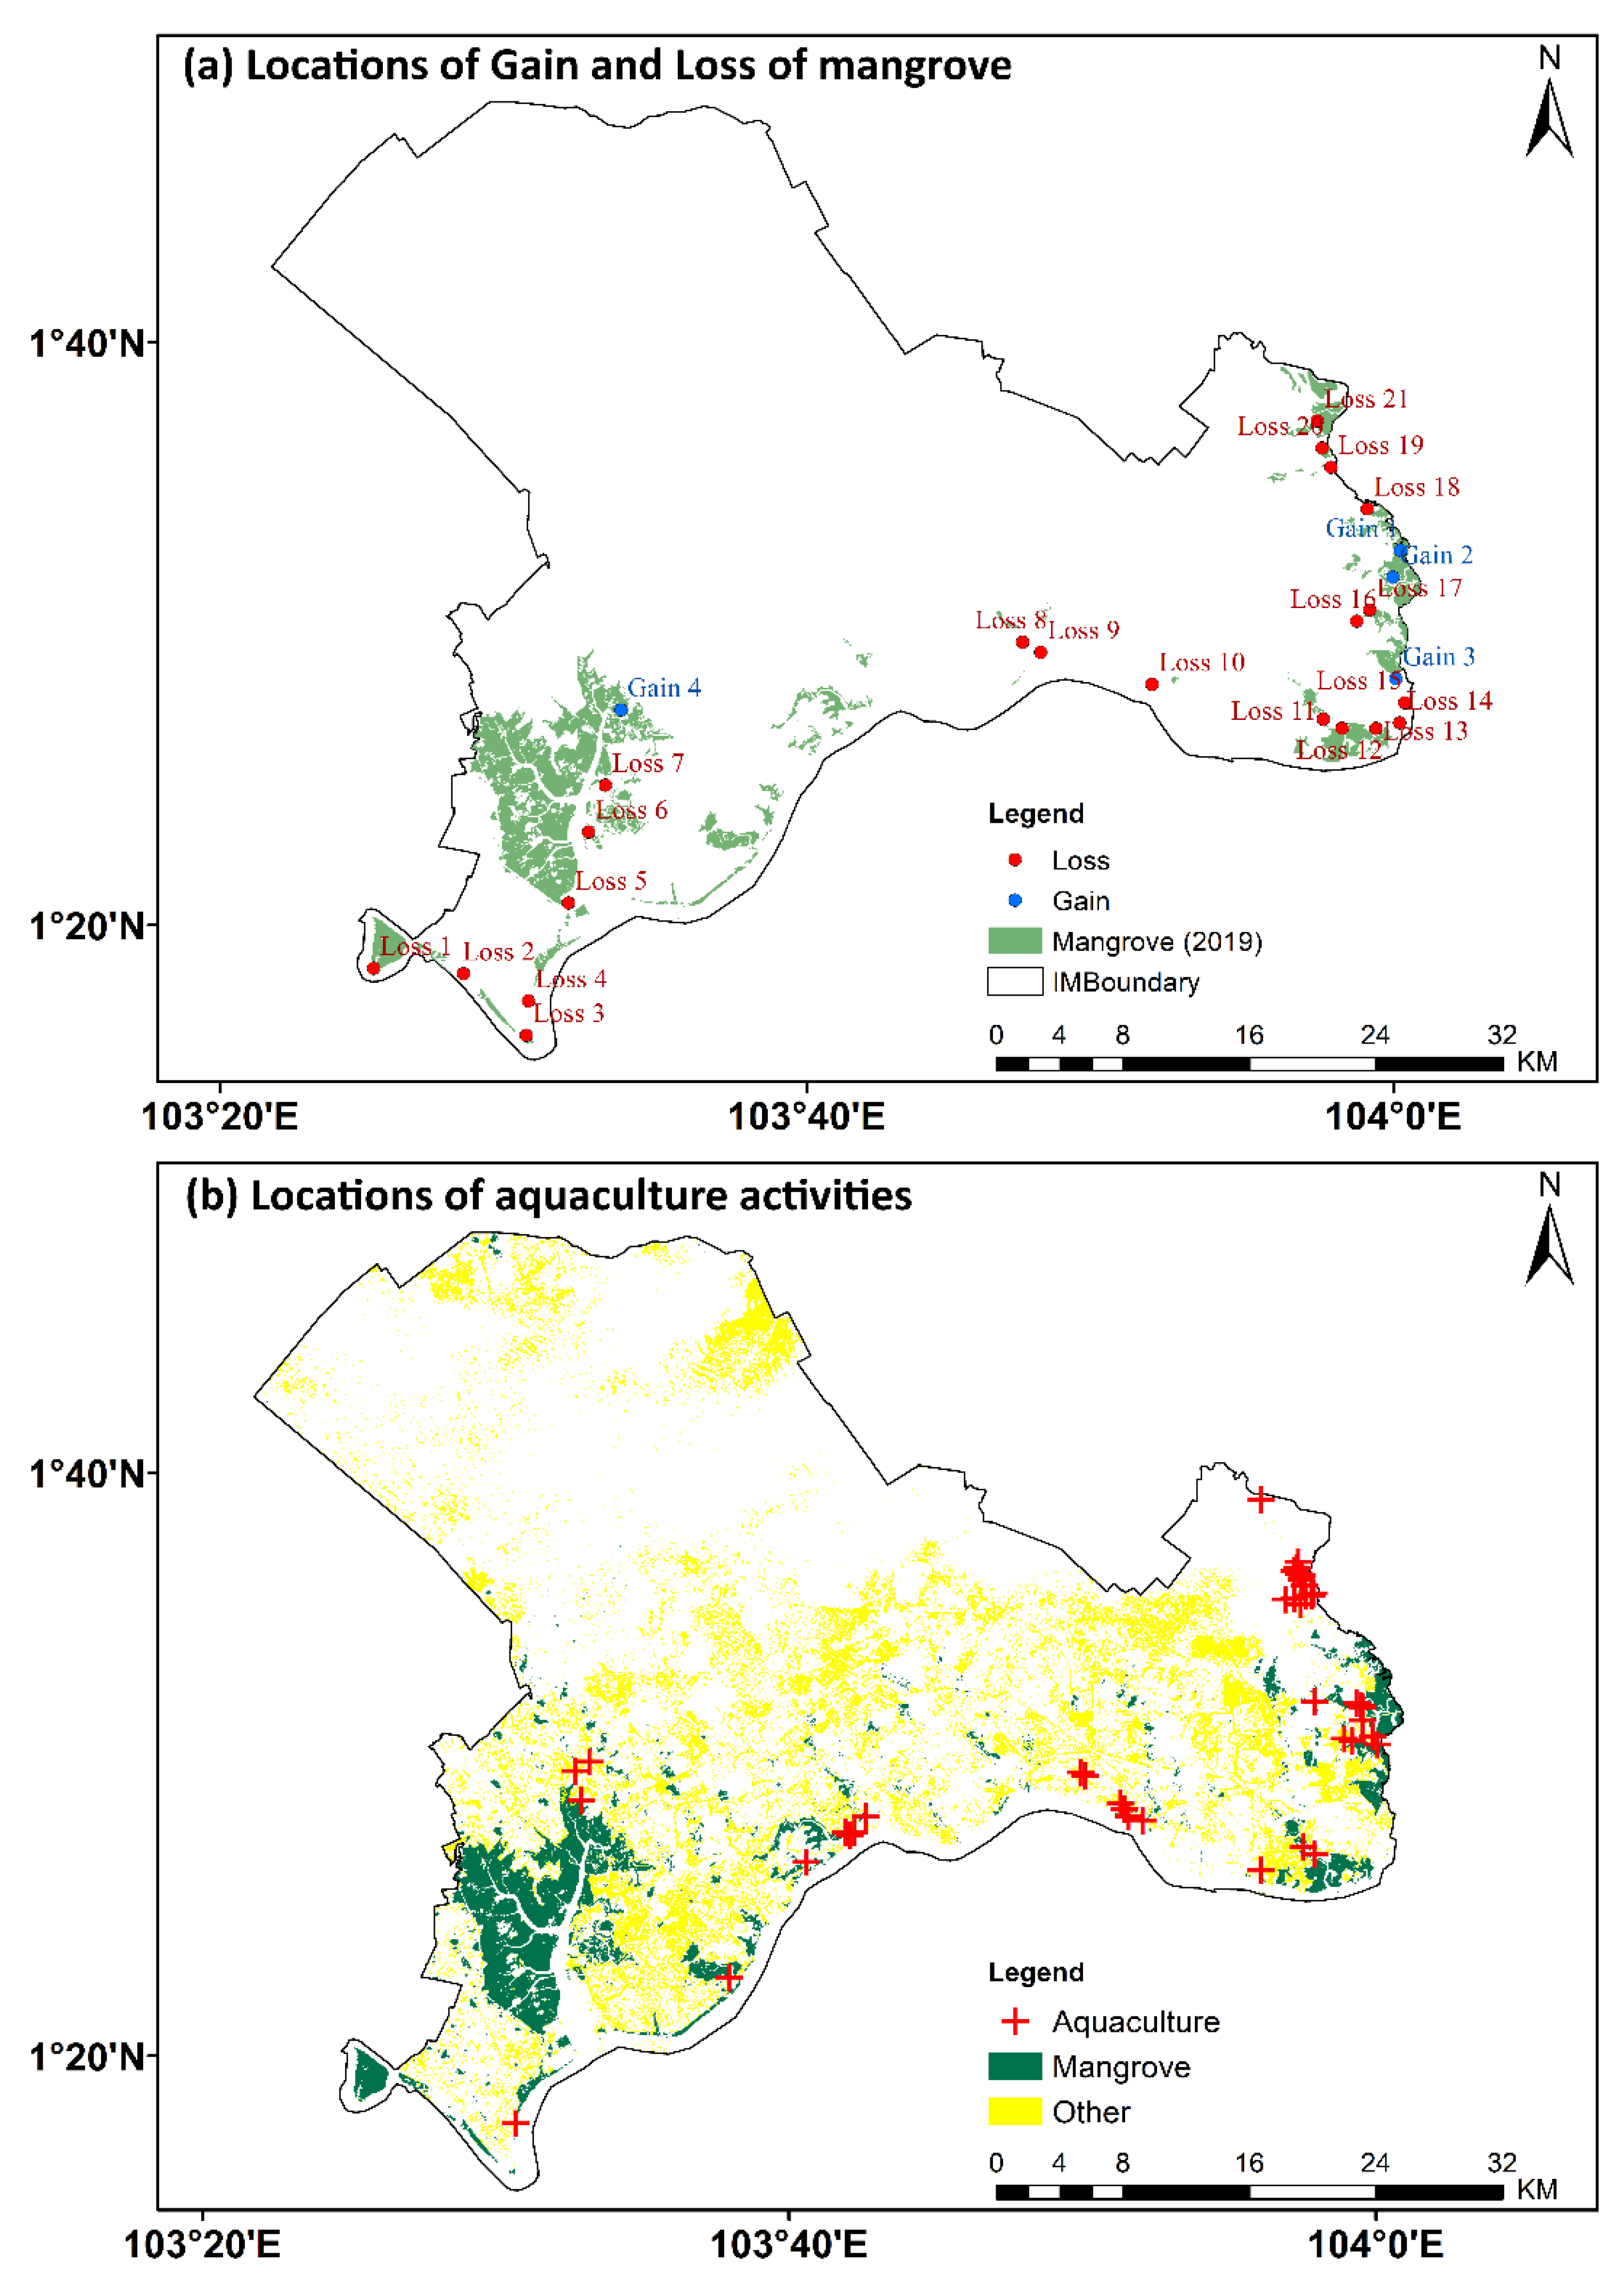
| Gain ID. | Places/Location | Transition Type |
| 1 | Pulau Kukup | Eroded mangrove |
| 2 | Serkat Berkat Village | Oil palm |
| 3 | Tanjung Piai | Eroded mangrove |
| 4 | Perpat Pasir Village | Oil palm |
| 5 | Sungai Boh Village | Urban |
| 6 | Pulai River—Custom Administration Building | Urban |
| 7 | Forest City Golf Hotel/ Resort | Urban—resort |
| 8 | Sri Tulang Residential Project | Urban—residential |
| 9 | Bayu Senibong Residential zone | Bare land |
| 10 | Changkat Village | Aquaculture |
| 11 | Sri Aman Village | Aquaculture |
| 12 | Sri Aman Village | Aquaculture |
| 13 | Sri Aman Village | Aquaculture |
| 14 | Tanjung Langsat | Urban—port expansion |
| 15 | Tanjung Langsat | Urban—port expansion |
| 16 | Kampung Kong Kong | Aquaculture |
| 17 | Kampung Kong Kong | Aquaculture |
| 18 | Layang River | Eroded mangrove |
| 19 | Tiram River Fishing Village | Aquaculture |
| 20 | Tiram River Fishing Village | Aquaculture |
| 21 | Tiram River Fishing Village | Aquaculture |
| Gain ID. | Places/Location | Transition Type |
| 1 | Kong Kong River | Eroded mangrove |
| 2 | Kong Kong River | Eroded mangrove |
| 3 | Tanjung Langsat Village | Aquaculture |
| 4 | Melayu Village | Aquaculture |
| Transition Type | ID. | Loss Area | ||
|---|---|---|---|---|
| Eroded mangrove | 1 | Pulau Kukup | ||
 | 23 Aug 2006 | 2 Aug 2019 | ||
| 18 | Layang River | |||
 | 6 Apr 2003 | 30 June 2017 | ||
| Urban | 5 | Sungai Boh Village | ||
 | 17 Jan 2008 | 10 Feb 2018 | ||
| 6 and 7 | Pulai River—Custom Administration Building and Forest City Golf Hotel/Resort | |||
 | July 2006 | 2 Aug 2019 | ||
| Aquaculture | 11 and 12 | Sri Aman Village | ||
 | 6 Apr 2003 | 23 Jan 2012 | ||
| 16 and 17 | Kong Kong Village | |||
 | 6 Apr 2003 | 19 July 2020 | ||
| Gain area | ||||
| Eroded mangrove | 1 and 2 | Kong Kong River | ||
 | 6 Apr 2003 | 30 June 2017 | ||
| Aquaculture | 3 | Tanjung Langsat Village | ||
 | 6 April 2003 | 10 Nov 2019 | ||
| 4 | Melayu Village | |||
 | 17 Jan 2008 | 2 Aug 2019 | ||
| Index | Unit | Year 2000 | Year 2019 |
|---|---|---|---|
| Class Area (CA) | ha | 13,612 | 10,705 |
| Total Landscape Area (TLA) | ha | 13,612 | 10,705 |
| Number of Patches (NP) | - | 130 | 402 |
| Mean Patch Size (MPS) | ha | 104.71 | 26.63 |
| Total Edge (TE) | m | 1,200,480 | 1,364,970 |
| Edge Density (ED) | m/ha | 88.20 | 127.509 |
| Mean Shape Index (MSI) | - | 2.796 | 1.962 |
| Average Weighted MSI (AWMSI) | - | 8.802 | 8.761 |
| Mean Perimeter Area Ratio (MPAR) | m/ha | 245.95 | 1685.40 |
| Mean Patch Fractal Dimension (MPFD) | - | 1.366 | 1.444 |
| LAI | GPP (g C m−2) | |||
|---|---|---|---|---|
| 2000 | 2019 | 2000 | 2019 | |
| All PW | 3.18 ± 1.56 (145) | 3.46 ± 2.09 (84) | 6.82 ± 15.26 (141) | 5.49 ± 15.10 (77) |
| Unchanged | 3.03 ± 1.94 (89) | 3.55 ± 1.97 (67) | 5.81 ± 14.05 (87) | 6.73 ± 16.65 (65) |
| Gain | 2.81 ± 1.79 (24) | 3.51 ± 2.20 (16) | 1.88 ± 6.75 (25) | 2.78 ± 8.88 (16) |
| Loss | 2.99 ± 2.02 (52) | 2.62 ± 2.15 (37) | 6.38 ± 14.34 (50) | 6.88 ± 15.60 (37) |
| Fragmented | 3.11 ± 1.71 (74) | 3.41 ± 1.79 (42) | 4.65 ± 12.76 (71) | 6.37 ± 16.46 (42) |
Publisher’s Note: MDPI stays neutral with regard to jurisdictional claims in published maps and institutional affiliations. |
© 2021 by the authors. Licensee MDPI, Basel, Switzerland. This article is an open access article distributed under the terms and conditions of the Creative Commons Attribution (CC BY) license (https://creativecommons.org/licenses/by/4.0/).
Share and Cite
Kanniah, K.D.; Kang, C.S.; Sharma, S.; Amir, A.A. Remote Sensing to Study Mangrove Fragmentation and Its Impacts on Leaf Area Index and Gross Primary Productivity in the South of Peninsular Malaysia. Remote Sens. 2021, 13, 1427. https://doi.org/10.3390/rs13081427
Kanniah KD, Kang CS, Sharma S, Amir AA. Remote Sensing to Study Mangrove Fragmentation and Its Impacts on Leaf Area Index and Gross Primary Productivity in the South of Peninsular Malaysia. Remote Sensing. 2021; 13(8):1427. https://doi.org/10.3390/rs13081427
Chicago/Turabian StyleKanniah, Kasturi Devi, Chuen Siang Kang, Sahadev Sharma, and A. Aldrie Amir. 2021. "Remote Sensing to Study Mangrove Fragmentation and Its Impacts on Leaf Area Index and Gross Primary Productivity in the South of Peninsular Malaysia" Remote Sensing 13, no. 8: 1427. https://doi.org/10.3390/rs13081427