
Exploring Fresh and Hardened Properties of Sustainable 3D-Printed Lightweight Cementitious Mixtures

Department of Civil, Construction, Environmental Engineering, University of New Mexico, Albuquerque, NM 87131, USA
*
Author to whom correspondence should be addressed.
Sustainability 2023, 15(19), 14425; https://doi.org/10.3390/su151914425
Submission received: 19 August 2023
/
Revised: 20 September 2023
/
Accepted: 26 September 2023
/
Published: 1 October 2023
(This article belongs to the Special Issue Application of Sustainable Cement-Based Materials in Civil Infrastructure Systems)
Abstract
:This study investigates using lightweight concrete in 3D printing to reduce transportation costs and maintain structural strength. Normal-weight river (RS) sand was replaced with pumice and expanded glass at 50% and 100% volumes to decrease the material density. This substitution reduced the weight of various mixes up to 25.1%, with apparent porosity ranging from 11.37% to 27.9%. This study found that aggregate characteristics, including the shape, size, and absorption capacity, influenced printability. Rounded aggregates like expanded glass flowed better and required less water than irregular pumice. Lightweight aggregates had finer textures and higher porosity, needing more water. According to the extrudability results, the best print quality was achieved using 100% expanded glass, incorporating methylcellulose (MC) and polyethylene (PE) fibers. Moreover, the buildability outcomes highlighted a reliance on the printing speed and the water-to-binder (W/B) ratio. Comparing cast and 3D printed specimens, cast concrete reached a maximum compressive strength of 65.6 MPa, while 3D printed concrete achieved a maximum strength of 43.4 MPa. RS had the highest strength (65.6 MPa), while expanded glass showed the lowest (17.5 MPa) in both cast and 3D printed specimens. Adding PE and MC enhanced the print quality and increased the compressive strength due to the fibers’ bridging capacity.
1. Introduction
3D printing, or additive manufacturing, has empowered engineers to leverage computerized programs for constructing elements by systematically printing layers of cementitious materials to achieve the desired final shape [1]. The introduction of innovative technologies, such as 3D printing, has revolutionized the construction industry by offering the ability to create intricate and complex geometries directly through printing, eliminating the need for traditional formwork methods [2]. Compared to conventional construction methods, additive manufacturing offers several advantages, including faster construction processes, decreased labor requirements, a safer environment, and reduced material waste [3]. However, the in situ construction of 3D-printed concrete structures faces challenges due to the prolonged exposure of fresh concrete to ambient conditions, potentially affecting the performance of the final structures. Therefore, large-scale 3D printing technology is better suited for the prefabrication industry. However, prefabrication may incur additional costs, such as transportation expenses for different elements. In this regard, different alternatives have been suggested to reduce the self-weight of 3Dprinted concrete, including creating textures of additive manufacturing for design [4], designing smaller modules for construction [5,6], and lightweight aggregate concrete [7]. Using lightweight materials can help mitigate these costs and facilitate the assembly of the components. Additionally, reducing the self-weight of concrete components would give more freedom in designing high-rise buildings with concrete and save more energy and material [4]. This paper investigates the feasibility of 3D printing lightweight cementitious mixes using locally sourced and sustainable alternatives.
3D printing could be adapted to form lightweight structures. In this regard, there are two approaches to making lightweight structural components. The first approach is using lightweight ingredients such as foam concrete [8,9], autoclave-aerated concrete [10] (producing lightweight concrete with a density lower than 1400 kg/cm3), lightweight aggregate concrete [11] (producing lightweight concrete with a density lower than 1680 kg/cm3 according to ASTM C90 [12]) and expanded polystyrene (EPS) geofoam concrete [13,14]. The second approach is the topology optimization of structural elements [2,9,15], meaning that using the optimized geometries and shapes to lower the material consumption and reducing the self-weight of elements. In addition to reducing the overall weight of structures, previous studies have shown that lightweight concrete offers improved thermal insulation performance compared to normal-weight concrete [2,3,16]. This paper focuses on utilizing lightweight aggregates to create printable cementitious mixes. The additive manufacturing of concrete poses certain requirements at different phases of the printing for a material to qualify as a printable. The material should be pumpable, extrudable, and buildable to qualify as a printable material. In addition, the printability of cementitious materials has a strong relationship with the rheological properties. All these important aspects of the additive manufacturing of concrete are addressed in this manuscript.
Certain challenges in the material mix design must be addressed to achieve printable lightweight mixes. Compared to cast concrete, 3D printed cementitious mixes need the adjustment of fresh properties to be pumped through the hose and adequately extruded from the nozzle; however, it should also reach enough strength to retain its shape under the weight of the upper layers added over time. Thus, some special terms for 3D printing have been introduced and widely used by previous studies to evaluate the printability and the fresh properties of 3D printing cementitious mixes that can be summarized as follows.
Flowability refers to the capacity of fresh cementitious mixes to flow smoothly through the pumping system, which is directly influenced by the rheological properties of fresh concrete within the pumping system [17]. The printable materials should possess enough flowability to get pumped easily and exit the nozzle head without clogging [15]. The flowability of 3D printing lightweight concrete was investigated in the present study to guarantee that developed mixtures will move through the pumping system without putting pressure on the pump for moving forward and with a low risk of clogging the hose.
Extrudability refers to the ability of fresh materials to pass through the printing nozzle and extrude consistently without flaws or cracks while maintaining dimensional accuracy for the size of the filaments. [18]. Based on previous research, it is recommended to keep the yield stress of the cementitious mortars within the range of 1.5–2.5 kPa to ensure proper extrudability. Values below this range can lead to a lack of shape stability, while values above this range can cause difficulties in printing and discontinuity in the extruded filament [19,20]. In line with this, the extrudability of cementitious materials has been investigated by testing the effective parameters such as mix proportions [11,18,21,22], fiber reinforcement [18,21,22], extrusion speed [19,23], and printing speed (nozzle travel speed) [19,24]. The present study also evaluated the extrudability of the 3D printing of lightweight concrete to make sure the designed mixes are meeting the extrudability requirements.
Buildability refers to the resistance of freshly printed materials to hold their shape under their own weight and the weight of subsequent layers without collapse (either buckling or plastic collapse) [25,26]. It is essential to evaluate possible failure criteria, including elastic buckling, plastic collapse, and their combination [13,14]. Thus, the extruded materials should have enough yield strength to minimize the deformation at the bottom layers; otherwise, the excessive applied stress from the weight of the upper layer(s) would result in plastic collapse. Additionally, the elastic buckling should also be evaluated, especially in the slender shape [11,17]. In this study, the buildability of 3D printed concrete is measured in terms of the number of layers that can be printed for each mix. This characteristic gave insight into the effect of lightweight aggregate on the maximum height that can be continuously printed with lightweight concrete mixtures.
Previous research on the 3D printing of lightweight concrete has provided valuable insights and knowledge in this field. Cuevas et al. [7] investigated the rheological, thermal, and mechanical properties of 3D printable lightweight concrete using waste glass (WG) sand and expanded thermoplastic microspheres (ETMs) to replace natural aggregates. The addition of WG and ETMs resulted in accelerating and retarding effects, respectively. Moreover, the rheological behavior was changed by the ETM spherical particles, where the yield stress was reduced while plastic viscosity was improved. However, in the case of WG, both the yield stress and plastic viscosity were improved. The yield stress and plastic viscosity were 608 Pa and 548 Pa, 1.975 Pa.s, and 2.188 Pa.s for 50% and 100% content of ETM, respectively. However, the incorporation of 50% and 100% of WG led to yield stress values of 614 Pa and 737 Pa and a plastic viscosity of 1.575 Pa.s and 1.672 Pa.s, respectively. Furthermore, the buildability of ETM-enriched mixes was also improved due to the tailored rheological properties. As far as the mechanical properties are concerned, adding 50% WG improved the compressive and flexural strength; however, at 100% replacement, a decline in compressive strength was reported. In addition, the ETM has contrasting responses where mechanical properties were improved at 50% and 100% ETM contents. Inozemtcev and Duong [27] studied the efficiency of using high-strength, lightweight fiber-reinforced concrete in construction. The authors concluded that material consumption was reduced by 6.1–19.1%, machine hours were reduced by 29.6–37.4%, and useful space increased by 1.1–5.4%. However, the overall efficiency of construction considering both economic and technical aspects was 30.8–50.4%. Furthermore, Ting et al. [28] investigated the influence of recycled glass aggregates as a replacement for river sand in 3D printed concrete. The plastic viscosity and dynamic yield stress were reduced, which improved the flowability of the mix; however, the buildability was weaker during the printing process. Also, mechanical properties such as compressive, flexural, and tensile strength were decreased. Mohammad et al. [29] used expanded perlite to produce printable lightweight mixtures. The replacement of expanded perlite led to a decrement in compressive strength, thermal conductivity, and flexural strength. Similarly, various lightweight aggregates can be incorporated, including fly ash cenospheres or hollow glass microspheres, to produce low-density printable mixtures [30]. To discuss further, the introduction of fiber to the printing mixture can improve the cracking resistance and prevent deformation in the plastic state. Le et al. [18] investigated the printability of fiber-reinforced mix design by evaluating the extrudability by printing a 9 mm width straight printing path with a 300 mm length. The results indicated the successful printability without segregation and breakage when the shear strength of fresh reinforced mixtures is between 0.3 and 0.9 kPa. Lee et al. examined the effects of the printing speed (i.e., 50 mm/s, 75 mm/s, 100 mm/s, and 125 mm/s) on the width of curved path width, where they found that, as the printing speed increased to 75 mm/s, 100 mm/s, and 125 mm/s, the layer width decreased by 28%, 42%, and 51%, respectively. Kruger et al. [31] proposed a model to predict the combined effect of the printing speed and filament layer height on the structural buildup rate of the 3D-printed concrete. The present study endeavored to take advantage of the fiber reinforcement of the 3D printable lightweight concrete.
To design a printable cementitious mix, after ensuring the quality of printing per layer, it is necessary to see the effect of layer weight on the maximum printed height that concerns the buildability. The buildability of printing materials has been investigated through different test methods [11,21]. Among the proposed methods, printing different objects and recording the maximum number of layers causing the failure is common [18,21,32,33], while shape retention under the dead load was also proposed as the method to assess the buildability of 3D printable cementitious materials at the fresh state [34,35].
This research paper explores the potential benefits of using lightweight aggregates, such as pumice and expanded glass, in large-scale 3D printing for the construction industry. It investigates the fresh and hardened properties of lightweight cementitious mixes and builds upon previous work in this area [36]. This paper investigated the potential of using lightweight aggregates to make 3D printed lightweight concrete. In this regard, the physical properties of 3D printed lightweight concrete in terms of density and porosity were evaluated. The fresh properties of 3D printed concrete were investigated to assess the effect of fiber reinforcement and viscosity modifying agent to reduce early age cracking and improve the quality of printing. In addition to the effect of mold casting and 3D printing, other parameters such as the type and content of sand and fiber reinforcement were analyzed for a compressive strength test.
2. Materials and Methods
2.1. Materials
Type I/II ordinary Portland cement (C) supplied by GCC Cement in New Mexico, meeting the requirements of ASTM C150 [37] for Type I/II, was used [38]. Additionally, silica fume (SF) with an average particle size of d50 = 0.15 μm and a bulk density of 2.2 kg/m³ was used. The dry binder (B) of all mixes consisted of a combination of C and SF whose chemical compositions are presented in Table 1.
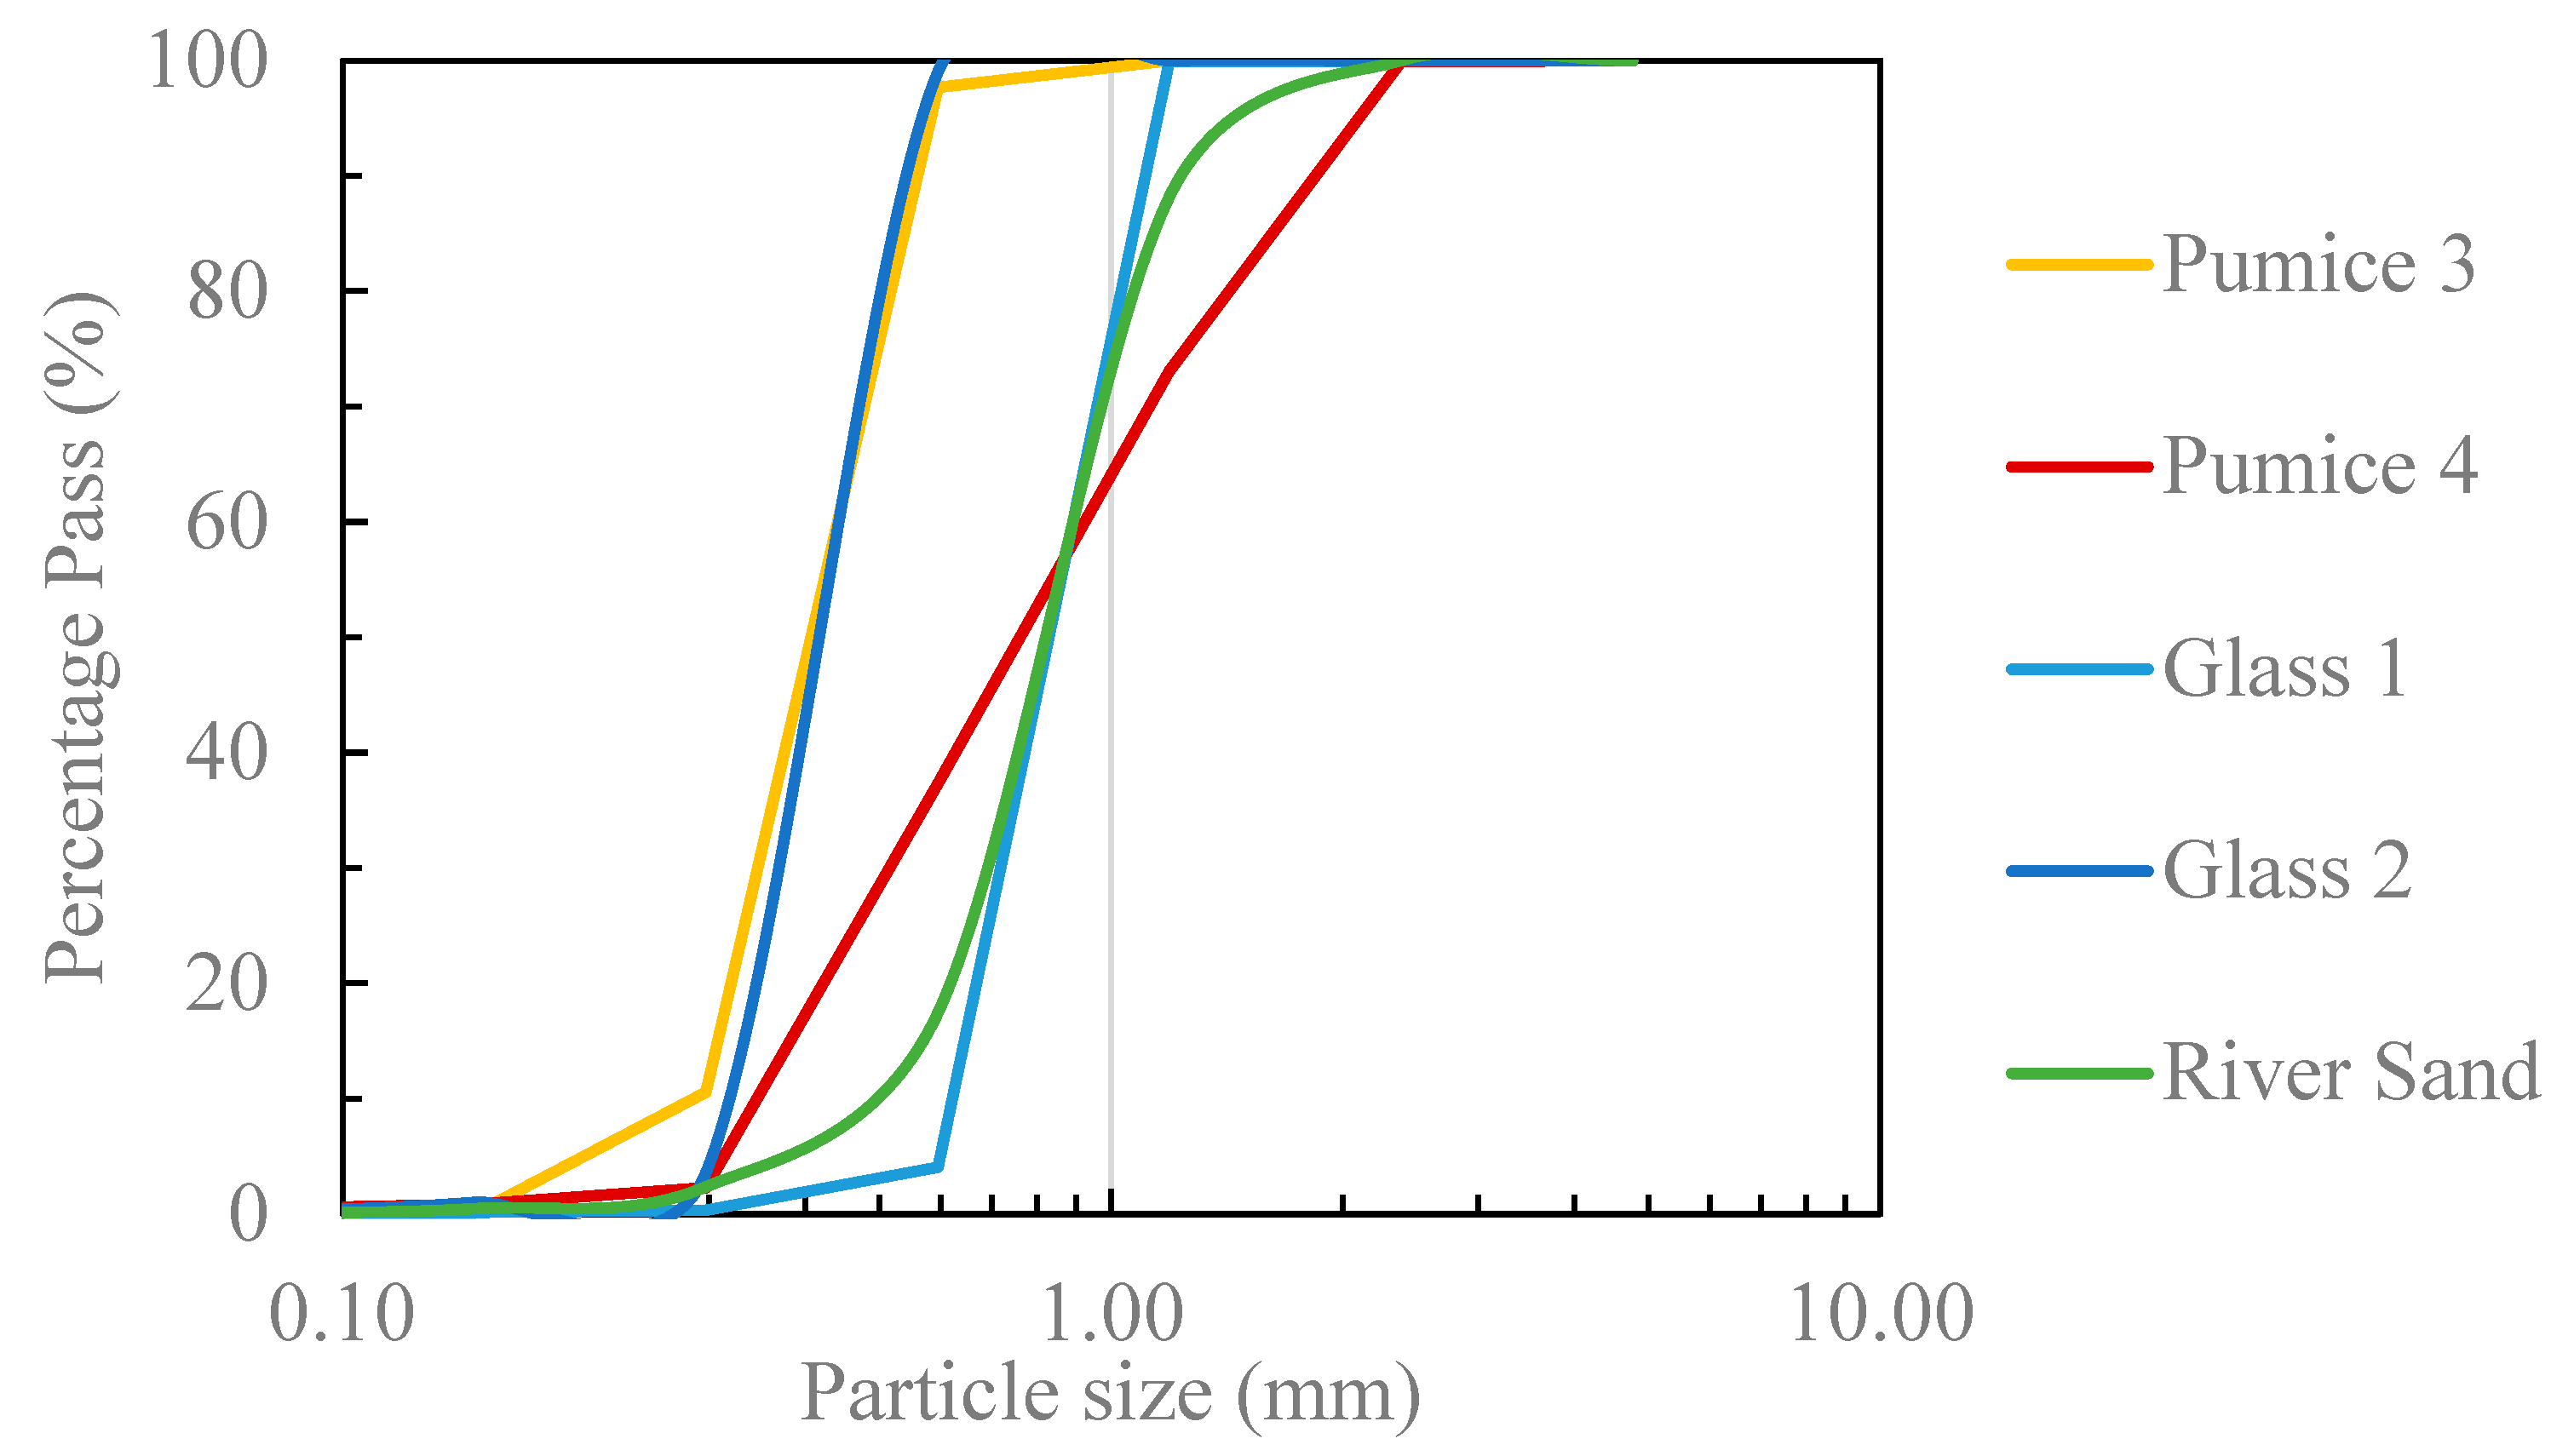
A control mix was formulated using a normal weight aggregate to assess the performance of lightweight aggregates. The control mix used natural river sand (RS) with a dry specific gravity of 2.59 and an absorption capacity of 0.44%. Two different grades of pumice and expanded glass were used to design the lightweight mixes. Poraver supplied the expanded glass in two different grades: Grade 1, with a specific gravity of 0.55, named Glass 1, and Grade 2, with a specific gravity of 0.43, named Glass 2. Pumice was supplied by CR Minerals in New Mexico in two grades, comprising Grade 3, named Pumice 3, and Grade 4, named Pumice 4. The chemical composition of the lightweight aggregate is reported in Table 1. Figure 1 shows the gradation curve of RS [39], Glass 1, Glass 2, Pumice 3, and Pumice 4. Table 2 displays the physical properties of these three aggregates, including the specific gravity, absorption, and thermal conductivity used in this paper. To achieve a diverse particle size distribution within each category of lightweight aggregate, the various grades of expanded glass (Glass 1 and 2) and the two grades of pumice (Pumice 3 and 4) were carefully blended.
All designed mixes include 0.002% of the total mix’s weight proportion of ADVA 195, high-range water reducer (HRWR) with a polycarboxylate composition, designed to comply with the requirements outlined in ASTM C494 [40]. Furthermore, a viscosity-modifying admixture (MC) was utilized in set-2 and set-3 of the mixes to tailor the rheological properties and enhance the printing quality of lightweight cementitious mixes, and Table 3 displays its properties. To mitigate the early age cracks of 3D printed filaments, the PE fibers were added by 0.35% of the total volume of each mix. The properties of the PE fiber are shown in Table 4.
This study investigates three sets of mixes, as displayed in Table 5, including:
- Set-1(S1): S1 includes five distinct mixes (M1–M5) based on previous research findings [36]. M1 represents a control mix with normal weight aggregate, serving as a reference or control mix. In M2 and M4, half of the normal weight aggregate (RS) volume was substituted with lightweight aggregates (a combination of two grades of pumice and glass, as previously described). In M3 and M5, the normal weight aggregate (RS) was entirely replaced with lightweight aggregates. S1 aims to assess the overall printability of lightweight mixes by comparing them to the normal-weight mix (M1).
- Set-2(S2): S2 comprises five mixes (MC1–MC5) created by incorporating 0.007 (wt%) MC of binder content into M1–M5 developed in S1. The objective of S2 was to investigate the impact of adding a viscosity-modifying agent on the printability of lightweight mixes. The content of MC was determined through several trials to achieve the desired fresh performance.
- Set-3 (S3): S3 consists of five mixes (FRM1–FRM5) created by incorporating PE fiber (0.35% of the total volume of each mix) into MC1–MC5 developed in S2. The designed mixes in S3 aimed to minimize the occurrence of early age cracks. The fiber content was determined by evaluating various levels to ensure the production of crack-free filaments.

Table 3.
Properties of MC as viscosity-modifying admixture.
| Material | Viscosity (cP) | Degree of Substitution | Methoxy Substitution | Molecular Weight |
|---|---|---|---|---|
| MC | 15 | 1.5–1.9 | 27.5–31.5 | 14,000 |
Table 4.
Properties of PE fibers.
| Material | Diameter (microns) | Length (mm) | Specific Gravity | Tensile Strength (MPa) | Flexural Strength (GPa) | Color |
|---|---|---|---|---|---|---|
| PE Fibers | 15 | 8 | 0.97 | 3000 | 100 | White |
Across all fifteen formulations spanning S1–S3, the initial water-to-binder (W/B) content was established at a consistent ratio (W/B = 0.3). This initial ratio was then fine-tuned individually for each mixture, considering both the specific flowability (as determined by the flow table test) and the requisite buildability criteria. As explained in Section 3.1 and Section 3.3, the pronounced porosity exhibited by the lightweight aggregate engendered heightened water absorption. Consequently, the application of a uniform W/B ratio of 0.3 proved unsuitable for all mixtures, as certain mixes displayed drying and non-printability. Ultimately, a decision was made to calibrate the W/B ratio to ensure the printability of each distinct mixture. The corresponding adjustments in water content for each formulation are comprehensively presented in Table 5.
Table 5.
Mix proportions of designed lightweight cementitious mixes.
| Set | Mix ID | Aggregate (Agg)-vol(%) | C/B (wt) | SF/B (wt) | Agg/B (wt) | Adjusted W/B (wt) | MC (wt%) | HRWR (wt%) | PE Fibers (vol%) | ||
|---|---|---|---|---|---|---|---|---|---|---|---|
| RS/Agg | Glass/Agg | Pumice/Agg | |||||||||
| S1 | M1 | 100 | 0.00 | 0.00 | 0.85 | 0.15 | 0.62 | 0.29 | 0.00 | 0.002 | 0.00 |
| M2 | 50 | 0.00 | 50 | 0.85 | 0.15 | 0.62 | 0.30 | 0.00 | 0.002 | 0.00 | |
| M3 | 0.00 | 0.00 | 100 | 0.85 | 0.15 | 0.62 | 0.35 | 0.00 | 0.002 | 0.00 | |
| M4 | 50 | 50 | 0.00 | 0.85 | 0.15 | 0.62 | 0.32 | 0.00 | 0.002 | 0.00 | |
| M5 | 0.00 | 100 | 0.00 | 0.85 | 0.15 | 0.62 | 0.33 | 0.00 | 0.002 | 0.00 | |
| S2 | MC1 | 100 | 0.00 | 0.00 | 0.85 | 0.15 | 0.62 | 0.30 | 0.005 | 0.002 | 0.00 |
| MC2 | 50 | 0.00 | 50 | 0.85 | 0.15 | 0.62 | 0.35 | 0.005 | 0.002 | 0.00 | |
| MC3 | 0.00 | 0.00 | 100 | 0.85 | 0.15 | 0.62 | 0.35 | 0.005 | 0.002 | 0.00 | |
| MC4 | 50 | 50 | 0.00 | 0.85 | 0.15 | 0.62 | 0.35 | 0.005 | 0.002 | 0.00 | |
| MC5 | 0.00 | 100 | 0.00 | 0.85 | 0.15 | 0.62 | 0.33 | 0.005 | 0.002 | 0.00 | |
| S3 | FRM1 | 100 | 0.00 | 0.00 | 0.85 | 0.15 | 0.62 | 0.33 | 0.005 | 0.002 | 0.350 |
| FRM2 | 50 | 0.00 | 50 | 0.85 | 0.15 | 0.62 | 0.35 | 0.005 | 0.002 | 0.350 | |
| FRM3 | 0.00 | 0.00 | 100 | 0.85 | 0.15 | 0.62 | 0.38 | 0.005 | 0.002 | 0.350 | |
| FRM4 | 50 | 50 | 0.00 | 0.85 | 0.15 | 0.62 | 0.34 | 0.005 | 0.002 | 0.350 | |
| FRM5 | 0.00 | 100 | 0.00 | 0.85 | 0.15 | 0.62 | 0.32 | 0.005 | 0.002 | 0.200 | |
Note: wt = weight; vol = volume; Agg = aggregate; B = binder, MC = methylcellulose; HRWR = high-range water reducer; PE = polyethylene.
The mixing procedure involves 5 min dry mixing at a low speed plus 5 min of adding water to reach a consistent mix. Also, this procedure was extended by 5 min for the fiber-reinforced mixes, including 2 min at low speed, and then the speed was increased to medium to ensure the uniform dispersion of fibers within the mix.
2.2. Methods
This experimental study encompasses various aspects, including surface morphology and microscopic properties, fresh properties (setting time, rheology, and printability), and hardened properties (physical properties and compressive strength of both cast and 3D printed samples). The following section provides a detailed explanation of the test methods employed.
2.2.1. Surface Morphology and Microscopic Properties
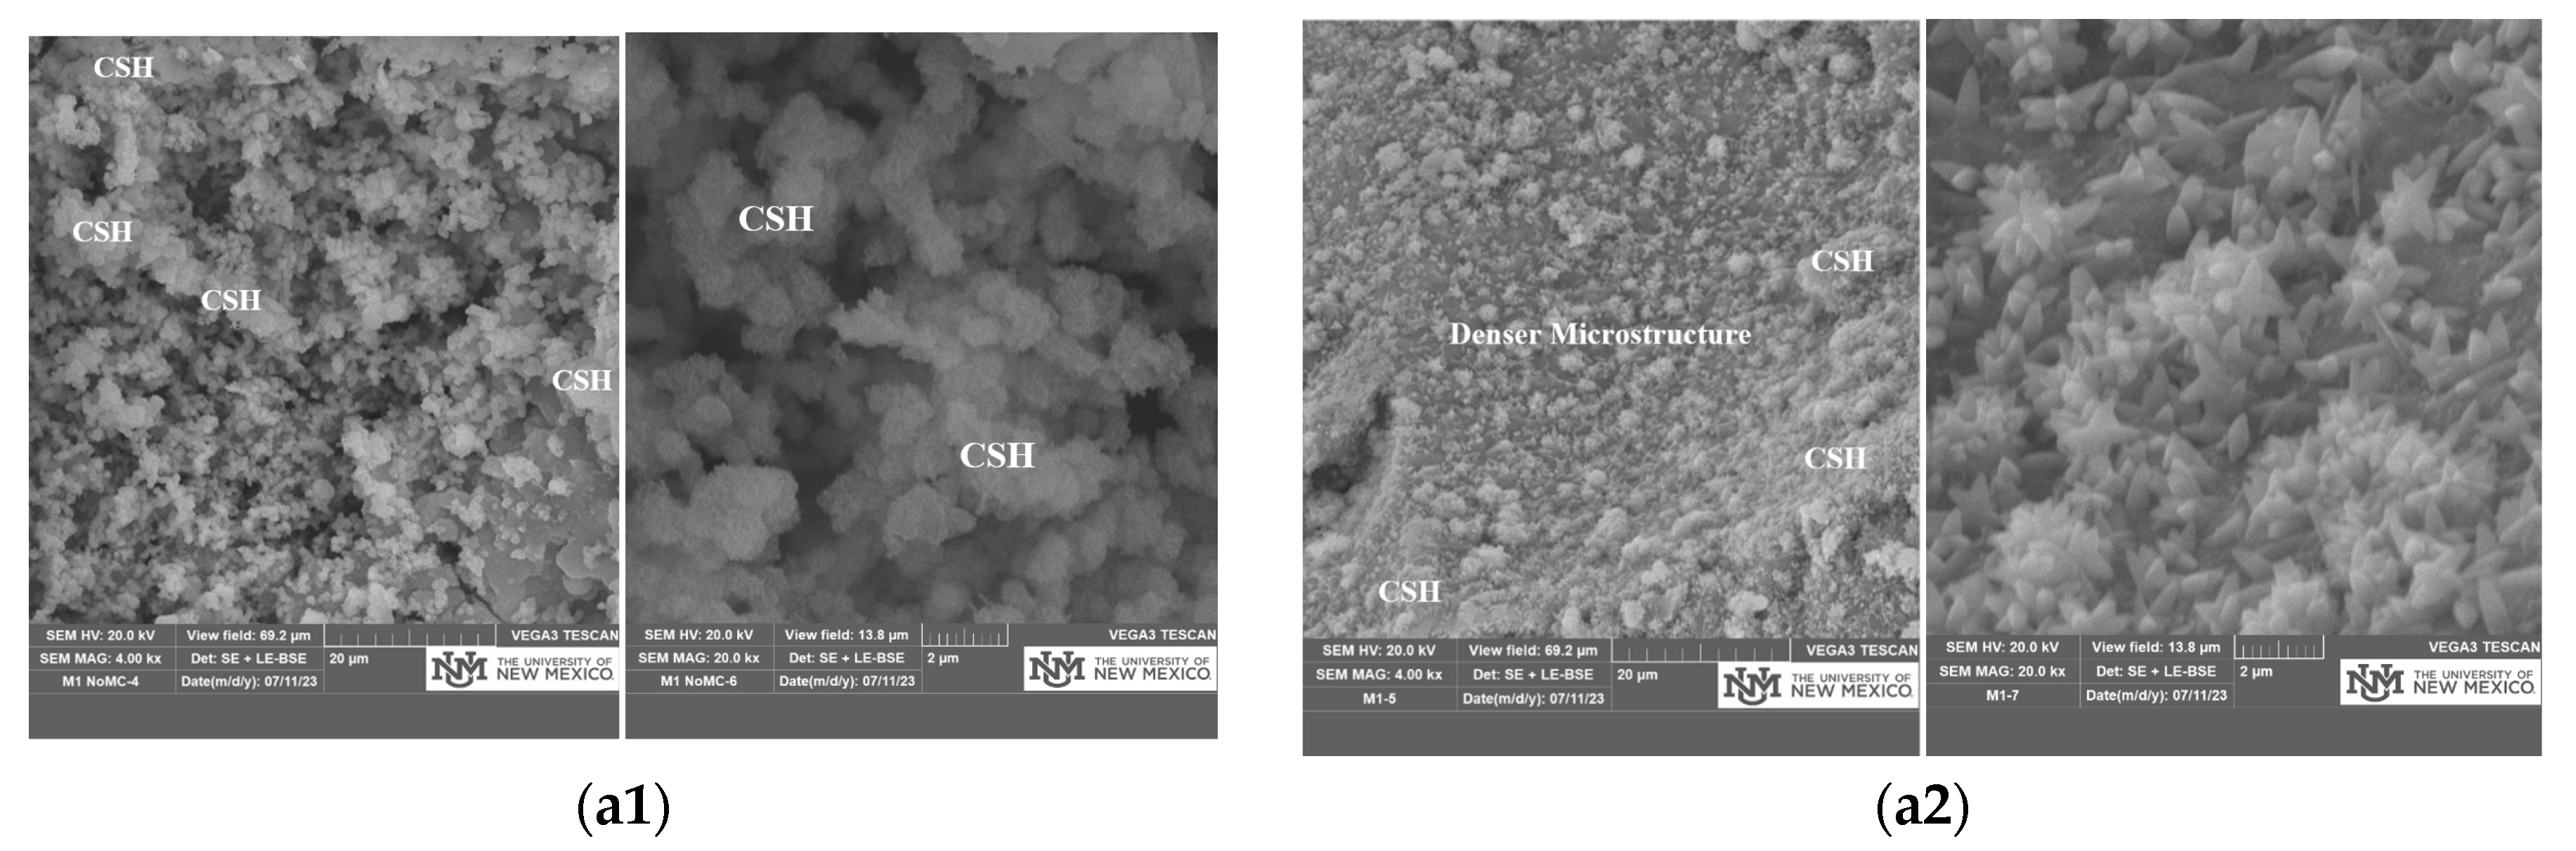
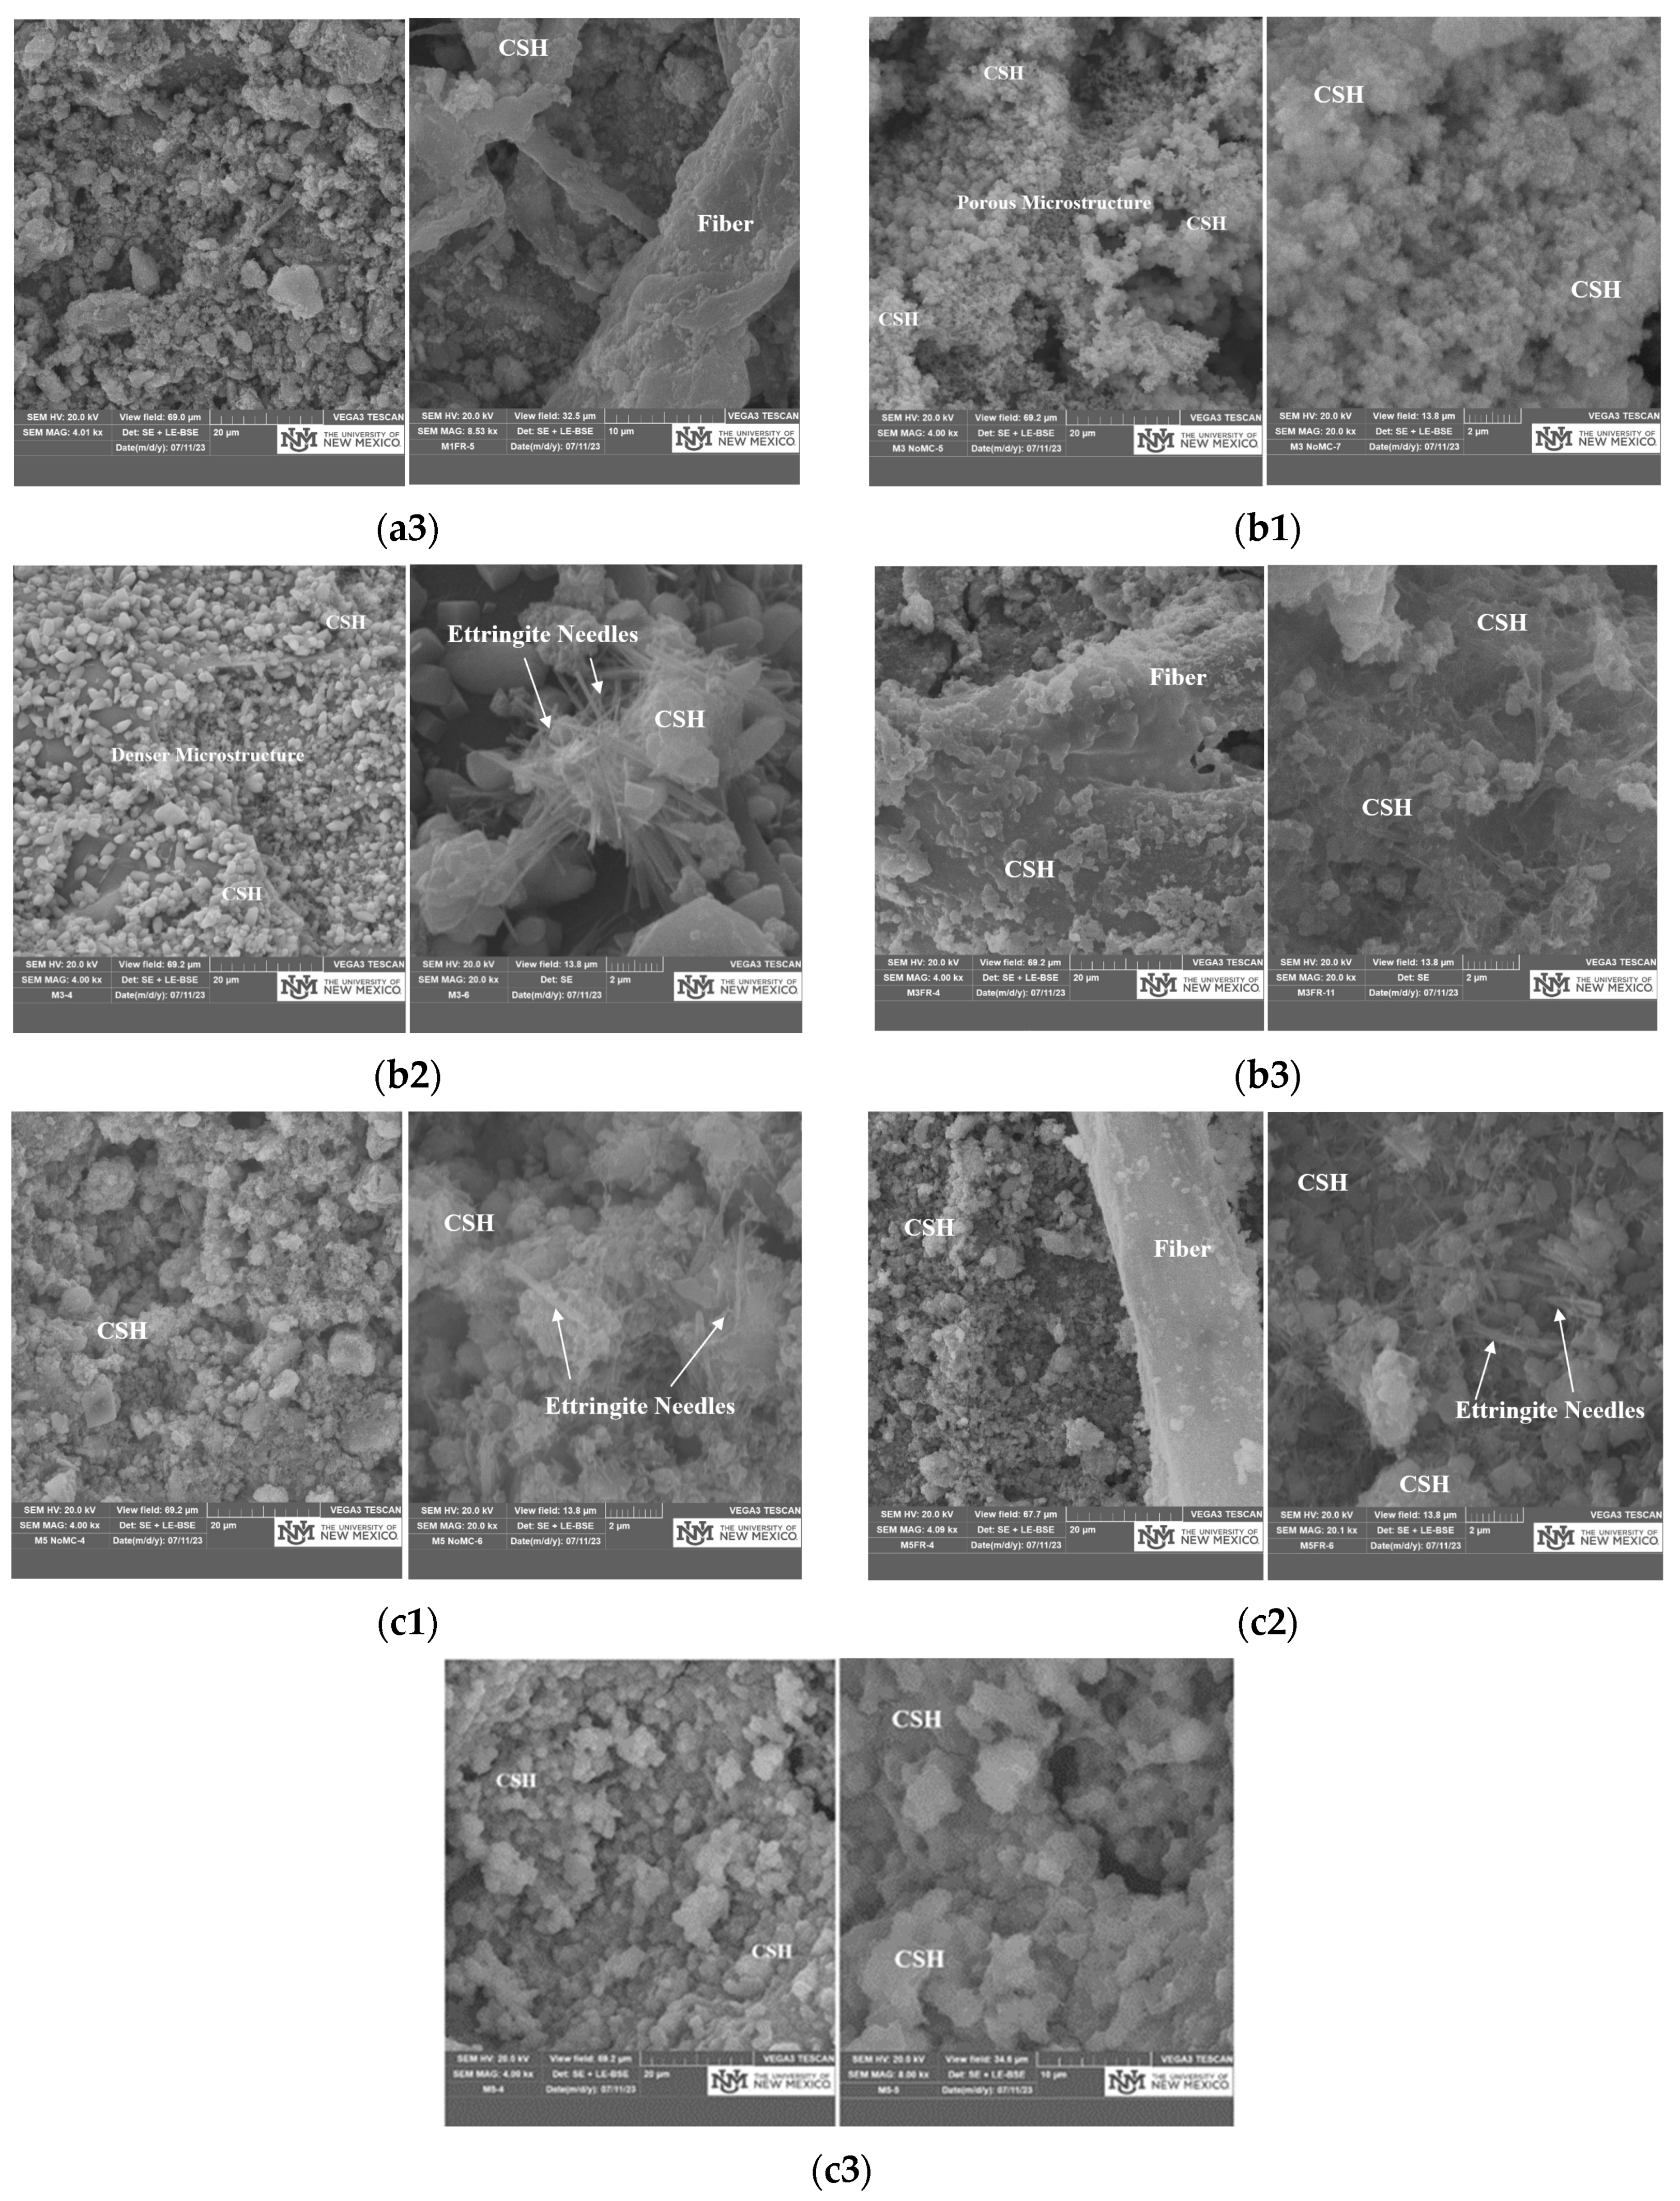
Understanding cementitious mixes’ rheology and water requirements relies significantly on the aggregate shape. Scanning electron microscopy (SEM) was employed to investigate the particle shape and various aggregate types and micro images of three distinct mixes (M1, M3, and M5) in each set (S1, S2, and S3). The SEM micro images facilitated a comparative assessment of the aggregate surface topography, particle, and grain shape within each aggregate, as well as the pore distribution in different mixes, considering aggregate type, MC, and fiber inclusion. Additionally, their microscopic properties significantly influence the mechanical and physical characteristics of cementitious materials. These properties are influenced by the interfacial transition zones (ITZs) that exist between the various phases of the matrix, such as the ITZ between the cement paste and aggregates and the ITZ between cement paste and fibers [41,42]. The distribution of hydration products, notably ettringite, CSH (calcium silicate hydrate), and CH (calcium hydroxide), with an emphasis on CSH, plays a crucial role. Therefore, comprehensive SEM analysis was dedicated to investigating these aspects.
The test was performed using JEOL 5800LV SEM equipped with the secondary and backscattered electron and cathodoluminescence (CL) imaging detectors at the Institute of Meteoritics, University of New Mexico. The samples were prepared by sawing pieces with the dimension of 10 mm × 10 mm × 10 mm from the printed prism and then in the oven at 110 °C for 48 h. Then, the dried oven samples were coated for the SEM test.
2.2.2. Fresh Properties
To investigate the printability of designed mixes in terms of their fresh properties, a series of experiments were conducted to establish the relationship between the fresh characteristics and the printing performance of 3D printed elements, including extrudability, shape retention, and buildability, which are all explained herein.
Flow Table Test
The quick preliminary flow test of mortars was performed following ASTM C1437–15 to determine the adequacy of the adjusted water content for each mix. To perform this test, the fresh mix was placed in the center of the flow table, filling half of the cone. The material was then tamped 20 times, followed by adding a second layer to fill the cone, tamping it as specified for the first layer. Excess material on the cone’s surface was removed, and the cone was gently lifted. Subsequently, the flow table was dropped 25 times within 15 s, and the diameter of specimens was measured following the end of the test. Finally, an average of three replicates was calculated for each mix.
Setting Time
The initial setting time of the designed mixes was determined according to ASTM C 191–19 [43]. To just see the effect of lightweight aggregate, the setting characteristics of M1, M3, and M5 were measured. Additionally, to evaluate the impact of MC and Fiber incorporation on setting properties, the setting of MC1, MC3, MC5, and FRM1, FRM 3, and FRM 5 were measured. The mixed materials were placed in a mold for the Vicat needle test in this test. After being conditioned in the moisture room for 30 min after mixing, the remaining procedures for the setting time test were carried out according to ASTM C 191–19 [43].
Rheology
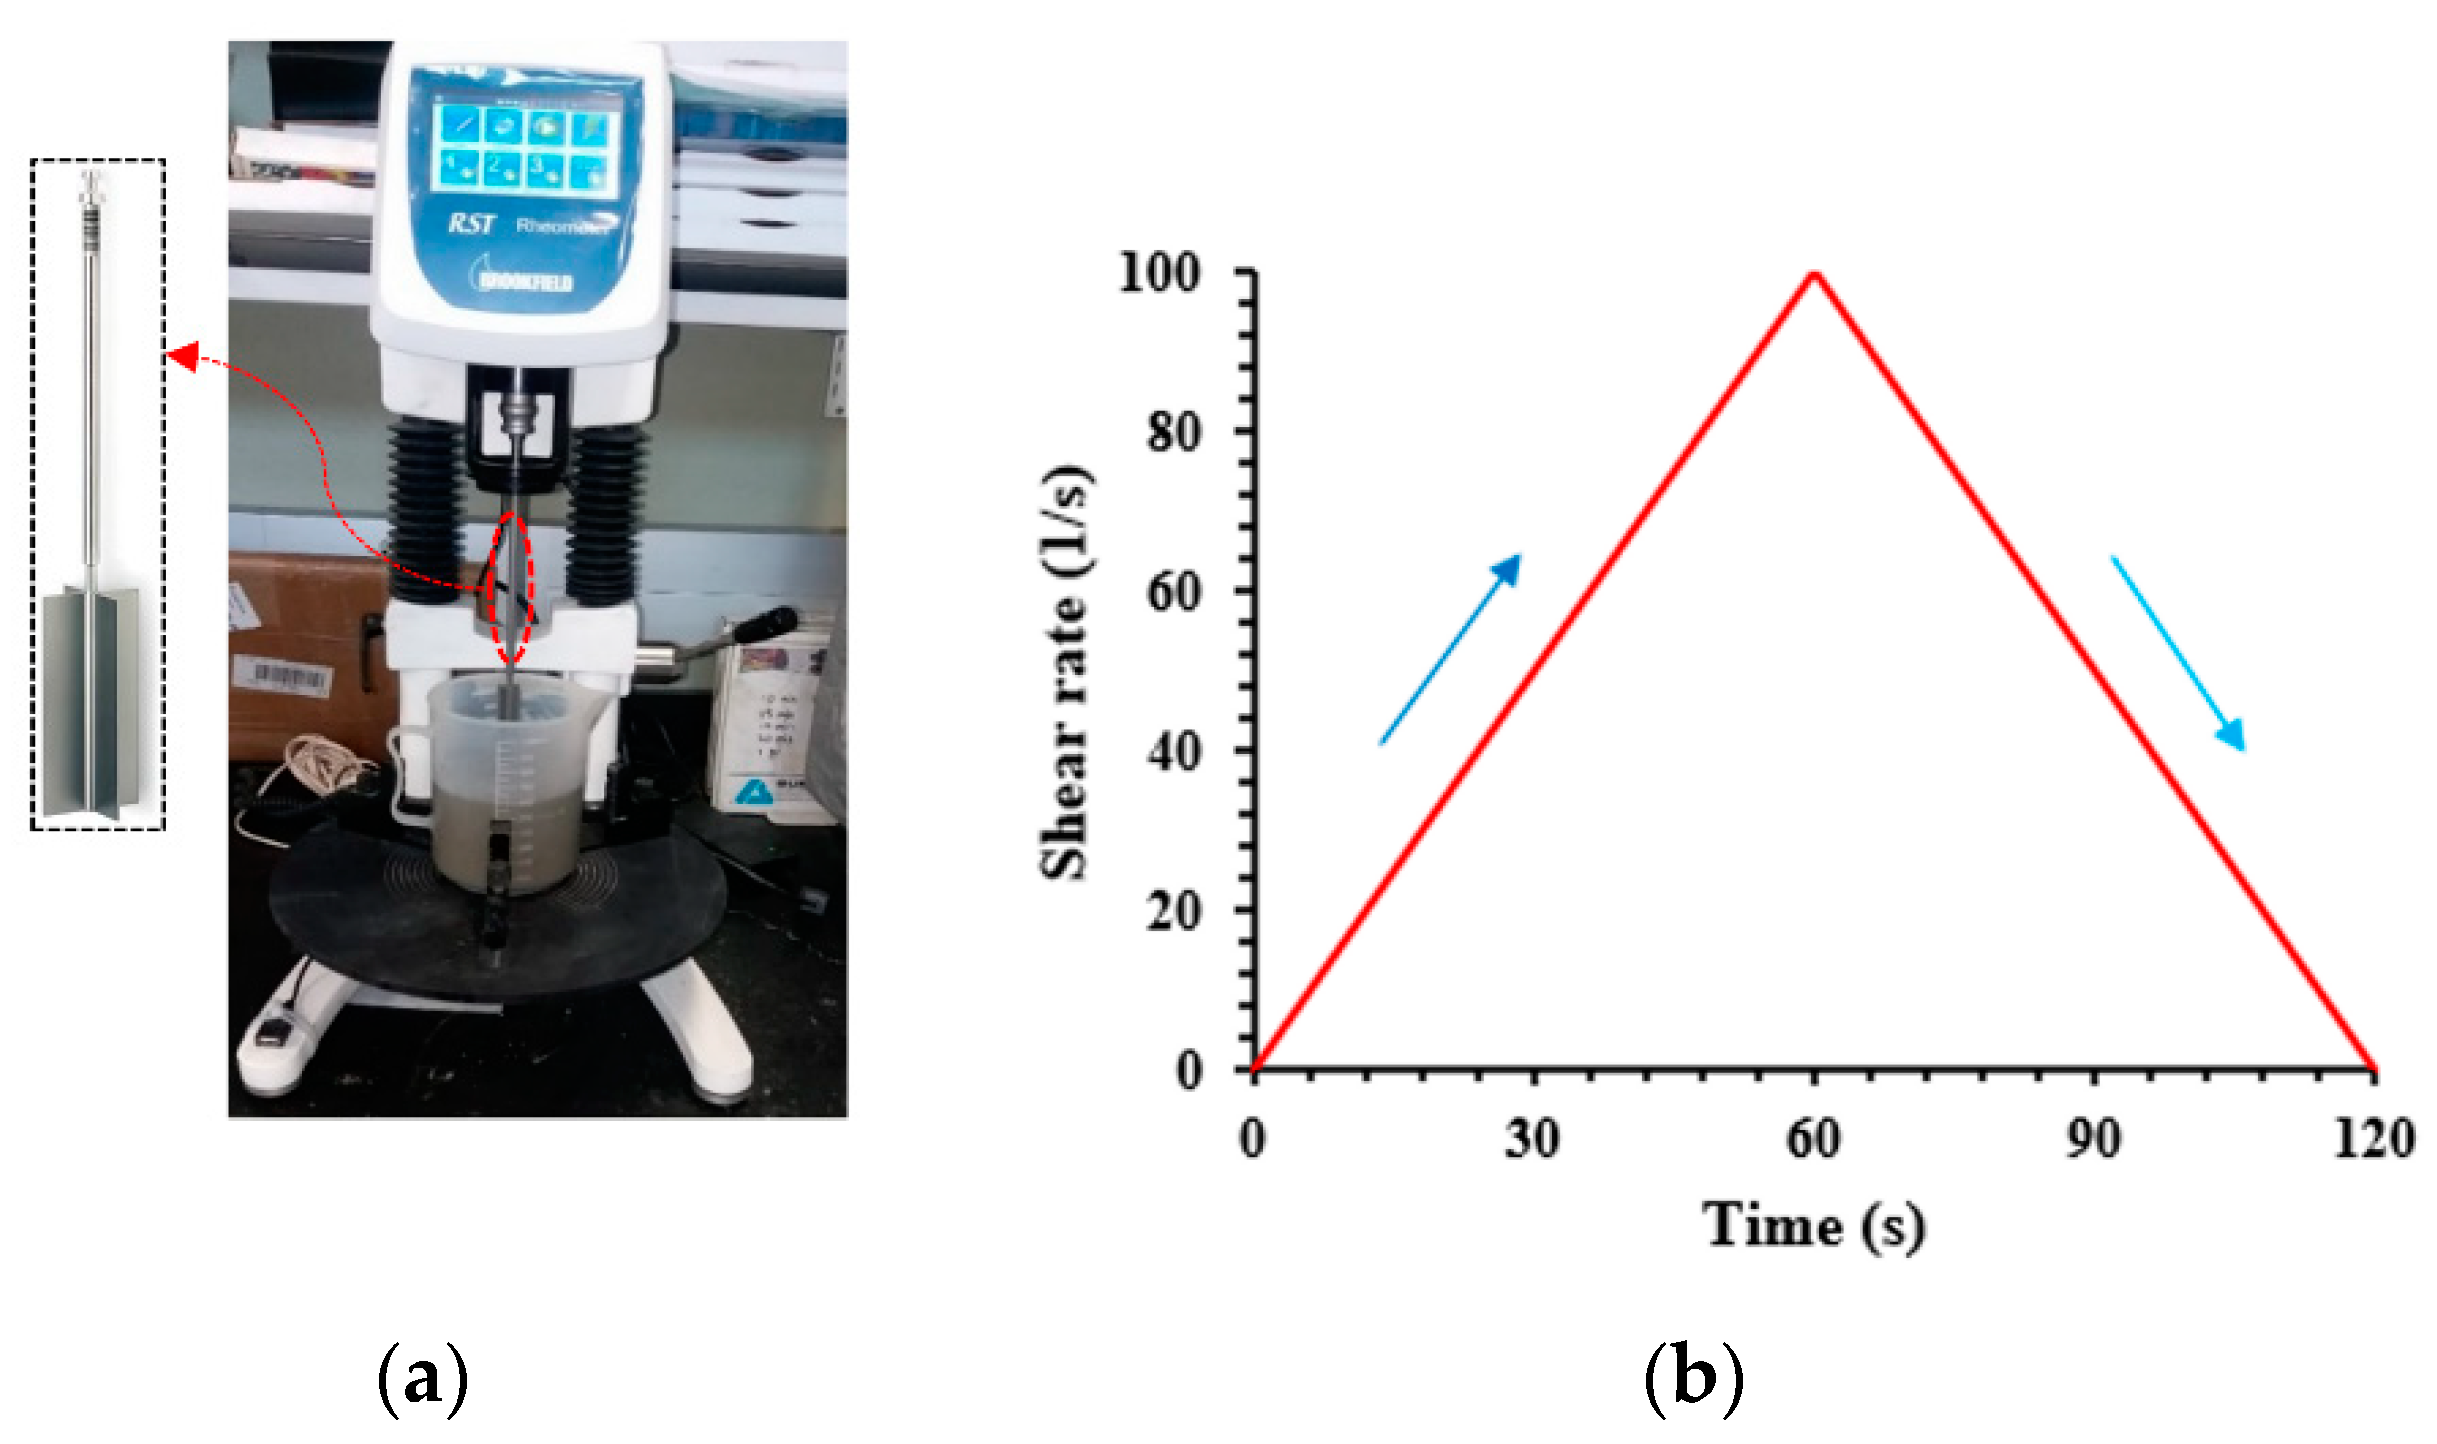
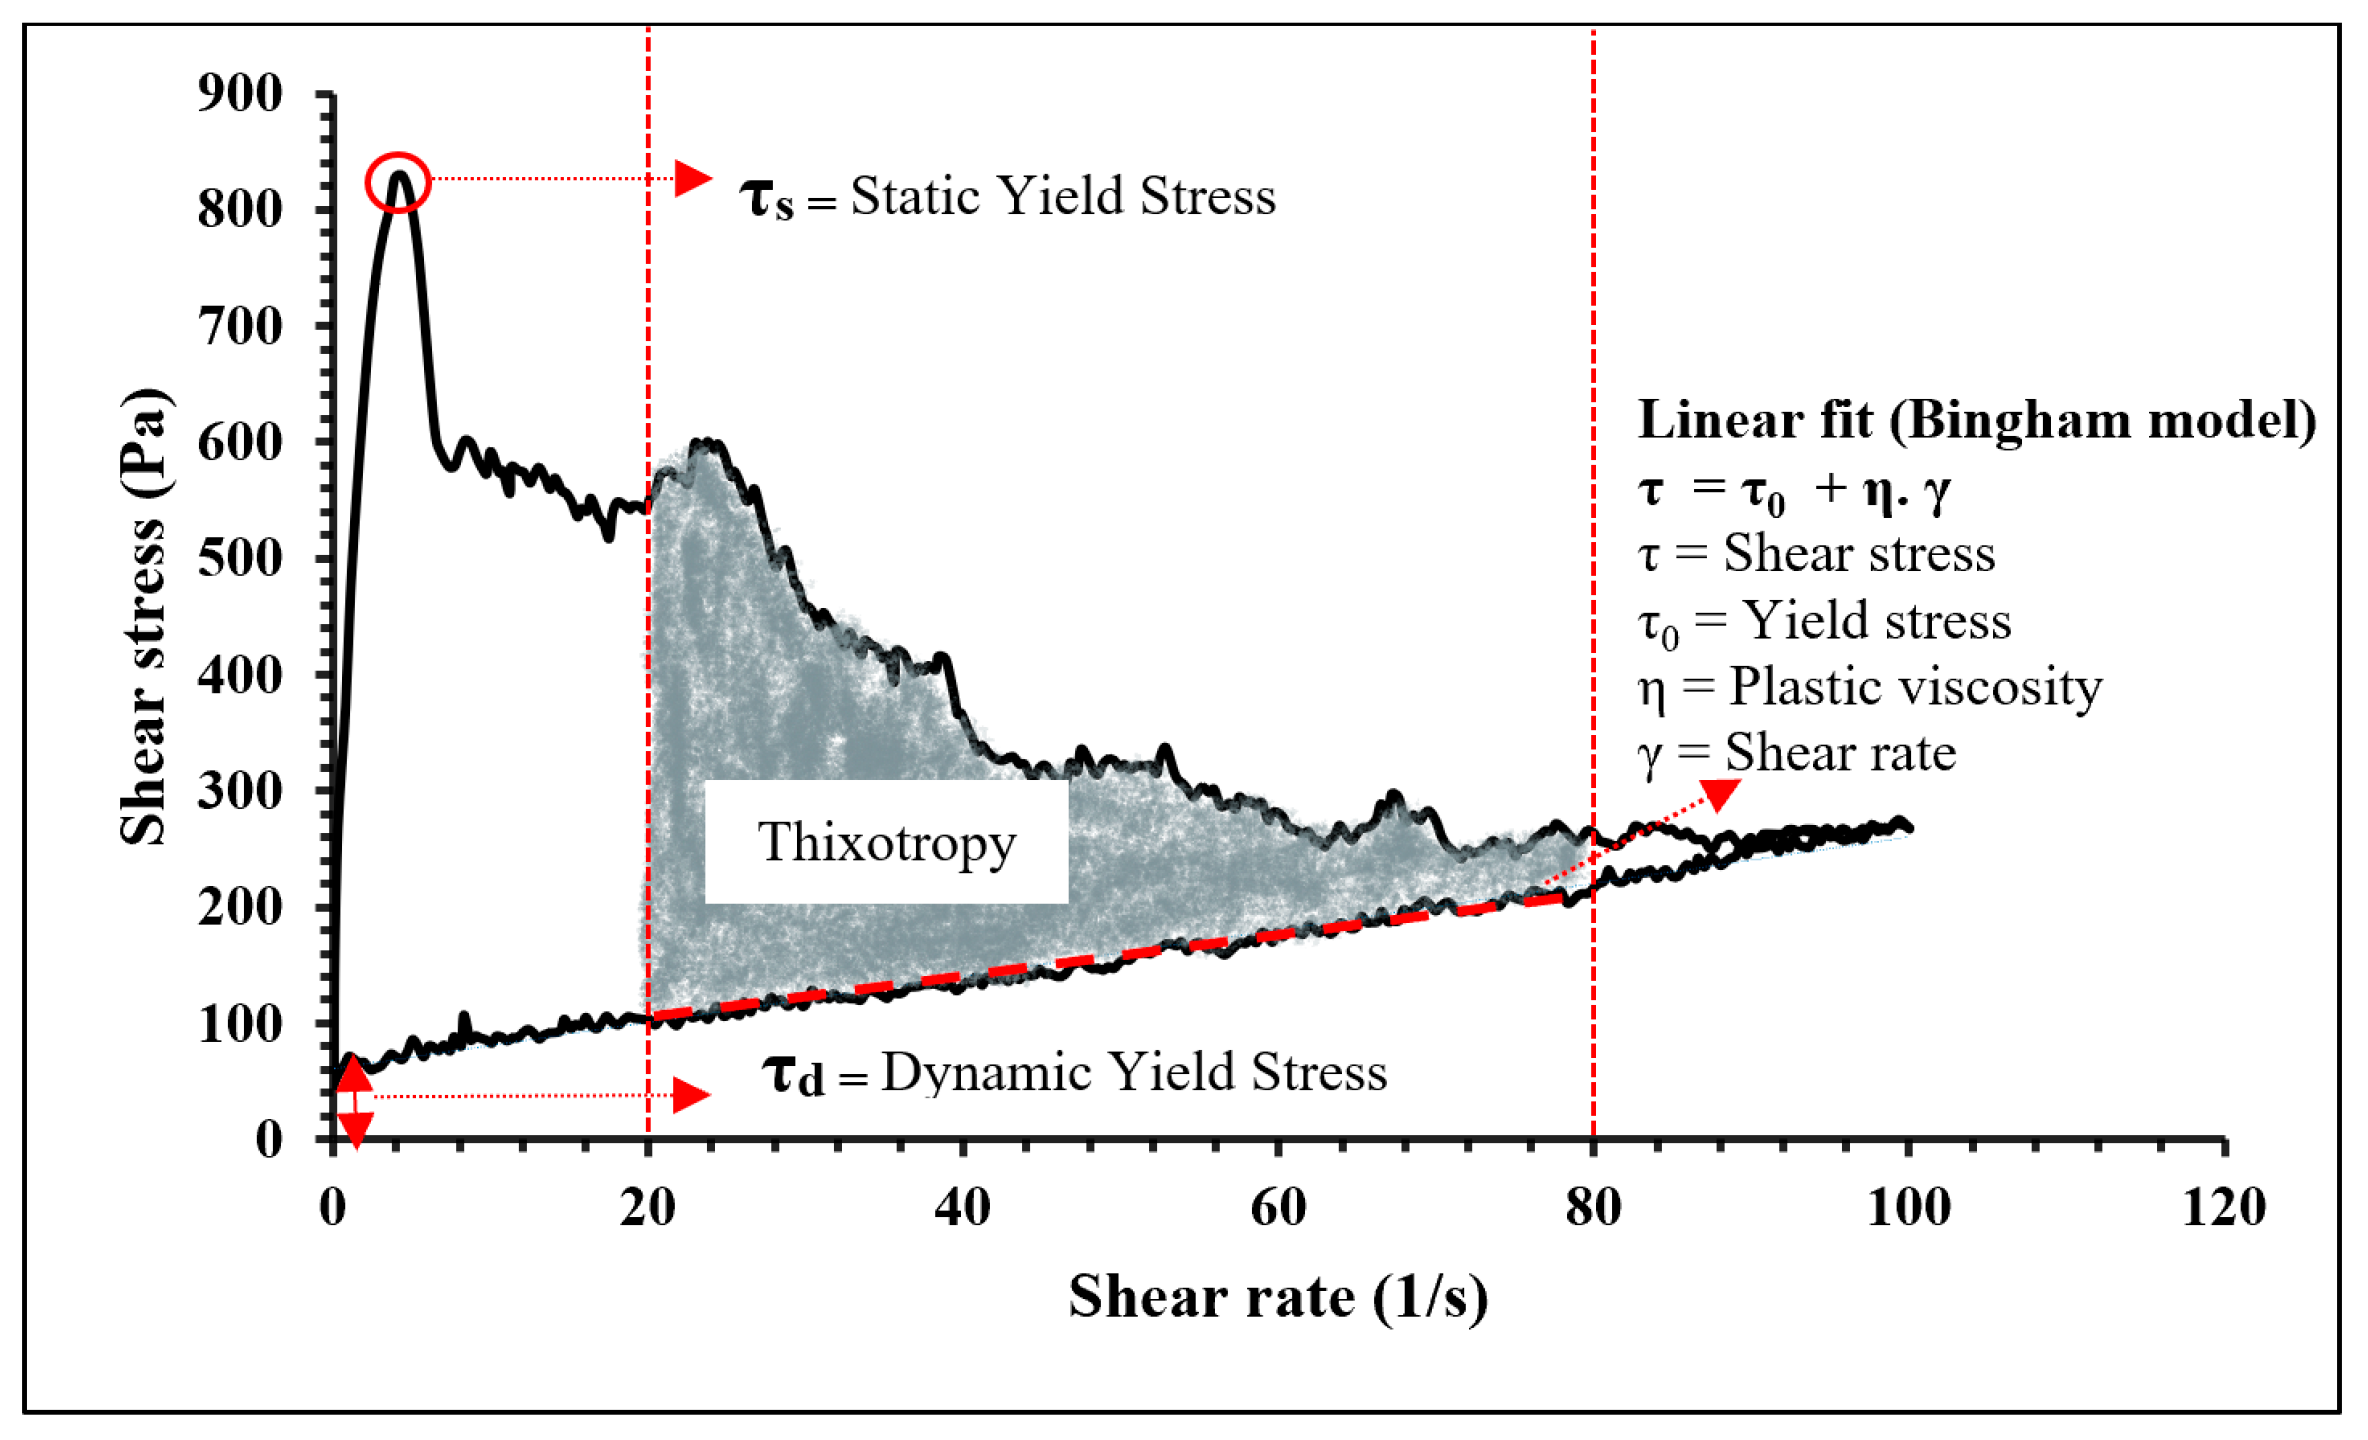
Rheological evaluations of lightweight mixes were carried out utilizing a Brookfield Rheometer RST-SST equipped with a vane spindle VT-40–20 (length = 40 mm, diameter = 20 mm). Rheology measurements were obtained employing the hysteresis technique, adapted from the existing literature [44], as shown in Figure 2 and Figure 3. The concrete mixes underwent rheological measurements for a total duration of 120 s. The initial 60 s encompassed a gradual increase in shear rate from 0 s−1 to 100 s−1, followed by a decrease from 100 s−1 back to 0 s−1 during the final 60 s. The Bingham model was utilized to analyze the various rheological parameters, as depicted in Figure 3. Each mixture underwent the experiment three times, and the average readings were recorded. The measurements were conducted under controlled environmental conditions, with regulated temperature and humidity levels.
Extrudability and Buildability
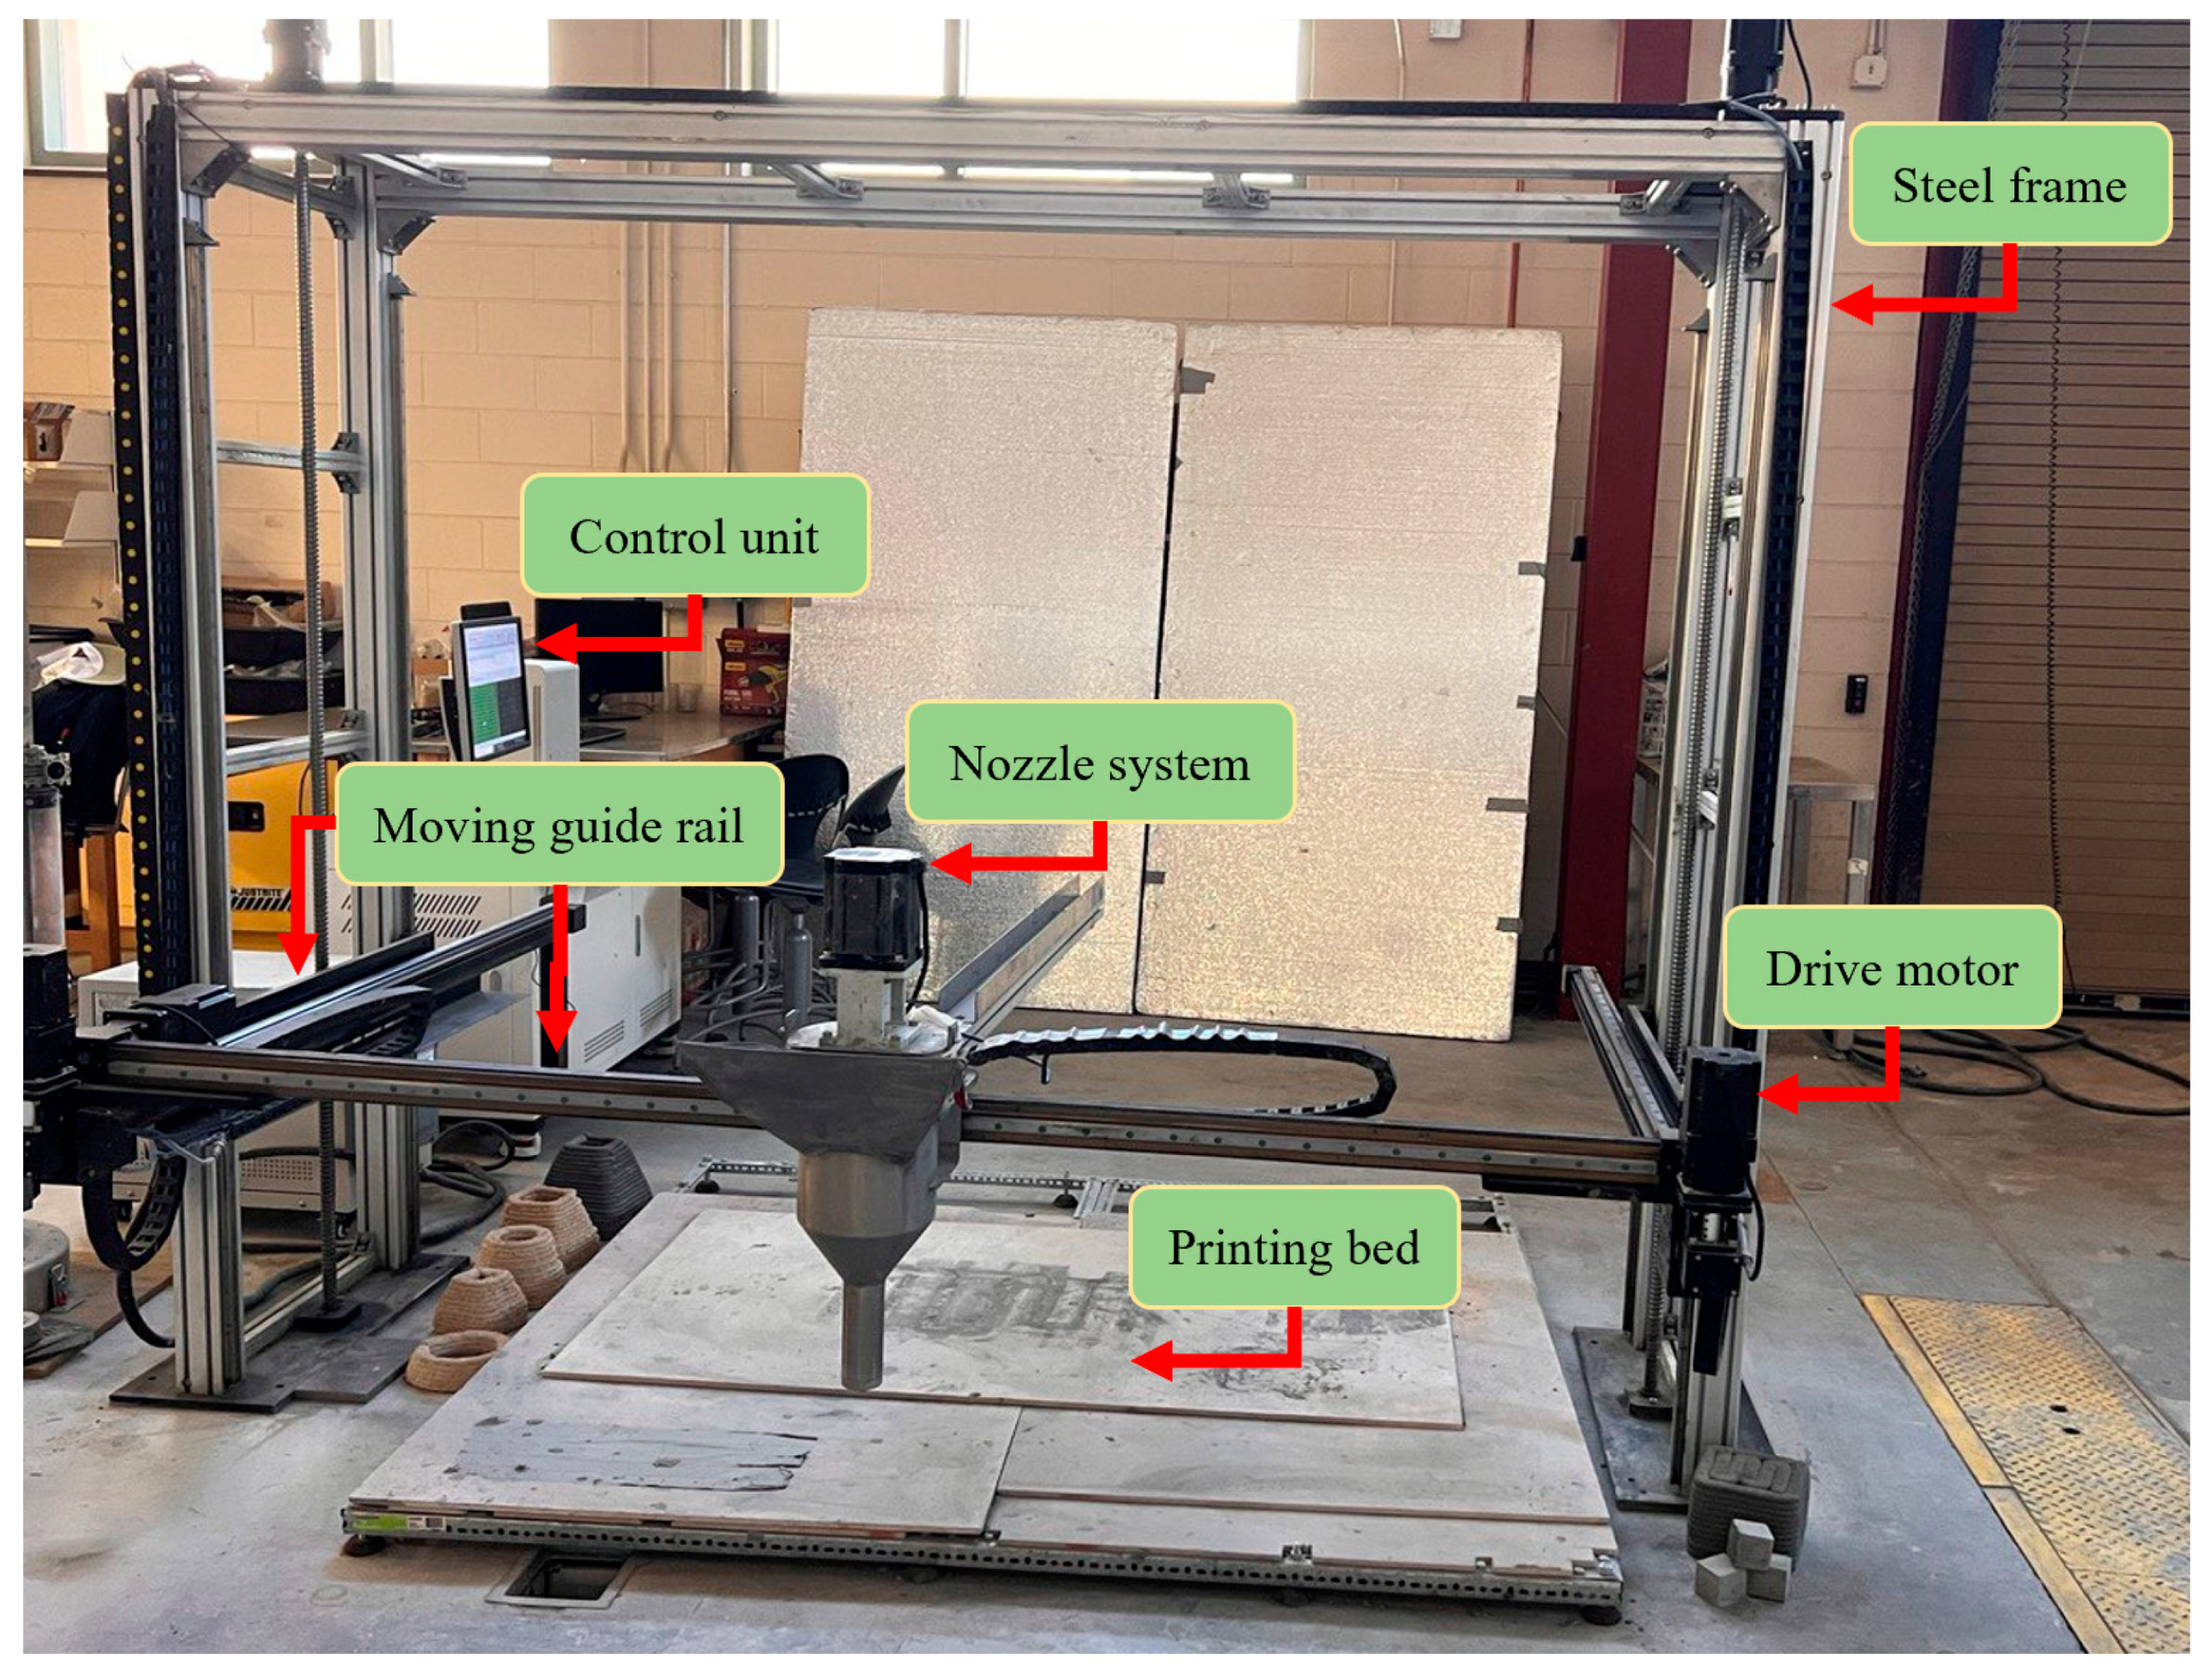
To evaluate the printability of the designed mixtures, a gantry 3D printer was employed within the Dana C. Wood Materials and Structures Lab at the University of New Mexico. The printing system comprises a control unit, a gantry robot, a concrete mixture, and a pump. The gantry system possesses three degrees of freedom. The control unit serves the purpose of interpreting STL files and converting them into G-code, a format readable by the system. Additionally, this control unit oversees the management of printing process parameters, including printing speeds along the horizontal axes (X and Y), vertical direction (Z), extrusion rate, infill pattern, nozzle diameter, and layer height. The nozzle system is guided by drive motors in horizontal and vertical directions, moving on guide rails. The configuration of the printing system and its constituent parts is illustrated in Figure 4. Throughout the printing process, a circular nozzle with a diameter of 20 mm was consistently utilized. Printability was evaluated based on two critical parameters: extrudability and buildability.
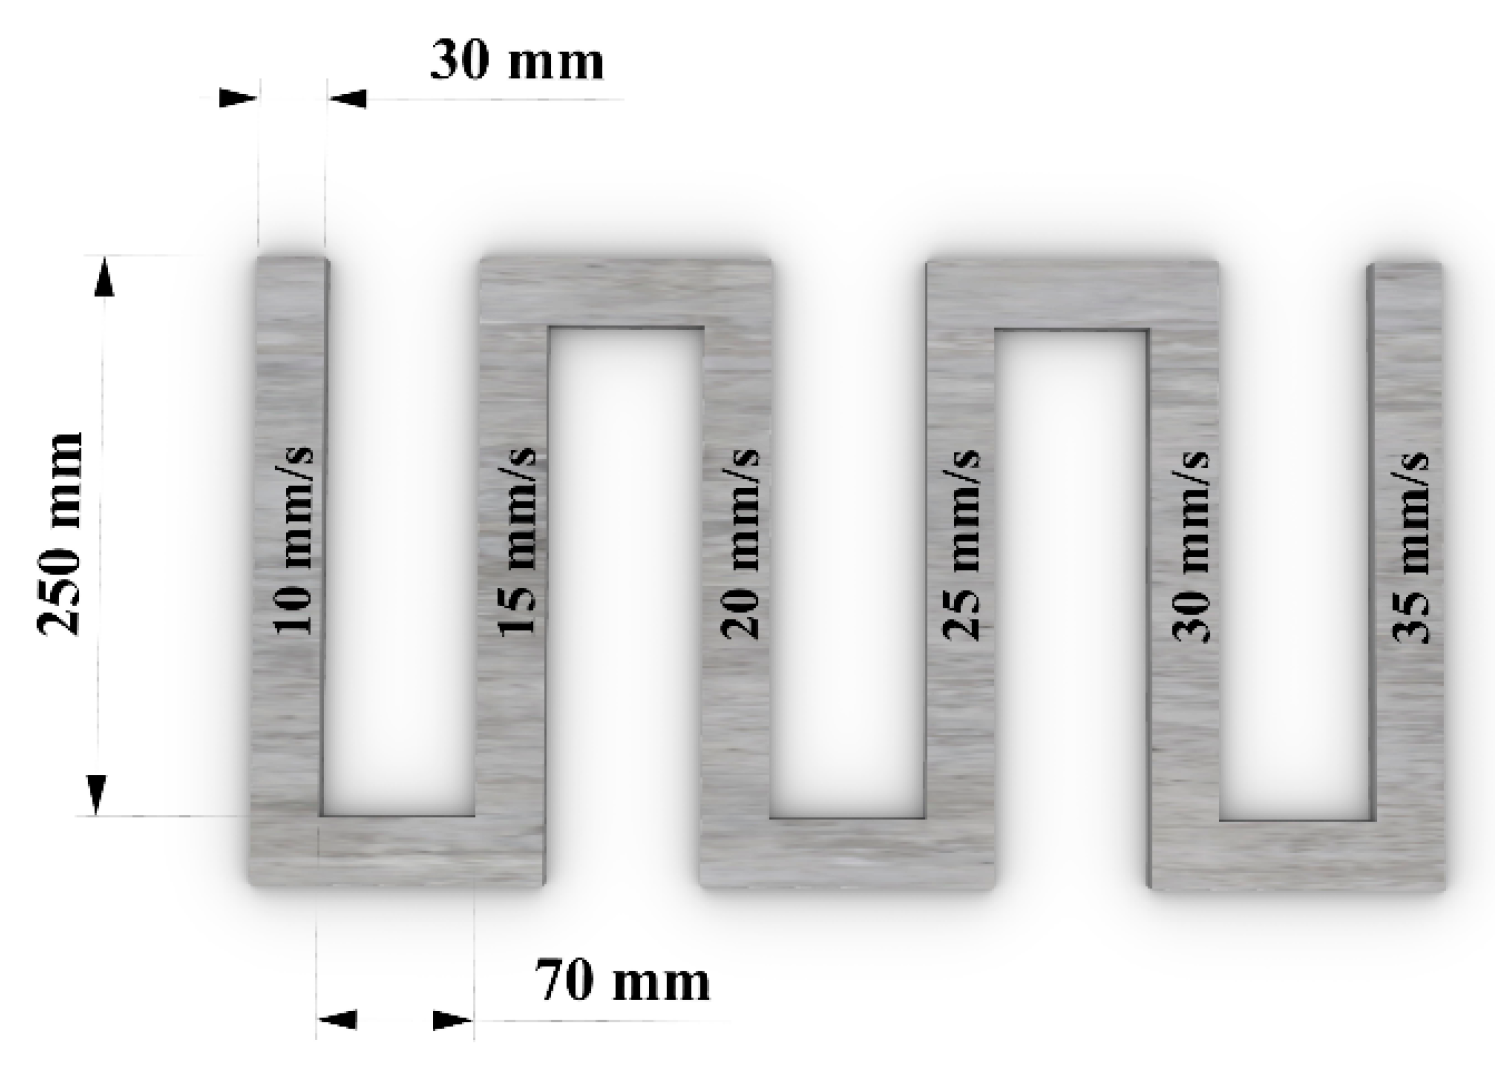
A zigzag pattern (with six different sides), as shown in Figure 5, was printed to evaluate the extrudability. Prior to printing the pattern, the mixes were tested to calibrate the extrusion rate at 0.1 round/s, 0.15 round/s, or 0.20 round/s for each mix. The extrusion speed was carefully determined for each mix to ensure proper material deposition from the nozzle. Then, each side of the zigzag pattern (in total, six sides) were 3D printed with varying printing speed, including 10 mm/s, 15 mm/s, 20 mm/s, 25 mm/s, 30 mm/s, and 35 mm/s to obtain an optimized printing speed which resulted in consistent filament width that was as close to the design width as possible. To determine the shape retention of printed filament for each mix, the width of each side of the zigzag pattern (printed at different speeds) was measured after 24 h at three different points along the filament. The consistency of the recorded values was analyzed to assess the reliability and uniformity of the printed filaments for each mix and each printing speed.
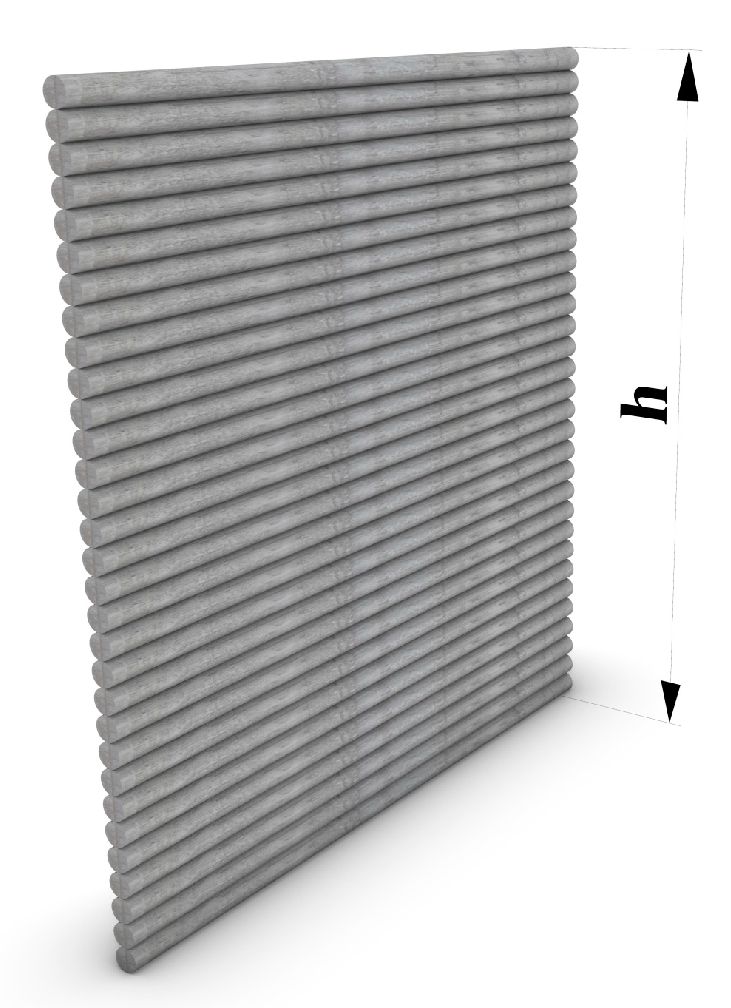
Moreover, the buildability evaluation was performed by printing a 20 mm × 300 mm wall, as shown in Figure 6, and the maximum wall height that was printed for each mix design before failure was measured.
2.2.3. Hardened Properties
The properties of the designed mixes were measured after setting and hardening. This included evaluating the physical properties to assess the weight reduction and porosity of the lightweight 3D printed components. Additionally, the compressive strength of both cast and 3D printed samples was determined to investigate whether the use of lightweight aggregate affected the compressive strength of the materials. The details of each test are presented here.
Physical Properties
To assess the weight reduction and porosity of the designed lightweight cementitious mixes, the characteristics such as apparent porosity and dry bulk density were evaluated in accordance with ASTM C830 [45]. For each mix, the sample with the size of 25 mm × 25 mm × 25 mm was extracted from a 3D-printed rectangular prism with the size of 140 mm × 140 mm × 50 mm which was moist cured for 28 days in 100% relative humidity and 25 °C. Also, three repetitions were considered for each mix. Apparent porosity determines the pores in the matrix, and in order to measure it, the cut samples were then placed in an oven at a temperature of 110 °C until a constant dry weight (D) was achieved. Then, after saturating the samples in a vacuum-pressure vessel, the suspended weight (S) and saturated weight (W) were determined. Equation (1) was used to measure the apparent porosity (P in %) of cut samples from the 3D printed prisms of each mix:
Additionally, Equation (2) was employed to calculate the bulk density for each mix and assess the weight reduction achieved by substituting the normal weight aggregate with different lightweight aggregates:
Compressive Strength
The potential impact of lightweight mixes on strength and bearing capacity is a concern. To investigate this, the compressive strength of both cast and 3D printed lightweight mixes was assessed using 50 × 50 × 50 mm cubes following ASTM C109 standards [46]. For the 3D printed samples, cubic 50 × 50 × 50 mm specimens were extracted from rectangular prisms with dimensions of 140 × 140 × 50 mm and a loading direction was considered to be perpendicular to the printing direction. Compressive strength measurements were conducted on three cast specimens for each mix at 28 days.
3. Results and Discussion
3.1. Surface Morphology and Microscopic Properties
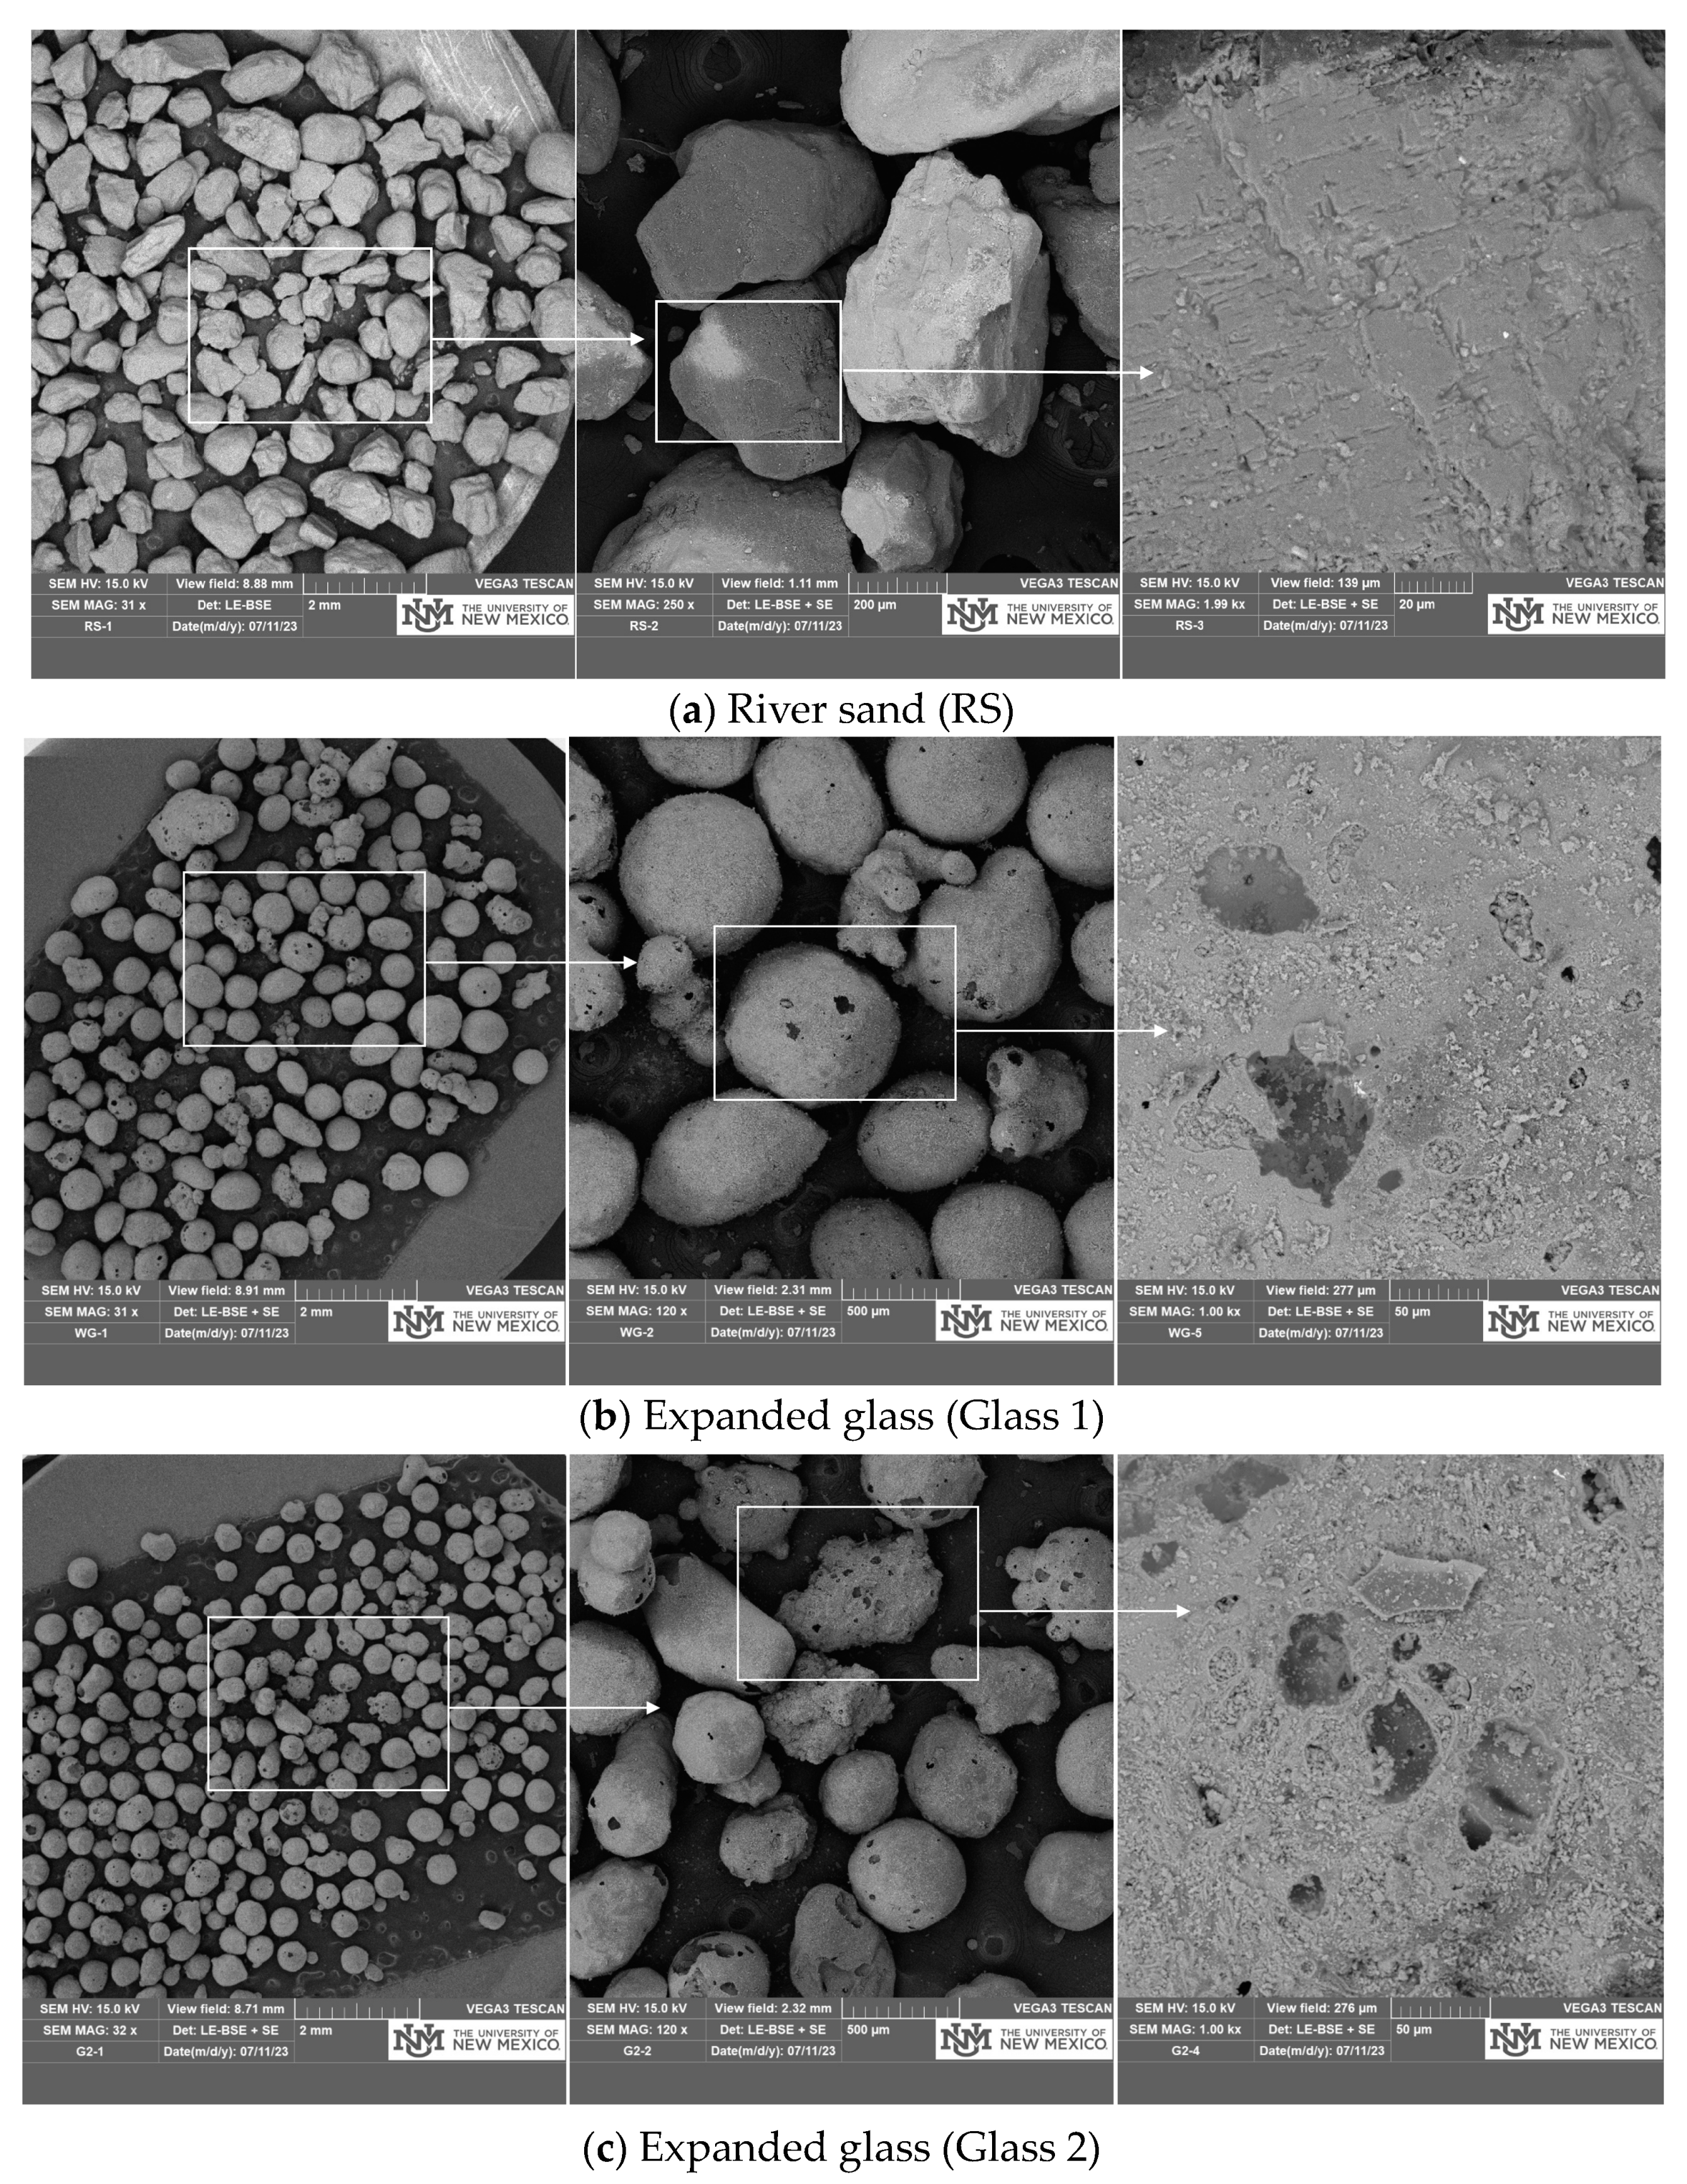
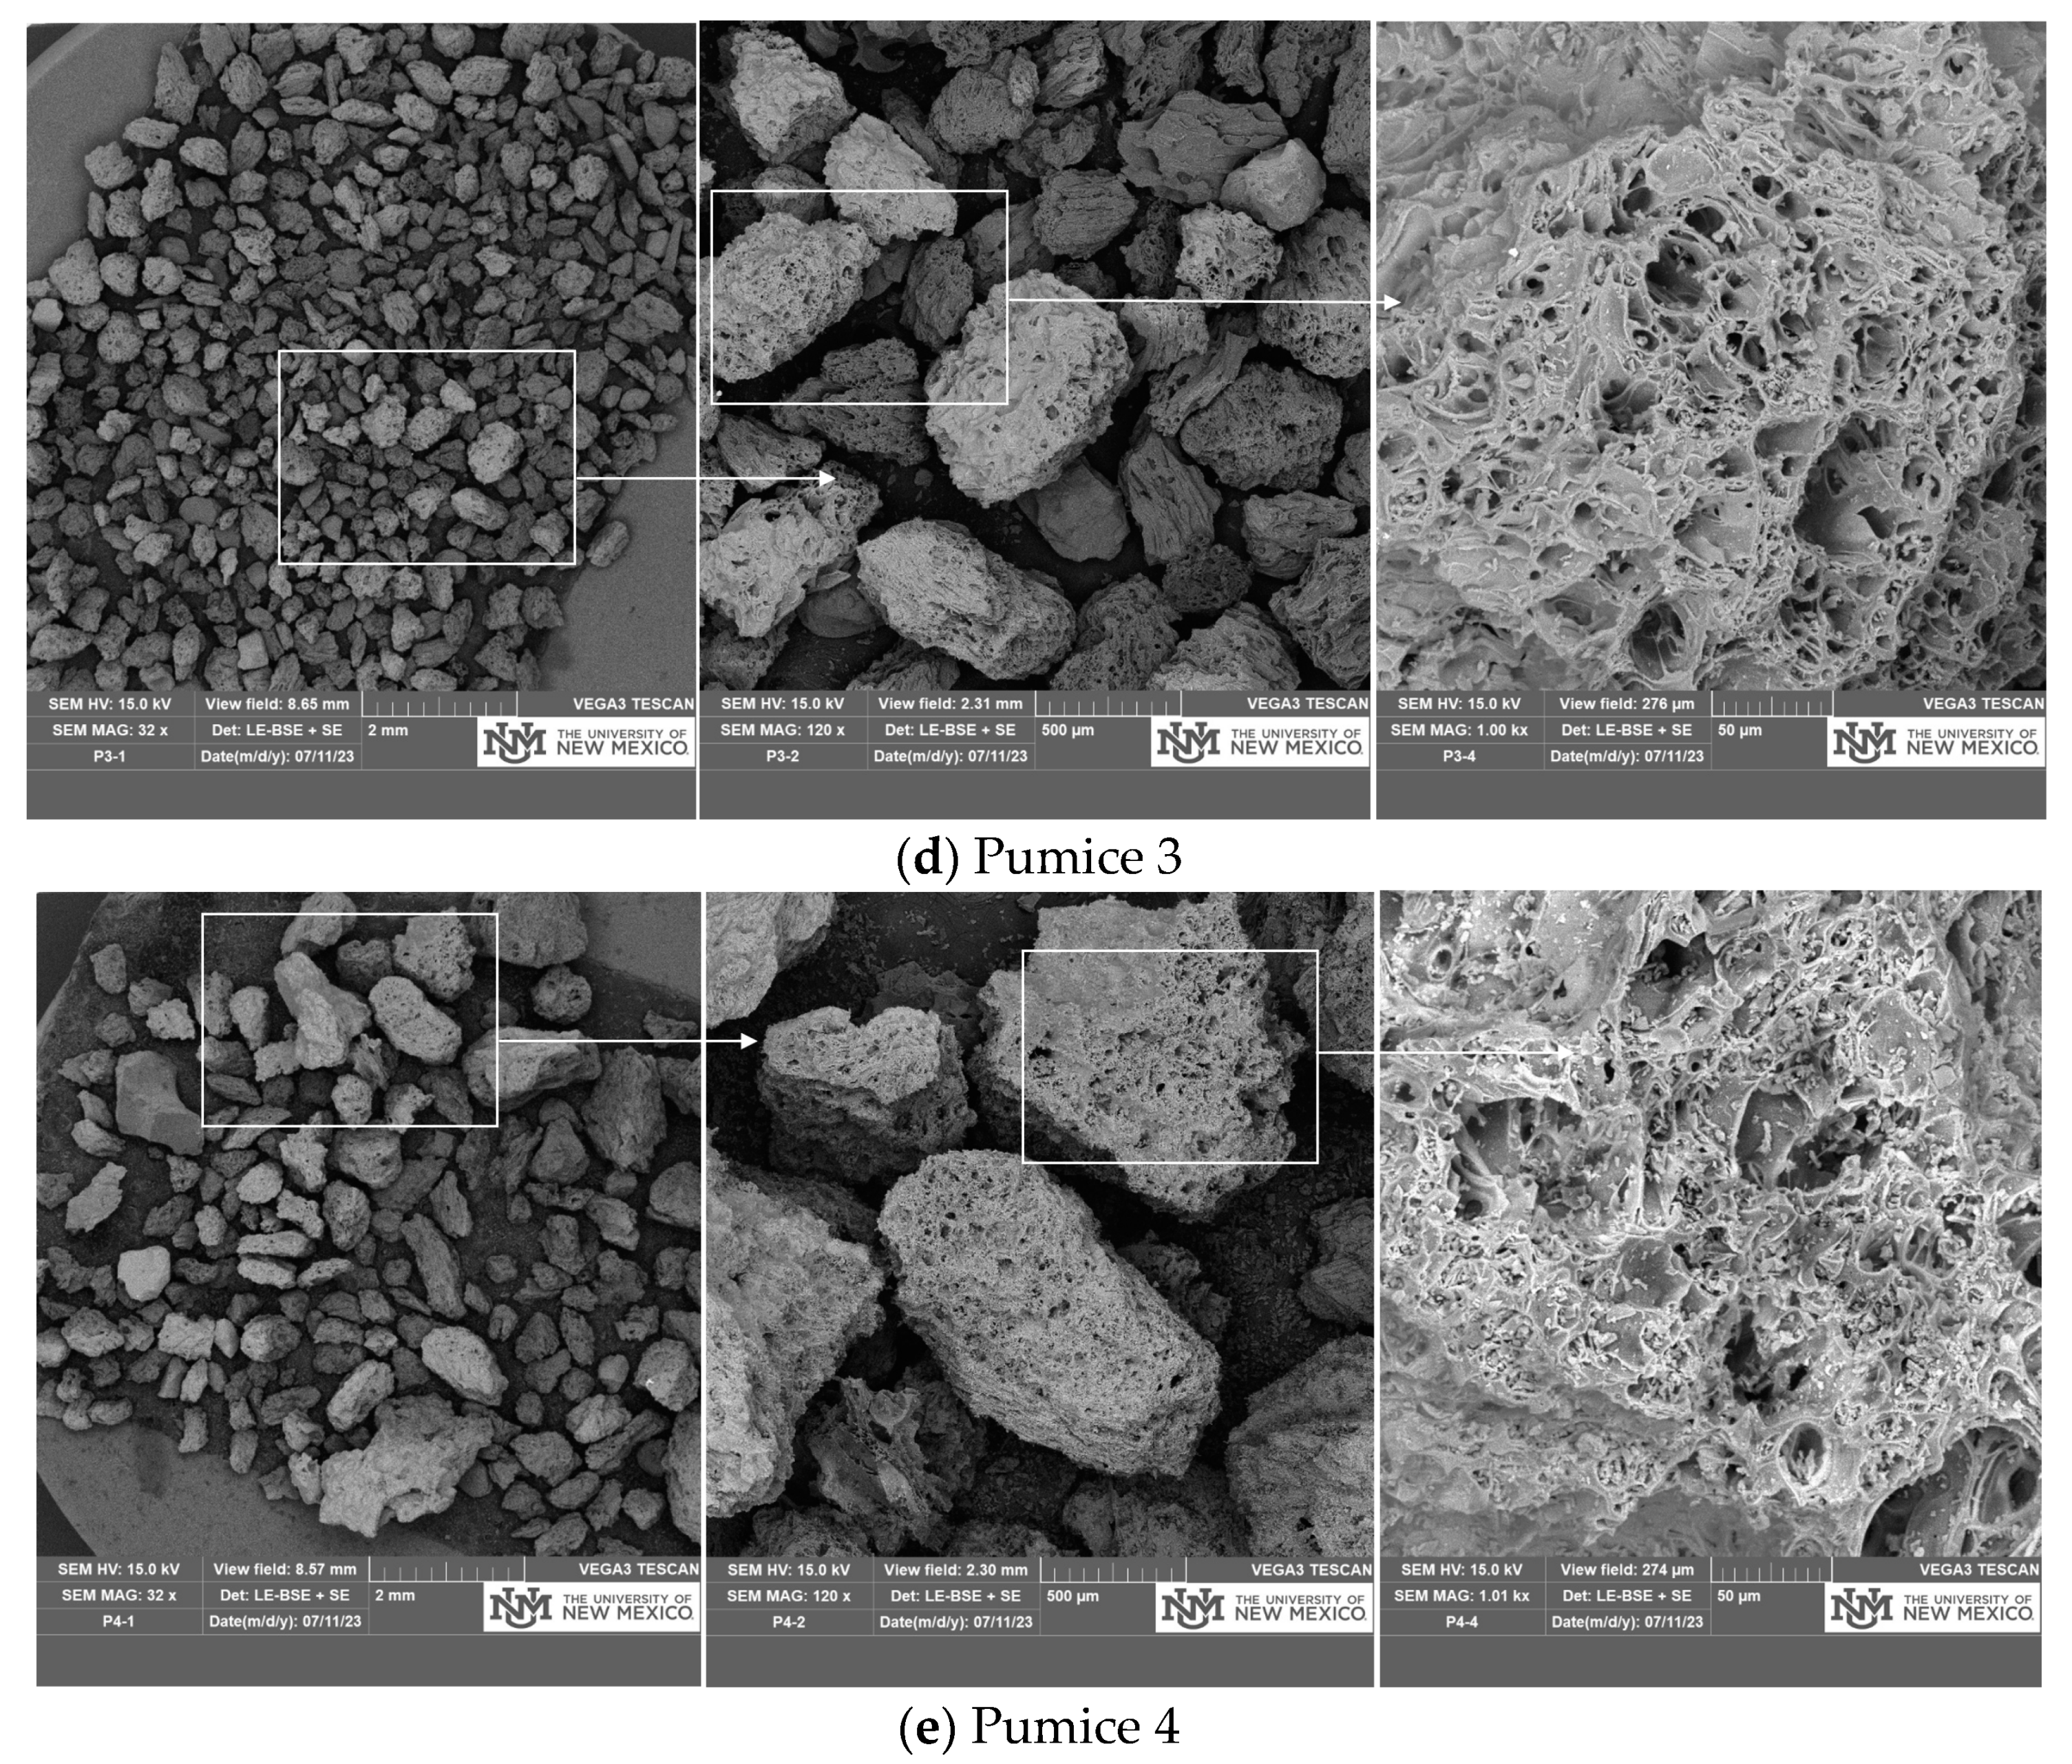
The SEM images of various aggregate types used in this study are presented in Figure 7 at three different scales from left to right (i.e., 2 mm, 200 μm and 20 μm for Figure 7a (RS) and 2 mm, 500 μm and 50 μm for RS for others Figure 7b–e). It has been observed in SEM micrographs that both expanded glass (Figure 7b,c) and pumice (Figure 7d,e) have highly porous structures. Nevertheless, the finer grades of both materials (Glass 1 and Pumice 3) are more porous than the coarser grades (Glass 2 and Pumice 4). Thus, as demonstrated in Table 5, the lightweight mixes exhibited the highest amount of adjusted water-to-binder (W/B) ratio.
In terms of grain shape, the shape of the expanded glass particles is mostly rounded with mixtures of smaller irregular fragments, which agrees with the study’s observation by Chung et al. [47]. However, pumice particles possess an irregular shape characterized by a rough texture and numerous hollow cavities. This fact is validated by their higher absorption capacity, as indicated in Table 2, which aligns with findings previously reported by Lura et al. [48]. However, the RS particles, in comparison, were irregular/partly rounded aggregate shapes with less porous and more impermeable surface texture. Thus, since cementitious mixes containing irregularly shaped or rough-textured particles demand more water to achieve the adequate workability and filling of voids, the mix with 100% pumice (M3, MC3, and FRM3) required more water to be flowable, as displayed in Table 5. On the other hand, mixes with well-graded and rounded particles may require less water due to better packing and improved flowability. Therefore, mixes that included expanded glass showed a lower water demand, but their finer porous structure made their adjusted water-to-binder (W/B) ratio larger in comparison with RS mixes [49,50,51].
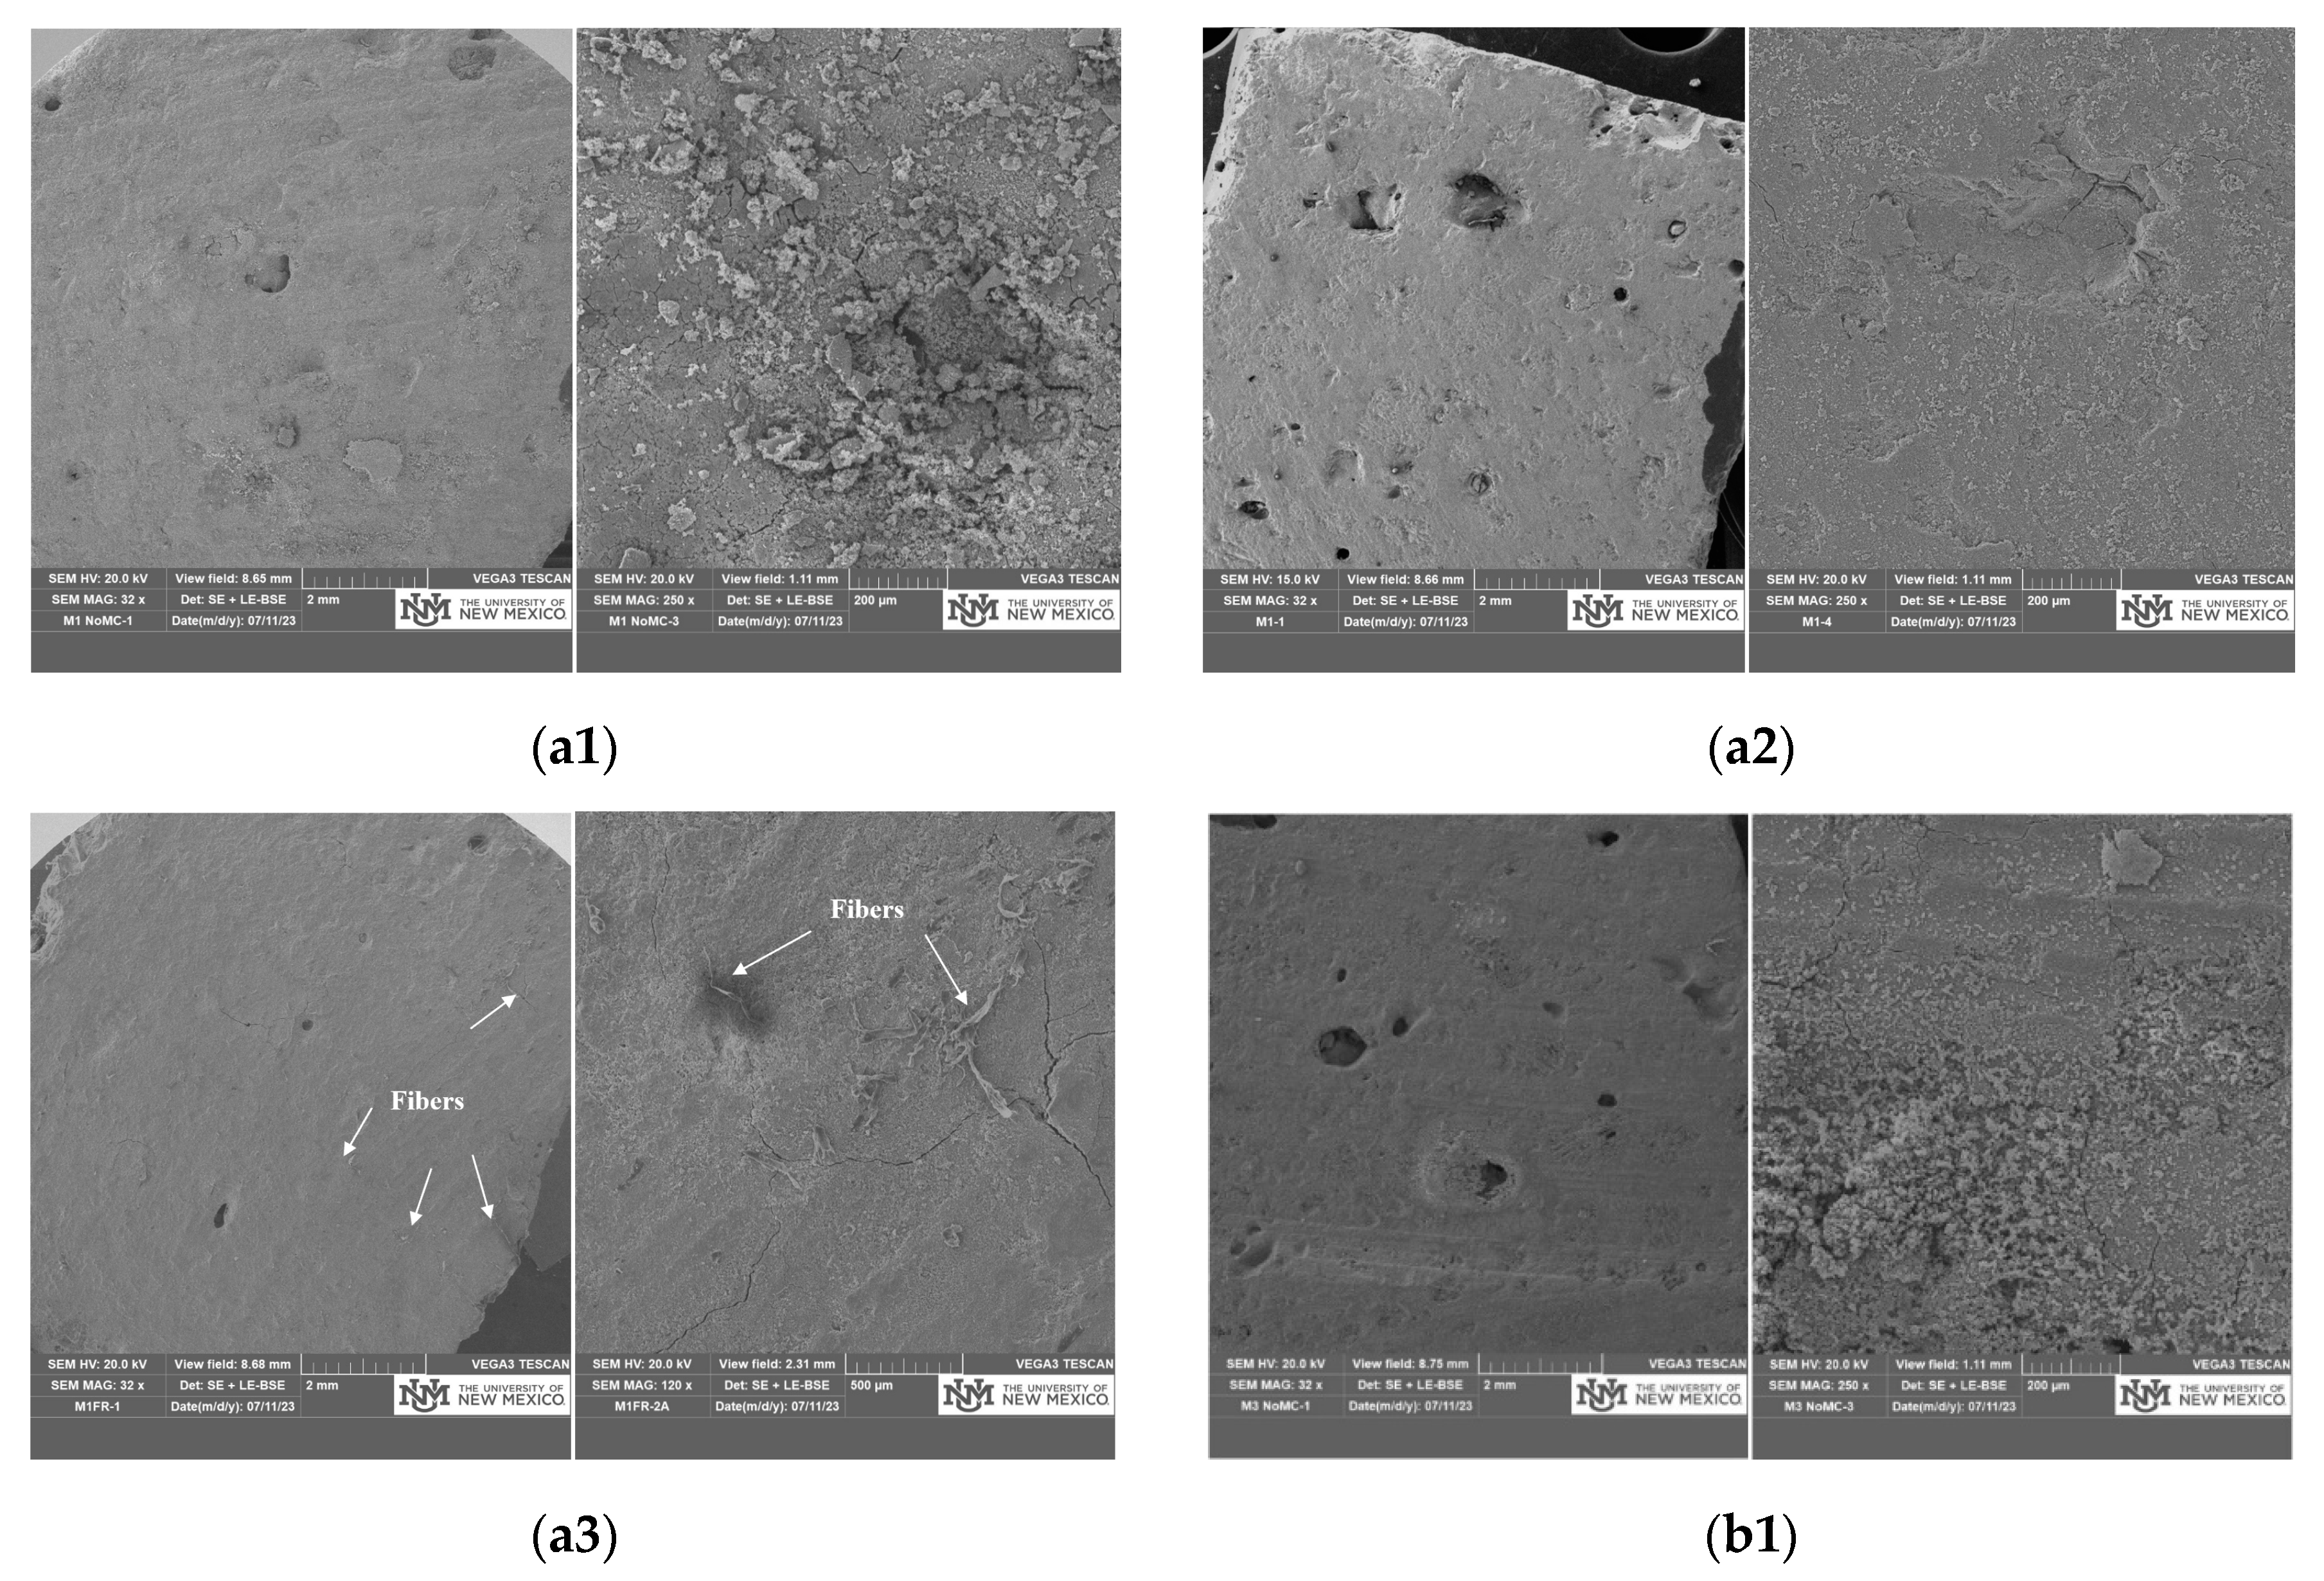
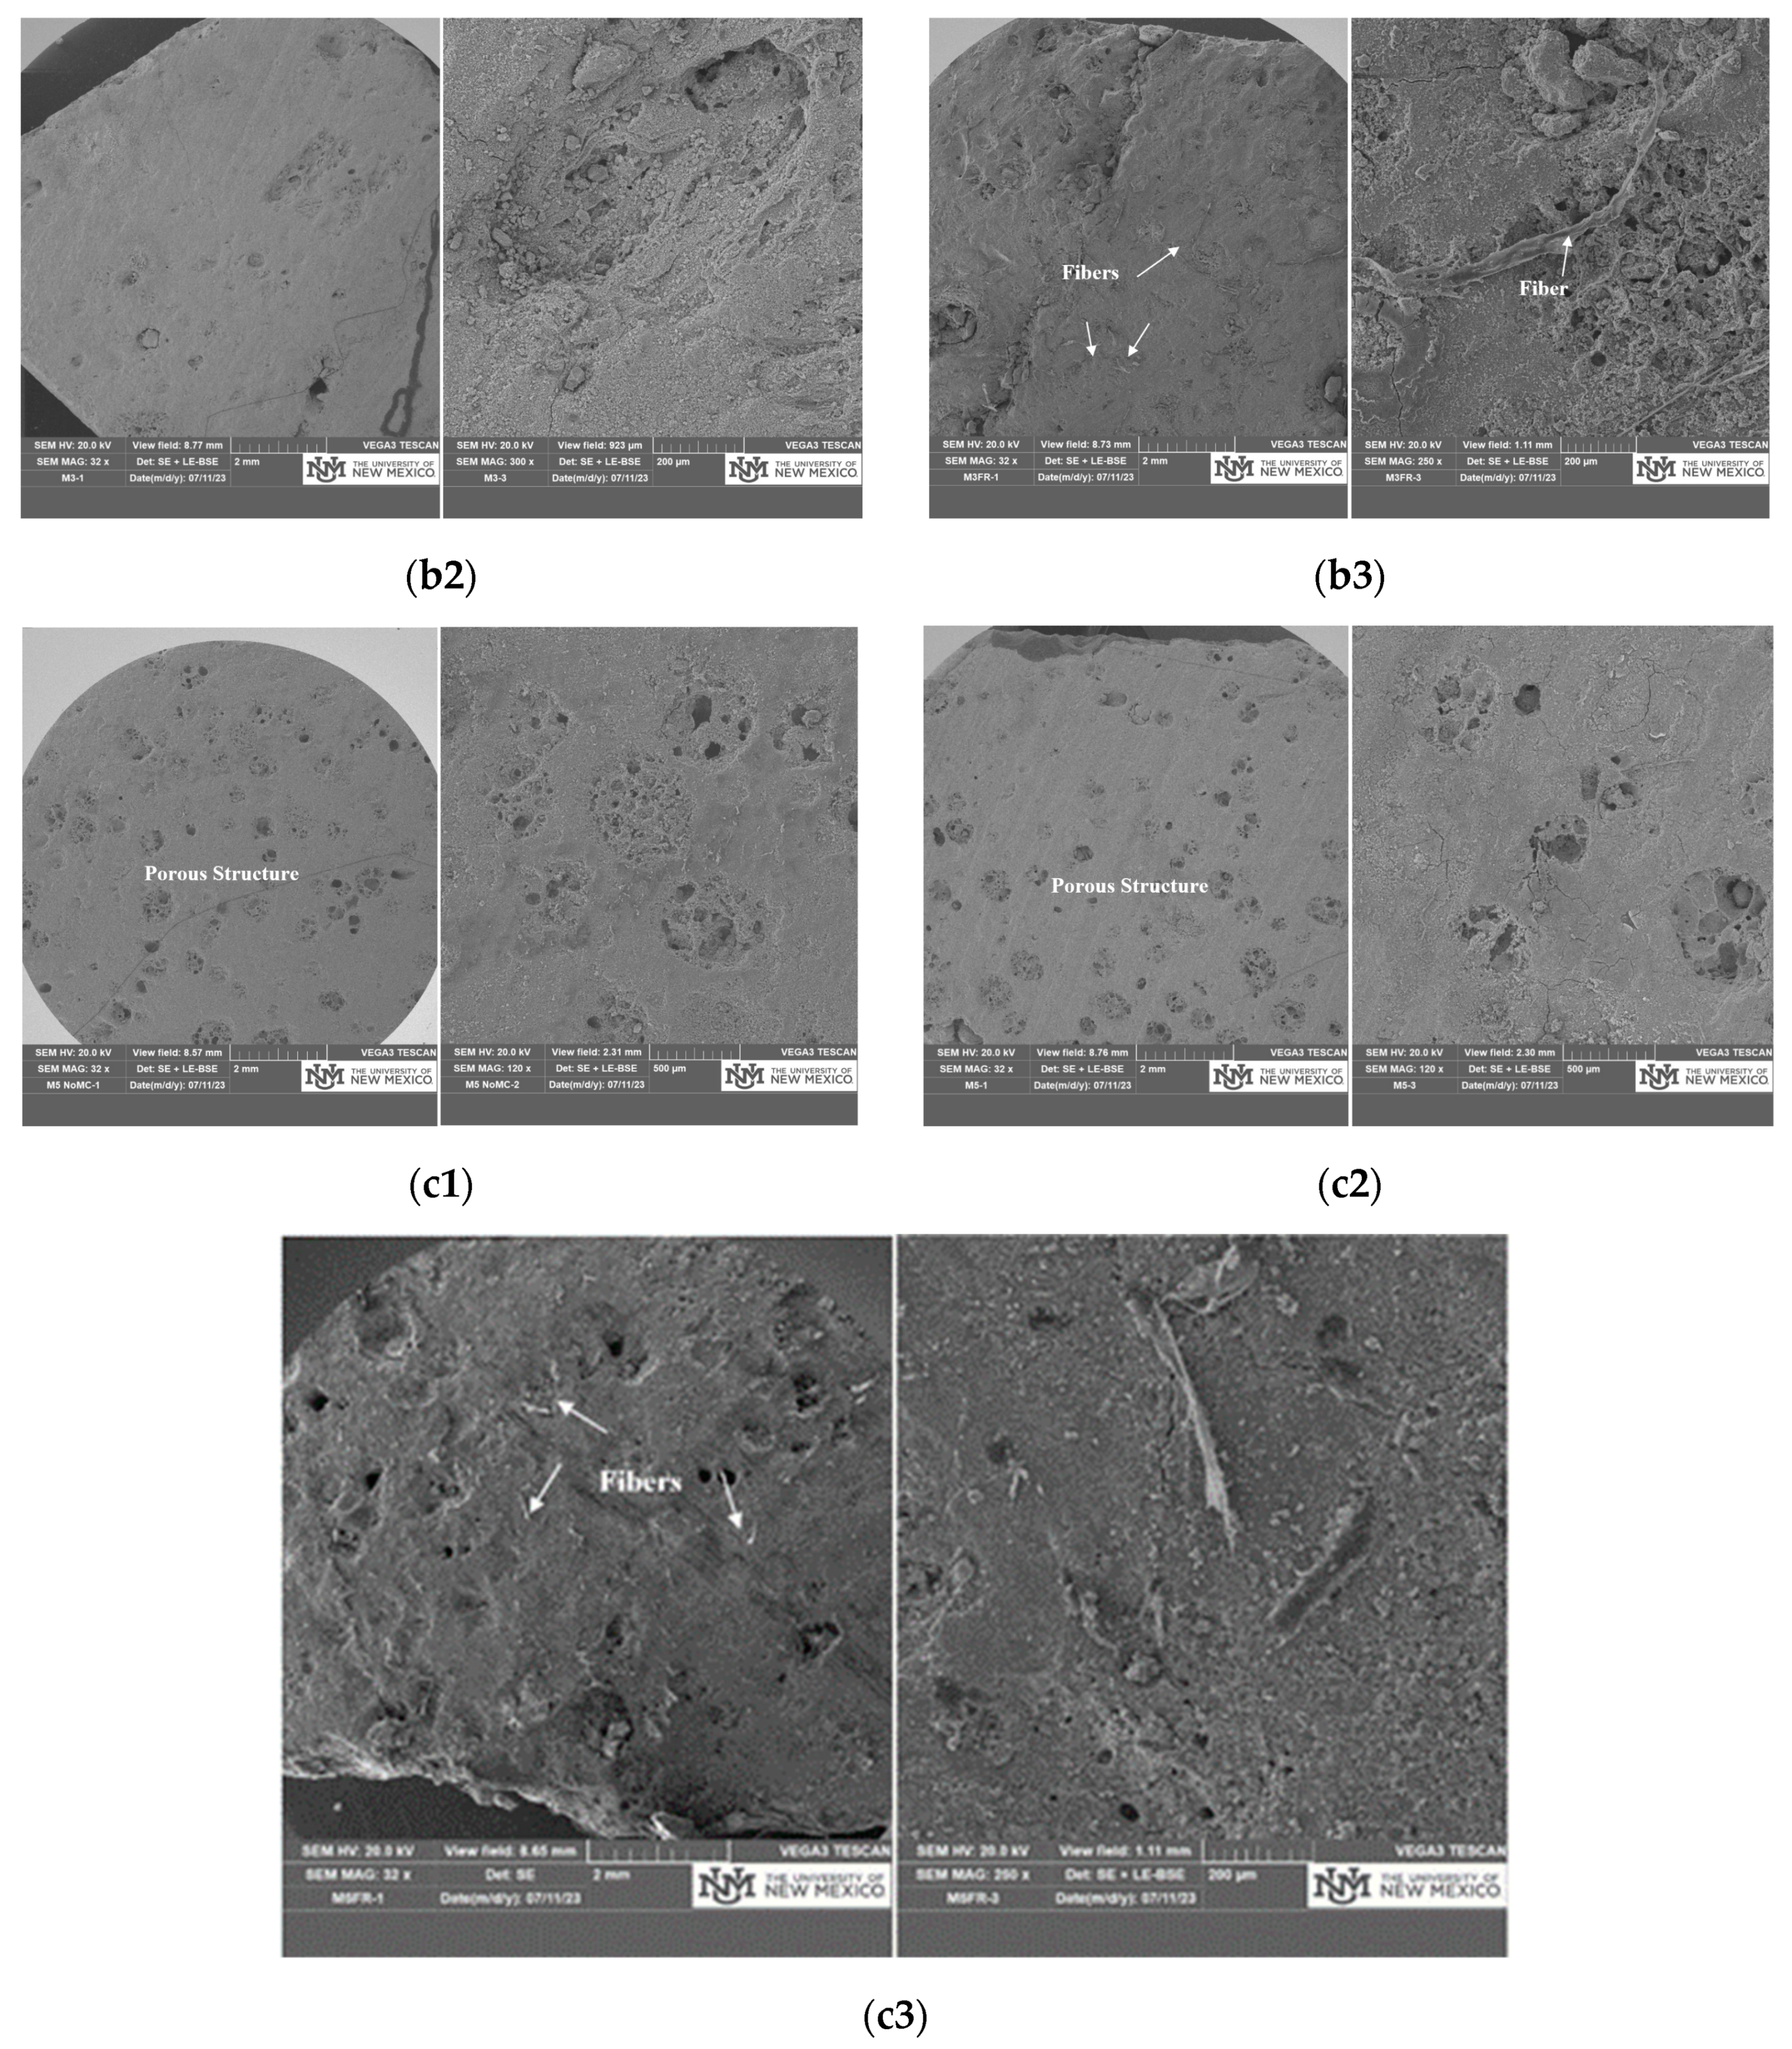
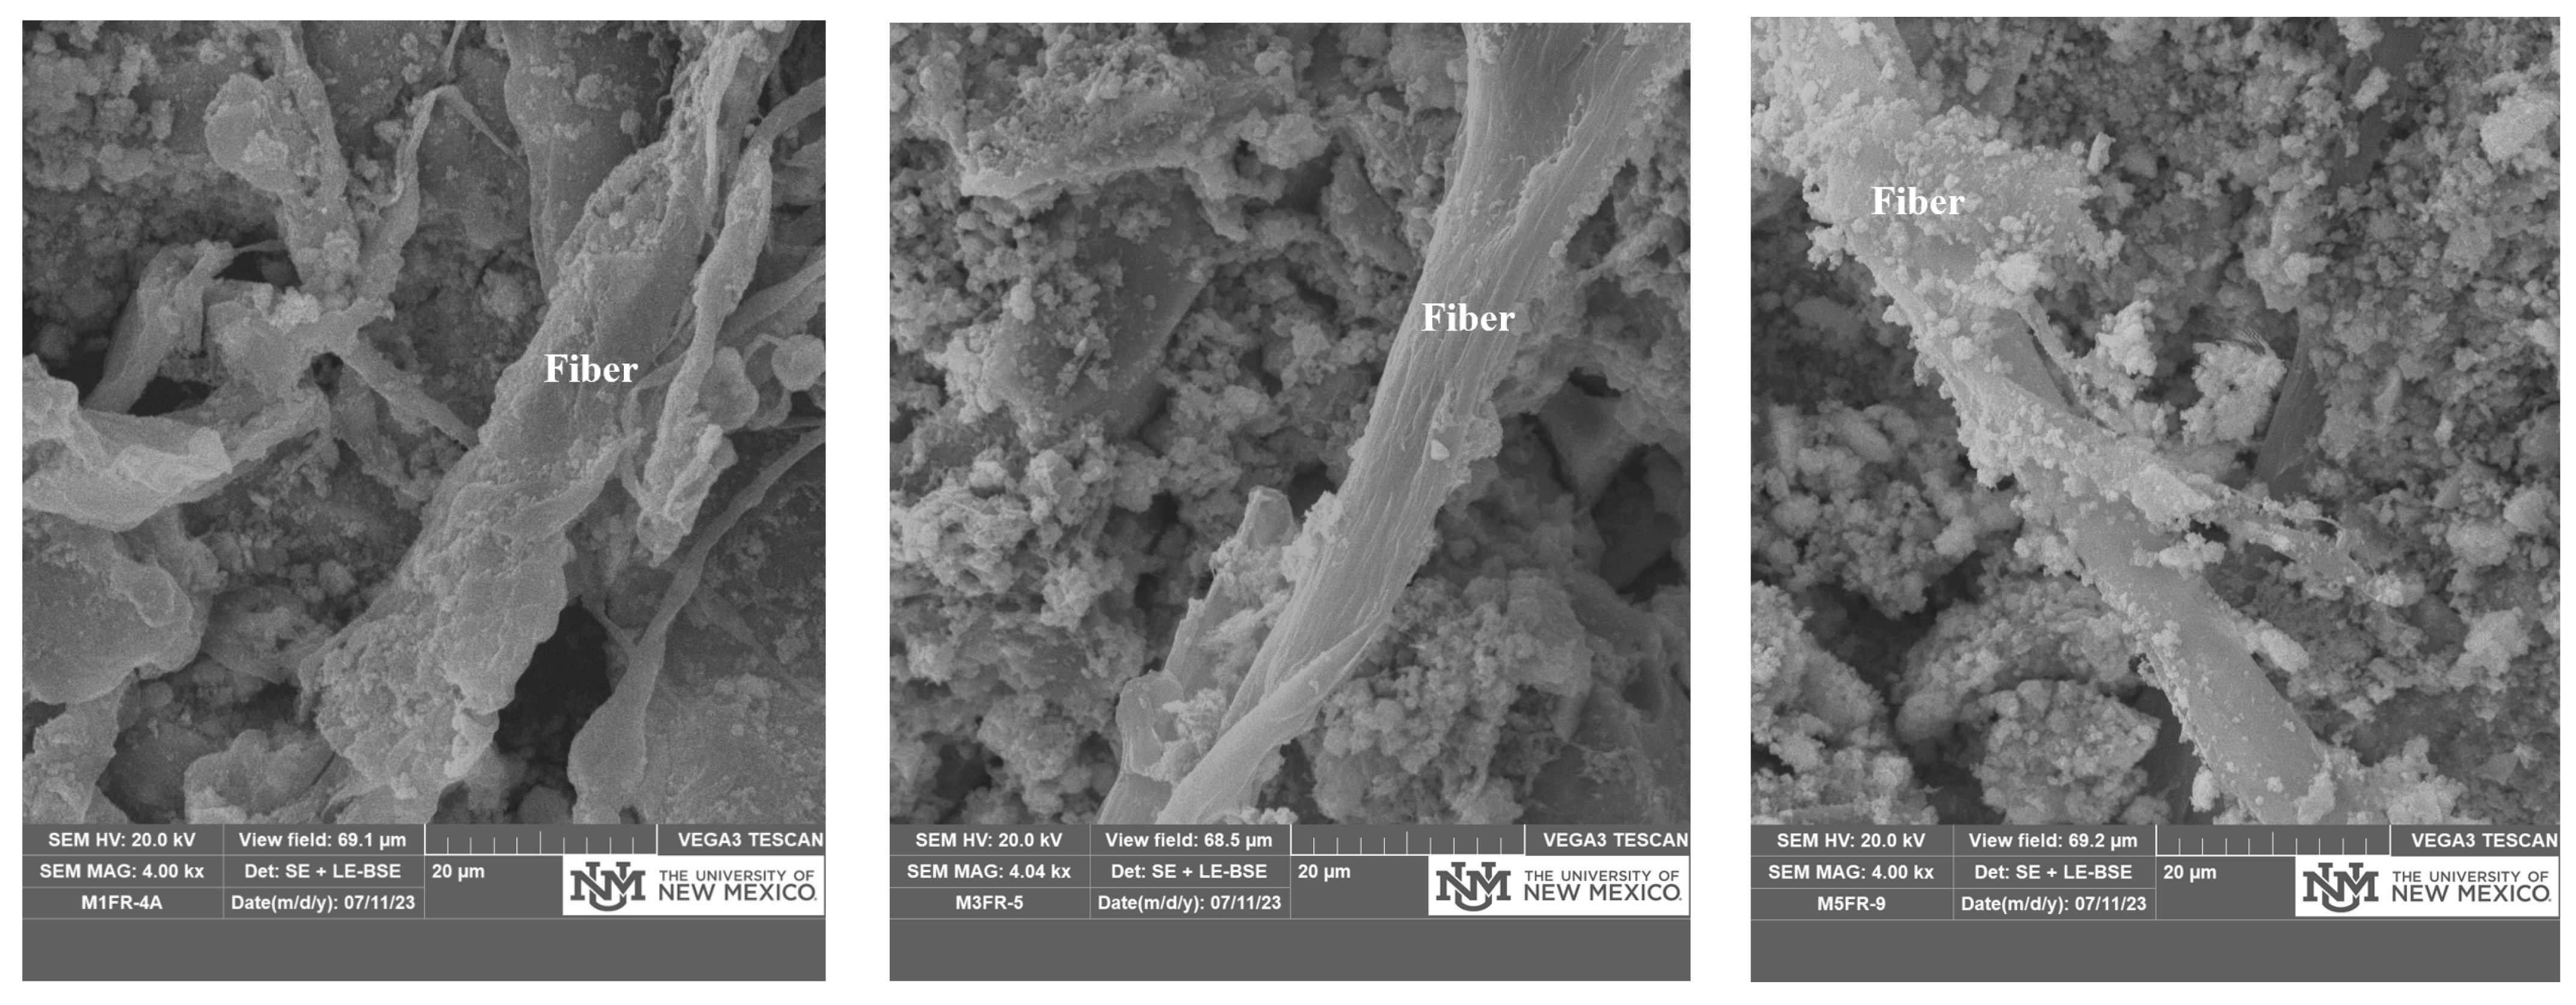
Figure 8, Figure 9 and Figure 10 show SEM micro images of mixes containing different types of aggregate (RS and lightweight aggregates) from three sets (S1, S2, S3), each captured at three different scales. The samples were taken from the broken cubes printed for the compressive strength test. As we progress from left to right in all these images, moving closer to a smaller scale, the structures exhibit increased disconnection, pores, and discontinuity, especially in their ITZ zones. Figure 8 and Figure 9 represent the SEM micrographs of the outer surface, pore structure, and hydration products of lightweight cementitious mixes. Figure 10 represents SEM micro images of ITZs between PE fibers and a matrix of lightweight cementitious mixes.
After comparing micrographs from different sets of mixes (S1, S2, and S3), it becomes evident that the mixes in S1 (M1, M3, and M5) exhibit a dense structure, characterized by a high quantity of CSH (calcium silicate hydrate) phase. This observation is consistent with the fact that these mixes have a lower adjusted W/B ratio. Additionally, incorporating MC into mixes led to a dense and compacted matrix. Conversely, in S3 mixes (FRM1, FRM3, FRM5), the inclusion of fibers led to the formation of another ITZ zone between the cement paste and fibers, resulting in the presence of more gaps and pores around the interface zones.
Regarding the three types of aggregate used, the mixes developed with RS (M1, MC1, and FRM1) exhibit a densely packed microstructure with an abundance of the CSH phase. This outcome can be attributed to the size, porosity, and shape of the RS aggregate, which resulted in a lower water demand during mixing. Consequently, more CSH product was formed, contributing to the denser structure observed in these mixes. On the other hand, the mixes containing 100% of lightweight aggregates (expanded glass and pumice) exhibited a higher porosity and a less dense structure. This observation is correlated with the inherent porous nature of lightweight aggregates.
3.2. Physical Properties
Table 6 presents the measured values for apparent porosity and the dry bulk density of 3D printed samples. Comparing the apparent density results of S1 mixes (M1–M5), it is observed that the addition of more lightweight aggregates increases the apparent porosity of the 3D printed specimens, ranging from 11.78% to 19.95%. Among the different aggregates, the mixes containing RS and expanded glass (MC1 and MC5) exhibited the lowest and highest apparent porosity in the S2 mixes, respectively, which could be attributed to the porous structures of expanded glass [52,53,54], resulting in a more porous matrix.
It was found that, when MC was added, lower apparent porosity was observed for MC2 and MC3 in S2 mixes and FRM2 and FRM3 in S3 mixes. Conversely, MC4 and MC5 in S2 mixes and FRM4 and FRM5 in S3 mixes had higher apparent porosity. These differing trends in observations highlight the effect of aggregate texture and shape on porosity. Expanded glass aggregates have a round shape with a porous internal structure, with fewer pores on their surface, as shown in Figure 7b,c. In contrast, the external surface of pumice aggregate is irregular and covered with pores.
This discrepancy can be attributed to the fact that, when expanded glass aggregates come into contact with the gel structures of the cement paste, most of the porous internal structures remain unfilled, and only the external surface of the expanded glass aggregates is covered with the gel structures of the cement paste. Conversely, most of the gel fills the pores on the surface of pumice aggregates. This observation is supported by the micro images of M3, MC3, and FRM3, as presented in Figure 8, Figure 9 and Figure 10.
For S3 mixes (FRM1–FRM5), it is noticeable that the addition of fiber resulted in more porosity for the FRM1, FRM4, and FRM5, which is in good agreement with SEM micro images and the formation of a new ITZ zone between fibers and cement paste. However, adding fiber did not change the dense structure of mixes with pumice (FRM2 and FRM3). Figure 8 shows that M3 has voids on its surface compared to MC3 and FRM3. This showed the presence of MC in both MC3 and FRM3, which facilitated the cement paste filling the porous structure of samples incorporating pumice aggregate.
Based on the findings shown in Table 6, substituting 50% and 100% of normal weight aggregate (RS) with lightweight aggregate led to a weight reduction in the range of 9.49–25.1% in the various cementitious mixes. Of all the mixes, M5, consisting of 100% expanded glass as the aggregate, exhibited the highest reduction in bulk density, measuring 25.1%. This reduction aligns with the specific gravity values of the aggregates listed in Table 2, where the average specific gravity of expanded glass is 0.4 and 0.2 times that of pumice and RS aggregates, respectively. The highest reduction in bulk density for S1, S2, and S3 mixes was obtained for M3, MC5, and FRM5 with 24.81%, 25.1%, and 21.42%, respectively, compared to the control mix in each set.
A comparison of the results of this study with the literature [53,54] shows that the densities of designed materials in this study are in the range of 1500–2081 kg/m3 and, therefore, could be considered lightweight cementitious mixes (with density in the range of 225–2400 kg/m3. However, in general, the collected results of porosity and density are subjective, and experimenting with a larger number of samples could reduce the errors and provide more precise and accurate information for future research.
3.3. Flow Table and Setting Time
The flow table test and setting time results were analyzed, as presented in Table 7 and Table 8, respectively. The addition of lightweight aggregate almost increased the water demand for all mixes compared to the control mix (except FRM5), which is attributed to the higher absorption of lightweight aggregates compared to the RS aggregate. Moreover, as previously discussed, the aggregate shape influences the water demand across different mixes. Rounded particles in the expanded glass, for instance, necessitate less water content than pumice particles while maintaining similar flowability characteristics. The adjusted W/B ratio was provided in the last column in Table 7 for further comparison. The results showed that the flow table test results range for the printable mix is approximately 12–17 cm. When comparing the results of the three different sets, it was revealed that S2 had a higher adjusted W/B ratio but lower flowability than S1 mixes. The higher adjusted W/B ratio in S2 mixes could be attributed to adding MC, as MC increases the viscosity of cement paste by retaining water. Chen et al. [55] stated that a linear relationship exists between water retention and the plastic viscosity of concrete mixes modified with MC. Therefore, efforts were made to ensure that the mix design is printable with the specified water-to-binder ratio for the remainder of this research, and the adjusted water-to-binder ratio was used for mixes based on their flowability and ease of printing. As a result, S2 mixes yielded a higher printing quality, as discussed in the following sections.
The change in the flowability of mixes with MC can be attributed to the influence of MC, such as increased viscosity, thixotropy, and the prevention of segregation [56,57]. These factors contribute to the retention of shape for mixes with MC, as opposed to those without MC. On the other hand, S1 mixes were dry and exhibited low-quality printing and filament separation during the buildability test. Additionally, the inclusion of 0.35% fiber helped, to some extent, in retaining the shape of cementitious materials due to the increase in the surface area of interfaces between the PE fibers and water in the motor. Thus, this increase in the interfaces reduced the workability [58,59].
The initial setting time of different types of aggregate in S1, S2, and S3 are presented in Table 8, indicating that lightweight aggregates, especially pumice, generally exhibited a longer setting time. This can be attributed to lightweight aggregates’ high water absorption capacity compared to RS sand. Furthermore, S2 and S3 mixes exhibited an increase in the initial setting time, which can be attributed to the incorporation of MC into these mixes that surround the cement particles by long-chain polymer and the retention of free water [60]. Adding MC alters these mixes’ water demand and setting properties, leading to the observed increase in the setting time. Also, the final setting time was not measured as the previous study pointed out that the setting time of the mixes is more sensitive to the MC application [60].
3.4. Rheology
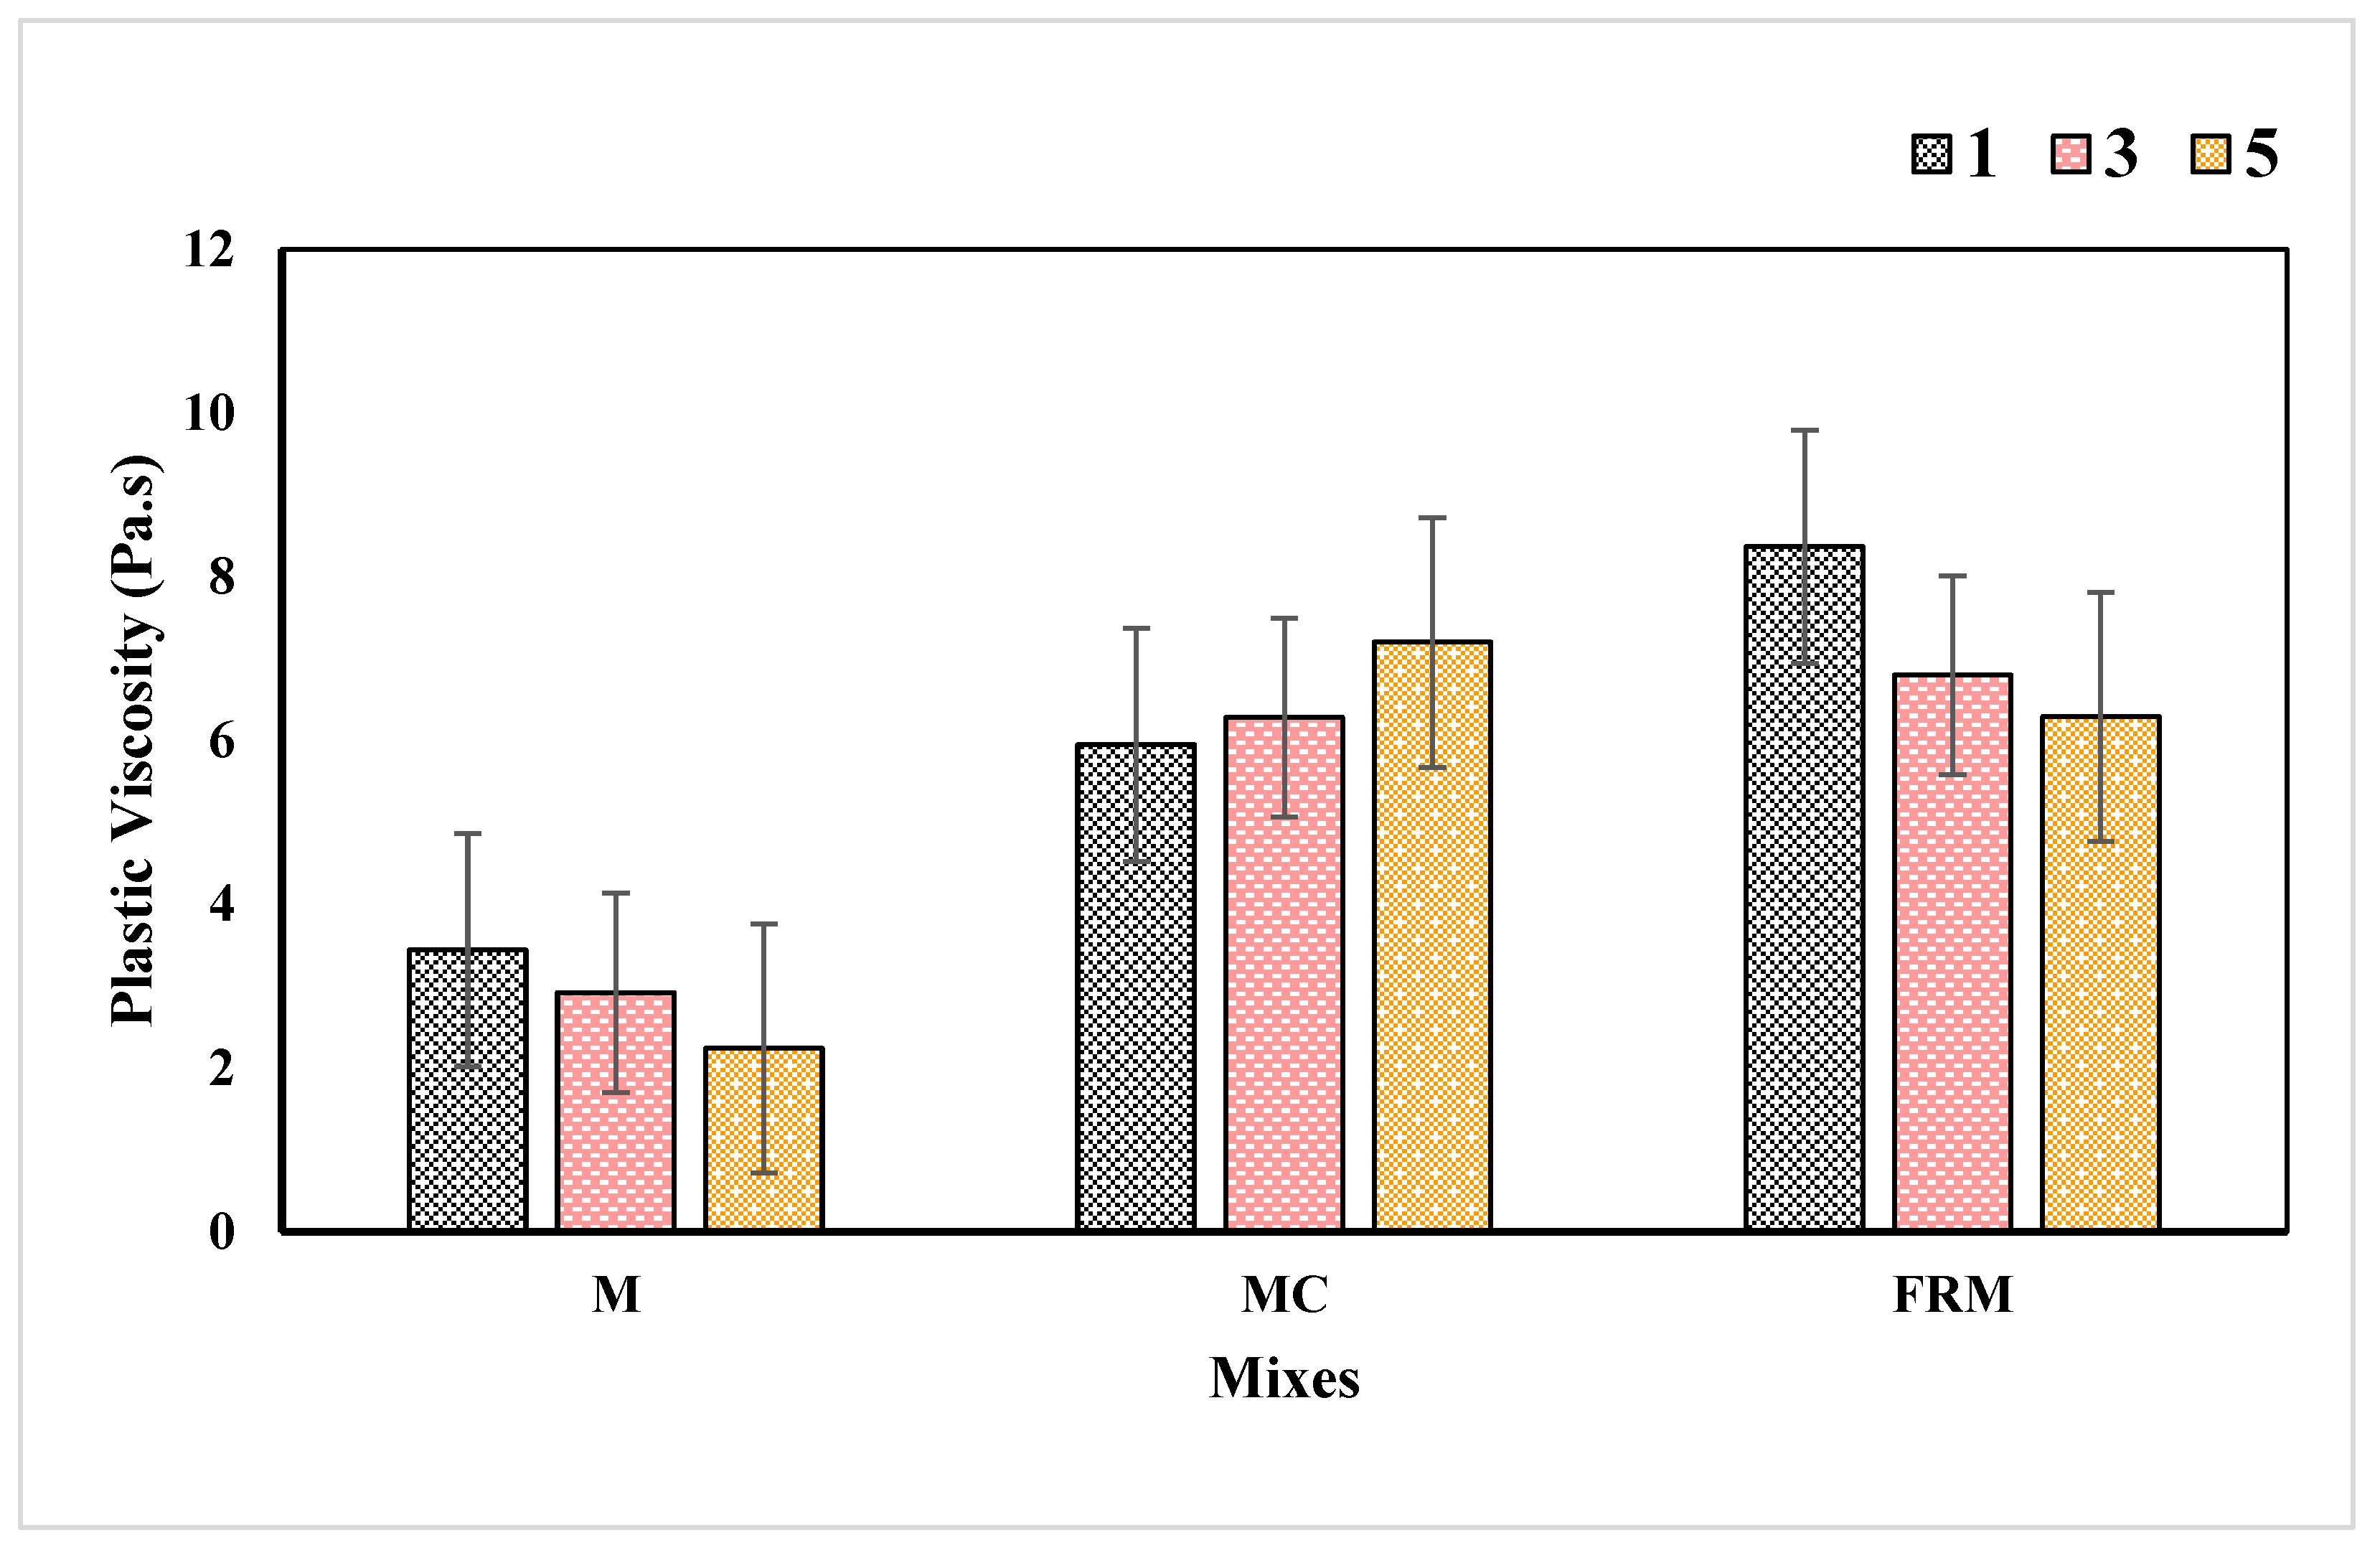
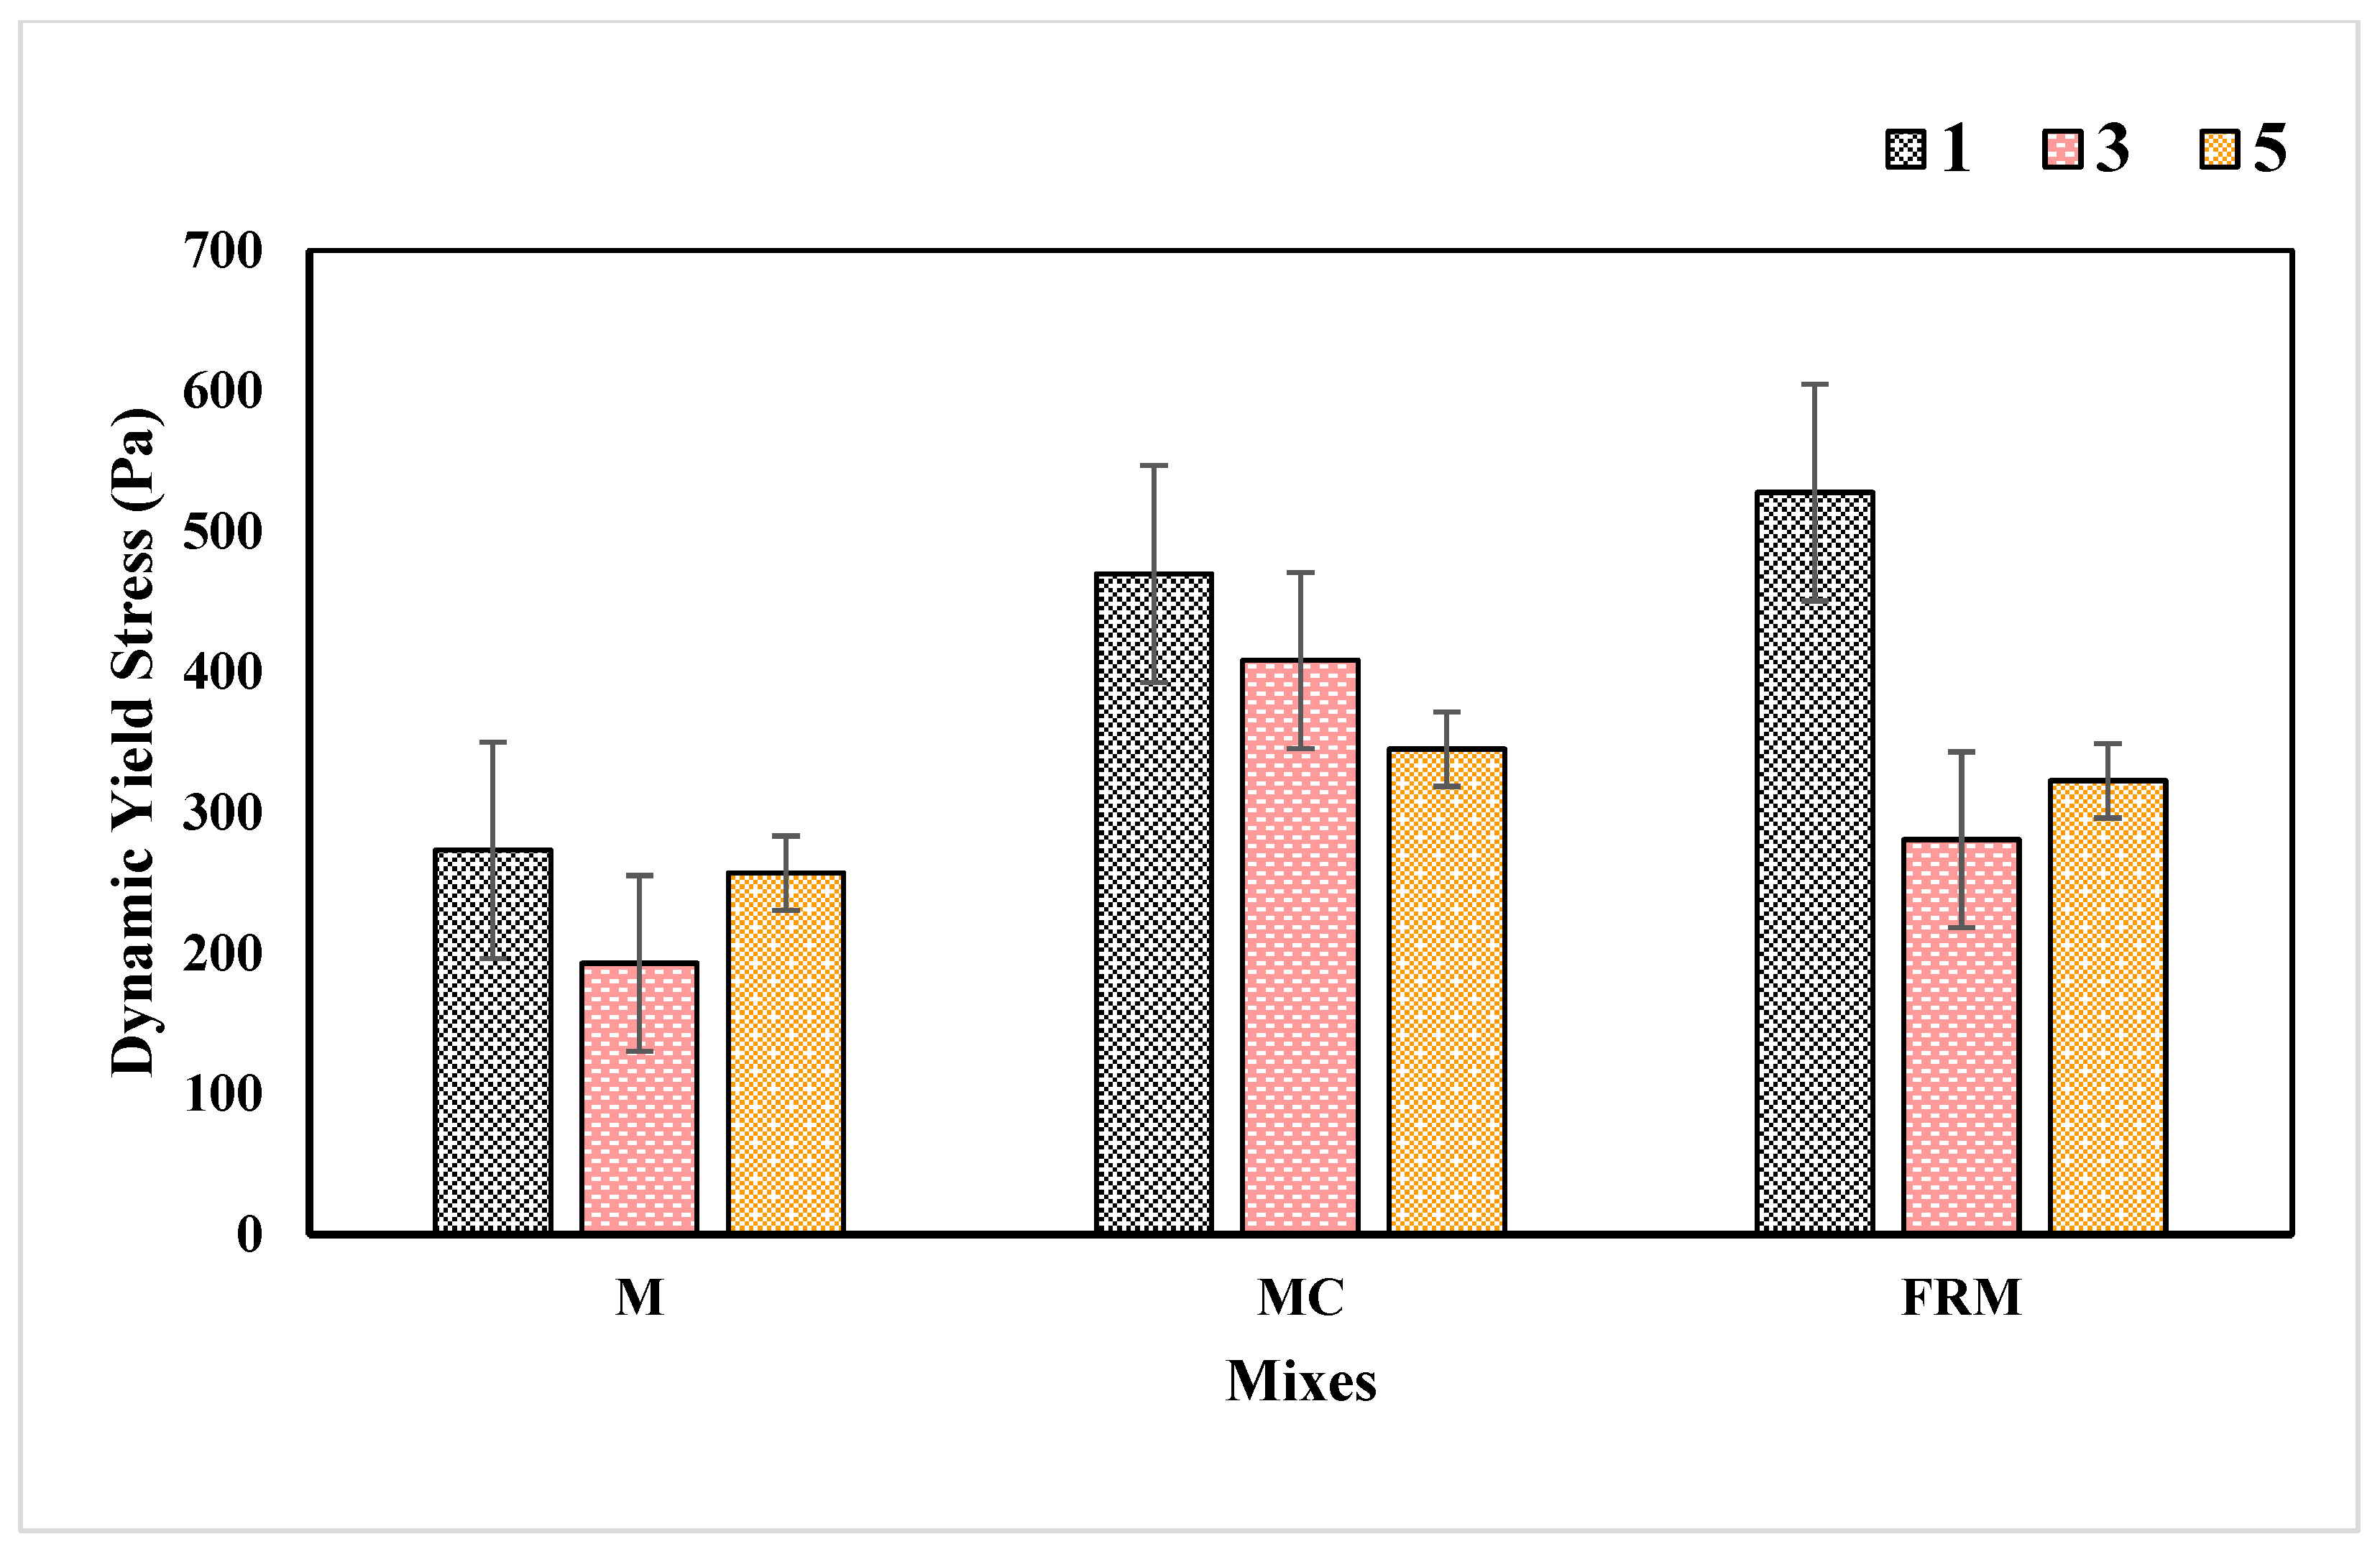
In the realm of 3D printing, careful control of rheological parameters is crucial for the successful production of printable mixes. These parameters, including plastic viscosity, dynamic yield stress, and static yield stress, play a significant role in determining the flowability, extrudability, buildability, and shape retention of the materials. By accurately measuring and controlling these rheological properties, this study aimed to achieve a printable lightweight cementitious mix with enhanced printability. The rheological parameters investigated in this study encompass plastic viscosity, dynamic yield stress, and static yield stress. Plastic viscosity refers to the resistance of the fresh mix to deformation, and it is an essential parameter in studying the flowability and extrudability of different 3D printed mixes. Dynamic yield stress represents the minimum stress required to sustain flow after the structural breakdown occurs, and it depends on the extent of the structural breakdown, which is a crucial factor for the pumpability and extrudability of mixes used in 3D printing. Static yield stress, on the other hand, signifies the critical stress at which the structure of the fresh mix experiences deformations, and it relies on structural buildup, which is an effective parameter for the buildability criteria [17].
Figure 11, Figure 12 and Figure 13 illustrate the rheology results of three different mixes from the three sets (S1, S2, and S3). The findings revealed varying trends for the same mixes across different sets. In S1 mixes (M1, M3, and M5), substituting RS with lightweight aggregate led to a decrease in viscosity and yield stress, aligning with the W/B ratio of these mixes. Specifically, when RS was fully replaced by expanded glass and pumice, the dynamic yield stress and static yield stress decreased by 6%, 7%, 29%, and 16%, respectively. As indicated in Figure 7, expanded glass particles are rounded and show lower flow resistance. Additionally, lightweight aggregates are more porous and require a larger water content; as shown in Table 5, the adjusted W/B ratio needed to achieve flowability was highest for M3 and lowest for M1 (with the lowest absorption capacity). The introduction of additional water to fill the pores and voids in the lightweight aggregate could contribute to the lower viscosity and yield stress observed in lightweight mixes of S1 mixes. To further optimize the rheological properties and enhance the printability, a viscosity modifier (MC) was incorporated in the mixes, as discussed in subsequent sections.
In the S2 and S3 mixes (MCs and FRMs), including MC and fibers into mixes improved the rheological parameters, plastic viscosity, and dynamic yield stress, directly impacting their extrudability. Including the MC could increase rheological parameters due to its adsorption capacity on the cement particle by creating particle bridges [61]. Chen et al. [55] found that an increase in the content of MC increased the plastic viscosity. They also pointed out that cellulose ether can be partly absorbed by the surface of cement paste, increasing its viscosity [55]. The plastic viscosity of the M1 in the S1 mix increased by 73% and 143% for the MC1 and FRM1 mixes, respectively. Similarly, the plastic viscosity of lightweight mixes, M3 and M5, in S1 increased by 115% and 221% in S2 mixes and by 133% and 181% in S3 mixes, respectively. A similar trend was observed for the dynamic yield stress. [61]. Furthermore, the inclusion of fiber also affects the fresh characteristics of the concrete mix [62]. The resistance to flow can be expected to increase with the addition of the fibers due to their needle-shaped particles forming internal structures [62]. Hence, the enhancement of the rheological parameters with fiber inclusion can be attributed to these facts.
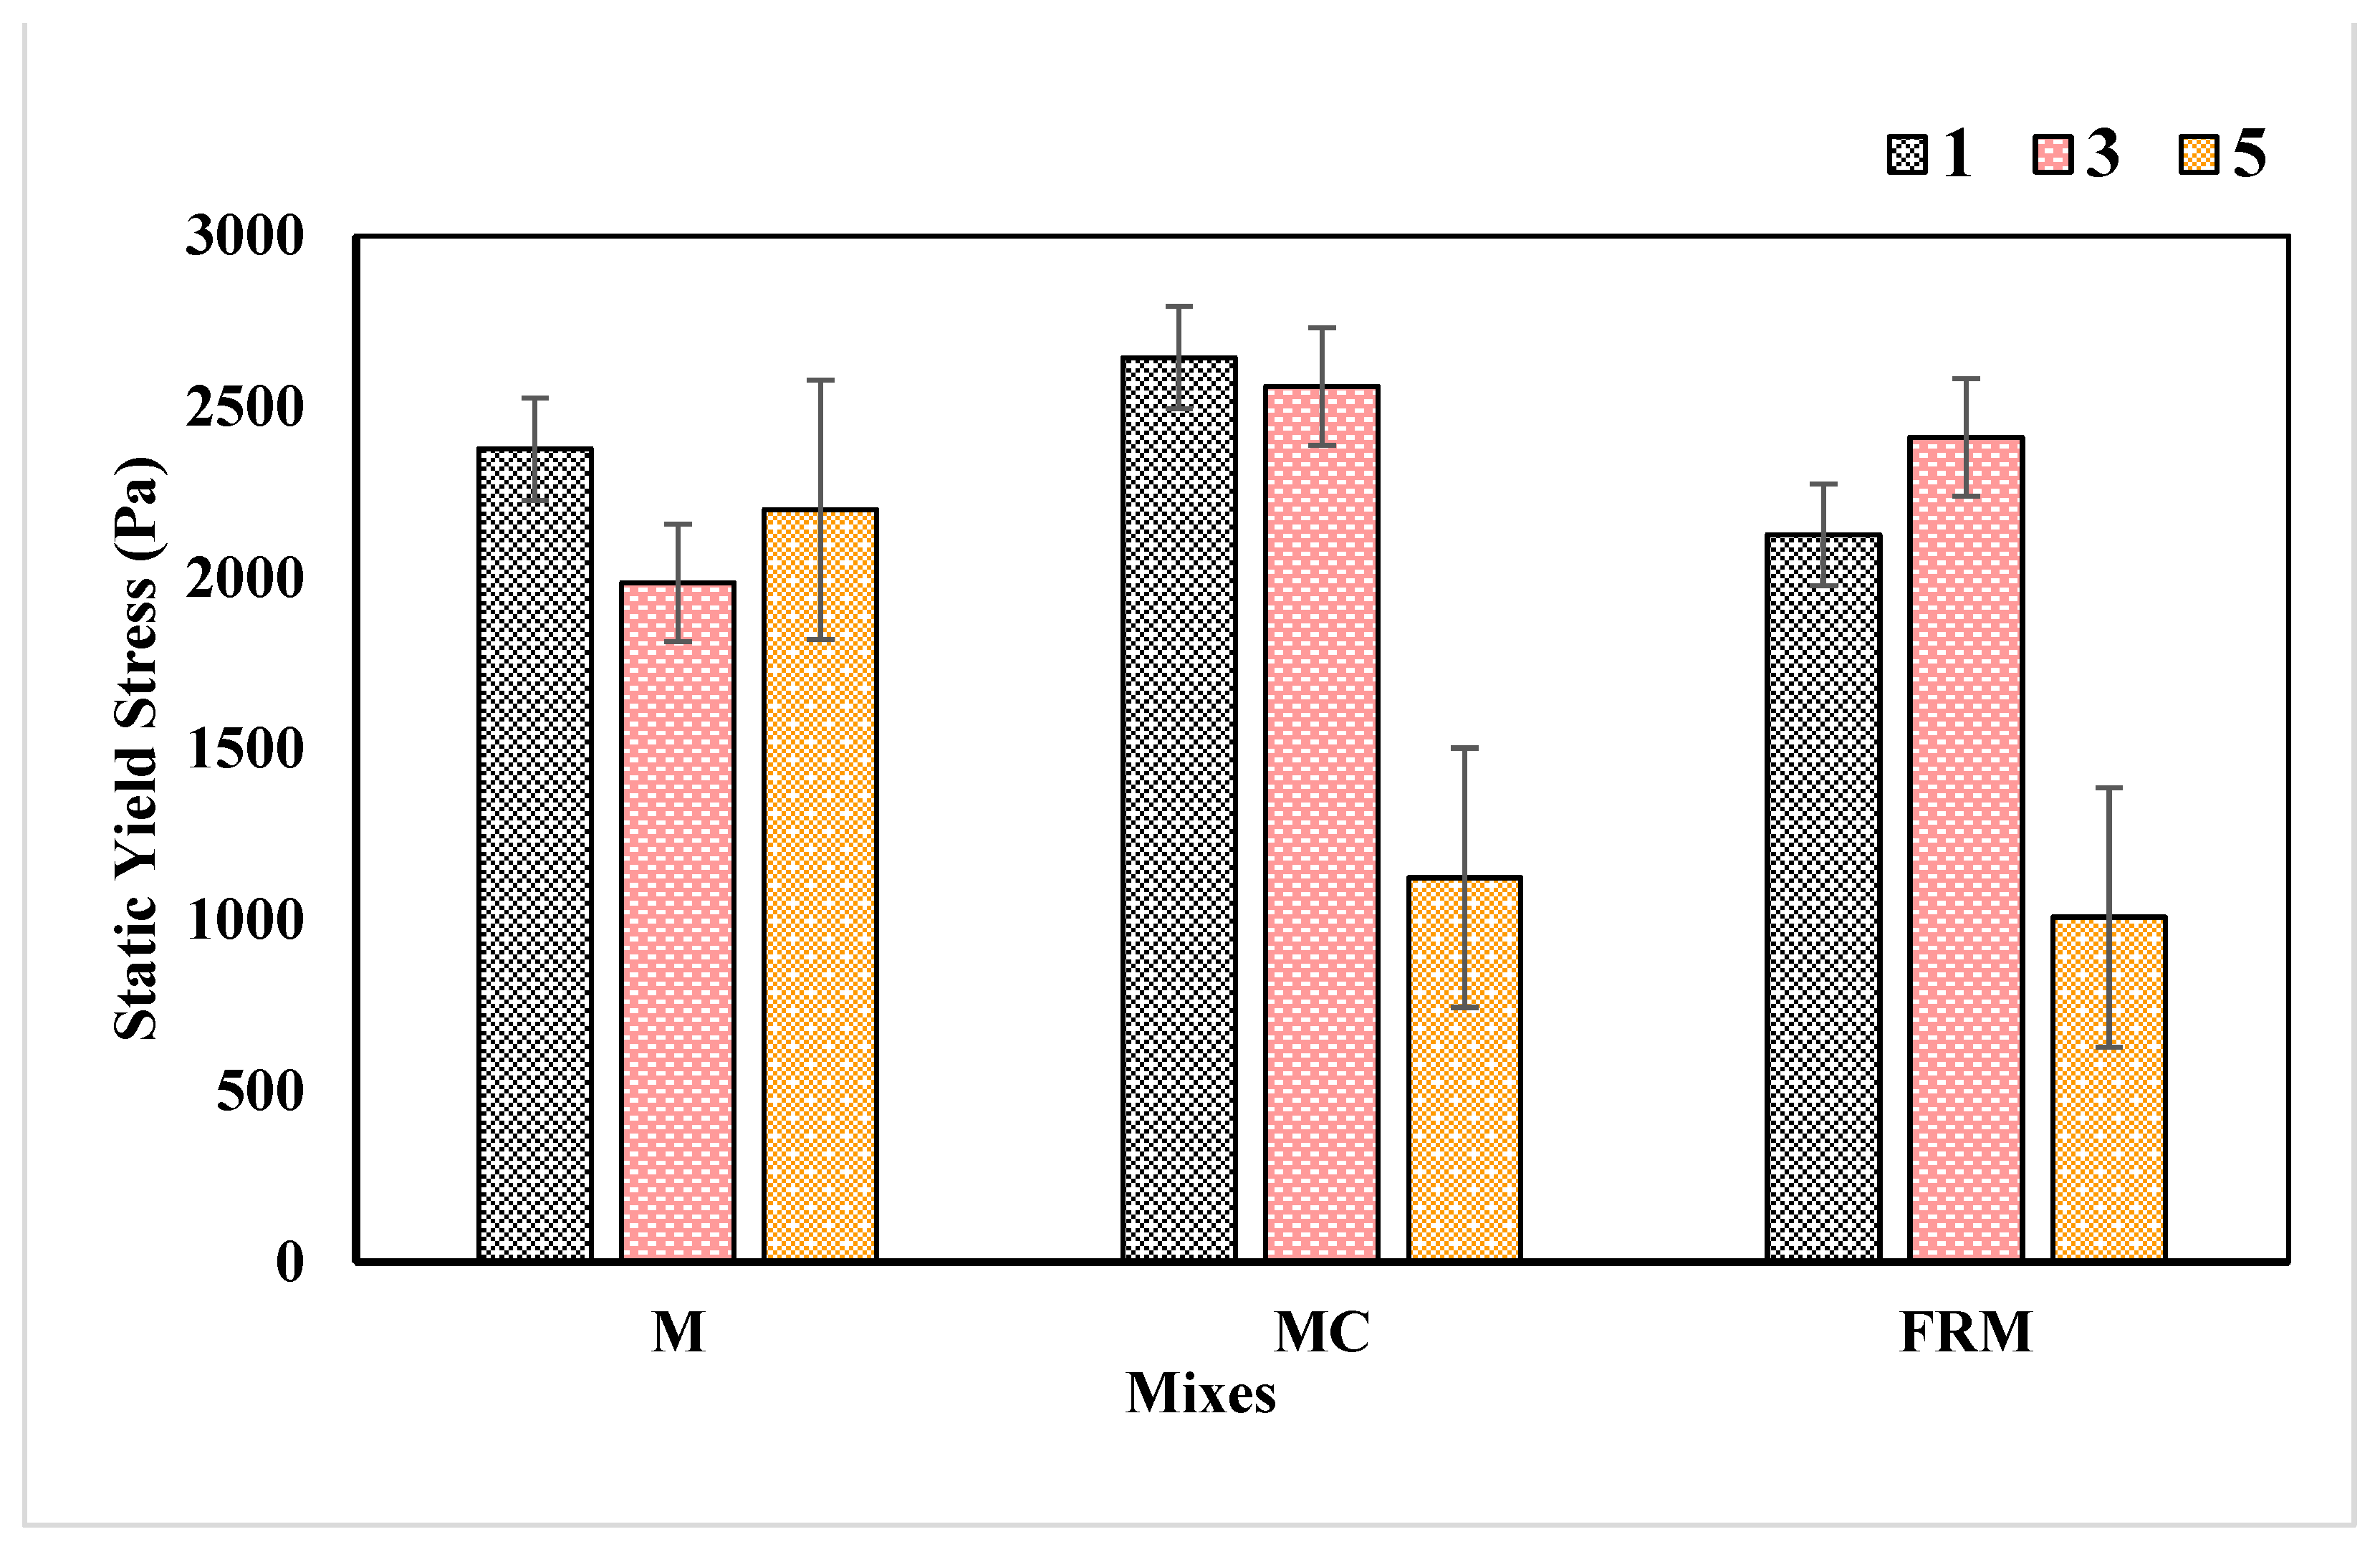
Despite the incorporation of MC or fibers, no notable change or improvement is observed in terms of static yield stress. Notably, the mix containing 100% expanded glass reduces up to 54% in static yield stress by incorporating MC and fibers compared to the control mix. This reduction can be attributed to the rounded particle shape of the aggregate, which impacts their stability as they settle during the fresh stage of the mixture. The granular shape [54] and finer particle size of the expanded glass aggregate compared to the angular shape and coarser size of RS and pumice give it better flowability and, as such, improves the quality of printing in the next sections, while these characteristics would decrease the interlocking between the aggregate in the matrix as the particles are sliding on each other and decrease the strength of materials to hold the shape after printing [24]. The static yield stress directly affects the buildability response of the mixes, as will be demonstrated in the following section. As stated by Kim et al. [63], the order of adding MC and HRWR influences the rheological evolution of the mix. Their observations revealed that introducing MC before HRWR resulted in a much lower enhancement of the rheology over time compared to adding HRWR first. This phenomenon was explained by the formation of electrostatic forces on the particle’s surface. In line with this research, in the present study, MC was added to the mix before HRWR in dry form, potentially contributing to a lower static yield stress for mixes containing MC and, consequently, it could reduce their buildability.
3.5. Extrudability
In this study, extrudability refers to the ability of the 3D printing process to produce printed components with satisfactory dimensions in terms of conformity, consistency, and the surface quality of the printed filaments. It assesses the overall quality and performance of the printed objects in terms of their dimensional accuracy, uniformity, and surface finish. A zigzag path was printed at various speeds to assess the extrudability of the designed mixes. Prior to the extrudability test, the extrusion rate was calibrated for each mix. Once a consistent extrusion rate was determined, the extrudability of the mixes was evaluated using a constant extrusion speed. The printing speed was incrementally increased from 10 mm/s to 35 mm/s on each side of the zigzag pattern, as shown in Figure 14, to identify the optimal printing speed for each mix. The printing path width of the extruded mixes was measured immediately after finishing the zigzag printing path width. This was performed to select the suitable printing speed that would result in the printing path width with less deviation from the design. After the selection of printing speed, the extrudability test was conducted with a constant extrusion rate and printing speed. After 24 h, the printed filament width was measured to ensure the dimensional conformity of each mix.
Table 9 marked the printing speeds at which the width of the printed patterns remained consistent and closely matched the intended design width for each mix. Additionally, it provides the corresponding adjusted extrusion rates for each printing speed and mix. This information helped identify the optimal printing parameters for achieving the desired dimensional accuracy and consistency in the printed components. The results show that the S1 mixes exhibited higher extrusion rates than the S2 and S3 series. This can be attributed to their lower adjusted W/B ratio, which required higher pressure for successful extrusion. Although adding MC facilitated extrusion by reducing the extrusion speed to 0.1 round/s, the incorporation of fibers necessitated increased pressure on the extruder to ensure a continuous flow of printing materials. As a result, the extrusion speed had to be adjusted accordingly.
The findings presented in Table 9 indicate that most mixes exhibited favorable extrudability when the printing speed ranged between 20 mm/s and 30 mm/s, resulting in compatible printing paths with a target printing width of 20 mm. Deviating below this range led to over-extrusion, while exceeding this range resulted in separated printed filaments.
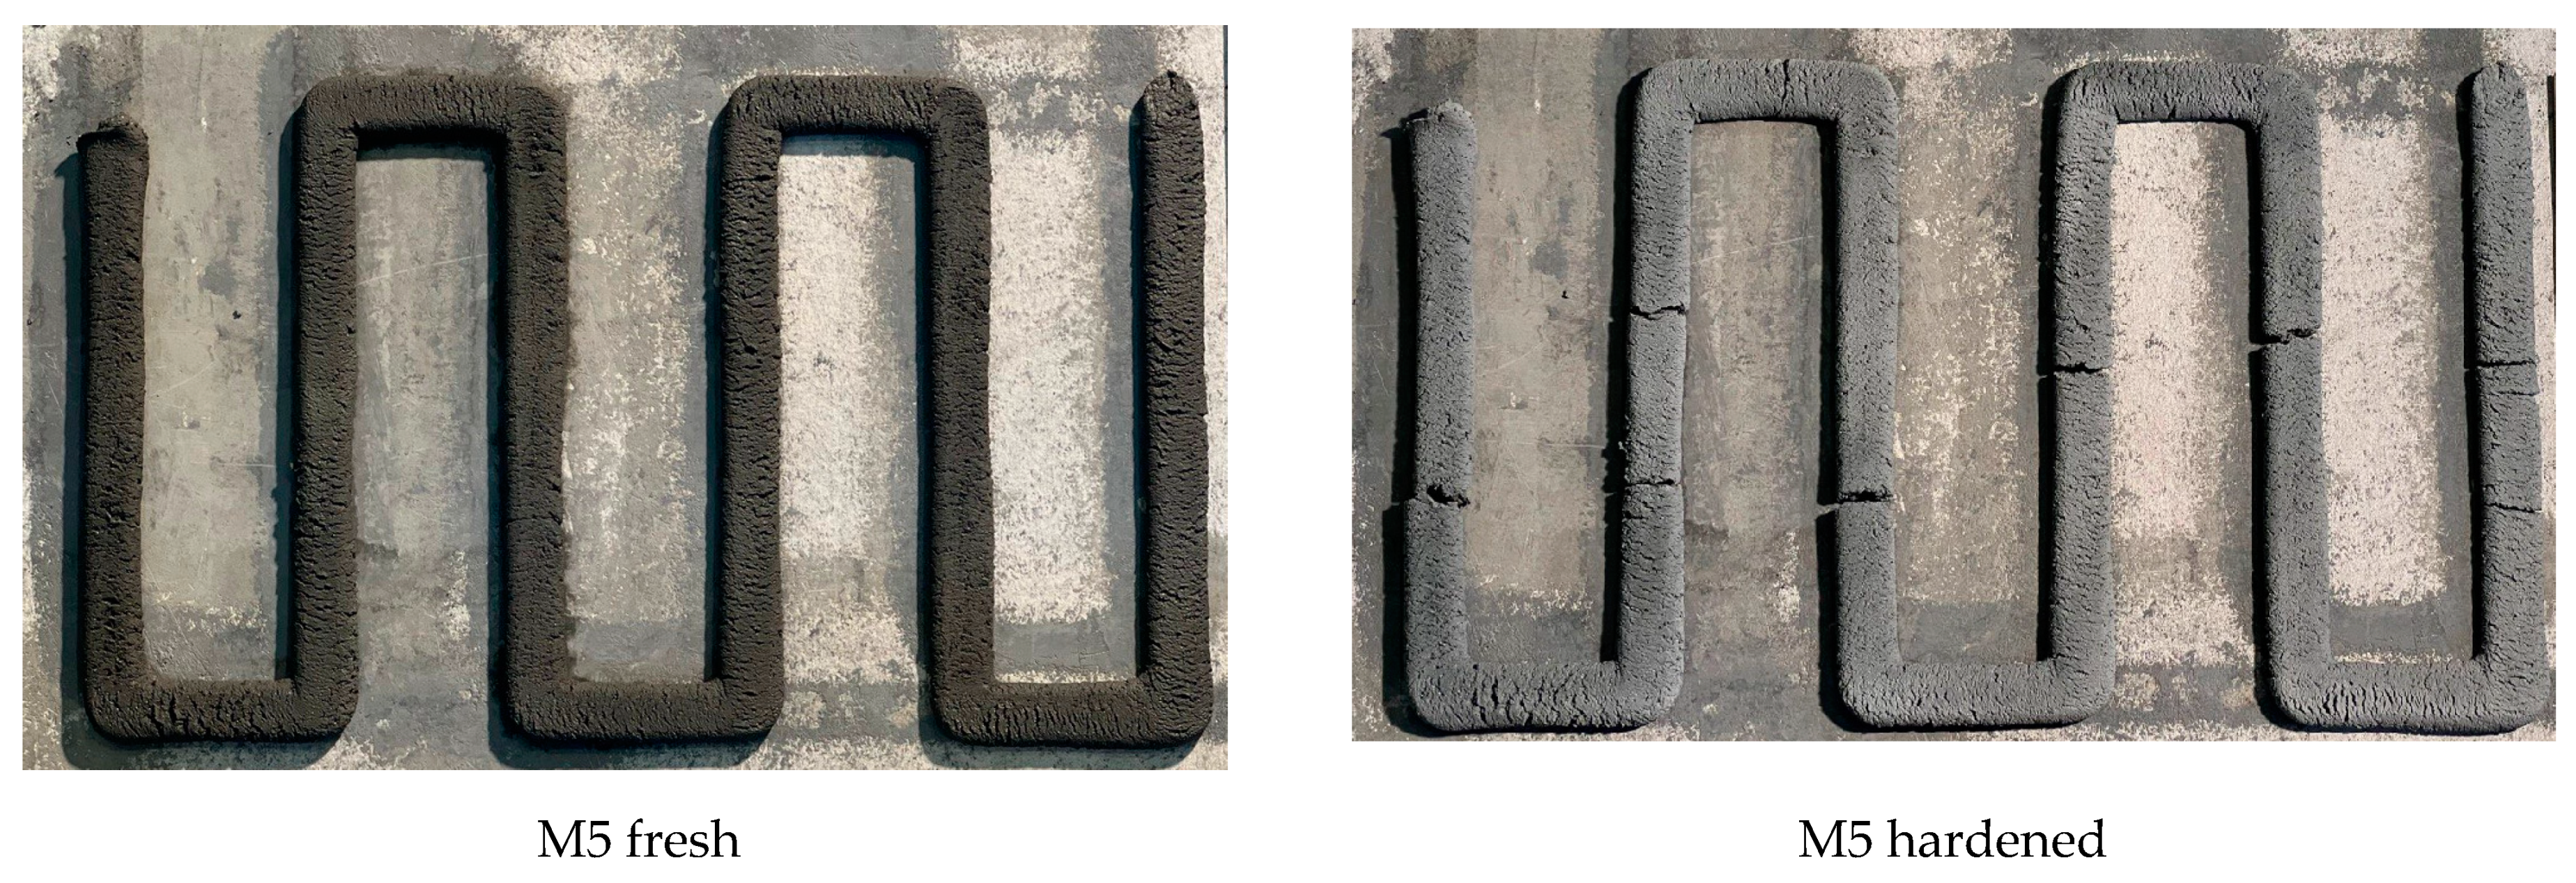
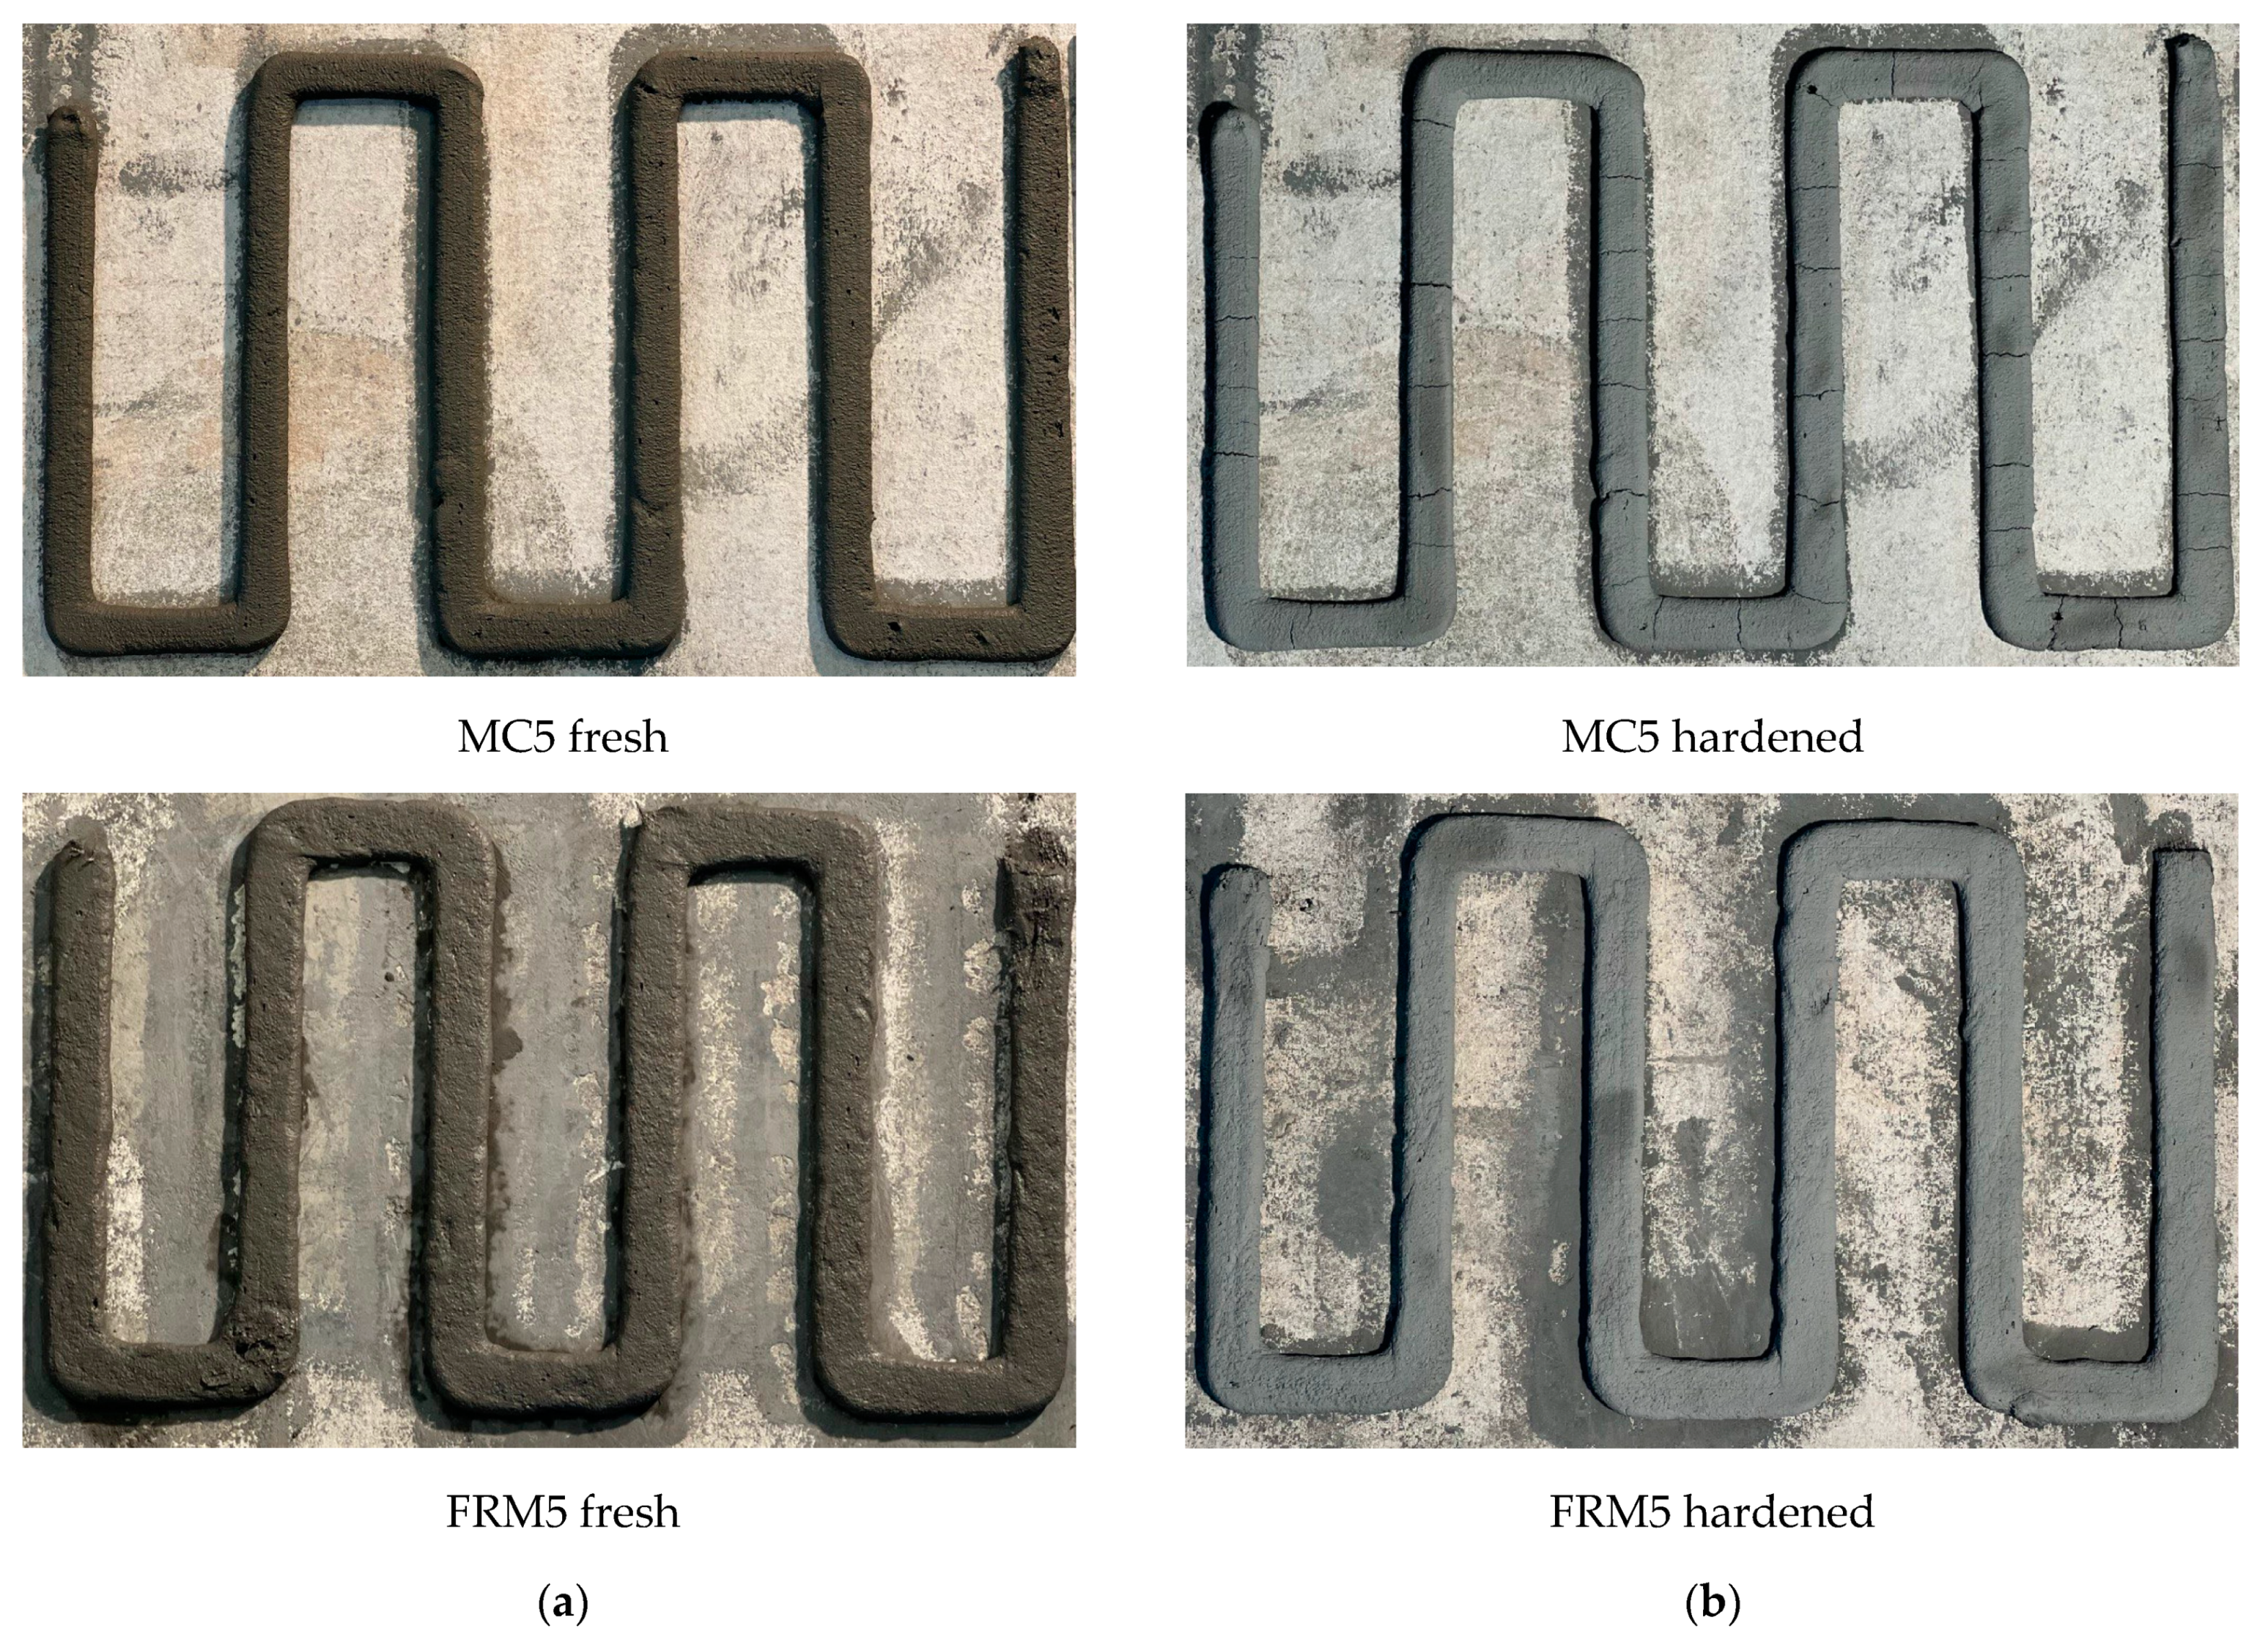
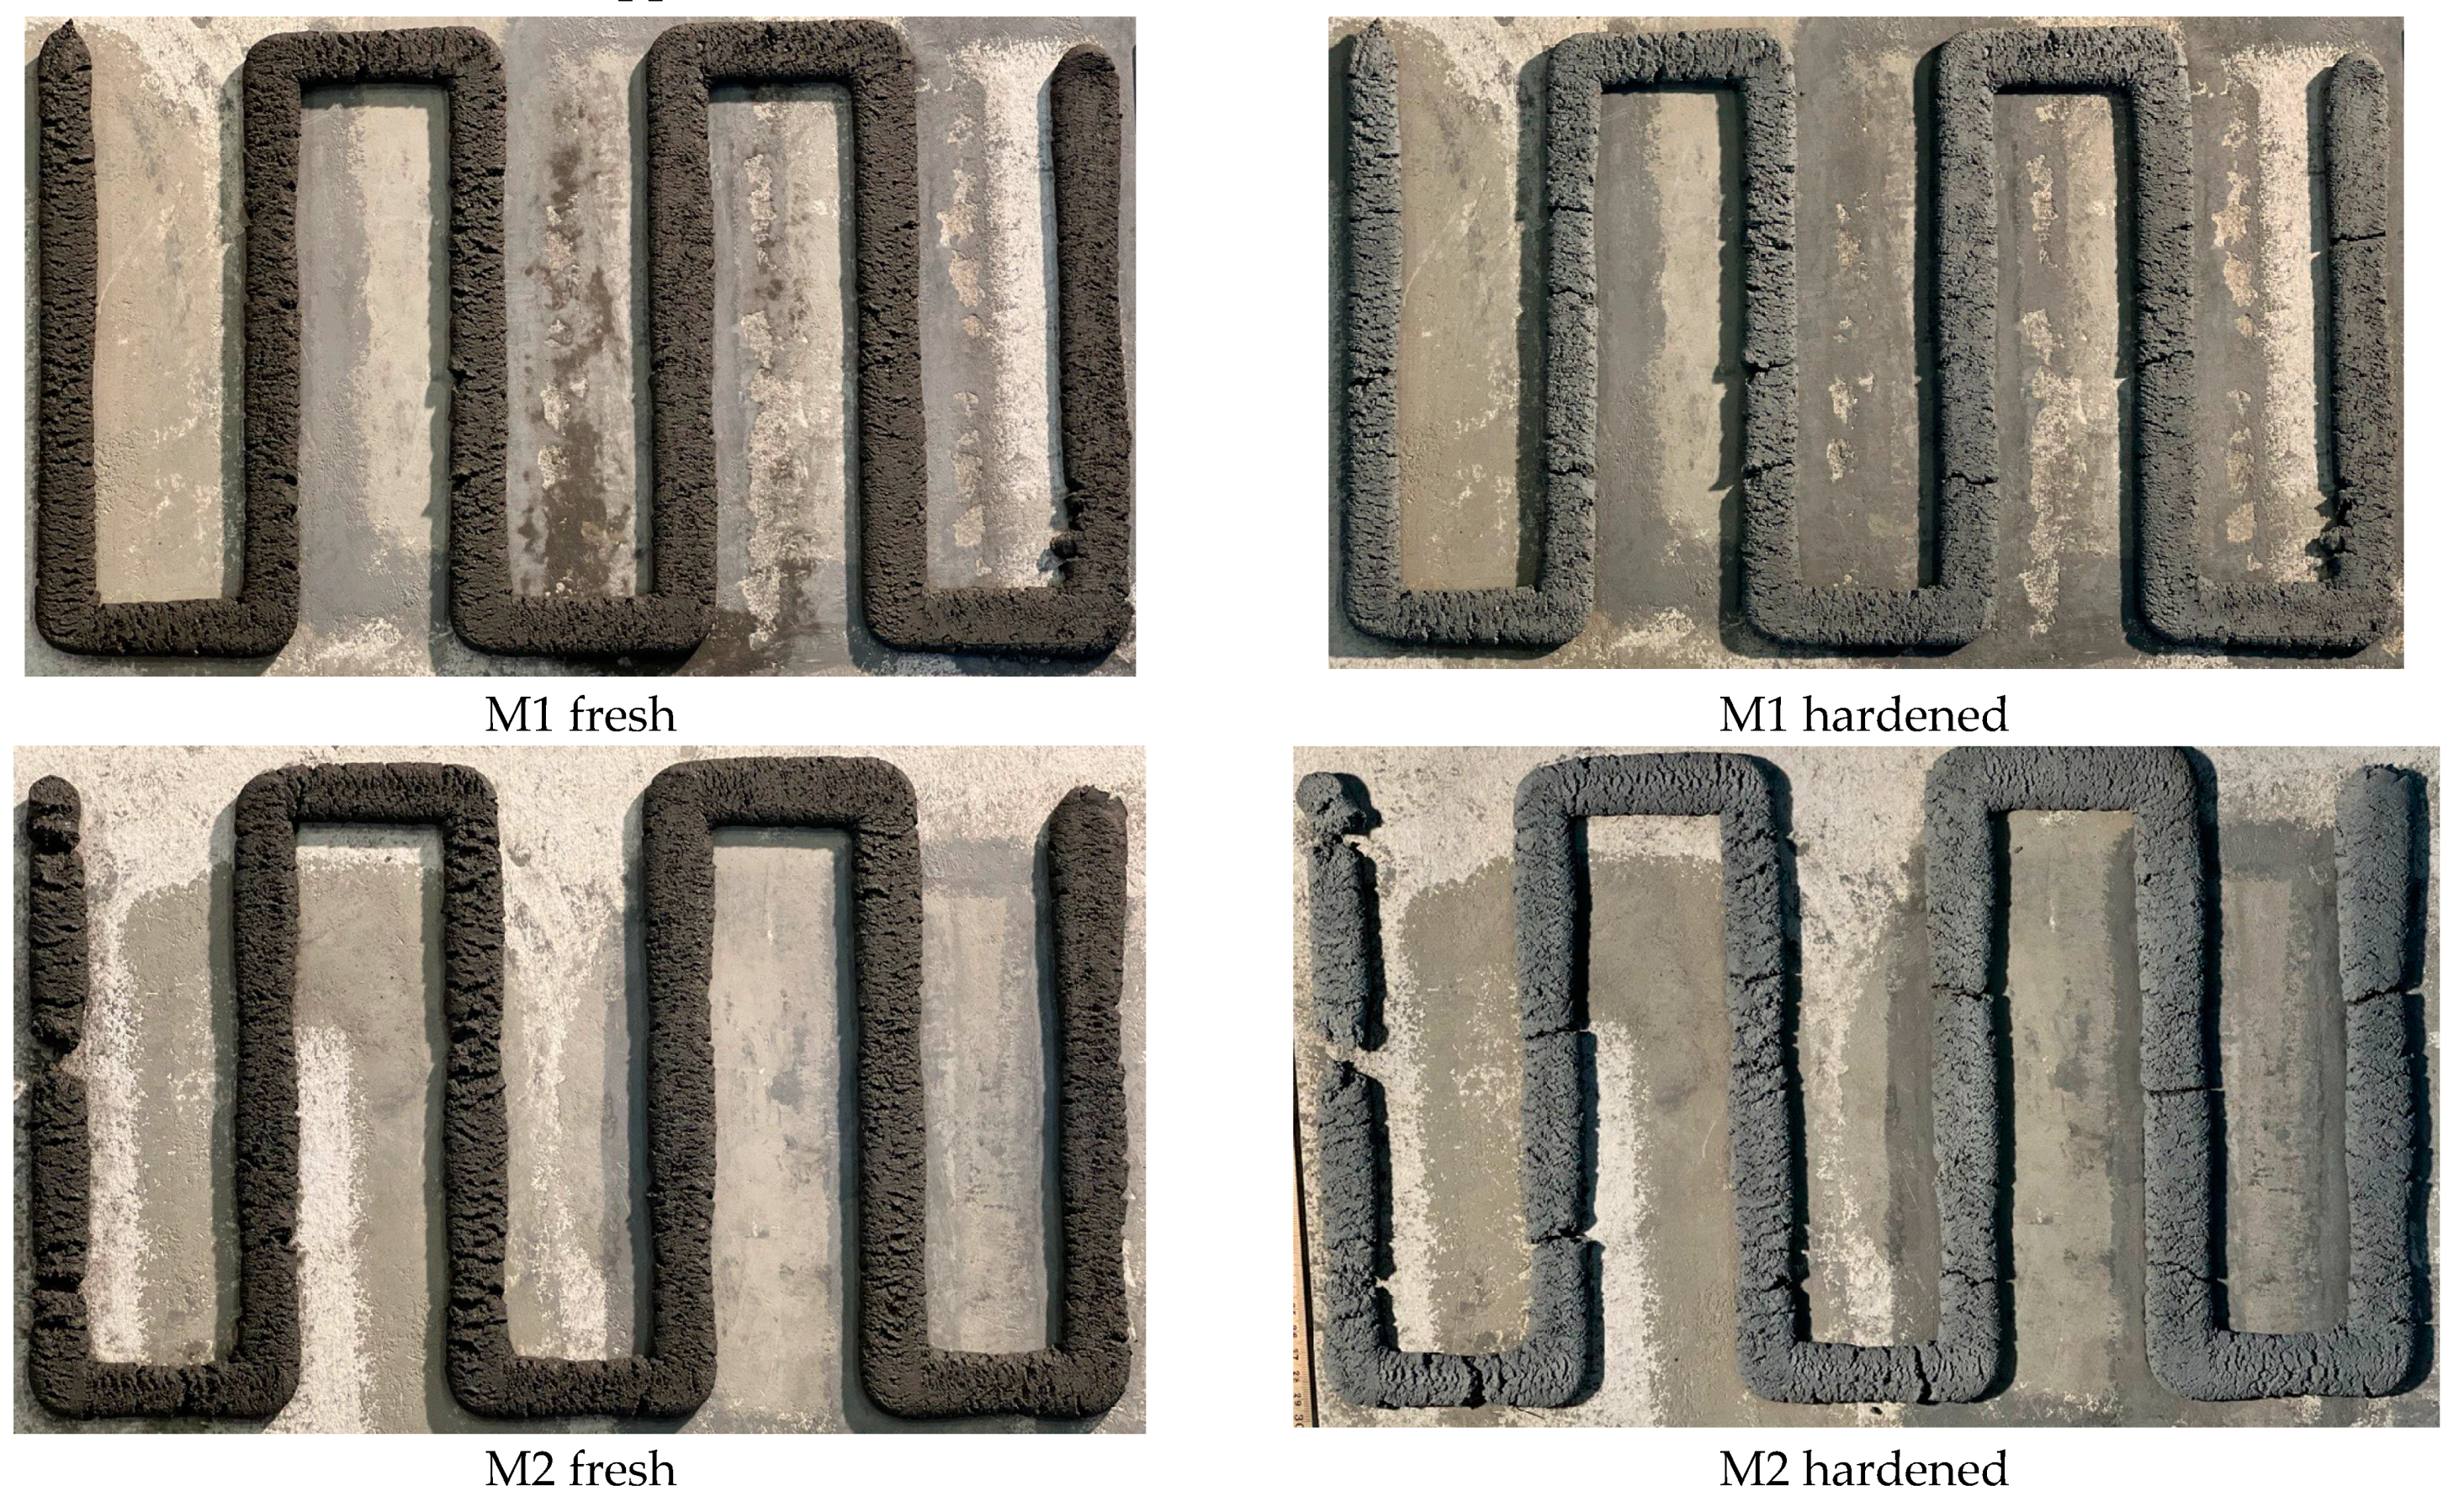
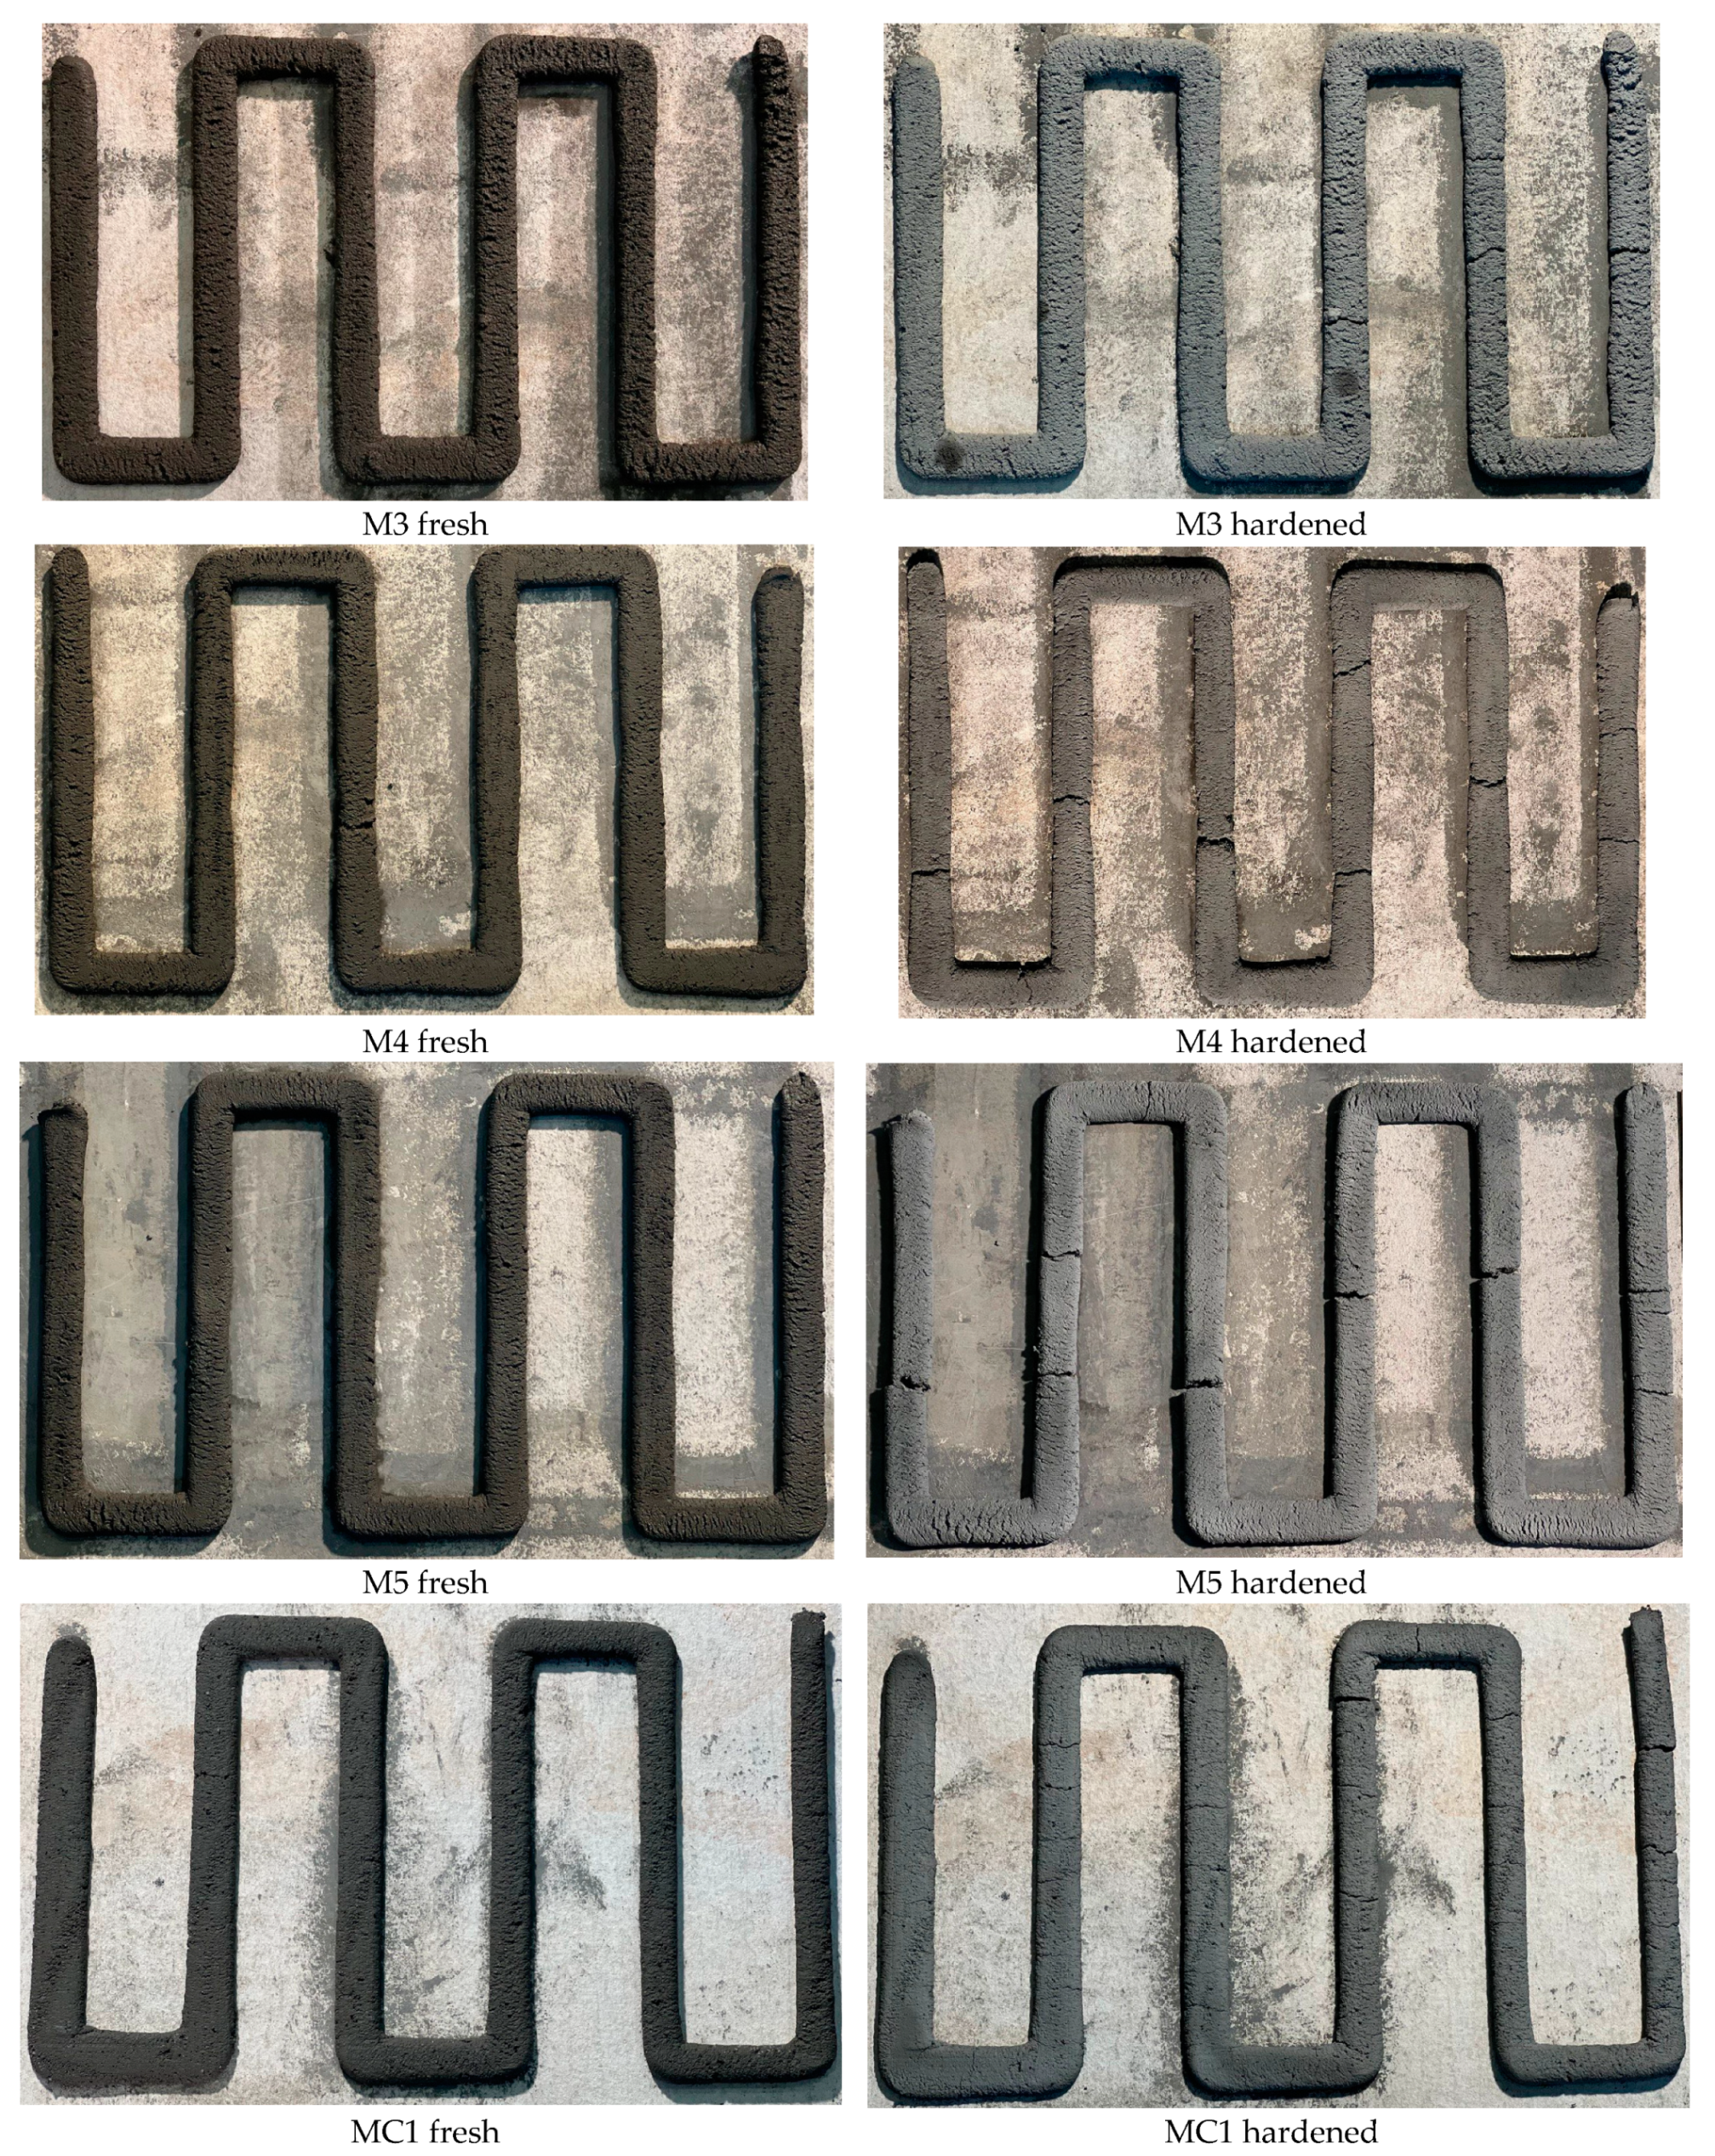
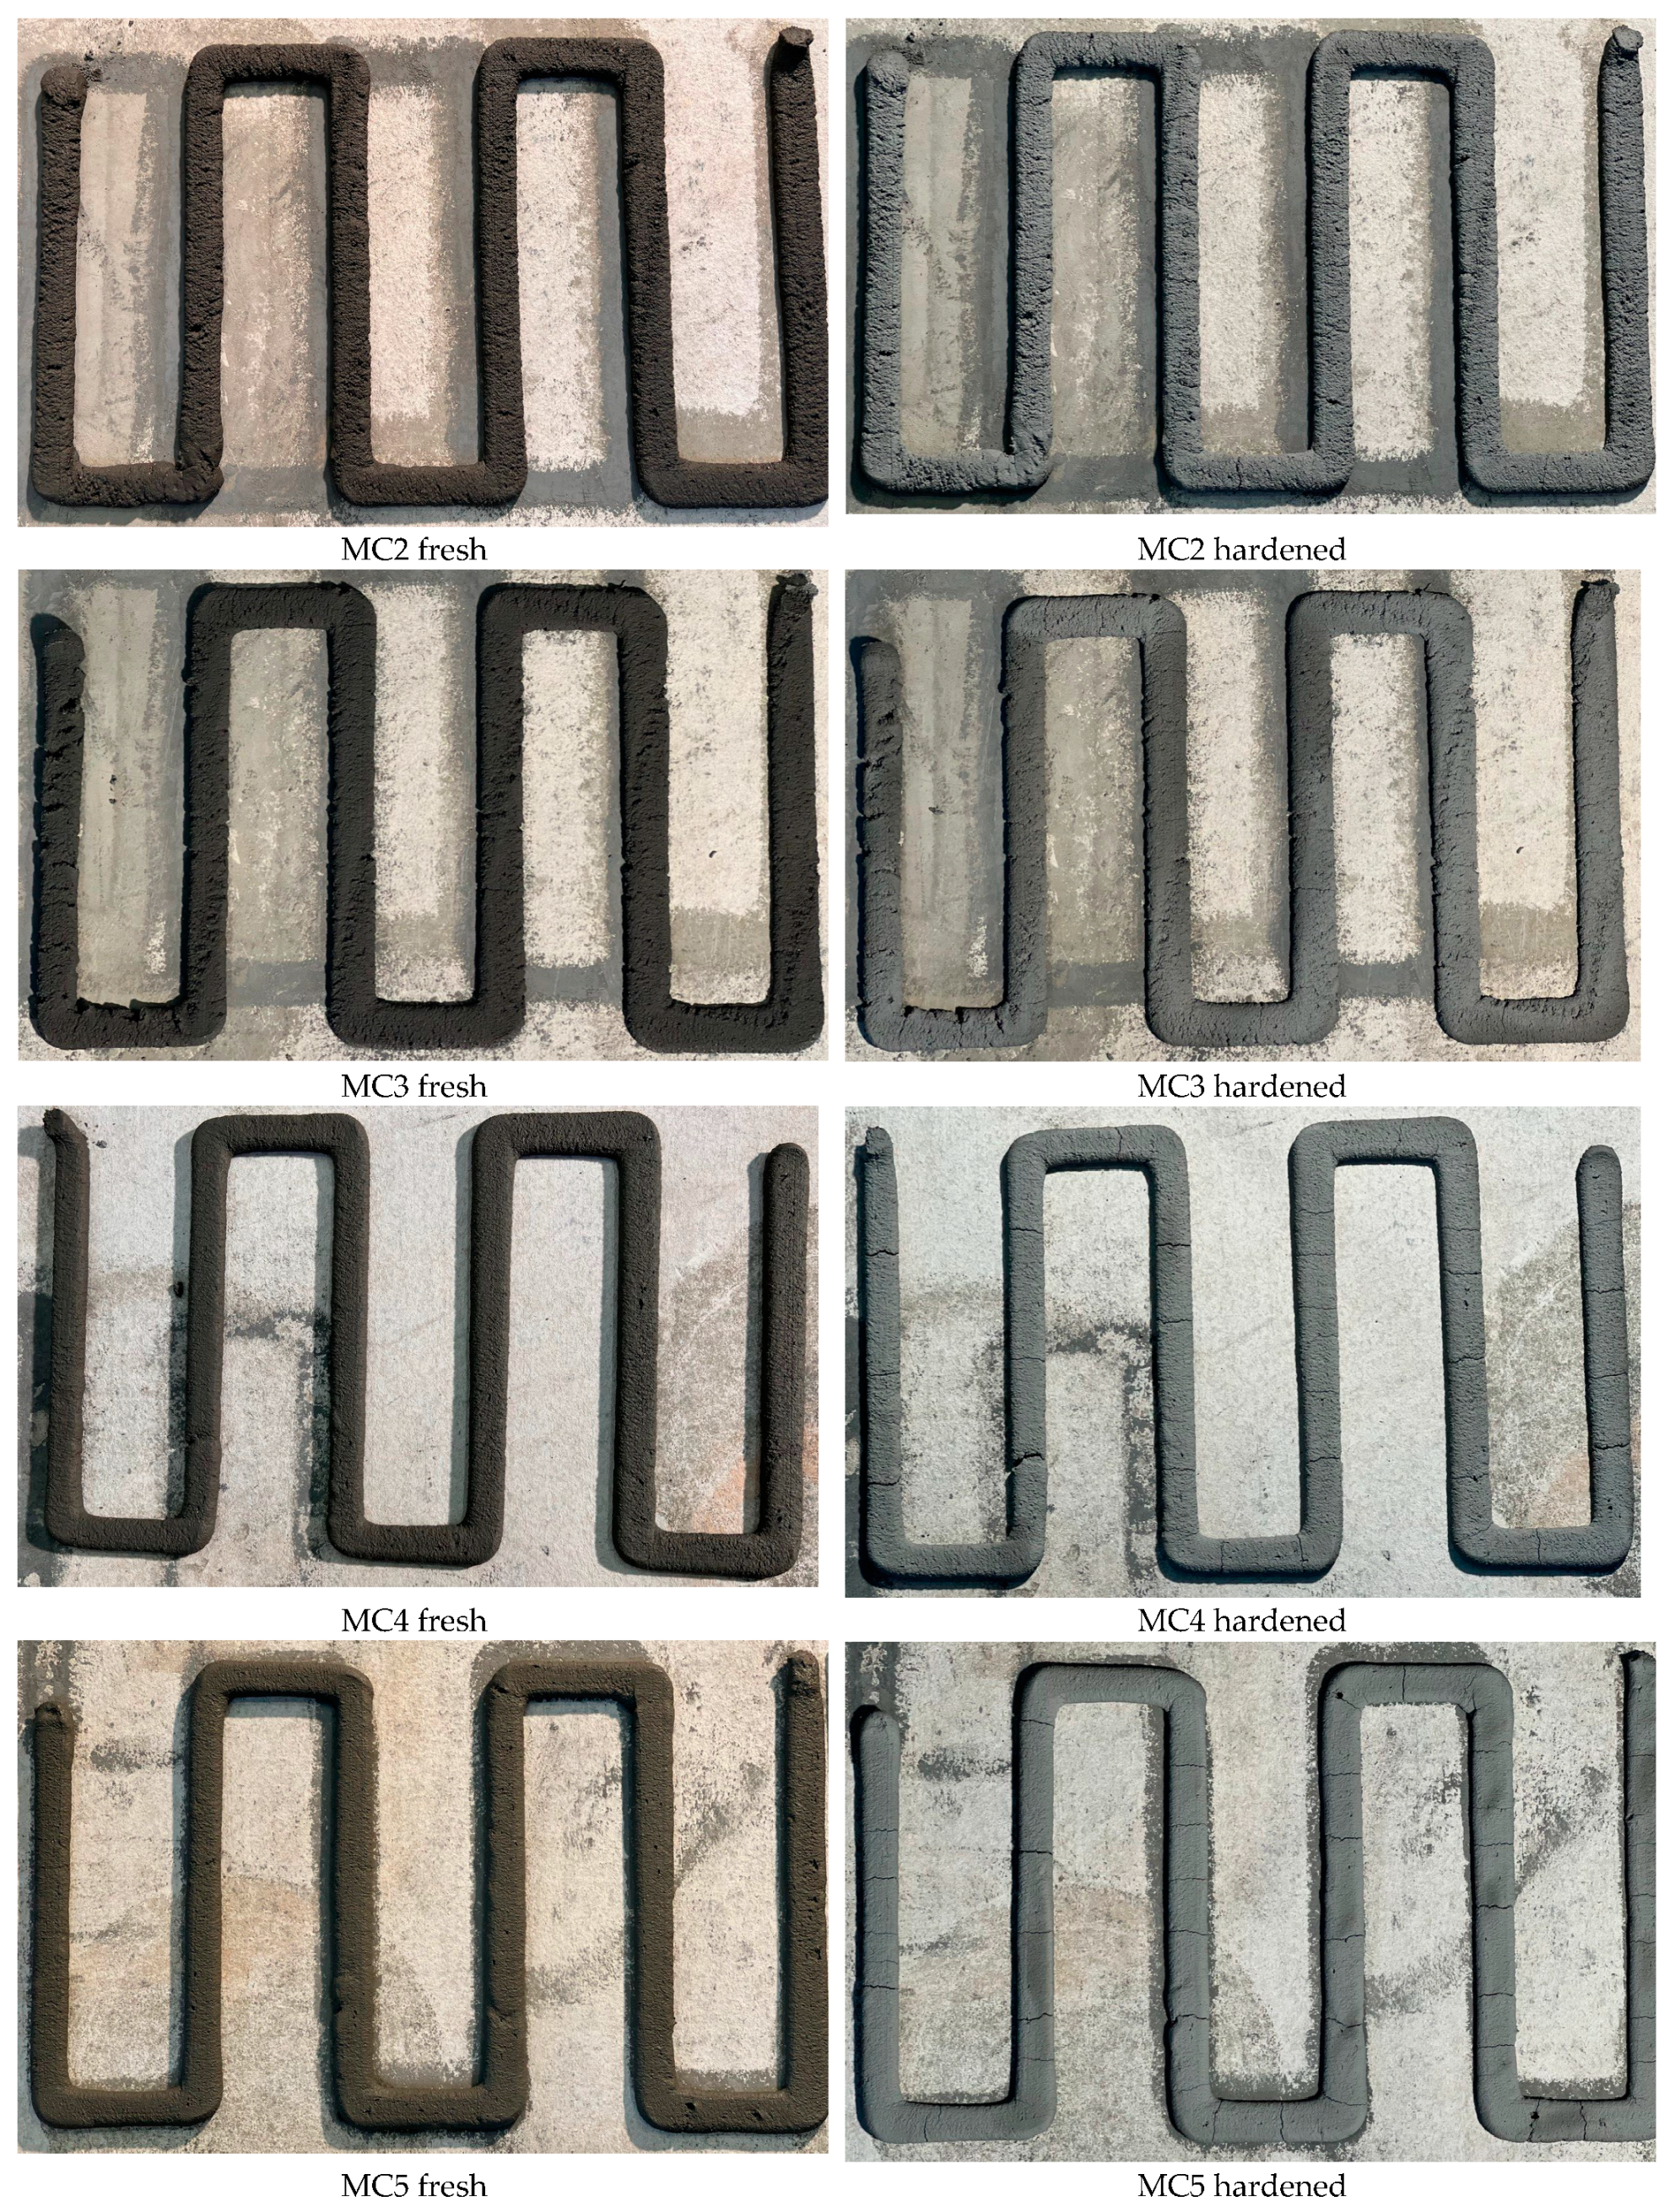
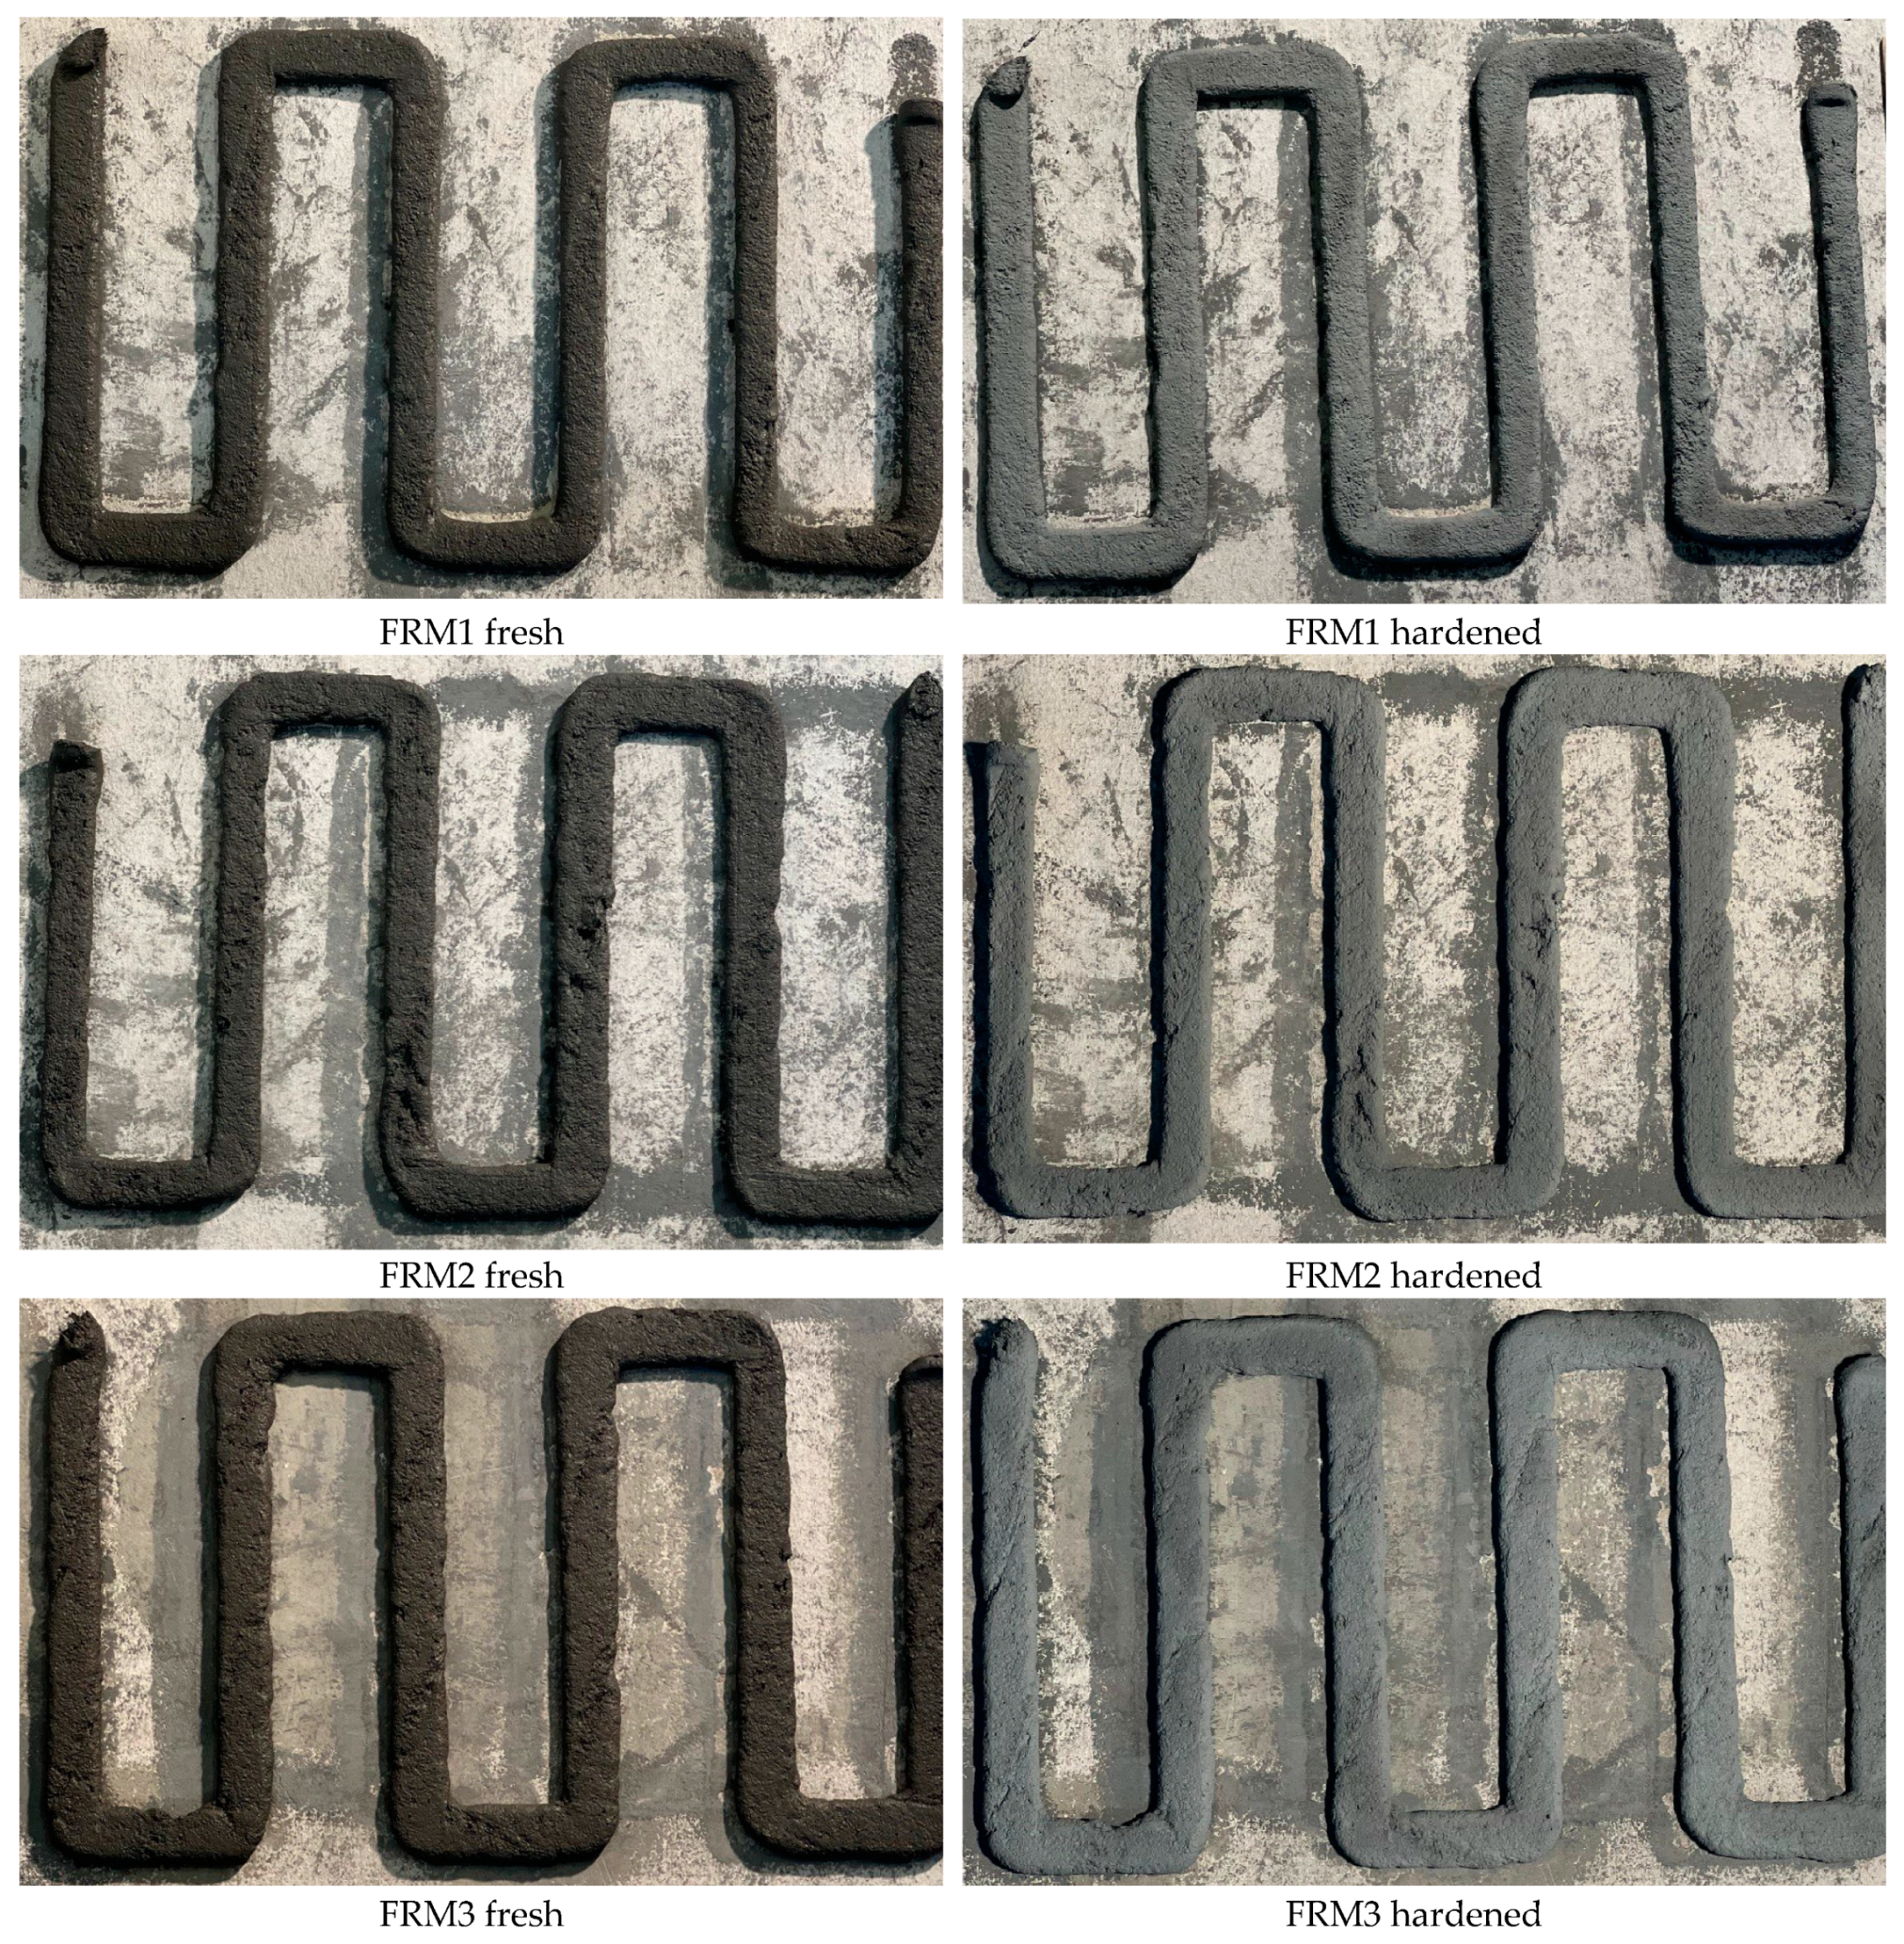
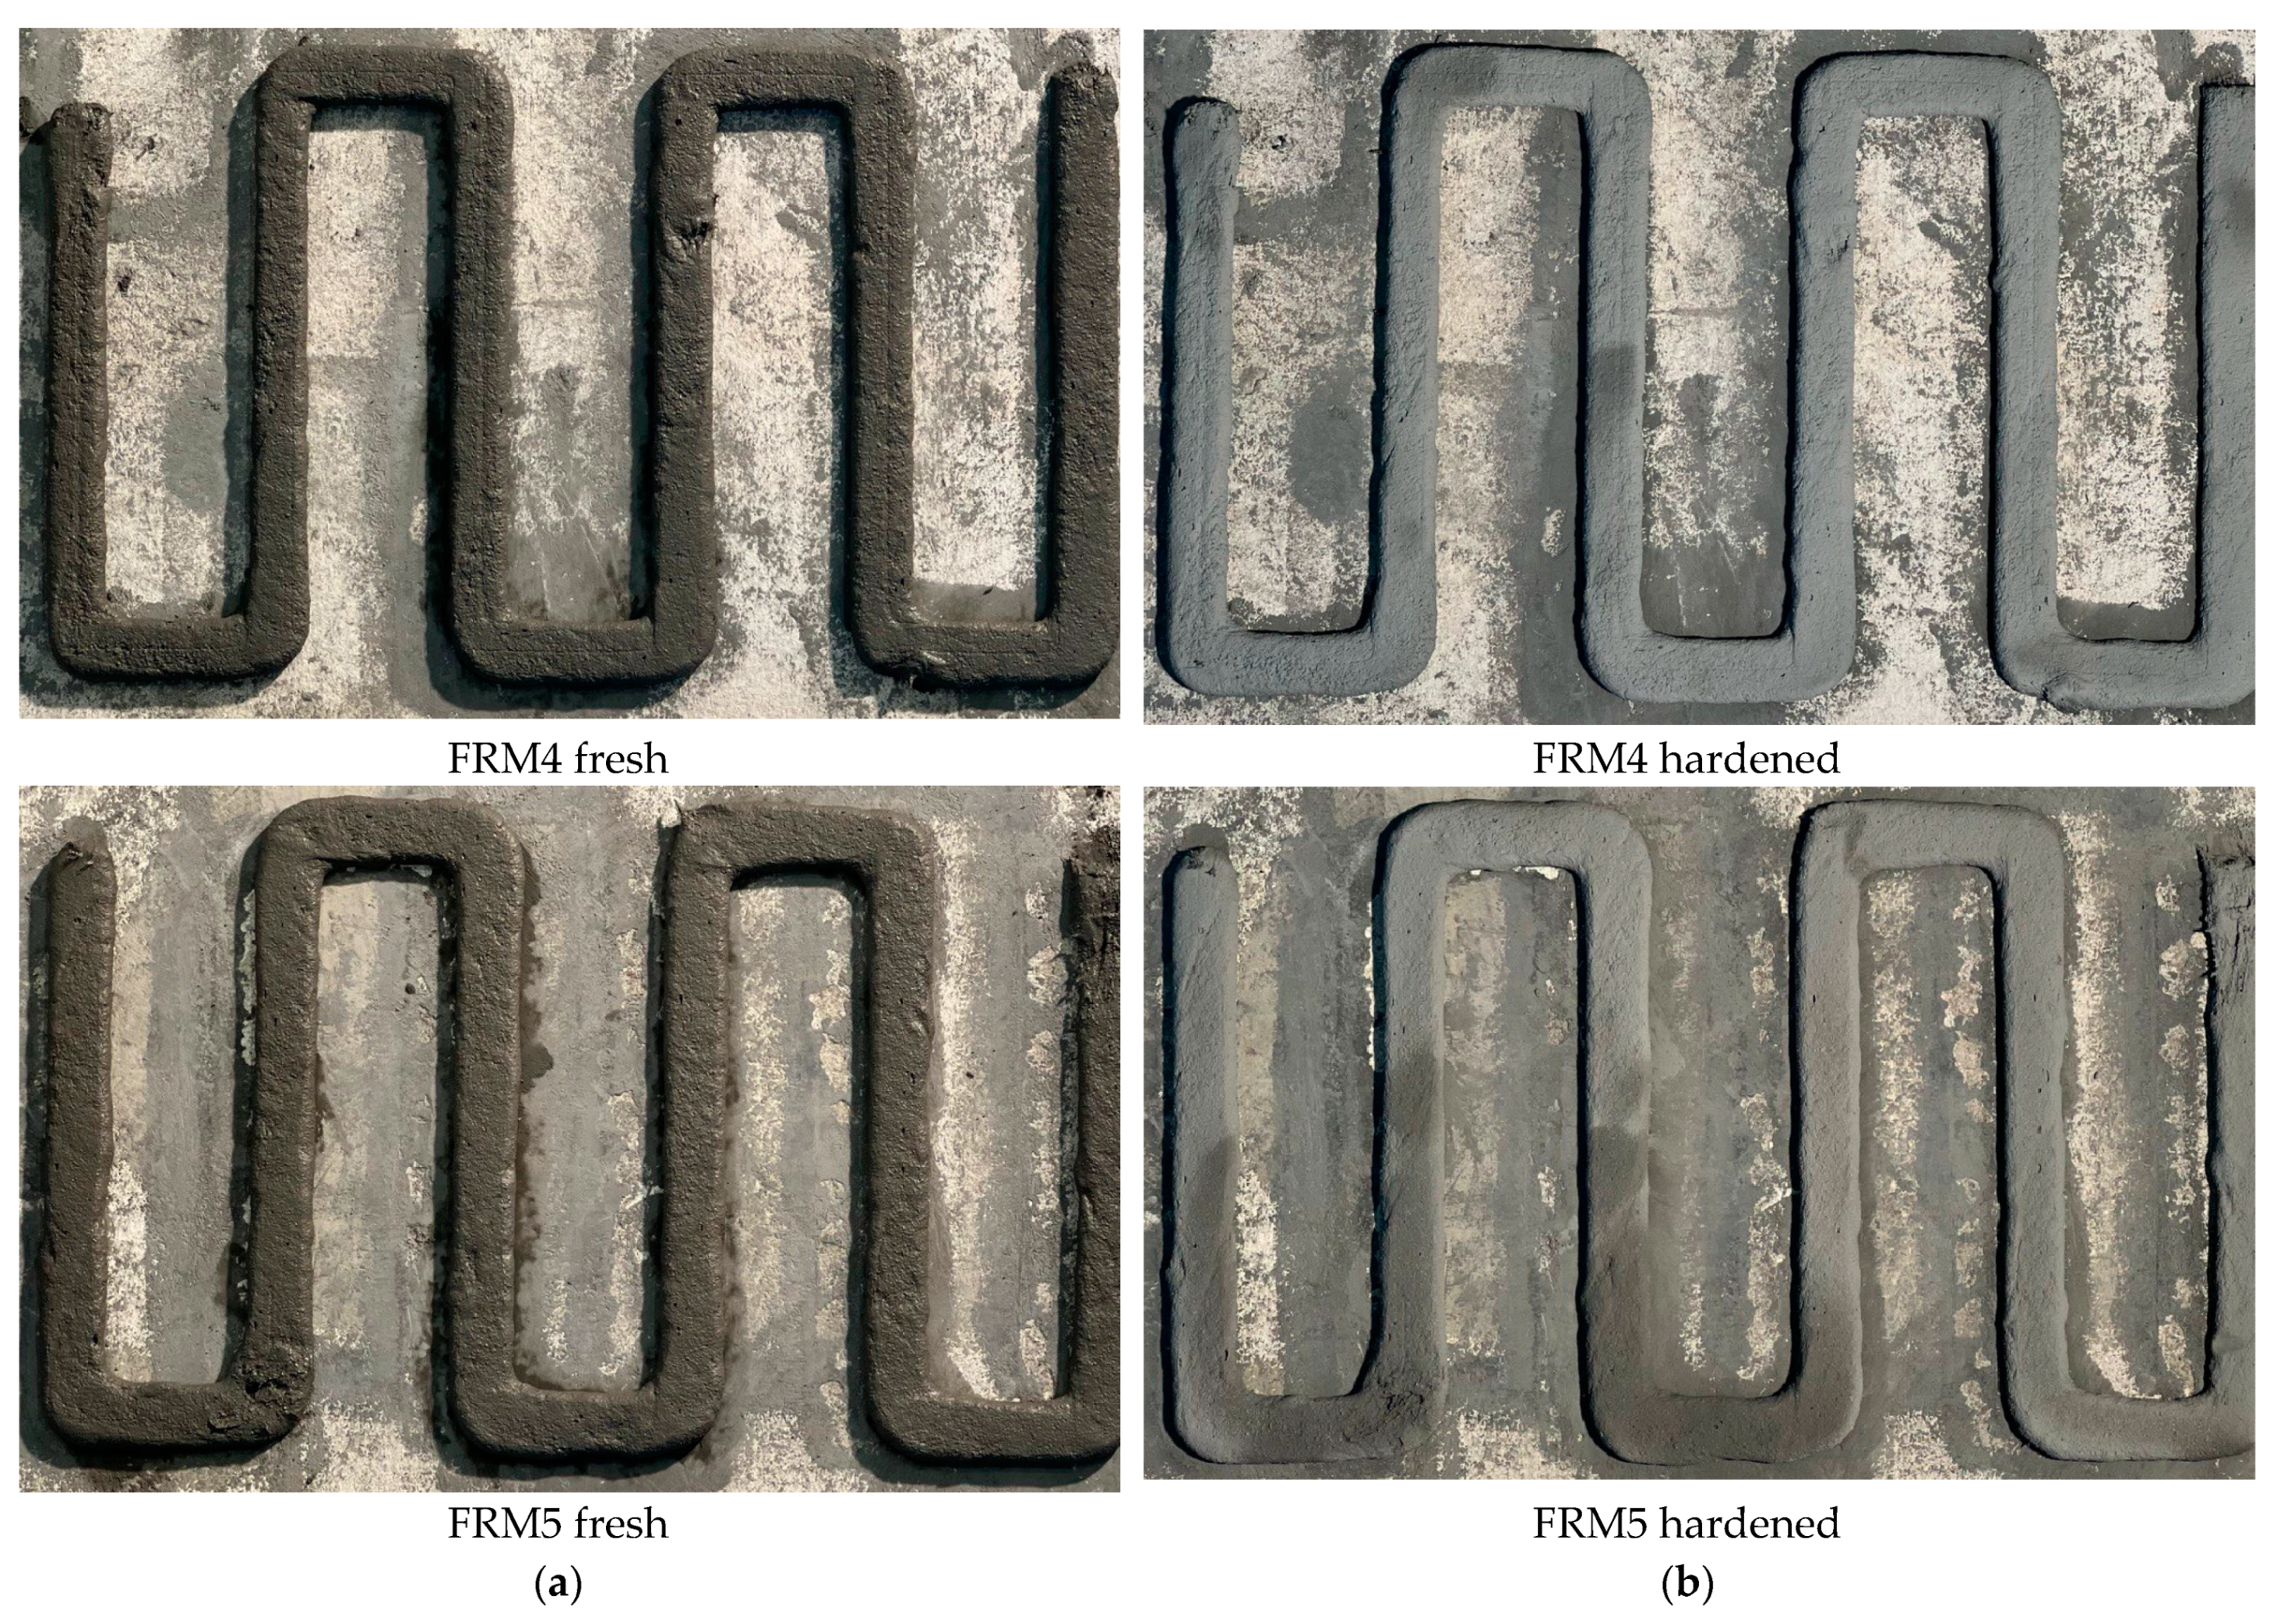
To evaluate the extrudability of each mix in terms of the printing quality and consistency of printed filament, the images of the extruded mixes were collected immediately after printing and after 24 h of printing. The fresh and hardened images of mixes developed by 100% expanded glass in S1, S2, and S3 (i.e., M5, MC5, and FRM5) are presented in Figure 14. The results revealed that the printing quality of the S1 lightweight mixes was not satisfactory, as evidenced by the presence of small wrinkles and hairline cracks along the freshly printed filaments. Furthermore, a significant number of filaments exhibited cracking within 24 h after printing. A similar trend was observed (as displayed in Figure A1 from Appendix A of this paper) for the other lightweight mixes in S1, including M2, M3, and M4. This can be attributed to the high absorption capacity of the lightweight aggregate used in these mixes, which increased their water demand. Consequently, this led to the formation of early age cracks in both the fresh and hardened states of the printed elements. According to the Figure A1, the M1 showed the lowest printing quality during the fresh state compared to the MC1 and FRM1. The low quality of printing in S1 mixes can be attributed to the absorption of water by the aggregate; however, the S2 and S3 mixes had viscosity modifying agents (MC) that can help the printing materials have a higher quality of printing absorbing water on the methoxyl group, and it forms a gel structure that provides a good surfactant [63,64], preventing the water from being absorbed to the pores and voids in the dry ingredients immediately after the mixing.
In S2 mixes, adding the viscosity modifier, MC, improved the rheological characteristics of the mixes, as mentioned earlier. This resulted in excellent printing quality in terms of consistency and the absence of any hairline cracks in the fresh state, as depicted in Figure 14 for MC5. However, after 24 h, early plastic shrinkage caused significant cracks to appear on the surface of the printed filaments of lightweight mixes, including MC5, as shown in Figure 14. A similar response was observed for other lightweight mixes in S2, as shown in the Figure A1. This shows that MC, as a viscosity modifying agent, cannot help prevent the cracking. Therefore, the mixes in S2 are not printable yet and require modifications to prevent the formation of cracks in the fresh and hardened states. On the other hand, fresh S3 mixes, compared to S1, had a better printing quality but lower than S2. However, referring to Figure 15, S3 mixes had a higher deviation from the designed printing path width of 20 mm compared to S1 and S2, which can be attributed to the higher adjusted W/B ratio and fiber reinforcement, which resulted in the low shape accuracy and the shape retention after 24 h of hydration.
The occurrence of early age cracks in lightweight mixes, resulting from their high water content and subsequent plastic shrinkage, can be effectively managed by incorporating PE fibers [65]. As illustrated in Figure 14, adding fibers acts as an internal reinforcement to mitigate cracks and surface imperfections effectively on the filaments in both the fresh and hardened states. Therefore, incorporating MC and PE fibers was crucial in designing printable lightweight cementitious mixes.
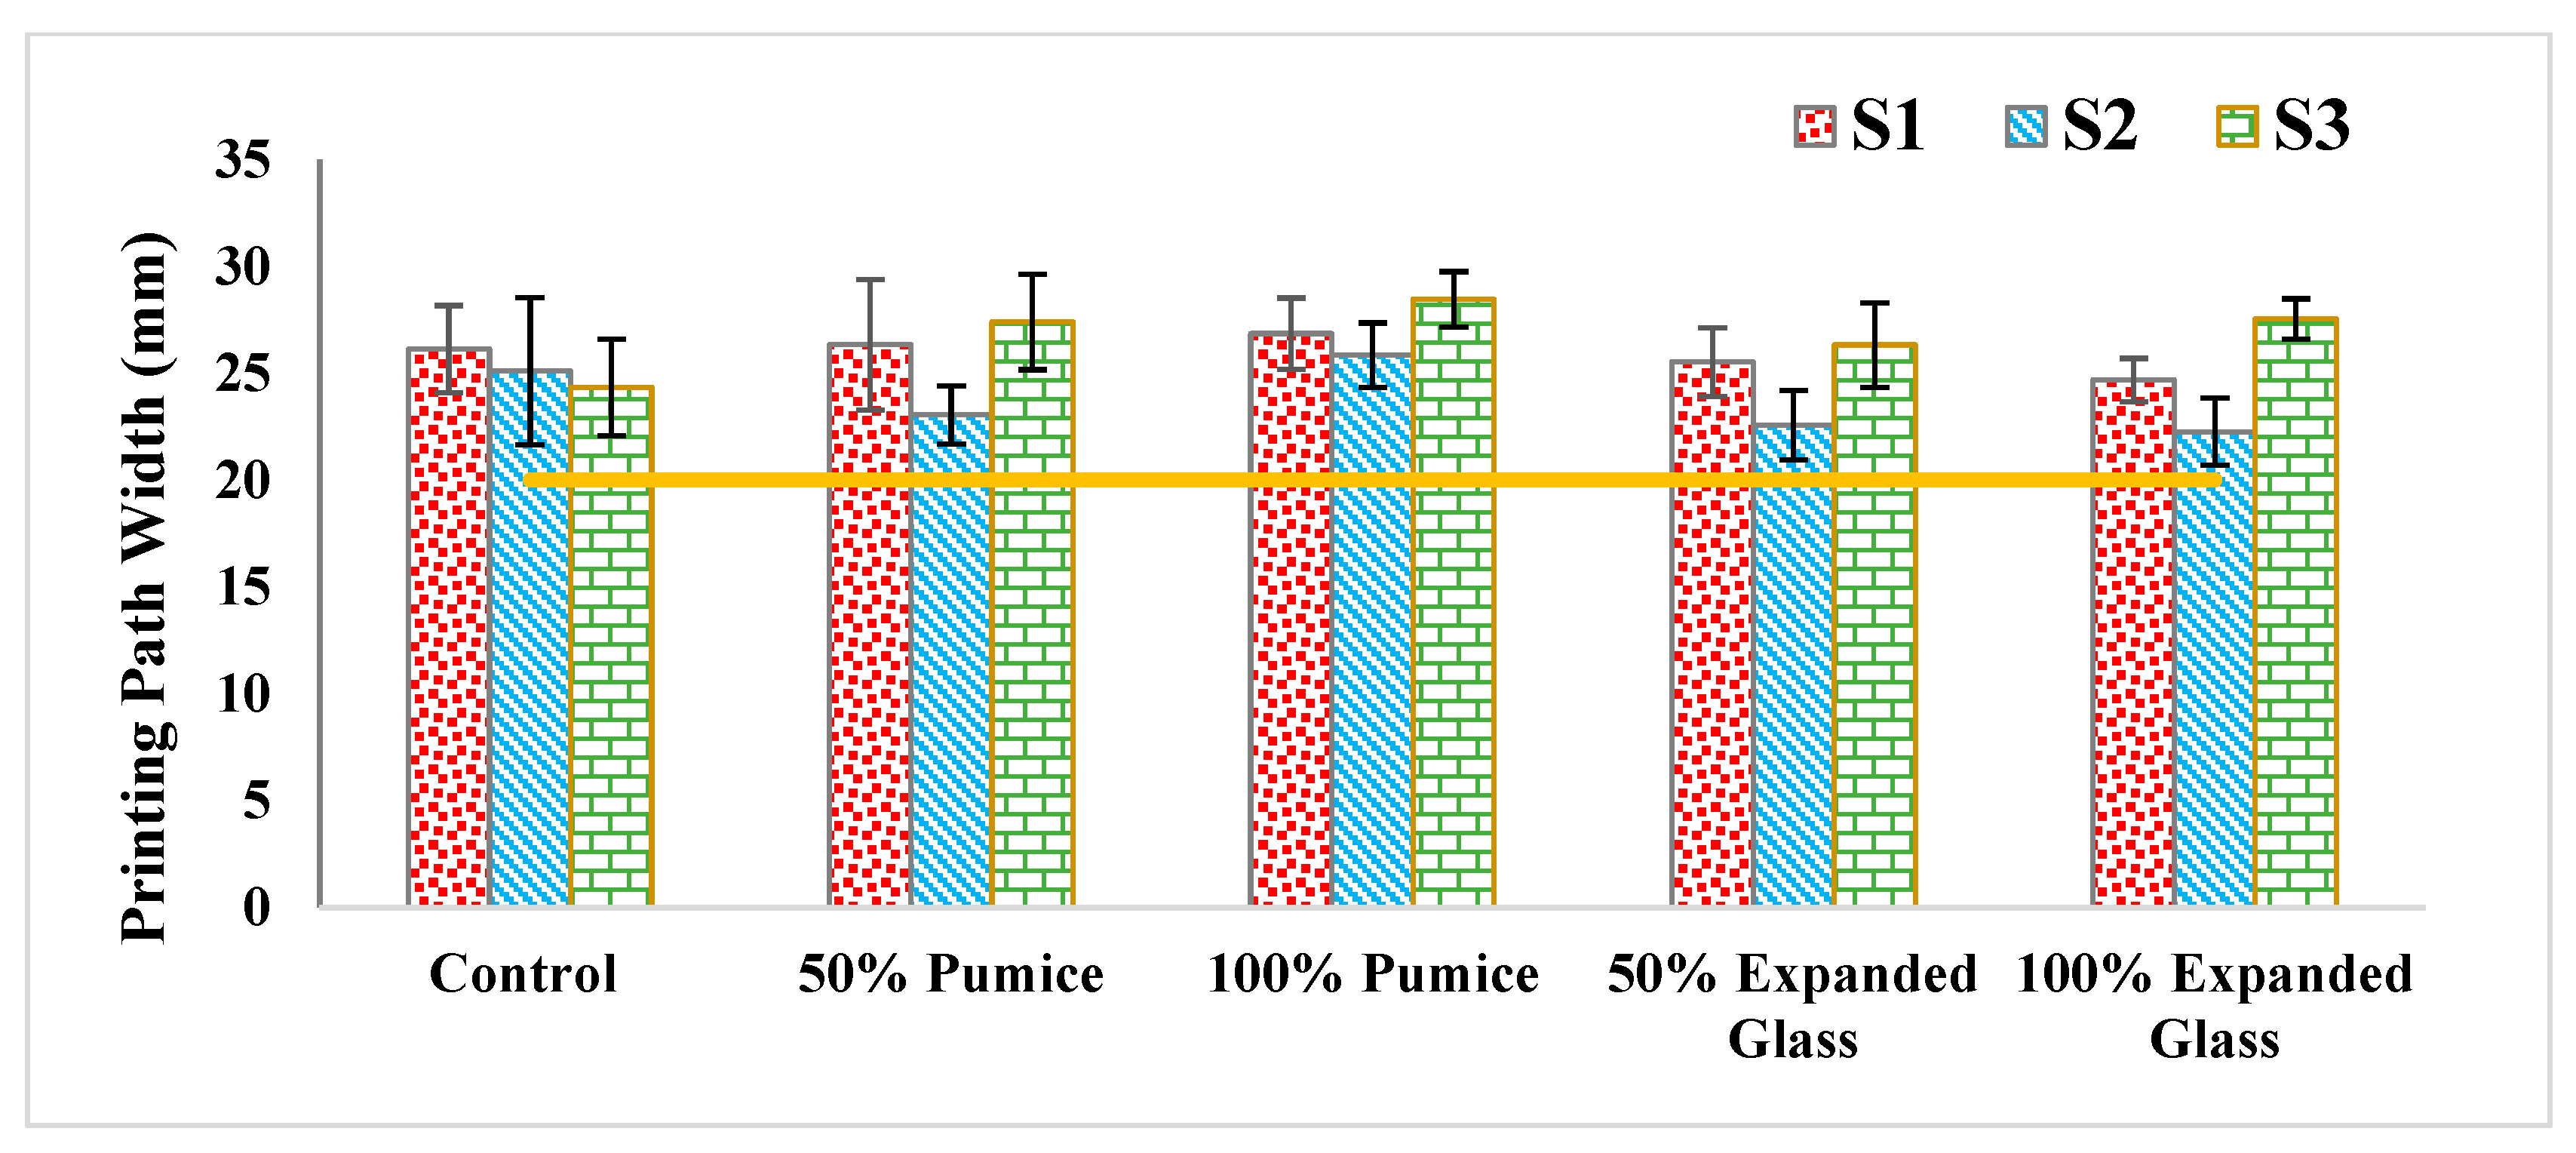
To evaluate the dimensional conformity of the selected mixes in each set, the width of the filaments was measured at three different points along the side of the zigzag path that was printed at the speeds marked in Table 9. The measurements were taken 24 h after printing, and the results for each designed mix are presented in Figure 15. The standard deviation is shown to represent the spread of the measured widths. There are two criteria used to assess the dimensional conformity: (C1) the proximity of the average measured width for each mix to the designed printing width of 20 mm, and (C2) the consistency of the width along the filament, which can be evaluated by comparing the standard deviation. A lower standard deviation indicates a better dimensional conformity.
Figure 15 illustrates that S2 mixes showed the highest dimensional consistency (C1) and the lowest standard deviation (C2), emphasizing the significant role of MC in enhancing the rheological properties, including viscosity and dynamic yield stress. In lightweight mixes of S3, it is evident that the average measured width is larger than the S1 and S2 mixes, indicating the influence of fiber addition on the fresh properties of the printed materials. Furthermore, considering the impact of the aggregate type and content, it is noteworthy that mixes containing 50% and 100% expanded glass exhibited a superior dimension conformity in terms of proximity to the designed filament width (C1) and a lower standard deviation. Conversely, mixes with 50% and 100% pumice displayed larger deviations from the designed filament width and higher standard deviations. Finally, it is concluded that FRM5 with 100% expanded glass, MC, and fibers can be selected as the one with the best printing quality among all three sets.
3.6. Buildability
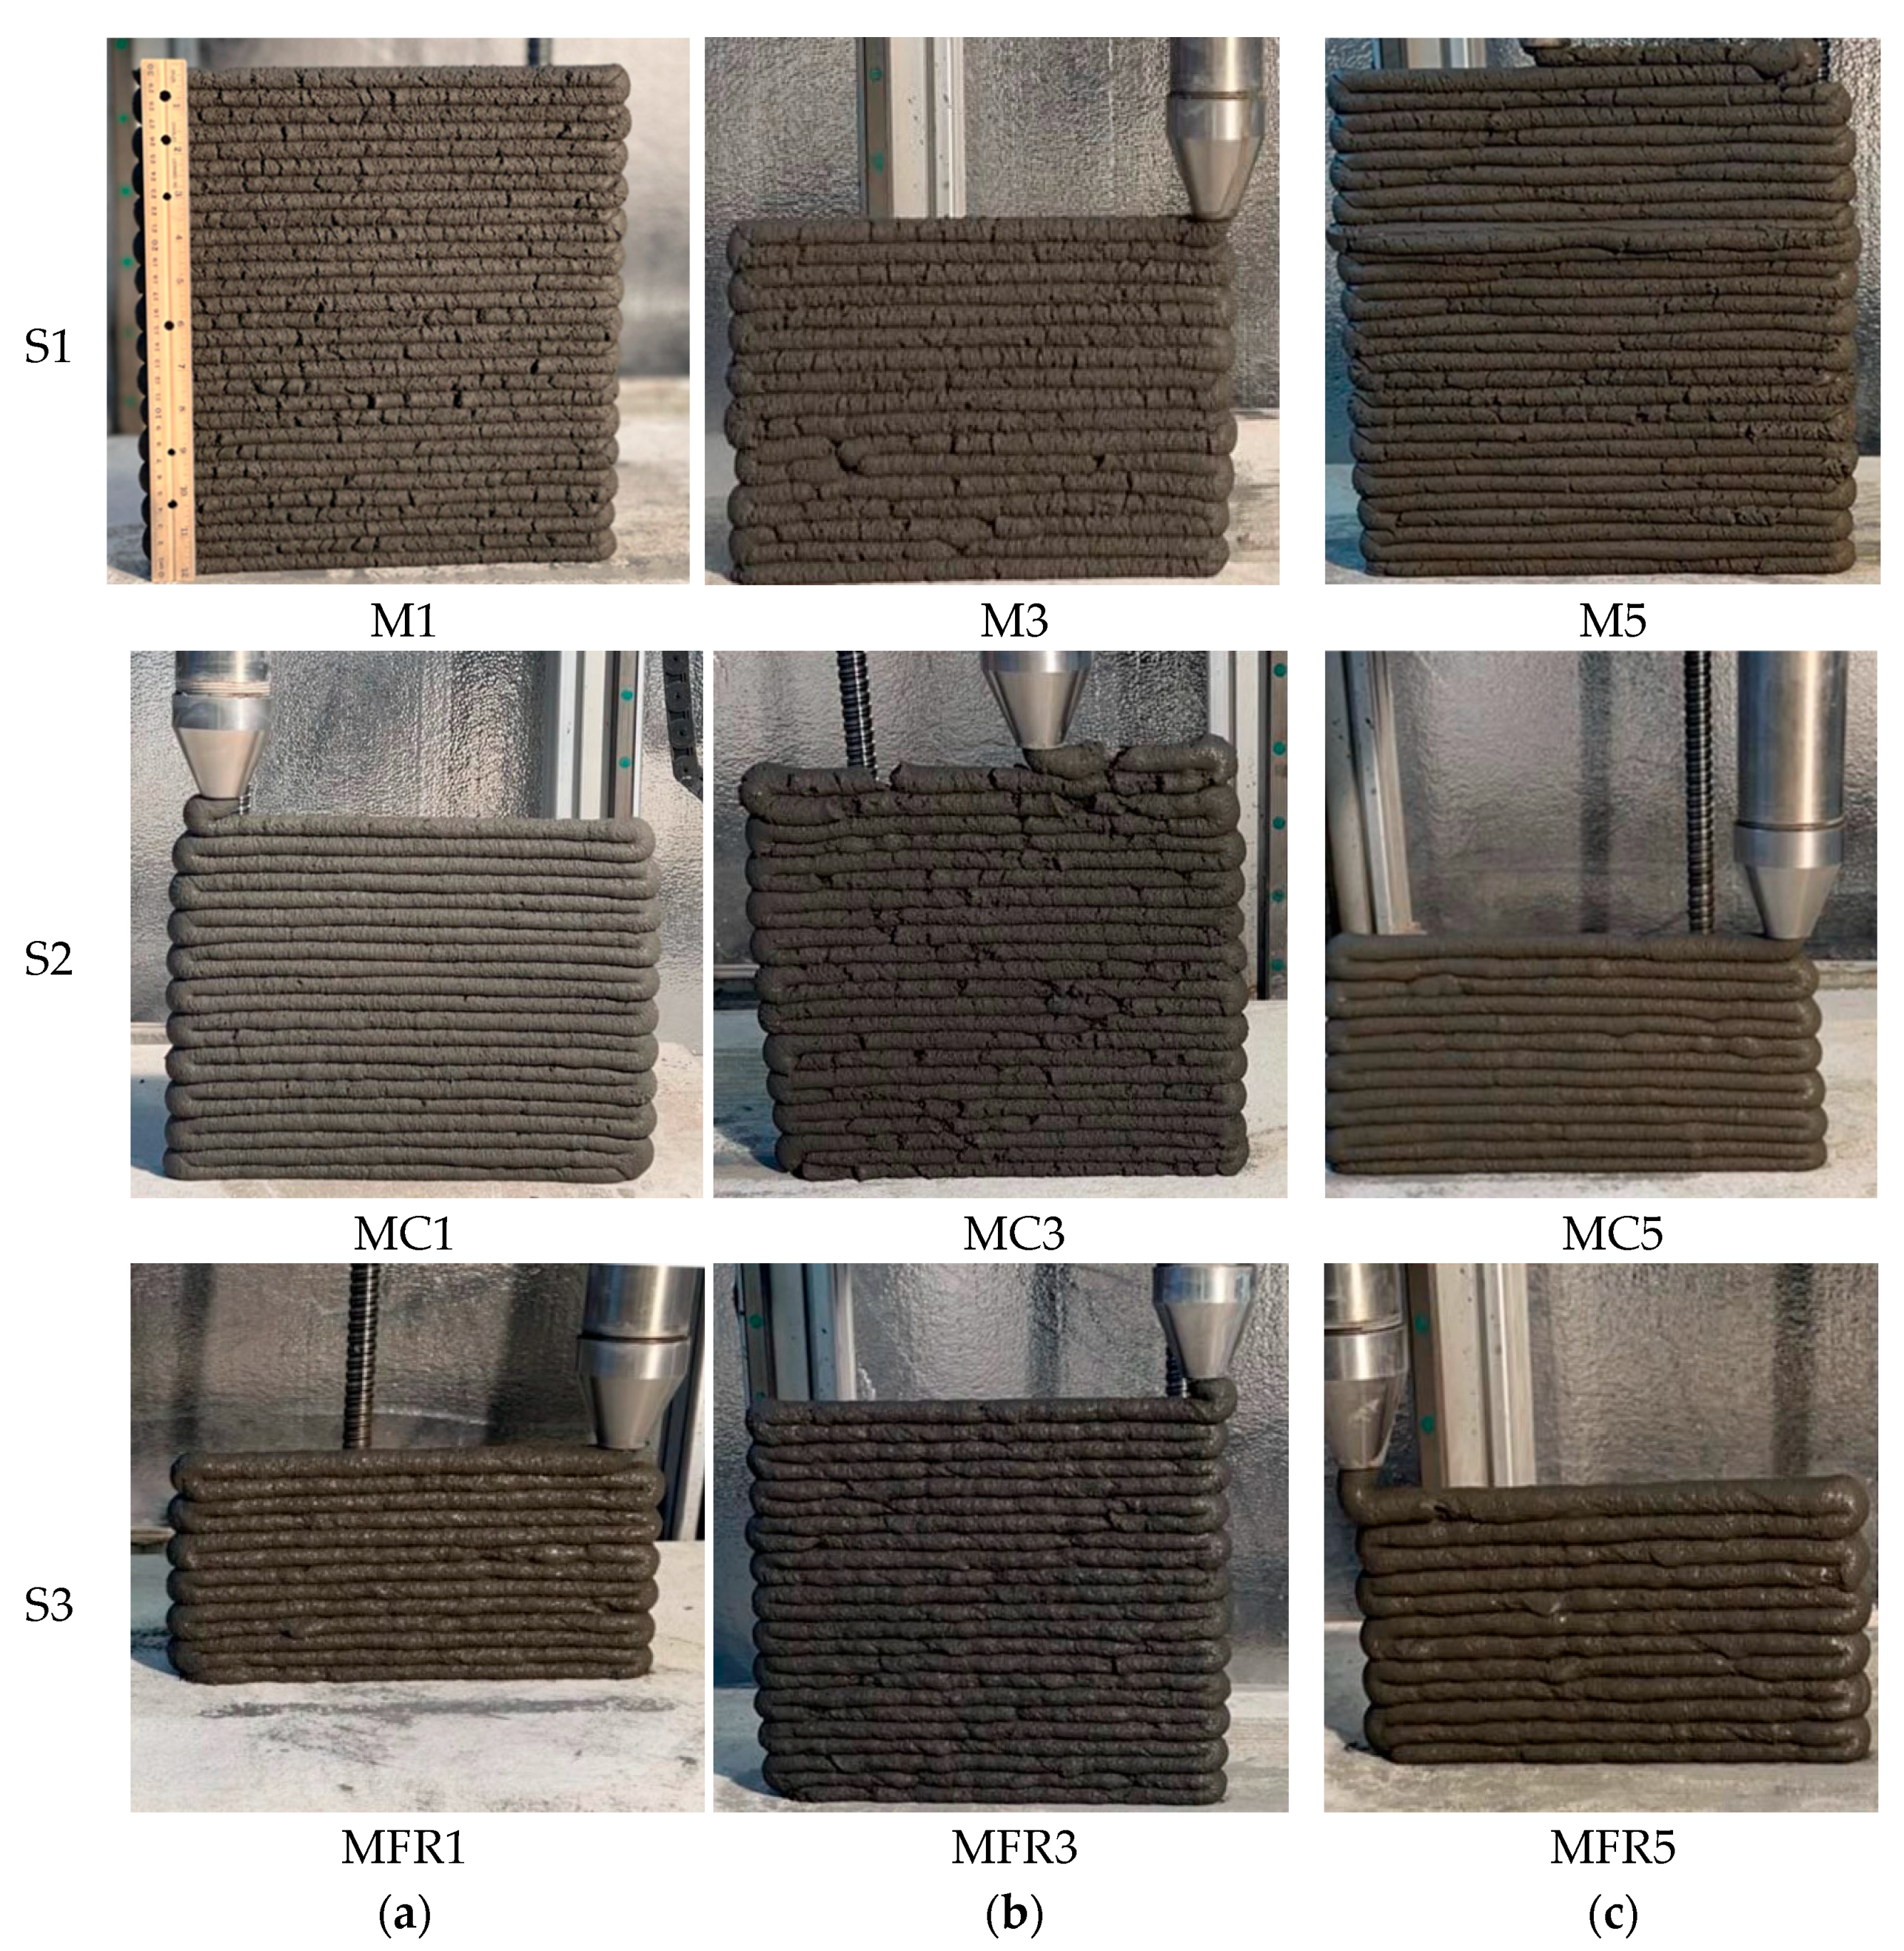
In the context of 3D concrete printing, achieving buildability and shape stability are key objectives. These aspects play a crucial role in ensuring that the printed objects adhere to the intended dimensions and prevent any possible failure in their fresh state. Table 10 and Figure 16 present the results of the buildability test. The images in Figure 16 were captured just before the single-layer printed wall experienced failure.
Generally, buildability is closely linked to the rheological properties, especially static yield stress, of the printing material. As depicted in Figure 13, adding MC and fibers (S2 and S3 mixes) did not lead to any notable change in the static yield stress. Interestingly, the mix containing 100% expanded glass aggregate reduced the static yield stress. The results from the buildability test align well with the static yield stress of the rheology measurement. As presented in Table 9, all S1 mixes, except for the one with 100% pumice, were printed to a greater number of layers than S2 mixes (with MC). Additionally, the shortest printed wall was observed for S3 mixes. Despite the improved printing quality observed in Figure 15 and the extrudability results due to the addition of expanded glass, MC, and fibers in S3 mixes, their buildability was reduced. This reduction in buildability can be attributed to the yield stress of these mixes. Particularly, as depicted in Figure 13, MC5 and FRM5 exhibited a reduction in yield stress, which can be correlated with the shape of the expanded glass particles. This reduction ultimately led to the 3D printing of less buildable materials.
The observation for mixes with 100% pumice demonstrates an Improvement in buildability and the number of printed layers from M3 to MC3 and FRM3. This improvement can be partly attributed to the printing process parameters, particularly the printing speed. In M3, the printing speed is higher than other mixes in S1 mixes and MC3 and FRM3. Consequently, besides rheology, the printing speed becomes a critical parameter influencing buildability and explaining the results obtained in this test. Specifically, the higher printing speed for M3 (30 mm/s) led to the printing of just 17 layers. In contrast, for MC3 and FRM3, the yield stress improved, and the printing speed decreased, resulting in better material stability and allowing the printing of a taller wall (23 layers).
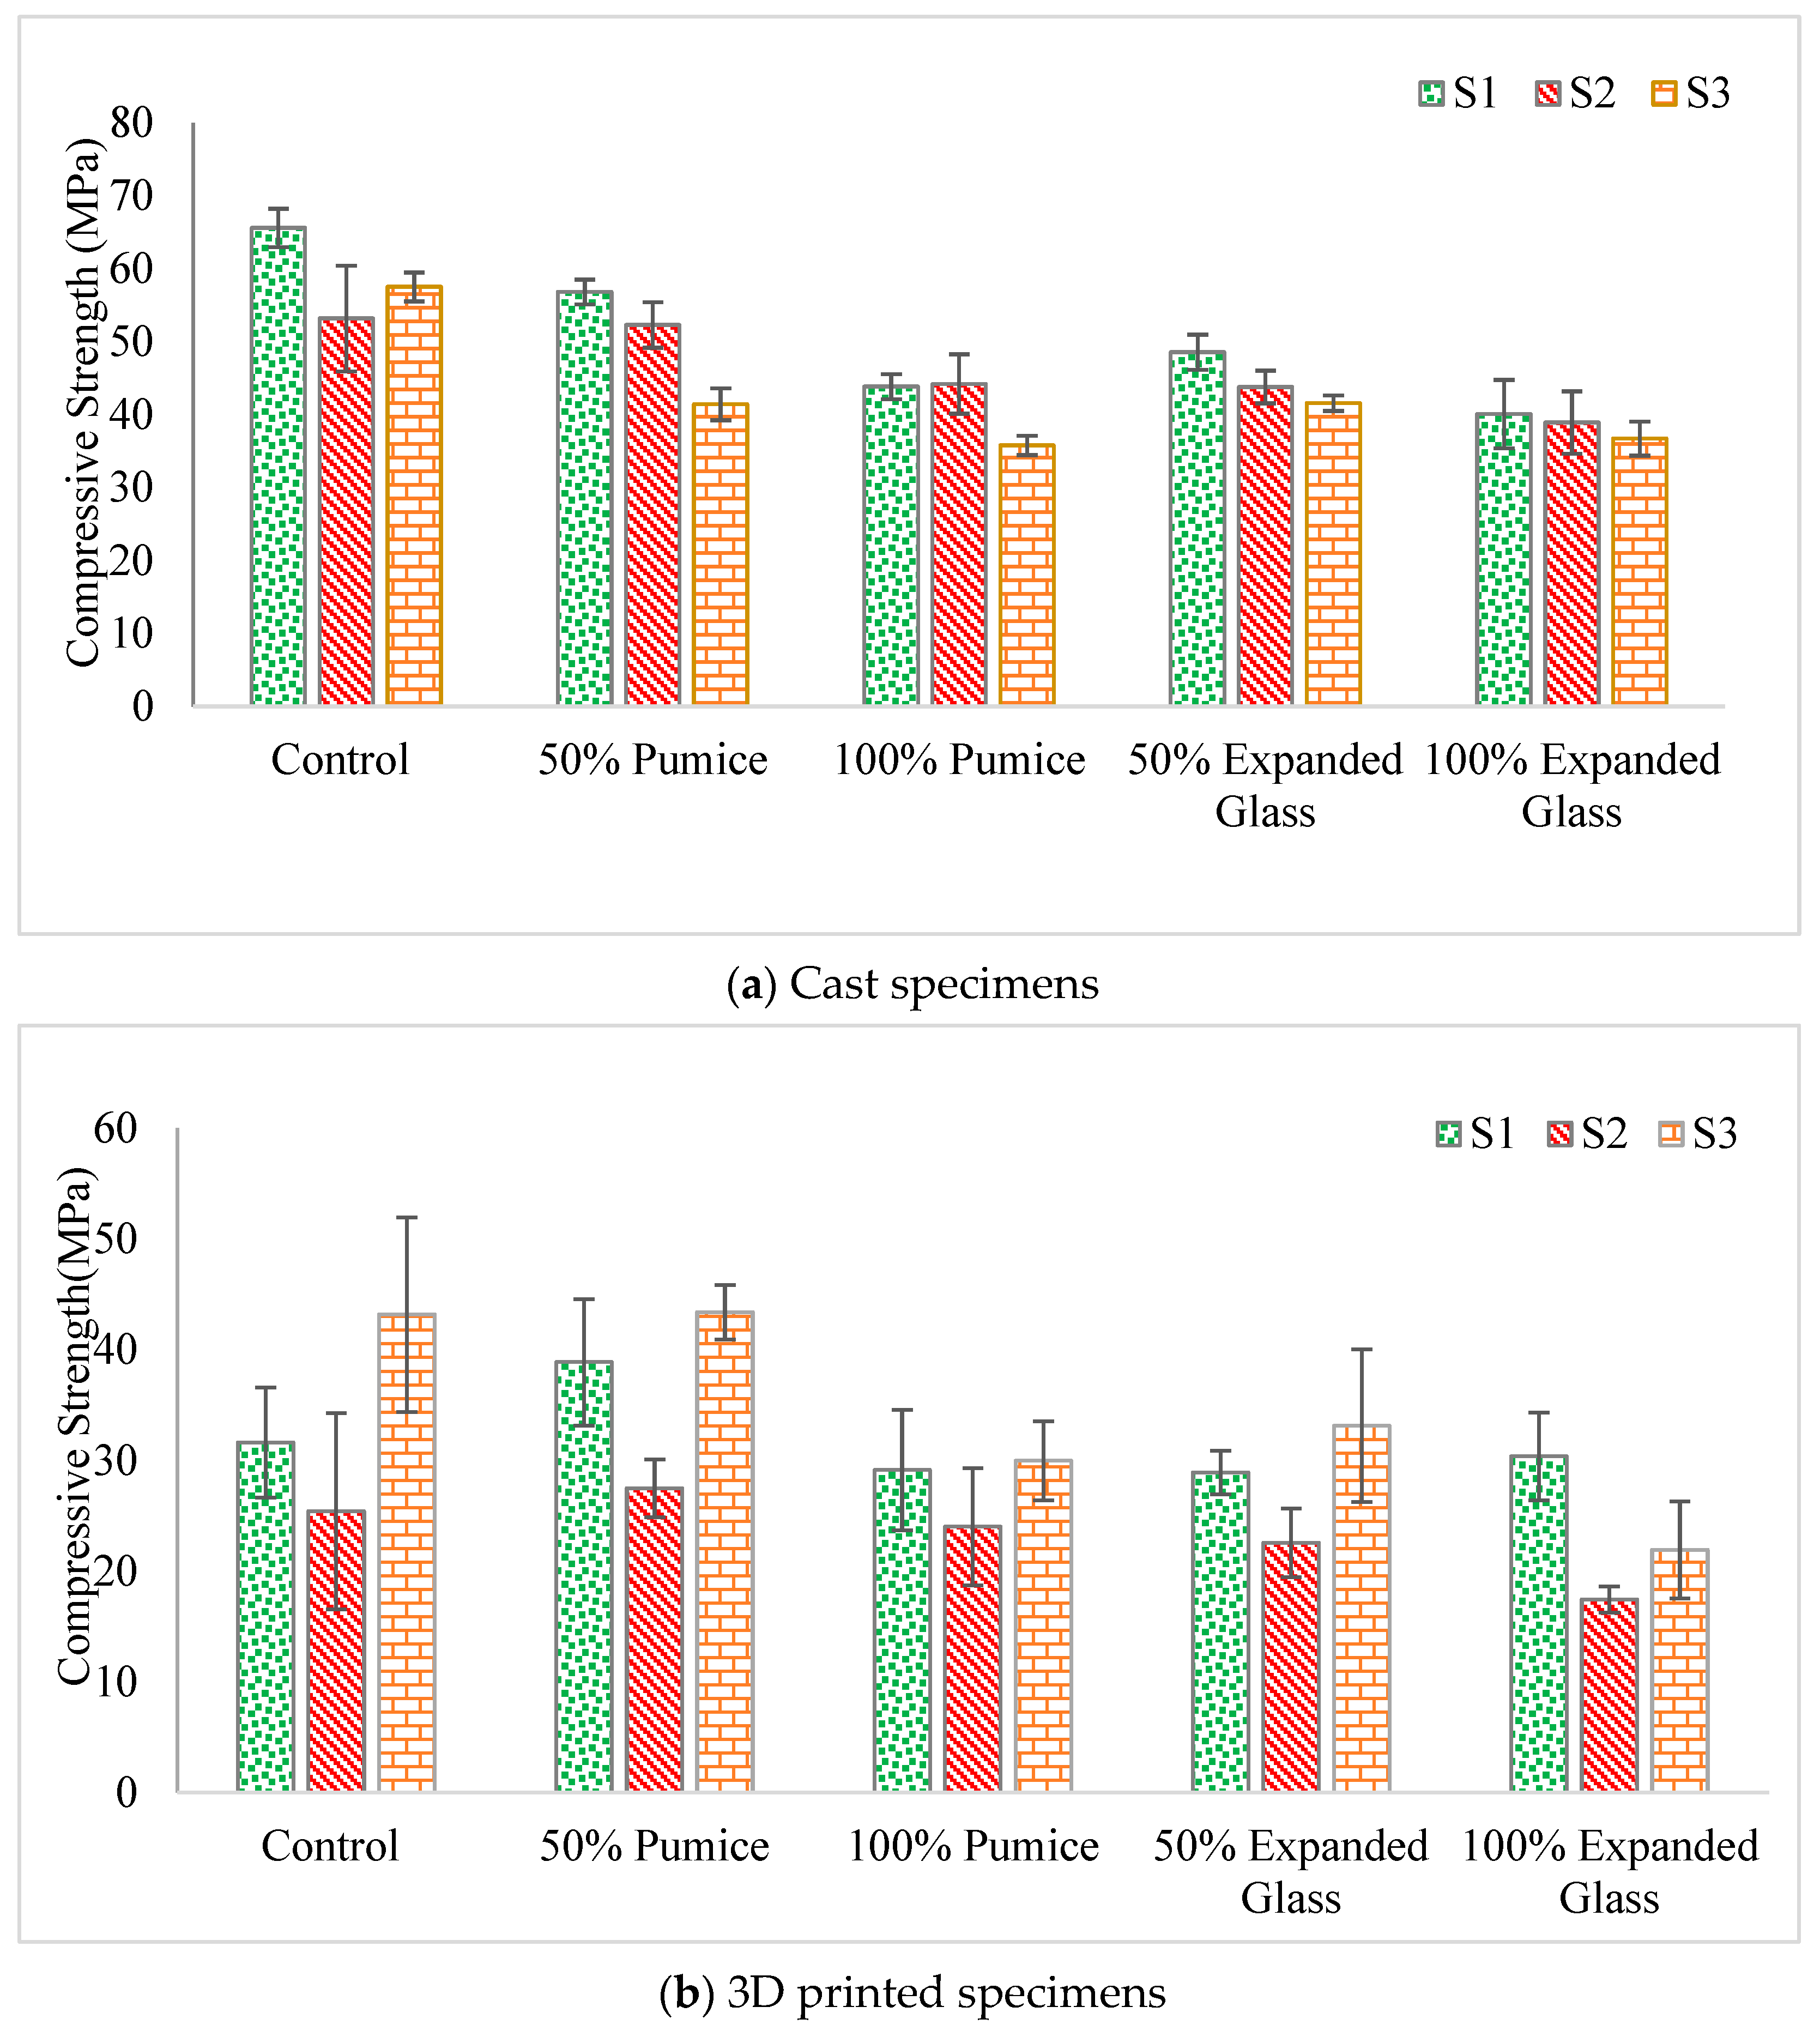
3.7. Compressive Strength
One concern in utilizing lightweight concrete for load-bearing walls is its relatively low mechanical performance. This section aimed to evaluate the changes in the mechanical properties of the designed mixes and investigate the impact of replacing a normal-weight aggregate with lightweight alternatives and the influence of 3D printing on mechanical performance. For this purpose, the compressive strength of the designed mixes in both cast and 3D-printed samples was compared after 28 days of curing. The results of compressive strength are provided in Figure 17. Generally, the compressive strength of the cast samples was higher than the 3D-printed ones. The observed reduction in compressive strength for the 3D-printed specimens can be attributed to the absence of vibration during the printing process, which limits the densification and compaction of the printed material. As a result, voids, both within each filament and between extruded filaments, are likely to form, leading to a decrease in compressive strength [66,67]. This finding is consistent with the previous studies, further supporting the impact of void formation on the mechanical properties of 3D-printed samples [66,68,69,70,71,72]. This strength reduction is the most significant for 3D printed M1 (51.76%) and the least for 3D printed FRM3 (16.18%). Furthermore, it is worth noting that the standard deviation bar is larger for the printed specimens, which can be related to the presence of void areas between the filaments and the weak interface formed during the printing.
The highest strength among the cast-in-place samples is achieved by the M1 mixes, with a maximum compressive strength of 65.6 MPa. On the other hand, the maximum compressive strength for the 3D printed specimens is reported in the FRM2, which equals 43.4 MPa. The addition of MC generally resulted in a reduction in the compressive strength of the cast samples. This reduction can be attributed to the increase in entrapped air content due to the reduced workability and the retardation effect of HPMC molecules on cement hydration [60]. Figure 17a demonstrates that S1 mixes exhibited higher strength than S2 mixes. Furthermore, including fibers in cast S3 specimens led to a slight decrease in the compressive strength of the cast-in-place samples compared to S2 and, accordingly, S1 mixes. This observation can be attributed to the lower adjusted W/B ratio of S1 mixes (as shown in Table 5) compared to S2 and S3 mixes, which may have contributed to a higher porosity and lower mechanical performance [73]. Moreover, as illustrated in Figure 8, Figure 9 and Figure 10, adding fibers introduces more pores and new interfacial transition zones (ITZs) between the fibers and cement paste. These changes have the potential to result in a reduction in strength.
In contrast, this trend among different series (S1, S2, S3) varies in the case of 3D-printed specimens. Except for the 100% expanded glass mix, the S3 mixes exhibited a larger compressive strength, increasing up to 36.44% compared to the S1 mixes. In general, a trade-off exists between the adjusted W/B ratio and the quality of the printed filament in terms of dimensional conformity and early age cracks for the 3D printed specimens, which helps explain this observation. The improvement in compressive strength in most S3 3D-printed specimens (except FRM5) can be attributed to the higher quality of the printed samples. As explained in the extrudability evaluation section, adding MC and fiber is crucial for achieving acceptable printing quality. Additionally, the beneficial effects of the fiber-reinforced 3D printed sample (S3 mixes) can be justified by several factors. Firstly, the presence of PE fibers provides a bridging effect [57,58], enhancing the overall strength of the material. Additionally, the interfacial bond between the PE fibers and the matrix improves the mechanical properties [74]. Furthermore, the orientation of the fibers plays a role in reinforcing the structure [75,76]. These factors help somewhat mitigate the negative impact of air void formation and a weak filament interface. Thus, for all the mixes except the 100% expanded glass mix, the high printing quality resulted in the highest compressive strength. Although Figure 17 indicates that S2 mixes have the lowest compressive strength (reaching as low as 17.6 MPa for M5) than S1 and S3 mixes for 3D printed cubes, a few factors contribute to this observation. Firstly, the adjusted W/B ratio of S2 mixes is larger than that of S1 mixes, which can result in a more porous matrix. Additionally, the formation of early age cracks can adversely affect the serviceability and mechanical properties of the printed materials, leading to a lower compressive strength. Therefore, while adding MC can improve the dimensional conformity of 3D printed filaments, early age cracks can reduce their compressive strengths.
When comparing different types of aggregates, it is evident that RS (normal-weight sand) exhibited the highest compressive strength (reaching as high as 65.6 MPa), while the expanded glass aggregate showed the lowest compressive strength (as low as 17.5 MPa) for both the cast and 3D printed specimens. The presence of lightweight aggregates such as pumice and expanded glass, which have a porous structure and lower mechanical strength, along with their influence on increasing the adjusted W/B ratio, resulted in a decrease in the compressive strength of both cast and 3D printed specimens [52,54].
By considering the extrudability, buildability, and mechanical properties of the different mixes, it is possible to define specific functionalities for each mix designed in the S3 series. For example, mixes containing expanded glass may result in a lower weight, indicating potentially better thermal resistance, but they exhibit a lower mechanical properties or buildability. On the other hand, pumice mixes are not as lightweight as expanded glass mixes, but they offer higher buildability and compressive strength. Consequently, all mixes should be classified based on their physical, printing, and mechanical properties, allowing for their specific application in appropriate contexts.
4. Conclusions
This paper aimed to develop lightweight 3D-printed cementitious mixes using lightweight aggregate by evaluating the printability and mechanical properties and finding solutions to improve these properties. The findings demonstrate that replacing normal-weight aggregate (RS) with lightweight alternatives (i.e., expanded glass and pumice) enhances the flowability and extrudability of 3D-printed components while reducing the dry density. However, this substitution also leads to a decrease in mechanical strength. Based on the aforementioned discussion, the following conclusions can be drawn:
- Analyzing the SEM images of the RS, expanded glass, and pumice aggregates revealed that pumice aggregates are more porous and have irregular shapes compared to the RS and expanded glass, while the expanded glass was more rounded than the other two aggregates. Additionally, the analysis of the SEM images for the 3D printed concrete samples indicated that S1 mixes had a denser structure characterized by high quantities of CSH structures. Adding MC to the mixes in S2 resulted in a dense structure; however, adding fiber in S3 mixes introduced pores and voids at the interface of the fiber and the mixes.
- Replacing the RS aggregate with lightweight aggregates (expanded glass and pumice) at two levels of 50% and 100% by volume in S1 mixes (M2–M5) resulted in the reduction in dry density to M1 by 13.3%, 24.81%, 9.49%, and 23.01%, respectively. This trend was also consistently observed for MC1–MC5 and FRM1–FRM5.
- The flow table and setting time showed that adding MC to the mixture increased the shape retention ability of mixes and decreased the workability. However, the adjusted W/B ratio was higher for both S2 and S3 mixes compared to S1 mixes. To ensure the adequate flowability of mixes containing the lightweight aggregates, a higher W/B ratio was increased to compensate the high-water absorption capacity of lightweight aggregates in the mixes. Thus, the W/B ratio increased up to 0.38 for FRM3.
- The extrudability test was performed to evaluate the printing quality at the early age of printed material. The results indicated that incorporating lightweight aggregates in S1 mixes contributed to the plastic shrinkage cracking, and that the filament experienced small wrinkles during printing and small cracks. Although MC addition helped to some extent by improving the printing quality at the fresh level, hairline cracks appeared after 24 h, even in S2 mixes, suggesting that MC was not fully effective in preventing these cracks. Adding fibers at a volume fraction of 0.35% in S3 mixes enhanced the shrinkage cracking resistance but lowered the printing quality compared to S2 mixes. Furthermore, mixes containing 50% and 100% expanded glass exhibited higher dimensional conformity in proximity to the designed filament width and a lower standard deviation.
- The buildability test results revealed that S1 mixes had a higher number of printed layers than S2 and S3 mixes, which can be attributed to a lower adjusted W/B ratio. Also, comparing the results for mixes in S1, S2, and S3 sets with RS, expanded glass, and pumice aggregates indicated that the addition of MC expanded glass and fiber resulted in a further reduction in the buildability of S3 mixes that can be related to the low static yield stress of S3. Also, comparing the pumice and expanded glass, it is concluded that expanded glass would lower the buildability of cementitious materials due to the rounded shape and less interlock between the aggregates and cement paste compared to RS and pumice aggregates.
- Control mixes and the mix with 100% pumice replacement had higher static yield stresses compared to the mix with 100% expanded glass. Although the addition of fiber increased the plastic viscosity of the M1 in the S1 mix by 73% and 143% for the MC1 and FRM1 mixes, respectively, the M3 and M5 in S1 increased by 115% and 221% in S2 mixes, and 133% and 181% in S3 mixes; however, this did not result in a good conclusion for yield stress. The yield stresses for FRM3 and FRM5 showed a 48.88% and 54.16% decline compared with FRM1, respectively.
- The compressive strength of 3D printed concrete specimens decreased compared to the cast ones, ranging from 16.18% (for 3D printed M1) to 51.76% (for 3D printed FRM3). This reduction is likely attributed to the formation of voids within each filament and between extruded filaments, leading to a decrease in compressive strength. Among the cast and 3D printed concrete specimens, cast M1 exhibited the maximum compressive strength of 65.6 MPa, while the minimum compressive strength was recorded for 3D printed FM5 at 17.5 MPa. The reduction in compressive strength of lightweight concrete is attributed to its porous structure, lower mechanical strength, and higher adjusted water-to-binder ratio.
Author Contributions
Conceptualization, R.S. and M.H.; methodology, R.S., M.S.Z., and M.H.; software, R.S. and M.S.Z.; validation, R.S., M.S.Z., and M.H.; formal analysis, R.S., M.S.Z., and M.H.; investigation, R.S.; resources, M.H.; data curation, R.S. and M.S.Z.; writing—original draft preparation, R.S. and M.S.Z.; writing—review and editing, M.H.; visualization, R.S.; supervision, M.H.; project administration, M.H.; funding acquisition, M.H. All authors have read and agreed to the published version of the manuscript.
Funding
This research was funded by the University of New Mexico Office of the Vice President for Research WeR1 Faculty Success.
Institutional Review Board Statement
This research study does not involve human participants, their data, or any related interactions. As such, it falls outside the purview of human subject research and, therefore, was not subject to review or approval by an Institutional Review Board (IRB).
Informed Consent Statement
Not applicable.
Data Availability Statement
This statement conveys that the data can be found within the paper itself and provides a direct means for interested parties to reach out to the authors for any further details or questions they may have.
Acknowledgments
The Dana C. Wood Materials and Structures Lab, Department of Civil, Construction, and Environmental Engineering and EPS/IOM Electron Microbeam Facility, Institute of Meteoritics at UNM provided the necessary facilities for conducting all the tests. The authors would like to express their gratitude for the valuable preliminary work carried out by Kourosh Rashidi, who initiated this research in his MS thesis. Furthermore, the assistance provided by undergraduate students Joseph Grout and Ethan Cipriano Rodriguez in conducting specific tests is greatly appreciated.
Conflicts of Interest
The authors declare no conflict of interest, and the funders had no role in the design of the study, in the collection, analyses, or interpretation of data, in the writing of the manuscript, or in the decision to publish the results.
Appendix A
Figure A1.
The zigzag printing path for (a) fresh and (b) hardened states of all mixes.


References
- Najvani, M.A.D.; Murcia, D.H.; Soliman, E.; Red Taha, M.M. Early-age strength and failure characteristics of 3D printable polymer concrete. Constr. Build. Mater. 2023, 394, 132119. [Google Scholar] [CrossRef]
- Dielemans, G.; Briels, D.; Jaugstetter, F.; Henke, K.; Dörfler, K. Additive Manufacturing of Thermally Enhanced Lightweight Concrete Wall Elements with Closed Cellular Structures. J. Facade Des. Eng. 2021, 9, 59–72. [Google Scholar] [CrossRef]
- Wang, L.; Jiang, H.; Li, Z.; Ma, G. Mechanical behaviors of 3D printed lightweight concrete structure with hollow section. Arch. Civ. Mech. Eng. 2020, 20, 16. [Google Scholar] [CrossRef]
- Prasittisopin, L.; Sakdanaraseth, T.; Horayangkura, V. Design and Construction Method of a 3D Concrete Printing Self-Supporting Curvilinear Pavilion. J. Archit. Eng. 2021, 27, 05021006. [Google Scholar] [CrossRef]
- Hua, T.; Lin, A.; Poh, W.J.D.; Charlene, D.H.A.; Wong, H.; Zhang, Y.Z.; Chan, W.; Liu, L. Zhao, 3D-printed concrete shear keys: Design and experimental study. Dev. Built. Environ. 2023, 15, 100180. [Google Scholar] [CrossRef]
- Tuvayanond, W.; Prasittisopin, L. Design for Manufacture and Assembly of Digital Fabrication and Additive Manufacturing in Construction: A Review. Buildings 2023, 13, 429. [Google Scholar] [CrossRef]
- Cuevas, K.; Chougan, M.; Martin, F.; Ghaffar, S.H.; Stephan, D.; Sikora, P. 3D printable lightweight cementitious composites with incorporated waste glass aggregates and expanded microspheres—Rheological, thermal and mechanical properties. J. Build. Eng. 2021, 44, 102718. [Google Scholar] [CrossRef]
- Kruger, J.; Van Den Heever, M.; Cho, S.; Zeranka, S.; van Zijl, G. High-performance 3D printable concrete enhanced with nanomaterials. In Proceedings of the International Conference on Sustainable Materials, Systems and Structures (SMSS 2019), Rovinj, Croatia, 20–22 March 2019; pp. 1–8. [Google Scholar]
- Marais, H.; Christen, H.; Cho, S.; De Villiers, W.; Van Zijl, G. Computational assessment of thermal performance of 3D printed concrete wall structures with cavities. J. Build. Eng. 2021, 41, 102431. [Google Scholar] [CrossRef]
- Zafar, M.S.; Javed, U.; Khushnood, R.A.; Nawaz, A.; Zafar, T. Sustainable incorporation of waste granite dust as partial replacement of sand in autoclave aerated concrete. Constr. Build. Mater. 2020, 250, 118878. [Google Scholar] [CrossRef]
- Rahul, A.V.; Santhanam, M. Evaluating the printability of concretes containing lightweight coarse aggregates. Cem. Concr. Compos. 2020, 109, 103570. [Google Scholar] [CrossRef]
- A. C90-22; Standard Specification For Loadbearing Concrete Masonry Units. ASTM International: West Conshohocken, PA, USA, 2022.
- Mandlik, A.; Sarthak Sood, T.; Karade, S.; Naik, S. Lightweight Concrete Using EPS. Int. J. Sci. Res. 2013, 4, 2319–7064. [Google Scholar]
- Sadrmomtazi, A.; Sobhani, J.; Mirgozar, M.A. Modeling compressive strength of EPS lightweight concrete using regression, neural network and ANFIS. Constr. Build. Mater. 2013, 42, 205–216. [Google Scholar] [CrossRef]
- Gosselin, C.; Duballet, R.; Roux, P.; Gaudillière, N.; Dirrenberger, J.; Morel, P. Large-scale 3D printing of ultra-high performance concrete—A new processing route for architects and builders. Mater. Des. 2016, 100, 102–109. [Google Scholar] [CrossRef]
- Henke, K.; Talke, D.; Winter, S. Multifunctional Concrete-Additive Manufacturing by the Use of Lightweight Concrete. In Proceedings of the IASS Annual Symposium 2017, Hamburg, Germany, 25–28 September 2017. [Google Scholar]
- Roussel, N. Rheological requirements for printable concretes. Cem. Concr. Res. 2018, 112, 76–85. [Google Scholar] [CrossRef]
- Le, T.T.; Austin, S.A.; Lim, S.; Buswell, R.A.; Gibb, A.G.F.; Thorpe, T. Mix design and fresh properties for high-performance printing concrete. Mater. Struct. Constr. 2012, 45, 1221–1232. [Google Scholar] [CrossRef]
- Rahul, A.V.; Santhanam, M.; Meena, H.; Ghani, Z. 3D printable concrete: Mixture design and test methods. Cem. Concr. Compos. 2019, 97, 13–23. [Google Scholar] [CrossRef]
- Senthilnathan, S.; Raphael, B. Using Computer Vision for Monitoring the Quality of 3D-Printed Concrete Structures. Sustainability 2022, 14, 15682. [Google Scholar] [CrossRef]
- Figueiredo, S.C.; Rodríguez, C.R.; Ahmed, Z.Y.; Bos, D.H.; Xu, Y.; Salet, T.M.; Çopuroğlu, O.; Schlangen, E.; Bos, F.P. An approach to develop printable strain hardening cementitious composites. Mater. Des. 2019, 169, 107651. [Google Scholar] [CrossRef]
- Zhou, X. Characterization of rheology of fresh fiber reinforced cementitious composites through ram extrusion. Mater. Struct. 2004, 38, 17–24. [Google Scholar] [CrossRef]
- Ji, G.; Xiao, J.; Zhi, P.; Wu, Y.-C.; Han, N. Effects of extrusion parameters on properties of 3D printing concrete with coarse aggregates. Constr. Build. Mater. 2022, 325, 126740. [Google Scholar] [CrossRef]
- Rehman, A.U.; Kim, J.-H. 3D Concrete Printing: A Systematic Review of Rheology, Mix Designs, Mechanical, Microstructural, and Durability Characteristics. Materials 2021, 14, 3800. [Google Scholar] [CrossRef]
- Lim, S.; Buswell, R.A.; Le, T.T.; Austin, S.A.; Gibb, A.G.F.; Thorpe, T. Developments in construction-scale additive manufacturing processes. Autom. Constr. 2012, 21, 262–268. [Google Scholar] [CrossRef]
- Paul, S.C.; Tay, Y.W.D.; Panda, B.; Tan, M.J. Fresh and hardened properties of 3D printable cementitious materials for building and construction. Arch. Civ. Mech. Eng. 2018, 18, 311–319. [Google Scholar] [CrossRef]
- Inozemtcev, A.; Qui Duong, T. High-strength lightweight concrete with internal curing for 3D-printing in construction. IOP Conf. Ser. Mater. Sci. Eng. 2020, 869, 032003. [Google Scholar] [CrossRef]
- Ting, G.H.A.; Tay, Y.W.D.; Qian, Y.; Tan, M.J. Utilization of recycled glass for 3D concrete printing: Rheological and mechanical properties. J. Mater. Cycles Waste Manag. 2019, 21, 994–1003. [Google Scholar] [CrossRef]
- Mohammad, M.; Masad, E.; Seers, T.; Al-Ghamdi, S.G. High-Performance Light-Weight Concrete for 3D Printing BT. In Second RILEM International Conference on Concrete and Digital Fabrication; Bos, F.P., Lucas, S.S., Wolfs, R.J.M., Salet, T.A.M., Eds.; Springer International Publishing: Berlin/Heidelberg, Germany, 2020; pp. 459–467. [Google Scholar]
- Hongyu, Z.; Brooks, A.L.; Dominic, H.; Babak, S. Thermal and Mechanical Properties of Cementitious Composites for Additive Construction of Energy-Saving Habitats. Earth Sp. 2018, 2018, 600–611. [Google Scholar] [CrossRef]
- Kruger, J.; Cho, S.; Zeranka, S.; Viljoen, C.; van Zijl, G. 3D concrete printer parameter optimisation for high rate digital construction avoiding plastic collapse. Compos. Part B Eng. 2020, 183, 107660. [Google Scholar] [CrossRef]
- Kruger, J. Rheo-mechanics modelling of 3D concrete printing constructability. Ph.D. Thesis, Stellenbosch University, Stellenbosch, South Africa, December 2019. [Google Scholar]
- Pham, L.; Tran, P.; Sanjayan, J. Steel fibres reinforced 3D printed concrete: Influence of fibre sizes on mechanical performance. Constr. Build. Mater. 2020, 250, 118785. [Google Scholar] [CrossRef]
- Zhang, Y.; Zhang, Y.; Liu, G.; Yang, Y.; Wu, M.; Pang, B. Fresh properties of a novel 3D printing concrete ink. Constr. Build. Mater. 2018, 174, 263–271. [Google Scholar] [CrossRef]
- Yuan, Q.; Li, Z.; Zhou, D.; Huang, T.; Huang, H.; Jiao, D.; Shi, C. A feasible method for measuring the buildability of fresh 3D printing mortar. Constr. Build. Mater. 2019, 227, 116600. [Google Scholar] [CrossRef]
- Rashidi, K. Additive Manufacturing of Lightweight Concrete Mixtures; University of New Mexico: Albuquerque, NM, USA, 2022. [Google Scholar]
- ASTM C150/C150M; Standard Specification for Portland Cement. ASTM International: West Conshohocken, PA, USA, 2012; pp. 1–9.
- Portland Cement Type II. Available online: https://www.gcc.com/product/type-1-11 (accessed on 27 September 2023).
- Bakhshi, A.; Sedghi, R.; Hojati, M. A Preliminary Study on the Mix Design of 3D-Printable Engineered Cementitious Composite. In Tran-SET 2021; American Society of Civil Engineers: Reston, VA, USA, 2021; pp. 199–211. [Google Scholar]
- A. C494/C494M-19e1; Standard Specification for Chemical Admixtures for Concrete. ASTM International: West Conshohocken, PA, USA, 2022. [CrossRef]
- Jin, B. Investigation on mechanical properties and microstructure of high performance polypropylene fiber reinforced lightweight aggregate concrete. Constr. Build. Mater. 2016, 118, 27–35. [Google Scholar] [CrossRef]
- Patel, S.K.; Majhi, R.K.; Satpathy, H.P.; Nayak, A.N. Durability and microstructural properties of lightweight concrete manufactured with fly ash cenosphere and sintered fly ash aggregate. Constr. Build. Mater. 2019, 226, 579–590. [Google Scholar] [CrossRef]
- ASTM C191; Standard Test Methods for Time of Setting of Hydraulic Cement by Vicat Needle. ASTM International: West Conshohocken, PA, USA, 2021. [CrossRef]
- Weltmann, R.N.; Green, H. Rheological properties of colloidal solutions, pigment suspensions, and oil mixtures. J. Appl. Phys. 1943, 14, 569–576. [Google Scholar] [CrossRef]
- ASTM C830-00; Standard Test Methods for Apparent Porosity, Liquid Absorption, Apparent Specific Gravity, and Bulk Density of Refractory Shapes by Vacuum Pressure. ASTM International: West Conshohocken, PA, USA, 2000.
- ASTM C109/C109M-21; Standard Test Method for Compressive Strength of Hydraulic Cement Mortars. ASTM International: West Conshohocken, PA, USA, 2022. [CrossRef]
- Id, S.C.; Elrahman, M.A.; Sikora, P.; Rucinska, T. Evaluation of the Effects of Crushed and Expanded Waste Glass Aggregates on the Material Properties of Lightweight Concrete Using Image-Based Approaches. Materials 2017, 10, 1354. [Google Scholar] [CrossRef]
- Lura, P.; Bentz, D.P.; Lange, D.A. Measurement of water transport from saturated pumice aggregates to hardening cement paste Measurement of water transport from saturated pumice aggregates to hardening cement paste. Mater. Struct. 2006, 39, 861–868. [Google Scholar] [CrossRef]
- Mehta, P.K.; Monteiro, P.J.M. Concrete: Microstructure, Properties, and Materials, 4th ed.; McGraw Hill: New York, NY, USA, 2013. [Google Scholar]
- Mindess, S.; Young, J.F.; Darwin, D. Concrete; Prentice Hall: New Jersey, NJ, USA, 2003. [Google Scholar]
- Alexander, M.; Bentur, A. Mindess, Durability of Concrete, 1st ed.; Modern Concrete Technology Series; CRC Press: Boca Raton, FL, USA, 2017. [Google Scholar]
- Augonis, A.; Ivanauskas, E.; Bocullo, V.; Kantautas, A.; Vaičiukynienė, D. The Influence of Expanded Glass and Expanded Clay on Lightweight Aggregate Shotcrete Properties. Materials 2022, 15, 1674. [Google Scholar] [CrossRef] [PubMed]
- Guo, P.; Meng, W.; Du, J.; Stevenson, L.; Han, B.; Bao, Y. Lightweight ultra-high-performance concrete (UHPC) with expanded glass aggregate: Development, characterization, and life-cycle assessment. Constr. Build. Mater. 2023, 371, 130441. [Google Scholar] [CrossRef]
- Adhikary, S.K.; Ashish, D.K.; Rudžionis, Ž. Expanded glass as light-weight aggregate in concrete—A review. J. Clean. Prod. 2021, 313, 127848. [Google Scholar] [CrossRef]
- Chen, N.; Wang, P.; Zhao, L.; Zhang, G. Water retention mechanism of HPMC in cement mortar. Materials 2020, 13, 2918. [Google Scholar] [CrossRef]
- Soltan, D.G.; Li, V.C. A self-reinforced cementitious composite for building-scale 3D printing. Cem. Concr. Compos. 2018, 90, 1–13. [Google Scholar] [CrossRef]
- Zhu, B.; Pan, J.; Nematollahi, B.; Zhou, Z.; Zhang, Y.; Sanjayan, J. Development of 3D printable engineered cementitious composites with ultra-high tensile ductility for digital construction. Mater. Des. 2019, 181, 108088. [Google Scholar] [CrossRef]
- Saeed, Z.M.; Amir, B.; Maryam, H. Toward 3D-Printable Engineered Cementitious Composites: Mix Design Proportioning, Flowability, and Mechanical Performance. In Proceedings of the Tran-SET 2022, San Antonio, TX, USA, 31 August–2 September 2022; pp. 102–114. [Google Scholar] [CrossRef]
- Bai, M.; Wu, Y.; Xiao, J.; Ding, T.; Yu, K. Workability and hardened properties of 3D printed engineered cementitious composites incorporating recycled sand and PE fibers. J. Build. Eng. 2023, 71, 106477. [Google Scholar] [CrossRef]
- Yalçınkaya, Ç. Influence of Hydroxypropyl Methylcellulose Dosage on the Mechanical Properties of 3D Printable Mortars with and without Fiber Reinforcement. Buildings 2022, 12, 360. [Google Scholar] [CrossRef]
- Khayat, K.H. Viscosity-enhancing admixtures for cement-based materials—An overview. Cem. Concr. Compos. 1998, 20, 171–188. [Google Scholar] [CrossRef]
- Roussel, N. (Ed.) Understanding the Rheology of Concrete, 1st ed.; W.P. Limited: Saffron Walden, UK, 2011. [Google Scholar]
- Kim, Y.Y.; Kong, H.J.; Li, V.C. Design of Engineered Cementitious Composite Suitable for Wet-Mixture Shotcreting. ACI Mater. J. 2003, 100, 511–518. [Google Scholar] [CrossRef]
- Abbas, G.A.; Irawan, S.; Memon, K.R.; Kumar, S.; Elrayah, A.A.I. Hydroxypropylmethylcellulose as a Primary Viscosifying Agent in Cement Slurry at High Temperature. Int. J. Automot. Mech. Eng. 2013, 8, 1218–1225. [Google Scholar] [CrossRef]
- Zhang, D.; Yu, J.; Wu, H.; Jaworska, B.; Ellis, B.R.; Li, V.C. Discontinuous micro-fibers as intrinsic reinforcement for ductile Engineered Cementitious Composites (ECC). Compos. Part B Eng. 2020, 184, 107741. [Google Scholar] [CrossRef]
- Le, T.T.; Austin, S.A.; Lim, S.; Buswell, R.A.; Law, R.; Gibb, A.G.F.; Thorpe, T. Hardened properties of high-performance printing concrete. Cem. Concr. Res. 2012, 42, 558–566. [Google Scholar] [CrossRef]
- Chen, Y.; Çopuroğlu, O.; Rodriguez, C.R.; de Mendonca Filho, F.F.; Schlangen, E. Characterization of air-void systems in 3D printed cementitious materials using optical image scanning and X-ray computed tomography. Mater. Charact. 2021, 173, 110948. [Google Scholar] [CrossRef]
- Khalil, N.; Aouad, G.; El Cheikh, K.; Rémond, S. Use of calcium sulfoaluminate cements for setting control of 3D-printing mortars. Constr. Build. Mater. 2017, 157, 382–391. [Google Scholar] [CrossRef]
- Shakor, P.; Nejadi, S.; Sutjipto, S.; Paul, G.; Gowripalan, N. Effects of deposition velocity in the presence/absence of E6-glass fibre on extrusion-based 3D printed mortar. Addit. Manuf. 2020, 32, 101069. [Google Scholar] [CrossRef]
- Jianchao, Z.; Zhang, T.; Faried, M.; Wengang, C. 3D printing cement based ink, and it’s application within the construction industry. MATEC Web Conf. 2017, 120, 02003. [Google Scholar] [CrossRef]
- Wolfs, R.J.M.; Bos, F.P.; Salet, T.A.M. Hardened properties of 3D printed concrete: The influence of process parameters on interlayer adhesion. Cem. Concr. Res. 2019, 119, 132–140. [Google Scholar] [CrossRef]
- Rahul, A.V.; Santhanam, M.; Meena, H.; Ghani, Z. Mechanical characterization of 3D printable concrete. Constr. Build. Mater. 2019, 227, 116710. [Google Scholar] [CrossRef]
- Zhang, C.; Nerella, V.N.; Krishna, A.; Wang, S.; Zhang, Y.; Mechtcherine, V.; Banthia, N. Mix design concepts for 3D printable concrete: A review. Cem. Concr. Compos. 2021, 122, 104155. [Google Scholar] [CrossRef]
- Xiao, J.; Zou, S.; Ding, T.; Duan, Z.; Liu, Q. Fiber-reinforced mortar with 100% recycled fine aggregates: A cleaner perspective on 3D printing. J. Clean. Prod. 2021, 319, 128720. [Google Scholar] [CrossRef]
- Kuchem, J.T. Development of Test Methods for Characterizing Extrudability of Cement-Based Materials for Use in 3D Printing. Master’s Thesis, Missouri University of Science and Technology, Rolla, MO, USA, 2019; p. 191. [Google Scholar]
- Hambach, M.; Rutzen, M.; Volkmer, D. Properties of 3D-Printed Fiber-Reinforced Portland Cement Paste. In 3D Concrete Printing Technology; Elsevier: Amsterdam, The Netherlands, 2019; pp. 73–113. [Google Scholar]
Figure 1.
The gradation curve of the aggregates.

Figure 2.
Rheology test setup: (a) Brookfield rheometer; and (b) shear profile.

Figure 3.
Rheological parameters illustration following the Bingham model.

Figure 4.
The 3D printing system used in the Dana C. Wood Materials and Structures Lab at the University of New Mexico.
Figure 4.
The 3D printing system used in the Dana C. Wood Materials and Structures Lab at the University of New Mexico.

Figure 5.
The extrudability test printing path for different printing speeds.

Figure 6.
Printing wall for testing the buildability of lightweight concrete.

Figure 7.
SEM micrographs of various aggregates.


Figure 8.
SEM micrographs of the outer surface and pore structure of designed mixes (a1) M1; (a2) MC1; (a3) FRM1; (b1) M3; (b2) MC3; (b3) FRM3; (c1) M5; (c2) MC5; and (c3) FRM5.
Figure 8.
SEM micrographs of the outer surface and pore structure of designed mixes (a1) M1; (a2) MC1; (a3) FRM1; (b1) M3; (b2) MC3; (b3) FRM3; (c1) M5; (c2) MC5; and (c3) FRM5.


Figure 9.
SEM micrographs of the hydration products of designed mixes (a1) M1; (a2) MC1; (a3) FRM1; (b1) M3; (b2) MC3; (b3) FRM3; (c1) M5; (c2) MC5; and (c3) FRM5.
Figure 9.
SEM micrographs of the hydration products of designed mixes (a1) M1; (a2) MC1; (a3) FRM1; (b1) M3; (b2) MC3; (b3) FRM3; (c1) M5; (c2) MC5; and (c3) FRM5.


Figure 10.
SEM micrographs of ITZs between PE fibers and matrix of lightweight cementitious mixes.

Figure 11.
Plastic viscosity of lightweight concrete.

Figure 12.
Dynamic yield stress of lightweight concrete.

Figure 13.
Static yield stress of lightweight concrete.

Figure 14.
The zigzag printing path for (a) fresh and (b) hardened states of M5, MC5, and FRM5.


Figure 15.
Measured printing width of filament 24 h after the time of printing.

Figure 16.
Buildability test of mixes of (a) normal weight (RS) aggregate, (b) pumice aggregate, and (c) expanded glass aggregate.
Figure 16.
Buildability test of mixes of (a) normal weight (RS) aggregate, (b) pumice aggregate, and (c) expanded glass aggregate.

Figure 17.
The results of 28-day compressive strength.

Table 1.
The chemical compositions (mass percentage) of C, and SF, expanded glass, pumice
| Solid Materials | SiO2 | Al2O3 | Fe2O3 | CaO | MgO | SO3 | K2O | TiO2 | Na2O | Specific Gravity |
|---|---|---|---|---|---|---|---|---|---|---|
| C | 19.24 | 4.75 | 3.35 | 65.80 | 2.20 | 3.61 | 0.54 | 0.21 | - | 3.13 |
| SF | 97.80 | 0.20 | 0.03 | 0.19 | 0.48 | 0.30 | - | - | 0.001 | 2.20 |
| Expanded Glass | 68.6 | 5.46 | 0.451 | 12.0 | 1.06 | 0.155 | 0.521 | 0.167 | 11.2 | 0.55 |
| Pumice | 75.1 | 12.5 | 2.00 | 0.425 | 0.072 | 0.018 | 5.67 | 0.086 | 3.55 | 1.35 |
Table 2.
The physical properties of different types of aggregate.
| Type | Grade | Absorption | Thermal Conductivity (w/m.k) | Specific Gravity |
|---|---|---|---|---|
| RS | River Sand | 0.44 | 0.25 | 2.59 |
| Expanded Glass | Glass 1 | 0.50 | 0.04 | 0.55 |
| Glass 2 | 0.66 | 0.05 | 0.43 | |
| Pumice | Pumice 3 | 1.20 | 0.13 | 1.35 |
| Pumice 4 | 1.30 | 0.11 | 1.12 |
Table 6.
Results of apparent porosity and bulk density.
| Set | Mix ID | Apparent Porosity (%) | Bulk Density (kg/m3) |
|---|---|---|---|
| S1 | M1 | 11.78 | 2081.25 |
| M2 | 15.55 | 1804.27 | |
| M3 | 18.54 | 1564.79 | |
| M4 | 15.82 | 1883.72 | |
| M5 | 19.95 | 1602.23 | |
| S2 | MC1 | 11.37 | 2011.55 |
| MC2 | 13.97 | 1789.25 | |
| MC3 | 12 | 1631.73 | |
| MC4 | 24.35 | 1748.85 | |
| MC5 | 27.9 | 1507.58 | |
| S3 | FRM1 | 18.37 | 1909.24 |
| FRM2 | 14.59 | 1733.68 | |
| FRM3 | 11.56 | 1578.58 | |
| FRM4 | 27.29 | 1762.23 | |
| FRM5 | 26.12 | 1500.14 |
Table 7.
The results of the flow table test.
| Set | Mix ID | Flow Table (cm) | Adjusted W/B |
|---|---|---|---|
| S1 | M1 | 14.5 | 0.29 |
| M2 | 16.0 | 0.30 | |
| M3 | 18.1 | 0.35 | |
| M4 | 16.5 | 0.32 | |
| M5 | 17.1 | 0.33 | |
| S2 | MC1 | 12.7 | 0.30 |
| MC2 | 14.1 | 0.35 | |
| MC3 | 12.5 | 0.35 | |
| MC4 | 15.4 | 0.35 | |
| MC5 | 15.1 | 0.33 | |
| S3 | FRM1 | 14.6 | 0.33 |
| FRM2 | 13.3 | 0.35 | |
| FRM3 | 13.4 | 0.38 | |
| FRM4 | 14.8 | 0.34 | |
| FRM5 | 14.4 | 0.32 |
Table 8.
The results of setting time tests.
| Set | Mix ID | Initial Setting Time (min) |
|---|---|---|
| S1 | M1 | 222 |
| M3 | 211 | |
| M5 | 189 | |
| S2 | MC1 | 247 |
| MC3 | 307 | |
| MC5 | 347 | |
| S3 | FRM1 | 322 |
| FRM3 | 273 | |
| FRM5 | 340 |
Table 9.
The results of the extrudability test of fresh mixes.
| Set | Mix ID | Printing Speed (mm/s) | Extrusion Speed (RPS) | Adjusted W/B | |||||
|---|---|---|---|---|---|---|---|---|---|
| 10 | 15 | 20 | 25 | 30 | 35 | ||||
| S1 | M1 | - | - | - | ✔ | - | - | 0.2 | 0.29 |
| M2 | - | - | ✔ | - | - | - | 0.2 | 0.30 | |
| M3 | - | - | - | - | ✔ | - | 0.2 | 0.35 | |
| M4 | - | - | ✔ | - | - | 0.15 | 0.32 | ||
| M5 | - | - | ✔ | - | - | - | 0.15 | 0.33 | |
| S2 | MC1 | - | - | - | ✔ | - | - | 0.15 | 0.30 |
| MC2 | - | - | ✔ | - | - | - | 0.1 | 0.35 | |
| MC3 | - | - | ✔ | - | - | - | 0.1 | 0.35 | |
| MC4 | - | - | ✔ | - | - | - | 0.1 | 0.35 | |
| MC5 | - | - | ✔ | - | - | - | 0.1 | 0.33 | |
| S3 | FRM1 | - | - | - | ✔ | - | - | 0.15 | 0.33 |
| FRM2 | - | - | - | ✔ | - | - | 0.15 | 0.35 | |
| FRM3 | - | - | ✔ | - | - | - | 0.15 | 0.38 | |
| FRM4 | - | - | - | ✔ | - | - | 0.15 | 0.34 | |
| FRM5 | - | - | - | ✔ | - | - | 0.15 | 0.32 | |
Table 10.
The results of the buildability test.
| Set | Mix ID | Maximum Number of Printed Layers | Printing Speed (mm/s) |
|---|---|---|---|
| S1 | M1 | 30 | 25 |
| M2 | 30 | 20 | |
| M3 | 17 | 30 | |
| M4 | 24 | 20 | |
| M5 | 29 | 20 | |
| S2 | MC1 | 21 | 25 |
| MC2 | 20 | 20 | |
| MC3 | 23 | 20 | |
| MC4 | 10 | 20 | |
| MC5 | 13 | 20 | |
| S3 | FRM1 | 13 | 25 |
| FRM2 | 18 | 25 | |
| FRM3 | 23 | 20 | |
| FRM4 | 13 | 25 | |
| FRM5 | 12 | 25 |
Disclaimer/Publisher’s Note: The statements, opinions and data contained in all publications are solely those of the individual author(s) and contributor(s) and not of MDPI and/or the editor(s). MDPI and/or the editor(s) disclaim responsibility for any injury to people or property resulting from any ideas, methods, instructions or products referred to in the content. |
© 2023 by the authors. Licensee MDPI, Basel, Switzerland. This article is an open access article distributed under the terms and conditions of the Creative Commons Attribution (CC BY) license (https://creativecommons.org/licenses/by/4.0/).
Share and Cite
MDPI and ACS Style
Sedghi, R.; Zafar, M.S.; Hojati, M. Exploring Fresh and Hardened Properties of Sustainable 3D-Printed Lightweight Cementitious Mixtures. Sustainability 2023, 15, 14425. https://doi.org/10.3390/su151914425
AMA Style
Sedghi R, Zafar MS, Hojati M. Exploring Fresh and Hardened Properties of Sustainable 3D-Printed Lightweight Cementitious Mixtures. Sustainability. 2023; 15(19):14425. https://doi.org/10.3390/su151914425
Chicago/Turabian StyleSedghi, Reza, Muhammad Saeed Zafar, and Maryam Hojati. 2023. "Exploring Fresh and Hardened Properties of Sustainable 3D-Printed Lightweight Cementitious Mixtures" Sustainability 15, no. 19: 14425. https://doi.org/10.3390/su151914425
Note that from the first issue of 2016, this journal uses article numbers instead of page numbers. See further details here.