
Carbon Dioxide Storage Potential of Cenozoic Saline Aquifers in the South Yellow Sea Basin
by
Yong Yuan
1,2,
Jianqiang Wang
1,2,*,
Jianwen Chen
1,2,*,
Ke Cao
1,2,
Jie Liang
1,2,
Tianyu Lan
3,
Dongyu Lu
4 and
Xudong Guo
4 1
Qingdao Institute of Marine Geology, China Geological Survey, Qingdao 266237, China
2
Laboratory for Marine Mineral Resources, Laoshan Laboratory, Qingdao 266071, China
3
College of Marine Geosciences, Ocean University of China, Qingdao 266100, China
4
Sanya Institute of South China Sea Geology, Guangzhou Marine Geological Survey, Sanya 572025, China
*
Authors to whom correspondence should be addressed.
Energies 2023, 16(4), 1578; https://doi.org/10.3390/en16041578
Submission received: 26 December 2022
/
Revised: 29 January 2023
/
Accepted: 1 February 2023
/
Published: 4 February 2023
(This article belongs to the Special Issue Geological Carbon Sinks and Sequestration)
Abstract
:Carbon dioxide (CO2) storage in underwater reservoirs is a valuable method of reducing carbon emissions. Saline aquifers such as those in the South Yellow Sea Basin (SYSB), China, have great potential for geological CO2 storage. Thus, we use the recommended calculation method of USDOE and a formation volume model to determine the geological conditions for CO2 storage and estimate the CO2 storage capacity of the Cenozoic saline aquifers in the SYSB (depth: 800–3200 m). Overall, the SYSB exhibits weak fault activity and seismicity, medium and low geothermal fields, four types of source sandstone reservoir, and four sets of carbon reservoir–caprock assemblages developed from the Cenozoic strata, providing relatively good geological conditions for CO2 storage. The estimated capacity of the Cenozoic strata ranges from 39.59 Gt to 426.94 Gt (average: 155.25 Gt), indicating an extensive storage capacity that can meet the carbon sequestration needs of Shandong and Jiangsu Provinces for approximately 89 years. The Yantai Depression has a lower geothermal gradient and terrestrial heat, weaker seismic activity, and double the storage capacity of the Qingdao Depression, indicating that it is the most suitable area for Cenozoic CO2 storage in the SYSB, whereas the Laoshan Uplift is not suitable for storage. This study provides a scientific basis for the selection of offshore CO2 storage sites.
1. Introduction
Geological carbon dioxide (CO2) storage refers to the engineering approach of injecting captured CO2 into deep geological reservoirs to achieve the long-term isolation of CO2 from the atmosphere. This technology is an important method for reducing greenhouse gas concentrations and mitigating the greenhouse effect [1,2,3]. Geological CO2 storage can be divided into two types according to the storage location: terrestrial and oceanic. The latter has the added benefit of seawater layer coverage, which can prevent unintentional discharge directly into the atmosphere in the event of leakage. Furthermore, appropriate caprock is still needed, thereby increasing the stability of CO2 storage [4].
CO2 storage can be further divided into types, incluing saline aquifer storage and depleted oil and gas reservoir storage [3,5]. The term “saline aquifer” refers to the “unusable” deep saline layer (salinity: 3–50 g/L) with high concentrations of dissolved salts (>10 g/L), which is unsuitable for agricultural production or drinking water [6]. However, saline aquifers have vast development prospects for CO2 storage [1,7]. At present, most field storage experiments are centered on saline aquifers, and have confirmed deep saline aquifers as a viable option [8,9,10]. For example, the world’s first geological CO2 storage project in a saline aquifer, which was implemented in Norway in the Sleipner gas field in the North Sea, achieves CO2 sequestration of approximately one million tons each year [9]. In 2014, Norway released dynamic monitoring results of the project, which revealed that the injected CO2 was concentrated within 3 km of the injection point, and typically migrated vertically toward deep strata, indicating the safe and feasible storage of CO2 in the underwater saline aquifer [9]. As of 2019, the project has achieved approximately 22 million tons of CO2 storage, with no leakage detected [9,10,11]. Since 2000, the United States, Norway, the United Kingdom, the European Union, and Australia have conducted successive evaluations of the geological CO2 storage capacity in oceanic strata, indicating a large storage capacity in saline aquifers. The U.S. Department of Energy (USDOE) has released five editions of the Carbon Storage Atlas, which project a storage capacity of two trillion tons in saline aquifers located within federal waters [12].
The trapping mechanisms of CO2 sequestration in saline aquifers generally include structural, capillary, solubility, and mineral trapping [13]. In addition, the scope of storage potential assessment can be divided into five scales according to size, including country scale, basin scale, regional scale, local scale, and site scale [5]. Bachu et al. [5] further divides the sequestration potential of carbon dioxide into four levels: theoretical, effective, practical, and matched capacity. Among them, the theoretical capacity is equivalent to the geological reserves of oil and gas resources, which is the upper limit of the storage potential [5]. In such a case, it assumes that all pore spaces of the reservoir can be used to store carbon dioxide, or that carbon dioxide can be dissolved in the formation water at maximum saturation. The calculation results of the theoretical capacity are thus helpful for the census of storage capacity and planning of the storage area. Furthermore, the effective, practical, and matched capacity are subsets of the theoretical capacity [5].
Organizations such as the Carbon Sequestration Leadership Forum [5,14], USDOE [12,15,16], and U.S. Geological Survey (USGS) [17,18], as well as other researchers [19,20,21], have proposed calculation methods for estimating the geological CO2 storage capacity in saline aquifers according to different evaluation scales. Among them, the calculation method proposed by the Carbon Sequestration Leadership Forum calculates the storage capacity of structural, capillary, solubility, and mineral trapping of saline aquifers, which is applicable to the first four scales, but not to the site scale [5,14]. Zhou et al. [19] proposed a calculation method suitable for the rapid evaluation of site-scale CO2 storage capacity. It is used to calculate the carbon dioxide capacity stored in the remaining space formed by the compression of pores and brine due to the increase in pressure caused by CO2 injection in closed or semi-closed geological systems. Shen et al. [19] further improved the calculation method of the dissolution mechanism storage capacity at the site scale based on the method proposed by the Carbon Sequestration Leadership Forum. In addition, Szulczewski et al. [21] proposed a method for calculating the CO2 geological sequestration potential of closed and open boundary systems at the basin scale, which assumes that CO2 will migrate to the boundary after injection into the saline aquifer, and eventually be sequestered by residual and solubility trapping mechanisms.
USGS [18] evaluated the amount of CO2 storage resources stored in local structures or strata in the floating form or the storage amount of CO2 stored in the pores of reservoirs, which is applicable to the first four scales, but not to the site scale. USDOE [12] calculated all pore spaces that could theoretically be used for CO2 storage in the evaluation area without considering the storage capacity of the dissolution mechanism, and introduced the storage efficiency factor (E) to evaluate the storage capacity. This method is also suitable for large-scale evaluation, but is not suitable for site-scale evaluation. Recent studies have analyzed the factor and determined the E value of the 10–90% confidence interval for a saline aquifer dominated by sandstone, dolomite, and limestone [22,23,24,25]. However, most calculation methods have strict requirements concerning the calculation parameters, including the accuracy and number of parameters, but are generally not appropriate for ocean basins with a low degree of exploration. Therefore, more appropriate and accurate calculation methods are required.
Some important progress has been made in the sequestration of CO2 in saline aquifers in recent years. CO2 in saline aquifers is initially dissolved via molecular diffusion and convection as the diffusion layer density increases [26,27,28]. Singh et al. [29,30] conducted numerical simulations of the solution process of liquid supercritical CO2 and found that the dissolving and trapping capacity of a medium-temperature reservoir (175 °C) and a high-permeability reservoir was stronger. Mahmoodpour et al. [28] estimated when the onset of convection occurred through experimental and numerical simulations, and found that the convective start-up time of the NaCl and CaCl2 mixed solution was later than that of the NaCl solution. In addition, examining the wetting characteristics and influencing parameters of geological formations is pertinent to understand the supercritical CO2 behavior in rock/brine systems [31]. Subsurface CO2 reservoirs are affected by the wetting characteristics of rock-forming minerals, which directly affect structural and capillary trapping [32] and indirectly affect solubility and mineral trapping [31,32,33]. Ali et al. [34,35] concluded through experimental simulation that the capacity and safety of CO2 geologic sequestration would be affected if the concentration of organic acids in saline aquifers is above a certain threshold. These studies have important implications for studying site-scale CO2 containment security, fluid dynamics, and storage potential.
The South Yellow Sea Basin (SYSB) is in the southern part of the Yellow Sea, adjacent to Shandong and Jiangsu Provinces in China. In 2019, the CO2 emissions of Shandong and Jiangsu Provinces were 937 Mt and 804 Mt, respectively [36,37], with the city of Qingdao (Shandong Province) alone emitting 49 Mt of CO2 [38,39]. Therefore, these provinces have a high demand for offshore geological CO2 storage. The SYSB has large-scale structural traps, good reservoir–caprock assemblages, and geological conditions that are suited for CO2 storage [40]; thus, this basin has the potential to meet the sequestration requirements of cities and coastal provinces in China. However, despite many calculations of geological CO2 storage capacity in China’s offshore basins with a high degree of exploration, such as the Bohai Basin, the Beibu Gulf Basin, and the Pearl River Mouth Basin [41,42,43,44], relatively few studies have attempted to estimate the storage capacity of the SYSB [40,45]. In this study, we attempt to calculate the theoretical capacity of CO2 sequestration in the saline aquifers of the South Yellow Sea Basin, which belongs to a basin-scale evaluation. This could provide a scientific basis for future site selection and a reference for future research.
2. Geographical Background
China’s mainland and eastern seas are located in the southeast of the Eurasian plate, which is separated from the Philippine Sea plate by the Ryukyu Trough in the east [46]. In China’s eastern seas and adjacent areas, the Eurasian plate can be further divided into the North China, Yangtze, and South China blocks. The SYSB is a seaward extension of the Yangtze Block [47,48]. The South Yellow Sea has an area of approximately 30 × 104 km2, approximately 13.6 × 10⁴ km2 of which is a sedimentary basin (Figure 1a) [47,49,50]. This large sedimentary basin is superimposed on the Mesozoic–Paleozoic oceanic sedimentary basin and the Mesozoic–Cenozoic terrestrial sedimentary basin. Since the Late Sinian, the basin has experienced multiple tectonic cycles, including the Caledonian, Hercynian, Indosinian, Yanshan, and Himalayan [48,51]. The Sinian–Early Triassic was a key evolutionary stage of marine basins. During the Indosinian intracontinental orogeny that occurred at the end of the Middle Triassic, the collision of the Yangtze and North China blocks signaled the transformation of the SYSB into a foreland basin stage. The Late Triassic was also a critical period for the transformation of marine and terrestrial sediments in the basin, after which large-scale continental fault-depression deposition was superimposed on the Mesozoic and Paleozoic marine residual and early foreland basins. Since the Late Cretaceous, the SYSB entered the evolutionary stage of faulted basins in the true sense. Strong regional uplift and denudation and flattening then occurred during the Sanduo movement at the end of the Eocene, leading to a general lack of late Eocene and Oligocene sediments in the basin (Figure 1b), with a sedimentation discontinuity of up to 13–15 Ma. After the Oligocene, the SYSB was unified into a widely distributed subsidence basin with weakened tectonic processes; deformation was extremely weak and almost free of folding [48,51,52]. The current tectonic framework of the SYSB is “one uplift between two depressions” [47,53], that is, the Qingdao Depression, Laoshan Uplift, and Yantai Depression from north to south (Figure 1). The Wunansha Uplift and Qianliyan Uplift lie to the south and north of the basin, respectively.
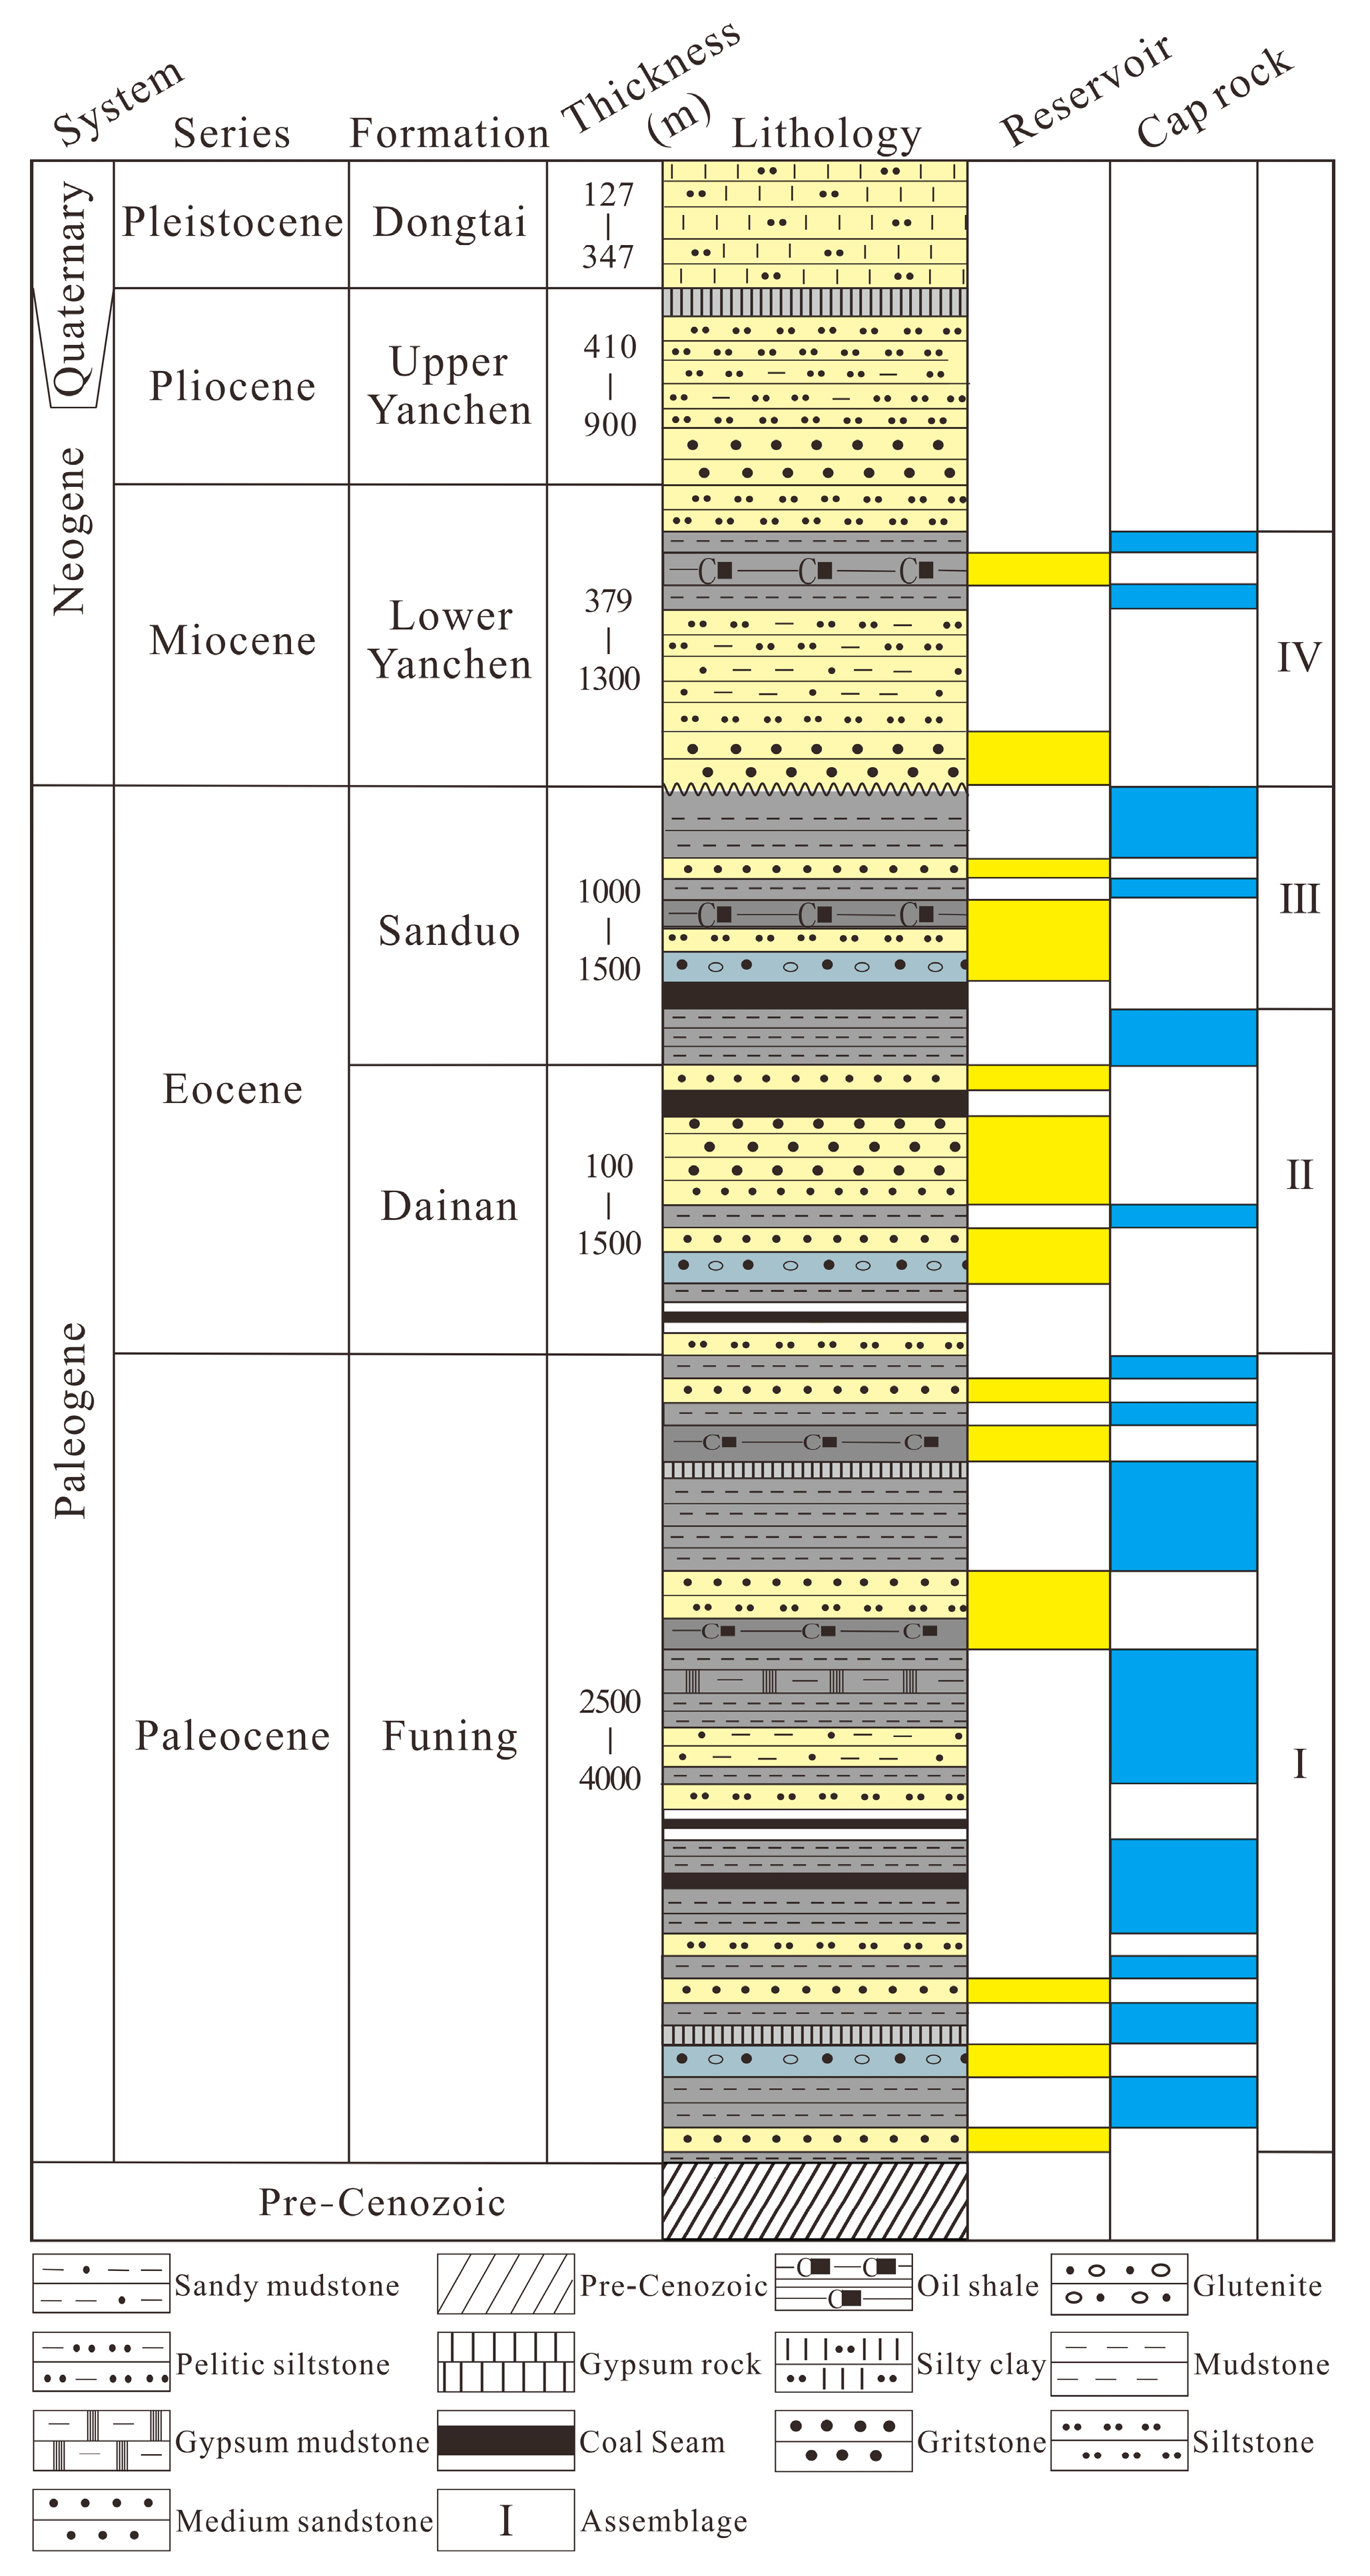
Oil and gas exploration in the SYSB began in the early 1960s. As of 2021, 30 wells had been drilled in the basin, revealing strata from the Upper Silurian and above [47,53]. Among them, wells H2, H5, H9, ZC1-2-1, and RC20-2-1 in the Yantai Depression, and wells CZ24-1-1, WX-20-ST1, WX4-2-1, CZ6-2-1, CZ6-1 1-1, and H4 in the Qingdao Depression, have generally completely revealed the Cenozoic strata; while well CSDP-2 reveals the Upper Silurian strata and above in the Laoshan Uplift. Drilling has revealed that the petrophysical properties of the Mesozoic reservoirs in the SYSB are unfavorable [54], whereas those of the Paleozoic reservoirs are relatively tight, with an average porosity of less than 3% and 4% for sandstone and carbonate reservoirs, respectively [55,56]. Conversely, the average porosity of the Cenozoic reservoirs is greater than 10% [54], making these strata the main carbon storage reservoir. From bottom to top, the Cenozoic strata in the SYSB consist of the Paleocene Funing Formation, the Eocene Dainan Formation, the Sanduo Formation, and the Neogene Yancheng Formation, and are characterized by clastic rocks (Figure 2).
Faults in the SYSB are predominantly oriented in NE, NNE, or approximately EW and NW directions, and can be divided into three faulting periods: the Caledonian, Indosinian, and Yanshan–Xishan [47,48,51]. Faults in the Caledonian period were predominantly NE-oriented and exhibited weak activity, which led to folding during the Lower Paleozoic. Indosinian faults exhibited weak activity on the Laoshan Uplift, and mainly manifested as a series of north-dipping high-angle thrust faults in the Yantai Depression (Figure 1b); however, the faulting intensity was greater than that of the Qingdao Depression. After the Yanshan Movement, the SYSB entered an extensional sedimentation environment, resulting in the development of normal faults. Currently, the SYSB exhibits medium–low fault activity [40].
3. Methods and Data
3.1. Capacity Evaluation Method
We conducted a large-scale evaluation of the CO2 storage capacity of saline aquifers in the SYSB, using the calculation method recommended by the USDOE [12]. For saline aquifers, this calculation method begins with the volume, and calculates all pore spaces that can theoretically be used to store CO2 in the area under evaluation. This method only considers the physical storage mechanism, while chemical mechanisms such as dissolution and mineral reaction are too complex to be calculated owing to the joint constraints of temperature, pressure, and fluid composition. It assumes that the pore fluid in the formation can either be driven to other locations in the same formation or adjacent formations by CO2 injection, or displaced by fluid production, treatment, and other means. In other words, the calculation is based on an open system, and the calculation results approximately represent the upper limit of the actual storage capacity [12]. The equation is as follows:
where is the effective storage capacity of CO2; is the total area of the saline aquifer; H is the thickness of the saline aquifer; is the porosity of the saline aquifer; is the density of CO2 in the saline aquifer; and E is the storage efficiency factor that reflects a fraction of the pore volume filled with CO2, with P10, P50, and P90 (i.e., a degree of uncertainty of 10%, 50%, and 90%) corresponding to a pore volume of 0.51%, 2.0%, and 5.5%, respectively.
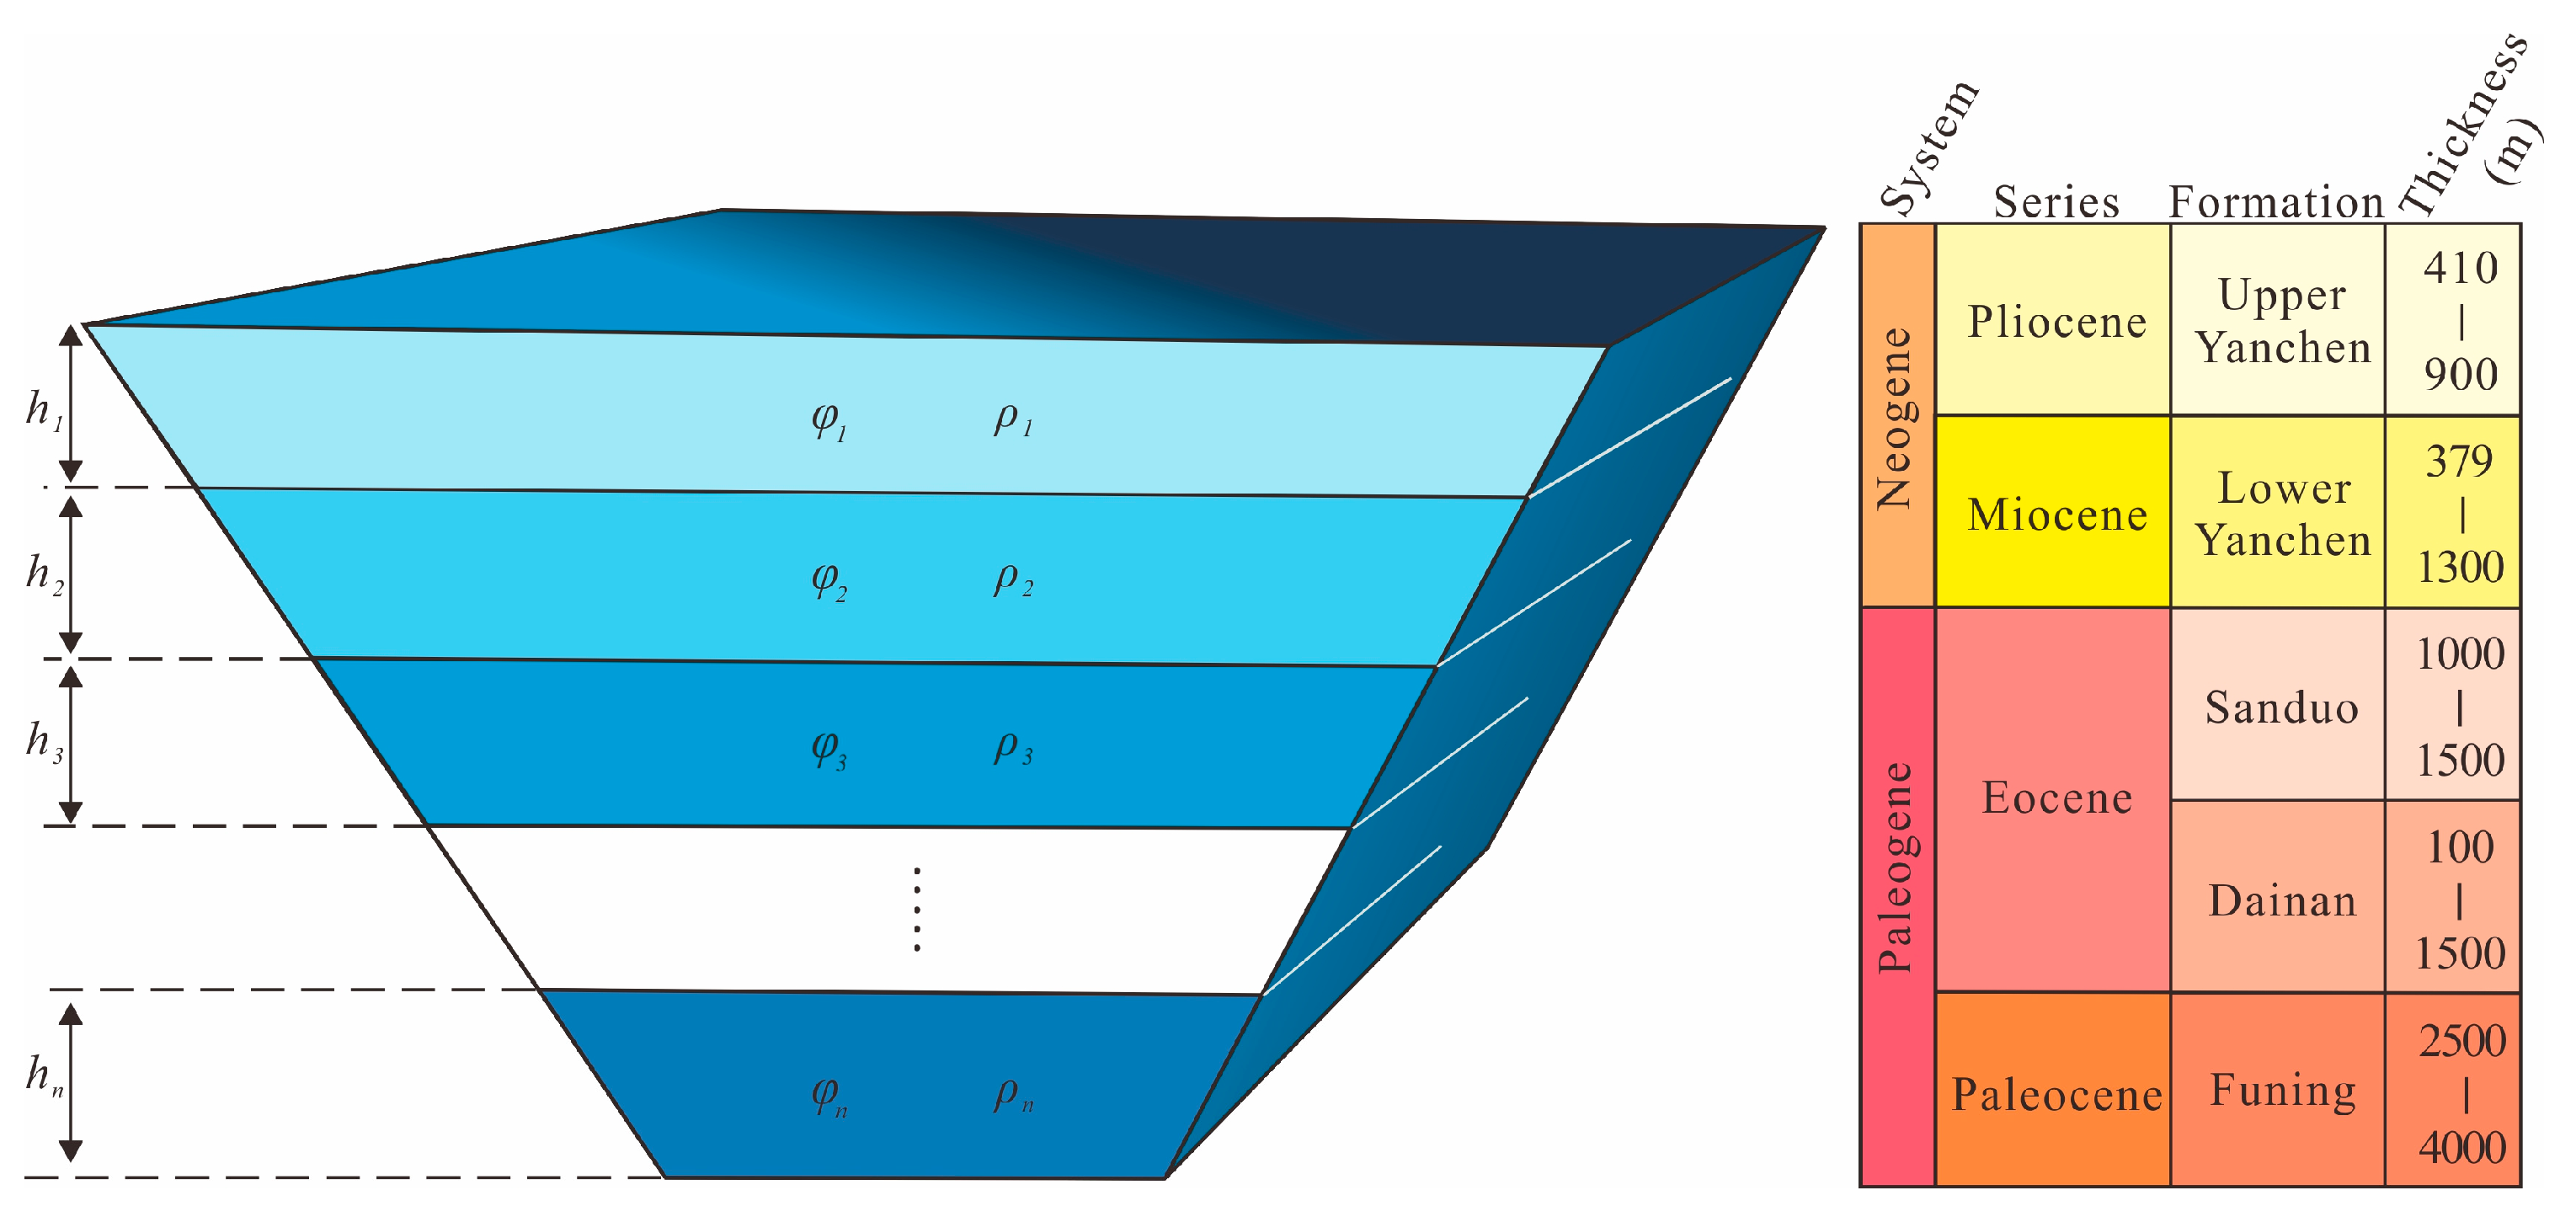
To further improve the accuracy of the calculations, Equation (1) was improved in this study. The calculation principle is based on dividing the sedimentation formation in the evaluation depth range into n calculation units from top to bottom according to a certain interval Hi (Figure 3). We used this model to describe the spatial heterogeneity of each parameter and obtain the CO2 storage capacity of each calculation unit, with the total storage capacity obtained through accumulation. Considering that the saline aquifer represented by the Cenozoic strata in the SYSB comprises a sandstone layer, the saline aquifer is replaced by a sandstone layer in the new calculation formula:
where is the effective storage capacity of CO2; is the sandstone volume of calculation unit i; is the sandstone porosity of calculation unit i; is the CO2 density of calculation unit i under storage conditions; is the area of calculation unit i; layer thickness of calculation unit i; R is the ratio of sandstone thickness to layer thickness; and E is the storage efficiency factor.
3.2. Calculation Parameters
The depth range in this study was 800–3200 m below the seabed. The critical temperature and pressure required for CO2 to achieve a supercritical state are 31.1 °C and 7.38 MPa, respectively [57]; thus, a depth of 800 m is required to ensure a supercritical CO2 state. The storage area is a crucial factor in determining the geological storage capacity, and the main characterization parameter is porosity, which is predominantly influenced by diagenesis [6,58]. Shallow Cenozoic strata at a depth of 2000 m in the SYSB are in the early diagenetic stage, with sediments under compaction and cementation, and the porosity of the reservoir decreases with increasing depth. Burial depths of 2000–3200 m represent the early stage of mesodiagenesis, where the soluble components have been dissolved by organic acid, resulting in a large number of secondary pores, which improves the petrophysical properties of the reservoir [59,60,61]. Hence, the lowermost depth in this study was 3200 m.
The Cenozoic strata at 800–3200 m below the seabed in the SYSB were divided into 14 calculation units with intervals of 200 m and different parameters in each calculation unit. The CO2 density was calculated according to formation pressure gradient and geothermal gradient, using the methods of Bachu [57] and Shen and Liao [62]. In each calculation unit, the depth value used to determine the pressure and ground temperature was the median depth of the calculation unit. The formula for calculating CO2 density under the formation conditions is as follows:
where 28.97 is the relative molecular mass of air; Z is the compressibility factor; is the ideal gas constant; γ is the relative density of CO2, where the relative density of pure CO2 is 1.15192; is the seabed pressure; is the pressure gradient of the basin; is the seabed temperature; is the basin geothermal gradient; and D is a certain depth below the seabed. The seabed pressure D1 was calculated using the seawater depth Ds and the hydrostatic pressure gradient. Previous research has indicated no pressure anomalies in the South Yellow Sea Cenozoic strata; thus, a normal pressure range was assumed [40].
4. Results and Discussion
4.1. Stability and Geothermal Field in the SYSB
The geothermal gradient range in the SYSB is 2.4–3.0 °C/100 m, with an average value of 2.93 °C/100 m, and the terrestrial heat flow range is 61–66 mW/m2, with an average value of 63.5 mW/m2. According to the basin geothermal zoning standard of Wu [63], the SYSB is characterized as a “warm basin” and is suitable for the geological storage of CO2. This study shows that the geothermal gradient gradually increases from north to south in the basin and is lowest in the Yantai Depression (Figure 4). Although the terrestrial heat flow exhibits no obvious north–south zoning, the mean terrestrial heat flow is lower in the Yantai Depression than in the Qingdao Depression (Figure 5). According to historical records, from 1495 to 2015, 18 earthquakes with a magnitude >6.0 occurred in the SYSB, of which 16 occurred in the southwest of the basin and only two occurred in the north [64]. In the past century, only two earthquakes of magnitude 6–7 have occurred in the SYSB, both in the Qingdao Depression [65]. In terms of earthquake activity, the Yantai Depression is more stable than the Qingdao Depression and Laoshan Uplift.
4.2. Carbon Reservoir–Caprock Assemblages
Cenozoic SYSB strata are 0–4000 m thick and are mainly distributed in the Yantai and Qingdao Depressions, whereas the Laoshan Uplift typically comprises thinner sediments of the Quaternary and Neogene, based on the interpretation of drilling and seismic data (Figure 6). The thickness of the Cenozoic strata in the Yantai Depression ranges from 400 to 4000 m (Figure 6), that of the Laoshan Uplift ranges from 0 to 400 m, and that of the Qingdao Depression ranges from 400 to 3600 m (Figure 5). The Cenozoic SYSB strata comprise four sets of sandstone carbon reservoir beds [54]: the Funing, Dainan, Sanduo, and Yancheng Formations, which tend to be buried in relatively shallow areas, exhibit relatively weak diagenesis, and have generally good physical properties. The average porosity range of all four sets of reservoirs is 9–24% [41,59,67,68]. In the perpendicular direction, the strata comprise four sets of carbon reservoir–caprock assemblages: the Funing, Dainan–Lower Sanduo, Sanduo, and Lower Yancheng Formations (Figure 2), all of which have lower-reservoir and upper-caprock assemblages.
Five wells in the Yantai Depression and six wells in the Qingdao Depression reveal that the Funing Formation can be separated into four lithological sections. From bottom to top, the Fu1 member contains dark gray to dark purple mudstone mixed with siltstone, sandstone, and glutenite; the Fu2 member comprises gray mudstone, sandy mudstone, light brown siltstone, and local oil shale; the Fu3 member comprises gray, gray–black mudstone, siltstone, and fine sandstone; and the Fu4 member contains dark gray mudstone mixed with thin gray–white sandstone and a small amount of oil shale. The Funing Formation assemblage is mainly composed of fluvial and delta sandstones in the lower part and lacustrine mudstone in the upper part, which forms a good reservoir–caprock assemblage with interbedded submarine fan and turbidite sands. These 11 wells reveal that the thickness of the mudstone caprock (381–842 m) in the Sanduo Formation accounts for an average of 70% of the formation.
The upper part of the Dainan Formation contains gray mudstone mixed with light gray fine–coarse sandstone, conglomerate, and a small amount of coal seam, and the lower part is dark gray mudstone mixed with conglomerate sandstone. The upper part of the Sanduo Formation contains brown–red, purple–red, purple–gray mudstone with gray–green, dark gray mudstone, silty mudstone, and a small amount of siltstone, and the lower part is gray, dark gray mudstone, and silty mudstone with gray, gray–white calcareous sandstone, containing pebbly sandstone. The fluvial, delta, and shallow lake facies sandstone of the Dainan Formation and mudstone in the lower part of the Sanduo Formation form a reservoir–caprock assemblage. The Sanduo Formation fluvial sandstone and upper mudstone also form a reservoir–caprock assemblage. In addition, the 11 wells in the Yantai and Qingdao Depressions reveal that the thickness of mudstone caprock (93–858 m) in the upper part of Lower Yancheng Formation accounts for an average of 30% of the formation.
The Yancheng Formation is divided into the Upper and Lower Yancheng Formation. The lower part of the Lower Yancheng Formation contains argillaceous siltstone, siltstone, and fine sandy mudstone, and the bottom comprises pebbly sandstone and mid sandstone, which are relatively good reservoirs. The upper part comprises gray, light brown, and black mudstone and siltstone mixed with the carbonaceous shale of the Lower Yancheng Formation, which form good caprocks and make up the reservoir–caprock assemblage. These 11 wells reveal that the thickness of mudstone caprock (113–409 m) in the upper part of the Lower Yancheng Formation accounts for an average of 30% of the formation.
4.3. Formation of Carbon Storage Layers in the SYSB
The tectonic framework of different tectonic stages has had a notable effect on sedimentation across the entire SYSB [41,54]. The Late Cretaceous–Paleocene was the peak period of extension and rifting, during which time clastic rock deposits dominated by lacustrine facies developed in the resulting half-graben. At the end of the Paleocene, the Wubao Movement led to uplift, resulting in a period of nonconformity in the region [68,69]. The Eocene was characterized by a reduction in fissure extension and the development of lacustrine–fluvial clastic deposits [70,71]. At the end of the Eocene, the Sanduo movement resulted in strong regional uplift, denudation, and flattening. The Neogene saw post-rift subsidence over the entire basin [51,72].
The 12 wells in the Yantai and Qingdao Depressions reveal that the SYSB underwent lacustrine–fluvial facies evolution from the sedimentation period of the Funing Formation to that of the Yancheng Formation [59,68,70,73,74]. In the former, fault depressions developed in the SYSB, with frequent tectonic activity. From the first to fourth Fu members, the sediments changed from fluvial to lacustrine deposits. As the water body deepened, the range of lakes gradually expanded, and even submerged the Laoshan Uplift and most of the Wunansha Uplift, forming a vast lake basin [59,70,73,74,75]. During the sedimentation period of the Dainan Formation, the SYSB was dominated by fault-block movement, the Laoshan Uplift developed, and the south and north Depressions became deeper, resulting in a dustpan-like structure [70,71,72], which was dominated by fluvial, delta, and shallow lake facies [59,68,73] (Figure 7). As the Sanduo Formation sedimentation period began, the topography of the SYSB gradually flattened. Fluvial facies were then deposited under the continuous activity of syngenetic faults. At this time, the extent of sedimentation in the Depression increased, and the sedimentation range exceeded that of the Eocene. In the early stage, oscillations were frequent, the sedimentary cycle was obvious, and the sediments were relatively coarse. In the late stage, sedimentation was dominated by purple–red mudstone, with the local development of submarine fans [54,59,71,73]. The Neogene period saw post-rift subsidence in the basin, characterized by meandering rivers, floodplains, and marine–terrestrial deposits [41,54]. In general, the Funing Formation is characterized by fluvial, delta, and shallow lake facies, and submarine fan sandstone; the Dainan Formation is characterized by fluvial, delta, and shallow lake facies sandstones; the Sanduo Formation predominantly comprises fluvial facies sandstones; and the Yancheng Formation predominantly comprises meandering fluvial sandstones.
4.4. Storage Potential of the SYSB
The value of each parameter used in this study is shown in Table 1. The ρi value of the key parameters was calculated using Equation (4), and the CO2 storage potential at a depth of 800–3200 m in the saline aquifer in the SYSB and the Yantai and Qingdao Depressions were calculated using Equations (2) and (3), respectively.
According to the calculation results, the average CO2 storage capacity of the SYSB saline aquifer at a depth of 800–3200 m is 155.25 Gt (E = 2%), with minimum and maximum values of 39.59 Gt (E = 0.51%) and 426.94 Gt (E = 5.5%), respectively. The estimated CO2 storage capacity of the Yantai Depression saline aquifer (depth: 800–3200 m) is 25.25–272.25 Gt, with an average of 99 Gt, and that of the Qingdao Depression saline aquifer (depth: 800–3200 m) is 11.94–128.79 Gt, with an average of 46.83 Gt.
The CO2 storage capacity of the SYSB saline aquifer estimated by the dissolution method was 133.8 Gt [45], which is slightly lower than our calculation result, yet remains within the range of possible values calculated in this study. Huo [40] also employed the USDOE calculation method to estimate a CO2 storage capacity for the SYSB saline aquifer of 113.4 Gt (E = 2%) at a depth of 800–3500 m, which is also within the range of possible values calculated in this study. However, Huo [40] calculated the storage capacity for the four sets of reservoirs at depths of 800–3500 m, whereas we divided the formations into 14 calculation units with intervals of 200 m and calculated the capacity estimates separately before accumulating them.
The distance between the carbon emission source and the reservoir is a key factor influencing the cost of CO2 storage [3]. Shandong and Jiangsu Provinces have 17 thermal power plants near the SYSB, with a shortest distance of 44 km and a maximum distance of 232 km [40]; thus, the SYSB is a relatively good match for the spatial distribution of carbon sources. According to the 2019 CO2 emission calculations for Shandong and Jiangsu Provinces (937 Mt and 804 Mt, respectively) [36,37], the SYSB can support the CO2 storage needs of both provinces for approximately 89 years, indicating significant storage potential and vast development prospects. Moreover, from the perspective of the storage suitability of each tectonic unit within the basin, the Cenozoic strata in the Laoshan Uplift are less than 800 m thick, which is not suitable for CO2 storage. However, the average CO2 storage potential of the Yantai Depression saline aquifer is approximately twice that of the Qingdao Depression, and the seismicity and geothermal field conditions are better; therefore, the Yantai Depression is a more suitable choice for CO2 storage in saline aquifers.
5. Conclusions
In this study, we analyzed the geological conditions for CO2 storage in the SYSB by establishing a formation volume model based on the USDOE method, selecting parameters from the previously published literature, and estimating the storage capacity. The conclusions are as follows.
- (1)
- Fault activity and seismicity in the SYSB are generally weak, with medium and low geothermal fields; thus, the SYSB is characterized as a “warm basin”. The Cenozoic strata in the basin are thick and comprise four sets of carbon reservoir–caprock assemblages: the Funing, Dainan–Lower Sanduo, Sanduo, and Lower Yancheng Formations. Four types of source sandstone carbon reservoir are present: fluvial, delta, shallow lake, and submarine fan facies, and the carbon storage layers have favorable petrophysical properties. Therefore, the SYSB has relatively good geological conditions for CO2 storage.
- (2)
- The estimated CO2 storage capacity of the SSYB saline aquifer (depth: 800–3200 m) is 39.59–426.94 Gt, with an average of 155.25 Gt; that of the Yantai Depression (depth: 800–3200 m) is 25.25–272.25 Gt, with an average of 99 Gt, and that of the Qingdao Depression (depth: 800–3200 m) is 11.94–128.79 Gt, with an average of 46.83 Gt. The SYSB can meet the offshore CO2 storage needs of both Shandong and Jiangsu Provinces. Therefore, the SYSB has great potential for the geological storage of CO2.
- (3)
- The location of the Yantai Depression and Qingdao Depression correlates well with the spatial distribution of carbon sources in the SYSB. However, compared with the Qingdao Depression, the Yantai Depression has a lower geothermal gradient and terrestrial heat flow, weaker seismic activity, and approximately twice the CO2 storage capacity. Therefore, the Yantai Depression is the most suitable region of the SYSB for CO2 storage, followed by the Qingdao Depression. Owing to the thin Cenozoic strata in the Laoshan Uplift, this region is not suitable for CO2 storage.
Author Contributions
Conceptualization, Y.Y., J.C., K.C. and J.W.; methodology, Y.Y., J.C. and D.L.; software, T.L. and X.G.; validation, Y.Y. and J.L.; data curation, J.W. and T.L.; investigation, Y.Y. and K.C.; writing—original draft preparation, Y.Y.; writing—review and editing, Y.Y. and J.C.; supervision, Y.Y. and J.L.; project administration, Y.Y. All authors have read and agreed to the published version of the manuscript.
Funding
This research was funded by Laoshan Laboratory, grant number LSKJ202203404; the National Natural Science Foundation of China, grant number 42206234 and 42076220; the Natural Science Foundation of Shandong Province, grant number ZR2020QD038 and ZR2020MD071; China Geological Survey Project, grant number DD20221723 and DD20190818. The APC was funded by the Qingdao Institute of Marine Geology, China Geological Survey.
Data Availability Statement
No new data were created or analyzed in this study. Data sharing is not applicable to this article.
Acknowledgments
We thank Xi Lin, Yan Wang, and Xia Li for assistance with figure preparation.
Conflicts of Interest
The authors declare no conflict of interest.
References
- IEA. Exploring Clean Energy Pathways: The Role of CO2 Storage; IEA: Paris, France, 2019. [Google Scholar]
- IEA. Net Zero by 2050: A Roadmap for the Global Energy Sector; OECD Publishing: Paris, France, 2021. [Google Scholar]
- Cai, B.; Cao, C.; Cao, L.; Chen, W.; Chen, Z.; Dong, J.; Fan, J.; Jiang, Y.; Jiang, F.; Lei, Y.; et al. China Carbon Dioxide Capture Utilization and Storage (CCUS) Annual Report (2021)—Research on CCUS path in China; Chinese Academy of Environmental Planning: Beijing, China, 2021.
- Schrag, D.P. Storage of carbon dioxide in offshore sediments. Science 2009, 325, 1658–1659. [Google Scholar] [CrossRef] [PubMed]
- Bachu, S.; Bonijoly, D.; Bradshaw, J.; Burruss, R.; Christensen, N.P.; Holloway, S.; Mathiassen, O. Estimation of CO2 Storage Capacity in Geological Media; Carbon Sequestration Leadership Forum: Washington, DC, USA, 2007; p. 43. [Google Scholar]
- Cao, M.; Chen, J. The site selection geological evaluation of the CO2 storage of the deep saline aquifer. Acta Geol. Sin. 2022, 96, 1868–1882. [Google Scholar]
- Xie, H.; Li, X.; Fang, Z.; Wang, Y.; Li, Q.; Shi, L.; Bai, B.; Wei, N.; Hou, Z. Carbon geological utilization and storage in China: Current status and perspectives. Acta Geotech. 2014, 9, 7–27. [Google Scholar] [CrossRef]
- Sawada, Y.; Tanaka, J.; Suzuki, C.; Tanase, D.; Tanaka, Y. Tomakomai CCS demonstration project of Japan, CO2 injection in progress. Energy Procedia 2018, 154, 3–8. [Google Scholar] [CrossRef]
- Akai, T.; Kuriyama, T.; Kato, S.; Okabe, H. Numerical modelling of long-term CO2 storage mechanisms in saline aquifers using the Sleipner benchmark dataset. Int. J. Greenhouse Gas Control 2021, 110, 103405. [Google Scholar] [CrossRef]
- Global CCS Institute. The Global Status of CCS 2020: Vital to Achieve Net Zero; Global CCS Institute: Melbourne, Australia, 2020. [Google Scholar]
- Furre, A.-K.; Eiken, O.; Alnes, H.; Vevatne, J.N.; Kiær, A.F. 20 years of monitoring CO2-injection at Sleipner. Energy Procedia 2017, 114, 3916–3926. [Google Scholar] [CrossRef]
- USDOE. Carbon Storage Atlas, 5th ed.; US Department of Energy: Washington, DC, USA, 2015.
- Emami-Meybodi, H.; Hassanzadeh, H.; Green, C.P.; Ennis-King, J. Convective dissolution of CO2 in saline aquifers: Progress in modeling and experiments. Int. J. Greenhouse Gas Control 2015, 40, 238–266. [Google Scholar] [CrossRef]
- Bachu, S.; Bonijoly, D.; Bradshaw, J. CO2 storage capacity estimation: Methodology and gaps. Int. J. Greenhouse Gas Control 2007, 1, 430–443. [Google Scholar] [CrossRef]
- USDOE. Carbon Sequestration Atlas of the United States and Canada, 3rd ed.; US Department of Energy: Washington, DC, USA, 2010.
- Goodman, A.; Hakala, A.; Bromhal, G.; Deel, D.; Rodosta, T.; Frailey, S.; Small, M.; Allen, D.; Romanov, V.; Fazio, J.; et al. U.S.DOE methodology for the development of geologic storage potential for carbon dioxide at the national and regional scale. Int. J. Greenhouse Gas Control 2011, 5, 952–965. [Google Scholar] [CrossRef]
- Brennan, S.T.; Burruss, R.C.; Merrill, M.D.; Freeman, P.A.; Ruppert, L.F. A Probabilistic Assessment Methodology for the Evaluation of Geologic Carbon Dioxide Storage; USGS Open-File Report 2010-1127; U.S. Geological Survey: Reston, Virginia, 2010; p. 31.
- USGS Geologic Carbon Dioxide Storage Resources Assessment Team. National Assessment of Geologic Carbon Dioxide Storage Resources—Results (ver. 1.13). USGS Circular 1386; 41p. Available online: https://pubs.usgs.gov/circ/1386/ (accessed on 1 September 2013).
- Zhou, Q.; Birkholzer, J.T.; Tsang, C.-F.; Rutqvist, J. A method for quick assessment of CO2 storage capacity in closed and semi-closed saline formations. Int. J. Greenhouse Gas Control 2008, 2, 626–639. [Google Scholar] [CrossRef]
- Shen, P.; Liao, X.; Liu, Q. Methodology for estimation of CO2 storage capacity in reservoirs. Pet. Explor. Dev. 2009, 36, 216–220. [Google Scholar]
- Szulczewski, M.L.; MacMinn, C.W.; Herzog, H.J.; Juanes, R. Lifetime of carbon capture and storage as a climate-change mitigation technology. Proc. Natl. Acad. Sci. USA 2012, 109, 5185–5189. [Google Scholar] [CrossRef] [PubMed] [Green Version]
- Kopp, A.; Probst, P.; Class, H.; Hurter, S.; Helmig, R. Estimation of CO2 storage capacity coefficients in geologic formations. Energy Procedia 2009, 1, 2863–2870. [Google Scholar] [CrossRef]
- Wildgust, N.; Gorecki, C.D.; Bremer, J.M. An overview of the IEA Greenhouse Gas R&D Programme regional geologic storage capacity studies. Energy Procedia 2011, 4, 4835–4840. [Google Scholar]
- Wang, Y.; Zhang, K.; Wu, N. Numerical investigation of the storage efficiency factor for CO2 geological sequestration in saline formations. Energy Procedia 2013, 37, 5267–5274. [Google Scholar] [CrossRef]
- Wang, S.; Vincent, C.J.; Zeng, R.; Stephenson, M.H. Geological suitability and capacity of CO2 storage in the Jiyang Depression, East China. Greenhouse Gas Sci. Technol. 2018, 8, 747–761. [Google Scholar] [CrossRef]
- Soltanian, M.R.; Amooie, M.A.; Dai, Z.; Cole, D.; Moortgat, J. Critical dynamics of gravito-convective mixing in geological carbon sequestration. Sci. Rep. 2016, 6, 35921. [Google Scholar] [CrossRef]
- Amooie, M.A.; Soltanian, M.R.; Moortgat, J. Solutal convection in porous media: Comparison between boundary conditions of constant concentration and constant flux. Phys. Rev. E 2018, 98, 033118. [Google Scholar] [CrossRef]
- Mahmoodpour, S.; Rostami, B.; Soltanian, M.R.; Amooie, M.A. Effect of brine composition on the onset of convection during CO2 dissolution in brine. Comput. Geosci. 2019, 124, 1–13. [Google Scholar] [CrossRef]
- Singh, M.; Chaudhuri, A.; Chu, S.P.; Stauffer, P.H.; Pawar, R.J. Analysis of evolving capillary transition, gravitational fingering, and dissolution trapping of CO2 in deep saline aquifers during continuous injection of supercritical CO2. Int. J. Greenhouse Gas Control 2019, 82, 281–297. [Google Scholar] [CrossRef]
- Singh, M.; Chaudhuri, A.; Stauffer, P.H.; Pawar, R.J. Simulation of gravitational instability and thermo-solutal convection during the dissolution of CO2 in deep storage reservoirs. Water Resour. Res. 2020, 56, e2019WR026126. [Google Scholar] [CrossRef]
- Ali, M.; Jha, N.K.; Pal, N.; Keshavarz, A.; Hoteit, H.; Sarmadivaleh, M. Recent advances in carbon dioxide geological storage, experimental procedures, influencing parameters, and future outlook. Earth-Sci. Rev. 2022, 225, 103895. [Google Scholar] [CrossRef]
- Al-Khdheeawi, E.A.; Vialle, S.; Barifcani, A.; Sarmadivaleh, M.; Iglauer, S. Impact of reservoir wettability and heterogeneity on CO2-plume migration and trapping capacity. Int. J. Greenhouse Gas Control 2017, 58, 142–158. [Google Scholar] [CrossRef]
- Al-Khdheeawi, E.A.; Vialle, S.; Barifcani, A.; Sarmadivaleh, M.; Iglauer, S. Influence of injection well configuration and rock wettability on CO2 plume behaviour and CO2 trapping capacity in heterogeneous reservoirs. Int. J. Greenhouse Gas Control 2017, 43, 190–206. [Google Scholar]
- Ali, M.; Al-Anssari, S.; Arif, M.; Barifcani, A.; Sarmadivaleh, M.; Stalker, L.; Lebedev, M.; Iglauer, S. Organic acid concentration thresholds for ageing of carbonate minerals: Implications for CO2 trapping/storage. J. Colloid Interf. Sci. 2019, 534, 88–94. [Google Scholar] [CrossRef] [PubMed]
- Ali, M.; Aftab, A.; Arain, Z.-U.; Al-Yaseri, A.; Roshan, H.; Saeedi, A.; Iglauer, S.; Sarmadivaleh, M. Influence of organic acid concentration on wettability alteration of cap-rock: Implications for CO2 trapping/storage. ACS Appl. Mater. Inter. 2020, 12, 39850–39858. [Google Scholar] [CrossRef] [PubMed]
- Shan, Y.; Huang, Q.; Guan, D.; Hubacek, K. China CO2 emission accounts 2016–2017. Sci. Data 2020, 7, 1–9. [Google Scholar] [CrossRef]
- Guan, Y.; Shan, Y.; Huang, Q.; Chen, H.; Wang, D.; Hubacek, K. Assessment to China’s recent emission pattern shifts. Earths Future 2021, 9, e2021EF002241. [Google Scholar] [CrossRef]
- Shan, Y.; Liu, J.; Liu, Z.; Shao, S.; Guan, D. An emissions-socioeconomic inventory of Chinese cities. Scientific data 2019, 6, 1–10. [Google Scholar] [CrossRef] [PubMed]
- Shan, Y.; Guan, Y.; Hang, Y.; Zheng, H.; Li, Y.; Guan, D.; Li, J.; Zhou, Y.; Li, L.; Hubacek, K. City-level emission peak and drivers in China. Sci. Bull. 2022, 67, 1910–1920. [Google Scholar] [CrossRef] [PubMed]
- Huo, C. Study on the Potential Evaluation and the Storage Areas of the Carbon Dioxide Seabed Storage in Offshore China. Ph.D. Thesis, Dalian Maritime University, Dalian, China, 2014. [Google Scholar]
- Li, N. Research on structural evolution and sedimentary facies in North Depression of South Yellow Sea Basin. Ph.D. Thesis, Ocean University of China, Qingdao, China, 2010. [Google Scholar]
- Li, P.; Zhou, D.; Zhang, C.; Chen, G. Assessment of the effective CO2 storage capacity in the Beibuwan Basin, offshore of southwestern PR China. Int. J. Greenhouse Gas Control 2015, 37, 325–339. [Google Scholar] [CrossRef]
- Li, G.; Huo, C.; Su, T.; Liu, B. Assessment of the CO2 Storage Potential in the Deep Saline Formation of Offshore Bohai Basin, China. Environ. Eng. Geosci. 2016, 22, 67–79. [Google Scholar] [CrossRef]
- Zhou, D.; Zhao, Z.; Liao, J.; Sun, Z. A preliminary assessment on CO2 storage capacity in the Pearl River Mouth Basin offshore Guangdong, China. Int. J. Greenhouse Gas Control 2011, 5, 308–317. [Google Scholar] [CrossRef]
- Li, X.; Wei, N.; Liu, Y.; Fang, Z.; Dahowski, R.; Davidson, C. CO2 point emission and geological storage capacity in China. Energy Procedia 2009, 1, 2793–2800. [Google Scholar] [CrossRef] [Green Version]
- Gao, Z.; Gou, Y.; Zhong, H.; Ren, Z.; Zhou, B.; Xu, J. Fault Structure Frame and Seismicity in the Sea on the East Side of Chinese Mainland. Technol. Earthquake Disaster Prev. 2021, 16, 11–18. [Google Scholar]
- Chen, J.; Liang, J.; Zhang, Y.; Yang, C.; Yuan, Y.; Xu, M.; Wang, J.; Lei, B.; Li, G.; Yang, Y. Regional evaluation of oil and gas resources in offshore China and exploration of marine Paleo-Mesozoic oil and gas in the Yellow Sea and East China Sea. Mar. Geol. Quat. Geol. 2019, 39, 1–29. [Google Scholar]
- Yuan, Y.; Chen, J.; Zhang, Y.; Liang, J.; Zhang, Y.; Zhang, P. Tectonic evolution and geological characteristics of hydrocarbon reservoirs in marine Mesozoic–Paleozoic strata in the South Yellow Sea Basin. J. Ocean Univ. China 2018, 17, 1075–1090. [Google Scholar] [CrossRef]
- Yuan, Y.; Chen, J.-W.; Zhang, Y.-G.; Zhang, Y.-X.; Liang, J.; Zhang, P.-H. Sedimentary system characteristics and depositional filling model of Upper Permian–Lower Triassic in South Yellow Sea Basin. J. Cent. South Univ. 2018, 25, 2910–2928. [Google Scholar] [CrossRef]
- Zhang, P.; Huang, H.M.; Hong, Y.; Tian, S.Y.; Liu, J.; Lee, Y.I.; Chen, J.; Liang, J.; Wang, H.; Yasuhara, M. Southward migration of Arctic Ocean species during the Last Glacial Period. Geophys. Res. Lett. 2022, 49, e2022GL100818. [Google Scholar] [CrossRef]
- Lei, B.; Chen, J.; Liang, J.; Hang, Y.; Li, G. Tectonic deformation and evolution of the South Yellow Sea basin since Indosinian movement. Mar. Geol. Quat. Geol. 2018, 38, 45–54. [Google Scholar]
- Pang, Y.; Zhang, X.; Xiao, G.; Wen, Z.; Guo, X.; Hou, F.; Zhu, X. Structural and geological characteristics of the South Yellow Sea Basin in lower Yangtze block. Geol. Rev. 2016, 62, 604–616. [Google Scholar]
- Yuan, Y.; Chen, J.; Liang, J.; Xu, M.; Wang, J. Hydrocarbon geological conditions and exploration potential of Mesozoic-Paleozoic marine strata in the South Yellow Sea Basin. J. Ocean Univ. China 2019, 18, 1329–1343. [Google Scholar] [CrossRef]
- Zhu, W.; Mi, L. Atlas of Oil and Gas Basins, China Sea; Petroleum Industry Press: Beijing, China, 2010; pp. 52–67. [Google Scholar]
- Yuan, Y.; Chen, J.; Liang, J.; Zhang, Y.; Xue, L.; Wu, S.; Lan, T.; Wu, P. Characteristics and hydrocarbon prospects of the Permian sandstone reservoirs of the Laoshan Uplift, South Yellow Sea. Mar. Geol. Quat. Geol. 2021, 41, 181–193. [Google Scholar]
- Wu, S.; Liu, J.; Chen, J.; Liang, J.; Zhang, Y.; Yuan, Y.; Xu, M. Prediction of pore-dominated Carboniferous-Lower Permian carbonate reservoir at the Laoshan Uplift, South Yellow Sea Basin. Mar. Geol. Quat. Geol. 2020, 40, 136–148. [Google Scholar]
- Bachu, S. Screening and ranking of sedimentary basins for sequestration of CO2 in geological media in response to climate change. Environ. Geol. 2003, 44, 277–289. [Google Scholar] [CrossRef]
- Zhang, P.; Lee, Y.I.; Zhang, J. A review of high-resolution X-ray computed tomography applied to petroleum geology and a case study. Micron 2019, 124, 102702. [Google Scholar] [CrossRef] [PubMed]
- Qu, X. Sedimentary characteristic and oil and gas prospect of Mesozoic and Cenozoic in North South Yellow Sea Basin. Master Thesis, Jilin University, Changchun, China, 2004. [Google Scholar]
- Shi, Z.; Zhang, Z.; Ye, S.; Cai, X.; Sun, J. The mechanism of secondary pores in the reservoir of Funing Formation in Gaoyou Depression of Subei Basin. Acta Sedimentol. Sin. 2005, 23, 429–436. [Google Scholar]
- Wang, L. Study on the Pore Structure Characteristics of the Reservoirs of the Fu 1 Member and the Fu 2 Member of Funing Formation in the Jinhu Depression, Subei Basin. Master Thesis, Yangtze University, Jingzhou, China, 2018. [Google Scholar]
- Shen, P.; Liao, X. The Technology of Carbon Dioxide Stored in Geological Media and Enhanced oil Recovery; Petroleum Industry Press: Beijing, China, 2009; pp. 43–62. [Google Scholar]
- Wu, S. A systematic study of the Chinese petroliferous basins. Acta Pet. Sin. 1993, 14, 20–34. [Google Scholar]
- Li, X.; Liu, S.; Wang, L. Spatiotemporal pattern of earthquake activities and seismotectonics in Jiangsu and adjacent southern Yellow Sea Area. Geol. J. China Univ. 2018, 24, 551–562. [Google Scholar]
- USGS Earthquake Hazards Program. Available online: https://earthquake.usgs.gov/ (accessed on 20 December 2022).
- International Heat Flow Commission. Available online: http://ihfc-iugg.org/ (accessed on 1 October 2019).
- Cai, J.; Cui, M.; Liu, Z.; Wang, P.; Huagn, W. Sedimentary facies and analyze on reservoir-seal assemblage of the Dainan formation of paleogene in Nan 5 sag, Nanhuanghai basin. J. East China Univ. Technol. 2014, 37, 395–402. [Google Scholar]
- Qi, J.; Huang, J.; Wang, D.; Huang, S. Mesozoic and Cenozoic Favorable Accumulation Zone Prediction in the South Depression of Southern Yellow Sea. Spec. Oil Gas Reservoirs 2019, 26, 34–39. [Google Scholar]
- Wang, Z.; Hu, M.; Tang, J.; Dan, X.; Sun, C. Control on Petroleum by tectonic evolution of the late Cretaceous-Quaternary in the South Depression of the South Yellow Sea Basin. Geol. Chem. Miner. 2014, 36, 129–138. [Google Scholar]
- Wang, M.; Zhang, X.; Xiao, G.; Wu, Z.; Wang, J.; Wang, A. Tectonic evolution and hydrocarbon accumulation since Triassic of the Southern Depression in South Yellow Sea Basin. Nat. Gas Geosci. 2014, 25, 991–998. [Google Scholar]
- Xiong, Z.; Jiang, Z.; Sun, P.; Tan, S.; Xu, Z.; Chen, W.; Shanghai Branch of CNOOC Ltd. Characteristics and tectonic evolution of the fault system in the north sag of Northern Depression of South Yellow Sea basin. Mar. Geol. Quat. Geol. 2018, 38, 75–84. [Google Scholar]
- Pang, Y.; Zhang, X.; Guo, X.; Xiao, G.; Zhu, X. Mesozoic and Cenozoic tectono-thermal evolution modeling in the Northern South Yellow Sea Basin. Chin. J. Geophys. 2017, 60, 3177–3190. [Google Scholar]
- Zhang, Y.; Xiao, G.; Wu, Z.; Lei, B.; Sun, J.; Wang, J. Sedimentary Characteristics and evolution of the Paleogene in the Northern Depression of the South Yellow Sea Basin. Mar. Geol. Front. 2014, 30, 26–33. [Google Scholar]
- Cai, J.; Wu, K.; Wang, P.; Cui, M.; Song, S. Sedimentary facies of the Paleogene Funing Formation in the south Depression of the South Yellow Sea Basin. J. Geol. 2016, 40, 125–134. [Google Scholar]
- Cai, J.; Zhao, Z.; Zhang, X.; Wang, C.; Wang, P.; Guo, R. On sedimentary facies in Funing formation of northern sag in north Depression in South Yellow Sea Basin. J. Geol. 2014, 38, 530–535. [Google Scholar]
- Chen, J.; Zhang, Y.; Chen, H.; Liu, J.; He, Y.; Shi, J.; Li, B.; Yuan, Y.; Liang, J.; Zhang, Y.; et al. Research experiences and application of Seismic exploration Technology to the Mesozoic-Paleozoic Marine strata in the South Yellow Sea Basin. Mar. Geol. Front. 2021, 37, 1–17. [Google Scholar]
Figure 1.
Map showing (a) the regional location of the South Yellow Sea Basin (modified from Chen et al. [47], and Yuan et al. [53]); (b) the geological profile of the Cenozoic strata in the South Yellow Sea Basin (see Figure 1 for the location of the profile).

Figure 2.
Stratigraphic column of Cenozoic strata in the South Yellow Sea Basin.

Figure 3.
Formation volume model (φi is the sandstone porosity; is the carbon dioxide density; hi is the calculation unit thickness).
Figure 3.
Formation volume model (φi is the sandstone porosity; is the carbon dioxide density; hi is the calculation unit thickness).

Figure 4.
Geothermal gradient map of Cenozoic strata in the South Yellow Sea Basin (geothermal gradient data from the International Heat Flow Commission [66]).
Figure 4.
Geothermal gradient map of Cenozoic strata in the South Yellow Sea Basin (geothermal gradient data from the International Heat Flow Commission [66]).

Figure 5.
Terrestrial heat flow map of Cenozoic strata in the South Yellow Sea Basin (terrestrial heat flow data from the International Heat Flow Commission [66]).
Figure 5.
Terrestrial heat flow map of Cenozoic strata in the South Yellow Sea Basin (terrestrial heat flow data from the International Heat Flow Commission [66]).

Figure 6.
Map of Cenozoic strata thickness in the South Yellow Sea Basin.

Figure 7.
Sedimentary facies of the Eocene Dainan Formation in the South Yellow Sea Basin (compiled from Zhu et al. [54]; Qi [59]; and Zhang et al. [73]).


Table 1.
Formulas and data sources of the calculation parameters used in this study.
| Parameter | Formula | Basin Scale Value | Yantai Depression Value | Qingdao Depression Value | Data Sources |
|---|---|---|---|---|---|
| Ds | Average seawater depth over 1–114 m | 45 m | 47 m | 50 m | Chen et al. [76] |
| T1 | Average temperature over the whole year | 12.5 °C | 12.5 °C | 12.5 °C | Chen et al. [76] |
| GT | Average geothermal gradient within the basin or tectonic unit | 2.93 °C/100 m | 2.4 °C/100 m | 2.7 °C/100 m | International Heat Flow Commission [66] |
| Gp | Capacity estimate of the saline aquifer, which was evaluated according to an open system, with the formation pressure gradient taken as the hydrostatic pressure gradient | 10 MPa/km | 10 MPa/km | 10 MPa/km | / |
| D1 | Calculated from the seawater depth Ds and hydrostatic pressure gradient Gp | 0.45 MPa | 0.47 MPa | 0.5 MPa | / |
| R | Average sand-to-ground ratio of Cenozoic strata based on wells drilled in the basin | 32% | 38% | 39% | Qu [59]; Cai et al. [75]; Zhang et al. [73]; Qi et al. [68] |
| φi | Average porosity of each calculation unit calculated according to the average relationship between sandstone porosity and depth in the basin | 9–24% | 9–24% | 9–24% | Qu [59]; Shi et al. [60]; Wang [61]; Qi et al. [68] |
| ρi | Carbon dioxide density under the pressure and temperature conditions of the median depth of each calculation unit | 573.3–672.3 kg/m3 | 673.4–733 kg/m3 | 616.1–697.5 kg/m3 | Bachu [57]; Shen and Liao [62] |
| E | Minimum, mean, and maximum capacity estimates are calculated using pore volume values of 0.51%, 2%, and 5.5%, respectively | 0.51%, 2.0%, and 5.5% | 0.51%, 2.0%, and 5.5% | 0.51%, 2.0%, and 5.5% | USDOE [12] |
Disclaimer/Publisher’s Note: The statements, opinions and data contained in all publications are solely those of the individual author(s) and contributor(s) and not of MDPI and/or the editor(s). MDPI and/or the editor(s) disclaim responsibility for any injury to people or property resulting from any ideas, methods, instructions or products referred to in the content. |
© 2023 by the authors. Licensee MDPI, Basel, Switzerland. This article is an open access article distributed under the terms and conditions of the Creative Commons Attribution (CC BY) license (https://creativecommons.org/licenses/by/4.0/).
Share and Cite
MDPI and ACS Style
Yuan, Y.; Wang, J.; Chen, J.; Cao, K.; Liang, J.; Lan, T.; Lu, D.; Guo, X. Carbon Dioxide Storage Potential of Cenozoic Saline Aquifers in the South Yellow Sea Basin. Energies 2023, 16, 1578. https://doi.org/10.3390/en16041578
AMA Style
Yuan Y, Wang J, Chen J, Cao K, Liang J, Lan T, Lu D, Guo X. Carbon Dioxide Storage Potential of Cenozoic Saline Aquifers in the South Yellow Sea Basin. Energies. 2023; 16(4):1578. https://doi.org/10.3390/en16041578
Chicago/Turabian StyleYuan, Yong, Jianqiang Wang, Jianwen Chen, Ke Cao, Jie Liang, Tianyu Lan, Dongyu Lu, and Xudong Guo. 2023. "Carbon Dioxide Storage Potential of Cenozoic Saline Aquifers in the South Yellow Sea Basin" Energies 16, no. 4: 1578. https://doi.org/10.3390/en16041578
Note that from the first issue of 2016, this journal uses article numbers instead of page numbers. See further details here.