
Physical Impact of a Typical Training Session with Different Volumes on the Day Preceding a Match in Academy Soccer Players


Abstract
:1. Introduction
2. Materials and Methods
2.1. Participants
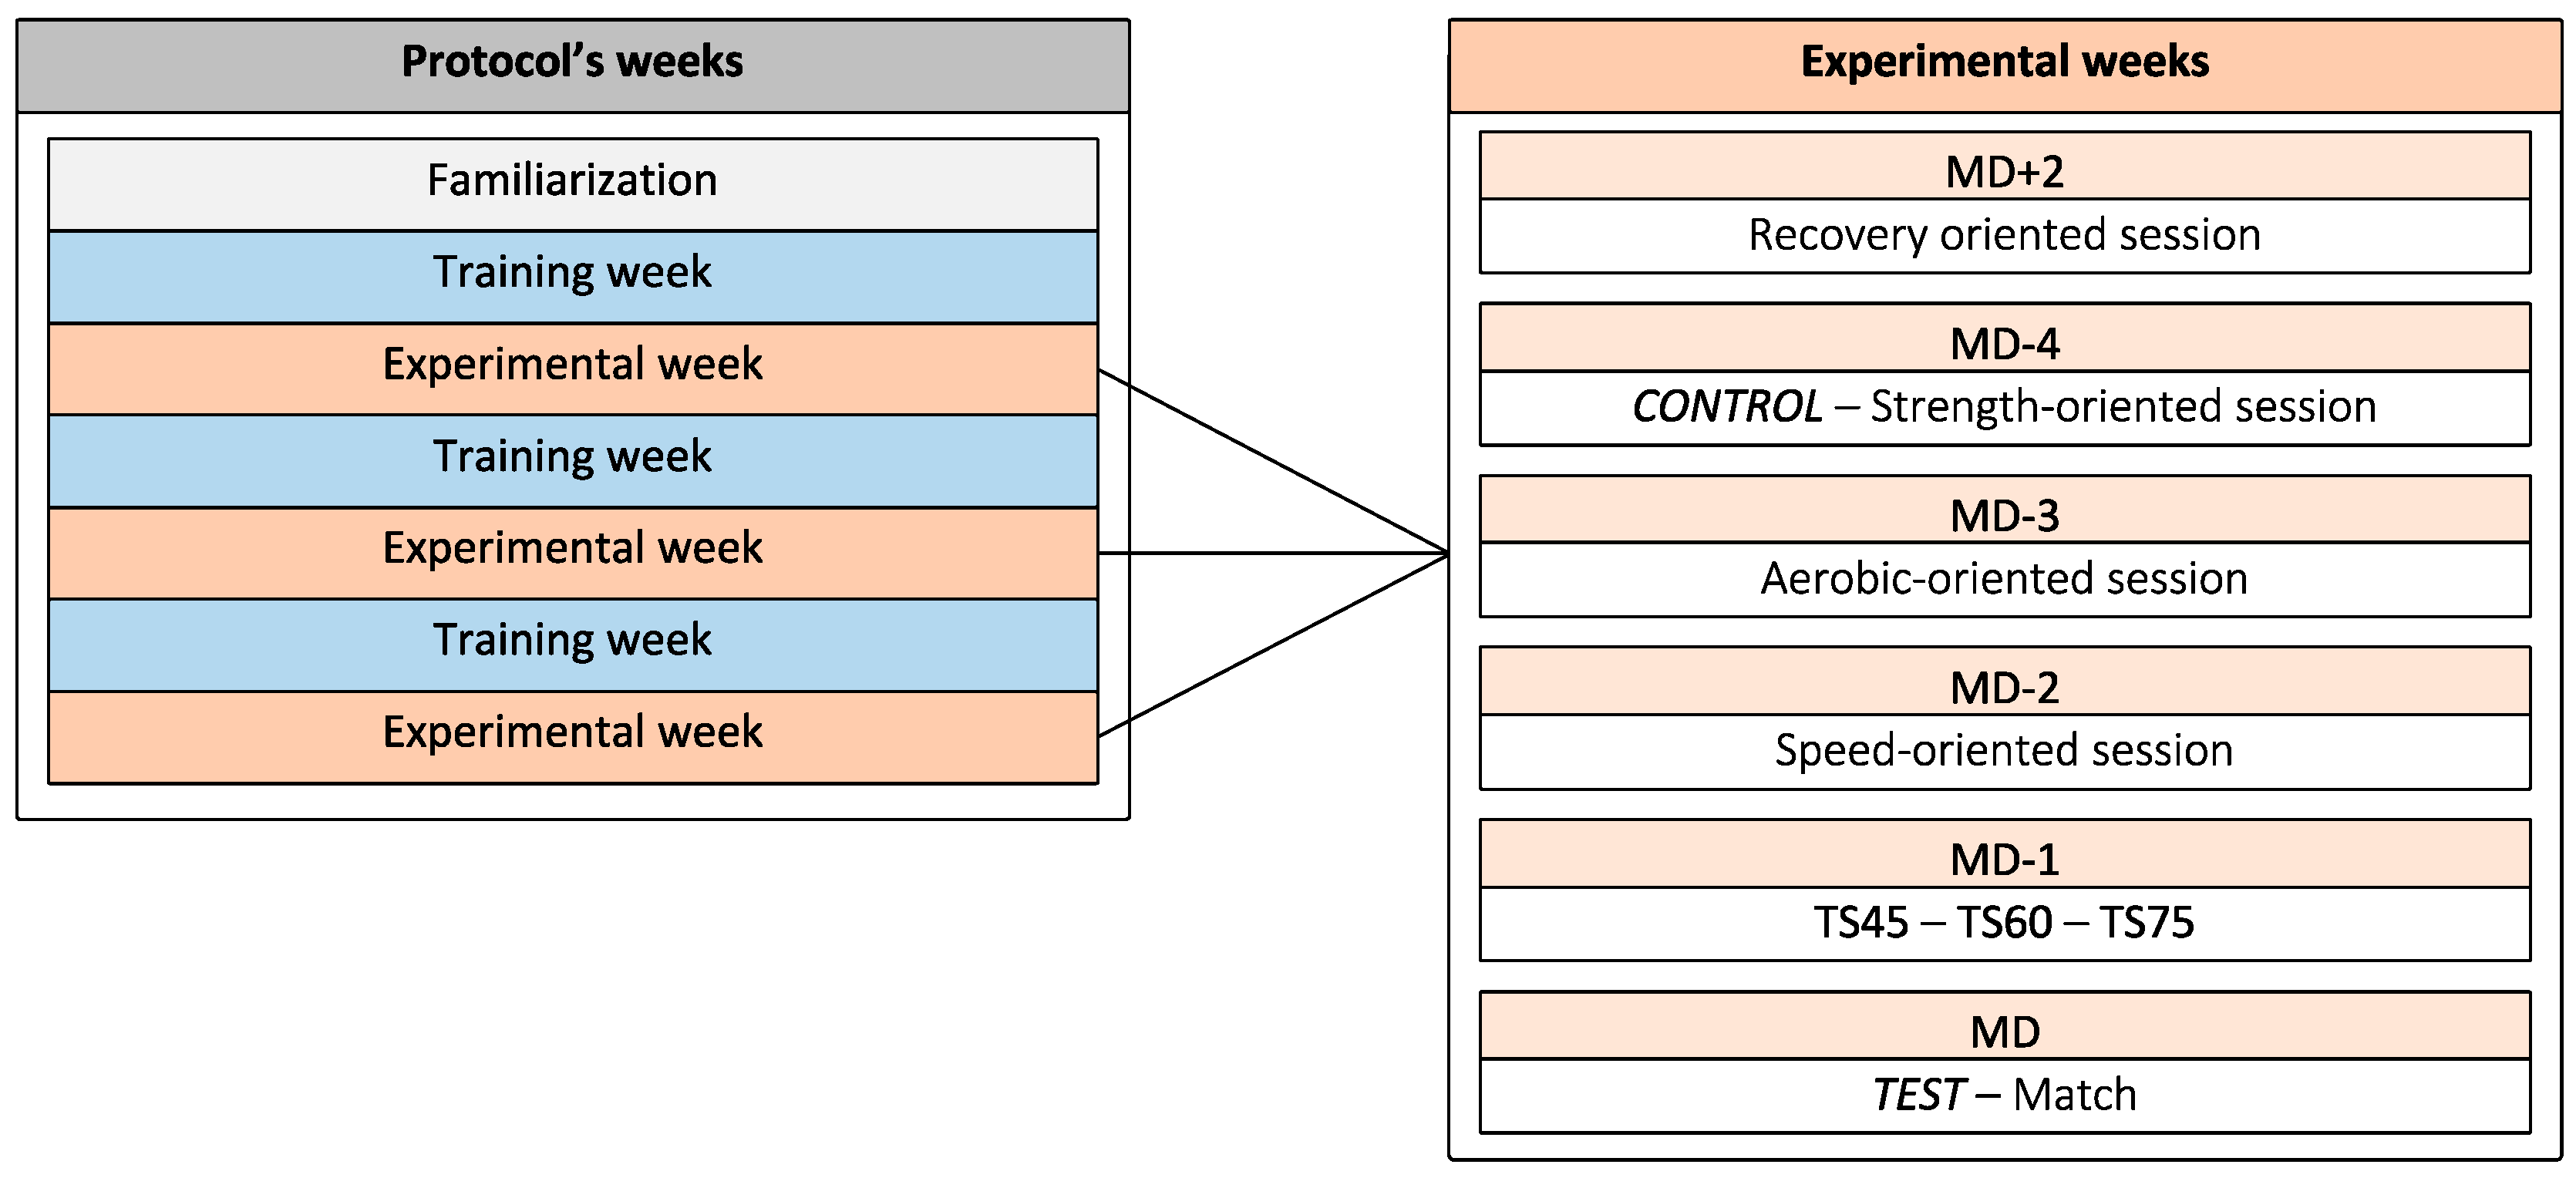
2.2. General Design
2.3. Testing Procedure
2.4. Statistical Analyses
3. Results
3.1. Physical Tests
3.2. Hooper Questionnaire
3.3. Field Session Performances
4. Discussion
5. Conclusions
Author Contributions
Funding
Institutional Review Board Statement
Informed Consent Statement
Data Availability Statement
Acknowledgments
Conflicts of Interest
References
- Reilly, T. An ergonomics model of the soccer training process. J. Sports Sci. 2005, 23, 561–572. [Google Scholar] [CrossRef] [PubMed]
- Martín-García, A.; Gómez Díaz, A.; Bradley, P.S.; Morera, F.; Casamichana, D. Quantification of a professional football team’s external load using a microcycle structure. J. Strength Cond. Res. 2018, 33, 3511–3518. [Google Scholar] [CrossRef] [PubMed] [Green Version]
- Wrigley, R.; Drust, B.; Stratton, G.; Scott, M.; Gregson, W. Quantification of the typical weekly in-season training load in elite junior soccer players. J. Sports Sci. 2012, 30, 1573–1580. [Google Scholar] [CrossRef] [PubMed]
- Coutinho, D.; Gonçalves, B.; Figueira, B.; Abade, E.; Marcelino, R.; Sampaio, J. Typical weekly workload of under 15, under 17, and under 19 elite Portuguese football players. J. Sports Sci. 2015, 33, 1229–1237. [Google Scholar] [CrossRef] [PubMed]
- Stevens, T.G.A.; de Ruiter, C.J.; Twisk, J.W.R.; Savelsbergh, G.J.P.; Beek, P.J. Quantification of in-season training load relative to match load in professional Dutch Eredivisie football players. Sci. Med. Footb. 2017, 1, 117–125. [Google Scholar] [CrossRef]
- Clemente, F.M.; Owen, A.; Serra-Olivares, J.; Nikolaidis, P.T.; van der Linden, C.M.I.; Mendes, B. Characterization of the Weekly External Load Profile of Professional Soccer Teams from Portugal and the Netherlands. J. Hum. Kinet. 2019, 66, 155–164. [Google Scholar] [CrossRef] [Green Version]
- Stoszkowski, J.; Collins, D. Sources, topics and use of knowledge by coaches. J. Sports Sci. 2016, 34, 794–802. [Google Scholar] [CrossRef]
- Malone, J.J.; Di Michele, R.; Morgans, R.; Burgess, D.; Morton, J.P.; Drust, B. Seasonal training-load quantification in elite English Premier League soccer players. Int. J. Sports Physiol. Perform. 2015, 10, 489–497. [Google Scholar] [CrossRef] [Green Version]
- Rahnama, N.; Reilly, T.; Lees, A. Injury risk associated with playing actions during competitive soccer. Br. J. Sports Med. 2002, 36, 354–359. [Google Scholar] [CrossRef] [Green Version]
- Owen, A.L.; Lago-Penñs, C.; Gómez, M.Á.; Mendes, B.; Dellal, A. Analysis of a training mesocycle and positional quantification in elite European soccer players. Int. J. Sport. Sci. Coach. 2017, 12, 665–676. [Google Scholar] [CrossRef]
- Douchet, T.; Paizis, C.; Babault, N. Typical weekly physical periodization in French academy soccer teams: A survey. Biol. Sport 2022, 40, 731–740. [Google Scholar] [CrossRef]
- Brito, J.; Hertzog, M.; Nassis, G.P. Do match-related contextual variables influence training load in highly trained soccer players? J. Strength Cond. Res. 2016, 30, 393–399. [Google Scholar] [CrossRef]
- Kelly, D.M.; Strudwick, A.J.; Atkinson, G.; Drust, B.; Gregson, W. Quantification of training and match-load distribution across a season in elite English Premier League soccer players. Sci. Med. Footb. 2020, 4, 59–67. [Google Scholar] [CrossRef]
- Osgnach, C.; Poser, S.; Bernardini, R.; Rinaldo, R.; Di Prampero, P.E. Energy cost and metabolic power in elite soccer: A new match analysis approach. Med. Sci. Sports Exerc. 2010, 42, 170–178. [Google Scholar] [CrossRef] [PubMed]
- Young, W.B.; Hepner, J.; Robbins, D.W. Movement demands in Australian Rules football as indicators of muscle damage. J. Strength Cond. Res. 2012, 26, 492–496. [Google Scholar] [CrossRef] [PubMed] [Green Version]
- Akenhead, R.; French, D.; Thompson, K.G.; Hayes, P.R. The physiological consequences of acceleration during shuttle running. Int. J. Sports Med. 2015, 36, 302–307. [Google Scholar] [CrossRef]
- Gaudino, P.; Alberti, G.; Iaia, F.M. Estimated metabolic and mechanical demands during different small-sided games in elite soccer players. Hum. Mov. Sci. 2014, 36, 123–133. [Google Scholar] [CrossRef]
- Castillo, D.; Rodríguez-Fernández, A.; Nakamura, F.Y.; Sanchez-Sanchez, J.; Ramirez-Campillo, R.; Yanci, J.; Zubillaga, A.; Raya-González, J. Influence of Different Small-Sided Game Formats on Physical and Physiological Demands and Physical Performance in Young Soccer Players. J. Strength Cond. Res. 2021, 35, 2287–2293. [Google Scholar] [CrossRef]
- Casamichana, D.; Castellano, J.; Dellal, A. Influence of different training regimes on physical and psychological demands during small-sided soccer games: Continuous vs. intermittent format. J. Strength Cond. Res. 2013, 18, 690–697. [Google Scholar] [CrossRef]
- Ryan, C.; Uthoff, A.; McKenzie, C.; Cronin, J. Traditional and Modified 5-0-5 Change of Direction Test: Normative and Reliability Analysis. Strength Cond. J. 2022, 44, 22–37. [Google Scholar] [CrossRef]
- Hooper, S.L.; Mackinnon, L.T. Monitoring Overtraining in Athletes: Recommendations. Sport. Med. 1995, 20, 321–327. [Google Scholar] [CrossRef] [PubMed]
- O’Brien, J.; Young, W.; Finch, C.F. The use and modification of injury prevention exercises by professional youth soccer teams. Scand. J. Med. Sci. Sport. 2017, 27, 1337–1346. [Google Scholar] [CrossRef] [PubMed]
- Malone, J.J.; Murtagh, C.F.; Morgans, R.; Burgess, D.J.; Morton, J.P.; Drust, B. Countermovement jump performance is not affected during an in-season training microcycle in elite youth soccer players. J. Strength Cond. Res. 2015, 29, 752–757. [Google Scholar] [CrossRef] [PubMed] [Green Version]
- Amiri-Khorasani, M.; Sahebozamani, M.; Tabrizi, K.G.; Yusof, A.B. Acute effect of different stretching methods on Illinois agility test in soccer players. J. Strength Cond. Res. 2010, 24, 2698–2704. [Google Scholar] [CrossRef] [PubMed] [Green Version]
- Brini, S.; Boullosa, D.; Calleja-González, J.; van den Hoek, D.J.; Nobari, H.; Clemente, F.M. Impact of combined versus single-mode training programs based on drop jump and specific multidirectional repeated sprint on bio-motor ability adaptations: A parallel study design in professional basketball players. BMC Sports Sci. Med. Rehabil. 2022, 14, 1–15. [Google Scholar] [CrossRef]
- Willmott, A.G.B.; James, C.A.; Bliss, A.; Leftwich, R.A.; Maxwell, N.S. A comparison of two global positioning system devices for team-sport running protocols. J. Biomech. 2019, 83, 324–328. [Google Scholar] [CrossRef]
- Impellizzeri, F.M.; Rampinini, E.; Coutts, A.J.; Sassi, A.; Marcora, S.M. Use of RPE-based training load in soccer. Med. Sci. Sports Exerc. 2004, 36, 1042–1047. [Google Scholar] [CrossRef]
- Cohen, J. Statistical Power Analysis for the Behavioral Sciences, 2nd ed.; Hillsdale, N., Ed.; Lawrence Erlbaum Associates: Mahwah, NJ, USA, 1988. [Google Scholar]
- Landis, J.R.; Koch, G.G. The Measurement of Observer Agreement for Categorical Data Published. Biometrics 1977, 33, 159–174. [Google Scholar] [CrossRef] [Green Version]
- Plisk, S.S. Speed, Agility, and Speed-Endurance Development. In Essentials of Strength Training and Conditioning; Human Kinetics: Champaign, IL, USA, 2000; pp. 427–470. [Google Scholar]
- Douchet, T.; Humbertclaude, A.; Cometti, C.; Paizis, C.; Babault, N. Quantifying Accelerations and Decelerations in Elite Women Soccer Players during Regular In-Season Training as an Index of Training Load. Sports 2021, 9, 109. [Google Scholar] [CrossRef]
- Mero, A.; Komi, P.V. Force-, EMG-, and elasticity-velocity relationships at submaximal, maximal and supramaximal running speeds in sprinters. Eur. J. Appl. Physiol. Occup. Physiol. 1986, 55, 553–561. [Google Scholar] [CrossRef]
- Alentorn-Geli, E.; Myer, G.D.; Silvers, H.J.; Samitier, G.; Romero, D.; Lázaro-Haro, C.; Cugat, R. Prevention of non-contact anterior cruciate ligament injuries in soccer players. Part 1: Mechanisms of injury and underlying risk factors. Knee Surgery, Sport. Traumatol. Arthrosc. 2009, 17, 705–729. [Google Scholar] [CrossRef] [PubMed]
- Little, T. Optimizing the use of soccer drills for physiological development. Strength Cond. J. 2009, 31, 67–74. [Google Scholar] [CrossRef]
- Sparkes, W.; Turner, A.; Weston, M.; Russell, M.; Johnston, M.; Kilduff, L. Neuromuscular, biochemical, endocrine, and mood responses to small-sided games’ training in professional soccer. J. Strength Cond. Res. 2018, 32, 2569–2576. [Google Scholar] [CrossRef] [PubMed] [Green Version]
- Papanikolaou, K.; Tsimeas, P.; Anagnostou, A.; Varypatis, A.; Mourikis, C.; Tzatzakis, T.; Draganidis, D.; Batsilas, D.; Mersinias, T.; Loules, G.; et al. Recovery Kinetics following Small-Sided Games in Competitive Soccer Players: Does Player Density Size Matter? Int. J. Sports Physiol. Perform. 2021, 16, 1270–1280. [Google Scholar] [CrossRef]
- Gabbett, T.J.; Mulvey, M.J. Time-motion analysis of small-sided training games and competition in elite women soccer players. J. Strength Cond. Res. 2008, 22, 543–552. [Google Scholar] [CrossRef] [PubMed]
- Kaplan, T. Examination of repeated sprinting ability and fatigue index of soccer players according to their positions. J. Strength Cond. Res. 2010, 24, 2115–2121. [Google Scholar] [CrossRef] [PubMed]
- Hodgson, C.; Akenhead, R.; Thomas, K. Time-motion analysis of acceleration demands of 4v4 small-sided soccer games played on different pitch sizes. Hum. Mov. Sci. 2014, 33, 25–32. [Google Scholar] [CrossRef] [PubMed]
- Fessi, M.S.; Zarrouk, N.; Filetti, C.; Rebai, H.; Elloumi, M.; Moalla, W. Physical and anthropometric changes during pre-and in-season in professional soccer players. J. Sports Med. Phys. Fitness 2016, 56, 1163–1170. [Google Scholar]
- Barnes, C.; Archer, D.T.; Hogg, B.; Bush, M.; Bradley, P.S. The evolution of physical and technical performance parameters in the English Premier League. Int. J. Sports Med. 2014, 35, 10951100. [Google Scholar] [CrossRef]
- Coppalle, S.; Ravé, G.; Moran, J.; Salhi, I.; Ben Abderrahman, A.; Zouita, S.; Granacher, U.; Zouhal, H. Internal and External Training Load in Under-19 versus Professional Soccer Players during the In-Season Period. Int. J. Environ. Res. Public Health 2021, 18, 558. [Google Scholar] [CrossRef]
- Bengtsson, H.; Ekstrand, J.; Hägglund, M. Muscle injury rates in professional football increase with fixture congestion: An 11-year follow-up of the UEFA Champions League injury study. Br. J. Sports Med. 2013, 47, 743–747. [Google Scholar] [CrossRef] [PubMed]
- Robineau, J.; Jouaux, T.; Lacroix, M.; Babault, N. Neuromuscular fatigue induced by a 90-minute soccer game modeling. J. Strength Cond. Res. 2012, 26, 555–562. [Google Scholar] [CrossRef] [PubMed]


| CONTROL | TEST | |
|---|---|---|
| CMJ | p = 0.124, moderate | p = 0.317, large |
| 10 m | p = 0.103, moderate | p = 0.283, large |
| 20 m | p = 0.095, moderate | p = 0.609, large |
| IAT | p = 0.103, moderate | p = 0.590, large |
| Fatigue | p = 0.767; W= 0.024, poor | p = 0.016; W = 0.379, fair |
| Sleep | p = 0.159; W = 0.167, poor | p = 0.409; W = 0.081, poor |
| Stress | p = 0.717; W = 0.030, poor | p = 0.368; W = 0.091, poor |
| DOMS | p = 0.497; W = 0.064, poor | p = 0.057; W = 0.249, fair |
| HI | p = 0.629; W = 0.042, poor | p = 0.010; W = 0.416, moderate |
| GPS INDICATORS | ||
| TD | p = 0.835, large | |
| LSD | p = 0.846, large | |
| MSD | p = 0.449, large | |
| HSD | p = 0.314, large | |
| SPR | p = 0.191, large | |
| ACC | p = 0.683, large | |
| DEC | p = 0.698, large | |
| RPE | p = 0.779; W = 0.023, poor | |
| CONTROL | TEST | |||||
|---|---|---|---|---|---|---|
| Indicator | TS45 | TS60 | TS75 | TS45 | TS60 | TS75 |
| CMJ (cm) | 41.3 ± 5.2 | 43.1 ± 5.40 | 41.9 ± 4.3 | 42.7 ± 5.1 $# | 40.7 ± 5.5 | 40.9 ± 5.7 |
| 10 m (s) | 1.85 ± 0.08 | 1.88 ± 0.06 | 1.86 ± 0.08 | 1.83 ± 0.07 # | 1.86 ± 0.07 | 1.90 ± 0.06 |
| 20 m (s) | 3.10 ± 0.11 | 3.09 ± 0.08 | 3.13 ± 0.12 | 3.07 ± 0.10 # | 3.13 ± 0.10 # | 3.20 ± 0.10 |
| IAT (s) | 15.05 ± 0.34 | 15.40 ± 0.59 | 15.22 ± 0.44 | 14.82 ± 0.49 $# | 15.43 ± 0.29 | 15.24 ± 0.33 |
| CONTROL | TEST | |||||
|---|---|---|---|---|---|---|
| Indicator | TS45 | TS60 | TS75 | TS45 | TS60 | TS75 |
| Fatigue | 2.82 ± 1.17 | 2.55 ± 0.82 | 2.55 ± 1.21 | 2.27 ± 0.47 $ | 3.36 ± 1.12 | 2.73 ± 0.90 |
| Sleep | 2.73 ± 1.56 | 2.91 ± 1.30 | 1.91 ± 1.04 | 1.73 ± 1.27 | 2.09 ± 0.70 | 1.91 ± 0.70 |
| Stress | 1.27 ± 0.65 | 1.36 ± 0.50 | 1.27 ± 0.47 | 1.09 ± 0.30 | 1.45 ± 0.93 | 1.27 ± 0.47 |
| DOMS | 2.27 ± 1.35 | 1.91 ± 1.22 | 2.36 ± 1.36 | 2.55 ± 0.82 | 4.09 ± 1.92 | 3.82 ± 1.25 |
| HI | 9.09 ± 2.47 | 8.73 ± 2.80 | 8.09 ± 3.59 | 7.64 ± 1.50 $# | 11.00 ± 3.49 | 9.73 ± 2.41 |
| Indicator | TS60 | TS75 | TS45 |
|---|---|---|---|
| TD | 3842.4 ± 225.8 @ | 4720.2 ± 343.4 $@ | 3053.9 ± 553.6 |
| LSD | 3594.0 ± 188.3 @ | 4358.4 ± 297.6 $@ | 2820.8 ± 485.8 |
| MSD | 215.2 ± 66.2 | 304.6 ± 79.0 $@ | 196.1 ± 100.4 |
| HSD | 31.7 ± 23.5 | 55.4 ± 21.5 $ | 35.7 ± 25.7 |
| SPR | 2.4 ± 5.0 | 3.9 ± 5.6 | 0 ± 0 |
| ACC | 48.3 ± 10.3 | 73.9 ± 17.8 $@ | 43.2 ± 10.5 |
| DEC | 39.5 ± 12.1 | 54.6 ± 11.1 $@ | 33.4 ± 7.0 |
| RPE | 5.73 ± 1.27 | 5.91 ± 0.90 | 5.82 ± 0.60 |
Publisher’s Note: MDPI stays neutral with regard to jurisdictional claims in published maps and institutional affiliations. |
© 2022 by the authors. Licensee MDPI, Basel, Switzerland. This article is an open access article distributed under the terms and conditions of the Creative Commons Attribution (CC BY) license (https://creativecommons.org/licenses/by/4.0/).
Share and Cite
Douchet, T.; Paizis, C.; Babault, N. Physical Impact of a Typical Training Session with Different Volumes on the Day Preceding a Match in Academy Soccer Players. Int. J. Environ. Res. Public Health 2022, 19, 13828. https://doi.org/10.3390/ijerph192113828
Douchet T, Paizis C, Babault N. Physical Impact of a Typical Training Session with Different Volumes on the Day Preceding a Match in Academy Soccer Players. International Journal of Environmental Research and Public Health. 2022; 19(21):13828. https://doi.org/10.3390/ijerph192113828
Chicago/Turabian StyleDouchet, Tom, Christos Paizis, and Nicolas Babault. 2022. "Physical Impact of a Typical Training Session with Different Volumes on the Day Preceding a Match in Academy Soccer Players" International Journal of Environmental Research and Public Health 19, no. 21: 13828. https://doi.org/10.3390/ijerph192113828