
Rational Design of a Fluorescent Chromophore as a Calcium Receptor via DFT and Multivariate Approaches
by

Leila Narimani
1,
Vannajan Sanghiran Lee
1,
Yatimah Alias
1,2,
Ninie Suhana Manan
1,2 and
Pei Meng Woi
1,2,* 1
Chemistry Department, Faculty of Science, Universiti Malaya, Kuala Lumpur 50603, Malaysia
2
Centre of Ionic Liquids (UMCiL), Chemistry Department, Faculty of Science, Universiti Malaya, Kuala Lumpur 50603, Malaysia
*
Author to whom correspondence should be addressed.
Molecules 2022, 27(19), 6248; https://doi.org/10.3390/molecules27196248
Submission received: 30 August 2022
/
Revised: 19 September 2022
/
Accepted: 20 September 2022
/
Published: 22 September 2022
(This article belongs to the Special Issue Advances in Environmental Analytical Chemistry)
Abstract
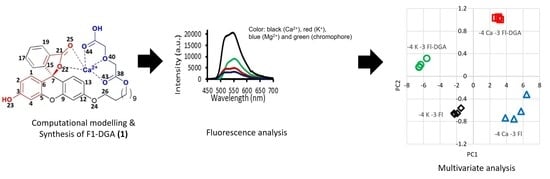
:Computational and experimental approaches were adopted to utilize a chromophore diglycolic functionalized fluorescein derivative as a Ca2+ receptor. Fluorescein diglycolic acid (Fl-DGA, 1) was synthesized and used in multivariate determination of Ca2+ and K+. Full-structure computation shows that the complexes of 1 and Ca2+ have comparable energies regardless of additional interaction with lactone moiety. The initial formation of diglycolic-Ca2+ complex followed by macrocyclization is thermodynamically disfavored. A U-shaped pre-organized 1 allows Ca2+ to interact simultaneously with diglycolic and lactone motifs. Both motifs actively participate in Ca2+ recognition and the eleven methylene units in the undecyl arm provides excellent flexibility for reorganization and optimum interaction. Principal component analysis (PCA) of computational molecular properties reveals a simple method in evaluating motifs for cation recognition. Fragment models support full-structure results that negative charge causes significant structural changes, but do not reproduce the full extent of C-O bond breaking observed in the latter. Experimental optical responses show that 1 is selective towards Ca2+ and discriminates against K+ and Mg2+. PCA of emission intensities affords distinct clusters of 0.01, 0.1 and 1 mM Ca2+ and K+, and suggests applicability of this technique for simultaneous determination of cationic plant macronutrients in precision agriculture and a wide variety of other applications.
1. Introduction
Fluorescein derivatives are one of the most widely used chromophores in the labelling of biomolecules. The hydrophilic nature of fluorescent dyes greatly contributes to its compatibility with biological systems such as in enzyme detection and cell tracking. Fluorescent sensors have successfully been utilized in imaging cell structures and for analyzing biophysical processes: for example, in the detection of Alzheimer’s disease and the activity of certain enzymes, as well as pH and the concentration of certain metal ions [1,2,3,4]. Due to its versatility and widespread utility as a fluorescent probe, numerous synthetic routes have been reported on xanthene dyes and fluorescein derivatives [5,6]. The xanthene core has also received considerable interest from the computational community, helping to highlight the importance of its numerous forms [7].
The development of optical sensors for metal cations has attracted much attention due to their wide applications, which provide reliable and highly sensitive detection of bioanalytes and chemical species [8,9]. Calcium and magnesium are of significant interest in biological analysis due to their role as essential nutrients in human body for bone formation and as intercellular messengers [10]. In precision agriculture, the two alkaline earth metals, in addition to potassium, are macronutrients and thus consumed in large quantities by plants. Potassium is required for fruit formation and carbohydrate metabolism. Calcium participates in cell division, respiration, and nitrogen metabolism, whereas magnesium plays a critical role in chlorophyll production and the activation of plant enzymes [11,12]. To avoid excessive fertilization, which gives rise to a greater extent of fertilizer run-off that can severely contaminate sources of fresh water and cause economic loss, such macronutrients need to be monitored [13,14]. For the divalent cations- Ca2+ and Mg2+, the conventional sensing method often leads to discrepancies between calibration equations and actual sensor characteristics attributed to erroneous or inaccurate sensor measurement [15,16]. This is the main cause of sensor signal drift error. Another common cause of sensor signal error is false signal due to interfering ions that compete with the target analyte. Thus, algorithms that compensate for the signal error due to these reasons are required.
The principal component analysis (PCA) method has been successfully implemented to determine chemical concentrations, standard formulations, industrial quality control and detection of food adulteration [17,18]. In this approach, variations in the variables are transformed into a few important components with the highest eigenvalues [19]. The score plot of the first two or three components typically afford distinct clusters that represent the populations of chemicals or standard formulations. We aim to simplify the complexity in the discrimination of these divalent cations by transforming the high-dimensional data into fewer dimensions, while retaining trends and patterns which will act as summaries of quantification features.
We earlier demonstrated a rational design of cation receptors using the DFT method [20,21,22]. Chemical selectivity could be described by understanding the nature of interaction between cations and commonly employed functionalities or motifs that include heteroatoms and various forms of carbonyls [23]. Breaking the carbon-heteroatom bond in lactone or lactam core presumably contributes to fluorescence enhancement in fluorescein derivatives. This is supported by the increase in fluorescence activity in alkaline solutions [24,25]. The onset of the bond-breaking event could be estimated from computational activation energy [26]. The dramatic reduction in the activation barrier has been rationalized in terms of the weakening of the C-O bond due to anionic substituent (especially alkoxy), the lack of ion-pair formation due to the chelation of the cation counter ion, formation of a stable intermediate complex and the absence of solvation [27,28,29].
In this study, our main interest is the facile functionalization of fluorescein with a Ca2+ receptor, which, when attached to an extended undecyl arm, provides free movement for binding with a cation and interacting with the chromophore core and its fragments (Scheme 1). We describe a rational design of a fluorescent Ca2+ receptor by employing density functional theory (DFT) computation to examine chromophore and receptor models. In the proposed fluorophore, the chromophore model comprises phenol with ene-lactone ring at the α-carbon and the receptor model is a diglycolic acid moiety.
Structural characteristics and energetics of the models and its complexes with cations are examined to elucidate cation recognition. In particular, the lactone C-O bond distance and the cation-oxygen bond distances are closely monitored. We are motivated to determine the roles of the fluorescein core and the diglycolic receptor in Ca2+ recognition. We explore the potential of utilizing computational molecular properties in the multivariate determination of cations. Electronic properties such as magnetic shielding coefficients, atomic valence, total overlap population (TOP) [30,31], atomic charge and bonding orbital characters are analyzed to extract useful trends that indicate preferential binding to cations and utilized as variables in multivariate analysis. We hope to gain insights into the effect of anion on the structure of fluorescein derivatives and its influence on lactone motif and cation selectivity. Next, a suitable functionalized fluorophore, fluorescein diglycolic acid derivative 1, subsequently abbreviated as Fl-DGA, is synthesized and its fluorescence emission responses with Ca2+, Mg2+ and K+ are studied. The emission intensities at wavelengths in the neighborhood of the maximum emission are taken as variables in PCA. Earlier, we attempted to use fragments to represent motifs in recognition molecules. Now that we have experimental and full-structure computational data, we can focus on the question of whether fragmented models represent reality. We seek the answer to this question in this report.
2. Results and Discussion
2.1. Full-Structure Computations
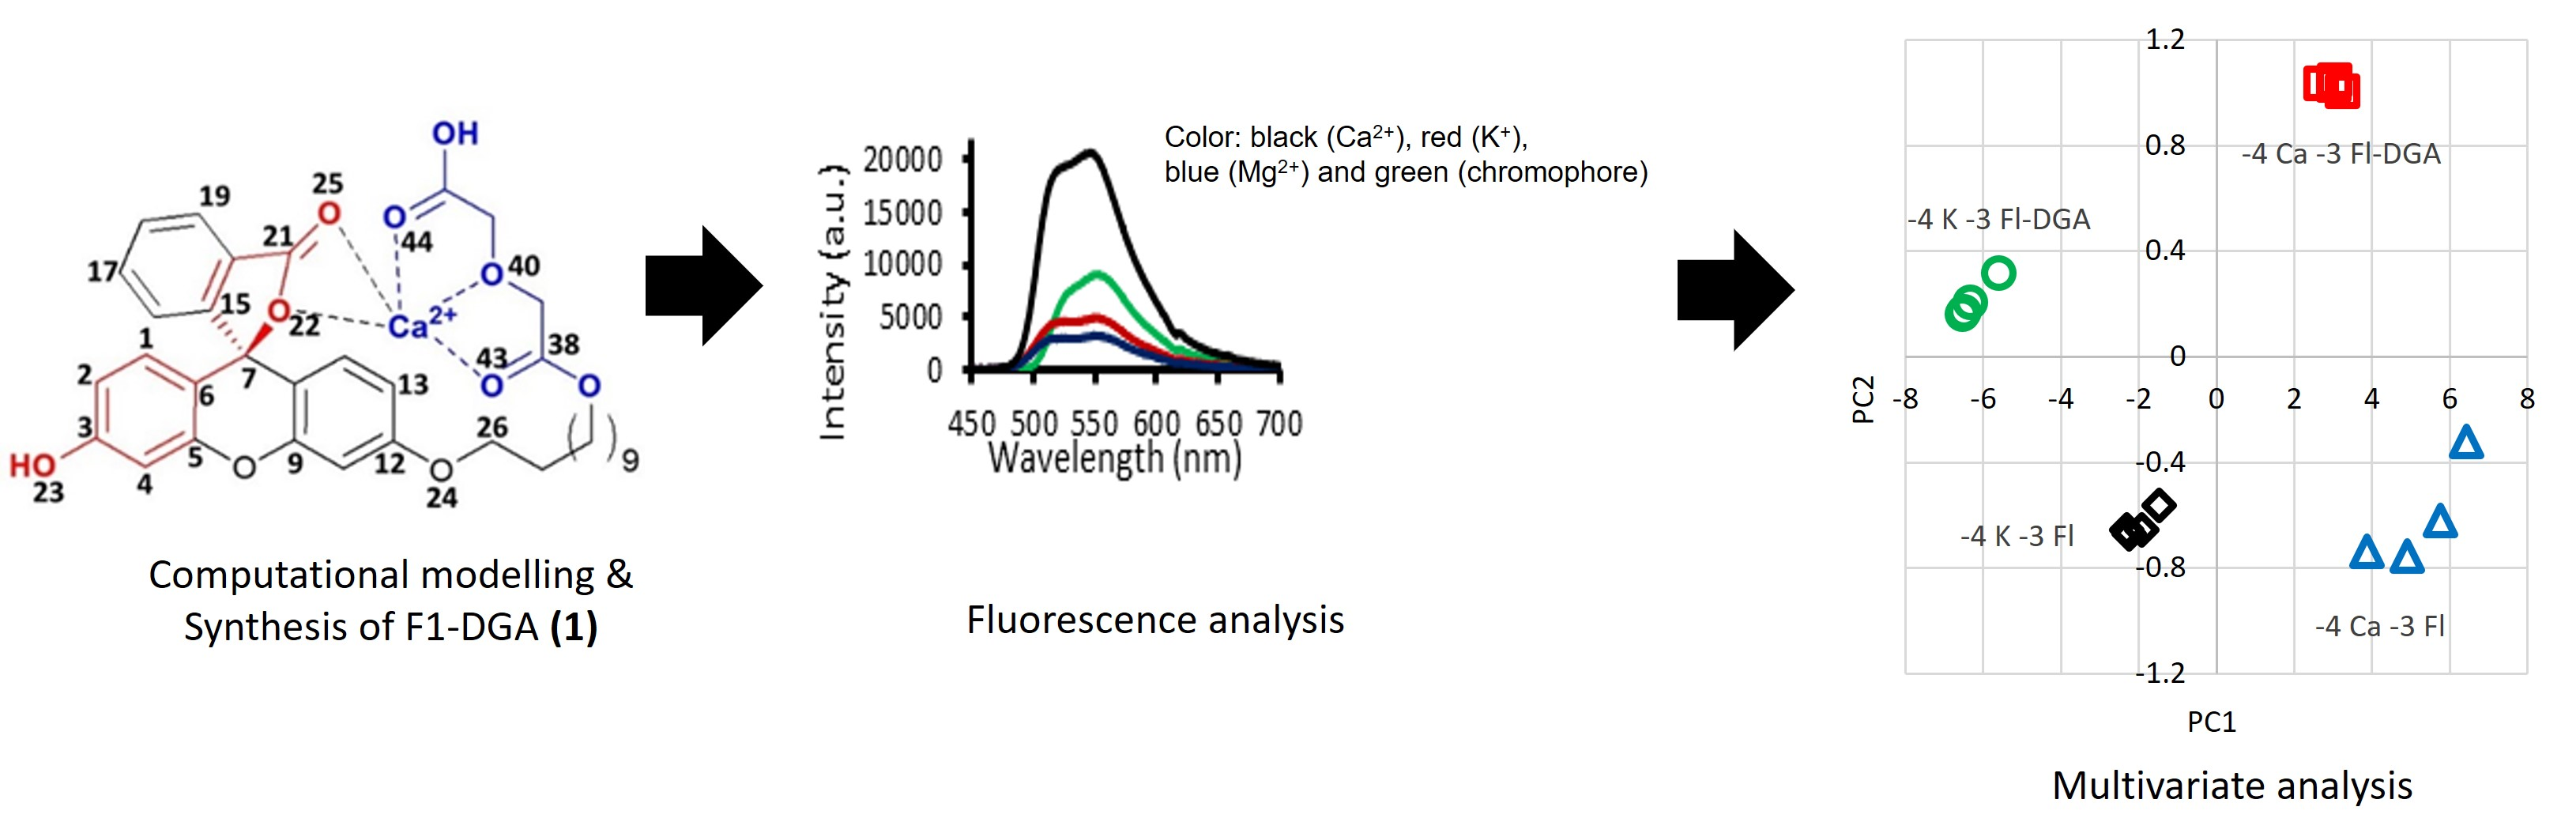
Optimized geometries of full fluorophore-cation complexes provide the most complete three-dimensional pictures to account for contribution from various motifs in cation recognition. The effect of cation on the structure of fluorophore could be visually inspected, and vice versa, the influence of motifs in the fluorophore to cation stabilization can be examined. The optimized geometry of 1 in methanol is obtained by removing Ca2+ from the interacting complex (Figure 1c). Ca2+ is bound to 1 through the diglycolic arm, which does not interact with the lactone core, as in Figure 1a, by 18.1 kcal mol−1. However, Ca2+ is bound in Figure 1c by only 17.7 kcal mol−1. This means the macrocyclization process that transforms the non-interacting complex in Figure 1a to the interacting one in Figure 1c is disfavored thermodynamically by 0.4 kcal mol−1. Considering the uncertainties in the employed level of theory and IEF-PCM model, it is reasonable to assume that the non-interacting and interacting complexes have similar energies.
In the absence of interaction between cation and the chromophore core, the lactone C7-O22 bond distance in methanol is 1.52 Å (Figure 1a). The C-C bonds in the xanthene ring system has approximately identical bond distances, i.e., 1.39 Å in C1-C2 and 1.40 Å in C2-C3.
The spirolactone ring on C7 is perpendicular to the planar xanthene framework. The undecyl arm moves above the plane with the following turning points and dihedral angles that position the diglycolic moiety on the right side above the lactone ring; C27 (80°), C32 (66°) and C36 (0°). The diglycolic group is planar and characterized by having three oxygens interact favorably with Ca2+ with the following bond distances: 2.47, 2.58 and 2.52 Å. The bond angle involving Ca2+ and two carbonyl oxygens is 124.2°. The Ca-O bond distance is indicative of cation binding strength and exhibits the following trend: ester carbonyl (O43) > acid carbonyl (O44) > ether linkage (O40).
Deprotonations of phenol and diglycolic moieties gives rise to dianion 1a in Figure 1b which is characterized by having both the chromophore and receptor strongly interacting with Ca2+. The C-C bonds in the xanthene framework show distinct single and double bond characteristics: the C1-C2 bond distance shrinks to 1.36 Å while the C2-C3 bond elongates to 1.44 Å. More importantly, the lactone C7-O22 bond with a bond distance of 2.75 Å is fully broken. The structural evidence suggests that at alkaline pH the phenoxy core has quinoid character and transforms the lactone ring to an electron rich carboxylate functionality that in turn binds strongly to Ca2+. The undecyl arm makes dihedral turns at C27 (80°) and C32 (72°) that position the diglycolic group exactly on top of the chromophore, sandwiching Ca2+ in the middle. Ca2+ makes strong interactions with five oxygens; two in the chromophore and three in the receptor, having the following bond distances; 2.47, 2.52, 2.39, 2.50 and 2.52 Å, respectively. The anion-bearing oxygen atom (O45) in the receptor has a shorter bond (2.39 Å) with Ca2+ compared with the ester carbonyl (O43, 2.50 Å) and ether linkage (O40, 2.54 Å).
Another case of interest is when 1 interacts with Ca2+ at pH neutral. The complex in Figure 1c shows similar characteristics in the xanthene framework as described earlier in Figure 1a. The lactone C7-O22 bond appears to be intact with a bond distance of 1.55 Å. Ca2+ interacts with only the lactone carbonyl (O25) in the chromophore with a bond distance of 2.41 Å. The carboxylic (O45) and ester (O43) carbonyl oxygens give bond distances of 2.52 Å and 2.45 Å, respectively. The ether linkage (O40) interacts weakly with Ca2+ with a bond distance of 2.61 Å. Ca2+ forms a bond angle of 122.4° with the diglycolic carbonyls. Due to restriction in the undecyl arm, the receptor does not make a perfect perpendicular alignment to the lactone ring.
A comparison of key properties in Ca2+ complexes with 1 and 1a is provided in Table 1. In the fully broken C7-O22 bond in 1a, the atomic valences decrease to 3.56 and 1.70 for C7 and O22, respectively, suggesting the formation of ionic centers. Likewise, 1a is more capable of reducing the charge of Ca2+ by more than 5% to 1.79, compared to 1.89 with 1. The Ca-O25 bond in the complex with 1 exhibit greater atomic valence in Ca2+ and higher total overlap population. The results suggest more efficient and ionic character in the interaction between Ca2+ and 1a at alkaline pH.
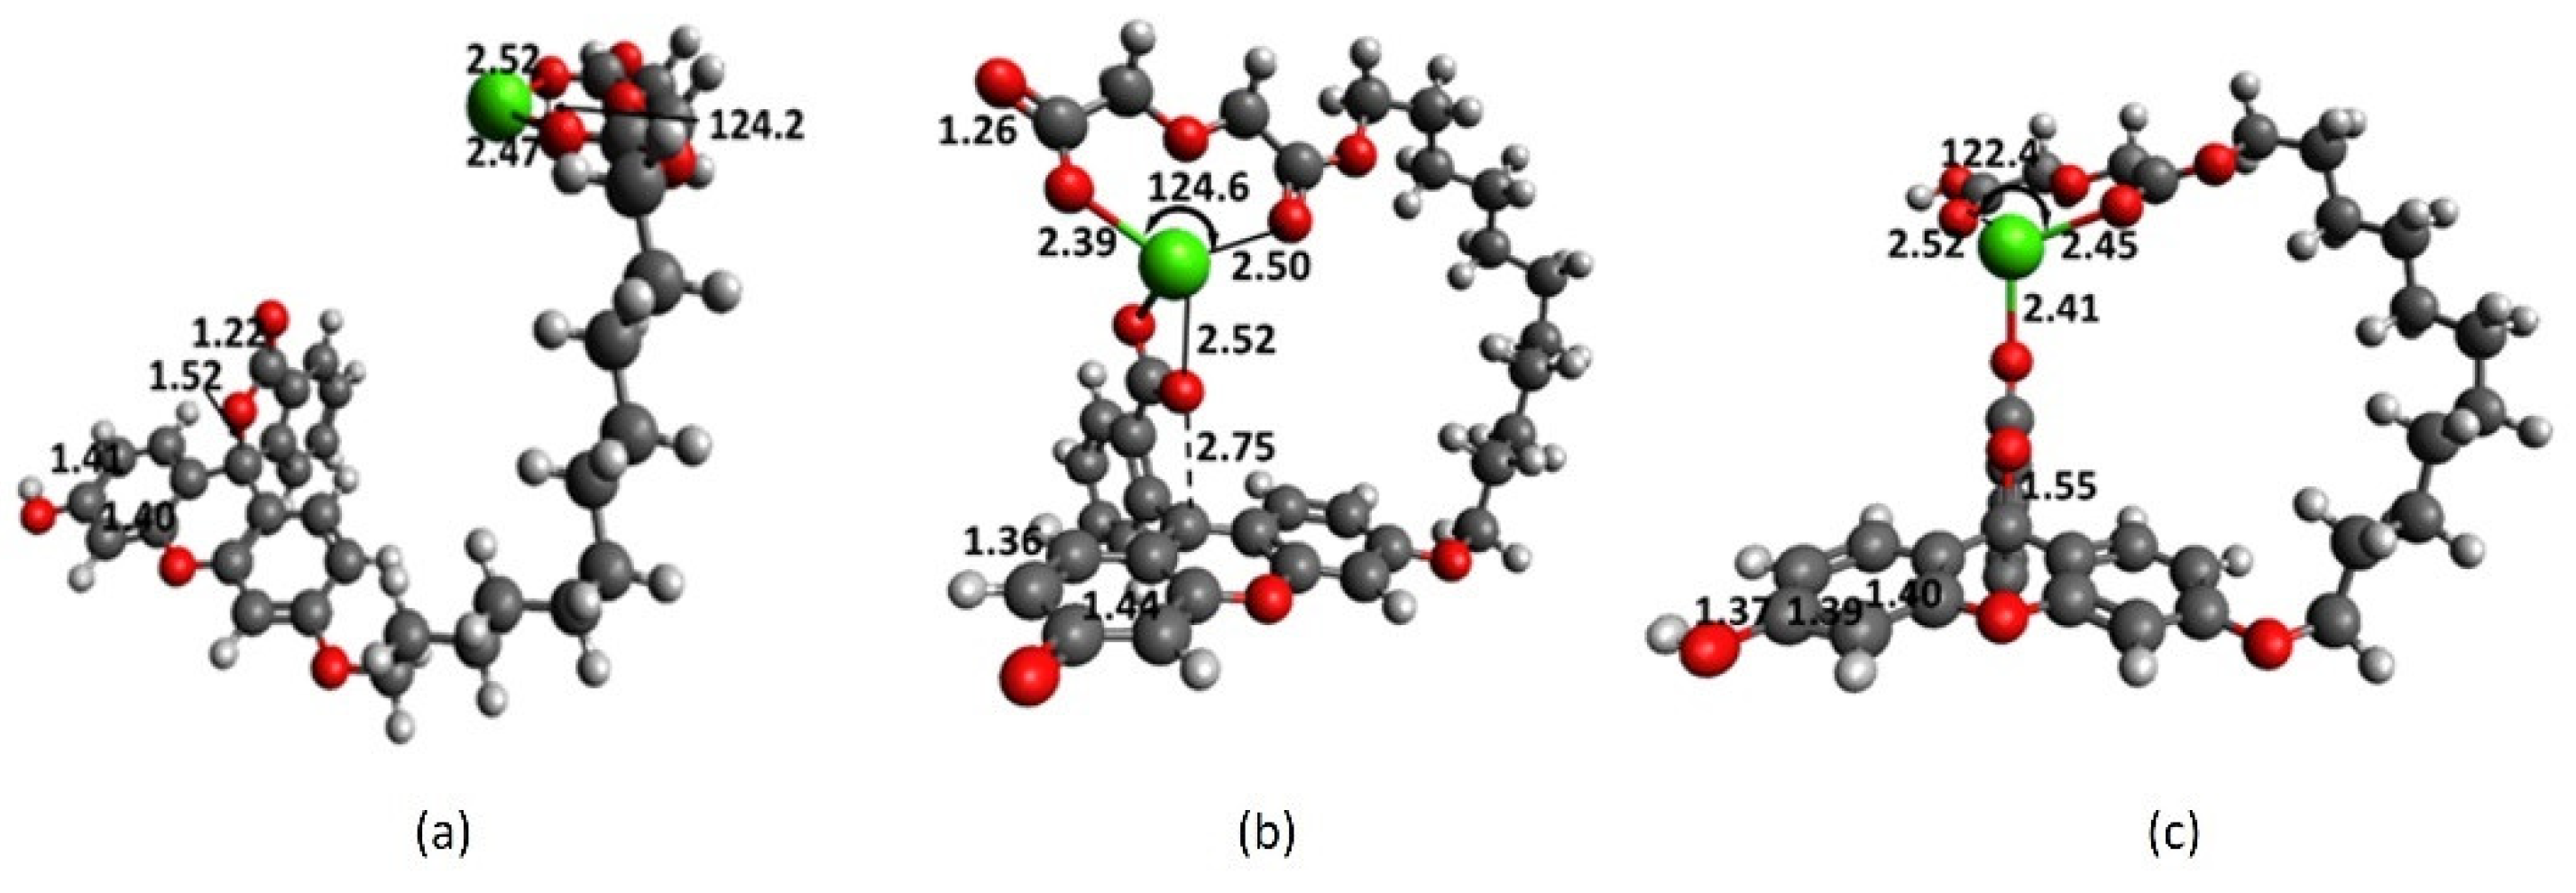
Full structure of fluorescein (Fl) and its deprotonated form in methanol provide insights into the structural effects of fluorescein derivatives such as 1 on its fluorescence activity. The uncharged form exhibits strong aromatic character with a similar C-C bond distance of 1.39 Å in the xanthene core. The C6-C7 ring linkage and C7-O22 lactone bond distances are 1.51 and 1.52 Å, respectively (Figure 2b). Deprotonation of phenolic hydrogen (Figure 2c) causes disruption to the xanthene aromaticity; the C3-C4 elongates to 1.43 Å, indicating a quinoid structure. The formation of the planar 1,4-cyclohexadiene ring system is accompanied by shortening of the C6-C7 bond to 1.49 Å due to -overlap within this bond and with its C1, C5 and C15 neighbors.
The optimized geometry of 1 in methanol is obtained by removing Ca2+ from the interacting complex (Figure 1c). During optimization, the diglycolic arm rapidly moved away from the chromophore and in the final structure the undecyl arm makes a 45° dihedral angle from the xanthene plane (Figure 2a). The lactone ring is perfectly perpendicular to the xanthene ring system. The uncomplexed 1 exhibits a U-shaped conformation, similar to the non-interacting complex 1-Ca2+ in Figure 1a. The diglycolic receptor is planar and the undecyl arm makes two critical turning points that decisively dictate the final geometry: at C32 and O37 with 67 and 66° dihedral angles, respectively. Ca2+ is bound to 1 through the diglycolic arm that does not interact with the lactone core, as in Figure 1a, by 18.1 kcal mol−1. However, Ca2+ is bound in Figure 1c by only 17.7 kcal mol−1. This means the macrocyclization process that transforms the non-interacting complex in Figure 1a to the interacting one in Figure 1c is disfavored thermodynamically by 0.4 kcal mol−1. Considering the uncertainties in the employed level of theory and IEF-PCM model, it is reasonable to assume that the non-interacting and interacting complexes have similar energies.
Significant fluorescence enhancement observed on 1 in the presence of Ca2+ could still be rationalized in terms of the formation of the interacting complex in Figure 1c. 1 Could have been pre-organized in a U-shaped conformation seen in Figure 2a. Ca2+ could approach 1 via the area between the lactone core and diglycolic receptor. Ca2+ is then sandwiched between the two motifs and this process is thermodynamically feasible. The initial formation of the diglycolic-Ca2+ complex not in close proximity with the chromophore, but later approaches the lactone moiety is unlikely. Full-structure results reveal key information on cation recognition with 1 and help identify key contributors that could be modeled and studied later in more detail. Eleven methylene units in the undecyl arm gives excellent flexibility for reorganization and optimum interaction with cation and chromophore core. Results from full-structure fluorescein and 1 confirm that anionic substituent breaks the aromaticity of the xanthene core, and two motifs actively participate in Ca2+ recognition: diglycolic and lactone.
2.2. Chromophore Models and Computational PCA
Chromophore models address key questions regarding the role of fluorescein core in cation recognition: (i) the effect of pH or the role of phenoxy anion on xanthene core, (ii) the versatility of the lactone functionality, (iii) the barrier to the lactone ring opening, (iv) the contribution of the chromophore to chemical selectivity, and (v) the charge transfer to the core and the effect on its structure. Diene lactones 2 and 3 serve as simple models to examine the interaction of chromophore in 1 with cations. Computations with B3LYP/6-311+G(2df,2p) [32] in methanol reveal that cations interact with diene lactone 2 through the carbonyl oxygen (Figure S1b–d).
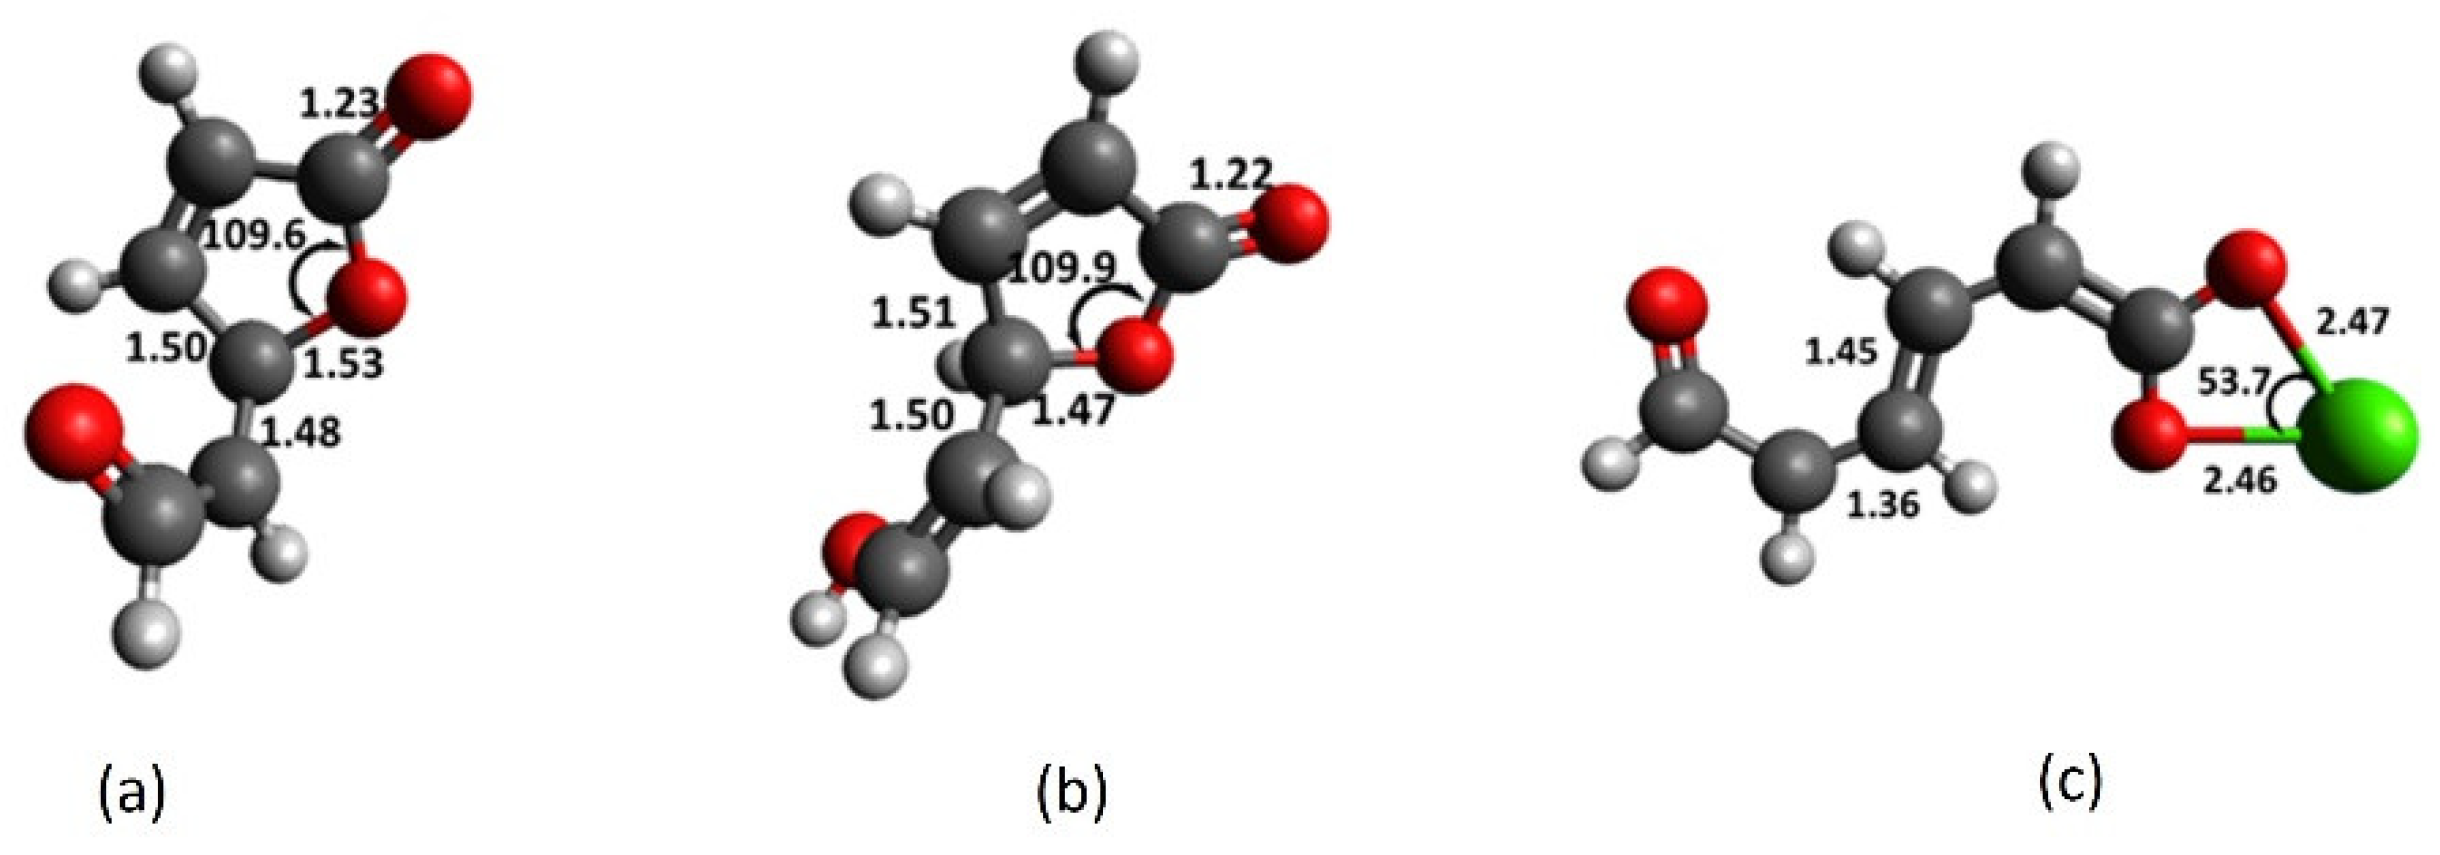
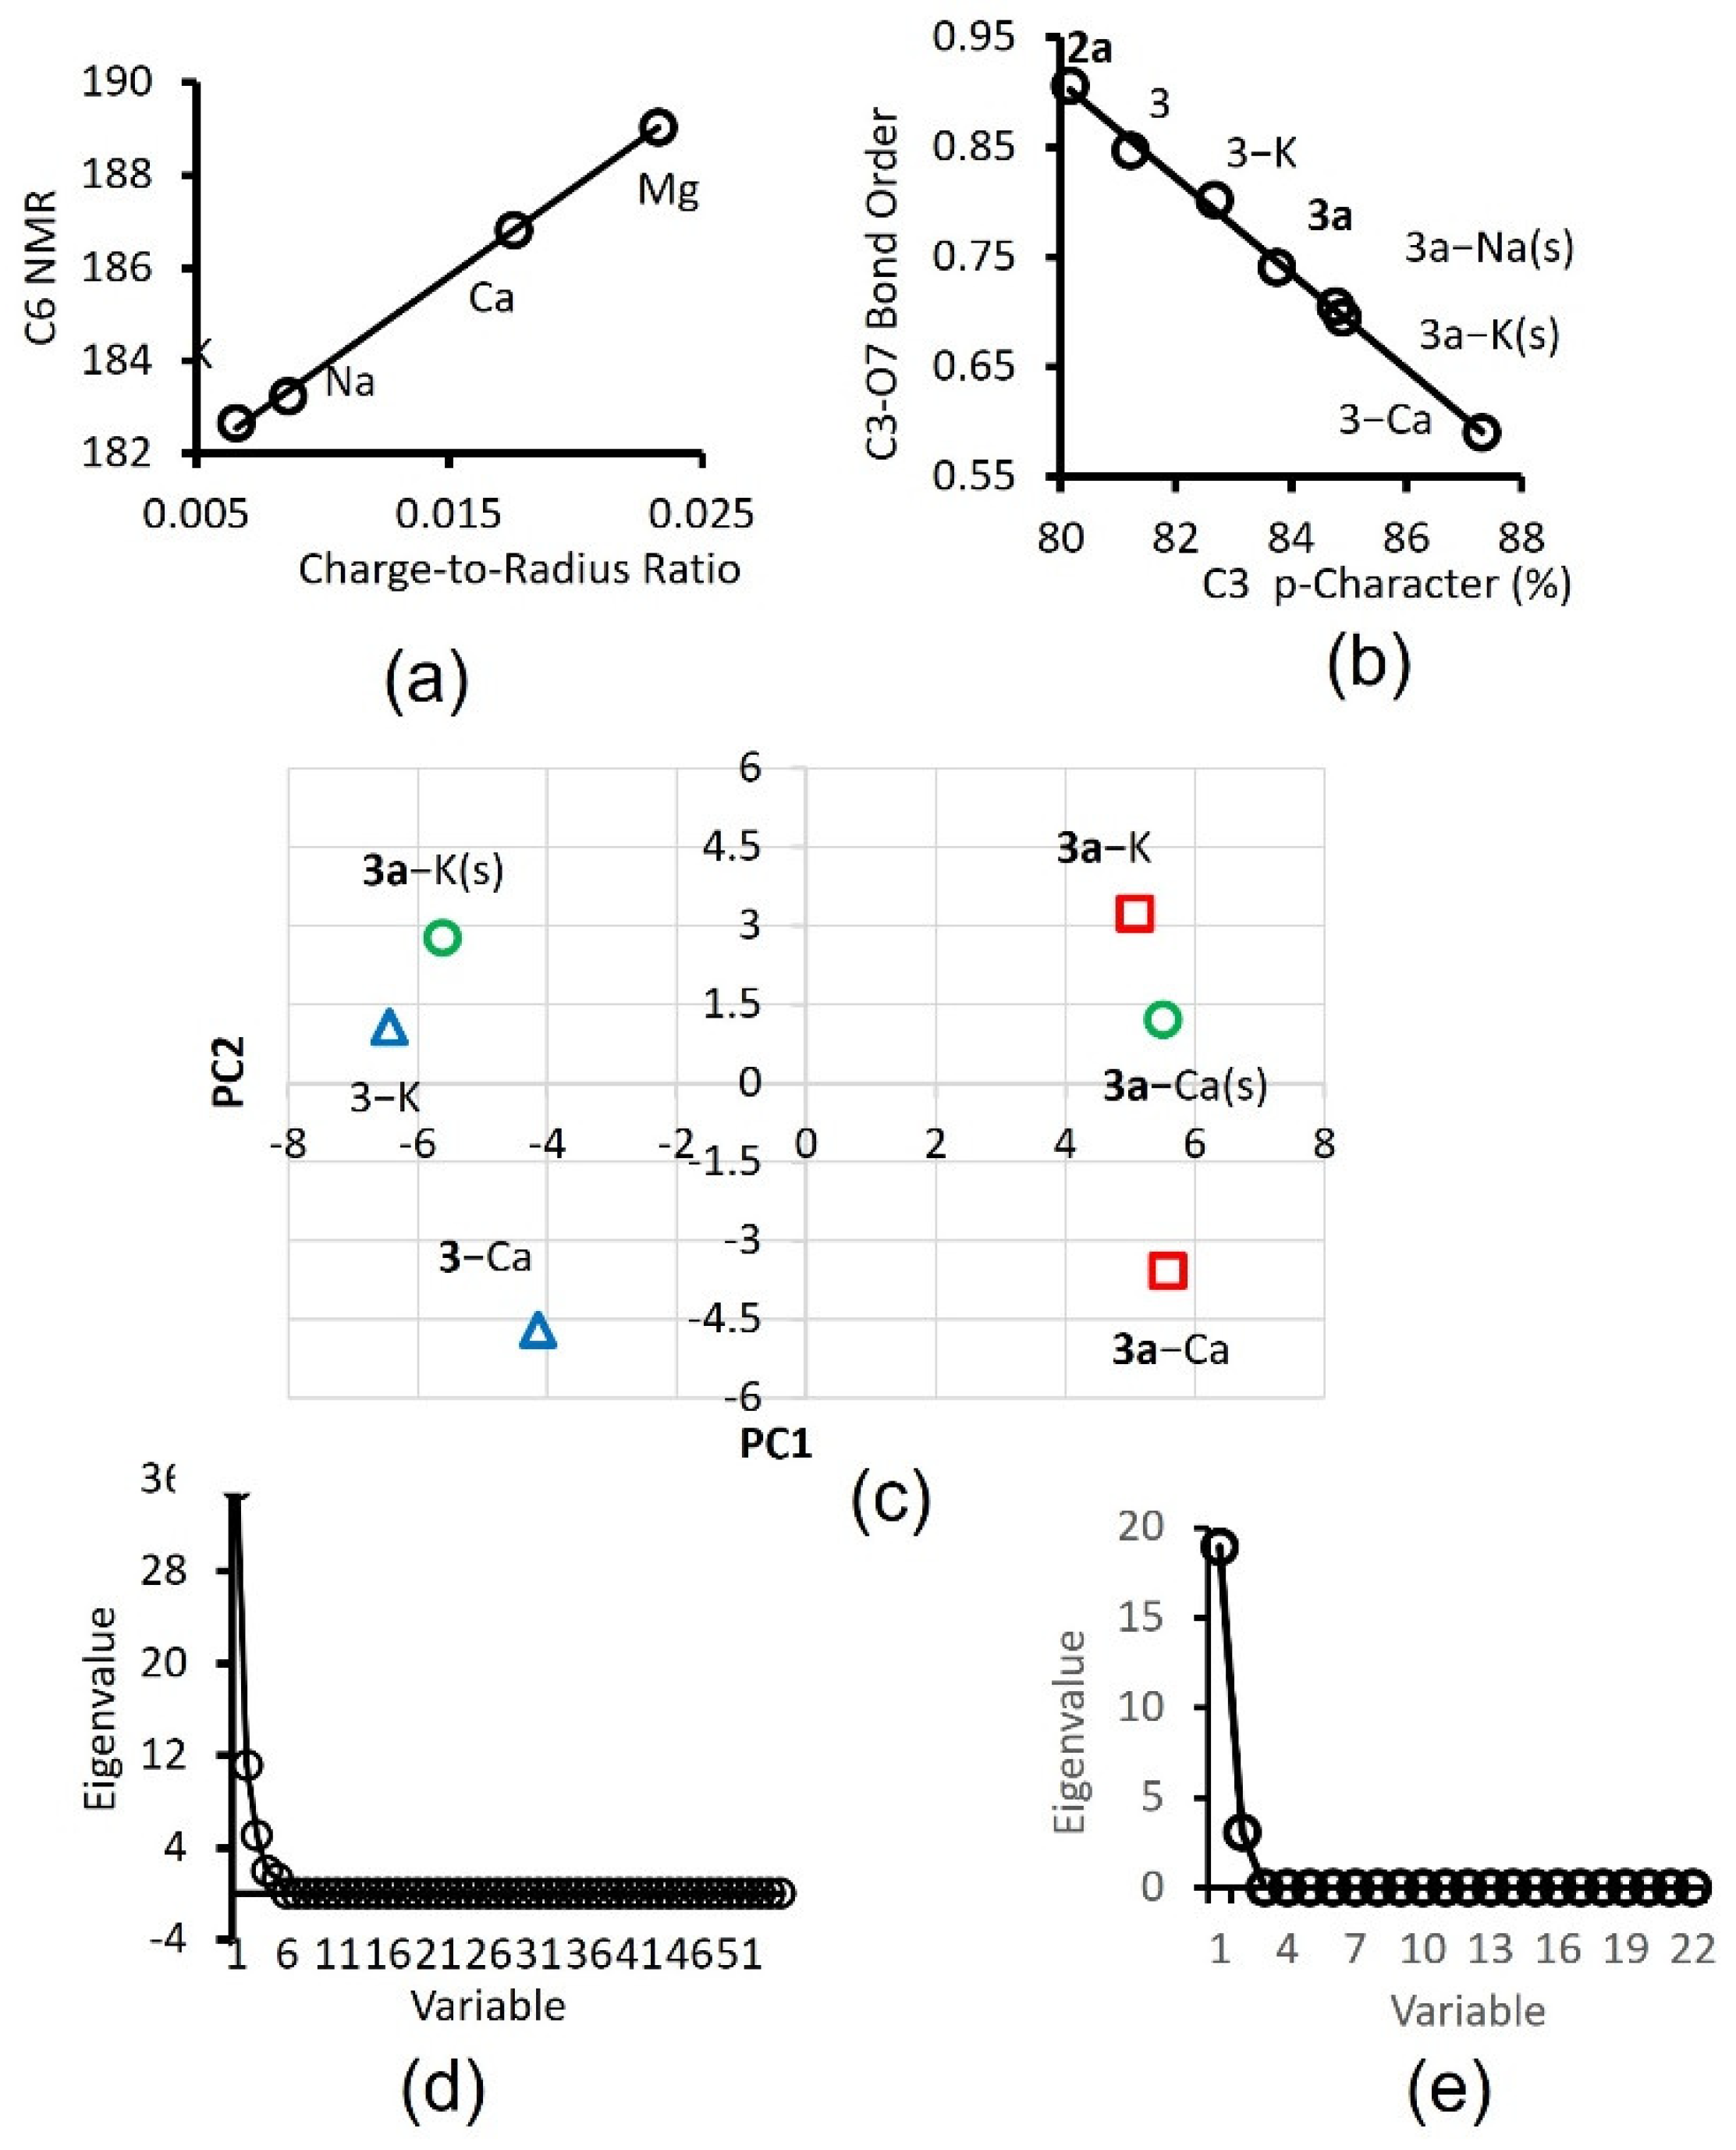
Using enolate as a model for phenolate, the results in Figure 3a show that at alkaline pH, the lactone C-O bond in 3a readily breaks and Ca2+ interacts with both oxygens in the resulting carboxylate (Figure 3c). Deprotonation of enol hydrogen in 3 lengthens the C3-O7 bond by 4% and shortens the C2-C3 bond by more than 1%, by virtue of the negative charge in 3a. The charge-to-radius ratio of the cation plays a decisive role in the C3-O7 bond breaking.
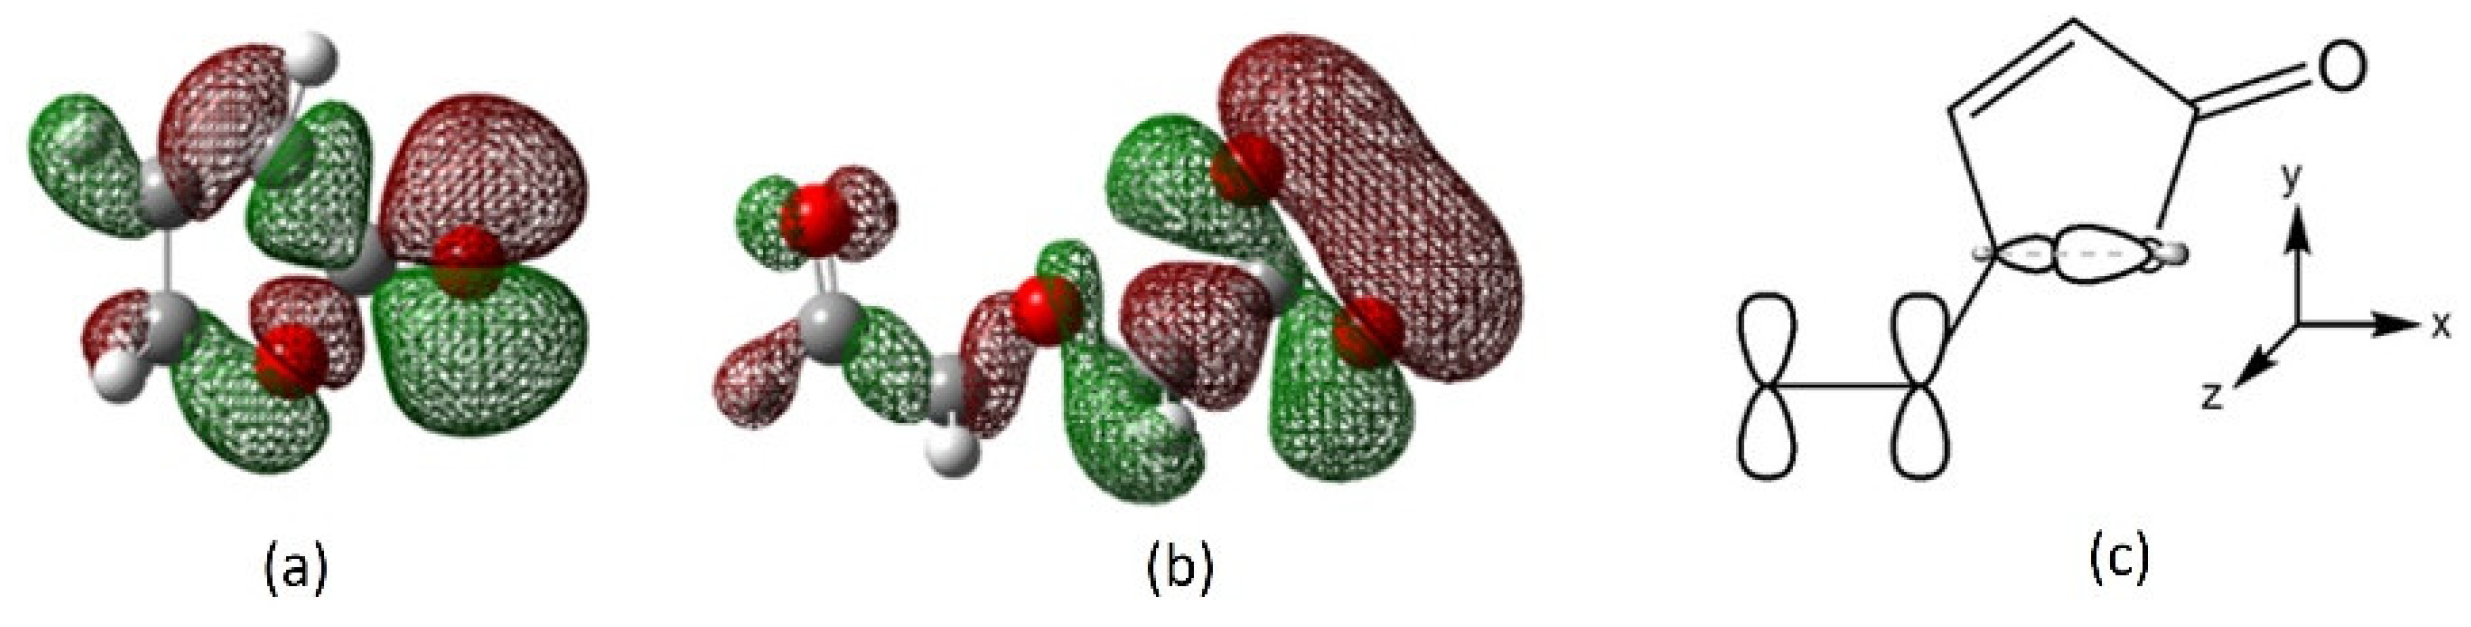
Figure 4a shows that the de-shielding of the carbonyl carbon (C6) is directly correlated to this ratio. Another key observation is the increase in the C3 p-character that accompanies the C3-O7 bond breaking. It indicates the formation of a double bond and -network (Figure 4b). Cation transfers its charge mainly to the carbonyl carbon (C6), as can be observed in the de-shielding of this nucleus. Chromophore-cation binding strength can be rationalized in terms of stabilization of the HOMO of the chromophore (Figure S2a) [33]. The cation-catalyzed ring opening of the lactone functionality occurs readily and gives rise to the participation of the chromophore (as carboxylate motif) in cation recognition, as described later in Section 2.7.
The structural and electronic properties of chromophore models, including those in the supplementary information, are utilized as variables in multivariate analyses of these systems. Over fifty variables including bond distance, bond angle, dihedral angle, NBO charge [34], AOMix [35] atomic valence, AOMix total overlap population, NMR GIAO shielding coefficient [36] and bond dissociation energy are used as variables in PCA. Variables from two chromophore systems, enol 3 and enolate 3a were the main sources due to economic reasons. Data from the gas phase are compared with those in methanol medium (depicted in Figure 4c as (s)). Determination of two cationic plant macronutrient, Ca2+ and K+, is the main focus of this study (Figure 4c).
The scree plot in Figure 4d shows the successful transformation of the variance in the data to three important principal components, PC1, PC2 and PC3, having eigenvalues of 35.5, 11.2 and 5.0, respectively [37]. Figure 4c displays a score plot of PC2 versus PC1, showing three pairs of chromophore-cation models [38]. There are six points or three Ca2+-versus-K+ pairs of interest on the score plot. The scores preferably are far away from the origin and separated into four distinct quadrons, hereinafter referred to using the following convention: top-left (Q1), top-right (Q2), bottom-right (Q3) and bottom-left (Q4). The first case involves the separation of 3a-Ca2+ from 3a-K+ in a vacuum. The two points (red squares) are very well separated vertically on the right into Q3 and Q2 quadrons, respectively.
The second scenario is more important to the practical application since it involves the separation of this pair in the actually used solvent (i.e., methanol denoted by (s)). The two points (green circles) are even better separated into Q2 and Q1 quadrons, respectively. The pair with enol 3 chromophore (blue triangles), 3-Ca2+ and 3-K+, is also well separated vertically on the left into Q4 and Q1 quadrons, in that order. The results suggest that the chromophore-cation systems afford distinct clusters and variations in the computational molecular properties give rise to good cluster separation. Score plots of PC3 versus PC1 and PC3 versus PC2 have also been analyzed and confirmed most of the extracted information above, albeit with less separations in certain pairs.
A scree plot from actual experimental data, employing 1 and fluorescein as fluorophores and with Ca2+ and K+ macronutrients, is provided in Figure 4e for comparison. The PCA utilized 22 emission intensities from 500 to 600 nm as variables. Diene lactones have successfully been employed as models in elucidating the nature of interaction between cations and the xanthene core and the effect of anionic substituent on lactone structure, as well as in providing molecular properties as variables in PCA. Our results show that ene- and diene lactones are responsive towards cation, and computational data can be employed in PCA to evaluate potential motifs for cation recognition. Facile ring opening at alkaline pH transforms the lactone moiety to carboxylate functionality that enhances selectivity towards Ca2+.
2.3. Diglycolic Ca2+ Receptor Models
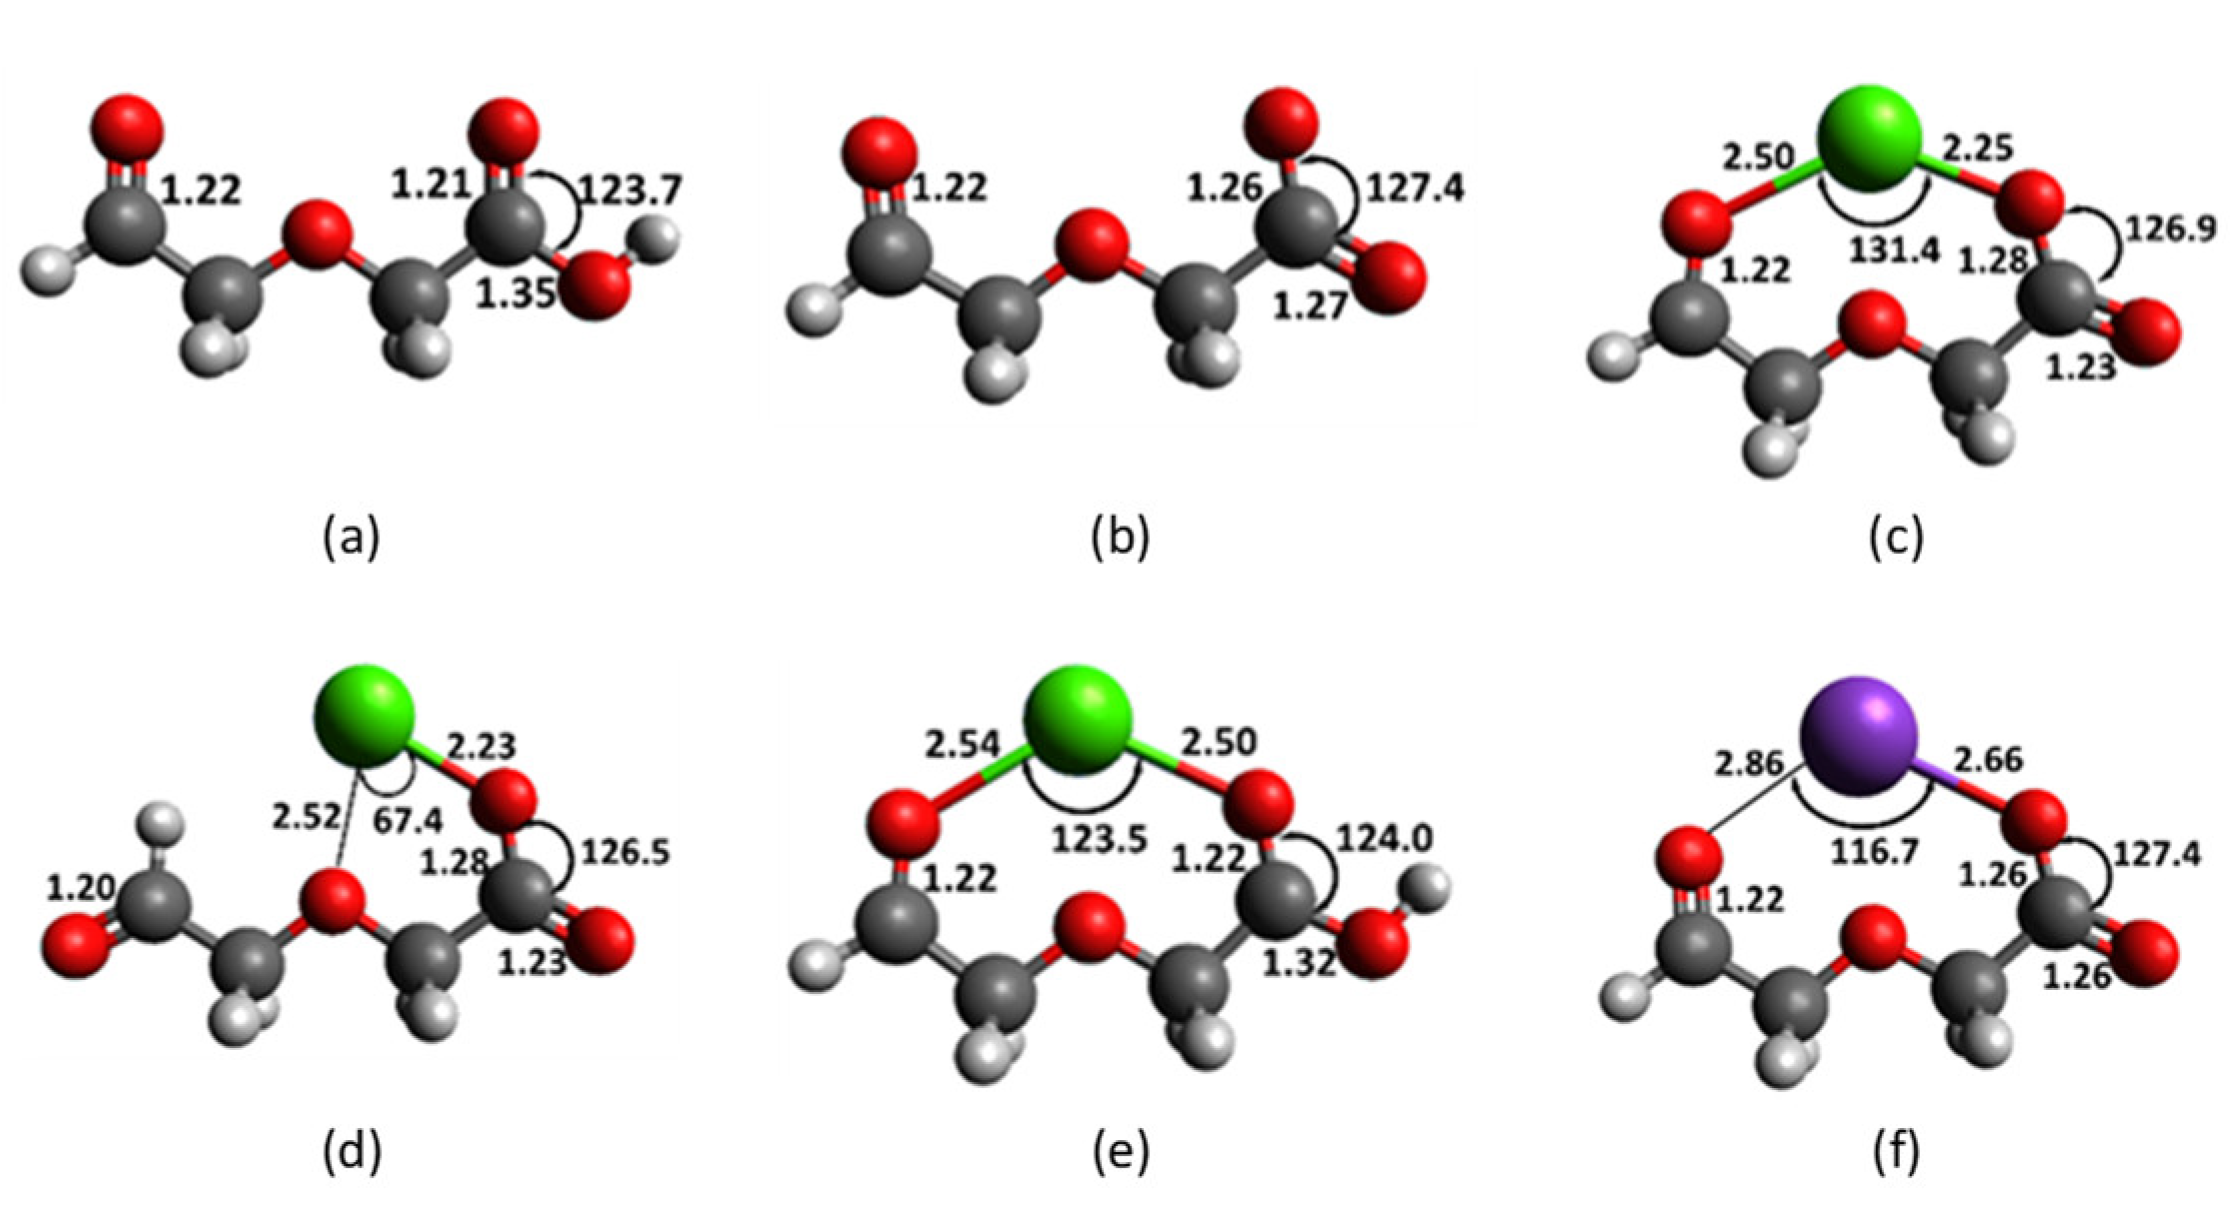
Computation on diglycolic models seeks to understand the following: (i) the origin of Ca2+ selectivity with this receptor, (ii) the participation of various types of oxygen atoms, and (iii) the effect of negative charge. This work focuses on two forms of diglycolic moiety as receptor for Ca2+; diglycolic acid 4 and diglycolate anion 4a (Figure 5). In the absence of cation, both 4 and 4a have been optimized as planar structures. In 4 the carboxylic hydrogen on O8 is in cisoid conformation with O7. For simplicity and economic reasons hydrogen is used as a substitute for the undecyl arm in 1. The two carbonyl C-O bond distances in 4 are similar, with a baseline length of 1.22 Å at the aldehyde terminal. The carboxylic C5-O8 bond is 1.35 Å, whereas, when deprotonated in 4a, the carboxylate C-O bonds have a common bond distance of 1.26 Å due to resonance. The distances between the two carbonyl oxygens in 4 and 4a are 4.78 and 4.33 Å, respectively.
The distance between the carbonyl oxygen (O6) at the aldehyde terminal and the ether linkage (O3) is 2.74 Å. Cation recognition by 4 or 4a most probably involves three oxygens in the diglycolic receptor. Ca2+, Mg2+ and K+ having Shannon ionic diameter [39] of 2.28, 1.72 and 3.04 Å, respectively, position itself in the middle, and make distinct cation-O bond distances and O-cation-O bond angles. The size of the cation and its charge-to-radius ratio are deciding factors that influence how best the cation fits into the cavity between the three oxygens. The 4a-Ca2+ complex in Figure 5c has bond distances of 2.50, 2.41 and 2.25 Å, each between Ca2+ and O6, O3 and O7, respectively. The carboxylate anion exhibits a short Ca-O8 bond of 2.25 Å. Ca2+ makes a 131.4° bond angle with the two carbonyls. In Figure 5d, O6 is not available for interaction and Ca2+ binds with O3 and O7 to give 2.52 and 2.23 Å bond distances, respectively, making a narrow O3-Ca-O7 angle of 67.4°.
Bonding with only two instead of three oxygens makes the 4a-Ca2+ complex less stable by 9.1 kcal mol−1. In contrast to the deprotonated form, the 4-Ca2+ complex in Figure 5e forms noticeably longer bond distances of 2.54 and 2.50 Å with O6 and O7, respectively. The O3-Ca-O7 angle was significantly reduced to 123.5°. The Ca-O3 bond distance of 4.78 Å indicates negligible interaction between Ca2+ and the ether linkage (O3) in the protonated receptor. Likewise, the long Ca-O bond distances of 2.86 and 2.66 Å with O6 and O7 in 4a-K+ indicate even weaker interaction with alkaline metals (Figure 5f).
Diglycolic dialdehyde 4b is a further simplified model for the Ca2+ receptor. This model is useful in examining the uncharged receptor, having identical carbonyl motifs. Binding energies in Table 2 indicate that Ca2+ is bound to dialdehyde 4b in methanol by 11.6 kcal mol−1. The 4b-Ca2+ complex is capable of further binding with diene-lactone 2 with additional 5.6 kcal mol−1 of binding strength. In striking contrast to the full-structure results, in separate fragment models, initial formation of the diglycolic-cation complex followed by the additional interaction of this complex with the chromophore lactone is thermodynamically feasible and is exothermic by more than 5 kcal mol−1. Difficulty in macrocyclization in Fl-DGA-Ca2+ complex involving initial formation of diglycolic-Ca2+ complex could be explained using the entropy argument [40].
The interacting and non-interacting 1-Ca2+ complexes have similar energies and thus additional interaction with the lactone group does not result in further stabilization. The undecyl arm could not have interacted with Ca2+ in an initial step. Likewise, initial binding between Ca2+ and the lactone motif in 1 is also unlikely, although the fragmented models suggest that the complex is bound by 6.5 kcal mol−1. In the carboxylate models (4a), Ca2+ binds to the anionic form by additional 15.4 kcal mol−1 compared with the binding energy with the uncharged form (4). A similar trend is true with K+ but the alkaline metal is only bound by 7.2 kcal mol−1 in methanol.
With ene-lactone 2a, alkaline earth and alkaline metal cations exhibit the following trend in binding energies: Mg2+ > Ca2+ > K+~Na+, and, likewise, with diglycolate 4a the three cations of interest afford the following order: Mg2+ > Ca2+ > K+. Binding strengths alone do not account for Ca2+ selectivity. The results, nonetheless, highlight the advantage of involving three oxygens instead of just two, and the importance of ionization with the diglycolic motif. The computational results show that all diglycolic-cation complexes are planar and attempts in locating complexes involving four oxygens have been unsuccessful. In the hypothetical four-oxygen interaction, the complex would have been bent. Fragmented models confirm that in a stepwise mechanism involving the initial formation of receptor-cation complex, the subsequent interaction with lactone motif is exothermic by 5 kcal mol−1. A long distance between the two carbonyl oxygens in diglycolic receptor, fortuitously in a 1, 5 position, and the ionizable nature of carboxylic functionality, tend to favor large and polarizable divalent cation such as Ca2+.
2.4. Interaction of Receptor and Chromophore Fragments with Cation
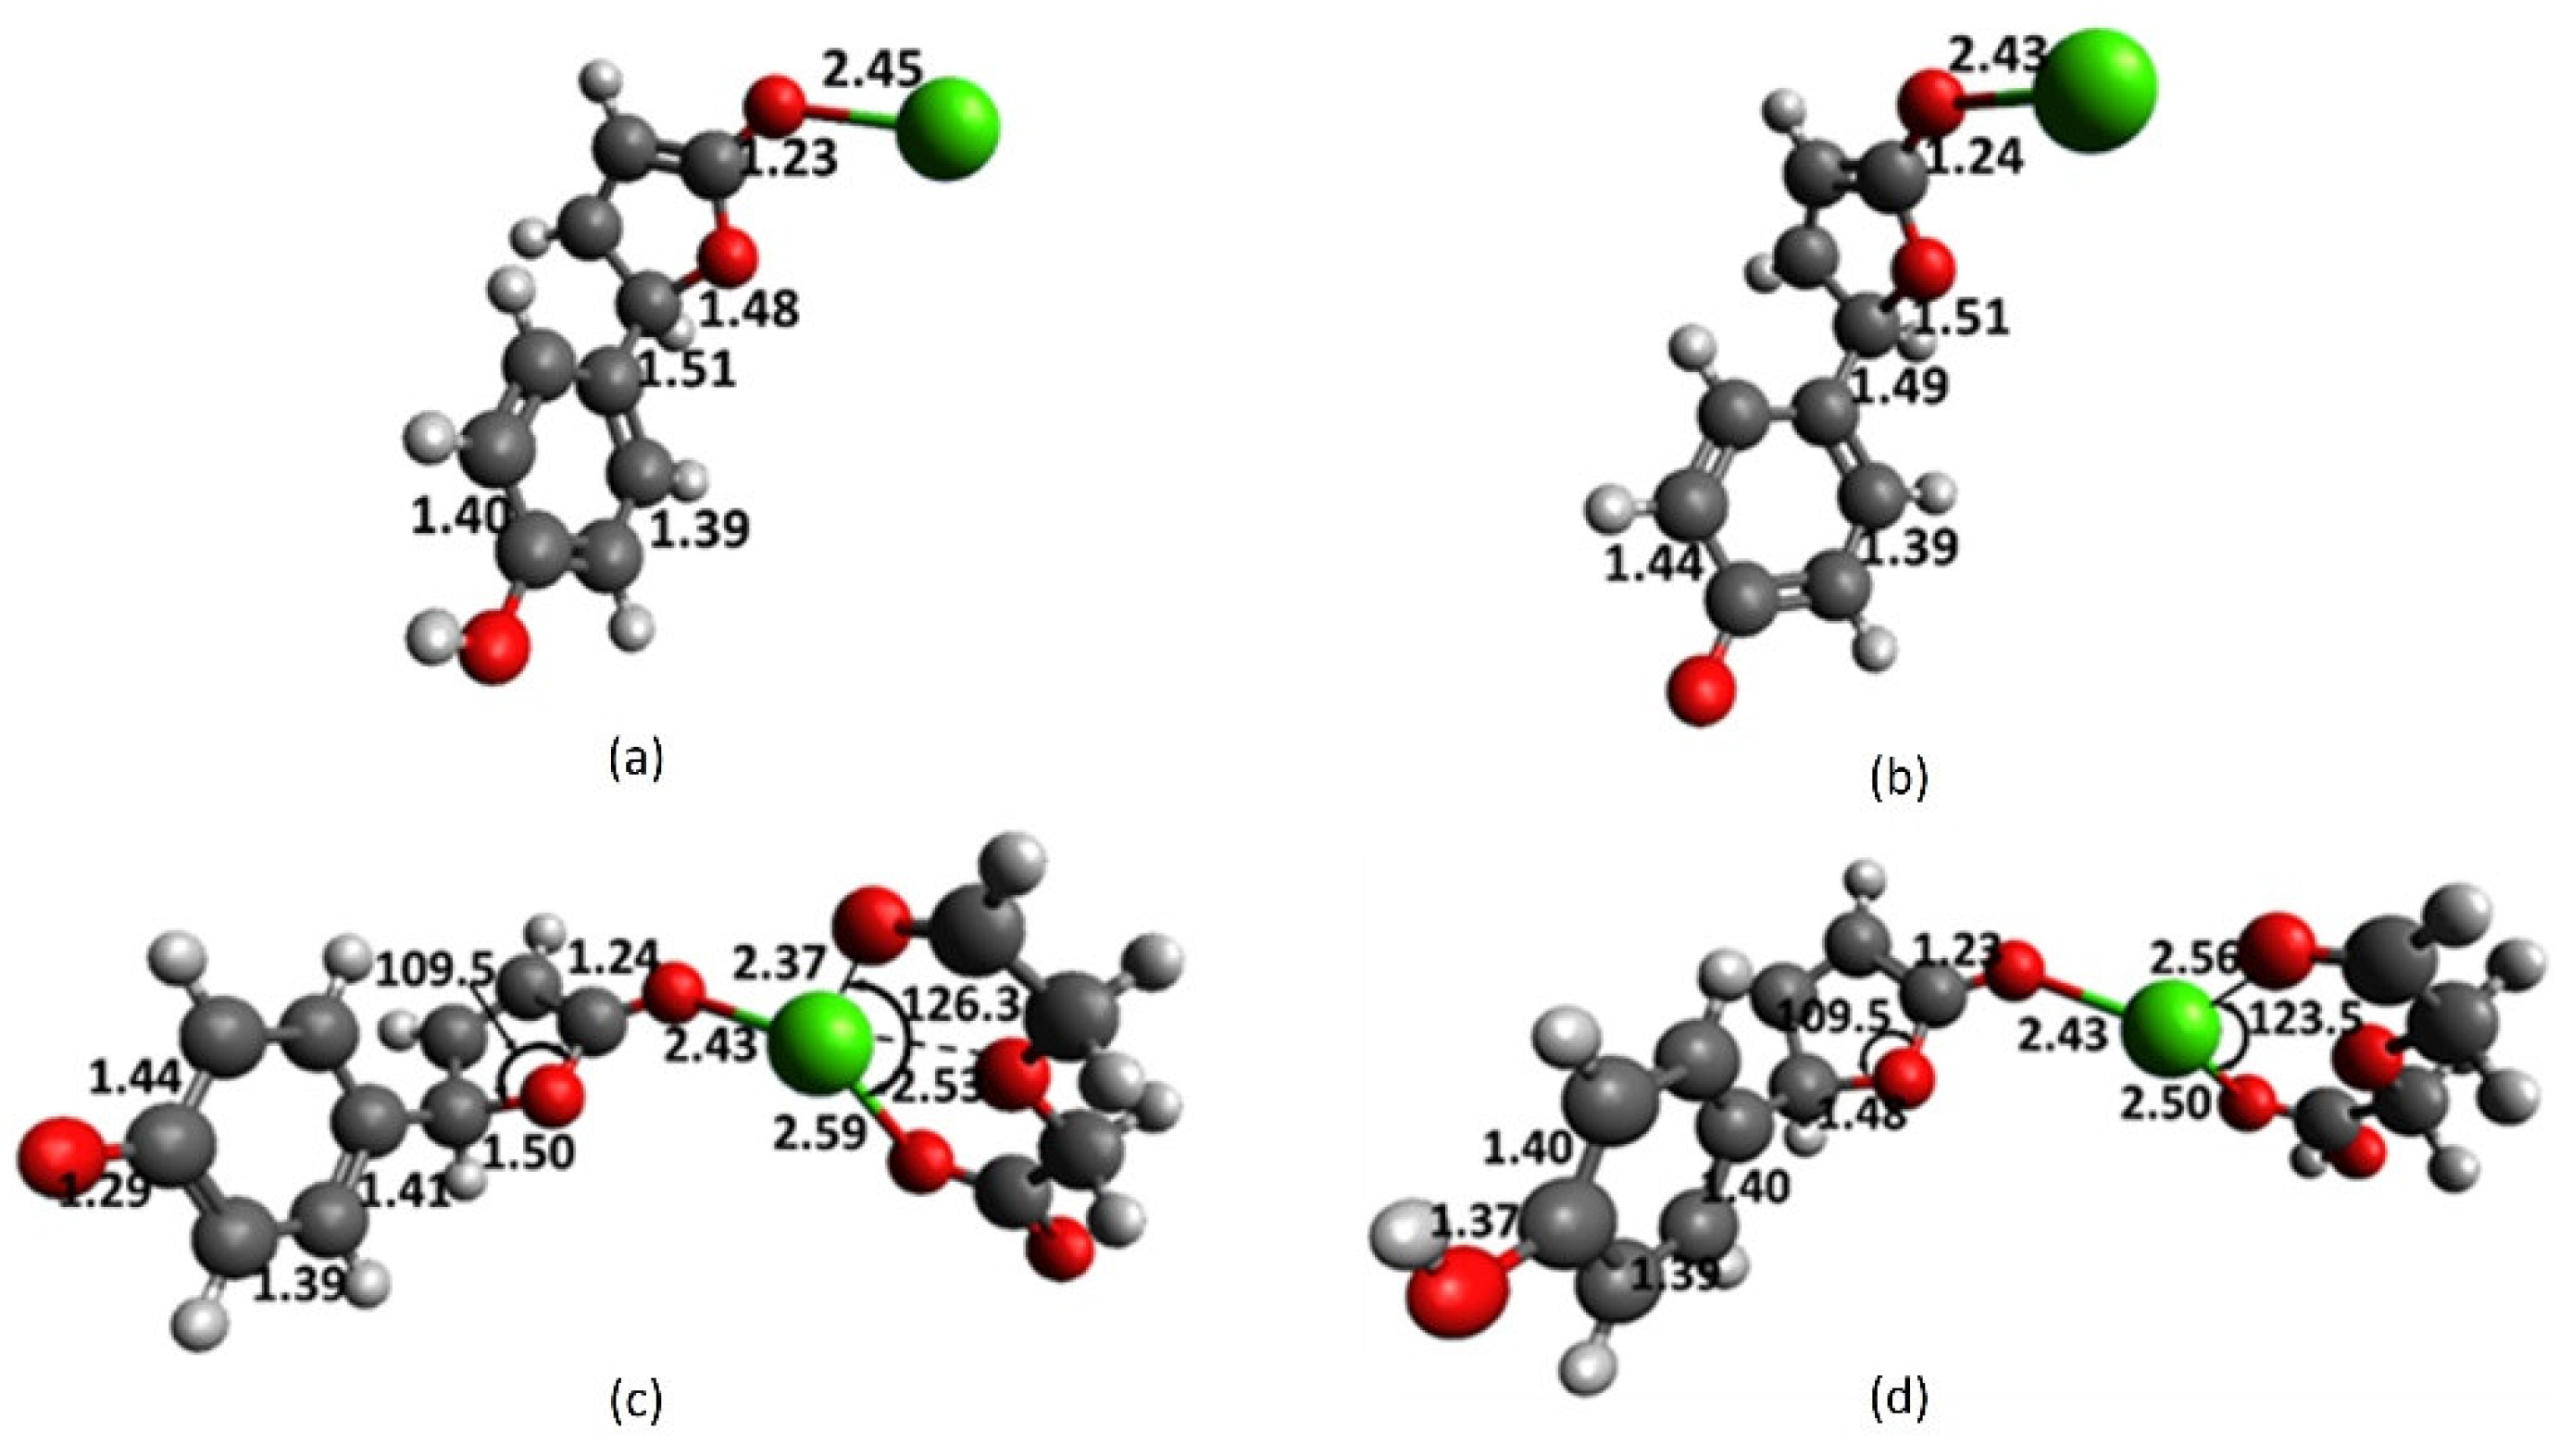
In Section 2.2, vinyl, enol and enolate were utilized as simple models for the phenol and phenoxy core. Chromophore 5 and 5a utilize full phenol and phenolate structures and thus serve as better models to examine the interactions of key contributors in 1, referred to as fragments, with cations. This section seeks to understand the structure of chromophore-receptor-cation complexes, utilizing fully functional models, albeit not bonded together via an extended arm. In methanol medium, 5 interacts with Ca2+, resulting in the elongation of the lactone C7-O11 and carbonyl C10-O13 bonds to 1.48 and 1.23 Å, respectively (Figure 6a). The aromatic C-C and the ring-linkage C4-C7 bonds remain practically unchanged.
Deprotonation of phenolic hydrogen causes the C-C bonds in the aromatic ring to be dissimilar, wherein the C1-C2 bond significantly lengthens to 1.44 Å. The lactone C7-O11 bond lengthens further to 1.51 Å, and the ring-linkage (C4-C7) and Ca-O13 bonds shrink to 1.49 and 2.43 Å, respectively. These results suggest that as the C7-O11 bond breaks, a quinoid -network that extends to the lactone ring forms and is characterized by C4-C7, having a double bond character. The interaction of 1 or its deprotonated form 1a and Ca2+ presumably involves a pre-organized structure that allows the diglycolic moiety and the lactone group, perpendicular to the xanthene plane, to simultaneously interact with the incoming cation. Therefore, cation-catalyzed lactone ring openings of 1 and 1a do not involve the initial formation of the chromophore-Ca2+ complexes modeled in Figure 6a,b.
The result in Figure 6c suggests that the interaction of the receptor-Ca2+ complex with the chromophore core affords a stable larger complex. However, in striking contrast to 1a-Ca2+, this does not lead to a greater extent of lactone C7-O11 bond breaking. The Ca-O13 bond distance remains at 2.43 Å and the rest of the features in the chromophore are not noticeably different from those in Figure 6b. A shorter C7-O11 bond distance of 1.50 Å in 5a-4a-Ca2+, compared with that in 5a-Ca2+, suggests an even lesser extent of bond breaking in the former. It is plausible that Ca2+ first binds with 5a through the electron-rich O11, instead of carbonyl O13 because the C7-O11 bond is partially broken by virtue of the anionic character. Likewise, similar initial interaction could happen in dianion 1a, involving the anionic chromophore, albeit having the ionized diglycolic arm in close proximity.
It is noteworthy that the Ca-O13 bond distance involving uncharged phenol core 5 and diglycolic acid receptor 4 in Figure 6d remains at 2.43 Å (as in Figure 6b,c). The rest of the chromophore features in the 5-4-Ca2+ complexes are comparable to those in 5-Ca2+. If it is viewed that the 5-Ca2+ complex forms first, receptor 4 approaches the complex, perpendicular to the lactone ring, and as the larger complex forms the Ca-O13 bond shrinks from 2.45 to 2.43 Å. The 5a-4a-K+ complex in Figure S4c could be viewed as having a phenoxy core that does not exhibit any structural change due to complexation. The 4a-K+ complex could form first and interact with 5a, or vice versa, 5a-K+ could approach 4a, giving rise to the Ca-O13 bond distance of 2.75 Å but leaves the entire structure of 5a practically unchanged.
Full-structure computations of interacting complexes involving 1 and 1a suggest that when the chromophore and the receptor components are bonded together via an extended arm, the two parts could, in the presence of cation, approach each other in near perfect perpendicular fashion. The results in Table 3 show that the breaking of the lactone C7-O11 bond in 5a-4a-Ca2+ is accompanied with a significant decrease in bond order and total overlap population in this bond. The reduction in C4 chemical shift indicates shielding due to the accumulation of electron density surrounding this nucleus, or, alternatively, because of the loss of the aromatic ring current. Likewise, the increase in C7 chemical shift suggests the increased vinylic character of this carbon and participation in the newly formed -network. The C4 does not exhibit a noticeable difference in the p-character in the bonding orbital. It remains at 70% or equivalent to the sp2.3 hybrid orbital since it involves changing from aromatic carbon to a vinylic one. The dianion form reduces more positive charge from Ca2+, but this is not accompanied by additional positive charge buildup at the carbonyl C10. Fragmented models further support the influence of negative charge on lactone motif and its contribution to cation recognition. However, a comparison of complexes with dianions, 1a-Ca2+ and 5a-4a-Ca2+, raised an important question: why does the lactone C-O bond break completely with full-structure 1a but only minimally with fragments of 5a and 4a? We propose that this arises from the rigid structure of 1a, wherein the diglycolate motif approaches the chromophore at a right angle to the lactone ring, achieving five optimized Ca-O bond distances by first ripping the lactone C-O bond.
2.5. Optical Response Characterization
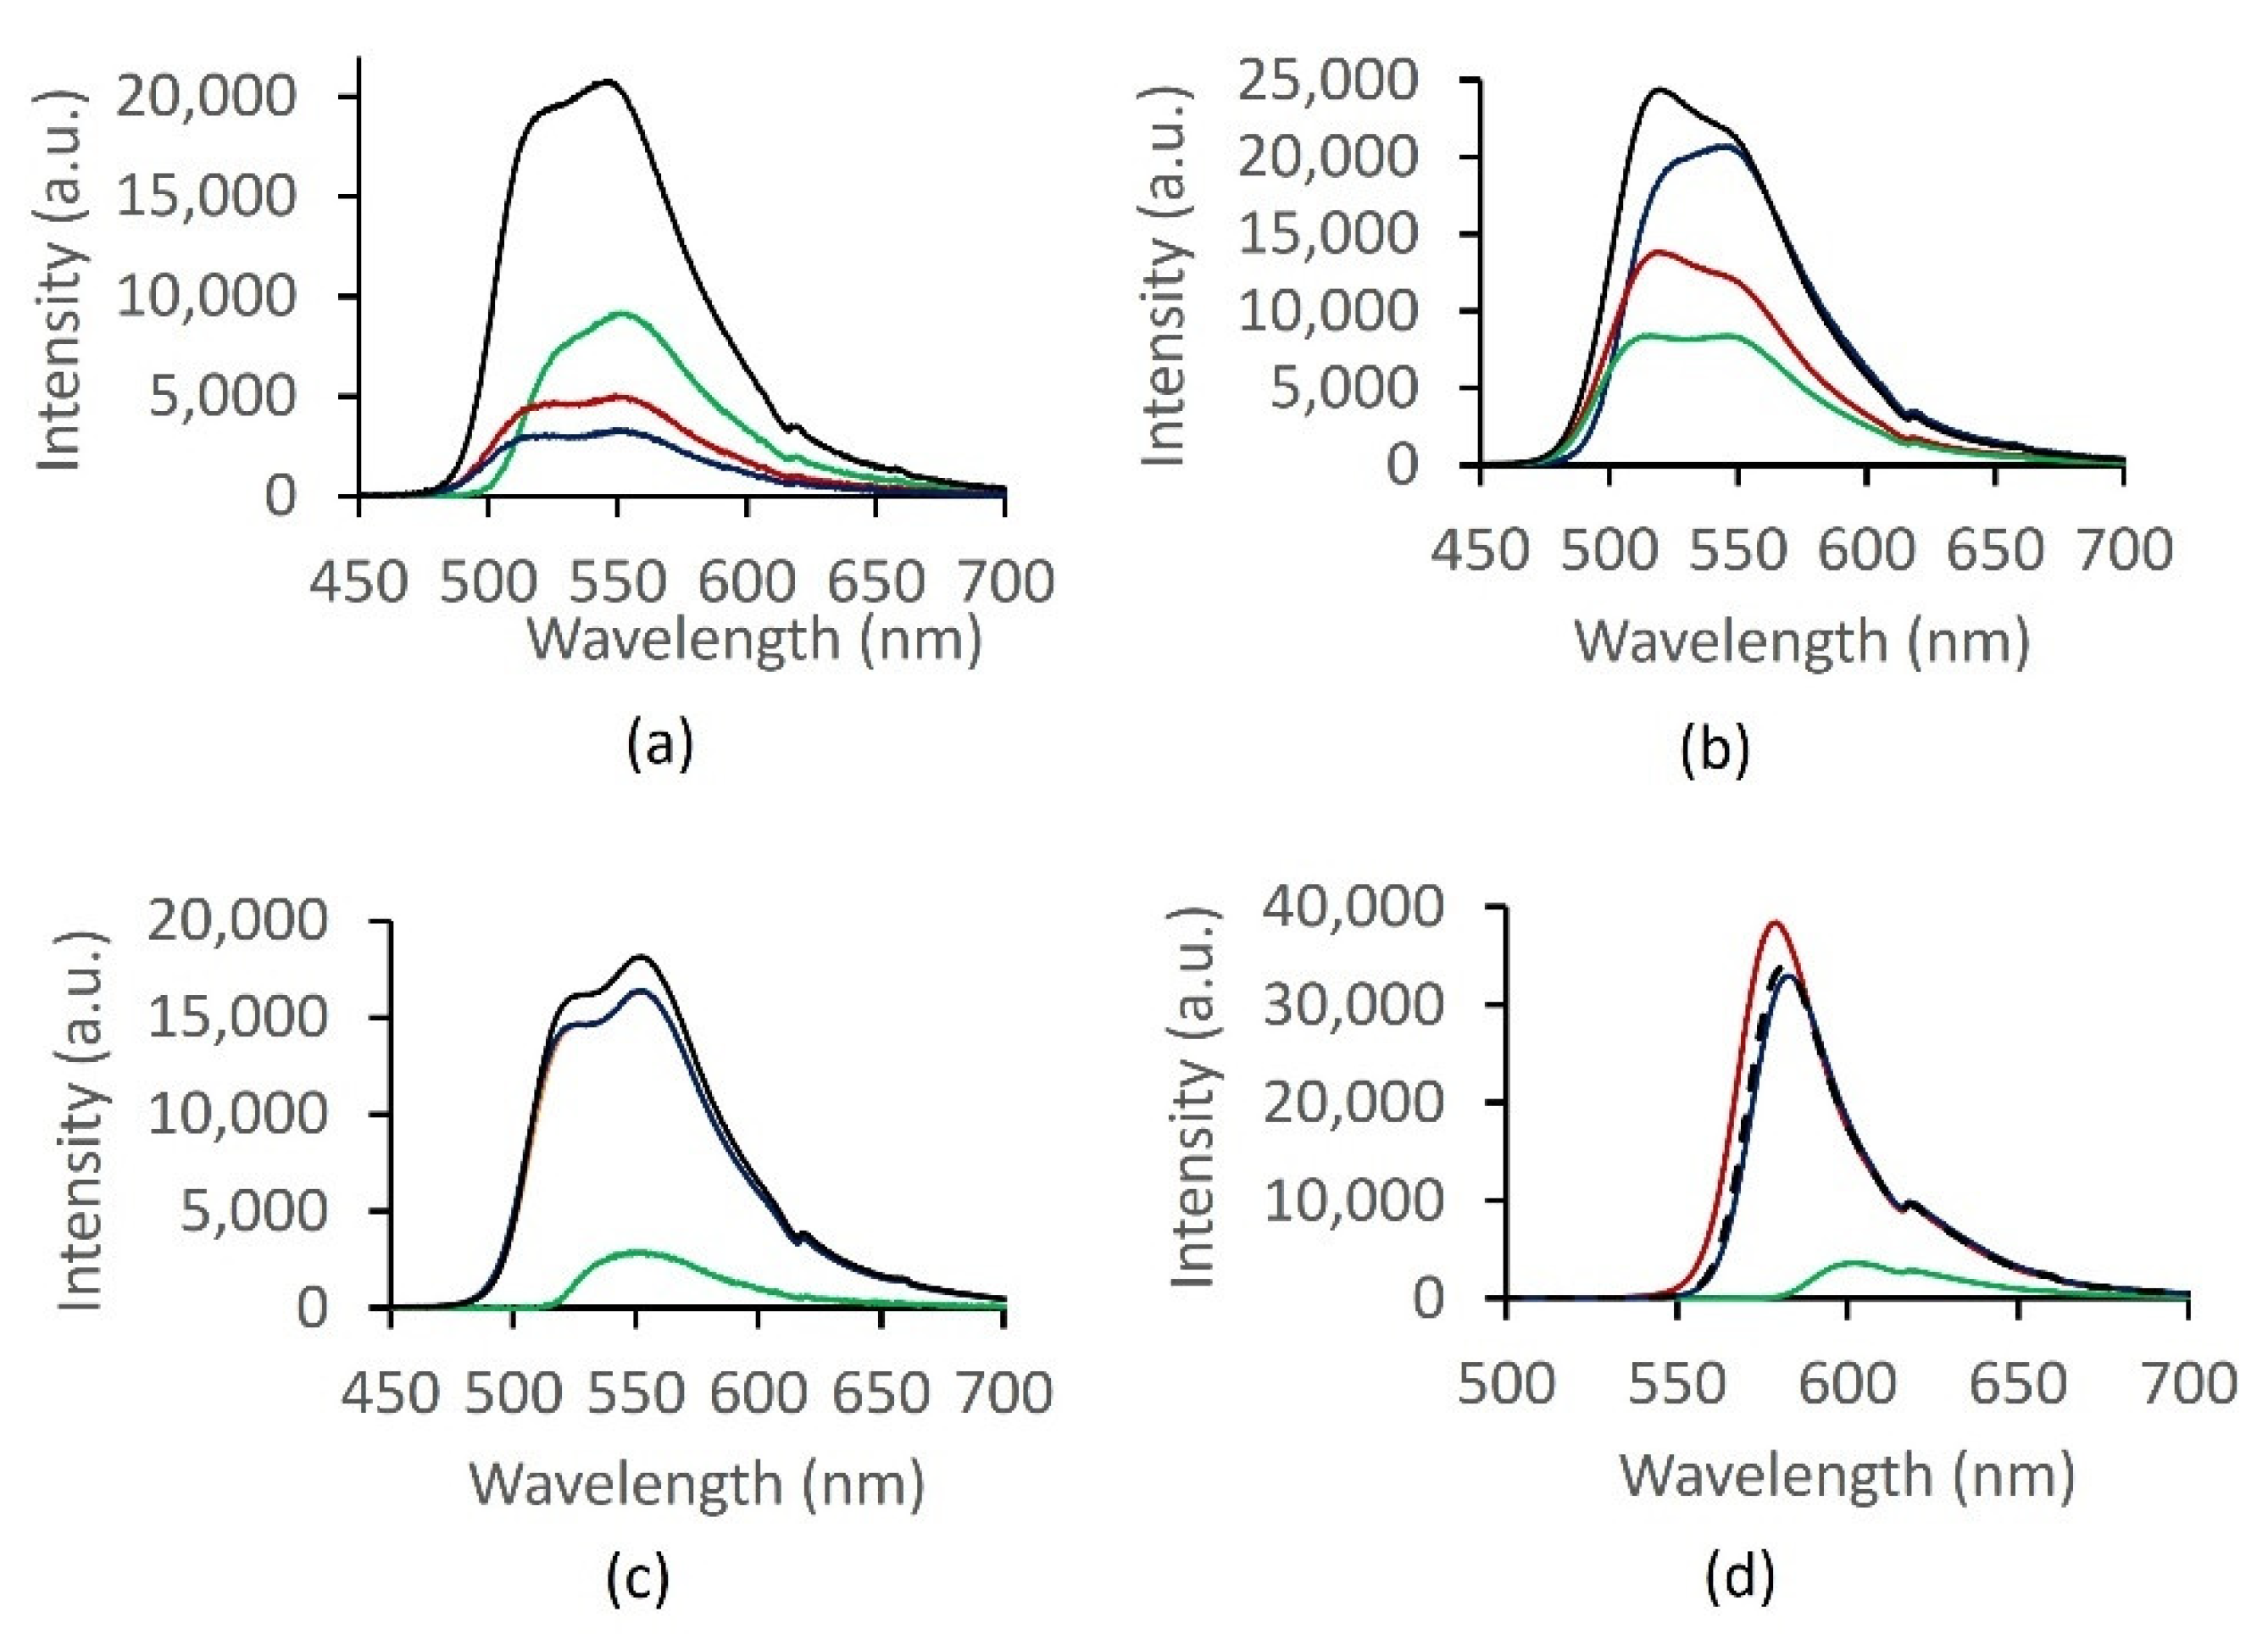
In optical characterization, we investigate the fluorescence response of 1 with three cationic macronutrients: Ca2+, K+ and Mg2+. Selectivity of 1 with cations is compared to those with other fluorophores: unsubstituted fluorescein, lipophilic derivative 7 and rhodamine-B. Capability for simultaneous determination of cations and resolving signal at sub mm levels are assessed from the quality of separation in the score plots. The optical sensor utility of 1 was explored by dissolving the fluorophore in methanol to form yellowish solutions that are stable at different concentrations (3.2, 1.0, 0.3 and 0.1 mM) for over two weeks. As can be seen from Table 4, the maximum fluorescence intensity (Im/I0) of 1 was observed when 1 mM solution of the fluorophore and 0.1 mM of metal cation were employed. Maximum emission peaks at wavelength of 544 ± 3 nm for all tested concentrations of 1 was observed due to high fluorescence quantum yields. Low peak intensities were apparently observed at higher concentrations (3.2 mM) due to a quenching effect, as has been reported by many studies previously. For example, the quenching effect of chloride on quinine fluorescence activity has been well documented [41].
Fluorescence spectroscopic tests were also carried out by the addition of chloride salts of three cations of interest in precision agriculture; Ca2+, Mg2+ and K+ (0.1 mM), into four 1 mM chromophores solution (fluorescein (Fl), lipophilic alcohol fluorescein derivative (Fl-OH), Fl-DGA and rhodamine-B (Rh-B)) and the effect of metal ions on fluorescence intensity of each chromophore system was examined. Figure 7a shows that Mg2+ and K+ give rise to quenching effect on the fluorescence intensity of 0.1 mM 1. On the contrary, significant fluorescence enhancements were observed with Ca2+, yielding the highest enhancement at 1 mM concentration of 1. Due to high charge-to-radius ratio and strong solvation of the two alkaline earth metals, comparable optical responses were expected with Mg2+ and Ca2+. Quite the contrary, our results suggest that 1 exhibits the ability to be selective towards Ca2+ and discriminate against Mg2+ and K+. Selectivity towards Ca2+ has been reported previously with tetracarboxylate chelators [42].
2.6. PCA of Optical Responses
Fluorescence emission intensities of 1 × 10⁻⁵, 1 × 10⁻⁴ and 1 × 10⁻³ M (subsequently referred to as 0.01, 0.1 and 1 mM or alternatively referred to in the legend as the abbreviated logarithmic form −5, −4 and −3 M, respectively) of Ca2+ and K+ with 1 × 10⁻³ M of fluorophore in methanol were used in multivariate analyses. Unsubstituted fluorescein (Fl), Fl-DGA, lipophilic alcohol fluorescein derivative (Fl-OH) and rhodamine-B (Rh-B) at 1 mM concentration were evaluated for to determine calcium using the PCA method. Based on its fluorescence emission characteristics, optical responses between 500 and 600 nm are suitable for Fl, Fl-DGA and Fl-OH.
Between twenty to sixty responses were utilized as variables in the principal component analysis. Successful extraction of principal components is characterized by a normal scree plot (Figure 4e) that can be interpreted as having sufficient variance in the data and the information reduced to a few dimensions having the highest eigenvalues. More importantly, in Ca2+ determination, the first two principal components should produce a score plot (PC2 vs. PC1) that exhibits distinct and well separated clusters. The results in Figure 8 suggest that over twenty experimental variables (22 emission intensities are used) afford decent principal components and an increase in the number of variables does not necessarily improve cluster separation. Since the PCA procedure allows only a comparison of common variables, rhodamine that exhibits a narrow emission window of 550–600 nm could not be employed in subsequent measurements and multivariate analyses. As in Section 2.2, the same naming convention is adopted: top-left (Q1), top-right (Q2), bottom-right (Q3), and bottom-left (Q4).
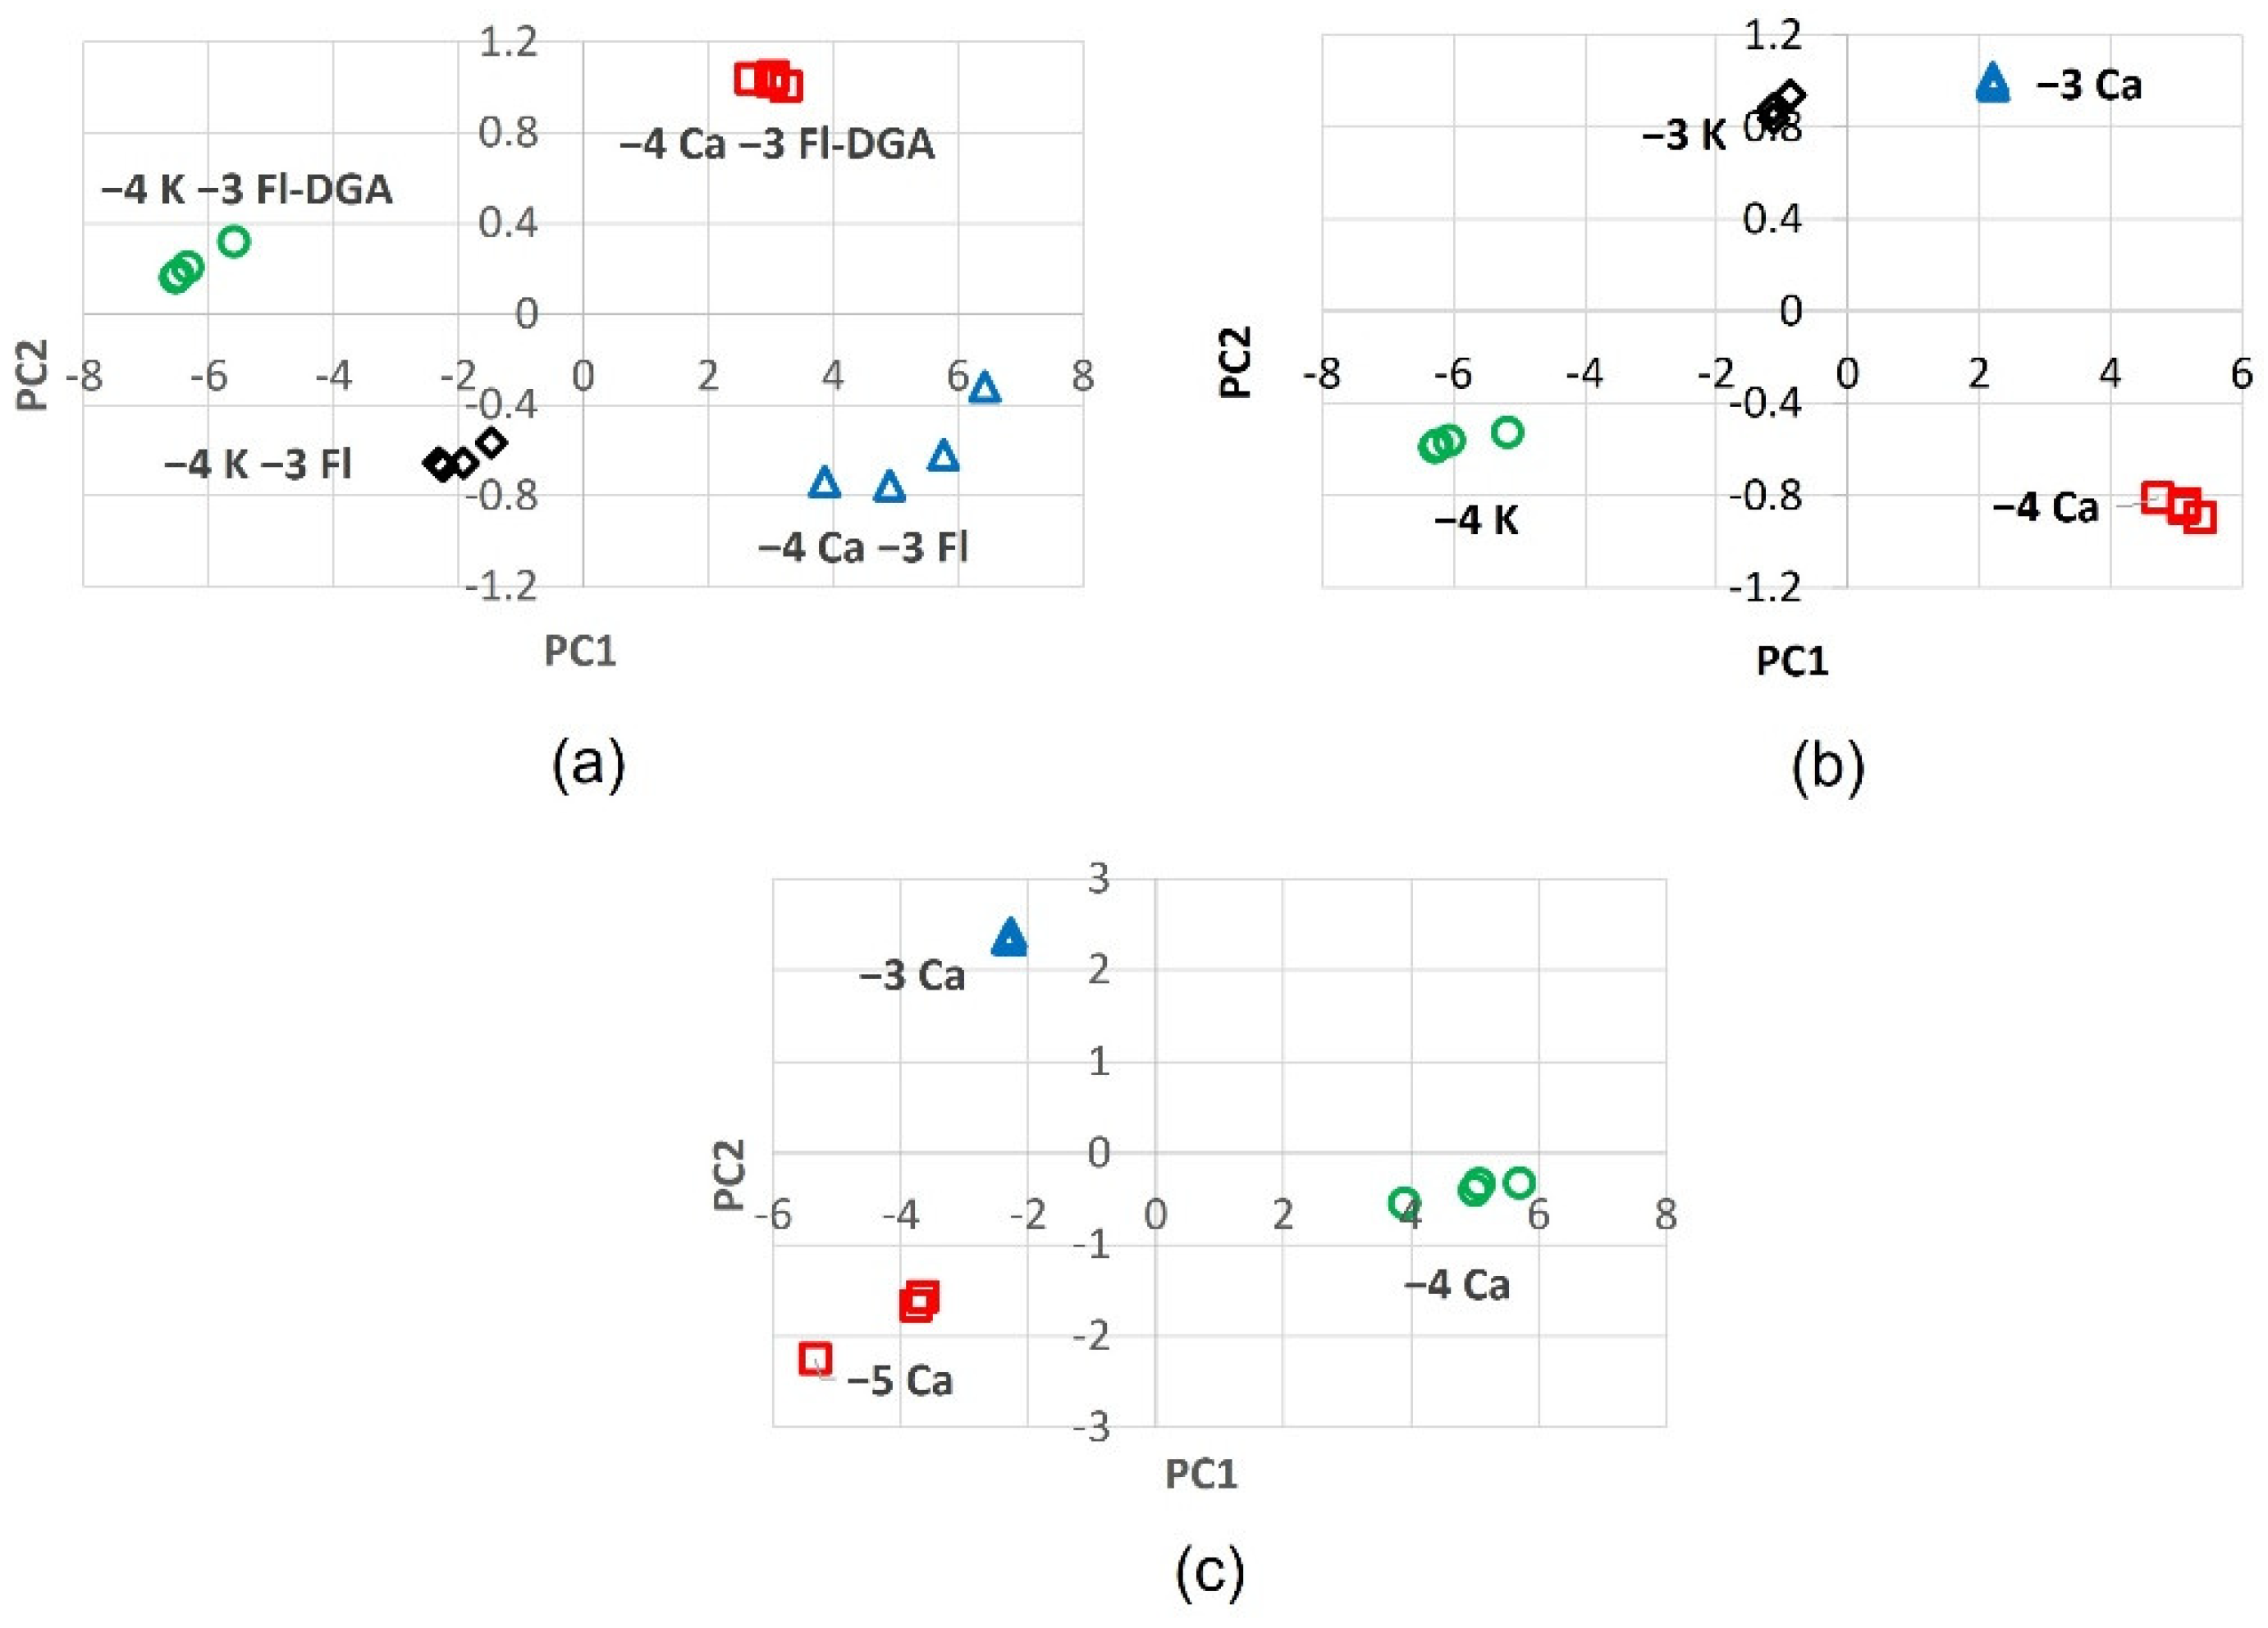
The first case of interest is the determination of 1 × 10⁻⁴ M (0.1 mM) of Ca2+ and its separation from 0.1 mM potassium (Figure 8a). Moreover, it is important to compare the score plot of Fl-DGA with that of the parent fluorescein compound (Fl). It is noteworthy that the four possible clusters, from four sets of samples, afford distinct clusters in dedicated quadrons. Fl-DGA separates 0.1 mM Ca2+ and 0.1 mM K+ into the Q2 and Q1 quadrons, respectively. Both cations exhibit tight clustering near (3,1) and (−6,0.2) coordinates, respectively. Fl separates the two cations at 0.1 mM, less effectively into the Q3 and Q4 quadrons. The 0.1 mM Ca2+ scores in Fl fluorophore are also poorly clustered, horizontally spread from 4 to 6 along the PC1 axis. These results confirm the photophysical observations that indicate improved responses with Fl-DGA and Ca2+.
The second scenario further examines the performance of Fl-DGA with different concentrations of Ca2+ and K+ at millimolar range. Results in Figure 8b show that Fl-DGA is capable of separating Ca2+ and K+ much more efficiently at 0.1 mM. The 0.1 mM Ca2+ and K+ are separated into tight clusters at the Q3 and Q4 quadrons, respectively. The 1 mM cations are located at the top quadrons, albeit only minimally separated. Despite the lack of separation, the scores of 1 mM cations appear to cluster more tightly. These results suggest that Fl-DGA has superior performance at sub-millimolar ranges.
Trace-level detection is of interest in water quality [43] and environmental monitoring. The optical responses and cluster separation at 0.01 mM indicate capability at sub-millimolar ranges. Figure 8c shows the good separation of 0.01, 0.1 and 1 mM Ca2+ by Fl-DGA. The good separation between 0.1 and 1 mM Ca2+ is retained by having the scores at the Q3 and Q1 quadrons, respectively. Moreover, similar to the observation in Figure 8b, a higher concentration of Ca2+ affords superior clustering. More importantly, 0.01 mM Ca2+, at the middle of Q4 quadron, is well separated from the rest of the scores, albeit less tightly clustered. The above experimental evidence confirms that fluorescent receptor 1 is selective towards Ca2+. The excellent separation of tightly populated clusters in the score plots proves that the probe can be employed for the simultaneous measurement of cationic macronutrients and detection at sub-millimolar levels.
2.7. Mechanistic Insights and Rationale for Calcium Selectivity
Computational bond dissociation energies in Table 2 are consistent in predicting the following preferential binding interactions between chromophore and receptor models with three cations of interest: Mg2+ > Ca2+ > K+. With ene-lactone 2a, Mg2+ is twice as strongly bound compared with Ca2+, and K+ is bound by only 4.3 kcal mol−1 and can be discriminated against. Likewise, with diglycolate anion 4a, Mg2+ is more strongly bound by two and a half times compared with Ca2+, while the interaction with K+ is only half that of Ca2+. On the contrary, optical responses with Fl-DGA (1) exhibit quite the opposite trend: Ca2+ >> K+~Mg2+. Furthermore, a decisive role of the charge-to-radius ratio of cations on the nature of lactone carbon-oxygen bond and other physical and electronic properties is consistent with all computational findings. Factors that contribute to the observed selectivity and insights into the roles of anion, the lactone motif, solvation and diglycolic receptor will be discussed further.
In the absence of solvation, cations bind with both oxygens in the lactone moiety. Cation approaches 2a from the same plane of the molecule and in the middle between ring oxygen (O5) and carbonyl oxygen (O6). The HOMO of 2a has a large in-plane lobe for frontal attack that covers this area (Figure 9a). Alternatively, the chromophore could approach a receptor-cation complex through the LUMO+1 which provides favorable frontal interaction (Figure S3b). Calcium interacts with the carbonyl and ether oxygens in 4 through the HOMO or HOMO-1 (Figure S4d,e). In 4a, the HOMO-1 provides favorable interaction with both carboxylate oxygens (Figure 9b). Resonance contributor in the lactone ring causes the carbonyl oxygen to be more negatively charged and is more strongly bound to cation than the ring oxygen is. In the IEF-PCM model, solvent molecules hinder interaction between cation and the ring oxygen, leaving carbonyl-cation interaction as the main factor in cation recognition.
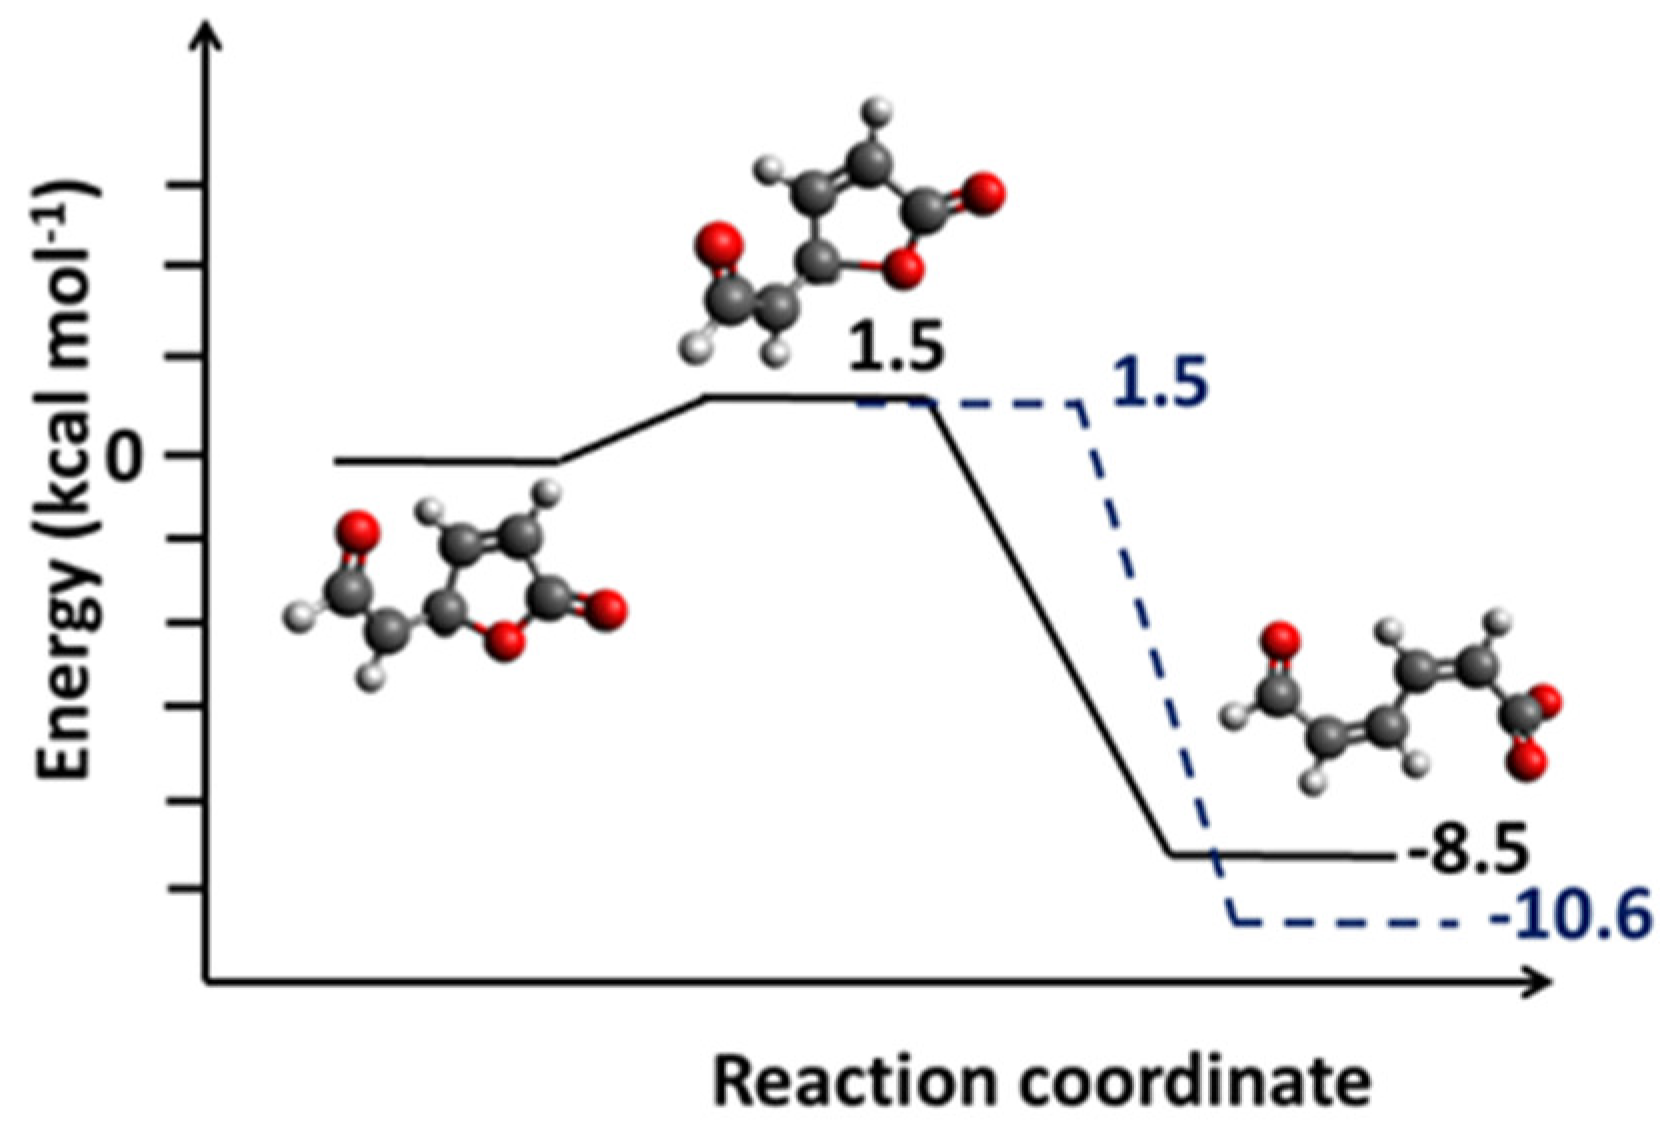
By virtue of the negative charge on C1, the C3-O7 bond in 3a lengthens to 1.53 Å (compared with 1.47 Å in 3). While interaction with Ca2+ leaves the lactone ring in enol 3 intact, the cation catalyzes the ring opening of enolate 3a (Figure 3c). The C2-C3 bond shrinks to 1.36Å, suggesting a double-bond character. Likewise, shortening of the C3-C4 bond to 1.45 Å indicates the formation of the -network (Figure 9c). Calcium interacts strongly with both carboxylate oxygens, affording a Ca-O bond distance of 2.47 Å and O7-Ca-O9 bond angle of 53.7° (Figure 3c). The results imply that the presence of a negatively charged substituent changes the chemistry of the lactone ring in fluorescein derivatives and influences its role in cation recognition. Cation catalyzes the facile ring opening of enolate 3a (Figure 10) with an early transition state and a low activation barrier of just 1.5 kcal mol−1. The transition structure exhibits new single and double C-C bonds, but the carboxylate functionality has not fully formed, and the geometry has not flattened. The transition structure is further characterized by having one imaginary frequency at −304 cm−1, C3-O7 bond distance of 1.83 Å and IRC paths that connect to enolate 3a and the ring-opened product [44]. In methanol, the lactone ring opening process is more exothermic by 2 kcal mol−1 but has the same activation barrier (Figure S5).
Computational binding energies from full structures and simple models consistently predict greater binding strengths with Mg2+, whereas experimental optical responses suggest selectivity towards Ca2+. Apparently, computational bond dissociation energies alone cannot explain the experimental observation. The fluorescein core and diglycolic receptor presumably contribute to selectivity towards Ca2+. Useful insights could be gained from the well documented selectivity of ionomycin towards Ca2+ [45]. The nature of Ca2+ itself most probably is key to the observed selectivity with both 1 and ionomycin.
Although binding energies alone could not account for Ca2+ selectivity, computational results are consistent in highlighting the importance of the charge-to-radius ratio of the cations. Charge density per unit area on Ca2+ is much smaller than that on Mg2+. Therefore, fluorophore, having flexible ionizable arms, can stabilize Ca2+ much more effectively through ion-pair mechanism and discriminate against other cations. On the contrary, K+ and other monovalent cations favor neutral recognition molecules and can be effectively determined through the size exclusion mechanism [46]. Magnesium recognition is more elusive [47] but computational natural bonding orbitals, atomic valence and charge analysis suggest that Mg2+ selectivity most probably arises from effective stabilization of the divalent cation that exhibits high charge density and strong tendency towards covalent interaction. At alkaline pH, the fluorescein core and diglycolate moieties in 1a function as two arms that can freely reorganize to effectively stabilize Ca2+. Rather fortuitously, the entire fluorescein structure acts in favor of Ca2+ recognition; it serves as the second arm that provides stability to Ca2+ by virtue of its carboxylate motif.
Carbonyls, polyethers, peptides and heterocycles have successfully been employed as motifs in cation recognition. The effective use of dicarbonyls as cation receptors is of interest in this study. Diglycolic acid 4 can be viewed as a 1,5-dicarbonyl receptor, having an ether linkage and ionizable carboxylic moiety. The long distance between the two carbonyl groups apparently favors interaction with a large and polarizable divalent cation such as Ca2+. Moreover, the ether linkage participates in cation binding, and the ionizable carboxylic functionality plays a key role in Ca2+ recognition. While the carboxylic moiety is also present in ionomycin, the dicarbonyl presents in the 1,3-position, making the distance between the two carbonyls much shorter and the α-protons significantly acidic for facile ionization. Instead of an ether linkage, ionomycin has two tetrahydrofuran rings that interact with Ca2+.
What then is the origin of Ca2+ selectivity in ionomycin and 1? There are two main reasons that determine the sensor signal: (i) the cation-receptor binding strength, and (ii) the probability of the cation being in contact with the recognition molecule. While binding energies predict stronger interaction with Mg2+, optical response confirms the selectivity towards Ca2+. Logically, something must have prevented Mg2+ from coming into close proximity with the receptor. The medium that surrounds Mg2+ is the most plausible agent that slows down its mobility due to its high charge density. Tight solvent cage encapsulates Mg2+ and hinders its movement. The Hofmeister effect, which favors large monovalent cation, invokes a similar argument [48]. Succinctly, 1 filters out Mg2+ due to the Hofmeister effect and discriminates against K+ via the ion-pair mechanism.
3. Conclusions
The simulation of full-structure 1 and 1a in methanol provides insights into the observed fluorescent enhancement with Ca2+. Selectivity towards Ca2+ and discrimination against Mg2+ and K+ are attributed to diglycolic and lactone motifs. The extent of the lactone C-O bond breaking is indicative of fluorescence activity. As the C-O bond breaks, the xanthene ring loses aromaticity and exhibits dissimilar C-C bonds. The C-O bond breaking, enhanced by the presence of anionic substituent, transforms the lactone motif to a carboxylate functionality that actively participates in Ca2+ recognition. Diene lactone models elucidate the nature of chromophore-cation interaction and provides molecular properties as variables in multivariate analysis. PCA score plots afford distinct and well-separated clusters and prove that computational approaches can be used to evaluate potential chromophores and receptors in the determination of cations for sensor array applications. Fragment models support the full-structure findings that the anionic substituent causes structural changes but does not reproduce the full extent of lactone C-O bond breaking observed in full-structure 1a-Ca2+. Rigid structure in 1a is attributed to the complete breaking of the C-O bond.
Fluorescein derivative 1 was prepared by functionalization of the parent molecule with undecyl arm having a diglycolic moiety at the terminal. Binding energies suggest similar energies for 1-Ca2+, regardless of additional interaction with the lactone motif. In a pre-organized U-shaped 1, Ca2+ can simultaneously interact with the lactone and diglycolic motifs. Emission intensities of 1 with mM and sub mm concentrations of Ca2+ and K+ yield score plots with distinct clusters and are thus suitable for simultaneous detection of these macronutrients in precision agriculture application. The size and charge density of Ca2+ are key factors in the rational design of its receptor. Insights from ionomycin suggest the importance of ionizable motifs in Ca2+ recognition. At an alkaline pH, deprotonation exposes anionic sites that stabilize the large and polarizable divalent cation via an ion-pair mechanism. Despite stronger binding interaction with the diglycolic receptor, Mg2+ is excluded due to its high charge density, poor mobility in polar medium and preference towards covalent bonding.
We have adopted the following methodology in the rational design of a cation receptor that could be generalized for the design of other fluorescent probes: (i) compute full-structure geometries of proposed molecule, (ii) identify key contributing components to a desired recognition, (iii) examine the nature of simple models, (iv) compare geometries of full and fragmented complexes, (v) determine optical responses and detection limits, (vi) account for observed selectivity, (vii) assess multiple-ion capability using PCA, and (viii) generalize the method, evaluate new motifs and target other applications. As evidenced by this report, the methodology involves the above activities, but not necessarily in any particular order. Key activities are most likely performed in parallel, and it is not uncommon that the end triggers the beginning of a new system.
Our findings show that conveniently prepared fluorescent molecules could be exploited in selective Ca2+ determination. In the sensor array and multivariate approach, several cations at mM and sub mm levels can be simultaneously detected for a wide range of applications, including precision agriculture and water quality. The combined computational and experimental approach has proven to be beneficial in the rational design of cation receptors. The approach can be extended to other cations of interest in the following areas: trace-level heavy metal detection, determination of ionic mixtures, precision measurement of anionic macronutrients [49], and rational design of Mg2+ selective fluorescent probe. Fluorescent probes provide an advantageous chemical sensing platform that does not depend on reference electrodes and thus is less prone to errors. It is anticipated that fluorescein, rhodamine and eosin derivatives will continue to play a dominant role in optical sensors. The sensitivity of such an optical sensor could also be improved by incorporating surface plasmon-coupled directional emission as the detector, which could offer new physicochemical insights into the interaction mechanism for such chromophores with its target [50,51]. We are motivated to explore the utility of other versatile motifs such as peptides via facile functionalization of xanthene chromophores.
4. Experimental Section
4.1. Materials and Methods
The chemicals and metal ions used: fluorescein, 4-dimethylaminopyridine (DMAP), 11-bromo-1-undecanol and diglycolic anhydride, were purchased from Sigma-Aldrich (Burlington, MA, USA) and Merck (Darmstadt, Germany) and used without further purification. Acetonitrile, ethanol, ethyl acetate, n-hexane, chloroform and anhydrous N,N’ dimethyl formamide (Sigma Aldrich) were all analytical grade and used without further purification. Deionized distilled water and methanol with HPLC grade, available from Merck (Darmstadt, Germany), were used as the solvent. Acetonitrile and triethylamine (Sigma Aldrich) were freshly distilled over barium oxide before use.
The melting points of samples were measured using a U Met-temp II Laboratory Devices USA. The FTIR spectra were recorded between 4000 and 400 cm−1 as attenuated total reflectance (ATR) on a Perkin Elmer Spectrum 400 FTIR spectrometer. 1H and 13C NMR were recorded on a Bruker Advance 400 spectrometer at 400 and 100 MHz, respectively, using tetramethylsilane (TMS) as the internal standard. The CHN elemental analysis of fluorescein derivatives were determined using a Perkin Elmer CHNS/O 2400 Series II. Fluorescence spectra were obtained using a Spectrometer Avantes 2048-L (Avantes, Netherlands) equipped with an AvaLight-XE LED light source. The spectrometer and the light source were both kept at a constant temperature of 28 °C ± 0.8 °C.
4.2. Synthesis
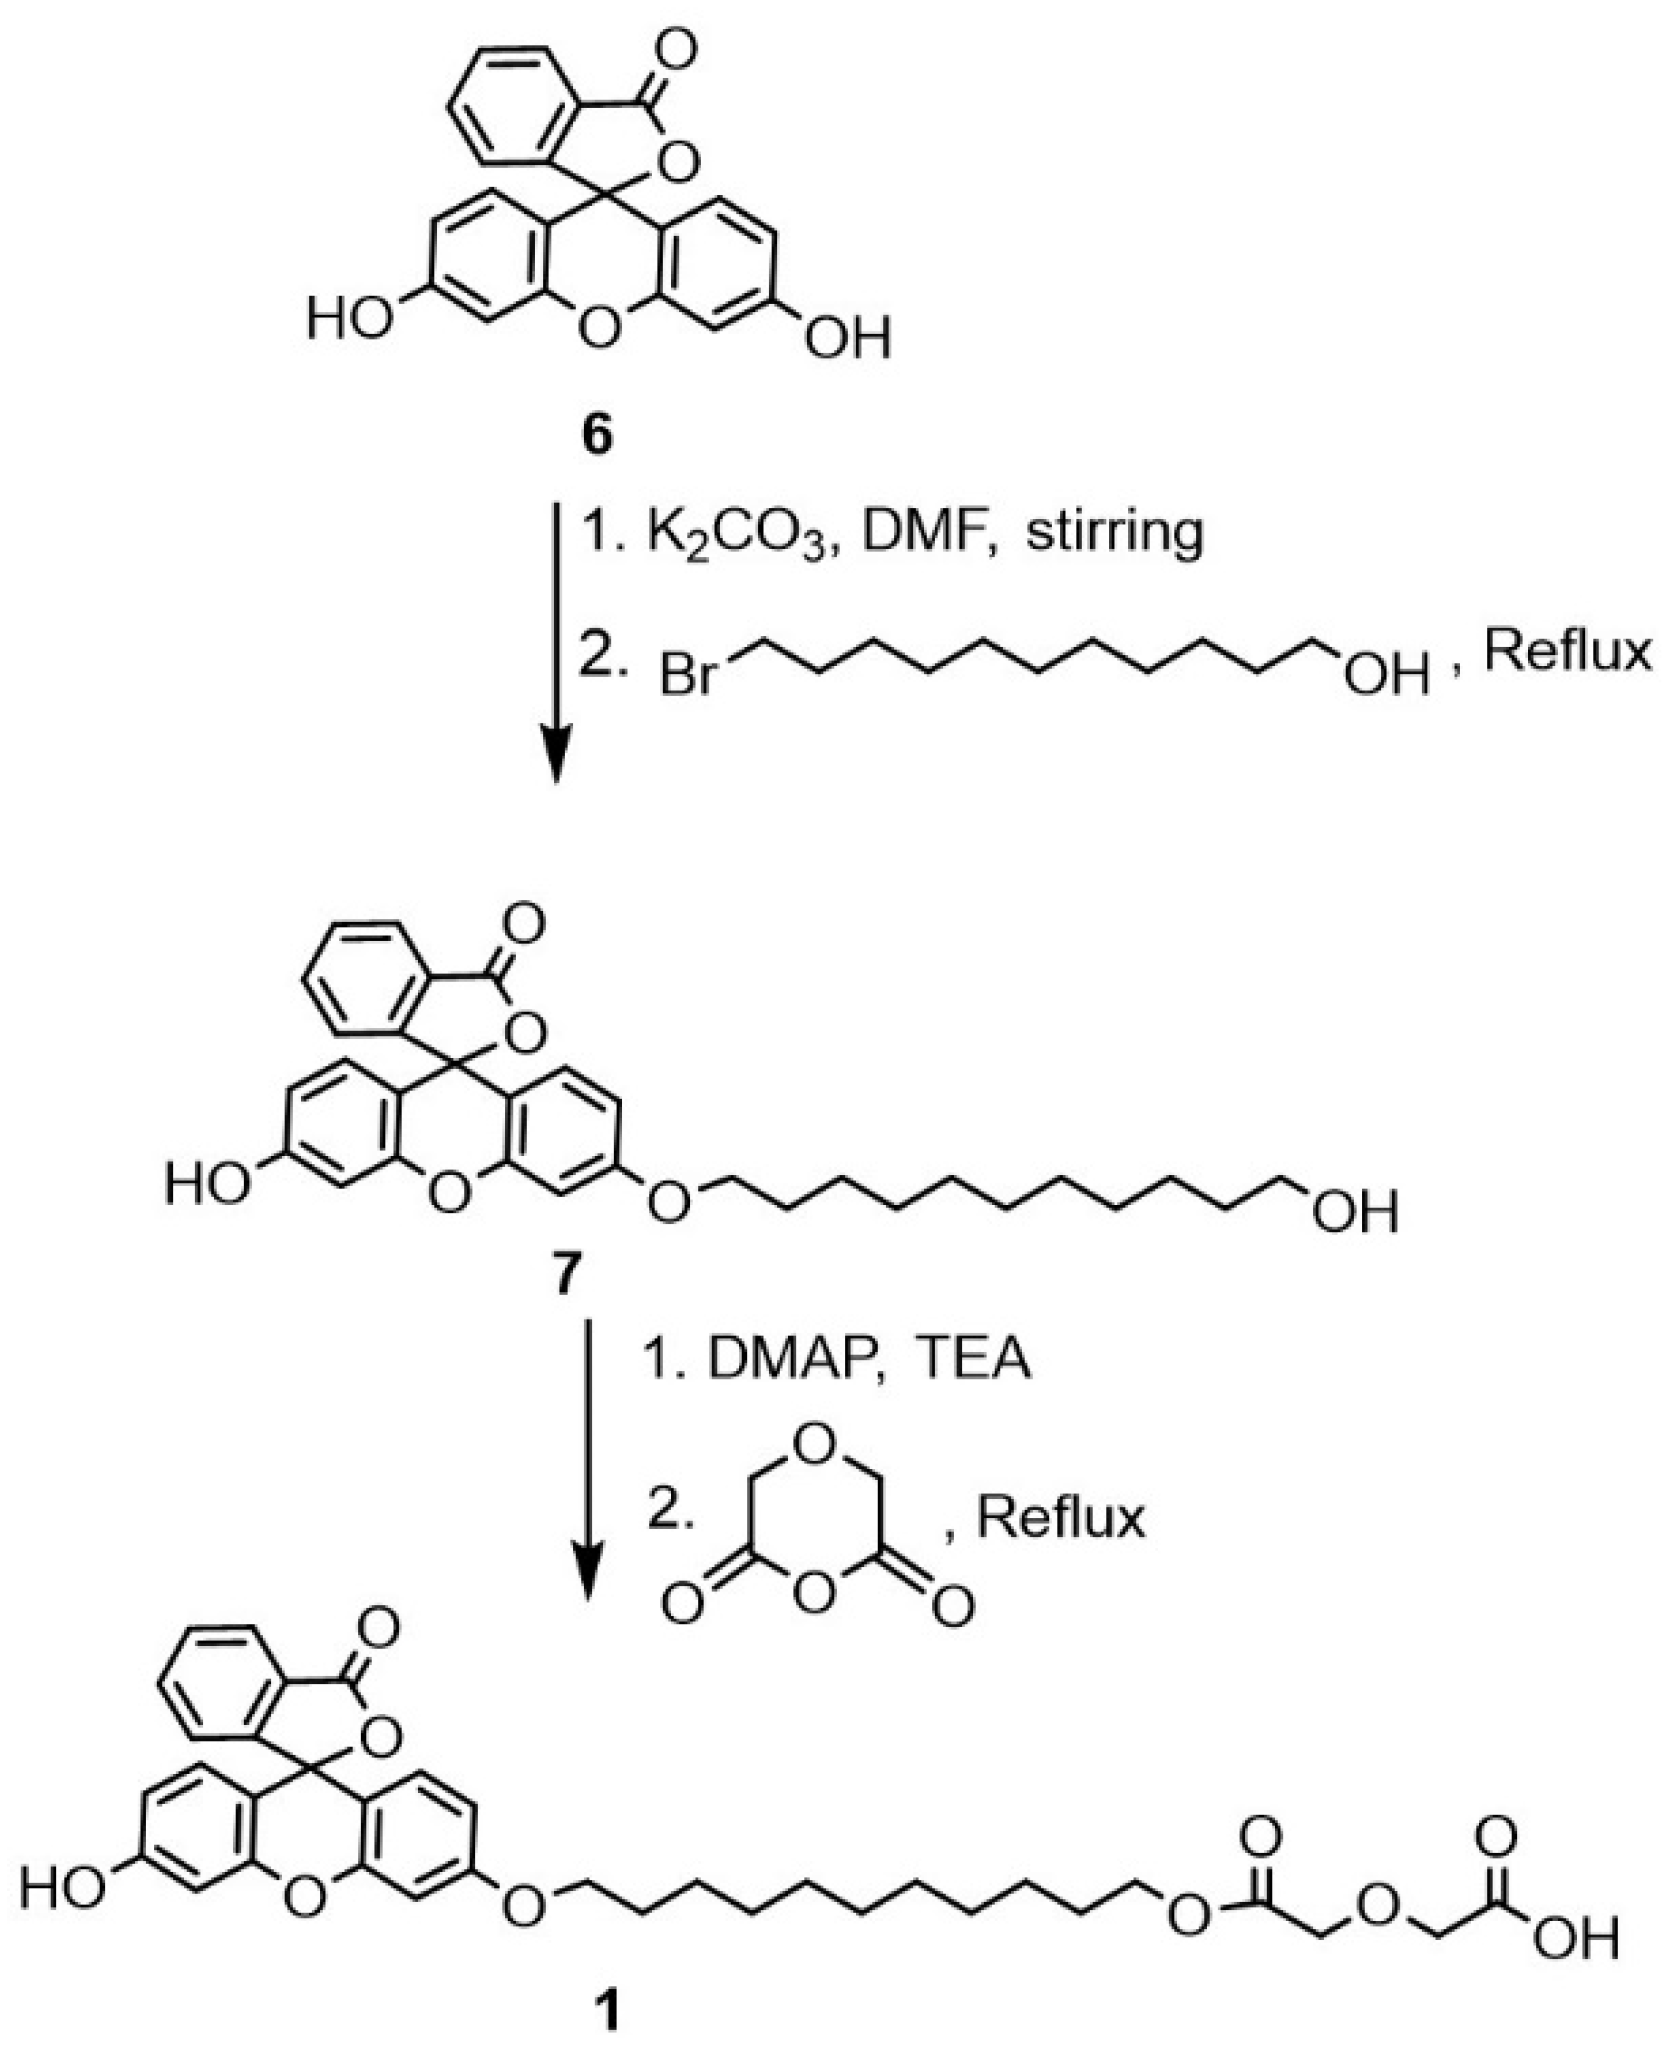
We adopt a three-step approach in preparing fluorescent cation receptors, using unsubstituted fluorescein as a starting material: (i) attach extended arm, (ii) functionalize arm with main motif, and (iii) convert ionizable terminals to esters or amides. Preparation of Fl-DGA, via lipophilic alcohol 7 and without further derivation of the resulting acid, is provided in the following. To a mixture of fluorescein 6 (1 g, 0.3 mmol) and potassium carbonate (0.9 g, 0.6 mmol) in dry DMF, 11-bromo-1-undecanol (0.6 mmol) was added in a dropwise manner and the mixture was refluxed overnight under an inert atmosphere (Scheme 2). The progress of the reaction was monitored by TLC, which indicated formation on a new product and completion of reaction after 18 h. The mixture was rotary evaporated and extracted with ethyl acetate, followed by 20 mL of distilled water (5 times) and the product (7) was purified by column chromatography with 2:1 ratio of ethyl acetate/n-hexane eluent.
7 (3′-hydroxy-6′-((11-hydroxyundecyl)oxy)-3H spiro[isobenzofuran-1,9′-xanthen]-3-one). Yield 58%. IR (ATR, cm−1): 3525 (OH). 3068 (C-H)Ar. 2850, 2919 (C-H)Aliph. 1712 (C=O)Ester. 1503 (C=C)Ar. 1253 (O-C-O)Ether. 1H-NMR (400, CDCl3-d, δ ppm): 8.184 (d, J = 8 Hz, 1H, C-HAr), 7.627 (m, J = 8 Hz 2H, C-HAr), 7.215 (t, J = 8 Hz, 1H, C-HAr), 6.836 (m, 3H, C-HAr), 6.665 (d, J = 8 Hz, 1H, C-HAr), 6.484 (d, J = 8 Hz,0 1H, C-HAr), 6.403 (d, J = 8 Hz, 1H, C-HAr), 3.995 (t, J = 8 Hz, 2H, C-HAliph), 3.567 (m, 2H, C-HAliph), 1.747 (m, 2H, C-HAliph), 1.48 (m, 2H, C-HAliph), 1.38 (m, 2H, C-HAliph); 1.23 (m, 12 H, C-HAliph), 13C-NMR (100 MHz, CDCl3-d, δ ppm): 184.93 (1C, C=O), 165.59 (1C, CAr), 164.16 (1C, C-HAr), 159.06 (1C, C-HAr), 154.63 (1C, C-HAr), 134.01 (1C, C-HAr), 132.54 (1C, C-HAr), 131.34 (1C, C-HAr), 130.79 (2C, C-HAr), 130.40 (2C, C-HAr), 129.75 (1C, C-HAr), 117.46 (1C, C-HAr), 114.85 (1C, C-HAr), 114.33 (1C, C-HAr), 105.54 (2C, C-HAr), 100.62 (2C, C-HAr), 69.08 (1C, C-HAliph), 65.81 (1C, C-HAliph), 32.76 (1C, C-HAliph), 32.76 (1C, C-HAliph), 32.75 (1C, C-HAliph), 32.55 (1C, C-HAliph), 29.55 (1C, C-HAliph), 29.47 (1C, C-HAliph), 29.40 (1C, C-HAliph), 29.37 (1C, C-HAliph), 25.76 (1C, C-HAliph). Elemental analysis; calculated: C, 74.08; H, 6.82; O, 19.10, found: C, 73.40; H, 6.14.
A solution of 0.01 mol of diglycolic anhydride in dry acetonitrile was added dropwise into a gently stirred solution containing 0.01 mol of 4-dimethylaminopyridine (DMAP), 0.01 mol of triethylamine and 0.01 mol of compound 7 in 20 mL of freshly distilled acetonitrile (Scheme 2). The mixture was stirred and refluxed under inert atmosphere for an additional three hours. The mixture was then cooled to room temperature before extraction with chloroform. The combined organic layer was washed with 15 mL of 5% of citric acid solution followed by 15 mL of saturated brine solution. The washing step was repeated for another two times and the organic layer dried with anhydrous magnesium sulfate. The chloroform solvent was removed by a rotary evaporator to produce orange oil product.
1 2-(2-((11-((3′-hydroxy-3-oxo-3H-spiro[isobenzofuran-1,9′-xanthen]-6′-yl)oxy)undecyl)oxy)-2-oxoethoxy)acetic acid. Yield 87%. IR (ATR, cm−1): 3525 (OH). 3074 (C-H)Ar. 2926, 2854 (C-H)Aliph. 1634 (C=O)Acid, 1732 (C=O)ester. 1453, 1421 (C=C)Ar. 1264 (O-C-O)Ether. 1H-NMR (400 MHz, CDCl3-d, δ ppm): 8.186 (d, J = 8 Hz, 1H, C-HAr), 7.819 (m, 1H, C-HAr), 7.692 (t, J = 8 Hz, 1H, C-HAr), 6.882 (m, 3H, C-HAr), 6.686 (d, J = 8 Hz, 1H, C-HAr), 6.614 (d, J = 8 Hz1H, C-HAr), 6.399 (d, J = 8 Hz, 1H, J = 8 Hz, C-HAr), 6.23 (s, C-HAr), 4.20 (s, 2H, C-HAliph), 4.17 (s, 2H, C-HAliph), 4.023 (t, J = 8 Hz, 2H, C-HAliph), 3.857 (m, 2H, C-HAliph), 1.725 (m, J = 8 Hz, 2H, C-HAliph), 1.319 (m, J = 8 Hz, 2H, C-HAliph), 1.339 (m, J = 8 Hz, 2H, C-HAliph); 1.14 (m, 12H, C-HAliph), 13C-NMR (100 MHz, CDCl3-d, δ ppm): 184.33 (1C, C=O), 171.54 (1C, C=O), 170.20 (1C, C=O), 165.82 (1C, C-HAr), 163.90 (1C, C-HAr), 158.82 (1C, C-HAr), 154.13 (1C, C-HAr), 150.47 (1C, C-HAr), 136.12 (1C, C-HAr), 131.05 (1C, C-HAr), 130.57 (1C, C-HAr), 130.48 (1C, C-HAr), 129.82 (1C, C-HAr), 129.11 (1C, C-HAr), 117.14 (1C, C-HAr), 114.69 (2C, C-HAr), 111.26 (2C, C-HAr), 105.01 (2C, C-HAr), 101.29 (1C, C-HAr), 83.23 (1C, C-HAcid), 79.59 (1C, C-HAcid), 68.43 (1C, C-HAliph), 64.62 (1C, C-HAliph), 29.54 (1C, C-HAliph), 29.44 (1C, C-HAliph), 29.40 (1C, C-HAliph), 29.14 (1C, C-HAliph), 28.91 (1C, C-HAliph), 28.79 (1C, C-HAliph), 28.54 (1C, C-HAliph), 25.98 (1C, C-HAliph), 25.83 (1C, C-HAliph), Elemental analysis; calculated: C, 67.95; H, 6.19; O, 25.86, found: C, 67.54; H, 6.30.
4.3. Computational Details
All computations were performed with the G09 [52] system of programs using the B3LYP [53,54] hybrid functional and the split valence basis set with polarization and diffuse functions for heavy atoms. Vibrational frequency calculations were carried out to confirm that the optimized structures produce only positive frequencies, and the transition structures give one and only one large negative frequency. The Becke three-parameter [55,56] uses the nonlocal correlation provided by the LYP expression and the VWN [57] functional III for local correlation. The hybrid functional utilizes Becke 88 exchange functional [58]. All geometry optimizations were initially performed at the B3LYP/6-31+G(d,p) level with IEF-PCM [59] methanol continuum solvation model. Binding energies on small structures and complexes (fewer than ten heavy atoms) were obtained at B3LYP/6-311+G(2df,2p) level with the IEF-PCM methanol solvation model. The AOMix package [35] was used to analyze the nature of interaction between heteroatom and cation and in estimating the atomic valence and bond order (Mayer) [60] of the lactone C-O bond. GIAO [36] nuclear magnetic shielding calculations on carbon nuclei were performed with B3LYP/6-311G(2d,p) level to investigate the changes in shielding characteristics as the chromophore interacts with cation, lactone C-O bond breaks and conjugated π-network forms in the chromophore-cation complex. Natural Bonding Orbital (NBO) [34] calculations were performed, utilizing the built-in features in G09, to estimate orbital characteristics in chemical bonds of interest, i.e., the lactone C-O bond and the neighboring C-C bonds. PCA of computational and experimental data were performed using R programming language [61]. Score plots were obtained from the highest three principal components using commercial spreadsheet software.
Supplementary Materials
The following supporting information can be downloaded at: https://www.mdpi.com/article/10.3390/molecules27196248/s1, Figure S1: Optimized geometries of diene-lactone 2 and its complexes; (a) diene-lactone 2, (b) complex of 2 and Ca2+, (c) complex of 2 and K+, and (d) complex of 2 and Mg2+.; Figure S2: Parameter plots for diene-lactone 2 with B3LYP 6-311+g (2df,2p) and in methanol; (a) cation binding energy vs. HOMO stabilization, (b) C3-O7 bond distance vs. charge transfer, (c) C3-O7 bond distance vs. charge-to-radius ratio, and (d) C3 NMR vs. C3 p-character; Figure S3: Frontier orbitals of models; (a) HOMO-1 of ene-lactone 2a, (b) LUMO+1 of 4a-Ca2+ complex, (c) LUMO of 4a-Ca2+ complex, (d) HOMO of diglycolic acid 4, (e) HOMO-1 of 4. (g) HOMO of diglycolate 4a; Figure S4: Optimized geometries and parameter plots simple in methanol; (a) complex of enol 3 and Ca2+, (b) complex of enol 3 and K+, (c) 5a-4a-K+ complex, (d) carbonyl CO bond distance vs. carbonyl O charge, (e) HOMO energy vs. carbonyl CO bond distance, and (f) C3-O7 bond distance vs. C3-O7 total overlap population; Figure S5: Structures of intermediates during formation of the acyclic form of 3a-Ca2+.
Author Contributions
Conceptualization, P.M.W. and V.S.L.; methodology, L.N. and N.S.M.; writing—original draft preparation, L.N. and Y.A.; writing—review and editing, P.M.W. and V.S.L. All authors have read and agreed to the published version of the manuscript.
Funding
This research was funded by Universiti Malaya (UM) International Collaboration Grant, ST005-2022 and UM KW IPPP—Research Maintenance Fee (RMF) RMF1433-2021.
Institutional Review Board Statement
Not applicable.
Informed Consent Statement
Not applicable.
Data Availability Statement
Not applicable.
Conflicts of Interest
The authors declare no competing financial interest.
References
- Robertson, T.; Bunel, F.; Roberts, M.S. Fluorescein Derivatives in Intravital Fluorescence Imaging. Cells 2013, 2, 591–606. [Google Scholar] [CrossRef] [PubMed]
- Qiu, J.; Zhong, C.; Liu, M.; Yuan, Y.; Zhu, H.; Gao, Y. Rational design and bioimaging application of water-soluble Fe3+ fluorescent probes. N. J. Chem. 2021, 45, 5184–5194. [Google Scholar] [CrossRef]
- Zhong, C.; Qiu, J.; Liu, M.; Yuan, Y.; Zhu, H.; Gao, Y. Rational design and bioimaging application of cholesterol conjugated fluorescence probe for Cu2+ detection. J. Photochem. Photobiol. A Chem. 2021, 414, 113267. [Google Scholar] [CrossRef]
- Wu, X.; Gong, X.; Dong, W.; Ma, J.; Chao, J.; Li, C.; Wang, L.; Dong, C. A novel fluorescein-based colorimetric probe for Cu2+ detection. RSC Adv. 2016, 6, 59677–59683. [Google Scholar] [CrossRef]
- Wysocki, L.M.; Grimm, J.B.; Tkachuk, A.; Brown, T.; Betzig, E.; Lavis, L.D. Facile and General Synthesis of Photoactivatable Xanthene Dyes. Angew. Chem. Int. Ed. 2011, 50, 11206–11209. [Google Scholar] [CrossRef]
- Cook, M.P.; Ando, S.; Koide, K. One-step synthesis of a fluorescein derivative and mechanistic studies. Tetrahedron Lett. 2012, 53, 5284–5286. [Google Scholar] [CrossRef]
- Batistela, V.R.; Cedran, J.D.C.; de Oliveira, H.P.M.; Scarminio, I.S.; Ueno, L.T.; Machado, A.E.D.H.; Hioka, N. Protolytic fluorescein species evaluated using chemometry and DFT studies. Dye. Pigment. 2010, 86, 15–24. [Google Scholar] [CrossRef]
- Carter, K.P.; Young, A.M.; Palmer, A.E. Fluorescent Sensors for Measuring Metal Ions in Living Systems. Chem. Rev. 2014, 114, 4564–4601. [Google Scholar] [CrossRef]
- Xu, W.; Park, J.Y.; Kattel, K.; Ahmad, W.; Alam Bony, B.; Heo, W.C.; Jin, S.; Park, J.W.; Chang, Y.; Kim, T.J.; et al. Fluorescein-polyethyleneimine coated gadolinium oxide nanoparticles as T1 magnetic resonance imaging (MRI)–cell labeling (CL) dual agents. RSC Adv. 2012, 2, 10907–10915. [Google Scholar] [CrossRef]
- Peterlik, M.; Kállay, E.; Cross, H.S. Calcium Nutrition and Extracellular Calcium Sensing: Relevance for the Pathogenesis of Osteoporosis, Cancer and Cardiovascular Diseases. Nutrients 2013, 5, 302–327. [Google Scholar] [CrossRef]
- Tripathi, D.K.; Singh, V.P.; Chauhan, D.K.; Prasad, S.M.; Dubey, N.K. Role of macronutrients in plant growth and acclimation: Recent advances and future prospective. In Improvement of Crops in the Era of Climatic Changes; Ahmad, P., Wani, M.R., Azooz, M.M., Phan Tran, L.S., Eds.; Springer: New York, NY, USA, 2014. [Google Scholar] [CrossRef]
- Maathuis, F.J.M. Physiological functions of mineral macronutrients. Curr. Opin. Plant Biol. 2009, 12, 250–258. [Google Scholar] [CrossRef]
- de Bang, T.C.; Husted, S.; Laursen, K.H.; Persson, D.P.; Schjoerring, J.K. The molecular–physiological functions of mineral macronutrients and their consequences for deficiency symptoms in plants. New Phytol. 2020, 229, 2446–2469. [Google Scholar] [CrossRef]
- Osório, C.R.W.D.S.; Teixeira, G.C.M.; Barreto, R.F.; Campos, C.N.S.; Leal, A.J.F.; Teodoro, P.E.; Prado, R.D.M. Macronutrient deficiency in snap bean considering physiological, nutritional, and growth aspects. PLoS ONE 2020, 15, e0234512. [Google Scholar] [CrossRef]
- Bedlechowicz, I.; Maj-Żurawska, M.; Sokalski, T.; Hulanicki, A. Effect of a plasticizer on the detection limit of calcium-selective electrodes. J. Electroanal. Chem. 2002, 537, 111–118. [Google Scholar] [CrossRef]
- Jiang, X.; Wang, P.; Liang, R.; Qin, W. Improving the Biocompatibility of Polymeric Membrane Potentiometric Ion Sensors by Using a Mussel-Inspired Polydopamine Coating. Anal. Chem. 2019, 91, 6424–6429. [Google Scholar] [CrossRef]
- Souza, S.S.; Cruz, A.G.; Walter, E.H.; Faria, J.A.; Celeghini, R.M.; Ferreira, M.M.; Granato, D.; Sant’Ana, A.D.S. Monitoring the authenticity of Brazilian UHT milk: A chemometric approach. Food Chem. 2011, 124, 692–695. [Google Scholar] [CrossRef]
- Feron, V.; Groten, J. Toxicological evaluation of chemical mixtures. Food Chem. Toxicol. 2002, 40, 825–839. [Google Scholar] [CrossRef]
- Johnson, R.A.; Wichern, D.W. Applied Multivariate Statistical Analysis; Prentice Hall: Englewood Cliffs, NJ, USA, 1992; Volume 4. [Google Scholar]
- Rosli, A.N.; Abu Bakar, M.A.; Manan, N.S.A.; Woi, P.M.; Lee, V.S.; Zain, S.; Ahmad, M.R.; Alias, Y. G3 Assisted Rational Design of Chemical Sensor Array Using Carbonitrile Neutral Receptors. Sensors 2013, 13, 13835–13860. [Google Scholar] [CrossRef]
- Woi, P.M.; Bakar, M.A.A.; Rosli, A.N.; Lee, V.S.; Ahmad, M.R.; Zain, S.; Alias, Y. Does cation break the cyano bond? A critical evaluation of nitrile-cation interaction. J. Mol. Model. 2014, 20, 2219. [Google Scholar] [CrossRef]
- Rosli, A.N.; Abu Bakar, M.A.; Lee, V.S.; Zain, S.; Ahmad, M.R.; Manan, N.S.A.; Alias, Y.; Woi, P.M. Rational design of carbonitrile-carboxaldehyde cation receptor models: Probing the nature of the heteroatom–metal interaction. J. Mol. Model. 2014, 20, 2428. [Google Scholar] [CrossRef]
- He, H.; Jenkins, K.; Lin, C. A fluorescent chemosensor for calcium with excellent storage stability in water. Anal. Chim. Acta 2008, 611, 197–204. [Google Scholar] [CrossRef]
- Fink, D.W.; Koehler, W.R. pH Effects on fluorescence of umbelliferone. Anal. Chem. 1970, 42, 990–993. [Google Scholar] [CrossRef]
- Haupts, U.; Maiti, S.; Schwille, P.; Webb, W.W. Dynamics of fluorescence fluctuations in green fluorescent protein observed by fluorescence correlation spectroscopy. Proc. Natl. Acad. Sci. USA 1998, 95, 13573–13578. [Google Scholar] [CrossRef]
- Pratt, L.M.; Nguỹên, N.V.; Ramachandran, B. Computational Strategies for Evaluating Barrier Heights for Gas-Phase Reactions of Lithium Enolates. J. Org. Chem. 2005, 70, 4279–4283. [Google Scholar] [CrossRef]
- Ahmad, M.R.; Dahlke, G.D.; Kass, S.R. The Thio-Wittig Rearrangement of Deprotonated Allyl Methyl Sulfide. A Gas-Phase Unimolecular Isomerization Probed with a Variable Temperature Flowing Afterglow-Triple Quadrupole Device. J. Am. Chem. Soc. 1996, 118, 1398–1407. [Google Scholar] [CrossRef]
- Evans, D.A.; Golob, A.M. [3,3]Sigmatropic rearrangements of 1,5-diene alkoxides. Powerful accelerating effects of the alkoxide substituent. J. Am. Chem. Soc. 1975, 97, 4765–4766. [Google Scholar] [CrossRef]
- Greeves, N.; Lee, W.-M. Synthetic Applications (I) of the Tandem [2,3]-Wittig-Anionic Oxy-Cope Rearrangement: Stereoselective Disubstituted Tetrahydropyran Synthesis by Electrophile Initiated Cyclisation. Tetrahedron Lett. 1997, 38, 6449–6452. [Google Scholar] [CrossRef]
- Glassey, W.V.; Hoffmann, R. A comparative study of Hamilton and overlap population methods for the analysis of chemical bonding. J. Chem. Phys. 2000, 113, 1698–1704. [Google Scholar] [CrossRef]
- Le Roy, J.J.; Jeletic, M.; Gorelsky, S.I.; Korobkov, I.; Ungur, L.; Chibotaru, L.F.; Murugesu, M. An Organometallic Building Block Approach To Produce a Multidecker 4f Single-Molecule Magnet. J. Am. Chem. Soc. 2013, 135, 3502–3510. [Google Scholar] [CrossRef]
- Wiberg, K.B. Basis set effects on calculated geometries: 6-311++G** vs. aug-cc-pVDZ. J. Comput. Chem. 2004, 25, 1342–1346. [Google Scholar] [CrossRef]
- Fleming, I. Frontier Orbitals and Organic Chemical Reactions; Wiley: New York, NY, USA, 1977. [Google Scholar]
- Weinhold, F.; Landis, C.R. Valency and Bonding: A Natural Bond Orbital Donor—Acceptor Perspective; Cambridge University Press: Cambridge, UK, 2005. [Google Scholar]
- Gorelsky, S. AOMix-Software Package for Electronic Structure Analysis, Revision 6.87 d; Ottawa, ON, Canada, 2013.
- Schreckenbach, G.; Ziegler, T. Calculation of NMR Shielding Tensors Using Gauge-Including Atomic Orbitals and Modern Density Functional Theory. J. Phys. Chem. 1995, 99, 606–611. [Google Scholar] [CrossRef]
- Zhu, M.; Ghodsi, A. Automatic dimensionality selection from the scree plot via the use of profile likelihood. Comput. Stat. Data Anal. 2006, 51, 918–930. [Google Scholar] [CrossRef]
- Brereton, R.G. Chemometrics: Data Analysis for the Laboratory and Chemical Plant; John Wiley & Sons: Hoboken, NJ, USA, 2003. [Google Scholar]
- Shannon, R.D. Revised effective ionic radii and systematic studies of interatomic distances in halides and chalcogenides. Acta Cryst. 1976, A32, 751–766. [Google Scholar] [CrossRef]
- Tirado, M.; Polfer, N.C. Defying Entropy: Forming Large Head-to-Tail Macrocycles in the Gas Phase. Angew. Chem. 2012, 124, 6542–6544. [Google Scholar] [CrossRef]
- Barrow, D.A.; Lentz, B.R. Quinine as a fluorescence lifetime standard: Conditions for effectively homogeneous decay. Chem. Phys. Lett. 1984, 104, 163–167. [Google Scholar] [CrossRef]
- Grynkiewicz, G.; Poenie, M.; Tsien, R.Y. A new generation of Ca2+ indicators with greatly improved fluorescence properties. J. Biol. Chem. 1985, 260, 3440–3450. [Google Scholar] [CrossRef]
- Ahmad, S.; Reynolds, D. Monitoring of water quality using fluorescence technique: Prospect of on-line process control. Water Res. 1999, 33, 2069–2074. [Google Scholar] [CrossRef]
- Ayala, P.Y.; Schlegel, H.B. A combined method for determining reaction paths, minima, and transition state geometries. J. Chem. Phys. 1997, 107, 375–384. [Google Scholar] [CrossRef]
- Liu, C.; Hermann, T. Characterization of ionomycin as a calcium ionophore. J. Biol. Chem. 1978, 253, 5892–5894. [Google Scholar] [CrossRef]
- Ertekin, K. Fiber optic sodium and potassium sensing by using a newly synthesized squaraine dye in PVC matrix. Talanta 2002, 58, 719–727. [Google Scholar] [CrossRef]
- Zhang, W.; Jenny, L.; Spichiger, U.E. A Comparison of Neutral Mg2+-Selective Ionophores in Solvent Polymeric Membranes: Complex Stoichiometry and Lipophilicity. Anal. Sci. 2000, 16, 11–18. [Google Scholar] [CrossRef]
- Ninham, A.B.W.; Yaminsky, V. Ion Binding and Ion Specificity: The Hofmeister Effect and Onsager and Lifshitz Theories. Langmuir 1997, 13, 2097–2108. [Google Scholar] [CrossRef]
- Zhang, D.; Cochrane, J.R.; Martinez, A.; Gao, G. Recent advances in H2PO4− fluorescent sensors. RSC Adv. 2014, 4, 29735–29749. [Google Scholar] [CrossRef]
- Rai, A.; Bhaskar, S.; Battampara, P.; Reddy, N.; Ramamurthy, S.S. Integrated Photo-Plasmonic Coupling of Bioinspired Sharp-Edged Silver Nano-particles with Nano-films in Extended Cavity Functional Interface for Cellphone-aided Femtomolar Sensing. Mater. Lett. 2022, 316, 132025. [Google Scholar] [CrossRef]
- Rai, A.; Bhaskar, S.; Mohan, G.K.; Ramamurthy, S.S. Biocompatible Gellucire® Inspired Bimetallic Nanohybrids for Augmented Fluorescence Emission Based on Graphene Oxide Interfacial Plasmonic Architectures. ECS Trans. 2022, 107, 4527–4535. [Google Scholar] [CrossRef]
- Frisch, M.; Trucks, G.W.; Schlegel, H.B.; Scuseria, G.E.; Robb, M.A.; Cheeseman, J.R.; Scalmani, G.; Barone, V.; Mennucci, B.; Petersson, G.A. Gaussian 09 rev. D 01; Gaussian Inc.: Wallingford, CT, USA, 2010. [Google Scholar]
- Kim, K.; Jordan, K.D. Comparison of Density Functional and MP2 Calculations on the Water Monomer and Dimer. J. Phys. Chem. 1994, 98, 10089–10094. [Google Scholar] [CrossRef]
- Perdew, J.P.; Ernzerhof, M.; Burke, K. Rationale for mixing exact exchange with density functional approximations. J. Chem. Phys. 1996, 105, 9982–9985. [Google Scholar] [CrossRef]
- Lee, C.; Yang, W.; Parr, R.G. Development of the Colle-Salvetti correlation-energy formula into a functional of the electron density. Phys. Rev. B 1988, 37, 785–789. [Google Scholar] [CrossRef]
- Becke, A.D. A new mixing of Hartree–Fock and local density-functional theories. J. Chem. Phys. 1993, 98, 1372–1377. [Google Scholar] [CrossRef]
- Vosko, S.H.; Wilk, L.; Nusair, M. Accurate spin-dependent electron liquid correlation energies for local spin density calculations: A critical analysis. Can. J. Phys. 1980, 58, 1200–1211. [Google Scholar] [CrossRef]
- Becke, A.D. Density-functional exchange-energy approximation with correct asymptotic behavior. Phys. Rev. A 1988, 38, 3098–3100. [Google Scholar] [CrossRef] [PubMed]
- Tomasi, J.; Mennucci, B.; Cancès, E. The IEF version of the PCM solvation method: An overview of a new method addressed to study molecular solutes at the QM ab initio level. J. Mol. Struct. THEOCHEM 1999, 464, 211–226. [Google Scholar] [CrossRef]
- Mayer, I. Bond order and valence indices: A personal account. J. Comput. Chem. 2006, 28, 204–221. [Google Scholar] [CrossRef]
- R Core Team. R: A Language and Environment for Statistical Computing; R Foundation for Statistical Computing: Vienna, Austria, 2012. [Google Scholar]
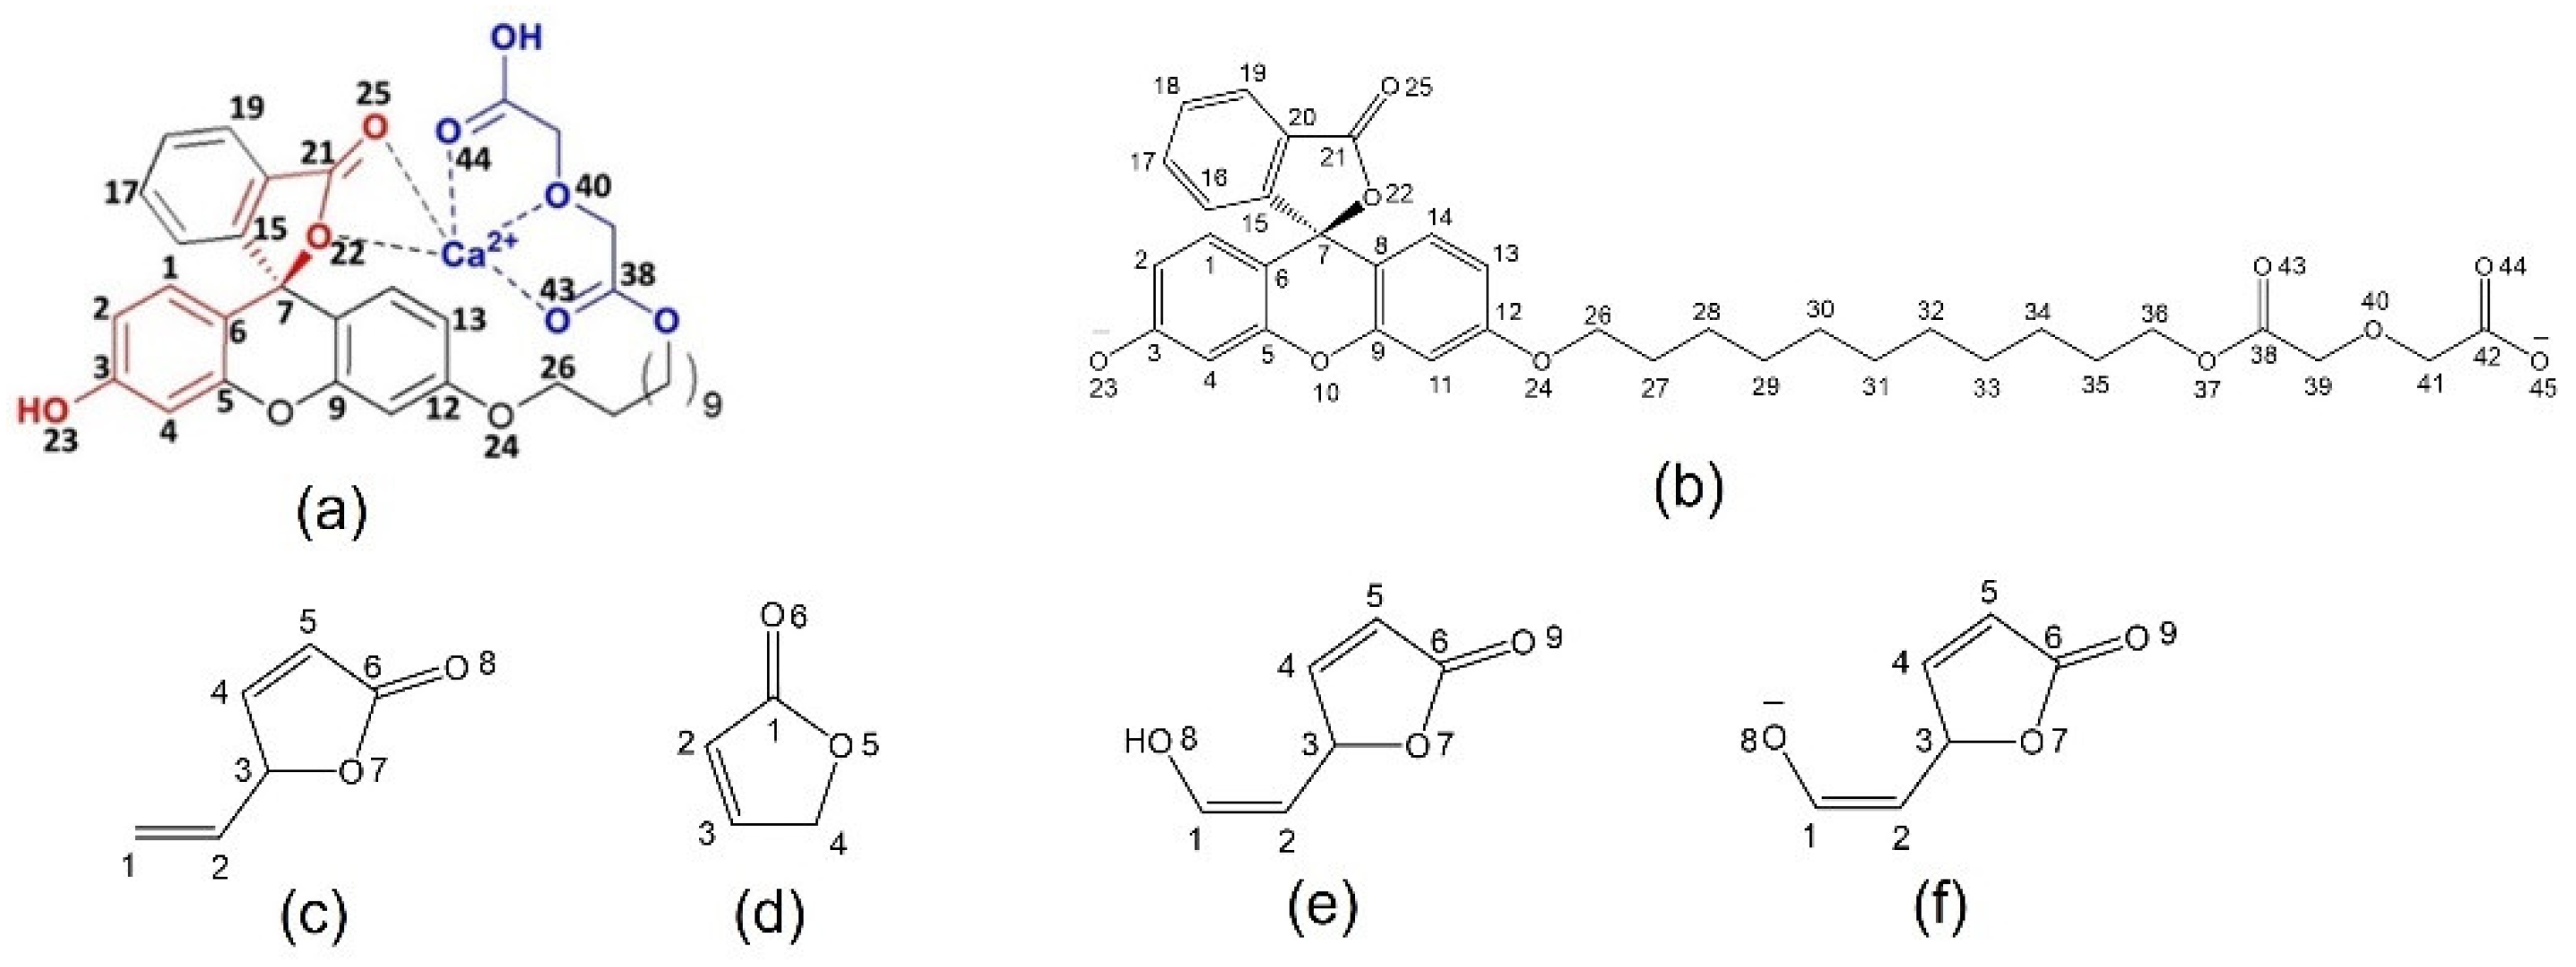
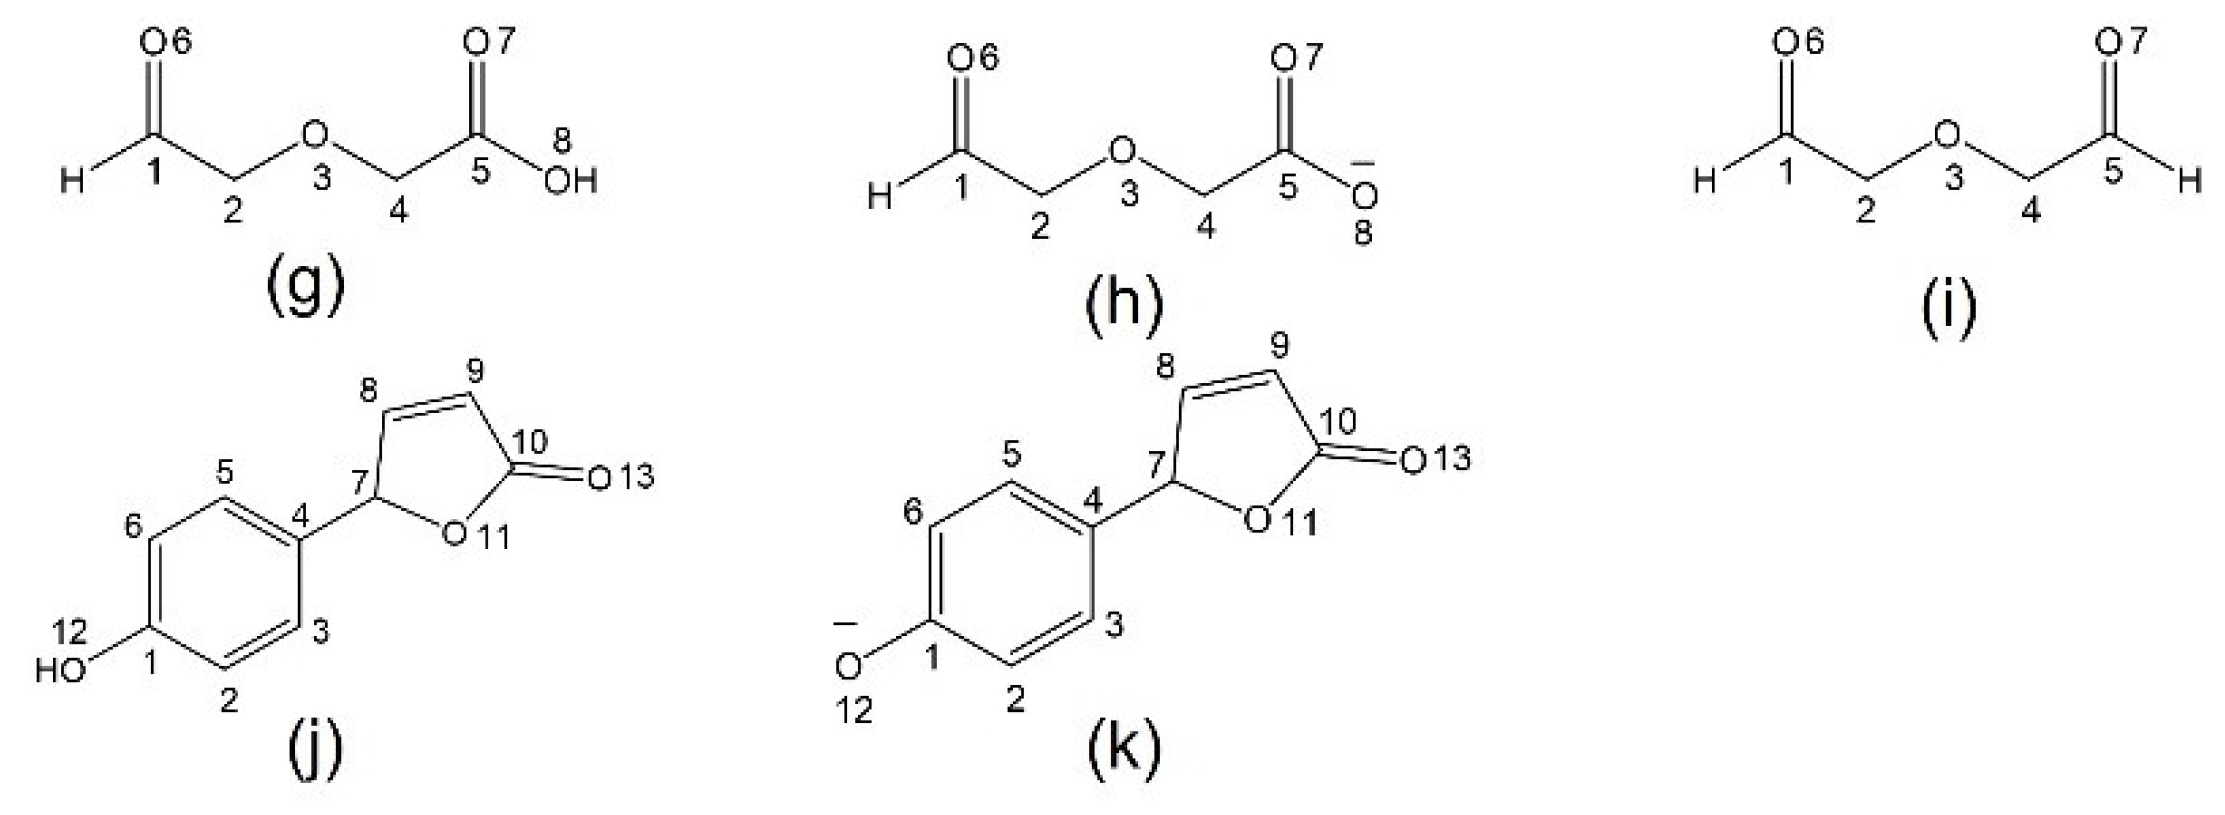
Scheme 1.
Models with atom numbering systems; (a) 1 (red is chromophore core; and blue is Ca2+ receptor), (b) 1a, (c) 2, (d) 2a, (e) 3, (f) 3a, (g) 4, (h) 4a, (i) 4b, (j) 5 and (k) 5a.
Scheme 1.
Models with atom numbering systems; (a) 1 (red is chromophore core; and blue is Ca2+ receptor), (b) 1a, (c) 2, (d) 2a, (e) 3, (f) 3a, (g) 4, (h) 4a, (i) 4b, (j) 5 and (k) 5a.


Figure 1.
Complexes of 1 and 1a with Ca2+ in methanol; (a) Non-interacting 1-Ca2+, (b) strongly interacting 1a-Ca2+, and (c) interacting 1-Ca2+.
Figure 1.
Complexes of 1 and 1a with Ca2+ in methanol; (a) Non-interacting 1-Ca2+, (b) strongly interacting 1a-Ca2+, and (c) interacting 1-Ca2+.

Figure 2.
Full-structure optimized geometries in methanol; (a) 1, (b) fluorescein, and (c) deprotonated fluorescein.
Figure 2.
Full-structure optimized geometries in methanol; (a) 1, (b) fluorescein, and (c) deprotonated fluorescein.

Figure 3.
Chromophore models in methanol; (a) enolate 3a, (b) enol 3, and (c) complex of 3a and Ca2+ exists in acyclic form.
Figure 3.
Chromophore models in methanol; (a) enolate 3a, (b) enol 3, and (c) complex of 3a and Ca2+ exists in acyclic form.

Figure 4.
(a) C6 NMR of 2 vs. cation charge-to-radius ratio in methanol, (b) C3-O7 bond order vs. C3 p-character for chromophore models, (c) PC2 vs. PC1 score plot, (d) computational Scree plot, and (e) experimental Scree plot.
Figure 4.
(a) C6 NMR of 2 vs. cation charge-to-radius ratio in methanol, (b) C3-O7 bond order vs. C3 p-character for chromophore models, (c) PC2 vs. PC1 score plot, (d) computational Scree plot, and (e) experimental Scree plot.

Figure 5.
Optimized geometries of 4 and 4a in methanol; (a) 4, (b) 4a, (c) complex of 4a and Ca2+, (d) complex of 4a and Ca2+ with 2 oxygens, (e) complex of 4 and Ca2+, and (f) complex of 4a and K+.
Figure 5.
Optimized geometries of 4 and 4a in methanol; (a) 4, (b) 4a, (c) complex of 4a and Ca2+, (d) complex of 4a and Ca2+ with 2 oxygens, (e) complex of 4 and Ca2+, and (f) complex of 4a and K+.

Figure 6.
Optimized geometries of complexes with 5 and 5a in methanol; (a) complex of 5 and Ca2+, (b) complex of 5a and Ca2+, (c) 5a-4a-Ca2+ complex, and (d) 5-4-Ca2+ complex.
Figure 6.
Optimized geometries of complexes with 5 and 5a in methanol; (a) complex of 5 and Ca2+, (b) complex of 5a and Ca2+, (c) 5a-4a-Ca2+ complex, and (d) 5-4-Ca2+ complex.

Figure 7.
Emission intensities with Ca2+, K+ and Mg2+; (a) 1, (b) Fl, (c) Fl-OH and (d) Rh. Color: black (Ca2+), red (K+), blue (Mg2+) and green (fluorophore).
Figure 7.
Emission intensities with Ca2+, K+ and Mg2+; (a) 1, (b) Fl, (c) Fl-OH and (d) Rh. Color: black (Ca2+), red (K+), blue (Mg2+) and green (fluorophore).

Figure 8.
Score plots; (a) 0.1 mM K+ and 0.1 mM Ca2+ in 1 mM 1, (b) 0.1 mM K+, 0.1 mM Ca2+, 1 mM K+, 1 mM Ca2+ in 1 mM 1, and (c) 0.01, 0.1 and 1 mM Ca2+ in 1 mM 1.
Figure 8.
Score plots; (a) 0.1 mM K+ and 0.1 mM Ca2+ in 1 mM 1, (b) 0.1 mM K+, 0.1 mM Ca2+, 1 mM K+, 1 mM Ca2+ in 1 mM 1, and (c) 0.01, 0.1 and 1 mM Ca2+ in 1 mM 1.

Figure 9.
Frontier orbitals of 2a and 4a; (a) HOMO of 2a, (b) HOMO-1 of 4a, and (c) orbitals involved in C-O bond breaking.
Figure 9.
Frontier orbitals of 2a and 4a; (a) HOMO of 2a, (b) HOMO-1 of 4a, and (c) orbitals involved in C-O bond breaking.

Figure 10.
Barrier of C-O bond breaking in enolate 3a chromophore model. Solid line is profile in vacuum and dotted line in methanol medium.
Figure 10.
Barrier of C-O bond breaking in enolate 3a chromophore model. Solid line is profile in vacuum and dotted line in methanol medium.

Scheme 2.
Synthesis of Fl-DGA.


Table 1.
Comparison of molecular properties in the interacting complexes of 1 and 1a with Ca2+.
| Parameter | a 1-Ca2+ | b 1a-Ca2+ |
|---|---|---|
| Ca Valence | 0.43 | 0.41 |
| Ca Charge | 1.89 | 1.79 |
| C6 p-Character | 68.6 | 64.0 |
| Ca-O25 TOP | 0.092 | 0.090 |
| C7-O22 BD | 1.55 | 2.75 |
| C7 Valence | 4.90 | 3.56 |
| O22 Valence | 1.95 | 1.70 |
Table 2.
Bond dissociation energies of complexes in methanol.
| Dissociation Reaction | BDE (kcal mol−1) |
|---|---|
| a2a-Mg2+ → 2a + Mg2+ | 18.2 |
| a2a-Ca2+ → 2a + Ca2+ | 9.1 |
| a2a-Na+ → 2a + Na+ | 4.3 |
| a2a-K+ → 2a + K+ | 3.5 |
| b4-Mg2+ → 4 + Mg2+ | 29.5 |
| b4-Ca2+ → 4 + Ca2+ | 11.8 |
| b4-K+ → 4 + K+ | 7.2 |
| b4a-Mg2+ → 4a + Mg2+ | 53.7 |
| b4a-Ca2+ → 4a + Ca2+ | 27.2 |
| b4a-K+ → 4a + K+ | 12.6 |
| b2-Ca2+ → 2 + Ca2+ | 6.5 |
| b4b-Ca2+ → 4b + Ca2+ | 11.6 |
| b2–4b-Ca2+ → 2 + 4b-Ca2+ | 5.6 |
| c3a-Ca2+ → 3a + Ca2+ | 22.1 |
a with 6-311+g(2df,2p) basis set and b with 6-31+g(d,p) basis set. c 3a-Ca2+ in acyclic form.
Table 3.
Comparison of molecular properties in the complexes of phenol core 5 and its deprotonated form (5a) with 4-Ca2+ and 4a-Ca2+.
Table 3.
Comparison of molecular properties in the complexes of phenol core 5 and its deprotonated form (5a) with 4-Ca2+ and 4a-Ca2+.
| Parameter | a 5-4-Ca2+ | b 5a-4a-Ca2+ |
|---|---|---|
| Ca Valence | 0.42 | 0.47 |
| Ca Charge | 1.88 | 1.86 |
| C4 p-Character | 69.5 | 69.1 |
| C7-O11 TOP | 0.412 | 0.028 |
| C7-O11 Bond Order | 1.34 | 1.25 |
| C7 Valence | 3.07 | 3.32 |
| O11 Valence | 1.85 | 1.81 |
| C4 NMR | 129.9 | 110.1 |
| C7 NMR | 96.5 | 100.8 |
Table 4.
Photophysical characteristics of Fl-DGA (1).
| [Fl-DGA] (mM) | 3.2 | 1.0 | 0.3 | 0.1 |
| λmax(nm) | 544 | 544 | 544 | 544 |
| Im/I0 | 1.0 | 5.2 | 2.1 | 1.2 |
λmax: maximum emission wavelength. Im/Io: ratio of maximum fluorescence intensity without metal cation.
Publisher’s Note: MDPI stays neutral with regard to jurisdictional claims in published maps and institutional affiliations. |
© 2022 by the authors. Licensee MDPI, Basel, Switzerland. This article is an open access article distributed under the terms and conditions of the Creative Commons Attribution (CC BY) license (https://creativecommons.org/licenses/by/4.0/).
Share and Cite
MDPI and ACS Style
Narimani, L.; Lee, V.S.; Alias, Y.; Manan, N.S.; Woi, P.M. Rational Design of a Fluorescent Chromophore as a Calcium Receptor via DFT and Multivariate Approaches. Molecules 2022, 27, 6248. https://doi.org/10.3390/molecules27196248
AMA Style
Narimani L, Lee VS, Alias Y, Manan NS, Woi PM. Rational Design of a Fluorescent Chromophore as a Calcium Receptor via DFT and Multivariate Approaches. Molecules. 2022; 27(19):6248. https://doi.org/10.3390/molecules27196248
Chicago/Turabian StyleNarimani, Leila, Vannajan Sanghiran Lee, Yatimah Alias, Ninie Suhana Manan, and Pei Meng Woi. 2022. "Rational Design of a Fluorescent Chromophore as a Calcium Receptor via DFT and Multivariate Approaches" Molecules 27, no. 19: 6248. https://doi.org/10.3390/molecules27196248